beyond water activity: recent advances based on an
TRANSCRIPT
Full Terms & Conditions of access and use can be found athttp://www.tandfonline.com/action/journalInformation?journalCode=bfsn20
Download by: [Texas A&M University Libraries] Date: 09 January 2018, At: 10:57
Critical Reviews in Food Science and Nutrition
ISSN: 1040-8398 (Print) 1549-7852 (Online) Journal homepage: http://www.tandfonline.com/loi/bfsn20
Beyond water activity: Recent advances based onan alternative approach to the assessment of foodquality and safety
Louise Slade , Harry Levine & David S. Reid
To cite this article: Louise Slade , Harry Levine & David S. Reid (1991) Beyond wateractivity: Recent advances based on an alternative approach to the assessment of foodquality and safety, Critical Reviews in Food Science and Nutrition, 30:2-3, 115-360, DOI:10.1080/10408399109527543
To link to this article: https://doi.org/10.1080/10408399109527543
Published online: 29 Sep 2009.
Submit your article to this journal
Article views: 772
View related articles
Citing articles: 846 View citing articles

Critical Reviews in Food Science and Nutrition, 30(2-3):! 15—360(1991)
Beyond Water Activity: Recent AdvancesBased on an Alternative Approach to theAssessment of Food Quality and Safety
Louise Slade and Harry LevineNabisco Brands, Inc., Fundamental Science Group, P.O. Box 1944, East Hanover, New Jersey07936-1944.
Referee: David S. Reid, Dept. of Food Science and Technology, Cruess Hall, University of California at Davis,
Davis, California 95616.
ABSTRACT: Water, the most abundant constituent of natural foods, is a ubiquitous plasticizer of most naturaland fabricated food ingredients and products. Many of the new concepts and developments in modern foodscience and technology revolve around the role of water, and its manipulation, in food manufacturing, processing,and preservation. This article reviews the, effects of water, as a near-universal solvent and plasticizer, on thebehavior of polymeric (as well as oligomeric and monomeric) food materials and systems, with emphasis onthe impact of water content (in terms of increasing system mobility and eventual water "availability") on foodquality, safety, stability, and technological performance. This review describes a new perspective on moisturemanagement, an old and established discipline now evolving to a theoretical basis of fundamental structure-property principles from the field of synthetic polymer science, including the innovative concepts of "waterdynamics" and "glass dynamics". These integrated concepts focus on the non-equilibrium nature of all "realworld" food products and processes, and stress the importance to successful moisture management of themaintenance of food systems in kinetically metastable, dynamically constrained glassy states rather than equi-librium thermodynamic phases. The understanding derived from this "food polymer science" approach to waterrelationships in foods has led to new insights arid advances beyond the limited applicability of traditional conceptsinvolving water activity. This article is neither a conventional nor comprehensive review of water activity, butrather a critical overview that presents and discusses current, usable information on moisture management theory,research, and practice applicable to food systems covering the broadest ranges of moisture content and processing/storage temperature conditions.
KEY WORDS: water activity, water relationships, moisture management, water as plasticizer, food polymerscience, glass transition, water dynamics, glass dynamics
I. INTRODUCTION
Before 1950, many of the attributes of water-based food products were expressed in terms ofwater content, as was the ability of living cellsto function optimally. In 1952, Scott1 suggestedthat the (equilibrium thermodynamic) water ac-tivity (Aw), rather than water content, providedthe true measure of physiological functioning andtechnological performance and quality. In recentyears, more perceptive studies have shown thatneither water content nor water activity can ad-
equately account for the observed behavior ofmost moist, semi-moist, or almost-dry food sys-tems.2 Processes such as "water binding" andosmoregulation have been invoked in several em-pirical descriptions of food product stability orbiological viability,3 but none of these descrip-tions can be correlated with product safety orperformance.4"8
In response to these shortcomings, a discus-sion conference, Water Activity: A CredibleMeasure of Technological Performance andPhysiological Viability?, was convened at Girton
1040-8398/91/$.50© 1991 by CRC Press, Inc.
115
Dow
nloa
ded
by [
Tex
as A
&M
Uni
vers
ity L
ibra
ries
] at
10:
57 0
9 Ja
nuar
y 20
18
College, Cambridge, July 1 to 3, 1985, by theIndustrial Physical Chemistry Group of the Far-aday Division of the Royal Society of Chemistry,in association with the Food Chemistry Group(Industrial Division). Its main purpose was toclarify the significance and relevance of wateractivity as a measure of food product perfor-mance or the ability of living organisms to sur-vive and function. A subsidiary objective was toarrive at recommendations for a more crediblequality standard beyond water activity, still basedon the properties of water. This conference wasthe genesis of this review.
The conference was divided into 4 half-daysessions on the basis of a "map of water re-gimes", defined by temperature and moisturecontent: very dilute systems near room temper-ature, steady-state systems at physiological tem-peratures, dry systems at and above room tem-perature, and concentrated systems over the broadrange from subzero to elevated temperatures. Thesessions emphasized the topics of the equilibriumthermodynamic basis of water activity, salting-in/salting-out phenomena, and specific molecu-lar/ionic effects in dilute solutions near room tem-perature;9-10 "compatible solutes" and osmore-gulation in microbiological systems as complexdilute systems at physiological temperatures;11
low-moisture food systems at room temperatureand above, water vapor sorption, and sorptionhysteresis as an indication of the inappropriateuse of vapor pressure as a measure of water ac-tivity;12-13 and intermediate-moisture, concen-trated, and supersaturated glassy and rubbery foodsystems over a broad range of temperatures fromsubzero to over 200°C, water as plasticizer, andthe mystique of "bound water".14 In each ses-sion, an introductory critical review, by thespeakers cited above,914 was followed by a dis-cussion among the participants (including indus-trial and academic scientists from the U.K., theNetherlands, France, Scotland, Switzerland, theU.S., Canada, and China; see Appendix) to de-velop a consensus of opinion. The final sessionwas devoted to the drafting of a set of guidelinesand recommendations for criteria of food qualityand safety, more consistent with the current stateof our knowledge of the physics and chemistryof aqueous systems.
The consensus of the meeting was that nei-
ther the equilibrium thermodynamic water activ-ity nor its use as a parameter in water vaporsorption experiments should be used any longeras a criteria for performance and functioning ofnonequilibrium food and biological systems inlimited water.2-15 Moreover, the concept of"bound water" is neither useful nor'correct.7-15
Discussion of alternative experimental ap-proaches and interpretations for prediction of sta-bility and biological behavior was based largelyon the dynamically constrained behavior of poly-mers at different levels of plasticization. The con-sensus led to the adoption of a "water dynamicsmap" to describe the "map of water regimes"categorized by the speakers and to the recom-mendation of' 'water dynamics"I5-16 as a conceptto serve as the next step in the evolution of criteriafor food quality and safety.
This review describes the concept of waterdynamics and its basis as a central element of aframework based on a "food polymer science"approach to the study of structure-property re-lationships in food products and processes.8-14"39
The depth, breadth, and utility of this new re-search approach is contrasted with the limitedscope and practical and technological shortcom-ings of the concept of water activity. In a criticalrather than comprehensive fashion, this articlereviews recent advances in the field of water re-lationships and moisture management in foodsystems during the decade of the 1980s, withemphasis on the period from the 1985 Faradayconference to the present. These advances haveresulted in part from new interpretations and in-sights derived from the understanding providedby water dynamics and related elements of thefood polymer science approach.
II. HISTORICAL BACKGROUND:SHORTCOMINGS OF THE TRADITIONALAPPROACH BASED ON THE CONCEPTOF Aw
It has been known for thousands of years thatthe quality and safety of naturally high-moisturefoods are best preserved by storage at low mois-ture content and/or low temperature. Since thetime of the Pharoahs, the shelf-lives of naturalfoods have been extended by removing water and
116
Dow
nloa
ded
by [
Tex
as A
&M
Uni
vers
ity L
ibra
ries
] at
10:
57 0
9 Ja
nuar
y 20
18
making foods dryer and/or by lowering the tem-perature and making foods colder. Ancient meth-ods of food preservation were based on the gen-erally correct assumption that the dryer and/orcolder, the better, in terms of longer shelf-life.However, in modern times economic consider-ations regarding drying and refrigeration pro-cesses require us to ask the question: How dryis dry enough and how cold is cold enough toensure optimum product quality and safety? Sincethe answers to these questions are not universalbut rather specific to individual foods, we mustbe able to determine these answers, either em-pirically or, preferably, theoretically and predic-tively, based on fundamental physicochemicalproperties, which are both meaningful and meas-urable, of specific food materials.4(M2
In recent decades, the concept of water ac-tivity advanced by Scott has become the tradi-tional approach used universally to try to answerthese questions. Because Aw (actually in termsof the relative vapor pressure of water in theheadspace above a food) is an easily measuredphysicochemical property that can be empiricallyrelated to product shelf-life, Aw has become astrongly entrenched concept in the food scienceand technology literature. Despite this fact, theAw concept is not universally useful or appli-cable, and an alternative, technologically prac-tical approach is needed. A number ofworkers2-1643 have pointed out shortcomings anddescribed serious problems that can arise whenAw is used as a predictor of food quality andsafety. An alternative approach to the technolog-ical challenges of moisture management shouldemphasize three fundamental principles.8-30 Thefirst is that real food systems are never equilib-rium systems, so that one must always deal withkinetics. Another is that there are interrelation-ships among the moisture content of a food sam-ple, the time of an experiment or of a storagestudy, and the temperature, and that one can makemanipulations or transformations among thesethree variables, so that one can predict shelf-lifeby interchanging the moisture and temperatureparameters. Lastly, with respect to the questionof just how cold and/or dry is good enough, one
can establish reference conditions of temperatureand moisture content to be measured for eachsolute or blend of solutes in an aqueous foodsystem, so that one can begin to say, for example,that a particular freezer temperature is low enough,and closer to that temperature is better than far-ther above it for a given food material whosespecific extent of maximal freeze-concentrationin a realistic time frame (the process whereby thewater-compatible solutes in a high-moisture foodare maximally concentrated, due to the maximalphase separation of some portion of the total waterin a food as pure ice, as the food is frozen bycooling to a sufficiently low subzero temperature4)can be measured quantitatively.27>3134>4<>42
The genesis of an alternative approach tomoisture management based on these three prin-ciples dates back at least to 1966 and a seminalreview by White and Cakebread44 of glassy statesin certain sugar-containing food products. Theyrecognized (1) the importance of the glassy state,and of the glass transition temperature (Tg) andits location relative to the temperature of storage(either ambient or subzero), in a variety of aqueousfood systems, including but not limited to boiledsugar candies, and (2) the critical role of wateras a plasticizer of food glasses and the quanti-tative Tg-depressing effect of increasing contentof plasticizing moisture, whereby Tg of a partic-ular glass-forming solute-water mixture dependson the corresponding content of plasticizing water(Wg) in that glass at its Tg.15 Tg and Wg rep-resent the reference conditions of temperature andmoisture content mentioned earlier.16>30-40-41 Whiteand Cakebread were apparently the first food sci-entists to allude to the broader implications ofnon-equilibrium glassy and rubbery states to thequality, safety, and storage stability of a widerange of glass-forming aqueous food systems.Evidently, outside a small community of candytechnologists, the work of White and Cakebread,and its broader relevance to the field of moisturemanagement and water relationships in foods,went largely unnoticed until the early 1980s. Sincethat time, other workers have helped to advance,with increasing momentum, concepts and ap-proaches based on a similar recognition and ap-
117
Dow
nloa
ded
by [
Tex
as A
&M
Uni
vers
ity L
ibra
ries
] at
10:
57 0
9 Ja
nuar
y 20
18

plication of the principles underlying the impor-tance of non-equihbrium glassy and rubbery statesto food quality and safety.4-8-14^3-45'66
A. Intermediate Moisture Foods —Chemical, Physical, and MicrobiologicalStability
1. Intermediate Moisture Systems —Definitions
Most composite materials derived from nat-urally occurring molecules are subject to chem-ical, physical, and/or microbiological degrada-tion and deterioration. As alluded to earlier, itwas realized quite early on that such systems canbe stabilized to some extent via the control ofthe moisture content. The role of water in pro-cesses that take place in semi-dry (or semi-moist)systems is complex: it can act as continuous phase(solvent, dispersion medium), as reactant (hy-drolysis, protonation, etc.), and as plasticizer ofbiopolymer structures.
As already noted, in 1952 Scott1 put forwardthe concept that it is the water activity, Aw, ratherthan the water content, that controls the variousdeterioration processes. (It should be clearly notedthat the definition used by Scott was not actuallythe thermodynamic activity, but rather a steady-state relative vapor pressure.) This view has sincebeen universally (and uncritically) adopted by thefood industry and regulatory authorities,67 andfood products are labeled "intermediate mois-ture" when they are so formulated that their sta-bilities (physical, chemical, microbiological) de-pend on a critical value of Aw that must not beexceeded. The remainder of Section II. A reviewsthe factors that limit the utility of Aw as a mea-sure of food quality and safety and as a predictivetool for the development of new "intermediatemoisture foods" (IMFs).
2. Equilibrium Water Activity
Basic equilibrium thermodynamics teachesthat the sign of the Fibbs free energy change,AG, determintes whether a given chemical re-
action can proceed or not. Thus, chemical equi-librium is associated with the condition
AG = 0 (at constant T and P)
but the equilibrium is of a dynamic nature, i.e.,the rates of the forward and backward reactionare equal. In an ideal aqueous system, the partialfree energy (chemical potential) jx; of any onecomponent i is proportional to its mol fractionconcentration Xj, which is itself proportional toits partial vapor pressure (Raoult's law). In amixture where water is the only volatile com-ponent, its chemical potential is expressed in termsof the vapor pressure p by the equation
+ RT In p (1)
where it is also assumed that the vapor above thesystem behaves as an ideal gas (pV = RT). Fora real system, which deviates from Raoult's lawand Henry's law, Equation 1 becomes increas-ingly approximate. Lewis and Randall68 ad-vanced the device of activity (Aw) to replacevapor pressure in Equation 1, such that Aw isproportional to p and becomes equal to p in theinfinite dilution limit where the solution is ideal.This device makes it possible to retain simple,compact equations for the various thermody-namic properties even for nonideal systems. (Thealternative would have been to add a series ofcorrection terms.) Equation 1 is now rewritten interms of Aw and contains a vapor pressure (p)term and an activity coefficient (f) term:
JJLW = fi° + RT In Aw
= n° + RT In p + RT In fideal nonideal
(2)
The last term is a correction to allow for nonidealbehavior in the system. In the limit of infinitedilution, f = 1 and
Aw = p/p° (3)
where p° is the vapor pressure of pure liquid waterunder the same external conditions. Equation 3is the expression usually found in the technicalliterature.
118
Dow
nloa
ded
by [
Tex
as A
&M
Uni
vers
ity L
ibra
ries
] at
10:
57 0
9 Ja
nuar
y 20
18
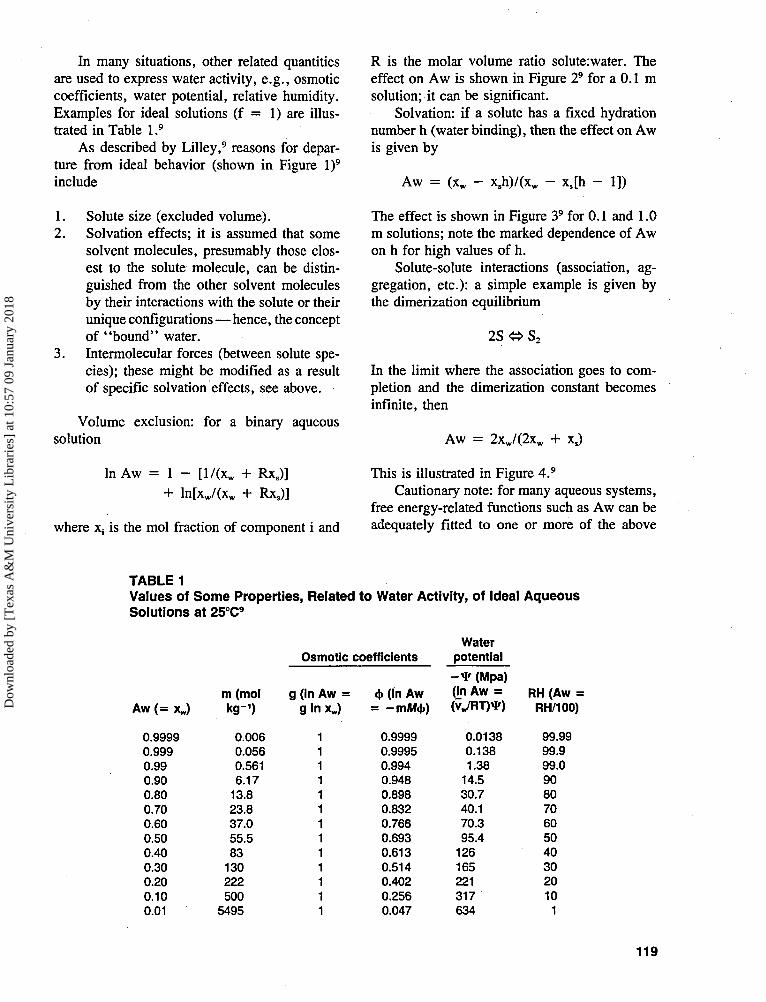
In many situations, other related quantitiesare used to express water activity, e.g., osmoticcoefficients, water potential, relative humidity.Examples for ideal solutions (f = 1) are illus-trated in Table 1.9
As described by Lilley,9 reasons for depar-ture from ideal behavior (shown in Figure I)9
include
1. Solute size (excluded volume).2. Solvation effects; it is assumed that some
solvent molecules, presumably those clos-est to the solute molecule, can be distin-guished from the other solvent moleculesby their interactions with the solute or theirunique configurations—hence, the conceptof "bound" water.
3. Intermolecular forces (between solute spe-cies); these might be modified as a resultof specific solvation effects, see above.
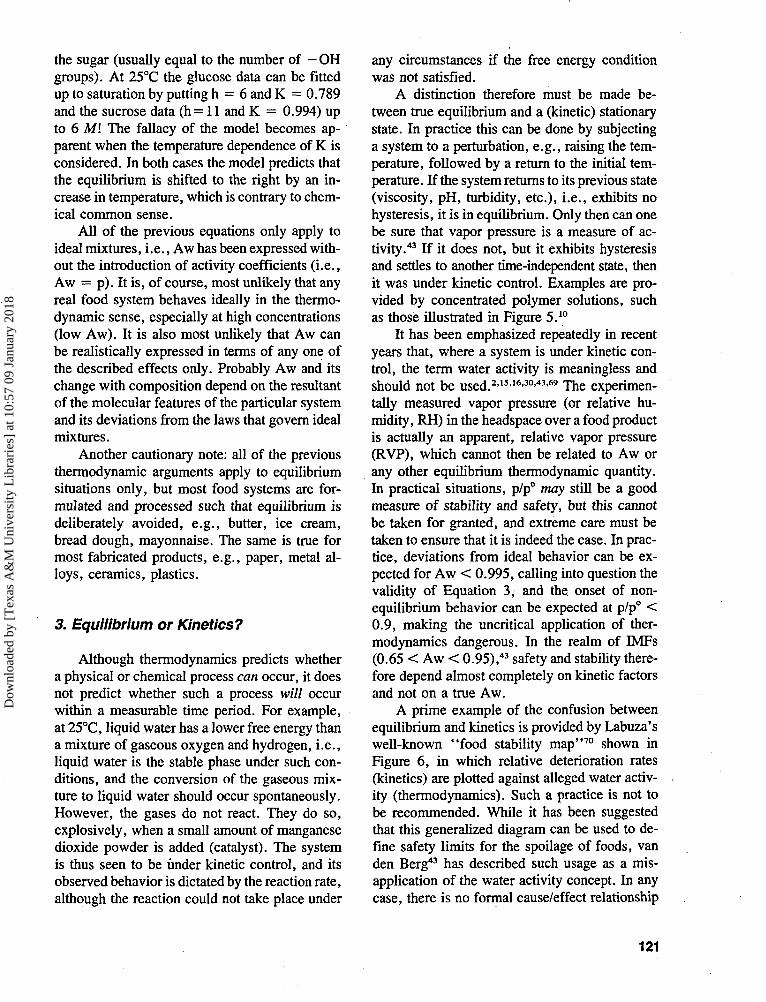
Volume exclusion: for a binary aqueoussolution
In Aw = 1 - [l/(xw + Rxs)]+ ln[xw/(xw + Rxs)]
where xt is the mol fraction of component i and
R is the molar volume ratio solute:water. Theeffect on Aw is shown in Figure 29 for a 0.1 msolution; it can be significant.
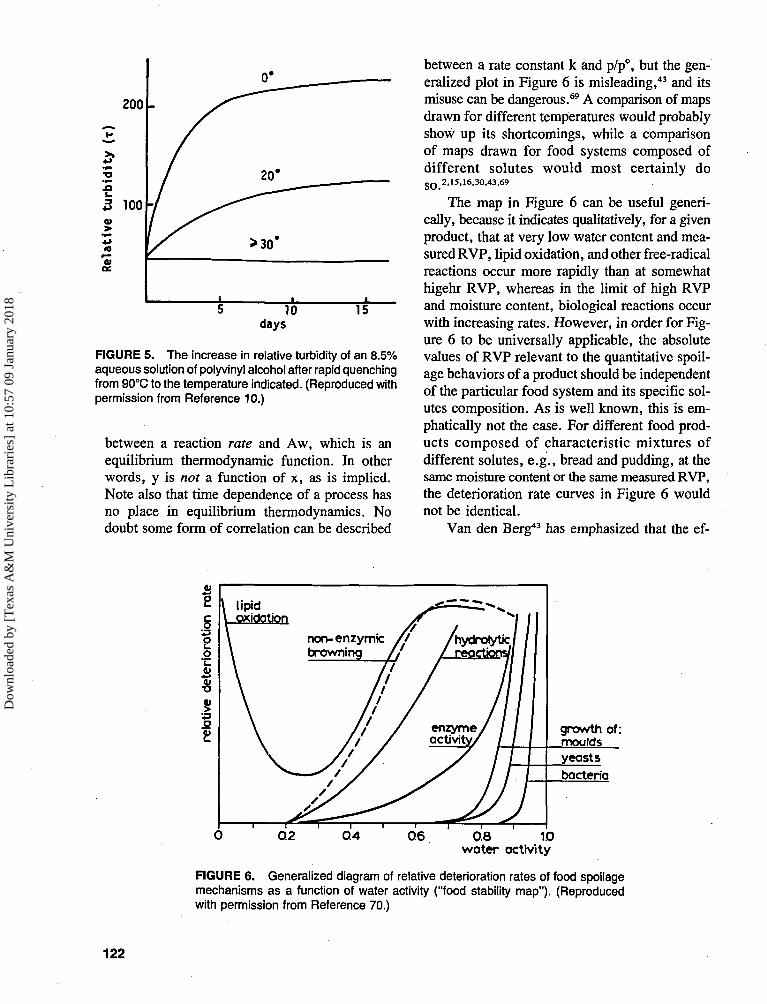
Solvation: if a solute has a fixed hydrationnumber h (water binding), then the effect on Awis given by
Aw = (xw — xsh)/(xw — xs[h — 1])
The effect is shown in Figure 39 for 0.1 and 1.0m solutions; note the marked dependence of Awon h for high values of h.
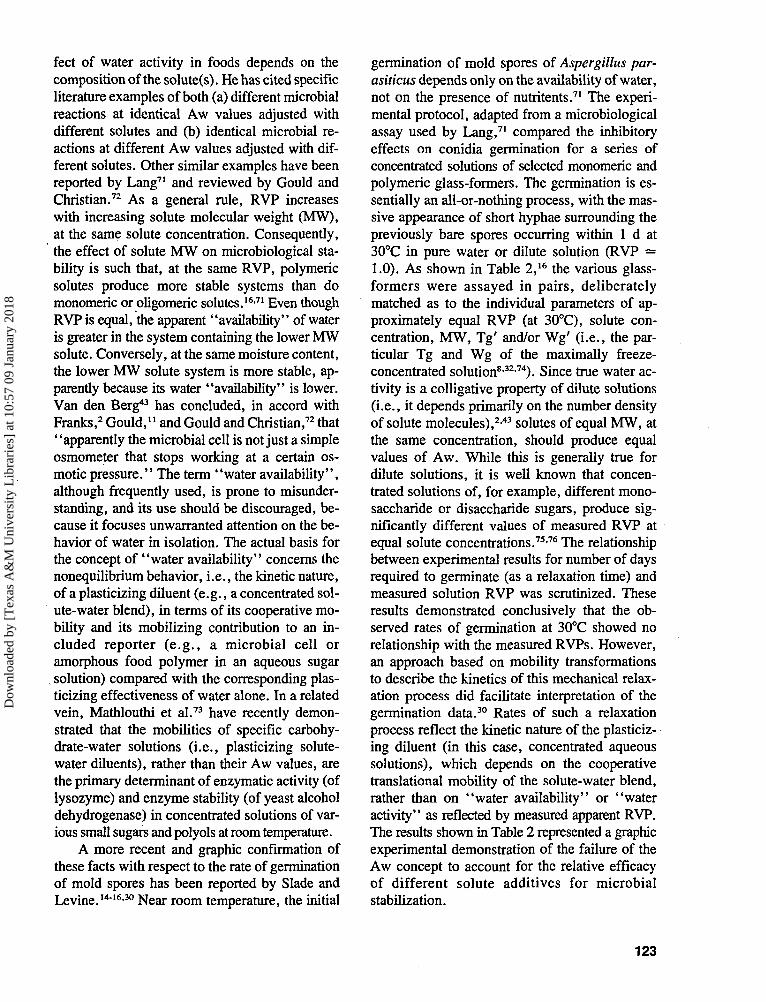
Solute-solute interactions (association, ag-gregation, etc.): a simple example is given bythe dimerization equilibrium
In the limit where the association goes to com-pletion and the dimerization constant becomesinfinite, then
Aw = 2xw/(2xw + xs)
This is illustrated in Figure 4.9
Cautionary note: for many aqueous systems,free energy-related functions such as Aw can beadequately fitted to one or more of the above
TABLE 1Values of Some Properties, Related to Water Activity, of Ideal AqueousSolutions at 25°C9
IW ( = X j
0.99990.9990.990.900.800.700.600.500.400.300.200.100.01
m (molkg-)
0.0060.0560.5616.17
13.823.837.055.583
130222500
5495
Osmotic
g (In Aw =
glnxj
1111111111111
coefficients
<}> (In A w= -mMcf . )
0.99990.99950.9940.9480.8980.8320.7660.6930.6130.5140.4020.2560.047
Waterpotential
- ¥ (Mpa)(jn Aw =(vJRT)*)
0.01380.1381.38
14.530.740.170.395.4
126165221317634
RH (Aw =RH/100)
99.9999.999.09080706050403020101
119
Dow
nloa
ded
by [
Tex
as A
&M
Uni
vers
ity L
ibra
ries
] at
10:
57 0
9 Ja
nuar
y 20
18
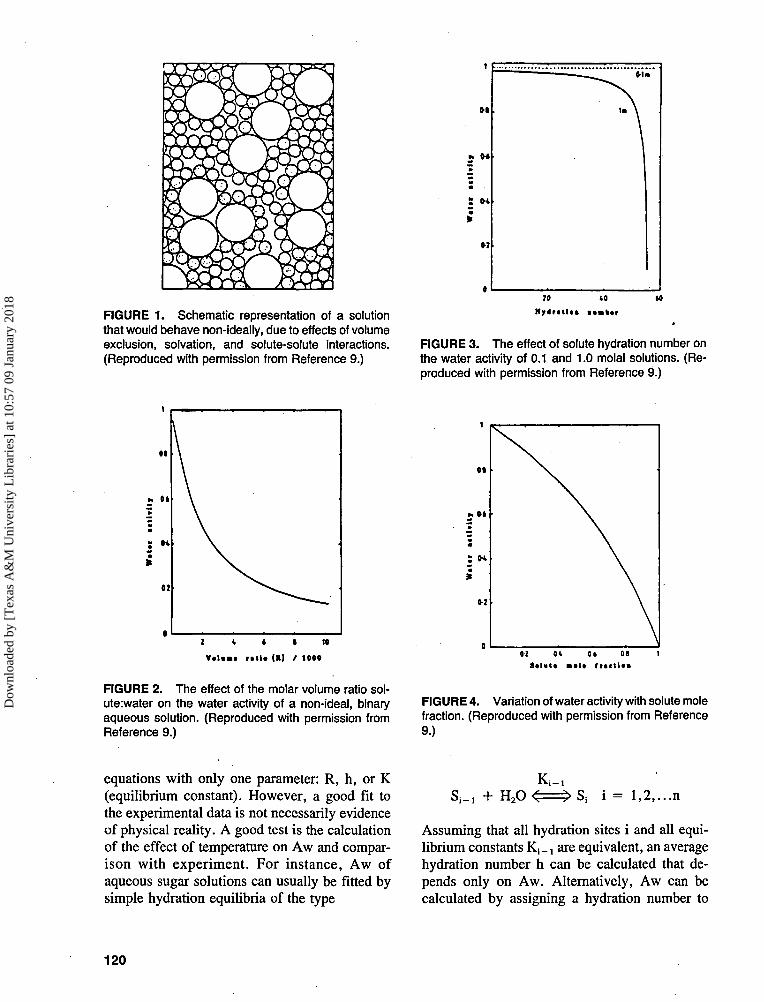
FIGURE 1. Schematic representation of a solutionthat would behave non-ideally, due to effects of volumeexclusion, solvation, and solute-solute interactions.(Reproduced with permission from Reference 9.)
FIGURE 3. The effect of solute hydration number onthe water activity of 0.1 and 1.0 molal solutions. (Re-produced with permission from Reference 9.)
* • io
¥•!••» Hill (ft) / t00»
FIGURE 2. The effect of the molar volume ratio sol-ute:water on the water activity of a non-ideal, binaryaqueous solution. (Reproduced with permission fromReference 9.)
FIGURE 4. Variation of water activity with solute molefraction. (Reproduced with permission from Reference9.)
equations with only one parameter: R, h, or K(equilibrium constant). However, a good fit tothe experimental data is not necessarily evidenceof physical reality. A good test is the calculationof the effect of temperature on Aw and compar-ison with experiment. For instance, Aw ofaqueous sugar solutions can usually be fitted bysimple hydration equilibria of the type
H2OK i_1
i = 1,2,...n
Assuming that all hydration sites i and all equi-librium constants Kj_, are equivalent, an averagehydration number h can be calculated that de-pends only on Aw. Alternatively, Aw can becalculated by assigning a hydration number to
120
Dow
nloa
ded
by [
Tex
as A
&M
Uni
vers
ity L
ibra
ries
] at
10:
57 0
9 Ja
nuar
y 20
18
the sugar (usually equal to the number of —OHgroups). At 25°C the glucose data can be fittedup to saturation by putting h = 6 and K = 0.789and the sucrose data (h= 11 and K = 0.994) upto 6 M\ The fallacy of the model becomes ap-parent when the temperature dependence of K isconsidered. In both cases the model predicts thatthe equilibrium is shifted to the right by an in-crease in temperature, which is contrary to chem-ical common sense.
All of the previous equations only apply toideal mixtures, i.e., Aw has been expressed with-out the introduction of activity coefficients (i.e.,Aw = p). It is, of course, most unlikely that anyreal food system behaves ideally in the thermo-dynamic sense, especially at high concentrations(low Aw). It is also most unlikely that Aw canbe realistically expressed in terms of any one ofthe described effects only. Probably Aw and itschange with composition depend on the resultantof the molecular features of the particular systemand its deviations from the laws that govern idealmixtures.
Another cautionary note: all of the previousthermodynamic arguments apply to equilibriumsituations only, but most food systems are for-mulated and processed such that equilibrium isdeliberately avoided, e.g., butter, ice cream,bread dough, mayonnaise. The same is true formost fabricated products, e.g., paper, metal al-loys, ceramics, plastics.
3. Equilibrium or Kinetics?
Although thermodynamics predicts whethera physical or chemical process can occur, it doesnot predict whether such a process will occurwithin a measurable time period. For example,at 25°C, liquid water has a lower free energy thana mixture of gaseous oxygen and hydrogen, i.e.,liquid water is the stable phase under such con-ditions, and the conversion of the gaseous mix-ture to liquid water should occur spontaneously.However, the gases do not react. They do so,explosively, when a small amount of manganesedioxide powder is added (catalyst). The systemis thus seen to be under kinetic control, and itsobserved behavior is dictated by the reaction rate,although the reaction could not take place under
any circumstances if the free energy conditionwas not satisfied.
A distinction therefore must be made be-tween true equilibrium and a (kinetic) stationarystate. In practice this can be done by subjectinga system to a perturbation, e.g., raising the tem-perature, followed by a return to the initial tem-perature. If the system returns to its previous state(viscosity, pH, turbidity, etc.), i.e., exhibits nohysteresis, it is in equilibrium. Only then can onebe sure that vapor pressure is a measure of ac-tivity.43 If it does not, but it exhibits hysteresisand settles to another time-independent state, thenit was under kinetic control. Examples are pro-vided by concentrated polymer solutions, suchas those illustrated in Figure 5.10
It has been emphasized repeatedly in recentyears that, where a system is under kinetic con-trol, the term water activity is meaningless andshould not be used.2-15-16-30-43-69 The experimen-tally measured vapor pressure (or relative hu-midity, RH) in the headspace over a food productis actually an apparent, relative vapor pressure(RVP), which cannot then be related to Aw orany other equilibrium thermodynamic quantity.In practical situations, p/p° may still be a goodmeasure of stability and safety, but this cannotbe taken for granted, and extreme care must betaken to ensure that it is indeed the case. In prac-tice, deviations from ideal behavior can be ex-pected for Aw < 0.995, calling into question thevalidity of Equation 3, and the. onset of non-equilibrium behavior can be expected at p/p° <0.9, making the uncritical application of ther-modynamics dangerous. In the realm of IMFs(0.65 < Aw < 0.95),43 safety and stability there-fore depend almost completely on kinetic factorsand not on a true Aw.
A prime example of the confusion betweenequilibrium and kinetics is provided by Labuza'swell-known "food stability map"70 shown inFigure 6, in which relative deterioration rates(kinetics) are plotted against alleged water activ-ity (thermodynamics). Such a practice is not tobe recommended. While it has been suggestedthat this generalized diagram can be used to de-fine safety limits for the spoilage of foods, vanden Berg43 has described such usage as a mis-application of the water activity concept. In anycase, there is no formal cause/effect relationship
121
Dow
nloa
ded
by [
Tex
as A
&M
Uni
vers
ity L
ibra
ries
] at
10:
57 0
9 Ja
nuar
y 20
18
10 15days
FIGURE 5. The increase in relative turbidity of an 8.5%aqueous solution of polyvinyl alcohol after rapid quenchingfrom 90°C to the temperature indicated. (Reproduced withpermission from Reference 10.)
between a reaction rate and Aw, which is anequilibrium thermodynamic function. In otherwords, y is not a function of x, as is implied.Note also that time dependence of a process hasno place in equilibrium thermodynamics. Nodoubt some form of correlation can be described
between a rate constant k and p/p°, but the gen-eralized plot in Figure 6 is misleading,43 and itsmisuse can be dangerous.69 A comparison of mapsdrawn for different temperatures would probablyshow up its shortcomings, while a comparisonof maps drawn for food systems composed ofdifferent solutes would most certainly dos o 2,15,16,30,43,69
The map in Figure 6 can be useful generi-cally, because it indicates qualitatively, for a givenproduct, that at very low water content and mea-sured RVP, lipid oxidation, and other free-radicalreactions occur more rapidly than at somewhathigehr RVP, whereas in the limit of high RVPand moisture content, biological reactions occurwith increasing rates. However, in order for Fig-ure 6 to be universally applicable, the absolutevalues of RVP relevant to the quantitative spoil-age behaviors of a product should be independentof the particular food system and its specific sol-utes composition. As is well known, this is em-phatically not the case. For different food prod-ucts composed of characteristic mixtures ofdifferent solutes, e.g., bread and pudding, at thesame moisture content or the same measured RVP,the deterioration rate curves in Figure 6 wouldnot be identical.
Van den Berg43 has emphasized that the ef-
0.8 1.0water activity
FIGURE 6. Generalized diagram of relative deterioration rates of food spoilagemechanisms as a function of water activity ("food stability map"). (Reproducedwith permission from Reference 70.)
122
Dow
nloa
ded
by [
Tex
as A
&M
Uni
vers
ity L
ibra
ries
] at
10:
57 0
9 Ja
nuar
y 20
18
feet of water activity in foods depends on thecomposition of the solute(s). He has cited specificliterature examples of both (a) different microbialreactions at identical Aw values adjusted withdifferent solutes and (b) identical microbial re-actions at different Aw values adjusted with dif-ferent solutes. Other similar examples have beenreported by Lang71 and reviewed by Gould andChristian.72 As a general rule, RVP increaseswith increasing solute molecular weight (MW),at the same solute concentration. Consequently,the effect of solute MW on microbiological sta-bility is such that, at the same RVP, polymericsolutes produce more stable systems than domonomeric or oligomeric solutes.16'71 Even thoughRVP is equal, the apparent "availability" of wateris greater in the system containing the lower MWsolute. Conversely, at the same moisture content,the lower MW solute system is more stable, ap-parently because its water "availability" is lower.Van den Berg43 has concluded, in accord withFranks,2 Gould,11 and Gould and Christian,72 that"apparently the microbial cell is not just a simpleosmometer that stops working at a certain os-motic pressure." The term "water availability",although frequently used, is prone to misunder-standing, and its use should be discouraged, be-cause it focuses unwarranted attention on the be-havior of water in isolation. The actual basis forthe concept of "water availability" concerns thenonequilibrium behavior, i.e., the kinetic nature,of a plasticizing diluent (e.g., a concentrated sol-ute-water blend), in terms of its cooperative mo-bility and its mobilizing contribution to an in-cluded reporter (e.g., a microbial cell oramorphous food polymer in an aqueous sugar
. solution) compared with the corresponding plas-ticizing effectiveness of water alone. In a relatedvein, Mathlouthi et al.73 have recently demon-strated that the mobilities of specific carbohy-drate-water solutions (i.e., plasticizing solute-water diluents), rather than their Aw values, arethe primary determinant of enzymatic activity (oflysozyme) and enzyme stability (of yeast alcoholdehydrogenase) in concentrated solutions of var-ious small sugars and polyols at room temperature.
A more recent and graphic confirmation ofthese facts with respect to the rate of germinationof mold spores has been reported by Slade andLevine.14"1630 Near room temperature, the initial
germination of mold spores of Aspergillus par-asiticus depends only on the availability of water,not on the presence of nutritents.71 The experi-mental protocol, adapted from a microbiologicalassay used by Lang,71 compared the inhibitoryeffects on conidia germination for a series ofconcentrated solutions of selected monomeric andpolymeric glass-formers. The germination is es-sentially an all-or-nothing process, with the mas-sive appearance of short hyphae surrounding thepreviously bare spores occurring within 1 d at30°C in pure water or dilute solution (RVP =1.0). As shown in Table 2,16 the various glass-formers were assayed in pairs, deliberatelymatched as to the individual parameters of ap-proximately equal RVP (at 30°C), solute con-centration, MW, Tg' and/or Wg' (i.e., the par-ticular Tg and Wg of the maximally freeze-concentrated solution8-32'74). Since true water ac-tivity is a colligative property of dilute solutions(i.e., it depends primarily on the number densityof solute molecules),2-43 solutes of equal MW, atthe same concentration, should produce equalvalues of Aw. While this is generally true fordilute solutions, it is well known that concen-trated solutions of, for example, different mono-saccharide or disaccharide sugars, produce sig-nificantly different values of measured RVP atequal solute concentrations.75'76 The relationshipbetween experimental results for number of daysrequired to germinate (as a relaxation time) andmeasured solution RVP was scrutinized. Theseresults demonstrated conclusively that the ob-served rates of germination at 30°C showed norelationship with the measured RVPs. However,an approach based on mobility transformationsto describe the kinetics of this mechanical relax-ation process did facilitate interpretation of thegermination data.30 Rates of such a relaxationprocess reflect the kinetic nature of the plasticiz-ing diluent (in this case, concentrated aqueoussolutions), which depends on the cooperativetranslational mobility of the solute-water blend,rather than on "water availability" or "wateractivity" as reflected by measured apparent RVP.The results shown in Table 2 represented a graphicexperimental demonstration of the failure of theAw concept to account for the relative efficacyof different solute additives for microbialstabilization.
123
Dow
nloa
ded
by [
Tex
as A
&M
Uni
vers
ity L
ibra
ries
] at
10:
57 0
9 Ja
nuar
y 20
18
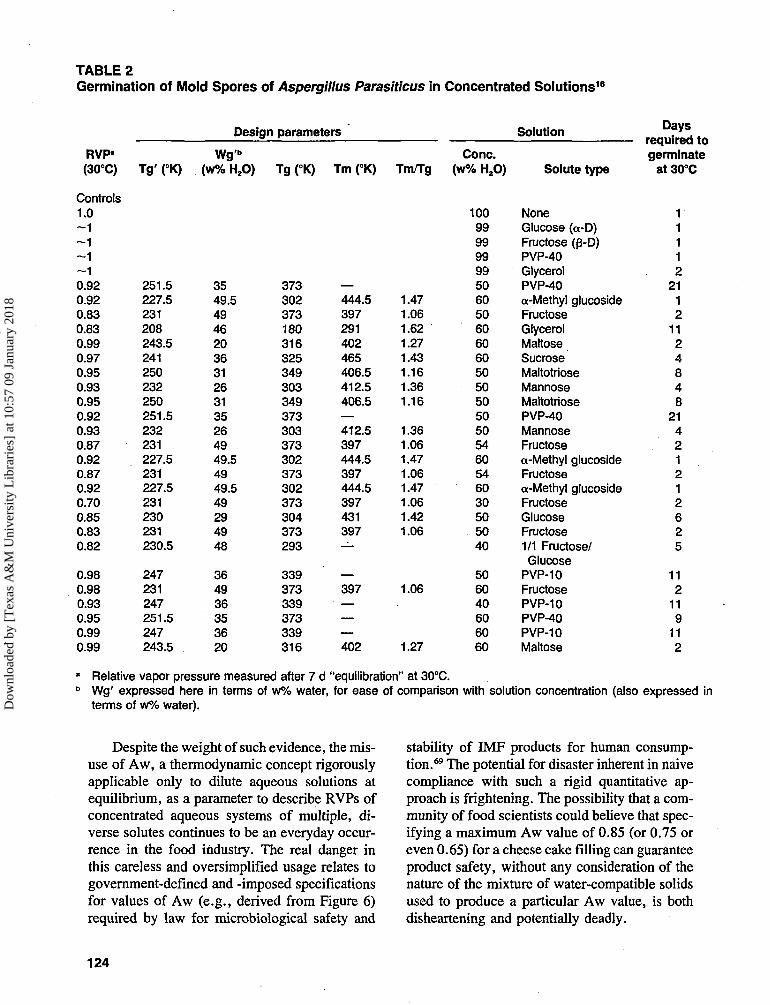
TABLE 2Germination of Mold Spores of Aspergillus Parasiticus in Concentrated Solutions16
RVP'(30°C)
Controls1.0~1~1~1
0.920.920.830.830.990.970.950.930.950.920.930.870.920.870.920.700.850.830.82
0.980.980.930.950.990.99
Tg' (°K)
251.5227.5231208243.5241250232250251.5232231227.5231227.5231230231230.5
247231247251.5247243.5
Design
Wg'»(w% H2O)
3549.54946203631263135264949.54949.549294948
364936353620
parameters
Tg (°K)
373302373180316325349303349373303373302373302373304373293
339373339373339316
Tm (°K)
—444.5397291402465406.5412.5406.5—412.5397444.5397444.5397431397—
—397———402
Tm/Tg
1.471.061.621.271.431.161.361.16
1.361.061.471.061.471.061.421.06
1.06
1.27
Cone.(w% H2O)
1009999999950605060606050505050505460546030505040
506040606060
Solution
Solute type
NoneGlucose (a-D)Fructose (fJ-D)PVP-40GlycerolPVP-40a-Methyl glucosideFructoseGlycerolMaltoseSucroseMaltotrioseMannoseMaltotriosePVP-40MannoseFructosea-Methyl glucosideFructosea-Methyl glucosideFructoseGlucoseFructose1/1 Fructose/Glucose
PVP-10FructosePVP-10PVP-40PVP-10Maltose
Daysrequired togerminate
at 30°C
11112
2112
1124848
21421212625
112
119
112
Relative vapor pressure measured after 7 d "equilibration" at 30°C.Wg' expressed here in terms of w% water, for ease of comparison with solution concentration (also expressed interms of w% water).
Despite the weight of such evidence, the mis-use of Aw, a thermodynamic concept rigorouslyapplicable only to dilute aqueous solutions atequilibrium, as a parameter to describe RVPs ofconcentrated aqueous systems of multiple, di-verse solutes continues to be an everyday occur-rence in the food industry. The real danger inthis careless and oversimplified usage relates togovernment-defined and -imposed specificationsfor values of Aw (e.g., derived from Figure 6)required by law for microbiological safety and
stability of IMF products for human consump-tion.69 The potential for disaster inherent in naivecompliance with such a rigid quantitative ap-proach is frightening. The possibility that a com-munity of food scientists could believe that spec-ifying a maximum Aw value of 0.85 (or 0.75 oreven 0.65) for a cheese cake filling can guaranteeproduct safety, without any consideration of thenature of the mixture of water-compatible solidsused to produce a particular Aw value, is bothdisheartening and potentially deadly.
124
Dow
nloa
ded
by [
Tex
as A
&M
Uni
vers
ity L
ibra
ries
] at
10:
57 0
9 Ja
nuar
y 20
18
Van den Berg43 has remarked, with consid-erable understatement, that "it is not surprisingtherefore that in recent years, misconceptions haveled to some difficulties in the preservation ofintermediate moisture products." For example,69
consider an intermediate-moisture pet food prod-uct that was originally formulated with a mixtureof solutes (so-called "water binders") predom-inated by glucose and glycerol. This commercialproduct was empirically determined to be micro-biologically safe and stable at an Aw of 0.92,which was thus incorporated as a product spec-ification. Then, for the purpose of cost reduction,the glucose-glycerol combination was replacedby fructose and propylene glycol, but the Awspecification was not lowered in a correspondingand appropriate fashion,30 but rather naively keptat 0.92. The financially disastrous result requireda recall of millions of dollars worth of spoiledproduct. With knowledge of similar cases, vanden Berg43 concluded that "although Scott in hisacclaimed papers was aware of the theoreticalbackground of water activity, he did not distin-guish clearly enough between product RVP andthermodynamic Aw." At least part of the sub-sequent blame for the current state of affairs mustalso rest with those who continue to make un-critical and indiscriminate use of Scott's work.
Take-home lesson: most physical and chem-ical processes that occur in intermediate moisturesystems are under kinetic control (diffusion-lim-ited), and product stability corresponds to a sta-tionary state but not to equilibrium. Importantpractical implications of this statement are treatedin later sections. Note: free radical-induced re-actions may be an exception to the above rule.For now, suffice it to quote van den Berg's43
conclusion regarding Figure 6: "it is more ap-propriate to make a clear distinction between theequilibrium nature of water activity and the ki-netics of deterioration reactions . . . In practice,conclusions with regard to safe and econo-mic specifications for dehydration and storageof a specific product should be drawn up onlyafter careful consideration of the relevant waterrelations and conducting shelf-life stud-ies . . . Because microorganisms respond differ-ently to identical Aw levels set by different sol-utes, and because many foods are not in a stateof equilibrium, as evidenced by hysteresis effects
during humidification and drying, the use of wateractivity concepts cannot guarantee the accurateprediction of food shelf-life."
4. Water Activity and the Control ofMicrobiological Growth
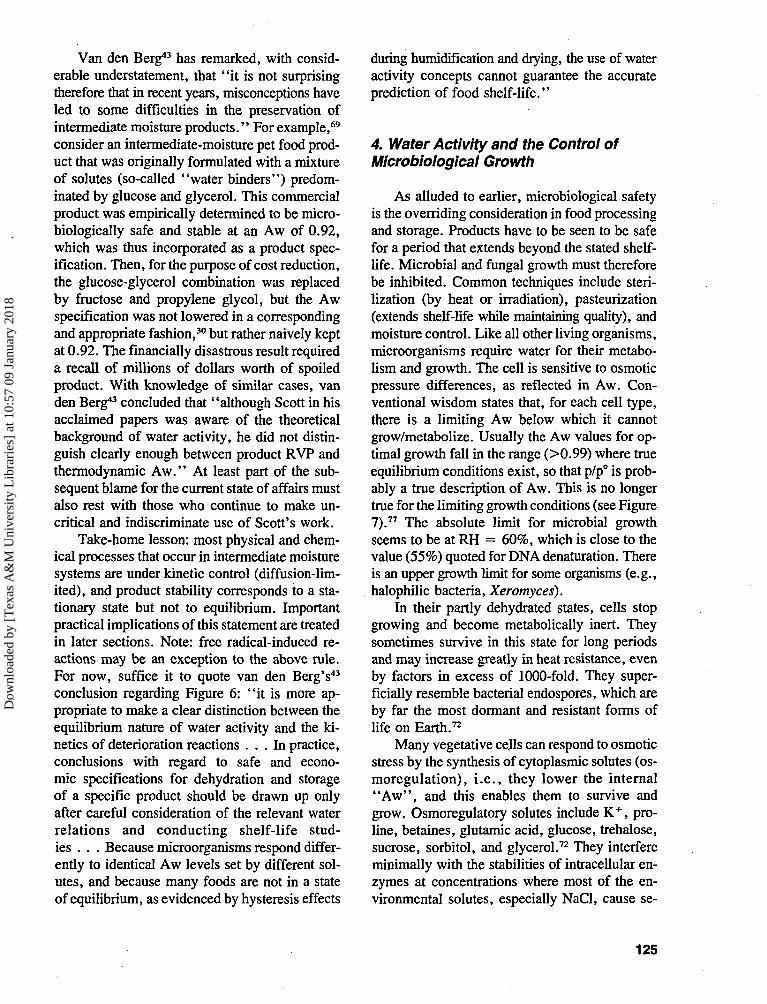
As alluded to earlier, microbiological safetyis the overriding consideration in food processingand storage. Products have to be seen to be safefor a period that extends beyond the stated shelf-life. Microbial and fungal growth must thereforebe inhibited. Common techniques include steri-lization (by heat or irradiation), pasteurization(extends shelf-life while maintaining quality), andmoisture control. Like all other living organisms,microorganisms require water for their metabo-lism and growth. The cell is sensitive to osmoticpressure differences, as reflected in Aw. Con-ventional wisdom states that, for each cell type,there is a limiting Aw below which it cannotgrow/metabolize. Usually the Aw values for op-timal growth fall in the range (>0.99) where trueequilibrium conditions exist, so that p/p° is prob-ably a true description of Aw. This is no longertrue for the limiting growth conditions (see Figure7).77 The absolute limit for microbial growthseems to be at RH = 60%, which is close to thevalue (55%) quoted for DNA denaturation. Thereis an upper growth limit for some organisms (e.g.,halophilic bacteria, Xeromyces).
In their partly dehydrated states, cells stopgrowing and become metabolically inert. Theysometimes survive in this state for long periodsand may increase greatly in heat resistance, evenby factors in excess of 1000-fold. They super-ficially resemble bacterial endospores, which areby far the most dormant and resistant forms oflife on Earth.72
Many vegetative cells can respond to osmoticstress by the synthesis of cytoplasmic solutes (os-moregulation), i.e., they lower the internal"Aw", and this enables them to survive andgrow, Osmoregulatory solutes include K+ , pro-line, betaines, glutamic acid, glucose, trehalose,sucrose, sorbitol, and glycerol.72 They interfereminimally with the stabilities of intracellular en-zymes at concentrations where most of the en-vironmental solutes, especially NaCl, cause se-
125
Dow
nloa
ded
by [
Tex
as A
&M
Uni
vers
ity L
ibra
ries
] at
10:
57 0
9 Ja
nuar
y 20
18
1.0
water activity-growth range
0.9 0.8 0.7 0.6
Xeromyces bisponaSacch. rouxiiHalobacteriumAspergillus flaws IStaph. aureus IEsch. coliCl. bolulimmPs. fluorescent
FIGURE 7. The water activity ranges for microbial growth ofvarious microorganisms. (From Gould, G. W. and Measures,J. C., Phil. Trans. Ft. Soc. London B., 278, 151, 1977. Withpermission.)
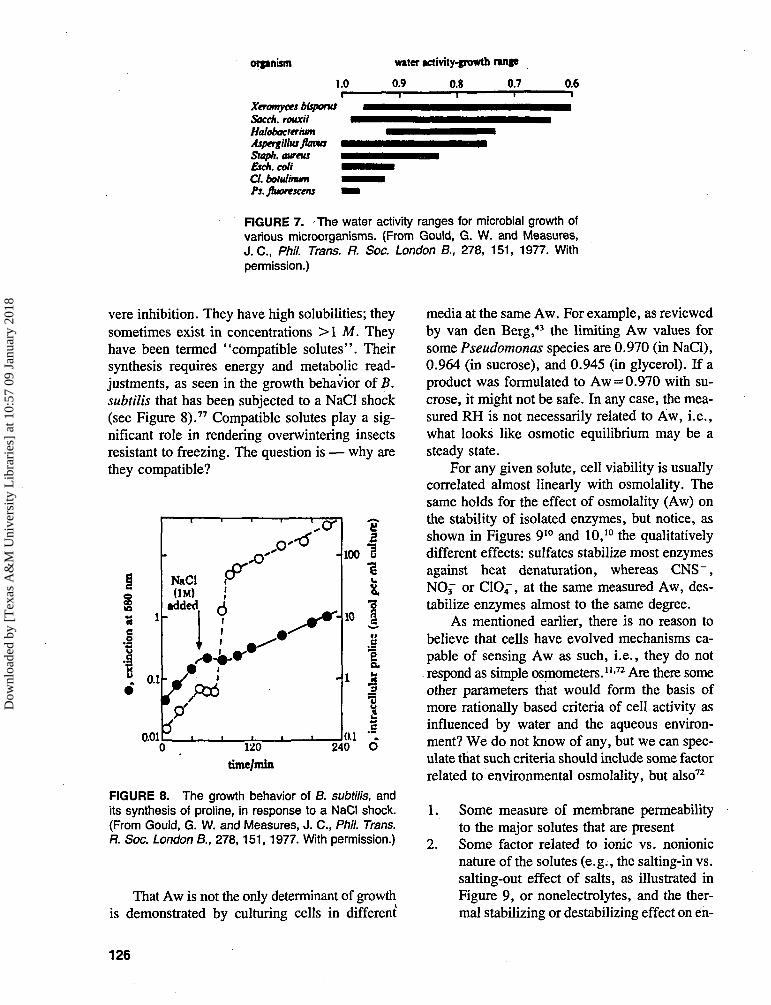
vere inhibition. They have high solubilities; theysometimes exist in concentrations >l M. Theyhave been termed "compatible solutes". Theirsynthesis requires energy and metabolic read-justments, as seen in the growth behavior of B.subtilis that has been subjected to a NaCl shock(see Figure 8).77 Compatible solutes play a sig-nificant role in rendering overwintering insectsresistant to freezing. The question is — why arethey compatible?
0.01
FIGURE 8. The growth behavior of B. subtilis, andits synthesis of proline, in response to a NaCl shock.(From Gould, G. W. and Measures, J. C., Phil. Trans.R. Soc. London B., 278,151,1977. With permission.)
That Aw is not the only determinant of growthis demonstrated by culturing cells in different
media at the same Aw. For example, as reviewedby van den Berg,43 the limiting Aw values forsome Pseudomonas species are 0.970 (in NaCl),0.964 (in sucrose), and 0.945 (in glycerol). If aproduct was formulated to Aw = 0.970 with su-crose, it might not be safe. In any case, the mea-sured RH is not necessarily related to Aw, i.e.,what looks like osmotic equilibrium may be asteady state.
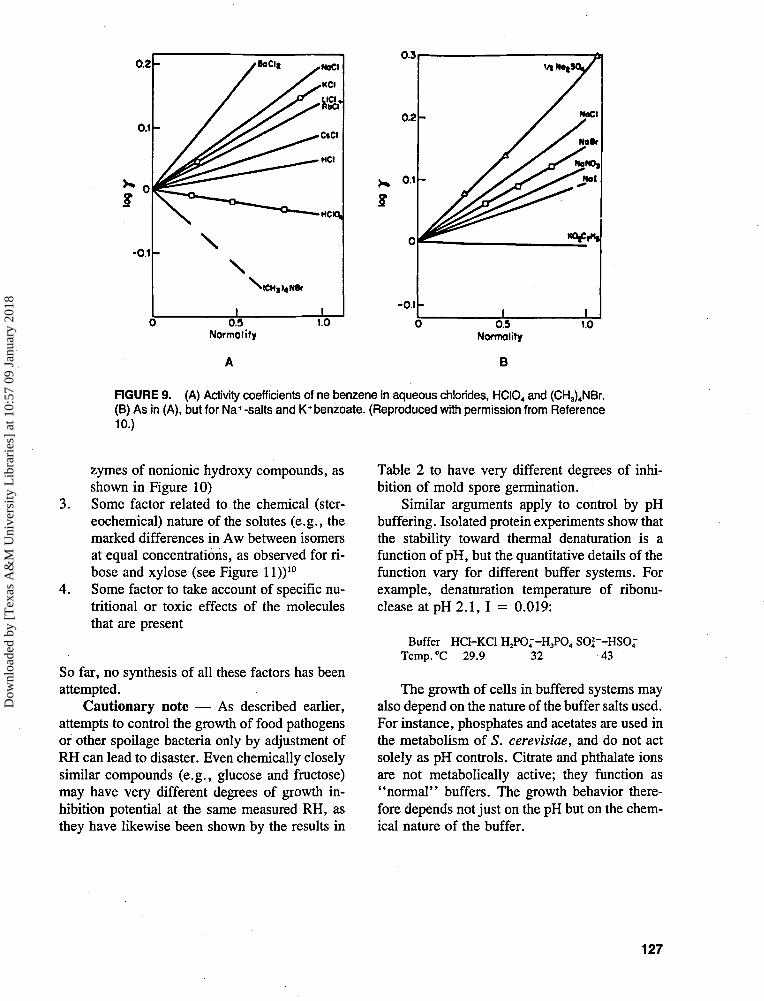
For any given solute, cell viability is usuallycorrelated almost linearly with osmolality. Thesame holds for the effect of osmolality (Aw) onthe stability of isolated enzymes, but notice, asshown in Figures 910 and 10,10 the qualitativelydifferent effects: sulfates stabilize most enzymesagainst heat denaturation, whereas CNS~,NOf or CICXr, at the same measured Aw, des-tabilize enzymes almost to the same degree.
As mentioned earlier, there is no reason tobelieve that cells have evolved mechanisms ca-pable of sensing Aw as such, i.e., they do notrespond as simple osmometers.11-72 Are there someother parameters that would form the basis ofmore rationally based criteria of cell activity asinfluenced by water and the aqueous environ-ment? We do not know of any, but we can spec-ulate that such criteria should include some factorrelated to environmental osmolality, but also72
1. Some measure of membrane permeabilityto the major solutes that are present
2. Some factor related to ionic vs. nonionicnature of the solutes (e.g., the salting-in vs.salting-out effect of salts, as illustrated inFigure 9, or nonelectrolytes, and the ther-mal stabilizing or destabilizing effect on en-
126
Dow
nloa
ded
by [
Tex
as A
&M
Uni
vers
ity L
ibra
ries
] at
10:
57 0
9 Ja
nuar
y 20
18
0.2-
0.1 -
-0.1 -\
vBoCIf
\
1
-—HCIQ,
r
10.5
Normolity1.0
-0.1-
0.5Normality
B
FIGURE 9. (A) Activity coefficients of ne benzene in aqueous chlorides, HCI04 and (CH3)4NBr.(B) As in (A), but for Na+-salts and K+benzoate. (Reproduced with permission from Reference10.)
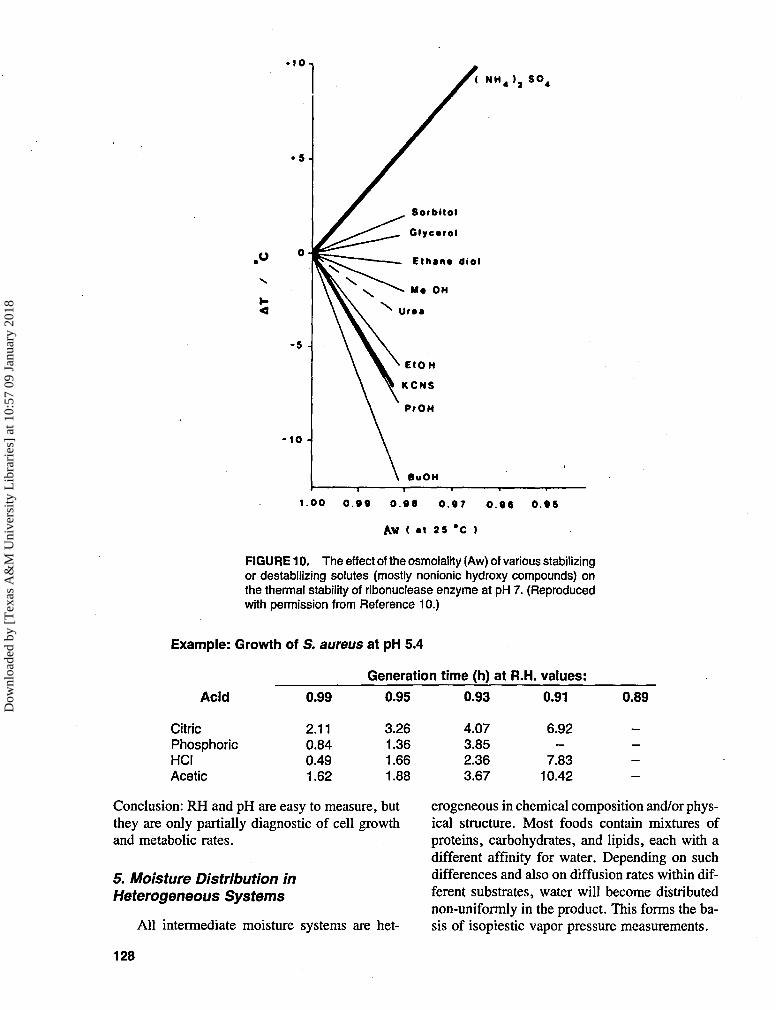
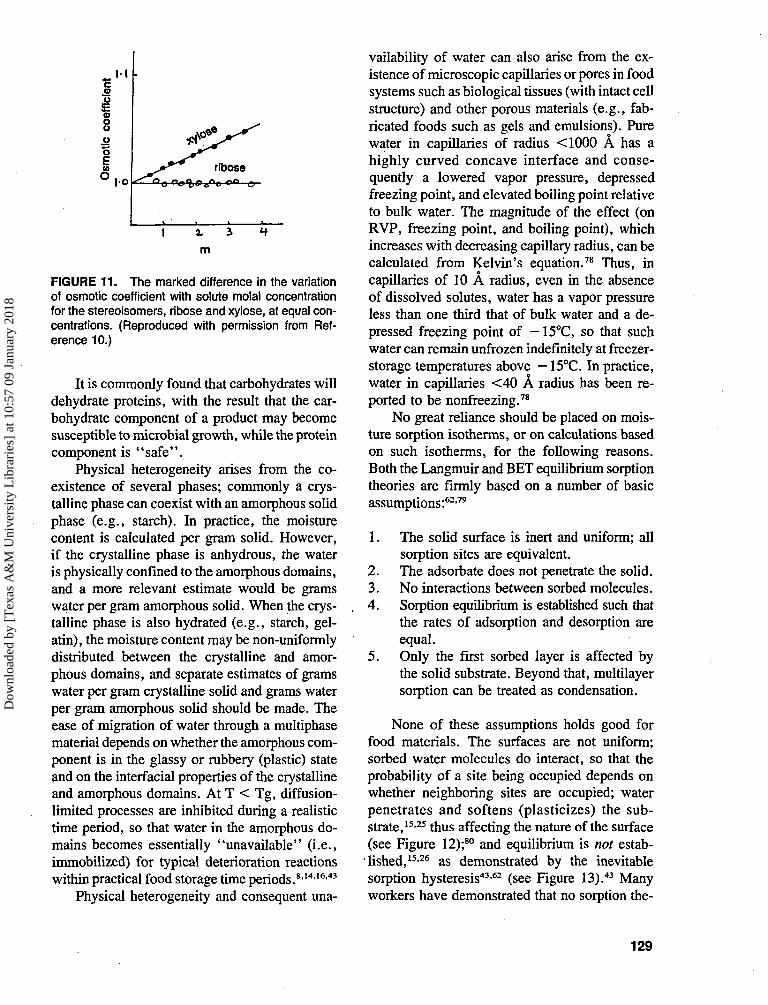
4.
zymes of nonionic hydroxy compounds, asshown in Figure 10)Some factor related to the chemical (ster-eochemical) nature of the solutes (e.g., themarked differences in Aw between isomersat equal concentrations, as observed for ri-bose and xylose (see Figure II))10
Some factor to take account of specific nu-tritional or toxic effects of the moleculesthat are present
So far, no synthesis of all these factors has beenattempted.
Cautionary note — As described earlier,attempts to control the growth of food pathogensor other spoilage bacteria only by adjustment ofRH can lead to disaster. Even chemically closelysimilar compounds (e.g., glucose and fructose)may have very different degrees of growth in-hibition potential at the same measured RH, asthey have likewise been shown by the results in
Table 2 to have very different degrees of inhi-bition of mold spore germination.
Similar arguments apply to control by pHbuffering. Isolated protein experiments show thatthe stability toward thermal denaturation is afunction of pH, but the quantitative details of thefunction vary for different buffer systems. Forexample, denaturation temperature of ribonu-cleaseatpH2.1, I = 0.019:
Buffer HO-KC1 H2PO4--H3PO4 S0|--HS04-Temp.°C 29.9 32 43
The growth of cells in buffered systems mayalso depend on the nature of the buffer salts used.For instance, phosphates and acetates are used inthe metabolism of 5. cerevisiae, and do not actsolely as pH controls. Citrate and phthalate ionsare not metabolically active; they function as"normal" buffers. The growth behavior there-fore depends not just on the pH but on the chem-ical nature of the buffer.
127
Dow
nloa
ded
by [
Tex
as A
&M
Uni
vers
ity L
ibra
ries
] at
10:
57 0
9 Ja
nuar
y 20
18
- 1 0
1.00 0.99 0.98 0.97 0.96 0.95
Aw ( at 2 5 *C >
FIGURE 10. The effect of the osmolality (Aw) of various stabilizingor destabilizing solutes (mostly nonionic hydroxy compounds) onthe thermal stability of ribonuclease enzyme at pH 7. (Reproducedwith permission from Reference 10.)
Example: Growth of S. aureus at pH 5.4
Generation time (h) at R.H. values:
0.99 0.95Acid
CitricPhosphoricHCIAcetic
Conclusion: RH and pH are easy to measure, butthey are only partially diagnostic of cell growthand metabolic rates.
5. Moisture Distribution inHeterogeneous Systems
All intermediate moisture systems are het-
0.93 0.91 0.89
2.110.840.491.62
3.261.361.661.88
4.073.852.363.67
6.92—
7.8310.42
erogeneous in chemical composition and/or phys-ical structure. Most foods contain mixtures ofproteins, carbohydrates, and lipids, each with adifferent affinity for water. Depending on suchdifferences and also on diffusion rates within dif-ferent substrates, water will become distributednon-uniformly in the product. This forms the ba-sis of isopiestic vapor pressure measurements.
128
Dow
nloa
ded
by [
Tex
as A
&M
Uni
vers
ity L
ibra
ries
] at
10:
57 0
9 Ja
nuar
y 20
18
IIJOoE
oo
I,
m
FIGURE 11. The marked difference in the variationof osmotic coefficient with solute molal concentrationfor the stereoisomers, ribose and xylose, at equal con-centrations. (Reproduced with permission from Ref-erence 10.)
It is commonly found that carbohydrates willdehydrate proteins, with the result that the car-bohydrate component of a product may becomesusceptible to microbial growth, while the proteincomponent is "safe".
Physical heterogeneity arises from the co-existence of several phases; commonly a crys-talline phase can coexist with an amorphous solidphase (e.g., starch). In practice, the moisturecontent is calculated per gram solid. However,if the crystalline phase is anhydrous, the wateris physically confined to the amorphous domains,and a more relevant estimate would be gramswater per gram amorphous solid. When the crys-talline phase is also hydrated (e.g., starch, gel-atin), the moisture content may be non-uniformlydistributed between the crystalline and amor-phous domains, and separate estimates of gramswater per gram crystalline solid and grams waterper gram amorphous solid should be made. Theease of migration of water through a multiphasematerial depends on whether the amorphous com-ponent is in the glassy or rubbery (plastic) stateand on the interfacial properties of the crystallineand amorphous domains. At T < Tg, diffusion-limited processes are inhibited during a realistictime period, so that water in the amorphous do-mains becomes essentially "unavailable" (i.e.,immobilized) for typical deterioration reactionswithin practical food storage time periods.8-14-16-43
Physical heterogeneity and consequent una-
vailability of water can also arise from the ex-istence of microscopic capillaries or pores in foodsystems such as biological tissues (with intact cellstructure) and other porous materials (e.g., fab-ricated foods such as gels and emulsions). Purewater in capillaries of radius <1000 A has ahighly curved concave interface and conse-quently a lowered vapor pressure, depressedfreezing point, and elevated boiling point relativeto bulk water. The magnitude of the effect (onRVP, freezing point, and boiling point), whichincreases with decreasing capillary radius, can becalculated from Kelvin's equation.78 Thus, incapillaries of 10 A radius, even in the absenceof dissolved solutes, water has a vapor pressureless than one third that of bulk water and a de-pressed freezing point of — 15°C, so that suchwater can remain unfrozen indefinitely at freezer-storage temperatures above — 15°C. In practice,water in capillaries <40 A radius has been re-ported to be nonfreezing.78
No great reliance should be placed on mois-ture sorption isotherms, or on calculations basedon such isotherms, for the following reasons.Both the Langmuir and BET equilibrium sorptiontheories are firmly based on a number of basicassumptions:62-79
1. The solid surface is inert and uniform; allsorption sites are equivalent.
2. The adsorbate does not penetrate the solid.3. No interactions between sorbed molecules.4. Sorption equilibrium is established such that
the rates of adsorption and desorption areequal.
5. Only the first sorbed layer is affected bythe solid substrate. Beyond that, multilayersorption can be treated as condensation.
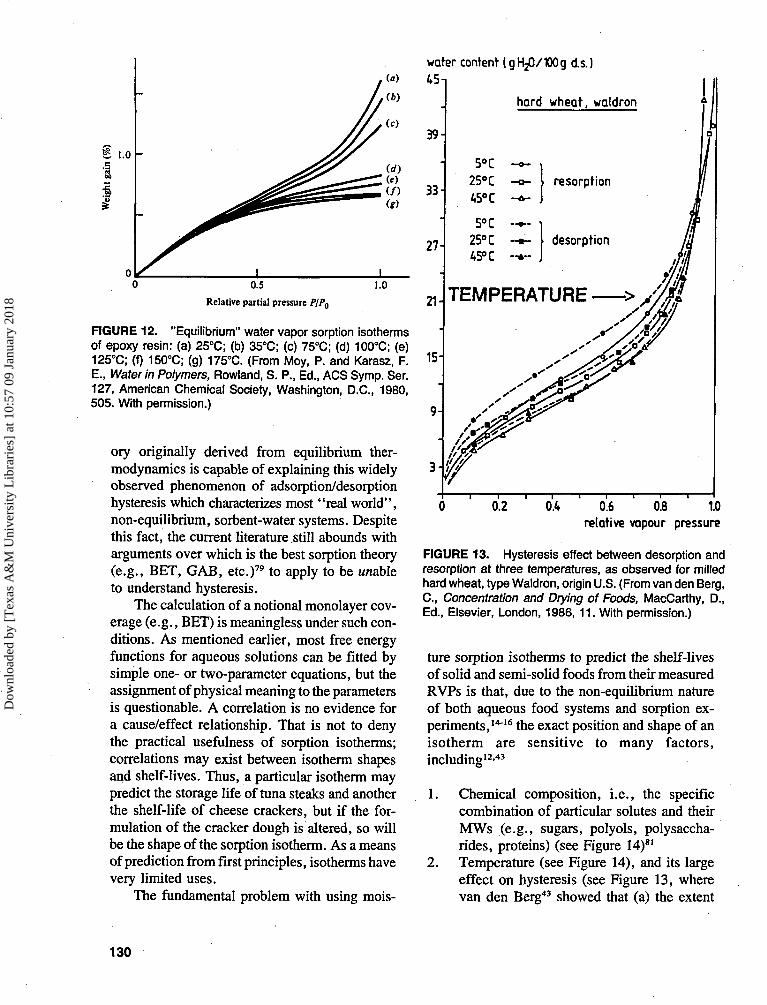
None of these assumptions holds good forfood materials. The surfaces are not uniform;sorbed water molecules do interact, so that theprobability of a site being occupied depends onwhether neighboring sites are occupied; waterpenetrates and softens (plasticizes) the sub-strate,15-25 thus affecting the nature of the surface(see Figure 12);80 and equilibrium is not estab-lished,15-26 as demonstrated by the inevitablesorption hysteresis43-62 (see Figure 13).43 Manyworkers have demonstrated that no sorption the-
129
Dow
nloa
ded
by [
Tex
as A
&M
Uni
vers
ity L
ibra
ries
] at
10:
57 0
9 Ja
nuar
y 20
18
S 1.0
wafer content (gH^/IOOg d.s.)
45
0.5
Relative partial pressure PjP0
1.0
FIGURE 12. "Equilibrium" water vapor sorption isothermsof epoxy resin: (a) 25°C; (b) 35°C; (c) 75°C; (d) 100°C; (e)125°C; (f) 150°C; (g) 175°C. (From Moy, P. and Karasz, F.E., Water in Polymers, Rowland, S. P., Ed., ACS Symp. Ser.127, American Chemical Society, Washington, D.C., 1980,505. With permission.)
ory originally derived from equilibrium ther-modynamics is capable of explaining this widelyobserved phenomenon of adsorption/desorptionhysteresis which characterizes most "real world",non-equilibrium, sorbent-water systems. Despitethis fact, the current literature still abounds witharguments over which is the best sorption theory(e.g., BET, GAB, etc.)79 to apply to be unableto understand hysteresis.
The calculation of a notional monolayer cov-erage (e.g., BET) is meaningless under such con-ditions. As mentioned earlier, most free energyfunctions for aqueous solutions can be fitted bysimple one- or two-parameter equations, but theassignment of physical meaning to the parametersis questionable. A correlation is no evidence fora cause/effect relationship. That is not to denythe practical usefulness of sorption isotherms;correlations may exist between isotherm shapesand shelf-lives. Thus, a particular isotherm maypredict the storage life of tuna steaks and anotherthe shelf-life of cheese crackers, but if the for-mulation of the cracker dough is altered, so willbe the shape of the sorption isotherm. As a meansof prediction from first principles, isotherms havevery limited uses.
The fundamental problem with using mois-
TEMPERATURE
0.2 OA 0.6 0.8 1.0relative vapour pressure
FIGURE 13. Hysteresis effect between desorption andresorption at three temperatures, as observed for milledhard wheat, type Waldron, origin U.S. (From van den Berg, C., Concentration and Drying of Foods, MacCarthy, D.,Ed., Elsevier, London, 1986, 11. With permission.)
ture sorption isotherms to predict the shelf-livesof solid and semi-solid foods from their measuredRVPs is that, due to the non-equilibrium natureof both aqueous food systems and sorption ex-periments,14"16 the exact position and shape of anisotherm are sensitive to many factors,including12-43
1. Chemical composition, i.e., the specificcombination of particular solutes and theirMWs (e.g., sugars, polyols, polysaccha-rides, proteins) (see Figure 14)81
2. Temperature (see Figure 14), and its largeeffect on hysteresis (see Figure 13, wherevan den Berg43 showed that (a) the extent
130
Dow
nloa
ded
by [
Tex
as A
&M
Uni
vers
ity L
ibra
ries
] at
10:
57 0
9 Ja
nuar
y 20
18

gH,o
lOOgDMo 40 »Ce (0*C
• we
lOOgDM
JO
w
0.2 01 0( 01 10
a.
So«ur» C W M U• 2$«eI Ute »O«C• #o«c
A, /
j
oi at o» »• toa.
B
10-
gH,og DM
08-
w
0.0-
MCvMol• J5«C HYO. «0'C SAP• eo *c SAP•B KK HYG
f 1
1 • II1
JJr
y
1.0
00 02 04 06 08 10
g DM08
0.6
Oi
02
00
• K
oeo
Hoi
•C MYo•C SAP•C SAP•C KYG
V
1\I1
I\1
00 02 0 4 06 08 10°w
FIGURE 14. Sorption isotherms of (A) apple pectin and (B) sodium caseinate at 25, 40,60, and 80°C. Adsorption isotherms of (C) sorbitol and (D) xyiitol at 25,60, and 80°C (HYG= Hygrostat; SAP = Sorption apparatus "rotasorp"). (From Weisser, H., Properties ofWater in Foods, Simatos, D. and Multon, J. I., Eds., Martinus Nijhoff, Dordrecht, 1985, 95.With permission.)
of hysteresis between resorption and de-sorption isotherms measured at 5, 25, and45°C for milled wheat increased with de-creasing temperature, and (b) the effect of
temperature was greater on the desorptionisotherms than on the resorption isotherms)
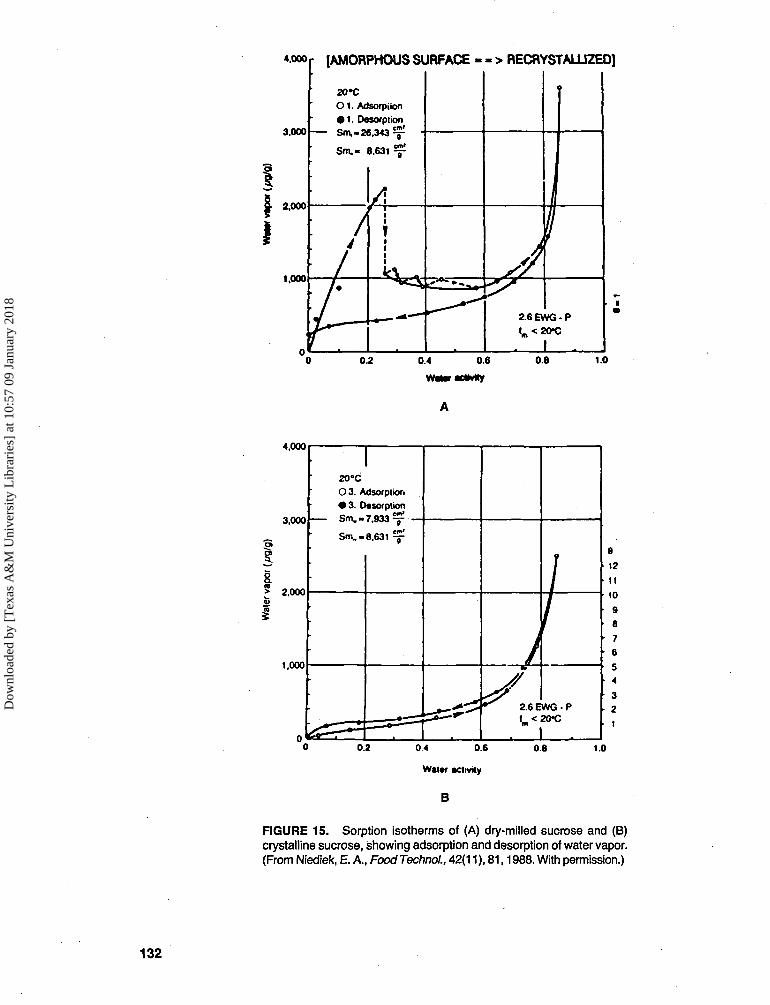
3. Physical structure and state, i.e., amor-phous or crystalline (see Figure 15A vs.
131
Dow
nloa
ded
by [
Tex
as A
&M
Uni
vers
ity L
ibra
ries
] at
10:
57 0
9 Ja
nuar
y 20
18
«.ooor [AMORPHOUS SURFACE - - > RECRYSTALLIZED]
3.000
2.000
1,000
2O*CO 1 . Adsorpiion• 1. Desorption
1.0
4.000
3.000
5 2,000v
1.000
20*CO 3. Adsorption• 3. OesorplionSm.» 7.933 —
S m . . 8.631 CJr
0.2 04 0.6
Water activity
B
0.8
J21110987654321
1.0
FIGURE 15. Sorption isotherms of (A) dry-milled sucrose and (B)crystalline sucrose, showing adsorption and desorption of water vapor.(From Niediek, E. A., Food Techno!., 42(11), 81,1988. With permission.)
132
Dow
nloa
ded
by [
Tex
as A
&M
Uni
vers
ity L
ibra
ries
] at
10:
57 0
9 Ja
nuar
y 20
18
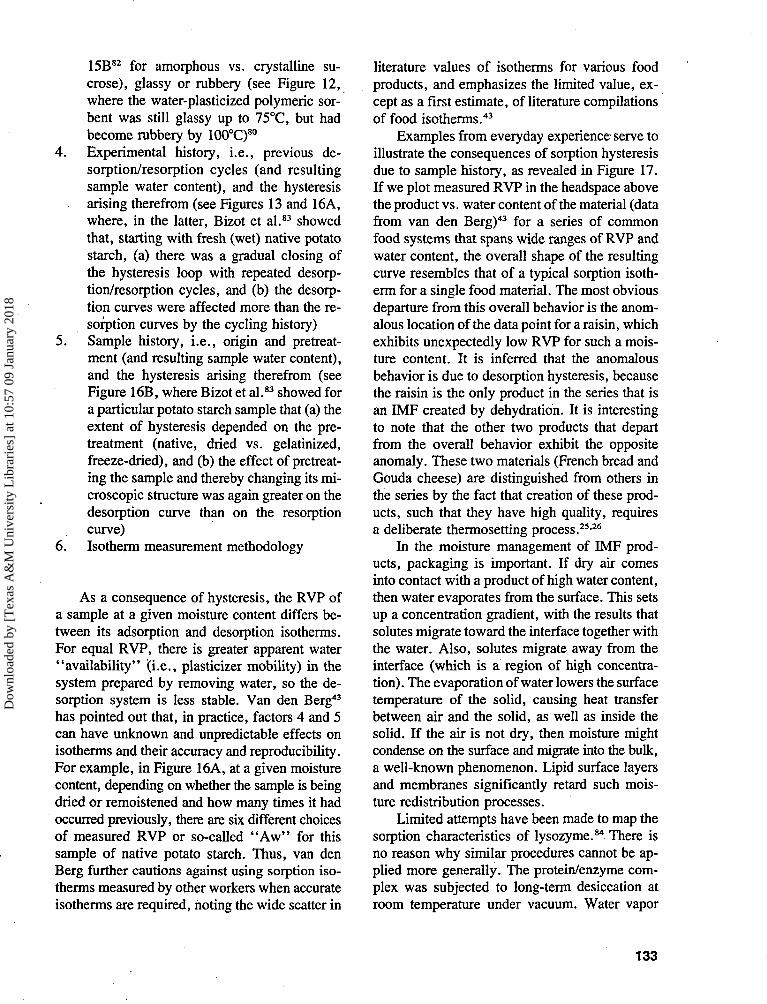
15B82 for amorphous vs. crystalline su-crose), glassy or rubbery (see Figure 12,where the water-plasticized polymeric sor-bent was still glassy up to 75°C, but hadbecome rubbery by 100°C)80
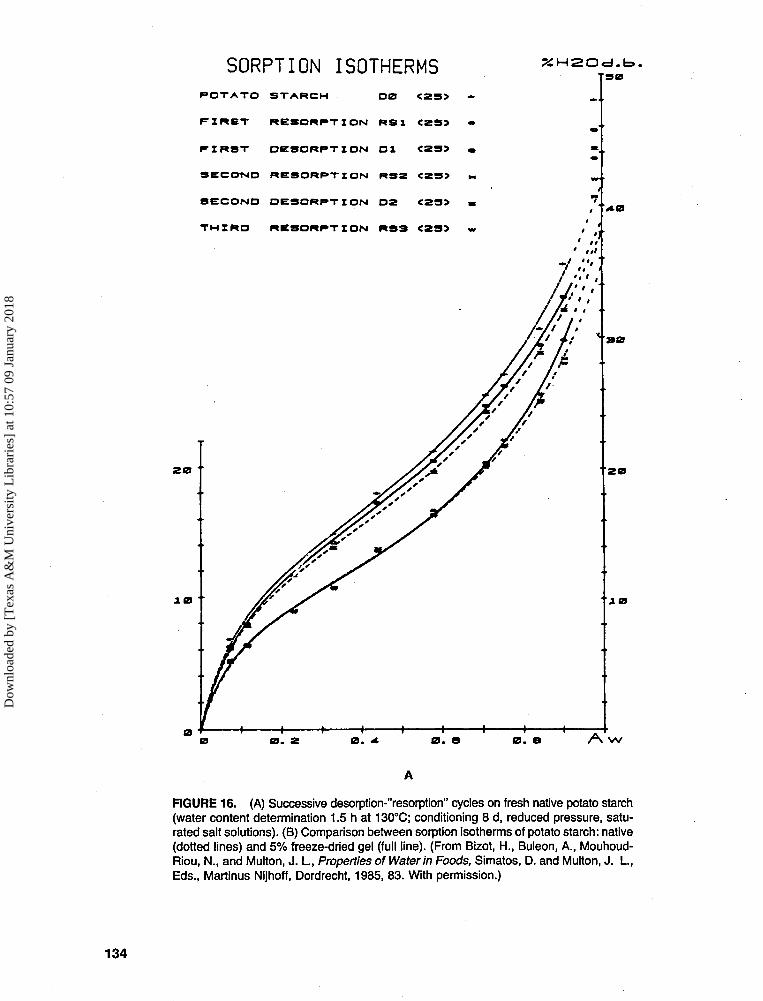
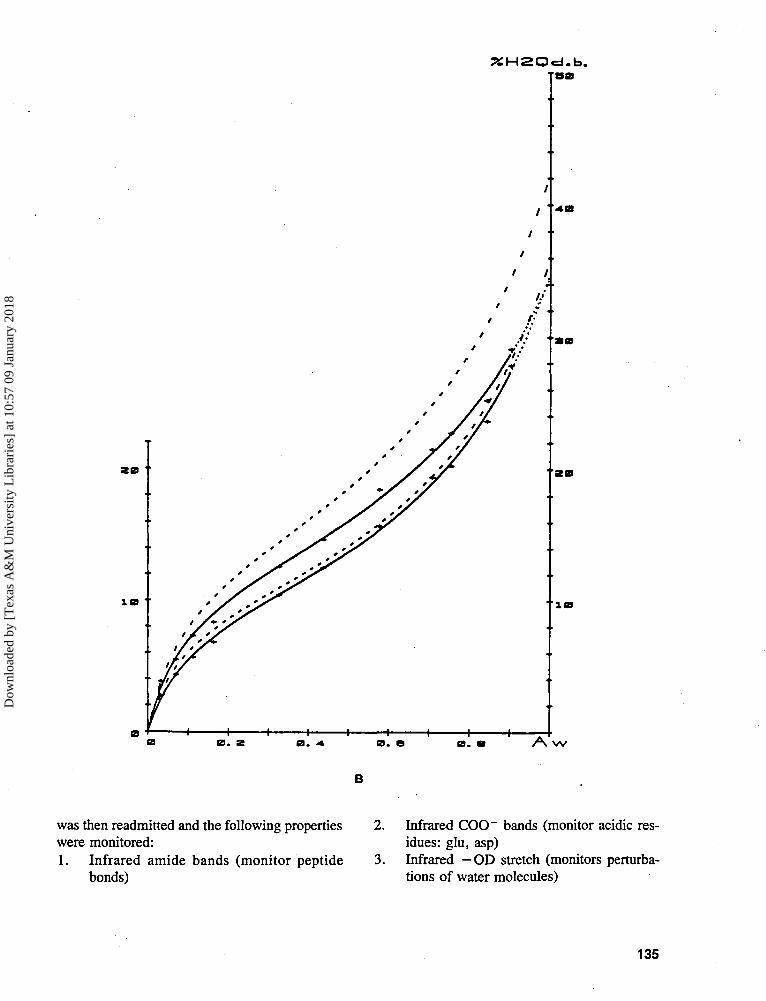
Experimental history, i.e., previous de-sorption/resorption cycles (and resultingsample water content), and the hysteresisarising therefrom (see Figures 13 and 16A,where, in the latter, Bizot et al.83 showedthat, starting with fresh (wet) native potatostarch, (a) there was a gradual closing ofthe hysteresis loop with repeated desorp-tion/resorption cycles, and (b) the desorp-tion curves were affected more than the re-sorption curves by the cycling history)Sample history, i.e., origin and pretreat-ment (and resulting sample water content),and the hysteresis arising therefrom (seeFigure 16B, where Bizot et al.83 showed fora particular potato starch sample that (a) theextent of hysteresis depended on the pre-treatment (native, dried vs. gelatinized,freeze-dried), and (b) the effect of pretreat-ing the sample and thereby changing its mi-croscopic structure was again greater on thedesorption curve than on the resorptioncurve)Isotherm measurement methodology
As a consequence of hysteresis, the RVP ofa sample at a given moisture content differs be-tween its adsorption and desorption isotherms.For equal RVP, there is greater apparent water"availability" (i.e., plasticizer mobility) in thesystem prepared by removing water, so the de-sorption system is less stable. Van den Berg43
has pointed out that, in practice, factors 4 and 5can have unknown and unpredictable effects onisotherms and their accuracy and reproducibility.For example, in Figure 16A, at a given moisturecontent, depending on whether the sample is beingdried or remoistened and how many times it hadoccurred previously, there are six different choicesof measured RVP or so-called "Aw" for thissample of native potato starch. Thus, van denBerg further cautions against using sorption iso-therms measured by other workers when accurateisotherms are required, noting the wide scatter in
literature values of isotherms for various foodproducts, and emphasizes the limited value, ex-cept as a first estimate, of literature compilationsof food isotherms.43
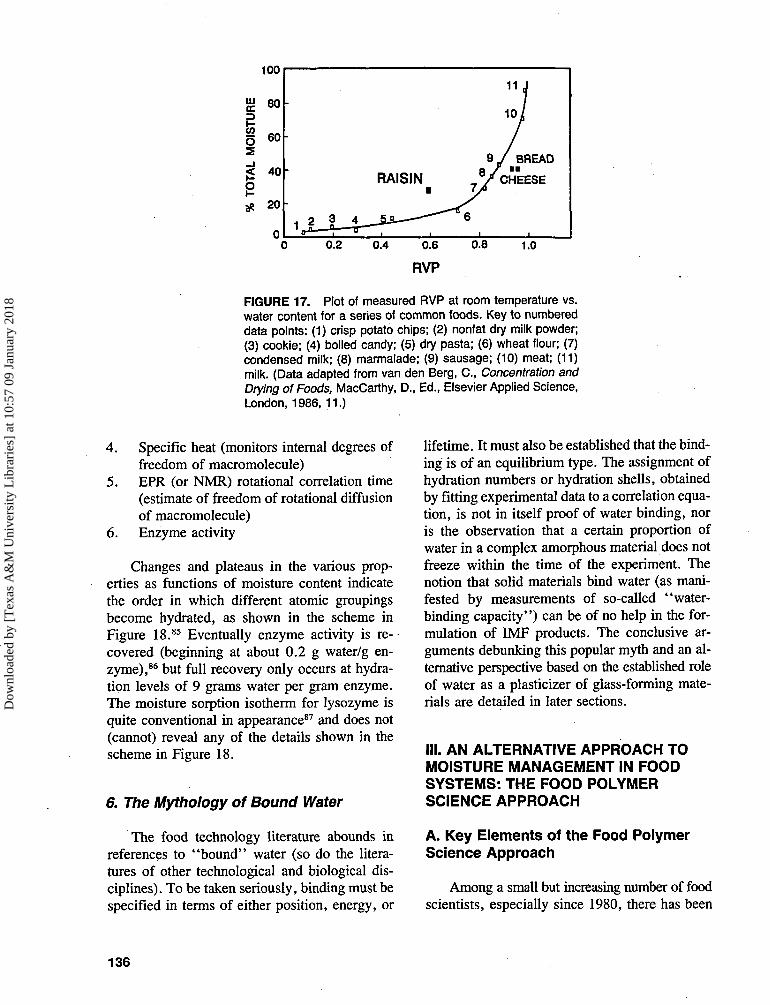
Examples from everyday experience serve toillustrate the consequences of sorption hysteresisdue to sample history, as revealed in Figure 17.If we plot measured RVP in the headspace abovethe product vs. water content of the material (datafrom van den Berg)43 for a series of commonfood systems that spans wide ranges of RVP andwater content, the overall shape of the resultingcurve resembles that of a typical sorption isoth-erm for a single food material. The most obviousdeparture from this overall behavior is the anom-alous location of the data point for a raisin, whichexhibits unexpectedly low RVP for such a mois-ture content. It is inferred that the anomalousbehavior is due to desorption hysteresis, becausethe raisin is the only product in the series that isan IMF created by dehydration. It is interestingto note that the other two products that departfrom the overall behavior exhibit the oppositeanomaly. These two materials (French bread andGouda cheese) are distinguished from others inthe series by the fact that creation of these prod-ucts, such that they have high quality, requiresa deliberate thermosetting process.25-26
In the moisture management of IMF prod-ucts, packaging is important. If dry air comesinto contact with a product of high water content,then water evaporates from the surface. This setsup a concentration gradient, with the results thatsolutes migrate toward the interface together withthe water. Also, solutes migrate away from theinterface (which is a region of high concentra-tion). The evaporation of water lowers the surfacetemperature of the solid, causing heat transferbetween air and the solid, as well as inside thesolid. If the air is not dry, then moisture mightcondense on the surface and migrate into the bulk,a well-known phenomenon. Lipid surface layersand membranes significantly retard such mois-ture redistribution processes.
Limited attempts have been made to map thesorption characteristics of lysozyme.84 There isno reason why similar procedures cannot be ap-plied more generally. The protein/enzyme com-plex was subjected to long-term desiccation atroom temperature under vacuum. Water vapor
133
Dow
nloa
ded
by [
Tex
as A
&M
Uni
vers
ity L
ibra
ries
] at
10:
57 0
9 Ja
nuar
y 20
18
SORPTION ISOTHERMSPOTATO STARCH D0 C2S>
FIRST RESORPTION RSI (ZS>
FIRST DESORPTXON OX <23>
SECOND RE9ORPTION RS2 <2S>
SECOND DESORPTION D2 C23>
THIRD RESORPTION RS3 <29>
%H2Od.b,
/ /I
J . 0
<te
0. 2 0 . 0. a 0. a A w
FIGURE 16. (A) Successive desorption-'Yesorption" cycles on fresh native potato starch(water content determination 1.5 h at 130°C; conditioning 8 d, reduced pressure, satu-rated salt solutions). (B) Comparison between sorption isotherms of potato starch: native(dotted lines) and 5% freeze-dried gel (full line). (From Bizot, H., Buleon, A., Mouhoud-Riou, N., and Multon, J. I., Properties of Water in Foods, Simatos, D. and Multon, J. I., Eds., Martinus Nijhoff, Dordrecht, 1985, 83. With permission.)
134
Dow
nloa
ded
by [
Tex
as A
&M
Uni
vers
ity L
ibra
ries
] at
10:
57 0
9 Ja
nuar
y 20
18
%H2Od.b.
2 0
as. 2 a. a
B
was then readmitted and the following properties 2.were monitored:1. Infrared amide bands (monitor peptide 3.
bonds)
Infrared COO~ bands (monitor acidic res-idues: glu, asp)Infrared — OD stretch (monitors perturba-tions of water molecules)
135
Dow
nloa
ded
by [
Tex
as A
&M
Uni
vers
ity L
ibra
ries
] at
10:
57 0
9 Ja
nuar
y 20
18
LLJ
OIS
2
100
80
60
40
20
0
•
RAISINg
2 3 4_JLS—•—""•'"'"1o-°-—1—^ T
11 J
/1 0 /
/
9 / BREAD
V CHEESE
6
0.2 0.4 0.6
RVP
0.8 1.0
FIGURE 17. Plot of measured RVP at room temperature vs.water content for a series of common foods. Key to numbereddata points: (1) crisp potato chips; (2) nonfat dry milk powder;(3) cookie; (4) boiled candy; (5) dry pasta; (6) wheat flour; (7)condensed milk; (8) marmalade; (9) sausage; (10) meat; (11)milk. (Data adapted from van den Berg, C., Concentration andDrying of Foods, MacCarthy, D., Ed., Elsevier Applied Science,London, 1986, 11.)
4. Specific heat (monitors internal degrees offreedom of macromolecule)
5. EPR (or NMR) rotational correlation time(estimate of freedom of rotational diffusionof macromolecule)
6. Enzyme activity
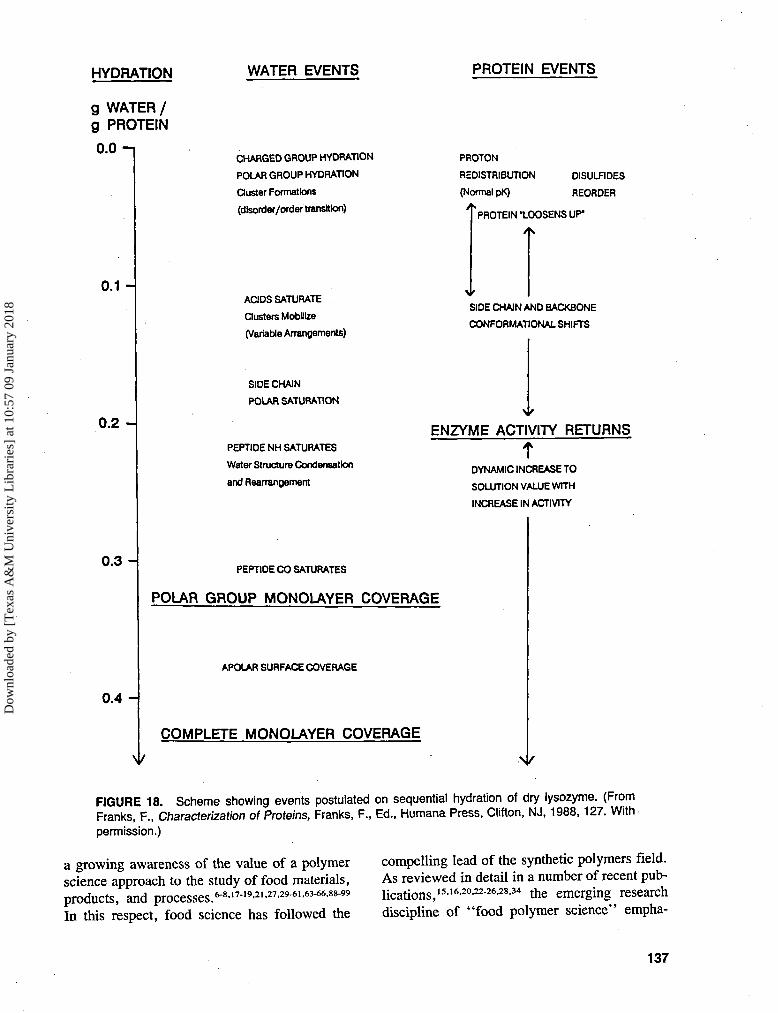
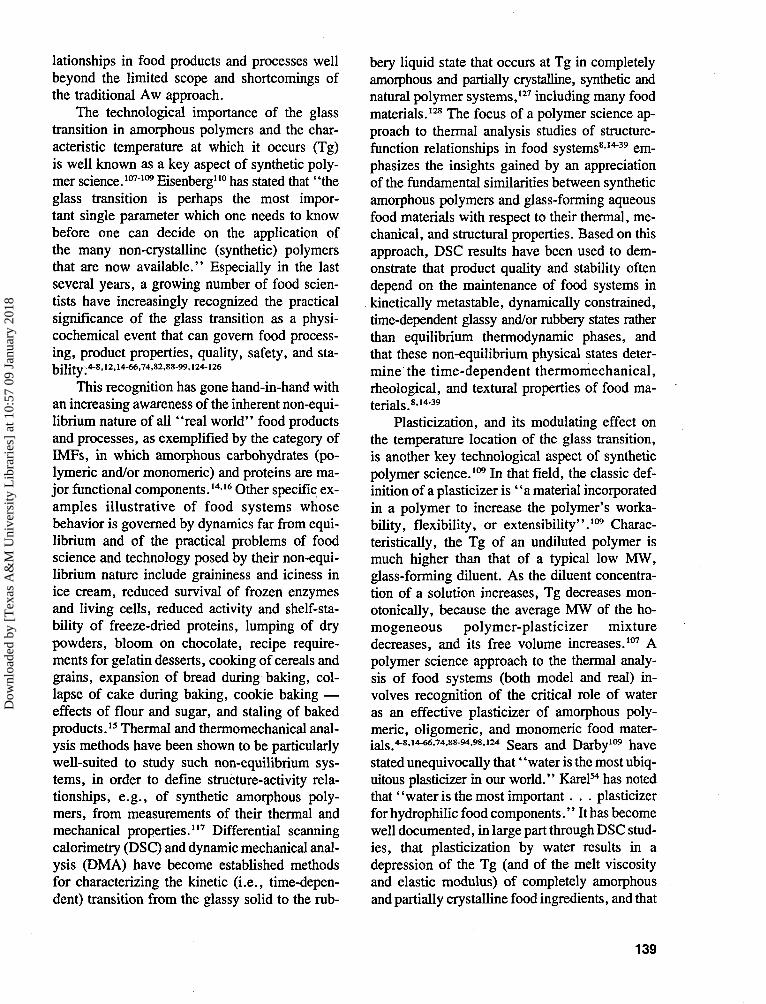
Changes and plateaus in the various prop-erties as functions of moisture content indicatethe order in which different atomic groupingsbecome hydrated, as shown in the scheme inFigure 18.85 Eventually enzyme activity is re-covered (beginning at about 0.2 g water/g en-zyme),86 but full recovery only occurs at hydra-tion levels of 9 grams water per gram enzyme.The moisture sorption isotherm for lysozyme isquite conventional in appearance87 and does not(cannot) reveal any of the details shown in thescheme in Figure 18.
6. The Mythology of Bound Water
The food technology literature abounds inreferences to "bound" water (so do the litera-tures of other technological and biological dis-ciplines). To be taken seriously, binding must bespecified in terms of either position, energy, or
lifetime. It must also be established that the bind-ing is of an equilibrium type. The assignment ofhydration numbers or hydration shells, obtainedby fitting experimental data to a correlation equa-tion, is not in itself proof of water binding, noris the observation that a certain proportion ofwater in a complex amorphous material does notfreeze within the time of the experiment. Thenotion that solid materials bind water (as mani-fested by measurements of so-called "water-binding capacity") can be of no help in the for-mulation of IMF products. The conclusive ar-guments debunking this popular myth and an al-ternative perspective based on the established roleof water as a plasticizer of glass-forming mate-rials are detailed in later sections.
III. AN ALTERNATIVE APPROACH TOMOISTURE MANAGEMENT IN FOODSYSTEMS: THE FOOD POLYMERSCIENCE APPROACH
A. Key Elements of the Food PolymerScience Approach
Among a small but increasing number of foodscientists, especially since 1980, there has been
136
Dow
nloa
ded
by [
Tex
as A
&M
Uni
vers
ity L
ibra
ries
] at
10:
57 0
9 Ja
nuar
y 20
18
HYDRATION WATER EVENTS PROTEIN EVENTS
g WATER/
g PROTEIN
O.O-i
0.1 -
0.2 -
0.3 -
0 .4 -
CHARGED GROUP HYDRATION
POLAR GROUP HYDRATION
Cluster Formations
(disorder/order transition)
PROTON
REDISTRIBUTION DISULFIDES
(Normal pK) REORDER
"PROTEIN -LOOSENS UP-
ACIDS SATURATE
Ousters Mobilize
(Variable Arrangements)
SIDE CHAIN
POLAR SATURATION
PEPTIDENH SATURATES
Water Structure Condensation
and Rearrangement
SIDE CHAIN AND BACKBONE
CONFORMATIONAL SHIFTS
ENZYME ACTIVITY RETURNS
fDYNAMIC INCREASE TO
SOLUTION VALUE WITH
INCREASE IN ACTIVITY
PEPTIDE CO SATURATES
POLAR GROUP MONOLAYER COVERAGE
APOLAR SURFACE COVERAGE
COMPLETE MONOLAYER COVERAGE
FIGURE 18. Scheme showing events postulated on sequential hydration of dry lysozyme. (FromFranks, F., Characterization of Proteins, Franks, F., Ed., Humana Press, Clifton, NJ, 1988, 127. Withpermission.)
a growing awareness of the value of a polymerscience approach to the study of food materials,products, and processes.6-8-17-19-21-27-29-61-63-66-88"In this respect, food science has followed the
compelling lead of the synthetic polymers field.As reviewed in detail in a number of recent pub-lications, is.16.20.22-26,28,34 ^g emerging researchdiscipline of "food polymer science" empha-
137
Dow
nloa
ded
by [
Tex
as A
&M
Uni
vers
ity L
ibra
ries
] at
10:
57 0
9 Ja
nuar
y 20
18
sizes the fundamental and generic similarities be-tween synthetic polymers and food molecules,and provides a new theoretical and experimentalframework for the study of food systems that arekinetically constrained. On a theoretical basis ofestablished structure-property relationships fromthe field of synthetic polymer science,100122 thisinnovative discipline has developed to unifystructural aspects of foods, conceptualized as ki-netically metastable, completely amorphous orpartially crystalline, homologous polymer sys-tems, with functional aspects, dependent uponmobility and conceptualized in terms of "waterdynamics" and "glass dynamics".15-16-20-22-26-28-34
These unified concepts have been used to explainand predict the functional properties of food ma-terials during processing and product stor-a g e 8,14.17-19,21.27.30-33.35-39 K e y e l e m e n t s Q f t h j s
theoretical approach to investigations of food sys-tems, with relevance to moisture managementand water relationships, include recognitionOf15.16,20,22-26,28,34-42
1. The behavior of foods and food materialsas classic polymer systems, and that thebehavior is governed by dynamics ratherthan energetics
2. The importance of the characteristic tem-perature Tg, at which the glass-rubber tran-sition occurs, as a physicochemical param-eter that can determine processibility,product properties, quality, stability, andsafety of food systems
3. The central role of water as a ubiquitousplasticizer of natural and fabricated amor-phous food ingredients and products
4. The effect of water as a plasticizer on Tgand the resulting non-Arrhenius, diffusion-limited behavior of amorphous polymeric,oligomeric, and monomeric food materialsin the rubbery liquid state at T > Tg
5. The significance of non-equilibrium glassysolid and rubbery liquid states (as opposedto equilibrium thermodynamic phases) in all"real world" food products and processes,and their effects on time-dependent struc-tural and mechanical properties related toquality and storage stability.
In previous reports and reviews,8-14"39 we have
described how the recognition of these key ele-ments of the food polymer science approach andtheir relevance to the behavior of a broad rangeof different types of foods (e.g., IMFs, low-mois-ture foods, frozen foods, starch-based foods, gel-atin-, gluten-, and other protein-based foods) andcorresponding aqueous model systems has in-creased markedly during this decade. We haveillustrated the perspective afforded by using thisconceptual framework and demonstrated thetechnological utility of this new approach to un-derstand and explain complex behavior, designprocesses, and predict product quality, safety,and storage stability, based on fundamental struc-ture-property relationships of food systems viewedas homologous families (i.e., monomers, oli-gomers, and high polymers) of partially crystal-line glassy polymer systems plasticized by water.Referring to the food polymer science approach,John Blanshard (personal communication, 1987)has stated that "it is not often that a new conceptcasts fresh light across a whole area of research,but there is little doubt that the recognition of theimportance of the transition from the glassy tothe crystalline or rubbery state in food-stuffs,though well known in synthetic polymers, hasopened up new and potentially very significantways of thinking about food properties and sta-bility." In a recent lecture on historical devel-opments in industrial polysaccharides, JamesBeMiller has echoed Blanshard's words by re-marking that a key point regarding the future ofpolysaccharide research and technology is "thepotential, already partly realized, in applying ideasdeveloped for synthetic polymers to polysaccha-rides; for example, the importance of the glassystate in many polysaccharide applications."123
In the rest of this article, we illustrate thetheory and practice of food polymer science byhighlighting selected aspects of experimentalstudies of both natural food materials and fab-ricated food ingredients and products, the resultsof which have been interpreted based on the the-oretical physicochemical foundation provided byfood polymer science. The studies have dem-onstrated the major opportunity offered by thisfood polymer science approach to expand notonly our quantitative knowledge but also, ofbroader practical value, our qualitative under-standing of moisture management and water re-
138
Dow
nloa
ded
by [
Tex
as A
&M
Uni
vers
ity L
ibra
ries
] at
10:
57 0
9 Ja
nuar
y 20
18
lationships in food products and processes wellbeyond the limited scope and shortcomings ofthe traditional Aw approach.
The technological importance of the glasstransition in amorphous polymers and the char-acteristic temperature at which it occurs (Tg)is well known as a key aspect of synthetic poly-mer science.107109 Eisenberg110 has stated that "theglass transition is perhaps the most impor-tant single parameter which one needs to knowbefore one can decide on the application ofthe many non-crystalline (synthetic) polymersthat are now available." Especially in the lastseveral years, a growing number of food scien-tists have increasingly recognized the practicalsignificance of the glass transition as a physi-cochemical event that can govern food process-ing, product properties, quality, safety, and sta-Jjjjjjy 4-8,12,14-66,74,82,88-99,124-126
This recognition has gone hand-in-hand withan increasing awareness of the inherent non-equi-librium nature of all "real world" food productsand processes, as exemplified by the category ofIMFs, in which amorphous carbohydrates (po-lymeric and/or monomeric) and proteins are ma-jor functional components.1416 Other specific ex-amples illustrative of food systems whosebehavior is governed by dynamics far from equi-librium and of the practical problems of foodscience and technology posed by their non-equi-librium nature include graininess and iciness inice cream, reduced survival of frozen enzymesand living cells, reduced activity and shelf-sta-bility of freeze-dried proteins, lumping of drypowders, bloom on chocolate, recipe require-ments for gelatin desserts, cooking of cereals andgrains, expansion of bread during baking, col-lapse of cake during baking, cookie baking —effects of flour and sugar, and staling of bakedproducts.15 Thermal and thermomechanical anal-ysis methods have been shown to be particularlywell-suited to study such non-equilibrium sys-tems, in order to define structure-activity rela-tionships, e.g., of synthetic amorphous poly-mers, from measurements of their thermal andmechanical properties.117 Differential scanningcalorimetry (DSC) and dynamic mechanical anal-ysis (DMA) have become established methodsfor characterizing the kinetic (i.e., time-depen-dent) transition from the glassy solid to the rub-
bery liquid state that occurs at Tg in completelyamorphous and partially crystalline, synthetic andnatural polymer systems,127 including many foodmaterials.128 The focus of a polymer science ap-proach to thermal analysis studies of structure-function relationships in food systems814"39 em-phasizes the insights gained by an appreciationof the fundamental similarities between syntheticamorphous polymers and glass-forming aqueousfood materials with respect to their thermal, me-chanical, and structural properties. Based on thisapproach, DSC results have been used to dem-onstrate that product quality and stability oftendepend on the maintenance of food systems inkinetically metastable, dynamically constrained,time-dependent glassy and/or rubbery states ratherthan equilibrium thermodynamic phases, andthat these non-equilibrium physical states deter-mine the time-dependent thermomechanical,rheqlogical, and textural properties of food ma-terials.8-14"39
Plasticization, and its modulating effect onthe temperature location of the glass transition,is another key technological aspect of syntheticpolymer science.109 In that field, the classic def-inition of a plasticizer is "a material incorporatedin a polymer to increase the polymer's worka-bility, flexibility, or extensibility".109 Charac-teristically, the Tg of an undiluted polymer ismuch higher than that of a typical low MW,glass-forming diluent. As the diluent concentra-tion of a solution increases, Tg decreases mon-otonically, because the average MW of the ho-mogeneous polymer-plasticizer mixturedecreases, and its free volume increases.107 Apolymer science approach to the thermal analy-sis of food systems (both model and real) in-volves recognition of the critical role of wateras an effective plasticizer of amorphous poly-meric, oligomeric, and monomeric food mater-i a l s 4-8.14-66,74,88-94,98,124 S e a r s and Darby 1 0 9 h a v e
stated unequivocally that' 'water is the most ubiq-uitous plasticizer in our world." Karel54 has notedthat "water is the most important . . . plasticizerfor hydrophilic food components.'' It has becomewell documented, in large part through DSC stud-ies, that plasticization by water results in adepression of the Tg (and of the melt viscosityand elastic modulus) of completely amorphousand partially crystalline food ingredients, and that
139
Dow
nloa
ded
by [
Tex
as A
&M
Uni
vers
ity L
ibra
ries
] at
10:
57 0
9 Ja
nuar
y 20
18
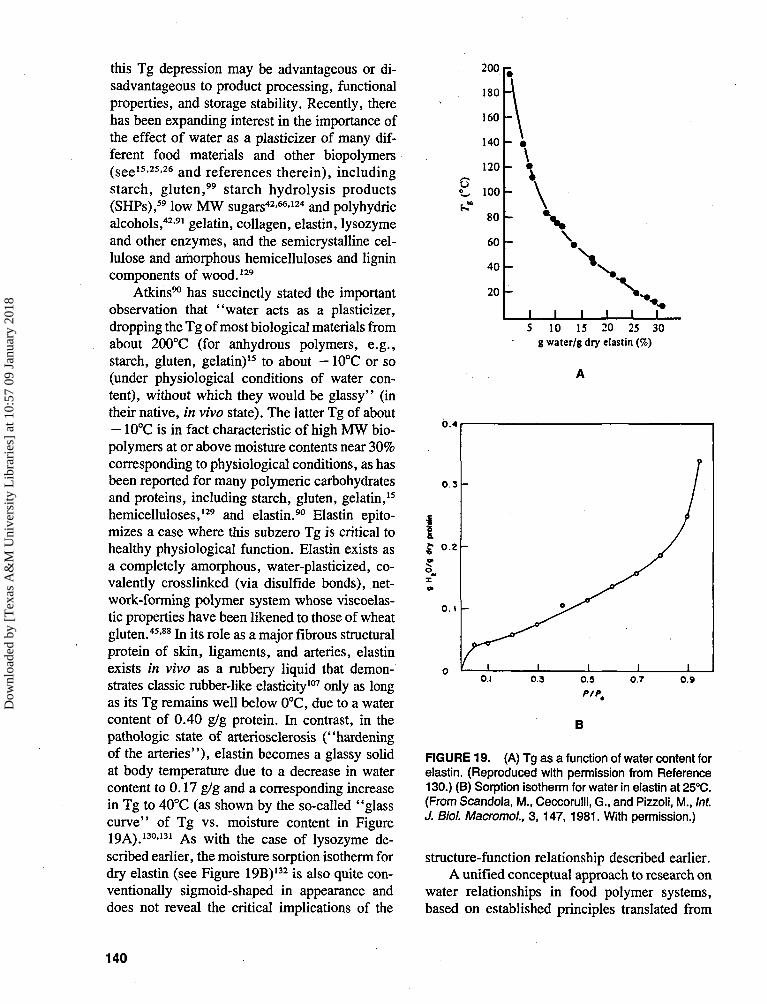
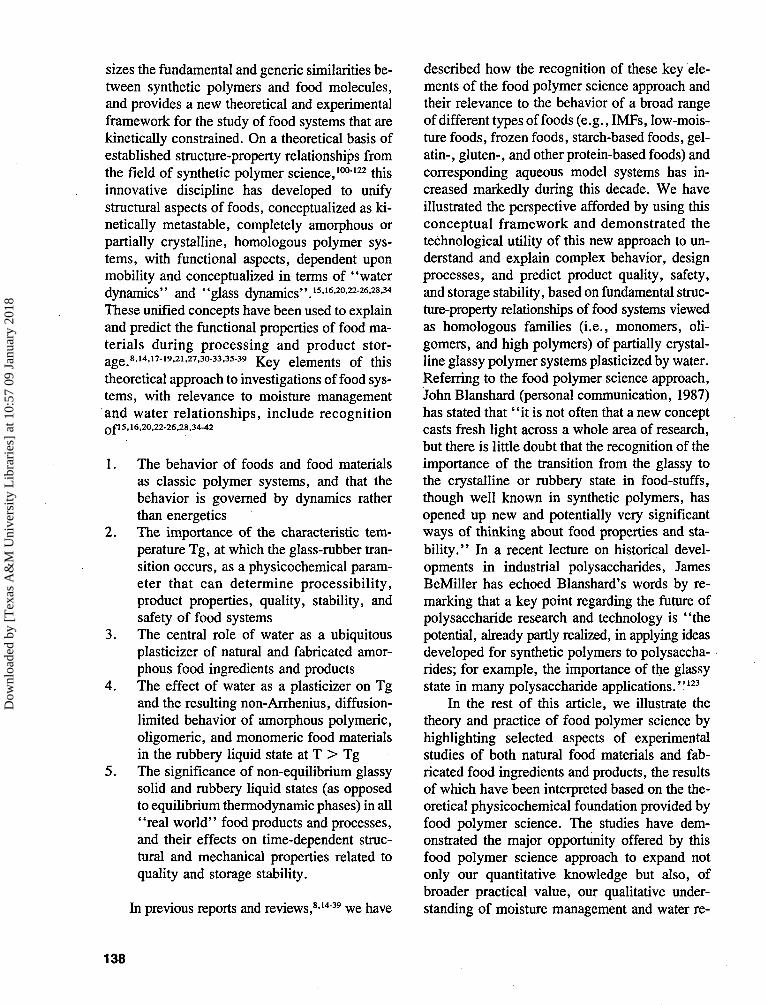
this Tg depression may be advantageous or di-sadvantageous to product processing, functionalproperties, and storage stability. Recently, therehas been expanding interest in the importance ofthe effect of water as a plasticizer of many dif-ferent food materials and other biopolymers(see15-2526 and references therein), includingstarch, gluten," starch hydrolysis products(SHPs),59 low MW sugars42-66-124 and polyhydricalcohols,42-91 gelatin, collagen, elastin, lysozymeand other enzymes, and the semicrystalline cel-lulose and amorphous hemicelluloses and lignincomponents of wood.129
Atkins90 has succinctly stated the importantobservation that "water acts as a plasticizer,dropping the Tg of most biological materials fromabout 200°C (for anhydrous polymers, e.g.,starch, gluten, gelatin)15 to about - 10°C or so(under physiological conditions of water con-tent), without which they would be glassy" (intheir native, in vivo state). The latter Tg of about- 10°C is in fact characteristic of high MW bio-polymers at or above moisture contents near 30%corresponding to physiological conditions, as hasbeen reported for many polymeric carbohydratesand proteins, including starch, gluten, gelatin,15
hemicelluloses,129 and elastin.90 Elastin epito-mizes a case where this subzero Tg is critical tohealthy physiological function. Elastin exists asa completely amorphous, water-plasticized, co-valently crosslinked (via disulfide bonds), net-work-forming polymer system whose viscoelas-tic properties have been likened to those of wheatgluten.45-88 In its role as a major fibrous structuralprotein of skin, ligaments, and arteries, elastinexists in vivo as a rubbery liquid that demon-strates classic rubber-like elasticity107 only as longas its Tg remains well below 0°C, due to a watercontent of 0.40 g/g protein. In contrast, in thepathologic state of arteriosclerosis ("hardeningof the arteries"), elastin becomes a glassy solidat body temperature due to a decrease in watercontent to 0.17 g/g and a corresponding increasein Tg to 40°C (as shown by the so-called "glass
curve" of Tg vs. moisture content in Figure1 9 A ) i3o,i3i A s w i t h t h e c a s e o f i y s o z y m e de-scribed earlier, the moisture sorption isotherm fordry elastin (see Figure 19B)132 is also quite con-ventionally sigmoid-shaped in appearance anddoes not reveal the critical implications of the
200
180
160
140
120
t 100
80
60
40
20
\
\\
•
-
-
15
1 1 1 1 I*10 15 20 25 30
g water/g dry elastin (%)
0 . 4
0 .3 -
0 . 2 -
O.I -
B
FIGURE 19. (A) Tg as a function of water content forelastin. (Reproduced with permission from Reference130.) (B) Sorption isotherm for water in elastin at 25°C.(From Scandola, M., Ceccorulli, G., and Pizzoli, M., Int.J. Biol. Macromol., 3, 147, 1981. With permission.)
structure-function relationship described earlier.A unified conceptual approach to research on
water relationships in food polymer systems,based on established principles translated from
140
Dow
nloa
ded
by [
Tex
as A
&M
Uni
vers
ity L
ibra
ries
] at
10:
57 0
9 Ja
nuar
y 20
18
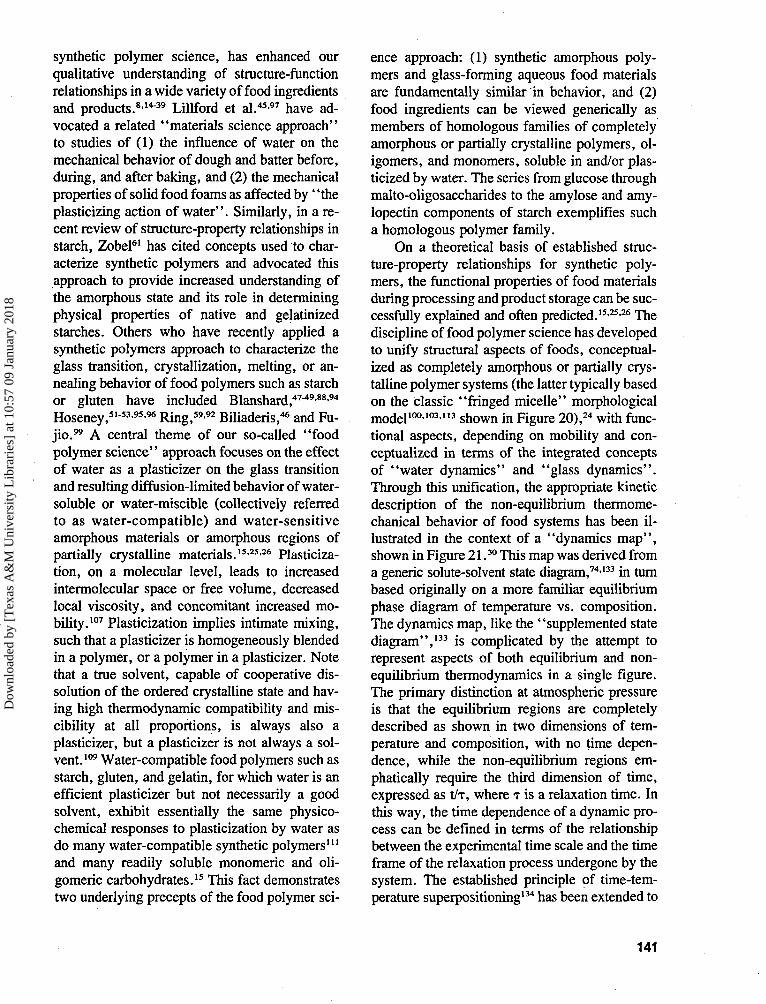
synthetic polymer science, has enhanced ourqualitative understanding of structure-functionrelationships in a wide variety of food ingredientsand products.8-1*"39 Lillford et al.45-97 have ad-vocated a related "materials science approach"to studies of (1) the influence of water on themechanical behavior of dough and batter before,during, and after baking, and (2) the mechanicalproperties of solid food foams as affected by "theplasticizing action of water". Similarly, in a re-cent review of structure-property relationships instarch, Zobel61 has cited concepts used to char-acterize synthetic polymers and advocated thisapproach to provide increased understanding ofthe amorphous state and its role in determiningphysical properties of native and gelatinizedstarches. Others who have recently applied asynthetic polymers approach to characterize theglass transition, crystallization, melting, or an-nealing behavior of food polymers such as starchor gluten have included Blanshard,47"49-88-94
Hoseney,5153-95-96 Ring,59-92 Biliaderis,46 and Fu-j io ." A central theme of our so-called "foodpolymer science" approach focuses on the effectof water as a plasticizer on the glass transitionand resulting diffusion-limited behavior of water-soluble or water-miscible (collectively referredto as water-compatible) and water-sensitiveamorphous materials or amorphous regions ofpartially crystalline materials.I5-25-26 Plasticiza-tion, on a molecular level, leads to increasedintermolecular space or free volume, decreasedlocal viscosity, and concomitant increased mo-bility.107 Plasticization implies intimate mixing,such that a plasticizer is homogeneously blendedin a polymer, or a polymer in a plasticizer. Notethat a true solvent, capable of cooperative dis-solution of the ordered crystalline state and hav-ing high thermodynamic compatibility and mis-cibility at all proportions, is always also aplasticizer, but a plasticizer is not always a sol-vent.109 Water-compatible food polymers such asstarch, gluten, and gelatin, for which water is anefficient plasticizer but not necessarily a goodsolvent, exhibit essentially the same physico-chemical responses to plasticization by water asdo many water-compatible synthetic polymers111
and many readily soluble monomeric and oli-gomeric carbohydrates." This fact demonstratestwo underlying precepts of the food polymer sci-
ence approach: (1) synthetic amorphous poly-mers and glass-forming aqueous food materialsare fundamentally similar in behavior, and (2)food ingredients can be viewed generically asmembers of homologous families of completelyamorphous or partially crystalline polymers, ol-igomers, and monomers, soluble in and/or plas-ticized by water. The series from glucose throughmalto-oligosaccharides to the amylose and amy-lopectin components of starch exemplifies sucha homologous polymer family.
On a theoretical basis of established struc-ture-property relationships for synthetic poly-mers, the functional properties of food materialsduring processing and product storage can be suc-cessfully explained and often predicted.15-25-26 Thediscipline of food polymer science has developedto unify structural aspects of foods, conceptual-ized as completely amorphous or partially crys-talline polymer systems (the latter typically basedon the classic "fringed micelle" morphologicalmodel100-103-113 shown in Figure 20),24 with func-tional aspects, depending on mobility and con-ceptualized in terms of the integrated conceptsof "water dynamics" and "glass dynamics".Through this unification, the appropriate kineticdescription of the non-equilibrium thermome-chanical behavior of food systems has been il-lustrated in the context of a "dynamics map",shown in Figure 21.30 This map was derived froma generic solute-solvent state diagram,74-133 in turnbased originally on a more familiar equilibriumphase diagram of temperature vs. composition.The dynamics map, like the "supplemented statediagram",133 is complicated by the attempt torepresent aspects of both equilibrium and non-equilibrium thermodynamics in a single figure.The primary distinction at atmospheric pressureis that the equilibrium regions are completelydescribed as shown in two dimensions of tem-perature and composition, with no time depen-dence, while the non-equilibrium regions em-phatically require the third dimension of time,expressed as t/T, where T is a relaxation time. Inthis way, the time dependence of a dynamic pro-cess can be defined in terms of the relationshipbetween the experimental time scale and the timeframe of the relaxation process undergone by thesystem. The established principle of time-tem-perature superpositioning134 has been extended to
141
Dow
nloa
ded
by [
Tex
as A
&M
Uni
vers
ity L
ibra
ries
] at
10:
57 0
9 Ja
nuar
y 20
18
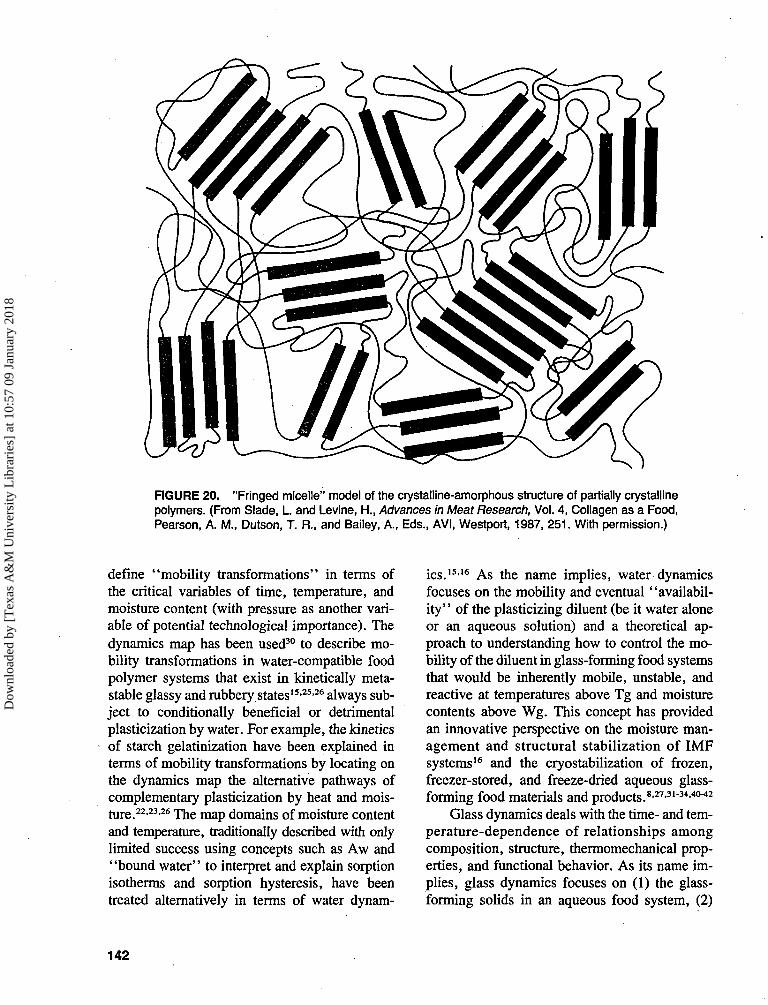
FIGURE 20. "Fringed micelle" model of the crystalline-amorphous structure of partially crystallinepolymers. (From Slade, L. and Levine, H., Advances in Meat Research, Vol. 4, Collagen as a Food,Pearson, A. M., Dutson, T. R., and Bailey, A., Eds., AVI, Westport, 1987, 251. With permission.)
define "mobility transformations" in terms ofthe critical variables of time, temperature, andmoisture content (with pressure as another vari-able of potential technological importance). Thedynamics map has been used30 to describe mo-bility transformations in water-compatible foodpolymer systems that exist in kinetically meta-stable glassy and rubbery states15-25-26 always sub-ject to conditionally beneficial or detrimentalplasticization by water. For example, the kineticsof starch gelatinization have been explained interms of mobility transformations by locating onthe dynamics map the alternative pathways ofcomplementary plasticization by heat and mois-ture.22-23-26 The map domains of moisture contentand temperature, traditionally described with onlylimited success using concepts such as Aw and"bound water" to interpret and explain sorptionisotherms and sorption hysteresis, have beentreated alternatively in terms of water dynam-
ics.15-16 As the name implies, water dynamicsfocuses on the mobility and eventual "availabil-ity" of the plasticizing diluent (be it water aloneor an aqueous solution) and a theoretical ap-proach to understanding how to control the mo-bility of the diluent in glass-forming food systemsthat would be inherently mobile, unstable, andreactive at temperatures above Tg and moisturecontents above Wg. This concept has providedan innovative perspective on the moisture man-agement and structural stabilization of IMFsystems16 and the cryostabilization of frozen,freezer-stored, and freeze-dried aqueous glass-forming food materials and products.8-27-31"34-40"42
Glass dynamics deals with the time- and tem-perature-dependence of relationships amongcomposition, structure, thermomechanical prop-erties, and functional behavior. As its name im-plies, glass dynamics focuses on (1) the glass-forming solids in an aqueous food system, (2)
142
Dow
nloa
ded
by [
Tex
as A
&M
Uni
vers
ity L
ibra
ries
] at
10:
57 0
9 Ja
nuar
y 20
18
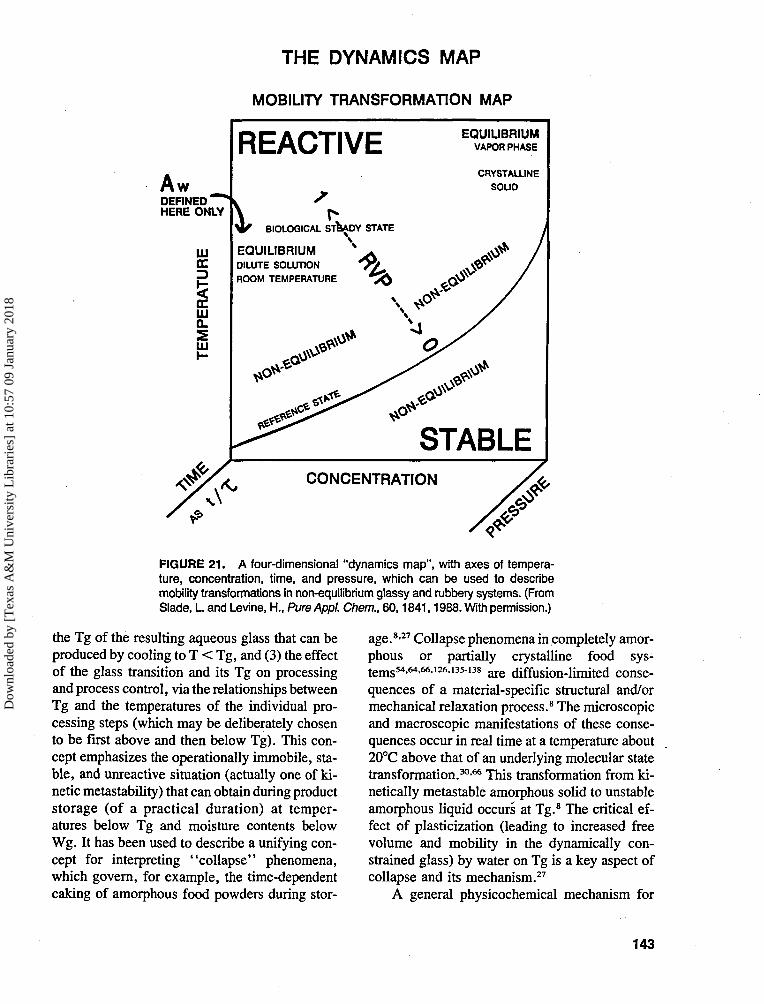
THE DYNAMICS MAP
MOBILITY TRANSFORMATION MAP
rtwDEFINED""1
HERE ONLY
LJJ
iLU
LJJ
REACTIVE
V BIOLOGICAL STEADY STATE
EQUILIBRIUM %
DILUTE SOLUTION
ROOM TEMPERATURE
EQUILIBRIUMVAPOR PHASE
CRYSTALLINE
SOUD
STABLECONCENTRATION
FIGURE 21. A four-dimensional "dynamics map", with axes of tempera-ture, concentration, time, and pressure, which can be used to describemobility transformations in non-equilibrium glassy and rubbery systems. (FromSlade, L and Levine, H., Pure Appl. Chem., 60,1841,1988. With permission.)
the Tg of the resulting aqueous glass that can beproduced by cooling to T < Tg, and (3) the effectof the glass transition and its Tg on processingand process control, via the relationships betweenTg and the temperatures of the individual pro-cessing steps (which may be deliberately chosento be first above and then below Tg). This con-cept emphasizes the operationally immobile, sta-ble, and unreactive situation (actually one of ki-netic metastability) that can obtain during productstorage (of a practical duration) at temper-atures below Tg and moisture contents belowWg. It has been used to describe a unifying con-cept for interpreting "collapse" phenomena,which govern, for example, the time-dependentcaking of amorphous food powders during stor-
age.8'27 Collapse phenomena in completely amor-phous or partially crystalline food sys-tems54-64-66-126-135138 are diffusion-limited conse-quences of a material-specific structural and/ormechanical relaxation process.8 The microscopicand macroscopic manifestations of these conse-quences occur in real time at a temperature about20°C above that of an underlying molecular statetransformation.30-66 This transformation from ki-netically metastable amorphous solid to unstableamorphous liquid occurs at Tg.8 The critical ef-fect of plasticization (leading to increased freevolume and mobility in the dynamically con-strained glass) by water on Tg is a key aspect ofcollapse and its mechanism.27
A general physicochemical mechanism for
143
Dow
nloa
ded
by [
Tex
as A
&M
Uni
vers
ity L
ibra
ries
] at
10:
57 0
9 Ja
nuar
y 20
18

collapse has been described,8 based on occur-rence of the material-specific structural transitionat Tg, followed by viscous flow in the rubberyliquid state.137 The mechanism was derived fromWilliams-Landel-Ferry (WLF) free volume the-ory for (synthetic) amorphous polymers.101'107 Ithas been concluded that Tg is identical to thephenomenological transition temperatures ob-served for structural collapse (Tc) and recrystal-lization (Tr). The non-Arrhenius kinetics of col-lapse and/or recrystallization in the high viscosityOn) rubbery state are governed by the mobilityof the water-plasticized polymer matrix.8 Thesekinetics depend on the magnitude of AT= T — Tg,866 as defined by a temperature-depen-dent exponential relationship derived from WLFtheory. Glass dynamics has proven a useful con-cept for elucidating the physicochemical mech-anisms of structural/mechanical changes in-volved in various melting and (re)crystallizationprocesses.15 Such phenomena are observed inmany partially crystalline food polymers and pro-cessing/storage situations, including, for exam-ple, the gelatinization and retrogradation ofstarches.20 Glass dynamics has also been used todescribe the viscoelastic behavior of amorphouspolymeric network-forming proteins such as glu-ten and elastin.25
1. "Fringed Micelle" Structural Model
The "fringed micelle" model, shown in Fig-ure 20, was originally developed to describe themorphology of partially crystalline syntheticpolymers. It is particularly useful for concep-tualizing a three-dimensional network composedof microcrystallites (with crystalline melting tem-perature, Tm) that crosslink amorphous regions(with glass transition temperature, Tg) of flexi-ble-coil chain segments.139 In pure homopoly-mers, for which Tg is always at a lower tem-perature than Tm,106 the amorphous domains canexist in a glassy solid physical state at T < Tgor in a rubbery liquid state at Tg < T < Tm.15
The model is especially applicable to syntheticpolymers that crystallize from an undercooledmelt or concentrated solution to produce a met-astable network of relatively low degree of crys-tallinity. Typically, such polymers contain small
crystalline regions of only about 100 A dimen-sions.103 Thus, the model has also often been usedto describe the partially crystalline structure ofaqueous gels of biopolymers such as starch andgelatin,17'18'61>65>103'139 in which the amorphous re-gions contain plasticizing water and the micro-crystalline regions, which serve as physical junc-tion zones, are crystalline hydrates. The modelhas also been used to conceptualize the partiallycrystalline morphology of frozen aqueous foodpolymer systems, in which case the ice crystalsrepresent the "micelles" dispersed in a contin-uous amorphous matrix (the "fringe") of solute-unfrozen water (UFW).15 An important featureof the model, as applied to high MW polymersystems such as starch (both native granular andgelatinized)21 and gelatin, concerns the intercon-nections between crystalline and amorphous do-mains. A single long polymer chain can havehelical (or other ordered) segments located withinone or more microcrystallites that are covalentlylinked to flexible-coil segments in one or moreamorphous regions.139 Moreover, in the amor-phous regions, chain segments may experiencerandom intermolecular "entanglement cou-plings",112 which are topological interactionsrather than covalent or non-covalent chemicalbonds.140 Thus, in terms of their thermomechan-ical behavior in response to plasticization by waterand/or heat, the crystalline and amorphous do-mains are neither independent of each other norhomogeneous.106
2. The Dynamics Map
The key to our new perspective on concen-trated, water-plasticized food polymer systemsrelates to recognition of the fundamental impor-tance of the dynamics map mentioned earlier. Asshown in Figure 21, the major area of the map(i.e., the area surrounding the reference state intwo dimensions and projecting into the third, time,dimension) represents a non-equilibrium situa-tion corresponding to the temperature-composi-tion region of most far-reaching technologicalconsequence to aqueous food systems, includ-ing IMFs.16 The critical feature in the use of thismap is identification of the glass transition asthe reference state, a conclusion30 based on WLF
144
Dow
nloa
ded
by [
Tex
as A
&M
Uni
vers
ity L
ibra
ries
] at
10:
57 0
9 Ja
nuar
y 20
18

theory for glass-forming polymers. This line ofdemarcation (representing tie glass curve ofTg vs. composition) serves as a basis for descrip-tion of the non-equilibrium thermomechanicalbehavior of water-compatible polymeric mate-rials in glassy and rubbery states, in response tochanges in moisture content, temperature, andtime.15-30-40"42 Mobility is the transcendent prin-ciple underlying the definition of the glass tran-sition as the appropriate reference state,16 becausemobility is the key to all transformations in time(or frequency), temperature, and composition be-tween different relaxation states for a technolog-ically practical system.30 An interesting illustra-tion of the practical relevance of mobilitytransformations to shelf-life problems in real foodproducts is shown in Figure 22.141 Marsh andWagner141 have described a "state of the art"computer model that can be used to predict theshelf-life of particular moisture-sensitive prod-ucts, based on the moisture-barrier properties ofa packaging material and the temperature/humid-
ity conditions of a specific storage environment.As shown in Figure 22, shelf-life (i.e., time)increases with decreasing temperature and hu-midity conditions (e.g., Minneapolis in the win-ter) and decreases correspondingly with increas-ing temperature and humidity (e.g., Miami in thesummer), such that shelf-life varies by a factorof 4 between the highest and lowest temperature/moisture combinations.
The interdependent concepts of water dy-namics and glass dynamics embodied in the dy-namics map have provided insights into the rel-evance of the glassy reference state to functionalaspects of a variety of food systems.15'30 For ex-ample, the kinetics of all constrained relaxationprocesses, such as translational and rotational dif-fusion, which are governed by the mobility of awater-plasticized polymer matrix in glass-form-ing systems, vary (from Arrhenius to WLF-type)between distinct temperature/structure domains,which are divided by this glass transition. 15-25>3°Thus, while familiar Arrhenius kinetics are ap-
SHELF LIFE vs. MONTH OF PRODUCTION
1 2 3 4 S « 7 « t 1 0MONTH O¥ PRODUCTION
FIGURE 22. Plot of shelf life vs. month of production for a typical moisture-sensitive food product. (From Marsh, K. S. and Wagner, J., FoodEng., 57(8),58, 1985. With permission.)
145
Dow
nloa
ded
by [
Tex
as A
&M
Uni
vers
ity L
ibra
ries
] at
10:
57 0
9 Ja
nuar
y 20
18
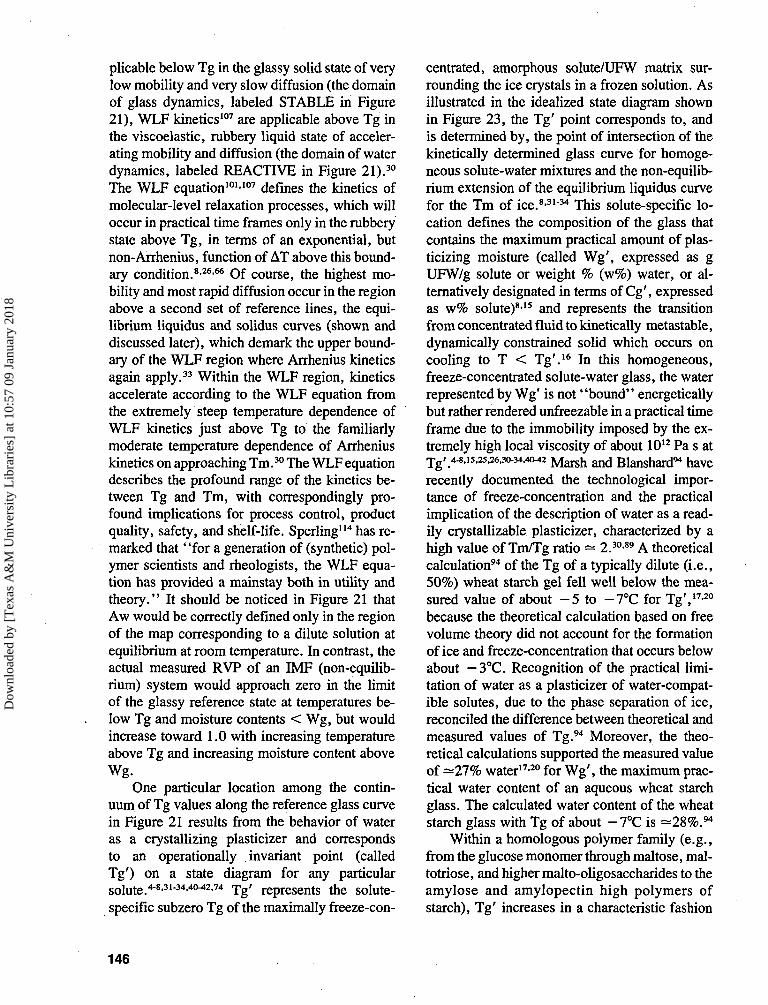
plicable below Tg in the glassy solid state of verylow mobility and very slow diffusion (the domainof glass dynamics, labeled STABLE in Figure21), WLF kinetics107 are applicable above Tg inthe viscoelastic, rubbery liquid state of acceler-ating mobility and diffusion (the domain of waterdynamics, labeled REACTIVE in Figure 21).30
The WLF equation101-107 defines the kinetics ofmolecular-level relaxation processes, which willoccur in practical time frames only in the rubberystate above Tg, in terms of an exponential, butnon-Arrhenius, function of AT above this bound-ary condition.8-26-66 Of course, the highest mo-bility and most rapid diffusion occur in the regionabove a second set of reference lines, the equi-librium liquidus and solidus curves (shown anddiscussed later), which demark the upper bound-ary of the WLF region where Arrhenius kineticsagain apply.33 Within the WLF region, kineticsaccelerate according to the WLF equation fromthe extremely steep temperature dependence ofWLF kinetics just above Tg to the familiarlymoderate temperature dependence of Arrheniuskinetics on approaching Tm.30 The WLF equationdescribes the profound range of the kinetics be-tween Tg and Tm, with correspondingly pro-found implications for process control, productquality, safety, and shelf-life. Sperling114 has re-marked that "for a generation of (synthetic) pol-ymer scientists and rheologists, the WLF equa-tion has provided a mainstay both in utility andtheory." It should be noticed in Figure 21 thatAw would be correctly defined only in the regionof the map corresponding to a dilute solution atequilibrium at room temperature. In contrast, theactual measured RVP of an IMF (non-equilib-rium) system would approach zero in the limitof the glassy reference state at temperatures be-low Tg and moisture contents < Wg, but wouldincrease toward 1.0 with increasing temperatureabove Tg and increasing moisture content aboveWg.
One particular location among the contin-uum of Tg values along the reference glass curvein Figure 21 results from the behavior of wateras a crystallizing plasticizer and correspondsto an operationally invariant point (calledTg') on a state diagram for any particularsolute.4-8'31"34-40^2-74 Tg' represents the solute-specific subzero Tg of the maximally freeze-con-
centrated, amorphous solute/UFW matrix sur-rounding the ice crystals in a frozen solution. Asillustrated in the idealized state diagram shownin Figure 23, the Tg' point corresponds to, andis determined by, the point of intersection of thekinetically determined glass curve for homoge-neous solute-water mixtures and the non-equilib-rium extension of the equilibrium liquidus curvefor the Tm of ice.8-3134 This solute-specific lo-cation defines the composition of the glass thatcontains the maximum practical amount of plas-ticizing moisture (called Wg', expressed as gUFW/g solute or weight % (w%) water, or al-ternatively designated in terms of Cg', expressedas w% solute)8-15 and represents the transitionfrom concentrated fluid to kinetically metastable,dynamically constrained solid which occurs oncooling to T < Tg'.16 In this homogeneous,freeze-concentrated solute-water glass, the waterrepresented by Wg' is not "bound" energeticallybut rather rendered unfreezable in a practical timeframe due to the immobility imposed by the ex-tremely high local viscosity of about 1012 Pa s atT g / 4-8,15,25.26.3^34.4042 M a r s h md Blanshard94 have
recently documented the technological impor-tance of freeze-concentration and the practicalimplication of the description of water as a read-ily crystallizable plasticizer, characterized by ahigh value of Tm/Tg ratio - 2.30-89 A theoreticalcalculation94 of the Tg of a typically dilute (i.e.,50%) wheat starch gel fell well below the mea-sured value of about - 5 to -7°C for Tg',17-20
because the theoretical calculation based on freevolume theory did not account for the formationof ice and freeze-concentration that occurs belowabout — 3°C. Recognition of the practical limi-tation of water as a plasticizer of water-compat-ible solutes, due to the phase separation of ice,reconciled the difference between theoretical andmeasured values of Tg.94 Moreover, the theo-retical calculations supported the measured valueof —27% water17-20 for Wg', the maximum prac-tical water content of an aqueous wheat starchglass. The calculated water content of the wheatstarch glass with Tg of about -7°C is =28%.94
Within a homologous polymer family (e.g.,from the glucose monomer through maltose, mal-totriose, and higher malto-oligosaccharides to theamylose and amylopectin high polymers ofstarch), Tg' increases in a characteristic fashion
146
Dow
nloa
ded
by [
Tex
as A
&M
Uni
vers
ity L
ibra
ries
] at
10:
57 0
9 Ja
nuar
y 20
18
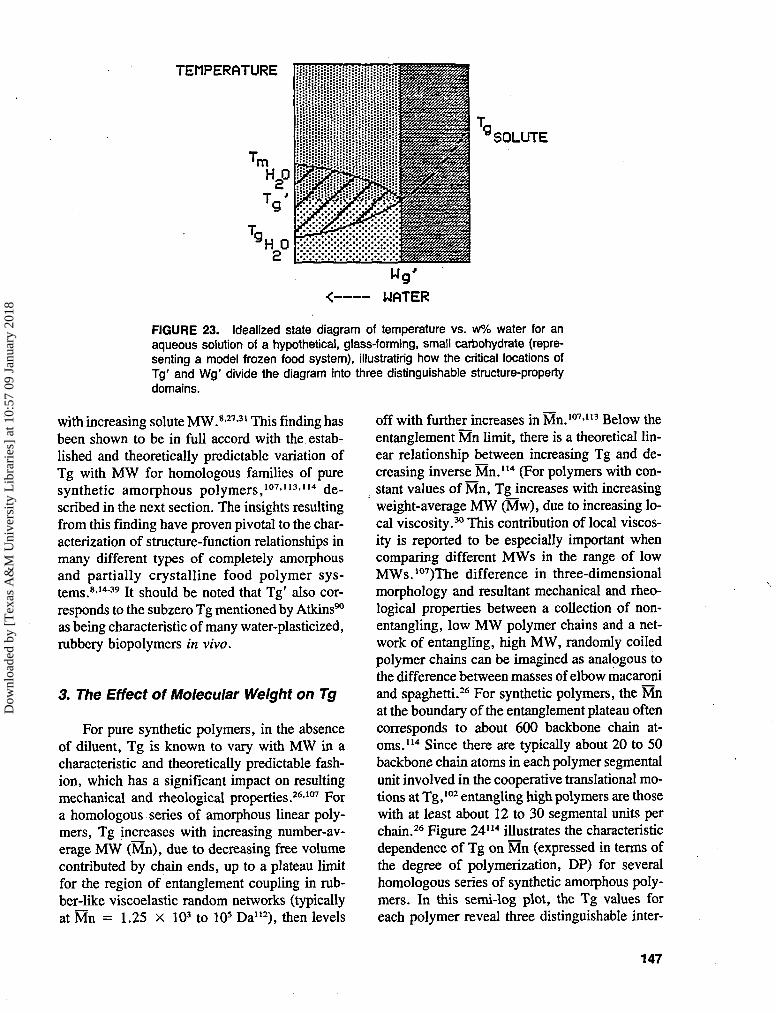
TEMPERATURE
SOLUTE
FIGURE 23. Idealized state diagram of temperature vs. w% water for anaqueous solution of a hypothetical, glass-forming, small carbohydrate (repre-senting a model frozen food system), illustrating how the critical locations ofTg' and Wg' divide the diagram into three distinguishable structure-propertydomains.
with increasing solute MW.8>27>31 This finding hasbeen shown to be in full accord with the estab-lished and theoretically predictable variation ofTg with MW for homologous families of puresynthetic amorphous polymers,107-113-114 de-scribed in the next section. The insights resultingfrom this finding have proven pivotal to the char-acterization of structure-function relationships inmany different types of completely amorphousand partially crystalline food polymer sys-tems.8-1439 It should be noted that Tg' also cor-responds to the subzero Tg mentioned by Atkins90
as being characteristic of many water-plasticized,rubbery biopolymers in vivo.
3. The Effect of Molecular Weight on Tg
For pure synthetic polymers, in the absenceof diluent, Tg is known to vary with MW in acharacteristic and theoretically predictable fash-ion, which has a significant impact on resultingmechanical and rheological properties.26-107 Fora homologous series of amorphous linear poly-mers, Tg increases with increasing number-av-erage MW (Mn), due to decreasing free volumecontributed by chain ends, up to a plateau limitfor the region of entanglement coupling in rub-ber-like viscoelastic random networks (typicallyat Mn = 1.25 x 10³ to 10s Da112), then levels
off with further increases in Mn.107-113 Below theentanglement Mn limit, there is a theoretical lin-ear relationship between increasing Tg and de-creasing inverse Mn.114 (For polymers with con-stant values of Mn, Tg increases with increasingweight-average MW (Mw), due to increasing lo-cal viscosity.30 This contribution of local viscos-ity is reported to be especially important whencomparing different MWs in the range of lowMWs.107)The difference in three-dimensionalmorphology and resultant mechanical and rheo-logical properties between a collection of non-entangling, low MW polymer chains and a net-work of entangling, high MW, randomly coiledpolymer chains can be imagined as analogous tothe difference between masses of elbow macaroniand spaghetti.26 For synthetic polymers, the Mnat the boundary of the entanglement plateau oftencorresponds to about 600 backbone chain at-oms.114 Since there are typically about 20 to 50backbone chain atoms in each polymer segmentalunit involved in the cooperative translational mo-tions at Tg,102 entangling high polymers are thosewith at least about 12 to 30 segmental units perchain.26 Figure 24114 illustrates the characteristicdependence of Tg on Mn (expressed in terms ofthe degree of polymerization, DP) for severalhomologous series of synthetic amorphous poly-mers. In this semi-log plot, the Tg values foreach polymer reveal three distinguishable inter-
147
Dow
nloa
ded
by [
Tex
as A
&M
Uni
vers
ity L
ibra
ries
] at
10:
57 0
9 Ja
nuar
y 20
18
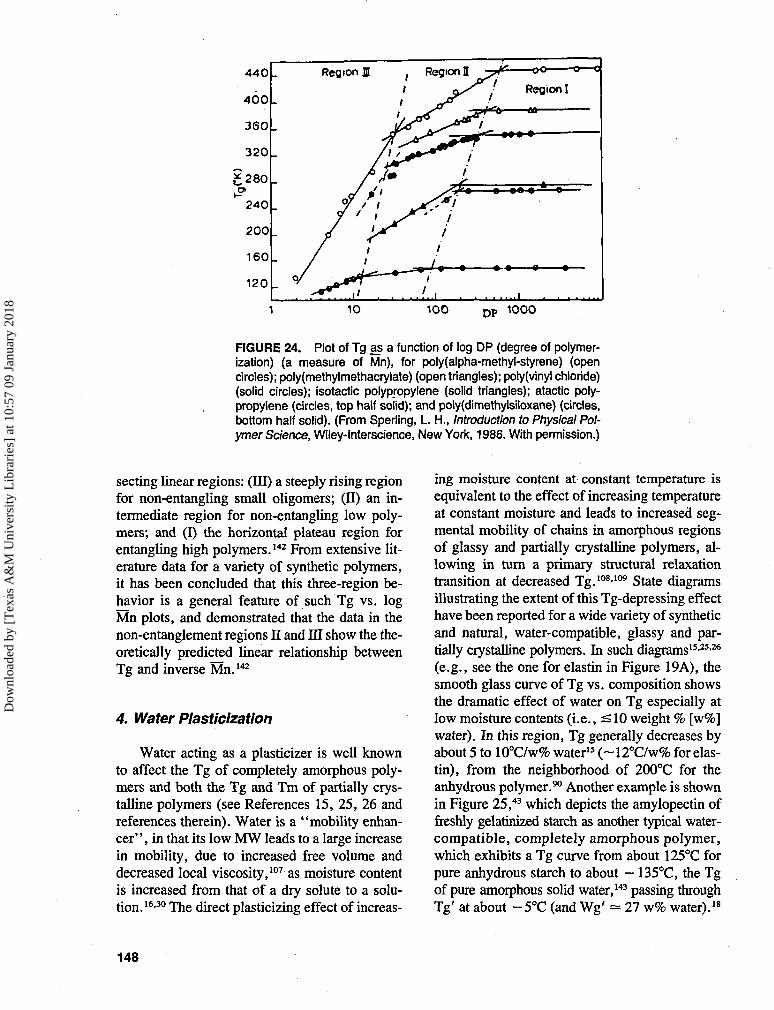
440
400
360
320
8 280
240
200
160
120
Region 1
" / '
1
s — • -
; Region H
*r*^ iI
11
if1./
f
11
—oo——
Region I
A
• o - - 0
1 10 100 D P 1000
FIGURE 24. Plot of Tg as a function of log DP (degree of polymer-ization) (a measure of Mn), for poiy(alpha-methyl-styrene) (opencircles); poly(methylmethacrylate) (open triangles); polyfvinyl chloride)(solid circles); isotactic polypropylene (solid triangles); atactic poly-propylene (circles, top half solid); and poly(dimethylsiloxane) (circles,bottom half solid). (From Sperling, L. H., Introduction to Physical Pol-ymer Science, Wiley-lnterscience, New York, 1986. With permission.)
secting linear regions: (DI) a steeply rising regionfor non-entangling small oligomers; (II) an in-termediate region for non-entangling low poly-mers; and (I) the horizontal plateau region forentangling high polymers.142 From extensive lit-erature data for a variety of synthetic polymers,it has been concluded that this three-region be-havior is a general feature of such Tg vs. logMn plots, and demonstrated that the data in thenon-entanglement regions II and III show the the-oretically predicted linear relationship betweenTg and inverse Mn.142
4. Water Plasticization
Water acting as a plasticizer is well knownto affect the Tg of completely amorphous poly-mers and both the Tg and Tm of partially crys-talline polymers (see References 15, 25, 26 andreferences therein). Water is a "mobility enhan-cer' ', in that its low MW leads to a large increasein mobility, due to increased free volume anddecreased local viscosity,107 as moisture contentis increased from that of a dry solute to a solu-tion.16-30 The direct plasticizing effect of increas-
ing moisture content at constant temperature isequivalent to the effect of increasing temperatureat constant moisture and leads to increased seg-mental mobility of chains in amorphous regionsof glassy and partially crystalline polymers, al-lowing in turn a primary structural relaxationtransition at decreased Tg.108-109 State diagramsillustrating the extent of this Tg-depressing effecthave been reported for a wide variety of syntheticand natural, water-compatible, glassy and par-tially crystalline polymers. In such diagrams15-25-26
(e.g., see the one for elastin in Figure 19A), thesmooth glass curve of Tg vs. composition showsthe dramatic effect of water on Tg especially atlow moisture contents (i.e., =£10 weight % [w%]water). In this region, Tg generally decreases byabout 5 to 10°C/w% water15 (~12°C/w% for elas-tin), from the neighborhood of 200°C for theanhydrous polymer.90 Another example is shownin Figure 25,43 which depicts the amylopectin offreshly gelatinized starch as another typical water-compatible, completely amorphous polymer,which exhibits a Tg curve from about 125°C forpure anhydrous starch to about — 135°C, the Tgof pure amorphous solid water,143 passing throughTg' at about -5°C (and Wg' = 27 w% water).18
148
Dow
nloa
ded
by [
Tex
as A
&M
Uni
vers
ity L
ibra
ries
] at
10:
57 0
9 Ja
nuar
y 20
18

200 r
g.w
0 0.2 0.4 0.6 0.8y, (weight fraction of water)
1.0
FIGURE 25. State diagram, showing the approximate Tg temperatures asa function of mass fraction, for a gelatinized starch-water system. (From vanden Berg, C., Concentration and Drying of Foods, MacCarthy, D., Ed., El-sevier, London, 1986, 11. With permission.)
Figure 25 shows the Tg of starch decreasing byabout 6°C/w% water for the first 10 w% mois-ture, in good agreement with another publishedglass curve for starch calculated from free volumetheory.49-94 Similarly, the glass curve for water-compatible, amorphous gluten99 in Figure 2651
shows a decrease in Tg from >160°C at ^ 1 w%water to 15°C at 16 w% water, a depression ofabout 10°C/w% water in this moisture range. The .plasticizing effect of water on gluten continuesat higher moisture contents, until Tg falls to Tg'= - 7.5°C and Wg reaches Wg' = 26 w% water=0.35 g UFW/g gluten.25
The plasticizing effect of water on the Tg ofthree other glass-forming food materials is illus-trated and compared in the state diagrams shownin Figure 27.91>129 Hemicellulose,129 an amor-phous component of wood, is another typicalwater-compatible biopolymer, with a dry Tg ofabout 200°C, which is dramatically depressed (bymore than 15°C/w% water for the first 10% water)
to a Tg around - 10°C (i.e., Tg') at about 30%moisture.90 Hemicellulose, like starch, gluten,and elastin, exhibits the characteristic behaviorcommon to all water-compatible, glass-formingsolutes:15 the practical limit to the extent of plas-ticization (i.e., depression of Tg by water) isdetermined by the phase separation of crystallineice below 0°C, so that the minimum Tg achiev-able during slow cooling in a practical time frameis the solute-specific Tg' (with the correspondingmaximum content of plasticizing moisture,Wg').8-30"34 Accordingly, the glass curve shownfor hemicellulose in Figure 27 is typical of the' 'practical glass curve for a water-compatible sol̂ute" that levels off at Tg'<0°C, rather than con-tinuing along the monotonic descent of the "com-plete glass curve" to the Tg of water itself. Incontrast to hemicellulose, lignin, the other majoramorphous component of wood, typifies a highpolymer that is only water-sensitive rather thanwater-compatible.15 Its glass curve also starts at
149
Dow
nloa
ded
by [
Tex
as A
&M
Uni
vers
ity L
ibra
ries
] at
10:
57 0
9 Ja
nuar
y 20
18
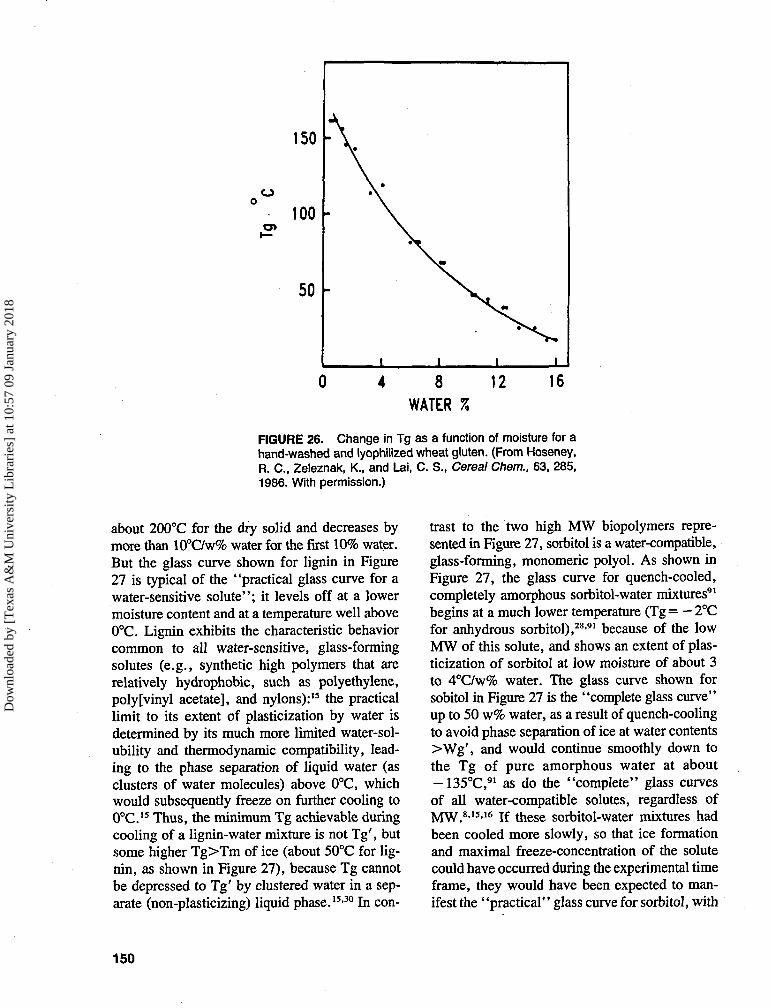
o>
16
FIGURE 26. Change in Tg as a function of moisture for ahand-washed and lyophilized wheat gluten. (From Hoseney,R. C., Zeleznak, K., and Lai, C. S., Cereal Chem., 63, 285,1986. With permission.)
about 200°C for the dry solid and decreases bymore than 10°C/w% water for the first 10% water.But the glass curve shown for lignin in Figure27 is typical of the "practical glass curve for awater-sensitive solute"; it levels off at a lowermoisture content and at a temperature well above0°C. Lignin exhibits the characteristic behaviorcommon to all water-sensitive, glass-formingsolutes (e.g., synthetic high polymers that arerelatively hydrophobic, such as polyethylene,poly[vinyl acetate], and nylons):15 the practicallimit to its extent of plasticization by water isdetermined by its much more limited water-sol-ubility and thermodynamic compatibility, lead-ing to the phase separation of liquid water (asclusters of water molecules) above 0°C, whichwould subsequently freeze on further cooling to0°C.15 Thus, the minimum Tg achievable duringcooling of a lignin-water mixture is not Tg', butsome higher Tg>Tm of ice (about 50°C for lig-nin, as shown in Figure 27), because Tg cannotbe depressed to Tg' by clustered water in a sep-arate (non-plasticizing) liquid phase.15-30 In con-
trast to the two high MW biopolymers repre-sented in Figure 27, sorbitol is a water-compatible,glass-forming, monomeric polyol. As shown inFigure 27, the glass curve for quench-cooled,completely amorphous sorbitol-water mixtures91
begins at a much lower temperature (Tg= — 2°Cfor anhydrous sorbitol),28-91 because of the lowMW of this solute, and shows an extent of plas-ticization of sorbitol at low moisture of about 3to 4°C/w% water. The glass curve shown forsobitol in Figure 27 is the "complete glass curve"up to 50 w% water, as a result of quench-coolingto avoid phase separation of ice at water contents>Wg', and would continue smoothly down tothe Tg of pure amorphous water at about-135°C,91 as do the "complete" glass curvesof all water-compatible solutes, regardless ofMW.8-15-16 If these sorbitol-water mixtures hadbeen cooled more slowly, so that ice formationand maximal freeze-concentration of the solutecould have occurred during the experimental timeframe, they would have been expected to man-ifest the ' 'practical'' glass curve for sorbitol, with
150
Dow
nloa
ded
by [
Tex
as A
&M
Uni
vers
ity L
ibra
ries
] at
10:
57 0
9 Ja
nuar
y 20
18
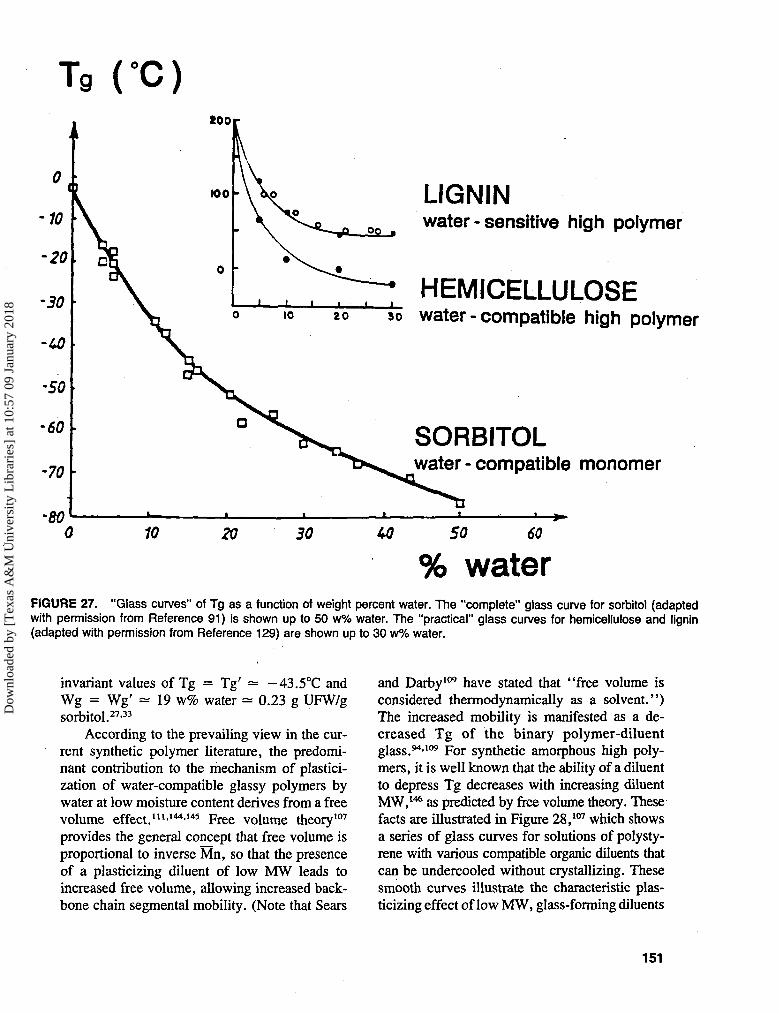
Tgtoo
LIGNINwater - sensitive high polymer
HEMICELLULOSE10 20 so water-compatible high polymer
SORBITOLwater - compatible monomer
60
% waterFIGURE 27. "Glass curves" of Tg as a function of weight percent water. The "complete" glass curve for sorbitol (adaptedwith permission from Reference 91) is shown up to 50 w% water. The "practical" glass curves for hemicellulose and lignin(adapted with permission from Reference 129) are shown up to 30 w% water.
invariant values of Tg = Tg' - -43.5°C andWg = Wg' = 19 w% water = 0.23 g UFW/gsorbitol.27-33
According to the prevailing view in the cur-rent synthetic polymer literature, the predomi-nant contribution to the mechanism of plastici-zation of water-compatible glassy polymers bywater at low moisture content derives from a freevolume effect.U1-144'145 Free volume theory107
provides the general concept that free volume isproportional to inverse Mn, so that the presenceof a plasticizing diluent of low MW leads toincreased free volume, allowing increased back-bone chain segmental mobility. (Note that Sears
and Darby109 have stated that "free volume isconsidered thermodynamically as a solvent.")The increased mobility is manifested as a de-creased Tg of the binary polymer-diluentglass.94-109 For synthetic amorphous high poly-mers, it is well known that the ability of a diluentto depress Tg decreases with increasing diluentMW,146 as predicted by free volume theory. Thesefacts are illustrated in Figure 28,107 which showsa series of glass curves for solutions of polysty-rene with various compatible organic diluents thatcan be undercooled without crystallizing. Thesesmooth curves illustrate the characteristic plas-ticizing effect of low MW, glass-forming diluents
151
Dow
nloa
ded
by [
Tex
as A
&M
Uni
vers
ity L
ibra
ries
] at
10:
57 0
9 Ja
nuar
y 20
18
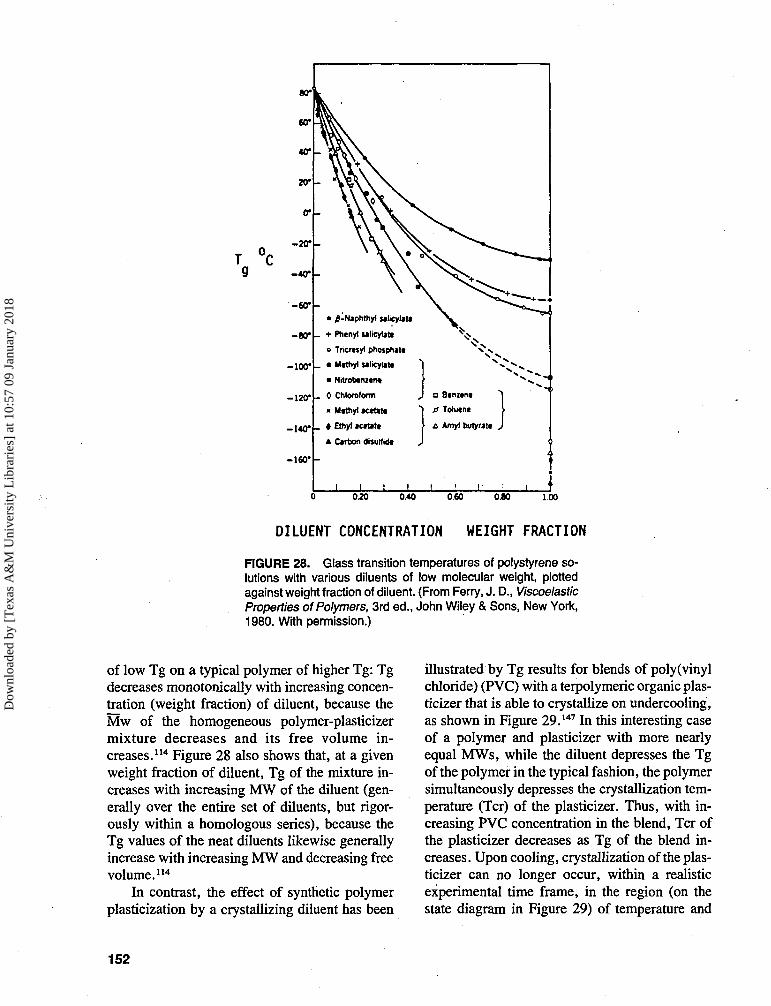
T °Cg
- 8 0 *
-100*
-120*
-140*
-160"
_ e Methyl salicylate
• Nitrobenier*
_ 0 Chloroform
x Methyl acetate
_ « Ethyl acetate
A Carbon disulfkte
a Benzene
g Toluene
£ Amyl butyrate
I L020 0.40 0.60 0.80 1.00
DILUENT CONCENTRATION WEIGHT FRACTION
FIGURE 28. Glass transition temperatures of polystyrene so-lutions with various diluents of low molecular weight, plottedagainst weight fraction of diluent. (From Ferry, J. D., ViscoelasticProperties of Polymers, 3rd ed., John Wiley & Sons, New York,1980. With permission.)
of low Tg on a typical polymer of higher Tg: Tgdecreases monotonically with increasing concen-tration (weight fraction) of diluent, because theMw of the homogeneous polymer-plasticizermixture decreases and its free volume in-creases.114 Figure 28 also shows that, at a givenweight fraction of diluent, Tg of the mixture in-creases with increasing MW of the diluent (gen-erally over the entire set of diluents, but rigor-ously within a homologous series), because theTg values of the neat diluents likewise generallyincrease with increasing MW and decreasing freevolume.114
In contrast, the effect of synthetic polymerplasticization by a crystallizing diluent has been
illustrated by Tg results for blends of poly (vinylchloride) (PVC) with a terpolymeric organic plas-ticizer that is able to crystallize on undercooling,as shown in Figure 29.147 In this interesting caseof a polymer and plasticizer with more nearlyequal MWs, while the diluent depresses the Tgof the polymer in the typical fashion, the polymersimultaneously depresses the crystallization tem-perature (Tcr) of the plasticizer. Thus, with in-creasing PVC concentration in the blend, Tcr ofthe plasticizer decreases as Tg of the blend in-creases. Upon cooling, crystallization of the plas-ticizer can no longer occur, within a realisticexperimental time frame, in the region (on thestate diagram in Figure 29) of temperature and
152
Dow
nloa
ded
by [
Tex
as A
&M
Uni
vers
ity L
ibra
ries
] at
10:
57 0
9 Ja
nuar
y 20
18
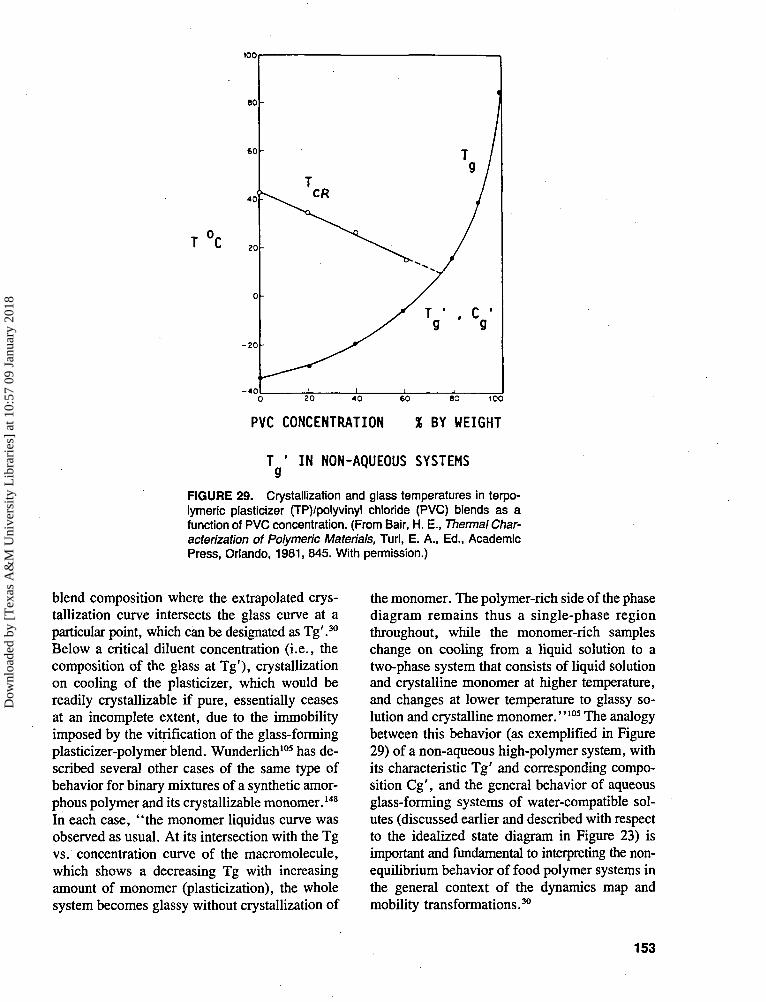
100
T ° C
-20 -
- 4 04 0 60 100
PVC CONCENTRATION % BY WEIGHT
T ' IN NON-AQUEOUS SYSTEMSg
FIGURE 29. Crystallization and glass temperatures in terpo-lymeric plasticizer (TP)/polyvinyl chloride (PVC) blends as afunction of PVC concentration. (From Bair, H. E., Thermal Char-acterization of Polymeric Materials, Turi, E. A., Ed., AcademicPress, Orlando, 1981, 845. With permission.)
blend composition where the extrapolated crys-tallization curve intersects the glass curve at aparticular point, which can be designated as Tg'.30
Below a critical diluent concentration (i.e., thecomposition of the glass at Tg'), crystallizationon cooling of the plasticizer, which would bereadily crystallizable if pure, essentially ceasesat an incomplete extent, due to the immobilityimposed by the vitrification of the glass-formingplasticizer-polymer blend. Wunderlich105 has de-scribed several other cases of the same type ofbehavior for binary mixtures of a synthetic amor-phous polymer and its crystallizable monomer.148
In each case, "the monomer liquidus curve wasobserved as usual. At its intersection with the Tgvs. concentration curve of the macromolecule,which shows a decreasing Tg with increasingamount of monomer (plasticization), the wholesystem becomes glassy without crystallization of
the monomer. The polymer-rich side of the phasediagram remains thus a single-phase regionthroughout, while the monomer-rich sampleschange on cooling from a liquid solution to atwo-phase system that consists of liquid solutionand crystalline monomer at higher temperature,and changes at lower temperature to glassy so-lution and crystalline monomer."105 The analogybetween this behavior (as exemplified in Figure29) of a non-aqueous high-polymer system, withits characteristic Tg' and corresponding compo-sition Cg', and the general behavior of aqueousglass-forming systems of water-compatible sol-utes (discussed earlier and described with respectto the idealized state diagram in Figure 23) isimportant and fundamental to interpreting the non-equilibrium behavior of food polymer systems inthe general context of the dynamics map andmobility transformations.30
153
Dow
nloa
ded
by [
Tex
as A
&M
Uni
vers
ity L
ibra
ries
] at
10:
57 0
9 Ja
nuar
y 20
18
Recent reports111-144-145 have demonstrated thatthe effectiveness of water as a plasticizer of syn-thetic polymers15 (by analogy with the effective-ness of typical low MW organic plasticizers, asshown in Figure 28) primarily reflects the lowmolar mass of water. These workers have dis-counted older concepts of specific interactions,such as disruptive water-polymer hydrogen bond-ing in polymer hydrogen-bonded networks, orplasticizing molecules becoming "firmly bound"to polar sites along a polymer chain, in explainingwater's plasticizing ability. Although hydrogenbonding certainly affects solubility parameters andcontributes to compatibility of polymer-waterblends,109 it has been convincingly shown thatpolymer flexibility does not depend on specifichydrogen bonding to backbone polar groups.121
Rather, the relative size of the mobile segmentof linear backbone,114 and thus the relative Mwof its blend with water, governs the magnitudeof plasticization and so determines Tg.121 To ne-gate the older arguments for site-specific hydro-gen bonding, NMR results have been cited thatclearly indicate that water molecules in polymerswith polar sites have a large degree of mobil-ity.144-145 As used in this context, mobility is de-fined in terms of translation^ and rotational de-grees of freedom for molecular diffusion on atime scale of experimental measurements.30
Franks4"7-40"42-149-150 has advocated a similar viewand presented similar evidence to try to dispelthe popular151 but outdated57 myths about"bound" water and "water-binding capacity" inglass-forming food polymers or low MW mate-rials. For example, as discussed later, protonNMR has been used to test the accessibility ofwater with reduced mobility in the crystallineregions of retrograded wheat starch gels.152 Suchgels are partially crystalline, with B-type hy-drated crystalline regions in which water mole-cules constitute an integral structural part of thecrystal unit cell.153-154 NMR results have shownthat all the water in such a starch gel can be freelyexchanged with deuterium oxide.152 Most re-cently, Ellis111 has reported results of a compre-hensive DSC study that show that several diversesynthetic "amorphous polyamides in pure andblended form exhibit a monotonic depression ofTg as a function of water content", and which' 'lend further credence to the simple and straight-
forward plasticizing action of water in polar poly-mers irrespective of their chemical and physicalconstitution." These results have helped to con-firm the conclusions15-25 that (1) the behavior ofhydrophilic polymers with aqueous diluents isprecisely the same as that of nonpolar syntheticpolymers (e.g., polystyrene in Figure 28) withorganic diluents, and (2) water-compatible foodpolymers such as starch, gelatin, elastin, and glu-ten, for which water is an efficient plasticizer butnot necessarily a good solvent, exhibit the samephysicochemical responses to plasticization as domany water-compatible synthetic polymers (e.g.,poly[vinyl pyrrolidone] [PVP]).15 A character-istic extent of plasticization at low moisture, typ-ically in the range of about 5 to 10°C/w% water(as shown for starch in Figure 25 and gluten inFigure 26), but occasionally somewhat less than5°C/w% (e.g., sorbitol in Figure 27) or as muchas 20°C/w% (e.g., hemicellulose in Figure27), has been shown to apply to a wide varietyof water-compatible glassy and partially crystal-line food monomers, oligomers, and high poly-mers. 15-25-26>66 As mentioned earlier, the excellentagreement between the measured value of Tg'17-20
and the theoretical value recently calculated fromfree volume theory49-94 for an aqueous wheat starchgel with S27% moisture also lends further sup-port to these conclusions.
In partially crystalline polymers, water plas-ticization occurs only in the amorphous re-gions.62-145-155"157 In linear synthetic polymers withanhydrous crystalline regions and a relatively lowcapacity for water in the amorphous regions (e.g.,nylons),155 the % crystallinity affects Tg, suchthat increasing % crystallinity generally leads toincreasing Tg.145 This is due primarily to the stiff-ening or "antiplasticizing" effect of disperse mi-crocrystalline crosslinks, which leads to de-creased mobility of chain segments in theinterconnected amorphous regions.156 The sameeffect is produced by covalent crosslinks,145
which, when produced by radiation, occur onlyin amorphous regions.144 In polymers with an-hydrous crystalline regions, only the amorphousregions are accessible to penetration and there-fore plasticization by water.144-145-157 Similar phe-nomena are observed in partially crystalline poly-mers with hydrated crystalline regions, such asgelatin and starch.15-19-24 In native starches, hy-
154
Dow
nloa
ded
by [
Tex
as A
&M
Uni
vers
ity L
ibra
ries
] at
10:
57 0
9 Ja
nuar
y 20
18

drolysis by aqueous acid ("acid etching") or en-zymes, at T < Tm, can occur initially only inamorphous regions.153 Similarly, acid etching ofretrograded starch progresses in amorphous re-gions, leading to increased relative crystallinity(or even increased absolute crystallinity, by crys-tal growth) of the residue.133 Dehumidificationof granular starch proceeds most readily frominitially mobile amorphous regions, leading tonon-uniform moisture distribution.62 In partiallygelatinized starches, dyeability by a pigment in-creases with increasing amorphous content.158 Itshould be noted, however, that plasticization ofthe amorphous regions (e.g., the backbone seg-ments and branch points of amylopectin mole-cules) of native granular starches by sorbed wateris neither instantaneous nor simultaneous with theinitial swelling caused by water uptake. It hasrecently been demonstrated by Aguerre et al.159
that "the uptake of water takes place betweenthe concentric layers" of the granule, leading to"interlamellar expansion of the starch granulestructure." This sorbed water must subsequentlydiffuse from the interlamellar spaces to the amor-phous regions of the granule before plasticizationof the polymer molecules or chain segments inthose amorphous regions can begin. The effectiveTg that immediately precedes and thereby deter-mines the temperature of gelatinization (Tgelat)in native starch depends on the extent and type(B vs. A vs. V polymorphs) of crystallinity inthe granule (but not on amylose content) and ontotal moisture content and moisture distribu-tion.1721 For normal and waxy (i.e., all amylo-pectin) starches, Tgelat increases with increasing% crystallinity,160 an indirect effect due to thedisproportionation of mobile short branches ofamylopectin from amorphous regions to micro-crystalline "micelles", thereby increasing theaverage MW and effective Tg of the residualamorphous constituents,21 because these branchesare unavailable to serve as "internal" plasticiz-ers.109 Two other related phenomena are observedas a result of the non-uniform moisture distri-bution in situations of overall low moisture con-tent for polymers with hydrated crystalline re-gions:15 (1) atypically high Tg/Tm (in K) ratios>0.80 but, of course, <1.0,89>105 in contrast tothe characteristic range of 0.5 to 0.8 for manypartially crystalline synthetic polymers,102 and (2)
a pronounced apparent depressing effect of wateron Tm93'161 as well as Tg, such that both Tg andTm decrease with increasing moisture content.
To put this modern concept of water plasti-cization in a more familiar context of the older,more traditional literature on "bound" and "un-freezable" water and on water sorption by foodpolymers at low moisture (reviewed in detail else-where),15-25 the earliest-sorbed water fraction ismost strongly plasticizing, always said to be ' 'un-freezable" in a practical time frame, and oftenreferred to as "bound". The later-sorbed water,fraction is said to be freezable, referred to as"free", "mobile", or "loosely bound", and iseither weakly or non-plasticizing, depending onthe degree of water compatibility of the specificpolymer. As mentioned earlier, the degree ofwater compatibility relates to the ability of waterto depress Tg to Tg', and to the magnitude ofWg'.15>16 Regardless of context, a key fact aboutthe "freezability" of water relates to the ho-mogeneous process for the prerequisite nuclea-tion step of ice crystallization.162 Even at tem-peratures as low as -40°C (the homogeneousnucleation temperature for ice in pure water),4 aminimum on the order of 200 water moleculesmust associate within a domain of about 40 A inorder to form a critical nucleus that will growspontaneously into an ice crystal.4 Thus, withinany food material at low moisture, clusters ofwater molecules of lower density than about 200molecules/40 A would certainly require temper-atures below — 40°C or heterogeneous catalystsfor nucleation to occur.33
The solute-specific, invariant quantity of un-frozen water captured in the glass that forms atTg', defined as Wg',8 is traditionally referred toby many food scientists and technologists as onemeasure of "bound" water.151 However,"bound" water, with respect to either frozen orroom-temperature food systems, is a misnomerthat has persisted for at least the last 30 years,despite constant debate3-8-15-25-26-57-58'64 and ever-more convincing arguments that the concepts of"bound" water, "water binding", and "water-binding capacity" of a solute are incorrect, in-appropriate, and misleading rather than help-ful .4-7,40-42,149.150 ^ g c o n C e p t of " b o u n d " water
originated in large part from a fundamental mis-conception that discrete "free" and "bound"
155
Dow
nloa
ded
by [
Tex
as A
&M
Uni
vers
ity L
ibra
ries
] at
10:
57 0
9 Ja
nuar
y 20
18
physical states of water in food materials (or"free", "loosely bound", and "tightly bound"states) could provide a valid representation ofwater molecules in a solution at ambient tem-perature.34 Actually, a t T > Tg', water moleculesin a solution exist within a single physical state(i.e., liquid) characterized not by any kind ofstatic geometry but rather by a dynamic contin-uum of degrees of hindered instantaneous mo-bility.25 In this liquid solution state, individualwater molecules are only transitorally hydrogen-bonded to individual polar sites on the solute. 149>15°
As explained recently ,8-30-34 the solute-spe-cific value of Wg' is the maximum amount ofwater that can exist with that solute in a spatiallyhomogeneous, compatible blend that, in the rub-bery state, exhibits long-range cooperative relax-ation behavior described by WLF kinetics, butnot long-range lattice order. Further dilution be-yond Wg' results in loss of cooperative mobilityand onset of short-range fluid mechanics, de-scribed by Arrhenius kinetics. Thus, expressionof Wg' as a water/solute number ratio (i.e., a"notional hydration number")149 actually rep-resents the technologically practical maximumlimit for the amount of water that can act as aplasticizer of a particular solute,615 rather thanthe amount of water that is ' 'bound'' to, or whosedynamics are governed by, that solute. Part ofthe reason for the persistence of the concept of"bound" water in such concentrated solute sys-tems, despite convincing evidence of its invalid-ity, relates to a conclusion inadvisedly extrapo-lated from findings for very dilute solutions. Theaddition of a few isolated solute molecules topure water already causes a profound effect onthe self-diffusion properties in the solution. Thehindered diffusion of water molecules instanta-neously in the vicinity of individual solute mol-ecules is construed as the effect of "viscous drag";these less-mobile water molecules are visualizedto be "pulled along" with the solute during flow.But it has been demonstrated repeatedly149150 thanthe less-mobile water molecules are freely ex-changeable with all of the water in the solution,leading to the inescapable consensus view thatthe water is not bound to the solute. On the otherhand, in describing dilute solutions, no one hasever suggested that the solute molecules are"bound" to water molecules. When the situation
is reversed, adding a few water molecules to ananhydrous solute profoundly changes the viscoe-lastic properties of the solute via water plastici-zation, which increases the free volume and de-creases the local viscosity.34 Why then, in lightof this evidence of a dramatic increase in themobility of the solute, have many found it soeasy to jump to the conclusion that these watermolecules must be ' 'bound'' to solute molecules?
It is only recently becoming more widelyacknowledged and accepted15-25-33-50-57-58 that theso-called "bound" water corresponding to Wg'is not energetically bound in any equilibriumthermodynamic sense. Rather, it is simply ki-netically retarded, due to the extremely high localviscosity (~1012 Pa s) of the metastable glass atTg', and thus dynamically constrained from thetranslational and rotational diffusion required forice crystal growth.4'8-30"34-4(M2 The crucial findingthat water is not "strongly bound" to polar groupson hydrophilic polymers has been demonstratedin an especially convincing fashion by the me-ticulous low-temperature DSC and ambient-temperature sorption studies of Pouchly andBiros163'166 on the thermodynamic interaction ofwater with (and plasticizing effect on) hydro-philic synthetic polymers in glassy and rubberystates. This conclusion regarding the true natureof "bound" water does not mean that there arenot solute-water hydrogen bonds in the glass atTg', only that such hydrogen bonds are the nor-mal consequence of dissolution of a solute inwater rather than the cause of the kinetic retar-dation that renders this water "unfreezable" inreal time.34 The stabilizing free energy of suchsolute-water hydrogen bonds is no greater thanfor water-water hydrogen bonds in ice.150-163166
Analogously, for model solutions of small sugarsat room temperature, results of NMR and die-lectric relaxation measurements have shown that"the residence time of a given water moleculeat a solvation site (i.e., a hydroxyl group on asugar) is extremely short, <1 ns."14?-150 Fur-thermore, such results, from studies of syntheticpolymers145 and polymeric carbohydrate and pro-tein gels58-152 alike, have demonstrated conclu-sively that water molecules said to be "bound"to polar groups on such polymeric solutes are infact highly mobile (especially compared to themobility of water in ice)167 and able to exchange
156
Dow
nloa
ded
by [
Tex
as A
&M
Uni
vers
ity L
ibra
ries
] at
10:
57 0
9 Ja
nuar
y 20
18
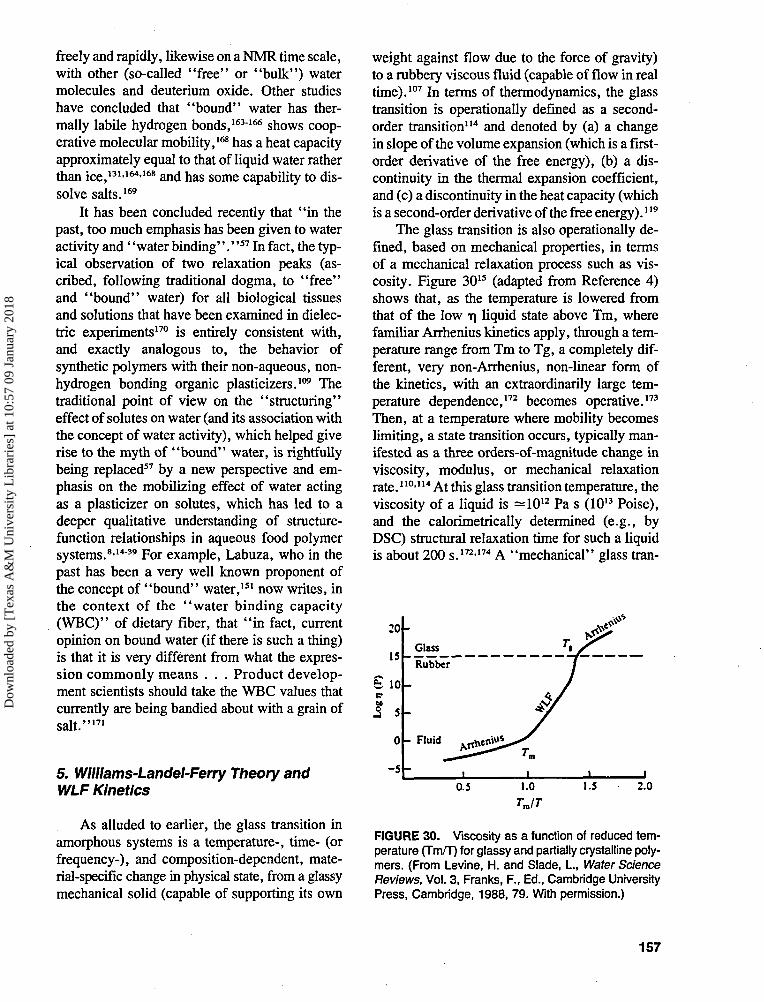
freely and rapidly, likewise on a NMR time scale,with other (so-called "free" or "bulk") watermolecules and deuterium oxide. Other studieshave concluded that "bound" water has ther-mally labile hydrogen bonds,163166 shows coop-erative molecular mobility,168 has a heat capacityapproximately equal to that of liquid water ratherthan ice,131-164-168 and has some capability to dis-solve salts.169
It has been concluded recently that "in thepast, too much emphasis has been given to wateractivity and ' 'water binding''. "5 7 In fact, the typ-ical observation of two relaxation peaks (as-cribed, following traditional dogma, to "free"and "bound" water) for all biological tissuesand solutions that have been examined in dielec-tric experiments170 is entirely consistent with,and exactly analogous to, the behavior ofsynthetic polymers with their non-aqueous, non-hydrogen bonding organic plasticizers.109 Thetraditional point of view on the "structuring"effect of solutes on water (and its association withthe concept of water activity), which helped giverise to the myth of "bound" water, is rightfullybeing replaced57 by a new perspective and em-phasis on the mobilizing effect of water actingas a plasticizer on solutes, which has led to adeeper qualitative understanding of structure-function relationships in aqueous food polymersystems.8-1439 For example, Labuza, who in thepast has been a very well known proponent ofthe concept of "bound" water,151 now writes, inthe context of the "water binding capacity(WBC)" of dietary fiber, that "in fact, currentopinion on bound water (if there is such a thing)is that it is very different from what the expres-sion commonly means . . . Product develop-ment scientists should take the WBC values thatcurrently are being bandied about with a grain ofsalt."171
5. Williams-Landel-Ferry Theory andWLF Kinetics
As alluded to earlier, the glass transition inamorphous systems is a temperature-, time- (orfrequency-), and composition-dependent, mate-rial-specific change in physical state, from a glassymechanical solid (capable of supporting its own
weight against flow due to the force of gravity)to a rubbery viscous fluid (capable of flow in realtime).107 In terms of thermodynamics, the glasstransition is operationally defined as a second-order transition114 and denoted by (a) a changein slope of the volume expansion (which is a first-order derivative of the free energy), (b) a dis-continuity in the thermal expansion coefficient,and (c) a discontinuity in the heat capacity (whichis a second-order derivative of the free energy).119
The glass transition is also operationally de-fined, based on mechanical properties, in termsof a mechanical relaxation process such as vis-cosity. Figure 3015 (adapted from Reference 4)shows that, as the temperature is lowered fromthat of the low i) liquid state above Tm, wherefamiliar Arrhenius kinetics apply, through a tem-perature range from Tm to Tg, a completely dif-ferent, very non-Arrhenius, non-linear form ofthe kinetics, with an extraordinarily large tem-perature dependence,172 becomes operative.173
Then, at a temperature where mobility becomeslimiting, a state transition occurs, typically man-ifested as a three orders-of-magnitude change inviscosity, modulus, or mechanical relaxationrate.110>114 At this glass transition temperature, theviscosity of a liquid is —1012 Pa s (1013 Poise),and the calorimetrically determined (e.g., byDSC) structural relaxation time for such a liquidis about 200 s.172-174 A "mechanical" glass tran-
20
is
fc. 10
S 50
-5
Glass
Rubber
- F l u i d XIthe
"* i i i i
0.5 1.0
TJT1.5 2.0
FIGURE 30. Viscosity as a function of reduced tem-perature (Tm/T) for glassy and partially crystalline poly-mers. (From Levine, H. and Slade, I., Water ScienceReviews, Vol. 3, Franks, F., Ed., Cambridge UniversityPress, Cambridge, 1988, 79. With permission.)
157
Dow
nloa
ded
by [
Tex
as A
&M
Uni
vers
ity L
ibra
ries
] at
10:
57 0
9 Ja
nuar
y 20
18

sition can be defined by combinations of tem-perature and deformation frequency for whichsufficiently large numbers of mobile units (e.g.,small molecules or backbone chain segments ofa macromolecule) become cooperatively immo-bilized (in terms of large-scale rotational andtranslational motion) during a time comparableto the experimental period,121>172il73>175 such thatthe material becomes a mechanical solid capableof supporting its own weight against flow. Ar-rhenius kinetics become operative once again inthe glassy solid, but the rates of all diffusion-limited processes are much lower in this high TJsolid state than in the liquid state.15 In fact, thedifference in average relaxation times betweenthe two Arrhenius regimes is typically more than14 orders of magnitude.30
At temperatures above Tg, plasticization bywater affects the viscoelastic, thermomechanical,electrical, guest/host diffusion, and gas perme-ability properties of completely amorphous andpartially crystalline polymer systems to an extentmirrored in its effect on Tg.I5 In the rubbery rangeabove Tg for completely amorphous polymers orbetween Tg and Tm for partially crystalline poly-mers (in either case, typically from Tg to aboutTg+ 100°C for well-behaved synthetic poly-mers),30 the dependence of viscoelastic propertieson temperature (i.e., the effect of increasing tem-perature on relative relaxation times) is success-fully predicted116 by the WLF equation, an em-pirical equation whose form was originally derivedfrom the free volume interpretation of the glasstransition.101-107 The WLF equation can be written
as189,101
log (JL / J D S - ^ = Cl(T-Tg)3VpT/ pgTg/ C2 + (T-Tg)
where T| is the viscosity or other diffusion-limitedrelaxation process, p the density, and Cl and C2are coefficients that describe the temperature de-pendence of the relaxation process at tempera-tures above the reference temperature, Tg. Cl isproportional to the inverse of the free volume ofthe system at Tg, while C2 is proportional to theratio of free volume at Tg over the increase infree volume due to thermal expansion above Tg(i.e., ratio of free volume at Tg to the differencebetween the volumes of the rubbery liquid and
glassy solid states, as a function of temperatureabove Tg).107 Cl and C2 take on the values of"universal constants" (17.44 and 51.6, respec-tively, as extracted from experimental data onmany synthetic amorphous polymers)101 for well-behaved polymers.30 The WLF equation de-scribes the kinetic nature of the glass transitionand has been shown to be applicable to any glass-forming polymer, oligomer, or monomer.107
These particular values for the "universal con-stants" have also been shown to apply to moltenglucose,101 amorphous glucose-water mix-tures,176 amorphous sucrose and lactose powdersat low moisture,66 and concentrated solutions ofmixed sugars,89 as examples of relevance to foods.
The equation defines mobility in terms of thenon-Arrhenius temperature dependence of the rateof any diffusion-limited relaxation process oc-curring at a temperature T compared to the rateof the relaxation at the reference temperature Tg,shown here in terms of log r\ related usefully toAT, where AT = T - T g . The WLF equation isvalid in the temperature range of the rubbery orundercooled liquid state, where it is typically usedto describe the time-/temperature-dependent be-havior of polymers.173 The equation is based onthe assumptions that polymer free volume in-creases linearly with increasing temperature aboveTg and that segmental or mobile unit viscosity,in turn, decreases rapidly with increasing freevolume (as illustrated implicitly in Figure 30).107
Thus, the greater the AT, the faster a system isable to move (due to increased free volume anddecreased mobile unit viscosity), so the greateris the mobility, and the shorter is the relaxationtime. In essence, the WLF equation and resultingmaster curve of log On/tig) vs. T—Tg89-101 rep-resent a mobility transformation, described interms of a time-temperature superposition.30 SuchWLF plots typically show a 5 orders-of-magni-tude change in viscosity (or in the rates of otherrelaxation processes) over a 20°C interval nearTg,6 which is characteristic of WLF behavior inthe rubbery fluid range.30 For example, as dem-onstrated by Soesanto and Williams,89 the effectsof temperature and concentration on the mobilityof fluids above Tg can be combined to create asingle master curve, which represents the WLFequation. The viscosity data shown in Figure 3189
were obtained for highly concentrated (>90 w%)
158
Dow
nloa
ded
by [
Tex
as A
&M
Uni
vers
ity L
ibra
ries
] at
10:
57 0
9 Ja
nuar
y 20
18
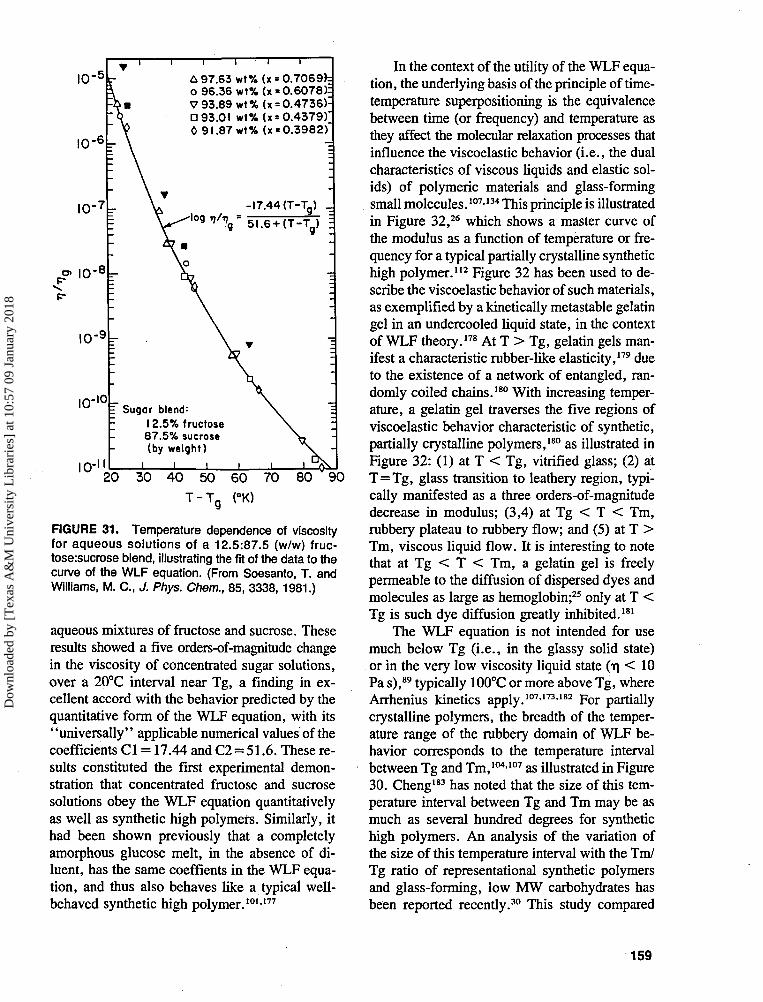
IO"5r A 97.63 wt% (x = 0.7069ho 96.36 wt% (x = 0.6078):V 93.89 v»t% (x = 0.4736):
D 93.01 wt%(x= 0.4379) 9l.87wt% (x = 0.3982)
-17.44 (T-Tg)l 0 f l 1 j /?a"5l .6+(T-T)
Sugar blend:12.5% fructose87.5% sucrose(by weight)
20 30 40 50 60 70 80 90
FIGURE 31. Temperature dependence of viscosityfor aqueous solutions of a 12.5:87.5 (w/w) fruc-tose:sucrose blend, illustrating the fit of the data to thecurve of the WLF equation. (From Soesanto, T. andWilliams, M. C., J. Phys. Chem., 85, 3338, 1981.)
aqueous mixtures of fructose and sucrose. Theseresults showed a five orders-of-magnitude changein the viscosity of concentrated sugar solutions,over a 20°C interval near Tg, a finding in ex-cellent accord with the behavior predicted by thequantitative form of the WLF equation, with its"universally" applicable numerical values of thecoefficients Cl = 17.44 and C2 = 51.6. These re-sults constituted the first experimental demon-stration that concentrated fructose and sucrosesolutions obey the WLF equation quantitativelyas well as synthetic high polymers. Similarly, ithad been shown previously that a completelyamorphous glucose melt, in the absence of di-luent, has the same coeffients in the WLF equa-tion, and thus also behaves like a typical well-behaved synthetic high polymer.101-177
In the context of the utility of the WLF equa-tion, the underlying basis of the principle of time-temperature superpositioning is the equivalencebetween time (or frequency) and temperature asthey affect the molecular relaxation processes thatinfluence the viscoelastic behavior (i.e., the dualcharacteristics of viscous liquids and elastic sol-ids) of polymeric materials and glass-formingsmall molecules.107-134 This principle is illustratedin Figure 32,26 which shows a master curve ofthe modulus as a function of temperature or fre-quency for a typical partially crystalline synthetichigh polymer.112 Figure 32 has been used to de-scribe the viscoelastic behavior of such materials,as exemplified by a kinetically metastable gelatingel in an undercooled liquid state, in the contextof WLF theory.178 At T > Tg, gelatin gels man-ifest a characteristic rubber-like elasticity,179 dueto the existence of a network of entangled, ran-domly coiled chains.180 With increasing temper-ature, a gelatin gel traverses the five regions ofviscoelastic behavior characteristic of synthetic,partially crystalline polymers,180 as illustrated inFigure 32: (1) at T < Tg, vitrified glass; (2) atT=Tg, glass transition to leathery region, typi-cally manifested as a three orders-of-magnitudedecrease in modulus; (3,4) at Tg < T < Tm,rubbery plateau to rubbery flow; and (5) at T >Tm, viscous liquid flow. It is interesting to notethat at Tg < T < Tm, a gelatin gel is freelypermeable to the diffusion of dispersed dyes andmolecules as large as hemoglobin;25 only at T <Tg is such dye diffusion greatly inhibited.181
The WLF equation is not intended for usemuch below Tg (i.e., in the glassy solid state)or in the very low viscosity liquid state On < 10Pa s),89 typically 100°C or more above Tg, whereArrhenius kinetics apply.I07>173-182 For partiallycrystalline polymers, the breadth of the temper-ature range of the rubbery domain of WLF be-havior corresponds to the temperature intervalbetween Tg and Tm,IO4>107 as illustrated in Figure30. Cheng183 has noted that the size of this tem-perature interval between Tg and Tm may be asmuch as several hundred degrees for synthetichigh polymers. An analysis of the variation ofthe size of this temperature interval with the Tm/Tg ratio of representational synthetic polymersand glass-forming, low MW carbohydrates hasbeen reported recently.30 This study compared
159
Dow
nloa
ded
by [
Tex
as A
&M
Uni
vers
ity L
ibra
ries
] at
10:
57 0
9 Ja
nuar
y 20
18
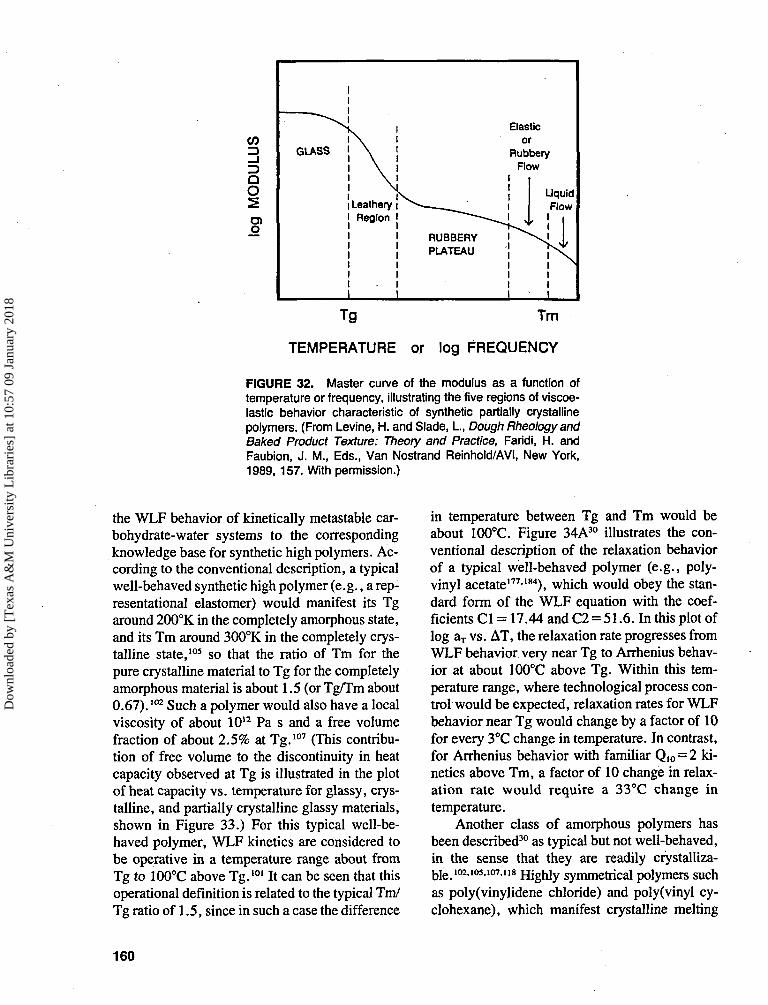
CO
3oo
o
— ^
GLASS
\\
LeatheryRegion
^ ^RUBBERYPLATEAU
Elasticor
RubberyFlow
LiquidFlow
1 .
Tg Tm
TEMPERATURE or log FREQUENCY
FIGURE 32. Master curve of the modulus as a function oftemperature or frequency, illustrating the five regions of viscoe-lastic behavior characteristic of synthetic partially crystallinepolymers. (From Levine, H. and Slade, I., Dough RheologyandBaked Product Texture: Theory and Practice, Faridi, H. andFaubion, J. M., Eds., Van Nostrand Reinhold/AVI, New York,1989, 157. With permission.)
the WLF behavior of kinetically metastable car-bohydrate-water systems to the correspondingknowledge base for synthetic high polymers. Ac-cording to the conventional description, a typicalwell-behaved synthetic high polymer (e.g., a rep-resentational elastomer) would manifest its Tgaround 200°K in the completely amorphous state,and its Tm around 300°K in the completely crys-talline state,105 so that the ratio of Tm for thepure crystalline material to Tg for the completelyamorphous material is about 1.5 (or Tg/Tm about0.67).I02 Such a polymer would also have a localviscosity of about 1012 Pa s and a free volumefraction of about 2.5% at Tg.107 (This contribu-tion of free volume to the discontinuity in heatcapacity observed at Tg is illustrated in the plotof heat capacity vs. temperature for glassy, crys-talline, and partially crystalline glassy materials,shown in Figure 33.) For this typical well-be-haved polymer, WLF kinetics are considered tobe operative in a temperature range about fromTg to 100°C above Tg.101 It can be seen that thisoperational definition is related to the typical Tm/Tg ratio of 1.5, since in such a case the difference
in temperature between Tg and Tm would beabout 100°C. Figure 34A30 illustrates the con-ventional description of the relaxation behaviorof a typical well-behaved polymer (e.g., poly-vinyl acetate177-184), which would obey the stan-dard form of the WLF equation with the coef-ficients Cl = 17.44 and C2 = 51.6. In this plot oflog aT vs. AT, the relaxation rate progresses fromWLF behavior very near Tg to Arrhenius behav-ior at about 100°C above Tg. Within this tem-perature range, where technological process con-trol would be expected, relaxation rates for WLFbehavior near Tg would change by a factor of 10for every 3°C change in temperature. In contrast,for Arrhenius behavior with familiar Q10 = 2 ki-netics above Tm, a factor of 10 change in relax-ation rate would require a 33°C change intemperature.
Another class of amorphous polymers hasbeen described30 as typical but not well-behaved,in the sense that they are readily crystalliza-y e io2.io5.io7.ii8 Highly symmetrical polymers suchas poly(vinylidene chloride) and poly(vinyl cy-clohexane), which manifest crystalline melting
160
Dow
nloa
ded
by [
Tex
as A
&M
Uni
vers
ity L
ibra
ries
] at
10:
57 0
9 Ja
nuar
y 20
18

Cp
FreeVolume
FIGURE 33. Plot of heat capacity as a function of temperaturefor glassy, crystalline, and partially crystalline glassy materials,illustrating the contribution of free volume to the discontinuity inheat capacity at Tg.
enthalpies of —170 J/g, fit this class. For suchpolymers, the ratio of Tm/Tg is frequently >\.5,so the temperature range between Tg and Tm is^>100°C. Different WLF coefficients would berequired to describe their relaxation profile, asillustrated by the plot in Figure 34B drawn forCl =20.4 and C2 = 154.8. For a representationalcase of Tg - 200°K (with T|g 2= 1012 Pa s, andfree volume fraction —2.5%) and Tm/Tg — 2(Tg/Tm - 0.5), Tm would be =400°K. Thus,there would be about a 200°C region in whichrelaxation rates would change from WLF behav-ior near Tg (in this case, by a factor of 10 forevery 6°C) to Arrhenius behavior near Tm (by afactor of 10 for every 33°C). A notable exampleof a material with Tm/Tg — 2 is water.89
A third class of polymers, often characterizedby highly unsymmetrical structures, has beendescribed30 as atypical and poorly behaved, inthat Tg is near Tm.102-105 For such polymers, withTm/Tg < 1.5 (i.e., =1.25, or Tg/Tm = 0.8), aquantitatively different form of the WLF equationwould be required to describe their relaxation
profile. In this case, as illustrated in Figure 34C,using Cl = 12.3 and C2 = 23.3, the intercept oflog aT was plotted as — — 3 for AT = 0 (i.e., atTg), in contrast to Figures 34A and B, where logaT was defined as 0 at Tg. For a representationalpolymer in this class, Tg = 200°K (with -rig <1012 Pa s, and free volume fraction ^>2.5%) andTm — 250°K. Thus, the temperature range inwhich WLF kinetics would be operative is muchsmaller than usual. Relaxation rates would changefrom WLF behavior near Tg (in this case, by afactor of 10 for every 1°C) to Arrhenius behaviorabove Tm (by a factor of 10 for every 33°C) overa region of only about 50°C. The synthetic pol-ymer cited as the classic example of this behav-ior, which has been attributed to anomalouslylarge free volume at Tg, is bisphenol polycar-bonate, with Tm/Tg - 1.18.102 This category ofbehavior has also been reported15-28 to be ex-emplified by food materials such as native starchand gelatin (due to non-uniform distribution ofmoisture in amorphous and crystalline regions ofthese high polymers at low moisture) and the
161
Dow
nloa
ded
by [
Tex
as A
&M
Uni
vers
ity L
ibra
ries
] at
10:
57 0
9 Ja
nuar
y 20
18
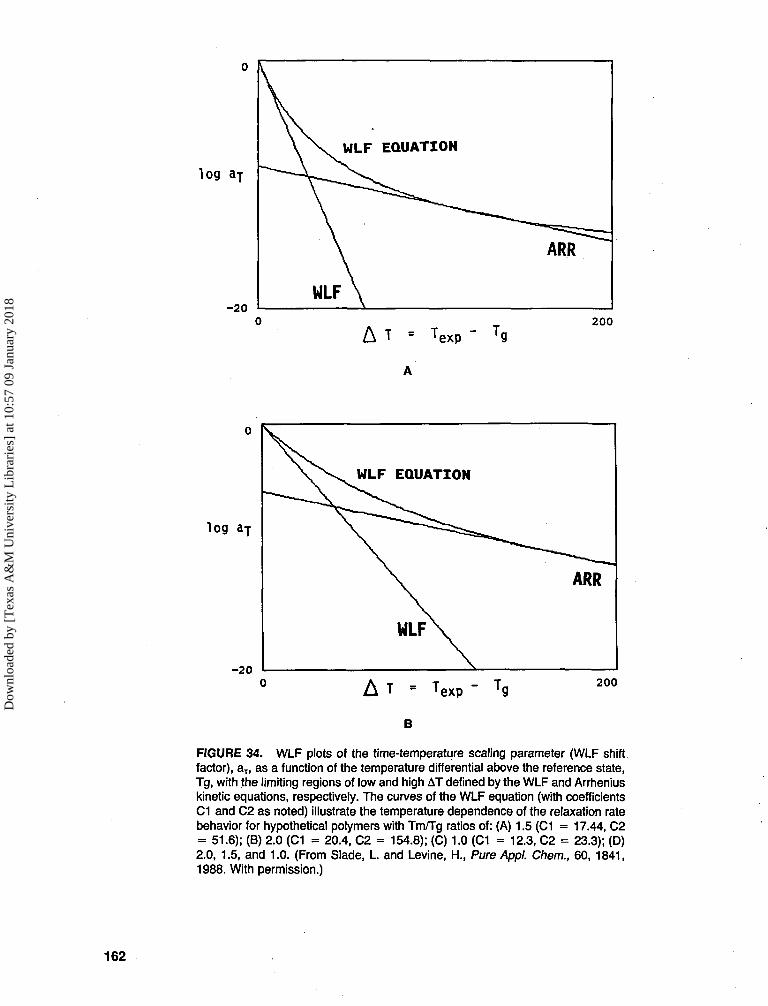
log a-r
- 2 0200
'exp
log ay
exp200
B
FIGURE 34. WLF plots of the time-temperature scaling parameter (WLF shiftfactor), aT, as a function of the temperature differential above the reference state,Tg, with the limiting regions of low and high AT defined by the WLF and Arrheniuskinetic equations, respectively. The curves of the WLF equation (with coefficientsC1 and C2 as noted) illustrate the temperature dependence of the relaxation ratebehavior for hypothetical polymers with Tm/Tg ratios of: (A) 1.5 (C1 = 17.44, C2= 51.6); (B) 2.0 (C1 = 20.4, C2 = 154.8); (C) 1.0 (C1 = 12.3, C2 = 23.3); (D)2.0, 1.5, and 1.0. (From Slade, L. and Levine, H., Pure Appl. Chem., 60, 1841,1988. With permission.)
162
Dow
nloa
ded
by [
Tex
as A
&M
Uni
vers
ity L
ibra
ries
] at
10:
57 0
9 Ja
nuar
y 20
18
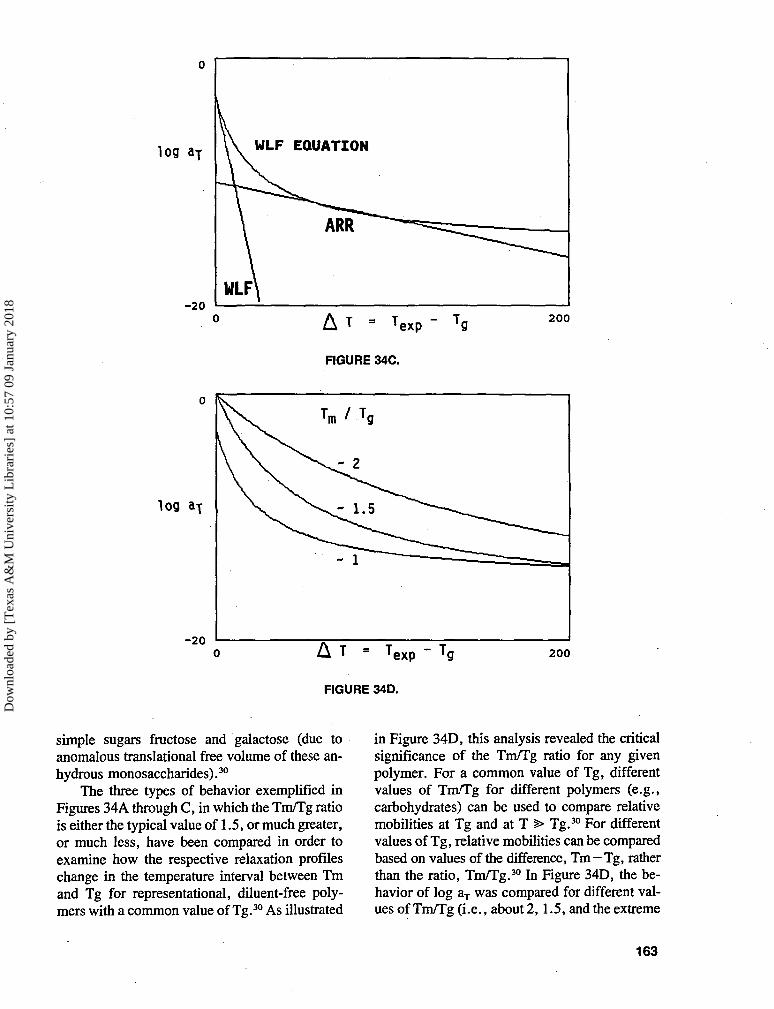
log a-r
Texp - Tg 200
log
- 2 0200
simple sugars fructose and galactose (due toanomalous translational free volume of these an-hydrous monosaccharides).30
The three types of behavior exemplified inFigures 34A through C., in which the Tm/Tg ratiois either the typical value of 1.5, or much greater,or much less, have been compared in order toexamine how the respective relaxation profileschange in the temperature interval between Tmand Tg for representational, diluent-free poly-mers with a common value of Tg.30 As illustrated
in Figure 34D, this analysis revealed the criticalsignificance of the Tm/Tg ratio for any givenpolymer. For a common value of Tg, differentvalues of Tm/Tg for different polymers (e.g.,carbohydrates) can be used to compare relativemobilities at Tg and at T > Tg.30 For differentvalues of Tg, relative mobilities can be comparedbased on values of the difference, Tm—Tg, ratherthan the ratio, Tm/Tg.30 In Figure 34D, the be-havior of log aT was compared for different val-ues of Tm/Tg (i.e., about 2,1.5, and the extreme
163
Dow
nloa
ded
by [
Tex
as A
&M
Uni
vers
ity L
ibra
ries
] at
10:
57 0
9 Ja
nuar
y 20
18
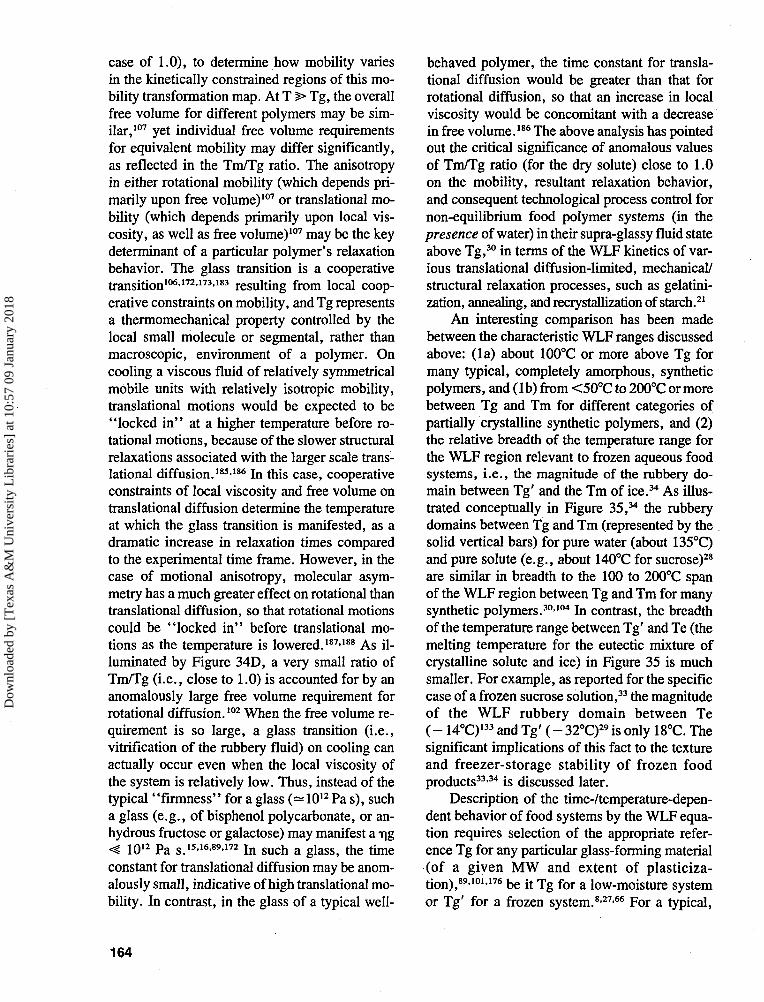
case of 1.0), to determine how mobility variesin the kinetically constrained regions of this mo-bility transformation map. At T > Tg, the overallfree volume for different polymers may be sim-ilar,107 yet individual free volume requirementsfor equivalent mobility may differ significantly,as reflected in the Tm/Tg ratio. The anisotropyin either rotational mobility (which depends pri-marily upon free volume)107 or translational mo-bility (which depends primarily upon local vis-cosity, as well as free volume)107 may be the keydeterminant of a particular polymer's relaxationbehavior. The glass transition is a cooperativetransition106172-173-183 resulting from local coop-erative constraints on mobility, and Tg representsa thermomechanical property controlled by thelocal small molecule or segmental, rather thanmacroscopic, environment of a polymer. Oncooling a viscous fluid of relatively symmetricalmobile units with relatively isotropic mobility,translational motions would be expected to be"locked in" at a higher temperature before ro-tational motions, because of the slower structuralrelaxations associated with the larger scale trans-lational diffusion.185-186 In this case, cooperativeconstraints of local viscosity and free volume ontranslational diffusion determine the temperatureat which the glass transition is manifested, as adramatic increase in relaxation times comparedto the experimental time frame. However, in thecase of motional anisotropy, molecular asym-metry has a much greater effect on rotational thantranslational diffusion, so that rotational motionscould be "locked in" before translational mo-tions as the temperature is lowered.187-188 As il-luminated by Figure 34D, a very small ratio ofTm/Tg (i.e., close to 1.0) is accounted for by ananomalously large free volume requirement forrotational diffusion.102 When the free volume re-quirement is so large, a glass transition (i.e.,vitrification of the rubbery fluid) on cooling canactually occur even when the local viscosity ofthe system is relatively low. Thus, instead of thetypical "firmness" for a glass (—1012 Pa s), sucha glass (e.g., of bisphenol polycarbonate, or an-hydrous fructose or galactose) may manifest a i\g< 1012 Pa s.15-16-89-172 In such a glass, the timeconstant for translational diffusion may be anom-alously small, indicative of high translational mo-bility. In contrast, in the glass of a typical well-
behaved polymer, the time constant for transla-tional diffusion would be greater than that forrotational diffusion, so that an increase in localviscosity would be concomitant with a decreasein free volume.186 The above analysis has pointedout the critical significance of anomalous valuesof Tm/Tg ratio (for the dry solute) close to 1.0on the mobility, resultant relaxation behavior,and consequent technological process control fornon-equilibrium food polymer systems (in thepresence of water) in their supra-glassy fluid stateabove Tg,30 in terms of the WLF kinetics of var-ious translational diffusion-limited, mechanical/structural relaxation processes, such as gelatini-zation, annealing, and recrystallization of starch.21
An interesting comparison has been madebetween the characteristic WLF ranges discussedabove: (la) about 100°C or more above Tg formany typical, completely amorphous, syntheticpolymers, and (lb) from <50°C to 200°C or morebetween Tg and Tm for different categories ofpartially crystalline synthetic polymers, and (2)the relative breadth of the temperature range forthe WLF region relevant to frozen aqueous foodsystems, i.e., the magnitude of the rubbery do-main between Tg' and the Tm of ice.34 As illus-trated conceptually in Figure 35,M the rubberydomains between Tg and Tm (represented by thesolid vertical bars) for pure water (about 135°C)and pure solute (e.g., about 140°C for sucrose)28
are similar in breadth to the 100 to 200°C spanof the WLF region between Tg and Tm for manysynthetic polymers.30'104 In contrast, the breadthof the temperature range between Tg' and Te (themelting temperature for the eutectic mixture ofcrystalline solute and ice) in Figure 35 is muchsmaller. For example, as reported for the specificcase of a frozen sucrose solution,33 the magnitudeof the WLF rubbery domain between Te( - 14°C)133 and Tg' ( - 32°C)29 is only 18°C. Thesignificant implications of this fact to the textureand freezer-storage stability of frozen foodproducts33-34 is discussed later.
Description of the time-/temperature-depen-dent behavior of food systems by the WLF equa-tion requires selection of the appropriate refer-ence Tg for any particular glass-forming material(of a given MW and extent of plasticiza-tion),89-101-176 be it Tg for a low-moisture systemor Tg' for a frozen system.827'66 For a typical,
164
Dow
nloa
ded
by [
Tex
as A
&M
Uni
vers
ity L
ibra
ries
] at
10:
57 0
9 Ja
nuar
y 20
18
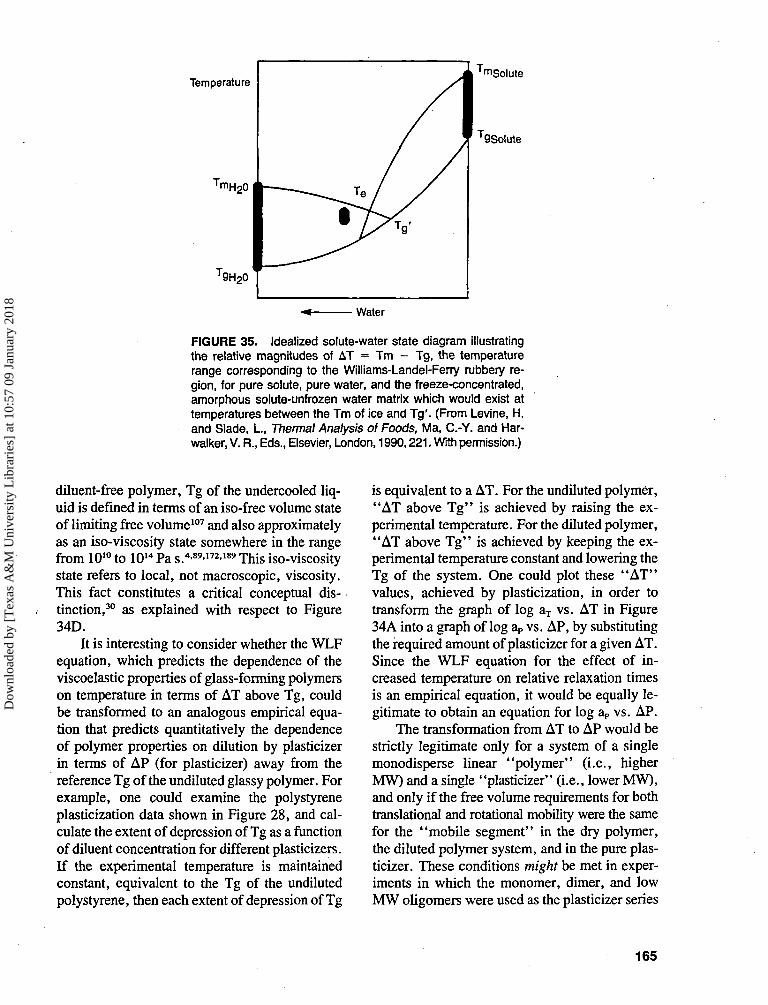
Temperature
' m H 2 o
'9H20
mSolute
QSolute
Water
FIGURE 35. Idealized solute-water state diagram illustratingthe relative magnitudes of AT = Tm - Tg, the temperaturerange corresponding to the Williams-Landel-Ferry rubbery re-gion, for pure solute, pure water, and the freeze-concentrated,amorphous solute-unfrozen water matrix which would exist attemperatures between the Tm of ice and Tg'. (From Levine, H.and Slade, I., Thermal Analysis of Foods, Ma, C.-Y. and Har-walker, V. Ft., Eds., Elsevier, London, 1990,221. With permission.)
diluent-free polymer, Tg of the undercooled liq-uid is defined in terms of an iso-free volume stateof limiting free volume107 and also approximatelyas an iso-viscosity state somewhere in the rangefrom 1O10 to 1014 Pa s.
4-89-172-189 This iso-viscositystate refers to local, not macroscopic, viscosity.This fact constitutes a critical conceptual dis-tinction,30 as explained with respect to Figure34D.
It is interesting to consider whether the WLFequation, which predicts the dependence of theviscoelastic properties of glass-forming polymerson temperature in terms of AT above Tg, couldbe transformed to an analogous empirical equa-tion that predicts quantitatively the dependenceof polymer properties on dilution by plasticizerin terms of AP (for plasticizer) away from thereference Tg of the undiluted glassy polymer. Forexample, one could examine the polystyreneplasticization data shown in Figure 28, and cal-culate the extent of depression of Tg as a functionof diluent concentration for different plasticizers.If the experimental temperature is maintainedconstant, equivalent to the Tg of the undilutedpolystyrene, then each extent of depression of Tg
is equivalent to a AT. For the undiluted polymer,"AT above Tg" is achieved by raising the ex-perimental temperature. For the diluted polymer,"AT above Tg" is achieved by keeping the ex-perimental temperature constant and lowering theTg of the system. One could plot these "AT"values, achieved by plasticization, in order totransform the graph of log aT vs. AT in Figure34A into a graph of log aP vs. AP, by substitutingthe required amount of plasticizer for a given AT.Since the WLF equation for the effect of in-creased temperature on relative relaxation timesis an empirical equation, it would be equally le-gitimate to obtain an equation for log aP vs. AP.
The transformation from AT to AP would bestrictly legitimate only for a system of a singlemonodisperse linear "polymer" (i.e., higherMW) and a single "plasticizer" (i.e., lower MW),and only if the free volume requirements for bothtranslational and rotational mobility were the samefor the "mobile segment" in the dry polymer,the diluted polymer system, and in the pure plas-ticizer. These conditions might be met in exper-iments in which the monomer, dimer, and lowMW oligomers were used as the plasticizer series
165
Dow
nloa
ded
by [
Tex
as A
&M
Uni
vers
ity L
ibra
ries
] at
10:
57 0
9 Ja
nuar
y 20
18
for a particular linear polymer. Certainly, theconditions are not met when water is the plasti-cizer, not even for plasticization of small sugars,much less for starch (which is a mixture ofbranched and linear polymers with at least bi-modal and broad MW distribution).
The most severe complication is that it wouldbe essentially impossible in practice to verify ex-perimentally the form of the WLF equation forlog aP vs. AP. Williams, Landel, and Ferry101
were able to obtain sufficient data for so manypolymers to be able to construct an empiricalequation for log aT vs. AT, because heat transferis quite efficient in the solid state. It is experi-mentally feasible to raise the internal temperatureof a sample with appropriate geometry from be-low Tg to well above Tg and expect that thetemperature will be essentially uniform through-out the sample. Then a determination of viscos-ity, or self-diffusion coefficient for a reportermolecule, or other manifestation of mechanicalrelaxation will give usable data for constructionof log aT vs. AT above Tg. In contrast, masstransport is "infinitely" slow in the (glassy) solidstate, and much slower in the leathery and rub-bery states than can be accommodated in typicalexperimental time frames. Consequently, onewould rarely be able to keep the experimentaltemperature constant and achieve AT values thatrepresent uniform, steady-state moisture distri-bution for a sample at varying amounts of sampletotal moisture. For biological high polymers, theTg of the undiluted polymer is usually so highas to cause degradation if this dry Tg is used asthe experimental temperature. If one uses exper-imental temperatures below dry Tg and waits forplasticized Tg to drop to and below the experi-mental temperature, the experimental time scaleswill be unreasonable, and the instantaneous mois-ture gradients will allow incidental chemical andphysical changes to occur in the system. For smallsugars with lower dry Tg values, but that arereadily crystallizable (a property usually relatedto a large temperature interval between Tm andTg, such that the homogeneous nucleation tem-perature is well above Tg),15 small extents ofplasticization allow crystallization, and the bulkmechanical properties no longer reflect the effectof plasticizer on Tg. Possibly the best experi-mental system for direct construction of log aP
vs. AP (to allow comparison to the indirect methodof transforming log aT vs. AT, based on Tg vs.AP data) would be dry amorphous fructose glassplasticized by water. However, it is notoriouslydifficult to dry fructose syrups, and, in any event,the resulting equation could not be used to predictbehavior for any other sugar.
Our feeling is that we must settle at presentfor a qualitative and indirect picture of log aP vs.AP as a universal concept. For particular com-binations of polymer and plasticizer, where theTg vs. AP are known, one can substitute, for ATin the WLF equation, the plasticizer concentra-tion that produces an extent of depression of dryTg equivalent to AT.
WLF kinetics differ from Arrhenius kineticsin several important respects,30-34 and we haveemphasized the contrast because we believe thatthe qualitative differences are as influential as thequantitative differences in their impact on bothexperimental approach and technological signif-icance.39 A comparison between WLF and Ar-rhenius kinetics begins with the recognition thatthe temperature dependence of microscopic re-laxation parameters (including the self-diffusioncoefficient, viscosity, rotational and translationalrelaxation rates or times, and macroscopic pro-cesses that rely on them) changes monotonicallyfrom a steep dependence of log relaxation rateon temperature just above Tg to a shallow de-pendence above Tm, i.e., over a material-spe-cific temperature range from Tg to far aboveT g 4,30,172.190 This realization manifests two un-derlying diagnostic characteristics that distin-guish WLF from Arrhenius kinetics.39 First, thecoefficient of the temperature dependence (so-called "activation energy") is defined as a con-stant in the expression for Arrhenius kinetics, anda plot of log relaxation rate vs. 1/T is a straightline. But the coefficient itself is temperature de-pendent in the WLF expression; a plot of logrelaxation rate vs. 1/T is characteristically cur-vilinear in the material-specific temperature rangebetween Tg and Tm,190 approaching linearity onlybelow Tg or above Tm.34 The absolute value ofthe derivative of log relaxation parameter vs. 1/T increases as Tg is approached from above, anddecreases abruptly to an approximately constantvalue as the temperature falls below Tg, or de-creases gently to an approximately constant value
166
Dow
nloa
ded
by [
Tex
as A
&M
Uni
vers
ity L
ibra
ries
] at
10:
57 0
9 Ja
nuar
y 20
18
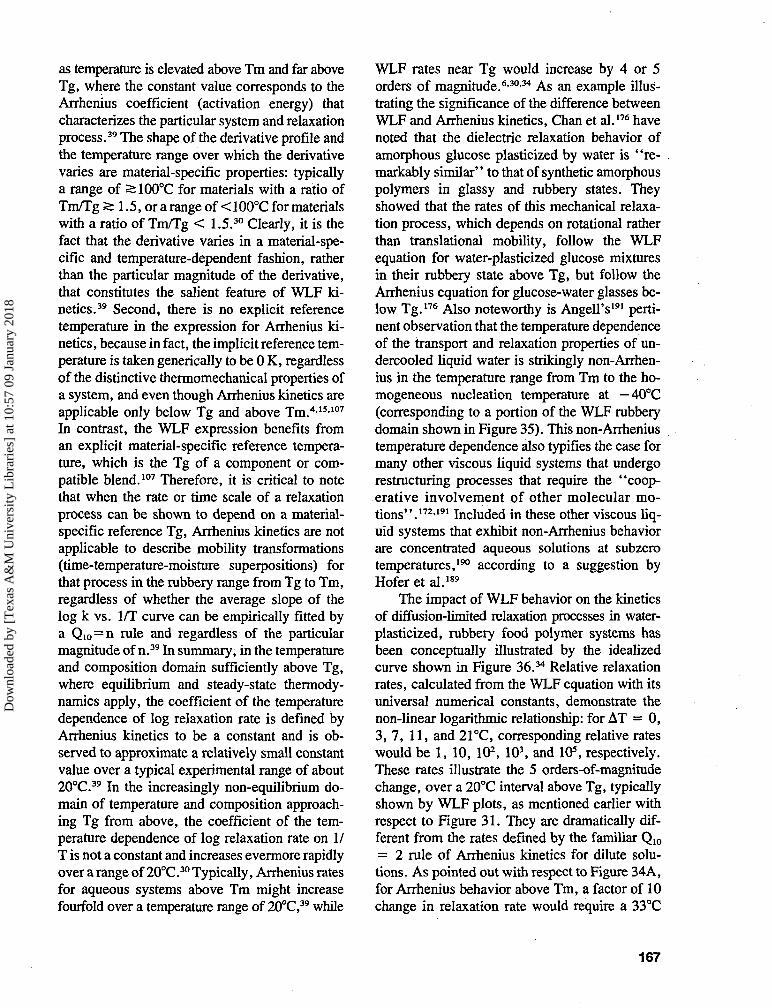
as temperature is elevated above Tm and far aboveTg, where the constant value corresponds to theArrhenius coefficient (activation energy) thatcharacterizes the particular system and relaxationprocess.39 The shape of the derivative profile andthe temperature range over which the derivativevaries are material-specific properties: typicallya range of ^100°C for materials with a ratio ofTm/Tg ^ 1.5, or a range of < 100°C for materialswith a ratio of Tm/Tg < 1.5.30 Clearly, it is thefact that the derivative varies in a material-spe-cific and temperature-dependent fashion, ratherthan the particular magnitude of the derivative,that constitutes the salient feature of WLF ki-netics.39 Second, there is no explicit referencetemperature in the expression for Arrhenius ki-netics, because in fact, the implicit reference tem-perature is taken generically to be 0 K, regardlessof the distinctive thermomechanical properties ofa system, and even though Arrhenius kinetics areapplicable only below Tg and above Tm.4>15-107
In contrast, the WLF expression benefits froman explicit material-specific reference tempera-ture, which is the Tg of a component or com-patible blend.107 Therefore, it is critical to notethat when the rate or time scale of a relaxationprocess can be shown to depend on a material-specific reference Tg, Arrhenius kinetics are notapplicable to describe mobility transformations(time-temperature-moisture superpositions) forthat process in the rubbery range from Tg to Tm,regardless of whether the average slope of thelog k vs. 1/T curve can be empirically fitted bya Qio = n rule and regardless of the particularmagnitude of n.39 In summary, in the temperatureand composition domain sufficiently above Tg,where equilibrium and steady-state thermody-namics apply, the coefficient of the temperaturedependence of log relaxation rate is defined byArrhenius kinetics to be a constant and is ob-served to approximate a relatively small constantvalue over a typical experimental range of about20°C.39 In the increasingly non-equilibrium do-main of temperature and composition approach-ing Tg from above, the coefficient of the tem-perature dependence of log relaxation rate on 1/T is not a constant and increases evermore rapidlyover a range of 20°C.30 Typically, Arrhenius ratesfor aqueous systems above Tm might increasefourfold over a temperature range of 20°C,39 while
WLF rates near Tg would increase by 4 or 5orders of magnitude.630'34 As an example illus-trating the significance of the difference betweenWLF and Arrhenius kinetics, Chan et al.176 havenoted that the dielectric relaxation behavior ofamorphous glucose plasticized by water is "re-markably similar'' to that of synthetic amorphouspolymers in glassy and rubbery states. Theyshowed that the rates of this mechanical relaxa-tion process, which depends on rotational ratherthan translational mobility, follow the WLFequation for water-plasticized glucose mixturesin their rubbery state above Tg, but follow theArrhenius equation for glucose-water glasses be-low Tg.176 Also noteworthy is Angell's191 perti-nent observation that the temperature dependenceof the transport and relaxation properties of un-dercooled liquid water is strikingly non-Arrhen-ius in the temperature range from Tm to the ho-mogeneous nucleation temperature at — 40°C(corresponding to a portion of the WLF rubberydomain shown in Figure 35). This non-Arrheniustemperature dependence also typifies the case formany other viscous liquid systems that undergorestructuring processes that require the "coop-erative involvement of other molecular mo-tions".172-191 Included in these other viscous liq-uid systems that exhibit non-Arrhenius behaviorare concentrated aqueous solutions at subzerotemperatures,190 according to a suggestion byHofer et al.189
The impact of WLF behavior on the kineticsof diffusion-limited relaxation processes in water-plasticized, rubbery food polymer systems hasbeen conceptually illustrated by the idealizedcurve shown in Figure 36.M Relative relaxationrates, calculated from the WLF equation with itsuniversal numerical constants, demonstrate thenon-linear logarithmic relationship: for AT = 0,3, 7, 11, and 21°C, corresponding relative rateswould be 1, 10, 102, 10\ and 105, respectively.These rates illustrate the 5 orders-of-magnitudechange, over a 20°C interval above Tg, typicallyshown by WLF plots, as mentioned earlier withrespect to Figure 31. They are dramatically dif-ferent from the rates defined by the familiar Q10
= 2 rule of Arrhenius kinetics for dilute solu-tions. As pointed out with respect to Figure 34A,for Arrhenius behavior above Tm, a factor of 10change in relaxation rate would require a 33°C
167
Dow
nloa
ded
by [
Tex
as A
&M
Uni
vers
ity L
ibra
ries
] at
10:
57 0
9 Ja
nuar
y 20
18
100000-
8 10 12 14
AT = T - Tg (°C)
16 20 22
FIGURE 36. Variation of the rate of a diffusion-limited relaxation processagainst AT = T - Tg, as defined by the Williams-Landel-Ferry equationwith its "universal" numerical constants of C1 = 17.44 and C2 = 51.6.(From Levine, H. and Slade, I., Thermal Analysis of Foods, Ma, C.-Y.,and Harwalker, V. R., Eds., Elsevier, London, 1990,221. With permission.)
change in temperature, in comparison to a 3°Cchange for WLF behavior near Tg of a partiallycrystalline polymer of Tg/Tm = 0.67.30
Another general example of WLF-governedrelaxation behavior concerns the kinetics of(re)crystallization.15>25>26 (Re)crystallization is adiffusion-limited process192 that, on a time scaleof technological significance, can only occurwithin the WLF rubbery domain.104 The propa-gation step in the recrystallization mechanism ap-proaches a zero rate at T < Tg for an amorphousbut crystallizable solute (either polymeric104 ormonomeric), initially quenched from the melt orliquid solution state to a kinetically metastablesolid state. Due to immobility in the glass, mi-gratory diffusion of either large main-chain seg-ments or small molecules, required for crystalgrowth, would be inhibited over realistic times.However, the propagation rate increases expo-nentially with increasing AT above Tg (up toTm),94 due to the mobility allowed in the rubberystate. Thus, a recrystallization transition fromunstable (i.e., undercooled) amorphous liquid to(partially) crystalline solid may occur at T >Tg,44-55-193 with a rate defined by the WLF equa-tion.8 The facts that time-dependent recrystalli-zation can only occur at temperatures above Tgand manifests kinetics defined by the WLF (ratherthan Arrhenius) equation27 were recently con-firmed in an experimental study of the recrys-
tallization of amorphous, freeze-dried sugars (i.e.,sucrose, lactose) by Roos and Karel.66 Other spe-cific examples of such a recrystallization process(i.e., a collapse phenomenon) include ice andsolute (e.g., lactose in dairy products)50 recrys-tallization in frozen aqueous systems at T > Tr= Tg'.8
One of the most critical messages to be dis-tilled at this point is that the structure-propertyrelationships of water-compatible food polymersystems are dictated by a moisture-temperature-time superposition.8'137-155 Referring to the ideal-ized state diagram in Figure 23 (which reflectsthe' 'real world'' cases illustrated in Figures 19A,25, 26, and 27) as a conceptual mobility map(which represents an extension of the dynamicsmap in Figure 21), one sees that the Tg curverepresents a boundary between non-equilibriumglassy and rubbery physical states in which var-ious diffusion-limited processes (e.g., collapsephenomena involving mechanical and structuralrelaxations) either can (at T > Tg and W > Wg',the high-moisture portion of the water dynamicsdomain corresponding to the upper-left part ofFigure 23, or T > Tg and W < Wg', the low-moisture portion of the water dynamics domaincorresponding to the upper-right part of Figure23) or cannot (at T < Tg, in the domain of glassdynamics corresponding to the bottom part ofFigure 23) occur over realistic times.8>15>40-41 The
168
Dow
nloa
ded
by [
Tex
as A
&M
Uni
vers
ity L
ibra
ries
] at
10:
57 0
9 Ja
nuar
y 20
18

WLF equation defines the kinetics of molecular-level relaxation processes, which will occur inpractical time frames only in the rubbery stateabove Tg, in terms of an exponential, but non-Arrhenius, function of AT above this boundarycondition.8
Further discussion of (1) Tg' as the appro-priate reference temperature for WLF kinetics inhigh-moisture food systems at temperatures aboveTg' and (2) Wg' as the maximum practicalamount of plasticizing water in such systems withwater contents > Wg' is detailed in a later Sec-tion IV.D.
6. Crystallization/Gelation Mechanism
A classic description of crystallization as athree-step mechanism has been widely used forpartially crystalline synthetic polymers crystal-lized, from the melt or concentrated solution, byundercooling from T > Tm to Tg < T < Tm.104139
The mechanism is conceptually compatible withthe "fringed micelle" model.194 It involves thefollowing sequential steps, which apply univer-sally to all crystallizable substances, regardlessof MW:104 (1) nucleation (homogeneous) — for-mation of critical nuclei, (2) propagation —growth of crystals from nuclei by intermolecularassociation, and (3) maturation — crystal per-fection (by annealing of metastable microcrys-tallites) and/or continued slow growth (via "Os-twald ripening"). Within this universaldescription, flexible macromolecules are distin-guished from small molecules by the possibilityof nucleation by intramolecular initiation of or-dered (e.g., helical) chain segments and propa-gation by association of chain segments for thehigh polymers.104
The thermoreversible gelation, from concen-trated solution, of a number of crystallizable syn-thetic homopolymers and copolymers has beenreported to occur by this crystallization mecha-nism.146-194"196 In contrast, a different gelationmechanism, not involving crystallization andconcomitant thermoreversibility, pertains topolymers in solution that remain completelyamorphous in the gel state.25 Such high polymersare distinguished from oligomers by their capac-ity for intermolecular entanglement coupling, re-
sulting in the formation of rubberlike viscoelasticrandom networks (called gels, in accord withFlory's197 nomenclature for disordered three-di-mensional networks formed by physical aggre-gation) above a critical polymer concentration.107
It has been demonstrated for many synthetic lin-ear high polymers that the mechanism of gelationfrom concentrated solution can be distinguishedby a simple dilution test.198 Gelation due to en-tanglement in a completely amorphous polymer-diluent network can be reversed by dilution,whereas a thermoreversible, partially crystalline,polymer-diluent network gel cannot be dispersedby dilution.15 Examples of food polymers thatcan form such amorphous entanglement gels in-clude gluten in unoriented wheat flour dough,sodium caseinate in imitation mozzarella cheese,and casein in real cheese.25 As summarized byMitchell,140 "entanglement coupling is seen inmost high MW polymer systems. Entanglements(in completely amorphous gels) behave as cross-links with short lifetimes. They are believed tobe topological in origin rather than involvingchemical bonds." Importantly, hydrogen bond-ing need not be invoked to explain the viscoe-lastic behavior of completely amorphous gelsformed from solutions of entangling polysaccha-rides or proteins.25
The gelation-via-crystallization process (de-scribed as a nucleation-limited growth process195)produces a metastable three-dimensionalnetwork196 crosslinked by "fringed micellar"194
or chain-folded lamellar195 microcrystalline junc-tion zones composed of intermolecularly asso-ciated helical chain segments.146 Such partiallycrystalline gel networks may also contain randominterchain entanglements in their amorphous re-gions.195 The non-equilibrium nature of the pro-cess is manifested by "well-known agingphenomena"194 (i.e., maturation),15 attributed totime-dependent crystallization processes that oc-cur subsequent to initial gelation. The thermo-reversibility of such gels is explained in terms ofa crystallization (on undercooling) <-» melting (onheating to T > Tm) process.195 Only recently hasit been recognized that for synthetic polymer-organic diluent systems (e.g., polystyrene-tol-uene), such gels are not glasses199 ("gelation isnot the glass transition of highly plasticizedpolymer"194) but partially crystalline rubbers,146
169
Dow
nloa
ded
by [
Tex
as A
&M
Uni
vers
ity L
ibra
ries
] at
10:
57 0
9 Ja
nuar
y 20
18
in which the mobility of the diluent (in terms ofrotational and translational motion) is not signif-icantly restricted by the gel structure.199 Simi-larly, for starch and gelatin gels, water as thediluent is highly mobile, and amounts > Wg'freeze readily at subzero temperatures.26 Thetemperature of gelation (Tgel) is above Tg,199 inthe rubbery fluid range up to about 100°C aboveTg. Tgel is related to the flow relaxation tem-perature, Tfr, observed in flow relaxation of rigidamorphous entangled polymers146 and to Tm ob-served in melts of partially crystalline poly-mers.194 The basis for the MW-dependence ofTgel has been identified146 as an iso-viscous state(which may include the existence of interchainentanglements) of T]gel/Tig = 105/1012 = 1/107,where nqg at Tg = 1012 Pa s.
The distinction among these transition tem-peratures becomes especially important for elu-cidating how the morphology and structure offood polymer systems relate to their thermal andmechanical behavior.25 This distinction is a par-ticularly important consideration when experi-mental methods involve very different time frames(e.g., mechanical measurements during compres-sion tests or over prolonged storage; thermal anal-ysis at scanning rates varying over 4 orders ofmagnitude; relaxation times from experiments atacoustic, microwave, or NMR frequencies)200"204
and sample preparation histories (i.e., tempera-ture, concentration, time).25 In the case of mor-phologically homogeneous, molecular amor-phous solids, Tg corresponds to the limitingrelaxation temperature for mobile polymer back-bone-chain segments. In the case of morpholog-ically heterogeneous, supra-molecular networks,the effective network Tg corresponds to the Tfrtransition above Tg for flow relaxation146 of thenetwork. For example, the ratio of Tfr/Tg varieswith MW from 1.02 to 1.20 for polystyrene aboveits entanglement MW.205 Tfr defines an iso-vis-cous state of 10s Pa s for entanglement networks(corresponding to Tgel for partially crystallinenetworks).146 Tgel of a partially crystalline net-work would always be observed at or above Tfr(= network Tg) of an entanglement network; bothtransitions occur above Tg, with an analogousinfluence of MW and plasticizing water.25 As anexample, the effective network Tg responsiblefor mechanical firmness of freshly baked bread
would be near room temperature for low extentsof network formation, well above room temper-ature for mature networks, and equivalent to Tgelnear 60°C for staled bread, even though the un-derlying Tg for segmental motion, responsiblefor the predominant second-order thermal tran-sition, remains below 0°C at Tg'.25
Curiously, it has been well-established for amuch longer time195 that the same three-step pol-ymer crystallization mechanism describes the ge-lation mechanism for the classic gelling system,gelatin-water.105-139 The fact that the resultingpartially crystalline gels206 can be modeled by the"fringed micelle" structure is also widely rec-ognized. 17.24104-139 However, while the same factsare true with respect to the aqueous gelation ofstarch (i.e., retrogradation, a thermoreversiblegelation-via-crystallization process that followsgelatinization and "pasting" of partially crys-talline native granular starch-water mixtures),207
and despite the established importance of gela-tinization to the rheological properties of breaddoughs during baking208-209 and of retrogradationto the time-dependent texture of fresh-baked vs.aged breads,210 recognition of starch (or pureamylose or amylopectin) retrogradation as athermoreversible polymer crystallization pro-cess has been much more recent and less wide-spread.45-47-61-63-65-92-211"221 Blanshard49-94 has re-cently applied synthetic polymer crystallizationtheory to investigate the kinetics of starch re-crystallization and thereby gain insight into thetime-dependent textural changes (i.e., staling dueto firming) occurring in baked products such asbread. Similarly, Zeleznak and Hoseney95 haveapplied principles of polymer crystallization tothe interpretation of results on annealing of re-trograded starch during aging of bread stored atsuperambient temperatures. Many of the persu-asive early insights in this area have resulted fromthe food polymer science approach to structure-property relationships in starch of Slade and hervarious co-workers. 1723i26-30>35>46
Slade et al.1723-26-30-35-46 have used DSC re-sults to demonstrate that native granular starch-es, both normal and waxy, exhibit non-equili-brium melting,105 annealing, and recrystalliza-tion behavior characteristic of a kinetically met-
. astable, water-plasticized, partially crystallinepolymer system with a small extent of crystal-
170
Dow
nloa
ded
by [
Tex
as A
&M
Uni
vers
ity L
ibra
ries
] at
10:
57 0
9 Ja
nuar
y 20
18
Unity. This group has stressed the significanceof the conclusion, in which others have con-curred,47-49-60-61-63-65-93-222-225 that gelatinization isa non-equilibrium polymer melting process. Ge-latinization actually represents a continuum ofrelaxation processes (underlying a structural col-lapse)207 that occurs (at T > Tg) during heatingof starch in the presence of plasticizing water andin which crystallite melting is indirectly con-trolled by the dynamically constrained, contin-uous amorphous surroundings.21 That is, meltingof microcrystallites, which are hydrated clustersof amylopectin branches,153-154 is controlled byprerequisite plasticization ("softening" above Tg)of flexibly coiled, possibly entangled chain seg-ments in the interconnected amorphous regionsof the native granule, for which the local structureis conceptualized according to the "fringed mi-celle" model.20 Such non-equilibrium melting inmetastable, partially crystalline polymer networksystems, in which the crystalline and amorphousphases are neither independent of each other norhomogeneous, is an established concept for syn-thetic polymers.105-183 In fact, Wunderlich106 andCheng183 have both stressed the point that themelting of partially crystalline synthetic poly-mers is never an equilibrium process. Slade etal. have suggested,1723>26-35-46 and others haveagreed,60-65-221-224-225 that previous attempts (e.g.,References 161, 226, 227) to use the Flory-Hug-gins thermodynamic treatment to interpret the ef-fect of water content on the Tm observed duringgelatinization of native starch have failed to pro-vide a mechanistic model, because Flory-Hug-gins theory100 only applies to melting of polymersin the presence of diluent under the conditionsof the equilibrium portion of the solidus curve.In this context, it is interesting to note Cheng's183
recent observation that multicomponent systemsof solid polymers (especially those containingcopolymers, such as a mixture of native normalstarch [amylose + amylopectin] and water, whereamylopectin can be considered a blockcopolymer21-105) "are even more beset by non-equilibrium problems (than are single-polymersystems). Only in the amorphous state above theglass transition can one expect (sluggish)equilibration."
An interesting and graphic illustration of theconcept of non-equilibrium melting in partially
crystalline synthetic polymer systems has beenpresented by Wunderlich105 and is detailed herein generic terms to help the reader better under-stand the applicability of this concept to the ge-latinization of native granular starch. Wunderlichdescribed the case of a synthetic block copoly-mer produced from comonomers A and B. Mon-omer A was readily crystallizable and capableof producing a high MW, crystalline homo-polymer of relatively low "equilibrium"Tm. In contrast, monomer B was not crystalliz-able and produced a completely amorphous, highMW homopolymer with a Tg much higherthan the "equilibrium" Tm of homopolymer A.When a minor amount of A and a major amountof B were copolymerized to produce a linearblock polymer (with runs of repeat A covalent-ly backbone-bonded to runs of repeat B toyield a molecular structure of the type
-BBBBB-AAAA-BBBBBBB-AAA-BBBBBB-), the re-
sulting product could be made partially crystal-line by crystallization from solution. Because theA and B domains were covalently linked, mac-roscopic phase separation upon crystallization ofA was prevented, and microcrystalline "mi-celles" of A blocks remained dispersed in a three-dimensional amorphous network of B block"fringes". When the melting behavior of thisblock copolymer was analyzed by DSC, the melt-ing transition of the crystalline A domains wasobserved at a temperature above the Tg of theamorphous B domains. The A domains were ki-netically constrained against melting (by disso-ciation and concomitant volume expansion)105 attheir "equilibrium" Tm by the surrounding con-tinuous glassy matrix of B. The A domains wereonly free to melt (at a non-equilibrium Tm §>"equilibrium" Tm) after the B domains trans-formed from glassy solid to rubbery liquid at theirTg. Another interesting example of similar non-equilibrium melting behavior is solution-crystal-lized poly(phenylene oxide).228
The fact that water plasticization occurs onlyin the amorphous regions of partially crystalline,water-compatible polymers is critical to the ex-planation of how these metastable amorphous re-gions control the non-equilibrium melting be-havior of the crystalline regions. The concept ofnon-equilibrium melting established for syntheticpartially crystalline polymers has been applied to
171
Dow
nloa
ded
by [
Tex
as A
&M
Uni
vers
ity L
ibra
ries
] at
10:
57 0
9 Ja
nuar
y 20
18

biopolymer systems such as native starch, in or-der to describe the mechanical relaxationprocess1723-26-30 that occurs as a consequence ofa dynamic heat/moisture/time treatment.229-230 Theexistence of contiguous microcrystalline andamorphous regions (e.g., in native starch, thecrystallizable short branches and backbone seg-ments with their branch points, respectively, ofamylopectin molecules) covalently linked throughindividual polymer chains creates a "fringed mi-celle" network. Relative dehydration of theamorphous regions to an initial low overall mois-ture content leads to the kinetically stable con-dition in which the effective Tg is higher thanthe ' 'equilibrium'' Tm of the hydrated crystallineregions. Consequently, the effective Tm21 is el-evated and observed only after softening of theamorphous regions at Tg. Added water acts di-rectly to plasticize the continuous glassy regions,leading to the kinetically metastable condition inwhich their effective Tg is depressed. Thus, the' 'fringe'' becomes an unstable rubber at T > Tg,allowing sufficient mobility and swelling by ther-mal expansion and water uptake for the inter-connected microcrystallites, embedded in the"fringed micelle" network, to melt (by disso-ciation, with concomitant volume expansion)105
on heating to a less kinetically constrained Tmonly slightly above the depressed Tg. For sucha melting process, use of the Hory-Huggins ther-modynamic treatment to interpret the effect ofwater content on Tm has no theoretical ba-sis,106-161-231 because, while water as a plasticizerdoes affect directly the Tg and indirectly the Tmof polymers such as starch, the effect on Tm isnot the direct effect experienced in equilibriummelting (i.e., dissolution) along the solidus curve.In contrast to the case of native starch, in whichinitial "as is" moisture is limiting, in an excess-moisture situation such as a retrograded wheatstarch gel with ^27 w% water (Wg'), in whichthe amorphous matrix would be fully plasticizedand ambient temperature would be above Tg (i.e.,Tg' = -5°C), the fully hydrated and maturedcrystalline junctions would show the actual, lower(and closer to "equilibrium") Tm of =60°C forretrograded B-type starch.17-23-26 (Note the anal-ogy between the above description of non-equi-librium melting in native granular starch and thecase described previously of non-equilibrium
melting in a synthetic, partially crystalline blockcopolymer. In this context, it is interesting thatWunderlich105 defines branched polymers as aspecial case of copolymers, using the exampleof a synthetic polymer with crystallizablebranches.)
Retrogradation has been described17-18-20"23-26
as a non-equilibrium (i.e., time/temperature/moisture-dependent) polymer recrystallizationprocess in completely amorphous (in the case ofwaxy starches) starch-water melts. In normalstarches, retrogradation has been recently con-firmed to involve both fast crystallization of amy-lose and slow recrystallization of amylopec-^63,92,215.218-221 Amylopectin recrystallization has
been described17-18-20"23-26 as a nucleation-limitedgrowth process that occurs, at T > Tg, in themobile, viscoelastic, "fringed micelle" gel net-work plasticized by water, and which is thermallyreversible at T > Tm. This description has alsobeen confirmed recently, for bothamylopectin92-215 and amylose.211"214-220 The ag-ing effects typically observed in starch gels andbaked bread have been attributed (as in syntheticpolymer-organic diluent gels) to time-dependentcrystallization processes (i.e., maturation), pri-marily involving amylopectin, which occur subr
sequent to initial gelation.63-65-92-94-219-221-225 Withrespect to these effects, Slade18 has reported that"analysis of results (of measurements of extentof recrystallization vs. time after gelatinization)by the classic Avrami equation may provide aconvenient means to represent empirical data fromretrogradation experiments,63-94-183-219-232 but somepublished theoretical interpretations233 have beenmisleading." Complications, due to the non-equilibrium nature of starch recrystallization viathe three-step mechanism, limit the theoreticalutility of the Avrami parameters, which wereoriginally derived to describe crystallization un-der conditions far above the glass curve26 andwhere details about nucleation events and con-stant linear growth rates were readily measur-able.104 Others have agreed with thisconclusion63-211 and pointed out that such anAvrami analysis allows no insight regarding crys-tal morphology219 and provides no clear mechan-istic information.49-183 Furthermore, the Avramitheory gives no indication of the temperature de-pendence of the crystallization rate.63-94
172
Dow
nloa
ded
by [
Tex
as A
&M
Uni
vers
ity L
ibra
ries
] at
10:
57 0
9 Ja
nuar
y 20
18
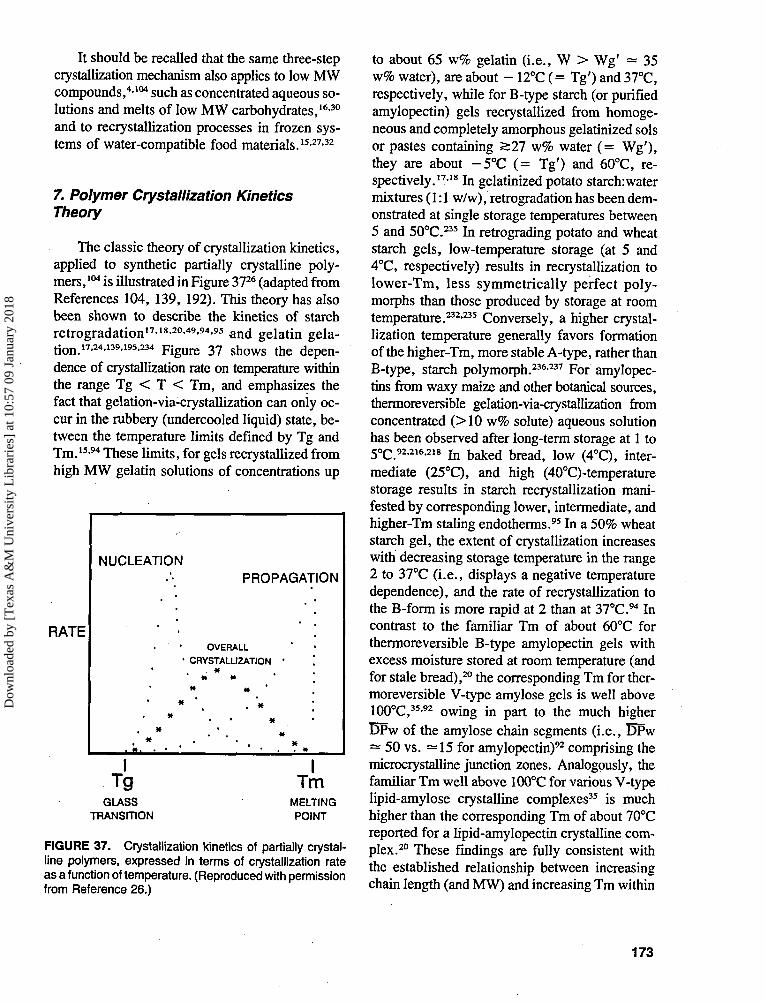
It should be recalled that the same three-stepcrystallization mechanism also applies to low MWcompounds,4-104 such as concentrated aqueous so-lutions and melts of low MW carbohydrates,16'30
and to recrystallization processes in frozen sys-tems of water-compatible food materials.15-27-32
7. Polymer Crystallization KineticsTheory
The classic theory of crystallization kinetics,applied to synthetic partially crystalline poly-mers,104 is illustrated in Figure 3726 (adapted fromReferences 104, 139, 192). This theory has alsobeen shown to describe the kinetics of starchretrogradation17-18-20-49-94-95 and gelatin gela-t i o n n.24,139,195.234 F i g u r e 37 s h o w s ^ d e p e n _
dence of crystallization rate on temperature withinthe range Tg < T < Tm, and emphasizes thefact that gelation-via-crystallization can only oc-cur in the rubbery (undercooled liquid) state, be-tween the temperature limits defined by Tg andTm.15-94 These limits, for gels recrystallized fromhigh MW gelatin solutions of concentrations up
RATE
NUCLEATION
•
*
*
PROPAGATION
OVERALLCRYSTALLIZATION •
* *
• *• *
GLASSTRANSITION
ITm
MELTINGPOINT
FIGURE 37. Crystallization kinetics of partially crystal-line polymers, expressed in terms of crystallization rateas a function of temperature. (Reproduced with permissionfrom Reference 26.)
to about 65 w% gelatin (i.e., W > Wg' = 35w% water), are about - 12°C (= Tg') and 37°C,respectively, while for B-type starch (or purifiedamylopectin) gels recrystallized from homoge-neous and completely amorphous gelatinized solsor pastes containing S27 w% water (= Wg'),they are about -5°C (= Tg') and 60°C, re-spectively.17-18 In gelatinized potato starch:watermixtures (1:1 w/w), retrogradation has been dem-onstrated at single storage temperatures between5 and SCPC.235 In retrograding potato and wheatstarch gels, low-temperature storage (at 5 and4°C, respectively) results in recrystallization tolower-Tm, less symmetrically perfect poly-morphs than those produced by storage at roomtemperature.232-235 Conversely, a higher crystal-lization temperature generally favors formationof the higher-Tm, more stable A-type, rather thanB-type, starch polymorph.236-237 For amylopec-tins from waxy maize and other botanical sources,thermoreversible gelation-via-crystallization fromconcentrated (>10 w% solute) aqueous solution
has been observed after long-term storage at 1 to5 o C 92.2i6.2i8 ju b a k e d b r e a d j I o w ( 4 o C ) > i m e r _
mediate (25°C), and high (40°C)-temperaturestorage results in starch recrystallization mani-fested by corresponding lower, intermediate, andhigher-Tm staling endotherms.95 In a 50% wheatstarch gel, the extent of crystallization increaseswith decreasing storage temperature in the range2 to 37°C (i.e., displays a negative temperaturedependence), and the rate of recrystallization tothe B-form is more rapid at 2 than at 3TC.9* Incontrast to the familiar Tm of about 60°C forthermoreversible B-type amylopectin gels withexcess moisture stored at room temperature (andfor stale bread),20 the corresponding Tm for ther-moreversible V-type amylose gels is well above100°C,35-92 owing in part to the much higherDPw of the amylose chain segments (i.e., DPw— 50 vs. =15 for amylopectin)92 comprising themicrocrystalline junction zones. Analogously, thefamiliar Tm well above 100°C for various V-typelipid-amylose crystalline complexes35 is muchhigher than the corresponding Tm of about 70°Creported for a lipid-amylopectin crystalline com-plex.20 These findings are fully consistent withthe established relationship between increasingchain length (and MW) and increasing Tm within
173
Dow
nloa
ded
by [
Tex
as A
&M
Uni
vers
ity L
ibra
ries
] at
10:
57 0
9 Ja
nuar
y 20
18
homologous families of partially crystalline syn-thetic polymers.105-113
As illustrated by Figure 37 and the aboveresults on the temperature dependence of starchrecrystallization, the rate of crystallization wouldbe practically negligible at T < Tg, because nu-cleation is a liquid-state phenomenon (i.e., inpart, a transport process through a viscous me-dium)49-94 that requires translational and orien-tational mobility, and such mobility is virtuallydisallowed (over realistic times) in a mechanicalsolid of -n ^ 1012 Pa s.4 The temperature of ho-mogeneous nucleation (Th) can be estimated fromthe ratio of Th/Tm (K),30 which is typically near0.8 for partially crystalline synthetic polymers aswell as small molecules, with a reported rangeof 0.78 to 0.85.1O4-115 The rate of propagationgoes essentially to zero below Tg, because prop-agation is a diffusion-limited process192 for whichpractical rates also require the liquid state. At T> Tm, the rate of overall crystallization also goesto zero, because, intuitively, one realizes thatcrystals can neither nucleate nor propagate at anytemperature at which they would be meltedinstantaneously.
Figure 37 illustrates the complex temperaturedependence of the overall crystallization rate andof the rates of the separate mechanistic steps ofnucleation and propagation. According to classicnucleation theory, the nucleation rate is zero atTm and increases rapidly with decreasing tem-perature (and increasing extent of undercooling(Tm — T)) over a relatively narrow temperatureinterval, which for undiluted synthetic polymersbegins at an undercooling of 30 to 100°C.104
Within this temperature region, the nucleationrate shows a large negative temperature coeffi-cient.94-139 At still lower temperatures (and greaterextents of undercooling), where nucleation relieson transport and depends on local viscosity, thenucleation rate decreases with decreasing tem-perature and increasing local viscosity, to a near-zero rate at Tg.94-104 In contrast, the propagationrate increases rapidly with increasing tempera-ture, from a near-zero rate at Tg, and shows alarge positive temperature coefficient over nearlythe entire rubbery range, until it drops precipi-tously to a zero rate at Tm.94-104-139 The fact thatthe nucleation and propagation rates show tem-perature coefficients of opposite sign in the tem-
perature region of intermediate undercooling hasbeen explained94 by pointing out that "when thetemperature has been lowered sufficiently to al-low the formation of (critical) nuclei (whose sizedecreases with decreasing temperature),4-49 the(local) viscosity is already so high that it preventsgrowth of crystalline material."192 The matura-tion rate for non-equilibrium crystallization pro-cesses, like the propagation rate, increases withincreasing temperature, up to the maximum Tmof the most mature crystals.15-18
As shown by the symmetrical curve in Figure37, the overall crystallization rate (i.e., the re-sultant rate of both the nucleation and propaga-tion processes), at a single holding temperature,reaches a maximum at a temperature about mid-way between Tg and Tm, and approaches zeroat Tg and Tm.17-18-49-94-104-139 Identification of thelocation of the temperature of maximum crys-tallization rate has been described104 in terms ofa universal empirical relationship (based on twounderlying concepts) for the crystallization ki-netics of synthetic high polymers. The first con-cept identifies a model polymer (e.g., a readilycrystallizable elastomer with Tg = 200 K andTm = 400 K) as one for which the temperaturedependence of polymer melt viscosity is de-scribed by WLF kinetics.104 (The same concepthas been shown to be applicable to describe thenon-equilibrium thermomechanical relaxationbehavior of "typical" and "atypical" food car-bohydrates in aqueous glassy and rubberystates.)30 The second concept empirically definesa reduced temperature, based on Tg and Tm fortypical polymers, as (T - Tg + 50 K)/(Tm -Tg + 50 K).104 (An analogous reduced temper-ature scale, based on Tg' and Tm, has been shownto describe the rotational mobility [i.e., dielectricrelaxation behavior] of concentrated aqueoussugar solutions in the supraglassy fluid state.)30
For all synthetic high polymers analyzed, thetemperature position of the maximum crystalli-zation rate, on a universal master curve like theone shown in Figure 37, occurs at about 0.6 ofthe reduced temperature scale.104 Low MW syn-thetic compounds have been fitted to a similarcurve, but with a different position for the max-imum crystallization rate, at about 0.8 of thereduced temperature scale.104 Based on this em-pirical relationship for synthetic high polymers,
174
Dow
nloa
ded
by [
Tex
as A
&M
Uni
vers
ity L
ibra
ries
] at
10:
57 0
9 Ja
nuar
y 20
18
the calculated single holding temperature formaximum crystallization rate would be about 300K for the model elastomer (in fact, exactly mid-way between Tg and Tm), -3°C for a gelatingel with ^35 w% water (a temperature madeinaccessible without detriment to product qualitydue to unavoidable ice formation), 14°C for atypical B-type starch (or amylopectin) gel with^27 w% water, and 70°C for a V-type amylosegel (based on Tm = 153°C92).26 It has been noted26
that the calculated value of about 14°C for B-type starch is similar to (1) the empirically de-termined subambient temperature for the maxi-mum rate of starch recrystallization and concom-itant crumb firming during aging, reported in anexcellent study of the kinetics of bread stalingby Guilbot and Godon,238 but not previously ex-plained on the basis of the polymer crystallizationkinetics theory described above, and (2) the tem-perature of about 5°C recently calculated fromLauritzen-Hoffman polymer crystallization ki-netics theory by Marsh and Blanshard94 for a 50%wheat starch gel. The fact that these subambienttemperatures are much closer to the operative Tg(i.e., Tg') than to Tm,26 unlike the situation de-picted by the symmetrical shape of the crystal-lization rate curve in Figure 37 that typifies thebehavior of many synthetic polymers, clearly in-dicates that the crystallization process for B-typestarch (or pure amylopectin) is strongly nuclea-tion-limited.1820-94
In contrast to the maximum crystallizationrate achievable at a single temperature, Ferry239
showed for gelatin that the rate of gelation canbe further increased, while the phenomenon ofsteadily increasing gel maturation over extendedstorage time can be eliminated, by a two-steptemperature-cycling gelation protocol that capi-talizes on the crystallization kinetics defined inFigure 37. He showed that a short period for fastnucleation at 0°C (a temperature above Tg' andnear the peak of the nucleation rate curve), fol-lowed by another short period for fast crystalgrowth at a temperature just below Tm, produceda gelatin gel of maximum and unchanging gelstrength in the shortest possible overall time. Re-cently, Slade has shown that a similar tempera-ture-cycling protocol can be used to maximizethe rate of starch recrystallization in freshly ge-latinized starch-water mixtures with at least 27
w% water,18-20 resulting in a patented process forthe accelerated staling of starch-based food prod-ucts.36 Zeleznak and Hoseney95 subsequentlyadopted this protocol in their study of the tem-perature dependence of bread staling.
IV. THE FOOD POLYMER SCIENCEDATA BANK AND ITSPHYSICOCHEMICAL FOUNDATION
As emphasized by the discussion in SectionII, for pragmatical time scales and conditions(temperature, concentration, pressure), where"real-world" food systems are usually far fromequilibrium, familiar treatments (e.g., water ac-tivity and moisture sorption isotherms) based onthe equilibrium thermodynamics of very dilutesolutions fail.30 This is not too surprising, sincelimiting partial molar properties reflect the in-dependent behavior of solute in the limit of in-finite dilution where free volume is maximum ata given temperature, while Tg'-Wg' propertiesreflect the cooperative behavior of plasticizerblends composed of concentrated solute-watermixtures at the limiting minimum value of freevolume to observe relaxation within experimentaltime scales. As suggested by the information re-viewed in Section HI, successful treatments re-quire a new approach to emphasize the kineticdescription, relate time-temperature-concentra-tion-pressure through underlying mobility trans-formations, and establish reference conditions oftemperature and concentration (characteristic foreach solute).30 In this section covering the foodpolymer science data bank and its physicochem-ical foundation, it is demonstrated (and then cor-roborated in Section V) that small carbohydrate-water systems, with well-characterized structureand MW above and below the limit for entan-glement coupling, provide a unique frameworkfor the investigation of non-equilibrium behav-ior:30 definition of conditions for its empiricaldemonstration, examination of materials prop-erties that allow its description and control, iden-tification of appropriate experimental ap-proaches, and exploration of theoreticalinterpretations. This framework has been appliedto the other major categories of food materialsincluded in the data bank.
175
Dow
nloa
ded
by [
Tex
as A
&M
Uni
vers
ity L
ibra
ries
] at
10:
57 0
9 Ja
nuar
y 20
18
The food polymer science data bank has beenestablished from measured thermal properties ofhundreds of individual food materials, including(a) small carbohydrates — sugars, polyhydric al-cohols, and glycoside derivatives; (b) carbohy-drate oligomers and high polymers — starchesand SHPs; (c) high MW, non-starch polysaccha-rides; (d) amino acids; (e) proteins; (f) organicacids; (g) biological tissues — fruits and vege-tables; and (h) a wide variety of other food in-gredients and products.8-14"39 The data bank con-sists of the following reference parameters,measured for each individual solute by DSC (seemethods described elsewhere):8-27-28-34 (1) Tg',the particular subzero Tg of the maximally freeze-concentrated glass that is formed on slow coolingof a 20 w% aqueous solution of the non-crystal-lizing solute to T < Tg'; (2) Wg', the corre-sponding water content of the maximally freeze-concentrated glass that is formed on slow coolingof a 20 w% aqueous solution of the non-crystal-lizing solute to T < Tg', representing the amountof water rendered "unfreezable" on a practicaltime scale (expressed as g UFW/g solute) by im-mobilization with the solute in this dynamicallyconstrained, kinetically metastable amorphous.solid of extremely high local viscosity; (3) Tmof the anhydrous crystalline solute; and (4) Tgof the completely amorphous, anhydrous solute,resulting from vitrification via quench-coolingafter melting of the crystalline solute.
A. Monomeric, Oligomeric, andPolymeric Carbohydrates
The 84 small carbohydrates listed in Table36-8,27-31.40-42 ̂ polyhydroxy compounds (PHCs)of known, monodisperse (i.e., Mw/Mn = 1)MWs. These PHCs represent a comprehensivebut non-homologous series of mono-, di-, andsmall oligosaccharides and their derivatives, in-cluding many common sugars, polyols, and gly-cosides, covering a MW range of 62 to 1153 Da.The 91 SHPs listed in Table 48-32-34 are mono-meric, oligomeric, and high-polymeric carbo-hydrates, representing a homologous family ofglucose polymers. These SHPs represent a spec-trum of commercial products (including modifiedstarches, dextrins, maltodextrins, corn syrup sol-
ids, and corn syrups), with poly disperse MWs(i.e., Mw/Mn §> 1), covering a very broad rangeof dextrose equivalent (DE, where DE = 100/(Mn/180.2)) values from 0.3 to 100.
1. Tg' Database
Figure 38s shows typical low-temperatureDSC thermograms for 20 w% solutions of (a)glucose and (b) a 10 DE maltodextrin (Star Dri10). In each, the heat flow curve begins at thetop (endothermic down), and the analog deriv-ative trace (endothermic up and zeroed to thetemperature axis) at the bottom. For both ther-mograms, instrumental amplification and sensi-tivity settings were identical, and sample weightscomparable. It is evident that the direct analogderivative feature of the DSC (DuPont Model990) greatly facilitates deconvolution of sequen-tial thermal transitions, assignment of precisetransition temperatures (to ±0.5°C for Tg' val-ues of duplicate samples), and thus overall inter-pretation of thermal behavior, especially for suchfrozen aqueous solutions exemplified by Figure38A. We commented in 19868 on the surprisingabsence of previous reports of the use of deriv-ative thermograms, in the many earlier DSC stud-ies of such systems with water content >Wg'(see Franks4 for an extensive bibliography), tosort out the small endothermic and exothermicchanges in heat flow that typically occur below0°C. Most modern commercial DSC instrumentsprovide a derivative feature, but its use for in-creased interpretative capability still appears toremain much neglected in the thermal analysisof foods in general, and frozen aqueous foodsystems in particular.34-189
Despite the handicap of such instrumentallimitations in the past, the theoretical basis forthe thermal properties of aqueous solutions atsubzero temperatures has come to be increasinglyunderstood.'"-74-133-240-242 As shown in Figure 38A,after rapid cooling (about 50°C/min) of the glu-cose solution from room temperature to < — 80°C,slow heating (5°C/min) reveals a minor Tg at— 61.5°C, followed by an exothermic devitrifi-cation (a crystallization of some of the previouslyUFW) at Td = -47.5°C, followed by another(major) Tg, namely, Tg', at -43°C, and finally
176
Dow
nloa
ded
by [
Tex
as A
&M
Uni
vers
ity L
ibra
ries
] at
10:
57 0
9 Ja
nuar
y 20
18
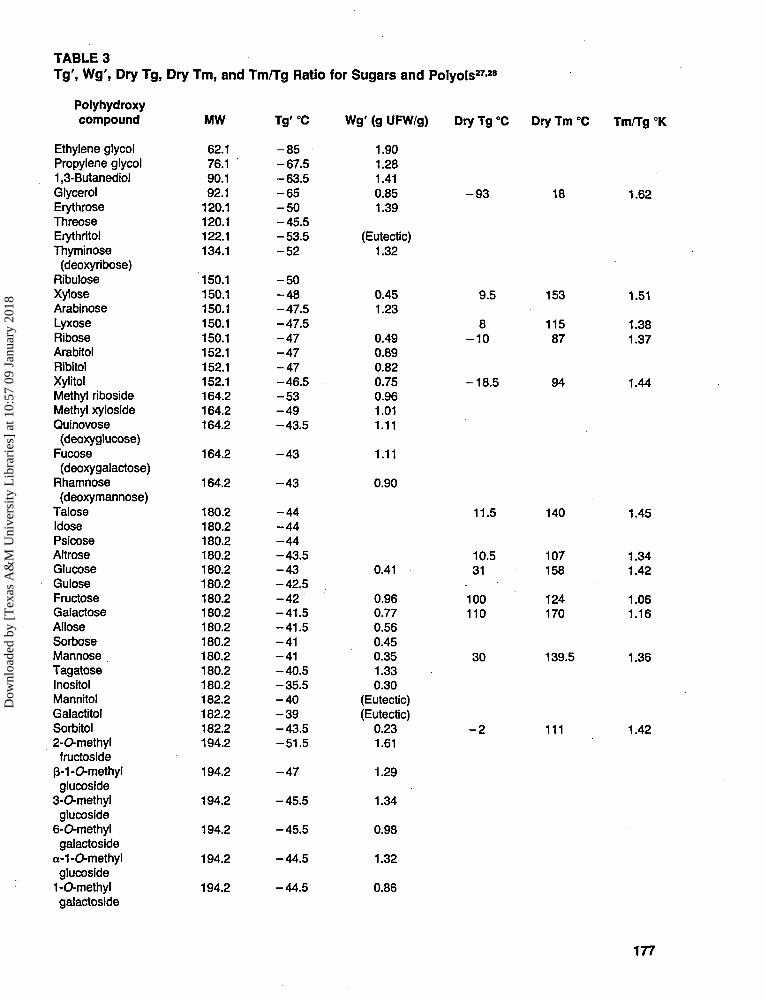
TABLE 3Tg', Wg\ Dry Tg, Dry Tm, and Tm/Tg Ratio for Sugars and Polyols27-28
Polyhydroxycompound
Ethylene glycolPropylene glycol1,3-ButanediolGlycerolErythroseThreoseErythritolThyminose
(deoxyribose)RibuloseXyloseArabinoseLyxoseRiboseArabitolRibitolXylitolMethyl ribosideMethyl xylosideQuinovose
(deoxyglucose)Fucose(deoxygalactose)
Rhamnose(deoxymannose)
TaloseIdosePsicoseAltroseGlucoseGuloseFructoseGalactoseAlloseSorboseMannoseTagatoseInositolMannitolGalactitolSorbitol2-O-methyl
fructosideB-1-O-methylglucoside
3-O-methylglucoside
6-O-methylgalactoside
a-1-O-methylglucoside
1-O-methylgalactoside
MW
62.176.190.192.1
120.1120.1122.1134.1
150.1150.1150.1150.1150.1152.1152.1152.1164.2164.2164.2
164.2
164.2
180.2180.2180.2180.2180.2180.2180.2180.2180.2180.2180.2180.2180.2182.2182.2182.2194.2
194.2
194.2
194.2
194.2
194.2
Tg'°C
- 8 5-67.5-63.5- 6 5- 5 0-45.5-53.5- 5 2
- 5 0- 4 8-47.5-47.5- 4 7- 4 7- 4 7-46.5- 5 3- 4 9-43.5
- 4 3
- 4 3
- 4 4- 4 4- 4 4-43.5- 4 3-42.5- 4 2-41.5-41.5-41-41-40.5-35.5- 4 0- 3 9-43.5-51.5
- 4 7
-45.5
-45.5
-44.5
-44.5
Wg' (g UFW/g)
1.901.281.410.851.39
(Eutectic)1.32
0.451.23
0.490.890.820.750.961.011.11
1.11
0.90
0.41
0.960.770.560.450.351.330.30
(Eutectic)(Eutectic)
0.231.61
1.29
1.34
0.98
1.32
0.86
Dry Tg °C Dry Tm °C Tm/Tg °K
- 9 3 18 1.62
9.5
8-10
-18.5
153
11587
94
1.51
1.381.37
1.44
11.5
10.531
100110
30
- 2
140
107158
124170
139.5
111
1.45
1.341.42
1.061.16
1.36
1.42
177
Dow
nloa
ded
by [
Tex
as A
&M
Uni
vers
ity L
ibra
ries
] at
10:
57 0
9 Ja
nuar
y 20
18
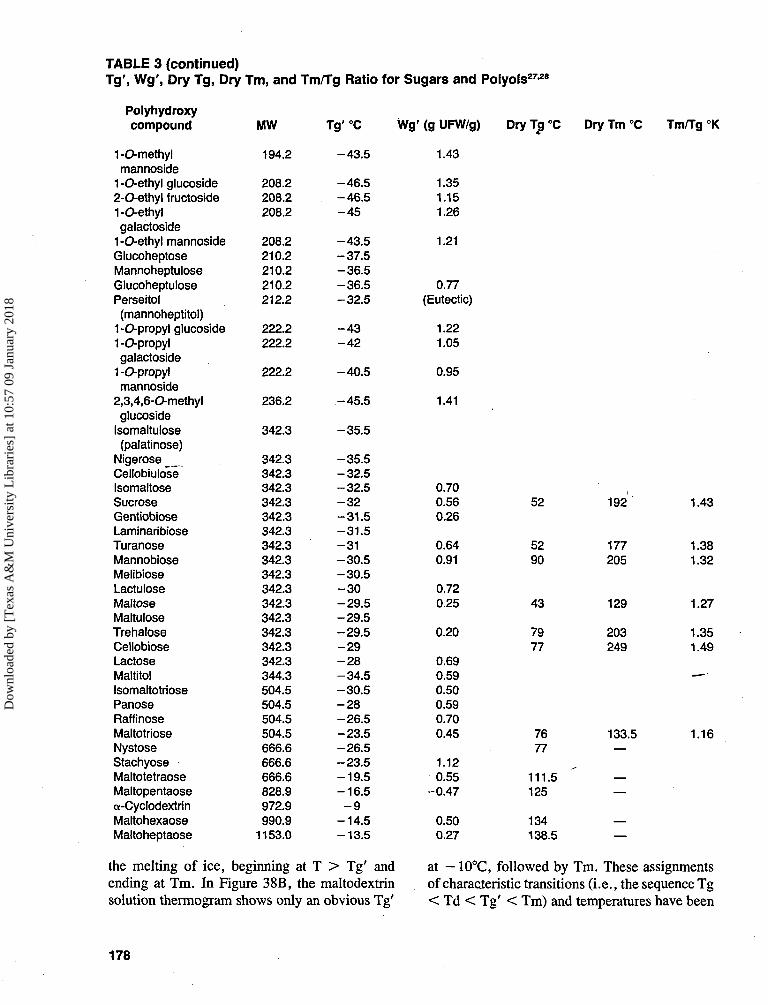
TABLE 3 (continued)Tg', Wg', Dry Tg, Dry Tm, and Tm/Tg Ratio for Sugars and Polyols27-28
Polyhydroxycompound
1-O-methylmannoside
1 -O-ethyl glucoside2-O-ethyl fructoside1-O-ethylgalactoside
1-O-ethyl mannosideGlucoheptoseMannoheptuloseGlucoheptulosePerseitol(mannoheptitol)
1-O-propyl glucoside1-O-propylgalactoside
1-O-propylmannoside
2,3,4,6-O-methylglucoside
Isomaltulose(palatinose)
NigeroseCellobiuloseIsomaltoseSucroseGentiobioseLaminaribioseTuranoseMannobioseMelibioseLactuloseMaltoseMaltuloseTrehaloseCellobioseLactoseMaltitolIsomaltotriosePanoseRaffinoseMaltotrioseNystoseStachyoseMaltotetraoseMaltopentaosea-CyclodextrinMaltohexaoseMaltoheptaose
MW
194.2
208.2208.2208.2
208.2210.2210.2210.2212.2
222.2222.2
222.2
236.2
342.3
342.3342.3342.3342.3342.3342.3342.3342.3342.3342.3342.3342.3342.3342.3342.3344.3504.5504.5504.5504.5666.6666.6666.6828.9972.9990.9
1153.0
Tg'°C
-43.5
-46.5-46.5- 4 5
-43.5-37.5-36.5-36.5-32.5
- 4 3- 4 2
-40.5
-45.5
-35.5
-35.5-32.5-32.5- 3 2-31.5-31.5-31-30.5-30.5- 3 0-29.5-29.5-29.5- 2 9- 2 8-34.5-30.5- 2 8-26.5-23.5-26.5-23.5-19.5-16.5
- 9-14.5-13.5
Wg' (g UFW/g)
1.43
1.351.151.26
1.21
0.77(Eutectic)
1.221.05
0.95
1.41
0.700.560.26
0.640.91
0.720.25
0.20
0.690.590.500.590.700.45
1.120.55
-0.47
0.500.27
Dry T£ °C Dry Tm °C Tm/Tg °K
the melting of ice, beginning at T > Tg' andending at Tm. In Figure 38B, the maltodextrinsolution thermogram shows only an obvious Tg'
52
5290
43
7977
192
177205
129
203249
1.43
1.381.32
1.27
1.351.49
7677
111.5125
134138.5
133.5 1.16
at - 10°C, followed by Tm. These assignmentsof characteristic transitions (i.e., the sequence Tg< Td < Tg' < Tm) and temperatures have been
178
Dow
nloa
ded
by [
Tex
as A
&M
Uni
vers
ity L
ibra
ries
] at
10:
57 0
9 Ja
nuar
y 20
18
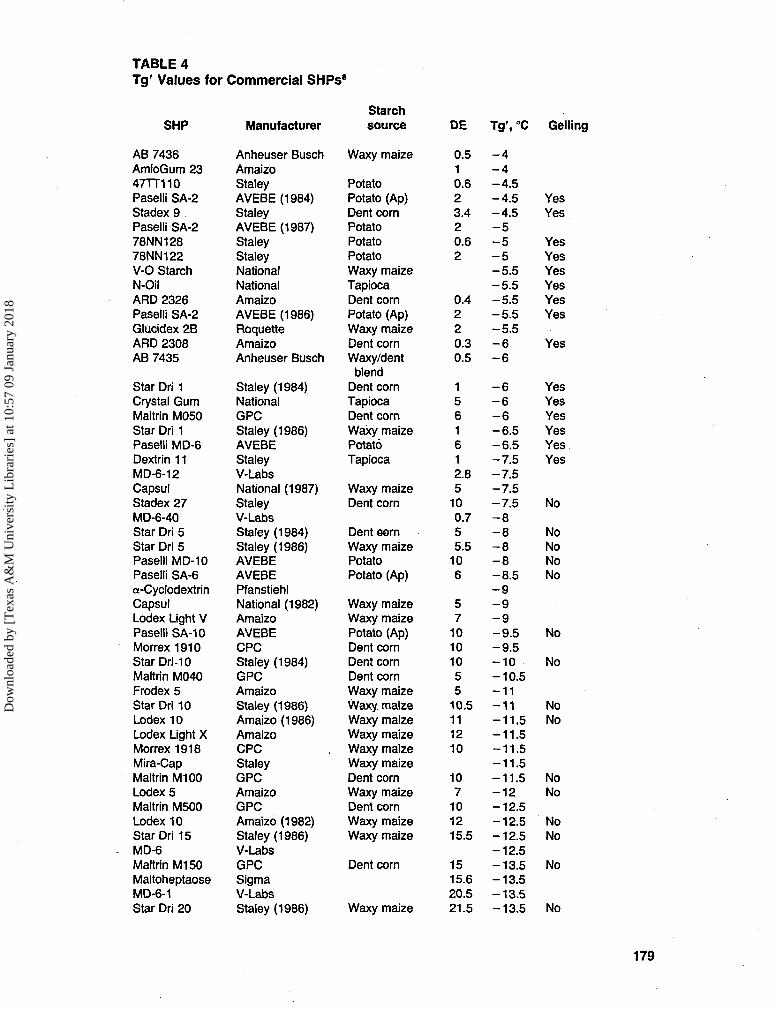
TABLE 4Tg' Values for Commercial SHPs*
SHP
AB 7436AmioGum 2347TT110Paselli SA-2Stadex 9Paselli SA-278NN12878NN122V-0 StarchN-OilARD 2326Paselli SA-2Glucidex 2BARD 2308AB 7435
Star Dri 1Crystal GumMaltrin M050Star Dri 1Paselli MD-6Dextrin 11MD-6-12CapsulStadex 27MD-6-40Star Dri 5Star Dri 5Paselli MD-10Paselli SA-6a-CyclodextrinCapsulLodex Light VPaselli SA-10Morrex 1910StarDri-10Maltrin M040Frodex 5Star Dri 10Lodex 10Lodex Light XMorrex 1918Mira-CapMaltrin M100Lodex 5Maltrin M500Lodex 10Star Dri 15MD-6
Maltrin M150MaltoheptaoseMD-6-1Star Dri 20
Manufacturer
Anheuser BuschAmaizoStaleyAVEBE (1984)StaleyAVEBE (1987)StaleyStaleyNationalNationalAmaizoAVEBE (1986)RoquetteAmaizoAnheuser Busch
Staley (1984)NationalGPCStaley (1986)AVEBEStaleyV-LabsNational (1987)StaleyV-LabsStaley (1984)Staley (1986)AVEBEAVEBEPfanstiehlNational (1982)AmaizoAVEBECPCStaley (1984)GPCAmaizoStaley (1986)Amaizo (1986)AmaizoCPCStaleyGPCAmaizoGPCAmaizo (1982)Staley (1986)V-LabsGPCSigmaV-LabsStaley (1986)
Starchsource
Waxy maize
PotatoPotato (Ap)Dent cornPotatoPotatoPotatoWaxy maizeTapiocaDent cornPotato (Ap)Waxy maizeDent cornWaxy/dentblend
Dent cornTapiocaDent cornWaxy maizePotatoTapioca
Waxy maizeDent corn
Dent cornWaxy maizePotatoPotato (Ap)
Waxy maizeWaxy maizePotato (Ap)Dent cornDent cornDent cornWaxy maizeWaxy maizeWaxy maizeWaxy maizeWaxy maizeWaxy maizeDent cornWaxy maizeDent cornWaxy maizeWaxy maize
Dent corn
Waxy maize
DE Tg', °C Gelling
0.510.623.420.62
0.4220.30.5
1561612.85
100.755.5
106
57
10101055
10.5111210
107
101215.5
1515.620.521.5
-4-4-4.5-4.5-4.5-5-5-5-5.5-5.5-5.5-5.5-5.5-6-6
-6-6-6-6.5-6.5-7.5-7.5-7.5-7.5-8-8-8-8-8.5-9-9-9-9.5-9.5-10-10.5-11-11-11.5-11.5-11.5-11.5-11.5-12-12.5-12.5-12.5-12.5-13.5-13.5-13.5-13.5
YesYes
YesYesYesYesYesYes
Yes
YesYesYesYesYesYes
No
NoNoNoNo
No
No
NoNo
NoNo
NoNo
No
No
179
Dow
nloa
ded
by [
Tex
as A
&M
Uni
vers
ity L
ibra
ries
] at
10:
57 0
9 Ja
nuar
y 20
18
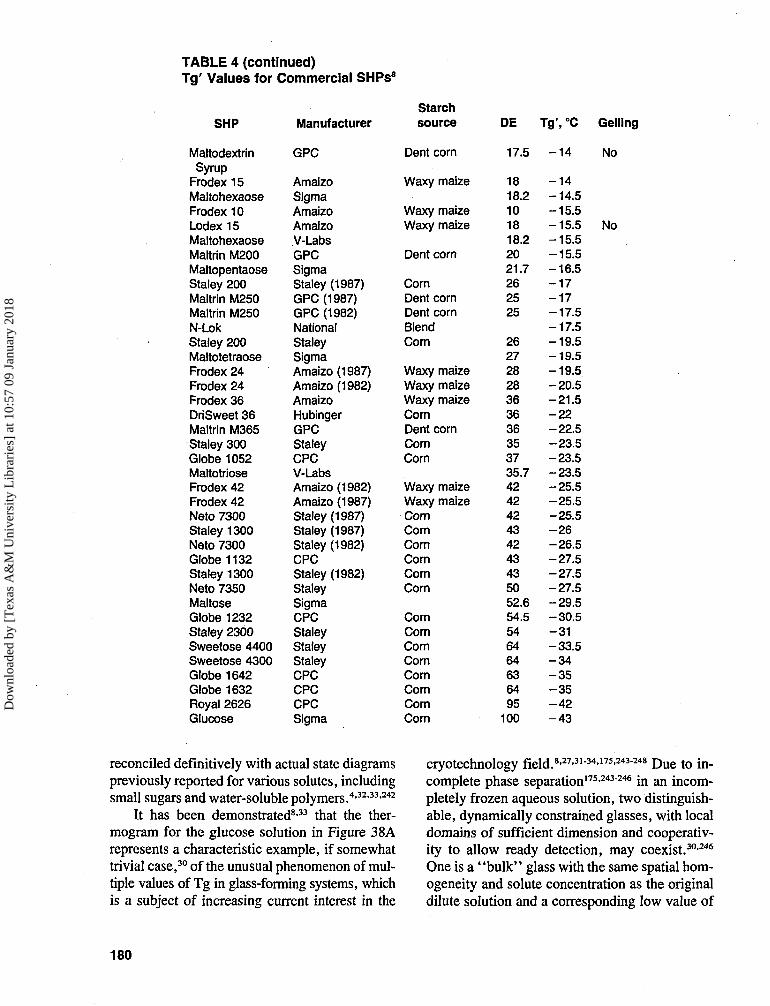
TABLE 4 (continued)Tg' Values for Commercial SHPs8
SHP
MaltodextrinSyrup
Frodex 15MaltohexaoseFrodex 10Lodex15MaltohexaoseMaltrin M200MaltopentaoseStaley 200Maltrin M250Maltrin M250N-LokStaley 200MaltotetraoseFrodex 24Frodex 24Frodex 36DriSweet 36Maltrin M365Staley 300Globe 1052MaltotrioseFrodex 42Frodex 42Neto 7300Staley 1300Neto 7300Globe 1132Staley 1300Neto 7350MaltoseGlobe 1232Staley 2300Sweetose 4400Sweetose 4300Globe 1642Globe 1632Royal 2626Glucose
Manufacturer
GPC
AmaizoSigmaAmaizoAmaizoV-LabsGPCSigmaStaley (1987)GPC (1987)GPC (1982)NationalStaleySigmaAmaizo (1987)Amaizo (1982)AmaizoHubingerGPCStaleyCPCV-LabsAmaizo (1982)Amaizo (1987)Staley (1987)Staley (1987)Staley (1982)CPCStaley (1982)StaleySigmaCPCStaleyStaleyStaleyCPCCPCCPCSigma
Starchsource
Dent corn
Waxy maize
Waxy maizeWaxy maize
Dent corn
CornDent cornDent cornBlendCorn
Waxy maizeWaxy maizeWaxy maizeCornDent cornCornCorn
Waxy maizeWaxy maizeCornCornCornCornCornCorn
CornCornCornCornCornCornCornCorn
DE
17.5
1818.2101818.22021.7262525
26272828363636353735.7424242434243435052.654.5546464636495
100
Tg', °C Gelling
- 1 4 No
- 1 4-14.5-15.5-15.5 No-15.5-15.5-16.5- 1 7- 1 7-17.5-17.5-19.5-19.5-19.5-20.5-21.5- 2 2-22.5-23.5-23.5-23.5-25.5-25.5-25.5- 2 6-26.5-27.5-27.5-27.5-29.5-30.5-31-33.5- 3 4- 3 5- 3 5- 4 2- 4 3
reconciled definitively with actual state diagramspreviously reported for various solutes, includingsmall sugars and water-soluble polymers.4-32-33-242
It has been demonstrated8-33 that the ther-mogram for the glucose solution in Figure 38Arepresents a characteristic example, if somewhattrivial case,30 of the unusual phenomenon of mul-tiple values of Tg in glass-forming systems, whichis a subject of increasing current interest in the
cryotechnology field.8-27-31-34-175-243"248 Due to in-complete phase separation175-243246 in an incom-pletely frozen aqueous solution, two distinguish-able, dynamically constrained glasses, with localdomains of sufficient dimension and cooperativ-ity to allow ready detection, may coexist.30-246
One is a "bulk" glass with the same spatial hom-ogeneity and solute concentration as the originaldilute solution and a corresponding low value of
180
Dow
nloa
ded
by [
Tex
as A
&M
Uni
vers
ity L
ibra
ries
] at
10:
57 0
9 Ja
nuar
y 20
18
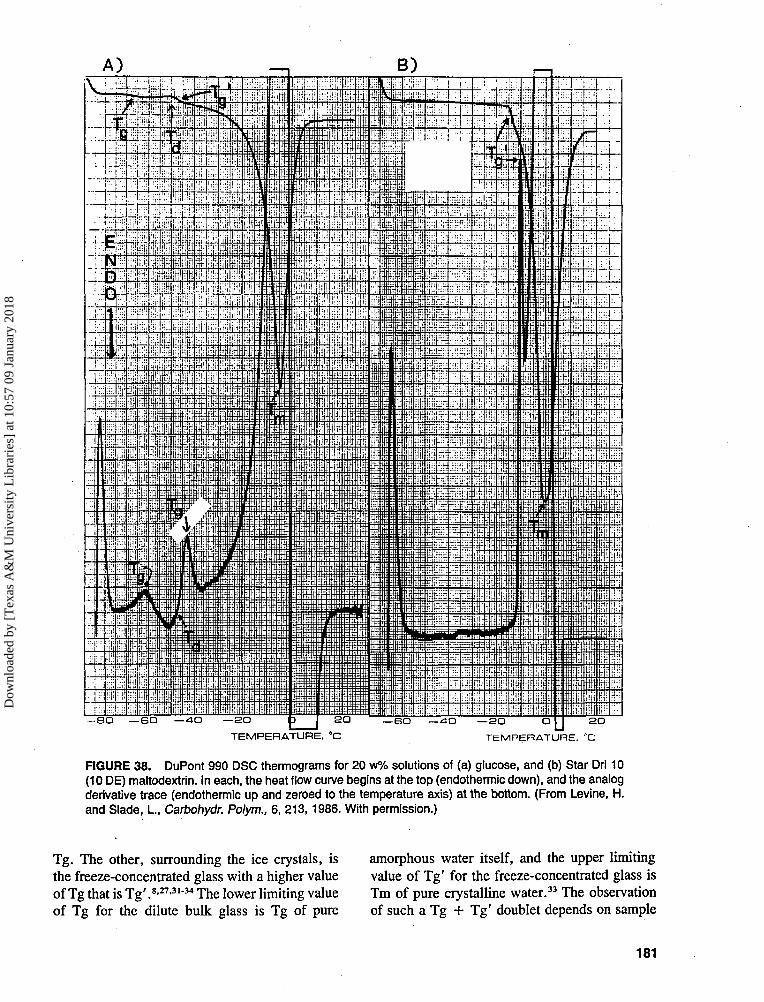
— BO —BO —AO — 2 O D I SOTEMPERATURE. °C
2O O 2O
TEMPERATURE. "C
FIGURE 38. DuPont 990 DSC thermograms for 20 w% solutions of (a) glucose, and (b) Star Dri 10(10 DE) maltodextrin. In each, the heat flow curve begins at the top (endothermic down), and the analogderivative trace (endothermic up and zeroed to the temperature axis) at the bottom. (From Levine, H.and Slade, I., Carbohydr. Polym., 6, 213, 1986. With permission.)
Tg. The other, surrounding the ice crystals, isthe freeze-concentrated glass with a higher valueof Tg that is Tg' .8-27-31-34 The lower limiting valueof Tg for the dilute bulk glass is Tg of pure
amorphous water itself, and the upper limitingvalue of Tg' for the freeze-concentrated glass isTm of pure crystalline water.33 The observationof such a Tg + Tg' doublet depends on sample
181
Dow
nloa
ded
by [
Tex
as A
&M
Uni
vers
ity L
ibra
ries
] at
10:
57 0
9 Ja
nuar
y 20
18
moisture content, cooling/heating history, andpressure history,30-246 and represents an exampleof the difficulty that can be encountered in de-convoluting the non-equilibrium effects of sam-ple history,249-250 and the resulting potential formisinterpretation that can arise when experi-ments on frozen aqueous systems are not design-ed from a knowledge of the operative referencestate.243'245 It should be noted that other cases ofmultiple-Tg phenomena that have been reportedare readily distinguishable from the Tg + Tg'doublet behavior of incompletely frozen aqueoussolutions. One type of general behavior (i.e., notrestricted to low-temperature aqueous systems),representing another trivial case, involves simplemolecular incompatibility in a two-componentsystem, where, due to a lack of spatial homo-geneity on a dimensional scale ^100 A,106 twoseparate glasses with different values of Tg maycoexist. A non-trivial case of multiple values ofTg can result from a liquid-liquid phase separa-tion (which can be pressure-induced or -facili-tated in some instances,247 but in others can occurat atmospheric pressure),248 leading to spatial in-homogeneity in aqueous solutions of, for ex-ample, lithium chloride and tetraalkylammoniumhalides at low temperatures. Another non-trivialcase can result from the formation of specificstoichiometric complexes in aqueous solutionsof, for example, glycerol, DMSO, and lithiumchloride247 where each complex would exhibit itsown discrete Tm (or eutectic melting tempera-ture) and Tg'.
The idealized state diagram shown in Figure39,33 modified from MacKenzie and Rasmus-sen,242 exemplifies those previously reported andreveals the various distinctive cooling/heatingpaths that can be followed by solutions of mon-omeric (glucose) vs. polymeric (maltodextrin)solutes. In the case of glucose, partial vitrifica-tion of the original solution can occur, as illus-trated by Figure 38A, when the selected coolingrate is high relative to the rate of freezing out ofice.5 Yet, in the case of maltodextrin, that samecooling rate would be low relative to the rate offreezing, and less vitrification is observed,8 asshown in Figure 38B. This result is perhaps sur-prising, since relative rates of diffusion processesmight have been expected to be more retarded inthe maltodextrin solution of greater Mw than in
the glucose solution.30-32 In fact, the relative rateof ice growth is greater in glucose solution thanin maltodextrin solution.32 However, in this ex-ample, the rate-limiting event that determineswhether freezing or vitrification will predominateis the prerequisite nucleation step for the freezingprocess.33 An empirical examination of availabledata8-30"34 shows that efficient retardation of icecrystal growth is provided by solutes for whichTg' of the freeze-concentrated glass is high, whileenhanced potential for partial vitrification is pro-vided by solutes for which the value of Wg' ishigh, most typically concomitant with a low valueof Tg'.32 This empirical observation serves as thebasis for two operational definitions of a ' 'good''aqueous-glass former:33251 (1) a solute that en-hances the vitrification of water as a solute-waterglass over the energetically favored phase sepa-ration of ice, and (2) a solute that provides anaqueous glass with a high value of Wg'. As canbe deduced from the relative sizes of the ice peaksfor the samples of identical concentration andcomparable weight in Figure 38A and 38B, Wg'for the glucose-water glass is greater than Wg'for this 10 DE maltodextrin-water glass,8 so thatglucose is a better aqueous-glass former than thismaltodextrin by both criteria. The greater effectof glucose than 10 DE maltodextrin on ice nu-cleation cannot be attributed simply to a greatercolligative depression of the homogeneous nu-cleation temperature by the smaller MW solutecompared to the larger solute at the same w%concentration.3033 PVP, with Mn more than 10times greater than that of a 10 DE maltodextrin,is a good aqueous-glass former,135 like glucose.Indeed, values of Wg' for aqueous glasses ofPVPs are greater than Wg' of the aqueous glucoseglass,27 an anomaly inconsistent with the ex-pected observation that the values of Tg' for PVPglasses are greater than that of the glucose glass.8
The location of Wg' and Tg' on the dynamicsmap for a particular solute determines the overallshape of the aqueous glass curve for that solute,such that higher values of either parameter resultin a steeper rise in Tg with increase in w% soluteat low solute concentrations.16-30 The number ofcritical nuclei formed in a volume of solution ata given temperature within a given time intervaldepends both on the local viscosity of the solutionand the temperature-dependence of the number
182
Dow
nloa
ded
by [
Tex
as A
&M
Uni
vers
ity L
ibra
ries
] at
10:
57 0
9 Ja
nuar
y 20
18
of water molecules required to constitute a criticalnucleus through density fluctuations of pure watermolecules.5-40"42 Higher values of Wg' suggestthat lower nucleation temperatures would be re-quired to create a critical nucleus, due to thesmaller local dimensions available for unper-turbed density fluctuations of pure water. Highervalues of Wg' or Tg' suggest that the local vis-cosity of the solution would become'limiting neartemperatures that would effect nucleation of purewater. The value of Wg' relates to both of thefactors that determine the kinetics of ice nuclea-tion in solution and, thus, to the ability of a soluteto enhance partial vitrification at a selected cool-ing rate.33
However, as demonstrated by the DSC ther-mograms in Figure 38, in either general case,and regardless of initial cooling rate, rewarmingfrom T < Tg' forces the system through a solute-specific glass transition at Tg'.8 As illustrated inthe state diagram in Figure 39, the Tg'-Cg' pointrepresents a "universal crossroads" on this map,in that all cooling/heating paths eventually leadto this point.33 As shown by one of the idealizedpaths in Figure 39, slow cooling of a stereotypicalsugar solution from room temperature (point X)to a temperature corresponding to point Y canfollow the path XVSUWY, which passes throughthe Tg'-Cg' point, W. In the absence of under-cooling (e.g., upon deliberate nucleation), freez-ing (ice formation) begins at point V (on theequilibrium liquidus curve, at a subzero temper-ature determined by the MW and concentrationof the particular solute, via colligative freezingpoint depression) and ends at point W (on thenon-equilibrium extension of the liquidus curve).Due to vitrification of the Tg'-Cg' glass at pointW, some of the water in the original solution(i.e., an amount defined as Wg') is left unfrozenin the time frame of the experiment. This UFWis not "bound" to the solute nor "unfreezable"on thermodynamic grounds, but simply experi-ences retarded mobility in the Tg'-Cg' glass. Theextremely high local viscosity of this kinetically-metastable, dynamically constrained glass pre-vents diffusion of a sufficient number of watermolecules to the surface of the ice lattice to allowmeasurement of its growth in real time.4-8-40"42 Asexemplified by the thermogram for the malto-dextrin solution in Figure 38B, rewarming from
point Y to point X can follow the reversible pathYWUSVX, passing back through the Tg'-Cg'point at W.33
In contrast to the slow-cooling pathXVSUWY in Figure 39, quench-cooling can fol-low the direct path from point X to point Z,whereby vitrification can occur at T = Tg, thetemperature corresponding to point A, withoutany freezing of ice or consequent change in theinitial solution concentration.242 However, unlikepath XVSUWY, path XZ is not realistically re-versible in the context of practical warmingrates.251 Upon slow, continuous rewarming frompoint Z to point X, the glass (of composition Cg-Wg rather than Cg'-Wg') softens as the systempasses through the Tg at point A, and then de-vitrifies at the Td at point D.242 Devitrificationleads to disproportionation, which results in thefreezing of pure ice (point E) and revitrificationvia freeze-concentration of the non-ice matrix toCg' (point F) during warming.242 Further warm-ing above Td causes the glass (of compositionCg'-Wg' rather than Cg-Wg) to pass through theTg'-Cg' point at W (where ice melting begins),after which the solution proceeds along the li-quidus curve to point V (where ice melting endsat Tm), and then back to point X. The rewarmingpath ZADFWUSVX33 is exemplified by the ther-mogram for the glucose solution in Figure 38A.
Mention can be made here about the possibleconsequences of an annealing treat-ment,l63-164-246-252-253 whereby the rewarming pro-cess just described is interrupted by an isothermalholding step carried out at different points alongthe path ZADFWUSV. As described for meta-stable, partially crystalline synthetic polymersystems,104 annealing is a kinetic (i.e., time-de-pendent), transport-controlled process of crystalgrowth and/or perfection that occurs at Ta, a tem-perature above Tg but below Tm, typically =0.75 to 0.88 Tm (K),102 for "well-behaved" pol-ymer systems30 with characteristic Tg/Tm ratiosof 0.5 to 0.8 (K).102105 In this metastable rubberydomain defined by WLF theory, within the tem-perature range between Tg and Tm, annealing isa diffusion-limited, non-equilibrium, structuralrelaxation process (another collapse phenome-non) for which the rate is governed by WLF,rather than Arrhenius, kinetics.15-21 Specificallywith respect to the behavior of frozen aqueous
183
Dow
nloa
ded
by [
Tex
as A
&M
Uni
vers
ity L
ibra
ries
] at
10:
57 0
9 Ja
nuar
y 20
18

Weight % SoluteFIGURE 39. Idealized state diagram of temperature vs. weight per-cent solute for an aqueous solution of a hypothetical small carbohy-drate (representing a model frozen food system), illustrating variouscooling/heating paths and associated thermal transitions measurableby low-temperature differential scanning calorimetry (e.g., as shownby the thermograms in Figure 38). See text for explanation of symbols.(From Levine, H. and Slade, I., Comments Agric. Food Chem., 1,315, 1989. With permission.)
model solutions described by Figure 39, recog-nition of the time- and temperature-dependenceof annealing is key to understanding the possibleconsequences potentially observable in a ther-mogram during rewarming after an annealingtreatment performed at Ta < Tm of ice.33 In allcases, the time required to achieve a measurableand comparable (in a reasonable and similar ex-perimental time frame) extent of annealing isshortest at Ta just below Tm (greatest AT aboveTg) and longest at Ta just above Tg (smallestAT).21 For a solution initially quench-cooled from
room temperature to T < Tg as described inFigure 39, the discussion33 of the consequencesof annealing can be complicated by the possiblecoexistence of two glasses with different glasstransition temperatures (Tg and Tg'),30 either orboth of which could govern a subsequent an-nealing treatment. Annealing by an isothermalholding step at Tg < Ta < Td < Tg' < Tmwould be predicted to occur quite slowly, becauseof the still very high local viscosity of the amor-phous matrix at Ta just above Tg. Unless theexperimental holding time were quite long, the
184
Dow
nloa
ded
by [
Tex
as A
&M
Uni
vers
ity L
ibra
ries
] at
10:
57 0
9 Ja
nuar
y 20
18

subsequent thermogram (during warming fromT < Tg, after recooling from Ta) might well beindistinguishable in appearance from the one inFigure 38A. Moreover, if both the Tg and Tg'glasses were present after initial quench-cooling,the slow annealing at Tg < Ta < Td < Tg' justdescribed would only occur locally, rather thanspacially homogeneously throughout the frozensample. In contrast, annealing by isothermalholding at Tg < Td < Tg' < Ta < Tm wouldbe a much faster and more spacially homoge-neous process. After a sufficiently long experi-mental holding time for complete annealing, thesubsequent thermogram (during warming fromT < Tg of the original sample, after recoolingfrom Ta > Tg') would be predicted to show nodetectable lower-temperature Tg or exothermicTd, only a Tg' and Tm (i.e., have the qualitativeappearance of Figure 38B). In the intermediatecase of annealing by isothermal holding at Tg <Td < Ta < Tg' < Tm, some of the consequencesof partial annealing could be seen after a reason-able holding time at Ta just below Tg'. The sub-sequent thermogram (during warming from T <Tg, after recooling from Ta) might still show aremnant of the lower-temperature Tg, but an un-detectably small Td, in addition to Tg' and Tm.In fact, thermograms similar to that just describedhave been reported for solutions of sugars andother solutes252-253 after an annealing treatment atTa = the so-called "antemelting" transition tem-perature (Tam, discussed later) just below Tg'.In the above discussion,33 the different annealingtimes have been, of necessity, described only inrelative qualitative terms, because experimentalresults of previously published studies are insuf-ficient to allow quantitative generalizations.Quantitative times corresponding to the differentannealing scenarios described above would haveto be determined experimentally on a system-specific basis, i.e., for each particular solute,solute concentration, range of absolute temper-atures, and cooling/warming rate protocol.443
The third cooling path illustrated in Figure39, XQSUWY, is the one most relevant to thepractical cooling and warming rates involved incommercial frozen food processes.33 Cooling ofa solution from point X can proceed beyond pointV (on the liquidus curve) to point Q, because thesystem can undercool to some significant extent
before heterogeneous nucleation occurs andfreezing begins.4 Upon freezing at point Q, dis-proportionation occurs, resulting in the formationof pure ice (point R) and freeze-concentration ofthe solution to point S.4 The temperature at pointS is above that at point Q due to the heat liberatedby the freezing of ice.4 The freeze-concentratedmatrix at point S concentrates further to point U,because more ice forms as the temperature of thesystem relaxes to that at point U. Upon furthercooling beyond point U, ice formation and freeze-concentration continue as the system proceedsalong the liquidus curve to point W. Vitrificationof the Tg'-Cg' glass occurs at point W, and fur-ther cooling of this glass can continue to pointY without additional ice formation in real time.Rewarming of the kinetically metastable glassfrom point Y to point X follows the pathYWUSVX, which passes through the Tg'-Cg'point at W. The above descriptions of the variouscooling/warming paths illustrated in Figure 39demonstrate the critical fact that, regardless ofcooling/warming rates (within practical limits),every aqueous system of initial concentration=£Cg', cooled to T =£ Tg', must pass through itsown characteristic and operationally invariantTg'-Cg' point.33 If, in commercial practice, afood product is not cooled to T =s Tg' after freez-ing, but rather is maintained within the temper-ature range between points V and W, that systemwould track back and forth along the liquiduscurve as Tf fluctuates during storage.
The technological significance of Tg' to thestorage stability of frozen food systems, implicitin the preceding description of Figure 39, is dis-cussed in Section IV.C. Suffice it to say for nowthat Tg' (of the freeze-concentrated solution),rather than Tg (of the original solution), is theonly glass transition temperature relevant tofreezer-storage stability at a given freezer tem-perature Tf,33 because almost all "frozen" prod-ucts contain at least some ice. Consistent withthe description of the cooling path XVQSUWY,most commercial food-freezing processes, re-gardless of cooling rate, induce ice formationbeginning at point Q (via heterogeneous nuclea-tion after some extent of undercooling). Sincethe temperature at point Q (generally in the neigh-borhood of - ZCC40-41) is well above that at pointA, the lower Tg, that of the glass with the original
185
Dow
nloa
ded
by [
Tex
as A
&M
Uni
vers
ity L
ibra
ries
] at
10:
57 0
9 Ja
nuar
y 20
18
solute(s) concentration in a typical high-moistureproduct, is never attained and therefore has nopractical relevance.33 Once ice formation occursin a frozen product, the predominant system-spe-cific Tg' becomes the one and only glass tran-sition temperature that controls the product's be-havior during freezer storage at any Tf below Tmand either above or below Tg'.33
In many earlier DSC studies,125-133-252"255 per-formed without benefit of derivative thermo-grams, a pair of transitions (each said to be in-dependent of initial concentration), called"antemelting" (am) and "incipient melting"(im), were reported in place of a single Tg'. Eventhough the underlying physicochemical nature ofthe antemelting transition has never been ex-plained,256 this interpretation is still advocated bysome workers.57-257 In fact, for many differentsolutes, reported values of Tam and Tim241-258-259
bracket that of Tg'. This led to the alternativeinterpretation8 that Tam and Tim actually rep-resent the temperatures of onset and completionof the single thermal relaxation event (a glasstransition) that must occur at Tg', as defined bythe state diagram in Figure 39. A similar lack ofconsensus among workers in this field persistswith respect to the Tg < Td < Tg' sequence oftransitions (Figure 38A) that is universally char-acteristic of frozen solutions of non-crystallizingsolutes rewarmed after cooling to T < Tg.32 In-stead, some have referred to "anomalous doubleglass transitions"243'245 or "the phenomenon ofvitreous polymorphs"246 exhibited by aqueoussolutions of, e.g., propylene glycol and glycerol.Far from anomalously, for each solute, the higherTg of the doublet coincides with Tg'.32 Similarly,Tr, corresponding to the onset temperature foropacity during warming of completely vitrifiedaqueous solutions, and known to be independentof initial concentration, is still a topic of currentinterest and discussion as to its origin,260-261 butis not yet widely recognized as simply coincidingwith Tg' for low MW, non-crystallizing carbo-hydrate solutes32 and non-crystallizing water-compatible polymers, e.g., PVP.8
In comparison to commercial SHPs, such asthe 10 DE maltodextrin in Figure 38B, a starchitself has a Tg' value of about -5°C,17-18 as il-lustrated by the low-temperature DSC thermo-gram in Figure 40B.21 A freshly gelatinized (but
not hydrolyzed) sample of native granular wheatstarch, at uniformly distributed 55 w% total mois-ture, showed a prominent and reversible glasstransition for the fully plasticized, completelyamorphous starch polymers at — 5°C, immedi-ately preceding the Tm of ice. This Tg is the Tg'for gelatinized wheat starch in excess moisture,where the latter condition is defined by Wg' =27 w% water (i.e., about 0.37 g UFW/gstarch),17-18 as illustrated by the state diagram inFigure 25. For the same instrumental sensitivitysettings, Tg' was not detectable in Figure 40A,because the cooperative, controlling majority ofthe amorphous regions of partially crystalline na-tive starch prior to gelatinization show a muchhigher Tg indicative of a much lower local ef-fective moisture content.20
For various PHC and SHP solutes listed inTables 3 and 4, the experimentally measured Tg'value falls between those reported for Tam andTim,241-259 and within a few degrees of valuesreported for Tr and Tc (see References 8 and 27and references therein). Reid262 has recently re-ported a Tg' value for glycerol similar to ours.Also in apparent agreement with one of our mea-sured Tg' values, i.e., of -85°C for ethyleneglycol, Hallbrucker and Mayer263 have observedan endothermic peak at — 86°C, following de-vitrification above Tg = - 128°C, in DSC re-warming scans of "hyperquenched" aqueousglasses of 47 and 50 w% ethylene glycol. Theyhave noted the good correspondence between then-peak at — 86°C and the weak endothermic peakobserved on rewarming slow-cooled ethyleneglycol-water solution glasses in DTA experi-ments by Luyet and Rasmussen,241-259 which theselatter workers named the putative "antemelting"transition, purported to take place at the ice-so-lution interface.
In Table 3, Tg' values for this non-homol-ogous collection of low MW, monodisperse sug-ars, polyols, and glycosides range from — 85°Cfor ethylene glycol (MW 62) to -13.5°C formaltoheptaose (MW 1153). These results, plot-ted in Figure 41,27 showed a monotonic relation-ship between increasing Tg' and MW, whichyielded a fair linear correlation (r = —0.934)between Tg' and 1/MW, as shown in the insetof Figure 41. The major source of scatter in thisplot was the group of glycosides with chemically
186
Dow
nloa
ded
by [
Tex
as A
&M
Uni
vers
ity L
ibra
ries
] at
10:
57 0
9 Ja
nuar
y 20
18
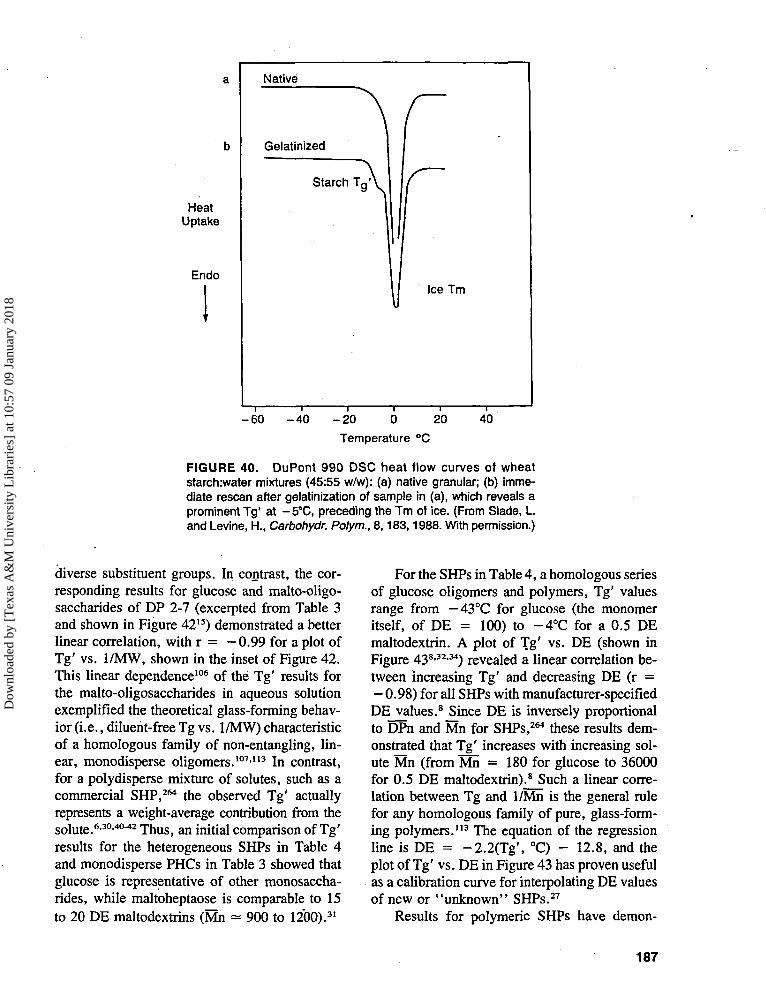
HeatUptake
Endo
Native
\
Gelatinized
Starch T a ' \
Ice Tm
- 6 0 - 4 0 - 2 0 0 20
Temperature °C
40
FIGURE 40. DuPont 990 DSC heat flow curves of wheatstarchrwater mixtures (45:55 w/w): (a) native granular; (b) imme-diate rescan after gelatinization of sample in (a), which reveals aprominent Tg' at -5°C, preceding the Tm of ice. (From Slade, L.and Levine, H., Carbohydr. Polym., 8,183,1988. With permission.)
diverse substituent groups. In contrast, the cor-responding results for glucose and malto-oligo-saccharides of DP 2-7 (excerpted from Table 3and shown in Figure 4215) demonstrated a betterlinear correlation, with r = —0.99 for a plot ofTg' vs. 1/MW, shown in the inset of Figure 42.This linear dependence106 of the Tg' results forthe malto-oligosaccharides in aqueous solutionexemplified the theoretical glass-forming behav-ior (i.e., diluent-free Tg vs. 1/MW) characteristicof a homologous family of non-entangling, lin-ear, monodisperse oligomers.107-113 In contrast,for a poly disperse mixture of solutes, such as acommercial SHP,264 the observed Tg' actuallyrepresents a weight-average contribution from thesolute.6-30-40"42 Thus, an initial comparison of Tg'results for the heterogeneous SHPs in Table 4and monodisperse PHCs in Table 3 showed thatglucose is representative of other monosaccha-rides, while maltoheptaose is comparable to 15to 20 DE maltodextrins (Mn = 900 to 1200).31
For the SHPs in Table 4, a homologous seriesof glucose oligomers and polymers, Tg' valuesrange from — 43°C for glucose (the monomeritself, of DE = 100) to -4°C for a 0.5 DEmaltodextrin. A plot of Tg' vs. DE (shown inFigure 438>32-34) revealed a linear correlation be-tween increasing Tg' and decreasing DE (r =— 0.98) for all SHPs with manufacturer-specifiedDE values.8 Since DE is inversely proportionalto DPn and Mn for SHPs,264 these results dem-onstrated that Tg' increases with increasing sol-ute Mn (from Mn = 180 for glucose to 36000for 0.5 DE maltodextrin).8 Such a linear corre-lation between Tg and 1/Mn is the general rulefor any homologous family of pure, glass-form-ing polymers.113 The equation of the regressionline is DE = -2 .2(Tg\ °C) - 12.8, and theplot of Tg' vs. DE in Figure 43 has proven usefulas a calibration curve for interpolating DE valuesof new or "unknown" SHPs.27
Results for polymeric SHPs have demon-
187
Dow
nloa
ded
by [
Tex
as A
&M
Uni
vers
ity L
ibra
ries
] at
10:
57 0
9 Ja
nuar
y 20
18
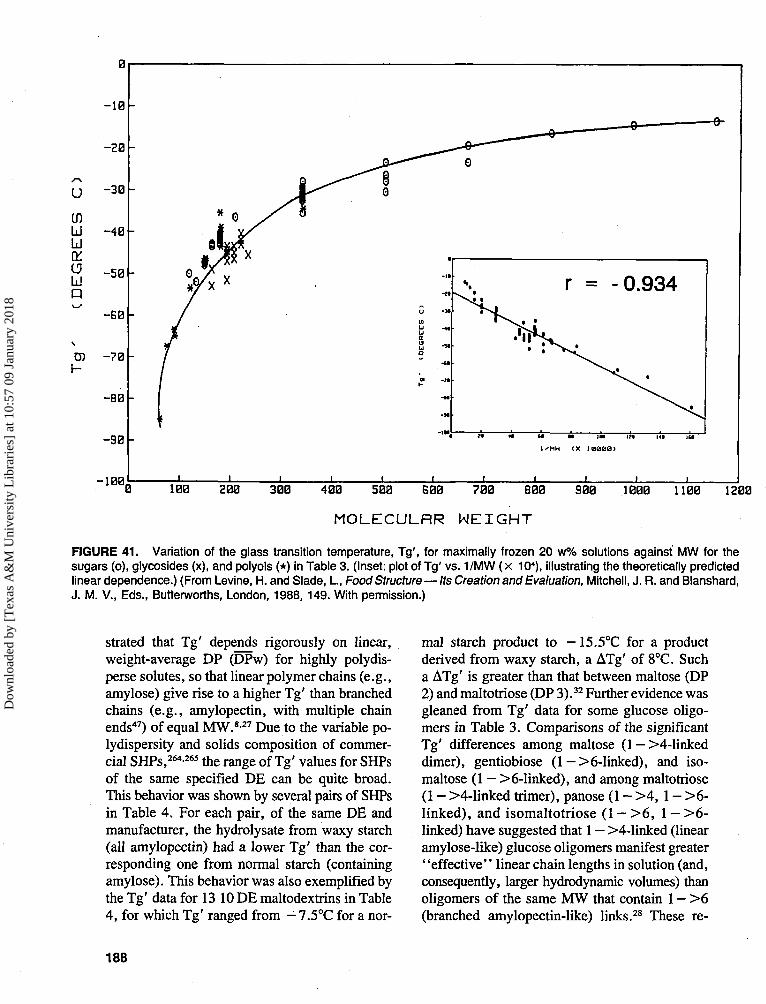
uinLJ
u
n
-10
-20
-30
-40
-50
-G0
-70
-80
-90
-100,
1'MH (X 1B000)
100 200 300 400 500 600 700 800
MOLECULRR HEIGHT
900 1000 1100 1200
FIGURE 41. Variation of the glass transition temperature, Tg', for maximally frozen 20 w% solutions against MW for thesugars (o), glycosides (x), and polyols (*) in Table 3. (Inset: plot of Tg' vs. 1/MW (x 10"), illustrating the theoretically predictedlinear dependence.) (From Levine, H. and Slade, I., Food Structure—Its Creation and Evaluation, Mitchell, J. R. and Blanshard,J. M. V., Eds., Butterworths, London, 1988, 149. With permission.)
strated that Tg' depends rigorously on linear,weight-average DP (DPw) for highly polydis-perse solutes, so that linear polymer chains (e.g.,amylose) give rise to a higher Tg' than branchedchains (e.g., amylopectin, with multiple chainends47) of equal MW.8-27 Due to the variable po-lydispersity and solids composition of commer-cial SHPs,264-265 the range of Tg' values for SHPsof the same specified DE can be quite broad.This behavior was shown by several pairs of SHPsin Table 4. For each pair, of the same DE andmanufacturer, the hydrolysate from waxy starch(all amylopectin) had a lower Tg' than the cor-responding one from normal starch (containingamylose). This behavior was also exemplified bythe Tg' data for 13 10 DE maltodextrins in Table4, for which Tg' ranged from — 7.5°C for a nor-
mal starch product to — 15.5°C for a productderived from waxy starch, a ATg' of 8°C. Sucha ATg' is greater than that between maltose (DP2) and maltotriose (DP 3).32 Further evidence wasgleaned from Tg' data for some glucose oligo-mers in Table 3. Comparisons of the significantTg' differences among maltose (1 — >4-linkeddimer), gentiobiose (1 — >6-linked), and iso-maltose (1 — >6-linked), and among maltotriose(1 — >4-linked trimer), panose (1 — >4, 1 — >6-linked), and isomaltotriose (1 - > 6 , 1 - >6-linked) have suggested that 1 — >4-linked (linearamylose-like) glucose oligomers manifest greater"effective" linear chain lengths in solution (and,consequently, larger hydrodynamic volumes) thanoligomers of the same MW that contain 1 — >6(branched amylopectin-like) links.28 These re-
188
Dow
nloa
ded
by [
Tex
as A
&M
Uni
vers
ity L
ibra
ries
] at
10:
57 0
9 Ja
nuar
y 20
18
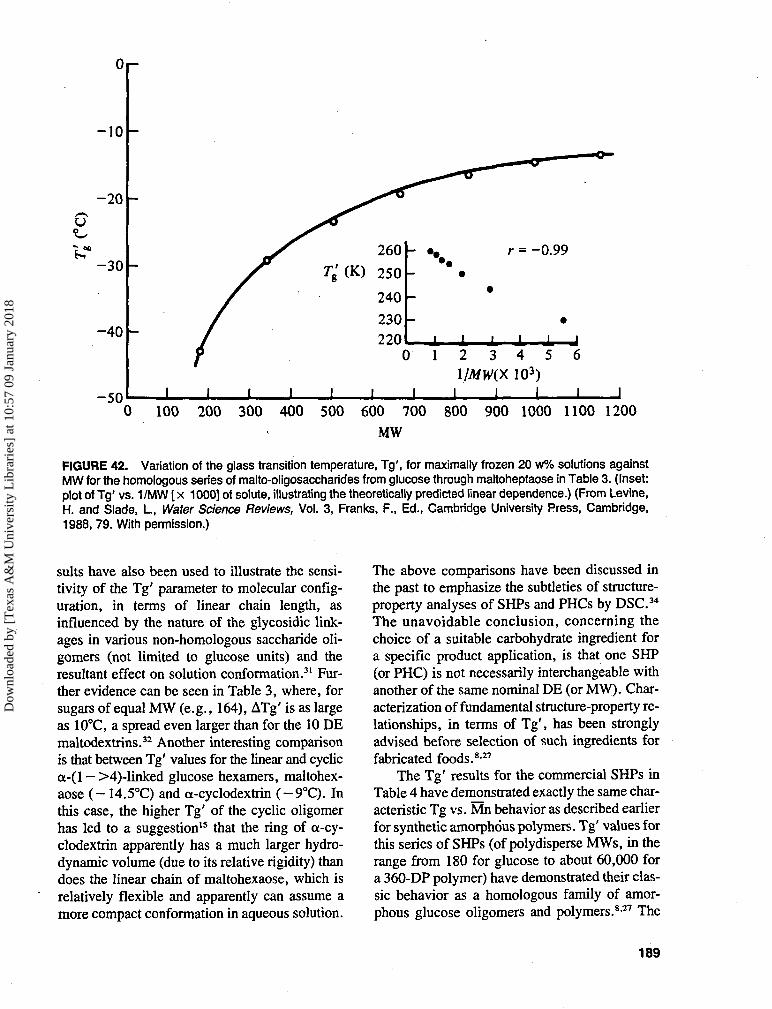
Oi-
- 1 0
-20
V
I,"- 3 0
- 4 0
- 5 0 I I I
0 1
I
2 3 4 5 6l/MW(X 103)
I I I I I
0 100 200 300 400 500 600 700 800 900 1000 1100 1200MW
FIGURE 42. Variation of the glass transition temperature, Tg', for maximally frozen 20 w% solutions againstMW for the homologous series of malto-oligosaccharides from glucose through maltoheptaose in Table 3. (Inset:plot of Tg' vs. 1 /MW [ x 1000] of solute, illustrating the theoretically predicted linear dependence.) (From Levine,H. and Slade, I., Water Science Reviews, Vol. 3, Franks, F., Ed., Cambridge University Press, Cambridge,1988, 79. With permission.)
suits have also been used to illustrate the sensi-tivity of the Tg' parameter to molecular config-uration, in terms of linear chain length, asinfluenced by the nature of the glycosidic link-ages in various non-homologous saccharide oli-gomers (not limited to glucose units) and theresultant effect on solution conformation.31 Fur-ther evidence can be seen in Table 3, where, forsugars of equal MW (e.g., 164), ATg' is as largeas 10°C, a spread even larger than for the 10 DEmaltodextrins.32 Another interesting comparisonis that between Tg' values for the linear and cyclica-(l - >4)-linked glucose hexamers, maltohex-aose ( - 14.5°C) and a-cyclodextrin (-9°C). Inthis case, the higher Tg' of the cyclic oligomerhas led to a suggestion15 that the ring of a-cy-clodextrin apparently has a much larger hydro-dynamic volume (due to its relative rigidity) thandoes the linear chain of maltohexaose, which isrelatively flexible and apparently can assume amore compact conformation in aqueous solution.
The above comparisons have been discussed inthe past to emphasize the subtleties of structure-property analyses of SHPs and PHCs by DSC.34
The unavoidable conclusion, concerning thechoice of a suitable carbohydrate ingredient fora specific product application, is that one SHP(or PHC) is not necessarily interchangeable withanother of the same nominal DE (or MW). Char-acterization of fundamental structure-property re-lationships, in terms of Tg', has been stronglyadvised before selection of such ingredients forfabricated foods.8-27
The Tg' results for the commercial SHPs inTable 4 have demonstrated exactly the same char-acteristic Tg vs. Mn behavior as described earlierfor synthetic amorphous polymers. Tg' values forthis series of SHPs (of polydisperse MWs, in therange from 180 for glucose to about 60,000 fora 360-DP polymer) have demonstrated their clas-sic behavior as a homologous family of amor-phous glucose oligomers and polymers.827 The
189
Dow
nloa
ded
by [
Tex
as A
&M
Uni
vers
ity L
ibra
ries
] at
10:
57 0
9 Ja
nuar
y 20
18
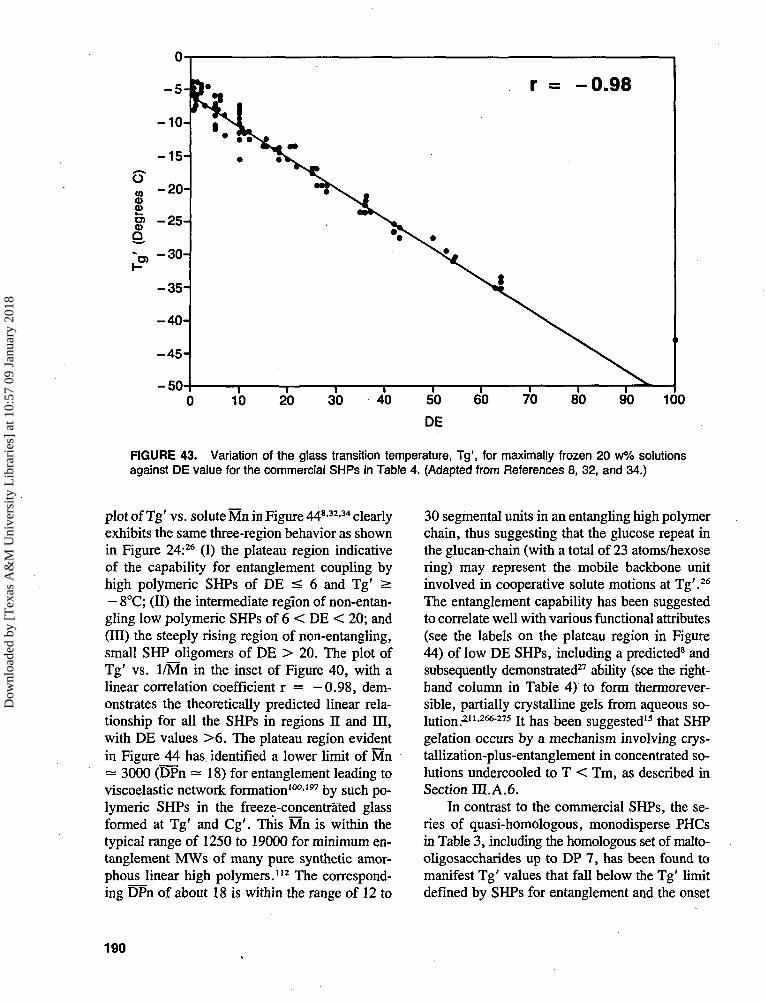
- 5 010 90 100
FIGURE 43. Variation of the glass transition temperature, Tg', for maximally frozen 20 w% solutionsagainst DE value for the commercial SHPs in Table 4. (Adapted from References 8, 32, and 34.)
plot of Tg' vs. solute Mn in Figure 448>32>34 clearlyexhibits the same three-region behavior as shownin Figure 24:26 (I) the plateau region indicativeof the capability for entanglement coupling byhigh polymeric SHPs of DE < 6 and Tg' >- 8°C; (II) the intermediate region of non-entan-gling low polymeric SHPs of 6 < DE < 20; and(III) the steeply rising region of non-entangling,small SHP_oligomers of DE > 20. The plot ofTg' vs. 1/Mn in the inset of Figure 40, with alinear correlation coefficient r = —0.98, dem-onstrates the theoretically predicted linear rela-tionship for all the SHPs in regions II and HI,with DE values >6 . The plateau region evidentin Figure 44 has identified a lower limit of Mn- 3000 (DPn = 18) for entanglement leading toviscoelastic network formation100'197 by such po-lymeric SHPs in the freeze-concentrated glassformed at Tg' and Cg'. This Mn is within thetypical range of 1250 to 19000 for minimum en-tanglement MWs of many pure synthetic amor-phous linear high polymers.112 The correspond-ing DPn of about 18 is within the range of 12 to
30 segmental units in an entangling high polymerchain, thus suggesting that the glucose repeat inthe glucan-chain (with a total of 23 atoms/hexosering) may represent the mobile backbone unitinvolved in cooperative solute motions at Tg'.26
The entanglement capability has been suggestedto correlate well with various functional attributes(see the labels on the plateau region in Figure44) of low DE SHPs, including a predicted8 andsubsequently demonstrated27 ability (see the right-hand column in Table 4) to form thermorever-sible, partially crystalline gels from aqueous so-lution.^1-266275 It has been suggested15 that SHPgelation occurs by a mechanism involving crys-tallization-plus-entanglement in concentrated so-lutions undercooled to T < Tm, as described inSection IH.A.6.
In contrast to the commercial SHPs, the se-ries of quasi-homologous, monodisperse PHCsin Table 3, including the homologous set of malto-oligosaccharides up to DP 7, has been found tomanifest Tg' values that fall below the Tg' limitdefined by SHPs for entanglement and the onset
190
Dow
nloa
ded
by [
Tex
as A
&M
Uni
vers
ity L
ibra
ries
] at
10:
57 0
9 Ja
nuar
y 20
18
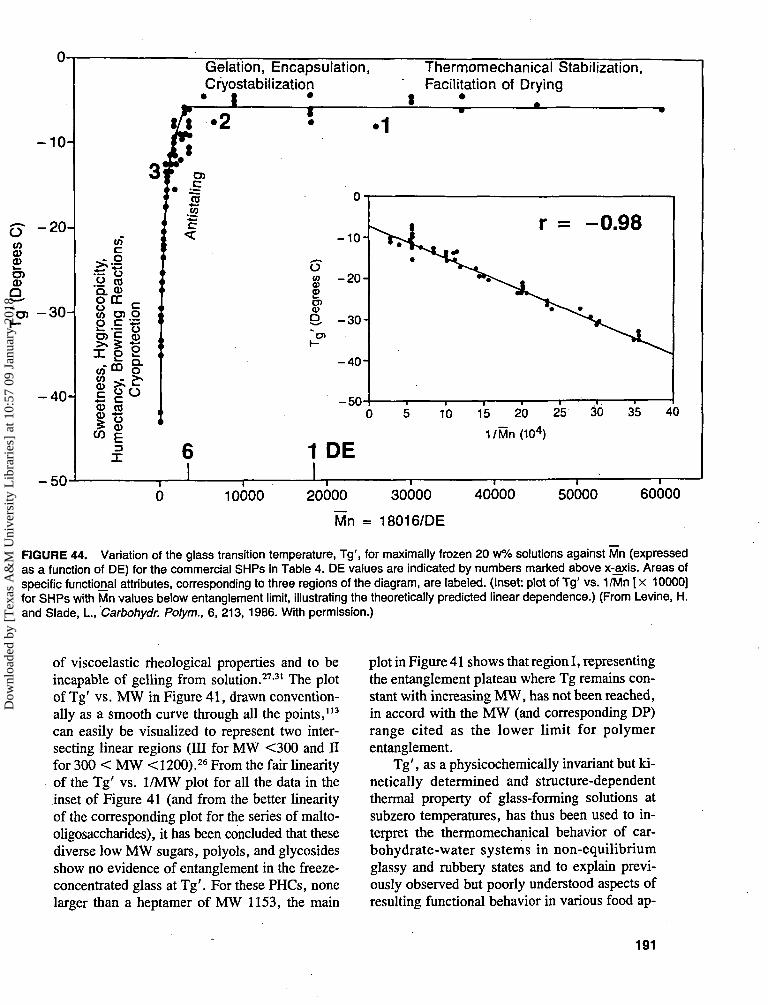
-10-
O -20 -COCD
CD
-30-
- 40 -
-50
^ -o'SQ. CDo rr
Gelation, Encapsulation,Cryostabilization
* 1 *
Thermomechanical Stabilization,Facilitation of Drying
1
-10-
o8
• 2 5
* iCOCD
• * - k—
CD COCD ft
O) O
Q.O
5to CD
E3X
uCO
a>a>o>a>Q,
f-
-20 -
-30-
-40-
-50-
r = -0.98
1 DE
10 15 20 25
1 /Mn (104)
30 35 40
0 10000 20000 30000
Mn = 18016/DE
40000 50000 60000
FIGURE 44. Variation of the glass transition temperature, Tg', for maximally frozen 20 w% solutions against Mn (expressedas a function of DE) for the commercial SHPs in Table 4. DE values are indicated by numbers marked above x-jxis. Areas ofspecific functional attributes, corresponding to three regions of the diagram, are labeled. (Inset: plot of Tg' vs. 1/Mn [x 10000]for SHPs with Mn values below entanglement limit, illustrating the theoretically predicted linear dependence.) (From Levine, H.and Slade, I., Carbohydr. Polym., 6, 213, 1986. With permission.)
of viscoelastic rheological properties and to beincapable of gelling from solution.27-31 The plotof Tg' vs. MW in Figure 41, drawn convention-ally as a smooth curve through all the points,113
can easily be visualized to represent two inter-secting linear regions (III for MW <300 and IIfor 300 < MW <1200).26 From the fair linearityof the Tg' vs. 1/MW plot for all the data in theinset of Figure 41 (and from the better linearityof the corresponding plot for the series of malto-oligosaccharides), it has been concluded that thesediverse low MW sugars, polyols, and glycosidesshow no evidence of entanglement in the freeze-concentrated glass at Tg'. For these PHCs, nonelarger than a heptamer of MW 1153, the main
plot in Figure 41 shows that region I, representingthe entanglement plateau where Tg remains con-stant with increasing MW, has not been reached,in accord with the MW (and corresponding DP)range cited as the lower limit for polymerentanglement.
Tg', as a physicochemically invariant but ki-netically determined and structure-dependentthermal property of glass-forming solutions atsubzero temperatures, has thus been used to in-terpret the thermomechanical behavior of car-bohydrate-water systems in non-equilibriumglassy and rubbery states and to explain previ-ously observed but poorly understood aspects ofresulting functional behavior in various food ap-
191
Dow
nloa
ded
by [
Tex
as A
&M
Uni
vers
ity L
ibra
ries
] at
10:
57 0
9 Ja
nuar
y 20
18

plications.8-27"34-40-42 It has been demonstrated thatinsights into structure-function relationships canbe gleaned by treating Figure 44 as a predictivemap, as indicated by the labeled regions of func-tional behavior for SHPs.8:27 Some of the func-tional attributes of polymeric SHPs that fall onthe entanglement plateau have been previouslyreported,136 but not quantitatively explained fromthe theoretical basis of the entanglement capa-bility revealed by DSC studies of Tg'.8 For ex-ample, low DE maltodextrins and other high MWpolymeric solutes are well known as drying aidsfor processes such as freeze-, spray-, and drum-drying. 137.138,254,276 g ^ p o i y m e r i c stabilizers raise
the observed Tc at a given moisture content, rel-ative to the drying temperature, through their si-multaneous effects of increasing the compositeTg' and reducing the unfrozen water fraction(Wg') of a system of low MW solids (with respectto freeze-drying)40'41 or increasing the RVP (forall drying processes).27 This stabilization of theglassy state facilitates drying without collapse or"melt-back".28'40-*2 By reducing the inherent hy-groscopicity of a mixture of amorphous solidsbeing dried, stabilizers such as proteins and po-lymeric carbohydrates can decrease the propens-ity of a system to collapse (from the rubbery state)due to plasticization by water.15 These attributesare illustrated by recent findings on the freeze-drying behavior of beef extract with addeddextrin276 and of horseradish roots.126 Figure 44also suggested that maltodextrins to be used forencapsulation of volatile flavor and aroma com-pounds by freeze-drying (an application requiringsuperior barrier properties, i.e., relative im-permeability to gases and vapors55) should becapable of entanglement and network formation(Tg' > -8°C). It had been reported136"138 thateffectiveness of encapsulation increases with in-creasing Tc, which increases with increasingDPn within a series of SHPs, but "a quantitativerelationship between Tc and MW had not beenestablished"136 previously.
Figure 44 has been used as a guide to chooseindividual SHPs or mixtures of SHPs and PHCsthat provide a particular target value of Tg' inorder to achieve desired complex functional be-havior for specific food products.8-27'3134 Espe-cially for applications involving such mixtures,data for the PHCs in Figure 41 have been used
in combination with Figure 44,37>38 since the left-most portion of Figure 41 pertaining to low MWsugars and polyols corresponds to the sweetness/hygroscopicity/humectancy/browning/cryopro-tection region of Figure 44. It was postulated thataddition of a glass-forming sugar to an encap-sulating maltodextrin would promote limited col-lapse and densification of the entangled networkaround an absorbed species, but would also de-crease the ease of freeze-drying.8 This postulateappeared consistent with reported results of im-proved encapsulation of volatiles in dense, amor-phous matrices composed of a majority of mal-todextrin (4 to 20 DE) plus a minority of mono-or disaccharide glass-former.277'278
2. Wg' Database
As alluded to earlier, the thermograms inFigure 38 have also been used to illustrate somesalient facts about Wg'.8-27-30"34 Wg' can be es-timated from the measured area (enthalpy) underthe ice-melting endotherm of the thermogram.By calibration with pure water, this measurementyields the weight of ice in a maximally frozensample. The difference between the weight of iceand the known weight of total water in an initialsolution is the weight of UFW in the glass at Tg',per unit weight of solute. For a homologous se-ries of 13 corn syrup solids (included among theSHPs listed in Table 4), a plot (not shown here)of Tg' vs. the corresponding measured value ofWg' demonstrated that Wg' decreases with in-creasing Tg', with r = - 0.91.8 For a larger, butless homologous, group of sugar syrup solids,another plot (not shown here) of Tg' vs. Wg'revealed the same trend of decreasing Tg' (from— 19.5°C for a sample of 26 DE corn syrup solidsto - 43°C for a high-fructose com syrup (HFCS)90) with increasing Wg' (from 0.52 to 1.01 gUFW/g, respectively), with r = -0.89.3 2 Theseresults showed that as the solute Mw increases,the fraction of total water unfrozen in the glassat Tg' decreases and the extent of freeze-con-centration increases. This fact is also illustratedby the thermograms in Figure 38. For comparableamounts of total water, the area under the ice-melting peak for the glucose solution is muchsmaller (i.e., Wg' much larger) than that for themaltodextrin solution. Again in the context of the
192
Dow
nloa
ded
by [
Tex
as A
&M
Uni
vers
ity L
ibra
ries
] at
10:
57 0
9 Ja
nuar
y 20
18
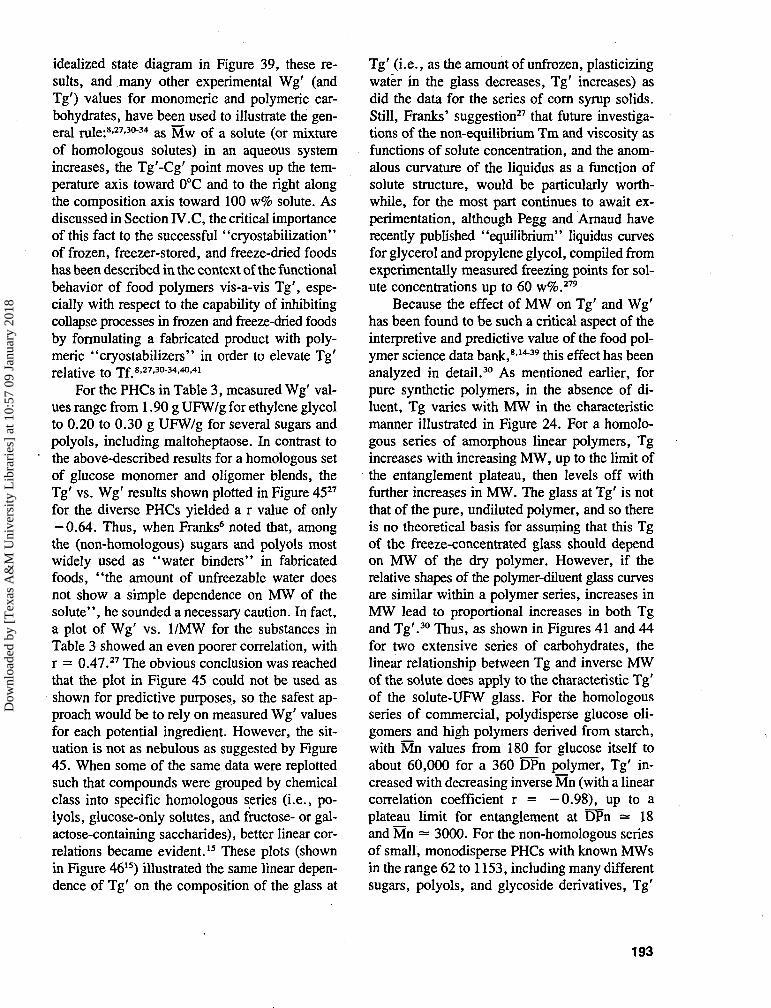
idealized state diagram in Figure 39, these re-sults, and many other experimental Wg' (andTg') values for monomeric and polymeric car-bohydrates, have been used to illustrate the gen-eral rule:8-27-30-34 as Mw of a solute (or mixtureof homologous solutes) in an aqueous systemincreases, the Tg'-Cg' point moves up the tem-perature axis toward 0°C and to the right alongthe composition axis toward 100 w% solute. Asdiscussed in Section FV.C, the critical importanceof this fact to the successful "cryostabilization"of frozen, freezer-stored, and freeze-dried foodshas been described in the context of the functionalbehavior of food polymers vis-a-vis Tg', espe-cially with respect to the capability of inhibitingcollapse processes in frozen and freeze-dried foodsby formulating a fabricated product with poly-meric "cryostabilizers" in order to elevate Tg'relative to Tf.8-27-30-34-40-41
For the PHCs in Table 3, measured Wg' val-ues range from 1.90 g UFW/g for ethylene glycolto 0.20 to 0.30 g UFW/g for several sugars andpolyols, including maltoheptaose. In contrast tothe above-described results for a homologous setof glucose monomer and oligomer blends, theTg' vs. Wg' results shown plotted in Figure 4527
for the diverse PHCs yielded a r value of only— 0.64. Thus, when Franks6 noted that, amongthe (non-homologous) sugars and polyols mostwidely used as "water binders" in fabricatedfoods, "the amount of unfreezable water doesnot show a simple dependence on MW of thesolute", he sounded a necessary caution. In fact,a plot of Wg' vs. 1/MW for the substances inTable 3 showed an even poorer correlation, withr = 0.47.27 The obvious conclusion was reachedthat the plot in Figure 45 could not be used asshown for predictive purposes, so the safest ap-proach would be to rely on measured Wg' valuesfor each potential ingredient. However, the sit-uation is not as nebulous as suggested by Figure45. When some of the same data were replottedsuch that compounds were grouped by chemicalclass into specific homologous series (i.e., po-lyols, glucose-only solutes, and fructose- or gal-actose-containing saccharides), better linear cor-relations became evident.15 These plots (shownin Figure 4615) illustrated the same linear depen-dence of Tg' on the composition of the glass at
Tg' (i.e., as the amount of unfrozen, plasticizingwater in the glass decreases, Tg' increases) asdid the data for the series of corn syrup solids.Still, Franks' suggestion27 that future investiga-tions of the non-equilibrium Tm and viscosity asfunctions of solute concentration, and the anom-alous curvature of the liquidus as a function ofsolute structure, would be particularly worth-while, for the most part continues to await ex-perimentation, although Pegg and Arnaud haverecently published "equilibrium" liquidus curvesfor glycerol and propylene glycol, compiled fromexperimentally measured freezing points for sol-ute concentrations up to 60 w%.279
Because the effect of MW on Tg' and Wg'has been found to be such a critical aspect of theinterpretive and predictive value of the food pol-ymer science data bank,8-14"39 this effect has beenanalyzed in detail.30 As mentioned earlier, forpure synthetic polymers, in the absence of di-luent, Tg varies with MW in the characteristicmanner illustrated in Figure 24. For a homolo-gous series of amorphous linear polymers, Tgincreases with increasing MW, up to the limit ofthe entanglement plateau, then levels off withfurther increases in MW. The glass at Tg' is notthat of the pure, undiluted polymer, and so thereis no theoretical basis for assuming that this Tgof the freeze-concentrated glass should dependon MW of the dry polymer. However, if therelative shapes of the polymer-diluent glass curvesare similar within a polymer series, increases inMW lead to proportional increases in both Tgand Tg'.30 Thus, as shown in Figures 41 and 44for two extensive series of carbohydrates, thelinear relationship between Tg and inverse MWof the solute does apply to the characteristic Tg'of the solute-UFW glass. For the homologousseries of commercial, polydisperse glucose oli-gomers and high polymers derived from starch,with Mn values from 180_for glucose itself toabout 60,000 for a 360 DPn polymer, Tg' in-creased with decreasing inverse Mn (with a linearcorrelation coefficient r = —0.98), up to aplateau limit for entanglement at DPn = 18and Mn — 3000. For the non-homologous seriesof small, monodisperse PHCs with known MWsin the range 62 to 1153, including many differentsugars, polyols, and glycoside derivatives, Tg'
193
Dow
nloa
ded
by [
Tex
as A
&M
Uni
vers
ity L
ibra
ries
] at
10:
57 0
9 Ja
nuar
y 20
18
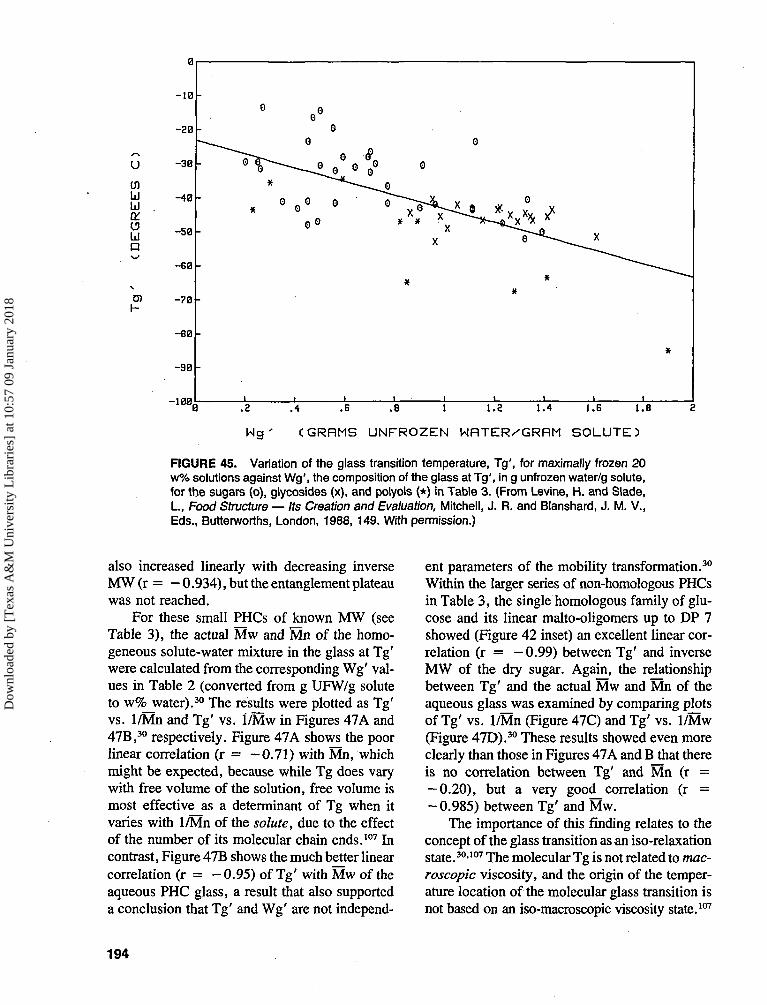
uinhiua:un
0)
-10
-20
-30
-40
-50
-E0
-70
-80
-90
iian
-
* 0
_
-
-
r f
o0
G (J
0 ° o° °
X Y ^ ~ - 5 ^ X Xv y"
*
*
i f • i i i i i
.2 .4 .6 .8 1 1.2 1.4 1.6 1.8
Wg' CGRRMS UNFROZEN WHTER/GRRM SOLUTE)
FIGURE 45. Variation of the glass transition temperature, Tg', for maximally frozen 20w% solutions against Wg', the composition of the glass at Tg', in g unfrozen water/g solute,for the sugars (o), glycosides (x), and polyols (*) in Table 3. (From Levine, H. and Slade, I., Food Structure — Its Creation and Evaluation, Mitchell, J. R. and Blanshard, J. M. V.,Eds., Butterworths, London, 1988, 149. With permission.)
also increased linearly with decreasing inverseMW (r = — 0.934), but the entanglement plateauwas not reached.
For these small PHCs of known MW (seeTable 3), the actual Mw and Mn of the homo-geneous solute-water mixture in the glass at Tg'were calculated from the corresponding Wg' val-ues in Table 2 (converted from g UFW/g soluteto w% water).30 The results were plotted as Tg'vs. 1/Mn and Tg' vs. 1/Mw in Figures 47A and47B,30 respectively. Figure 47A shows the poorlinear correlation (r = -0.71) with Mn, whichmight be expected, because while Tg does varywith free volume of the solution, free volume ismost effective as a determinant of Tg when itvaries with 1/Mn of the solute, due to the effectof the number of its molecular chain ends.107 Incontrast, Figure 47B shows the much better linearcorrelation (r = -0.95) of Tg' with Mw of theaqueous PHC glass, a result that also supporteda conclusion that Tg' and Wg' are not independ-
ent parameters of the mobility transformation.30
Within the larger series of non-homologous PHCsin Table 3, the single homologous family of glu-cose and its linear malto-oligomers up to DP 7showed (Figure 42 inset) an excellent linear cor-relation (r = -0.99) between Tg' and inverseMW of the dry sugar. Again, the relationshipbetween Tg' and the actual Mw and Mn of theaqueous glass was examined by comparing plotsof Tg' vs. 1/Mn (Figure 47C) and Tg' vs. 1/Mw(Figure 47D).30 These results showed even moreclearly than those in Figures 47A and B that thereis no correlation between Tg' and Mn (r =— 0.20), but a very good correlation (r =-0.985) between Tg' and Mw.
The importance of this finding relates to theconcept of the glass transition as an iso-relaxationstate.30-107 The molecular Tg is not related to mac-roscopic viscosity, and the origin of the temper-ature location of the molecular glass transition isnot based on an iso-macroscopic viscosity state.107
194
Dow
nloa
ded
by [
Tex
as A
&M
Uni
vers
ity L
ibra
ries
] at
10:
57 0
9 Ja
nuar
y 20
18
-10
-20
-70
-80
-90
u
RE
ES
(DE
G
N
0)1-
-30
-40
-50
-G0
-
GLUCOSE-ONLYr = 0.73
10 20 30
FRUCTOSE-CONTAININGr = 0.96
X
X *
POLYOLSr = 0.83
GALACTOSE-CONTAININGr = 0.94
50 60 70 B0 90 100
C g ' Cw* SOLUTE IN THE GLRSS RT Tg
FIGURE 46. Variation of the glass transition temperature, Tg', for maximally frozen 20 w% solutions against Cg', the com-position of the glass at Tg', in weight percent solute, for homologous series of polyhydric alcohols (o), glucose-only solutes(*), fructose- (x), and galactose-containing saccharides (O) in Table 3. (From Levine, H. and Slade, I., Water Science Reviews,Vol. 3, Franks, F., Ed., Cambridge University Press, Cambridge, 1988, 79. With permission.)
Moreover, the location of Tg is not based simplyon either an iso-free volume or an iso-local vis-cosity state alone.107 For MWs below the entan-glement limit (e.g., =3000 for a-1 — > 4 glucanoligomers), the temperature location of the mo-lecular glass transition depends on the instanta-neous average relaxation time compared to theexperimental time frame. The operational relax-ation time is an instantaneous property, becauseit depends on the instantaneous values of freevolume and local viscosity. Free volume is as-sociated with inverse Mn, rotational relaxationtimes, high average MWs, and low values of Tm/Tg ratio. Local viscosity is associated with Mw,translational relaxation times, low average MWs(e.g., small PHCs), and high values of Tm/Tgratio.30 (In contrast to the molecular glass tran-
sition, for MWs above the entanglement limit,the network Tg does involve macroscopic vis-cosity.107) The insight derived from these resultsled to the new suggestion30 that different portionsof the glass curve must be controlled by differentparameters that determine molecular-level mo-bility, i.e., Tg is controlled by free volume (afunction of inverse Mn) rather than local viscosityat higher values of average MW (i.e., highersolute concentrations in the glass, Cg), but bylocal viscosity (a function of Mw) rather thanfree volume at lower values of average MW (i.e.,higher water concentrations in the glass, Wg).
The value of Tg' appears to reflect the hy-drodynamic volume, in the glass, of the mobile"cluster entity"89 represented by a solute mol-ecule and its complement of unfrozen water mol-
195
Dow
nloa
ded
by [
Tex
as A
&M
Uni
vers
ity L
ibra
ries
] at
10:
57 0
9 Ja
nuar
y 20
18
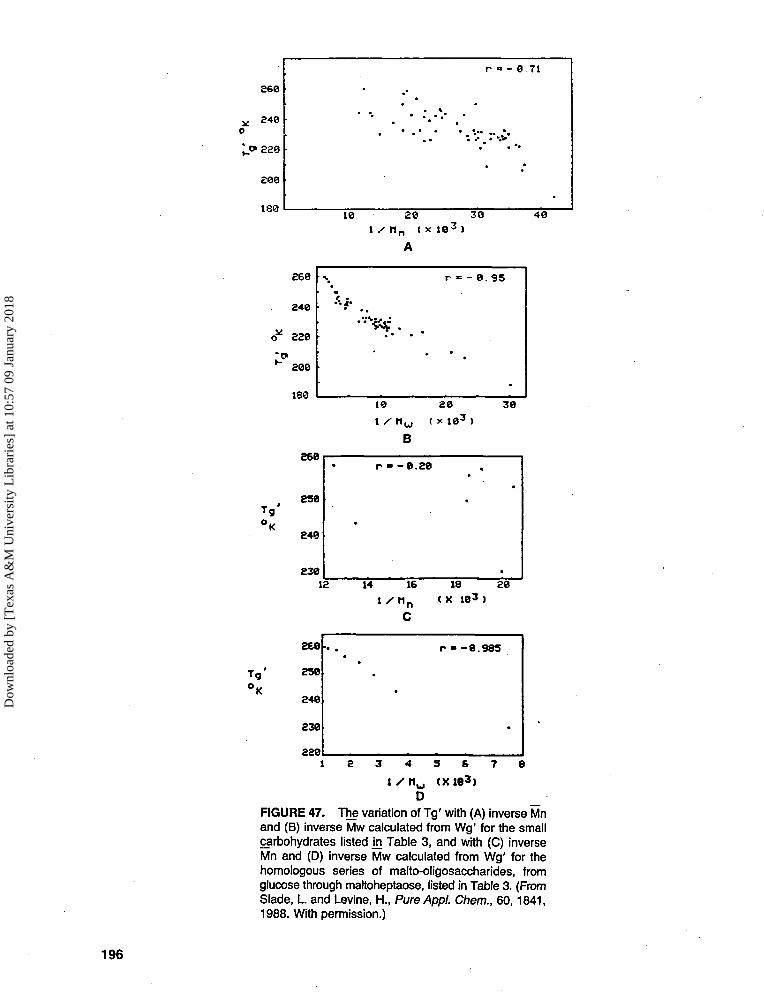
0
I9
260
240
£28
£00
180
£66
246
226
260
180
•
• •
10 261 / M n I
A
\
* * • . .
* • " • .
x 10 3 )
r =
3 0
- 0
r = - e
•
. 9 5
•
71
•40
18 £ 6 36
B
COO
230
248
£36
r «= -8.26
•
12 14 16i / r i n
c
18 28c x i e 3 )
268
250
246
236
226
r»-6.985
i / nw txD _
FIGURE 47. The variation of Tg' with (A) inverse Mnand (B) inverse Mw calculated from Wg' for the smallcarbohydrates listed ]n Table 3, and with (C) inverseMn and (D) inverse Mw calculated from Wg' for thehomologous series of malto-oligosaccharides, fromglucose through maltoheptaose, listed in Table 3. (FromSlade, L and Levine, H., PureAppl. Chem., 60,1841,1988. With permission.)
196
Dow
nloa
ded
by [
Tex
as A
&M
Uni
vers
ity L
ibra
ries
] at
10:
57 0
9 Ja
nuar
y 20
18
ecules, rather than a property of the isolated sol-ute.30 We have considered the question of whetherit would be preferable to correlate Tg' with partialmolar volume (V°) rather than MW of dry sol-ute,31 since V°, like intrinsic viscosity, gives anindication of the effective solute size in solution.Just as free volume is related to inverse MW ofmonodisperse solutes (or inverse Mn for poly-disperse solutes) in the limit of zero dilution,107
free volume should be related to inverse V° forcomparison of conformation^ homologs of dif-ferent MW in the limit of infinite dilution. But,of course, it is for comparison of different con-formers of the same MW that we look for anadvantage in the use of V° to replace MW. Un-fortunately, while MW values are exact, an ap-proach based on V° is not straightforward.31
Despite a relative wealth of V° data,280 dif-ferences in the values for isomeric sugars aresufficiently small to discourage their use to in-terpret the influence of conformation onhydration281 and may lie within the range of val-ues reported by different research groups for asingle sugar, in part due to differences in ano-meric ratios.282 If this complication is removedby comparison of methyl pyranosides, larger val-ues of V° are observed for conformers with equa-torial rather than axial OCH3 substituents.282 Sim-ilarly, for comparison of conformers at C4,contributions to apparent molar volumes are saidto be greater for equatorial than for axial hy-droxyls.283 Yet, the general observation, for PHCscompared to their apolar structural analogs, isthat hydroxyl groups are effectively invisible tolimiting density measurements.281-282 The greatercontribution of certain equatorial hydroxyl groupsto V° is attributed to greater spatial and orien-tational compatibility with the preexisting liquidwater structure,282 i.e., greater effective "spe-cific hydration". Data for a few of the samesugars show that intrinsic viscosity increases withboth contributions (MW and "specific hydra-tion") to increasing V°.284 We might expect, fromthis slim evidence, that both contributions to in-creased V° would also lead to increased Tg'.31
However, there still remain the questions of tem-perature and concentration dependence of appar-ent molar volumes of PHCs.
Systematic extrapolation of V° data to sub-zero temperatures of interest for correlation with
Tg' is hindered by the paucity of data for meanlimiting apparent molar expansibilities. Based ontwo relevant cases for which data are available,282
such extrapolations would magnify differences inbehavior predicted from measurements made nearroom temperature. The concentration depen-dence of apparent molar volumes is more ques-tionable. As mentioned earlier, one of the mostimportant, but often overlooked, aspects of the-glass transition is its cooperative nature.106 Uponslow cooling, the glass at Tg', with .solute-spe-cific composition Wg', represents the greatestdilution that retains this maximally cooperativebehavior.30 Cooperativity is maximum at the glasstransition (where arrestation of large-scale mo-lecular mobility occurs without change in struc-ture), but decreases with increasing temperatureor dilution above Tg (where retardation of mo-bility occurs and shows a WLF-type temperaturedependence).106-107 Of the two extremes, behav-ior in the limit of zero dilution is less remotefrom that of the cooperative system than is be-havior in the limit of infinite dilution.31 Apparentmolar volumes of PHCs in aqueous solution havebeen shown to be characteristically (in contrastto apolar solutes) independent of concentra-tion,282 yet reported differences between apparentmolar volumes for 3 and 10 w% solutions of asingle sugar approach the greatest differences seenbetween equatorial vs. axial conformers at a sin-gle concentration.283 There exists the possibilitythat a decrease in apparent molar volume uponextrapolation toward Tg' and an increase uponextrapolation toward Cg' might counterbal-ance.31 Despite these issues, the subject is ofsufficient interest to merit further exploration.
Wg' results for the series of monomeric alkylglycosides in Table 3 have been described27-34 interms of a possible relationship between the gly-coside structure (e.g., position and size of thehydrophobic aglycone, which is absent in theparent sugar) and its function reflected by Wg'.Wg' values for all methyl, ethyl, and propyl de-rivatives are much larger than those for the cor-responding parent monosaccharides. However,Wg' values appear consistently to be maximizedfor methyl or ethyl derivatives, and somewhatlower for the n-propyl derivatives. (In a relatedvein, Fahy et al.251 have recently reported thatmethylation significantly enhances the glass-
197
Dow
nloa
ded
by [
Tex
as A
&M
Uni
vers
ity L
ibra
ries
] at
10:
57 0
9 Ja
nuar
y 20
18
forming tendency [i.e., potential for completevitrification] of concentrated aqueous solutionsof various polyols and other biological cryopro-tectants.) It has been suggested that increasinghydrophobicity (of the aglycone) leads to bothdecreasing Wg' and the demonstrated tendencytoward increasing insolubility of propyl and largerglycosides in water.27 The combined effects ofseveral related mechanistic contributions almostobscure the underlying basis for this behavior.The predominant role of the methyl group pro-vides the clue to the overall mechanism,34 i.e.,the phenomenon of "internal plasticization", bywhich the desired properties of depressed Tg andincreased free volume and segmental mobility areachieved by incorporating them into the polymeritself, rather than by addition of exogenous plas-ticizer.109 Internal plasticization to increase mo-bility of the polymer backbone can be achievedby branching. Additional free volume is providedby the motion of side chains, with greater con-tributions from chain ends associated with shorterside chains.109 The traditional example of internalplasticization by side chains from synthetic pol-ymer science, the poly(n-alkyl methacrylates),109
mirrors the behavior of the alkyl glycosides ofTable S.34 A monotonic depression of Tg is ob-served with increasing alkyl chain length, but themethyl group is most effective, and longer chainsare progressively less effective. For the alkyl gly-cosides, internal plasticization is observed bothdirectly, as depression of Tg', and indirectly, asincrease in Wg'. Although internal plasticization,by covalent attachment of the plasticizer to thepolymer, serves to increase efficiency by retard-ing loss of plasticizer upon crystallization, longalkyl side chains eventually associate as seen forpropyl side chains in the alkyl glycosides and forlonger alkanes in high polymers.105
It has been demonstrated34 that Wg' valuesdetermined by the DSC method mentioned aboveare generally in good agreement with literatureranges for the so-called "water binding capacity(WBC)" values (determined by various methodsother than DSC) of many different food ingre-dients, even though the spread of reported valuesfor individual materials has often been consid-erable.25'57 The latter fact is not surprising in viewof experimental difficulties imposed by the ki-netic constraints of the water-immobilization pro-
cess and the wide variation in time frames (dif-fering by orders of magnitude) for measurementsof such relaxation processes.167 Not surprisingeither is the consequent lack of reproducibilityin, as well as frequent disagreement among, manytypes of "WBC" measurements,34 includingDSC. The dependence of the value of Wg' onthe specific time frame of the DSC measurementhas been illustrated by a study of hydrated ly-sozyme glasses recently reported by Wolanczykand Baust.285 These workers have noted that themeasured amount of unfrozen water decreaseswith increasing sub-ambient hold time (from 0min to 24 h between cooling and subsequent re-warming) and decreasing sub-ambient hold tem-perature (from - 5 0 to - 150°C).
Ordinarily, one does not claim an accuracyof better than about 10% for DSC measurementsof Wg',34 although some exceptionally precisestudies have been reported.163166 Franks149 haspresented a comparison of experimental data fromDSC, NMR, and dielectric relaxation measure-ments on concentrated solutions of several com-mon small sugars, which summarizes the stateof affairs. DSC results for unfrozen water at Tg',expressed as a "notional hydration number" (ex-plained earlier), were 3.7 for glucose and xylose,3.5 for mannose, and 5.0 for maltose, with stan-dard deviations of 12 to 20%. These "hydrationnumbers" were in surprisingly good agreementwith NMR and dielectric relaxation results of 3.7for glucose, 3.9 for mannose, and 5.0 for mal-tose. In comparison to the above DSC results,the Wg' values shown in Table 3 correspond tocalculated values of 4.1 for glucose, 3.7 for xy-lose, 3.5 for mannose, and 4.8 for maltose, inall cases within 11%34 of the values reported byFranks.149
The method we advocate for determiningWg',8>27 i.e., from DSC measurements on a sin-gle maximally freeze-concentrated aqueous so-lution of 20 w% initial solute concentration, isnot the only DSC method one can use to deter-mine this technologically important quantity.Other workers253-257•286-287 have recommended an"extrapolation method" for estimation of thelimiting UFW content of a solute. In that method,a series of solutions covering a wide range ofsolute concentrations is analyzed, and the mea-sured ice-melting peak areas (which decrease with
198
Dow
nloa
ded
by [
Tex
as A
&M
Uni
vers
ity L
ibra
ries
] at
10:
57 0
9 Ja
nuar
y 20
18
increasing solute concentration) are extrapolatedto the solute concentration corresponding to zeropeak area, i.e., the concentration that would al-low no ice to form on slow cooling or rewarming,because all the water present in the solution wouldbe "unfreezable" in the experimental time frame.In comparing results from the method we favorwith those from the extrapolation method, andusing sucrose as a common example, the follow-ing points are noteworthy. While we have re-ported a Cg' value for sucrose of 64.1 w%,27 asmeasured for a 20 w% sucrose solution (with aTg' of -32°C), Izzard et al.287 have more re-cently reported Cg' values for 2.6, 10.7, 20.2,40.0, 60.1, and 65.8 w% (i.e., C > Ce) sucrosesolutions of 35.1, 61.9, 63.9 (very close to ourvalue), 71.7, 75.8, and 77.7 w% sucrose, re-spectively. Izzard et al.287 have extrapolated theirdata to a limiting Cg' value of ~80 w% sucrose
(and a corresponding Tg' value of 35°C),which they claim to be the correct Cg' for su-crose, while they claim that our value (which is20% different from theirs) "is clearly incorrect".After considering the discussion below, the readerwill have to decide if there is such a thing as a"right" or "wrong" answer for Cg', as Izzardet al.287 claim.
Obviously, the extrapolation method is muchmore time-consuming than the one-solution, con-stant-concentration method, and this aspect rep-resents a practical disadvantage. Moreover, the20 w% solute concentration that we use in de-termining Wg' (and Tg') for PHCs has greatertechnological relevance to, for example, the totalsaccharides content in many frozen desserts andrelated products than do other much higher ormuch lower solute concentrations. In rational-izing its disadvantages, advocates of the extrap-olation method have, as mentioned above, claimedit to be more accurate than alternative one-pointmeasurements of Wg'.257-287 However, it has beenrecently pointed out,39 and illustrated with theparticular case of the galactose-water system re-ported by Blond,257 that the extrapolation methodis invalidated in every case in which solute orhydrate crystallization during the DSC measure-ments (which would be favored by higher soluteconcentrations and might or might not be re-vealed by separate or multimodal melting peaksduring warming) cannot be ruled out explicitly.
In other words, whenever one cannot be certainthat the so-called "ice-melting" peak representsonly the melting of crystalline ice and not crys-talline solute (i.e., eutectic melting) or crystallinehydrate, the potential accuracy of the extrapo-lation method is obvidted.
The foundation for understanding the behav-ior of the galactose-water system, and others likeit that are subject to solute or hydrate crystalli-zation, has been provided by Forsyth andMacFarlane:260 "The phase behaviour of a num-ber of solutions of possible interest in cryopres-ervation as a function of solute concentration hasbeen investigated by thermal analysis techniqueswith three regions being identifiable288
1. Solutions of low solute concentration (e.g.,20 w%, for most small PHCs) that super-cool below their equilibrium melting tem-perature but eventually freeze on sufficientcooling
2. Intermediate concentration regions wherethe solution will vitrify (i.e., become glassy)on rapid cooling; however, on rewarmingdevitrification (i.e., crystallization) will takeplace at some temperature Td
3. High solute concentration where the samplebecomes vitreous on cooling and does noteasily crystallize ice on warming, but maycrystallize a hydrate"
In this context of the distinctive behavior ob-served for the three regions of concentration iden-tified by the investigations of Angell and co-workers,260-288 the extrapolation method for theestimation of UFW content (by extrapolation tozero of the measured total heat of melting ofunidentified species after cooling and rewarmingof solutions with a wide range of initial concen-trations, spanning the three behavioral regions)is invalidated in principle (regardless of whetherthe melting enthalpy of crystalline solute or hy-drate can be deconvoluted from the overallheat of melting). For each of the three kineticallydistinctive regions of concentration, pertinentcooling and heating rates would have to beused, corresponding to the critically differenttime scales of the relaxation behavior in thethree concentration regimes. This is not routinelydone by practitioners of the extrapolation
199
Dow
nloa
ded
by [
Tex
as A
&M
Uni
vers
ity L
ibra
ries
] at
10:
57 0
9 Ja
nuar
y 20
18
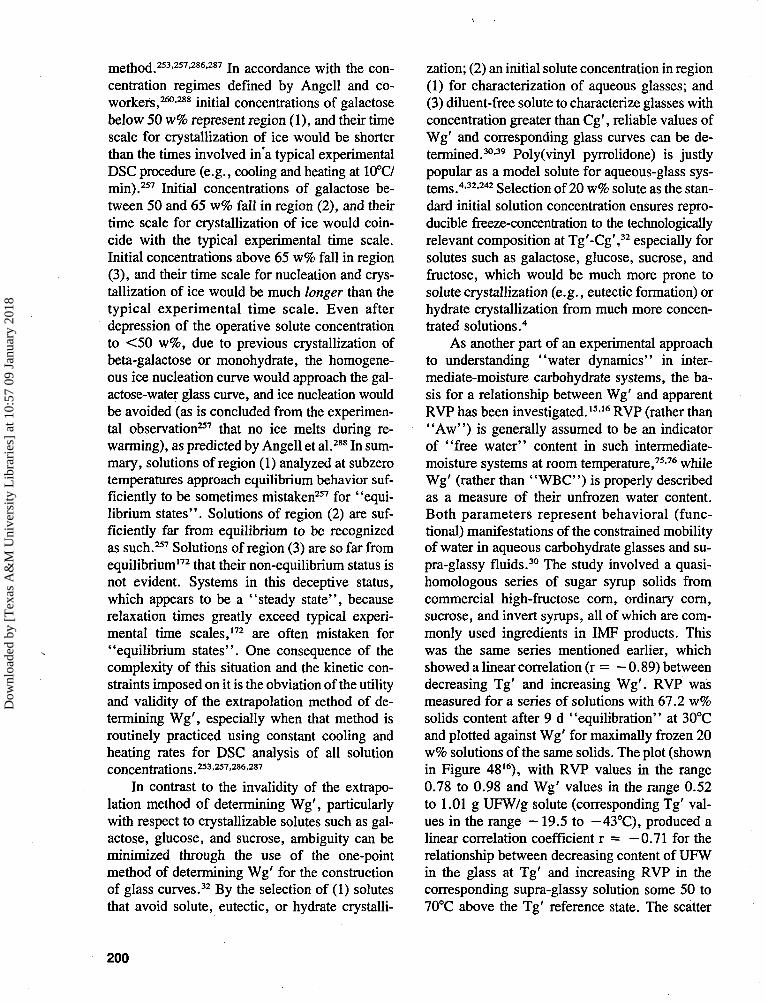
method.253-257-286-287 In accordance with the con-centration regimes defined by Angell and co-workers,260-288 initial concentrations of galactosebelow 50 w% represent region (1), and their timescale for crystallization of ice would be shorterthan the times involved in'a typical experimentalDSC procedure (e.g., cooling and heating at 10°C/min).257 Initial concentrations of galactose be-tween 50 and 65 w% fall in region (2), and theirtime scale for crystallization of ice would coin-cide with the typical experimental time scale.Initial concentrations above 65 w% fall in region(3), and their time scale for nucleation and crys-tallization of ice would be much longer than thetypical experimental time scale. Even afterdepression of the operative solute concentrationto <50 w%, due to previous crystallization ofbeta-galactose or monohydrate, the homogene-ous ice nucleation curve would approach the gal-actose-water glass curve, and ice nucleation wouldbe avoided (as is concluded from the experimen-tal observation257 that no ice melts during re-warming), as predicted by Angell et al.288 In sum-mary, solutions of region (1) analyzed at subzerotemperatures approach equilibrium behavior suf-ficiently to be sometimes mistaken257 for "equi-librium states". Solutions of region (2) are suf-ficiently far from equilibrium to be recognizedas such.257 Solutions of region (3) are so far fromequilibrium172 that their non-equilibrium status isnot evident. Systems in this deceptive status,which appears to be a "steady state", becauserelaxation times greatly exceed typical experi-mental time scales,172 are often mistaken for"equilibrium states". One consequence of thecomplexity of this situation and the kinetic con-straints imposed on it is the obviation of the utilityand validity of the extrapolation method of de-termining Wg', especially when that method isroutinely practiced using constant cooling andheating rates for DSC analysis of all solutionconcentrations .253-257-286-287
In contrast to the invalidity of the extrapo-lation method of determining Wg', particularlywith respect to crystallizable solutes such as gal-actose, glucose, and sucrose, ambiguity can beminimized through the use of the one-pointmethod of determining Wg' for the constructionof glass curves.32 By the selection of (1) solutesthat avoid solute, eutectic, or hydrate crystalli-
zation; (2) an initial solute concentration in region(1) for characterization of aqueous glasses; and(3) diluent-free solute to characterize glasses withconcentration greater than Cg', reliable values ofWg' and corresponding glass curves can be de-termined.30-39 Poly(vinyl pyrrolidone) is justlypopular as a model solute for aqueous-glass sys-tems.4-32-242 Selection of 20 w% solute as the stan-dard initial solution concentration ensures repro-ducible freeze-concentration to the technologicallyrelevant composition at Tg'-Cg',32 especially forsolutes such as galactose, glucose, sucrose, andfructose, which would be much more prone tosolute crystallization (e.g., eutectic formation) orhydrate crystallization from much more concen-trated solutions.4
As another part of an experimental approachto understanding "water dynamics" in inter-mediate-moisture carbohydrate systems, the ba-sis for a relationship between Wg' and apparentRVP has been investigated.1516 RVP (rather than"Aw") is generally assumed to be an indicatorof "free water" content in such intermediate-moisture systems at room temperature,75-76 whileWg' (rather than "WBC") is properly describedas a measure of their unfrozen water content.Both parameters represent behavioral (func-tional) manifestations of the constrained mobilityof water in aqueous carbohydrate glasses and su-pra-glassy fluids.30 The study involved a quasi-homologous series of sugar syrup solids fromcommercial high-fructose corn, ordinary corn,sucrose, and invert syrups, all of which are com-monly used ingredients in IMF products. Thiswas the same series mentioned earlier, whichshowed a linear correlation (r = — 0.89) betweendecreasing Tg' and increasing Wg'. RVP wasmeasured for a series of solutions with 67.2 w%solids content after 9 d "equilibration" at 30°Cand plotted against Wg' for maximally frozen 20w% solutions of the same solids. The plot (shownin Figure 4816), with RVP values in the range0.78 to 0.98 and Wg' values in the range 0.52to 1.01 g UFW/g solute (corresponding Tg' val-ues in the range —19.5 to — 43°C), produced alinear correlation coefficient r = —0.71 for therelationship between decreasing content of UFWin the glass at Tg' and increasing RVP in thecorresponding supra-glassy solution some 50 to70°C above the Tg' reference state. The scatter
200
Dow
nloa
ded
by [
Tex
as A
&M
Uni
vers
ity L
ibra
ries
] at
10:
57 0
9 Ja
nuar
y 20
18
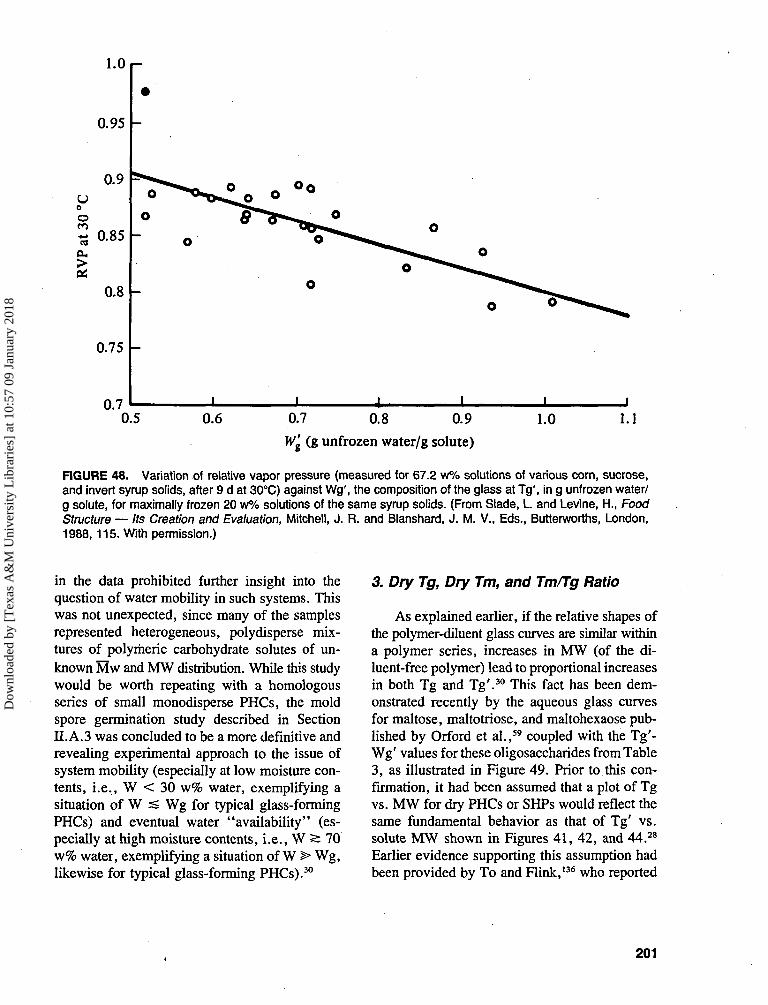
1.0
0.95
0.9uoO
13 0-85
0.8
0.75
0.70.5 0.6 0.7 0.8 0.9
Wg (g unfrozen water/g solute)
1.0 1.1
FIGURE 48. Variation of relative vapor pressure (measured for 67.2 w% solutions of various corn, sucrose,and invert syrup solids, after 9 d at 30°C) against Wg', the composition of the glass at Tg', in g unfrozen water/g solute, for maximally frozen 20 w% solutions of the same syrup solids. (From Slade, L. and Levine, H., FoodStructure — Its Creation and Evaluation, Mitchell, J. R. and Blanshard, J. M. V., Eds., Butterworths, London,1988,115. With permission.)
in the data prohibited further insight into thequestion of water mobility in such systems. Thiswas not unexpected, since many of the samplesrepresented heterogeneous, polydisperse mix-tures of polymeric carbohydrate solutes of un-known Mw and MW distribution. While this studywould be worth repeating with a homologousseries of small monodisperse PHCs, the moldspore germination study described in Sectionn.A.3 was concluded to be a more definitive andrevealing experimental approach to the issue ofsystem mobility (especially at low moisture con-tents, i.e., W < 30 w% water, exemplifying asituation o f W s Wg for typical glass-formingPHCs) and eventual water "availability" (es-pecially at high moisture contents, i.e., W s 70w% water, exemplifying a situation of W > Wg,likewise for typical glass-forming PHCs).30
3. Dry Tg, Dry Tm, and Tm/Tg Ratio
As explained earlier, if the relative shapes ofthe polymer-diluent glass curves are similar withina polymer series, increases in MW (of the di-luent-free polymer) lead to proportional increasesin both Tg and Tg'.30 This fact has been dem-onstrated recently by the aqueous glass curvesfor maltose, maltotriose, and maltohexaose pub-lished by Orford et al.,59 coupled with the Tg'-Wg' values for these oligosaccharides from Table3, as illustrated in Figure 49. Prior to this con-firmation, it had been assumed that a plot of Tgvs. MW for dry PHCs or SHPs would reflect thesame fundamental behavior as that of Tg' vs.solute MW shown in Figures 41, 42, and 44.28
Earlier evidence supporting this assumption hadbeen provided by To and Flink,136 who reported
201
Dow
nloa
ded
by [
Tex
as A
&M
Uni
vers
ity L
ibra
ries
] at
10:
57 0
9 Ja
nuar
y 20
18
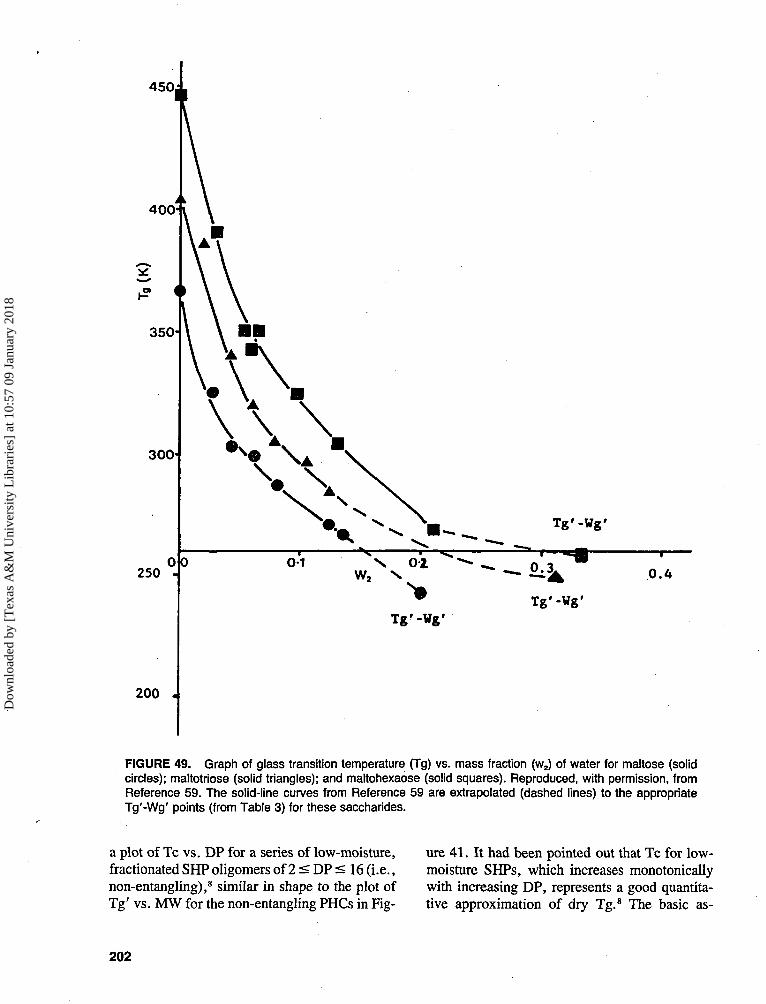
450,
400
350
300
250 0.4
200 -
Tg ' -Wg '
FIGURE 49. Graph of glass transition temperature (Tg) vs. mass fraction (w2) of water for maltose (solidcircles); maltotriose (solid triangles); and maltohexaose (solid squares). Reproduced, with permission, fromReference 59. The solid-line curves from Reference 59 are extrapolated (dashed lines) to the appropriateTg'-Wg' points (from Table 3) for these saccharides.
a plot of Tc vs. DP for a series of low-moisture,fractionated SHP oligomers of 2 < DP < 16 (i.e.,non-entangling),8 similar in shape to the plot ofTg' vs. MW for the non-entangling PHCs in Fig-
ure 41. It had been pointed out that Tc for low-moisture SHPs, which increases monotonicallywith increasing DP, represents a good quantita-tive approximation of dry Tg.8 The basic as-
202
Dow
nloa
ded
by [
Tex
as A
&M
Uni
vers
ity L
ibra
ries
] at
10:
57 0
9 Ja
nuar
y 20
18
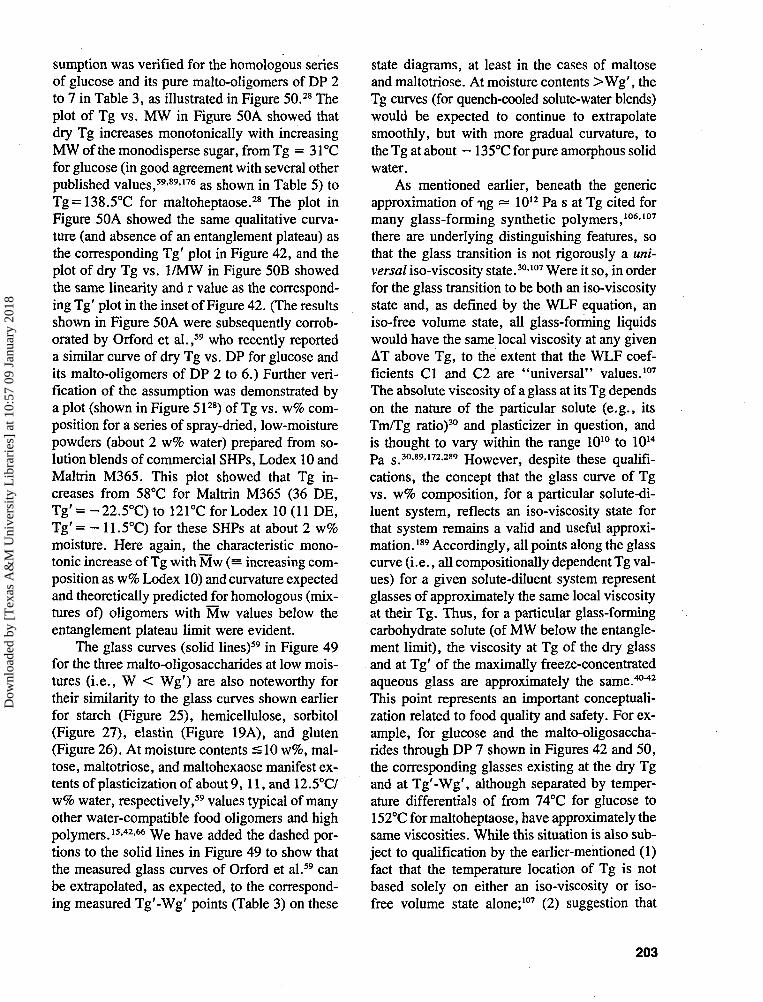
sumption was verified for the homologous seriesof glucose and its pure malto-oligomers of DP 2to 7 in Table 3, as illustrated in Figure 50.28 Theplot of Tg vs. MW in Figure 50A showed thatdry Tg increases monotonically with increasingMW ofthemonodisperse sugar, from Tg = 31°Cfor glucose (in good agreement with several otherpublished values,59-89-176 as shown in Table 5) toTg=138.5°C for maltoheptaose.28 The plot inFigure 50A showed the same qualitative curva-ture (and absence of an entanglement plateau) asthe corresponding Tg' plot in Figure 42, and theplot of dry Tg vs. 1/MW in Figure 50B showedthe same linearity and r value as the correspond-ing Tg' plot in the inset of Figure 42. (The resultsshown in Figure 50A were subsequently corrob-orated by Orford et al.,59 who recently reporteda similar curve of dry Tg vs. DP for glucose andits malto-oligomers of DP 2 to 6.) Further veri-fication of the assumption was demonstrated bya plot (shown in Figure 5128) of Tg vs. w% com-position for a series of spray-dried, low-moisturepowders (about 2 w% water) prepared from so-lution blends of commercial SHPs, Lodex 10 andMaltrin M365. This plot showed that Tg in-creases from 58°C for Maltrin M365 (36 DE,Tg' = -22.5°C) to 121°C for Lodex 10 (11 DE,Tg' = - 11.5°C) for these SHPs at about 2 w%moisture. Here again, the characteristic mono-tonic increase of Tg with Mw (= increasing com-position as w% Lodex 10) and curvature expectedand theoretically predicted for homologous (mix-tures of) oligomers with Mw values below theentanglement plateau limit were evident.
The glass curves (solid lines)59 in Figure 49for the three malto-oligosaccharides at low mois-tures (i.e., W < Wg') are also noteworthy fortheir similarity to the glass curves shown earlierfor starch (Figure 25), hemicellulose, sorbitol(Figure 27), elastin (Figure 19A), and gluten(Figure 26). At moisture contents <10 w%, mal-tose, maltotriose, and maltohexaose manifest ex-tents of plasticization of about 9,11, and 12.5°C/w% water, respectively,59 values typical of manyother water-compatible food oligomers and highpolymers. 15-42>66 We have added the dashed por-tions to the solid lines in Figure 49 to show thatthe measured glass curves of Orford et al.59 canbe extrapolated, as expected, to the correspond-ing measured Tg'-Wg' points (Table 3) on these
state diagrams, at least in the cases of maltoseand maltotriose. At moisture contents >Wg', theTg curves (for quench-cooled solute-water blends)would be expected to continue to extrapolatesmoothly, but with more gradual curvature, tothe Tg at about — 135°C for pure amorphous solidwater.
As mentioned earlier, beneath the genericapproximation of Tig — 1012 Pa s at Tg cited formany glass-forming synthetic polymers,106-107
there are underlying distinguishing features, sothat the glass transition is not rigorously a uni-versal iso-viscosity state.30-107 Were it so, in orderfor the glass transition to be both an iso-viscositystate and, as defined by the WLF equation, aniso-free volume state, all glass-forming liquidswould have the same local viscosity at any givenAT above Tg, to the extent that the WLF coef-ficients Cl and C2 are "universal" values.107
The absolute viscosity of a glass at its Tg dependson the nature of the particular solute (e.g., itsTm/Tg ratio)30 and plasticizer in question, andis thought to vary within the range 1010 to 1014
Pa s.30-89-172-289 However, despite these qualifi-cations, the concept that the glass curve of Tgvs. w% composition, for a particular solute-di-luent system, reflects an iso-viscosity state forthat system remains a valid and useful approxi-mation.189 Accordingly, all points along the glasscurve (i.e., all compositionally dependent Tg val-ues) for a given solute-diluent system representglasses of approximately the same local viscosityat their Tg. Thus, for a particular glass-formingcarbohydrate solute (of MW below the entangle-ment limit), the viscosity at Tg of the dry glassand at Tg' of the maximally freeze-concentratedaqueous glass are approximately the same.40^2
This point represents an important conceptuali-zation related to food quality and safety. For ex-ample, for glucose and the malto-oligosaccha-rides through DP 7 shown in Figures 42 and 50,the corresponding glasses existing at the dry Tgand at Tg'-Wg', although separated by temper-ature differentials of from 74°C for glucose to152°C for maltoheptaose, have approximately thesame viscosities. While this situation is also sub-ject to qualification by the earlier-mentioned (1)fact that the temperature location of Tg is notbased solely on either an iso-viscosity or iso-free volume state alone;107 (2) suggestion that
203
Dow
nloa
ded
by [
Tex
as A
&M
Uni
vers
ity L
ibra
ries
] at
10:
57 0
9 Ja
nuar
y 20
18
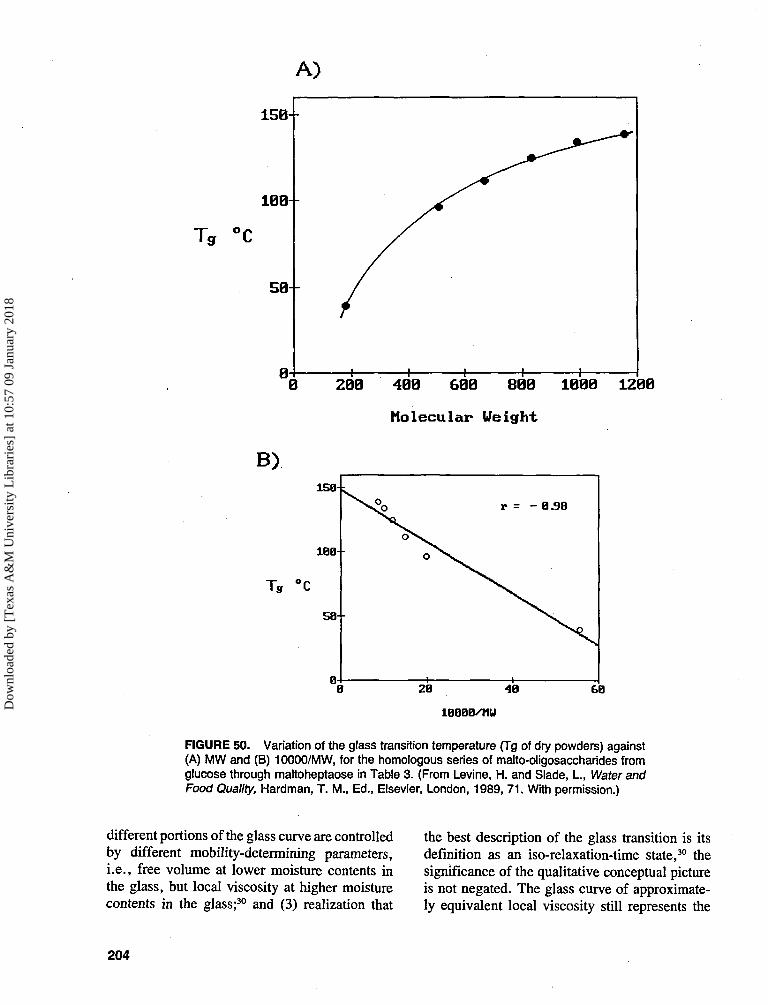
A)
158-
108--
Tg °C
58--
8 288 488 688 888 1888 1288
Molecular Weight
B)158-:
1B0-
Ta °C
5 8 -
1B8BB/MU
FIGURE 50. Variation of the glass transition temperature (Tg of dry powders) against(A) MW and (B) 10000/MW, for the homologous series of malto-oligosaccharides fromglucose through maltoheptaose in Table 3. (From Levine, H. and Slade, I., Water andFood Quality, Hardman, T. M., Ed., Elsevier, London, 1989, 71. With permission.)
different portions of the glass curve are controlledby different mobility-determining parameters,i.e., free volume at lower moisture contents inthe glass, but local viscosity at higher moisturecontents in the glass;30 and (3) realization that
the best description of the glass transition is itsdefinition as an iso-relaxation-time state,30 thesignificance of the qualitative conceptual pictureis not negated. The glass curve of approximate-ly equivalent local viscosity still represents the
204
Dow
nloa
ded
by [
Tex
as A
&M
Uni
vers
ity L
ibra
ries
] at
10:
57 0
9 Ja
nuar
y 20
18

TABLE 5Tg Values fromSugar Mixtures
Sugar
FructoseGlucose
SucroseFructose:glucose
(1:1 w/w)Fructose:sucrose
(1:7 w/w)
DSC of Dry Sugars and
Tg, °K
286,* 373" and 284b
312," 304," 302,c 310,d
303,' 302'330," 325," 340°294," 293"
326," 331c
a Value measured at 10°K/min heating rate.124
b Value measured at 10°K/min heating rate.30
c Value calculated or assumed, rather thanmeasured.89
d Value measured at 10°K/min heating rate.59
• Value extrapolated to 0°K/min heating rate.59
1 Value measured at 5°K/min heating rate.176
138
"B IB 28 38 48 50 68 78 88 98 188
Composition as ux Lodex IB
FIGURE 51. Variation of the glass transition tempera-ture, Tg, against weight percent composition for spray-dried, low-moisture powders prepared from aqueous so-lution blends of Lodex 10 and Maltrin M365 SHPs. (FromLevine, H. and Slade, I., Water and Food Quality, Hard-man, T. M., Ed., Elsevier, London, 1989, 71. Withpermission.)
line of demarcation between long-term stability(at i\ ^ Tig) and gradual deterioration (atT) < Tig),8-40"42 whether one is talking about theshelf-life of a dry glucose candy glass (of Tg =31°C) stored at ambient temperature or of a glu-cose-sweetened ice cream (of Tg' = — 43°C)stored in a freezer.
A compilation of measured values of dry Tg
and dry Tm, and calculated Tm/Tg ratios, forvarious sugars and polyols is shown in Table3 28,30 r^ry Tg values range from — 93°C for glyc-erol (MW 92) to 138.5°C for maltoheptaose (MW1153), and generally show the expected relation-ship of increasing Tg with increasing MW of thediluent-free PHC, but with several striking ex-ceptions. Moreover, for a given MW, the spreadof dry Tg values for different isomeric PHCs islarge; in fact, many times larger than the corre-sponding spread of Tg' values. For example: (1)among several pentoses and pentitols (MW =150), dry Tg values range from - 18.5°C forxylitol to 9.5°C for xylose; (2) among severalhexoses and hexitols (MW=180), dry Tg valuesrange from — 2°C for sorbitol to 31 °C for glucose(the anomalously high Tg values for anhydrousfructose and galactose are discussed in detail be-low); and (3) among several disaccharides (MW342), dry Tg values range from 43°C for maltoseto 90°C for mannobiose.
In Table 3, the calculated values of Tm/Tg(°K) ratio range from 1.62 to 1.06, with mostvalues in the range 1.32 to 1.44. Of these sugarsand polyols, fructose shows the most extremelyanomalous Tm/Tg ratio of 1.06.15-16 This valueis much lower even than the lowest Tm/Tg ratioreported for a synthetic high polymer, i.e., 1.18for bisphenol polycarbonate.102 Levine and Slade15
had reported previously that fructose's Tm/Tgratio of 1.06 derives from the observation of twowidely separated glass transition temperatures (seeTable 5) in a quench-cooled, completely amor-phous melt of pure crystalline p-D-fructose. Thelower Tg appears at a lower temperature (11°C30
or 13°C124) than the single values of Tg (around30°C) of other common monosaccharides of thesame MW, such as glucose and mannose. How-ever, the much higher Tg is readily detectable at100°C, a temperature only 24°C below the mea-sured Tm of p-D-fructose. Another monosacch-aride, galactose, shows analogous anomalous be-havior, with a lower Tg similar to that of glucoseand mannose, but a second, much higher Tg sim-ilar to the higher Tg of fructose.28 The observedchange in heat capacity at the higher Tg of fruc-tose is smaller in magnitude than at the lowerTg, which may reflect either a smaller actualdifference in heat capacity of the fructose pop-ulation that vitrifies at the higher Tg than of the
205
Dow
nloa
ded
by [
Tex
as A
&M
Uni
vers
ity L
ibra
ries
] at
10:
57 0
9 Ja
nuar
y 20
18
second, structurally different fructose populationthat vitrifies at the lower Tg, or that the popu-lation of fructose molecules that vitrifies at thehigher Tg of the conformationally heterogeneousmelt is smaller, while the second population thatvitrifies at the lower Tg is larger.30 However, forreasons explained later, which are based on aninterpretation of experimental results (includingthose in Table 2) involving several aspects of theanomalous behavior of fructose in non-equilib-rium aqueous systems and processes, Slade andLevine have hypothesized that the higher Tg ofdry fructose (and of galactose as well) is thecritical one that defines the Tm/Tg ratio and con-trols the consequent mobility of plasticizing sol-ute-water blends in their glassy and supra-glassystates.15-16-30
With respect to the unusual phenomenon oftwo values of Tg exhibited by quenched melts offructose or galactose, Finegold et al.,124 in theirrecent study of glass/rubber transitions and heatcapacities of dry binary sugar blends, have re-ported similar anomalous behavior for the sametwo monosaccharides, and their contrast to well-behaved glucose and mannose. They have con-firmed the existence of the higher-temperature"relaxation process" and that its amplitude (forfructose) is only 25% of that at the lower-tem-perature Tg.124 While Finegold et al.124 have re-marked that "the actual physical origin of twodistinct relaxation processes in an ostensibly one-component system is obscure", they have pointedout that both fructose and galactose are subjectto complex mutarotation and have granted thepossibility (suggested by Slade and Levine30)"that a quenched melt might exhibit microhet-erogeneity, with the appearance of two or morestructural relaxations. This hypothesis is sup-ported by the observation that annealing even-tually removes the high-temperature relaxationprocess and increases the amplitude of the (low-temperature) relaxation."124 Finegold et al. havealso confirmed the earlier finding15 that, in atwo-component glass with another small sugar(in their case, sucrose or glucose124), the higherTg of fructose is no longer detectable, as shownin Table 5 for a 1:1 (w/w) glucose:fructose glass(Tg = 20°C30 or 21"C124) and a 1:7 (w:w) fruc-tose:sucrose mixture.89 This change in the ther-momechanical behavior of fructose, to become
more like glucose in the 1:1 mixture in the ab-sence of diluent, is also manifested in the relativemicrobiological stability of concentrated solu-tions of glucose, fructose, and the 1:1 mix-ture, as will be discussed further with respect toTable 2.
In a possibly related vein discussed furtherbelow, it is interesting to note that Hallbruckerand Mayer263 have also suggested the possibilityof local microstructure in a heterogeneous moltenfluid or glass of a one-component glass-formingsystem, in their discussion of the differences inthermal relaxation behavior between "hyper-quenched" (i.e., cooling rate >105 °C/s) vs. slow-cooled glasses of aqueous or diluent-free PHCsystems. They mentioned that the developmentof heterogeneous microstructure (i.e., local re-gions of different constitution and "activationenergies") in a melt could contribute to the non-Arrhenius behavior of viscosity and flow pro-cesses in the temperature region above Tg. Theyhave suggested "that hyperquenching producesa glass differing in local microstructure and (thetemperature dependence of its) relaxation behav-ior from a slow-cooled glass," due to a corre-sponding difference in the temperature (relativeto the Tg measured during subsequent rewarm-ing) at which the molten fluid is immobilized toa glassy solid during cooling and thus at whichthe temperature dependence of relaxation pro-cesses switches from non-Arrhenius back to Ar-rhenius behavior.263 Also pertinent to this line ofdiscussion are recent remarks of Green and An-gell,290 who noted "that constant-compositionsamples (of molten glucose monohydrate) didyield variable Tg values depending on heat treat-ment. This reminds us that there is a structuralvariable for the solution (the anomer ratio), thetime scale of which is much longer than the vis-coelastic relaxation time and that may, therefore,be able to influence glass properties in new ways— all of which adds strength to Franks' recentcall281 (echoed by Slade and Levine30) for a re-newed physicochemical interest in saccharidesolutions."
Among a number of different cases of mul-tiple values of Tg observed in amorphous andpartially crystalline systems,26-33 fructose mayrepresent the interesting situation where two con-formationally different populations of the same
206
Dow
nloa
ded
by [
Tex
as A
&M
Uni
vers
ity L
ibra
ries
] at
10:
57 0
9 Ja
nuar
y 20
18
chemical species manifest different free volumeand local viscosity requirements for mobility.30
Such a situation would arise if one of the con-formational populations in a heterogeneous meltexhibited anisotropic rotational and translationalmobilities, while the second population exhibitedisotropic motion. For motional anisotropy, thefree volume requirements for rotational mobilitybecome much more stringent than those for trans-lation,187-188 and rotational relaxation would be-come limiting at a higher temperature than trans-lational relaxation, as described with respect toFigure 34D for polymers with anomalously lowvalues of Tm/Tg. For isotropic motion, the largerscale, slower translational relaxations becomelimiting at a higher temperature than rotationalrelaxations,186187 as described with respect toFigure 34D for polymers with typical and highvalues of Tm/Tg. For both anisotropic and iso-tropic motion, the temperature at which trans-lational relaxations become limiting would benearly the same. Thus, relaxation times for aconformational population with anisotropic mo-tion would become limiting at a higher temper-ature, manifested as a higher Tg, than relaxationtimes for a second population with isotropic mo-tion, manifested as a lower Tg.30 A documentedcase, which might provide an explanation for theappearance of two conformationally differentpopulations in a heterogeneous melt from a singlecrystalline conformation of a single chemical spe-cies, involves xylose, which has been shown toundergo rapid anomerization during melting.291
During the time between heating a-D-xyloseto a temperature only slightly above Tm, to avoiddecomposition, and quench-cooling the resultingmelt to a glass in a conventional DSC experi-ment, a mixed population of anomers is able toform in the melt and be captured in the glass.291
Thus, the initial crystal contains only the alphaanomer, while the final glass contains a simpleanomeric mixture of a- and (3-xylose,124 and theparticular conformer distribution in the glass de-pends on the experimental variables of temper-ature, pressure, and concentration. The fact thatonly a single value of Tg is observed for thexylose melt,28-124 which is known to be confor-mationally heterogeneous, indicates either thatall of the conformers are chemically and me-chanically compatible so that a single glass vi-
trifies, or that all of the glasses that vitrify havethe same free volume and local viscosity require-ments for mobility and so the same value of Tg.30
If other small PHCs, such as fructose and gal-actose, behave like xylose with respect to an-omerization during the melting process, then de-pending on the specific Tm, the time the melt isheld above Tm, and the quenching rate, they mayalso be capable of forming heterogeneous meltswith conformationally different populations.30
Then the fact that two values of Tg are observedwould indicate that the two populations are notchemically and mechanically compatible and thatthey exhibit different free volume and local vis-cosity requirements for mobility. Finegold et al.124
have reported another observation about the higherTg of fructose that could support such speculationabout the possibility of anomerization in a fruc-tose melt. They noted that, after repeated heatingand recooling of the initial fructose melt, themagnitude of the observed change in heat ca-pacity at the higher Tg diminished and ultimatelybecame undetectable, leaving only the lower Tg(representing the glass of the more stable an-omer?30). This observation of changes in the sizesof the two populations upon repeated heating sug-gested that the difference in magnitude of theobserved heat capacity for the two glasses afterthe initial fructose melt was due to different sizesof the two populations rather than different actualchanges in heat capacities.30
There appear to be a number of analogiesbetween aspects of (1) the double-glass-formingbehavior of fructose and galactose and (2) thedifferences in thermal behavior, thermodynamic,and kinetic properties between ordinary slow-cooled vs. hyperquenched, diluent-free glassesof small PHCs such as ethylene glycol263 andpropylene glycol.174 These analogies lead us tospeculate about a common thread, as yet uni-dentified, in the two phenomena. Johari et al.174
have suggested that "the temperature range overwhich the liquid-to-glass transition occurs on hy-perquenching is wider than the range over whichthe transition occurs on normal cooling." In acorresponding fashion for each type of glass (andfor glasses in general), "the temperature rangeof the glass transition is much less during theheating of a glass to liquid than it is during thecooling of a liquid to glass".174 A hyperquenched
207
Dow
nloa
ded
by [
Tex
as A
&M
Uni
vers
ity L
ibra
ries
] at
10:
57 0
9 Ja
nuar
y 20
18
glass has a "fictive temperature" much higherthan the normal Tg of a slow-cooled glass (of i\= 1012 Pa s) of the same material, i.e., hyper-quenching immobilizes the liquid during quench-ing at higher temperatures than slow cool-ing.174'263 Consequently, the kinetic andthermodynamic properties of a hyperquenchedglass differ from those of a glass obtained byslow cooling.174-263 For example, on subsequentrewarming, the Tg of a hyperquenched glass isobserved at a higher temperature than the Tg ofa corresponding slow-cooled glass.174'263 (The Tgobserved during heating [e.g., at 10°C/min] as aconsequence of a particular previous sample his-tory is a value of Tg somewhere below the fictivetemperature [i.e., the fictively high Tg observedduring fast cooling] and above the practical lowerlimiting Tg [i.e., the limiting value observed withever slower cooling rates].174) As a consequenceof higher fictive temperature, hyperquenchingproduces "a less dense glass (i.e., of lower vis-cosity) of a structure with a higher enthalpy andentropy, but with a much narrower distributionof structural relaxation times," the latter becausethe requirement for molecular cooperativity isgradually removed as the average intermoleculardistance increases.174 (It should be noted that thedependence of density on cooling rate is a generalcharacteristic of glasses.172) As a consequence oflower density and viscosity in a hyperquenchedglass at Tg, during rewarming of such a glass totemperatures above Tg, its constituent moleculesexhibit greater rotational and translational mo-bility for diffusion-limited structural relaxationprocesses such as crystallization in the rubberyfluid.263 For the same reasons, hyperquenchedglasses show greater extents of structural collapseand resulting gradual viscous flow and concom-itant densification (also referred to as sinteringduring heating) at temperatures 4 to 5°C aboveTg than do slow-cooled glasses.174 In contrast tothe behavior of hyperquenched glasses at T >Tg, during sub-Tg "aging" (referred to by Johariet al. as "annealing", but distinguished from theconventional definition of annealing at Tg < Ta< Tm104) of hyperquenched glasses, a sponta-neous but slow structural relaxation, to a denserstructure of lower fictive temperature and higherviscosity (more similar to the structure, viscosity,and fictive temperature of a slow-cooled glass),
has been observed to begin at a temperature —0.73Tg (K).174 (By analogy, relative to the higher Tgof fructose at 100°C, the temperature at whichsuch sub-Tg aging would begin would be 0°C.)It has been suggested that hyperquenched andslow-cooled samples of the same PHC glass-for-mer, after sufficient aging at a temperature veryclose to Tg, would reach an identical structuralstate and show indistinguishable DSC scans.174
However, "for the same temperature and timeof (aging), spontaneous structural relaxation inhyperquenched glasses at T < Tg is much slowerthan in ordinary glasses".174
We infer from the above comparison of theproperties and behavior of hyperquenched vs.slow-cooled glasses of the polyols, ethylene gly-col and propylene glycol, that the higher-Tg glassof fructose (and galactose) appears to manifestcertain characteristics of a hyperquenched glass,while in contrast, the lower-Tg glass of fructose(and galactose) manifests the expected charac-teristics of a slow-cooled glass. The parallels,even though not all-inclusive, are provocative.But how and why a single cooling rate of 50°C/min, applied to a molten fluid of diluent-freefructose or galactose, could cause the formationof two distinct glasses, with properties analogousto those produced (in separate experiments) inpolyol systems by two drastically different ex-perimental cooling rates, are unknown and es-pecially mystifying in light of the fact that oursame experimental protocol has produced a singleglass with a single Tg for every other small PHCthat we have examined, including glucose, man-nose, xylose, etc.30 Likewise, in the studies ofhyperquenched vs. slow-cooled polyol glasses,only a single Tg was observed in all cases uponrewarming of the glass following vitrificationduring cooling of the liquid, regardless of thecooling rate.174-263 We can only speculate aboutthe possibility of a different relationship betweencooling rate and the kinetics of mutarotation for(what could be)30 the two distinguishable popu-lations of structural entities existing, at least in-itially, in a cooled melt of fructose or galactose.
The fundamental issue regarding the anom-alous thermomechanical properties of fructose (vs.e.g., glucose) in foods16-30 is still open to debate.As mentioned earlier, Slade and Levine30 havestressed the evidently controlling influence of the
208
Dow
nloa
ded
by [
Tex
as A
&M
Uni
vers
ity L
ibra
ries
] at
10:
57 0
9 Ja
nuar
y 20
18
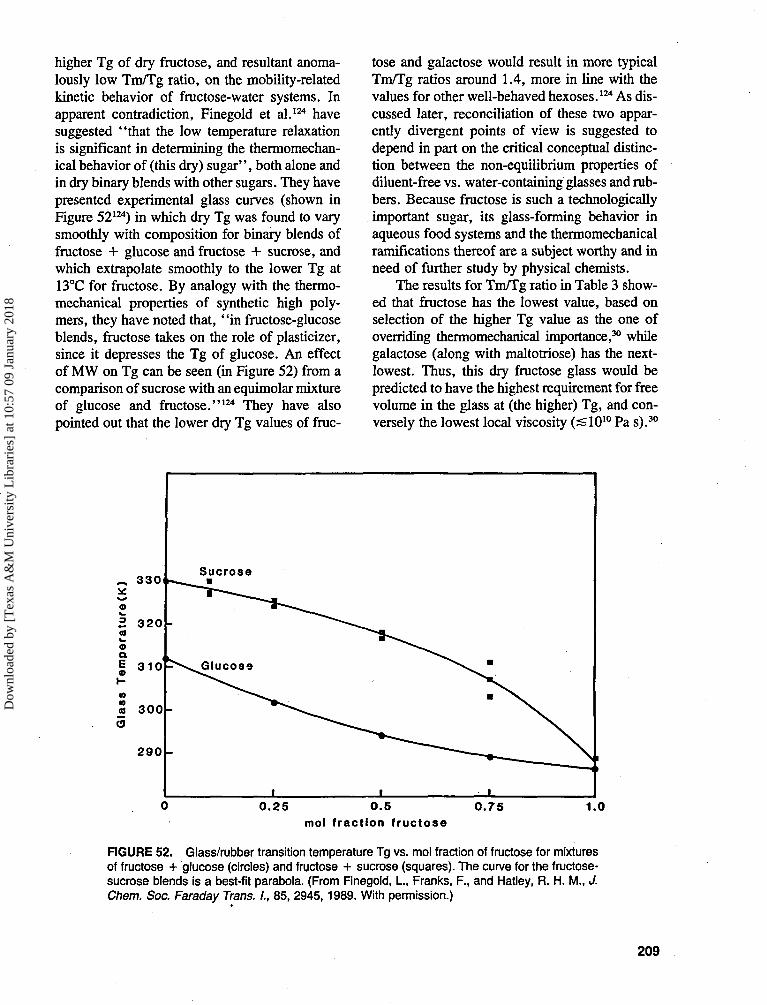
higher Tg of dry fructose, and resultant anoma-lously low Tm/Tg ratio, on the mobility-relatedkinetic behavior of fructose-water systems. Inapparent contradiction, Finegold et al.124 havesuggested "that the low temperature relaxationis significant in determining the thermomechan-ical behavior of (this dry) sugar", both alone andin dry binary blends with other sugars. They havepresented experimental glass curves (shown inFigure 52124) in which dry Tg was found to varysmoothly with composition for binary blends offructose + glucose and fructose + sucrose, andwhich extrapolate smoothly to the lower Tg at13°C for fructose. By analogy with the thermo-mechanical properties of synthetic high poly-mers, they have noted that, "in fructose-glucoseblends, fructose takes on the role of plasticizer,since it depresses the Tg of glucose. An effectof MW on Tg can be seen (in Figure 52) from acomparison of sucrose with an equimolar mixtureof glucose and fructose."124 They have alsopointed out that the lower dry Tg values of fruc-
tose and galactose would result in more typicalTm/Tg ratios around 1.4, more in line with thevalues for other well-behaved hexoses.124 As dis-cussed later, reconciliation of these two appar-ently divergent points of view is suggested todepend in part on the critical conceptual distinc-tion between the non-equilibrium properties ofdiluent-free vs. water-containing glasses and rub-bers. Because fructose is such a technologicallyimportant sugar, its glass-forming behavior inaqueous food systems and the thermomechanicalramifications thereof are a subject worthy and inneed of further study by physical chemists.
The results for Tm/Tg ratio in Table 3 show-ed that fructose has the lowest value, based onselection of the higher Tg value as the one ofoverriding thermomechanical importance,30 whilegalactose (along with maltotriose) has the next-lowest. Thus, this dry fructose glass would bepredicted to have the highest requirement for freevolume in the glass at (the higher) Tg, and con-versely the lowest local viscosity (:£1O10 Pa s).30
^ 330
1 320(9t.<D
| 310
(0
a 300
a
2 9 0
Sucrose
^ G l u c o s e
-
i 1 1
0.25 O.Smol fraction fructose
0.75 1.0
FIGURE 52. Glass/rubber transition temperature Tg vs. mol fraction of fructose for mixturesof fructose + glucose (circles) and fructose + sucrose (squares). The curve for the fructose-sucrose blends is a best-fit parabola. (From Finegold, I., Franks, F., and Hatley, R. H. M., J.Chem. Soc. Faraday Trans. I., 85, 2945,1989. With permission.)
209
Dow
nloa
ded
by [
Tex
as A
&M
Uni
vers
ity L
ibra
ries
] at
10:
57 0
9 Ja
nuar
y 20
18
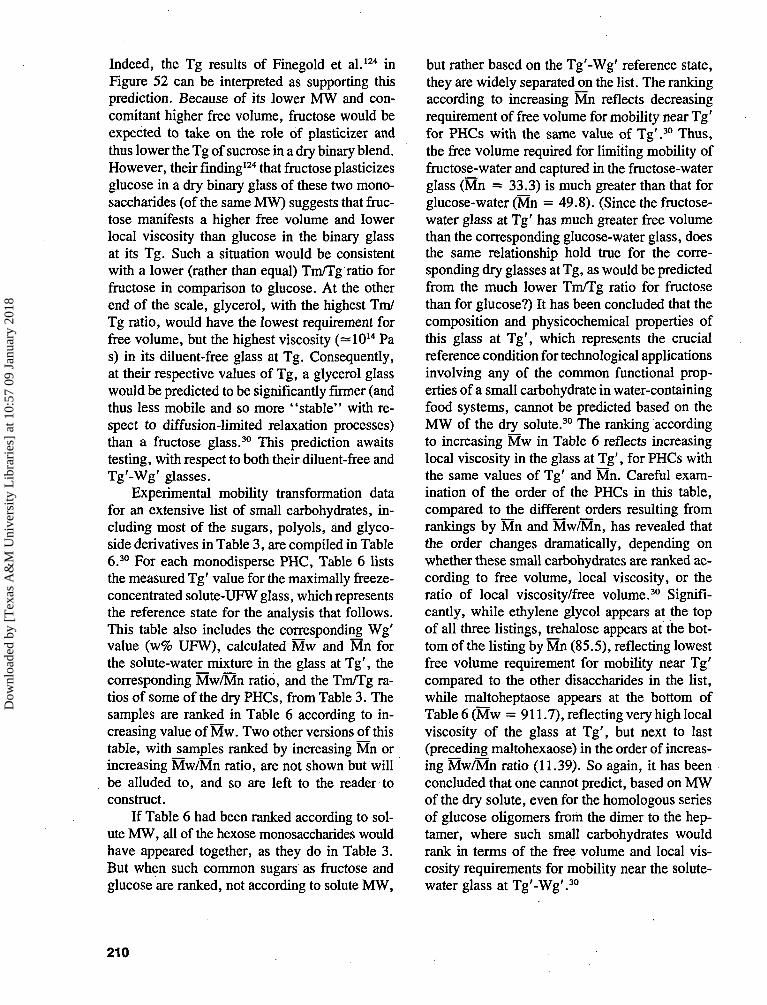
Indeed, the Tg results of Finegold et al.124 inFigure 52 can be interpreted as supporting thisprediction. Because of its lower MW and con-comitant higher free volume, fructose would beexpected to take on the role of plasticizer andthus lower the Tg of sucrose in a dry binary blend.However, their finding124 that fructose plasticizesglucose in a dry binary glass of these two mono-saccharides (of the same MW) suggests that fruc-tose manifests a higher free volume and lowerlocal viscosity than glucose in the binary glassat its Tg. Such a situation would be consistentwith a lower (rather than equal) Tm/Tg ratio forfructose in comparison to glucose. At the otherend of the scale, glycerol, with the highest Tm/Tg ratio, would have the lowest requirement forfree volume, but the highest viscosity (^lO14 Pas) in its diluent-free glass at Tg. Consequently,at their respective values of Tg, a glycerol glasswould be predicted to be significantly firmer (andthus less mobile and so more "stable" with re-spect to diffusion-limited relaxation processes)than a fructose glass.30 This prediction awaitstesting, with respect to both their diluent-free andTg'-Wg' glasses.
Experimental mobility transformation datafor an extensive list of small carbohydrates, in-cluding most of the sugars, polyols, and glyco-side derivatives in Table 3, are compiled in Table6.30 For each monodisperse PHC, Table 6 liststhe measured Tg' value for the maximally freeze-concentrated solute-UFW glass, which representsthe reference state for the analysis that follows.This table also includes the corresponding Wg'value (w% UFW), calculated Mw and Mn forthe solute-water mixture in the glass at Tg', thecorresponding Mw/Mn ratio, and the Tm/Tg ra-tios of some of the dry PHCs, from Table 3. Thesamples are ranked in Table 6 according to in-creasing value of Mw. Two other versions of thistable, with samples ranked by increasing Mn orincreasing Mw/Mn ratio, are not shown but willbe alluded to, and so are left to the reader toconstruct.
If Table 6 had been ranked according to sol-ute MW, all of the hexose monosaccharides wouldhave appeared together, as they do in Table 3.But when such common sugars as fructose andglucose are ranked, not according to solute MW,
but rather based on the Tg'-Wg' reference state,they are widely separated on the list. The rankingaccording to increasing Mn reflects decreasingrequirement of free volume for mobility near Tg'for PHCs with the same value of Tg'.30 Thus,the free volume required for limiting mobility offructose-water and captured in the fructose-waterglass (Mn = 33.3) is much greater than that forglucose-water (Mn = 49.8). (Since the fructose-water glass at Tg' has much greater free volumethan the corresponding glucose-water glass, doesthe same relationship hold true for the corre-sponding dry glasses at Tg, as would be predictedfrom the much lower Tm/Tg ratio for fructosethan for glucose?) It has been concluded that thecomposition and physicochemical properties ofthis glass at Tg', which represents the crucialreference condition for technological applicationsinvolving any of the common functional prop-erties of a small carbohydrate in water-containingfood systems, cannot be predicted based on theMW of the dry solute.30 The ranking accordingto increasing Mw in Table 6 reflects increasinglocal viscosity in the glass at Tg', for PHCs withthe same values of Tg' and Mn. Careful exam-ination of the order of the PHCs in this table,compared to the different orders resulting fromrankings by Mn and Mw/Mn, has revealed thatthe order changes dramatically, depending onwhether these small carbohydrates are ranked ac-cording to free volume, local viscosity, or theratio of local viscosity/free volume.30 Signifi-cantly, while ethylene glycol appears at the topof all three listings, trehalose appears at the bot-tom of the listing by Mn (85.5), reflecting lowestfree volume requirement for mobility near Tg'compared to the other disaccharides in the list,while maltoheptaose appears at the bottom ofTable 6 (Mw = 911.7), reflecting very high localviscosity of the glass at Tg', but next to last(preceding maltohexaose) in the order of increas-ing Mw/Mn ratio (11.39). So again, it has beenconcluded that one cannot predict, based on MWof the dry solute, even for the homologous seriesof glucose oligomers from the dimer to the hep-tamer, where such small carbohydrates wouldrank in terms of the free volume and local vis-cosity requirements for mobility near the solute-water glass at Tg'-Wg'.30
210
Dow
nloa
ded
by [
Tex
as A
&M
Uni
vers
ity L
ibra
ries
] at
10:
57 0
9 Ja
nuar
y 20
18
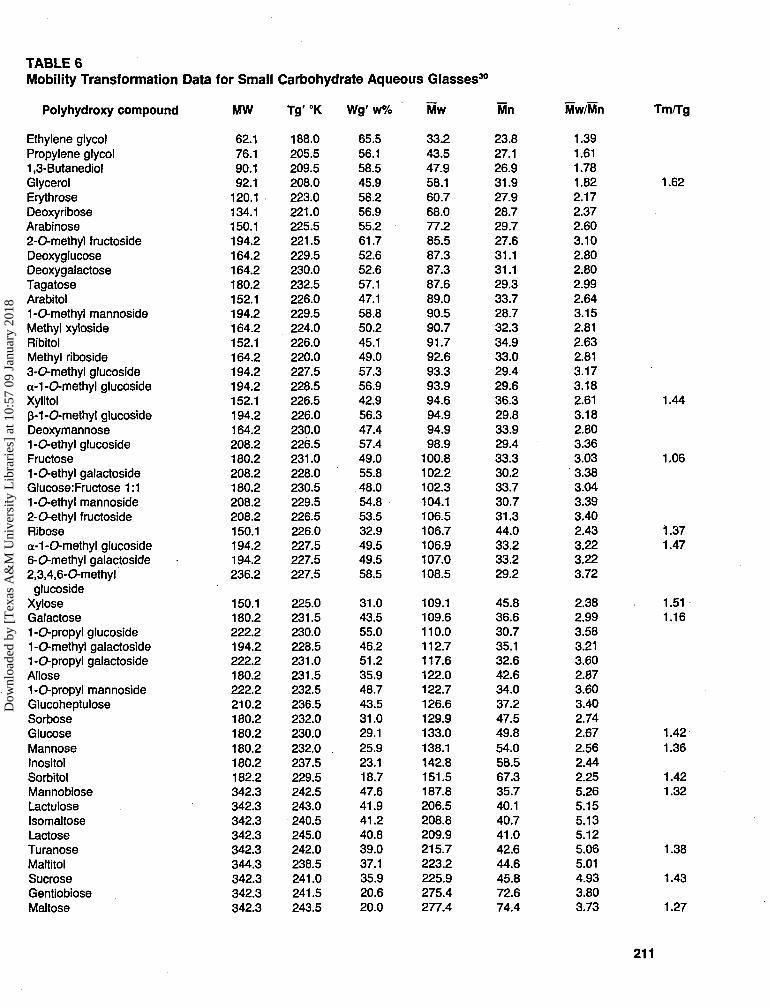
TABLE 6Mobility Transformation Data for Small Carbohydrate Aqueous Glasses30
Polyhydroxy compound MW Tg' °K Wg' w% Mw Mn Mw/Mn Tm/Tg
Ethylene glycolPropylene glycol1,3-ButanediolGlycerolErythroseDeoxyriboseArabinose2-O-methyl fructosideDeoxyglucoseDeoxygalactoseTagatoseArabitol1-O-methyl mannosideMethyl xylosideRibitolMethyl riboside3-O-methyl glucosidea-1-O-methyl glucosideXylitolp-1-O-methyl glucosideDeoxymannose1-O-ethyl glucosideFructose1-O-ethyl galactosideGlucose:Fructose 1:11-O-ethyl mannoside2-O-ethyl fructosideRibosea-1-O-methyl glucoside6-O-methyl galactoside2,3,4,6-O-methyl
glucosideXyloseGalactose1-O-propyl glucoside1-O-methyl galactoside1-O-propyl galactosideAllose1-O-propyl mannosideGlucoheptuloseSorboseGlucoseMannoseInositolSorbitolMannobioseLactuloseIsomaltoseLactoseTuranoseMaltitolSucroseGentiobioseMaltose
62.176.190.192.1
120.1134.1150.1194.2164.2164.2180.2152.1194.2164.2152.1164.2194.2194.2152.1194.2164.2208.2180.2208.2180.2208.2208.2150.1194.2194.2236.2
150.1180.2222.2194.2222.2180.2222.2210.2180.2180.2180.2180.2182.2342.3342.3342.3342.3342.3344.3342.3342.3342.3
188.0205.5209.5208.0223.0221.0225.5221.5229.5230.0232.5226.0229.5224.0226.0220.0227.5228.5226.5226.0230.0226.5231.0228.0230.5229.5226.5226.0227.5227.5227.5
225.0231.5230.0228.5231.0231.5232.5236.5232.0230.0232.0237.5229.5242.5243.0240.5245.0242.0238.5241.0241.5243.5
65.556.158.545.958.256.955.261.752.652.657.147.158.850.245.149.057.356.942.956.347.457.449.055.848.054.853.532.949.549.558.5
31.043.555.046.251.235.948.743.531.029.125.923.118.747.641.941.240.839.037.135.920.620.0
33.243.547.958.160.768.077.285.587.387.387.689.090.590.791.792.693.393.994.694.994.998.9
100.8102.2102.3104.1106.5106.7106.9107.0108.5
109.1109.6110.0112.7117.6122.0122.7126.6129.9133.0138.1142.8151.5187.8206.5208.8209.9215.7223.2225.9275.4277.4
23.827.126.931.927.928.729.727.631.131.129.333.728.732.334.933.029.429.636.329.833.929.433.330.233.730.731.344.033.233.229.2
45.836.630.735.132.642.634.037.247.549.854.058.567.335.740.140.741.042.644.645.872.674.4
1.391.611.781.822.172.372.603.102.802.802.992.643.152.812.632.813.173.182.613.182.803.363.033.383.043.393.402.433.223.223.72
2.382.993.583.213.602.873.603.402.742.672.562.442.255.265.155.135.125.065.014.933.803.73
1.62
1.44
1.06
1.371.47
1.511.16
1.421.36
1.421.32
1.38
1.43
1.27
211
Dow
nloa
ded
by [
Tex
as A
&M
Uni
vers
ity L
ibra
ries
] at
10:
57 0
9 Ja
nuar
y 20
18
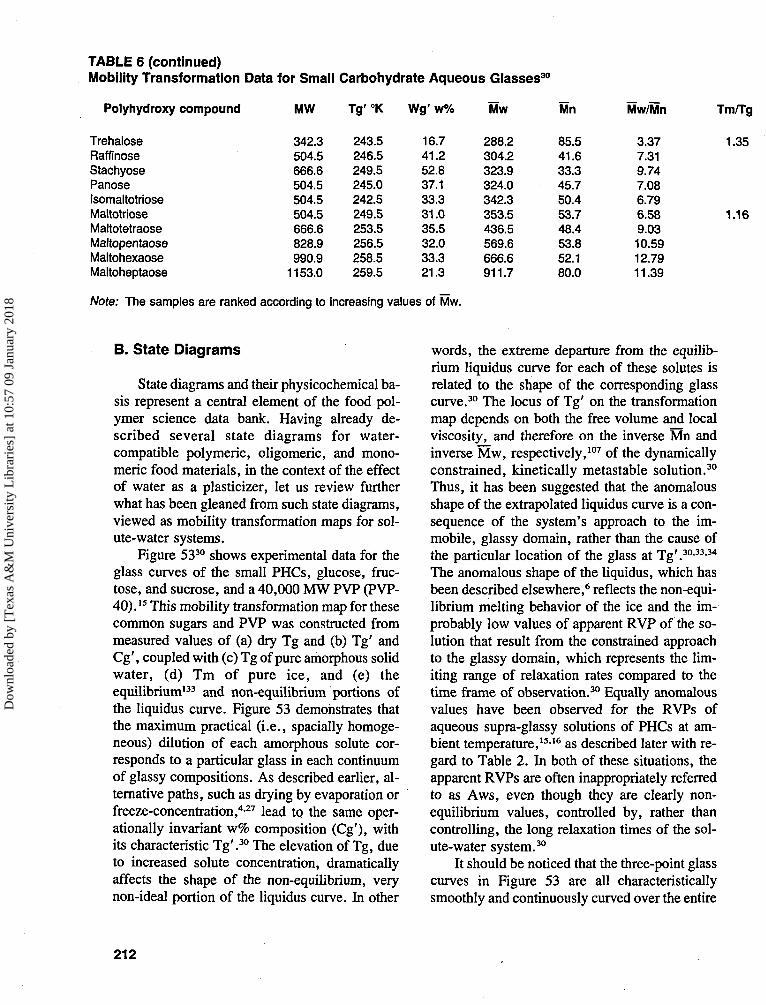
TABLE 6 (continued)Mobility Transformation Data for Small Carbohydrate Aqueous Glasses30
Polyhydroxy compound
TrehaloseRaffinoseStachyosePanoseIsomaltotrioseMaltotrioseMaltotetraoseMaltopentaoseMaltohexaoseMaltoheptaose
Note: The samples are ranked according to increasing values of Mw.
MW
342.3504.5666.6504.5504.5504.5666.6828.9990.9
1153.0
Tg'°K
243.5246.5249.5245.0242.5249.5253.5256.5258.5259.5
Wg' w%
16.741.252.837.133.331.035.532.033.321.3
Mw
288.2304.2323.9324.0342.3353.5436.5569.6666.6911.7
Mn
85.541.633.345.750.453.748.453.852.180.0
Mw/Mn
3.377.319.747.086.796.589.0310.5912.7911.39
Tm/Tg
1.35
1.16
B. State Diagrams
State diagrams and their physicochemical ba-sis represent a central element of the food pol-ymer science data bank. Having already de-scribed several state diagrams for water-compatible polymeric, oligomeric, and mono-meric food materials, in the context of the effectof water as a plasticizer, let us review furtherwhat has been gleaned from such state diagrams,viewed as mobility transformation maps for sol-ute-water systems.
Figure 5330 shows experimental data for theglass curves of the small PHCs, glucose, fruc-tose, and sucrose, and a 40,000 MW PVP (PVP-40).I5 This mobility transformation map for thesecommon sugars and PVP was constructed frommeasured values of (a) dry Tg and (b) Tg' andCg', coupled with (c) Tg of pure amorphous solidwater, (d) Tm of pure ice, and (e) theequilibrium133 and non-equilibrium portions ofthe liquidus curve. Figure 53 demonstrates thatthe maximum practical (i.e., spacially homoge-neous) dilution of each amorphous solute cor-responds to a particular glass in each continuumof glassy compositions. As described earlier, al-ternative paths, such as drying by evaporation orfreeze-concentration,4-27 lead to the same oper-ationally invariant w% composition (Cg'), withits characteristic Tg'.30 The elevation of Tg, dueto increased solute concentration, dramaticallyaffects the shape of the non-equilibrium, verynon-ideal portion of the liquidus curve. In other
words, the extreme departure from the equilib-rium liquidus curve for each of these solutes isrelated to the shape of the corresponding glasscurve.30 The locus of Tg' on the transformationmap depends on both the free volume and localviscosity, and therefore on the inverse Mn andinverse Mw, respectively,107 of the dynamicallyconstrained, kinetically metastable solution.30
Thus, it has been suggested that the anomalousshape of the extrapolated liquidus curve is a con-sequence of the system's approach to the im-mobile, glassy domain, rather than the cause ofthe particular location of the glass at Tg'.3033-34
The anomalous shape of the liquidus, which hasbeen described elsewhere,6 reflects the non-equi-librium melting behavior of the ice and the im-probably low values of apparent RVP of the so-lution that result from the constrained approachto the glassy domain, which represents the lim-iting range of relaxation rates compared to thetime frame of observation.30 Equally anomalousvalues have been observed for the RVPs ofaqueous supra-glassy solutions of PHCs at am-bient temperature,15-16 as described later with re-gard to Table 2. In both of these situations, theapparent RVPs are often inappropriately referredto as Aws, even though they are clearly non-equilibrium values, controlled by, rather thancontrolling, the long relaxation times of the sol-ute-water system.30
It should be noticed that the three-point glasscurves in Figure 53 are all characteristicallysmoothly and continuously curved over the entire
212
Dow
nloa
ded
by [
Tex
as A
&M
Uni
vers
ity L
ibra
ries
] at
10:
57 0
9 Ja
nuar
y 20
18
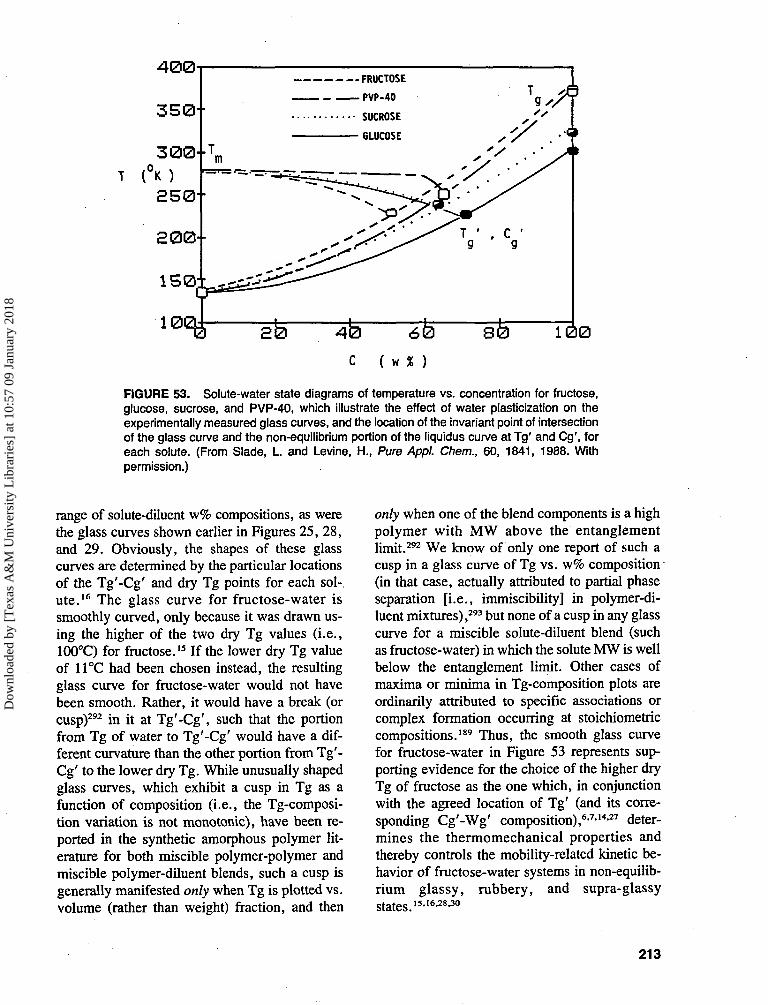
FRUCTOSE
PVP-40
SUCROSE
GLUCOSE
10 100C ( W % )
FIGURE 53. Solute-water state diagrams of temperature vs. concentration for fructose,glucose, sucrose, and PVP-40, which illustrate the effect of water plasticization on theexperimentally measured glass curves, and the location of the invariant point of intersectionof the glass curve and the non-equilibrium portion of the liquidus curve at Tg' and Cg\ foreach solute. (From Slade, L. and Levine, H., Pure Appl. Chem., 60, 1841, 1988. Withpermission.)
range of solute-diluent w% compositions, as werethe glass curves shown earlier in Figures 25, 28,and 29. Obviously, the shapes of these glasscurves are determined by the particular locationsof the Tg'-Cg' and dry Tg points for each sol-ute.16 The glass curve for fructose-water issmoothly curved, only because it was drawn us-ing the higher of the two dry Tg values (i.e.,100°C) for fructose.15 If the lower dry Tg valueof 11°C had been chosen instead, the resultingglass curve for fructose-water would not havebeen smooth. Rather, it would have a break (orcusp)292 in it at Tg'-Cg', such that the portionfrom Tg of water to Tg'-Cg' would have a dif-ferent curvature than the other portion from Tg'-Cg' to the lower dry Tg. While unusually shapedglass curves, which exhibit a cusp in Tg as afunction of composition (i.e., the Tg-composi-tion variation is not monotonic), have been re-ported in the synthetic amorphous polymer lit-erature for both miscible polymer-polymer andmiscible polymer-diluent blends, such a cusp isgenerally manifested only when Tg is plotted vs.volume (rather than weight) fraction, and then
only when one of the blend components is a highpolymer with MW above the entanglementlimit.292 We know of only one report of such acusp in a glass curve of Tg vs. w% composition(in that case, actually attributed to partial phaseseparation [i.e., immiscibility] in polymer-di-luent mixtures),293 but none of a cusp in any glasscurve for a miscible solute-diluent blend (suchas fructose-water) in which the solute MW is wellbelow the entanglement limit. Other cases ofmaxima or minima in Tg-composition plots areordinarily attributed to specific associations orcomplex formation occurring at stoichiometriccompositions.189 Thus, the smooth glass curvefor fructose-water in Figure 53 represents sup-porting evidence for the choice of the higher dryTg of fructose as the one which, in conjunctionwith the agreed location of Tg' (and its corre-sponding Cg'-Wg' composition),67-1427 deter-mines the thermomechanical properties andthereby controls the mobility-related kinetic be-havior of fructose-water systems in non-equilib-rium glassy, rubbery, and supra-glassystates, i5.i6.28 jo
213
Dow
nloa
ded
by [
Tex
as A
&M
Uni
vers
ity L
ibra
ries
] at
10:
57 0
9 Ja
nuar
y 20
18
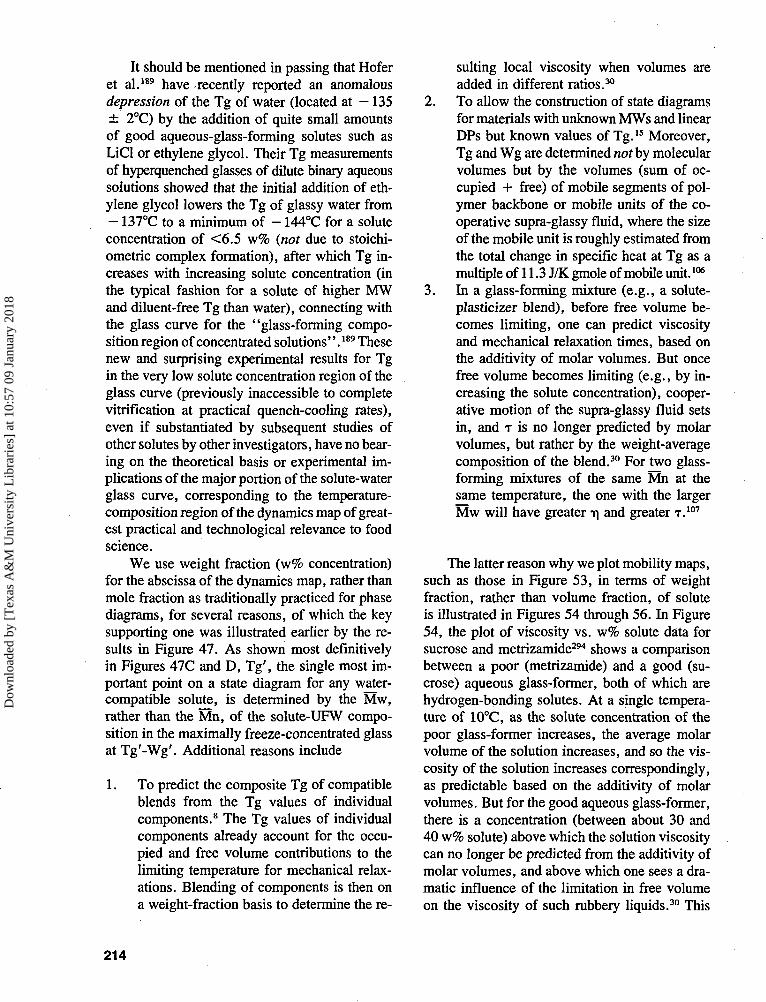
It should be mentioned in passing that Hoferet al.189 have recently reported an anomalousdepression of the Tg of water (located at -135± 2°C) by the addition of quite small amountsof good aqueous-glass-forming solutes such asLiCl or ethylene glycol. Their Tg measurementsof hyperquenched glasses of dilute binary aqueoussolutions showed that the initial addition of eth-ylene glycol lowers the Tg of glassy water from— 137°C to a minimum of — 144°C for a soluteconcentration of <6.5 w% (not due to stoichi-ometric complex formation), after which Tg in-creases with increasing solute concentration (inthe typical fashion for a solute of higher MWand diluent-free Tg than water), connecting withthe glass curve for the "glass-forming compo-sition region of concentrated solutions".189 Thesenew and surprising experimental results for Tgin the very low solute concentration region of theglass curve (previously inaccessible to completevitrification at practical quench-cooling rates),even if substantiated by subsequent studies ofother solutes by other investigators, have no bear-ing on the theoretical basis or experimental im-plications of the major portion of the solute-waterglass curve, corresponding to the temperature-composition region of the dynamics map of great-est practical and technological relevance to foodscience.
We use weight fraction (w% concentration)for the abscissa of the dynamics map, rather thanmole fraction as traditionally practiced for phasediagrams, for several reasons, of which the keysupporting one was illustrated earlier by the re-sults in Figure 47. As shown most definitivelyin Figures 47C and D, Tg', the single most im-portant point on a state diagram for any water-compatible solute, is determined by the Mw,rather than the Mn, of the solute-UFW compo-sition in the maximally freeze-concentrated glassat Tg'-Wg'. Additional reasons include
1. To predict the composite Tg of compatibleblends from the Tg values of individualcomponents.8 The Tg values of individualcomponents already account for the occu-pied and free volume contributions to thelimiting temperature for mechanical relax-ations. Blending of components is then ona weight-fraction basis to determine the re-
sulting local viscosity when volumes areadded in different ratios.30
2. To allow the construction of state diagramsfor materials with unknown MWs and linearDPs but known values of Tg.15 Moreover,Tg and Wg are determined not by molecularvolumes but by the volumes (sum of oc-cupied + free) of mobile segments of pol-ymer backbone or mobile units of the co-operative supra-glassy fluid, where the sizeof the mobile unit is roughly estimated fromthe total change in specific heat at Tg as amultiple of 11.3 J/K gmole of mobile unit.106
3. In a glass-forming mixture (e.g., a solute-plasticizer blend), before free volume be-comes limiting, one can predict viscosityand mechanical relaxation times, based onthe additivity of molar volumes. But oncefree volume becomes limiting (e.g., by in-creasing the solute concentration), cooper-ative motion of the supra-glassy fluid setsin, and T is no longer predicted by molarvolumes, but rather by the weight-averagecomposition of the blend.30 For two glass-forming mixtures of the same Mn at thesame temperature, the one with the largerMw will have greater T| and greater T.107
The latter reason why we plot mobility maps,such as those in Figure 53, in terms of weightfraction, rather than volume fraction, of soluteis illustrated in Figures 54 through 56. In Figure54, the plot of viscosity vs. w% solute data forsucrose and metrizamide294 shows a comparisonbetween a poor (metrizamide) and a good (su-crose) aqueous glass-former, both of which arehydrogen-bonding solutes. At a single tempera-ture of 10°C, as the solute concentration of thepoor glass-former increases, the average molarvolume of the solution increases, and so the vis-cosity of the solution increases correspondingly,as predictable based on the additivity of molarvolumes. But for the good aqueous glass-former,there is a concentration (between about 30 and40 w% solute) above which the solution viscositycan no longer be predicted from the additivity ofmolar volumes, and above which one sees a dra-matic influence of the limitation in free volumeon the viscosity of such rubbery liquids.30 This
214
Dow
nloa
ded
by [
Tex
as A
&M
Uni
vers
ity L
ibra
ries
] at
10:
57 0
9 Ja
nuar
y 20
18
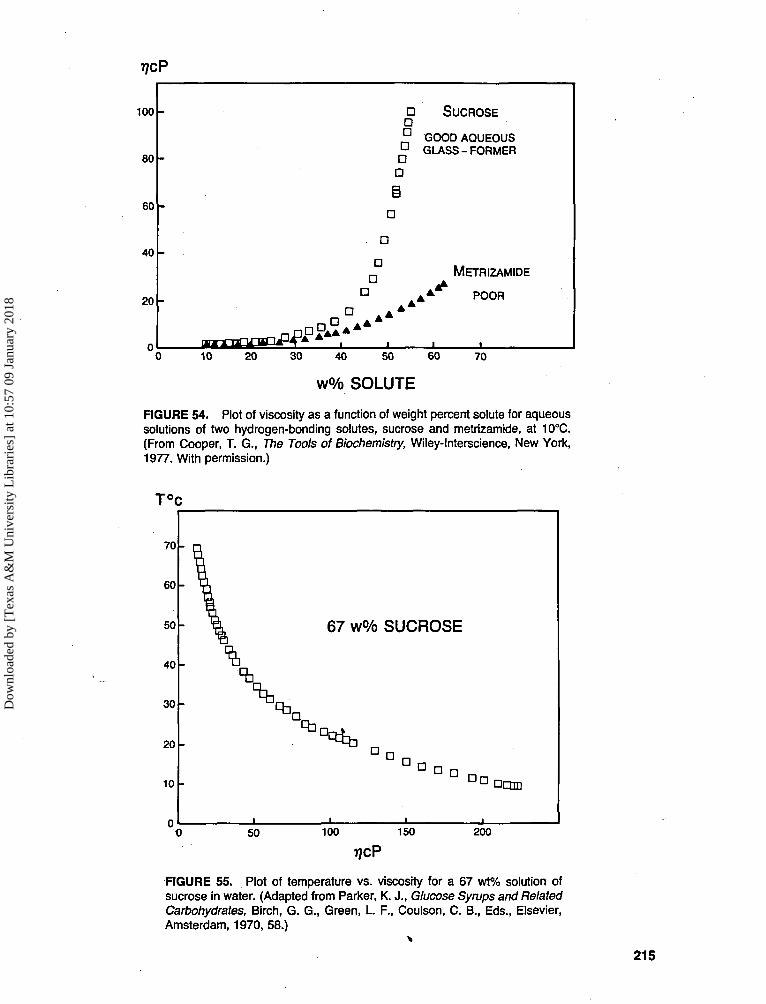
rjcP
100 -
80 -
60 -
40 -
20 -
0'—
-
•
•D•D•D
iD
• •
D•
•
SUCROSE
GOOD AQUEOUSGLASS - FORMER
METRIZAMIDE
k* POOR
• i
10 20 30 40 50 60 70
w% SOLUTE
FIGURE 54. Plot of viscosity as a function of weight percent solute for aqueoussolutions of two hydrogen-bonding solutes, sucrose and metrizamide, at 10°C.(From Cooper, T. G., The Tools of Biochemistry, Wiley-lnterscience, New York,1977. With permission.)
T°c
67 w°/o SUCROSE
FIGURE 55. Plot of temperature vs. viscosity for a 67 wt% solution ofsucrose in water. (Adapted from Parker, K. J., Glucose Syrups and RelatedCarbohydrates, Birch, G. G., Green, L. F., Coulson, C. B., Eds., Elsevier,Amsterdam, 1970, 58.)
215
Dow
nloa
ded
by [
Tex
as A
&M
Uni
vers
ity L
ibra
ries
] at
10:
57 0
9 Ja
nuar
y 20
18
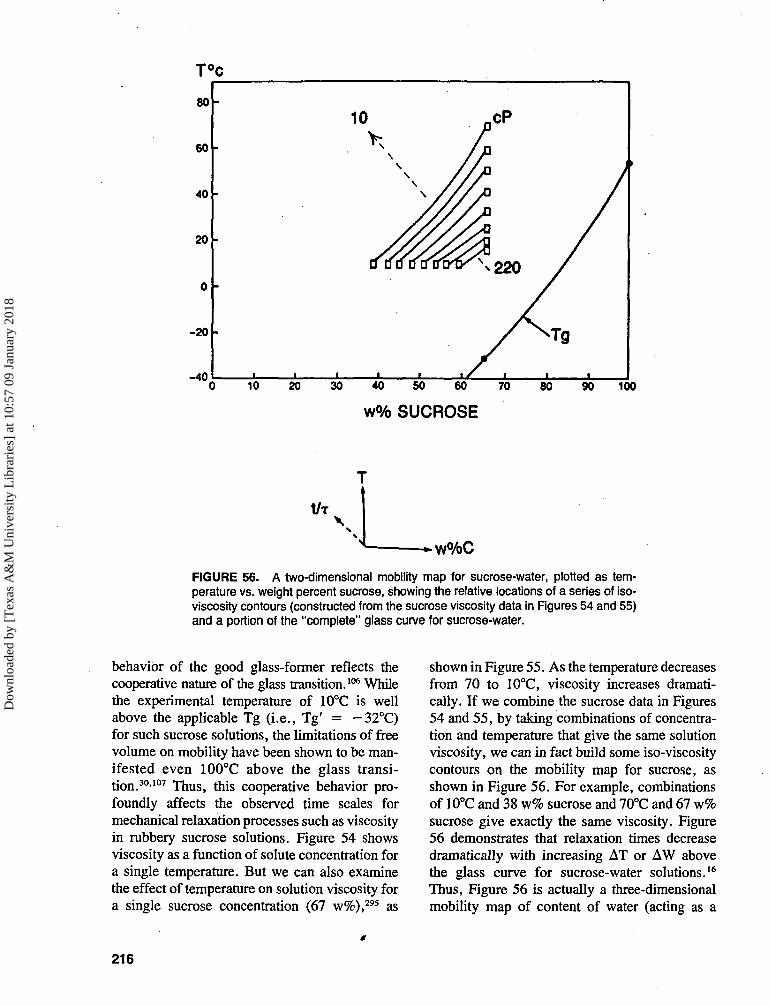
-20 h
-40"0 10 20 30 40 SO 60 70 80 90 100
w% SUCROSE
t/T
FIGURE 56. A two-dimensional mobility map for sucrose-water, plotted as tem-perature vs. weight percent sucrose, showing the relative locations of a series of iso-viscosity contours (constructed from the sucrose viscosity data in Figures 54 and 55)and a portion of the "complete" glass curve for sucrose-water.
behavior of the good glass-former reflects thecooperative nature of the glass transition.106 Whilethe experimental temperature of 10°C is wellabove the applicable Tg (i.e., Tg' = -32°C)for such sucrose solutions, the limitations of freevolume on mobility have been shown to be man-ifested even 100°C above the glass transi-tion.30-107 Thus, this cooperative behavior pro-foundly affects the observed time scales formechanical relaxation processes such as viscosityin rubbery sucrose solutions. Figure 54 showsviscosity as a function of solute concentration fora single temperature. But we can also examinethe effect of temperature on solution viscosity fora single sucrose concentration (67 w%),295 as
shown in Figure 55. As the temperature decreasesfrom 70 to 10°C, viscosity increases dramati-cally. If we combine the sucrose data in Figures54 and 55, by taking combinations of concentra-tion and temperature that give the same solutionviscosity, we can in fact build some iso-viscositycontours on the mobility map for sucrose, asshown in Figure 56. For example, combinationsof 10°C and 38 w% sucrose and 70°C and 67 w%sucrose give exactly the same viscosity. Figure56 demonstrates that relaxation times decreasedramatically with increasing AT or AW abovethe glass curve for sucrose-water solutions.16
Thus, Figure 56 is actually a three-dimensionalmobility map of content of water (acting as a
216
Dow
nloa
ded
by [
Tex
as A
&M
Uni
vers
ity L
ibra
ries
] at
10:
57 0
9 Ja
nuar
y 20
18
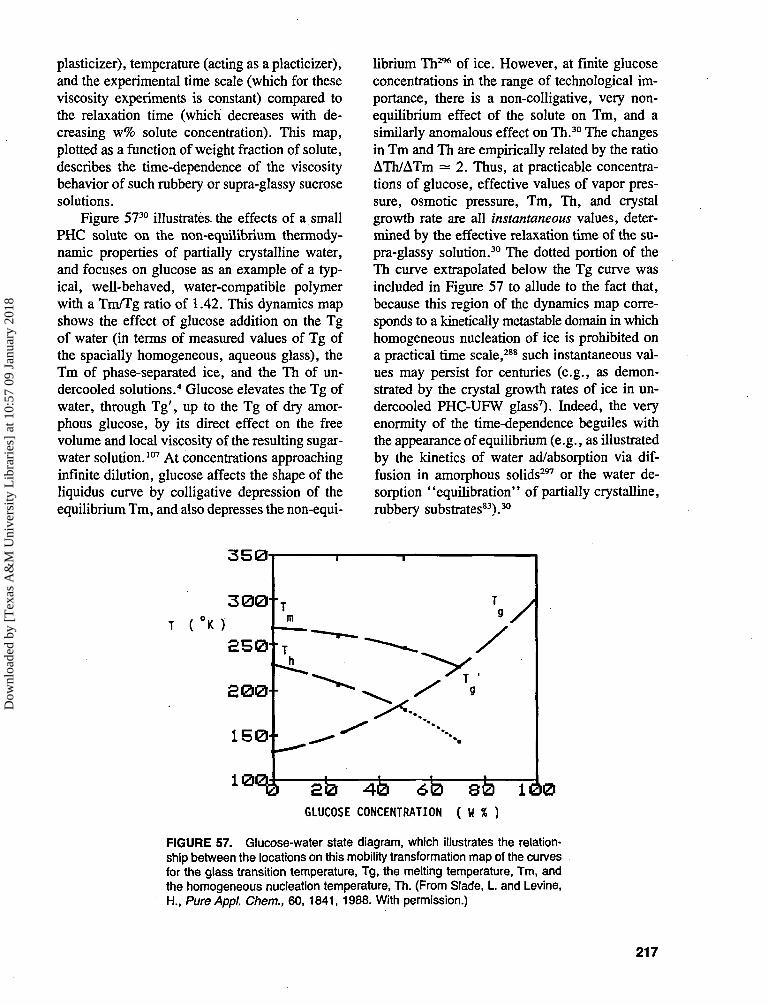
plasticizer), temperature (acting as a placticizer),and the experimental time scale (which for theseviscosity experiments is constant) compared tothe relaxation time (which decreases with de-creasing w% solute concentration). This map,plotted as a function of weight fraction of solute,describes the time-dependence of the viscositybehavior of such rubbery or supra-glassy sucrosesolutions.
Figure 5730 illustrates, the effects of a smallPHC solute on the non-equilibrium thermody-namic properties of partially crystalline water,and focuses on glucose as an example of a typ-ical, well-behaved, water-compatible polymerwith a Tm/Tg ratio of 1.42. This dynamics mapshows the effect of glucose addition on the Tgof water (in terms of measured values of Tg ofthe spacially homogeneous, aqueous glass), theTm of phase-separated ice, and the Th of un-dercooled solutions.4 Glucose elevates the Tg ofwater, through Tg', up to the Tg of dry amor-phous glucose, by its direct effect on the freevolume and local viscosity of the resulting sugar-water solution.107 At concentrations approachinginfinite dilution, glucose affects the shape of theliquidus curve by colligative depression of theequilibrium Tm, and also depresses the non-equi-
librium Th296 of ice. However, at finite glucoseconcentrations in the range of technological im-portance, there is a non-colligative, very non-equilibrium effect of the solute on Tm, and asimilarly anomalous effect on Th.30 The changesin Tm and Th are empirically related by the ratioATh/ATm = 2. Thus, at practicable concentra-tions of glucose, effective values of vapor pres-sure, osmotic pressure, Tm, Th, and crystalgrowth rate are all instantaneous values, deter-mined by the effective relaxation time of the su-pra-glassy solution.30 The dotted portion of theTh curve extrapolated below the Tg curve wasincluded in Figure 57 to allude to the fact that,because this region of the dynamics map corre-sponds to a kinetically metastable domain in whichhomogeneous nucieation of ice is prohibited ona practical time scale,288 such instantaneous val-ues may persist for centuries (e.g., as demon-strated by the crystal growth rates of ice in un-dercooled PHC-UFW glass7). Indeed, the veryenormity of the time-dependence beguiles withthe appearance of equilibrium (e.g., as illustratedby the kinetics of water ad/absorption via dif-fusion in amorphous solids297 or the water de-sorption "equilibration" of partially crystalline,rubbery substrates83).30
350
100GLUCOSE CONCENTRATION ( W % )
FIGURE 57. Glucose-water state diagram, which illustrates the relation-ship between the locations on this mobility transformation map of the curvesfor the glass transition temperature, Tg, the melting temperature, Tm, andthe homogeneous nucieation temperature, Th. (From Slade, L. and Levine,H., PureAppl. Chem., 60, 1841, 1988. With permission.)
217
Dow
nloa
ded
by [
Tex
as A
&M
Uni
vers
ity L
ibra
ries
] at
10:
57 0
9 Ja
nuar
y 20
18
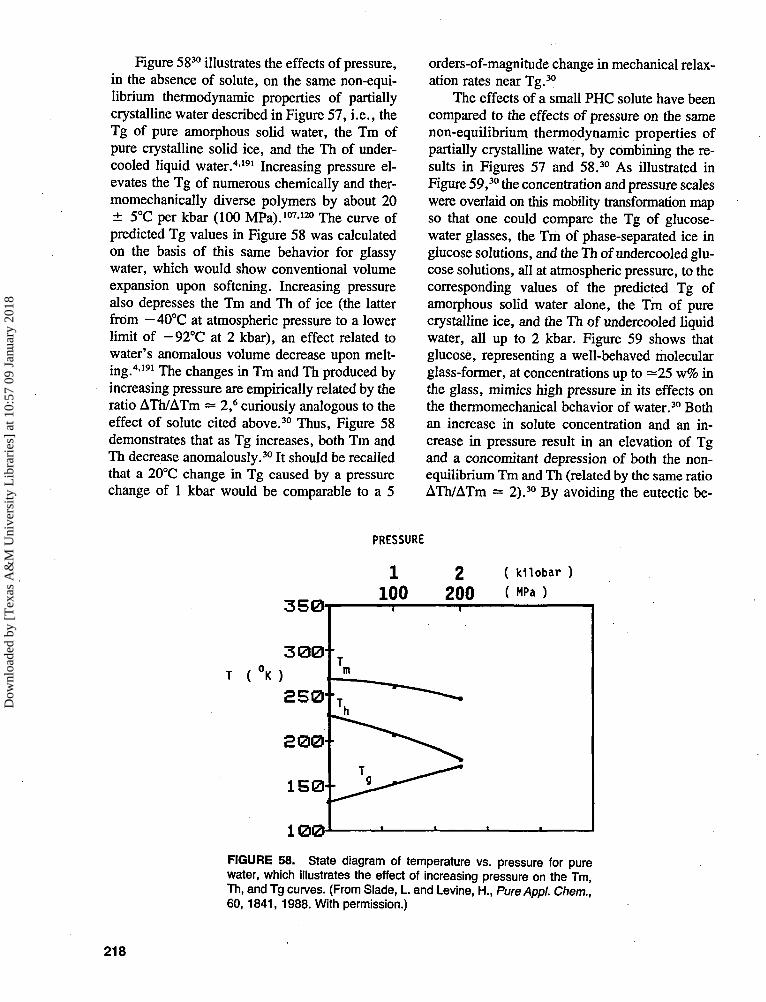
Figure 5830 illustrates the effects of pressure,in the absence of solute, on the same non-equi-librium thermodynamic properties of partiallycrystalline water described in Figure 57, i.e., theTg of pure amorphous solid water, the Tm ofpure crystalline solid ice, and the Th of under-cooled liquid water.4-191 Increasing pressure el-evates the Tg of numerous chemically and ther-momechanically diverse polymers by about 20± 5°C per kbar (100 MPa).107-120 The curve ofpredicted Tg values in Figure 58 was calculatedon the basis of this same behavior for glassywater, which would show conventional volumeexpansion upon softening. Increasing pressurealso depresses the Tm and Th of ice (the latterfrom — 40°C at atmospheric pressure to a lowerlimit of -92°C at 2 kbar), an effect related towater's anomalous volume decrease upon melt-ing.4-191 The changes in Tm and Th produced byincreasing pressure are empirically related by theratio ATh/ATm = 2,6 curiously analogous to theeffect of solute cited above.30 Thus, Figure 58demonstrates that as Tg increases, both Tm andTh decrease anomalously.30 It should be recalledthat a 20°C change in Tg caused by a pressurechange of 1 kbar would be comparable to a 5
orders-of-magnitude change in mechanical relax-ation rates near Tg.30
The effects of a small PHC solute have beencompared to the effects of pressure on the samenon-equilibrium thermodynamic properties ofpartially crystalline water, by combining the re-sults in Figures 57 and 58.30 As illustrated inFigure 59,30 the concentration and pressure scaleswere overlaid on this mobility transformation mapso that one could compare the Tg of glucose-water glasses, the Tm of phase-separated ice inglucose solutions, and the Th of undercooled glu-cose solutions, all at atmospheric pressure, to thecorresponding values of the predicted Tg ofamorphous solid water alone, the Tm of purecrystalline ice, and the Th of undercooled liquidwater, all up to 2 kbar. Figure 59 shows thatglucose, representing a well-behaved molecularglass-former, at concentrations up to —25 w% inthe glass, mimics high pressure in its effects onthe thermomechanical behavior of water.30 Bothan increase in solute concentration and an in-crease in pressure result in an elevation of Tgand a concomitant depression of both the non-equilibrium Tm and Th (related by the same ratioATh/ATm = 2).30 By avoiding the eutectic be-
350
PRESSURE
1100
2200
( kilobar )
( HPa )
100FIGURE 58. State diagram of temperature vs. pressure for purewater, which illustrates the effect of increasing pressure on the Tm,Th, and Tg curves. (From Slade, L. and Levine, H., PureAppl. Chem.,60, 1841, 1988. With permission.)
218
Dow
nloa
ded
by [
Tex
as A
&M
Uni
vers
ity L
ibra
ries
] at
10:
57 0
9 Ja
nuar
y 20
18
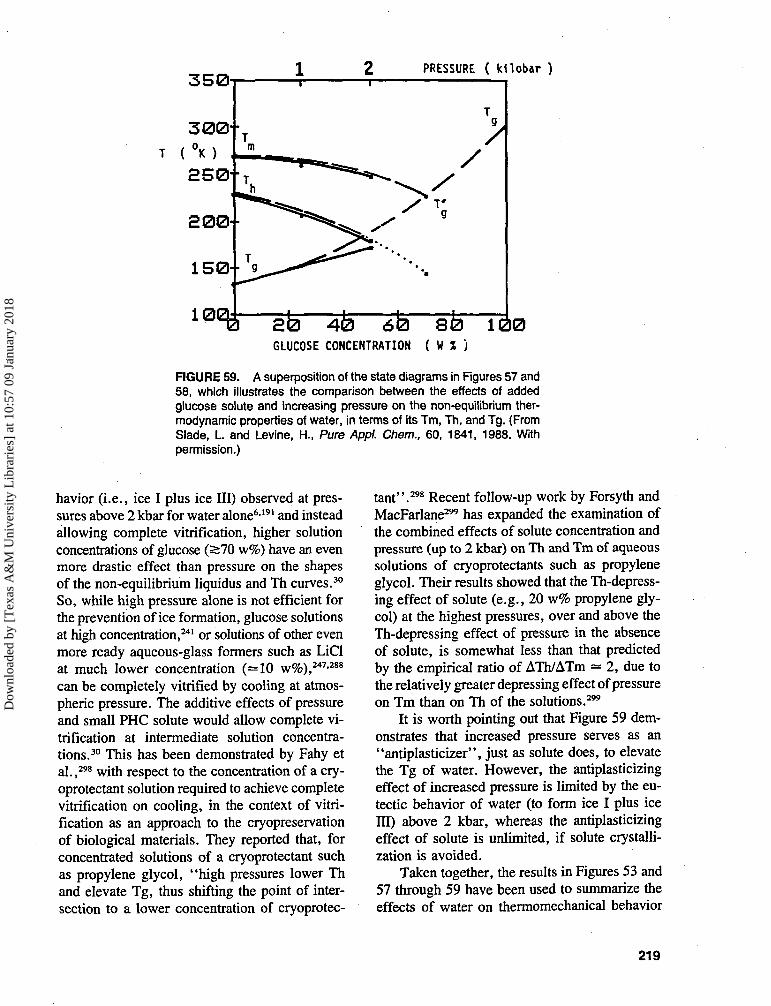
350PRESSURE ( k i lobar )
100GLUCOSE CONCENTRATION ( W X )
FIGURE 59. A superposition of the state diagrams in Figures 57 and58, which illustrates the comparison between the effects of addedglucose solute and increasing pressure on the non-equilibrium ther-modynamic properties of water, in terms of its Tm, Th, and Tg. (FromSlade, L. and Levine, H., Pure Appl. Chem., 60, 1841, 1988. Withpermission.)
havior (i.e., ice I plus ice III) observed at pres-sures above 2 kbar for water alone6-191 and insteadallowing complete vitrification, higher solutionconcentrations of glucose (S70 w%) have an evenmore drastic effect than pressure on the shapesof the non-equilibrium liquidus and Th curves.30
So, while high pressure alone is not efficient forthe prevention of ice formation, glucose solutionsat high concentration,241 or solutions of other evenmore ready aqueous-glass formers such as LiClat much lower concentration (=10 w%),247>288
can be completely vitrified by cooling at atmos-pheric pressure. The additive effects of pressureand small PHC solute would allow complete vi-trification at intermediate solution concentra-tions.30 This has been demonstrated by Fahy etal.,298 with respect to the concentration of a cry-oprotectant solution required to achieve completevitrification on cooling, in the context of vitri-fication as an approach to the cryopreservationof biological materials. They reported that, forconcentrated solutions of a cryoprotectant suchas propylene glycol, "high pressures lower Thand elevate Tg, thus shifting the point of inter-section to a lower concentration of cryoprotec-
tant".298 Recent follow-up work by Forsyth andMacFarlane299 has expanded the examination ofthe combined effects of solute concentration andpressure (up to 2 kbar) on Th and Tm of aqueoussolutions of cryoprotectants such as propyleneglycol. Their results showed that the Th-depress-ing effect of solute (e.g., 20 w% propylene gly-col) at the highest pressures, over and above theTh-depressing effect of pressure in the absenceof solute, is somewhat less than that predictedby the empirical ratio of ATh/ATm = 2, due tothe relatively greater depressing effect of pressureon Tm than on Th of the solutions.299
It is worth pointing out that Figure 59 dem-onstrates that increased pressure serves as an"antiplasticizer", just as solute does, to elevatethe Tg of water. However, the antiplasticizingeffect of increased pressure is limited by the eu-tectic behavior of water (to form ice I plus iceTH) above 2 kbar, whereas the antiplasticizingeffect of solute is unlimited, if solute crystalli-zation is avoided.
Taken together, the results in Figures 53 and57 through 59 have been used to summarize theeffects of water on thermomechanical behavior
219
Dow
nloa
ded
by [
Tex
as A
&M
Uni
vers
ity L
ibra
ries
] at
10:
57 0
9 Ja
nuar
y 20
18
of common sugars and the effects of pressure andcommon sugars on the non-equilibrium thermo-dynamics of partially crystalline water andaqueous solutions.30 The aqueous glass curves inFigure 53 have been compared,30 with emphasison the recent finding of the striking difference inlocation on the mobility map of the curves forthe two monosaccharides, fructose and glucose.14
This comparison has shown that the glass curvefor sucrose, at <50 w% solute, is located closerto that of fructose than glucose, but at >50 w%solute, sucrose is closer to glucose than fructose.In contrast, PVP-40, at <50 w% solute, is closerto glucose than fructose, but at >50 w% solute,PVP-40 is closer to fructose than glucose. Asmentioned earlier, the insight derived from theseresults has led to the new suggestion that differentportions of the glass curve must be controlled bydifferent parameters that determine molecular-level mobility, i.e., Tg is controlled by free vol-ume (a function of inverse Mn) rather than localviscosity at higher values of average MW (i.e.,higher solute concentrations in the glass, Cg),but by local viscosity (a function of Mw) ratherthan free volume at lower values of average MW(i.e., higher water concentrations in the glass,Wg).30
The origin of the empirical ratio ATh/ATm— 24-6 had been previously obscured by the ex-pectation that the liquidus curve must be colli-gatively controlled, while the Th curve is in partdiffusion-controlled. The results in Figures 53and 57 through 59 illustrated the parallel dynamiccontrol over the non-equilibrium regions of boththe liquidus and nucleation curves.30 Figure 53also points out that, at solute concentrations >20w%, fructose and glucose (of equal MW) solu-tions have very different Tm, as well as Tg, pro-files. So at these PHC concentrations (which aretechnologically the most important), the Tm curveis certainly not an equilibrium liquidus, but rathera non-equilibrium melting profile, which is af-fected by the underlying glass behavior.30 Onceagain, the explanation for this behavior derivesfrom the WLF kinetics governing the rubberydomain near Tg, where a 20°C temperature in-terval is equivalent to a range of 5 orders-of-magnitude in relaxation rates. Hence, withinpractical time frames, the immobility imposed bythe glassy domain can have an all-or-nothing ef-
fect on homogeneous nucleation and crystalgrOWth. 15.16.104,288
As mentioned earlier, the effect on water ofglucose concentrations up to 25 w% mimics theeffect of pressure up to 100 MPa, and is nearlyequivalent up to 50 w% glucose and 200 MPapressure. However, while still higher pressureleads to nucleation of ice II or growth of ice HI,4
glucose concentrations >50 w% lead to contin-ued elevation of Tg and so steadily increasinginhibition of all diffusion-limited processes, in-cluding nucleation and crystal growth of ice.15'16
As a consequence, the lower limit of Th, to whichpure water under high pressure can be under-cooled without freezing, is — 92°C.4191 In con-trast, a glucose solution, of C > Cg' — 70 w%,can be undercooled without limit, and completevitrification will prevent ice formation in prac-tical time frames.241 In fact, Franks has calculatedthat the linear growth rate of ice, in an under-cooled aqueous glass of typical viscosity of about1013 Pa s at Tg, would be about 10,000 years percm.7 It should also be noted that, as a conse-quence of the differences between the map lo-cations of the glass curves for fructose and glu-cose, the effect of fructose on the behavior ofwater is very different from the effect of pres-sure.30 Even at concentrations as low as 20 w%,fructose causes a much greater elevation of theTg of water and, concomitantly, a greater de-parture from the equilibrium liquidus curve.
As shown earlier by the results for PHCs inFigure 47, there is no correlation between Tg'and Mn of a given solute-UFW mixture, but avery good correlation between Tg' and Mw. Thesignificance of this finding has been related tothe concept of the glass transition as an iso-re-laxation state.30107 In order to explore the originof this concept, the glass curves for the four sol-utes in Figure 53 were compared on the basis ofa common value of Tg, and on the basis of aparticular, distinctive Tg, as illustrated in Table7.30 For convenience, -32°C (the Tg' of su-crose) was used as a common Tg, equivalent todrawing a horizontal line at Tg = — 32°C so thatit intersects the glass curves of Figure 53, asshown in Figure 60. The values of Tg', as op-erationally invariant properties of the individualsolutes, were used as a particular Tg. Then foreach solute, the values of Wg or Wg' corre-
220
Dow
nloa
ded
by [
Tex
as A
&M
Uni
vers
ity L
ibra
ries
] at
10:
57 0
9 Ja
nuar
y 20
18
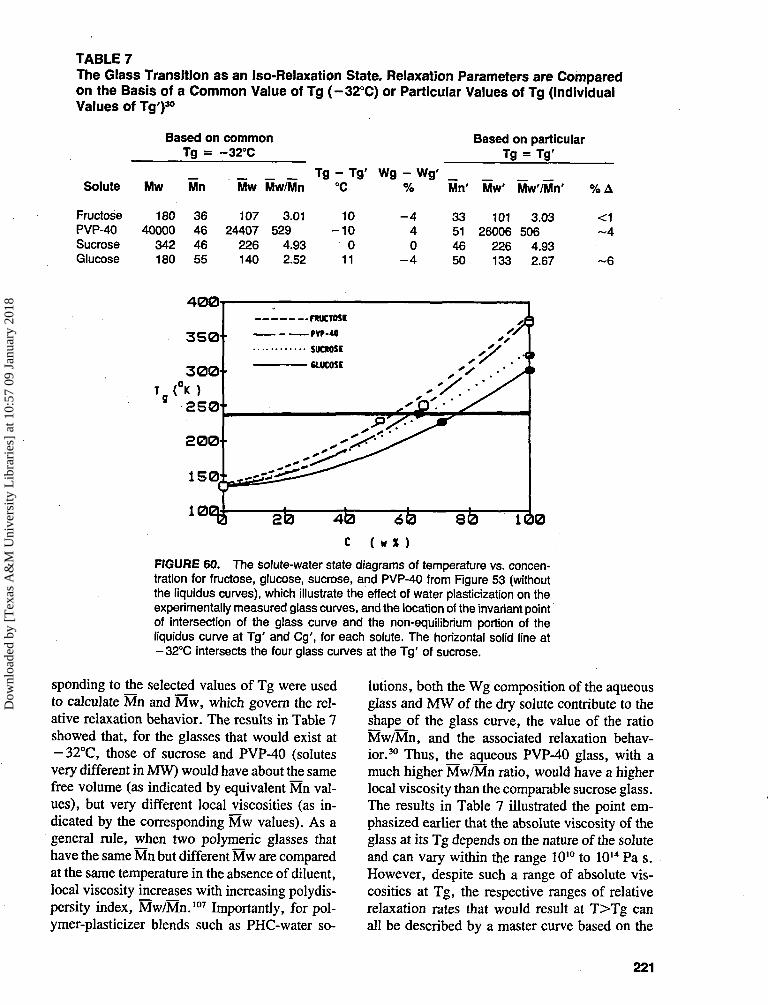
TABLE 7The Glass Transition as an Iso-Relaxation State. Relaxation Parameters are Comparedon the Basis of a Common Value of Tg (-32°C) or Particular Values of Tg (IndividualValues of Tg')30
Based on commonTg = -32°C
Based on particularTg = Tg'
Solute Mw Mn
Fructose 180 36PVP-40 40000 46Sucrose 342 46Glucose 180 55
_ _ _ Tg - Tg'Mw Mw/Mn °C
Wg - Wg' _% Mn'
107 3.0124407 529
226 4.93140 2.52
10-10
011
Mw' Mw'/Mn' %A
-4 33 101 3.03 <14 51 26006 506 ~40 46 226 4.93
-4 50 133 2.67 ~6
40" 60"
C ( « ( )
FIGURE 60. The solute-water state diagrams of temperature vs. concen-tration for fructose, glucose, sucrose, and PVP-40 from Figure 53 (withoutthe liquidus curves), which illustrate the effect of water plasticization on theexperimentally measured glass curves, and the location of the invariant pointof intersection of the glass curve and the non-equilibrium portion of theliquidus curve at Tg' and Cg', for each solute. The horizontal solid line at-32°C intersects the four glass curves at the Tg' of sucrose.
sponding to the selected values of Tg were usedto calculate Mn and Mw, which govern the rel-ative relaxation behavior. The results in Table 7showed that, for the glasses that would exist at-32°C, those of sucrose and PVP-40 (solutesvery different in MW) would have about the samefree volume (as indicated by equivalent Mn val-ues), but very different local viscosities (as in-dicated by the corresponding Mw values). As ageneral rule, when two polymeric glasses thathave the same Mn but different Mw are comparedat the same temperature in the absence of diluent,local viscosity increases with increasing polydis-persity index, Mw/Mn.107 Importantly, for pol-ymer-plasticizer blends such as PHC-water so-
lutions, both the Wg composition of the aqueousglass and MW of the dry solute contribute to theshapejof the glass curve, the value of the ratioMw/Mn, and the associated relaxation behav-ior.30 Thus, the aqueous PVP-40 glass, with amuch higher Mw/Mn ratio, would have a higherlocal viscosity than the comparable sucrose glass.The results in Table 7 illustrated the point em-phasized earlier that the absolute viscosity of theglass at its Tg depends on the nature of the soluteand can vary within the range 10'° to 1014 Pa s.However, despite such a range of absolute vis-cosities at Tg, the respective ranges of relativerelaxation rates that would result at T>Tg canall be described by a master curve based on the
221
Dow
nloa
ded
by [
Tex
as A
&M
Uni
vers
ity L
ibra
ries
] at
10:
57 0
9 Ja
nuar
y 20
18
WLF equation with appropriate respective valuesof the WLF coefficients.107 The aqueous-glassformers in Table 7 were also compared at theirindividual Tg' temperatures and characteristicWg' compositions.30 These results showed, forexample, that while the corresponding Mn' val-ues for PVP-40 and glucose are similar, indica-tive of similar free volumes, their Mw' valuesare very different. Again, this indicated that theaqueous PVP-40 glass at its Tg' has a much higherlocal viscosity, and so much longer relaxationtimes, than the aqueous glucose glass at its Tg'.This comparison shed light on the underlyingmechanism for the greater microbiological sta-bility provided by polymers and proteins than bysmall PHCs in concentrated solutions with equiv-alent RVPs, which has been observed empiri-cally, and ascribed to a hypothetical ability ofpolymers to ' 'bind'' water more tightly (so-called"polymer water") than can small PHCs (so-called"solute water").71 The actual mechanism playsan important role in the mold spore germinationexperiment mentioned earlier and discussed fur-ther later with respect to Table 2. Overall, theresults^ in Table 7 demonstrated that the ratio ofMw/Mn provides a better prediction of the shapeof the glass curve as an iso-state, which requiresa description of both the temperature and themoisture content at which relaxation times be-come limiting, than does MW or Mn or Mwalone.30
(Further comment on the concept of "poly-mer water" vs. "solute water" is in order. It hasbeen suggested30 that this distinction between sol-utes and polymers, and between their correspond-ing "states" [i.e., extents of mobility] of water,with respect to the water sorption behavior ofsuch substrates, is artificial, meaningless, andmisleading. This speculative concept of "poly-mer water" vs. "solute water", advocated bySteinberg and co-workers,71 is completely un-tested and unproven to date. It has beensuggested15 that the actual basis for a proper dis-tinction among different solid substrates, duringnon-equilibrium water sorption, lies in the struc-tural state [i.e., completely crystalline, partiallycrystalline, or completely amorphous] of a givensubstrate at a given sorption temperature. The"acid test" would be to compare the water sorp-tion behavior at 25°C of two water-compatible
substrates, a completely amorphous, high MWpolymer [e.g., water-sensitive polyvinyl acetate]and a completely amorphous, low MW solute[e.g., water-soluble maltose], of the same struc-tural and physical [i.e., solid or liquid] states atlow moisture contents. PVAc and maltose hap-pen to have essentially the same Tg values of39°C at 0 w% moisture and about 19°C at 4 w%moisture. Because amorphous maltose and PVAcshare essentially the same Tg vs. w% water "glasscurve" at these low moisture contents, they wouldbe predicted to show indistinguishable sorptionbehavior, as solid or rubbery liquid substrates,in the 0 to 4 w% moisture range at 25°C.)
The Tg'-Cg' point represents the endof ice formation in real time on cooling toT < Tg', and conversely, the beginning of icemelting and concomitant melt-dilution (i.e., theopposite of freeze-concentration) of the solute inthe aqueous rubber on heating to T > Tg'.33 Forvery dilute solutions, the shape of the equilibriumliquidus curve is defined energetically, based oncolligative freezing point depression by solute.At solute concentrations near and above the eu-tectic composition, melting of the metastable so-lution is described by a non-equilibrium exten-sion of the equilibrium liquidus curve.4-34 Thishas been illustrated by the actual state diagramfor sucrose-water shown in Figure 61,33 whichwas compiled from-several sources, includingFigure 53.15,27-30,50,133,300 A s m e n t i o n e d above, the
shape of the non-equilibrium extension of theliquidus curve is kinetically determined by theunderlying glass curve,34 as illustrated by the por-tion of the liquidus curve in Figure 61 betweenthe points Te-Ce and Tg'-Cg', where Ce is thecomposition of the eutectic mixture of pure crys-talline ice plus pure crystalline solute.33 Thus,for a typical solute that does not readily undergoeutectic crystallization on cooling (e.g., su-crose), Tg' does not represent the incidental in-tersection of an independently existing equilib-rium liquidus curve with the glass curve, butrather corresponds to the circumstantial intersec-tion of the non-equilibrium extension of the li-quidus curve and the underlying supersaturatedglass curve that determined its shape.30
The state diagram for sucrose in Figure 61has provided several noteworthy revelations con-cerning the relative locations of the glass, soli-
222
Dow
nloa
ded
by [
Tex
as A
&M
Uni
vers
ity L
ibra
ries
] at
10:
57 0
9 Ja
nuar
y 20
18
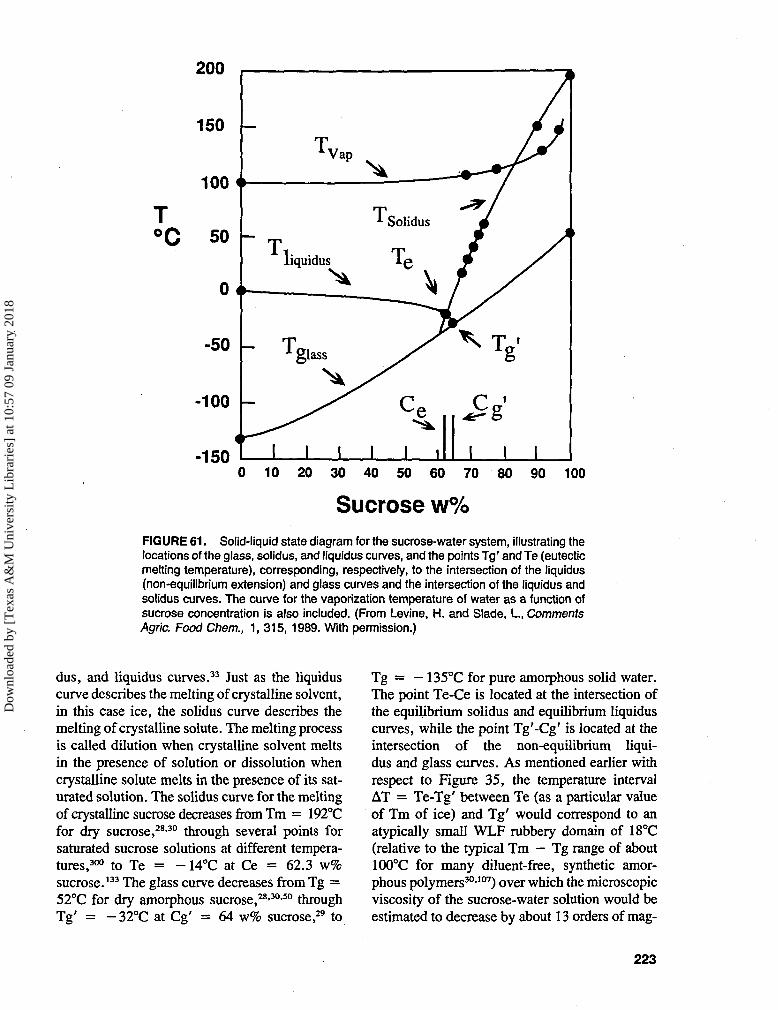
200
150 -
T°C 50
TiVap
Tliquidus
" —
- T1 glass
1 1 1
T1 Solidus
Te
I^ T g -
C '
1M i l
-50
-100 -
-1500 10 20 30 40 50 60 70 80 90 100
Sucrose w%FIGURE 61. Solid-liquid state diagram for the sucrose-water system, illustrating thelocations of the glass, solidus, and liquidus curves, and the points Tg' and Te (eutecticmelting temperature), corresponding, respectively, to the intersection of the liquidus(non-equilibrium extension) and glass curves and the intersection of the liquidus andsolidus curves. The curve for the vaporization temperature of water as a function ofsucrose concentration is also included. (From Levine, H. and Slade, I., CommentsAgric. Food Chem., 1, 315, 1989. With permission.)
dus, and liquidus curves.33 Just as the liquiduscurve describes the melting of crystalline solvent,in this case ice, the solidus curve describes themelting of crystalline solute. The melting processis called dilution when crystalline solvent meltsin the presence of solution or dissolution whencrystalline solute melts in the presence of its sat-urated solution. The solidus curve for the meltingof crystalline sucrose decreases from Tm = 192°Cfor dry sucrose,28-30 through several points forsaturated sucrose solutions at different tempera-tures,300 to Te = - 14°C at Ce = 62.3 w%sucrose.I33 The glass curve decreases from Tg =52°C for dry amorphous sucrose,28-30-50 throughTg' = -32°C at Cg' = 64 w% sucrose,29 to
Tg = — 135°C for pure amorphous solid water.The point Te-Ce is located at the intersection ofthe equilibrium solidus and equilibrium liquiduscurves, while the point Tg'-Cg' is located at theintersection of the non-equilibrium liqui-dus and glass curves. As mentioned earlier withrespect to Figure 35, the temperature intervalAT = Te-Tg' between Te (as a particular valueof Tm of ice) and Tg' would correspond to anatypically small WLF rubbery domain of 18°C(relative to the typical Tm — Tg range of about100°C for many diluent-free, synthetic amor-phous polymers30-107) over which the microscopicviscosity of the sucrose-water solution would beestimated to decrease by about 13 orders of mag-
223
Dow
nloa
ded
by [
Tex
as A
&M
Uni
vers
ity L
ibra
ries
] at
10:
57 0
9 Ja
nuar
y 20
18
nitude from the characteristic iqg at Tg'.30>89>107
(This value of At] was estimated as follows:33
(1) at Tg'-Cg\ -rjg - 1013 Pa s,89 (2) at 20°C,•n = 0.1 Pa s for 62.3 w% sucrose,300 and (3) atTe-Ce, -ne — 1 Pa s, based on an assumption ofArrhenius behavior between - 1 4 and 20°C [i.e.,at T > Tm, Q10 = 2 => a factor of 10 changefor a AT of 33°C].)30 Consequently, the rates ofdeteriorative changes that depend on constraineddiffusion in a frozen aqueous system of pure su-crose would be predicted correspondingly to in-crease by about 13 orders of magnitude vs. therates at Tg',33 with profound implications for thestorage stability and kinetics of collapse pro-cesses in frozen food systems (e.g., ice creamand other frozen desserts and novelties) for whicha freeze-concentrated sucrose solution could serveas a limiting model.32-34 It has been noted thatthe 13 orders of magnitude predicted from theWLF equation101 for the decrease in microscopicviscosity and concomitant increase in diffusion-limited relaxation rate over a rubbery domainwith a temperature span from Tg' to Tg' + 18°Care based only on the effect of increasing tem-perature above the Tg' reference state, and noton any effect of dilution due to the melting ofice, which would begin on heating to T > Tg',on the solute concentration in the rubbery fluid.33
Such an effect of melt-dilution would obviouslycause a further decrease in viscosity over andabove the WLF-governed behavior. The resultanteffect on diffusion-limited reaction rate (e.g., en-zyme-substrate interactions)8 would not be so ob-vious. The rate could increase or decrease, de-pending on whether or not the solute being dilutedis a participant in the reaction.33 The sucrose-water system shown in Figure 61 is remarkablewith respect to the minimal effect of melt-dilutionon heating from Tg' to Te. The sucrose concen-tration only decreases by 1.7 w%, from Cg' =64 w% to Ce = 62.3 w%, over a tempera-ture range of 18°C, due to the near-vertical path(compared to the path of colligative freez-ing point depression in the equilibrium portion)of the extremely non-equilibrium extension of theliquidus curve at C > Ce.33 Despite this fact, theabove discussion is not meant to negate the im-portance of melt-dilution (stressed by Simatos etal.98) as temperature is increased above Tg'.
Analogous to experience in drier systems at T >Tg' and W < Wg',28 either addition of water(AW) or increase in temperature (AT) above theglass curve accomplishes decreased relaxationtimes. However, water-rich systems differ fromdrier systems in that water is equivalently as ef-fective as temperature as a plasticizer for driersystems at C > Cg', but the practical limit ofefficacy of water as a plasticizer is exceeded atC < Cg'.26-30
PVP is a completely water-miscible, non-crystallizable, synthetic, flexible-coil polymer thatrepresents a much-studied model for amorphouspolymeric food materials.4 The state diagram forPVP-water(PVPsofMn = 104, 4.4 X 10⁴, and7 x 105) in Figure 62,15 compiled from severalsources,4>8>74>133>242>301 is the most complete onepresently available for this polymer.27 We includeit here, because this figure exemplifies in a singlediagram a number of the points illustrated by theother state diagrams described earlier. For ex-ample, as shown in Figure 62, PVP exhibits asmooth Tg curve from about 100°C for dry PVP-44 to — 135°C for amorphous solid water. Aswith the various other water-compatible materialsdescribed earlier, the plasticizing effect of wateron the Tg of PVP is most dramatic at low mois-ture contents, such that for PVP-44, Tg decreasesby about 6°C/w% water for the first 10 w%.Figure 62 also illustrates that the phenomenolog-ical threshold temperatures for different collapseprocesses all correspond to the particular Tg' (orother Tg relevant to the situation in question),which is a function of the MW and concentrationof the solute.8-27 Thus, for PVP-44, Tg' = Tr =Tc = -21.5°C and Cg' = 65 w% PVP (Wg' =0.54 g UFW/g PVP),4-8-133-242 while for PVP-700,Tg = Tc = T sticky point = 120°C at about5 w% residual moisture.27 The equivalent of Trfor ice or solute recrystallization, Tc for collapse,and the concentration-invariant Tg' for an ice-containing system has explained8 why Tr and Tcare always observed to be concentration-inde-pendent for any initial solute concentration lowerthan Cg',4-260 as illustrated in Figure 62. Figure62 also illustrates the effect of increasing soluteMW on dry Tg (which increases in the orderPVP-10 < PVP-44 < PVP-700) and on Tg' andCg'. As mentioned earlier, with increasing solute
224
Dow
nloa
ded
by [
Tex
as A
&M
Uni
vers
ity L
ibra
ries
] at
10:
57 0
9 Ja
nuar
y 20
18

Grams Water/Gram PVP
2.3 1.5 1 0.67 0.43 0.25 0.11 0i
i PVP-700
PVP-44
PVP-10
10 20 30 40 50 60 70 80 90 100
Weight Percent PVP
FIGURE 62. Solid-liquid state diagram for water-PVP, showing the following tran-sitions: Tm, Tg, Tg', Td, Tr, Tc. ( = PVP-44, = PVP-700, - • - • - • - • - • -• - • - • - = PVP-10.) (From Levine, H. and Slade, I., Water Science Reviews, Vol. 3,Franks, F., Ed., Cambridge University Press, Cambridge, 1988,79. With permission.)
MW, the Tg'-Cg' point moves up the temperatureaxis toward 0°C and to the right along the com-position axis toward 100 w% solute.8
C. Cryostabilization Technology
"Cryostabilization technology"8>27>31-34 rep-resents a new conceptual approach to a practicalindustrial technology for the stabilization duringprocessing and storage of frozen, freezer-stored,and freeze-dried foods. This technology emergedfrom our food polymer science research approachand developed from a fundamental understandingof the critical physicochemical and thermome-
chanical structure-property relationships that un-derlie the behavior of water in all non-equilibriumfood systems at subzero temperatures.46 Cryos-tabilization provides a means of protecting prod-ucts, stored for long periods at typical freezertemperatures (e.g., Tf = -18°C), from dele-terious changes in texture (e.g., "grain growth"of ice, solute crystallization), structure (e.g., col-lapse, shrinkage), and chemical composition(e.g., enzymatic activity, oxidative reactions suchas fat rancidity, flavor/color degradation). Suchchanges are exacerbated in many typical fabri-cated foods whose formulas are dominated bylow MW carbohydrates. The key to this protec-tion, and resulting improvement in product qual-
225
Dow
nloa
ded
by [
Tex
as A
&M
Uni
vers
ity L
ibra
ries
] at
10:
57 0
9 Ja
nuar
y 20
18
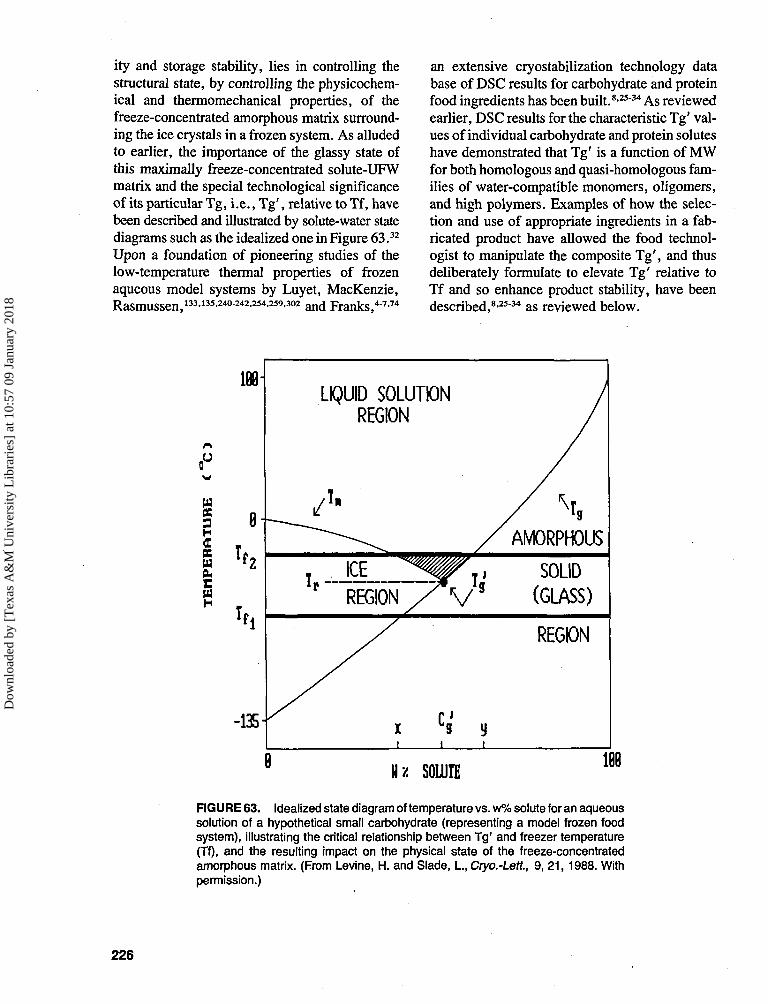
ity and storage stability, lies in controlling thestructural state, by controlling the physicochem-ical and thermomechanical properties, of thefreeze-concentrated amorphous matrix surround-ing the ice crystals in a frozen system. As alludedto earlier, the importance of the glassy state ofthis maximally freeze-concentrated solute-UFWmatrix and the special technological significanceof its particular Tg, i.e., Tg' , relative to Tf, havebeen described and illustrated by solute-water statediagrams such as the idealized one in Figure 63.32
Upon a foundation of pioneering studies of thelow-temperature thermal properties of frozenaqueous model systems by Luyet, MacKenzie,Rasmussen,133-135-240-242-254-259-302 and Franks,4"7-74
an extensive cryostabilization technology database of DSC results for carbohydrate and proteinfood ingredients has been built.8-25'34 As reviewedearlier, DSC results for the characteristic Tg' val-ues of individual carbohydrate and protein soluteshave demonstrated that Tg' is a function of MWfor both homologous and quasi-homologous fam-ilies of water-compatible monomers, oligomers,and high polymers. Examples of how the selec-tion and use of appropriate ingredients in a fab-ricated product have allowed the food technol-ogist to manipulate the composite Tg', and thusdeliberately formulate to elevate Tg' relative toTf and so enhance product stability, have beendescribed,8-25'34 as reviewed below.
WDC
H
cKWD-W
LIQUID SOLUTION
-135
Hx SOLUTEFIGURE 63. Idealized state diagram of temperature vs. w% solute for an aqueoussolution of a hypothetical small carbohydrate (representing a model frozen foodsystem), illustrating the critical relationship between Tg' and freezer temperature(Tf). and the resulting impact on the physical state of the freeze-concentratedamorphous matrix. (From Levine, H. and Slade, I., Cryo.-Lett., 9, 21, 1988. Withpermission.)
226
Dow
nloa
ded
by [
Tex
as A
&M
Uni
vers
ity L
ibra
ries
] at
10:
57 0
9 Ja
nuar
y 20
18
1. Historical Relationship betweenCryotechnology and CollapsePhenomena
Much of our understanding of the thermaland thermomechanical properties of concentratedaqueous solutions has been derived from exten-sive studies of small glass-forming carbohydratesat subzero temperatures. These studies, whichbegan over 50 years ago with the seminal workof Luyet,302 have established that Tr, the mic-roscopically observed temperature of irruptive icerecrystallization in such glass-forming systemsof low MW sugars and polyols,4-74-133-240"242-250-261
coincides with the solute-specific Tg' measuredby thermal or thermomechanical analy-s i s 6.8.27.29.31.4CM2.50.262 J{ h a g ^ b e £ n r e c o g n i z e d
that ice recrystallization is but one of many pos-sible manifestations (referred to as collapse phe-nomena) of the dynamically controlled behaviorof aqueous glasses and rubbers, which exist atsubzero temperatures in kinetically constrained,metastable states rather than equilibriumphases.8-2534 Generic use of the term "rubber"in this context describes all glass-forming liquidsat Tg < T < Tm, including both molecular rub-bers (viscous liquids) of low MW monomers andoligomers and viscoelastic network-forming rub-bers of entangling high polymers.
As introduced earlier, a unifying concept forinterpreting collapse phenomena, based on glassdynamics, has been described.8-27 Collapse phe-nomena have been defined as macroscopic andmicroscopic relaxation processes. These trans-lational and rotational diffusion-limited, mate-rial-specific, structural and/or mechanical relax-ation processes occur far from equilibrium33 andare therefore governed by the critical systemvariables of moisture content, temperature, andtime.303 Collapse processes occur at a char-acteristic collapse transition temperature,jCj4,64,66,i35,i36 w n j c n c a n c o i n c i d e , on a com-
parable time scale (e.g., during storage), with anunderlying Tg,8 or can be manifested in real time(e.g., during processing) at a temperature about20°C above Tg (i.e., at a relaxation rate 105 fasterthan at Tg).30-33-66 At the relaxation temperature,moisture content is the critical determinant ofcollapse and its consequences,138 through theplasticizing effect of water on Tg of the amor-
phous regions in both glassy and partially crys-talline food polymer systems. Because the ki-netics of collapse processes are governed by thefree volume, local viscosity, and resultant mo-bility of the water-plasticized glass or rubber,30
the effect of plasticization (leading to increasedfree volume and mobility in the dynamically con-strained glass) by water on Tg is a key aspect ofcollapse and its mechanism.8-27-28>66 In the rub-bery liquid, rates of all translational and rota-tional diffusion-limited relaxation processes, in-cluding structural collapse and recrystallization,increase according to WLF kinetics with increas-ing AT above Tg.8-3066
A generalized physicochemical mechanismfor collapse, based on occurrence of the material-specific structural transition at Tg, followed byviscous flow in the rubbery liquid state,137 hasbeen derived from WLF theory and described asfollows.827 When the ambient temperature (dur-ing processing or storage) becomes greater thanTg, the free volume of the system increases, lead-ing to increased cooperative mobility in the en-vironment of polymer chain segments or smallmolecules in the amorphous regions of both glassyand partially crystalline systems. Consequently,the local viscosity of the dynamically constrainedsolid falls below the characteristic microscopicviscosity of about 1012 Pa s at Tg,289 which per-mits viscous liquid flow.137 In this rubbery state,translational diffusion can occur on a practicaltime scale, and diffusion-limited relaxations(which also frequently exhibit a prerequisite fornucleation) are free to proceed with rates definedby the WLF equation (i.e., rates that increaselogarithmically in a non-linear fashion with in-creasing AT above Tg). The generalization of thismechanism is made possible by the fact that thereare two paths by which the ambient temperaturecan become greater than Tg.26 Heating (plasti-cization by heat) elevates the ambient tempera-ture to above Tg for both diluent-free (bone-dry)and diluted (water-containing) systems. Increas-ing the moisture content (plasticization by water)depresses the Tg to below the ambient temper-ature for diluted systems only.
A comparison of literature values of subzerocollapse transition temperatures for an exten-sive list of water-compatible monomers and poly-mers (shown in Table 827) has established the
227
Dow
nloa
ded
by [
Tex
as A
&M
Uni
vers
ity L
ibra
ries
] at
10:
57 0
9 Ja
nuar
y 20
18
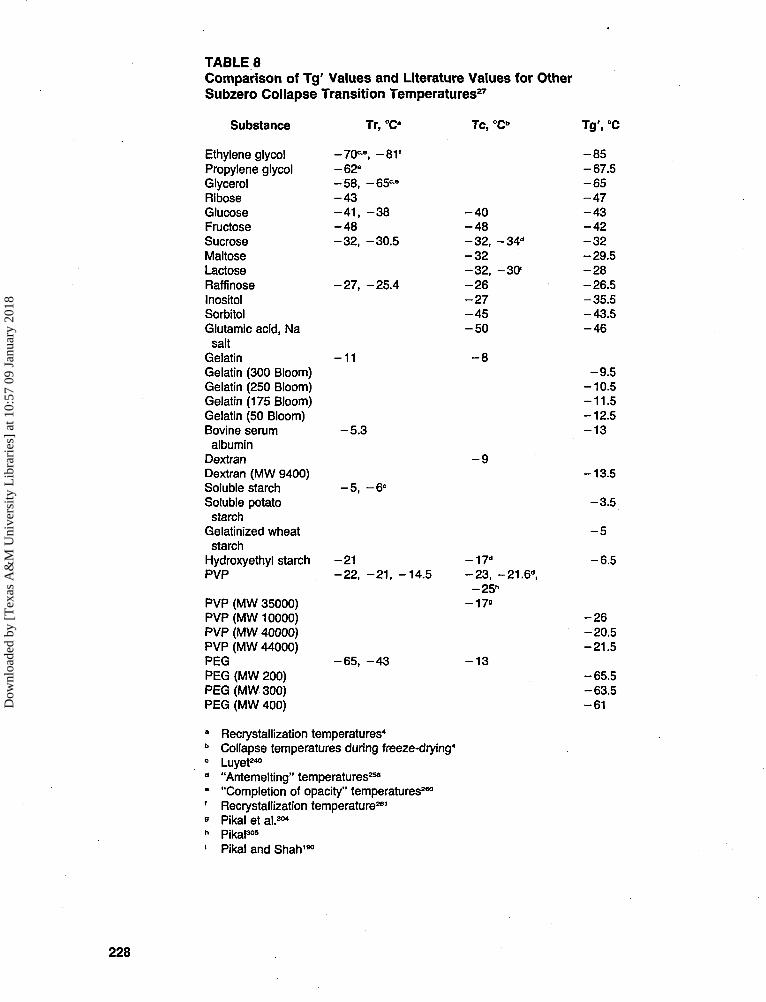
TABLE 8Comparison of Tg' Values and Literature Values for OtherSubzero Collapse Transition Temperatures27
Substance Tr, °C Tc, "C" Tg', °C
Ethylene glycol -7(F', - 8 1 ' - 8 5Propylene glycol -62° -67.5Glycerol - 5 8 , - 6 5 " - 6 5Ribose - 4 3 - 4 7Glucose - 4 1 , - 3 8 - 4 0 - 4 3Fructose - 4 8 - 4 8 - 4 2Sucrose - 3 2 , -30.5 - 3 2 , - 3 4 " - 3 2Maltose - 3 2 -29.5Lactose - 3 2 , -30 ' - 2 8Raffinose - 2 7 , -25.4 - 2 6 -26.5Inositol - 2 7 -35.5Sorbitol - 4 5 -43.5Glutamic acid, Na - 5 0 - 4 6
saltGelatin - 1 1 - 8Gelatin (300 Bloom) -9 .5Gelatin (250 Bloom) -10.5Gelatin (175 Bloom) -11.5Gelatin (50 Bloom) -12.5Bovine serum - 5 . 3 - 1 3albumin
Dextran - 9Dextran (MW 9400) -13.5Soluble starch - 5 , - 6 C
Soluble potato - 3 . 5starch
Gelatinized wheat - 5starch
Hydroxyethyl starch - 2 1 - 1 7 d - 6 .5PVP -22, - 2 1 , -14 .5 - 2 3 , -21.6d ,
- 2 5 "PVP (MW 35000) -17=PVP (MW 10000) - 2 6PVP (MW 40000) -20.5PVP (MW 44000) -21.5PEG - 6 5 , - 4 3 - 1 3PEG (MW 200) -65.5PEG (MW 300) -63.5PEG (MW 400) - 6 1
a Recrystallization temperatures"b Collapse temperatures during freeze-drying4
c Luyet240
d "Antemelting" temperatures258
e "Completion of opacity" temperatures260
' Recrystallization temperature261
8 Pikal et al.304
h Pikal305
1 Pikal and Shah190
228
Dow
nloa
ded
by [
Tex
as A
&M
Uni
vers
ity L
ibra
ries
] at
10:
57 0
9 Ja
nuar
y 20
18

fundamental identity of Tg' with the minimumonset temperatures observed for various struc-tural collapse and recrystallization processes,8-27
for both model solutions and real systems offoods, as well as pharmaceuticals and biologic-^4,4042,190,262,304-306 . j ^ J c ^ T f ^ ^ Q{ fr().
zen or vitrified samples, such as those in Table8, are typically determined by cryomicros-copy,135-304-305 thermal analysis,307 or electricalresistance measurements,258 on an experimentaltime scale similar to that for Tg' by DSC.190-262
A comprehensive list of collapse processes (shownin Table 98), all of which are governed by Tg'of frozen systems (or a higher Tg pertaining tolow-moisture systems processed or stored at T >0°C) and involve potentially detrimental plastic-ization by water, has been identified and eluci-dated.815-25-28-31-34 Part B of Table 9 is includedto emphasize how the Tg values relevant to bothlow- and high-temperature collapse processes aresystematically related through the correspondingwater contents, thus illustrating how this inter-pretation of collapse phenomena has been gen-eralized to include both high-temperature/low-moisture and low-temperature/high-moisture foodproducts and processes.8-27-28 Table 9 containsextensive references from the food science andtechnology literature to specific examples of bothlow-temperature/high-moisture and high-temper-ature/low-moisture collapse processes. In allcases, a partially or completely amorphous sys-tem in the mechanical solid state at T < Tg andlocal viscosity >-ng would be stable against col-lapse, within the period of experimental mea-surements of Tg, Tc, and/or Tr.8-66 Increasedmoisture content (and concomitant plasticization)would lead to decreased stability and shelf-life,at any particular storage temperature.126-138 Thevarious phenomenonological threshold tempera-tures for the diverse collapse processes listed inTable 9 all correspond to the particular Tg' orother Tg relevant to the solute(s) system and itscontent of plasticizing water.8-27
The examination of the relationship betweencryostabilization technology and collapse pro-cesses, and the interpretation of the latter withina conceptual context of glass dynamics, has re-sulted in a conclusion and explanation of the fun-damental equivalence of Tg, Tc, and Tr, and theirdependence on solute MW and concentration.815
This new interpretive approach has provided abetter qualitative understanding of empirical re-sults previously observed but not explained on abasis of polymer structure-property principles.136
While the similarity and apparent identity of mea-sured Tc and Tr values for various frozen aqueousmodel systems (as illustrated in Table 8) hadoften been noted,4-6-254 the conclusion regardingthe fundamental equivalence of Tg, Tc, and Tr8
represented a departure from the previous liter-ature. For example, while To and Flink136 hadacknowledged that "the relationship between Tcand MW is identical to the equation for Tg ofmixed polymers" and that "collapse and glasstransition are (clearly) phenomenologically sim-ilar events," they differentiated between Tg andTc by pointing out that "while glass transitionsin polymeric materials are generally reversible,the collapse of freeze-dried matrices is irrever-sible". A molecular-level examination of this ar-gument, which had been based on the observationof a macroscopic structural change, has shownit to be misleading.27 At the molecular level, theglass transition for an amorphous thermoplasticaqueous food material is reversible, if the watercontent of the glass is always <Wg'. That is, aglass at Tg'-Wg' can be repeatedly warmed andrecooled (slowly) over a completely reversibleT-W path between its solid and liquid states. Thesame is true for a completely amorphous (andnon-crystallizable) freeze-dried material. Obser-vation of irreversible collapse for a porous matrixdoes not negate the underlying reversibility be-tween molecular states. Irreversible loss of po-rosity is simply a macroscopic, morphologicalconsequence of viscous flow in the rubbery stateat T > Tg, whereby a porous glass relaxes ("meltsback") to a lower-viscosity fluid that is incapableof supporting its own weight against flow andthus becomes non-porous and more dense. Asshown in Table 9, the same is true for shrinkagedue to loss of entrapped leavening gases in frozenbread dough blanks or loss of overrun in ice creamproducts stored at Tf > Tg'.25-32 Subsequent re-cooling to T < Tg yields a non-porous glass ofthe original composition, which can then be tem-perature-cycled with even macroscopic reversi-bility. The only irreversible aspect of this typeof Tg-govemed structural collapse is loss of po-rosity. However, as alluded to in Table 9, a dif-
229
Dow
nloa
ded
by [
Tex
as A
&M
Uni
vers
ity L
ibra
ries
] at
10:
57 0
9 Ja
nuar
y 20
18
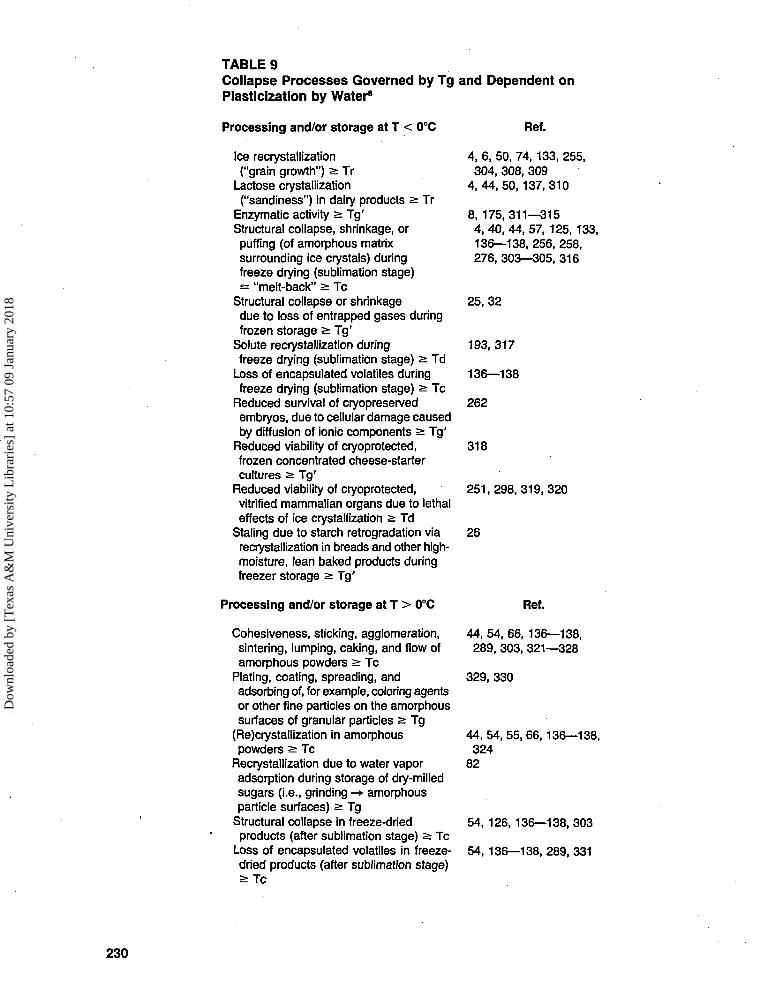
TABLE 9Collapse Processes Governed by Tg and Dependent onPlasticization by Water8
Processing and/or storage at T < 0°C
Ice recrystallization("grain growth") s Tr
Lactose crystallization("sandiness") in dairy products a Tr
Enzymatic activity > Tg'Structural collapse, shrinkage, orpuffing (of amorphous matrixsurrounding ice crystals) duringfreeze drying (sublimation stage)s "melt-back" > Tc
Structural collapse or shrinkagedue to loss of entrapped gases duringfrozen storage s: Tg'
Solute recrystallization duringfreeze drying (sublimation stage) a Td
Loss of encapsulated volatiles duringfreeze drying (sublimation stage) a Tc
Reduced survival of cryopreservedembryos, due to cellular damage causedby diffusion of ionic components a Tg'
Reduced viability of cryoprotected,frozen concentrated cheese-startercultures a Tg'
Reduced viability of cryoprotected,vitrified mammalian organs due to lethaleffects of ice crystallization a Td
Staling due to starch retrogradation viarecrystallization in breads and other high-moisture, lean baked products duringfreezer storage > Tg'
Processing and/or storage at T > 0°C
Cohesiveness, sticking, agglomeration,sintering, lumping, caking, and flow ofamorphous powders > Tc
Plating, coating, spreading, andadsorbing of, for example, coloring agentsor other fine particles on the amorphoussurfaces of granular particles a Tg
(Re)crystallization in amorphouspowders a Tc
Recrystallization due to water vaporadsorption during storage of dry-milledsugars (i.e., grinding -»• amorphousparticle surfaces) a Tg
Structural collapse in freeze-driedproducts (after sublimation stage) a Tc
Loss of encapsulated volatiles in freeze-dried products (after sublimation stage)
Ref.
4, 6, 50, 74, 133, 255,304, 308, 309
4,44,50,137,310
8,175,311-3154, 40, 44, 57, 125, 133,136—138, 256, 258,276, 303—305, 316
25,32
193,317
136—138
262
318
251,298,319,320
26
Ref.
44, 54, 66, 136—138,289, 303, 321—328
329, 330
44,54,55,66,136—138,324
82
54, 126, 136—138, 303
54, 136—138, 289, 331
230
Dow
nloa
ded
by [
Tex
as A
&M
Uni
vers
ity L
ibra
ries
] at
10:
57 0
9 Ja
nuar
y 20
18
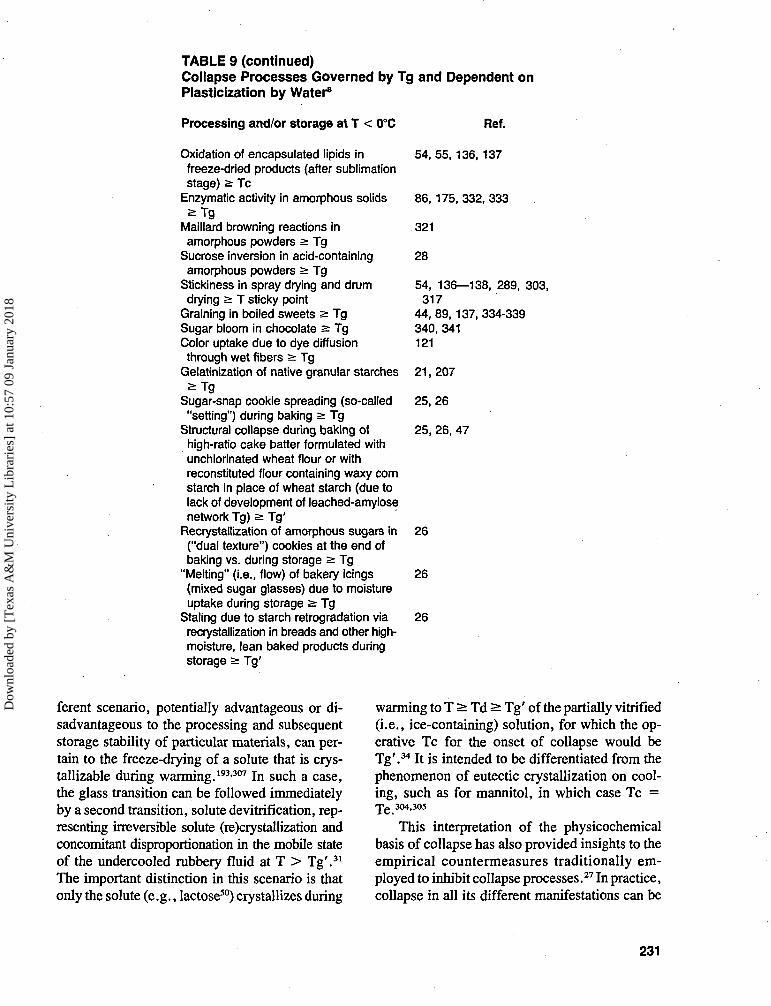
TABLE 9 (continued)Collapse Processes Governed by Tg and Dependent onPlasticization by Water8
Processing and/or storage at T < 0°C
Oxidation of encapsulated lipids infreeze-dried products (after sublimationstage) a Tc
Enzymatic activity in amorphous solids^ T g
Maillard browning reactions inamorphous powders a Tg
Sucrose inversion in acid-containingamorphous powders > Tg
Stickiness in spray drying and drumdrying a T sticky point
Graining in boiled sweets 2 TgSugar bloom in chocolate 2 TgColor uptake due to dye diffusionthrough wet fibers > Tg
Gelatinization of native granular starches^ T g
Sugar-snap cookie spreading (so-called"setting") during baking > Tg
Structural collapse during baking ofhigh-ratio cake batter formulated withunchlorinated wheat flour or withreconstituted flour containing waxy cornstarch in place of wheat starch (due tolack of development of leached-amylosenetwork Tg) a Tg'
Recrystallization of amorphous sugars in("dual texture") cookies at the end ofbaking vs. during storage a Tg
"Melting" (i.e., flow) of bakery icings(mixed sugar glasses) due to moistureuptake during storage a Tg
Staling due to starch retrogradation viarecrystallization in breads and other high-moisture, lean baked products duringstorage > Tg'
Ref.
54, 55, 136, 137
86, 175, 332, 333
321
28
54, 136—138, 289, 303,317
44, 89, 137, 334-339340,341121
21,207
25,26
25, 26, 47
26
26
26
ferent scenario, potentially advantageous or di-sadvantageous to the processing and subsequentstorage stability of particular materials, can per-tain to the freeze-drying of a solute that is crys-tallizable during warming.193-307 In such a case,the glass transition can be followed immediatelyby a second transition, solute devitrification, rep-resenting irreversible solute (re)crystaUization andconcomitant disproportionation in the mobile stateof the undercooled rubbery fluid at T > Tg'.31
The important distinction in this scenario is thatonly the solute (e.g., lactose50) crystallizes during
warming to T > Td S: Tg' of the partially vitrified(i.e., ice-containing) solution, for which the op-erative Tc for the onset of collapse would beTg'.34 It is intended to be differentiated from thephenomenon of eutectic crystallization on cool-ing, such as for mannitol, in which case Tc =Tg 304,305
This interpretation of the physicochemicalbasis of collapse has also provided insights to theempirical countermeasures traditionally em-ployed to inhibit collapse processes.27 In practice,collapse in all its different manifestations can be
231
Dow
nloa
ded
by [
Tex
as A
&M
Uni
vers
ity L
ibra
ries
] at
10:
57 0
9 Ja
nuar
y 20
18
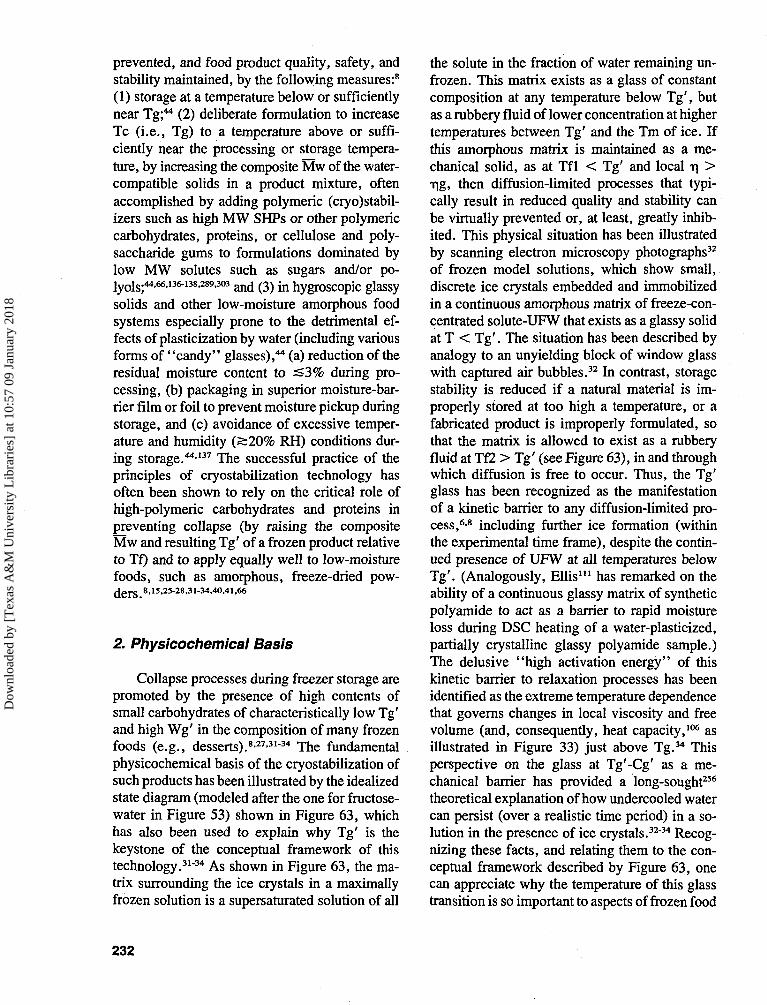
prevented, and food product quality, safety, andstability maintained, by the following measures:8
(1) storage at a temperature below or sufficientlynear Tg;44 (2) deliberate formulation to increaseTc (i.e., Tg) to a temperature above or suffi-ciently near the processing or storage tempera-ture, by increasing the composite Mw of the water-compatible solids in a product mixture, oftenaccomplished by adding polymeric (cryo)stabil-izers such as high MW SHPs or other polymericcarbohydrates, proteins, or cellulose and poly-saccharide gums to formulations dominated bylow MW solutes such as sugars and/or po-]yols;44,66,136-138,289.303 ^ (3) ^ hygTOSCOpJC glaSSy
solids and other low-moisture amorphous foodsystems especially prone to the detrimental ef-fects of plasticization by water (including variousforms of "candy" glasses),44 (a) reduction of theresidual moisture content to =£3% during pro-cessing, (b) packaging in superior moisture-bar-rier film or foil to prevent moisture pickup duringstorage, and (c) avoidance of excessive temper-ature and humidity (S20% RH) conditions dur-ing storage.44-137 The successful practice of theprinciples of cryostabilization technology hasoften been shown to rely on the critical role ofhigh-polymeric carbohydrates and proteins inpreventing collapse (by raising the compositeMw and resulting Tg' of a frozen product relativeto Tf) and to apply equally well to low-moisturefoods, such as amorphous, freeze-dried pow-ders 8.15.25-28,31-34.40,41,66
2. Physicochemical Basis
Collapse processes during freezer storage arepromoted by the presence of high contents ofsmall carbohydrates of characteristically low Tg'and high Wg' in the composition of many frozenfoods (e.g., desserts).8-273134 The fundamentalphysicochemical basis of the cryostabilization ofsuch products has been illustrated by the idealizedstate diagram (modeled after the one for fructose-water in Figure 53) shown in Figure 63, whichhas also been used to explain why Tg' is thekeystone of the conceptual framework of thistechnology.3134 As shown in Figure 63, the ma-trix surrounding the ice crystals in a maximallyfrozen solution is a supersaturated solution of all
the solute in the fraction of water remaining un-frozen. This matrix exists as a glass of constantcomposition at any temperature below Tg', butas a rubbery fluid of lower concentration at highertemperatures between Tg' and the Tm of ice. Ifthis amorphous matrix is maintained as a me-chanical solid, as at Tfl < Tg' and local -n >•ng, then diffusion-limited processes that typi-cally result in reduced quality and stability canbe virtually prevented or, at least, greatly inhib-ited. This physical situation has been illustratedby scanning electron microscopy photographs32
of frozen model solutions, which show small,discrete ice crystals embedded and immobilizedin a continuous amorphous matrix of freeze-con-centrated solute-UFW that exists as a glassy solidat T < Tg'. The situation has been described byanalogy to an unyielding block of window glasswith captured air bubbles.32 In contrast, storagestability is reduced if a natural material is im-properly stored at too high a temperature, or afabricated product is improperly formulated, sothat the matrix is allowed to exist as a rubberyfluid at Tf2 > Tg' (see Figure 63), in and throughwhich diffusion is free to occur. Thus, the Tg'glass has been recognized as the manifestationof a kinetic barrier to any diffusion-limited pro-cess,6-8 including further ice formation (withinthe experimental time frame), despite the contin-ued presence of UFW at all temperatures belowTg'. (Analogously, Ellis111 has remarked on theability of a continuous glassy matrix of syntheticpolyamide to act as a barrier to rapid moistureloss during DSC heating of a water-plasticized,partially crystalline glassy polyamide sample.)The delusive "high activation energy" of thiskinetic barrier to relaxation processes has beenidentified as the extreme temperature dependencethat governs changes in local viscosity and freevolume (and, consequently, heat capacity,106 asillustrated in Figure 33) just above Tg.34 Thisperspective on the glass at Tg'-Cg' as a me-chanical barrier has provided a long-sought256
theoretical explanation of how undercooled watercan persist (over a realistic time period) in a so-lution in the presence of ice crystals.32'34 Recog-nizing these facts, and relating them to the con-ceptual framework described by Figure 63, onecan appreciate why the temperature of this glasstransition is so important to aspects of frozen food
232
Dow
nloa
ded
by [
Tex
as A
&M
Uni
vers
ity L
ibra
ries
] at
10:
57 0
9 Ja
nuar
y 20
18
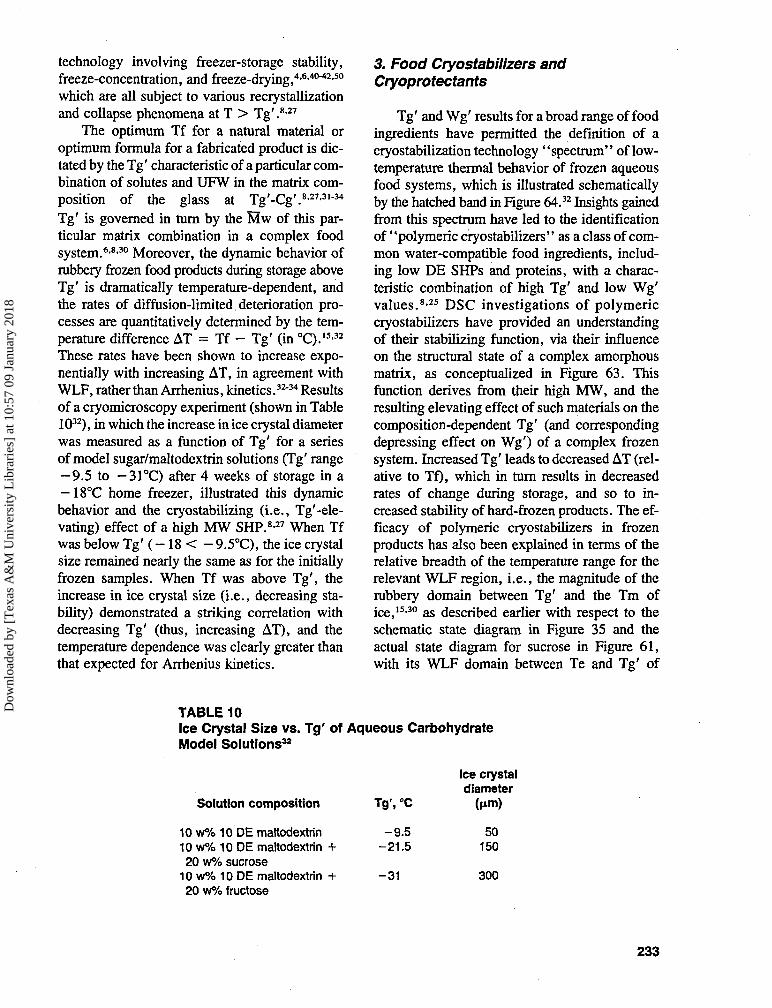
technology involving freezer-storage stability,freeze-concentration, and freeze-drying,4-6-40"42-50
which are all subject to various recrystallizationand collapse phenomena at T > Tg'.8-27
The optimum Tf for a natural material oroptimum formula for a fabricated product is dic-tated by the Tg' characteristic of a particular com-bination of solutes and UFW in the matrix com-position of the glass at Tg'-Cg'.8-27'31"34
Tg' is governed in turn by the Mw of this par-ticular matrix combination in a complex foodsystem.6-8-30 Moreover, the dynamic behavior ofrubbery frozen food products during storage aboveTg' is dramatically temperature-dependent, andthe rates of diffusion-limited deterioration pro-cesses are quantitatively determined by the tem-perature difference AT = Tf - Tg' (in °C).15-32
These rates have been shown to increase expo-nentially with increasing AT, in agreement withWLF, rather than Arrhenius, kinetics.32"34 Resultsof a cryomicroscopy experiment (shown in Table1032), in which the increase in ice crystal diameterwas measured as a function of Tg' for a seriesof model sugar/maltodextrin solutions (Tg' range
— 9.5 to — 31°C) after 4 weeks of storage in a— 18°C home freezer, illustrated this dynamicbehavior and the cryostabilizing (i.e., Tg'-ele-vating) effect of a high MW SHP.8-27 When Tfwas below Tg' ( - 1 8 < -9.5°C), the ice crystalsize remained nearly the same as for the initiallyfrozen samples. When Tf was above Tg', theincrease in ice crystal size (i.e., decreasing sta-bility) demonstrated a striking correlation withdecreasing Tg' (thus, increasing AT), and thetemperature dependence was clearly greater thanthat expected for Arrhenius kinetics.
3. Food Cryostabilizers andCryoprotectants
Tg' and Wg' results for a broad range of foodingredients have permitted the definition of acryostabilization technology "spectrum" of low-temperature thermal behavior of frozen aqueousfood systems, which is illustrated schematicallyby the hatched band in Figure 64.32 Insights gainedfrom this spectrum have led to the identificationof "polymeric cryostabilizers" as a class of com-mon water-compatible food ingredients, includ-ing low DE SHPs and proteins, with a charac-teristic combination of high Tg' and low Wg'values.8-25 DSC investigations of polymericcryostabilizers have provided an understandingof their stabilizing function, via their influenceon the structural state of a complex amorphousmatrix, as conceptualized in Figure 63. Thisfunction derives from their high MW, and theresulting elevating effect of such materials on thecomposition-dependent Tg' (and correspondingdepressing effect on Wg') of a complex frozensystem. Increased Tg' leads to decreased AT (rel-ative to Tf), which in turn results in decreasedrates of change during storage, and so to in-creased stability of hard-frozen products. The ef-ficacy of polymeric cryostabilizers in frozenproducts has also been explained in terms of therelative breadth of the temperature range for therelevant WLF region, i.e., the magnitude of therubbery domain between Tg' and the Tm ofice,15-30 as described earlier with respect to theschematic state diagram in Figure 35 and theactual state diagram for sucrose in Figure 61,with its WLF domain between Te and Tg' of
TABLE 10Ice Crystal Size vs. Tg' of Aqueous CarbohydrateModel Solutions32
Solution composition
10 w% 10 DE maltodextrin10 w% 10 DE maltodextrin +20 w% sucrose
10 w% 10 DE maltodextrin +20 w% fructose
Tg', °C
-9 .5-21.5
-31
Ice crystaldiameter
(nm)
50150
300
233
Dow
nloa
ded
by [
Tex
as A
&M
Uni
vers
ity L
ibra
ries
] at
10:
57 0
9 Ja
nuar
y 20
18

InulinCryostabilizers
CMaltodextrin• PPG
Cryo (Stabilizer +Protectant)s
Methyl InulinMaltotriose *
Raffinose
HydroxypropylinulinHydroxypropylinulin
•Stachyose
'AEthyleneGlycol
.4 .6 .8 1 1.2 1.4 1.6
Wg' (Grams Unfrozen Water/Gram Solute)
FIGURE 64. Variation of the glass transition temperature, Tg', for maximally frozen 20 w% solutionsagainst Wg', the composition of the glass at Tg', in g unfrozen water/g solute, for a series of water-compatible carbohydrates, including many compounds represented in Figures 41 and 44, illustrating thecryostabilization "spectrum" from monomeric cryoprotectants to polymeric cryostabilizers. (Solutes lyingoutside the hatched area of the "spectrum" [toward the upper right corner] exhibit properties of bothcryoprotectants and cryostabilizers.) (From Levine, H. and Slade, I., Cryo.-Lett., 9,21,1988. With permission.)
only 18°C. This AT (= Tm - Tg') decreaseswith increasing solute MW, from >50°C for verylow MW polyols and amino acids (with Tg' <- SCTC)25-27 to <5°C for very low DE SHPs (withTg' > -5°C).32 Thus, as this AT decreases, themagnitude of the corresponding temperature re-gion of freezer-storage instability (between Tfand a lower Tg') likewise decreases, so that evenat higher freezer temperatures, the probability ofacceptable product stability would be im-proved.34 It has also been inferred from Figure35 that the use of polymeric cryostabilizers pro-vides another potential product benefit, in that itwould only be necessary to traverse a muchsmaller temperature range in order to go fromthe hard-frozen (storage-stable) state of a glassyproduct at T < Tg' to the soft texture of a partiallymelted product (of desirable eating quality) at T> Tm.34 Again, the specific case of sucrose inFigure 61 illustrates this point explicitly. Over
the temperature range of only 18°C from Tg' toTe, the microscopic viscosity of the amorphoussucrose-water matrix would decrease dramati-cally from T) s 1013 Pa s at T < Tg' to -n ;s 1Pa s at T > Te.
In contrast to cryostabilizers, low MW sol-utes (e.g., sugars, polyols, glycosides, and aminoacids)25-27 with a characteristic combination oflow Tg' and high Wg' values have been predictedand subsequently demonstrated to have utility as"monomeric cryoprotectants" in freezer-storedfood products with desirably soft-frozen texture,but undesirably poor stability.8>15-32'34 The poorstability results from low Tg' and consequentlyrelatively large AT of Tf above Tg'. The soft-frozen texture has a dual origin: high Wg', theUFW in the reference glass, reflects the relativelylow ice content of the system and large AT re-flects the relatively large extent of softening ofthe non-ice portion of the system.32 In contrast
234
Dow
nloa
ded
by [
Tex
as A
&M
Uni
vers
ity L
ibra
ries
] at
10:
57 0
9 Ja
nuar
y 20
18

to the use of cryoprotectants for soft-frozen tex-ture of food products,15 the medical use of cry-oprotectants benefits only from the low ice con-tent of cryopreserved specimens.34251-298
For many of the low MW reducing sugars inTable 3, sweetness, hygroscopicity, humectancy,and browning reactions are salient functionalproperties.8-264 A more specialized application in-volves the potential for cryoprotection of biolog-ical materials, for which the utility of variouslow MW, glass-forming sugars, polyols, andamino acids is well known.4-5-243-260-261 Such cry-oprotectants can be produced endogenously incomplex biological systems or added as exoge-nous agents.5 A recent illustration of the latterinvolved a straightforward example of cryopro-tection by dilute PHCs in ice-containing solu-tions. As alluded to in Table 9, results of Chavarriet al.318 showed that frozen concentrated cheese-starter cultures, stored for 2 months at Tf < Tg'of a lactose or sucrose cryoprotectant solution,manifested higher viability and acid-produc-ing activity than corresponding samples stored atTf > Tg'.
In a different vein, complete vitrification hasbeen mentioned as another possible approach tothe prolonged cryopreservation of complex bio-logical systems,50 such as mammalian or-gans.251-298-319-320 Consistent with this view, acomparison of Figure 41 with the functionalitymap of Figure 44 suggested that small sugars andglycosides, in sufficiently concentrated solution(i.e., C > Cg', as illustrated in Figure 63), canbe undercooled to a completely vitrified state, sothat all the water would be immobilized in thesolute-UFW glass.27 Such vitrification, which canbe easily achieved in the laboratory,241 has beensuggested as a natural, intracellular, cryoprotec-tive mechanism in winter-hardened poplartrees,342-343 and demonstrated as a potential meansof cryoprotecting whole body organs and em-bryos.251-298-319-320-344 The essence of this cry-oprotective activity appears to be the prolongedavoidance (via kinetic metastability) of poten-tially lethal ice formation and solute crystalli-zation in concentrated, undercooled solutions ofPHCs with high Wg' values.50 For several po-lyols typically used as exogenous cryoprotec-tants, a comparison of the concentration of in-fused cryoprotectant required to vitrify rabbit
kidneys at atmospheric pressure298 with the cor-responding solute concentration, Cg', in the glassat Tg' has shown that, in each case, the minimumsolute concentration required for complete organvitrification was closely related to Cg'.34
This functionality of PHCs also appears tobe related to food applications involving soft-,spoonable-, or pourable-from-the-freezer prod-ucts.15 An example is Rich's patented "Freeze-Flo" beverage concentrate formulated with high-fructose com syrup.345 Part of the underlyingphysicochemical basis of such products involvesboth colligative and non-equilibrium freezingpoint depression. This is illustrated by the ideal-ized state diagram in Figure 63, which reveals ahatched liquid solution zone, bordered by theliquidus and glass curves and extending belowTf2, for w% solute concentrations between x andy, which bracket Cg'. However, contrary to firstappearances, the functionality of specific PHCsolutes in practical products depends more on thekinetically determined properties of Tg' and Wg'than on simple colligative depression of equilib-rium freezing point.31 This fact has been dem-onstrated by model-system experiments in which60 w% solutions of fructose and mannose (3.3M), methyl fructoside (3.1 M), ethyl fructoside,ethyl mannoside, and ethyl glucoside (2.9 M)remained pourable fluids (completely ice- andsolute crystal-free) during more than 4 years offreezer storage at — 18°C (i.e., at a temperaturesubstantially below their equilibrium freezingpoints),15 at which point the experimental sam-ples were left behind when the experimenterschanged companies.
In the context of the above discussion of theaqueous-glass-forming properties of small PHCs,and their consequent functionality as endogenousor exogenous cryoprotectants in the cryopreser-vation (via complete vitrification) of biologicalsystems, the remarkable properties of trehaloseare worthy of special mention. This non-reducingdisaccharide has attracted a great deal of recentinterest (see290 and references therein), due to itsdemonstrated role as the key endogenous bio-preservation agent responsible for producing an"astounding propensity for drought survival" incertain plant seeds, spores, and lower animalscapable of "passing, in dry times, into a state ofsuspended animation" (suggested to correspond
235
Dow
nloa
ded
by [
Tex
as A
&M
Uni
vers
ity L
ibra
ries
] at
10:
57 0
9 Ja
nuar
y 20
18
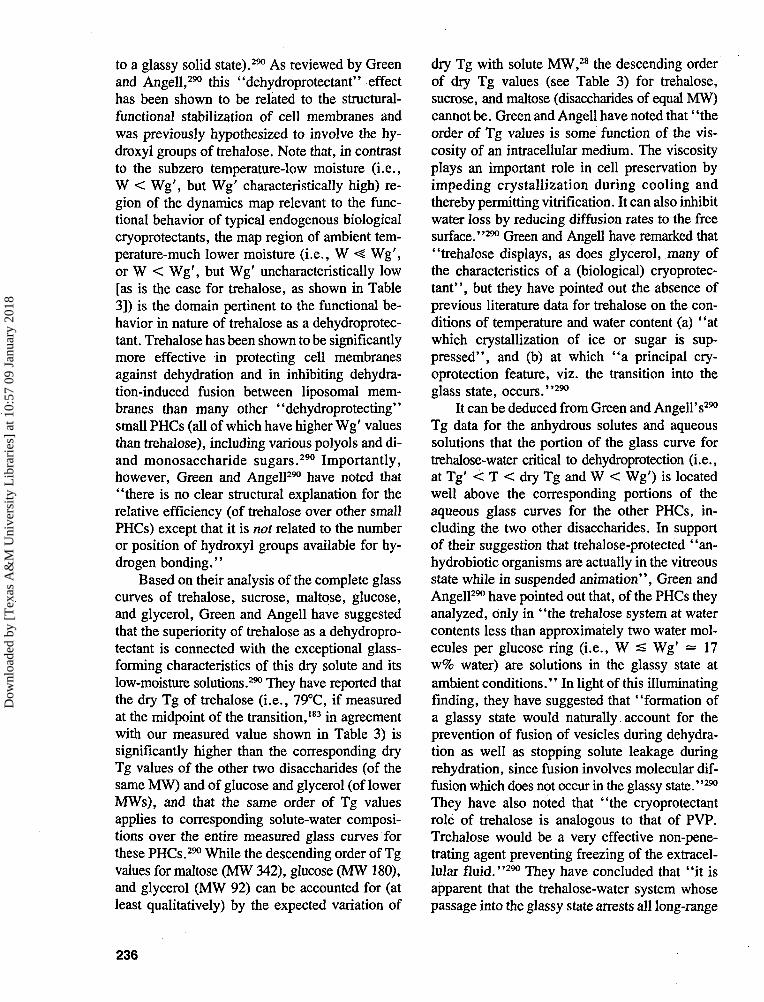
to a glassy solid state).290 As reviewed by Greenand Angell,290 this "dehydroprotectant" effecthas been shown to be related to the structural-functional stabilization of cell membranes andwas previously hypothesized to involve the hy-droxyl groups of trehalose. Note that, in contrastto the subzero temperature-low moisture (i.e.,W < Wg', but Wg' characteristically high) re-gion of the dynamics map relevant to the func-tional behavior of typical endogenous biologicalcryoprotectants, the map region of ambient tem-perature-much lower moisture (i.e., W <̂ Wg',or W < Wg', but Wg' uncharacteristically low[as is the case for trehalose, as shown in Table3]) is the domain pertinent to the functional be-havior in nature of trehalose as a dehydroprotec-tant. Trehalose has been shown to be significantlymore effective in protecting cell membranesagainst dehydration and in inhibiting dehydra-tion-induced fusion between liposomal mem-branes than many other "dehydroprotecting"small PHCs (all of which have higher Wg' valuesthan trehalose), including various polyols and di-and monosaccharide sugars.290 Importantly,however, Green and Angell290 have noted that"there is no clear structural explanation for therelative efficiency (of trehalose over other smallPHCs) except that it is not related to the numberor position of hydroxyl groups available for hy-drogen bonding."
Based on their analysis of the complete glasscurves of trehalose, sucrose, maltose, glucose,and glycerol, Green and Angell have suggestedthat the superiority of trehalose as a dehydropro-tectant is connected with the exceptional glass-forming characteristics of this dry solute and itslow-moisture solutions.290 They have reported thatthe dry Tg of trehalose (i.e., 79°C, if measuredat the midpoint of the transition,183 in agreementwith our measured value shown in Table 3) issignificantly higher than the corresponding dryTg values of the other two disaccharides (of thesame MW) and of glucose and glycerol (of lowerMWs), and that the same order of Tg valuesapplies to corresponding solute-water composi-tions over the entire measured glass curves forthese PHCs.290 While the descending order of Tgvalues for maltose (MW 342), glucose (MW 180),and glycerol (MW 92) can be accounted for (atleast qualitatively) by the expected variation of
dry Tg with solute MW,28 the descending orderof dry Tg values (see Table 3) for trehalose,sucrose, and maltose (disaccharides of equal MW)cannot be. Green and Angell have noted that' 'theorder of Tg values is some function of the vis-cosity of an intracellular medium. The viscosityplays an important role in cell preservation byimpeding crystallization during cooling andthereby permitting vitrification. It can also inhibitwater loss by reducing diffusion rates to the freesurface."290 Green and Angell have remarked that"trehalose displays, as does glycerol, many ofthe characteristics of a (biological) cryoprotec-tant", but they have pointed out the absence ofprevious literature data for trehalose on the con-ditions of temperature and water content (a) "atwhich crystallization of ice or sugar is sup-pressed", and (b) at which "a principal cry-oprotection feature, viz. the transition into theglass state, occurs."290
It can be deduced from Green and Angell's290
Tg data for the anhydrous solutes and aqueoussolutions that the portion of the glass curve fortrehalose-water critical to dehydroprotection (i.e.,at Tg' < T < dry Tg and W < Wg') is locatedwell above the corresponding portions of theaqueous glass curves for the other PHCs, in-cluding the two other disaccharides. In supportof their suggestion that trehalose-protected "an-hydrobiotic organisms are actually in the vitreousstate while in suspended animation", Green andAngell290 have pointed out that, of the PHCs theyanalyzed, only in "the trehalose system at watercontents less than approximately two water mol-ecules per glucose ring (i.e., W :S Wg' — 17w% water) are solutions in the glassy state atambient conditions." In light of this illuminatingfinding, they have suggested that "formation ofa glassy state would naturally account for theprevention of fusion of vesicles during dehydra-tion as well as stopping solute leakage duringrehydration, since fusion involves molecular dif-fusion which does not occur in the glassy state."290
They have also noted that "the cryoprotectantrole of trehalose is analogous to that of PVP.Trehalose would be a very effective non-pene-trating agent preventing freezing of the extracel-lular fluid."290 They have concluded that "it isapparent that the trehalose-water system whosepassage into the glassy state arrests all long-range
236
Dow
nloa
ded
by [
Tex
as A
&M
Uni
vers
ity L
ibra
ries
] at
10:
57 0
9 Ja
nuar
y 20
18
molecular motion, suspending both life and de-cay processes, should be further investigated withrespect to biopreservation."290
We echo the sentiment of their importantconclusion, and suggest that it has broader rel-evance to the issue of the potential utility of tre-halose as a preservative in foods. Coupling thefindings of Green and Angell290 with our ownresults, we suggest that the effectiveness of tre-halose as a dehydroprotectant evidently involvesits exceptional (for its MW) combination of highdry Tg and low Wg'. As shown by our data inTable 3, only one disaccharide (mannobiose) hasa higher measured dry Tg than trehalose. Andtrehalose has the lowest measured Wg' of all thePHCs listed in Table 3. Moreover, as pointed outearlier in Table 6, because it has the lowest Wg',trehalose has the highest Mn for the compositionof the solute-UFW glass at Tg', reflecting thelowest free volume requirement for mobility nearTg'. In the context of the spectrum of cryosta-bilizers and cryoprotectants illustrated in Figure64, the anomalously low Wg' and high dry Tgof trehalose correspond more closely (than do theTg' and Wg' values of any other small PHC ofcomparable MW) to the characteristics diagnosticof a polymeric cryostabilizer. Thus, the uniqueaqueous-glass-forming characteristics and lipidbilayer membrane-protecting effects of trehalosestrongly suggest its consideration as a stabilizerin a broad range of food applications involvingwater- and/or fat-based products (both natural andfabricated) that span the entire spectrum of watercontents and processing/storage temperatures, in-cluding, for example (a) high-moisture, frozen,fat-containing (e.g., emulsified) products, and(b) intermediate-moisture or low-moisture, shelf-stored, fat-containing (e.g., emulsified) or fat-free products. The potential utility of trehalose(exogenous or endogenous) for the structural-functional stabilization of notoriously delicateplant cell membranes in certain fruits and veg-etables (in fresh, refrigerated, frozen, freeze-driedor otherwise dehydrated forms) should be an ob-vious area of special focus.
Returning once more to the context of bio-logical cryopreservation via glass formation, afinal point is worthy of mention. As shown in
Figure 64, certain solutes are unusual in theirlow-temperature thermal behavior, in that theyexhibit the combined properties of both poly-meric cryostabilizers (high Tg') and monomericcryoprotectants (high Wg'). For example, as il-lustrated in Figure 62, high-polymeric PVP hasa typically high Tg' of about — 20°C, coupledwith an unusually high Wg' of about 0.54 g UFW/g (about the same Wg' as sucrose). A recent studyby Hirsh of the mechanism of biological cry-oprotection of cells by extracellular polymericcryoprotectants "showed that polymers whichprotect cells best have a Tg' value of about — 20°C(e.g., PVP); below -20°C, glass formation pre-vents the injurious osmotic stress that cells faceduring slow freezing by isolating cells from ex-tracellular ice crystals, thus virtually eliminatingcell water loss at lower temperatures".346 Due toits high Wg', as well as its high Tg', PVP wouldbe effective as an extracellular polymeric cry-oprotectant by limiting the amount of extracel-lular ice formed, and thus reducing the osmoticstress on intracellular water, during slow freezingto T < Tg'.
The elucidation of the structure-property re-lationships of food cryostabilizers and cryopro-tectants has revealed the underlying physico-chemical basis of fundamental (and intuitive)correlations between the critical functional attri-butes of storage stability and texture of frozenfoods.32-34 As an essentially universal rule, forboth complex products and model systems of sin-gle or multiple solutes, higher Tg' and lower Wg'values (due to higher Mw) have been shown togo hand-in-hand with, and be predictive of,harder-frozen texture and increased storage sta-bility at a given Tf, while conversely, lower Tg'and higher Wg' values (due to lower Mw) gohand-in-hand with, and are predictive of, softer-frozen texture and decreased storage stability.These intrinsic correlations, which have beenfound to apply to various types of frozenfoods,25-37-38 have been recognized as underlyingprecepts of the cryostabilization technology spec-trum, which derive from the effect of solute MWon Tg' and Wg'.32 A second contribution to tex-tural hardness of products characterized by highTg' values derives from the elevated modulus of
237
Dow
nloa
ded
by [
Tex
as A
&M
Uni
vers
ity L
ibra
ries
] at
10:
57 0
9 Ja
nuar
y 20
18

the amorphous matrix and is directly related tothe mechanical stabilization against diffusion-limited processes such as ice crystal growth.34
D. Ramifications of WLF Behavior inHigh-Moisture Food Systems at T > Tg'
In a further effort to clarify an area of possibleconfusion and contention, identified by the ref-eree, we discuss in this section the following twointerrelated issues: (1) Tg' as the appropriate ref-erence temperature for WLF kinetics in high-moisture food systems at temperatures above Tg';and (2) Wg' as the maximum practical amountof plasticizing water (but not to be defined as themythical "bound water") in such systems withwater contents >Wg'.
Let us consider first the case of an ice-con-taining, solute-water system located somewherealong the liquidus curve (i.e., at some Tm >Tg'), having originated at the Tg'-Wg' glass andundergone partial melting of ice during warmingto the instant solute-unfrozen water composition(W > Wg') of the non-ice portion of the sample.For this particular case, with pre-existing ice,cooling at practical rates would return the systemto the Tg'-Wg' glass. Still, one might ask whyanother Tg, lower than Tg' and corresponding tothe glass with the same instant composition (W= Wg > Wg'), is not a more appropriate ref-erence than Tg' for description of the behaviorof this system according to WLF-type kinetics.As mentioned earlier, we consider this lower Tgto be an artificial, rather than pertinent, referencestate for the ice-containing system under discus-sion, because the system would not have comefrom this lower Tg upon heating, nor would itreturn to this lower Tg upon cooling at practicalrates.33
For this reason, we consider the Tg'-Wg'glass as the "practical reference state" for thisparticular ice-containing system at Tm > Tg' andW > Wg'. (An experimental validation of thispoint, with respect to the behavior of rubberyfrozen food products during storage, is describedlater in Section V.D.3.) But what about a dif-ferent case of (1) a system that is neither nu-cleated nor ice-containing, perhaps situated onlyjust above the liquidus curve (i.e., at T[c] >
Tm[c]), and (2) any desired, hypothetical coolingand warming rates, perhaps supplemented by anydesired manipulation of pressure in the kilobarrange? Then we may consider a solute-water so-lution instantaneously captured in an unstable,ice-free condition at some point along an ima-ginary vertical line between its Tm and Tg. Thecaptivation might be accomplished by (a) ex-tremely rapid cooling to T < Tg, followed byextremely rapid heating to Tg < T < Tm, or (b)cooling to Tm > T > Th > Tg, and prior tohomogeneous nucleation upon further cooling toTm > Th > T > Tg, or by cooling at 2 kbarpressure to Tg < T < Tm. This Tg below Tg'would then be a candidate for consideration as aWLF reference state, albeit not a practical one.
As discussed earlier in Section IH.A.4, wemake a critical distinction between water-com-patible and water-sensitive solutes, with respectto the temperature-dependence of their practical(i.e., effective), solute-water glass curves. Be-cause of the much more limited thermodynamiccompatibility of water-sensitive solutes (e.g., ny-lons, PVAc, lignin) for solvating/plasticizingwater, their practical glass curves are depressedmuch less by increasing water content and remainwell above 0°C, no matter how much water isadded to such a solute. The solubility parameter113
of water is too high at room temperature to makewater an effective plasticizer of nylon;155 it de-creases, and water becomes a more compatibleplasticizer of nylon as temperature is increasedabove room temperature; it increases further, andwater becomes incapable of plasticizing nylon astemperature is decreased. If water were added tonylon at a sufficiently high temperature and thenquench-cooled at a sufficiently rapid rate, a lowerTg than the effective minimum value at about6.5 w% water155 could be demonstrated. How-ever, the Tg of a water-sensitive solute is nevercapable of being depressed enough, such that,upon cooling at practical rates in the presence ofexcess water, it would reach a subzero Tg' (andcorresponding Wg') that would be characteristicof, and specific for, each given solute-water sys-tem.15 In contrast, the practical glass curve for awater-compatible solute can be depressed muchmore by increasing water content. Consequently,the Tg of a water-compatible solute is alwayscapable of being depressed enough, such that,
238
Dow
nloa
ded
by [
Tex
as A
&M
Uni
vers
ity L
ibra
ries
] at
10:
57 0
9 Ja
nuar
y 20
18
upon cooling at practical rates in the presence ofexcess water, it reaches a subzero Tg' (and cor-responding Wg') that is characteristic of, andspecific for, each given solute-water system.15
An important, related symptom of this greaterextent of solute-water compatibility is that thesolute-specific Tg' is, by definition, equal to thecorresponding solute-water Tm at Wg', such thatonly the amount of water in excess of this Wg'amount will be freezable (in a practical timeframe) upon cooling at practical rates.8 Thus,Wg' represents the maximum practical amountof plasticizing water (= "unfreezable" water)for a given solute, and amounts of water inexcess of Wg' would not be additionally plasti-cizing under practical conditions.81530 (Notethat we also distinguish, for this reason and basedon grounds of what is practical [as already de-fined] and relevant to ice-containing, frozenaqueous systems, between the practical glasscurve [which levels off at Tg' for water contents^Wg'] and the complete glass curve [which de-creases smoothly and continuously from the sol-ute's dry Tg to the Tg of pure amorphous water
at 135°C] for a water-compatible solute, asillustrated in Figure 27.) Wg' represents the max-imum amount of water that can exist with all ofthe solute, under practical conditions at any tem-perature from T < Tvap to T = 0°K, in a ho-mogeneous, single phase (liquid or metastableamorphous solid) capable of cooperative, molec-ular mobility (at T > Tg').30 In contrast, amountsof water in excess of Wg' would exist in a sep-arate, water-rich phase, as pure ice at T < Tmor as dilute solution at Tm < T < Tvap.30 Thus,in the first case described above, the amount ofwater in the system that had arisen from the par-tial melting of ice would not be solute-plasticiz-ing water (even though it would obviously besolute-diluting and viscosity-lowering water), andso would not alter the appropriateness of Tg' asthe Tg reference state for WLF-type kinetics.
In many critical aspects, the behavior of awater-compatible solute at a water content > Wg'would be analogous to that of a synthetic highpolymer in the presence of an excess amount(say, >30 w%, where Dg' = 30 w%) of anorganic plasticizing diluent (D) that can crystal-lize (as exemplified in Figure 29). For example,if one cooled the latter system at a sufficient rate,
one could capture a metastable, homogeneousglass with a diluent content >30 w% and main-tain this glassy state at temperatures below theTg of the 7 0 - w% polymer/30 + w% diluentmixture. However, if one then raised the tem-perature to T > Tg, under conditions such thatsome of the diluent could and would crystallizeafter devitrification, then Tg' of the remaining70 w% polymer/30 w% diluent mixture wouldbecome the appropriate reference Tg. If the ex-cess amount of diluent (i.e., 30+ w% — Dg'),which had crystallized on wanning, were per-mitted to melt on further warming to T > Tg',this excess diluent would exist as a separate, di-luent-rich phase, perturbed by the solute, but notplasticizing the solute.
We have suggested that, for water-compat-ible solutes at low moisture contents (0 < W <Wg'), the portion of the practical glass curvebetween Tg of the dry solute and Tg' serves todefine a continuum of real reference states (cor-responding to a continuum of practical solute-water compositions) for WLF-type kinetics.15-30
This suggestion has been recently validated bythe results of an experimental study of the crys-tallization kinetics of amorphous sugars at lowmoisture contents by Roos and Karel.66 In theregion of the state diagram surrounding this por-tion of the glass curve, Tg is both defined andaccessible on a 200-s time scale,174 because nophase separation of water can occur, so the sol-ute-water composition of the system remains con-stant and homogeneous.30 In contrast, in the re-gion of the state diagram (lower left quadrant)surrounding the portion of the glass curve be-tween Tg' and the Tg of water, Tg is still definedon a 200-s time scale, but is only accessible ona time scale many orders of magnitude smaller;4
otherwise, water phase-separates as ice and theremainder of the system arrives at Tg'-Wg'.33
Thus, in practice, Tg values in this region areneither real nor relevant to questions about thekinetics of diffusion-limited processes.33-39 Un-fortunately, it is in this same region of the statediagram, for higher-moisture situations (W ~SiWg') for the diluted solute, that our interpretationof the applicable form of the WLF equation andthe appropriate reference state for its use has beenquestioned.98 Based on (1) the explicit descrip-tion, in Chapter 17 of Ferry's book,107 of the
239
Dow
nloa
ded
by [
Tex
as A
&M
Uni
vers
ity L
ibra
ries
] at
10:
57 0
9 Ja
nuar
y 20
18
variation of the WLF coefficients (Cl and C2)with increasing diluent concentration, for plas-ticizers that are both (a) non-crystallizing, and(b) thermodynamically compatible over the entiretemperature range of dilution, and (2) ouranalysis30 of (a) the effect of temperature-depen-dent thermodynamic compatibility of the plasti-cizer, and (b) the effect of the variation of themagnitude of the WLF region (Tm - Tg) forcrystallizing plasticizers on the WLF coeffi-cients, we have suggested that the proper coef-ficients of the WLF equation must change withchanging diluent concentration.30 When the plas-ticizer is non-crystallizing and thermodynami-cally compatible over the entire temperaturerange, (1) the change in coefficients is continuousfrom 0 to 100% plasticizer, (2) the total diluentconcentration defines the concentration of theplasticizer in the glassy solute-diluent blend, and(3) the Tg of the glassy solute-diluent blend isthe reference temperature for the WLF equationwith appropriate coefficients for that extent ofdilution.107 Most of the literature on the free vol-ume description of WLF kinetics deals with eitherundiluted synthetic polymers or dilution by suchwell-behaved, non-crystallizing, thermodynam-ically compatible plasticizers.107 In contrast, whenthe plasticizer becomes ever-less thermodynam-ically compatible with decreasing temperature,such as tricresyl phosphate with poly(vinyl chlo-ride),109 or in the extreme case, when the diluent,such as water, is capable of complete phase sep-aration via crystallization, (1) the change in coef-ficients is only continuous from 0% diluent tothe region of diluent concentration-temperaturewhere incompatibility or phase separation is ex-hibited (namely, Wg'-Tg' for water), (2) the totaldiluent concentration does not define the con-centration of plasticizer in the glassy, plasticizer-plasticized solute blend, and (3) the minimumreference Tg is that of the glass with maximumeffective plasticizer content. This complicated be-havior, which is the rule for aqueous systems,has not been extensively described in the litera-ture. In Chapters 11, 12, and 17 of his book,107
Ferry provides the bare minimum of informationthat is required to deal with systems of smallmolecular weight, plasticizers of marginal com-patibility, and crystallizing diluents. We have ex-panded his analysis by demonstrating that the
Tm/Tg ratio or Tm — Tg for the diluent-freesolute can be used to provide normalizing guide-lines for the identification of appropriate WLFcoefficients.30
Another salient feature of the behavior ofwater-compatible solutes, at water contents bothabove and below Wg', which we believe em-phasizes the singularity of the Tg'-Wg' referencestate/point, involves sorption isotherm data thatwe have treated in terms of iso-RVP contours forglassy, rubbery, and supra-glassy substrates (seeFigure 65, described in detail later in SectionV.A.2). RVP goes from zero for a glassy sub-strate at temperatures and moisture contents be-low its effective Tg to 1 for the correspondingliquid substrate at temperatures higher than thosecorresponding to its rubbery state (i.e., temper-atures corresponding to its supra-glassy state).However, while at temperatures (T > Tg) andmoisture contents (W > Wg) corresponding tothe rubbery region, RVP increases significantlywith increasing water content, and the iso-RVPcontours (like iso-viscosity contours) essentiallyparallel the shape of the solute-water glass curve;at temperatures >Tg' and water contents >Wg',RVP approaches 1, and the iso-RVP contoursbecome vertical, i.e., lose their temperature-dependence. We interpret this as evidence forthe fact that the substrate would exist under theseT-W conditions in a supra-glassy, liquid statewell above the relevant reference state, Tg'-Wg'.Importantly, if sorption were to continue and,thus, the water content of the substrate were tocontinue to increase to higher and higher levelsabove Wg' (a situation analogous in certain vitalrespects to that of the partially melted, frozenaqueous system described earlier), the resultantchanges in RVP, caused by this additional amountof sorbed water, would become insignificant.
The focal point of our interpretations regard-ing Tg' as the appropriate reference state for WLF-type kinetics in high-moisture systems of water-compatible solutes32 concerns the singularity ofthe Tg'-Wg' point for a given solute.27 For ex-ample, were it not for this singularity, how elsecould one explain the frequently anomalous shapeof the non-equilibrium extension of the equilib-rium liquidus curve? We have suggested that theTg'-Wg' point is not one of accidental intersec-tion of the liquidus and glass curves, but rather
240
Dow
nloa
ded
by [
Tex
as A
&M
Uni
vers
ity L
ibra
ries
] at
10:
57 0
9 Ja
nuar
y 20
18

T°c
200 -
150 -
100 -
60 70
•
t/T
80
w°/o APPLE
— - w%C
90
PECTIN
FIGURE 65. Ad/absorption isotherm data for apple pectin from Figure14A transformed into a two-dimensional water/glass dynamics map oftemperature vs. weight percent solids, on which are compared the relativelocations of a series of iso-RVP contours and a schematic, "practical"glass curve for pectin-water, based on data for hemicellulose (from Ref-erence 129).
the critical point to which the non-equilibriumportion of the liquidus curve must fall.30 We havealso noted that the shape of the liquidus curve isalso determined indirectly and in part by the shapeof the underlying homogeneous nucleationcurve.30 In the region around the Th curve, icecrystal formation (i.e., nucleation) in a dilutesolution (W > Wg') at a given T is influenced,in part, by the portion of the glass curve belowthe Th curve (i.e., by Tg values <Tg'). How-ever, ice crystal growth (i.e., propagation) in that
solution at a given T (and the kinetics thereof)is controlled by Tg'.32 Once the homogeneousTg'-Wg' glass has been formed as a consequenceof freezing, one would not expect that subsequentdilution of this glass (via partial ice melting atTm > T > Tg') would occur uniformly to pro-duce a new supra-glassy, cooperative system.
Information in Chapters 11, 12, and 17 ofFerry's book,107 on the effects of free volume andlocal viscosity in concentrated, plasticized poly-mers, has helped to provide a basis for under-
241
Dow
nloa
ded
by [
Tex
as A
&M
Uni
vers
ity L
ibra
ries
] at
10:
57 0
9 Ja
nuar
y 20
18
standing what determines the location of Tg' (andcorresponding Wg') for a given solute. For syn-thetic high polymer-organic diluent systems, Ferryteaches that different factors/mechanisms are op-erative/predominant for different portions of thesolute-diluent glass curve, i.e., free volume atlow extents of solute dilution vs. local viscosityat lower solute concentrations (e.g., near Dg').The simple WLF free volume theoretical ap-proach based on the AT above Tg (described inFerry's Chapter 11) is only applicable to the for-mer case, i.e., low extents of solute dilution.However, our experimental results for frozenaqueous solutions of monodisperse PHCs havesuggested that, in the maximally freeze-concen-trated solute-UFW glass, Tg' is not dependenton/determined by free volume, as evidenced bythe lack of correlation between Tg' and 1/Mn (ofthe solute-UFW glass), but rather is dependenton/determined by local viscosity, as evidencedby the excellent linear correlation between Tg'and 1/Mw (Figure 47).30 Thus, the simple WLFfree volume treatment is evidently not applicablein a straightforward way to frozen food systems,and one must instead consider the solute-specific,maximum water content of the glass (Wg' at Tg')and base the treatment of kinetics on this singularTg'-Wg' reference state.
For the reasons described above, we haveconcluded that, for water-compatible solutes(monomeric, oligomeric, and polymeric, alike),at water contents ^Wg ' , Tg' is the appropriateTg corresponding to the reference state for WLF-type kinetics in the rubbery liquid region at T >Tg',32 and to the temperature boundary for Ar-rhenius kinetics in the glassy solid region at T <Tg'.15 In contrast to some imaginary, artificial,or purely theoretical reference state, Tg' is thereal, practical reference state (and Tg'-Wg' isthe reference point on the state diagram) to whichsuch a solute-water system goes upon cooling atrates such that ice formation occurs at some T <Tm but > Tg', and from which it subsequentlycomes upon heating at rates such that the meltingof pre-existing ice occurs in the temperature rangebetween Tg' and Tm.33>39 This is what we meanby real and practical — cooling rates that permitice formation, and wanning rates that permit icemelting, in the rubbery region between Tg' andTm — and why our interpretations have been
focused on this Tg' reference state. It should berecognized that this interpretation goes beyondthe WLF theory for diluent-free, synthetic highpolymers described in Chapter 11 of Ferry'sbook,107 and relies more on the material in Ferry'sChapter 17 on concentrated, plasticized polymers.
As described earlier in Section 1H. A.4, thereis a growing appreciation of the fact that theexistence of' 'bound water'' is a myth. However,the preceding explanation of why Tg' is a pivotalreference temperature for descriptions of WLFbehavior depends on a supplementary apprecia-tion of four underlying precepts: (1) rationale forselection of the particular state diagram used asa dynamics map; (2) definition of plasticizingwater, in the context of the two primary require-ments for an effective plasticizer; (3) identifi-cation of Wg' as the maximum amount of plas-ticizing water in a practical operational time scale;and (4) reference to melt-dilution as the effect,at temperatures above Tg', of amounts of waterin excess of Wg'. As a result of an incompletediscussion of these points, possible philosophicalriddles might appear to arise.374
If there is plasticizing water, and non-plasticizing, melt-diluting water, could not one equate plasticizing water with"bound water"? In what ways would plasticizing water bedifferent from the mythical "bound water"? On the otherhand, if all of the water is considered a uniform species,with no distinction between plasticizing water and melt-diluting water above Tg', then the riddle reverts to theoriginal question — is Tg' the correct temperature to useas a reference for WLF kinetics above Tg'?
For considering the effects of changes in tem-perature or water content in the region of watercontent less than Wg', there is, as alluded toearlier, a general consensus that the appropriatereference locations are the continuous set of pairsof solute-specific Tg-Wg values (such that Tg >Tg', but Wg < Wg') on a particular state dia-gram. This state diagram is a particular two-di-mensional (temperature vs. water content, ex-pressed as weight fraction or %) "snapshot" intime, which contains both equilibrium and non-equilibrium states and serves as a dynamics ormobility map.30 The unique selection of this"snapshot", with its' relevant set of Tg-Wg val-ues, reflects the choice of 200 s by polymer sci-entists as the time scale for the conventional def-
242
Dow
nloa
ded
by [
Tex
as A
&M
Uni
vers
ity L
ibra
ries
] at
10:
57 0
9 Ja
nuar
y 20
18

inition of the glass transition.174 In terms of aDSC experiment, the glass transition temperatureis defined by convention as the midpoint of thetemperature range (corresponding to a time in-terval of 200 s) from the onset to the completionof the relaxation that accounts for the increase infree volume that is manifested as a step-increase(discontinuity) in heat capacity (with a concom-itant increase in expansion coefficient).106 Forexample, at a heating rate of 10 K/min, the glass-to-rubber relaxation is observed as a step-increasein heat capacity over a temperature range of about33 K; at a heating rate of 1 K/min, the midpointof the transition is expected to occur about 3 Klower, with the temperature range decreased toabout 3 K.15 The curved line segment, containingthe reference set of Tg-Wg values on the two-dimensional map, represents a single contour linefrom a three-dimensional surface, at a value of200 s for the third (time) dimension. This 200-stime scale refers only to the convention used tospecify a reference value of Tg; it should not beconfused with the operational time scale that isrelevant to the use of the dynamics map for thediagnosis of mobility. For practical application,the third dimension of the mobility map is ex-pressed as a temporal ratio, rather than time it-self.30 This operational time scale is defined asthe ratio of experimental time duration (or inverseexperimental frequency) to the relaxation time ofthe relevant underlying process, at specified con-ditions of temperature and moisture content. A"practical operational time scale" is any timescale for which the quotient "experimental timescale/relaxation time of the relevant process inthe glassy state" approaches a value sufficientlynear zero as to be "practicably" zero.
As noted earlier in Section III.A.2, in all suchdiscussions of the dynamics map, "mobility"refers specifically to cooperative segmental (orunit) motions, which are the underlying basis ofall Tg-dependent relaxation behavior (also re-ferred to as alpha relaxations),15 with respect tothe ratios of allowed (by the local environment,where "local" refers to dimensions greater thanabout 10 nm,106 but smaller than bulk sampledimensions)/required (by the size and shape ofthe mobile unit) free volume, local viscosity, andtime.30 Thus, (1) inherent requirements of freevolume, local viscosity, and time for cooperative
rotational or translational motions and (2) method-related requirements of sufficient mobility for de-tection determine the observed relationship andlocation of the operational values of measuredtransition temperatures of polymer-plasticizerblends. In contrast, small-scale motions (also re-ferred to as beta and gamma relaxations, such asnon-cooperative vibrations and rotations15) arenot kinetically constrained with the same non-Arrhenius temperature dependence as Tg-depen-dent relaxations15 and, thus, are not diagnosedby the dynamics map. From a recent study oftracer diffusion at the glass transition, Ehlich andSillescu347 have suggested that the coupling ofthe diffusional motion of a tracer and the glass-to-rubber relaxation of a polymeric matrix "willincrease with the size of the diffusant, whichfinally becomes a probe for monitoring the glasstransition process."
The philosophical question relates to the re-gion of water content greater than or equivalentto Wg' and the designation of Tg'-Wg' as theappropriate reference location on the dynamicsmap. As already noted, we have suggested thatwater contents greater than Wg' are not effectiveto provide further plasticization at temperaturesbelow Tg', due to phase separation of ice, so thatTg'-Wg' is the glass with the maximum contentof plasticizing water in a practical time scale,8*30
and water contents greater than Wg' lead to melt-dilution at temperatures above Tg'.33 Pure water,per se, exists in only two relevant circumstances:complete absence of solute, or occurrence of phaseseparation of ice in the presence of solute. Clearly,"plasticizing water" refers to the aqueous com-ponent of a water-solute blend in the non-iceportion of a sample and should not be confusedwith pure water as a separate entity.
Since there is a practical limit to the amountof plasticizing water, such that water content upto Wg' is plasticizing, but water content greaterthan Wg' is melt-diluting and non-plasticizing,the question might be raised as to how this newerdescription differs from the older and unaccept-able description in terms of' 'bound'' and' 'free''water. The question would require an answer toprevent the equivalence of "bound water" toplasticizing water and "free water" to melt-di-luting water. The primary distinction between thetwo descriptions is that the use of "bound" and
243
Dow
nloa
ded
by [
Tex
as A
&M
Uni
vers
ity L
ibra
ries
] at
10:
57 0
9 Ja
nuar
y 20
18
"free" implies that there are two types of water,suggesting that they could be distinguished eitherchemically or energetically, a conclusion that isclearly contradicted by experimental observa-tions. 149-150 In contrast, plasticizing and non-plas-ticizing refer to the temperature- and time-de-pendent operational conditions that result fromdifferent amounts of water, not different types ofwater. In short, "free" and "bound" unaccept-ably suggest two types of water that differ en-ergetically, in contradiction to experimental ob-servation. Plasticizing and non-plasticizingdescribe two regimes of operational conditionsthat have been observed experimentally, as dis-cussed further later in Section V.A.2, in the con-text of Figure 65.
Moreover, the newer description is in accordwith the fact that water, outside of an ice or othercrystalline lattice, is considered a uniform spe-cies, with no existence of distinguishable types.4
Then the question might arise as to why someamounts of water could be plasticizing, and otheramounts (greater than Wg') be non-plasticizing,if water is a uniform species. The answer hereis based on an understanding that there are twonecessary conditions for a diluent to act as aneffective plasticizer: (1) thermodynamic com-patibility over the entire temperature range be-tween Tg of the pure solute and Tg of the purediluent; and (2) the ability of the diluent to in-crease the free volume and decrease the localeffective viscosity of the blend, compared to thatof the solute alone at the same temperature. Thefirst condition is typically determined as a sol-ubility parameter (a measure of thermodynamiccompatibility) for polymers.113 Thermodynamiccompatibility refers to both equilibrium ther-modynamic compatibility (temperature-depen-dent, but time-independent) and non-equilibriumthermodynamic compatibility (time- and temper-ature-dependent). The most effective plasticizerwould not require kinetic constraint to maintaina spatially homogeneous distribution of soluteand diluent. The second condition requires that,in the context of translational mobility, the Tgof the diluent be less than the Tg of the solute,which is usually equivalent to the linear DP ofthe diluent being less than the linear DP of thesolute. As a consequence, the free volume (re-quired for translational motion) of the diluent
alone > that of the compatible blend > that ofthe solute alone at the same experimental tem-perature. This understanding of the necessaryconditions for effective plasticization also sup-ports the nomination of Tg'-Wg' as the practicalreference state for systems with T > Tg' and W> Wg'. For practical time scales, the time- andtemperature-dependence of the thermodynamiccompatibility of water with common food ma-terials, such as PHCs, precludes its use as aneffective plasticizer at T < Tg'. Only in shortertime scales compared to the effective relaxationtime of the system (i.e., at small temperatureintervals above Tg) would the family of Tg-Wgvalues at Wg > Wg' and Tg < Tg' be appropriatereference locations. Such an appropriate use ofthis part of the complete glass curve as a referencecontour would be the explanation of the controlof ice nucleation and initial growth of criticalnuclei as a function of solute concentration orpressure, before maximum freeze concentrationoccurs.30 In contrast, the sorption behavior men-tioned earlier (to be described in the context ofFigure 65) demands the use of Tg'-Wg' as theprimary reference location. In a typical experi-mental time scale, a dramatic dependence of theapparent RVP on the underlying glass curve isalready observed as a strong temperature-depen-dence at constant moisture content for values ofapparent RVP < 0.9. This condition exists atT > Tg', when Wg' > W > Wg. When W fallsbelow Wg, the apparent RVP approaches zero,and the strong temperature-dependence at con-stant W is no longer observed. When W risesabove Wg', the apparent RVP approaches 1, andagain the strong temperature-dependence at con-stant W is no longer observed.
E. Polysaccharides
The functionality of high MW polysaccha-ride gums as polymeric cryostabilizers in three-component model systems (polysaccharide:smallsugarwater) has been demonstrated.33 The Tg'values shown in Table 11 (updated from Refer-ence 33) illustrate the cryostabilizing contribu-tion of several widely used saccharide high poly-mers (e.g., alginate, pectin, carageenan, xanthan,CMC, methocel) at the low concentrations rel-
244
Dow
nloa
ded
by [
Tex
as A
&M
Uni
vers
ity L
ibra
ries
] at
10:
57 0
9 Ja
nuar
y 20
18
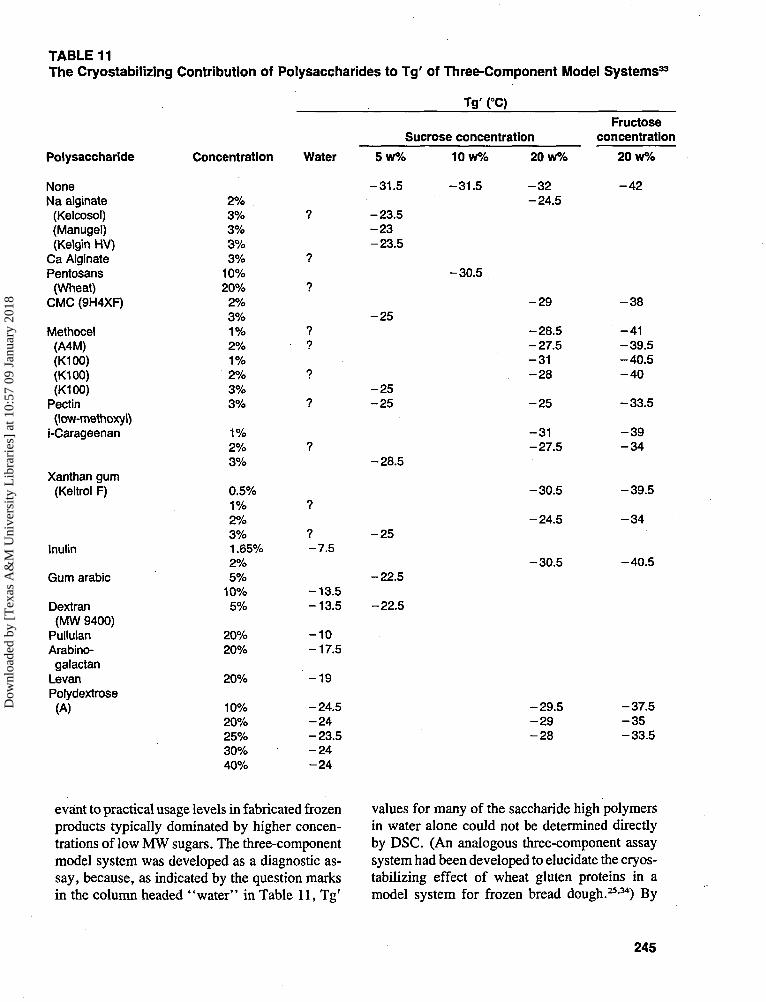
TABLE 11The Cryostabilizing Contribution of Polysaccharides to Tg' of Three-Component Model Systems33
Tg'
Polysaccharide
NoneNa alginate
(Kelcosol)(Manugel)(Kelgin HV)
Ca Alginate
Pentosans(Wheat)
CMC (9H4XF)
Methocel(A4M)(K100)(K100)(K100)
Pectin(low-methoxyl)
i-Carageenan
Xanthan gum(Keltrol F)
Inulin
Gum arabic
Dextran(MW 9400)
PullulanArabino-
galactanLevanPolydextrose(A)
Concentration
2%3%3%3%3%
10%20%2%3%1%2%1%2%3%3%
1%2%3%
0.5%1%2%3%1.65%2%5%
10%5%
20%20%
20%
10%20%25%30%40%
Water
?
?
?
??
?
?
?
?
?-7 .5
-13.5-13.5
- 1 0-17 .5
- 1 9
-24.5- 2 4-23 .5- 2 4- 2 4
Sucrose concentration
5w%
-31 .5
-23 .5- 2 3-23 .5
- 2 5
- 2 5- 2 5
-28 .5
- 2 5
-22 .5
-22.5
10 W%
-31.5
-30 .5
20 w%
- 3 2-24.5
- 2 9
-28.5-27.5-31- 2 8
- 2 5
-31-27.5
-30.5
-24.5
-30.5
-29.5- 2 9- 2 8
Fructoseconcentration
20 w%
- 4 2
- 3 8
-41-39.5-40.5- 4 0
-33.5
- 3 9- 3 4
-39.5
- 3 4
-40.5
-37.5- 3 5-33.5
evant to practical usage levels in fabricated frozenproducts typically dominated by higher concen-trations of low MW sugars. The three-componentmodel system was developed as a diagnostic as-say, because, as indicated by the question marksin the column headed "water" in Table 11, Tg'
values for many of the saccharide high polymersin water alone could not be determined directlyby DSC. (An analogous three-component assaysystem had been developed to elucidate the cryos-tabilizing effect of wheat gluten proteins in amodel system for frozen bread dough.25-34) By
245
Dow
nloa
ded
by [
Tex
as A
&M
Uni
vers
ity L
ibra
ries
] at
10:
57 0
9 Ja
nuar
y 20
18
extrapolation from measured Tg' values for thehighest MW SHPs (of <1 DE, Tg' = -4°C)8
and soluble potato starch (Tg' = -3.5°C),27 itwas reasoned that, due to the very high MW ofsuch water-soluble polysaccharides, the Tg' tran-sition would occur so close to 0°C that it wouldbe buried under the predominating ice-meltingendotherm and therefore not detectable. How-ever, in the presence of a higher concentration(5 to 20 w%) of a small sugar (fructose or su-crose), the significant Tg'-elevating effect of alow concentration of polysaccharide, relative tothe much lower Tg' value of the correspondingsugar solution without added polysaccharide (thefirst line in Table 11), was clearly revealed. Formany of the polysaccharides in Table 11, thediagnostic assay demonstrated that Tg' increasessignificantly with increasing concentration of highpolymer, relative to a constant concentration ofsmall sugar. In other words, as previouslyreported32 for three-component model systemscontaining polymeric SHPs and low MW sugars(reviewed below), Tg' increases in a completelypredictable way with increasing composite Mwof a mixture of compatible solutes. It has beenpointed out that the Tg'-elevating effect of pectinon sugar solutions is noteworthy in the contextof its possible relevance to fruit-based food prod-ucts, as inferred from measured Tg' values forvarious fruit juices.33
It should be noted that, for some of the poly-saccharides listed in Table 11, it was not nec-essary to infer their cryostabilizing functionalityfrom Tg' results for the diagnostic three-com-ponent assay system. In contrast to the gumsalready mentioned, polysaccharides such as gumarabic, dextran, pullulan, arabinogalactan, andlevan, of higher water solubility and/or lowerMW, showed Tg' values (for solutions in wateralone) in the range —10 to — 19°C, comparableto Tg' values for oligomeric and low-polymericSHP cryostabilizers with DE values in the range10 to 25. The samples of gum arabic and dextranillustrated very clearly the dependence of Tg' onthe weight-average composition of a compatible,multi-solute mixture.8 In each case, the compos-ite Tg' of -22.5°C for a 1:1 w:w mixture ofsucrose and polysaccharide was exactly midway
between the Tg' values for the individual solutes.In the context of the cryostabilizing function
of high MW polysaccharides in three-componentaqueous solutions as model systems for frozenfoods, an interesting illustration of what has beengleaned from an analysis of glass curves for suchcomplex aqueous mixtures is shown in Figure66.15 In this artist's rendering of a three-dimen-sional state diagram for a hypothetical three-com-ponent system, both solutes (e.g., a polymer, 2,and its monomer, 1) are non-crystallizing, inter-acting (i.e., compatible), and plasticized by water,which is the crystallizing solvent, 3. The diagramrevealed the postulated origin of a sigmoidalTg'(c) curve, i.e., the Tg' glass curve ABCDEF.15
In fact, similar sigmoidal curves of Tc vs. w%concentration, for collapse during freeze-dryingof analogous three-component aqueous systems,had previously been reported (Figure 5 inMacKenzie135), but "the basis for their non-lin-earity had not been determined".135 Four seriesof model solutions at 10 w% total solids com-posed of mixtures with varying ratios of malto-dextrins (0.5 to 15 DE) to fructose demonstratedan experimental verification of the postulated sig-moidal shape of Tg'(c) curves, as shown by theplots of Tg' vs. w% maltodextrin in Figure 67.32
It has been found that such sigmoidal glass curvesrepresent the general behavior of compatible mix-tures of both homologous and non-homologouspolymeric (including Na caseinate protein) andlow MW (including various sugars and acids)solutes.32 In all such curves, the low- and high-Tg' tie points were determined by the Tg' valuesof the individual low and high MW solutes, re-spectively. Figure 67 illustrated (as did the resultsin Table 11 for gum arabic-sucrose and dextran-sucrose mixtures) that the composite Tg' valuecharacteristic of a given amorphous solute(s)-.UFW composition is governed by the Mw of theparticular combination of compatible water-sol-uble solids in a complex frozen system. It hasalso been used to illustrate the principle of po-lymeric crystabilization: the stabilizing influenceon the structural state of a complex amorphousmatrix derives from the high MW of polymericcryostabilizers and the resulting elevating effecton Tg' of a food product.8-32
246
Dow
nloa
ded
by [
Tex
as A
&M
Uni
vers
ity L
ibra
ries
] at
10:
57 0
9 Ja
nuar
y 20
18
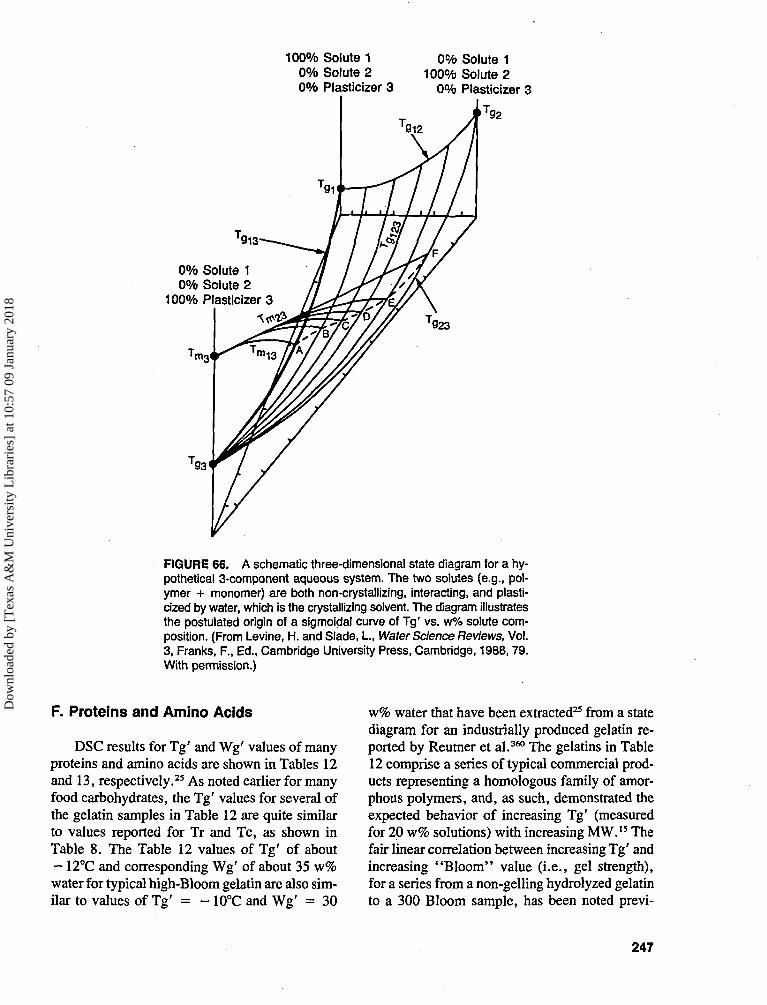
100% Solute 10% Solute 20% Plasticizer 3
0% Solute 1100% Solute 2
0% Plasticizer 3
'913
0% Solute 10% Solute 2
100% Plasticizer 3
S23
FIGURE 66. A schematic three-dimensional state diagram for a hy-pothetical 3-component aqueous system. The two solutes (e.g., pol-ymer + monomer) are both non-crystallizing, interacting, and plasti-cized by water, which is the crystallizing solvent. The diagram illustratesthe postulated origin of a sigmoidal curve of Tg' vs. w% solute com-position. (From Levine, H. and Slade, I., Water Science Reviews, Vol.3, Franks, F., Ed., Cambridge University Press, Cambridge, 1988,79.With permission.)
F. Proteins and Amino Acids
DSC results for Tg' and Wg' values of manyproteins and amino acids are shown in Tables 12and 13, respectively.25 As noted earlier for manyfood carbohydrates, the Tg' values for several ofthe gelatin samples in Table 12 are quite similarto values reported for Tr and Tc, as shown inTable 8. The Table 12 values of Tg' of about— 12°C and corresponding Wg' of about 35 w%water for typical high-Bloom gelatin are also sim-ilar to values of Tg' = - 10°C and Wg' = 30
w% water that have been extracted25 from a statediagram for an industrially produced gelatin re-ported by Reutner et al.360 The gelatins in Table12 comprise a series of typical commercial prod-ucts representing a homologous family of amor-phous polymers, and, as such, demonstrated theexpected behavior of increasing Tg' (measuredfor 20 w% solutions) with increasing MW." Thefair linear correlation between increasing Tg' andincreasing "Bloom" value (i.e., gel strength),for a series from a non-gelling hydrolyzed gelatinto a 300 Bloom sample, has been noted previ-
247
Dow
nloa
ded
by [
Tex
as A
&M
Uni
vers
ity L
ibra
ries
] at
10:
57 0
9 Ja
nuar
y 20
18
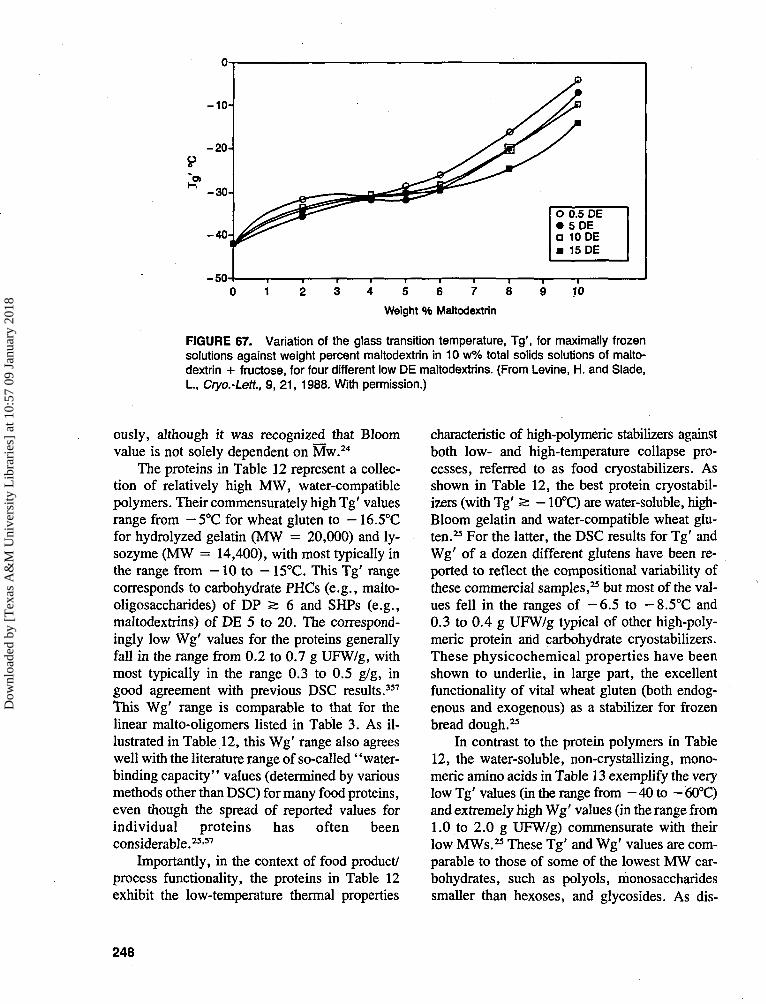
- 1 0 -
- 2 0 -
h-?- 30 -
- 4 0 -
-50-
O 0.5 DE• 5DED 10 DE• 15 DE
4 5 6 7 8
Weight % Maltodextrin
10
FIGURE 67. Variation of the glass transition temperature, Tg\ for maximally frozensolutions against weight percent maltodextrin in 10 w% total solids solutions of malto-dextrin + fructose, for four different low DE maltodextrins. (From Levine, H. and Slade, I., Cryo.-Lett., 9, 21, 1988. With permission.)
ously, although it was recognized that Bloomvalue is not solely dependent on Mw.24
The proteins in Table 12 represent a collec-tion of relatively high MW, water-compatiblepolymers. Their commensurately high Tg' valuesrange from — 5°C for wheat gluten to - 16.5°Cfor hydrolyzed gelatin (MW = 20,000) and ly-sozyme (MW = 14,400), with most typically inthe range from - 1 0 to - 15°C. This Tg' rangecorresponds to carbohydrate PHCs (e.g., malto-oligosaccharides) of DP s 6 and SHPs (e.g.,maltodextrins) of DE 5 to 20. The correspond-ingly low Wg' values for the proteins generallyfall in the range from 0.2 to 0.7 g UFW/g, withmost typically in the range 0.3 to 0.5 g/g, ingood agreement with previous DSC results.357
This Wg' range is comparable to that for thelinear malto-oligomers listed in Table 3. As il-lustrated in Table 12, this Wg' range also agreeswell with the literature range of so-called' 'water-binding capacity" values (determined by variousmethods other than DSC) for many food proteins,even though the spread of reported values forindividual proteins has often beenconsiderable.25-57
Importantly, in the context of food product/process functionality, the proteins in Table 12exhibit the low-temperature thermal properties
characteristic of high-polymeric stabilizers againstboth low- and high-temperature collapse pro-cesses, referred to as food cryostabilizers. Asshown in Table 12, the best protein cryostabil-izers (with Tg' a: - 10°C) are water-soluble, high-Bloom gelatin and water-compatible wheat glu-ten.25 For the latter, the DSC results for Tg' andWg' of a dozen different glutens have been re-ported to reflect the compositional variability ofthese commercial samples,25 but most of the val-ues fell in the ranges of —6.5 to — 8.5°C and0.3 to 0.4 g UFW/g typical of other high-poly-meric protein arid carbohydrate cryostabilizers.These physicochemical properties have beenshown to underlie, in large part, the excellentfunctionality of vital wheat gluten (both endog-enous and exogenous) as a stabilizer for frozenbread dough.25
In contrast to the protein polymers in Table12, the water-soluble, non-crystallizing, mono-meric amino acids in Table 13 exemplify the verylow Tg' values (in the range from - 4 0 to -60°C)and extremely high Wg' values (in the range from1.0 to 2.0 g UFW/g) commensurate with theirlow MWs.25 These Tg' and Wg' values are com-parable to those of some of the lowest MW car-bohydrates, such as polyols, monosaccharidessmaller than hexoses, and glycosides. As dis-
248
Dow
nloa
ded
by [
Tex
as A
&M
Uni
vers
ity L
ibra
ries
] at
10:
57 0
9 Ja
nuar
y 20
18
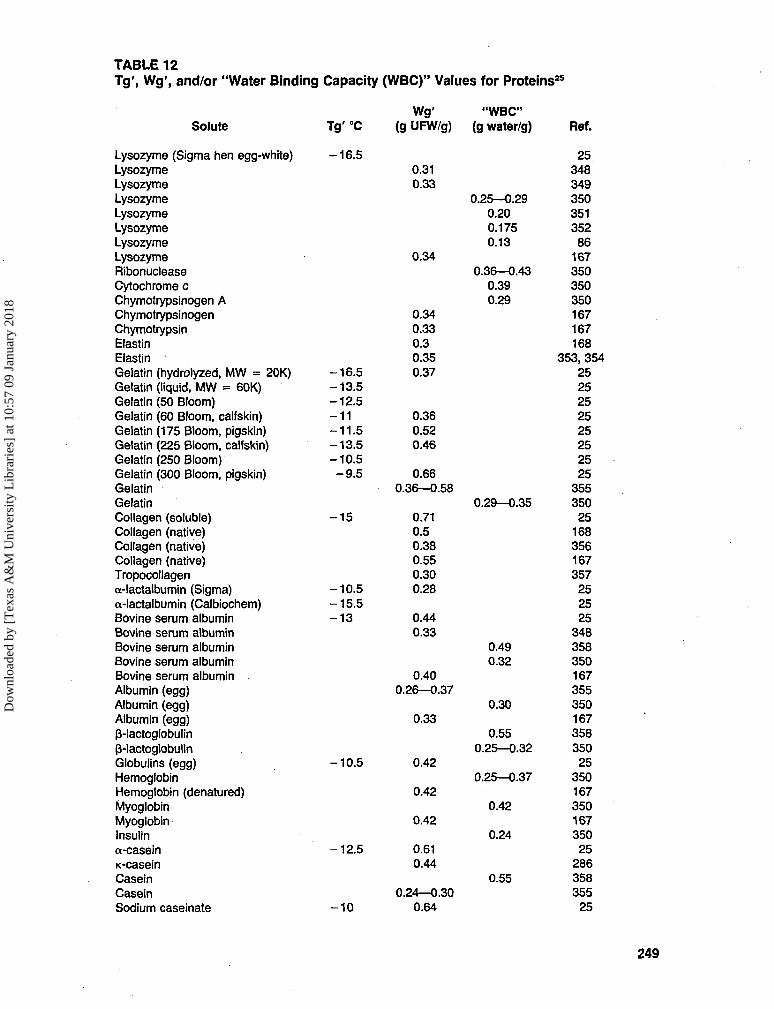
TABLE 12Tg', Wg', and/or "Water Binding Capacity (WBC)" Values for Proteins25
Solute
Lysozyme (Sigma hen egg-white)LysozymeLysozymeLysozymeLysozymeLysozymeLysozymeLysozymeRibonucleaseCytochrome cChymotrypsinogen AChymotrypsinogenChymotrypsinElastinElastinGelatin (hydrolyzed, MW = 20K)Gelatin (liquid, MW = 60K)Gelatin (50 Bloom)Gelatin (60 Bloom, calfskin)Gelatin (175 Bloom, pigskin)Gelatin (225 Bloom, calfskin)Gelatin (250 Bloom)Gelatin (300 Bloom, pigskin)GelatinGelatinCollagen (soluble)Collagen (native)Collagen (native)Collagen (native)Tropocollagena-lactalbumin (Sigma)a-lactalbumin (Calbiochem)Bovine serum albuminBovine serum albuminBovine serum albuminBovine serum albuminBovine serum albuminAlbumin (egg)Albumin (egg)Albumin (egg)p-lactoglobulinB-lactoglobulinGlobulins (egg)HemoglobinHemoglobin (denatured)MyoglobinMyoglobinInsulina-caseinK-caseinCaseinCaseinSodium caseinate
Tg'°C
-16.5
-16.5-13.5-12.5- 11-11.5-13.5-10.5-9.5
- 1 5
-10.5-15.5- 1 3
-10.5
-12.5
- 1 0
Wg'(g UFW/g)
0.310.33
0.34
0.340.330.30.350.37
0.360.520.46
0.660.36—0.58
0.710.50.380.550.300.28
0.440.33
0.400.26—0.37
0.33
0.42
0.42
0.42
0.610.44
0.24—0.300.64
"WBC"(g water/g)
0.25—0.290.200.1750.13
0.36—0.430.390.29
0.29—0.35
0.490.32
0.30
0.550.25—0.32
0.25—0.37
0.42
0.24
0.55
Ref.
2534834935035135286
167350350350167167168
353, 3542525252525252525
35535025
168356167357
252525
348358350167355350167358350
2535016735016735025
286358355
25
249
Dow
nloa
ded
by [
Tex
as A
&M
Uni
vers
ity L
ibra
ries
] at
10:
57 0
9 Ja
nuar
y 20
18

TABLE 12 (continued)Tg', Wg', and/or "Water Binding Capacity (WBC)" Values for Proteins25
Solute
KeratinZeinWheyWheyGluten (Sigma - wheat)Gluten ("vital wheat gluten"
commercial samples)
Tg'°C
- 6 . 5- 5 to- 1 0
Wg'(g UFW/g)
0.440.450.5
0.20—0.250.39
0.07—0.41
"WBC"(g water/g) Ref.
2525
359355
2525
TABLE 13Tg' and Wg' Values for Amino Acids25
Solute
GlycineGlycineDL-AlanineDL-AlanineDL-SerineDL-ProlineDL-ValineDL-NorvalineDL-ThreonineHydroxy-L-prolineDL-LeucineDL-NorleucineDL-lsoleucineDL-Aspartic acidDL-Glutamic acid • H20DL-MethionineDL-AsparagineDL-EthionineDL-PhenylalanineDL-CitrullineDL-TyrosineDL-Lysine HCIDL-DOPA
DL-TryptophanDL-Histidine HCI • H2ODL-Histidine HCI • H2ODL-Arginine HCIDL-Cystine
MW
75.175.189.189.1
105.1115.1117.2117.2119.1131.0131.2131.2131.2133.1147.1149.2150.1163.2165.2175.2181.2182.7197.2204.2209.6209.6210.7240.3
pH(20w /©/
6.59.16.22.0
10.17.2
10.710.16.06.1
12.30.59.98.40.8
10.11.1
10.6
5.50.6
4.01.36.1
Tg'°C
—- 5 8-50.5-55.5-51.5
—- 5 0-54.5-40.5-53.5
- 5 4-59.5-49.5- 4 8- 5 2-49.5-50.5
- 5 0
-47.5- 4 7
- 4 4- 5 2-43.5
Wg'(gUFW/g)
—1.72——1.88———1.04—
——1.981.591.251.481.11
1.98
1.211.58
—1.040.74
Remarks
Wcb,fa,dc
a,ba,ca,cbb,fe
a,ca.d.f
ccdcdecebdeb,fdbe
Undergoes eutectic melting"As is" pH in waterSolubilized with 1N NaOHSolubilized with 1N HCIInsoluble at 20 w%Undergoes solute crystallization
250
Dow
nloa
ded
by [
Tex
as A
&M
Uni
vers
ity L
ibra
ries
] at
10:
57 0
9 Ja
nuar
y 20
18

cussed earlier, these properties of amino acids,which characterize food cryoprotectants, trans-late to potential functionality in protein-based andother freezer-stored (but "soft-from-the-freezer")fabricated foods and as "moisture management"agents in "intermediate moisture" shelf-stableproducts.16-25 As indicated by the remarks in Ta-ble 13 pertaining to aqueous solubility and pHsensitivity, the potential utility of amino acids infood systems would depend on usage levels andcompatibility with product pH, in addition to di-etary considerations.25
G. Tg' Doublet Phenomena
As mentioned earlier, in order to refine thediscriminative capability of DSC analysis to eval-uate high-polymeric wheat gluten proteins for theircryostabilizing potential in frozen bread doughapplications, a low-temperature DSC assay basedon a three-component model system was devel-oped.25 The assay measured Tg' of a hand-mixedsample of gluten/sucrose/water (100/10/100 partsby weight, prepared by addition of sucrose insolution to gluten powder), to examine the extentof depression by sucrose of Tg' in the ternaryglass, compared to the Tg' of hydrated gluten inthe simple binary glass. As described for thepolysaccharide gums in Table 11, such a diag-nostic assay, using sucrose or fructose to providea ternary glass with a lower value of Mw, isuseful in the characterization of high polymerswith values of Tg' near 0°C.34 The Tg' resultsshown in Table 1425 for the gluten assay systemhave also been used to illustrate the non-trivialphenomenon of Tg' doublets,30 which has beenobserved in various model aqueous solutions andreal frozen products composed of partially orcompletely incompatible blends of two or morewater-compatible solids.3334 This phenomenonof two different Tg' values detectable in the ther-mogram of a maximally frozen solution of twoor more incompletely compatible solutes is dis-tinguishable from the more trivial phenomenon,described earlier with respect to Figure 39, of apair of glass transitions, Tg and Tg', arising fromthe possible coexistence of two distinct glassesformed due to incomplete phase separation in anincompletely frozen solution of a single solute.30
As indicated by the results in Table 14, Tg'for the freeze-concentrated, entangled-polymerglass occurred as a superimposed shoulder on thelow-temperature side of the ice-melting endoth-erm. In the simplest case, when all of the addedsucrose contributed to the ternary glass, depres-sion of Mw and Tg' was dramatic and quanti-tative, allowing deconvolution of Tg' from theTm of ice, which was only colligatively de-pressed by more dilute sucrose upon melting. Inthe most complex cases for multicomponent sys-tems, when only part of the added sucrose con-tributed to the major ternary glass, deconvolutionwas still possible, but the depression of Tg' wasonly qualitative. Table 14 illustrates the effect ofsucrose in ternary glasses of aqueous gluten sam-ples. It is important to note that all of the testcompositions in Table 14 contained excess water(i.e., water in excess of Wg'), which froze read-ily. Variation of the test system composition couldhave led to constraints in solubility and solutecompatibility for different solute ratios and con-centrations. The simplest case was exemplifiedby Henkel Pro-Vim. The ternary glass exhibiteda single value of Tg', depressed compared to thebinary glass. For the same assay test system com-position, gluten isolated from a high-protein var-ietal wheat flour (5409) exhibited the same, sin-gle value of Tg'. In contrast, a more complexcase was exemplified by the same sample of iso-lated gluten when a higher concentration of su-crose was used in the assay, in that two valuesof Tg' were observed. The expected furtherdepression of Tg' for the ternary glass was ob-served as a smaller transition, but the major tran-sition occurred near Tg' of sucrose itself (—32°C).For this same higher-sucrose composition in thetest system, additional complexity was observedwhen another commercial gluten (IGP SG-80)was assayed. Again two values of Tg' were ob-served, but the minor transition occurred near Tg'of sucrose itself.
Based on other studies30 of complex aqueousmodel systems, including mixtures of variousproteins-sugars, polysaccharides-sugars, andmany different multicomponent food ingredientsand products, multiple Tg' values have been at-tributed to the coexistence of two distinct aqueousglasses.25-32"34 In a maximally frozen matrix, thepresence of multiple aqueous glasses, having dif-
251
Dow
nloa
ded
by [
Tex
as A
&M
Uni
vers
ity L
ibra
ries
] at
10:
57 0
9 Ja
nuar
y 20
18
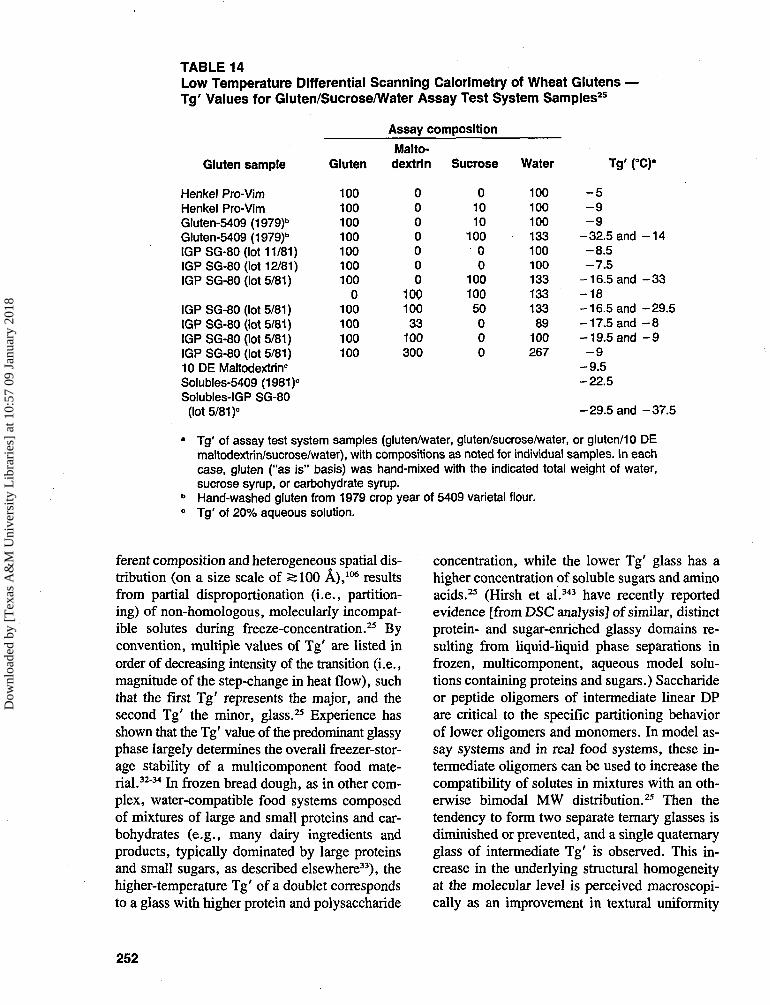
TABLE 14Low Temperature Differential Scanning Caiorimetry of Wheat Glutens —Tg' Values for Gluten/Sucrose/Water Assay Test System Samples25
Gluten sample
Henkel Pro-VimHenkel Pro-VimGluten-5409 (1979)b
Gluten-5409 (1979)"IGPSG-80 (lot 11/81)IGP SG-80 (lot 12/81)IGPSG-80 (lot 5/81)
IGP SG-80 (lot 5/81)IGP SG-80 (lot 5/81)IGP SG-80 (lot 5/81)IGP SG-80 (lot 5/81)10 DE Maltodextrinc
Solubles-5409 (1981)c
Solubles-IGP SG-80(lot 5/81 )c
Gluten
100100100100100100100
0100100100100
Assay composition
Malto-dextrin
0000000
10010033
100300
Sucrose
01010
10000
10010050000
Water
10010010013310010013313313389
100267
Tg' (°C)-
- 5- 9- 9
-32.5 and - 1 4-8 .5-7 .5
-16.5 and - 3 3- 1 8-16.5 and -29.5-17.5 and - 8-19.5 and - 9
- 9-9 .5-22.5
-29.5 and -37 .5
Tg' of assay test system samples (gluten/water, gluten/sucrose/water, or gluten/10 DEmaltodextrin/sucrose/water), with compositions as noted for individual samples. In eachcase, gluten ("as is" basis) was hand-mixed with the indicated total weight of water,sucrose syrup, or carbohydrate syrup.Hand-washed gluten from 1979 crop year of 5409 varietal flour.Tg' of 20% aqueous solution.
ferent composition and heterogeneous spatial dis-tribution (on a size scale of ^100 A),106 resultsfrom partial disproportionate (i.e., partition-ing) of non-homologous, molecularly incompat-ible solutes during freeze-concentration.25 Byconvention, multiple values of Tg' are listed inorder of decreasing intensity of the transition (i.e.,magnitude of the step-change in heat flow), suchthat the first Tg' represents the major, and thesecond Tg' the minor, glass.25 Experience hasshown that the Tg' value of the predominant glassyphase largely determines the overall freezer-stor-age stability of a multicomponent food mate-rial.32"34 In frozen bread dough, as in other com-plex, water-compatible food systems composedof mixtures of large and small proteins and car-bohydrates (e.g., many dairy ingredients andproducts, typically dominated by large proteinsand small sugars, as described elsewhere33), thehigher-temperature Tg' of a doublet correspondsto a glass with higher protein and polysaccharide
concentration, while the lower Tg' glass has ahigher concentration of soluble sugars and aminoacids.25 (Hirsh et al.343 have recently reportedevidence [from DSC analysis] of similar, distinctprotein- and sugar-enriched glassy domains re-sulting from liquid-liquid phase separations infrozen, multicomponent, aqueous model solu-tions containing proteins and sugars.) Saccharideor peptide oligomers of intermediate linear DPare critical to the specific partitioning behaviorof lower oligomers and monomers. In model as-say systems and in real food systems, these in-termediate oligomers can be used to increase thecompatibility of solutes in mixtures with an oth-erwise bimodal MW distribution.25 Then thetendency to form two separate ternary glasses isdiminished or prevented, and a single quaternaryglass of intermediate Tg' is observed. This in-crease in the underlying structural homogeneityat the molecular level is perceived macroscopi-cally as an improvement in textural uniformity
252
Dow
nloa
ded
by [
Tex
as A
&M
Uni
vers
ity L
ibra
ries
] at
10:
57 0
9 Ja
nuar
y 20
18
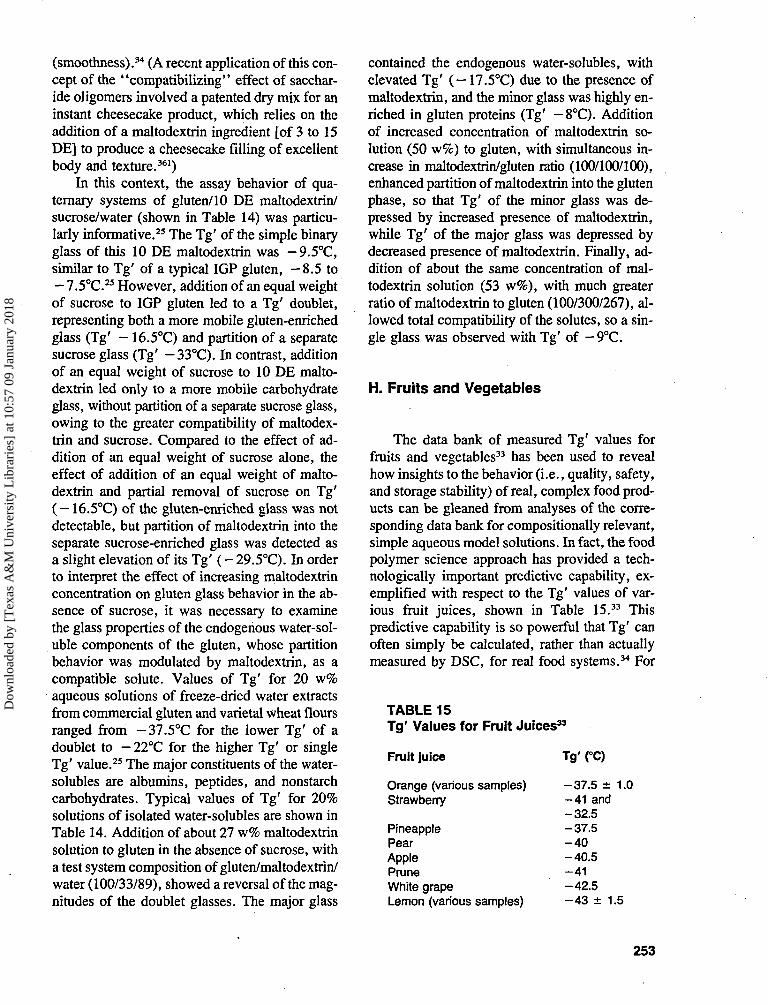
(smoothness).34 (A recent application of this con-cept of the "compatibilizing" effect of sacchar-ide oligomers involved a patented dry mix for aninstant cheesecake product, which relies on theaddition of a maltodextrin ingredient [of 3 to 15DE] to produce a cheesecake filling of excellentbody and texture.361)
In this context, the assay behavior of qua-ternary systems of gluten/10 DE maltodextrin/sucrose/water (shown in Table 14) was particu-larly informative.25 The Tg' of the simple binaryglass of this 10 DE maltodextrin was -9.5°C,similar to Tg' of a typical IGP gluten, - 8 . 5 to— 7.5°C.25 However, addition of an equal weightof sucrose to IGP gluten led to a Tg' doublet,representing both a more mobile gluten-enrichedglass (Tg' — 16.5°C) and partition of a separatesucrose glass (Tg' — 33°C). In contrast, additionof an equal weight of sucrose to 10 DE malto-dextrin led only to a more mobile carbohydrateglass, without partition of a separate sucrose glass,owing to the greater compatibility of maltodex-trin and sucrose. Compared to the effect of ad-dition of an equal weight of sucrose alone, theeffect of addition of an equal weight of malto-dextrin and partial removal of sucrose on Tg'(— 16.5°C) of the gluten-enriched glass was notdetectable, but partition of maltodextrin into theseparate sucrose-enriched glass was detected asa slight elevation of its Tg' ( - 29.5°C). In orderto interpret the effect of increasing maltodextrinconcentration on gluten glass behavior in the ab-sence of sucrose, it was necessary to examinethe glass properties of the endogenous water-sol-uble components of the gluten, whose partitionbehavior was modulated by maltodextrin, as acompatible solute. Values of Tg' for 20 w%aqueous solutions of freeze-dried water extractsfrom commercial gluten and varietal wheat floursranged from -37.5°C for the lower Tg' of adoublet to -22°C for the higher Tg' or singleTg' value.25 The major constituents of the water-solubles are albumins, peptides, and nonstarchcarbohydrates. Typical values of Tg' for 20%solutions of isolated water-solubles are shown inTable 14. Addition of about 27 w% maltodextrinsolution to gluten in the absence of sucrose, witha test system composition of gluten/maltodextrin/water (100/33/89), showed a reversal of the mag-nitudes of the doublet glasses. The major glass
contained the endogenous water-solubles, withelevated Tg' ( - 17.5°C) due to the presence ofmaltodextrin, and the minor glass was highly en-riched in gluten proteins (Tg' -8°C). Additionof increased concentration of maltodextrin so-lution (50 w%) to gluten, with simultaneous in-crease in maltodextrin/gluten ratio (100/100/100),enhanced partition of maltodextrin into the glutenphase, so that Tg' of the minor glass was de-pressed by increased presence of maltodextrin,while Tg' of the major glass was depressed bydecreased presence of maltodextrin. Finally, ad-dition of about the same concentration of mal-todextrin solution (53 w%), with much greaterratio of maltodextrin to gluten (100/300/267), al-lowed total compatibility of the solutes, so a sin-gle glass was observed with Tg' of — 9°C.
H. Fruits and Vegetables
The data bank of measured Tg' values forfruits and vegetables33 has been used to revealhow insights to the behavior (i.e., quality, safety,and storage stability) of real, complex food prod-ucts can be gleaned from analyses of the corre-sponding data bank for compositionally relevant,simple aqueous model solutions. In fact, the foodpolymer science approach has provided a tech-nologically important predictive capability, ex-emplified with respect to the Tg' values of var-ious fruit juices, shown in Table 15.33 Thispredictive capability is so powerful that Tg' canoften simply be calculated, rather than actuallymeasured by DSC, for real food systems.34 For
TABLE 15Tg' Values for Fruit Juices33
Fruit juice
Orange (various samples)Strawberry
PineapplePearApplePruneWhite grapeLemon (various samples)
Tg' CO
-37.5 ± 1.0-41 and-32.5-37.5- 4 0-40.5
-41-42.5- 4 3 ± 1.5
253
Dow
nloa
ded
by [
Tex
as A
&M
Uni
vers
ity L
ibra
ries
] at
10:
57 0
9 Ja
nuar
y 20
18
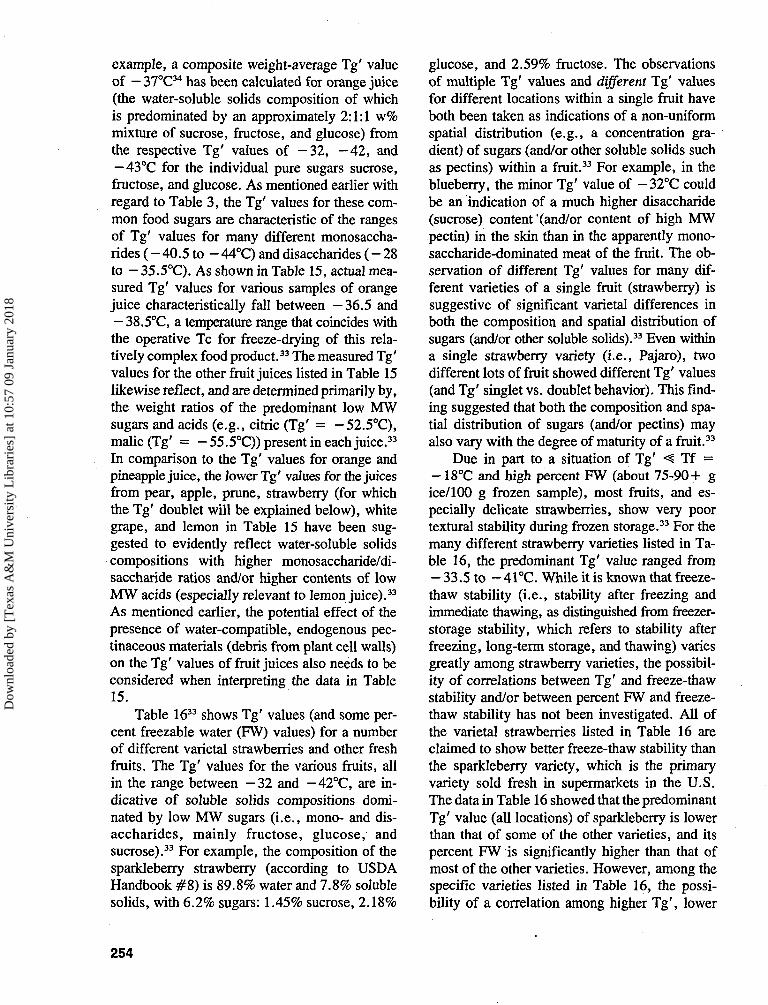
example, a composite weight-average Tg' valueof — 37°C34 has been calculated for orange juice(the water-soluble solids composition of whichis predominated by an approximately 2:1:1 w%mixture of sucrose, fructose, and glucose) fromthe respective Tg' values of - 3 2 , - 4 2 , and— 43°C for the individual pure sugars sucrose,fructose, and glucose. As mentioned earlier withregard to Table 3, the Tg' values for these com-mon food sugars are characteristic of the rangesof Tg' values for many different monosaccha-rides ( - 40.5 to - 44°C) and disaccharides ( - 28to — 35.5°C). As shown in Table 15, actual mea-sured Tg' values for various samples of orangejuice characteristically fall between - 36.5 and— 38.5°C, a temperature range that coincides withthe operative Tc for freeze-drying of this rela-tively complex food product.33 The measured Tg'values for the other fruit juices listed in Table 15likewise reflect, and are determined primarily by,the weight ratios of the predominant low MWsugars and acids (e.g., citric (Tg' = -52.5°C),malic (Tg' = — 55.5°C)) present in each juice.33
In comparison to the Tg' values for orange andpineapple juice, the lower Tg' values for the juicesfrom pear, apple, prune, strawberry (for whichthe Tg' doublet will be explained below), whitegrape, and lemon in Table 15 have been sug-gested to evidently reflect water-soluble solidscompositions with higher monosaccharide/di-saccharide ratios and/or higher contents of lowMW acids (especially relevant to lemon juice).33
As mentioned earlier, the potential effect of thepresence of water-compatible, endogenous pec-tinaceous materials (debris from plant cell walls)on the Tg' values of fruit juices also needs to beconsidered when interpreting the data in Table15.
Table 1633 shows Tg' values (and some per-cent freezable water (FW) values) for a numberof different varietal strawberries and other freshfruits. The Tg' values for the various fruits, allin the range between - 3 2 and -42°C, are in-dicative of soluble solids compositions domi-nated by low MW sugars (i.e., mono- and dis-accharides, mainly fructose, glucose, andsucrose).33 For example, the composition of thesparkleberry strawberry (according to USDAHandbook #8) is 89.8% water and 7.8% solublesolids, with 6.2% sugars: 1.45% sucrose, 2.18%
glucose, and 2.59% fructose. The observationsof multiple Tg' values and different Tg' valuesfor different locations within a single fruit haveboth been taken as indications of a non-uniformspatial distribution (e.g., a concentration gra-dient) of sugars (and/or other soluble solids suchas pectins) within a fruit.33 For example, in theblueberry, the minor Tg' value of -32°C couldbe an indication of a much higher disaccharide(sucrose) content '(and/or content of high MWpectin) in the skin than in the apparently mono-saccharide-dominated meat of the fruit. The ob-servation of different Tg' values for many dif-ferent varieties of a single fruit (strawberry) issuggestive of significant varietal differences inboth the composition and spatial distribution ofsugars (and/or other soluble solids).33 Even withina single strawberry variety (i.e., Pajaro), twodifferent lots of fruit showed different Tg' values(and Tg' singlet vs. doublet behavior). This find-ing suggested that both the composition and spa-tial distribution of sugars (and/or pectins) mayalso vary with the degree of maturity of a fruit.33
Due in part to a situation of Tg' < Tf =
- 18°C and high percent FW (about 75-90+ gice/100 g frozen sample), most fruits, and es-pecially delicate strawberries, show very poortextural stability during frozen storage.33 For themany different strawberry varieties listed in Ta-ble 16, the predominant Tg' value ranged from- 33.5 to -41°C. While it is known that freeze-thaw stability (i.e., stability after freezing andimmediate thawing, as distinguished from freezer-storage stability, which refers to stability afterfreezing, long-term storage, and thawing) variesgreatly among strawberry varieties, the possibil-ity of correlations between Tg' and freeze-thawstability and/or between percent FW and freeze-thaw stability has not been investigated. All ofthe varietal strawberries listed in Table 16 areclaimed to show better freeze-thaw stability thanthe sparkleberry variety, which is the primaryvariety sold fresh in supermarkets in the U.S.The data in Table 16 showed that the predominantTg' value (all locations) of sparkleberry is lowerthan that of some of the other varieties, and itspercent FW is significantly higher than that ofmost of the other varieties. However, among thespecific varieties listed in Table 16, the possi-bility of a correlation among higher Tg', lower
254
Dow
nloa
ded
by [
Tex
as A
&M
Uni
vers
ity L
ibra
ries
] at
10:
57 0
9 Ja
nuar
y 20
18
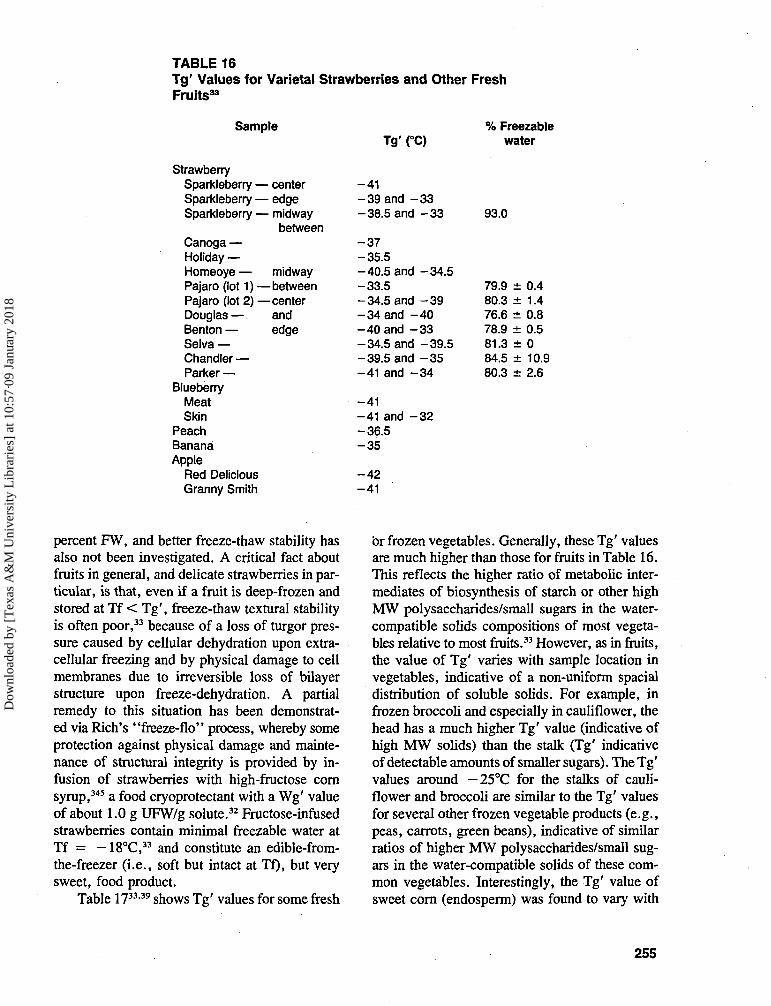
TABLE 16Tg' Values for Varietal Strawberries and OtherFruits33
Sample
StrawberrySparkleberry — centerSparkleberry — edgeSparkleberry — midway
betweenCanoga —Holiday —Homeoye — midwayPajaro (lot 1) —betweenPajaro (lot 2) —centerDouglas— andBenton — edgeSelva —Chandler —Parker —
BlueberryMeatSkin
PeachBananaApple
Red DeliciousGranny Smith
Tg' (°C)
-41- 3 9 and - 3 3-38.5 and - 3 3
- 3 7-35.5-40.5 and -34.5-33.5-34.5 and - 3 9- 3 4 and - 4 0- 4 0 and - 3 3-34.5 and -39.5-39.5 and - 3 5-41 and - 3 4
-41- 4 1 and - 3 2-36.5- 3 5
- 4 2-41
Fresh
% Freezablewater
93.0
79.980.376.678.981.384.580.3
± 0.4± 1.4± 0.8± 0.5± 0± 10.9± 2.6
percent FW, and better freeze-thaw stability hasalso not been investigated. A critical fact aboutfruits in general, and delicate strawberries in par-ticular, is that, even if a fruit is deep-frozen andstored at Tf < Tg', freeze-thaw textural stabilityis often poor,33 because of a loss of turgor pres-sure caused by cellular dehydration upon extra-cellular freezing and by physical damage to cellmembranes due to irreversible loss of bilayerstructure upon freeze-dehydration. A partialremedy to this situation has been demonstrat-ed via Rich's "freeze-flo" process, whereby someprotection against physical damage and mainte-nance of structural integrity is provided by in-fusion of strawberries with high-fructose cornsyrup,345 a food cryoprotectant with a Wg' valueof about 1.0 g UFW/g solute.32 Fructose-infusedstrawberries contain minimal freezable water atTf = - 18°C,33 and constitute an edible-from-the-freezer (i.e., soft but intact at Tf), but verysweet, food product.
Table 1733-39 shows Tg' values for some fresh
or frozen vegetables. Generally, these Tg' valuesare much higher than those for fruits in Table 16.This reflects the higher ratio of metabolic inter-mediates of biosynthesis of starch or other highMW polysaccharides/small sugars in the water-compatible solids compositions of most vegeta-bles relative to most fruits.33 However, as in fruits,the value of Tg' varies with sample location invegetables, indicative of a non-uniform spacialdistribution of soluble solids. For example, infrozen broccoli and especially in cauliflower, thehead has a much higher Tg' value (indicative ofhigh MW solids) than the stalk (Tg' indicativeof detectable amounts of smaller sugars). TheTg'values around — 25°C for the stalks of cauli-flower and broccoli are similar to the Tg' valuesfor several other frozen vegetable products (e.g.,peas, carrots, green beans), indicative of similarratios of higher MW polysaccharides/small sug-ars in the water-compatible solids of these com-mon vegetables. Interestingly, the Tg' value ofsweet corn (endosperm) was found to vary with
255
Dow
nloa
ded
by [
Tex
as A
&M
Uni
vers
ity L
ibra
ries
] at
10:
57 0
9 Ja
nuar
y 20
18
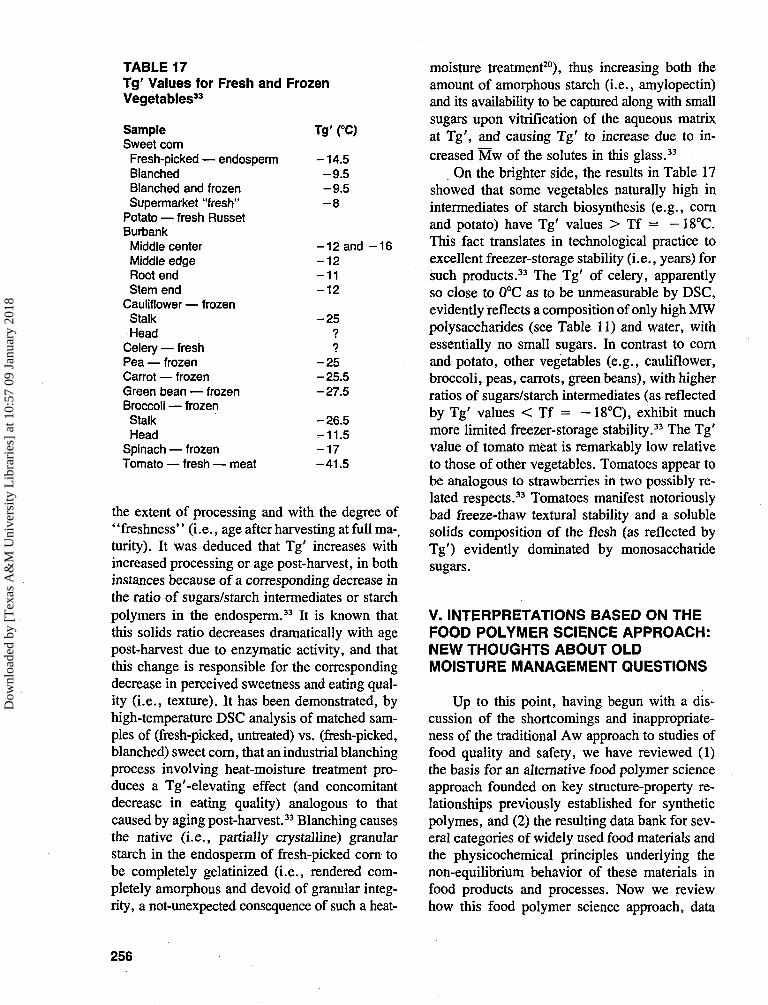
TABLE 17Tg' Values for Fresh and FrozenVegetables33
SampleSweet com
Fresh-picked — endospermBlanchedBlanched and frozenSupermarket "fresh"
Potato — fresh RussetBurbankMiddle centerMiddle edgeRoot endStem end
Cauliflower — frozenStalkHead
Celery — freshPea — frozenCarrot — frozenGreen bean — frozenBroccoli — frozenStalkHead
Spinach — frozenTomato — fresh — meat
Tg' (°C)
-14.5-9 .5-9 .5- 8
- 1 2 and - 1 6- 1 2-11- 1 2
- 2 5??
- 2 5-25.5-27.5
-26.5-11.5- 1 7-41.5
the extent of processing and with the degree of"freshness" (i.e., age after harvesting at full ma-,turity). It was deduced that Tg' increases withincreased processing or age post-harvest, in bothinstances because of a corresponding decrease inthe ratio of sugars/starch intermediates or starchpolymers in the endosperm.33 It is known thatthis solids ratio decreases dramatically with agepost-harvest due to enzymatic activity, and thatthis change is responsible for the correspondingdecrease in perceived sweetness and eating qual-ity (i.e., texture). It has been demonstrated, byhigh-temperature DSC analysis of matched sam-ples of (fresh-picked, untreated) vs. (fresh-picked,blanched) sweet corn, that an industrial blanchingprocess involving heat-moisture treatment pro-duces a Tg'-elevating effect (and concomitantdecrease in eating quality) analogous to thatcaused by aging post-harvest.33 Blanching causesthe native (i.e., partially crystalline) granularstarch in the endosperm of fresh-picked corn tobe completely gelatinized (i.e., rendered com-pletely amorphous and devoid of granular integ-rity, a not-unexpected consequence of such a heat-
moisture treatment20), thus increasing both theamount of amorphous starch (i.e., amylopectin)and its availability to be captured along with smallsugars upon vitrification of the aqueous matrixat Tg', and causing Tg' to increase due to in-creased Mw of the solutes in this glass.33
On the brighter side, the results in Table 17showed that some vegetables naturally high inintermediates of starch biosynthesis (e.g., cornand potato) have Tg' values > Tf = -18°C.This fact translates in technological practice toexcellent freezer-storage stability (i.e., years) forsuch products.33 The Tg' of celery, apparentlyso close to 0°C as to be unmeasurable by DSC,evidently reflects a composition of only high MWpolysaccharides (see Table 11) and water, withessentially no small sugars. In contrast to cornand potato, other vegetables (e.g., cauliflower,broccoli, peas, carrots, green beans), with higherratios of sugars/starch intermediates (as reflectedby Tg' values < Tf = - 18°C), exhibit muchmore limited freezer-storage stability.33 The Tg'value of tomato meat is remarkably low relativeto those of other vegetables. Tomatoes appear tobe analogous to strawberries in two possibly re-lated respects.33 Tomatoes manifest notoriouslybad freeze-thaw textural stability and a solublesolids composition of the flesh (as reflected byTg') evidently dominated by monosaccharidesugars.
V. INTERPRETATIONS BASED ON THEFOOD POLYMER SCIENCE APPROACH:NEW THOUGHTS ABOUT OLDMOISTURE MANAGEMENT QUESTIONS
Up to this point, having begun with a dis-cussion of the shortcomings and inappropriate-ness of the traditional Aw approach to studies offood quality and safety, we have reviewed (1)the basis for an alternative food polymer scienceapproach founded on key structure-property re-lationships previously established for syntheticpolymes, and (2) the resulting data bank for sev-eral categories of widely used food materials andthe physicochemical principles underlying thenon-equilibrium behavior of these materials infood products and processes. Now we reviewhow this food polymer science approach, data
256
Dow
nloa
ded
by [
Tex
as A
&M
Uni
vers
ity L
ibra
ries
] at
10:
57 0
9 Ja
nuar
y 20
18
bank, and underlying physicochemical founda-tion have been used to provide new and revealinginterpretations of a number of old problems andquestions, related to moisture management andwater relationships in food systems, to which thetraditional Aw approach has been unable to pro-vide solutions, explanations, or answers.
As emphasized in Section IV. A, small PHCsand their aqueous solutions offer a unique frame-work for the investigation of non-equilibrium be-havior under conditions of importance to tech-nological applications.30 The small PHCs aremonodisperse with known MW below the entan-glement limit. They provide several homologousor nearly homologous series of oligomers. Theyexhibit an astonishing diversity of thermal andthermomechanical properties that can be studiedwithin particular sub-groups: PHCs with the sameMW, PHCs with different MW in a homologousseries, single PHC with different conformations.It has been shown that use of the dynamics mapas a new conceptual approach to the study ofnon-equilibrium thermomechanical behavior fa-cilitates the selection of experimental conditionsto allow each PHC to be examined at an equiv-alent distance of moisture (i.e., AW) and tem-perature (i.e., AT) from its respective referenceglass curve.30 For most effective use of the dy-namics map as a mobility transformation map toelucidate the underlying basis of the differencesin behavior of PHCs, it has been necessary toidentify appropriate experimental approaches thatare capable of separating the effects of transla-tional and rotational mobility on different me-chanical relaxation properties.30 Since local vis-cosity is related to relaxations that are controlledby translational diffusion, it reflects the mobilityof the molecular-level environment. Thus, thesame relaxation rates and temperature depen-dence would be expected for results of, for ex-ample, small molecule diffusion, polymer fric-tional coefficient, and pulsed field gradient-spinecho NMR spectroscopy of PHC-water sys-tems.200"204
In general, mechanical relaxations depend onboth translational and rotational mobility. For atypical, well-behaved polymer, an increase in freevolume would be expected to go hand-in-handwith a decrease in local viscosity. However, wheneither the rotational or translational relaxation time
is the limiting aspect for a particular small PHC-water glass-forming system, the ranking of sol-utes, i.e., either by Mn or Mw (as in Table 6),would be expected to depend on the underlyingmechanism of the specific mechanicalrelaxation.30
Experimental mechanical relaxation pro-cesses can be categorized in terms of their controlby rotational or translational mobility.30 Forexample, homogeneous nucleation depends onboth translation and rotation, but can be com-pletely controlled and limited by the rotationalmobility.4-104-113-296 The response to microwaves,in a microwave dielectric dispersion experi-ment,200"202-204 is another rotational response. Incontrast, the apparent, non-equilibrium RVP de-pends on translational mobility.15-16 Other me-chanical relaxation processes controlled by trans-lational mobility include starch gelatinization,20-21
mold spore germination,15-16 crystal growth,15-104
collapse phenomena,8-27 and freeze-drying.33-40-41
A conceptual experimental approach to the studyof these various relaxation processes,30 as theypertain to the non-equilibrium behavior of PHC-water and other aqueous food systems, are re-viewed in the remainder of Section V.
The selection of a molecule to be used as areporter to probe the local environment is a crit-ical element of experiments to study mechanicalrelaxation processes. A very low concentrationof reporter molecule (e.g., a dye) is required fortranslational and rotational diffusion experi-ments, in order to avoid concentration gradientsand perturbation of the local relaxation due toplasticization by the reporter.362 Water itself isnot a good candidate for the role of reporter mol-ecule to study the mobility of aqueous glasses,because water would then be both a functionalpart of the sample matrix and a reporter in manyexperiments.30 For example, in a NMR investi-gation of the mobility of water in an amorphouspolymer, the water concentration cannot bechanged without significantly changing the sys-tem itself, because of the effect of water as aplasticizer.25 Thus, a third molecule would beneeded to act as the reporter. Later, we describehow high-polymeric starch has been used to fillthis key role.30 In this context of a discriminatingexperimental approach, it is worth reiterating thatsmall-PHC aqueous glasses are uniquely excel-
257
Dow
nloa
ded
by [
Tex
as A
&M
Uni
vers
ity L
ibra
ries
] at
10:
57 0
9 Ja
nuar
y 20
18
lent model systems for the study of non-equilib-rium relaxation processes.30 For solute MWs be-low the entanglement MW of =3000 (glucoseDP :£ 18), such non-entangling polymers allowthe study of the contributions of free volume andlocal viscosity (as the measured viscosity), with-out the ambiguity introduced by convolution withthe bulk entanglement-network viscosity, whichwould be essentially the same for all polymers.107
As shown earlier in Table 8, glass compositionscan be measured quantitatively in terms of Mnand Mw. Moreover, in contrast to aqueous glassesof ionic salts, complicating effects due to specificion hydration and concentration-dependent pKcan be avoided.30
A. Water Sorption Isotherms for Glassyand Rubbery Polymer Systems
Water sorption, and the beneficial or detri-mental effects thereof, can play a critical role inmany food processes and products. For example,with respect to doughs and baked goods,26 ab-sorption of liquid water by the amorphous po-lymeric carbohydrates and proteins in flours,leading to their kinetically controlled plasticiza-tion ("hydration") during dough mixing, is ob-viously a key element of dough formation andan important determinant of the Theological prop-erties and mechanical behavior of doughs.45>209-363
Non-equilibrium evaporative desorption of watervapor58 is a crucial aspect of the baking process.Time- and temperature-dependent ad/desorptionof water vapor during ambient storage is a po-tentially important aspect of the stability and shelf-life of baked products.26 These examples simplyhelp to emphasize the universal and indisputablefact that an understanding of the water sorptionbehavior of (1) individual ingredients or naturalfood materials prior to processing, (2) formula-tions of ingredients during processing, and (3)finished products after processing is a vital re-quirement of any assessment of food quality,safety, and stability.
1. Sorption Hysteresis, SorptionKinetics, and Effect of Temperature onSorption
It has been recently stated364 that the reasonsfor the well-known irreversibility and hysteresisshown by water vapor sorption isotherms of bio-polymers, including various food proteins andcarbohydrates,62>36S-366 are not established.Bryan364 has suggested that observed "irregular-ities reflect changes in the conformation and/ordynamic behavior of the biopolymer molecule."He has noted that "recent work on water-proteininteractions367-368 is compatible with the occur-rence of small conformational changes and in-creased flexibility (perhaps a loosening of theprotein structure) as more water is added to aprotein" in the solid state. Lillford58 has ex-pressed a similar opinion, crediting (as others hadpreviously8) the onset of enzymatic activity inlow-moisture, amorphous lysozyme powders toplasticization by sorbed water, leading to suffi-cient segmental mobility for diffusion-limited en-zyme-substrate interactions to occur. With re-spect to water-protein sorption hysteresis, Bryan369
has suggested that hysteresis "could result fromslow, incomplete conformational changes occur-ring upon addition of water'' to proteins in thesolid state, and its subsequent removal. Thesechanges could result from incomplete "inter-molecular phase annealing" or "phase changes",and the resulting hysteresis "might be related tothe physical state and prior history of the sam-ple".369 Again, Lillford58 has expressed similarsentiments, pointing out (again as others hadpreviously15) that starch62 and other hydrophilicpolymers plasticized by water "are far from inertin the adsorption process", should not be mod-eled as "an immobile and unaffected substrate",manifest a "non-equilibrium desorption processresponsible for hysteresis", and probably are"usually in a metastable kinetic state . . . wherethe interaction of polymers and water cannot betreated in terms of equilibrium thermody-namics". Bryan369 has also noted the fact that
258
Dow
nloa
ded
by [
Tex
as A
&M
Uni
vers
ity L
ibra
ries
] at
10:
57 0
9 Ja
nuar
y 20
18
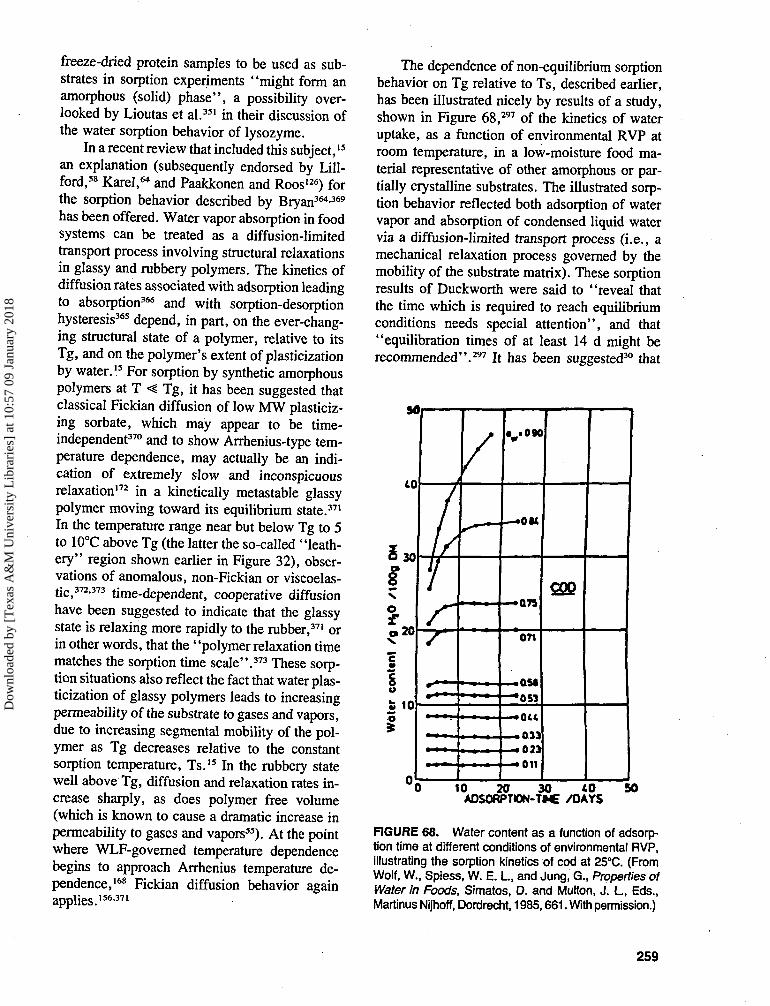
freeze-dried protein samples to be used as sub-strates in sorption experiments "might form anamorphous (solid) phase", a possibility over-looked by Lioutas et al.351 in their discussion ofthe water sorption behavior of lysozyme.
In a recent review that included this subject,15
an explanation (subsequently endorsed by Lill-ford,58 Karel,64 and Paakkonen and Roos126) forthe sorption behavior described by Bryan364-369
has been offered. Water vapor absorption in foodsystems can be treated as a diffusion-limitedtransport process involving structural relaxationsin glassy and rubbery polymers. The kinetics ofdiffusion rates associated with adsorption leadingto absorption366 and with sorption-desorptionhysteresis363 depend, in part, on the ever-chang-ing structural state of a polymer, relative to itsTg, and on the polymer's extent of plasticizationby water.15 For sorption by synthetic amorphouspolymers at T « Tg, it has been suggested thatclassical Fickian diffusion of low MW plasticiz-ing sorbate, which may appear to be time-independent370 and to show Arrhenius-type tem-perature dependence, may actually be an indi-cation of extremely slow and inconspicuousrelaxation172 in a kinetically metastable glassypolymer moving toward its equilibrium state.371
In the temperature range near but below Tg to 5to 10°C above Tg (the latter the so-called "leath-ery" region shown earlier in Figure 32), obser-vations of anomalous, non-Fickian or viscoelas-tic372.373 time-dependent, cooperative diffusionhave been suggested to indicate that the glassystate is relaxing more rapidly to the rubber,371 orin other words, that the ' 'polymer relaxation timematches the sorption time scale".373 These sorp-tion situations also reflect the fact that water plas-ticization of glassy polymers leads to increasingpermeability of the substrate to gases and vapors,due to increasing segmental mobility of the pol-ymer as Tg decreases relative to the constantsorption temperature, Ts.15 In the rubbery statewell above Tg, diffusion and relaxation rates in-crease sharply, as does polymer free volume(which is known to cause a dramatic increase inpermeability to gases and vapors55). At the pointwhere WLF-governed temperature dependencebegins to approach Arrhenius temperature de-pendence,168 Fickian diffusion behavior againapplies.156-371
The dependence of non-equilibrium sorptionbehavior on Tg relative to Ts, described earlier,has been illustrated nicely by results of a study,shown in Figure 68,297 of the kinetics of wateruptake, as a function of environmental RVP atroom temperature, in a low-moisture food ma-terial representative of other amorphous or par-tially crystalline substrates. The illustrated sorp-tion behavior reflected both adsorption of watervapor and absorption of condensed liquid watervia a diffusion-limited transport process (i.e., amechanical relaxation process governed by themobility of the substrate matrix). These sorptionresults of Duckworth were said to "reveal thatthe time which is required to reach equilibriumconditions needs special attention", and that"equilibration times of at least 14 d might berecommended".297 It has been suggested30 that
3d
(0
2 30
fof
cont
tnt
/g
fc 10o
/
1
/.....
—»0«
071
10 20 30 10A0S0RPTI0N-Tt€ /DAYS
50
FIGURE 68. Water content as a function of adsorp-tion time at different conditions of environmental RVP,illustrating the sorption kinetics of cod at 25°C. (FromWolf, W., Spiess, W. E. I., and Jung, G., Properties ofWater in Foods, Simatos, D. and Multon, J. I., Eds.,Martinus Nijhoff, Dordrecht, 1985,661. With permission.)
259
Dow
nloa
ded
by [
Tex
as A
&M
Uni
vers
ity L
ibra
ries
] at
10:
57 0
9 Ja
nuar
y 20
18
the results in Figure 68 in fact demonstrated thattimes that are orders-of-magnitude greater than14 d would be required to approach equilibriumconditions. In such sorption experiments, a low-moisture, amorphous food system may be in anextremely low mobility, "stationary" solid stateso far from equilibrium172 that it can be easilyconfused with equilibrium. Figure 68 showed that,even in 25 d, there was no change in water uptakewhen the environmental RH was 11%. The es-sentially immobile solid sample remained far fromequilibrium in a low-moisture, negligibly plas-ticized "apparent steady state". In sharp con-trast, in less than 25 d, there was a dramaticchange in water uptake by the same substratematerial when the RH was 90%. Under theseconditions, the higher moisture sample was sig-nificantly plasticized and exhibited sufficient mo-bility to allow a more rapid approach toward astill-higher moisture and not-yet-achieved equi-librium condition. The fundamental trend of in-creasing sorption rate with increasing environ-mental RH evidenced by the results in Figure 68has suggested a mechanistic correlation betweenincreasing mobility and increasing rate of relax-ation of the substrate-water system toward itsunique final state of equilibrium.30 This corre-lation reflects the sequential relationship betweenincreasing water uptake, increasing plasticiza-tion, increasing free volume and decreasing localviscosity, which result in decreasing Tg. (Recallthat the sequence of plasticization lagging behindwater uptake and swelling was also suggestedearlier in Section III. A.4 with respect to the sorp-tion of water by native granular starches.159)Viewed in isolation on a practical time scale, theunchanging nature of the low-moisture substrateat low RH would prevent an observer from re-cognizing this non-equilibrium situation of ex-tremely slow mechanical relaxation.30
From countless studies of so-called "equi-librium" water vapor sorption and sorption iso-therms for completely amorphous or partial-ly crystalline, water-compatible polymers, twogeneral characteristics have become widely ac-knowledged.15 One is that such experimentsdo not usually represent a true thermodynamicequilibrium situation, since the polymer sub-strate is changing structurally (and slowly,during sorption experiments that are often
[and sometimes recognized to be]370-376 much tooshort) due to plasticization by sorbedwater.4-62-64-79-363-365371-372 Secondly,-since Tg de-creases during sorption, such experiments are noteven isothermal with respect to the AT-governedviscoelastic properties of the polymer, becauseAT (= Ts — Tg) changes dynamically over thesorption time course.15-365-371 Consequently, boththe extent of sorption and the mobility of sorbedmolecules generally increase with increasingplasticization by water.375-376
As reviewed recently elsewhere,15 the basicpremises that underlie the interpretation of thewater sorption characteristics of food polymersystems include the following: (1) the sorptionproperties of a "dry" polymer depend on its in-itial structural state and thermodynamic compat-ibility with water;372 (2) in both completely amor-phous and partially crystalline polymers, only theamorphous regions preferentially absorbwater;157-377 and (3) the shape of a particular sorp-tion isotherm depends critically on the relation-ship between Ts and both the initial Tg of the"dry" polymer and Tg of the water-plasticizedpolymer during the sorption experiment.378 Sev-eral interesting illustrations of these points havebeen described.15 For example, for sorption ex-periments done at a series of temperatures thatbracket Tg of the water-plasticized polymer, theclassic sigmoidal shape of the isotherm, at Ts <Tg, flattens suddenly, at Ts > Tg, to one char-acteristic of solution sorption by a rubbery pol-ymer. Such behavior was illustrated earlier foran epoxy resin in Figure 12.80 This synthetic,water-sensitive polymer system manifests iso-therms approaching linearity at high RVP forsorption temperatures above the water-plasticizedTg, which evidently lies between 75 and 100°Cfor this sample. It has been noted that the onsetof the glass transition is indicated by a conspic-uous change in a polymer's sorption behavior,which coincides with a dramatic change in thepolymer's specific volume.15 Thus, the temper-ature-percent moisture point (i.e., Tg) at whicha plot of specific volume vs. temperature15 char-acteristically changes slope is reflected in sorp-tion isotherms (such as those in Figure 12) as thecoincident temperature-percent moisture condi-tion above which the sorption curve is a flat linecharacteristic of solution sorption by a rubbery
260
Dow
nloa
ded
by [
Tex
as A
&M
Uni
vers
ity L
ibra
ries
] at
10:
57 0
9 Ja
nuar
y 20
18
polymer, but below which the sigmoid sorptioncurve is characteristic of so-called "waferclustering"379 in a glassy polymer.15
In other instances of sorption at a series oftemperatures, all well below the initial Tg of the"dry" polymer, the effect of increasing Ts onsorption behavior can be less pronounced thanthat evidenced in Figure 12. The result can be aset of typical sigmoid adsorption curves, such asshown in Figures 14A and B for pectin and cas-einate,81 two high MW biopolymers with dry Tg> 100°C. In these cases, initial sorption, at anyTs, was by an immobile, glassy solid substrate.The effect of increasing plasticization of the sub-strate due to increasing Ts and increasing wateruptake (thus, decreasing "wet" Tg) resulted inincreasing system mobility, as both AT (i.e.,Ts - Tg) and AW (i.e., Ws - Wg) increasedwith increasing moisture content. As shown inFigure 14 for these two amorphous food poly-mers, at a given moisture content, increased sys-tem mobility was reflected by increased RVPwith increased Ts, but there was no sudden changein shape of the isotherms to that characteristic ofliquid solution sorption at Ts > Tg.
Unlike the typical isotherms for amorphoushigh polymers in Figures 12,13, 14A, and 14B,the adsorption isotherms for sorbitol and xylitolin Figures 14C and D81 are not smooth sigmoidalcurves. Moreover, at a given moisture content(e.g., 0.1 g water/g solid), these isotherms showedRVP decreasing with increasing Ts. These lowMW, water-soluble polyols were initially crys-talline solids, so the atypical shape of the isoth-erm at a given Ts reflected the amount of sorbedwater needed to act as a solvent and dissolve thecrystals. As the crystals began to dissolve, a su-persaturated solution was formed. Thus, insteadof the typical situation of increasing moisturecontent and increasing Ts acting together to plas-ticize an amorphous substrate and increase sys-tem mobility, these conditions acted together todissolve more and more crystalline material andincrease the amount of concentrated solutionformed, thereby actually decreasing the mobilityof the solute-solvent system. As shown in Figures14C and D, this situation was manifested by RVPdecreasing with increasing Ts, until enough waterhad been sorbed to dissolve all the crystallinesolid. Beyond this point, increasing sorbed water
and increasing Ts were acting to plasticize anamorphous substrate (i.e., a concentrated PHCsyrup), so the isotherms (in Figure 14C) "crossedover" at higher moisture contents and showedthe more typical sorption behavior of RVP in-creasing with increasing Ts. Thus, this unusual"crossover" behavior was revealed to be symp-tomatic of a change in structural state (and phase)of the water-soluble substrate, with increasingwater uptake, from crystalline solid (with RVPdecreasing with increasing Ts) to amorphous liq-uid (with RVP increasing with increasing Ts).
The adsorption isotherms for amorphous glu-cose (dry Tg = 31°C) at 30 and 80°C, shown inFigure 69 (adapted from Loncin75), illustrate an-other interesting example of "crossover" behav-ior. However, in this case, the "crossover" be-havior was opposite to that shown in Figure 14C,and so was revealed to be symptomatic of a changein structural state (and phase) of the substratewith increasing water uptake at 30°C, from amor-phous liquid (with higher RVP at higher Ts) tocrystalline solid (with lower RVP at higher Ts).Initially, one of these sorption experiments wasconducted right at Tg of the amorphous substrate(i.e., assuming bone-dryness), while the otherwas performed at Ts 50°C above dry Tg. In eachcase, by a given low moisture content, the sub-strate was an amorphous rubbery fluid, so theisotherms showed the typical relationship ofhigher RVP at higher Ts. By the time amorphousglucose picked up about 9 w% water, its "wet"Tg was depressed to about 10°C, at which pointthe two sorption temperatures were 20 and 70°Cabove Tg. In the latter situation, the mobile glu-cose-water substrate evidently remained a veryconcentrated (but not supersaturated at 80°C) liq-uid solution as its moisture content and RVP con-tinued to increase. (If glucose, under these tem-perature/moisture content conditions, hadcrystallized to the anhydrous crystalline solidform, the isotherm would have shown a discon-tinuity resulting from such a phase change,64 asdid the one for sucrose in Figure 15A.) However,in the former situation, the viscous fluid glucose-water substrate (which was a supersaturated so-lution at 30°C) became sufficiently mobile, dueto plasticization by water, at about 20°C aboveTg to permit some of the glucose to crystallizeto the solid monohydrate (containing 10 w%
261
Dow
nloa
ded
by [
Tex
as A
&M
Uni
vers
ity L
ibra
ries
] at
10:
57 0
9 Ja
nuar
y 20
18
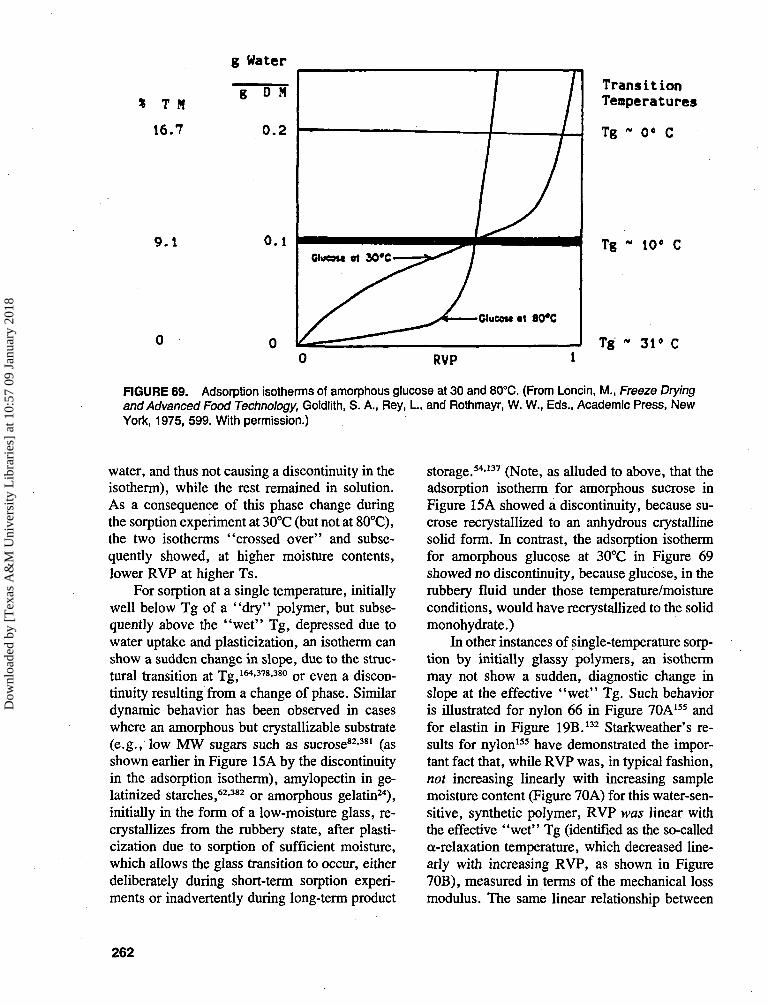
* T N
16.7
9.1
g Water
TransitionTemperatures
Tg - 0* C
Tg - 10* C
Tg - 31* CRVP
FIGURE 69. Adsorption isotherms of amorphous glucose at 30 and 80°C. (From Loncin, M., Freeze Dryingand Advanced Food Technology, Goldlith, S. A., Rey, I., and Rothmayr, W. W., Eds., Academic Press, NewYork, 1975, 599. With permission.)
water, and thus not causing a discontinuity in theisotherm), while the rest remained in solution.As a consequence of this phase change duringthe sorption experiment at 30°C (but not at 80°C),the two isotherms "crossed over" and subse-quently showed, at higher moisture contents,lower RVP at higher Ts.
For sorption at a single temperature, initiallywell below Tg of a "dry" polymer, but subse-quently above the "wet" Tg, depressed due towater uptake and plasticization, an isotherm canshow a sudden change in slope, due to the struc-tural transition at Tg,164'378'380 or even a discon-tinuity resulting from a change of phase. Similardynamic behavior has been observed in caseswhere an amorphous but crystallizable substrate(e.g., low MW sugars such as sucrose82-381 (asshown earlier in Figure 15A by the discontinuityin the adsorption isotherm), amylopectin in ge-latinized starches,62-382 or amorphous gelatin24),initially in the form of a low-moisture glass, re-crystallizes from the rubbery state, after plasti-cization due to sorption of sufficient moisture,which allows the glass transition to occur, eitherdeliberately during short-term sorption experi-ments or inadvertently during long-term product
storage.54-137 (Note, as alluded to above, that theadsorption isotherm for amorphous sucrose inFigure 15A showed a discontinuity, because su-crose recrystallized to an anhydrous crystallinesolid form. In contrast, the adsorption isothermfor amorphous glucose at 30°C in Figure 69showed no discontinuity, because glucose, in therubbery fluid under those temperature/moistureconditions, would have recrystallized to the solidmonohydrate.)
In other instances of single-temperature sorp-tion by initially glassy polymers, an isothermmay not show a sudden, diagnostic change inslope at the effective "wet" Tg. Such behavioris illustrated for nylon 66 in Figure 70A155 andfor elastin in Figure 19B.132 Starkweather's re-sults for nylon155 have demonstrated the impor-tant fact that, while RVP was, in typical fashion,not increasing linearly with increasing samplemoisture content (Figure 70A) for this water-sen-sitive, synthetic polymer, RVP was linear withthe effective "wet" Tg (identified as the so-calleda-relaxation temperature, which decreased line-arly with increasing RVP, as shown in Figure70B), measured in terms of the mechanical lossmodulus. The same linear relationship between
262
Dow
nloa
ded
by [
Tex
as A
&M
Uni
vers
ity L
ibra
ries
] at
10:
57 0
9 Ja
nuar
y 20
18
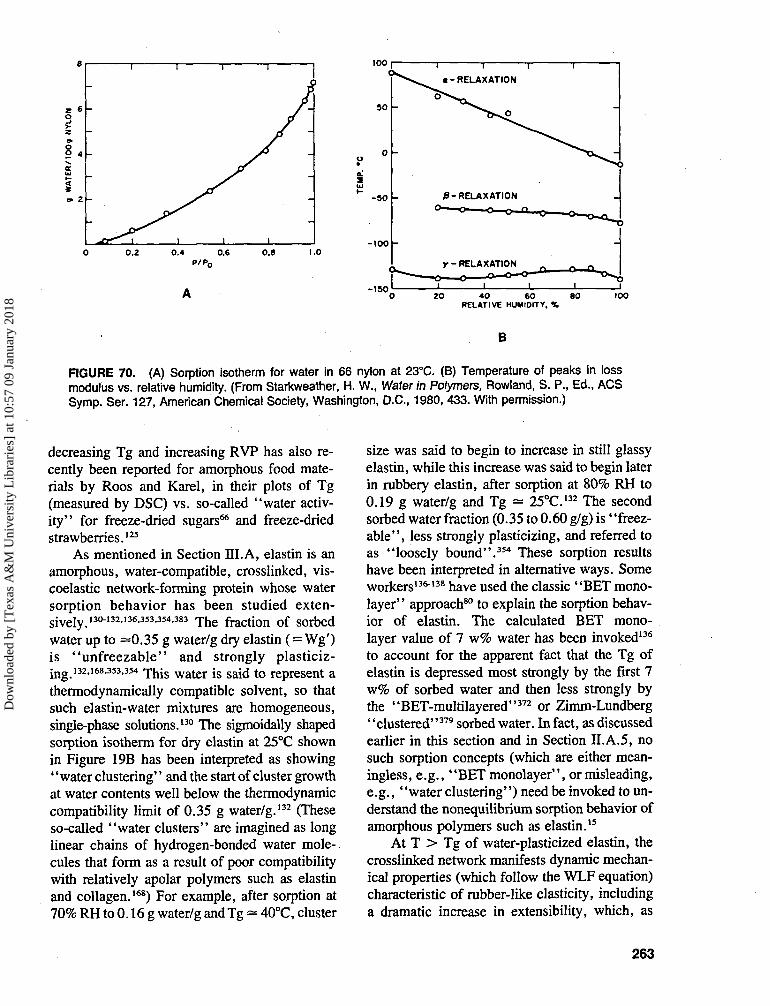
100
-150
-50 -
-100 -
20 4 0 60 80RELATIVE HUMIDITY, %
100
B
FIGURE 70. (A) Sorption isotherm for water in 66 nylon at 23°C. (B) Temperature of peaks in lossmodulus vs. relative humidity. (From Starkweather, H. W., Water in Polymers, Rowland, S. P., Ed., ACSSymp. Ser. 127, American Chemical Society, Washington, D.C., 1980, 433. With permission.)
decreasing Tg and increasing RVP has also re-cently been reported for amorphous food mate-rials by Roos and Karel, in their plots of Tg(measured by DSC) vs. so-called "water activ-ity" for freeze-dried sugars66 and freeze-driedstrawberries.125
As mentioned in Section III.A, elastin is anamorphous, water-compatible, crosslinked, vis-coelastic network-forming protein whose watersorption behavior has been studied exten-sively. '30-132,136,353,354,383 T h e fractiOn of SOrbedwater up to =0.35 g water/g dry elastin ( = Wg')is "unfreezable" and strongly plasticiz-j n g 132,168.353,354 -j^is w a t e r j s sa[& to represent a
thermodynamically compatible solvent, so thatsuch elastin-water mixtures are homogeneous,single-phase solutions.130 The sigmoidally shapedsorption isotherm for dry elastin at 25°C shownin Figure 19B has been interpreted as showing' 'water clustering'' and the start of cluster growthat water contents well below the thermodynamiccompatibility limit of 0.35 g water/g.132 (Theseso-called "water clusters" are imagined as longlinear chains of hydrogen-bonded water mole-cules that form as a result of poor compatibilitywith relatively apolar polymers such as elastinand collagen.168) For example, after sorption at70% RH to 0.16 g water/g and Tg - 40°C, cluster
size was said to begin to increase in still glassyelastin, while this increase was said to begin laterin rubbery elastin, after sorption at 80% RH to0.19 g water/g and Tg - 25°C.132 The secondsorbed water fraction (0.35 to 0.60 g/g) i s ' 'freez-able", less strongly plasticizing, and referred toas "loosely bound".354 These sorption resultshave been interpreted in alternative ways. Someworkers136"138 have used the classic "BET mono-layer" approach80 to explain the sorption behav-ior of elastin. The calculated BET mono-layer value of 7 w% water has been invoked136
to account for the apparent fact that the Tg ofelastin is depressed most strongly by the first 7w% of sorbed water and then less strongly bythe "BET-multilayered"372 or Zimm-Lundberg' 'clustered"379 sorbed water. In fact, as discussedearlier in this section and in Section II.A.5, nosuch sorption concepts (which are either mean-ingless, e.g., "BETmonolayer", or misleading,e.g., "water clustering") need be invoked to un-derstand the nonequilibrium sorption behavior ofamorphous polymers such as elastin.15
At T > Tg of water-plasticized elastin, thecrosslinked network manifests dynamic mechan-ical properties (which follow the WLF equation)characteristic of rubber-like elasticity, includinga dramatic increase in extensibility, which, as
263
Dow
nloa
ded
by [
Tex
as A
&M
Uni
vers
ity L
ibra
ries
] at
10:
57 0
9 Ja
nuar
y 20
18

explained earlier, are critical to the physiologicalactivity of this protein.354 Elastin has been re-ferred to as an especially mobile rubbery poly-mer.132 The elastin-water system exhibits theclassic symptoms of an amorphous polymer-plas-ticizer interaction.130-131 From a comparison ofthe Tg curves for elastin (e.g., see Figure 19A)and collagen, Batzer and Kreibich383 reported thatthe extent of plasticization is somewhat less forelastin, because elastin is more heavily cross-linked than collagen, but still within the typicalrange, at about 8°C/w% water, up to 24 w%water. The smooth glass curve for elastin in Fig-ure 19A illustrates the dramatic plasticizing effectof sorbed water (initially, at Ts <§ Tg) on sucha water-compatible glassy polymer at low mois-ture. The first 7 w% moisture depresses the Tgof bone-dry elastin (about 200°C) by about 110°C,while the next 17 w% moisture depresses Tg byan additional 4°C/w% water. By the time dryelastin has sorbed about 24 w% water, its Tg hasbeen depressed below room temperature, so thatTs > Tg, and the kinetics that govern the dif-fusion-limited sorption by rubbery elastin haveswitched from Arrhenius to WLF (i.e., increasesin diffusion rates have changed from about a dou-bling to about a factor of 10 for each 1 w%increase in water).15 This fact, combined withrecognition and quantitation of how AT changesduring water sorption by elastin, can account forthe shape of the Tg curve and the observation132
of increased sorptive capacity by this especiallymobile rubbery polymer.15
Sorption-desorption hysteresis has been called"the outstanding unexplained problem in sorp-tion studies".365 Many completely amorphous andpartially crystalline polymers, both synthetic andnatural, which swell slowly and irreversibly dur-ing water sorption, show marked hysteresis be-tween their absorption and desorption iso-therms.64-366 In partially crystalline biopolymers(e.g., native starch), hysteresis increases withincreasing percent crystallinity.62 Buleon et al.384
have attributed the sorption hysteresis observedin acid-hydrolyzed ("lintnerized") native starchesto their metastable semicrystalline structure, byanalogy to synthetic elastomers with crystallinedomains, which "are more prone to develop hys-teresis in association with internal stresses than
other (completely amorphous) polymers, in whichrelaxation processes occur with ease".
Water-soluble polymers such as PVP havebeen reported to show hysteresis (for sorption atroom temperature) at moisture contents <Wg',which corresponds to the "unfreezable" fractionof total sorbed water.4 The PVP-water system atsubzero temperatures has also been reported toshow hysteresis in sorption behavior, as illus-trated in Figure 71.242 The sets of desorption andresorption isotherms measured at sample tem-peratures from —40 to 25°C, shown in Figure71A and B, are those related to the freeze-dryingprocess for PVP. These isotherms, like the onesin Figures 12, 13, 14A, and 14B, showed theexpected variation of sorption behavior with tem-perature for amorphous polymers: i.e., at a givensample moisture content, sample RVP increaseswith increasing temperature. (The "crossover"behavior [in this case to RVP decreasing withincreasing temperature] at the highest RVPsshown by the resorption isotherms in Figure 13are discussed later, in comparison to the "cross-over" behavior already described with respect toFigures 14C and 69.) They also showed, like theones in Figures 13 and 16, the expected conse-quence of hysteresis: i.e., at a given sample mois-ture content and temperature, sample RVP islower during desorption than during resorption.However, the set of desorption isotherms in Fig-ure 71A showed an unexpected and unexplaineddiscontinuity in behavior between — 10 and 2°C.Below — 10°C, 10°C jumps in temperature pro-duced proportional changes in desorption behav-ior, but between — 10 and 2°C (a similar jumpof 12°C), a discontinuity was manifested. Wesuggest that this discontinuity arose as a conse-quence of the structural transition of the freeze-concentrated PVP-UFW matrix (i.e., the amor-phous substrate undergoing desorption), whichoccurs at Tg' around -20°C (see Table 8). Thediscontinuity was not observed, on the time scaleof the sorption experiment, until the temperaturewas increased to 2°C, because, as dictated byWLF kinetics and illustrated earlier in Figure 36,the mechanical/structural relaxation process un-derlying this sorption behavior by the rubberyfluid PVP-UFW substrate would not have oc-curred in real time, with a significant, experi-
264
Dow
nloa
ded
by [
Tex
as A
&M
Uni
vers
ity L
ibra
ries
] at
10:
57 0
9 Ja
nuar
y 20
18
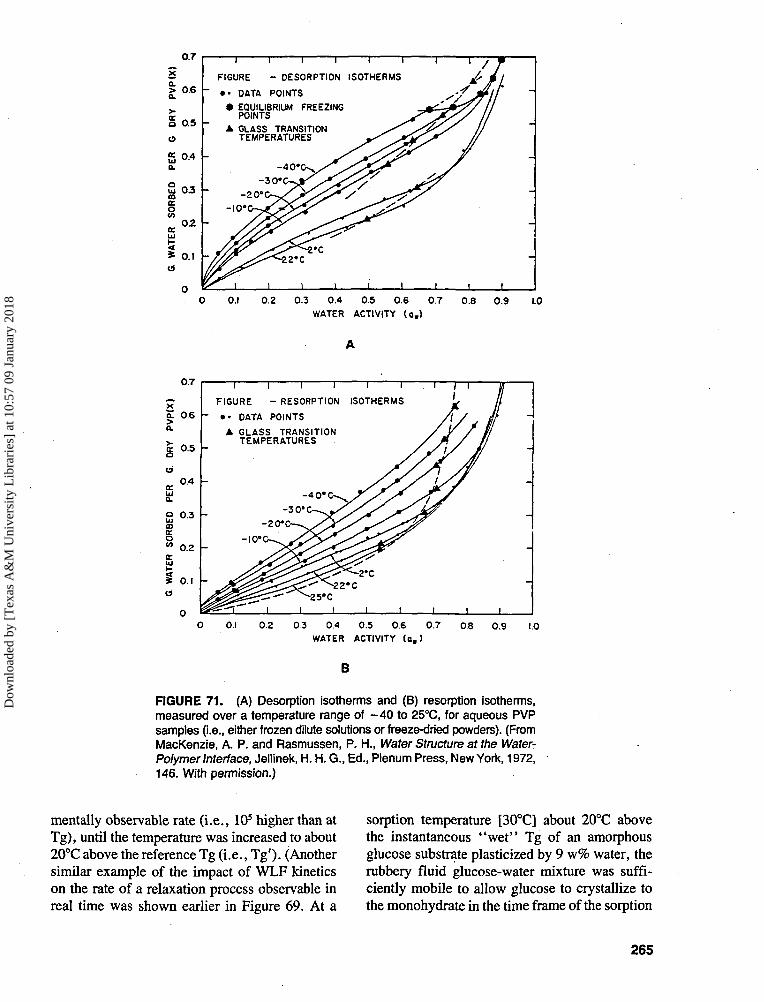
0.7
0.6 -
o 0.5o
£ 0.4Q.
02 -
* 0.1<9
1 1 1 1
FIGURE - DES0RPTI0N
" • • OATA POINTS
• EQUILIBRIUM FREEZINGPOINTS
A GLASS TRANSITIONTEMPERATURES
-/JZ^'O^^^'C
i i
ISOTHERMS
i I
1 ' / T
i i i
O.I 0.2 0.3 0.4 0.5 0.6 0.7
WATER ACTIVITY (o.)
0.8 0.9 1.0
0.7
xa 0.6a.
I 0.5
0.4
0.3
0.2
O.I
I I I I I I
FIGURE - RESORPTION ISOTHERMS
• • DATA POINTS
• GLASS TRANSITIONTEMPERATURES
- 2 0 *
-10'
O.I 0.2 0.3 0.4 0.5 0.6 0.7 08 0.9 1.0
WATER ACTIVITY (o. )
B
FIGURE 71. (A) Desorption isotherms and (B) resorption isotherms,measured over a temperature range of - 4 0 to 25°C, for aqueous PVPsamples (i.e., either frozen dilute solutions or freeze-dried powders). (FromMacKenzie, A. P. and Rasmussen, P. H., Water Structure at the Water-Polymer Interface, Jellinek, H. H. G., Ed., Plenum Press, New York, 1972,146. With permission.)
mentally observable rate (i.e., 105 higher than atTg), until the temperature was increased to about20°C above the reference Tg (i.e., Tg'). (Anothersimilar example of the impact of WLF kineticson the rate of a relaxation process observable inreal time was shown earlier in Figure 69. At a
sorption temperature [30°C] about 20°C abovethe instantaneous "wet" Tg of an amorphousglucose substrate plasticized by 9 w% water, therubbery fluid glucose-water mixture was suffi-ciently mobile to allow glucose to crystallize tothe monohydrate in the time frame of the sorption
265
Dow
nloa
ded
by [
Tex
as A
&M
Uni
vers
ity L
ibra
ries
] at
10:
57 0
9 Ja
nuar
y 20
18
experiment.) It should be noticed that the set ofresorption isotherms in Figure 7IB also showeda similar (albeit smaller) discontinuity, but it wasmanifested at a different temperature, i.e., be-tween - 1 0 and -20°C. We suggest that thereason for this difference in temperature is thatthe appropriate reference Tg underlying the dis-continuity in the resorption behavior of already-freeze-dried, glassy solid PVP is not Tg' but rathera higher-temperature Tg corresponding to aninstantaneous condition of lower moisture (i.e.,Wg < Wg').
As illustrated by the PVP-water system de-scribed above, the extent of hysteresis (or othermanifestations of anomalous sorption behavior)at a particular Ts depends on the rate of the swell-ing/deswelling relaxation process in an amor-phous polymer substrate,365-366-370-371-378 and thushas been suggested to depend on the instanta-neous value of Tg (as governed by the instan-taneous value of Wg21) and the correspondingmagnitude of AT, during both the sorption anddesorption experiments, in a manner consistentwith WLF free volume theory.15 Unfortunately,as has been noted frequently,58'83 hysteresis can-not be explained by any thermodynamic treat-ment that applies only to, or any model originallyderived for, reversible equilibrium states. Hys-teresis is not an intrinsic feature of a sorbingpolymer, but depends on the experimental con-ditions.366 The often anomalous nature of sorp-tion-desorption that has been associated with hys-teresis, including non-Fickian diffusion behavior,is due to dynamic plasticization of a glassy orpartially crystalline polymer by water during asorption experiment.62-371-372 It has been con-cluded that hysteresis characteristically resultsfrom a moisture-/temperature-/time-dependent,slow, non-equilibrium, swelling-related confor-mational change (involving a structural relaxa-tion [as illustrated in Figure 71], and in somecases, even a subsequent phase change [as illus-trated in Figure 15A]), which is facilitated byincreasing free volume and segmental mobilityin a polymer that is being plasticized dynamicallyduring sorption.58-64-83-126-366 For example, Buleonet al.384 have suggested that the irreversible sorp-tion behavior of lintnerized starches is due to awater-plasticized conformational change, leadingto a "structural hysteresis" that develops in a
temperature/moisture content domain corre-sponding to a partially rubbery, partially crys-talline system. In such systems, true thermody-namic equilibration can take weeks, months, oreven years to be achieved.370-376
Sorption hysteresis has also been observedin molten polymers well above their Tg, for ex-ample, in concentrated molten synthetic poly-mer-organic solvent solutions.385 It had beenargued83 that such hysteresis cannot be simplyexplained by linking this behavior to non-equi-librium effects imposed by the properties of theglassy solid state. However, it has been recentlydemonstrated30 that the correlated parameters oflocal viscosity and polymer Tm/Tg ratio do infact critically influence the mobility of supra-glassy liquids (i.e., low-viscosity liquids wellabove their rubbery domain), such as moltenpolymers, even at temperatures 100°C or moreabove Tg. Figure 7230 (adapted from Reference107) revealed the critical importance of local vis-cosity even at 100°C above Tg, and disclosed therelationship between this local viscosity, the cor-responding translational relaxation time, and pol-ymer Tm/Tg ratio. The figure presents a rankingof values of log (translational friction coefficient)measured at T = Tg + 100°C, for a variety ofsynthetic polymers. The frictional coefficient wasmeasured in two ways with equivalent results, assegmental mobility of the polymer backbone andas small-molecule diffusion of a reporter (probe)molecule at sufficiently low concentration thatthere was no measurable depression of Tg due toplasticization. Thus, the translational relaxationtime, as reflected by the frictional coefficient orthe translational diffusion coefficient, is relatedto the local viscosity surrounding polymer chainsegments, rather than to an inherent structural/mechanical feature of the chain itself.107 Decreas-ing translational relaxation time correlates withdecreasing frictional coefficient, increasing dif-fusion coefficient, and decreasing local viscosity.
It has been generally thought that one canbest compare and control the behavior of amor-phous materials at temperatures at or near theirTg, and that in order to "freeze" events in timeand thus magnify the behavioral differences be-tween materials, one must do experiments atT < Tg, where relaxation rates are extremelyslow. However, Figure 72 illustrated that when
266
Dow
nloa
ded
by [
Tex
as A
&M
Uni
vers
ity L
ibra
ries
] at
10:
57 0
9 Ja
nuar
y 20
18
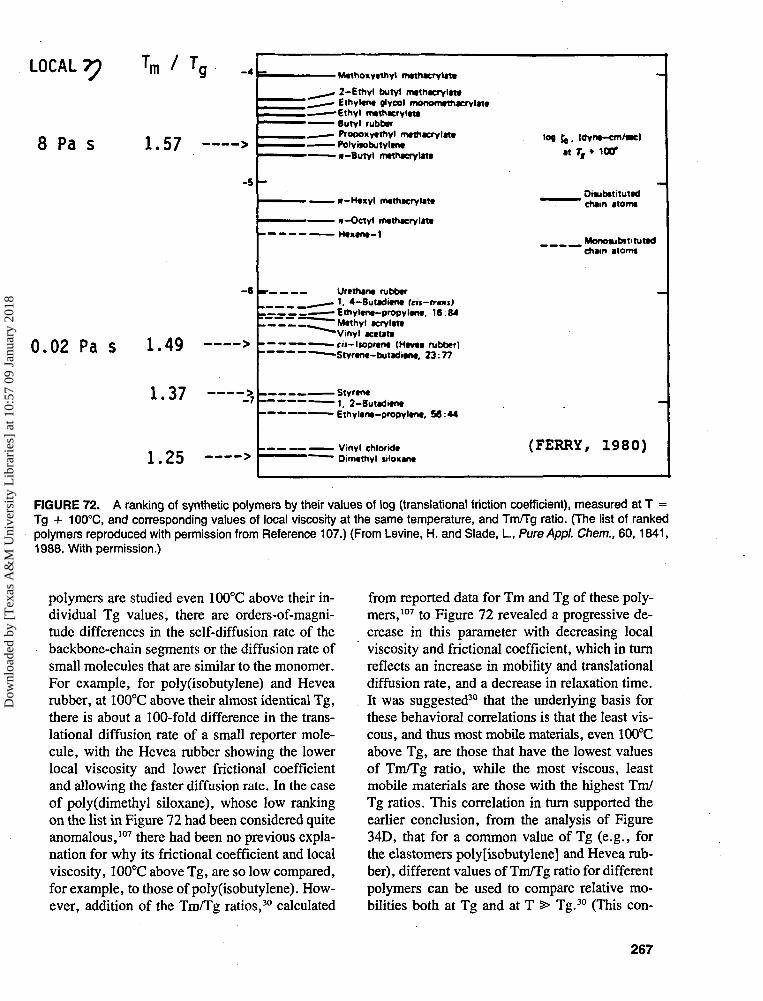
LOCAL 7 7 Tn
8 Pa s
- 4
1.57 >
-5
0.02 Pa s 1.49 >
1.37
1.25 >
• Mcthoxytthyl mtthacrytat*
2-Ethyl butyl mtthacrylitt• Ethylene glyeol monomtthacrylatt
— Ethyl mtthacrylatt— Butyl rubbar— Propoxyethyl mcthacrylata— Polyoobutyltn*— x-Butyl mtthacrylata
• K-Htxyl methacrylate
• H-Octyl methacryltte
• Haxana-1
Urathant rubbtr• 1. 4-Butadi«na (cit-trnt)• Ethylene-propylen*. 16:84"Methyl ecrylatt"Vinyl acetate-fij-lioprene (Htvtl rubber)-Styrenc-butadian*. 23:77
• Styrene-1 . 2-Butaditnt• Ethylene-propylana, 56:
Vinyl chlorideDimethyl siloxane
Co- (dynt-cm/ae)
•t T, • 100T
_ Oiubftituted' chain atorm
. Monokibstituttdchain atorm
(FERRY, 1980)
FIGURE 72. A ranking of synthetic polymers by their values of log (translation^ friction coefficient), measured at T =Tg + 100°C, and corresponding values of local viscosity at the same temperature, and Tm/Tg ratio. (The list of rankedpolymers reproduced with permission from Reference 107.) (From Levine, H. and Slade, I., PureAppl. Chem., 60,1841,1988. With permission.)
polymers are studied even 100°C above their in-dividual Tg values, there are orders-of-magni-tude differences in the self-diffusion rate of thebackbone-chain segments or the diffusion rate ofsmall molecules that are similar to the monomer.For example, for poly(isobutylene) and Hevearubber, at 100°C above their almost identical Tg,there is about a 100-fold difference in the trans-lational diffusion rate of a small reporter mole-cule, with the Hevea rubber showing the lowerlocal viscosity and lower frictional coefficientand allowing the faster diffusion rate. In the caseof poly(dimethyl siloxane), whose low rankingon the list in Figure 72 had been considered quiteanomalous,107 there had been no previous expla-nation for why its frictional coefficient and localviscosity, 100°C above Tg, are so low compared,for example, to those of poly(isobutylene). How-ever, addition of the Tm/Tg ratios,30 calculated
from reported data for Tm and Tg of these poly-mers,107 to Figure 72 revealed a progressive de-crease in this parameter with decreasing localviscosity and frictional coefficient, which in turnreflects an increase in mobility and translationaldiffusion rate, and a decrease in relaxation time.It was suggested30 that the underlying basis forthese behavioral correlations is that the least vis-cous, and thus most mobile materials, even 100°Cabove Tg, are those that have the lowest valuesof Tm/Tg ratio, while the most viscous, leastmobile materials are those with the highest Tm/Tg ratios. This correlation in turn supported theearlier conclusion, from the analysis of Figure34D, that for a common value of Tg (e.g., forthe elastomers poly[isobutylene] and Hevea rub-ber), different values of Tm/Tg ratio for differentpolymers can be used to compare relative mo-bilities both at Tg and at T > Tg.30 (This con-
267
Dow
nloa
ded
by [
Tex
as A
&M
Uni
vers
ity L
ibra
ries
] at
10:
57 0
9 Ja
nuar
y 20
18
elusion was also supported by the results of themold spore germination experiment, analyzed asa mechanical relaxation process, mentioned ear-lier with respect to Table 2.) It was noted that asmall difference in the values of Tm/Tg is man-ifested as a dramatic difference in local viscosityand translational diffusion. In the example de-scribed above, the values of Tm/Tg for Hevearubber and poly(isobutylene) are 1.43 and 1.57,respectively, and the local viscosities at 100°Cabove Tg differ by nearly 2 orders of magnitude.
The importance of this correlation betweenlocal viscosity and Tm/Tg ratio has been relatedto the apparently pivotal influence of these twoparameters on the mobility of supra-glassy liq-uids, such as molten polymers, even well aboveTg.30 This finding was coupled with the earlierexplanation of how the relationship between -ng,Tm/Tg ratio, and mobility can be used to char-acterize the non-equilibrium behavior in the glassysolid state at Tg and in the rubbery fluid stateabove Tg, and also the size of the temperaturedomain corresponding to the WLF region.30 Itwas mentioned with respect to Figure 34C thatfor an atypical, poorly behaved polymer with Tm/Tg = 1.25, the rubbery region of WLF behaviormight only extend about 50°C above Tg. Thus,some of the polymers listed in Figure 72 (espe-cially poly (dimethyl siloxane)), at 100°C aboveTg, probably exist as low-viscosity liquids wellabove their rubbery domain. Yet, the influenceof local viscosity and Tm/Tg ratio still carriesover to their supra-glassy, non-equilibrium be-havior. It has been suggested30 that this point iscrucial in countering the argument83 mentionedearlier that sorption hysteresis observed in moltenpolymers well above their Tg cannot be simplyexplained by linking this behavior to non-equi-librium effects imposed by the properties of theglassy solid state. Analogous hysteresis betweenwater vapor ad/absorption and liquid water de-sorption in native starch (shown earlier in Figure16A) has been reported to result from desorptionthat remains non-equilibrated even after 2 years,vs. adsorption that achieves and remains in "well-defined equilibrium" states over the same pe-riod.83 An alternative explanation for the ob-served hysteresis has been suggested,30 wherebyboth limbs of the isotherm reflect the persistenceof non-equilibrium states. The desorption limb
represents the behavior of supra-glassy, partiallycrystalline starch drying slowly and irreversiblyto a partially crystalline glassy state20*21 differentfrom the original native state. In contrast, the ad/absorption limb represents the behavior of par-tially crystalline glassy native starch undergoingan extremely slow, water-plasticized relaxationprocess,62 which remains very far fromequilibrium172 even after 2 years, to a supra-glassy, partially crystalline state, i.e., a "pseudosteady state" easily mistaken for equilibrium.This same "pseudo steady state" behavior hasbeen observed for the sorption of water vapor bycod,297 as described earlier with respect to Figure68.
It has been noted that the low values of localviscosity at T = Tg + 100°C shown in Figure72 compare to a macroscopic viscosity of about109 Pa s for an entanglement network, and evenhigher viscosities if the network is crosslinked.107
This point and the above discussion of the im-plications of Figure 72 have underlined the im-portance of research on small PHC-water sys-tems,281 based on a polymer science approach.30
Synthetic high polymers, as well as many high-polymeric food materials, often suffer from thehandicaps of unknown, polydisperse MW andMW distribution, and MWs above their entan-glement limit, in which case local viscosity isnot equivalent to macroscopic viscosity. For suchcases of MWs above the entanglement limit, ahalving of MW results in a tenfold reduction inthe macroscopic viscosity of the network.107 (Thisbehavior is illustrated, for a series of syntheticpolymers, by the log-log plot of viscosity vs.MW in Figure 73.107 In this plot, the entangle-ment MW limit, coinciding with the critical linearDP required for intermolecular network forma-tion, corresponds to the point at which the slopechanges abruptly.) In contrast, small PHCs haveknown, monodisperse values of MW, all belowthe entanglement limit, so that local viscosity isequivalent to macroscopic viscosity, and a halv-ing of MW results only in a halving of localviscosity (as also illustrated in Figure 73 for syn-thetic polymers with MWs below their entangle-ment limits).107 Such small PHCs offer a greatvariety and selection of glass-forming food ma-terials for the study of water sorption and otheraspects of non-equilibrium behavior.30
268
Dow
nloa
ded
by [
Tex
as A
&M
Uni
vers
ity L
ibra
ries
] at
10:
57 0
9 Ja
nuar
y 20
18
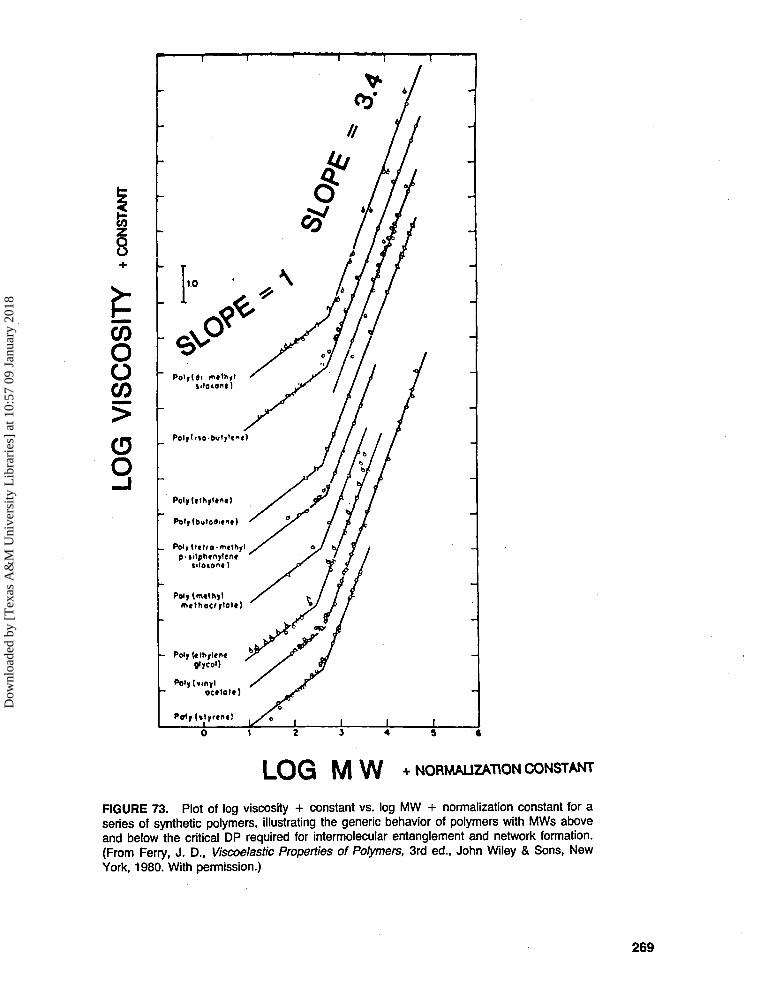
COOOCO
CDO
L O G M W + NORMALIZATION CONSTANT
FIGURE 73. Plot of log viscosity + constant vs. log MW + normalization constant for aseries of synthetic polymers, illustrating the generic behavior of polymers with MWs aboveand below the critical DP required for intermolecular entanglement and network formation.(From Ferry, J. D., Viscoelastic Properties of Polymers, 3rd ed., John Wiley & Sons, NewYork, 1980. With permission.)
269
Dow
nloa
ded
by [
Tex
as A
&M
Uni
vers
ity L
ibra
ries
] at
10:
57 0
9 Ja
nuar
y 20
18
A complete mechanistic understanding of thewater sorption process for a water-plasticizablepolymer, and the resulting predictive capabilitythat this would provide, would require definitionof the dependence of sorption behavior on theindependent variables of moisture content, tem-perature, time (in other words, on a three-di-mensional dynamics map, as described in thefollowing section), and polymer MW (and dryTg), and the dependent variable of the structuralstate of a water-plasticized polymer, in terms ofits instantaneous Tg and AT, during sorption. Ithas been pointed out that, unfortunately, no sin-gle currently available sorption isotherm equa-tion, model, or theory is capable of such a com-plete description.15
2. Sorption Isotherms Transformed intoa Water/Glass Dynamics Map
Paakkonen and Roos126 have recently illus-trated the value of an experimental approach thatcombined measurements of water sorption iso-therms and DSC measurements of Tg in an eval-uation of the physical stability of freeze-driedhorseradish roots. They concluded from theirstudy that "sorption data and thermal behaviorshould be combined and used to determine theproper drying and storage conditions for suchcarbohydrate food materials".126
When DSC (or other thermal or mechanicalanalyses) instrumentation is not available, howcan one "measure" glass curves for aqueous foodsystems? Illustrated below is a new experimentalapproach, whereby one can transform sorptionisotherm data, based on RVP measurements asa function of temperature, into a water/glass dy-namics map.
The first example of this approach utilizesthe sorption data reported by Weisser81 for applepectin at temperatures of 25, 40, 60, and 80°C,shown in Figure 14A. As described earlier, theconventional data treatment illustrated the typicalbehavior of this amorphous substrate, i.e., at agiven water content, the observed RVP increaseswith increasing temperature. But one can treatthese temperature-moisture content data in a dif-ferent way, as shown in Figure 65. One can takecombinations of moisture content and tempera-
ture that give the same value of observed RVP,and replot these data (as a series of iso-RVPcontours) in the two dimensions of temperatureand w% solids, compared to the correspondingtemperature-moisture content location of a hy-pothetical glass curve for pectin (Figure 65 ac-tually utilizes the glass curve for hemicellulosein Figure 27). Figure 65 reveals that combina-tions of temperature and moisture content (in-creasing from bottom right to top left) that fallbelow the glass curve give observed RVPs ap-proaching zero. As the combinations of temper-ature and moisture content rise above the glasscurve, the observed RVP increases. In this regionof the map above Tg' but below Wg' (corre-sponding to the contours for iso-RVPs of >0.17to 0.89), the interaction of temperature- andmoisture content-dependence with the time-de-pendence of the experiment increases, as evi-denced by those iso-RVP contours that are in-creasingly slanted and more nearly parallel to theglass curve. (All of the experimental tempera-tures are well above Tg', but the water contentscorresponding to RVPs of 0.02 to 0.09 fall belowboth the effective Tg and the effective Wg.) Onlyfor water content situations both above Tg' andat or above Wg' (which is estimated to be about25 w% water, from the glass curve for hemicel-lulose in Figure 27) does one observe RVPs near1.0 (i.e., the 0.93 RVP contour, which is notslanted).
The RVP data in Figure 65 were all obtainedfrom water-uptake experiments that started outwith essentially bone-dry pectin to which waterwas added. As noted earlier with respect to thead/absorption isotherms for native starch in Fig-ure 16A, results of such sorption experiments canbe misleading, because the bone-dry glassy solidbehaves like an inert substrate at time zero. Solet us re-examine and compare the resorption/desorption data reported by van den Berg43 formilled hard wheat at temperatures of 5, 25, and45°C, shown in Figure 13. As discussed earlier,classic hysteresis was observed between the iso-therms obtained by adding water to the bone-dry,partially crystalline glassy solid and by removingwater from the wet substrate. In this second ex-ample of our new approach, we can once againtake combinations of moisture content and tem-perature (for both dehumudification and humid-
270
Dow
nloa
ded
by [
Tex
as A
&M
Uni
vers
ity L
ibra
ries
] at
10:
57 0
9 Ja
nuar
y 20
18
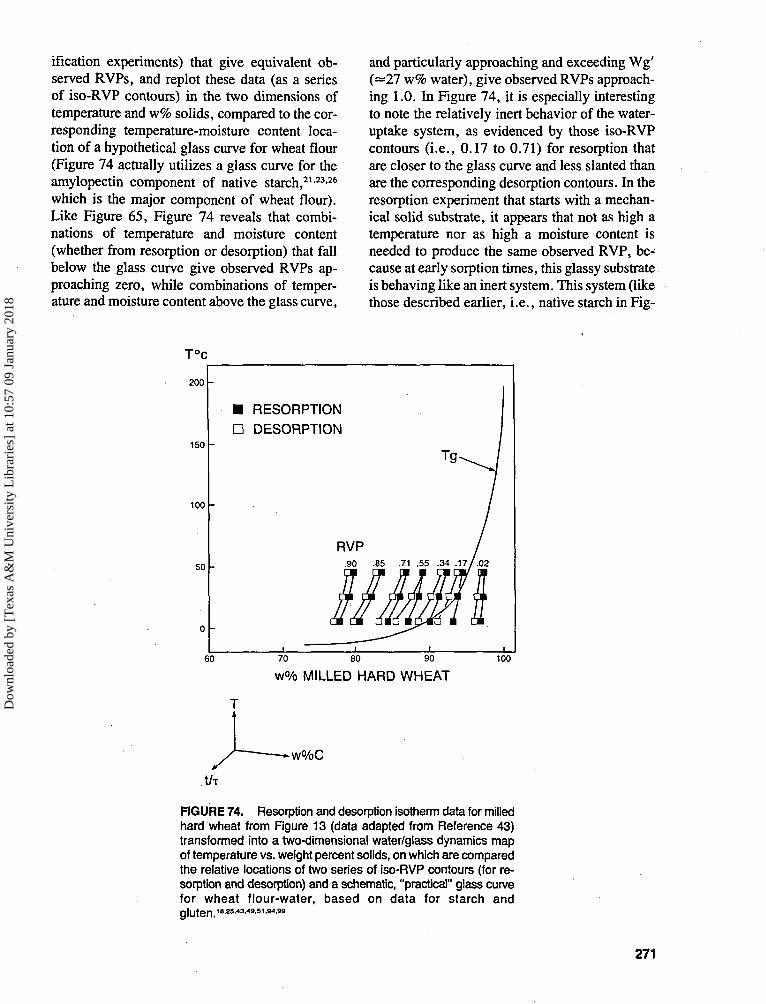
ification experiments) that give equivalent ob-served RVPs, and replot these data (as a seriesof iso-RVP contours) in the two dimensions oftemperature and w% solids, compared to the cor-responding temperature-moisture content loca-tion of a hypothetical glass curve for wheat flour(Figure 74 actually utilizes a glass curve for theamylopectin component of native starch,212326
which is the major component of wheat flour).Like Figure 65, Figure 74 reveals that combi-nations of temperature and moisture content(whether from resorption or desorption) that fallbelow the glass curve give observed RVPs ap-proaching zero, while combinations of temper-ature and moisture content above the glass curve,
and particularly approaching and exceeding Wg'(—27 w% water), give observed RVPs approach-ing 1.0. In Figure 74, it is especially interestingto note the relatively inert behavior of the water-uptake system, as evidenced by those iso-RVPcontours (i.e., 0.17 to 0.71) for resorption thatare closer to the glass curve and less slanted thanare the corresponding desorption contours. In theresorption experiment that starts with a mechan-ical solid substrate, it appears that not as high atemperature nor as high a moisture content isneeded to produce the same observed RVP, be-cause at early sorption times, this glassy substrateis behaving like an inert system. This system (likethose described earlier, i.e., native starch in Fig-
T°c
200
150
100
50
• RESORPTION
• DESORPTION
60 70 80 90
w% MILLED HARD WHEAT
100
t/T
FIGURE 74. Resorption and desorption isotherm data for milledhard wheat from Figure 13 (data adapted from Reference 43)transformed into a two-dimensional water/glass dynamics mapof temperature vs. weight percent solids, on which are comparedthe relative locations of two series of iso-RVP contours (for re-sorption and desorption) and a schematic, "practical" glass curvefor wheat flour-water, based on data for starch andgluten.18'25i43'49i51t941"
271
Dow
nloa
ded
by [
Tex
as A
&M
Uni
vers
ity L
ibra
ries
] at
10:
57 0
9 Ja
nuar
y 20
18
ure 16A and cod in Figure 68) is so far fromequilibrium172 that it is essentially inert at timezero. Eventually, as a result of increased tem-perature or increased moisture content, the sys-tem begins to be plasticized and reveal the lim-itation in diffusion that is so readily seen for therubbery desorption system, during water removalfrom an already plasticized substrate above itsglass curve. Thus, just because the resorptionsystem looks like a steady-state system (in fact,it even begins to look like an equilibrium situa-tion, because such long times are required beforeany changes in behavior are seen), one shouldnot confuse this situation with that of true equi-librium. We suggest that what one is actuallyobserving is a system so far from equilibriumthat one cannot wait long enough (not experi-mentally feasible) to see that the system is not atequilibrium, much less wait long enough to mea-sure true equilibrium RVPs.
Our treatment in Figure 74 of van den Berg'sclassic sorption data illustrates the salient pointthat water is an effective plasticizer of starch andother food polymers, but the mere presence ofwater does not attest that plasticization has oc-curred. Thus, when one reads the following quotefrom Hoseney,386
"When starch is placed in water, the granule is freelypenetrated by water, or for that matter, by most small mol-ecules. The starch can hold about 30% of its dry weight asmoisture. The granule swells slightly; its increase is gen-erally considered to be about 5%. The volume change andwater absorption are reversible, and heating the system tojust below its gelatinization temperature will not bring aboutany other changes."
one must be careful not to equate rapid penetra-tion (e.g., through pre-existing channels andvoids) with rapid plasticization by water. In fact,plasticization at T < the initial Tg of a givensubstrate is slow, whereas plasticization occursmore rapidly at T > the initial Tg. This has beendemonstrated most graphically by some remark-able swelling studies of PVC described by Searsand Darby.109 It was found that several' 'commonPVC plasticizers . . . would not swell an un-plasticized PVC sheet at room temperature in twoyears' time . . . Yet, all of the plasticizers swelledthe rigid PVC sheet at 76°C, the approximate Tgof the resin. When the same PVC was hot-com-
pounded with a plasticizer, cooled, and then im-mersed in various other plasticizers, it would im-bibe more plasticizer."
The above information and interpretationssupport the concept of time as a plasticizer, whichdepresses the Tg of a solute, just as water does.Water is extremely efficient as a plasticizer inthe range where it is effective in practice, i.e.,up to the level of Wg' for a given water-com-patible solute. In this range, 1 w% water canoften depress Tg by 10 to 15°C; this extent ofTg depression is equivalent to that produced bya 3 orders-of-magnifude increase in time. Thus,in this range, water is more effective as a plas-ticizer than log time. However, when consideredin isolation, there is no limit to plasticization ofa solute by time. In contrast, when the operativetime scale becomes short, water's ability to plas-ticize has a practical limit. For example, onceice forms in a solution during cooling to a givensubzero temperature, this ice will not melt at thistemperature, so this phase-separated water willnot be able to diffuse back to plasticize the solute.Analogously, for a water-sensitive solute at itsmaximum extent of plasticization by water (e.g.,lignin in Figure 27, with a resulting Tg > 0°Cat W = Wg), once water in excess of Wg isremoved by phase separation at this Tg above0°C, this phase-separated water will also not beable to diffuse back to plasticize the solute uponfurther cooling.
For those readers who find three-dimensionalrepresentations of data more intuitive, under-standable, and interpretable than two-dimen-sional ones, Figure 75 shows such three-dimen-sional representations of the two series of iso-RVP contours in Figure 74. Like Figure 74, Fig-ures 75 A and B show contours of equivalent RVPgoing from zero to 1.0, in the concentration rangeof water from zero to Wg'. Comparing the re-sorption and desorption experiments, we see agreater effect of temperature on resorption thanon desorption, i.e., there is a greater temperature-dependence for the addition of water to the drysubstrate below its Tg than for the removal ofwater from the wet substrate above its Tg. For agiven moisture content, only at the higher sorp-tion temperatures is the same RVP behavior ap-proached during resorption as during desorption,i.e., the sorption behavior of the dry substrate is
272
Dow
nloa
ded
by [
Tex
as A
&M
Uni
vers
ity L
ibra
ries
] at
10:
57 0
9 Ja
nuar
y 20
18

RESORPTION
DESORPTION
w%C
RVPFIGURE 75. A three-dimensional representation of the two series of iso-RVP contours in Figure 74, for theresorption (A) and desorption (B) isotherm data for milled hard wheat from Rgure 13. The location of thethree-dimensional desorption data from part B on the three axes in part C illustrates the fact that the observedRVP goes from zero to one in a very small region of moisture content from 0% moisture to Wg'.
more sensitive to temperature. The most impor-tant feature of Figure 75 is revealed by the lo-cation of the three-dimensional desorption datafrom part B on the three axes in part C. Figure75C illustrates the fact that the experimentallyobserved RVP goes from zero to 1.0 in a smallregion of moisture content from 0% moisture toWg', i.e., a RVP of 1.0 is already reached bythe time the moisture content reaches the Wg' ofonly about 27 w% water.
Despite the non-equilibrium nature of typical
water sorption experiments, the measurement ofsuch sorption data is a useful exercise, becausewithout a DSC, one can, at least qualitatively,estimate the location of the glass curve on a two-dimensional mobility map of temperature and w%moisture, by the experimental approach illus-trated in Figures 65 and 74. In fact, one couldeven estimate the shape of the glass curve, if onehad a few more temperature points and a fewmore sorption time points to add to the sorptiondata in Figures 65 and 74.
273
Dow
nloa
ded
by [
Tex
as A
&M
Uni
vers
ity L
ibra
ries
] at
10:
57 0
9 Ja
nuar
y 20
18
With respect to this last conclusion, evidentlysuch analogous temperature-time data have al-ready been provided by Ferry, as shown in Figure76.107 Notice the strikingly similar appearance ofthe sorption data in Figures 65 and 74 and thedata in Figure 76, for the storage compliance (aviscoelastic property related to creep in en-tangling high polymers) of a synthetic poly-mer in the transition zone between glasslikeand rubberlike consistency, measured at 24 dif-ferent temperatures and 12 different frequencies(= times). Notice how the orientations of the iso-RVP contours in Figures 65 and 74, i.e., fromnearly vertical below the glass curve, to mostslanted in the rubbery region above the glasscurve, back to nearly vertical well above the glasscurve, faithfully mimic the orientations of thestorage compliance isotherms in Figure 76, foran entangling high polymer (with a measured Tgof — 2O°C,107 corresponding to the conventionaltimescale of 200 s172-174) that, on the frequencyscale of Figure 76, acts as a glassy solid at T <— 5°C (for which compliance is low and little-changing with frequency), but as a supra-glassyliquid at T > 120°C (for which compliance ishigh and again little-changing with frequency).107
Ferry has presented Figure 76 as a classic ex-ample of the fact that "it is in the transition zonebetween glasslike and rubberlike consistency thatthe dependence of viscoelastic functions on tem-perature is most spectacular, just as is the de-pendence on time or frequency."107 The data inFigure 76 were actually used by Ferry in theoriginal development of the WLF equation.101
The new data treatment illustrated in Figures65 and 74 (which Ferry would characterize as amethod of "viscoelastic corresponding states"107)also reinforces our recognition of two critical facts:
1. The relative partial pressure of water vaporin the gas phase of the sample headspace(colloquially referred to as "Aw") is cer-tainly not controlling the mechanical relax-ation rates and chemical reaction rates inthe rubbery fluid phase or glassy solid phaseof an aqueous sample matrix. Rather, theobserved RVP is controlled by the temper-ature-moisture content location of the ma-trix relative to the location of its glass curveon the dynamics map.
2. Liquid water as a plasticizer, which in-creases the mobility of a multicomponentsupra-glassy matrix, is the key to under-standing relaxation rates in restricted waterenvironments.
B. Microbiological Stability —Germination of Mold Spores
As introduced earlier by the results in Table2,14"16 a microbiological experiment demon-strated that the rates of germination of mold sporesin different PHC solutions can be analyzed as amechanical relaxation process that is governedby the translation^ mobility of water.30 In turn,the local viscosity of individual supra-glassy PHCsolutions at the experimental temperature, whichwas 50 to 95°C above their Tg' reference states,appeared to control the relative mobility of water.Results of the experiment revealed that the mo-bility of water in PHC-water solutions can bebetter understood and explained in terms of mo-bility transformations based on Tg', Wg', andthe Tm/Tg ratios of PHC solutes of equal MW,rather than in terms of the measured RVP of thesolutions. These results further demonstrated theundeniable technological importance of Tg', Wg',and Tm/Tg ratio as critical physicochemical pa-rameters for IMF systems.30 These parametersenable us to extend our predictive capability be-yond the limitations imposed by characterizingIMF systems only in terms of total moisture con-tent and RVP. Moreover, as illustrated by theresults described below, even such simple modelaqueous food systems reveal the necessity of in-creased understanding of the underlying physi-cochemical principles that govern their behavior.For example, in comparison to fructose-only andglucose-only solutions, the results for the 1:1fructose:glucose mixture in Table 2 revealed thatthe thermal behavior of this mixture in concen-trated aqueous solution is controlled by fructose,whereas its mechanical behavior is controlled byglucose.
As shown in Table 2, for the matched pairof fructose and glucose solutions at equal soluteconcentration, MW, and Tg', fructose produceda much less stable system in which the moldspores germinated much faster, even at slightly
274
Dow
nloa
ded
by [
Tex
as A
&M
Uni
vers
ity L
ibra
ries
] at
10:
57 0
9 Ja
nuar
y 20
18
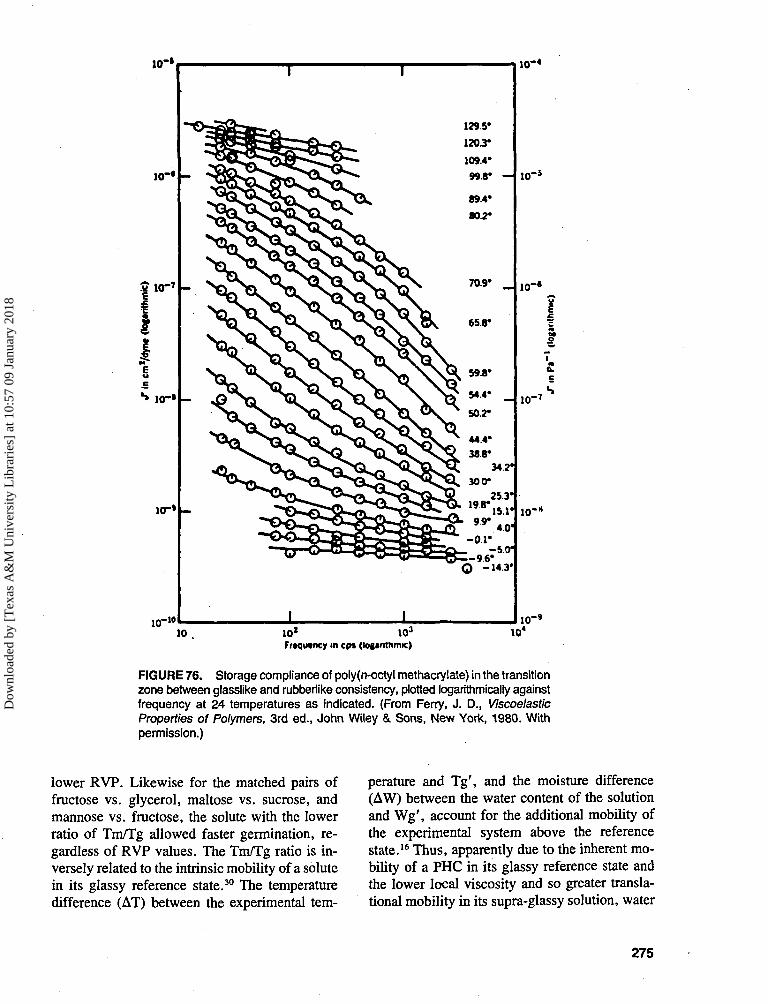
10*Frtqutncy in cps (togtnthmic)
FIGURE 76. Storage compliance of poly(n-octyl methacrylate) in the transitionzone between glasslike and rubberiike consistency, plotted logarithmically againstfrequency at 24 temperatures as indicated. (From Ferry, J. D., ViscoelasticProperties of Polymers, 3rd ed., John Wiley & Sons, New York, 1980. Withpermission.)
lower RVP. Likewise for the matched pairs offructose vs. glycerol, maltose vs. sucrose, andmannose vs. fructose, the solute with the lowerratio of Tm/Tg allowed faster germination, re-gardless of RVP values. The Tm/Tg ratio is in-versely related to the intrinsic mobility of a solutein its glassy reference state.30 The temperaturedifference (AT) between the experimental tem-
perature and Tg\ and the moisture difference(AW) between the water content of the solutionand Wg', account for the additional mobility ofthe experimental system above the referencestate.16 Thus, apparently due to the inherent mo-bility of a PHC in its glassy reference state andthe lower local viscosity and so greater transla-tional mobility in its supra-glassy solution, water
275
Dow
nloa
ded
by [
Tex
as A
&M
Uni
vers
ity L
ibra
ries
] at
10:
57 0
9 Ja
nuar
y 20
18
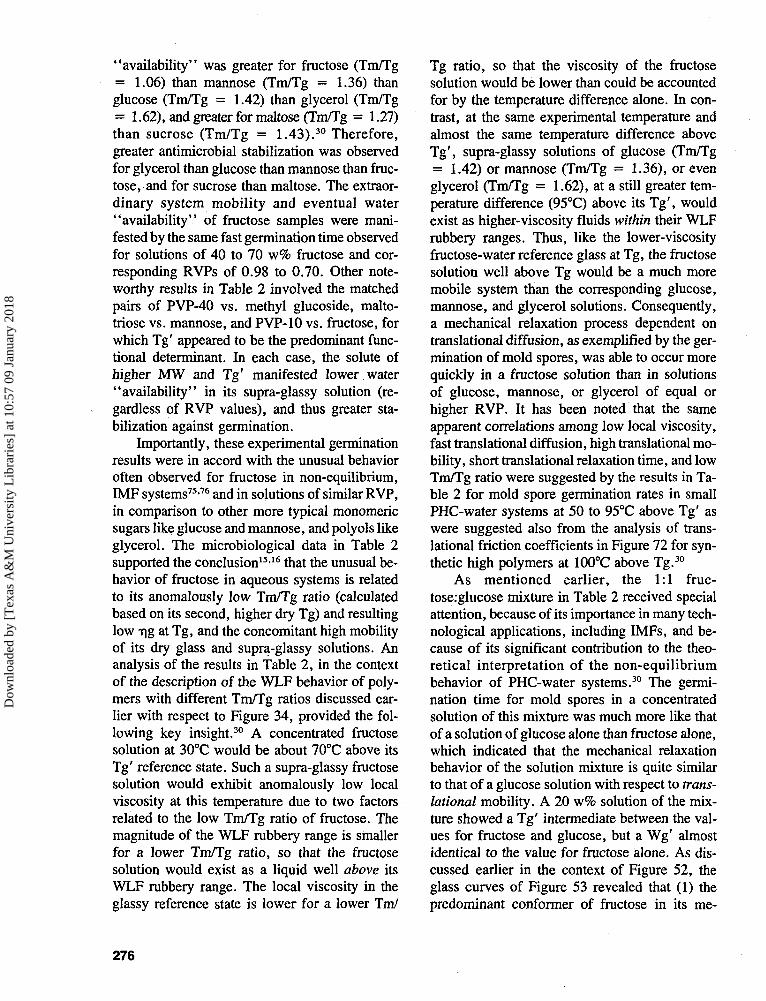
"availability" was greater for fructose (Tm/Tg= 1.06) than mannose (Tm/Tg = 1.36) thanglucose (Tm/Tg = 1.42) than glycerol (Tm/Tg= 1.62), and greater for maltose (Tm/Tg = 1.27)than sucrose (Tm/Tg = 1.43).30 Therefore,greater antimicrobial stabilization was observedfor glycerol than glucose than mannose than fruc-tose, and for sucrose than maltose. The extraor-dinary system mobility and eventual water"availability" of fructose samples were mani-fested by the same fast germination time observedfor solutions of 40 to 70 w% fructose and cor-responding RVPs of 0.98 to 0.70. Other note-worthy results in Table 2 involved the matchedpairs of PVP-40 vs. methyl glucoside, malto-triose vs. mannose, and PVP-10 vs. fructose, forwhich Tg' appeared to be the predominant func-tional determinant. In each case, the solute ofhigher MW and Tg' manifested lower water"availability" in its supra-glassy solution (re-gardless of RVP values), and thus greater sta-bilization against germination.
Importantly, these experimental germinationresults were in accord with the unusual behavioroften observed for fructose in non-equilibrium,IMF systems75-76 and in solutions of similar RVP,in comparison to other more typical monomericsugars like glucose and mannose, and polyols likeglycerol. The microbiological data in Table 2supported the conclusion15-16 that the unusual be-havior of fructose in aqueous systems is relatedto its anomalously low Tm/Tg ratio (calculatedbased on its second, higher dry Tg) and resultinglow T|g at Tg, and the concomitant high mobilityof its dry glass and supra-glassy solutions. Ananalysis of the results in Table 2, in the contextof the description of the WLF behavior of poly-mers with different Tm/Tg ratios discussed ear-lier with respect to Figure 34, provided the fol-lowing key insight.30 A concentrated fructosesolution at 30°C would be about 70°C above itsTg' reference state. Such a supra-glassy fructosesolution would exhibit anomalously low localviscosity at this temperature due to two factorsrelated to the low Tm/Tg ratio of fructose. Themagnitude of the WLF rubbery range is smallerfor a lower Tm/Tg ratio, so that the fructosesolution would exist as a liquid well above itsWLF rubbery range. The local viscosity in theglassy reference state is lower for a lower Tm/
Tg ratio, so that the viscosity of the fructosesolution would be lower than could be accountedfor by the temperature difference alone. In con-trast, at the same experimental temperature andalmost the same temperature difference aboveTg', supra-glassy solutions of glucose (Tm/Tg= 1.42) or mannose (Tm/Tg = 1.36), or evenglycerol (Tm/Tg = 1.62), at a still greater tem-perature difference (95°C) above its Tg', wouldexist as higher-viscosity fluids within their WLFrubbery ranges. Thus, like the lower-viscosityfructose-water reference glass at Tg, the fructosesolution well above Tg would be a much moremobile system than the corresponding glucose,mannose, and glycerol solutions. Consequently,a mechanical relaxation process dependent ontranslational diffusion, as exemplified by the ger-mination of mold spores, was able to occur morequickly in a fructose solution than in solutionsof glucose, mannose, or glycerol of equal orhigher RVP. It has been noted that the sameapparent correlations among low local viscosity,fast translational diffusion, high translational mo-bility, short translational relaxation time, and lowTm/Tg ratio were suggested by the results in Ta-ble 2 for mold spore germination rates in smallPHC-water systems at 50 to 95°C above Tg' aswere suggested also from the analysis of trans-lational friction coefficients in Figure 72 for syn-thetic high polymers at 100°C above Tg.30
As mentioned earlier, the 1:1 fruc-tose:glucose mixture in Table 2 received specialattention, because of its importance in many tech-nological applications, including IMFs, and be-cause of its significant contribution to the theo-retical interpretation of the non-equilibriumbehavior of PHC-water systems.30 The germi-nation time for mold spores in a concentratedsolution of this mixture was much more like thatof a solution of glucose alone than fructose alone,which indicated that the mechanical relaxationbehavior of the solution mixture is quite similarto that of a glucose solution with respect to trans-lational mobility. A 20 w% solution of the mix-ture showed a Tg' intermediate between the val-ues for fructose and glucose, but a Wg' almostidentical to the value for fructose alone. As dis-cussed earlier in the context of Figure 52, theglass curves of Figure 53 revealed that (1) thepredominant conformer of fructose in its me-
276
Dow
nloa
ded
by [
Tex
as A
&M
Uni
vers
ity L
ibra
ries
] at
10:
57 0
9 Ja
nuar
y 20
18

chanically and spatially homogeneous vitrifiedaqueous solutions is the one responsible for thehigher Tg value of dry fructose alone at 100°C,and (2) the anomalously large value of Wg' foraqueous solutions of fructose alone results fromthe free volume requirement for rotational mo-bility of this "anisotropic" fructose conformer.30
This important conclusion concerning the iden-tity of the predominant fructose conformer inaqueous fructose glasses was demanded by therecognition, gained from the vast literature forplasticized synthetic polymers107'109 and men-tioned earlier, that the glass curve always exhibitsa smooth monotonic decrease in Tgnvith increasein plasticizer content expressed as a weight frac-tion (because free volume in the plasticized blendis additive or cumulative, depending on the dis-parity in MW, on a weight fraction basis), withno local maxima unless stoichiometric complexesarise in particular composition ranges. Thus, themechanical behavior of the solution of the 1:1mixture of glucose with fructose is dominated bythe free volume requirements of the "aniso-tropic" fructose conformer, with respect to ro-tational mobility. As mentioned earlier, the me-chanically homogeneous dry glass obtained bymelting a 1:1 mixture of (3-D-fructose and a-D-glucose exhibited only one Tg at 20°C, exactlyintermediate between the Tg of dry glucose aloneat 31°C and the Tg of the second conformer ofdry fructose at 11°C. It was suggested30 and sub-sequently inferred from the results of Finegoldet al.124 that the predominant fructose conformerin the mixed dry glass is the second, glucose-like or "isotropic" conformer, with the lower ofthe two Tg values of fructose. The mold sporegermination time for the solution mixture wasdetermined by its constrained translational mo-bility. The constraint was much greater than fora solution of fructose alone and somewhat lessthan for a solution of glucose alone. This con-strained translational mobility in the supra-glassyfluid was related to the single dry Tg of the mix-ture, which was much closer to that of glucose,with its higher value of Tm/Tg, than to that ofthe anomalous conformer of fructose, with itsvery low value of Tm/Tg. It was concluded30 thatthe apparent RVP of a concentrated PHC solutiondoes not control system mobility and eventual
water "availability", but is simply another di-agnostic manifestation, like the times requiredfor spore germination, of the non-equilibriumtranslational relaxation behavior of the solution.It was suggested30 that (1) the anomalous fructoseconformer is the predominant species in aqueousfructose glasses and in aqueous glasses of the 1:1mixture of fructose and glucose, (2) the anom-alous fructose conformer is mechanically incom-patible with the glucose-like fructose conformerin the dry melt of fructose alone, and (3) theglucose-like fructose conformer is the predomi-nant species in the single dry glass of the 1:1mixture. It was hoped that this speculative dis-cussion,30 which should have provided pregnantclues to one versed in the stereochemistry of smallPHCs, might provoke appropriate experimenta-tion with molecular modeling, NMR, and die-lectric relaxation techniques to explore the effectsof concentration, temperature, and pressure onthe nature and kinetics of conformational changesduring melting and vitrification of dry PHC sys-tems and their aqueous solutions.
In the field of food technology, comparisonsof the technological properties of the three mostreadily available sugars, fructose, glucose, andsucrose, are important and topical. Especially forapplications involving the moisture managementof IMFs, the choice between fructose and glucoseto depress RVP and thus increase shelf-life isoften controversial, confusing, and contradic-tory.1516 The situation has been summarized bythe following paradoxical "truths".75-76 In foodswith limited total moisture, formulation on anequal weight basis with fructose rather than glu-cose typically results in a lower value of apparentRVP and greater storage stability, because themuch greater solubility of fructose results in agreater effective concentration of fructose thanglucose. However, if a product is formulated withglucose to achieve a certain RVP value that hasbeen empirically demonstrated to provide stabil-ity with respect to a particular test microorganism(such as the IMF pet food product mentioned inSection II.A.3), then reformulation with fructoseto the same RVP often produces a less stableproduct. This is so, because less fructose thanglucose is required to achieve the same RVP,while, as illustrated by the mold spore germi-
277
Dow
nloa
ded
by [
Tex
as A
&M
Uni
vers
ity L
ibra
ries
] at
10:
57 0
9 Ja
nuar
y 20
18
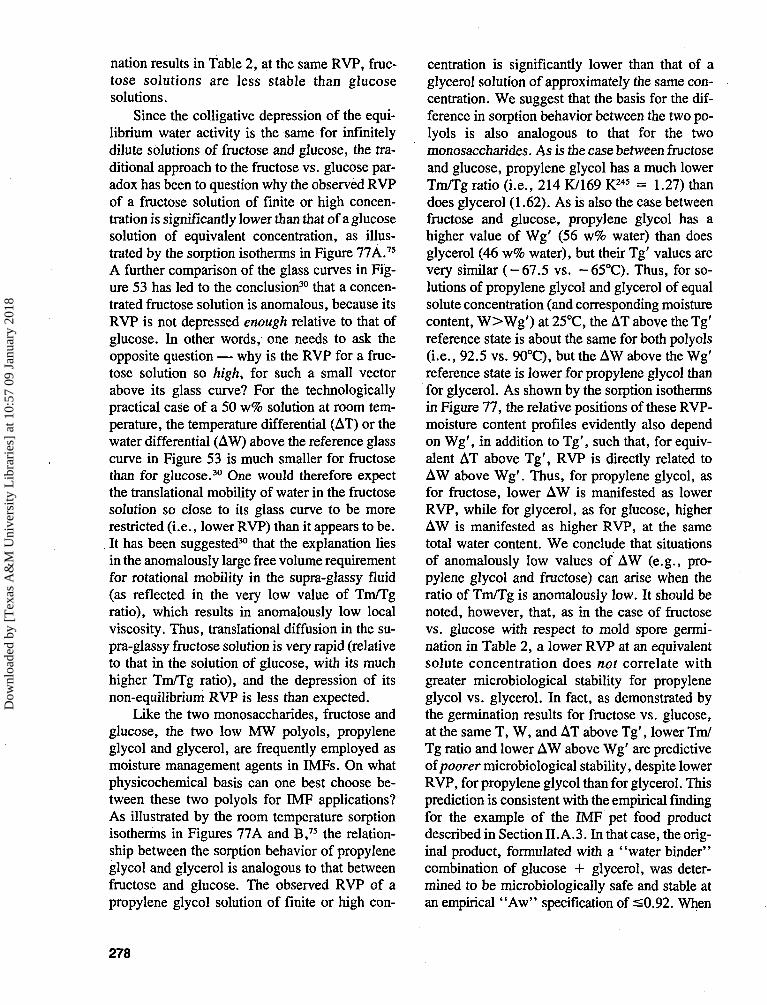
nation results in table 2, at the same RVP, fruc-tose solutions are less stable than glucosesolutions.
Since the colligative depression of the equi-librium water activity is the same for infinitelydilute solutions of fructose and glucose, the tra-ditional approach to the fructose vs. glucose par-adox has been to question why the observed RVPof a fructose solution of finite or high concen-tration is significantly lower than that of a glucosesolution of equivalent concentration, as illus-trated by the sorption isotherms in Figure 77A.75
A further comparison of the glass curves in Fig-ure 53 has led to the conclusion30 that a concen-trated fructose solution is anomalous, because itsRVP is not depressed enough relative to that ofglucose. In other words, one needs to ask theopposite question — why is the RVP for a fruc-tose solution so high, for such a small vectorabove its glass curve? For the technologicallypractical case of a 50 w% solution at room tem-perature, the temperature differential (AT) or thewater differential (AW) above the reference glasscurve in Figure 53 is much smaller for fructosethan for glucose.30 One would therefore expectthe translational mobility of water in the fructosesolution so close to its glass curve to be morerestricted (i.e., lower RVP) than it appears to be.It has been suggested30 that the explanation liesin the anomalously large free volume requirementfor rotational mobility in the supra-glassy fluid(as reflected in the very low value of Tm/Tgratio), which results in anomalously low localviscosity. Thus, translational diffusion in the su-pra-glassy fructose solution is very rapid (relativeto that in the solution of glucose, with its muchhigher Tm/Tg ratio), and the depression of itsnon-equilibrium RVP is less than expected.
Like the two monosaccharides, fructose andglucose, the two low MW polyols, propyleneglycol and glycerol, are frequently employed asmoisture management agents in IMFs. On whatphysicochemical basis can one best choose be-tween these two polyols for IMF applications?As illustrated by the room temperature sorptionisotherms in Figures 77A and B,75 the relation-ship between the sorption behavior of propyleneglycol and glycerol is analogous to that betweenfructose and glucose. The observed RVP of apropylene glycol solution of finite or high con-
centration is significantly lower than that of aglycerol solution of approximately the same con-centration. We suggest that the basis for the dif-ference in sorption behavior between the two po-lyols is also analogous to that for the twomonosaccharides. As is the case between fructoseand glucose, propylene glycol has a much lowerTnVTg ratio (i.e., 214 K/169 K245 = 1.27) thandoes glycerol (1.62). As is also the case betweenfructose and glucose, propylene glycol has ahigher value of Wg' (56 w% water) than doesglycerol (46 w% water), but their Tg' values arevery similar ( -67 .5 vs. -65°C). Thus, for so-lutions of propylene glycol and glycerol of equalsolute concentration (and corresponding moisturecontent, W>Wg') at 25°C, the AT above the Tg'reference state is about the same for both polyols(i.e., 92.5 vs. 90°C), but the AW above the Wg'reference state is lower for propylene glycol thanfor glycerol. As shown by the sorption isothermsin Figure 77, the relative positions of these RVP-moisture content profiles evidently also dependon Wg', in addition to Tg', such that, for equiv-alent AT above Tg', RVP is directly related toAW above Wg'. Thus, for propylene glycol, asfor fructose, lower AW is manifested as lowerRVP, while for glycerol, as for glucose, higherAW is manifested as higher RVP, at the sametotal water content. We conclude that situationsof anomalously low values of AW (e.g., pro-pylene glycol and fructose) can arise when theratio of Tm/Tg is anomalously low. It should benoted, however, that, as in the case of fructosevs. glucose with respect to mold spore germi-nation in Table 2, a lower RVP at an equivalentsolute concentration does not correlate withgreater microbiological stability for propyleneglycol vs. glycerol. In fact, as demonstrated bythe germination results for fructose vs. glucose,at the same T, W, and AT above Tg', lower Tm/Tg ratio and lower AW above Wg' are predictiveof poorer microbiological stability, despite lowerRVP, for propylene glycol than for glycerol. Thisprediction is consistent with the empirical findingfor the example of the IMF pet food productdescribed in Section II.A.3. In that case, the orig-inal product, formulated with a "water binder"combination of glucose + glycerol, was deter-mined to be microbiologically safe and stable atan empirical "Aw" specification of ^0.92. When
278
Dow
nloa
ded
by [
Tex
as A
&M
Uni
vers
ity L
ibra
ries
] at
10:
57 0
9 Ja
nuar
y 20
18
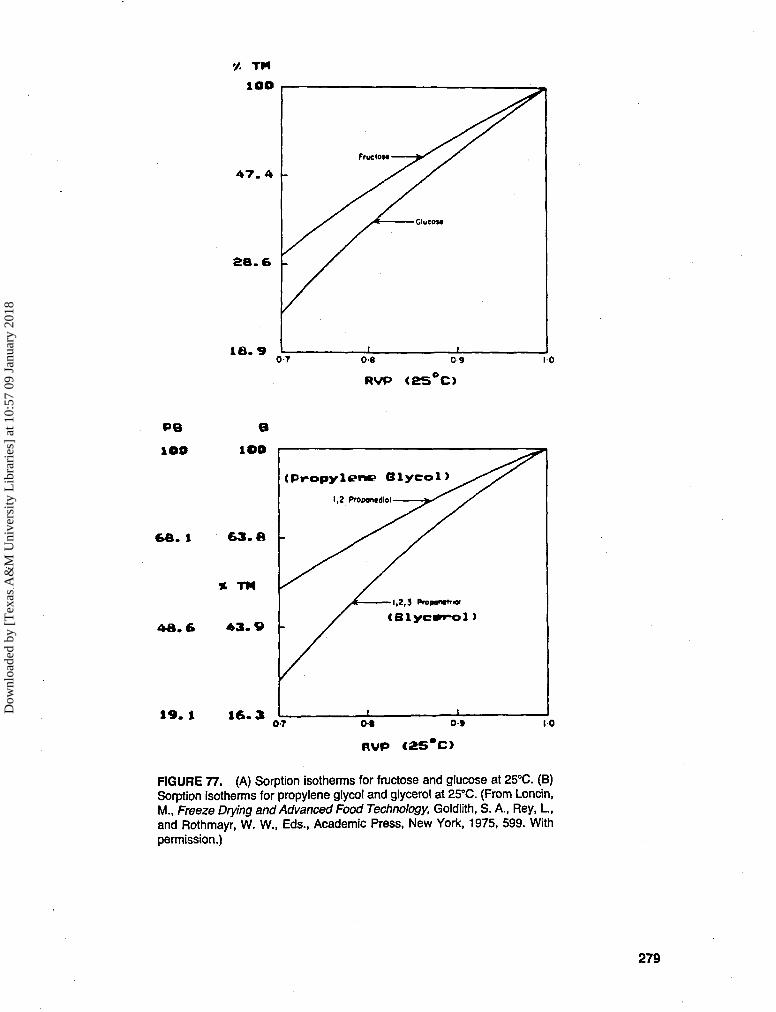
too
47.4 -
SB.
IB. 90-7 0 8 0 9
RVP ( 2 S C )
PB
1OO
etoo
6a. 63. e
* TM
43. 9
19.1 16.3
(Propylene Glycol)
1,2 Propontdiol-
- 1 ,2 ,3 Propomtfrioi
(Blycvrol)
or o« o>RVP <2S*C>
10
FIGURE 77. (A) Sorption isotherms for fructose and glucose at 25°C. (B)Sorption isotherms for propylene glycol and glycerol at 25°C. (From Loncin,M., Freeze Drying and Advanced Food Technology, Goldlith, S. A., Rey, I., and Rothmayr, W. W., Eds., Academic Press, New York, 1975, 599. Withpermission.)
279
Dow
nloa
ded
by [
Tex
as A
&M
Uni
vers
ity L
ibra
ries
] at
10:
57 0
9 Ja
nuar
y 20
18
the product was reformulated and the "safe"combination of glucose + glycerol was replacedby a fructose + propylene glycol combinationto achieve the same "Aw" specification, the newproduct spoiled catastrophically.
C. Enzymatic Activity
1. Prevention of Enzymatic Activity inAmorphous Media atT < Tg
Enzyme-substrate interactions in amorphousaqueous media have been demonstrated to rep-resent an example of a diffusion-limited chemicalreaction that can be characterized as a collapseprocess governed by Tg and dependent on plas-ticization by water.8 Such diffusion-limited en-zymatic activity, which can only occur at T>Tg,is potentially important in many food applicationsthat cover the entire spectrum of processing/stor-age temperatures and moisture contents, and isespecially relevant to the issue of product shelf-life. For example, recent reports have docu-mented (1) the significant reductions in qualityand shelf-life that can be caused by residual en-zymatic activity during frozen storage of cod fil-lets,312 parsley,311 cauliflower,315 and greenbeans;313 (2) the finding that the extent of productdeterioration caused by enzymatic reactions in-creases with increasing freezer-storage temper-ature;311-312 (3) the complementary finding thatenzymatic reaction rates and the correspondingrates of quality loss increase with increasing Tf;312
and (4) the unexplained finding312 that the de-pendence of enzymatic reaction rates in cod filletson Tf could not be predicted by the Arrheniusequation, as evidenced by non-linear Arrheniusplots. As described earlier in Table 9, examplesexist which elegantly illustrate the fact that en-zymatic activity is suppressed in low-moistureglassy solids at T < Tg,54 and in frozen systemsat T < Tg',8 but commences in a rubbery fluid,at T>Tg or Tg'.314 Examples of frozen vegeta-bles that have recently been reported to showsignificant enzymatic activity and resultant qual-ity loss during freezer storage (at a Tf above ourmeasured value of Tg') include cauliflower315 (atTf (-20°C)>Tg' (-25°C)) and green beans313
(at Tf (-23°C)>Tg' (-27.5°C)).39
Studies by Bone and Pethig86368 of the dy-namics of lysozyme activity, involving the hy-dration of freeze-dried lysozyme powder at 20°C,showed that, at 20 w% water, lysozyme becomessufficiently plasticized, so that measurable en-zymatic activity commences. Their results wereinterpreted as follows.8 A diffusion-limited en-zyme-substrate interaction is essentially prohib-ited in a partially glassy solid at T < Tg, butsufficient water plasticization depresses the Tgof the lysozyme-containing medium to below20°C, allowing the onset of enzymatic activity ina rubbery lysozyme solution at T>Tg, the thresh-old temperature for activity. This interpretationwas consistent with results of related studies of"solid glassy lysozyme samples" by Poole andFinney,332-333367 who noted conformationalchanges in the protein as a consequence of hy-dration to the same 20 w% level, and were"tempted to suggest that this solvent-related ef-fect is required before (enzymatic) activity is pos-sible." Morozov et al.87 studied the water de-sorption behavior and corresponding mechanicalproperties of amorphous lysozyme films at 25°C,and reported a sudden increase in modulus, at-tributed to an increase in the rigidity of lysozymemolecules (corresponding to a loss of enzymaticactivity), at moisture contents <0.22 g water/gprotein. Work by Morozov and Gevorkian175 alsorevealed the critical requirement of low-temper-ature glass transitions for the physiological ac-tivity of lysozyme and other globular proteinsplasticized by water.
Within a context of cryostabilization tech-nology, such enzyme-substrate interactions infrozen food systems depend on the relationshipbetween Tf and Tg' (as illustrated in Figure 63).8
Tg', representing the threshold temperature forthe onset of enzymatic activity in a frozen me-dium, depends in turn on the composition of aparticular product, in terms of the average MWof the water-compatible solids. Rates of enzy-matic reactions would be predicted to increaseexponentially with the AT between Tf and Tg' ,314
as dictated by WLF, rather than Arrhenius,kinetics.32-39
The prevention of enzymatic activity at T <Tg' has been demonstrated experimentally in vi-tro in a maximally frozen model system con-sisting of glucose oxidase, glucose, methyl red,
280
Dow
nloa
ded
by [
Tex
as A
&M
Uni
vers
ity L
ibra
ries
] at
10:
57 0
9 Ja
nuar
y 20
18
and bulk solutions of sucrose, a 10 DE malto-dextrin, and their mixtures, which provided arange of samples with known values of Tg'.8 Theenzymatic oxidation of glucose produces an acidthat causes a diagnostic color change from yellowto pink in the reaction mixture. Samples with arange of Tg' values from - 9 . 5 to -32°C werestored at various temperatures: 25, 3, —15, and— 23°C. All samples were fluid at the two highertemperatures, while all looked like colored blocksof ice at —15 and — 23°C. However, only sam-ples for which the storage temperature was aboveTg' turned pink. Even after 2 months storage at— 23°C, samples containing maltodextrin, withTg'> — 23°C, were still yellow. Frozen samplesthat turned pink, even at — 23°C, contained aconcentrated, substrate- and enzyme-enrichedfluid surrounding the ice crystals, while in thosethat remained yellow, the non-ice matrix was aglassy solid. Significantly, enzymatic activity wasprevented below Tg', but the enzyme itself waspreserved (via cryostabilization with a low DESHP) rather than inactivated during storage. Whenyellow samples were thawed, they quickly turnedpink. As a necessary extension of this qualitativeexperiment, future studies of quantitative en-zyme-substrate reaction rates, as a function ofAT between Tf and Tg', in frozen model systemscontaining a variety of cryostabilizers and/or cry-oprotectants would be quite informative.33
2. Unfolding of Native Globular Enzymesand Proteins at Subzero Temperatures
"Cold denaturation or inactivation" of na-tive globular enzymes and proteins is a topic ofmuch current interest in the protein litera-tuj-e 5.387,388 j n e t e r m j s u s e ( j t o describe a co-operative, fully thermoreversible inactivationprocess, common to many enzymes and proteinsin concentrated aqueous systems, involving dis-ruption of the native structure by cooling, eitherdue to a conformational transition involving dis-sociation of multiple peptide subunits or unfold-ing of a globular polypeptide chain.5 Cold-in-duced unfolding has been conceptualized as anall-or-none, two-state, first-order phase transitionfrom compact globule to disordered coil,387-389
where the denatured, flexible-coil state has been
modeled by PVP in aqueous solution at subzerotemperatures.390 Recently, direct experimentalstudies have been reported of cold inactivationin undercooled (or freezing-point depressed) solu-tions at subzero temperatures, involving subunitdissociation of lactate dehydrogenase,391 and un-folding of chymotrypsinogen392 and metmyoglo-bin.389 In the chymotrypsinogen study, an emul-sion droplet technique was employed to achievesubstantial undercooling of aqueous solutions andmaintain the inherent mobility of the liquid state,while in the work on lactate dehydrogenase, thesame requirement of liquid state mobility wasachieved through the use of a "cryosolvent" withsignificant colligative freezing point depression.Both experimental approaches permitted a cold-induced conformational transition to occur by aprocess entirely different from that of "freeze-denaturation" of proteins in freeze-concentratedsolutions.387*391 In the case of the cold-dissociatedmultisubunit enzyme, a low degree of enzymaticactivity was retained.391 Cold denaturation is sim-ilar in some but different in other thermodynamicaspects387 to the more familiar high-temperature"thermal" or "heat denaturation" of nativeglobular proteins,5 a phase transition (analogousto crystal melting) typically analyzed by DSCmeasurements of concentrated solutions or hy-drated crystals (as exemplified by the method-ology of Sochava et al.393). However, while colddenaturation is not subject to the typical irrev-ersibility caused by rapid aggregation immedi-ately following unfolding that characterizes heatdenaturation (and often leads to so-called "heat-set gelation") of many proteins in concentratedaqueous systems,393 cold denaturation does man-ifest an unusual temperature hysteresis effect inthe unfolding/refolding392 and dissociation/reas-sociation processes.391
Reversible cold inactivation of proteins mighthave practical relevance387 and offer potentialbenefit to commercial food processes such asblast-freezing of frozen products or freeze-dryingof concentrated aqueous systems. In such pro-cesses, a significantly undercooled metastableliquid state might persist for a time long enoughto allow cold inactivation to occur, although ithas been suggested that such native/denaturedtransformations at subzero temperatures may beslow, kinetically governed changes.388 Despite
281
Dow
nloa
ded
by [
Tex
as A
&M
Uni
vers
ity L
ibra
ries
] at
10:
57 0
9 Ja
nuar
y 20
18
this qualification, it has been stated that "lowtemperature denaturation could probably be usedto enhance the storage stability of protein con-centrates and may offer an attractive alternativeto lyophilization".391 These workers also notedthat, "for practical applications, such as long-term storage, a reversible low-temperature in-activation, aided by cryosolvents, would appearto be a highly desirable process".391 (This grouphas subsequently demonstrated the long-term sta-bilization, via substantial undercooling of solu-tions utilizing the emulsion droplet technique, ofproteins subject to cold inactivation.394) In con-trast, the significant undesirable consequences ofirreversible freeze-denaturation of proteins (e.g.,the syneresis due to protein denaturation in frozenmeats) during ordinary frozen food processingare familiar. However, a potential remedy in cer-tain cases of this type of damage could involvethe use of low MW solutes (e.g., sugars andpolyols), which are well known as stabilizers ofnative proteins against heat denaturation, and havebeen suggested (on the same physicochemicalbasis as used to explain the functional propertiesof food cryoprotectants15) to be capable of play-ing the same role against freeze denaturation.5
Their protective effect, which has been attributedto their ability to "maintain the hydration shellof a protein under conditions of lowered wateractivity", has been noted to be "reflected in theapplication of sugars during industrial spray andfreeze drying operations".5
D. Inhibition of Collapse Phenomenawith Saccharide Polymers
1. Entanglement and Network Formation— Network Tg
There is a profound technological importanceof MWs above the entanglement MW limit, asillustrated earlier for commercial SHPs (as a modelfor other homologous families of amorphous sac-charide oligomers and polymers) by the structure-function relationships defined by the entangle-ment plateau in Figure 44.8-27 Ferry107 has de-scribed the generic behavior observed for all pol-ymer systems with respect to the relationshipsbetween linear DP of the backbone chain, pol-
ymer concentration, and viscosity. MW is a rel-ative measure of linear DP of the primary chainwhen the polymer has a uniform structure alongits entire length. At any given concentration, thereis a minimum DP required for entanglement andnetwork formation. For very dilute solutions (suchthat the solution viscosity, measured as a relativeflow rate, is similar to that of the solvent alone),high MW polymers are necessary to form gelsor networks (characterized by very high macro-scopic viscosity, measured as a relative firm-ness). For example, 1.5 w% gelatin solutions inwater can form firm gel networks (which exhibitresistance to dehydration, due to mechanical re-sistance to shrinkage), through entanglement fol-lowed by crystallization of junction zones, if thelinear DP is 2:1000 (MW > 105).239 Similarly,1.5 w% amylose solutions in water can form firmgel networks if the linear DP is about 3000 (Mw- 5 x 10⁵).211-273 At intermediate chain lengths,greater concentrations of chains are required forentanglement and network formation. In the caseof SHPs, such as the low DE maltodextrins pat-ented for partially crystalline, fat-mimeticgels,266-267-272 concentrations must be increased toat least about 20 to 25 w% in water (i.e., typicalof Cg' of the freeze-concentrated glass at Tg')as linear DP is decreased to approach 18 glucoseunits (MW - 3000).15-27 In contrast, oligomersof hydrolyzed gelatin (peptones) or hydrolyzedstarch (corn syrup solids or higher DE malto-dextrins with MW ;£ 3000) are incapable of gelnetwork formation via entanglement at any con-centration.15>24>27 However, recrystallization ofsuch oligomers can occur due to concentrationabove the saturation limit or to a change of sol-vent. For carbohydrate polymers based on pri-mary chains of a-1,4 glucans, the critical DPrequired for network formation via entanglementis 5:18.
Network formation, especially in the absenceof crystallization, depends on the ability of flex-ible chains to entangle.107 (The contribution ofcrystallization to network formation and gelation,described earlier in Section III.A.6, is discussedfurther below in the specific context of saccharidepolymers, with respect to the question — Whenis retrogradation synonymous with recrystalli-zation and with gelation?) One convenient di-agnostic test for entanglement relies on the fact,
282
Dow
nloa
ded
by [
Tex
as A
&M
Uni
vers
ity L
ibra
ries
] at
10:
57 0
9 Ja
nuar
y 20
18

previously illustrated in Figures 24 and 44, thatthe Tg values of a homologous family of poly-mers increase with increasing linear DP up to thechain length sufficient to allow entanglement.Entanglement networks consist of inter-nodechains and network junction zones (nodes) thatare transient topological constraints to chain mo-tion. The probability of formation of (non-crys-talline) junctions depends on chain length andconcentration. The greater the number of junc-tions, the shorter the inter-node chain length (fora fixed parent chain length). Thus, there is alimiting length for any chain that exhibits trans-lational freedom, and a limiting molecular Tg forthat DP.
A second important diagnostic test for en-tanglement was illustrated earlier in Figure 73.For undiluted polymers or for polymer solutionsstudied at constant total concentration, a criticalchain length can be demonstrated, above or be-low which the dependence of viscosity on MWchanges dramatically.107 Above the critical chainlength, entanglement results in a drastic sensitiv-ity of viscosity to chain length. In the absenceof entanglement, chains shorter than the criticallength show solution behavior with relative in-sensitivity of viscosity to chain length. The to-pological constraints of the (non-crystalline) en-tanglement network are not due to any particularchemical interactions (such as hydrogen bondsor dipolar or charge interactions) nor to any par-ticular structural features. As demonstrated inFigure 73, entanglement is a generic behavior ofpolymers of sufficient chain length and can beseen equally in poly (ethylene glycol) and in non-polar, structurally featureless polymers such aspoly(isobutylene). The important lesson to belearned from Figure 73 was alluded to earlier. Inthe region of MW above the critical DP, the slopeof log viscosity vs. log MW is 3.4. In this region,cutting molecules (e.g., SHPs) of DP 300 in half,to obtain the same total concentration of mole-cules with DP 150, would result in a dramatictenfold reduction in viscosity. In contrast, in theabsence of entanglement, the slope of log vis-cosity vs. log MW in the region below the criticalDP is 1. In this region, cutting molecules of DPs 18 in half would result in only a twofold re-duction in viscosity.
In the context of starch retrogradation as
a collapse process included in Table 9, retro-gradation of gelatinized starch involves the re-crystallization of both amylopectin and amy-] o s e 61,63,65.215.219.221,395 I t h a s b e e n demonstrated
for SHPs that the minimum linear chain lengthrequired for intermolecular entanglement uponconcentration to Cg' corresponds to DPn = 1 8and Mn — 3000.8 Sufficiently long linear chainlength (DPn s 15 to 20) has also been correlatedwith intermolecular network formation and ther-moreversible gelation of SHPs15-18-27-271-275
and amylopectin,92 and with starch (re)cry-stallization.92-215-218-221-396 It has been suggestedthat, in a partially crystalline starch, SHP, oramylopectin gel network, the existence of ran-dom interchain entanglements in amorphous re-gions and "fringed micelle" or chain-folded mi-crocrystalline junction zones271 each represents amanifestation of sufficiently long chain length.8
This suggestion was supported by otherwork211-215-273-397 that has shown that amylose gels,which are partially crystalline,396 are formed bycooling solutions of entangled chains. For aqueoussolutions of both high MW amylose211>214-273 andamylopectin,92-398 intermolecular entanglementand network formation have been evidenced bylog-log plots of viscosity vs. concentration witha characteristic break in the curve (analogous tothe break in the curves of log viscosity vs. logMW for the synthetic polymers shown earlier inFigure 73), such that the slope of the linear por-tion above the so-called "coil overlap" concen-tration is steeper than the slope of the other linearportion at lower concentrations. From such a plot,Miles et al.211 have identified a critical minimumconcentration ( s i . 5 w% amylose) for entangle-ment of high-polymeric amylose (Mw — 5 x10³). These workers have stated that amylosegelation requires network formation, and this net-work formation requires entanglement, and theyhave concluded that "polymer entanglement isimportant in understanding the gelation of amy-lose".211 A more recent study of aqueous amy-lose gelation by Gidley et al.,212214 using nearlymonodisperse amyloses of DP 250-2800, hasidentified a somewhat lower critical gelling con-centration of ==1.0 w%. This finding has beencorroborated in a subsequent rheological studyby Doublier and Choplin.397 Gidley et al., whileaccepting the concept of intermolecular entan-
283
Dow
nloa
ded
by [
Tex
as A
&M
Uni
vers
ity L
ibra
ries
] at
10:
57 0
9 Ja
nuar
y 20
18
glement in "semi-dilute" amylose solutions ad-vanced by Miles et al. ,211 have suggested that thelower gelling concentration of 1.0 w% resultsfrom the predominant contribution of crystallinejunction zone formation to the gelation mecha-nism for amylose.212214
The time-dependent gelation of amylose fromdilute aqueous solution is generally agreed to oc-cur in two stages: a relatively fast but finite stagedue to viscoelastic network formation via entan-glement (which is reversible by dilution but notthermoreversible); followed closely by a slower,but continually maturing, crystallization (in achain-folded or extended-chain morphology) pro-cess (which is thermoreversible above100°C).92-211-215-217-220-221-273-397-399 In contrast, inpartially crystalline, thermoreversible (below100°C), aqueous amylopectin gels, viscoelasticnetwork formation (which is relatively slow andtime-dependent) is more closely related to thepresence of microcrystalline junctions than to en-tanglements, although entanglement does oc-cur.92-218221 Since most normal starches are 70 to80% amylopectin,400 their gelatinization and re-trogradation processes are dominated by the non-equilibrium melting and recrystallization behav-ior of amylopectin,17-18-20-63-65-219 although con-tributions due to amylose can be ob-served.232>395>397 Generally, the early stages ofstarch retrogradation are dominated by chain-folded amylose (of DP from about 15 to about50 and fold length about 100 A92-221-401); the laterstages by extended-chain amylopectin94 outerbranches (of DP about 12 to 1692-402).18-20
Experimental evidence, which supports theseconclusions about the thermoreversible gelationmechanism for partially crystalline polymeric gelsof starch, amylopectin, amylose, and SHPs, hascome from DSC studies,20 the favored techniquefor evaluating starch retrogradation.207 Analysisof 25 w% SHP gels, set by overnight refrigera-tion, has revealed a small crystalline melting en-dotherm with Tm = 60°C,15 similar to the char-acteristic melting transition of retrograded B-typewheat starch gels.20 Similar DSC results havebeen reported for 20 w% amylopectin (from waxymaize) gels.216-218 The small extent of crystallin-ity in SHP gels can be increased significantly byan alternative two-step temperature-cycling ge-lation protocol (12 h at 0°C, followed by 12 h at
40°C),18-20 adapted from the one originally de-veloped by Ferry239 for gelatin gels, and subse-quently applied by Slade et al.36 to retrogradedstarch gels. In many fundamental respects, thethermoreversible gelation of aqueous solutions ofpolymeric SHPs, amylopectin, amylose, and ge-latinized starch is analogous to the gelation-via-crystallization of synthetic homopolymer and co-polymer-organic diluent systems, described ear-lier in Section III.A.6.20 For the latter partiallycrystalline gels, the possibly simultaneous pres-ence of random interchain entanglements inamorphous regions146 and microcrystalline junc-tion zones195 has been reported. However, con-troversy exists146195 (as it also does for the caseof amylose211-212"214-397) over which of the twoconditions (if either alone) might be the necessaryand sufficient one primarily responsible for thestructure-viscoelastic property relationships ofsuch polymeric systems. Part of this controversycould be resolved by the simple dilution test men-tioned earlier,198 which could also be applied topolysaccharide gels (e.g., amylose); entangle-ment gels can be dispersed by dilution at roomtemperature, microcrystalline gels cannot be whenroom temperature is <Tm.15
In the context of SHPs as inhibitors of col-lapse processes, it is worth mentioning that theliterature on SHPs as anti-staling ingredients forstarch-based foods (reviewed elsewhere18-20) in-cludes a report by Krusi and Neukom403 that (non-entangling) SHP oligomers of DPn 3 to 8 (i.e.,within the intermediate region II of Figure 44)are effective in inhibiting, and not participatingin, starch recrystallization.
An important consequence of entanglementand network formation is the effect on the Tgthat determines all diffusion-limited structural andmechanical relaxation processes of the system.As shown schematically in Figure 78, while themolecular or segmental Tg remains constant abovethe entanglement MW limit, the network Tg, i.e.,the macroscopic, controlling Tg of the supra-molecular network (that would affect Instronmeasurements of the modulus for instance), con-tinues to increase with increasing MW above theentanglement MW, because of the increasedprobability of crosslinks.146-205 This fact has ma-jor structural and textural implications for foodpolymer systems, because such systems with
284
Dow
nloa
ded
by [
Tex
as A
&M
Uni
vers
ity L
ibra
ries
] at
10:
57 0
9 Ja
nuar
y 20
18
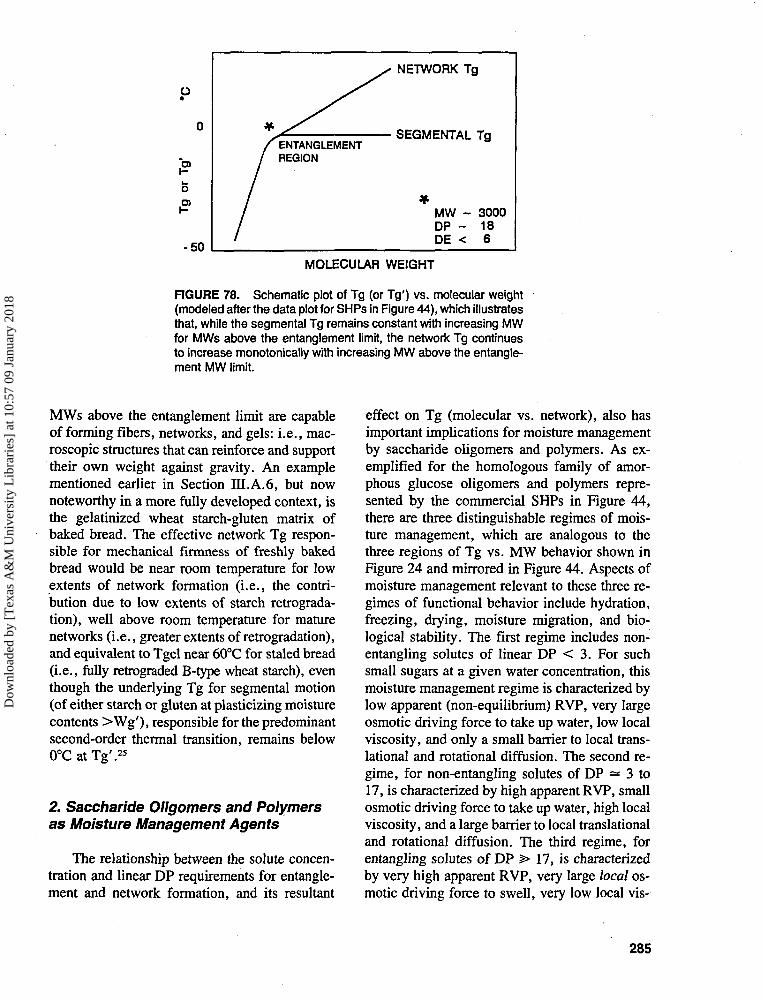
o
o>
o
-50
ENTANGLEMENTREGION
NETWORK Tg
SEGMENTAL Tg
MW - 3000DP - 18DE < 6
MOLECULAR WEIGHT
FIGURE 78. Schematic plot of Tg (or Tg') vs. molecular weight(modeled after the data plot for SHPs in Figure 44), which illustratesthat, while the segmental Tg remains constant with increasing MWfor MWs above the entanglement limit, the network Tg continuesto increase monotonically with increasing MW above the entangle-ment MW limit.
MWs above the entanglement limit are capableof forming fibers, networks, and gels: i.e., mac-roscopic structures that can reinforce and supporttheir own weight against gravity. An examplementioned earlier in Section III.A.6, but nownoteworthy in a more fully developed context, isthe gelatinized wheat starch-gluten matrix ofbaked bread. The effective network Tg respon-sible for mechanical firmness of freshly bakedbread would be near room temperature for lowextents of network formation (i.e., the contri-bution due to low extents of starch retrograda-tion), well above room temperature for maturenetworks (i.e., greater extents of retrogradation),and equivalent to Tgel near 60°C for staled bread(i.e., rally retrograded B-type wheat starch), eventhough the underlying Tg for segmental motion(of either starch or gluten at plasticizing moisturecontents >Wg'), responsible for the predominantsecond-order thermal transition, remains below(TCatTg'.25
2. Saccharide Oligomers and Polymersas Moisture Management Agents
The relationship between the solute concen-tration and linear DP requirements for entangle-ment and network formation, and its resultant
effect on Tg (molecular vs. network), also hasimportant implications for moisture managementby saccharide oligomers and polymers. As ex-emplified for the homologous family of amor-phous glucose oligomers and polymers repre-sented by the commercial SHPs in Figure 44,there are three distinguishable regimes of mois-ture management, which are analogous to thethree regions of Tg vs. MW behavior shown inFigure 24 and mirrored in Figure 44. Aspects ofmoisture management relevant to these three re-gimes of functional behavior include hydration,freezing, drying, moisture migration, and bio-logical stability. The first regime includes non-entangling solutes of linear DP < 3. For suchsmall sugars at a given water concentration, thismoisture management regime is characterized bylow apparent (non-equilibrium) RVP, very largeosmotic driving force to take up water, low localviscosity, and only a small barrier to local trans-lational and rotational diffusion. The second re-gime, for non-entangling solutes of DP — 3 to17, is characterized by high apparent RVP, smallosmotic driving force to take up water, high localviscosity, and a large barrier to local translationaland rotational diffusion. The third regime, forentangling solutes of DP > 17, is characterizedby very high apparent RVP, very large local os-motic driving force to swell, very low local vis-
285
Dow
nloa
ded
by [
Tex
as A
&M
Uni
vers
ity L
ibra
ries
] at
10:
57 0
9 Ja
nuar
y 20
18

cosity, and essentially no barrier to local trans-lational and rotational diffusion. In this context,it is interesting to note that our finding of DPn— 18 for the minimum DP for entanglement andnetwork formation by commercial SHPs, a resultidentified from the polymer characterizationanalysis represented by Figure 44, has been con-firmed by a revealing finding recently reportedby Radosta et al.275 From their study of the watersorption behavior of maltodextrins, they con-cluded that "the transition between "polymer"and "oligomer" behavior under sorption con-ditions is located in the region of DPn valuesbetween 60 and 16. In this DPn region, the shift-ing from restricted swelling (by what Radosta etal. refer to as a "sorption gel") to solution undersorption conditions takes place."275
A conceptual representation of the three re-gimes of moisture management is shown in Fig-ure 79. For a given temperature (e.g., room tem-perature) and time (e.g., a practical experimental
I T> >Tg
T>Tg
III NETWORK Tg > T > Tg
FIGURE 79. Conceptual representation of the threeregimes of moisture management by a homologousfamily of saccharide polymers (e.g., the SHPs in Figure44): (I) at T > Tg of a concentrated solution of non-entangling saccharide oligomers of linear DP =s 3; (II)at T > Tg of a less-concentrated solution of non-en-tangling saccharide polymers of linear DP = 3 to 17;(III) at network Tg > T > Tg of a dilute solution (butabove the critical concentration for entanglement) ofentangling saccharide high polymers of linear DP >17.
time frame), T is well above Tg for concentratedsolutions of regime I solutes, and such a systemwould be subject to viscous liquid flow due togravity. In regime II at T > Tg, apparent RVPis not depressed as much as in regime I, becausethere are fewer solute molecules in solution.However, their higher linear DP results in higherlocal viscosity, which in turn results in a largerbarrier to local diffusion and reduced viscous liq-uid flow due to gravity. In regime III (for a soluteconcentration high enough to allow entangle-ment), at network Tg > T > molecular Tg, thereis elastic resistance to flow, and the gel is ableto support its own weight against the force ofgravity. In this regime, there is essentially nobarrier to local diffusion, so a small moleculesuch as water or a dye molecule can diffuse freelyin the gel network.181 Hence, regime HI manifestsvery high apparent RVP. Despite this, however,there is a very large local osmotic driving forceto take up water, not only via hygroscopicity butvia swelling, the latter due to the mechanicalresistance of the entangled network to shrinkage.This mechanical resistance to shrinkage, whichis analogous to hydraulic resistance to water re-moval, has an effect on the local chemical po-tential of the solvent, analogous to an additionto the osmotic pressure.373 Thus, while there isa very large driving force to take up water viaswelling in regime HI, and a normal, classic os-motic driving force to take up water via hygro-scopicity in regime I, there is a much lower driv-ing force to take up water via classic osmoticpressure effects in regime n , because of the ab-sence of a swelling force due to entanglement.
To illustrate the consequences of the threeregimes of functional behavior of saccharidemoisture management agents, one could use re-sults from, for example, drying or freezing ex-periments. Drying and freezing are equivalentdiffusion-limited processes in the sense that bothinvolve removal of water via phase separation;in drying by increasing the temperature to pro-duce water vapor and in freezing by decreasingthe temperature to produce ice. Muhr andBlanshard404 have measured the relative rates oflinear ice front advancement at subzero temper-atures in aqueous solutions of 35 w% sucrosewith and without added polysaccharide "stabi-lizers". Their results showed conclusively that
286
Dow
nloa
ded
by [
Tex
as A
&M
Uni
vers
ity L
ibra
ries
] at
10:
57 0
9 Ja
nuar
y 20
18

the rates depend critically on the presence or ab-sence of a gel network, even for exactly the sameformulation. For the solution of sucrose alone atT > Tg' (regime I), the relative rate of ice frontadvancement was 6.0. (It would have been es-sentially zero at T < Tg'.) At the same temper-ature, the rate was 4.1 in a sucrose solution con-taining 0.75 w% non-entangling (i.e., non-gelling) Na alginate (regime II), but only 1.0 ina sucrose solution containing 0.75 w% entangling(i.e., gelling) Ca alginate (regime HI). Thus, whenthere was a hydraulic resistance to water removal,due to the resistance of the Ca alginate gel net-work to shrinkage, the rate of ice front advance-ment was dramatically reduced.
By analogy to other moisture managementproblems involving diffusion-limited processes(e.g., "Aw" control, textural stabilization), en-tangling, network-forming saccharide high poly-mers from regime III can be used as functionaladditives to retard moisture migration in bakedgoods, retain crispness of breakfast cereals, andreduce sogginess of pastries and pie crusts.
3. WLF Kinetics of Collapse Processesin Rubbery Frozen Products
For the cryostabilization of real frozen foodproducts such as ice cream (with desirable smooth,creamy texture) against ice crystal growth overstorage time (at Tf > Tg'), inclusion of poly-meric cryostabilizers such as low DE maltodex-trins elevates the composite Tg' of a mix of sol-uble solids that is typically dominated by lowMW sugars.832 In practice, a retarded rate ofmigratory ice recrystallization ("grain growth"of pre-existing ice crystals)240 at Tf and an in-crease in observed Tr result. Such behavior hasbeen documented in several "soft-serve" icecream patents.37-38-405 in such products (and in avariety of other frozen foods and aqueous modelsystems), ice recrystallization has been shown toinvolve a diffusion-limited maturation processwith a mechanism analogous to "Ostwald rip-ening", whereby larger crystals grow with timeat the expense of smaller ones that eventuallydisappear.50-255-308309-406^08 The ripening rate at Tfis reduced (due to reduced AT above Tg') byformulation with low DE maltodextrins of high
Tg'.8-32 Low DE maltodextrins have also beenused to stabilize frozen dairy products againstlactose crystallization during storage,310 anothercollapse process (see Table 9) that can occur ina practical time frame at Tf > Tg'.
Ice recrystallization has been shown to ex-emplify a collapse process for which the kineticsfit the form of the WLF, but not the Arrhenius,equation.15-3234 As demonstrated by the Tg' re-sults for a series of commercial products in Table18,34 typical ice creams and related frozen foodshave composite Tg' values in the range —23 to-43°C,15-32-50 representative of water-solublesolids compositions dominated by compatibleblends of milk proteins and sugars with weight-average Tg' values analogous to those of sac-charide oligomers of DP 1-4.8-34 As illustrated inFigure 63, such products exist as inherently unst-able rubbery fluids with embedded ice and fatcrystals under normal freezer storage at — 18°C,and so WLF rather than Arrhenius kinetics areappropriate to describe their rates of ice crystalgrowth. Figure 8034 contains two WLF plots oflog (iciness score) vs. AT, one for a series of icecream protocepts and the other for a set of frozennovelties, which verified the applicability of WLFkinetics to storage-stability data for such frozendesserts. Both plots show clearly that the rate oficiness development increased dramatically withincreasing AT. Because the numerical values ofthe constants Cl and C2 in the WLF equation,appropriate for these two frozen products, wereunknown and unassumable,30 the two data setswere not fitted to a quantitative form of the WLFequation.34 Instead, empirical curves were drawnthrough the data points in each plot. These curves(especially the one extrapolated to the origin inpart B) are clearly similar in shape to the theo-retical curve defined by the quantitative WLFequation, shown in Figure 36 as a plot of logrelaxation rate vs. AT. In contrast, the straightdashed line drawn in part B represents the be-havior expected for Arrhenius kinetics (i.e., Q10
= 2). Considering that iciness scores were mea-sured by sensory evaluation, this unprecedentedexperimental demonstration of WLF behavior infrozen food systems was viewed as remarka-ble,15-32 despite the obvious fact (discussed insubsequent papers33-39-98) that further studies, andmore quantitative data, would be useful in con-
287
Dow
nloa
ded
by [
Tex
as A
&M
Uni
vers
ity L
ibra
ries
] at
10:
57 0
9 Ja
nuar
y 20
18
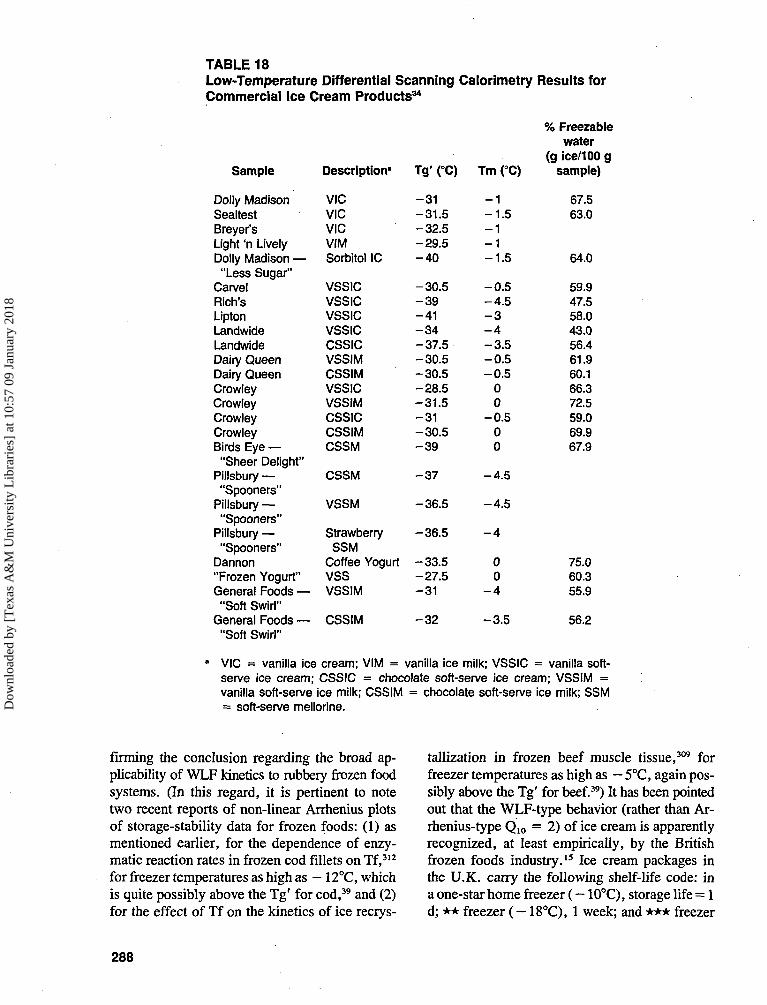
TABLE 18Low-Temperature Differential Scanning Calorimetry Results forCommercial Ice Cream Products34
Sample
Dolly MadisonSealtestBreyer"sLight 'n LivelyDolly Madison —
"Less Sugar"CarvelRich'sLiptonLandwideLandwideDairy QueenDairy QueenCrowleyCrowleyCrowleyCrowleyBirds Eye —
"Sheer Delight"Pillsbury —"Spooners"
Pillsbury —"Spooners"
Pillsbury —"Spooners"
Dannon"Frozen Yogurt"General Foods —"Soft Swirl"
General Foods —"Soft Swirl"
Description'
VICVICVICVIMSorbitol IC
VSSICVSSICVSSICVSSICCSSICVSSIMCSSIMVSSICVSSIMCSSICCSSIMCSSM
CSSM
VSSM
StrawberrySSM
Coffee YogurtVSSVSSIM
CSSIM
Tg' (°C)
-31-31.5-32.5-29.5- 4 0
-30.5- 3 9-41- 3 4-37.5-30.5-30.5-28.5-31.5-31-30.5- 3 9
- 3 7
-36.5
-36.5
-33.5-27.5-31
- 3 2
Tm (°C)
- 1- 1 . 5- 1- 1- 1 . 5
- 0 . 5- 4 . 5- 3- 4- 3 . 5- 0 . 5- 0 . 5
00
- 0 . 500
- 4 . 5
- 4 . 5
- 4
00
- 4
-3 .5
% Freezablewater
(g ice/100 gsample)
67.563.0
64.0
59.947.558.043.056.461.960.166.372.559.069.967.9
75.060.355.9
56.2
VIC = vanilla ice cream; VIM = vanilla ice milk; VSSIC = vanilla soft-serve ice cream; CSSIC = chocolate soft-serve ice cream; VSSIM =vanilla soft-serve ice milk; CSSIM = chocolate soft-serve ice milk; SSM= soft-serve mellorine.
firming the conclusion regarding the broad ap-plicability of WLF kinetics to rubbery frozen foodsystems. (In this regard, it is pertinent to notetwo recent reports of non-linear Arrhenius plotsof storage-stability data for frozen foods: (1) asmentioned earlier, for the dependence of enzy-matic reaction rates in frozen cod fillets on Tf,312
for freezer temperatures as high as — 12°C, whichis quite possibly above the Tg' for cod,39 and (2)for the effect of Tf on the kinetics of ice recrys-
tallization in frozen beef muscle tissue,309 forfreezer temperatures as high as — 5°C, again pos-sibly above the Tg' for beef.39) It has been pointedout that the WLF-type behavior (rather than Ar-rhenius-type Q,o = 2) of ice cream is apparentlyrecognized, at least empirically, by the Britishfrozen foods industry.15 Ice cream packages inthe U.K. carry the following shelf-life code: ina one-star home freezer ( - 10°C), storage life = 1d; ** freezer (— 18°C), 1 week; and *** freezer
288
Dow
nloa
ded
by [
Tex
as A
&M
Uni
vers
ity L
ibra
ries
] at
10:
57 0
9 Ja
nuar
y 20
18
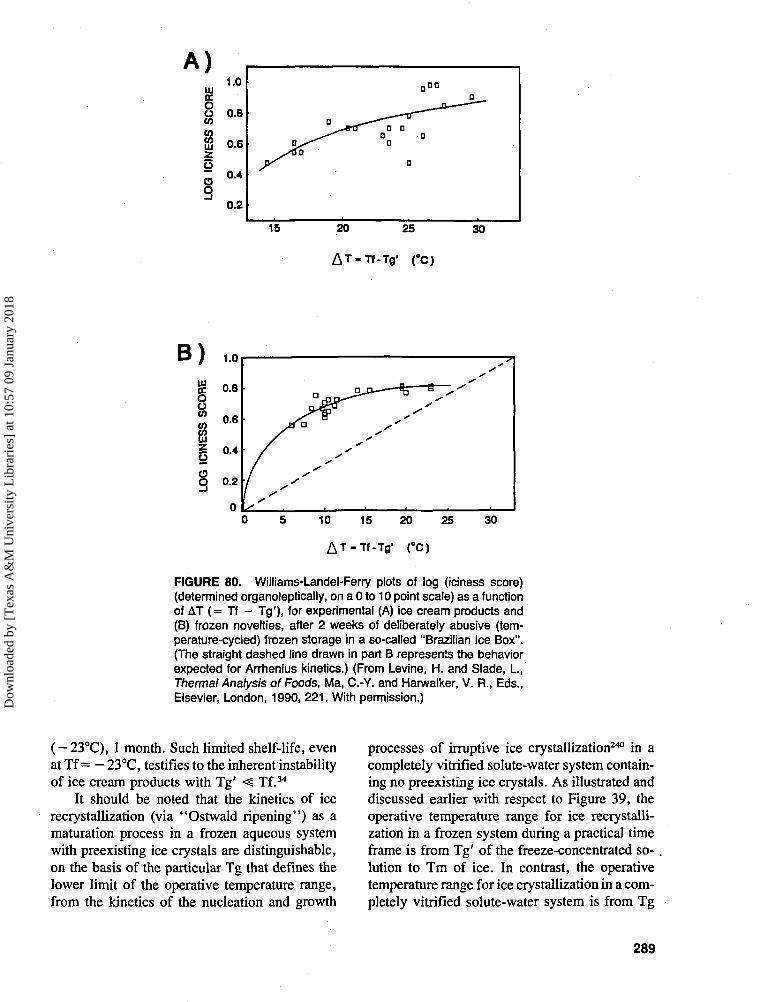
10 15 20 25
AT-Tf-Tg1 (°C)
30
FIGURE 80. Williams-Landel-Ferry plots of log (iciness score)(determined organoleptically, on a 0 to 10 point scale) as a functionof AT (= Tf - Tg'), for experimental (A) ice cream products and(B) frozen novelties, after 2 weeks of deliberately abusive (tem-perature-cycled) frozen storage in a so-called "Brazilian Ice Box".(The straight dashed line drawn in part B represents the behaviorexpected for Arrhenius kinetics.) (From Levine, H. and Slade, I., Thermal Analysis of Foods, Ma, C.-Y. and Harwalker, V. R., Eds.,Elsevier, London, 1990, 221. With permission.)
( —23°C), 1 month. Such limited shelf-life, evenat Tf = - 23°C, testifies to the inherent instabilityof ice cream products with Tg' < Tf.34
It should be noted that the kinetics of icerecrystallization (via "Ostwald ripening") as amaturation process in a frozen aqueous systemwith preexisting ice crystals are distinguishable,on the basis of the particular Tg that defines thelower limit of the operative temperature range,from the kinetics of the nucleation and growth
processes of irruptive ice crystallization240 in acompletely vitrified solute-water system contain-ing no preexisting ice crystals. As illustrated anddiscussed earlier with respect to Figure 39, theoperative temperature range for ice recrystalli-zation in a frozen system during a practical timeframe is from Tg' of the freeze-concentrated so-lution to Tm of ice. In contrast, the operativetemperature range for ice crystallization in a com-pletely vitrified solute-water system is from Tg
289
Dow
nloa
ded
by [
Tex
as A
&M
Uni
vers
ity L
ibra
ries
] at
10:
57 0
9 Ja
nuar
y 20
18
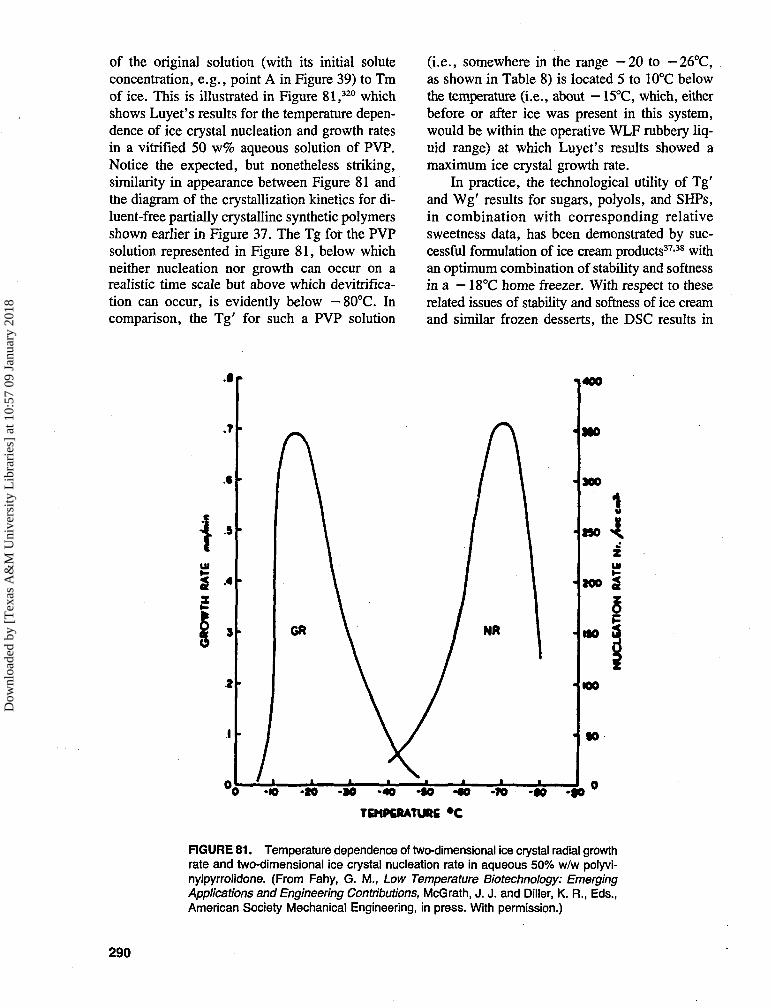
of the original solution (with its initial soluteconcentration, e.g., point A in Figure 39) to Tmof ice. This is illustrated in Figure 81,320 whichshows Luyet's results for the temperature depen-dence of ice crystal nucleation and growth ratesin a vitrified 50 w% aqueous solution of PVP.Notice the expected, but nonetheless striking,similarity in appearance between Figure 81 andthe diagram of the crystallization kinetics for di-luent-free partially crystalline synthetic polymersshown earlier in Figure 37. The Tg for the PVPsolution represented in Figure 81, below whichneither nucleation nor growth can occur on arealistic time scale but above which devitrifica-tion can occur, is evidently below — 80°C. Incomparison, the Tg' for such a PVP solution
(i.e., somewhere in the range —20 to — 26°C,as shown in Table 8) is located 5 to 10°C belowthe temperature (i.e., about — 15°C, which, eitherbefore or after ice was present in this system,would be within the operative WLF rubbery liq-uid range) at which Luyet's results showed amaximum ice crystal growth rate.
In practice, the technological utility of Tg'and Wg' results for sugars, polyols, and SHPs,in combination with corresponding relativesweetness data, has been demonstrated by suc-cessful formulation of ice cream products37-38 withan optimum combination of stability and softnessin a — 18°C home freezer. With respect to theserelated issues of stability and softness of ice creamand similar frozen desserts, the DSC results in
400
•W -tO -SO -40 -«O • «
TEMP6RATURS *C
FIGURE 81. Temperature dependence of two-dimensional ice crystal radial growthrate and two-dimensional ice crystal nucleation rate in aqueous 50% w/w polyvi-nylpyrrolidone. (From Fahy, G. M., Low Temperature Biotechnology: EmergingApplications and Engineering Contributions, McGrath, J. J. and Diller, K. R., Eds.,American Society Mechanical Engineering, in press. With permission.)
290
Dow
nloa
ded
by [
Tex
as A
&M
Uni
vers
ity L
ibra
ries
] at
10:
57 0
9 Ja
nuar
y 20
18
Table 18 have revealed some interesting and fun-damental correlations.34 As a general rule, highervalues of Tg' go hand-in-hand with higher valuesof Tm and percent freezable water (% FW, de-fined as maximum g ice/100 g sample), whilelower Tg' values go along with lower values ofTm and percent FW. (The rationale behind theseinternally consistent trends is easily explainedbased on state diagrams [analogous to Figure 39]constructed from DSC analyses for such complexsystems.) For such products, increasing percentFW correlates intuitively with increasing hard-ness (due to more ice) at a given Tf. Since percentFW corresponds to an inverse measure of productWg', the correlation between increasing Tg' andincreasing percent FW is actually analogous tothe overall trend of increasing Tg' with decreas-ing Wg' described earlier with respect to thecryostabilization technology spectrum in Figure64. Thus, the fundamental and essentially uni-versal correlations between the critical and re-lated functional attributes of storage stability andtexture for such products, which are directly re-flected by their thermal properties of Tg', Tm,and percent FW, are as follows:34 at a given Tf,greater relative stability is coupled with harder-frozen texture, as determined by, and predictablefrom, higher values of Tg' (thus smaller AT),Tm, and percent FW, while at the same Tf, poorerstability is coupled with softer-frozen texture ofproduct variants with lower values of Tg' (largerAT), Tm, and percent FW. As mentioned earlier,these intrinsic correlations of stability (high Tg')with "hard-frozen" (low Wg') and instability(low Tg') with the "soft-frozen" (high Wg') na-ture of products, which have been found to applyto many different types of frozen foods,25-34 havebeen recognized as underlying precepts of cryos-tabilization technology,32 as illustrated by thespectrum of cryostabilizers and cryoprotectantsshown in Figure 64.
In the present context, another point empha-sizes the distinction in functional behavior be-tween non-entangling small carbohydrates andhigh-polymeric saccharides capable of intermo-lecular entanglement.8 A freeze-concentratedglass at Tg' of a SHP cryostabilizer (of DE < 6)would contain entangled polymer chains, whilein the glass at Tg' of a low MW cryoprotectant,solute molecules could not be individually en-
tangled.8 (However, the possibility that smallcarbohydrates might form long-chain aggregatesby hydrogen bonding or complex formation withalkaline salts should not be overlooked.) By anal-ogy, various high MW polysaccharide gums, typ-ically used at concentrations below 1 w%(whereby their impact on a product's compositeMW and Tg' would be small, as discussed earlierwith respect to Table 11), are believed by someto be capable of improving freezer-storage sta-bility of ice-containing fabricated foods, in somepoorly understood way. In the absence of directevidence of any effect on ice crystal size, anddespite evidence that such "stabilizers" have nosignificant effect on ice nucleation or propagationrates,50-404409 or on rates of ice recrystallizationat T^Tg' , 3 0 8 this stabilizing effect of gums hasbeen attributed to viscosity enhancement.407-410 Ithas been suggested8 that such gums may owetheir limited success not only to their ability toincrease microscopic viscosity (a property sharedby all glass-formers, regardless of MW, in thesense that T)g at Tg is independent of MW30), butto their capability to undergo intermolecular en-tanglement and increase macroscopic viscosityvia network formation (thereby physically inhib-iting translational diffusion-limited pro-cesses)34-404 in the freeze-concentrated, amor-phous matrix of a frozen food. Entanglementmight provide an improved mouthfeel that masksthe limited ability of gums to inhibit the growthof ice crystals.
E. Small Sugars at Low Moisture
1. Crystallization Kinetics
A conceptual description of the kineticallycontrolled relaxation process of sugar crystalli-zation in aqueous systems at low moisture15 hasbeen illustrated by the schematic state diagramsin Figure 82.30 These in turn were based on theidealized state diagram shown in Figure 8323 fora plasticizer (component 3)-solute (component 2)system that exemplifies a typical sugar-water sys-tem. Notice the progression in the complexity ofschematic state diagrams from (1) Figure 21 —glass curve only — neither the plasticizer nor thesolute are crystallizable; to (2) Figure 23 — glass
291
Dow
nloa
ded
by [
Tex
as A
&M
Uni
vers
ity L
ibra
ries
] at
10:
57 0
9 Ja
nuar
y 20
18

TEMPERATURE
TEMPERATURE
WATERSOLUTE
ice* Hg < HATERSOLUTE
100% 3 100% 2
FIGURE 83. Idealized state diagram for a plasticizer(component 3)-solute (component 2) system in whichboth components are crystallizable. Diagram illustratesthe locations of the glass, solidus, and liquidus curves.See text for definitions of symbols. (Reproduced withpermission from Reference 23).
TEMPERATURE
100V. MO WATER
108*SOLUTE
FIGURE 82. Schematic state diagrams for represen-tational small PHC solutes with Tm/Tg ratios of (A) 1.5,(B) < 1.4, and (C) close to 1.0. The diagrams illustratethe locations of the solute-water Tm and Tg curvesrelative to the curve of estimated Th, and emphasizehow the influence of the glass transition on the ho-mogeneous nucleation of solute from undercooled con-centrated solutions differs according to the location ofTh within or outside the WLF region between Tm andTg. (From Slade, L. and Levine, H., PureAppl. Chem.,60, 1841, 1988. With permission.)
curve plus liquidus curve for the Tm of pure ice— the plasticizer is crystallizable but the soluteis not; to (3) Figure 83 — glass curve plus li-quidus curve plus solidus curve for the Tm ofthe solute — complete state diagram for a systemin which both the plasticizer and the solute arecrystallizable (e.g., sucrose in Figure 61). Asshown by the solidus curve in Figure 83 for themelting or dissolution of solute as a function ofsolute-plasticizer blend composition, Tm de-creases with increasing plasticizer content66 fromTm2 for the pure dry solute to Te, the eutecticmelting temperature, for the eutectic composition(Ce) of crystalline solute plus crystalline plasti-cizer. The solid-line portions of the liquidus andsolidus curves in Figure 83 denote locations onthis dynamics map, only far above the glass curve,which may be observed on a practical time scaleto exist at equilibrium.30 In contrast, the dashed-line portions of these curves (i.e., the solidus atcompositions < Cg' and the liquidus at com-positions corresponding to the dashed-line por-
292
Dow
nloa
ded
by [
Tex
as A
&M
Uni
vers
ity L
ibra
ries
] at
10:
57 0
9 Ja
nuar
y 20
18
tion of the solidus) do not exist at equilibriumon a practical time scale and therefore contributeto the observed dependence of sample perfor-mance on processing rates, storage times, andprevious sample history.30 The critical area of themap in Figure 83, labeled "crystal 2" , definesthe metastable WLF rubbery region, bounded bythe operative glass and solidus curves, withinwhich solute crystallization can occur in under-cooled solute-plasticizer blends.23 By analogy tothe metastable region (' 'cryst 3") in which watercan crystallize and avoid its eutectic behavior,"crystal 2 " is the region in which solute cancrystallize or not, depending on the relationshipof the temperature and moisture content to theunderlying glass curve, and thereby avoid eutec-tic crystallization.15-3066 "Crystal 2 " is the mapdomain relevant to the crystallization kinetics ofsmall sugars in low-moisture food systems.28-66
As illustrated in Figure 83 and earlier in Fig-ure 37, on a time scale of technological signifi-cance, crystallization can only occur within thekinetically metastable region of the dynamics mapbetween Tm and Tg of a system.15104 In the pro-cess of crystallization for a polymer that is com-pletely amorphous and unseeded, homogeneousnucleation in an undercooled melt is the first me-chanistic stage, which must precede crystalgrowth. The necessary extent of undercooling in°K from Tm to Th, the homogeneous nucleationtemperature, is a universal property of crystal-lizable materials. Just as Tg is related to Tm bythe ratio Tm/Tg — 1.5, with a range of 1 to 2,for essentially all molecular glass-formers, in-cluding small molecules and high polymers, This related to Tm by the ratio Tm/Th — 1.25, witha narrow range of 1.17 to 1.28 for essentially allcrystallizable substances, including metals, salts,small organic molecules, and high poly-mers.104-115 Thus, in almost all known cases, Th> Tg.28 For example, for the representationaltypical elastomer (Figure 34A) with Tg = 200°Kand Tm = 300°K, the calculated Th value wouldbe 240°K.
The relationship between Th, Tm, and Tg,for representational small PHCs in water, is il-lustrated in Figure 82,30 which shows schematicstate diagrams for three different situations thatcan govern homogeneous nucleation. The situ-ations result from different values of the ratio
Tm/Tg, which reflects the magnitude of the met-astable WLF region in which crystallization canoccur. In each case, Th was located according tothe typical ratio of Tm to Th. These stylized statediagrams highlight the different ways in whichTh and Tg can be related, depending on the Tm/Tg ratio for a particular PHC solute, and thusreveal how the relationship between Th and Tgdetermines and allows prediction of the stabilityagainst recrystallization of concentrated or su-persaturated aqueous solutions of specific PHCs,such as small sugars.15 In the first case (Figure82A), for a PHC with a typical, higher Tm/Tgratio of —1.5, homogeneous nucleation of thesolute would be very efficient, because Th lieswell above Tg. Therefore, upon undercooling thisconcentrated PHC solution from T > Tm, ho-mogeneous nucleation would occur at Th withinthe liquid zone, before vitrification could im-mobilize the system at Tg. Common examplesof PHCs whose actual state diagrams resemblethe one in Figure 82A, and which are known tocrystallize readily from concentrated aqueous so-lution, include xylose (Tm/Tg = 1.51) and glu-cose (Tm/Tg = 1.42), and to a lesser extent,sucrose (Tm/Tg = 1.43).15-28-66 The ratios Tm/Th and Tm/Tg reflect the relative distances Tm— Th and Tm — Tg on the dynamics map. Thesecondary influence of the magnitude of Wg' forthese PHCs on the relative mobility within theWLF region is reflected in the greater ease ofhomogeneous nucleation for glucose than su-crose, since the opposite behavior would be pre-dicted on the basis of the ratio of Tm/Tg alone.30
Both xylose and glucose exhibit simple muta-rotation in aqueous solution, with their anomericratio depending on temperature and concentra-tion.281 Xylose also exhibits simple mutarotationin the diluent-free melt.291 For both xylose andglucose, the anomers vitrify compatibly as a sin-gle glass. Sucrose, of course, does not exhibitmutarotation and vitrifies as a single glass.
In the second case (Figure 82B), for a PHCwith an atypical, lower Tm/Tg ratio < 1.4, ho-mogeneous nucleation would be retarded, be-cause Th falls much closer to Tg, in the moreviscous fluid region where transport propertiescan become a significant limiting factor on nu-cleation in non-equilibrium systems.296 Ribose(Tm/Tg = 1.37) is an example of a PHC with
293
Dow
nloa
ded
by [
Tex
as A
&M
Uni
vers
ity L
ibra
ries
] at
10:
57 0
9 Ja
nuar
y 20
18
a state diagram resembling Figure 82B, whosenucleation would be so retarded.30 Ribose ex-hibits complex mutarotation to six tautomeric andanomeric forms in aqueous solution,281 which vi-trify compatibly as a single aqueous glass. Fur-ther study is needed to determine if this existenceof multiple conformers contributes to its crystal-lization inhibition. It is interesting that mannose(Tm/Tg = 1.36), which does not obey the "ano-meric rule"281 that water favors the species intautomeric and anomeric equilibria with the larg-est number of equatorial -OH groups, has a Tm/Tg ratio more like ribose than like glucose, whichdoes obey the rule.30
In the last case (Figure 82C), for a PHC withan anomalously low Tm/Tg ratio close to 1.0,homogeneous nucleation would be prevented ona practical time scale, because Th actually liesbelow Tg.30-288 Thus, on undercooling a concen-trated solution, vitrification would occur first,thereby immobilizing the system and preventingthe possibility of solute nucleation at Th. Fruc-tose (Tm/Tg = 1.06), which is well-known tobe almost impossible to crystallize from aqueoussolution without pre-seeding or precipitating withnon-solvent, exemplifies the state diagram in Fig-ure 82C and the nucleation inhibition behaviorpredicted from it.15 Like ribose, fructose alsoexhibits complex mutarotation, with the com-position of tautomers and their anomers depend-ing on temperature and concentration.281 Unlikeribose with its complex mutarotation, or xyloseand glucose with their simple mutarotation, theconformers of fructose do not vitrify compatiblyas a single glass, as discussed earlier with respectto the free volume requirements for mobility offructose conformers. From the standpoint of me-chanical relaxations, the compatibility of a solutewith the structure of liquid water and the mutualcompatibility of a mixture of solutes with waterin aqueous glasses are highly cooperative prop-erties, governed by the spatial and orientationalrequirements for isotropic or anisotropic mobil-ity.30 From the standpoint of energetics, little isknown about cooperative effects that might dif-ferentiate between solute-solute or solute-waterinteractions, but differences in compatibility basedon spatial and orientational requirements for la-bile intermolecular solute-solute and solute-waterhydrogen bonds and maintenance of the time-
averaged tetrahedral geometry of water are ex-pected to be marginal.281 Thus, in aqueous so-lutions and glasses of PHCs, the mutual com-patibility of chemically heterogeneous solutes andwater is likely to be governed by dynamics andmechanical requirements, rather than energet-ics.30 Moreover, the marginal differences in en-ergetics of solute-solute and solute-water inter-actions are reflected in the limiting partial molarvolumes of PHCs, where differences betweenisomeric sugars are too small to interpret the ef-fect of sugar stereochemistry on hydration281 invery dilute solutions. It has been suggested thatmore can be learned about the effect of sugarstereochemistry on the solution behavior of PHCsin the region of the mobility transformation mapwhere dynamics, rather than energetics,dominates.30'31
It should also be noted from the schematicmobility maps in Figure 82 that the homogeneousnucleation of ice from dilute solutions would notbe prohibited during slow cooling, no matter whatthe Tm/Tg ratio of the PHC solute.30 Because theTm/Tg ratio of pure water is about 2.0, its Thlies well above its Tg of about 140°K.89 Theobserved Th of pure water is about 233°K,4 sothat its ratio of Tm/Th is about 1.17, which fallsat the low end of the reported range of valuesfor essentially all crystallizable substances.30
Thus, at least some of the water in a dilute PHCsolution would freeze before it could vitrify, ex-cept under extremely fast cooling (e.g., "hyper-quenching") conditions.4
2. Dynamics of Sucrose Glass-Formation and Recrystallization
Sucrose is arguably the most important singlesugar for food manufacturing and also the sugarabout which the most is known, as exemplifiedby the detailed state diagram for sucrose-watershown earlier in Figure 61. In many differentfood products and processes, the glass-formingvs. crystallizing behaviors of sucrose constitutecritical functional attributes.66 In the context ofthe kinetically controlled crystallization of sugarsin low-moisture food systems, as described withreference to Figures 82 and 83, let us reexaminethe state diagram for sucrose. And let us focus
294
Dow
nloa
ded
by [
Tex
as A
&M
Uni
vers
ity L
ibra
ries
] at
10:
57 0
9 Ja
nuar
y 20
18
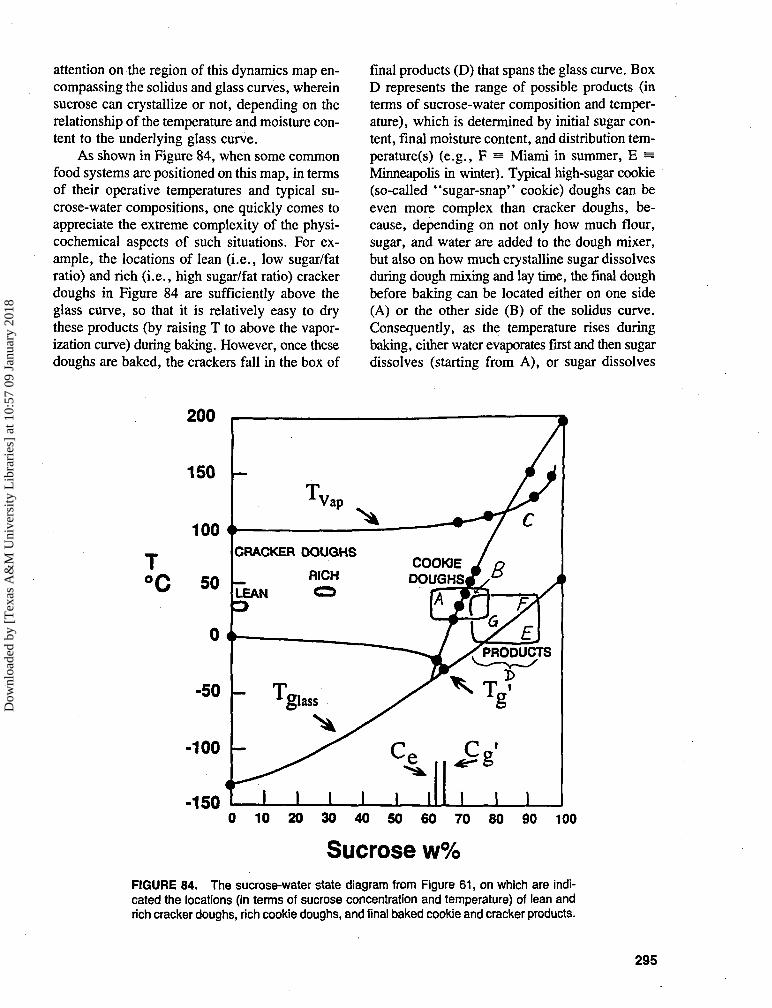
attention on the region of this dynamics map en-compassing the solidus and glass curves, whereinsucrose can crystallize or not, depending on therelationship of the temperature and moisture con-tent to the underlying glass curve.
As shown in Figure 84, when some commonfood systems are positioned on this map, in termsof their operative temperatures and typical su-crose-water compositions, one quickly comes toappreciate the extreme complexity of the physi-cochemical aspects of such situations. For ex-ample, the locations of lean (i.e., low sugar/fatratio) and rich (i.e., high sugar/fat ratio) crackerdoughs in Figure 84 are sufficiently above theglass curve, so that it is relatively easy to drythese products (by raising T to above the vapor-ization curve) during baking. However, once thesedoughs are baked, the crackers fall in the box of
final products (D) that spans the glass curve. BoxD represents the range of possible products (interms of sucrose-water composition and temper-ature), which is determined by initial sugar con-tent, final moisture content, and distribution tem-perature^) (e.g., F = Miami in summer, E =Minneapolis in winter). Typical high-sugar cookie(so-called "sugar-snap" cookie) doughs can beeven more complex than cracker doughs, be-cause, depending on not only how much flour,sugar, and water are added to the dough mixer,but also on how much crystalline sugar dissolvesduring dough mixing and lay time, the final doughbefore baking can be located either on one side(A) or the other side (B) of the solidus curve.Consequently, as the temperature rises duringbaking, either water evaporates first and then sugardissolves (starting from A), or sugar dissolves
200
ACRACKER DOUGHS
RICHCOOKIE J n
D O U G H S * /
PRODUCTS— • — v — '
-1500 10 20 30 40 50 60 70 80 90 100
Sucrose w%FIGURE 84. The sucrose-water state diagram from Figure 61, on which are indi-cated the locations (in terms of sucrose concentration and temperature) of lean andrich cracker doughs, rich cookie doughs, and final baked cookie and cracker products.
295
Dow
nloa
ded
by [
Tex
as A
&M
Uni
vers
ity L
ibra
ries
] at
10:
57 0
9 Ja
nuar
y 20
18
first and then water evaporates (starting from B).And if enough evaporation occurs during baking,the half-baked product can find itself in the met-astable region (C) in which the sugar can re-crystallize. Because of all these possible routesand scenarios, the DSC curves that one measuresfor such doughs, half-products, and final prod-ucts can be exceedingly busy.
The most important point illustrated in Figure84 is that all of the potential cracker and cookieproducts span the sucrose-water glass curve.Therefore, their storage stability against a varietyof collapse processes (e.g., textural changes, fla-vor changes, oxidative rancidity) depends on thetemperature and time (as well as the possibilityof moisture-content changes) during distribution.By definition, high-quality products fall some-where within box D. Classic sugar-snap cookiesare composed of a continuous glassy sucrose-water matrix containing embedded ungelatinizedstarch granules, undeveloped gluten, and fat; typ-ical crackers are composed of a continuous glassynetwork of (partially) gelatinized starch, (par-tially) developed gluten, amorphous sucrose, andfat.26 Such products are deliberately formulatedand processed to begin their shelf-lives in a ki-netically metastable glassy solid state (E) com-mensurate with optimal initial quality (e.g., crisptexture) and storage stability. In contrast, fin-ished products at F or G (i.e., an unstable rubberyliquid state) would have inferior (rubbery) textureand unacceptably short shelf-life. It is also criticalto recognize that, in order to maintain the initialhigh quality of such cookie and cracker productsduring storage, one must control the distributionsystem/environment, so that the kinetically met-astable glassy solid state is maintained and thepotentially unstable rubbery liquid state isavoided.
F. Drying Processes
1. Mobility Map of a Generic Drying RateProfile
When we examine drying as a moisture man-agement problem and use the food polymer sci-ence approach to interpret results from analysesof conventional drying processes, increased un-
derstanding and insight result. Ease of drying canbe viewed as a functional manifestation of mo-bility in a food system.
Food engineers and drying technologists or-dinarily analyze drying processes in terms of adrying rate profile. The idealized drying rate pro-file of sample weight loss vs. time shown inFigure 85 is a typical profile of the time courseof weight loss due to evaporation of sample vol-atiles, such as is used to explore ingredient in-fluence on drying behavior and to evaluate theperformance of drying equipment. At a selecteddrying temperature, residual sample weight ismonitored as a function of time. For typical foodingredients and products, weight loss due to ev-olution and evaporation of volatiles is predomi-nantly attributed to moisture loss.
Typical drying rate profiles,411 e.g., Figure85, have a characteristic sigmoid shape that canbe described in terms of four distinct time periodsduring drying. Because heat transfer (thermal dif-fusivity) is much more efficient than mass trans-fer (effective diffusion coefficient of water), tem-perature gradients within the sample areconsidered to be near zero during the drying pro-cess.412 The four periods of drying illustrated inFigure 85 are described as follows:
1. Sample temperature rises to a constant value,<100°C at atmospheric pressure, deter-mined by the balance of applied heat andevaporative cooling.
2. Linear portion of the drying profile = theperiod of constant-rate drying before thesample experiences constrained moisturediffusion. The sample temperature and rateof moisture loss are constant. The slope ofthe drying rate profile in period 2 = a con-stant rate of drying, labeled re.
3. Non-linear portion of the drying profile =the period of falling (decreasing) rate dryingdue to ever-increasing diffusion constraint.The sample temperature and rate of mois-ture loss are not constant. As the rate ofmoisture loss decreases but the applicationof heat remains constant, the temperatureof the sample increases up to the tempera-ture of the environment by the end of drying.The decrease in moisture content is partiallybalanced by the increase in sample temper-
296
Dow
nloa
ded
by [
Tex
as A
&M
Uni
vers
ity L
ibra
ries
] at
10:
57 0
9 Ja
nuar
y 20
18
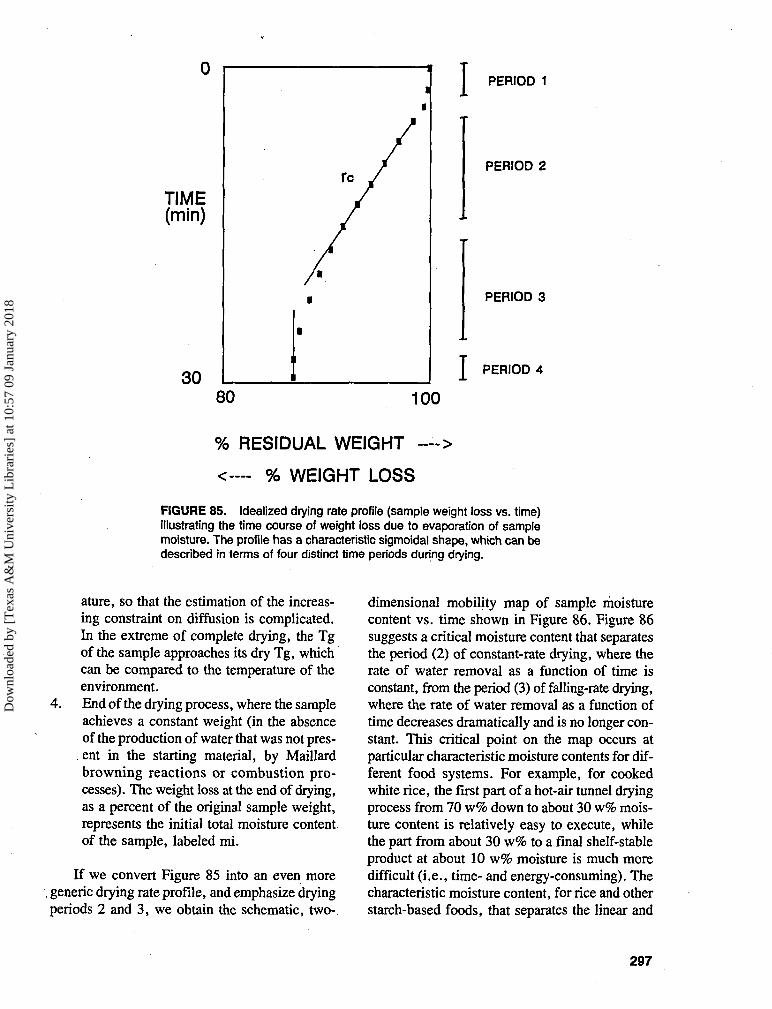
TIME(min)
I PERIOD 1
PERIOD 2
I
PERIOD 3
PERIOD 4
100
% RESIDUAL WEIGHT -—>
<--- % WEIGHT LOSS
FIGURE 85. Idealized drying rate profile (sample weight loss vs. time)illustrating the time course of weight loss due to evaporation of samplemoisture. The profile has a characteristic sigmoidal shape, which can bedescribed in terms of four distinct time periods during drying.
ature, so that the estimation of the increas-ing constraint on diffusion is complicated.In the extreme of complete drying, the Tgof the sample approaches its dry Tg, whichcan be compared to the temperature of theenvironment.
4. End of the drying process, where the sampleachieves a constant weight (in the absenceof the production of water that was not pres-ent in the starting material, by Maillardbrowning reactions or combustion pro-cesses). The weight loss at the end of drying,as a percent of the original sample weight,represents the initial total moisture contentof the sample, labeled mi.
If we convert Figure 85 into an even more. generic drying rate profile, and emphasize dryingperiods 2 and 3, we obtain the schematic, two-
dimensional mobility map of sample moisturecontent vs. time shown in Figure 86. Figure 86suggests a critical moisture content that separatesthe period (2) of constant-rate drying, where therate of water removal as a function of time isconstant, from the period (3) of falling-rate drying,where the rate of water removal as a function oftime decreases dramatically and is no longer con-stant. This critical point on the map occurs atparticular characteristic moisture contents for dif-ferent food systems. For example, for cookedwhite rice, the first part of a hot-air tunnel dryingprocess from 70 w% down to about 30 w% mois-ture content is relatively easy to execute, whilethe part from about 30 w% to a final shelf-stableproduct at about 10 w% moisture is much moredifficult (i.e., time- and energy-consuming). Thecharacteristic moisture content, for rice and otherstarch-based foods, that separates the linear and
297
Dow
nloa
ded
by [
Tex
as A
&M
Uni
vers
ity L
ibra
ries
] at
10:
57 0
9 Ja
nuar
y 20
18

GENERIC DRYING PROFILE
MOISTURECONTENT
OF PRODUCT
CRITICALnOISTURECONTENT
TIHE
FIGURE 86. Generic representation of a dryingrate profile plotted as a two-dimensional mobilitymap of sample moisture content vs. time. The criticalmoisture content that separates the constant-rateand falling-rate stages of drying at constant tem-perature is related to Wg' of the sample.
non-linear drying rate periods is about 27 to 30w% water. This critical moisture content fordrying of starch-based products is found to berelated to Wg'. Thus, the solute-specific watercontent (UFW) that defines the maximally freeze-concentrated glass is also a reference point forfunctional behavior of the same system at highertemperatures and higher water contents. This re-flects the fact that, as the sample moves (in termsof increasing temperature and decreasing mois-ture content) closer and closer to its glass curveas drying progresses from period 2 to period 3,its mobility decreases, resulting in increasing dy-namic constraints on the diffusion-limited pro-cess of water removal.
One interesting example of the technologicalimportance of the drying behavior described inFigures 85 and 86 involves Maillard browningreactions in dried foods, as-reviewed by Nurstenand illustrated in Figure 87.411 Nursten has usedthe example of browning during air drying ofcarrot cubes to illustrate the interrelated effectsof moisture content, temperature, and time onMaillard browning reactions,411 effects that canbe generalized to browning during processing andchanges in browning during storage of other low-moisture food systems, such as baked goods. Fig-ure 87 shows that the rates of development ofbrowning reaction precursors and final browningproducts as a function of time depend on sampletemperature and moisture content as determinedby the progress of the drying (e.g., baking) pro-cess. Only when the moisture content becomes
FIGURE 87. Plot of water content vs. drying time,describing the formation of browning intermediates andbrowning during air drying of carrot cubes (air temper-ature: 110°C). (From Nursten, H. E., Concentration andDrying of Foods, MacCarthy, D., Ed., Elsevier, London,1986, 53. With permission.)
sufficiently low, once the temperature of theproduct is no longer being depressed by evapo-rative cooling, but rather is approaching the en-vironmental temperature of the oven, do thebrowning reaction precursors start to build up.And the final browning products start to becomeapparent only after the maximum level of pre-cursors is achieved, once the product reaches themaximum temperature and minimum moisturecontent at the effective end of the drying process.Thus, for example, if during baking, the processis stopped before the final minimum moisturecontent is achieved, only browning intermediatesare produced, which form unstable browning re-action products. Consequently, fading can occurduring subsequent shelf-storage of the bakedproduct.
2. Improved Freeze-Drying: TheSignificance of Tg' and the Glass Curve
Freeze-drying is an increasingly importantcommercial drying process for foods, pharma-ceuticals, and biologicals.40-41 However, despiteits long history and widespread use, surprisinglylittle knowledge of its governing physicochemi-cal principles is evidenced by the routine practice
298
Dow
nloa
ded
by [
Tex
as A
&M
Uni
vers
ity L
ibra
ries
] at
10:
57 0
9 Ja
nuar
y 20
18
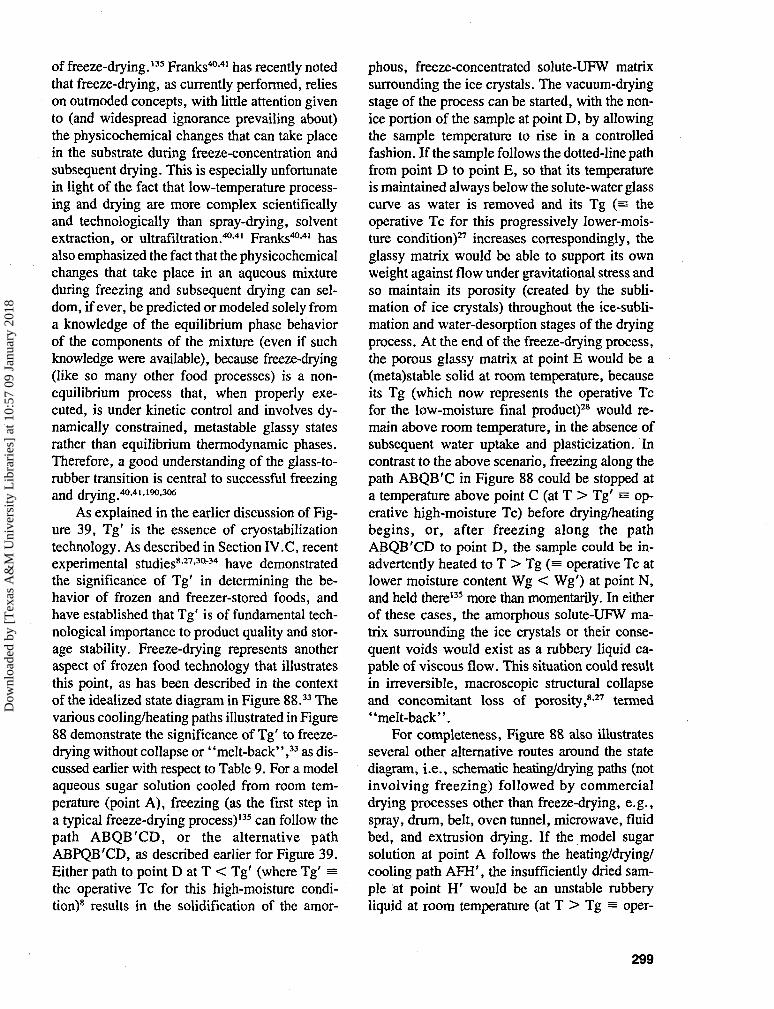
of freeze-drying.135 Franks40-41 has recently notedthat freeze-drying, as currently performed, relieson outmoded concepts, with little attention givento (and widespread ignorance prevailing about)the physicochemical changes that can take placein the substrate during freeze-concentration andsubsequent drying. This is especially unfortunatein light of the fact that low-temperature process-ing and drying are more complex scientificallyand technologically than spray-drying, solventextraction, or ultrafiltration.40-41 Franks40-41 hasalso emphasized the fact that the physicochemicalchanges that take place in an aqueous mixtureduring freezing and subsequent drying can sel-dom, if ever, be predicted or modeled solely froma knowledge of the equilibrium phase behaviorof the components of the mixture (even if suchknowledge were available), because freeze-drying(like so many other food processes) is a non-equilibrium process that, when properly exe-cuted, is under kinetic control and involves dy-namically constrained, metastable glassy statesrather than equilibrium thermodynamic phases.Therefore, a good understanding of the glass-to-rubber transition is central to successful freezingand drying.40-41-190-306
As explained in the earlier discussion of Fig-ure 39, Tg' is the essence of cryostabilizationtechnology. As described in Section IV.C, recentexperimental studies8-27-3034 have demonstratedthe significance of Tg' in determining the be-havior of frozen and freezer-stored foods, andhave established that Tg' is of fundamental tech-nological importance to product quality and stor-age stability. Freeze-drying represents anotheraspect of frozen food technology that illustratesthis point, as has been described in the contextof the idealized state diagram in Figure 88.33 Thevarious cooling/heating paths illustrated in Figure88 demonstrate the significance of Tg' to freeze-drying without collapse or ' 'melt-back'' ,33 as dis-cussed earlier with respect to Table 9. For a modelaqueous sugar solution cooled from room tem-perature (point A), freezing (as the first step ina typical freeze-drying process)135 can follow thepath ABQB'CD, or the alternative pathABPQB'CD, as described earlier for Figure 39.Either path to point D at T < Tg' (where Tg' =the operative Tc for this high-moisture condi-tion)8 results in the solidification of the amor-
phous, freeze-concentrated solute-UFW matrixsurrounding the ice crystals. The vacuum-dryingstage of the process can be started, with the non-ice portion of the sample at point D, by allowingthe sample temperature to rise in a controlledfashion. If the sample follows the dotted-line pathfrom point D to point E, so that its temperatureis maintained always below the solute-water glasscurve as water is removed and its Tg (= theoperative Tc for this progressively lower-mois-ture condition)27 increases correspondingly, theglassy matrix would be able to support its ownweight against flow under gravitational stress andso maintain its porosity (created by the subli-mation of ice crystals) throughout the ice-subli-mation and water-desorption stages of the dryingprocess. At the end of the freeze-drying process,the porous glassy matrix at point E would be a(meta)stable solid at room temperature, becauseits Tg (which now represents the operative Tcfor the low-moisture final product)28 would re-main above room temperature, in the absence ofsubsequent water uptake and plasticization. Incontrast to the above scenario, freezing along thepath ABQB'C in Figure 88 could be stopped ata temperature above point C (at T > Tg' = op-erative high-moisture Tc) before drying/heatingbegins, or, after freezing along the pathABQB'CD to point D, the sample could be in-advertently heated to T > Tg (= operative Tc atlower moisture content Wg < Wg') at point N,and held there135 more than momentarily. In eitherof these cases, the amorphous solute-UFW ma-trix surrounding the ice crystals or their conse-quent voids would exist as a rubbery liquid ca-pable of viscous flow. This situation could resultin irreversible, macroscopic structural collapseand concomitant loss of porosity,8-27 termed"melt-back".
For completeness, Figure 88 also illustratesseveral other alternative routes around the statediagram, i.e., schematic heating/drying paths (notinvolving freezing) followed by commercialdrying processes other than freeze-drying, e.g.,spray, drum, belt, oven tunnel, microwave, fluidbed, and extrusion drying. If the model sugarsolution at point A follows the heating/drying/cooling path AFH', the insufficiently dried sam-ple at point H' would be an unstable rubberyliquid at room temperature (at T > Tg = oper-
299
Dow
nloa
ded
by [
Tex
as A
&M
Uni
vers
ity L
ibra
ries
] at
10:
57 0
9 Ja
nuar
y 20
18
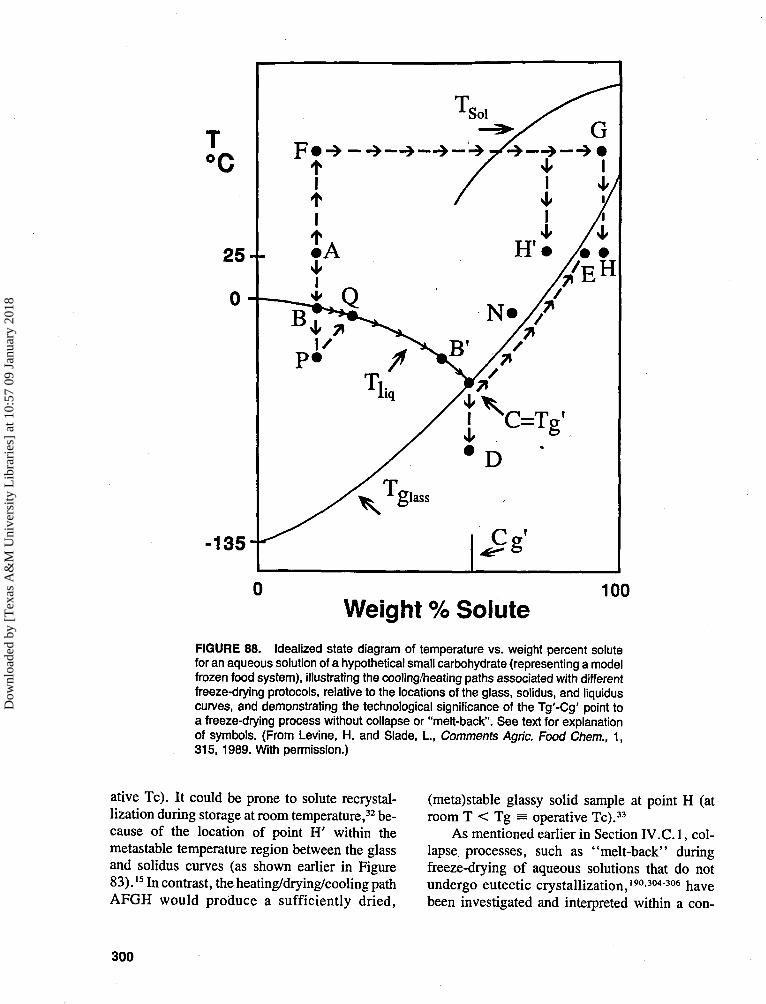
T°C
25-
0 -
-135-
tItI
•Ai
Ki
H ' # /
/
-1 rp f
t
G
4EH
Weight % Solute100
FIGURE 88. Idealized state diagram of temperature vs. weight percent solutefor an aqueous solution of a hypothetical small carbohydrate (representing a modelfrozen food system), illustrating the cooling/heating paths associated with differentfreeze-drying protocols, relative to the locations of the glass, solidus, and liquiduscurves, and demonstrating the technological significance of the Tg'-Cg' point toa freeze-drying process without collapse or "melt-back". See text for explanationof symbols. (From Levine, H. and Slade, I., Comments Agric. Food Chem., 1,315,1989. With permission.)
ative Tc). It could be prone to solute recrystal-lization during storage at room temperature,32 be-cause of the location of point H' within themetastable temperature region between the glassand solidus curves (as shown earlier in Figure83).15 In contrast, the heating/drying/cooling pathAFGH would produce a sufficiently dried,
(meta)stable glassy solid sample at point H (atroom T < Tg = operative Tc).33
As mentioned earlier in Section IV.C. 1, col-lapse processes, such as "melt-back" duringfreeze-drying of aqueous solutions that do notundergo eutectic crystallization,190304306 havebeen investigated and interpreted within a con-
300
Dow
nloa
ded
by [
Tex
as A
&M
Uni
vers
ity L
ibra
ries
] at
10:
57 0
9 Ja
nuar
y 20
18
ceptual context of "glass dynamics",15-32 result-ing in a conclusion regarding the fundamentalequivalence of Tg, Tc, and Tr, and their depen-dence on solute Mw.27 This new interpretive ap-proach has provided a better qualitative and quan-titative understanding of the equivalence of Trfor ice or solute recrystallization, Tc for collapse,and the concentration-invariant Tg' for an ice-containing system, and has been used to explainwhy Tr and Tc are always observed to be con-centration-independent for any initial solute con-centration lower than Cg',4-260 as illustrated inFigure 88. This approach has also provided atechnologically important predictive capability,exemplified with respect to freeze-drying.33-34
Since Tg' underlies and coincides with Tc andcan be directly determined experimentally byDSC, Tc can be accurately predicted prior to thedesign of a freeze-drying process, rather thanempirically determined by costly trial-and-errorfreeze-drying runs. In fact, this predictive ca-pability is so powerful that Tg' can often simplybe calculated, rather than actually measured byDSC, for real food systems, as was describedearlier in Section IV.G for orange and other fruitjuices in Table 15.3334 Prior knowledge of Tg'identifies the maximum allowable temperaturefor both initial product freezing and the primarystage of vacuum drying via sublimation of ice inthe freeze-drying process.34-40-41-190 Coupled withthe Tg of the dry solute and the Tg of pure water,the Tg'-Cg' point on the state diagram in Figure88 defines a three-point glass curve. Knowledgeof the location of this glass curve enables one todesign a freeze-drying process with an optimumheating-rate profile, wherein the temperature-moisture-time protocol can be pre-programmedand controlled to maintain the temperature of thesample below its instantaneous Tg (determinedby its instantaneous moisture content).34 This en-sures that the non-ice matrix remains a glassymechanical solid capable of supporting its ownweight against rubbery flow throughout the courseof the ice-sublimation and desorption stages ofthe vacuum-drying process.190-306 The latter stage,also referred to as secondary drying, is designedto remove residual plasticizer (moisture) from theglass and render the product stable at tempera-tures up to its dry Tg.40-41-306 It is also critical torecall, as described earlier and emphasized re-
cently by Franks,40-41 that the composite Tg' ofa multicomponent product to be freeze-dried canbe elevated (and should be, as much as is prac-tical) and its composite Wg' can be lowered (thelower, the better) by incorporation of polymericcryostabilizers of high Tg' and low Wg'.8-27-28-32
Formulation with such high MW additives raisesTg' (quantifiably and predictively), dry Tg, andthus the entire glass curve of a multicomponent,glass-forming blend, while shifting its compositeunfrozen (but not "bound") water content tolower Wg' values, thereby increasing the effec-tiveness (by lowering the probability of "melt-back") and efficiency (e.g., lower energy re-quirements, shorter secondary drying time) of thedrying process and the subsequent shelf-stabilityof the freeze-dried product.8-27-40-41
Among a number of factors that should beknown and taken into account in the productionby freeze-drying of products of constant highquality and optimum stability, Franks has in-cluded the following, in summarizing his recentessay on the subject:40
1. Knowledge of Tg' and Wg' of the freeze-concentrate is essential.190
2. Knowledge of the Tg curve as a functionof moisture content is essential for the propercontrol of secondary drying.306
3. For a stable, high-quality product, W < Wgat ambient temperatures.
G. Cooking of Whole Cereal GrainsViewed as a Moisture ManagementProcess
Cooking of whole cereal grains is a dynamicheat/moisture/time treatment that can be viewedas a moisture management process. The majoreffect of cooking of whole cereal grains is on thestructure of native granular starch, because gran-ular starch is the predominant component of theendosperm of cereal grains.153-400 Thus, the pro-cess of complete cooking of whole cereal grainscan be described in the context of a dynamicsmap of the amorphous regions of granular starch,as shown in Figure 89. The numbered locations(temperature-moisture content) on this schematicstate diagram for starch correspond to different
301
Dow
nloa
ded
by [
Tex
as A
&M
Uni
vers
ity L
ibra
ries
] at
10:
57 0
9 Ja
nuar
y 20
18
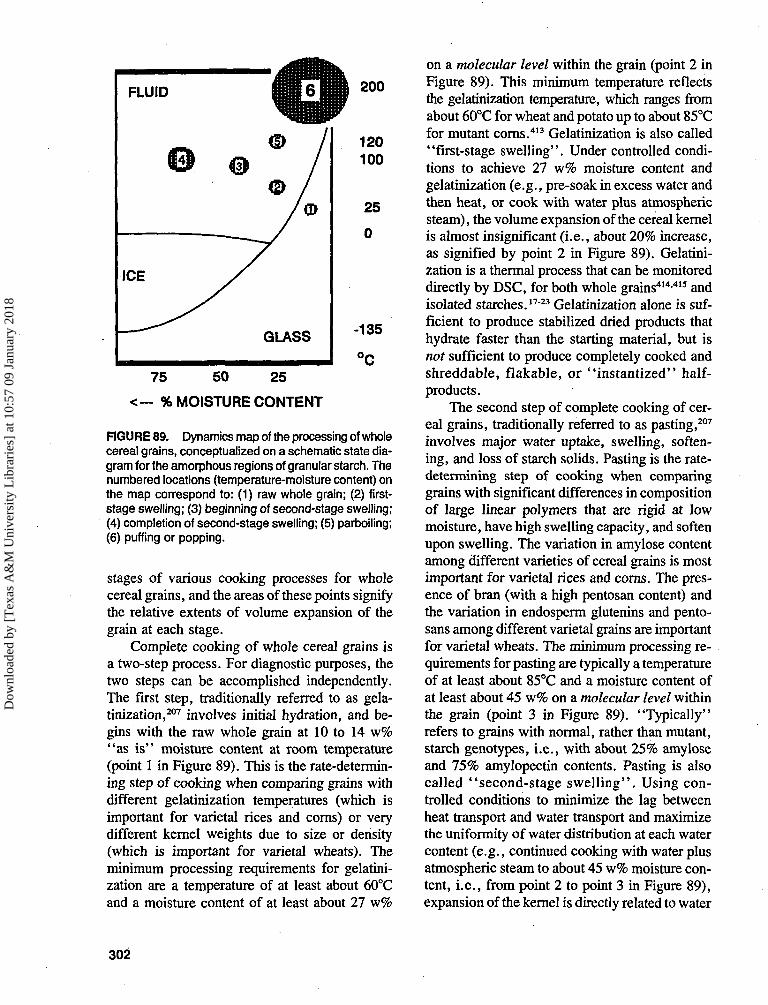
200
75 50 25
<— % MOISTURE CONTENT
FIGURE 89. Dynamics map of the processing of wholecereal grains, conceptualized on a schematic state dia-gram for the amorphous regions of granular starch. Thenumbered locations (temperature-moisture content) onthe map correspond to: (1) raw whole grain; (2) first-stage swelling; (3) beginning of second-stage swelling;(4) completion of second-stage swelling; (5) parboiling;(6) puffing or popping.
stages of various cooking processes for wholecereal grains, and the areas of these points signifythe relative extents of volume expansion of thegrain at each stage.
Complete cooking of whole cereal grains isa two-step process. For diagnostic purposes, thetwo steps can be accomplished independently.The first step, traditionally referred to as gela-tinization,207 involves initial hydration, and be-gins with the raw whole grain at 10 to 14 w%"as is" moisture content at room temperature(point 1 in Figure 89). This is the rate-determin-ing step of cooking when comparing grains withdifferent gelatinization temperatures (which isimportant for varietal rices and corns) or verydifferent kernel weights due to size or density(which is important for varietal wheats). Theminimum processing requirements for gelatini-zation are a temperature of at least about 60°Cand a moisture content of at least about 27 w%
on a molecular level within the grain (point 2 inFigure 89). This minimum temperature reflectsthe gelatinization temperature, which ranges fromabout 60°C for wheat and potato up to about 85°Cfor mutant corns.413 Gelatinization is also called"first-stage swelling". Under controlled condi-tions to achieve 27 w% moisture content andgelatinization (e.g., pre-soak in excess water andthen heat, or cook with water plus atmosphericsteam), the volume expansion of the cereal kernelis almost insignificant (i.e., about 20% increase,as signified by point 2 in Figure 89). Gelatini-zation is a thermal process that can be monitoreddirectly by DSC, for both whole grains414-415 andisolated starches.1723 Gelatinization alone is suf-ficient to produce stabilized dried products thathydrate faster than the starting material, but isnot sufficient to produce completely cooked andshreddable, flakable, or "instantized" half-products.
The second step of complete cooking of cer-eal grains, traditionally referred to as pasting,207
involves major water uptake, swelling, soften-ing, and loss of starch solids. Pasting is the rate-determining step of cooking when comparinggrains with significant differences in compositionof large linear polymers that are rigid at lowmoisture, have high swelling capacity, and softenupon swelling. The variation in amylose contentamong different varieties of cereal grains is mostimportant for varietal rices and corns. The pres-ence of bran (with a high pentosan content) andthe variation in endosperm glutenins and pento-sans among different varietal grains are importantfor varietal wheats. The minimum processing re-quirements for pasting are typically a temperatureof at least about 85°C and a moisture content ofat least about 45 w% on a molecular level withinthe grain (point 3 in Figure 89). "Typically"refers to grains with normal, rather than mutant,starch genotypes, i.e., with about 25% amyloseand 75% amylopectin contents. Pasting is alsocalled "second-stage swelling". Using con-trolled conditions to minimize the lag betweenheat transport and water transport and maximizethe uniformity of water distribution at each watercontent (e.g., continued cooking with water plusatmospheric steam to about 45 w% moisture con-tent, i.e., from point 2 to point 3 in Figure 89),expansion of the kernel is directly related to water
302
Dow
nloa
ded
by [
Tex
as A
&M
Uni
vers
ity L
ibra
ries
] at
10:
57 0
9 Ja
nuar
y 20
18

uptake. Pasting is a mechanical process that canbe monitored directly by Theological methods,413
but not by DSC.Gelatinization/>/«.y pasting (to point 3 in Fig-
ure 89) are required to produce half-products thatare optimally softened for shreddability and flak-ability, or dried quick-cooking/instantized prod-ucts that hydrate and soften to ready-to-eat tex-ture more rapidly than the starting material, sothat overall cooking time is reduced during con-sumer preparation. (Tempering, as a shreddingprocess step, appears to compensate for under-pasting ("white spot" = uncooked kernel cen-ters) by allowing time for uniform water distri-bution [which is most efficient near 85°C] and/or to compensate for overpasting [resulting instickiness] by allowing retrogradation [which ismost efficient below about 20°C]. Cooking onlyto the minimum requirements for pasting wouldminimize the requirement for tempering.)
In comparison to the above description,cooking of whole cereal grains is typically carriedout as a continuous process, which masks theunderlying two-step mechanism. The typicalcontinuous cooking process used in the home orin commercial manufacturing depends on boilingwater temperatures (e.g., atmospheric steam) anda great excess of cooking water (at or beyond therequirement for swelling to ready-to-eat soft-ness). The overall cooking time is inversely re-lated to the magnitude of the difference betweenthe cooking temperature (about 100°C) and thegelatinization temperature (which is a glass tran-sition temperature17"23). Because heat transfer ismore efficient than mass transfer in the solid state,water uptake by the grain lags behind its increasein temperature and occurs from the outside to thecenter of the kernel. As a result, most of thekernel is above 27 w% moisture, when all of thekernel is at least 27 w%, in a typical continuousprocess with great excess water.
Parboiling is the best-known process to createstabilized half-products. The kernels with branpresent are soaked at room temperature for a dayor days to achieve an overall (but not necessarilyuniform) moisture content above 27 w% (point1 to point 2 in Figure 89) and then heated for 15min at about 120°C in a pressurized steam (15psi) chamber (point 2 to point 5 in Figure 89).The starch gelatinizes and recrystallizes in situ
(without swelling of the kernel) to produce a ker-nel structure that is more stable to milling, hy-drates more rapidly (because step 1 of cooking[i.e., point 1 to point 2] has already beenachieved), but takes longer to soften to eatingtexture (because step 2 [point 2 to point 3] hasnot already occurred, and the new stable structurerequires a greater extent of swelling to achievethe same softness) than does the starting material.When the parboiled grain at point 5 in Figure 89is further cooked to point 3, the resulting producthas a rubbery texture, reduced loss of starch sol-ids, and reduced stickiness.
A variation on the parboiling process in-volves annealing (in place of gelatinization plusrecrystallization) to perfect the native starchstructure.65 This is accomplished by atmosphericsteam treatment of cereal kernels, grits, or floursat 30 w% moisture content and temperatures above65°C but below 100°C. The so-called "steam-stabilized" half-product hydrates (step 1 in sub-sequent cooking by the consumer) faster than thestarting material and softens to ready-to-eat tex-ture (step 2 in cooking by the consumer) eitherfaster (to be "quick-cooking") or slower (to berecipe-tolerant), depending on the process sta-bilization temperature.
Another variation, this on the conventionalcooking process in excess water, involves thepuffing or popping of whole grains to producepuffed wheat or rice, or popcorn.416 In the puffingprocess, the temperature of the raw grain with"as is" 10 to 14 w% moisture (point 1 in Figure89) is raised directly to about 185°C (point 6 inFigure 89) via gun-puffing, hot-air popping, hot-oil popping, or microwave popping. As the Tgand then the Tm of the partially crystalline nativegranular starch in the kernel endosperm are rap-idly exceeded, there is a violent volatilization ofthe "as i s " water, resulting in a dramatic ex-pansion in volume to that characteristic of thepuffed or popped grain.
Complete cooking to an end-point defined byready-to-eat texture (i.e., from points 3 or 5, bycontinued cooking with water plus atmosphericsteam, to the end of second-stage swelling atpoint 4 in Figure 89) typically requires wateruptake to 70 w% moisture content or above withkernel expansion of 300% (i.e., 200% increasein volume) or even 400%. In contrast, complete
303
Dow
nloa
ded
by [
Tex
as A
&M
Uni
vers
ity L
ibra
ries
] at
10:
57 0
9 Ja
nuar
y 20
18

cooking to the minimum requirements for pasting(i.e., to point 3 in Figure 89), using controlledconditions of steam plus limited water, allows"instantization" with minimization of starch sol-ids loss, stickiness, and drying requirements forquick-cooking consumer products or fouling ofrollers in industrial shredding and flaking man-ufacturing operations.
The end-point for complete cooking in com-mercial processing of quick-cooking cereals (i.e.,point 3 in Figure 89) is defined as the ability ofthe dried half-product to hydrate and soften toeating texture within a short target consumerpreparation time. The standard assay for extentof cook is a "pour-off test, applied to thecooked-and-dried half-product. One goal of cur-rent research is to replace such out-of-processassays by an in-process method using NMR (eitherpulsed or solid state) for the simultaneous deter-mination of moisture content and its uniformityof distribution within the grain. A successful NMRmethod, to assess when the minimum require-ments for pasting have been met (i.e., point 3 inFigure 89), would allow process optimization andenhanced product uniformity in commercialshredding, flaking, and instantization operations.
H. Starch Gelatinization andRetrogradation: Mechanical RelaxationProcesses Affected by Mobility ofAqueous Sugar Solutions
Much has been learned about the structure-function relationships of starch in foods fromanalyses of the thermal and thermomechanicalproperties of starch in aqueous model systemsand real products.23 Just as the glass transitiongoverns the practical temperature range for pro-cessing and commercial use of synthetic poly-mers, as well as the mechanical properties of bothraw materials and products,112-114 the same is trueof the glass transition for starch, because of thedynamic influence of the glass transition on theevents of annealing, gelatinization, pasting, andretrogradation.17'23 Thermal analysis by DSC hasrevealed the critical role of water as a plasticizerfor native, freshly gelatinized, and retrograded
starches, and the importance of the glass tran-sition as a physicochemical event that governsstarch raw material properties, processibility,product quality, and storage stability.15-26 The foodpolymer science approach has been used to studystructure-property relationships of starches andsugars as water-compatible food polymers, whichare treated as homologous systems of polymers,oligomers, and monomers with their plasticizersand solvents.30 Recognition of the relevance ofthe key elements of the food polymer scienceapproach to the behavior of starch-based foodsystems has provided a conceptual framework forunderstanding and explaining complex behavior,designing technologically useful processes, andpredicting product quality and storage stability,based on fundamental structure-property rela-tionships of starch viewed as a partially crystal-line glassy polymer system.15-26 The mechanicalrelaxation behavior of starch-water systems hasbeen described in the context of a dynamics mapof the critical variables of moisture content, tem-perature, and time.23-26 Normal and waxy nativegranular starches have been found to exhibit non-equilibrium "melting, annealing, and recrystalli-zation behavior characteristic of kinetically met-astable, partially crystalline polymer systems witha small extent of crystallinity.1723 Starch gelatin-ization and retrogradation in the presence of smallsugars have been described as mechanical relax-ation processes affected by the mobility of aqueoussugar solutions.30 The retardation effect of con-centrated sugar solutions on, for example, the Tggoverning starch gelatinization, has been sug-gested to result from "antiplasticization" bysugar-water cosolvents, relative to the extent ofplasticization by water alone.20 Plasticization bysugar-water, of higher average MW than wateralone, produces a smaller depression of starchTg than does plasticization by water.20 It has beenshown that the non-Arrhenius kinetics of gela-tinization, retrogradation, and annealing, definedby WLF relaxation transformations, depend onthe magnitude of AT above the appropriate ref-erence Tg.21-26 It has also been demonstrated thatthe Tg observed during DSC analysis is often aneffective Tg, resulting from instantaneous rela-tive relaxation rates and non-uniform distributionof total sample moisture.21
304
Dow
nloa
ded
by [
Tex
as A
&M
Uni
vers
ity L
ibra
ries
] at
10:
57 0
9 Ja
nuar
y 20
18
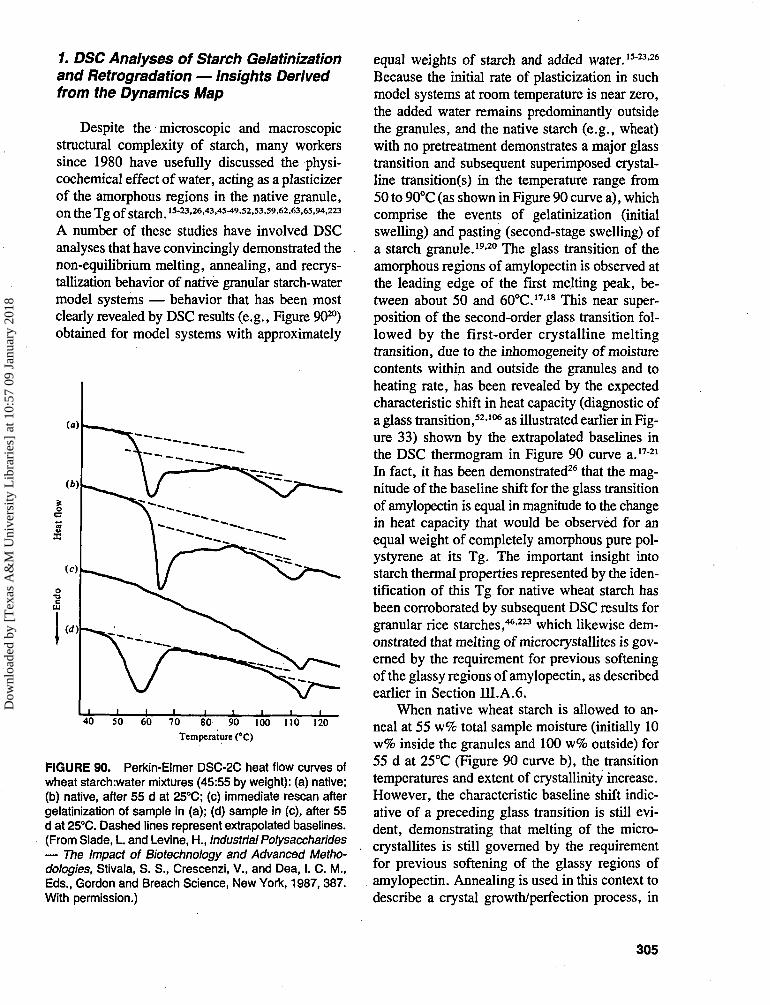
1. DSC Analyses of Starch Gelatinizationand Retrogradation — Insights Derivedfrom the Dynamics Map
Despite the microscopic and macroscopicstructural complexity of starch, many workerssince 1980 have usefully discussed the physi-cochemical effect of water, acting as a plasticizerof the amorphous regions in the native granule,o n the T g o f starch. 15-23,26,43,45-49.52.53,59.62,63,65,94,223
A number of these studies have involved DSCanalyses that have convincingly demonstrated thenon-equilibrium melting, annealing, and recrys-tallization behavior of native granular starch-watermodel systems — behavior that has been mostclearly revealed by DSC results (e.g., Figure 9020)obtained for model systems with approximately
SO 60 70 80 90 100 110 120
Temperature (°C)
FIGURE 90. Perkin-Elmer DSC-2C heat flow curves ofwheat starch:water mixtures (45:55 by weight): (a) native;(b) native, after 55 d at 25°C; (c) immediate rescan aftergelatinization of sample in (a); (d) sample in (c), after 55d at 25°C. Dashed lines represent extrapolated baselines.(From Slade, L and Levine, H., Industrial Polysaccharides— The Impact of Biotechnology and Advanced Metho-dologies, Stivala, S. S., Crescenzi, V., and Dea, I. C. M.,Eds., Gordon and Breach Science, New York, 1987,387.With permission.)
equal weights of starch and added water.15'23-26
Because the initial rate of plasticization in suchmodel systems at room temperature is near zero,the added water remains predominantly outsidethe granules, and the native starch (e.g., wheat)with no pretreatment demonstrates a major glasstransition and subsequent superimposed crystal-line transition(s) in the temperature range from50 to 90°C (as shown in Figure 90 curve a), whichcomprise the events of gelatinization (initialswelling) and pasting (second-stage swelling) ofa starch granule.19-20 The glass transition of theamorphous regions of amylopectin is observed atthe leading edge of the first melting peak, be-tween about 50 and 60°C.17-18 This near super-position of the second-order glass transition fol-lowed by the first-order crystalline meltingtransition, due to the inhomogeneity of moisturecontents within and outside the granules and toheating rate, has been revealed by the expectedcharacteristic shift in heat capacity (diagnostic ofa glass transition,52-106 as illustrated earlier in Fig-ure 33) shown by the extrapolated baselines inthe DSC thermogram in Figure 90 curve a.1721
In fact, it has been demonstrated26 that the mag-nitude of the baseline shift for the glass transitionof amylopectin is equal in magnitude to the changein heat capacity that would be observed for anequal weight of completely amorphous pure pol-ystyrene at its Tg. The important insight intostarch thermal properties represented by the iden-tification of this Tg for native wheat starch hasbeen corroborated by subsequent DSC results forgranular rice starches,46-223 which likewise dem-onstrated that melting of microcrystallites is gov-erned by the requirement for previous softeningof the glassy regions of amylopectin, as describedearlier in Section m.A.6.
When native wheat starch is allowed to an-neal at 55 w% total sample moisture (initially 10w% inside the granules and 100 w% outside) for55 d at 25°C (Figure 90 curve b), the transitiontemperatures and extent of crystallinity increase.However, the characteristic baseline shift indic-ative of a preceding glass transition is still evi-dent, demonstrating that melting of the micro-crystallites is still governed by the requirementfor previous softening of the glassy regions ofamylopectin. Annealing is used in this context todescribe a crystal growth/perfection process, in
305
Dow
nloa
ded
by [
Tex
as A
&M
Uni
vers
ity L
ibra
ries
] at
10:
57 0
9 Ja
nuar
y 20
18
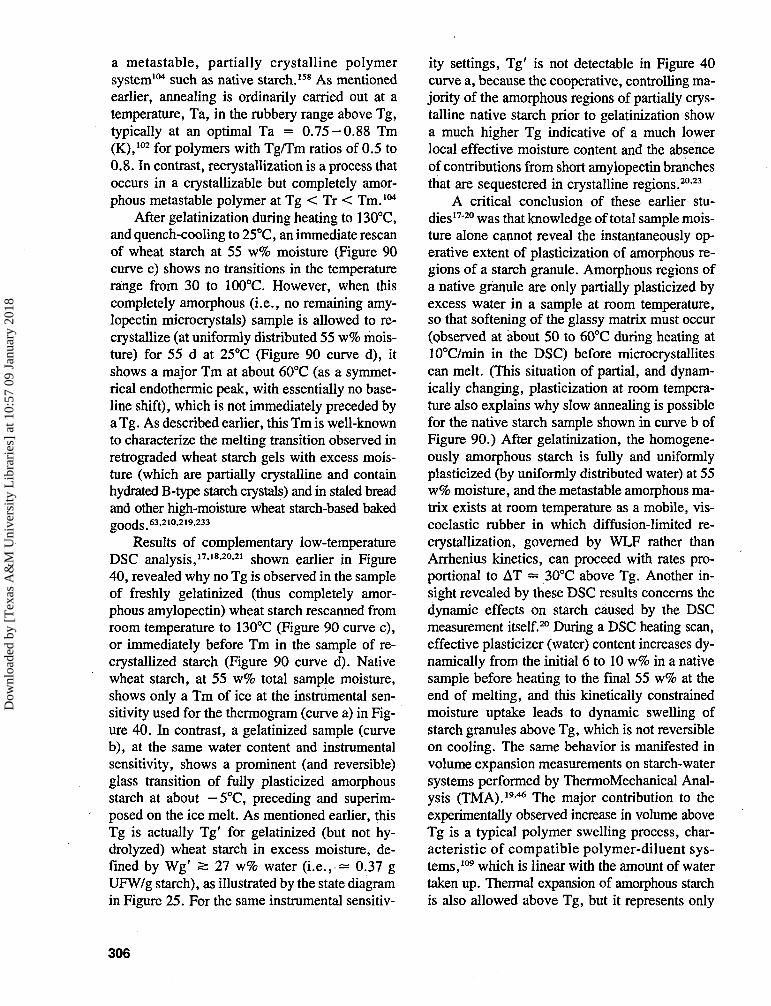
a metastable, partially crystalline polymersystem104 such as native starch.158 As mentionedearlier, annealing is ordinarily carried out at atemperature, Ta, in the rubbery range above Tg,typically at an optimal Ta = 0.75-0.88 Tm(K),102 for polymers with Tg/Tm ratios of 0.5 to0.8. In contrast, recrystallization is a process thatoccurs in a crystallizable but completely amor-phous metastable polymer at Tg < Tr < Tm.104
After gelatinization during heating to 130°C,and quench-cooling to 25°C, an immediate rescanof wheat starch at 55 w% moisture (Figure 90curve c) shows no transitions in the temperaturerange from 30 to 100°C. However, when thiscompletely amorphous (i.e., no remaining amy-lopectin microcrystals) sample is allowed to re-crystallize (at uniformly distributed 55 w% mois-ture) for 55 d at 25°C (Figure 90 curve d), itshows a major Tm at about 60°C (as a symmet-rical endothermic peak, with essentially no base-line shift), which is not immediately preceded bya Tg. As described earlier, this Tm is well-knownto characterize the melting transition observed inretrograded wheat starch gels with excess mois-ture (which are partially crystalline and containhydrated B-type starch crystals) and in staled breadand other high-moisture wheat starch-based bakedgoods.63-210-219-233
Results of complementary low-temperatureDSC analysis,17-18-20-21 shown earlier in Figure40, revealed why no Tg is observed in the sampleof freshly gelatinized (thus completely amor-phous amylopectin) wheat starch rescanned fromroom temperature to 130°C (Figure 90 curve c),or immediately before Tm in the sample of re-crystallized starch (Figure 90 curve d). Nativewheat starch, at 55 w% total sample moisture,shows only a Tm of ice at the instrumental sen-sitivity used for the thermogram (curve a) in Fig-ure 40. In contrast, a gelatinized sample (curveb), at the same water content and instrumentalsensitivity, shows a prominent (and reversible)glass transition of fully plasticized amorphousstarch at about — 5°C, preceding and superim-posed on the ice melt. As mentioned earlier, thisTg is actually Tg' for gelatinized (but not hy-drolyzed) wheat starch in excess moisture, de-fined by Wg' 5: 27 w% water ( i . e . , = 0.37 gUFW/g starch), as illustrated by the state diagramin Figure 25. For the same instrumental sensitiv-
ity settings, Tg' is not detectable in Figure 40curve a, because the cooperative, controlling ma-jority of the amorphous regions of partially crys-talline native starch prior to gelatinization showa much higher Tg indicative of a much lowerlocal effective moisture content and the absenceof contributions from short amylopectin branchesthat are sequestered in crystalline regions.20-23
A critical conclusion of these earlier stu-dies1720 was that knowledge of total sample mois-ture alone cannot reveal the instantaneously op-erative extent of plasticization of amorphous re-gions of a starch granule. Amorphous regions ofa native granule are only partially plasticized byexcess water in a sample at room temperature,so that softening of the glassy matrix must occur(observed at about 50 to 60°C during heating at10°C/min in the DSC) before microcrystallitescan melt. (This situation of partial, and dynam-ically changing, plasticization at room tempera-ture also explains why slow annealing is possiblefor the native starch sample shown in curve b ofFigure 90.) After gelatinization, the homogene-ously amorphous starch is fully and uniformlyplasticized (by uniformly distributed water) at 55w% moisture, and the metastable amorphous ma-trix exists at room temperature as a mobile, vis-coelastic rubber in which diffusion-limited re-crystallization, governed by WLF rather thanArrhenius kinetics, can proceed with rates pro-portional to AT = 30°C above Tg. Another in-sight revealed by these DSC results concerns thedynamic effects on starch caused by the DSCmeasurement itself.20 During a DSC heating scan,effective plasticizer (water) content increases dy-namically from the initial 6 to 10 w% in a nativesample before heating to the final 55 w% at theend of melting, and this kinetically constrainedmoisture uptake leads to dynamic swelling ofstarch granules above Tg, which is not reversibleon cooling. The same behavior is manifested involume expansion measurements on starch-watersystems performed by ThermoMechanical Anal-ysis (TMA).19'46 The major contribution to theexperimentally observed increase in volume aboveTg is a typical polymer swelling process, char-acteristic of compatible polymer-diluent sys-tems,109 which is linear with the amount of watertaken up. Thermal expansion of amorphous starchis also allowed above Tg, but it represents only
306
Dow
nloa
ded
by [
Tex
as A
&M
Uni
vers
ity L
ibra
ries
] at
10:
57 0
9 Ja
nuar
y 20
18
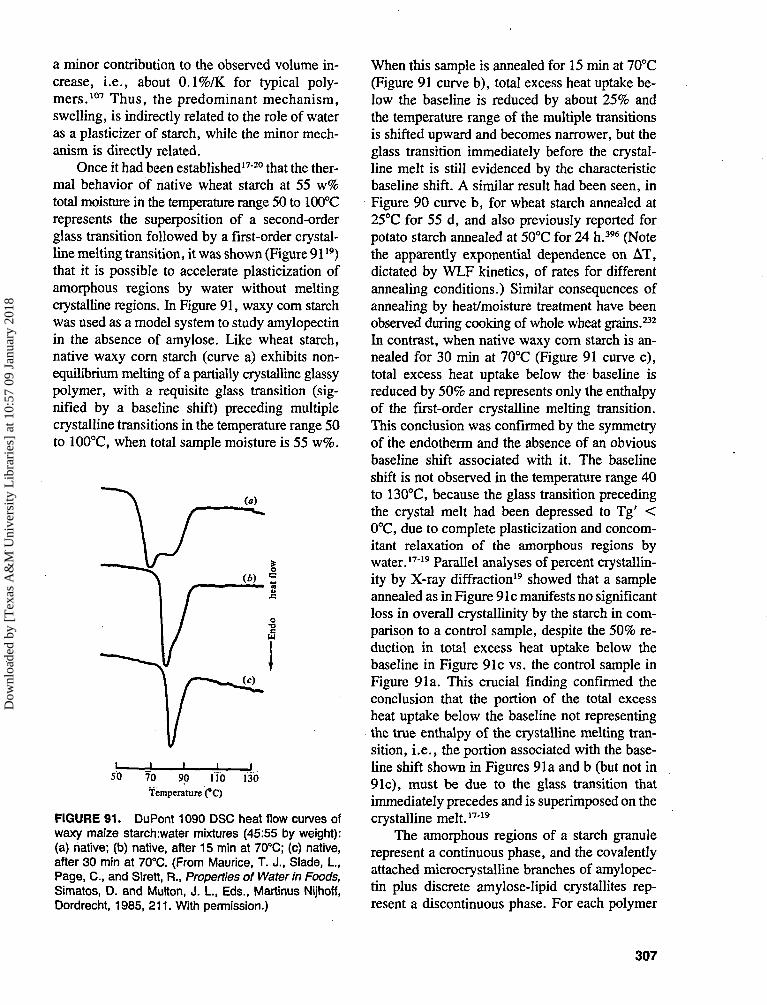
a minor contribution to the observed volume in-crease, i.e., about 0.1 %/K for typical poly-mers.107 Thus, the predominant mechanism,swelling, is indirectly related to the role of wateras a plasticizer of starch, while the minor mech-anism is directly related.
Once it had been established17'20 that the ther-mal behavior of native wheat starch at 55 w%total moisture in the temperature range 50 to 100°Crepresents the superposition of a second-orderglass transition followed by a first-order crystal-line melting transition, it was shown (Figure 9119)that it is possible to accelerate plasticization ofamorphous regions by water without meltingcrystalline regions. In Figure 91, waxy com starchwas used as a model system to study amylopectinin the absence of amylose. Like wheat starch,native waxy corn starch (curve a) exhibits non-equilibrium melting of a partially crystalline glassypolymer, with a requisite glass transition (sig-nified by a baseline shift) preceding multiplecrystalline transitions in the temperature range 50to 100°C, when total sample moisture is 55 w%.
50 70 90 110 130
Temperature (°C)
FIGURE 91. DuPont 1090 DSC heat flow curves ofwaxy maize starchrwater mixtures (45:55 by weight):(a) native; (b) native, after 15 min at 70°C; (c) native,after 30 min at 70°C. (From Maurice, T. J., Slade, I., Page, C., and Sirett, R., Properties of Water In Foods,Simatos, D. and Multon, J. I., Eds., Martinus Nijhoff,Dordrecht, 1985, 211. With permission.)
When this sample is annealed for 15 min at 70°C(Figure 91 curve b), total excess heat uptake be-low the baseline is reduced by about 25% andthe temperature range of the multiple transitionsis shifted upward and becomes narrower, but theglass transition immediately before the crystal-line melt is still evidenced by the characteristicbaseline shift. A similar result had been seen, inFigure 90 curve b, for wheat starch annealed at25°C for 55 d, and also previously reported forpotato starch annealed at 50°C for 24 h.396 (Notethe apparently exponential dependence on AT,dictated by WLF kinetics, of rates for differentannealing conditions.) Similar consequences ofannealing by heat/moisture treatment have beenobserved during cooking of whole wheat grains.232
In contrast, when native waxy corn starch is an-nealed for 30 min at 70°C (Figure 91 curve c),total excess heat uptake below the baseline isreduced by 50% and represents only the enthalpyof the first-order crystalline melting transition.This conclusion was confirmed by the symmetryof the endotherm and the absence of an obviousbaseline shift associated with it. The baselineshift is not observed in the temperature range 40to 130°C, because the glass transition precedingthe crystal melt had been depressed to Tg' <0°C, due to complete plasticization and concom-itant relaxation of the amorphous regions bywater.1719 Parallel analyses of percent crystallin-ity by X-ray diffraction19 showed that a sampleannealed as in Figure 91c manifests no significantloss in overall crystallinity by the starch in com-parison to a control sample, despite the 50% re-duction in total excess heat uptake below thebaseline in Figure 91c vs. the control sample inFigure 91a. This crucial finding confirmed theconclusion that the portion of the total excessheat uptake below the baseline not representingthe true enthalpy of the crystalline melting tran-sition, i.e., the portion associated with the base-line shift shown in Figures 91a and b (but not in91c), must be due to the glass transition thatimmediately precedes and is superimposed on thecrystalline melt.1719
The amorphous regions of a starch granulerepresent a continuous phase, and the covalentlyattached microcrystalline branches of amylopec-tin plus discrete amylose-lipid crystallites rep-resent a discontinuous phase. For each polymer
307
Dow
nloa
ded
by [
Tex
as A
&M
Uni
vers
ity L
ibra
ries
] at
10:
57 0
9 Ja
nuar
y 20
18
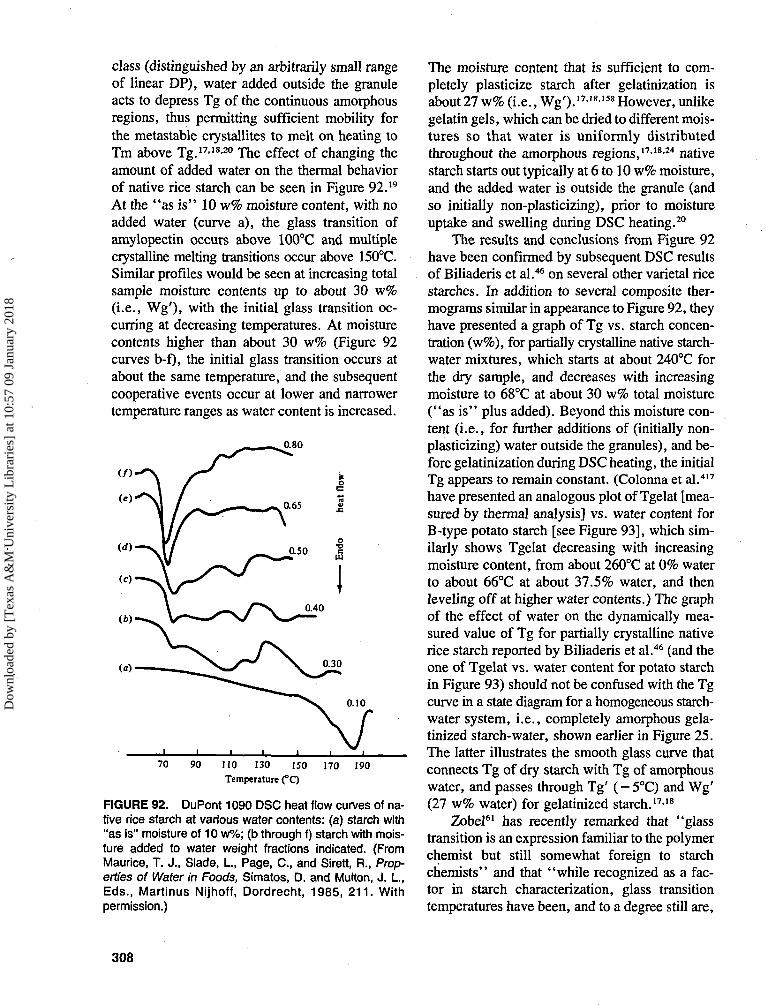
class (distinguished by an arbitrarily small rangeof linear DP), water added outside the granuleacts to depress Tg of the continuous amorphousregions, thus permitting sufficient mobility forthe metastable crystallites to melt on heating toTm above Tg.17-18-20 The effect of changing theamount of added water on the thermal behaviorof native rice starch can be seen in Figure 92.19
At the "as is" 10 w% moisture content, with noadded water (curve a), the glass transition ofamylopectin occurs above 100°C and multiplecrystalline melting transitions occur above 150°C.Similar profiles would be seen at increasing totalsample moisture contents up to about 30 w%(i.e., Wg'), with the initial glass transition oc-curring at decreasing temperatures. At moisturecontents higher than about 30 w% (Figure 92curves b-f), the initial glass transition occurs atabout the same temperature, and the subsequentcooperative events occur at lower and narrowertemperature ranges as water content is increased.
0.80
(a)
70 90 110 130 150Temperature (°C)
170 190
FIGURE 92. DuPont 1090 DSC heat flow curves of na-tive rice starch at various water contents: (a) starch with"as is" moisture of 10 w%; (b through f) starch with mois-ture added to water weight fractions indicated. (FromMaurice, T. J., Slade, I., Page, C., and Sirett, R., Prop-erties of Water in Foods, Simatos, D. and Multon, J. I., Eds., Martinus Nijhoff, Dordrecht, 1985, 211. Withpermission.)
The moisture content that is sufficient to com-pletely plasticize starch after gelatinization isabout 27 w% (i.e., Wg').17lI8>158 However, unlikegelatin gels, which can be dried to different mois-tures so that water is uniformly distributedthroughout the amorphous regions,17-1824 nativestarch starts out typically at 6 to 10 w% moisture,and the added water is outside the granule (andso initially non-plasticizing), prior to moistureuptake and swelling during DSC heating.20
The results and conclusions from Figure 92have been confirmed by subsequent DSC resultsof Biliaderis et al.46 on several other varietal ricestarches. In addition to several composite ther-mograms similar in appearance to Figure 92, theyhave presented a graph of Tg vs. starch concen-tration (w%), for partially crystalline native starch-water mixtures, which starts at about 240°C forthe dry sample, and decreases with increasingmoisture to 68°C at about 30 w% total moisture("as is" plus added). Beyond this moisture con-tent (i.e., for further additions of (initially non-plasticizing) water outside the granules), and be-fore gelatinization during DSC heating, the initialTg appears to remain constant. (Colonna et al.417
have presented an analogous plot of Tgelat [mea-sured by thermal analysis] vs. water content forB-type potato starch [see Figure 93], which sim-ilarly shows Tgelat decreasing with increasingmoisture content, from about 260°C at 0% waterto about 66°C at about 37.5% water, and thenleveling off at higher water contents.) The graphof the effect of water on the dynamically mea-sured value of Tg for partially crystalline nativerice starch reported by Biliaderis et al.46 (and theone of Tgelat vs. water content for potato starchin Figure 93) should not be confused with the Tgcurve in a state diagram for a homogeneous starch-water system, i.e., completely amorphous gela-tinized starch-water, shown earlier in Figure 25.The latter illustrates the smooth glass curve thatconnects Tg of dry starch with Tg of amorphouswater, and passes through Tg' (-5°C) and Wg'(27 w% water) for gelatinized starch.17-18
Zobel61 has recently remarked that "glasstransition is an expression familiar to the polymerchemist but still somewhat foreign to starchchemists" and that "while recognized as a fac-tor in starch characterization, glass transitiontemperatures have been, and to a degree still are,
308
Dow
nloa
ded
by [
Tex
as A
&M
Uni
vers
ity L
ibra
ries
] at
10:
57 0
9 Ja
nuar
y 20
18
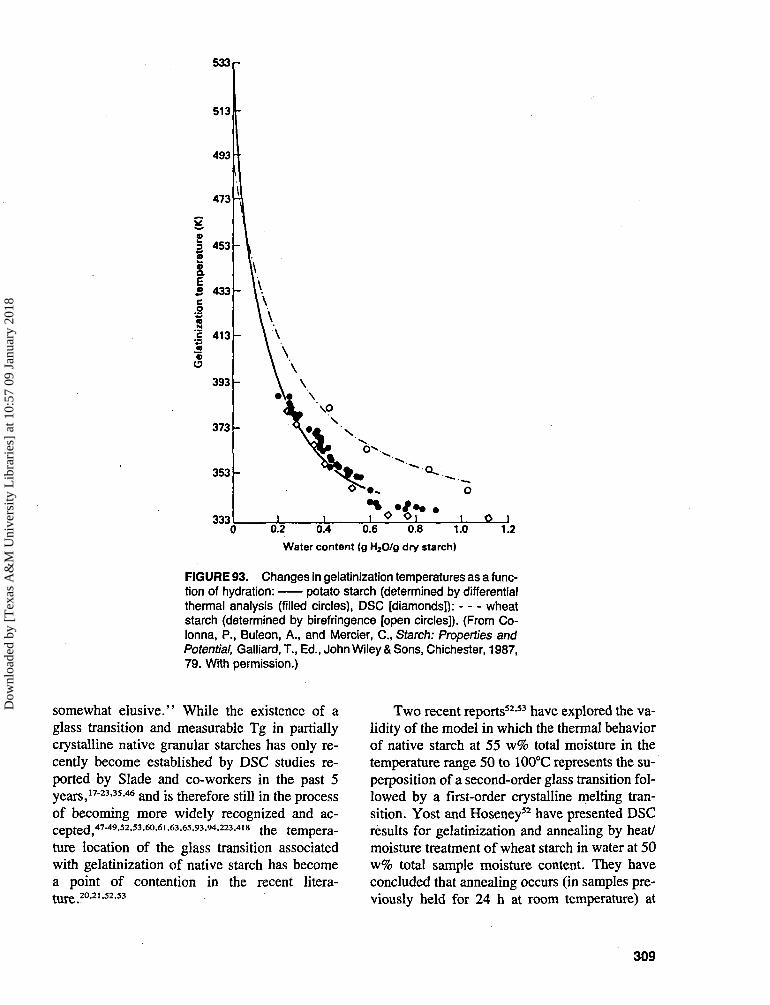
533 r
513
eD
si
tem
c
•
tini;
ela
u
493
473
453
433
413
393
373
353
333
\
I
\-\\
\\\ \
" \ A
\ \\ \\ N
>v
0^
ML i
i O '
o
>l 1 O0.2 0.4 0.6 0.8 1.0
Water content (g H2O/g dry starch)1.2
FIGURE 93. Changes in gelatinization temperatures as a func-tion of hydration: potato starch (determined by differentialthermal analysis (filled circles), DSC [diamonds]): wheatstarch (determined by birefringence [open circles]). (From Co-lonna, P., Buleon, A., and Mercier, C., Starch: Properties andPotential, Galliard, T., Ed., John Wiley & Sons, Chichester, 1987,79. With permission.)
somewhat elusive." While the existence of aglass transition and measurable Tg in partiallycrystalline native granular starches has only re-cently become established by DSC studies re-ported by Slade and co-workers in the past 5years,I7"23-35-46 and is therefore still in the processof becoming more widely recognized and ac-cepted,47-49-52-53-60-61-63-65-93-94-223-418 the tempera-ture location of the glass transition associatedwith gelatinization of native starch has becomea point of contention in the recent litera-tUj.g2O.21.52.53
Two recent reports52-53 have explored the va-lidity of the model in which the thermal behaviorof native starch at 55 w% total moisture in thetemperature range 50 to 100°C represents the su-perposition of a second-order glass transition fol-lowed by a first-order crystalline melting tran-sition. Yost and Hoseney52 have presented DSCresults for gelatinization and annealing by heat/moisture treatment of wheat starch in water at 50w% total sample moisture content. They haveconcluded that annealing occurs (in samples pre-viously held for 24 h at room temperature) at
309
Dow
nloa
ded
by [
Tex
as A
&M
Uni
vers
ity L
ibra
ries
] at
10:
57 0
9 Ja
nuar
y 20
18
temperatures 3 to 8°C below the gelatinizationTm for wheat starch, but not at lower tempera-tures. These results do not contradict previousDSC results and conclusions1720 about the rela-tive locations of Tg and Tm for gelatinization ofstarch, especially in light of existing knowledgeabout annealing of metastable, partially crystal-line synthetic polymers.102-104 As mentioned ear-lier, annealing occurs at Tg < Ta < Tm, typicallyat Ta = 0.75-0.88 Tm (°K), for polymers withTg/Tm ratios of 0.5 to 0.8. In this metastablerubbery domain defined by WLF theory, an-nealing is another diffusion-limited, non-equilib-rium process for which rate is governed by WLF,rather than Arrhenius, kinetics.15-21-419 As dem-onstrated for various native granular starches inexcess moisture situations,17-20-48-52-158-419-420 thetime required to achieve a measurable and com-parable (in a reasonable and similar experimentaltime frame) extent of annealing is shortest at Tajust below Tm (greatest AT above Tg) and long-est at Ta just above Tg (smallest AT). The min-imum value of the Tg/Tm ratio for wheat starch(at a uniformly distributed excess moisture con-tent 2=27 w%) is about 0.80 (i.e., Tg'/Tm =268/333K), and this ratio increases with decreas-ing moisture content to an anomalously high value>0.9.21 This anomalous situation corresponds toconditions of the non-equilibrium gelatinizationor annealing of native starch upon heating in thepresence of water added to 50 w%. Conse-quently, the temperature range that encompassesthe effective locations of Tg, Ta, and Tm fornative starch heated with excess added water isquite narrow, a conclusion also suggested by theDSC results of Nakazawa et al.419 Zeleznak andHoseney53 have investigated the Tg of both nativeand pregelatinized wheat starches as a functionof moisture content, and concluded, in seemingconflict with the annealing results previously re-ported,52 that their findings "contradicted thesuggestion that Tg immediately precedes meltingin starch." In both papers,52-53 Hoseney and co-workers have based their argument, in large part,on the failure to observe a glass transition (in theform of a discontinuous change in heat capacity)in a rescan after gelatinization of native starch inexcess added moisture in the DSC. Unfortu-nately, their DSC measurements were not ex-tended below 0°C, and so the prominent Tg at
Tg' = -5°C for gelatinized starch, illustratedearlier in Figure 40, was not observed.
In an effort to resolve any questions raisedby the conclusions of Yost and Hoseney52 andZeleznak and Hoseney,53 a subsequent DSC studyof representative A-type cereal starches21 has ver-ified and further quantified the temperature lo-cation of the effective glass transition that im-mediately precedes the non-equilibrium meltingtransition of amylopectin microcrystallites andthereby controls the melting process associatedwith gelatinization. For that study, native gran-ular wheat and waxy corn starches were heatedat 10°C/min in the presence of water added toabout 55 w% total moisture to facilitate temporalresolution of the thermal events. This practice isconsistent with the general rule of thumb thatDSC experiments should be conducted with sam-ples containing about 30 to 70 w% moisture fordiagnostic evaluation of ingredient structure-function relationships for food materials.23 Thediagnostic information about potential ingredientfunctionality can be related to the real-worldevents that would be retarded by moisture con-tents below 30 w% or accelerated above 70 w%.Addition of water to less than about 30 w% mois-ture retards the thermomechanical events of ge-latinization and pasting in time and temperatureto such an extent that all of the thermal eventsoccur cooperatively over a higher, narrower tem-perature range, due to excessive plasticizationand mobilization by heat.19-20 Addition of waterto more than about 70 w% moisture acceleratesall of the thermal events so that they occur co-operatively in a much lower, narrower temper-ature range, due to excessive plasticization andmobilization by water. Addition of an equalweight of water to starch having "as is" moisturecontent of 6 to 10 w% eases the preparation ofsamples for DSC analysis and allows separationin time and temperature of the successive, nownon-cooperative, thermal events to provide di-agnostic thermal profiles.23 Such diagnostic pro-files are required to isolate and demonstrate thecontribution of free volume to heat capacity, ob-served as the characteristic step change in DSCbaseline at Tg.106 In the absence of such decon-volution of the thermal events, smaller and lessreproducible changes in heat capacity are ob-served, due to the superposition of vibrational
310
Dow
nloa
ded
by [
Tex
as A
&M
Uni
vers
ity L
ibra
ries
] at
10:
57 0
9 Ja
nuar
y 20
18
and free volume contributions to heat capacityand endothermic and exothermic contributions toenthalpy for both amorphous and crystalline re-gions of the sample.106 An exactly analogous be-havior has been observed for the plasticizationof synthetic high polymers by their compatiblediluents.109 Up to about 30 w% uniformly dis-tributed diluent, the solute is incompletely plas-ticized by diluent alone, complete plasticizationis achieved by a combination of diluent plus heat,and the microscopic behavior of the sample isdominated by the solute as modulated by the plas-ticizer in the blend. Between about 30 and 70w% uniformly distributed plasticizer, completeplasticization can be achieved by diluent alone,and two distinguishable microscopic behaviorsof the sample can be observed: solute modulatedby plasticizing diluent and diluent modulated bysolute. Above about 70 w% diluent, ambient tem-perature is typically far above the sample Tg, anda single microscopic behavior of the sample isagain observed, that of the diluent modulated bythe solute, exemplified in the extreme by thebehavior of dilute solutions.109 Of course, thebehavior of solute modulated by plasticizer canbe observed at diluent concentrations above 70w%, but only at the macroscopic level, in theform of entanglement and partially crystallinenetworks and gels.23 It should be noted that thisdescription and the particular w% compositionsof solute and diluent apply to the typical case ofhigh MW food materials and synthetic polymers,for which Wg' (or the organic equivalent) is about30 w%.25 For those materials with values of Wg'very different from about 30 w%, appropriateranges of diluent would be used to effect the samemodulation of the Tg and mechanical behaviorof the solute-diluent blend.23
The experimental DSC protocol used to studythe A-type cereal starches21 represents a noveland critically discriminative extension of proce-dures previously recommended48 and used5260 toanalyze starch gelatinization. Definitive DSC ex-periments, involving partial initial heating scansto intermediate temperatures in the range from30 to 130°C, followed by quench-cooling andimmediate complete rescans, have revealed theoperational location of Tg for wheat starch (above54°C and completed by 63°C) and waxy cornstarch (above 63°C and completed by 71.5°C).
Corresponding effective "end of melting" tem-peratures (Tm)60-100105-161-419 for the non-equilib-rium melting transition of annealed amylopectinmicrocrystallites in normal wheat (about 92°C)and waxy corn (about 95°C) starches have alsobeen identified. Results of this study have madeit possible to achieve a deconvolution of the con-tributions of amylopectin and amylose to the non-equilibrium melting behavior of native granularstarches,21 through DSC analyses of normal wheatand waxy com starches. These results have alsobeen used to demonstrate the kinetically con-trolled relationship (based on the dynamics ofplasticization by water) between the operativeTa, at which a non-equilibrium process of an-nealing can occur in native granular starches sub-jected to various heat/moisture/time treatments,and the effective Tg and Tm which are relevantto gelatinization and which bracket Ta,48102-104
thereby confirming that the location of Ta 3 to8°C below Tm52 is not inconsistent with a Tgimmediately preceding melting.
The study has demonstrated that the effectiveTg associated with gelatinization of native gran-ular starch, most readily resolved as describedabove by heating in excess added moisture atnearly equal weights of starch and water, dependson the instantaneously operative conditions ofmoisture content, temperature, and time.21 Thisfinding has helped to eliminate any potential con-fusion over the absence of a single, "absolute"value of Tg for starch. Location of the effectiveTg of gelatinization has illustrated the establishedfactio7,120.172,250 m a t m e Ope rational designation
of a particular Tg value for any partially or com-pletely amorphous material is only relevant to theinstantaneously operative conditions of its mea-surement. This point has been depicted concep-tually by the schematic state diagram for theamorphous regions of native granular cereal starchin Figure 94,26 which has been used in the contextof a dynamics map to describe the process ofgelatinization. Figure 94 traces the route fol-lowed during a DSC experiment, in terms of thefollowing path of temperature-moisture contentloci: (1) initial heating of native starch (N), at"as i s" moisture and blended with excess water,from room temperature, through the instanta-neously operative Tg, into the rubbery region(whereupon the rates of moisture uptake and
311
Dow
nloa
ded
by [
Tex
as A
&M
Uni
vers
ity L
ibra
ries
] at
10:
57 0
9 Ja
nuar
y 20
18
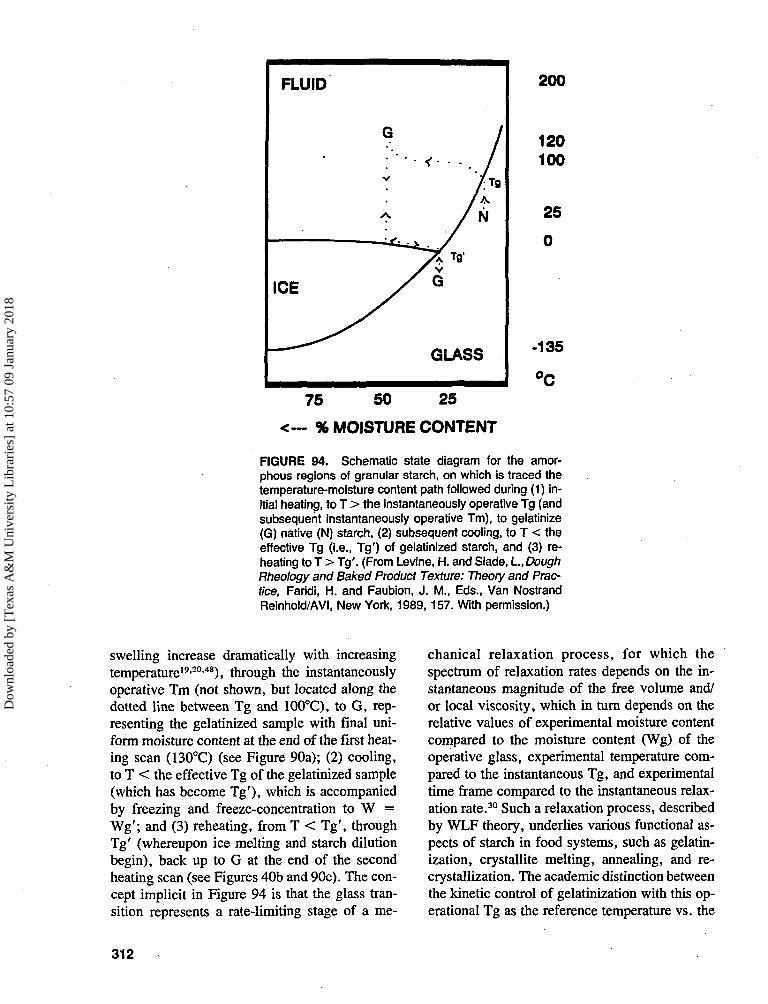
200
120100
25
0
-135
°C75 50 25
<~- % MOISTURE CONTENT
FIGURE 94. Schematic state diagram for the amor-phous regions of granular starch, on which is traced thetemperature-moisture content path followed during (1) in-itial heating, to T > the instantaneously operative Tg (andsubsequent instantaneously operative Tm), to gelatinize(G) native (N) starch, (2) subsequent cooling, to T < theeffective Tg (i.e., Tg') of gelatinized starch, and (3) re-heating to T > Tg'. (From Levine, H. and Slade, L.DoughRheology and Baked Product Texture: Theory and Prac-tice, Faridi, H. and Faubion, J. M., Eds., Van NostrandReinhold/AVI, New York, 1989, 157. With permission.)
swelling increase dramatically with increasingtemperature19-20-48), through the instantaneouslyoperative Tm (not shown, but located along thedotted line between Tg and 100°C), to G, rep-resenting the gelatinized sample with final uni-form moisture content at the end of the first heat-ing scan (130°C) (see Figure 90a); (2) cooling,to T < the effective Tg of the gelatinized sample(which has become Tg'), which is accompaniedby freezing and freeze-concentration to W =Wg'; and (3) reheating, from T < Tg', throughTg' (whereupon ice melting and starch dilutionbegin), back up to G at the end of the secondheating scan (see Figures 40b and 90c). The con-cept implicit in Figure 94 is that the glass tran-sition represents a rate-limiting stage of a me-
chanical relaxation process, for which thespectrum of relaxation rates depends on the in-stantaneous magnitude of the free volume and/or local viscosity, which in turn depends on therelative values of experimental moisture contentcompared to the moisture content (Wg) of theoperative glass, experimental temperature com-pared to the instantaneous Tg, and experimentaltime frame compared to the instantaneous relax-ation rate.30 Such a relaxation process, describedby WLF theory, underlies various functional as-pects of starch in food systems, such as gelatin-ization, crystallite melting, annealing, and re-crystallization. The academic distinction betweenthe kinetic control of gelatinization with this op-erational Tg as the reference temperature vs. the
312
Dow
nloa
ded
by [
Tex
as A
&M
Uni
vers
ity L
ibra
ries
] at
10:
57 0
9 Ja
nuar
y 20
18

energetic control through Tm might be dismissedas a semantic issue were it not for its overridingtechnological importance.23 Control through Tmwould dictate that the gelatinization temperatureand mechanical behavior of a starch system dur-ing the events of gelatinization depend solely onthe identity of the starch crystalline polymorph,without regard to the previous history of the sam-ple. Practical experience related to aging of cerealgrains prior to industrial processing, variationsin the wet-milling process to isolate starches, andother heat/moisture treatments clearly confirm therole of sample history and the kinetic control ofgelatinization through the path-determined op-erational location of the starch Tg.22>23
Conceptual descriptions of the kineticallycontrolled relaxation processes of annealing innative granular cereal starch and recrystallizationin gelatinized cereal starch, analogous to the de-scription of gelatinization according to the dy-namics map in Figure 94, have been illustratedby the schematic state diagrams in Figures 95and 96, respectively.23 These in turn have beenbased on the idealized state diagram shown ear-lier in Figure 83 for a plasticizer (component 3)-solute (component 2) system in which both com-ponents are crystallizable, as exemplified by thestarch-water system. Figure 95 traces the routefollowed during a DSC experiment, in terms ofthe following path of temperature-moisture con-tent loci: initial heating of native granular A-typecereal starch (N), at "as is" moisture and blendedwith excess water, from room temperature,through the instantaneously operative Tg, into therubbery region, through the instantaneously op-erative Tm for A-type microcrystalline regions(<100°C), to G, representing the gelatinizedsample with final uniform moisture content at theend of the heating scan (130°C). Annealing insuch a metastable, partially crystalline polymersystem, subjected to such a heat/moisture treat-ment, can occur within the experimental timeframe, during heating along the portion of thedotted path within the temperature range betweenthe instantaneously operative Tg and Tm. If theinitial DSC heating scan had been stopped some-where between the effective Tg and Tm, or ifthe original starch-water mixture had been sub-jected to a heat/moisture/time treatment withinthe' 'crystal 2 ' ' domain in Figure 83 (as described
earlier with respect to Figures 90b and 91b andc), the consequences of annealing would be man-ifested during subsequent DSC analysis. Crystalgrowth and/or perfection would be evidenced bya narrower melting endotherm (indicative of amore cooperative transition) of higher peak Tmand possibly higher enthalpy.23
The schematic state diagram in Figure 96illustrates the process of recrystallization in ge-latinized cereal starch. Figure 96 traces the routefollowed during a DSC experiment, in terms ofthe following path of temperature-moisture con-tent loci: (1) initial heating, to T > the instan-taneously operative Tg (and subsequent instan-taneously operative Tm, not shown), to gelatinize(G) native (N) starch (as described in Figure 94and illustrated by Figure 90a), (2) subsequentcooling to room temperature (i.e., to T > theeffective Tg (i.e., Tg') of gelatinized starch), incontrast to the cooling path of step 2 in Figure94, (3) storage at room temperature to allow ge-lation and recrystallization of B-type microcrys-talline regions, and (4) reheating from room tem-perature to T > the instantaneously operative Tmof B-type crystalline starch at >27 w% moisture,to melt the retrograded B-type starch gel (seeFigure 90d).
The composite diagram of DSC heat flowcurves for native wheat starch, shown in Figure97,21 has demonstrated conclusively that initialheating to at least 92°C is required (for a heatingrate of 10°C/min, to a final sample moisture con-tent of 50 w%) to complete the non-equilibriummelting process associated with gelatinization andpasting of this native granular starch. Partial in-itial scanning to temperatures 2:72°C but <92°Cresults in only partial melting, as evidenced inthe rescans by a remnant of the melting profile,compared to the thermal profile of the completemelting process shown at the top of Figure 97.This remnant decreases in area with increasingmaximum temperature (in the 72 to 92°C range)of the partial initial scan, but only disappearscompletely (yielding a featureless thermogram,as evidenced by a flat baseline, from 30 to 100°C)after initial heating to S92CC. From these pre-liminary DSC measurements, it was concludedthat 92°C represents the effective Tm at the "endof melting" for native wheat starch heated at10°C/min with 50 w% total moisture. The tem-
313
Dow
nloa
ded
by [
Tex
as A
&M
Uni
vers
ity L
ibra
ries
] at
10:
57 0
9 Ja
nuar
y 20
18

200
120100
25
0
-135
°C75 50 25
<— % MOISTURE CONTENT
FIGURE 95. Schematic state diagram for the amorphous and A-typecrystalline regions of granular cereal starch, on which is traced thetemperature-moisture content path followed during heating, to T > theinstantaneously operative Tg and subsequent instantaneously oper-ative Tm, to gelatinize (G) native (N) starch. Annealing during initialheating can occur along the portion of the dotted path between theinstantaneously operative Tg and Tm. (Reproduced with permissionfrom Reference 23.)
perature at which melting begins was deducedfrom the DSC results shown in Figure 98,21 whichalso reveal the temperature location of the effec-tive glass transition that must precede the onsetof this non-equilibrium melting process for wheatstarch with water added to 55 w% total moisture.On the time scale of the DSC measurement, thesetwo temperatures are essentially identical. Im-plicit in the results shown in Figure 97 is the factthat, at temperatures within the range from theeffective Tg to the end-of-melting Tm, the extentof gelatinization is temperature-dependent. Asmentioned earlier, this condition prohibits the ap-plication of Arrhenius kinetics to model the ge-
latinization process65-222224 and emphasizes theapplicability of WLF kinetics.17-18-20-21-30
The composite diagram of DSC heat flowcurves for native wheat starch with 55 w% waterin Figure 98 shows the complete non-equilibriummelting process as an initial scan in curve A; thepartial initial scans, with their end-of-scan tem-peratures indicated, as solid lines in parts Bthrough K; and the complete rescans as dashedlines in parts B through L. For parts B through I., the TADS computer on the Perkin-Elmer DSC-2C was instructed to display simultaneously theinitial and rescans and allowed to confirm thatthe same instrumental baseline response of heat
314
Dow
nloa
ded
by [
Tex
as A
&M
Uni
vers
ity L
ibra
ries
] at
10:
57 0
9 Ja
nuar
y 20
18
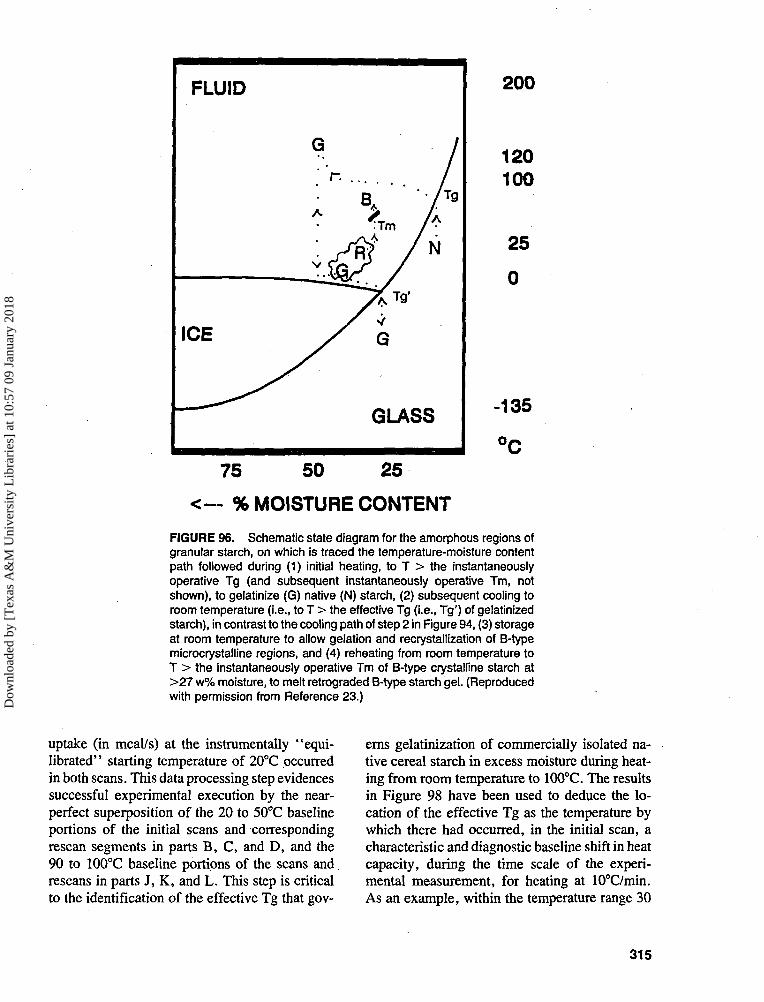
FLUID
ICE
y
B 7 T o
• y A
S G
GLASS
200
120100
25
0
-135
°C75 50 25
<— % MOISTURE CONTENT
FIGURE 96. Schematic state diagram for the amorphous regions ofgranular starch, on which is traced the temperature-moisture contentpath followed during (1) initial heating, to T > the instantaneouslyoperative Tg (and subsequent instantaneously operative Tm, notshown), to gelatinize (G) native (N) starch, (2) subsequent cooling toroom temperature (i.e., to T > the effective Tg (i.e., Tg') of gelatinizedstarch), in contrast to the cooling path of step 2 in Figure 94, (3) storageat room temperature to allow gelation and recrystallization of B-typemicrocrystalline regions, and (4) reheating from room temperature toT > the instantaneously operative Tm of B-type crystalline starch at>27 w% moisture, to melt retrograded B-type starch gel. (Reproducedwith permission from Reference 23.)
uptake (in mcal/s) at the instrumentally "equi-librated" starting temperature of 20°C occurredin both scans. This data processing step evidencessuccessful experimental execution by the near-perfect superposition of the 20 to 50°C baselineportions of the initial scans and correspondingrescan segments in parts B, C., and D, and the90 to 100°C baseline portions of the scans andrescans in parts J, K, and L. This step is criticalto the identification of the effective Tg that gov-
erns gelatinization of commercially isolated na-tive cereal starch in excess moisture during heat-ing from room temperature to 100°C. The resultsin Figure 98 have been used to deduce the lo-cation of the effective Tg as the temperature bywhich there had occurred, in the initial scan, acharacteristic and diagnostic baseline shift in heatcapacity, during the time scale of the experi-mental measurement, for heating at 10°C/min.As an example, within the temperature range 30
315
Dow
nloa
ded
by [
Tex
as A
&M
Uni
vers
ity L
ibra
ries
] at
10:
57 0
9 Ja
nuar
y 20
18
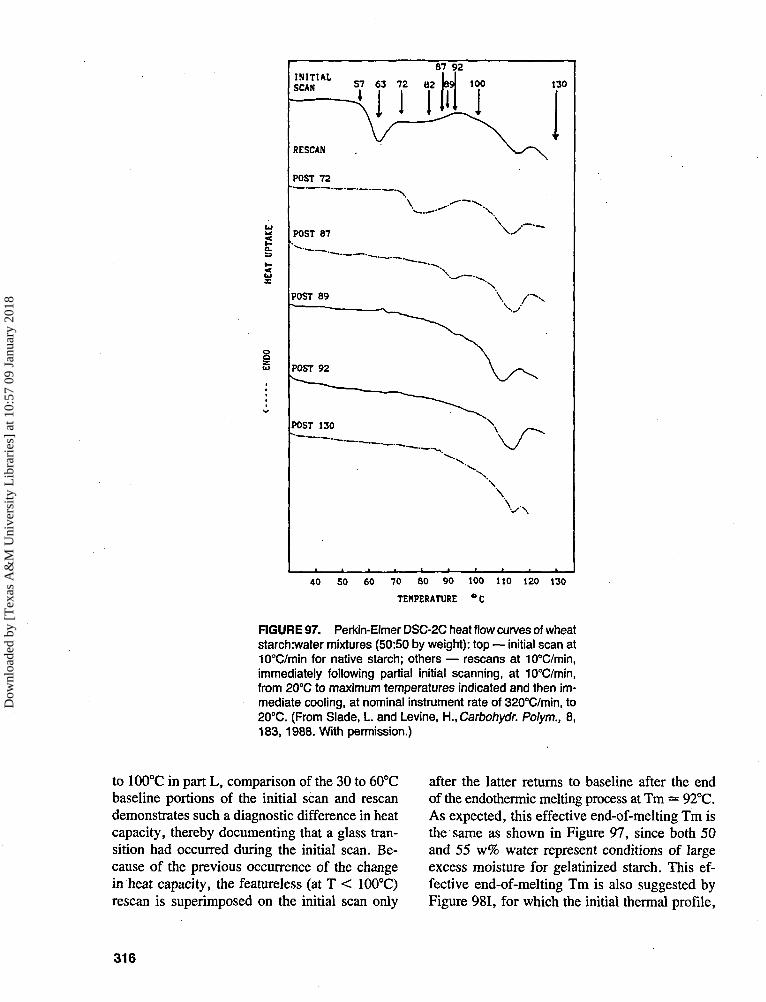
g
87 92
=7 « 72
RESCAN
POST 72
POST 87
POST 89
130
40 50 60 70 80 90 100 110 120 130
TEHPERATURE ° C
FIGURE 97. Perkin-Elmer DSC-2C heat flow curves of wheatstarch:water mixtures (50:50 by weight): top — initial scan at10°C/min for native starch; others — rescans at 10°C/min,immediately following partial initial scanning, at 10°C/min,from 20°C to maximum temperatures indicated and then im-mediate cooling, at nominal instrument rate of 320°C/min, to20°C. (From Slade, L. and Levine, H.,Carbohydr. Polym., 8,183, 1988. With permission.)
to 100°C in part I., comparison of the 30 to 60°Cbaseline portions of the initial scan and rescandemonstrates such a diagnostic difference in heatcapacity, thereby documenting that a glass tran-sition had occurred during the initial scan. Be-cause of the previous occurrence of the changein heat capacity, the featureless (at T < 100°C)rescan is superimposed on the initial scan only
after the latter returns to baseline after the endof the endothermic melting process at Tm = 92°C.As expected, this effective end-of-melting Tm isthe same as shown in Figure 97, since both 50and 55 w% water represent conditions of largeexcess moisture for gelatinized starch. This ef-fective end-of-melting Tm is also suggested byFigure 981, for which the initial thermal profile,
316
Dow
nloa
ded
by [
Tex
as A
&M
Uni
vers
ity L
ibra
ries
] at
10:
57 0
9 Ja
nuar
y 20
18

»T
C. »7
M W Jo 40 70 tO «0 100 110 l »
FIGURE 98. Perkin-Elmer DSC-2C heat flow curves ofwheat starch:water mixtures (45:55 by weight): (A) initialscan at 10°C/min for native starch; (B through L) solidlines = partial initial scans for native starch, at 10°C/min,from 20°C to maximum temperatures indicated, dashedlines = rescans at 10°C/min, immediately following partialinitial scanning and then immediate cooling, at nominal320°C/min, to 20°C. (From Slade, L. and Levine, H.,Car-bohydr. Polym., 8, 183, 1988. With permission.)
upon heating to 89°C, stops just short of a returnto baseline. The reason for the apparent absenceof a Tg in the rescan of part L was explainedearlier by reference to Figure 40. After completegelatinization upon heating to 130°C and 55 w%final moisture content, Tg = Tg' = -5°C.
The effective Tg preceding and controllingthe non-equilibrium melting process associatedwith gelatinization is identified as that minimum,narrow temperature span in the initial scan, belowwhich the change in heat capacity had not yetoccurred (as reflected by superimposed baselinesfor scan and rescan), but at and above which italready had (as reflected by a displacement ofbaselines, at T < Tg, between scan and rescan).It can be seen in Figure 98 parts B, C., and Dthat the scans and corresponding rescan segmentsare essentially identical up to 54°C, and the heatcapacity change had not yet occurred before therescans, because initial heating to 37,47, or 54°Chad not yet reached the uniform requirements oftime, temperature, and moisture for cooperativerelaxation at Tg. In contrast, in parts E throughK, the scan and rescan baselines, at T < Tg, aredisplaced, because initial heating to T ^ 63°Chad allowed the amorphous regions of the nativegranules to undergo a glass transition. By theconvention described above, the effective "endof softening" Tg preceding crystallite melting isthus identified as >54 and <63°C, as illustratedin Figure 98E. This upper limit for Tg corre-sponds to the temperature at the "peak mini-mum" in the characteristic DSC thermal profilefor wheat starch gelatinization shown in Figure98A. As mentioned earlier, the narrow 55 to 63°Ctemperature span of the effective Tg occurs alongthe leading edge of the "gelatinization endoth-erm."17-18 Figure 98E represents a temporal andthermal deconvolution of the melting transitionof microcrystalline regions from the precedingglass transition of amorphous regions of water-plasticized starch. Nakazawa et al.419 have al-luded to a similar differentiation between the mo-bile amorphous regions and immobile crystallineregions with respect to the time frame of theirDSC results for normal rice starches analyzed at50 w% total moisture, but they have implausiblysuggested that the elevated Tm observed in an-nealed starches is due to increased stability in theamorphous regions. Rather, for this case of starch
317
Dow
nloa
ded
by [
Tex
as A
&M
Uni
vers
ity L
ibra
ries
] at
10:
57 0
9 Ja
nuar
y 20
18

in excess moisture, annealing allows a relaxationin the amorphous regions from a more to a less(kinetically meta-) stable state, while the crys-talline regions perfect from a less (meta-) stablestate to a more stable state with higher Tm.106
The rescan of Figure 98 part E exhibits the fol-lowing features, compared to the typical appear-ance of curve A below 100°C; a more symmet-rical melting endotherm with essentially nobaseline shift, an onset temperature (essentiallycoincident with the initial effective Tg) of 63°C,a peak minimum of 70°C, and an effective end-of-melting Tm of 92°C. The essentially unde-tectable baseline shift in heat capacity associatedwith the crystalline melting transition at the in-strumental settings that allow ready demonstra-tion of the large change in heat capacity asso-ciated with the glass transition is expected, asexplained by Wunderlich (Reference 106, Fig-ures 13 and 16), due to the free volume contri-bution to heat capacity. The appearance of thethermal profile in the region of the glass transitionis analogous in shape to an endothermic hyster-esis peak, a common characteristic manifestedby partially crystalline polymers.106 An endoth-ermic hysteresis peak is indicative of some jump,during the sample history, in temperature, plas-ticizer content, or pressure at a rate exceedingthe relaxation rate of the appropriate process andis observed during subsequent DSC analysis asa "stress relief via "enthalpic relaxation."106
The apparent enthalpic relaxation of starch,53 witha peak minimum at 63°C, is superimposed on theuniversal step-change in heat capacity. One canfurther imagine summing the glass and meltingtransitions, superimposed on one another in thetemperature range 50 to 100°C, by adding to-gether the scan and rescan in Figure 98 part E,thus reconstituting, with no discernible loss oftotal heat uptake below the baseline, the char-acteristic DSC thermal profile (curve A) for wheatstarch gelatinization in excess water.
Figure 9921 contains the analogous compositediagram of DSC heat flow curves for waxy cornstarch with 55 w% total moisture. As in Figure98, Figure 99 shows the complete non-equilib-rium melting process as an initial scan in curveA; the partial initial scans, with their maximumtemperatures indicated, as solid lines in parts Bthrough G; and the complete rescans as dashed
i inn
to ioo no in
•c
FIGURE 99. Perkin-Elmer DSC-2C heat flow curvesof waxy corn starch:water mixtures (45:55 by weight):(A) initial scan at 10°C/min for native starch; (B throughH) solid lines = partial initial scans for native starch,at 10°C/min, from 20°C to maximum temperatures in-dicated, dashed lines = rescans at 10°C/min, imme-diately following partial initial scanning and then im-mediate cooling, at nominal 320°C/min, to 20°C. (FromSlade, L and Levine, H., Carbohydr. Polym., 8, 183,1988. With permission.)
lines in parts B through H. In contrast to Figure98, amylose-lipid melting transitions above 100°Care absent for this essentially amylose-free starch.Based on the same analysis and logic describedfor Figure 98, and equally successful superpo-
318
Dow
nloa
ded
by [
Tex
as A
&M
Uni
vers
ity L
ibra
ries
] at
10:
57 0
9 Ja
nuar
y 20
18
sition of the instrumental baseline response ofinitial and rescans (e.g., Figure 99 part B in thetemperature range from 30 to 60°C and H from95 to 130°C), the following results have beenobtained from Figure 99. Parts C through H man-ifest displaced baselines, in the temperature range30 to =s 65°C, for the initial and rescans, whilepart B shows superimposed baselines in the sametemperature range. Accordingly, the effectiveend-of-softening Tg preceding crystallite meltingis identified as >63 and <71.5°C from Figure99C. As for wheat starch in Figure 98, this upperlimit for Tg corresponds to the temperature at the"peak minimum" in the typical DSC thermo-gram for waxy corn starch gelatinization shownin Figure 99A. The narrow temperature span ofthis Tg occurs within the range 64 to 71.5°C,along the leading edge of the endotherm. Part Hreveals an effective end-of-melting Tm = 95°C,where the initial scan returns to baseline aftergelatinization. This is corroborated in part G,where the thermal profile, upon initial heating to94°C, stops just short of a return to baseline. Asin Figure 98E, Figure 99C illustrates a separationof the melting transition of A-type microcrystal-lites from the glass transition that must precedeit. However, in this case, the melting transitioncan be unambiguously assigned to the micro-crystalline, clustered amylopectin branches, andthe glass transition to the contiguous amorphousregions of water-plasticized amylopectin. Therescan of Figure 99C shows a nearly symmetricalmelting endotherm with the following features:onset temperature of 71.5°C, coinciding with Tg;peak minimum of about 78°C; and end-of-melt-ing Tm at 95°C. Waxy corn starch in Figure 99C,like normal wheat starch in Figure 98E, showsan undetectably small baseline shift from its lead-ing to trailing end for the isolated melting tran-sition associated with gelatinization in excessmoisture. Thus, these DSC results demonstrateconclusively that the change in heat capacity,illustrated in Figures 98 and 99, is associatedentirely with the glass transition that immediatelyprecedes the crystalline melting endotherm. Incontrast, Yost and Hoseney52 have also observedsuch a change in heat capacity (between an initialpartial heating scan, to a single intermediate tem-perature, and a complete rescan) for native wheatstarch in 50 w% water, but because they did not
observe a Tg (at the subzero Tg') in the DSCrescan, Zeleznak and Hoseney53 have suggestedinstead that it "merely indicates that the heatcapacity of a starch-water suspension is lowerthan that of gelatinized starch." Figures 98E and99C demonstrate the actual explanation for theirobservation.
Russell60 has published DSC thermograms(showing initial complete heating scans and su-perimposed immediate complete rescans) for na-tive wheat and waxy corn starches at 57 w% totalmoisture content that are very similar in appear-ance to Figure 98 (curves A and L) and Figure99 (curves A and H), respectively. He also ob-served and recognized the characteristic changein heat capacity (ACp) as signifying a glass tran-sition immediately preceding crystallite melting.However, because of the "very small ACp (about0.1 J/°C g sample)" associated with this baselineshift, Russell's60 concluding remarks stoppedshort of a wholehearted endorsement (' 'it is likelythat a glass transition is associated with starchgelatinization") of the concept1721 by subse-quently referring to "the putative glass transi-tion". With respect to the magnitude of ACp forthe glass transition exhibited in Figures 98 "and99, it has been demonstrated,23 as mentioned ear-lier, that the magnitude of the baseline shift forthe glass transition of amylopectin is equivalentin magnitude to the ACp that would be observedfor a comparable weight of completely amor-phous pure polystyrene at its Tg.
With the aim of deconvolving the contri-butions of amylopectin and amylose to the non-equilibrium melting behavior of native granularwheat and waxy corn starches in 55 w% mois-ture, the effective values of Tg and end-of-melt-ing Tm have been compared: for wheat starch,Tg - 63°C and Tm = 92°C, while for waxy cornstarch, Tg = 71.5°C and Tm « 95°C. Theseeffective end-of-melting Tm values, rather thanthe corresponding onset or peak values, have beenchosen for comparison,21 because they wouldrepresent melting of the largest and/or most per-fected microcrystals,100-105 and so would be mostrelevant to the comparison of Tg/Tm ratios.60-161
For both starches, the Tm values are similar. Incontrast, the effective Tg for wheat starch is sig-nificantly lower than the value for waxy cornstarch. The values of the ratio of effective Tg/
319
Dow
nloa
ded
by [
Tex
as A
&M
Uni
vers
ity L
ibra
ries
] at
10:
57 0
9 Ja
nuar
y 20
18
end-of-melting Tm, relevant to gelatinization ofthese native granular starches in 55 w% water byDSC heating at 10°C/min, are 0.92 for wheat and0.94 for waxy corn. For water-compatible poly-mers other than starch, such anomalously highTg/Tm ratios >0.9 have been attributed to theinfluence of metastable supramolecular structurewith non-uniform moisture distribution.15-383
The effective values of Tg identified as de-scribed earlier, which are associated with first-stage swelling of native granular starches heatedin 55 w% water, do not represent the Tg of amor-phous regions of native granules at about 10 w%total moisture. Recent evidence has suggestedthat the value for that operative Tg is >100°Cfor several different normal and waxy cereal grainstarches.19-46-53 Nor do they represent the Tg ofcompletely amorphous gelatinized starch at 55w% moisture, which is actually Tg' of — 5°C.The values of Tg reported are those manifestedby the amorphous regions of native granules dur-ing the dynamic process of plasticization by heat(increasing at 10°C/min in the temperature rangefrom 20 to 130°C) and moisture uptake (increas-ing in the range from 10 to 55 w%) and representparticular, intermediate values, within a contin-uum, which depend on the instantaneously op-erative temperature and content of plasticizingwater.21
As discussed earlier, when the experimentalhistory with respect to heating rate, temperaturerange, and total sample moisture content is thesame, the thermal profiles of amylose-containingnormal wheat starch in Figure 98 and essentiallyamylose-free waxy corn starch in Figure 99 donot differ qualitatively below 100°C. The majorqualitative difference is the presence of a meltingtransition above 100°C for crystalline lipid-amy-lose complex in the initial scans of normal wheatstarch (also seen in immediate rescans as a resultof recrystallization from the self-seeded melt),and the absence of this transition in the thermalprofiles for waxy corn starch. The qualitativesimilarity of the thermal behavior of normal andwaxy starches below 100°C indicates that thethermal profiles represent non-equilibrium melt-ing of microcrystals composed of hydrated clus-ters of amylopectin branches in both cases, withno significant contributions from amylose.21 Thus,the quantitative differences between the values
of the operative end-of-softening Tg and end-of-melting Tm for normal wheat vs. waxy corn starchshould be explained on the basis of structure-property differences in their amylopectin com-ponents. Sample history (path dependence, suchas jumps in moisture, temperature, or pressure)is often more important than inherent equilibriumthermodynamic properties, and as important aschemical structure for the explication of struc-ture-property differences in non-equilibrium sys-tems.26-30 Moreover, the starch-water system isneither spatially nor molecularly homogeneous,and the greater anomaly in Tg/Tm ratio for waxycorn starch compared to normal wheat starch willalso depend highly on contributions of samplehistory as well as the structural biochemistry ofthe starch.21
For a similar initial operative level of waterplasticization in both the normal wheat and waxycorn starch systems, the quantitative differencesseen for Tg, non-equilibrium Tm, and Tg/Tmratio associated with gelatinization and pasting,can be explained by the previously mentionedfact that, for homologous amorphous polymers,Tg increases with increasing average MW.21 Sig-nificantly lower average MW of the amorphousregions of the starch granule would allow a greaterrate of water uptake and greater values for theinstantaneous extent of water plasticization at eachtime point in the DSC experiment. The under-lying basis for the difference in operative averageMW of the amorphous regions of the native amy-lopectins was described earlier. Disproportiona-tion of more mobile branches with lower linearDP to the microcrystalline domains leads to higheraverage MW in the residual amorphous regions,and, consequently, to higher effective values ofTg and kinetically constrained Tm.20 For this rea-son, the relative extents of crystallinity, rangingfrom 15 to 45%, of native starches from varioussources and with both A- and B-type diffractionpatterns, are directly related to their gelatiniza-tion temperatures.160-413-421 The "high amylose"starches that result from the amylose-extendermutation, and which give misleading blue valuedeterminations of 60% amylose content,422 are anapparent exception to this rule of thumb. Buteven in the case of this so-called high-amylosestarch, it is the anomalous amylopectin, with itslong, unclustered, non-crystalline branches, that
320
Dow
nloa
ded
by [
Tex
as A
&M
Uni
vers
ity L
ibra
ries
] at
10:
57 0
9 Ja
nuar
y 20
18
produces the dramatically elevated values of Tgand, indirectly, of Tm, in spite of the inherentlylow Tm of (isolated) B-type crystals.21 (B-typecrystals, isolated to remove kinetic constraints onmelting due to amorphous surroundings, wouldmelt at a lower temperature than isolated A-typecrystals.21) Like the silo-aging process for riceand high-humidity drying process for potato,421
the wet-milling process for corn provides an op-portunity for annealing of starch420 and concom-itant elevation in extent of crystallinity, averageMW of residual disproportionated amorphous re-gions of amylopectin, and gelatinization Tg.21
The study of the gelatinization process bySlade and Levine21 has dealt exclusively with A-type cereal grain starches rather than B-type tuberand root starches, such as from potato. The sameis true of earlier studies: (1) by Slade and co-workers,1720-46 (2) of Tg and annealing by Yostand Hoseney52 and Zeleznak and Hoseney,53 and(3) of annealing by Krueger et al.420 and Naka-zawa et al.419 In addition to possible differencesin extent of crystallinity due to process varia-tions,421 B-type native granular starches often havehigher "as is" moisture contents in both theamorphous and crystalline regions than A-typestarches (i.e., overall, but likewise heteroge-neously distributed, moisture contents of about18 to 20 w% for B-type vs. about 6 to 10 w%for A-type).153-400 Thus, the initial instanta-neously operative extent of plasticization of thecontinuous amorphous matrix, which subse-quently governs the non-equilibrium melting ofthe disperse microcrystalline regions, can be sig-nificantly different for B- vs. A-type starches20
and can contribute to the observed lower gela-tinization temperature of potato starch.421 How-ever, the generic description of the gelatinizationprocess for cereal starches17-18 is still valid forpotato starch. Less extensive drying subsequentto starch biosynthesis results in greater preexist-ing moisture content in the amorphous regionsof commercial potato starch, greater free volume,and depressed effective Tg, and in the crystallineregions, depressed effective end-of-melting Tm.23
The functional attributes and physical properties,including extent of crystallinity and X-ray dif-fraction pattern, of potato starch can be alteredby deliberate drying226-421 or heat/moisturetreatment158-421-423 to resemble those of cereal
starches. As a consequence of preexisting plas-ticization by water, depressed initial Tg, greaterinitial mobility, and lower end-of-melting Tm,the entire heating profile of the gelatinization ofnative potato starch is sharper and narrower thanfor cereal-like treated potato starch at the sametotal moisture content of the sample (moisturecontent of starch plus added water) and is cen-tered at a lower temperature.21
It cannot be overemphasized that the glasstransition in starch, as in any other amorphousor partially crystalline material, represents a rate-limiting stage of a relaxation process,107 for whichthe spectrum of relaxation rates depends on theinstantaneous magnitude of the free volume and/or local viscosity, which in turn depends on therelative values of experimental moisture com-pared to Wg of the operative glass, experimentaltemperature compared to instantaneous Tg, andexperimental time frame compared to the instan-taneous relaxation time.21 Thus, when DSC heat-ing rates approach the operative relaxation ratesfor a measured process, a lower heating rate wouldresult in observation of a lower Tg value. Angell172
has described the heating-rate dependence ofthermograms used to define Tg as "the mostfamiliar feature of the glass transition." Theo-retically, heating at 1°C rather than 10°C/minwould result in a Tg lower by about 3°C, ascalculated from the WLF equation for well-be-haved polymers with Tg/Tm ratios near 0.67.50
Tg differences of 3 to 5°C per order of magnitudeare expected over broader ranges of experimentalrates (or frequencies) for such well-behaved poly-mers, since the relaxation spectrum changesgradually from WLF to Arrhenius kinetics overa temperature interval of about 100°C above Tg.30
Experimentally, this expectation has been con-firmed in the case of polystyrene, for which thevalue of Tg is lower by 15°C when the heatingrate is decreased from l°C/s to l°C/h, a factor of3600.10S DSC experiments with slow heating ratesof less than 0.5°C/min, for very dilute aqueouspotato starch suspensions of about 2% solids,have allowed a very small scale micro-reversi-bility, which has been misinterpreted as the abil-ity to achieve and maintain equilibrium through-out the gelatinization process.424 Loss of temporalresolution of the thermal events due to the greatlyexcess moisture content accounted for part of the
321
Dow
nloa
ded
by [
Tex
as A
&M
Uni
vers
ity L
ibra
ries
] at
10:
57 0
9 Ja
nuar
y 20
18

apparent micro-reversibility.21 Actually, isoth-ermal treatment of aqueous rice starch slurrieswith excess moisture (50% solids), for more than100 h at various temperatures between 40 to 85°C(equivalent to infinitely slow heating rates), isnot sufficient to approach an equilibrium state,419
as expected, since the melting of partially crys-talline systems is never an equilibrium process.106
The dynamic nature of the glass transition isalso reflected in the non-equilibrium annealingprocess for native starches in the presence ofmoisture which is insufficient for massive sec-ond-stage swelling. For example, recent resultsfor annealing (to measurable, but not necessarilyequal, extents, for different granular starches) atdifferent temperatures and times have includedthe following: (1) waxy corn at 55 w% moisture,70°C for 10 min or 65°C for 30 min;19 (2) wheatat 50 w% moisture, 72°C for 30 min or roomtemperature for 24 h;52 (3) dent corn in excessadded water, 60°C for 15 min, 55°C for 2 h, or50°C for 48 h;420 (4) normal and waxy rices at50 w% moisture, at from 85°C for 5 min to 40°Cfor 140 h;419 and (5) wheat at 55 w% moisture,25°C for 55 d.17-18 Comparison of these resultsdemonstrates a mobility transformation with re-spect to time, temperature, and effectively plas-ticizing moisture content and has led to the con-clusion that significant annealing at lowertemperatures for longer times is controlled by alower operative Tg (resulting from a longer ex-perimental time frame) than the Tg that precedescrystallite melting by heat/moisture treatment inthe DSC.21 In other words, the operative Tg rel-evant to annealing at Tg < Ta < Tm decreaseswith increasing holding time in excess addedmoisture at lower temperatures, due to the effectof dynamic plasticization. This situation can bevisualized in the dynamics map in Figure 95. Asthe extent of plasticization increases (i.e., as Wgincreases toward Wg'), the effective Tg de-creases toward Tg', and so the temperature rangefor annealing between the operative Tg and Tmbroadens. Under conditions where the operativeTg has clearly fallen to Tg' at -5°C (and Wghas increased to Wg'), significant annealing hasalso been observed in retrograded starch gels andbaked bread aged at storage temperatures wellabove room temperature, and thus much closerto Tm than Tg.95-425 The unifying explanation lies
in the fact that the progressively resultant eventsof plasticization, mechanical relaxation above theglass transition, and functional manifestation (in-cluding starch gelatinization, crystallite melting,annealing, and recrystallization) are all dynamic,non-equilibrium processes, the kinetics of whichare governed by WLF theory for glass-formingsystems.21
2. Effect of Sugars on StarchGelatinization
The description of the effect of water as aplasticizer on native starch, from the perspectiveof starch as a partially crystalline glassy polymersystem, has been extended to the next level ofcomplexity, i.e., three-component model sys-tems of native starch, water, plus added sug-ars.17'18-20 This extension is based on a recogni-tion of gelatinization of granular starch in aqueousmedia as (1) a diffusion-limited, mechanical re-laxation process with non-Arrhenius kinetics thatdepend on the mobility of the added plasti-cizer;21-30 and (2) a non-equilibrium melting pro-cess (as a consequence of heat/moisture treat-ment), which becomes cooperative and occurs ata significant rate at a characteristic gelatinizationtemperature corresponding to the instantaneousTg (i.e., Tgelat = Tg) of the water-plasticizedamorphous regions of amylopectin.21 Gelatini-zation in concentrated aqueous solutions of com-mon small sugars begins at a higher Tgelat thanin water alone; a retardation effect that has beensuggested to result from "antiplasticization" (asdefined for synthetic polymers109) by sugar-watercosolvents, relative to the extent of plasticizationby water alone.17-18-20 Sugar-water, of higher av-erage MW than water alone, causes a smallerdepression of starch Tg than does pure water. Infact, isothermal treatment of starch in sugar-water,at a temperature that would result in non-equi-librium melting of amylopectin in water alone,results instead in antiplasticization by annealingand crystallite perfection.20
It has been known empirically for decadesthat various sugars, including sucrose, fructose,and glucose, raise the temperature of gelatini-zation of starch in water and delay the increasein viscosity (pasting), and that this effect in-
322
Dow
nloa
ded
by [
Tex
as A
&M
Uni
vers
ity L
ibra
ries
] at
10:
57 0
9 Ja
nuar
y 20
18
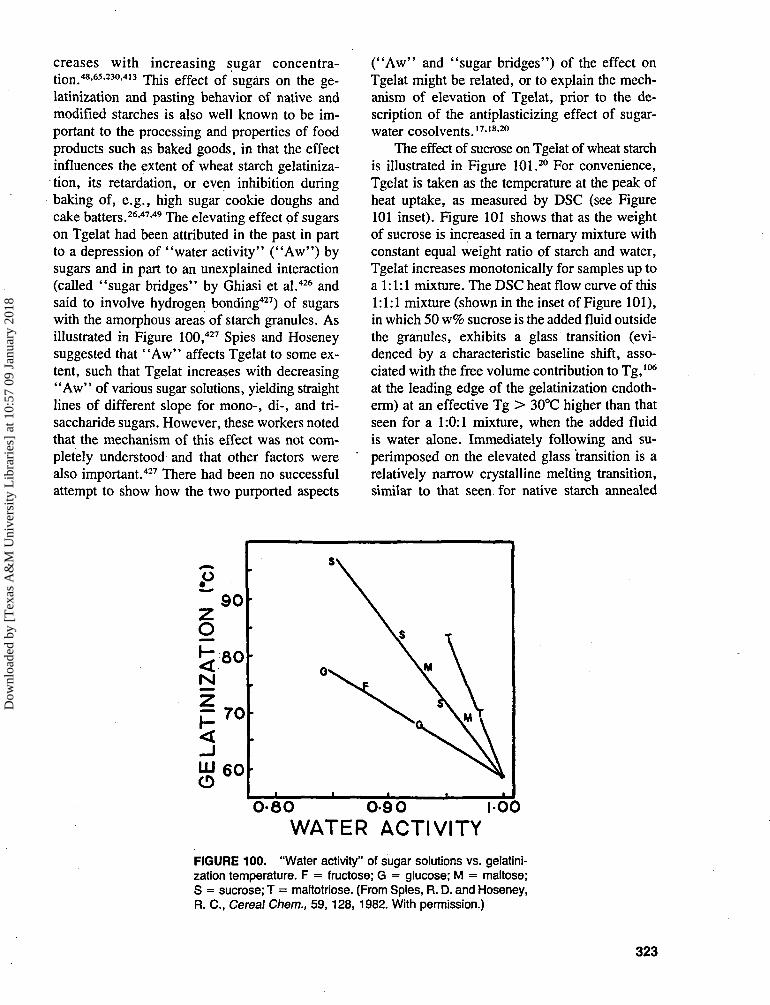
creases with increasing sugar concentra-tion.4865-230-413 This effect of sugars on the ge-latinization and pasting behavior of native andmodified starches is also well known to be im-portant to the processing and properties of foodproducts such as baked goods, in that the effectinfluences the extent of wheat starch gelatiniza-tion, its retardation, or even inhibition duringbaking of, e.g., high sugar cookie doughs andcake batters.2647-49 The elevating effect of sugarson Tgelat had been attributed in the past in partto a depression of "water activity" ("Aw") bysugars and in part to an unexplained interaction(called "sugar bridges" by Ghiasi et al.426 andsaid to involve hydrogen bonding427) of sugarswith the amorphous areas of starch granules. Asillustrated in Figure 100,427 Spies and Hoseneysuggested that "Aw" affects Tgelat to some ex-tent, such that Tgelat increases with decreasing"Aw" of various sugar solutions, yielding straightlines of different slope for mono-, di-, and tri-saccharide sugars. However, these workers notedthat the mechanism of this effect was not com-pletely understood and that other factors werealso important.427 There had been no successfulattempt to show how the two purported aspects
("Aw" and "sugar bridges") of the effect onTgelat might be related, or to explain the mech-anism of elevation of Tgelat, prior to the de-scription of the antiplasticizing effect of sugar-water cosolvents.17'18-20
The effect of sucrose on Tgelat of wheat starchis illustrated in Figure 101.20 For convenience,Tgelat is taken as the temperature at the peak ofheat uptake, as measured by DSC (see Figure101 inset). Figure 101 shows that as the weightof sucrose is increased in a ternary mixture withconstant equal weight ratio of starch and water,Tgelat increases monotonically for samples up toa 1:1:1 mixture. The DSC heat flow curve of this1:1:1 mixture (shown in the inset of Figure 101),in which 50 w% sucrose is the added fluid outsidethe granules, exhibits a glass transition (evi-denced by a characteristic baseline shift, asso-ciated with the free volume contribution to Tg,106
at the leading edge of the gelatinization endoth-erm) at an effective Tg > 30°C higher than thatseen for a 1:0:1 mixture, when the added fluidis water alone. Immediately following and su-perimposed on the elevated glass transition is arelatively narrow crystalline melting transition,similar to that seen for native starch annealed
0-80 0-90 100WATER ACTIVITY
FIGURE 100. "Water activity" of sugar solutions vs. gelatini-zation temperature. F = fructose; G = glucose; M = maltose;S = sucrose; T = maltotriose. (From Spies, R. D. and Hoseney,R. C., Cereal Chem., 59, 128, 1982. With permission.)
323
Dow
nloa
ded
by [
Tex
as A
&M
Uni
vers
ity L
ibra
ries
] at
10:
57 0
9 Ja
nuar
y 20
18
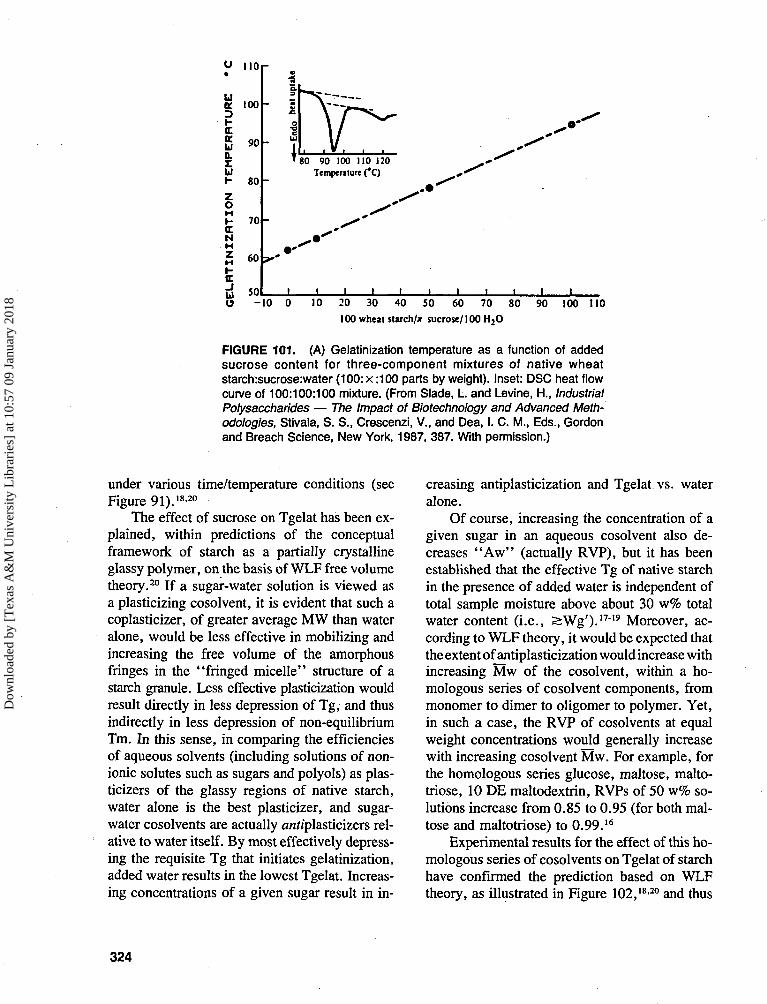
110
a. too
a.g 900.
u
o
a.N
80
70
M 6 0
cJ 50Id
o
'80 90 100 110 120Tempenlure (*C)
-10 0 10 20 30 40 50 60 70 80 90 100 110100 wheat starch/* sucrose/100 H2O
FIGURE 101. (A) Gelatinization temperature as a function of addedsucrose content for three-component mixtures of native wheatstarch:sucrose:water (100:x :100 parts by weight). Inset: DSC heat flowcurve of 100:100:100 mixture. (From Slade, L and Levine, H., IndustrialPolysaccharides — The Impact of Biotechnology and Advanced Meth-odologies, Stivala, S. S., Crescenzi, V., and Dea, I. C. M., Eds., Gordonand Breach Science, New York, 1987, 387. With permission.)
under various time/temperature conditions (seeFigure 91).18-20
The effect of sucrose on Tgelat has been ex-plained, within predictions of the conceptualframework of starch as a partially crystallineglassy polymer, on the basis of WLF free volumetheory.20 If a sugar-water solution is viewed asa plasticizing cosolvent, it is evident that such acoplasticizer, of greater average MW than wateralone, would be less effective in mobilizing andincreasing the free volume of the amorphousfringes in the "fringed micelle" structure of astarch granule. Less effective plasticization wouldresult directly in less depression of Tg, and thusindirectly in less depression of non-equilibriumTm. In this sense, in comparing the efficienciesof aqueous solvents (including solutions of non-ionic solutes such as sugars and polyols) as plas-ticizers of the glassy regions of native starch,water alone is the best plasticizer, and sugar-water cosolvents are actually a/tf/plasticizers rel-ative to water itself. By most effectively depress-ing the requisite Tg that initiates gelatinization,added water results in the lowest Tgelat. Increas-ing concentrations of a given sugar result in in-
creasing antiplasticization and Tgelat vs. wateralone.
Of course, increasing the concentration of agiven sugar in an aqueous cosolvent also de-creases "Aw" (actually RVP), but it has beenestablished that the effective Tg of native starchin the presence of added water is independent oftotal sample moisture above about 30 w% totalwater content (i.e., ^Wg')-17"19 Moreover, ac-cording to WLF theory, it would be expected thatthe extent of antiplasticization would increase withincreasing Mw of the cosolvent, within a ho-mologous series of cosolvent components, frommonomer to dimer to oligomer to polymer. Yet,in such a case, the RVP of cosolvents at equalweight concentrations would generally increasewith increasing cosolvent Mw. For example, forthe homologous series glucose, maltose, malto-triose, 10 DE maltodextrin, RVPs of 50 w% so-lutions increase from 0.85 to 0.95 (for both mal-tose and maltotriose) to 0.99.16
Experimental results for the effect of this ho-mologous series of cosolvents on Tgelat of starchhave confirmed the prediction based on WLFtheory, as illustrated in Figure 102,18>2° and thus
324
Dow
nloa
ded
by [
Tex
as A
&M
Uni
vers
ity L
ibra
ries
] at
10:
57 0
9 Ja
nuar
y 20
18
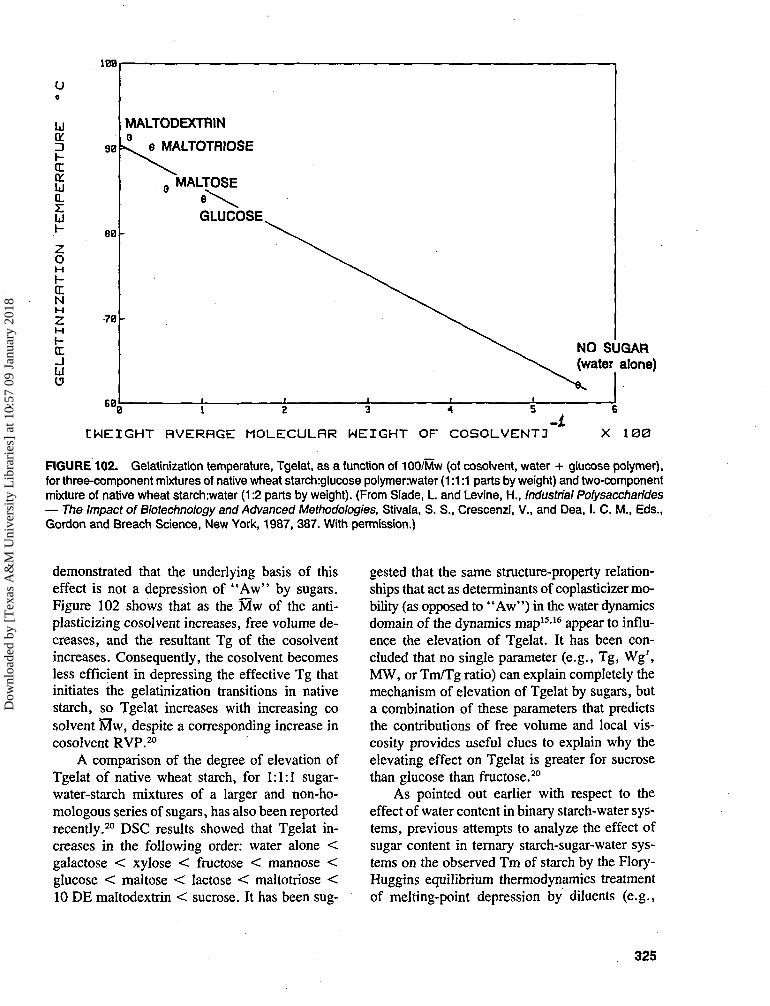
108
u0
hrxonuQ.
zuI -
zoHI -rxNH
zH
I -rr_Ju
70
60,
MALTODEXTRIN
8 o MALTOTRIOSE
MALTOSE
GLUCOSE.
NO SUGAR(water alone)
CWEIGHT RVERRGE MOLECULRR WEIGHT OF COSOLVENT3 X 1O0
FIGURE 102. Gelatinization temperature, Tgelat, as a function of 100/Mw (of cosolvent, water + glucose polymer),for three-component mixtures of native wheat starch:glucose polymer:water (1:1:1 parts by weight) and two-componentmixture of native wheat starch:water (1:2 parts by weight). (From Slade, L and Levine, H., Industrial Polysaccharides— The Impact of Biotechnology and Advanced Methodologies, Stivala, S. S., Crescenzi, V., and Dea, I. C. M., Eds.,Gordon and Breach Science, New York, 1987, 387. With permission.)
demonstrated that the underlying basis of thiseffect is not a depression of "Aw" by sugars.Figure 102 shows that as the Mw of the anti-plasticizing cosolvent increases, free volume de-creases, and the resultant Tg of the cosolventincreases. Consequently, the cosolvent becomesless efficient in depressing the effective Tg thatinitiates the gelatinization transitions in nativestarch, so Tgelat increases with increasing cosolvent Mw, despite a corresponding increase incosolvent RVP.20
A comparison of the degree of elevation ofTgelat of native wheat starch, for 1:1:1 sugar-water-starch mixtures of a larger and non-ho-mologous series of sugars, has also been reportedrecently.20 DSC results showed that Tgelat in-creases in the following order: water alone <galactose < xylose < fructose < mannose <glucose < maltose < lactose < maltotriose <10 DE maltodextrin < sucrose. It has been sug-
gested that the same structure-property relation-ships that act as determinants of coplasticizer mo-bility (as opposed to "Aw") in the water dynamicsdomain of the dynamics map15-16 appear to influ-ence the elevation of Tgelat. It has been con-cluded that no single parameter (e.g., Tg, Wg\MW, or Tm/Tg ratio) can explain completely themechanism of elevation of Tgelat by sugars, buta combination of these parameters that predictsthe contributions of free volume and local vis-cosity provides useful clues to explain why theelevating effect on Tgelat is greater for sucrosethan glucose than fructose.20
As pointed out earlier with respect to theeffect of water content in binary starch-water sys-tems, previous attempts to analyze the effect ofsugar content in ternary starch-sugar-water sys-tems on the observed Tm of starch by the Flory-Huggins equilibrium thermodynamics treatmentof melting-point depression by diluents (e.g.,
325
Dow
nloa
ded
by [
Tex
as A
&M
Uni
vers
ity L
ibra
ries
] at
10:
57 0
9 Ja
nuar
y 20
18
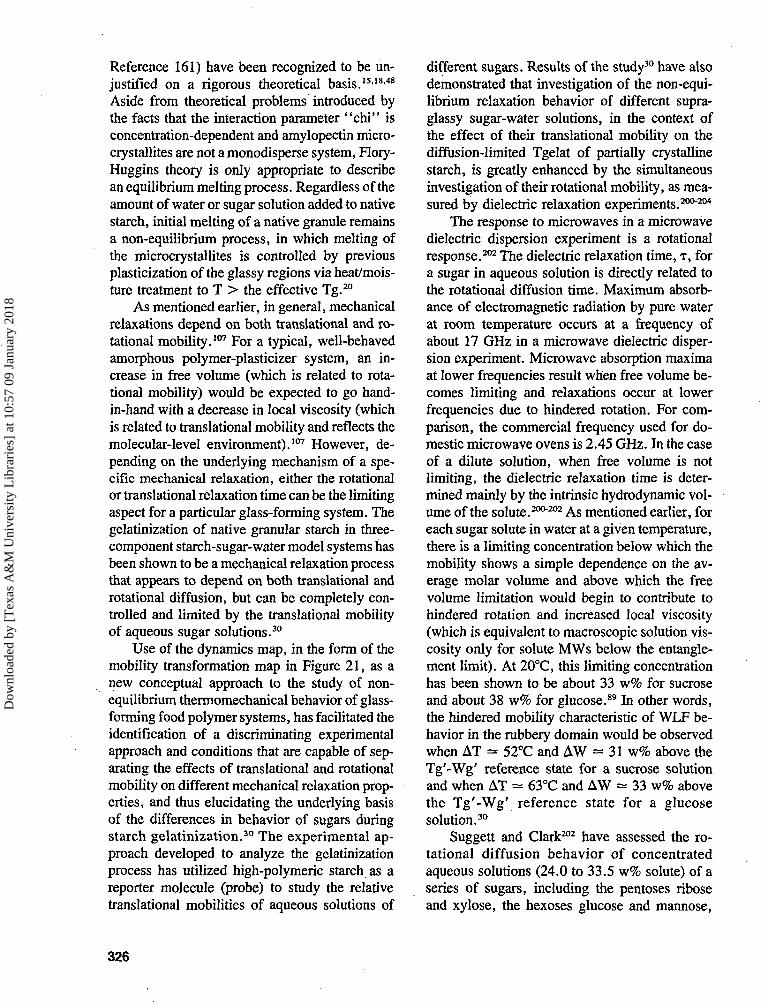
Reference 161) have been recognized to be un-justified on a rigorous theoretical basis.151848
Aside from theoretical problems introduced bythe facts that the interaction parameter "chi" isconcentration-dependent and amylopectin micro-crystallites are not a monodisperse system, Flory-Huggins theory is only appropriate to describean equilibrium melting process. Regardless of theamount of water or sugar solution added to nativestarch, initial melting of a native granule remainsa non-equilibrium process, in which melting ofthe microcrystallites is controlled by previousplasticization of the glassy regions via heat/mois-ture treatment to T > the effective Tg.20
As mentioned earlier, in general, mechanicalrelaxations depend on both translational and ro-tational mobility.107 For a typical, well-behavedamorphous polymer-plasticizer system, an in-crease in free volume (which is related to rota-tional mobility) would be expected to go hand-in-hand with a decrease in local viscosity (whichis related to translational mobility and reflects themolecular-level environment).107 However, de-pending on the underlying mechanism of a spe-cific mechanical relaxation, either the rotationalor translational relaxation time can be the limitingaspect for a particular glass-forming system. Thegelatinization of native granular starch in three-component starch-sugar-water model systems hasbeen shown to be a mechanical relaxation processthat appears to depend on both translational androtational diffusion, but can be completely con-trolled and limited by the translational mobilityof aqueous sugar solutions.30
Use of the dynamics map, in the form of themobility transformation map in Figure 21, as anew conceptual approach to the study of non-equilibrium thermomechanical behavior of glass-forming food polymer systems, has facilitated theidentification of a discriminating experimentalapproach and conditions that are capable of sep-arating the effects of translational and rotationalmobility on different mechanical relaxation prop-erties, and thus elucidating the underlying basisof the differences in behavior of sugars duringstarch gelatinization.30 The experimental ap-proach developed to analyze the gelatinizationprocess has utilized high-polymeric starch as areporter molecule (probe) to study the relativetranslational mobilities of aqueous solutions of
different sugars. Results of the study30 have alsodemonstrated that investigation of the non-equi-librium relaxation behavior of different supra-glassy sugar-water solutions, in the context ofthe effect of their translational mobility on thediffusion-limited Tgelat of partially crystallinestarch, is greatly enhanced by the simultaneousinvestigation of their rotational mobility, as mea-sured by dielectric relaxation experiments.200204
The response to microwaves in a microwavedielectric dispersion experiment is a rotationalresponse.202 The dielectric relaxation time, T, fora sugar in aqueous solution is directly related tothe rotational diffusion time. Maximum absorb-ance of electromagnetic radiation by pure waterat room temperature occurs at a frequency ofabout 17 GHz in a microwave dielectric disper-sion experiment. Microwave absorption maximaat lower frequencies result when free volume be-comes limiting and relaxations occur at lowerfrequencies due to hindered rotation. For com-parison, the commercial frequency used for do-mestic microwave ovens is 2.45 GHz. In the caseof a dilute solution, when free volume is notlimiting, the dielectric relaxation time is deter-mined mainly by the intrinsic hydrodynamic vol-ume of the solute.200"202 As mentioned earlier, foreach sugar solute in water at a given temperature,there is a limiting concentration below which themobility shows a simple dependence on the av-erage molar volume and above which the freevolume limitation would begin to contribute tohindered rotation and increased local viscosity(which is equivalent to macroscopic solution vis-cosity only for solute MWs below the entangle-ment limit). At 20°C, this limiting concentrationhas been shown to be about 33 w% for sucroseand about 38 w% for glucose.89 In other words,the hindered mobility characteristic of WLF be-havior in the rubbery domain would be observedwhen AT = 52°C and AW = 31 w% above theTg'-Wg' reference state for a sucrose solutionand when AT = 63°C and AW = 33 w% abovethe Tg'-Wg' reference state for a glucosesolution.30
Suggett and Clark202 have assessed the ro-tational diffusion behavior of concentratedaqueous solutions (24.0 to 33.5 w% solute) of aseries of sugars, including the pentoses riboseand xylose, the hexoses glucose and mannose,
326
Dow
nloa
ded
by [
Tex
as A
&M
Uni
vers
ity L
ibra
ries
] at
10:
57 0
9 Ja
nuar
y 20
18
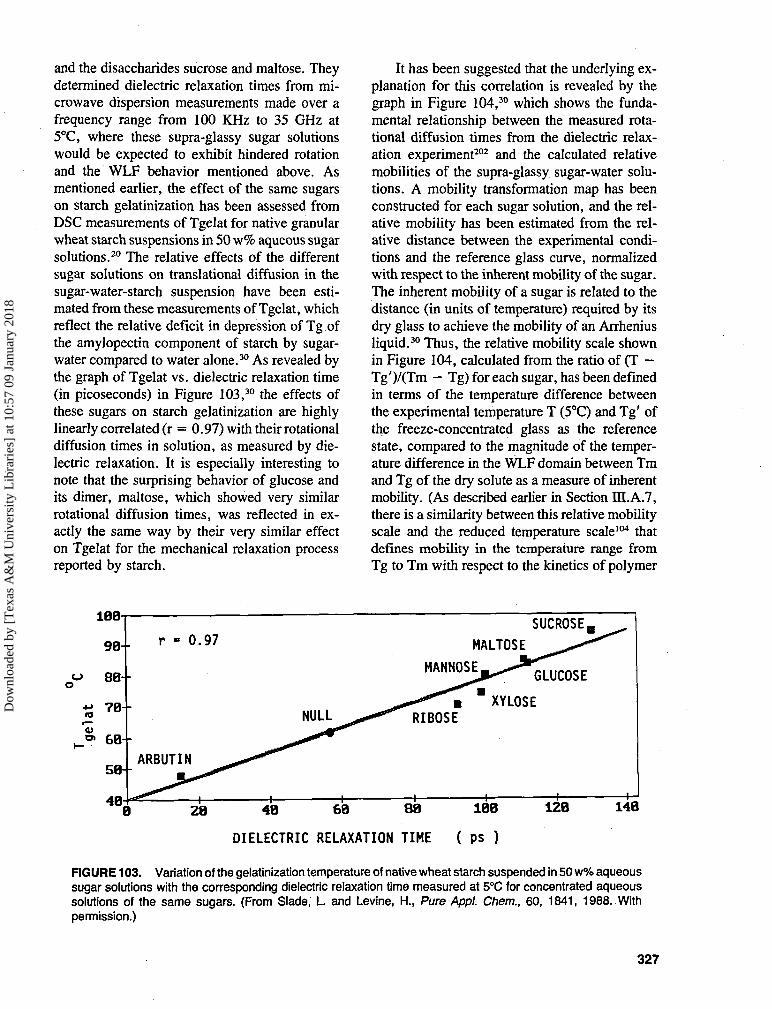
and the disaccharides sucrose and maltose. Theydetermined dielectric relaxation times from mi-crowave dispersion measurements made over afrequency range from 100 KHz to 35 GHz at5°C, where these supra-glassy sugar solutionswould be expected to exhibit hindered rotationand the WLF behavior mentioned above. Asmentioned earlier, the effect of the same sugarson starch gelatinization has been assessed fromDSC measurements of Tgelat for native granularwheat starch suspensions in 50 w% aqueous sugarsolutions.20 The relative effects of the differentsugar solutions on translational diffusion in thesugar-water-starch suspension have been esti-mated from these measurements of Tgelat, whichreflect the relative deficit in depression of Tg ofthe amylopectin component of starch by sugar-water compared to water alone.30 As revealed bythe graph of Tgelat vs. dielectric relaxation time(in picoseconds) in Figure 103,30 the effects ofthese sugars on starch gelatinization are highlylinearly correlated (r = 0.97) with their rotationaldiffusion times in solution, as measured by die-lectric relaxation. It is especially interesting tonote that the surprising behavior of glucose andits dimer, maltose, which showed very similarrotational diffusion times, was reflected in ex-actly the same way by their very similar effecton Tgelat for the mechanical relaxation processreported by starch.
It has been suggested that the underlying ex-planation for this correlation is revealed by thegraph in Figure 104,30 which shows the funda-mental relationship between the measured rota-tional diffusion times from the dielectric relax-ation experiment202 and the calculated relativemobilities of the supra-glassy sugar-water solu-tions. A mobility transformation map has beenconstructed for each sugar solution, and the rel-ative mobility has been estimated from the rel-ative distance between the experimental condi-tions and the reference glass curve, normalizedwith respect to the inherent mobility of the sugar.The inherent mobility of a sugar is related to thedistance (in units of temperature) required by itsdry glass to achieve the mobility of an Arrheniusliquid.30 Thus, the relative mobility scale shownin Figure 104, calculated from the ratio of (T —Tg')/(Tm — Tg) for each sugar, has been definedin terms of the temperature difference betweenthe experimental temperature T (5°C) and Tg' ofthe freeze-concentrated glass as the referencestate, compared to the magnitude of the temper-ature difference in the WLF domain between Tmand Tg of the dry solute as a measure of inherentmobility. (As described earlier in Section III.A.7,there is a similarity between this relative mobilityscale and the reduced temperature scale104 thatdefines mobility in the temperature range fromTg to Tm with respect to the kinetics of polymer
0)
188
98
88
; 78
58
48
SUCROSE,r = 0.97 MALTOSE
MANNOSE,GLUCOSE
NULLXYLOSE
RIBOSE
ARBUTIN
8 48 68 88 188
DIELECTRIC RELAXATION TIME ( ps )
128 148
FIGURE 103. Variation of the gelatinization temperature of native wheat starch suspended in 50 w% aqueoussugar solutions with the corresponding dielectric relaxation time measured at 5°C for concentrated aqueoussolutions of the same sugars. (From Slade, L. and Levine, H., Pure Appl. Chem., 60, 1841, 1988. Withpermission.)
327
Dow
nloa
ded
by [
Tex
as A
&M
Uni
vers
ity L
ibra
ries
] at
10:
57 0
9 Ja
nuar
y 20
18
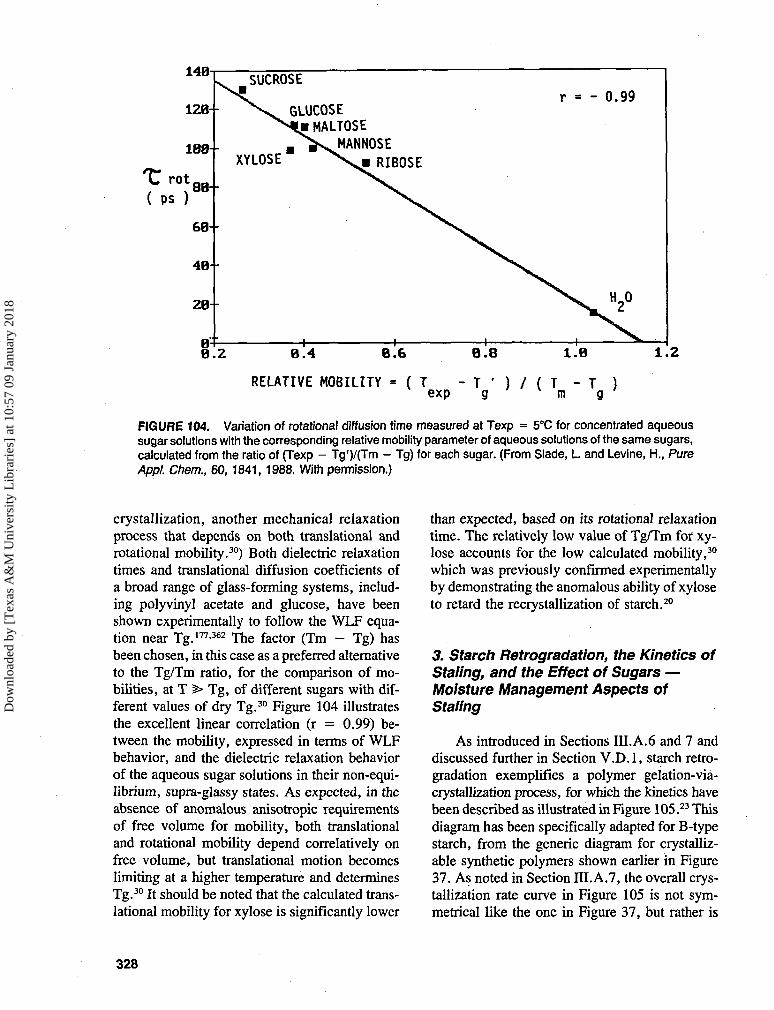
148
128-
188 •
trot( PS )
88-•
68
48-
28-
SUCROSE
GLUCOSEiMALTOSE
MANNOSEXYLOSE" \ . R I B O S E
- 0.99
• + •
8.4 8.6
RELATIVE MOBILITY = ( T
8 . 8 1.8 1.2
- T ' ) / ( T - T )exp g m g
FIGURE 104. Variation of rotational diffusion time measured at Texp = 5°C for concentrated aqueoussugar solutions with the corresponding relative mobility parameter of aqueous solutions of the same sugars,calculated from the ratio of (Texp - Tg')/(Tm - Tg) for each sugar. (From Slade, L. and Levine, H., PureAppl. Chem., 60,1841,1988. With permission.)
crystallization, another mechanical relaxationprocess that depends on both translational androtational mobility.30) Both dielectric relaxationtimes and translational diffusion coefficients ofa broad range of glass-forming systems, includ-ing polyvinyl acetate and glucose, have beenshown experimentally to follow the WLF equa-tion near Tg.177-362 The factor (Tm - Tg) hasbeen chosen, in this case as a preferred alternativeto the Tg/Tm ratio, for the comparison of mo-bilities, at T >̂ Tg, of different sugars with dif-ferent values of dry Tg.30 Figure 104 illustratesthe excellent linear correlation (r = 0.99) be-tween the mobility, expressed in terms of WLFbehavior, and the dielectric relaxation behaviorof the aqueous sugar solutions in their non-equi-librium, supra-glassy states. As expected, in theabsence of anomalous anisotropic requirementsof free volume for mobility, both translationaland rotational mobility depend correlatively onfree volume, but translational motion becomeslimiting at a higher temperature and determinesTg.30 It should be noted that the calculated trans-lational mobility for xylose is significantly lower
than expected, based on its rotational relaxationtime. The relatively low value of Tg/Tm for xy-lose accounts for the low calculated mobility,30
which was previously confirmed experimentallyby demonstrating the anomalous ability of xyloseto retard the recrystallization of starch.20
3. Starch Retrogradation, the Kinetics ofStaling, and the Effect of Sugars —Moisture Management Aspects ofStaling
As introduced in Sections III.A.6 and 7 anddiscussed further in Section V.D.I, starch retro-gradation exemplifies a polymer gelation-via-crystallization process, for which the kinetics havebeen described as illustrated in Figure 105.23 Thisdiagram has been specifically adapted for B-typestarch, from the generic diagram for crystalliz-able synthetic polymers shown earlier in Figure37. As noted in Section III.A.7, the overall crys-tallization rate curve in Figure 105 is not sym-metrical like the one in Figure 37, but rather is
328
Dow
nloa
ded
by [
Tex
as A
&M
Uni
vers
ity L
ibra
ries
] at
10:
57 0
9 Ja
nuar
y 20
18
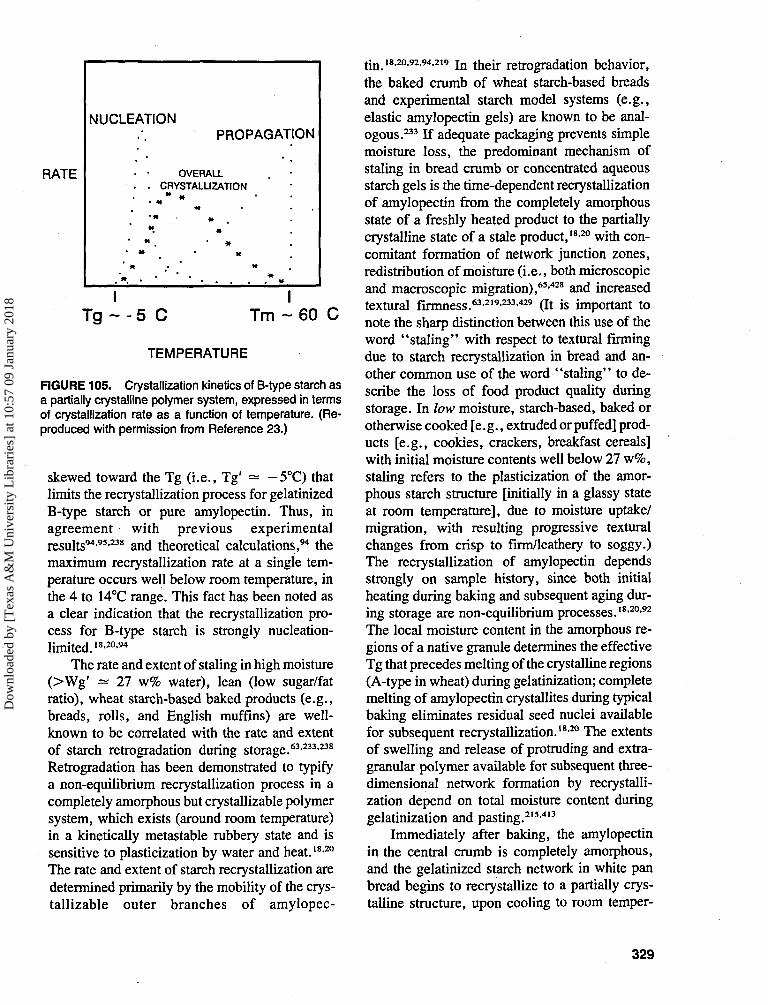
RATE
NUCLEATIONPROPAGATION
• • OVERALL
. . CRYSTALLIZATION
T g ~ - 5 CI
Tm ~ 60 C
TEMPERATURE
FIGURE 105. Crystallization kinetics of B-type starch asa partially crystalline polymer system, expressed in termsof crystallization rate as a function of temperature. (Re-produced with permission from Reference 23.)
skewed toward the Tg (i.e., Tg' — -5°C) thatlimits the recrystallization process for gelatinizedB-type starch or pure amylopectin. Thus, inagreement with previous experimentalresults94-95-238 and theoretical calculations,94 themaximum recrystallization rate at a single tem-perature occurs well below room temperature, inthe 4 to 14°C range. This fact has been noted asa clear indication that the recrystallization pro-cess for B-type starch is strongly nucleation-lirnited.18-20-94
The rate and extent of staling in high moisture(>Wg' =* 27 w% water), lean (low sugar/fatratio), wheat starch-based baked products (e.g.,breads, rolls, and English muffins) are well-known to be correlated with the rate and extentof starch retrogradation during storage.63-233-238
Retrogradation has been demonstrated to typifya non-equilibrium recrystallization process in acompletely amorphous but crystallizable polymersystem, which exists (around room temperature)in a kinetically metastable rubbery state and issensitive to plasticization by water and heat.18-20
The rate and extent of starch recrystallization aredetermined primarily by the mobility of the crys-tallizable outer branches of amylopec-
tin.18-20-92-94-219 In their retrogradation behavior,the baked crumb of wheat starch-based breadsand experimental starch model systems (e.g.,elastic amylopectin gels) are known to be anal-ogous.233 If adequate packaging prevents simplemoisture loss, the predominant mechanism ofstaling in bread crumb or concentrated aqueousstarch gels is the time-dependent recrystallizationof amylopectin from the completely amorphousstate of a freshly heated product to the partiallycrystalline state of a stale product,18-20 with con-comitant formation of network junction zones,redistribution of moisture (i.e., both microscopicand macroscopic migration),65-428 and increasedtextural firmness.63-219-233-429 (It is important tonote the sharp distinction between this use of theword "staling" with respect to textural firmingdue to starch recrystallization in bread and an-other common use of the word "staling" to de-scribe the loss of food product quality duringstorage. In low moisture, starch-based, baked orotherwise cooked [e.g., extruded or puffed] prod-ucts [e.g., cookies, crackers, breakfast cereals]with initial moisture contents well below 27 w%,staling refers to the plasticization of the amor-phous starch structure [initially in a glassy stateat room temperature], due to moisture uptake/migration, with resulting progressive texturalchanges from crisp to firm/leathery to soggy.)The recrystallization of amylopectin dependsstrongly on sample history, since both initialheating during baking and subsequent aging dur-ing storage are non-equilibrium processes.18-20-92
The local moisture content in the amorphous re-gions of a native granule determines the effectiveTg that precedes melting of the crystalline regions(A-type in wheat) during gelatinization; completemelting of amylopectin crystallites during typicalbaking eliminates residual seed nuclei availablefor subsequent recrystallization.18-20 The extentsof swelling and release of protruding and extra-granular polymer available for subsequent three-dimensional network formation by recrystalli-zation depend on total moisture content duringgelatinization and pasting.215-413
Immediately after baking, the amylopectinin the central crumb is completely amorphous,and the gelatinized starch network in white panbread begins to recrystallize to a partially crys-talline structure, upon cooling to room temper-
329
Dow
nloa
ded
by [
Tex
as A
&M
Uni
vers
ity L
ibra
ries
] at
10:
57 0
9 Ja
nuar
y 20
18

ature.18-20 Concomitantly, freshly baked breadbegins a process of mechanical firming (mani-fested by increasing modulus) and moisture re-distribution,65-428 which is perceived sensorily asa loss of "softness and moistness".233 As de-scribed earlier, the early stages of these concur-rent processes are dominated by amylose: for-mation of entanglement networks (followedclosely by crystallization) by high MW amylosealone, and partially crystalline networks or chain-folded crystals by lower MW amylose-lipid com-plexes. Crystallization of amylose-lipid is fa-vored over retrogradation.20 The baking processis insufficient to melt the seeds of pre-existingamylose-lipid crystals, and homogeneous nu-cleation of new amylose-lipid crystals should oc-cur somewhat above room temperature, whilenucleation of retrograded amylose crystals in ahigh-moisture environment would be most rapid
near -5°C (i.e., Tg').18'20
The later stages of these concurrent pro-cesses, and the overall aging of bread, are dom-inated by recrystallization of amylopectin to apartially crystalline structure containing disperseB-type crystalline regions (see, for example, Ref-erence 20 and references therein). As noted ear-lier, the B-type polymorph is a higher moisture
crystalline hydrate than A-type starch. i"-154-400 I t s
recrystallization requires incorporation of watermolecules into the crystal lattice,154 which mustoccur while starch chain segments are becomingaligned. Thus, this recrystallization necessitatesmoisture migration within the crumb structure,whereby water (previously homogeneously dis-tributed) must diffuse from the surroundingamorphous matrix and be incorporated as struc-tural components in crystalline regions.18-20 Onemanifestation of this moisture migration duringamylopectin recrystallization is illustrated in Fig-ure 106. This plot of percent freezable water (i.e.,maximum grams of ice per 100 g sample, mea-sured by DSC) vs. days after baking, for whitepan bread samples hermetically sealed in DSCpans immediately after baking to prevent anychanges in total sample moisture content duringaging, demonstrates the progressive decrease inpercent FW (from 21% on day 0 to 16% by day11) with increasing extent of starch retrograda-tion that results from the migration of "freeza-ble" water from the amorphous crumb matrix tothe crystalline hydrate of recrystallized B-typewheat starch, wherein this crystalline hydratewater is structurally immobilized and thus ren-dered unfreezable. Since crystalline hydrate water
LU
maLULU
E
1
2 0 -
15 -
(
j
• -
i
o
— ^ T.
^ ^t i l l
1 3 5 7 9 11
DAYS AFTER BAKING
FIGURE 106. Plot of percent freezable water (measuredby DSC) vs. days after baking for hermetically staled whitepan bread, illustrating the decrease in percent FW with in-creasing extent of starch retrogradation that results from themigration of "freezable" water from the amorphous crumbmatrix to the crystalline hydrate of recrystallized B-type wheatstarch.
330
Dow
nloa
ded
by [
Tex
as A
&M
Uni
vers
ity L
ibra
ries
] at
10:
57 0
9 Ja
nuar
y 20
18
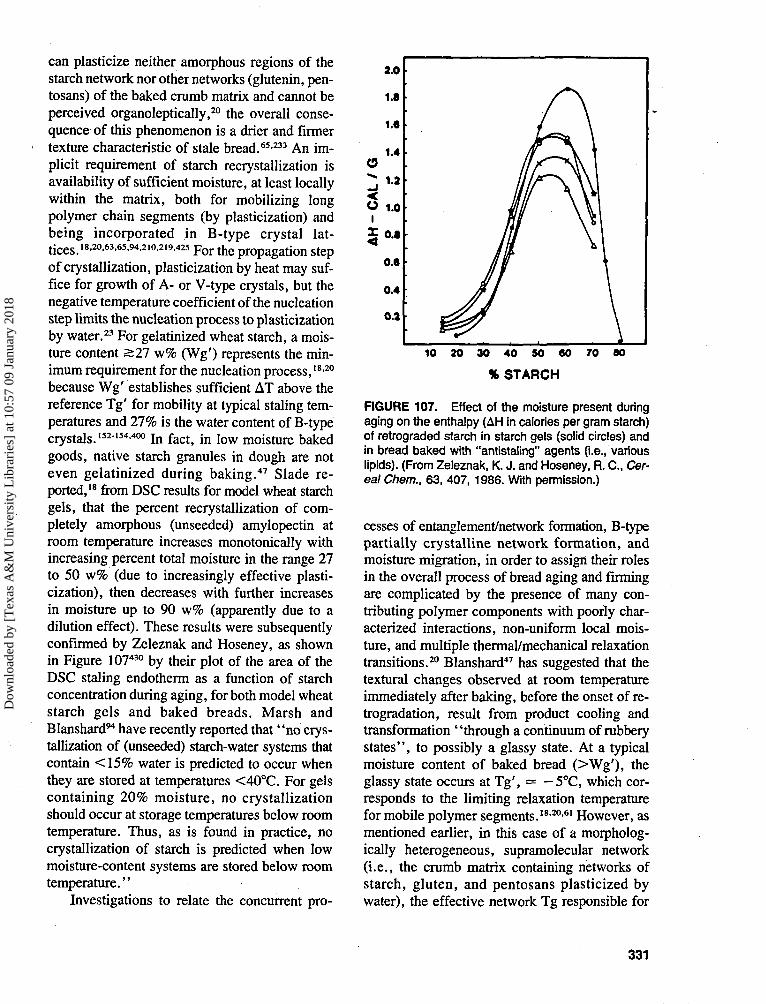
can plasticize neither amorphous regions of thestarch network nor other networks (glutenin, pen-tosans) of the baked crumb matrix and cannot beperceived organoleptically,20 the overall conse-quence of this phenomenon is a drier and firmertexture characteristic of stale bread.65233 An im-plicit requirement of starch recrystallization isavailability of sufficient moisture, at least locallywithin the matrix, both for mobilizing longpolymer chain segments (by plasticization) andbeing incorporated in B-type crystal lat-tices. '8.20,63,65.94,2.0.219,425 p o r t h e p r o p a g a t i o n s t e p
of crystallization, plasticization by heat may suf-fice for growth of A- or V-type crystals, but thenegative temperature coefficient of the nucleationstep limits the nucleation process to plasticizationby water.23 For gelatinized wheat starch, a mois-ture content S27 w% (Wg') represents the min-imum requirement for the nucleation process, 18i2°because Wg' establishes sufficient AT above thereference Tg' for mobility at typical staling tem-peratures and 27% is the water content of B-typecrystals.152154400 In fact, in low moisture bakedgoods, native starch granules in dough are noteven gelatinized during baking.47 Slade re-ported,18 from DSC results for model wheat starchgels, that the percent recrystallization of com-pletely amorphous (unseeded) amylopectin atroom temperature increases monotonically withincreasing percent total moisture in the range 27to 50 w% (due to increasingly effective plasti-cization), then decreases with further increasesin moisture up to 90 w% (apparently due to adilution effect). These results were subsequentlyconfirmed by Zeleznak and Hoseney, as shownin Figure 107430 by their plot of the area of theDSC staling endotherm as a function of starchconcentration during aging, for both model wheatstarch gels and baked breads. Marsh andBlanshard94 have recently reported that' 'no crys-tallization of (unseeded) starch-water systems thatcontain <15% water is predicted to occur whenthey are stored at temperatures <40°C. For gelscontaining 20% moisture, no crystallizationshould occur at storage temperatures below roomtemperature. Thus, as is found in practice, nocrystallization of starch is predicted when lowmoisture-content systems are stored below roomtemperature."
Investigations to relate the concurrent pro-
10 20 30 40 50 60 70 80
% STARCH
FIGURE 107. Effect of the moisture present duringaging on the enthalpy (AH in calories per gram starch)of retrograded starch in starch gels (solid circles) andin bread baked with "antistaling" agents (i.e., variouslipids). (From Zeleznak, K. J. and Hoseney, R. C., Cer-eal Chem., 63, 407, 1986. With permission.)
cesses of entanglement/network formation, B-typepartially crystalline network formation, andmoisture migration, in order to assign their rolesin the overall process of bread aging and firmingare complicated by the presence of many con-tributing polymer components with poorly char-acterized interactions, non-uniform local mois-ture, and multiple thermal/mechanical relaxationtransitions.20 Blanshard47 has suggested that thetextural changes observed at room temperatureimmediately after baking, before the onset of re-trogradation, result from product cooling andtransformation "through a continuum of rubberystates", to possibly a glassy state. At a typicalmoisture content of baked bread (>Wg'), theglassy state occurs at Tg', = — 5°C, which cor-responds to the limiting relaxation temperaturefor mobile polymer segments.18'2061 However, asmentioned earlier, in this case of a morpholog-ically heterogeneous, supramolecular network(i.e., the crumb matrix containing networks ofstarch, gluten, and pentosans plasticized bywater), the effective network Tg responsible for
331
Dow
nloa
ded
by [
Tex
as A
&M
Uni
vers
ity L
ibra
ries
] at
10:
57 0
9 Ja
nuar
y 20
18
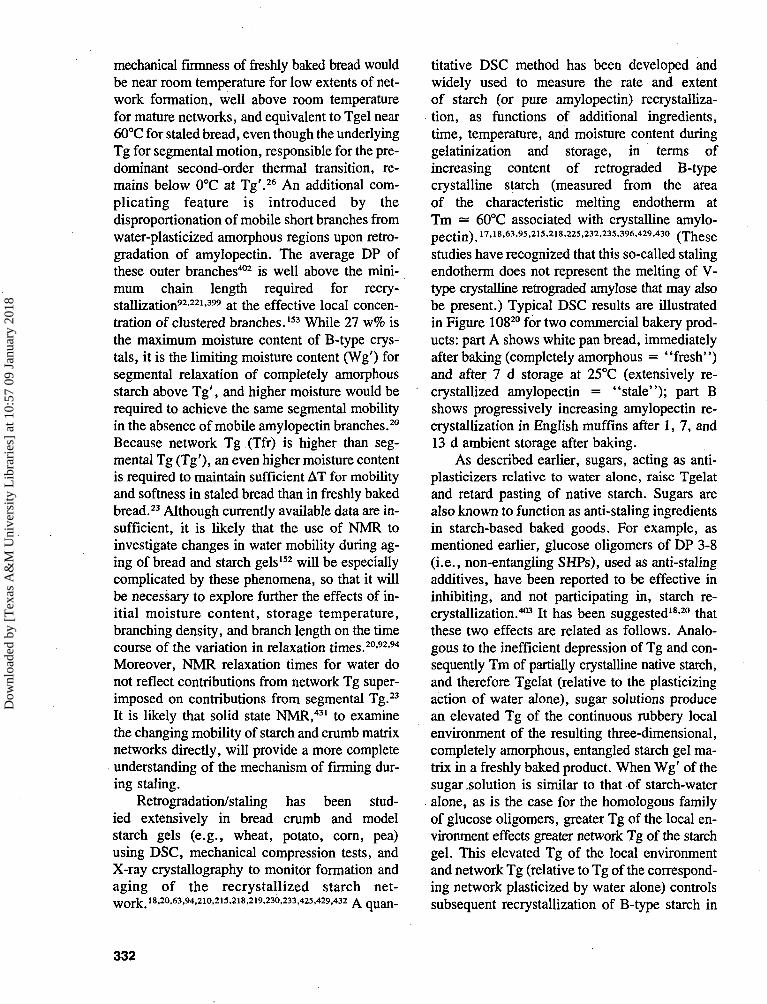
mechanical firmness of freshly baked bread wouldbe near room temperature for low extents of net-work formation, well above room temperaturefor mature networks, and equivalent to Tgel near60°C for staled bread, even though the underlyingTg for segmental motion, responsible for the pre-dominant second-order thermal transition, re-mains below 0°C at Tg'.2 6 An additional com-plicating feature is introduced by thedisproportionation of mobile short branches fromwater-plasticized amorphous regions upon retro-gradation of amylopectin. The average DP ofthese outer branches402 is well above the mini-mum chain length required for recry-stallization92-221-3" at the effective local concen-tration of clustered branches.153 While 27 w% isthe maximum moisture content of B-type crys-tals, it is the limiting moisture content (Wg') forsegmental relaxation of completely amorphousstarch above Tg ' , and higher moisture would berequired to achieve the same segmental mobilityin the absence of mobile amylopectin branches.20
Because network Tg (Tfr) is higher than seg-mental Tg (Tg'), an even higher moisture contentis required to maintain sufficient AT for mobilityand softness in staled bread than in freshly bakedbread.23 Although currently available data are in-sufficient, it is likely that the use of NMR toinvestigate changes in water mobility during ag-ing of bread and starch gels152 will be especiallycomplicated by these phenomena, so that it willbe necessary to explore further the effects of in-itial moisture content, storage temperature,branching density, and branch length on the timecourse of the variation in relaxation times.20-9294
Moreover, NMR relaxation times for water donot reflect contributions from network Tg super-imposed on contributions from segmental Tg.23
It is likely that solid state NMR,431 to examinethe changing mobility of starch and crumb matrixnetworks directly, will provide a more completeunderstanding of the mechanism of firming dur-ing staling.
Retrogradation/staling has been stud-ied extensively in bread crumb and modelstarch gels (e.g., wheat, potato, corn, pea)using DSC, mechanical compression tests, andX-ray crystallography to monitor formation andaging of the recrystallized starch net-work 18'20-63'94.210.215'218'219'230-233.425'429.432 A quan-
titative DSC method has been developed andwidely used to measure the rate and extentof starch (or pure amylopectin) recrystalliza-tion, as functions of additional ingredients,time, temperature, and moisture content duringgelatinization and storage, in terms ofincreasing content of retrograded B-typecrystalline starch (measured from the areaof the characteristic melting endotherm atTm — 60°C associated with crystalline amylo-oect in) i7.18.63-95.2i5.2i8,225,232,235,396,429,43o (These
studies have recognized that this so-called stalingendotherm does not represent the melting of V-type crystalline retrograded amylose that may alsobe present.) Typical DSC results are illustratedin Figure 10820 for two commercial bakery prod-ucts: part A shows white pan bread, immediatelyafter baking (completely amorphous = "fresh")and after 7 d storage at 25°C (extensively re-crystallized amylopectin = "stale"); part Bshows progressively increasing amylopectin re-crystallization in English muffins after 1,7, and13 d ambient storage after baking.
As described earlier, sugars, acting as anti-plasticizers relative to water alone, raise Tgelatand retard pasting of native starch. Sugars arealso known to function as anti-staling ingredientsin starch-based baked goods. For example, asmentioned earlier, glucose oligomers of DP 3-8(i.e., non-entangling SHPs), used as anti-stalingadditives, have been reported to be effective ininhibiting, and not participating in, starch re-crystallization.403 It has been suggested18-20 thatthese two effects are related as follows. Analo-gous to the inefficient depression of Tg and con-sequently Tm of partially crystalline native starch,and therefore Tgelat (relative to the plasticizingaction of water alone), sugar solutions producean elevated Tg of the continuous rubbery localenvironment of the resulting three-dimensional,completely amorphous, entangled starch gel ma-trix in a freshly baked product. When Wg' of thesugar .solution is similar to that of starch-wateralone, as is the case for the homologous familyof glucose oligomers, greater Tg of the local en-vironment effects greater network Tg of the starchgel. This elevated Tg of the local environmentand network Tg (relative to Tg of the correspond-ing network plasticized by water alone) controlssubsequent recrystallization of B-type starch in
332
Dow
nloa
ded
by [
Tex
as A
&M
Uni
vers
ity L
ibra
ries
] at
10:
57 0
9 Ja
nuar
y 20
18
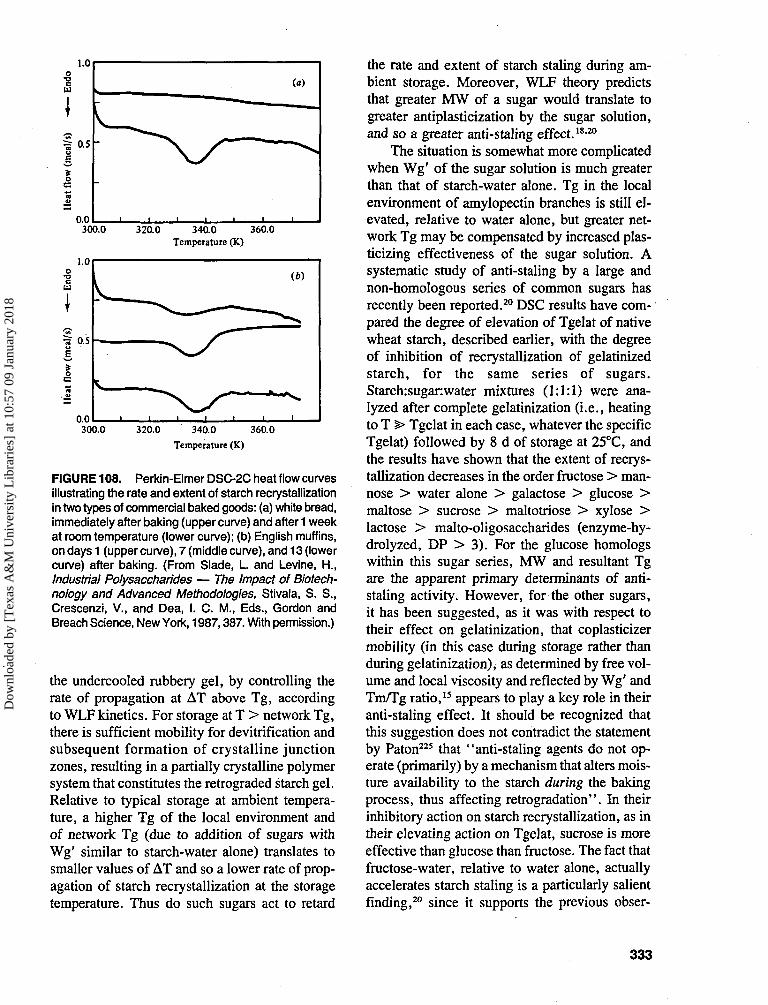
300.0 320.0 340.0 360.0Temperature (K)
300.0 320.0 340.0 360.0Temperature (K)
FIGURE 108. Perkin-Elmer DSC-2C heat flow curvesillustrating the rate and extent of starch recrystallizationin two types of commercial baked goods: (a) white bread,immediately after baking (upper curve) and after 1 weekat room temperature (lower curve); (b) English muffins,on days 1 (upper curve), 7 (middle curve), and 13 (lowercurve) after baking. (From Slade, L and Levine, H.,Industrial Polysaccharides — The Impact of Biotech-nology and Advanced Methodologies, Stivala, S. S.,Crescenzi, V., and Dea, I. C. M., Eds., Gordon andBreach Science, New York, 1987,387. With permission.)
the undercooled rubbery gel, by controlling therate of propagation at AT above Tg, accordingto WLF kinetics. For storage at T > network Tg,there is sufficient mobility for devitrification andsubsequent formation of crystalline junctionzones, resulting in a partially crystalline polymersystem that constitutes the retrograded starch gel.Relative to typical storage at ambient tempera-ture, a higher Tg of the local environment andof network Tg (due to addition of sugars withWg' similar to starch-water alone) translates tosmaller values of AT and so a lower rate of prop-agation of starch recrystallization at the storagetemperature. Thus do such sugars act to retard
the rate and extent of starch staling during am-bient storage. Moreover, WLF theory predictsthat greater MW of a sugar would translate togreater antiplasticization by the sugar solution,and so a greater anti-staling effect.18-20
The situation is somewhat more complicatedwhen Wg' of the sugar solution is much greaterthan that of starch-water alone. Tg in the localenvironment of amylopectin branches is still el-evated, relative to water alone, but greater net-work Tg may be compensated by increased plas-ticizing effectiveness of the sugar solution. Asystematic study of anti-staling by a large andnon-homologous series of common sugars hasrecently been reported.20 DSC results have com-pared the degree of elevation of Tgelat of nativewheat starch, described earlier, with the degreeof inhibition of recrystallization of gelatinizedstarch, for the same series of sugars.Starch:suganwater mixtures (1:1:1) were ana-lyzed after complete gelatinization (i.e., heatingto T > Tgelat in each case, whatever the specificTgelat) followed by 8 d of storage at 25°C, andthe results have shown that the extent of recrys-tallization decreases in the order fructose > man-nose > water alone > galactose > glucose >maltose > sucrose > maltotriose > xylose >lactose > malto-oligosaccharides (enzyme-hy-drolyzed, DP > 3). For the glucose homologswithin this sugar series, MW and resultant Tgare the apparent primary determinants of anti-staling activity. However, for the other sugars,it has been suggested, as it was with respect totheir effect on gelatinization, that coplasticizermobility (in this case during storage rather thanduring gelatinization), as determined by free vol-ume and local viscosity and reflected by Wg' andTnVTg ratio,15 appears to play a key role in theiranti-staling effect. It should be recognized thatthis suggestion does not contradict the statementby Paton225 that "anti-staling agents do not op-erate (primarily) by a mechanism that alters mois-ture availability to the starch during the bakingprocess, thus affecting retrogradation". In theirinhibitory action on starch recrystallization, as intheir elevating action on Tgelat, sucrose is moreeffective than glucose than fructose. The fact thatfructose-water, relative to water alone, actuallyaccelerates starch staling is a particularly salientfinding,20 since it supports the previous obser-
333
Dow
nloa
ded
by [
Tex
as A
&M
Uni
vers
ity L
ibra
ries
] at
10:
57 0
9 Ja
nuar
y 20
18
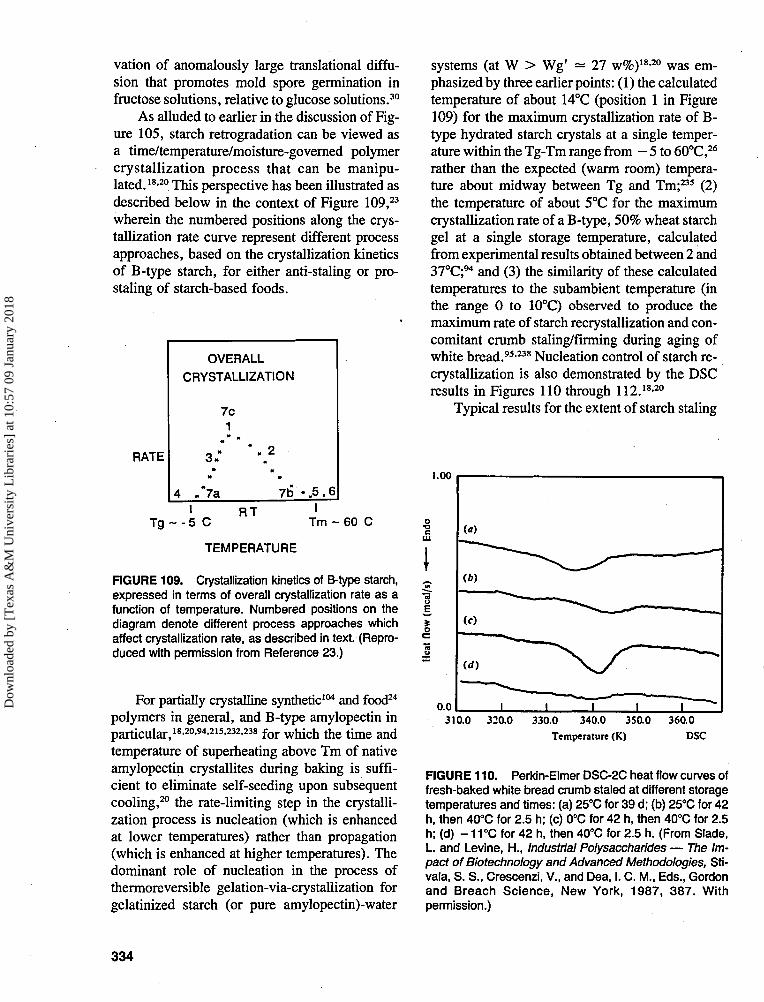
vation of anomalously large translational diffu-sion that promotes mold spore germination infructose solutions, relative to glucose solutions.30
As alluded to earlier in the discussion of Fig-ure 105, starch retrogradation can be viewed asa time/temperature/moisture-governed polymercrystallization process that can be manipu-lated.18-20 This perspective has been illustrated asdescribed below in the context of Figure 109,23
wherein the numbered positions along the crys-tallization rate curve represent different processapproaches, based on the crystallization kineticsof B-type starch, for either anti-staling or pro-staling of starch-based foods.
RATE
OVERALL
CRYSTALLIZATION
7c1
. 2
4 . 7a 7b" - . 5 , 6
I RT ITg ~ - 5 C Tm - 60 C
TEMPERATURE
FIGURE 109. Crystallization kinetics of B-type starch,expressed in terms of overall crystallization rate as afunction of temperature. Numbered positions on thediagram denote different process approaches whichaffect crystallization rate, as described in text. (Repro-duced with permission from Reference 23.)
For partially crystalline synthetic104 and food24
polymers in general, and B-type amylopectin inparticular,18-20-94-215-232-238 for which the time andtemperature of superheating above Tm of nativeamylopectin crystallites during baking is suffi-cient to eliminate self-seeding upon subsequentcooling,20 the rate-limiting step in the crystalli-zation process is nucleation (which is enhancedat lower temperatures) rather than propagation(which is enhanced at higher temperatures). Thedominant role of nucleation in the process ofthermoreversible gelation-via-crystallization forgelatinized starch (or pure amylopectin)-water
systems (at W > Wg' - 27 w%)18-20 was em-phasized by three earlier points: (1) the calculatedtemperature of about 14°C (position 1 in Figure109) for the maximum crystallization rate of B-type hydrated starch crystals at a single temper-ature within the Tg-Tm range from - 5 to 60°C,26
rather than the expected (warm room) tempera-ture about midway between Tg and Tm;235 (2)the temperature of about 5°C for the maximumcrystallization rate of a B-type, 50% wheat starchgel at a single storage temperature, calculatedfrom experimental results obtained between 2 and3TC;94 and (3) the similarity of these calculatedtemperatures to the subambient temperature (inthe range 0 to 10°C) observed to produce themaximum rate of starch recrystallization and con-comitant crumb staling/firming during aging ofwhite bread.95-238 Nucleation control of starch re-crystallization is also demonstrated by the DSCresults in Figures 110 through 112.18-20
Typical results for the extent of starch staling
1.00
310.0 320.0 330.0 340.0 350.0 360.0Temperature (K) DSC
FIGURE 110. Perkin-Elmer DSC-2C heat flow curves offresh-baked white bread crumb staled at different storagetemperatures and times: (a) 25°C for 39 d; (b) 25°C for 42h, then 40°C for 2.5 h; (c) 0°C for 42 h, then 40°C for 2.5h; (d) -11°C for 42 h, then 40°C for 2.5 h. (From Slade,L. and Levine, H., Industrial Polysaccharides — The Im-pact of Biotechnology and Advanced Methodologies, Sti-vala, S. S., Crescenzi, V., and Dea, I. C. M., Eds., Gordonand Breach Science, New York, 1987, 387. Withpermission.)
334
Dow
nloa
ded
by [
Tex
as A
&M
Uni
vers
ity L
ibra
ries
] at
10:
57 0
9 Ja
nuar
y 20
18
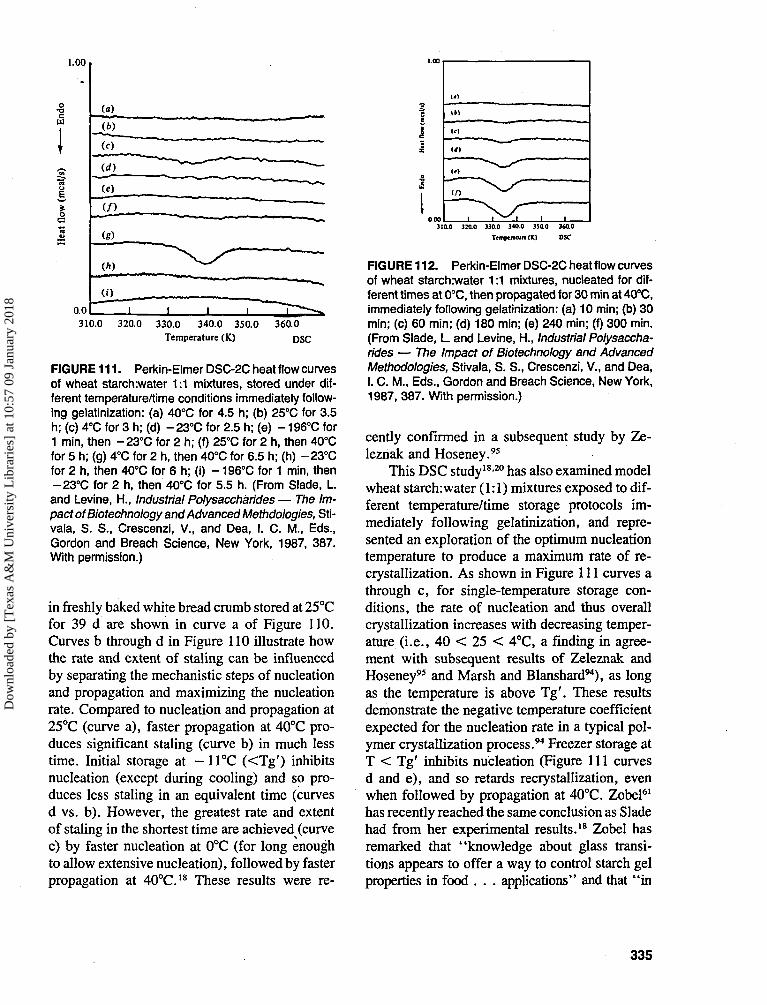
1.00
0.0310.0 320.0 330.0 340.0 350.0 360.0
Temperature (K) use
FIGURE 111. Perkin-Elmer DSC-2C heat flow curvesof wheat starch:water 1:1 mixtures, stored under dif-ferent temperature/time conditions immediately follow-ing gelatinization: (a) 40°C for 4.5 h; (b) 25°C for 3.5h; (c) 4°C for 3 h; (d) -23°C for 2.5 h; (e) -196°C for1 min, then -23°C for 2 h; (f) 25°C for 2 h, then 40°Cfor 5 h; (g) 4°C for 2 h, then 40°C for 6.5 h; (h) -23°Cfor 2 h, then 40°C for 6 h; (i) - 196°C for 1 min, then-23°C for 2 h, then 40°C for 5.5 h. (From Slade, Land Levine, H., Industrial Polysaccharides — The Im-pact of Biotechnology and Advanced Methdologies, Sti-vala, S. S., Crescenzi, V., and Dea, I. C. M., Eds.,Gordon and Breach Science, New York, 1987, 387.With permission.)
in freshly baked white bread crumb stored at 25°Cfor 39 d are shown in curve a of Figure 110.Curves b through d in Figure 110 illustrate howthe rate and extent of staling can be influencedby separating the mechanistic steps of nucleationand propagation and maximizing the nucleationrate. Compared to nucleation and propagation at25°C (curve a), faster propagation at 40°C pro-duces significant staling (curve b) in much lesstime. Initial storage at -11°C (<Tg') inhibitsnucleation (except during cooling) and so pro-duces less staling in an equivalent time (curvesd vs. b). However, the greatest rate and extentof staling in the shortest time are achieved (curvec) by faster nucleation at 0°C (for long enoughto allow extensive nucleation), followed by fasterpropagation at 40°C.18 These results were re-
3100 320-0 330.0 340.0 3500 360.0
Ttmpemuit(IC) DSC
FIGURE 112. Perkin-Elmer DSC-2C heat flow curvesof wheat starchrwater 1:1 mixtures, nucleated for dif-ferent times at 0°C, then propagated for 30 min at 40°C,immediately following gelatinization: (a) 10 min; (b) 30min; (c) 60 min; (d) 180 min; (e) 240 min; (f) 300 min.(From Slade, L and Levine, H., Industrial Polysaccha-rides — The Impact of Biotechnology and AdvancedMethodologies, Stivala, S. S., Crescenzi, V., and Dea,I. C. M., Eds., Gordon and Breach Science, New York,1987, 387. With permission.)
cently confirmed in a subsequent study by Ze-leznak and Hoseney.95
This DSC study18-20 has also examined modelwheat starch:water (1:1) mixtures exposed to dif-ferent temperature/time storage protocols im-mediately following gelatinization, and repre-sented an exploration of the optimum nucleationtemperature to produce a maximum rate of re-crystallization. As shown in Figure 111 curves athrough C., for single-temperature storage con-ditions, the rate of nucleation and thus overallcrystallization increases with decreasing temper-ature (i.e., 40 < 25 < 4°C, a finding in agree-ment with subsequent results of Zeleznak andHoseney95 and Marsh and Blanshard94), as longas the temperature is above Tg'. These resultsdemonstrate the negative temperature coefficientexpected for the nucleation rate in a typical pol-ymer crystallization process.94 Freezer storage atT < Tg' inhibits nucleation (Figure 111 curvesd and e), and so retards recrystallization, evenwhen followed by propagation at 40°C. Zobel61
has recently reached the same conclusion as Sladehad from her experimental results.18 Zobel hasremarked that "knowledge about glass transi-tions appears to offer a way to control starch gelproperties in food . . . applications" and that "in
335
Dow
nloa
ded
by [
Tex
as A
&M
Uni
vers
ity L
ibra
ries
] at
10:
57 0
9 Ja
nuar
y 20
18

the context of bread staling, a rational explana-tion of why freezing preserves bread from stalingis that the bread is held below its Tg." It isimportant to note that, as represented by position4 in Figure 109, starch recrystallization wouldbe inhibited only while bread remains at a freezertemperature Tf < Tg', but not during cooling toTf (when fast nucleation could occur) or afterthawing (when propagation could occur in a pre-viously nucleated matrix).8>18>26 Once again, asfor white bread crumb in Figure 110 curve C., starch gels first held at 4°C to promote rapidnucleation, then at 40°C to allow rapid propa-gation (Figure 111 curve g), show by far thegreatest overall rate and extent of starch stalingvia amylopectin recrystallization. This finding ofan optimum practical nucleation temperature of4°C18 to produce a maximum rate of recrystal-lization (also confirmed by Zeleznak andHoseney95) is critically relevant to high moisture(i.e., starch gelatinized during baking) bakedproducts with coatings, such as chocolate-cov-ered cake donuts. When such a product is runthrough a refrigerated cooling tunnel (at 40°F)immediately after baking and coating, in orderto rapidly solidify ("set") the coating, this pro-cess step can result in accelerated starch stalingwithin the crumb matrix during subsequent am-bient temperature storage, relative to the corre-sponding rate of staling in the same product notsubjected to faster nucleation at subambient tem-perature via the cooling-tunnel treatment.26
Figure 112 shows DSC results for modelwheat starch:water (1:1) mixtures, examined forthe effect of increasing nucleation time at 0°C,immediately after gelatinization, and prior to 30min of propagation at 40°C. It is apparent fromthe trend of steadily increasing endotherm areasin curves a through f that the extent of nucleationand overall crystallization increases monotoni-cally with increasing time of nucleation. More-over, amylopectin recrystallization is alreadymeasurable after only 1 h of total storage, andquite extensive after 5.5 h. The extraordinary rateand extent of recrystallization are evidenced bycomparing the endotherm areas in Figure 112with those in Figures 108, 110, and 111, all ofwhich are plotted with 1.0 mcal/s full scale andfor similar sample weights.
As mentioned earlier, these results18 have been
used to design a patented industrial process forthe accelerated staling of bread (for stuffing) andother high moisture, lean, starch-based foods.36
By a two-step temperature-cycling protocol in-volving, first, a several-hour holding period at4°C (to maximize the nucleation rate) (position7a in Figure 109), followed by a second several-hour holding period at 40°C (to maximize thepropagation rate) (position 7b in Figure 109), amuch greater overall extent of staling (indicatedby position 7c in Figure 109) due to amylopectinrecrystallization is achieved (vs. the same totaltime spent under constant ambient storage), whichis equivalent to staling bread for several days atroom temperature.20
Returning to Figure 109 for the last time, theremaining numbered positions represent anti-stal-ing approaches that are either empirically wellknown or intuitively obvious, but not previouslyexplained and understood on the basis of polymercrystallization kinetics theory.23 Position 5 sig-nifies the zero rate of staling achievable at T >Tin, for example, by holding bread or Englishmuffins above about 60°C (at about 50% relativehumidity to inhibit moisture loss) during the timebetween baking and arrival at the point-of-sale.Similarly, position 6 represents the familiarmethod of refreshening stale baked goods by mi-crowave heating to 60 to 65°C in order to remeltB-type retrograded starch crystals. Position 2 de-notes the classic empirical approach to retardingthe rate of staling by storing products in a warmbread box at about 35°C. Lastly, position 3 in-dicates the slower rate of staling achievable, be-tween the extremes of a maximum rate around14°C and a near-zero rate below — 5°C, duringrefrigerator storage near 5°C. In practice, the fastnucleation rate produced by slow cooling to re-frigerator temperature, followed by the faster rateof propagation possible in an extensively pre-seeded matrix wanned slowly from refrigeratorto room temperature by ambient thawing, mayobviate the potential anti-staling benefit of re-frigerator storage.23
4. Amylopectin-Lipid CrystallineComplex Formation at Low Moisture
It has long been known that amylose forms
336
Dow
nloa
ded
by [
Tex
as A
&M
Uni
vers
ity L
ibra
ries
] at
10:
57 0
9 Ja
nuar
y 20
18
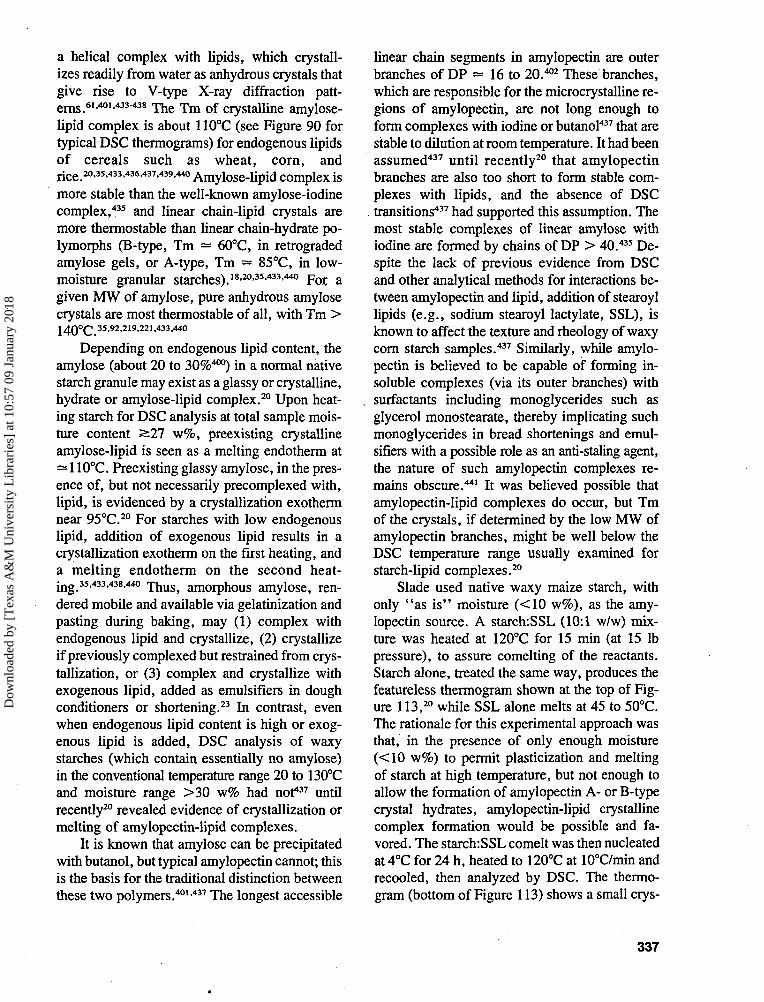
a helical complex with lipids, which crystall-izes readily from water as anhydrous crystals thatgive rise to V-type X-ray diffraction patt-e r n s ei.401.433-438 - j ^ T m o f c r v s t a n m e amylose-
lipid complex is about 110°C (see Figure 90 fortypical DSC thermograms) for endogenous lipidsof cereals such as wheat, corn, andrice 20.35.433.436.437.439.440 Amylose-lipid complex is
more stable than the well-known amylose-iodinecomplex,435 and linear chain-lipid crystals aremore thermostable than linear chain-hydrate po-lymorphs (B-type, Tm = 60°C, in retrogradedamylose gels, or A-type, Tm = 85°C, in low-moisture granular starches). 18-20'35>433>44° For agiven MW of amylose, pure anhydrous amylosecrystals are most thermostable of all, with Tm >140°C 35'92'219-221'433-440
Depending on endogenous lipid content, theamylose (about 20 to 30%400) in a normal nativestarch granule may exist as a glassy or crystalline,hydrate or amylose-lipid complex.20 Upon heat-ing starch for DSC analysis at total sample mois-ture content ^27 w%, preexisting crystallineamylose-lipid is seen as a melting endotherm at— 110°C. Preexisting glassy amylose, in the pres-ence of, but not necessarily precomplexed with,lipid, is evidenced by a crystallization exothermnear 95°C.20 For starches with low endogenouslipid, addition of exogenous lipid results in acrystallization exotherm on the first heating, anda melting endotherm on the second heat-m g 35.433.438,440 T h u S ) amOrphous amylose, ren-dered mobile and available via gelatinization andpasting during baking, may (1) complex withendogenous lipid and crystallize, (2) crystallizeif previously complexed but restrained from crys-tallization, or (3) complex and crystallize withexogenous lipid, added as emulsifiers in doughconditioners or shortening.23 In contrast, evenwhen endogenous lipid content is high or exog-enous lipid is added, DSC analysis of waxystarches (which contain essentially no amylose)in the conventional temperature range 20 to 130°Cand moisture range >30 w% had not437 untilrecently20 revealed evidence of crystallization ormelting of amylopectin-lipid complexes.
It is known that amylose can be precipitatedwith butanol, but typical amylopectin cannot; thisis the basis for the traditional distinction betweenthese two polymers.401-437 The longest accessible
linear chain segments in amylopectin are outerbranches of DP — 16 to 20.402 These branches,which are responsible for the microcrystalline re-gions of amylopectin, are not long enough toform complexes with iodine or butanol437 that arestable to dilution at room temperature. It had beenassumed437 until recently20 that amylopectinbranches are also too short to form stable com-plexes with lipids, and the absence of DSCtransitions437 had supported this assumption. Themost stable complexes of linear amylose withiodine are formed by chains of DP > 40.435 De-spite the lack of previous evidence from DSCand other analytical methods for interactions be-tween amylopectin and lipid, addition of stearoyllipids (e.g., sodium stearoyl lactylate, SSL), isknown to affect the texture and rheology of waxycorn starch samples.437 Similarly, while amylo-pectin is believed to be capable of forming in-soluble complexes (via its outer branches) withsurfactants including monoglycerides such asglycerol monostearate, thereby implicating suchmonoglycerides in bread shortenings and emul-sifiers with a possible role as an anti-staling agent,the nature of such amylopectin complexes re-mains obscure.441 It was believed possible thatamylopectin-lipid complexes do occur, but Tmof the crystals, if determined by the low MW ofamylopectin branches, might be well below theDSC temperature range usually examined forstarch-lipid complexes.20
Slade used native waxy maize starch, withonly "as i s " moisture (<10 w%), as the amy-lopectin source. A starch:SSL (10:1 w/w) mix-ture was heated at 120°C for 15 min (at 15 lbpressure), to assure comelting of the reactants.Starch alone, treated the same way, produces thefeatureless thermogram shown at the top of Fig-ure 113,20 while SSL alone melts at 45 to 50°C,The rationale for this experimental approach wasthat, in the presence of only enough moisture(<10 w%) to permit plasticization and meltingof starch at high temperature, but not enough toallow the formation of amylopectin A- or B-typecrystal hydrates, amylopectin-lipid crystallinecomplex formation would be possible and fa-vored. The starch:SSL comelt was then nucleatedat 4°C for 24 h, heated to 120°C at 10°C/min andrecooled, then analyzed by DSC. The thermo-gram (bottom of Figure 113) shows a small crys-
337
Dow
nloa
ded
by [
Tex
as A
&M
Uni
vers
ity L
ibra
ries
] at
10:
57 0
9 Ja
nuar
y 20
18
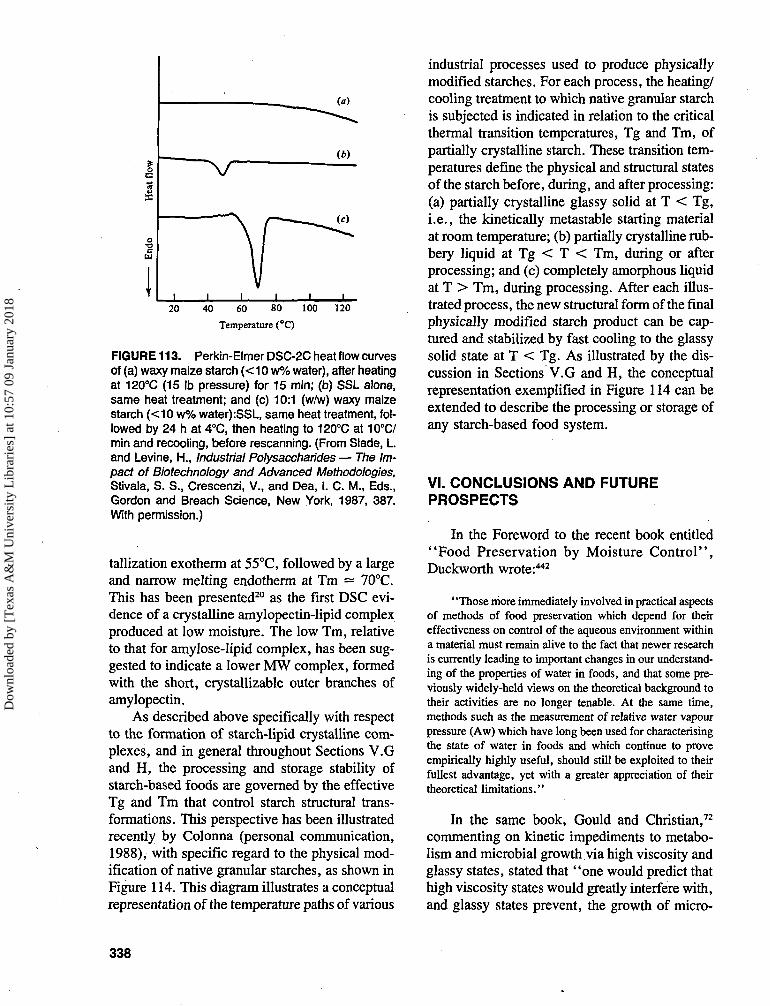
(a)
(W
20 40 60 80 100
Temperature (°C)120
FIGURE 113. Perkin-Elmer DSC-2C heat flow curvesof (a) waxy maize starch (<10 w% water), after heatingat 120°C (15 Ib pressure) for 15 min; (b) SSL alone,same heat treatment; and (c) 10:1 (w/w) waxy maizestarch (<10 w% water):SSL, same heat treatment, fol-lowed by 24 h at 4°C, then heating to 120°C at 10°C/min and recooling, before rescanning. (From Slade, L.and Levine, H., Industrial Polysaccharides — The Im-pact of Biotechnology and Advanced Methodologies,Stivala, S. S., Crescenzi, V., and Dea, I. C. M., Eds.,Gordon and Breach Science, New York, 1987, 387.With permission.)
tallization exotherm at 55°C, followed by a largeand narrow melting endotherm at Tm — 70°C.This has been presented20 as the first DSC evi-dence of a crystalline amylopectin-lipid complexproduced at low moisture. The low Tm, relativeto that for amylose-lipid complex, has been sug-gested to indicate a lower MW complex, formedwith the short, crystallizable outer branches ofamylopectin.
As described above specifically with respectto the formation of starch-lipid crystalline com-plexes, and in general throughout Sections V.Gand H, the processing and storage stability ofstarch-based foods are governed by the effectiveTg and Tm that control starch structural trans-formations. This perspective has been illustratedrecently by Colonna (personal communication,1988), with specific regard to the physical mod-ification of native granular starches, as shown inFigure 114. This diagram illustrates a conceptualrepresentation of the temperature paths of various
industrial processes used to produce physicallymodified starches. For each process, the heating/cooling treatment to which native granular starchis subjected is indicated in relation to the criticalthermal transition temperatures, Tg and Tm, ofpartially crystalline starch. These transition tem-peratures define the physical and structural statesof the starch before, during, and after processing:(a) partially crystalline glassy solid at T < Tg,i.e., the kinetically metastable starting materialat room temperature; (b) partially crystalline rub-bery liquid at Tg < T < Tm, during or afterprocessing; and (c) completely amorphous liquidat T > Tm, during processing. After each illus-trated process, the new structural form of the finalphysically modified starch product can be cap-tured and stabilized by fast cooling to the glassysolid state at T < Tg. As illustrated by the dis-cussion in Sections V.G and H, the conceptualrepresentation exemplified in Figure 114 can beextended to describe the processing or storage ofany starch-based food system.
VI. CONCLUSIONS AND FUTUREPROSPECTS
In the Foreword to the recent book entitled"Food Preservation by Moisture Control",Duckworth wrote:442
"Those more immediately involved in practical aspectsof methods of food preservation which depend for theireffectiveness on control of the aqueous environment withina material must remain alive to the fact that newer researchis currently leading to important changes in our understand-ing of the properties of water in foods, and that some pre-viously widely-held views on the theoretical background totheir activities are no longer tenable. At the same time,methods such as the measurement of relative water vapourpressure (Aw) which have long been used for characterisingthe state of water in foods and which continue to proveempirically highly useful, should still be exploited to theirfullest advantage, yet with a greater appreciation of theirtheoretical limitations."
In the same book, Gould and Christian,72
commenting on kinetic impediments to metabo-lism and microbial growth via high viscosity andglassy states, stated that "one would predict thathigh viscosity states would greatly interfere with,and glassy states prevent, the growth of micro-
338
Dow
nloa
ded
by [
Tex
as A
&M
Uni
vers
ity L
ibra
ries
] at
10:
57 0
9 Ja
nuar
y 20
18
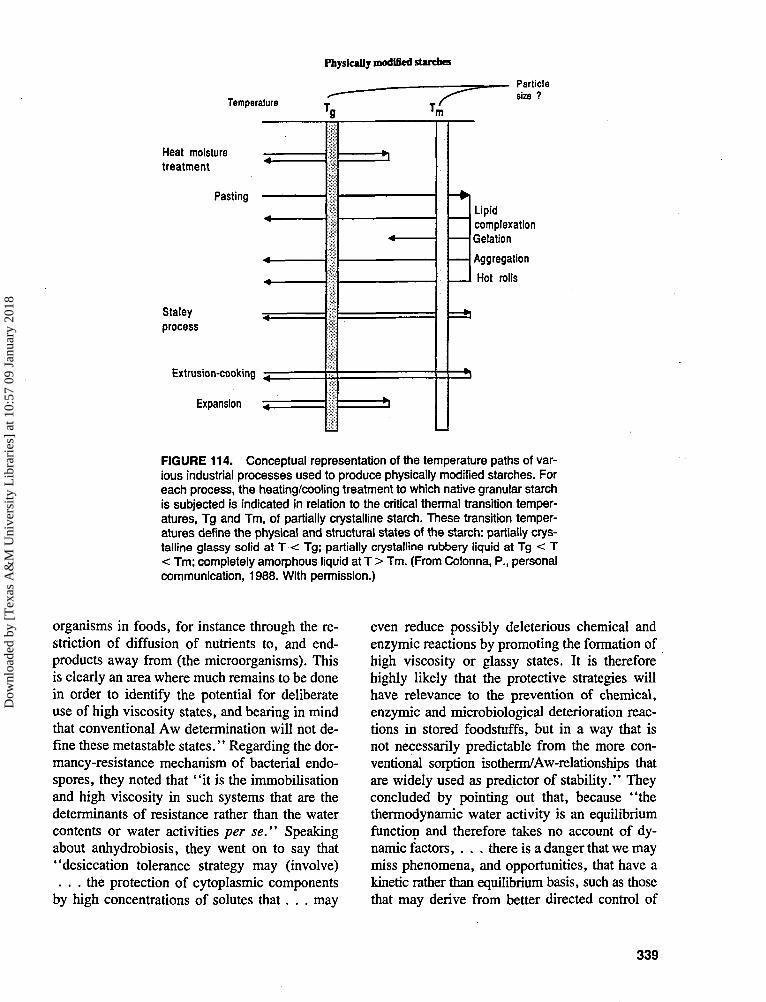
Physically modified starches
Temperature
Particlesize ?
Heat moisturetreatment
Pasting
Staleyprocess
Extrusion-cooking 5 ;
Expansion 51
Lipidcomplexation
Gelation
Aggregation
Hot rolls
FIGURE 114. Conceptual representation of the temperature paths of var-ious industrial processes used to produce physically modified starches. Foreach process, the heating/cooling treatment to which native granular starchis subjected is indicated in relation to the critical thermal transition temper-atures, Tg and Tm, of partially crystalline starch. These transition temper-atures define the physical and structural states of the starch: partially crys-talline glassy solid at T < Tg; partially crystalline rubbery liquid at Tg < T< Tm; completely amorphous liquid at T > Tm. (From Colonna, P., personalcommunication, 1988. With permission.)
organisms in foods, for instance through the re-striction of diffusion of nutrients to, and end-products away from (the microorganisms). Thisis clearly an area where much remains to be donein order to identify the potential for deliberateuse of high viscosity states, and bearing in mindthat conventional Aw determination will not de-fine these metastable states." Regarding the dor-mancy-resistance mechanism of bacterial endo-spores, they noted that "it is the immobilisationand high viscosity in such systems that are thedeterminants of resistance rather than the watercontents or water activities per se." Speakingabout anhydrobiosis, they went on to say that"desiccation tolerance strategy may (involve). . . the protection of cytoplasmic components
by high concentrations of solutes that. . . may
even reduce possibly deleterious chemical andenzymic reactions by promoting the formation ofhigh viscosity or glassy states. It is thereforehighly likely that the protective strategies willhave relevance to the prevention of chemical,enzymic and microbiological deterioration reac-tions in stored foodstuffs, but in a way that isnot necessarily predictable from the more con-ventional sorption isotherm/Aw-relationships thatare widely used as predictor of stability." Theyconcluded by pointing out that, because "thethermodynamic water activity is an equilibriumfunction and therefore takes no account of dy-namic factors, . . . there is a danger that we maymiss phenomena, and opportunities, that have akinetic rather than equilibrium basis, such as thosethat may derive from better directed control of
339
Dow
nloa
ded
by [
Tex
as A
&M
Uni
vers
ity L
ibra
ries
] at
10:
57 0
9 Ja
nuar
y 20
18
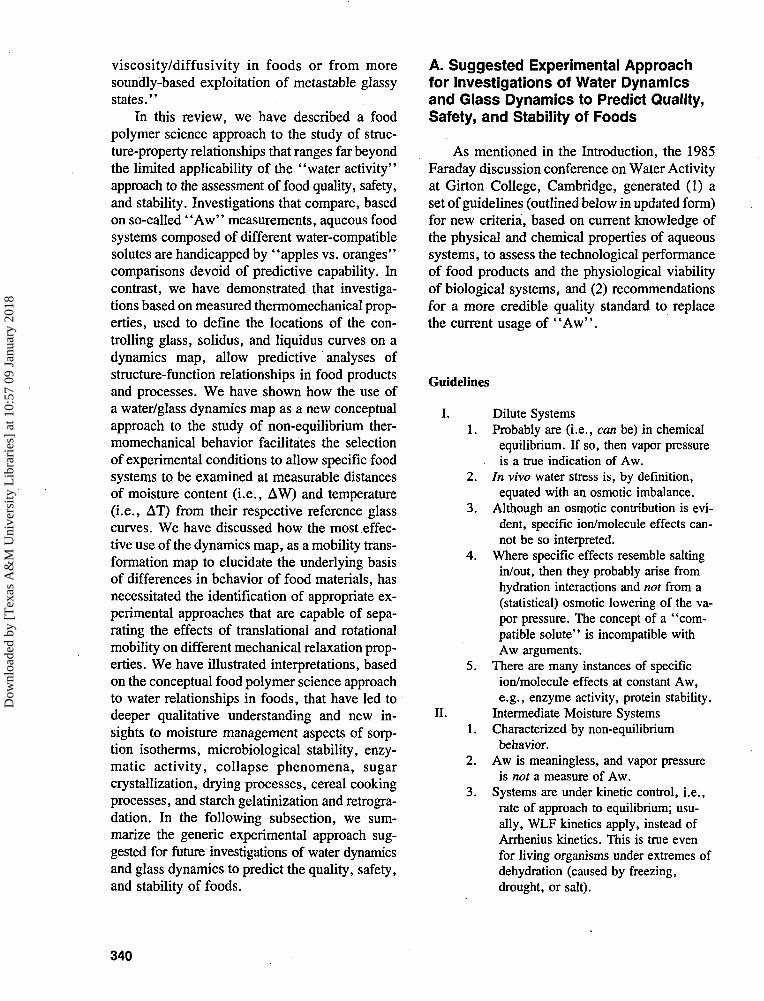
viscosity/diffusivity in foods or from moresoundly-based exploitation of metastable glassystates."
In this review, we have described a foodpolymer science approach to the study of struc-ture-property relationships that ranges far beyondthe limited applicability of the "water activity"approach to the assessment of food quality, safety,and stability. Investigations that compare, basedon so-called "Aw" measurements, aqueous foodsystems composed of different water-compatiblesolutes are handicapped by "apples vs. oranges"comparisons devoid of predictive capability. Incontrast, we have demonstrated that investiga-tions based on measured thermomechanical prop-erties, used to define the locations of the con-trolling glass, solidus, and liquidus curves on adynamics map, allow predictive analyses ofstructure-function relationships in food productsand processes. We have shown how the use ofa water/glass dynamics map as a new conceptualapproach to the study of non-equilibrium ther-momechanical behavior facilitates the selectionof experimental conditions to allow specific foodsystems to be examined at measurable distancesof moisture content (i.e., AW) and temperature(i.e., AT) from their respective reference glasscurves. We have discussed how the most effec-tive use of the dynamics map, as a mobility trans-formation map to elucidate the underlying basisof differences in behavior of food materials, hasnecessitated the identification of appropriate ex-perimental approaches that are capable of sepa-rating the effects of translational and rotationalmobility on different mechanical relaxation prop-erties. We have illustrated interpretations, basedon the conceptual food polymer science approachto water relationships in foods, that have led todeeper qualitative understanding and new in-sights to moisture management aspects of sorp-tion isotherms, microbiological stability, enzy-matic activity, collapse phenomena, sugarcrystallization, drying processes, cereal cookingprocesses, and starch gelatinization and retrogra-dation. In the following subsection, we sum-marize the generic experimental approach sug-gested for future investigations of water dynamicsand glass dynamics to predict the quality, safety,and stability of foods.
A. Suggested Experimental Approachfor Investigations of Water Dynamicsand Glass Dynamics to Predict Quality,Safety, and Stability of Foods
As mentioned in the Introduction, the 1985Faraday discussion conference on Water Activityat Girton College, Cambridge, generated (1) aset of guidelines (outlined below in updated form)for new criteria, based on current knowledge ofthe physical and chemical properties of aqueoussystems, to assess the technological performanceof food products and the physiological viabilityof biological systems, and (2) recommendationsfor a more credible quality standard to replacethe current usage of "Aw".
Guidelines
I. Dilute Systems1. Probably are (i.e., can be) in chemical
equilibrium. If so, then vapor pressureis a true indication of Aw.
2. In vivo water stress is, by definition,equated with an osmotic imbalance.
3. Although an osmotic contribution is evi-dent, specific ion/molecule effects can-not be so interpreted.
4. Where specific effects resemble saltingin/out, then they probably arise fromhydration interactions and not from a(statistical) osmotic lowering of the va-por pressure. The concept of a "com-patible solute" is incompatible withAw arguments.
5. There are many instances of specificion/molecule effects at constant Aw,e.g., enzyme activity, protein stability.
II. Intermediate Moisture Systems1. Characterized by non-equilibrium
behavior.2. Aw is meaningless, and vapor pressure
is not a measure of Aw.3. Systems are under kinetic control, i.e.,
rate of approach to equilibrium; usu-ally, WLF kinetics apply, instead ofArrhenius kinetics. This is true evenfor living organisms under extremes ofdehydration (caused by freezing,drought, or salt).
340
Dow
nloa
ded
by [
Tex
as A
&M
Uni
vers
ity L
ibra
ries
] at
10:
57 0
9 Ja
nuar
y 20
18
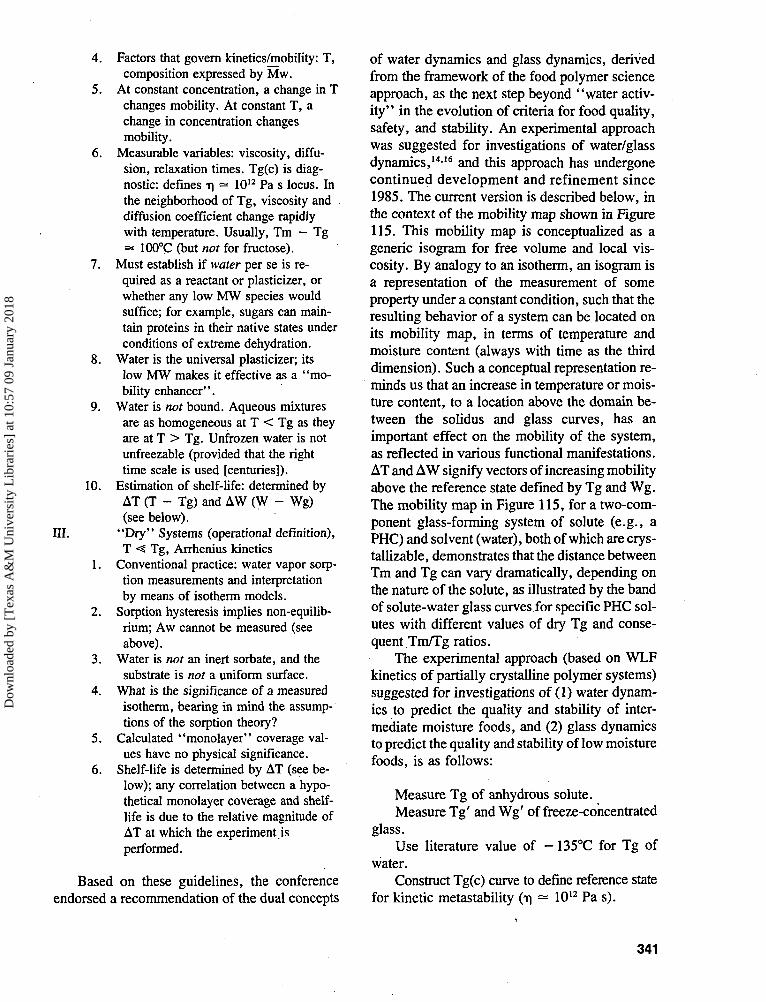
4. Factors that govern kinetics/mobility: T,composition expressed by Mw.
5. At constant concentration, a change in Tchanges mobility. At constant T, achange in concentration changesmobility.
6. Measurable variables: viscosity, diffu-sion, relaxation times. Tg(c) is diag-nostic: defines TI = 1012 Pa s locus. Inthe neighborhood of Tg, viscosity anddiffusion coefficient change rapidlywith temperature. Usually, Tm - Tg= 100°C (but not for fructose).
7. Must establish if water per se is re-quired as a reactant or plasticizer, orwhether any low MW species wouldsuffice; for example, sugars can main-tain proteins in their native states underconditions of extreme dehydration.
8. Water is the universal plasticizer; itslow MW makes it effective as a "mo-bility enhancer".
9. Water is not bound. Aqueous mixturesare as homogeneous at T < Tg as theyare at T > Tg. Unfrozen water is notunfreezable (provided mat the righttime scale is used [centuries]).
10. Estimation of shelf-life: determined byAT (T - Tg) and AW (W - Wg)(see below).
in. "Dry" Systems (operational definition),T <$ Tg, Arrhenius kinetics
1. Conventional practice: water vapor sorp-tion measurements and interpretationby means of isotherm models.
2. Sorption hysteresis implies non-equilib-rium; Aw cannot be measured (seeabove).
3. Water is not an inert sorbate, and thesubstrate is not a uniform surface.
4. What is the significance of a measuredisotherm, bearing in mind the assump-tions of the sorption theory?
5. Calculated "monolayer" coverage val-ues have no physical significance.
6. Shelf-life is determined by AT (see be-low); any correlation between a hypo-thetical monolayer coverage and shelf-life is due to the relative magnitude ofAT at which the experiment isperformed.
Based on these guidelines, the conferenceendorsed a recommendation of the dual concepts
of water dynamics and glass dynamics, derivedfrom the framework of the food polymer scienceapproach, as the next step beyond "water activ-ity" in the evolution of criteria for food quality,safety, and stability. An experimental approachwas suggested for investigations of water/glassdynamics,1416 and this approach has undergonecontinued development and refinement since1985. The current version is described below, inthe context of the mobility map shown in Figure115. This mobility map is conceptualized as ageneric isogram for free volume and local vis-cosity. By analogy to an isotherm, an isogram isa representation of the measurement of someproperty under a constant condition, such that theresulting behavior of a system can be located onits mobility map, in terms of temperature andmoisture content (always with time as the thirddimension). Such a conceptual representation re-minds us that an increase in temperature or mois-ture content, to a location above the domain be-tween the solidus and glass curves, has animportant effect on the mobility of the system,as reflected in various functional manifestations.AT and AW signify vectors of increasing mobilityabove the reference state defined by Tg and Wg.The mobility map in Figure 115, for a two-com-ponent glass-forming system of solute (e.g., aPHC) and solvent (water), both of which are crys-tallizable, demonstrates that the distance betweenTm and Tg can vary dramatically, depending onthe nature of the solute, as illustrated by the bandof solute-water glass curves for specific PHC sol-utes with different values of dry Tg and conse-quent Tm/Tg ratios.
The experimental approach (based on WLFkinetics of partially crystalline polymer systems)suggested for investigations of (1) water dynam-ics to predict the quality and stability of inter-mediate moisture foods, and (2) glass dynamicsto predict the quality and stability of low moisturefoods, is as follows:
Measure Tg of anhydrous solute.Measure Tg' and Wg' of freeze-concentrated
glass.Use literature value of - 135°C for Tg of
water.Construct Tg(c) curve to define reference state
for kinetic metastability On = 1012 Pa s).
341
Dow
nloa
ded
by [
Tex
as A
&M
Uni
vers
ity L
ibra
ries
] at
10:
57 0
9 Ja
nuar
y 20
18
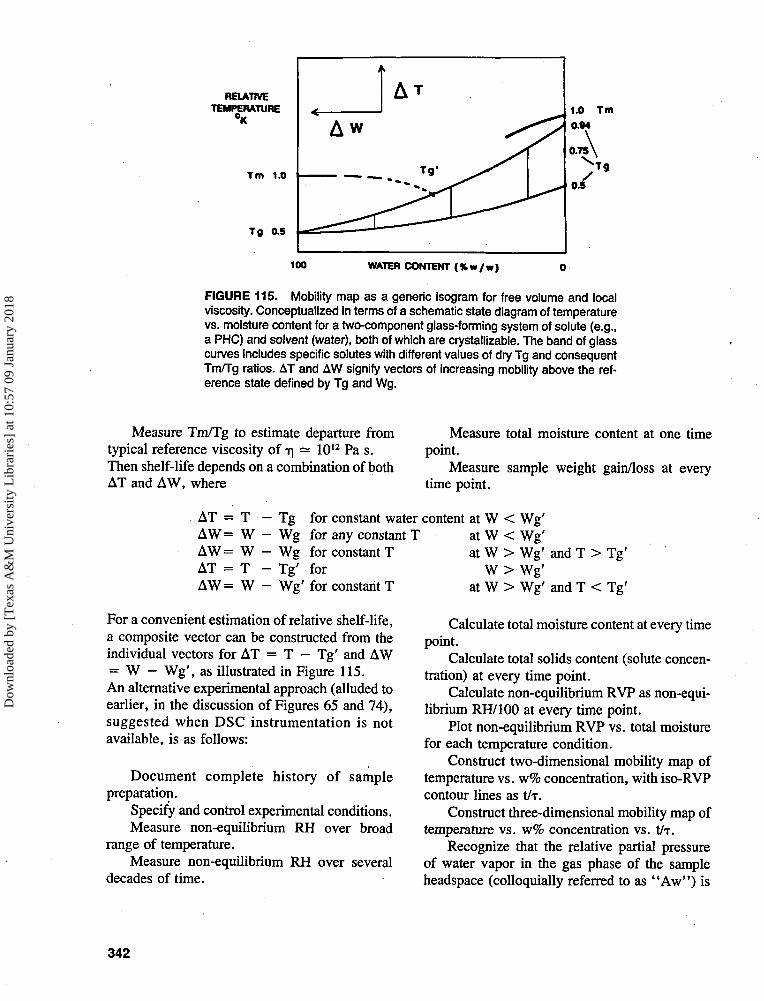
JIVEMTU
Tm
TO
RE
1.0
0.S - — :
A
— •
w
A
—
T
Tg* ^ S ^
1.0 Tm0.94
0.75
0/
100 WATER CONTENT ( % w / w )
FIGURE 115. Mobility map as a generic isogram for free volume and localviscosity. Conceptualized in terms of a schematic state diagram of temperaturevs. moisture content for a two-component glass-forming system of solute (e.g.,a PHC) and solvent (water), both of which are crystallizable. The band of glasscurves includes specific solutes with different values of dry Tg and consequentTm/Tg ratios. AT and AW signify vectors of increasing mobility above the ref-erence state defined by Tg and Wg.
Measure Tm/Tg to estimate departure fromtypical reference viscosity of T\ — 1012 Pa s.Then shelf-life depends on a combination of bothAT and AW, where
Measure total moisture content at one timepoint.
Measure sample weight gain/loss at everytime point.
AT = T - Tg for constant water content at W < Wg'AW= W - Wg for any constant T at W < Wg'AW= W - Wg for constant T at W > Wg' and T > Tg'AT = T - Tg' for W > Wg'AW= W - Wg' for constant T at W > Wg' and T < Tg'
For a convenient estimation of relative shelf-life,a composite vector can be constructed from theindividual vectors for AT = T - Tg' and AW= W - Wg', as illustrated in Figure 115.An alternative experimental approach (alluded toearlier, in the discussion of Figures 65 and 74),suggested when DSC instrumentation is notavailable, is as follows:
Document complete history of samplepreparation.
Specify and control experimental conditions.Measure non-equilibrium RH over broad
range of temperature.Measure non-equilibrium RH over several
decades of time.
Calculate total moisture content at every timepoint.
Calculate total solids content (solute concen-tration) at every time point.
Calculate non-equilibrium RVP as non-equi-librium RH/100 at every time point.
Plot non-equilibrium RVP vs. total moisturefor each temperature condition.
Construct two-dimensional mobility map oftemperature vs. w% concentration, with iso-RVPcontour lines as tAr.
Construct three-dimensional mobility map oftemperature vs. w% concentration vs. tAr.
Recognize that the relative partial pressureof water vapor in the gas phase of the sampleheadspace (colloquially referred to as "Aw") is
342
Dow
nloa
ded
by [
Tex
as A
&M
Uni
vers
ity L
ibra
ries
] at
10:
57 0
9 Ja
nuar
y 20
18
certainly not controlling the mechanical relaxa-tion rates and chemical reaction rates in the rub-bery fluid phase or glassy solid phase of anaqueous sample matrix. Rather, the observed RVPis controlled by the temperature-moisture contentlocation of the matrix relative to the location ofits glass curve on the mobility map.
Recognize that liquid water as a plasticizer,which increases the mobility of a multicompo-nent supra-glassy matrix, is the key to under-standing relaxation rates in restricted waterenvironments.
As described in this review, the field of foodscience and technology has recently enjoyed aseemingly exponential growth of interest inglasses and glass transitions in foods and in theplasticizing effect of water on Tg. This spurt ofinterest stems from the growing realization of theimportance of glassy and rubbery states to thequality, safety, and stability of foods. This stateof affairs is evidenced by the fact that over 20%of the more than 400 references cited in this re-view were published in 1988, 1989, or 1990. Inthe decade of the 1990s, we expect to witnesseven greater growth and interest in this excitingsubject area, because it offers so many challeng-ing questions still to be answered, while prom-ising so many opportunities for technologicaladvancement.
GLOSSARY OF SYMBOLS ANDABBREVIATIONS
A AngstromARR ArrheniusA-type polymorphic crystalline form
of starchAp amylopectinAw water activity"Aw" "water activity" (i.e., relative
vapor pressure, p/p°)aT WLF shift factor as a
function of temperatureaP WLF shift factor as a
function of plasticizer contentBET Brunauer-Epstein-TellerB-type polymorphic crystalline form
of starch
c°cCMCCeeg
eg'
CpACpC1.C2
calcmcPcpsDDEDg
Dg'
DMDMADMSODNADPDFn
DPw
DSC
dDTAd.b.d.s.EPR
e.g.,endo°FFWfGAGGAB
GHzGR
concentrationdegrees Centigradecarboxymethyl cellulosesolute concentration at Tesolute concentration in anaqueous glass at its Tgsolute concentration in anaqueous glass at its Tg'heat capacitychange in heat capacitycoefficients in the WLFequationcaloriecentimetercentipoisecycles per seconddiluent concentrationdextrose equivalentdiluent concentration in aglass at its Tgdiluent concentration in aglass at its Tg'dry matterdynamic mechanical analysisdimethyl sulfoxidedeoxyribonucleic aciddegree of polymerizationnumber-average degree ofpolymerizationweight-average degree ofpolymerizationdifferential scanningcalorimetrydaydifferential thermal analysisdry basisdry solidselectron paramagneticresonancefor exampleendothermicdegrees Farenheitfreezable wateractivity coefficientGibbs free energychange in Gibbs free energyGuggenheim-Anderson-DeBoergigahertzgrowth rate
343
Dow
nloa
ded
by [
Tex
as A
&M
Uni
vers
ity L
ibra
ries
] at
10:
57 0
9 Ja
nuar
y 20
18
gHAHHFCShh1IMFi.e.,JJ 'K
°KKHzkkgkbarIogioInMMPaMWMWDMn
Mw
Mn'
Mw'
Mw/MnmmealminmmNNMRNRnnmnsPAPPaPasPEG
gramenthalpyenthalpy changehigh fructose corn syruphydration numberhourionic strengthintermediate-moisture foodthat isJoulestorage complianceequilibrium dissociationconstantdegrees Kelvinkilohertzrate constantkilogram1000 atmospheres pressurelogarithm, base 10natural logarithmmolar concentrationmegaPascalmolecular weightmolecular weight distributionnumber-average molecularweightweight-average molecularweightnumber-average molecularweight of the solute-UFWglass at its Tg'weight-average molecularweight of the solute-UFWglass at its Tg'polydispersity indexmolal concentrationmillicalorieminutemillimeternormal concentrationnuclear magnetic resonancenucleation ratenumbernanometernanosecondpressureplasticizer differentialPascalPascal secondpoly(ethylene glycol)
PHCPPGPVAcPVCPVP
PP°
PH
pK
P/P°ps or psecQ,o
RR.H. or RH%RHRNaseRTRVPrSSHPSSL
s or secTTADS%TMTMAAT
TaTarn
Tc
TcrTdTeTexpTfTfrTgTg'
polyhydroxy compoundpolypropylene glycol)poly(vinyl acetate)poly(vinyl chloride)poly(vinyl pyrrolidone)vapor pressurevapor pressure of pure liquidwater- log of the hydronium ionconcentration in aqueoussolution- log of the equilibriumdissociation constantrelative vapor pressurepicosecondrate expression associatedwith Arrhenius kineticsgas constantrelative humiditypercent relative humidityribonucleaseroom temperaturerelative vapor pressurelinear correlation coefficientsolutestarch hydrolysis productsodium stearoyl lactylatesecondtemperaturethermal analysis data stationpercent total moisturethermomechanical analysistemperature differential (e.g.,T - T g )annealing temperature"antemelting" transitiontemperaturecollapse transitiontemperaturecrystallization temperaturedevitrification temperatureeutectic melting temperatureexperimental temperaturefreezer temperatureflow relaxation temperatureglass transition temperaturesubzero glass transitiontemperature of theamorphous solute/unfrozenwater matrix surrounding the
344
Dow
nloa
ded
by [
Tex
as A
&M
Uni
vers
ity L
ibra
ries
] at
10:
57 0
9 Ja
nuar
y 20
18
Tg/TmTgelTgelatTh
Th/TmTim
TliqTm
Tm/TTm/TgTmfThTrTsTsolTspTvaptUFWVV°V-type
vs.WAW
WBCWg
ice crystals in a maximallyfreeze-concentrated aqueoussolutionratio of Tg to Tmgelation temperaturegelatinization temperaturehomogeneous nucleationtemperatureratio of Th to Tm"incipient melting"temperatureliquidus temperaturecrystalline meltingtemperaturereduced temperatureratio of Tm to Tgratio of Tm to Threcrystallization temperaturesorption temperaturesolidus temperaturesticky point temperaturevaporization temperaturetimeunfrozen watervolumepartial molar volumepolymorphic crystalline formof starchversuswater contentwater content differential
• (e.g., W - Wg)"water-binding capacity"content of plasticizing water
xs
xw
-ne1̂9
•ngelp
Hi
MSfxcal
pg*
T
Trot%=
><><
>
/
mole fraction concentrationof solutemole fraction concentrationof waterviscosityviscosity at Teviscosity of a glass at its Tgviscosity at Tgeldensitychemical potentialchemical potential ofcomponent ichemical potential of watermicrocaloriemicrometerdensity of a glass at its Tgosmotic coefficientwater potentialrelaxation timerotational relaxation timepercentequal toessentially identical toaboutabout equal togreater thanless thangreater than or equal toless than or equal togreater than aboutless than aboutmuch greater thanmuch less thanper
in an aqueous glass at its TgWg' content of plasticizing water
in an aqueous glass at itsTg'
WLF Williams-Landel-FerryWs water content at Tsw weight (or mass) fractionw/w or w:w composition of a mixture,
expressed as a weight ratiow% or wt% weight percent concentrationw% C weight percent concentrationx mole fraction concentrationXj mole fraction concentration
of component i
ACKNOWLEDGMENTS
We thank F. Franks, C. van den Berg, T. H.Lilley, G. W. Gould, and K. Johnston, speakersat the 1985 Faraday Discussion Conference onWater Activity at Cambridge, for their importantcontributions to this review. We especially thankProfessor Franks, whose lecture notes from acourse on Moisture Management in Food Sys-tems served as the basis for the material in Sec-tion II.A.
345
Dow
nloa
ded
by [
Tex
as A
&M
Uni
vers
ity L
ibra
ries
] at
10:
57 0
9 Ja
nuar
y 20
18
REFERENCES
1. Scott, W. J., Water relations of food spoilage mi-croorganisms, Adv. Food Res., 7, 83, 1957.
2. Franks, F., Water activity as a measure of biologicalviability and technological quality control, CerealFoods World, 27, 403, 1982.
3. Kuprianoff, J., Fundamental aspects of the dehy-dration of foodstuffs, in Conference on FundamentalAspects of the Dehydration of Foodstuffs, Society ofChemical Industry, Aberdeen, 1958, 14.
4. Franks, F. , The properties of aqueous solutions atsubzero temperatures, in Water: A ComprehensiveTreatise, Vol. 7, Franks, F., Ed., Plenum Press, NewYork, 1982, 215.
5. Franks, F., Biophysics and Biochemistry at LowTemperatures, Cambridge University Press, Cam-bridge, 1985.
6. Franks, F. , Complex aqueous systems at subzerotemperatures, in Properties of Water in Foods, Sim-atos, D. and Multon, J. L., Eds., Martinus Nijhoff,Dordrecht, 1985, 497.
7. Franks, F., Metastable water at subzero tempera-tures, J. Microsc, 141, 243, 1986.
8. Levine, H. and Slade, L., A polymer physicochem-ical approach to the study of commercial starch hy-drolysis products (SHPs), Carbohydr. Polym., 6, 213,1986.
9. Lilley, T. H., Water activity as a thermodynamicdevice; definitions and assumptions, presented at Far-aday Division, Royal Society of Chemistry Discus-sion Conference — Water Activity: A Credible Mea-sure of Technological Performance and PhysiologicalViability?, Cambridge, July 1-3, 1985, 1.
10. Franks, F., Water activity and biochemistry — spe-cific ionic and molecular effects, presented at FaradayDivision, Royal Society of Chemistry DiscussionConference — Water Activity: A Credible Measureof Technological Performance and Physiological Vi-ability?, Cambridge, July 1-3, 1985, 7.
11. Gould, G. W., Complex dilute solutions. Osmore-gulation: is the cell just a simple osmometer? Themicrobiological experience, presented at Faraday Di-vision, Royal Society of Chemistry Discussion Con-ference, Water Activity: A Credible Measure ofTechnological Performance and Physiological Via-bility?, Cambridge, July 1-3, 1985, 11.
12. van den Berg, C., On the significance of water ac-tivity in low moisture systems; water vapor sorptionequilibrium and hysteresis; the starch/water systemas a model, presented at Faraday Division, RoyalSociety of Chemistry Discussion Conference — WaterActivity: A Credible Measure of Technological Per-formance and Physiological Viability?, Cambridge,July 1-3, 1985, 16.
13. Johnston, K., Water-sorbent-solute relationships indry food model systems, presented at Faraday Di-vision, Royal Society of Chemistry Discussion Con-ference — Water Activity: A Credible Measure of
Technological Performance and Physiological Via-bility?, Cambridge, July 1-3, 1985, 21.
14. Slade, L. and Levine, H., Intermediate moisturesystems; concentrated and supersaturated solutions;pastes and dispersions; water as plasticizer; the mys-tique of "bound" water; thermodynamics versus ki-netics, presented at Faraday Division, Royal Societyof Chemistry Discussion Conference — Water Ac-tivity: A Credible Measure of Technological Perfor-mance and Physiological Viability?, Cambridge, July1-3, 1985, 24.
15. Levine, H. and Slade, L., Water as a plasticizer:physico-chemical aspects of low-moisture polymericsystems, in Water Science Reviews, Vol. 3, Franks,F., Ed., Cambridge University Press, Cambridge,1988, 79.
16. Slade, L. and Levine, H., Structural stability ofintermediate moisture foods — a new understand-ing?, in Food Structure — Its Creation and Evalu-ation, Mitchell, J. R. and Blanshard, J. M. V., Eds.,Butterworths, London, 1988, 115.
17. Slade, L. and Levine, H., Thermal analysis of starchand gelatin, in Proc. 13th NATAS Conf., McGhie,A. R., Ed., Philadelphia, 1984, 64.
18. Slade, L., Starch properties in processed, foods: stal-ing of starch-based products, presented at AACC 69thAnn. Meet., Minneapolis, Sept. 30 to Oct. 4, 1984,Abstr. #112.
19. Maurice, T. J., Slade, L., Page, C., and Sirett, R.,Polysaccharide-water interactions — thermal behav-ior of rice starch, in Properties of Water in Foods,Simatos, D. and Multon, J. L., Eds., Martinus Nijhoff,Dordrecht, 1985, 211.
20. Slade, L. and Levine, H., Recent advances in starchretrogradation, in Industrial Polysaccharides — TheImpact of Biotechnology and Advanced Methodolo-gies, Stivala, S. S., Crescenzi, V., and Dea, I. C. M.,Eds., Gordon and Breach Science, New York, 1987,387.
21. Slade, L. and Levine, H., Non-equilibrium meltingof native granular starch. I. Temperature location ofthe glass transition associated with gelatinization ofA-type cereal starches, Carbohydr. Polym., 8, 183,1988.
22. Slade, L. and Levine, H., A food polymer scienceapproach to selected aspects of starch gelatinizationand retrogradation, in Frontiers in Carbohydrate Re-search-I: Food Applications, Millane, R. P., Be-Miller, J. N., and Chandrasekaran, R., Eds., ElsevierApplied Science, London, 1989, 215.
23. Slade, L. and Levine, H., Thermal analysis of starch,in 1988 CRA Scientific Conf., Corn Refiners Assoc.,Washington, D.C., 1988, 169.
24. Slade, L. and Levine, H., Polymer-chemical prop-erties of gelatin in foods, in Advances in Meat Re-search, Vol. 4, Collagen as a Food, Pearson, A.M.,Dutson, T. R., and Bailey, A., Eds., AVI, Westport,1987, 251.
25. Slade, L., Levine, H., and Finley, J. W., Protein-
346
Dow
nloa
ded
by [
Tex
as A
&M
Uni
vers
ity L
ibra
ries
] at
10:
57 0
9 Ja
nuar
y 20
18
water interactions: water as a plasticizer of gluten andother protein polymers, in Protein Quality and theEffects of Processing, Phillips, D. and Finley, J. W.,Eds., Marcel Dekker, New York, 1989, 9.
26. Levine, H. and Slade, L., Influences of the glassyand rubbery states on the thermal, mechanical, andstructural properties of doughs and baked products,in Dough Rheology and Baked Product Texture: The-ory and Practice, Faridi, H. and Faubion, J. M.,Eds., Van Nostrand Reinhold/AVI, New York, 1989,157.
27. Levine, H. and Slade, L., Collapse phenomena —a unifying concept for interpreting the behavior oflow-moisture foods, in Food Structure — Its Creationand Evaluation, Mitchell, J. R. and Blanshard,J. M. V., Eds., Butterworths, London, 1988, 149.
28. Levine, H. and Slade, L., Interpreting the behaviorof low-moisture foods, in Water and Food Quality,Hardman, T. M., Ed., Elsevier Science, London,1989, 71.
29. Schenz, T. W., Rosolen, M. A., Levine, H., andSlade, L., DMA of frozen aqueous solutions, in Proc.13th NATAS Conf., A. R. McGhie, Ed., Philadel-phia, 1984, 57.
30. Slade, L. and Levine, H., Non-equilibrium behaviorof small carbohydrate-water systems, Pure Appl.Chem., 60, 1841, 1988.
31. Levine, H. and Slade, L., Thermomechanical prop-erties of small carbohydrate-water glasses and "rub-bers": kinetically metastable systems at subzero tem-peratures, J. Chem. Soc. Faraday Trans. I, 84, 2619,1988.
32. Levine, H. and Slade, L., Principles of cryostabil-ization technology from structure/property relation-ships of water-soluble food carbohydrates — a re-view, Cryo.-Lett., 9, 21, 1988.
33. Levine, H. and Slade, L., A food polymer scienceapproach to the practice of cryostabilization tech-nology, Comments Agric. FoodChem., 1, 315, 1989.
34. Levine, H. and Slade, L., Cryostabilization tech-nology: thermoanalytical evaluation of food ingre-dients and systems, in Thermal Analysis of Foods,Ma, C.-Y. and Harwalkar, V. R., Eds., ElsevierApplied Science, London, 1990, 221.
35. Biliaderis, C. G., Page, C. M., Slade, L., andSirett, R. R., Thermal behavior of amylose-lipidcomplexes, Carbohydr. Polym., 5, 367, 1985.
36. Slade, L., Altomare, R., Oltzik, R., and Medcalf,D. G., Accelerated Staling of Starch-Based FoodProducts, U.S. Patent 4,657,770, 1987.
37. Cole, B. A., Levine, H. I., McGuire, M. T., Nelson,K. J., and Slade, L., Soft, Frozen Dessert For-mulation, U.S. Patent 4,374,154, 1983.
38. Cole, B. A., Levine, H. I., McGuire, M. T., Nelson,K. J., and Slade, L., Soft, Frozen Dessert For-mulation, U.S. Patent 4,452,824, 1984.
39. Levine, H. and Slade, L., Response to the letter bySimatos, Blond, and Le Meste on the relation be-
tween glass transition and stability of a frozen prod-uct, Cryo.-Lett., 10, 347, 1989.
40. Franks, F. , Improved freeze-drying: an analysis ofthe basic scientific principles, Process Biochem.,24(1), R3, 1989.
41. Franks, F., Freeze drying: from empiricism to pre-dictability, Cryo.-Lett., 11, 93, 1990.
42. Franks, F. and Grigera, J. R., Solution propertiesof low molecular weight polyhydroxy compounds, inWater Science Reviews, Vol. 5, The Molecules ofLife, F. Franks, Ed., Cambridge University Press,Cambridge, 1990, 187.
43. van den Berg, C., Water activity, in Concentrationand Drying of Foods, MacCarthy, D., Ed., ElsevierApplied Science, London, 1986, 11.
44. White, G. W. and Cakebread, S. H., The glassystate in certain sugar-containing food products, J.Food Technol., 1, 73, 1966.
45. Ablett, S., Attenburrow, G. E., and Lillford, P. J.,The significance of water in the baking process, inChemistry and Physics of Baking, Blanshard,J. M. V., Frazier, P. J., Galliard, T., Eds., RoyalSociety of Chemistry, London, 1986, 30.
46. Biliaderis, C. G., Page, C. M., Maurice, T. J.,and Juliano, B. O., Thermal characterization of ricestarches: a polymeric approach to phase transitionsof granular starch, J. Agric. Food Chem., 34, 6,1986.
47. Blanshard, J. M. V., The significance of the struc-ture and function of the starch granule in baked prod-ucts, in Chemistry and Physics of Baking, Blanshard,J. M. V., Frazier, P. J., and Galliard, T., Eds., RoyalSociety of Chemistry, London, 1986, 1.
48. Blanshard, J. M. V., Starch granule structure andfunction: physicochemical approach, in Starch: Prop-erties and Potential, Galliard, T., Ed., John Wiley& Sons, New York, 1987, 16.
49. Blanshard, J. M. V., Elements of cereal productstructure, in Food Structure — Its Creation and Eval-uation, Blanshard, J. M. V. and Mitchell, J. R., Eds.,Butterworths, London, 1988, 313.
50. Blanshard, J. M. V. and Franks, F., Ice crystal-lization and its control in frozen food systems, inFood Structure and Behaviour, Blanshard, J. M. V.and Lillford, P., Eds., Academic Press, London, 1987,51.
51. Hoseney, R. C., Zeleznak, K., and Lai, C. S.,Wheat gluten: a glassy polymer, Cereal Chem., 63,285, 1986.
52. Yost, D. A. and Hoseney, R. C., Annealing andglass transition of starch, Starke, 38, 289, 1986.
53. Zeleznak, K. J. and Hoseney, R. C., The glasstransition in starch, Cereal Chem., 64, 121, 1987.
54. Karel, M., Effects of water activity and water con-tent on mobility of food components, and their effectson phase transitions in food systems, in Propertiesof Water in Foods, Simatos, D. and Multon, J. L.,Eds., Martinus Nijhoff, Dordrecht, 1985, 153.
347
Dow
nloa
ded
by [
Tex
as A
&M
Uni
vers
ity L
ibra
ries
] at
10:
57 0
9 Ja
nuar
y 20
18
55. Karel, M., Control of lipid oxidation in dried foods,in Concentration and Drying of Foods, MacCarthy,D., Ed., Elsevier Applied Science, London, 1986,37.
56. Karel, M. and Langer, R., Controlled release offood additives, in Flavor Encapsulation, ACS Symp.Ser. 370, Risch, S. J. and Reineccius, G. A., Eds.,American Chemical Society, Washington, D.C.,1988, 177.
57. Simatos, D. and Karel, M., Characterizing condi-tion of water in foods: physico-chemical aspects, inFood Preservation by Moisture Control, Seow, C. C.,Ed., Elsevier Applied Science, London, 1988, 1.
58. Lillford, P. J., The polymer/water relationship —its importance for food structure, in Food Structure— Its Creation and Evaluation, Blanshard, J. M. V.and Mitchell, J. R., Eds., Butterworths, London,1988, 75.
59. Orford, P. D., Parker, R., Ring, S. G., and Smith,A. C., The effect of water as a diluent on the glasstransition behavior of malto-oligosaccharides, amy-lose and amylopectin, Int. J. Biol. Macromol., 11,91, 1989.
60. Russell, P. L., Gelatinization of starches of differentamylose/amylopectin content — DSC study, J. Cer-eal Sci., 6, 133, 1987.
61. Zobel, H. F., Starch crystal transformations and theirindustrial importance, Starke, 40, 1, 1988.
62. van den Berg, C., Vapour Sorption Equilibria andOther Water-Starch Interactions: A PhysicochemicalApproach, Doctoral thesis, Agricultural University,Wageningen, 1981.
63. Russell, P. L. and Oliver, G., The effect of pH andNaCl content on starch gel ageing, a study by DSCand rheology, J. Cereal ScL, 10, 123, 1989.
64. Karel, M., Role of water activity, in Food Propertiesand Computer-Aided Engineering of Food Process-ing Systems, Singh, R. P. and Medina, A. G., Eds.,Kluwer, Dordrecht, 1989, 135.
65. Lund, D. B., Starch gelatinization, in Food Prop-erties and Computer-Aided Engineering of Food Pro-cessing Systems, Singh, R. P. and Medina, A. G.,Eds., Kluwer, Dordrecht, 1989, 299.
66. Roos, Y. and Karel, M., Plasticizing effect of wateron thermal behavior and crystallization of amorphousfood models, J. Food Sci., 56, 38, 1991.
67. Labuza, T. P. and Contreras-Medellin, R., Pre-diction of moisture protection requirements for foods,Cereal Foods World, 26, 335, 1981.
68. Lewis, G. N. and Randall, M., Thermodynamics,2nd ed., McGraw-Hill, New York, 1961.
69. Levine, H., The value of a qualitative, conceptualapproach to scientific understanding, Cryo.-Lett., 9,140, 1988.
70. Labuza, T. P., Properties of water as related to thekeeping quality of foods, in Proceedings 3rd Inter-national Conference Food Science and Technology,SOS 70, Institute Food Technologists, Washington,DC, 1970, 618.
71. Lang, K. W., Physical, Chemical and Microbiol-ogical Characterization of Polymer and Solute BoundWater, Doctoral thesis, University of Illinois, 1981.
72. Gould, G. W. and Christian, J. H. B., Character-ization of the state of water in foods — biologicalaspects, in Food Preservation by Moisture Control,Seow, C. C., Ed., Elsevier Applied Science, Lon-don, 1988, 43.
73. Mathlouthi, M., Larreta-Garde, V., Xu, Z. F.,and Thomas, D., Solute-solvent and water activityof small carbohydrates: application to the study ofenzyme stability in aqueous sugar solutions, J. Car-bohydr. Chem., 8, 233, 1989.
74. Franks, F., Asquith, M. H., Hammond, C. C.,Skaer, H. B., and Echlin, P., Polymeric cryopro-tectants in the preservation of biological ultrastruc-ture. I, J. Microsc., 110, 223, 1977.
75. Loncin, M., Basic principles of moisture equilibria,in Freeze Drying and Advanced Food Technology,Goldlith, S. A., Rey, L., and Rothmayr, W. W.,Eds., Academic Press, New York, 1975, 599.
76. Chirife, J., Favetto, G., and Fontan, C., The wateractivity of fructose solutions in the intermediate mois-ture range, Lebensm.-Wiss. u.-Technol., 15, 159,1982.
77. Gould, G. W. and Measures, J. C., Water relationsin single cells, Phil. Trans. R. Soc. London B., 278,151, 1977.
78. Deodhar, S. and Luner, P., Measurement of bound(nonfreezing) water by DSC, in Water in Polymers,Rowland, S. P., Ed., ACS Symp. Ser. 127, Amer-ican Chemical Society, Washington, DC, 1980, 273.
79. van den Berg, C. and Bruin, S., Water activity andits estimation in food systems: theoretical aspects, inWater Activity: Influences on Food Quality, Rock-land, L. B. and Stewart, G. F., Eds., AcademicPress, New York, 1981, 1.
80. Moy, P. and Karasz, F. E., The interactions ofwater with epoxy resins, in Water in Polymers, Row-land, S. P., Ed., ACS Symp. Ser. 127, AmericanChemical Society, Washington, DC, 1980, 505.
81. Weisser, H., Influence of temperature on sorptionequilibria, in Properties of Water in Foods, Simatos,D. and Multon, J. L., Eds., Martinus Nijhoff, Dor-drecht, 1985, 95.
82. Niediek, E. A., Effect of processing on the physicalstate and aroma sorption properties of carbohydrates,Food Technol., 42(11), 81, 1988.
83. Bizot, H., Buleon, A., Mouhoud-Riou, N., andMulton, J. L., Water vapor sorption hysteresis inpotato starch, in Properties of Water in Foods, Sim-atos, D. and Multon, J. L., Eds., Martinus Nijhoff,Dordrecht, 1985, 83.
84. Rupley, J. A., Gratton, E., and Careri, G., TrendsBiochem. Sci., p. 18, 1983.
85. Franks, F., Protein hydration, in Characterizationof Proteins, Franks, F., Ed., Humana Press, Clifton,NJ, 1988, 127.
86. Bone, S. and Pethig, R., Dielectric studies of the
348
Dow
nloa
ded
by [
Tex
as A
&M
Uni
vers
ity L
ibra
ries
] at
10:
57 0
9 Ja
nuar
y 20
18
binding of water to lysozyme, J. Mol. Biol., 157,571, 1982.
87. Morozov, V. N., Morozova, T. Y., Kachalova,G. S., and Myachin, E. T., Interpretation of waterdesorption isotherms of lysozyme, Int. J. Biol. Ma-cromol., 10, 329, 1988.
88. Edwards, S. F., Lillford, P. J., and Blanshard,J. M. V., Gels and networks in practice and theory,in Food Structure and Behaviour, Blanshard, J. M. V.and Lillford, P., Eds., Academic Press, London, 1987,1.
89. Soesanto, T. and Williams, M. C., Volumetricinterpretation of viscosity for concentrated and dilutesugar solutions, J. Phys. Chem., 85, 3338, 1981.
90. Atkins, A. G., Basic principles of mechanical failurein biological systems, in Food Structure and Behav-iour, Blanshard, J. M. V. and Lillford, P., Eds.,Academic Press, London, 1987, 149.
91. Quinquenet, S., Grabielle-Madelmont, C., Ollivon,M., and Serpelloni, M., Influence of water on puresorbitol polymorphism, J. Chem. Soc, FaradayTrans. I, 84, 2609, 1988.
92. Ring, S. G., Colonna, P., l'Anson, K. J.,Kalichevsky, M. T., Miles, M. J., Morris, V. J.,and Orford, P. D., Gelation and crystallization ofamylopectin, Carbohydr. Res., 162, 277, 1987.
93. Zobel, H. F., Young, S. N., and Rocca, L. A.,Starch gelatinization: an X-ray diffraction study, Cer-eal Chem., 65, 443, 1988.
94. Marsh, R. D. L. and Blanshard, J. M. V., Theapplication of polymer crystal growth theory to thekinetics of formation of the B-amylose polymorph ina 50% wheat starch gel, Carbohydr. Polym., 9, 301,1988.
95. Zeleznak, K. J. and Hoseney, R. C., Characteri-zation of starch from bread aged at different tem-peratures, Starke, 39, 231, 1987.
96. Doescher, L. C., Hoseney, R. C., and Milliken,G. A., Mechanism for cookie dough setting, CerealChem., 64, 158, 1987.
97. Attenburrow, G. E., Goodband, R. M., Taylor,L. J., and Lillford, P. J., Structure, mechanics, andtexture of a food sponge, J. Cereal Sci., 9, 61, 1989.
98. Simatos, D., Blond, G., and Le Meste, M., Re-lation between glass transition and stability of a fro-zen product, Cryo.-Lett., 10, 77, 1989.
99. Fujio, Y. and Lim, J. K., Correlation between theglass-transition point and color change of heat-treatedgluten, Cereal Chem., 66, 268, 1989.
100. Flory, P. J., Principles of Polymer Chemistry, Cor-nell University Press, Ithaca, 1953.
101. Williams, M. L., Landel, R. F., and Ferry, J. D.,Temperature dependence of relaxation mechanismsin amorphous polymers and other glass-forming liq-uids, J. Am. Chem. Soc., 77, 3701, 1955.
102. Brydson, J. A., The glass transition, melting pointand structure, in Polymer Science, Jenkins, A. D.,Ed., North-Holland, Amsterdam, 1972, 194.
103. Wunderlich, B., Macromolecular Physics, Vol. 1,
Crystal Structure, Morphology, Defects, AcademicPress, New York, 1973.
104. Wunderlich, B., Macromolecular Physics, Vol. 2,Crystal Nucleation, Growth, Annealing, AcademicPress, New York, 1976.
105. Wunderlich, B., Macromolecular Physics, Vol. 3,Crystal Melting, Academic Press, New York, 1980.
106. Wunderlich, B., The basis of thermal analysis, inThermal Characterization of Polymeric Materials,Turi, E. A., Ed., Academic Press, Orlando, 1981,91.
107. Ferry, J . D., Viscoelastic Properties of Polymers,3rd ed., John Wiley & Sons, New York, 1980.
108. Rowland, S. P., Water in Polymers, ACS Symp.Ser. 127, American Chemical Society, Washington,DC, 1980.
109. Sears, J. K. and Darby, J. R., The Technology ofPlasticizers, Wiley-Interscience, New York, 1982.
110. Eisenberg, A., The glassy state and the glass tran-sition, in Physical Properties of Polymers, Mark,J. E., Eisenberg, A., Graessley, W. W., Mandelk-em, L., and Koenig, J. L., Eds., American ChemicalSociety, Washington, DC, 1984, 55.
111. Ellis, T. S., Moisture-induced plasticization of amor-phous polyamides and their blends, J. Appl. Polym.Sci., 36, 451, 1988.
112. Graessley, W. W., Viscoelasticity and flow in pol-ymer melts and concentrated solutions, in PhysicalProperties of Polymers, Mark, J. E., Eisenberg, A.,Graessley, W. W., Mandelkern, L., and Koenig,J. L., Eds., American Chemical Society, Washing-ton, DC, 1984, 97.
113. Billmeyer, F. W., Textbook of Polymer Science, 3rded., Wiley-Interscience, New York, 1984.
114. Sperling, L. H., Introduction to Physical PolymerScience, Wiley-Interscience, New York, 1986.
115. Walton, A. G., Nucleation in liquids and solutions,in Nucleation, Zettlemoyer, A. C., Ed., Marcel Dek-ker, New York, 1969, 225.
116. Cowie, J . M. G., Polymers: Chemistry and Physicsof Modern Materials, Intertext, New York, 1973.
117. Turi, E. A., Thermal Characterization of PolymericMaterials, Academic Press, Orlando, 1981.
118. Haward, R. N., The Physics of Glassy Polymers,Applied Science, London, 1973.
119. Kauzmann, W., Nature of the glassy state and be-havior of liquids at low temperatures, Chem. Rev.,43, 219, 1948.
120. Petrie, S. E. B., The problem of thermodynamicequilibrium in glassy polymers, in Polymeric Mate-rials: Relationships Between Structure and Mechan-ical Behavior, Baer, E. and Radcliffe, S. V., Eds.,American Society Metals, Metals Park, Ohio, 1975,55.
121. Buchanan, D. R. and Walters, J. P., Glass-tran-sition temperatures of polyamide textile fibers. I. Ef-fect of water, Textile Res. J., 47, 398, 1977.
122. Sharpies, A., Crystallinity, in Polymer Science, Jen-
349
Dow
nloa
ded
by [
Tex
as A
&M
Uni
vers
ity L
ibra
ries
] at
10:
57 0
9 Ja
nuar
y 20
18
kins, A. D., Ed., North-Holland, Amsterdam, 1972,251.
123. BeMiller, J. N., as reported by M. A. Hill, Car-bohydr. Polym., 10, 64, 1989.
124. Finegold, L., Franks, F., and Hatley, R. H. M.,Glass/rubber transitions and heat capacities of binarysugar blends, J. Chem. Soc. Faraday Trans. I, 85,2945, 1989.
125. Roos, Y., Effect of moisture on the thermal behaviorof strawberries studied using DSC, J. Food Sci., 52,146, 1987.
126. Paakkonen, K. and Roos, Y. H., Effects of dryingconditions on water sorption and phase transitions offreeze-dried horseradish roots, J. Food Sci., 55, 206,1990.
127. Fuzek, J . F. , Glass transition temperature of wetfibers: its measurement and significance, in Water inPolymers, Rowland, S. P., Ed., ACS Symp. Ser.127, American Chemical Society, Washington, DC,1980, 515.
128. Ma, C. Y. and Harwalkar, V. R., Thermal Analysisof Foods, Elsevier Applied Science, London, 1990.
129. Kelley, S. S., Rials, T. G., and Glasser, W. G.,Relaxation behavior of the amorphous componentsof wood, J. Materials Sci., 22, 617, 1987.
130. Kakivaya, S. R. and Hoeve, C. A. J., The glasstransition of elastin, Proc. Natl. Acad. Sci. U.S.A.,72, 3505, 1975.
131. Hoeve, C. A. J. and Hoeve, M. B. J. A., The glasspoint of elastin as a function of diluent concentration,Organ. Coat. Plast. Chem., 39, 441, 1978.
132. Scandola, M., Ceccorulli, G., and Pizzoli, M.,Water clusters in elastin, Int. J. Biol. Macromol., 3,147, 1981.
133. MacKenzie, A. P. , Non-equilibrium freezing be-havior of aqueous systems, Phil. Trans. R. Soc. Lon-don B, 278, 167, 1977.
134. Sichina, W. J., Predicting mechanical performanceand lifetime of polymeric materials, Am. Lab., 20(1),42, 1988.
135. MacKenzie, A. P. , Collapse during freeze drying —qualitative and quantitative aspects, in Freeze Dryingand Advanced Food Technology, Goldlith, S. A.,Rey, L., and Rothmayr, W. W., Eds., AcademicPress, New York, 1975, 277.
136. To, E.C. and Flink, J.M., "Collapse", a structuraltransition in freeze dried carbohydrates. I, II, III, J.Food Technol., 13, 551, 1978.
137. Flink, J. M., Structure and structure transitions indried carbohydrate materials, in Physical Propertiesof Foods, Peleg, M. and Bagley, E. B., Eds., AVI,Westport, 1983, 473.
138. Karel, M. and Flink, J. M., Some recent devel-opments in food dehydration research, in Advancesin Drying, Mujumdar, A. S., Ed., Vol. 2, Hemi-sphere, Washington, 1983, 103.
139. Jolley, J. E., The microstructure of photographicgelatin binders, Photog. Sci. Eng., 14, 169, 1970.
140. Mitchell, J. R., The rheology of gels, J. Text. Stud.,11, 315, 1980.
141. Marsh, K. S. and Wagner, J., Predict Shelf Life,Food Eng., 57(8), 58, 1985.
142. Shalaby, S. W., Thermoplastic Polymers, in Ther-mal Characterization of Polymeric Materials, Tun,E. A., Ed., Academic Press, Orlando, 1981, 235.
143. Mayer, E., Hyperquenching of water and diluteaqueous solutions into their glassy states: an approachto cryofixation, Cryo.-Lett., 9, 66, 1988.
144. Ellis, T. S., Jin, X., and Karasz, F. E., The waterinduced plasticization behavior of semi-crystallinepolyamides, Polym. Prep., 25(2), 197, 1984.
145. Jin, X., Ellis, T. S., and Karasz, F. E., The effectof crystallinity and crosslinking on the depression ofthe glass transition temperature in nylon 6 by water,J. Polym. Sci.: Polym. Phys. Edn., 22, 1701, 1984.
146. Boyer, R. F., Baer, E., and Hiltner, A., Concern-ing gelation effects in atactic polystyrene solutions,Macromolecules, 18, 427, 1985.
147. Bair, H. E., Thermal analysis of additives in poly-mers, in Thermal Characterization of Polymeric Ma-terials, Turi, E. A., Ed., Academic Press, Orlando,1981, 845.
148. Hardy, G., Cser, F., and Takacs, E., Investigationof the binary system of a crystalline monomer andits polymer, J. Polym. Sci.: Symp. No. 42, 663,1973.
149. Franks, F., Solute-water interactions: do polyhy-droxy compounds alter the properties of water?, Cry-obiology, 20, 335, 1983.
150. Franks, F., Bound water: fact and fiction, Cryo.-Lett., 4, 73, 1983.
151. Labuza, T. P., Water binding of humectants, inProperties of Water in Foods, Simatos, D. and Mul-ton, J. L., Eds., Martinus Nijhoff, Dordrecht, 1985,421.
152. Wynne-Jones, S. and Blanshard, J. M. V., Hy-dration studies of wheat starch, amylopectin, amylosegels and bread by proton magnetic resonance, Car-bohydr. Polym., 6, 289, 1986.
153. French, D., Organization of starch granules, inStarch: Chemistry and Technology, Whistler, R. L.,BeMiller, J. N., and Paschall, E. F., Eds., 2nd ed.,Academic Press, Orlando, 1984, 183.
154. Imberty, A. and Perez, S., A revisit to the three-dimensional structure of B-type starch, Biopolymers,27, 1205, 1988.
155. Starkweather, H. W., Water in nylon, in Water inPolymers, Rowland, S. P., Ed., ACS Symp. Ser.127, American Chemical Society, Washington, DC,1980, 433.
156. Gaeta, S., Apicella, A., and Hopfenberg, H. B.,Kinetics and equilibria associated with the absorptionand desorption of water and lithium chloride in anethylene-vinyl alcohol copolymer, J. Membrane Sci.,12, 195, 1982.
157. Murthy, N. S., Stamm, M., Sibilia, J. P., and
350
Dow
nloa
ded
by [
Tex
as A
&M
Uni
vers
ity L
ibra
ries
] at
10:
57 0
9 Ja
nuar
y 20
18
Krimm, S., Structural changes accompanying hy-dration in nylon 6, Macromolecules, 22, 1261, 1989.
158. Kuge, T. and Kitamura, S., Annealing of starchgranules — warm water treatment and heat-moisturetreatment, J. Jpn. Soc. Starch Sci., 32, 65, 1985.
159. Aguerre, R. J., Suarez, C., and Viollaz, P. E.,Swelling and pore structure in starchy materials, J.Food Engn., 9, 71, 1989.
160. Juliano, B. O., Properties of rice starch in relationto varietal differences in processing characteristics ofrice grain, J. Jpn. Soc. Starch Sci., 29, 305, 1982.
161. Lelievre, J., Theory of gelatinization in a starch-water-solute system, Polymer, 17, 854, 1976.
162. Franks, F., Nucleation: a maligned and misunder-stood concept, Cryo.-Lett., 8, 53, 1987.
163. Biros, J., Madan, R. L., and Pouchly, J., Heatcapacity of water-swollen polymers above and below0°C, Collect. Czech. Chem. Commun., 44, 3566,1979.
164. Pouchly, J., Biros, J., and Benes, S., Heat capac-ities of water-swollen hydrophilic polymers aboveand below 0°C, Makromol. Chem., 180, 745, 1979.
165. Pouchly, J., Benes, S., Masa, Z., and Biros, J.,Sorption of water in hydrophilic polymers, Mak-romol. Chem., 183, 1565, 1982.
166. Pouchly, J. and Biros, J., Comments on the inter-pretation of thermodynamic data on swollen hydro-gels, Polym. Bull., 19, 513, 1988.
167. Derbyshire, W., Dynamics of water in heteroge-neous systems with emphasis on subzero tempera-tures, in Water: A Comprehensive Treatise, Franks,F., Ed., Vol. 7, Plenum Press, New York, 1982,339.
168. Hoeve, C. A. J., The structure of water in polymers,in Water in Polymers, Rowland, S. P., Ed., ACSSymp. Ser. 127, American Chemical Society, Wash-ington, DC, 1980, 135.
169. Burghoff, H. G. and Pusch, W., Thermodynamicstate of water in cellulose acetate membranes, Polym.Eng. Sci., 20, 305, 1980.
170. Mashimo, S., Kuwabara, S., Yagihara, S., andHigasi, K., Dielectric relaxation time and structureof bound water in biological materials, J. Phys. Chem.,91, 6337, 1987.
171. Labuza, T. P., Fiber's water binding capacity, Cer-eal Foods World, 34, 566, 1989.
172. Angell, C. A., Perspective on the glass transition,J. Phys. Chem. Solids, 49, 863, 1988.
173. Roberts, G. E. and White, E. F. T., Relaxationprocesses in amorphous polymers, in The Physics ofGlassy Polymers, Haward, R. N., Ed., Applied Sci-ence, London, 1973, 153.
174. Johari, G. P., Hallbrucker, A., and Mayer, E.,Thermal behavior of several hyperquenched organicglasses, J. Phys. Chem., 93, 2648, 1989.
175. Morozov, V. N. and Gevorkian, S. G., Low-tem-perature glass transition in proteins, Biopolymers, 24,1785, 1985.
176. Chan, R. K., Pathmanathan, K., and Johari,
G. P., Dielectric relaxations in the liquid and glassystates of glucose and its water mixtures, J. Phys.Chem., 90, 6358, 1986.
177. Matsuoka, S., Williams, G., Johnson, G. E.,Anderson, E. W., and Furukawa, T., Phenome-nological relationship between dielectric relaxationand thermodynamic recovery processes near the glasstransition, Macromolecules, 18, 2652, 1985.
178. Borchard, W., Bremer, W., and Keese, A., Statediagram of the water-gelatin system, Colloid Polym.Sci., 258, 516, 1980.
179. Tomka, I., Bohonek, J., Spuhler, A., and Ribeaud,M., Structure and formation of the gelatin gel, J.Photogr. Sci., 23, 97, 1975.
180. Yannas, I. V., Collagen and gelatin in the solid state,J. Macromol. Sci.-Revs. Macromol. Chem., C7, 49,1972.
181. Wesson, J. A., Takezoe, H., Yu, H., and Chen,S. P., Dye diffusion in swollen gels by forced Ray-leigh scattering, J. Appl. Phys., 53, 6513, 1982.
182. Robertson, R. E., Segmental mobility in the equi-librium liquid below the glass transition, Macromol-ecules, 18, 953, 1985.
183. Cheng, S. Z. D., Thermal characterization of mac-romolecules, J. Appl. Polym. Sci.: Appl. Polym.Symp., 43, 315, 1989.
184. Johnson, G. E., Bair, H. E., Matsuoka, S.,Anderson, E. W., and Scott, J. E., Water sorptionand its effects on a polymer's dielectric behavior, inWater in Polymers, Rowland, S. P., Ed., ACS Symp.Ser. 127, American Chemical Society, Washington,DC, 1980, 451.
185. Franks, F., Biophysics and biochemistry of low tem-peratures and freezing, in Effects of Low Tempera-tures on Biological Membranes, Morris, G. J. andClarke, A., Eds., Academic Press, London, 1981,3.
186. Bengtzelius, U. and Sjolander, A., Glass transitionsin hard sphere and Lennard-Jones fluids, in Confer-ence on Dynamic Aspects of Structural Change inLiquids and Glasses, New York Academy of Sci-ences, New York, Dec. 1-3, 1986, Abstr. #16.
187. Cantor, C. R. and Schimmel, P. R., BiophysicalChemistry. I. The Conformation of Biological Mac-romolecules, W. H. Freeman, San Francisco, 1980.
188. Van Holde, K. E., Physical Biochemistry, Prentice-Hall, Englewood Cliffs, New Jersey, 1971.
189. Hofer, K., Hallbrucker, A., Mayer, E., and Johari,G. P., Vitrified dilute aqueous solutions. III. Plas-ticization of water's H-bonded network and the glasstransition temperature's minimum, J. Phys. Chem.,93, 4674, 1989.
190. Pikal, M. J. and Shah, S., The collapse temperaturein freeze drying: dependence on measurement meth-odology and rate of water removal from the glassyphase, Int. J. Pharm., 62, 165, 1990.
191. Angell, C. A., Supercooled water, Ann. Rev. Phys.Chem., 34, 593, 1983.
192. Baro, M. D., Clavaguera, N., Bordas, S.,
351
Dow
nloa
ded
by [
Tex
as A
&M
Uni
vers
ity L
ibra
ries
] at
10:
57 0
9 Ja
nuar
y 20
18

Clavaguera-Mora, M. T., and Casa-Vazquez, J.,Evaluation of crystallization kinetics by DTA, J.Thermal Anal., 11, 271, 1977.
193. Phillips, A. J., Yarwood, R. J., and Collett, J. H.,Thermal analysis of freeze-dried products, Anal. Pro-ceed., 23, 394, 1986.
194. Hiltner, A. and Baer, E., Reversible gelation ofmacromolecular systems, Polym. Prep., 27(1), 207,1986.
195. Domszy, R. C., Alamo, R., Edwards, C. O., andMandelkern, L., Thermoreversible gelation andcrystallization of homopolymers and copolymers,Macromolecules, 19, 310, 1986.
196. Mandelkern, L., Thermoreversible gelation andcrystallization from solution, Polym. Prep., 27(1),206, 1986.
197. Flory, P. J., Introductory lecture — gels and gellingprocesses, Faraday Disc. Chem. Soc., 57, 7, 1974.
198. Burchard, W., Entanglement and reversible gelationfor polymers of different architectures, Prog. ColloidPolym. Sci., 78, 63, 1988.
199. Blum, F. D. and Nagara, B., Solvent mobility ingels of atactic polystyrene, Polym. Prep., 27(1), 211,1986.
200. Tait, M. J., Suggett, A., Franks, F., Ablett, S.,and Quickenden, P. A., Hydration of monosacch-arides: study by dielectric and NMR, J. SolutionChem., 1, 131, 1972.
201. Franks, F., Reid, D. S., and Suggett, A., Con-formation and hydration of sugars and related com-pounds in dilute aqueous solution, J. Solution Chem.,2, 99, 1973.
202. Suggett, A. and Clark, A. H., Molecular motionand interactions in aqueous carbohydrate solutions.I. Dielectric relaxation studies, J. Solution Chem.,5, 1, 1976.
203. Suggett, A., Ablett, S., and Lillford, P. J., Mo-lecular motion and interactions in aqueous carbohy-drate solutions. II. NMR studies, J. Solution Chem.,5, 17, 1976.
204. Suggett, A., Molecular motion and interactions inaqueous carbohydrate solutions. III. A combined NMRand dielectric relaxation strategy, J. Solution Chem.,5, 33, 1976.
205. Keinath, S. E. and Boyer, R. F., Thermomechan-ical analysis of Tg and T > Tg transitions in poly-styrene, J. Appl. Polym. Sci., 26, 2077, 1981.
206. Marshall, A. S. and Petrie, S. E. B., Thermal tran-sitions in gelatin and aqueous gelatin solutions, J.Photogr. Sci., 28, 128, 1980.
207. Atwell, W. A., Hood, L. F., Lineback, D. R.,Varriano-Marston, E., and Zobel, H. F., Termi-nology and methodology associated with basic starchphenomena, Cereal Foods World, 33, 306, 1988.
208. Bloksma, A. H., Rheological aspects of structuralchanges during baking, in Chemistry and Physics ofBaking, Blanshard, J. M. V., Frazier, P. J., andGalliard, T., Eds., Royal Society of Chemistry, Lon-don, 1986, 170.
209. Bloksma, A. H. and Bushuk, W., Rheology andchemistry of dough, in Wheat Science and Technol-ogy, 3rd ed., Pomeranz, Y., Ed., Vol. II, AmericanAssociation of Cereal Chemists, St. Paul, Minn.,1988, 131.
210. Hoseney, R. C., Component interaction during heat-ing and storage of baked products, in Chemistry andPhysics of Baking, Blanshard, J. M. V., Frazier,P. J., and Galliard, T., Eds., Royal Society of Chem-istry, London, 1986, 216.
211. Miles, M. J., Morris, V. J., and Ring, S. G.,Gelation of amylose, Carbohydr. Res., 135, 257,1985.
212. Gidley, M. J. and Bulpin, P. V., Aggregation ofamylose in aqueous systems: the effect of chain lengthon phase behavior and aggregation kinetics, Mac-romolecules, 22, 341, 1989.
213. Clark, A. H., Gidley, M. J., Richardson, R. K.,and Ross-Murphy, S. B., Rheological studies ofaqueous amylose gels: the effect of chain length andconcentration on gel modulus, Macromolecules, 22,346, 1989.
214. Gidley, M. J., Molecular mechanisms underlyingamylose aggregation and gelation, Macromolecules,22, 351, 1989.
215. Miles, M. J., Morris, V. J., Orford, P. D., andRing, S. G., Roles of amylose and amylopectin ingelation and retrogradation of starch, Carbohydr. Res.,135, 271, 1985.
216. Ring, S. G., Observations on crystallization of amy-lopectin from aqueous solution, Int. J. Biol. Ma-cromol., 7, 253, 1985.
217. Ring, S. G., Studies on starch gelation, Starke, 37,80, 1985.
218. Ring, S. G. and Orford, P. D., Recent observationson retrogradation of amylopectin, in Gums and Sta-bilizers for the Food Industry 3, Phillips, G. O.,Wedlock, D. J., and Williams, P. A., Eds., ElsevierApplied Science, London, 1986, 159.
219. Russell, P. L., Aging of gels from starches of dif-ferent amylose/amylopectin content studied by DSC,J. Cereal Sci., 6, 147, 1987.
220. l'Anson, K. J., Miles, M. J., Morris, V. J., Ring,S. G., and Nave, C., Study of amylose gelationusing synchrotron X-ray source, Carbohydr. Polym.,8, 45, 1988.
221. Mestres, C., Colonna, P., and Buleon, A., Gela-tion and crystallization of maize starch after pasting,drum-drying, or extrusion cooking, J. Cereal Sci.,7, 123, 1988.
222. Reid, D. S. and Charoenrein, S., DSC studies ofstarch-water interaction in gelatinization process, inProceedings 14th NATAS Conference, NATAS, SanFrancisco, 1985, 335.
223. Chungcharoen, A. and Lund, D. B., Influence ofsolutes and water on rice starch gelatinization, CerealChem., 64, 240, 1987.
224. Burros, B. C., Young, L. A., and Carroad, P. A.,Kinetics of corn meal gelatinization at high temper-
352
Dow
nloa
ded
by [
Tex
as A
&M
Uni
vers
ity L
ibra
ries
] at
10:
57 0
9 Ja
nuar
y 20
18
ature and low moisture, J. Food Sci., 52, 1372, 1987.225. Paton, D., DSC of oat starch pastes, Cereal Chem.,
64, 394, 1987.226. Donovan, J. W., Phase transitions of the starch-
water system, Biopolymers, 18, 263, 1979.227. Biliaderis, C. G., Maurice, T. J., and Vose, J. R.,
Starch gelatinization phenomena studied by DSC, J.Food Sci., 45, 1669, 1980.
228. Cheng, S. Z. D. and Wundertich, B., Glass tran-sition and melting behavior of poly(oxy-2,6-di-methyl-l,4-phenylene), Macromolecules, 20, 1630,1987.
229. Blanshard, J. M. V., Physicochemical aspects ofstarch gelatinization, in Polysaccharides in Food,Blanshard, J. M. V. and Mitchell, J. R., Eds., But-terworths, London, 1979, 139.
230. Lund, D. B., Influence of time, temperature, mois-ture, ingredients, and processing conditions on starchgelatinization, Crit. Rev. Food Sci. Nutr., 20, 249,1984.
231. Alfonso, G. C. and Russell, T. P., Kinetics of crys-tallization in semicrystalline/amorphous polymermixtures, Macromolecules, 19, 1143, 1986.
232. Jankowski, T. and Rha, C. K., Retrogradation ofstarch in cooked wheat, Starke, 38, 6, 1986.
233. Kulp, K. and Ponte, J. G., Staling of white panbread: fundamental causes, Crit. Rev. Food Sci. Nutr.,15, 1, 1981.
234. Flory, P. J. and Weaver, E. S., Phase transitionsin collagen and gelatin systems, J. Am. Chem. Soc,82, 4518, 1960.
235. Nakazawa, F., Noguchi, S., Takahashi, J., andTakada, M., Retrogradation of gelatinized potatostarch studied by DSC, Agric. Biol. Chem., 49, 953,1985.
236. Gidley, M. J., Factors affecting crystalline type ofnative starches and model materials, Carbohydr. Res.,161, 301, 1987.
237. Gidley, M. J. and Bulpin, P. V., Crystallization ofmaltaoses as models of the crystalline forms of starch,Carbohydr. Res., 161, 291, 1987.
238. Guilbot, A. and Godon, B., Le pain rassis, Cah.Nut. Diet., 19, 171, 1984.
239. Ferry, J. D., Mechanical properties of substancesof high molecular weight, J. Am. Chem. Soc., 70,2244, 1948.
240. Luyet, B., On various phase transitions occurring inaqueous solutions at low temperatures, Ann. NY Acad.Scl., 85, 549, 1960.
241. Rasmussen, D. and Luyet, B., Complementary studyof some non-equilibrium phase transitions in frozensolutions of glycerol, ethylene glycol, glucose andsucrose, Biodynamica, 10, 319, 1969.
242. MacKenzie, A. P. and Rasmussen, D. H., Inter-actions in the water-PVP system at low temperatures,in Water Structure at the Water-Polymer Interface,Jellinek, H. H. G., Ed., Plenum Press/New York,1972, 146.
243. Vassoille, R., El Hachadi, A., and Vigier, G.,
Study by internal friction measurements of vitreoustransition in aqueous propylene glycol solutions,Cryo.-Lett., 7, 305, 1986.
244. MacFarlane, D. R., Anomalous glass transitions inaqueous propylene glycol solutions, Cryo.-Lett., 6,313, 1985.
245. Boutron, P. and Kaufmann, A., Stability of theamorphous state in the water-propylene glycol sys-tem, Cryobiology, 16, 557, 1979.
246. Bohon, R. L. and Conway, W. T., DTA studieson the glycerol-water system, Thermochim. Acta, 4,321, 1972.
247. Kanno, H., Double glass transitions in aqueous lith-ium chloride solutions vitrified at high pressures,J. Phys. Chem., 91, 1967, 1987.
248. Kanno, H., Shimada, K., and Katoh, T., A glassformation study of aqueous tetraalkylammonium hal-ide solutions, J. Phys. Chem., 93, 4981, 1989.
249. Vrentas, J. S. and Hou, A. C., History dependenceof diffusion coefficients for glassy polymer-penetrantsystems, J. Appl. Polym. Sci., 36, 1933, 1988.
250. Aras, L. and Richardson, M. J., The glass tran-sition behavior and thermodynamic properties ofamorphous polystyrene, Polymer, 30, 2246, 1989.
251. Fahy, G. M., Levy, D. I., and Ali, S. E., Someemerging principles underlying the physical proper-ties, biological actions, and utility of vitrification so-lutions, Cryobiology, 24, 196, 1987.
252. Simatos, D., Faure, M., Bonjour, E., andCouacb, M., DTA and DSC in the study of waterin foods, in Water Relations of Foods, Duckworth,R. B., Ed., Academic Press, New York, 1975, 193.
253. Simatos, D., Faure, M., Bonjour, E., and Couach,M., Physical state of water at low temperatures inplasma — DTA and DSC, Cryobiology, 12, 202,1975.
254. MacKenzie, A. P., Modeling the ultra-rapid freezingof cells and tissues, in Microprobe Analysis of Bio-logical Systems, Hutchinson, T. E. and Somlyo,A. P., Eds., Academic Press, New York, 1981, 397.
255. Maltini, E., Studies on the physical changes in fro-zen aqueous solutions by DSC and microscopic ob-servations, I.I.F.-I.I.R. -Karlsruhe, 1, 1, 1977.
256. Guegov, Y., Phase transitions of water in productsof plant origin at low temperatures, Adv. Food Res.,27, 297, 1981.
257. Blond, G., Water-galactose system: supplementedstate diagram and unfrozen water, Cryo.-Lett., 10,299, 1989.
258. Virtis SRC Sublimators Manual, Virtis Co., Inc.,Gardiner, New York, 1983.
259. Luyet, B. and Rasmussen, D., Study by differentialthermal analysis of the temperatures of instability ofrapidly cooled solutions of glycerol, ethylene glycol,sucrose, and glucose, Biodynamica, 10, 167, 1968.
260. Forsyth, M. and MacFarlane, D. R., Recrystalli-zation revisited, Cryo.-Lett., 7, 367, 1986.
261. Thorn, F. and Matthes, G., Ice formation in binary
353
Dow
nloa
ded
by [
Tex
as A
&M
Uni
vers
ity L
ibra
ries
] at
10:
57 0
9 Ja
nuar
y 20
18

aqueous solutions of ethylene glycol, Cryo.-Lett., 7,311, 1986.
262. Reid, D. S., Correlation of the phase behavior ofDMSO/NaCl/water and glycerol/NaCl/water as de-termined by DSC with their observed behavior on acryomicroscope, Cryo.-Lett., 6, 181, 1985.
263. Hallbrucker, A. and Mayer, E., Vitrified diluteaqueous solutions. II. Thermal behavior of hyper-quenched NaCl-H2O and ethylene glycol-H2O glasses,J. Phys. Chem., 92, 2007, 1988.
264. Dziedzic, S. Z. and Kearsley, M. W., Physico-chemical properties of glucose syrups, in GlucoseSyrups: Science and Technology, Dziedzic, S. Z. andKearsley, M. W., Eds., Elsevier Applied Science,London, 1984, 137.
265. Brooks, J. R. and Griffin, V. K., Saccharide anal-ysis of com syrup solids and maltodextrins usingHPLC, Cereal Chem., 64, 253, 1987.
266. Richter, M., Schierbaum, F., Augustat, S., andKnoch, K. D., Method of Producing Starch Hydro-lysis Products for Use as Food Additives, U.S. Patent3,962,465, 1976.
267. Richter, M., Schierbaum, F., Augustat, S., andKnoch, K. D., Method of Producing Starch Hydro-lysis Products for Use as Food Additives, U.S. Patent3,986,890, 1976.
268. Braudo, E. E., Belavtseva, E. M., Titova, E. F.,Plashchina, I. G., Krylov, V. L., Tolstoguzov,V. B., Schierbaum, F. R., and Richter, M., Struk-tur und eigenschaften von maltodextrin-hydrogelen,Starke, 31, 188, 1979.
269. Braudo, E. E., Plashchina, I. G., and Tolstoguzov,V. B., Structural characterisation of thermoreversibleanionic polysaccharide gels by their elastoviscousproperties, Carbohydr. Polym., 4, 23, 1984.
270. Bulpin, P. V., Cutler, A. N., and Dea, I. C. M.,Thermally reversible gels from low DE maltodex-trins, in Gums and Stabilizers for the Food Industry2, Phillips, G. O., Wedlock, D. J., and Williams,P. A., Eds., Pergamon Press, Oxford, 1984, 475.
271. Reuther, F . , Damaschun, G., Gernat, C.,Schierbaum, F., Kettlitz, B., Radosta, S., andNothnagel, A., Molecular gelation mechanism ofmaltodextrins investigated by wide-angle X-ray scat-tering, Coll. Polym. Sci., 262, 643, 1984.
272. Lenchin, J. M., Trubiano, P. C., and Hoffman, S.,Converted Starches for Use as a Fat- or Oil-Replace-ment in Foodstuffs, U.S. Patent 4,510,166, 1985.
273. Ellis, H. S. and Ring, S. G., A study of some factorsinfluencing amylose gelation, Carbohydr. Polym., 5,201, 1985.
274. German, M. L., Blumenfeld, A. L., Yuryev, V. P.,and Tolstoguzov, V. B., An NMR study of structureformation in maltodextrin systems, Carbohydr. Po-lym., 11, 139, 1989.
275. Radosta, S., Schierbaum, F., Reuther, F., andAnger, H., Polymer-water interaction of maltodex-trins. I. Water vapor sorption and desorption of mal-todextrin powders, Starke, 41, 395, 1989.
276. Nagashima, N. and Suzuki, E., The behavior ofwater in foods during freezing and thawing, in Prop-erties of Water in Foods, Simatos, D. and Multon,J. L., Eds., Martinus Nijhoff, Dordrecht, 1985, 555.
277. Saleeb, F. Z. and Pickup, J. G., Fixing Volatilesin an Amorphous Substrate and Products Therefrom,U.S. Patent 4,532,145, 1985.
278. Saleeb, F. Z. and Pickup, J. G., Fixation of Vol-atiles in Extruded Glass Substrates, U.S. Patent4,820,534, 1989.
279. Pegg, D. E. and Arnaud, F. G., Equations for ob-taining melting points in the quaternary system pro-pane-1,2-diol/glycerol/sodium chloride/water, Cryo.-Lett., 9, 404, 1988.
280. Cesaro, A., Thermodynamic Data for Biochemistryand Biotechnology, Hinz, H. J., Ed., Springer-Ver-lag, Heidelberg, 1986, 177.
281. Franks, F., Physical chemistry of small carbohy-drates — equilibrium solution properties, Pure Appl.Chem., 59, 1189, 1987.
282. Franks, F., Ravenhill, J. R., and Reid, D. S.,Thermodynamic studies of dilute aqueous solutionsof cyclic ethers and simple carbohydrates, J. SolutionChem., 1, 3, 1972.
283. Birch, G. G. and Shamil, S., Structure, sweetnessand solution properties of small carbohydrates, J.Chem. Soc., Faraday Trans. I, 84, 2635, 1988.
284. Mathlouthi, M. and Seuvre, A. M., Solution prop-erties and sweet taste of small carbohydrates, J. Chem.Soc, Faraday Trans. I, 84, 2641, 1988.
285. Wolanczyk, J. P. and Baust, J. G., The influenceof hold temperature on the phenomenon of "timedepency" in hydrated lysozyme glasses, Cryo.-Lett.,10, 215, 1989.
286. Ruegg, M., Luscher, M., and Blanc, B., Hydrationof caseins as determined by DSC and sorption mea-surements, J. Dairy Sci., 57, 387, 1974.
287. Izzard, M. J., Ablett, S., and Lillford, P. J., Acalorimetric study of the glass transition occurring insucrose solutions, presented at Food Polymers, Gelsand Colloids, University of East Anglia, Norwich,UK, March 28-30, 1990.
288. Angell, C. A., Sare, E. J., Donnella, J., andMacFarlane, D. R., Homogeneous nucleation andglass transition temperatures in solutions of Li saltsin deuterium oxide and water. Doubly unstable glassregions, J. Phys. Chem., 85, 1461, 1981.
289. Downton, G. E., Flores-Luna, J. L., and King,C. J., Mechanism of stickiness in hygroscopic, amor-phous powders, Indust. Eng. Chem. Fund., 21, 447,1982.
290. Green, J. L. and Angell, C. A., Phase relations andvitrification in saccharide-water solutions and the tre-halose anomaly, J. Phys. Chem., 93, 2880, 1989.
291. Shafizadeh, F., McGinnis, G. D., Susott, R. A.,and Tatton, H. W., Thermal reactions of alpha-D-xylopyranose and beta-D-xylopyranosides, J. Organ.Chem., 36, 2813, 1971.
292. Aubin, M. and Prud'homme, R. E., Analysis of
354
Dow
nloa
ded
by [
Tex
as A
&M
Uni
vers
ity L
ibra
ries
] at
10:
57 0
9 Ja
nuar
y 20
18
the glass transition temperature of miscible polymerblends, Macromolecules, 21, 2945, 1988.
293. Fried, J. R., Lai, S. Y., Kleiner, L. W., andWheeler, M. E., Experimental assessment of thethermodynamic theory of the compositional variationof Tg: PVC systems, J. Appl. Polym. Sci., 27, 2869,1982.
294. Cooper, T. G., The Tools of Biochemistry, Wiley-Interscience, New York, 1977.
295. Parker, K. J., The role of sucrose syrups in foodmanufacture, in Glucose Syrups and Related Car-bohydrates, Birch, G. G., Green, L. F., and Coulson,C. B., Eds., Elsevier, Amsterdam, 1970, 58.
296. Leubner, I. H., Crystal nucleation under diffusion-controlled conditions, J. Phys. Chem., 91, 6069, 1987.
297. Wolf, W., Spiess, W. E. L., and Jung, G., Stand-ardization of isotherm measurements, in Propertiesof Water in Foods, Simatos, D. and Multon, J. L.,Eds., Martinus Nijhoff, Dordrecht, 1985, 661.
298. Fahy, G. M., MacFarlane, D. R., Angell, C. A.,and Meryman, H. T., Vitrification as an approachto cryopreservation, Cryobiology, 21, 407, 1984.
299. Forsyth, M. and MacFarlane, D. R., Homogene-ous nucleation at high pressures in some aqueoussolutions of cryoprotectant interest, Cryo.-Lett., 10,139, 1989.
300. Nicol, W. M., Sucrose and food technology, in Sugar:Science and Technology, Birch, G. G. and Parker,K. J., Eds., Applied Science, London, 1979, 211.
301. Olson, D. R. and Webb, K. K., The effect of hu-midity on the glass transition temperature, Organ.Coat. Plast. Chem., 39, 518, 1978.
302. Luyet, B. J., The devitrification temperatures of so-lutions of a carbohydrate series, J. Phys. Chem., 43,881, 1939.
303. Tsourouflis, S., Flink, J. M., and Karel, M., Lossof structure in freeze-dried carbohydrate solutions, J.Sci. Food Agric., 27, 509, 1976.
304. Pikal, M. J., Shah, S., Senior, D., and Lang,J. E., Physical chemistry of freeze-drying, J. Pharm.Sci., 72, 635, 1983.
305. Pikal, M. J., Use of laboratory data in freeze-dryingprocess design, J. Parent. Sci. Technol., 39, 115,1985.
306. Pikal, M. J., Shah, S., Roy, M. L. , andPutman, R., The secondary drying stage of freezedrying: drying kinetics as a function of temperatureand chamber pressure, Int. J. Pharm., 60, 203, 1990.
307. Gatlin, L. and Deluca, P. P., Study of phase tran-sitions in frozen antibiotic solutions by DSC, J. Par-ent. Drug Assoc, 34, 398, 1980.
308. Reid, D. S., Alviar, M. S. B., and Lim, M. H.,The rates of change of ice crystal size in model sys-tems stored at different temperatures relevant to thestorage of frozen food, in Development in Refriger-ation, Refrigeration for Development, Proceedings17th Int. Congress Refrigeration, Vol. C., Biologyand Food Science, Austrian Assoc. of Refrigerationand Air Conditioning, IIR, 1987, 397.
309. Martino, M. N. and Zaritzky, N. E., Ice crystalsize modifications during frozen beef storage, J. FoodSci., 53, 1631, 1988.
310. Kahn, M. L. and Lynch, R. J., Freezer StableWhipped Ice Cream and Milk Shake Food Products,U.S. Patent 4,552,773, 1985.
311. Duden, R. and Scholz, A., Enzymatic decomposi-tion of phospholipids in frozen parsley, Z. Ernah-rungswiss., 21, 266, 1982.
312. LeBlanc, E. L., LeBlanc, R. J., and Blum, I. E.,Prediction of quality of frozen cod fillets, J. FoodSci., 53, 328, 1988.
313. Lee, C. Y., Smith, N. L., and Hawbecker, D. E.,Enzyme activity and quality of frozen green beans asaffected by blanching and storage, J. Food Qual.,11, 279, 1988.
314. Fennema, O., Activity of enzymes in partially frozenaqueous systems, in Water Relations of Foods, Duck-worth, R. B., Ed., Academic Press, New York, 1975,397.
315. Baardseth, P. and Naesset, E., The effect of lipid-degrading enzyme activities on quality of blanchedand unblanched frozen stored cauliflower estimatedby sensory and instrumental analysis, Food Chem.,32, 39, 1989.
316. Maltini, E., Thermophysical properties of frozen juicerelated to freeze drying problems, Ann. 1st. Sper.Valor. Tech. Prod. Agric., 5, 65, 1974.
317. Wallack, D. A. and King, C. J., Sticking and ag-glomeration of hygroscopic, amorphous carbohydrateand food powders, Biotechnol. Prog., 4, 31, 1988.
318. Chavarri, F. J., DePaz, M., and Nunez, M., Cry-oprotective agents for frozen concentrated cheesestarter cultures, Biotechnol. Lett., 10, 11, 1988.
319. Fahy, G. M., Vitrification: a new approach to organcryopreservation, in Transplantation: Approaches toGraft Rejection, Meryman, H. T., Ed., Alan R. Liss,New York, 1986, 305.
320. Fahy, G. M., Vitrification, in Low Temperature Bio-technology: Emerging Applications and EngineeringContributions, McGrath, J. J. and Diller, K. R., Eds.,American Society Mechanical Engineering, in press.
321. Ogawa, H. and Imamura, Y., Stabilized SolidCompositions, U.S. Patent 4,547,377, 1985.
322. Fukuoka, E., Kimura, S., Yamazaki, M., andTanaka, T., Cohesion of particulate solids. VI, Chem.Pharmaceut. Bull., 31, 221, 1983.
323. Miller, D. H. and Mutka, J. R., Process for Form-ing Solid Juice Composition and Product of the Pro-cess, U.S. Patent 4,499,112, 1985.
324. Moreyra, R. and Peleg, M., Effect of equilibriumwater activity on the bulk properties of selected foodpowders, J. Food Sci., 46, 1918, 1981.
325. Passy, N. and Mannheim, C. H., Flow propertiesand water sorption of food powders. II, Lebensm.-Wiss. u.-Technol., 15, 222, 1982.
326. Peleg, M. and Mannheim, C. H., The mechanismof caking of powdered onion, J. Food Process. Pre-serv., 1, 3, 1977.
355
Dow
nloa
ded
by [
Tex
as A
&M
Uni
vers
ity L
ibra
ries
] at
10:
57 0
9 Ja
nuar
y 20
18
327. Rosenzweig, N. and Narkis, M., Sintering rheologyof amorphous polymers, Polym. Eng. Sci., 21, 1167,1981.
328. Tardos, G., Mazzone, D., and Pfeffer, R., Mea-surement of surface viscosities using a dilatometer,Can. J. Chem. Eng., 62, 884, 1984.
329. Barbosa-Canovas, G. V., Rufner, R., andPeleg, M., Microstructure of selected binary foodpowder mixtures, J. Food Sci., 50, 473, 1985.
330. Wuhrmann, J. J., Venries, B., and Buri, R., Pro-cess for Preparing a Colored Powdered Edible Com-position, U.S. Patent 3,920,854, 1975.
331. Szejtli, J. and Tardy, M., Honey Powder Preserv-ing its Natural Aroma Components, U.S. Patent4,529,608, 1985.
332. Poole, P. L. and Finney, J. L., Sequential hydrationof a dry globular protein, Biopolymers, 22, 255, 1983.
333. Poole, P. L. and Finney, J. L., Sequential hydrationof dry proteins, Biopolymers, 23, 1647, 1984.
334. Cakebread, S. H., Factors affecting the shelf life ofhigh boilings, Manufact. Confect., 49(8), 41, 1969.
335. Gueriviere, J. F., Recent developments in extrusioncooking of foods, Indust. Aliment. Agric, 93, 587,1976.
336. Herrington, T. M. and Branfield, A. C., Physi-cochemical studies on sugar glasses, J. Food Tech-nol., 19, 409, 1984.
337. Lees, R., Quality control in the production of hardand soft sugar confectionery, Confect. Prod., Feb.,50, 1982.
338. McNulty, P. B. and Flynn, D. G., Force-defor-mation and texture profile behavior of aqueous sugarglasses, J. Text. Stud., 8, 417, 1977.
339. Vink, W. and Deptula, R. W., High Fructose HardCandy, U.S. Patent 4,311,722, 1982.
340. Chevalley, J., Rostagno, W., and Egli, R. H., Astudy of the physical properties of chocolate. V, Rev.Int. Chocolat, 25, 3, 1970.
341. Niediek, E. A. and Barbernics, L., Amorphisierungvon Zucker Durch das Feinwalzen von Schokolad-enmassen, Gordian, 80, 267, 1981.
342. Hirsh, A. G., Williams, R. J., and Meryman,H. T., Novel method of natural cryoprotection, PlantPhysiol., 79, 41 , 1985.
343. Hirsh, A., Bent, T., and Erbe, E., Localizationand characterization of intracellular liquid-liquid phaseseparations in deeply frozen Populus using electronmicroscopy, DMA, and DSC, Thermochim. Acta, inpress.
344. Rall, W. F. and Fahy, G. M., Ice-free cryopres-ervation of mouse embryos by vitrification, Nature,313, 573, 1985.
345. Kahn, M. L. and Eapen, K. E., Intermediate-Mois-ture Frozen Foods, U.S. Patent 4,332,824, 1982.
346. Takahashi, T., Hirsh, A., Erbe, E., and Williams,R. J., Mechanisms of cryoprotection by extracellularpolymeric solutes, Biophys. J., 54, 509, 1988.
347. Ehlich, D. and Sillescu, H., Tracer diffusion at theglass transition, Macromolecules, 23, 1600, 1990.
348. Gekko, K. and Satake, I., DSC of unfreezable waterin water-protein-polyol systems, Agric. Biol. Chem.,45, 2209, 1981.
349. Hays, D. L. and Fennema, O., Methodology fordetermining unfreezable water in protein suspensionsby low-temperature NMR, Arch. Biochem. Biophys.,213, 1, 1982.
350. Fullerton, G. D., Potter, J. L., and Dornbluth,N. C., NMR relaxation of protons in tissues and othermacromolecular water solutions, Mag. Res. Imag.,1, 209, 1982.
351. Lioutas, T. S., Baianu, I. C., and Steinberg, M. P.,O-17 and deuterium NMR studies of lysozyme hy-dration, Arch. Biochem. Biophys., 247, 68, 1986.
352. Blake, C. C. F., Pulford, W. C. A., and Artymiuk,P. J., X-ray studies of water in crystals of lysozyme,J. Mol. Biol., 167, 693, 1983.
353. Scandola, M. and Pezzin, G., Density of elastin-water system, in Water in Polymers, Rowland, S. P.,Ed., ACS Symp. Ser. 127, American Chemical So-ciety, Washington, D.C., 1980, 225.
354. Gosline, J. M. and French, C. J., Dynamic me-chanical properties of elastin, Biopolymers, 18, 2091,1979.
355. Duckworth, R. B., DTA of frozen food systems. I.Determination of unfreezable water, J. Food Tech-nol., 6, 317, 1971.
356. Sasaki, N., Shiwa, S., Yagihara, S., andHikichi, K., X-ray diffraction studies on the struc-ture of hydrated collagen, Biopolymers, 22, 2539,1983.
357. Wright, D. J., Thermoanalytical methods in foodresearch, Crit. Rev. Appl. Chem., 5, 1, 1984.
358. Berlin, E., Kliman, P. G., and Pallansch, M. J.,Changes in state of water in proteinaceous systems,J. Colloid Interface Sci., 34, 488, 1970.
359. Berlin, E., Kliman, P. G., Anderson, B. A., andPallansch, M. J., Water binding in whey proteinconcentrates, J. Dairy Sci., 56, 984, 1973.
360. Reutner, P., Luft, B., and Borchard, W., Com-pound formation and glassy solidification in the sys-tem gelatin-water, Colloid Polym. Sci., 263, 519,1985.
361. Wilson, M. N. and Steensen, W. L., Sugar-FreeCheesecake Filling and Dry Mix for PreparationThereof, U.S. Patent 4,594,255, 1986.
362. Huang, W. J., Frick, T. S., Landry, M. R., Lee,J. A., Lodge, T. P., and Tirrell, M., Tracer dif-fusion measurement in polymer solutions near theglass transition by forced Rayleigh scattering, AIChEJ., 33, 573, 1987.
363. Riganakos, K. A., Demertzis, P. G., andKontominas, M. G., Gas chromatographic study ofwater sorption by wheat flour, J. Cereal Sci., 9, 261,1989.
364. Bryan, W. P., Thermodynamics of water-biopoly-mer interactions: irreversible sorption by two uniformsorbent phases, Biopolymers, 26, 387, 1987.
356
Dow
nloa
ded
by [
Tex
as A
&M
Uni
vers
ity L
ibra
ries
] at
10:
57 0
9 Ja
nuar
y 20
18

365. Watt, I. C., Adsorption-desorption hysteresis inpolymers, J. Macromol. Sci.-Chem., A14, 245, 1980.
366. D'Arcy, R. L. and Watt, I. C., Water vapor sorp-tion isotherms on macromolecular substrates, in WaterActivity: Influences on Food Quality, Rockland, L. B.and Stewart, G. F., Eds., Academic Press, New York,1981, 111.
367. Finney, J. L. and Poole, P. L., Protein hydrationand enzyme activity: role of hydration-induced con-formation and dynamic changes in activity of lyso-zyme, Comments Mol. Cell. Biophys., 2, 129, 1984.
368. Bone, S. and Pethig, R., Dielectric studies of proteinhydration and hydration-induced flexibility, J. Mol.Biol., 181, 323, 1985.
369. Bryan, W. P., Thermodynamic models for water-protein sorption hysteresis, Biopolymers, in press.
370. Berens, A. and Hopfenberg, H. B., Induction andmeasurement of glassy state relaxations by vaporsorption methods, Stud. Phys. Theoret. Chem., 10,77, 1980.
371. Neogi, P., Anomalous diffusion of vapors throughsolid polymers, Am. Inst. Chem. Eng. J., 29, 829,1983.
372. Roussis, P. P., Diffusion of water vapor in celluloseacetate. I-II, Polymer, 22, 768, 1058, 1981.
373. Durning, C. J. and Tabor, M., Mutual diffusionin concentrated polymer solutions under small drivingforce, Macromolecules, 19, 2220, 1986.
374. Reid, D., personal communication, 1990.375. Hopfenberg, H. B., Apicella, A., and Saleeby,
D. E., Factors affecting water sorption in and soluterelease from EVA copolymers, J. Membr. Sci., 8,273, 1981.
376. Apicella, A. and Hopfenberg, H. B., Water-swell-ing behavior of EVA copolymer, J. Appl. Polym.Sci., 27, 1139, 1982.
377. Starkweather, H. W. and Barkley, J. R., Effectof water on secondary dielectric relaxations in nylon66, J. Polym. Scl. Polym. Phys. Ed., 19, 1211, 1981.
378. Pace, R. J. and Datyner, A., Temperature depen-dence of Langmuir sorption capacity factor in glassypolymers, J. Polym. Sci.: Poly. Phys. Ed., 19, 1657,1981.
379. Brown, G. L., Clustering of water in polymers, inWater in Polymers, Rowland, S. P., Ed., ACS Symp.Ser. 127, American Chemical Society, Washington,D.C., 1980, 441.
380. Iglesias, H. A., Chirife, J., and Boquet, R., Pre-diction of water sorption isotherms of food modelsfrom sorption of components, J. Food Sci., 45, 450,1980.
381. Chinachoti, P. and Steinberg, M. P., Moisture hys-teresis due to amorphous sucrose in sucrose-starchmixtures, J. Food Sci., 51, 453, 1986.
382. Chinachoti, P. and Steinberg, M. P., Interactionof solutes with raw starch during desorption as shownby water retention, J. Food Sci., 51, 997, 1986.
383. Batzer, H. and Kreibich, U., Influence of water on
thermal transitions in natural polymers and syntheticpolyamides, Polym. Bull., 5, 585, 1981.
384. Buleon, A., Bizot, H., Delage, M. M., andPontoire, B., Comparison of X-ray diffraction andsorption properties of hydrolyzed starches, Carbo-hydr. Polym., 7, 461, 1987.
385. Bonner, D. C. and Prausnitz, J. M., Thermody-namic properties of some concentrated polymer so-lutions, J. Polym. Sci.: Polym. Phys. Ed., 12, 51,1974.
386. Hoseney, R. C., Principles of Cereal Science andTechnology, American Association of Cereal Chem-ists, St. Paul, MN, 1986.
387. Franks, F., Hatley, R. H. M., and Friedman,H. L., Thermodynamics of protein stability: colddestabilization as a general phenomenon, Biophys.Chem., 31, 307, 1988.
388. Franks, F., Protein stability and function at low tem-peratures, Cryo.-Lett., 8, 108, 1987.
389. Privalov, P. L., Griko, Y. V., Venyaminov, S. Y.,and Kutyshenko, V. P., Cold denaturation of myo-globin, J. Mol. Biol., 190, 487, 1986.
390. Wakabayashi, T. and Franks, F., Heat capacitiesof aqueous PVP solutions at subzero temperatures,Cryo.-Lett., 7, 361, 1986.
391. Hatley, R. H. M. and Franks, F., Denaturation oflactate dehydrogenase at subzero temperatures, Cryo.-Lett., 7, 226, 1986.
392. Franks, F. and Hatley, R. H. M., Low temperatureunfolding of chymotrypsinogen, Cryo.-Lett., 6, 171,1985.
393. Sochava, I. V., Belopolskaya, T. V., and Smirnova,O. I., DSC study of reversible and irreversible ther-mal denaturation of concentrated globular protein so-lutions, Biophys. Chem., 22, 323, 1985.
394. Hatley, R. H. M., Franks, F., and Mathias, S. F.,Stabilization of labile biochemicals by undercooling,Process Biochem., 22, 169, 1987.
395. Matsukura, U., Matsunaga, A., and Kainuma, K.,Contribution of amylose to starch retrogradation, J.Jpn. Soc. Starch Sci., 30, 106, 1983.
396. Welsh, E. J., Bailey, J., Chandarana, R., andNorris, W. E., Physical characterization of inter-chain association in starch systems, Prog. Fd. Nutr.Sci., 6, 45, 1982.
397. Doublier, J. L. and Choplin, L., A rheologicaldescription of amylose gelation, Carbohydr. Res.,193, 215, 1989.
398. Steeneken, P. A. M., Rheological properties ofaqueous suspensions of swollen starch granules, Car-bohydr. Polym., 11, 23, 1989.
399. Gidley, M. J., Bulpin, P. V., and Kay, S., Effectof chain length on amylose retrogradation, in Gumsand Stabilizers for the Food Industry, 3, Phillips, G.O., Wedlock, D. J., Williams, P. A., Eds., ElsevierApplied Science, London, 1986, 167.
400. Whistler, R. L. and Daniel, J. R., Molecular struc-ture of starch, in Starch: Chemistry and Technology,
357
Dow
nloa
ded
by [
Tex
as A
&M
Uni
vers
ity L
ibra
ries
] at
10:
57 0
9 Ja
nuar
y 20
18
2nd ed., Whistler, R. L., BeMiller, J. N., and Pas-chall, E. F., Eds., Academic Press, Orlando, 1984,153.
401. Buleon, A., Duprat, F., Booy, F. P., andChanzy, H., Single crystals of amylose with a lowdegree of polymerization, Carbohydr. Polym., 4, 161,1984.
402. Hizukuri, S., Polymodal distribution of chain lengthsof amylopectins and its significance, Carbohydr. Res.,147, 342, 1986.
403. Krusi, H. and Neukom, H., Untersuchungen uberdie Retrogradation der Starke in Konzentrierten Wei-zenstarkegelen, Starke, 36, 300, 1984.
404. Muhr, A. H. and Blanshard, J. M. V., Effect ofpolysaccharide stabilizers on the rate of growth ofice, J. Food Technol., 21, 683, 1986.
405. Holbrook, J. L. and Hanover, L. M., Fructose-Containing Frozen Dessert Products, U.S. Patent4,376,791, 1983.
406. Bevilacqua, A. E. and Zaritzky, N. E., Ice re-crystallization in frozen beef, J. Food Sci., 47, 1410,1982.
407. Harper, E. K. and Shoemaker, C. F., Effect oflocust bean gum and selected sweetening agents onice recrystallization rates, J. Food Sci., 48, 1801,1983.
408. Franks, F., Darlington, J., Schenz, T., Mathias,S. F., Slade, L., and Levine, H., Antifreeze activityof Antarctic fish glycoprotein and a synthetic poly-mer, Nature, 325, 146, 1987.
409. Muhr, A. H., Blanshard, J. M. V., and Sheard,S. J., Effects of polysaccharide stabilizers on thenucleation of ice, J. Food Technol., 21, 587, 1986.
410. Keeney, P. G. and Kroger, M., Frozen dairy prod-ucts, in Fundamentals of Dairy Chemistry, 2nd ed.,Webb, B. H., Ed., AVI, Westport, 1974, 890.
411. Nursten, H. E., Maillard browning reactions in driedfoods, in Concentration and Drying of Foods,MacCarthy, D., Ed., Elsevier Applied Science, Lon-don, 1986, 53.
412. Bakker-Artema, F. W., Heat and mass transfer as-pects and modeling of dryers — a critical evaluation,in Concentration and Drying of Foods, MacCarthy,D., Ed., Elsevier Applied Science, London, 1986,165.
413. Zobel, H. F., Gelatinization of starch and mechan-ical properties of starch pastes, in Starch: Chemistryand Technology, 2nd ed., Whistler, R. L., BeMiller,J. N., and Paschall, E. F., Eds., Academic Press,Orlando, 1984, 285.
414. Jankowski, T. and Rha, C. K., DSC study of wheatgrain cooking process, Starke, 38, 45, 1986.
415. Normand, F. L. and Marshall, W. E., DSC ofwhole grain milled rice and milled rice flour, CerealChem., 66, 317, 1989.
416. Hoseney, R. C., Zeleznak, K., and Abdelrahman,A., Mechanism of popcorn popping, J. Cereal Sci.,1, 43, 1983.
417. Colonna, P., Buleon, A., and Mercier, C., Phys-
ically modified starches, in Starch: Properties andPotential, Galliard, T., Ed., John Wiley & Sons,Chichester, 1987, 79.
418. Shi, Y. C. and Seib, P., Properties of wheat starchcompared to normal maize starch, in Wheat is Unique,Pomeranz, Y., Ed., Am. Assoc. Cereal Chem., St.Paul, MN, 1989, 215.
419. Nakazawa, F., Noguchi, S., Takahashi, J., andTakada, M., Thermal equilibrium state of starch-water mixture studied by DSC, Agric. Biol. Chem.,48, 2647, 1984.
420. Krueger, B. R., Knutson, C. A., Inglett, G. E.,and Walker, C. E., DSC study on effect of annealingon gelatinization behavior of com starch, J. FoodSci., 52, 715, 1987.
421. Snyder, E. M., Industrial microscopy of starches,in Starch: Chemistry and Technology, 2nd ed., Whis-tler, R. L., BeMiller, J. N., Paschall, E. F., Eds.,Academic Press, Orlando, 1984, 661.
422. Shannon, J. C. and Garwood, D. L., Genetics andphysiology of starch development, in Starch: Chem-istry and Technology, 2nd ed., Whistler, R. L.,BeMiller, J. N., and Paschall, E. F., Eds., AcademicPress, Orlando, 1984, 25.
423. Donovan, J. W., Lorenz, K., and Kulp, K., DSCof heat-moisture treated wheat and potato starches,Cereal Chem., 60, 381, 1983.
424. Shiotsubo, T. and Takahashi, K., Changes in en-thalpy and heat capacity associated with gelatiniza-tion of potato starch, evaluated by isothermal calor-imetry, Carbohydr. Res., 158, 1, 1986.
425. Longton, J. and LeGrys, G. A., DSC studies oncrystallinity of aging wheat starch gels, Starke, 33,410, 1981.
426. Ghiasi, K., Hoseney, R. C., and Varriano-Marston, E., Effects of flour components and doughingredients on starch gelatinization, Cereal Chem.,60, 58, 1983.
427. Spies, R. D. and Hoseney, R. C., Effect of sugarson starch gelatinization, CerealChem., 59, 128, 1982.
428. Czuchajowska, Z. and Pomeranz, Y., DSC, wateractivity, and moisture contents in crumb center andnear-crust zones of bread during storage, CerealChem., 66, 305, 1989.
429. Russell, P. L., Kinetic study of bread staling byDSC, Starke, 35, 277, 1983.
430. Zeleznak, K. J. and Hoseney, R. C., Role of waterin retrogradation of wheat starch gels and bread crumb,Cereal Chem., 63, 407, 1986.
431. Schaefer, J., Garbow, J. R., Stejskal, E. O., andLefelar, J. A., Plasticization of poly(butyral-co-vi-nyl alcohol), Macromolecules, 20, 1271, 1987.
432. Eliasson, A. C., Retrogradation of starch as mea-sured by DSC, in New Approaches to Research onCereal Carbohydrates, Hill, R. D. and Munck, L.,Eds., Elsevier, Amsterdam, 1985, 93.
433. Biliaderis, C. G. and Galloway, G., Crystallizationbehavior of amylose-V complexes: structure-propertyrelationships, Carbohydr. Res., 189, 31, 1989.
358
Dow
nloa
ded
by [
Tex
as A
&M
Uni
vers
ity L
ibra
ries
] at
10:
57 0
9 Ja
nuar
y 20
18
434. Jane, J. L. and Robyt, J., Structure studies of amy-lose-V complexes and retrograded amylose, Carbo-hydr. Res., 132, 105, 1984.
435. Yamamoto, M., Harada, S., Sano, T., Yasunaga,T., and Tatsumoto, N., Kinetic studies of complexformation in amylose-SDS-iodine ternary system,Biopolymers, 23, 2083, 1984.
436. Kowblansky, M., Calorimetric investigation of in-clusion complexes of amylose with long-chain ali-phatic compounds, Macromolecules, 18, 1776, 1985.
437. Evans, I. D., Investigation of starch/surfactant in-teractions using viscosimetry and DSC, Starke, 38,227, 1986.
438. Galloway, G. I., Biliaderis, C. G., and Stanley,D. W., Properties and structure of amylose-glycerol
monostearate complexes formed in solution or onextrusion of wheat flour, J. Food Scl., 54, 950, 1989.
439. Eliasson, A. C., On the effects of surface activeagents on the gelatinization of starch — a calorimetricinvestigation, Carbohydr. Polym., 6, 463, 1986.
440. Biliaderis, C. G., Page, C. M., and Maurice, T. J.,Non-equilibrium melting of amylose-V complexes,Carbohydr. Polym., 6, 269, 1986.
441. Batres, L. V. and White, P. J., Interaction of amy-lopectin with monoglycerides in model systems, J.Am. Oil Chem. Soc, 63, 1537, 1986.
442. Duckworth, R. B., Foreword, in Food Preservationby Moisture Control, Seow, C. C., Ed., ElsevierApplied Science, London, 1988, ix.
443. Simatos, D., personal communication, 1988.
APPENDIX
List of Participants at Faraday Discussion Conference, July 1-3,1985
Arnold, Dr. B. J.van den Berg, Dr. C.Bizot, Dr. H.Blanshard, Prof. J. M. V.Corbet, Dr. Sarah A.Duckworth, Dr. R. B.Evans, Dr. E. W.Franks, Dr. FelixGal, Dr. StefanGedney, Miss S. E.Gervais, Dr. PatrickGordon, Miss KayGould, Dr. G. W.Grant, Mr. A. J.Hanson, Dr. Steven W.Holland, Mr. W. H.Johnston, Dr. KennethKent, Dr. MichaelKinderlerer, Mrs. J. LLeMeste, Dr. MartineLeslie, Miss TracyLilley, Dr. T. H.Marquis, Dr. Robert W.Morley, Mr. M. J.Morley, Dr. Robert G.Myers, Dr. ChesterOkojie, Dr. N. F.Parker, Dr. Stephen B.Paynter, Dr. O.Poole, Dr. P. L.Ratcliffe, Mr. G. C.
Mars UKAgricultural University WageningenINRA NantesUniversity of NottinghamCambridge UniversityUniversity of StrathclydeFRIR UKCambridge University & PafraHACO SwitzerlandUniversity of NottinghamENSBANA DijonUnited Biscuits UKUnilever UKUniversity of SheffieldHumberside CollegeLyons Bakery UKFarley Health Products UKTorry Research Station UKSheffield City PolytechnicENSBANA DijonUniversity of SheffieldUniversity of SheffieldUniversity of Rochester USAFood Research Institute — BristolDelphi Consultant Services Inc. USAGeneral Foods CobourgBritish Sugar UKUnilever UKLyons Bakery UKUniversity of LondonPillsbury UK
359
Dow
nloa
ded
by [
Tex
as A
&M
Uni
vers
ity L
ibra
ries
] at
10:
57 0
9 Ja
nuar
y 20
18
Russell, Dr. Peter L. FMBRA ChorleywoodSlade, Dr. Louise General Foods TarrytownTsvetkov, Dr. Tsvetan D. BulgariaVinnicombe, Ms. Debra Helen Imperial College LondonWalstra, Dr. P. Walstra Agricultural University WageningenWebster, Mr. Stephen University of NottinghamWilkes, Mr. M. S. United Biscuits UKWolanczyk, Dr. Jan University of LondonZhen Zhang, Dr. Ji University of London
360
Dow
nloa
ded
by [
Tex
as A
&M
Uni
vers
ity L
ibra
ries
] at
10:
57 0
9 Ja
nuar
y 20
18