behavior of financial markets efficiency during the financial market crisis: 2007 – 2009
TRANSCRIPT
BEHAVIOR OF FINANCIAL MARKETS EFFICIENCY DURING THE
FINANCIAL MARKET CRISIS: 2007 – 2009
This paper examines the behavior of financial markets efficiency during the recent
financial market crisis. Using the Hurst exponent as a criterion of market
efficiency we show that level of market efficiency is different for pre-crisis and
crisis periods. We also classify financial markets of different countries by the level
of their efficiency and reaffirm that financial markets of developed countries are
more efficient than the developing ones. Based on Ukrainian financial market
analysis we show the reasons of inefficiency of financial markets and provide some
recommendations on their solution and thus improving the efficiency.
Keywords: Persistence, R/S Analysis, Hurst exponent, Fractal market Hypothesis,
efficiency of financial market.
Corresponding author: Prof. Ronald H Mynhardt *University of South Africa PO Box 392, Unisa 0003 Tel: +27 12 429 4927 [email protected] and Assos. Prof. Alexey Plastun * Ukrainian academy of banking of the National bank of Ukraine 57, Petropavlivska Str., 40000, Sumy, Ukraine Tel. +350509339027 [email protected] and Assist. Prof. Inna Makarenko * Ukrainian academy of banking of the National bank of Ukraine 57, Petropavlivska Str., 40000, Sumy, Ukraine Tel. +350669356016 [email protected]
1. Introduction
In time of the financial markets reforms in response to the global financial crisis consequences
the process of rethinking of the theoretical concepts explaining the behavior of these markets is
activated.
The Efficient Market Hypothesis (EMH), proposed by Fama (1970), has for a long time
occupied the leading position in the explanation of the financial markets behavior. Even today it
is a cornerstone of modern finance theory and the majority of methodological approaches to the
valuation of financial instruments.
However, history shows that the EMH is not always confirmed (see Jensen (1978) and
Malkiel (2003) for details) and the level of market efficiency differs for different countries (see Lo
and MacKinlay (1988), Urrutia (1995), Huang, B. (1995), Hassan, Shah and Abdullah (2007),
Borges (2008) and many others). In addition, during the financial crisis of 2007-2009, market
participants have suffered the greatest losses in the markets that are traditionally considered to
be effective (see Ball (2009)). Similar examples have been observed earlier during other crises.
These and many other examples of inconsistency of the EMH have led to the
emergence and development of alternative concepts that explain the behavior of financial
markets: behavioral finance (Kahneman and Tversky (1979)), adaptive market hypothesis (first
mentioned by Lo (2004)), fractal market hypothesis (FMH - see Mandelbrot, 1972, Peters, 1994)
and many others.
An important role in the process of rethinking is the FMH which is seen as an alternative
to the traditional EMH. The use of key categories of this hypothesis such as market persistence,
noise of index series, fractality, and some specific indicators showing the state of the market
such as: the Hurst exponent and fractal dimension is an important way for the formation of a
new non-linear methods of modeling the behavior of the financial market during the crisis and
for crises prognoses in the future. Methodology of FMH also helps to measure the level of
market efficiency.
Despite a considerable amount of research already conducted on measuring the market
efficiency the problem is not solved yet (Peters (1994), Daw et al. (2003), Grech and Mazur
(2004), Bassler et al. (2006), McCauley et al. (2007) and many others). There is no common
methodology, results differ, some aspects are discussed insufficiently etc. For example,
behavior of market efficiency during crisis in general and from the position of differences
between countries is not clear even nowadays.
This paper aims to expand the results of financial markets efficiency metrics using data
from different countries during different economic phases (normal and crisis). The purpose of
this study is to confirm/reject hypothesis of instability of financial markets efficiency in different
economic conditions.
We analyze data from different financial markets divided into two groups: developed
(U.S., Japan, UK, EU) and developing (China, India, Brazil, Russia and Ukraine). As examples
of concrete financial markets we choose national stock markets (as a concrete indicator stock
index of the country was used), foreign exchange market (the official exchange rate fluctuations
of the national currency). This allows us to get general (common) result for different countries
and financial markets based on same methodology. To measure the level of market efficiency
we used Hurst exponent calculated with R/S analysis. Hurst exponent close to 0.5 evidences in
favor of efficiency of the market, the more Hurst exponent differs from 0.5 the less effective the
market is.
The paper is organized as follows: A review of the existing literature on Fractal Market
hypothesis. A section that provides the methodology followed in the study. Next follows a
section that presents the results and key findings of the study. A separate section is devoted to
the problems of market efficiency increasing. Last there a section on the conclusions and
summary of the paper.
2. Analysis of key theoretical concepts explaining financial market behavior
The EMH used to occupy the leading position in the explanation of the financial markets
behavior; it remained dominant for a long time and has been a cornerstone of modern finance
theory and the majority of methodological approaches to the valuation of financial instruments.
EMH, proposed by Fama (1970), provides that a market in which prices reflect all
available information is effective. According to this hypothesis, modern financial markets are
informational transparent and correspond to the notion of efficient markets.
It should also be noted that the EMH describes the ideal state of the market, is easy to
interpret and uses a convenient and apprehensible mathematical approaches. It is usually
relevant on a variety of financial markets in the absence of financial crises. Furthermore,
numerous models of evaluation of financial instruments and of their portfolios are built
considering that this hypothesis is confirmed (for example CAPM - J. Treynor (1962), W.
Sharpe (1964), J. Lintner (1965) and J. Mossin (1966); Black–Scholes options pricing model, F.
Black, M. Scholes (1973)).
However, experience shows that the EMH is not always confirmed. In favor of its failure
indicates the presence of numerous market anomalies: the excess volatility puzzle, time effects,
positive serial correlation of price growth in the period up to six months and negative - in periods
of three to eight years for the market indexes, a number of calendar anomalies (effect of
months, effect of the year, effect of the day, effect of the week, effect of the full moon, the effect
of the time of the year) etc (see Damodaran A., 2002 for details).
In addition, during the financial crisis of 2007-2009, market participants have suffered
the greatest losses in the markets that are traditionally considered to be effective and with an
extraordinary opportunity of a crisis from the perspective of the EMH, the markets of developed
countries in particular. The crisis in these markets has become a source of propagation of
shocks in the financial markets of other countries and led to a general destabilization of the
world financial and economic systems.
Similar examples have been observed earlier. For example, in 1997, the Dow Jones fell
in a single day by 7.7 % (the probability of such an event - one to 50 billions). In July 2002, the
index dipped three times during seven trading days (the probability of this event - one chance in
four trillion). October 19, 1987 (the famous «Black Monday»), the index fell by 29.2 %. This is
probably one of the worst trading days in the last century. According to the standard models of
financial theory such event could occur less than at one of the 1050 cases (Hudson, Richard L.;
Mandelbrot, Benoît B., 2004)).
These and many other examples of inconsistency of the EMH have led to the
emergence and development of alternative concepts that explain the behavior of financial
markets: behavioral finance, adaptive market hypothesis (AMH), fractal market hypothesis
(FMH) and many others.
According to the theory of behavioral finance efficient financial markets with equilibrium
prices would not be attractive to their participants. Proceedings of the Nobel laureates in
economic studies of human behavior – Kahneman and Tversky (1979) – initiated the concept of
alternative finance, based on a statement that the behavior of a market is not always
determined correctly and predictably, it depends on the subjective psychological factors.
The АMH was first mentioned by Lo (2004), who proves the existence of connection
between the economy and sociobiological theories of evolution. This theory is some sort of
compromise between the rational expectations theory and behavioral finance.
Quite often the EMH and AMH are opposed to one of the hypotheses of fractal geometry
– FMH, which proposes more complex stochastic processes to be the basis of the
understanding of the market essence and behavior.
Mandelbrot (1969, 1971, 1972) was the first who fixed the fact of market persistence –
the ability of the state to exist longer than the process that created it. According to his results
financial markets have long-memory.
Further development of the Mandelbrots’ ideas was done by Greene and Fielitz (1977).
They proved presence of long-term dependence in prices of the stocks in the NY stock
exchange. Booth, Kaen, and Koveos (1982) also confirmed that some financial data has long
memory. Helms et al. (1984) as an object of analysis chose prices on futures and also proved
the fact of market persistence.
Ideas of FMH were actively popularized by Peters (1991, 1994).
Further methodology of market persistence estimation was improved and tested on
financial data of different countries, periods and time intervals.

For example, Lo (1991) substantiated the necessity of short-term memory incorporation
in estimations of long-term memory. According to his results quite often long-term memory
detection can be explained by mistakes in methodology caused by the presence of short-
memory. Lo (1991) and other authors, who used his methodology (Fung and Lo (1993), Cheung
and Lai (1993), Crato (1994)) proved the fact of the absence of long-term memory on the main
financial markets.
Sufficient number of researches devoted to the problem of market persistence and long-
term memory, different methodology and absence of unified one, cause further development of
this problematic, especially in the context of long-term memory identification and methodology
of market persistence estimation.
Important contribution in research of financial markets persistence was done by Los
(2003), who analyzed the existing methodology quite carefully. According to Los (2003), one of
the key indicators of the level of persistence is so called Hurst exponent. Hurst exponent was
created by hydrologist Hurst (1951).
Traditional methodology of Hurst exponent estimation includes the following methods:
rescaled range analysis (R/S analysis);
generalized Hurst exponent approach (GHE),
stabilogram diffusion analysis (SDA);
detrended fluctuation analysis (DFA);
multifractal generalization (MF-DFA);
others.
Modern methodology of markets persistence estimation is quite diverse that is why it is
important to choose appropriate one for the financial data analysis.
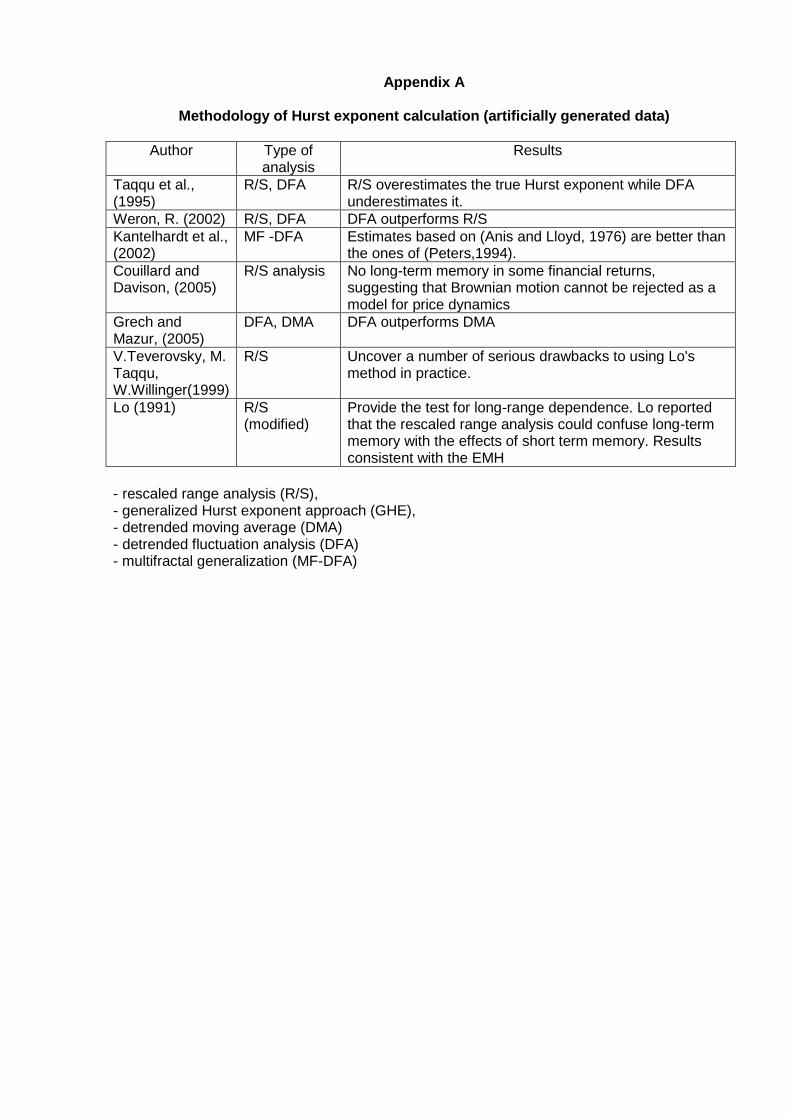
Some of researches were devoted to the theoretical foundations of certain methodology.
In such works as an object of analysis acted not real financial data, but data artificially
generated by certain algorithm. As a rule, to generate data set Monte-Carlo method was used.
Results are presented in Appendix A.
Results of artificially generated time-series analysis are mixed. In general advantage is
given to detrended fluctuation analysis (DFA) (Weron, R. (2002), Grech and Mazur, (2005)).
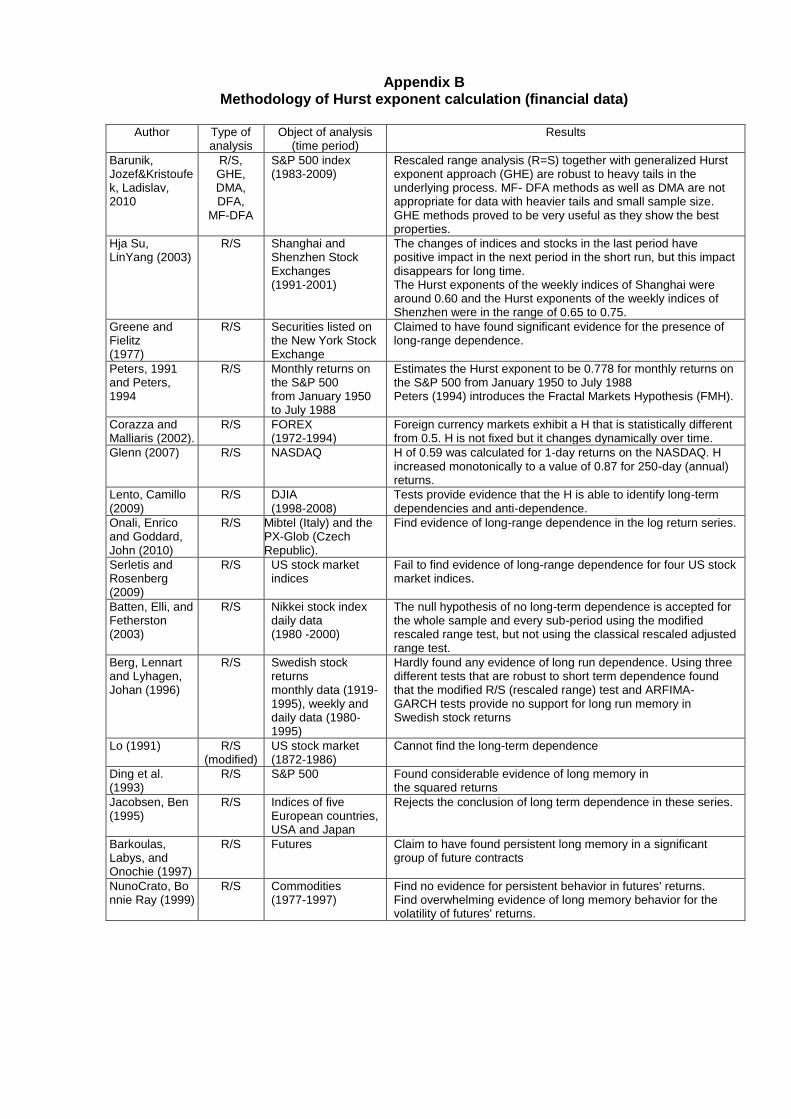
Financial data time-series and their persistence were analyzed very thorough in case of
different types of financial markets: stock markets (Greene and Fielitz (1977),Lo (1991), Cheung
and Lai (1995), Jacobsen (1995), Opong et al. (1999), McKenzie, 2001, Costa and
Vasconcelos, 2003, Los (2006), Onali and Goddard (2009), commodities markets (Cheung and
Lai (1993); Barkoulas, Labys, and Onochie (1997), Crato and Ray (1999), Alvarez-Ramirez et
al. (2002), Serletis and Rosenberg (2007)), FOREX (Mulligan (2000), Kim and Yoon (2004), Da
Silva et al. (2007)).
More detailed results for different types of financial markets are presented in Appendix
B.
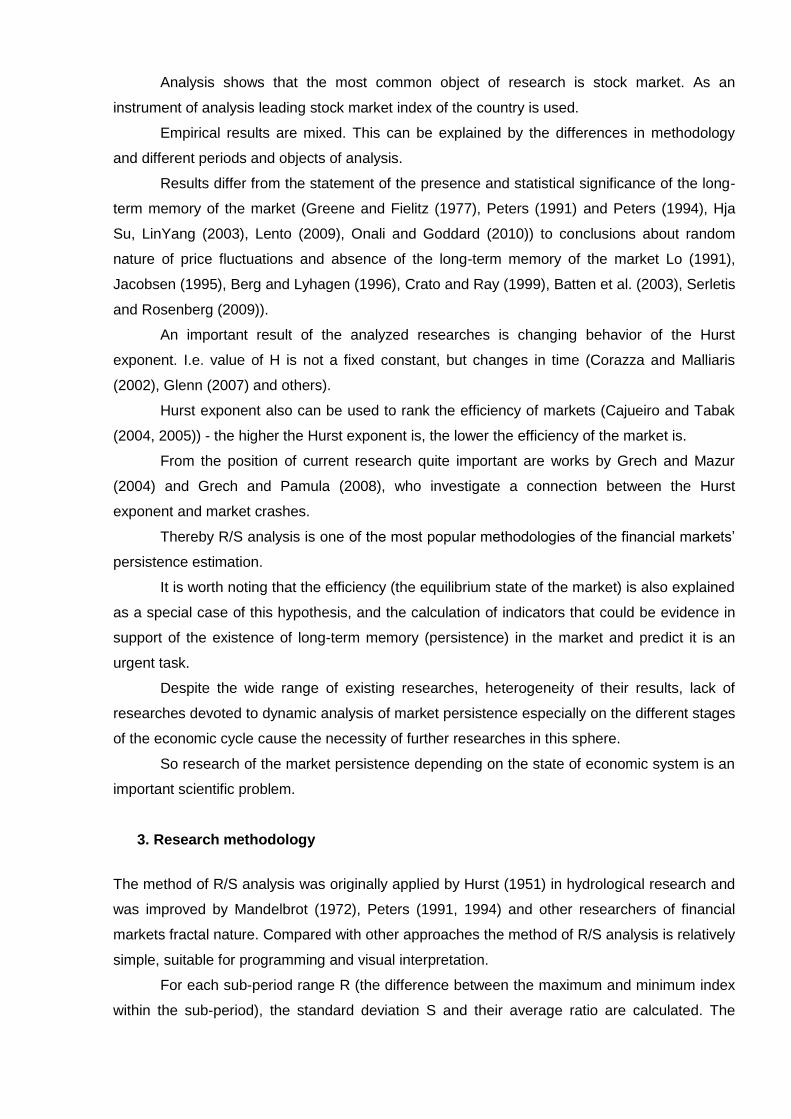
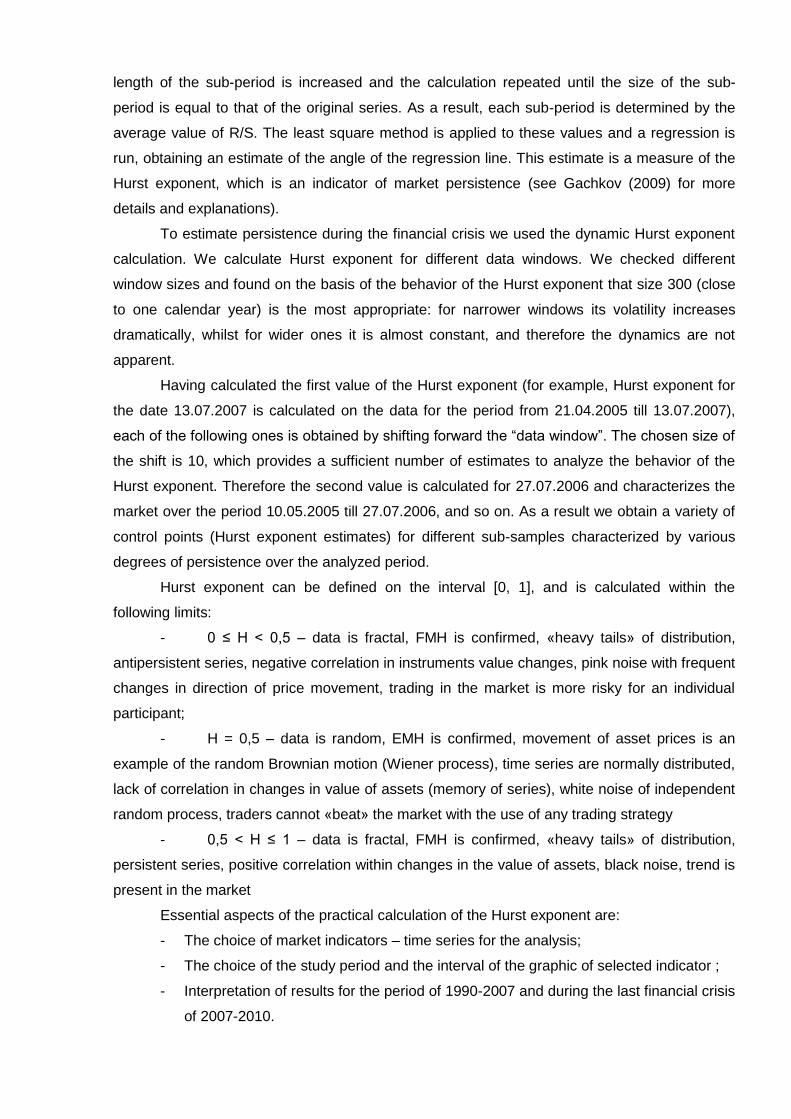
Analysis shows that the most common object of research is stock market. As an
instrument of analysis leading stock market index of the country is used.
Empirical results are mixed. This can be explained by the differences in methodology
and different periods and objects of analysis.
Results differ from the statement of the presence and statistical significance of the long-
term memory of the market (Greene and Fielitz (1977), Peters (1991) and Peters (1994), Hja
Su, LinYang (2003), Lento (2009), Onali and Goddard (2010)) to conclusions about random
nature of price fluctuations and absence of the long-term memory of the market Lo (1991),
Jacobsen (1995), Berg and Lyhagen (1996), Crato and Ray (1999), Batten et al. (2003), Serletis
and Rosenberg (2009)).
An important result of the analyzed researches is changing behavior of the Hurst
exponent. I.e. value of H is not a fixed constant, but changes in time (Corazza and Malliaris
(2002), Glenn (2007) and others).
Hurst exponent also can be used to rank the efficiency of markets (Cajueiro and Tabak
(2004, 2005)) - the higher the Hurst exponent is, the lower the efficiency of the market is.
From the position of current research quite important are works by Grech and Mazur
(2004) and Grech and Pamula (2008), who investigate a connection between the Hurst
exponent and market crashes.
Thereby R/S analysis is one of the most popular methodologies of the financial markets’
persistence estimation.
It is worth noting that the efficiency (the equilibrium state of the market) is also explained
as a special case of this hypothesis, and the calculation of indicators that could be evidence in
support of the existence of long-term memory (persistence) in the market and predict it is an
urgent task.
Despite the wide range of existing researches, heterogeneity of their results, lack of
researches devoted to dynamic analysis of market persistence especially on the different stages
of the economic cycle cause the necessity of further researches in this sphere.
So research of the market persistence depending on the state of economic system is an
important scientific problem.
3. Research methodology
The method of R/S analysis was originally applied by Hurst (1951) in hydrological research and
was improved by Mandelbrot (1972), Peters (1991, 1994) and other researchers of financial
markets fractal nature. Compared with other approaches the method of R/S analysis is relatively
simple, suitable for programming and visual interpretation.
For each sub-period range R (the difference between the maximum and minimum index
within the sub-period), the standard deviation S and their average ratio are calculated. The
length of the sub-period is increased and the calculation repeated until the size of the sub-
period is equal to that of the original series. As a result, each sub-period is determined by the
average value of R/S. The least square method is applied to these values and a regression is
run, obtaining an estimate of the angle of the regression line. This estimate is a measure of the
Hurst exponent, which is an indicator of market persistence (see Gachkov (2009) for more
details and explanations).
To estimate persistence during the financial crisis we used the dynamic Hurst exponent
calculation. We calculate Hurst exponent for different data windows. We checked different
window sizes and found on the basis of the behavior of the Hurst exponent that size 300 (close
to one calendar year) is the most appropriate: for narrower windows its volatility increases
dramatically, whilst for wider ones it is almost constant, and therefore the dynamics are not
apparent.
Having calculated the first value of the Hurst exponent (for example, Hurst exponent for
the date 13.07.2007 is calculated on the data for the period from 21.04.2005 till 13.07.2007),
each of the following ones is obtained by shifting forward the “data window”. The chosen size of
the shift is 10, which provides a sufficient number of estimates to analyze the behavior of the
Hurst exponent. Therefore the second value is calculated for 27.07.2006 and characterizes the
market over the period 10.05.2005 till 27.07.2006, and so on. As a result we obtain a variety of
control points (Hurst exponent estimates) for different sub-samples characterized by various
degrees of persistence over the analyzed period.
Hurst exponent can be defined on the interval [0, 1], and is calculated within the
following limits:
- 0 ≤ H < 0,5 – data is fractal, FMH is confirmed, «heavy tails» of distribution,
antipersistent series, negative correlation in instruments value changes, pink noise with frequent
changes in direction of price movement, trading in the market is more risky for an individual
participant;
- H = 0,5 – data is random, EMH is confirmed, movement of asset prices is an
example of the random Brownian motion (Wiener process), time series are normally distributed,
lack of correlation in changes in value of assets (memory of series), white noise of independent
random process, traders cannot «beat» the market with the use of any trading strategy
- 0,5 < H ≤ 1 – data is fractal, FMH is confirmed, «heavy tails» of distribution,
persistent series, positive correlation within changes in the value of assets, black noise, trend is
present in the market
Essential aspects of the practical calculation of the Hurst exponent are:
- The choice of market indicators – time series for the analysis;
- The choice of the study period and the interval of the graphic of selected indicator ;
- Interpretation of results for the period of 1990-2007 and during the last financial crisis
of 2007-2010.
The selection of market indicators in the form of an index series was carried out by us for
the world's biggest developed financial markets and emerging markets. Among the developed
ones the U.S., Japan, UK, EU markets have been traditionally chosen, among developing
markets – China, India, Brazil, Russia and Ukraine.
The range of tools for analysis was determined by the market under investigation. For
example, during the study of the stock market of each of these countries its benchmark index
was selected, in the study of the foreign exchange market– the official exchange rate
fluctuations of the national currency of each country to the U.S. dollar.
To illustrate the importance of both hypotheses – the EMH and FMH to explain the
behavior of financial markets at different stages of their development it is important to choose
the period of the study. Thus, to compare the data one should make the calculations for a
certain period of operation of the financial markets in general as well as for the period of the
crisis in them.
Therefore we propose to carry out calculations on separate financial markets for the
earliest possible period starting from 1990s, given the homogeneity of dates.
What is concerned about the choice of the interval graphs of index fluctuations (5, 30, 60
min.), 1 day, a week, a month – within the selected periods of research we will focus on a range
of 1 day, because, in our opinion, the price fluctuations of this dimension meet the objectives of
the analysis better – greater frequency generates significant fluctuations of fractals, at a lower
frequency analytical value of data is lost.
4. Findings
First we analyze the persistence of financial markets before the global financial crisis. The
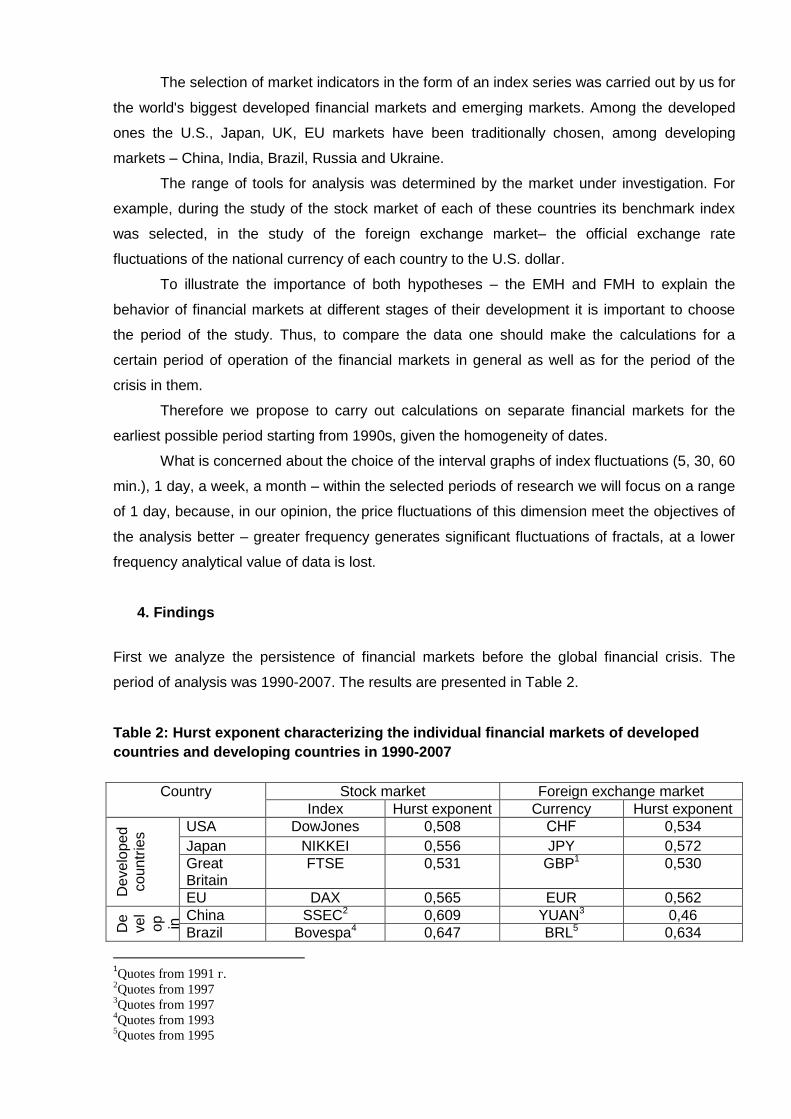
period of analysis was 1990-2007. The results are presented in Table 2.
Table 2: Hurst exponent characterizing the individual financial markets of developed
countries and developing countries in 1990-2007
Country Stock market Foreign exchange market
Index Hurst exponent Currency Hurst exponent
De
velo
pe
d
co
un
trie
s USA DowJones 0,508 СHF 0,534
Japan NIKKEI 0,556 JPY 0,572
Great Britain
FTSE 0,531 GBP1 0,530
EU DAX 0,565 EUR 0,562
De
ve
l
op in g
co
un tri
es China SSEC2 0,609 YUAN3 0,46
Brazil Bovespa4 0,647 BRL5 0,634
1Quotes from 1991 г.
2Quotes from 1997
3Quotes from 1997
4Quotes from 1993
5Quotes from 1995
India BSE SenSex6 0,621 INR7 0,596
Russia RTS8 0,601 RUB9 0,631
Ukraine PFTS 0,665 UAH10 0,464
UX 0,667
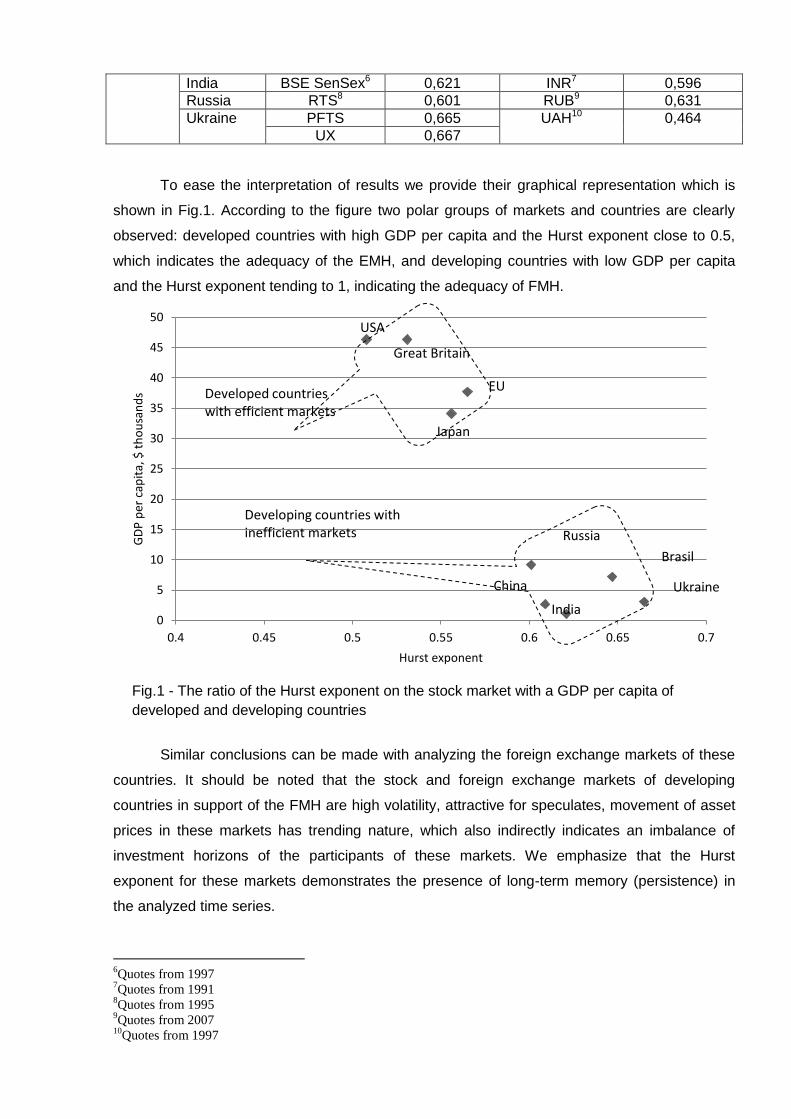
To ease the interpretation of results we provide their graphical representation which is
shown in Fig.1. According to the figure two polar groups of markets and countries are clearly
observed: developed countries with high GDP per capita and the Hurst exponent close to 0.5,
which indicates the adequacy of the EMH, and developing countries with low GDP per capita
and the Hurst exponent tending to 1, indicating the adequacy of FMH.
Fig.1 - The ratio of the Hurst exponent on the stock market with a GDP per capita of
developed and developing countries
Similar conclusions can be made with analyzing the foreign exchange markets of these
countries. It should be noted that the stock and foreign exchange markets of developing
countries in support of the FMH are high volatility, attractive for speculates, movement of asset
prices in these markets has trending nature, which also indirectly indicates an imbalance of
investment horizons of the participants of these markets. We emphasize that the Hurst
exponent for these markets demonstrates the presence of long-term memory (persistence) in
the analyzed time series.
6Quotes from 1997
7Quotes from 1991
8Quotes from 1995
9Quotes from 2007
10Quotes from 1997
0
5
10
15
20
25
30
35
40
45
50
0.4 0.45 0.5 0.55 0.6 0.65 0.7
GD
P p
er c
apit
a, $
th
ou
san
ds
Hurst exponent
Developed countries with efficient markets
Great Britain
EU
India
China
Russia
Brasil
Ukraine
Developing countries with inefficient markets
Japan
USA
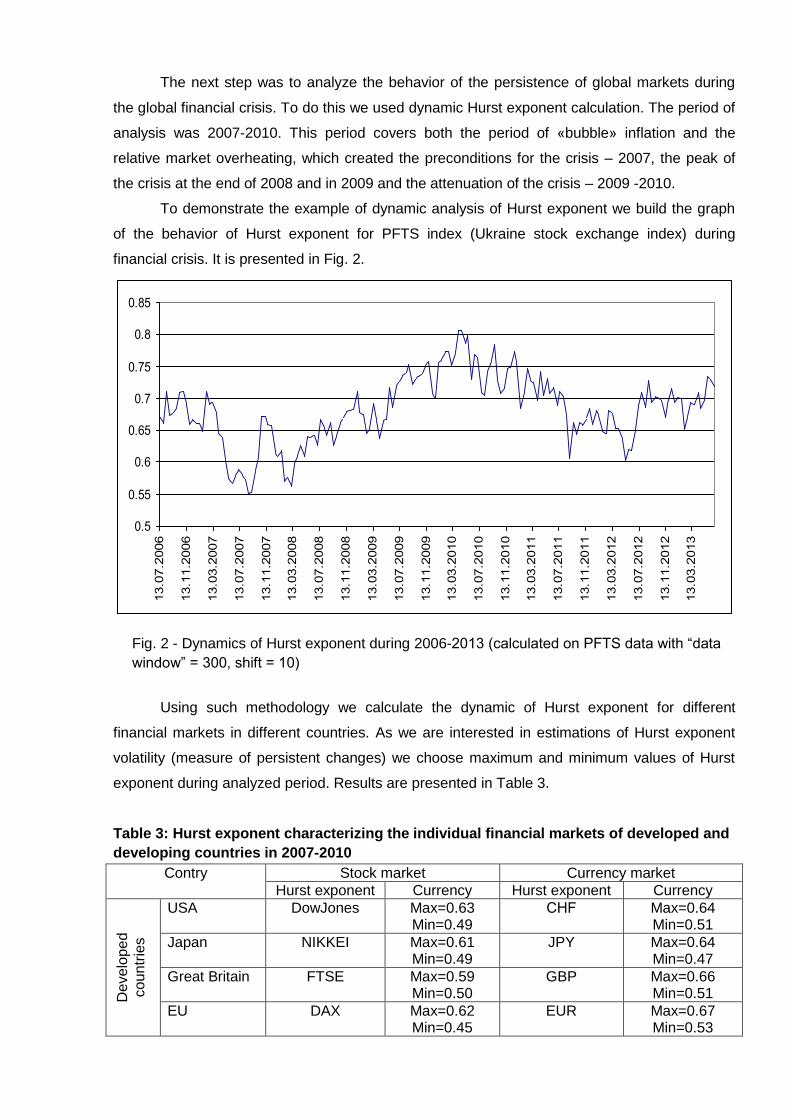
The next step was to analyze the behavior of the persistence of global markets during
the global financial crisis. To do this we used dynamic Hurst exponent calculation. The period of
analysis was 2007-2010. This period covers both the period of «bubble» inflation and the
relative market overheating, which created the preconditions for the crisis – 2007, the peak of
the crisis at the end of 2008 and in 2009 and the attenuation of the crisis – 2009 -2010.
To demonstrate the example of dynamic analysis of Hurst exponent we build the graph
of the behavior of Hurst exponent for PFTS index (Ukraine stock exchange index) during
financial crisis. It is presented in Fig. 2.
Fig. 2 - Dynamics of Hurst exponent during 2006-2013 (calculated on PFTS data with “data
window” = 300, shift = 10)
Using such methodology we calculate the dynamic of Hurst exponent for different
financial markets in different countries. As we are interested in estimations of Hurst exponent
volatility (measure of persistent changes) we choose maximum and minimum values of Hurst
exponent during analyzed period. Results are presented in Table 3.
Table 3: Hurst exponent characterizing the individual financial markets of developed and
developing countries in 2007-2010
Contry Stock market Currency market
Hurst exponent Currency Hurst exponent Currency
De
velo
pe
d
co
un
trie
s
USA DowJones Max=0.63 Min=0.49
СHF Max=0.64 Min=0.51
Japan NIKKEI Max=0.61 Min=0.49
JPY Max=0.64 Min=0.47
Great Britain FTSE Max=0.59 Min=0.50
GBP Max=0.66 Min=0.51
EU DAX Max=0.62 Min=0.45
EUR Max=0.67 Min=0.53
0.5
0.55
0.6
0.65
0.7
0.75
0.8
0.85
13.07.2006
13.11.2006
13.03.2007
13.07.2007
13.11.2007
13.03.2008
13.07.2008
13.11.2008
13.03.2009
13.07.2009
13.11.2009
13.03.2010
13.07.2010
13.11.2010
13.03.2011
13.07.2011
13.11.2011
13.03.2012
13.07.2012
13.11.2012
13.03.2013
De
velo
pin
g c
oun
trie
s
China SSEC Max=0.61 Min=0.45
YUAN Max=0.60 Min=0.44
Brasil Bovespa Max=0.61 Min=0.51
BRL Max=0.69 Min=0.48
India BSE SenSex Max=0.62 Min=0.54
INR Max=0.67 Min=0.51
Russia RTS Max=0.65 Min=0.57
RUB Max=0.64 Min=0.52
Ukraine PFTS Max=0.82 Min=0.61
UAH Max=0.62 Min=0.40
UX Max=0.63 Min=0.49
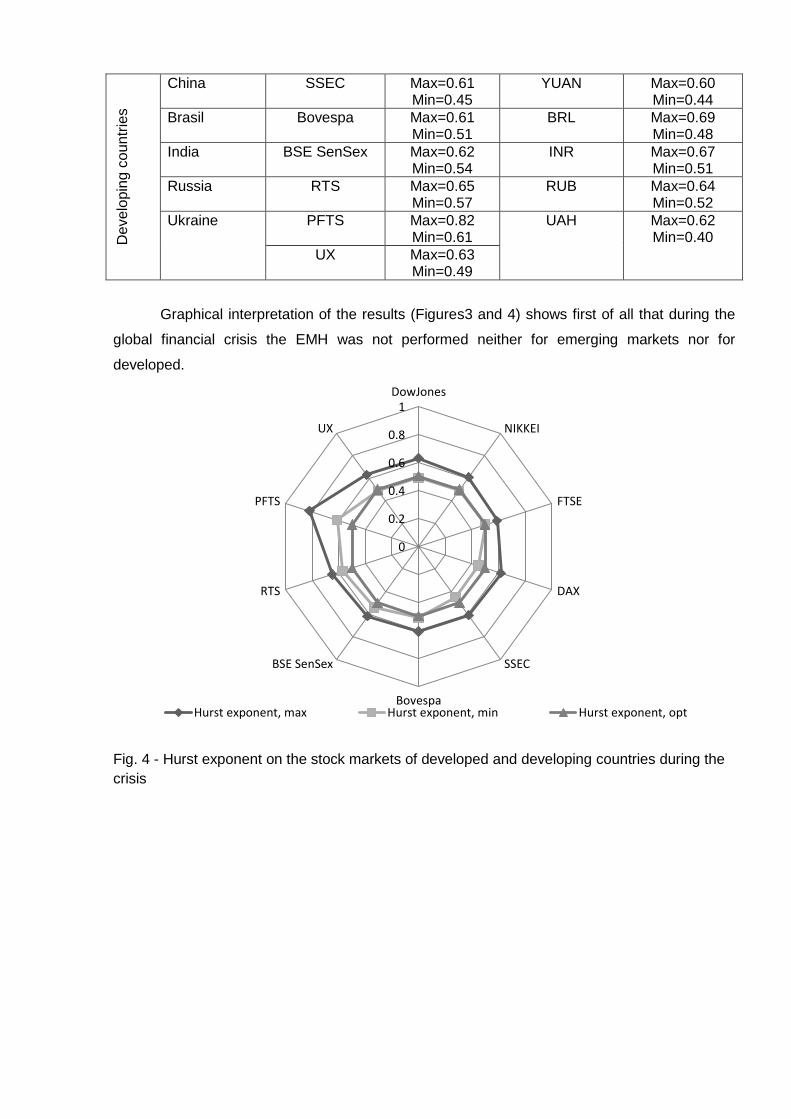
Graphical interpretation of the results (Figures3 and 4) shows first of all that during the
global financial crisis the EMH was not performed neither for emerging markets nor for
developed.
Fig. 4 - Hurst exponent on the stock markets of developed and developing countries during the
crisis
0
0.2
0.4
0.6
0.8
1DowJones
NIKKEI
FTSE
DAX
SSEC
Bovespa
BSE SenSex
RTS
PFTS
UX
Hurst exponent, max Hurst exponent, min Hurst exponent, opt
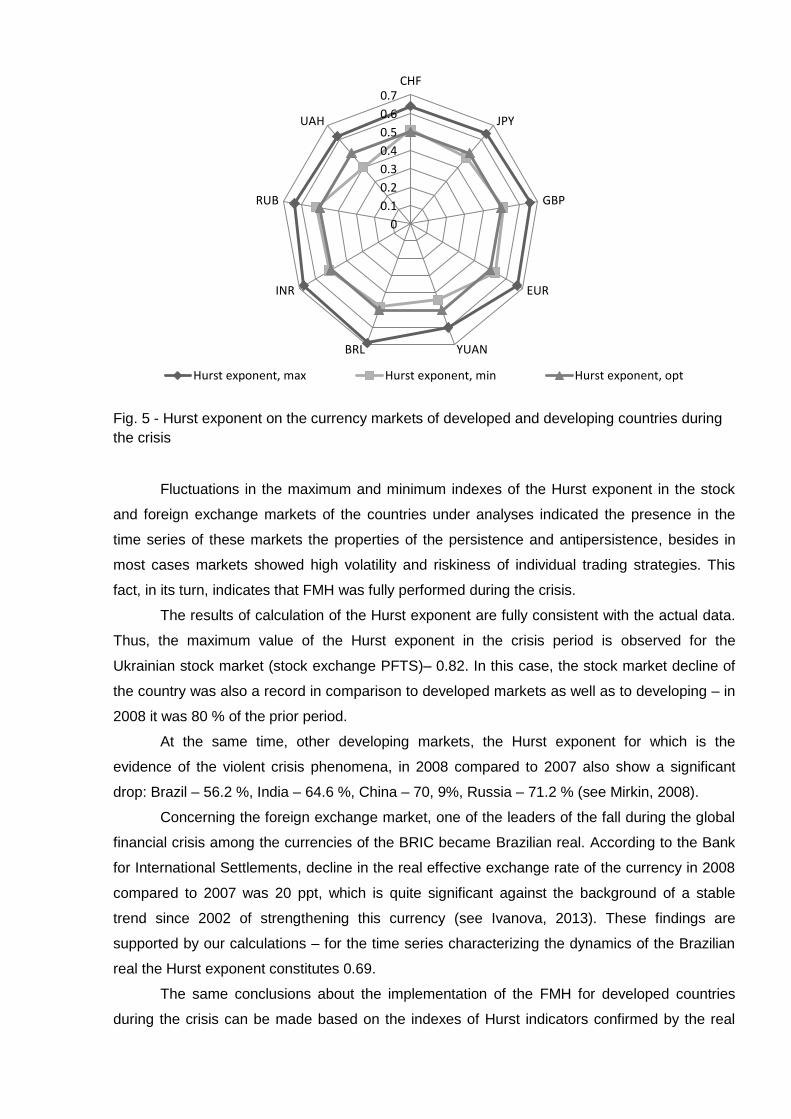
Fig. 5 - Hurst exponent on the currency markets of developed and developing countries during
the crisis
Fluctuations in the maximum and minimum indexes of the Hurst exponent in the stock
and foreign exchange markets of the countries under analyses indicated the presence in the
time series of these markets the properties of the persistence and antipersistence, besides in
most cases markets showed high volatility and riskiness of individual trading strategies. This
fact, in its turn, indicates that FMH was fully performed during the crisis.
The results of calculation of the Hurst exponent are fully consistent with the actual data.
Thus, the maximum value of the Hurst exponent in the crisis period is observed for the
Ukrainian stock market (stock exchange PFTS)– 0.82. In this case, the stock market decline of
the country was also a record in comparison to developed markets as well as to developing – in
2008 it was 80 % of the prior period.
At the same time, other developing markets, the Hurst exponent for which is the
evidence of the violent crisis phenomena, in 2008 compared to 2007 also show a significant
drop: Brazil – 56.2 %, India – 64.6 %, China – 70, 9%, Russia – 71.2 % (see Mirkin, 2008).
Concerning the foreign exchange market, one of the leaders of the fall during the global
financial crisis among the currencies of the BRIC became Brazilian real. According to the Bank
for International Settlements, decline in the real effective exchange rate of the currency in 2008
compared to 2007 was 20 ppt, which is quite significant against the background of a stable
trend since 2002 of strengthening this currency (see Ivanova, 2013). These findings are
supported by our calculations – for the time series characterizing the dynamics of the Brazilian
real the Hurst exponent constitutes 0.69.
The same conclusions about the implementation of the FMH for developed countries
during the crisis can be made based on the indexes of Hurst indicators confirmed by the real
0
0.1
0.2
0.3
0.4
0.5
0.6
0.7СHF
JPY
GBP
EUR
YUANBRL
INR
RUB
UAH
Hurst exponent, max Hurst exponent, min Hurst exponent, opt
dynamics of the analyzed indexes. Thus, the decline in developed markets in 2008 (stock index
on November 26, 2008 compared to December 31, 2007, in dollar terms) was: USA – 34.2%,
Japan – 36.9%, UK – 50.2%; France – 50.2%, Germany – 50.2%, Italy – 54.5% (see Mirkin,
2008).
Achieved results may act as a basis for the formation of trading strategies for the
participants of the market. The value of the Hurst exponent allows making conclusions about
the current level of market efficiency. The inefficiency of the market signals about the possibility
of profitable trading. For example high persistence allows using trend-oriented trading
strategies. Plus low efficiency of the financial markets activates numerous market anomalies.
Trading strategies, based on anomalies, also may become the source of speculative profits. So
the Hurst exponent by the R/S analysis can certainly be useful to create customized strategies
for traders in financial markets.
Concerning the volatility of the Hurst exponent in times of crisis, in this context we
consider it necessary to emphasize that the Hurst exponent can be used as a tool to predict the
expectations of investors in general and on the macro level. Hurst exponent can act as a kind of
fear index, which reflects the current market conditions, the direction of its future development
and the appropriate level of uncertainty (volatility), and investor sentiment. The growth of the
Hurst exponent shows continuous market inefficiencies, and conversely, the lower the exponent
is – the more efficient the market gets.
As we can see, methodology of FMH can be useful in market efficiency metrics.
5. Improving the market efficiency: Case of Ukraine
As we can see, financial markets can be quite unstable from the position of their efficiency.
Nevertheless it is clear that efficient state is evolutional norm for the financial markets (see
results of developed countries for pre-crisis period). That is why it is quite important to find out
how to improve the efficiency of the financial markets.
Based on result of analysis we can point out, that Ukrainian financial market is the most
ineffective among the analyzed ones. So we will use it as an example to find out the reasons of
market inefficiency and to provide some recommendations on improving the market efficiency.
Low efficiency of Ukrainian financial market decreases investment attractiveness of
Ukraine. As a result it has insufficient financing, bad credit ratings and low positions in different
international rankings. For example Index of Economic Freedom (by Heritage Foundation)
published in 2013 put Ukraine on the 161-st place among 185 countries. The reasons were:
restrictions for investment activity, undeveloped financial sector and unsatisfied state regulation.
Another example is Global Competitiveness index (by World Economic Forum): Ukraine takes
84-th place among 152 countries. The main factors of low competitiveness are poor institution
infrastructure, opacity and problems with access to financial resources (see The Global
Competitiveness Report 2013–2014 for details).
Among other factors that should be mentioned is distorted structure of Ukrainian stock
market: OTC-part is 10 times bigger than the organized one.
The result of these and other facts concerned Ukraine is inefficient financial market with
the following list of properties:
- Financial market of Ukraine is small, unformed and is under construction;
- It is high volatility and risky;
- It has unconsolidated infrastructure;
- Unformed institutes of depositary and clearing activity, absence of market-makers
and other element of infrastructure;
- The list of financial instruments is quite limited; some of common financial operations
are prohibited by regulators.
We were trying to classify the main problems of Ukrainian financial market (see Fig. 6) in
order to find out the reasons of inefficiency and to propose some concrete steps to solve them
and thus to improve its efficiency.
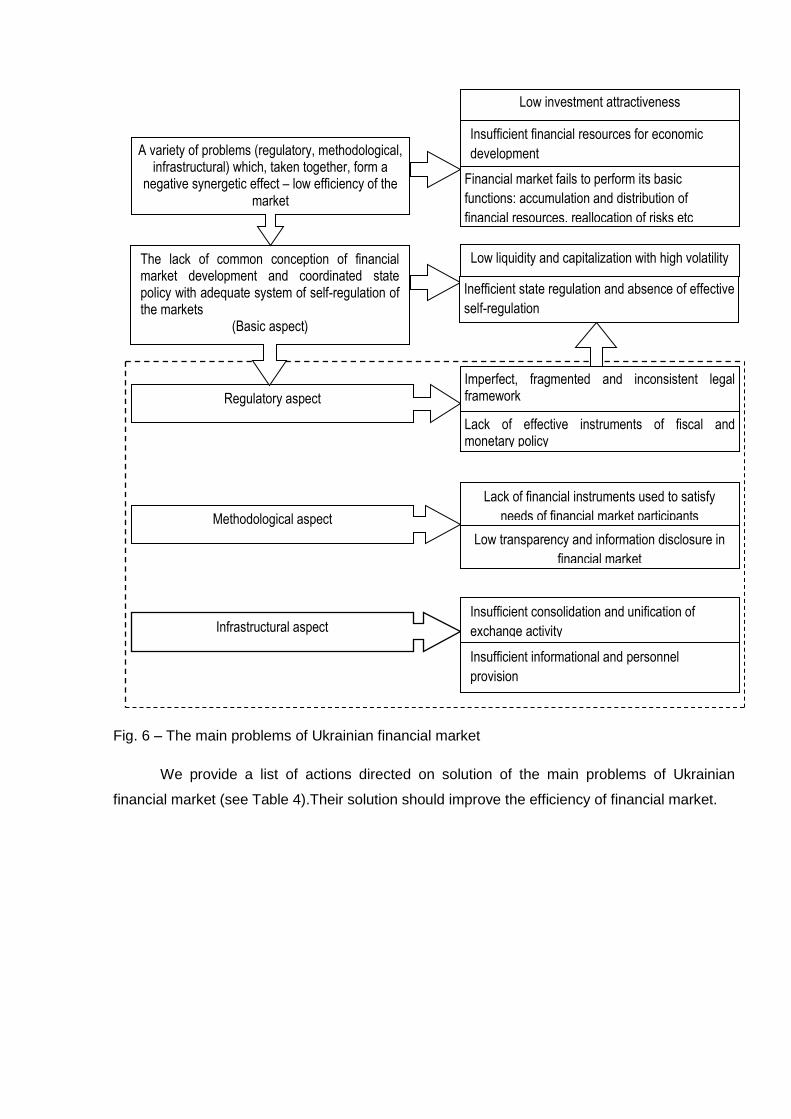
Fig. 6 – The main problems of Ukrainian financial market
We provide a list of actions directed on solution of the main problems of Ukrainian
financial market (see Table 4).Their solution should improve the efficiency of financial market.
Regulatory aspect
Methodological aspect
Infrastructural aspect
Lack of effective instruments of fiscal and monetary policy
Lack of financial instruments used to satisfy
needs of financial market participants
Low liquidity and capitalization with high volatility
Low investment attractiveness
Insufficient financial resources for economic
development
Financial market fails to perform its basic
functions: accumulation and distribution of
financial resources, reallocation of risks etc
Inefficient state regulation and absence of effective
self-regulation
Imperfect, fragmented and inconsistent legal framework
Low transparency and information disclosure in
financial market
Insufficient consolidation and unification of
exchange activity
Insufficient informational and personnel
provision
The lack of common conception of financial market development and coordinated state policy with adequate system of self-regulation of the markets
(Basic aspect)
A variety of problems (regulatory, methodological, infrastructural) which, taken together, form a
negative synergetic effect – low efficiency of the market
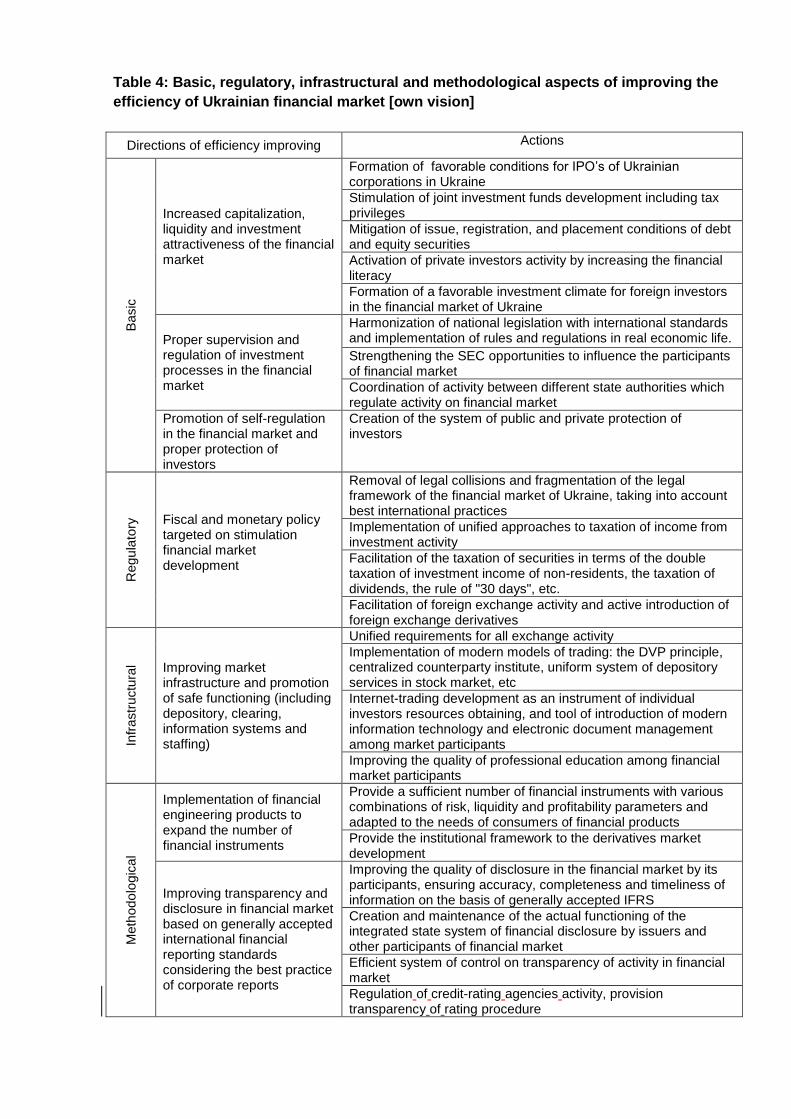
Table 4: Basic, regulatory, infrastructural and methodological aspects of improving the
efficiency of Ukrainian financial market [own vision]
Directions of efficiency improving Actions B
asic
Increased capitalization, liquidity and investment attractiveness of the financial market
Formation of favorable conditions for IPO’s of Ukrainian corporations in Ukraine
Stimulation of joint investment funds development including tax privileges
Mitigation of issue, registration, and placement conditions of debt and equity securities
Activation of private investors activity by increasing the financial literacy
Formation of a favorable investment climate for foreign investors in the financial market of Ukraine
Proper supervision and regulation of investment processes in the financial market
Harmonization of national legislation with international standards and implementation of rules and regulations in real economic life.
Strengthening the SEC opportunities to influence the participants of financial market
Coordination of activity between different state authorities which regulate activity on financial market
Promotion of self-regulation in the financial market and proper protection of investors
Creation of the system of public and private protection of investors
Regu
lato
ry
Fiscal and monetary policy targeted on stimulation financial market development
Removal of legal collisions and fragmentation of the legal framework of the financial market of Ukraine, taking into account best international practices
Implementation of unified approaches to taxation of income from investment activity
Facilitation of the taxation of securities in terms of the double taxation of investment income of non-residents, the taxation of dividends, the rule of "30 days", etc.
Facilitation of foreign exchange activity and active introduction of foreign exchange derivatives
Infr
astr
uctu
ral
Improving market infrastructure and promotion of safe functioning (including depository, clearing, information systems and staffing)
Unified requirements for all exchange activity
Implementation of modern models of trading: the DVP principle, centralized counterparty institute, uniform system of depository services in stock market, etc
Internet-trading development as an instrument of individual investors resources obtaining, and tool of introduction of modern information technology and electronic document management among market participants
Improving the quality of professional education among financial market participants
Meth
odo
logic
al
Implementation of financial engineering products to expand the number of financial instruments
Provide a sufficient number of financial instruments with various combinations of risk, liquidity and profitability parameters and adapted to the needs of consumers of financial products
Provide the institutional framework to the derivatives market development
Improving transparency and disclosure in financial market based on generally accepted international financial reporting standards considering the best practice of corporate reports
Improving the quality of disclosure in the financial market by its participants, ensuring accuracy, completeness and timeliness of information on the basis of generally accepted IFRS
Creation and maintenance of the actual functioning of the integrated state system of financial disclosure by issuers and other participants of financial market
Efficient system of control on transparency of activity in financial market
Regulation of credit-rating agencies activity, provision transparency of rating procedure
6. Conclusions
In response to the deepening impact of the crisis on the financial markets the issues explaining
the behavior of the markets in general and the early prediction of a crisis for them in particular
have become relevant. In the context of the search for alternative concepts of financial markets,
as opposition to the EMH in the post-crisis period, the FMH becomes popular; it has got new
categories and uses property of their long-term memory – so-called persistency to model the
behavior of market indicators. A key indicator for its evaluation is the Hurst exponent with the
R/S analysis as the highest priority calculation method.
Interpretation of the Hurst exponent for the world's developed and developing stock and
foreign exchange markets led to the conclusion about the effectiveness of the implementation of
the hypothesis for developed markets and FMH for developing markets in the pre-crisis period.
Moreover, our calculations confirm the FMH during the crisis period for all the analyzed markets
and indicators.
The results of the research substantiate the use of FMH as a basis for modeling the
behavior of the financial market as well as the Hurst exponent to predict the direction of its
development, has practical application both at the micro level (by the individual market
participants), and macro-level (its regulators).
Based on results of research, using Ukraine as a country with extremely low level of
market efficiency, we provide some recommendations on market efficiency increase. To do this
we analyze the main problems of Ukrainian financial market and propose basic approaches to
their solution.
References
1. Alvarez-Ramirez, J., Cisneros, M., Ibarra-Valdez, C., Soriano A. (2002), “Multifractal
Hurst analysis of crude oil prices”, Physica A, Vol. 313, pp. 651-670.
2. Ball Ray (2009), “The Global Financial Crisis and the Efficient Market Hypothesis: What
Have We Learned?”. Electronic copy available at: http://ssrn.com/abstract=1502815
3. Barkoulas, J. T., Labys, W. C., and Onochie, J. I. (1997), “Fractional dynamics in
international commodity prices”, Journal of Futures Markets,Vol. 17 No 2, рр. 737–745.
4. Barone Raffaella (2003), “From Efficient Markets to Behavioral Finance”, University of
Lecce Economics Working Paper No. 46/24
5. Barunik, J,Kristoufek, L.(2010), “On Hurst exponent estimation under heavy-tailed
distributions”, Physica A: Statistical Mechanics and its Applications, Elsevier, vol.
389(18), pр. 3844-3855.
6. Bassler, K., Gunaratne, G., McCauley, J., (2006), “Markov processes, Hurst exponents,
and nonlinear diffusion equations: With application to finance”, Physica A, Vol. 369, No.
2, pp. 343-353
7. Batten, J. A., Ellis, C., Fetherston, T. A. (2003), “Return Anomalies on the Nikkei: Are
they Statistical Illusions?”, Available at SSRN: http://ssrn.com/abstract=396680.
8. Beechey M., Gruen D. and Vickery J. (2000), “The Efficient Market Hypothesis: a
Survey”, Reserve Bank of Australia Research Discussion Paper №2000-01, January
2000, p. 4.
9. Berg, L., Lyhagen, J. (1996), “Short and Long Run Dependence in Swedish Stock
Returns”, Available at SSRN: http://ssrn.com/abstract=2270.
10. Black, F., Scholes, M. (1973), “The Pricing of Options and Corporate Liabilities”, Journal
of Political Economy, Vol. 81 (3), pp. 637–654.
11. Booth, G. G., Kaen, F. R., Koveos, P. E. (1982), “R/S analysis of foreign exchange rates
under two international monetary regimes”, Journal of Monetary Economics, Elsevier,
vol. 10(3), pp 407-415.
12. Borges. M ,R (2008), “Efficient Market Hypothesis in European Stock Markets”, working
paper series, WP 20/2008/DE/CIEF, School of Economics and Management, Technical
University of Lisbon.
13. Cajueiro D. O., Tabak B. M. (2004),“Ranking efficiency for emerging markets”, Chaos,
Solitons and Fractals, Vol. 22 No 2, pp. 349-352.
14. Cajueiro D. O., Tabak B. M., (2005), “Ranking efficiency for emerging equity markets II”,
Chaos, Solitons and Fractals, Vol. 23 No 2, pp. 671-675.
15. Cheung Y. W., Lai K. S. (1993), “Do gold market returns have long-range dependence?”,
The Financial Review, Vol. 28 No. 2, pp. 181-202.
16. Cheung Y. W., Lai K. S. (1995), “A search for long-range dependence in international
stock market returns”, Journal of International Money and Finance, Vol. 14 No. 4, pp.
597-615.
17. Corazza, M., Malliaris, A. G. (Tassos) (2002), “Multifractality in Foreign Currency
Markets”, Multinational Finance Journal, Vol. 6, pp. 387-401.
18. Costa R. L., Vasconcelos G. L., (2003),“Long-range correlations and nonstationarity in
the Brazilian stock market”, Physica A : Statistical Mechanics and its Applications, Vol.
329 No. 1-2, pp. 231-248.
19. Couillard, M. and M. Davison (2005), “A comment on measuring the hurst exponent of
financial time series”, Physica A:Statistical Mechanics and its Applications, Vol. 348, pp.
404-418.
20. Crato, N. (1994), “Some international evidence regarding the stochastic memory of stock
returns”, Applied Financial Economics, Vol. 4 No. 1, pp. 33-39.
21. Crato, N., Ray, B. (1999), “Memory in Returns and Volatilities of Commodity Futures'
Contracts”, Available
athttp://citeseerx.ist.psu.edu/viewdoc/summary?doi=10.1.1.42.6774
22. Da Silva S., Matsushita R., Gleria I., Figueiredo A. (2007), “Hurst exponents, power
laws, and efficiency in the Brazilian foreign exchange market”, Economics Bulletin, Vol.7
No.1, pp. 1-11.
23. Damodaran, A (2012), Investment Valuation: Tools and Techniques for Determining
theValue of Any Asset : 3rd ed., Wiley & Sons.
24. Daw, C., Finney, C., Tracy, E., (2003), "A review of symbolic analysis of experimental
data", Review of Scientific Instruments, Vol. 74, No. 2, pp. 915-930
25. Ding, Z., Granger, C., and Engle, R. F. (1993), “A long memory property of stock market
returns and a new model”, Journal of Empirical Finance, Vol.1, pp. 83-106.
26. Fama, E (1970), “Efficient Capital Markets: A Review of Theory and Empirical Evidence”,
Journal of Finance, No. 25, pp. 383-417.
27. Fung, H. G. and Lo, W. C. (1993), “Memory in interest rate futures”, The Journal of
Futures Markets, Vol. 13, pp. 865-872.
28. Gabjin O., Seunghwan, K., Cheoljun, E. (2007), “Market efficiency in foreign exchange
markets”, Physica A: Statistical Mechanics and its Applications, Vol. 382 No. 1, pp. 209-
212
29. Gachkov A. (2009), “Randomized R/S-analysis of financial data”. Available at:
http://www.math.spbu.ru/user/gran/soi5/Gatchkov5.pdf.
30. Glenn, L. A. (2007), “On Randomness and the NASDAQ Composite”, Working Paper,
Available at SSRN: http://ssrn.com/abstract=1124991
31. Grech D., Mazur Z. (2004), “Can one make any crash prediction in finance using the
local Hurst exponent idea?”, Physica A : Statistical Mechanics and its Applications, Vol.
336, pp.133-145.
32. Grech D., Pamula, G. (2008), “The local Hurst exponent of the financial time series in
the vicinity of crashes on the Polish stock exchange market”, Physica A :Statistical
Mechanics and its Applications, Vol. 387, pp. 4299-4308.
33. Grech, D. and Mazur, Z. (2005), “Statistical properties of old and new techniques in
detrended analysis of time series”, ActaPhysicaPolonica,Vol. 36 No. 8, pp. 2403-2406.
34. Greene, M.T., Fielitz, B.D. (1977), “Long-term dependence in common stock returns”,
Journal of Financial Economics, Vol. 4, pp. 339-349.
35. Hassan, Shah and Abdullah, (2007), “Testing of Random Walks and Efficiency in an
Emerging Market”, The Business Review Cambridge, Volume 9, Nov 1
36. Helms, B. P., Kaen, F. R. and Rosenman, R. E. (1984), “Memory in commodity futures
contracts”, Journal of Futures Markets, Vol. 4, pp. 559-567.
37. Hja, S., Lin, Y. (2003), “R/ S Analysis of China Securities Markets”, Tsinghua Soence
and Technology, Vol. 8 No.5, pp. 537 – 540.
38. Huang, B., (1995), “Do Asian Stock Market Prices Follow Random Walks? Evidence
From The Variance Ratio Test”, Applied Financial Economics, 5, p. 251 – 256
39. Hudson, R. L.; Mandelbrot, B. B. (2004), The (Mis)Behavior of Markets: A Fractal View
of Risk, Ruin, and Reward, Basic Books, New York.
40. Hurst, H.E. (1951), “Long-term storage of reservoirs: an experimental study”,
Transactions of the American Society of Civil Engineers, Vol. 116, pp. 770-799.
41. Ivanova N., Sinyakov A. (2013), “Strengthening of Brazil Real: lessons for Russia and
other developing countries Center of macroeconomic research”, Available at:
http://www.sberbank.ru/common/img/uploaded/analytics/2013/cmi_30052013.pdf
42. Jacobsen, B. (1995), “Are Stock Returns Long Term Dependent? Some Empirical
Evidence”, Journal of International Financial Markets, Institutions and Money, Vol. 5, No.
2/3, Available at SSRN: http://ssrn.com/abstract=7459
43. Jensen Michael C. (1978), “Some Anomalous Evidence Regarding Market Efficiency”,
Journal of Financial Economics, Vol. 6, Nos. 2/3 95 - 101.
44. Kahneman, D. Tversky, А. (1979), “Prospect theory : An analysis of decisions under
risk”, Econometrica, No. 47,рр. 313-327.
45. Kantelhardt, J., S. Zschiegner, E. Koscielny-Bunde, A. Bunde, S. Havlin, and E. Stanley
(2002), “Multifractaldetrended fluctuation analysis of nonstationary time series”, Physica
A: Statistical Mechanics and its Applications,Vol. 316, pp.1-4.
46. Kim, K. Yoon, Seong-Min (2004), “Multifractal features of financial markets”, Physica A:
Statistical Mechanics and its Applications, Vol. 344 No.1, pp. 272-278.
47. Lento, C. (2009), “A Synthesis of Technical Analysis and Fractal Geometry - Evidence
from the Dow Jones Industrial Average Components”, Available at SSRN:
http://ssrn.com/abstract=1263615.
48. Lintner, J. (1965), “The valuation of risk assets and the selection of risky investments in
stock portfolios and capital budgets”, Review of Economics and Statistics, Vol. 47 No 1,
pp. 13-37/
49. Lo, A. (2004), “The Adaptive Markets Hypothesis: Market Efficiency from an Evolutionary
Perspective”, Journal of Portfolio Management, Vol. 30, pp. 15-29
50. Lo, A. and C. Mackinlay, (1988), “Stock Market Do Not follow Random Walks: Evidence
From a Simple Specification Test”, Review of Financial Studies,1, p. 41 – 66
51. Lo, A.W. (1991), “Long-term memory in stock market prices”, Econometrica, Vol. 59,
pp.1279-1313.
52. Los, C. A. (2000), Visualization of Chaos for Finance Majors, Available at SSRN:
http://ssrn.com/abstract=253357.
53. Los, C. A. (2003), Financial Market Risk: Measurement & Analysis, Routledge
International Studies in Money and Banking, Vol. 24, Taylor & Francis Books Ltd,
London, UK.
54. Los, C. A. and Yalamova, R. M. (2006), “Multi-Fractal Spectral Analysis of the 1987
Stock Market Crash”, International Research Journal of Finance and Economics, Vol. 1,
No. 4, pp. 106-133.
55. Malkiel, Burton G. (2003), “The Efficient Market Hypothesis and Its Critics”, Journal of
Economic Perspectives 17, no. 1: 59–82
56. Mandelbrot, B (1982), The Fractal Geometry of Nature, W.H. Freeman, New York.
57. Mandelbrot, B. (1971), “When can price be arbitraged efficiently? A limit to the validity of
the random walk and martingale models”, The Review of Economics and Statistics, Vol.
53 No 3, pp. 225-236.
58. Mandelbrot, B. (1972), “Statistical Methodology ForNonperiodic Cycles: From The
Covariance To Rs Analysis”, Annals of Economic and Social Measurement, Vol. 1, No.
3, pp. 259-290.
59. Mandelbrot, B. (1969), “Robustness of the rescaled range R/S in the measurement of
non-cycling long-run statistical dependence”, Water Resources Research, Vol. 5. No
5,pp. 967-988.
60. Markov A. (2010), Mathematical approach to fractal properties of stock markets analysis.
PhD paper, Moskow. – 165 p.
61. McKenzie, M. D. (2001), “Non-periodic Australian stock market cycles: evidence from
rescaled range analysis”, The Economic Record, Vol. 77, pp. 393-406.
62. Mirkin Y. (2008), “Russian financial sector: crisis counteraction and post-crisis
development”, Available at: http://www.mirkin.ru/_docs/fin_sector_russ.pdf
63. Mossin, J. (1966), “Equilibrium in a Capital Asset Market”, Econometrica, Vol. 34, No. 4,
pp. 768–783.
64. Mulligan R. F.(2000), “A fractal analysis of foreign exchange markets”, International
Advances in Economic Research, Vol. 6 (1), pp. 33-49.
65. Onali, E. and Goddard, J. (2010), “Are European Equity Markets Efficient? New
Evidence from Fractal Analysis”, Available at SSRN: http://ssrn.com/abstract=1805044.
66. Opong K. K., Mulholland G., Fox A.F., Farahmand K. (1999), “The behaviour of some
UK equity indices: an application of Hurst and BDS tests”. Journal of Empirical Finance,
Vol. 6, pp.267-282.
67. Peters, E. E. (1991), Chaos and Order in the Capital Markets: A New View of Cycles,
Prices, and Market Volatility, John Wiley and Sons, New York.
68. Peters, E. E. (1994), Fractal Market Analysis: Applying Chaos Theory to Investment and
Economics,John Wiley and Sons, New York.
69. Podpiera, R. (2000), Efficiency of Financial Markets in Transition: The Case of
Macroeconomic Releases , Available at http://iweb.cerge-ei.cz/pdf/wp/Wp156.pdf
70. Serletis A., Rosenberg A. A. (2007), “The Hurst exponent in energy futures prices”,
Physica A: Statistical Mechanics and its Applications, Vol. 380, pp. 325-332.
71. Serletis A., Rosenberg A. A., (2009), “Mean reversion in the US stock market. Chaos,
solitons and fractals”, Vol. 40, pp. 2007-2015.
72. Sharpe, W. F. (1964), “Capital asset prices: A theory of market equilibrium under
conditions of risk”, Journal of Finance, Vol.19 (3), pp. 425–442.
73. Shiller, Robert J. “From Efficient Markets to Behavioral Finance”, Journal of Economic
Perspectives 17, no. 1 (2003): 83–104.
74. Taqqu, M., W. Teverosky, and W. Willinger (1995), “Estimators for long-range
dependence: an empirical study”, Fractals, Vol 3, No. 4, pp. 785-788.
75. Teverovsky, V. Taqqu,M. S., Willinger W. (1999),“A critical look at Lo's modified R=S
statistic”, Journal of Statistical Planning and Inference, Vol. 80, pp. 211-227
76. The Global Competitiveness Report 2013–2014 - World Economic Forum //
www3.weforum.org/docs/WEF_GlobalCompetitivenessReport_2013-14.pdf
77. Treynor, J. L. (1962), “Toward a Theory of Market Value of Risky Assets”. In Korajczyk
R. A. (Ed.), Asset Pricing and Portfolio Performance: Models, Strategy and Performance
Metrics, London, Risk Books, pp. 15–22.
78. Tversky, A. (1982), “Judgment under uncertainty: Heuristics and biases”, Cambridge
University Press, New York.
79. Ulici, M-L., Nistor I. A. (2011), “Financial Liberalization and Stock Market
Efficiency”, Finance - Challenges of the Futur, Vol. 13, pp 154-160
80. Urrutia, J. (1995), “Tests of Random Walk and Market Efficiency for Latin American
Emerging Markets”, Journal of Financial Research, 1995, pp. 299-309

81. Weron, R.(2002), “Estimating long-range dependence: finite sample properties and
confidence intervals”, Physica A: Statistical Mechanics and its Applications, Vol. 312(1),
pp. 285-299.
Appendix A
Methodology of Hurst exponent calculation (artificially generated data)
Author Type of analysis
Results
Taqqu et al., (1995)
R/S, DFA R/S overestimates the true Hurst exponent while DFA underestimates it.
Weron, R. (2002) R/S, DFA DFA outperforms R/S
Kantelhardt et al., (2002)
MF -DFA Estimates based on (Anis and Lloyd, 1976) are better than the ones of (Peters,1994).
Couillard and Davison, (2005)
R/S analysis No long-term memory in some financial returns, suggesting that Brownian motion cannot be rejected as a model for price dynamics
Grech and Mazur, (2005)
DFA, DMA DFA outperforms DMA
V.Teverovsky, M. Taqqu, W.Willinger(1999)
R/S Uncover a number of serious drawbacks to using Lo's method in practice.
Lo (1991) R/S (modified)
Provide the test for long-range dependence. Lo reported that the rescaled range analysis could confuse long-term memory with the effects of short term memory. Results consistent with the EMH
- rescaled range analysis (R/S), - generalized Hurst exponent approach (GHE), - detrended moving average (DMA) - detrended fluctuation analysis (DFA) - multifractal generalization (MF-DFA)
Appendix B Methodology of Hurst exponent calculation (financial data)
Author Type of
analysis Object of analysis
(time period) Results
Barunik, Jozef&Kristoufek, Ladislav, 2010
R/S, GHE, DMA, DFA,
MF-DFA
S&P 500 index (1983-2009)
Rescaled range analysis (R=S) together with generalized Hurst exponent approach (GHE) are robust to heavy tails in the underlying process. MF- DFA methods as well as DMA are not appropriate for data with heavier tails and small sample size. GHE methods proved to be very useful as they show the best properties.
Hja Su, LinYang (2003)
R/S Shanghai and Shenzhen Stock Exchanges (1991-2001)
The changes of indices and stocks in the last period have positive impact in the next period in the short run, but this impact disappears for long time. The Hurst exponents of the weekly indices of Shanghai were around 0.60 and the Hurst exponents of the weekly indices of Shenzhen were in the range of 0.65 to 0.75.
Greene and Fielitz (1977)
R/S Securities listed on the New York Stock Exchange
Claimed to have found significant evidence for the presence of long-range dependence.
Peters, 1991 and Peters, 1994
R/S Monthly returns on the S&P 500 from January 1950 to July 1988
Estimates the Hurst exponent to be 0.778 for monthly returns on the S&P 500 from January 1950 to July 1988 Peters (1994) introduces the Fractal Markets Hypothesis (FMH).
Corazza and Malliaris (2002).
R/S FOREX (1972-1994)
Foreign currency markets exhibit a H that is statistically different from 0.5. H is not fixed but it changes dynamically over time.
Glenn (2007) R/S NASDAQ H of 0.59 was calculated for 1-day returns on the NASDAQ. H increased monotonically to a value of 0.87 for 250-day (annual) returns.
Lento, Camillo (2009)
R/S DJIA (1998-2008)
Tests provide evidence that the H is able to identify long-term dependencies and anti-dependence.
Onali, Enrico and Goddard, John (2010)
R/S Mibtel (Italy) and the PX-Glob (Czech Republic).
Find evidence of long-range dependence in the log return series.
Serletis and Rosenberg (2009)
R/S US stock market indices
Fail to find evidence of long-range dependence for four US stock market indices.
Batten, Elli, and Fetherston (2003)
R/S Nikkei stock index daily data (1980 -2000)
The null hypothesis of no long-term dependence is accepted for the whole sample and every sub-period using the modified rescaled range test, but not using the classical rescaled adjusted range test.
Berg, Lennart and Lyhagen, Johan (1996)
R/S Swedish stock returns monthly data (1919-1995), weekly and daily data (1980-1995)
Hardly found any evidence of long run dependence. Using three different tests that are robust to short term dependence found that the modified R/S (rescaled range) test and ARFIMA-GARCH tests provide no support for long run memory in Swedish stock returns
Lo (1991) R/S (modified)
US stock market (1872-1986)
Cannot find the long-term dependence
Ding et al. (1993)
R/S S&P 500 Found considerable evidence of long memory in the squared returns
Jacobsen, Ben (1995)
R/S Indices of five European countries, USA and Japan
Rejects the conclusion of long term dependence in these series.
Barkoulas, Labys, and Onochie (1997)
R/S Futures Claim to have found persistent long memory in a significant group of future contracts
NunoCrato, Bonnie Ray (1999)
R/S Commodities (1977-1997)
Find no evidence for persistent behavior in futures' returns. Find overwhelming evidence of long memory behavior for the volatility of futures' returns.