bcc50_si_h.pdf - bulgarian chemical communications
TRANSCRIPT
BULGARIAN CHEMICAL
COMMUNICATIONS
Volume 50 / Special Issue H
Selected papers from the 15th
National Conference on Catalysis,
November 30, 2017, Sofia
Journal of the Chemical Institutes
of the Bulgarian Academy of Sciences
and of the Union of Chemists in Bulgaria

ANNOTATION
The present issue of the Bulgarian Chemical Communications contains selected papers
based on presentations at the 15th National Conference on Catalysis organised by Bulgarian
Catalysis Club and Institute of Catalysis of the Bulgarian Academy of Sciences in memoriam of
Professor Atanas Andreev who left the catalysis community in 1997. He was a prominent
Bulgarian chemist with important contributions to fundamental and applied catalysis.
Submitted papers by Bulgarian and foreign scientists in the field of catalysis are a tribute to
Professor A. Andreev for his achievements as a leading representative of the Bulgarian school
of catalysis. We are indebted to all contributors for their effort to accomplish this issue.
This issue of the Bulgarian Chemical Communications is published with the kind financial
support from Bulgarian Catalysis Club and Institute of Catalysis of the Bulgarian Academy of
Sciences.
The Editors
3
Bulgarian Chemical Communications, Volume 50, Special issue H (pp. 3–8) 2018
Physicochemical properties of monometallic Rh and Ni and bimetallic RhNi catalyst
materials supported on unmodified and yttrium-modified alumina
R. Palcheva, I. Shtereva, Y. Karakirova, G. Tyuliev, S. Damyanova*
Institute of Catalysis, Bulgarian Academy of Sciences, G. Bonchev St., Bldg. 11, 1113 Sofia, Bulgaria
Received: February 06, 2018; Revised: March 07, 2018
The effect of Y2O3 addition to -alumina carrier on the structure and surface and reductive properties of supported
monometallic Rh and Ni bimetallic RhNi materials was studied. Various techniques for physicochemical
characterization were used, such as N2 adsorption-desorption isotherms, XRD, UV-vis DRS, XPS, EPR, and TPR.
XRD, UV-vis DRS, and XPS results of calcined samples showed the presence of Ni2+
ions in different environment:
octahedral and tetrahedral coordination. Well-dispersed yttrium and rhodium oxide species were detected. EPR and
TPR data indicated a strong interaction between Ni and yttria, as revealed by higher temperature of reduction of nickel
oxide species. Rh promoting effect on the reduction of Ni oxide species was related to hydrogen spillover effect of the
noble metal.
Key words: nickel catalysts, rhodium, yttrium, characterization.
INTRODUCTION
Due to high availability and low cost, alumina-
supported nickel catalyst materials have been widely
used for hydrogen production by reforming processes
of ethanol [1,2] and for synthesis gas or hydrogen-
rich synthesis gas production by reforming of
methane with CO2 [3]. On the other hand, methane
and carbon dioxide are greenhouse gases that cause
the global climate change and considerable attention
has been given to control and utilize these gases
[4,5]. It is well known that Ni-based catalysts sup-
ported on alumina suffer from carbon deposition
over the active phase. Different studies have been
focused on problems how to eliminate coke forma-
tion on Ni catalysts including use of suitable addi-
tives or supports to modify the physicochemical
properties of Ni/Al2O3 with beneficial features, such
as high metal dispersion, high number of basic sites,
and superior reducible nature [6–8]. Another pro-
mising alternative to obtain highly active and coke
resistant Ni-based catalysts is addition of small
amount of noble metal [9–12]. The aim of the
present work was to study the effect of yttrium
addition to -alumina carrier and of Rh introduction
to supported Ni catalysts on their structure and sur-
face and reductive properties. Sample physicoche-
mical properties were examined by applying N2
adsorption-desorption isotherms, X-ray diffraction
(XRD), UV-vis diffuse reflectance spectroscopy
(UV-vis DRS), X-ray photoelectron spectroscopy
(XPS), electron paramagnetic resonance (EPR), and
temperature-programmed reduction (TPR).
EXPERIMENTAL
Sample preparation
Modified alumina support with yttrium was pre-
pared by impregnation of γ-Al2O3 with an aqueous
solution of Y(NO3)3.6H2O. Monometallic Ni and Rh
catalysts were prepared by impregnation of unmodi-
fied and yttrium modified alumina with aqueous
solution of Ni(NO3)2.6H2O and ethanol solution of
RhCl3.3H2O salt, respectively. Supported bimetallic
NiRh samples were prepared by co-impregnation of
unmodified and modified alumina with solutions of
rhodium chloride and nickel nitrate salts in ethanol.
Obtained solids were dried at 110 °C for 12 h and
calcined at 550 °C for 4 h. The theoretical content of
Y, Ni, and Rh was 10, 10, and 1 wt.%, respectively.
The samples were denoted as Y-Al, Ni/Al, Rh/Al,
Ni/Y-Al, RhNi/Al, and RhNi/Y-Al.
Methods
N2 adsorption-desorption isotherms of samples
were recorded at 77 K by means of a Quantachrome
Instruments NOVA 1200e (USA) 3000 apparatus.
Beforehand the samples were outgassed under
vacuum at 200 °C for 18 h. The surface area was
calculated according to the BET method. XRD
analysis was performed according to step scanning
procedure (step size 0.02°; 0.5 s) with a compu-
terized Seifert 3000 diffractometer, using Ni-filtered
CuKα (λ = 0.15406 nm) radiation and a PW 2200
Bragg-Brentano θ/2θ goniometer equipped with a
© 2018 Bulgarian Academy of Sciences, Union of Chemists in Bulgaria
* To whom all correspondence should be sent
E-mail: [email protected]
4
bent graphite monochromator and an automatic slit.
The assignment of the various crystalline phases
was based on JPDS powder diffraction file cards.
UV-vis DRS spectra of the samples were recorded
in the range of 200–800 nm at room temperature
using a Varian Cary 5000 UV-vis spectrometer
equipped with an integration sphere. XPS measure-
ments of the samples were carried out on an
ESCALAB-MkII (VG Scientific) spectrometer with
a base pressure in the analysis chamber of ∼10−8
Pa.
The spectra were excited with an Al Kα radiation
(hν = 1253.6 eV) at total instrumental resolution of
∼0.9 eV as measured by FWHM of Ag 3d5/2 photo-
electron line. The binding energy (BE) scale of the
spectrometer was calibrated with respect to the Au
4f7/2 peak of gold fixed at 83.98 eV and the BE’s of
O 1s, Al 2p, Ni 2p, Y 3d, and Rh 3d electrons were
referenced to the O1s band at 531.5 eV. Peak decom-
position was performed using Casa XPS program
(Casa Software, UK) assuming 85/15 Gaussian/Lo-
rentzian product function. EPR spectra of calcined
(550 °C in air) and reduced (550 °C in 10% H2/N2
flow) samples were recorded as a first deri-vative of
the absorption signal of JEOL JES-FA 100 EPR
spectrometer at room temperature. The spectrometer
operated in X-band equipped with a standard TE011
cylindrical resonator. The samples were placed in a
special quartz reactor and fixed in the cavity centre.
A variable temperature controller ES-DVT4 was
used to permit detection of EPR spectra at tempera-
tures from 123 to 298 K. Desired temperature could
be easily obtained by moving liquid nitrogen at a
certain temperature controlled by the EPR spectro-
meter data system computer to the sample area. The
reduction temperature of the various phases in the
oxide form of the samples was determined by the
method of TPR. The reducing mixture containing
10% H2 in Ar was deoxygenated over Pt/asbestos
filter at 130 °C, dried in a molecular sieve 5A filter,
and then fed into the a tubular quartz reactor at a
flow rate of 25 cm3/min. The program started from
room temperature at a ramp rate of 10 deg/min up to
1000 °C. Catalyst sample amount charged in the
reactor was 0.1 g. The TPR set-up was equipped with
a thermal conductivity detector.
RESULTS AND DISCUSSION
Structure and surface properties
Nitrogen adsorption-desorption isotherms of cal-
cined samples (not shown) were classified as a type
IV isotherm according to IUPAC, which is typical
of mesoporous materials [13]. Specific surface area
(SBET), total pore volume (Vp), and average pore
diameter (Dp) values are summarized in Table 1.
Table 1. Textural properties of calcined monometallic
and bimetallic RhNi samples
Sample SBET
(m2/g)
Vp
(cm3/g)
Pore diameter
(nm)
Al2O3 232 0.90 15.5
Y-Al 183 0.79 17.2
Ni/Al 187 0.55 11.7
Ni/Y-Al 163 0.66 16.2
Rh/Y-Al 185 0.72 15.7
NiRh/Al 161 0.65 16.2 NiRh/Y-Al 171 0.70 16.2
A decrease in specific surface area and pore
volume of the alumina carrier was observed after
addition of yttrium or nickel (from 232 to 183 and
187 m2/g for Y-Al and Ni/Al, respectively, Table 1)
due to blockage of alumina pores by yttrium or
nickel oxide species. The SBET of modified Y-Al
support continued to decrease for Y-Al2O3-sup-
ported monometallic Ni and Rh samples and it is
more obvious with the former one. The bimetallic
NiRh samples have the lowest specific surface area.
It is interesting to note that with exception of Ni/Al
the mean pore diameter of the supported samples is
higher than that of pure alumina (Table 1). Probably,
this is caused by the presence of particles with larger
pores and owing to possible blockage of the small
pores by yttrium oxide species.
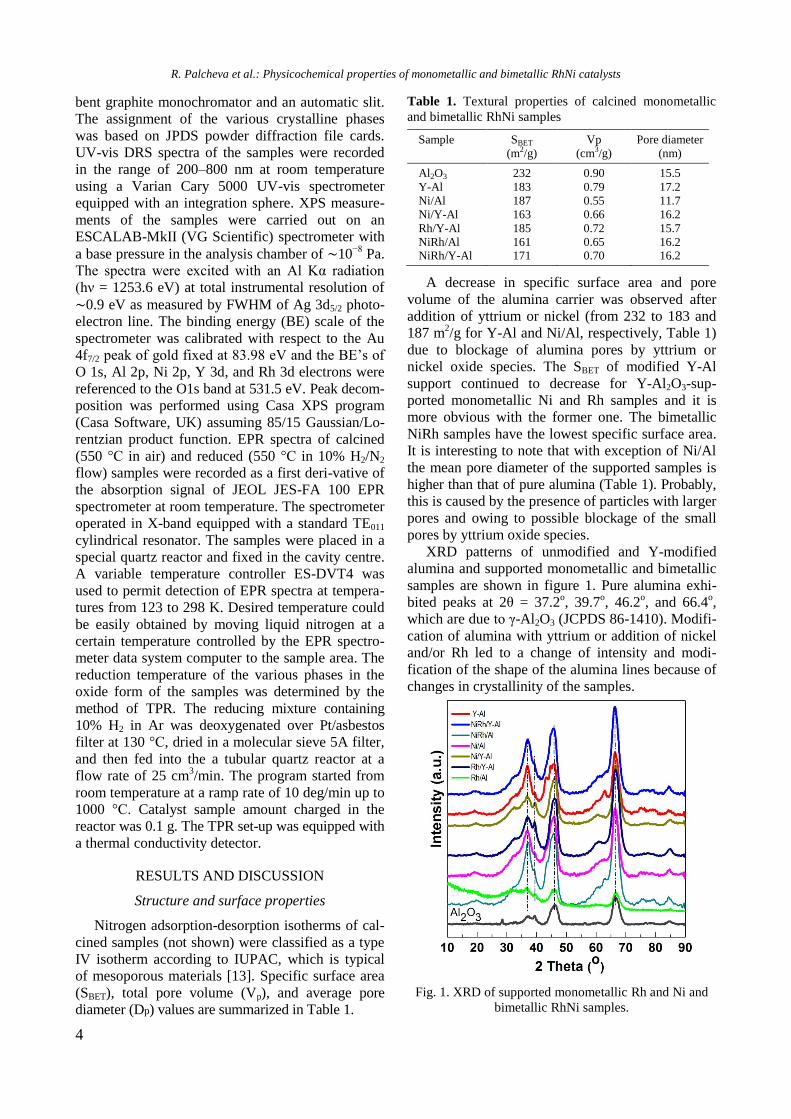
XRD patterns of unmodified and Y-modified
alumina and supported monometallic and bimetallic
samples are shown in figure 1. Pure alumina exhi-
bited peaks at 2θ = 37.2o, 39.7
o, 46.2
o, and 66.4
o,
which are due to γ-Al2O3 (JCPDS 86-1410). Modifi-
cation of alumina with yttrium or addition of nickel
and/or Rh led to a change of intensity and modi-
fication of the shape of the alumina lines because of
changes in crystallinity of the samples.
Fig. 1. XRD of supported monometallic Rh and Ni and
bimetallic RhNi samples.
R. Palcheva et al.: Physicochemical properties of monometallic and bimetallic RhNi catalysts
5
Diffraction lines of Y2O3 at 2θ = 33.77o, 48.54
o,
and 57.6o (JCPDS 65-3178) were not detected in
yttrium modified samples, which is an indication of
the amorphous nature of the compound. In spite of
the absence of peaks characteristic of NiAl2O4 phase,
the presence of some surface spinel species cannot
be excluded. In addition, the peaks of NiAl2O4 over-
lap with those of -Al2O3. For Ni/Al and NiRh/Y-Al
samples XRD lines at 2θ = 37o, 43.2
o, 62.9
o, and 76
o
are registered, which could be related to the pre-
sence of cubic NiO species (JCPDS 47-1049). How-
ever, these lines were not definitely detected with
other samples. Since the main characteristic peaks
of rhodium oxide species in the 2θ interval of 16–
18o [14] were absent, it could be assumed that these
species were well dispersed.
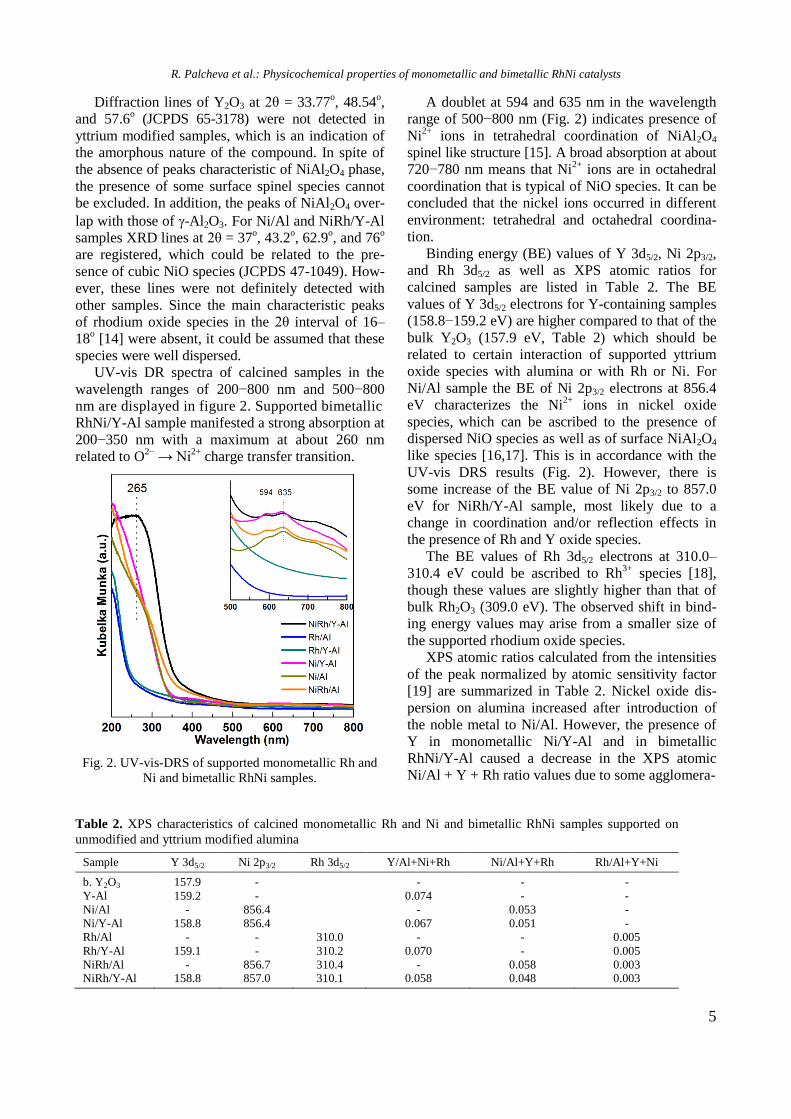
UV-vis DR spectra of calcined samples in the
wavelength ranges of 200−800 nm and 500−800
nm are displayed in figure 2. Supported bimetallic
RhNi/Y-Al sample manifested a strong absorption at
200−350 nm with a maximum at about 260 nm
related to O2−
→ Ni2+
charge transfer transition.
Fig. 2. UV-vis-DRS of supported monometallic Rh and
Ni and bimetallic RhNi samples.
A doublet at 594 and 635 nm in the wavelength
range of 500−800 nm (Fig. 2) indicates presence of
Ni2+
ions in tetrahedral coordination of NiAl2O4
spinel like structure [15]. A broad absorption at about
720−780 nm means that Ni2+
ions are in octahedral
coordination that is typical of NiO species. It can be
concluded that the nickel ions occurred in different
environment: tetrahedral and octahedral coordina-
tion.
Binding energy (BE) values of Y 3d5/2, Ni 2p3/2,
and Rh 3d5/2 as well as XPS atomic ratios for
calcined samples are listed in Table 2. The BE
values of Y 3d5/2 electrons for Y-containing samples
(158.8−159.2 eV) are higher compared to that of the
bulk Y2O3 (157.9 eV, Table 2) which should be
related to certain interaction of supported yttrium
oxide species with alumina or with Rh or Ni. For
Ni/Al sample the BE of Ni 2p3/2 electrons at 856.4
eV characterizes the Ni2+
ions in nickel oxide
species, which can be ascribed to the presence of
dispersed NiO species as well as of surface NiAl2O4
like species [16,17]. This is in accordance with the
UV-vis DRS results (Fig. 2). However, there is
some increase of the BE value of Ni 2p3/2 to 857.0
eV for NiRh/Y-Al sample, most likely due to a
change in coordination and/or reflection effects in
the presence of Rh and Y oxide species.
The BE values of Rh 3d5/2 electrons at 310.0–
310.4 eV could be ascribed to Rh3+
species [18],
though these values are slightly higher than that of
bulk Rh2O3 (309.0 eV). The observed shift in bind-
ing energy values may arise from a smaller size of
the supported rhodium oxide species.
XPS atomic ratios calculated from the intensities
of the peak normalized by atomic sensitivity factor
[19] are summarized in Table 2. Nickel oxide dis-
persion on alumina increased after introduction of
the noble metal to Ni/Al. However, the presence of
Y in monometallic Ni/Y-Al and in bimetallic
RhNi/Y-Al caused a decrease in the XPS atomic
Ni/Al + Y + Rh ratio values due to some agglomera-
Table 2. XPS characteristics of calcined monometallic Rh and Ni and bimetallic RhNi samples supported on
unmodified and yttrium modified alumina
Sample Y 3d5/2 Ni 2p3/2 Rh 3d5/2 Y/Al+Ni+Rh Ni/Al+Y+Rh Rh/Al+Y+Ni
b. Y2O3 157.9 - - - -
Y-Al 159.2 - 0.074 - -
Ni/Al - 856.4 - 0.053 -
Ni/Y-Al 158.8 856.4 0.067 0.051 -
Rh/Al - - 310.0 - - 0.005
Rh/Y-Al 159.1 - 310.2 0.070 - 0.005
NiRh/Al - 856.7 310.4 - 0.058 0.003 NiRh/Y-Al 158.8 857.0 310.1 0.058 0.048 0.003
R. Palcheva et al.: Physicochemical properties of monometallic and bimetallic RhNi catalysts
6
tion of nickel oxide species. Yttrium oxide species
were well dispersed on pure alumina. However, addi-
tion of other elements led to a decrease of the ac-
cessibility of Y-containing species, which is more
pronounced for the bimetallic RhNi/Y-Al sample
(Table 2). Rh oxide species were well dispersed on
the surface of unmodified and Y-modified alumina.
A decrease of the atomic XPS Rh/Al+Y+Ni values
with the bimetallic RhNi samples was observed
(Table 2), probably due to some Rh coverage, bear-
ing in mind nickel higher concentration. It has been
reported [20] that yttrium oxide species had no im-
portant impact on oxidation state and dispersion of
metallic centres, but substantially altered support
acid-base properties.
Reductive properties
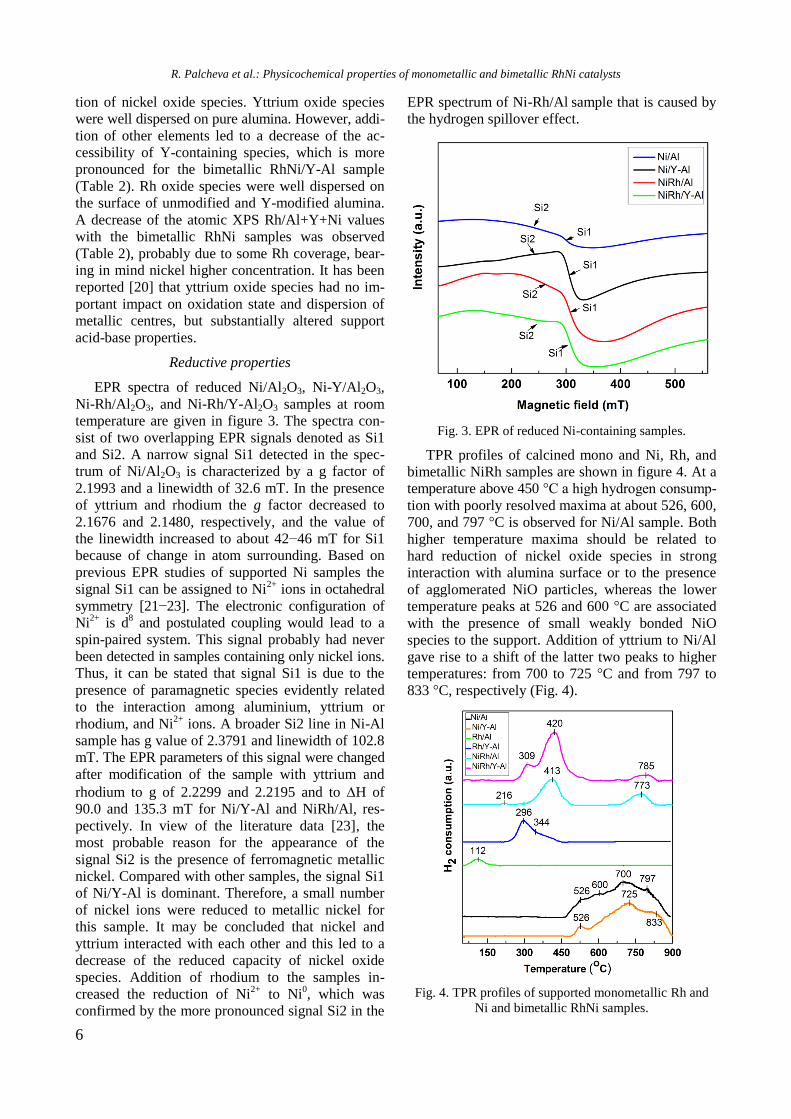
EPR spectra of reduced Ni/Al2O3, Ni-Y/Al2O3,
Ni-Rh/Al2O3, and Ni-Rh/Y-Al2O3 samples at room
temperature are given in figure 3. The spectra con-
sist of two overlapping EPR signals denoted as Si1
and Si2. A narrow signal Si1 detected in the spec-
trum of Ni/Al2O3 is characterized by a g factor of
2.1993 and a linewidth of 32.6 mT. In the presence
of yttrium and rhodium the g factor decreased to
2.1676 and 2.1480, respectively, and the value of
the linewidth increased to about 42−46 mT for Si1
because of change in atom surrounding. Based on
previous EPR studies of supported Ni samples the
signal Si1 can be assigned to Ni2+
ions in octahedral
symmetry [21−23]. The electronic configuration of
Ni2+
is d8 and postulated coupling would lead to a
spin-paired system. This signal probably had never
been detected in samples containing only nickel ions.
Thus, it can be stated that signal Si1 is due to the
presence of paramagnetic species evidently related
to the interaction among aluminium, yttrium or
rhodium, and Ni2+
ions. A broader Si2 line in Ni-Al
sample has g value of 2.3791 and linewidth of 102.8
mT. The EPR parameters of this signal were changed
after modification of the sample with yttrium and
rhodium to g of 2.2299 and 2.2195 and to H of
90.0 and 135.3 mT for Ni/Y-Al and NiRh/Al, res-
pectively. In view of the literature data [23], the
most probable reason for the appearance of the
signal Si2 is the presence of ferromagnetic metallic
nickel. Compared with other samples, the signal Si1
of Ni/Y-Al is dominant. Therefore, a small number
of nickel ions were reduced to metallic nickel for
this sample. It may be concluded that nickel and
yttrium interacted with each other and this led to a
decrease of the reduced capacity of nickel oxide
species. Addition of rhodium to the samples in-
creased the reduction of Ni2+
to Ni0, which was
confirmed by the more pronounced signal Si2 in the
EPR spectrum of Ni-Rh/Al sample that is caused by
the hydrogen spillover effect.
Fig. 3. EPR of reduced Ni-containing samples.
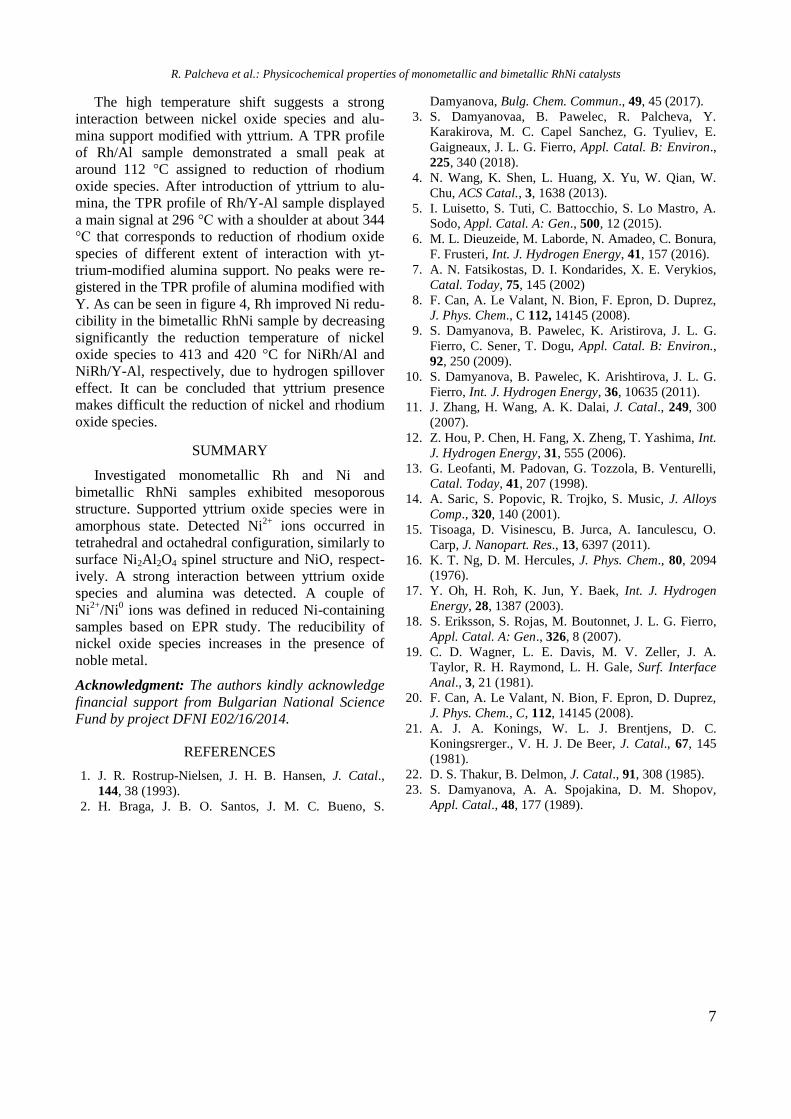
TPR profiles of calcined mono and Ni, Rh, and
bimetallic NiRh samples are shown in figure 4. At a
temperature above 450 °C a high hydrogen consump-
tion with poorly resolved maxima at about 526, 600,
700, and 797 °C is observed for Ni/Al sample. Both
higher temperature maxima should be related to
hard reduction of nickel oxide species in strong
interaction with alumina surface or to the presence
of agglomerated NiO particles, whereas the lower
temperature peaks at 526 and 600 °C are associated
with the presence of small weakly bonded NiO
species to the support. Addition of yttrium to Ni/Al
gave rise to a shift of the latter two peaks to higher
temperatures: from 700 to 725 °C and from 797 to
833 °C, respectively (Fig. 4).
Fig. 4. TPR profiles of supported monometallic Rh and
Ni and bimetallic RhNi samples.
R. Palcheva et al.: Physicochemical properties of monometallic and bimetallic RhNi catalysts
7
The high temperature shift suggests a strong
interaction between nickel oxide species and alu-
mina support modified with yttrium. A TPR profile
of Rh/Al sample demonstrated a small peak at
around 112 °C assigned to reduction of rhodium
oxide species. After introduction of yttrium to alu-
mina, the TPR profile of Rh/Y-Al sample displayed
a main signal at 296 °C with a shoulder at about 344
°C that corresponds to reduction of rhodium oxide
species of different extent of interaction with yt-
trium-modified alumina support. No peaks were re-
gistered in the TPR profile of alumina modified with
Y. As can be seen in figure 4, Rh improved Ni redu-
cibility in the bimetallic RhNi sample by decreasing
significantly the reduction temperature of nickel
oxide species to 413 and 420 °C for NiRh/Al and
NiRh/Y-Al, respectively, due to hydrogen spillover
effect. It can be concluded that yttrium presence
makes difficult the reduction of nickel and rhodium
oxide species.
SUMMARY
Investigated monometallic Rh and Ni and
bimetallic RhNi samples exhibited mesoporous
structure. Supported yttrium oxide species were in
amorphous state. Detected Ni2+
ions occurred in
tetrahedral and octahedral configuration, similarly to
surface Ni2Al2O4 spinel structure and NiO, respect-
ively. A strong interaction between yttrium oxide
species and alumina was detected. A couple of
Ni2+
/Ni0 ions was defined in reduced Ni-containing
samples based on EPR study. The reducibility of
nickel oxide species increases in the presence of
noble metal.
Acknowledgment: The authors kindly acknowledge
financial support from Bulgarian National Science
Fund by project DFNI E02/16/2014.
REFERENCES
1. J. R. Rostrup-Nielsen, J. H. B. Hansen, J. Catal.,
144, 38 (1993).
2. H. Braga, J. B. O. Santos, J. M. C. Bueno, S.
Damyanova, Bulg. Chem. Commun., 49, 45 (2017).
3. S. Damyanovaa, B. Pawelec, R. Palcheva, Y.
Karakirova, M. C. Capel Sanchez, G. Tyuliev, E.
Gaigneaux, J. L. G. Fierro, Appl. Catal. B: Environ.,
225, 340 (2018).
4. N. Wang, K. Shen, L. Huang, X. Yu, W. Qian, W.
Chu, ACS Catal., 3, 1638 (2013).
5. I. Luisetto, S. Tuti, C. Battocchio, S. Lo Mastro, A.
Sodo, Appl. Catal. A: Gen., 500, 12 (2015).
6. M. L. Dieuzeide, M. Laborde, N. Amadeo, C. Bonura,
F. Frusteri, Int. J. Hydrogen Energy, 41, 157 (2016).
7. A. N. Fatsikostas, D. I. Kondarides, X. E. Verykios,
Catal. Today, 75, 145 (2002)
8. F. Can, A. Le Valant, N. Bion, F. Epron, D. Duprez,
J. Phys. Chem., C 112, 14145 (2008).
9. S. Damyanova, B. Pawelec, K. Aristirova, J. L. G.
Fierro, C. Sener, T. Dogu, Appl. Catal. B: Environ.,
92, 250 (2009).
10. S. Damyanova, B. Pawelec, K. Arishtirova, J. L. G.
Fierro, Int. J. Hydrogen Energy, 36, 10635 (2011).
11. J. Zhang, H. Wang, A. K. Dalai, J. Catal., 249, 300
(2007).
12. Z. Hou, P. Chen, H. Fang, X. Zheng, T. Yashima, Int.
J. Hydrogen Energy, 31, 555 (2006).
13. G. Leofanti, M. Padovan, G. Tozzola, B. Venturelli,
Catal. Today, 41, 207 (1998).
14. A. Saric, S. Popovic, R. Trojko, S. Music, J. Alloys
Comp., 320, 140 (2001).
15. Tisoaga, D. Visinescu, B. Jurca, A. Ianculescu, O.
Carp, J. Nanopart. Res., 13, 6397 (2011).
16. K. T. Ng, D. M. Hercules, J. Phys. Chem., 80, 2094
(1976).
17. Y. Oh, H. Roh, K. Jun, Y. Baek, Int. J. Hydrogen
Energy, 28, 1387 (2003).
18. S. Eriksson, S. Rojas, M. Boutonnet, J. L. G. Fierro,
Appl. Catal. A: Gen., 326, 8 (2007).
19. C. D. Wagner, L. E. Davis, M. V. Zeller, J. A.
Taylor, R. H. Raymond, L. H. Gale, Surf. Interface
Anal., 3, 21 (1981).
20. F. Can, A. Le Valant, N. Bion, F. Epron, D. Duprez,
J. Phys. Chem., C, 112, 14145 (2008).
21. A. J. A. Konings, W. L. J. Brentjens, D. C.
Koningsrerger., V. H. J. De Beer, J. Catal., 67, 145
(1981).
22. D. S. Thakur, B. Delmon, J. Catal., 91, 308 (1985).
23. S. Damyanova, A. A. Spojakina, D. M. Shopov,
Appl. Catal., 48, 177 (1989).
R. Palcheva et al.: Physicochemical properties of monometallic and bimetallic RhNi catalysts
8
ФИЗИКОХИМИЧНИ СВОЙСТВА НА МОНОМЕТАЛНИ Ni И Rh И БИМЕТАЛНИ NiRh
КАТАЛИТИЧНИ МАТЕРИАЛИ, НАНЕСЕНИ ВЪРХУ НЕМОДИФИЦИРАН И МОДИФИЦИРАН
С ИТРИЙ АЛУМИНИЕВ ОКСИД
Р. Палчева, И. Щерева, Й. Каракирова, Г. Тюлиев, С. Дамянова*
Институт по катализ, Българска академия на науките, ул. „Акад. Г. Бончев“, блок 11, 1113 София, България
Постъпила на 6 февруари 2018 г.; Преработена на 7 март 2018 г.
(Резюме)
Изучен е ефектът на Y2O3, добавен в носител -Al2O3, върху структурата, повърхностните и редукционните
свойства на нанесени монометални Rh и Ni и биметални RhNi каталитични материали. Използвани са различни
техники за тяхното физикохимично охарактеризиране: адсорбционни-десорбционни изотерми на азот, дифузно
отражателна и рентгенова фотоелектронна спектроскопия, електронен парамагнитен резонанс и температурно
програмирана редукция. Установено е, че Ni2+
йони в накалени образци са в октаедрично и тетраедрично
обкръжение, съответстващо на това в NiO и NiAl2O4 шпинел. Присъствието на двойка йони Ni2+
/Ni0 е
регистрирано с помощта на ЕПР в оксидни Ni-съдържащи образци. Наблюдавано е силно взаимодействие
между Ni и Y2O3, проявяващо се в по-трудна редукция на никелови оксидни частици. Промотиращият ефект на
Rh върху високата редуцируемост на NiO до Ni0 се дължи на спиловер ефект на благородния метал.
R. Palcheva et al.: Physicochemical properties of monometallic and bimetallic RhNi catalysts
9
Bulgarian Chemical Communications, Volume 50, Special issue H (pp. 9–16) 2018
Y-doped ceria-supported gold and palladium mono- and bimetallic catalysts
for complete propene oxidation
P. Ts. Petrova1,
*, G. Pantaleo2, A. M. Venezia
2, L. F. Liotta
2, Z. Kaszkur
3, T. T. Tabakova
1,
L. I. Ilieva1
1 Institute of Catalysis, Bulgarian Academy of Sciences, 1113 Sofia, Bulgaria
2 Istituto per lo Studio dei Materiali Nanostrutturati (ISMN)-CNR, 90146, Palermo, Italy
3 Institute of Physical Chemistry, Polish Academy of Sciences, Kasprzaka 44/52, 01-224 Warsaw, Poland
Received: January 29, 2018; Revised: March 19, 2018
Monometallic Au and Pd as well as bimetallic Pd-Au particles deposited on Y-doped ceria supports were studied in
complete propene oxidation (CPO), which was used as a probe reaction for aliphatic hydrocarbons abatement. Y-
modified ceria supports (1 wt.% Y2O3) were prepared by impregnation and coprecipitation. Gold (3 wt.% Au) and
palladium (1 wt.% Pd) containing samples were prepared by deposition-precipitation method. Bimetallic Pd-Au
catalysts were prepared by adding palladium to already deposited gold. Catalyst samples were characterized by BET,
XRD, TPR, and XPS techniques. In general, the catalytic activity in CPO did not differ significantly in the presence of
Y dopant and because of synthesis method of mixed oxide support. Total propene conversion over gold catalysts was
reached at 220 °C. Pd-based catalysts demonstrated a higher oxidation activity in comparison with Au-based samples
showing 100% propene conversion at 200 °C. The lowest temperature of total propene oxidation of 180 °C was
achieved over the bimetallic Pd-Au catalysts and long-term catalytic performance showed good stability with no loss of
catalytic activity.
Key words: Au, Pd, and Pd-Au catalysts, Y-doped ceria, complete propene oxidation.
INTRODUCTION
Treatment of gaseous emissions containing
volatile organic compounds (VOCs) has been an
increasing concern in the last years. Catalytic com-
bustion is considered a promising way to convert
VOCs, especially of low concentration, into harm-
less CO2 and water. Selection of catalytic materials
for the reduction of VOCs is not easy because
several factors such as support type, active sites
distribution, and synthesis methods would influence
catalyst activity and catalyst lifetime.
Gold-based catalysts are already well known as
promising candidates for the total oxidation of
VOCs at relatively low temperatures [1]. Rapid
change in cerium oxidation state (Ce4+
↔Ce3+
) makes
ceria a suitable reducible support, which is also able
to stabilize finely dispersed gold particles. Due to
the formation of oxygen vacancies, CeO2 modifica-
tion with metal dopant of proper oxidation state and
concentration could lead to further increase of
oxygen mobility in ceria-based catalysts. Own
results of gold deposited on ceria doped with MeOx
(Me = Fe, Mn, Co, and Sn) have shown an effect of
mixed oxide support composition and structure on
the catalytic behaviour in complete benzene oxide-
tion [2,3]. Recent results have shown a beneficial
effect on the catalytic performance in complete
benzene oxidation in the case of Au deposited on Y-
doped ceria support (1 wt.% Y2O3) prepared by
impregnation as compared to gold on bare ceria [4].
Catalysts containing both highly dispersed gold
and palladium particles were reported as very ef-
fective in many reactions including organic com-
pounds oxidation. A higher catalytic activity in the
case of bimetallic formulation as compared to the
corresponding monometallic Au and Pd catalysts for
catalytic destruction of p-aniline [5] and toluene [6]
was observed. An important role of metal loading
sequence was established [7,8]. Catalysts prepared
by palladium introduction to already deposited gold,
containing Pd(shell)–Au(core) particles, exhibited
the best catalytic activity in toluene and propene
oxidation [7]. In accordance with these observa-
tions, the highest complete benzene oxidation acti-
vity has been reported for Pd-Au catalyst prepared
by impregnation of Fe-doped ceria support when Pd
loading followed gold deposition [9].
The present study is focused on the complete
oxidation of propene, the latter being selected as a
probe molecule for aliphatic hydrocarbon combus-
tion. The activity of mono- (Au, Pd) and bimetallic
Pd-Au particles (Pd added to deposited Au particles)
supported on differently prepared Y-doped ceria (1
© 2018 Bulgarian Academy of Sciences, Union of Chemists in Bulgaria
* To whom all correspondence should be sent
E-mail: [email protected]
10
wt.% dopant) in the complete propene oxidation
(CPO) was investigated. Modification of Au, Pd,
and Y oxidation state before and after catalytic work
was elucidated
EXPERIMENTAL
Sample preparation
Three series of catalysts containing Au (3 wt.%),
Pd (1 wt.%), and Pd (1 wt.%)-Au (3 wt.%) sup-
ported on bare ceria, Y-doped ceria prepared by
impregnation (IM), and Y-doped ceria prepared by
co-precipitation (CP) were synthesised. Yttria dopant
amount was 1 wt.%.
Ceria was prepared by precipitation of aqueous
solution of Ce(NO3)3.6H2O with K2CO3 at 60°C and
constant pH = 9.0. The resulting precursor was aged
at the same temperature for 1 h, filtered and care-
fully washed until NO3− ions removal, dried in
vacuum at 80 °C, and calcined in air at 400 °C for 2
h. Using IM method ceria was impregnated with
aqueous solution of appropriate amount of
Y(NO3)3.6H2O under vigorous stirring at room
temperature for 4 h. Then, the suspension was eva-
porated under vacuum at 70 °C in a rotary evapo-
rator until water was completely removed. By CP
method a solution of Y and Ce nitrates at an appro-
priate ratio were co-precipitated with a solution of
K2CO3 at constant pH = 9.0 and temperature of 60
°C. The precipitates were aged at the same tem-
perature for 1 h, filtered, and washed until removal
of NO3− ions. All resulting precursors were dried in
vacuum at 80 °C and calcined in air at 400 °C for 2
h. Before metal deposition, the support was
dispersed in water and activated in an ultrasound
disintegrator.
Gold was deposited by deposition-precipitation
method from HAuCl4.3H2O and K2CO3 precursors
under vigorous stirring. The precipitation was
carried out under full control of all parameters of
preparation (constant pH = 7, T = 60 °C, stirring
speed = 250 rpm, reactant feed flow rate = 0.15
l.h−1
, etc.). After filtering and careful washing, the
solid was dried under vacuum and calcined in air at
400 °C for 2 h. The gold catalysts were denoted as
AuCe, AuYCeIM, and AuYCeCP.
Pd-containing samples were prepared from
Pd(NO3)2.xH2O precursor following aforementioned
preparation method and calcination procedure for
gold catalysts. These samples were denoted as
PdCe, PdYCeIM, and PdYCeCP.
Sequential deposition-precipitation was applied
for the preparation of bimetallic Pd-Au catalysts.
Palladium was loaded on already prepared and
calcined Au/Y-doped ceria. After Pd deposition
calcination in air at 400 °C for 2 h was carried out.
The samples were denoted as Pd-AuCe, Pd-
AuYCeIM, and Pd-AuYCeCP.
Sample characterization
Sample BET surface area (SBET) was evaluated
by performing nitrogen adsorption/desorption expe-
riments on a Carlo Erba Sorptomat 1900 instrument.
Prior to the measurements, each sample was out-
gassed at 200 °C for 1 h under vacuum. Compu-
terized analysis of the nitrogen adsorption isotherm
at −196 °C allowed estimating the specific surface
areas of the samples in the standard pressure range
of 0.05–0.3 P/P0.
X-ray powder diffraction (XRD) measurements
were performed using a D5000 diffractometer
(Bruker AXS), with Cu sealed tube operating at 40
kV and 40 mA. The setup employed Bragg-Bren-
tano focusing geometry with 1° beam divergence
and LynxEye strip detector. Data were analysed
using PeakFit program (Jandel Scientific) and fityk
(Copyright 2001–2014 Marcin Wojdyr) fitting XRD
profiles to Kα 1,2 doublets having PEARSON VII
analytical form. The CeO2 phase was analysed on
the basis of 14 well measured reflections and
Williamson-Hall plot [10,11] to calculate the aver-
age crystal size. Gold particle crystal size was esti-
mated based on the strongest (111) reflection as the
only one detectable. The procedure is described in
detail elsewhere [4].
X-ray photoelectron spectroscopy (XPS) analysis
was performed by VG Microtech ESCA 3000
Multilab equipped with a dual Mg/Al anode [12].
The spectra were excited by unmonochromatized Al
Kα source (1486.6 eV) run at 14 kV and 15 mA.
The analyser was operated in the constant analyser
energy (CAE) mode. For the individual peak energy
regions, a pass energy of 20 eV set across the hemi-
spheres was used. Sample powders were pelletized
and mounted on a double-sided adhesive tape. The
pressure in the analysis chamber was in the range of
10−8
Torr during data collection. Constant charging
of the samples was removed by referencing all the
energies to the C1s set at 285.1 eV arising from
adventitious carbon. Peak analysis was performed
with software provided by VG based on non-linear
least squares fitting program using a weighted sum
of Lorentzian and Gaussian component curves after
background subtraction according to Shirley and
Sherwood [13,14].
Temperature-programmed reduction (TPR)
measurements were carried out by means of an
apparatus described elsewhere [15]. A cooling trap
(40 °C) for removing water formed during reduc-
tion was mounted in the gas line prior to the thermal
P. Ts. Petrova et al.: Gold and palladium mono- and bimetallic catalysts on Y-doped ceria
11
conductivity detector. A hydrogen-argon mixture
(10% H2), dried over a molecular sieve 5A (40 °C),
was used to reduce the samples at a flow rate of 24
ml.min−1
. The temperature was linearly raised at a
rate of 15 °C min−1
. The amount of sample used was
0.05 g based on a criterion proposed by Monti and
Baiker [16]. Hydrogen consumption during the
reduction process was calculated using preliminary
calibration of the thermal conductivity detector per-
formed by reducing different amounts of NiO to Ni0,
NiO – ‘analytical grade’ being calcined at 800 °C
for 2 h to avoid presence of non-stoichiometric
oxygen).
Catalytic activity measurements in CPO
The catalytic activity in CPO, expressed as degree
of propene conversion, was evaluated in the tem-
perature range of 100–300 °C after catalyst pretreat-
ment using 50 ml.min−1
of 5% O2 in He for 1 h at
350 °C. The measurements were carried out in U-
shaped quartz reactor under reactive gas mixture
containing 1500 ppm C3H6 + 4.2% O2 (He as
balance) at weight hourly space velocity (WHSV) of
60000 ml.h−1
.g−1
. The reactants and products were
examined by IR analysers (ABB Uras 14) for CO
and CO2 species, while oxygen concentration in the
feed was measured by ABB paramagnetic analyser.
Propene conversion was evaluated taking into
account the CO2 formed during the reaction.
RESULTS AND DISCUSSION
Catalytic activity measurements
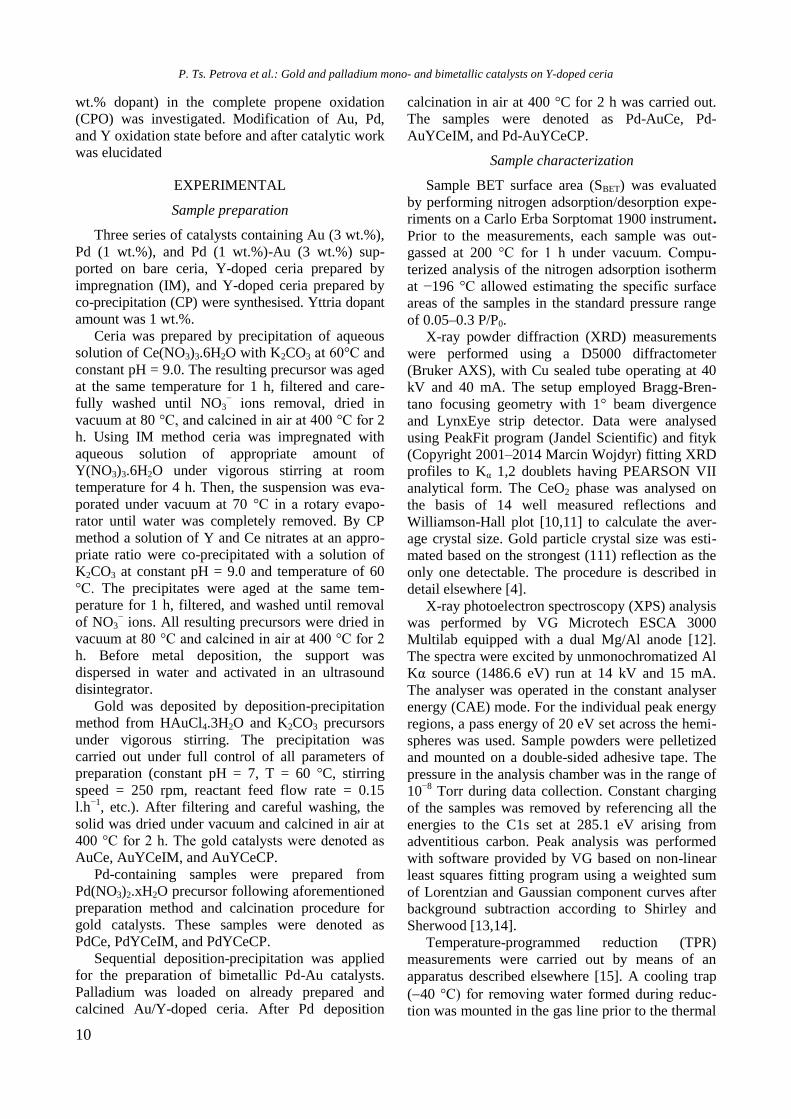
The catalytic results of CPO over the studied
catalysts as a function of reaction temperature are
compared in figure 1. In all cases, detected CO was
negligible and no intermediate products of partial
propene oxidation were registered. The effect of
monometallic (Au and Pd) and bimetallic Pd-Au
deposition on combustion activity is clearly seen in
the figure. In general, the Pd-based catalysts exhi-
bited a higher catalytic activity than the matching
Au-containing samples. A higher activity of Pd as
compared to Au catalysts in total oxidation of
propene and methyl ethyl ketone has been shown in
a comparative study of Au and Pd deposited on
titanium oxide nanotubes [17]. In a recent investi-
gation of toluene catalytic oxidation over Au and Pd
supported on macro-mesoporous metal-doped titania,
it has been reported that Pd-containing systems also
exhibited a better performance [18]. Formation of
highly dispersed Pd2+
species on different oxides as
supports was considered responsible for the propene
oxidation at lower temperatures by Gil et al. [19].
The present results indicated the same catalytic
behaviour in CPO over Pd and Pd-Au catalysts on
bare ceria. The effect of Y was negligible for the
monometallic gold and palladium catalysts and
slightly positive with the bimetallic samples. How-
ever, a definitive positive effect of the palladium
deposition after gold loading was observed for Y-
doped ceria supports. The reason for higher catalytic
activity over bimetallic Pd-Au catalysts as reviewed
above is still not exactly clarified. Enache et al. [20]
supposed that gold influenced electronically the
catalytic properties of Pd. Hosseini et al. [7] have
proposed a Langmuir-Hinshelwood mechanism for
toluene and propene oxidation over Pd-Au/TiO2 cata-
lysts, suggesting that a VOC molecule and oxygen
from a [Pd–O] complex compete for adsorption. The
authors explained the higher activity of the
Pd(shell)–Au(core) as compared to the Au(shell)–
Pd(core) system by easier [Pd–O] formation and
low adsorption of oxygen on gold due to its lower
ability to polarize the O=O bond as compared to Pd.
In the present study, the lowest temperature of
total propene conversion was achieved at 180 °C
over both Pd-AuYCeIM and Pd-AuYCeCP cata-
lysts. Bimetallic Pd-Au entity on IM support demon-
strated better activity at a lower temperature (150
°C) as compared to Pd-Au on CP support (see Fig. 1).
Long lasting tests (72 h) in CPO at 180 °C per-
formed over Pd-AuYCeIM sample showed that the
catalyst was stable with no loss of oxidation activity.
Fig. 1. Effect of monometallic (Au and Pd) and bimetallic Pd-Au loading on ceria (A) and Y-doped ceria supports (B
and C) on propene conversion degree.
P. Ts. Petrova et al.: Gold and palladium mono- and bimetallic catalysts on Y-doped ceria
12
Sample characterization
Specific surface area (SBET) values are given in
table 1. All SBET values are ranging around 100 10
m2.g
−1. No substantial differences between mono-
and bimetallic catalysts were observed; slightly
lower values were found in the case of CP supports.
Table 1. Specific surface area (SBET), and hydrogen
consumption of the studied catalysts
Catalyst SBET (m2.g−1) HC (mmol.g−1)
to 250 °C to 800 °C
AuCe 102.4 0.5 0.5
PdCe 101.9 0.6 1.0
Pd-AuCe 108.5 0.6 1.2
AuYCeCP 90.0 0.7 0.7
PdYCeCP 99.6 0.7 1.4
Pd-AuYCeCP 90.0 0.7 1.1
AuYCeIM 107.2 0.6 0.6
PdYCeIM 105.0 0.7 1.2
Pd-AuYCeIM 105.5 0.5 1.1
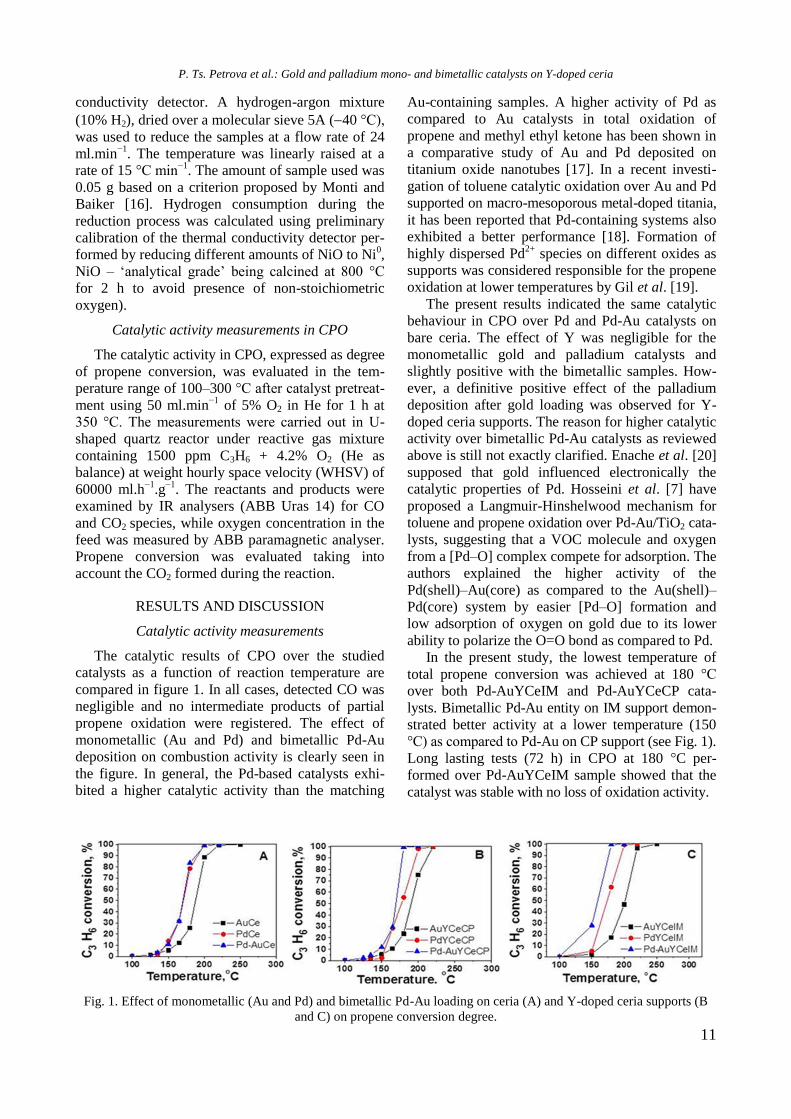
X-ray diffractograms of all the studied catalysts
showed typical reflections of face-centred cubic
fluorite-type structure of CeO2 (Fig. 2). A separate
Y2O3 phase was not visible. Pd was not detectable in
the Pd containing samples. For the gold containing
samples a weak Au(111) peak was registered at 2θ =
38.2° suggesting absence of alloying between Au
and Pd. As expected ceria and gold average particle
sizes were in accord with those obtained previously
using the same synthesis procedure [4].
Fig. 2. XRD patterns of the studied Pd and Pd-Au
catalysts.
The average particle size of bare ceria, Y-doped
ceria prepared by IM, and Y-doped ceria prepared
by CP was 5.7, 7.1, and 8.1 nm, respectively, where-
as the average particle size of gold in Au and Pd-Au
entities on bare ceria, Y-doped ceria prepared by
IM, and Y-doped ceria prepared by CP was 4.1, 4.0,
and 5.8 nm, correspondingly.
As reported before, based on HRTEM/HAADF
analyses evaluated gold average particle size in
AuCe, AuYCeIM, and AuYCeCP (valid for the Pd-
Au samples as well) was 2.1, 2.6, and 3.2 nm, res-
pectively [21]. Measurements of interplanar distances
in selected HRTEM images of AuYCeIM catalyst
evidenced the presence of Y2O3 crystals (not detect-
able by XRD) even in the case of 1 wt.% dopant
content [21]. HRTEM measurements of Pd-con-
taining samples are not reported. Due to similarity
in lattice distances of PdO and CeO2 it was difficult
to distinguish unambiguously between ceria and
PdO crystals by HRTEM [9].
Sample reducibility was evaluated by means of
TPR measurements. The reduction of ceria proceeds
in two steps: surface layer reduction at around 500
°C and bulk reduction above 800 °C [22]. It is known
that the presence of noble metals is beneficial for the
ceria reduction. Such effect has also been observed
for gold when supported as nanoparticles. Many
studies have confirmed the first observations of the
research groups of Stephanopoulos [23] and Andre-
eva [24] that the role of nanogold is to lower sub-
stantially the temperature of the ceria surface layer
reduction. Doping ceria with low concentration of
Y3+
ions leads to random oxygen vacancies forma-
tion accompanied by enhanced reduction of Au/Y-
doped ceria catalysts [4 and references therein].
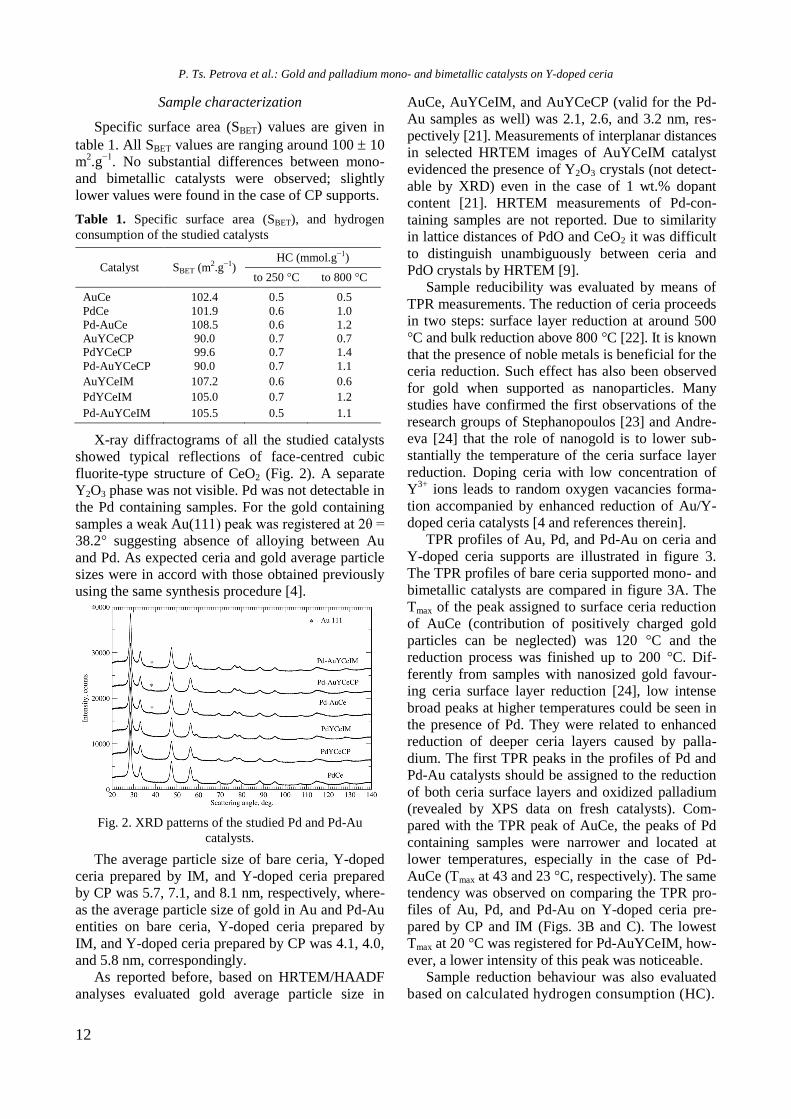
TPR profiles of Au, Pd, and Pd-Au on ceria and
Y-doped ceria supports are illustrated in figure 3.
The TPR profiles of bare ceria supported mono- and
bimetallic catalysts are compared in figure 3A. The
Tmax of the peak assigned to surface ceria reduction
of AuCe (contribution of positively charged gold
particles can be neglected) was 120 °C and the
reduction process was finished up to 200 °C. Dif-
ferently from samples with nanosized gold favour-
ing ceria surface layer reduction [24], low intense
broad peaks at higher temperatures could be seen in
the presence of Pd. They were related to enhanced
reduction of deeper ceria layers caused by palla-
dium. The first TPR peaks in the profiles of Pd and
Pd-Au catalysts should be assigned to the reduction
of both ceria surface layers and oxidized palladium
(revealed by XPS data on fresh catalysts). Com-
pared with the TPR peak of AuCe, the peaks of Pd
containing samples were narrower and located at
lower temperatures, especially in the case of Pd-
AuCe (Tmax at 43 and 23 °C, respectively). The same
tendency was observed on comparing the TPR pro-
files of Au, Pd, and Pd-Au on Y-doped ceria pre-
pared by CP and IM (Figs. 3B and C). The lowest
Tmax at 20 °C was registered for Pd-AuYCeIM, how-
ever, a lower intensity of this peak was noticeable.
Sample reduction behaviour was also evaluated
based on calculated hydrogen consumption (HC).
P. Ts. Petrova et al.: Gold and palladium mono- and bimetallic catalysts on Y-doped ceria
13
Fig. 3. TPR profiles of the studied ceria- (A) and Y-doped ceria-supported (B and C) monometallic (Au and Pd) and
bimetallic Pd-Au catalysts.
Table 1 presents experimental HC values during
TPR up to 250 and 800 °C. In agreement with litera-
ture data, theoretical HC values for ceria surface
layer reduction without changes in ceria bulk struc-
ture are limited to 17% [25] or 20% [26]. This
means stoichiometric HC values of 0.49–0.58 and
0.49–0.57 mmol.g−1
for bare ceria and ceria doped
with 1 wt.% Y2O3, respectively. Hydrogen consump-
tion of AuCe was in the frame of the theoretical
values for ceria surface layer reduction; a relatively
higher HC in the case of CP method as compared to
the IM mode was observed (even HC of the
AuYCeCP catalysts exceeded 20% reduction).
For palladium containing catalysts, bearing in
mind that the calculated HC value needed for the
process PdO + H2 → Pd0 is 0.08 mmol.g
−1, the HC
for ceria surface layers reduction up to 250 °C was
almost the same as for the matching gold catalysts.
These close results justify the similarity of the CPO
activities regardless of support nature. However,
there existed differences in the oxidation activities
determined by the type of loaded metal. The bime-
tallic catalysts exhibited the best performance irres-
pective of support composition. Sample activities fol-
lowed an inverse trend of the reduction Tmax: the
C3H6 conversion varied with the supported metal
catalysts as Pd-Au > Pd > Au. The TPR Tmax of the
catalysts followed the order Tmax of Pd-Au catalysts
< Tmax of Pd catalysts < Tmax of Au catalysts. Such
an inverse relationship confirmed the important role
of the oxygen being supplied by the support. Indeed
the Tmax of the TPR peak is indicative of the easiness
with which the oxygen from ceria can be extracted.
A lower HC value obtained for Pd-AuYCeIM
catalyst, which was mentioned above in relation to
TPR peak intensity, is not in agreement with its
highest CPO activity up to 180 °C, the latter being
the temperature at which complete oxidation was
also achieved over Pd-AuYCeCP. Tabakova et al.
have observed a similar discrepancy for bimetallic
catalyst of best catalytic performance in a study of
Pd-Au deposited on Fe-modified ceria for complete
benzene oxidation [9]. Based on XPS evidence for
metallic Pd particles at the onset of the low tempera-
ture TPR peak, the authors explained unexpectedly
decreased reducibility by the formation of inactive
AuxPdy alloy species in the hydrogen flow [9].
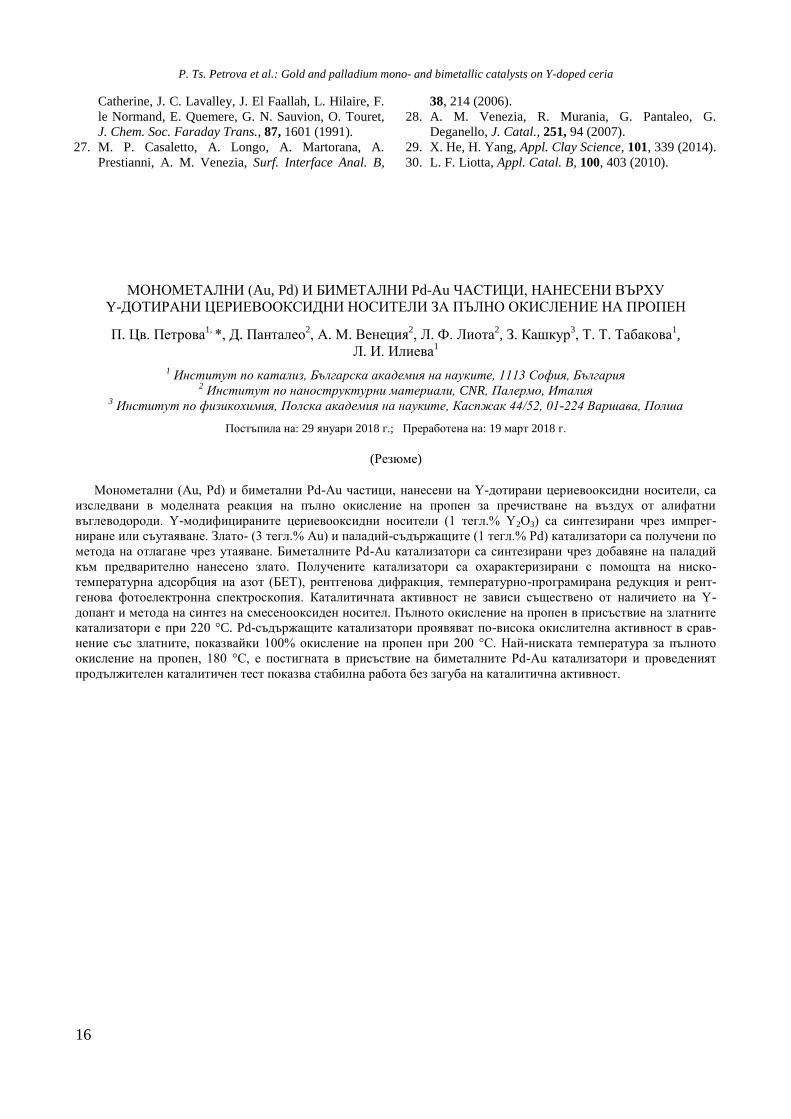
XPS data on fresh and used samples in CPO are
summarized in table 2. All samples contained Ce4+
and a minor percentage of Ce3+
ions. A certain
amount of Ce3+
in the fresh samples could be related
to X-ray beam induced reduction during XPS ana-
lysis. For a fresh AuCe catalyst, the Au 4f7/2 binding
energy (BE) was typical of metallic Au0 [27].
Yttrium presence induced a slight increase of the BE
especially for AuYCeCP catalyst sample, thus indi-
cating occurrence of partly positively charged Auδ+
.
Charged Auδ+
particles were also registered in Pd-
Au catalysts. Calculated atomic ratios showed that
the Au catalysts exposed a gold-enriched surface of
nominal Au/Ce of 0.03. After palladium deposition
over gold, the Au/Ce ratio in the Pd-Au catalysts
became closer to the nominal value. The monome-
tallic palladium catalysts were characterized by Pd
3d5/2 BE of 337.1 eV that is typical of Pd2+
[28]. The
bimetallic samples exhibited somewhat higher Pd 3d
binding energy as compared to the monometallic
ones, which may be attributed to a charge transfer
from palladium to the more electronegative gold
species. The Pd/Ce atomic ratio was always much
higher than the nominal one (0.016) showing a
strong surface segregation of palladium.
The binding energy of Y 3d5/2 at 157.6 ± 0.2 eV
is typical of Y3+
. In the palladium containing
samples, another Y 3d5/2 component at a lower
energy (about 153.3 ± 0.3 eV) was registered. Such
a component assigned to partially reduced yttrium
(Y(3-)+
) has been related to alloying effect in the
presence of the noble metal [29]. Enrichment of the
ceria surface by yttrium was evidenced by the Y/Ce
atomic ratio values, which were larger than the
analytical one (0.016).
XPS analysis of samples after reaction was
carried out for the best performing bimetallic cata-
P. Ts. Petrova et al.: Gold and palladium mono- and bimetallic catalysts on Y-doped ceria
14
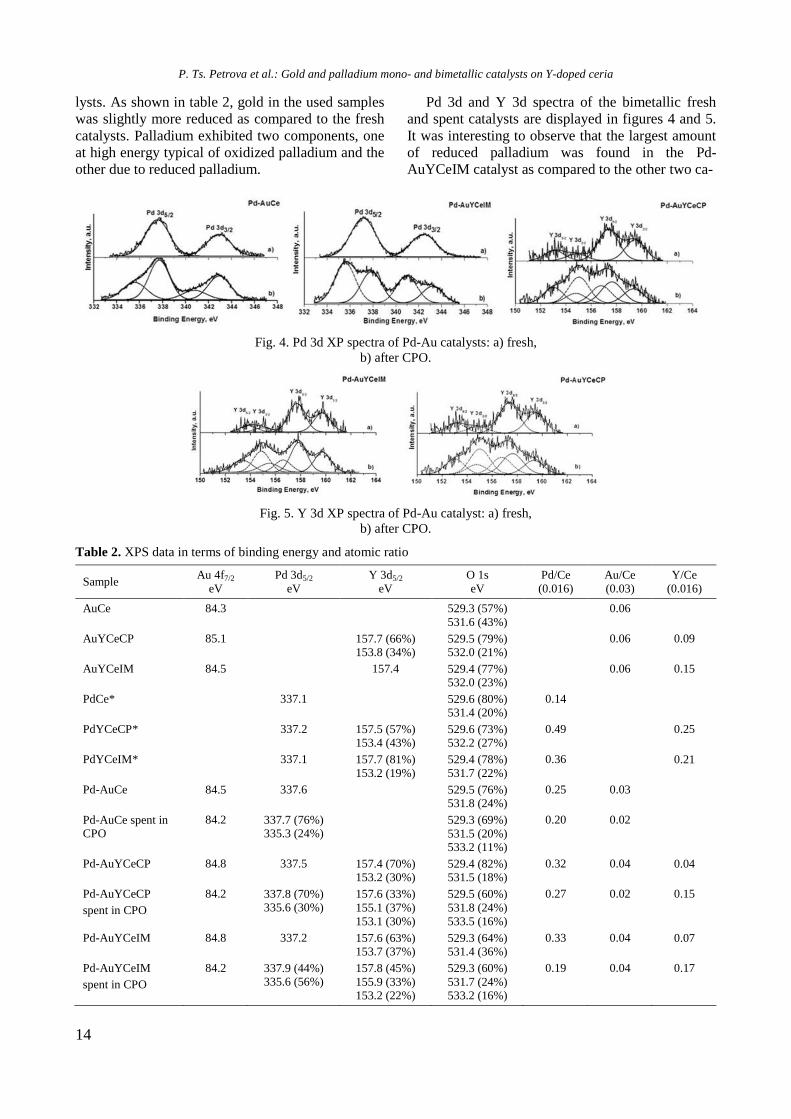
lysts. As shown in table 2, gold in the used samples
was slightly more reduced as compared to the fresh
catalysts. Palladium exhibited two components, one
at high energy typical of oxidized palladium and the
other due to reduced palladium.
Pd 3d and Y 3d spectra of the bimetallic fresh
and spent catalysts are displayed in figures 4 and 5.
It was interesting to observe that the largest amount
of reduced palladium was found in the Pd-
AuYCeIM catalyst as compared to the other two ca-
Fig. 4. Pd 3d XP spectra of Pd-Au catalysts: a) fresh,
b) after CPO.
Fig. 5. Y 3d XP spectra of Pd-Au catalyst: a) fresh,
b) after CPO.
Table 2. XPS data in terms of binding energy and atomic ratio
Sample Au 4f7/2
eV
Pd 3d5/2
eV
Y 3d5/2
eV
O 1s
eV
Pd/Ce
(0.016)
Au/Ce
(0.03)
Y/Ce
(0.016)
AuCe 84.3
529.3 (57%)
531.6 (43%)
0.06
AuYCeCP 85.1 157.7 (66%) 153.8 (34%)
529.5 (79%) 532.0 (21%)
0.06 0.09
AuYCeIM 84.5 157.4 529.4 (77%) 532.0 (23%)
0.06 0.15
PdCe* 337.1 529.6 (80%) 531.4 (20%)
0.14
PdYCeCP* 337.2 157.5 (57%) 153.4 (43%)
529.6 (73%) 532.2 (27%)
0.49 0.25
PdYCeIM* 337.1 157.7 (81%)
153.2 (19%)
529.4 (78%)
531.7 (22%)
0.36 0.21
Pd-AuCe 84.5
337.6 529.5 (76%) 531.8 (24%)
0.25 0.03
Pd-AuCe spent in CPO
84.2 337.7 (76%) 335.3 (24%)
529.3 (69%)
531.5 (20%) 533.2 (11%)
0.20 0.02
Pd-AuYCeCP 84.8 337.5 157.4 (70%) 153.2 (30%)
529.4 (82%) 531.5 (18%)
0.32 0.04 0.04
Pd-AuYCeCP
spent in CPO
84.2 337.8 (70%) 335.6 (30%)
157.6 (33%)
155.1 (37%)
153.1 (30%)
529.5 (60%)
531.8 (24%)
533.5 (16%)
0.27 0.02 0.15
Pd-AuYCeIM 84.8 337.2 157.6 (63%) 153.7 (37%)
529.3 (64%) 531.4 (36%)
0.33 0.04 0.07
Pd-AuYCeIM
spent in CPO
84.2 337.9 (44%) 335.6 (56%)
157.8 (45%)
155.9 (33%) 153.2 (22%)
529.3 (60%)
531.7 (24%) 533.2 (16%)
0.19 0.04 0.17
P. Ts. Petrova et al.: Gold and palladium mono- and bimetallic catalysts on Y-doped ceria
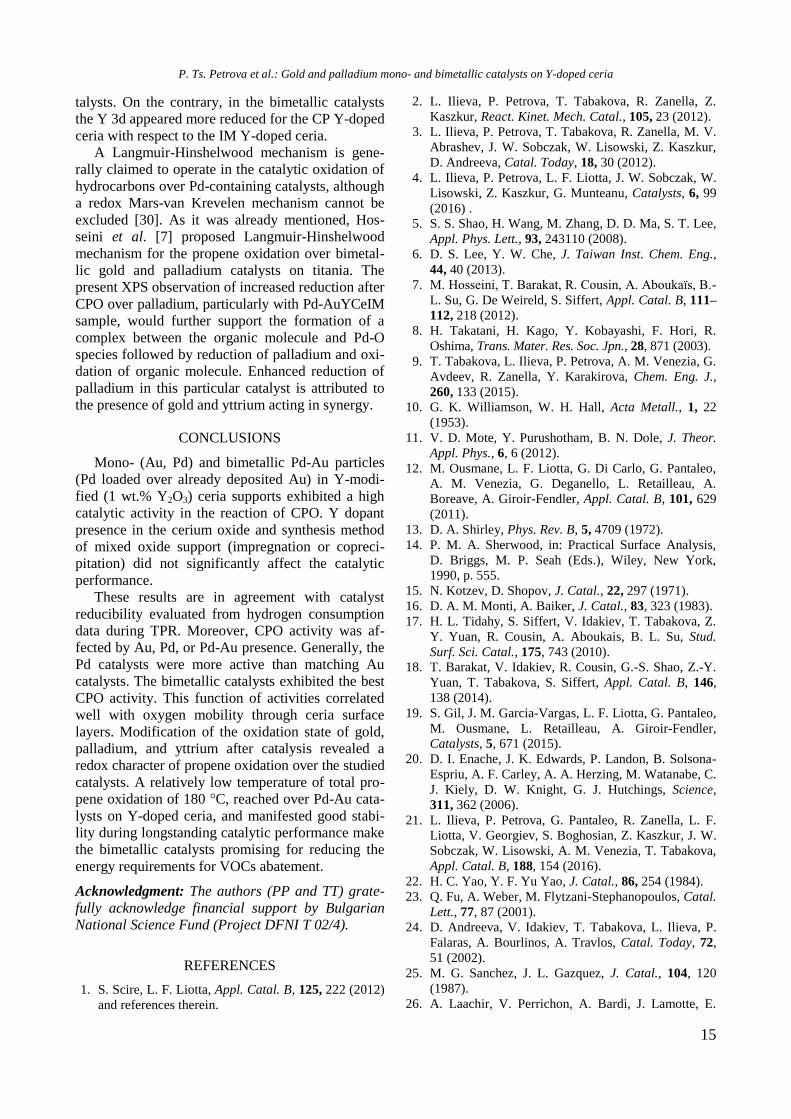
15
talysts. On the contrary, in the bimetallic catalysts
the Y 3d appeared more reduced for the CP Y-doped
ceria with respect to the IM Y-doped ceria.
A Langmuir-Hinshelwood mechanism is gene-
rally claimed to operate in the catalytic oxidation of
hydrocarbons over Pd-containing catalysts, although
a redox Mars-van Krevelen mechanism cannot be
excluded [30]. As it was already mentioned, Hos-
seini et al. [7] proposed Langmuir-Hinshelwood
mechanism for the propene oxidation over bimetal-
lic gold and palladium catalysts on titania. The
present XPS observation of increased reduction after
CPO over palladium, particularly with Pd-AuYCeIM
sample, would further support the formation of a
complex between the organic molecule and Pd-O
species followed by reduction of palladium and oxi-
dation of organic molecule. Enhanced reduction of
palladium in this particular catalyst is attributed to
the presence of gold and yttrium acting in synergy.
CONCLUSIONS
Mono- (Au, Pd) and bimetallic Pd-Au particles
(Pd loaded over already deposited Au) in Y-modi-
fied (1 wt.% Y2O3) ceria supports exhibited a high
catalytic activity in the reaction of CPO. Y dopant
presence in the cerium oxide and synthesis method
of mixed oxide support (impregnation or copreci-
pitation) did not significantly affect the catalytic
performance.
These results are in agreement with catalyst
reducibility evaluated from hydrogen consumption
data during TPR. Moreover, CPO activity was af-
fected by Au, Pd, or Pd-Au presence. Generally, the
Pd catalysts were more active than matching Au
catalysts. The bimetallic catalysts exhibited the best
CPO activity. This function of activities correlated
well with oxygen mobility through ceria surface
layers. Modification of the oxidation state of gold,
palladium, and yttrium after catalysis revealed a
redox character of propene oxidation over the studied
catalysts. A relatively low temperature of total pro-
pene oxidation of 180 °C, reached over Pd-Au cata-
lysts on Y-doped ceria, and manifested good stabi-
lity during longstanding catalytic performance make
the bimetallic catalysts promising for reducing the
energy requirements for VOCs abatement.
Acknowledgment: The authors (PP and TT) grate-
fully acknowledge financial support by Bulgarian
National Science Fund (Project DFNI T 02/4).
REFERENCES
1. S. Scire, L. F. Liotta, Appl. Catal. B, 125, 222 (2012)
and references therein.
2. L. Ilieva, P. Petrova, T. Tabakova, R. Zanella, Z.
Kaszkur, React. Kinet. Mech. Catal., 105, 23 (2012).
3. L. Ilieva, P. Petrova, T. Tabakova, R. Zanella, M. V.
Abrashev, J. W. Sobczak, W. Lisowski, Z. Kaszkur,
D. Andreeva, Catal. Today, 18, 30 (2012).
4. L. Ilieva, P. Petrova, L. F. Liotta, J. W. Sobczak, W.
Lisowski, Z. Kaszkur, G. Munteanu, Catalysts, 6, 99
(2016) .
5. S. S. Shao, H. Wang, M. Zhang, D. D. Ma, S. T. Lee,
Appl. Phys. Lett., 93, 243110 (2008).
6. D. S. Lee, Y. W. Che, J. Taiwan Inst. Chem. Eng.,
44, 40 (2013).
7. M. Hosseini, T. Barakat, R. Cousin, A. Aboukaïs, B.-
L. Su, G. De Weireld, S. Siffert, Appl. Catal. B, 111–
112, 218 (2012).
8. H. Takatani, H. Kago, Y. Kobayashi, F. Hori, R.
Oshima, Trans. Mater. Res. Soc. Jpn., 28, 871 (2003).
9. T. Tabakova, L. Ilieva, P. Petrova, A. M. Venezia, G.
Avdeev, R. Zanella, Y. Karakirova, Chem. Eng. J.,
260, 133 (2015).
10. G. K. Williamson, W. H. Hall, Acta Metall., 1, 22
(1953).
11. V. D. Mote, Y. Purushotham, B. N. Dole, J. Theor.
Appl. Phys., 6, 6 (2012).
12. M. Ousmane, L. F. Liotta, G. Di Carlo, G. Pantaleo,
A. M. Venezia, G. Deganello, L. Retailleau, A.
Boreave, A. Giroir-Fendler, Appl. Catal. B, 101, 629
(2011).
13. D. A. Shirley, Phys. Rev. B, 5, 4709 (1972).
14. P. M. A. Sherwood, in: Practical Surface Analysis,
D. Briggs, M. P. Seah (Eds.), Wiley, New York,
1990, p. 555.
15. N. Kotzev, D. Shopov, J. Catal., 22, 297 (1971).
16. D. A. M. Monti, A. Baiker, J. Catal., 83, 323 (1983).
17. H. L. Tidahy, S. Siffert, V. Idakiev, T. Tabakova, Z.
Y. Yuan, R. Cousin, A. Aboukais, B. L. Su, Stud.
Surf. Sci. Catal., 175, 743 (2010).
18. T. Barakat, V. Idakiev, R. Cousin, G.-S. Shao, Z.-Y.
Yuan, T. Tabakova, S. Siffert, Appl. Catal. B, 146,
138 (2014).
19. S. Gil, J. M. Garcia-Vargas, L. F. Liotta, G. Pantaleo,
M. Ousmane, L. Retailleau, A. Giroir-Fendler,
Catalysts, 5, 671 (2015).
20. D. I. Enache, J. K. Edwards, P. Landon, B. Solsona-
Espriu, A. F. Carley, A. A. Herzing, M. Watanabe, C.
J. Kiely, D. W. Knight, G. J. Hutchings, Science,
311, 362 (2006).
21. L. Ilieva, P. Petrova, G. Pantaleo, R. Zanella, L. F.
Liotta, V. Georgiev, S. Boghosian, Z. Kaszkur, J. W.
Sobczak, W. Lisowski, A. M. Venezia, T. Tabakova,
Appl. Catal. B, 188, 154 (2016).
22. H. C. Yao, Y. F. Yu Yao, J. Catal., 86, 254 (1984).
23. Q. Fu, A. Weber, M. Flytzani-Stephanopoulos, Catal.
Lett., 77, 87 (2001).
24. D. Andreeva, V. Idakiev, T. Tabakova, L. Ilieva, P.
Falaras, A. Bourlinos, A. Travlos, Catal. Today, 72,
51 (2002).
25. M. G. Sanchez, J. L. Gazquez, J. Catal., 104, 120
(1987).
26. A. Laachir, V. Perrichon, A. Bardi, J. Lamotte, E.
P. Ts. Petrova et al.: Gold and palladium mono- and bimetallic catalysts on Y-doped ceria
16
Catherine, J. C. Lavalley, J. El Faallah, L. Hilaire, F.
le Normand, E. Quemere, G. N. Sauvion, O. Touret,
J. Chem. Soc. Faraday Trans., 87, 1601 (1991).
27. M. P. Casaletto, A. Longo, A. Martorana, A.
Prestianni, A. M. Venezia, Surf. Interface Anal. B,
38, 214 (2006).
28. A. M. Venezia, R. Murania, G. Pantaleo, G.
Deganello, J. Catal., 251, 94 (2007).
29. X. He, H. Yang, Appl. Clay Science, 101, 339 (2014).
30. L. F. Liotta, Appl. Catal. B, 100, 403 (2010).
МОНОМЕТАЛНИ (Au, Pd) И БИМЕТАЛНИ Pd-Au ЧАСТИЦИ, НАНЕСЕНИ ВЪРХУ
Y-ДОТИРАНИ ЦЕРИЕВООКСИДНИ НОСИТЕЛИ ЗА ПЪЛНО ОКИСЛЕНИЕ НА ПРОПЕН
П. Цв. Петрова1,
*, Д. Панталео2, А. М. Венеция
2, Л. Ф. Лиота
2, З. Кашкур
3, Т. Т. Табакова
1,
Л. И. Илиева1
1 Институт по катализ, Българска академия на науките, 1113 София, България
2 Институт по наноструктурни материали, CNR, Палермо, Италия
3 Институт по физикохимия, Полска академия на науките, Каспжак 44/52, 01-224 Варшава, Полша
Постъпила на: 29 януари 2018 г.; Преработена на: 19 март 2018 г.
(Резюме)
Монометални (Au, Pd) и биметални Pd-Au частици, нанесени на Y-дотирани цериевооксидни носители, са
изследвани в моделната реакция на пълно окисление на пропен за пречистване на въздух от алифатни
въглеводороди. Y-модифицираните цериевооксидни носители (1 тегл.% Y2О3) са синтезирани чрез импрег-
ниране или съутаяване. Злато- (3 тегл.% Au) и паладий-съдържащите (1 тегл.% Pd) катализатори са получени по
метода на отлагане чрез утаяване. Биметалните Pd-Au катализатори са синтезирани чрез добавяне на паладий
към предварително нанесено злато. Получените катализатори са охарактеризирани с помощта на ниско-
температурна адсорбция на азот (БET), рентгенова дифракция, температурно-програмирана редукция и рент-
генова фотоелектронна спектроскопия. Каталитичната активност не зависи съществено от наличието на Y-
допант и метода на синтез на смесенооксиден носител. Пълното окисление на пропен в присъствие на златните
катализатори е при 220 °C. Pd-съдържащите катализатори проявяват по-висока окислителна активност в срав-
нение със златните, показвайки 100% окисление на пропен при 200 °C. Най-ниската температура за пълното
окисление на пропен, 180 °C, е постигната в присъствие на биметалните Pd-Au катализатори и проведеният
продължителен каталитичен тест показва стабилна работа без загуба на каталитична активност.
P. Ts. Petrova et al.: Gold and palladium mono- and bimetallic catalysts on Y-doped ceria
17
Bulgarian Chemical Communications, Volume 50, Special issue H (pp. 17–23) 2018
Silver-based catalysts for preferential CO oxidation in hydrogen-rich gases (PROX)
S. Zh. Todorova1*, H. G. Kolev
1, M. G. Shopska
1, G. B. Kadinov
1, J. P. Holgado
2, A. Caballero
2
1 Institute of Catalysis, Bulgarian Academy of Sciences, Acad. G. Bonchev St., Block 11, 1113 Sofia, Bulgaria,
2 Instituto de Ciencia de Materiales and Dpto. Química Inorgánica, CSIC-University of Sevilla, Sevilla, Spain
Received: February 05, 2018; Revised: March 19, 2018
Silver samples were prepared by impregnation of different supports (SiO2, CeO2, and MnO2) with aqueous solution
of AgNO3. The catalysts were characterized by X-ray diffraction, X-ray photoelectron spectroscopy, temperature-
programmed reduction, temperature-programmed desorption of oxygen, high resolution SEM, in situ diffuse reflectance
infrared Fourier transform spectroscopy of adsorbed CO, and tested in the reaction of preferential CO oxidation in H2-
rich gases. A 15%Ag/SiO2 sample pretreated in pure oxygen showed the best catalytic performance. It is suggested that
oxidative pretreatment leads to the formation of surface and subsurface oxygen species, which rearrange the silver
surface thus increasing significantly silver catalyst activity for CO oxidation in hydrogen-rich gases.
Key words: Ag/SiO2 catalyst, Ag/CeO2 catalyst, Ag/MnO2 catalyst, CO oxidation, PROX.
INTRODUCTION
CO preferential oxidation in hydrogen-rich gases
(PROX process) has been studied for application to
polymer electrolyte membrane fuel cells (PEMFCs)
to reduce CO in the fuel gases below 10 ppm. The
catalysts, proposed so far for the PROX process, are
based mainly on noble metals such as Pt, Rh, and
Ru, deposited on different supports with or without
promoters [1–9]. The working temperature of these
catalysts is within the range of 130–200 C [10–12].
It seems to be too high to match subsequent reaction
in a PEMFC, which is usually carried out at 50–125
C [13]. Decreasing the reaction temperature and
search for more economic catalysts for PROX are
challenging objectives for the near future. IB-group
metals, supported on suitable metal oxides, are very
promising as PROX catalysts. Highly dispersed gold
exhibits an extraordinarily high activity in low-tem-
perature CO oxidation [14–19], however, it deacti-
vates rapidly during long-term operation [20–22]. A
very promising catalytic system that has received a
great attention during the last years is the copper-
cerium mixed oxide composites [23–24]. These
oxides show a practically constant and high selecti-
vity towards CO oxidation within a wide tempera-
ture interval. However, satisfactory CO conversion
(about 90%) is obtained at a temperature above 150
°C [25–28]. Silver, another member of group IB,
has been scarcely investigated as a PROX catalyst in
spite of its high activity in low temperature CO
oxidation in absence of hydrogen [29–31]. Reports
concerning utilization of Ag as catalyst for selective
CO oxidation are few and they examine only mono-
metallic silver supported on SiO2 or carbon [32–34]
and composites like Ag/Co and Ag/Mn oxides [35,
36]. Qu and co-workers [31–33] have observed that
SiO2 and siliceous mesoporous materials, such as
MCM-41 and SBA-15, are suitable supports for
active PROX catalysts. An increase in Si/Al ratio of
H-ZSM-5-supported catalysts results in a decrease
in activity due to strong interaction between Ag
atoms and Al ions in the zeolite framework. The
authors communicate a maximal conversion of about
40% at 45 C. Zhang et al. [37] have found that the
Si/Al ratio of the support has an important effect on
the structure of Ag catalysts and as a consequence
on the catalytic activity and selectivity in preferen-
tial CO oxidation. Derekaya and co-authors found
that a 50/50 (mol.%) Ag-Co mixed oxide sample
calcined at 200 °C was the most active catalyst and
a 50/50 (mol.%) Co-Ce mixed oxide sample cal-
cined at 200 °C was the most selective catalyst for
PROX process [35]. Very active and stable Ag/OMS-
2 catalysts were obtained by Hu et al. [38] through a
simple reflux method. It was found that addition of a
small amount of Al is beneficial to the formation of
small sized highly dispersed Ag metal particles.
This paper is a first part of our research targeting
at the influence of metal oxides of high oxygen
capacity as CeO2 and MnOx on the properties of
silver catalysts in the reaction of selective CO oxi-
dation in hydrogen-rich gases. Preliminary catalytic
tests showed that silica is the most suitable support.
The main objective of the present study is to inves-
tigate the effect of silver loading on the activity and
selectivity of Ag/SiO2 in PROX process.
© 2018 Bulgarian Academy of Sciences, Union of Chemists in Bulgaria
* To whom all correspondence should be sent
E-mail: [email protected]
18
EXPERIMENTAL
Catalysts preparation
Silver catalysts were prepared by addition of
respective support (SiO2, CeO2 or MnO2) to an
aqueous solution of AgNO3 to obtain 5, 10, and 15
wt.% Ag on SiO2 (Aerosil, SBET = 147 m2/g), and
5 wt.% Ag on CeO2 (SBET = 130 m2/g) and MnO2
(Fluka, SBET = 58 m2/g). Reference data [32] and
preliminary catalytic measurements showed that pre-
treatment in oxygen at high temperatures increased
the catalytic activity. For this reason, all samples
were calcined and pretreated in pure O2 for 2 h at
450 °C before the catalytic tests.
Catalyst characterization
Powder XRD patterns were collected at room
temperature in a step-scan regime (step = 0.05º,
count time = 2 s) on a Siemens D-501 diffracto-
meter using CuKα radiation (λ = 1.5718 Å). XRD
data processing was performed by using X'Pert
HighScore program. SEM images were recorded by
a field emission scanning electron microscope (FE-
SEM) model S5200. Temperature-programmed re-
duction (TPR) was carried out by an equipment
described elsewhere [38] using a flow mixture of
5% H2 in Ar at a flow rate of 10 ml/min, and a
temperature ramp of 10 C /min up to 900 C. Prior
to TPR experimental run the samples were treated in
He for 30 min at 150 C. Temperature-programmed
desorption of oxygen (TPD-O2) experiments were
performed on the same experimental setup. Oxygen
desorbed from the samples was determined by
means of a mass spectrometer (QMS-422 Baltzers)
and a thermal conductivity detector. Before TPD-O2
experiment each sample was pretreated in oxygen
flow for 2 h at 450 °C, cooled down to room tem-
perature in oxygen followed by 30 min in He.
Desorption of O2 was carried out in He flow until
reaching 900 °C at a ramp rate of 20 °C/min.
X-ray photoelectron measurements were con-
ducted on an ESCALAB MkII (VG Scientific) elec-
tron spectrometer at a base pressure in the analysis
chamber of 5.10−10
mbar using a twin anode
MgKα/AlKα X-ray source with excitation energies
of 1253.6 and 1486.6 eV, respectively. Passing
through a 6-mm slit (entrance/exit) of a hemisphe-
rical analyser, electrons of 20 eV energy were
detected by a channeltron. Because of small con-
centration and natural width of the AgMNN peak,
50 eV pass energy was used. The spectra were
recorded with a total instrumental resolution (as
measured with the FWHM of Ag3d5/2 photo-
electron line) of 1.06 and 1.18 eV for MgKα and
AlKα excitation sources, respectively. The energy
scale was calibrated by normalizing the Si2p line to
103.3 eV. Spectra processing included subtraction
of X-ray satellites and Shirley-type background
[39]. Peak positions and areas were evaluated by a
symmetrical Gaussian-Lorentzian curve fitting.
Relative concentrations of the different chemical
species were determined by normalization of the
peak areas to their photoionization cross-sections
calculated by Scofield’s approach [40].
Carbon monoxide adsorption on 15% Ag/SiO2
catalyst was studied by in situ diffuse reflectance
infrared Fourier transform spectroscopy (DRIFTS)
using a Nicolet 6700 spectrometer equipped with a
high temperature/vacuum chamber installed in
Collector II accessory (Thermo Spectra-Tech). The
CO was adsorbed from CO + Ar mixture flow at
room temperature. Experiments were carried out on
oxidized or calcined samples, being pretreated in
O2 + Ar for 2 h at 450 °C or in air for 2 h at 450 °C,
respectively.
Catalytic activity measurements
The catalytic activity tests were carried out in a
continuous flow type glass reactor at atmospheric
pressure with a catalyst bed loading of about 0.8
cm3 (fraction 0.25–0.31 mm). The gas mixture
consisted of 1 vol.% CO, 1 vol.% O2, 40 vol.% H2,
and He as balance to 100 vol.%. External mass
transfer limitations were minimized by working at
high GHSV (18750 h–1
). The reaction temperature
was measured by an internal thermocouple. Con-
verted gas mixture analysis at the outlet was per-
formed by a HP5890 series II gas chromatograph
equipped with a thermal conductivity detector and
Carboxen-1000 column. Helium was used as a car-
rier gas. Aalborg mass flow controllers were used to
regulate gas flow rates. Before catalytic test each
sample was calcined and pretreated in oxygen for 2
h at 450 °C.
Carbon monoxide conversion was calculated
based on changes in CO concentration:
COconversion = ([CO]in – [CO]out)*100/[CO]in, %
Oxygen conversion degree was based on O2
consumption:
O2conversion = ([O2]in – [O2]out)*100/[O2]in, %
Finally, the selectivity for CO oxidation (SCO)
was calculated based on the oxygen mass balance as
follows:
SCO = 0.5*([CO]in – [CO]out)*100/([O2]in – [O2]out) %
RESULTS AND DISCUSSION
Preliminary tests with 5% Ag on a different
S. Zh. Todorova et al.: Silver-based catalysts for preferential CO oxidation
19
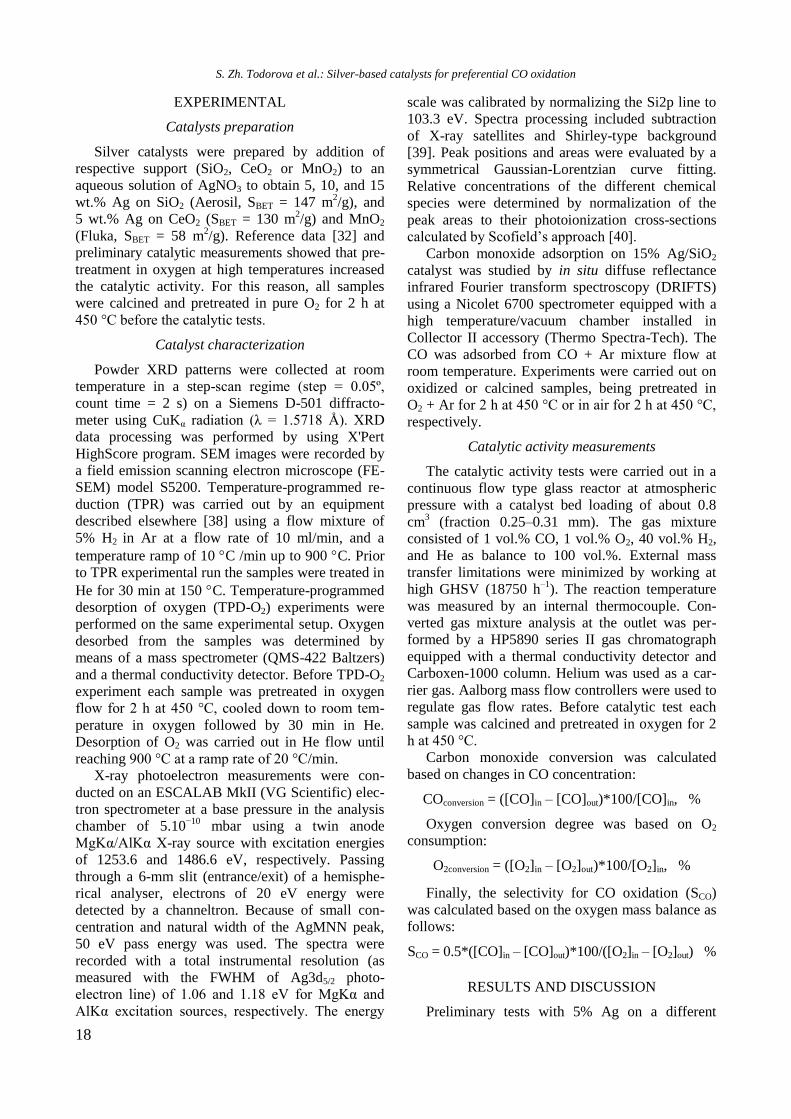
support, SiO2, CeO2, and MnO2, indicated that 5%
Ag/SiO2 and 5% Ag/CeO2 samples reached a maxi-
mal activity in the temperature range of 60–100 °C
(Fig. 1A). A maximum of catalytic activity (20%
CO conversion) with Ag/MnO2 was observed at a
higher temperature – 130 °C. Since the catalyst of
better performance was Ag/SiO2, silica was the
selected support for future preparation of samples of
different Ag loading (5, 10, 15 wt.%). As it was
mentioned in the Experimental section, all samples
were pretreated in oxygen before catalytic tests.
Figure 1B presents CO and O2 conversions, and
selectivity to CO2 with temperature on silica-
supported catalysts of different Ag loading. The
conversion curves are ‘volcano-shaped’ and a maxi-
mum was reached within the temperature interval of
70–100 °C. The activity increased with the increase
in Ag loading. For all samples, the selectivity to
CO2 decreased with temperature rise.
A C
B
Fig. 1. A. CO conversion degree with catalyst bed temperature on Ag supported on different oxides; B. CO (a) and O2
(b) conversion degrees with temperature on silica-supported catalysts of different Ag loading; (c) selectivity to CO2.
A drop in CO2 selectivity observed with all
samples and compatible with results reported in the
literature is attributed to the fact that the activation
energy of H2 oxidation was found to be considerably
higher than that of CO oxidation [41,42]. A sample
of the most active catalyst, 15% Ag/SiO2, reached a
maximum activity of 60% within 70–90 °C, i.e. it
dropped down. This catalyst was further examined
by different physicochemical methods.
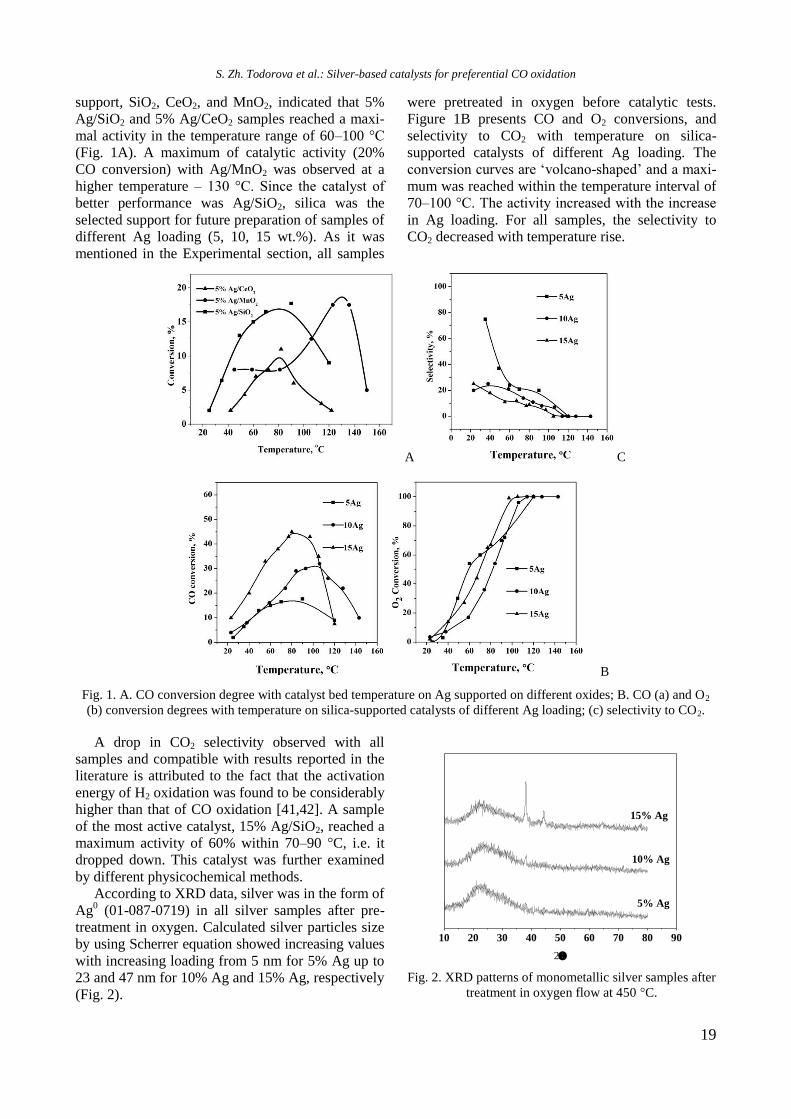
According to XRD data, silver was in the form of
Ag0 (01-087-0719) in all silver samples after pre-
treatment in oxygen. Calculated silver particles size
by using Scherrer equation showed increasing values
with increasing loading from 5 nm for 5% Ag up to
23 and 47 nm for 10% Ag and 15% Ag, respectively
(Fig. 2).
10 20 30 40 50 60 70 80 90
10% Ag
2
5% Ag
15% Ag
Fig. 2. XRD patterns of monometallic silver samples after
treatment in oxygen flow at 450 °C.
S. Zh. Todorova et al.: Silver-based catalysts for preferential CO oxidation
20
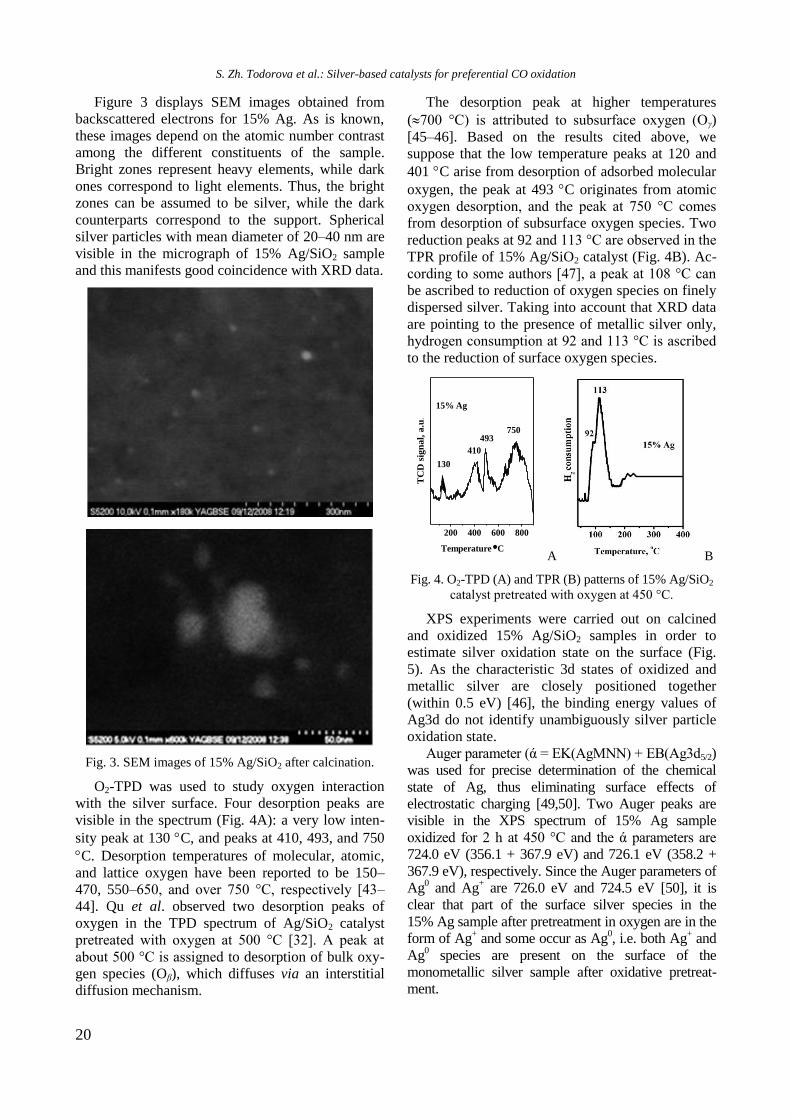
Figure 3 displays SEM images obtained from
backscattered electrons for 15% Ag. As is known,
these images depend on the atomic number contrast
among the different constituents of the sample.
Bright zones represent heavy elements, while dark
ones correspond to light elements. Thus, the bright
zones can be assumed to be silver, while the dark
counterparts correspond to the support. Spherical
silver particles with mean diameter of 20–40 nm are
visible in the micrograph of 15% Ag/SiO2 sample
and this manifests good coincidence with XRD data.
Fig. 3. SEM images of 15% Ag/SiO2 after calcination.
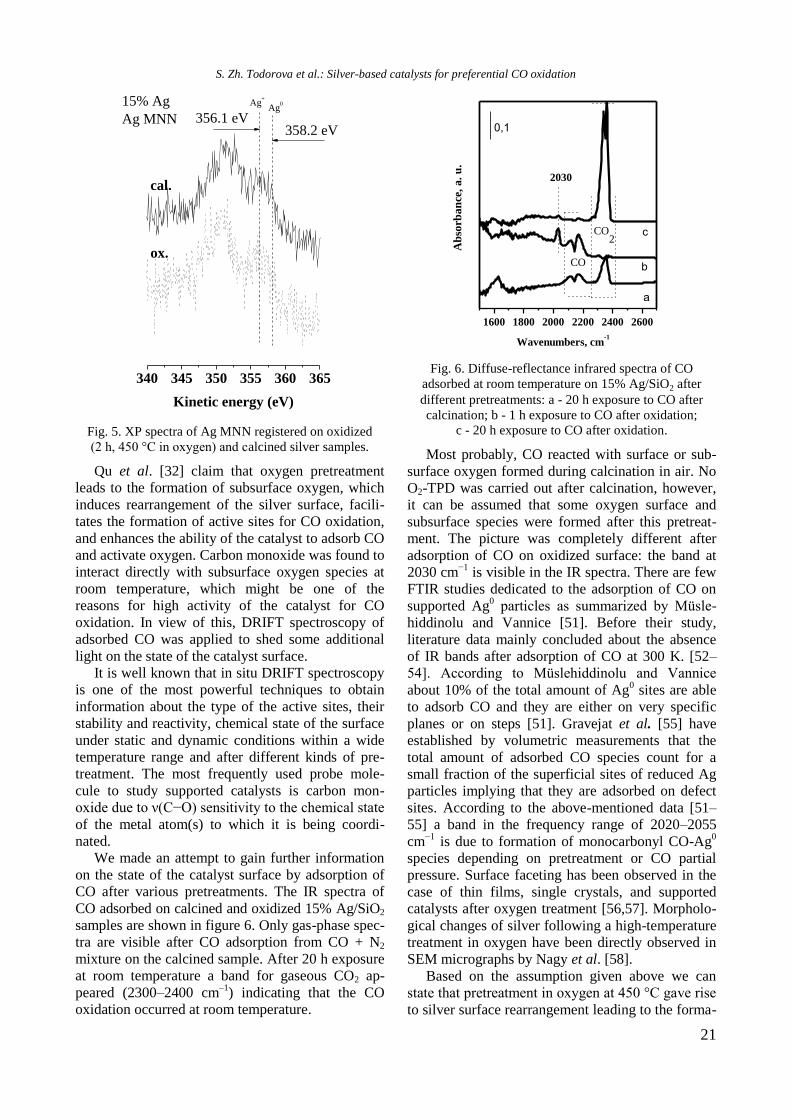
O2-TPD was used to study oxygen interaction
with the silver surface. Four desorption peaks are
visible in the spectrum (Fig. 4A): a very low inten-
sity peak at 130 C, and peaks at 410, 493, and 750
C. Desorption temperatures of molecular, atomic,
and lattice oxygen have been reported to be 150–
470, 550–650, and over 750 °C, respectively [43–
44]. Qu et al. observed two desorption peaks of
oxygen in the TPD spectrum of Ag/SiO2 catalyst
pretreated with oxygen at 500 °C [32]. A peak at
about 500 °C is assigned to desorption of bulk oxy-
gen species (Oβ), which diffuses via an interstitial
diffusion mechanism.
The desorption peak at higher temperatures
(700 °C) is attributed to subsurface oxygen (Oγ)
[45–46]. Based on the results cited above, we
suppose that the low temperature peaks at 120 and
401 C arise from desorption of adsorbed molecular
oxygen, the peak at 493 C originates from atomic
oxygen desorption, and the peak at 750 °C comes
from desorption of subsurface oxygen species. Two
reduction peaks at 92 and 113 °C are observed in the
TPR profile of 15% Ag/SiO2 catalyst (Fig. 4B). Ac-
cording to some authors [47], a peak at 108 °C can
be ascribed to reduction of oxygen species on finely
dispersed silver. Taking into account that XRD data
are pointing to the presence of metallic silver only,
hydrogen consumption at 92 and 113 °C is ascribed
to the reduction of surface oxygen species.
200 400 600 800
TC
D s
ign
al,
a.u
.
Temperature C
410
493750
15% Ag
130
A B
Fig. 4. O2-TPD (A) and TPR (B) patterns of 15% Ag/SiO2
catalyst pretreated with oxygen at 450 °C.
XPS experiments were carried out on calcined
and oxidized 15% Ag/SiO2 samples in order to
estimate silver oxidation state on the surface (Fig.
5). As the characteristic 3d states of oxidized and
metallic silver are closely positioned together
(within 0.5 eV) [46], the binding energy values of
Ag3d do not identify unambiguously silver particle
oxidation state.
Auger parameter (ά = EK(AgMNN) + EB(Ag3d5/2)
was used for precise determination of the chemical
state of Ag, thus eliminating surface effects of
electrostatic charging [49,50]. Two Auger peaks are
visible in the XPS spectrum of 15% Ag sample
oxidized for 2 h at 450 °C and the ά parameters are
724.0 eV (356.1 + 367.9 eV) and 726.1 eV (358.2 +
367.9 eV), respectively. Since the Auger parameters of
Ag0 and Ag
+ are 726.0 eV and 724.5 eV [50], it is
clear that part of the surface silver species in the
15% Ag sample after pretreatment in oxygen are in the
form of Ag+ and some occur as Ag
0, i.e. both Ag
+ and
Ag0 species are present on the surface of the
monometallic silver sample after oxidative pretreat-
ment.
S. Zh. Todorova et al.: Silver-based catalysts for preferential CO oxidation
21
340 345 350 355 360 365
Ag+
356.1 eV
15% Ag
Ag MNN
ox.
Kinetic energy (eV)
cal.
358.2 eV
Ag0
Fig. 5. XP spectra of Ag MNN registered on oxidized
(2 h, 450 °C in oxygen) and calcined silver samples.
Qu et al. [32] claim that oxygen pretreatment
leads to the formation of subsurface oxygen, which
induces rearrangement of the silver surface, facili-
tates the formation of active sites for CO oxidation,
and enhances the ability of the catalyst to adsorb CO
and activate oxygen. Carbon monoxide was found to
interact directly with subsurface oxygen species at
room temperature, which might be one of the
reasons for high activity of the catalyst for CO
oxidation. In view of this, DRIFT spectroscopy of
adsorbed CO was applied to shed some additional
light on the state of the catalyst surface.
It is well known that in situ DRIFT spectroscopy
is one of the most powerful techniques to obtain
information about the type of the active sites, their
stability and reactivity, chemical state of the surface
under static and dynamic conditions within a wide
temperature range and after different kinds of pre-
treatment. The most frequently used probe mole-
cule to study supported catalysts is carbon mon-
oxide due to ν(C−O) sensitivity to the chemical state
of the metal atom(s) to which it is being coordi-
nated.
We made an attempt to gain further information
on the state of the catalyst surface by adsorption of
CO after various pretreatments. The IR spectra of
CO adsorbed on calcined and oxidized 15% Ag/SiO2
samples are shown in figure 6. Only gas-phase spec-
tra are visible after CO adsorption from CO + N2
mixture on the calcined sample. After 20 h exposure
at room temperature a band for gaseous CO2 ap-
peared (2300–2400 cm–1
) indicating that the CO
oxidation occurred at room temperature.
1600 1800 2000 2200 2400 2600
CO
Ab
sorb
an
ce,
a.
u.
Wavenumbers, cm-1
0,1
a
b
c
2030
CO2
Fig. 6. Diffuse-reflectance infrared spectra of CO
adsorbed at room temperature on 15% Ag/SiO2 after
different pretreatments: a - 20 h exposure to CO after
calcination; b - 1 h exposure to CO after oxidation;
c - 20 h exposure to CO after oxidation.
Most probably, CO reacted with surface or sub-
surface oxygen formed during calcination in air. No
O2-TPD was carried out after calcination, however,
it can be assumed that some oxygen surface and
subsurface species were formed after this pretreat-
ment. The picture was completely different after
adsorption of CO on oxidized surface: the band at
2030 cm−1
is visible in the IR spectra. There are few
FTIR studies dedicated to the adsorption of CO on
supported Ag0 particles as summarized by Müsle-
hiddinolu and Vannice [51]. Before their study,
literature data mainly concluded about the absence
of IR bands after adsorption of CO at 300 K. [52–
54]. According to Müslehiddinolu and Vannice
about 10% of the total amount of Ag0 sites are able
to adsorb CO and they are either on very specific
planes or on steps [51]. Gravejat et al. [55] have
established by volumetric measurements that the
total amount of adsorbed CO species count for a
small fraction of the superficial sites of reduced Ag
particles implying that they are adsorbed on defect
sites. According to the above-mentioned data [51–
55] a band in the frequency range of 2020–2055
cm−1
is due to formation of monocarbonyl CO-Ag0
species depending on pretreatment or CO partial
pressure. Surface faceting has been observed in the
case of thin films, single crystals, and supported
catalysts after oxygen treatment [56,57]. Morpholo-
gical changes of silver following a high-temperature
treatment in oxygen have been directly observed in
SEM micrographs by Nagy et al. [58].
Based on the assumption given above we can
state that pretreatment in oxygen at 450 °C gave rise
to silver surface rearrangement leading to the forma-
S. Zh. Todorova et al.: Silver-based catalysts for preferential CO oxidation
22
tion of sites suitably exposed to linear CO bonding.
After 20 h exposure at room temperature in CO + N2
mixture, the band for CO–Ag0 decreased its inten-
sity along with the appearance of a band due to
gaseous CO2 to demonstrate interaction between ad-
sorbed CO and subsurface oxygen. The band of li-
nearly adsorbed carbon monoxide disappeared com-
pletely after a purge thus revealing its low stability.
CONCLUSIONS
According to the results presented above, we can
conclude that supported silver catalysts are pro-
mising systems for selective oxidation of CO at low
temperatures. Among all studied supports, silica was
the most suitable. Oxidation pretreatment led to the
formation of surface and subsurface oxygen species
that rearranged the silver surface and signifycantly
affected silver catalyst activity for CO oxidation in
hydrogen-rich gases.
Acknowledgement: The authors gratefully acknow-
ledge financial support by Bulgarian National
Science Fund (Grant No DN 09/5).
REFERENCES
1. P. V. Snytnikov, V. A. Sobyanin, V. D. Belyaev, P.
G. Tsyrulnikov, N. B. Shitova, D. A. Shlyapin, Appl.
Catal. A: General, 239, 149 (2003).
2. T. İnce, G. Uysal, A. N. Akin, R. Yildirim, Appl.
Catal. A-Gen, 292, 171 (2005).
3. D. Teschner, A. Wootsch, O. Pozdnyakova-Tellinger,
J. Kröhnert, E. M. Vass, M. Hävecker, S. Zafeiratos,
P. Schnörch, P. C. Jentoft, A. Knop-Gericke, R.
Schlögl, J. Catal., 249, 316 (2007).
4. P. V. Snytnikov, V. A. Sobyanin, V. D. Belyaev, P.
G. Tsyrulnikov, N. B. Shitova, D. A. Shlyapin, Appl.
Catal. A-Gen, 239, 149 (2003).
5. M. Kipnis, E. Volnina, Appl. Catal. B-Environ, 98,
193 (2010).
6. D. Teschner, A. Wootsch, O. Pozdnyakova-Tellinger,
J. Kröhnert, E. M. Vass, M. Hävecker, S. Zafeiratos,
P. Schnörch, P. C. Jentoft, A. Knop-Gericke, R.
Schlögl, J. Catal., 249, 316 (2007).
7. R. H. Liu, N. S. Gao, F. Zhen, Y. Y. Zhang, L. Mei,
X. W. Zeng, Chem. Eng. J. 225, 245 (2013).
8. F. G. Wang, K. F. Zhao, H. J. Zhang, Y. M. Dong, T.
Wang, D. N. He, Chem. Eng. J. 242, 10 (2014).
9. L. Wang, J. Chen, A. Patel, V. Rudolph, Z. Zhu,
Appl. Catal. A: Gen., 447–448, 200 (2012).
10. H. Igarashi, H. Uchida, M. Suzuki, Y. Sasaki, M.
Watanabe, Appl. Catal. A: Gen., 159, 159 (1997).
11. M. J. Kahlich, H. A. Gasteiger, R. J. Behm, J. Catal.
171, 93 (1997).
12. O. Korotkikh, R. Farrauto, Catal. Today, 62, 249
(2000).
13. M. J. Kahlich, H. A. Gasteiger, R. J. Behm, J. Catal.,
182, 430 (1999).
14. S. Kandoi, A. A. Gokhale, L. C. Grabow, J. A.
Dumesic, M. Mavrikakis, Catal. Lett. 93, 93 (2004).
15. G. Avgouropoulos, M. Manzoli, F. Boccuzzi, T.
Tabakova, J. Papavasiliou, T. Ioannides, V. Idakiev,
J. Catal., 256, 237 (2008).
16. G. Avgouropoulos, T. Ioannides, Ch. Papadopoulou,
J. Batista, S. Hocevar, H. K. Matralis, Catal. Today,
75, 157 (2002).
17. S. S. Pansare, A. Sirijaruphan, J. G. Goodwin, J.
Catal., 234, 151 (2005).
18. C. Rossignol, S. Arrii, F. Morfin, L. Piccolo, V.
Caps, J. Rousset, J. Catal., 203, 476 (2005).
19. A. Luengnaruemitchai, S. Osuwan, E. Gulari, Int. J.
Hydrogen Energy, 29, 429 (2004).
20. A. Luengnaruemitchai, D. T. K. Thoa, S. Osuwan, E.
Gulari, Int. J. Hydrogen Energy, 30, 981 (2005).
21. M. Schubert, M. Kahlich, H. Gasteiger, R. Behm, J.
Power Sources, 84, 175, (1999).
22. G. Avgouropoulos, Th. Ioannides, H. K. Matralis, J.
Batista, St. Hocevar, Catal. Lett., 73, 33 (2001).
23. P. Y. Peng, I. Jin, T. C. K. Yang, C. M. Huang,
Chem. Eng. J., 251, 228 (2014).
24. E. Moretti, L. Storaro, A. Talon, M. Lenarda, P.
Riello, R. Frattini, M. del V. Martínez de Yuso, A.
Jiménez-López, E. Rodríguez-Castellón, F. Ternero,
A. Caballero, J. P. Holgado, Appl. Catal. B-Env.,
102, 627 (2011).
25. F. Marin, C. Descorme, D. Duprez, Appl. Catal. B-
Env., 58, 175 (2005).
26. A. Martínez-Arias, A. B. Hungría, G. Munuera, D.
Gamarra, Appl. Catal. B-Env., 65, 207 (2006).
27. P. Ratnasamy, D. Srinivas, C. V. V. Satyanarayana,
P. Manikandan, R. S. Senthil Kumaran, M. Sachin,
V. N. Shetti, J. Catal., 221, 455 (2004).
28. G. Avgouropoulos, J. Papavasiliou, T. Tabakova, V.
Idakiev, T. Ioannides, Chem. Eng. J., 124, 41 (2006).
29. S. Imamura, H. Yamada, K. Utani, Appl. Catal. A-
Gen., 192, 221 (2000).
30. K. Song, S. Kang, S. D. Kim, Catal. Lett., 49, 65
(1997).
31. Z. Qu, S. Zhou, W. Wu, Can Li, X. Bao, Catal. Lett.,
101, 21 (2005).
32. Z. Qu, M. Cheng, W. Huang, X. Bao, J. Catal., 229,
446 (2005).
33. Z. Qu, M. Cheng, C. Shi, X. Bao, J. Mol. Catal. A-
Chem., 239, 22 (2005).
34. L. Chen, D. Ma, X. Li, X. Bao, Catal. Lett., 111, 133
(2006).
35. G. Güldür F. Balikçi, Int. J. Hydrogen Energy, 27,
219 (2002).
36. F. B. Derekaya, G. Güldür, Int. J. Hydrogen
Energy, 35, 2247 (2010).
37. R. Hu, C, Yan, L. Xie, Yi Cheng, D. Wang, Int. J
Hydrogen Energy, 36, 64 (2011).
38. P. Malet, A. Caballero, J. Chem. Soc. Faraday Trans.,
84, 2369 (1988).
39. D. Shirley, Phys. Rev. B, 5, 4709 (1972) .
40. J. H. Scofield, J. Electron Spectrosc. Relat. Phenom.,
8, 129 (1976).
41. S. Scire, C. Crisafulli, S. Minico, G. G. Condorelli,
S. Zh. Todorova et al.: Silver-based catalysts for preferential CO oxidation
23
A. Di Mauro, J. Mol. Catal. A-Chem., 284, 24 (2008).
42. M. J. Kahlich, H. A. Gasteiger, R. J. Behm, J. Catal.,
182, 430 (1999).
43. Y.-E. Sung, W. Y. Lee, H.-K. Rhee, H.-I. Lee, Kor.
J. Chem. Eng., 6, 300 (1989).
44. C. Backx, C. P. M. de Groot, P. Biloen, W. M. H.
Sachtler, Surf. Sci., 128, 81 (1983).
45. X. H. Bao, J. Barth, G. Lempfuhl, R. Schuster, Y.
Uchida, R. Schlögl, G. Ertl, Surf. Sci., 284, 14 (1993).
46. A. J. Nagy, G. Mestl, D. Herein, G. Weinberg, E.
Kitzelmann, R. Schlögl, J. Catal., 182, 417 (1999).
47. F. Boccuzzi, A. Chiorino, M. Manzoli, D. Andreeva,
T. Tabakova, L. Ilieva, V. Iadakiev, Catal. Today,
75, 169 (2002).
48. L. J. Kundakovic, M. Flytzani-Stephanopoulos, Appl.
Catal. A-Gen., 183, 35 (1999).
49. C. D. Wagner, Faraday Discuss. Chem. Soc., 60, 291
(1975).
50. G. Atanasova, D. Guergova, D. Stoychev, A.
Naydenov, P. Stefanov, Reac. Kinet. Mech. Catal.,
101, 397 (2010).
51. J. Müslehiddinoǧlu, M. A. Vannice, J. Catal., 213,
305 (2003).
52. G. W. Keulks, A. Ravi, J. Phys. Chem., 74, 783
(1970).
53. A. N. Pestryakov, A. A. Davydov, L. N. Kurina,
Russ. J. Phys. Chem., 62, 926 (1988).
54. Y. Y. Huang, J. Catal., 32, 482 (1974).
55. P. Gravejat, S. Derrouiche, D. Farrussengn, K.
Lombaert, C. Mirodatos, D. Bianchi, J. Phys. Chem.,
C, 111, 9496 (2007).
56. R. A. Marbrow, R. M. Lamber, Surf. Sci., 71, 107
(1978)
57. D. Herein, A. Nagy, H. Schubert, G. Weinberg, E.
Kitzelmann, E. R. Schlögl, Z. Phys. Chem., 197, 67
(1996).
58. A. J. Nagy, G. Mestl, D. Herein, G. Weinberg, E.
Kitzelmann, E. R. Schlögl, J. Catal., 182, 417 (1999).
КАТАЛИЗАТОРИ НА ОСНОВАТА НА СРЕБРО ЗА СЕЛЕКТИВНО ОКИСЛЕНИЕ НА СО
В БОГАТИ НА ВОДОРОД СМЕСИ
С. Ж. Тодорова1*, Х. Г. Колев
1, М. Г. Шопска
1, Г. Б. Кадинов
1, H.-P. Холгадо
2, А. Кабалеро
2
1 Институт по катализ, Българска академия на науките, ул. „Акад. Г. Бончев“, бл. 11, 1113 София, България
2 Институт за изследване на материали и департамент по неорганична химия, CSIC-Университет в Севиля,
Севиля, Испания
Постъпила на 5 февруари 2018 г.; Преработена на 19 март 2018 г.
(Резюме)
Получени са сребърни катализатори посредством импрегниране на различни носители (SiO2, CeO2 и MnO2) с
воден разтвор на AgNO3. Те са охарактеризирани с помощта на различни методи: рентгенова дифракция,
рентгенова фотоелектронна спектроскопия, температурно програмирана редукция, температурно програмирана
десорбция на кислород, сканираща електронна спектроскопия с висока резолюция, in situ дифузно-отражателна
инфрачервена спектроскопия на адсорбиран CO. Образците са тествани в реакция на селективно окисление на
CO в богати на водород смеси. Установено е, че проба с най-добра каталитична активност е предварително
обработен в чист кислород образец Ag/SiO2. Предположено е, че използването на окислителна предварителна
обработка води до образуване на повърхностни и подповърхностни кислородни форми и преструктуриране на
повърхността на сребърните частици, което значително увеличава активността на катализатора в изследваната
реакция.
S. Zh. Todorova et al.: Silver-based catalysts for preferential CO oxidation
24
Bulgarian Chemical Communications, Volume 50, Special issue H (pp. 24–33) 2018
Structure and activity of M-Al layered double hydroxides in CO2 methanation
reaction as function of the divalent metal
M. V. Gabrovska1*, D.
Crişan
2, D. A. Nikolova
1, I. Z. Shtereva
1, L. P. Bilyarska
1, M.
Crişan
2,
R. M. Edreva-Kardjieva1
1 Institute of Catalysis, Bulgarian Academy of Sciences, Acad. G. Bonchev St., Bldg. 11, 1113 Sofia, Bulgaria
2 Ilie Murgulescu Institute of Physical Chemistry, Romanian Academy, Splaiul Independentei 202, 060021 Bucharest,
Romania
Received: March 04, 2018; Revised: March 26, 2018
The effect of divalent metal (Ni or Co) on the structure, phase composition, thermal stability, and reducibility of co-
precipitated Al-containing layered double hydroxides (LDHs) as catalyst precursors for CO2 removal by methanation
reaction was examined. The catalytic activity was estimated by varying reduction and reaction temperature and space
velocity as well. It was observed that the divalent metal in Al-containing LDHs affects the crystallisation degree of the
formed layered compounds, their specific surface area, and temperature of LDH decomposition with parallel phase
transformation to resultant mixed metal oxides. It was found that Co2+
ions stabilised in CoAl2O4 spinel structure
hampered their reduction to metal state, thus leading to deficiency of Co0 active metal surface phase. This phenomenon
determined a low activity of Co/Al2O3 catalyst, especially at low reduction temperatures. In contrast, the interaction
between Ni2+
and Al3+
ions resulted in generation of readily reducible Ni2+
-O species, which favoured a higher activity
of Ni/Al2O3 catalyst after reduction at the same temperatures. Spinel-type phases were formed at different temperatures
as a function of the divalent metal and determined catalyst activity in the purification of H2-rich streams from traces of
CO2 by methanation reaction.
Key words: CoAl and Ni-Al layered double hydroxides, structure, mixed metal oxides, reducibility; CO2 methanation.
INTRODUCTION
Carbon dioxide (CO2) is a major greenhouse gas
and makes a significant contribution to global
warming and climate change. The pressing necessity
for greenhouse gas emissions control concentrates
scientists’ attention to decrease CO2 accumulation in
the atmosphere. On this occasion, mitigation and
effective utilisation of the CO2 emissions have
become major areas of research worldwide [1,2]
Among catalysed reactions, the catalytic hydro-
genation of CO2 over transition metal catalysts to
form methane, simply called methanation (CO2 +
4H2 = CH4 + 2H2O), is one of the most appropriate
and efficient techniques for CO2 removal. Direct
synthesis of methane from CO2 is favourable not
only for reduction of greenhouse gas emissions, but
also for fuel and chemicals production [2,3]. More-
over, CO2 methanation is used as a promising
technique for purification of H2-rich streams from
traces of CO2 to prevent catalyst poisoning espe-
cially in the ammonia synthesis industry [4] and in
the fuel cell anode technology [5].
Although many different metals supported on
various oxide carriers have been used, nickel and
ruthenium are two of the most effective. Despite the
highest activity observed of Ru metal, it is not of
practical interest due to its high cost [6]. Nickel
catalysts at a large scale of concentrations (2577
wt.%) are a choice of the industrial methanation
because of their high activity, effectivity, selectivity
toward methane formation in preference to other
hydrocarbons, and relatively low cost [79].
Layered double hydroxides are lamellar mate-
rials belonging to a great group of natural or syn-
thetic inorganic layered compounds, named anionic
clays or hydrotalcite-like materials, because of the
similarity existing between their structures and that
of mineral hydrotalcite, (Mg6Al2(OH)16CO3·4H2O).
The structure of LDHs can be expressed by the
general formula [M2+
1–x M3+
x (OH)2]x+
[An
x/n mH2O]x
,
where bivalent M2+
(Mg2+
, Ni2+
, Co2+
, Zn2+
, etc.) and
trivalent M3+
(Al3+
, Cr3+
, In3+
, etc.) metal cations are
located in the brucite-like hydroxide layers. Due to
charge disequilibrium, a substituted trivalent M3+
cation for a M2+
ion gives rise to infinite repetition
of positively charged sheets alternating with An
ions which are required to balance the net positive
charges of the hydroxide layers. The charge com-
pensating exchangeable anions An
, such as CO32–
,
NO3–, SO4
2–, Cl
–, etc., as well as water molecules,
© 2018 Bulgarian Academy of Sciences, Union of Chemists in Bulgaria
* To whom all correspondence should be sent
E-mail: [email protected]
25
are situated in the interlayer gallery of the layered
structure. Herewith, x represents the fraction of the
M3+
cation, more precisely x = M3+
/(M3+
+ M2+
), the
most reliable composition range being approxi-
mately 0.2 ≤ x ≤ 0.4, and m is the number of co-
intercalated water molecules which prevent inter-
anion repulsion. The LDH compounds are character-
ised by uniform homogeneous distribution of the
M2+
and M3+
metal cations at the octahedral sites of
the brucitelike layer on an atomic level. The cations
are crosslinked through hydroxyl groups to form a
bimetal hydroxide sheet similar to that of brucite
[10−13].
Our research efforts have been directed to assess
the potential use of Ni-Al layered systems as cata-
lysts for CO2 removal in place of conventional Ni-
based catalysts. It has been established that depend-
ing on the Ni2+
/Al3+
molar ratio and temperature of
treatment in hydrogen ambience, Ni-Al LDHs are
promising precursors for catalysts for fine CO2
removal from hydrogen-rich gas streams through the
CO2 methanation reaction both as-synthesised [14]
and after thermal treatment to cause formation of
finely dispersed Ni-Al mixed oxides [15].
While numerous studies have been focused on
CO2 methanation over Ni catalysts, there are only
scarce attempts to elucidate the role of Co catalysts
in the same reaction [16,17].
In this regard, the object of the present investiga-
tion is to elucidate the effect of divalent cation, Ni2+
and Co2+
, in co-precipitated Al-containing LDHs on
phase composition, structure, thermal stability, redu-
cibility, and activity estimation in CO2 methanation
by varying reduction and reaction temperature and
space velocity as well.
Until now, an extensive comparative study of
CO2 methanation on non-calcined co-precipitated
Co-Al and Ni-Al LDH has not been reported in the
literature.
EXPERIMENTAL
Sample preparation
Carbonate forms of LDH precursors of identical
composition (M2+
/Al3+
molar ratio of 3.0, M2+
=
Co2+
or Ni2+
) were obtained by co-precipitation of
mixed Co-Al or Ni-Al aqueous nitrate solution with
Na2CO3 as precipitating agent at constant pH = 8
and temperature of 80 °C under vigorous stirring.
The initial salts of analytical grade, provided by
Alfa Aesar (USA), were used as received without
further purification. Detailed description of the
preparation procedure is presented in Ref. 14. The
obtained precipitate was further dried at 80 °C for
20 h, named as-synthesised precursor, and designated
as CoAl or NiAl (Table 1). After reaction run, the
spent catalysts were labelled as CoAl-s or NiAl-s.
Dried layered systems were step-wise treated in
air for 2 h in the temperature range 2001000 °C at
a heating rate of 3 °C/min in order to understand
phase composition changes.
Sample characterisation
The chemical composition of the as-synthesised
materials was determined by inductively coupled
plasma atomic emission spectroscopy (ICP-AES)
using JY (Jobin Yvon) 38 spectrometer.
Specific surface areas were measured employing
the single point BET method using a FlowSorb II
2300 Micromeritics apparatus with a N2/He mixture
(30/70) at the boiling temperature of liquid nitrogen.
Thermal analysis (DTA-TG) was carried out
simultaneously on a Stanton Redcroft conventional
TG-DTA system. Measurements were carried out
under airflow (ca. 3 ml/h) at a heating rate of 10
deg/min.
The phase composition of as-synthesised, cal-
cined, and spent samples was established by powder
X-ray diffraction (PXRD) analysis. Data were col-
lected on a Bruker D8 Advance powder diffracto-
meter employing CuKα radiation. Crystalline phases
were identified by means of International Centre for
Diffraction Data (ICDD) powder diffraction files.
The temperature-programmed reduction (TPR)
behaviour of the investigated samples (~0.025 g)
was evaluated by means of a laboratory setup using
a thermal conductivity detector. The temperature
was linearly raised from 25 to 850 °C at a heating
rate of 10 deg/min. The TPR experiments were
accomplished by a gaseous mixture of 10% H2 in Ar
at a flow rate of 25 cm3/min. The samples were
heated in nitrogen to 80 °C at a rate of 30 deg/min to
remove adsorbed water. Then the nitrogen was
replaced by a gaseous mixture of 10% H2 in Ar and
the temperature was raised again at a rate of 10
deg/min up to 850 °C. The selected conditions were
compatible with the criteria proposed by Monti and
Baiker [18] that avoid mass transfer and temperature
control limitations.
Gas-phase hydrogenation of CO2 to CH4 was
carried out in a fixed-bed flow reactor setup under
atmospheric pressure. For each catalytic measure-
ment, 0.8 g of as-synthesised precursor of 0.4–0.8
mm particle size were loaded into a quartz reactor.
Quartz glass pellets of 1.0–1.25 mm size were used
to fill up reactor to eliminate mass transfer effects.
Catalyst activation was successively performed by
in situ reduction at 400, 450, 530, and 600 °C for 3 h
with pure hydrogen (Messer MG, Chimco Gas) at a
constant gas hourly space velocity (GHSV) of 2000
M. V. Gabrovska et al.: M-Al layered double hydroxides in CO2 methanation
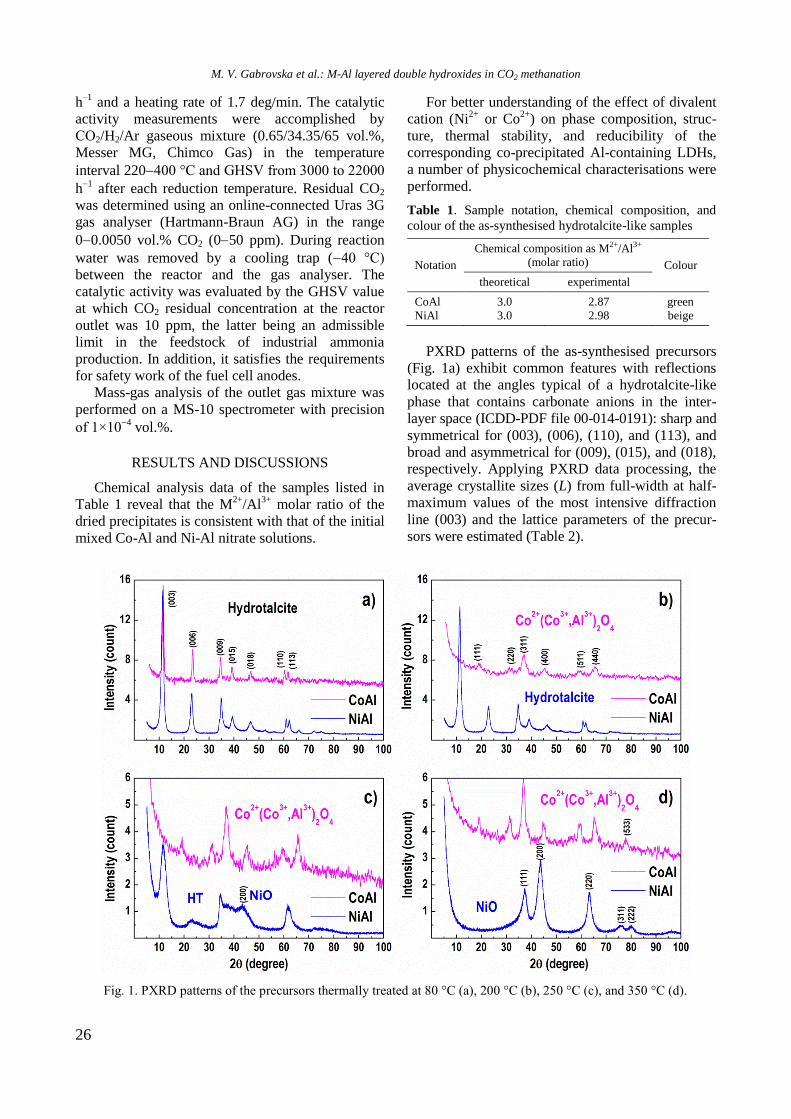
26
h–1
and a heating rate of 1.7 deg/min. The catalytic
activity measurements were accomplished by
СО2/H2/Ar gaseous mixture (0.65/34.35/65 vol.%,
Messer MG, Chimco Gas) in the temperature
interval 220400 °C and GHSV from 3000 to 22000
h1
after each reduction temperature. Residual CO2
was determined using an online-connected Uras 3G
gas analyser (Hartmann-Braun AG) in the range
00.0050 vol.% CO2 (050 ppm). During reaction
water was removed by a cooling trap (40 °С)
between the reactor and the gas analyser. The
catalytic activity was evaluated by the GHSV value
at which CO2 residual concentration at the reactor
outlet was 10 ppm, the latter being an admissible
limit in the feedstock of industrial ammonia
production. In addition, it satisfies the requirements
for safety work of the fuel cell anodes.
Mass-gas analysis of the outlet gas mixture was
performed on a MS-10 spectrometer with precision
of 1×10⁴
vol.%.
RESULTS AND DISCUSSIONS
Chemical analysis data of the samples listed in
Table 1 reveal that the M2+
/Al3+
molar ratio of the
dried precipitates is consistent with that of the initial
mixed Co-Al and Ni-Al nitrate solutions.
For better understanding of the effect of divalent
cation (Ni2+
or Co2+
) on phase composition, struc-
ture, thermal stability, and reducibility of the
corresponding co-precipitated Al-containing LDHs,
a number of physicochemical characterisations were
performed.
Table 1. Sample notation, chemical composition, and
colour of the as-synthesised hydrotalcite-like samples
Notation
Chemical composition as M2+/Al3+
(molar ratio) Colour
theoretical experimental
CoAl 3.0 2.87 green
NiAl 3.0 2.98 beige
PXRD patterns of the as-synthesised precursors
(Fig. 1a) exhibit common features with reflections
located at the angles typical of a hydrotalcite-like
phase that contains carbonate anions in the inter-
layer space (ICDD-PDF file 00-014-0191): sharp and
symmetrical for (003), (006), (110), and (113), and
broad and asymmetrical for (009), (015), and (018),
respectively. Applying PXRD data processing, the
average crystallite sizes (L) from full-width at half-
maximum values of the most intensive diffraction
line (003) and the lattice parameters of the precur-
sors were estimated (Table 2).
Fig. 1. PXRD patterns of the precursors thermally treated at 80 °C (a), 200 °C (b), 250 °C (c), and 350 °C (d).
M. V. Gabrovska et al.: M-Al layered double hydroxides in CO2 methanation
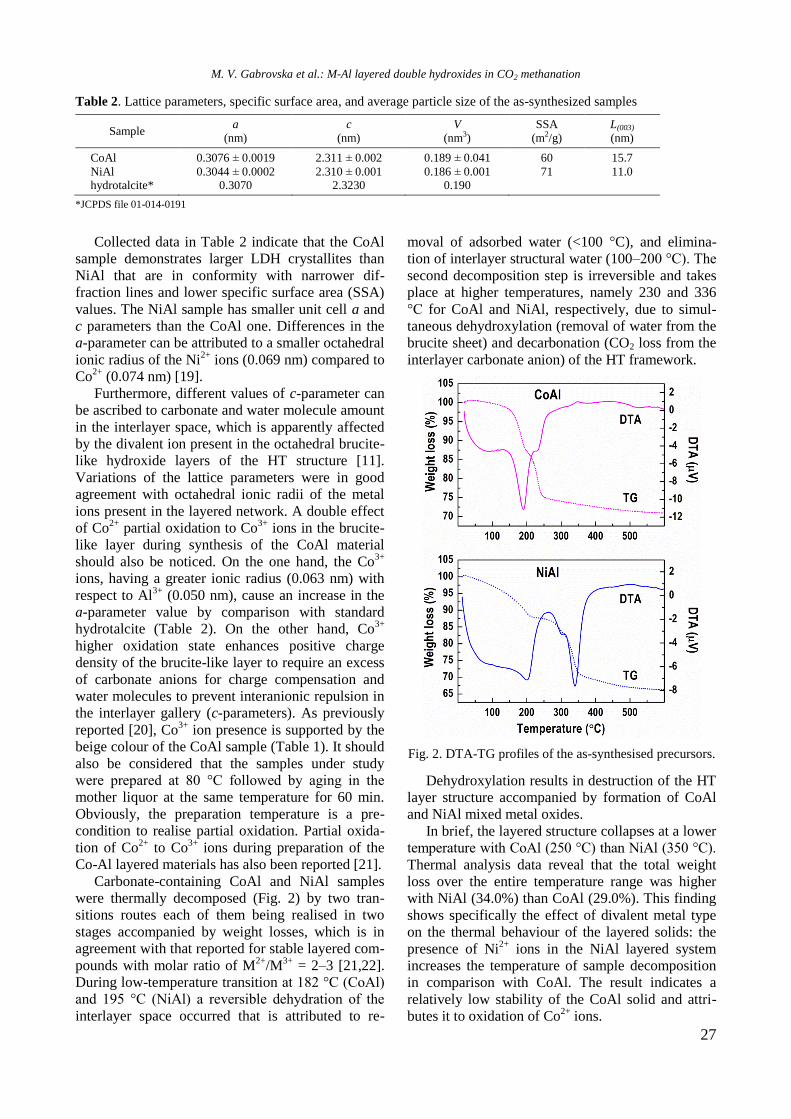
27
Table 2. Lattice parameters, specific surface area, and average particle size of the as-synthesized samples
Sample a
(nm)
c
(nm)
V
(nm3)
SSA
(m2/g)
L(003)
(nm)
CoAl 0.3076 ± 0.0019 2.311 ± 0.002 0.189 ± 0.041 60 15.7
NiAl 0.3044 ± 0.0002 2.310 ± 0.001 0.186 ± 0.001 71 11.0 hydrotalcite* 0.3070 2.3230 0.190
*JCPDS file 01-014-0191
Collected data in Table 2 indicate that the CoAl
sample demonstrates larger LDH crystallites than
NiAl that are in conformity with narrower dif-
fraction lines and lower specific surface area (SSA)
values. The NiAl sample has smaller unit cell a and
c parameters than the CoAl one. Differences in the
a-parameter can be attributed to a smaller octahedral
ionic radius of the Ni2+
ions (0.069 nm) compared to
Co2+
(0.074 nm) [19].
Furthermore, different values of c-parameter can
be ascribed to carbonate and water molecule amount
in the interlayer space, which is apparently affected
by the divalent ion present in the octahedral brucite-
like hydroxide layers of the HT structure [11].
Variations of the lattice parameters were in good
agreement with octahedral ionic radii of the metal
ions present in the layered network. A double effect
of Co2+
partial oxidation to Co3+
ions in the brucite-
like layer during synthesis of the CoAl material
should also be noticed. On the one hand, the Co3+
ions, having a greater ionic radius (0.063 nm) with
respect to Al3+
(0.050 nm), cause an increase in the
a-parameter value by comparison with standard
hydrotalcite (Table 2). On the other hand, Co3+
higher oxidation state enhances positive charge
density of the brucite-like layer to require an excess
of carbonate anions for charge compensation and
water molecules to prevent interanionic repulsion in
the interlayer gallery (c-parameters). As previously
reported [20], Co3+
ion presence is supported by the
beige colour of the CoAl sample (Table 1). It should
also be considered that the samples under study
were prepared at 80 °C followed by aging in the
mother liquor at the same temperature for 60 min.
Obviously, the preparation temperature is a pre-
condition to realise partial oxidation. Partial oxida-
tion of Co2+
to Co3+
ions during preparation of the
Co-Al layered materials has also been reported [21].
Carbonate-containing CoAl and NiAl samples
were thermally decomposed (Fig. 2) by two tran-
sitions routes each of them being realised in two
stages accompanied by weight losses, which is in
agreement with that reported for stable layered com-
pounds with molar ratio of M2+
/M3+
= 2–3 [21,22].
During low-temperature transition at 182 °C (CoAl)
and 195 °C (NiAl) a reversible dehydration of the
interlayer space occurred that is attributed to re-
moval of adsorbed water (<100 °C), and elimina-
tion of interlayer structural water (100–200 °C). The
second decomposition step is irreversible and takes
place at higher temperatures, namely 230 and 336
°C for CoAl and NiAl, respectively, due to simul-
taneous dehydroxylation (removal of water from the
brucite sheet) and decarbonation (CO2 loss from the
interlayer carbonate anion) of the HT framework.
Fig. 2. DTA-TG profiles of the as-synthesised precursors.
Dehydroxylation results in destruction of the HT
layer structure accompanied by formation of CoAl
and NiAl mixed metal oxides.
In brief, the layered structure collapses at a lower
temperature with CoAl (250 °C) than NiAl (350 °C).
Thermal analysis data reveal that the total weight
loss over the entire temperature range was higher
with NiAl (34.0%) than CoAl (29.0%). This finding
shows specifically the effect of divalent metal type
on the thermal behaviour of the layered solids: the
presence of Ni2+
ions in the NiAl layered system
increases the temperature of sample decomposition
in comparison with CoAl. The result indicates a
relatively low stability of the CoAl solid and attri-
butes it to oxidation of Co2+
ions.
M. V. Gabrovska et al.: M-Al layered double hydroxides in CO2 methanation
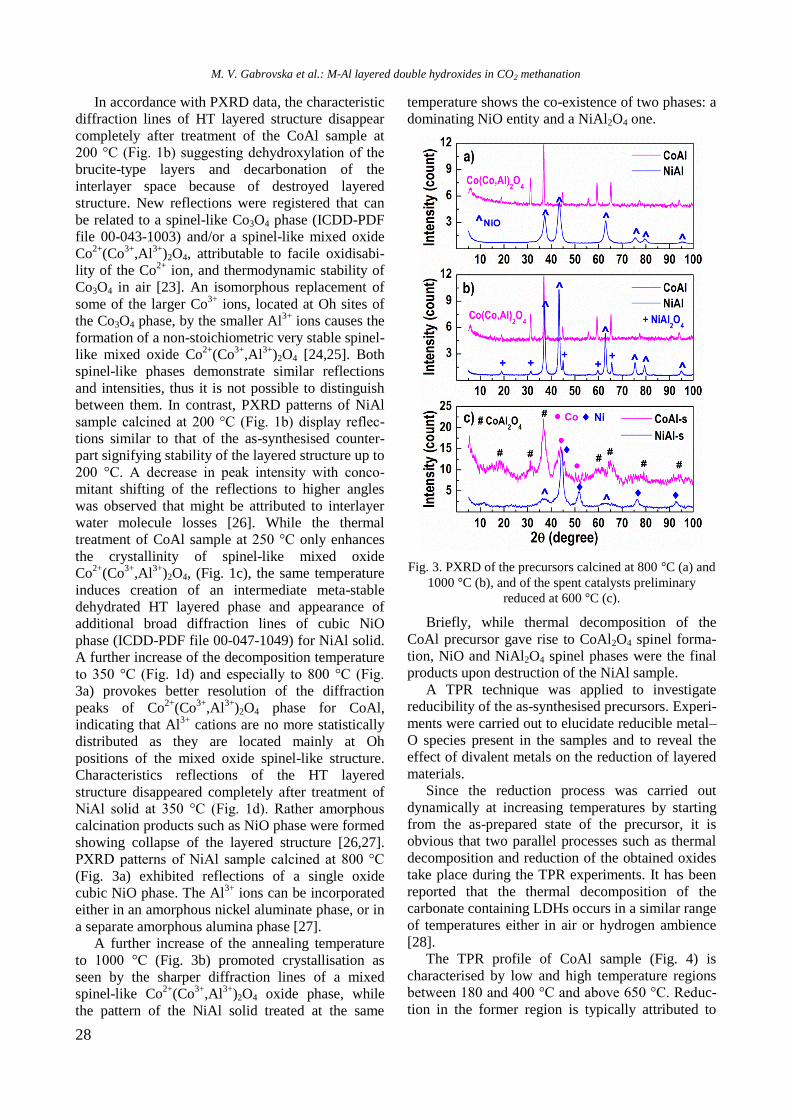
28
In accordance with PXRD data, the characteristic
diffraction lines of HT layered structure disappear
completely after treatment of the CoAl sample at
200 °C (Fig. 1b) suggesting dehydroxylation of the
brucite-type layers and decarbonation of the
interlayer space because of destroyed layered
structure. New reflections were registered that can
be related to a spinel-like Co3O4 phase (ICDD-PDF
file 00-043-1003) and/or a spinel-like mixed oxide
Co2+
(Co3+
,Al3+
)2O4, attributable to facile oxidisabi-
lity of the Co2+
ion, and thermodynamic stability of
Co3O4 in air [23]. An isomorphous replacement of
some of the larger Co3+
ions, located at Oh sites of
the Co3O4 phase, by the smaller Al3+
ions causes the
formation of a non-stoichiometric very stable spinel-
like mixed oxide Co2+
(Co3+
,Al3+
)2O4 [24,25]. Both
spinel-like phases demonstrate similar reflections
and intensities, thus it is not possible to distinguish
between them. In contrast, PXRD patterns of NiAl
sample calcined at 200 °C (Fig. 1b) display reflec-
tions similar to that of the as-synthesised counter-
part signifying stability of the layered structure up to
200 °C. A decrease in peak intensity with conco-
mitant shifting of the reflections to higher angles
was observed that might be attributed to interlayer
water molecule losses [26]. While the thermal
treatment of CoAl sample at 250 °C only enhances
the crystallinity of spinel-like mixed oxide
Co2+
(Co3+
,Al3+
)2O4, (Fig. 1c), the same temperature
induces creation of an intermediate meta-stable
dehydrated HT layered phase and appearance of
additional broad diffraction lines of cubic NiO
phase (ICDD-PDF file 00-047-1049) for NiAl solid.
A further increase of the decomposition temperature
to 350 °C (Fig. 1d) and especially to 800 °C (Fig.
3a) provokes better resolution of the diffraction
peaks of Co2+
(Co3+
,Al3+
)2O4 phase for CoAl,
indicating that Al3+
cations are no more statistically
distributed as they are located mainly at Oh
positions of the mixed oxide spinel-like structure.
Characteristics reflections of the HT layered
structure disappeared completely after treatment of
NiAl solid at 350 °C (Fig. 1d). Rather amorphous
calcination products such as NiO phase were formed
showing collapse of the layered structure [26,27].
PXRD patterns of NiAl sample calcined at 800 °C
(Fig. 3a) exhibited reflections of a single oxide
cubic NiO phase. The Al3+
ions can be incorporated
either in an amorphous nickel aluminate phase, or in
a separate amorphous alumina phase [27].
A further increase of the annealing temperature
to 1000 °C (Fig. 3b) promoted crystallisation as
seen by the sharper diffraction lines of a mixed
spinel-like Co2+
(Co3+
,Al3+
)2O4 oxide phase, while
the pattern of the NiAl solid treated at the same
temperature shows the co-existence of two phases: a
dominating NiO entity and a NiAl2O4 one.
Fig. 3. PXRD of the precursors calcined at 800 °C (a) and
1000 °C (b), and of the spent catalysts preliminary
reduced at 600 °C (c).
Briefly, while thermal decomposition of the
CoAl precursor gave rise to CoAl2O4 spinel forma-
tion, NiO and NiAl2O4 spinel phases were the final
products upon destruction of the NiAl sample.
A TPR technique was applied to investigate
reducibility of the as-synthesised precursors. Experi-
ments were carried out to elucidate reducible metal–
O species present in the samples and to reveal the
effect of divalent metals on the reduction of layered
materials.
Since the reduction process was carried out
dynamically at increasing temperatures by starting
from the as-prepared state of the precursor, it is
obvious that two parallel processes such as thermal
decomposition and reduction of the obtained oxides
take place during the TPR experiments. It has been
reported that the thermal decomposition of the
carbonate containing LDHs occurs in a similar range
of temperatures either in air or hydrogen ambience
[28].
The TPR profile of CoAl sample (Fig. 4) is
characterised by low and high temperature regions
between 180 and 400 °C and above 650 °C. Reduc-
tion in the former region is typically attributed to
M. V. Gabrovska et al.: M-Al layered double hydroxides in CO2 methanation
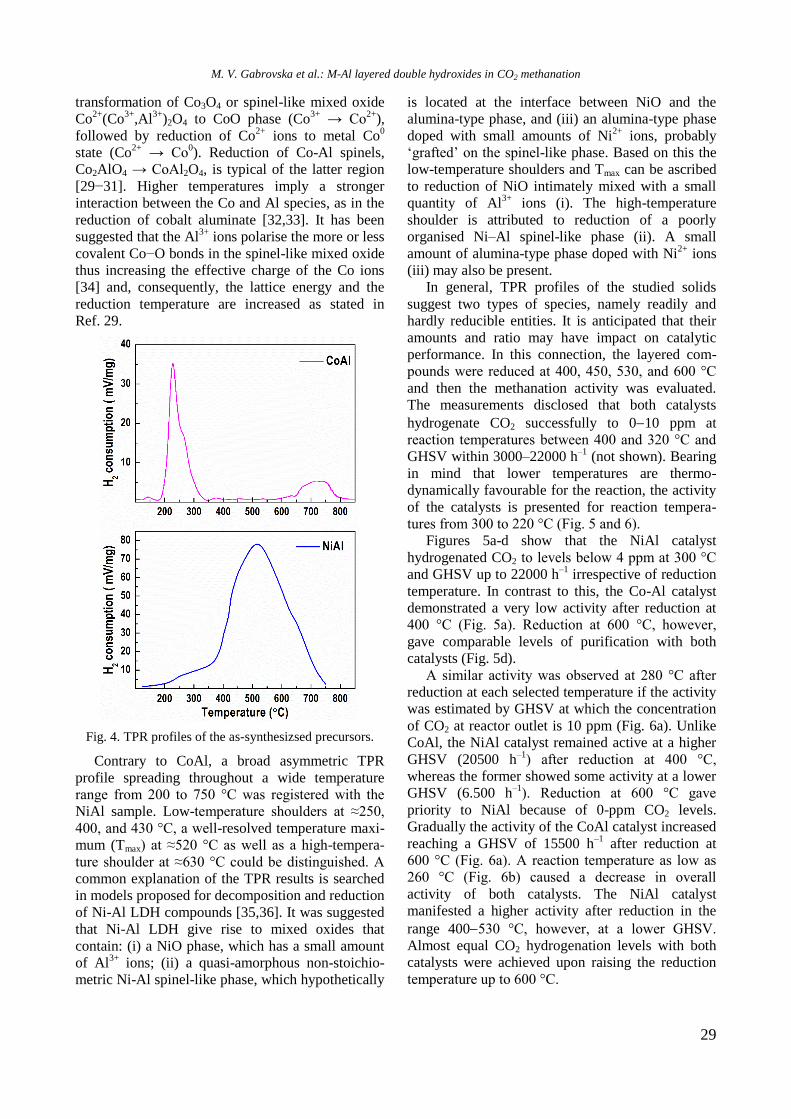
29
transformation of Co3O4 or spinel-like mixed oxide
Co2+
(Co3+
,Al3+
)2O4 to CoO phase (Co3+
→ Co2+
),
followed by reduction of Co2+
ions to metal Co0
state (Co2+
→ Co0). Reduction of Co-Al spinels,
Co2AlO4 → CoAl2O4, is typical of the latter region
[29−31]. Higher temperatures imply a stronger
interaction between the Co and Al species, as in the
reduction of cobalt aluminate [32,33]. It has been
suggested that the Al3+
ions polarise the more or less
covalent Co−O bonds in the spinel-like mixed oxide
thus increasing the effective charge of the Co ions
[34] and, consequently, the lattice energy and the
reduction temperature are increased as stated in
Ref. 29.
Fig. 4. TPR profiles of the as-synthesizsed precursors.
Contrary to CoAl, a broad asymmetric TPR
profile spreading throughout a wide temperature
range from 200 to 750 °C was registered with the
NiAl sample. Low-temperature shoulders at ≈250,
400, and 430 °C, a well-resolved temperature maxi-
mum (Tmax) at ≈520 °C as well as a high-tempera-
ture shoulder at ≈630 °C could be distinguished. A
common explanation of the TPR results is searched
in models proposed for decomposition and reduction
of Ni-Al LDH compounds [35,36]. It was suggested
that Ni-Al LDH give rise to mixed oxides that
contain: (i) a NiO phase, which has a small amount
of Al3+
ions; (ii) a quasi-amorphous non-stoichio-
metric Ni-Al spinel-like phase, which hypothetically
is located at the interface between NiO and the
alumina-type phase, and (iii) an alumina-type phase
doped with small amounts of Ni2+
ions, probably
‘grafted’ on the spinel-like phase. Based on this the
low-temperature shoulders and Tmax can be ascribed
to reduction of NiO intimately mixed with a small
quantity of Al3+
ions (i). The high-temperature
shoulder is attributed to reduction of a poorly
organised Ni–Al spinel-like phase (ii). A small
amount of alumina-type phase doped with Ni2+
ions
(iii) may also be present.
In general, TPR profiles of the studied solids
suggest two types of species, namely readily and
hardly reducible entities. It is anticipated that their
amounts and ratio may have impact on catalytic
performance. In this connection, the layered com-
pounds were reduced at 400, 450, 530, and 600 °C
and then the methanation activity was evaluated.
The measurements disclosed that both catalysts
hydrogenate CO2 successfully to 010 ppm at
reaction temperatures between 400 and 320 °C and
GHSV within 3000–22000 h–1
(not shown). Bearing
in mind that lower temperatures are thermo-
dynamically favourable for the reaction, the activity
of the catalysts is presented for reaction tempera-
tures from 300 to 220 °C (Fig. 5 and 6).
Figures 5a-d show that the NiAl catalyst
hydrogenated CO2 to levels below 4 ppm at 300 °C
and GHSV up to 22000 h–1
irrespective of reduction
temperature. In contrast to this, the Co-Al catalyst
demonstrated a very low activity after reduction at
400 °C (Fig. 5a). Reduction at 600 °C, however,
gave comparable levels of purification with both
catalysts (Fig. 5d).
A similar activity was observed at 280 °C after
reduction at each selected temperature if the activity
was estimated by GHSV at which the concentration
of CO2 at reactor outlet is 10 ppm (Fig. 6a). Unlike
CoAl, the NiAl catalyst remained active at a higher
GHSV (20500 h–1
) after reduction at 400 °C,
whereas the former showed some activity at a lower
GHSV (6.500 h–1
). Reduction at 600 °C gave
priority to NiAl because of 0-ppm CO2 levels.
Gradually the activity of the CoAl catalyst increased
reaching a GHSV of 15500 h–1
after reduction at
600 °C (Fig. 6a). A reaction temperature as low as
260 °C (Fig. 6b) caused a decrease in overall
activity of both catalysts. The NiAl catalyst
manifested a higher activity after reduction in the
range 400530 °C, however, at a lower GHSV.
Almost equal CO2 hydrogenation levels with both
catalysts were achieved upon raising the reduction
temperature up to 600 °C.
M. V. Gabrovska et al.: M-Al layered double hydroxides in CO2 methanation
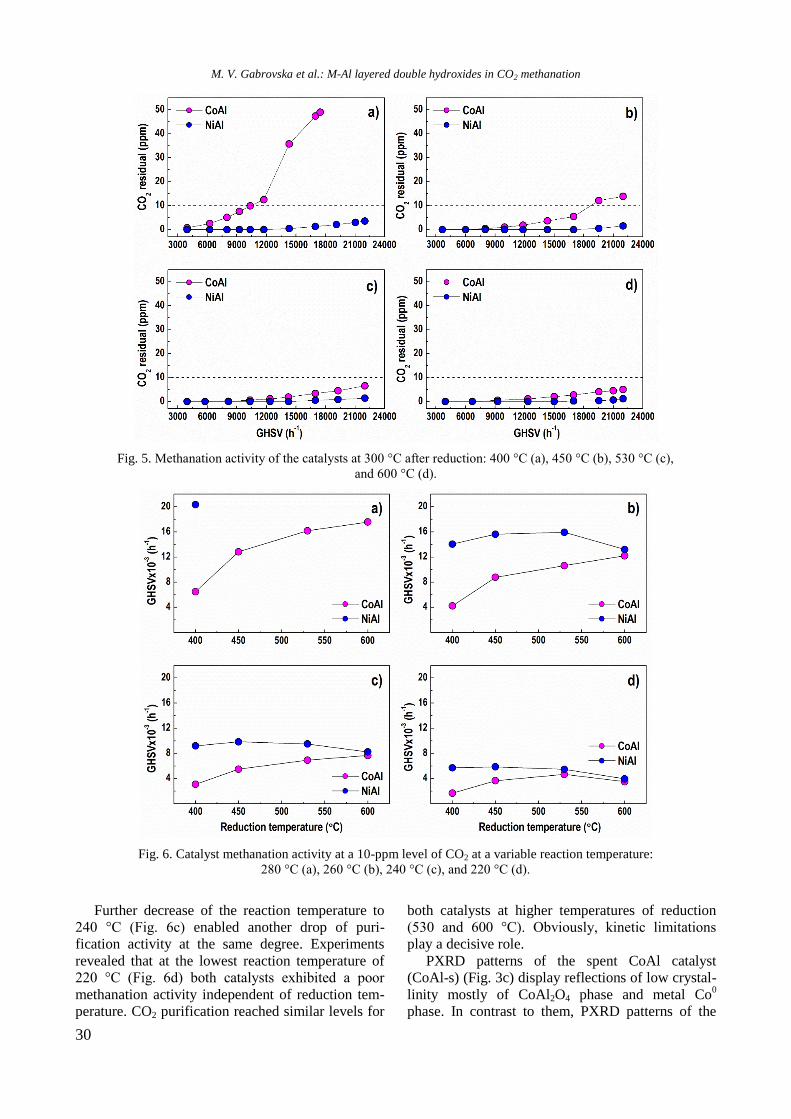
30
Fig. 5. Methanation activity of the catalysts at 300 °C after reduction: 400 °C (a), 450 °C (b), 530 °C (c),
and 600 °C (d).
Fig. 6. Catalyst methanation activity at a 10-ppm level of CO2 at a variable reaction temperature:
280 °C (a), 260 °C (b), 240 °C (c), and 220 °C (d).
Further decrease of the reaction temperature to
240 °C (Fig. 6c) enabled another drop of puri-
fication activity at the same degree. Experiments
revealed that at the lowest reaction temperature of
220 °C (Fig. 6d) both catalysts exhibited a poor
methanation activity independent of reduction tem-
perature. CO2 purification reached similar levels for
both catalysts at higher temperatures of reduction
(530 and 600 °C). Obviously, kinetic limitations
play a decisive role.
PXRD patterns of the spent CoAl catalyst
(CoAl-s) (Fig. 3c) display reflections of low crystal-
linity mostly of CoAl2O4 phase and metal Co0
phase. In contrast to them, PXRD patterns of the
M. V. Gabrovska et al.: M-Al layered double hydroxides in CO2 methanation
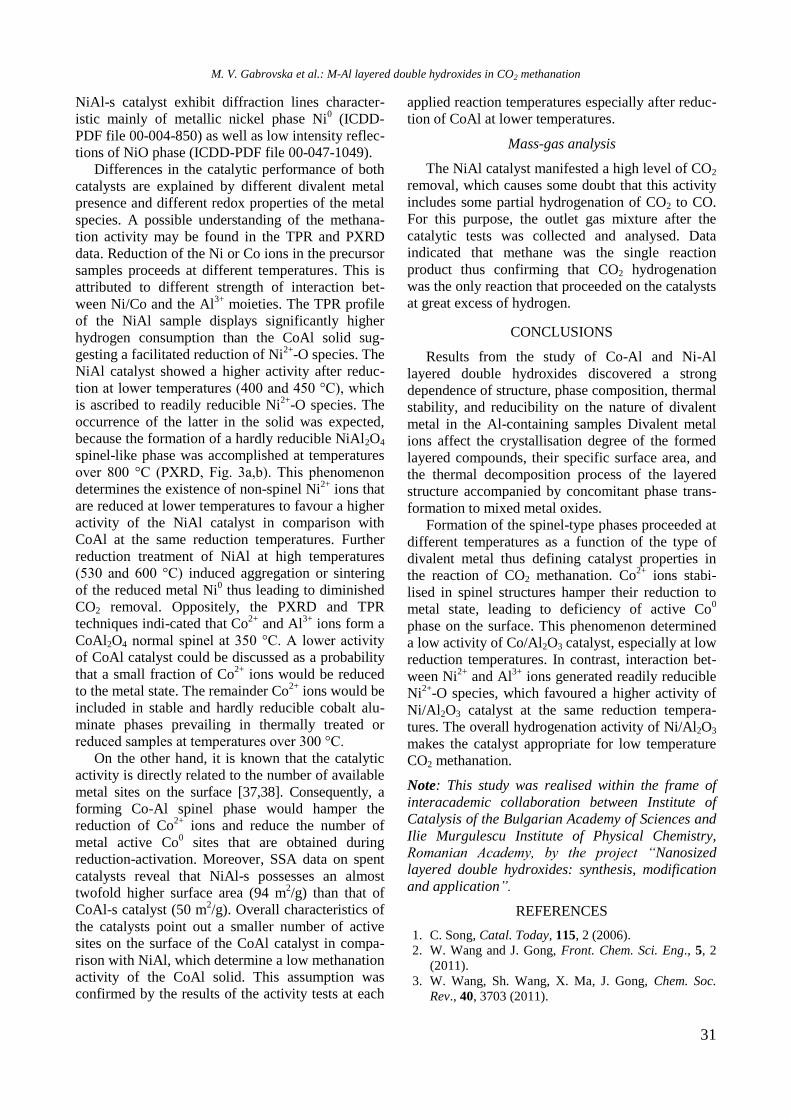
31
NiAl-s catalyst exhibit diffraction lines character-
istic mainly of metallic nickel phase Ni0 (ICDD-
PDF file 00-004-850) as well as low intensity reflec-
tions of NiO phase (ICDD-PDF file 00-047-1049).
Differences in the catalytic performance of both
catalysts are explained by different divalent metal
presence and different redox properties of the metal
species. A possible understanding of the methana-
tion activity may be found in the TPR and PXRD
data. Reduction of the Ni or Co ions in the precursor
samples proceeds at different temperatures. This is
attributed to different strength of interaction bet-
ween Ni/Co and the Al3+
moieties. The TPR profile
of the NiAl sample displays significantly higher
hydrogen consumption than the CoAl solid sug-
gesting a facilitated reduction of Ni2+
-O species. The
NiAl catalyst showed a higher activity after reduc-
tion at lower temperatures (400 and 450 °C), which
is ascribed to readily reducible Ni2+
-O species. The
occurrence of the latter in the solid was expected,
because the formation of a hardly reducible NiAl2O4
spinel-like phase was accomplished at temperatures
over 800 °C (PXRD, Fig. 3a,b). This phenomenon
determines the existence of non-spinel Ni2+
ions that
are reduced at lower temperatures to favour a higher
activity of the NiAl catalyst in comparison with
CoAl at the same reduction temperatures. Further
reduction treatment of NiAl at high temperatures
(530 and 600 °C) induced aggregation or sintering
of the reduced metal Ni0 thus leading to diminished
CO2 removal. Oppositely, the PXRD and TPR
techniques indi-cated that Co2+
and Al3+
ions form a
CoAl2O4 normal spinel at 350 °C. A lower activity
of CoAl catalyst could be discussed as a probability
that a small fraction of Co2+
ions would be reduced
to the metal state. The remainder Co2+
ions would be
included in stable and hardly reducible cobalt alu-
minate phases prevailing in thermally treated or
reduced samples at temperatures over 300 °C.
On the other hand, it is known that the catalytic
activity is directly related to the number of available
metal sites on the surface [37,38]. Consequently, a
forming Co-Al spinel phase would hamper the
reduction of Co2+
ions and reduce the number of
metal active Co0 sites that are obtained during
reduction-activation. Moreover, SSA data on spent
catalysts reveal that NiAl-s possesses an almost
twofold higher surface area (94 m2/g) than that of
CoAl-s catalyst (50 m2/g). Overall characteristics of
the catalysts point out a smaller number of active
sites on the surface of the CoAl catalyst in compa-
rison with NiAl, which determine a low methanation
activity of the CoAl solid. This assumption was
confirmed by the results of the activity tests at each
applied reaction temperatures especially after reduc-
tion of CoAl at lower temperatures.
Mass-gas analysis
The NiAl catalyst manifested a high level of CO2
removal, which causes some doubt that this activity
includes some partial hydrogenation of CO2 to CO.
For this purpose, the outlet gas mixture after the
catalytic tests was collected and analysed. Data
indicated that methane was the single reaction
product thus confirming that CO2 hydrogenation
was the only reaction that proceeded on the catalysts
at great excess of hydrogen.
CONCLUSIONS
Results from the study of Co-Al and Ni-Al
layered double hydroxides discovered a strong
dependence of structure, phase composition, thermal
stability, and reducibility on the nature of divalent
metal in the Al-containing samples Divalent metal
ions affect the crystallisation degree of the formed
layered compounds, their specific surface area, and
the thermal decomposition process of the layered
structure accompanied by concomitant phase trans-
formation to mixed metal oxides.
Formation of the spinel-type phases proceeded at
different temperatures as a function of the type of
divalent metal thus defining catalyst properties in
the reaction of CO2 methanation. Co2+
ions stabi-
lised in spinel structures hamper their reduction to
metal state, leading to deficiency of active Co0
phase on the surface. This phenomenon determined
a low activity of Co/Al2O3 catalyst, especially at low
reduction temperatures. In contrast, interaction bet-
ween Ni2+
and Al3+
ions generated readily reducible
Ni2+
-O species, which favoured a higher activity of
Ni/Al2O3 catalyst at the same reduction tempera-
tures. The overall hydrogenation activity of Ni/Al2O3
makes the catalyst appropriate for low temperature
CO2 methanation.
Note: This study was realised within the frame of
interacademic collaboration between Institute of
Catalysis of the Bulgarian Academy of Sciences and
Ilie Murgulescu Institute of Physical Chemistry,
Romanian Academy, by the project “Nanosized
layered double hydroxides: synthesis, modification
and application”.
REFERENCES
1. C. Song, Catal. Today, 115, 2 (2006).
2. W. Wang and J. Gong, Front. Chem. Sci. Eng., 5, 2
(2011).
3. W. Wang, Sh. Wang, X. Ma, J. Gong, Chem. Soc.
Rev., 40, 3703 (2011).
M. V. Gabrovska et al.: M-Al layered double hydroxides in CO2 methanation
32
4. K. Xavier, R, Sreekala, K. Rashid, K. Yusuff, B. Sen,
Catal. Today, 49, 17 (1999).
5. G. Xu, X. Chen, Z.-G. Zhang, Chem. Eng. J., 121, 97
(2006).
6. M. Duyar, A. Ramachandran, C. Wan, J. CO2 Util.,
12, 27 (2015).
7. H. Takano, K. Izumiya, N. Kumagai, K. Hashimoto,
Appl. Surf. Sci., 257, 8171 (2011).
8. G. Garbarino, P. Riani, L. Magistri, G. Busca, Int. J.
Hydrogen Energy, 39, 11557 (2014).
9. P. Frontera, A. Macario, M. Ferraro, P-L. Antonucci,
Catalysts, 7, 59 (2017).
10. R. Allmann, Chimia, 24, 99(1970).
11. F. Cavani, F. Trifirò, A. Vaccari, Catal. Today, 11,
173 (1991).
12. A. Vaccari, Catal. Today, 41, 53(1998).
13. A. Vaccari, Appl. Clay Sci., 14, 161 (1999).
14. M. Gabrovska, R. Edreva-Kardjieva, D. Crişan, P.
Tzvetkov, M. Shopska, I. Shtereva, React. Kinet.
Mech. Cat., 105, 79 (2012).
15. M. V. Gabrovska, R. M. Edreva-Kardjieva, D. D.
Crişan, K. K. Tenchev, D. A. Nikolova, M. Crişan,
Bulg. Chem. Commun., 45, 617 (2013).
16. J. Janlamool, P. Praserthdam, B. Jongsomjit, J. Nat.
Gas Chem., 20, 558 (2011).
17. G. Zhou, T. Wu, H. Xie, X. Zheng, Int. J. Hydrogen
Energy, 38, 10012 (2013).
18. D. Monti, A. Baiker, J. Catal., 83, 323 (1983).
19. R. Shannon, Acta Crystallogr. A, 32, 751 (1976).
20. M. Gabrovska, R. Edreva-Kardjieva, K. Tenchev, P.
Tzvetkov, A. Spojakina, L. Petrov, Appl. Catal. A:
Gen., 399, 242 (2011).
21. M. Ulibarri, J. Fernández, F. Labajos, V. Rives,
Chem. Mater., 3, 626 (1991).
22. S. Kannan, S. Velu, V. Ramkumar, C. Swamy, J.
Mater. Sci., 30, 1462 (1995).
23. T. Sato, U. Fujita, T. Endo, M. Shimada, A.
Tsunashima, Reactivity of Solids, 5, 219 (1988).
24. S. Kannan, C. Swamy, Catal. Today, 53, 725 (1999).
25. J. Pérez-Ramírez, G. Mul, F. Kapteijn, J. Moulijn, J.
Mater. Chem., 11, 821 (2001).
26. S. Kannan, A. Narayanan, C. Swamy, J. Mater. Sci.,
31, 2353 (1996).
27. J. Pérez-Ramírez, G. Mul, J. Moulijn, Vib.
Spectrosc., 27, 75 (2001).
28. O. Lebedeva, D. Tichit, B. Coq, Appl Catal. A: Gen.,
183, 61 (1999).
29. P. Arnoldy, J. Moulijn, J. Catal., 93, 38 (1985);
30. S. Velu, K. Suzuki, T. Osaki, Catal. Lett., 69, 43
(2000).
31. A. Alvarez, S. Ivanova, M. Centeno, J. Odriozola,
Appl. Catal. A: Gen., 431–432, 9 (2012).
32. S. Rane, O. Borg, J. Yang, E. Rytter, A. Holmen,
Appl. Catal. A: Gen., 388, 160 (2010).
33. M. de Beer, A. Kunene, D. Nabaho, M. Claeys, E.
van Steen, J. South. Afr. Inst. Min. Metall., 114, 157
(2014).
34. H. Kung, J. Catal., 73, 387 (1982).
35. O. Clause, B. Rebours, E. Merlen, F. Trifiro, A.
Vaccari, J. Catal., 133, 231 (1992).
36. F. Trifiro, A. Vaccari, O. Clause, Catal. Today, 21,
185 (1994).
37. J. Lahtinen, T. Anraku, G. Somorjai, Catal. Lett., 25,
241 (1994).
38. G. Fröhlich, U. Kestel, J. Lojewska, T. Lojewski, G.
Meyer, M. Voß, D. Borgmann, R. Dziembaj, G.
Wedler, Appl. Catal. A: Gen., 134, 1 (1996).
M. V. Gabrovska et al.: M-Al layered double hydroxides in CO2 methanation
33
СТРУКТУРА И АКТИВНОСТ НА М-Аl СЛОЕСТИ ДВОЙНИ ХИДРООКИСИ В РЕАКЦИЯТА НА
МЕТАНИРАНЕ НА СО2 КАТО ФУНКЦИЯ НА ДВУВАЛЕНТНИЯ МЕТАЛ
М. В. Габровска1*, Д. Кришан
2, Д. А. Николова
1, И. Ж. Щерева
1, Л. П. Билярска
1, М. Кришан
2,
Р. М. Едрева-Кърджиева1
1 Институт по катализ, Българска академия на науките, ул. Акад. Г. Бончев, бл. 11, 1113 София, България
2 Институт по физикохимия „Илие Мъргулеску“, Румънска академия, 202 бул. „Индепенденцей“,
060021 Букурещ-12, Румъния
Постъпила на: 04 март 2018 г.; Преработена на 26 март 2018 г.
(Резюме)
Изследван е ефектът на вида на двувалентния метал (Ni или Co) върху структурата, фазовия състав,
термичната стабилност и редуцируемостта на съутаени Аl-съдържащи слоести двойни хидроксиди (СДХ) като
прекурсори на катализатори за фино очистване от СО2 чрез реакцията на метаниране. Направена е оценка на
каталитичната активност чрез промяна на температурата на редукция, реакционната температура и обемната
скорост. Разкрито е, че природата на двувалентния метал в Аl-съдържащите СДХ влияе върху кристалността на
образуваните СДХ, специфичната им повърхност и температурата на разлагане на слоеста структура до
съответните смесени метални оксиди. Установено е, че стабилизирането на Co2+
йоните в шпинелната CoAl2O4
структура възпрепятства редукцията им до метално състояние, което води до недостатъчно количество от
активна метална Co0 фаза на повърхността. Този факт определя ниската метанираща активност на Co/Al2O3
катализатор, особено при по-ниски температури на редукция. В контраст на това, взаимодействието между Ni2+
и Al3+
йоните предизвиква формиране на лесно редуцируеми Ni2+
‒O структури, което благоприятства по-висока
активност на Ni/Al2O3 катализатор при същите температури на редукция. Образуването на шпинело-подобни
фази е функция на вида на двувалентния метал и е определящо за активността на катализаторите при фино
очистване от СО2 на богати на водород газови смеси чрез реакцията на метаниране.
M. V. Gabrovska et al.: M-Al layered double hydroxides in CO2 methanation
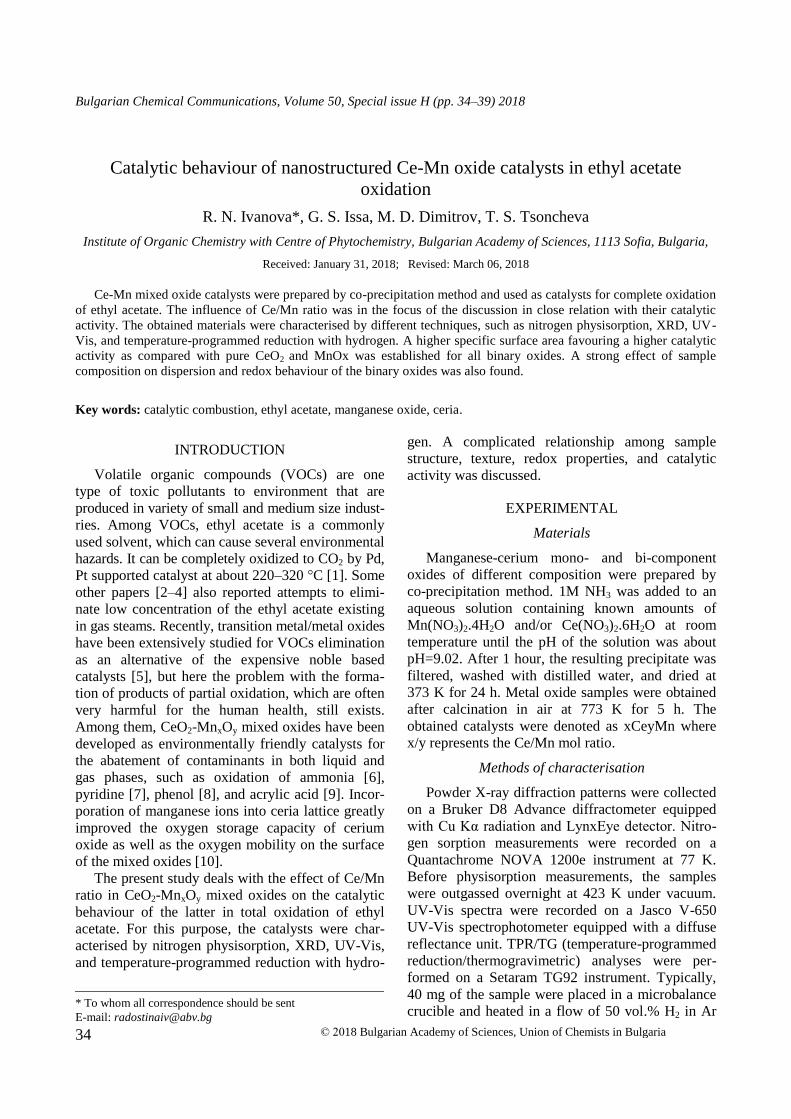
34
Bulgarian Chemical Communications, Volume 50, Special issue H (pp. 34–39) 2018
Catalytic behaviour of nanostructured Ce-Mn oxide catalysts in ethyl acetate
oxidation
R. N. Ivanova*, G. S. Issa, M. D. Dimitrov, T. S. Tsoncheva
Institute of Organic Chemistry with Centre of Phytochemistry, Bulgarian Academy of Sciences, 1113 Sofia, Bulgaria,
Received: January 31, 2018; Revised: March 06, 2018
Ce-Mn mixed oxide catalysts were prepared by co-precipitation method and used as catalysts for complete oxidation
of ethyl acetate. The influence of Ce/Mn ratio was in the focus of the discussion in close relation with their catalytic
activity. The obtained materials were characterised by different techniques, such as nitrogen physisorption, XRD, UV-
Vis, and temperature-programmed reduction with hydrogen. A higher specific surface area favouring a higher catalytic
activity as compared with pure CeO2 and MnOx was established for all binary oxides. A strong effect of sample
composition on dispersion and redox behaviour of the binary oxides was also found.
Key words: catalytic combustion, ethyl acetate, manganese oxide, ceria.
INTRODUCTION
Volatile organic compounds (VOCs) are one
type of toxic pollutants to environment that are
produced in variety of small and medium size indust-
ries. Among VOCs, ethyl acetate is a commonly
used solvent, which can cause several environmental
hazards. It can be completely oxidized to CO2 by Pd,
Pt supported catalyst at about 220–320 °C [1]. Some
other papers [2–4] also reported attempts to elimi-
nate low concentration of the ethyl acetate existing
in gas steams. Recently, transition metal/metal oxides
have been extensively studied for VOCs elimination
as an alternative of the expensive noble based
catalysts [5], but here the problem with the forma-
tion of products of partial oxidation, which are often
very harmful for the human health, still exists.
Among them, CeO2-MnxOy mixed oxides have been
developed as environmentally friendly catalysts for
the abatement of contaminants in both liquid and
gas phases, such as oxidation of ammonia [6],
pyridine [7], phenol [8], and acrylic acid [9]. Incor-
poration of manganese ions into ceria lattice greatly
improved the oxygen storage capacity of cerium
oxide as well as the oxygen mobility on the surface
of the mixed oxides [10].
The present study deals with the effect of Ce/Mn
ratio in CeO2-MnxOy mixed oxides on the catalytic
behaviour of the latter in total oxidation of ethyl
acetate. For this purpose, the catalysts were char-
acterised by nitrogen physisorption, XRD, UV-Vis,
and temperature-programmed reduction with hydro-
gen. A complicated relationship among sample
structure, texture, redox properties, and catalytic
activity was discussed.
EXPERIMENTAL
Materials
Manganese-cerium mono- and bi-component
oxides of different composition were prepared by
co-precipitation method. 1M NH3 was added to an
aqueous solution containing known amounts of
Mn(NO3)2.4H2O and/or Ce(NO3)2.6H2O at room
temperature until the pH of the solution was about
pH=9.02. After 1 hour, the resulting precipitate was
filtered, washed with distilled water, and dried at
373 K for 24 h. Metal oxide samples were obtained
after calcination in air at 773 K for 5 h. The
obtained catalysts were denoted as xCeyMn where
x/y represents the Ce/Mn mol ratio.
Methods of characterisation
Powder X-ray diffraction patterns were collected
on a Bruker D8 Advance diffractometer equipped
with Cu Kα radiation and LynxEye detector. Nitro-
gen sorption measurements were recorded on a
Quantachrome NOVA 1200e instrument at 77 K.
Before physisorption measurements, the samples
were outgassed overnight at 423 K under vacuum.
UV-Vis spectra were recorded on a Jasco V-650
UV-Vis spectrophotometer equipped with a diffuse
reflectance unit. TPR/TG (temperature-programmed
reduction/thermogravimetric) analyses were per-
formed on a Setaram TG92 instrument. Typically,
40 mg of the sample were placed in a microbalance
crucible and heated in a flow of 50 vol.% H2 in Ar
© 2018 Bulgarian Academy of Sciences, Union of Chemists in Bulgaria
* To whom all correspondence should be sent
E-mail: [email protected]
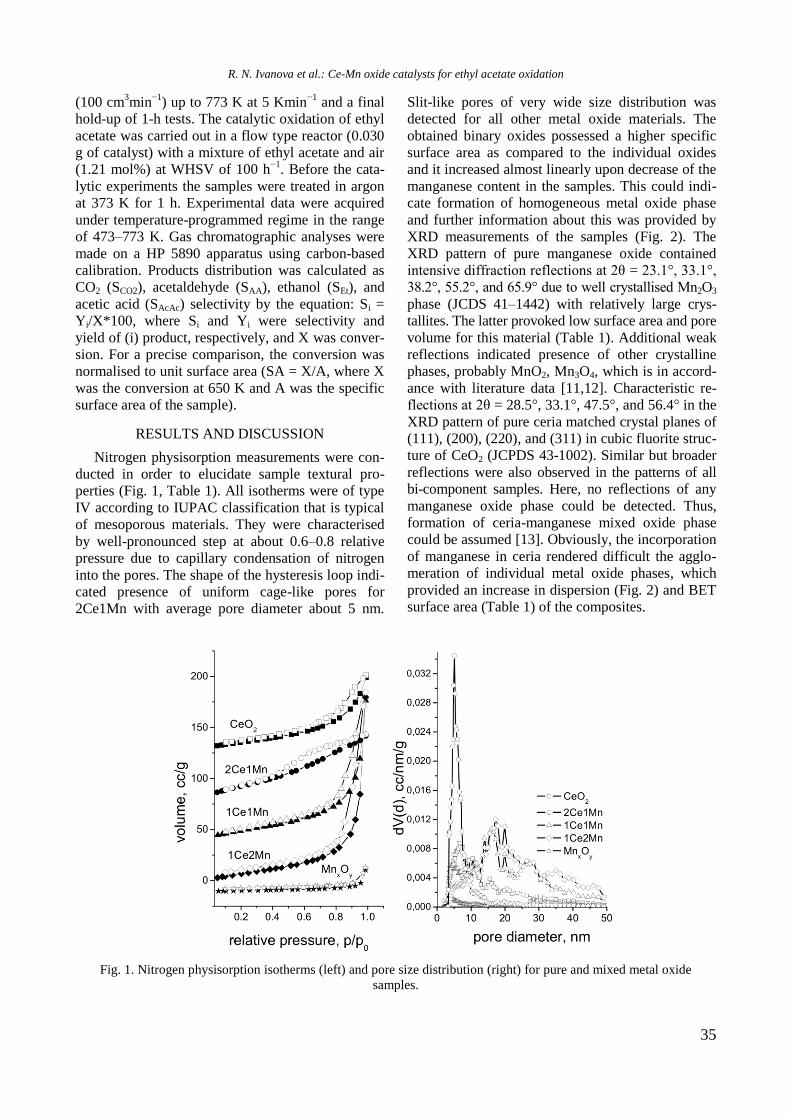
35
(100 cm3min
−1) up to 773 K at 5 Kmin
−1 and a final
hold-up of 1-h tests. The catalytic oxidation of ethyl
acetate was carried out in a flow type reactor (0.030
g of catalyst) with a mixture of ethyl acetate and air
(1.21 mol%) at WHSV of 100 h−1
. Before the cata-
lytic experiments the samples were treated in argon
at 373 K for 1 h. Experimental data were acquired
under temperature-programmed regime in the range
of 473–773 K. Gas chromatographic analyses were
made on a HP 5890 apparatus using carbon-based
calibration. Products distribution was calculated as
CO2 (SCO2), acetaldehyde (SAA), ethanol (SEt), and
acetic acid (SAcAc) selectivity by the equation: Si =
Yi/X*100, where Si and Yi were selectivity and
yield of (i) product, respectively, and X was conver-
sion. For a precise comparison, the conversion was
normalised to unit surface area (SA = X/A, where X
was the conversion at 650 K and A was the specific
surface area of the sample).
RESULTS AND DISCUSSION
Nitrogen physisorption measurements were con-
ducted in order to elucidate sample textural pro-
perties (Fig. 1, Table 1). All isotherms were of type
IV according to IUPAC classification that is typical
of mesoporous materials. They were characterised
by well-pronounced step at about 0.6–0.8 relative
pressure due to capillary condensation of nitrogen
into the pores. The shape of the hysteresis loop indi-
cated presence of uniform cage-like pores for
2Ce1Mn with average pore diameter about 5 nm.
Slit-like pores of very wide size distribution was
detected for all other metal oxide materials. The
obtained binary oxides possessed a higher specific
surface area as compared to the individual oxides
and it increased almost linearly upon decrease of the
manganese content in the samples. This could indi-
cate formation of homogeneous metal oxide phase
and further information about this was provided by
XRD measurements of the samples (Fig. 2). The
XRD pattern of pure manganese oxide contained
intensive diffraction reflections at 2θ = 23.1°, 33.1°,
38.2°, 55.2°, and 65.9° due to well crystallised Mn2O3
phase (JCDS 41–1442) with relatively large crys-
tallites. The latter provoked low surface area and pore
volume for this material (Table 1). Additional weak
reflections indicated presence of other crystalline
phases, probably MnO2, Mn3O4, which is in accord-
ance with literature data [11,12]. Characteristic re-
flections at 2θ = 28.5°, 33.1°, 47.5°, and 56.4° in the
XRD pattern of pure ceria matched crystal planes of
(111), (200), (220), and (311) in cubic fluorite struc-
ture of CeO2 (JCPDS 43-1002). Similar but broader
reflections were also observed in the patterns of all
bi-component samples. Here, no reflections of any
manganese oxide phase could be detected. Thus,
formation of ceria-manganese mixed oxide phase
could be assumed [13]. Obviously, the incorporation
of manganese in ceria rendered difficult the agglo-
meration of individual metal oxide phases, which
provided an increase in dispersion (Fig. 2) and BET
surface area (Table 1) of the composites.
Fig. 1. Nitrogen physisorption isotherms (left) and pore size distribution (right) for pure and mixed metal oxide
samples.
R. N. Ivanova et al.: Ce-Mn oxide catalysts for ethyl acetate oxidation
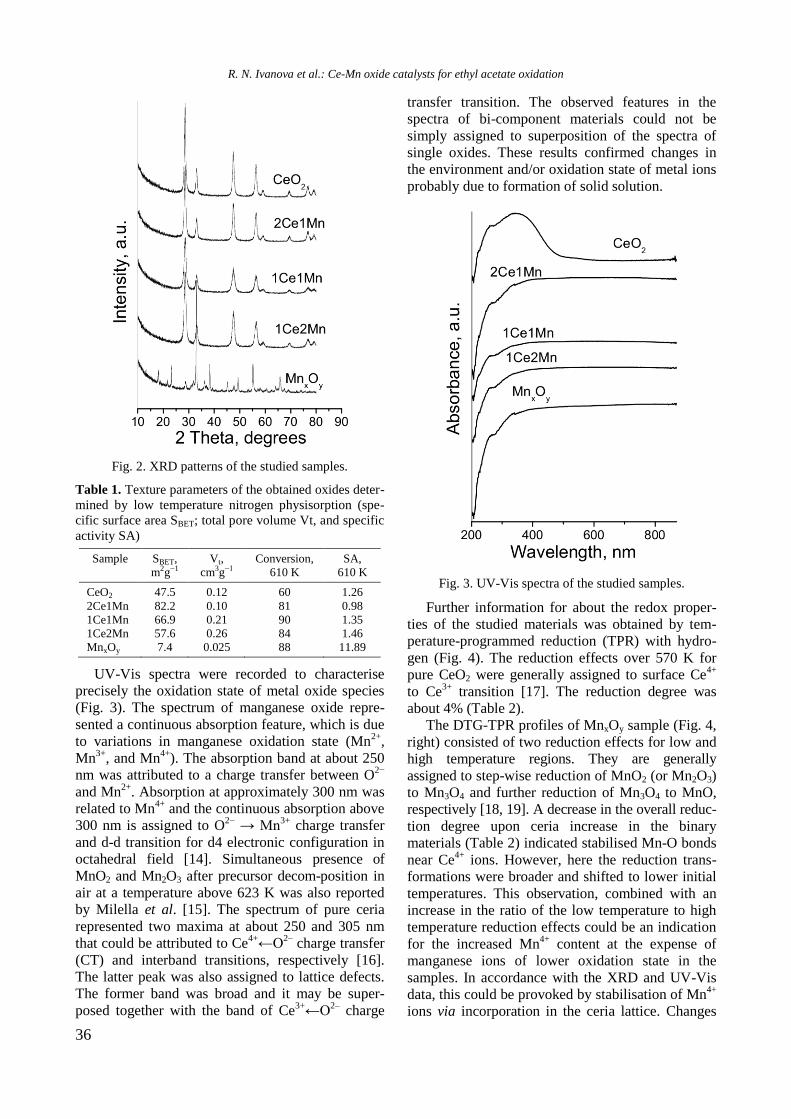
36
Fig. 2. XRD patterns of the studied samples.
Table 1. Texture parameters of the obtained oxides deter-
mined by low temperature nitrogen physisorption (spe-
cific surface area SBET; total pore volume Vt, and specific
activity SA)
Sample SBET,
m2g−1
Vt,
cm3g−1
Conversion,
610 K
SA,
610 K
CeO2 47.5 0.12 60 1.26
2Ce1Mn 82.2 0.10 81 0.98
1Ce1Mn 66.9 0.21 90 1.35
1Ce2Mn 57.6 0.26 84 1.46
MnxOy 7.4 0.025 88 11.89
UV-Vis spectra were recorded to characterise
precisely the oxidation state of metal oxide species
(Fig. 3). The spectrum of manganese oxide repre-
sented a continuous absorption feature, which is due
to variations in manganese oxidation state (Mn2+
,
Mn3+
, and Mn4+
). The absorption band at about 250
nm was attributed to a charge transfer between O2−
and Mn2+
. Absorption at approximately 300 nm was
related to Mn4+
and the continuous absorption above
300 nm is assigned to O2−
→ Mn3+
charge transfer
and d-d transition for d4 electronic configuration in
octahedral field [14]. Simultaneous presence of
MnO2 and Mn2O3 after precursor decom-position in
air at a temperature above 623 K was also reported
by Milella et al. [15]. The spectrum of pure ceria
represented two maxima at about 250 and 305 nm
that could be attributed to Ce4+
←O2‒
charge transfer
(CT) and interband transitions, respectively [16].
The latter peak was also assigned to lattice defects.
The former band was broad and it may be super-
posed together with the band of Ce3+
←O2‒
charge
transfer transition. The observed features in the
spectra of bi-component materials could not be
simply assigned to superposition of the spectra of
single oxides. These results confirmed changes in
the environment and/or oxidation state of metal ions
probably due to formation of solid solution.
Fig. 3. UV-Vis spectra of the studied samples.
Further information for about the redox proper-
ties of the studied materials was obtained by tem-
perature-programmed reduction (TPR) with hydro-
gen (Fig. 4). The reduction effects over 570 K for
pure CeO2 were generally assigned to surface Ce4+
to Ce3+
transition [17]. The reduction degree was
about 4% (Table 2).
The DTG-TPR profiles of MnxOy sample (Fig. 4,
right) consisted of two reduction effects for low and
high temperature regions. They are generally
assigned to step-wise reduction of MnO2 (or Mn2O3)
to Mn3O4 and further reduction of Mn3O4 to MnO,
respectively [18, 19]. A decrease in the overall reduc-
tion degree upon ceria increase in the binary
materials (Table 2) indicated stabilised Mn-O bonds
near Ce4+
ions. However, here the reduction trans-
formations were broader and shifted to lower initial
temperatures. This observation, combined with an
increase in the ratio of the low temperature to high
temperature reduction effects could be an indication
for the increased Mn4+
content at the expense of
manganese ions of lower oxidation state in the
samples. In accordance with the XRD and UV-Vis
data, this could be provoked by stabilisation of Mn4+
ions via incorporation in the ceria lattice. Changes
R. N. Ivanova et al.: Ce-Mn oxide catalysts for ethyl acetate oxidation
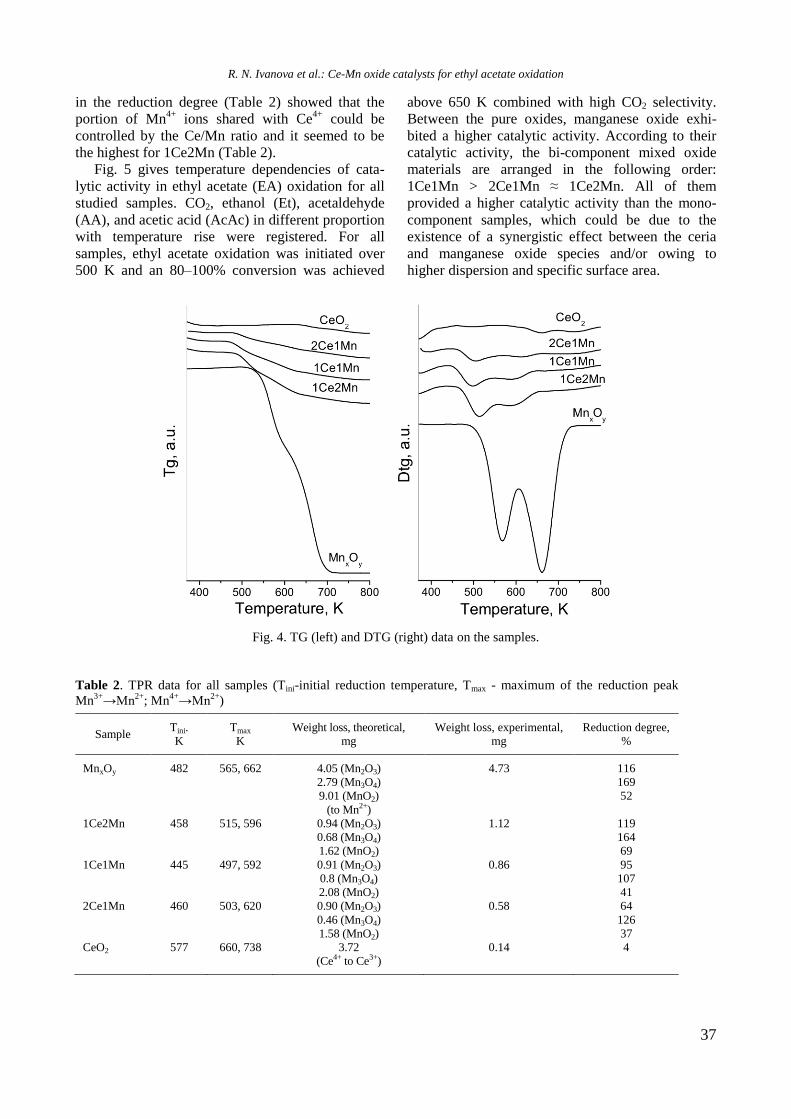
37
in the reduction degree (Table 2) showed that the
portion of Mn4+
ions shared with Ce4+
could be
controlled by the Ce/Mn ratio and it seemed to be
the highest for 1Ce2Mn (Table 2).
Fig. 5 gives temperature dependencies of cata-
lytic activity in ethyl acetate (EA) oxidation for all
studied samples. CO2, ethanol (Et), acetaldehyde
(AA), and acetic acid (AcAc) in different proportion
with temperature rise were registered. For all
samples, ethyl acetate oxidation was initiated over
500 K and an 80–100% conversion was achieved
above 650 K combined with high CO2 selectivity.
Between the pure oxides, manganese oxide exhi-
bited a higher catalytic activity. According to their
catalytic activity, the bi-component mixed oxide
materials are arranged in the following order:
1Ce1Mn > 2Ce1Mn ≈ 1Ce2Mn. All of them
provided a higher catalytic activity than the mono-
component samples, which could be due to the
existence of a synergistic effect between the ceria
and manganese oxide species and/or owing to
higher dispersion and specific surface area.
Fig. 4. TG (left) and DTG (right) data on the samples.
Table 2. TPR data for all samples (Tini-initial reduction temperature, Tmax - maximum of the reduction peak
Mn3+
→Mn2+
; Mn4+
→Mn2+
)
Sample Tini.
K
Tmax
K
Weight loss, theoretical,
mg
Weight loss, experimental,
mg
Reduction degree,
%
MnxOy 482 565, 662 4.05 (Mn2O3)
2.79 (Mn3O4)
9.01 (MnO2)
(to Mn2+)
4.73 116
169
52
1Ce2Mn 458 515, 596 0.94 (Mn2O3)
0.68 (Mn3O4)
1.62 (MnO2)
1.12 119
164
69
1Ce1Mn 445 497, 592 0.91 (Mn2O3)
0.8 (Mn3O4)
2.08 (MnO2)
0.86 95
107
41
2Ce1Mn 460 503, 620 0.90 (Mn2O3)
0.46 (Mn3O4)
1.58 (MnO2)
0.58 64
126
37
CeO2 577 660, 738 3.72
(Ce4+ to Ce3+)
0.14 4
R. N. Ivanova et al.: Ce-Mn oxide catalysts for ethyl acetate oxidation
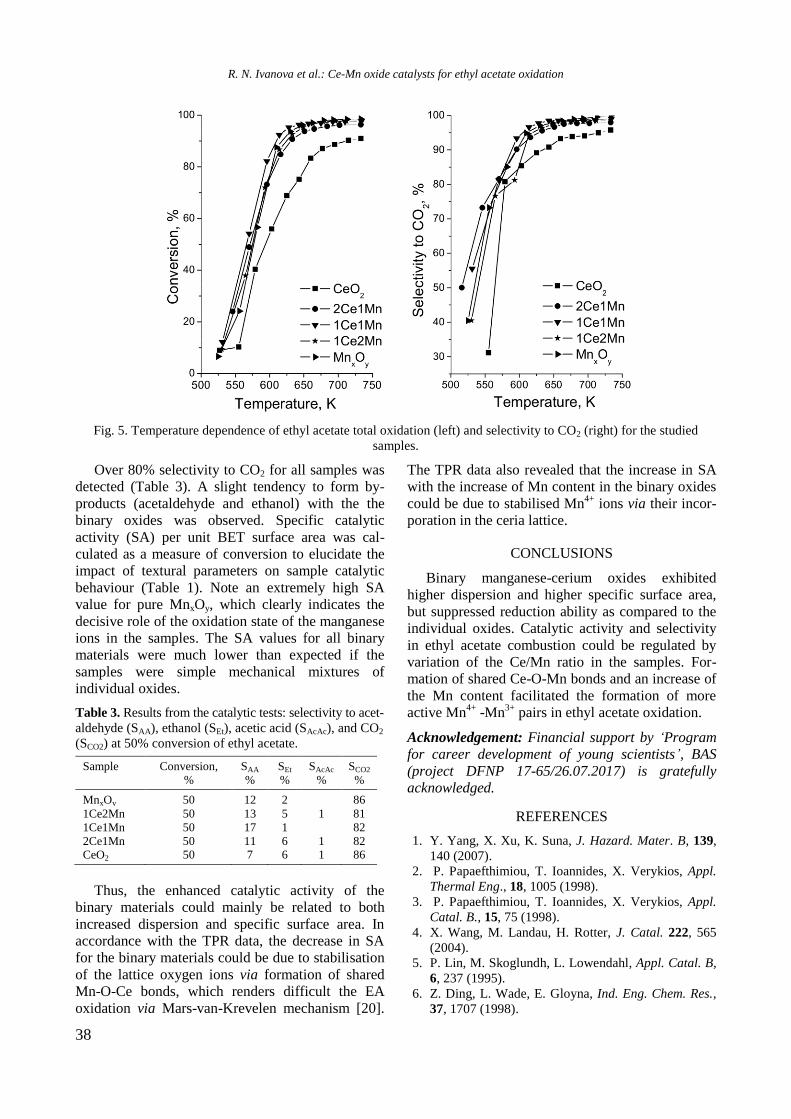
38
Fig. 5. Temperature dependence of ethyl acetate total oxidation (left) and selectivity to CO2 (right) for the studied
samples.
Over 80% selectivity to CO2 for all samples was
detected (Table 3). A slight tendency to form by-
products (acetaldehyde and ethanol) with the the
binary oxides was observed. Specific catalytic
activity (SA) per unit BET surface area was cal-
culated as a measure of conversion to elucidate the
impact of textural parameters on sample catalytic
behaviour (Table 1). Note an extremely high SA
value for pure MnxOy, which clearly indicates the
decisive role of the oxidation state of the manganese
ions in the samples. The SA values for all binary
materials were much lower than expected if the
samples were simple mechanical mixtures of
individual oxides.
Table 3. Results from the catalytic tests: selectivity to acet-
aldehyde (SAA), ethanol (SEt), acetic acid (SAcAc), and CO2
(SCO2) at 50% conversion of ethyl acetate.
Sample Conversion,
%
SAA
%
SEt
%
SAcAc
%
SCO2
%
MnxOy 50 12 2 86
1Ce2Mn 50 13 5 1 81
1Ce1Mn 50 17 1 82
2Ce1Mn 50 11 6 1 82 CeO2 50 7 6 1 86
Thus, the enhanced catalytic activity of the
binary materials could mainly be related to both
increased dispersion and specific surface area. In
accordance with the TPR data, the decrease in SA
for the binary materials could be due to stabilisation
of the lattice oxygen ions via formation of shared
Mn-O-Ce bonds, which renders difficult the EA
oxidation via Mars-van-Krevelen mechanism [20].
The TPR data also revealed that the increase in SA
with the increase of Mn content in the binary oxides
could be due to stabilised Mn4+
ions via their incor-
poration in the ceria lattice.
CONCLUSIONS
Binary manganese-cerium oxides exhibited
higher dispersion and higher specific surface area,
but suppressed reduction ability as compared to the
individual oxides. Catalytic activity and selectivity
in ethyl acetate combustion could be regulated by
variation of the Ce/Mn ratio in the samples. For-
mation of shared Ce-O-Mn bonds and an increase of
the Mn content facilitated the formation of more
active Mn4+
-Mn3+
pairs in ethyl acetate oxidation.
Acknowledgement: Financial support by ‘Program
for career development of young scientists’, BAS
(project DFNP 17-65/26.07.2017) is gratefully
acknowledged.
REFERENCES
1. Y. Yang, X. Xu, K. Suna, J. Hazard. Mater. B, 139,
140 (2007).
2. P. Papaefthimiou, T. Ioannides, X. Verykios, Appl.
Thermal Eng., 18, 1005 (1998).
3. P. Papaefthimiou, T. Ioannides, X. Verykios, Appl.
Catal. B., 15, 75 (1998).
4. X. Wang, M. Landau, H. Rotter, J. Catal. 222, 565
(2004).
5. P. Lin, M. Skoglundh, L. Lowendahl, Appl. Catal. B,
6, 237 (1995).
6. Z. Ding, L. Wade, E. Gloyna, Ind. Eng. Chem. Res.,
37, 1707 (1998).
R. N. Ivanova et al.: Ce-Mn oxide catalysts for ethyl acetate oxidation
39
7. S. Aki, M. Abraham, Ind. Eng. Chem. Res., 38, 358
(1999).
8. H. Chen, A. Sayari, A. Adnot, F. Larachi, Appl.
Catal. B, 32, 195 (2001).
9. A. Silva, R. Marques, R. Quinta-Ferreira, Appl.
Catal. B, 47, 269 (2004).
10. X.Tang, Y. Li, X. Huang, Y. Xu, H. Zhu, J. Wang,
W. Shen, Appl. Catal. B, 62, 265 (2006).
11. S. Todorova, A. Naydenov, H. Kolev, K. Tenchev, G.
Ivanov, G. Kadinov, J. Mater. Sci., 46, 7152 (2011).
12. S. Kanungo, J. Catal., 58, 419 (1979).
13. M. Machida, M. Uto, D. Kurogi, T. Kijima, Chem.
Mater., 12, 3158 (2000).
14. Y. Lin, S. Ming, Y. Jian, Y. Qian, H. Zhifeng, L.
Chaosheng, Chin. J. Catal., 29, 1127 (2008).
15. F. Milella, J. Gallardo-Amores, M. Baldic, G. Busca,
J. Mater. Chem., 8, 2525 (1998).
16. A. Kambolis, H. Matralis, A. Trovarelli, C.
Papadopoulou, Appl. Catal. A, 377, 16 (2010).
17. L. Shi, W. Chu, F. Qu, J. Hu, M. Li, J. Rare Earths,
26, 836 (2008).
18. Y. Du, Q. Meng, J. Wanga, J. Yan, H. Fan, Y. Liu,
H. Dai, Micropor. Mesopor. Mater. 162, 199 (2012).
19. D. Delimaris, T. Ioannides, Appl. Catal. B, 84, 303
(2008).
20. P. Larsson, A. Andersson, Appl. Catal. B, 24, 175
(2000).
КАТАЛИТИЧНИ СВОЙСТВА НА НАНОСТРУКТУРИРАНИ Ce-Mn ОКСИДНИ КАТАЛИЗАТОРИ
ЗА ОКИСЛЕНИЕ НА ЕТИЛАЦЕТАТ
Р. Н. Иванова*, Г. С. Исса, М. Д. Димитров, Т. С. Цончева
Институт по органична химия с Център по фитохимия, БАН, 1113 София, България
Постъпила на 31 януари 2018 г.; Преработена на 6 март 2018 г.
(Резюме)
За настоящото изследване бяха получени Ce-Mn смесени оксидни катализатори за изгаряне на етилацетат
чрез метод на съутаяване. Специално внимание бе обърнато на влиянието на съотношението на Ce/Mn, което е
в тясна връзка с каталитичната им активност. Получените материали бяха характеризирани с помощта на
различни методи, сред които азотна физисорбция, прахова рентгенова дифракция, УВ-видима спектроскопия и
температурно-програмирана редукция с водород. Резултатите от физикохимичните изследвания показаха, че
бинарните материали притежават по-висока специфична повърхност, което благоприятства по-високата
каталитична активност в сравнение с еднокомпонентните оксиди. Беше установен значителен ефект на състава
на образците върху тяхната дисперсност и редокси свойства.
R. N. Ivanova et al.: Ce-Mn oxide catalysts for ethyl acetate oxidation
40
Bulgarian Chemical Communications, Volume 50, Special issue H (pp. 40–48) 2018
Biogenic iron-containing materials synthesised in modified Lieske medium:
composition, porous structure, and catalytic activity in n-hexane oxidation
M. Shopska*, G. Kadinov, D. Paneva, I. Yordanova, D. Kovacheva1, A. Naydenov
1,
S. Todorova, Z. Cherkezova-Zheleva, I. Mitov
Institute of Catalysis, Bulgarian Academy of Sciences, Acad. G. Bonchev St., Bldg. 11, 1113 Sofia, Bulgaria 1 Institute of General and Inorganic Chemistry, Bulgarian Academy of Sciences, Acad. G. Bonchev St., Bldg. 11,
1113 Sofia, Bulgaria
Received: January 26, 2018; Revised March 20, 2018
Leptothrix genus bacteria were cultivated in Lieske medium modified by the presence of inorganic material. Two
modifiers were used: a fibrous 0.3% Pd/mesoporous silica-alumina catalyst and a one-side anodic oxidised aluminium
foil. Obtained biomasses (named LieskeV and LieskeA, respectively) were studied by the methods of infrared and
Mössbauer spectroscopy, X-ray diffraction, nitrogen adsorption, and chemical analysis. Examination of fresh samples
revealed that LieskeA contained γ-FeOOH, α-FeOOH, and Fe3O4, whereas LieskeV comprised γ-FeOOH, α-FeOOH,
and γ-Fe2O3 of various ratios. Elemental analysis indicated 0.003% Pd and proved that some amount of the modifier is
incorporated in the LieskeV material. Registered transformations in original (biogenic or chemical) iron oxide/hy-
droxide phases after catalytic activity tests confirmed that LieskeV samples contained a larger amount of γ-Fe2O3
obtained from biogenic precursor, and some γ-FeOOH. LieskeV biomass was found to be more active in the reaction of
n-hexane oxidation. This material also impeded incomplete oxidation to carbon monoxide. Despite very small amounts
of palladium present in LieskeV samples, the latter process is probably assisted since palladium is an active catalyst for
CO oxidation. Carbon monoxide oxidation in the case of LieskeV samples was stimulated by two components, which
exhibit a certain activity in the studied process. Biogenic γ-Fe2O3 showed some intrinsic activity in CO oxidation and its
dominance is a second reason for control of the incomplete hexane oxidation. A third feature of the Pd-modified
samples, determining their relatively higher activity, is the presence of slightly larger pores that allow enhanced mass
transfer of the reagents inside the catalytic particles.
Key words: Leptothrix sp., biogenic iron-containing material, hexane oxidation.
INTRODUCTION
Volatile organic compounds (VOCs) as low
molecular weight hydrocarbons and oxygen con-
taining compounds are main air pollutants. They are
precursors of ozone formation in the air ground
layer and have influence on processes of greenhouse
gas oxidation and formation in troposphere. Volatile
organic compounds together with fine dust particles
cause photochemical smog formation. The smog has
a harmful effect on the human health and plants.
Hexane is a representative of the volatile hydro-
carbons group and is widely used in a number of
chemical productions as solvent or reagent, e.g. glue
production, leather treatment, and pharmaceutical
industry. It participates in radical reactions in the air
and the formed products become involved in a
photochemical smog. Hexane is included in Direc-
tive 2008/50/EC list about air quality as a compound
referred to be strictly monitored and measured
because it is a precursor for ozone formation [1].
One way to decrease and/or eliminate hexane
emissions is their catalytic oxidation to carbon
dioxide and water. The catalysts applied in this
process should exhibit high activity in a wide range
of reaction temperature even in the presence of
various contaminants, stable performance over a
large variety space velocities and substance concen-
trations, resistance to deactivation, and ability for
regeneration [2]. There are three groups of oxidation
catalysts: i) supported noble metals; ii) metal oxides
and supported metal oxides; iii) mixtures of noble
metal and metal oxide. The most explored catalysts
for complete oxidation contain mono- and bimetallic
Pt, Pd, and Rh [3,4]. They satisfy to high extent
above-mentioned requirements, however, high cost
and easy particle agglomeration encourage search
for other active materials. Single and mixed metal
oxides of Cu, Mn, Cr, Fe, and Ni can be applied as
catalytic materials to this process [5,6]. Transition
metal oxide catalysts are moderately resistant to
sulphur poisoning and are less active at low tem-
peratures than noble metals but a combination of
several oxides could result in highly thermally
stable catalysts of satisfactory activity. Transition * To whom all correspondence should be sent
E-mail: [email protected]
© 2018 Bulgarian Academy of Sciences, Union of Chemists in Bulgaria
41
metal oxides of Mn, Fe, and Co are most active in
the oxidation of volatile organic compounds [7].
Single metal oxides, amongst them FexOy, have also
been used for this purpose [8]. It has been found that
nanosized iron oxides show high activity in CO,
CH4, C3H8, and C3H6 oxidation, selective oxidation
of alcohols and olefins, and ethylbenzene dehydro-
genation [9]. They are also active in soot removal.
However, published investigations on hexane oxida-
tion in the presence of iron oxide catalysts are few.
Mixed valence oxides containing divalent and
trivalent cations of transition metals form stable
spinel structures of the AB2O4 type, in particular
Fe3O4. Cations with multiple oxidation states having
close values of the crystal field stabilisation energy
of octahedral and tetrahedral sites are the main
reason for existing abundant defective spinel struc-
tures and non-stoichiometry [10]. Me2O3 oxides (e.g.
γ-Fe2O3) crystallise in metastable spinel structures.
Corundum is an exception because it is thermodyna-
mically stable. Non-stoichiometric cation-deficient
spinel structures are known for different transition
metal oxides. These materials have been applied as
oxidation catalysts and electrode materials [11–14].
Metal oxide bulk and surface oxygen mobility is
significant to enhance catalyst performance in oxi-
dation reactions. A fast electron exchange in the
Fe2+
/Fe3+
couple in magnetite (Fe3O4) is directly
related to oxygen mobility that facilitates redox
reactions. Iron oxide nanoparticles have largely a
defect crystal structure, which is energy uncomp-
ensated. Particle sizes, smaller than about 15 nm,
induce a unique magnetic property of superpara-
magnetism. The latter has attracted much attention
because of useful applications in different fields of
science and practice.
Iron oxide compounds can be synthesised by
different abiotic and biotic methods. Conventional
techniques (chemical, mechanical) use toxic and
expensive chemicals and devices, and require high-
energy consumption and detoxification of waste
flows that raise catalyst costs [15–19]. However,
obtained products are of good purity and have well-
defined properties. Bio-inspired technologies imitate
natural processes of iron mineralisation by inclusion
of different mediators. One trend is to exploit dif-
ferent bacteria. These microorganisms are wide-
spread in nature and their possibilities are not fully
investigated and used [15,20]. Iron biomineralisa-
tion through bacteria is clean, simple, nontoxic, low-
cost, and needs ambient conditions. Produced iron
oxide materials are cheap. This kind of synthesis
does not use dangerous reagents. Cultivation of iron
bacteria for biogenic iron (oxy)(hydr)oxides syn-
thesis takes part in diluted feeding solutions till their
nutrition components are running low or their con-
centration decreases under critical values related to
microorganism life support. Because of that, there is
no evolution of toxic products and this approach
enables material preparation without evolving haz-
ardous waste. Thus, biomineralisation methods are
definitely environmentally friendly [15,18,21–30].
Ferric ion deposition by bacteria is relatively a slow
process in comparison with other methods but it is
not associated with energy supply because the bac-
teria are natural cell metabolites and no, or at least
very low, energy consumption is necessary for syn-
thesis [21–27].
Biogenic iron-containing materials are applicable
to heterogeneous catalysis as catalyst precursors,
active components, catalyst supports, and immobi-
lising carriers. Studies are concentrated on different
reactions and one of them is oxidation [18,19,22,28–
37]. Own previously published results have shown
that biogenic iron-containing materials obtained by
cultivation of Leptothrix sp. in different feeding
media exhibit a certain activity in the reaction of CO
oxidation and it was found that maghemite obtained
from lepidocrocite bioprecursor was more active
than other bioproducts (goethite and lepidocrocite)
[35]. In view of aforementioned, it is reasonable to
study hexane complete oxidation in presence of bio-
genic iron-containing materials as a model reaction
and the present work is focused on this problem.
EXPERIMENTAL
Biogenic materials were prepared by Leptothrix
genus bacteria cultivation in Lieske medium, which
contained different inorganic materials. The medium
was modified by introduction of 0.3% Pd/Al-Si-O
fibrous material or anodised Al foil (anodic
Al2O3/Al). 0.3% Pd/Al-Si-O was obtained by sol-gel
method [38], reduced at 400 °C, and then kept in air.
The fibrous material was sterilised for 15 min by
autoclaving at 1 atm and 120 °C. The aluminium
foil was one-side covered with alumina by anodic
oxidation in 0.3M H2C2O4 electrolyte [39]. Lamellae
of this material were cold sterilised by UV light.
After immersing the modifiers into the feeding
solutions, the latter were infected with 10% inocu-
lum from Leptothrix genus bacteria. Cultivation was
realised under static conditions at 20 °C for a period
of 36(40) days. The produced precipitates were
separated by decantation, washed with distilled
water and filtered, and then dried at 40 (105) °C.
The materials thus prepared are denoted as LieskeV
(obtained in presence of 0.3% Pd/Al-Si-O) and
LieskeA (in presence of anodic Al2O3/Al).
Powder X-ray diffraction patterns of the biogenic
materials were collected within the range from 5.3
M. Shopska et al.: Biogenic iron-containing materials
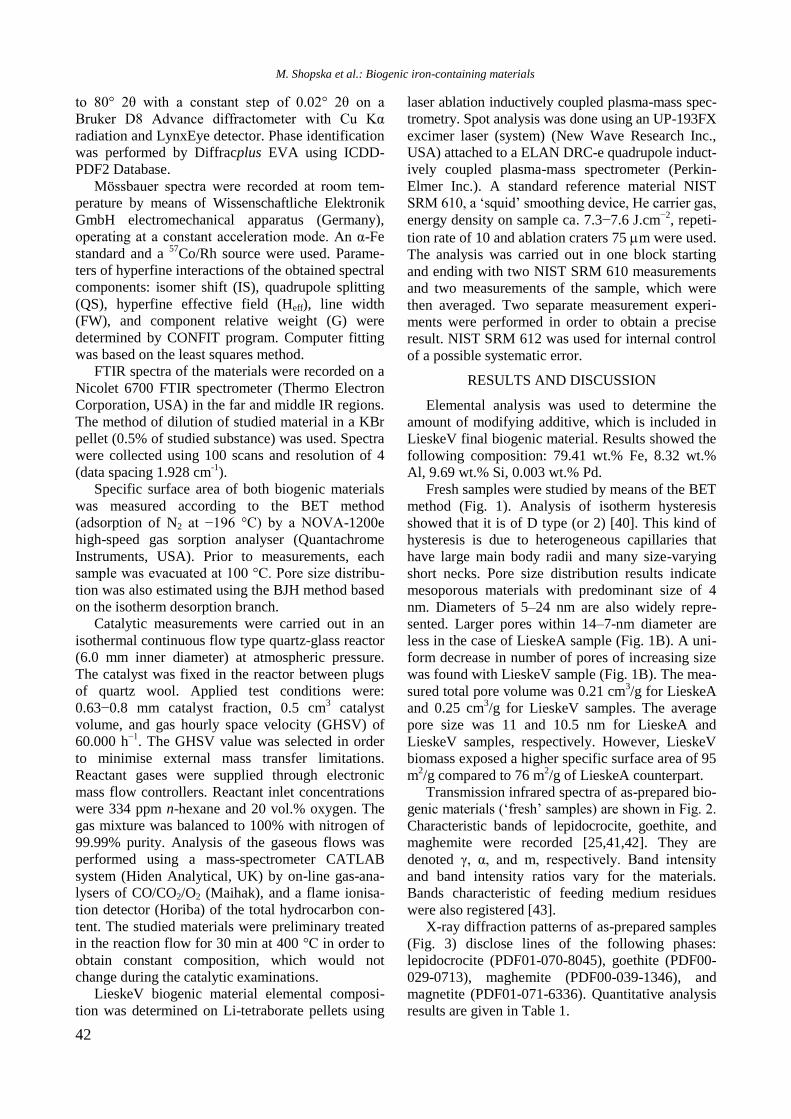
42
to 80° 2θ with a constant step of 0.02° 2θ on a
Bruker D8 Advance diffractometer with Cu Kα
radiation and LynxEye detector. Phase identification
was performed by Diffracplus EVA using ICDD-
PDF2 Database.
Mössbauer spectra were recorded at room tem-
perature by means of Wissenschaftliche Elektronik
GmbH electromechanical apparatus (Germany),
operating at a constant acceleration mode. An α-Fe
standard and a 57
Co/Rh source were used. Parame-
ters of hyperfine interactions of the obtained spectral
components: isomer shift (IS), quadrupole splitting
(QS), hyperfine effective field (Heff), line width
(FW), and component relative weight (G) were
determined by CONFIT program. Computer fitting
was based on the least squares method.
FTIR spectra of the materials were recorded on a
Nicolet 6700 FTIR spectrometer (Thermo Electron
Corporation, USA) in the far and middle IR regions.
The method of dilution of studied material in a KBr
pellet (0.5% of studied substance) was used. Spectra
were collected using 100 scans and resolution of 4
(data spacing 1.928 cm-1
).
Specific surface area of both biogenic materials
was measured according to the BET method
(adsorption of N2 at −196 °C) by a NOVA-1200e
high-speed gas sorption analyser (Quantachrome
Instruments, USA). Prior to measurements, each
sample was evacuated at 100 °C. Pore size distribu-
tion was also estimated using the BJH method based
on the isotherm desorption branch.
Catalytic measurements were carried out in an
isothermal continuous flow type quartz-glass reactor
(6.0 mm inner diameter) at atmospheric pressure.
The catalyst was fixed in the reactor between plugs
of quartz wool. Applied test conditions were:
0.63−0.8 mm catalyst fraction, 0.5 cm3 catalyst
volume, and gas hourly space velocity (GHSV) of
60.000 h−1
. The GHSV value was selected in order
to minimise external mass transfer limitations.
Reactant gases were supplied through electronic
mass flow controllers. Reactant inlet concentrations
were 334 ppm n-hexane and 20 vol.% oxygen. The
gas mixture was balanced to 100% with nitrogen of
99.99% purity. Analysis of the gaseous flows was
performed using a mass-spectrometer CATLAB
system (Hiden Analytical, UK) by on-line gas-ana-
lysers of CO/CO2/O2 (Maihak), and a flame ionisa-
tion detector (Horiba) of the total hydrocarbon con-
tent. The studied materials were preliminary treated
in the reaction flow for 30 min at 400 °C in order to
obtain constant composition, which would not
change during the catalytic examinations.
LieskeV biogenic material elemental composi-
tion was determined on Li-tetraborate pellets using
laser ablation inductively coupled plasma-mass spec-
trometry. Spot analysis was done using an UP-193FX
excimer laser (system) (New Wave Research Inc.,
USA) attached to a ELAN DRC-e quadrupole induct-
ively coupled plasma-mass spectrometer (Perkin-
Elmer Inc.). A standard reference material NIST
SRM 610, a ‘squid’ smoothing device, He carrier gas,
energy density on sample ca. 7.3−7.6 J.cm−2
, repeti-
tion rate of 10 and ablation craters 75 m were used.
The analysis was carried out in one block starting
and ending with two NIST SRM 610 measurements
and two measurements of the sample, which were
then averaged. Two separate measurement experi-
ments were performed in order to obtain a precise
result. NIST SRM 612 was used for internal control
of a possible systematic error.
RESULTS AND DISCUSSION
Elemental analysis was used to determine the
amount of modifying additive, which is included in
LieskeV final biogenic material. Results showed the
following composition: 79.41 wt.% Fe, 8.32 wt.%
Al, 9.69 wt.% Si, 0.003 wt.% Pd.
Fresh samples were studied by means of the BET
method (Fig. 1). Analysis of isotherm hysteresis
showed that it is of D type (or 2) [40]. This kind of
hysteresis is due to heterogeneous capillaries that
have large main body radii and many size-varying
short necks. Pore size distribution results indicate
mesoporous materials with predominant size of 4
nm. Diameters of 5–24 nm are also widely repre-
sented. Larger pores within 14–7-nm diameter are
less in the case of LieskeA sample (Fig. 1B). A uni-
form decrease in number of pores of increasing size
was found with LieskeV sample (Fig. 1B). The mea-
sured total pore volume was 0.21 cm3/g for LieskeA
and 0.25 cm3/g for LieskeV samples. The average
pore size was 11 and 10.5 nm for LieskeA and
LieskeV samples, respectively. However, LieskeV
biomass exposed a higher specific surface area of 95
m2/g compared to 76 m
2/g of LieskeA counterpart.
Transmission infrared spectra of as-prepared bio-
genic materials (‘fresh’ samples) are shown in Fig. 2.
Characteristic bands of lepidocrocite, goethite, and
maghemite were recorded [25,41,42]. They are
denoted γ, α, and m, respectively. Band intensity
and band intensity ratios vary for the materials.
Bands characteristic of feeding medium residues
were also registered [43].
X-ray diffraction patterns of as-prepared samples
(Fig. 3) disclose lines of the following phases:
lepidocrocite (PDF01-070-8045), goethite (PDF00-
029-0713), maghemite (PDF00-039-1346), and
magnetite (PDF01-071-6336). Quantitative analysis
results are given in Table 1.
M. Shopska et al.: Biogenic iron-containing materials
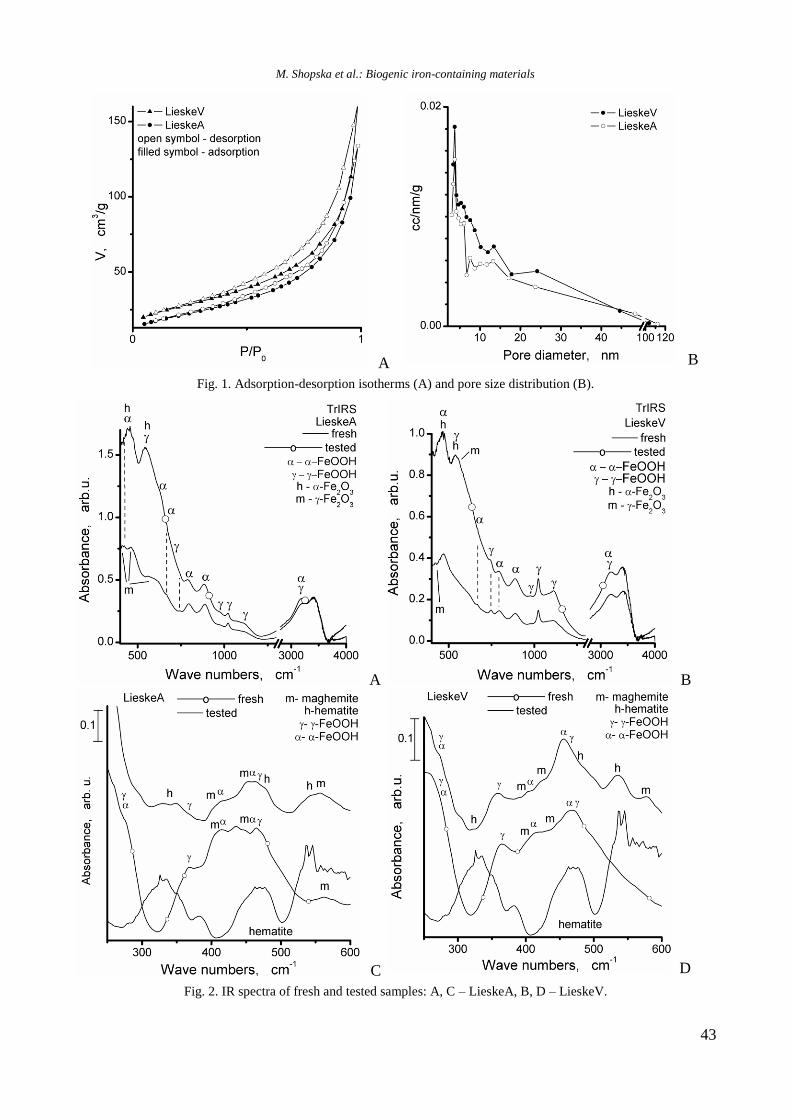
43
A B
Fig. 1. Adsorption-desorption isotherms (A) and pore size distribution (B).
A B
C D
Fig. 2. IR spectra of fresh and tested samples: A, C – LieskeA, B, D – LieskeV.
M. Shopska et al.: Biogenic iron-containing materials
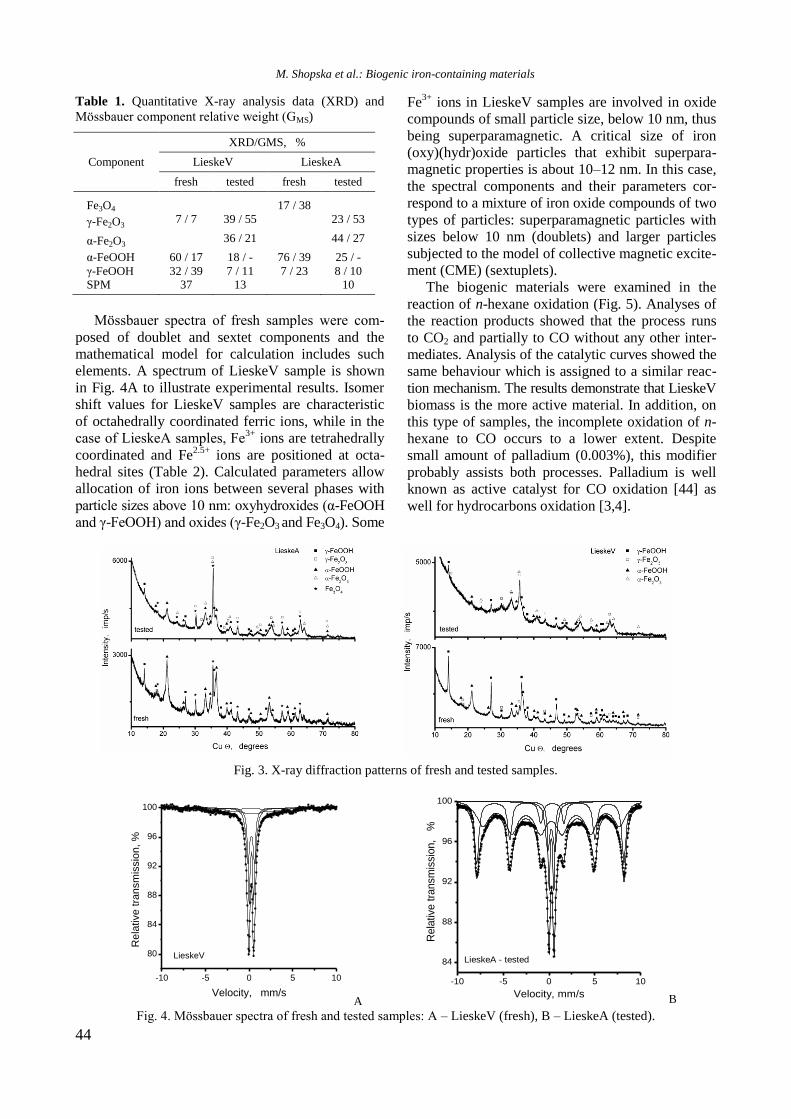
44
Table 1. Quantitative X-ray analysis data (XRD) and
Mössbauer component relative weight (GMS)
Component
XRD/GMS, %
LieskeV LieskeA
fresh tested fresh tested
Fe3O4 17 / 38
γ-Fe2O3 7 / 7 39 / 55 23 / 53
α-Fe2O3 36 / 21 44 / 27
α-FeOOH 60 / 17 18 / - 76 / 39 25 / -
γ-FeOOH 32 / 39 7 / 11 7 / 23 8 / 10 SPM 37 13 10
Mössbauer spectra of fresh samples were com-
posed of doublet and sextet components and the
mathematical model for calculation includes such
elements. A spectrum of LieskeV sample is shown
in Fig. 4A to illustrate experimental results. Isomer
shift values for LieskeV samples are characteristic
of octahedrally coordinated ferric ions, while in the
case of LieskeА samples, Fe3+
ions are tetrahedrally
coordinated and Fe2.5+
ions are positioned at octa-
hedral sites (Table 2). Calculated parameters allow
allocation of iron ions between several phases with
particle sizes above 10 nm: oxyhydroxides (α-FeOOH
and γ-FeOOH) and oxides (γ-Fe2O3 and Fe3O4). Some
Fe3+
ions in LieskeV samples are involved in oxide
compounds of small particle size, below 10 nm, thus
being superparamagnetic. A critical size of iron
(oxy)(hydr)oxide particles that exhibit superpara-
magnetic properties is about 10–12 nm. In this case,
the spectral components and their parameters cor-
respond to a mixture of iron oxide compounds of two
types of particles: superparamagnetic particles with
sizes below 10 nm (doublets) and larger particles
subjected to the model of collective magnetic excite-
ment (CME) (sextuplets).
The biogenic materials were examined in the
reaction of n-hexane oxidation (Fig. 5). Analyses of
the reaction products showed that the process runs
to CO2 and partially to CO without any other inter-
mediates. Analysis of the catalytic curves showed the
same behaviour which is assigned to a similar reac-
tion mechanism. The results demonstrate that LieskeV
biomass is the more active material. In addition, on
this type of samples, the incomplete oxidation of n-
hexane to CO occurs to a lower extent. Despite
small amount of palladium (0.003%), this modifier
probably assists both processes. Palladium is well
known as active catalyst for CO oxidation [44] as
well for hydrocarbons oxidation [3,4].
Fig. 3. X-ray diffraction patterns of fresh and tested samples.
-10 -5 0 5 10
80
84
88
92
96
100
LieskeV
Re
lative
tra
nsm
issio
n,
%
Velocity, mm/s A
-10 -5 0 5 10
84
88
92
96
100
LieskeA - tested
Rela
tive t
ransm
issio
n,
%
Velocity, mm/s B
Fig. 4. Mössbauer spectra of fresh and tested samples: A – LieskeV (fresh), B – LieskeA (tested).
M. Shopska et al.: Biogenic iron-containing materials
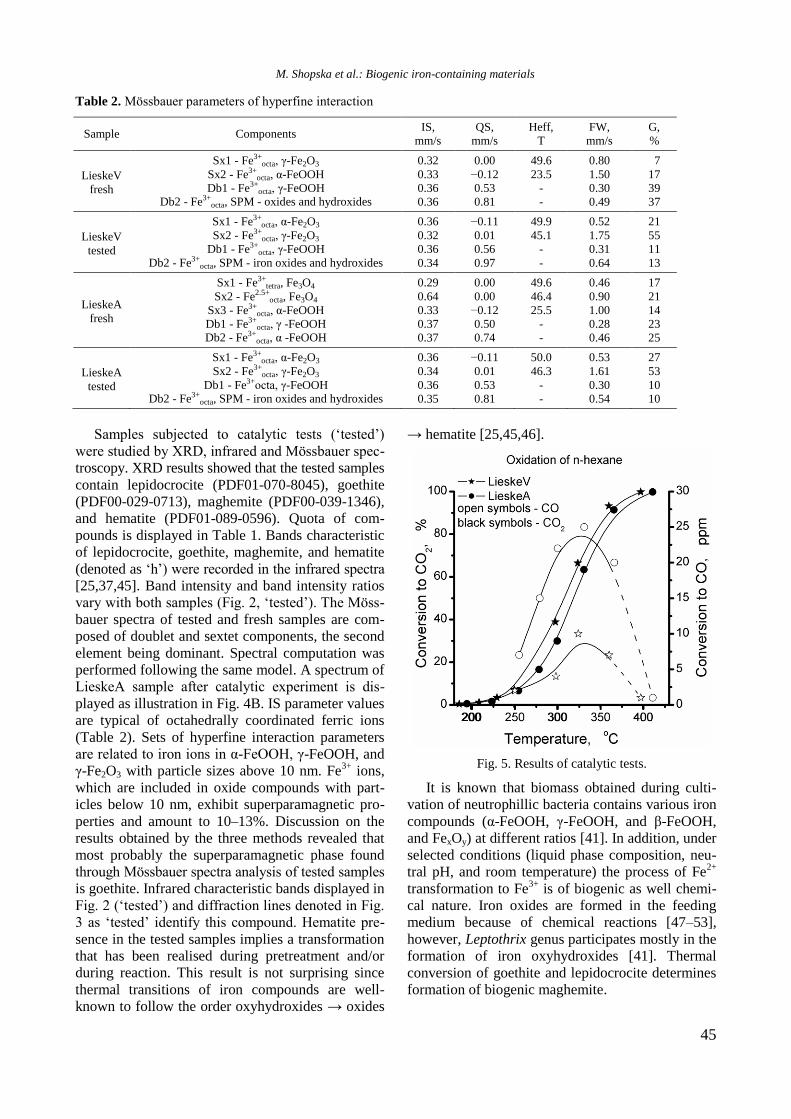
45
Table 2. Mössbauer parameters of hyperfine interaction
Sample Components IS,
mm/s
QS,
mm/s
Heff,
T
FW,
mm/s
G,
%
LieskeV
fresh
Sx1 - Fe3+octa, γ-Fe2O3
Sx2 - Fe3+octa, α-FeOOH
Db1 - Fe3+octa, γ-FeOOH
Db2 - Fe3+octa, SPM - oxides and hydroxides
0.32
0.33
0.36
0.36
0.00
−0.12
0.53
0.81
49.6
23.5
-
-
0.80
1.50
0.30
0.49
7
17
39
37
LieskeV
tested
Sx1 - Fe3+octa, α-Fe2O3
Sx2 - Fe3+octa, γ-Fe2O3
Db1 - Fe3+octa, γ-FeOOH
Db2 - Fe3+octa, SPM - iron oxides and hydroxides
0.36
0.32
0.36
0.34
−0.11
0.01
0.56
0.97
49.9
45.1
-
-
0.52
1.75
0.31
0.64
21
55
11
13
LieskeA
fresh
Sx1 - Fe3+tetra, Fe3O4
Sx2 - Fe2.5+octa, Fe3O4
Sx3 - Fe3+octa, α-FeOOH
Db1 - Fe3+octa, γ -FeOOH
Db2 - Fe3+octa, α -FeOOH
0.29
0.64
0.33
0.37
0.37
0.00
0.00
−0.12
0.50
0.74
49.6
46.4
25.5
-
-
0.46
0.90
1.00
0.28
0.46
17
21
14
23
25
LieskeA
tested
Sx1 - Fe3+octa, α-Fe2O3
Sx2 - Fe3+octa, γ-Fe2O3
Db1 - Fe3+octa, γ-FeOOH Db2 - Fe3+
octa, SPM - iron oxides and hydroxides
0.36
0.34
0.36
0.35
−0.11
0.01
0.53
0.81
50.0
46.3
-
-
0.53
1.61
0.30
0.54
27
53
10
10
Samples subjected to catalytic tests (‘tested’)
were studied by XRD, infrared and Mössbauer spec-
troscopy. XRD results showed that the tested samples
contain lepidocrocite (PDF01-070-8045), goethite
(PDF00-029-0713), maghemite (PDF00-039-1346),
and hematite (PDF01-089-0596). Quota of com-
pounds is displayed in Table 1. Bands characteristic
of lepidocrocite, goethite, maghemite, and hematite
(denoted as ‘h’) were recorded in the infrared spectra
[25,37,45]. Band intensity and band intensity ratios
vary with both samples (Fig. 2, ‘tested’). The Möss-
bauer spectra of tested and fresh samples are com-
posed of doublet and sextet components, the second
element being dominant. Spectral computation was
performed following the same model. A spectrum of
LieskeА sample after catalytic experiment is dis-
played as illustration in Fig. 4B. IS parameter values
are typical of octahedrally coordinated ferric ions
(Table 2). Sets of hyperfine interaction parameters
are related to iron ions in α-FeOOH, γ-FeOOH, and
γ-Fe2O3 with particle sizes above 10 nm. Fe3+
ions,
which are included in oxide compounds with part-
icles below 10 nm, exhibit superparamagnetic pro-
perties and amount to 10–13%. Discussion on the
results obtained by the three methods revealed that
most probably the superparamagnetic phase found
through Mössbauer spectra analysis of tested samples
is goethite. Infrared characteristic bands displayed in
Fig. 2 (‘tested’) and diffraction lines denoted in Fig.
3 as ‘tested’ identify this compound. Hematite pre-
sence in the tested samples implies a transformation
that has been realised during pretreatment and/or
during reaction. This result is not surprising since
thermal transitions of iron compounds are well-
known to follow the order oxyhydroxides → oxides
→ hematite [25,45,46].
Fig. 5. Results of catalytic tests.
It is known that biomass obtained during culti-
vation of neutrophillic bacteria contains various iron
compounds (α-FeOOH, γ-FeOOH, and β-FeOOH,
and FexOy) at different ratios [41]. In addition, under
selected conditions (liquid phase composition, neu-
tral pH, and room temperature) the process of Fe2+
transformation to Fe3+
is of biogenic as well chemi-
cal nature. Iron oxides are formed in the feeding
medium because of chemical reactions [47–53],
however, Leptothrix genus participates mostly in the
formation of iron oxyhydroxides [41]. Thermal
conversion of goethite and lepidocrocite determines
formation of biogenic maghemite.
M. Shopska et al.: Biogenic iron-containing materials
46
Tested catalysts have almost the same composi-
tion, the differences being negligibly small. Bearing
in mind possible transformations of iron
(oxy)(hydr)oxide phases and whether they have
biogenic or chemical origin [25,41,45,46], it can be
affirmed that the LieskeV biomass contains a larger
amount of maghemite originating from a biogenic
precursor. The amount of this precursor (lepido-
crocite) in fresh LieskeA biomass is less. Biogenic
maghemite manifests some intrinsic activity in CO
oxidation [35]. Together with available traces of
palladium in LieskeV, it is reasonable to expect im-
peded n-hexane incomplete oxidation to CO. Carbon
monoxide oxidation in the case of LieskeV samples
is stimulated to a higher extent depending on two
components that are active in this process. These
special features of LieskeV biomass composition
determine its higher activity at lower temperatures.
Pore structure of the studied systems has some
influence on the catalytic behaviour. Although the
textural features were determined for fresh samples,
they could be used to explain the catalytic behaviour
already discussed above. It has been found that
biogenic iron is a hybrid product structured com-
posed of iron oxide units and organic residues of
bacterial origin [54-60]. It has been suggested that
bacterially formed mineral deposits have wall struc-
ture, which contains iron (oxy)hydroxide spheres
stabilized by organic carbon inclusions [54–57].
This structure is sterically stable to different impacts
[15,28,32,34,61–63]. The LieskeV samples are char-
acterised by relatively larger pores. This facilitates
hexane molecules contact with the catalyst surface
for long residence time. As a result, n-hexane trans-
formation to CO2 proceeds to a much higher extent
in comparison with conversion to carbon monoxide.
CONCLUSIONS
Biogenic material, synthesised in Lieske culti-
vation medium in the presence of 0.3% Pd/Al-Si-O
fibrous catalyst, was more active in the reaction of
n-hexane oxidation than a counterpart material syn-
thesised in the same medium in the presence of
anodic oxidised aluminium foil. Incomplete oxida-
tion to CO was also registered, however, to a lower
extent if compared with the latter biomass. Bene-
ficial catalytic properties were determined by two
basic factors: (i) presence of traces of the 0.3%
Pd/Al-Si-O fibrous material, which actually cor-
responds to 0.0003% Pd in the biomass and (ii)
larger amount of maghemite obtained from a bio-
genic precursor in comparison with the material
formed in presence of alumina/Al lamellae. Con-
tribution by relatively larger pores and higher spe-
cific surface area is also suggested.
Acknowledgements: The authors are grateful to
Bulgarian Science Fund for financial support by
project T02-17/2014. Preparation of the anodic
alumina/Al support by Assoc. Prof. B. Tsaneva from
Technical University, Sofia, and of the biogenic
materials by Prof. V. Groudeva and co-workers from
Faculty of Biology of St. Kliment Ohridski University
of Sofia is greatly acknowledged.
REFERENCES
1. Directive 2008/50/EC of the European Parliament
and of the Council of 21 May 2008 on ambient air
quality and cleaner air for Europe, Official Journal of
the European Union, L 152, 1–44 (11.6.2008).
2. R.M Heck, R.J. Farrauto, Catalytic Pollution Control,
second ed., Wiley-Interscience, New York, 2002.
3. S. C. Kim, W. G. Shim, Appl. Catal. B: Environ., 92,
429 (2009).
4. L. F. Liotta, Appl. Catal. B: Environ., 100, 403 (2010).
5. K. Everaert, J. Baeyens, J. Hazard. Mater., 109, 113
(2004).
6. J. J. Spivey, Ind. Eng. Chem. Res., 26, 2165 (1987).
7. U. Zavyalova, P. Scholz, B. Ondruschka, Appl.
Catal. A: General, 323, 226 (2007).
8. S. Scirè, S. Minicò, C. Crisafulli, S. Galvagno, Catal.
Commun., 2, 229 (2001).
9. M. Baldi, V. S. Escribano, J. M. G. Amores, F.
Milella, G. Busca, Appl. Catal. B-Environ., 17, L175
(1998).
10. A. Wells, Structural Inorganic Chemistry, 5th
ed.,
Clarendon Press, Oxford, 1986, Ch. 13.
11. H. Hung, Stud. Surf. Sci. Catal., 45, 171 (1989).
12. J. Barrault, C. Renard, Appl. Catal., 14, 133 (1985).
13. T. Baird, K. Campbell, P. Holliman, R. Hoyle, D.
Stirling, B. Williams, M. Morris, J. Mater. Chem., 7,
319 (1997).
14. A. C. Tavares, M. A. Cartaxo, M. I. Pereira, F. M.
Costa, J. Electroanal. Chem., 464, 187 (1999).
15. A. B. Seabra, P. Haddad, N. Duran, IET
Nanobiotechnol., 7, 90 (2013).
16. K. B. Narayanan, N. Sakthivel, Adv. Coll. Interface
Sci., 156, 1 (2010).
17. H. Jung, J.-W. Kim, H. Choi, J.-H. Lee, H.-G. Hur,
Appl. Catal. B: Environ., 83, 208 (2008).
18. B. Kazprzyk-Hordern, M. Ziolek, J. Nawrocik, Appl.
Catal. B: Environ., 46, 639 (2003).
19. T. Shahwan, S. Abu Sirriah, M. Nairat, E. Boyaci, A.
E. Eroglu, T. B. Scott, K. R. Hallam, Chem. Eng. J.,
172, 258 (2011).
20. T. Ema, Y. Miyazaki, I. Kozuki, T. Sakai, H.
Hashimoto, J. Takada, Green Chem., 13, 3187 (2011).
21. H. Hashimoto, S. Yokoyama, H. Asaoka, Y. Kusano,
Y. Ikeda, M. Seno, J. Takada, T. Fujii, M. Nakanishi,
R. Murakami, J. Magnet. Magnet. Mater., 310, 2405
(2007).
22. T. Sakai, Y. Miyazaki, A. Murakami, N. Sakamoto,
T. Ema, H. Hashimoto, M. Furutani, M. Nakanishi,
T. Fujiia, J. Takada, Org. Biomol.Chem., 8, 336
(2010).
M. Shopska et al.: Biogenic iron-containing materials
47
23. B. Xin, D. Zhang, X. Zhang, Y. Xia, F. Wu, S. Chen,
L. Li, Bioresour. Technol., 100, 6163 (2009).
24. J. A. Rentz, I. P. Turner, J. L. Ullman, Water Res.,
43, 2029 (2009).
25. R. Cornell, U. Schwertmann, Iron Oxides, Wiley-
VCH Verlag, Weinheim, Germany, 2003.
26. R. W. Fitzpatrick, R. Naidu, P. G. Self, in: Biomine-
ralization Processes of Iron and Manganese - Modern
and Ancient Environments, Catena Supplement 21,
H. C. W. Skinner, R. W. Fitzpatrick (eds.), Catena
Verlag, Reiskirchen, Germany, 1992, p. 263.
27. D. A. Ankrah, E. G. Sogaard, in: 13th
Int. Water
Technol. Conf., IWTC 13, Hurghada, Egypt, 2009, p.
999.
28. T. Ema, Y. Miyazaki, I. Kozuki, T. Sakai, H.
Hashimoto, J. Takada, Green Chem., 13, 3187 (2011).
29. A. Alharthi, R. A. Blackley, T. H. Flowers, J. S. J.
Hergreaves, I. D. Pulford, J. Wigzell, W. Zhou, J.
Chem. Technol. Biotechnol., 89, 1317 (2014).
30. G. E. Hoag, J. B. Collins, J. L. Holcomb, J. R. Hoag,
M. N. Nadagouda, R. S. Varma, J. Mater. Chem., 19,
8671 (2009).
31. H. Jung, H. Park, J. Kim, J.-H. Lee, H.-G. Hur, N. V.
Myung, H. Choi, Environ. Sci. Technol., 41, 4741
(2007).
32. K. Mandai, T. Korenaga, T. Ema, T. Sakai, M.
Furutani, H. Hashimoto, J. Takada, Tetrahedron
Lett., 53, 329 (2012).
33. R. A. Maithreepala, R.-A. Doong, Chemosphere, 70,
1405 (2008).
34. B. Kumar, K. Smita, L. Cumbal, A. Debut, J. Saudi
Chem. Soc.,18, 364 (2014).
35. M. Shopska, D. Paneva, G. Kadinov, S. Todorova,
M. Fabian, I. Yordanova, Z. Cherkezova-Zheleva, I.
Mitov, React. Kinet. Mech. Catal., 118, 179 (2016).
36. M. Shopska, Z. Cherkezova-Zheleva, D. Paneva, M.
Iliev, G. Kadinov, I. Mitov, V. Groudeva, Cent. Eur.
J. Chem. (Open Chemistry), 11, 215 (2013).
37. M. G. Shopska, D. G. Paneva, H. G. Kolev, G. B.
Kadinov, R. Ilieva, M. Iliev, Z. P. Cherkezova-
Zheleva, I. G. Mitov, Helv. Chim. Acta, 100,
e1700172 (2017).
38. L. Spasov, P. Dimitrov, Ch. Vladov, V. Zhelyazkov,
Ch. Bonev, L. Petrov, in: Heterogeneous Catalysis
(Proc. 8th Int. Symp. Heterogen. Catal., Varna, 5−9
October 1996), Institute of Catalysis, Bulgarian
Academy of Sciences, Sofia, 1996, p. 751.
39. B. R. Tzaneva, A. I. Naydenov, S. Zh. Todorova, V.
H. Videkov, V. S. Milusheva, P. K. Stefanov,
Electrochim. Acta, 191, 192 (2016).
40. A. Adamson, Physical Chemistry of Surfaces, 3rd
ed.,
Z. M. Zorin, V. M. Muller (eds.), Mir, Moscow, 1979.
41. M. Shopska, D. Paneva, G. Kadinov, Z. Cherkezova-
Zheleva, I. Mitov, M. Iliev, Appl. Biochem.
Biotechnol., 181, 867 (2017).
42. B. Weckler, H. D. Lutz, Eur. J. Solid State Inorg.
Chem., 35, 531 (1998).
43. L. H. Little, Infrared spectra of adsorbed species,
Academic Press Inc., London, New York, 1966.
44. O. V. Krylov, Heterogeneous Catalysis: Textbook,
Akademkniga, Moscow, 2004.
45. H. Lepp, Am. Miner. (Notes and News), 42, 679
(1957).
46. A. U. Gehring, A. M. Hofmeister, Clays Clay Miner.,
42, 409 (1994).
47. H. L. Ehrlich, D. K. Newman, Geomicrobiology,
USA: CRC Press - Taylor & Francis Group, 2009.
48. A. Kappler, K. L. Straub, Geomicrobiological
Cycling of Iron, In: Molecular Geomicrobiology (J.
F. Banfield, J. Cervini-Silva, K. H. Nealson, Eds.),
Reviews in Mineralogy and Geochemistry, vol. 59 (J.
J. Rosso, Series ed.), Mineralogical Society of
America (Geochemical Society), 2005.
49. M. Shopska, S. Todorova, I. Yordanova, S. Mondal,
G. Kadinov, Bulg. Chem. Commun., 47 (Special issue
C), 73 (2015).
50. D. Emerson, J. V. Weiss, Geomicrobiol. J., 21, 405
(2004).
51. S. Vollrath, T. Behrends, C. Bender Koch, P. Van
Cappellen, Geochim. Cosmochim. Acta, 108, 107
(2013).
52. E. D. Melton, E. D. Swanner, S. Behrens, C.
Schmidt, A. Kappler, Nature Reviews. Microbiology,
12, 797 (2014).
53. Z. Cherkezova-Zheleva, M. Shopska, D. Paneva, D.
Kovacheva, G. Kadinov, I. Mitov, Hyperfine Interact.,
237, (2016).
54. C. S. Chan, S. C. Fakra, D. S. Edwards, D. Emerson,
J. F. Banfield, Geochim. Cosmochim. Acta, 73, 3807
(2009).
55. F. G. Ferris, R. O. Hallberg, B. Lyven, K. Pedersen,
Appl. Geochem., 15, 1035 (2000).
56. K. Benzerara, T. H. Yooh, T. Tyliszczak, B.
Constantz, A. M. Spormann, G. E. Brown, Jr.,
Geobiology, 2, 249 (2004).
57. D. Emerson, H. Lin, L. Agulto, L. Lin, Bioscience,
58, 925 (2008).
58. T. Suzuki, H. Hashimoto, H. Ishihara, T. Kasai, H.
Kunoh, J. Takada, Appl. Environ. Microbiol., 77,
7873 (2011).
59. M. Furutani, T. Suzuki, H. Ishihara, H. Hashimoto,
H. Kunoh, J. Takada, Minerals, 1, 157 (2011).
60. M. G. Shopska, Z. P. Cherkezova-Zheleva, D. G.
Paneva, V. Petkova, G. B. Kadinov, I. G. Mitov,
Croat. Chem. Acta, 87, 161 (2014).
61. T. Shahwan, S. Abu Sirriah, M. Nairat, E. Boyaci, A.
E. Eroglu, T. B. Scott, K. R. Hallam, Chem. Eng. J.,
172, 258 (2011).
62. M. Harshiny, C. N. Iswarya, M. Matheswaran, Powder
Technol., 286, 744 (2015).
63. T. Ema, Y. Miyazaki, T. Taniguchi, J. Takada, Green
Chem., 15, 2485 (2013).
M. Shopska et al.: Biogenic iron-containing materials
48
БИОГЕННИ ЖЕЛЯЗО-СЪДЪРЖАЩИ МАТЕРИАЛИ СИНТЕЗИРАНИ В МОДИФИЦИРАНА
СРЕДА НА ЛИСКЕ – СЪСТАВ, ПОРИСТА СТРУКТУРА И КАТАЛИТИЧНА АКТИВНОСТ В
ОКИСЛЕНИЕТО НА n-ХЕКСАН
М. Шопска*, Г. Кадинов, Д. Панева, Ил. Йорданова, Д. Ковачева1, Ант. Найденов
1, С. Тодорова,
З. Черкезова-Желева, Ив. Митов
Институт по катализ, Българска академия на науките, ул. „Акад. Г. Бончев“ бл. 11, 1113 София, България 1 Институт по обща и неорганична химия, Българска академия на науките, ул. „Акад. Г. Бончев“ бл. 11,
1113 София, България
Постъпила на 26 януари 2018 г.; Преработена на 20 март 2018 г.
(Резюме)
Бактерии от род Leptothrix са култивирани в среда на Лиске модифицирана с неорганичен материал.
Използвани са два вида модификатори: 0.3% Pd/мезопорест Al-Si-O влакнест катализатор и едностранно анодно
окислено алуминиево фолио. Получените биомаси (означени съответно ЛискеВ и ЛискеА) са изследвани чрез
методите инфрачервена и Мьосбауерова спектроскопия, Рентгенова дифракция, адсорбция на азот и ката-
литични изпитания. Охарактеризирането на свежи образци показа, че ЛискеА съдържа γ-FeOOH, α-FeOOH и
Fe3O4, докато ЛискеВ се състои от γ-FeOOH, α-FeOOH и γ-Fe2O3 в различни съотношения. Чрез елементен
анализ бе доказано, че малко количество от модифициращия материал е включено в ЛискеВ и образецът
съдържа 0.003% Pd. Регистрирани превръщания на изходните (биогенни и абиотични) желязооксидни/хидрок-
сидни фази след участието на материалите в каталитичните изпитания потвърдиха, че образец ЛискеВ съдържа
по-голямо количество γ-Fe2O3, получен от биогенен прекурсор, както и малко количество γ-FeOOH. Беше
установено, че материалът ЛискеВ е по-активен в реакцията на окисление на n-хексан. Освен това, в присъствие
на този образец непълното окисление до СО протича в по-малка степен. Въпреки, че паладият присъства в
много малко количество в образец ЛискеВ, той най-вероятно подпомага каталитичния процес, тъй като е
активен катализатор за окислението на СО. При употребата на образец ЛискеВ окислението на СО се
стимулира от два компонента, които са активни в изследвания процес. Активност в окислението на СО е
присъща и на биогенния γ-Fe2O3, а по-високото му съдържание в образеца е втората причина за по-ниската
степен на непълно окисление на C6H14. Трета особеност на образец ЛискеВ, която определя неговата относи-
телно по-добра активност, е присъствието на малко по-широки пори, което позволява подобрен масопренос на
реагентите в катализаторните частици.
M. Shopska et al.: Biogenic iron-containing materials
49
Bulgarian Chemical Communications, Volume 50, Special issue H (pp. 49–55) 2018
Modification and characterization of iron-containing biogenic materials as catalysts
for the reaction of CO oxidation
T. M. Petrova*, D. G. Paneva, S. Zh. Todorova, Z. P. Cherkezova-Zheleva, D. G. Filkova,
M. G. Shopska, N. I. Velinov, B. N. Kunev, G. B. Kadinov, I. G. Mitov
Institute of Catalysis, Bulgarian Academy of Sciences, Acad. G. Bonchev St., Bldg. 11, 1113 Sofia, Bulgaria
Received: February 12, 2018; Revised: March 14, 2018
The present study is focused on the preparation of modified iron-containing biogenic materials and testing them as
catalysts for the reaction of CO oxidation. Modification was performed by impregnation of biogenic material obtained
in Lieske cultivation medium. Impregnation was done using solutions of palladium chloride, cobalt nitrate, and manganese
nitrate. Samples were characterized by X-ray diffraction, infrared spectroscopy, and Mössbauer spectroscopy. XRD
results revealed that the starting biogenic material was X-ray amorphous, however, the presence of mixtures of low-
crystalline iron oxyhydroxides, goethite and lepidocrocite, could not be excluded. Heating of Pd- and Co-modified
materials led to the formation of oxide phases of Co3O4, γ-Fe2O3, and α-Fe2O3. Infrared spectra confirmed metal
oxyhydroxide complete transformation to metal oxides in thermally treated samples. Mössbauer spectra of samples
preheated at 300 °C indicated that the formed materials had a low degree of crystallinity, which is a specific feature of
highly dispersed oxide materials. Doublet components in the Mössbauer spectra are indicative of nanosized highly
dispersed particles demonstrating superparamagnetic behaviour. A ferrite MnFe2O4 phase was formed during synthesis
of Mn-modified sample. Mössbauer spectra recorded at the temperature of liquid nitrogen showed a decrease of doublet
part, which is typical of iron oxide particles of sizes below 4–10 nm. All the prepared samples were active in the
reaction of CO oxidation, most active being manganese-modified catalyst. A synergistic effect was proposed between iron
and manganese oxide components. Sample analysis after catalytic tests by means of Mössbauer spectroscopy revealed
no changes in phase composition and dispersion.
Key words: biogenic iron-containing materials, chemical modification, X-ray diffraction, Infrared spectroscopy,
Mössbauer spectroscopy, CO oxidation.
INTRODUCTION
Biogenic iron-containing materials are products
of iron-transforming bacteria lifecycle [1–3]. Iron-
containing bacteria of the Sphaerotilus-Leptothrix
group are typical water representatives. In presence
of these bacteria, Fe2+
ions are transformed into Fe3+
containing compounds [2,4–6]. These compounds
are insoluble and the iron is deposited in the form of
oxides, hydroxides, and salts [2,7–10], which have
different phase composition, and different shape and
size (globules, tubes, etc.). These materials demon-
strate high specific surface area and high reactivity,
which facilitate adsorption and decomposition of
various contaminants [7–9,11–18]. Specific physical,
chemical, and biological features of nanomaterials
have motivated researchers for intensive studies.
Iron oxides/hydroxides are a particular class of bio-
compatible compounds having natural biogenic ana-
logues. Such materials being developed by various
methods of synthesis are widely applied as catalysts.
Many synthetic techniques for the production of
various types of iron oxide nanoparticle materials
(hematite, magnetite, goethite, etc.) are well estab-
lished. However, most of these methods are costly
and involve the use of hazardous chemicals [19].
Therefore, there is growing necessity to develop
ecological and sustainable methods, such as bio-
synthesis [20]. Various studies have found that bio-
genic iron oxides, especially those of bacterial origin,
are low crystalline aggregates composed of smaller
species [7–10,17,21–23]. Biogenic iron specific pro-
perties are crucial for its application as an active
component in catalysis in gaseous and liquid media
[13,19,23–31], catalyst precursors [19,32], and cata-
lysts [33]. In the course of the catalytic process, the
stability of the biogenic materials is a very import-
ant property. In previous studies, it was found that
their catalytic activity was preserved or slightly
decreased after repeated use [26,32–35]. Actually,
chemical modification of the biogenic materials is
focused on improving some chemical properties.
This work is aimed at modifying iron containing
biogenic materials by Pd, Co, and Mn and studying
their catalytic behaviour in the reaction of CO
oxidation.
© 2018 Bulgarian Academy of Sciences, Union of Chemists in Bulgaria
* To whom all correspondence should be sent
E-mail: [email protected]
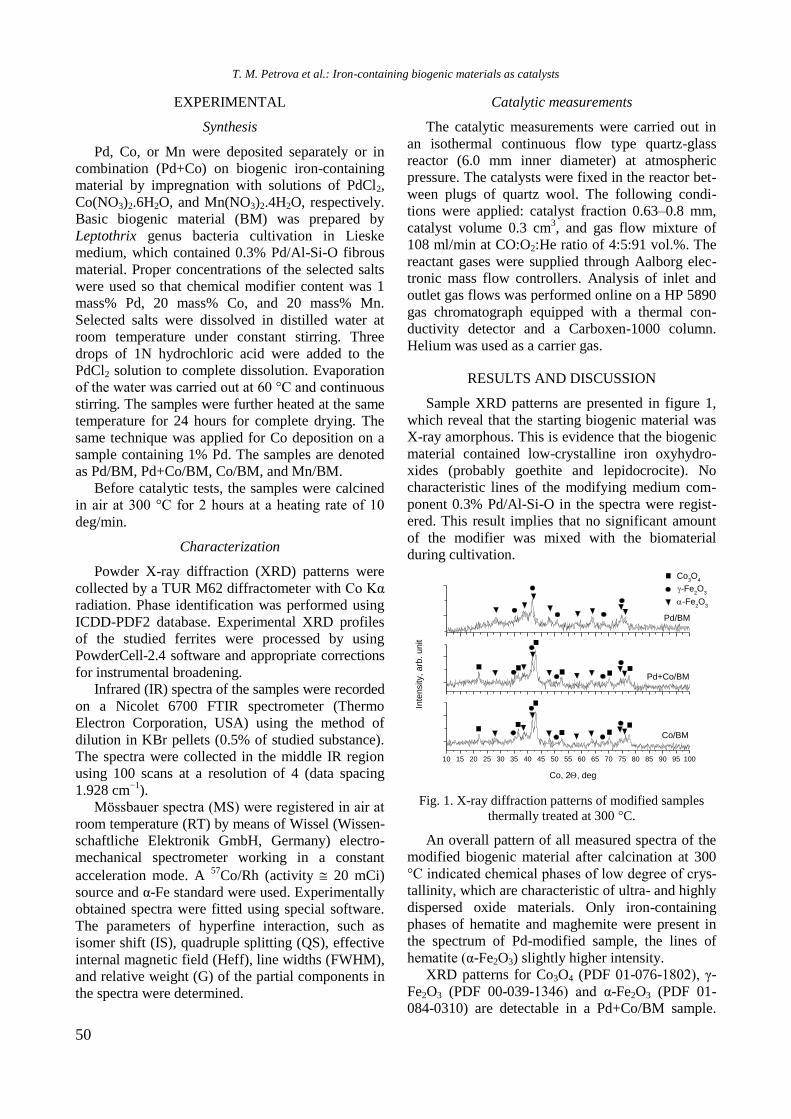
50
EXPERIMENTAL
Synthesis
Pd, Co, or Mn were deposited separately or in
combination (Pd+Co) on biogenic iron-containing
material by impregnation with solutions of PdCl2,
Co(NO3)2.6H2O, and Mn(NO3)2.4H2O, respectively.
Basic biogenic material (BM) was prepared by
Leptothrix genus bacteria cultivation in Lieske
medium, which contained 0.3% Pd/Al-Si-O fibrous
material. Proper concentrations of the selected salts
were used so that chemical modifier content was 1
mass% Pd, 20 mass% Co, and 20 mass% Mn.
Selected salts were dissolved in distilled water at
room temperature under constant stirring. Three
drops of 1N hydrochloric acid were added to the
PdCl2 solution to complete dissolution. Evaporation
of the water was carried out at 60 °C and continuous
stirring. The samples were further heated at the same
temperature for 24 hours for complete drying. The
same technique was applied for Co deposition on a
sample containing 1% Pd. The samples are denoted
as Pd/BM, Pd+Co/BM, Co/BM, and Mn/BM.
Before catalytic tests, the samples were calcined
in air at 300 °C for 2 hours at a heating rate of 10
deg/min.
Characterization
Powder X-ray diffraction (XRD) patterns were
collected by a TUR M62 diffractometer with Co Kα
radiation. Phase identification was performed using
ICDD-PDF2 database. Experimental XRD profiles
of the studied ferrites were processed by using
PowderCell-2.4 software and appropriate corrections
for instrumental broadening.
Infrared (IR) spectra of the samples were recorded
on a Nicolet 6700 FTIR spectrometer (Thermo
Electron Corporation, USA) using the method of
dilution in KBr pellets (0.5% of studied substance).
The spectra were collected in the middle IR region
using 100 scans at a resolution of 4 (data spacing
1.928 cm−1
).
Mössbauer spectra (MS) were registered in air at
room temperature (RT) by means of Wissel (Wissen-
schaftliche Elektronik GmbH, Germany) electro-
mechanical spectrometer working in a constant
acceleration mode. A 57
Co/Rh (activity 20 mCi)
source and α-Fe standard were used. Experimentally
obtained spectra were fitted using special software.
The parameters of hyperfine interaction, such as
isomer shift (IS), quadruple splitting (QS), effective
internal magnetic field (Heff), line widths (FWHM),
and relative weight (G) of the partial components in
the spectra were determined.
Catalytic measurements
The catalytic measurements were carried out in
an isothermal continuous flow type quartz-glass
reactor (6.0 mm inner diameter) at atmospheric
pressure. The catalysts were fixed in the reactor bet-
ween plugs of quartz wool. The following condi-
tions were applied: catalyst fraction 0.63–0.8 mm,
catalyst volume 0.3 cm3, and gas flow mixture of
108 ml/min at CO:O2:He ratio of 4:5:91 vol.%. The
reactant gases were supplied through Aalborg elec-
tronic mass flow controllers. Analysis of inlet and
outlet gas flows was performed online on a HP 5890
gas chromatograph equipped with a thermal con-
ductivity detector and a Carboxen-1000 column.
Helium was used as a carrier gas.
RESULTS AND DISCUSSION
Sample XRD patterns are presented in figure 1,
which reveal that the starting biogenic material was
X-ray amorphous. This is evidence that the biogenic
material contained low-crystalline iron oxyhydro-
xides (probably goethite and lepidocrocite). No
characteristic lines of the modifying medium com-
ponent 0.3% Pd/Al-Si-O in the spectra were regist-
ered. This result implies that no significant amount
of the modifier was mixed with the biomaterial
during cultivation.
Fig. 1. X-ray diffraction patterns of modified samples
thermally treated at 300 °C.
An overall pattern of all measured spectra of the
modified biogenic material after calcination at 300
°C indicated chemical phases of low degree of crys-
tallinity, which are characteristic of ultra- and highly
dispersed oxide materials. Only iron-containing
phases of hematite and maghemite were present in
the spectrum of Pd-modified sample, the lines of
hematite (α-Fe2O3) slightly higher intensity.
XRD patterns for Co3O4 (PDF 01-076-1802), γ-
Fe2O3 (PDF 00-039-1346) and α-Fe2O3 (PDF 01-
084-0310) are detectable in a Pd+Co/BM sample.
Pd/BM
-Fe2O
3
-Fe2O
3
Co3O
4
Pd+Co/BM
Inte
nsity,
arb
. un
it
10 15 20 25 30 35 40 45 50 55 60 65 70 75 80 85 90 95 100
Co/BM
Co, 2, deg
T. M. Petrova et al.: Iron-containing biogenic materials as catalysts
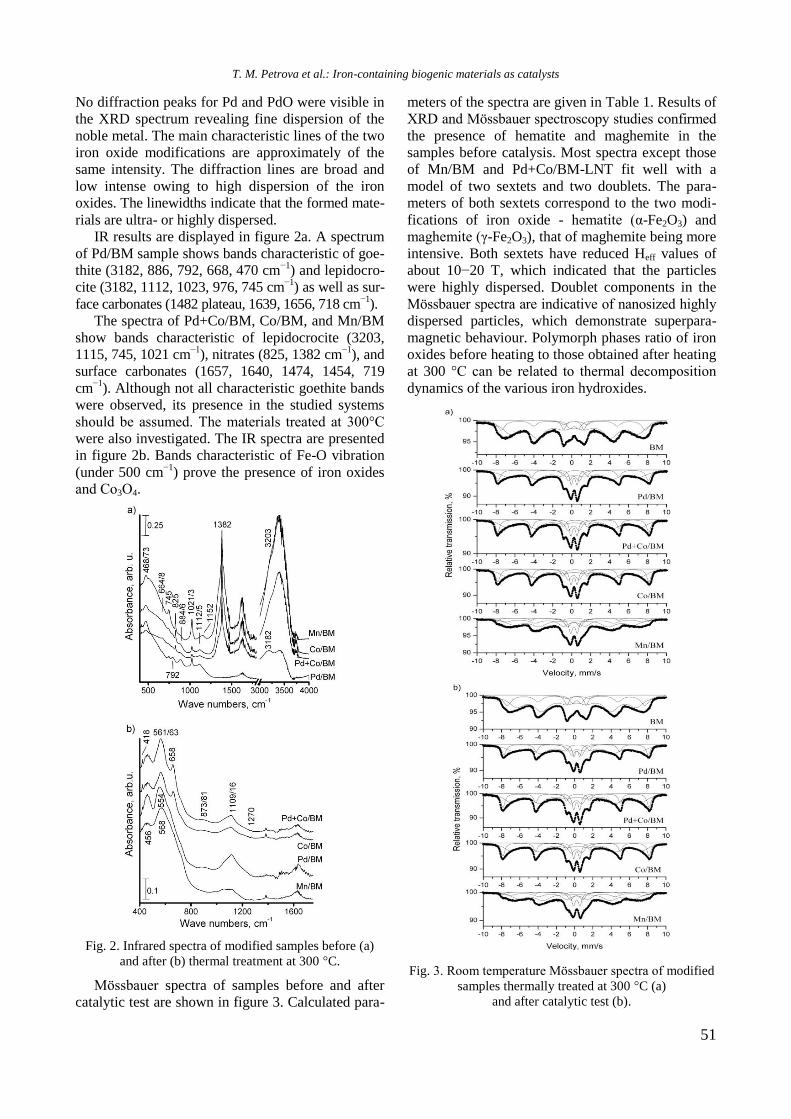
51
No diffraction peaks for Pd and PdO were visible in
the XRD spectrum revealing fine dispersion of the
noble metal. The main characteristic lines of the two
iron oxide modifications are approximately of the
same intensity. The diffraction lines are broad and
low intense owing to high dispersion of the iron
oxides. The linewidths indicate that the formed mate-
rials are ultra- or highly dispersed.
IR results are displayed in figure 2a. A spectrum
of Pd/BM sample shows bands characteristic of goe-
thite (3182, 886, 792, 668, 470 cm−1
) and lepidocro-
cite (3182, 1112, 1023, 976, 745 cm−1
) as well as sur-
face carbonates (1482 plateau, 1639, 1656, 718 cm−1
).
The spectra of Pd+Co/BM, Co/BM, and Mn/BM
show bands characteristic of lepidocrocite (3203,
1115, 745, 1021 cm−1
), nitrates (825, 1382 cm−1
), and
surface carbonates (1657, 1640, 1474, 1454, 719
cm−1
). Although not all characteristic goethite bands
were observed, its presence in the studied systems
should be assumed. The materials treated at 300°C
were also investigated. The IR spectra are presented
in figure 2b. Bands characteristic of Fe-O vibration
(under 500 cm−1
) prove the presence of iron oxides
and Со3О4.
Fig. 2. Infrared spectra of modified samples before (a)
and after (b) thermal treatment at 300 °C.
Mössbauer spectra of samples before and after
catalytic test are shown in figure 3. Calculated para-
meters of the spectra are given in Table 1. Results of
XRD and Mössbauer spectroscopy studies confirmed
the presence of hematite and maghemite in the
samples before catalysis. Most spectra except those
of Mn/BM and Pd+Co/BM-LNT fit well with a
model of two sextets and two doublets. The para-
meters of both sextets correspond to the two modi-
fications of iron oxide - hematite (α-Fe2O3) and
maghemite (γ-Fe2O3), that of maghemite being more
intensive. Both sextets have reduced Heff values of
about 10−20 T, which indicated that the particles
were highly dispersed. Doublet components in the
Mössbauer spectra are indicative of nanosized highly
dispersed particles, which demonstrate superpara-
magnetic behaviour. Polymorph phases ratio of iron
oxides before heating to those obtained after heating
at 300 °C can be related to thermal decomposition
dynamics of the various iron hydroxides.
Fig. 3. Room temperature Mössbauer spectra of modified
samples thermally treated at 300 °C (a)
and after catalytic test (b).
T. M. Petrova et al.: Iron-containing biogenic materials as catalysts
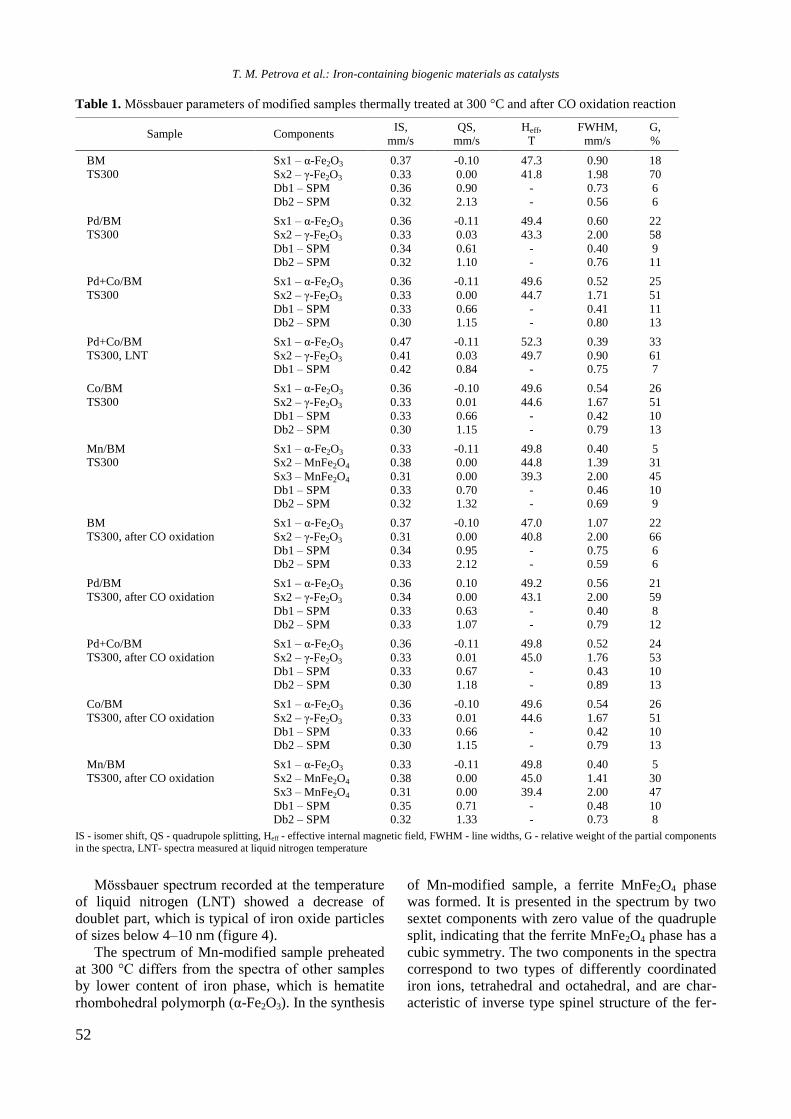
52
Table 1. Mössbauer parameters of modified samples thermally treated at 300 °C and after CO oxidation reaction
IS - isomer shift, QS - quadrupole splitting, Heff - effective internal magnetic field, FWHM - line widths, G - relative weight of the partial components
in the spectra, LNT- spectra measured at liquid nitrogen temperature
Mössbauer spectrum recorded at the temperature
of liquid nitrogen (LNT) showed a decrease of
doublet part, which is typical of iron oxide particles
of sizes below 4–10 nm (figure 4).
The spectrum of Mn-modified sample preheated
at 300 °C differs from the spectra of other samples
by lower content of iron phase, which is hematite
rhombohedral polymorph (α-Fe2O3). In the synthesis
of Mn-modified sample, a ferrite MnFe2O4 phase
was formed. It is presented in the spectrum by two
sextet components with zero value of the quadruple
split, indicating that the ferrite MnFe2O4 phase has a
cubic symmetry. The two components in the spectra
correspond to two types of differently coordinated
iron ions, tetrahedral and octahedral, and are char-
acteristic of inverse type spinel structure of the fer-
Sample Components IS,
mm/s
QS,
mm/s
Heff,
T
FWHM,
mm/s
G,
%
BM
TS300
Sx1 – α-Fe2O3
Sx2 – γ-Fe2O3
Db1 – SPM
Db2 – SPM
0.37
0.33
0.36
0.32
-0.10
0.00
0.90
2.13
47.3
41.8
-
-
0.90
1.98
0.73
0.56
18
70
6
6
Pd/BM TS300
Sx1 – α-Fe2O3
Sx2 – γ-Fe2O3
Db1 – SPM Db2 – SPM
0.36
0.33
0.34 0.32
-0.11
0.03
0.61 1.10
49.4
43.3
- -
0.60
2.00
0.40 0.76
22
58
9 11
Pd+Co/BM
TS300
Sx1 – α-Fe2O3
Sx2 – γ-Fe2O3
Db1 – SPM Db2 – SPM
0.36
0.33
0.33 0.30
-0.11
0.00
0.66 1.15
49.6
44.7
- -
0.52
1.71
0.41 0.80
25
51
11 13
Pd+Co/BM
TS300, LNT
Sx1 – α-Fe2O3
Sx2 – γ-Fe2O3 Db1 – SPM
0.47
0.41 0.42
-0.11
0.03 0.84
52.3
49.7 -
0.39
0.90 0.75
33
61 7
Co/BM
TS300
Sx1 – α-Fe2O3
Sx2 – γ-Fe2O3
Db1 – SPM
Db2 – SPM
0.36
0.33
0.33
0.30
-0.10
0.01
0.66
1.15
49.6
44.6
-
-
0.54
1.67
0.42
0.79
26
51
10
13
Mn/BM TS300
Sx1 – α-Fe2O3
Sx2 – MnFe2O4
Sx3 – MnFe2O4
Db1 – SPM Db2 – SPM
0.33
0.38
0.31
0.33 0.32
-0.11
0.00
0.00
0.70 1.32
49.8
44.8
39.3
- -
0.40
1.39
2.00
0.46 0.69
5
31
45
10 9
BM
TS300, after CO oxidation
Sx1 – α-Fe2O3
Sx2 – γ-Fe2O3
Db1 – SPM Db2 – SPM
0.37
0.31
0.34 0.33
-0.10
0.00
0.95 2.12
47.0
40.8
- -
1.07
2.00
0.75 0.59
22
66
6 6
Pd/BM
TS300, after CO oxidation
Sx1 – α-Fe2O3
Sx2 – γ-Fe2O3
Db1 – SPM Db2 – SPM
0.36
0.34
0.33 0.33
0.10
0.00
0.63 1.07
49.2
43.1
- -
0.56
2.00
0.40 0.79
21
59
8 12
Pd+Co/BM
TS300, after CO oxidation
Sx1 – α-Fe2O3
Sx2 – γ-Fe2O3
Db1 – SPM Db2 – SPM
0.36
0.33
0.33 0.30
-0.11
0.01
0.67 1.18
49.8
45.0
- -
0.52
1.76
0.43 0.89
24
53
10 13
Co/BM
TS300, after CO oxidation
Sx1 – α-Fe2O3
Sx2 – γ-Fe2O3
Db1 – SPM Db2 – SPM
0.36
0.33
0.33 0.30
-0.10
0.01
0.66 1.15
49.6
44.6
- -
0.54
1.67
0.42 0.79
26
51
10 13
Mn/BM
TS300, after CO oxidation
Sx1 – α-Fe2O3
Sx2 – MnFe2O4
Sx3 – MnFe2O4
Db1 – SPM Db2 – SPM
0.33
0.38
0.31
0.35 0.32
-0.11
0.00
0.00
0.71 1.33
49.8
45.0
39.4
- -
0.40
1.41
2.00
0.48 0.73
5
30
47
10 8
T. M. Petrova et al.: Iron-containing biogenic materials as catalysts
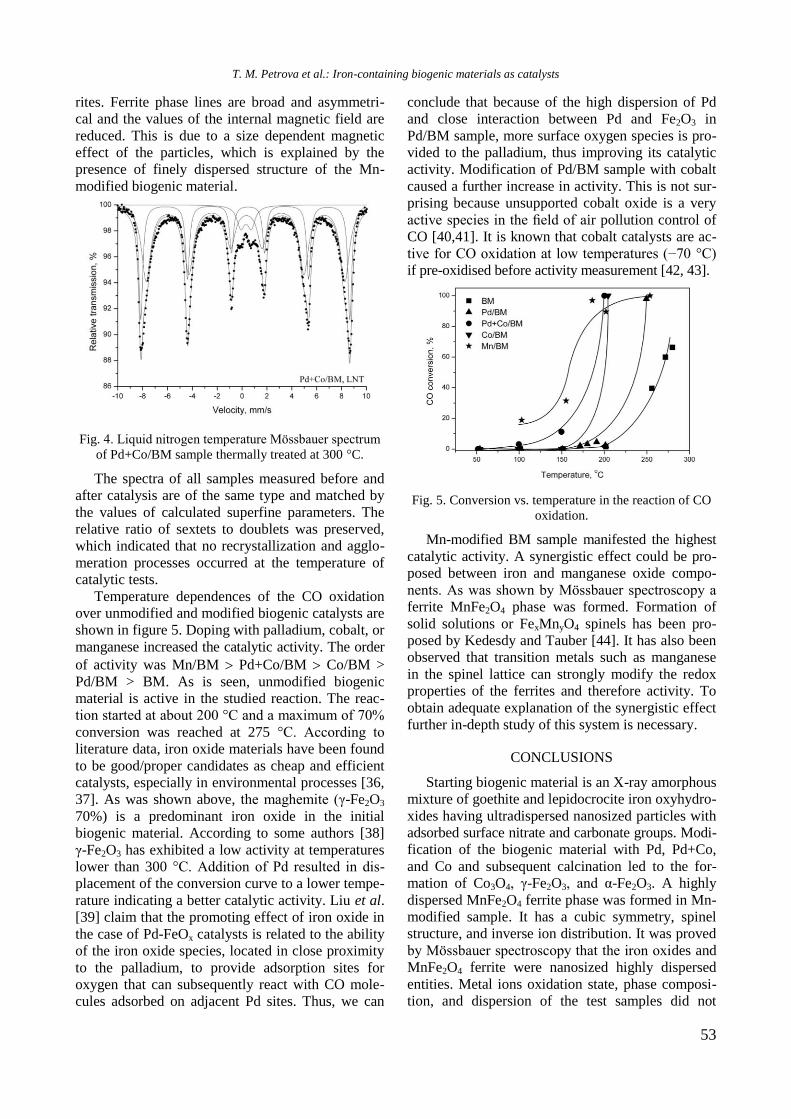
53
rites. Ferrite phase lines are broad and asymmetri-
cal and the values of the internal magnetic field are
reduced. This is due to a size dependent magnetic
effect of the particles, which is explained by the
presence of finely dispersed structure of the Mn-
modified biogenic material.
Fig. 4. Liquid nitrogen temperature Mössbauer spectrum
of Pd+Co/BM sample thermally treated at 300 °C.
The spectra of all samples measured before and
after catalysis are of the same type and matched by
the values of calculated superfine parameters. The
relative ratio of sextets to doublets was preserved,
which indicated that no recrystallization and agglo-
meration processes occurred at the temperature of
catalytic tests.
Temperature dependences of the CO oxidation
over unmodified and modified biogenic catalysts are
shown in figure 5. Doping with palladium, cobalt, or
manganese increased the catalytic activity. The order
of activity was Mn/BM Pd+Co/BM Co/BM >
Pd/BM > BM. As is seen, unmodified biogenic
material is active in the studied reaction. The reac-
tion started at about 200 °C and a maximum of 70%
conversion was reached at 275 °C. According to
literature data, iron oxide materials have been found
to be good/proper candidates as cheap and efficient
catalysts, especially in environmental processes [36,
37]. As was shown above, the maghemite (γ-Fe2O3
70%) is a predominant iron oxide in the initial
biogenic material. According to some authors [38]
γ-Fe2O3 has exhibited a low activity at temperatures
lower than 300 °C. Addition of Pd resulted in dis-
placement of the conversion curve to a lower tempe-
rature indicating a better catalytic activity. Liu et al.
[39] claim that the promoting effect of iron oxide in
the case of Pd-FeOx catalysts is related to the ability
of the iron oxide species, located in close proximity
to the palladium, to provide adsorption sites for
oxygen that can subsequently react with CO mole-
cules adsorbed on adjacent Pd sites. Thus, we can
conclude that because of the high dispersion of Pd
and close interaction between Pd and Fe2O3 in
Pd/BM sample, more surface oxygen species is pro-
vided to the palladium, thus improving its catalytic
activity. Modification of Pd/BM sample with cobalt
caused a further increase in activity. This is not sur-
prising because unsupported cobalt oxide is a very
active species in the field of air pollution control of
CO [40,41]. It is known that cobalt catalysts are ac-
tive for CO oxidation at low temperatures (−70 °C)
if pre-oxidised before activity measurement [42, 43].
Fig. 5. Conversion vs. temperature in the reaction of CO
oxidation.
Mn-modified BM sample manifested the highest
catalytic activity. A synergistic effect could be pro-
posed between iron and manganese oxide compo-
nents. As was shown by Mössbauer spectroscopy a
ferrite MnFe2O4 phase was formed. Formation of
solid solutions or FexMnyO4 spinels has been pro-
posed by Kedesdy and Tauber [44]. It has also been
observed that transition metals such as manganese
in the spinel lattice can strongly modify the redox
properties of the ferrites and therefore activity. To
obtain adequate explanation of the synergistic effect
further in-depth study of this system is necessary.
CONCLUSIONS
Starting biogenic material is an X-ray amorphous
mixture of goethite and lepidocrocite iron oxyhydro-
xides having ultradispersed nanosized particles with
adsorbed surface nitrate and carbonate groups. Modi-
fication of the biogenic material with Pd, Pd+Co,
and Co and subsequent calcination led to the for-
mation of Co3O4, γ-Fe2O3, and α-Fe2O3. A highly
dispersed MnFe2O4 ferrite phase was formed in Mn-
modified sample. It has a cubic symmetry, spinel
structure, and inverse ion distribution. It was proved
by Mössbauer spectroscopy that the iron oxides and
MnFe2O4 ferrite were nanosized highly dispersed
entities. Metal ions oxidation state, phase composi-
tion, and dispersion of the test samples did not
T. M. Petrova et al.: Iron-containing biogenic materials as catalysts
54
change during catalytic tests. Catalytic measure-
ments showed that all prepared samples were active
in the reaction of CO oxidation and the catalytic
properties depended on dopant type. A synergistic
effect was proposed between iron and manganese
oxide components.
Acknowledgements: This work is financially
supported by National Science Fund through project
DFNI T02-17/12.12.2014. The authors are grateful
to Prof. V. Groudeva and R. Angelova from Faculty
of Biology of St. Kliment Ohridski University of
Sofia for providing iron-containing biogenic
material.
REFERENCES
1. D. Ellis, Microbiology of the Iron-depositing Bacteria,
Wexford College Press, Palm Springs, CA, 2003.
2. A. Kappler, K. L. Straub, Rev. Miner. Geochem., 59,
85 (2005).
3. Z. Cherkezova-Zheleva, D. Paneva, M. Shopska, R.
Ilieva, M. Iliev, D. Kovacheva, G. Kadinov, Hyperfine
Interact., 239, 6 (2018).
4. M. Shopska, D. Paneva, Z. Cherkezova-Zheleva, G.
Kadinov, I. Mitov, V. Grudeva, Nanoscience &
Nanotechnology, 14, 21 (2014).
5. D. Emerson, E. J. Fleming and J. M. McBeth, Annu.
Rev. Microbiol., 64, 561 (2010).
6. H. L. Ehrlich, D. K. Newman, Geomicrobiology,
CRC Press, Boca Raton, 2009.
7. C. Chan, S. Fakra, D. Edwards, D. Emerson, J.
Banfield, Geochim. Cosmochim. Acta, 73, 3807
(2009).
8. F. G. Ferris, R. O. Hallberg, B. Lyven, K. Pedersen,
Appl. Geochem., 15, 1035 (2000).
9. K. Benzerara, T. Yooh, T. Tyliszczak, B. Constantz, A.
Spormann, G. Brown, Jr., Geobiology, 2, 249 (2004).
10. T. Ema, Y. Miyazaki, I. Kozuki, T. Sakai, H.
Hashimoto, J. Takada, Green Chem., 13, 3187 (2011).
11. X. Wang, M. Zhu, S. Lan, M. Ginder-Vogel, F. Liu,
X. Feng, Chem. Geol., 415, 37 (2015).
12. Z. Cherkezova-Zheleva, M. Shopska, D. Paneva, D.
Kovacheva, G. Kadinov, I. Mitov, Hyperfine Interact.,
237, 56 (2016).
13. T. Sakai, Y. Miyazaki, A. Murakami, N. Sakamoto, T.
Ema, H. Hashimoto, M. Furutani, M. Nakanishi, T.
Fujiia, J. Takada, Org. Biomol. Chem., 8, 336 (2010).
14. P. C. Francisco, T. Sato, T. Otake, T. Kasama, Am.
Mineral., 101, 2057 (2016).
15. J. A. Rentz, Phosphorus Removal Potential Using
Biogenic Iron Oxides, WERF Research Report
Series, vol. 10, IWA Publishing, London, 2010.
16. D. Pragnesh, C. Lakhan, J. Nanotechnol., Article ID
398569 (2014).
17. M. Shopska, D. Paneva, G. Kadinov, S. Todorova,
M. Fabian, I. Yordanova, Z. Cherkezova-Zheleva, I.
Mitov, Reac. Kinet. Mech. Catal., 118, 179 (2016).
18. M. Shopska, D. Paneva, G. Kadinov, Z. Cherkezova-
Zheleva, I. Mitov, M. Iliev, Appl. Biochem.
Biotechnol., 181, 867 (2017).
19. M. Shopska, Z. Cherkezova-Zheleva, D. Paneva, M.
Iliev, G. Kadinov, I. Mitov, V. Groudeva, Cent. Eur.
J. Chem., 11, 215 (2013).
20. K. B. Narayanan, N. Sakthivel, Adv. Colloid Interface
Sci., 156, 1 (2010).
21. H. Hashimoto, S. Yokoyama, H. Asaoka, Y. Kusano,
Y. Ikeda, M. Seno, J. Takada, T. Fujii, M. Nakanishi,
R. Murakami, J. Magnet. Magnet. Mater., 310, 2405
(2007).
22. D. Emerson, H. Lin, L. Agulto, L. Lin, Bioscience,
58, 925 (2008).
23. J. S. J. Hargreaves, A. I. Alharthi, J. Chem. Technol.
Biotechnol., 91, 296 (2016).
24. B. Kazprzyk-Hordern, M. Ziolek, J. Nawrocik, Appl.
Catal. B., 46, 639 (2003).
25. T. Shahwan, S. Abu Sirriah, M. Nairat, E. Boyaci, A.
E. Eroglu, T. B. Scott, K. R. Hallam, Chem. Eng. J.,
172, 258 (2011).
26. B. Kumar, K. Smita, L. Cumbal, A. Debut, J. Saudi.
Chem. Soc., 18, 364 (2014).
27. G. E. Hoag, J. B. Collins, J. L. Holcomb, J. R. Hoag,
M. N. Nadagouda, R. S. Varma, J. Mater. Chem., 19,
8671 (2009).
28. H. Jung, H. Park, J. Kim, J-H Lee, H-G Hur, N. V.
Myung, H. Choi, Environ. Sci. Technol., 41, 4741
(2007).
29. M. G. Shopska, G. B. Kadinov, J. Briancin, I. D.
Yordanova, H. G. Kolev, M. Fabian, Bulg. Chem.
Commun., 47 (Special Issue C), 79 (2015).
30. M. Shopska, S. Todorova, I. Yordanova, S. Mondal,
G. Kadinov, Bulg. Chem. Commun., 47 (Special Issue
C), 73 (2015).
31. S. Y. Lee, M. H. Baik, H-R Cho, E. C. Jung, J. T.
Jeong, J. W. Choi, Y. B. Lee, Y. J. Lee, J. Radioanal.
Nucl. Chem., 296, 1311 (2013).
32. A. Alharthi, R. A. Blackley, T. H. Flowers, J. S. J.
Hergreaves, I. D. Pulford, J. Wigzell, W. Zhou, J.
Chem. Technol. Biotechnol., 89, 1317 (2014).
33. K. Mandai, T. Korenaga, T. Ema, T. Sakai, M.
Furutani, H. Hashimoto, J. Takada, Tetrahedron Lett.,
53, 329 (2012).
34. M. Harshiny, C. N. Iswarya, M. Matheswaran, Powder
Technol., 286, 744 (2015).
35. T. Ema, Y. Miyazaki, T. Taniguchi, J. Takada, Green
Chem., 15, 2485 (2013).
36. M. Mohapatra, S. Anand, Int. J. Eng. Sci. Technol.,
2, 127 (2010).
37. S. C. Kwon, M. Fan, T. D. Wheelock, B. Saha, Sep.
Purif. Technol., 58, 40 (2007).
38. L. C. A. Oliveira, J. D. Fabris, R. R. V. A. Rios, W.
N. Mussel, R. M. Lago, Appl. Catal. A: Gen., 259,
253 (2004).
39. L. Liu, F. Zhou, L. Wang, X. Qi, F. Shi, Y. Deng, J.
Catal., 274, 1 (2010).
40. Y. J. Mergler, J. Hoebink, B. E. Nieuwenhuys, J.
Catal., 167, 305 (1997).
41. J. Jansson, J. Catal., 194, 55 (2000).
42. P. Thormählen, M. Skoglundh, E. Fridell, B.
Andersson, J. Catal., 188, 300 (1999).
T. M. Petrova et al.: Iron-containing biogenic materials as catalysts
55
43. D. A. H. Cunningham, T. Kobayashi, N. Kamijo, M.
Haruta, Catal. Lett., 25, 257 (1994).
44. H. H. Kedesdy, A. Tauber, J. Americ. Ceram. Soc.,
39, 425 (1956).
МОДИФИЦИРАНЕ И ОХАРАКТЕРИЗИРАНЕ НА ЖЕЛЯЗОСЪДЪРЖАЩИ БИОГЕННИ
МАТЕРИАЛИ КАТО КАТАЛИЗАТОРИ ЗА РЕАКЦИЯТА НА ОКИСЛЕНИЕ НА СО
Т. М. Петрова*, Д. Г. Панева, С. Ж. Тодорова, З. П. Черкезова-Желева, Д. Г. Филкова,
М. Г. Шопска, Н. И. Велинов, Б. Н. Кунев, Г. Б. Кадинов, Ив. Г. Митов
Институт по катализ, Българска академия на науките, ул. „Акад. Г. Бончев“, бл. 11, 1113 София, България
Постъпила на 12 февруари 2018 г.; Преработена на 14 март 2018 г.
(Резюме)
Настоящото изследване е насочено към получаване на модифицирани желязо-съдържащи биогенни мате-
риали и тяхното изпитване като катализатори в реакцията на окисление на CO. Модифицирането е осъществено
чрез импрегниране на биогенен материал, получен в хранителна среда Lieske. Импрегнирането е извършено с
използване на разтвори на паладиев хлорид, кобалтов нитрат и манганов нитрат. Пробите са охарактеризирани
с рентгенова дифракция (XRD), инфрачервена и Мьосбауерова спектроскопия. Резултатите от XRD показват, че
изходният биогенен материал е рентгеноаморфен, но въпреки това не се изключва наличието на смес от ниско-
кристални железни оксихидроксиди гьотит и лепидокрокит. Нагряване на Pd- и Co-модифицирани материали
води до образуване на фази от Co3O4, γ-Fe2O3 и α-Fe2O3. В термично третираните проби, инфрачервените
спектри потвърждават пълно трансформиране на оксихидроксидите до оксиди. Мьосбауерови спектри на проби
обработени при 300 °С показват, че образуваните материали имат ниска степен на кристалност, която е специ-
фична характеристика за наноразмерни високо дисперсни оксидни материали. Дублетни компоненти в
Мьосбауеровите спектри са показателни за наличието на наноразмерни високо-дисперсни частици демонстри-
ращи суперпарамагнитно поведение. При синтеза на образец модифициран с манган се формира феритна
MnFe2O4 фаза. Мьосбауеров спектър, регистриран при температурата на течен азот, показва намаляване на
дублетната част, което е типично за железни оксидни частици с размер под 4–10 nm. Всички изследвани
образци показват активност в реакцията на окисление на СО, като най-високо активен е катализаторът моди-
фициран с манган. Анализ на Мьосбауеровите спектри на пробите след каталитични тестове не показва
промени във фазовия състав и дисперсността.
T. M. Petrova et al.: Iron-containing biogenic materials as catalysts
56
Bulgarian Chemical Communications, Volume 50, Special issue H (pp. 56–60) 2018
Levulinic acid esterification on SO3H-modified mesoporous silicas
H. I. Lazarova1*, M. D. Popova
1, A. Szegedi
2, B. Likozar
3, V. Dasireddy
3, N. Novak-Tusar
3
1 Institute of Organic Chemistry with Centre of Phytochemistry, Bulgarian Academy of Science, 1113 Sofia, Bulgaria, 2 Research Centre for Natural Sciences, Institute of Materials and Environmental Chemistry, Hungarian Academy of
Sciences, 1117 Budapest, Magyar tudósok körútja 2, Hungary 3 National Institute of Chemistry, Hajdrihova 19, 1001 Ljubljana, Slovenia
Received: January 16, 2018; Revised: March 02, 2018
Ordered mesoporous SBA-15 silica and a nanosized KIL-2 material with textural mesoporosity were synthesised
and modified with sulphonic groups. Functionalisation with SO3H groups was performed by a two-step procedure, in
which mercapto-modified mesoporous silicas were obtained first in reaction with mercaptosilane followed by treatment
in H2O2 to result SO3H-modified mesoporous silicas. Initial and SO3H-containing mesoporous materials were char-
acterised by X-ray diffraction (XRD), N2 physisorption, TG analysis, and TPD of ammonia. The catalytic performance
of the SO3H/SBA-15 and SO3H/KIL-2 catalysts was studied in levulinic acid esterification with ethanol. A sulphonic-
functionalised SBA-15 mesoporous material showed a higher conversion of levulinic acid to ethyl levulinate.
Key words: levulinic acid esterification, mesoporous silicas, KIL-2, SBA-15, biomass valorisation.
INTRODUCTION
The growing energy crisis and environmental
concerns have prompted the utilisation of readily
available lignocellulosic biomass materials as an
alternative to the limited fossil resources [1,2]. Levu-
linic acid and its esters are promising platform che-
micals for the production of a wide range of sources
for biofuel, polymer, and fine chemicals industry
[3−7]. Levulinic acid (LA) is generally produced by
acid-catalysed hydrolysis of cellulose, and can be
converted into levulinate esters, g-valerolactone,
1,4-pentanediol, and 5-nonanone (via pentanoic
acid) as well as diphenolic acid as an intermediate
for the synthesis of epoxy resins and polycarbo-
nates [8−12]. Levulinate esters are also valuable
compounds that can be used as fuel additives, sol-
vents, and plasticisers. In particular, up to 5 wt.%
ethyl levulinate can directly be used as a diesel mis-
cible biofuel in regular diesel engines without modi-
fication because of its physicochemical properties
similar to those of biodiesel, i.e., fatty acid methyl
esters (FAME) [8]. Therefore, it has the potential to
decrease the consumption of petroleum-derived fossil
fuels. Generally, levulinate esters are produced by
esterification of LA with several alcohols using
mineral acids like HCl, H2SO4, and H3PO4 as cata-
lysts, to give a high yield of corresponding products
within a short reaction time. However, such
homogenous acid catalysts cannot be recycled and
always lead to technological problems (e.g., use of a
large volume of base for neutralisation and corro-
sion of equipment). Their replacement with hetero-
geneous analogues, which are easily separable and
reusable, is thus highly desirable. Various solid acids
have been used for the esterification of levulinic
acid with alcohols, e.g., zeolites and sulphated mixed
oxides (sulphated zirconia (SO42−
/ZrO2), niobia
(SO42−
/Nb2O5), titania (SO42−
/TiO2), and stannia
(SO42−
/SnO2) [8−12]. The number and the strength
of acid sites and the applied preparation conditions
are the key parameters for catalyst activity. One
possible strategy to increase catalyst activity is to
use a neutral, high surface area support, e.g., meso-
porous silica materials, in order to ensure fine dis-
persion of the supported active phase. This approach
may enhance the catalytic activity of the obtained
catalysts in liquid-phase reactions by accelerating
mass transport of reactant and product molecules as
well.
In the present study mesoporous SBA-15 and
KIL-2 materials were prepared and modified with
SO3H groups and studied in liquid phase esterifi-
cation of levulinic acid with ethanol. The effect of
the structural, textural, and acid properties of the
obtained materials on their catalytic activity and
stability was discussed.
EXPERIMENTAL
Synthesis of mesoporous KIL-2 silica
In the first step, the silica source (tetraethyl
orthosilicate, 98% TEOS, Acros) as well as the tem-
plates (triethanolamine (99% TEA, Fluka) and tetra-
© 2018 Bulgarian Academy of Sciences, Union of Chemists in Bulgaria
* To whom all correspondence should be sent
E-mail: [email protected]
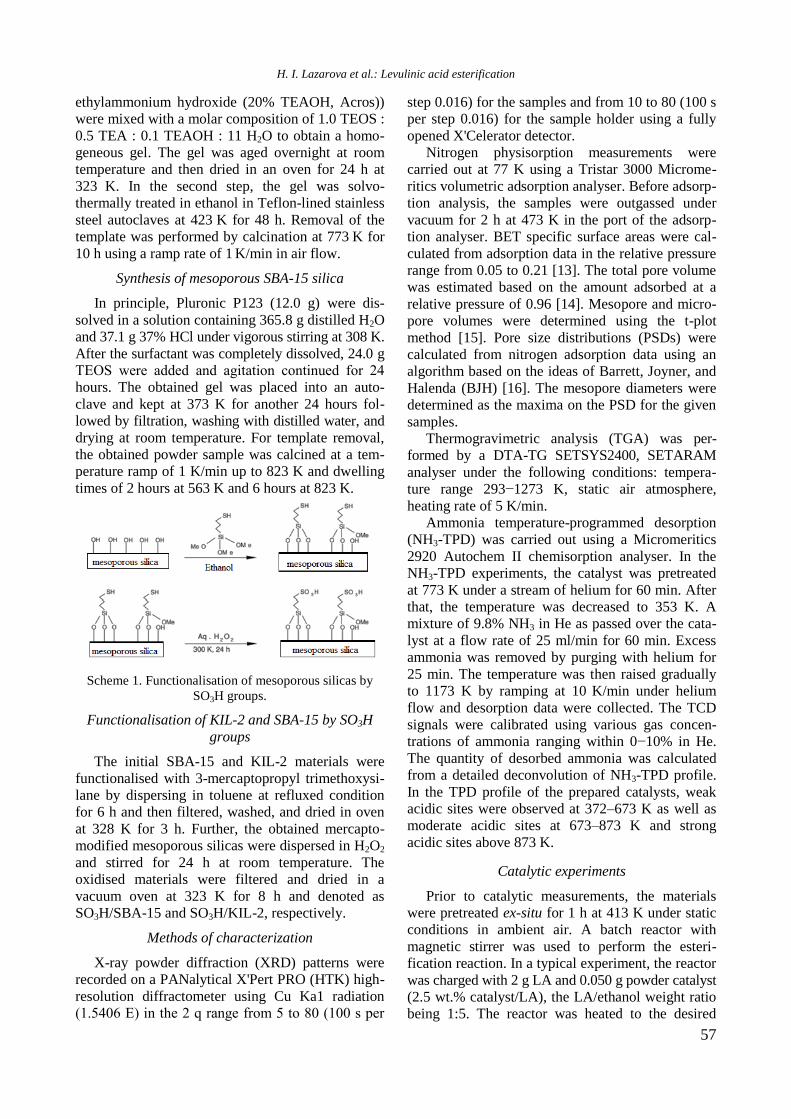
57
ethylammonium hydroxide (20% TEAOH, Acros))
were mixed with a molar composition of 1.0 TEOS :
0.5 TEA : 0.1 TEAOH : 11 H2O to obtain a homo-
geneous gel. The gel was aged overnight at room
temperature and then dried in an oven for 24 h at
323
K. In the second step, the gel was solvo-
thermally treated in ethanol in Teflon-lined stainless
steel autoclaves at 423 K for 48 h. Removal of the
template was performed by calcination at 773 K for
10 h using a ramp rate of 1 K/min in air flow.
Synthesis of mesoporous SBA-15 silica
In principle, Pluronic P123 (12.0 g) were dis-
solved in a solution containing 365.8 g distilled H2O
and 37.1 g 37% HCl under vigorous stirring at 308 K.
After the surfactant was completely dissolved, 24.0 g
ТЕОS were added and agitation continued for 24
hours. The obtained gel was placed into an auto-
clave and kept at 373 K for another 24 hours fol-
lowed by filtration, washing with distilled water, and
drying at room temperature. For template removal,
the obtained powder sample was calcined at a tem-
perature ramp of 1 K/min up to 823 K and dwelling
times of 2 hours at 563 K and 6 hours at 823 K.
Scheme 1. Functionalisation of mesoporous silicas by
SO3H groups.
Functionalisation of KIL-2 and SBA-15 by SO3H
groups
The initial SBA-15 and KIL-2 materials were
functionalised with 3-mercaptopropyl trimethoxysi-
lane by dispersing in toluene at refluxed condition
for 6 h and then filtered, washed, and dried in oven
at 328 K for 3 h. Further, the obtained mercapto-
modified mesoporous silicas were dispersed in H2O2
and stirred for 24 h at room temperature. The
oxidised materials were filtered and dried in a
vacuum oven at 323 K for 8 h and denoted as
SO3H/SBA-15 and SO3H/KIL-2, respectively.
Methods of characterization
X-ray powder diffraction (XRD) patterns were
recorded on a PANalytical X'Pert PRO (HTK) high-
resolution diffractometer using Cu Ka1 radiation
(1.5406 Е) in the 2 q range from 5 to 80 (100 s per
step 0.016) for the samples and from 10 to 80 (100 s
per step 0.016) for the sample holder using a fully
opened X'Celerator detector.
Nitrogen physisorption measurements were
carried out at 77 K using a Tristar 3000 Microme-
ritics volumetric adsorption analyser. Before adsorp-
tion analysis, the samples were outgassed under
vacuum for 2 h at 473 K in the port of the adsorp-
tion analyser. BET specific surface areas were cal-
culated from adsorption data in the relative pressure
range from 0.05 to 0.21 [13]. The total pore volume
was estimated based on the amount adsorbed at a
relative pressure of 0.96 [14]. Mesopore and micro-
pore volumes were determined using the t-plot
method [15]. Pore size distributions (PSDs) were
calculated from nitrogen adsorption data using an
algorithm based on the ideas of Barrett, Joyner, and
Halenda (BJH) [16]. The mesopore diameters were
determined as the maxima on the PSD for the given
samples.
Thermogravimetric analysis (TGA) was per-
formed by a DTA-TG SETSYS2400, SETARAM
analyser under the following conditions: tempera-
ture range 293−1273 K, static air atmosphere,
heating rate of 5 K/min.
Ammonia temperature-programmed desorption
(NH3-TPD) was carried out using a Micromeritics
2920 Autochem II chemisorption analyser. In the
NH3-TPD experiments, the catalyst was pretreated
at 773 K under a stream of helium for 60 min. After
that, the temperature was decreased to 353 K. A
mixture of 9.8% NH3 in He as passed over the cata-
lyst at a flow rate of 25 ml/min for 60 min. Excess
ammonia was removed by purging with helium for
25 min. The temperature was then raised gradually
to 1173 K by ramping at 10 K/min under helium
flow and desorption data were collected. The TCD
signals were calibrated using various gas concen-
trations of ammonia ranging within 0−10% in He.
The quantity of desorbed ammonia was calculated
from a detailed deconvolution of NH3-TPD profile.
In the TPD profile of the prepared catalysts, weak
acidic sites were observed at 372–673 K as well as
moderate acidic sites at 673–873 K and strong
acidic sites above 873 K.
Catalytic experiments
Prior to catalytic measurements, the materials
were pretreated ex-situ for 1 h at 413 K under static
conditions in ambient air. A batch reactor with
magnetic stirrer was used to perform the esteri-
fication reaction. In a typical experiment, the reactor
was charged with 2 g LA and 0.050 g powder catalyst
(2.5 wt.% catalyst/LA), the LA/ethanol weight ratio
being 1:5. The reactor was heated to the desired
H. I. Lazarova et al.: Levulinic acid esterification
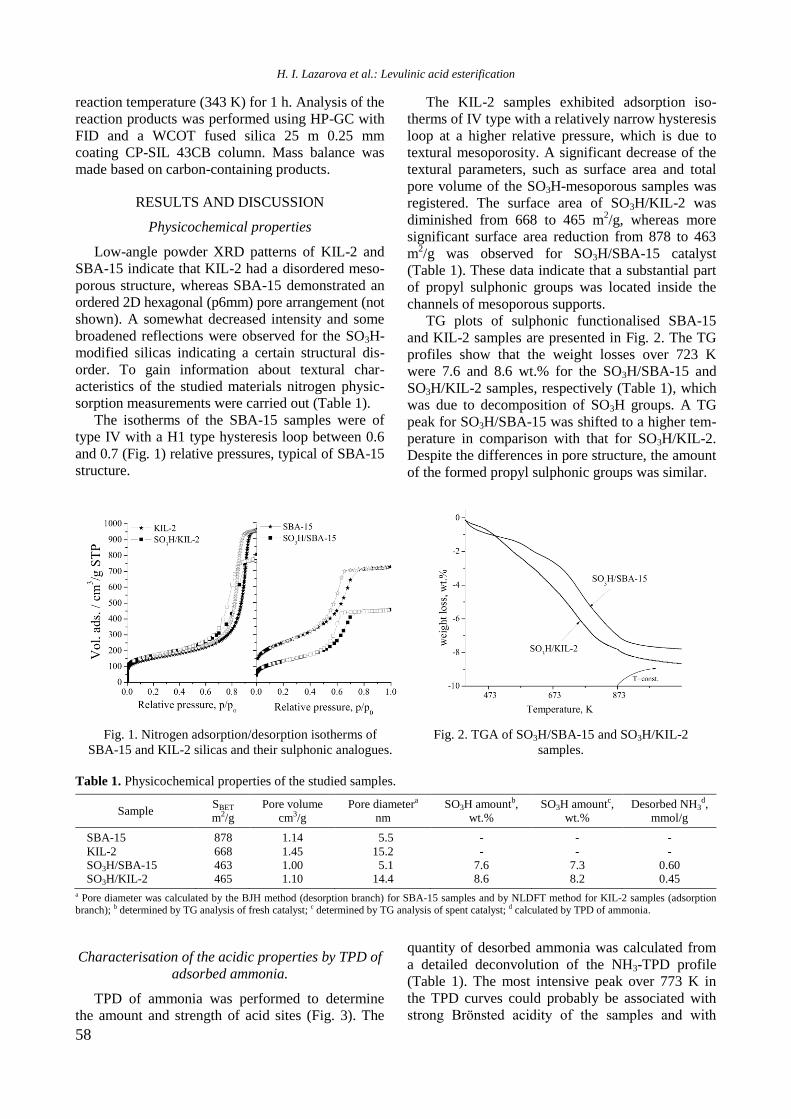
58
reaction temperature (343 K) for 1 h. Analysis of the
reaction products was performed using HP-GC with
FID and a WCOT fused silica 25 m 0.25 mm
coating CP-SIL 43CB column. Mass balance was
made based on carbon-containing products.
RESULTS AND DISCUSSION
Physicochemical properties
Low-angle powder XRD patterns of KIL-2 and
SBA-15 indicate that KIL-2 had a disordered meso-
porous structure, whereas SBA-15 demonstrated an
ordered 2D hexagonal (p6mm) pore arrangement (not
shown). A somewhat decreased intensity and some
broadened reflections were observed for the SO3H-
modified silicas indicating a certain structural dis-
order. To gain information about textural char-
acteristics of the studied materials nitrogen physic-
sorption measurements were carried out (Table 1).
The isotherms of the SBA-15 samples were of
type IV with a H1 type hysteresis loop between 0.6
and 0.7 (Fig. 1) relative pressures, typical of SBA-15
structure.
The KIL-2 samples exhibited adsorption iso-
therms of IV type with a relatively narrow hysteresis
loop at a higher relative pressure, which is due to
textural mesoporosity. A significant decrease of the
textural parameters, such as surface area and total
pore volume of the SO3H-mesoporous samples was
registered. The surface area of SO3H/KIL-2 was
diminished from 668 to 465 m2/g, whereas more
significant surface area reduction from 878 to 463
m2/g was observed for SO3H/SBA-15 catalyst
(Table 1). These data indicate that a substantial part
of propyl sulphonic groups was located inside the
channels of mesoporous supports.
TG plots of sulphonic functionalised SBA-15
and KIL-2 samples are presented in Fig. 2. The TG
profiles show that the weight losses over 723 K
were 7.6 and 8.6 wt.% for the SO3H/SBA-15 and
SO3H/KIL-2 samples, respectively (Table 1), which
was due to decomposition of SO3H groups. A TG
peak for SO3H/SBA-15 was shifted to a higher tem-
perature in comparison with that for SO3H/KIL-2.
Despite the differences in pore structure, the amount
of the formed propyl sulphonic groups was similar.
Fig. 1. Nitrogen adsorption/desorption isotherms of
SBA-15 and KIL-2 silicas and their sulphonic analogues.
Fig. 2. TGA of SO3H/SBA-15 and SO3H/KIL-2
samples.
Table 1. Physicochemical properties of the studied samples.
Sample SBET
m2/g
Pore volume
cm3/g
Pore diametera
nm
SO3H amountb,
wt.%
SO3H amountc,
wt.%
Desorbed NH3d,
mmol/g
SBA-15 878 1.14 5.5 - - -
KIL-2 668 1.45 15.2 - - -
SO3H/SBA-15 463 1.00 5.1 7.6 7.3 0.60 SO3H/KIL-2 465 1.10 14.4 8.6 8.2 0.45
a Pore diameter was calculated by the BJH method (desorption branch) for SBA-15 samples and by NLDFT method for KIL-2 samples (adsorption branch); b determined by TG analysis of fresh catalyst; c determined by TG analysis of spent catalyst; d calculated by TPD of ammonia.
Characterisation of the acidic properties by TPD of
adsorbed ammonia.
TPD of ammonia was performed to determine
the amount and strength of acid sites (Fig. 3). The
quantity of desorbed ammonia was calculated from
a detailed deconvolution of the NH3-TPD profile
(Table 1). The most intensive peak over 773 K in
the TPD curves could probably be associated with
strong Brönsted acidity of the samples and with
H. I. Lazarova et al.: Levulinic acid esterification
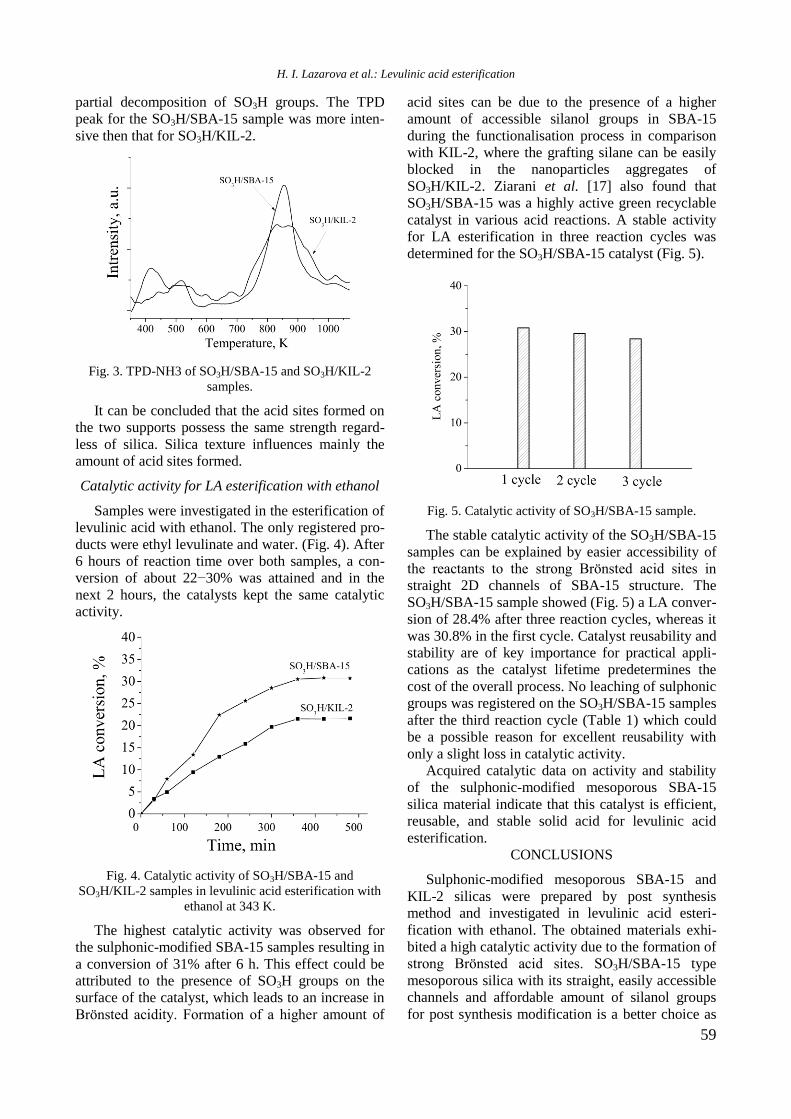
59
partial decomposition of SO3H groups. The TPD
peak for the SO3H/SBA-15 sample was more inten-
sive then that for SO3H/KIL-2.
Fig. 3. TPD-NH3 of SO3H/SBA-15 and SO3H/KIL-2
samples.
It can be concluded that the acid sites formed on
the two supports possess the same strength regard-
less of silica. Silica texture influences mainly the
amount of acid sites formed.
Catalytic activity for LA esterification with ethanol
Samples were investigated in the esterification of
levulinic acid with ethanol. The only registered pro-
ducts were ethyl levulinate and water. (Fig. 4). After
6 hours of reaction time over both samples, a con-
version of about 22−30% was attained and in the
next 2 hours, the catalysts kept the same catalytic
activity.
Fig. 4. Catalytic activity of SO3H/SBA-15 and
SO3H/KIL-2 samples in levulinic acid esterification with
ethanol at 343 K.
The highest catalytic activity was observed for
the sulphonic-modified SBA-15 samples resulting in
a conversion of 31% after 6 h. This effect could be
attributed to the presence of SO3H groups on the
surface of the catalyst, which leads to an increase in
Brönsted acidity. Formation of a higher amount of
acid sites can be due to the presence of a higher
amount of accessible silanol groups in SBA-15
during the functionalisation process in comparison
with KIL-2, where the grafting silane can be easily
blocked in the nanoparticles aggregates of
SO3H/KIL-2. Ziarani et al. [17] also found that
SO3H/SBA-15 was a highly active green recyclable
catalyst in various acid reactions. A stable activity
for LA esterification in three reaction cycles was
determined for the SO3H/SBA-15 catalyst (Fig. 5).
Fig. 5. Catalytic activity of SO3H/SBA-15 sample.
The stable catalytic activity of the SO3H/SBA-15
samples can be explained by easier accessibility of
the reactants to the strong Brönsted acid sites in
straight 2D channels of SBA-15 structure. The
SO3H/SBA-15 sample showed (Fig. 5) a LA conver-
sion of 28.4% after three reaction cycles, whereas it
was 30.8% in the first cycle. Catalyst reusability and
stability are of key importance for practical appli-
cations as the catalyst lifetime predetermines the
cost of the overall process. No leaching of sulphonic
groups was registered on the SO3H/SBA-15 samples
after the third reaction cycle (Table 1) which could
be a possible reason for excellent reusability with
only a slight loss in catalytic activity.
Acquired catalytic data on activity and stability
of the sulphonic-modified mesoporous SBA-15
silica material indicate that this catalyst is efficient,
reusable, and stable solid acid for levulinic acid
esterification.
CONCLUSIONS
Sulphonic-modified mesoporous SBA-15 and
KIL-2 silicas were prepared by post synthesis
method and investigated in levulinic acid esteri-
fication with ethanol. The obtained materials exhi-
bited a high catalytic activity due to the formation of
strong Brönsted acid sites. SO3H/SBA-15 type
mesoporous silica with its straight, easily accessible
channels and affordable amount of silanol groups
for post synthesis modification is a better choice as
H. I. Lazarova et al.: Levulinic acid esterification
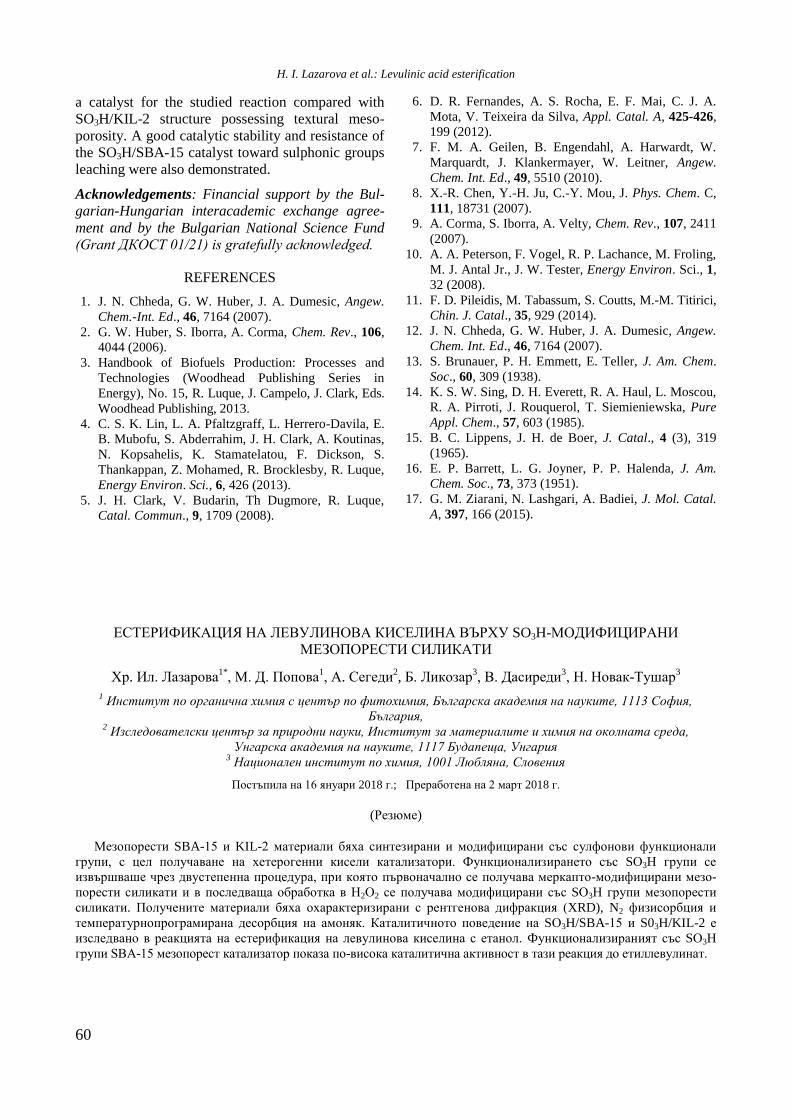
60
a catalyst for the studied reaction compared with
SO3H/KIL-2 structure possessing textural meso-
porosity. A good catalytic stability and resistance of
the SO3H/SBA-15 catalyst toward sulphonic groups
leaching were also demonstrated.
Acknowledgements: Financial support by the Bul-
garian-Hungarian interacademic exchange agree-
ment and by the Bulgarian National Science Fund
(Grant ДКОСТ 01/21) is gratefully acknowledged.
REFERENCES
1. J. N. Chheda, G. W. Huber, J. A. Dumesic, Angew.
Chem.-Int. Ed., 46, 7164 (2007).
2. G. W. Huber, S. Iborra, A. Corma, Chem. Rev., 106,
4044 (2006).
3. Handbook of Biofuels Production: Processes and
Technologies (Woodhead Publishing Series in
Energy), No. 15, R. Luque, J. Campelo, J. Clark, Eds.
Woodhead Publishing, 2013.
4. C. S. K. Lin, L. A. Pfaltzgraff, L. Herrero-Davila, E.
B. Mubofu, S. Abderrahim, J. H. Clark, A. Koutinas,
N. Kopsahelis, K. Stamatelatou, F. Dickson, S.
Thankappan, Z. Mohamed, R. Brocklesby, R. Luque,
Energy Environ. Sci., 6, 426 (2013).
5. J. H. Clark, V. Budarin, Th Dugmore, R. Luque,
Catal. Commun., 9, 1709 (2008).
6. D. R. Fernandes, A. S. Rocha, E. F. Mai, C. J. A.
Mota, V. Teixeira da Silva, Appl. Catal. A, 425-426,
199 (2012).
7. F. M. A. Geilen, B. Engendahl, A. Harwardt, W.
Marquardt, J. Klankermayer, W. Leitner, Angew.
Chem. Int. Ed., 49, 5510 (2010).
8. X.-R. Chen, Y.-H. Ju, C.-Y. Mou, J. Phys. Chem. C,
111, 18731 (2007).
9. A. Corma, S. Iborra, A. Velty, Chem. Rev., 107, 2411
(2007).
10. A. A. Peterson, F. Vogel, R. P. Lachance, M. Froling,
M. J. Antal Jr., J. W. Tester, Energy Environ. Sci., 1,
32 (2008).
11. F. D. Pileidis, M. Tabassum, S. Coutts, M.-M. Titirici,
Chin. J. Catal., 35, 929 (2014).
12. J. N. Chheda, G. W. Huber, J. A. Dumesic, Angew.
Chem. Int. Ed., 46, 7164 (2007).
13. S. Brunauer, P. H. Emmett, E. Teller, J. Am. Chem.
Soc., 60, 309 (1938).
14. K. S. W. Sing, D. H. Everett, R. A. Haul, L. Moscou,
R. A. Pirroti, J. Rouquerol, T. Siemieniewska, Pure
Appl. Chem., 57, 603 (1985).
15. B. C. Lippens, J. H. de Boer, J. Catal., 4 (3), 319
(1965).
16. E. P. Barrett, L. G. Joyner, P. P. Halenda, J. Am.
Chem. Soc., 73, 373 (1951).
17. G. M. Ziarani, N. Lashgari, A. Badiei, J. Mol. Catal.
A, 397, 166 (2015).
ЕСТЕРИФИКАЦИЯ НА ЛЕВУЛИНОВА КИСЕЛИНА ВЪРХУ SO3H-МОДИФИЦИРАНИ
МЕЗОПОРЕСТИ СИЛИКАТИ
Хр. Ил. Лазарова1*
, М. Д. Попова1, А. Сегеди
2, Б. Ликозар
3, В. Дасиреди
3, Н. Новак-Тушар
3
1 Институт по органична химия с център по фитохимия, Българска академия на науките, 1113 София,
България, 2 Изследователски център за природни науки, Институт за материалите и химия на околната среда,
Унгарска академия на науките, 1117 Будапеща, Унгария 3 Национален институт по химия, 1001 Любляна, Словения
Постъпила на 16 януари 2018 г.; Преработена на 2 март 2018 г.
(Резюме)
Мезопорести SBA-15 и KIL-2 материали бяха синтезирани и модифицирани със сулфонови функционали
групи, с цел получаване на хетерогенни кисели катализатори. Функционализирането със SО3H групи се
извършваше чрез двустепенна процедура, при която първоначално се получава меркапто-модифицирани мезо-
порести силикати и в последваща обработка в Н2О2 се получава модифицирани със SО3H групи мезопорести
силикати. Получените материали бяха охарактеризирани с рентгенова дифракция (XRD), N2 физисорбция и
температурнопрограмирана десорбция на амоняк. Каталитичното поведение на SО3H/SBA-15 и S03H/KIL-2 е
изследвано в реакцията на естерификация на левулинова киселина с етанол. Функционализираният със SО3H
групи SBA-15 мезопорест катализатор показа по-висока каталитична активност в тази реакция до етиллевулинат.
H. I. Lazarova et al.: Levulinic acid esterification
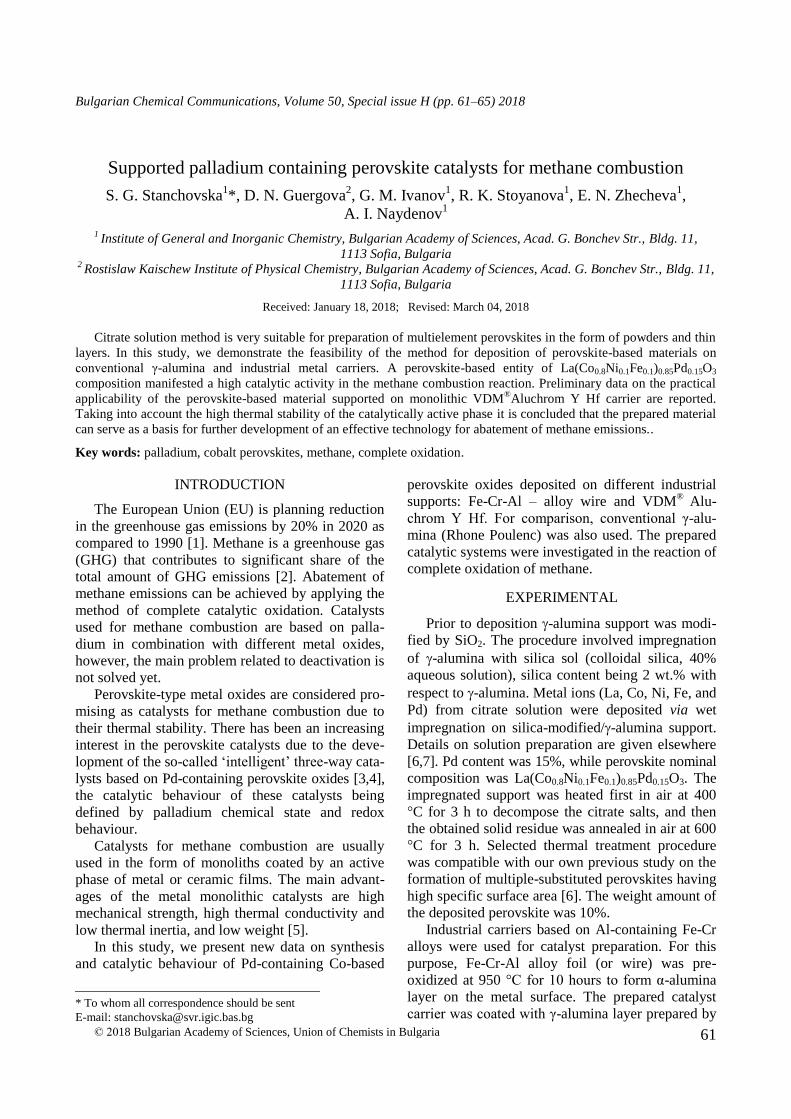
61
Bulgarian Chemical Communications, Volume 50, Special issue H (pp. 61–65) 2018
Supported palladium containing perovskite catalysts for methane combustion
S. G. Stanchovska1*, D. N. Guergova
2, G. M. Ivanov
1, R. K. Stoyanova
1, E. N. Zhecheva
1,
A. I. Naydenov1
1 Institute of General and Inorganic Chemistry, Bulgarian Academy of Sciences, Acad. G. Bonchev Str., Bldg. 11,
1113 Sofia, Bulgaria 2 Rostislaw Kaischew Institute of Physical Chemistry, Bulgarian Academy of Sciences, Acad. G. Bonchev Str., Bldg. 11,
1113 Sofia, Bulgaria
Received: January 18, 2018; Revised: March 04, 2018
Citrate solution method is very suitable for preparation of multielement perovskites in the form of powders and thin
layers. In this study, we demonstrate the feasibility of the method for deposition of perovskite-based materials on
conventional γ-alumina and industrial metal carriers. A perovskite-based entity of La(Co0.8Ni0.1Fe0.1)0.85Pd0.15O3
composition manifested a high catalytic activity in the methane combustion reaction. Preliminary data on the practical
applicability of the perovskite-based material supported on monolithic VDM®
Aluchrom Y Hf carrier are reported.
Taking into account the high thermal stability of the catalytically active phase it is concluded that the prepared material
can serve as a basis for further development of an effective technology for abatement of methane emissions..
Key words: palladium, cobalt perovskites, methane, complete oxidation.
INTRODUCTION
The European Union (EU) is planning reduction
in the greenhouse gas emissions by 20% in 2020 as
compared to 1990 [1]. Methane is a greenhouse gas
(GHG) that contributes to significant share of the
total amount of GHG emissions [2]. Abatement of
methane emissions can be achieved by applying the
method of complete catalytic oxidation. Catalysts
used for methane combustion are based on palla-
dium in combination with different metal oxides,
however, the main problem related to deactivation is
not solved yet.
Perovskite-type metal oxides are considered pro-
mising as catalysts for methane combustion due to
their thermal stability. There has been an increasing
interest in the perovskite catalysts due to the deve-
lopment of the so-called ‘intelligent’ three-way cata-
lysts based on Pd-containing perovskite oxides [3,4],
the catalytic behaviour of these catalysts being
defined by palladium chemical state and redox
behaviour.
Catalysts for methane combustion are usually
used in the form of monoliths coated by an active
phase of metal or ceramic films. The main advant-
ages of the metal monolithic catalysts are high
mechanical strength, high thermal conductivity and
low thermal inertia, and low weight [5].
In this study, we present new data on synthesis
and catalytic behaviour of Pd-containing Co-based
perovskite oxides deposited on different industrial
supports: Fe-Cr-Al – alloy wire and VDM®
Alu-
chrom Y Hf. For comparison, conventional γ-alu-
mina (Rhone Poulenc) was also used. The prepared
catalytic systems were investigated in the reaction of
complete oxidation of methane.
EXPERIMENTAL
Prior to deposition -alumina support was modi-
fied by SiO2. The procedure involved impregnation
of -alumina with silica sol (colloidal silica, 40%
aqueous solution), silica content being 2 wt.% with
respect to -alumina. Metal ions (La, Co, Ni, Fe, and
Pd) from citrate solution were deposited via wet
impregnation on silica-modified/-alumina support.
Details on solution preparation are given elsewhere
[6,7]. Pd content was 15%, while perovskite nominal
composition was La(Co0.8Ni0.1Fe0.1)0.85Pd0.15O3. The
impregnated support was heated first in air at 400
°C for 3 h to decompose the citrate salts, and then
the obtained solid residue was annealed in air at 600
°C for 3 h. Selected thermal treatment procedure
was compatible with our own previous study on the
formation of multiple-substituted perovskites having
high specific surface area [6]. The weight amount of
the deposited perovskite was 10%.
Industrial carriers based on Al-containing Fe-Cr
alloys were used for catalyst preparation. For this
purpose, Fe-Cr-Al alloy foil (or wire) was pre-
oxidized at 950 °C for 10 hours to form α-alumina
layer on the metal surface. The prepared catalyst
carrier was coated with γ-alumina layer prepared by
© 2018 Bulgarian Academy of Sciences, Union of Chemists in Bulgaria
* To whom all correspondence should be sent
E-mail: [email protected]
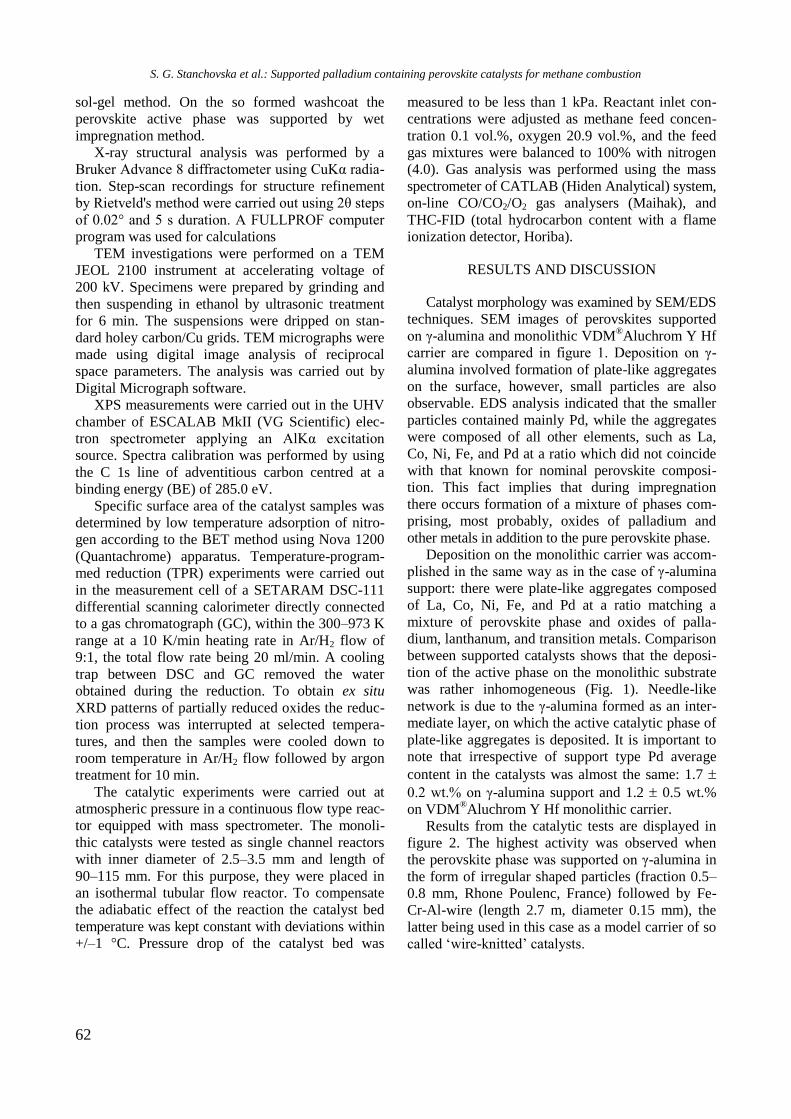
62
sol-gel method. On the so formed washcoat the
perovskite active phase was supported by wet
impregnation method.
X-ray structural analysis was performed by a
Bruker Advance 8 diffractometer using CuKα radia-
tion. Step-scan recordings for structure refinement
by Rietveld's method were carried out using 2θ steps
of 0.02° and 5 s duration. A FULLPROF computer
program was used for calculations
TEM investigations were performed on a TEM
JEOL 2100 instrument at accelerating voltage of
200 kV. Specimens were prepared by grinding and
then suspending in ethanol by ultrasonic treatment
for 6 min. The suspensions were dripped on stan-
dard holey carbon/Cu grids. TEM micrographs were
made using digital image analysis of reciprocal
space parameters. The analysis was carried out by
Digital Micrograph software.
XPS measurements were carried out in the UHV
chamber of ESCALAB MkII (VG Scientific) elec-
tron spectrometer applying an AlKα excitation
source. Spectra calibration was performed by using
the C 1s line of adventitious carbon centred at a
binding energy (BE) of 285.0 eV.
Specific surface area of the catalyst samples was
determined by low temperature adsorption of nitro-
gen according to the BET method using Nova 1200
(Quantachrome) apparatus. Temperature-program-
med reduction (TPR) experiments were carried out
in the measurement cell of a SETARAM DSC-111
differential scanning calorimeter directly connected
to a gas chromatograph (GC), within the 300–973 K
range at a 10 K/min heating rate in Ar/H2 flow of
9:1, the total flow rate being 20 ml/min. A cooling
trap between DSC and GC removed the water
obtained during the reduction. To obtain ex situ
XRD patterns of partially reduced oxides the reduc-
tion process was interrupted at selected tempera-
tures, and then the samples were cooled down to
room temperature in Ar/H2 flow followed by argon
treatment for 10 min.
The catalytic experiments were carried out at
atmospheric pressure in a continuous flow type reac-
tor equipped with mass spectrometer. The monoli-
thic catalysts were tested as single channel reactors
with inner diameter of 2.5–3.5 mm and length of
90–115 mm. For this purpose, they were placed in
an isothermal tubular flow reactor. To compensate
the adiabatic effect of the reaction the catalyst bed
temperature was kept constant with deviations within
+/–1 °C. Pressure drop of the catalyst bed was
measured to be less than 1 kPa. Reactant inlet con-
centrations were adjusted as methane feed concen-
tration 0.1 vol.%, oxygen 20.9 vol.%, and the feed
gas mixtures were balanced to 100% with nitrogen
(4.0). Gas analysis was performed using the mass
spectrometer of CATLAB (Hiden Analytical) system,
on-line CO/CO2/O2 gas analysers (Maihak), and
THC-FID (total hydrocarbon content with a flame
ionization detector, Horiba).
RESULTS AND DISCUSSION
Catalyst morphology was examined by SEM/EDS
techniques. SEM images of perovskites supported
on γ-alumina and monolithic VDM®Aluchrom Y Hf
carrier are compared in figure 1. Deposition on γ-
alumina involved formation of plate-like aggregates
on the surface, however, small particles are also
observable. EDS analysis indicated that the smaller
particles contained mainly Pd, while the aggregates
were composed of all other elements, such as La,
Co, Ni, Fe, and Pd at a ratio which did not coincide
with that known for nominal perovskite composi-
tion. This fact implies that during impregnation
there occurs formation of a mixture of phases com-
prising, most probably, oxides of palladium and
other metals in addition to the pure perovskite phase.
Deposition on the monolithic carrier was accom-
plished in the same way as in the case of γ-alumina
support: there were plate-like aggregates composed
of La, Co, Ni, Fe, and Pd at a ratio matching a
mixture of perovskite phase and oxides of palla-
dium, lanthanum, and transition metals. Comparison
between supported catalysts shows that the deposi-
tion of the active phase on the monolithic substrate
was rather inhomogeneous (Fig. 1). Needle-like
network is due to the γ-alumina formed as an inter-
mediate layer, on which the active catalytic phase of
plate-like aggregates is deposited. It is important to
note that irrespective of support type Pd average
content in the catalysts was almost the same: 1.7
0.2 wt.% on γ-alumina support and 1.2 0.5 wt.%
on VDM®Aluchrom Y Hf monolithic carrier.
Results from the catalytic tests are displayed in
figure 2. The highest activity was observed when
the perovskite phase was supported on γ-alumina in
the form of irregular shaped particles (fraction 0.5–
0.8 mm, Rhone Poulenc, France) followed by Fe-
Cr-Al-wire (length 2.7 m, diameter 0.15 mm), the
latter being used in this case as a model carrier of so
called ‘wire-knitted’ catalysts.
S. G. Stanchovska et al.: Supported palladium containing perovskite catalysts for methane combustion
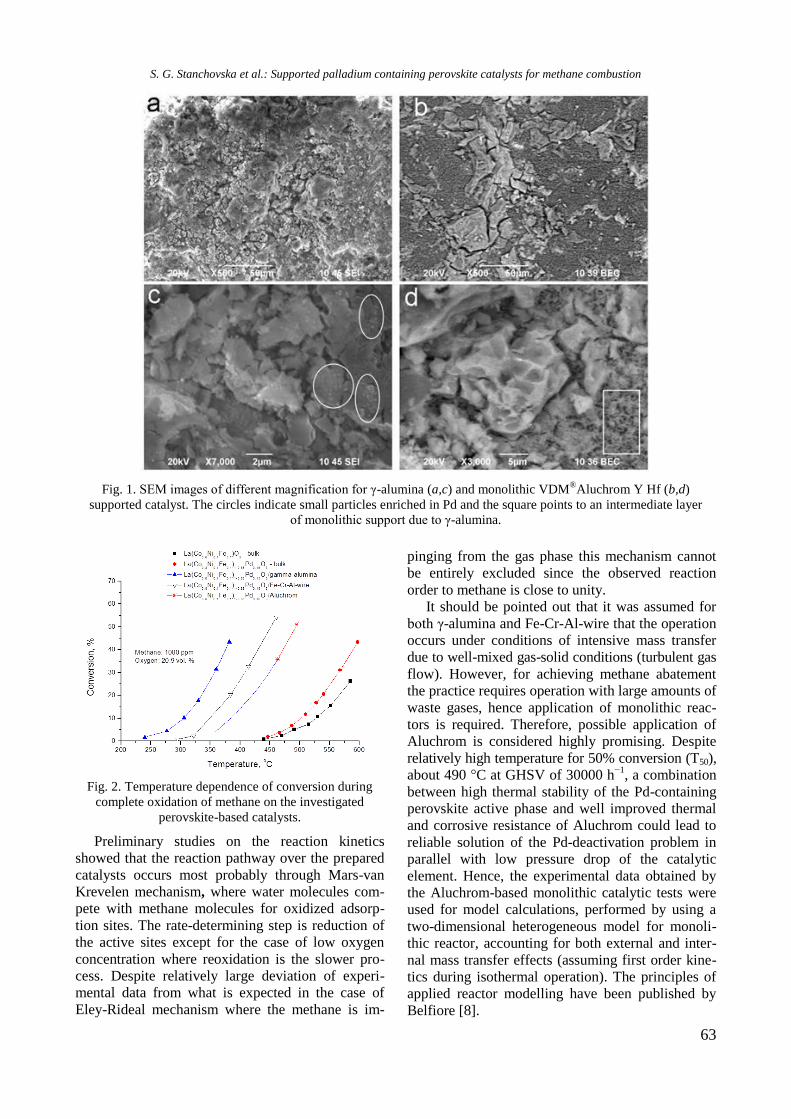
63
Fig. 1. SEM images of different magnification for γ-alumina (a,c) and monolithic VDM®
Aluchrom Y Hf (b,d)
supported catalyst. The circles indicate small particles enriched in Pd and the square points to an intermediate layer
of monolithic support due to γ-alumina.
Fig. 2. Temperature dependence of conversion during
complete oxidation of methane on the investigated
perovskite-based catalysts.
Preliminary studies on the reaction kinetics
showed that the reaction pathway over the prepared
catalysts occurs most probably through Mars-van
Krevelen mechanism, where water molecules com-
pete with methane molecules for oxidized adsorp-
tion sites. The rate-determining step is reduction of
the active sites except for the case of low oxygen
concentration where reoxidation is the slower pro-
cess. Despite relatively large deviation of experi-
mental data from what is expected in the case of
Eley-Rideal mechanism where the methane is im-
pinging from the gas phase this mechanism cannot
be entirely excluded since the observed reaction
order to methane is close to unity.
It should be pointed out that it was assumed for
both γ-alumina and Fe-Cr-Al-wire that the operation
occurs under conditions of intensive mass transfer
due to well-mixed gas-solid conditions (turbulent gas
flow). However, for achieving methane abatement
the practice requires operation with large amounts of
waste gases, hence application of monolithic reac-
tors is required. Therefore, possible application of
Aluchrom is considered highly promising. Despite
relatively high temperature for 50% conversion (T50),
about 490 °C at GHSV of 30000 h−1
, a combination
between high thermal stability of the Pd-containing
perovskite active phase and well improved thermal
and corrosive resistance of Aluchrom could lead to
reliable solution of the Pd-deactivation problem in
parallel with low pressure drop of the catalytic
element. Hence, the experimental data obtained by
the Aluchrom-based monolithic catalytic tests were
used for model calculations, performed by using a
two-dimensional heterogeneous model for monoli-
thic reactor, accounting for both external and inter-
nal mass transfer effects (assuming first order kine-
tics during isothermal operation). The principles of
applied reactor modelling have been published by
Belfiore [8].
S. G. Stanchovska et al.: Supported palladium containing perovskite catalysts for methane combustion
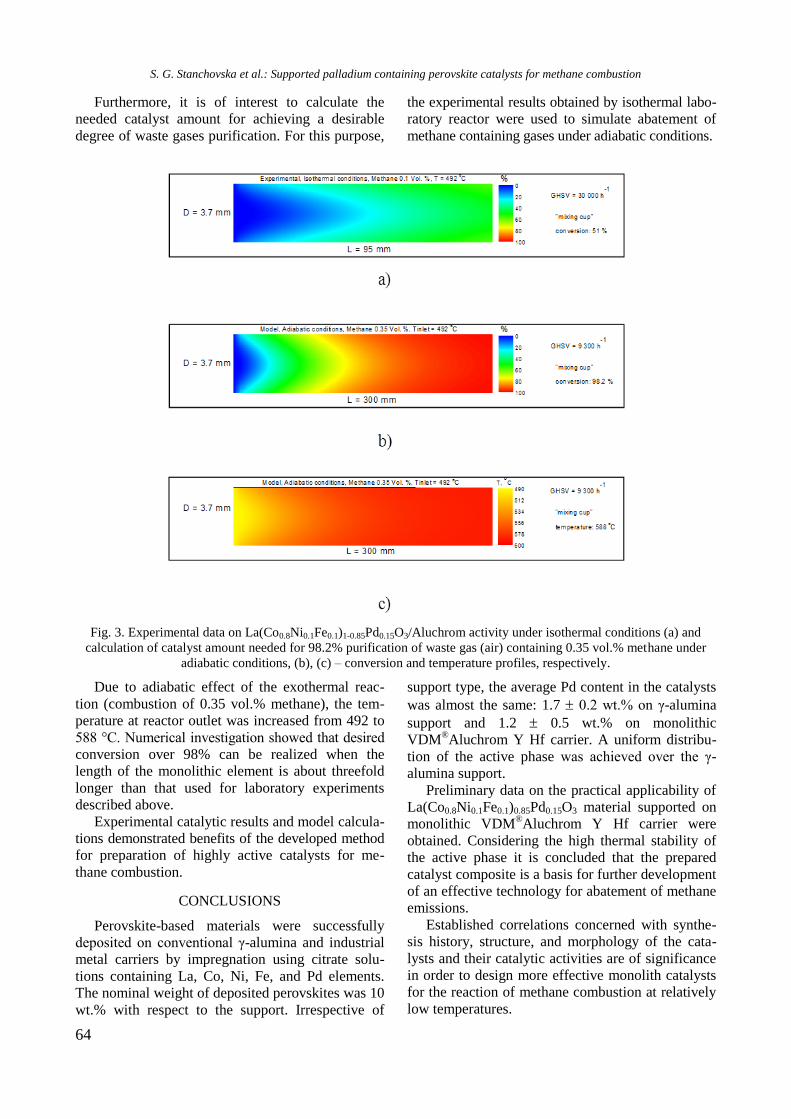
64
Furthermore, it is of interest to calculate the
needed catalyst amount for achieving a desirable
degree of waste gases purification. For this purpose,
the experimental results obtained by isothermal labo-
ratory reactor were used to simulate abatement of
methane containing gases under adiabatic conditions.
Fig. 3. Experimental data on La(Co0.8Ni0.1Fe0.1)1-0.85Pd0.15O3/Aluchrom activity under isothermal conditions (a) and
calculation of catalyst amount needed for 98.2% purification of waste gas (air) containing 0.35 vol.% methane under
adiabatic conditions, (b), (c) – conversion and temperature profiles, respectively.
Due to adiabatic effect of the exothermal reac-
tion (combustion of 0.35 vol.% methane), the tem-
perature at reactor outlet was increased from 492 to
588 °C. Numerical investigation showed that desired
conversion over 98% can be realized when the
length of the monolithic element is about threefold
longer than that used for laboratory experiments
described above.
Experimental catalytic results and model calcula-
tions demonstrated benefits of the developed method
for preparation of highly active catalysts for me-
thane combustion.
CONCLUSIONS
Perovskite-based materials were successfully
deposited on conventional γ-alumina and industrial
metal carriers by impregnation using citrate solu-
tions containing La, Co, Ni, Fe, and Pd elements.
The nominal weight of deposited perovskites was 10
wt.% with respect to the support. Irrespective of
support type, the average Pd content in the catalysts
was almost the same: 1.7 0.2 wt.% on γ-alumina
support and 1.2 0.5 wt.% on monolithic
VDM®Aluchrom Y Hf carrier. A uniform distribu-
tion of the active phase was achieved over the γ-
alumina support.
Preliminary data on the practical applicability of
La(Co0.8Ni0.1Fe0.1)0.85Pd0.15O3 material supported on
monolithic VDM®Aluchrom Y Hf carrier were
obtained. Considering the high thermal stability of
the active phase it is concluded that the prepared
catalyst composite is a basis for further development
of an effective technology for abatement of methane
emissions.
Established correlations concerned with synthe-
sis history, structure, and morphology of the cata-
lysts and their catalytic activities are of significance
in order to design more effective monolith catalysts
for the reaction of methane combustion at relatively
low temperatures.
S. G. Stanchovska et al.: Supported palladium containing perovskite catalysts for methane combustion
65
REFERENCES
1. European Commission Global Methane Reduction
Actions, Ref. Ares (2013) 2843722 – 06/08/2013.
2. Federal Register/ Vol. 78, No. 63 / Tuesday, April 2,
2013 / Proposed Rules, Environmental Protection
Agency, 40 CFR Part 98, 2013 Revisions to the
Greenhouse Gas Reporting Rule and Proposed Con-
fidentiality Determinations for New or Substantially
Revised Data Elements.
3. Y. Nishihata, J. Mizuki, T. Akao, H. Tanaka, M.
Uenishi, M. Kimura, T. Okamoto, N. Hamada,
Nature, 418, 164 (2002).
4. H. Tanaka, M. Taniguchi, M. Uenishi, N. Kajita, I.
Tan, Y. Nishihata, J. Mizuki, K. Narita, M. Kimura,
K. Kaneko, Angewandte Chemie, 45, 5998 (2006).
5. V. G. Milt, S. Ivanova, O. Sanz, M. I. Domínguez, A.
Corrales, J. A. Odriozola, M. Centeno, Appl. Surf.
Sci., 270, 169 (2013).
6. S. Stanchovska, R. Stoyanova, E. Zhecheva, A.
Naydenov, Bulg. Chem. Commun., 49, 107 (2017).
7. S. Stanchovska, P. Markov, K. Tenchev, R.
Stoyanova, E. Zhecheva, A. Naydenov, React. Kinet.
Mech. Catal., 122, 931 (2017).
L. A. Belfiore, Transport Phenomena for Chemical
Reactor Design, John Wiley & Sons, Inc., (2003).
НАНЕСЕНИ ПАЛАДИЙ СЪДЪРЖАЩИ ПЕРОВСКИТОВИ КАТАЛИЗАТОРИ ЗА ПЪЛНО
ОКИСЛЕНИЕ НА МЕТАН
С. Г. Станчовска1, Д. Н. Гергова
2, Г. М. Иванов
1, Р. К. Стоянова
1, Е. Н. Жечева
1, А. И. Найденов
1
1 Институт по обща и неорганична химия, БАН, ул. „Акад. Г. Бончев“, бл. 11, 1113 София, България
2 Институт по физикохимия „Академик Ростислав Каишев“, БАН, ул. „Акад. Г. Бончев“, бл. 11, 1113 София,
България
Постъпила на 18 януари 2018 г.; Преработена на 4 март 2018 г.
(Резюме)
Методът на основата на цитратни разтвори е подходящ за получаване на многоелементни перовскити под
формата на прахове и тънки слоеве. В това изследване показваме приложимостта на този метод за отлагане на
перовскит-съдържащи материали върху конвенционални γ-алуминиеви и промишлени метални носители.
Перовскитовият катализатор с номинален състав на активния компонент La(Co0.8Ni0.1Fe0.1)0.85Pd0.15O3 показва
висока каталитична активност в реакцията на изгаряне на метан. Представени са предварителни данни за
практическата приложимост на катализатор с монолитен носител VDM®Aluchrom Y Hf. Благодарение на
високата си термична стабилност, предложената активна фаза може да служи като основа за разработване на
ефективна технология за намаляване на емисиите на метан.
S. G. Stanchovska et al.: Supported palladium containing perovskite catalysts for methane combustion
66
Bulgarian Chemical Communications, Volume 50, Special issue H (pp. 66–73) 2018
Catalytic abatement of CO and VOCs in waste gases over alumina-supported Cu-Mn
catalysts modified by cobalt
E. N. Kolentsova1, D. Y. Dimitrov
1, D. B. Karashanova
2, Y. G. Karakirova
3, P. Ts. Petrova
3,
T. T. Tabakova3,
*, G. V. Avdeev4, K. I. Ivanov
1
1 Department of Chemistry, Agricultural University, 4000 Plovdiv, Bulgaria
2 Institute of Optical Materials and Technologies, Bulgarian Academy of Sciences, 1113 Sofia, Bulgaria
3 Institute of Catalysis, Bulgarian Academy of Sciences, 1113 Sofia, Bulgaria
4 Institute of Physical Chemistry, Bulgarian Academy of Sciences, 1113 Sofia, Bulgaria
Received: February 01, 2018; Revised: March 11, 2018
Production of formaldehyde by selective oxidation of methanol is an important industrial process. The main by-
products in the waste gases are CO and dimethyl ether (DME). Currently, rational design of new catalytic materials
with improved efficiency in the removal of air pollutants is a topic of appreciable research. The aim of this study was to
combine advantages of both Cu-Mn and Cu-Co catalytic systems by obtaining a new mixed Cu-Mn-Co catalyst of high
activity and selectivity in the simultaneous oxidation of CO, methanol, and DME. XRD, TEM, EPR and TPR
techniques were used to characterise prepared samples.
Key words: Copper-manganese-cobalt catalyst, CO and VOCs oxidation.
INTRODUCTION
Catalytic oxidation is a widely applied and
effective method of removing toxic components
such as CO and volatile organic compounds (VOCs)
emitted by transport activities, and petrochemical
and chemical industries [1‒4], including formalin
production by selective oxidation of methanol [5].
Many studies have shown that precious metals such
as Pt, Pd, Au, and Ag [2,3] demonstrate high
activity at a relatively low temperature, but are more
expensive and some of the problems associated with
their industrial exploitation (such as low stability,
particle agglomeration, and susceptibility to
poisoning) limit their wide application. On the other
hand, transition metal oxides (Fe2O3, Co3O4, NiO,
Cr2O3, CuO, and MnO2) are subject to significant
studies [2,4,6]. Advantages of these catalysts are
related to lower costs, but also to higher thermal
stability and resistance to catalytic poisons, which is
essential for their performance [4,7]. At low
temperatures, they are less active than precious
metal catalysts; however, some specific combina-
tions of metal oxides may improve their activity in
VOC elimination reactions [2]. For example, Faure
et al. [8] have investigated Cu-Co catalysts for
catalytic oxidation of model VOCs (toluene and
ethyl acetate) prepared by the precipitation method.
The results indicated the presence of synergistic
effect between copper and cobalt in the mixed Cu-
Co oxide catalysts, which showed a higher activity
compared to copper oxide or cobalt oxide.
According to the authors, finely divided copper
particles on a Co3О4 surface especially in the Cu-Co
spinel is the most likely reason of increased specific
surface area and improved catalytic activity
regarding VOC oxidation. According to other
authors, mixed spinel-type Co-Mn oxides that have
better oxidation properties than Co3O4 concerned
with VOC complete oxidation [9] are produced by
partial replacement of cobalt by manganese. Cu-Mn
catalysts have also been shown to be effective in the
oxidation reaction of CO [10‒12], a wide range of
VOCs [13‒15], water-gas shift reaction [16],
methanol steam reforming [17], etc. Own studies
[15] have revealed that alumina-supported mixed
Cu-Mn oxide catalysts manifest an increased
activity with respect to the oxidation of CO,
methanol and DME. A synergistic interaction
between copper and manganese species was
observed to increase the activity for total oxidation
of tested toxic components compared to the activity
of CuO/γ-Al2O3 and MnOx/γ-Al2O3 catalysts. It has
been found that carrier type, calcination tempera-
ture, and active phase composition are important
factors influencing the catalytic activity [15]. Due to
mentioned properties nanosized mixed spinel-type
oxides have been extensively studied in recent
decades [1,13]. Improved properties of mixed
oxides against individual oxides are well known
especially in environmental catalysis [1,15]. Spinel
© 2018 Bulgarian Academy of Sciences, Union of Chemists in Bulgaria
* To whom all correspondence should be sent
E-mail: [email protected]
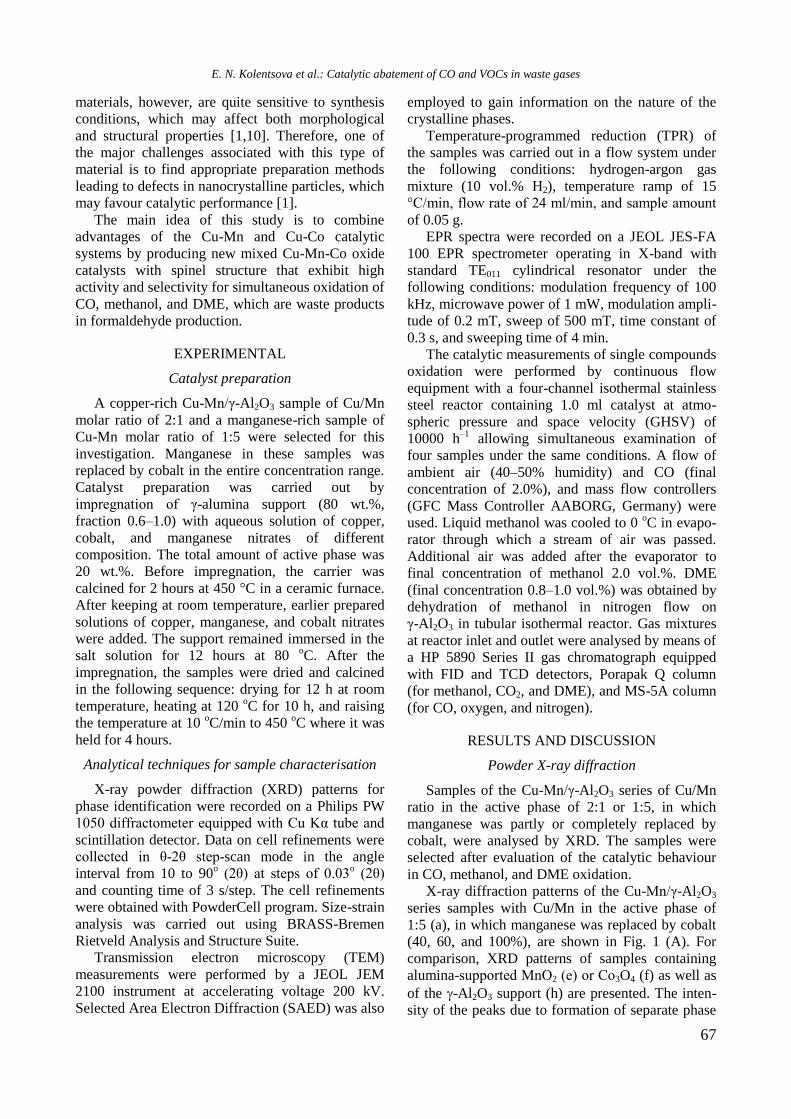
67
materials, however, are quite sensitive to synthesis
conditions, which may affect both morphological
and structural properties [1,10]. Therefore, one of
the major challenges associated with this type of
material is to find appropriate preparation methods
leading to defects in nanocrystalline particles, which
may favour catalytic performance [1].
The main idea of this study is to combine
advantages of the Cu-Mn and Cu-Co catalytic
systems by producing new mixed Cu-Mn-Co oxide
catalysts with spinel structure that exhibit high
activity and selectivity for simultaneous oxidation of
CO, methanol, and DME, which are waste products
in formaldehyde production.
EXPERIMENTAL
Catalyst preparation
A copper-rich Cu-Mn/γ-Al2O3 sample of Cu/Mn
molar ratio of 2:1 and a manganese-rich sample of
Cu-Mn molar ratio of 1:5 were selected for this
investigation. Manganese in these samples was
replaced by cobalt in the entire concentration range.
Catalyst preparation was carried out by
impregnation of γ-alumina support (80 wt.%,
fraction 0.6‒1.0) with aqueous solution of copper,
cobalt, and manganese nitrates of different
composition. The total amount of active phase was
20 wt.%. Before impregnation, the carrier was
calcined for 2 hours at 450 °C in a ceramic furnace.
After keeping at room temperature, earlier prepared
solutions of copper, manganese, and cobalt nitrates
were added. The support remained immersed in the
salt solution for 12 hours at 80 oC. After the
impregnation, the samples were dried and calcined
in the following sequence: drying for 12 h at room
temperature, heating at 120 oC for 10 h, and raising
the temperature at 10 oC/min to 450
oC where it was
held for 4 hours.
Analytical techniques for sample characterisation
X-ray powder diffraction (XRD) patterns for
phase identification were recorded on a Philips PW
1050 diffractometer equipped with Cu Kα tube and
scintillation detector. Data on cell refinements were
collected in θ-2θ step-scan mode in the angle
interval from 10 to 90o (2θ) at steps of 0.03
o (2θ)
and counting time of 3 s/step. The cell refinements
were obtained with PowderCell program. Size-strain
analysis was carried out using BRASS-Bremen
Rietveld Analysis and Structure Suite.
Transmission electron microscopy (TEM)
measurements were performed by a JEOL JEM
2100 instrument at accelerating voltage 200 kV.
Selected Area Electron Diffraction (SAED) was also
employed to gain information on the nature of the
crystalline phases.
Temperature-programmed reduction (TPR) of
the samples was carried out in a flow system under
the following conditions: hydrogen-argon gas
mixture (10 vol.% H2), temperature ramp of 15
°C/min, flow rate of 24 ml/min, and sample amount
of 0.05 g.
EPR spectra were recorded on a JEOL JES-FA
100 EPR spectrometer operating in X-band with
standard TE011 cylindrical resonator under the
following conditions: modulation frequency of 100
kHz, microwave power of 1 mW, modulation ampli-
tude of 0.2 mT, sweep of 500 mT, time constant of
0.3 s, and sweeping time of 4 min.
The catalytic measurements of single compounds
oxidation were performed by continuous flow
equipment with a four-channel isothermal stainless
steel reactor containing 1.0 ml catalyst at atmo-
spheric pressure and space velocity (GHSV) of
10000 h‒1
allowing simultaneous examination of
four samples under the same conditions. A flow of
ambient air (40–50% humidity) and CO (final
concentration of 2.0%), and mass flow controllers
(GFC Mass Controller AABORG, Germany) were
used. Liquid methanol was cooled to 0 oC in evapo-
rator through which a stream of air was passed.
Additional air was added after the evaporator to
final concentration of methanol 2.0 vol.%. DME
(final concentration 0.8–1.0 vol.%) was obtained by
dehydration of methanol in nitrogen flow on
γ-Al2O3 in tubular isothermal reactor. Gas mixtures
at reactor inlet and outlet were analysed by means of
a HP 5890 Series II gas chromatograph equipped
with FID and TCD detectors, Porapak Q column
(for methanol, CO2, and DME), and MS-5A column
(for CO, oxygen, and nitrogen).
RESULTS AND DISCUSSION
Powder X-ray diffraction
Samples of the Cu-Mn/γ-Al2O3 series of Cu/Mn
ratio in the active phase of 2:1 or 1:5, in which
manganese was partly or completely replaced by
cobalt, were analysed by XRD. The samples were
selected after evaluation of the catalytic behaviour
in CO, methanol, and DME oxidation.
X-ray diffraction patterns of the Cu-Mn/γ-Al2O3
series samples with Cu/Mn in the active phase of
1:5 (a), in which manganese was replaced by cobalt
(40, 60, and 100%), are shown in Fig. 1 (A). For
comparison, XRD patterns of samples containing
alumina-supported MnО2 (e) or Cо3O4 (f) as well as
of the -Al2O3 support (h) are presented. The inten-
sity of the peaks due to formation of separate phase
E. N. Kolentsova et al.: Catalytic abatement of CO and VOCs in waste gases
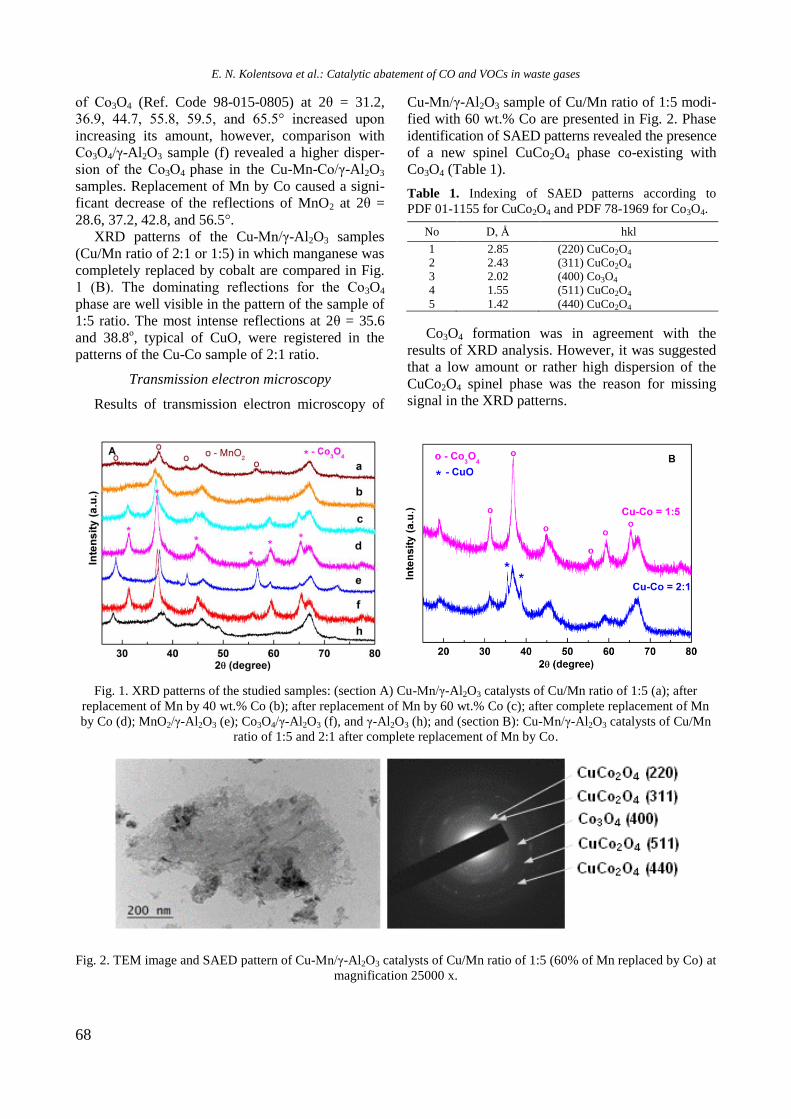
68
of Cо3O4 (Ref. Code 98-015-0805) at 2θ = 31.2,
36.9, 44.7, 55.8, 59.5, and 65.5° increased upon
increasing its amount, however, comparison with
Со3О4/γ-Al2O3 sample (f) revealed a higher disper-
sion of the Со3О4 phase in the Cu-Mn-Со/γ-Al2O3
samples. Replacement of Mn by Co caused a signi-
ficant decrease of the reflections of MnO2 at 2θ =
28.6, 37.2, 42.8, and 56.5°.
XRD patterns of the Cu-Mn/γ-Al2O3 samples
(Cu/Mn ratio of 2:1 or 1:5) in which manganese was
completely replaced by cobalt are compared in Fig.
1 (B). The dominating reflections for the Cо3O4
phase are well visible in the pattern of the sample of
1:5 ratio. The most intense reflections at 2θ = 35.6
and 38.8о, typical of CuO, were registered in the
patterns of the Cu-Co sample of 2:1 ratio.
Transmission electron microscopy
Results of transmission electron microscopy of
Cu-Mn/γ-Al2O3 sample of Cu/Mn ratio of 1:5 modi-
fied with 60 wt.% Co are presented in Fig. 2. Phase
identification of SAED patterns revealed the presence
of a new spinel CuCo2O4 phase co-existing with
Co3O4 (Table 1).
Table 1. Indexing of SAED patterns according to
PDF 01-1155 for CuCo2O4 and PDF 78-1969 for Co3O4.
No D, Å hkl
1 2.85 (220) CuCo2O4
2 2.43 (311) CuCo2O4
3 2.02 (400) Co3O4
4 1.55 (511) CuCo2O4
5 1.42 (440) CuCo2O4
Co3O4 formation was in agreement with the
results of XRD analysis. However, it was suggested
that a low amount or rather high dispersion of the
CuCo2O4 spinel phase was the reason for missing
signal in the XRD patterns.
Fig. 1. XRD patterns of the studied samples: (section A) Cu-Mn/γ-Al2O3 catalysts of Cu/Mn ratio of 1:5 (a); after
replacement of Mn by 40 wt.% Co (b); after replacement of Mn by 60 wt.% Co (c); after complete replacement of Mn
by Co (d); MnO2/γ-Al2O3 (e); Co3O4/γ-Al2O3 (f), and γ-Al2O3 (h); and (section B): Cu-Mn/γ-Al2O3 catalysts of Cu/Mn
ratio of 1:5 and 2:1 after complete replacement of Mn by Co.
Fig. 2. TEM image and SAED pattern of Cu-Mn/γ-Al2O3 catalysts of Cu/Mn ratio of 1:5 (60% of Mn replaced by Co) at
magnification 25000 x.
E. N. Kolentsova et al.: Catalytic abatement of CO and VOCs in waste gases
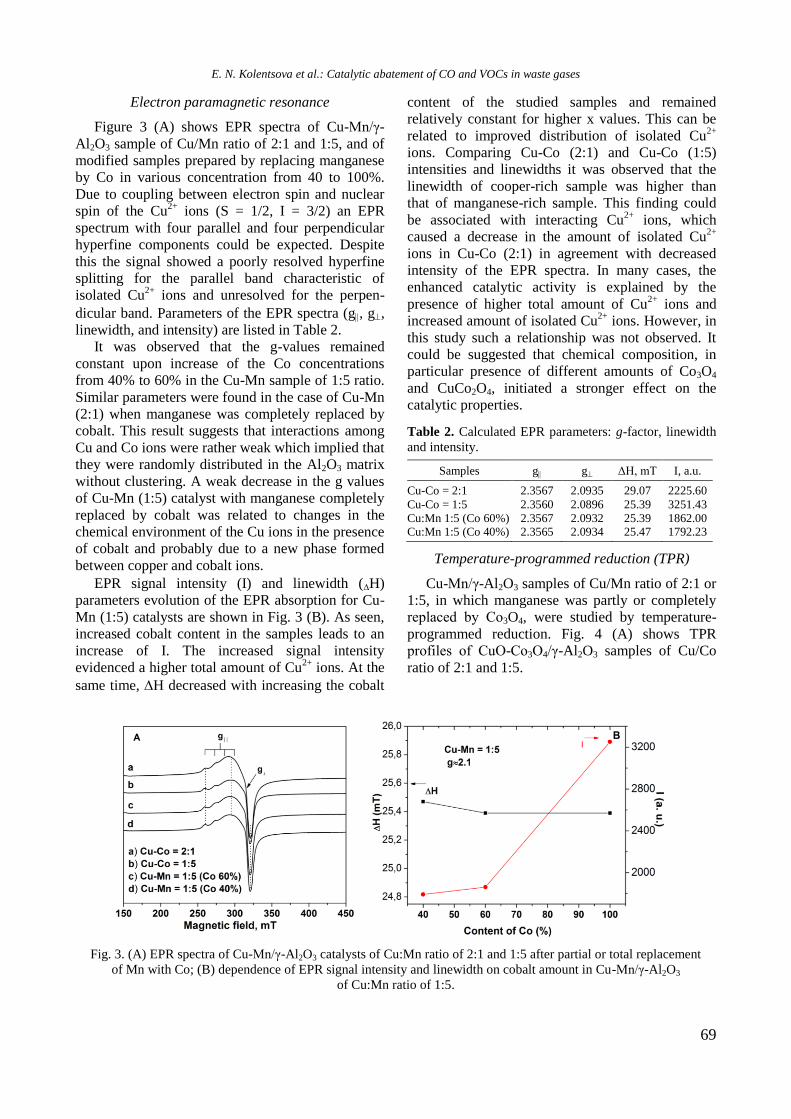
69
Electron paramagnetic resonance
Figure 3 (A) shows EPR spectra of Cu-Mn/γ-
Al2O3 sample of Cu/Mn ratio of 2:1 and 1:5, and of
modified samples prepared by replacing manganese
by Co in various concentration from 40 to 100%.
Due to coupling between electron spin and nuclear
spin of the Cu2+
ions (S = 1/2, I = 3/2) an EPR
spectrum with four parallel and four perpendicular
hyperfine components could be expected. Despite
this the signal showed a poorly resolved hyperfine
splitting for the parallel band characteristic of
isolated Cu2+
ions and unresolved for the perpen-
dicular band. Parameters of the EPR spectra (g, g,
linewidth, and intensity) are listed in Table 2.
It was observed that the g-values remained
constant upon increase of the Co concentrations
from 40% to 60% in the Cu-Mn sample of 1:5 ratio.
Similar parameters were found in the case of Cu-Mn
(2:1) when manganese was completely replaced by
cobalt. This result suggests that interactions among
Cu and Co ions were rather weak which implied that
they were randomly distributed in the Al2O3 matrix
without clustering. A weak decrease in the g values
of Cu-Mn (1:5) catalyst with manganese completely
replaced by cobalt was related to changes in the
chemical environment of the Cu ions in the presence
of cobalt and probably due to a new phase formed
between copper and cobalt ions.
EPR signal intensity (I) and linewidth (H)
parameters evolution of the EPR absorption for Cu-
Mn (1:5) catalysts are shown in Fig. 3 (B). As seen,
increased cobalt content in the samples leads to an
increase of I. The increased signal intensity
evidenced a higher total amount of Cu2+
ions. At the
same time, H decreased with increasing the cobalt
content of the studied samples and remained
relatively constant for higher x values. This can be
related to improved distribution of isolated Cu2+
ions. Comparing Cu-Co (2:1) and Cu-Co (1:5)
intensities and linewidths it was observed that the
linewidth of cooper-rich sample was higher than
that of manganese-rich sample. This finding could
be associated with interacting Cu2+
ions, which
caused a decrease in the amount of isolated Cu2+
ions in Cu-Co (2:1) in agreement with decreased
intensity of the EPR spectra. In many cases, the
enhanced catalytic activity is explained by the
presence of higher total amount of Cu2+
ions and
increased amount of isolated Cu2+
ions. However, in
this study such a relationship was not observed. It
could be suggested that chemical composition, in
particular presence of different amounts of Co3O4
and CuCo2O4, initiated a stronger effect on the
catalytic properties.
Table 2. Calculated EPR parameters: g-factor, linewidth
and intensity.
Samples g g ΔH, mT I, a.u.
Cu-Co = 2:1 2.3567 2.0935 29.07 2225.60
Cu-Co = 1:5 2.3560 2.0896 25.39 3251.43
Cu:Mn 1:5 (Co 60%) 2.3567 2.0932 25.39 1862.00 Cu:Mn 1:5 (Co 40%) 2.3565 2.0934 25.47 1792.23
Temperature-programmed reduction (TPR)
Cu-Mn/γ-Al2O3 samples of Cu/Mn ratio of 2:1 or
1:5, in which manganese was partly or completely
replaced by Cо3O4, were studied by temperature-
programmed reduction. Fig. 4 (A) shows TPR
profiles of CuО-Со3О4/γ-Al2O3 samples of Cu/Co
ratio of 2:1 and 1:5.
Fig. 3. (A) EPR spectra of Cu-Mn/γ-Al2O3 catalysts of Cu:Mn ratio of 2:1 and 1:5 after partial or total replacement
of Mn with Co; (B) dependence of EPR signal intensity and linewidth on cobalt amount in Cu-Mn/γ-Al2O3
of Cu:Mn ratio of 1:5.
E. N. Kolentsova et al.: Catalytic abatement of CO and VOCs in waste gases
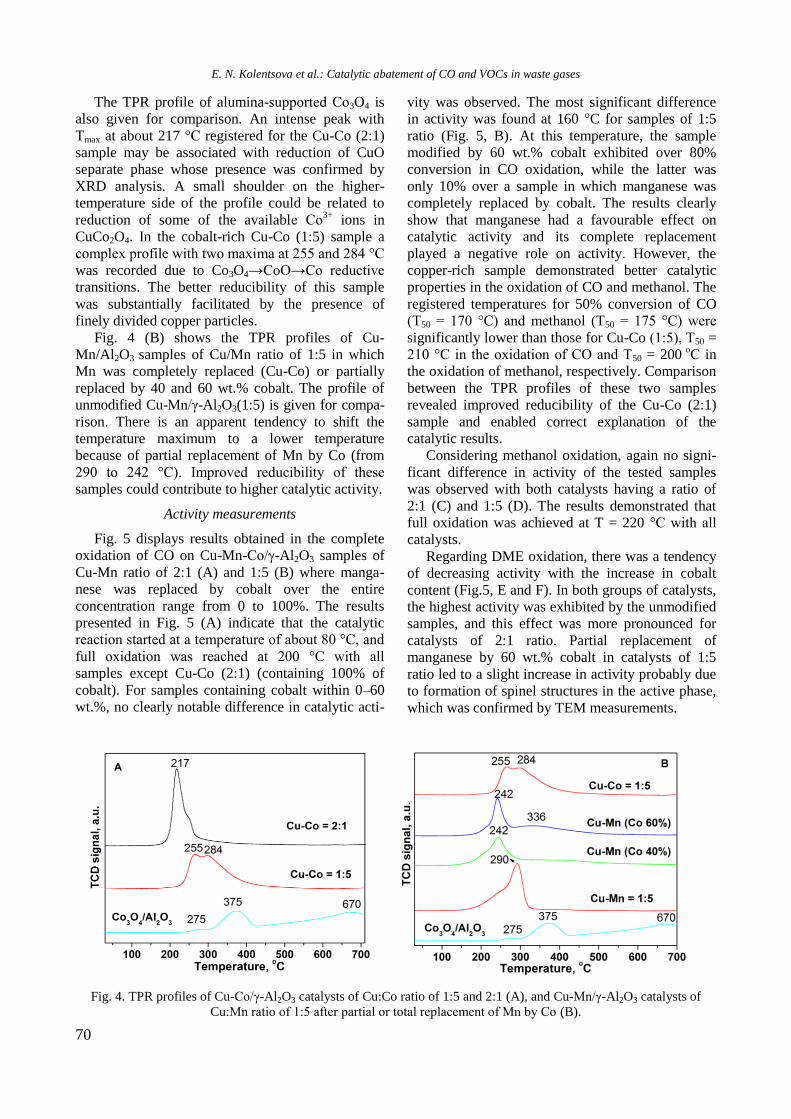
70
The TPR profile of alumina-supported Со3О4 is
also given for comparison. An intense peak with
Тmax at about 217 °C registered for the Cu-Co (2:1)
sample may be associated with reduction of CuO
separate phase whose presence was confirmed by
XRD analysis. A small shoulder on the higher-
temperature side of the profile could be related to
reduction of some of the available Со3+
ions in
CuCo2O4. In the cobalt-rich Cu-Co (1:5) sample a
complex profile with two maxima at 255 and 284 °C
was recorded due to Co3O4→CoO→Co reductive
transitions. The better reducibility of this sample
was substantially facilitated by the presence of
finely divided copper particles.
Fig. 4 (B) shows the TPR profiles of Cu-
Mn/Al2O3 samples of Cu/Mn ratio of 1:5 in which
Mn was completely replaced (Cu-Co) or partially
replaced by 40 and 60 wt.% cobalt. The profile of
unmodified Cu-Mn/γ-Al2O3(1:5) is given for compa-
rison. There is an apparent tendency to shift the
temperature maximum to a lower temperature
because of partial replacement of Mn by Co (from
290 to 242 °C). Improved reducibility of these
samples could contribute to higher catalytic activity.
Activity measurements
Fig. 5 displays results obtained in the complete
oxidation of CO on Cu-Mn-Co/γ-Al2O3 samples of
Cu-Mn ratio of 2:1 (A) and 1:5 (B) where manga-
nese was replaced by cobalt over the entire
concentration range from 0 to 100%. The results
presented in Fig. 5 (A) indicate that the catalytic
reaction started at a temperature of about 80 °C, and
full oxidation was reached at 200 °C with all
samples except Cu-Co (2:1) (containing 100% of
cobalt). For samples containing cobalt within 0–60
wt.%, no clearly notable difference in catalytic acti-
vity was observed. The most significant difference
in activity was found at 160 °C for samples of 1:5
ratio (Fig. 5, B). At this temperature, the sample
modified by 60 wt.% cobalt exhibited over 80%
conversion in CO oxidation, while the latter was
only 10% over a sample in which manganese was
completely replaced by cobalt. The results clearly
show that manganese had a favourable effect on
catalytic activity and its complete replacement
played a negative role on activity. However, the
copper-rich sample demonstrated better catalytic
properties in the oxidation of CO and methanol. The
registered temperatures for 50% conversion of CO
(Т50 = 170 °C) and methanol (Т50 = 175 °C) were
significantly lower than those for Cu-Co (1:5), Т50 =
210 °C in the oxidation of CO and Т50 = 200 о
С in
the oxidation of methanol, respectively. Comparison
between the TPR profiles of these two samples
revealed improved reducibility of the Cu-Co (2:1)
sample and enabled correct explanation of the
catalytic results.
Considering methanol oxidation, again no signi-
ficant difference in activity of the tested samples
was observed with both catalysts having a ratio of
2:1 (C) and 1:5 (D). The results demonstrated that
full oxidation was achieved at T = 220 °C with all
catalysts.
Regarding DME oxidation, there was a tendency
of decreasing activity with the increase in cobalt
content (Fig.5, E and F). In both groups of catalysts,
the highest activity was exhibited by the unmodified
samples, and this effect was more pronounced for
catalysts of 2:1 ratio. Partial replacement of
manganese by 60 wt.% cobalt in catalysts of 1:5
ratio led to a slight increase in activity probably due
to formation of spinel structures in the active phase,
which was confirmed by TEM measurements.
Fig. 4. TPR profiles of Cu-Co/γ-Al2O3 catalysts of Cu:Co ratio of 1:5 and 2:1 (A), and Cu-Mn/γ-Al2O3 catalysts of
Cu:Mn ratio of 1:5 after partial or total replacement of Mn by Cо (B).
E. N. Kolentsova et al.: Catalytic abatement of CO and VOCs in waste gases
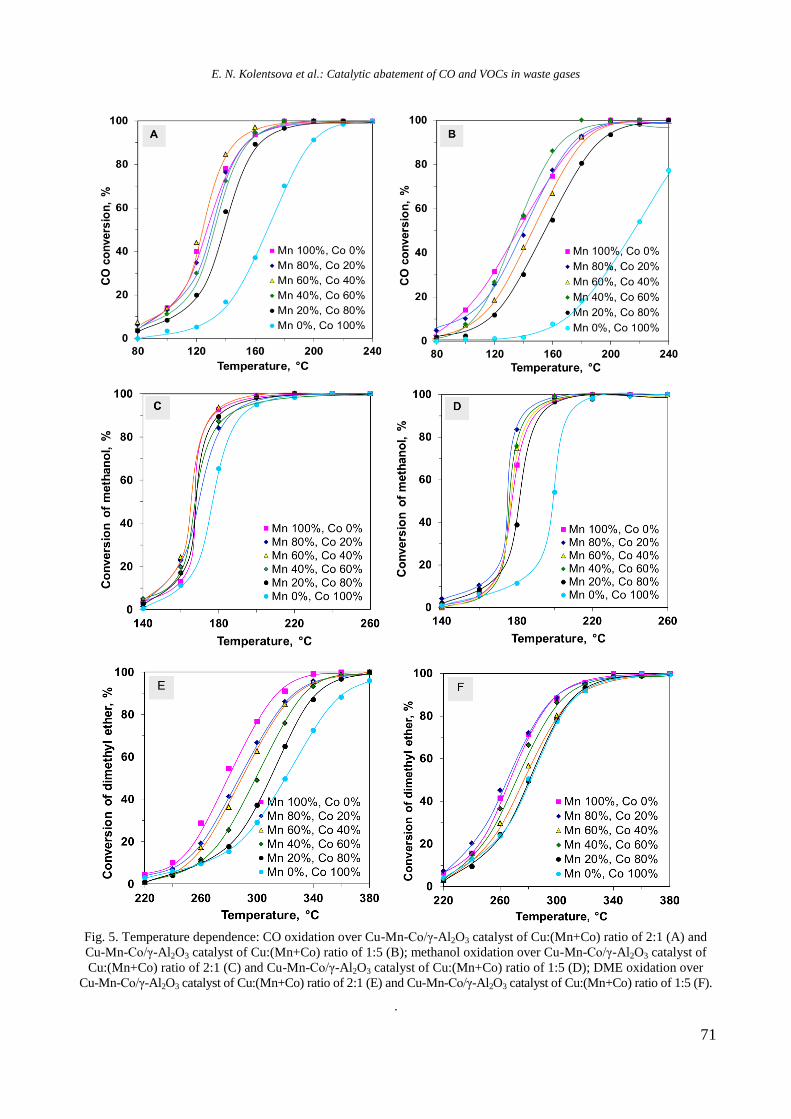
71
Fig. 5. Temperature dependence: CO oxidation over Cu-Mn-Co/γ-Al2O3 catalyst of Cu:(Mn+Co) ratio of 2:1 (A) and
Cu-Mn-Co/γ-Al2O3 catalyst of Cu:(Mn+Co) ratio of 1:5 (B); methanol oxidation over Cu-Mn-Co/γ-Al2O3 catalyst of
Cu:(Mn+Co) ratio of 2:1 (C) and Cu-Mn-Co/γ-Al2O3 catalyst of Cu:(Mn+Co) ratio of 1:5 (D); DME oxidation over
Cu-Mn-Co/γ-Al2O3 catalyst of Cu:(Mn+Co) ratio of 2:1 (E) and Cu-Mn-Co/γ-Al2O3 catalyst of Cu:(Mn+Co) ratio of 1:5 (F).
.
E. N. Kolentsova et al.: Catalytic abatement of CO and VOCs in waste gases
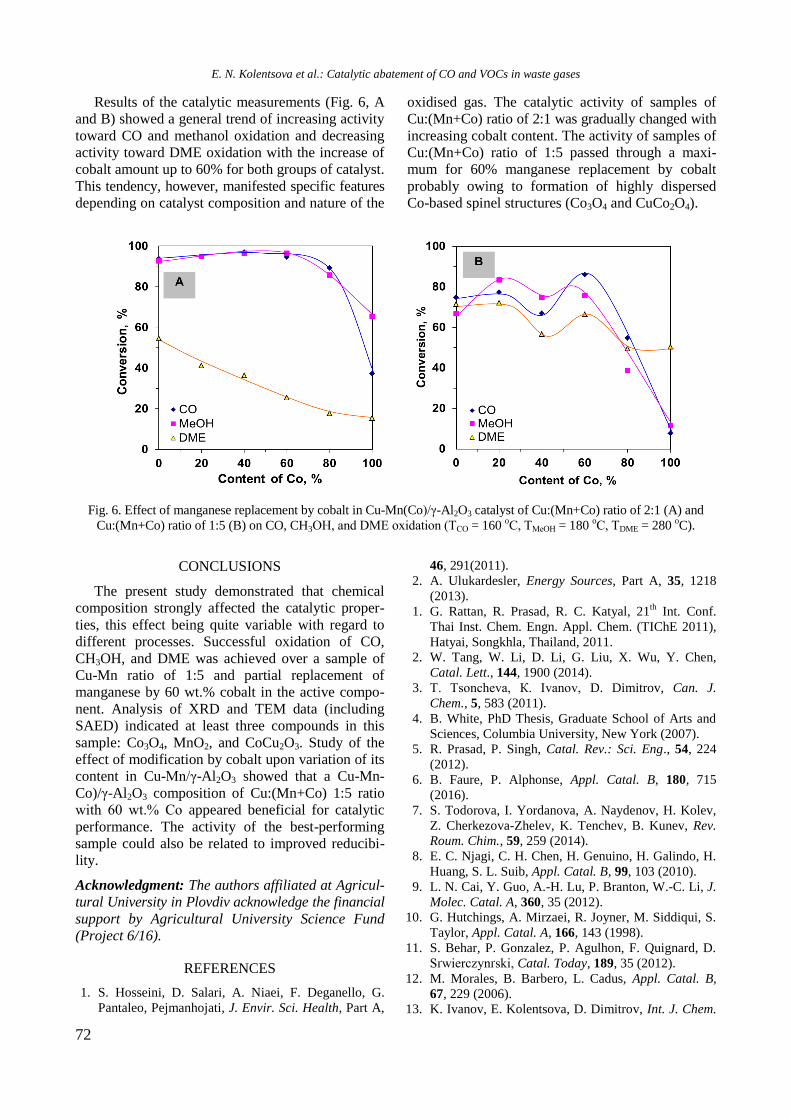
72
Results of the catalytic measurements (Fig. 6, A
and B) showed a general trend of increasing activity
toward CO and methanol oxidation and decreasing
activity toward DME oxidation with the increase of
cobalt amount up to 60% for both groups of catalyst.
This tendency, however, manifested specific features
depending on catalyst composition and nature of the
oxidised gas. The catalytic activity of samples of
Cu:(Mn+Co) ratio of 2:1 was gradually changed with
increasing cobalt content. The activity of samples of
Cu:(Mn+Co) ratio of 1:5 passed through a maxi-
mum for 60% manganese replacement by cobalt
probably owing to formation of highly dispersed
Co-based spinel structures (Co3O4 and CuCo2O4).
Fig. 6. Effect of manganese replacement by cobalt in Cu-Mn(Co)/γ-Al2O3 catalyst of Cu:(Mn+Co) ratio of 2:1 (A) and
Cu:(Mn+Co) ratio of 1:5 (B) on CO, CH3OH, and DME oxidation (ТСО = 160 oC, ТМеОН = 180
oC, ТDME = 280
oC).
CONCLUSIONS
The present study demonstrated that chemical
composition strongly affected the catalytic proper-
ties, this effect being quite variable with regard to
different processes. Successful oxidation of CO,
CH3OH, and DME was achieved over a sample of
Cu-Mn ratio of 1:5 and partial replacement of
manganese by 60 wt.% cobalt in the active compo-
nent. Analysis of XRD and TEM data (including
SAED) indicated at least three compounds in this
sample: Co3O4, MnO2, and CoCu2O3. Study of the
effect of modification by cobalt upon variation of its
content in Cu-Mn/γ-Al2O3 showed that a Cu-Mn-
Co)/γ-Al2O3 composition of Cu:(Mn+Co) 1:5 ratio
with 60 wt.% Cо appeared beneficial for catalytic
performance. The activity of the best-performing
sample could also be related to improved reducibi-
lity.
Acknowledgment: The authors affiliated at Agricul-
tural University in Plovdiv acknowledge the financial
support by Agricultural University Science Fund
(Project 6/16).
REFERENCES
1. S. Hosseini, D. Salari, A. Niaei, F. Deganello, G.
Pantaleo, Pejmanhojati, J. Envir. Sci. Health, Part A,
46, 291(2011).
2. A. Ulukardesler, Energy Sources, Part A, 35, 1218
(2013).
1. G. Rattan, R. Prasad, R. C. Katyal, 21th
Int. Conf.
Thai Inst. Chem. Engn. Appl. Chem. (TIChE 2011),
Hatyai, Songkhla, Thailand, 2011.
2. W. Tang, W. Li, D. Li, G. Liu, X. Wu, Y. Chen,
Catal. Lett., 144, 1900 (2014).
3. Т. Tsoncheva, К. Ivanov, D. Dimitrov, Can. J.
Chem., 5, 583 (2011).
4. B. White, PhD Thesis, Graduate School of Arts and
Sciences, Columbia University, New York (2007).
5. R. Prasad, P. Singh, Catal. Rev.: Sci. Eng., 54, 224
(2012).
6. B. Faure, P. Alphonse, Appl. Catal. B, 180, 715
(2016).
7. S. Todorova, I. Yordanova, A. Naydenov, H. Kolev,
Z. Cherkezova-Zhelev, K. Tenchev, B. Kunev, Rev.
Roum. Chim., 59, 259 (2014).
8. E. C. Njagi, C. H. Chen, H. Genuino, H. Galindo, H.
Huang, S. L. Suib, Appl. Catal. B, 99, 103 (2010).
9. L. N. Cai, Y. Guo, A.-H. Lu, P. Branton, W.-C. Li, J.
Molec. Catal. A, 360, 35 (2012).
10. G. Hutchings, A. Mirzaei, R. Joyner, M. Siddiqui, S.
Taylor, Appl. Catal. A, 166, 143 (1998).
11. S. Behar, P. Gonzalez, P. Agulhon, F. Quignard, D.
Sґwierczynґski, Catal. Today, 189, 35 (2012).
12. M. Morales, B. Barbero, L. Cadus, Appl. Catal. B,
67, 229 (2006).
13. K. Ivanov, E. Kolentsova, D. Dimitrov, Int. J. Chem.
E. N. Kolentsova et al.: Catalytic abatement of CO and VOCs in waste gases
73
Molec. Nuclear Mater. Metallurg. Eng., 9, 548
(2015).
14. K.-D. Zhi, Q.-S. Liu, Y.-G. Zhang, S. He, R.-X. He,
J. Fuel Chem. Technol., 38 (4), 445 (2010).
15. J. Papavasiliou, G. Avgouropoulos, T. Ioannides,
Catal. Commun., 6, 497 (2005).
КАТАЛИТИЧНО ОЧИСТВАНЕ НА ОТПАДЪЧНИ ГАЗОВЕ ОТ CO И ЛЕТЛИВИ ОРГАНИЧНИ
СЪЕДИНЕНИЯ ВЪРХУ Cu-Mn/γ-Al2O3 КАТАЛИЗАТОРИ МОДИФИЦИРАНИ С КОБАЛТ
E. Н. Коленцова1, Д. Я. Димитров
1, Д. Б. Карашанова
2, Й. Г. Каракирова
3, П. Цв. Петрова
3,
T. Т. Табаковa3*, Г. В. Авдеев
4, K. И. Иванов
1
1 Катедра „Обща химия“, Аграрен университет, 4000 Пловдив, България
2 Институт по катализ, Българска академия на науките, 1113 София, България
3 Институт по оптични материали и технологии, Българска академия на науките, 1113 София, България
4 Институт по физикохимия, Българска академия на науките, 1113 София, България
Постъпила на 1 февруари 2018 г.; Преработена на 11 март 2018 г.
(Резюме)
Производството на формалдехид чрез селективно окисление на метанол е важен промишлен процес.
Основните странични продукти в отпадните газове са СО и диметилов етер (ДME). Понастоящем дизайнът на
нови каталитични материали с подобрена ефективност за отстраняване на замърсители на въздуха е предмет на
значителни проучвания. Целта на това изследване е да се съчетаят предимствата на Cu-Mn и Cu-Co
каталитични системи, като се получи нов смесен Cu-Mn-Co катализатор с висока активност и селективност за
едновременно окисление на СО, метанол и ДME. Катализаторните образци са охарактеризирани с рентгено-
структурен анализ, трансмисионна електронна микроскопия, електронен парамагнитен резонанс и темпера-
турно-програмирана редукция.
E. N. Kolentsova et al.: Catalytic abatement of CO and VOCs in waste gases
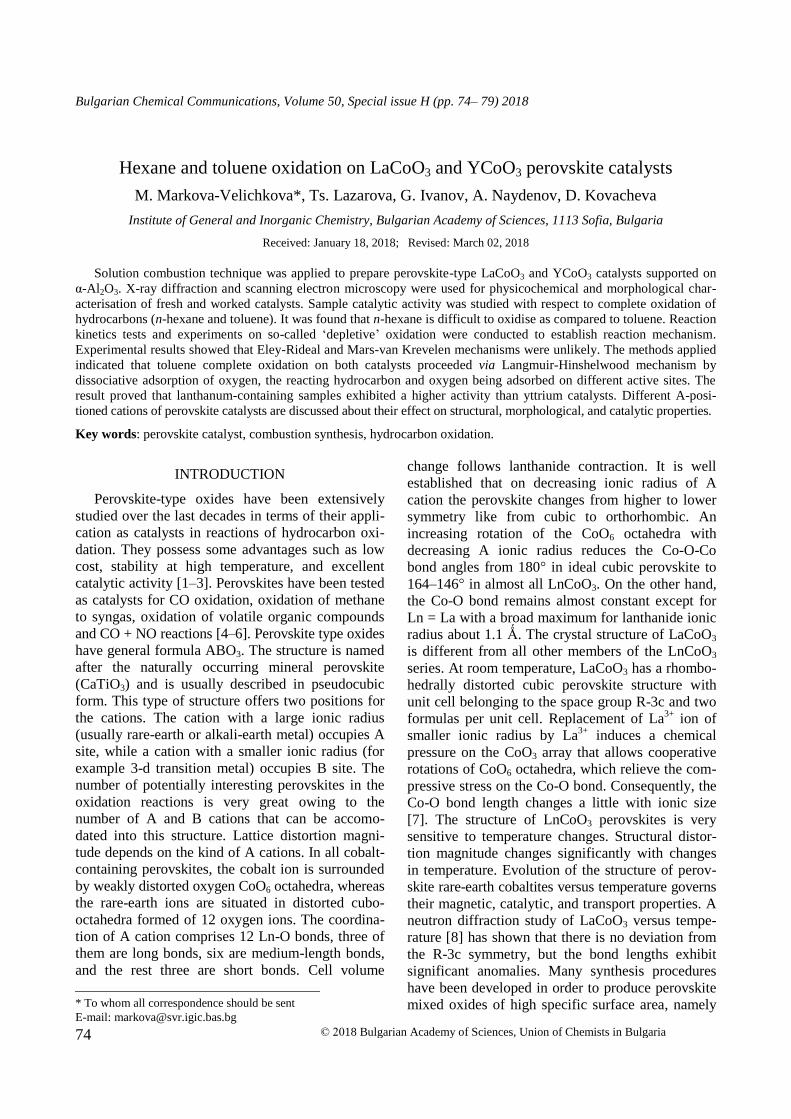
74
Bulgarian Chemical Communications, Volume 50, Special issue H (pp. 74– 79) 2018
Hexane and toluene oxidation on LaCoO3 and YCoO3 perovskite catalysts
M. Markova-Velichkova*, Ts. Lazarova, G. Ivanov, A. Naydenov, D. Kovacheva
Institute of General and Inorganic Chemistry, Bulgarian Academy of Sciences, 1113 Sofia, Bulgaria
Received: January 18, 2018; Revised: March 02, 2018
Solution combustion technique was applied to prepare perovskite-type LaCoO3 and YCoO3 catalysts supported on
α-Al2O3. X-ray diffraction and scanning electron microscopy were used for physicochemical and morphological char-
acterisation of fresh and worked catalysts. Sample catalytic activity was studied with respect to complete oxidation of
hydrocarbons (n-hexane and toluene). It was found that n-hexane is difficult to oxidise as compared to toluene. Reaction
kinetics tests and experiments on so-called ‘depletive’ oxidation were conducted to establish reaction mechanism.
Experimental results showed that Eley-Rideal and Mars-van Krevelen mechanisms were unlikely. The methods applied
indicated that toluene complete oxidation on both catalysts proceeded via Langmuir-Hinshelwood mechanism by
dissociative adsorption of oxygen, the reacting hydrocarbon and oxygen being adsorbed on different active sites. The
result proved that lanthanum-containing samples exhibited a higher activity than yttrium catalysts. Different A-posi-
tioned cations of perovskite catalysts are discussed about their effect on structural, morphological, and catalytic properties.
Key words: perovskite catalyst, combustion synthesis, hydrocarbon oxidation.
INTRODUCTION
Perovskite-type oxides have been extensively
studied over the last decades in terms of their appli-
cation as catalysts in reactions of hydrocarbon oxi-
dation. They possess some advantages such as low
cost, stability at high temperature, and excellent
catalytic activity [1‒3]. Perovskites have been tested
as catalysts for CO oxidation, oxidation of methane
to syngas, oxidation of volatile organic compounds
and CO + NO reactions [4‒6]. Perovskite type oxides
have general formula ABO3. The structure is named
after the naturally occurring mineral perovskite
(CaTiO3) and is usually described in pseudocubic
form. This type of structure offers two positions for
the cations. The cation with a large ionic radius
(usually rare-earth or alkali-earth metal) occupies A
site, while a cation with a smaller ionic radius (for
example 3-d transition metal) occupies B site. The
number of potentially interesting perovskites in the
oxidation reactions is very great owing to the
number of A and B cations that can be accomo-
dated into this structure. Lattice distortion magni-
tude depends on the kind of A cations. In all cobalt-
containing perovskites, the cobalt ion is surrounded
by weakly distorted oxygen CoO6 octahedra, whereas
the rare-earth ions are situated in distorted cubo-
octahedra formed of 12 oxygen ions. The coordina-
tion of A cation comprises 12 Ln-O bonds, three of
them are long bonds, six are medium-length bonds,
and the rest three are short bonds. Cell volume
change follows lanthanide contraction. It is well
established that on decreasing ionic radius of A
cation the perovskite changes from higher to lower
symmetry like from cubic to orthorhombic. An
increasing rotation of the CoO6 octahedra with
decreasing A ionic radius reduces the Co-O-Co
bond angles from 180° in ideal cubic perovskite to
164–146° in almost all LnCoO3. On the other hand,
the Co-O bond remains almost constant except for
Ln = La with a broad maximum for lanthanide ionic
radius about 1.1 Ǻ. The crystal structure of LaCoO3
is different from all other members of the LnCoO3
series. At room temperature, LaCoO3 has a rhombo-
hedrally distorted cubic perovskite structure with
unit cell belonging to the space group R-3c and two
formulas per unit cell. Replacement of La3+
ion of
smaller ionic radius by La3+
induces a chemical
pressure on the CoO3 array that allows cooperative
rotations of CoO6 octahedra, which relieve the com-
pressive stress on the Co-O bond. Consequently, the
Co-O bond length changes a little with ionic size
[7]. The structure of LnCoO3 perovskites is very
sensitive to temperature changes. Structural distor-
tion magnitude changes significantly with changes
in temperature. Evolution of the structure of perov-
skite rare-earth cobaltites versus temperature governs
their magnetic, catalytic, and transport properties. A
neutron diffraction study of LaCoO3 versus tempe-
rature [8] has shown that there is no deviation from
the R-3c symmetry, but the bond lengths exhibit
significant anomalies. Many synthesis procedures
have been developed in order to produce perovskite
mixed oxides of high specific surface area, namely
© 2018 Bulgarian Academy of Sciences, Union of Chemists in Bulgaria
* To whom all correspondence should be sent
E-mail: [email protected]
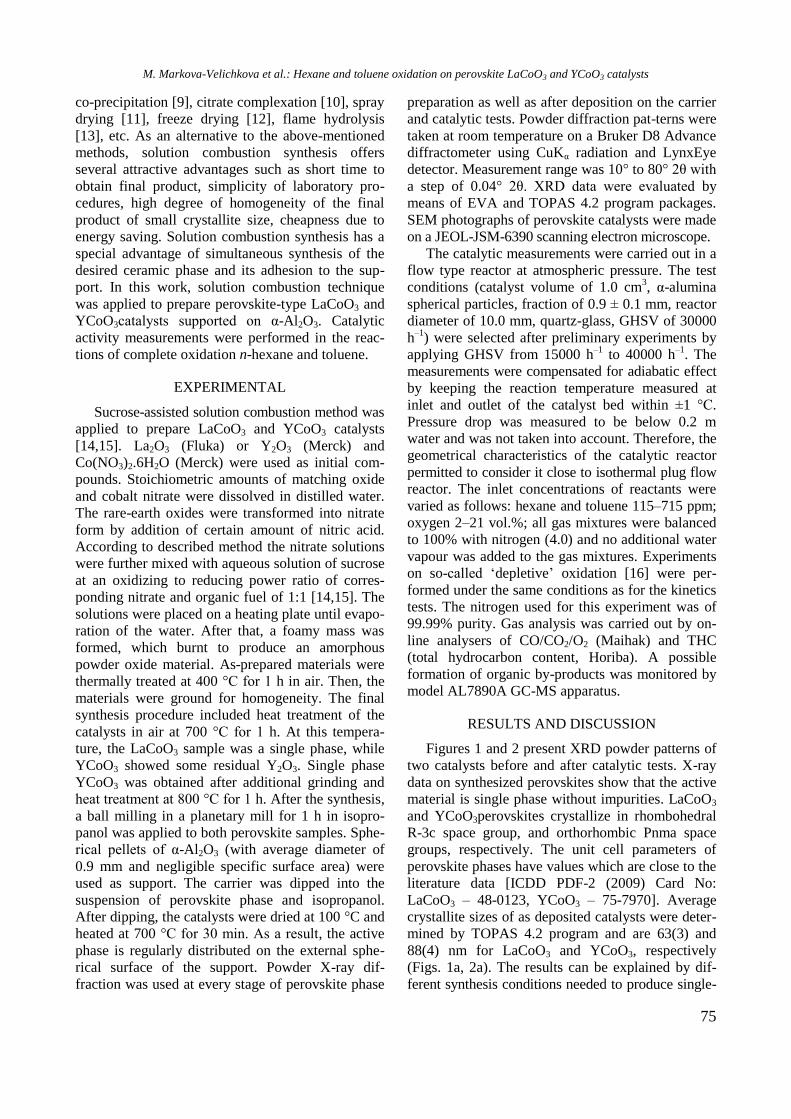
75
co-precipitation [9], citrate complexation [10], spray
drying [11], freeze drying [12], flame hydrolysis
[13], etc. As an alternative to the above-mentioned
methods, solution combustion synthesis offers
several attractive advantages such as short time to
obtain final product, simplicity of laboratory pro-
cedures, high degree of homogeneity of the final
product of small crystallite size, cheapness due to
energy saving. Solution combustion synthesis has a
special advantage of simultaneous synthesis of the
desired ceramic phase and its adhesion to the sup-
port. In this work, solution combustion technique
was applied to prepare perovskite-type LaCoO3 and
YCoO3catalysts supported on α-Al2O3. Catalytic
activity measurements were performed in the reac-
tions of complete oxidation n-hexane and toluene.
EXPERIMENTAL
Sucrose-assisted solution combustion method was
applied to prepare LaCoO3 and YCoO3 catalysts
[14,15]. La2O3 (Fluka) or Y2O3 (Merck) and
Co(NO3)2.6H2O (Merck) were used as initial com-
pounds. Stoichiometric amounts of matching oxide
and cobalt nitrate were dissolved in distilled water.
The rare-earth oxides were transformed into nitrate
form by addition of certain amount of nitric acid.
According to described method the nitrate solutions
were further mixed with aqueous solution of sucrose
at an oxidizing to reducing power ratio of corres-
ponding nitrate and organic fuel of 1:1 [14,15]. The
solutions were placed on a heating plate until evapo-
ration of the water. After that, a foamy mass was
formed, which burnt to produce an amorphous
powder oxide material. As-prepared materials were
thermally treated at 400 °C for 1 h in air. Then, the
materials were ground for homogeneity. The final
synthesis procedure included heat treatment of the
catalysts in air at 700 °C for 1 h. At this tempera-
ture, the LaCoO3 sample was a single phase, while
YCoO3 showed some residual Y2O3. Single phase
YCoO3 was obtained after additional grinding and
heat treatment at 800 °C for 1 h. After the synthesis,
a ball milling in a planetary mill for 1 h in isopro-
panol was applied to both perovskite samples. Sphe-
rical pellets of α-Al2O3 (with average diameter of
0.9 mm and negligible specific surface area) were
used as support. The carrier was dipped into the
suspension of perovskite phase and isopropanol.
After dipping, the catalysts were dried at 100 °C and
heated at 700 °C for 30 min. As a result, the active
phase is regularly distributed on the external sphe-
rical surface of the support. Powder X-ray dif-
fraction was used at every stage of perovskite phase
preparation as well as after deposition on the carrier
and catalytic tests. Powder diffraction pat-terns were
taken at room temperature on a Bruker D8 Advance
diffractometer using CuKα radiation and LynxEye
detector. Measurement range was 10° to 80° 2θ with
a step of 0.04° 2θ. XRD data were evaluated by
means of EVA and TOPAS 4.2 program packages.
SEM photographs of perovskite catalysts were made
on a JEOL-JSM-6390 scanning electron microscope.
The catalytic measurements were carried out in a
flow type reactor at atmospheric pressure. The test
conditions (catalyst volume of 1.0 cm3, α-alumina
spherical particles, fraction of 0.9 ± 0.1 mm, reactor
diameter of 10.0 mm, quartz-glass, GHSV of 30000
h–1
) were selected after preliminary experiments by
applying GHSV from 15000 h‒1
to 40000 h‒1
. The
measurements were compensated for adiabatic effect
by keeping the reaction temperature measured at
inlet and outlet of the catalyst bed within ±1 °C.
Pressure drop was measured to be below 0.2 m
water and was not taken into account. Therefore, the
geometrical characteristics of the catalytic reactor
permitted to consider it close to isothermal plug flow
reactor. The inlet concentrations of reactants were
varied as follows: hexane and toluene 115–715 ppm;
oxygen 2–21 vol.%; all gas mixtures were balanced
to 100% with nitrogen (4.0) and no additional water
vapour was added to the gas mixtures. Experiments
on so-called ‘depletive’ oxidation [16] were per-
formed under the same conditions as for the kinetics
tests. The nitrogen used for this experiment was of
99.99% purity. Gas analysis was carried out by on-
line analysers of CO/CO2/O2 (Maihak) and THC
(total hydrocarbon content, Horiba). A possible
formation of organic by-products was monitored by
model AL7890A GC-MS apparatus.
RESULTS AND DISCUSSION
Figures 1 and 2 present XRD powder patterns of
two catalysts before and after catalytic tests. X-ray
data on synthesized perovskites show that the active
material is single phase without impurities. LaCoO3
and YCoO3perovskites crystallize in rhombohedral
R-3c space group, and orthorhombic Pnma space
groups, respectively. The unit cell parameters of
perovskite phases have values which are close to the
literature data [ICDD PDF-2 (2009) Card No:
LaCoO3 – 48-0123, YCoO3 – 75-7970]. Average
crystallite sizes of as deposited catalysts were deter-
mined by TOPAS 4.2 program and are 63(3) and
88(4) nm for LaCoO3 and YCoO3, respectively
(Figs. 1a, 2a). The results can be explained by dif-
ferent synthesis conditions needed to produce single-
M. Markova-Velichkova et al.: Hexane and toluene oxidation on perovskite LaCoO3 and YCoO3 catalysts
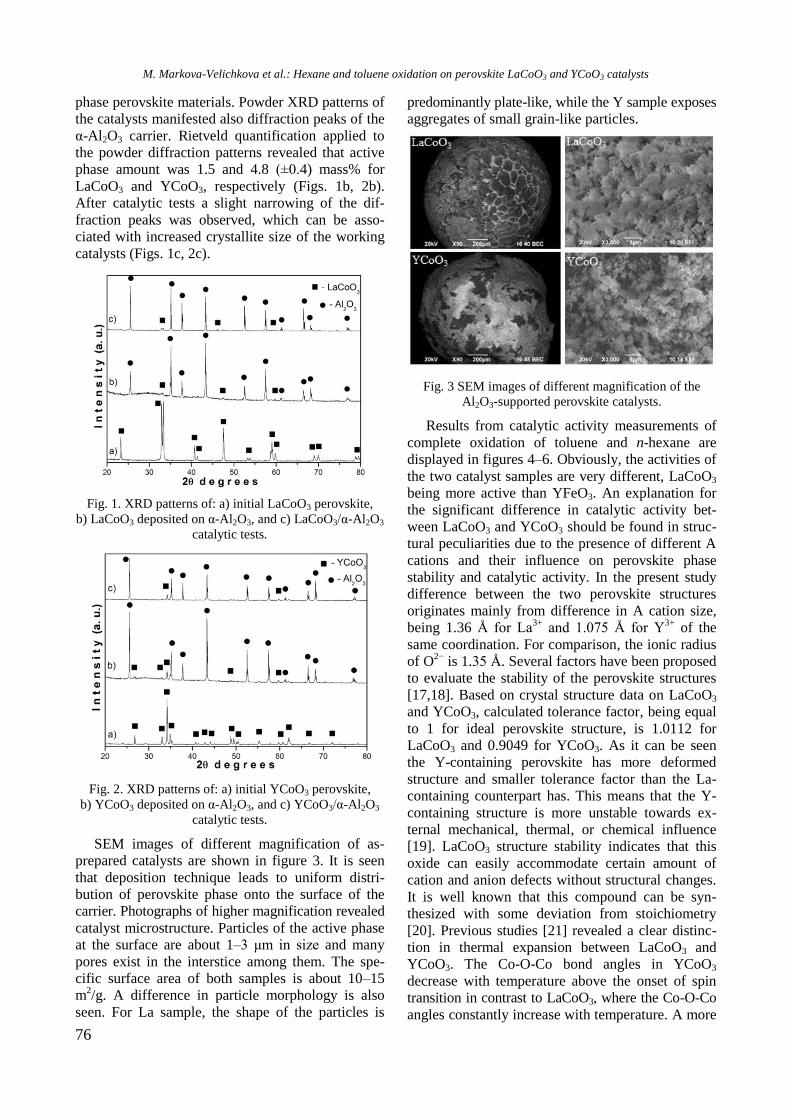
76
phase perovskite materials. Powder XRD patterns of
the catalysts manifested also diffraction peaks of the
α-Al2O3 carrier. Rietveld quantification applied to
the powder diffraction patterns revealed that active
phase amount was 1.5 and 4.8 (±0.4) mass% for
LaCoO3 and YCoO3, respectively (Figs. 1b, 2b).
After catalytic tests a slight narrowing of the dif-
fraction peaks was observed, which can be asso-
ciated with increased crystallite size of the working
catalysts (Figs. 1c, 2c).
Fig. 1. XRD patterns of: a) initial LaCoO3 perovskite,
b) LaCoO3 deposited on α-Al2O3, and c) LaCoO3/α-Al2O3
catalytic tests.
Fig. 2. XRD patterns of: a) initial YCoO3 perovskite,
b) YCoO3 deposited on α-Al2O3, and c) YCoO3/α-Al2O3
catalytic tests.
SEM images of different magnification of as-
prepared catalysts are shown in figure 3. It is seen
that deposition technique leads to uniform distri-
bution of perovskite phase onto the surface of the
carrier. Photographs of higher magnification revealed
catalyst microstructure. Particles of the active phase
at the surface are about 1‒3 μm in size and many
pores exist in the interstice among them. The spe-
cific surface area of both samples is about 10‒15
m2/g. A difference in particle morphology is also
seen. For La sample, the shape of the particles is
predominantly plate-like, while the Y sample exposes
aggregates of small grain-like particles.
Fig. 3 SEM images of different magnification of the
Al2O3-supported perovskite catalysts.
Results from catalytic activity measurements of
complete oxidation of toluene and n-hexane are
displayed in figures 4‒6. Obviously, the activities of
the two catalyst samples are very different, LaCoO3
being more active than YFeO3. An explanation for
the significant difference in catalytic activity bet-
ween LaCoO3 and YCoO3 should be found in struc-
tural peculiarities due to the presence of different A
cations and their influence on perovskite phase
stability and catalytic activity. In the present study
difference between the two perovskite structures
originates mainly from difference in A cation size,
being 1.36 Å for La3+
and 1.075 Å for Y3+
of the
same coordination. For comparison, the ionic radius
of O2−
is 1.35 Å. Several factors have been proposed
to evaluate the stability of the perovskite structures
[17,18]. Based on crystal structure data on LaCoO3
and YCoO3, calculated tolerance factor, being equal
to 1 for ideal perovskite structure, is 1.0112 for
LaCoO3 and 0.9049 for YCoO3. As it can be seen
the Y-containing perovskite has more deformed
structure and smaller tolerance factor than the La-
containing counterpart has. This means that the Y-
containing structure is more unstable towards ex-
ternal mechanical, thermal, or chemical influence
[19]. LaCoO3 structure stability indicates that this
oxide can easily accommodate certain amount of
cation and anion defects without structural changes.
It is well known that this compound can be syn-
thesized with some deviation from stoichiometry
[20]. Previous studies [21] revealed a clear distinc-
tion in thermal expansion between LaCoO3 and
YCoO3. The Co-O-Co bond angles in YCoO3
decrease with temperature above the onset of spin
transition in contrast to LaCoO3, where the Co-O-Co
angles constantly increase with temperature. A more
M. Markova-Velichkova et al.: Hexane and toluene oxidation on perovskite LaCoO3 and YCoO3 catalysts
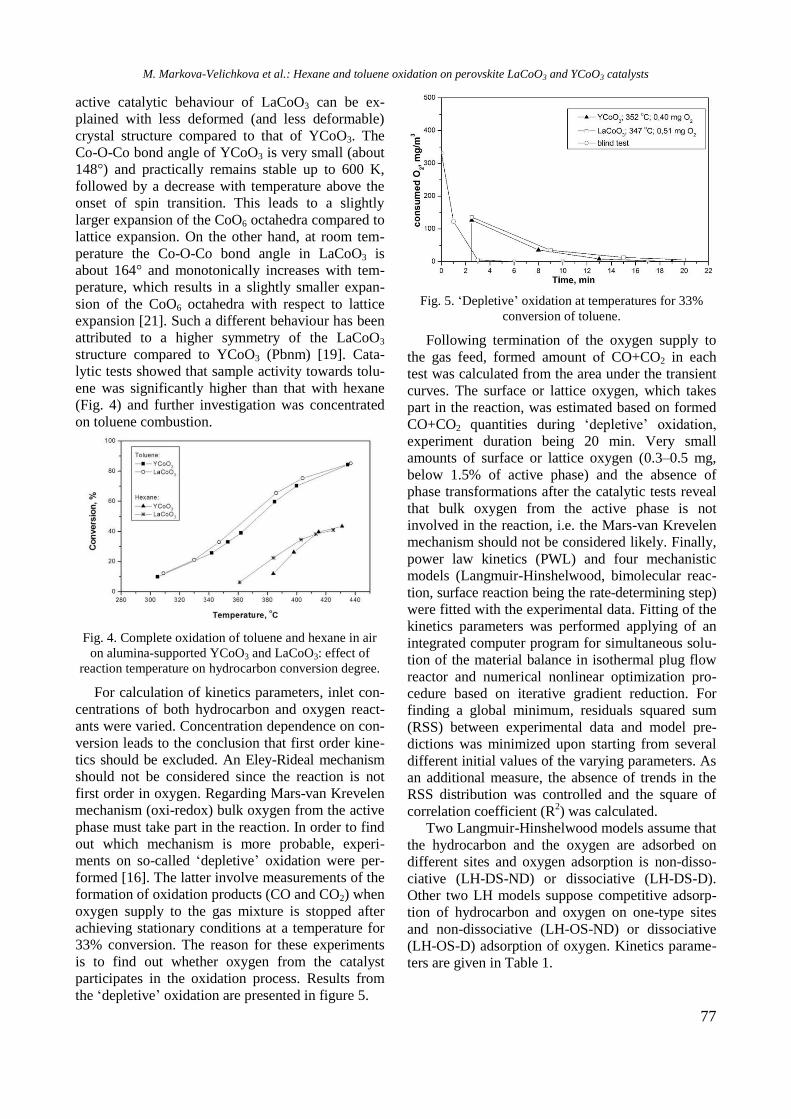
77
active catalytic behaviour of LaCoO3 can be ex-
plained with less deformed (and less deformable)
crystal structure compared to that of YCoO3. The
Co-O-Co bond angle of YCoO3 is very small (about
148°) and practically remains stable up to 600 K,
followed by a decrease with temperature above the
onset of spin transition. This leads to a slightly
larger expansion of the CoO6 octahedra compared to
lattice expansion. On the other hand, at room tem-
perature the Co-O-Co bond angle in LaCoO3 is
about 164° and monotonically increases with tem-
perature, which results in a slightly smaller expan-
sion of the CoO6 octahedra with respect to lattice
expansion [21]. Such a different behaviour has been
attributed to a higher symmetry of the LaCoO3
structure compared to YCoO3 (Pbnm) [19]. Cata-
lytic tests showed that sample activity towards tolu-
ene was significantly higher than that with hexane
(Fig. 4) and further investigation was concentrated
on toluene combustion.
Fig. 4. Complete oxidation of toluene and hexane in air
on alumina-supported YCoO3 and LaCoO3: effect of
reaction temperature on hydrocarbon conversion degree.
For calculation of kinetics parameters, inlet con-
centrations of both hydrocarbon and oxygen react-
ants were varied. Concentration dependence on con-
version leads to the conclusion that first order kine-
tics should be excluded. An Eley-Rideal mechanism
should not be considered since the reaction is not
first order in oxygen. Regarding Mars-van Krevelen
mechanism (oxi-redox) bulk oxygen from the active
phase must take part in the reaction. In order to find
out which mechanism is more probable, experi-
ments on so-called ‘depletive’ oxidation were per-
formed [16]. The latter involve measurements of the
formation of oxidation products (CO and CO2) when
oxygen supply to the gas mixture is stopped after
achieving stationary conditions at a temperature for
33% conversion. The reason for these experiments
is to find out whether oxygen from the catalyst
participates in the oxidation process. Results from
the ‘depletive’ oxidation are presented in figure 5.
Fig. 5. ‘Depletive’ oxidation at temperatures for 33%
conversion of toluene.
Following termination of the oxygen supply to
the gas feed, formed amount оf CO+CO2 in each
test was calculated from the area under the transient
curves. The surface or lattice oxygen, which takes
part in the reaction, was estimated based on formed
CO+CO2 quantities during ‘depletive’ oxidation,
experiment duration being 20 min. Very small
amounts of surface or lattice oxygen (0.3–0.5 mg,
below 1.5% of active phase) and the absence of
phase transformations after the catalytic tests reveal
that bulk oxygen from the active phase is not
involved in the reaction, i.e. the Mars-van Krevelen
mechanism should not be considered likely. Finally,
power law kinetics (PWL) and four mechanistic
models (Langmuir-Hinshelwood, bimolecular reac-
tion, surface reaction being the rate-determining step)
were fitted with the experimental data. Fitting of the
kinetics parameters was performed applying of an
integrated computer program for simultaneous solu-
tion of the material balance in isothermal plug flow
reactor and numerical nonlinear optimization pro-
cedure based on iterative gradient reduction. For
finding a global minimum, residuals squared sum
(RSS) between experimental data and model pre-
dictions was minimized upon starting from several
different initial values of the varying parameters. As
an additional measure, the absence of trends in the
RSS distribution was controlled and the square of
correlation coefficient (R2) was calculated.
Two Langmuir-Hinshelwood models assume that
the hydrocarbon and the oxygen are adsorbed on
different sites and oxygen adsorption is non-disso-
ciative (LH-DS-ND) or dissociative (LH-DS-D).
Other two LH models suppose competitive adsorp-
tion of hydrocarbon and oxygen on one-type sites
and non-dissociative (LH-OS-ND) or dissociative
(LH-OS-D) adsorption of oxygen. Kinetics parame-
ters are given in Table 1.
M. Markova-Velichkova et al.: Hexane and toluene oxidation on perovskite LaCoO3 and YCoO3 catalysts
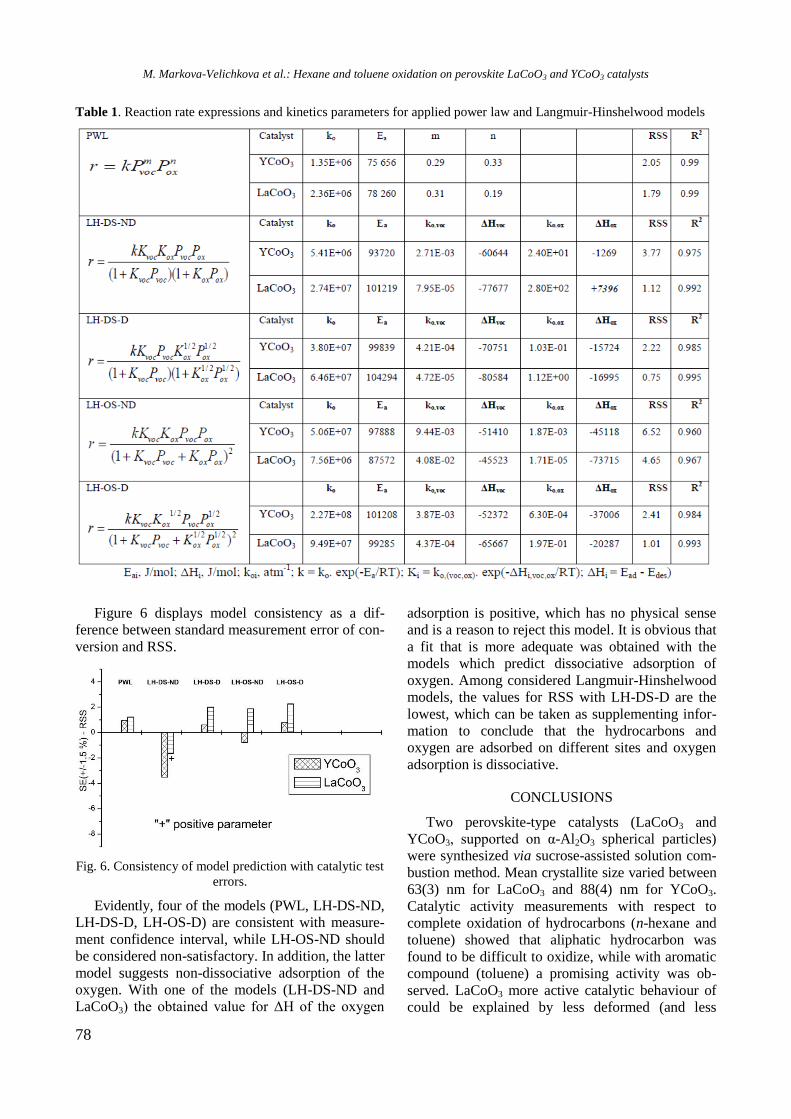
78
Table 1. Reaction rate expressions and kinetics parameters for applied power law and Langmuir-Hinshelwood models
Figure 6 displays model consistency as a dif-
ference between standard measurement error of con-
version and RSS.
Fig. 6. Consistency of model prediction with catalytic test
errors.
Evidently, four of the models (PWL, LH-DS-ND,
LH-DS-D, LH-OS-D) are consistent with measure-
ment confidence interval, while LH-OS-ND should
be considered non-satisfactory. In addition, the latter
model suggests non-dissociative adsorption of the
oxygen. With one of the models (LH-DS-ND and
LaCoO3) the obtained value for ΔH of the oxygen
adsorption is positive, which has no physical sense
and is a reason to reject this model. It is obvious that
a fit that is more adequate was obtained with the
models which predict dissociative adsorption of
oxygen. Among considered Langmuir-Hinshelwood
models, the values for RSS with LH-DS-D are the
lowest, which can be taken as supplementing infor-
mation to conclude that the hydrocarbons and
oxygen are adsorbed on different sites and oxygen
adsorption is dissociative.
CONCLUSIONS
Two perovskite-type catalysts (LaCoO3 and
YCoO3, supported on α-Al2O3 spherical particles)
were synthesized via sucrose-assisted solution com-
bustion method. Mean crystallite size varied between
63(3) nm for LaCoO3 and 88(4) nm for YCoO3.
Catalytic activity measurements with respect to
complete oxidation of hydrocarbons (n-hexane and
toluene) showed that aliphatic hydrocarbon was
found to be difficult to oxidize, while with aromatic
compound (toluene) a promising activity was ob-
served. LaCoO3 more active catalytic behaviour of
could be explained by less deformed (and less
M. Markova-Velichkova et al.: Hexane and toluene oxidation on perovskite LaCoO3 and YCoO3 catalysts
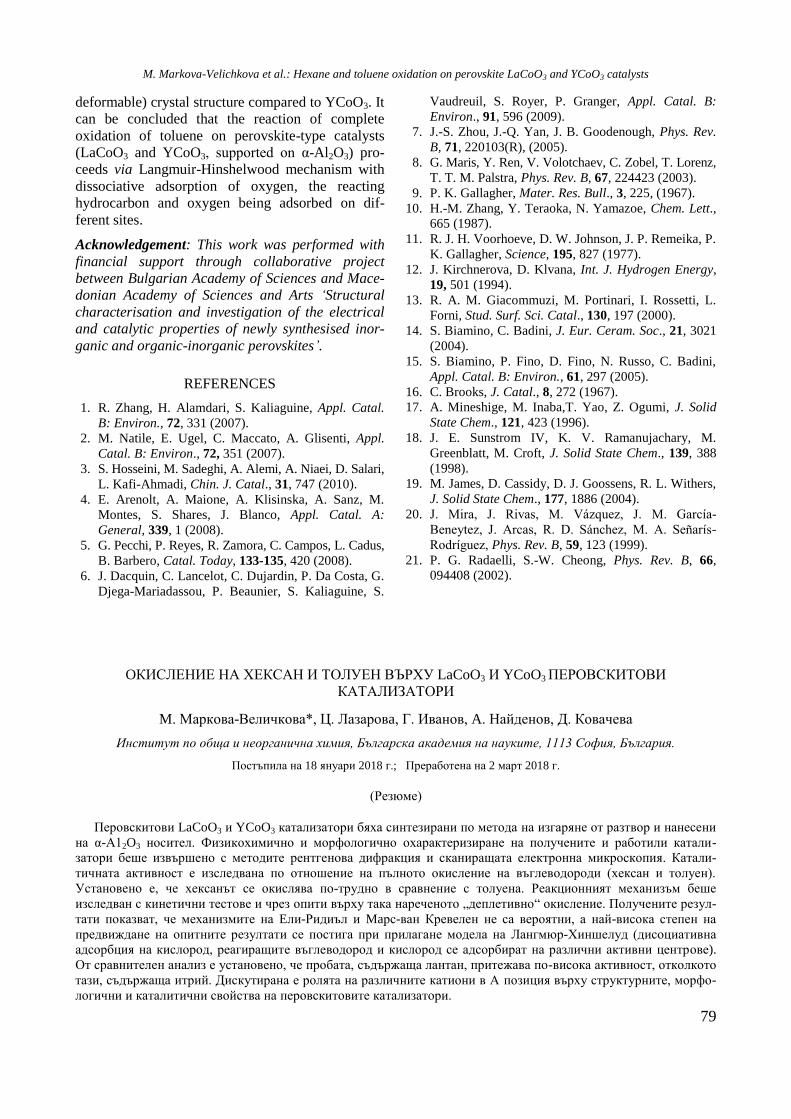
79
deformable) crystal structure compared to YCoO3. It
can be concluded that the reaction of complete
oxidation of toluene on perovskite-type catalysts
(LaCoO3 and YCoO3, supported on α-Al2O3) pro-
ceeds via Langmuir-Hinshelwood mechanism with
dissociative adsorption of oxygen, the reacting
hydrocarbon and oxygen being adsorbed on dif-
ferent sites.
Acknowledgement: This work was performed with
financial support through collaborative project
between Bulgarian Academy of Sciences and Mace-
donian Academy of Sciences and Arts ‘Structural
characterisation and investigation of the electrical
and catalytic properties of newly synthesised inor-
ganic and organic-inorganic perovskites’.
REFERENCES
1. R. Zhang, H. Alamdari, S. Kaliaguine, Appl. Catal.
B: Environ., 72, 331 (2007).
2. M. Natile, E. Ugel, C. Maccato, A. Glisenti, Appl.
Catal. B: Environ., 72, 351 (2007).
3. S. Hosseini, M. Sadeghi, A. Alemi, A. Niaei, D. Salari,
L. Kafi-Ahmadi, Chin. J. Catal., 31, 747 (2010).
4. E. Arenolt, A. Maione, A. Klisinska, A. Sanz, M.
Montes, S. Shares, J. Blanco, Appl. Catal. A:
General, 339, 1 (2008).
5. G. Pecchi, P. Reyes, R. Zamora, C. Campos, L. Cadus,
B. Barbero, Catal. Today, 133-135, 420 (2008).
6. J. Dacquin, C. Lancelot, C. Dujardin, P. Da Costa, G.
Djega-Mariadassou, P. Beaunier, S. Kaliaguine, S.
Vaudreuil, S. Royer, P. Granger, Appl. Catal. B:
Environ., 91, 596 (2009).
7. J.-S. Zhou, J.-Q. Yan, J. B. Goodenough, Phys. Rev.
B, 71, 220103(R), (2005).
8. G. Maris, Y. Ren, V. Volotchaev, C. Zobel, T. Lorenz,
T. T. M. Palstra, Phys. Rev. B, 67, 224423 (2003).
9. P. K. Gallagher, Mater. Res. Bull., 3, 225, (1967).
10. H.-M. Zhang, Y. Teraoka, N. Yamazoe, Chem. Lett.,
665 (1987).
11. R. J. H. Voorhoeve, D. W. Johnson, J. P. Remeika, P.
K. Gallagher, Science, 195, 827 (1977).
12. J. Kirchnerova, D. Klvana, Int. J. Hydrogen Energy,
19, 501 (1994).
13. R. A. M. Giacommuzi, M. Portinari, I. Rossetti, L.
Forni, Stud. Surf. Sci. Catal., 130, 197 (2000).
14. S. Biamino, C. Badini, J. Eur. Ceram. Soc., 21, 3021
(2004).
15. S. Biamino, P. Fino, D. Fino, N. Russo, C. Badini,
Appl. Catal. B: Environ., 61, 297 (2005).
16. C. Brooks, J. Catal., 8, 272 (1967).
17. A. Mineshige, M. Inaba,T. Yao, Z. Ogumi, J. Solid
State Chem., 121, 423 (1996).
18. J. E. Sunstrom IV, K. V. Ramanujachary, M.
Greenblatt, M. Croft, J. Solid State Chem., 139, 388
(1998).
19. M. James, D. Cassidy, D. J. Goossens, R. L. Withers,
J. Solid State Chem., 177, 1886 (2004).
20. J. Mira, J. Rivas, M. Vázquez, J. M. García-
Beneytez, J. Arcas, R. D. Sánchez, M. A. Señarís-
Rodríguez, Phys. Rev. B, 59, 123 (1999).
21. P. G. Radaelli, S.-W. Cheong, Phys. Rev. B, 66,
094408 (2002).
OКИСЛЕНИЕ НА ХЕКСАН И ТОЛУЕН ВЪРХУ LaCoO3 И YCoO3 ПЕРОВСКИТОВИ
КАТАЛИЗАТОРИ
M. Маркова-Величкова*, Ц. Лазаровa, Г. Иванов, A. Найденов, Д. Ковачева
Институт по обща и неорганична химия, Българска академия на науките, 1113 София, България.
Постъпила на 18 януари 2018 г.; Преработена на 2 март 2018 г.
(Резюме)
Перовскитови LaCoO3 и YCoO3 катализатори бяха синтезирани по метода на изгаряне от разтвор и нанесени
на α-А12O3 носител. Физикохимично и морфологично охарактеризиране на получените и работили катали-
затори беше извършено с методите рентгенова дифракция и сканиращата електронна микроскопия. Катали-
тичната активност е изследвана по отношение на пълното окисление на въглеводороди (хексан и толуен).
Установено е, че хексанът се окислява по-трудно в сравнение с толуена. Реакционният механизъм беше
изследван с кинетични тестове и чрез опити върху така нареченото „деплетивно“ окисление. Получените резул-
тати показват, че механизмите на Eли-Ридиъл и Maрс-ван Кревелен не са вероятни, а най-висока степен на
предвиждане на опитните резултати се постига при прилагане модела на Лангмюр-Хиншелуд (дисоциативна
адсорбция на кислород, реагиращите въглеводород и кислород се адсорбират на различни активни центрове).
От сравнителен анализ е установено, че пробата, съдържаща лантан, притежава по-висока активност, отколкото
тази, съдържаща итрий. Дискутирана е ролята на различните катиони в А позиция върху структурните, морфо-
логични и каталитични свойства на перовскитовите катализатори.
M. Markova-Velichkova et al.: Hexane and toluene oxidation on perovskite LaCoO3 and YCoO3 catalysts
80
Bulgarian Chemical Communications, Volume 50, Special issue H (pp. 80–86) 2018
Nanosized mesoporous titania composites promoted with ceria and zirconia
as catalysts for ethyl acetate oxidation: effect of preparation procedure
G. S. Issa1*, M. D. Dimitrov
1, D. G. Kovacheva
2, T. S. Tsoncheva
1
1 Institute of Organic Chemistry with Centre of Phytochemistry, Bulgarian Academy of Sciences, Acad. G. Bonchev St.,
Bldg. 9, 1113 Sofia, Bulgaria, 2 Institute of General and Inorganic Chemistry, Bulgarian Academy of Sciences, Acad. G. Bonchev St., Bldg. 11,
1113 Sofia, Bulgaria
Received: January 15, 2018; Revised: March 07, 2018
The aim of the current investigation was to develop a series of titania-based nanosized mesoporous binary materials
promoted with Ce and Zr and to test them as catalysts for total oxidation of ethyl acetate. Metal oxide materials were
synthesised by template-assisted hydrothermal approach and homogeneous precipitation with urea. The main aspect of
the study was to find a relationship between preparation procedure and structure, texture, surface, and catalytic
properties of the obtained materials. These materials were characterised by low temperature nitrogen physisorption,
XRD, Raman and UV-Vis spectroscopy, and temperature-programmed reduction with hydrogen. The hydrothermal
method enabled formation of mesoporous materials of better homogeneity as compared to urea-synthesised counterparts
where certain microporosity was registered as well. Doping agents affected preparation procedures. Improved texture
parameters of ZrTi binary oxides obtained by the hydrothermal technique facilitated their catalytic activity as compared
to urea analogues. Just an opposite effect of preparation was observed for CeTi materials.
Key words: mesoporous catalysts, Ce-pomoted titania, Zr-promoted titania, ethyl acetate oxidation.
INTRODUCTION
Volatile organic compounds (VOCs) are im-
portant environmental pollutants produced from
refineries, fuel storage and loading operations,
motor vehicles, solvent cleaning, printing and
painting operations [1]. VOCs are regarded as criti-
cal precursors for the potential formation of
tropospheric ozone and photochemical smog.
Examples of common VOCs are ethyl acetate, ben-
zene, toluene, acetone, and ethanol [2]. In particular,
ethyl acetate is one of the most common VOCs,
used in printing operations, glues, and nail polish
removers, often employed as a model compound for
VOCs oxidation [3,4]. Catalytic oxidation seems to
be very promising for VOCs elimination. Practical
realisation of each of these catalytic processes
requires the development of effective catalysts
remarkable not only for their activity, stability, and
selectivity, but for their low cost and ability to
operate at relatively low temperatures. In recent
years, efforts in this direction were focused on
obtaining new porous materials based on transition
metal oxides [5]. Improved methods for their
synthesis have led to new materials of different
morphology, high specific surface area, and well
developed porous structure. These materials contain
pores of different size, shape, and topology, and in
some cases functionalise the surface of the metal
oxide to acquire tunable surface properties [5−10].
Moreover, multicomponent nanosized metal oxide
materials are subject of even greater interest for
improving their properties via exhibited synergism
among the individual components, i.e. one of the
metal oxides may change the properties of another
one because of electronic and structural impacts.
Recently titania has received much attention owing
to its non-toxicity, chemical and biological inert-
ness, availability, and low cost. Preparation of nano-
disperse mesoporous titania and its doping with
different metal oxides provide good opportunities
not only for improved catalytic behaviour, but also
for formation of new stable composites, which could
manifest completely different physicochemical and
catalytic properties [6]. Titania-ceria materials re-
present undoubted interest due to an important role
of the cerium dopant to decrease particle size, and to
cause a strong effect on metal oxide reducibility,
high degree of synergistic interaction between com-
ponents, and favourable modification of structural
and catalytic properties [8]. It has been established
that isomorphous substitution of cerium ions into
the TiO2 lattice generates oxygen vacancies, which
stabilise the anatase phase, increases the specific
surface area and the dispersion of the metal oxide
particles [8]. It has been demonstrated that addition
© 2018 Bulgarian Academy of Sciences, Union of Chemists in Bulgaria
* To whom all correspondence should be sent
E-mail: [email protected]
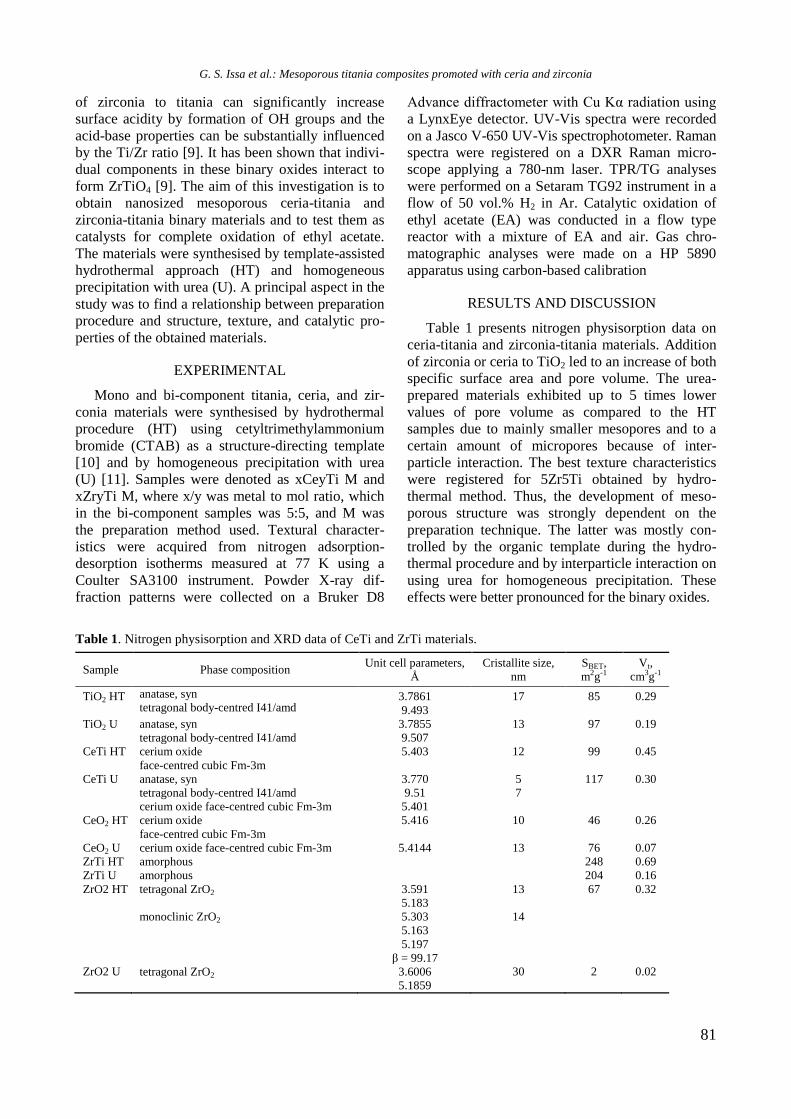
81
of zirconia to titania can significantly increase
surface acidity by formation of OH groups and the
acid-base properties can be substantially influenced
by the Ti/Zr ratio [9]. It has been shown that indivi-
dual components in these binary oxides interact to
form ZrTiO4 [9]. The aim of this investigation is to
obtain nanosized mesoporous ceria-titania and
zirconia-titania binary materials and to test them as
catalysts for complete oxidation of ethyl acetate.
The materials were synthesised by template-assisted
hydrothermal approach (HT) and homogeneous
precipitation with urea (U). A principal aspect in the
study was to find a relationship between preparation
procedure and structure, texture, and catalytic pro-
perties of the obtained materials.
EXPERIMENTAL
Mono and bi-component titania, ceria, and zir-
conia materials were synthesised by hydrothermal
procedure (HT) using cetyltrimethylammonium
bromide (CTAB) as a structure-directing template
[10] and by homogeneous precipitation with urea
(U) [11]. Samples were denoted as xCeyTi M and
xZryTi M, where x/y was metal to mol ratio, which
in the bi-component samples was 5:5, and M was
the preparation method used. Textural character-
istics were acquired from nitrogen adsorption-
desorption isotherms measured at 77 K using a
Coulter SA3100 instrument. Powder X-ray dif-
fraction patterns were collected on a Bruker D8
Advance diffractometer with Cu Kα radiation using
a LynxEye detector. UV-Vis spectra were recorded
on a Jasco V-650 UV-Vis spectrophotometer. Raman
spectra were registered on a DXR Raman micro-
scope applying a 780-nm laser. TPR/TG analyses
were performed on a Setaram TG92 instrument in a
flow of 50 vol.% H2 in Ar. Catalytic oxidation of
ethyl acetate (EA) was conducted in a flow type
reactor with a mixture of EA and air. Gas chro-
matographic analyses were made on a HP 5890
apparatus using carbon-based calibration
RESULTS AND DISCUSSION
Table 1 presents nitrogen physisorption data on
ceria-titania and zirconia-titania materials. Addition
of zirconia or ceria to TiO2 led to an increase of both
specific surface area and pore volume. The urea-
prepared materials exhibited up to 5 times lower
values of pore volume as compared to the HT
samples due to mainly smaller mesopores and to a
certain amount of micropores because of inter-
particle interaction. The best texture characteristics
were registered for 5Zr5Ti obtained by hydro-
thermal method. Thus, the development of meso-
porous structure was strongly dependent on the
preparation technique. The latter was mostly con-
trolled by the organic template during the hydro-
thermal procedure and by interparticle interaction on
using urea for homogeneous precipitation. These
effects were better pronounced for the binary oxides.
Table 1. Nitrogen physisorption and XRD data of CeTi and ZrTi materials.
Sample Phase composition Unit cell parameters,
Å
Cristallite size,
nm
SBET,
m2g-1
Vt,
cm3g-1
TiO2 HT anatase, syn
tetragonal body-centred I41/amd 3.7861
9.493
17 85 0.29
TiO2 U anatase, syn
tetragonal body-centred I41/amd
3.7855
9.507
13 97 0.19
CeTi HT cerium oxide
face-centred cubic Fm-3m
5.403 12 99 0.45
CeTi U anatase, syn
tetragonal body-centred I41/amd
cerium oxide face-centred cubic Fm-3m
3.770
9.51
5.401
5
7
117 0.30
CeO2 HT cerium oxide
face-centred cubic Fm-3m
5.416 10 46 0.26
CeO2 U cerium oxide face-centred cubic Fm-3m 5.4144 13 76 0.07
ZrTi HT amorphous 248 0.69
ZrTi U amorphous 204 0.16
ZrO2 HT tetragonal ZrO2
monoclinic ZrO2
3.591
5.183
5.303
5.163
5.197
β = 99.17
13
14
67 0.32
ZrO2 U tetragonal ZrO2 3.6006
5.1859
30 2 0.02
G. S. Issa et al.: Mesoporous titania composites promoted with ceria and zirconia
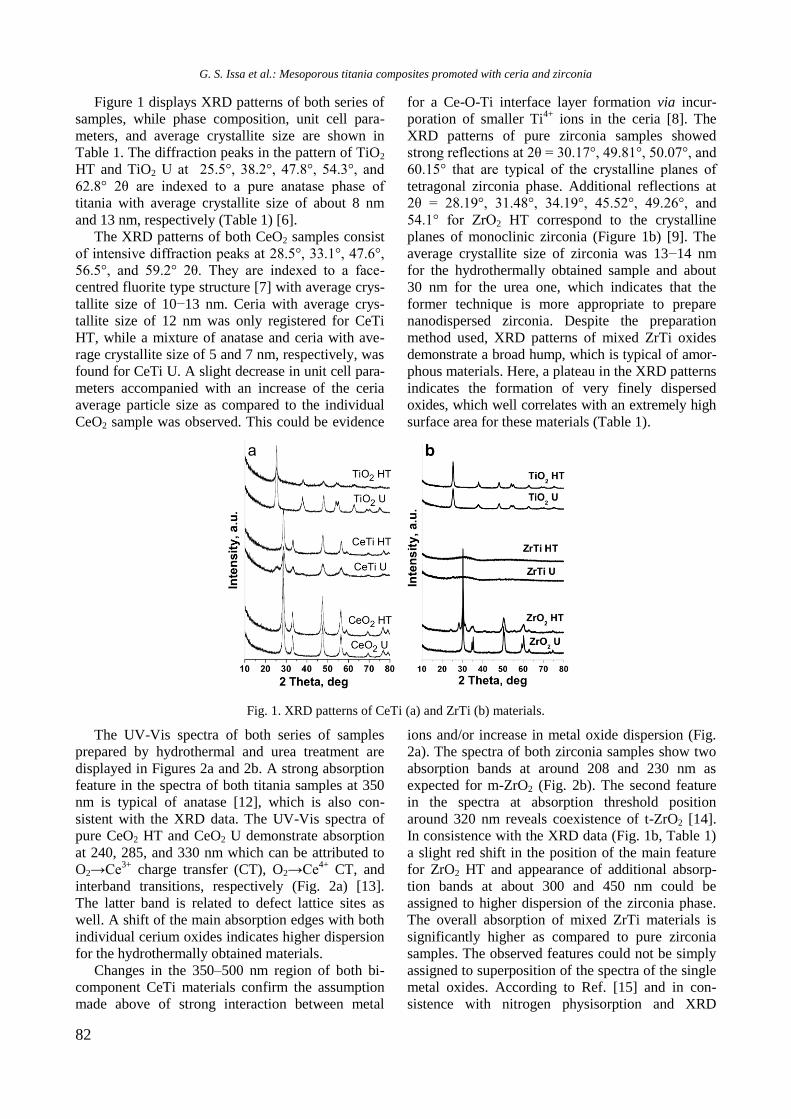
82
Figure 1 displays XRD patterns of both series of
samples, while phase composition, unit cell para-
meters, and average crystallite size are shown in
Table 1. The diffraction peaks in the pattern of TiO2
HT and TiO2 U at 25.5°, 38.2°, 47.8°, 54.3°, and
62.8° 2θ are indexed to a pure anatase phase of
titania with average crystallite size of about 8 nm
and 13 nm, respectively (Table 1) [6].
The XRD patterns of both CeO2 samples consist
of intensive diffraction peaks at 28.5°, 33.1°, 47.6°,
56.5°, and 59.2° 2θ. They are indexed to a face-
centred fluorite type structure [7] with average crys-
tallite size of 10−13 nm. Ceria with average crys-
tallite size of 12 nm was only registered for CeTi
HT, while a mixture of anatase and ceria with ave-
rage crystallite size of 5 and 7 nm, respectively, was
found for CeTi U. A slight decrease in unit cell para-
meters accompanied with an increase of the ceria
average particle size as compared to the individual
CeO2 sample was observed. This could be evidence
for a Ce-O-Ti interface layer formation via incur-
poration of smaller Ti4+
ions in the ceria [8]. The
XRD patterns of pure zirconia samples showed
strong reflections at 2θ = 30.17°, 49.81°, 50.07°, and
60.15° that are typical of the crystalline planes of
tetragonal zirconia phase. Additional reflections at
2θ = 28.19°, 31.48°, 34.19°, 45.52°, 49.26°, and
54.1° for ZrO2 HT correspond to the crystalline
planes of monoclinic zirconia (Figure 1b) [9]. The
average crystallite size of zirconia was 13−14 nm
for the hydrothermally obtained sample and about
30 nm for the urea one, which indicates that the
former technique is more appropriate to prepare
nanodispersed zirconia. Despite the preparation
method used, XRD patterns of mixed ZrTi oxides
demonstrate a broad hump, which is typical of amor-
phous materials. Here, a plateau in the XRD patterns
indicates the formation of very finely dispersed
oxides, which well correlates with an extremely high
surface area for these materials (Table 1).
Fig. 1. XRD patterns of CeTi (a) and ZrTi (b) materials.
The UV-Vis spectra of both series of samples
prepared by hydrothermal and urea treatment are
displayed in Figures 2a and 2b. A strong absorption
feature in the spectra of both titania samples at 350
nm is typical of anatase [12], which is also con-
sistent with the XRD data. The UV-Vis spectra of
pure CeO2 HT and CeO2 U demonstrate absorption
at 240, 285, and 330 nm which can be attributed to
O2→Ce3+
charge transfer (CT), O2→Ce4+
CT, and
interband transitions, respectively (Fig. 2a) [13].
The latter band is related to defect lattice sites as
well. A shift of the main absorption edges with both
individual cerium oxides indicates higher dispersion
for the hydrothermally obtained materials.
Changes in the 350–500 nm region of both bi-
component CeTi materials confirm the assumption
made above of strong interaction between metal
ions and/or increase in metal oxide dispersion (Fig.
2a). The spectra of both zirconia samples show two
absorption bands at around 208 and 230 nm as
expected for m-ZrO2 (Fig. 2b). The second feature
in the spectra at absorption threshold position
around 320 nm reveals coexistence of t-ZrO2 [14].
In consistence with the XRD data (Fig. 1b, Table 1)
a slight red shift in the position of the main feature
for ZrO2 HT and appearance of additional absorp-
tion bands at about 300 and 450 nm could be
assigned to higher dispersion of the zirconia phase.
The overall absorption of mixed ZrTi materials is
significantly higher as compared to pure zirconia
samples. The observed features could not be simply
assigned to superposition of the spectra of the single
metal oxides. According to Ref. [15] and in con-
sistence with nitrogen physisorption and XRD
G. S. Issa et al.: Mesoporous titania composites promoted with ceria and zirconia
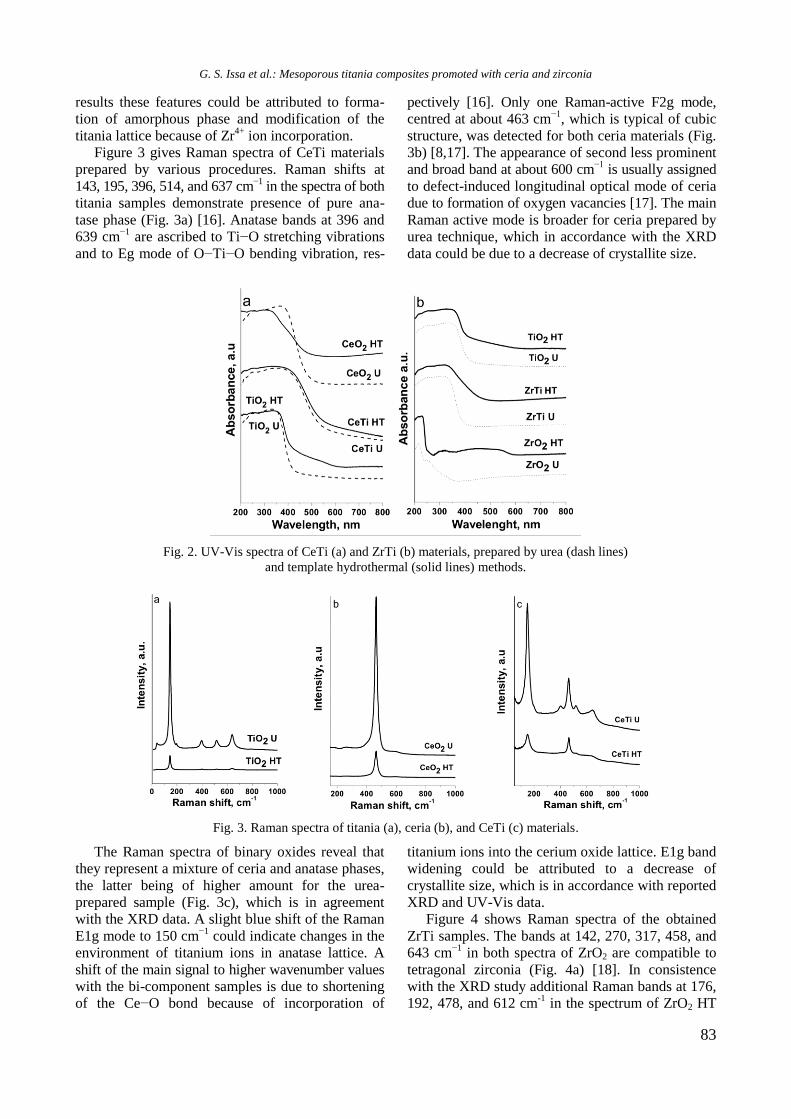
83
results these features could be attributed to forma-
tion of amorphous phase and modification of the
titania lattice because of Zr4+
ion incorporation.
Figure 3 gives Raman spectra of CeTi materials
prepared by various procedures. Raman shifts at
143, 195, 396, 514, and 637 cm−1
in the spectra of both
titania samples demonstrate presence of pure ana-
tase phase (Fig. 3a) [16]. Anatase bands at 396 and
639 cm−1
are ascribed to Ti−O stretching vibrations
and to Eg mode of O−Ti−O bending vibration, res-
pectively [16]. Only one Raman-active F2g mode,
centred at about 463 cm−1
, which is typical of cubic
structure, was detected for both ceria materials (Fig.
3b) [8,17]. The appearance of second less prominent
and broad band at about 600 cm−1
is usually assigned
to defect-induced longitudinal optical mode of ceria
due to formation of oxygen vacancies [17]. The main
Raman active mode is broader for ceria prepared by
urea technique, which in accordance with the XRD
data could be due to a decrease of crystallite size.
Fig. 2. UV-Vis spectra of CeTi (a) and ZrTi (b) materials, prepared by urea (dash lines)
and template hydrothermal (solid lines) methods.
Fig. 3. Raman spectra of titania (a), ceria (b), and CeTi (c) materials.
The Raman spectra of binary oxides reveal that
they represent a mixture of ceria and anatase phases,
the latter being of higher amount for the urea-
prepared sample (Fig. 3c), which is in agreement
with the XRD data. A slight blue shift of the Raman
E1g mode to 150 cm−1
could indicate changes in the
environment of titanium ions in anatase lattice. A
shift of the main signal to higher wavenumber values
with the bi-component samples is due to shortening
of the Ce−O bond because of incorporation of
titanium ions into the cerium oxide lattice. E1g band
widening could be attributed to a decrease of
crystallite size, which is in accordance with reported
XRD and UV-Vis data.
Figure 4 shows Raman spectra of the obtained
ZrTi samples. The bands at 142, 270, 317, 458, and
643 cm−1
in both spectra of ZrO2 are compatible to
tetragonal zirconia (Fig. 4a) [18]. In consistence
with the XRD study additional Raman bands at 176,
192, 478, and 612 cm-1
in the spectrum of ZrO2 HT
G. S. Issa et al.: Mesoporous titania composites promoted with ceria and zirconia
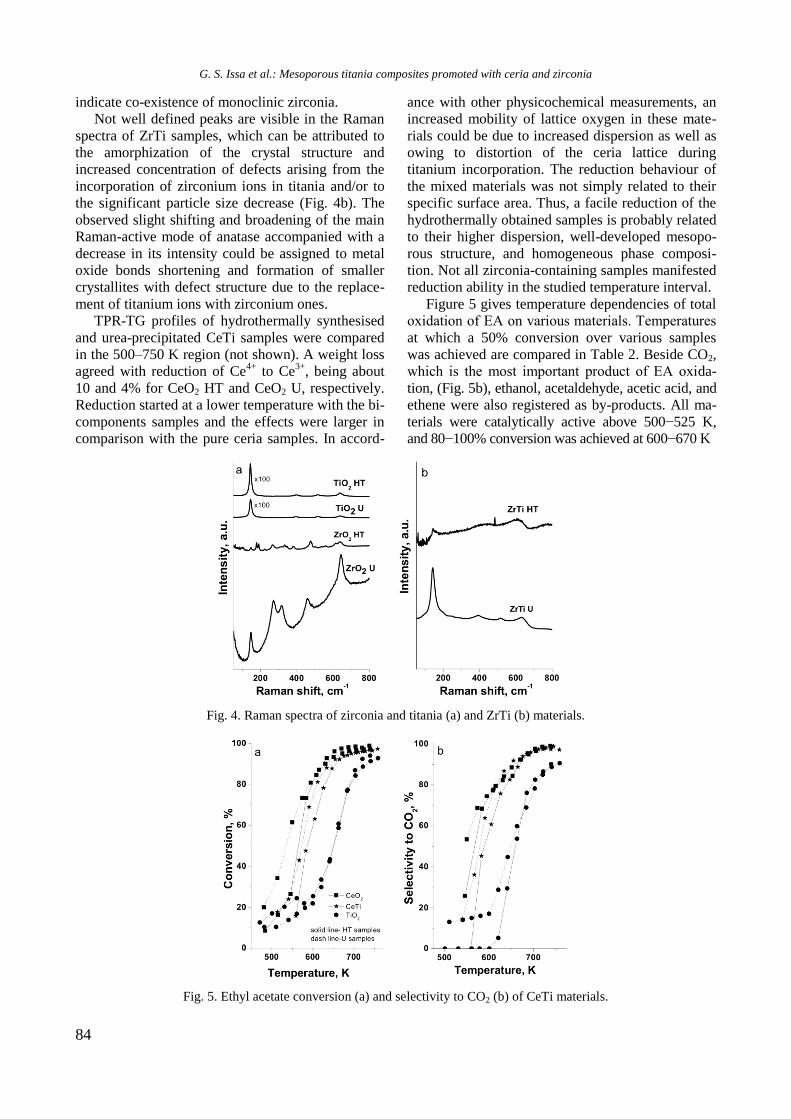
84
indicate co-existence of monoclinic zirconia.
Not well defined peaks are visible in the Raman
spectra of ZrTi samples, which can be attributed to
the amorphization of the crystal structure and
increased concentration of defects arising from the
incorporation of zirconium ions in titania and/or to
the significant particle size decrease (Fig. 4b). The
observed slight shifting and broadening of the main
Raman-active mode of anatase accompanied with a
decrease in its intensity could be assigned to metal
oxide bonds shortening and formation of smaller
crystallites with defect structure due to the replace-
ment of titanium ions with zirconium ones.
TPR-TG profiles of hydrothermally synthesised
and urea-precipitated CeTi samples were compared
in the 500–750 K region (not shown). A weight loss
agreed with reduction of Ce4+
to Ce3+
, being about
10 and 4% for CeO2 HT and CeO2 U, respectively.
Reduction started at a lower temperature with the bi-
components samples and the effects were larger in
comparison with the pure ceria samples. In accord-
ance with other physicochemical measurements, an
increased mobility of lattice oxygen in these mate-
rials could be due to increased dispersion as well as
owing to distortion of the ceria lattice during
titanium incorporation. The reduction behaviour of
the mixed materials was not simply related to their
specific surface area. Thus, a facile reduction of the
hydrothermally obtained samples is probably related
to their higher dispersion, well-developed mesopo-
rous structure, and homogeneous phase composi-
tion. Not all zirconia-containing samples manifested
reduction ability in the studied temperature interval.
Figure 5 gives temperature dependencies of total
oxidation of ЕА on various materials. Temperatures
at which a 50% conversion over various samples
was achieved are compared in Table 2. Beside CO2,
which is the most important product of ЕА oxida-
tion, (Fig. 5b), ethanol, acetaldehyde, acetic acid, and
ethene were also registered as by-products. All ma-
terials were catalytically active above 500−525 K,
and 80−100% conversion was achieved at 600−670 K
Fig. 4. Raman spectra of zirconia and titania (a) and ZrTi (b) materials.
Fig. 5. Ethyl acetate conversion (a) and selectivity to CO2 (b) of CeTi materials.
G. S. Issa et al.: Mesoporous titania composites promoted with ceria and zirconia
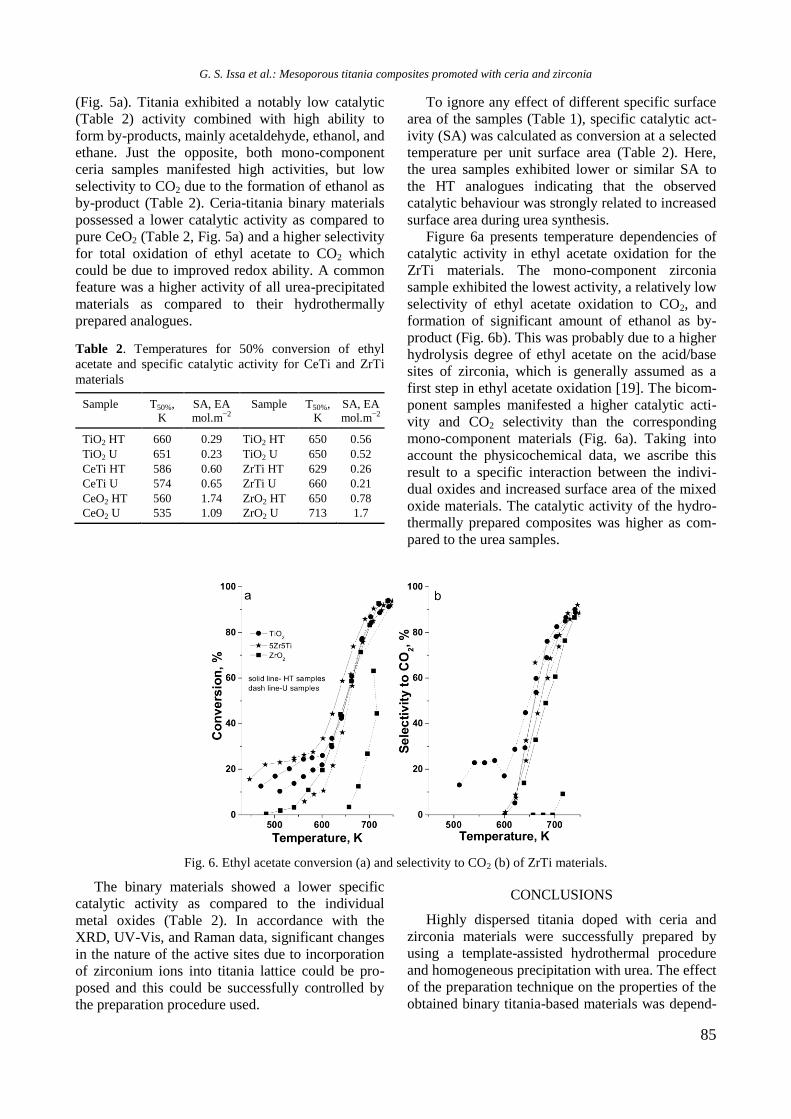
85
(Fig. 5a). Titania exhibited a notably low catalytic
(Table 2) activity combined with high ability to
form by-products, mainly acetaldehyde, ethanol, and
ethane. Just the opposite, both mono-component
ceria samples manifested high activities, but low
selectivity to CO2 due to the formation of ethanol as
by-product (Table 2). Ceria-titania binary materials
possessed a lower catalytic activity as compared to
pure CeO2 (Table 2, Fig. 5a) and a higher selectivity
for total oxidation of ethyl acetate to CO2 which
could be due to improved redox ability. A common
feature was a higher activity of all urea-precipitated
materials as compared to their hydrothermally
prepared analogues.
Table 2. Temperatures for 50% conversion of ethyl
acetate and specific catalytic activity for CeTi and ZrTi
materials
Sample T50%,
K
SA, EA
mol.m−2
Sample T50%,
K
SA, EA
mol.m−2
TiO2 HT 660 0.29 TiO2 HT 650 0.56
TiO2 U 651 0.23 TiO2 U 650 0.52
CeTi HT 586 0.60 ZrTi HT 629 0.26
CeTi U 574 0.65 ZrTi U 660 0.21
CeO2 HT 560 1.74 ZrO2 HT 650 0.78
CeO2 U 535 1.09 ZrO2 U 713 1.7
To ignore any effect of different specific surface
area of the samples (Table 1), specific catalytic act-
ivity (SA) was calculated as conversion at a selected
temperature per unit surface area (Table 2). Here,
the urea samples exhibited lower or similar SA to
the HT analogues indicating that the observed
catalytic behaviour was strongly related to increased
surface area during urea synthesis.
Figure 6a presents temperature dependencies of
catalytic activity in ethyl acetate oxidation for the
ZrTi materials. The mono-component zirconia
sample exhibited the lowest activity, a relatively low
selectivity of ethyl acetate oxidation to CO2, and
formation of significant amount of ethanol as by-
product (Fig. 6b). This was probably due to a higher
hydrolysis degree of ethyl acetate on the acid/base
sites of zirconia, which is generally assumed as a
first step in ethyl acetate oxidation [19]. The bicom-
ponent samples manifested a higher catalytic acti-
vity and CO2 selectivity than the corresponding
mono-component materials (Fig. 6a). Taking into
account the physicochemical data, we ascribe this
result to a specific interaction between the indivi-
dual oxides and increased surface area of the mixed
oxide materials. The catalytic activity of the hydro-
thermally prepared composites was higher as com-
pared to the urea samples.
Fig. 6. Ethyl acetate conversion (a) and selectivity to CO2 (b) of ZrTi materials.
The binary materials showed a lower specific
catalytic activity as compared to the individual
metal oxides (Table 2). In accordance with the
XRD, UV-Vis, and Raman data, significant changes
in the nature of the active sites due to incorporation
of zirconium ions into titania lattice could be pro-
posed and this could be successfully controlled by
the preparation procedure used.
CONCLUSIONS
Highly dispersed titania doped with ceria and
zirconia materials were successfully prepared by
using a template-assisted hydrothermal procedure
and homogeneous precipitation with urea. The effect
of the preparation technique on the properties of the
obtained binary titania-based materials was depend-
G. S. Issa et al.: Mesoporous titania composites promoted with ceria and zirconia
86
ent on the nature of dopant. In the case of ceria
doping, the template-assisted hydrothermal synthe-
sis facilitated formation of more homogeneous mate-
rials, but exhibiting lower dispersion and lower spe-
cific surface area. This provided a lower catalytic act-
ivity for complete oxidation of ethyl acetate. In con-
trast, the zirconia dopant significantly improved the
texture characteristics of titania and enhanced the cata-
lytic activity of hydrothermally synthesised materials.
Acknowledgements: Financial support by project
DM-09/4/2016 is gratefully acknowledged. A bila-
teral project between Bulgarian Academy of
Sciences and Czech Academy of Sciences is also
acknowledged. The authors thank V. Stengl, J.
Henych, and M. Slusna from Institute of Inorganic
Chemistry of the Czech Academy of Sciences for
Raman spectra and nitrogen physisorption measure-
ments and synthesis of urea samples.
REFERENCES
1. W. G. Tucker, Digital Engineering Library, @
McGraw-Hill, New York, 2004.
2. F. I. Khan, A.K. Ghoshal, J. Loss Prev. Process Ind.,
13, 527 (2000).
3. S. Akram, Z. Wang, L. Chen, Q. Wang, G. Shen, N.
Han, Y. Chen, G. Ge, Catal. Commun., 73, 123 (2016).
4. S. Carabineiro, M. Konsolakis, G. Marnellos, M.
Asad, O. Soares, P. Tavares, M. Pereira, J. Órfão, J.
Figueiredo, Molecules, 21, 644 (2016).
5. S. Yuesong , Z. Dahai, Y. Bo, N. Songbo, Z. Shemin,
J. Rare Earths, 30, 431 (2012).
6. M. Altomare, M. Dozzi, G. Chiarello, A. Paola, L.
Palmisano, E. Selli, Catal. Today, 252, 184 (2015).
7. D. W. Wheeler, I. Khan, Vib. Spectrosc., 70, 200
(2014).
8. J. Fang, X. Bi, D. Si, Z. Jiang, W. Huang, Appl. Surf.
Sci., 253, 8952 (2007).
9. B. Neppolian, Q. Wang, H. Yamashita, H. Choi,
Appl. Catal. A: Gen., 333, 264 (2001).
10. T. Tsoncheva, I. Genova, M. Dimitrov, E. Sarcadi-
Priboczki, A. M. Venezia, D. Kovacheva, N. Scotti,
V. dal Santo, Appl. Catal. B: Environ., 165, 599
(2015).
11. J. Subrt, V. Stengl, S. Bakardjieva, L. Szatmary,
Powder Technol., 169, 33 (2006).
12. M. N. Iliev, V. G. Hadjiev, A. P. Litvinchuk,
Spectroscopy, 64, 148 (2013).
13. A. Kambolis, H. Matralis, A. Trovarelli, Ch.
Papadopoulou, Appl. Catal. A: Gen., 377, 16 (2010).
14. S. Damyanova, B. Pawelec, K. Arishtirova, M. V.
Martinez Huerta, J. L. G. Fierro, Appl. Catal. A:
Gen., 337, 86 (2008).
15. M. Fernàndez-Garcίa, A. Martίnez-Arias, J. C. Hanson,
J. A. Rodriguez, Chem. Rev., 104, 4063 (2004).
16. K. C. Silva, P. Corio, J. J. Santos, Vib. Spectrosc., 86,
103 (2016).
17. D. R. Sellick, A. Aranda, T. García, J. M. López, B.
Solsona, A. M. Mastral, D. J. Morgan, A. F. Carley,
S. H. Taylo, Appl. Catal. B: Environ., 132–133, 98
(2013).
18. W. Zhu, N. Sugano, G. Pezzotti, J. Biomed. Opt., 18,
127 (2013).
19. P.-O. Larsson, A. Andersson, Appl. Catal. B:
Environ., 24, 175 (2000).
ВЛИЯНИЕ НА МЕТОДА НА ПОЛУЧАВАНЕ ВЪРХУ ФОРМИРАНЕТО НА
НАНОСТРУКТУРИРАНИ МЕЗОПОРЕСТИ CeO2-TiO2 И ZrO2-TiO2 КАТАЛИЗАТОРИ
ЗА ПЪЛНО ОКИСЛЕНИЕ НА ЕТИЛАЦЕТАТ
Г. С. Исса1, M. Д. Димитров
1, Д. Г. Ковачева
2, Т. С. Цончева
1
1 Институт по органична химия с Център по фитохимия, БАН, 1113 София, България
2 Институт по обща и неорганична химия, БАН, 1113 София, България
Постъпила на 15 януари 2018 г.; Преработена на 7 март 2018 г.
(Резюме)
Цел на настоящото изследване е получаване на наноразмерни мезопорести смесени материали на основата
на промотиран с Ce и Zr титанов оксид и тестването им като катализатори в реакция на пълно окисление на
етилацетат. Получените оксиди бяха синтезирани чрез хидротермален синтез в присъствието на органичен
темплейт и хомогенно утаяване с карбамид. Основен аспект в изследването е изясняване на връзката между
използвания метод на получаване и текстурата, структурата и окислително-редукционните свойства на получе-
ните материали. Образците бяха характеризирани чрез физична адсобция на азот, рентгеноструктурен анализ,
UV-Vis и Раманова спектроскопия, както и температурно програмирана редукция. Хидротермалният метод
благоприятства формирането на мезопорести и по-хомогенни материали в сравнение със синтезираните с
карбамид образци, където се регистрира и известна микропористост. Ефектът от процедурата на получаване
зависи от вида на металооксидната добавка към TiO2. Подобрените текстурни характеристики на смесените
ZrTi оксиди, получени чрез хидротермален метод благоприятстват тяхната каталитична активност в сравнение с
получените с карбамид аналози. Точно обратният ефект се наблюдава при CeTi материалите.
G. S. Issa et al.: Mesoporous titania composites promoted with ceria and zirconia
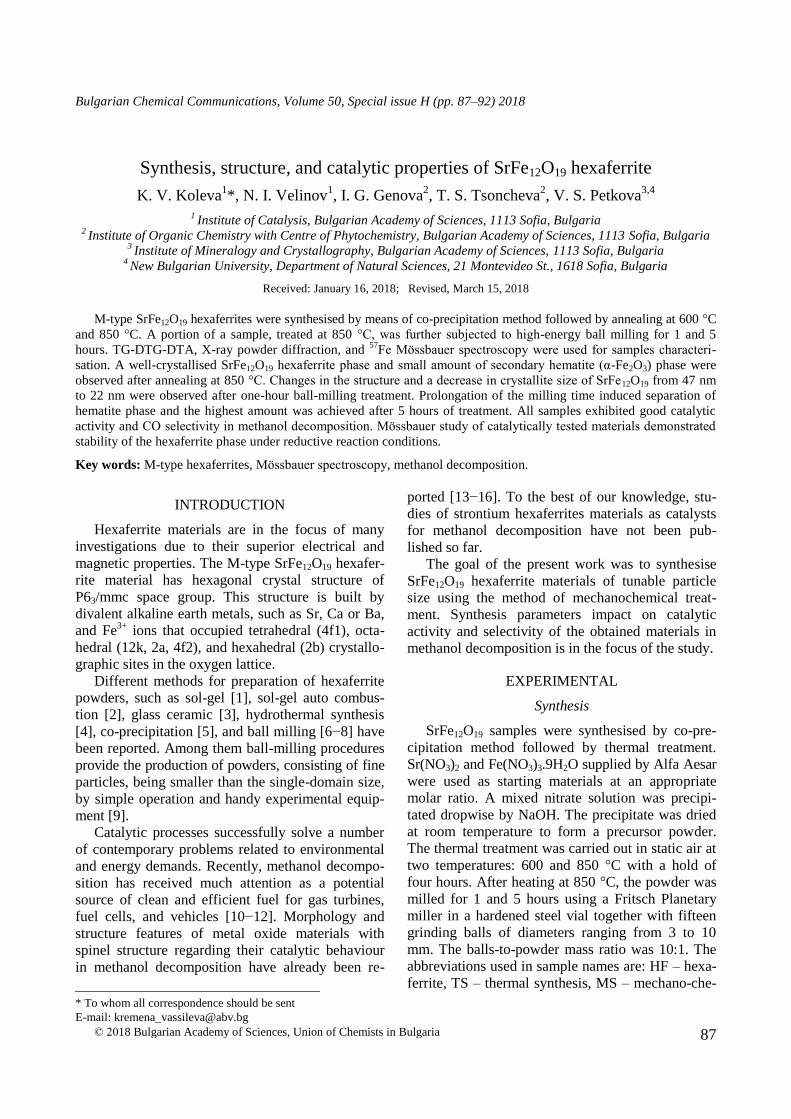
87
Bulgarian Chemical Communications, Volume 50, Special issue H (pp. 87–92) 2018
Synthesis, structure, and catalytic properties of SrFe12O19 hexaferrite
K. V. Koleva1*, N. I. Velinov
1, I. G. Genova
2, T. S. Tsoncheva
2, V. S. Petkova
3,4
1 Institute of Catalysis, Bulgarian Academy of Sciences, 1113 Sofia, Bulgaria
2 Institute of Organic Chemistry with Centre of Phytochemistry, Bulgarian Academy of Sciences, 1113 Sofia, Bulgaria
3 Institute of Mineralogy and Crystallography, Bulgarian Academy of Sciences, 1113 Sofia, Bulgaria
4 New Bulgarian University, Department of Natural Sciences, 21 Montevideo St., 1618 Sofia, Bulgaria
Received: January 16, 2018; Revised, March 15, 2018
M-type SrFe12O19 hexaferrites were synthesised by means of co-precipitation method followed by annealing at 600 °C
and 850 °C. A portion of a sample, treated at 850 °C, was further subjected to high-energy ball milling for 1 and 5
hours. TG-DTG-DTA, X-ray powder diffraction, and 57
Fe Mössbauer spectroscopy were used for samples characteri-
sation. A well-crystallised SrFe12O19 hexaferrite phase and small amount of secondary hematite (α-Fe2O3) phase were
observed after annealing at 850 °C. Changes in the structure and a decrease in crystallite size of SrFe12O19 from 47 nm
to 22 nm were observed after one-hour ball-milling treatment. Prolongation of the milling time induced separation of
hematite phase and the highest amount was achieved after 5 hours of treatment. All samples exhibited good catalytic
activity and CO selectivity in methanol decomposition. Mössbauer study of catalytically tested materials demonstrated
stability of the hexaferrite phase under reductive reaction conditions.
Key words: M-type hexaferrites, Mössbauer spectroscopy, methanol decomposition.
INTRODUCTION
Hexaferrite materials are in the focus of many
investigations due to their superior electrical and
magnetic properties. The M-type SrFe12O19 hexafer-
rite material has hexagonal crystal structure of
P63/mmc space group. This structure is built by
divalent alkaline earth metals, such as Sr, Ca or Ba,
and Fe3+
ions that occupied tetrahedral (4f1), octa-
hedral (12k, 2a, 4f2), and hexahedral (2b) crystallo-
graphic sites in the oxygen lattice.
Different methods for preparation of hexaferrite
powders, such as sol-gel [1], sol-gel auto combus-
tion [2], glass ceramic [3], hydrothermal synthesis
[4], co-precipitation [5], and ball milling [6−8] have
been reported. Among them ball-milling procedures
provide the production of powders, consisting of fine
particles, being smaller than the single-domain size,
by simple operation and handy experimental equip-
ment [9].
Catalytic processes successfully solve a number
of contemporary problems related to environmental
and energy demands. Recently, methanol decompo-
sition has received much attention as a potential
source of clean and efficient fuel for gas turbines,
fuel cells, and vehicles [10−12]. Morphology and
structure features of metal oxide materials with
spinel structure regarding their catalytic behaviour
in methanol decomposition have already been re-
ported [13−16]. To the best of our knowledge, stu-
dies of strontium hexaferrites materials as catalysts
for methanol decomposition have not been pub-
lished so far.
The goal of the present work was to synthesise
SrFe12O19 hexaferrite materials of tunable particle
size using the method of mechanochemical treat-
ment. Synthesis parameters impact on catalytic
activity and selectivity of the obtained materials in
methanol decomposition is in the focus of the study.
EXPERIMENTAL
Synthesis
SrFe12O19 samples were synthesised by co-pre-
cipitation method followed by thermal treatment.
Sr(NO3)2 and Fe(NO3)3.9H2O supplied by Alfa Aesar
were used as starting materials at an appropriate
molar ratio. A mixed nitrate solution was precipi-
tated dropwise by NaOH. The precipitate was dried
at room temperature to form a precursor powder.
The thermal treatment was carried out in static air at
two temperatures: 600 and 850 °C with a hold of
four hours. After heating at 850 °C, the powder was
milled for 1 and 5 hours using a Fritsch Planetary
miller in a hardened steel vial together with fifteen
grinding balls of diameters ranging from 3 to 10
mm. The balls-to-powder mass ratio was 10:1. The
abbreviations used in sample names are: HF – hexa-
ferrite, TS – thermal synthesis, MS – mechano-che-
© 2018 Bulgarian Academy of Sciences, Union of Chemists in Bulgaria
* To whom all correspondence should be sent
E-mail: [email protected]
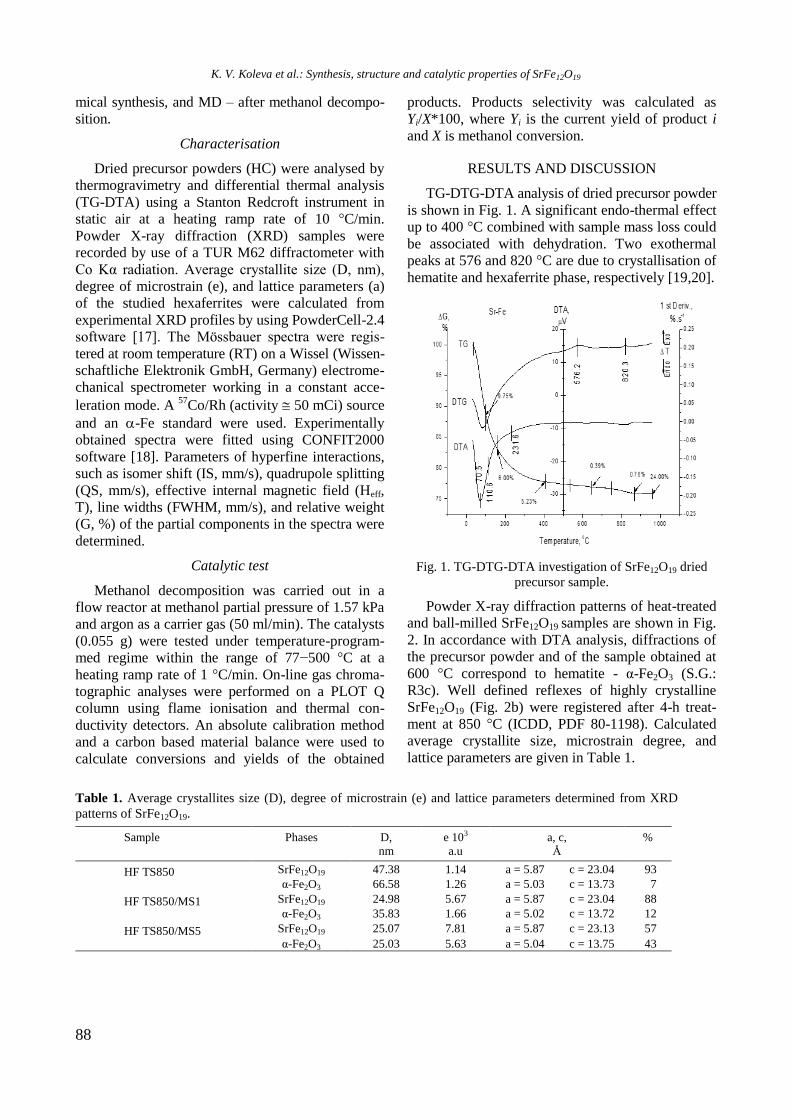
88
mical synthesis, and MD – after methanol decompo-
sition.
Characterisation
Dried precursor powders (HC) were analysed by
thermogravimetry and differential thermal analysis
(TG-DTA) using a Stanton Redcroft instrument in
static air at a heating ramp rate of 10 °C/min.
Powder X-ray diffraction (XRD) samples were
recorded by use of a TUR M62 diffractometer with
Co Kα radiation. Average crystallite size (D, nm),
degree of microstrain (e), and lattice parameters (a)
of the studied hexaferrites were calculated from
experimental XRD profiles by using PowderCell-2.4
software [17]. The Mössbauer spectra were regis-
tered at room temperature (RT) on a Wissel (Wissen-
schaftliche Elektronik GmbH, Germany) electrome-
chanical spectrometer working in a constant acce-
leration mode. A 57
Co/Rh (activity 50 mCi) source
and an -Fe standard were used. Experimentally
obtained spectra were fitted using CONFIT2000
software [18]. Parameters of hyperfine interactions,
such as isomer shift (IS, mm/s), quadrupole splitting
(QS, mm/s), effective internal magnetic field (Heff,
T), line widths (FWHM, mm/s), and relative weight
(G, %) of the partial components in the spectra were
determined.
Catalytic test
Methanol decomposition was carried out in a
flow reactor at methanol partial pressure of 1.57 kPa
and argon as a carrier gas (50 ml/min). The catalysts
(0.055 g) were tested under temperature-program-
med regime within the range of 77−500 °C at a
heating ramp rate of 1 °C/min. On-line gas chroma-
tographic analyses were performed on a PLOT Q
column using flame ionisation and thermal con-
ductivity detectors. An absolute calibration method
and a carbon based material balance were used to
calculate conversions and yields of the obtained
products. Products selectivity was calculated as
Yi/X*100, where Yi is the current yield of product i
and X is methanol conversion.
RESULTS AND DISCUSSION
TG-DTG-DTA analysis of dried precursor powder
is shown in Fig. 1. A significant endo-thermal effect
up to 400 °C combined with sample mass loss could
be associated with dehydration. Two exothermal
peaks at 576 and 820 °C are due to crystallisation of
hematite and hexaferrite phase, respectively [19,20].
Fig. 1. TG-DTG-DTA investigation of SrFe12O19 dried
precursor sample.
Powder X-ray diffraction patterns of heat-treated
and ball-milled SrFe12O19 samples are shown in Fig.
2. In accordance with DTA analysis, diffractions of
the precursor powder and of the sample obtained at
600 °C correspond to hematite - α-Fe2O3 (S.G.:
R3c). Well defined reflexes of highly crystalline
SrFe12O19 (Fig. 2b) were registered after 4-h treat-
ment at 850 °C (ICDD, PDF 80-1198). Calculated
average crystallite size, microstrain degree, and
lattice parameters are given in Table 1.
Table 1. Average crystallites size (D), degree of microstrain (e) and lattice parameters determined from XRD
patterns of SrFe12O19.
Sample Phases D,
nm
e 103
a.u
a, c,
Å
%
HF TS850 SrFe12O19 47.38 1.14 a = 5.87 c = 23.04 93
α-Fe2O3 66.58 1.26 a = 5.03 c = 13.73 7
HF TS850/MS1 SrFe12O19 24.98 5.67 a = 5.87 c = 23.04 88
α-Fe2O3 35.83 1.66 a = 5.02 c = 13.72 12
HF TS850/MS5 SrFe12O19 25.07 7.81 a = 5.87 c = 23.13 57
α-Fe2O3 25.03 5.63 a = 5.04 c = 13.75 43
K. V. Koleva et al.: Synthesis, structure and catalytic properties of SrFe12O19
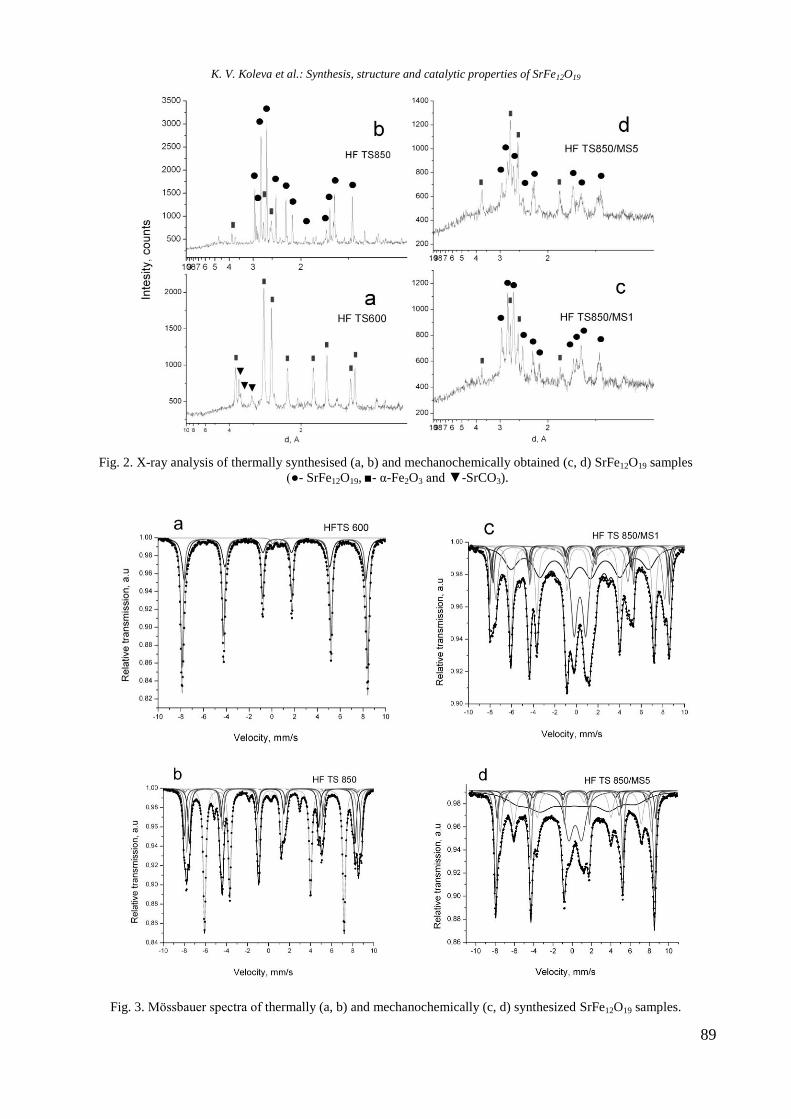
89
Fig. 2. X-ray analysis of thermally synthesised (a, b) and mechanochemically obtained (c, d) SrFe12O19 samples
(●- SrFe12O19, ■- α-Fe2O3 and ▼-SrCO3).
Fig. 3. Mössbauer spectra of thermally (a, b) and mechanochemically (c, d) synthesized SrFe12O19 samples.
K. V. Koleva et al.: Synthesis, structure and catalytic properties of SrFe12O19
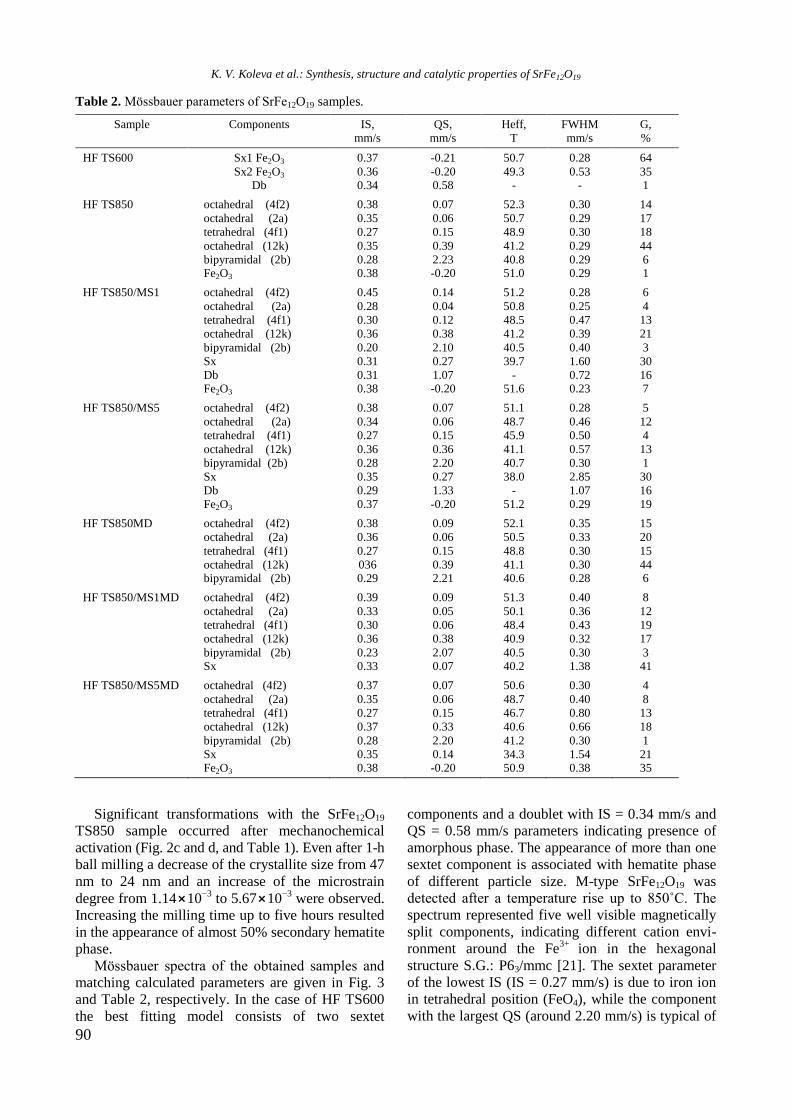
90
Table 2. Mössbauer parameters of SrFe12O19 samples.
Sample Components IS,
mm/s
QS,
mm/s
Heff,
T
FWHM
mm/s
G,
%
HF TS600 Sx1 Fe2O3
Sx2 Fe2O3 Db
0.37
0.36 0.34
-0.21
-0.20 0.58
50.7
49.3 -
0.28
0.53 -
64
35 1
HF TS850 octahedral (4f2)
octahedral (2a)
tetrahedral (4f1)
octahedral (12k)
bipyramidal (2b) Fe2O3
0.38
0.35
0.27
0.35
0.28 0.38
0.07
0.06
0.15
0.39
2.23 -0.20
52.3
50.7
48.9
41.2
40.8 51.0
0.30
0.29
0.30
0.29
0.29 0.29
14
17
18
44
6 1
HF TS850/MS1 octahedral (4f2)
octahedral (2a)
tetrahedral (4f1)
octahedral (12k)
bipyramidal (2b)
Sx
Db Fe2O3
0.45
0.28
0.30
0.36
0.20
0.31
0.31 0.38
0.14
0.04
0.12
0.38
2.10
0.27
1.07 -0.20
51.2
50.8
48.5
41.2
40.5
39.7
- 51.6
0.28
0.25
0.47
0.39
0.40
1.60
0.72 0.23
6
4
13
21
3
30
16 7
HF TS850/MS5 octahedral (4f2)
octahedral (2a)
tetrahedral (4f1)
octahedral (12k)
bipyramidal (2b)
Sx
Db
Fe2O3
0.38
0.34
0.27
0.36
0.28
0.35
0.29
0.37
0.07
0.06
0.15
0.36
2.20
0.27
1.33
-0.20
51.1
48.7
45.9
41.1
40.7
38.0
-
51.2
0.28
0.46
0.50
0.57
0.30
2.85
1.07
0.29
5
12
4
13
1
30
16
19
HF TS850MD octahedral (4f2)
octahedral (2a)
tetrahedral (4f1)
octahedral (12k) bipyramidal (2b)
0.38
0.36
0.27
036 0.29
0.09
0.06
0.15
0.39 2.21
52.1
50.5
48.8
41.1 40.6
0.35
0.33
0.30
0.30 0.28
15
20
15
44 6
HF TS850/MS1MD octahedral (4f2)
octahedral (2a)
tetrahedral (4f1)
octahedral (12k)
bipyramidal (2b) Sx
0.39
0.33
0.30
0.36
0.23 0.33
0.09
0.05
0.06
0.38
2.07 0.07
51.3
50.1
48.4
40.9
40.5 40.2
0.40
0.36
0.43
0.32
0.30 1.38
8
12
19
17
3 41
HF TS850/MS5MD octahedral (4f2)
octahedral (2a)
tetrahedral (4f1)
octahedral (12k)
bipyramidal (2b)
Sx Fe2O3
0.37
0.35
0.27
0.37
0.28
0.35 0.38
0.07
0.06
0.15
0.33
2.20
0.14 -0.20
50.6
48.7
46.7
40.6
41.2
34.3 50.9
0.30
0.40
0.80
0.66
0.30
1.54 0.38
4
8
13
18
1
21 35
Significant transformations with the SrFe12O19
TS850 sample occurred after mechanochemical
activation (Fig. 2c and d, and Table 1). Even after 1-h
ball milling a decrease of the crystallite size from 47
nm to 24 nm and an increase of the microstrain
degree from 1.14⨯10−3
to 5.67⨯10−3
were observed.
Increasing the milling time up to five hours resulted
in the appearance of almost 50% secondary hematite
phase.
Mössbauer spectra of the obtained samples and
matching calculated parameters are given in Fig. 3
and Table 2, respectively. In the case of HF TS600
the best fitting model consists of two sextet
components and a doublet with IS = 0.34 mm/s and
QS = 0.58 mm/s parameters indicating presence of
amorphous phase. The appearance of more than one
sextet component is associated with hematite phase
of different particle size. M-type SrFe12O19 was
detected after a temperature rise up to 850˚C. The
spectrum represented five well visible magnetically
split components, indicating different cation envi-
ronment around the Fe3+
ion in the hexagonal
structure S.G.: P63/mmc [21]. The sextet parameter
of the lowest IS (IS = 0.27 mm/s) is due to iron ion
in tetrahedral position (FeO4), while the component
with the largest QS (around 2.20 mm/s) is typical of
K. V. Koleva et al.: Synthesis, structure and catalytic properties of SrFe12O19
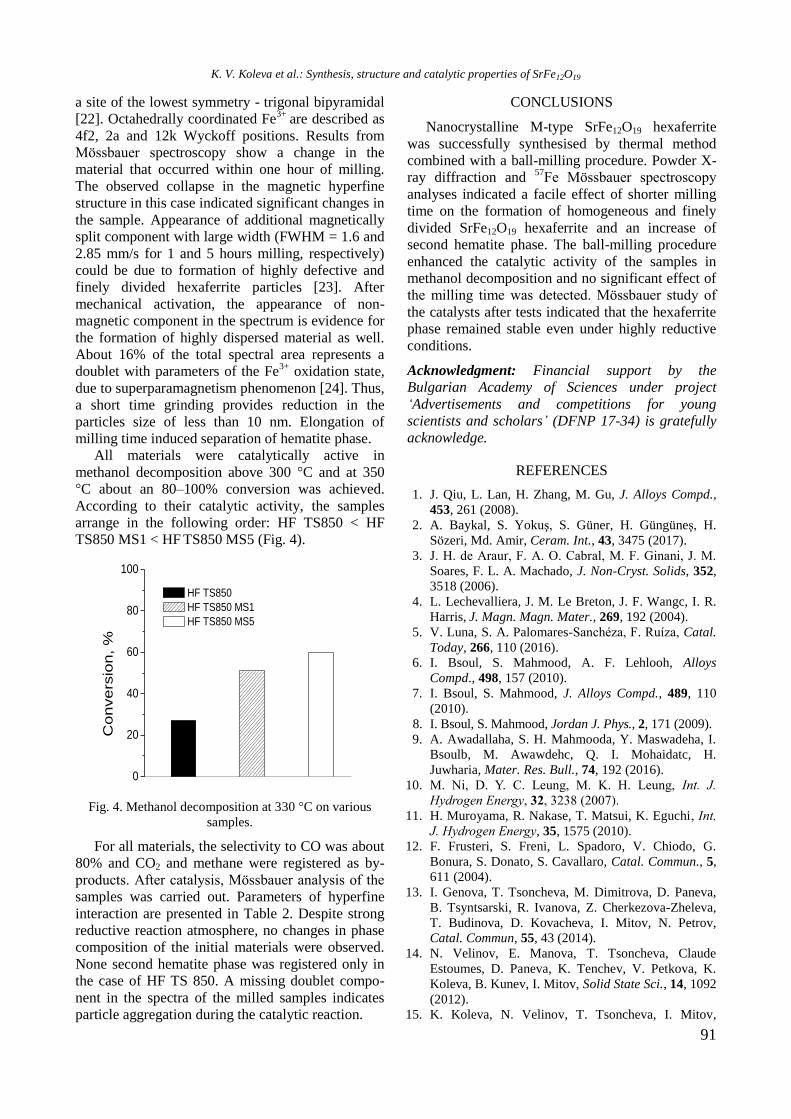
91
a site of the lowest symmetry - trigonal bipyramidal
[22]. Octahedrally coordinated Fe3+
are described as
4f2, 2a and 12k Wyckoff positions. Results from
Mössbauer spectroscopy show a change in the
material that occurred within one hour of milling.
The observed collapse in the magnetic hyperfine
structure in this case indicated significant changes in
the sample. Appearance of additional magnetically
split component with large width (FWHM = 1.6 and
2.85 mm/s for 1 and 5 hours milling, respectively)
could be due to formation of highly defective and
finely divided hexaferrite particles [23]. After
mechanical activation, the appearance of non-
magnetic component in the spectrum is evidence for
the formation of highly dispersed material as well.
About 16% of the total spectral area represents a
doublet with parameters of the Fe3+
oxidation state,
due to superparamagnetism phenomenon [24]. Thus,
a short time grinding provides reduction in the
particles size of less than 10 nm. Elongation of
milling time induced separation of hematite phase.
All materials were catalytically active in
methanol decomposition above 300 °C and at 350
°C about an 80‒100% conversion was achieved.
According to their catalytic activity, the samples
arrange in the following order: HF TS850 < HF
TS850 MS1 < HF TS850 MS5 (Fig. 4).
0
20
40
60
80
100
Co
nve
rsio
n, %
HF TS850
HF TS850 MS1
HF TS850 MS5
Fig. 4. Methanol decomposition at 330 °C on various
samples.
For all materials, the selectivity to CO was about
80% and CO2 and methane were registered as by-
products. After catalysis, Mössbauer analysis of the
samples was carried out. Parameters of hyperfine
interaction are presented in Table 2. Despite strong
reductive reaction atmosphere, no changes in phase
composition of the initial materials were observed.
None second hematite phase was registered only in
the case of HF TS 850. A missing doublet compo-
nent in the spectra of the milled samples indicates
particle aggregation during the catalytic reaction.
CONCLUSIONS
Nanocrystalline M-type SrFe12O19 hexaferrite
was successfully synthesised by thermal method
combined with a ball-milling procedure. Powder X-
ray diffraction and 57
Fe Mössbauer spectroscopy
analyses indicated a facile effect of shorter milling
time on the formation of homogeneous and finely
divided SrFe12O19 hexaferrite and an increase of
second hematite phase. The ball-milling procedure
enhanced the catalytic activity of the samples in
methanol decomposition and no significant effect of
the milling time was detected. Mössbauer study of
the catalysts after tests indicated that the hexaferrite
phase remained stable even under highly reductive
conditions.
Acknowledgment: Financial support by the
Bulgarian Academy of Sciences under project
‘Advertisements and competitions for young
scientists and scholars’ (DFNP 17-34) is gratefully
acknowledge.
REFERENCES
1. J. Qiu, L. Lan, H. Zhang, M. Gu, J. Alloys Compd.,
453, 261 (2008).
2. A. Baykal, S. Yokuş, S. Güner, H. Güngüneş, H.
Sözeri, Md. Amir, Ceram. Int., 43, 3475 (2017). 3. J. H. de Arauґ, F. A. O. Cabral, M. F. Ginani, J. M.
Soares, F. L. A. Machado, J. Non-Cryst. Solids, 352,
3518 (2006). 4. L. Lechevalliera, J. M. Le Breton, J. F. Wangc, I. R.
Harris, J. Magn. Magn. Mater., 269, 192 (2004).
5. V. Luna, S. A. Palomares-Sanchéza, F. Ruíza, Catal.
Today, 266, 110 (2016).
6. I. Bsoul, S. Mahmood, A. F. Lehlooh, Alloys
Compd., 498, 157 (2010).
7. I. Bsoul, S. Mahmood, J. Alloys Compd., 489, 110
(2010).
8. I. Bsoul, S. Mahmood, Jordan J. Phys., 2, 171 (2009).
9. A. Awadallaha, S. H. Mahmooda, Y. Maswadeha, I.
Bsoulb, M. Awawdehc, Q. I. Mohaidatc, H.
Juwharia, Mater. Res. Bull., 74, 192 (2016).
10. M. Ni, D. Y. C. Leung, M. K. H. Leung, Int. J.
Hydrogen Energy, 32, 3238 (2007).
11. H. Muroyama, R. Nakase, T. Matsui, K. Eguchi, Int.
J. Hydrogen Energy, 35, 1575 (2010).
12. F. Frusteri, S. Freni, L. Spadoro, V. Chiodo, G.
Bonura, S. Donato, S. Cavallaro, Catal. Commun., 5,
611 (2004).
13. I. Genova, T. Tsoncheva, M. Dimitrova, D. Paneva,
B. Tsyntsarski, R. Ivanova, Z. Cherkezova-Zheleva,
T. Budinova, D. Kovacheva, I. Mitov, N. Petrov,
Catal. Commun, 55, 43 (2014).
14. N. Velinov, E. Manova, T. Tsoncheva, Claude
Estoumes, D. Paneva, K. Tenchev, V. Petkova, K.
Koleva, B. Kunev, I. Mitov, Solid State Sci., 14, 1092
(2012).
15. K. Koleva, N. Velinov, T. Tsoncheva, I. Mitov,
K. V. Koleva et al.: Synthesis, structure and catalytic properties of SrFe12O19
92
Hyperfine Interact., 226, 89 (2014).
16. N. Velinov, K. Koleva, T. Tsoncheva, E. Manova, D.
Paneva, K. Tenchev, B. Kunev, I. Mitov, Catal.
Commun., 32, 41 (2012).
17. W. Kraus, G. Nolze, PowderCell for Windows,
Federal Institute for Materials Research and Testing,
Berlin, 2000.
18. T. Žák, Y. Jirásková, CONFIT: Mössbauer Spectra
fitting program, Surf. Interface Anal., 38, 710 (2006).
19. E. Darezereshki, Mater. Lett., 65, 642 (2011).
20. M. V. Bukhtiyarova, A. S. Ivanova, E. M.
Slavinskaya, L. M. Plyasova, V. A. Rogov, V. V.
Kaichev, A. S. Noskov, Fuel, 90, 1245 (2011).
21. I. A. Auwal, H. Güngüneş, A. Baykal, S. Güner, S. E.
Shirsath, M. Sertkol, Ceram. Int., 42, 8627 (2016).
22. S. K. Chawla, R. K. Mudsainiyan, S. S. Meena, S. M.
Yusuf, J. Magn. Magn. Mater., 350, 23 (2014).
23. V. Šepelák, M. Myndyk, R. Witte, J. Röder, D.
Menzel, R. H. Schuster, H. Hahn, P. Heitjans, K.-D.
Becker, Faraday Discuss., 170, 121 (2014).
24. M. Sorescu, A. Grabias, L. Diamandescu, D.
Tarabasanu, J. Mater. Synth. Process., 8, 2 (2000).
СИНТЕЗ, СТРУКТУРА И КАТАЛИТИЧНИ СВОЙСТВА НА SrFe12O19 ХЕКСАФЕРИТ
К. В. Колева1*, Н. И. Велинов
1, И. Г. Генова
2, Т. С. Цончева
2, В. С. Петкова
3,4
1 Институт по катализ, БАН, 1113 София, България
2 Институт по органична химия с център по фитохимия, БАН, 1113 София, България
3 Институт по минералогия и кристалография, БАН, 1113 София, България
4 Нов български университет, 1618 София, България
Постъпила на 16 януари 2018 г.; Преработена на 15 март 2018 г.
(Резюме)
Хексаферитната структура от М-тип (МеFe12O19) се състои от редуващи се шпинелни и хексагонални
блокове, което поражда голямо разнообразие от разпределение на йоните в кристалната решетка. Елемен-
тарната клетка на този вид съединения е изградена от двувалентни алкалоземни метали Ca, Sr, Ba, а също така и
метали от преходния ред (Co, Cu, Cr). Fe3+
йоните са разположени в пет кристалографски позиции: тетра-
едрична-FeO4 (4f1), октаедрична-FeO6 (12k, 2a, 4f2) и бипирамидална-FeO5 (2b).
Цел на настоящото изследване е синтез на хексаферитни материали от М-тип (SrFe12O19) при ниска темпе-
ратура и контрол на размера на частиците чрез механохимично третиране, както и определяне на влиянието на
структурните особености на образците върху техните каталитични свойства в реакция на разлагане на метанол.
Феритните материали са получени по метода на съутаяване с последваща термична обработка при 600 °C и
850 °C. На образец, получен при 850 °C, е приложено механично въздействие чрез смилане 1 и 5 часа.
Образците са охарактеризирани с помощта на ДТА, рентгенофазов анализ и Мьосбауерова спектроскопия.
Термично обработен при 850 °C образец е високо кристален SrFe12O19 хексаферит с наличие на втора фаза -
хематит. Установено е редуциране на частиците по размер от 47 нм до 21 нм след един час механохимична
обработка. Изследваните материали показват добра каталитична активност и селективност по CO в реакцията
на разлагане на метанол. Образци, изследвани с Мьосбауерова спектроскопия след катализ, се отличават със
стабилна хексаферитна фаза в силно редукционната среда на разлагане на метанол.
K. V. Koleva et al.: Synthesis, structure and catalytic properties of SrFe12O19
93
Bulgarian Chemical Communications, Volume 50, Special issue H (pp. 93–98) 2018
Mechanochemically assisted solid state synthesis and catalytic properties of CuWO4
M. N. Gancheva*, P. M. Konova, G. M. Ivanov, L. I. Aleksandrov, R. S. Iordanova, A. I. Naydenov
Institute of General and Inorganic Chemistry, Bulgarian Academy of Science,
Acad. G. Bonchev St., Bldg. 11, 1113 Sofia, Bulgaria
Received: January 16, 2018; Revised: April 26, 2018
The synthesis and catalytic properties of nanostructured copper tungstate have been investigated in this study. A
mixture of CuO and WO3 at a molar ratio of 1:1 was subjected to intensive mechanical treatment in air using a planetary
ball mill for different periods of time. Structural and phase transformations were monitored by X-ray diffraction
analysis, differential thermal analysis, and infrared spectroscopy. Mechanochemical treatment promoted progressive
amorphisation of the initial oxides. Full amorphisation was achieved after 7 h milling time and remained up to 20 h
milling time. DTA measurements of amorphous sample showed that the crystallization temperature was 430 °C. A pure
nanostructured CuWO4 phase was prepared after thermal treatment of amorphous phase at 400 °C. Nanostructured
CuWO4 was tested in the reactions of complete oxidation of C1-C4 hydrocarbons and the highest temperature for 10%
conversion (T10) was measured with methane. Repeated addition of one further carbon atom to the methane molecule
led to a decrease in T10 by about 70 °C (from methane to propane) and further by 30 °C from propane to n-butane.
Calculated apparent activation energies for the reaction of complete oxidation decreased from methane to n-butane, and
this effect correlated with diminished strength of the weakest C-H bond of the corresponding hydrocarbon.
Key words: mechanochemistry, nanoparticles, catalytic activity, preparation of single phase CuWO4.
INTRODUCTION
CuWO4 is a member of metal tungstate oxides
(AWO4) group, which have received much attention
due to their application in various fields as catalysts
[1‒3], optical devices [4], sensors [5], and magnetic
properties [6]. AWO4 (A = Ni, Fe, Zn, and Cu)
tungstate family oxides exhibit a wolframite-type of
monoclinic structure, where both A and W atoms
are bonded to six surrounding oxygen atoms by
forming octahedral chains [7]. Like-filled octahedra
share edges, but unlike octahedra share vertex. In
this way edge-sharing distorted WO6 octahedra form
W2O8 structural units. Among these tungstates only
CuWO4 crystallizes in a triclinic wolframite-type of
structure at room temperature composed by CuO6
and WO6 octahedra distorted by the first-order and
second-order Jahn-Teller effects, respectively [8‒
10]. Some authors have suggested that the CuO6
octahedra possess a pseudo-tetragonally elongated
geometry [10,11]. Ruiz-Fuertes еt al. [12] have es-
tablished that CuWO4 undergoes phase transition
from a low temperature triclinic phase to a mono-
clinic one with wolframite-type of structure at 10
GPa involving a change in the magnetic order.
Different methods for CuWO4 preparation as sol-gel
[5], coprecipitation [2,4,10], solid state reaction
[10,11], sonochemistry [3], microwave-assisted syn-
thesis [13], polyol-mediated approach [1], electro-
chemical synthesis [14], and hydrothermal route
[5,15,16] have been developed. There are some
disadvantages concerned with metal salts used as
raw materials (necessity of anion removal), strictly
controlled synthesis media, high costs, and thermal
treatment after synthesis. Up to now, mechano-
chemical synthesis of CuWO4 compound from
initial oxides has not been studied. It is well known
that the mechanochemical activation is a suitable
method for preparation of complex inorganic oxides
[16‒18]. It is characterized by lower synthesis tem-
perature, chemical homogeneity, high purity, and
sample crystallite size and morphology control.
Careful regulation of milling parameters is a pro-
mising way to improve the physicochemical pro-
perties of the final products as compared to conven-
tional routes. We have found out that ball milling is
an appropriate approach to synthesis different inor-
ganic materials like ZnO, NiWO4, ZnWO4, ZrMo2O8,
Bi2WO6, and MgWO4 [19‒24]. Our investigations
showed that metal tungstates (MgWO4 and Bi2WO6)
obtained by mechano-chemical activation exhibit a
moderate catalytic activity for oxidation of CO and
volatile organic compounds (VOCs) [23,24]. This
motivated us to continue experiments in the same
field. The aim of this study was to investigate the
catalytic activity of nanopowder CuWO4 prepared
via mechanochemically assisted solid-state syn-
thesis.
© 2018 Bulgarian Academy of Sciences, Union of Chemists in Bulgaria
* To whom all correspondence should be sent
E-mail: [email protected]
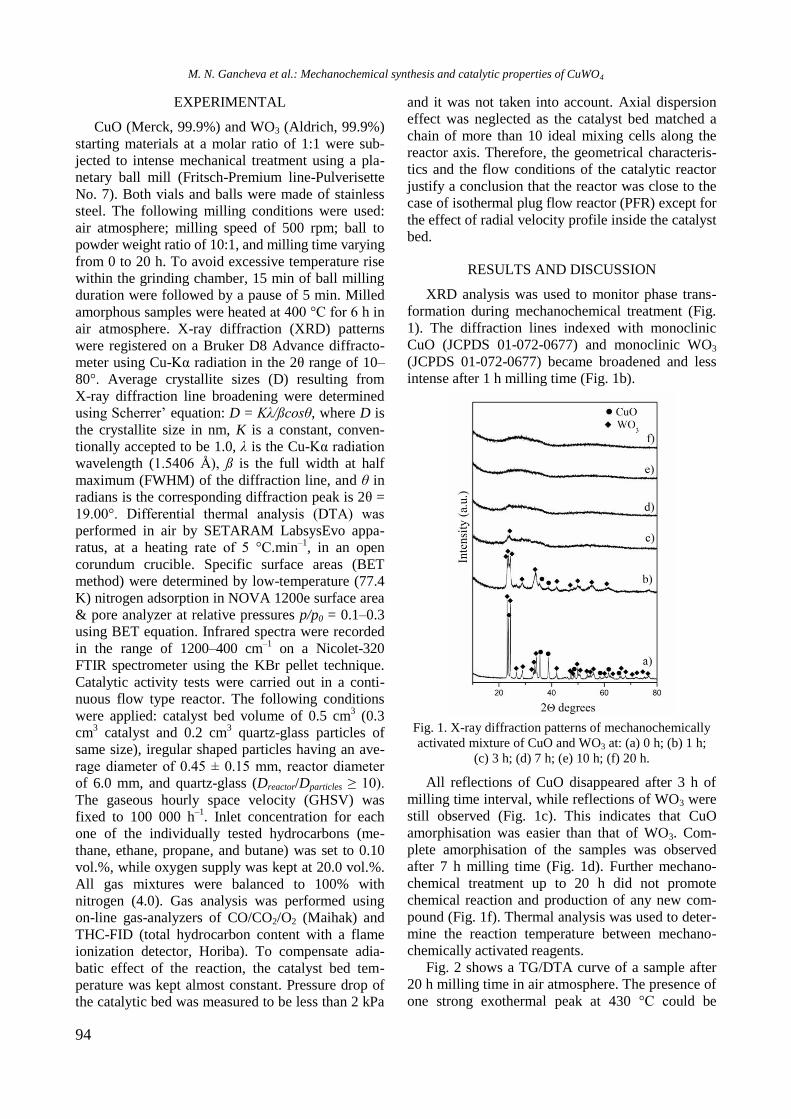
94
EXPERIMENTAL
CuO (Merck, 99.9%) and WO3 (Aldrich, 99.9%)
starting materials at a molar ratio of 1:1 were sub-
jected to intense mechanical treatment using a pla-
netary ball mill (Fritsch-Premium line-Pulverisette
No. 7). Both vials and balls were made of stainless
steel. The following milling conditions were used:
air atmosphere; milling speed of 500 rpm; ball to
powder weight ratio of 10:1, and milling time varying
from 0 to 20 h. To avoid excessive temperature rise
within the grinding chamber, 15 min of ball milling
duration were followed by a pause of 5 min. Milled
amorphous samples were heated at 400 °C for 6 h in
air atmosphere. X-ray diffraction (XRD) patterns
were registered on a Bruker D8 Advance diffracto-
meter using Cu-Kα radiation in the 2θ range of 10–
80°. Average crystallite sizes (D) resulting from
X-ray diffraction line broadening were determined
using Scherrer’ equation: D = Kλ/ßcosθ, where D is
the crystallite size in nm, K is a constant, conven-
tionally accepted to be 1.0, λ is the Cu-Kα radiation
wavelength (1.5406 Å), ß is the full width at half
maximum (FWHM) of the diffraction line, and θ in
radians is the corresponding diffraction peak is 2θ =
19.00°. Differential thermal analysis (DTA) was
performed in air by SETARAM LabsysEvo appa-
ratus, at a heating rate of 5 °C.min‒1
, in an open
corundum crucible. Specific surface areas (BET
method) were determined by low-temperature (77.4
K) nitrogen adsorption in NOVA 1200e surface area
& pore analyzer at relative pressures p/p0 = 0.1–0.3
using BET equation. Infrared spectra were recorded
in the range of 1200–400 cm‒1
on a Nicolet-320
FTIR spectrometer using the KBr pellet technique.
Catalytic activity tests were carried out in a conti-
nuous flow type reactor. The following conditions
were applied: catalyst bed volume of 0.5 cm3 (0.3
cm3 catalyst and 0.2 cm
3 quartz-glass particles of
same size), iregular shaped particles having an ave-
rage diameter of 0.45 ± 0.15 mm, reactor diameter
of 6.0 mm, and quartz-glass (Dreactor/Dparticles ≥ 10).
The gaseous hourly space velocity (GHSV) was
fixed to 100 000 h–1
. Inlet concentration for each
one of the individually tested hydrocarbons (me-
thane, ethane, propane, and butane) was set to 0.10
vol.%, while oxygen supply was kept at 20.0 vol.%.
All gas mixtures were balanced to 100% with
nitrogen (4.0). Gas analysis was performed using
on-line gas-analyzers of CO/CO2/O2 (Maihak) and
THC-FID (total hydrocarbon content with a flame
ionization detector, Horiba). To compensate adia-
batic effect of the reaction, the catalyst bed tem-
perature was kept almost constant. Pressure drop of
the catalytic bed was measured to be less than 2 kPa
and it was not taken into account. Axial dispersion
effect was neglected as the catalyst bed matched a
chain of more than 10 ideal mixing cells along the
reactor axis. Therefore, the geometrical characteris-
tics and the flow conditions of the catalytic reactor
justify a conclusion that the reactor was close to the
case of isothermal plug flow reactor (PFR) except for
the effect of radial velocity profile inside the catalyst
bed.
RESULTS AND DISCUSSION
XRD analysis was used to monitor phase trans-
formation during mechanochemical treatment (Fig.
1). The diffraction lines indexed with monoclinic
CuO (JCPDS 01-072-0677) and monoclinic WO3
(JCPDS 01-072-0677) became broadened and less
intense after 1 h milling time (Fig. 1b).
Fig. 1. X-ray diffraction patterns of mechanochemically
activated mixture of CuO and WO3 at: (a) 0 h; (b) 1 h;
(c) 3 h; (d) 7 h; (e) 10 h; (f) 20 h.
All reflections of CuO disappeared after 3 h of
milling time interval, while reflections of WO3 were
still observed (Fig. 1c). This indicates that CuO
amorphisation was easier than that of WO3. Com-
plete amorphisation of the samples was observed
after 7 h milling time (Fig. 1d). Further mechano-
chemical treatment up to 20 h did not promote
chemical reaction and production of any new com-
pound (Fig. 1f). Thermal analysis was used to deter-
mine the reaction temperature between mechano-
chemically activated reagents.
Fig. 2 shows a TG/DTA curve of a sample after
20 h milling time in air atmosphere. The presence of
one strong exothermal peak at 430 °C could be
M. N. Gancheva et al.: Mechanochemical synthesis and catalytic properties of CuWO4
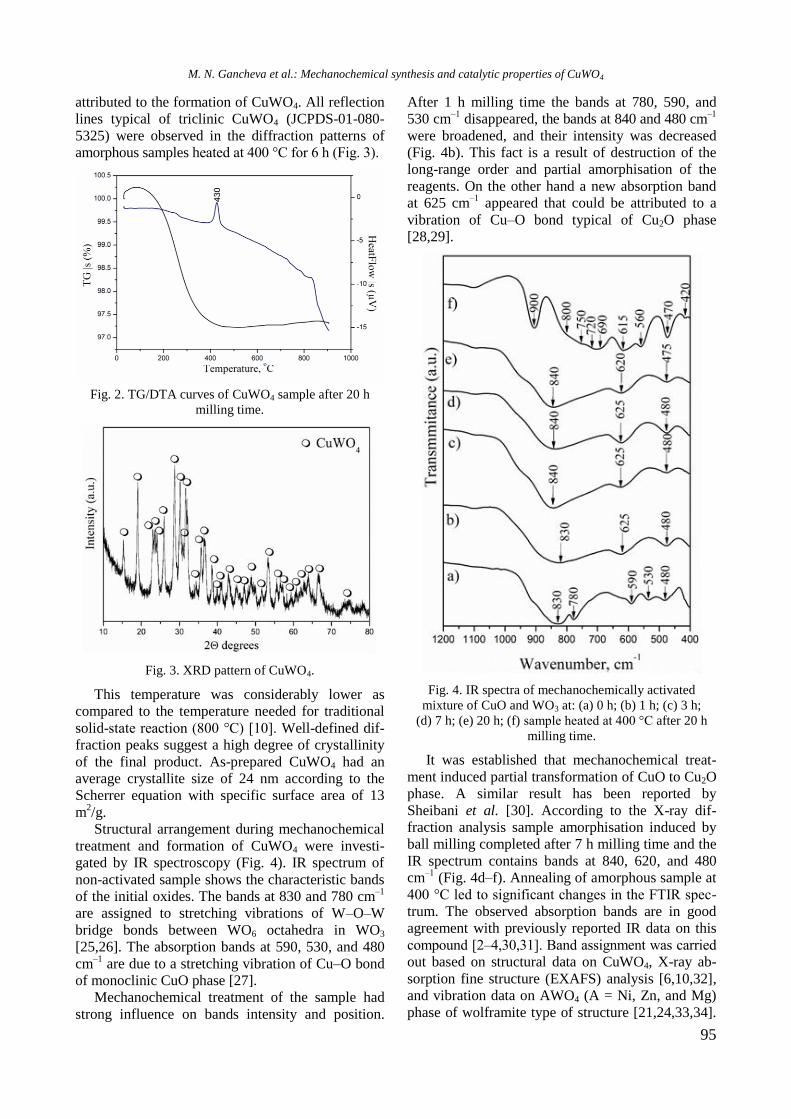
95
attributed to the formation of CuWO4. All reflection
lines typical of triclinic CuWO4 (JCPDS-01-080-
5325) were observed in the diffraction patterns of
amorphous samples heated at 400 °C for 6 h (Fig. 3).
Fig. 2. TG/DTA curves of CuWO4 sample after 20 h
milling time.
Fig. 3. XRD pattern of CuWO4.
This temperature was considerably lower as
compared to the temperature needed for traditional
solid-state reaction (800 °C) [10]. Well-defined dif-
fraction peaks suggest a high degree of crystallinity
of the final product. As-prepared CuWO4 had an
average crystallite size of 24 nm according to the
Scherrer equation with specific surface area of 13
m2/g.
Structural arrangement during mechanochemical
treatment and formation of CuWO4 were investi-
gated by IR spectroscopy (Fig. 4). IR spectrum of
non-activated sample shows the characteristic bands
of the initial oxides. The bands at 830 and 780 cm‒1
are assigned to stretching vibrations of W‒O‒W
bridge bonds between WO6 octahedra in WO3
[25,26]. The absorption bands at 590, 530, and 480
cm‒1
are due to a stretching vibration of Cu‒O bond
of monoclinic CuO phase [27].
Mechanochemical treatment of the sample had
strong influence on bands intensity and position.
After 1 h milling time the bands at 780, 590, and
530 cm‒1
disappeared, the bands at 840 and 480 cm‒1
were broadened, and their intensity was decreased
(Fig. 4b). This fact is a result of destruction of the
long-range order and partial amorphisation of the
reagents. On the other hand a new absorption band
at 625 cm‒1
appeared that could be attributed to a
vibration of Cu‒O bond typical of Cu2O phase
[28,29].
Fig. 4. IR spectra of mechanochemically activated
mixture of CuO and WO3 at: (a) 0 h; (b) 1 h; (c) 3 h;
(d) 7 h; (e) 20 h; (f) sample heated at 400 °C after 20 h
milling time.
It was established that mechanochemical treat-
ment induced partial transformation of CuO to Cu2O
phase. A similar result has been reported by
Sheibani et al. [30]. According to the X-ray dif-
fraction analysis sample amorphisation induced by
ball milling completed after 7 h milling time and the
IR spectrum contains bands at 840, 620, and 480
cm‒1
(Fig. 4d–f). Annealing of amorphous sample at
400 °C led to significant changes in the FTIR spec-
trum. The observed absorption bands are in good
agreement with previously reported IR data on this
compound [2‒4,30,31]. Band assignment was carried
out based on structural data on CuWO4, X-ray ab-
sorption fine structure (EXAFS) analysis [6,10,32],
and vibration data on AWO4 (A = Ni, Zn, and Mg)
phase of wolframite type of structure [21,24,33,34].
M. N. Gancheva et al.: Mechanochemical synthesis and catalytic properties of CuWO4
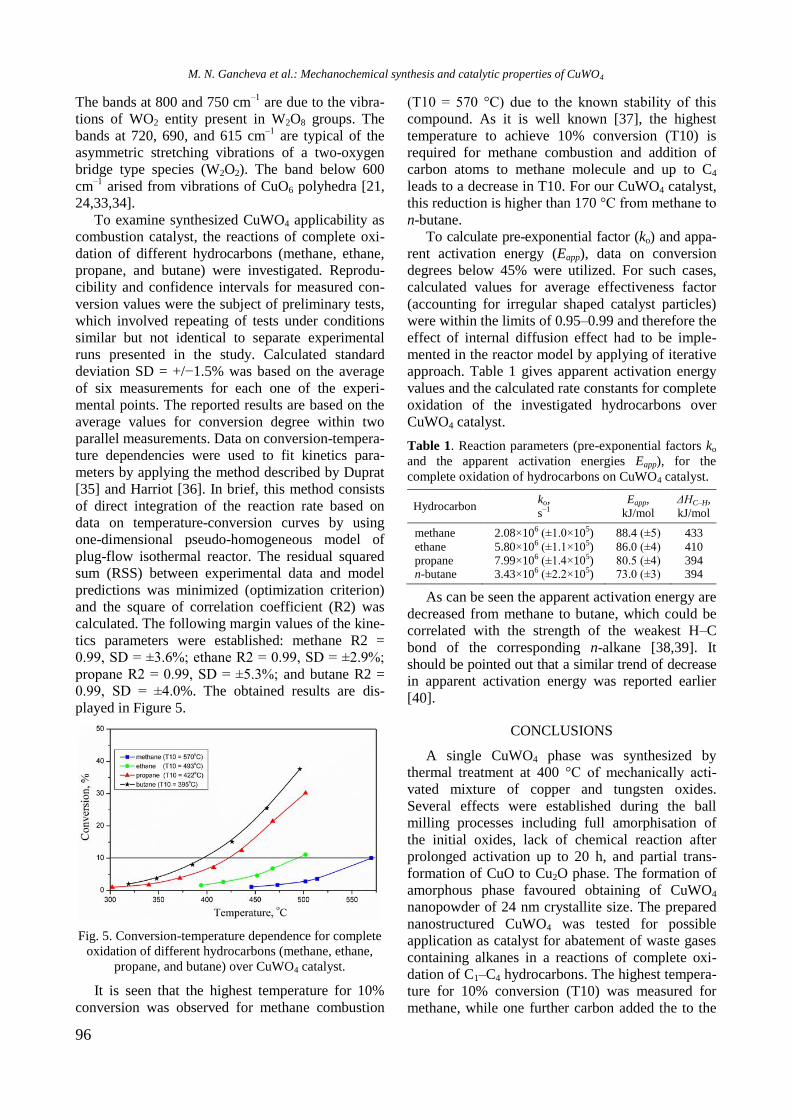
96
The bands at 800 and 750 cm‒1
are due to the vibra-
tions of WO2 entity present in W2O8 groups. The
bands at 720, 690, and 615 cm‒1
are typical of the
asymmetric stretching vibrations of a two-oxygen
bridge type species (W2O2). The band below 600
cm‒1
arised from vibrations of CuO6 polyhedra [21,
24,33,34].
To examine synthesized CuWO4 applicability as
combustion catalyst, the reactions of complete oxi-
dation of different hydrocarbons (methane, ethane,
propane, and butane) were investigated. Reprodu-
cibility and confidence intervals for measured con-
version values were the subject of preliminary tests,
which involved repeating of tests under conditions
similar but not identical to separate experimental
runs presented in the study. Calculated standard
deviation SD = +/−1.5% was based on the average
of six measurements for each one of the experi-
mental points. The reported results are based on the
average values for conversion degree within two
parallel measurements. Data on conversion-tempera-
ture dependencies were used to fit kinetics para-
meters by applying the method described by Duprat
[35] and Harriot [36]. In brief, this method consists
of direct integration of the reaction rate based on
data on temperature-conversion curves by using
one-dimensional pseudo-homogeneous model of
plug-flow isothermal reactor. The residual squared
sum (RSS) between experimental data and model
predictions was minimized (optimization criterion)
and the square of correlation coefficient (R2) was
calculated. The following margin values of the kine-
tics parameters were established: methane R2 =
0.99, SD = ±3.6%; ethane R2 = 0.99, SD = ±2.9%;
propane R2 = 0.99, SD = ±5.3%; and butane R2 =
0.99, SD = ±4.0%. The obtained results are dis-
played in Figure 5.
Fig. 5. Conversion-temperature dependence for complete
oxidation of different hydrocarbons (methane, ethane,
propane, and butane) over CuWO4 catalyst.
It is seen that the highest temperature for 10%
conversion was observed for methane combustion
(T10 = 570 °C) due to the known stability of this
compound. As it is well known [37], the highest
temperature to achieve 10% conversion (T10) is
required for methane combustion and addition of
carbon atoms to methane molecule and up to C4
leads to a decrease in T10. For our CuWO4 catalyst,
this reduction is higher than 170 °C from methane to
n-butane.
To calculate pre-exponential factor (ko) and appa-
rent activation energy (Eapp), data on conversion
degrees below 45% were utilized. For such cases,
calculated values for average effectiveness factor
(accounting for irregular shaped catalyst particles)
were within the limits of 0.95–0.99 and therefore the
effect of internal diffusion effect had to be imple-
mented in the reactor model by applying of iterative
approach. Table 1 gives apparent activation energy
values and the calculated rate constants for complete
oxidation of the investigated hydrocarbons over
CuWO4 catalyst.
Table 1. Reaction parameters (pre-exponential factors ko
and the apparent activation energies Eapp), for the
complete oxidation of hydrocarbons on CuWO4 catalyst.
Hydrocarbon ko,
s‒1
Eapp,
kJ/mol
ΔHC‒H, kJ/mol
methane 2.08×10⁶ (±1.0×10⁵) 88.4 (±5) 433
ethane 5.80×10⁶ (±1.1×10⁵) 86.0 (±4) 410
propane 7.99×10⁶ (±1.4×10⁵) 80.5 (±4) 394 n-butane 3.43×10⁶ (±2.2×10⁵) 73.0 (±3) 394
As can be seen the apparent activation energy are
decreased from methane to butane, which could be
correlated with the strength of the weakest H‒C
bond of the corresponding n-alkane [38,39]. It
should be pointed out that a similar trend of decrease
in apparent activation energy was reported earlier
[40].
CONCLUSIONS
A single CuWO4 phase was synthesized by
thermal treatment at 400 °C of mechanically acti-
vated mixture of copper and tungsten oxides.
Several effects were established during the ball
milling processes including full amorphisation of
the initial oxides, lack of chemical reaction after
prolonged activation up to 20 h, and partial trans-
formation of CuO to Cu2O phase. The formation of
amorphous phase favoured obtaining of CuWO4
nanopowder of 24 nm crystallite size. The prepared
nanostructured CuWO4 was tested for possible
application as catalyst for abatement of waste gases
containing alkanes in a reactions of complete oxi-
dation of C1‒C4 hydrocarbons. The highest tempera-
ture for 10% conversion (T10) was measured for
methane, while one further carbon added the to the
M. N. Gancheva et al.: Mechanochemical synthesis and catalytic properties of CuWO4
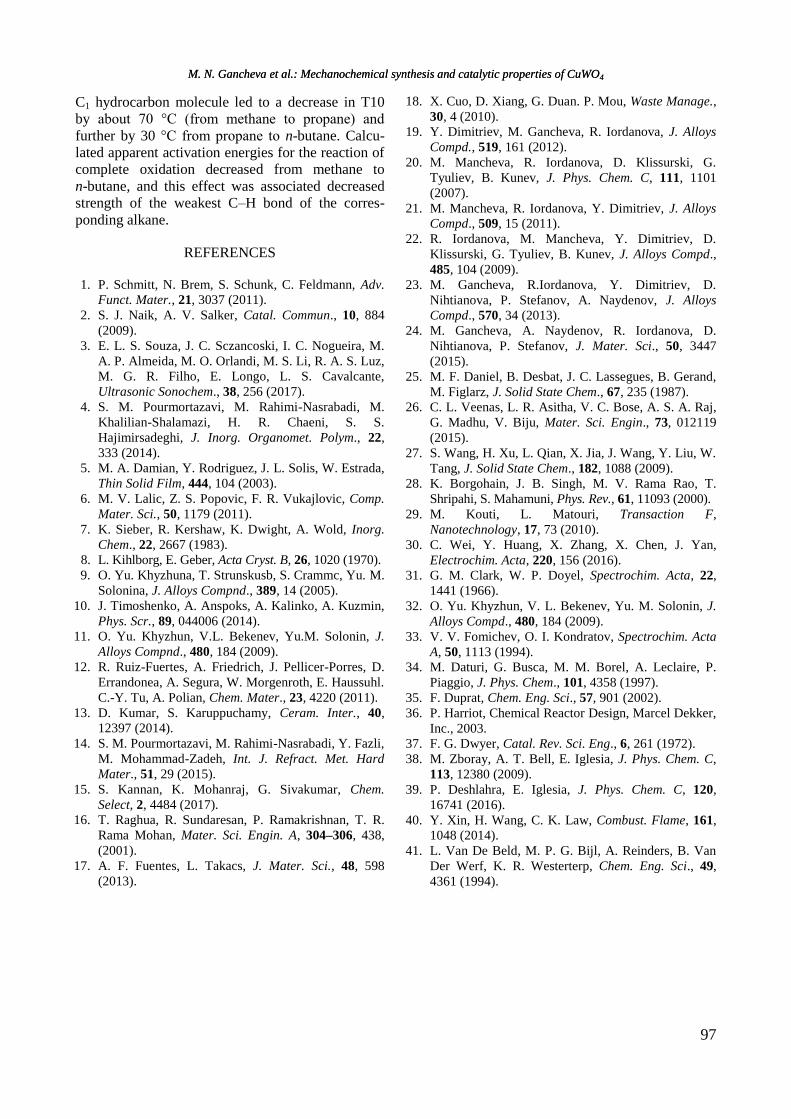
97
C1 hydrocarbon molecule led to a decrease in T10
by about 70 °C (from methane to propane) and
further by 30 °C from propane to n-butane. Calcu-
lated apparent activation energies for the reaction of
complete oxidation decreased from methane to
n-butane, and this effect was associated decreased
strength of the weakest C‒H bond of the corres-
ponding alkane.
REFERENCES
1. P. Schmitt, N. Brem, S. Schunk, C. Feldmann, Adv.
Funct. Mater., 21, 3037 (2011).
2. S. J. Naik, A. V. Salker, Catal. Commun., 10, 884
(2009).
3. E. L. S. Souza, J. C. Sczancoski, I. C. Nogueira, M.
A. P. Almeida, M. O. Orlandi, M. S. Li, R. A. S. Luz,
M. G. R. Filho, E. Longo, L. S. Cavalcante,
Ultrasonic Sonochem., 38, 256 (2017).
4. S. M. Pourmortazavi, M. Rahimi-Nasrabadi, M.
Khalilian-Shalamazi, H. R. Chaeni, S. S.
Hajimirsadeghi, J. Inorg. Organomet. Polym., 22,
333 (2014).
5. M. A. Damian, Y. Rodriguez, J. L. Solis, W. Estrada,
Thin Solid Film, 444, 104 (2003).
6. M. V. Lalic, Z. S. Popovic, F. R. Vukajlovic, Comp.
Mater. Sci., 50, 1179 (2011).
7. K. Sieber, R. Kershaw, K. Dwight, A. Wold, Inorg.
Chem., 22, 2667 (1983).
8. L. Kihlborg, E. Geber, Acta Cryst. B, 26, 1020 (1970).
9. O. Yu. Khyzhuna, T. Strunskusb, S. Crammc, Yu. M.
Solonina, J. Alloys Compnd., 389, 14 (2005).
10. J. Timoshenko, A. Anspoks, A. Kalinko, A. Kuzmin,
Phys. Scr., 89, 044006 (2014).
11. O. Yu. Khyzhun, V.L. Bekenev, Yu.M. Solonin, J.
Alloys Compnd., 480, 184 (2009).
12. R. Ruiz-Fuertes, A. Friedrich, J. Pellicer-Porres, D.
Errandonea, A. Segura, W. Morgenroth, E. Haussuhl.
C.-Y. Tu, A. Polian, Chem. Mater., 23, 4220 (2011).
13. D. Kumar, S. Karuppuchamy, Ceram. Inter., 40,
12397 (2014).
14. S. M. Pourmortazavi, M. Rahimi-Nasrabadi, Y. Fazli,
M. Mohammad-Zadeh, Int. J. Refract. Met. Hard
Mater., 51, 29 (2015).
15. S. Kannan, K. Mohanraj, G. Sivakumar, Chem.
Select, 2, 4484 (2017).
16. T. Raghua, R. Sundaresan, P. Ramakrishnan, T. R.
Rama Mohan, Mater. Sci. Engin. A, 304–306, 438,
(2001).
17. A. F. Fuentes, L. Takacs, J. Mater. Sci., 48, 598
(2013).
18. X. Cuo, D. Xiang, G. Duan. P. Mou, Waste Manage.,
30, 4 (2010).
19. Y. Dimitriev, M. Gancheva, R. Iordanova, J. Alloys
Compd., 519, 161 (2012).
20. М. Mancheva, R. Iordanova, D. Klissurski, G.
Tyuliev, B. Kunev, J. Phys. Chem. C, 111, 1101
(2007).
21. M. Mancheva, R. Iordanova, Y. Dimitriev, J. Alloys
Compd., 509, 15 (2011).
22. R. Iordanova, M. Mancheva, Y. Dimitriev, D.
Klissurski, G. Tyuliev, B. Kunev, J. Alloys Compd.,
485, 104 (2009).
23. M. Gancheva, R.Iordanova, Y. Dimitriev, D.
Nihtianova, P. Stefanov, A. Naydenov, J. Alloys
Compd., 570, 34 (2013).
24. M. Gancheva, A. Naydenov, R. Iordanova, D.
Nihtianova, P. Stefanov, J. Mater. Sci., 50, 3447
(2015).
25. M. F. Daniel, B. Desbat, J. C. Lassegues, B. Gerand,
M. Figlarz, J. Solid State Chem., 67, 235 (1987).
26. C. L. Veenas, L. R. Asitha, V. C. Bose, A. S. A. Raj,
G. Madhu, V. Biju, Mater. Sci. Engin., 73, 012119
(2015).
27. S. Wang, H. Xu, L. Qian, X. Jia, J. Wang, Y. Liu, W.
Tang, J. Solid State Chem., 182, 1088 (2009).
28. K. Borgohain, J. B. Singh, M. V. Rama Rao, T.
Shripahi, S. Mahamuni, Phys. Rev., 61, 11093 (2000).
29. M. Kouti, L. Matouri, Transaction F,
Nanotechnology, 17, 73 (2010).
30. C. Wei, Y. Huang, X. Zhang, X. Chen, J. Yan,
Electrochim. Acta, 220, 156 (2016).
31. G. M. Clark, W. P. Doyel, Spectrochim. Acta, 22,
1441 (1966).
32. O. Yu. Khyzhun, V. L. Bekenev, Yu. M. Solonin, J.
Alloys Compd., 480, 184 (2009).
33. V. V. Fomichev, O. I. Kondratov, Spectrochim. Acta
A, 50, 1113 (1994).
34. M. Daturi, G. Busca, M. M. Borel, A. Leclaire, P.
Piaggio, J. Phys. Chem., 101, 4358 (1997).
35. F. Duprat, Chem. Eng. Sci., 57, 901 (2002).
36. P. Harriot, Chemical Reactor Design, Marcel Dekker,
Inc., 2003.
37. F. G. Dwyer, Catal. Rev. Sci. Eng., 6, 261 (1972).
38. M. Zboray, A. T. Bell, E. Iglesia, J. Phys. Chem. C,
113, 12380 (2009).
39. P. Deshlahra, E. Iglesia, J. Phys. Chem. C, 120,
16741 (2016).
40. Y. Xin, H. Wang, C. K. Law, Combust. Flame, 161,
1048 (2014).
41. L. Van De Beld, M. P. G. Bijl, A. Reinders, B. Van
Der Werf, K. R. Westerterp, Chem. Eng. Sci., 49,
4361 (1994).
M. N. Gancheva et al.: Mechanochemical synthesis and catalytic properties of CuWO4 M. N. Gancheva et al.: Mechanochemical synthesis and catalytic properties of CuWO4
98
МЕХАНОХИМИЧЕН АКТИВИРАН ТВЪРДОФАЗЕН СИНТЕЗ И КАТАЛИТИЧНИ
СВОЙСТВА НА CuWO4
М. Н. Ганчева*, П. М. Конова, Г. М. Иванов, Л. И. Александров, Р. С. Йорданова,
А. И. Найденов
Институт по обща и неорганична химия, Българска академия на науките,
ул. „Акад. Георги Бончев“, бл. 11, 1113 София, България
Постъпила на: 16 януари 2018 г.; Преработена на: 26 април 2018 г.
(Резюме)
Изучено е получаването и каталитичните свойства на наноструктуриран меден волфрамат. Смес от CuO и
WO3 в молно отношение 1:1 бе подложена на механохимично активиране на въздух използвайки планетарна
топкова мелница за различен период от време. Структурните и фазовите трансформации бяха проследени чрез
рентгенофазов анализ, диференциален термичен анализ (ДТА) и инфрачервена спектроскопия. Механо-
химичното третиране доведе до прогресивно аморфизиране на изходните оксиди. Пълна аморфизация бе
осъществена след 7 часа механохимична обработка и се запази до 20 часа време на активиране. ДТА на
аморфния образец показа, че температурата на кристализация е 430 °С. Монофазен наноструктуриран CuWO4
бе синтезиран след термична обработка на аморфната фаза при 400 °С. CuWO4 бе тестван в реакция на пълно
каталитично окисление на C1-C4 въглеводороди, като най-високата температура за постигане на степен на
превръщане 10% (Т10) бе установена при метана, а добавянето на всеки следващ въглероден атом към
метановата молекула води до понижаване на Т10 с около 70 °С (от метан до пропан) и с около 30 °С от пропан
до n-бутан. Изчислените стойности на наблюдаемата активираща енергия за реакцията на пълно каталитично
окисление показа понижение в реда от метан до n-бутан, като ефектът е в корелационна зависимост от
енергията за разкъсване на най-слабата C‒H връзка в съответния въглеводород.
M. N. Gancheva et al.: Mechanochemical synthesis and catalytic properties of CuWO4
99
Bulgarian Chemical Communications, Volume 50, Special issue H (pp. 99–104) 2018
Mesoporous nanostructured TixSn1-xO4 mixed oxides as catalysts for methanol
decomposition: effect of Ti/Sn ratio
I. Genova1*, T. Tsoncheva
1, M. Dimitrov
1, D. Kovacheva
2
1 Institute of Organic Chemistry with Centre of Phytochemistry, Bulgarian Academy of Sciences, 1113 Sofia, Bulgaria
2 Institute of General and Inorganic Chemistry, Bulgarian Academy of Sciences, 1113 Sofia, Bulgaria
Received: January 16, 2018; Revised: March 07, 2018
The aim of the current investigation is to elucidate the impact of the Ti/Sn ratio in TixSn1-xO4 mixed oxides on their
textural, structural, redox, and catalytic features. Mesoporous mixed oxides of different Ti/Sn ratio were synthesised by
template-assisted hydrothermal technique. The obtained materials were characterised by a complex of physicochemical
techniques, such as nitrogen physisorption, XRD, Raman, UV–Vis, FTIR, and TPR with hydrogen. Methanol
decomposition to syngas was used as a test reaction. The catalytic activity of the binary materials was affected in a
complicated way by their phase composition. The latter was improved due to an increase in material specific surface
area and pore volume and strongly suppressed because of significant structural changes.
Key words: tin-titania binary oxides, template-assisted hydrothermal synthesis, methanol decomposition.
INTRODUCTION
In last decades, hydrogen was considered most
effective fuel, but the problem with its safety
storage and transport is still a matter of challenge.
One reliable solution is to apply various chemical
compounds, which in case of need easily release
hydrogen. Among them, methanol gains much
interest because it possesses high H/C ratio, releases
hydrogen at relatively low temperatures, and can be
synthesised from valuable and renewable sources by
well-developed technologies. An important step in
the control of this catalytic process is to develop
highly efficient catalysts with regulated properties.
Titania has received much attention due to its
superior optical, electrical, mechanical, and catalytic
properties combined with non-toxicity and cost
effectiveness [1]. Dopant introduction into titania
lattice is well known procedure to improve its
dispersion and redox and catalytic properties due to
a specific interaction and/or synergism between
components [2]. It has been shown that incorpora-
tion of Sn4+
ions into the titania lattice increases its
dispersion, provides significant structural and
texture changes [3−5], and improves the photo-
catalytic activity [6].
Much effort has been focused on the preparation
of Sn-Ti metal oxides with porous structure, high
specific surface area, and good crystallinity by vari-
ous synthetic routes, such as sol-gel, solvothermal,
direct oxidation, electrodeposition, chemical/phy-
sical vapour deposition, emulsion or hydrolysis
precipitation, etc. [7−10]. Among these procedures,
the hydrothermal technique is considered suitable to
prepare mesoporous mixed oxide materials of high
surface area and pore volume [11]. However, to our
knowledge no data on the preparation of binary
titania-tin oxide materials by template-assisted
hydrothermal technique have been reported. The
aim of the present investigation was to prepare a
series of titania-tin oxide materials of different
Ti/Sn ratio. The effect of phase composition on their
textural, structural, and redox properties was studied
using a complex of various physicochemical tech-
niques, such as nitrogen physicsorption, XRD,
Raman, UV–Vis, FTIR, and TPR. The potential of
application of these materials as catalysts was tested
in methanol decomposition to syngas.
EXPERIMENTAL
Materials
TiO2 and SnO2 materials were synthesised by
template-assisted technique using hexadecyl-N,N,N-
trimethyl ammonium bromide (CTAB) as a temp-
late, hydrothermal treatment at 373 K, and calci-
nation at 773 K [12]. The same synthesis was ap-
plied to prepare bi-component metal oxides. The
samples were denoted as xTiySn, where x/y is the
metal mol ratio, which was 2:8, 5:5, or 8:2.
Methods of characterisation
Specific surface area (ABET) and total pore
volume (Vtot) were measured by nitrogen adsorp-
tion-desorption isotherms at 77 K on a Beckman
© 2018 Bulgarian Academy of Sciences, Union of Chemists in Bulgaria
* To whom all correspondence should be sent
E-mail: [email protected]
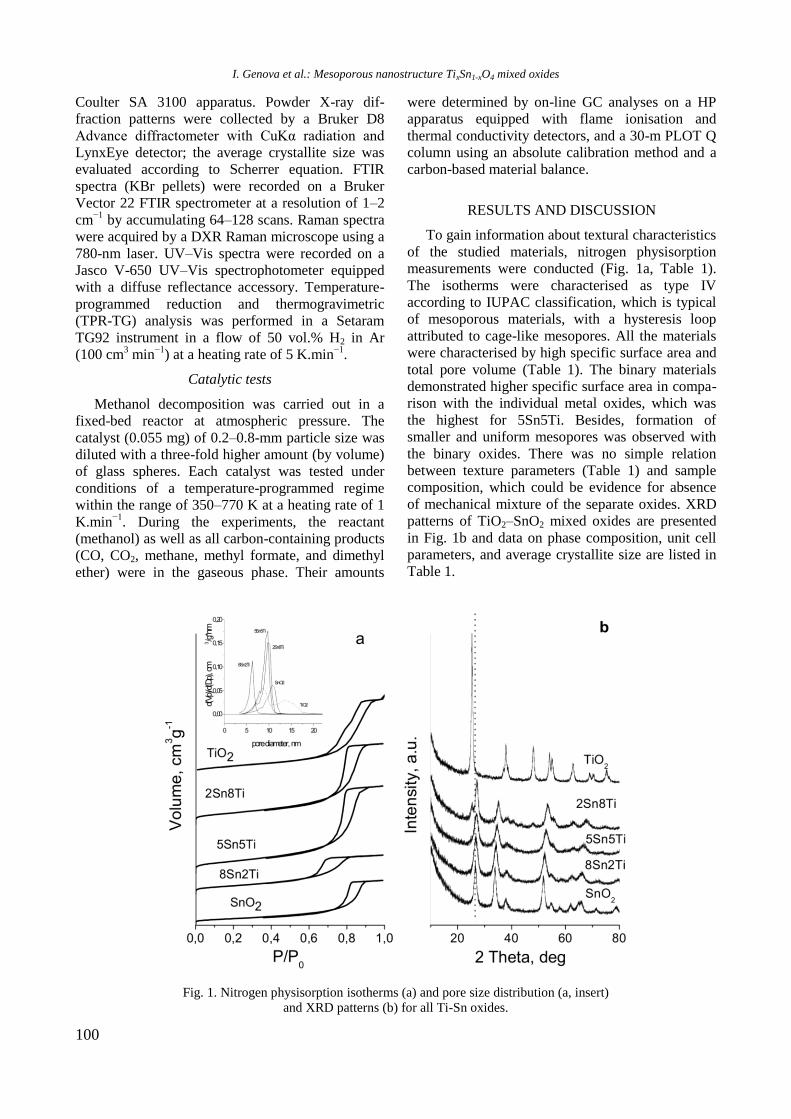
100
Coulter SA 3100 apparatus. Powder X-ray dif-
fraction patterns were collected by a Bruker D8
Advance diffractometer with CuKα radiation and
LynxEye detector; the average crystallite size was
evaluated according to Scherrer equation. FTIR
spectra (KBr pellets) were recorded on a Bruker
Vector 22 FTIR spectrometer at a resolution of 1–2
cm−1
by accumulating 64–128 scans. Raman spectra
were acquired by a DXR Raman microscope using a
780-nm laser. UV–Vis spectra were recorded on a
Jasco V-650 UV–Vis spectrophotometer equipped
with a diffuse reflectance accessory. Temperature-
programmed reduction and thermogravimetric
(TPR-TG) analysis was performed in a Setaram
TG92 instrument in a flow of 50 vol.% H2 in Ar
(100 cm3 min
−1) at a heating rate of 5 K.min
−1.
Catalytic tests
Methanol decomposition was carried out in a
fixed-bed reactor at atmospheric pressure. The
catalyst (0.055 mg) of 0.2–0.8-mm particle size was
diluted with a three-fold higher amount (by volume)
of glass spheres. Each catalyst was tested under
conditions of a temperature-programmed regime
within the range of 350–770 K at a heating rate of 1
K.min−1
. During the experiments, the reactant
(methanol) as well as all carbon-containing products
(CO, CO2, methane, methyl formate, and dimethyl
ether) were in the gaseous phase. Their amounts
were determined by on-line GC analyses on a HP
apparatus equipped with flame ionisation and
thermal conductivity detectors, and a 30-m PLOT Q
column using an absolute calibration method and a
carbon-based material balance.
RESULTS AND DISCUSSION
To gain information about textural characteristics
of the studied materials, nitrogen physisorption
measurements were conducted (Fig. 1a, Table 1).
The isotherms were characterised as type IV
according to IUPAC classification, which is typical
of mesoporous materials, with a hysteresis loop
attributed to cage-like mesopores. All the materials
were characterised by high specific surface area and
total pore volume (Table 1). The binary materials
demonstrated higher specific surface area in compa-
rison with the individual metal oxides, which was
the highest for 5Sn5Ti. Besides, formation of
smaller and uniform mesopores was observed with
the binary oxides. There was no simple relation
between texture parameters (Table 1) and sample
composition, which could be evidence for absence
of mechanical mixture of the separate oxides. XRD
patterns of TiO2–SnO2 mixed oxides are presented
in Fig. 1b and data on phase composition, unit cell
parameters, and average crystallite size are listed in
Table 1.
Fig. 1. Nitrogen physisorption isotherms (a) and pore size distribution (a, insert)
and XRD patterns (b) for all Ti-Sn oxides.
I. Genova et al.: Mesoporous nanostructure TixSn1-xO4 mixed oxides
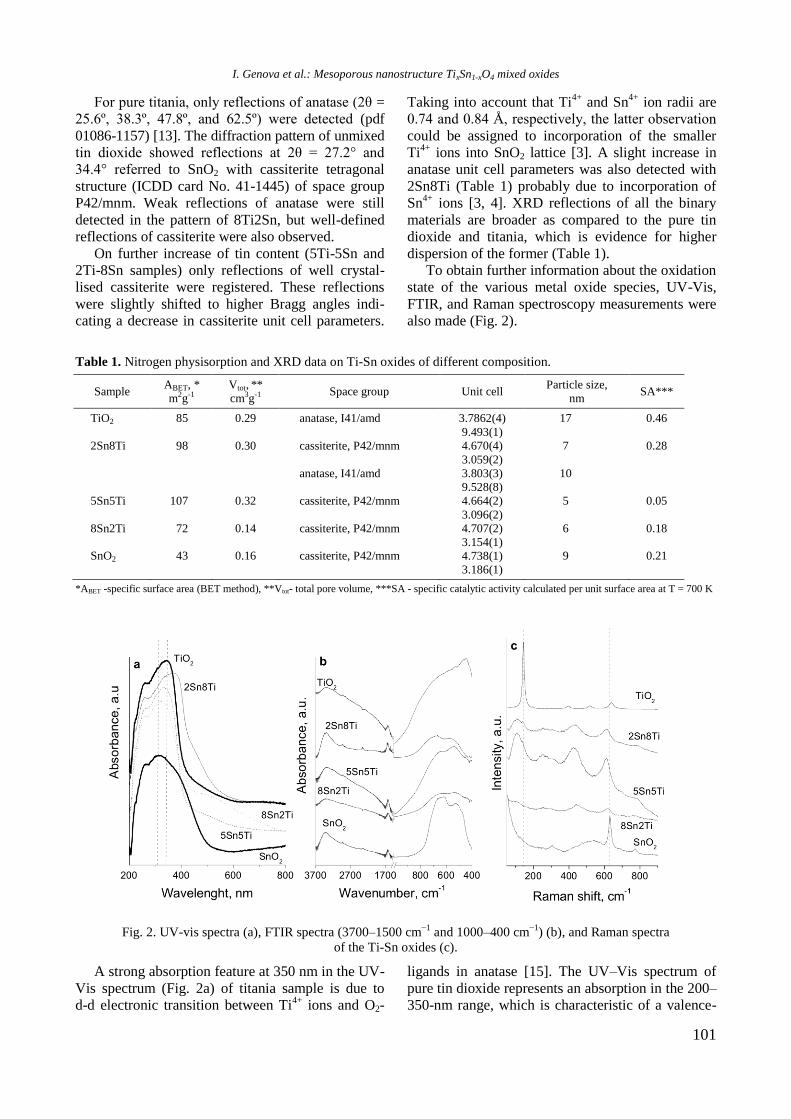
101
For pure titania, only reflections of anatase (2θ =
25.6º, 38.3º, 47.8º, and 62.5º) were detected (pdf
01086-1157) [13]. The diffraction pattern of unmixed
tin dioxide showed reflections at 2θ = 27.2° and
34.4° referred to SnO2 with cassiterite tetragonal
structure (ICDD card No. 41-1445) of space group
P42/mnm. Weak reflections of anatase were still
detected in the pattern of 8Ti2Sn, but well-defined
reflections of cassiterite were also observed.
On further increase of tin content (5Ti-5Sn and
2Ti-8Sn samples) only reflections of well crystal-
lised cassiterite were registered. These reflections
were slightly shifted to higher Bragg angles indi-
cating a decrease in cassiterite unit cell parameters.
Taking into account that Ti4+
and Sn4+
ion radii are
0.74 and 0.84 Å, respectively, the latter observation
could be assigned to incorporation of the smaller
Ti4+
ions into SnO2 lattice [3]. A slight increase in
anatase unit cell parameters was also detected with
2Sn8Ti (Table 1) probably due to incorporation of
Sn4+
ions [3, 4]. XRD reflections of all the binary
materials are broader as compared to the pure tin
dioxide and titania, which is evidence for higher
dispersion of the former (Table 1).
To obtain further information about the oxidation
state of the various metal oxide species, UV-Vis,
FTIR, and Raman spectroscopy measurements were
also made (Fig. 2).
Table 1. Nitrogen physisorption and XRD data on Ti-Sn oxides of different composition.
Sample ABET, *
m2g-1
Vtot, **
cm3g-1 Space group Unit cell
Particle size,
nm SA***
TiO2 85 0.29 anatase, I41/amd 3.7862(4)
9.493(1)
17 0.46
2Sn8Ti 98 0.30 cassiterite, P42/mnm
anatase, I41/amd
4.670(4)
3.059(2)
3.803(3)
9.528(8)
7
10
0.28
5Sn5Ti 107 0.32 cassiterite, P42/mnm 4.664(2)
3.096(2)
5 0.05
8Sn2Ti 72 0.14 cassiterite, P42/mnm 4.707(2)
3.154(1)
6 0.18
SnO2 43 0.16 cassiterite, P42/mnm 4.738(1)
3.186(1)
9 0.21
*ABET -specific surface area (BET method), **Vtot- total pore volume, ***SA - specific catalytic activity calculated per unit surface area at T = 700 K
Fig. 2. UV-vis spectra (a), FTIR spectra (3700–1500 cm−1
and 1000–400 cm−1
) (b), and Raman spectra
of the Ti-Sn oxides (c).
A strong absorption feature at 350 nm in the UV-
Vis spectrum (Fig. 2a) of titania sample is due to
d-d electronic transition between Ti4+
ions and O2-
ligands in anatase [15]. The UV–Vis spectrum of
pure tin dioxide represents an absorption in the 200–
350-nm range, which is characteristic of a valence-
I. Genova et al.: Mesoporous nanostructure TixSn1-xO4 mixed oxides
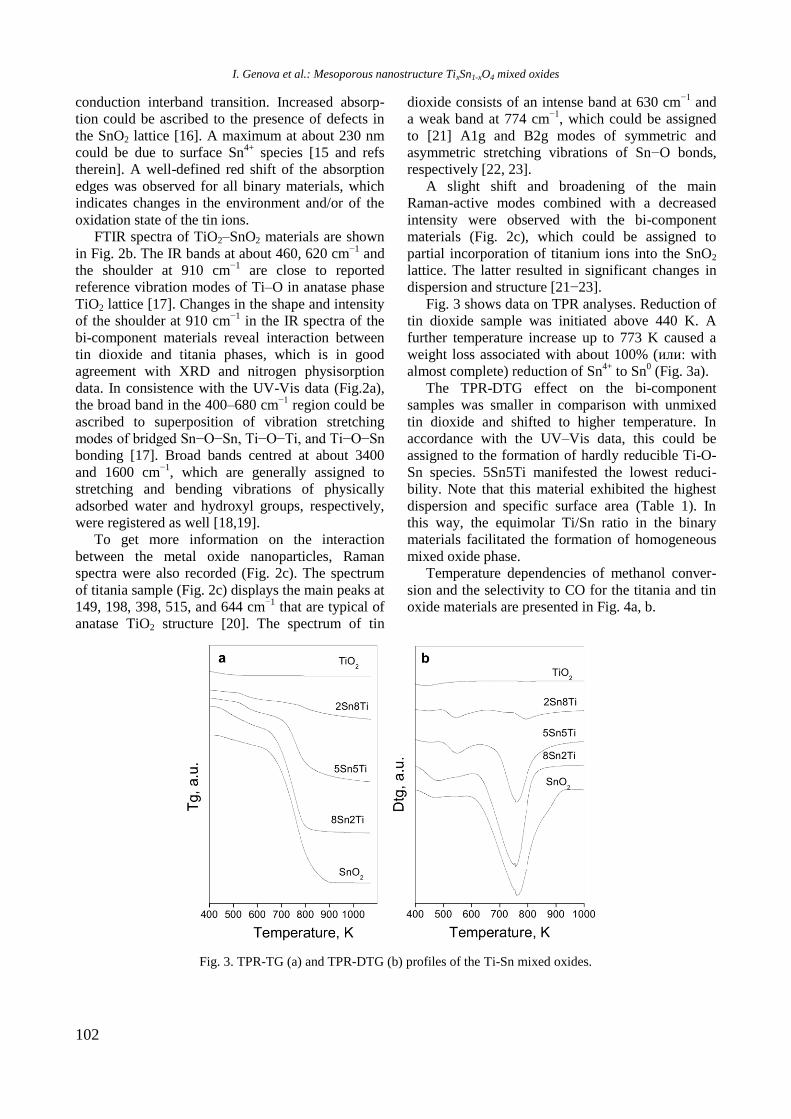
102
conduction interband transition. Increased absorp-
tion could be ascribed to the presence of defects in
the SnO2 lattice [16]. A maximum at about 230 nm
could be due to surface Sn4+
species [15 and refs
therein]. A well-defined red shift of the absorption
edges was observed for all binary materials, which
indicates changes in the environment and/or of the
oxidation state of the tin ions.
FTIR spectra of TiO2–SnO2 materials are shown
in Fig. 2b. The IR bands at about 460, 620 cm−1
and
the shoulder at 910 cm−1
are close to reported
reference vibration modes of Ti–O in anatase phase
TiO2 lattice [17]. Changes in the shape and intensity
of the shoulder at 910 cm−1
in the IR spectra of the
bi-component materials reveal interaction between
tin dioxide and titania phases, which is in good
agreement with XRD and nitrogen physisorption
data. In consistence with the UV-Vis data (Fig.2a),
the broad band in the 400–680 cm−1
region could be
ascribed to superposition of vibration stretching
modes of bridged Sn−O−Sn, Ti−O−Ti, and Ti−O−Sn
bonding [17]. Broad bands centred at about 3400
and 1600 cm−1
, which are generally assigned to
stretching and bending vibrations of physically
adsorbed water and hydroxyl groups, respectively,
were registered as well [18,19].
To get more information on the interaction
between the metal oxide nanoparticles, Raman
spectra were also recorded (Fig. 2c). The spectrum
of titania sample (Fig. 2c) displays the main peaks at
149, 198, 398, 515, and 644 cm−1
that are typical of
anatase TiO2 structure [20]. The spectrum of tin
dioxide consists of an intense band at 630 cm−1
and
a weak band at 774 cm−1
, which could be assigned
to [21] A1g and B2g modes of symmetric and
asymmetric stretching vibrations of Sn−O bonds,
respectively [22, 23].
A slight shift and broadening of the main
Raman-active modes combined with a decreased
intensity were observed with the bi-component
materials (Fig. 2c), which could be assigned to
partial incorporation of titanium ions into the SnO2
lattice. The latter resulted in significant changes in
dispersion and structure [21−23].
Fig. 3 shows data on TPR analyses. Reduction of
tin dioxide sample was initiated above 440 K. A
further temperature increase up to 773 K caused a
weight loss associated with about 100% (или: with
almost complete) reduction of Sn4+
to Sn0 (Fig. 3a).
The TPR-DTG effect on the bi-component
samples was smaller in comparison with unmixed
tin dioxide and shifted to higher temperature. In
accordance with the UV–Vis data, this could be
assigned to the formation of hardly reducible Ti-O-
Sn species. 5Sn5Ti manifested the lowest reduci-
bility. Note that this material exhibited the highest
dispersion and specific surface area (Table 1). In
this way, the equimolar Ti/Sn ratio in the binary
materials facilitated the formation of homogeneous
mixed oxide phase.
Temperature dependencies of methanol conver-
sion and the selectivity to CO for the titania and tin
oxide materials are presented in Fig. 4a, b.
Fig. 3. TPR-TG (a) and TPR-DTG (b) profiles of the Ti-Sn mixed oxides.
I. Genova et al.: Mesoporous nanostructure TixSn1-xO4 mixed oxides
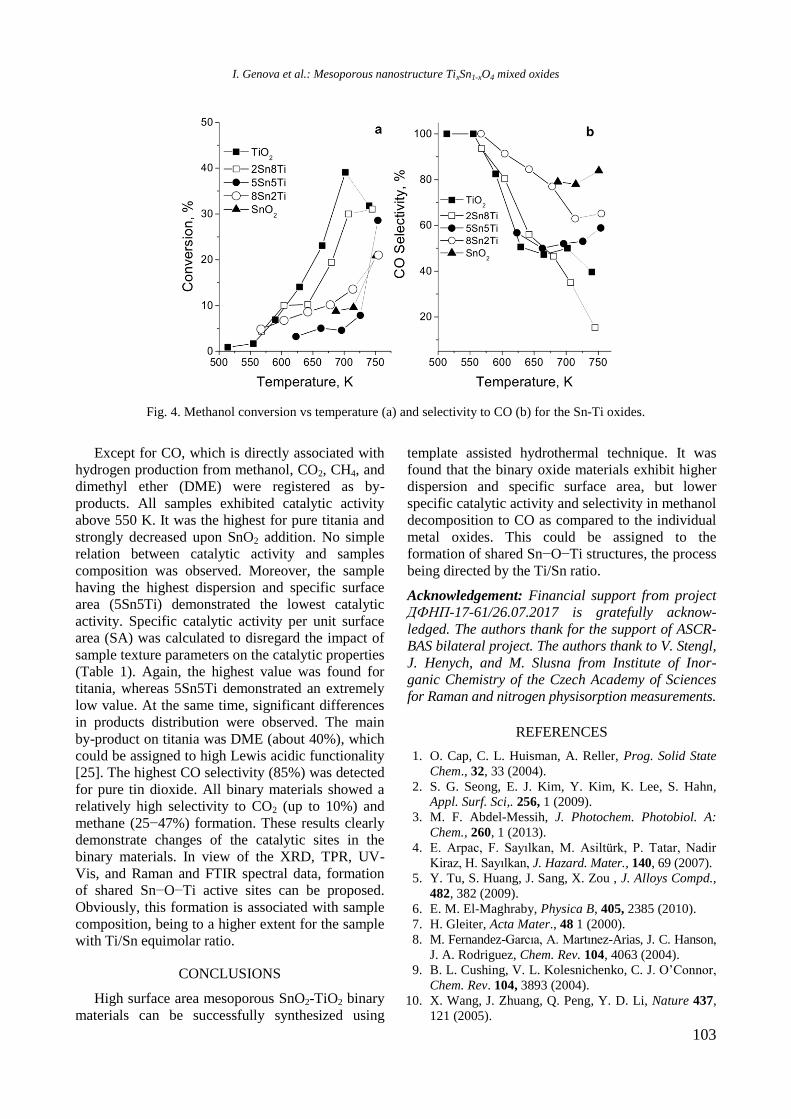
103
Fig. 4. Methanol conversion vs temperature (a) and selectivity to CO (b) for the Sn-Ti oxides.
Except for CO, which is directly associated with
hydrogen production from methanol, CO2, CH4, and
dimethyl ether (DME) were registered as by-
products. All samples exhibited catalytic activity
above 550 K. It was the highest for pure titania and
strongly decreased upon SnO2 addition. No simple
relation between catalytic activity and samples
composition was observed. Moreover, the sample
having the highest dispersion and specific surface
area (5Sn5Ti) demonstrated the lowest catalytic
activity. Specific catalytic activity per unit surface
area (SA) was calculated to disregard the impact of
sample texture parameters on the catalytic properties
(Table 1). Again, the highest value was found for
titania, whereas 5Sn5Ti demonstrated an extremely
low value. At the same time, significant differences
in products distribution were observed. The main
by-product on titania was DME (about 40%), which
could be assigned to high Lewis acidic functionality
[25]. The highest CO selectivity (85%) was detected
for pure tin dioxide. All binary materials showed a
relatively high selectivity to CO2 (up to 10%) and
methane (25−47%) formation. These results clearly
demonstrate changes of the catalytic sites in the
binary materials. In view of the XRD, TPR, UV-
Vis, and Raman and FTIR spectral data, formation
of shared Sn−O−Ti active sites can be proposed.
Obviously, this formation is associated with sample
composition, being to a higher extent for the sample
with Ti/Sn equimolar ratio.
CONCLUSIONS
High surface area mesoporous SnO2-TiO2 binary
materials can be successfully synthesized using
template assisted hydrothermal technique. It was
found that the binary oxide materials exhibit higher
dispersion and specific surface area, but lower
specific catalytic activity and selectivity in methanol
decomposition to CO as compared to the individual
metal oxides. This could be assigned to the
formation of shared Sn−O−Ti structures, the process
being directed by the Ti/Sn ratio.
Acknowledgement: Financial support from project
ДФНП-17-61/26.07.2017 is gratefully acknow-
ledged. The authors thank for the support of ASCR-
BAS bilateral project. The authors thank to V. Stengl,
J. Henych, and M. Slusna from Institute of Inor-
ganic Chemistry of the Czech Academy of Sciences
for Raman and nitrogen physisorption measurements.
REFERENCES
1. O. Cap, C. L. Huisman, A. Reller, Prog. Solid State
Chem., 32, 33 (2004).
2. S. G. Seong, E. J. Kim, Y. Kim, K. Lee, S. Hahn,
Appl. Surf. Sci,. 256, 1 (2009).
3. M. F. Abdel-Messih, J. Photochem. Photobiol. A:
Chem., 260, 1 (2013).
4. E. Arpac, F. Sayılkan, M. Asiltürk, P. Tatar, Nadir
Kiraz, H. Sayılkan, J. Hazard. Mater., 140, 69 (2007).
5. Y. Tu, S. Huang, J. Sang, X. Zou , J. Alloys Compd.,
482, 382 (2009).
6. E. M. El-Maghraby, Physica B, 405, 2385 (2010).
7. H. Gleiter, Acta Mater., 48 1 (2000).
8. M. Fernandez-Garcıa, A. Martınez-Arias, J. C. Hanson,
J. A. Rodriguez, Chem. Rev. 104, 4063 (2004).
9. B. L. Cushing, V. L. Kolesnichenko, C. J. O’Connor,
Chem. Rev. 104, 3893 (2004).
10. X. Wang, J. Zhuang, Q. Peng, Y. D. Li, Nature 437,
121 (2005).
I. Genova et al.: Mesoporous nanostructure TixSn1-xO4 mixed oxides
104
11. Y. Ju-Nam, J. R. Lead, Sci. Total Environ. 400, 396
(2008).
12. I. T. Weber, A. Valentini, L. F. D. Probst, E. Longo,
E. R. Leite, Mater. Lett. 62, 1677 (2008).
13. T. Tsoncheva, L. Ivanova, D. Paneva, I. Mitov, C.
Minchev, M. Fröba, Micropor. Mesopor. Mater.,
120, 389 (2009).
14. M. Altomare, M. V. Dozzi, G. L. Chiarello, A. D. Paola,
L. Palmisano, E. Selli, Catal. Today, 252, 184 (2015).
15. Q. Shen, H. Yang, Q. Xu Qian, Y. Yang, R. Hao,
Mater. Lett. 64, 442 (2010).
16. I. Nitoi, P. Oancea, M. Raileanu, M. Crisan, L.
Constantin, I. Cristea, J. Ind. Eng. Chem., 21, 677
(2015).
17. D. A. Popescu, J.-M. Herrmann, A. Ensuque, F. Bozon-
Verduraz, Phys. Chem. Chem. Phys., 3, 2522 (2001).
18. Y. A. Cao, W. S. Yang, W. F. Zhang, G. Z. Liu, P.
Yue, New J. Chem., 28, 218 (2004).
19. C. P. Sbu, S. R. Kumar, P. Mukundan, K. G. K.
Warrier, Chem. Mater. 14, 2876 (2002).
20. H. Nur, Mater. Sci. Eng. B – Sol, 133, 49 (2006).
21. W. Wang, Appl. Surf. Sci., 261, 890 (2012).
22. S. Cui, J. Mater. Chem. A, 1, 4462 (2013).
23. T. Jia, Mater. Sci. Eng. B, 189, 32 (2014).
24. X. Liu, J. Iqbal, Z. Wu, B. He, R. Yu, J. Phys. Chem.
C, 114, 4790 (2010).
25. G. Issa, A. Mileva, M. Dimitrov, J. Henych, V. Štengl,
T. Tsoncheva, Nanosci & Nanotech., 17, 18 (2017).
НАНОСТРУКТУРИРАНИ МЕЗОПОРЕСТИ TiXSn1-XO4 СМЕСЕНИ ОКСИДИ КАТО
КАТАЛИЗАТОРИ ЗА РАЗПАДАНЕ НА МЕТАНОЛ: ЕФЕКТ НА СЪОТНОШЕНИЕТО Ti/Sn
И. Генова1*, T. Цончева
1, M. Димитров
1, Д. Ковачева
2
1 Институт по органична химия с Център по фитохимия, БАН, 1113 София, България
2 Институт по обща и неорганична химия, БАН, 1113 София, България
Постъпила на 16 януари 2018 г.; Преработена на 7 март 2018 г.
(Резюме)
Целта на настоящето изследване е да се изясни влиянието на Ti / Sn съотношението на смесени TixSn1-xO4
оксиди върху техните структурни, редукционни и каталитични свойства. Мезопорести смесени оксиди с
различно съотношение Ti/Sn са синтезирани чрез хидротермална техника в присъствие на органичен темплейт.
Получените материали са характеризирани с комплекс от физикохимични техники, като асорбция на азот,
рентгенофазов анализ, Раманова, УВ-видима и ИЧ спектроскопия и ТПР с водород. Като каталитична тест-
реакция е използвана реакция на разпадане на метанол до синтез газ. Каталитичната активност на бинарните
материали зависи по сложен начин от техния фазов състав. Той е подобрен благодарение на увеличаването на
специфичната повърхност и обема на порите, но силно потиснат поради значителните структурни промени.
I. Genova et al.: Mesoporous nanostructure TixSn1-xO4 mixed oxides
105
Bulgarian Chemical Communications, Volume 50, Special issue H (pp. 105–108) 2018
Synthesis, characterization and photocatalytic performance of brannerite-type
LiVMoO6
M. K. Milanova*, R. S. Iordanova, M. N. Gancheva
Institute of General and Inorganic Chemistry, Bulgarian Academy of Sciences, Acad. G. Bonchev
St., Bldg. 11, 1113 Sofia, Bulgaria
Received: January 17, 2018; Revised, March 25, 2018
Crystalline LiVMoO6 with brannerite structure was synthesized by mechanochemically assisted solid-state
synthesis. A mixture of Li2CO3; V2O5, and MoO3 of oxide 1:1:2 molar ratio was subjected to intense mechanical
treatment for 10 min in air using a planetary ball mill (Fritsch-Premium line-Pulversette No 7) and zirconia vials and
balls (5 mm in diameter). The mechanically treated mixture of the metal oxides was subsequently heated for 1 hour at
450 °C. XRD, Raman spectroscopy, and SEM investigations were performed to examine phase formation, local
structure, and morphology of the obtained product. Preliminary mechanical activation of the reagents led to the
formation of highly reactive precursor and annealing of the latter formed submicron-sized particles of LiVMoO6 with
irregular shape, which were highly agglomerated. Photocatalytic results showed that adsorption of Маlachite Green dye
(MG) on the LiVMoO6 surface is a prerequisite for its photodegradation. Degradation percentage of Маlachite Green in
the presence of LiVMoO6 photocatalyst was about 70% after 210 min of UV irradiation time.
Key words: mechanochemistry, Raman spectroscopy, photocatalysis.
INTRODUCTION
Over the last decades, photocatalysis has been
extensively explored as a process to efficiently
conduct oxidation of organic compounds, mainly
pollutants. In this sense, TiO2 has been preferred by
far over other materials as photocatalyst. Despite the
proven efficiency of titania, some issues still
challenge the scientific community dedicated to
photo-catalysis. Recently, scientific efforts have
been directed to design titania-free visible-light
active photocatalysts. For example, monoclinic and
perovskite materials, such as InMO4 (M = V, Nb,
Ta), BiVO4, AgTaO3, AgNbO3, and Ag3VO4, have
been confirmed to be active visible-light responsive
photocatalysts [1‒4]. In this context, some other
monoclinic systems may deserve special attention.
Among them, brannerite-type LiMoVO6 compound
calls the attention due to its electrochemical
properties and recognised application as a positive
electrode material for lithium secondary batteries
[5‒7]. The aim of the present study was to obtain
LiMoVO6 compound by mechanochemically
assisted solid-state synthesis and to explore its
structural and photocatalytic properties.
EXPERIMENTAL
Crystalline LiVMoO6 with brannerite structure
was prepared by mechanochemically assisted solid-
state synthesis. A mixture of Li2CO3, V2O5, and
MoO3 of oxide 1:1:2 molar ratio was subjected to
intense mechanical treatment for 10 min in air using
a planetary ball mill (Fritsch-Premium line-
Pulversette No 7) and zirconia vials and balls (5 mm
in diameter). Balls to powder weight ratio was 10:1.
The mechanically treated mixture of the reagents
was subsequently heated for 1 hour at 450 °C. Phase
formation was checked by XRD (CuKα, Ultima IV;
Rigaku Corp.). Room temperature Raman spectro-
scopy measurements of LiVMoO6 were performed
in the range of 200‒1200 cm‒1
on a micro-Raman
system of Jobin-Yvon Horiba (LABRAM HR-800)
spectrometer with green laser (wavelength of 532
nm). LiVMoO6 morphology and microstructure
were investigated by JEOL JSM-5300 scanning
electron microscope. The photocatalytic activity of
the obtained LiVMoO6 was evaluated toward the
degradation of a model aqueous solution of
Malachite Green (MG) oxalate (Sigma-Aldrich)
under UV irradiation at room temperature. A MG
solution (150 ml, 5 ppm, pH = 7) containing 0.1 g of
as-prepared powder was placed into a glass beaker.
Before turning on the light, the solution was
ultrasonicated for 10 min and after that stirred for 10
min to ensure adsorption-desorption equilibrium in
the solid/solution system. A solution of 3 ml volume
was taken at regular time intervals and separated
through centrifugation (5000 rpm, 5 min). Then MG
© 2018 Bulgarian Academy of Sciences, Union of Chemists in Bulgaria
* To whom all correspondence should be sent
E-mail: [email protected]
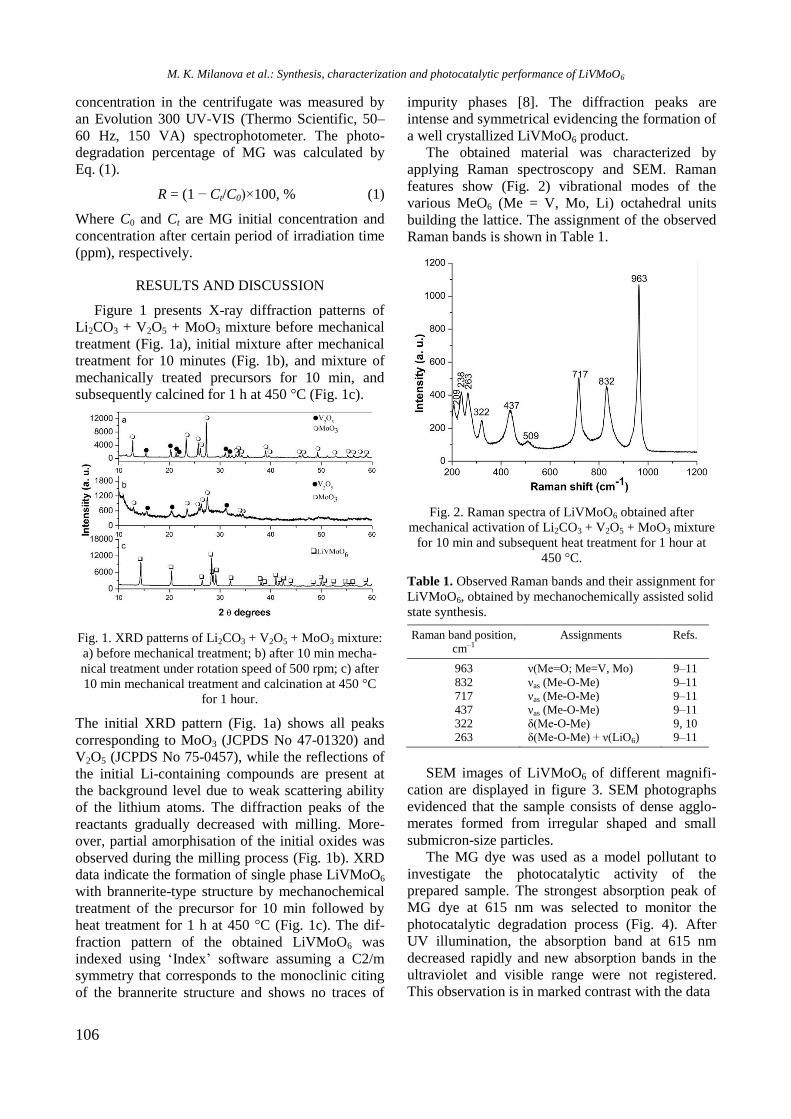
106
concentration in the centrifugate was measured by
an Evolution 300 UV-VIS (Thermo Scientific, 50‒
60 Hz, 150 VA) spectrophotometer. The photo-
degradation percentage of MG was calculated by
Eq. (1).
R = (1 − Ct/C0)×100, % (1)
Where C0 and Ct are MG initial concentration and
concentration after certain period of irradiation time
(ppm), respectively.
RESULTS AND DISCUSSION
Figure 1 presents X-ray diffraction patterns of
Li2CO3 + V2O5 + MoO3 mixture before mechanical
treatment (Fig. 1a), initial mixture after mechanical
treatment for 10 minutes (Fig. 1b), and mixture of
mechanically treated precursors for 10 min, and
subsequently calcined for 1 h at 450 °C (Fig. 1c).
Fig. 1. XRD patterns of Li2CO3 + V2O5 + MoO3 mixture:
a) before mechanical treatment; b) after 10 min mecha-
nical treatment under rotation speed of 500 rpm; c) after
10 min mechanical treatment and calcination at 450 °C
for 1 hour.
The initial XRD pattern (Fig. 1a) shows all peaks
corresponding to MoO3 (JCPDS No 47-01320) and
V2O5 (JCPDS No 75-0457), while the reflections of
the initial Li-containing compounds are present at
the background level due to weak scattering ability
of the lithium atoms. The diffraction peaks of the
reactants gradually decreased with milling. More-
over, partial amorphisation of the initial oxides was
observed during the milling process (Fig. 1b). XRD
data indicate the formation of single phase LiVMoO6
with brannerite-type structure by mechanochemical
treatment of the precursor for 10 min followed by
heat treatment for 1 h at 450 °C (Fig. 1c). The dif-
fraction pattern of the obtained LiVMoO6 was
indexed using ‘Index’ software assuming a C2/m
symmetry that corresponds to the monoclinic citing
of the brannerite structure and shows no traces of
impurity phases [8]. The diffraction peaks are
intense and symmetrical evidencing the formation of
a well crystallized LiVMoO6 product.
The obtained material was characterized by
applying Raman spectroscopy and SEM. Raman
features show (Fig. 2) vibrational modes of the
various MeO6 (Me = V, Mo, Li) octahedral units
building the lattice. The assignment of the observed
Raman bands is shown in Table 1.
Fig. 2. Raman spectra of LiVMoO6 obtained after
mechanical activation of Li2CO3 + V2O5 + MoO3 mixture
for 10 min and subsequent heat treatment for 1 hour at
450 °C.
Table 1. Observed Raman bands and their assignment for
LiVMoO6, obtained by mechanochemically assisted solid
state synthesis.
Raman band position,
cm‒1
Assignments Refs.
963 ν(Me=O; Me=V, Mo) 9‒11
832 νas (Me-O-Me) 9‒11
717 νas (Me-O-Me) 9‒11
437 νas (Me-O-Me) 9‒11
322 δ(Me-O-Me) 9, 10
263 δ(Me-O-Me) + ν(LiO6) 9‒11
SEM images of LiVMoO6 of different magnifi-
cation are displayed in figure 3. SEM photographs
evidenced that the sample consists of dense agglo-
merates formed from irregular shaped and small
submicron-size particles.
The MG dye was used as a model pollutant to
investigate the photocatalytic activity of the
prepared sample. The strongest absorption peak of
MG dye at 615 nm was selected to monitor the
photocatalytic degradation process (Fig. 4). After
UV illumination, the absorption band at 615 nm
decreased rapidly and new absorption bands in the
ultraviolet and visible range were not registered.
This observation is in marked contrast with the data
M. K. Milanova et al.: Synthesis, characterization and photocatalytic performance of LiVMoO6
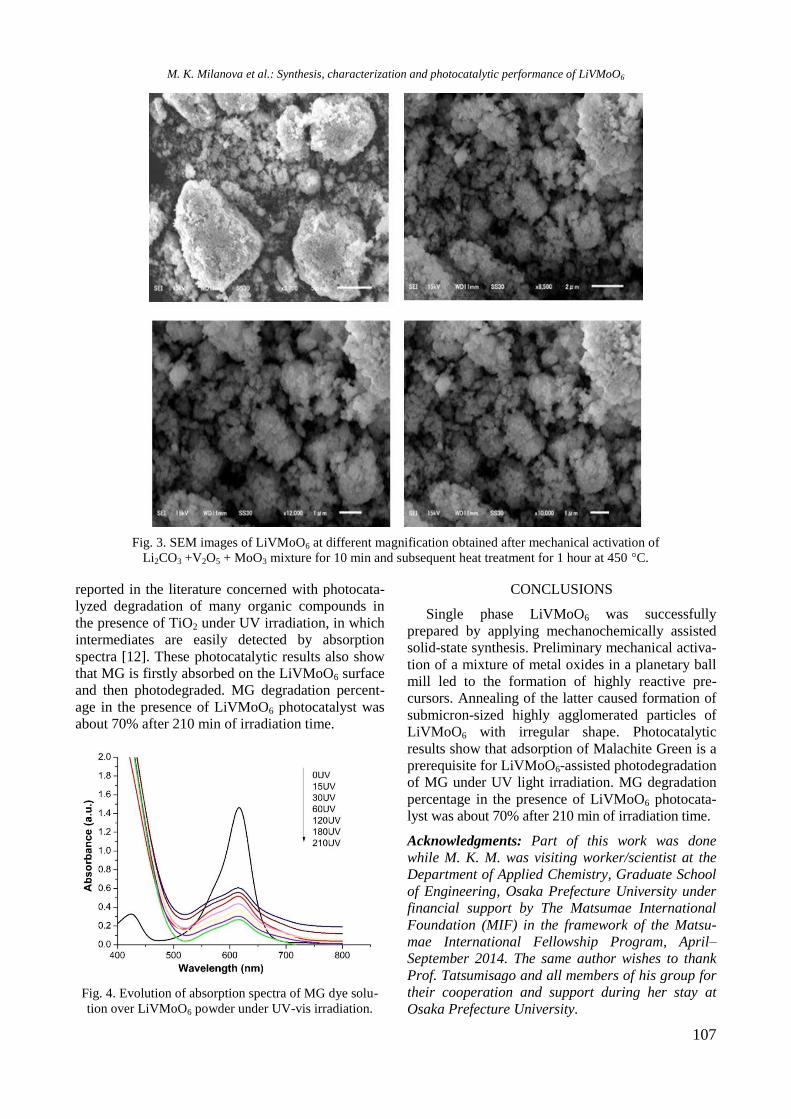
107
Fig. 3. SEM images of LiVMoO6 at different magnification obtained after mechanical activation of
Li2CO3 +V2O5 + MoO3 mixture for 10 min and subsequent heat treatment for 1 hour at 450 °C.
reported in the literature concerned with photocata-
lyzed degradation of many organic compounds in
the presence of TiO2 under UV irradiation, in which
intermediates are easily detected by absorption
spectra [12]. These photocatalytic results also show
that MG is firstly absorbed on the LiVMoO6 surface
and then photodegraded. MG degradation percent-
age in the presence of LiVMoO6 photocatalyst was
about 70% after 210 min of irradiation time.
Fig. 4. Evolution of absorption spectra of MG dye solu-
tion over LiVMoO6 powder under UV-vis irradiation.
CONCLUSIONS
Single phase LiVMoO6 was successfully
prepared by applying mechanochemically assisted
solid-state synthesis. Preliminary mechanical activa-
tion of a mixture of metal oxides in a planetary ball
mill led to the formation of highly reactive pre-
cursors. Annealing of the latter caused formation of
submicron-sized highly agglomerated particles of
LiVMoO6 with irregular shape. Photocatalytic
results show that adsorption of Malachite Green is a
prerequisite for LiVMoO6-assisted photodegradation
of MG under UV light irradiation. MG degradation
percentage in the presence of LiVMoO6 photocata-
lyst was about 70% after 210 min of irradiation time.
Acknowledgments: Part of this work was done
while M. K. M. was visiting worker/scientist at the
Department of Applied Chemistry, Graduate School
of Engineering, Osaka Prefecture University under
financial support by The Matsumae International
Foundation (MIF) in the framework of the Matsu-
mae International Fellowship Program, April–
September 2014. The same author wishes to thank
Prof. Tatsumisago and all members of his group for
their cooperation and support during her stay at
Osaka Prefecture University.
M. K. Milanova et al.: Synthesis, characterization and photocatalytic performance of LiVMoO6
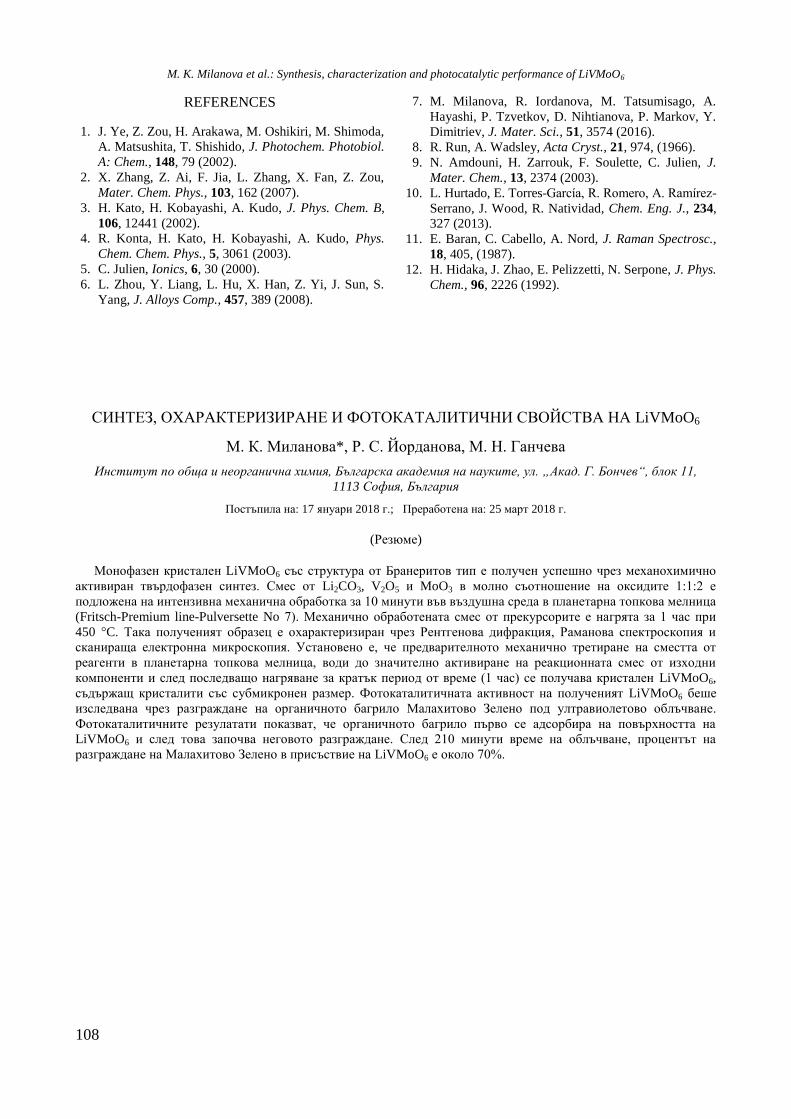
108
REFERENCES
1. J. Ye, Z. Zou, H. Arakawa, M. Oshikiri, M. Shimoda,
A. Matsushita, T. Shishido, J. Photochem. Photobiol.
A: Chem., 148, 79 (2002).
2. X. Zhang, Z. Ai, F. Jia, L. Zhang, X. Fan, Z. Zou,
Mater. Chem. Phys., 103, 162 (2007).
3. H. Kato, H. Kobayashi, A. Kudo, J. Phys. Chem. B,
106, 12441 (2002).
4. R. Konta, H. Kato, H. Kobayashi, A. Kudo, Phys.
Chem. Chem. Phys., 5, 3061 (2003).
5. C. Julien, Ionics, 6, 30 (2000).
6. L. Zhou, Y. Liang, L. Hu, X. Han, Z. Yi, J. Sun, S.
Yang, J. Alloys Comp., 457, 389 (2008).
7. M. Milanova, R. Iordanova, M. Tatsumisago, A.
Hayashi, P. Tzvetkov, D. Nihtianova, P. Markov, Y.
Dimitriev, J. Mater. Sci., 51, 3574 (2016).
8. R. Run, A. Wadsley, Acta Cryst., 21, 974, (1966).
9. N. Amdouni, H. Zarrouk, F. Soulette, C. Julien, J.
Mater. Chem., 13, 2374 (2003).
10. L. Hurtado, E. Torres-García, R. Romero, A. Ramírez-
Serrano, J. Wood, R. Natividad, Chem. Eng. J., 234,
327 (2013).
11. E. Baran, C. Cabello, A. Nord, J. Raman Spectrosc.,
18, 405, (1987).
12. H. Hidaka, J. Zhao, E. Pelizzetti, N. Serpone, J. Phys.
Chem., 96, 2226 (1992).
СИНТЕЗ, ОХАРАКТЕРИЗИРАНЕ И ФОТОКАТАЛИТИЧНИ СВОЙСТВА НА LiVMoO6
М. К. Миланова*, Р. С. Йорданова, М. Н. Ганчева
Институт по обща и неорганична химия, Българска aкадемия на науките, ул. „Акад. Г. Бончев“, блок 11,
1113 София, България
Постъпила на: 17 януари 2018 г.; Преработена на: 25 март 2018 г.
(Резюме)
Монофазен кристален LiVMoO6 със структура от Бранеритов тип е получен успешно чрез механохимично
активиран твърдофазен синтез. Смес от Li2CO3, V2O5 и MoO3 в молно съотношение на оксидите 1:1:2 е
подложена на интензивна механична обработка за 10 минути във въздушна среда в планетарна топкова мелница
(Fritsch-Premium line-Pulversette No 7). Механично обработената смес от прекурсорите е нагрята за 1 час при
450 °C. Така полученият образец е охарактеризиран чрез Рентгенова дифракция, Раманова спектроскопия и
сканираща електронна микроскопия. Установено е, че предварителното механично третиране на сместта от
реагенти в планетарна топкова мелница, води до значително активиране на реакционната смес от изходни
компоненти и след последващо нагряване за кратък период от време (1 час) се получава кристален LiVMoO6,
съдържащ кристалити със субмикронен размер. Фотокаталитичната активност на полученият LiVMoO6 беше
изследвана чрез разграждане на органичното багрило Малахитово Зелено под ултравиолетово облъчване.
Фотокаталитичните резулатати показват, че органичното багрило първо се адсорбира на повърхността на
LiVMoO6 и след това започва неговото разграждане. След 210 минути време на облъчване, процентът на
разграждане на Малахитово Зелено в присъствие на LiVMoO6 е около 70%.
M. K. Milanova et al.: Synthesis, characterization and photocatalytic performance of LiVMoO6
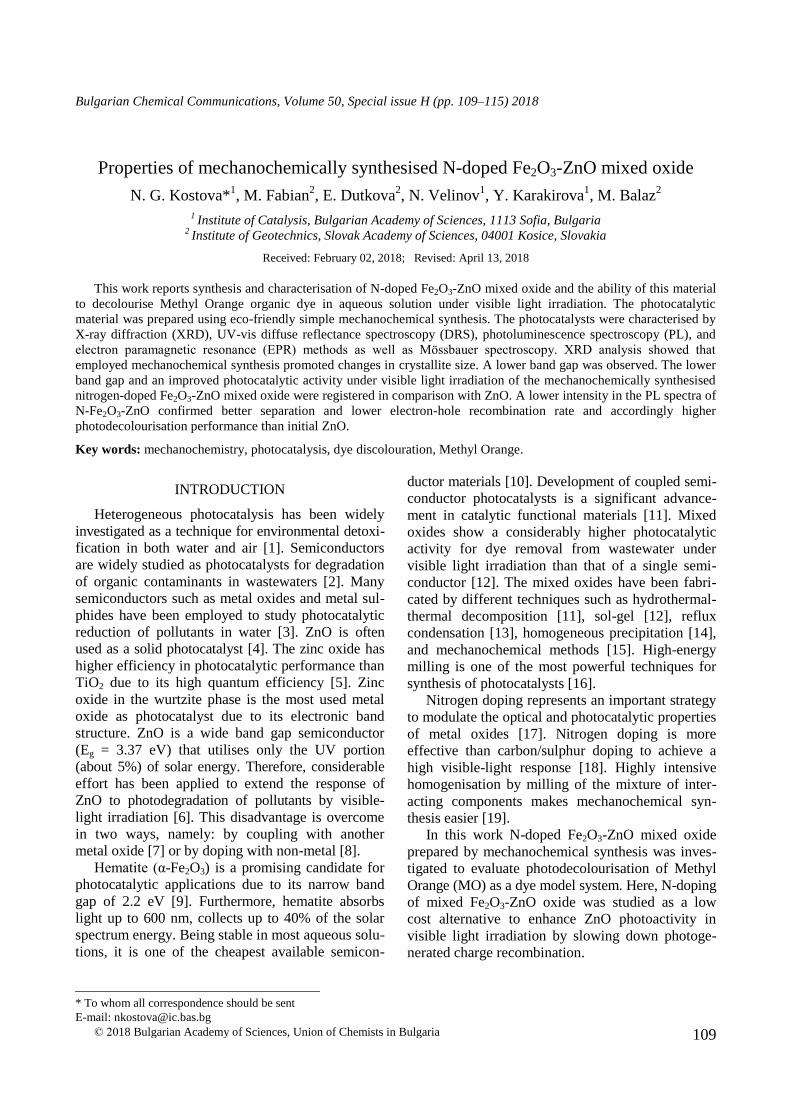
109
Bulgarian Chemical Communications, Volume 50, Special issue H (pp. 109–115) 2018
Properties of mechanochemically synthesised N-doped Fe2O3-ZnO mixed oxide
N. G. Kostova*1, M. Fabian
2, E. Dutkova
2, N. Velinov
1, Y. Karakirova
1, M. Balaz
2
1 Institute of Catalysis, Bulgarian Academy of Sciences, 1113 Sofia, Bulgaria
2 Institute of Geotechnics, Slovak Academy of Sciences, 04001 Kosice, Slovakia
Received: February 02, 2018; Revised: April 13, 2018
This work reports synthesis and characterisation of N-doped Fe2O3-ZnO mixed oxide and the ability of this material
to decolourise Methyl Orange organic dye in aqueous solution under visible light irradiation. The photocatalytic
material was prepared using eco-friendly simple mechanochemical synthesis. The photocatalysts were characterised by
X-ray diffraction (XRD), UV-vis diffuse reflectance spectroscopy (DRS), photoluminescence spectroscopy (PL), and
electron paramagnetic resonance (EPR) methods as well as Mössbauer spectroscopy. XRD analysis showed that
employed mechanochemical synthesis promoted changes in crystallite size. A lower band gap was observed. The lower
band gap and an improved photocatalytic activity under visible light irradiation of the mechanochemically synthesised
nitrogen-doped Fe2O3-ZnO mixed oxide were registered in comparison with ZnO. A lower intensity in the PL spectra of
N-Fe2O3-ZnO confirmed better separation and lower electron-hole recombination rate and accordingly higher
photodecolourisation performance than initial ZnO.
Key words: mechanochemistry, photocatalysis, dye discolouration, Methyl Orange.
INTRODUCTION
Heterogeneous photocatalysis has been widely
investigated as a technique for environmental detoxi-
fication in both water and air [1]. Semiconductors
are widely studied as photocatalysts for degradation
of organic contaminants in wastewaters [2]. Many
semiconductors such as metal oxides and metal sul-
phides have been employed to study photocatalytic
reduction of pollutants in water [3]. ZnO is often
used as a solid photocatalyst [4]. The zinc oxide has
higher efficiency in photocatalytic performance than
TiO2 due to its high quantum efficiency [5]. Zinc
oxide in the wurtzite phase is the most used metal
oxide as photocatalyst due to its electronic band
structure. ZnO is a wide band gap semiconductor
(Eg = 3.37 eV) that utilises only the UV portion
(about 5%) of solar energy. Therefore, considerable
effort has been applied to extend the response of
ZnO to photodegradation of pollutants by visible-
light irradiation [6]. This disadvantage is overcome
in two ways, namely: by coupling with another
metal oxide [7] or by doping with non-metal [8].
Hematite (α-Fe2O3) is a promising candidate for
photocatalytic applications due to its narrow band
gap of 2.2 eV [9]. Furthermore, hematite absorbs
light up to 600 nm, collects up to 40% of the solar
spectrum energy. Being stable in most aqueous solu-
tions, it is one of the cheapest available semicon-
ductor materials [10]. Development of coupled semi-
conductor photocatalysts is a significant advance-
ment in catalytic functional materials [11]. Mixed
oxides show a considerably higher photocatalytic
activity for dye removal from wastewater under
visible light irradiation than that of a single semi-
conductor [12]. The mixed oxides have been fabri-
cated by different techniques such as hydrothermal-
thermal decomposition [11], sol-gel [12], reflux
condensation [13], homogeneous precipitation [14],
and mechanochemical methods [15]. High-energy
milling is one of the most powerful techniques for
synthesis of photocatalysts [16].
Nitrogen doping represents an important strategy
to modulate the optical and photocatalytic properties
of metal oxides [17]. Nitrogen doping is more
effective than carbon/sulphur doping to achieve a
high visible-light response [18]. Highly intensive
homogenisation by milling of the mixture of inter-
acting components makes mechanochemical syn-
thesis easier [19].
In this work N-doped Fe2O3-ZnO mixed oxide
prepared by mechanochemical synthesis was inves-
tigated to evaluate photodecolourisation of Methyl
Orange (MO) as a dye model system. Here, N-doping
of mixed Fe2O3-ZnO oxide was studied as a low
cost alternative to enhance ZnO photoactivity in
visible light irradiation by slowing down photoge-
nerated charge recombination.
© 2018 Bulgarian Academy of Sciences, Union of Chemists in Bulgaria
* To whom all correspondence should be sent
E-mail: [email protected]
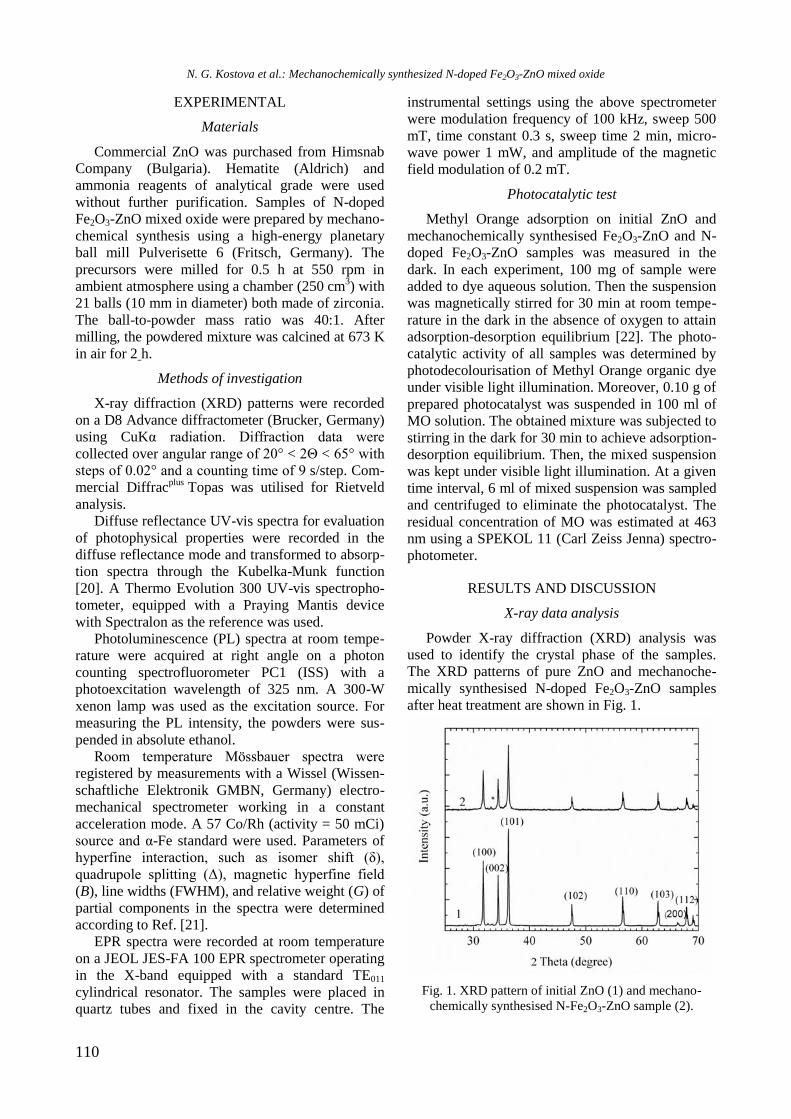
110
EXPERIMENTAL
Materials
Commercial ZnO was purchased from Himsnab
Company (Bulgaria). Hematite (Aldrich) and
ammonia reagents of analytical grade were used
without further purification. Samples of N-doped
Fe2O3-ZnO mixed oxide were prepared by mechano-
chemical synthesis using a high-energy planetary
ball mill Pulverisette 6 (Fritsch, Germany). The
precursors were milled for 0.5 h at 550 rpm in
ambient atmosphere using a chamber (250 cm3) with
21 balls (10 mm in diameter) both made of zirconia.
The ball-to-powder mass ratio was 40:1. After
milling, the powdered mixture was calcined at 673 K
in air for 2 h.
Methods of investigation
X-ray diffraction (XRD) patterns were recorded
on a D8 Advance diffractometer (Brucker, Germany)
using CuKα radiation. Diffraction data were
collected over angular range of 20° < 2Θ < 65° with
steps of 0.02° and a counting time of 9 s/step. Com-
mercial Diffracplus
Topas was utilised for Rietveld
analysis.
Diffuse reflectance UV-vis spectra for evaluation
of photophysical properties were recorded in the
diffuse reflectance mode and transformed to absorp-
tion spectra through the Kubelka-Munk function
[20]. A Thermo Evolution 300 UV-vis spectropho-
tometer, equipped with a Praying Mantis device
with Spectralon as the reference was used.
Photoluminescence (PL) spectra at room tempe-
rature were acquired at right angle on a photon
counting spectrofluorometer PC1 (ISS) with a
photoexcitation wavelength of 325 nm. A 300-W
xenon lamp was used as the excitation source. For
measuring the PL intensity, the powders were sus-
pended in absolute ethanol.
Room temperature Mössbauer spectra were
registered by measurements with a Wissel (Wissen-
schaftliche Elektronik GMBN, Germany) electro-
mechanical spectrometer working in a constant
acceleration mode. A 57 Co/Rh (activity = 50 mCi)
source and α-Fe standard were used. Parameters of
hyperfine interaction, such as isomer shift (δ),
quadrupole splitting (Δ), magnetic hyperfine field
(B), line widths (FWHM), and relative weight (G) of
partial components in the spectra were determined
according to Ref. [21].
EPR spectra were recorded at room temperature
on a JEOL JES-FA 100 EPR spectrometer operating
in the X-band equipped with a standard TE011
cylindrical resonator. The samples were placed in
quartz tubes and fixed in the cavity centre. The
instrumental settings using the above spectrometer
were modulation frequency of 100 kHz, sweep 500
mT, time constant 0.3 s, sweep time 2 min, micro-
wave power 1 mW, and amplitude of the magnetic
field modulation of 0.2 mT.
Photocatalytic test
Methyl Orange adsorption on initial ZnO and
mechanochemically synthesised Fe2O3-ZnO and N-
doped Fe2O3-ZnO samples was measured in the
dark. In each experiment, 100 mg of sample were
added to dye aqueous solution. Then the suspension
was magnetically stirred for 30 min at room tempe-
rature in the dark in the absence of oxygen to attain
adsorption-desorption equilibrium [22]. The photo-
catalytic activity of all samples was determined by
photodecolourisation of Methyl Orange organic dye
under visible light illumination. Moreover, 0.10 g of
prepared photocatalyst was suspended in 100 ml of
MO solution. The obtained mixture was subjected to
stirring in the dark for 30 min to achieve adsorption-
desorption equilibrium. Then, the mixed suspension
was kept under visible light illumination. At a given
time interval, 6 ml of mixed suspension was sampled
and centrifuged to eliminate the photocatalyst. The
residual concentration of MO was estimated at 463
nm using a SPEKOL 11 (Carl Zeiss Jenna) spectro-
photometer.
RESULTS AND DISCUSSION
X-ray data analysis
Powder X-ray diffraction (XRD) analysis was
used to identify the crystal phase of the samples.
The XRD patterns of pure ZnO and mechanoche-
mically synthesised N-doped Fe2O3-ZnO samples
after heat treatment are shown in Fig. 1.
Fig. 1. XRD pattern of initial ZnO (1) and mechano-
chemically synthesised N-Fe2O3-ZnO sample (2).
N. G. Kostova et al.: Mechanochemically synthesized N-doped Fe2O3-ZnO mixed oxide
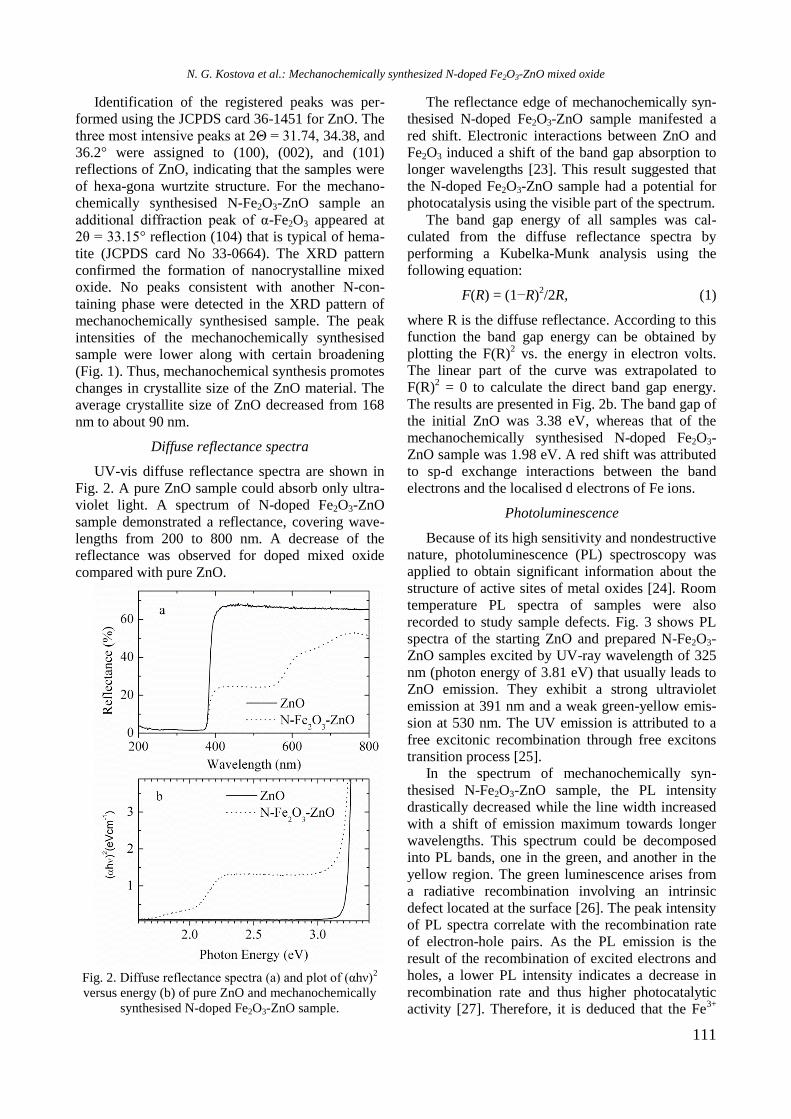
111
Identification of the registered peaks was per-
formed using the JCPDS card 36-1451 for ZnO. The
three most intensive peaks at 2Θ = 31.74, 34.38, and
36.2° were assigned to (100), (002), and (101)
reflections of ZnO, indicating that the samples were
of hexa-gona wurtzite structure. For the mechano-
chemically synthesised N-Fe2O3-ZnO sample an
additional diffraction peak of α-Fe2O3 appeared at
2θ = 33.15° reflection (104) that is typical of hema-
tite (JCPDS card No 33-0664). The XRD pattern
confirmed the formation of nanocrystalline mixed
oxide. No peaks consistent with another N-con-
taining phase were detected in the XRD pattern of
mechanochemically synthesised sample. The peak
intensities of the mechanochemically synthesised
sample were lower along with certain broadening
(Fig. 1). Thus, mechanochemical synthesis promotes
changes in crystallite size of the ZnO material. The
average crystallite size of ZnO decreased from 168
nm to about 90 nm.
Diffuse reflectance spectra
UV-vis diffuse reflectance spectra are shown in
Fig. 2. A pure ZnO sample could absorb only ultra-
violet light. A spectrum of N-doped Fe2O3-ZnO
sample demonstrated a reflectance, covering wave-
lengths from 200 to 800 nm. A decrease of the
reflectance was observed for doped mixed oxide
compared with pure ZnO.
Fig. 2. Diffuse reflectance spectra (a) and plot of (αhν)
2
versus energy (b) of pure ZnO and mechanochemically
synthesised N-doped Fe2O3-ZnO sample.
The reflectance edge of mechanochemically syn-
thesised N-doped Fe2O3-ZnO sample manifested a
red shift. Electronic interactions between ZnO and
Fe2O3 induced a shift of the band gap absorption to
longer wavelengths [23]. This result suggested that
the N-doped Fe2O3-ZnO sample had a potential for
photocatalysis using the visible part of the spectrum.
The band gap energy of all samples was cal-
culated from the diffuse reflectance spectra by
performing a Kubelka-Munk analysis using the
following equation:
F(R) = (1−R)2/2R, (1)
where R is the diffuse reflectance. According to this
function the band gap energy can be obtained by
plotting the F(R)2 vs. the energy in electron volts.
The linear part of the curve was extrapolated to
F(R)2 = 0 to calculate the direct band gap energy.
The results are presented in Fig. 2b. The band gap of
the initial ZnO was 3.38 eV, whereas that of the
mechanochemically synthesised N-doped Fe2O3-
ZnO sample was 1.98 eV. A red shift was attributed
to sp-d exchange interactions between the band
electrons and the localised d electrons of Fe ions.
Photoluminescence
Because of its high sensitivity and nondestructive
nature, photoluminescence (PL) spectroscopy was
applied to obtain significant information about the
structure of active sites of metal oxides [24]. Room
temperature PL spectra of samples were also
recorded to study sample defects. Fig. 3 shows PL
spectra of the starting ZnO and prepared N-Fe2O3-
ZnO samples excited by UV-ray wavelength of 325
nm (photon energy of 3.81 eV) that usually leads to
ZnO emission. They exhibit a strong ultraviolet
emission at 391 nm and a weak green-yellow emis-
sion at 530 nm. The UV emission is attributed to a
free excitonic recombination through free excitons
transition process [25].
In the spectrum of mechanochemically syn-
thesised N-Fe2O3-ZnO sample, the PL intensity
drastically decreased while the line width increased
with a shift of emission maximum towards longer
wavelengths. This spectrum could be decomposed
into PL bands, one in the green, and another in the
yellow region. The green luminescence arises from
a radiative recombination involving an intrinsic
defect located at the surface [26]. The peak intensity
of PL spectra correlate with the recombination rate
of electron-hole pairs. As the PL emission is the
result of the recombination of excited electrons and
holes, a lower PL intensity indicates a decrease in
recombination rate and thus higher photocatalytic
activity [27]. Therefore, it is deduced that the Fe3+
N. G. Kostova et al.: Mechanochemically synthesized N-doped Fe2O3-ZnO mixed oxide
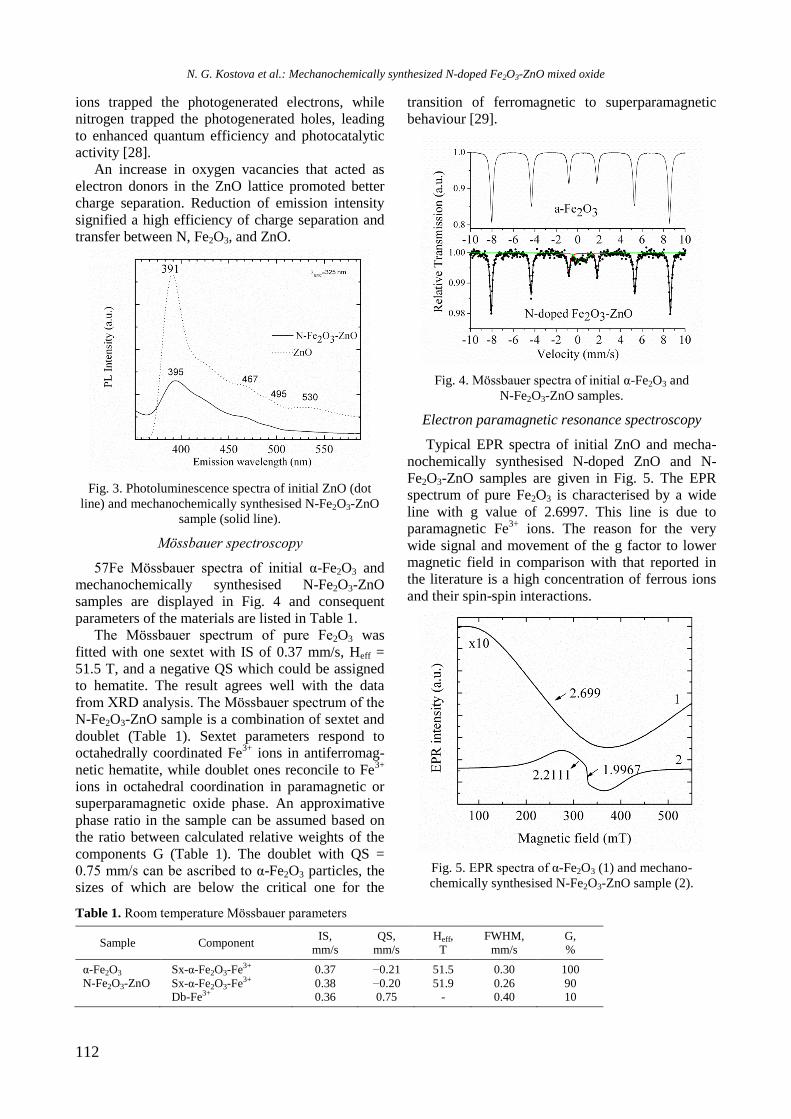
112
ions trapped the photogenerated electrons, while
nitrogen trapped the photogenerated holes, leading
to enhanced quantum efficiency and photocatalytic
activity [28].
An increase in oxygen vacancies that acted as
electron donors in the ZnO lattice promoted better
charge separation. Reduction of emission intensity
signified a high efficiency of charge separation and
transfer between N, Fe2O3, and ZnO.
Fig. 3. Photoluminescence spectra of initial ZnO (dot
line) and mechanochemically synthesised N-Fe2O3-ZnO
sample (solid line).
Mössbauer spectroscopy
57Fe Mössbauer spectra of initial α-Fe2O3 and
mechanochemically synthesised N-Fe2O3-ZnO
samples are displayed in Fig. 4 and consequent
parameters of the materials are listed in Table 1.
The Mössbauer spectrum of pure Fe2O3 was
fitted with one sextet with IS of 0.37 mm/s, Heff =
51.5 T, and a negative QS which could be assigned
to hematite. The result agrees well with the data
from XRD analysis. The Mössbauer spectrum of the
N-Fe2O3-ZnO sample is a combination of sextet and
doublet (Table 1). Sextet parameters respond to
octahedrally coordinated Fe3+
ions in antiferromag-
netic hematite, while doublet ones reconcile to Fe3+
ions in octahedral coordination in paramagnetic or
superparamagnetic oxide phase. An approximative
phase ratio in the sample can be assumed based on
the ratio between calculated relative weights of the
components G (Table 1). The doublet with QS =
0.75 mm/s can be ascribed to α-Fe2O3 particles, the
sizes of which are below the critical one for the
transition of ferromagnetic to superparamagnetic
behaviour [29].
Fig. 4. Mössbauer spectra of initial α-Fe2O3 and
N-Fe2O3-ZnO samples.
Electron paramagnetic resonance spectroscopy
Typical EPR spectra of initial ZnO and mecha-
nochemically synthesised N-doped ZnO and N-
Fe2O3-ZnO samples are given in Fig. 5. The EPR
spectrum of pure Fe2O3 is characterised by a wide
line with g value of 2.6997. This line is due to
paramagnetic Fe3+
ions. The reason for the very
wide signal and movement of the g factor to lower
magnetic field in comparison with that reported in
the literature is a high concentration of ferrous ions
and their spin-spin interactions.
Fig. 5. EPR spectra of α-Fe2O3 (1) and mechano-
chemically synthesised N-Fe2O3-ZnO sample (2).
Table 1. Room temperature Mössbauer parameters
Sample Component IS,
mm/s
QS,
mm/s
Heff,
T
FWHM,
mm/s
G,
%
α-Fe2O3 Sx-α-Fe2O3-Fe3+ 0.37 −0.21 51.5 0.30 100
N-Fe2O3-ZnO Sx-α-Fe2O3-Fe3+ Db-Fe3+
0.38 0.36
−0.20 0.75
51.9 -
0.26 0.40
90 10
N. G. Kostova et al.: Mechanochemically synthesized N-doped Fe2O3-ZnO mixed oxide
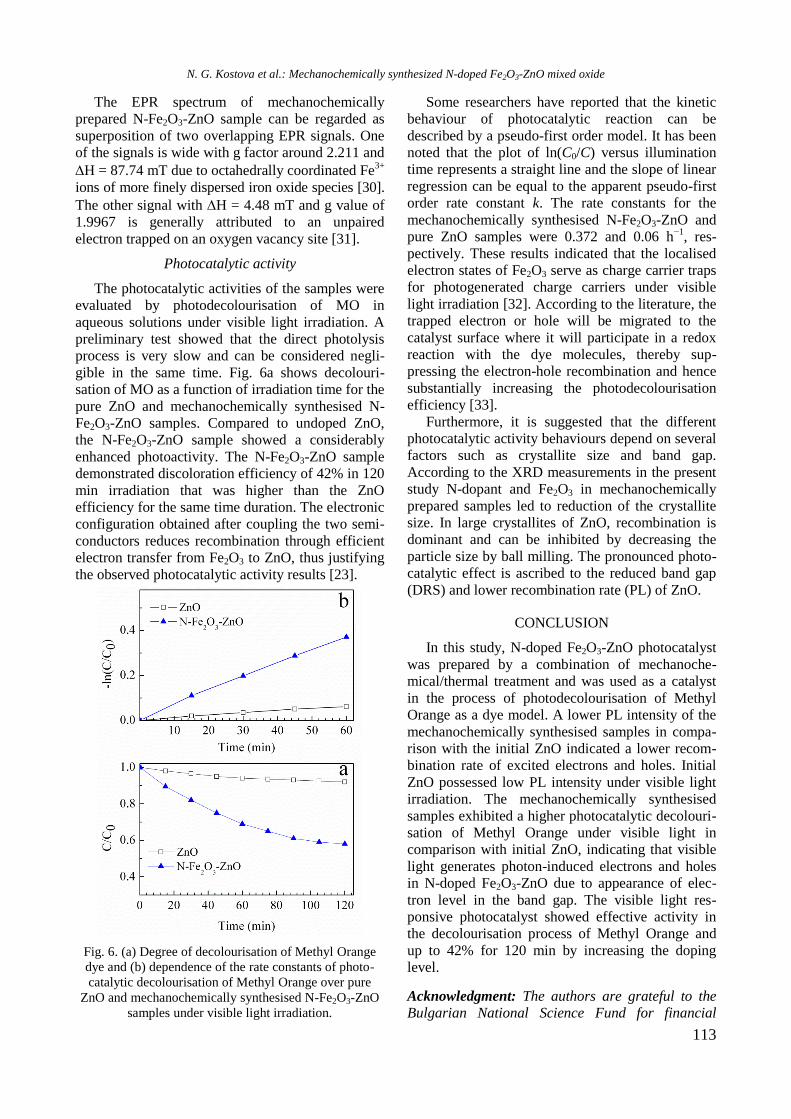
113
The EPR spectrum of mechanochemically
prepared N-Fe2O3-ZnO sample can be regarded as
superposition of two overlapping EPR signals. One
of the signals is wide with g factor around 2.211 and
H = 87.74 mT due to octahedrally coordinated Fe3+
ions of more finely dispersed iron oxide species [30].
The other signal with H = 4.48 mT and g value of
1.9967 is generally attributed to an unpaired
electron trapped on an oxygen vacancy site [31].
Photocatalytic activity
The photocatalytic activities of the samples were
evaluated by photodecolourisation of MO in
aqueous solutions under visible light irradiation. A
preliminary test showed that the direct photolysis
process is very slow and can be considered negli-
gible in the same time. Fig. 6a shows decolouri-
sation of MO as a function of irradiation time for the
pure ZnO and mechanochemically synthesised N-
Fe2O3-ZnO samples. Compared to undoped ZnO,
the N-Fe2O3-ZnO sample showed a considerably
enhanced photoactivity. The N-Fe2O3-ZnO sample
demonstrated discoloration efficiency of 42% in 120
min irradiation that was higher than the ZnO
efficiency for the same time duration. The electronic
configuration obtained after coupling the two semi-
conductors reduces recombination through efficient
electron transfer from Fe2O3 to ZnO, thus justifying
the observed photocatalytic activity results [23].
Fig. 6. (a) Degree of decolourisation of Methyl Orange
dye and (b) dependence of the rate constants of photo-
catalytic decolourisation of Methyl Orange over pure
ZnO and mechanochemically synthesised N-Fe2O3-ZnO
samples under visible light irradiation.
Some researchers have reported that the kinetic
behaviour of photocatalytic reaction can be
described by a pseudo-first order model. It has been
noted that the plot of ln(C0/C) versus illumination
time represents a straight line and the slope of linear
regression can be equal to the apparent pseudo-first
order rate constant k. The rate constants for the
mechanochemically synthesised N-Fe2O3-ZnO and
pure ZnO samples were 0.372 and 0.06 h−1
, res-
pectively. These results indicated that the localised
electron states of Fe2O3 serve as charge carrier traps
for photogenerated charge carriers under visible
light irradiation [32]. According to the literature, the
trapped electron or hole will be migrated to the
catalyst surface where it will participate in a redox
reaction with the dye molecules, thereby sup-
pressing the electron-hole recombination and hence
substantially increasing the photodecolourisation
efficiency [33].
Furthermore, it is suggested that the different
photocatalytic activity behaviours depend on several
factors such as crystallite size and band gap.
According to the XRD measurements in the present
study N-dopant and Fe2O3 in mechanochemically
prepared samples led to reduction of the crystallite
size. In large crystallites of ZnO, recombination is
dominant and can be inhibited by decreasing the
particle size by ball milling. The pronounced photo-
catalytic effect is ascribed to the reduced band gap
(DRS) and lower recombination rate (PL) of ZnO.
CONCLUSION
In this study, N-doped Fe2O3-ZnO photocatalyst
was prepared by a combination of mechanoche-
mical/thermal treatment and was used as a catalyst
in the process of photodecolourisation of Methyl
Orange as a dye model. A lower PL intensity of the
mechanochemically synthesised samples in compa-
rison with the initial ZnO indicated a lower recom-
bination rate of excited electrons and holes. Initial
ZnO possessed low PL intensity under visible light
irradiation. The mechanochemically synthesised
samples exhibited a higher photocatalytic decolouri-
sation of Methyl Orange under visible light in
comparison with initial ZnO, indicating that visible
light generates photon-induced electrons and holes
in N-doped Fe2O3-ZnO due to appearance of elec-
tron level in the band gap. The visible light res-
ponsive photocatalyst showed effective activity in
the decolourisation process of Methyl Orange and
up to 42% for 120 min by increasing the doping
level.
Acknowledgment: The authors are grateful to the
Bulgarian National Science Fund for financial
N. G. Kostova et al.: Mechanochemically synthesized N-doped Fe2O3-ZnO mixed oxide
114
support under project DNTS/Slovakia 01/2 and to
the Slovak Research and Development Agency for
contracts SK-BG-2013-0011 and 14-0103. M.F.
thanks VEGA (project 2/0128/16).
REFERENCES
1. M. Janczarek, E. Kowalska, Catalysts, 7, 317 (2017).
2. W. Chiron, A. Fernandes-Cilba, A. Rodriguez, E.
Garcia-Calvo, Water Res., 34, 366 (2000).
3. K. M. Lee, Ch. W. Lai, K. S. Ngai, J. Ch. Juan,
Water Res., 88, 428 (2016).
4. A. di Mauro, M. E. Fragala, V. Privitera, Mat. Sci.
Semicon. Proc., 69, 44 (2017).
5. C. Tian, Q. Zhang, A. Wu, M. Jiang, Z. Liang, Chem.
Commun., 48, 2858 (2012).
6. Z. Wang, Y. Liu, B. Huang, Y. Dai, Z. Lou, G.
Wang, X., Zhang, X. Qin, Phys. Chem. Chem. Phys.,
16, 2758 (2014).
7. K. Mageshwari, D. Nataraj, T. Pal, R. Sathymoorthy,
J. Park, J. Alloys Comp., 625, 362 (2015).
8. G. T. S. T. da Silva, K. T. G. Carvalho, O. F. Lopes,
E. S. Gomes, A. R. Maliagutti, V. R. Mastelaro, C.
Ribeiro, H. A. J. L. Mourao, Chemcatchem, 9, 3795
(2017).
9. P. S. Bassi, L. H. Wong, J. Barber, Phys. Chem.
Chem. Phys., 16, 11834 (2014).
10. M. Mishra, D.-M. Chun, Appl. Catal. A: General
498, 126 (2015).
11. S. Balachandran, M. Swaminathan, J. Phys. Chem. C,
116, 26306 (2012).
12. M. Dorraj, M. Alizadeh, N. A. Sairi, W. J. Basirun,
B. T. Goh, P. M. Woi, Y. Alias, Appl. Surface Sci.,
414, 251 (2017).
13. K. Madeshwari, D. Nataraj, T. Pal, R. Sathyamoorthy,
J. Park, J. Alloys Comp. 625, 362 (2015).
14. R. K. Sharma, D. Kumar, R. Ghose, Ceram. Int., 42,
4090 (2016).
15. V. Sepelak, A. Duvel, M. Wilkening, K. D. Becker,
Chem. Soc. Rev., 42, 7507 (2013).
16. M. P. Tsvetkov, K. L. Zaharieva, Z. P. Cherkezova-
Zheleva, M. M. Milanova, I. G. Mitov, Bulg. Chem.
Commun., 47, 354 (2015).
17. V. Polliotto, E. Albanese, S. Livraghi, G. Pacchioni,
E. Giamello, J. Mater. Chem. A, 5, 13062 (2017).
18. W. Wang, M. O. Tade, Z. Shao, Prog. Mater. Sci.,
92, 33 (2018).
19. K. Jiratova, A. Spojakina, L. Kaluza, R. Palcheva, J.
Balabanova, G. Tyuliev, Chinese J. Catal., 37, 258
(2016).
20. D. R. Cummins, H. B. Russell, J. B. Jasinski, M.
Menon, K. M. Sunkara, Nano Lett., 13, 2423 (2013).
21. T. Žák, Y. Jirásková, CONFIT: Mössbauer spectra
fitting program, Surf. Interface Anal., 38, 710 (2006).
22. V. I. Iliev, D. V. Tomova, V. F. Georgiev, S. K.
Rakovski, Bulg. Chem. Commun., 49 Special Issue L,
17 (2017).
23. H. Lachheb, F. Ajala, A. Hamrouni, A. Houas, F.
Parrino, L. Palmisano, Catal. Sci. Technol., 7, 4041
(2017).
24. M. Anpo, S. Dzwigaj, M. Che, Adv. Catal., 52, 1
(2009).
25. N. S. Portillo-Velez, A. Hernando-Gordillo, M.
Bizarro, Catal. Today, 287 106 (2017).
26. M. Scepanovic, T. Sreckovic, K. Vojisavljevic, M.
M. Ristic, Sci. Sinter., 38, 169 (2006).
27. H. Ozaki, S. Iwamoto, M. Inoue, J. Phys. Chem. C,
111, 17061 (2007).
28. Y. Cong, J. L. Zhang, F. Chen, M. Anpo, D. N. He, J.
Phys. Chem. C, 111, 10618 (2007).
29. T. Tsoncheva, R. Ivanova, M. Dimitrov, D. Paneva,
D. Kovacheva, J. Heynych, P. Vomacka, M.
Kormunda, N. Velinov, I. Mitov, V. Stengl, Appl.
Catal. A: General, 528, 24 (2016).
30. S. S. R. Putluru, S. Mossin, A. Riisager, R.
Fehrmann, Catal. Today, 176, 292 (2011).
31. H. Kaftelen, K. Ocakoglu, R. Thomann, S. Tu, S.
Weber, E. Erdem, Phys. Rev. B, 86, 014113 (2012).
32. L. G. Devi, N. Kottam, B. Narasimha, B. N. Murthy,
S. G. Kumar, J. Mol. Catal. A: Chem., 328, 44 (2010).
33. R. Chauhan, A. Kumar, R. P. Chaudhary, P. Ram,
Spectrochim. Acta Part A: Mol. Biomol. Spectrosc.,
98, 256 (2012).
N. G. Kostova et al.: Mechanochemically synthesized N-doped Fe2O3-ZnO mixed oxide
115
СВОЙСТВА НА МЕХАНОХИМИЧНО СИНТЕЗИРАН ДОТИРАН С АЗОТ Fe2O3-ZnO СМЕСЕН
ОКСИД
Н. Г. Костова*1, М. Фабиан
2, Е. Дуткова
2, Н. Велинов
1, Й. Каракирова
1, М. Балаж
2
1 Институт по катализ, Българска академия на науките, 1113 София, България
2 Институт по геотехника, Словашка академия на науките, 04001 Кошице, Словакия
Постъпила на: 2 февруари 2018 г.; Преработена на: 13 април 2018 г.
(Резюме)
Настоящата статия се отнася до получаването и охарактеризирането на дотиран с азот Fe2O3-ZnO смесен
оксид и способността на този материал да обезцвети органичното багрило Метил Оранж във воден разтвор при
облъчване с видима светлина. Фотокаталитичният материал беше получен чрез екологичен механохимичен
метод на синтез. Фотокатализаторите бяха охарактеризирани с рентгенофазов анализ (РФА), УВ-видима
дифузно-отражателна спектроскопия (ДОС), фотолуминесцентна спектроскопия (ФЛ), електронен парамаг-
нитен резонанс (ЕПР) и Мьосбауерова спектроскопия. РФА показа, че прилагането на механохимичен синтез
промотира промени в размера на кристалитите. Беше регистрирано стесняване на забранената зона на механо-
химично синтезирания дотиран с азот Fe2O3-ZnO смесен оксид и подобряване на фотокаталитичната активност
при облъчване с видима светлина в сравнение с изходния ZnO. Пониженият интензитет във фотолуминес-
центния спектър на N-Fe2O3-ZnO свидетелства за подобрено разделяне на зарядите, по-ниска скорост на
рекомбиниране на електрон-дупка и съответно по-висока фотокаталитична активност в сравнение с изходния
ZnO.
N. G. Kostova et al.: Mechanochemically synthesized N-doped Fe2O3-ZnO mixed oxide
116
Bulgarian Chemical Communications, Volume 50, Special issue H (pp. 116–121) 2018
Mineralization of pharmaceutical drugs by ZnO photocatalysts
under UV light illumination
N. Kaneva*, A. Bojinova, K. Papazova, D. Dimitrov
Laboratory of Nanoparticle Science and Technology, Department of General and Inorganic Chemistry,
Faculty of Chemistry and Pharmacy, University of Sofia, 1164 Sofia, Bulgaria
Received: February 05, 2018; Revised: April 06, 2018
Zinc oxide films were obtained by simple suspension method through mixing commercial ZnO powder, ethanol, and
polyethylene glycol. Samples were deposited with one and five layers by dip coating. Film efficiency was evaluated by
decolourisation of the pharmaceutical drugs Paracetamol and Chloramphenicol. Drugs mineralisation kinetics in
distilled water upon UV light illumination was studied as a model system for contaminated wastewater. Photocatalytic
experiments with commercial ZnO powders (unannealed and annealed) were also investigated. The films and the
powders were characterised by SEM, XRD, BET, and UV-vis spectroscopy. The effects of catalysts amount and
annealing temperature were examined. ZnO showed higher photocatalytic efficiency in Paracetamol degradation as
compared to that of Chloramphenicol.
Key words: ZnO, thin films, powders, photocatalysis, pharmaceutical drugs.
INTRODUCTION
Zinc oxide is one of the most important
inorganic, multifunctional, and promising materials
in the family of wide-gap semiconductors due to its
unique properties, such as chemical, radiation and
thermal resistance, optical transparency, and high
piezoelectric and photocatalytic properties. It has
been extensively used in industrial and medical
applications such as UV light emitting diodes [1],
UV laser [2], solar cells [3], gas sensors [4], photo-
catalysts [5], photovoltaic devices [6], toxicological
materials [7], etc. It is well known that the proper-
ties of nanomaterials depend not only on the
composition but also on the structure. There are
various ZnО nanostructures, such as nanoparticles
[8], nanorods [9], nanoflowers [10], nanowires [11],
and nanosheets [12], which have been successfully
synthesised by different approaches: thermal decom-
position [13,14], sol-gel method [15], microwave
method [16], chemical precipitation method [17],
hydrothermal method [18], etc.
ZnO is widely utilised semiconductor catalyst
that exhibits an attractive and promising property. In
regarding to its high photocatalytic activity, ZnO
nanostructures have attracted a considerable atten-
tion, which is due to their superior performance in
the range of ultraviolet and visible light compared
with well-known catalysts such as titania [19]. Zinc
oxide nanomaterials exhibit unique properties owing
to their complicated structure, among which photo-
catalysis is the most important for degradation of
organic pollutants in aqueous solution: dyes [20,21],
pesticides [22], pharmaceutical drugs [23‒25], etc.
Pharmaceutical products are considered harmful
pollutants in the aquatic ecosystem even at low
concentrations due to their continuous input and
accumulation in the environment. They have been
detected worldwide in environmental matrices
indicating their ineffective removal from waste-
waters using conventional purification methods. To
prevent this contamination several processes of drug
removal have been studied [26]. Heterogeneous
photocatalysis of organic pollutants in wastewater is
an advanced method for environmental protection.
As a well-known photocatalyst, ZnO has the poten-
tial for degradation and complete mineralisation of
environmental pollutants [27]. Besides photopuri-
fication of water suspensions seems more promising
(high scores and degree of photodegradation and a
greater amount of treated solution), there are crucial
limitations for its application in practice: unsolved
problems like light penetration into solutions and
final separation of the catalysts from treated solu-
tion. Therefore, the purification of contaminated
water via photocatalytic films is still preferable for
practical application.
In this study, nanostructured ZnO photocatalysts
(powders and thin films, prepared by dip coating
from suspensions) were characterised and tested for
the photocatalytic degradation of two commonly
used drugs: Paracetamol (PCA) and Chloramphe-
nicol (CA). Photomineralisation kinetics of drugs in
© 2018 Bulgarian Academy of Sciences, Union of Chemists in Bulgaria
* To whom all correspondence should be sent
E-mail: [email protected]
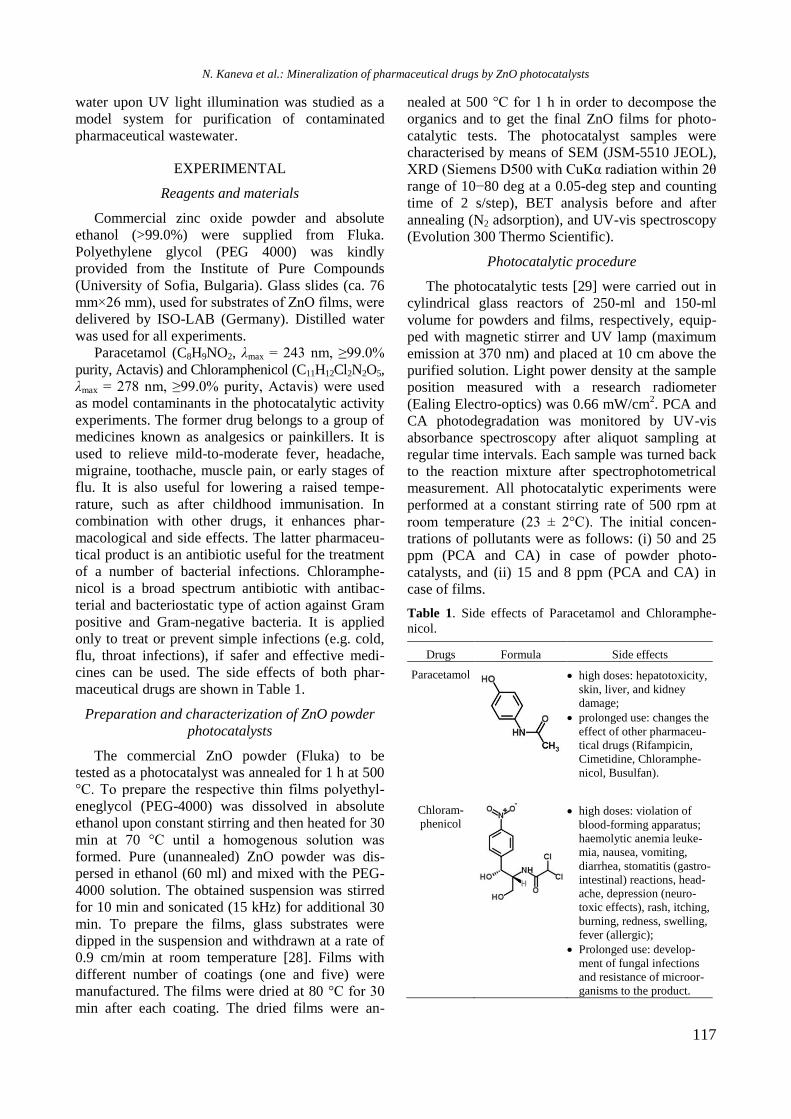
117
water upon UV light illumination was studied as a
model system for purification of contaminated
pharmaceutical wastewater.
EXPERIMENTAL
Reagents and materials
Commercial zinc oxide powder and absolute
ethanol (>99.0%) were supplied from Fluka.
Polyethylene glycol (PEG 4000) was kindly
provided from the Institute of Pure Compounds
(University of Sofia, Bulgaria). Glass slides (ca. 76
mm×26 mm), used for substrates of ZnO films, were
delivered by ISO-LAB (Germany). Distilled water
was used for all experiments.
Paracetamol (C8H9NO2, λmax = 243 nm, ≥99.0%
purity, Actavis) and Chloramphenicol (C11H12Cl2N2O5,
λmax = 278 nm, ≥99.0% purity, Actavis) were used
as model contaminants in the photocatalytic activity
experiments. The former drug belongs to a group of
medicines known as analgesics or painkillers. It is
used to relieve mild-to-moderate fever, headache,
migraine, toothache, muscle pain, or early stages of
flu. It is also useful for lowering a raised tempe-
rature, such as after childhood immunisation. In
combination with other drugs, it enhances phar-
macological and side effects. The latter pharmaceu-
tical product is an antibiotic useful for the treatment
of a number of bacterial infections. Chloramphe-
nicol is a broad spectrum antibiotic with antibac-
terial and bacteriostatic type of action against Gram
positive and Gram-negative bacteria. It is applied
only to treat or prevent simple infections (e.g. cold,
flu, throat infections), if safer and effective medi-
cines can be used. The side effects of both phar-
maceutical drugs are shown in Table 1.
Preparation and characterization of ZnO powder
photocatalysts
The commercial ZnO powder (Fluka) to be
tested as a photocatalyst was annealed for 1 h at 500
°C. To prepare the respective thin films polyethyl-
eneglycol (PEG-4000) was dissolved in absolute
ethanol upon constant stirring and then heated for 30
min at 70 °C until a homogenous solution was
formed. Pure (unannealed) ZnO powder was dis-
persed in ethanol (60 ml) and mixed with the PEG-
4000 solution. The obtained suspension was stirred
for 10 min and sonicated (15 kHz) for additional 30
min. To prepare the films, glass substrates were
dipped in the suspension and withdrawn at a rate of
0.9 cm/min at room temperature [28]. Films with
different number of coatings (one and five) were
manufactured. The films were dried at 80 °C for 30
min after each coating. The dried films were an-
nealed at 500 °C for 1 h in order to decompose the
organics and to get the final ZnO films for photo-
catalytic tests. The photocatalyst samples were
characterised by means of SEM (JSM-5510 JEOL),
XRD (Siemens D500 with CuKα radiation within 2θ
range of 10−80 deg at a 0.05-deg step and counting
time of 2 s/step), BET analysis before and after
annealing (N2 adsorption), and UV-vis spectroscopy
(Evolution 300 Thermo Scientific).
Photocatalytic procedure
The photocatalytic tests [29] were carried out in
cylindrical glass reactors of 250-ml and 150-ml
volume for powders and films, respectively, equip-
ped with magnetic stirrer and UV lamp (maximum
emission at 370 nm) and placed at 10 cm above the
purified solution. Light power density at the sample
position measured with a research radiometer
(Ealing Electro-optics) was 0.66 mW/cm2. PCA and
CA photodegradation was monitored by UV-vis
absorbance spectroscopy after aliquot sampling at
regular time intervals. Each sample was turned back
to the reaction mixture after spectrophotometrical
measurement. All photocatalytic experiments were
performed at a constant stirring rate of 500 rpm at
room temperature (23 ± 2°C). The initial concen-
trations of pollutants were as follows: (i) 50 and 25
ppm (PCA and CA) in case of powder photo-
catalysts, and (ii) 15 and 8 ppm (PCA and CA) in
case of films.
Table 1. Side effects of Paracetamol and Chloramphe-
nicol.
Drugs Formula Side effects
Paracetamol
high doses: hepatotoxicity,
skin, liver, and kidney
damage;
prolonged use: changes the
effect of other pharmaceu-
tical drugs (Rifampicin,
Cimetidine, Chloramphe-
nicol, Busulfan).
Chloram-
phenicol
high doses: violation of
blood-forming apparatus;
haemolytic anemia leuke-
mia, nausea, vomiting,
diarrhea, stomatitis (gastro-
intestinal) reactions, head-
ache, depression (neuro-
toxic effects), rash, itching,
burning, redness, swelling,
fever (allergic);
Prolonged use: develop-
ment of fungal infections
and resistance of microor-
ganisms to the product.
N. Kaneva et al.: Mineralization of pharmaceutical drugs by ZnO photocatalysts
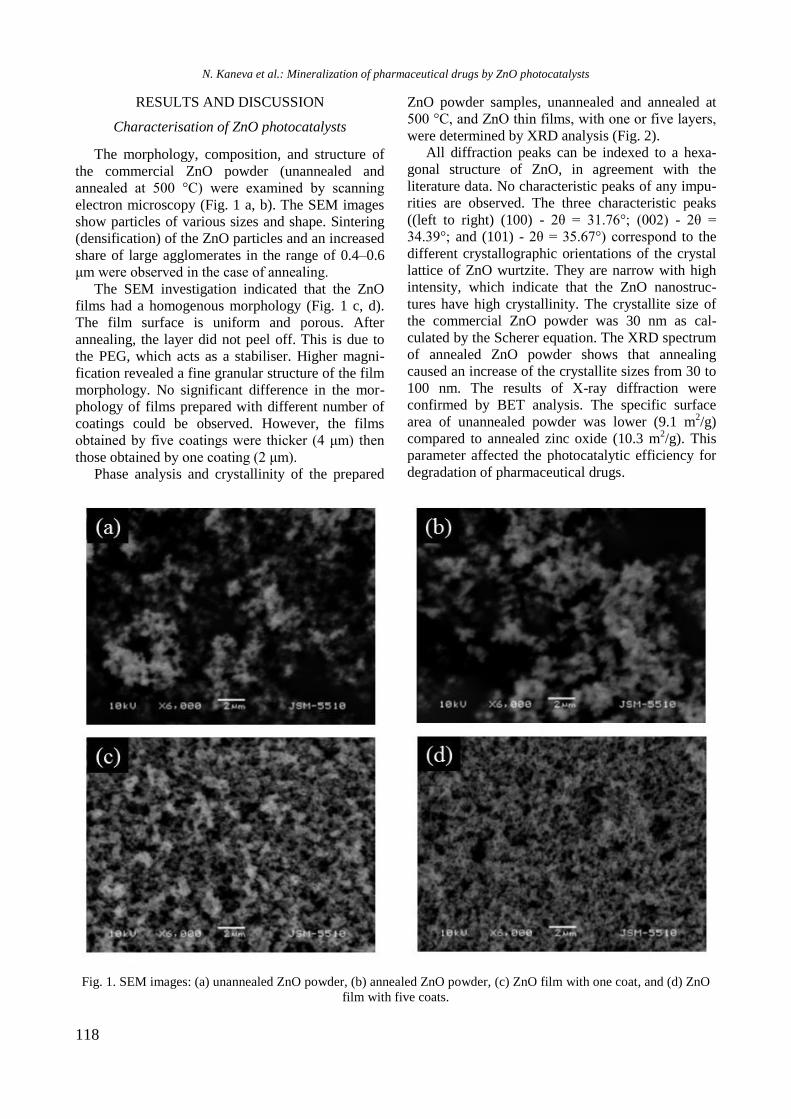
118
RESULTS AND DISCUSSION
Characterisation of ZnO photocatalysts
The morphology, composition, and structure of
the commercial ZnO powder (unannealed and
annealed at 500 °C) were examined by scanning
electron microscopy (Fig. 1 a, b). The SEM images
show particles of various sizes and shape. Sintering
(densification) of the ZnO particles and an increased
share of large agglomerates in the range of 0.4–0.6
μm were observed in the case of annealing.
The SEM investigation indicated that the ZnO
films had a homogenous morphology (Fig. 1 c, d).
The film surface is uniform and porous. After
annealing, the layer did not peel off. This is due to
the PEG, which acts as a stabiliser. Higher magni-
fication revealed a fine granular structure of the film
morphology. No significant difference in the mor-
phology of films prepared with different number of
coatings could be observed. However, the films
obtained by five coatings were thicker (4 μm) then
those obtained by one coating (2 μm).
Phase analysis and crystallinity of the prepared
ZnO powder samples, unannealed and annealed at
500 °C, and ZnO thin films, with one or five layers,
were determined by XRD analysis (Fig. 2).
All diffraction peaks can be indexed to a hexa-
gonal structure of ZnO, in agreement with the
literature data. No characteristic peaks of any impu-
rities are observed. The three characteristic peaks
((left to right) (100) - 2θ = 31.76°; (002) - 2θ =
34.39°; and (101) - 2θ = 35.67°) correspond to the
different crystallographic orientations of the crystal
lattice of ZnO wurtzite. They are narrow with high
intensity, which indicate that the ZnO nanostruc-
tures have high crystallinity. The crystallite size of
the commercial ZnO powder was 30 nm as cal-
culated by the Scherer equation. The XRD spectrum
of annealed ZnO powder shows that annealing
caused an increase of the crystallite sizes from 30 to
100 nm. The results of X-ray diffraction were
confirmed by BET analysis. The specific surface
area of unannealed powder was lower (9.1 m2/g)
compared to annealed zinc oxide (10.3 m2/g). This
parameter affected the photocatalytic efficiency for
degradation of pharmaceutical drugs.
Fig. 1. SEM images: (a) unannealed ZnO powder, (b) annealed ZnO powder, (c) ZnO film with one coat, and (d) ZnO
film with five coats.
N. Kaneva et al.: Mineralization of pharmaceutical drugs by ZnO photocatalysts
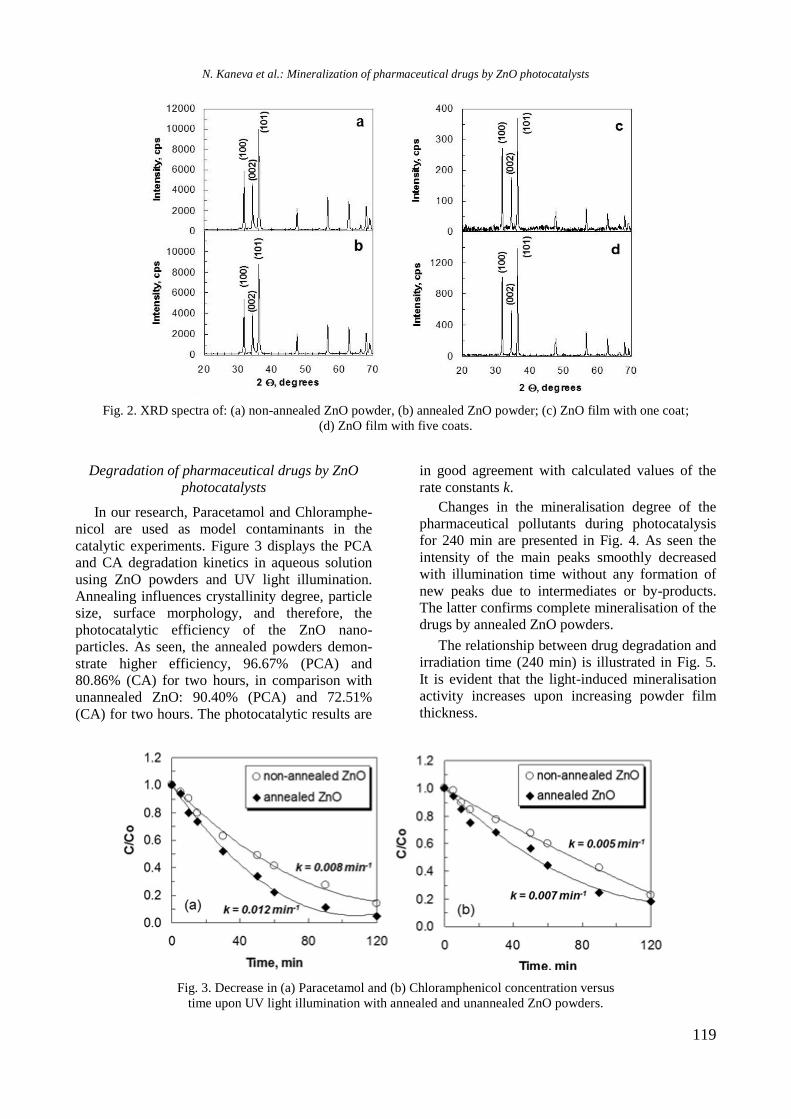
119
Fig. 2. XRD spectra of: (a) non-annealed ZnO powder, (b) annealed ZnO powder; (c) ZnO film with one coat;
(d) ZnO film with five coats.
Degradation of pharmaceutical drugs by ZnO
photocatalysts
In our research, Paracetamol and Chloramphe-
nicol are used as model contaminants in the
catalytic experiments. Figure 3 displays the PCA
and CA degradation kinetics in aqueous solution
using ZnO powders and UV light illumination.
Annealing influences crystallinity degree, particle
size, surface morphology, and therefore, the
photocatalytic efficiency of the ZnO nano-
particles. As seen, the annealed powders demon-
strate higher efficiency, 96.67% (PCA) and
80.86% (CA) for two hours, in comparison with
unannealed ZnO: 90.40% (PCA) and 72.51%
(CA) for two hours. The photocatalytic results are
in good agreement with calculated values of the
rate constants k.
Changes in the mineralisation degree of the
pharmaceutical pollutants during photocatalysis
for 240 min are presented in Fig. 4. As seen the
intensity of the main peaks smoothly decreased
with illumination time without any formation of
new peaks due to intermediates or by-products.
The latter confirms complete mineralisation of the
drugs by annealed ZnO powders.
The relationship between drug degradation and
irradiation time (240 min) is illustrated in Fig. 5.
It is evident that the light-induced mineralisation
activity increases upon increasing powder film
thickness.
Fig. 3. Decrease in (a) Paracetamol and (b) Chloramphenicol concentration versus
time upon UV light illumination with annealed and unannealed ZnO powders.
N. Kaneva et al.: Mineralization of pharmaceutical drugs by ZnO photocatalysts
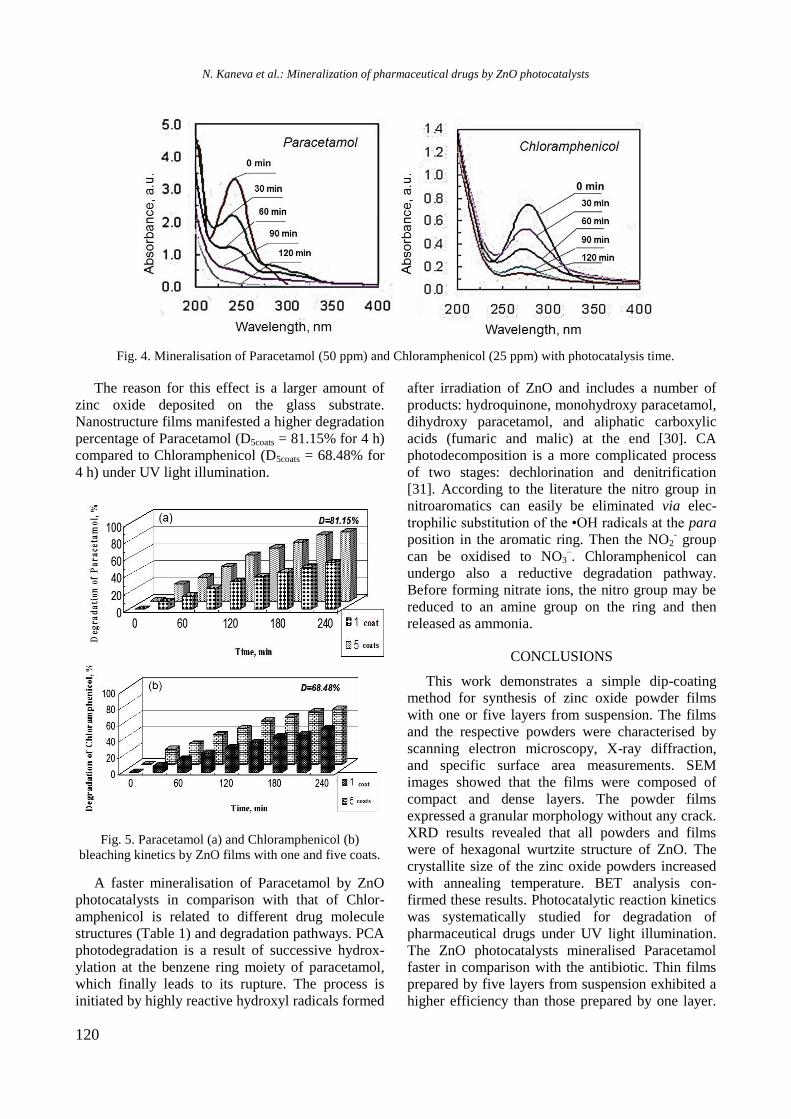
120
Fig. 4. Mineralisation of Paracetamol (50 ppm) and Chloramphenicol (25 ppm) with photocatalysis time.
The reason for this effect is a larger amount of
zinc oxide deposited on the glass substrate.
Nanostructure films manifested a higher degradation
percentage of Paracetamol (D5coats = 81.15% for 4 h)
compared to Chloramphenicol (D5coats = 68.48% for
4 h) under UV light illumination.
Fig. 5. Paracetamol (a) and Chloramphenicol (b)
bleaching kinetics by ZnO films with one and five coats.
A faster mineralisation of Paracetamol by ZnO
photocatalysts in comparison with that of Chlor-
amphenicol is related to different drug molecule
structures (Table 1) and degradation pathways. PCA
photodegradation is a result of successive hydrox-
ylation at the benzene ring moiety of paracetamol,
which finally leads to its rupture. The process is
initiated by highly reactive hydroxyl radicals formed
after irradiation of ZnO and includes a number of
products: hydroquinone, monohydroxy paracetamol,
dihydroxy paracetamol, and aliphatic carboxylic
acids (fumaric and malic) at the end [30]. CA
photodecomposition is a more complicated process
of two stages: dechlorination and denitrification
[31]. According to the literature the nitro group in
nitroaromatics can easily be eliminated via elec-
trophilic substitution of the •OH radicals at the para
position in the aromatic ring. Then the NO2- group
can be oxidised to NO3‒. Chloramphenicol can
undergo also a reductive degradation pathway.
Before forming nitrate ions, the nitro group may be
reduced to an amine group on the ring and then
released as ammonia.
CONCLUSIONS
This work demonstrates a simple dip-coating
method for synthesis of zinc oxide powder films
with one or five layers from suspension. The films
and the respective powders were characterised by
scanning electron microscopy, X-ray diffraction,
and specific surface area measurements. SEM
images showed that the films were composed of
compact and dense layers. The powder films
expressed a granular morphology without any crack.
XRD results revealed that all powders and films
were of hexagonal wurtzite structure of ZnO. The
crystallite size of the zinc oxide powders increased
with annealing temperature. BET analysis con-
firmed these results. Photocatalytic reaction kinetics
was systematically studied for degradation of
pharmaceutical drugs under UV light illumination.
The ZnO photocatalysts mineralised Paracetamol
faster in comparison with the antibiotic. Thin films
prepared by five layers from suspension exhibited a
higher efficiency than those prepared by one layer.
N. Kaneva et al.: Mineralization of pharmaceutical drugs by ZnO photocatalysts
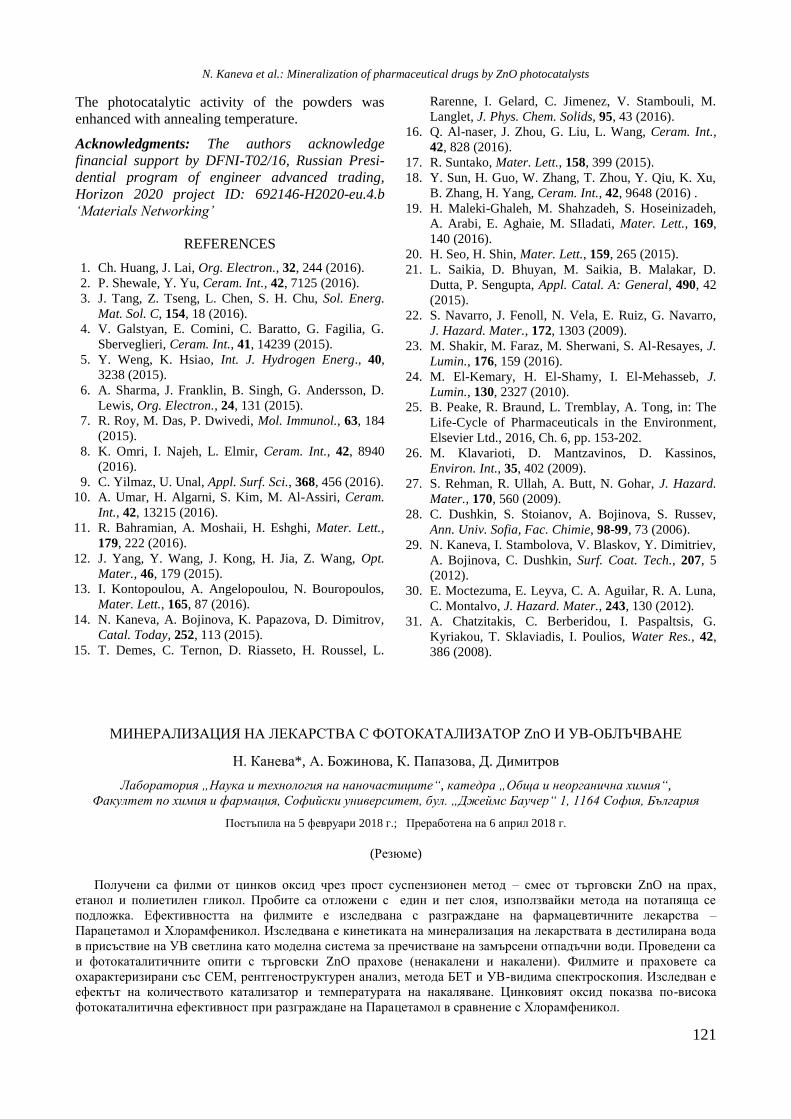
121
The photocatalytic activity of the powders was
enhanced with annealing temperature.
Acknowledgments: The authors acknowledge
financial support by DFNI-T02/16, Russian Presi-
dential program of engineer advanced trading,
Horizon 2020 project ID: 692146-H2020-eu.4.b
‘Materials Networking’
REFERENCES
1. Ch. Huang, J. Lai, Org. Electron., 32, 244 (2016).
2. P. Shewale, Y. Yu, Ceram. Int., 42, 7125 (2016).
3. J. Tang, Z. Tseng, L. Chen, S. H. Chu, Sol. Energ.
Mat. Sol. C, 154, 18 (2016).
4. V. Galstyan, E. Comini, C. Baratto, G. Fagilia, G.
Sberveglieri, Ceram. Int., 41, 14239 (2015).
5. Y. Weng, K. Hsiao, Int. J. Hydrogen Energ., 40,
3238 (2015).
6. A. Sharma, J. Franklin, B. Singh, G. Andersson, D.
Lewis, Org. Electron., 24, 131 (2015).
7. R. Roy, M. Das, P. Dwivedi, Mol. Immunol., 63, 184
(2015).
8. K. Omri, I. Najeh, L. Elmir, Ceram. Int., 42, 8940
(2016).
9. C. Yilmaz, U. Unal, Appl. Surf. Sci., 368, 456 (2016).
10. A. Umar, H. Algarni, S. Kim, M. Al-Assiri, Ceram.
Int., 42, 13215 (2016).
11. R. Bahramian, A. Moshaii, H. Eshghi, Mater. Lett.,
179, 222 (2016).
12. J. Yang, Y. Wang, J. Kong, H. Jia, Z. Wang, Opt.
Mater., 46, 179 (2015).
13. I. Kontopoulou, A. Angelopoulou, N. Bouropoulos,
Mater. Lett., 165, 87 (2016).
14. N. Kaneva, A. Bojinova, K. Papazova, D. Dimitrov,
Catal. Today, 252, 113 (2015).
15. T. Demes, C. Ternon, D. Riasseto, H. Roussel, L.
Rarenne, I. Gelard, C. Jimenez, V. Stambouli, M.
Langlet, J. Phys. Chem. Solids, 95, 43 (2016).
16. Q. Al-naser, J. Zhou, G. Liu, L. Wang, Ceram. Int.,
42, 828 (2016).
17. R. Suntako, Mater. Lett., 158, 399 (2015).
18. Y. Sun, H. Guo, W. Zhang, T. Zhou, Y. Qiu, K. Xu,
B. Zhang, H. Yang, Ceram. Int., 42, 9648 (2016) .
19. H. Maleki-Ghaleh, M. Shahzadeh, S. Hoseinizadeh,
A. Arabi, E. Aghaie, M. SIladati, Mater. Lett., 169,
140 (2016).
20. H. Seo, H. Shin, Mater. Lett., 159, 265 (2015).
21. L. Saikia, D. Bhuyan, M. Saikia, B. Malakar, D.
Dutta, P. Sengupta, Appl. Catal. A: General, 490, 42
(2015).
22. S. Navarro, J. Fenoll, N. Vela, E. Ruiz, G. Navarro,
J. Hazard. Mater., 172, 1303 (2009).
23. M. Shakir, M. Faraz, M. Sherwani, S. Al-Resayes, J.
Lumin., 176, 159 (2016).
24. M. El-Kemary, H. El-Shamy, I. El-Mehasseb, J.
Lumin., 130, 2327 (2010).
25. B. Peake, R. Braund, L. Tremblay, A. Tong, in: The
Life-Cycle of Pharmaceuticals in the Environment,
Elsevier Ltd., 2016, Ch. 6, pp. 153-202.
26. M. Klavarioti, D. Mantzavinos, D. Kassinos,
Environ. Int., 35, 402 (2009).
27. S. Rehman, R. Ullah, A. Butt, N. Gohar, J. Hazard.
Mater., 170, 560 (2009).
28. C. Dushkin, S. Stoianov, A. Bojinova, S. Russev,
Ann. Univ. Sofia, Fac. Chimie, 98-99, 73 (2006).
29. N. Kaneva, I. Stambolova, V. Blaskov, Y. Dimitriev,
A. Bojinova, C. Dushkin, Surf. Coat. Tech., 207, 5
(2012).
30. E. Moctezuma, E. Leyva, C. A. Aguilar, R. A. Luna,
C. Montalvo, J. Hazard. Mater., 243, 130 (2012).
31. A. Chatzitakis, C. Berberidou, I. Paspaltsis, G.
Kyriakou, T. Sklaviadis, I. Poulios, Water Res., 42,
386 (2008).
МИНЕРАЛИЗАЦИЯ НА ЛЕКАРСТВА С ФОТОКАТАЛИЗАТОР ZnO И УВ-ОБЛЪЧВАНЕ
Н. Канева*, А. Божинова, К. Папазова, Д. Димитров
Лаборатория „Наука и технология на наночастиците“, катедра „Обща и неорганична химия“,
Факултет по химия и фармация, Софийски университет, бул. „Джеймс Баучер“ 1, 1164 София, България
Постъпила на 5 февруари 2018 г.; Преработена на 6 април 2018 г.
(Резюме)
Получени са филми от цинков оксид чрез прост суспензионен метод – смес от търговски ZnO на прах,
етанол и полиетилен гликол. Пробите са отложени с един и пет слоя, използвайки метода на потапяща се
подложка. Ефективността на филмите е изследвана с разграждане на фармацевтичните лекарства –
Парацетамол и Хлорамфеникол. Изследвана е кинетиката на минерализация на лекарствата в дестилирана вода
в присъствие на УВ светлина като моделна система за пречистване на замърсени отпадъчни води. Проведени са
и фотокаталитичните опити с търговски ZnO прахове (ненакалени и накалени). Филмите и праховете са
охарактеризирани със СЕМ, рентгеноструктурен анализ, метода БЕТ и УВ-видима спектроскопия. Изследван е
ефектът на количеството катализатор и температурата на накаляване. Цинковият оксид показва по-висока
фотокаталитична ефективност при разграждане на Парацетамол в сравнение с Хлорамфеникол.
N. Kaneva et al.: Mineralization of pharmaceutical drugs by ZnO photocatalysts
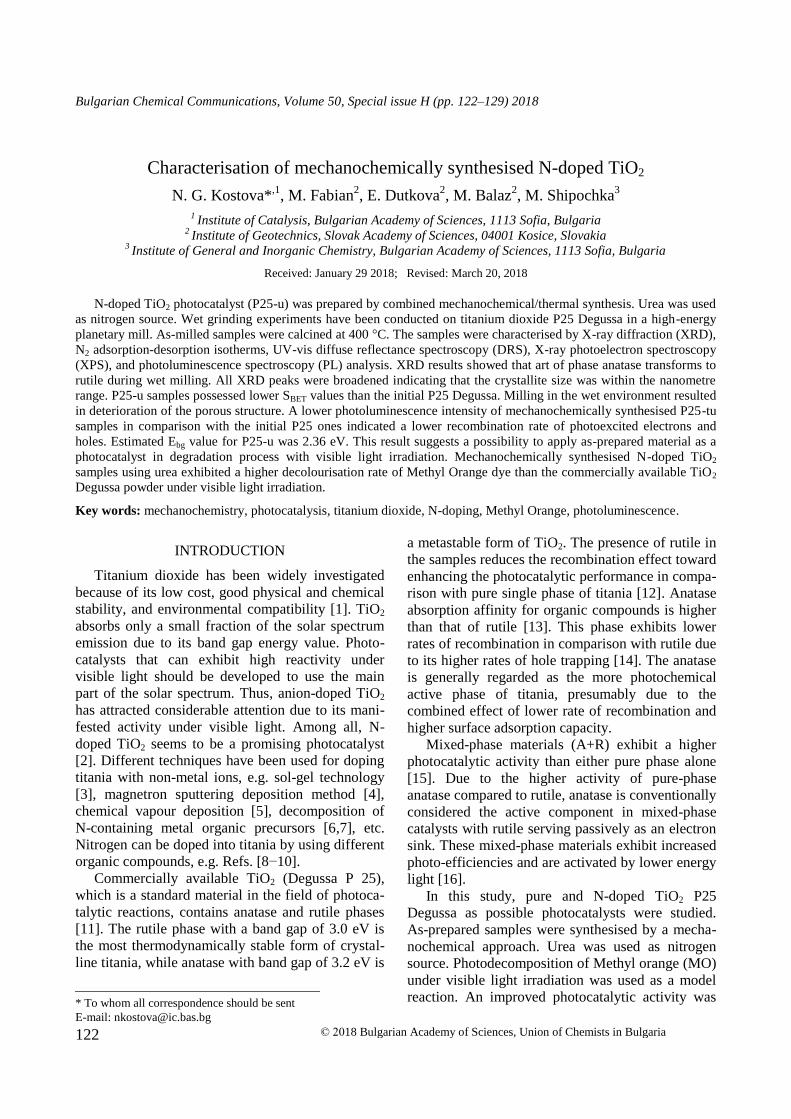
122
Bulgarian Chemical Communications, Volume 50, Special issue H (pp. 122–129) 2018
Characterisation of mechanochemically synthesised N-doped TiO2
N. G. Kostova*,1
, M. Fabian2, E. Dutkova
2, M. Balaz
2, M. Shipochka
3
1 Institute of Catalysis, Bulgarian Academy of Sciences, 1113 Sofia, Bulgaria
2 Institute of Geotechnics, Slovak Academy of Sciences, 04001 Kosice, Slovakia
3 Institute of General and Inorganic Chemistry, Bulgarian Academy of Sciences, 1113 Sofia, Bulgaria
Received: January 29 2018; Revised: March 20, 2018
N-doped TiO2 photocatalyst (P25-u) was prepared by combined mechanochemical/thermal synthesis. Urea was used
as nitrogen source. Wet grinding experiments have been conducted on titanium dioxide P25 Degussa in a high-energy
planetary mill. As-milled samples were calcined at 400 °C. The samples were characterised by X-ray diffraction (XRD),
N2 adsorption-desorption isotherms, UV-vis diffuse reflectance spectroscopy (DRS), X-ray photoelectron spectroscopy
(XPS), and photoluminescence spectroscopy (PL) analysis. XRD results showed that art of phase anatase transforms to
rutile during wet milling. All XRD peaks were broadened indicating that the crystallite size was within the nanometre
range. P25-u samples possessed lower SBET values than the initial P25 Degussa. Milling in the wet environment resulted
in deterioration of the porous structure. A lower photoluminescence intensity of mechanochemically synthesised P25-tu
samples in comparison with the initial P25 ones indicated a lower recombination rate of photoexcited electrons and
holes. Estimated Ebg value for P25-u was 2.36 eV. This result suggests a possibility to apply as-prepared material as a
photocatalyst in degradation process with visible light irradiation. Mechanochemically synthesised N-doped TiO2
samples using urea exhibited a higher decolourisation rate of Methyl Orange dye than the commercially available TiO2
Degussa powder under visible light irradiation.
Key words: mechanochemistry, photocatalysis, titanium dioxide, N-doping, Methyl Orange, photoluminescence.
INTRODUCTION
Titanium dioxide has been widely investigated
because of its low cost, good physical and chemical
stability, and environmental compatibility [1]. TiO2
absorbs only a small fraction of the solar spectrum
emission due to its band gap energy value. Photo-
catalysts that can exhibit high reactivity under
visible light should be developed to use the main
part of the solar spectrum. Thus, anion-doped TiO2
has attracted considerable attention due to its mani-
fested activity under visible light. Among all, N-
doped TiO2 seems to be a promising photocatalyst
[2]. Different techniques have been used for doping
titania with non-metal ions, e.g. sol-gel technology
[3], magnetron sputtering deposition method [4],
chemical vapour deposition [5], decomposition of
N-containing metal organic precursors [6,7], etc.
Nitrogen can be doped into titania by using different
organic compounds, e.g. Refs. [8−10].
Commercially available TiO2 (Degussa P 25),
which is a standard material in the field of photoca-
talytic reactions, contains anatase and rutile phases
[11]. The rutile phase with a band gap of 3.0 eV is
the most thermodynamically stable form of crystal-
line titania, while anatase with band gap of 3.2 eV is
a metastable form of TiO2. The presence of rutile in
the samples reduces the recombination effect toward
enhancing the photocatalytic performance in compa-
rison with pure single phase of titania [12]. Anatase
absorption affinity for organic compounds is higher
than that of rutile [13]. This phase exhibits lower
rates of recombination in comparison with rutile due
to its higher rates of hole trapping [14]. The anatase
is generally regarded as the more photochemical
active phase of titania, presumably due to the
combined effect of lower rate of recombination and
higher surface adsorption capacity.
Mixed-phase materials (A+R) exhibit a higher
photocatalytic activity than either pure phase alone
[15]. Due to the higher activity of pure-phase
anatase compared to rutile, anatase is conventionally
considered the active component in mixed-phase
catalysts with rutile serving passively as an electron
sink. These mixed-phase materials exhibit increased
photo-efficiencies and are activated by lower energy
light [16].
In this study, pure and N-doped TiO2 P25
Degussa as possible photocatalysts were studied.
As-prepared samples were synthesised by a mecha-
nochemical approach. Urea was used as nitrogen
source. Photodecomposition of Methyl orange (MO)
under visible light irradiation was used as a model
reaction. An improved photocatalytic activity was
© 2018 Bulgarian Academy of Sciences, Union of Chemists in Bulgaria
* To whom all correspondence should be sent
E-mail: [email protected]
123
found for all N-doped TiO2 Degussa P25 samples.
The aim of the present study was to investigate the
influence of doping and of the local structure varia-
tion of titania on its photocatalytic properties.
EXPERIMENTAL
Mechanochemical synthesis
Commercial TiO2 P25 (Degussa, Holand) and
urea of analytical grade were used without further
purification. N-doped TiO2 samples were prepared
by addition of urea as modifier to TiO2 P25 Degussa
by mechanochemical/thermal synthesis using a high-
energy planetary ball mill Pulverisette 6 (Fritsch,
Germany). Titania powder was mixed with 5 wt.%
urea before being placed in the reactor vessel. Wet
milling was performed in presence of 1.2 ml dis-
tilled water. The sample was milled for 30 min at
550 rpm under argon using a chamber (250 cm3 in
volume) with 21 balls (10 mm in diameter) both
made of zirconia. The ball-to-powder mass ratio was
40:1. To remove residual urea, the yellowish sample
of N-doped TiO2 P25 Degussa was calcined at 400 oC in air for 1 h. According to urea modifier, the N-
doped samples were denoted as P25-u. An original
TiO2 P25 powder was also used as a reference
sample (P25).
Characterisation techniques
The crystal structure was characterised by using a
D8 Advance X-ray diffractometer (Bruker, Germany)
in the Bragg-Brentano geometry working with a
CuKα radiation (λ = 0.15406 nm) and a scintillation
detector. Data were collected over the angular range
of 20o < 2θ < 65
o with scanning steps of 0.020
o and
a measurement step time interval of 9 s. For data
processing, commercial Bruker tools were used.
Specifically, Diffracplus
Eva database was utilised
for phase identification.
A nitrogen adsorption apparatus NOVA 1200e
Surface Area & Pore Size Analyzer (Quantachrome
Instruments, United Kingdom) was employed to
record adsorption-desorption isotherms. Specific
surface area (SBET) values were calculated using
Brunauer-Emmett-Teller (BET) equation. The pore
size distribution was calculated using the Barrett-
Joyner-Halenda (BJH) method. The measurements
were performed at the liquid nitrogen temperature.
Diffuse reflectance UV-vis spectra for evaluation
of photophysical properties were recorded in the
diffuse reflectance mode (R) and transformed to
absorption spectra through the Kubelka-Munk func-
tion [17]. A Thermo Evolution 300 UV-vis spectro-
photometer (Thermo Scientific, USA) equipped with
a Praying Mantis device with Spectralon as the refer-
ence was used. Reflectance data were obtained as a
relative percentage reflectance to a non-absorbing
material (spectralon) which could optically diffuse
light.
Sample composition and electronic structure were
investigated by X-ray photoelectron spectroscopy
(XPS). The measurements were carried out on an
AXIS Supra electron - spectrometer (Kratos Anali-
tycal Ltd., Japan) using monochromatic AlKα radia-
tion with photon energy of 1486.6 eV and charge
neutralisation system. Binding energies (BE) were
determined with an accuracy of ±0.1 eV. The che-
mical composition of the films was determined by
monitoring the areas and binding energies of C1s,
O1s, and Ti2p photoelectron peaks using an asym-
metric Gaussian-Lorentzian function fit. Applying
commercial data-processing software of Kratos
Analytical Ltd. concentrations of the different
chemical elements (as atomic %) were calculated by
normalising the areas of the photoelectron peaks to
their relative sensitivity factors.
Photoluminescence (PL) spectra at room tempe-
rature were acquired at right angle on a photon
counting spectrofluorometer PC1 (ISS, USA) with a
photoexcitation wavelength of 325 nm. A 300-W
xenon lamp was used as the excitation source. For
measuring the PL intensity, the powders were sus-
pended in absolute ethanol.
Sample photocatalytic activity in the reaction of
Methyl orange decolourisation was measured under
visible light illumination. The photocatalytic expe-
riments were carried out in a semi-batch photore-
actor equipped with a magnetic stirrer as reported in
previous work [18]. Methyl Orange dye was used as
reactant with a concentration of 10 mg/L. The sus-
pension was prepared by adding N-doped TiO2
sample (100 mg) to 100 ml of Methyl Orange solu-
tion. MO degree of decolourisation could be easily
monitored by optical absorption spectroscopy. Prior
to deposition, the suspension of MO with N-doped
TiO2 was sonicated for 5 min to obtain an optimally
dispersed system using an UP200S ultrasound pro-
cessor (Hielscher, Germany) at 24 Hz in a pulse mode.
The suspension was magnetically stirred in the dark
for 30 min to ensure an adsorption-desorption
equilibrium. Then the light was turned on and this
was considered to be the initial moment (t = 0 s) of
the photocatalytic reaction. The suspension was irra-
diated by a Philips TUV lamp (4 W) at UV-C mono-
chromatic radiation (λ = 254 nm). All experiments
were performed at a constant stirring rate of 400
rpm at room temperature. During the photo-catalytic
reaction the concentration of MO was determined by
monitoring the changes of the main absorbance peak
at λ = 463 nm. MO decolourisation reaction course
N. G. Kostova et al.: Characterization of mechanochemically synthesized N-doped TiO2
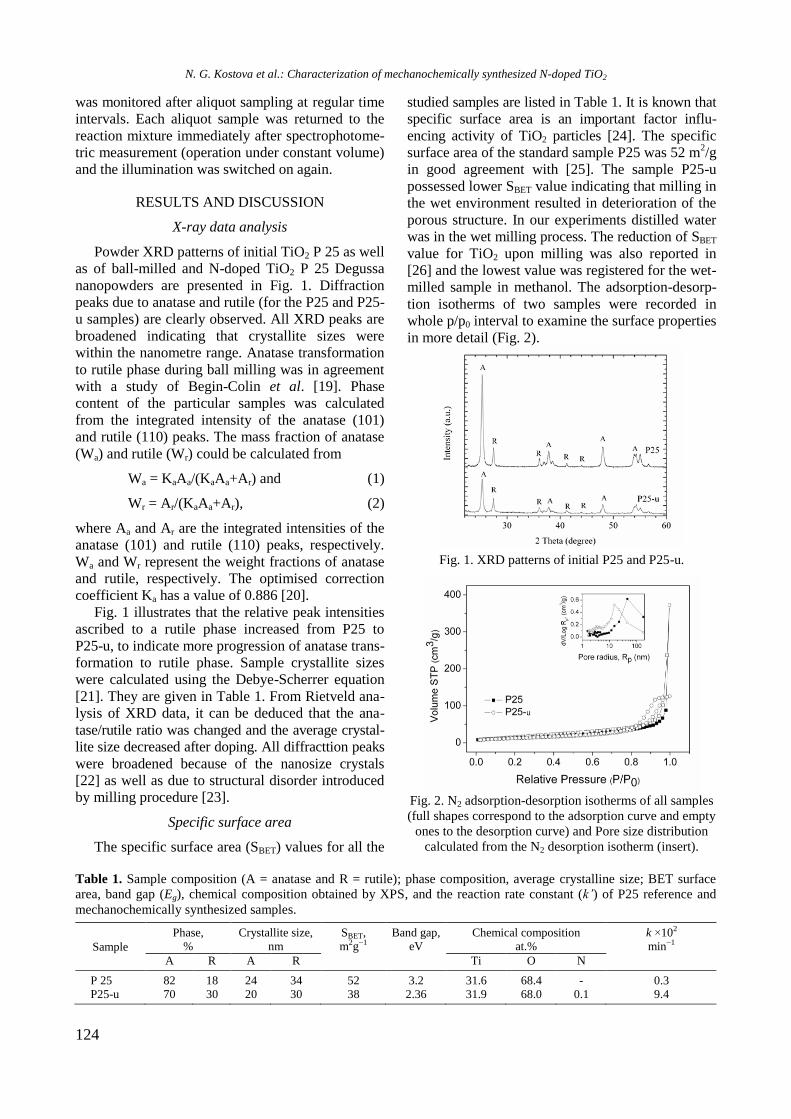
124
was monitored after aliquot sampling at regular time
intervals. Each aliquot sample was returned to the
reaction mixture immediately after spectrophotome-
tric measurement (operation under constant volume)
and the illumination was switched on again.
RESULTS AND DISCUSSION
X-ray data analysis
Powder XRD patterns of initial TiO2 P 25 as well
as of ball-milled and N-doped TiO2 P 25 Degussa
nanopowders are presented in Fig. 1. Diffraction
peaks due to anatase and rutile (for the P25 and P25-
u samples) are clearly observed. All XRD peaks are
broadened indicating that crystallite sizes were
within the nanometre range. Anatase transformation
to rutile phase during ball milling was in agreement
with a study of Begin-Colin et al. [19]. Phase
content of the particular samples was calculated
from the integrated intensity of the anatase (101)
and rutile (110) peaks. The mass fraction of anatase
(Wa) and rutile (Wr) could be calculated from
Wa = KaAa/(KaAa+Ar) and (1)
Wr = Ar/(KaAa+Ar), (2)
where Aa and Ar are the integrated intensities of the
anatase (101) and rutile (110) peaks, respectively.
Wa and Wr represent the weight fractions of anatase
and rutile, respectively. The optimised correction
coefficient Ka has a value of 0.886 [20].
Fig. 1 illustrates that the relative peak intensities
ascribed to a rutile phase increased from P25 to
P25-u, to indicate more progression of anatase trans-
formation to rutile phase. Sample crystallite sizes
were calculated using the Debye-Scherrer equation
[21]. They are given in Table 1. From Rietveld ana-
lysis of XRD data, it can be deduced that the ana-
tase/rutile ratio was changed and the average crystal-
lite size decreased after doping. All diffracttion peaks
were broadened because of the nanosize crystals
[22] as well as due to structural disorder introduced
by milling procedure [23].
Specific surface area
The specific surface area (SBET) values for all the
studied samples are listed in Table 1. It is known that
specific surface area is an important factor influ-
encing activity of TiO2 particles [24]. The specific
surface area of the standard sample P25 was 52 m2/g
in good agreement with [25]. The sample P25-u
possessed lower SBET value indicating that milling in
the wet environment resulted in deterioration of the
porous structure. In our experiments distilled water
was in the wet milling process. The reduction of SBET
value for TiO2 upon milling was also reported in
[26] and the lowest value was registered for the wet-
milled sample in methanol. The adsorption-desorp-
tion isotherms of two samples were recorded in
whole p/p0 interval to examine the surface properties
in more detail (Fig. 2).
Fig. 1. XRD patterns of initial P25 and P25-u.
Fig. 2. N2 adsorption-desorption isotherms of all samples
(full shapes correspond to the adsorption curve and empty
ones to the desorption curve) and Pore size distribution
calculated from the N2 desorption isotherm (insert).
Table 1. Sample composition (A = anatase and R = rutile); phase composition, average crystalline size; BET surface
area, band gap (Eg), chemical composition obtained by XPS, and the reaction rate constant (k’) of P25 reference and
mechanochemically synthesized samples.
Sample
Phase,
%
Crystallite size,
nm
SBET,
m2g−1
Band gap,
eV
Chemical composition
at.%
k ×102
min−1
A R A R Ti O N
P 25 82 18 24 34 52 3.2 31.6 68.4 - 0.3
P25-u 70 30 20 30 38 2.36 31.9 68.0 0.1 9.4
N. G. Kostova et al.: Characterization of mechanochemically synthesized N-doped TiO2
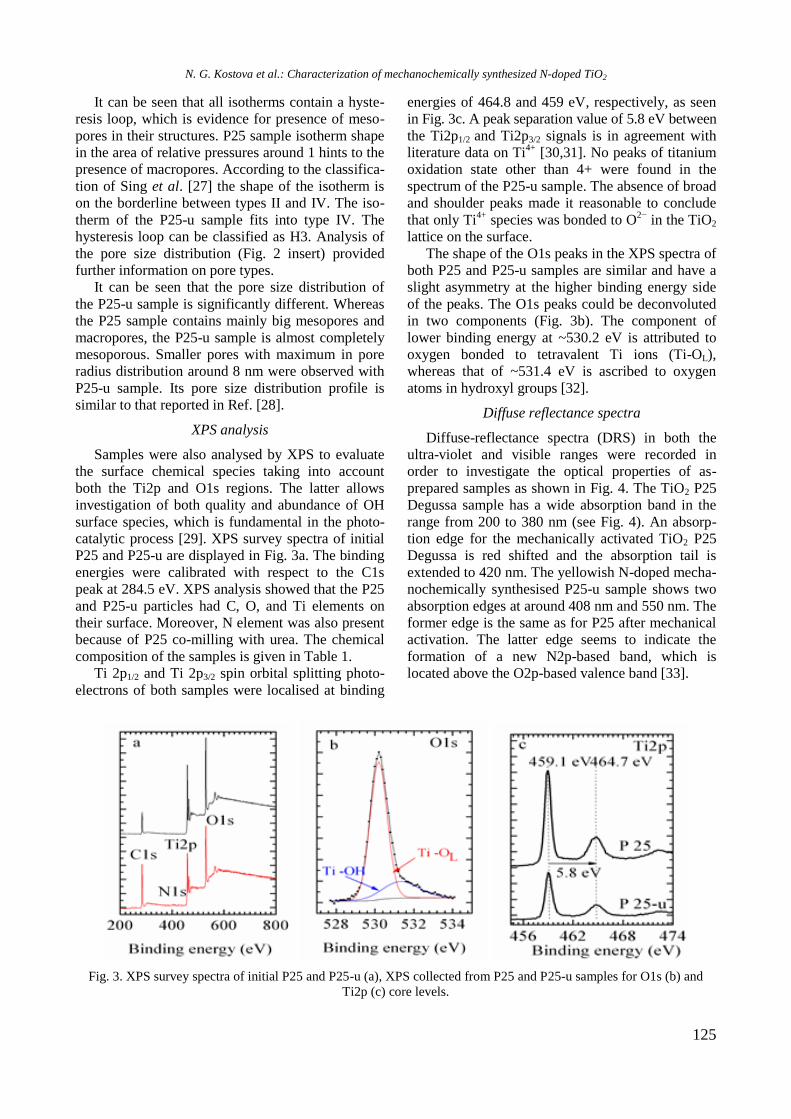
125
It can be seen that all isotherms contain a hyste-
resis loop, which is evidence for presence of meso-
pores in their structures. P25 sample isotherm shape
in the area of relative pressures around 1 hints to the
presence of macropores. According to the classifica-
tion of Sing et al. [27] the shape of the isotherm is
on the borderline between types II and IV. The iso-
therm of the P25-u sample fits into type IV. The
hysteresis loop can be classified as H3. Analysis of
the pore size distribution (Fig. 2 insert) provided
further information on pore types.
It can be seen that the pore size distribution of
the P25-u sample is significantly different. Whereas
the P25 sample contains mainly big mesopores and
macropores, the P25-u sample is almost completely
mesoporous. Smaller pores with maximum in pore
radius distribution around 8 nm were observed with
P25-u sample. Its pore size distribution profile is
similar to that reported in Ref. [28].
XPS analysis
Samples were also analysed by XPS to evaluate
the surface chemical species taking into account
both the Ti2p and O1s regions. The latter allows
investigation of both quality and abundance of OH
surface species, which is fundamental in the photo-
catalytic process [29]. XPS survey spectra of initial
P25 and P25-u are displayed in Fig. 3a. The binding
energies were calibrated with respect to the C1s
peak at 284.5 eV. XPS analysis showed that the P25
and P25-u particles had C, O, and Ti elements on
their surface. Moreover, N element was also present
because of P25 co-milling with urea. The chemical
composition of the samples is given in Table 1.
Ti 2p1/2 and Ti 2p3/2 spin orbital splitting photo-
electrons of both samples were localised at binding
energies of 464.8 and 459 eV, respectively, as seen
in Fig. 3c. A peak separation value of 5.8 eV between
the Ti2p1/2 and Ti2p3/2 signals is in agreement with
literature data on Ti4+
[30,31]. No peaks of titanium
oxidation state other than 4+ were found in the
spectrum of the P25-u sample. The absence of broad
and shoulder peaks made it reasonable to conclude
that only Ti4+
species was bonded to O2−
in the TiO2
lattice on the surface.
The shape of the O1s peaks in the XPS spectra of
both P25 and P25-u samples are similar and have a
slight asymmetry at the higher binding energy side
of the peaks. The O1s peaks could be deconvoluted
in two components (Fig. 3b). The component of
lower binding energy at ~530.2 eV is attributed to
oxygen bonded to tetravalent Ti ions (Ti-OL),
whereas that of ~531.4 eV is ascribed to oxygen
atoms in hydroxyl groups [32].
Diffuse reflectance spectra
Diffuse-reflectance spectra (DRS) in both the
ultra-violet and visible ranges were recorded in
order to investigate the optical properties of as-
prepared samples as shown in Fig. 4. The TiO2 P25
Degussa sample has a wide absorption band in the
range from 200 to 380 nm (see Fig. 4). An absorp-
tion edge for the mechanically activated TiO2 P25
Degussa is red shifted and the absorption tail is
extended to 420 nm. The yellowish N-doped mecha-
nochemically synthesised P25-u sample shows two
absorption edges at around 408 nm and 550 nm. The
former edge is the same as for P25 after mechanical
activation. The latter edge seems to indicate the
formation of a new N2p-based band, which is
located above the O2p-based valence band [33].
Fig. 3. XPS survey spectra of initial P25 and P25-u (a), XPS collected from P25 and P25-u samples for O1s (b) and
Ti2p (c) core levels.
N. G. Kostova et al.: Characterization of mechanochemically synthesized N-doped TiO2
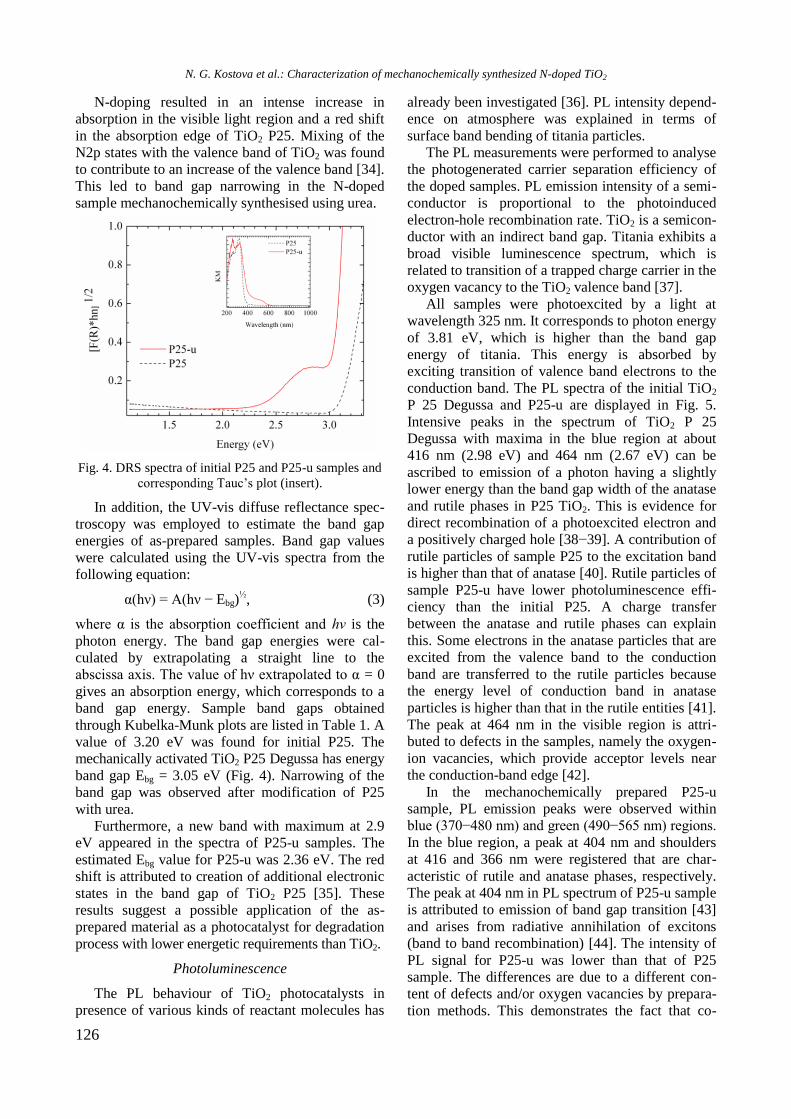
126
N-doping resulted in an intense increase in
absorption in the visible light region and a red shift
in the absorption edge of TiO2 P25. Mixing of the
N2p states with the valence band of TiO2 was found
to contribute to an increase of the valence band [34].
This led to band gap narrowing in the N-doped
sample mechanochemically synthesised using urea.
Fig. 4. DRS spectra of initial P25 and P25-u samples and
corresponding Tauc’s plot (insert).
In addition, the UV-vis diffuse reflectance spec-
troscopy was employed to estimate the band gap
energies of as-prepared samples. Band gap values
were calculated using the UV-vis spectra from the
following equation:
α(hν) = A(hν − Ebg)½, (3)
where α is the absorption coefficient and hν is the
photon energy. The band gap energies were cal-
culated by extrapolating a straight line to the
abscissa axis. The value of hν extrapolated to α = 0
gives an absorption energy, which corresponds to a
band gap energy. Sample band gaps obtained
through Kubelka-Munk plots are listed in Table 1. A
value of 3.20 eV was found for initial P25. The
mechanically activated TiO2 P25 Degussa has energy
band gap Ebg = 3.05 eV (Fig. 4). Narrowing of the
band gap was observed after modification of P25
with urea.
Furthermore, a new band with maximum at 2.9
eV appeared in the spectra of P25-u samples. The
estimated Ebg value for P25-u was 2.36 eV. The red
shift is attributed to creation of additional electronic
states in the band gap of TiO2 P25 [35]. These
results suggest a possible application of the as-
prepared material as a photocatalyst for degradation
process with lower energetic requirements than TiO2.
Photoluminescence
The PL behaviour of TiO2 photocatalysts in
presence of various kinds of reactant molecules has
already been investigated [36]. PL intensity depend-
ence on atmosphere was explained in terms of
surface band bending of titania particles.
The PL measurements were performed to analyse
the photogenerated carrier separation efficiency of
the doped samples. PL emission intensity of a semi-
conductor is proportional to the photoinduced
electron-hole recombination rate. TiO2 is a semicon-
ductor with an indirect band gap. Titania exhibits a
broad visible luminescence spectrum, which is
related to transition of a trapped charge carrier in the
oxygen vacancy to the TiO2 valence band [37].
All samples were photoexcited by a light at
wavelength 325 nm. It corresponds to photon energy
of 3.81 eV, which is higher than the band gap
energy of titania. This energy is absorbed by
exciting transition of valence band electrons to the
conduction band. The PL spectra of the initial TiO2
P 25 Degussa and P25-u are displayed in Fig. 5.
Intensive peaks in the spectrum of TiO2 P 25
Degussa with maxima in the blue region at about
416 nm (2.98 eV) and 464 nm (2.67 eV) can be
ascribed to emission of a photon having a slightly
lower energy than the band gap width of the anatase
and rutile phases in P25 TiO2. This is evidence for
direct recombination of a photoexcited electron and
a positively charged hole [38−39]. A contribution of
rutile particles of sample P25 to the excitation band
is higher than that of anatase [40]. Rutile particles of
sample P25-u have lower photoluminescence effi-
ciency than the initial P25. A charge transfer
between the anatase and rutile phases can explain
this. Some electrons in the anatase particles that are
excited from the valence band to the conduction
band are transferred to the rutile particles because
the energy level of conduction band in anatase
particles is higher than that in the rutile entities [41].
The peak at 464 nm in the visible region is attri-
buted to defects in the samples, namely the oxygen-
ion vacancies, which provide acceptor levels near
the conduction-band edge [42].
In the mechanochemically prepared P25-u
sample, PL emission peaks were observed within
blue (370−480 nm) and green (490−565 nm) regions.
In the blue region, a peak at 404 nm and shoulders
at 416 and 366 nm were registered that are char-
acteristic of rutile and anatase phases, respectively.
The peak at 404 nm in PL spectrum of P25-u sample
is attributed to emission of band gap transition [43]
and arises from radiative annihilation of excitons
(band to band recombination) [44]. The intensity of
PL signal for P25-u was lower than that of P25
sample. The differences are due to a different con-
tent of defects and/or oxygen vacancies by prepara-
tion methods. This demonstrates the fact that co-
N. G. Kostova et al.: Characterization of mechanochemically synthesized N-doped TiO2
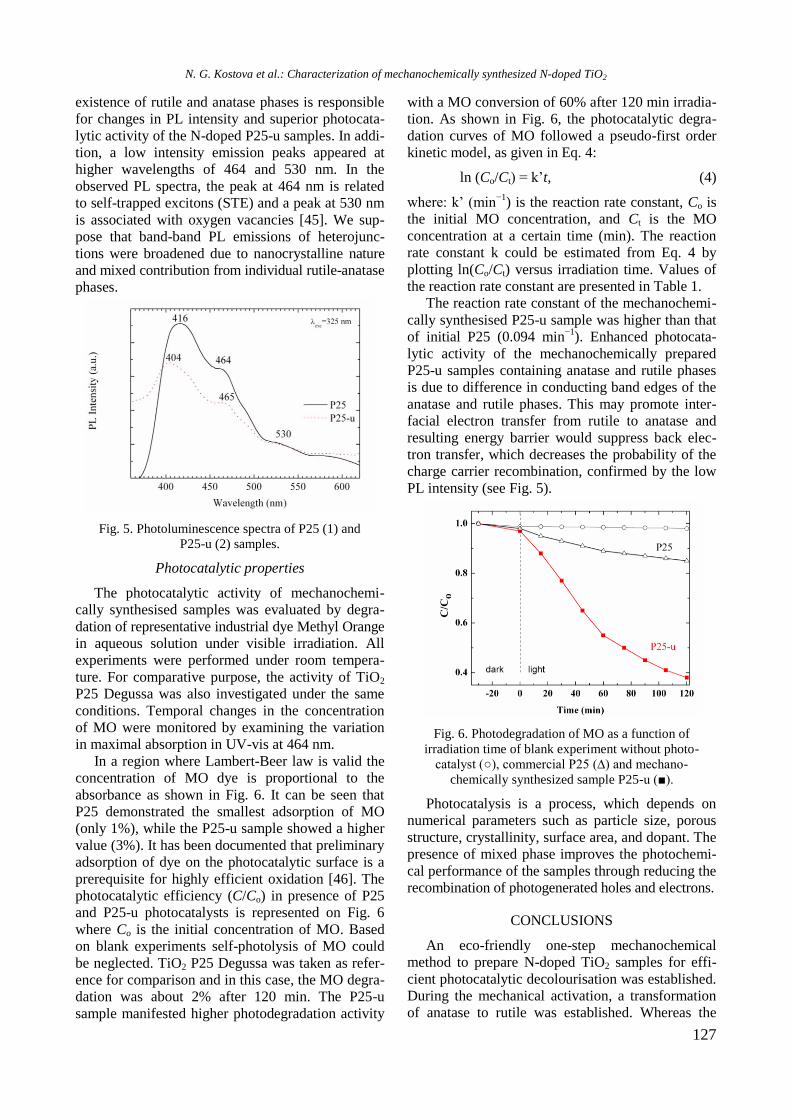
127
existence of rutile and anatase phases is responsible
for changes in PL intensity and superior photocata-
lytic activity of the N-doped P25-u samples. In addi-
tion, a low intensity emission peaks appeared at
higher wavelengths of 464 and 530 nm. In the
observed PL spectra, the peak at 464 nm is related
to self-trapped excitons (STE) and a peak at 530 nm
is associated with oxygen vacancies [45]. We sup-
pose that band-band PL emissions of heterojunc-
tions were broadened due to nanocrystalline nature
and mixed contribution from individual rutile-anatase
phases.
Fig. 5. Photoluminescence spectra of P25 (1) and
P25-u (2) samples.
Photocatalytic properties
The photocatalytic activity of mechanochemi-
cally synthesised samples was evaluated by degra-
dation of representative industrial dye Methyl Orange
in aqueous solution under visible irradiation. All
experiments were performed under room tempera-
ture. For comparative purpose, the activity of TiO2
P25 Degussa was also investigated under the same
conditions. Temporal changes in the concentration
of MO were monitored by examining the variation
in maximal absorption in UV-vis at 464 nm.
In a region where Lambert-Beer law is valid the
concentration of MO dye is proportional to the
absorbance as shown in Fig. 6. It can be seen that
P25 demonstrated the smallest adsorption of MO
(only 1%), while the P25-u sample showed a higher
value (3%). It has been documented that preliminary
adsorption of dye on the photocatalytic surface is a
prerequisite for highly efficient oxidation [46]. The
photocatalytic efficiency (C/Co) in presence of P25
and P25-u photocatalysts is represented on Fig. 6
where Co is the initial concentration of MO. Based
on blank experiments self-photolysis of MO could
be neglected. TiO2 P25 Degussa was taken as refer-
ence for comparison and in this case, the MO degra-
dation was about 2% after 120 min. The P25-u
sample manifested higher photodegradation activity
with a MO conversion of 60% after 120 min irradia-
tion. As shown in Fig. 6, the photocatalytic degra-
dation curves of MO followed a pseudo-first order
kinetic model, as given in Eq. 4:
ln (Co/Ct) = k’t, (4)
where: k’ (min−1
) is the reaction rate constant, Co is
the initial MO concentration, and Ct is the MO
concentration at a certain time (min). The reaction
rate constant k could be estimated from Eq. 4 by
plotting ln(Co/Ct) versus irradiation time. Values of
the reaction rate constant are presented in Table 1.
The reaction rate constant of the mechanochemi-
cally synthesised P25-u sample was higher than that
of initial P25 (0.094 min−1
). Enhanced photocata-
lytic activity of the mechanochemically prepared
P25-u samples containing anatase and rutile phases
is due to difference in conducting band edges of the
anatase and rutile phases. This may promote inter-
facial electron transfer from rutile to anatase and
resulting energy barrier would suppress back elec-
tron transfer, which decreases the probability of the
charge carrier recombination, confirmed by the low
PL intensity (see Fig. 5).
Fig. 6. Photodegradation of MO as a function of
irradiation time of blank experiment without photo-
catalyst (○), commercial P25 (∆) and mechano-
chemically synthesized sample P25-u (■).
Photocatalysis is a process, which depends on
numerical parameters such as particle size, porous
structure, crystallinity, surface area, and dopant. The
presence of mixed phase improves the photochemi-
cal performance of the samples through reducing the
recombination of photogenerated holes and electrons.
CONCLUSIONS
An eco-friendly one-step mechanochemical
method to prepare N-doped TiO2 samples for effi-
cient photocatalytic decolourisation was established.
During the mechanical activation, a transformation
of anatase to rutile was established. Whereas the
N. G. Kostova et al.: Characterization of mechanochemically synthesized N-doped TiO2
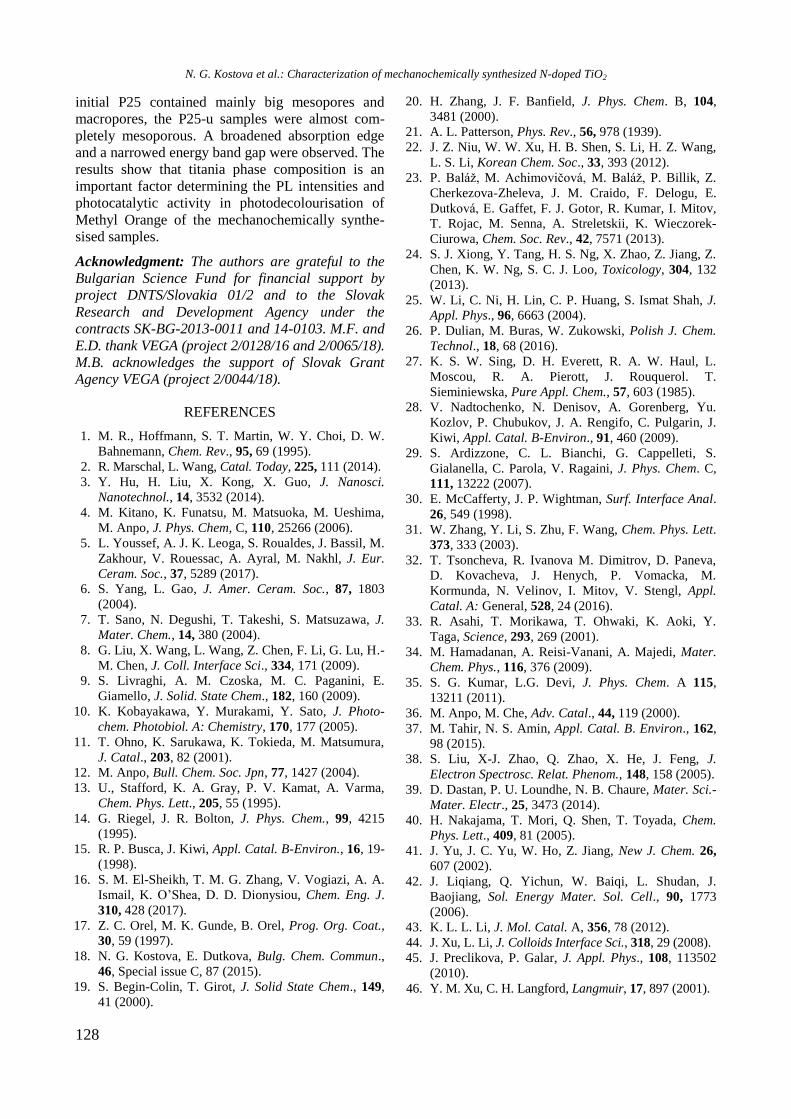
128
initial P25 contained mainly big mesopores and
macropores, the P25-u samples were almost com-
pletely mesoporous. A broadened absorption edge
and a narrowed energy band gap were observed. The
results show that titania phase composition is an
important factor determining the PL intensities and
photocatalytic activity in photodecolourisation of
Methyl Orange of the mechanochemically synthe-
sised samples.
Acknowledgment: The authors are grateful to the
Bulgarian Science Fund for financial support by
project DNTS/Slovakia 01/2 and to the Slovak
Research and Development Agency under the
contracts SK-BG-2013-0011 and 14-0103. M.F. and
E.D. thank VEGA (project 2/0128/16 and 2/0065/18).
M.B. acknowledges the support of Slovak Grant
Agency VEGA (project 2/0044/18).
REFERENCES
1. M. R., Hoffmann, S. T. Martin, W. Y. Choi, D. W.
Bahnemann, Chem. Rev., 95, 69 (1995).
2. R. Marschal, L. Wang, Catal. Today, 225, 111 (2014).
3. Y. Hu, H. Liu, X. Kong, X. Guo, J. Nanosci.
Nanotechnol., 14, 3532 (2014).
4. M. Kitano, K. Funatsu, M. Matsuoka, M. Ueshima,
M. Anpo, J. Phys. Chem, C, 110, 25266 (2006).
5. L. Youssef, A. J. K. Leoga, S. Roualdes, J. Bassil, M.
Zakhour, V. Rouessac, A. Ayral, M. Nakhl, J. Eur.
Ceram. Soc., 37, 5289 (2017).
6. S. Yang, L. Gao, J. Amer. Ceram. Soc., 87, 1803
(2004).
7. T. Sano, N. Degushi, T. Takeshi, S. Matsuzawa, J.
Mater. Chem., 14, 380 (2004).
8. G. Liu, X. Wang, L. Wang, Z. Chen, F. Li, G. Lu, H.-
M. Chen, J. Coll. Interface Sci., 334, 171 (2009).
9. S. Livraghi, A. M. Czoska, M. C. Paganini, E.
Giamello, J. Solid. State Chem., 182, 160 (2009).
10. K. Kobayakawa, Y. Murakami, Y. Sato, J. Photo-
chem. Photobiol. A: Chemistry, 170, 177 (2005).
11. T. Ohno, K. Sarukawa, K. Tokieda, M. Matsumura,
J. Catal., 203, 82 (2001).
12. M. Anpo, Bull. Chem. Soc. Jpn, 77, 1427 (2004).
13. U., Stafford, K. A. Gray, P. V. Kamat, A. Varma,
Chem. Phys. Lett., 205, 55 (1995).
14. G. Riegel, J. R. Bolton, J. Phys. Chem., 99, 4215
(1995).
15. R. P. Busca, J. Kiwi, Appl. Catal. B-Environ., 16, 19-
(1998).
16. S. M. El-Sheikh, T. M. G. Zhang, V. Vogiazi, A. A.
Ismail, K. O’Shea, D. D. Dionysiou, Chem. Eng. J.
310, 428 (2017).
17. Z. C. Orel, M. K. Gunde, B. Orel, Prog. Org. Coat.,
30, 59 (1997).
18. N. G. Kostova, E. Dutkova, Bulg. Chem. Commun.,
46, Special issue C, 87 (2015).
19. S. Begin-Colin, T. Girot, J. Solid State Chem., 149,
41 (2000).
20. H. Zhang, J. F. Banfield, J. Phys. Chem. B, 104,
3481 (2000).
21. A. L. Patterson, Phys. Rev., 56, 978 (1939).
22. J. Z. Niu, W. W. Xu, H. B. Shen, S. Li, H. Z. Wang,
L. S. Li, Korean Chem. Soc., 33, 393 (2012).
23. P. Baláž, M. Achimovičová, M. Baláž, P. Billik, Z.
Cherkezova-Zheleva, J. M. Craido, F. Delogu, E.
Dutková, E. Gaffet, F. J. Gotor, R. Kumar, I. Mitov,
T. Rojac, M. Senna, A. Streletskii, K. Wieczorek-
Ciurowa, Chem. Soc. Rev., 42, 7571 (2013).
24. S. J. Xiong, Y. Tang, H. S. Ng, X. Zhao, Z. Jiang, Z.
Chen, K. W. Ng, S. C. J. Loo, Toxicology, 304, 132
(2013).
25. W. Li, C. Ni, H. Lin, C. P. Huang, S. Ismat Shah, J.
Appl. Phys., 96, 6663 (2004).
26. P. Dulian, M. Buras, W. Zukowski, Polish J. Chem.
Technol., 18, 68 (2016).
27. K. S. W. Sing, D. H. Everett, R. A. W. Haul, L.
Moscou, R. A. Pierott, J. Rouquerol. T.
Sieminiewska, Pure Appl. Chem., 57, 603 (1985).
28. V. Nadtochenko, N. Denisov, A. Gorenberg, Yu.
Kozlov, P. Chubukov, J. A. Rengifo, C. Pulgarin, J.
Kiwi, Appl. Catal. B-Environ., 91, 460 (2009).
29. S. Ardizzone, C. L. Bianchi, G. Cappelleti, S.
Gialanella, C. Parola, V. Ragaini, J. Phys. Chem. C,
111, 13222 (2007).
30. E. McCafferty, J. P. Wightman, Surf. Interface Anal.
26, 549 (1998).
31. W. Zhang, Y. Li, S. Zhu, F. Wang, Chem. Phys. Lett.
373, 333 (2003).
32. T. Tsoncheva, R. Ivanova M. Dimitrov, D. Paneva,
D. Kovacheva, J. Henych, P. Vomacka, M.
Kormunda, N. Velinov, I. Mitov, V. Stengl, Appl.
Catal. A: General, 528, 24 (2016).
33. R. Asahi, T. Morikawa, T. Ohwaki, K. Aoki, Y.
Taga, Science, 293, 269 (2001).
34. M. Hamadanan, A. Reisi-Vanani, A. Majedi, Mater.
Chem. Phys., 116, 376 (2009).
35. S. G. Kumar, L.G. Devi, J. Phys. Chem. A 115,
13211 (2011).
36. M. Anpo, M. Che, Adv. Catal., 44, 119 (2000).
37. M. Tahir, N. S. Amin, Appl. Catal. B. Environ., 162,
98 (2015).
38. S. Liu, X-J. Zhao, Q. Zhao, X. He, J. Feng, J.
Electron Spectrosc. Relat. Phenom., 148, 158 (2005).
39. D. Dastan, P. U. Loundhe, N. B. Chaure, Mater. Sci.-
Mater. Electr., 25, 3473 (2014).
40. H. Nakajama, T. Mori, Q. Shen, T. Toyada, Chem.
Phys. Lett., 409, 81 (2005).
41. J. Yu, J. C. Yu, W. Ho, Z. Jiang, New J. Chem. 26,
607 (2002).
42. J. Liqiang, Q. Yichun, W. Baiqi, L. Shudan, J.
Baojiang, Sol. Energy Mater. Sol. Cell., 90, 1773
(2006).
43. K. L. L. Li, J. Mol. Catal. A, 356, 78 (2012).
44. J. Xu, L. Li, J. Colloids Interface Sci., 318, 29 (2008).
45. J. Preclikova, P. Galar, J. Appl. Phys., 108, 113502
(2010).
46. Y. M. Xu, C. H. Langford, Langmuir, 17, 897 (2001).
N. G. Kostova et al.: Characterization of mechanochemically synthesized N-doped TiO2
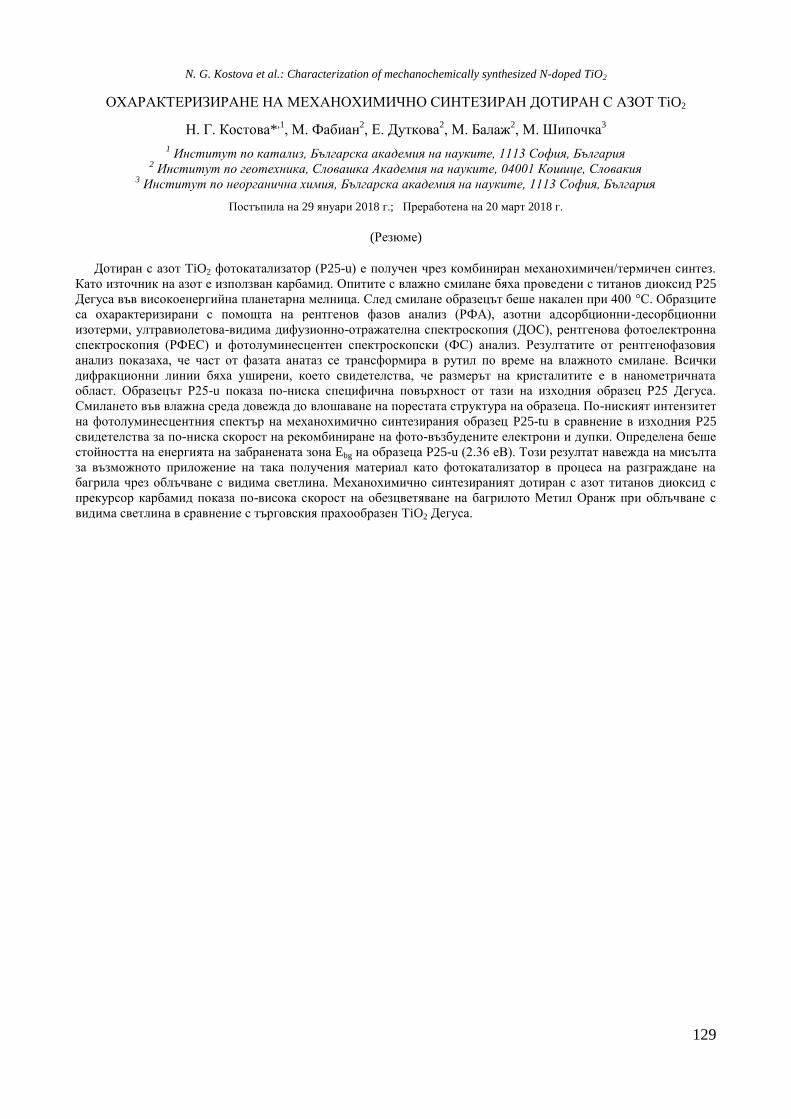
129
ОХАРАКТЕРИЗИРАНЕ НА МЕХАНОХИМИЧНО СИНТЕЗИРАН ДОТИРАН С АЗОТ TiO2
Н. Г. Костова*,1, М. Фабиан
2, Е. Дуткова
2, М. Балаж
2, М. Шипочка
3
1 Институт по катализ, Българска академия на науките, 1113 София, България
2 Институт по геотехника, Словашка Академия на науките, 04001 Кошице, Словакия
3 Институт по неорганична химия, Българска академия на науките, 1113 София, България
Постъпила на 29 януари 2018 г.; Преработена на 20 март 2018 г.
(Резюме)
Дотиран с азот TiO2 фотокатализатор (P25-u) е получен чрез комбиниран механохимичен/термичен синтез.
Като източник на азот е използван карбамид. Опитите с влажно смилане бяха проведени с титанов диоксид Р25
Дегуса във високоенергийна планетарна мелница. След смилане образецът беше накален при 400 °С. Образците
са охарактеризирани с помощта на рентгенов фазов анализ (РФА), азотни адсорбционни-десорбционни
изотерми, ултравиолетова-видима дифузионно-отражателна спектроскопия (ДОС), рентгенова фотоелектронна
спектроскопия (РФЕС) и фотолуминесцентен спектроскопски (ФС) анализ. Резултатите от рентгенофазовия
анализ показаха, че част от фазата анaтаз се трансформира в рутил по време на влажното смилане. Всички
дифракционни линии бяха уширени, което свидетелства, че размерът на кристалитите е в нанометричната
област. Образецът Р25-u показа по-ниска специфична повърхност от тази на изходния образец Р25 Дегуса.
Смилането във влажна среда довежда до влошаване на порестата структура на образеца. По-ниският интензитет
на фотолуминесцентния спектър на механохимично синтезирания образец P25-tu в сравнение в изходния P25
свидетелства за по-ниска скорост на рекомбиниране на фото-възбудените електрони и дупки. Определена беше
стойността на енергията на забранената зона Ebg на образеца P25-u (2.36 еВ). Този резултат навежда на мисълта
за възможното приложение на така получения материал като фотокатализатор в процеса на разграждане на
багрила чрез облъчване с видима светлина. Механохимично синтезираният дотиран с азот титанов диоксид с
прекурсор карбамид показа по-висока скорост на обезцветяване на багрилото Метил Оранж при облъчване с
видима светлина в сравнение с търговския прахообразен TiO2 Дегуса.
N. G. Kostova et al.: Characterization of mechanochemically synthesized N-doped TiO2
130
Bulgarian Chemical Communications, Volume 50, Special issue H (pp. 130–134) 2018
Synthesis and investigation of composite photocatalysts on the base of
nickel and zinc oxides
K. I. Milenova1*, K. L. Zaharieva
1, S. V. Vassilev
2, S. S. Dimova
3, I. D. Stambolova
4,
V. N. Blaskov4
1 Institute of Catalysis, Bulgarian Academy of Sciences, Acad. G. Bonchev St., Bldg. 11, 1113 Sofia, Bulgaria
2 Institute of Electrochemistry and Energy Systems, Bulgarian Academy of Sciences, Acad. G. Bonchev St., Bldg. 10,
1113, Sofia, Bulgaria 3 Institute of Polymers, Bulgarian Academy of Sciences, Acad. G. Bonchev St., Bldg. 103A, 1113 Sofia, Bulgaria
4 Institute of General and Inorganic Chemistry, Bulgarian Academy of Sciences, Acad. G. Bonchev St., Bldg. 11,
1113 Sofia, Bulgaria
Received: January 14, 2018; Revised: March 19, 2018
Photocatalytic activities of NiO0.8ZnO0.2-ZnO samples obtained by precipitation from various starting materials
(chlorides and nitrates) followed by thermal treatment at two different temperatures (450 °C or 650 °C) were compared.
Powder X-ray diffraction and FTIR spectroscopy were used to characterize the investigated catalysts. Oxidative
photodegradation of Malachite Green dye on NiO0.8ZnO0.2-ZnO catalysts over a period of 2 hours using UV light was
studied. Photodegradation degree of the Malachite Green dye using NiO0.8ZnO0.2-ZnO obtained from chlorides and
treated at 450 °C or 650 °C, are 89 and 86%, respectively. Samples from nitrate precursors calcined at 450 °C or 650 °C
exhibited a higher photocatalytic degradation activity 99 and 94%, respectively.
Key words: photocatalysts, photodegradation, Malachite Green, dye, pollutant.
INTRODUCTION
Synthetic dyes are one of the most important
pollutants from the textile industry [1]. They may
cause serious health and environmental problems
because of their stability, and toxicity [2]. Hetero-
geneous photocatalysis, being highly efficient
advanced oxidation means, has been applied as an
environmentally friendly, cost effective, and green
process for successful degradation of many harmful
organic compounds [3]. Recently there has been an
increasing tendency of applying thermally and
chemically stable semiconductor metal oxides as
photocatalysts in aqueous systems [4]. In the recent
years, scientists are excited by the opportunity to
create low cost photocatalytic materials of high
catalytic activity [5]. Due to modified electronic and
structural properties, nanocomposites can possess
enhanced photocatalytic activity in comparison with
monocomponent oxides [6]. The role of incorporated
foreign material such as metal/metal oxide, ceramic
or polymer is to trap and transfer photoexcited
electrons on the semiconductor surface and over-
come the problem of recombination of the electron-
hole pairs. NiO-ZnO coupled systems have demon-
strated excellent photocatalytic efficiency under UV
and visible light irradiation, when compared to
individual ZnO and NiO due to the effective separa-
tion of photogenerated electron-hole pairs. [7]. Low
lattice mismatch between NiO and ZnO is important
for the formation of p-n heterojunction [8]. Zinc
oxide hybrid photocatalyst [9] and NiO-ZnO com-
posites [10] were also studied as photocatalysts for
water pollutant degradation.
NiO photocatalytic activity for bleaching of Rose
Bengal [11] and degradation of Rhodamin-B dye
under visible light has also been examined [12].
NiO-ZnO composites have been investigated for
photodecomposition of Methylene Blue under UV
[13] and visible light [14,15] irradiation and of
Methyl Orange under UV light [4,16]. NiO-coupled
ZnO photocatalysts have been tested for degradation
of 2,4-dichlorophenol [7]. Introduction of Ni as
dopant into ZnO can be efficient way to improve the
activity of ZnO photocatalyst [17,18]. Composites
on the base of ZnO-NiO supported on zeolites were
also studied [3,19].
The aim of this work was to compare the
photocatalytic activities towards degradation of
Malachite Green dye of NiO0.8ZnO0.2-ZnO samples
prepared from different precursors (chlorides and
nitrates) and calcined at a different temperature (450
or 650 °C).
© 2018 Bulgarian Academy of Sciences, Union of Chemists in Bulgaria
* To whom all correspondence should be sent
E-mail: [email protected]
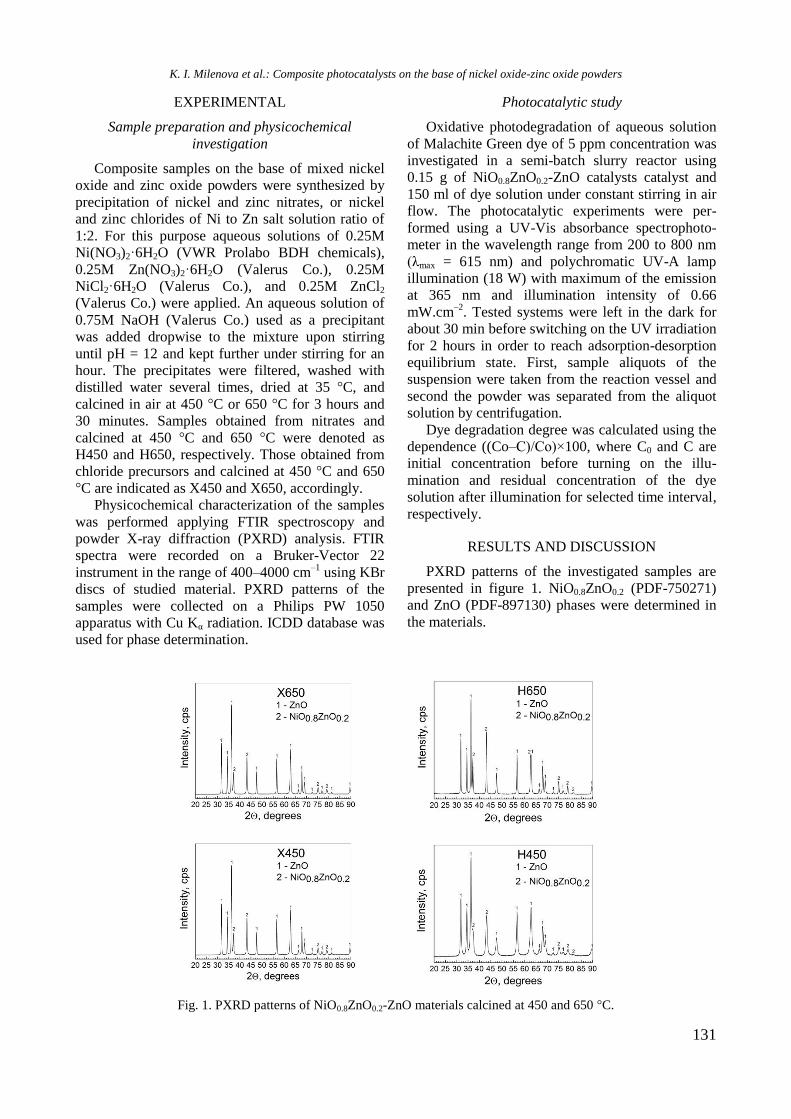
131
EXPERIMENTAL
Sample preparation and physicochemical
investigation
Composite samples on the base of mixed nickel
oxide and zinc oxide powders were synthesized by
precipitation of nickel and zinc nitrates, or nickel
and zinc chlorides of Ni to Zn salt solution ratio of
1:2. For this purpose aqueous solutions of 0.25M
Ni(NO3)2·6H2O (VWR Prolabo BDH chemicals),
0.25M Zn(NO3)2·6H2O (Valerus Co.), 0.25M
NiCl2·6H2O (Valerus Co.), and 0.25M ZnCl2
(Valerus Co.) were applied. An aqueous solution of
0.75M NaOH (Valerus Co.) used as a precipitant
was added dropwise to the mixture upon stirring
until pH = 12 and kept further under stirring for an
hour. The precipitates were filtered, washed with
distilled water several times, dried at 35 °C, and
calcined in air at 450 °C or 650 °C for 3 hours and
30 minutes. Samples obtained from nitrates and
calcined at 450 °C and 650 °C were denoted as
H450 and H650, respectively. Those obtained from
chloride precursors and calcined at 450 °C and 650
°C are indicated as X450 and X650, accordingly.
Physicochemical characterization of the samples
was performed applying FTIR spectroscopy and
powder X-ray diffraction (PXRD) analysis. FTIR
spectra were recorded on a Bruker-Vector 22
instrument in the range of 400‒4000 cm‒1
using KBr
discs of studied material. PXRD patterns of the
samples were collected on a Philips PW 1050
apparatus with Cu Kα radiation. ICDD database was
used for phase determination.
Photocatalytic study
Oxidative photodegradation of aqueous solution
of Malachite Green dye of 5 ppm concentration was
investigated in a semi-batch slurry reactor using
0.15 g of NiO0.8ZnO0.2-ZnO catalysts catalyst and
150 ml of dye solution under constant stirring in air
flow. The photocatalytic experiments were per-
formed using a UV-Vis absorbance spectrophoto-
meter in the wavelength range from 200 to 800 nm
(λmax = 615 nm) and polychromatic UV-A lamp
illumination (18 W) with maximum of the emission
at 365 nm and illumination intensity of 0.66
mW.cm‒2
. Tested systems were left in the dark for
about 30 min before switching on the UV irradiation
for 2 hours in order to reach adsorption-desorption
equilibrium state. First, sample aliquots of the
suspension were taken from the reaction vessel and
second the powder was separated from the aliquot
solution by centrifugation.
Dye degradation degree was calculated using the
dependence ((Co‒C)/Co)×100, where C0 and C are
initial concentration before turning on the illu-
mination and residual concentration of the dye
solution after illumination for selected time interval,
respectively.
RESULTS AND DISCUSSION
PXRD patterns of the investigated samples are
presented in figure 1. NiO0.8ZnO0.2 (PDF-750271)
and ZnO (PDF-897130) phases were determined in
the materials.
Fig. 1. PXRD patterns of NiO0.8ZnO0.2-ZnO materials calcined at 450 and 650 °C.
K. I. Milenova et al.: Composite photocatalysts on the base of nickel oxide-zinc oxide powders
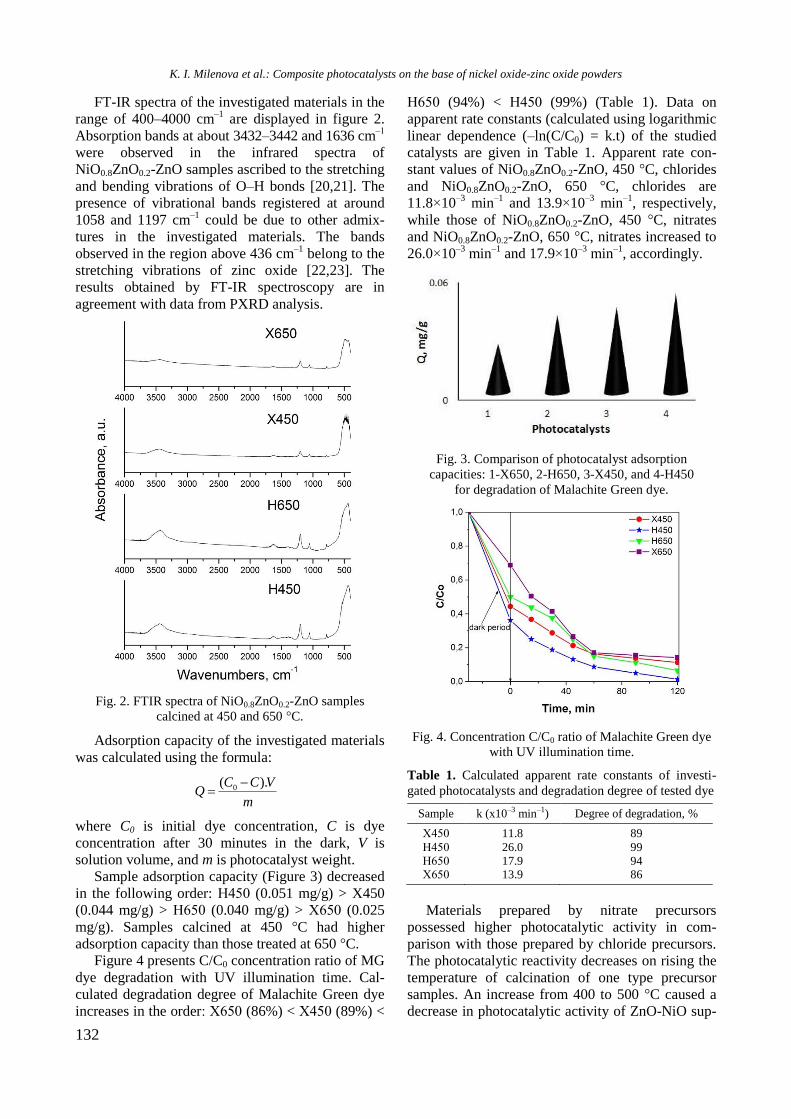
132
FT-IR spectra of the investigated materials in the
range of 400–4000 cm‒1
are displayed in figure 2.
Absorption bands at about 3432‒3442 and 1636 cm‒1
were observed in the infrared spectra of
NiO0.8ZnO0.2-ZnO samples ascribed to the stretching
and bending vibrations of O–H bonds [20,21]. The
presence of vibrational bands registered at around
1058 and 1197 cm‒1
could be due to other admix-
tures in the investigated materials. The bands
observed in the region above 436 cm‒1
belong to the
stretching vibrations of zinc oxide [22,23]. The
results obtained by FT-IR spectroscopy are in
agreement with data from PXRD analysis.
Fig. 2. FTIR spectra of NiO0.8ZnO0.2-ZnO samples
calcined at 450 and 650 °C.
Adsorption capacity of the investigated materials
was calculated using the formula:
m
VCCQ
).( 0
where C0 is initial dye concentration, C is dye
concentration after 30 minutes in the dark, V is
solution volume, and m is photocatalyst weight.
Sample adsorption capacity (Figure 3) decreased
in the following order: Н450 (0.051 mg/g) > X450
(0.044 mg/g) > Н650 (0.040 mg/g) > Х650 (0.025
mg/g). Samples calcined at 450 °C had higher
adsorption capacity than those treated at 650 °C.
Figure 4 presents C/C0 concentration ratio of MG
dye degradation with UV illumination time. Cal-
culated degradation degree of Malachite Green dye
increases in the order: Х650 (86%) < Х450 (89%) <
Н650 (94%) < Н450 (99%) (Table 1). Data on
apparent rate constants (calculated using logarithmic
linear dependence (–ln(C/C0) = k.t) of the studied
catalysts are given in Table 1. Apparent rate con-
stant values of NiO0.8ZnO0.2-ZnO, 450 °C, chlorides
and NiO0.8ZnO0.2-ZnO, 650 °C, chlorides are
11.8×10‒3
min‒1
and 13.9×10‒3
min‒1
, respectively,
while those of NiO0.8ZnO0.2-ZnO, 450 °C, nitrates
and NiO0.8ZnO0.2-ZnO, 650 °C, nitrates increased to
26.0×10‒3
min‒1
and 17.9×10‒3
min‒1
, accordingly.
Fig. 3. Comparison of photocatalyst adsorption
capacities: 1-X650, 2-H650, 3-X450, and 4-H450
for degradation of Malachite Green dye.
Fig. 4. Concentration C/C0 ratio of Malachite Green dye
with UV illumination time.
Table 1. Calculated apparent rate constants of investi-
gated photocatalysts and degradation degree of tested dye
Sample k (x10‒3 min‒1) Degree of degradation, %
Х450 11.8 89
Н450 26.0 99
Н650 17.9 94 Х650 13.9 86
Materials prepared by nitrate precursors
possessed higher photocatalytic activity in com-
parison with those prepared by chloride precursors.
The photocatalytic reactivity decreases on rising the
temperature of calcination of one type precursor
samples. An increase from 400 to 500 °C caused a
decrease in photocatalytic activity of ZnO-NiO sup-
K. I. Milenova et al.: Composite photocatalysts on the base of nickel oxide-zinc oxide powders
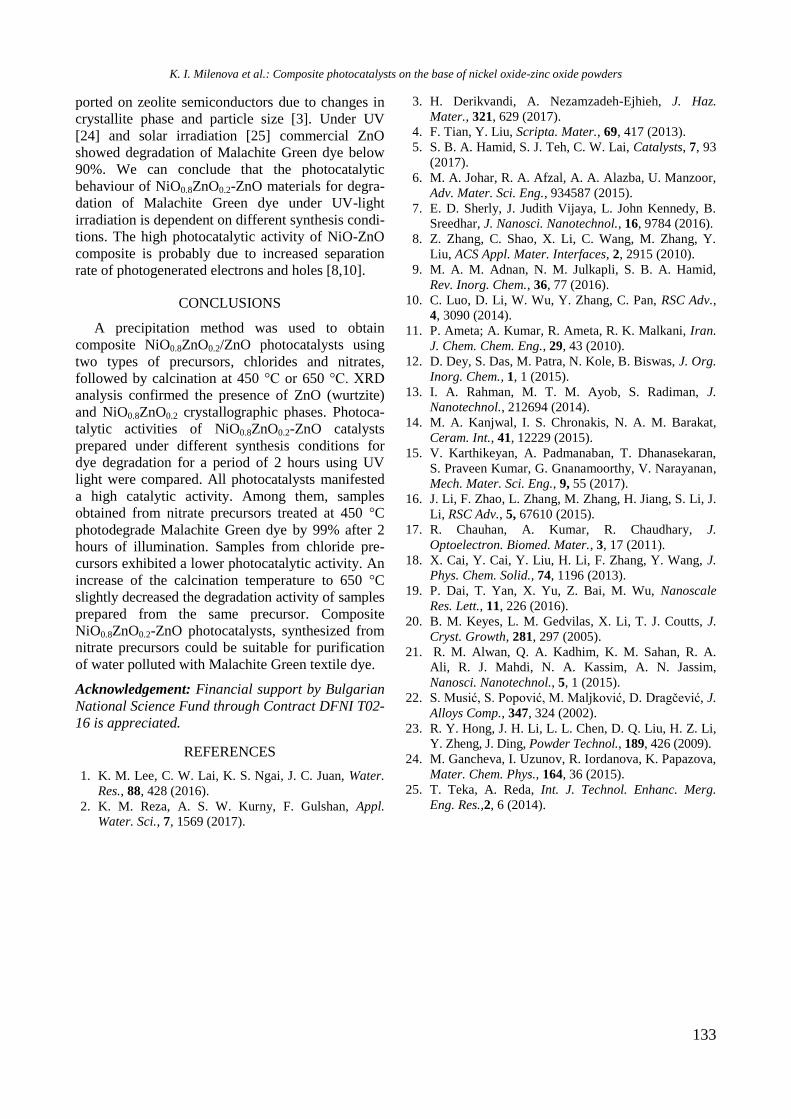
133
ported on zeolite semiconductors due to changes in
crystallite phase and particle size [3]. Under UV
[24] and solar irradiation [25] commercial ZnO
showed degradation of Malachite Green dye below
90%. We can conclude that the photocatalytic
behaviour of NiO0.8ZnO0.2-ZnO materials for degra-
dation of Malachite Green dye under UV-light
irradiation is dependent on different synthesis condi-
tions. The high photocatalytic activity of NiO-ZnO
composite is probably due to increased separation
rate of photogenerated electrons and holes [8,10].
CONCLUSIONS
A precipitation method was used to obtain
composite NiO0.8ZnO0.2/ZnO photocatalysts using
two types of precursors, chlorides and nitrates,
followed by calcination at 450 °C or 650 °C. XRD
analysis confirmed the presence of ZnO (wurtzite)
and NiO0.8ZnO0.2 crystallographic phases. Photoca-
talytic activities of NiO0.8ZnO0.2-ZnO catalysts
prepared under different synthesis conditions for
dye degradation for a period of 2 hours using UV
light were compared. All photocatalysts manifested
a high catalytic activity. Among them, samples
obtained from nitrate precursors treated at 450 °C
photodegrade Malachite Green dye by 99% after 2
hours of illumination. Samples from chloride pre-
cursors exhibited a lower photocatalytic activity. An
increase of the calcination temperature to 650 °C
slightly decreased the degradation activity of samples
prepared from the same precursor. Composite
NiO0.8ZnO0.2-ZnO photocatalysts, synthesized from
nitrate precursors could be suitable for purification
of water polluted with Malachite Green textile dye.
Acknowledgement: Financial support by Bulgarian
National Science Fund through Contract DFNI T02-
16 is appreciated.
REFERENCES
1. K. M. Lee, C. W. Lai, K. S. Ngai, J. C. Juan, Water.
Res., 88, 428 (2016).
2. K. M. Reza, A. S. W. Kurny, F. Gulshan, Appl.
Water. Sci., 7, 1569 (2017).
3. H. Derikvandi, A. Nezamzadeh-Ejhieh, J. Haz.
Mater., 321, 629 (2017).
4. F. Tian, Y. Liu, Scripta. Mater., 69, 417 (2013).
5. S. B. A. Hamid, S. J. Teh, C. W. Lai, Catalysts, 7, 93
(2017).
6. M. A. Johar, R. A. Afzal, A. A. Alazba, U. Manzoor,
Adv. Mater. Sci. Eng., 934587 (2015).
7. E. D. Sherly, J. Judith Vijaya, L. John Kennedy, B.
Sreedhar, J. Nanosci. Nanotechnol., 16, 9784 (2016).
8. Z. Zhang, C. Shao, X. Li, C. Wang, M. Zhang, Y.
Liu, ACS Appl. Mater. Interfaces, 2, 2915 (2010).
9. M. A. M. Adnan, N. M. Julkapli, S. B. A. Hamid,
Rev. Inorg. Chem., 36, 77 (2016).
10. C. Luo, D. Li, W. Wu, Y. Zhang, C. Pan, RSC Adv.,
4, 3090 (2014).
11. P. Ameta; A. Kumar, R. Ameta, R. K. Malkani, Iran.
J. Chem. Chem. Eng., 29, 43 (2010).
12. D. Dey, S. Das, M. Patra, N. Kole, B. Biswas, J. Org.
Inorg. Chem., 1, 1 (2015).
13. I. A. Rahman, M. T. M. Ayob, S. Radiman, J.
Nanotechnol., 212694 (2014).
14. M. A. Kanjwal, I. S. Chronakis, N. A. M. Barakat,
Ceram. Int., 41, 12229 (2015).
15. V. Karthikeyan, A. Padmanaban, T. Dhanasekaran,
S. Praveen Kumar, G. Gnanamoorthy, V. Narayanan,
Mech. Mater. Sci. Eng., 9, 55 (2017).
16. J. Li, F. Zhao, L. Zhang, M. Zhang, H. Jiang, S. Li, J.
Li, RSC Adv., 5, 67610 (2015).
17. R. Chauhan, A. Kumar, R. Chaudhary, J.
Optoelectron. Biomed. Mater., 3, 17 (2011).
18. X. Cai, Y. Cai, Y. Liu, H. Li, F. Zhang, Y. Wang, J.
Phys. Chem. Solid., 74, 1196 (2013).
19. P. Dai, T. Yan, X. Yu, Z. Bai, M. Wu, Nanoscale
Res. Lett., 11, 226 (2016).
20. B. M. Keyes, L. M. Gedvilas, X. Li, T. J. Coutts, J.
Cryst. Growth, 281, 297 (2005).
21. R. M. Alwan, Q. A. Kadhim, K. M. Sahan, R. A.
Ali, R. J. Mahdi, N. A. Kassim, A. N. Jassim,
Nanosci. Nanotechnol., 5, 1 (2015).
22. S. Musić, S. Popović, M. Maljković, D. Dragčević, J.
Alloys Comp., 347, 324 (2002).
23. R. Y. Hong, J. H. Li, L. L. Chen, D. Q. Liu, H. Z. Li,
Y. Zheng, J. Ding, Powder Technol., 189, 426 (2009).
24. M. Gancheva, I. Uzunov, R. Iordanova, K. Papazova,
Mater. Chem. Phys., 164, 36 (2015).
25. T. Teka, A. Reda, Int. J. Technol. Enhanc. Merg.
Eng. Res.,2, 6 (2014).
K. I. Milenova et al.: Composite photocatalysts on the base of nickel oxide-zinc oxide powders
134
СИНТЕЗ И ИЗСЛЕДВАНЕ НА КОМПОЗИТНИ ФОТОКАТАЛИЗАТОРИ НА ОСНОВАТА НА
СМЕС ОТ НИКЕЛОВ ОКСИД И ЦИНКОВ ОКСИД
K. И. Миленова1*, К. Л. Захариева
1, С. В. Василев
2, С. С. Димова
3, И. Д. Стамболова
4, В. Н. Блъсков
4
1 Институт по катализ, Българска академия на науките, ул. „Акад. Г. Бончев“, бл. 11, 1113 София, България 2 Институт по електрохимия и енергийни системи, Българска академия на науките, ул. „Акад. Г. Бончев“,
бл. 10, 1113 София, България 3 Институт по полимери, Българска академия на науките, ул. „Акад. Г. Бончев“, бл. 103A, 1113 София,
България 4 Институт по обща и неорганична химия, Българска академия на науките, ул. „Акад. Г. Бончев“, бл. 11,
1113 София, България
Постъпила на: 14 януари 2018 г.; Преработена на 19 март 2018 г.
(Резюме)
Сравнена е фотокаталитичната активност на NiO0.8ZnO0.2-ZnO образци, получени при утаяване от различни
изходни материали (хлориди и нитрати), последвано от термична обработка при две различни температури
(450 °C или 650 °C). Рентгенов анализ и инфрачервена спектроскопия с Фурие трансформация са използвани за
охарактеризиране на изследваните катализатори. Изучено е окислителното фоторазграждане на багрилото
Малахитово Зелено върху NiO0.8ZnO0.2-ZnO образци за период от 2 часа, използвайки ултравиолетова светлина.
Степените на разграждане на багрилото Малахитово Зелено oт NiO0.8ZnO0.2-ZnO образци, получени от хлориди,
третирани при 450 °C и 650 °C, са съответно 89 и 86%. Образците, получени от нитратни прекурсори обрабо-
тени при 450 °C и 650 °C проявяват по-висока степен на фотокаталитична деградация (съответно 99% и 94%).
K. I. Milenova et al.: Composite photocatalysts on the base of nickel oxide-zinc oxide powders
135
Bulgarian Chemical Communications, Volume 50, Special issue H (pp. 135–139) 2018
Photocatalytic behaviour of NiMnO3/Mn2O3 materials for degradation of
Malachite Green and Methylene Blue dyes under UV irradiation
K. L. Zaharieva1*
, K. I. Milenova1, S. V. Vassilev
2, S. S. Dimova
3, I. D. Stambolova
4,
V. N. Blaskov4
1 Institute of Catalysis, Bulgarian Academy of Sciences, Acad. G. Bonchev St., Bldg. 11, 1113 Sofia, Bulgaria
2 Institute of Electrochemistry and Energy Systems, Bulgarian Academy of Sciences, Acad. G. Bonchev St., Bldg. 10,
1113, Sofia, Bulgaria 3 Institute of Polymers, Bulgarian Academy of Sciences, Acad. G. Bonchev St., Bldg. 103A, 1113 Sofia, Bulgaria
4 Institute of General and Inorganic Chemistry, Bulgarian Academy of Sciences, Acad. G. Bonchev St., Bldg. 11,
1113 Sofia, Bulgaria
Received: January 14, 2018; Revised: March 20, 2018
The present work describes a study of the photocatalytic behaviour of NiMnO3/Mn2O3 materials for degradation of
Malachite Green (MG) and Methylene Blue (MB) dyes as model contaminants under UV light irradiation. Samples
were prepared by precipitation using nickel and manganese acetates as starting materials and sodium hydroxide
precipitant, and then thermally treated at a different temperature – 450 and 650 °C. Powder X-ray diffraction analysis
and Fourier-transform infrared spectroscopy were applied to study phase composition and structure of synthesized
NiMnO3/Mn2O3 samples. Photocatalytic measurements were carried out using MG or MB aqueous solution with
starting concentration of 5 ppm. According to experiments using NiMnO3/Mn2O3 photocatalysts calcined at 450 and
650 °C the degree of degradation of Malachite Green and Methylene Blue dyes after 120 minutes was increased as
follows: NiMnO3/Mn2O3, 450 °C, MB (10%) ˂ NiMnO3/Mn2O3, 650 °C, MB (13%) ˂ NiMnO3/Mn2O3, 650 °C, MG
(67%) ˂ NiMnO3/Mn2O3, 450 °C, MG (78%). It was established that the NiMnO3/Mn2O3 samples showed a much
higher photocatalytic ability for degradation of Malachite Green relative to Methylene Blue dye under UV illumination..
Keywords: Malachite Green, Methylene Blue, degradation, NiMnO3/Mn2O3, photocatalytic ability.
INTRODUCTION
Metal oxides can demonstrate an enormous
number of structural geometries with an electronic
structure that can possess semiconductor, metallic or
insulator character and consequently show a very
important role in various fields of physics, chemistry,
and materials science [1]. Manganese oxides are
famous to be active catalysts for various chemical
processes such as dye degradation, water oxidation,
organic synthesis, and CO and NOx removal from
waste gases [2]. Heterogeneous photocatalysis using
metal oxides due to its potential application to both
organic synthesis and environmental applications
has attracted considerable attention [1,3].
Catalytic oxidation of Methylene Blue by H2O2
has been tested on manganese oxide loaded hollow
silica particles (MHSPs). The MHSPs with hollow
structure and high surface areas enhance the cata-
lytic activity compared to the matching manganese
oxide solid particles (MSPs) [2]. Xia et al. have
prepared Mn2O3 microspheres by a two-step method
in ethylene glycol system. The obtained samples
were tested for photodegradation of Methylene Blue
solution in the presence of H2O2 under ultraviolet
illumination. The Mn2O3 microspheres exhibited
moderate photocatalytic ability due to their parti-
cular structure [4]. In addition, Mn2O3 microspheres
obtained by a hydrothermal route have been studied
for purification of water polluted with Methylene
Blue dye [5].
Han et al. have investigated a Mn2O3/MCM-41
composite for degradation of Methyl Orange (MO),
Congo Red (CR), Methylene Blue (MB), and Rhod-
amine B (RB) with/without visible light irradiation
at room temperature. The Mn2O3/MCM-41 compo-
site demonstrated superb removal efficiency for RB
and MB [6]. A Ni/α-Mn2O3 catalyst has been tested
for reduction in aqueous phase of 4-nitrophenol and
organic dye pollutants - Rhodamine B, Methylene
Blue, Rose Bengal, Congo Red, and Methyl Orange
in the presence of a mild reducing agent, NaBH4 [7].
Yang et al. have prepared single-crystalline nano-
rods of beta-MnO2, alpha-Mn2O3, and Mn3O4 using
heat-treatment of γ-MnOOH nanorods obtained by a
hydrothermal method. The synthesized manganese
oxide nanorods manifested catalytic ability to oxidise
and decompose Methylene Blue dye with H2O2 [8].
© 2018 Bulgarian Academy of Sciences, Union of Chemists in Bulgaria
* To whom all correspondence should be sent
E-mail: [email protected]
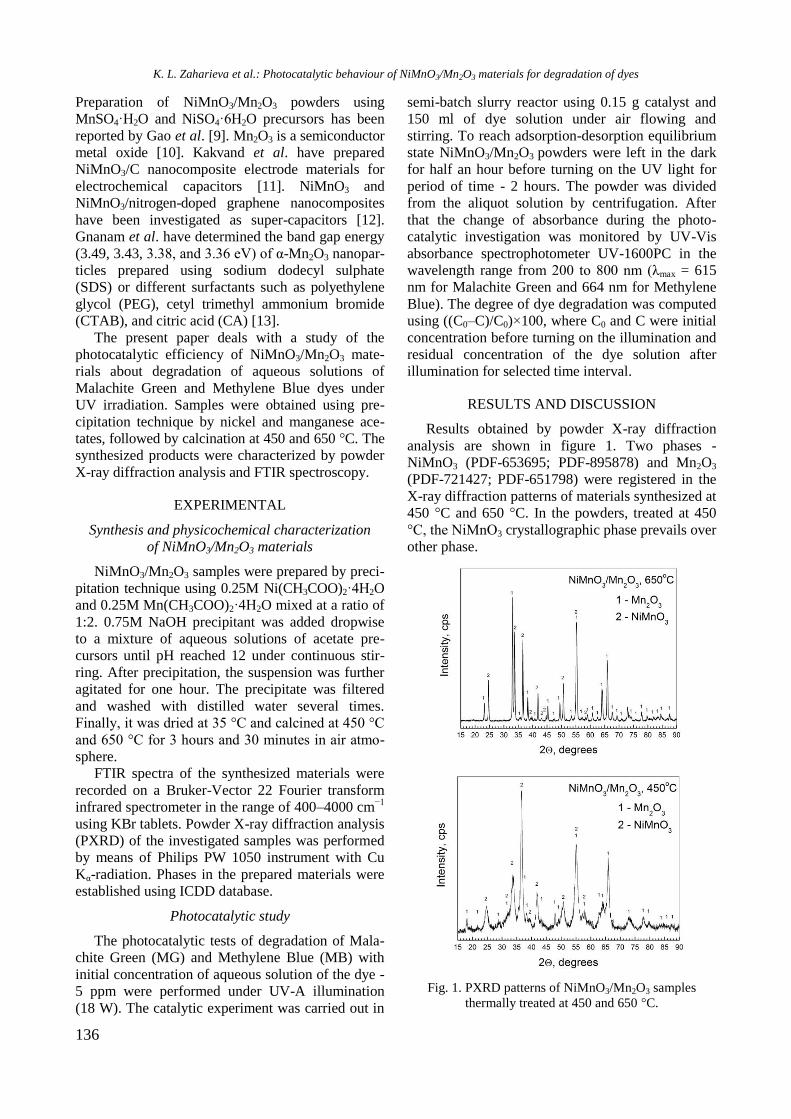
136
Preparation of NiMnO3/Mn2O3 powders using
MnSO4·H2O and NiSO4·6H2O precursors has been
reported by Gao et al. [9]. Mn2O3 is a semiconductor
metal oxide [10]. Kakvand et al. have prepared
NiMnO3/C nanocomposite electrode materials for
electrochemical capacitors [11]. NiMnO3 and
NiMnO3/nitrogen-doped graphene nanocomposites
have been investigated as super-capacitors [12].
Gnanam et al. have determined the band gap energy
(3.49, 3.43, 3.38, and 3.36 eV) of α-Mn2O3 nanopar-
ticles prepared using sodium dodecyl sulphate
(SDS) or different surfactants such as polyethylene
glycol (PEG), cetyl trimethyl ammonium bromide
(CTAB), and citric acid (CA) [13].
The present paper deals with a study of the
photocatalytic efficiency of NiMnO3/Mn2O3 mate-
rials about degradation of aqueous solutions of
Malachite Green and Methylene Blue dyes under
UV irradiation. Samples were obtained using pre-
cipitation technique by nickel and manganese ace-
tates, followed by calcination at 450 and 650 °C. The
synthesized products were characterized by powder
X-ray diffraction analysis and FTIR spectroscopy.
EXPERIMENTAL
Synthesis and physicochemical characterization
of NiMnO3/Mn2O3 materials
NiMnO3/Mn2O3 samples were prepared by preci-
pitation technique using 0.25M Ni(CH3COO)2·4H2O
and 0.25M Mn(CH3COO)2·4H2O mixed at a ratio of
1:2. 0.75M NaOH precipitant was added dropwise
to a mixture of aqueous solutions of acetate pre-
cursors until pH reached 12 under continuous stir-
ring. After precipitation, the suspension was further
agitated for one hour. The precipitate was filtered
and washed with distilled water several times.
Finally, it was dried at 35 °C and calcined at 450 °C
and 650 °C for 3 hours and 30 minutes in air atmo-
sphere.
FTIR spectra of the synthesized materials were
recorded on a Bruker-Vector 22 Fourier transform
infrared spectrometer in the range of 400–4000 cm−1
using KBr tablets. Powder X-ray diffraction analysis
(PXRD) of the investigated samples was performed
by means of Philips PW 1050 instrument with Cu
Kα-radiation. Phases in the prepared materials were
established using ICDD database.
Photocatalytic study
The photocatalytic tests of degradation of Mala-
chite Green (MG) and Methylene Blue (MB) with
initial concentration of aqueous solution of the dye -
5 ppm were performed under UV-A illumination
(18 W). The catalytic experiment was carried out in
semi-batch slurry reactor using 0.15 g catalyst and
150 ml of dye solution under air flowing and
stirring. To reach adsorption-desorption equilibrium
state NiMnO3/Mn2O3 powders were left in the dark
for half an hour before turning on the UV light for
period of time - 2 hours. The powder was divided
from the aliquot solution by centrifugation. After
that the change of absorbance during the photo-
catalytic investigation was monitored by UV-Vis
absorbance spectrophotometer UV-1600PC in the
wavelength range from 200 to 800 nm (λmax = 615
nm for Malachite Green and 664 nm for Methylene
Blue). The degree of dye degradation was computed
using ((C0–C)/C0)×100, where C0 and C were initial
concentration before turning on the illumination and
residual concentration of the dye solution after
illumination for selected time interval.
RESULTS AND DISCUSSION
Results obtained by powder X-ray diffraction
analysis are shown in figure 1. Two phases -
NiMnO3 (PDF-653695; PDF-895878) and Mn2O3
(PDF-721427; PDF-651798) were registered in the
X-ray diffraction patterns of materials synthesized at
450 °C and 650 °C. In the powders, treated at 450
°C, the NiMnO3 crystallographic phase prevails over
other phase.
Fig. 1. PXRD patterns of NiMnO3/Mn2O3 samples
thermally treated at 450 and 650 °C.
K. L. Zaharieva et al.: Photocatalytic behaviour of NiMnO3/Mn2O3 materials for degradation of dyes
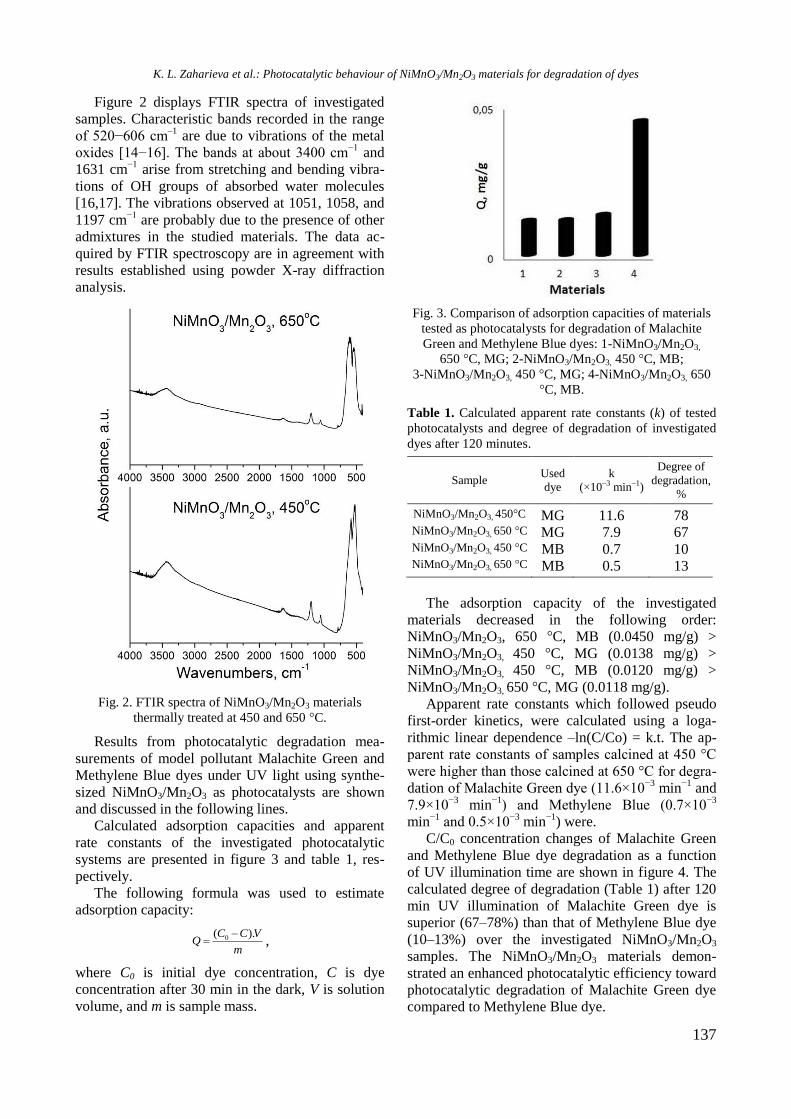
137
Figure 2 displays FTIR spectra of investigated
samples. Characteristic bands recorded in the range
of 520−606 cm–1
are due to vibrations of the metal
oxides [14−16]. The bands at about 3400 cm−1
and
1631 cm−1
arise from stretching and bending vibra-
tions of OH groups of absorbed water molecules
[16,17]. The vibrations observed at 1051, 1058, and
1197 cm−1
are probably due to the presence of other
admixtures in the studied materials. The data ac-
quired by FTIR spectroscopy are in agreement with
results established using powder X-ray diffraction
analysis.
Fig. 2. FTIR spectra of NiMnO3/Mn2O3 materials
thermally treated at 450 and 650 °C.
Results from photocatalytic degradation mea-
surements of model pollutant Malachite Green and
Methylene Blue dyes under UV light using synthe-
sized NiMnO3/Mn2O3 as photocatalysts are shown
and discussed in the following lines.
Calculated adsorption capacities and apparent
rate constants of the investigated photocatalytic
systems are presented in figure 3 and table 1, res-
pectively.
The following formula was used to estimate
adsorption capacity:
m
VCCQ
).( 0 ,
where C0 is initial dye concentration, C is dye
concentration after 30 min in the dark, V is solution
volume, and m is sample mass.
Fig. 3. Comparison of adsorption capacities of materials
tested as photocatalysts for degradation of Malachite
Green and Methylene Blue dyes: 1-NiMnO3/Mn2O3,
650 °C, MG; 2-NiMnO3/Mn2O3, 450 °C, MB;
3-NiMnO3/Mn2O3, 450 °C, MG; 4-NiMnO3/Mn2O3, 650
°C, MB.
Table 1. Calculated apparent rate constants (k) of tested
photocatalysts and degree of degradation of investigated
dyes after 120 minutes.
Sample Used
dye
k
(×10‒3 min‒1)
Degree of
degradation, %
NiMnO3/Mn2O3, 450°C MG 11.6 78 NiMnO3/Mn2O3, 650 °C MG 7.9 67 NiMnO3/Mn2O3, 450 °C MB 0.7 10 NiMnO3/Mn2O3, 650 °C MB 0.5 13
The adsorption capacity of the investigated
materials decreased in the following order:
NiMnO3/Mn2O3, 650 °C, MB (0.0450 mg/g) >
NiMnO3/Mn2O3, 450 °C, MG (0.0138 mg/g) >
NiMnO3/Mn2O3, 450 °C, MB (0.0120 mg/g) >
NiMnO3/Mn2O3, 650 °C, MG (0.0118 mg/g).
Apparent rate constants which followed pseudo
first-order kinetics, were calculated using a loga-
rithmic linear dependence –ln(C/Co) = k.t. The ap-
parent rate constants of samples calcined at 450 °C
were higher than those calcined at 650 °C for degra-
dation of Malachite Green dye (11.6×10⁻³
min−1
and
7.9×10⁻³
min−1
) and Methylene Blue (0.7×10⁻³
min−1
and 0.5×10⁻³
min−1
) were.
C/C0 concentration changes of Malachite Green
and Methylene Blue dye degradation as a function
of UV illumination time are shown in figure 4. The
calculated degree of degradation (Table 1) after 120
min UV illumination of Malachite Green dye is
superior (67–78%) than that of Methylene Blue dye
(10–13%) over the investigated NiMnO3/Mn2O3
samples. The NiMnO3/Mn2O3 materials demon-
strated an enhanced photocatalytic efficiency toward
photocatalytic degradation of Malachite Green dye
compared to Methylene Blue dye.
K. L. Zaharieva et al.: Photocatalytic behaviour of NiMnO3/Mn2O3 materials for degradation of dyes
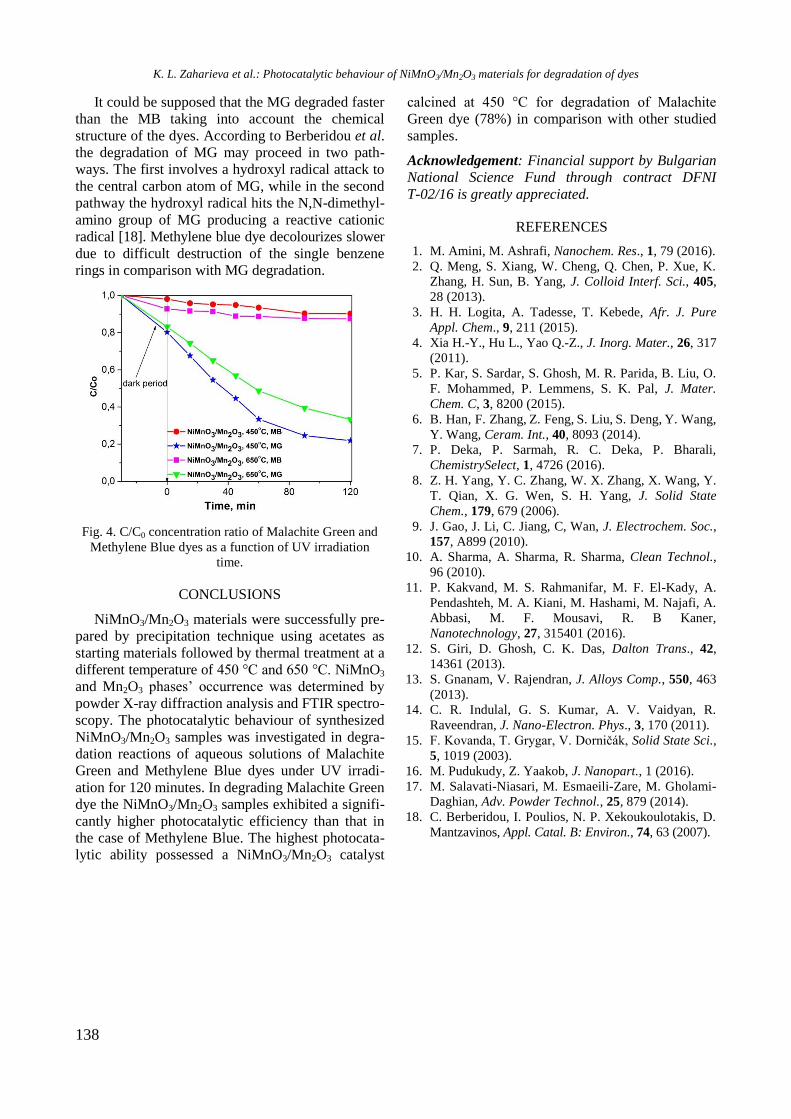
138
It could be supposed that the MG degraded faster
than the MB taking into account the chemical
structure of the dyes. According to Berberidou et al.
the degradation of MG may proceed in two path-
ways. The first involves a hydroxyl radical attack to
the central carbon atom of MG, while in the second
pathway the hydroxyl radical hits the N,N-dimethyl-
amino group of MG producing a reactive cationic
radical [18]. Methylene blue dye decolourizes slower
due to difficult destruction of the single benzene
rings in comparison with MG degradation.
Fig. 4. C/C0 concentration ratio of Malachite Green and
Methylene Blue dyes as a function of UV irradiation
time.
CONCLUSIONS
NiMnO3/Mn2O3 materials were successfully pre-
pared by precipitation technique using acetates as
starting materials followed by thermal treatment at a
different temperature of 450 °C and 650 °C. NiMnO3
and Mn2O3 phases’ occurrence was determined by
powder X-ray diffraction analysis and FTIR spectro-
scopy. The photocatalytic behaviour of synthesized
NiMnO3/Mn2O3 samples was investigated in degra-
dation reactions of aqueous solutions of Malachite
Green and Methylene Blue dyes under UV irradi-
ation for 120 minutes. In degrading Malachite Green
dye the NiMnO3/Mn2O3 samples exhibited a signifi-
cantly higher photocatalytic efficiency than that in
the case of Methylene Blue. The highest photocata-
lytic ability possessed a NiMnO3/Mn2O3 catalyst
calcined at 450 °C for degradation of Malachite
Green dye (78%) in comparison with other studied
samples.
Acknowledgement: Financial support by Bulgarian
National Science Fund through contract DFNI
T-02/16 is greatly appreciated.
REFERENCES
1. M. Amini, M. Ashrafi, Nanochem. Res., 1, 79 (2016).
2. Q. Meng, S. Xiang, W. Cheng, Q. Chen, P. Xue, K.
Zhang, H. Sun, B. Yang, J. Colloid Interf. Sci., 405,
28 (2013).
3. H. H. Logita, A. Tadesse, T. Kebede, Afr. J. Pure
Appl. Chem., 9, 211 (2015).
4. Xia H.-Y., Hu L., Yao Q.-Z., J. Inorg. Mater., 26, 317
(2011).
5. P. Kar, S. Sardar, S. Ghosh, M. R. Parida, B. Liu, O.
F. Mohammed, P. Lemmens, S. K. Pal, J. Mater.
Chem. C, 3, 8200 (2015).
6. B. Han, F. Zhang, Z. Feng,
S. Liu,
S. Deng,
Y. Wang,
Y. Wang, Ceram. Int., 40, 8093 (2014).
7. P. Deka, P. Sarmah, R. C. Deka, P. Bharali,
ChemistrySelect, 1, 4726 (2016).
8. Z. H. Yang, Y. C. Zhang, W. X. Zhang, X. Wang, Y.
T. Qian, X. G. Wen, S. H. Yang, J. Solid State
Chem., 179, 679 (2006).
9. J. Gao, J. Li, C. Jiang, C, Wan, J. Electrochem. Soc.,
157, A899 (2010).
10. A. Sharma, A. Sharma, R. Sharma, Clean Technol.,
96 (2010).
11. P. Kakvand, M. S. Rahmanifar, M. F. El-Kady, A.
Pendashteh, M. A. Kiani, M. Hashami, M. Najafi, A.
Abbasi, M. F. Mousavi, R. B Kaner,
Nanotechnology, 27, 315401 (2016).
12. S. Giri, D. Ghosh, C. K. Das, Dalton Trans., 42,
14361 (2013).
13. S. Gnanam, V. Rajendran, J. Alloys Comp., 550, 463
(2013).
14. C. R. Indulal, G. S. Kumar, A. V. Vaidyan, R.
Raveendran, J. Nano-Electron. Phys., 3, 170 (2011).
15. F. Kovanda, T. Grygar, V. Dorničák, Solid State Sci.,
5, 1019 (2003).
16. M. Pudukudy, Z. Yaakob, J. Nanopart., 1 (2016).
17. M. Salavati-Niasari, M. Esmaeili-Zare, M. Gholami-
Daghian, Adv. Powder Technol., 25, 879 (2014).
18. C. Berberidou, I. Poulios, N. P. Xekoukoulotakis, D.
Mantzavinos, Appl. Catal. B: Environ., 74, 63 (2007).
K. L. Zaharieva et al.: Photocatalytic behaviour of NiMnO3/Mn2O3 materials for degradation of dyes
139
ФОТОКАТАЛИТИЧНО ПОВЕДЕНИЕ НА NiMnO3/Mn2O3 МАТЕРИАЛИ ЗА РАЗГРАЖДАНЕ НА
БАГРИЛАТА МАЛАХИТОВО ЗЕЛЕНО И МЕТИЛЕНОВО СИНЬО ПОД УВ ОБЛЪЧВАНЕ
К. Л. Захариева1*, K. И. Миленова
1, С. В. Василев
2, С. С. Димова
3, И. Д. Стамболова
4, В. Н. Блъсков
4
1 Институт по катализ, Българска академия на науките, ул. „Акад. Г. Бончев“, бл. 11, 1113 София, България 2 Институт по електрохимия и енергийни системи, Българска академия на науките, ул. „Акад. Г. Бончев“,
бл. 10, 1113 София, България 3 Институт по полимери, Българска академия на науките, ул. „Акад. Г. Бончев“, бл. 103A, 1113 София,
България 4 Институт по обща и неорганична химия, Българска академия на науките, ул. „Акад. Г. Бончев“, бл. 11,
1113 София, България
Постъпила на 14 януари 2018 г.; Преработена на 20 март 2018 г.
(Резюме)
В настоящата работа е изследвано фотокаталитичното поведение на NiMnO3/Mn2O3 материали под дей-
ствието на УВ облъчване за разграждане на багрилата малахитово зелено (МЗ) и метиленово синьо (МС) като
моделни замърсители. Получени са образци чрез утаяване използвайки никелов и манганов ацетат и утаител
натриева основа и след това термична обработка при различна температура - 450 и 650 °C. Рентгенов фазов
анализ и инфрачервена спектроскопия с Фурие преобразуване бяха използвани за да се изследва фазовия състав
и структурата на синтезираните NiMnO3/Mn2O3 образци. Фотокаталитичните изследвания бяха проведени
използвайки воден разтвор на багрилата МЗ и МС с начална концентрация 5 ppm. От фотокаталитичните
тестове се установи, че степента на разграждане на багрилата малахитово зелено и метиленово синьо след 120
минути използвайки NiMnO3/Mn2O3 фотокатализатори, накалени при 450 и 650 °C, нараства както следва:
NiMnO3/Mn2O3, 450oC, МС (10%) ˂ NiMnO3/Mn2O3, 650
oC, МС (13%) ˂ NiMnO3/Mn2O3, 650
oC, МЗ (67%) ˂
NiMnO3/Mn2O3, 450oC, МЗ (78%). Установено е, че NiMnO3/Mn2O3 образци показват много по-висока фотоката-
литична способност за разграждане на малахитово зелено отколкото на метиленово синьо под действието на
УВ облъчване.
K. L. Zaharieva et al.: Photocatalytic behaviour of NiMnO3/Mn2O3 materials for degradation of dyes
140
Bulgarian Chemical Communications, Volume 50, Special issue H (pp. 140–143) 2018
Investigations of abiotic and biotic materials based on iron oxyhydroxides for
photocatalytic dеcolourization of dyes in aqueous solutions
K. L. Zaharieva1,
*, M. G. Shopska1, K. I. Milenova
1, R. Angelova
2, M. Iliev
2, G. B. Kadinov
1
1 Institute of Catalysis, Bulgarian Academy of Sciences, Acad. G. Bonchev St., Bldg. 11, 1113 Sofia, Bulgaria
2 Faculty of Biology, St. Kliment Ohridski University of Sofia, 8 Dragan Tsankov Blvd., 1000 Sofia, Bulgaria
Received: January 31, 2018; Revised: March 04, 2018
Photocatalytic ability of abiotic and biotic materials was investigated in the reaction of dеcolourization of Methylene
Blue and Malachite Green dyes under UV illumination. Tests were carried out with aqueous solution of studied dyes at
a concentration of 5 ppm. Biotic material containing lepidocrocite was synthesized by cultivation of Leptothrix genus of
bacteria in a Sphaerotilus-Leptothrix group bacteria isolation medium (ICCL). A reference abiotic sample was prepared
in a sterile ICCL not infected by bacteria. Photocatalytic efficiency of examined materials was compared with lepido-
crocite synthesized by precipitation. Abiotic, biotic, and synthesized materials were studied by infrared spectroscopy.
The biotic material demonstrated a higher photocatalytic activity in Methylene Blue dye dеcolourization than abiotic
sample. In contrast, a higher dеcolourization degree for Malachite Green dye (83%) was determined using abiotic mate-
rial in comparison with a biotic sample (70%). Synthesized lepidocrocite demonstrated a higher degree of dеcolouri-
zation of Malachite Green dye (89%) in comparison with that of Methylene Blue dye for the same period of 120
minutes.
Key words: photocatalytic discolouration, Malachite Green, Methylene Blue, lepidocrocite, biogenic material.
INTRODUCTION
In the field of heterogeneous catalysis, materials
synthesis by biogenic or biomorphic methods may
provide promising resources. Biogenically obtained
iron oxyhydroxides and iron oxides have been
attractive objects in view of their catalytic appli-
cation. Interesting subjects of study have been iron
oxyhydroxides produced by Leptothrix sp. Lepto-
thrix is a filamentous bacterium and its sheath can
be coated with iron oxyhydroxide or analogous man-
ganese compounds [1].
Water is very important for life and the presence
of undesirable chemical components leads to its
pollution and makes it unsuitable for use by living
organisms. Industrial effluents containing dyes and
going into aquatic ecosystems cause environmental
pollution. Dyes may induce harmful effects on plants
and animals [2–5]. Photocatalytic oxidation is an
efficient method for removal of various contami-
nants [6].
Using photocatalytic oxidation of Fe(II) in the
presence of traces of citric acid Chen et al. have
synthesized Lepidocrocite (γ-FeOOH) under visible
light illumination [7]. The obtained low-crystalline
γ-FeOOH was easily dissolved in aqueous solution
and demonstrated high ability for degradation of
Orange II dye by homogeneous photo-Fenton reac-
tion [7]. Jelle et al. have prepared and investigated
the relationship among goethite (α-FeOOH), aka-
ganeite (β-FeOOH), lepidocrocite (γ-FeOOH), and
feroxyhyte (δ-FeOOH) and their photocatalytic
properties for degradation of Methylene Blue dye
under visible light irradiation [8]. Chen et al. have
studied adsorption and degradation of Rhodamine B
dye during lepidocrocite formation by air oxidation
of Fe(OH)2 under visible light illumination in the
presence of trace ethylenediaminetetracetic acid
(EDTA) [9]. Sheydaei et al. have prepared nano-
sized lepidocrocite using iron(II) sulphate solution.
These authors reported that optimum adsorption
conditions of Lanacron Brown S-GL dye (LBS-GL)
removal from aqueous solution involved lepidocro-
cite dosage of 0.015 g, pH 3.5, temperature of 38
°C, and contact time of 100 min [10]. Lin et al. have
obtained lepidocrocites by aerial oxidation using a
ferrous solution under different LED visible light in
the presence of trace EDTA. Catalytic studies have
shown the ability of lepidocrocite about decolouri-
zation of Crystal Violet dye with traces of H2O2
under visible light illumination [11].
Many researchers have yet synthesized lepido-
crocite using FeCl2·4H2O, FeSO4·7H2O, and other
salts by different techniques [12-16]. Ristić et al.
synthesized γ-FeOOH, α-FeOOH, and α-Fe2O3 by
hydrolysis of Fe3+
ions in aqueous solution of per-
chlorate [17].
© 2018 Bulgarian Academy of Sciences, Union of Chemists in Bulgaria
* To whom all correspondence should be sent
E-mail: [email protected]
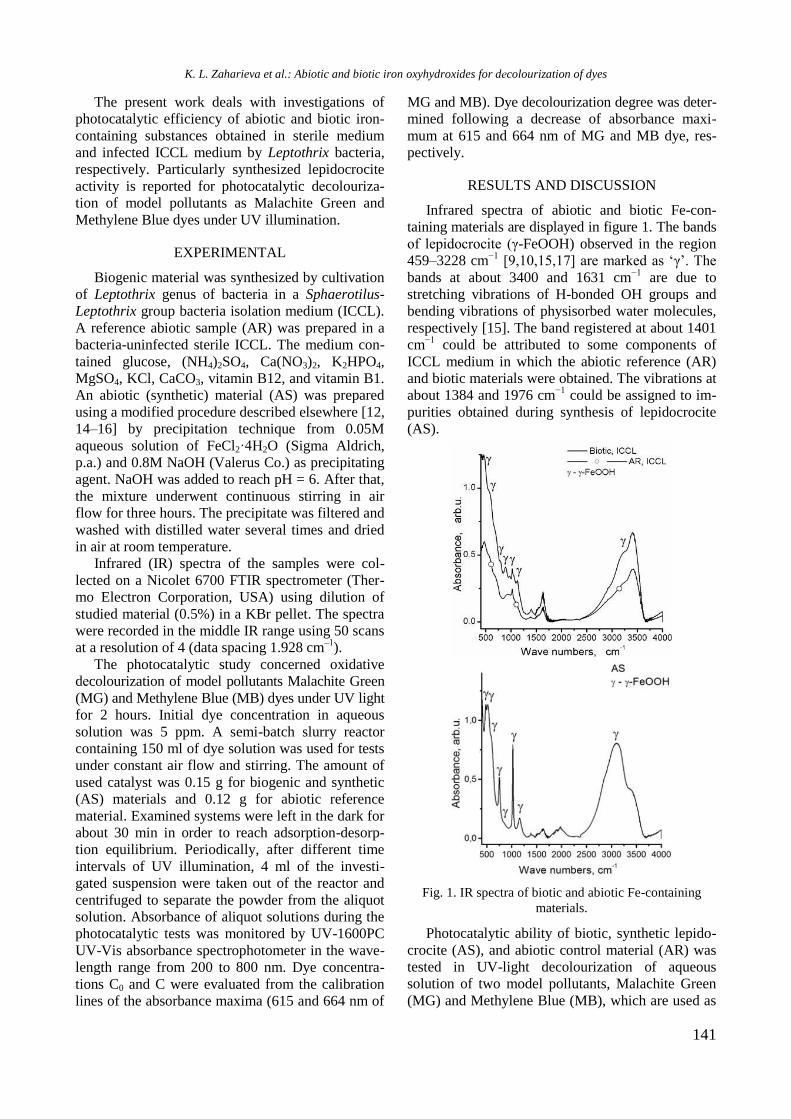
141
The present work deals with investigations of
photocatalytic efficiency of abiotic and biotic iron-
containing substances obtained in sterile medium
and infected ICCL medium by Leptothrix bacteria,
respectively. Particularly synthesized lepidocrocite
activity is reported for photocatalytic dеcolouriza-
tion of model pollutants as Malachite Green and
Methylene Blue dyes under UV illumination.
EXPERIMENTAL
Biogenic material was synthesized by cultivation
of Leptothrix genus of bacteria in a Sphaerotilus-
Leptothrix group bacteria isolation medium (ICCL).
A reference abiotic sample (AR) was prepared in a
bacteria-uninfected sterile ICCL. The medium con-
tained glucose, (NH4)2SO4, Ca(NO3)2, K2HPO4,
MgSO4, KCl, CaCO3, vitamin B12, and vitamin B1.
An abiotic (synthetic) material (AS) was prepared
using a modified procedure described elsewhere [12,
14–16] by precipitation technique from 0.05M
aqueous solution of FeCl2·4H2O (Sigma Aldrich,
p.a.) and 0.8M NaOH (Valerus Co.) as precipitating
agent. NaOH was added to reach pH = 6. After that,
the mixture underwent continuous stirring in air
flow for three hours. The precipitate was filtered and
washed with distilled water several times and dried
in air at room temperature.
Infrared (IR) spectra of the samples were col-
lected on a Nicolet 6700 FTIR spectrometer (Ther-
mo Electron Corporation, USA) using dilution of
studied material (0.5%) in a KBr pellet. The spectra
were recorded in the middle IR range using 50 scans
at a resolution of 4 (data spacing 1.928 cm‒1
).
The photocatalytic study concerned oxidative
dеcolourization of model pollutants Malachite Green
(MG) and Methylene Blue (MB) dyes under UV light
for 2 hours. Initial dye concentration in aqueous
solution was 5 ppm. A semi-batch slurry reactor
containing 150 ml of dye solution was used for tests
under constant air flow and stirring. The amount of
used catalyst was 0.15 g for biogenic and synthetic
(AS) materials and 0.12 g for abiotic reference
material. Examined systems were left in the dark for
about 30 min in order to reach adsorption-desorp-
tion equilibrium. Periodically, after different time
intervals of UV illumination, 4 ml of the investi-
gated suspension were taken out of the reactor and
centrifuged to separate the powder from the aliquot
solution. Absorbance of aliquot solutions during the
photocatalytic tests was monitored by UV-1600PC
UV-Vis absorbance spectrophotometer in the wave-
length range from 200 to 800 nm. Dye concentra-
tions C0 and C were evaluated from the calibration
lines of the absorbance maxima (615 and 664 nm of
MG and MB). Dye decolourization degree was deter-
mined following a decrease of absorbance maxi-
mum at 615 and 664 nm of MG and MB dye, res-
pectively.
RESULTS AND DISCUSSION
Infrared spectra of abiotic and biotic Fe-con-
taining materials are displayed in figure 1. The bands
of lepidocrocite (γ-FeOOH) observed in the region
459–3228 cm−1
[9,10,15,17] are marked as ‘γ’. The
bands at about 3400 and 1631 cm−1
are due to
stretching vibrations of H-bonded OH groups and
bending vibrations of physisorbed water molecules,
respectively [15]. The band registered at about 1401
cm−1
could be attributed to some components of
ICCL medium in which the abiotic reference (AR)
and biotic materials were obtained. The vibrations at
about 1384 and 1976 cm−1
could be assigned to im-
purities obtained during synthesis of lepidocrocite
(AS).
Fig. 1. IR spectra of biotic and abiotic Fe-containing
materials.
Photocatalytic ability of biotic, synthetic lepido-
crocite (AS), and abiotic control material (AR) was
tested in UV-light decolourization of aqueous
solution of two model pollutants, Malachite Green
(MG) and Methylene Blue (MB), which are used as
K. L. Zaharieva et al.: Abiotic and biotic iron oxyhydroxides for dеcolourization of dyes
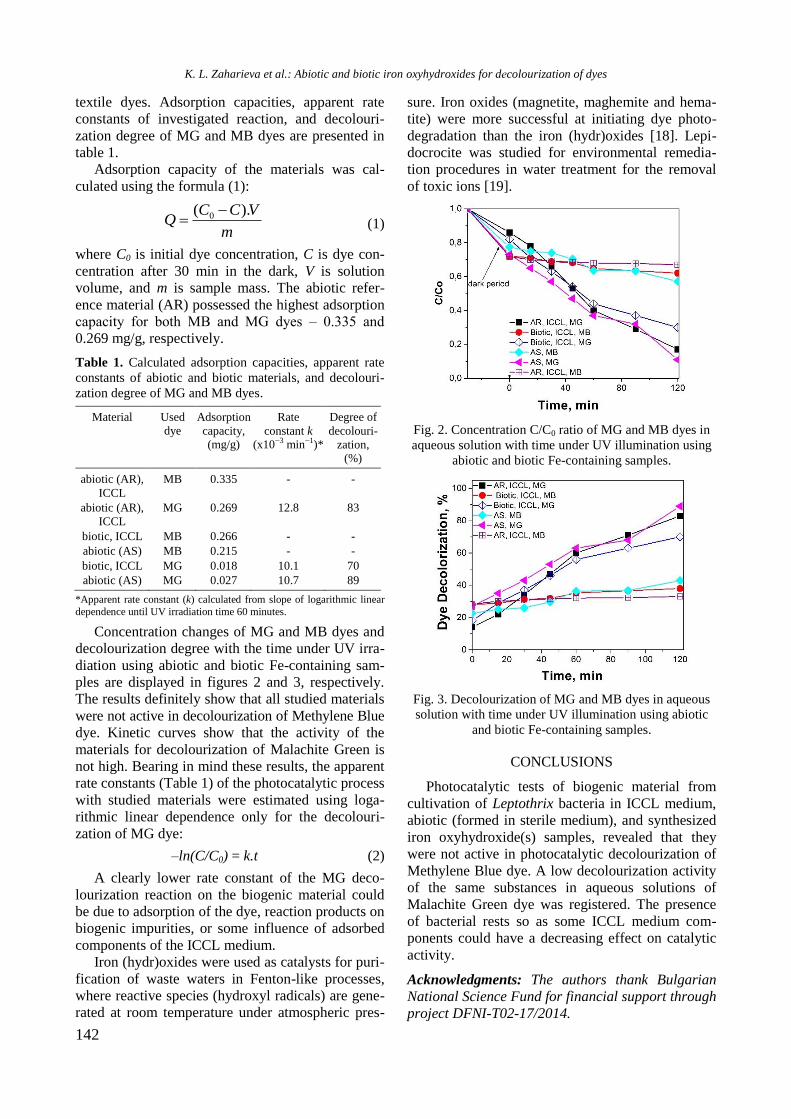
142
textile dyes. Adsorption capacities, apparent rate
constants of investigated reaction, and decolouri-
zation degree of MG and MB dyes are presented in
table 1.
Adsorption capacity of the materials was cal-
culated using the formula (1):
m
VCCQ
).( 0 (1)
where C0 is initial dye concentration, C is dye con-
centration after 30 min in the dark, V is solution
volume, and m is sample mass. The abiotic refer-
ence material (AR) possessed the highest adsorption
capacity for both MB and MG dyes ‒ 0.335 and
0.269 mg/g, respectively.
Table 1. Calculated adsorption capacities, apparent rate
constants of abiotic and biotic materials, and decolouri-
zation degree of MG and MB dyes.
Material Used
dye
Adsorption
capacity, (mg/g)
Rate
constant k (x10−3 min−1)*
Degree of
decolouri-
zation, (%)
abiotic (AR),
ICCL
MB 0.335 - -
abiotic (AR),
ICCL
MG 0.269 12.8 83
biotic, ICCL MB 0.266 - -
abiotic (AS) MB 0.215 - -
biotic, ICCL MG 0.018 10.1 70
abiotic (AS) MG 0.027 10.7 89
*Apparent rate constant (k) calculated from slope of logarithmic linear
dependence until UV irradiation time 60 minutes.
Concentration changes of MG and MB dyes and
decolourization degree with the time under UV irra-
diation using abiotic and biotic Fe-containing sam-
ples are displayed in figures 2 and 3, respectively.
The results definitely show that all studied materials
were not active in decolourization of Methylene Blue
dye. Kinetic curves show that the activity of the
materials for decolourization of Malachite Green is
not high. Bearing in mind these results, the apparent
rate constants (Table 1) of the photocatalytic process
with studied materials were estimated using loga-
rithmic linear dependence only for the decolouri-
zation of MG dye:
–ln(C/C0) = k.t (2)
A clearly lower rate constant of the MG deco-
lourization reaction on the biogenic material could
be due to adsorption of the dye, reaction products on
biogenic impurities, or some influence of adsorbed
components of the ICCL medium.
Iron (hydr)oxides were used as catalysts for puri-
fication of waste waters in Fenton-like processes,
where reactive species (hydroxyl radicals) are gene-
rated at room temperature under atmospheric pres-
sure. Iron oxides (magnetite, maghemite and hema-
tite) were more successful at initiating dye photo-
degradation than the iron (hydr)oxides [18]. Lepi-
docrocite was studied for environmental remedia-
tion procedures in water treatment for the removal
of toxic ions [19].
Fig. 2. Concentration C/C0 ratio of MG and MB dyes in
aqueous solution with time under UV illumination using
abiotic and biotic Fe-containing samples.
Fig. 3. Decolourization of MG and MB dyes in aqueous
solution with time under UV illumination using abiotic
and biotic Fe-containing samples.
CONCLUSIONS
Photocatalytic tests of biogenic material from
cultivation of Leptothrix bacteria in ICCL medium,
abiotic (formed in sterile medium), and synthesized
iron oxyhydroxide(s) samples, revealed that they
were not active in photocatalytic decolourization of
Methylene Blue dye. A low decolourization activity
of the same substances in aqueous solutions of
Malachite Green dye was registered. The presence
of bacterial rests so as some ICCL medium com-
ponents could have a decreasing effect on catalytic
activity.
Acknowledgments: The authors thank Bulgarian
National Science Fund for financial support through
project DFNI-T02-17/2014.
K. L. Zaharieva et al.: Abiotic and biotic iron oxyhydroxides for dеcolourization of dyes
143
REFERENCES
1. J. S. J. Hargreaves, A. I. Alharthi, J. Chem. Technol.
Biotechnol., 91, 296 (2016).
2. R. Ameta, J. Vardia, P. B. Punjabi, S. C. Ameta,
Indian J. Chem. Technol., 13, 114 (2006).
3. B. H. Hameed, M. I. El-Khaiary, J. Hazard. Mater.,
154, 237 (2008).
4. A. Safavi, S. Momeni, J. Hazard. Mater., 201–202,
125 (2012).
5. A. R. Khataee, M. B. Kasiri, J. Mol. Catal. A: Chem.,
328, 8 (2010).
6. O. Brahmia, International Journal of Advances in
Chemical Engineering and Biological Sciences
(IJACEBS) 3, 225 (2016).
7. R. Chen, S. Zhao, H. Liu, X. Song, Y. Wei, J.
Photochem. Photobiol. A: Chemistry, 312, 73 (2015).
8. A. A. Jelle, M. Hmadeh, P. G. O’Brien, D. D. Perovic,
G. A. Ozin, ChemNanoMat, 2, 1047 (2016).
9. R. Chen, J. Zhao, H. Liu, Y. Wei, J. Environ. Chem.
Eng., 3, 202 (2015).
10. M. Sheydaei, S. Aber, Clean-Soil, Air, Water, 41,
890 (2013).
11. Y. Lin, Y. Wei, Y. Sun, J. Mol. Catal. A: Chemical,
353–354, 67 (2012).
12. G. Navarro, R. Acevedo, A. Soto, M. Herane, (in:
XV Chilean Physics Symposium, 2006, IOP Publ.
Ltd, 2008) J. Phys.: Conf. Ser., 134, 012023 (2008).
13. U. Schwertmann, H. Fechter, Clay Miner., 29, 87
(1994).
14. E. Mlirad, U. Schwertmann, Miner. Mag., 48, 507
(1984).
15. S. Rahimi, R. M. Moattari, L. Rajabi, A. Ashraf
Derakhshan, M. Keyhani, J. Ind. Eng. Chem., 23, 33
(2015).
16. R. M. Cornell, U. Schwertmann, The Iron Oxides:
Structure, Properties, Reactions, Occurences and Uses,
Wiley-VCH Verlag GmbH & Co. KGaA Weinheim,
2003.
17. M. Ristić, S. Musić, M. Godec, J. Alloys Comp., 417,
292 (2006).
18. M. C. Pereira, L. C. A. Oliveira, E. Murad, Clay
Miner., 47, 285 (2012).
19. M. Mohapatra, S. Anand, Int. J. Eng. Sci. Technol.,
2, 127 (2010).
ИЗСЛЕДВАНИЯ НА АБИОТИЧНИ И БИОТИЧНИ МАТЕРИАЛИ НА ОСНОВАТА НА ЖЕЛЕЗНИ
ОКСИХИДРОКСИДИ ЗА ФОТОКАТАЛИТИЧНО ОБЕЗЦВЕТЯВАНЕ НА БАГРИЛА ВЪВ ВОДНИ
РАЗТВОРИ
К. Л. Захариева1,*, М. Г. Шопска
1, К. И. Миленова
1, Р. Ангелова
2, М. Илиев
2, Г. Б. Кадинов
1
1 Институт по катализ, Българска академия на науките, ул. „Акад. Г. Бончев“, бл. 11, 1113 София, България
2 Биологически факултет, Софийски университет „Св. Климент Охридски“, бул. „Драган Цанков“ 8,
1000 София, България
Постъпила на: 31 януари 2018 г.; Преработена на: 4 март 2018 г.
(Резюме)
Фотокаталитичната способност на абиотичен и биогенен материал е изследвана в реакцията на обезцве-
тяване на багрилата метиленово синьо и малахитово зелено под действието на УВ облъчване. Опитите са
проведени във водни разтвори на изследваните багрила с концентрация 5 ppm. Биогенният материал съдържащ
лепидокрокит е получен при култивиране на бактерии Leptothrix в изолационна среда за бактерии от групата
Sphaerotilus-Leptothrix (ИССЛ). Абиотичен сравнителен материал (AR) е получен в стерилна ИССЛ (незаразена
с бактерии). Фотокаталитичната способност на тестваните материали беше сравнена с тази на синтезиран чрез
утаяване лепидокрокит (AS). Абиотичният, биогенният и синтезираният материал бяха изследвани посредством
инфрачервена спектроскопия. Биогенният материал демонстрира по-висока фотокаталитична активност в
обезцветяването на метиленово синьо от абиотичния сравнителен материал. Обратното бе наблюдавано при
обезцветяване на малахитово зелено, като регистрираният ефект е много по-голям (83% с абиотичния сравни-
телен материал, 70% с биогенния материал). Синтезираният лепидокрокит показа по-висока степен на обезцве-
тяване на разтвора с малахитово зелено (89%) в сравнение с тази на разтвора с метиленово синьо за еднакъв
период от 120 минути.
K. L. Zaharieva et al.: Abiotic and biotic iron oxyhydroxides for dеcolourization of dyes
144
Bulgarian Chemical Communications, Volume 50, Special issue H (pp. 144–150) 2018
Enhancing the PMS activation ability of Co3O4 by doping with Bi and Mg
V. V. Ivanova-Kolcheva, M. K. Stoyanova*
Department of Physical Chemistry, University of Plovdiv, 24 Tsar Asen St., 4000 Plovdiv, Bulgaria
Received: January 30, 2018; Revised: March 09, 2018
A series of Co-Bi and Co-Mg composite oxides were prepared by co-precipitation method and their catalytic activity
for heterogeneous peroxymonosulphate (PMS) activation was investigated through Acid Orange 7 (AO7) degradation in
aqueous solutions. The as-prepared catalysts were characterized by XRD, XPS, TEM, and ICP-OES. A significant
increase in catalytic activity of Co3O4 by modifying with Bi and Mg oxides was registered. Composites with 50 wt.%
Co3O4 content displayed the best catalytic activity by achieving complete removal of 50 mg dm–3
AO7 within 12–15
minutes under the reaction conditions of 0.1 g dm–3
catalyst and PMS/AO7 molar ratio of 6:1. The enhanced PMS
activation functionality of the composite catalysts was ascribed to an increased amount of surface hydroxyl groups
because of modifying with the basic oxides. Surface hydroxyls favoured the formation of a surface Co(II)-OH
intermediate and thus the generation of sulphate radicals (SRs) from PMS was accelerated. АО7 degradation was found
to follow first order kinetics. The quenching study clearly indicated that oxidative degradation of AO7 is a radical-
involved process with SRs being the dominant radical species. The Co-Bi and Co-Mg composite oxides presented stable
performance with minor cobalt leaching even under acidic conditions.
Key words: composite oxides, Co3O4, Bi2O3, MgO, peroxymonosulphate, AO7 degradation.
INTRODUCTION
In recent decades, advanced oxidation processes
(AOPs) based on in situ generation of highly
reactive radical species by activation of inorganic
peroxides have emerged as a promising technology
for degradation of refractory organic compounds to
harmless products in water at ambient conditions
[1–3]. Despite promising performance and cost-
effectiveness of the conventional Fenton process,
several significant drawbacks limit its practical
applications such as a low pH range (2–4), a large
catalyst dosage, and large amount of iron sludge
produced [4]. Sulphate radical induced AOPs are
regarded as a more feasible and effective alternative
to the Fenton process, owing to comparative
standard reduction potential, longer half-life, and
better selectivity of SRs than hydroxyl radicals, to
remove or even mineralize organic pollutants [5,6].
Homogeneous activation of unsymmetrical per-
oxide PMS by transition metal ions is proven an
efficient route for production of SRs with cobalt
ions being the best activator [7]. However, the
adverse effect of dissolved cobalt ions on animals
and human beings raise a great concern. Hence, the
development of cobalt-based heterogeneous cata-
lysts of high PMS activating ability to conduct
catalytic oxidation of organic pollutants is highly
desirable. For the first time Anipsitakis et al.
explored the possibilities of CoO and Co3O4 in acti-
vation of PMS for 2,4-dichlorophenol degradation
in replacing homogeneous Co(II)/PMS [8]. Nano-
sized Co3O4 catalyst was found to exhibit an excel-
lent long-term stability and low dissolved Co ions,
especially under neutral conditions in degradation of
AO7 by PMS activation [9]. Although Co3O4 nano-
particles present good catalytic performance, they
can easily agglomerate during catalytic reaction to
cause a drop of the catalytic efficiency. To tune the
surface properties, and therefore improve the cata-
lytic activity, various supports such as TiO2, Al2O3,
SiO2, carbon materials, MgO, etc. have been used to
prepare supported cobalt catalysts [10−12]. Among
these, metal oxides with abundant surface basic sites
such as MgO and TiO2 were reported to lead to a
relative high catalytic activity. Besides, supports can
also act as components with synergistic and hybrid
property dramatically boosting the catalytic effi-
ciency [13]. Mixed metal catalysts have improved
stability (reduced leaching), multifunctionality (e.g.
photoactive, magnetically separable, etc.), high redox
activity, and better catalytic activity compared to
single metal [14]. Many cobalt composite catalysts
that have been used as PMS activators including
CoFe2O4 [15], CoMn2O4 [16], CuFe2O4 [17], and
CuBi2O4 [18] were found to exhibit a much stronger
catalytic activity in PMS oxidation process than
Co3O4. As PMS activation is favoured on a basic
surface, modification of the Co3O4 with basic metal
oxides would have a promotional effect on its PMS
© 2018 Bulgarian Academy of Sciences, Union of Chemists in Bulgaria
* To whom all correspondence should be sent
E-mail: [email protected]
145
activation ability. AO7 is a representative azo dye
widely used for the dyeing of textiles, food, and cos-
metics. It is reported that AO7 shows good resist-
ance to biodegradation, thus it is normally not amen-
able for the conventional wastewater treatment pro-
cess [19].
The aim of the present work was to examine the
effect of Bi and Mg oxides addition to Co3O4 on
the catalytic performance in PMS activation for
degrading Acid Orange 7 as a model water pollutant.
EXPERIMENTAL
Co3O4-MgO and Co3O4-Bi2O3 composite cata-
lysts of various Co3O4 content (20, 50, and 80 wt.%)
were synthesised by co-precipitation method using
NaOH as a precipitation agent and subsequent an-
nealing of the precursor at 773 K. In a typical pro-
cedure, 0.8 mol l–1
NaOH were added dropwise at
333 K into a certain volume of aqueous solution
containing fixed amounts of cobalt nitrate and mag-
nesium or bismuth nitrate under vigorous stirring
until solution pH reached 10. The obtained precipi-
tate was further aged at 333 K for 30 minutes under
continuous stirring. The solid product was collected
by filtration, washed with deionised water and etha-
nol several times to neutral pH, dried at 378 K over-
night, and finally calcined at 773 K for 3 h in static
air. For comparative purposes, pristine Co3O4, MgO,
and Bi2O3 were also prepared by the same synthesis
procedure.
The amount of Co, Bi, and Mg in the prepared
samples as well as the concentration of leached cobalt
ions after the reaction were measured by ICP-OES
analysis (iCAP 6300 Thermo Scientific). XRD
analysis was performed using Bruker D8 Advance
diffractometer with Cu Kα radiation and LynxEye
detector. Phase identification was accomplished by
Diffracplus EVA using ICDD-PDF2 Database. Cata-
lyst morphology was determined on a JEOL JEM
2100 high-resolution transmission electron micro-
scope using an accelerating voltage of 200 kV. Two
basic regimes of microscope mode were used: bright
field transmission microscopy (TEM) and selected
area electron diffraction (SAED). X-ray photoelec-
tron spectroscopy (XPS) measurements were carried
out on an AXIS Supra photoelectron spectrometer
(Kratos Analytical Ltd.) using monochromatic AlKα
radiation with photon energy of 1486.6 eV. The
binding energies (BEs) were determined with an
accuracy of ±0.1 eV utilising the C1s line of adventi-
tious carbon as a reference with energy of 285.0 eV.
The pH of the point of zero charge (pHPZC) of the
catalysts was determined by pH drift method [20].
Degradation experiments were carried out in a
400-cm3 glass reactor at 293 K under constant stir-
ring at around 400 rpm. In a typical run, a fixed
amount of PMS (in the form of Oxone,
2KHSO5.KHSO4.K2SO4) was added into a 200-cm3
aqueous solution (50 mg dm–3
AO7) to attain a pre-
defined PMS/AO7 molar ratio and stirred until
dissolved. Degradation reaction was initiated by
adding a specified amount of catalyst. Aliquots of
4.0 cm3 were taken at given time intervals, imme-
diately mixed with 1 ml methanol to quench the
reaction, and centrifuged at 4000 rpm for 1 min to
remove the catalyst. The AO7 concentration was
determined by measuring the absorbance at a fixed
wavelength of 486 nm using UV-Vis spectrophoto-
meter (Cintra 101, GBS). All tests were conducted
in triplicate to ensure the reproducibility of experi-
mental results. For quenching experiments, prior to
addition of oxidant and catalyst, a known amount of
the alcohol quencher (ethanol or tert-butyl alcohol)
was added into the AO7 solution to obtain a
required molar ratio of alcohol to PMS.
RESULTS AND DISCUSSION
Calculated Co3O4 content in the synthesised
composite materials based on ICP-OES results and
XRD characterisation is given in Table 1 along with
preparation parameters for comparison.
Table 1. ICP-OES results for Co, Bi, and Mg content in
synthesised catalysts
Catalyst Co3O4 content (wt.%)
Preparation ICP-OES
X% Co3O4-MgO 20 21.6
50 47.1
80 74.3
X% Co3O4-Bi2O3 20 23.8
50 45.1
80 79.2
Fig. 1 shows XRD pattern of the 20% Co3O4-
Bi2O3 catalyst in comparison with Bi2O3 and Co3O4
as reference compounds. The diffraction peaks of
the pristine metal oxides can be indexed to single-
phase monoclinic α-Bi2O3, (JCPDS 41-1449) and
cubic spinel-type Co3O4 (JCPDS 42-1467), respect-
ively. Reflexes typical of the two individual metal
oxides were observed in the spectrum of the com-
posite sample, which indicated the presence of Co3O4
and Bi2O3 in the catalyst. Notably, the intensity of
peaks associated with cobalt species was very weak,
suggesting good dispersion of the Co3O4 particles in
the resulting product. Similarly, the peaks corres-
ponding to the MgO were clearly observed and domi-
V. V. Ivanova-Kolcheva, M. K. Stoyanova: PMS activation ability of Co3O4 by doping with Bi and Mg
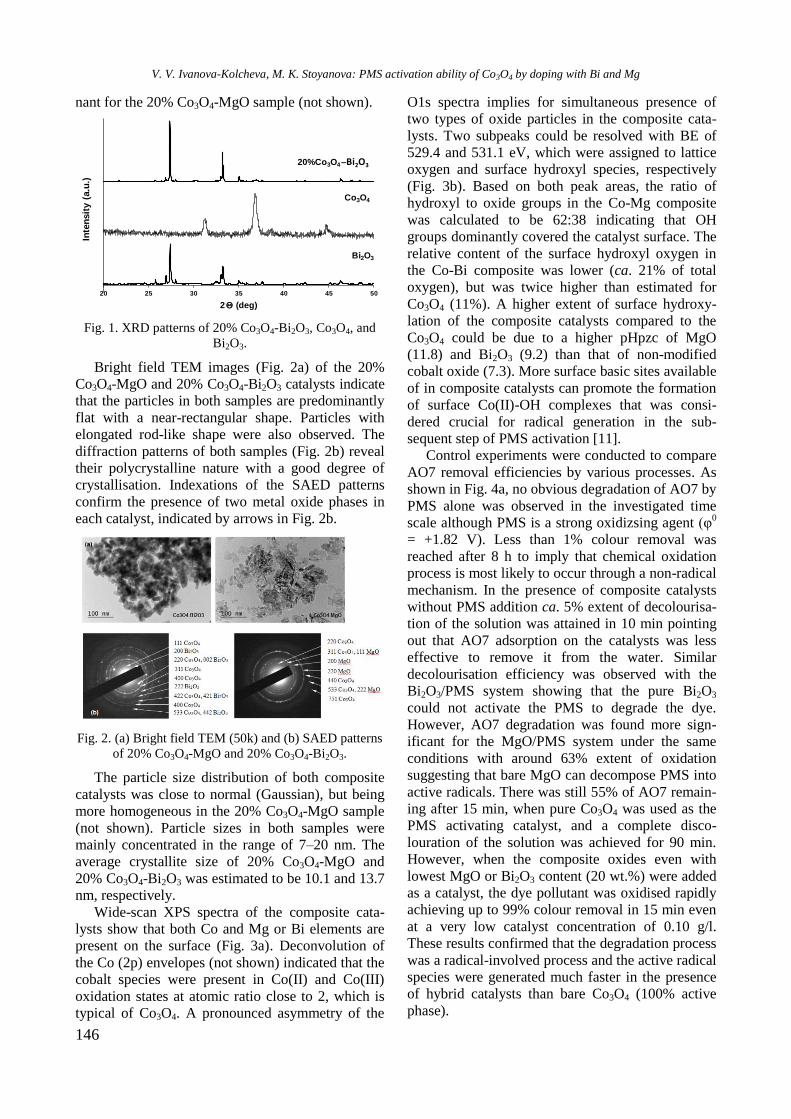
146
nant for the 20% Co3O4-MgO sample (not shown).
Fig. 1. XRD patterns of 20% Co3O4-Bi2O3, Co3O4, and
Bi2O3.
Bright field TEM images (Fig. 2a) of the 20%
Co3O4-MgO and 20% Co3O4-Bi2O3 catalysts indicate
that the particles in both samples are predominantly
flat with a near-rectangular shape. Particles with
elongated rod-like shape were also observed. The
diffraction patterns of both samples (Fig. 2b) reveal
their polycrystalline nature with a good degree of
crystallisation. Indexations of the SAED patterns
confirm the presence of two metal oxide phases in
each catalyst, indicated by arrows in Fig. 2b.
Fig. 2. (a) Bright field TEM (50k) and (b) SAED patterns
of 20% Co3O4-MgO and 20% Co3O4-Bi2O3.
The particle size distribution of both composite
catalysts was close to normal (Gaussian), but being
more homogeneous in the 20% Co3O4-MgO sample
(not shown). Particle sizes in both samples were
mainly concentrated in the range of 7–20 nm. The
average crystallite size of 20% Co3O4-MgO and
20% Co3O4-Bi2O3 was estimated to be 10.1 and 13.7
nm, respectively.
Wide-scan XPS spectra of the composite cata-
lysts show that both Co and Mg or Bi elements are
present on the surface (Fig. 3a). Deconvolution of
the Co (2p) envelopes (not shown) indicated that the
cobalt species were present in Co(II) and Co(III)
oxidation states at atomic ratio close to 2, which is
typical of Co3O4. A pronounced asymmetry of the
O1s spectra implies for simultaneous presence of
two types of oxide particles in the composite cata-
lysts. Two subpeaks could be resolved with BE of
529.4 and 531.1 eV, which were assigned to lattice
oxygen and surface hydroxyl species, respectively
(Fig. 3b). Based on both peak areas, the ratio of
hydroxyl to oxide groups in the Co-Mg composite
was calculated to be 62:38 indicating that OH
groups dominantly covered the catalyst surface. The
relative content of the surface hydroxyl oxygen in
the Co-Bi composite was lower (ca. 21% of total
oxygen), but was twice higher than estimated for
Co3O4 (11%). A higher extent of surface hydroxy-
lation of the composite catalysts compared to the
Co3O4 could be due to a higher pHpzc of MgO
(11.8) and Bi2O3 (9.2) than that of non-modified
cobalt oxide (7.3). More surface basic sites available
of in composite catalysts can promote the formation
of surface Co(II)-OH complexes that was consi-
dered crucial for radical generation in the sub-
sequent step of PMS activation [11].
Control experiments were conducted to compare
AO7 removal efficiencies by various processes. As
shown in Fig. 4a, no obvious degradation of AO7 by
PMS alone was observed in the investigated time
scale although PMS is a strong oxidizsing agent (φ0
= +1.82 V). Less than 1% colour removal was
reached after 8 h to imply that chemical oxidation
process is most likely to occur through a non-radical
mechanism. In the presence of composite catalysts
without PMS addition ca. 5% extent of decolourisa-
tion of the solution was attained in 10 min pointing
out that AO7 adsorption on the catalysts was less
effective to remove it from the water. Similar
decolourisation efficiency was observed with the
Bi2O3/PMS system showing that the pure Bi2O3
could not activate the PMS to degrade the dye.
However, AO7 degradation was found more sign-
ificant for the MgO/PMS system under the same
conditions with around 63% extent of oxidation
suggesting that bare MgO can decompose PMS into
active radicals. There was still 55% of AO7 remain-
ing after 15 min, when pure Co3O4 was used as the
PMS activating catalyst, and a complete disco-
louration of the solution was achieved for 90 min.
However, when the composite oxides even with
lowest MgO or Bi2O3 content (20 wt.%) were added
as a catalyst, the dye pollutant was oxidised rapidly
achieving up to 99% colour removal in 15 min even
at a very low catalyst concentration of 0.10 g/l.
These results confirmed that the degradation process
was a radical-involved process and the active radical
species were generated much faster in the presence
of hybrid catalysts than bare Co3O4 (100% active
phase).
20 25 30 35 40 45 50
2 (deg)
Bi2O3
Co3O4
20%Co3O4 –Bi2O3
Inte
nsit
y(a
.u.)
V. V. Ivanova-Kolcheva, M. K. Stoyanova: PMS activation ability of Co3O4 by doping with Bi and Mg
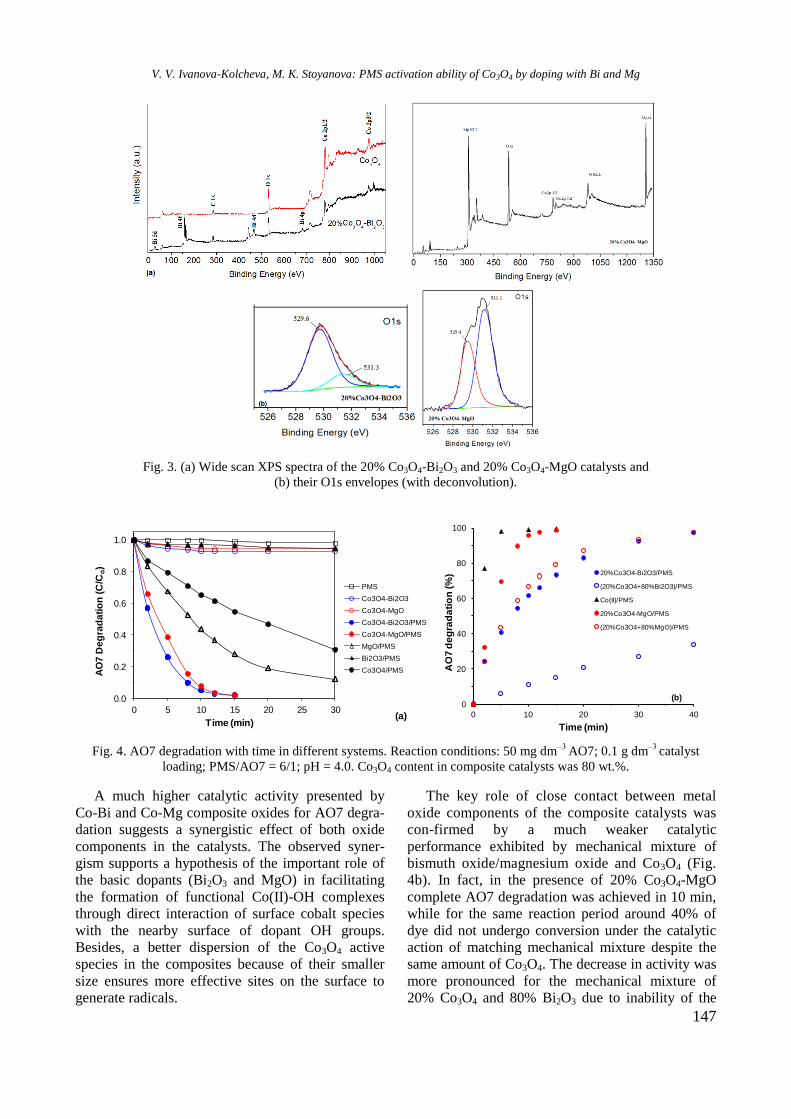
147
Fig. 3. (a) Wide scan XPS spectra of the 20% Co3O4-Bi2O3 and 20% Co3O4-MgO catalysts and
(b) their O1s envelopes (with deconvolution).
Fig. 4. AO7 degradation with time in different systems. Reaction conditions: 50 mg dm‒3
AO7; 0.1 g dm‒3
catalyst
loading; PMS/AO7 = 6/1; pH = 4.0. Co3O4 content in composite catalysts was 80 wt.%.
A much higher catalytic activity presented by
Co-Bi and Co-Mg composite oxides for AO7 degra-
dation suggests a synergistic effect of both oxide
components in the catalysts. The observed syner-
gism supports a hypothesis of the important role of
the basic dopants (Bi2O3 and MgO) in facilitating
the formation of functional Co(II)-OH complexes
through direct interaction of surface cobalt species
with the nearby surface of dopant OH groups.
Besides, a better dispersion of the Co3O4 active
species in the composites because of their smaller
size ensures more effective sites on the surface to
generate radicals.
The key role of close contact between metal
oxide components of the composite catalysts was
con-firmed by a much weaker catalytic
performance exhibited by mechanical mixture of
bismuth oxide/magnesium oxide and Co3O4 (Fig.
4b). In fact, in the presence of 20% Co3O4-MgO
complete AO7 degradation was achieved in 10 min,
while for the same reaction period around 40% of
dye did not undergo conversion under the catalytic
action of matching mechanical mixture despite the
same amount of Co3O4. The decrease in activity was
more pronounced for the mechanical mixture of
20% Co3O4 and 80% Bi2O3 due to inability of the
0.0
0.2
0.4
0.6
0.8
1.0
0 5 10 15 20 25 30
AO
7 D
eg
rad
ati
on
(C
/Co)
Time (min)
PMS
Co3O4-Bi2O3
Co3O4-MgO
Co3O4-Bi2O3/PMS
Co3O4-MgO/PMS
MgO/PMS
Bi2O3/PMS
Co3O4/PMS
(a)
0
20
40
60
80
100
0 10 20 30 40
AO
7 d
eg
rad
ati
on
(%
)
Time (min)
20%Co3O4-Bi2O3/PMS
(20%Co3O4+80%Bi2O3)/PMS
Co(II)/PMS
20%Co3O4-MgO/PMS
(20%Co3O4+80%MgO)/PMS
(b)
V. V. Ivanova-Kolcheva, M. K. Stoyanova: PMS activation ability of Co3O4 by doping with Bi and Mg
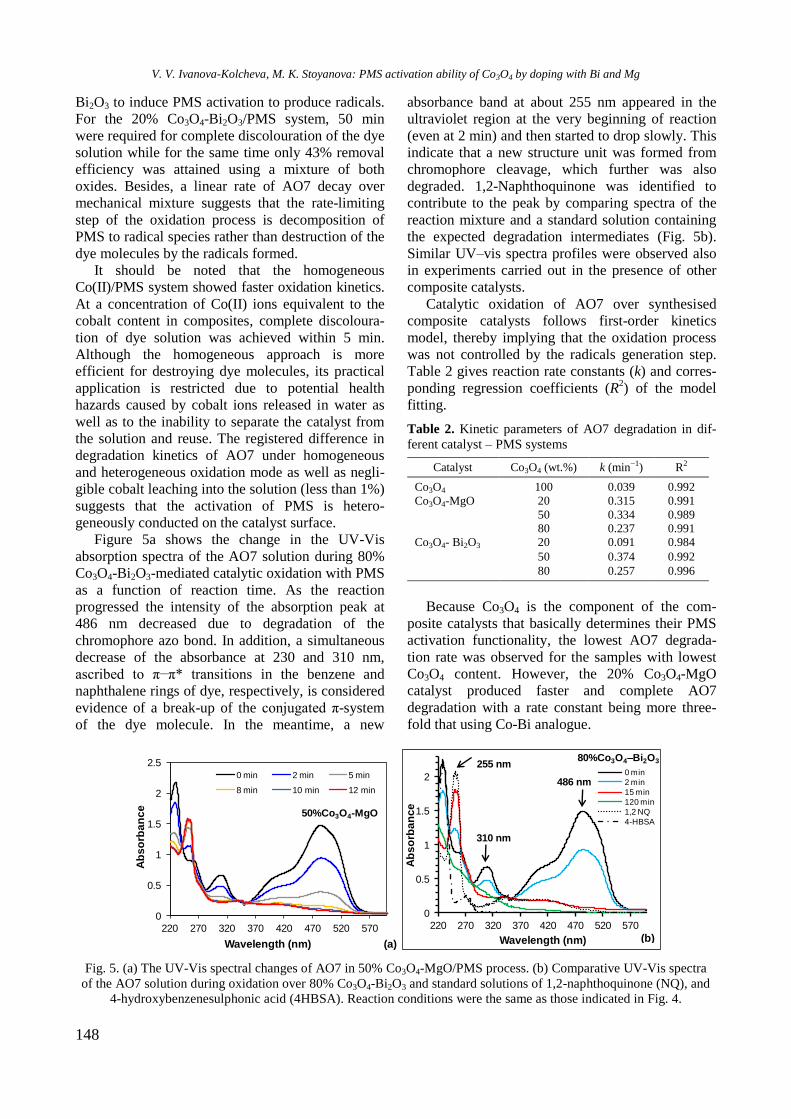
148
Bi2O3 to induce PMS activation to produce radicals.
For the 20% Co3O4-Bi2O3/PMS system, 50 min
were required for complete discolouration of the dye
solution while for the same time only 43% removal
efficiency was attained using a mixture of both
oxides. Besides, a linear rate of AO7 decay over
mechanical mixture suggests that the rate-limiting
step of the oxidation process is decomposition of
PMS to radical species rather than destruction of the
dye molecules by the radicals formed.
It should be noted that the homogeneous
Co(II)/PMS system showed faster oxidation kinetics.
At a concentration of Co(II) ions equivalent to the
cobalt content in composites, complete discoloura-
tion of dye solution was achieved within 5 min.
Although the homogeneous approach is more
efficient for destroying dye molecules, its practical
application is restricted due to potential health
hazards caused by cobalt ions released in water as
well as to the inability to separate the catalyst from
the solution and reuse. The registered difference in
degradation kinetics of AO7 under homogeneous
and heterogeneous oxidation mode as well as negli-
gible cobalt leaching into the solution (less than 1%)
suggests that the activation of PMS is hetero-
geneously conducted on the catalyst surface.
Figure 5a shows the change in the UV-Vis
absorption spectra of the AO7 solution during 80%
Co3O4-Bi2O3-mediated catalytic oxidation with PMS
as a function of reaction time. As the reaction
progressed the intensity of the absorption peak at
486 nm decreased due to degradation of the
chromophore azo bond. In addition, a simultaneous
decrease of the absorbance at 230 and 310 nm,
ascribed to π−π* transitions in the benzene and
naphthalene rings of dye, respectively, is considered
evidence of a break-up of the conjugated π-system
of the dye molecule. In the meantime, a new
absorbance band at about 255 nm appeared in the
ultraviolet region at the very beginning of reaction
(even at 2 min) and then started to drop slowly. This
indicate that a new structure unit was formed from
chromophore cleavage, which further was also
degraded. 1,2-Naphthoquinone was identified to
contribute to the peak by comparing spectra of the
reaction mixture and a standard solution containing
the expected degradation intermediates (Fig. 5b).
Similar UV–vis spectra profiles were observed also
in experiments carried out in the presence of other
composite catalysts.
Catalytic oxidation of AO7 over synthesised
composite catalysts follows first-order kinetics
model, thereby implying that the oxidation process
was not controlled by the radicals generation step.
Table 2 gives reaction rate constants (k) and corres-
ponding regression coefficients (R2) of the model
fitting.
Table 2. Kinetic parameters of AO7 degradation in dif-
ferent catalyst – PMS systems
Catalyst Co3O4 (wt.%) k (min−1) R2
Co3O4 100 0.039 0.992
Co3O4-MgO 20 0.315 0.991
50 0.334 0.989
80 0.237 0.991
Co3O4- Bi2O3 20 0.091 0.984
50 0.374 0.992
80 0.257 0.996
Because Co3O4 is the component of the com-
posite catalysts that basically determines their PMS
activation functionality, the lowest AO7 degrada-
tion rate was observed for the samples with lowest
Co3O4 content. However, the 20% Co3O4-MgO
catalyst produced faster and complete AO7
degradation with a rate constant being more three-
fold that using Co-Bi analogue.
Fig. 5. (a) The UV-Vis spectral changes of AO7 in 50% Co3O4-MgO/PMS process. (b) Comparative UV-Vis spectra
of the AO7 solution during oxidation over 80% Co3O4-Bi2O3 and standard solutions of 1,2-naphthoquinone (NQ), and
4-hydroxybenzenesulphonic acid (4HBSA). Reaction conditions were the same as those indicated in Fig. 4.
0
0.5
1
1.5
2
220 270 320 370 420 470 520 570
Ab
so
rba
nc
e
Wavelength (nm)
80%Co3O4–Bi2O3
0 min
2 min
15 min
120 min
1,2 NQ
4-HBSA
255 nm
486 nm
310 nm
(b)
0
0.5
1
1.5
2
2.5
220 270 320 370 420 470 520 570
Ab
so
rba
nc
e
Wavelength (nm) (a)
50%Co3O4-MgO
0 min 2 min 5 min
8 min 10 min 12 min
V. V. Ivanova-Kolcheva, M. K. Stoyanova: PMS activation ability of Co3O4 by doping with Bi and Mg
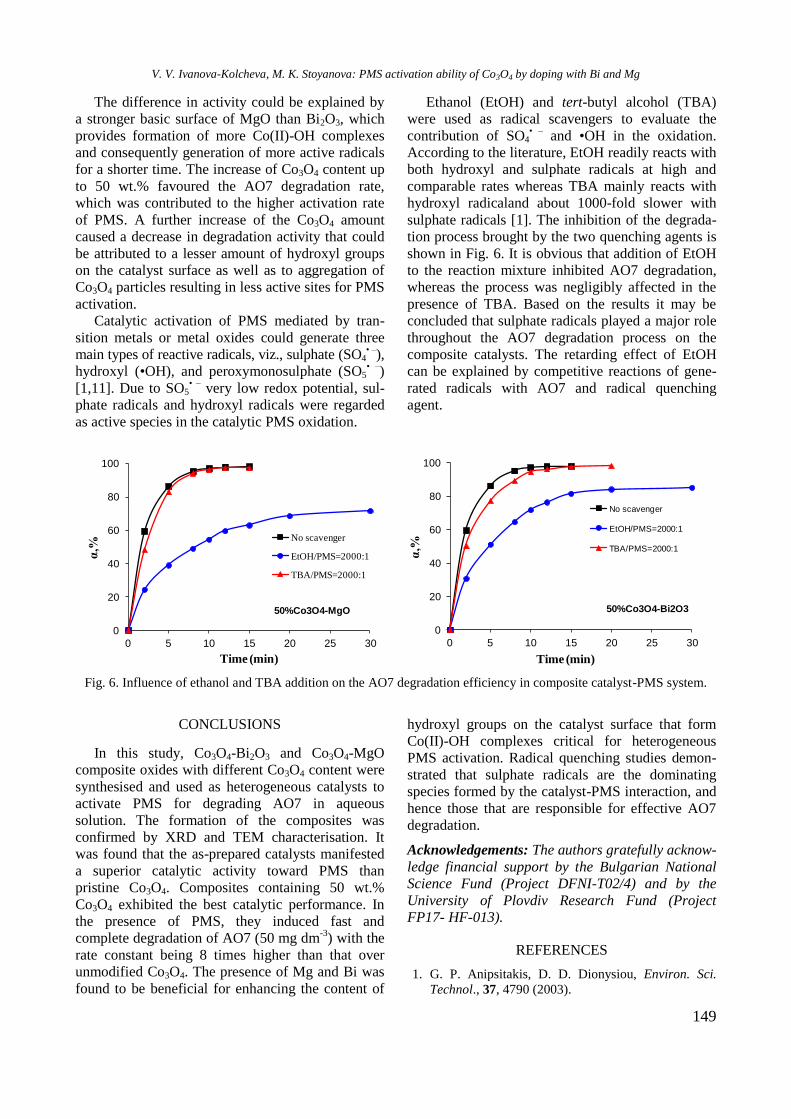
149
The difference in activity could be explained by
a stronger basic surface of MgO than Bi2O3, which
provides formation of more Co(II)-OH complexes
and consequently generation of more active radicals
for a shorter time. The increase of Co3O4 content up
to 50 wt.% favoured the AO7 degradation rate,
which was contributed to the higher activation rate
of PMS. A further increase of the Co3O4 amount
caused a decrease in degradation activity that could
be attributed to a lesser amount of hydroxyl groups
on the catalyst surface as well as to aggregation of
Co3O4 particles resulting in less active sites for PMS
activation.
Catalytic activation of PMS mediated by tran-
sition metals or metal oxides could generate three
main types of reactive radicals, viz., sulphate (SO4• ‒
),
hydroxyl (•OH), and peroxymonosulphate (SO5• ‒
)
[1,11]. Due to SO5• ‒
very low redox potential, sul-
phate radicals and hydroxyl radicals were regarded
as active species in the catalytic PMS oxidation.
Ethanol (EtOH) and tert-butyl alcohol (TBA)
were used as radical scavengers to evaluate the
contribution of SO4• ‒
and •OH in the oxidation.
According to the literature, EtOH readily reacts with
both hydroxyl and sulphate radicals at high and
comparable rates whereas TBA mainly reacts with
hydroxyl radicaland about 1000-fold slower with
sulphate radicals [1]. The inhibition of the degrada-
tion process brought by the two quenching agents is
shown in Fig. 6. It is obvious that addition of EtOH
to the reaction mixture inhibited AO7 degradation,
whereas the process was negligibly affected in the
presence of TBA. Based on the results it may be
concluded that sulphate radicals played a major role
throughout the AO7 degradation process on the
composite catalysts. The retarding effect of EtOH
can be explained by competitive reactions of gene-
rated radicals with AO7 and radical quenching
agent.
Fig. 6. Influence of ethanol and TBA addition on the AO7 degradation efficiency in composite catalyst-PMS system.
CONCLUSIONS
In this study, Co3O4-Bi2O3 and Co3O4-MgO
composite oxides with different Co3O4 content were
synthesised and used as heterogeneous catalysts to
activate PMS for degrading AO7 in aqueous
solution. The formation of the composites was
confirmed by XRD and TEM characterisation. It
was found that the as-prepared catalysts manifested
a superior catalytic activity toward PMS than
pristine Co3O4. Composites containing 50 wt.%
Co3O4 exhibited the best catalytic performance. In
the presence of PMS, they induced fast and
complete degradation of AO7 (50 mg dm-3
) with the
rate constant being 8 times higher than that over
unmodified Co3O4. The presence of Mg and Bi was
found to be beneficial for enhancing the content of
hydroxyl groups on the catalyst surface that form
Co(II)-OH complexes critical for heterogeneous
PMS activation. Radical quenching studies demon-
strated that sulphate radicals are the dominating
species formed by the catalyst-PMS interaction, and
hence those that are responsible for effective AO7
degradation.
Acknowledgements: The authors gratefully acknow-
ledge financial support by the Bulgarian National
Science Fund (Project DFNI-T02/4) and by the
University of Plovdiv Research Fund (Project
FP17- HF-013).
REFERENCES
1. G. P. Anipsitakis, D. D. Dionysiou, Environ. Sci.
Technol., 37, 4790 (2003).
0
20
40
60
80
100
0 5 10 15 20 25 30
α,%
Time (min)
No scavenger
EtOH/PMS=2000:1
TBA/PMS=2000:1
50%Co3O4-MgO
0
20
40
60
80
100
0 5 10 15 20 25 30
α,%
Time (min)
No scavenger
EtOH/PMS=2000:1
TBA/PMS=2000:1
50%Co3O4-Bi2O3
V. V. Ivanova-Kolcheva, M. K. Stoyanova: PMS activation ability of Co3O4 by doping with Bi and Mg
150
2. W. Zhang, H. Tay, S. Lim, Y. Wang, Z. Zhong, R.
Xu, Appl. Catal. B: Environ, 95, 93 (2010).
3. P. Shukla, H. Sun, S. Wang, H. Ang, M. Tadé, Sep.
Purif. Technol., 77, 230 (2011).
4. A. Hu, X. Li, Sh. Ye, G. Yin, Q. Zeng, Appl. Catal.
B: Environ., 102, 37 (2011).
5. Y. Gao; Z. Zhang; S. Li, L. Liu, L. Yao, Y. Li, H.
Zhang, Appl. Catal. B: Environ., 185, 22 (2016).
6. L. Xu, R. Yuan, Y. Guo, D. Xiao, Y. Cao, Z. Wang,
J. Liu, Chem. Eng. J., 217, 169 (2013).
7. S. Yang, P. Wang, X. Yang, L. Shan, W. Zhang, X.
Shao, R. Niu, J. Hazard. Mater., 179 552 (2010) 552.
8. G. Anipsitakis, E. Stathatos, D. Dionysiou,, J. Phys.
Chem. B, 109, 13052 (2005).
9. X. Chen, J. Chen, X. Qiao, D. Wang, X. Cai, Appl.
Catal. B: Environ., 80, 116 (2008).
10. P. Shukla, H.Q. Sun, S. B. Wang, H. M. Ang, M. O.
Tade, Catal. Today, 175, 380 (2011).
11. Q. Yang, H. Choi, Y. Chen, D. D. Dionysiou, Appl.
Catal. B: Environ., 77, 300 (2008).
12. E. Saputra, S. Muhammad, H. Sun, H. M. Ang, M. O.
Tade, S. Wang, J. Colloid Interface Sci., 407, 467
(2013).
13. J. Deng, Sh. Feng, K. Zhang, J. Li, H. Wang, Z.
Wang, T. Zhang, X. Ma, Chem. Eng. J., 308, 505
(2017).
14. W. Wu, Z.-H. Huang, T.-T. Lim, Appl. Catal. A:
Gen., 480, 58 (2014).
15. Q. Yang, H. Choi, S. Al-Abed, D. Dionysiou, Appl.
Catal. B: Environ, 88, 462 (2009)
16. Y. Yao, Y. Cai, G. Wu, F. Wei, H. Chen, S. Wang, J.
Hazard. Mater., 296, 128 (2015).
17. Y. Feng, J. Liu, D. Wu, Z. Zhou, Y. Deng, T. Zgang,
K. Shih, Chem. Eng. J., 280, 514 (2015).
18. W.-D. Oh, S. K. Lua, Z. Dong, T.-T. Lim, Nanoscale,
8, 2046 (2016).
19. J. Deng, Sh. Feng, X. Ma, Ch. Tan, H. Wang, Sh.
Zhou, T. Zhang, J. Li, Sep. Purif. Technol., 167, 181
(2016).
20. P. Faria, J. Órfão, M. Pereira, Water Res., 38, 2043
(2004).
ПОВИШАВАНЕ НА PMS-АКТИВАЦИОННАТА СПОСОБНОСТ НА Co3O4
ЧРЕЗ ДОТИРАНЕ С Bi И Mg
В. В. Иванова-Колчева, М. К. Стоянова*
Катедра „Физикохимия“, Пловдивски университет „Паисий Хилендарски“, ул. „Цар Асен“, № 24,
4000 Пловдив, България
Постъпила на 30 януари 2018 г.; Преработена на 9 март 2018 г.
(Резюме)
Синтезирани са серия от композитни Co-Bi и Co-Mg оксиди чрез метод на съутаяване и е изследвана
каталитичната им активност за хетерогенно активиране на пероксимоносулфат (PMS) за разграждане на Кисело
Оранжево 7 (AO7) във водни разтвори. Катализаторите са охарактеризирани чрез XRD, XPS, TEM, и ICP-OES.
Установено е съществено увеличаване на каталитичната активност на Co3O4 чрез модифициране с Bi2O3 и MgO.
Композитите с 50% тегловно съдържание на Co3O4 показват най-висока каталитична активност, постигайки
пълно разграждане на 50 mg dm‒3
AO7 в рамките на 12−15 минути при концентрация на катализатора 0.1 g dm‒3
и молно съотношение PMS/AO7 = 6:1. Повишената PMS-активационна функционалност на композитните
катализатори се дължи на по-високото съдържание на повърхностни хидроксилни групи вследствие модифи-
цирането с базичните оксиди. Хидроксилните групи върху катализаторната повърхност благоприятстват
образуването на повърхностни Со(II)-ОН комплекси, което ускорява генерирането на сулфатни радикали (SRs)
от PMS. Разграждането на АО7 се подчинява на кинетичните закономерности на реакции от първи порядък.
Експериментите с добавяне на радикал-улавящи агенти показват, че окислителното разграждане на АО7 е
радикалов процес, като SRs са доминиращите радикалови частици. Co-Bi и Co-Mg композитните оксиди
демонстрират устойчива активност с ниска разтворимост на Co дори в кисела среда.
V. V. Ivanova-Kolcheva, M. K. Stoyanova: PMS activation ability of Co3O4 by doping with Bi and Mg
151
Bulgarian Chemical Communications, Volume 50, Special issue H (pp. 151–155) 2018
Green seed-assisted fly ash zeolitisation at room temperature
B. Z. Barbov1, Yu. A. Kalvachev
2*
1 Institute of Mineralogy and Crystallography, Bulgarian Academy of Sciences, Acad. G. Bonchev St., Bldg. 107,
1113 Sofia, Bulgaria 2 Institute of Catalysis, Bulgarian Academy of Sciences, Acad. G. Bonchev St., Bldg. 11, 1113 Sofia, Bulgaria
Received: February 01, 2018; Revised: March 20, 2018
Zeolite X has been successfully synthesised from fly ash produced by combustion of lignite coal at Maritsa Iztok 2
thermal power plant using a two-stage process: fusion with sodium hydroxide followed by hydrothermal treatment at
room temperature. NaX zeolite crystallisation started later by decreasing NaOH amount. In order to optimise synthesis
process a seed-assisted procedure was introduced. Preliminary synthesised zeolite X from pure chemicals was used as a
seed material. On the one hand, seed addition affected synthesis direction to the desired zeolite structure (a monophase
zeolite X product) and resulted in reduced synthesis time, but also reduced sodium hydroxide amount upon melting. In
this way, zeolitisation may increase cost-effectiveness and eco-efficiency.
Key words: zeolite X, fly ash, zeolite synthesis, seed, green synthesis.
INTRODUCTION
Coal-fired thermal power plants (TPP) are a
major source of fly ash (FA). Depending on the type
of source and composition of the combustion coal,
solid by-product components may vary signi-
ficantly, but all types of FA include large amounts
of silica (amorphous and crystalline) and alumina,
both of which are constituent parts of many coal
bedrocks. FA world production is over 750 million
tons per year [1]. The areas where the production
waste from the TPPs is deposited are huge terrains.
Due to dusting during drying and release of harmful
substances, FA represents an environmental hazard
for soils, waters, and air. Discharges of the ash
create environmental risks due to increased acid
content and infiltration of heavy metals and radio-
active elements in the soil. Toxic components in FA
depend on the specific structure of the deposit and
they may include a variety of the following elements
found in negligible quantities: arsenic, beryllium,
boron, cadmium, chromium, cobalt, lead, mercury,
selenium, thallium, and vanadium. Many approaches
to the use of FA have been developed, given their
composition and degree of crystallinity. Part of
deposited ash is used in the construction of roads
and buildings, in the form of gypsum, gypsum
board, cement, and concrete, in the ceramic indus-
try, and other building mixes. Zeolite synthesis is
another solution to utilise FA [2,3]. Zeolite produc-
tion from FA results in a good practice with higher
added value compared to ash usage as a cement
additive [4–6]. In recent years, many studies have
also been accomplished on zeolite synthesis from
other alternative sources of SiO2 and Al2O3 because
the production of synthetic zeolites from pure silica
and alumina sources is quite expensive. For alter-
native sources of silicon and aluminium, industrial
waste or geothermal materials rich in Si and Al [7–
14] may be used, as well as FA, which is largely
composed of silicon and aluminium units. So natu-
rally, one of the approaches to use FA is their zeo-
litisation. Zeolites synthesised from fly ash have
many applications, including ion exchangers, mole-
cular sieves, and adsorbents, similar to the zeolites
obtained by conventional methods.
Generally, zeolites represent a group of natural or
synthetic crystalline microporous aluminasilicates
having a pore size of 0.3 to 2.0 nm [15]. Zeolite pores
form a system of channels and cavities with well-
defined shape and dimensions. These micro-porous
materials are used as adsorbents [16,17], for ion
exchange processes [18], and in catalysis [19–22].
Thus, from an environmental point of view the
synthesis of coal ash zeolites and their use as adsor-
bents, catalysts, and ion exchangers is considered
one of the most effective applications of fly ash.
FA is fine particles that are trapped by the TPP
filters. They are collected by electrostatic or mecha-
nical precipitation. The ash mainly contains amor-
phous and crystalline silica as well as hematite,
mullite, and magnetite [3,23–25]. It has been found
that different zeolite structures can be synthesised
from the same ash but under different crystallisation
conditions, the A, NaX, and NaY zeolites being of
utmost importance [26]. One of them, namely NaX
© 2018 Bulgarian Academy of Sciences, Union of Chemists in Bulgaria
* To whom all correspondence should be sent
E-mail: [email protected]
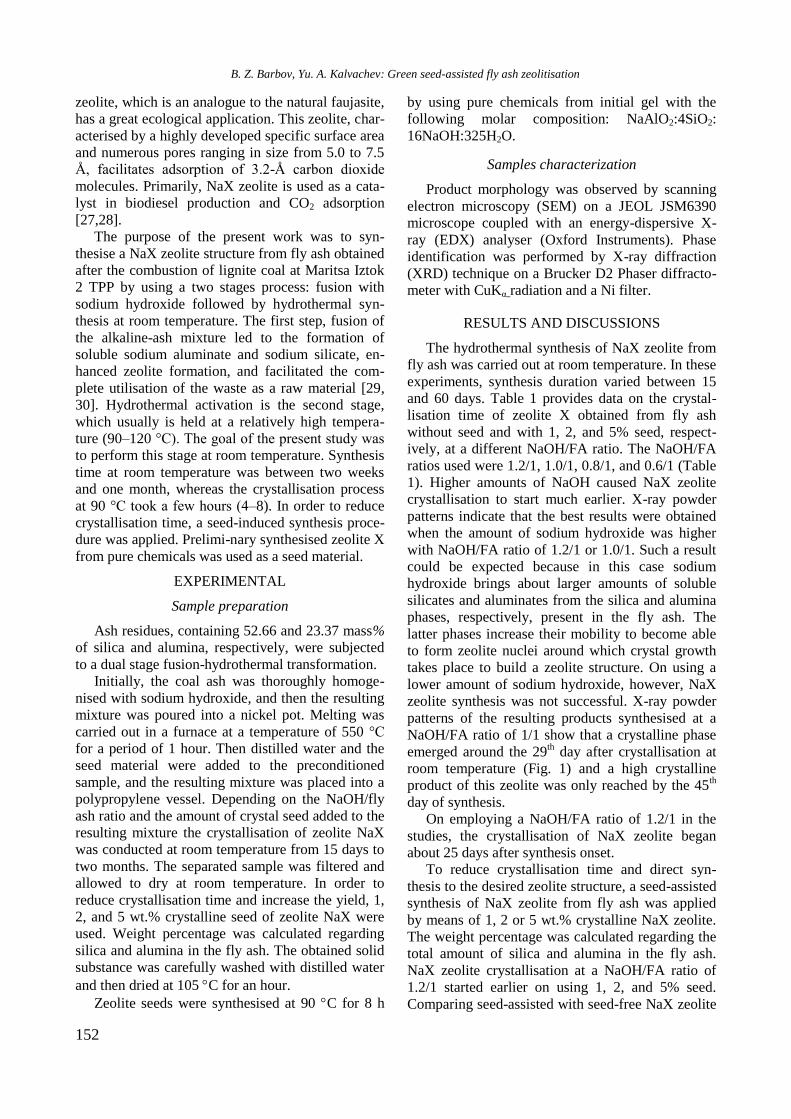
152
zeolite, which is an analogue to the natural faujasite,
has a great ecological application. This zeolite, char-
acterised by a highly developed specific surface area
and numerous pores ranging in size from 5.0 to 7.5
Å, facilitates adsorption of 3.2-Å carbon dioxide
molecules. Primarily, NaX zeolite is used as a cata-
lyst in biodiesel production and CO2 adsorption
[27,28].
The purpose of the present work was to syn-
thesise a NaX zeolite structure from fly ash obtained
after the combustion of lignite coal at Maritsa Iztok
2 TPP by using a two stages process: fusion with
sodium hydroxide followed by hydrothermal syn-
thesis at room temperature. The first step, fusion of
the alkaline-ash mixture led to the formation of
soluble sodium aluminate and sodium silicate, en-
hanced zeolite formation, and facilitated the com-
plete utilisation of the waste as a raw material [29,
30]. Hydrothermal activation is the second stage,
which usually is held at a relatively high tempera-
ture (90–120 °C). The goal of the present study was
to perform this stage at room temperature. Synthesis
time at room temperature was between two weeks
and one month, whereas the crystallisation process
at 90 °C took a few hours (4–8). In order to reduce
crystallisation time, a seed-induced synthesis proce-
dure was applied. Prelimi-nary synthesised zeolite X
from pure chemicals was used as a seed material.
EXPERIMENTAL
Sample preparation
Ash residues, containing 52.66 and 23.37 mass%
of silica and alumina, respectively, were subjected
to a dual stage fusion-hydrothermal transformation.
Initially, the coal ash was thoroughly homoge-
nised with sodium hydroxide, and then the resulting
mixture was poured into a nickel pot. Melting was
carried out in a furnace at a temperature of 550 °C
for a period of 1 hour. Then distilled water and the
seed material were added to the preconditioned
sample, and the resulting mixture was placed into a
polypropylene vessel. Depending on the NaOH/fly
ash ratio and the amount of crystal seed added to the
resulting mixture the crystallisation of zeolite NaX
was conducted at room temperature from 15 days to
two months. The separated sample was filtered and
allowed to dry at room temperature. In order to
reduce crystallisation time and increase the yield, 1,
2, and 5 wt.% crystalline seed of zeolite NaX were
used. Weight percentage was calculated regarding
silica and alumina in the fly ash. The obtained solid
substance was carefully washed with distilled water
and then dried at 105 C for an hour.
Zeolite seeds were synthesised at 90 C for 8 h
by using pure chemicals from initial gel with the
following molar composition: NaAlO2:4SiO2:
16NaOH:325H2O.
Samples characterization
Product morphology was observed by scanning
electron microscopy (SEM) on a JEOL JSM6390
microscope coupled with an energy-dispersive X-
ray (EDX) analyser (Oxford Instruments). Phase
identification was performed by X-ray diffraction
(XRD) technique on a Brucker D2 Phaser diffracto-
meter with CuKα radiation and a Ni filter.
RESULTS AND DISCUSSIONS
The hydrothermal synthesis of NaX zeolite from
fly ash was carried out at room temperature. In these
experiments, synthesis duration varied between 15
and 60 days. Table 1 provides data on the crystal-
lisation time of zeolite X obtained from fly ash
without seed and with 1, 2, and 5% seed, respect-
ively, at a different NaOH/FA ratio. The NaOH/FA
ratios used were 1.2/1, 1.0/1, 0.8/1, and 0.6/1 (Table
1). Higher amounts of NaOH caused NaX zeolite
crystallisation to start much earlier. X-ray powder
patterns indicate that the best results were obtained
when the amount of sodium hydroxide was higher
with NaOH/FA ratio of 1.2/1 or 1.0/1. Such a result
could be expected because in this case sodium
hydroxide brings about larger amounts of soluble
silicates and aluminates from the silica and alumina
phases, respectively, present in the fly ash. The
latter phases increase their mobility to become able
to form zeolite nuclei around which crystal growth
takes place to build a zeolite structure. On using a
lower amount of sodium hydroxide, however, NaX
zeolite synthesis was not successful. X-ray powder
patterns of the resulting products synthesised at a
NaOH/FA ratio of 1/1 show that a crystalline phase
emerged around the 29th day after crystallisation at
room temperature (Fig. 1) and a high crystalline
product of this zeolite was only reached by the 45th
day of synthesis.
On employing a NaOH/FA ratio of 1.2/1 in the
studies, the crystallisation of NaX zeolite began
about 25 days after synthesis onset.
To reduce crystallisation time and direct syn-
thesis to the desired zeolite structure, a seed-assisted
synthesis of NaX zeolite from fly ash was applied
by means of 1, 2 or 5 wt.% crystalline NaX zeolite.
The weight percentage was calculated regarding the
total amount of silica and alumina in the fly ash.
NaX zeolite crystallisation at a NaOH/FA ratio of
1.2/1 started earlier on using 1, 2, and 5% seed.
Comparing seed-assisted with seed-free NaX zeolite
B. Z. Barbov, Yu. A. Kalvachev: Green seed-assisted fly ash zeolitisation
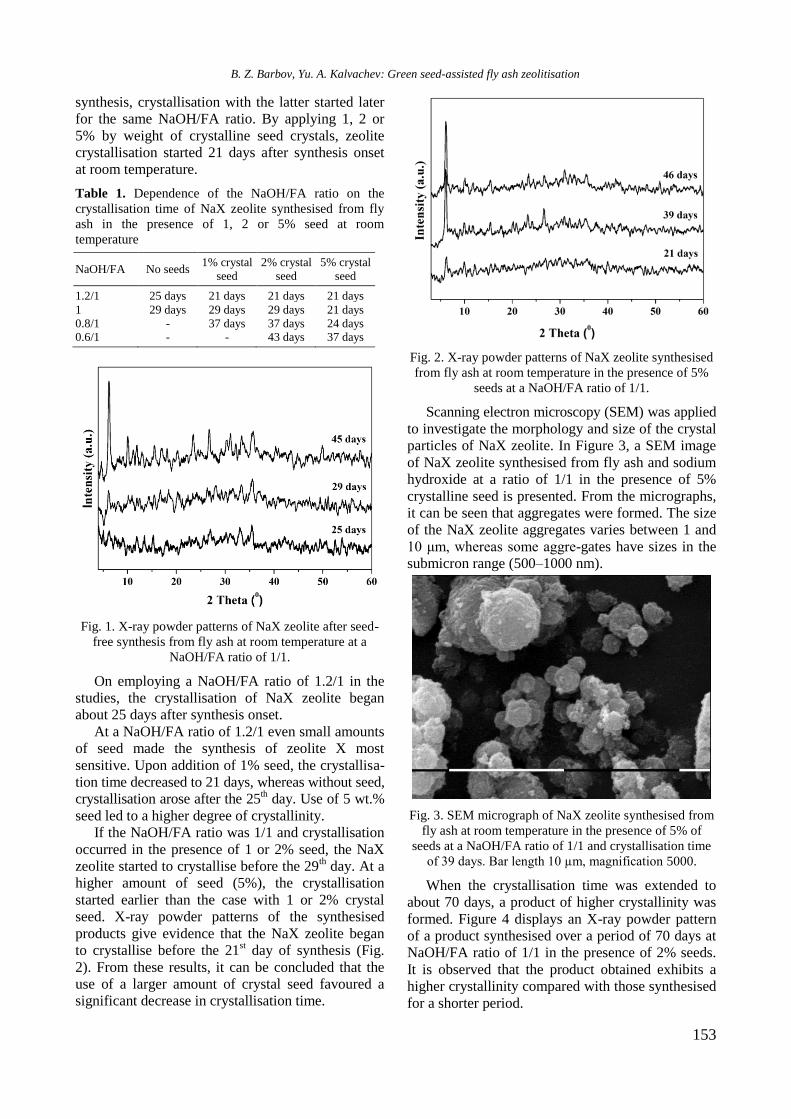
153
synthesis, crystallisation with the latter started later
for the same NaOH/FA ratio. By applying 1, 2 or
5% by weight of crystalline seed crystals, zeolite
crystallisation started 21 days after synthesis onset
at room temperature.
Table 1. Dependence of the NaOH/FA ratio on the
crystallisation time of NaX zeolite synthesised from fly
ash in the presence of 1, 2 or 5% seed at room
temperature
NaOH/FA No seeds 1% crystal
seed
2% crystal
seed
5% crystal
seed
1.2/1 25 days 21 days 21 days 21 days
1 29 days 29 days 29 days 21 days
0.8/1 - 37 days 37 days 24 days 0.6/1 - - 43 days 37 days
Fig. 1. X-ray powder patterns of NaX zeolite after seed-
free synthesis from fly ash at room temperature at a
NaOH/FA ratio of 1/1.
On employing a NaOH/FA ratio of 1.2/1 in the
studies, the crystallisation of NaX zeolite began
about 25 days after synthesis onset.
At a NaOH/FA ratio of 1.2/1 even small amounts
of seed made the synthesis of zeolite X most
sensitive. Upon addition of 1% seed, the crystallisa-
tion time decreased to 21 days, whereas without seed,
crystallisation arose after the 25th day. Use of 5 wt.%
seed led to a higher degree of crystallinity.
If the NaOH/FA ratio was 1/1 and crystallisation
occurred in the presence of 1 or 2% seed, the NaX
zeolite started to crystallise before the 29th day. At a
higher amount of seed (5%), the crystallisation
started earlier than the case with 1 or 2% crystal
seed. X-ray powder patterns of the synthesised
products give evidence that the NaX zeolite began
to crystallise before the 21st day of synthesis (Fig.
2). From these results, it can be concluded that the
use of a larger amount of crystal seed favoured a
significant decrease in crystallisation time.
Fig. 2. X-ray powder patterns of NaX zeolite synthesised
from fly ash at room temperature in the presence of 5%
seeds at a NaOH/FA ratio of 1/1.
Scanning electron microscopy (SEM) was applied
to investigate the morphology and size of the crystal
particles of NaX zeolite. In Figure 3, a SEM image
of NaX zeolite synthesised from fly ash and sodium
hydroxide at a ratio of 1/1 in the presence of 5%
crystalline seed is presented. From the micrographs,
it can be seen that aggregates were formed. The size
of the NaX zeolite aggregates varies between 1 and
10 μm, whereas some aggre-gates have sizes in the
submicron range (500–1000 nm).
Fig. 3. SEM micrograph of NaX zeolite synthesised from
fly ash at room temperature in the presence of 5% of
seeds at a NaOH/FA ratio of 1/1 and crystallisation time
of 39 days. Bar length 10 µm, magnification 5000.
When the crystallisation time was extended to
about 70 days, a product of higher crystallinity was
formed. Figure 4 displays an X-ray powder pattern
of a product synthesised over a period of 70 days at
NaOH/FA ratio of 1/1 in the presence of 2% seeds.
It is observed that the product obtained exhibits a
higher crystallinity compared with those synthesised
for a shorter period.
B. Z. Barbov, Yu. A. Kalvachev: Green seed-assisted fly ash zeolitisation
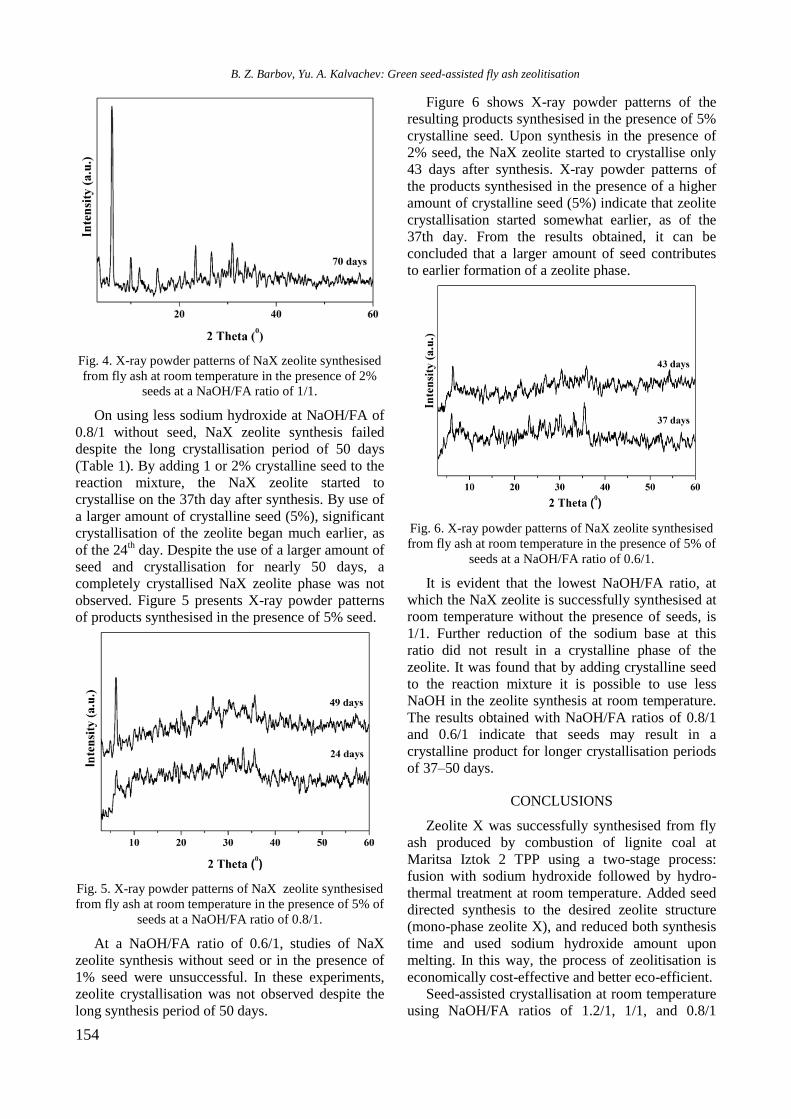
154
Fig. 4. X-ray powder patterns of NaX zeolite synthesised
from fly ash at room temperature in the presence of 2%
seeds at a NaOH/FA ratio of 1/1.
On using less sodium hydroxide at NaOH/FA of
0.8/1 without seed, NaX zeolite synthesis failed
despite the long crystallisation period of 50 days
(Table 1). By adding 1 or 2% crystalline seed to the
reaction mixture, the NaX zeolite started to
crystallise on the 37th day after synthesis. By use of
a larger amount of crystalline seed (5%), significant
crystallisation of the zeolite began much earlier, as
of the 24th day. Despite the use of a larger amount of
seed and crystallisation for nearly 50 days, a
completely crystallised NaX zeolite phase was not
observed. Figure 5 presents X-ray powder patterns
of products synthesised in the presence of 5% seed.
Fig. 5. X-ray powder patterns of NaX zeolite synthesised
from fly ash at room temperature in the presence of 5% of
seeds at a NaOH/FA ratio of 0.8/1.
At a NaOH/FA ratio of 0.6/1, studies of NaX
zeolite synthesis without seed or in the presence of
1% seed were unsuccessful. In these experiments,
zeolite crystallisation was not observed despite the
long synthesis period of 50 days.
Figure 6 shows X-ray powder patterns of the
resulting products synthesised in the presence of 5%
crystalline seed. Upon synthesis in the presence of
2% seed, the NaX zeolite started to crystallise only
43 days after synthesis. X-ray powder patterns of
the products synthesised in the presence of a higher
amount of crystalline seed (5%) indicate that zeolite
crystallisation started somewhat earlier, as of the
37th day. From the results obtained, it can be
concluded that a larger amount of seed contributes
to earlier formation of a zeolite phase.
Fig. 6. X-ray powder patterns of NaX zeolite synthesised
from fly ash at room temperature in the presence of 5% of
seeds at a NaOH/FA ratio of 0.6/1.
It is evident that the lowest NaOH/FA ratio, at
which the NaX zeolite is successfully synthesised at
room temperature without the presence of seeds, is
1/1. Further reduction of the sodium base at this
ratio did not result in a crystalline phase of the
zeolite. It was found that by adding crystalline seed
to the reaction mixture it is possible to use less
NaOH in the zeolite synthesis at room temperature.
The results obtained with NaOH/FA ratios of 0.8/1
and 0.6/1 indicate that seeds may result in a
crystalline product for longer crystallisation periods
of 37–50 days.
CONCLUSIONS
Zeolite X was successfully synthesised from fly
ash produced by combustion of lignite coal at
Maritsa Iztok 2 TPP using a two-stage process:
fusion with sodium hydroxide followed by hydro-
thermal treatment at room temperature. Added seed
directed synthesis to the desired zeolite structure
(mono-phase zeolite X), and reduced both synthesis
time and used sodium hydroxide amount upon
melting. In this way, the process of zeolitisation is
economically cost-effective and better eco-efficient.
Seed-assisted crystallisation at room temperature
using NaOH/FA ratios of 1.2/1, 1/1, and 0.8/1
B. Z. Barbov, Yu. A. Kalvachev: Green seed-assisted fly ash zeolitisation
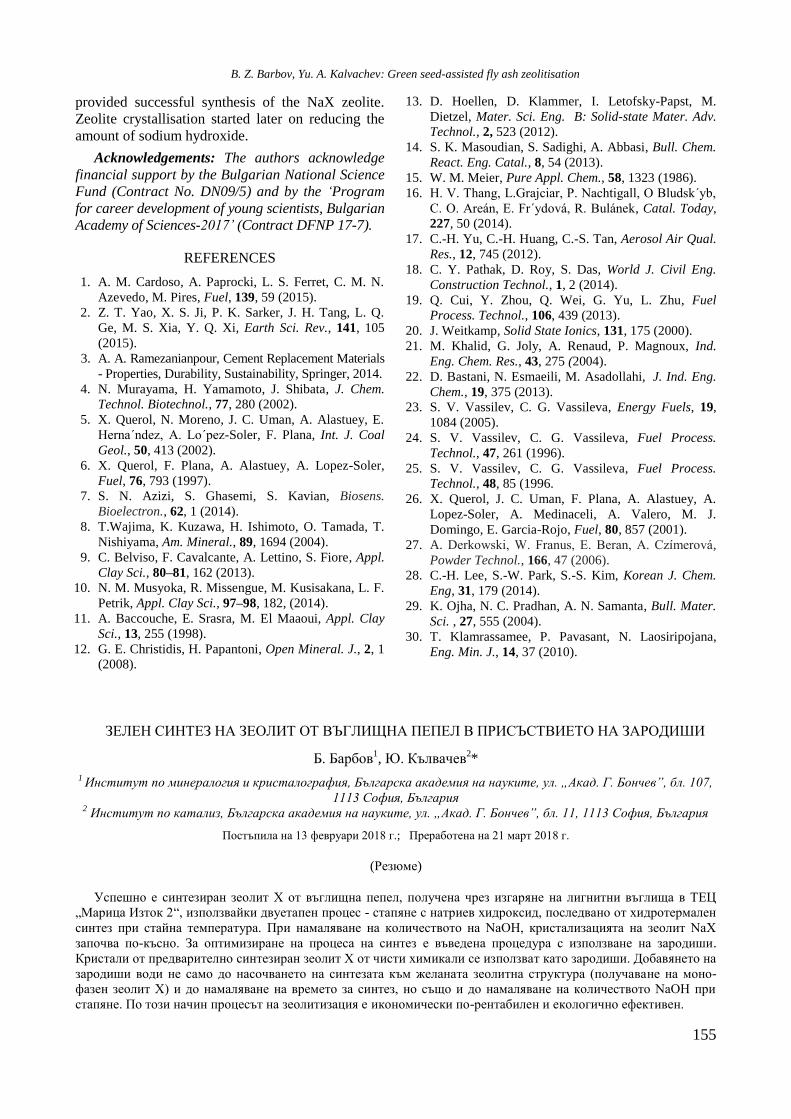
155
provided successful synthesis of the NaX zeolite.
Zeolite crystallisation started later on reducing the
amount of sodium hydroxide.
Acknowledgements: The authors acknowledge
financial support by the Bulgarian National Science
Fund (Contract No. DN09/5) and by the ‘Program
for career development of young scientists, Bulgarian
Academy of Sciences-2017’ (Contract DFNP 17-7).
REFERENCES
1. A. M. Cardoso, A. Paprocki, L. S. Ferret, C. M. N.
Azevedo, M. Pires, Fuel, 139, 59 (2015).
2. Z. T. Yao, X. S. Ji, P. K. Sarker, J. H. Tang, L. Q.
Ge, M. S. Xia, Y. Q. Xi, Earth Sci. Rev., 141, 105
(2015).
3. A. A. Ramezanianpour, Cement Replacement Materials
- Properties, Durability, Sustainability, Springer, 2014.
4. N. Murayama, H. Yamamoto, J. Shibata, J. Chem.
Technol. Biotechnol., 77, 280 (2002).
5. X. Querol, N. Moreno, J. C. Uman, A. Alastuey, E.
Herna´ndez, A. Lo´pez-Soler, F. Plana, Int. J. Coal
Geol., 50, 413 (2002).
6. X. Querol, F. Plana, A. Alastuey, A. Lopez-Soler,
Fuel, 76, 793 (1997).
7. S. N. Azizi, S. Ghasemi, S. Kavian, Biosens.
Bioelectron., 62, 1 (2014).
8. T.Wajima, K. Kuzawa, H. Ishimoto, O. Tamada, T.
Nishiyama, Am. Mineral., 89, 1694 (2004).
9. C. Belviso, F. Cavalcante, A. Lettino, S. Fiore, Appl.
Clay Sci., 80–81, 162 (2013).
10. N. M. Musyoka, R. Missengue, M. Kusisakana, L. F.
Petrik, Appl. Clay Sci., 97–98, 182, (2014).
11. A. Baccouche, E. Srasra, M. El Maaoui, Appl. Clay
Sci., 13, 255 (1998).
12. G. E. Christidis, H. Papantoni, Open Mineral. J., 2, 1
(2008).
13. D. Hoellen, D. Klammer, I. Letofsky-Papst, M.
Dietzel, Mater. Sci. Eng. B: Solid-state Mater. Adv.
Technol., 2, 523 (2012).
14. S. K. Masoudian, S. Sadighi, A. Abbasi, Bull. Chem.
React. Eng. Catal., 8, 54 (2013).
15. W. M. Meier, Pure Appl. Chem., 58, 1323 (1986).
16. H. V. Thang, L.Grajciar, P. Nachtigall, O Bludsk´yb,
C. O. Areán, E. Fr´ydová, R. Bulánek, Catal. Today,
227, 50 (2014).
17. C.-H. Yu, C.-H. Huang, C.-S. Tan, Aerosol Air Qual.
Res., 12, 745 (2012). 18. C. Y. Pathak, D. Roy, S. Das, World J. Civil Eng.
Construction Technol., 1, 2 (2014).
19. Q. Cui, Y. Zhou, Q. Wei, G. Yu, L. Zhu, Fuel
Process. Technol., 106, 439 (2013).
20. J. Weitkamp, Solid State Ionics, 131, 175 (2000).
21. M. Khalid, G. Joly, A. Renaud, P. Magnoux, Ind.
Eng. Chem. Res., 43, 275 (2004).
22. D. Bastani, N. Esmaeili, M. Asadollahi, J. Ind. Eng.
Chem., 19, 375 (2013). 23. S. V. Vassilev, C. G. Vassileva, Energy Fuels, 19,
1084 (2005).
24. S. V. Vassilev, C. G. Vassileva, Fuel Process.
Technol., 47, 261 (1996).
25. S. V. Vassilev, C. G. Vassileva, Fuel Process.
Technol., 48, 85 (1996.
26. X. Querol, J. C. Uman, F. Plana, A. Alastuey, A.
Lopez-Soler, A. Medinaceli, A. Valero, M. J.
Domingo, E. Garcia-Rojo, Fuel, 80, 857 (2001).
27. A. Derkowski, W. Franus, E. Beran, A. Czímerová,
Powder Technol., 166, 47 (2006).
28. C.-H. Lee, S.-W. Park, S.-S. Kim, Korean J. Chem.
Eng, 31, 179 (2014).
29. K. Ojha, N. C. Pradhan, A. N. Samanta, Bull. Mater.
Sci. , 27, 555 (2004).
30. T. Klamrassamee, P. Pavasant, N. Laosiripojana,
Eng. Min. J., 14, 37 (2010).
ЗЕЛЕН СИНТЕЗ НА ЗЕОЛИТ ОТ ВЪГЛИЩНА ПЕПЕЛ В ПРИСЪСТВИЕТО НА ЗАРОДИШИ
Б. Барбов1, Ю. Кълвачев
2*
1 Институт по минералогия и кристалография, Българска академия на науките, ул. „Акад. Г. Бончев”, бл. 107,
1113 София, България 2 Институт по катализ, Българска академия на науките, ул. „Акад. Г. Бончев”, бл. 11, 1113 София, България
Постъпила на 13 февруари 2018 г.; Преработена на 21 март 2018 г.
(Резюме)
Успешно е синтезиран зеолит Х от въглищна пепел, получена чрез изгаряне на лигнитни въглища в ТЕЦ
„Марица Изток 2“, използвайки двуетапен процес - стапяне с натриев хидроксид, последвано от хидротермален
синтез при стайна температура. При намаляване на количеството на NaOH, кристализацията на зеолит NaX
започва по-късно. За оптимизиране на процеса на синтез е въведена процедура с използване на зародиши.
Кристали от предварително синтезиран зеолит X от чисти химикали се използват като зародиши. Добавянето на
зародиши води не само до насочването на синтезата към желаната зеолитна структура (получаване на моно-
фазен зеолит Х) и до намаляване на времето за синтез, но също и до намаляване на количеството NaOH при
стапяне. По този начин процесът на зеолитизация е икономически по-рентабилен и екологично ефективен.
B. Z. Barbov, Yu. A. Kalvachev: Green seed-assisted fly ash zeolitisation
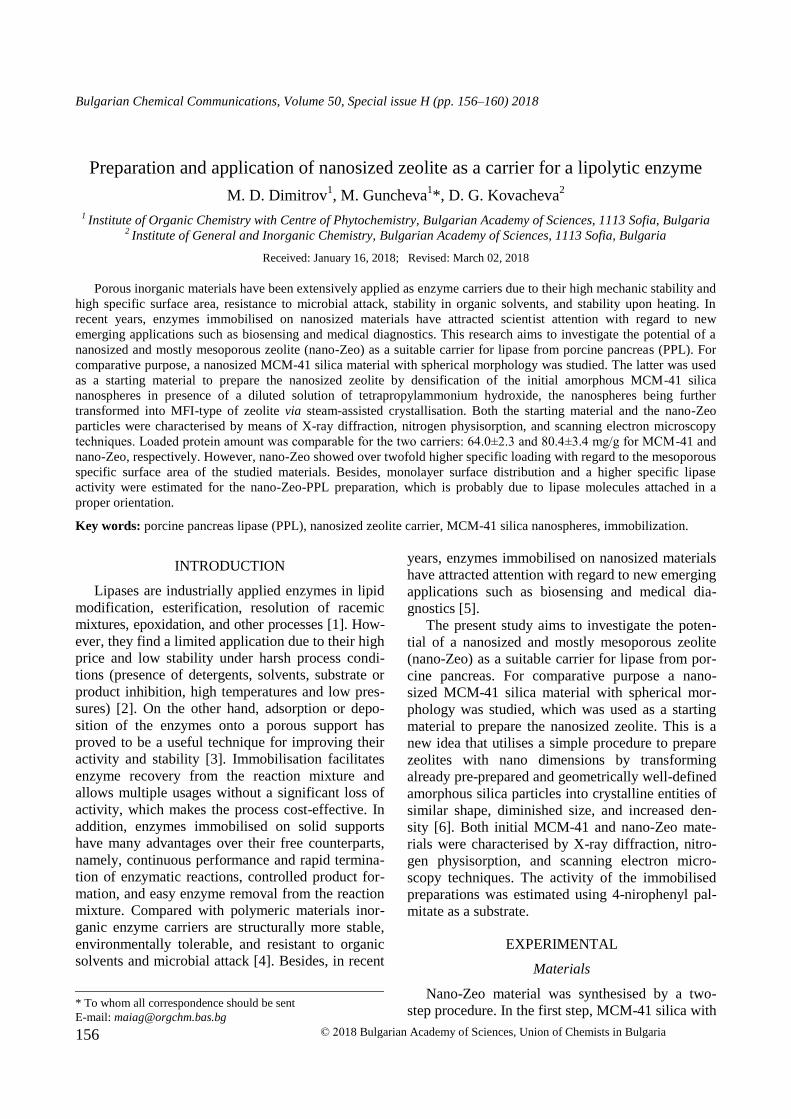
156
Bulgarian Chemical Communications, Volume 50, Special issue H (pp. 156–160) 2018
Preparation and application of nanosized zeolite as a carrier for a lipolytic enzyme
M. D. Dimitrov1, M. Guncheva
1*, D. G. Kovacheva
2
1 Institute of Organic Chemistry with Centre of Phytochemistry, Bulgarian Academy of Sciences, 1113 Sofia, Bulgaria
2 Institute of General and Inorganic Chemistry, Bulgarian Academy of Sciences, 1113 Sofia, Bulgaria
Received: January 16, 2018; Revised: March 02, 2018
Porous inorganic materials have been extensively applied as enzyme carriers due to their high mechanic stability and
high specific surface area, resistance to microbial attack, stability in organic solvents, and stability upon heating. In
recent years, enzymes immobilised on nanosized materials have attracted scientist attention with regard to new
emerging applications such as biosensing and medical diagnostics. This research aims to investigate the potential of a
nanosized and mostly mesoporous zeolite (nano-Zeo) as a suitable carrier for lipase from porcine pancreas (PPL). For
comparative purpose, a nanosized MCM-41 silica material with spherical morphology was studied. The latter was used
as a starting material to prepare the nanosized zeolite by densification of the initial amorphous MCM-41 silica
nanospheres in presence of a diluted solution of tetrapropylammonium hydroxide, the nanospheres being further
transformed into MFI-type of zeolite via steam-assisted crystallisation. Both the starting material and the nano-Zeo
particles were characterised by means of X-ray diffraction, nitrogen physisorption, and scanning electron microscopy
techniques. Loaded protein amount was comparable for the two carriers: 64.0±2.3 and 80.4±3.4 mg/g for MCM-41 and
nano-Zeo, respectively. However, nano-Zeo showed over twofold higher specific loading with regard to the mesoporous
specific surface area of the studied materials. Besides, monolayer surface distribution and a higher specific lipase
activity were estimated for the nano-Zeo-PPL preparation, which is probably due to lipase molecules attached in a
proper orientation.
Key words: porcine pancreas lipase (PPL), nanosized zeolite carrier, MCM-41 silica nanospheres, immobilization.
INTRODUCTION
Lipases are industrially applied enzymes in lipid
modification, esterification, resolution of racemic
mixtures, epoxidation, and other processes [1]. How-
ever, they find a limited application due to their high
price and low stability under harsh process condi-
tions (presence of detergents, solvents, substrate or
product inhibition, high temperatures and low pres-
sures) [2]. On the other hand, adsorption or depo-
sition of the enzymes onto a porous support has
proved to be a useful technique for improving their
activity and stability [3]. Immobilisation facilitates
enzyme recovery from the reaction mixture and
allows multiple usages without a significant loss of
activity, which makes the process cost-effective. In
addition, enzymes immobilised on solid supports
have many advantages over their free counterparts,
namely, continuous performance and rapid termina-
tion of enzymatic reactions, controlled product for-
mation, and easy enzyme removal from the reaction
mixture. Compared with polymeric materials inor-
ganic enzyme carriers are structurally more stable,
environmentally tolerable, and resistant to organic
solvents and microbial attack [4]. Besides, in recent
years, enzymes immobilised on nanosized materials
have attracted attention with regard to new emerging
applications such as biosensing and medical dia-
gnostics [5].
The present study aims to investigate the poten-
tial of a nanosized and mostly mesoporous zeolite
(nano-Zeo) as a suitable carrier for lipase from por-
cine pancreas. For comparative purpose a nano-
sized MCM-41 silica material with spherical mor-
phology was studied, which was used as a starting
material to prepare the nanosized zeolite. This is a
new idea that utilises a simple procedure to prepare
zeolites with nano dimensions by transforming
already pre-prepared and geometrically well-defined
amorphous silica particles into crystalline entities of
similar shape, diminished size, and increased den-
sity [6]. Both initial MCM-41 and nano-Zeo mate-
rials were characterised by X-ray diffraction, nitro-
gen physisorption, and scanning electron micro-
scopy techniques. The activity of the immobilised
preparations was estimated using 4-nirophenyl pal-
mitate as a substrate.
EXPERIMENTAL
Materials
Nano-Zeo material was synthesised by a two-
step procedure. In the first step, MCM-41 silica with * To whom all correspondence should be sent
E-mail: [email protected]
© 2018 Bulgarian Academy of Sciences, Union of Chemists in Bulgaria
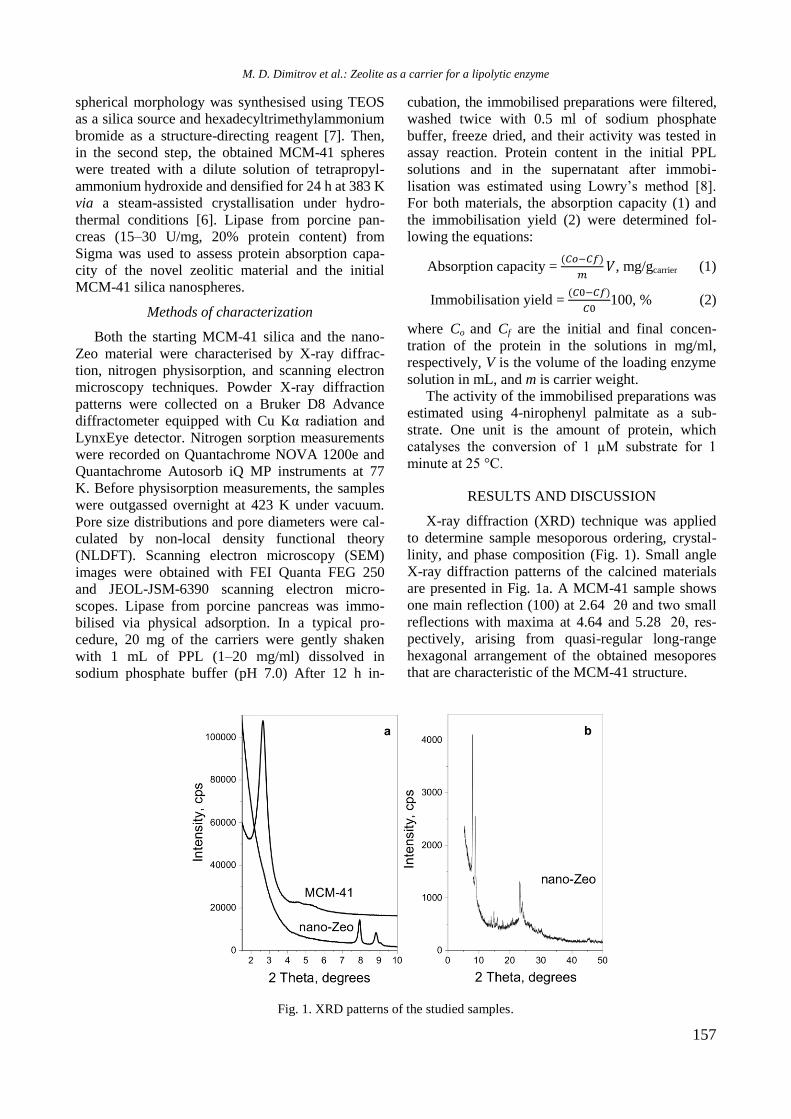
157
spherical morphology was synthesised using TEOS
as a silica source and hexadecyltrimethylammonium
bromide as a structure-directing reagent [7]. Then,
in the second step, the obtained MCM-41 spheres
were treated with a dilute solution of tetrapropyl-
ammonium hydroxide and densified for 24 h at 383 K
via a steam-assisted crystallisation under hydro-
thermal conditions [6]. Lipase from porcine pan-
creas (15‒30 U/mg, 20% protein content) from
Sigma was used to assess protein absorption capa-
city of the novel zeolitic material and the initial
MCM-41 silica nanospheres.
Methods of characterization
Both the starting MCM-41 silica and the nano-
Zeo material were characterised by X-ray diffrac-
tion, nitrogen physisorption, and scanning electron
microscopy techniques. Powder X-ray diffraction
patterns were collected on a Bruker D8 Advance
diffractometer equipped with Cu Kα radiation and
LynxEye detector. Nitrogen sorption measurements
were recorded on Quantachrome NOVA 1200e and
Quantachrome Autosorb iQ MP instruments at 77
K. Before physisorption measurements, the samples
were outgassed overnight at 423 K under vacuum.
Pore size distributions and pore diameters were cal-
culated by non-local density functional theory
(NLDFT). Scanning electron microscopy (SEM)
images were obtained with FEI Quanta FEG 250
and JEOL-JSM-6390 scanning electron micro-
scopes. Lipase from porcine pancreas was immo-
bilised via physical adsorption. In a typical pro-
cedure, 20 mg of the carriers were gently shaken
with 1 mL of PPL (1‒20 mg/ml) dissolved in
sodium phosphate buffer (pH 7.0) After 12 h in-
cubation, the immobilised preparations were filtered,
washed twice with 0.5 ml of sodium phosphate
buffer, freeze dried, and their activity was tested in
assay reaction. Protein content in the initial PPL
solutions and in the supernatant after immobi-
lisation was estimated using Lowry’s method [8].
For both materials, the absorption capacity (1) and
the immobilisation yield (2) were determined fol-
lowing the equations:
Absorption capacity =
, mg/gcarrier (1)
Immobilisation yield =
100, % (2)
where Co and Cf are the initial and final concen-
tration of the protein in the solutions in mg/ml,
respectively, V is the volume of the loading enzyme
solution in mL, and m is carrier weight.
The activity of the immobilised preparations was
estimated using 4-nirophenyl palmitate as a sub-
strate. One unit is the amount of protein, which
catalyses the conversion of 1 µM substrate for 1
minute at 25 °C.
RESULTS AND DISCUSSION
X-ray diffraction (XRD) technique was applied
to determine sample mesoporous ordering, crystal-
linity, and phase composition (Fig. 1). Small angle
X-ray diffraction patterns of the calcined materials
are presented in Fig. 1a. A MCM-41 sample shows
one main reflection (100) at 2.64 2θ and two small
reflections with maxima at 4.64 and 5.28 2θ, res-
pectively, arising from quasi-regular long-range
hexagonal arrangement of the obtained mesopores
that are characteristic of the MCM-41 structure.
Fig. 1. XRD patterns of the studied samples.
M. D. Dimitrov et al.: Zeolite as a carrier for a lipolytic enzyme
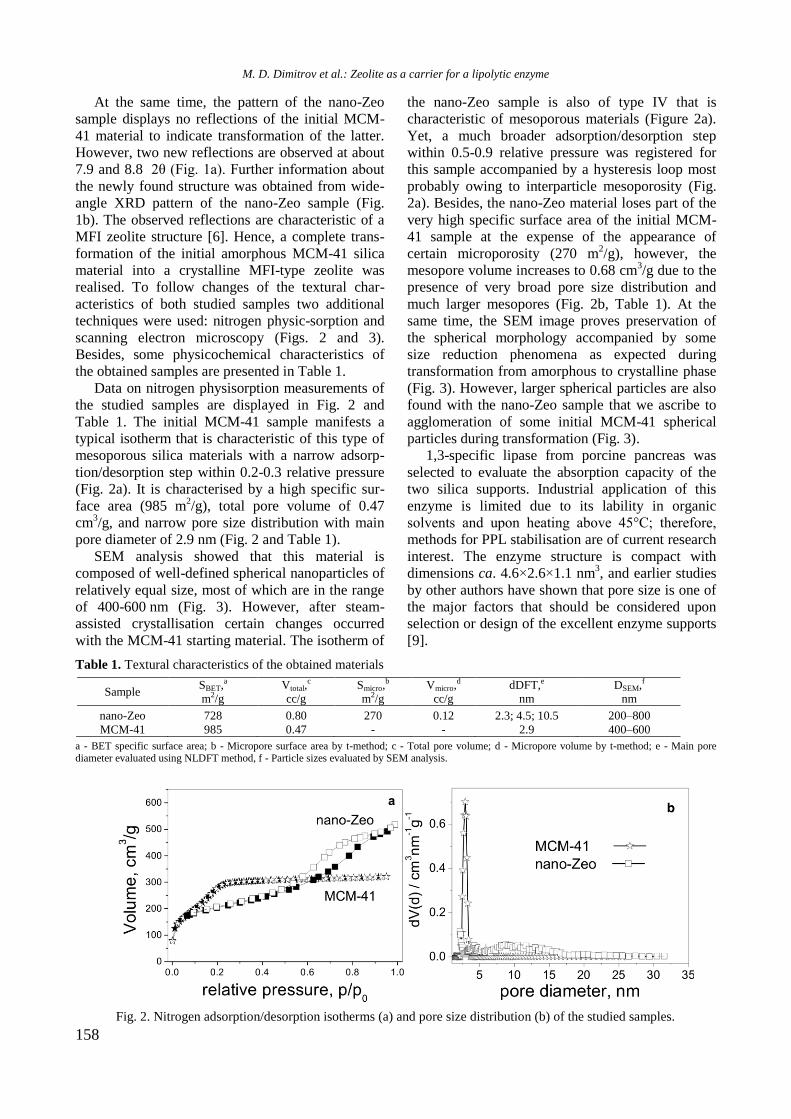
158
At the same time, the pattern of the nano-Zeo
sample displays no reflections of the initial MCM-
41 material to indicate transformation of the latter.
However, two new reflections are observed at about
7.9 and 8.8 2θ (Fig. 1a). Further information about
the newly found structure was obtained from wide-
angle XRD pattern of the nano-Zeo sample (Fig.
1b). The observed reflections are characteristic of a
MFI zeolite structure [6]. Hence, a complete trans-
formation of the initial amorphous MCM-41 silica
material into a crystalline MFI-type zeolite was
realised. To follow changes of the textural char-
acteristics of both studied samples two additional
techniques were used: nitrogen physic-sorption and
scanning electron microscopy (Figs. 2 and 3).
Besides, some physicochemical characteristics of
the obtained samples are presented in Table 1.
Data on nitrogen physisorption measurements of
the studied samples are displayed in Fig. 2 and
Table 1. The initial MCM-41 sample manifests a
typical isotherm that is characteristic of this type of
mesoporous silica materials with a narrow adsorp-
tion/desorption step within 0.2-0.3 relative pressure
(Fig. 2a). It is characterised by a high specific sur-
face area (985 m2/g), total pore volume of 0.47
cm3/g, and narrow pore size distribution with main
pore diameter of 2.9 nm (Fig. 2 and Table 1).
SEM analysis showed that this material is
composed of well-defined spherical nanoparticles of
relatively equal size, most of which are in the range
of 400-600 nm (Fig. 3). However, after steam-
assisted crystallisation certain changes occurred
with the MCM-41 starting material. The isotherm of
the nano-Zeo sample is also of type IV that is
characteristic of mesoporous materials (Figure 2a).
Yet, a much broader adsorption/desorption step
within 0.5-0.9 relative pressure was registered for
this sample accompanied by a hysteresis loop most
probably owing to interparticle mesoporosity (Fig.
2a). Besides, the nano-Zeo material loses part of the
very high specific surface area of the initial MCM-
41 sample at the expense of the appearance of
certain microporosity (270 m2/g), however, the
mesopore volume increases to 0.68 cm3/g due to the
presence of very broad pore size distribution and
much larger mesopores (Fig. 2b, Table 1). At the
same time, the SEM image proves preservation of
the spherical morphology accompanied by some
size reduction phenomena as expected during
transformation from amorphous to crystalline phase
(Fig. 3). However, larger spherical particles are also
found with the nano-Zeo sample that we ascribe to
agglomeration of some initial MCM-41 spherical
particles during transformation (Fig. 3).
1,3-specific lipase from porcine pancreas was
selected to evaluate the absorption capacity of the
two silica supports. Industrial application of this
enzyme is limited due to its lability in organic
solvents and upon heating above 45°C; therefore,
methods for PPL stabilisation are of current research
interest. The enzyme structure is compact with
dimensions ca. 4.6×2.6×1.1 nm3, and earlier studies
by other authors have shown that pore size is one of
the major factors that should be considered upon
selection or design of the excellent enzyme supports
[9].
Table 1. Textural characteristics of the obtained materials
Sample SBET,a
m2/g
Vtotal,c
cc/g
Smicro,b
m2/g
Vmicro,d
cc/g
dDFT,e
nm
DSEM,f
nm
nano-Zeo 728 0.80 270 0.12 2.3; 4.5; 10.5 200–800
MCM-41 985 0.47 - - 2.9 400–600
a - BET specific surface area; b - Micropore surface area by t-method; c - Total pore volume; d - Micropore volume by t-method; e - Main pore diameter evaluated using NLDFT method, f - Particle sizes evaluated by SEM analysis.
Fig. 2. Nitrogen adsorption/desorption isotherms (a) and pore size distribution (b) of the studied samples.
M. D. Dimitrov et al.: Zeolite as a carrier for a lipolytic enzyme
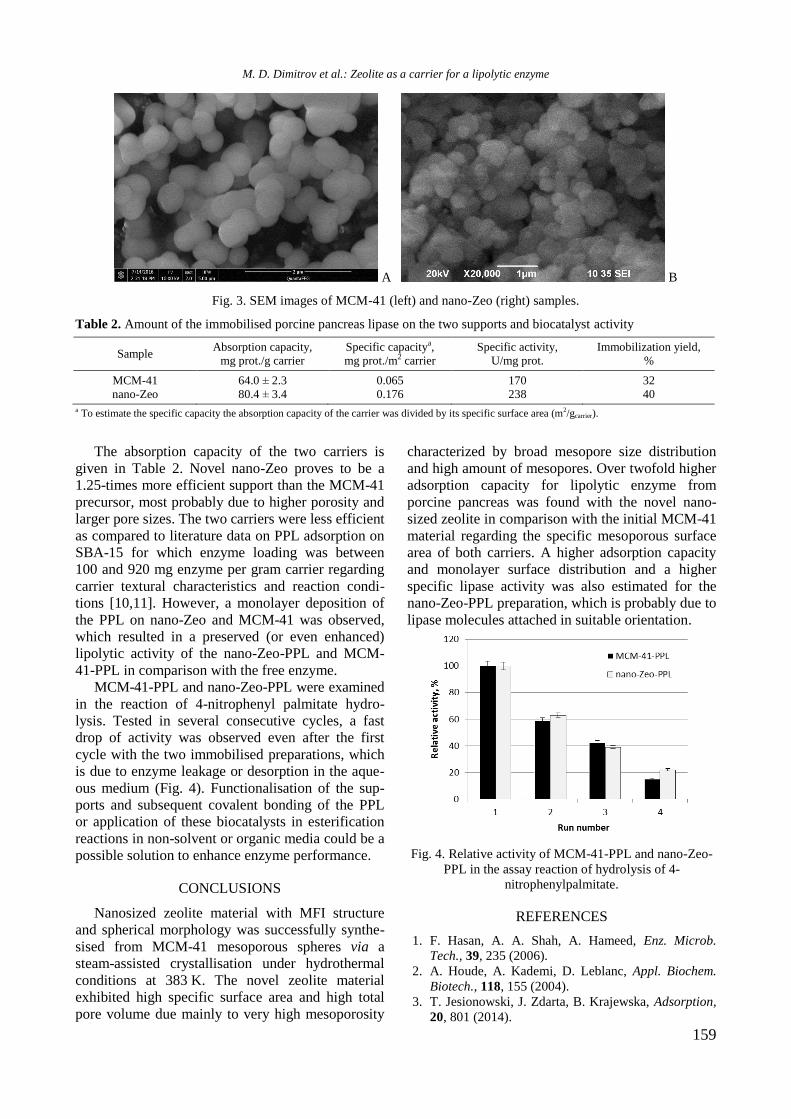
159
A B
Fig. 3. SEM images of MCM-41 (left) and nano-Zeo (right) samples.
Table 2. Amount of the immobilised porcine pancreas lipase on the two supports and biocatalyst activity
Sample Absorption capacity,
mg prot./g carrier
Specific capacitya,
mg prot./m2 carrier
Specific activity,
U/mg prot.
Immobilization yield,
%
MCM-41 64.0 ± 2.3 0.065 170 32
nano-Zeo 80.4 ± 3.4 0.176 238 40
a To estimate the specific capacity the absorption capacity of the carrier was divided by its specific surface area (m2/gcarrier).
The absorption capacity of the two carriers is
given in Table 2. Novel nano-Zeo proves to be a
1.25-times more efficient support than the MCM-41
precursor, most probably due to higher porosity and
larger pore sizes. The two carriers were less efficient
as compared to literature data on PPL adsorption on
SBA-15 for which enzyme loading was between
100 and 920 mg enzyme per gram carrier regarding
carrier textural characteristics and reaction condi-
tions [10,11]. However, a monolayer deposition of
the PPL on nano-Zeo and MCM-41 was observed,
which resulted in a preserved (or even enhanced)
lipolytic activity of the nano-Zeo-PPL and MCM-
41-PPL in comparison with the free enzyme.
MCM-41-PPL and nano-Zeo-PPL were examined
in the reaction of 4-nitrophenyl palmitate hydro-
lysis. Tested in several consecutive cycles, a fast
drop of activity was observed even after the first
cycle with the two immobilised preparations, which
is due to enzyme leakage or desorption in the aque-
ous medium (Fig. 4). Functionalisation of the sup-
ports and subsequent covalent bonding of the PPL
or application of these biocatalysts in esterification
reactions in non-solvent or organic media could be a
possible solution to enhance enzyme performance.
CONCLUSIONS
Nanosized zeolite material with MFI structure
and spherical morphology was successfully synthe-
sised from MCM-41 mesoporous spheres via a
steam-assisted crystallisation under hydrothermal
conditions at 383 K. The novel zeolite material
exhibited high specific surface area and high total
pore volume due mainly to very high mesoporosity
characterized by broad mesopore size distribution
and high amount of mesopores. Over twofold higher
adsorption capacity for lipolytic enzyme from
porcine pancreas was found with the novel nano-
sized zeolite in comparison with the initial MCM-41
material regarding the specific mesoporous surface
area of both carriers. A higher adsorption capacity
and monolayer surface distribution and a higher
specific lipase activity was also estimated for the
nano-Zeo-PPL preparation, which is probably due to
lipase molecules attached in suitable orientation.
Fig. 4. Relative activity of MCM-41-PPL and nano-Zeo-
PPL in the assay reaction of hydrolysis of 4-
nitrophenylpalmitate.
REFERENCES
1. F. Hasan, A. A. Shah, A. Hameed, Enz. Microb.
Tech., 39, 235 (2006).
2. A. Houde, A. Kademi, D. Leblanc, Appl. Biochem.
Biotech., 118, 155 (2004).
3. T. Jesionowski, J. Zdarta, B. Krajewska, Adsorption,
20, 801 (2014).
M. D. Dimitrov et al.: Zeolite as a carrier for a lipolytic enzyme
160
4. S. Y. Lee, J. Lee, J. H. Chang, J. H. Lee, BMB Rep.,
44, 77 (2011).
5. M. Leitgeb, Ž. Knez, K. Vasić, Micro‐ and Nano-
carriers for Immobilization of Enzymes, in: Nano-
technology and Nanomaterials "Micro and Nanotech-
nologies for Biotechnology", S. G. Stanciu (ed.), CC
BY 3.0 license, 2016, Ch. 2.
6. A. G. F. Machoke, B. Apeleo Zubiri, R. Leonhardt,
V. R. R. Marthala, M. Schmiele, T. Unruh, M.
Hartmann, E. Spiecker, W. Schwieger, Chem. Eur.
J., 23, 10983 (2017).
7. M. Guncheva, M. Dimitrov, P. Ossowicz, E. Janus,
J. Porous Mater. (2017), https://doi.org/10.1007/
s10934-017-0505-z
8. O. H. Lowry, N. J. Rosebrough, A. L. Farr, R. J.
Randall, J. Biol. Chem., 193, 275 (1951).
9. H. Ma, J. He, D. G. Evans, X. Duan, J. Mol. Cat. B:
Enzym., 30, 209 (2004).
10. Y. Li, G. Zhou, W. Qiao, Y. Wang, Mat. Sci. Eng. B,
162, 120 (2009).
11. G. D. Yadav, S. R. Jadhav, Micro. Meso. Mat., 86,
215 (2005).
ПОЛУЧАВАНЕ И ПРИЛОЖЕНИЕ НА НАНОРАЗМЕРЕН ЗЕОЛИТ КАТО НОСИТЕЛ ЗА ЛИПАЗА
М. Д. Димитров1, М. Гунчева
1*, Д. Г. Ковачева
2
1 Институт по органична химия с Център по фитохимия, БАН, 1113 София, България
2 Институт по обща и неорганична химия, БАН, 1113 София, България
Постъпила на 7 февруари 2018 г.; Преработена на 20 март 2018 г.
(Резюме)
Порестите неорганични материали се прилагат широко като носители на ензими, поради тяхната висока
механична стабилност и висока специфична повърхност, устойчивост на микробиална атака, стабилност в
органичните разтворители и стабилност при нагряване. През последните години ензимите, имобилизирани
върху наноразмерни материали, са атрактивни обекти за изследване поради разширяването на областта им на
приложение, например като биосензори или в медицинската диагностика.
Настоящото изследване е фокусирано върху проучване на потенциала на наноразмерен и преобладаващо
мезопорест зеолит (nano-Zeo) като подходящ носител за липаза от свински панкреас (PPL). За сравнение
проведохме експерименти и с наноразмерен MCM-41 силикат със сферична морфология на частиците, който е
изходен материал за получаване на наноразмерния зеолит посредством процес на “уплътняване” на изходните
аморфни МCM-41 наночастици в присъствието на разреден разтвор на тетрапропиламониев хидроксид и
последващото им превръщане в зеолит тип MFI чрез кристализация в присъствие на водна пара. Материалите
са охарактеризирани с помощта на рентгенова дифракция, физична адсорбция на азот и сканираща електронна
микроскопия. Количеството на натоварения протеин е съизмеримо за двата носителя и е съответно 64,0 ± 2,3
mg/g за MCM-41 и 80,4 ± 3,4 mg/g за nano-Zeo. Струва да се отбележи, че нанозеолитът показва повече от два
пъти по-голямо специфично натоварване по отношение на мезопорестата повърхност на изследваните
материали. Освен това, за nano-Zeo-PPL бяха отчетени монослойно повърхностно разпределение и по-висока
специфична хидролитична активност, което вероятно се дължи на закрепването на липазните молекули в по-
подходяща ориентация за този носител.
M. D. Dimitrov et al.: Zeolite as a carrier for a lipolytic enzyme
161
Bulgarian Chemical Communications, Volume 50, Special issue H (pp. 161–168) 2018
Improved catalyst performance of Ni/SiO2 in vegetable oil hydrogenation:
impact of Mg dopant
M. V. Gabrovska1*, D. A. Nikolova
1, J. B. Krstić
2, D. R. Loncarević
2, P. T. Tzvetkov
3, M. G. Shopska
1,
V. D. Radonjić2, M. V. Stanković
2, D. M. Jovanović
2, L. Т. Spasov
1, D. B. Simeonov
3
1 Institute of Catalysis, Bulgarian Academy of Sciences, Acad. G. Bonchev St., Bldg. 11, 1113 Sofia, Bulgaria 2 University of Belgrade,
Institute of Chemistry, Technology and Metallurgy, Department of Catalysis and
Chemical Engineering, Belgrade 11000, Republic of Serbia 3 Institute of General and Inorganic Chemistry, Bulgarian Academy of Sciences, Acad. G. Bonchev St., Bldg. 11,
1113 Sofia, Bulgaria
Received: February 15, 2018; Revised: April 01, 2018
Mg-doped co-precipitated Ni/SIG precursors were studied as edible sunflower oil hydrogenation catalysts applying
two types of commercial silica gels (SIG) as supports of different texture characteristics: a microporous type (SIG-A)
and a mesoporous type (SIG-C). It was found that texture parameters of both the silica gels and magnesium addition
allow obtaining of catalysts of various hydrogenation activities and fatty acid composition of the products. The results
reveal the highest hydrogenation activity of MgNi/SIG-C catalyst because of higher amount and accessibility of metal
nickel particles on the catalyst surface generated through reduction procedure. A dominant activity of MgNi/SIG-C
catalyst is ascribed to appropriate mesoporosity, which controls diffusion. It was established that Mg-doped Ni/SIG-C
possessed a capacity for use as an efficient edible vegetable oil hydrogenation catalyst due to high hydrogenation
activity, high saturation level of linoleic acid (C18:2cis), moderate amounts of C18:1trans fatty acids, and C18:0 stearin
acid formation in the partially hydrogenated sunflower oil.
Key words: Ni catalyst; silica gel; Mg additive; hydrogenation; sunflower oil; trans-isomers.
INTRODUCTION
Metal nickel (21–25 wt.% Ni) supported on silica
represents one proven and thereat widely produced
and practiced catalyst in the partial hydrogenation of
vegetable oils. The process continues to be applied
as universal method in modern food industry to
enhance oxidation and thermal stability of the
hydrogenated products by decreasing unsaturation
of the naturally occurring triacylglycerides and
changing solidification characteristics and plasticity
of the hydrogenated oils [1]. Nickel has been
selected due to its high activity, inert nature relative
to oil, availability, and economic price, which
makes it superior over other metals [2].
During hydrogenation of fatty acids (FAs),
several simultaneous processes can be distinguished,
such as saturation, migration, and geometric isome-
risation of double bonds. Some unsaturated FAs that
are normally in cis-configuration may be isomerised
into trans-FAs [3]. In the light of recent recom-
mendations issued by international food associ-
ations, the formation of trans-FAs during hydro-
genation using conventional nickel catalysts is
considered undesirable. Conventional partial hydro-
genation results in the formation of up to 40% of
trans-FAs in the hardened products. None of the
commercially available catalysts enable the
production of partially hydrogenated sunflower oil
having insignificant trans-FAs content [4].
While numerous studies have been focused on
improving catalyst preparation, there are only scarce
attempts to elucidate the role of additives or
modifiers on the structural and textural properties of
nickel catalyst precursors, particularly those, which
might form compounds similar to those of the parent
metal [4,5]. Moreover, the effect of dopants on the
catalytic performance in vegetable oil hydrogenation
is rarely discussed in the literature [6].
To promote cis-FA selectivity it is necessary to
dope Ni-containing catalysts with a suitable pro-
motor or modifier [7].
Alkaline, alkaline earth, and rare earth metals are
generally employed as promoters. The impact of
promoters is mostly related to the following aspects:
altering catalyst surface acid-base property, im-
proving dispersion of active species, and consi-
dering the type and extent of active species-support
interactions. An alkaline earth metal could affect the
reducibility, the morphology, and the electronic
properties of catalysts [8]. In this connection,
doping Ni-based catalysts by Mg alkaline earth
© 2018 Bulgarian Academy of Sciences, Union of Chemists in Bulgaria
* To whom all correspondence should be sent
E-mail: [email protected]
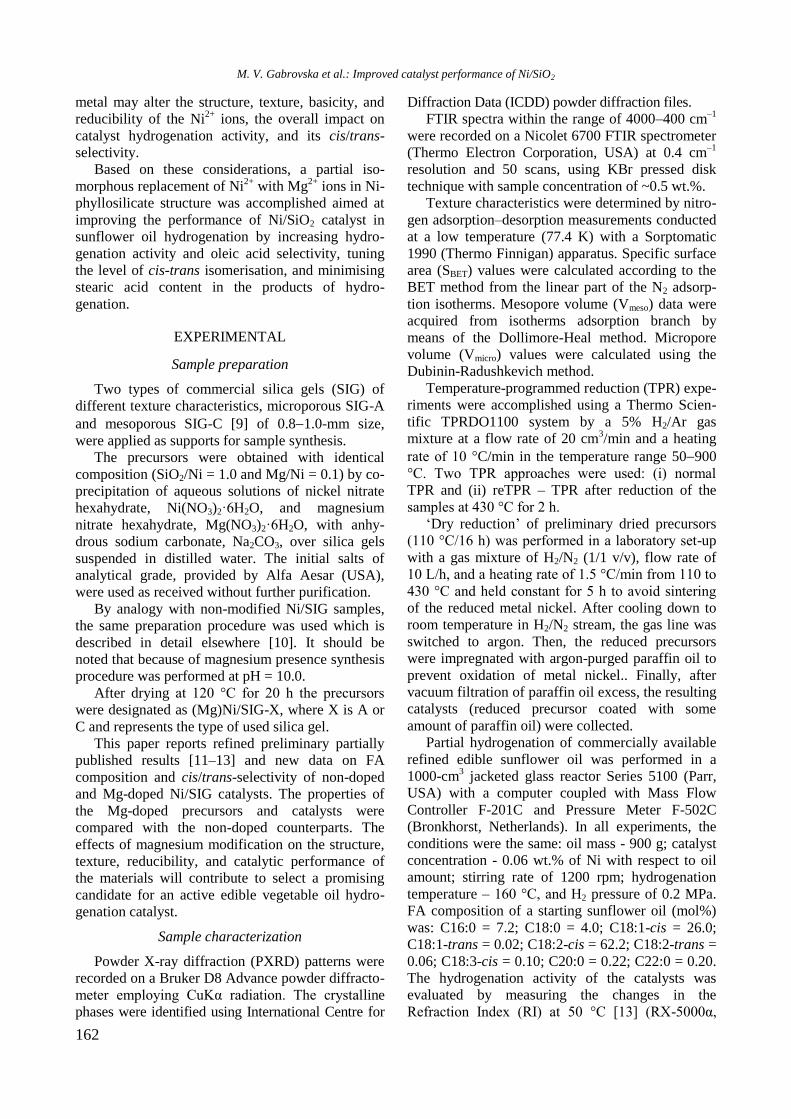
162
metal may alter the structure, texture, basicity, and
reducibility of the Ni2+
ions, the overall impact on
catalyst hydrogenation activity, and its cis/trans-
selectivity.
Based on these considerations, a partial iso-
morphous replacement of Ni2+
with Mg2+
ions in Ni-
phyllosilicate structure was accomplished aimed at
improving the performance of Ni/SiO2 catalyst in
sunflower oil hydrogenation by increasing hydro-
genation activity and oleic acid selectivity, tuning
the level of cis-trans isomerisation, and minimising
stearic acid content in the products of hydro-
genation.
EXPERIMENTAL
Sample preparation
Two types of commercial silica gels (SIG) of
different texture characteristics, microporous SIG-A
and mesoporous SIG-C [9] of 0.81.0-mm size,
were applied as supports for sample synthesis.
The precursors were obtained with identical
composition (SiO2/Ni = 1.0 and Mg/Ni = 0.1) by co-
precipitation of aqueous solutions of nickel nitrate
hexahydrate, Ni(NO3)2·6H2O, and magnesium
nitrate hexahydrate, Mg(NO3)2·6H2O, with anhy-
drous sodium carbonate, Na2CO3, over silica gels
suspended in distilled water. The initial salts of
analytical grade, provided by Alfa Aesar (USA),
were used as received without further purification.
By analogy with non-modified Ni/SIG samples,
the same preparation procedure was used which is
described in detail elsewhere [10]. It should be
noted that because of magnesium presence synthesis
procedure was performed at pH = 10.0.
After drying at 120 °C for 20 h the precursors
were designated as (Mg)Ni/SIG-X, where X is A or
C and represents the type of used silica gel.
This paper reports refined preliminary partially
published results [11‒13] and new data on FA
composition and cis/trans-selectivity of non-doped
and Mg-doped Ni/SIG catalysts. The properties of
the Mg-doped precursors and catalysts were
compared with the non-doped counterparts. The
effects of magnesium modification on the structure,
texture, reducibility, and catalytic performance of
the materials will contribute to select a promising
candidate for an active edible vegetable oil hydro-
genation catalyst.
Sample characterization
Powder X-ray diffraction (PXRD) patterns were
recorded on a Bruker D8 Advance powder diffracto-
meter employing CuKα radiation. The crystalline
phases were identified using International Centre for
Diffraction Data (ICDD) powder diffraction files.
FTIR spectra within the range of 4000–400 cm–1
were recorded on a Nicolet 6700 FTIR spectrometer
(Thermo Electron Corporation, USA) at 0.4 cm–1
resolution and 50 scans, using KBr pressed disk
technique with sample concentration of ~0.5 wt.%.
Texture characteristics were determined by nitro-
gen adsorption–desorption measurements conducted
at a low temperature (77.4 K) with a Sorptomatic
1990 (Thermo Finnigan) apparatus. Specific surface
area (SBET) values were calculated according to the
BET method from the linear part of the N2 adsorp-
tion isotherms. Mesopore volume (Vmeso) data were
acquired from isotherms adsorption branch by
means of the Dollimore-Heal method. Micropore
volume (Vmicro) values were calculated using the
Dubinin-Radushkevich method.
Temperature-programmed reduction (TPR) expe-
riments were accomplished using a Thermo Scien-
tific TPRDO1100 system by a 5% H2/Ar gas
mixture at a flow rate of 20 cm3/min and a heating
rate of 10 °C/min in the temperature range 50900
°C. Two TPR approaches were used: (i) normal
TPR and (ii) reTPR – TPR after reduction of the
samples at 430 °C for 2 h.
„Dry reduction‟ of preliminary dried precursors
(110 °C/16 h) was performed in a laboratory set-up
with a gas mixture of H2/N2 (1/1 v/v), flow rate of
10 L/h, and a heating rate of 1.5 °C/min from 110 to
430 °C and held constant for 5 h to avoid sintering
of the reduced metal nickel. After cooling down to
room temperature in H2/N2 stream, the gas line was
switched to argon. Then, the reduced precursors
were impregnated with argon-purged paraffin oil to
prevent oxidation of metal nickel.. Finally, after
vacuum filtration of paraffin oil excess, the resulting
catalysts (reduced precursor coated with some
amount of paraffin oil) were collected.
Partial hydrogenation of commercially available
refined edible sunflower oil was performed in a
1000-cm3 jacketed glass reactor Series 5100 (Parr,
USA) with a computer coupled with Mass Flow
Controller F-201C and Pressure Meter F-502C
(Bronkhorst, Netherlands). In all experiments, the
conditions were the same: oil mass - 900 g; catalyst
concentration - 0.06 wt.% of Ni with respect to oil
amount; stirring rate of 1200 rpm; hydrogenation
temperature – 160 °C, and H2 pressure of 0.2 MPa.
FA composition of a starting sunflower oil (mol%)
was: C16:0 = 7.2; C18:0 = 4.0; C18:1-cis = 26.0;
C18:1-trans = 0.02; C18:2-cis = 62.2; C18:2-trans =
0.06; C18:3-cis = 0.10; C20:0 = 0.22; C22:0 = 0.20.
The hydrogenation activity of the catalysts was
evaluated by measuring the changes in the
Refraction Index (RI) at 50 °C [13] (RX-5000α,
M. V. Gabrovska et al.: Improved catalyst performance of Ni/SiO2
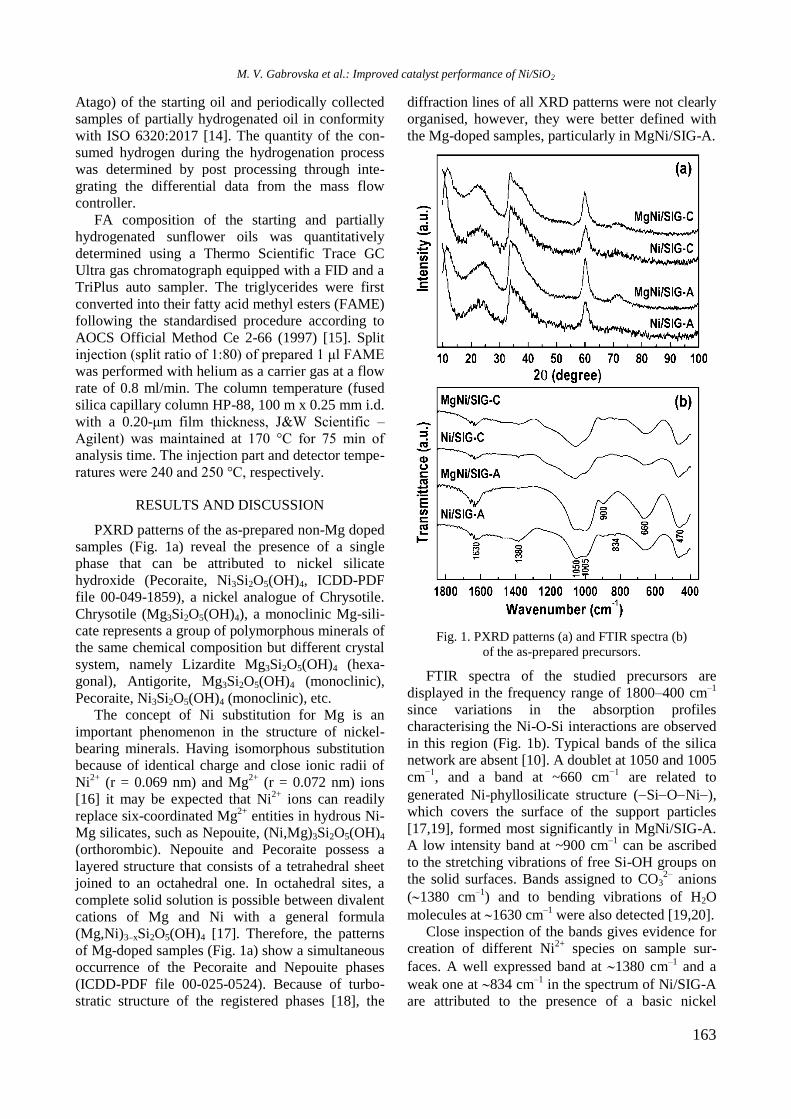
163
Atago) of the starting oil and periodically collected
samples of partially hydrogenated oil in conformity
with ISO 6320:2017 [14]. The quantity of the con-
sumed hydrogen during the hydrogenation process
was determined by post processing through inte-
grating the differential data from the mass flow
controller.
FA composition of the starting and partially
hydrogenated sunflower oils was quantitatively
determined using a Thermo Scientific Trace GC
Ultra gas chromatograph equipped with a FID and a
TriPlus auto sampler. The triglycerides were first
converted into their fatty acid methyl esters (FAME)
following the standardised procedure according to
AOCS Official Method Ce 2-66 (1997) [15]. Split
injection (split ratio of 1:80) of prepared 1 μl FAME
was performed with helium as a carrier gas at a flow
rate of 0.8 ml/min. The column temperature (fused
silica capillary column HP-88, 100 m x 0.25 mm i.d.
with a 0.20-μm film thickness, J&W Scientific –
Agilent) was maintained at 170 °C for 75 min of
analysis time. The injection part and detector tempe-
ratures were 240 and 250 °C, respectively.
RESULTS AND DISCUSSION
PXRD patterns of the as-prepared non-Mg doped
samples (Fig. 1a) reveal the presence of a single
phase that can be attributed to nickel silicate
hydroxide (Pecoraite, Ni3Si2O5(OH)4, ICDD-PDF
file 00-049-1859), a nickel analogue of Chrysotile.
Chrysotile (Mg3Si2O5(OH)4), a monoclinic Mg-sili-
cate represents a group of polymorphous minerals of
the same chemical composition but different crystal
system, namely Lizardite Mg3Si2O5(OH)4 (hexa-
gonal), Antigorite, Mg3Si2O5(OH)4 (monoclinic),
Pecoraite, Ni3Si2O5(OH)4 (monoclinic), etc.
The concept of Ni substitution for Mg is an
important phenomenon in the structure of nickel-
bearing minerals. Having isomorphous substitution
because of identical charge and close ionic radii of
Ni2+
(r = 0.069 nm) and Mg2+
(r = 0.072 nm) ions
[16] it may be expected that Ni2+
ions can readily
replace six-coordinated Mg2+
entities in hydrous Ni-
Mg silicates, such as Nepouite, (Ni,Mg)3Si2O5(OH)4
(orthorombic). Nepouite and Pecoraite possess a
layered structure that consists of a tetrahedral sheet
joined to an octahedral one. In octahedral sites, a
complete solid solution is possible between divalent
cations of Mg and Ni with a general formula
(Mg,Ni)3–xSi2O5(OH)4 [17]. Therefore, the patterns
of Mg-doped samples (Fig. 1a) show a simultaneous
occurrence of the Pecoraite and Nepouite phases
(ICDD-PDF file 00-025-0524). Because of turbo-
stratic structure of the registered phases [18], the
diffraction lines of all XRD patterns were not clearly
organised, however, they were better defined with
the Mg-doped samples, particularly in MgNi/SIG-A.
Fig. 1. PXRD patterns (a) and FTIR spectra (b)
of the as-prepared precursors.
FTIR spectra of the studied precursors are
displayed in the frequency range of 1800–400 cm–1
since variations in the absorption profiles
characterising the Ni-O-Si interactions are observed
in this region (Fig. 1b). Typical bands of the silica
network are absent [10]. A doublet at 1050 and 1005
cm−1
, and a band at ~660 cm−1
are related to
generated Ni-phyllosilicate structure (SiONi),
which covers the surface of the support particles
[17,19], formed most significantly in MgNi/SIG-A.
A low intensity band at ~900 cm–1
can be ascribed
to the stretching vibrations of free Si-OH groups on
the solid surfaces. Bands assigned to CO32–
anions
(1380 cm–1
) and to bending vibrations of H2O
molecules at 1630 cm–1
were also detected [19,20].
Close inspection of the bands gives evidence for
creation of different Ni2+
species on sample sur-
faces. A well expressed band at 1380 cm–1
and a
weak one at 834 cm–1
in the spectrum of Ni/SIG-A
are attributed to the presence of a basic nickel
M. V. Gabrovska et al.: Improved catalyst performance of Ni/SiO2
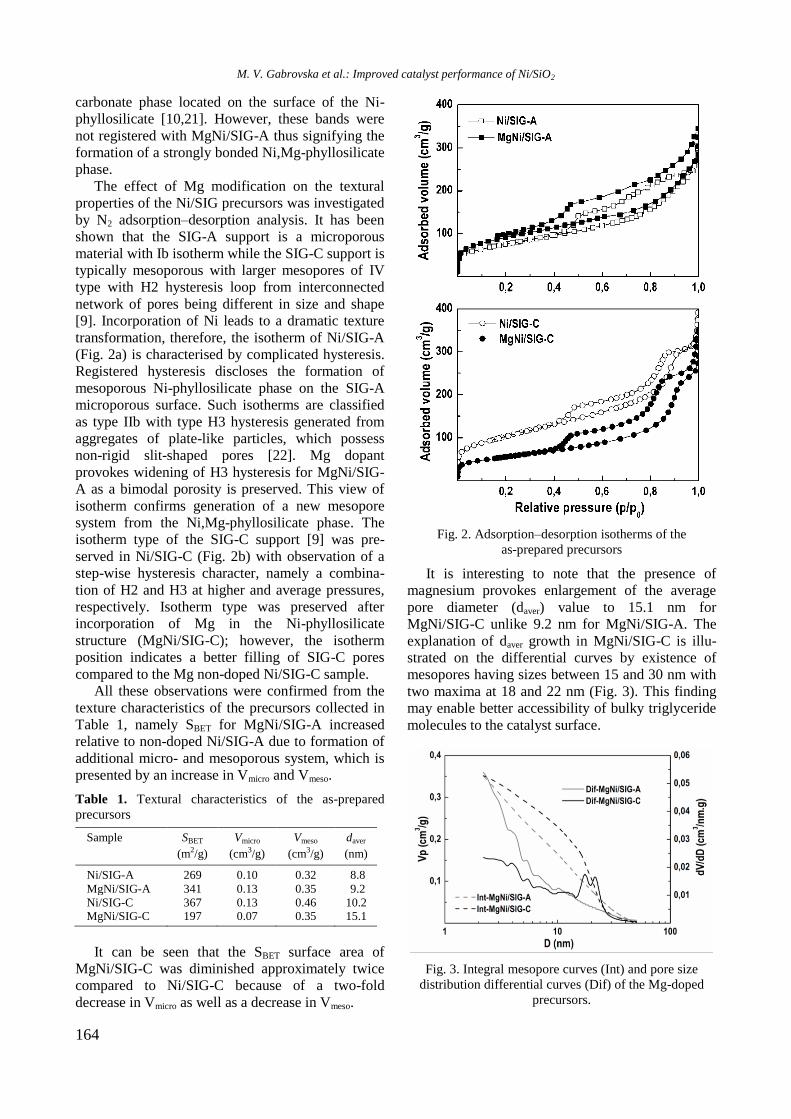
164
carbonate phase located on the surface of the Ni-
phyllosilicate [10,21]. However, these bands were
not registered with MgNi/SIG-A thus signifying the
formation of a strongly bonded Ni,Mg-phyllosilicate
phase.
The effect of Mg modification on the textural
properties of the Ni/SIG precursors was investigated
by N2 adsorption–desorption analysis. It has been
shown that the SIG-A support is a microporous
material with Ib isotherm while the SIG-C support is
typically mesoporous with larger mesopores of IV
type with H2 hysteresis loop from interconnected
network of pores being different in size and shape
[9]. Incorporation of Ni leads to a dramatic texture
transformation, therefore, the isotherm of Ni/SIG-A
(Fig. 2a) is characterised by complicated hysteresis.
Registered hysteresis discloses the formation of
mesoporous Ni-phyllosilicate phase on the SIG-A
microporous surface. Such isotherms are classified
as type IIb with type H3 hysteresis generated from
aggregates of plate-like particles, which possess
non-rigid slit-shaped pores [22]. Mg dopant
provokes widening of H3 hysteresis for MgNi/SIG-
A as a bimodal porosity is preserved. This view of
isotherm confirms generation of a new mesopore
system from the Ni,Mg-phyllosilicate phase. The
isotherm type of the SIG-C support [9] was pre-
served in Ni/SIG-C (Fig. 2b) with observation of a
step-wise hysteresis character, namely a combina-
tion of H2 and H3 at higher and average pressures,
respectively. Isotherm type was preserved after
incorporation of Mg in the Ni-phyllosilicate
structure (MgNi/SIG-C); however, the isotherm
position indicates a better filling of SIG-C pores
compared to the Mg non-doped Ni/SIG-C sample.
All these observations were confirmed from the
texture characteristics of the precursors collected in
Table 1, namely SBET for MgNi/SIG-A increased
relative to non-doped Ni/SIG-A due to formation of
additional micro- and mesoporous system, which is
presented by an increase in Vmicro and Vmeso.
Table 1. Textural characteristics of the as-prepared
precursors
Sample SBET
(m2/g)
Vmicro
(cm3/g)
Vmeso
(cm3/g)
daver
(nm)
Ni/SIG-A 269 0.10 0.32 8.8
MgNi/SIG-A 341 0.13 0.35 9.2
Ni/SIG-C 367 0.13 0.46 10.2 MgNi/SIG-C 197 0.07 0.35 15.1
It can be seen that the SBET surface area of
MgNi/SIG-C was diminished approximately twice
compared to Ni/SIG-C because of a two-fold
decrease in Vmicro as well as a decrease in Vmeso.
Fig. 2. Adsorption–desorption isotherms of the
as-prepared precursors
It is interesting to note that the presence of
magnesium provokes enlargement of the average
pore diameter (daver) value to 15.1 nm for
MgNi/SIG-C unlike 9.2 nm for MgNi/SIG-A. The
explanation of daver growth in MgNi/SIG-C is illu-
strated on the differential curves by existence of
mesopores having sizes between 15 and 30 nm with
two maxima at 18 and 22 nm (Fig. 3). This finding
may enable better accessibility of bulky triglyceride
molecules to the catalyst surface.
Fig. 3. Integral mesopore curves (Int) and pore size
distribution differential curves (Dif) of the Mg-doped
precursors.
M. V. Gabrovska et al.: Improved catalyst performance of Ni/SiO2
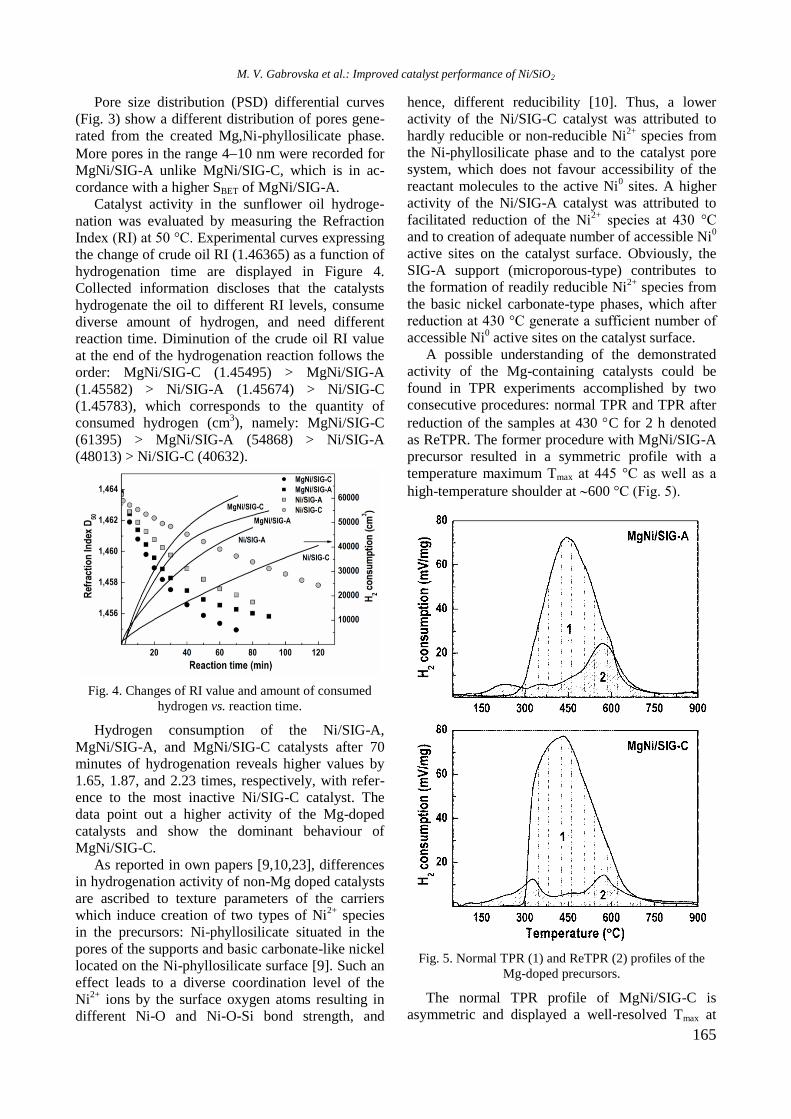
165
Pore size distribution (PSD) differential curves
(Fig. 3) show a different distribution of pores gene-
rated from the created Mg,Ni-phyllosilicate phase.
More pores in the range 410 nm were recorded for
MgNi/SIG-A unlike MgNi/SIG-C, which is in ac-
cordance with a higher SBET of MgNi/SIG-A.
Catalyst activity in the sunflower oil hydroge-
nation was evaluated by measuring the Refraction
Index (RI) at 50 °C. Experimental curves expressing
the change of crude oil RI (1.46365) as a function of
hydrogenation time are displayed in Figure 4.
Collected information discloses that the catalysts
hydrogenate the oil to different RI levels, consume
diverse amount of hydrogen, and need different
reaction time. Diminution of the crude oil RI value
at the end of the hydrogenation reaction follows the
order: MgNi/SIG-C (1.45495) > MgNi/SIG-A
(1.45582) > Ni/SIG-A (1.45674) > Ni/SIG-C
(1.45783), which corresponds to the quantity of
consumed hydrogen (cm3), namely: MgNi/SIG-C
(61395) > MgNi/SIG-A (54868) > Ni/SIG-A
(48013) > Ni/SIG-C (40632).
Fig. 4. Changes of RI value and amount of consumed
hydrogen vs. reaction time.
Hydrogen consumption of the Ni/SIG-A,
MgNi/SIG-A, and MgNi/SIG-C catalysts after 70
minutes of hydrogenation reveals higher values by
1.65, 1.87, and 2.23 times, respectively, with refer-
ence to the most inactive Ni/SIG-C catalyst. The
data point out a higher activity of the Mg-doped
catalysts and show the dominant behaviour of
MgNi/SIG-C.
As reported in own papers [9,10,23], differences
in hydrogenation activity of non-Mg doped catalysts
are ascribed to texture parameters of the carriers
which induce creation of two types of Ni2+
species
in the precursors: Ni-phyllosilicate situated in the
pores of the supports and basic carbonate-like nickel
located on the Ni-phyllosilicate surface [9]. Such an
effect leads to a diverse coordination level of the
Ni2+
ions by the surface oxygen atoms resulting in
different Ni-O and Ni-O-Si bond strength, and
hence, different reducibility [10]. Thus, a lower
activity of the Ni/SIG-C catalyst was attributed to
hardly reducible or non-reducible Ni2+
species from
the Ni-phyllosilicate phase and to the catalyst pore
system, which does not favour accessibility of the
reactant molecules to the active Ni0 sites. A higher
activity of the Ni/SIG-A catalyst was attributed to
facilitated reduction of the Ni2+
species at 430 °C
and to creation of adequate number of accessible Ni0
active sites on the catalyst surface. Obviously, the
SIG-A support (microporous-type) contributes to
the formation of readily reducible Ni2+
species from
the basic nickel carbonate-type phases, which after
reduction at 430 °C generate a sufficient number of
accessible Ni0 active sites on the catalyst surface.
A possible understanding of the demonstrated
activity of the Mg-containing catalysts could be
found in TPR experiments accomplished by two
consecutive procedures: normal TPR and TPR after
reduction of the samples at 430 C for 2 h denoted
as ReTPR. The former procedure with MgNi/SIG-A
precursor resulted in a symmetric profile with a
temperature maximum Tmax at 445 °C as well as a
high-temperature shoulder at 600 °C (Fig. 5).
Fig. 5. Normal TPR (1) and ReTPR (2) profiles of the
Mg-doped precursors.
The normal TPR profile of MgNi/SIG-C is
asymmetric and displayed a well-resolved Tmax at
M. V. Gabrovska et al.: Improved catalyst performance of Ni/SiO2
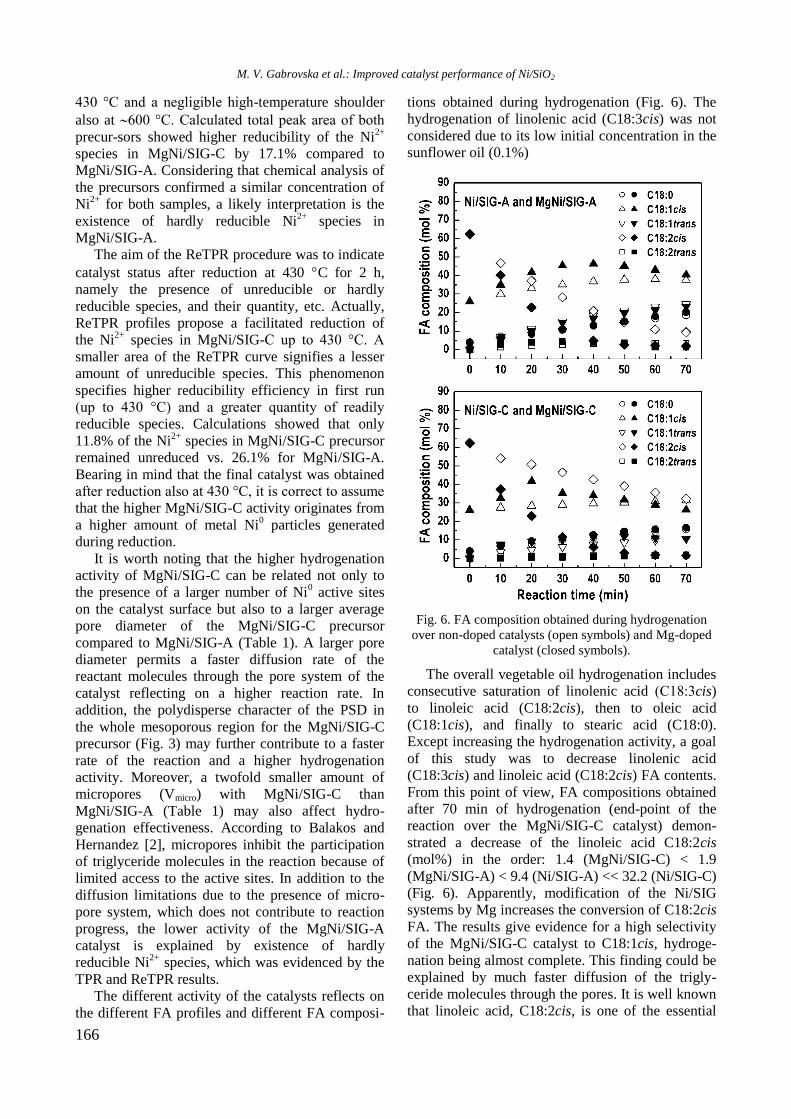
166
430 °C and a negligible high-temperature shoulder
also at 600 °C. Calculated total peak area of both
precur-sors showed higher reducibility of the Ni2+
species in MgNi/SIG-C by 17.1% compared to
MgNi/SIG-A. Considering that chemical analysis of
the precursors confirmed a similar concentration of
Ni2+
for both samples, a likely interpretation is the
existence of hardly reducible Ni2+
species in
MgNi/SIG-A.
The aim of the ReTPR procedure was to indicate
catalyst status after reduction at 430 C for 2 h,
namely the presence of unreducible or hardly
reducible species, and their quantity, etc. Actually,
ReTPR profiles propose a facilitated reduction of
the Ni2+
species in MgNi/SIG-C up to 430 °C. A
smaller area of the ReTPR curve signifies a lesser
amount of unreducible species. This phenomenon
specifies higher reducibility efficiency in first run
(up to 430 °C) and a greater quantity of readily
reducible species. Calculations showed that only
11.8% of the Ni2+
species in MgNi/SIG-C precursor
remained unreduced vs. 26.1% for MgNi/SIG-A.
Bearing in mind that the final catalyst was obtained
after reduction also at 430 °C, it is correct to assume
that the higher MgNi/SIG-C activity originates from
a higher amount of metal Ni0 particles generated
during reduction.
It is worth noting that the higher hydrogenation
activity of MgNi/SIG-C can be related not only to
the presence of a larger number of Ni0 active sites
on the catalyst surface but also to a larger average
pore diameter of the MgNi/SIG-C precursor
compared to MgNi/SIG-A (Table 1). A larger pore
diameter permits a faster diffusion rate of the
reactant molecules through the pore system of the
catalyst reflecting on a higher reaction rate. In
addition, the polydisperse character of the PSD in
the whole mesoporous region for the MgNi/SIG-C
precursor (Fig. 3) may further contribute to a faster
rate of the reaction and a higher hydrogenation
activity. Moreover, a twofold smaller amount of
micropores (Vmicro) with MgNi/SIG-C than
MgNi/SIG-A (Table 1) may also affect hydro-
genation effectiveness. According to Balakos and
Hernandez [2], micropores inhibit the participation
of triglyceride molecules in the reaction because of
limited access to the active sites. In addition to the
diffusion limitations due to the presence of micro-
pore system, which does not contribute to reaction
progress, the lower activity of the MgNi/SIG-A
catalyst is explained by existence of hardly
reducible Ni2+
species, which was evidenced by the
TPR and ReTPR results.
The different activity of the catalysts reflects on
the different FA profiles and different FA composi-
tions obtained during hydrogenation (Fig. 6). The
hydrogenation of linolenic acid (C18:3cis) was not
considered due to its low initial concentration in the
sunflower oil (0.1%)
Fig. 6. FA composition obtained during hydrogenation
over non-doped catalysts (open symbols) and Mg-doped
catalyst (closed symbols).
The overall vegetable oil hydrogenation includes
consecutive saturation of linolenic acid (С18:3cis)
to linoleic acid (C18:2cis), then to oleic acid
(C18:1cis), and finally to stearic acid (C18:0).
Except increasing the hydrogenation activity, a goal
of this study was to decrease linolenic acid
(C18:3cis) and linoleic acid (C18:2cis) FA contents.
From this point of view, FA compositions obtained
after 70 min of hydrogenation (end-point of the
reaction over the MgNi/SIG-C catalyst) demon-
strated a decrease of the linoleic acid C18:2cis
(mol%) in the order: 1.4 (MgNi/SIG-C) < 1.9
(MgNi/SIG-A) < 9.4 (Ni/SIG-A) << 32.2 (Ni/SIG-C)
(Fig. 6). Apparently, modification of the Ni/SIG
systems by Mg increases the conversion of C18:2cis
FA. The results give evidence for a high selectivity
of the MgNi/SIG-C catalyst to C18:1cis, hydroge-
nation being almost complete. This finding could be
explained by much faster diffusion of the trigly-
ceride molecules through the pores. It is well known
that linoleic acid, C18:2cis, is one of the essential
M. V. Gabrovska et al.: Improved catalyst performance of Ni/SiO2
167
fatty acids. Small amounts are sufficient for human
nutrition and allowable in the edible hydrogenated
oils.
As mentioned above, along with saturation of the
double bonds during hydrogenation, two reversible
reactions of cis-FA to trans-FA isomerisation take
place: linoleic (C18:2cis) (C18:2trans) and oleic
(C18:1cis) (C18:1trans), which lead to a broad
product distribution [1,3]. Due to increasing concern
about the negative effect of trans-FA on human
health, it is desirable to reduce the formation of
trans-FA isomers [24] and significantly impede
stearic acid FA C18:0 formation in the hydroge-
nated vegetable oil. The latter is better exhibited by
the MgNi/SIG-A catalyst than MgNi/SIG-C (Figure
6) and is therefore a promising feature.
Concerning the content of all C18trans FA
isomers, the MgNi/SIG-C catalyst demonstrated a
lower value by 46% than MgNi/SIG-A under the
same operating conditions and for the same activity.
In this case, the activity was compared for approxi-
mately the same value of H2 consumption, namely:
41 900 cm3 for MgNi/SIG-A reached for 40 min and
40 723 cm3 for MgNi/SIG-C reached for 30 min.
The content of all C18trans with MgNi/SIG-A for
40 min was 20.78 mol.%, whereas MgNi/SIG-C
manifested 11.22 mol.% for 30 min. It is known that
the trans-isomers are formed when the triglyceride
desorbs from the catalyst surface without being
hydrogenated [2]. The increase of trans-FA amount
with the MgNi/SIG-A catalyst could be explained
by mass-transfer limitations due to twofold higher
microporosity as compared to MgNi/SIG-C (Table
1). Veldsink et al. [3] who stated that an increase of
trans-isomer content might be caused by pore
diffusion resistance sustained this standpoint.
It was testified that modifying the electronic
density of the metallic phase may alter the
adsorption-desorption strength of reactants and/or
products [7,25]. A lower amount of C18:1trans FA
isomers formed by the MgNi/SIG-C catalyst relative
to the MgNi/SIG-A catalyst can be interpreted also
in terms of a greater number of Ni0 sites on the
catalyst surface, which leads to higher electron
density of Ni because of an electron transfer from
the basic Mg promotor. The increase in electron
density of nickel induces a weak interaction of the
adsorbed and hydrogenated molecules, and makes
easier theirs desorption to minimise the transfor-
mation from cis- to trans-FA isomers [7,25].
It may be summarised that Mg-doping has a
measurable impact on the characteristics of the
catalysts affecting the hydrogenation activity as well
as the quality of the hydrogenated products.
CONCLUSIONS
Results obtained in this study reveal that both the
application of silica gels of different texture
parameters and magnesium addition results in
catalysts of different hydrogenation activity and
variation in fatty acid composition of the reaction
products.
A considerable effect of magnesium dopant was
established on the reducibility of Ni2+
ions from
MgNi/SIG-C precursor thus contributing to a greater
quantity of readily reducible Ni2+
species and
generating a sufficient number of accessible metal
nickel active sites on the catalyst surface through
applied reduction procedure.
The role of the magnesium on catalyst perform-
ance in sunflower oil hydrogenation was clearly
demonstrated by the MgNi/SIG-C catalyst. A domi-
nant activity and lower amount of formed C18trans
isomers could be attributed to formation of suitable
catalyst mesoporosity, thereby, restricting diffusion
effects.
In conclusion, Mg-doping of Ni/SIG-C is pro-
mising for use to obtain an efficient edible vegetable
oil hydrogenation catalyst of high activity, high
saturation value of linoleic (C18:2cis) acid, and
moderate amounts of C18:1trans and C18:0 stearin
FA in partially hydrogenated sunflower oil
Acknowledgment: This work is partially supported
by the Ministry of Science of the Republic of Serbia
(Grants no. III 45001).
Note: This study was realised in the frame of inter-
academic collaboration between Institute of
Catalysis, Bulgarian Academy of Sciences, Sofia,
Bulgaria and University of Belgrade, Institute of
Chemistry, Technology and Metallurgy, Department
of Catalysis and Chemical Engineering, Belgrade,
Serbia through the project “Layered systems as
precursors of nanosized catalysts applied to clean
fuels and healthy foods production”.
REFERENCES
1. M. Fernández, G. Tonetto, G. Crapiste, D. Damiani,
J. Food Eng., 82, 199 (2007).
2. M. Balakos, E. Hernandez, Catal. Today, 35, 415
(1997).
3. J. Veldsink, M. Bouma, N. Schöön, A. Beenackers,
Catal. Rev. - Sci. Eng., 39, 253 (1997).
4. Vegetable Oils in Food Technology: Composition,
Properties and Uses, Second Edition. Edited by Frank
D. Gunstone, Blackwell Publishing Ltd., 2011, pp.
353.
5. G. Babu, K. Ghuge, S. Rammohan, V. Krishnan, A.
Bhat, Catal. Lett., 15, 95 (1992).
M. V. Gabrovska et al.: Improved catalyst performance of Ni/SiO2
168
6. E. Jang, M. Jung, D. Min, Compr. Rev. Food Sci. F.,
1, 22 (2005).
7. G. Tonetto, M. Sánchez, M. Ferreira, D. Damiani, J.
Mol. Catal. A: Chem., 299, 88 (2009).
8. J. Zhu, X. Peng, L. Yao, J. Shen, D. Tong, C. Hu, Int.
J. Hydrogen Energy, 36, 7094 (2011).
9. D. Nikolova, J. Krstić, L. Spasov, D. Simeonov, D.
Lončarević, Pl. Stefanov, D. Jovanović, Russ. J.
Phys. Chem. A, 85, 2380 (2011).
10. M. Gabrovska, J. Krstić, P. Tzvetkov, K. Tenchev,
M. Shopska, N. Vukelić, D. Jovanović, Russ. J. Phys.
Chem. A, 85, 2392 (2011).
11. M. Gabrovska, D. Nikolova, M. Shopska, P.
Tzvetkov, L. Spasov, D. Simeonov, D. Jovanović,
Physical Chemistry 2014 (Proc. 12th Int. Conf. Funda-
mental and Applied Aspects of Physical Chemistry,
September 22−26, 2014, Belgrad, Serbia), Eds., Z.
Cupić, S. Anić, Society of Physical Chemists of
Serbia, vol. 1, p. 235.
12. J. Krstić, V. Radonjić, M. Gabrovska, D. Nikolova,
L. Bilyarska, K. Tenchev, N. Vukelić, Physical
Chemistry 2014 (Proc. 12th
Int. Conf. Fundam. Appl.
Aspects Phys. Chem., September 22−26, 2014,
Belgrade, Serbia), Eds., Z. Cupić, S. Anić, Society of
Physical Chemists of Serbia, vol. 1, p. 276.
13. J. Krstić, M. Gabrovska, D. Lončarević, D. Nikolova,
V. Radonjić, N. Vukelić, D. M. Jovanović, Chem.
Eng. Res. Des., 100, 72 (2015).
14. ISO 6320:2017, Animal and vegetable fats and oils -
Determination of refractive index.
15. AOCS Official Method Ce 2-66, 1997, Preparations
of Methyl Esters of Fatty Acids.
16. R. Shannon, Acta Crystallogr. A, 32, 751 (1976).
17. B. Reddy, R. Frost, M. Dickfos, Spectrochim. Acta
Part A, 71, 1762 (2009).
18. K. Ghuge, A. Bhat, G. Babu, Appl. Catal. A: Gen.,
103, 183 (1993).
19. J. Sohn, Catal. Today, 73, 197 (2002).
20. R. Lenza, W. Vasconcelos, Mater. Res., 4, 189 (2001).
21. O. Solcova, D.-C. Uecker, U. Steinike, K. Jiratova,
Appl. Catal. A: Gen., 94, 153 (1993).
22. F. Rouquerol, J. Rouquerol, K. Sing, in: Adsorption
by Powders and Porous Solids, Principle, Methodo-
logy and Applications, Academic Press, New York,
1999.
23. J. Krstić, M. Gabrovska, D. Lončarević, D. Nikolova,
D. Simeonov, M. Stanković, N. Vukelić, Physical
Chemistry 2012 (Proc. 11th
Int. Conf. Fundam. Appl.
Aspects Phys. Chem., September 24−28, 2012,
Belgrade, Serbia), Eds., Z. Cupić, S. Anić, Society of
Physical Chemists of Serbia, vol. 1, p. 175.
24. H. Choo, K. Liew, H. Liu, C. Seng, J. Mol. Catal.
A: Chem., 165, 127 (2001).
25. C. Thunyaratchatanon, J. Jitjamnong, A.
Luengnaruemitchai, N. Numwong, N. Chollacoop, Y.
Yoshimurda, Appl. Catal. A: Gen., 520, 170 (2016)
ПОДОБРЕНО КАТАЛИТИЧНО ПОВЕДЕНИЕ НА Ni/SiO2 ПРИ ХИДРОГЕНИРАНЕ НА
РАСТИТЕЛНИ МАСЛА: ВЛИЯНИЕ НА ДОБАВКАТА ОТ Mg
М. В. Габровска1*, Д. А. Николова
1, Ю. Б. Кръстич
2, Д. Р. Лонцаревич
2, П. Цв. Цветков
3,
М. Г. Шопска1, В. Д. Радонич
2, М. В. Станкович
2, Д. M. Йованович
2, Л. Т. Спасов
1, Д. Б. Симеонов
3
1 Институт по катализ, Българска академия на науките, ул. „Акад. Г. Бончев“, бл. 11, 1113 София, България
2 Белградски университет, Институт по химия, технология и металургия,
Център по катализ и инженерна химия, ул. Ньегошева 12, 11000 Белград, Сърбия 3 Институт по обща и неорганична химия, Българска академия на науките, ул. „Акад. Г. Бончев“, бл. 11,
1113 София, България
Постъпила на: 15 февруари 2018 г.; Преработена на: 1 април 2018 г.
(Резюме)
Изследвани са Ni-Mg/SIG катализатори за хидрогениране на слънчогледово масло за хранителни цели,
получени чрез съутаяване на прекурсори върху носители от търговски силикагели с различни текстурни
характеристики - SIG-A (микропорест тип) и SIG-C (мезопорест тип). Установено е, че двата фактора –
текстурните параметри на силикагелите и добавката от магнезий – водят до получаване на катализатори с
различна хидрогенираща активност и различен състав на мастните киселини в реакционните продукти.
Получените резултати разкриват висока хидрогенираща активност на Ni-Mg/SIG-C катализатор като резултат
от по-голямо количество и достъпност на метални никелови частици в катализатора, образувани с процедурата
на редукция. По-високата активност на MgNi/SIG-C катализатор може да се отдаде на неговата мезопорeстост,
благодарение на която се избягват дифузионните ограничения. Добавката от Mg подобрява качествата на
прекурсора Ni-Mg/SIG-C за получаване на ефективен катализатор за хидрогениране на растителни масла за
хранителни цели с висока активност, висока степен на насищане на линоловата киселина (С18:2cis) и
присъствие на умерени количества от олеинова (C18:1trans) и стеаринова (С18:0) киселини в частично
хидрогенираното слънчогледово масло.
M. V. Gabrovska et al.: Improved catalyst performance of Ni/SiO2
169
Bulgarian Chemical Communications, Volume 50, Special issue H (pp. 169–173) 2018
Synthesis of polyphenylacetylene by iron(III) chloride catalyzed carbonyl olefin
metathesis polymerization of chalcone
H. Penchev1, S. S. Dimova
1,*, K. L. Zaharieva
2, F. S. Ublekov
1, Ch. Novakov
1, V. Sinigersky
1
1 Institute of Polymers, Bulgarian Academy of Sciences, Acad. G. Bonchev St., Bldg. 103A, 1113 Sofia, Bulgaria 2 Institute of Catalysis, Bulgarian Academy of Sciences, Acad. G. Bonchev St., Bldg. 11, 1113 Sofia, Bulgaria
Received: January 15, 2018; Revised, March 22, 2018
Carbon-carbon bond formation is a fundamental reaction in organic synthesis, one of its most important applications
being synthesis of polymers and copolymers. Studies of the olefin metathesis reaction have resulted in extensive
knowledge regarding synthesis of molecules applied in agricultural, petroleum, and pharmaceutical industries. The most
commonly used catalysts for this purpose are ruthenium, molybdenum, and tungsten-based complexes.
Recently, Ludwig et al. have successfully conducted iron(III)-catalysed carbonyl-olefin metathesis reaction for
synthesis of low molecular weight compounds.
In this study, we demonstrate for the first time that the carbonyl-olefin metathesis reaction, catalysed by anhydrous
iron(III) chloride, can also be effectively applied in polymerization mode by using a single bifunctional monomer as
chalcone. Polymerization was performed in a simple and efficient way under mild reaction conditions in solvents of
various polarity, such as 1,2-dichloroethane and toluene. The average molecular mass of the synthesized oligomers
reached 5000 g.mol−1
, which was higher than reference values so far reported. In situ doping of the as synthesized
polyphenylacetylenes with FeCl3 represents another advantage of selected synthetic approach.
Obtained products were characterized by gel permeation chromatography, 1H NMR, and FTIR spectroscopy. The
structure of the obtained oligomers was studied by X-ray diffraction analysis.
Key words: carbonyl olefin metathesis polymerization, Iron(III) chloride, polyphenylacetylenes, chalcone, catalyst
dopant.
INTRODUCTION
During the last decade, a new synthetic route for
the preparation of oligomeric products based on
carbonyl-olefin exchange reaction and reductive
coupling of conjugated compounds has been
developed using novel catalyst systems. The control
over the polymer structure provided by metathesis
polymerization makes fine-tuning of polymer
properties and functionality possible.
Carbonyl olefin metathesis (COM) has been
reported for the first time by Schopov et all. [1].
COM has been applied for polymerization of α,β-
unsaturated carbonyl compounds in the presence of
WCl6 [2]. It has been shown that treatment of α,β-
unsaturated carbonyl compound as 1,3-diphenyl-
prop-2-en-1-one (chalcone) with WCl6 resulted in
the formation of polyphenylacetylene. Using this
procedure several substituted α,β-unsaturated
carbonyl compounds were polymerized. A series of
substituted polyacetylenes (polyphenylacetylene,
polydiphenylacetylene, polymethylacetylene, poly-
camphor, etc.) was obtained. The most commonly
used catalysts for this purpose are ruthenium,
molybdenum, and tungsten-based complexes. Until
now, COM has not been widely applied. The
requirement of stoichiometric amounts of transition
metals with concurrent formation of inert metal oxo
species, which preclude regeneration of the active
metal catalyst, has probably been the main reason
for obscurity of the carbonyl-olefin metathesis reac-
tion [3]. Finding mild catalytic conditions to
perform carbonyl olefin metathesis has always been
a significant challenge.
Remarkable innovations have been made in the
field of olefin metathesis concerned with design and
preparation of new catalysts. Considerable break-
through has been achieved exploring iron(III)-cata-
lysed carbonyl-olefin metathesis reactions. This
approach is characterized by operational simplicity,
high functional group compatibility, and region-
selectivity using anhydrous FeCl3 as a cheap, non-
toxic, and environmentally friendly compound.
Ludwig and co-workers have successfully demon-
strated iron(III)-catalysed carbonyl-olefin ring-
closing metathesis reaction for synthesis of low-
molecular cyclic compounds [4, 5].
The goal of the present work was to synthesise
polyphenylacetylene by iron(III)-catalysed carbonyl
olefin metathesis polymerization of chalcone. Struc-
© 2018 Bulgarian Academy of Sciences, Union of Chemists in Bulgaria
* To whom all correspondence should be sent
E-mail: [email protected]
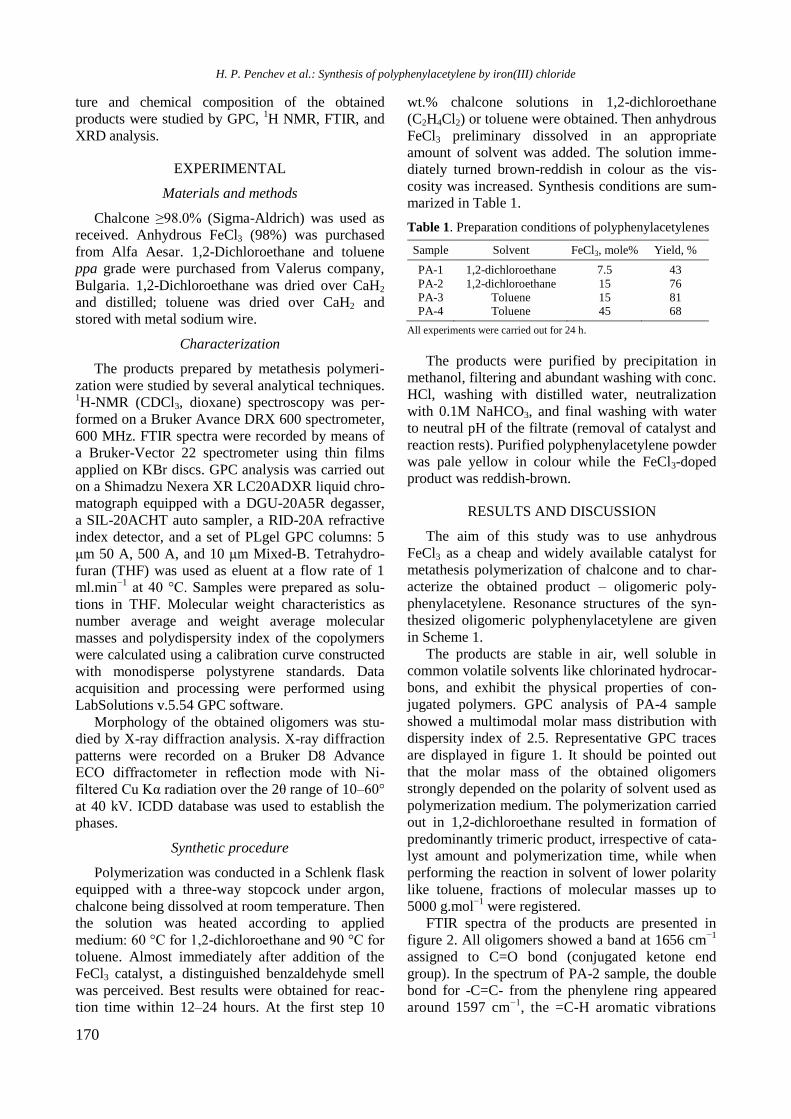
170
ture and chemical composition of the obtained
products were studied by GPC, 1H NMR, FTIR, and
XRD analysis.
EXPERIMENTAL
Materials and methods
Chalcone ≥98.0% (Sigma-Aldrich) was used as
received. Anhydrous FeCl3 (98%) was purchased
from Alfa Aesar. 1,2-Dichloroethane and toluene
ppa grade were purchased from Valerus company,
Bulgaria. 1,2-Dichloroethane was dried over CaH2
and distilled; toluene was dried over CaH2 and
stored with metal sodium wire.
Characterization
The products prepared by metathesis polymeri-
zation were studied by several analytical techniques. 1H-NMR (CDCl3, dioxane) spectroscopy was per-
formed on a Bruker Avance DRX 600 spectrometer,
600 MHz. FTIR spectra were recorded by means of
a Bruker-Vector 22 spectrometer using thin films
applied on KBr discs. GPC analysis was carried out
on a Shimadzu Nexera XR LC20ADXR liquid chro-
matograph equipped with a DGU-20A5R degasser,
a SIL-20ACHT auto sampler, a RID-20A refractive
index detector, and a set of PLgel GPC columns: 5
μm 50 A, 500 A, and 10 μm Mixed-B. Tetrahydro-
furan (THF) was used as eluent at a flow rate of 1
ml.min−1
at 40 °C. Samples were prepared as solu-
tions in THF. Molecular weight characteristics as
number average and weight average molecular
masses and polydispersity index of the copolymers
were calculated using a calibration curve constructed
with monodisperse polystyrene standards. Data
acquisition and processing were performed using
LabSolutions v.5.54 GPC software.
Morphology of the obtained oligomers was stu-
died by X-ray diffraction analysis. X-ray diffraction
patterns were recorded on a Bruker D8 Advance
ECO diffractometer in reflection mode with Ni-
filtered Cu Kα radiation over the 2θ range of 10–60°
at 40 kV. ICDD database was used to establish the
phases.
Synthetic procedure
Polymerization was conducted in a Schlenk flask
equipped with a three-way stopcock under argon,
chalcone being dissolved at room temperature. Then
the solution was heated according to applied
medium: 60 °C for 1,2-dichloroethane and 90 °C for
toluene. Almost immediately after addition of the
FeCl3 catalyst, a distinguished benzaldehyde smell
was perceived. Best results were obtained for reac-
tion time within 12–24 hours. At the first step 10
wt.% chalcone solutions in 1,2-dichloroethane
(C2H4Cl2) or toluene were obtained. Then anhydrous
FeCl3 preliminary dissolved in an appropriate
amount of solvent was added. The solution imme-
diately turned brown-reddish in colour as the vis-
cosity was increased. Synthesis conditions are sum-
marized in Table 1.
Table 1. Preparation conditions of polyphenylacetylenes
Sample Solvent FeCl3, mole% Yield, %
PA-1 1,2-dichloroethane 7.5 43
PA-2 1,2-dichloroethane 15 76
PA-3 Toluene 15 81
PA-4 Toluene 45 68
All experiments were carried out for 24 h.
The products were purified by precipitation in
methanol, filtering and abundant washing with conc.
HCl, washing with distilled water, neutralization
with 0.1M NaHCO3, and final washing with water
to neutral pH of the filtrate (removal of catalyst and
reaction rests). Purified polyphenylacetylene powder
was pale yellow in colour while the FeCl3-doped
product was reddish-brown.
RESULTS AND DISCUSSION
The aim of this study was to use anhydrous
FeCl3 as a cheap and widely available catalyst for
metathesis polymerization of chalcone and to char-
acterize the obtained product – oligomeric poly-
phenylacetylene. Resonance structures of the syn-
thesized oligomeric polyphenylacetylene are given
in Scheme 1.
The products are stable in air, well soluble in
common volatile solvents like chlorinated hydrocar-
bons, and exhibit the physical properties of con-
jugated polymers. GPC analysis of PA-4 sample
showed a multimodal molar mass distribution with
dispersity index of 2.5. Representative GPC traces
are displayed in figure 1. It should be pointed out
that the molar mass of the obtained oligomers
strongly depended on the polarity of solvent used as
polymerization medium. The polymerization carried
out in 1,2-dichloroethane resulted in formation of
predominantly trimeric product, irrespective of cata-
lyst amount and polymerization time, while when
performing the reaction in solvent of lower polarity
like toluene, fractions of molecular masses up to
5000 g.mol−1
were registered.
FTIR spectra of the products are presented in
figure 2. All oligomers showed a band at 1656 cm−1
assigned to C=O bond (conjugated ketone end
group). In the spectrum of PA-2 sample, the double
bond for -C=C- from the phenylene ring appeared
around 1597 cm−1
, the =C-H aromatic vibrations
H. P. Penchev et al.: Synthesis of polyphenylacetylene by iron(III) chloride
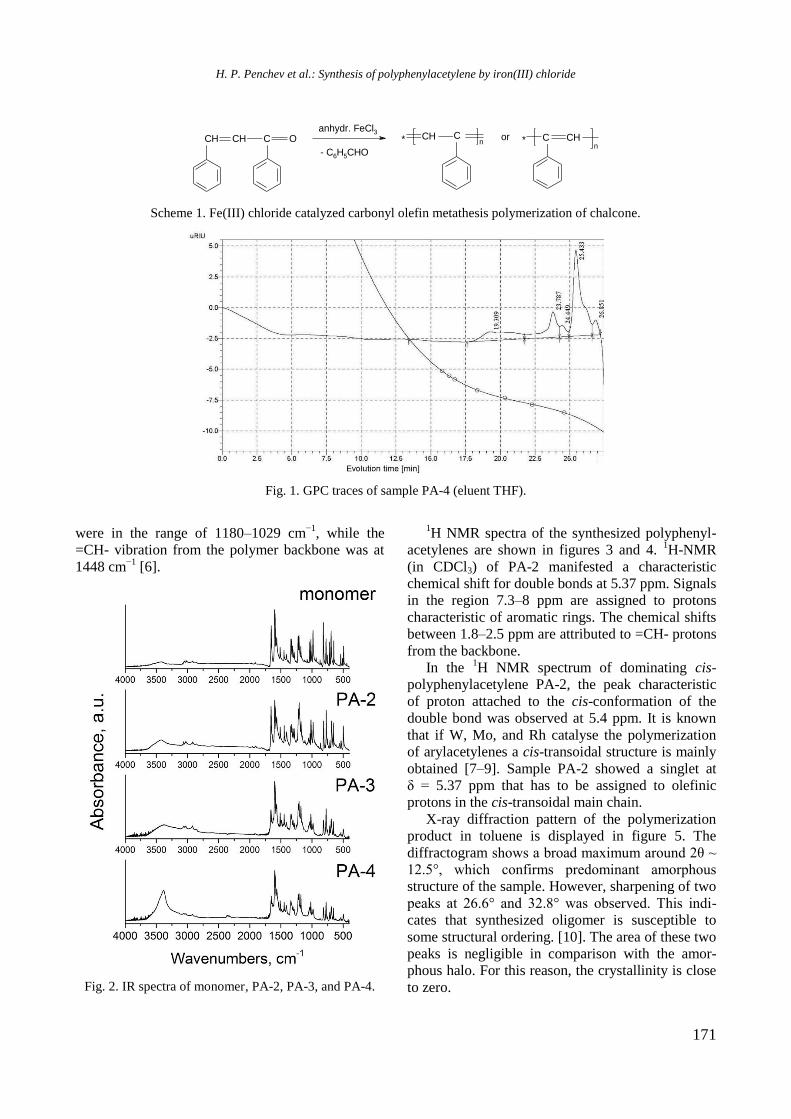
171
Scheme 1. Fe(III) chloride catalyzed carbonyl olefin metathesis polymerization of chalcone.
Fig. 1. GPC traces of sample PA-4 (eluent THF).
were in the range of 1180–1029 cm
−1, while the
=CH- vibration from the polymer backbone was at
1448 cm−1
[6].
Fig. 2. IR spectra of monomer, PA-2, PA-3, and PA-4.
1H NMR spectra of the synthesized polyphenyl-
acetylenes are shown in figures 3 and 4. 1H-NMR
(in CDCl3) of PA-2 manifested a characteristic
chemical shift for double bonds at 5.37 ppm. Signals
in the region 7.3–8 ppm are assigned to protons
characteristic of aromatic rings. The chemical shifts
between 1.8–2.5 ppm are attributed to =CH- protons
from the backbone.
In the 1H NMR spectrum of dominating cis-
polyphenylacetylene PA-2, the peak characteristic
of proton attached to the cis-conformation of the
double bond was observed at 5.4 ppm. It is known
that if W, Mo, and Rh catalyse the polymerization
of arylacetylenes a cis-transoidal structure is mainly
obtained [7–9]. Sample PA-2 showed a singlet at
δ = 5.37 ppm that has to be assigned to olefinic
protons in the cis-transoidal main chain.
X-ray diffraction pattern of the polymerization
product in toluene is displayed in figure 5. The
diffractogram shows a broad maximum around 2θ ~
12.5°, which confirms predominant amorphous
structure of the sample. However, sharpening of two
peaks at 26.6° and 32.8° was observed. This indi-
cates that synthesized oligomer is susceptible to
some structural ordering. [10]. The area of these two
peaks is negligible in comparison with the amor-
phous halo. For this reason, the crystallinity is close
to zero.
* n
*
n
CH CH C O
anhydr. FeCl3
- C6H5CHO
CH C or C CH
H. P. Penchev et al.: Synthesis of polyphenylacetylene by iron(III) chloride
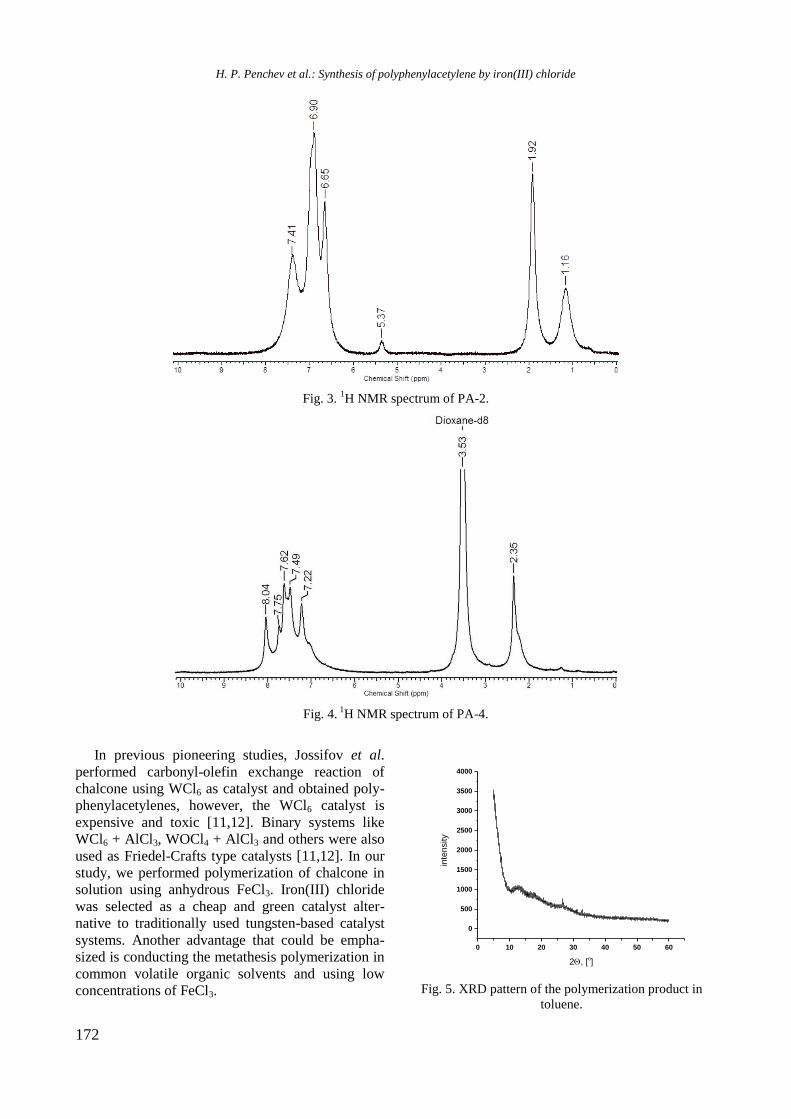
172
Fig. 3. 1H NMR spectrum of PA-2.
Fig. 4. 1H NMR spectrum of PA-4.
In previous pioneering studies, Jossifov et al.
performed carbonyl-olefin exchange reaction of
chalcone using WCl6 as catalyst and obtained poly-
phenylacetylenes, however, the WCl6 catalyst is
expensive and toxic [11,12]. Binary systems like
WCl6 + AlCl3, WOCl4 + AlCl3 and others were also
used as Friedel-Crafts type catalysts [11,12]. In our
study, we performed polymerization of chalcone in
solution using anhydrous FeCl3. Iron(III) chloride
was selected as a cheap and green catalyst alter-
native to traditionally used tungsten-based catalyst
systems. Another advantage that could be empha-
sized is conducting the metathesis polymerization in
common volatile organic solvents and using low
concentrations of FeCl3.
0 10 20 30 40 50 60
0
500
1000
1500
2000
2500
3000
3500
4000
inte
nsity
2, [o]
Fig. 5. XRD pattern of the polymerization product in
toluene.
H. P. Penchev et al.: Synthesis of polyphenylacetylene by iron(III) chloride
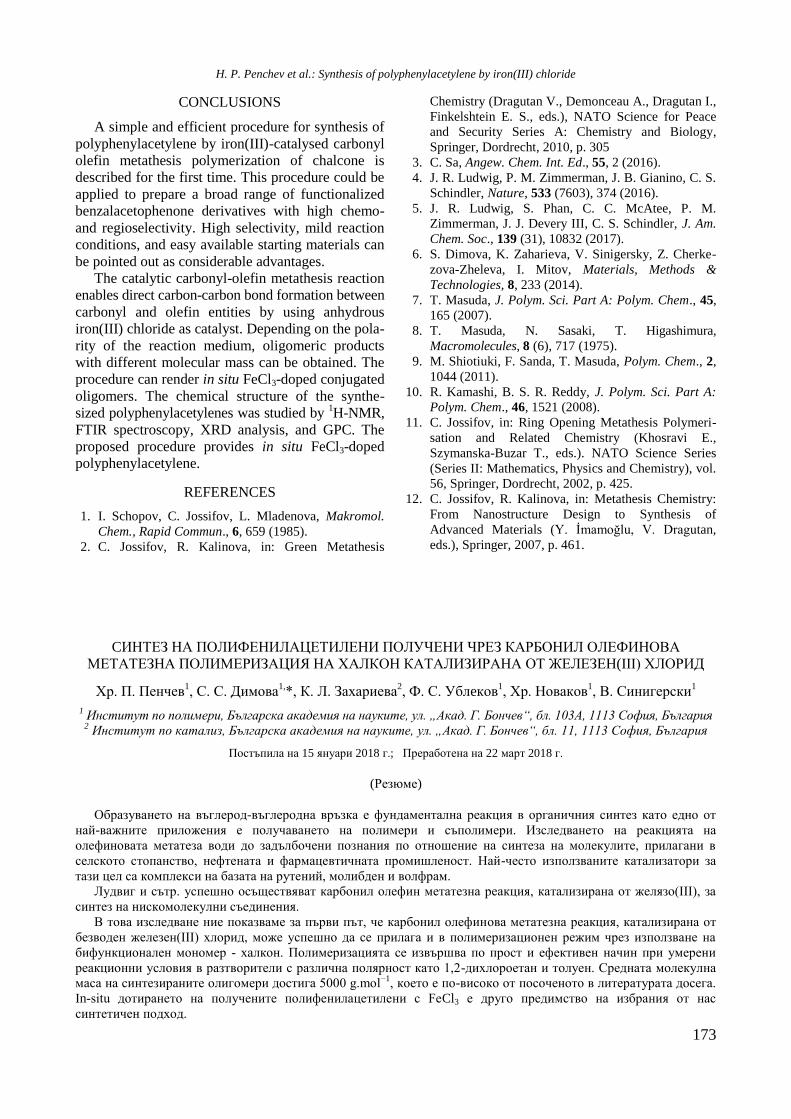
173
CONCLUSIONS
A simple and efficient procedure for synthesis of
polyphenylacetylene by iron(III)-catalysed carbonyl
olefin metathesis polymerization of chalcone is
described for the first time. This procedure could be
applied to prepare a broad range of functionalized
benzalacetophenone derivatives with high chemo-
and regioselectivity. High selectivity, mild reaction
conditions, and easy available starting materials can
be pointed out as considerable advantages.
The catalytic carbonyl-olefin metathesis reaction
enables direct carbon-carbon bond formation between
carbonyl and olefin entities by using anhydrous
iron(III) chloride as catalyst. Depending on the pola-
rity of the reaction medium, oligomeric products
with different molecular mass can be obtained. The
procedure can render in situ FeCl3-doped conjugated
oligomers. The chemical structure of the synthe-
sized polyphenylacetylenes was studied by 1H-NMR,
FTIR spectroscopy, XRD analysis, and GPC. The
proposed procedure provides in situ FeCl3-doped
polyphenylacetylene.
REFERENCES
1. I. Schopov, C. Jossifov, L. Mladenova, Makromol.
Chem., Rapid Commun., 6, 659 (1985).
2. C. Jossifov, R. Kalinova, in: Green Metathesis
Chemistry (Dragutan V., Demonceau A., Dragutan I.,
Finkelshtein E. S., eds.), NATO Science for Peace
and Security Series A: Chemistry and Biology,
Springer, Dordrecht, 2010, p. 305
3. C. Sa, Angew. Chem. Int. Ed., 55, 2 (2016).
4. J. R. Ludwig, P. M. Zimmerman, J. B. Gianino, C. S.
Schindler, Nature, 533 (7603), 374 (2016).
5. J. R. Ludwig, S. Phan, C. C. McAtee, P. M.
Zimmerman, J. J. Devery III, C. S. Schindler, J. Am.
Chem. Soc., 139 (31), 10832 (2017).
6. S. Dimova, K. Zaharieva, V. Sinigersky, Z. Cherke-
zova-Zheleva, I. Mitov, Materials, Methods &
Technologies, 8, 233 (2014).
7. T. Masuda, J. Polym. Sci. Part A: Polym. Chem., 45,
165 (2007).
8. T. Masuda, N. Sasaki, T. Higashimura,
Macromolecules, 8 (6), 717 (1975).
9. M. Shiotiuki, F. Sanda, T. Masuda, Polym. Chem., 2,
1044 (2011).
10. R. Kamashi, B. S. R. Reddy, J. Polym. Sci. Part A:
Polym. Chem., 46, 1521 (2008).
11. C. Jossifov, in: Ring Opening Metathesis Polymeri-
sation and Related Chemistry (Khosravi E.,
Szymanska-Buzar T., eds.). NATO Science Series
(Series II: Mathematics, Physics and Chemistry), vol.
56, Springer, Dordrecht, 2002, p. 425.
12. C. Jossifov, R. Kalinova, in: Metathesis Chemistry:
From Nanostructure Design to Synthesis of
Advanced Materials (Y. İmamoğlu, V. Dragutan,
eds.), Springer, 2007, p. 461.
CИНТЕЗ НА ПОЛИФЕНИЛАЦЕТИЛЕНИ ПОЛУЧЕНИ ЧРЕЗ КАРБОНИЛ ОЛЕФИНОВА
МЕТАТЕЗНА ПОЛИМЕРИЗАЦИЯ НА ХАЛКОН КАТАЛИЗИРАНА ОТ ЖЕЛЕЗЕН(III) ХЛОРИД
Хр. П. Пенчев1, С. С. Димова
1,*, К. Л. Захариева
2, Ф. С. Ублeков
1, Хр. Новаков
1, В. Синигерски
1
1 Институт по полимери, Българска академия на науките, ул. „Акад. Г. Бончев“, бл. 103А, 1113 София, България 2 Институт по катализ, Българска академия на науките, ул. „Акад. Г. Бончев“, бл. 11, 1113 София, България
Постъпила на 15 януари 2018 г.; Преработена на 22 март 2018 г.
(Резюме)
Образуването на въглерод-въглеродна връзка е фундаментална реакция в органичния синтез като едно от
най-важните приложения е получаването на полимери и съполимери. Изследването на реакцията на
олефиновата метатеза води до задълбочени познания по отношение на синтеза на молекулите, прилагани в
селското стопанство, нефтената и фармацевтичната промишленост. Най-често използваните катализатори за
тази цел са комплекси на базата на рутений, молибден и волфрам.
Лудвиг и сътр. успешно осъществяват карбонил олефин метатезна реакция, катализирана от желязо(III), за
синтез на нискомолекулни съединения.
В това изследване ние показваме за първи път, че карбонил олефинова метатезна реакция, катализирана от
безводен железен(III) хлорид, може успешно да се прилага и в полимеризационен режим чрез използване на
бифункционален мономер - халкон. Полимеризацията се извършва по прост и ефективен начин при умерени
реакционни условия в разтворители с различна полярност като 1,2-дихлороетан и толуен. Средната молекулна
маса на синтезираните олигомери достига 5000 g.mol−1
, което е по-високо от посоченото в литературата досега.
In-situ дотирането на получените полифенилацетилени с FeCl3 е друго предимство на избрания от нас
синтетичен подход.
H. P. Penchev et al.: Synthesis of polyphenylacetylene by iron(III) chloride
174
Bulgarian Chemical Communications, Volume 50, Special issue H (pp. 174–180) 2018
Adsorption of thiophene and its polyaromatic derivatives from model fuel on
pyrolyzed rice husks: kinetics and equilibrium
S. A. Uzunova1, I. M. Uzunov
2,*, I. R. Ivanov
1, D. B. Angelova
1
1 University of Chemical Technology and Metallurgy, 8 Kliment Ohridski Blvd., 1756 Sofia, Bulgaria
2 Institute of General and Inorganic Chemistry, Bulgarian Academy of Sciences, Acad. G. Bonchev St., Bldg. 11,
1113 Sofia, Bulgaria
Received: January 23, 2018; Revised: March 13, 2018
Kinetics of fuel adsorptive desulphurisation was studied using a model fuel containing thiophene, benzothiophene,
and dibenzothiophene of initial total sulphur content (Sin) of 415, 218, and 111 wppm over pyrolyzed rice husks (PRH)
under batch mode conditions. Total sulphur content was determined by X-ray fluorescence analysis. Second order
kinetics, intraparticle diffusion model, and Elovich equation were used to analyse kinetic data. It was found that a
second-order kinetics model adequately described adsorption of the three sulphur compounds on pyrolyzed rice husks.
The equation provided the best fit between calculated and experimentally determined values of adsorption capacity.
Value differences varied between 1.3% for Sin 111 ppm and 5.9% for Sin 415 ppm. Adsorption affinity of the three
sulphur compounds as well as equilibrium adsorption capacity of pyrolyzed rice husks were investigated by deter-
mination of adsorption isotherm. Analysis of experimental data was conducted by using the isotherms of Langmuir,
Temkin, and Freundlich. Data from multiple linear regression analysis pointed out that Freundlich isotherm described
most adequately the adsorption equilibrium of polyaromatic sulphur heterocycles in the system fuel/PRH.
Key words: desulphurization, adsorption, aromatic sulphur heterocycles, pyrolyzed rice husks, kinetics, adsorption
isotherm.
INTRODUCTION
Depletion of the fossil fuel deposits, periodically
emerging economic or political crises, and environ-
mental pollution in recent decades imposed demand
and development of alternative energy sources.
However, the part of energy obtained from fossil
feedstocks remains significant, more than 82% and
half of them are produced from the crude oil [1].
Intense oil production worldwide leads to depletion
of old and commissioning of new oil fields, con-
taining increasingly high sulphur quantity. This in
turn leads to new challenges related to technological
and environmental problems in removal of the
sulphur compounds in oil refinery streams. Conven-
tional hydrodesulphurisation (HDS) of high sulphur
feedstocks is unable to ensure sulphur levels, close
to the limit ones whereas preserving other important
quality indicators, such as content of polycyclic
arenes, cetane number, density, etc. The process is
not effective with respect to the deep removal of the
polycyclic aromatic sulphur compounds such as
thiophene (T) and its derivatives. Hereby, the sul-
phur compounds are passed into the industrial and
automotive fuels. This leads to emissions of sulphur
oxides, with all the resulting harmful effects on the
environment and human health. The presence of
organic sulphur compounds in the automotive fuels
also reduces largely catalyst system efficiency in
modern cars. In addition, the tendency in recent
years aimed at developing the so-called ‘hydrogen
economy’ is closely connected with the production
of fuel cells but they require <1 ppm sulphur-
hydrogen containing feeds [2]. Considering the
importance of the problem concerning the emissions
of sulphur oxides EU adopted a number of direc-
tives and decisions to control total sulphur in fuels
[3,4]. Implementation of these directives is a major
challenge and requires improving of the existing
purification technologies to minimize sulphur con-
tent in petroleum derivatives. In addition to their
effectiveness, the methods must ensure well-ba-
lanced prices of the final products. Research in the
field over the last decade has been focused on the
development of alternative methods for deep or
ultra-deep fuel purification from sulphur. Most often
these methods accompany conventional purification
by HDS and provide fuels production with a total
sulphur content of up to and below 10 ppm. The so-
called non-HDS based desulphurisation processes
refer to desulphurisation by extraction [5–8],
olefinic alkylation of thiophenic sulphur (OATS
process) [9], selective oxidative desulphurisation
[10], and desulphurisation via precipitation [11].
© 2018 Bulgarian Academy of Sciences, Union of Chemists in Bulgaria
* To whom all correspondence should be sent
E-mail: [email protected]
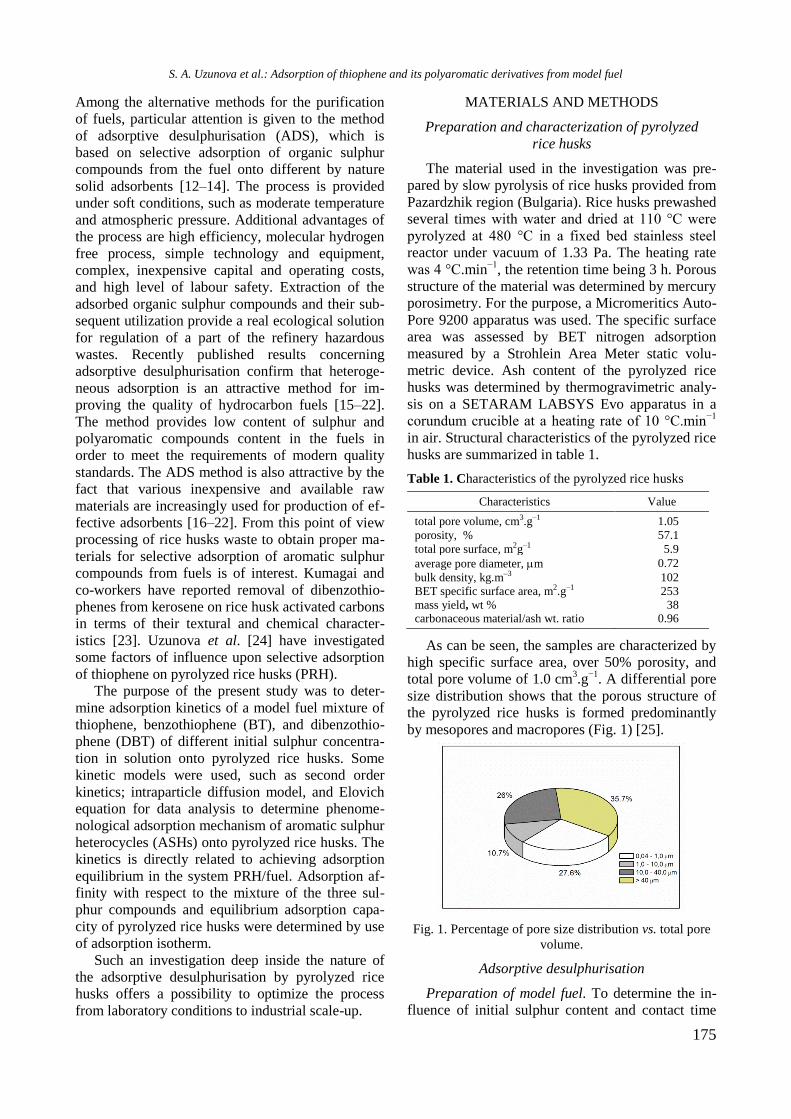
175
Among the alternative methods for the purification
of fuels, particular attention is given to the method
of adsorptive desulphurisation (ADS), which is
based on selective adsorption of organic sulphur
compounds from the fuel onto different by nature
solid adsorbents [12–14]. The process is provided
under soft conditions, such as moderate temperature
and atmospheric pressure. Additional advantages of
the process are high efficiency, molecular hydrogen
free process, simple technology and equipment,
complex, inexpensive capital and operating costs,
and high level of labour safety. Extraction of the
adsorbed organic sulphur compounds and their sub-
sequent utilization provide a real ecological solution
for regulation of a part of the refinery hazardous
wastes. Recently published results concerning
adsorptive desulphurisation confirm that heteroge-
neous adsorption is an attractive method for im-
proving the quality of hydrocarbon fuels [15–22].
The method provides low content of sulphur and
polyaromatic compounds content in the fuels in
order to meet the requirements of modern quality
standards. The ADS method is also attractive by the
fact that various inexpensive and available raw
materials are increasingly used for production of ef-
fective adsorbents [16–22]. From this point of view
processing of rice husks waste to obtain proper ma-
terials for selective adsorption of aromatic sulphur
compounds from fuels is of interest. Kumagai and
co-workers have reported removal of dibenzothio-
phenes from kerosene on rice husk activated carbons
in terms of their textural and chemical character-
istics [23]. Uzunova et al. [24] have investigated
some factors of influence upon selective adsorption
of thiophene on pyrolyzed rice husks (PRH).
The purpose of the present study was to deter-
mine adsorption kinetics of a model fuel mixture of
thiophene, benzothiophene (BT), and dibenzothio-
phene (DBT) of different initial sulphur concentra-
tion in solution onto pyrolyzed rice husks. Some
kinetic models were used, such as second order
kinetics; intraparticle diffusion model, and Elovich
equation for data analysis to determine phenome-
nological adsorption mechanism of aromatic sulphur
heterocycles (ASHs) onto pyrolyzed rice husks. The
kinetics is directly related to achieving adsorption
equilibrium in the system PRH/fuel. Adsorption af-
finity with respect to the mixture of the three sul-
phur compounds and equilibrium adsorption capa-
city of pyrolyzed rice husks were determined by use
of adsorption isotherm.
Such an investigation deep inside the nature of
the adsorptive desulphurisation by pyrolyzed rice
husks offers a possibility to optimize the process
from laboratory conditions to industrial scale-up.
MATERIALS AND METHODS
Preparation and characterization of pyrolyzed
rice husks
The material used in the investigation was pre-
pared by slow pyrolysis of rice husks provided from
Pazardzhik region (Bulgaria). Rice husks prewashed
several times with water and dried at 110 °C were
pyrolyzed at 480 °C in a fixed bed stainless steel
reactor under vacuum of 1.33 Pa. The heating rate
was 4 °C.min−1
, the retention time being 3 h. Porous
structure of the material was determined by mercury
porosimetry. For the purpose, a Micromeritics Auto-
Pore 9200 apparatus was used. The specific surface
area was assessed by BET nitrogen adsorption
measured by a Strohlein Area Meter static volu-
metric device. Ash content of the pyrolyzed rice
husks was determined by thermogravimetric analy-
sis on a SETARAM LABSYS Evo apparatus in a
corundum crucible at a heating rate of 10 °C.min−1
in air. Structural characteristics of the pyrolyzed rice
husks are summarized in table 1.
Table 1. Characteristics of the pyrolyzed rice husks
Characteristics Value
total pore volume, cm3.g‒1 1.05
porosity, % 57.1
total pore surface, m2g‒1 5.9
average pore diameter, m 0.72
bulk density, kg.m‒3 102
BET specific surface area, m2.g‒1 253
mass yield, wt % 38 carbonaceous material/ash wt. ratio 0.96
As can be seen, the samples are characterized by
high specific surface area, over 50% porosity, and
total pore volume of 1.0 cm3.g
−1. A differential pore
size distribution shows that the porous structure of
the pyrolyzed rice husks is formed predominantly
by mesopores and macropores (Fig. 1) [25].
Fig. 1. Percentage of pore size distribution vs. total pore
volume.
Adsorptive desulphurisation
Preparation of model fuel. To determine the in-
fluence of initial sulphur content and contact time
S. A. Uzunova et al.: Adsorption of thiophene and its polyaromatic derivatives from model fuel
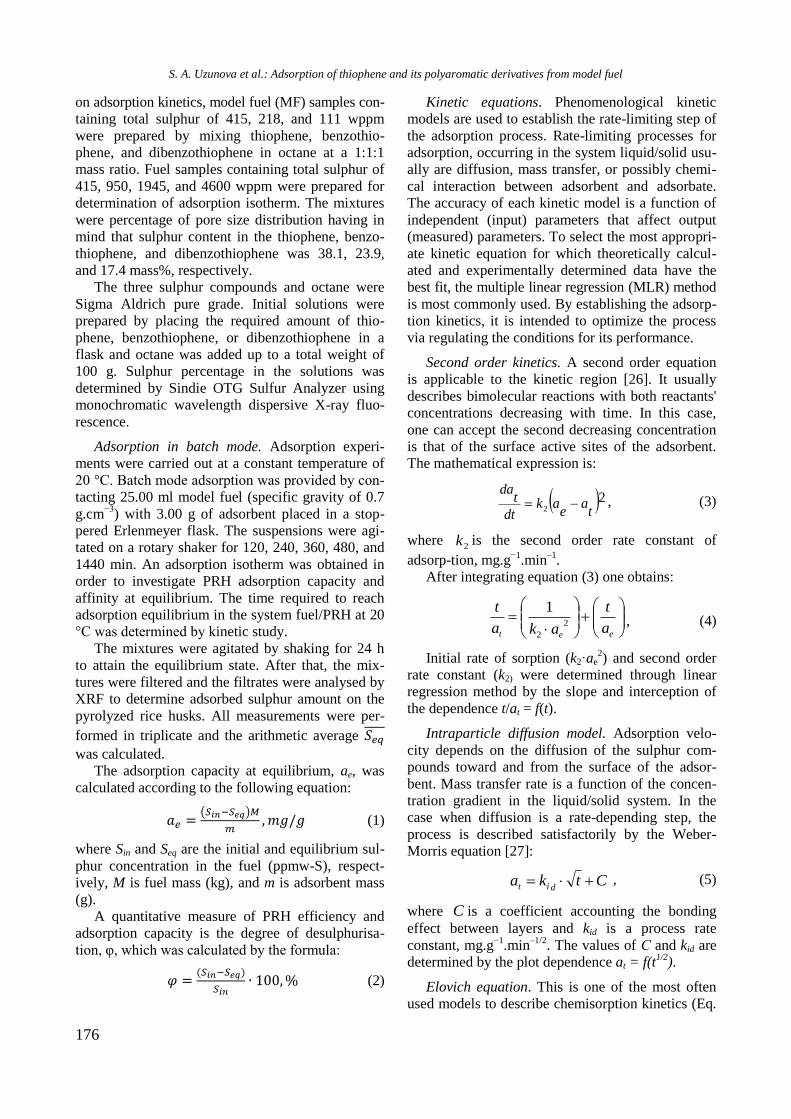
176
on adsorption kinetics, model fuel (MF) samples con-
taining total sulphur of 415, 218, and 111 wppm
were prepared by mixing thiophene, benzothio-
phene, and dibenzothiophene in octane at a 1:1:1
mass ratio. Fuel samples containing total sulphur of
415, 950, 1945, and 4600 wppm were prepared for
determination of adsorption isotherm. The mixtures
were percentage of pore size distribution having in
mind that sulphur content in the thiophene, benzo-
thiophene, and dibenzothiophene was 38.1, 23.9,
and 17.4 mass%, respectively.
The three sulphur compounds and octane were
Sigma Aldrich pure grade. Initial solutions were
prepared by placing the required amount of thio-
phene, benzothiophene, or dibenzothiophene in a
flask and octane was added up to a total weight of
100 g. Sulphur percentage in the solutions was
determined by Sindie OTG Sulfur Analyzer using
monochromatic wavelength dispersive X-ray fluo-
rescence.
Adsorption in batch mode. Adsorption experi-
ments were carried out at a constant temperature of
20 °C. Batch mode adsorption was provided by con-
tacting 25.00 ml model fuel (specific gravity of 0.7
g.cm−3
) with 3.00 g of adsorbent placed in a stop-
pered Erlenmeyer flask. The suspensions were agi-
tated on a rotary shaker for 120, 240, 360, 480, and
1440 min. An adsorption isotherm was obtained in
order to investigate PRH adsorption capacity and
affinity at equilibrium. The time required to reach
adsorption equilibrium in the system fuel/PRH at 20
°C was determined by kinetic study.
The mixtures were agitated by shaking for 24 h
to attain the equilibrium state. After that, the mix-
tures were filtered and the filtrates were analysed by
XRF to determine adsorbed sulphur amount on the
pyrolyzed rice husks. All measurements were per-
formed in triplicate and the arithmetic average
was calculated.
The adsorption capacity at equilibrium, ae, was
calculated according to the following equation:
( )
(1)
where Sin and Seq are the initial and equilibrium sul-
phur concentration in the fuel (ppmw-S), respect-
ively, M is fuel mass (kg), and m is adsorbent mass
(g).
A quantitative measure of PRH efficiency and
adsorption capacity is the degree of desulphurisa-
tion, φ, which was calculated by the formula:
(2)
Kinetic equations. Phenomenological kinetic
models are used to establish the rate-limiting step of
the adsorption process. Rate-limiting processes for
adsorption, occurring in the system liquid/solid usu-
ally are diffusion, mass transfer, or possibly chemi-
cal interaction between adsorbent and adsorbate.
The accuracy of each kinetic model is a function of
independent (input) parameters that affect output
(measured) parameters. To select the most appropri-
ate kinetic equation for which theoretically calcul-
ated and experimentally determined data have the
best fit, the multiple linear regression (MLR) method
is most commonly used. By establishing the adsorp-
tion kinetics, it is intended to optimize the process
via regulating the conditions for its performance.
Second order kinetics. A second order equation
is applicable to the kinetic region [26]. It usually
describes bimolecular reactions with both reactants'
concentrations decreasing with time. In this case,
one can accept the second decreasing concentration
is that of the surface active sites of the adsorbent.
The mathematical expression is:
22 ta
eak
dt
tda
, (3)
where 2k is the second order rate constant of
adsorp-tion, mg.g−1
.min‒1
.
After integrating equation (3) one obtains:
eet a
t
aka
t2
2
1, (4)
Initial rate of sorption (k2·ae2) and second order
rate constant (k2) were determined through linear
regression method by the slope and interception of
the dependence t/at = f(t).
Intraparticle diffusion model. Adsorption velo-
city depends on the diffusion of the sulphur com-
pounds toward and from the surface of the adsor-
bent. Mass transfer rate is a function of the concen-
tration gradient in the liquid/solid system. In the
case when diffusion is a rate-depending step, the
process is described satisfactorily by the Weber-
Morris equation [27]:
Ctkadit , (5)
where C is a coefficient accounting the bonding
effect between layers and kid is a process rate
constant, mg.g−1
.min‒1/2
. The values of С and kid are
determined by the plot dependence at = f(t1/2
).
Elovich equation. This is one of the most often
used models to describe chemisorption kinetics (Eq.
S. A. Uzunova et al.: Adsorption of thiophene and its polyaromatic derivatives from model fuel
177
6) [28]. It is also successfully applied to describe the
initial adsorption step and multilayer adsorption on
a high heterogeneous surface area. The equation is
empirical and does not refer to any particular me-
chanism:
tt ba
dt
da exp , (6)
where α is the initial rate of sorption, mg.g−1
.min−1
,
and b is desorption constant, g.mg-1
. Chen and
Clayton [29] developed further the equation of
Elovich, accepting the assumption (α.b.t) >>> 1. For
the boundary conditions at = 0 at t = 0 and at = ae at
t = te, Eq. 7 was derived:
tb
bb
at ln1
ln1
, (7)
where: b is a constant referred to surface coverage
and activation energy of chemisorption mg.g‒1
, α is
equilibrium rate constant, mg.g‒1
.min‒1
. The
constants α and b in the exponential equation (7) are
determined from the intercept and the slope of the
dependence at vs lnt. In the case when the cor-
relation between the adsorption capacity and the
constant b is negative it is assumed that the adsor-
bent does not retain the adsorbate.
RESULTS AND DISCUSSION
Adsorption kinetics
Adsorption ability of pyrolyzed rice husks from
model solutions containing different initial amount
of thiophene, benzothiophene, and dibenzothiophene
is presented in figure 2.
Fig. 2. Adsorption kinetics of aromatic sulphur hetero-
cycles from model fuel on pyrolyzed rice husks.
The type of kinetic curves shows that the process
of adsorption of a mixture of thiophene and its aro-
matic derivatives from fuel on pyrolyzed rice husks
was carried out at two distinct stages. The first of
them had duration of about 240 min. and is charact-
erised by a sharp increase in the rate of adsorption.
During this stage, a desulphurisation rate between 28
and 54 mass% was achieved depending on the initial
content of total sulphur in the fuel. The second stage
is related to saturation of the active adsorption sites
giving rise to reduction in velocity of the process and
establishment of adsorption-desorption equilibrium.
The degree of desulphurisation varied between 1 and
12 mass%. The observed relationships are directly
related to the structural characteristics of pyrolyzed
rice husks. The rate to achieve adsorption-desorp-
tion equilibrium determines adsorbent effectiveness,
i.e. duration of the first stage is of practical signifi-
cance.
In order to investigate the dependence between
input parameters (initial sulphur concentration in the
fuel and contact time between adsorbent and adsor-
bate) and adsorption rate (output parameter) the
above-mentioned four kinetic models were applied
to analyse the experimental data. These phenomeno-
logical models describe the mechanism by which the
adsorption of aromatic sulphur heterocycles from fuel
on pyrolyzed rice husks occurred. Model parameters
and multiple linear statistics are presented in table 2.
Table 2. Kinetic parameters for thiophene, benzothio-
phene, and dibenzothiophene adsorption from model fuel
Kinetic constants Initial sulphur content ,wppm
415 218 111
Second order kinetics
ae,calc, mg.g‒1
ae,exp, mg.g‒1
k2, g.mg‒1.min‒1
R2
1.033
0.971
0.0110
0.998
0.602
0.581
0.033
0.999
0.366
0.361
0.177
1.000
Elovich equation
b, mg.g‒1
1/b
α, mg.g‒1.min‒1
R2
6.794
0.1472
0.096
0.876
13.49
0.074
0.197
0.692
43.74
0.029
210.1
0.601
Intraparticle
diffusion model
C
Kid, mg.g-1.min‒1/2 R2
0.244
0.0245 0.757
0.174
0.014 0.671
0.137
0.005 0.567
According to the linear regression statistics
obtained, high values as 99% of the determination
coefficient indicate that adsorption is best fitted to a
second order kinetics equation for different initial
sulphur concentrations in the fuel. For this kinetic
model, a very good match was observed between
calculated and experimentally determined values for
adsorption capacity, ae. Value deviation varied from
1 to 6%. On increasing the initial sulphur content in
the model fuel the rate constant k2 decreased by more
than one order of magnitude. This is probably due
to: (i) competitive adsorption of the three sulphur
compounds and (ii) mutual hindrance (steric effects)
in the occupation of the active sites on the surface.
S. A. Uzunova et al.: Adsorption of thiophene and its polyaromatic derivatives from model fuel
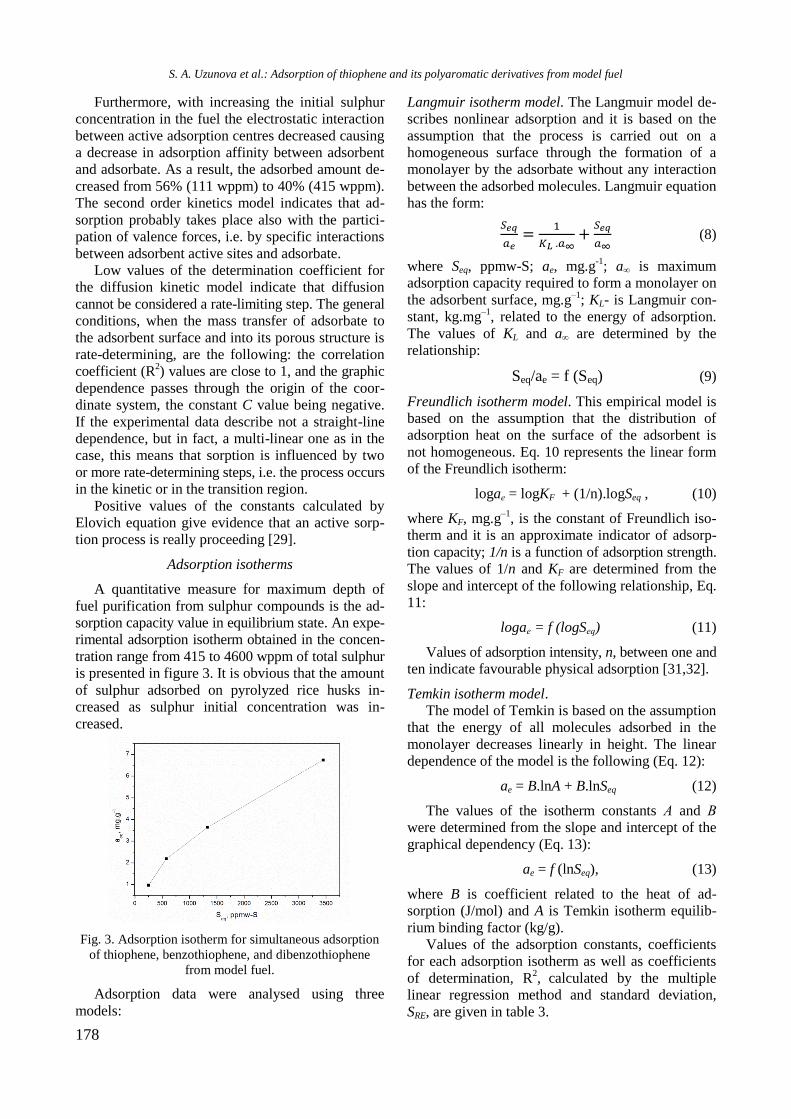
178
Furthermore, with increasing the initial sulphur
concentration in the fuel the electrostatic interaction
between active adsorption centres decreased causing
a decrease in adsorption affinity between adsorbent
and adsorbate. As a result, the adsorbed amount de-
creased from 56% (111 wppm) to 40% (415 wppm).
The second order kinetics model indicates that ad-
sorption probably takes place also with the partici-
pation of valence forces, i.e. by specific interactions
between adsorbent active sites and adsorbate.
Low values of the determination coefficient for
the diffusion kinetic model indicate that diffusion
cannot be considered a rate-limiting step. The general
conditions, when the mass transfer of adsorbate to
the adsorbent surface and into its porous structure is
rate-determining, are the following: the correlation
coefficient (R2) values are close to 1, and the graphic
dependence passes through the origin of the coor-
dinate system, the constant C value being negative.
If the experimental data describe not a straight-line
dependence, but in fact, a multi-linear one as in the
case, this means that sorption is influenced by two
or more rate-determining steps, i.e. the process occurs
in the kinetic or in the transition region.
Positive values of the constants calculated by
Elovich equation give evidence that an active sorp-
tion process is really proceeding [29].
Adsorption isotherms
A quantitative measure for maximum depth of
fuel purification from sulphur compounds is the ad-
sorption capacity value in equilibrium state. An expe-
rimental adsorption isotherm obtained in the concen-
tration range from 415 to 4600 wppm of total sulphur
is presented in figure 3. It is obvious that the amount
of sulphur adsorbed on pyrolyzed rice husks in-
creased as sulphur initial concentration was in-
creased.
Fig. 3. Adsorption isotherm for simultaneous adsorption
of thiophene, benzothiophene, and dibenzothiophene
from model fuel.
Adsorption data were analysed using three
models:
Langmuir isotherm model. The Langmuir model de-
scribes nonlinear adsorption and it is based on the
assumption that the process is carried out on a
homogeneous surface through the formation of a
monolayer by the adsorbate without any interaction
between the adsorbed molecules. Langmuir equation
has the form:
(8)
where Seq, ppmw-S; ae, mg.g-1
; a∞ is maximum
adsorption capacity required to form a monolayer on
the adsorbent surface, mg.g‒1
; KL- is Langmuir con-
stant, kg.mg‒1
, related to the energy of adsorption.
The values of KL and a∞ are determined by the
relationship:
Seq/ae = f (Seq) (9)
Freundlich isotherm model. This empirical model is
based on the assumption that the distribution of
adsorption heat on the surface of the adsorbent is
not homogeneous. Eq. 10 represents the linear form
of the Freundlich isotherm:
logaе = logKF + (1/n).logSeq , (10)
where KF, mg.g‒1
, is the constant of Freundlich iso-
therm and it is an approximate indicator of adsorp-
tion capacity; 1/n is a function of adsorption strength.
The values of 1/n and KF are determined from the
slope and intercept of the following relationship, Eq.
11:
logaе = f (logSеq) (11)
Values of adsorption intensity, n, between one and
ten indicate favourable physical adsorption [31,32].
Temkin isotherm model.
The model of Temkin is based on the assumption
that the energy of all molecules adsorbed in the
monolayer decreases linearly in height. The linear
dependence of the model is the following (Eq. 12):
ae = B.lnA + B.lnSeq (12)
The values of the isotherm constants А and В
were determined from the slope and intercept of the
graphical dependency (Eq. 13):
ae = f (lnSeq), (13)
where B is coefficient related to the heat of ad-
sorption (J/mol) and A is Temkin isotherm equilib-
rium binding factor (kg/g).
Values of the adsorption constants, coefficients
for each adsorption isotherm as well as coefficients
of determination, R2,
calculated by the multiple
linear regression method and standard deviation,
SRE, are given in table 3.
S. A. Uzunova et al.: Adsorption of thiophene and its polyaromatic derivatives from model fuel
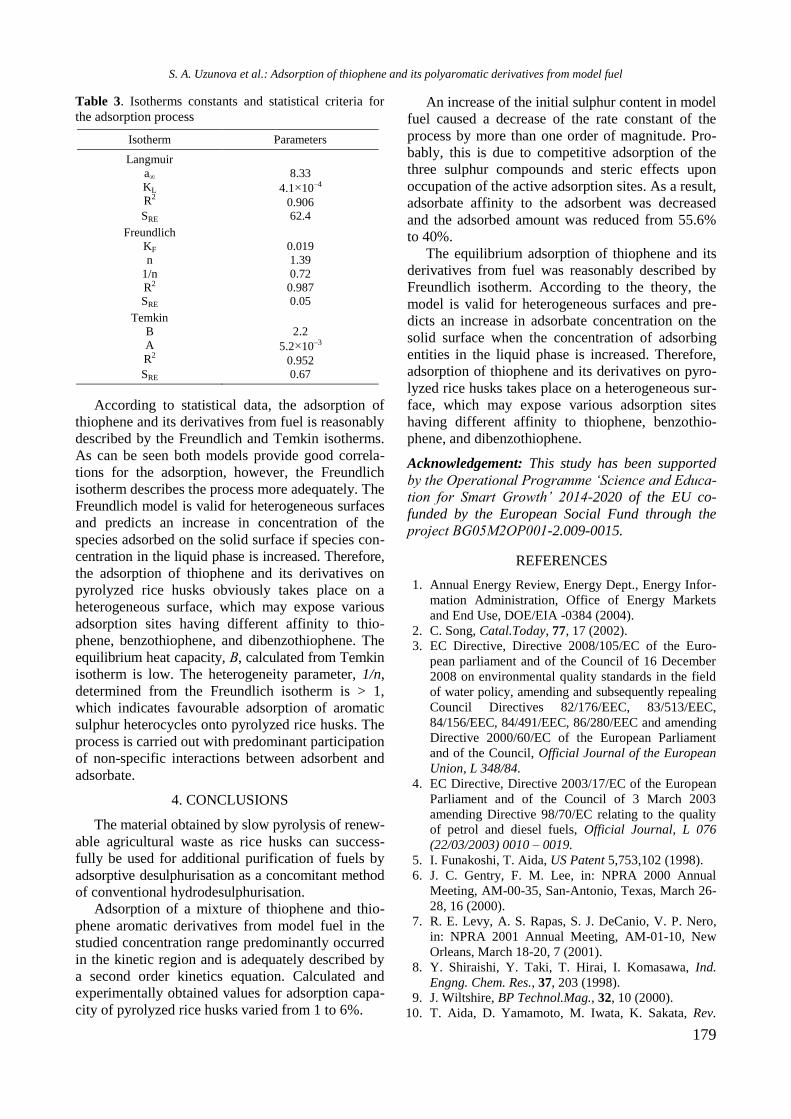
179
Table 3. Isotherms constants and statistical criteria for
the adsorption process
Isotherm Parameters
Langmuir
a∞
KL
R2
8.33
4.1×10‒4
0.906 SRE 62.4
Freundlich
KF
n
1/n
R2
0.019
1.39
0.72
0.987 SRE 0.05
Temkin
B
A
R2
2.2
5.2×10‒3
0.952
SRE 0.67
According to statistical data, the adsorption of
thiophene and its derivatives from fuel is reasonably
described by the Freundlich and Temkin isotherms.
As can be seen both models provide good correla-
tions for the adsorption, however, the Freundlich
isotherm describes the process more adequately. The
Freundlich model is valid for heterogeneous surfaces
and predicts an increase in concentration of the
species adsorbed on the solid surface if species con-
centration in the liquid phase is increased. Therefore,
the adsorption of thiophene and its derivatives on
pyrolyzed rice husks obviously takes place on a
heterogeneous surface, which may expose various
adsorption sites having different affinity to thio-
phene, benzothiophene, and dibenzothiophene. The
equilibrium heat capacity, В, calculated from Temkin
isotherm is low. The heterogeneity parameter, 1/n,
determined from the Freundlich isotherm is > 1,
which indicates favourable adsorption of aromatic
sulphur heterocycles onto pyrolyzed rice husks. The
process is carried out with predominant participation
of non-specific interactions between adsorbent and
adsorbate.
4. CONCLUSIONS
The material obtained by slow pyrolysis of renew-
able agricultural waste as rice husks can success-
fully be used for additional purification of fuels by
adsorptive desulphurisation as a concomitant method
of conventional hydrodesulphurisation.
Adsorption of a mixture of thiophene and thio-
phene aromatic derivatives from model fuel in the
studied concentration range predominantly occurred
in the kinetic region and is adequately described by
a second order kinetics equation. Calculated and
experimentally obtained values for adsorption capa-
city of pyrolyzed rice husks varied from 1 to 6%.
An increase of the initial sulphur content in model
fuel caused a decrease of the rate constant of the
process by more than one order of magnitude. Pro-
bably, this is due to competitive adsorption of the
three sulphur compounds and steric effects upon
occupation of the active adsorption sites. As a result,
adsorbate affinity to the adsorbent was decreased
and the adsorbed amount was reduced from 55.6%
to 40%.
The equilibrium adsorption of thiophene and its
derivatives from fuel was reasonably described by
Freundlich isotherm. According to the theory, the
model is valid for heterogeneous surfaces and pre-
dicts an increase in adsorbate concentration on the
solid surface when the concentration of adsorbing
entities in the liquid phase is increased. Therefore,
adsorption of thiophene and its derivatives on pyro-
lyzed rice husks takes place on a heterogeneous sur-
face, which may expose various adsorption sites
having different affinity to thiophene, benzothio-
phene, and dibenzothiophene.
Acknowledgement: This study has been supported
by the Operational Programme ‘Science and Educa-
tion for Smart Growth’ 2014-2020 of the EU co-
funded by the European Social Fund through the
project BG05M2ОP001-2.009-0015.
REFERENCES
1. Annual Energy Review, Energy Dept., Energy Infor-
mation Administration, Office of Energy Markets
and End Use, DOE/EIA -0384 (2004).
2. C. Song, Catal.Today, 77, 17 (2002).
3. EC Directive, Directive 2008/105/EC of the Euro-
pean parliament and of the Council of 16 December
2008 on environmental quality standards in the field
of water policy, amending and subsequently repealing
Council Directives 82/176/EEC, 83/513/EEC,
84/156/EEC, 84/491/EEC, 86/280/EEC and amending
Directive 2000/60/EC of the European Parliament
and of the Council, Official Journal of the European
Union, L 348/84.
4. EC Directive, Directive 2003/17/EC of the European
Parliament and of the Council of 3 March 2003
amending Directive 98/70/EC relating to the quality
of petrol and diesel fuels, Official Journal, L 076
(22/03/2003) 0010 – 0019.
5. I. Funakoshi, T. Aida, US Patent 5,753,102 (1998).
6. J. C. Gentry, F. M. Lee, in: NPRA 2000 Annual
Meeting, AM-00-35, San-Antonio, Texas, March 26-
28, 16 (2000).
7. R. E. Levy, A. S. Rapas, S. J. DeCanio, V. P. Nero,
in: NPRA 2001 Annual Meeting, AM-01-10, New
Orleans, March 18-20, 7 (2001).
8. Y. Shiraishi, Y. Taki, T. Hirai, I. Komasawa, Ind.
Engng. Chem. Res., 37, 203 (1998).
9. J. Wiltshire, BP Technol.Mag., 32, 10 (2000).
10. T. Aida, D. Yamamoto, M. Iwata, K. Sakata, Rev.
S. A. Uzunova et al.: Adsorption of thiophene and its polyaromatic derivatives from model fuel
180
Heteroatom Chem., 22, 241 (2000).
11. V. Mielle, E. Shulz, M. Vrinat, M. Lemaire, Chem.
Commun., 305 (1998).
12. A. B. S. H. Salem, Ind. Eng. Chem. Res., 33, 336
(1994).
13. D. W.Savage, B. K. Kaul, G. D. Dupre, J. T. O’Bara,
W. E. Wales, T. C. Ho, US Patent 5,454,933 (1995).
14. R. L. Irvine, B. A. Benson, D. M. Varraveto, R. A.
Frye, in: NPRA 1999 Annual Meeting, AM-99-42,
San-Antonio, Texas, March 21‒23, 1999.
15. J. Bu, G. Loh, C. G. Gwie, S. Dewiyanti, M. Tasrif,
A. Borgna, Chem. Eng. J., 166, 207 (2011).
16. J. Kim, X. Ma, A. Zhou, Ch. Song, Catal. Today,
111, 74 (2006).
17. H. Farag, J. Colloid Interf. Sci., 307, 1 (2007).
18. I. Dahlan, K. Lee, A. Kamaruddin, A. Mohamed, J.
Hazard. Mater., 161 570 (2009).
19. M. Seredych, J. Lison, U. Jans, T. Bandosz, Carbon,
47, 2491 (2009).
20. K. Lee, A. Mohtar, N. Zainudin, S. Bhatia, A.
Mohamed, Fuel, 84, 143 (2005).
21. A. Srivastav, V. Srivastava, J. Hazard. Mater., 170,
1133 (2009).
22. Z. Cheng, X. Liu, J. Lu, M. Luo, React. Kinet. Catal.
Lett., 97 1 (2009).
23. S. Kumagai, Y. Shimizu, Y. Toida, Y. Enda, Fuel,
88, 1975 (2009).
24. S. Uzunova, L. Minchev, I. Uzunov, V. Toteva,
Chem. Ecol., 32, 976 (2016).
25. J. Rouquerol, D. Avnir, C. Fairbridge, D. Everett, J.
Haynes, N. Pernicone, J. Ramsay, K. Sing, K. Unger,
Pure Appl. Chem., 66, 1739 (1994).
26. F. Wu, R. Tseng, R. Juang, Water Res., 35, 613
(2001).
27. W. Weber, J. Morris, J. Sanitery Eng. Div. ASCE,
89(SA2), 31 (1963).
28. D. Eley, H. Pines, P. Weisz (eds.), in: Advance in
Catalysis and Related Subjects, vol. 21, Academic
Press, NY, 1970, p. 1.
29. S. Chien, W. Clayton, Soil Sci. Soc. Am. J., 44, 265
(1980).
30. V. Srihari, A. Das, Desalination, 225, 220 (2008).
31. S. Goldberg, in: Equations and models describing
adsorption processes in soils, Chemical Processes in
Soils. Soil Science Society of America, 677 S. Segoe
Road, Madison, WI 53711, USA, SSSA Book Series,
2005, № 8.
32. E. Voudrias, F. Fytianos, E. Bozani, Global Nest, The
Int. J., 4, 75 (2002).
АДСОРБЦИЯ НА ТИОФЕН И НЕГОВИ АРОМАТНИ ПРОИЗВОДНИ ОТ МОДЕЛНО ГОРИВО
ВЪРХУ ПИРОЛИЗИРАНИ ОРИЗОВИ ЛЮСПИ: КИНЕТИКА И РАВНОВЕСИЕ
С. А. Узунова1, И. М. Узунов
2*, И. Р. Иванов
1, Д. Б. Ангелова
1
1 Химикотехнологичен и металургичен университет, бул. „Кл. Охридски“ № 8, 1756 София, България
2 Институт по обща и неорганична химия, БАН, ул. „Акад. Г. Бончев“, бл. 11, 1113 София, България
Постъпила на 23 януари 2018 г.; Преработена на 13 март 2018 г.
(Резюме)
Изследвано е адсорбционното десулфуриране на горива чрез използване на моделно гориво, съдържащо
смес от тиофен, бензотиофен и дибензотиофен при изходно общо съдържание на сяра (Sin) 415, 218 и 111 wppm
с пиролизирани оризови люспи (ПОЛ) в статични условия. Общото съдържание на сяра в разтвора беше
определено чрез рентгенов-флуоресцентен анализ. Кинетиката на процеса бе определена чрез използване на
уравнение от втори порядък, дифузионен модел и уравнението на Елович. Установено е, че кинетичният модел
от втори порядък описва адекватно адсорбцията на трите серни съединения върху пиролизирани оризови
люспи. Това уравнение осигурява и най-добро съвпадение между пресметнатите и експериментално определени
стойности на адсорбционния капацитет. Разликата между тях варира от 1.3% при Sin 111 ppm до 5.9% за Sin 415
ppm. Адсорбционният афинитет на трите серни съединения, както и равновесният адсорбционен капацитет на
пиролизирани оризови люспи, бяха определени чрез снемане на адсорбционна изотерма. Опитните данни бяха
анализирани чрез използване на изотермите на Лангмюр, Фройндлих и Тьомкин. Данни от регресионния анализ
показаха, че изотермата на Фройндлих най-адекватно описва адсорбционното равновесие на полиароматните
серни хетеро-циклични съединения в системата гориво/ПОЛ.
S. A. Uzunova et al.: Adsorption of thiophene and its polyaromatic derivatives from model fuel
181
Bulgarian Chemical Communications, Volume 50, Special issue H (pp. 181–188) 2018
Study of Fe3Mo3N catalyst for ammonia decomposition
S. F. Zaman*, L. A. Jolaloso, A. A. Al-Zahrani, Y. A. Alhamed, S. Podila, H. Driss, M. A. Daous,
L. A. Petrov
Chemical and Materials Engineering Department, Faculty of Engineering, King Abdulaziz University, P.O. Box 80204,
Jeddah 21589, Saudi Arabia
Received: February 05, 2018; Revised, March 23, 2018
A novel synthesis route, using citric acid as a chelating agent, for the preparation of high surface area γ-Mo2N and
Fe3Mo3N bulk samples and their application as catalysts for hydrogen production via NH3 decomposition reaction were
investigated. Successful formation of high surface area pure bulk phase of Fe3Mo3N (SBET = 24.9 m2
g‒1
) was confirmed
by using XRD, XPS, SEM-EDX, and HRTEM techniques. The Fe3Mo3N catalyst showed moderate catalytic activity
for ammonia decomposition reaction. It demonstrates 100% conversion of NH3 at 600 °C at 6000 h‒1
GHSV. At lower
reaction temperatures the Fe3Mo3N catalyst has higher catalytic activity than γ-Mo2N.
Key words: Ammonia decomposition, γ-Mo2N, Fe3Mo3N, Citric acid, Chelating agentл
INTRODUCTION
The high level of environmental pollution and
the craving for alternative sustainable clean energy
sources is currently a global issue. Hydrogen is a
potential alternative fuel due to COx-free emissions
and its versatility as an energy carrier. Hydrogen has
been used as the primary energy source for internal
combustion engines or for fuel cells. The problem of
using hydrogen as a transportation fuel arises due to
the difficulties for finding a proper hydrogen storage
system, i.e. as compressed gas or in cryogenic form.
Researchers intensively are looking for a suitable
hydrogen storage material with high hydrogen
density and mild release conditions, which can be
safely used in transportation vehicles.
Ammonia, whose synthesis is well matured and
in worldwide commercial practice, has been
considered as a potential source for the production
of hydrogen free of COx. NH3 molecule contains
17.2 wt.% H2 and agrees with the DOE’s criteria to
be considered as a commercialisable hydrogen
storage material for fuel cell driven transportation
vehicles. The cracking of NH3, an endothermic
reaction, must be pursued via a heterogeneous
catalytic route. Big number of materials has been
tested as catalysts for ammonia decomposition.
Unfortunately, ruthenium has been reported to be
the most active catalyst [1]. For a short period of
time the efforts of the researchers were focused on
the ruthenium-based catalysts for ammonia decom-
position but considering the cost benefit, the bulk
price of ruthenium, which is 50000 times higher
than that of iron, thereby calls for the need to
develop cheap transition metals-based catalysts with
high catalytic performance [2].
Iron is one of the early studied transition metals
extensively studied as a catalyst for the decomposi-
tion of ammonia reaction for better understanding of
ammonia synthesis kinetics over iron based catalysts
[3,4]. Very few investigations on iron catalysts for
the decomposition of ammonia were reported due to
its much smaller activity and stability in contrast to
the ruthenium catalysts. This was related to the very
strong iron-nitrogen interaction unlike the ruthe-
nium-nitrogen interaction [5]. This strong Fe-N2
interaction leads to formation subnitrides (stable
nitrides) or even bulk nitrides, which were consi-
dered in the early studies to be the inhibitors for the
ammonia decomposition reaction and eventually
deactivating of the catalysts [6‒8]. The ammonia
decomposition kinetic study reviles that the rate
limiting step is the associative desorption of
nitrogen over Fe based catalysts [7]. The kinetics
follows a Temkin–Pyzhev type rate equation [9].
In this study, we are presenting results of
investigation of hydrogen production via ammonia
decomposition reaction over high surface area bulk
γ-Mo2N and Fe3Mo3N (pure phase) catalysts.
Catalysts were prepared using sol-gel method, i.e.
using citric acid as a chelating agent. The prepared
catalysts were properly characterized using BET,
XRD, XPS, SEM-EDX and HRTEM techniques to
identify the textural and chemical properties of the
prepared catalyst samples.
© 2018 Bulgarian Academy of Sciences, Union of Chemists in Bulgaria
* To whom all correspondence should be sent
E-mail: [email protected]; [email protected]
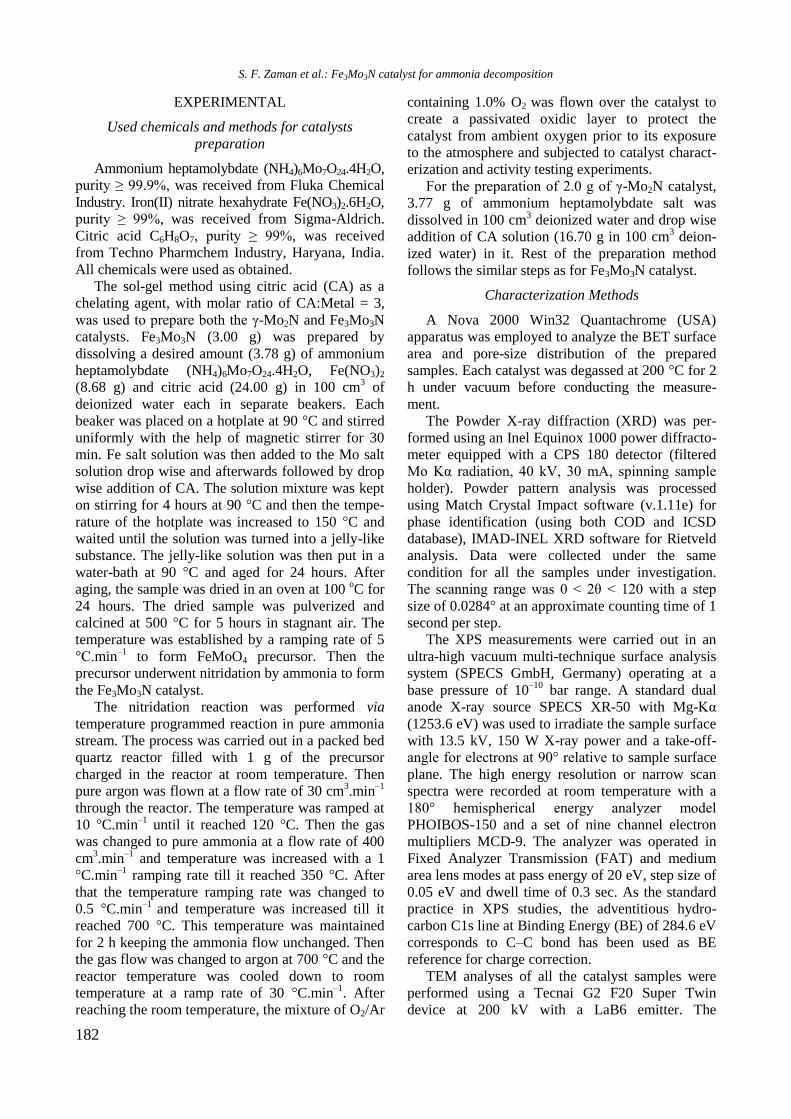
182
EXPERIMENTAL
Used chemicals and methods for catalysts
preparation
Ammonium heptamolybdate (NH4)6Mo7O24.4H2O,
purity ≥ 99.9%, was received from Fluka Chemical
Industry. Iron(II) nitrate hexahydrate Fe(NO3)2.6H2O,
purity ≥ 99%, was received from Sigma-Aldrich.
Citric acid C6H8O7, purity ≥ 99%, was received
from Techno Pharmchem Industry, Haryana, India.
All chemicals were used as obtained.
The sol-gel method using citric acid (CA) as a
chelating agent, with molar ratio of CA:Metal = 3,
was used to prepare both the γ-Mo2N and Fe3Mo3N
catalysts. Fe3Mo3N (3.00 g) was prepared by
dissolving a desired amount (3.78 g) of ammonium
heptamolybdate (NH4)6Mo7O24.4H2O, Fe(NO3)2
(8.68 g) and citric acid (24.00 g) in 100 cm3 of
deionized water each in separate beakers. Each
beaker was placed on a hotplate at 90 °C and stirred
uniformly with the help of magnetic stirrer for 30
min. Fe salt solution was then added to the Mo salt
solution drop wise and afterwards followed by drop
wise addition of CA. The solution mixture was kept
on stirring for 4 hours at 90 °C and then the tempe-
rature of the hotplate was increased to 150 °C and
waited until the solution was turned into a jelly-like
substance. The jelly-like solution was then put in a
water-bath at 90 °C and aged for 24 hours. After
aging, the sample was dried in an oven at 100 oC for
24 hours. The dried sample was pulverized and
calcined at 500 °C for 5 hours in stagnant air. The
temperature was established by a ramping rate of 5
°C.min‒1
to form FeMoO4 precursor. Then the
precursor underwent nitridation by ammonia to form
the Fe3Mo3N catalyst.
The nitridation reaction was performed via
temperature programmed reaction in pure ammonia
stream. The process was carried out in a packed bed
quartz reactor filled with 1 g of the precursor
charged in the reactor at room temperature. Then
pure argon was flown at a flow rate of 30 cm3.min
‒1
through the reactor. The temperature was ramped at
10 °C.min‒1
until it reached 120 °C. Then the gas
was changed to pure ammonia at a flow rate of 400
cm3.min
‒1 and temperature was increased with a 1
°C.min‒1
ramping rate till it reached 350 °C. After
that the temperature ramping rate was changed to
0.5 °C.min‒1
and temperature was increased till it
reached 700 °C. This temperature was maintained
for 2 h keeping the ammonia flow unchanged. Then
the gas flow was changed to argon at 700 °C and the
reactor temperature was cooled down to room
temperature at a ramp rate of 30 °C.min‒1
. After
reaching the room temperature, the mixture of O2/Ar
containing 1.0% O2 was flown over the catalyst to
create a passivated oxidic layer to protect the
catalyst from ambient oxygen prior to its exposure
to the atmosphere and subjected to catalyst charact-
erization and activity testing experiments.
For the preparation of 2.0 g of γ-Mo2N catalyst,
3.77 g of ammonium heptamolybdate salt was
dissolved in 100 cm3 deionized water and drop wise
addition of CA solution (16.70 g in 100 cm3 deion-
ized water) in it. Rest of the preparation method
follows the similar steps as for Fe3Mo3N catalyst.
Characterization Methods
A Nova 2000 Win32 Quantachrome (USA)
apparatus was employed to analyze the BET surface
area and pore-size distribution of the prepared
samples. Each catalyst was degassed at 200 °C for 2
h under vacuum before conducting the measure-
ment.
The Powder X-ray diffraction (XRD) was per-
formed using an Inel Equinox 1000 power diffracto-
meter equipped with a CPS 180 detector (filtered
Mo Kα radiation, 40 kV, 30 mA, spinning sample
holder). Powder pattern analysis was processed
using Match Crystal Impact software (v.1.11e) for
phase identification (using both COD and ICSD
database), IMAD-INEL XRD software for Rietveld
analysis. Data were collected under the same
condition for all the samples under investigation.
The scanning range was 0 < 2θ < 120 with a step
size of 0.0284° at an approximate counting time of 1
second per step.
The XPS measurements were carried out in an
ultra-high vacuum multi-technique surface analysis
system (SPECS GmbH, Germany) operating at a
base pressure of 10‒10
bar range. A standard dual
anode X-ray source SPECS XR-50 with Mg-Kα
(1253.6 eV) was used to irradiate the sample surface
with 13.5 kV, 150 W X-ray power and a take-off-
angle for electrons at 90° relative to sample surface
plane. The high energy resolution or narrow scan
spectra were recorded at room temperature with a
180° hemispherical energy analyzer model
PHOIBOS-150 and a set of nine channel electron
multipliers MCD-9. The analyzer was operated in
Fixed Analyzer Transmission (FAT) and medium
area lens modes at pass energy of 20 eV, step size of
0.05 eV and dwell time of 0.3 sec. As the standard
practice in XPS studies, the adventitious hydro-
carbon C1s line at Binding Energy (BE) of 284.6 eV
corresponds to C‒C bond has been used as BE
reference for charge correction.
TEM analyses of all the catalyst samples were
performed using a Tecnai G2 F20 Super Twin
device at 200 kV with a LaB6 emitter. The
S. F. Zaman et al.: Fe3Mo3N catalyst for ammonia decomposition
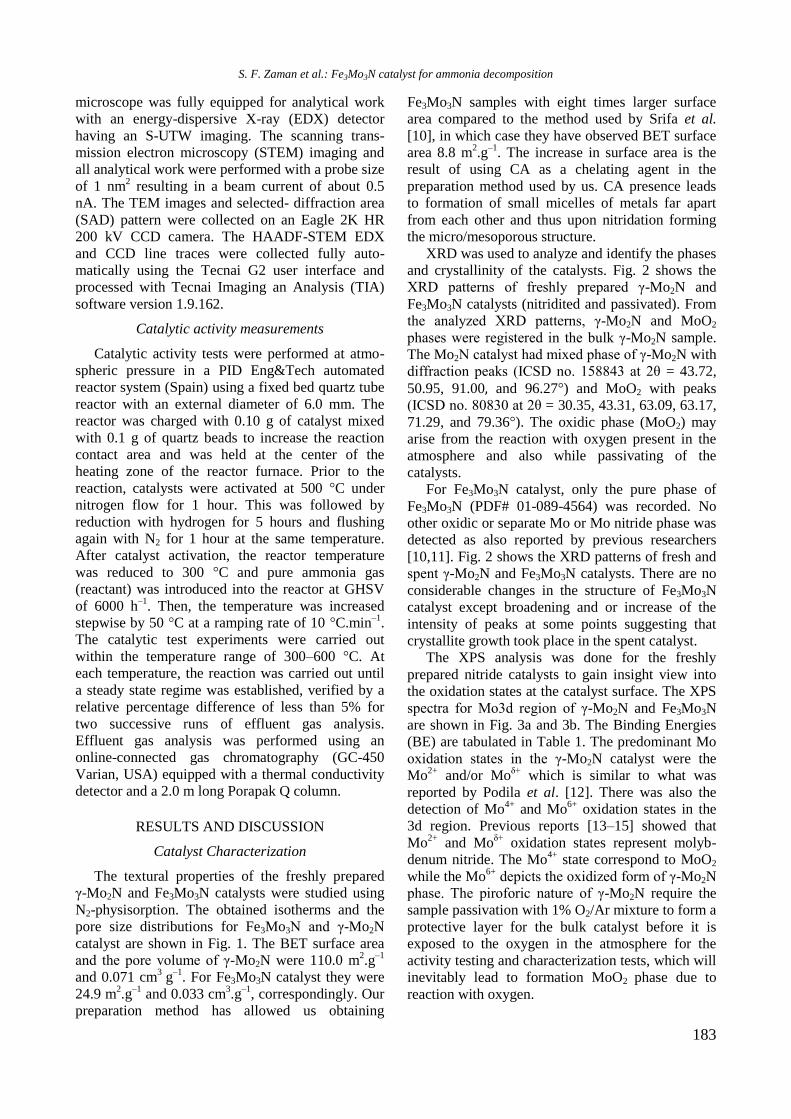
183
microscope was fully equipped for analytical work
with an energy-dispersive X-ray (EDX) detector
having an S-UTW imaging. The scanning trans-
mission electron microscopy (STEM) imaging and
all analytical work were performed with a probe size
of 1 nm2 resulting in a beam current of about 0.5
nA. The TEM images and selected- diffraction area
(SAD) pattern were collected on an Eagle 2K HR
200 kV CCD camera. The HAADF-STEM EDX
and CCD line traces were collected fully auto-
matically using the Tecnai G2 user interface and
processed with Tecnai Imaging an Analysis (TIA)
software version 1.9.162.
Catalytic activity measurements
Catalytic activity tests were performed at atmo-
spheric pressure in a PID Eng&Tech automated
reactor system (Spain) using a fixed bed quartz tube
reactor with an external diameter of 6.0 mm. The
reactor was charged with 0.10 g of catalyst mixed
with 0.1 g of quartz beads to increase the reaction
contact area and was held at the center of the
heating zone of the reactor furnace. Prior to the
reaction, catalysts were activated at 500 °C under
nitrogen flow for 1 hour. This was followed by
reduction with hydrogen for 5 hours and flushing
again with N2 for 1 hour at the same temperature.
After catalyst activation, the reactor temperature
was reduced to 300 °C and pure ammonia gas
(reactant) was introduced into the reactor at GHSV
of 6000 h‒1
. Then, the temperature was increased
stepwise by 50 °C at a ramping rate of 10 °C.min‒1
.
The catalytic test experiments were carried out
within the temperature range of 300‒600 °C. At
each temperature, the reaction was carried out until
a steady state regime was established, verified by a
relative percentage difference of less than 5% for
two successive runs of effluent gas analysis.
Effluent gas analysis was performed using an
online-connected gas chromatography (GC-450
Varian, USA) equipped with a thermal conductivity
detector and a 2.0 m long Porapak Q column.
RESULTS AND DISCUSSION
Catalyst Characterization
The textural properties of the freshly prepared
γ-Mo2N and Fe3Mo3N catalysts were studied using
N2-physisorption. The obtained isotherms and the
pore size distributions for Fe3Mo3N and γ-Mo2N
catalyst are shown in Fig. 1. The BET surface area
and the pore volume of γ-Mo2N were 110.0 m2.g
‒1
and 0.071 cm3
g‒1
. For Fe3Mo3N catalyst they were
24.9 m2.g
‒1 and 0.033 cm
3.g
‒1, correspondingly. Our
preparation method has allowed us obtaining
Fe3Mo3N samples with eight times larger surface
area compared to the method used by Srifa et al.
[10], in which case they have observed BET surface
area 8.8 m2.g
‒1. The increase in surface area is the
result of using CA as a chelating agent in the
preparation method used by us. CA presence leads
to formation of small micelles of metals far apart
from each other and thus upon nitridation forming
the micro/mesoporous structure.
XRD was used to analyze and identify the phases
and crystallinity of the catalysts. Fig. 2 shows the
XRD patterns of freshly prepared γ-Mo2N and
Fe3Mo3N catalysts (nitridited and passivated). From
the analyzed XRD patterns, γ-Mo2N and MoO2
phases were registered in the bulk γ-Mo2N sample.
The Mo2N catalyst had mixed phase of γ-Mo2N with
diffraction peaks (ICSD no. 158843 at 2θ = 43.72,
50.95, 91.00, and 96.27°) and MoO2 with peaks
(ICSD no. 80830 at 2θ = 30.35, 43.31, 63.09, 63.17,
71.29, and 79.36°). The oxidic phase (MoO2) may
arise from the reaction with oxygen present in the
atmosphere and also while passivating of the
catalysts.
For Fe3Mo3N catalyst, only the pure phase of
Fe3Mo3N (PDF# 01-089-4564) was recorded. No
other oxidic or separate Mo or Mo nitride phase was
detected as also reported by previous researchers
[10,11]. Fig. 2 shows the XRD patterns of fresh and
spent γ-Mo2N and Fe3Mo3N catalysts. There are no
considerable changes in the structure of Fe3Mo3N
catalyst except broadening and or increase of the
intensity of peaks at some points suggesting that
crystallite growth took place in the spent catalyst.
The XPS analysis was done for the freshly
prepared nitride catalysts to gain insight view into
the oxidation states at the catalyst surface. The XPS
spectra for Mo3d region of γ-Mo2N and Fe3Mo3N
are shown in Fig. 3a and 3b. The Binding Energies
(BE) are tabulated in Table 1. The predominant Mo
oxidation states in the γ-Mo2N catalyst were the
Mo2+
and/or Moδ+
which is similar to what was
reported by Podila et al. [12]. There was also the
detection of Mo4+
and Mo6+
oxidation states in the
3d region. Previous reports [13‒15] showed that
Mo2+
and Moδ+
oxidation states represent molyb-
denum nitride. The Mo4+
state correspond to MoO2
while the Mo6+
depicts the oxidized form of γ-Mo2N
phase. The piroforic nature of γ-Mo2N require the
sample passivation with 1% O2/Ar mixture to form a
protective layer for the bulk catalyst before it is
exposed to the oxygen in the atmosphere for the
activity testing and characterization tests, which will
inevitably lead to formation MoO2 phase due to
reaction with oxygen.
S. F. Zaman et al.: Fe3Mo3N catalyst for ammonia decomposition
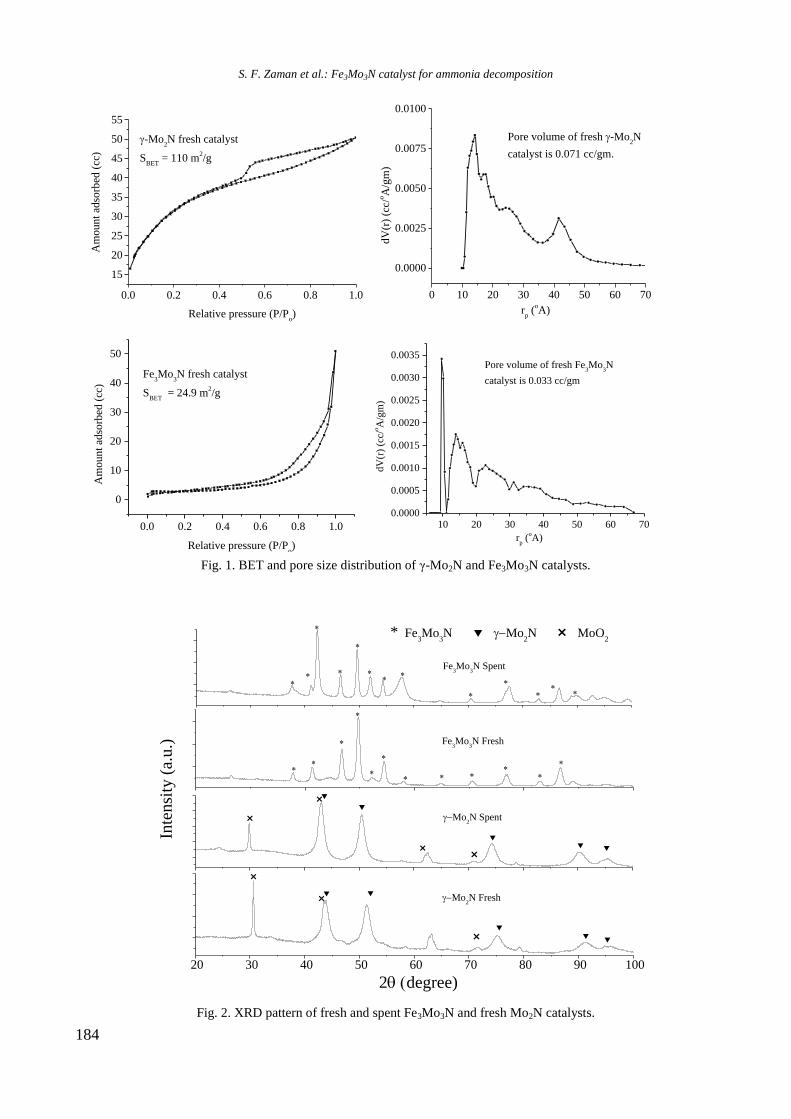
184
Fig. 1. BET and pore size distribution of γ-Mo2N and Fe3Mo3N catalysts.
Fig. 2. XRD pattern of fresh and spent Fe3Mo3N and fresh Mo2N catalysts.
0.0 0.2 0.4 0.6 0.8 1.0
15
20
25
30
35
40
45
50
55
-Mo2N fresh catalyst
SBET
= 110 m2/g
Am
ou
nt
adso
rbed
(cc
)
Relative pressure (P/Po)
0 10 20 30 40 50 60 70
0.0000
0.0025
0.0050
0.0075
0.0100
Pore volume of fresh -Mo2N
catalyst is 0.071 cc/gm.
dV
(r)
(cc/
oA
/gm
)
rp (
oA)
0.0 0.2 0.4 0.6 0.8 1.0
0
10
20
30
40
50
Am
ou
nt
adso
rbed
(cc
)
Relative pressure (P/Po)
Fe3Mo
3N fresh catalyst
SBET
= 24.9 m2/g
10 20 30 40 50 60 700.0000
0.0005
0.0010
0.0015
0.0020
0.0025
0.0030
0.0035
dV
(r)
(cc/
oA
/gm
)
rp (
oA)
Pore volume of fresh Fe3Mo
3N
catalyst is 0.033 cc/gm
20 30 40 50 60 70 80 90 100
Inte
nsi
ty (
a.u.)
Fe3Mo
3N Spent
2(degree)
Fe3Mo
3N Fresh
* Fe3Mo
3N Mo
2N MoO
2
Mo2N Fresh
Mo2N Spent
S. F. Zaman et al.: Fe3Mo3N catalyst for ammonia decomposition
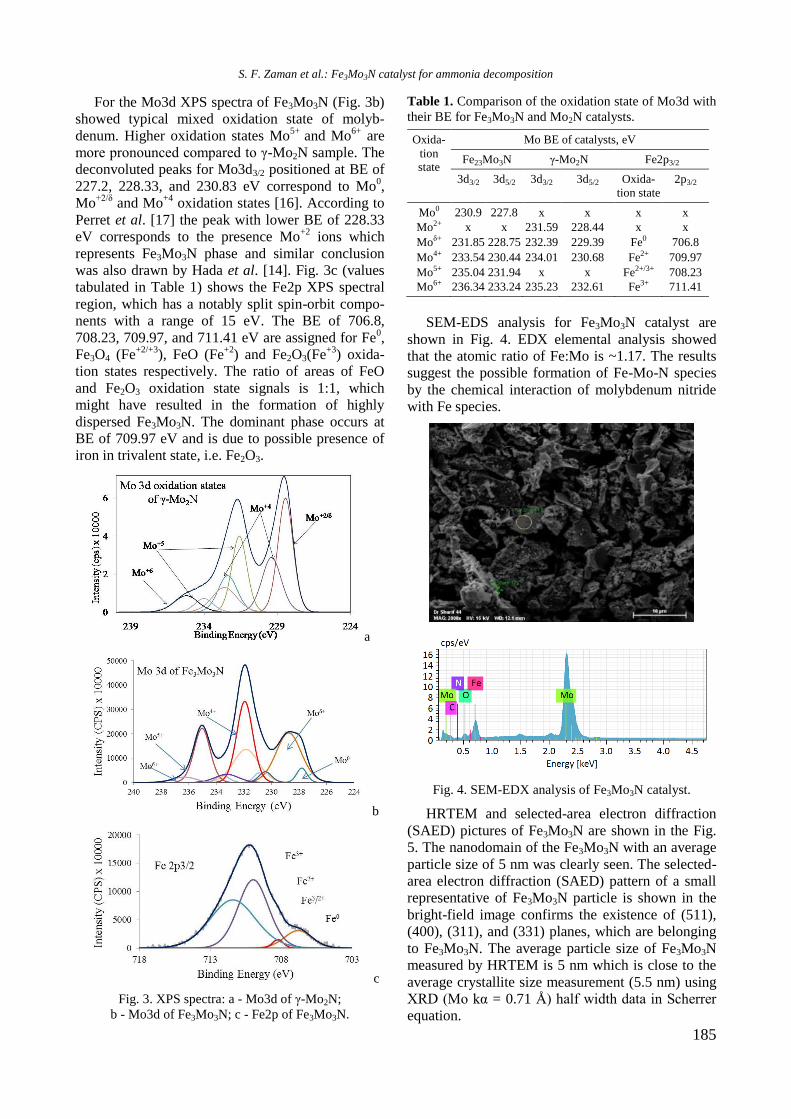
185
For the Mo3d XPS spectra of Fe3Mo3N (Fig. 3b)
showed typical mixed oxidation state of molyb-
denum. Higher oxidation states Mo5+
and Mo6+
are
more pronounced compared to γ-Mo2N sample. The
deconvoluted peaks for Mo3d3/2 positioned at BE of
227.2, 228.33, and 230.83 eV correspond to Mo0,
Mo+2/δ
and Mo+4
oxidation states [16]. According to
Perret et al. [17] the peak with lower BE of 228.33
eV corresponds to the presence Mo+2
ions which
represents Fe3Mo3N phase and similar conclusion
was also drawn by Hada et al. [14]. Fig. 3c (values
tabulated in Table 1) shows the Fe2p XPS spectral
region, which has a notably split spin-orbit compo-
nents with a range of 15 eV. The BE of 706.8,
708.23, 709.97, and 711.41 eV are assigned for Fe0,
Fe3O4 (Fe+2/+3
), FeO (Fe+2
) and Fe2O3(Fe+3
) oxida-
tion states respectively. The ratio of areas of FeO
and Fe2O3 oxidation state signals is 1:1, which
might have resulted in the formation of highly
dispersed Fe3Mo3N. The dominant phase occurs at
BE of 709.97 eV and is due to possible presence of
iron in trivalent state, i.e. Fe2O3.
a
b
c
Fig. 3. XPS spectra: a - Mo3d of γ-Mo2N;
b - Mo3d of Fe3Mo3N; c - Fe2p of Fe3Mo3N.
Table 1. Comparison of the oxidation state of Mo3d with
their BE for Fe3Mo3N and Mo2N catalysts.
Oxida-
tion state
Mo BE of catalysts, eV
Fe23Mo3N γ-Mo2N Fe2p3/2
3d3/2 3d5/2 3d3/2 3d5/2 Oxida-
tion state
2p3/2
Mo0 230.9 227.8 x x x x
Mo2+ x x 231.59 228.44 x x
Moδ+ 231.85 228.75 232.39 229.39 Fe0 706.8
Mo4+ 233.54 230.44 234.01 230.68 Fe2+ 709.97
Mo5+ 235.04 231.94 x x Fe2+/3+ 708.23
Mo6+ 236.34 233.24 235.23 232.61 Fe3+ 711.41
SEM-EDS analysis for Fe3Mo3N catalyst are
shown in Fig. 4. EDX elemental analysis showed
that the atomic ratio of Fe:Mo is ~1.17. The results
suggest the possible formation of Fe-Mo-N species
by the chemical interaction of molybdenum nitride
with Fe species.
Fig. 4. SEM-EDX analysis of Fe3Mo3N catalyst.
HRTEM and selected-area electron diffraction
(SAED) pictures of Fe3Mo3N are shown in the Fig.
5. The nanodomain of the Fe3Mo3N with an average
particle size of 5 nm was clearly seen. The selected-
area electron diffraction (SAED) pattern of a small
representative of Fe3Mo3N particle is shown in the
bright-field image confirms the existence of (511),
(400), (311), and (331) planes, which are belonging
to Fe3Mo3N. The average particle size of Fe3Mo3N
measured by HRTEM is 5 nm which is close to the
average crystallite size measurement (5.5 nm) using
XRD (Mo kα = 0.71 Å) half width data in Scherrer
equation.
S. F. Zaman et al.: Fe3Mo3N catalyst for ammonia decomposition
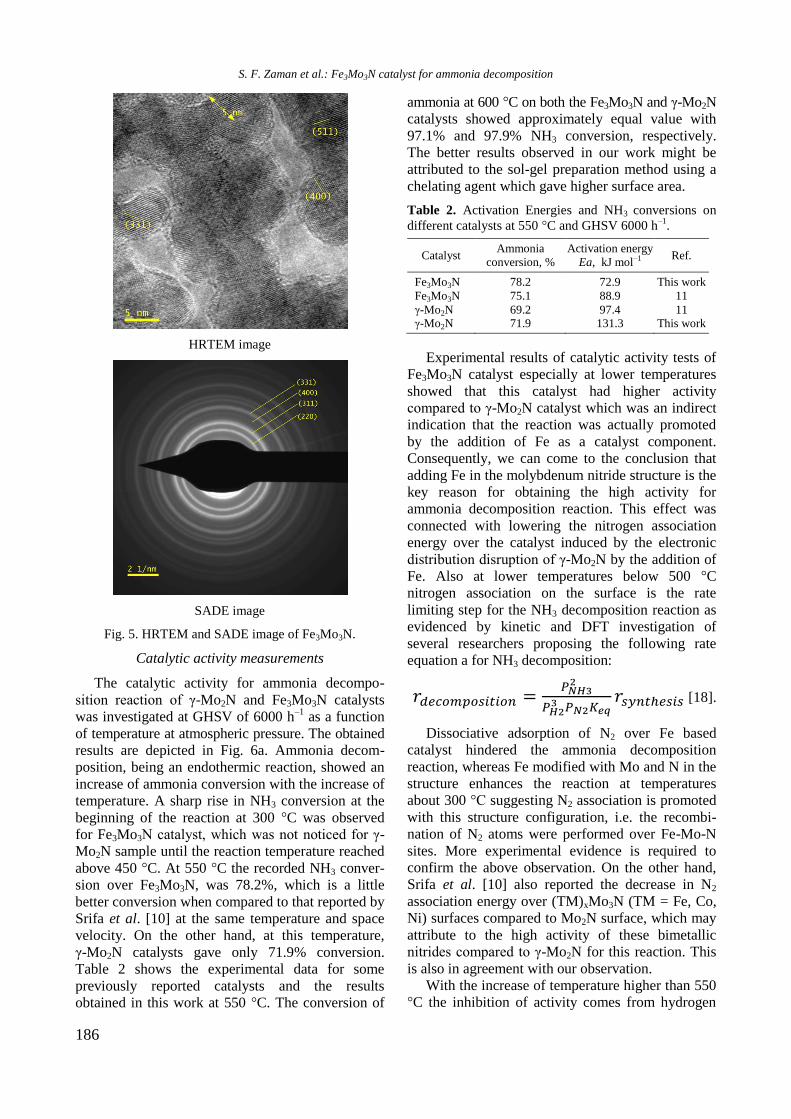
186
HRTEM image
SADE image
Fig. 5. HRTEM and SADE image of Fe3Mo3N.
Catalytic activity measurements
The catalytic activity for ammonia decompo-
sition reaction of γ-Mo2N and Fe3Mo3N catalysts
was investigated at GHSV of 6000 h‒1
as a function
of temperature at atmospheric pressure. The obtained
results are depicted in Fig. 6a. Ammonia decom-
position, being an endothermic reaction, showed an
increase of ammonia conversion with the increase of
temperature. A sharp rise in NH3 conversion at the
beginning of the reaction at 300 °C was observed
for Fe3Mo3N catalyst, which was not noticed for γ-
Mo2N sample until the reaction temperature reached
above 450 °C. At 550 °C the recorded NH3 conver-
sion over Fe3Mo3N, was 78.2%, which is a little
better conversion when compared to that reported by
Srifa et al. [10] at the same temperature and space
velocity. On the other hand, at this temperature,
γ-Mo2N catalysts gave only 71.9% conversion.
Table 2 shows the experimental data for some
previously reported catalysts and the results
obtained in this work at 550 °C. The conversion of
ammonia at 600 °C on both the Fe3Mo3N and γ-Mo2N
catalysts showed approximately equal value with
97.1% and 97.9% NH3 conversion, respectively.
The better results observed in our work might be
attributed to the sol-gel preparation method using a
chelating agent which gave higher surface area.
Table 2. Activation Energies and NH3 conversions on
different catalysts at 550 °C and GHSV 6000 h‒1
.
Catalyst Ammonia
conversion, %
Activation energy
Ea, kJ mol‒1 Ref.
Fe3Mo3N 78.2 72.9 This work
Fe3Mo3N 75.1 88.9 11
γ-Mo2N 69.2 97.4 11 γ-Mo2N 71.9 131.3 This work
Experimental results of catalytic activity tests of
Fe3Mo3N catalyst especially at lower temperatures
showed that this catalyst had higher activity
compared to γ-Mo2N catalyst which was an indirect
indication that the reaction was actually promoted
by the addition of Fe as a catalyst component.
Consequently, we can come to the conclusion that
adding Fe in the molybdenum nitride structure is the
key reason for obtaining the high activity for
ammonia decomposition reaction. This effect was
connected with lowering the nitrogen association
energy over the catalyst induced by the electronic
distribution disruption of γ-Mo2N by the addition of
Fe. Also at lower temperatures below 500 °C
nitrogen association on the surface is the rate
limiting step for the NH3 decomposition reaction as
evidenced by kinetic and DFT investigation of
several researchers proposing the following rate
equation a for NH3 decomposition:
[18].
Dissociative adsorption of N2 over Fe based
catalyst hindered the ammonia decomposition
reaction, whereas Fe modified with Mo and N in the
structure enhances the reaction at temperatures
about 300 °C suggesting N2 association is promoted
with this structure configuration, i.e. the recombi-
nation of N2 atoms were performed over Fe-Mo-N
sites. More experimental evidence is required to
confirm the above observation. On the other hand,
Srifa et al. [10] also reported the decrease in N2
association energy over (TM)xMo3N (TM = Fe, Co,
Ni) surfaces compared to Mo2N surface, which may
attribute to the high activity of these bimetallic
nitrides compared to γ-Mo2N for this reaction. This
is also in agreement with our observation.
With the increase of temperature higher than 550
°C the inhibition of activity comes from hydrogen
S. F. Zaman et al.: Fe3Mo3N catalyst for ammonia decomposition
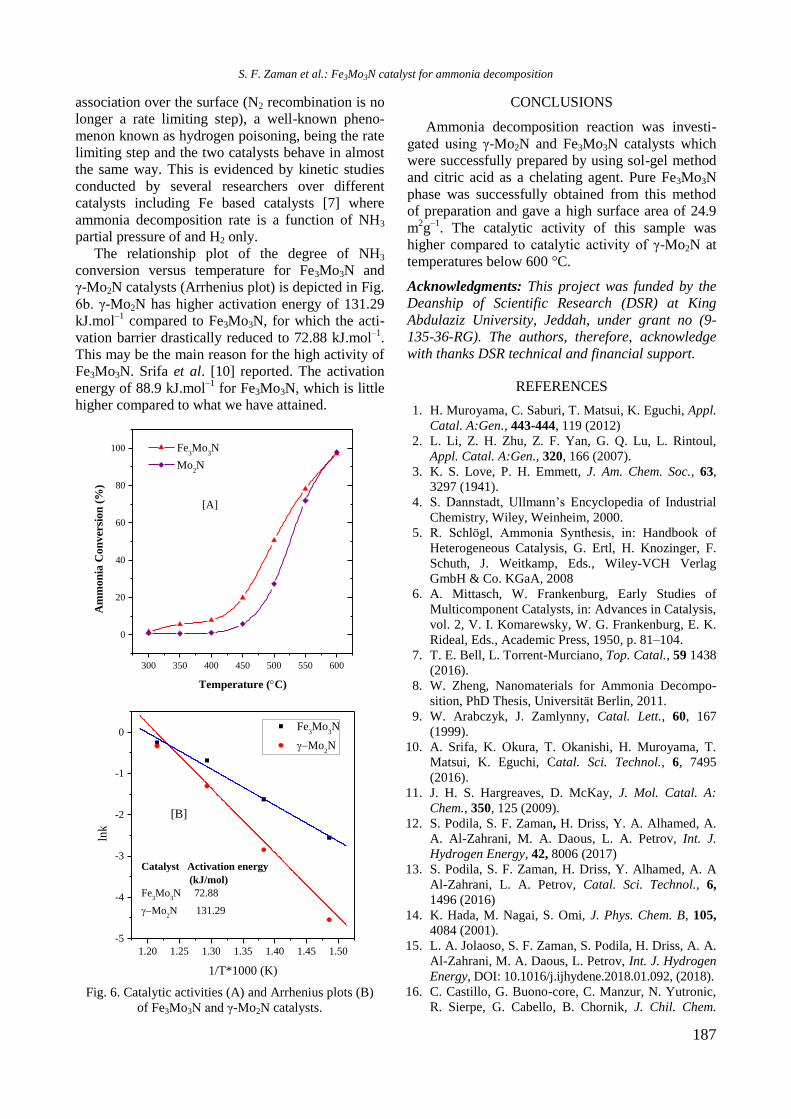
187
association over the surface (N2 recombination is no
longer a rate limiting step), a well-known pheno-
menon known as hydrogen poisoning, being the rate
limiting step and the two catalysts behave in almost
the same way. This is evidenced by kinetic studies
conducted by several researchers over different
catalysts including Fe based catalysts [7] where
ammonia decomposition rate is a function of NH3
partial pressure of and H2 only.
The relationship plot of the degree of NH3
conversion versus temperature for Fe3Mo3N and
γ-Mo2N catalysts (Arrhenius plot) is depicted in Fig.
6b. γ-Mo2N has higher activation energy of 131.29
kJ.mol‒1
compared to Fe3Mo3N, for which the acti-
vation barrier drastically reduced to 72.88 kJ.mol‒1
.
This may be the main reason for the high activity of
Fe3Mo3N. Srifa et al. [10] reported. The activation
energy of 88.9 kJ.mol‒1
for Fe3Mo3N, which is little
higher compared to what we have attained.
Fig. 6. Catalytic activities (A) and Arrhenius plots (B)
of Fe3Mo3N and γ-Mo2N catalysts.
CONCLUSIONS
Ammonia decomposition reaction was investi-
gated using γ-Mo2N and Fe3Mo3N catalysts which
were successfully prepared by using sol-gel method
and citric acid as a chelating agent. Pure Fe3Mo3N
phase was successfully obtained from this method
of preparation and gave a high surface area of 24.9
m2g
‒1. The catalytic activity of this sample was
higher compared to catalytic activity of γ-Mo2N at
temperatures below 600 °C.
Acknowledgments: This project was funded by the
Deanship of Scientific Research (DSR) at King
Abdulaziz University, Jeddah, under grant no (9-
135-36-RG). The authors, therefore, acknowledge
with thanks DSR technical and financial support.
REFERENCES
1. H. Muroyama, C. Saburi, T. Matsui, K. Eguchi, Appl.
Catal. A:Gen., 443-444, 119 (2012)
2. L. Li, Z. H. Zhu, Z. F. Yan, G. Q. Lu, L. Rintoul,
Appl. Catal. A:Gen., 320, 166 (2007).
3. K. S. Love, P. H. Emmett, J. Am. Chem. Soc., 63,
3297 (1941).
4. S. Dannstadt, Ullmann’s Encyclopedia of Industrial
Chemistry, Wiley, Weinheim, 2000.
5. R. Schlögl, Ammonia Synthesis, in: Handbook of
Heterogeneous Catalysis, G. Ertl, H. Knozinger, F.
Schuth, J. Weitkamp, Eds., Wiley-VCH Verlag
GmbH & Co. KGaA, 2008
6. A. Mittasch, W. Frankenburg, Early Studies of
Multicomponent Catalysts, in: Advances in Catalysis,
vol. 2, V. I. Komarewsky, W. G. Frankenburg, E. K.
Rideal, Eds., Academic Press, 1950, p. 81‒104.
7. T. E. Bell, L. Torrent-Murciano, Top. Catal., 59 1438
(2016).
8. W. Zheng, Nanomaterials for Ammonia Decompo-
sition, PhD Thesis, Universität Berlin, 2011.
9. W. Arabczyk, J. Zamlynny, Catal. Lett., 60, 167
(1999).
10. A. Srifa, K. Okura, T. Okanishi, H. Muroyama, T.
Matsui, K. Eguchi, Catal. Sci. Technol., 6, 7495
(2016).
11. J. H. S. Hargreaves, D. McKay, J. Mol. Catal. A:
Chem., 350, 125 (2009).
12. S. Podila, S. F. Zaman, H. Driss, Y. A. Alhamed, A.
A. Al-Zahrani, M. A. Daous, L. A. Petrov, Int. J.
Hydrogen Energy, 42, 8006 (2017)
13. S. Podila, S. F. Zaman, H. Driss, Y. Alhamed, A. A
Al-Zahrani, L. A. Petrov, Catal. Sci. Technol., 6,
1496 (2016)
14. K. Hada, M. Nagai, S. Omi, J. Phys. Chem. B, 105,
4084 (2001).
15. L. A. Jolaoso, S. F. Zaman, S. Podila, H. Driss, A. A.
Al-Zahrani, M. A. Daous, L. Petrov, Int. J. Hydrogen
Energy, DOI: 10.1016/j.ijhydene.2018.01.092, (2018).
16. C. Castillo, G. Buono-core, C. Manzur, N. Yutronic,
R. Sierpe, G. Cabello, B. Chornik, J. Chil. Chem.
300 350 400 450 500 550 600
0
20
40
60
80
100
Am
mo
nia
Co
nv
ersi
on
(%
)
Temperature (C)
Fe3Mo
3N
Mo2N
[A]
1.20 1.25 1.30 1.35 1.40 1.45 1.50
-5
-4
-3
-2
-1
0
lnk
1/T*1000 (K)
Fe3Mo
3N
Mo2N
Catalyst Activation energy
(kJ/mol)
Fe3Mo
3N 72.88
Mo2N 131.29
[B]
S. F. Zaman et al.: Fe3Mo3N catalyst for ammonia decomposition
188
Soc., 61, 2816 ( 2016).
17. N. Perret, A. Alexander, S. T. Hunter, P. Chung, J. S.
J. Hargreaves, R. F. Howe, M. A. Keane, Appl.
Catal. A: Gen., 488, 128 (2014).
A. Boisen, S. Dahl, J. K. Nørskov, C. H. Christensen,
J. Catal., 230, 309 (2005)..
ИЗСЛЕДВАНЕ НА КАТАЛИЗАТОР Fe3Mo3N ЗА РАЗЛАГАНЕ НА АМОНЯК
Ш. Ф. Заман*, Л. А. Жолалозо, А. А. Ал-Захрани, Я. А. Алхамед, С. Подила, Х. Идрис, М. А. Даус,
Л. Петров
Департамент по химично инженерство и материалознание, Инженерен факултет,
Университет „Крал Абдулазис“, п.к. 80204, 21589 Джеда, Саудитска Арабия
Постъпила на 5 февруари 2018 г.; Преработена на 23 март 2018 г.
(Резюме)
Предложен е нов метод за синтез на масивни γ-Mo2N и Fe3Mo3N образци с висока специфична повърхност
при използване на хелати. Получените катализатори са изследвани в реакцията на разлагане на амоняк с цел
получаване на чист водород без съдържание на СО. Получаването на образец Fe3Mo3N (SBET = 24.9 m2.g
‒1) с
висока специфична повърхност е потвърдено чрез използването на XRD, XPS, SEM-EDX, и HRTEM методи.
Катализаторът притежава добра активност. При 600 °C и GHSV 6000 h‒1
конверсията на амоняк достига 100%.
При по ниски температури катализатор Fe3Mo3N е по- активен от γ-Mo2N.
S. F. Zaman et al.: Fe3Mo3N catalyst for ammonia decomposition
189
Bulgarian Chemical Communications, Volume 50, Special issue H (pp. 189–195) 2018
DRIFT study of the mechanism of methanol synthesis from CO2 and H2
on CeO2-supported CaPdZn catalyst
A. S. Malik, S. F. Zaman*, A. A. Al-Zahrani, M. A. Daous, H. Driss, L. A. Petrov
Chemical and Materials Engineering Department, Faculty of Engineering, King Abdulaziz University, P.O. Box 80204,
Jeddah 21589, Saudi Arabia
Received: February 02, 2018; Revised, March 23, 2018
This article reports results of mechanistic DRIFTS study of methanol synthesis from CO2 and H2 on CaPdZn/CeO2
catalyst. The catalyst exhibited superior catalytic performance with ~100% selectivity to methanol and 7.7% conversion
of CO2 at 30 bar and 220 °C. In situ DRIFTS measurements were carried out under experimental conditions and the
presence of various surface reaction intermediate species and their subsequent conversion to methanol were carefully
monitored. The catalyst was characterised by BET, CO chemisorption, CO2-TPD, and HRTEM to evaluate the
physiochemical properties and structure morphology of fresh and spent samples. DRIFTS investigation confirmed the
formation of mono- and bidentate formates, CH2O, and CH3O intermediate species suggesting that the reaction
mechanism follows formate pathway for the synthesis of methanol from CO2 hydrogenation over CaPdZn/CeO2.
Key words: CO2 hydrogenation, methanol, CaPdZn/CeO2 catalyst, DRIFTS, reaction mechanism.
INTRODUCTION
Carbon dioxide utilisation as a feedstock for
industrial production of valuable chemicals has
recently been involved as an active area of catalysis
research. The utilisation of CO2 was addressing the
possible solution of critical issues like global warm-
ing, depleting of high quality fossil fuel sources, and
availability of a cheap and abundant CO2 raw mate-
rial for the synthesis of different chemical products
[1,2]. Carbon dioxide hydrogenation to methanol is
the most viable route for application of the former.
Methanol serves as an excellent energy storage
material alternative to traditional fossil fuels as well
as a fuel for direct methanol fuel cell [3–5].
Palladium-based catalysts have exhibited supe-
rior catalytic performance in recent years, especially
in the reaction of methanol synthesis from CO2 and
H2 [6–9]. The properties of these catalysts are strongly
influenced by preparation method [10–12] and cata-
lyst reduction procedure [7,8,12,13] as well as by
type of support [14–17] and promoter [18,19]. Syn-
ergic effects and chemistry of the strong metal sup-
port and metal-metal interaction of Pd and ZnO
have also been widely studied. Pd/ZnO system ap-
peared to be highly active towards methanol forma-
tion from CO2 [6–9,12,14,20]. The observed high
catalytic activity of this system is associated mainly
with the formation of PdZn bimetallic alloy, which
was formed due to electrons transfer from Pd to
ZnO at elevated temperatures over 500 °C of cata-
lyst reduction [6–9,12].
In the present study, we report results of DRIFTS
study of methanol synthesis from CO2 and H2 on
CaPdZn/CeO2 catalyst. A reaction mechanism was
proposed based on evidences obtained from spectro-
scopic registration of the formation of various
intermediate species over the catalyst surface during
the reaction of methanol synthesis from CO2 and H2.
The catalyst was prepared by the chelating
method employing citric acid as a chelating agent.
This method was previously used for synthesising
nanosized high surface area CeO2 particles. The
citric acid was used as a chelating agent for its well-
known positive contribution in controlling the
morphology of the metal particles size and useful
assistance to avoid sintering of synthesized nano-
materials [21‒23].
EXPERIMENTAL
Catalyst preparation
A typical preparation procedure of 2.0 g of
CaPdZn/CeO2 sample is presented in the following
lines.
Needed amounts of desired catalyst component
salts were dissolved in separate beakers containing
30 cm3 deionised water, i.e. 0.2165 g of Pd (palla-
dium(II) nitrate hydrate ≥99.9%-metal basis, Alfa
Aesar), 0.4549 g of Zn (zinc nitrate hexahydrate
≥98%, Aldrich Chemical Company), 0.059 g of Ca
(calcium nitrate tetrahydrate, Techno Pharmchem
© 2018 Bulgarian Academy of Sciences, Union of Chemists in Bulgaria
* To whom all correspondence should be sent
E-mail: [email protected]; [email protected]
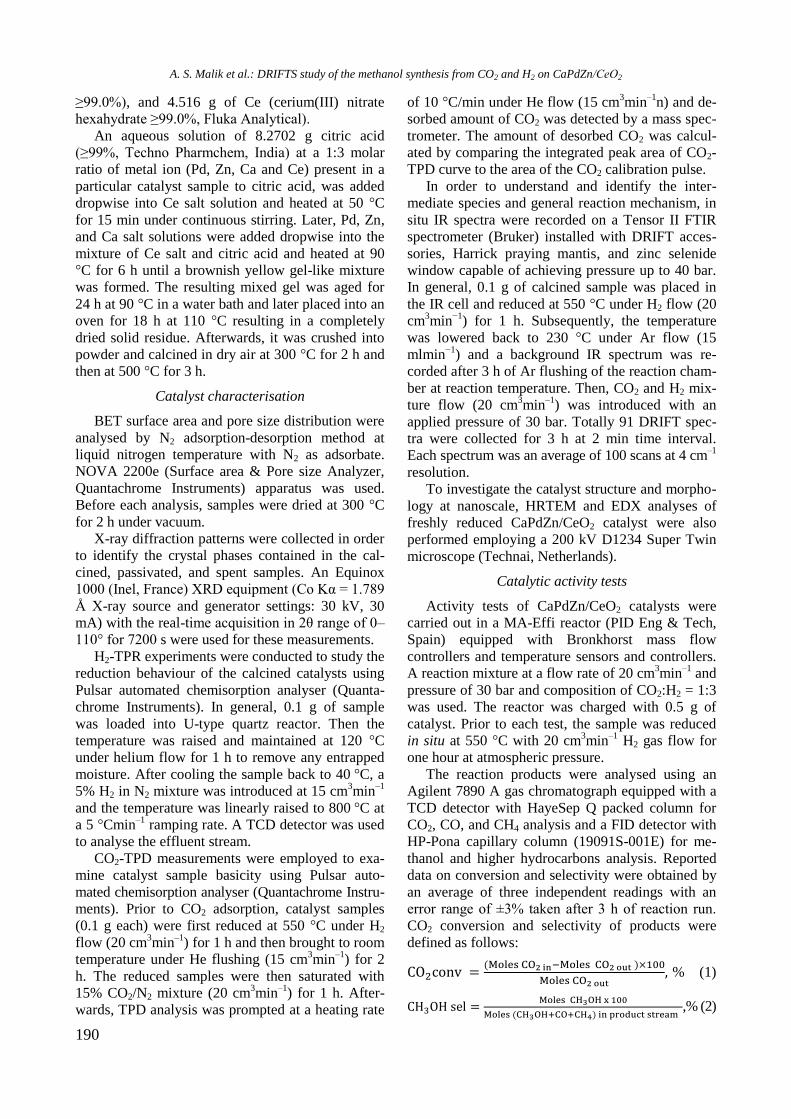
190
≥99.0%), and 4.516 g of Ce (cerium(III) nitrate
hexahydrate ≥99.0%, Fluka Analytical).
An aqueous solution of 8.2702 g citric acid
(≥99%, Techno Pharmchem, India) at a 1:3 molar
ratio of metal ion (Pd, Zn, Ca and Ce) present in a
particular catalyst sample to citric acid, was added
dropwise into Ce salt solution and heated at 50 °C
for 15 min under continuous stirring. Later, Pd, Zn,
and Ca salt solutions were added dropwise into the
mixture of Ce salt and citric acid and heated at 90
°C for 6 h until a brownish yellow gel-like mixture
was formed. The resulting mixed gel was aged for
24 h at 90 °C in a water bath and later placed into an
oven for 18 h at 110 °C resulting in a completely
dried solid residue. Afterwards, it was crushed into
powder and calcined in dry air at 300 °C for 2 h and
then at 500 °C for 3 h.
Catalyst characterisation
BET surface area and pore size distribution were
analysed by N2 adsorption-desorption method at
liquid nitrogen temperature with N2 as adsorbate.
NOVA 2200e (Surface area & Pore size Analyzer,
Quantachrome Instruments) apparatus was used.
Before each analysis, samples were dried at 300 °C
for 2 h under vacuum.
X-ray diffraction patterns were collected in order
to identify the crystal phases contained in the cal-
cined, passivated, and spent samples. An Equinox
1000 (Inel, France) XRD equipment (Co Kα = 1.789
Å X-ray source and generator settings: 30 kV, 30
mA) with the real-time acquisition in 2θ range of 0‒
110° for 7200 s were used for these measurements.
H2-TPR experiments were conducted to study the
reduction behaviour of the calcined catalysts using
Pulsar automated chemisorption analyser (Quanta-
chrome Instruments). In general, 0.1 g of sample
was loaded into U-type quartz reactor. Then the
temperature was raised and maintained at 120 °C
under helium flow for 1 h to remove any entrapped
moisture. After cooling the sample back to 40 °C, a
5% H2 in N2 mixture was introduced at 15 cm3min
‒1
and the temperature was linearly raised to 800 °C at
a 5 °Cmin‒1
ramping rate. A TCD detector was used
to analyse the effluent stream.
CO2-TPD measurements were employed to exa-
mine catalyst sample basicity using Pulsar auto-
mated chemisorption analyser (Quantachrome Instru-
ments). Prior to CO2 adsorption, catalyst samples
(0.1 g each) were first reduced at 550 °C under H2
flow (20 cm3min
‒1) for 1 h and then brought to room
temperature under He flushing (15 cm3min
‒1) for 2
h. The reduced samples were then saturated with
15% CO2/N2 mixture (20 cm3min
‒1) for 1 h. After-
wards, TPD analysis was prompted at a heating rate
of 10 °C/min under He flow (15 cm3min
‒1n) and de-
sorbed amount of CO2 was detected by a mass spec-
trometer. The amount of desorbed CO2 was calcul-
ated by comparing the integrated peak area of CO2-
TPD curve to the area of the CO2 calibration pulse.
In order to understand and identify the inter-
mediate species and general reaction mechanism, in
situ IR spectra were recorded on a Tensor II FTIR
spectrometer (Bruker) installed with DRIFT acces-
sories, Harrick praying mantis, and zinc selenide
window capable of achieving pressure up to 40 bar.
In general, 0.1 g of calcined sample was placed in
the IR cell and reduced at 550 °C under H2 flow (20
cm3min
−1) for 1 h. Subsequently, the temperature
was lowered back to 230 °C under Ar flow (15
mlmin−1
) and a background IR spectrum was re-
corded after 3 h of Ar flushing of the reaction cham-
ber at reaction temperature. Then, CO2 and H2 mix-
ture flow (20 cm3min
‒1) was introduced with an
applied pressure of 30 bar. Totally 91 DRIFT spec-
tra were collected for 3 h at 2 min time interval.
Each spectrum was an average of 100 scans at 4 cm‒1
resolution.
To investigate the catalyst structure and morpho-
logy at nanoscale, HRTEM and EDX analyses of
freshly reduced CaPdZn/CeO2 catalyst were also
performed employing a 200 kV D1234 Super Twin
microscope (Technai, Netherlands).
Catalytic activity tests
Activity tests of CaPdZn/CeO2 catalysts were
carried out in a MA-Effi reactor (PID Eng & Tech,
Spain) equipped with Bronkhorst mass flow
controllers and temperature sensors and controllers.
A reaction mixture at a flow rate of 20 cm3min
‒1 and
pressure of 30 bar and composition of CO2:H2 = 1:3
was used. The reactor was charged with 0.5 g of
catalyst. Prior to each test, the sample was reduced
in situ at 550 °C with 20 cm3min
‒1 H2 gas flow for
one hour at atmospheric pressure.
The reaction products were analysed using an
Agilent 7890 A gas chromatograph equipped with a
TCD detector with HayeSep Q packed column for
CO2, CO, and CH4 analysis and a FID detector with
HP-Pona capillary column (19091S-001E) for me-
thanol and higher hydrocarbons analysis. Reported
data on conversion and selectivity were obtained by
an average of three independent readings with an
error range of ±3% taken after 3 h of reaction run.
CO2 conversion and selectivity of products were
defined as follows:
% (1)
,% (2)
A. S. Malik et al.: DRIFTS study of the methanol synthesis from CO2 and H2 on CaPdZn/СеО2
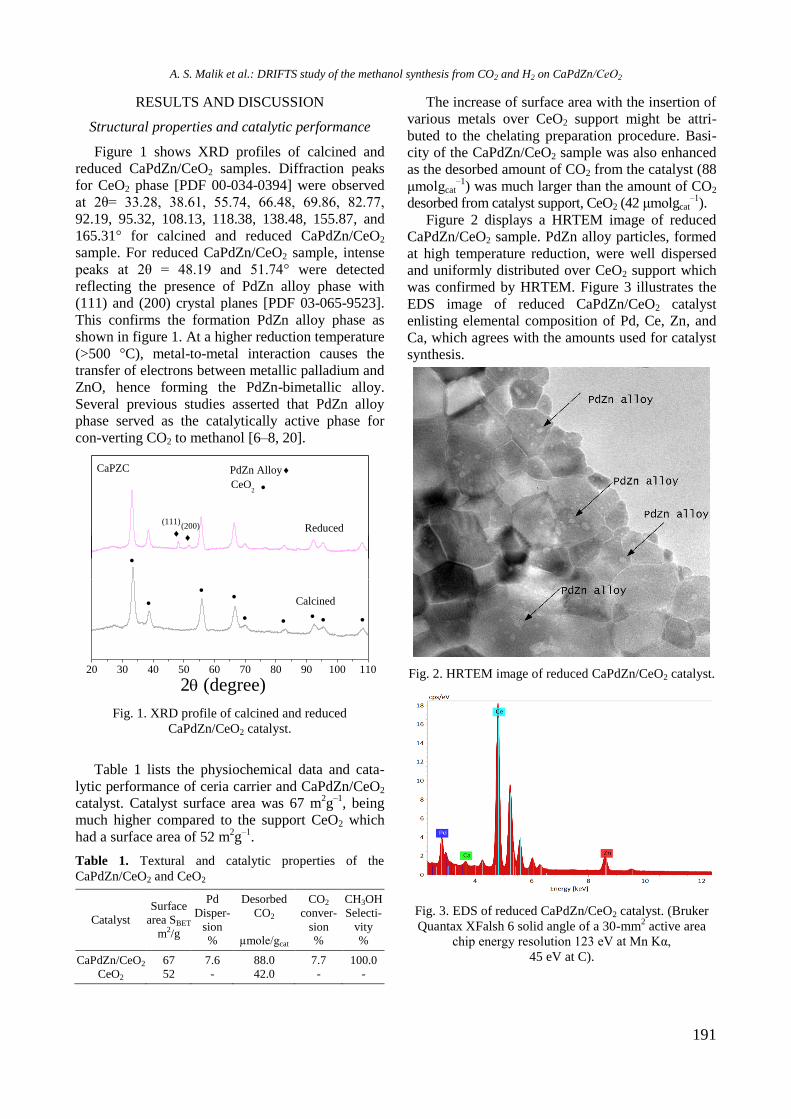
191
RESULTS AND DISCUSSION
Structural properties and catalytic performance
Figure 1 shows XRD profiles of calcined and
reduced CaPdZn/CeO2 samples. Diffraction peaks
for CeO2 phase [PDF 00-034-0394] were observed
at 2θ= 33.28, 38.61, 55.74, 66.48, 69.86, 82.77,
92.19, 95.32, 108.13, 118.38, 138.48, 155.87, and
165.31° for calcined and reduced CaPdZn/CeO2
sample. For reduced CaPdZn/CeO2 sample, intense
peaks at 2θ = 48.19 and 51.74° were detected
reflecting the presence of PdZn alloy phase with
(111) and (200) crystal planes [PDF 03-065-9523].
This confirms the formation PdZn alloy phase as
shown in figure 1. At a higher reduction temperature
(>500 °C), metal-to-metal interaction causes the
transfer of electrons between metallic palladium and
ZnO, hence forming the PdZn-bimetallic alloy.
Several previous studies asserted that PdZn alloy
phase served as the catalytically active phase for
con-verting CO2 to methanol [6‒8, 20].
(200)
Reduced
CaPZC PdZn Alloy
CeO2
2 (degree)
(111)
20 30 40 50 60 70 80 90 100 110
Calcined
Fig. 1. XRD profile of calcined and reduced
CaPdZn/CeO2 catalyst.
Table 1 lists the physiochemical data and cata-
lytic performance of ceria carrier and CaPdZn/CeO2
catalyst. Catalyst surface area was 67 m2g
‒1, being
much higher compared to the support CeO2 which
had a surface area of 52 m2g
‒1.
Table 1. Textural and catalytic properties of the
CaPdZn/CeO2 and CeO2
Catalyst
Surface
area SBET
m2/g
Pd
Disper-
sion %
Desorbed
CO2
µmole/gcat
CO2
conver-
sion %
CH3OH
Selecti-
vity %
CaPdZn/CeO2 67 7.6 88.0 7.7 100.0
CeO2 52 - 42.0 - -
The increase of surface area with the insertion of
various metals over CeO2 support might be attri-
buted to the chelating preparation procedure. Basi-
city of the CaPdZn/CeO2 sample was also enhanced
as the desorbed amount of CO2 from the catalyst (88
μmolgcat‒1
) was much larger than the amount of CO2
desorbed from catalyst support, CeO2 (42 μmolgcat‒1
).
Figure 2 displays a HRTEM image of reduced
CaPdZn/CeO2 sample. PdZn alloy particles, formed
at high temperature reduction, were well dispersed
and uniformly distributed over CeO2 support which
was confirmed by HRTEM. Figure 3 illustrates the
EDS image of reduced CaPdZn/CeO2 catalyst
enlisting elemental composition of Pd, Ce, Zn, and
Ca, which agrees with the amounts used for catalyst
synthesis.
Fig. 2. HRTEM image of reduced CaPdZn/CeO2 catalyst.
Fig. 3. EDS of reduced CaPdZn/CeO2 catalyst. (Bruker
Quantax XFalsh 6 solid angle of a 30-mm2 active area
chip energy resolution 123 eV at Mn Kα,
45 eV at C).
A. S. Malik et al.: DRIFTS study of the methanol synthesis from CO2 and H2 on CaPdZn/СеО2
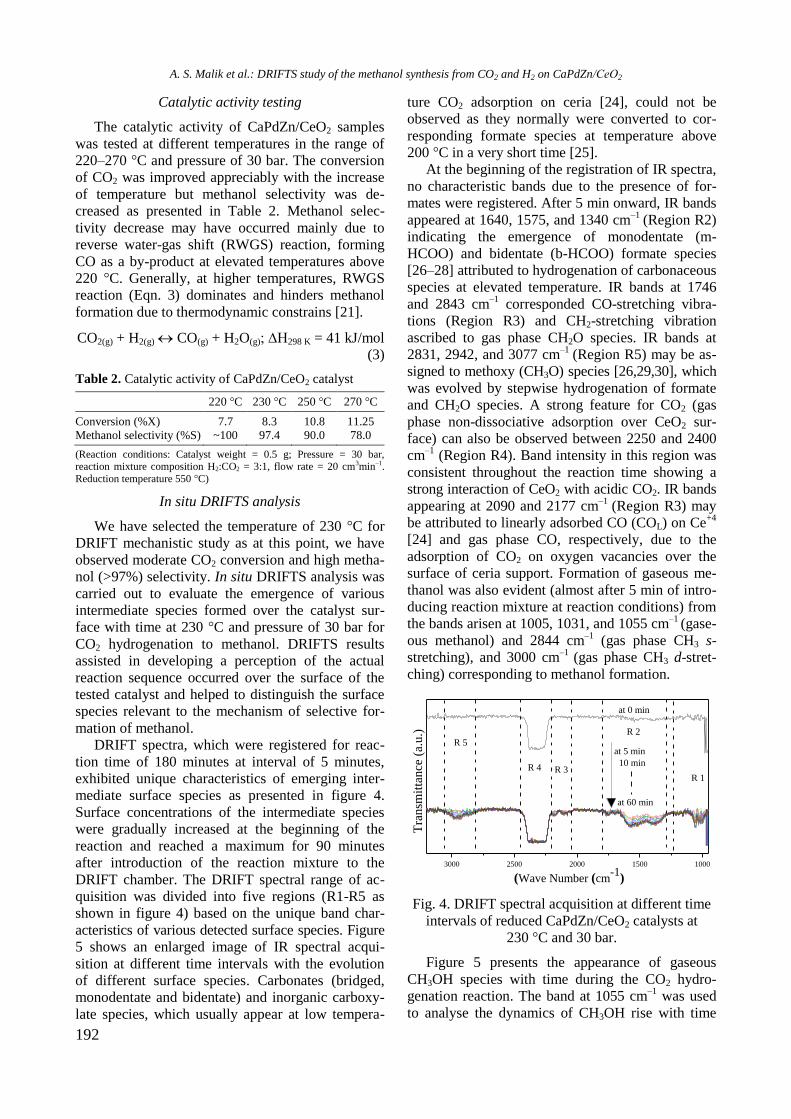
192
Catalytic activity testing
The catalytic activity of CaPdZn/CeO2 samples
was tested at different temperatures in the range of
220‒270 °C and pressure of 30 bar. The conversion
of CO2 was improved appreciably with the increase
of temperature but methanol selectivity was de-
creased as presented in Table 2. Methanol selec-
tivity decrease may have occurred mainly due to
reverse water-gas shift (RWGS) reaction, forming
CO as a by-product at elevated temperatures above
220 °C. Generally, at higher temperatures, RWGS
reaction (Eqn. 3) dominates and hinders methanol
formation due to thermodynamic constrains [21].
CO2(g) + H2(g) CO(g) + H2O(g); ∆H298 K = 41 kJ/mol
(3)
Table 2. Catalytic activity of CaPdZn/CeO2 catalyst
220 °C 230 °C 250 °C 270 °C
Conversion (%X) 7.7 8.3 10.8 11.25
Methanol selectivity (%S) ~100 97.4 90.0 78.0
(Reaction conditions: Catalyst weight = 0.5 g; Pressure = 30 bar, reaction mixture composition H2:CO2 = 3:1, flow rate = 20 cm3min‒1.
Reduction temperature 550 °C)
In situ DRIFTS analysis
We have selected the temperature of 230 °C for
DRIFT mechanistic study as at this point, we have
observed moderate CO2 conversion and high metha-
nol (>97%) selectivity. In situ DRIFTS analysis was
carried out to evaluate the emergence of various
intermediate species formed over the catalyst sur-
face with time at 230 °C and pressure of 30 bar for
CO2 hydrogenation to methanol. DRIFTS results
assisted in developing a perception of the actual
reaction sequence occurred over the surface of the
tested catalyst and helped to distinguish the surface
species relevant to the mechanism of selective for-
mation of methanol.
DRIFT spectra, which were registered for reac-
tion time of 180 minutes at interval of 5 minutes,
exhibited unique characteristics of emerging inter-
mediate surface species as presented in figure 4.
Surface concentrations of the intermediate species
were gradually increased at the beginning of the
reaction and reached a maximum for 90 minutes
after introduction of the reaction mixture to the
DRIFT chamber. The DRIFT spectral range of ac-
quisition was divided into five regions (R1-R5 as
shown in figure 4) based on the unique band char-
acteristics of various detected surface species. Figure
5 shows an enlarged image of IR spectral acqui-
sition at different time intervals with the evolution
of different surface species. Carbonates (bridged,
monodentate and bidentate) and inorganic carboxy-
late species, which usually appear at low tempera-
ture CO2 adsorption on ceria [24], could not be
observed as they normally were converted to cor-
responding formate species at temperature above
200 °C in a very short time [25].
At the beginning of the registration of IR spectra,
no characteristic bands due to the presence of for-
mates were registered. After 5 min onward, IR bands
appeared at 1640, 1575, and 1340 cm‒1
(Region R2)
indicating the emergence of monodentate (m-
HCOO) and bidentate (b-HCOO) formate species
[26‒28] attributed to hydrogenation of carbonaceous
species at elevated temperature. IR bands at 1746
and 2843 cm‒1
corresponded CO-stretching vibra-
tions (Region R3) and CH2-stretching vibration
ascribed to gas phase CH2O species. IR bands at
2831, 2942, and 3077 cm‒1
(Region R5) may be as-
signed to methoxy (CH3O) species [26,29,30], which
was evolved by stepwise hydrogenation of formate
and CH2O species. A strong feature for CO2 (gas
phase non-dissociative adsorption over CeO2 sur-
face) can also be observed between 2250 and 2400
cm‒1
(Region R4). Band intensity in this region was
consistent throughout the reaction time showing a
strong interaction of CeO2 with acidic CO2. IR bands
appearing at 2090 and 2177 cm‒1
(Region R3) may
be attributed to linearly adsorbed CO (COL) on Ce+4
[24] and gas phase CO, respectively, due to the
adsorption of CO2 on oxygen vacancies over the
surface of ceria support. Formation of gaseous me-
thanol was also evident (almost after 5 min of intro-
ducing reaction mixture at reaction conditions) from
the bands arisen at 1005, 1031, and 1055 cm‒1
(gase-
ous methanol) and 2844 cm‒1
(gas phase CH3 s-
stretching), and 3000 cm‒1
(gas phase CH3 d-stret-
ching) corresponding to methanol formation.
3000 2500 2000 1500 1000
R 1
R 2
R 3R 4
at 60 min
at 5 min
10 min
Tra
nsm
itta
nce
(a.
u.)
(Wave Number (cm-1
)
at 0 min
R 5
Fig. 4. DRIFT spectral acquisition at different time
intervals of reduced CaPdZn/CeO2 catalysts at
230 °C and 30 bar.
Figure 5 presents the appearance of gaseous
CH3OH species with time during the CO2 hydro-
genation reaction. The band at 1055 cm‒1
was used
to analyse the dynamics of CH3OH rise with time
A. S. Malik et al.: DRIFTS study of the methanol synthesis from CO2 and H2 on CaPdZn/СеО2
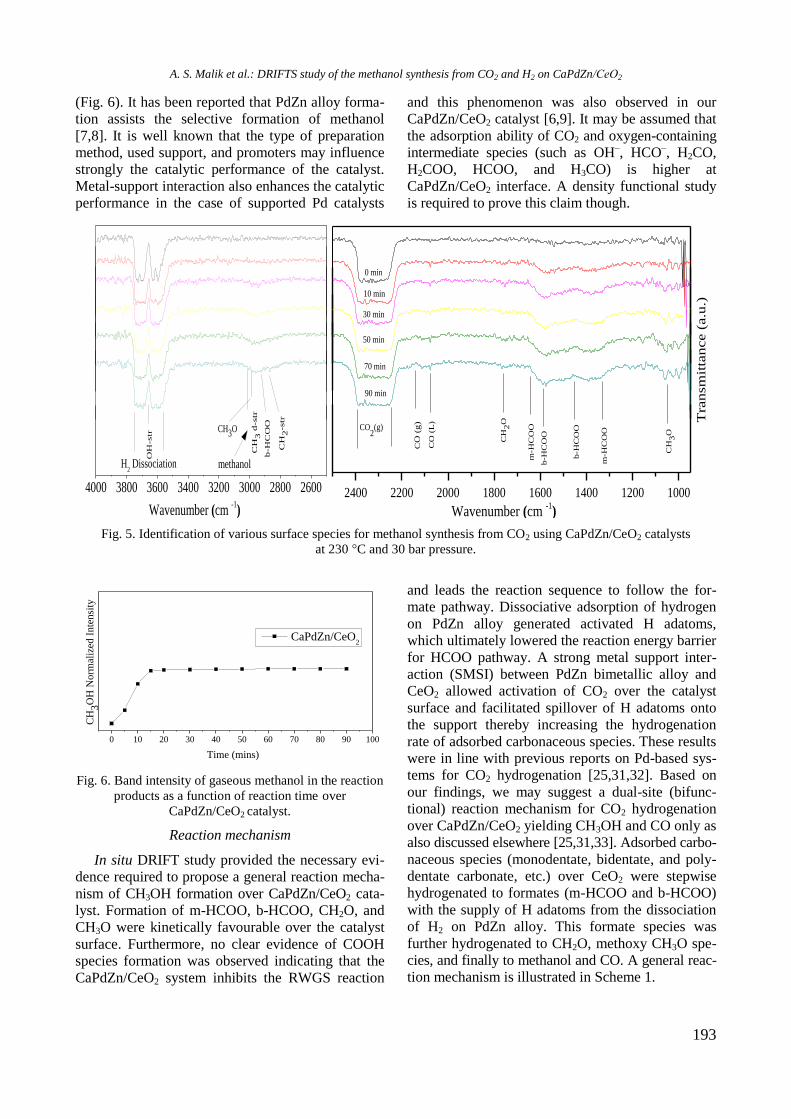
193
(Fig. 6). It has been reported that PdZn alloy forma-
tion assists the selective formation of methanol
[7,8]. It is well known that the type of preparation
method, used support, and promoters may influence
strongly the catalytic performance of the catalyst.
Metal-support interaction also enhances the catalytic
performance in the case of supported Pd catalysts
and this phenomenon was also observed in our
CaPdZn/CeO2 catalyst [6,9]. It may be assumed that
the adsorption ability of CO2 and oxygen-containing
intermediate species (such as OH‒, HCO
‒, H2CO,
H2COO, HCOO, and H3CO) is higher at
CaPdZn/CeO2 interface. A density functional study
is required to prove this claim though.
4000 3800 3600 3400 3200 3000 2800 2600
CH
2-str
CH3O
H2 Dissociation
OH
-str
methanol
CH
3 d
-str
b-H
CO
O
Wavenumber (cm -1)
10 min
Tra
nsm
itta
nce (
a.u
.)
0 min
30 min
50 min
70 min
90 min
2400 2200 2000 1800 1600 1400 1200 1000C
H2O
CO
(g)
Wavenumber (cm -1)
CO
(L
)
m-H
CO
O
b-H
CO
O
b-H
CO
O
m-H
CO
O
CH
3O
CO2(g)
Fig. 5. Identification of various surface species for methanol synthesis from CO2 using CaPdZn/CeO2 catalysts
at 230 °C and 30 bar pressure.
0 10 20 30 40 50 60 70 80 90 100
CH
3O
H N
orm
aliz
ed I
nte
nsi
ty
Time (mins)
CaPdZn/CeO2
Fig. 6. Band intensity of gaseous methanol in the reaction
products as a function of reaction time over
CaPdZn/CeO2 catalyst.
Reaction mechanism
In situ DRIFT study provided the necessary evi-
dence required to propose a general reaction mecha-
nism of CH3OH formation over CaPdZn/CeO2 cata-
lyst. Formation of m-HCOO, b-HCOO, CH2O, and
CH3O were kinetically favourable over the catalyst
surface. Furthermore, no clear evidence of COOH
species formation was observed indicating that the
CaPdZn/CeO2 system inhibits the RWGS reaction
and leads the reaction sequence to follow the for-
mate pathway. Dissociative adsorption of hydrogen
on PdZn alloy generated activated H adatoms,
which ultimately lowered the reaction energy barrier
for HCOO pathway. A strong metal support inter-
action (SMSI) between PdZn bimetallic alloy and
CeO2 allowed activation of CO2 over the catalyst
surface and facilitated spillover of H adatoms onto
the support thereby increasing the hydrogenation
rate of adsorbed carbonaceous species. These results
were in line with previous reports on Pd-based sys-
tems for CO2 hydrogenation [25,31,32]. Based on
our findings, we may suggest a dual-site (bifunc-
tional) reaction mechanism for CO2 hydrogenation
over CaPdZn/CeO2 yielding CH3OH and CO only as
also discussed elsewhere [25,31,33]. Adsorbed carbo-
naceous species (monodentate, bidentate, and poly-
dentate carbonate, etc.) over CeO2 were stepwise
hydrogenated to formates (m-HCOO and b-HCOO)
with the supply of H adatoms from the dissociation
of H2 on PdZn alloy. This formate species was
further hydrogenated to CH2O, methoxy CH3O spe-
cies, and finally to methanol and CO. A general reac-
tion mechanism is illustrated in Scheme 1.
A. S. Malik et al.: DRIFTS study of the methanol synthesis from CO2 and H2 on CaPdZn/СеО2
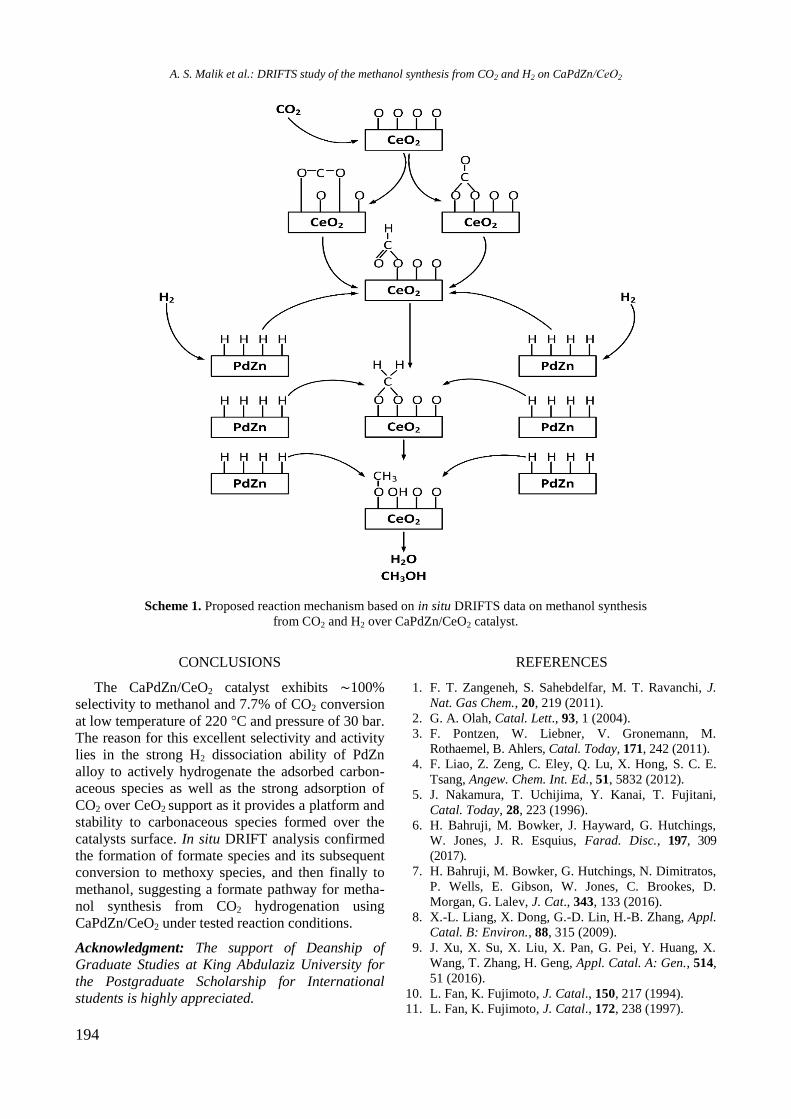
194
Scheme 1. Proposed reaction mechanism based on in situ DRIFTS data on methanol synthesis
from CO2 and H2 over CaPdZn/CeO2 catalyst.
CONCLUSIONS
The CaPdZn/CeO2 catalyst exhibits ∼100%
selectivity to methanol and 7.7% of CO2 conversion
at low temperature of 220 °C and pressure of 30 bar.
The reason for this excellent selectivity and activity
lies in the strong H2 dissociation ability of PdZn
alloy to actively hydrogenate the adsorbed carbon-
aceous species as well as the strong adsorption of
CO2 over CeO2 support as it provides a platform and
stability to carbonaceous species formed over the
catalysts surface. In situ DRIFT analysis confirmed
the formation of formate species and its subsequent
conversion to methoxy species, and then finally to
methanol, suggesting a formate pathway for metha-
nol synthesis from CO2 hydrogenation using
CaPdZn/CeO2 under tested reaction conditions.
Acknowledgment: The support of Deanship of
Graduate Studies at King Abdulaziz University for
the Postgraduate Scholarship for International
students is highly appreciated.
REFERENCES
1. F. T. Zangeneh, S. Sahebdelfar, M. T. Ravanchi, J.
Nat. Gas Chem., 20, 219 (2011).
2. G. A. Olah, Catal. Lett., 93, 1 (2004).
3. F. Pontzen, W. Liebner, V. Gronemann, M.
Rothaemel, B. Ahlers, Catal. Today, 171, 242 (2011).
4. F. Liao, Z. Zeng, C. Eley, Q. Lu, X. Hong, S. C. E.
Tsang, Angew. Chem. Int. Ed., 51, 5832 (2012).
5. J. Nakamura, T. Uchijima, Y. Kanai, T. Fujitani,
Catal. Today, 28, 223 (1996).
6. H. Bahruji, M. Bowker, J. Hayward, G. Hutchings,
W. Jones, J. R. Esquius, Farad. Disc., 197, 309
(2017).
7. H. Bahruji, M. Bowker, G. Hutchings, N. Dimitratos,
P. Wells, E. Gibson, W. Jones, C. Brookes, D.
Morgan, G. Lalev, J. Cat., 343, 133 (2016).
8. X.-L. Liang, X. Dong, G.-D. Lin, H.-B. Zhang, Appl.
Catal. B: Environ., 88, 315 (2009).
9. J. Xu, X. Su, X. Liu, X. Pan, G. Pei, Y. Huang, X.
Wang, T. Zhang, H. Geng, Appl. Catal. A: Gen., 514,
51 (2016).
10. L. Fan, K. Fujimoto, J. Catal., 150, 217 (1994).
11. L. Fan, K. Fujimoto, J. Catal., 172, 238 (1997).
A. S. Malik et al.: DRIFTS study of the methanol synthesis from CO2 and H2 on CaPdZn/СеО2
195
12. C.-H. Kim, J. S. Lee, D. Trimm, Top. Catal., 22, 319
(2003).
13. L. Fan, K. Fujimoto, Appl. Catal. A: Gen., 106, L1
(1993).
14. Y. A. Ryndin, R. Hicks, A. Bell, Y. I. Yermakov, J.
Catal., 70, 287 (1981).
15. T. Fujitani, M. Saito, Y. Kanai, T. Watanabe, J.
Nakamura, T. Uchijima, Appl. Catal. A: Gen., 125,
L199 (1995).
16. W.-J. Shen, M. Okumura, Y. Matsumura, M. Haruta,
Appl. Catal. A: Gen., 213, 225 (2001).
17. P. J. Berlowitz, D. W. Goodman, J. Catal., 108, 364
(1987).
18. J. Driessen, E. Poels, J. Hindermann, V. Ponec, J.
Catal., 82, 26 (1983).
19. V. Ponec, Surf. Sci., 272, 111 (1992).
20. N. Iwasa, H. Suzuki, M. Terashita, M. Arai, N.
Takezawa, Catal. Lett., 96, 75 (2004).
21. J. Trujillo-Reyes, A. Vilchis-Nestor, S. Majumdar, J.
Peralta-Videa, J. Gardea-Torresdey, J. Haz. Mat.,
263, 677 (2013).
22. T. Masui, H. Hirai, N. Imanaka, G. Adachi, T.
Sakata, H. Mori, J. Mat. Sci. Lett., 21, 489 (2002).
23. C. H. Wang, S. S. Lin, Appl. Catal. A: Gen., 268, 227
(2004).
24. C. Li, Y. Sakata, T. Arai, K. Domen, K.-I. Maruya,
T. Onishi, J. Chem. Soc. Faraday Trans. 1, 85, 929
(1989).
25. S. E. Collins, M. A. Baltanás, A. L. Bonivardi, J.
Catal., 226, 410 (2004).
26. G. C. Cabilla, A. L. Bonivardi, M. A. Baltanás, J.
Catal., 210, 213 (2001).
27. D. H. Gibson, Coord. Chem. Rev., 185, 335 (1999).
28. R. Burch, S. Chalker, J. Pritchard, J. Chem. Soc.,
Faraday Trans., 87, 193 (1991).
29. J. Weigel, R. Koeppel, A. Baiker, A. Wokaun,
Langmuir, 12, 5319 (1996).
30. L. J. Burcham, L. E. Briand, I. E. Wachs, Langmuir,
17, 6164 (2001).
31. S. E. Collins, J. J. Delgado, C. Mira, J. J. Calvino, S.
Bernal, D. L. Chiavassa, M. A. Baltanás, A. L.
Bonivardi, J. Catal., 292, 90 (2012).
32. N. Rui, Z. Wang, K. Sun, J. Ye, Q. Ge, C.-J. Liu,
Appl. Catal. B: Environ., 218, 488 (2017).
33. X. Guo, D. Mao, G. Lu, S. Wang, G. Wu, J. Mol.
Cat. A: Chem., 345, 60 (2011)...
ИЗСЛЕДВАНЕ С ДОИЧС НА МЕХАНИЗМА НА СИНТЕЗ НА МЕТАНОЛ ОТ СО2 И ВОДОРОД
С КАТАЛИЗАТОР CaPdZn/СеО2
А. С. Малик*, Ш. Ф. Заман1, А. А. Ал-Захрани, М. А. Даус, Х. Идрис, Л. А. Петров
Департамент по инженерна химия и материалознание, Инженерен факултет,
Университет „Крал Абдулазис“, п.к. 80204, 21589 Джеда, Саудитска Арабия
Постъпила на 2 февруари 2018 г.; Преработена на 23 март 2018 г.
(Резюме)
В настоящата работа са представени резултати от DRIFTS изследване на механизма на синтез на метанол от
CO2 и Н2 върху катализатор CaPdZn/CeO2. Катализаторът притежава превъзходни каталитични свойства.
Селективността на процеса при 220 °C и налягане 30 атм. е 100% при 7.7% конверсия на СО2. Измерванията с
DRIFTS са проведени in situ при налягане 30 атм. и са проследени във времето промените в концентрациите на
поърхностните междинни съединения. Катализаторът и използваният носител са охарактеризирани с метода
БЕТ, хемосорбция на СО, ТПД на СО2, рентгеноструктурен анализ и ТЕМ с висока разделителна способност.
Установено е формирането на моно- и бидентантни формиати, CH2O и CH3O, което сочи че синтеза на метанол
протича през формирането на формиати. Предложен е и вероятен механизъм на процеса на синтез на метанол
от СО2 и водород.
A. S. Malik et al.: DRIFTS study of the methanol synthesis from CO2 and H2 on CaPdZn/СеО2
196
Bulgarian Chemical Communications, Volume 50, Special issue H (pp. 196–200) 2018
Ionic gold and catalytic activity of gold catalysts for CO oxidation
A. M. Ali
Department of Chemical and Materials Engineering, Faculty of Engineering, King Abdulaziz University
P.O. Box 80204, Jeddah 21589, Kingdom of Saudi Arabia
Received: January 31, 2018; Revised: March 14, 2018
This study is aimed to investigate the catalytic activity of freshly prepared gold catalysts supported on three metal
oxide supports CeO2, ZrO2 and mechanically mixed CeO2+ZrO2 (DOS) for the CO oxidation under atmospheric
pressure. The catalytic activity of both Au/CeO2 and Au/DOS were nearly the same and far higher than that of an
Au/ZrO2 sample. The higher catalytic activity of both the Au/CeO2 and Au/DOS catalysts is attributed to the presence of
Au+1
and Ce+4
ions as well as to enhanced CeO2 oxygen mobility in the presence of ZrO2.
Key words: gold catalyst, ionic gold, ceria, CO oxidation.
INTRODUCTION
Traditionally, gold was considered one of the
most stable metals [1]. In 1987, Haruta et.al found
that gold nanoparticles have high catalytic activity
for the CO oxidation, and overturned the conven-
tional paradigm about the gold [2,3]. Currently gold
catalysts has become one of the most studied
catalysts, due to their high activity in many
oxidation reactions at low temperatures [4]. This
allows reduction of energy costs in the industry and
offers low-cost solutions of many global environ-
mental issues [5–9]. Additionally, the gold catalysts
exhibit unusual selectivity in many important reac-
tions [10,11]. Further, it is also cost-effective to use
the gold catalysts for the industries [4,12].
It has been widely accepted that the performance
of the gold catalysts depend on the size distribution
of the gold particles, gold-support interaction and on
the electronic properties of both gold and support [1,
4, 13–18]. Also, many other parameters such as
nature of the support [3,19–21], preparation method
[1,22,23], calcination conditions [24–28], as well as
the pH [29] and the precipitating agent [30, 31] have
strong influence on the catalytic behavior of the
gold catalysts.
CO oxidation is one of the most widely studied
fields of application of the gold catalysts [32–36]
because of many important applications for this
reaction at low temperature, such as gas sensors
[37], carbon monoxide laser [30] and air purification
[38], etc. Among the catalyst supports, ceria is one
of the most widely studied carriers for gold
catalysts, due to its ability to maintain high Au
dispersion. In addition, stabilized cationic Au
species on the CeO2 surface, and ceria redox
property to exchange the available oxygen are very
useful to produce a strong promoting effect on gold
oxidation state [39–42]. Further, the catalytic
performance of Au/CeO2 can be improved by
several methods such as doping with other metals,
nano-crystallisation and mixing with other metal
oxides [39,40,43]. Among these, mixing ceria with
other metal oxides is found to be beneficial for the
enhanced catalytic activity of gold catalysts. For
example, the catalytic performance of Au/CeO2-
Co3O4 in the CO oxidation has been reported to be
much higher than that of Au/CeO2 [44]. Zirconia is
another interesting metal oxide to mix with CeO2,
because it can retard ceria degradation, improve the
redox property of the latter, and preserve the oxygen
defects in the metal oxide structure [45].
Based on available literature and as per author’s
best knowledge, none of the study results have been
reported on the possible catalytic activity of gold
catalysts supported on a mixture of two metal oxides
(CeO2 and ZrO2) and/or their comparison to each
metal oxide as support during CO oxidation.
Therefore, the aim of this study is to investigate
the impact of support type and the possible role of
ionic gold during CO oxidation on the gold catalyst.
EXPERIMENTAL
Catalyst preparation
Precisely calculated 10 g of each pure CeO2
(Rhodia) and pure ZrO2 (Rhodia) or 10 g DOS
[CeO2 : ZrO2 = 3:1] were mechanically mixed in a
Power Sonic instrument. Well-dried support at 120
°C was further used in a Mettler Toledo Labmax
reactor for gold deposition. 13.5 cm3 of 0.1M KOH
* To whom all correspondence should be sent
E-mail: [email protected]
© 2018 Bulgarian Academy of Sciences, Union of Chemists in Bulgaria
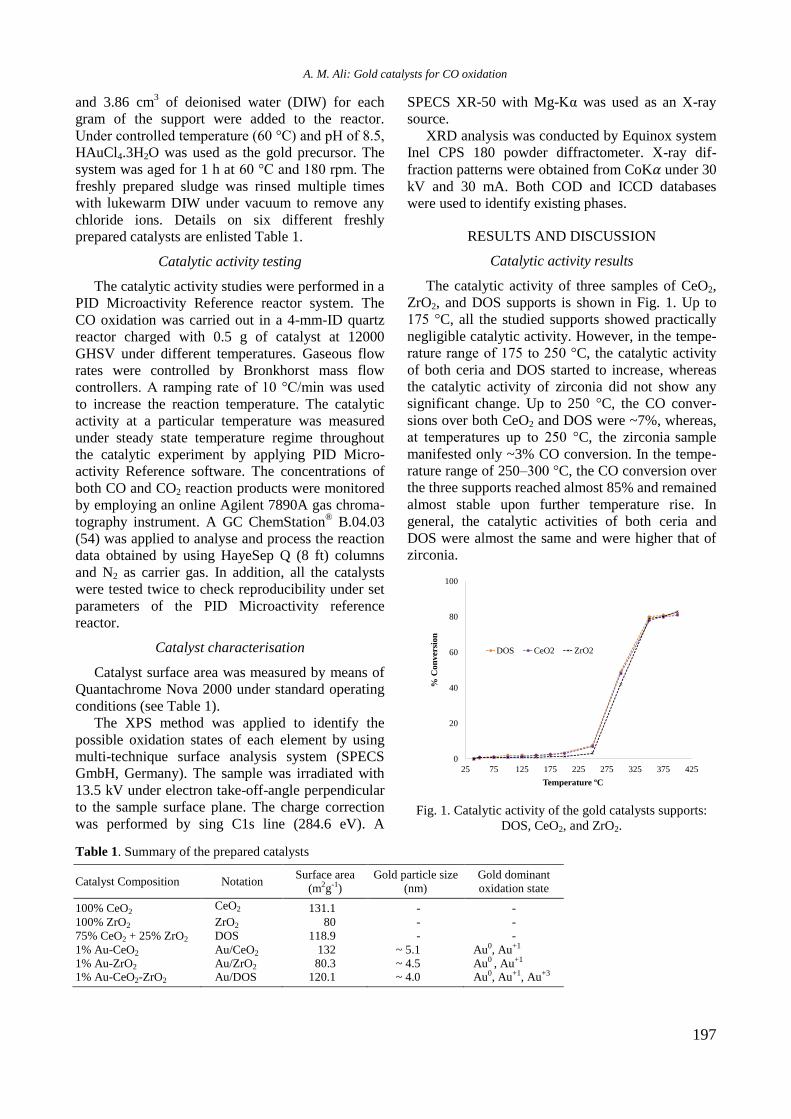
197
and 3.86 cm3 of deionised water (DIW) for each
gram of the support were added to the reactor.
Under controlled temperature (60 °C) and pH of 8.5,
HAuCl4.3H2O was used as the gold precursor. The
system was aged for 1 h at 60 °C and 180 rpm. The
freshly prepared sludge was rinsed multiple times
with lukewarm DIW under vacuum to remove any
chloride ions. Details on six different freshly
prepared catalysts are enlisted Table 1.
Catalytic activity testing
The catalytic activity studies were performed in a
PID Microactivity Reference reactor system. The
CO oxidation was carried out in a 4-mm-ID quartz
reactor charged with 0.5 g of catalyst at 12000
GHSV under different temperatures. Gaseous flow
rates were controlled by Bronkhorst mass flow
controllers. A ramping rate of 10 °C/min was used
to increase the reaction temperature. The catalytic
activity at a particular temperature was measured
under steady state temperature regime throughout
the catalytic experiment by applying PID Micro-
activity Reference software. The concentrations of
both CO and CO2 reaction products were monitored
by employing an online Agilent 7890A gas chroma-
tography instrument. A GC ChemStation® B.04.03
(54) was applied to analyse and process the reaction
data obtained by using HayeSep Q (8 ft) columns
and N2 as carrier gas. In addition, all the catalysts
were tested twice to check reproducibility under set
parameters of the PID Microactivity reference
reactor.
Catalyst characterisation
Catalyst surface area was measured by means of
Quantachrome Nova 2000 under standard operating
conditions (see Table 1).
The XPS method was applied to identify the
possible oxidation states of each element by using
multi-technique surface analysis system (SPECS
GmbH, Germany). The sample was irradiated with
13.5 kV under electron take-off-angle perpendicular
to the sample surface plane. The charge correction
was performed by sing C1s line (284.6 eV). A
SPECS XR-50 with Mg-Kα was used as an X-ray
source.
XRD analysis was conducted by Equinox system
Inel CPS 180 powder diffractometer. X-ray dif-
fraction patterns were obtained from CoK𝛼 under 30
kV and 30 mA. Both COD and ICCD databases
were used to identify existing phases.
RESULTS AND DISCUSSION
Catalytic activity results
The catalytic activity of three samples of CeO2,
ZrO2, and DOS supports is shown in Fig. 1. Up to
175 °C, all the studied supports showed practically
negligible catalytic activity. However, in the tempe-
rature range of 175 to 250 °C, the catalytic activity
of both ceria and DOS started to increase, whereas
the catalytic activity of zirconia did not show any
significant change. Up to 250 °C, the CO conver-
sions over both CeO2 and DOS were ~7%, whereas,
at temperatures up to 250 °C, the zirconia sample
manifested only ~3% CO conversion. In the tempe-
rature range of 250–300 °C, the CO conversion over
the three supports reached almost 85% and remained
almost stable upon further temperature rise. In
general, the catalytic activities of both ceria and
DOS were almost the same and were higher that of
zirconia.
Fig. 1. Catalytic activity of the gold catalysts supports:
DOS, CeO2, and ZrO2.
Table 1. Summary of the prepared catalysts
Catalyst Composition Notation Surface area
(m2g-1)
Gold particle size
(nm)
Gold dominant
oxidation state
100% CeO2 CeO2 131.1 - -
100% ZrO2 ZrO2 80 - -
75% CeO2 + 25% ZrO2 DOS 118.9 - -
1% Au-CeO2 Au/CeO2 132 ~ 5.1 Au0, Au+1
1% Au-ZrO2 Au/ZrO2 80.3 ~ 4.5 Au0 , Au+1 1% Au-CeO2-ZrO2 Au/DOS 120.1 ~ 4.0 Au0, Au+1, Au+3
0
20
40
60
80
100
25 75 125 175 225 275 325 375 425
% C
on
ver
sio
n
Temperature ºC
DOS CeO2 ZrO2
A. M. Ali: Gold catalysts for CO oxidation
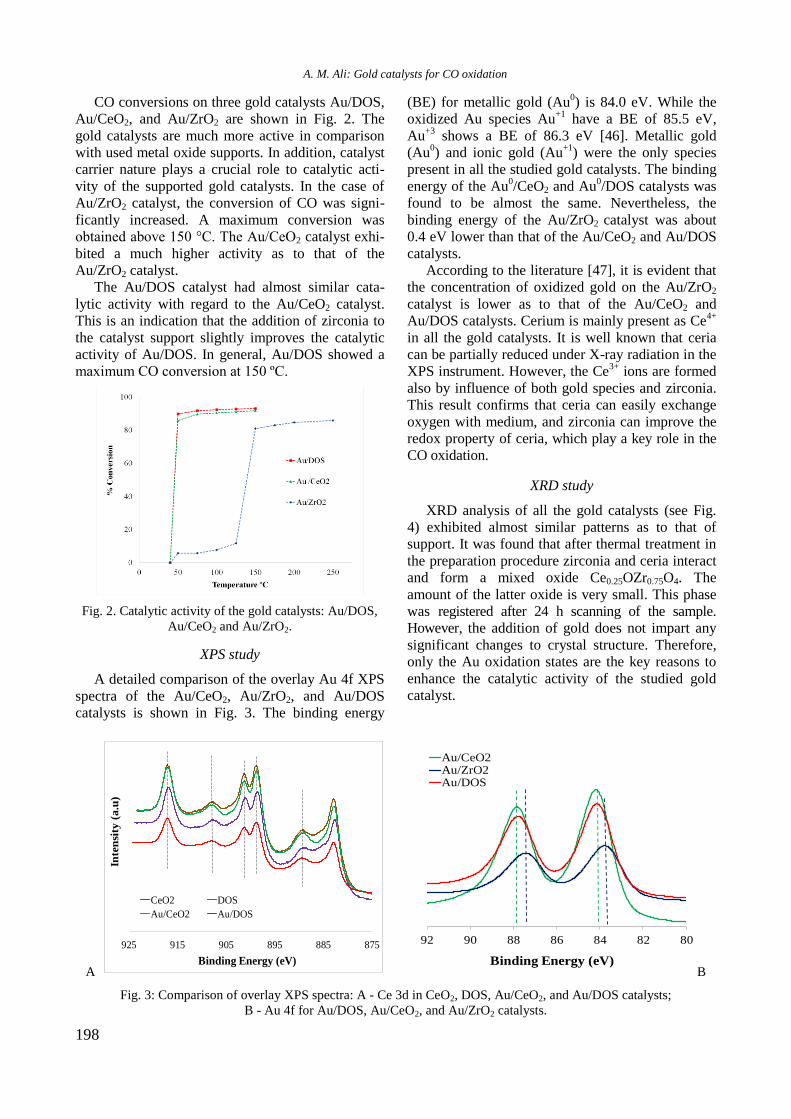
198
CO conversions on three gold catalysts Au/DOS,
Au/CeO2, and Au/ZrO2 are shown in Fig. 2. The
gold catalysts are much more active in comparison
with used metal oxide supports. In addition, catalyst
carrier nature plays a crucial role to catalytic acti-
vity of the supported gold catalysts. In the case of
Au/ZrO2 catalyst, the conversion of CO was signi-
ficantly increased. A maximum conversion was
obtained above 150 °C. The Au/CeO2 catalyst exhi-
bited a much higher activity as to that of the
Au/ZrO2 catalyst.
The Au/DOS catalyst had almost similar cata-
lytic activity with regard to the Au/CeO2 catalyst.
This is an indication that the addition of zirconia to
the catalyst support slightly improves the catalytic
activity of Au/DOS. In general, Au/DOS showed a
maximum CO conversion at 150 ºC.
Fig. 2. Catalytic activity of the gold catalysts: Au/DOS,
Au/CeO2 and Au/ZrO2.
XPS study
A detailed comparison of the overlay Au 4f XPS
spectra of the Au/CeO2, Au/ZrO2, and Au/DOS
catalysts is shown in Fig. 3. The binding energy
(BE) for metallic gold (Au0) is 84.0 eV. While the
oxidized Au species Au+1
have a BE of 85.5 eV,
Au+3
shows a BE of 86.3 eV [46]. Metallic gold
(Au0) and ionic gold (Au
+1) were the only species
present in all the studied gold catalysts. The binding
energy of the Au0/CeO2 and Au
0/DOS catalysts was
found to be almost the same. Nevertheless, the
binding energy of the Au/ZrO2 catalyst was about
0.4 eV lower than that of the Au/CeO2 and Au/DOS
catalysts.
According to the literature [47], it is evident that
the concentration of oxidized gold on the Au/ZrO2
catalyst is lower as to that of the Au/CeO2 and
Au/DOS catalysts. Cerium is mainly present as Ce4+
in all the gold catalysts. It is well known that ceria
can be partially reduced under X-ray radiation in the
XPS instrument. However, the Ce3+
ions are formed
also by influence of both gold species and zirconia.
This result confirms that ceria can easily exchange
oxygen with medium, and zirconia can improve the
redox property of ceria, which play a key role in the
CO oxidation.
XRD study
XRD analysis of all the gold catalysts (see Fig.
4) exhibited almost similar patterns as to that of
support. It was found that after thermal treatment in
the preparation procedure zirconia and ceria interact
and form a mixed oxide Ce0.25OZr0.75O4. The
amount of the latter oxide is very small. This phase
was registered after 24 h scanning of the sample.
However, the addition of gold does not impart any
significant changes to crystal structure. Therefore,
only the Au oxidation states are the key reasons to
enhance the catalytic activity of the studied gold
catalyst.
A B
Fig. 3: Comparison of overlay XPS spectra: A - Ce 3d in CeO2, DOS, Au/CeO2, and Au/DOS catalysts;
B - Au 4f for Au/DOS, Au/CeO2, and Au/ZrO2 catalysts.
A. M. Ali: Gold catalysts for CO oxidation
875885895905915925
CeO2 DOS
Au/CeO2 Au/DOS
Binding Energy (eV)
Inte
nsi
ty (
a.u
)
80828486889092
Au/CeO2Au/ZrO2Au/DOS
Binding Energy (eV)
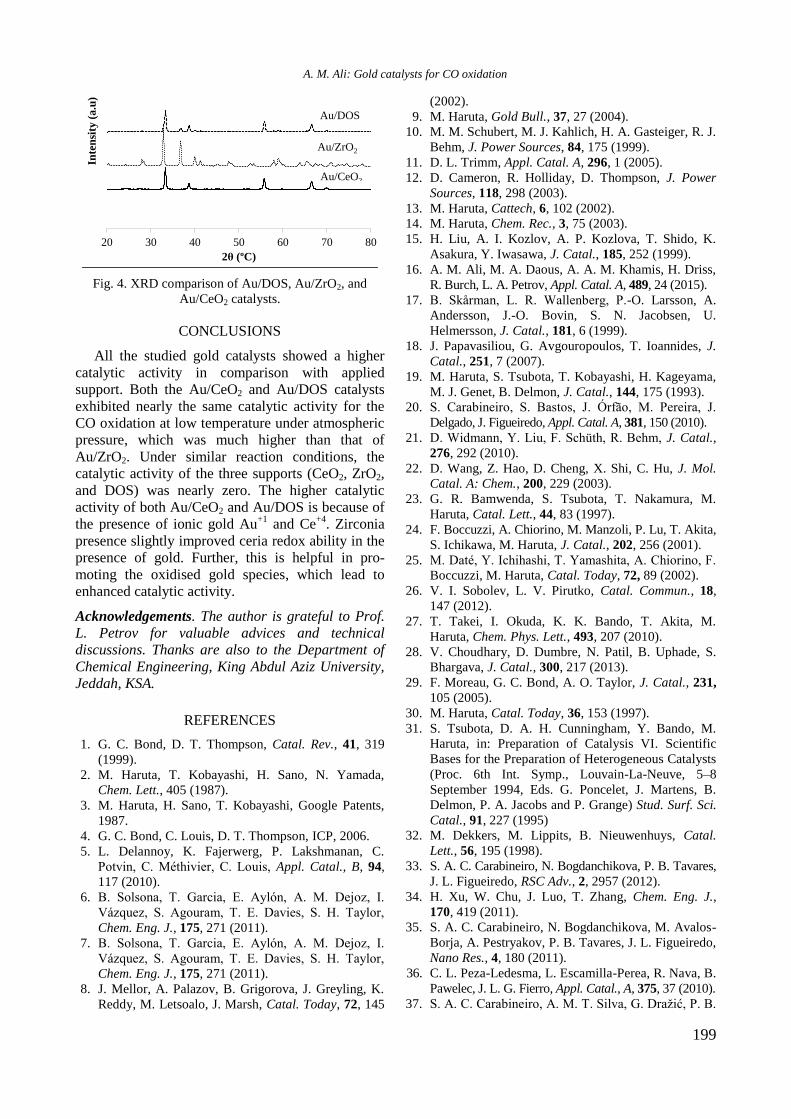
199
Fig. 4. XRD comparison of Au/DOS, Au/ZrO2, and
Au/CeO2 catalysts.
CONCLUSIONS
All the studied gold catalysts showed a higher
catalytic activity in comparison with applied
support. Both the Au/CeO2 and Au/DOS catalysts
exhibited nearly the same catalytic activity for the
CO oxidation at low temperature under atmospheric
pressure, which was much higher than that of
Au/ZrO2. Under similar reaction conditions, the
catalytic activity of the three supports (CeO2, ZrO2,
and DOS) was nearly zero. The higher catalytic
activity of both Au/CeO2 and Au/DOS is because of
the presence of ionic gold Au+1
and Ce+4
. Zirconia
presence slightly improved ceria redox ability in the
presence of gold. Further, this is helpful in pro-
moting the oxidised gold species, which lead to
enhanced catalytic activity.
Acknowledgements. The author is grateful to Prof.
L. Petrov for valuable advices and technical
discussions. Thanks are also to the Department of
Chemical Engineering, King Abdul Aziz University,
Jeddah, KSA.
REFERENCES
1. G. C. Bond, D. T. Thompson, Catal. Rev., 41, 319
(1999).
2. M. Haruta, T. Kobayashi, H. Sano, N. Yamada,
Chem. Lett., 405 (1987).
3. M. Haruta, H. Sano, T. Kobayashi, Google Patents,
1987.
4. G. C. Bond, C. Louis, D. T. Thompson, ICP, 2006.
5. L. Delannoy, K. Fajerwerg, P. Lakshmanan, C.
Potvin, C. Méthivier, C. Louis, Appl. Catal., B, 94,
117 (2010).
6. B. Solsona, T. Garcia, E. Aylón, A. M. Dejoz, I.
Vázquez, S. Agouram, T. E. Davies, S. H. Taylor,
Chem. Eng. J., 175, 271 (2011).
7. B. Solsona, T. Garcia, E. Aylón, A. M. Dejoz, I.
Vázquez, S. Agouram, T. E. Davies, S. H. Taylor,
Chem. Eng. J., 175, 271 (2011).
8. J. Mellor, A. Palazov, B. Grigorova, J. Greyling, K.
Reddy, M. Letsoalo, J. Marsh, Catal. Today, 72, 145
(2002).
9. M. Haruta, Gold Bull., 37, 27 (2004).
10. M. M. Schubert, M. J. Kahlich, H. A. Gasteiger, R. J.
Behm, J. Power Sources, 84, 175 (1999).
11. D. L. Trimm, Appl. Catal. A, 296, 1 (2005).
12. D. Cameron, R. Holliday, D. Thompson, J. Power
Sources, 118, 298 (2003).
13. M. Haruta, Cattech, 6, 102 (2002).
14. M. Haruta, Chem. Rec., 3, 75 (2003).
15. H. Liu, A. I. Kozlov, A. P. Kozlova, T. Shido, K.
Asakura, Y. Iwasawa, J. Catal., 185, 252 (1999).
16. A. M. Ali, M. A. Daous, A. A. M. Khamis, H. Driss,
R. Burch, L. A. Petrov, Appl. Catal. A, 489, 24 (2015).
17. B. Skårman, L. R. Wallenberg, P.-O. Larsson, A.
Andersson, J.-O. Bovin, S. N. Jacobsen, U.
Helmersson, J. Catal., 181, 6 (1999).
18. J. Papavasiliou, G. Avgouropoulos, T. Ioannides, J.
Catal., 251, 7 (2007).
19. M. Haruta, S. Tsubota, T. Kobayashi, H. Kageyama,
M. J. Genet, B. Delmon, J. Catal., 144, 175 (1993).
20. S. Carabineiro, S. Bastos, J. Órfão, M. Pereira, J.
Delgado, J. Figueiredo, Appl. Catal. A, 381, 150 (2010).
21. D. Widmann, Y. Liu, F. Schüth, R. Behm, J. Catal.,
276, 292 (2010).
22. D. Wang, Z. Hao, D. Cheng, X. Shi, C. Hu, J. Mol.
Catal. A: Chem., 200, 229 (2003).
23. G. R. Bamwenda, S. Tsubota, T. Nakamura, M.
Haruta, Catal. Lett., 44, 83 (1997).
24. F. Boccuzzi, A. Chiorino, M. Manzoli, P. Lu, T. Akita,
S. Ichikawa, M. Haruta, J. Catal., 202, 256 (2001).
25. M. Daté, Y. Ichihashi, T. Yamashita, A. Chiorino, F.
Boccuzzi, M. Haruta, Catal. Today, 72, 89 (2002).
26. V. I. Sobolev, L. V. Pirutko, Catal. Commun., 18,
147 (2012).
27. T. Takei, I. Okuda, K. K. Bando, T. Akita, M.
Haruta, Chem. Phys. Lett., 493, 207 (2010).
28. V. Choudhary, D. Dumbre, N. Patil, B. Uphade, S.
Bhargava, J. Catal., 300, 217 (2013).
29. F. Moreau, G. C. Bond, A. O. Taylor, J. Catal., 231,
105 (2005).
30. M. Haruta, Catal. Today, 36, 153 (1997).
31. S. Tsubota, D. A. H. Cunningham, Y. Bando, M.
Haruta, in: Preparation of Catalysis VI. Scientific
Bases for the Preparation of Heterogeneous Catalysts
(Proc. 6th Int. Symp., Louvain-La-Neuve, 5–8
September 1994, Eds. G. Poncelet, J. Martens, B.
Delmon, P. A. Jacobs and P. Grange) Stud. Surf. Sci.
Catal., 91, 227 (1995)
32. M. Dekkers, M. Lippits, B. Nieuwenhuys, Catal.
Lett., 56, 195 (1998).
33. S. A. C. Carabineiro, N. Bogdanchikova, P. B. Tavares,
J. L. Figueiredo, RSC Adv., 2, 2957 (2012).
34. H. Xu, W. Chu, J. Luo, T. Zhang, Chem. Eng. J.,
170, 419 (2011).
35. S. A. C. Carabineiro, N. Bogdanchikova, M. Avalos-
Borja, A. Pestryakov, P. B. Tavares, J. L. Figueiredo,
Nano Res., 4, 180 (2011).
36. C. L. Peza-Ledesma, L. Escamilla-Perea, R. Nava, B.
Pawelec, J. L. G. Fierro, Appl. Catal., A, 375, 37 (2010).
37. S. A. C. Carabineiro, A. M. T. Silva, G. Dražić, P. B.
20 30 40 50 60 70 80
2θ (ºC)
Au/CeO2
Au/DOS
Au/ZrO2
Inte
nsi
ty (
a.u
)
A. M. Ali: Gold catalysts for CO oxidation
200
Tavares, J. L. Figueiredo, Catal. Today, 154, 21 (2010).
38. T. Kobayashi, M. Haruta, S. Tsubota, H. Sano, B.
Delmon, Sens. Actuator B-Chem., 1, 222 (1990).
39. M. Ikegami, T. Matsumoto, Y. Kobayashi, Y. Jikihara,
T. Nakayama, H. Ohashi, T. Honma, T. Takei, M.
Haruta, Appl. Catal. B, 134, 130 (2013).
40. S. Carrettin, P. Concepción, A. Corma, J. M. Lopez
Nieto, V. F. Puntes, Angew. Chem. Int. Ed., 43, 2538
(2004).
41. O. H. Laguna, F. Romero Sarria, M. A. Centeno, J.
A. Odriozola, J. Catal., 276, 360 (2010).
42. T. Tabakova, G. Avgouropoulos, J. Papavasiliou, M.
Manzoli, F. Boccuzzi, K. Tenchev, F. Vindigni, T.
Ioannides, Appl. Catal. B, 101, 256 (2011).
43. H.-F. Li, N. Zhang, P. Chen, M.-F. Luo, J.-Q. Lu,
Appl. Catal. B, 110, 279 (2011).
44. E. Smolentseva, A. Simakov, S. Beloshapkin, M.
Estrada, E. Vargas, V. Sobolev, R. Kenzhin, S.
Fuentes, Appl. Catal. B, 115-116, 117 (2012).
45. H. Wang, H. Zhu, Z. Qin, G. Wang, F. Liang, J.
Wang, Catal. Commun., 9, 1487 (2008).
46. E. Mamontov, T. Egami, R. Brezny, M. Koranne, S.
Tyagi, J. Phys. Chem. B, 104, 11110 (2000).
47. G. J. Hutchings, M. S. Hall, A. F. Carley, P. Landon,
B. E. Solsona, C. J. Kiely, A. Herzing, M. Makkee, J.
A. Moulijn, A. Overweg, J. Catal., 242, 71 (2006).
48. K. M. Parida, N. Sahu, P. Mohapatra, M. S. Scurrell,
J. Mol. Catal. A: Chem., 319, 92 (2010).
ЗЛАТНИ ЙОНИ И КАТАЛИТИЧНА АКТИВНОСТ НА ЗЛАТНИ КАТАЛИЗАТОРИ ЗА
ОКИСЛЕНИЕ НА СО
А. М. Али
Департамент по инженерна химия и материали, Инженерен факултет, Университет „Крал Абдулазис“,
п.к. 80204, Джеда 21589, Кралство Саудитска Арабия
Постъпила на 31 януари 2018 г., Преработена на 14 март 2018 г.
(Резюме)
Изследвани са прясно приготвени златни катализатори нанесени върху три оксидни носителя CeO2, ZrO2 и
тяхна механична смес CeO2+ZrO2 (DOS) като катализатори за реакцията на окисление на СО при атмосферно
налягане. Каталитичната активност на образци от Au/CeO2 и Au/DOS е приблизително равна и е значително по-
висока от активността на Au/ZrO2 катализатор. Активността на изследваните златни катализатори се дължи на
присъствието на златни Au+1
йони, на Ce+4
и на високата мобилност на кислорода в цериевия диоксид.
A. M. Ali: Gold catalysts for CO oxidation
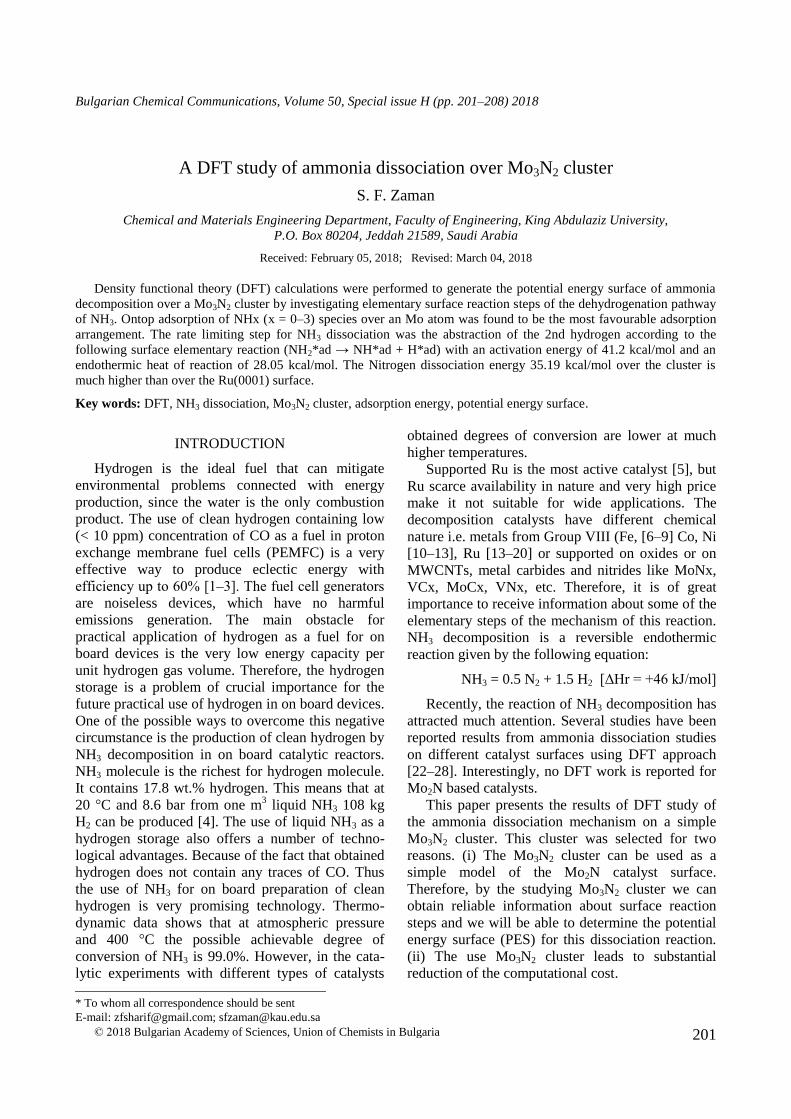
201
Bulgarian Chemical Communications, Volume 50, Special issue H (pp. 201–208) 2018
A DFT study of ammonia dissociation over Mo3N2 cluster
S. F. Zaman
Chemical and Materials Engineering Department, Faculty of Engineering, King Abdulaziz University,
P.O. Box 80204, Jeddah 21589, Saudi Arabia
Received: February 05, 2018; Revised: March 04, 2018
Density functional theory (DFT) calculations were performed to generate the potential energy surface of ammonia
decomposition over a Mo3N2 cluster by investigating elementary surface reaction steps of the dehydrogenation pathway
of NH3. Ontop adsorption of NHx (x = 0‒3) species over an Mo atom was found to be the most favourable adsorption
arrangement. The rate limiting step for NH3 dissociation was the abstraction of the 2nd hydrogen according to the
following surface elementary reaction (NH2*ad → NH*ad + H*ad) with an activation energy of 41.2 kcal/mol and an
endothermic heat of reaction of 28.05 kcal/mol. The Nitrogen dissociation energy 35.19 kcal/mol over the cluster is
much higher than over the Ru(0001) surface.
Key words: DFT, NH3 dissociation, Mo3N2 cluster, adsorption energy, potential energy surface.
INTRODUCTION
Hydrogen is the ideal fuel that can mitigate
environmental problems connected with energy
production, since the water is the only combustion
product. The use of clean hydrogen containing low
(< 10 ppm) concentration of CO as a fuel in proton
exchange membrane fuel cells (PEMFC) is a very
effective way to produce eclectic energy with
efficiency up to 60% [1‒3]. The fuel cell generators
are noiseless devices, which have no harmful
emissions generation. The main obstacle for
practical application of hydrogen as a fuel for on
board devices is the very low energy capacity per
unit hydrogen gas volume. Therefore, the hydrogen
storage is a problem of crucial importance for the
future practical use of hydrogen in on board devices.
One of the possible ways to overcome this negative
circumstance is the production of clean hydrogen by
NH3 decomposition in on board catalytic reactors.
NH3 molecule is the richest for hydrogen molecule.
It contains 17.8 wt.% hydrogen. This means that at
20 °C and 8.6 bar from one m3 liquid NH3 108 kg
H2 can be produced [4]. The use of liquid NH3 as a
hydrogen storage also offers a number of techno-
logical advantages. Because of the fact that obtained
hydrogen does not contain any traces of CO. Thus
the use of NH3 for on board preparation of clean
hydrogen is very promising technology. Thermo-
dynamic data shows that at atmospheric pressure
and 400 °C the possible achievable degree of
conversion of NH3 is 99.0%. However, in the cata-
lytic experiments with different types of catalysts
obtained degrees of conversion are lower at much
higher temperatures.
Supported Ru is the most active catalyst [5], but
Ru scarce availability in nature and very high price
make it not suitable for wide applications. The
decomposition catalysts have different chemical
nature i.e. metals from Group VIII (Fe, [6‒9] Co, Ni
[10‒13], Ru [13‒20] or supported on oxides or on
MWCNTs, metal carbides and nitrides like MoNx,
VCx, MoCx, VNx, etc. Therefore, it is of great
importance to receive information about some of the
elementary steps of the mechanism of this reaction.
NH3 decomposition is a reversible endothermic
reaction given by the following equation:
NH3 = 0.5 N2 + 1.5 H2 [ΔHr = +46 kJ/mol]
Recently, the reaction of NH3 decomposition has
attracted much attention. Several studies have been
reported results from ammonia dissociation studies
on different catalyst surfaces using DFT approach
[22‒28]. Interestingly, no DFT work is reported for
Mo2N based catalysts.
This paper presents the results of DFT study of
the ammonia dissociation mechanism on a simple
Mo3N2 cluster. This cluster was selected for two
reasons. (i) The Mo3N2 cluster can be used as a
simple model of the Mo2N catalyst surface.
Therefore, by the studying Mo3N2 cluster we can
obtain reliable information about surface reaction
steps and we will be able to determine the potential
energy surface (PES) for this dissociation reaction.
(ii) The use Mo3N2 cluster leads to substantial
reduction of the computational cost.
© 2018 Bulgarian Academy of Sciences, Union of Chemists in Bulgaria
* To whom all correspondence should be sent
E-mail: [email protected]; [email protected]
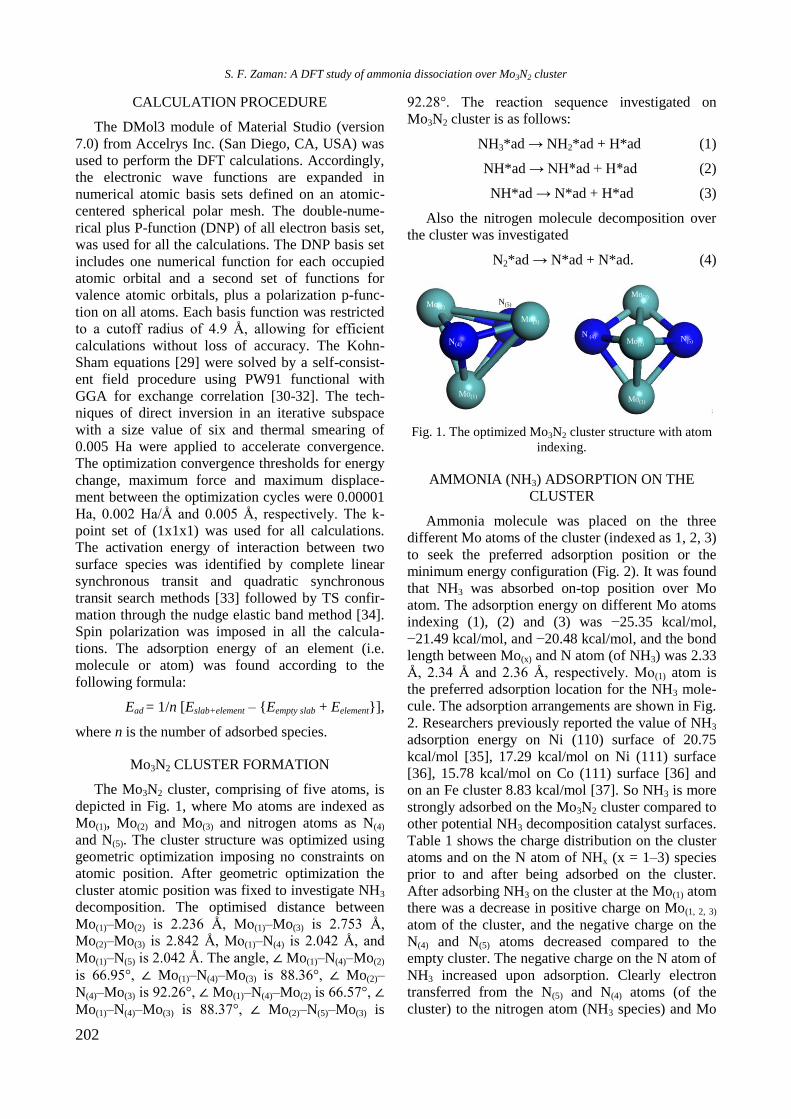
202
CALCULATION PROCEDURE
The DMol3 module of Material Studio (version
7.0) from Accelrys Inc. (San Diego, CA, USA) was
used to perform the DFT calculations. Accordingly,
the electronic wave functions are expanded in
numerical atomic basis sets defined on an atomic-
centered spherical polar mesh. The double-nume-
rical plus P-function (DNP) of all electron basis set,
was used for all the calculations. The DNP basis set
includes one numerical function for each occupied
atomic orbital and a second set of functions for
valence atomic orbitals, plus a polarization p-func-
tion on all atoms. Each basis function was restricted
to a cutoff radius of 4.9 Å, allowing for efficient
calculations without loss of accuracy. The Kohn-
Sham equations [29] were solved by a self-consist-
ent field procedure using PW91 functional with
GGA for exchange correlation [30-32]. The tech-
niques of direct inversion in an iterative subspace
with a size value of six and thermal smearing of
0.005 Ha were applied to accelerate convergence.
The optimization convergence thresholds for energy
change, maximum force and maximum displace-
ment between the optimization cycles were 0.00001
Ha, 0.002 Ha/Å and 0.005 Å, respectively. The k-
point set of (1x1x1) was used for all calculations.
The activation energy of interaction between two
surface species was identified by complete linear
synchronous transit and quadratic synchronous
transit search methods [33] followed by TS confir-
mation through the nudge elastic band method [34].
Spin polarization was imposed in all the calcula-
tions. The adsorption energy of an element (i.e.
molecule or atom) was found according to the
following formula:
Ead = 1/n [Eslab+element – {Eempty slab + Eelement}],
where n is the number of adsorbed species.
Mo3N2 CLUSTER FORMATION
The Mo3N2 cluster, comprising of five atoms, is
depicted in Fig. 1, where Mo atoms are indexed as
Mo(1), Mo(2) and Mo(3) and nitrogen atoms as N(4)
and N(5). The cluster structure was optimized using
geometric optimization imposing no constraints on
atomic position. After geometric optimization the
cluster atomic position was fixed to investigate NH3
decomposition. The optimised distance between
Mo(1)‒Mo(2) is 2.236 Å, Mo(1)‒Mo(3) is 2.753 Å,
Mo(2)‒Mo(3) is 2.842 Å, Mo(1)‒N(4) is 2.042 Å, and
Mo(1)‒N(5) is 2.042 Å. The angle, ∠ Mo(1)‒N(4)‒Mo(2)
is 66.95°, ∠ Mo(1)‒N(4)‒Mo(3) is 88.36°, ∠ Mo(2)‒
N(4)‒Mo(3) is 92.26°, ∠ Mo(1)‒N(4)‒Mo(2) is 66.57°, ∠
Mo(1)‒N(4)‒Mo(3) is 88.37°, ∠ Mo(2)‒N(5)‒Mo(3) is
92.28°. The reaction sequence investigated on
Mo3N2 cluster is as follows:
NH3*ad → NH2*ad + H*ad (1)
NH*ad → NH*ad + H*ad (2)
NH*ad → N*ad + H*ad (3)
Also the nitrogen molecule decomposition over
the cluster was investigated
N2*ad → N*ad + N*ad. (4)
Fig. 1. The optimized Mo3N2 cluster structure with atom
indexing.
AMMONIA (NH3) ADSORPTION ON THE
CLUSTER
Ammonia molecule was placed on the three
different Mo atoms of the cluster (indexed as 1, 2, 3)
to seek the preferred adsorption position or the
minimum energy configuration (Fig. 2). It was found
that NH3 was absorbed on-top position over Mo
atom. The adsorption energy on different Mo atoms
indexing (1), (2) and (3) was −25.35 kcal/mol,
−21.49 kcal/mol, and −20.48 kcal/mol, and the bond
length between Mo(x) and N atom (of NH3) was 2.33
Å, 2.34 Å and 2.36 Å, respectively. Mo(1) atom is
the preferred adsorption location for the NH3 mole-
cule. The adsorption arrangements are shown in Fig.
2. Researchers previously reported the value of NH3
adsorption energy on Ni (110) surface of 20.75
kcal/mol [35], 17.29 kcal/mol on Ni (111) surface
[36], 15.78 kcal/mol on Co (111) surface [36] and
on an Fe cluster 8.83 kcal/mol [37]. So NH3 is more
strongly adsorbed on the Mo3N2 cluster compared to
other potential NH3 decomposition catalyst surfaces.
Table 1 shows the charge distribution on the cluster
atoms and on the N atom of NHx (x = 1‒3) species
prior to and after being adsorbed on the cluster.
After adsorbing NH3 on the cluster at the Mo(1) atom
there was a decrease in positive charge on Mo(1, 2, 3)
atom of the cluster, and the negative charge on the
N(4) and N(5) atoms decreased compared to the
empty cluster. The negative charge on the N atom of
NH3 increased upon adsorption. Clearly electron
transferred from the N(5) and N(4) atoms (of the
cluster) to the nitrogen atom (NH3 species) and Mo
Mo(3)
Mo(2)
Mo(1)
N(4)
N(5)
Mo(1)
Mo(2)
Mo(3)
N (4) N(5)
S. F. Zaman: A DFT study of ammonia dissociation over Mo3N2 cluster
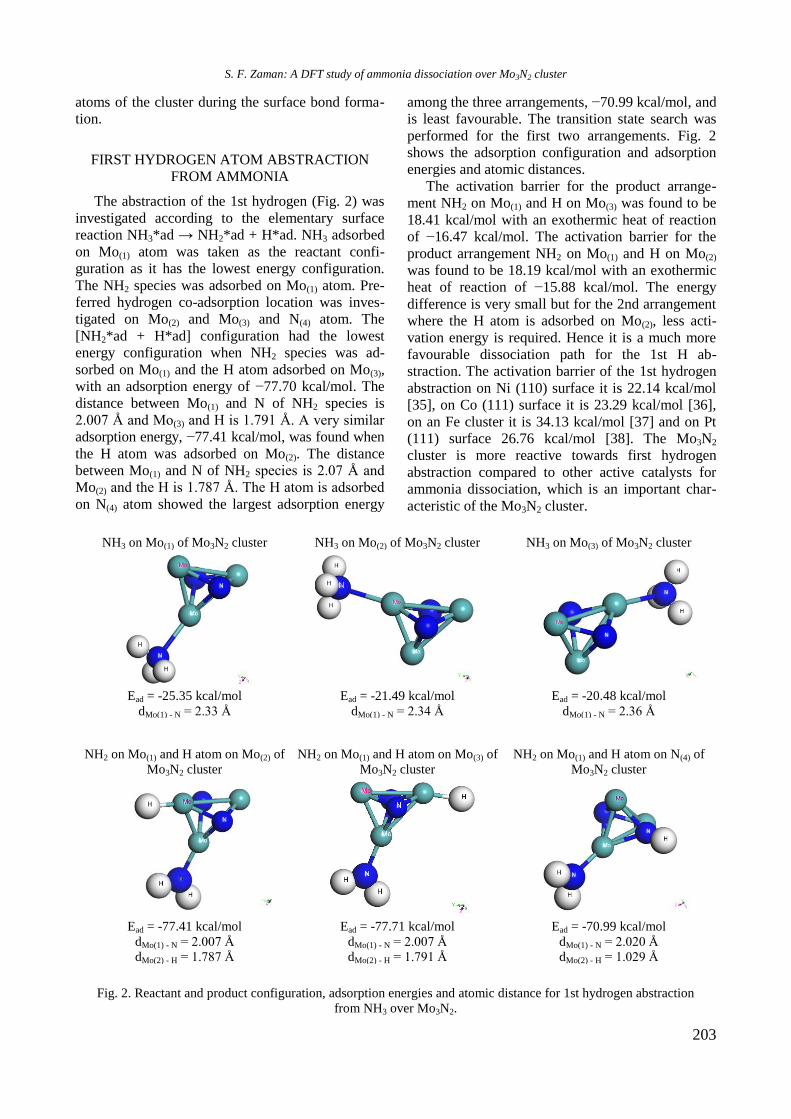
203
atoms of the cluster during the surface bond forma-
tion.
FIRST HYDROGEN ATOM ABSTRACTION
FROM AMMONIA
The abstraction of the 1st hydrogen (Fig. 2) was
investigated according to the elementary surface
reaction NH3*ad → NH2*ad + H*ad. NH3 adsorbed
on Mo(1) atom was taken as the reactant confi-
guration as it has the lowest energy configuration.
The NH2 species was adsorbed on Mo(1) atom. Pre-
ferred hydrogen co-adsorption location was inves-
tigated on Mo(2) and Mo(3) and N(4) atom. The
[NH2*ad + H*ad] configuration had the lowest
energy configuration when NH2 species was ad-
sorbed on Mo(1) and the H atom adsorbed on Mo(3),
with an adsorption energy of −77.70 kcal/mol. The
distance between Mo(1) and N of NH2 species is
2.007 Å and Mo(3) and H is 1.791 Å. A very similar
adsorption energy, −77.41 kcal/mol, was found when
the H atom was adsorbed on Mo(2). The distance
between Mo(1) and N of NH2 species is 2.07 Å and
Mo(2) and the H is 1.787 Å. The H atom is adsorbed
on N(4) atom showed the largest adsorption energy
among the three arrangements, −70.99 kcal/mol, and
is least favourable. The transition state search was
performed for the first two arrangements. Fig. 2
shows the adsorption configuration and adsorption
energies and atomic distances.
The activation barrier for the product arrange-
ment NH2 on Mo(1) and H on Mo(3) was found to be
18.41 kcal/mol with an exothermic heat of reaction
of −16.47 kcal/mol. The activation barrier for the
product arrangement NH2 on Mo(1) and H on Mo(2)
was found to be 18.19 kcal/mol with an exothermic
heat of reaction of −15.88 kcal/mol. The energy
difference is very small but for the 2nd arrangement
where the H atom is adsorbed on Mo(2), less acti-
vation energy is required. Hence it is a much more
favourable dissociation path for the 1st H ab-
straction. The activation barrier of the 1st hydrogen
abstraction on Ni (110) surface it is 22.14 kcal/mol
[35], on Co (111) surface it is 23.29 kcal/mol [36],
on an Fe cluster it is 34.13 kcal/mol [37] and on Pt
(111) surface 26.76 kcal/mol [38]. The Mo3N2
cluster is more reactive towards first hydrogen
abstraction compared to other active catalysts for
ammonia dissociation, which is an important char-
acteristic of the Mo3N2 cluster.
NH3 on Mo(1) of Mo3N2 cluster NH3 on Mo(2) of Mo3N2 cluster NH3 on Mo(3) of Mo3N2 cluster
Ead = -25.35 kcal/mol
dMo(1) - N = 2.33 Å
Ead = -21.49 kcal/mol
dMo(1) - N = 2.34 Å
Ead = -20.48 kcal/mol
dMo(1) - N = 2.36 Å
NH2 on Mo(1) and H atom on Mo(2) of
Mo3N2 cluster
NH2 on Mo(1) and H atom on Mo(3) of
Mo3N2 cluster
NH2 on Mo(1) and H atom on N(4) of
Mo3N2 cluster
Ead = -77.41 kcal/mol
dMo(1) - N = 2.007 Å
dMo(2) - H = 1.787 Å
Ead = -77.71 kcal/mol
dMo(1) - N = 2.007 Å
dMo(2) - H = 1.791 Å
Ead = -70.99 kcal/mol
dMo(1) - N = 2.020 Å
dMo(2) - H = 1.029 Å
Fig. 2. Reactant and product configuration, adsorption energies and atomic distance for 1st hydrogen abstraction
from NH3 over Mo3N2.
S. F. Zaman: A DFT study of ammonia dissociation over Mo3N2 cluster
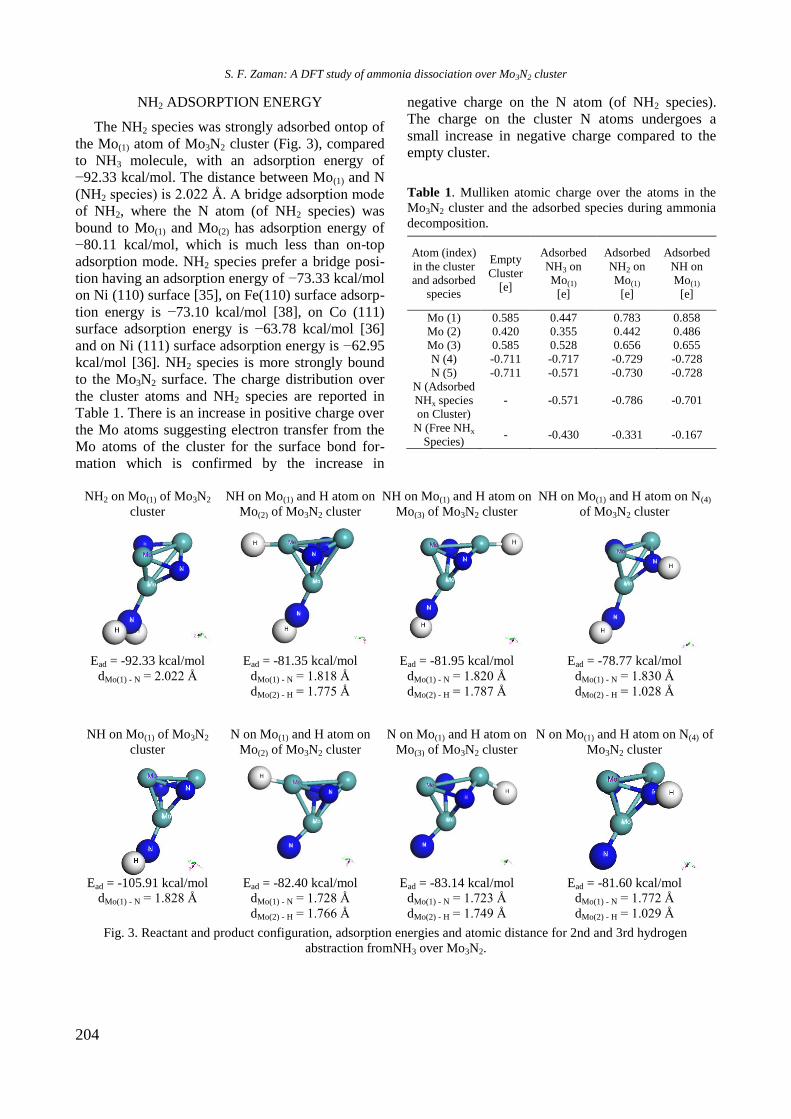
204
NH2 ADSORPTION ENERGY
The NH2 species was strongly adsorbed ontop of
the Mo(1) atom of Mo3N2 cluster (Fig. 3), compared
to NH3 molecule, with an adsorption energy of
−92.33 kcal/mol. The distance between Mo(1) and N
(NH2 species) is 2.022 Å. A bridge adsorption mode
of NH2, where the N atom (of NH2 species) was
bound to Mo(1) and Mo(2) has adsorption energy of
−80.11 kcal/mol, which is much less than on-top
adsorption mode. NH2 species prefer a bridge posi-
tion having an adsorption energy of −73.33 kcal/mol
on Ni (110) surface [35], on Fe(110) surface adsorp-
tion energy is −73.10 kcal/mol [38], on Co (111)
surface adsorption energy is −63.78 kcal/mol [36]
and on Ni (111) surface adsorption energy is −62.95
kcal/mol [36]. NH2 species is more strongly bound
to the Mo3N2 surface. The charge distribution over
the cluster atoms and NH2 species are reported in
Table 1. There is an increase in positive charge over
the Mo atoms suggesting electron transfer from the
Mo atoms of the cluster for the surface bond for-
mation which is confirmed by the increase in
negative charge on the N atom (of NH2 species).
The charge on the cluster N atoms undergoes a
small increase in negative charge compared to the
empty cluster.
Table 1. Mulliken atomic charge over the atoms in the
Mo3N2 cluster and the adsorbed species during ammonia
decomposition.
Atom (index)
in the cluster
and adsorbed
species
Empty
Cluster
[e]
Adsorbed
NH3 on
Mo(1)
[e]
Adsorbed
NH2 on
Mo(1)
[e]
Adsorbed
NH on
Mo(1)
[e]
Mo (1) 0.585 0.447 0.783 0.858
Mo (2) 0.420 0.355 0.442 0.486
Mo (3) 0.585 0.528 0.656 0.655
N (4) -0.711 -0.717 -0.729 -0.728
N (5) -0.711 -0.571 -0.730 -0.728
N (Adsorbed
NHx species
on Cluster)
- -0.571 -0.786 -0.701
N (Free NHx
Species) - -0.430 -0.331 -0.167
NH2 on Mo(1) of Mo3N2
cluster
NH on Mo(1) and H atom on
Mo(2) of Mo3N2 cluster
NH on Mo(1) and H atom on
Mo(3) of Mo3N2 cluster
NH on Mo(1) and H atom on N(4)
of Mo3N2 cluster
Ead = -92.33 kcal/mol
dMo(1) - N = 2.022 Å
Ead = -81.35 kcal/mol
dMo(1) - N = 1.818 Å
dMo(2) - H = 1.775 Å
Ead = -81.95 kcal/mol
dMo(1) - N = 1.820 Å
dMo(2) - H = 1.787 Å
Ead = -78.77 kcal/mol
dMo(1) - N = 1.830 Å
dMo(2) - H = 1.028 Å
NH on Mo(1) of Mo3N2
cluster
N on Mo(1) and H atom on
Mo(2) of Mo3N2 cluster
N on Mo(1) and H atom on
Mo(3) of Mo3N2 cluster
N on Mo(1) and H atom on N(4) of
Mo3N2 cluster
Ead = -105.91 kcal/mol
dMo(1) - N = 1.828 Å
Ead = -82.40 kcal/mol
dMo(1) - N = 1.728 Å
dMo(2) - H = 1.766 Å
Ead = -83.14 kcal/mol
dMo(1) - N = 1.723 Å
dMo(2) - H = 1.749 Å
Ead = -81.60 kcal/mol
dMo(1) - N = 1.772 Å
dMo(2) - H = 1.029 Å
Fig. 3. Reactant and product configuration, adsorption energies and atomic distance for 2nd and 3rd hydrogen
abstraction fromNH3 over Mo3N2.
S. F. Zaman: A DFT study of ammonia dissociation over Mo3N2 cluster
205
SECOND HYDROGEN ATOM ABSTRACTION
The abstraction of the 2nd hydrogen was inves-
tigated according to the elementary surface reaction
NH2*ad → NH*ad + H*ad. NH* species adsorbed
on the Mo(1) atom was taken as the reactant confi-
guration (Fig. 3). For the product configuration,
three different surface arrangement were investi-
gated with NH species on Mo(1) and H on three
different positions, Mo(2), Mo(3) and N(4) atom. The
binding energies are −95.98 kcal/mol, 81.95
kcal/mol and −78.78 kcal/mol, respectively. Hence
NH species on Mo(1) and H atom on Mo(2) is ener-
getically the most favourable product configuration
where the atomic distance between Mo(1) and N (NH
species) is 1.818 Å and between Mo(2) and H atom is
1.775 Å. Fig. 3 shows the adsorption configuration
and adsorption energies and atomic distances. A
transition state search found that the dissociation
energy barrier is 41.20 kcal/mol with an endo-
thermic reaction energy of 28.08 kcal/mol. X. Duan
et al. [35] reported an activation barrier of 37.59
kcal/mol over Ni(110) plane, over Pt (111) surface
the barrier is 36.09 kcal/mol [38], over Co (111)
surface the barrier is 4.84 kcal/mol [36] and over Fe
cluster the barrier 20.75 kcal/mol [37].
NH ADSORPTION ENERGY
The NH species is strongly adsorbed ontop of the
Mo(1) atom of the Mo3N2 cluster (Fig. 3) compared
to NH3 and NH2, with an adsorption energy of
-105.91 kcal/mol. The distance between Mo(1) and N
(NH species) is 1.828 Å. A bridge adsorption mode
of NH, where the N atom is bound to Mo(1) and
Mo(2), has an adsorption energy of -94.79 kcal/mol,
which is much less than the on-top adsorption mode.
The NH species prefer a bridge position having an
adsorption energy of −91.08 kcal/mol on Ni(110)
[35], on Co(111) surface, the hcp location has
adsorption energy of -106.76 kcal/mol [36] and on
Ni(111) surface, the fcc location has adsorption
energy of −105.38 kcal/mol [36]. There is an
increase in positive charge over the cluster Mo
atoms, especially on the Mo(1) and Mo(3) suggesting
the electron transfer from the Mo atoms of the
cluster for the surface bond formation with NH
species, which is confirmed by the increase in
negative charge on the N atom (of NH species). The
charge on the cluster N atoms undergoes small
increase in negative charge.
THIRD HYDROGEN ATOM ABSTRACTION
The abstraction of the 3rd hydrogen atom from
NH3 was investigated according to the elementary
surface reaction NH*ad → N*ad + H*ad (Fig. 3).
The NH species adsorbed on the Mo(1) atom was
taken as the reactant configuration. For the product
configuration three different surface arrangements
were investigated with N species on Mo(1) and H on
three different positions, Mo(2), Mo(3) and N(4) atom
with binding energy −82.40 kcal/mol, −83.14
kcal/mol and −77.41 kcal/mol, respectively. Hence
the N species on Mo(1) and the H atom on Mo(3) is
energetically the most favourable product configu-
ration where the atomic distance between Mo(1) and
N (NH species) is 1.723 Å and Mo(2) and H is 1.749
Å. Fig. 3 shows the adsorption configuration, ad-
sorption energies and atomic distances. A transition
state search found that the dissociation energy
barrier is 33.89 kcal/mol with the endothermic
reaction energy of 28.38 kcal/mol. Duan X. et al.
[35] reported an activation barrier 20.52 kcal/mol
over Ni(110) plane, over Pt(111) surface the barrier
is 34.42 kcal/mol [38], over Co(111) surface the
barrier is 24.44 kcal/mol [36] and over Fe cluster
7.84 kcal/mol [37]. Charges on atoms of the cluster
and on the adsorbed molecules are tabulated in
Table 1.
POTENTIAL ENERGY SURFACE OF NH3
DISSOCIATION
The activation barrier and reaction energies of
the surface elementary reactions of ammonia
decomposition for the Mo3N2 cluster and some other
potential surfaces are tabulated in Table 2 and the
potential energy surface on the Mo3N2 cluster is
depicted in Fig. 4, taking free Mo3N2 cluster and
free NH3 molecule as the zero energy reference.
Only the 1st hydrogen abstraction step is exothermic
(-15.88 kcal/mol) and the other two are highly
endothermic (28.05 and 28.35 kcal/mol for the 2nd
and 3rd abstraction respectively), make the overall
hydrogen abstraction process highly endothermic
(15.12 kcal/mol). The activation barrier has the
highest value for the 2nd hydrogen abstraction step
(NH2*ad → NH*ad + H*ad), 41.2 kcal/mol (172.21
kJ/mol), and this is the rate limiting step for NH3
dissociation over Mo3N2 cluster. Offermans et al.
[38] also reported the 2nd hydrogen abstraction as
the rate limiting step for Pt (111) surface and also
found the same rate limiting step was reported by
Duan et al. [36] for Ni (110) and by Mhadeshwar et
al. [39] over Ru (0001) plane. Lanzania [37]
reported the 1st hydrogen abstraction as the rate
limiting step for NH3 dissociation on nanosized iron
cluster and Duan et al. [36] reported the 3rd
hydrogen abstraction step as the rate limiting step.
Mo3N2 cluster resembles Pt (111), Ru (0001) and Ni
(111) plane regarding the rate-limiting step.
S. F. Zaman: A DFT study of ammonia dissociation over Mo3N2 cluster
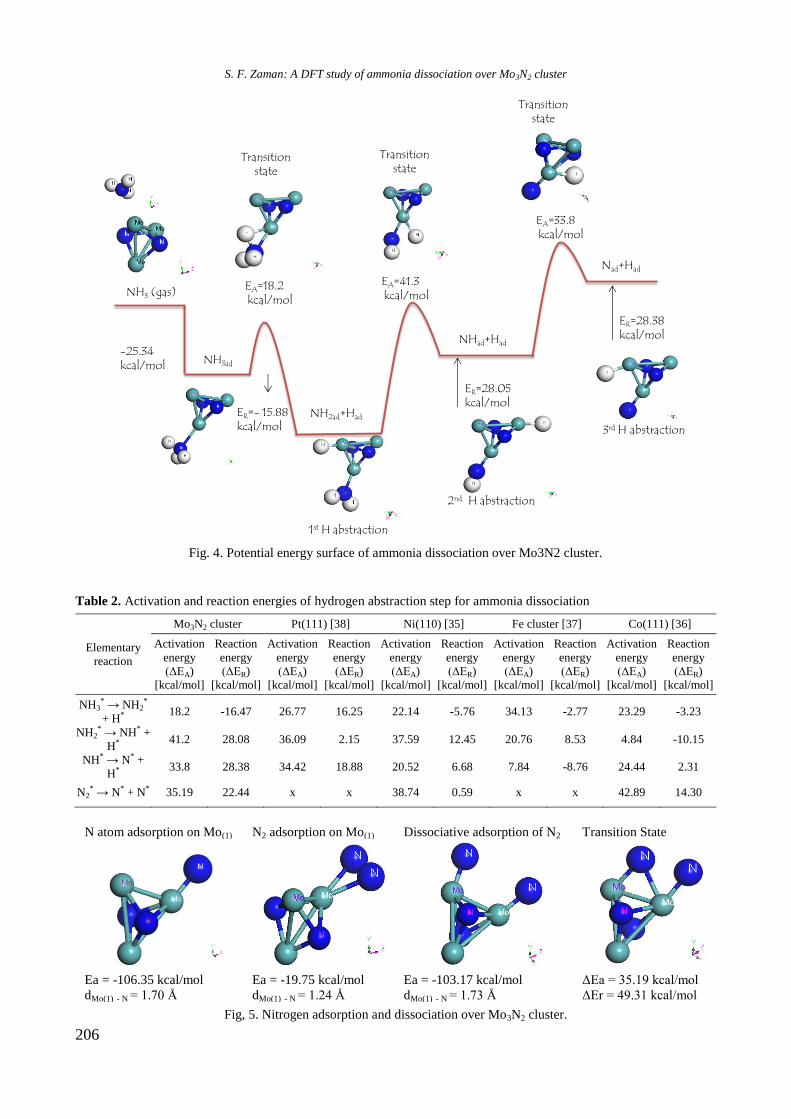
206
Fig. 4. Potential energy surface of ammonia dissociation over Mo3N2 cluster.
Table 2. Activation and reaction energies of hydrogen abstraction step for ammonia dissociation
Elementary
reaction
Mo3N2 cluster Pt(111) [38] Ni(110) [35] Fe cluster [37] Co(111) [36]
Activation
energy
(ΔEA) [kcal/mol]
Reaction
energy
(ΔER) [kcal/mol]
Activation
energy
(ΔEA) [kcal/mol]
Reaction
energy
(ΔER) [kcal/mol]
Activation
energy
(ΔEA) [kcal/mol]
Reaction
energy
(ΔER) [kcal/mol]
Activation
energy
(ΔEA) [kcal/mol]
Reaction
energy
(ΔER) [kcal/mol]
Activation
energy
(ΔEA) [kcal/mol]
Reaction
energy
(ΔER) [kcal/mol]
NH3* → NH2
*
+ H* 18.2 -16.47 26.77 16.25 22.14 -5.76 34.13 -2.77 23.29 -3.23
NH2* → NH* +
H* 41.2 28.08 36.09 2.15 37.59 12.45 20.76 8.53 4.84 -10.15
NH* → N* +
H* 33.8 28.38 34.42 18.88 20.52 6.68 7.84 -8.76 24.44 2.31
N2* → N* + N* 35.19 22.44 x x 38.74 0.59 x x 42.89 14.30
N atom adsorption on Mo(1) N2 adsorption on Mo(1) Dissociative adsorption of N2 Transition State
Ea = -106.35 kcal/mol
dMo(1) - N = 1.70 Å
Ea = -19.75 kcal/mol
dMo(1) - N = 1.24 Å
Ea = -103.17 kcal/mol
dMo(1) - N = 1.73 Å
ΔEa = 35.19 kcal/mol
ΔEr = 49.31 kcal/mol
Fig, 5. Nitrogen adsorption and dissociation over Mo3N2 cluster.
-25.34 kcal/mol
ER=- 15.88 kcal/mol
EA=18.2kcal/mol
NH2ad+Had
NHad+Had
ER=28.05 kcal/mol
EA=41.3kcal/mol
ER=28.38 kcal/mol
NH3ad
NH3 (gas)
EA=33.8kcal/mol
Nad+Had
Transition state
Transition state
Transition state
1st H abstraction
3rd H abstraction
2nd H abstraction
S. F. Zaman: A DFT study of ammonia dissociation over Mo3N2 cluster
207
NITROGEN ADSORPTION AND
DISSOCIATION
Fig. 5 depicts the adsorption and dissociation of
the nitrogen molecule. Atomic adsorption of the N
atom on the Mo(1) atom of the cluster is −106.35
kcal/mol and when two N atoms adsorb on two
different Mo atoms, Mo(1) and Mo(2), the adsorption
energy is −103.73 kcal/mol, showing a small
decrease due to interaction effects. The N2 molecule
adsorbed on the Mo(1) atom making a bond with two
N atoms has an adsorption energy of −19.75
kcal/mol. The molecular nitrogen dissociation
energy has an activation barrier of 35.19 kcal/mol
and an endothermic reaction energy of 49 kcal/mol.
The dissociation barrier of the N2 molecule is 38.78
kcal/mol on Ni (110) surface [35], 43.82 kcal/mol
on terraces of Ru (0001) surface [40], and 9.42
kcal/mol on steps of Ru(0001) [40] and 9.42
kcal/mol on V(110) surface [41]. Nitrogen disso-
ciation is much more difficult on the Mo3N2 cluster
compared to the other promising catalyst surfaces,
which suggests that the ammonia decomposition
follows the Tamaru mechanism over the Mo3N2
cluster, where ammonia activation and nitrogen
desorption are rate limiting, similar to VN catalysts
reported by Oyama et al. [42].
CONCLUSIONS
A DFT study was employed to determine the
adsorption energy of NHx (x = 1‒3) and the
transition state and the activation barrier of NH3
dehydrogenation and N2 dissociation over the
Mo3N2 cluster. The results of calculations have
shown that On-top adsorption configuration was the
preferred adsorption arrangement for NHx species
over an Mo atom. The rate-limiting step for NH3
decomposition is the second hydrogen abstraction
step according to the following surface elementary
reaction (NH2*ad → NH*ad + H*ad) having an
activation energy of 41.2 kcal/mol with an endo-
thermic heat of reaction of 28.05 kcal/mol. Nitrogen
dissociation has a barrier of 35.19 kcal/mol on the
Mo3N2, which is much higher than on Ru and V
catalysts.
Acknowledgment: This work was supported by
Chemical and Materials Engineering Department at
King Abdulaziz University, Jeddah, Saudi Arabia.
REFERENCES
1. B. L. Yi, Fuel Cells – Principle, Technology and
Application, Chemical Industrial Publisher, Beijing,
2003.
2. A. S. Chellappal, C. M. Fischer, W. J. Thomson,
App. Catal. A, 227, 231 (2002).
3. L. F. Brown, Int. J. Hydrog. Energy, 26, 381 (2001).
4. C. Zamfirescu, I. Dincer, Fuel Proc. Tech., 90, 729
(2009).
5. S. F. Yin, B. Q. Xu, C. F. Ng, C. T. Au, App. Catal.
B: Environ., 52, 287 (2004).
6. S. F. Yin, B. Q. Xu, X. P. Zhou, C. T. Au, Appl.
Catal. A, 277, 1 (2004).
7. J. Zhang, M. Comotti, F. Schuth, R. Schlogl, D. S.
Su, Chem. Commun., 17, 1916 (2007).
8. R. Pelka, I. Moszynska, W. Arabczyk, Catal. Lett.,
128, 72 (2009).
9. Y. Liu, H. Wang, J. F. Li, Y. Lu, Q. S. Xue, J. C.
Chen, AIChE, 53, 1845 (2007).
10. Y. Lu, H. Wang, Y. Liu, Q. S. Xue, J. C. Chen, M. Y.
He, Lab Chip., 7, 133 (2007).
11. X. K. Li, W. J. Ji, J. Zhao, S. J. Wang, C. T. Au, J.
Catal., 236, 181 (2005).
12. T. V. Choudhary, D. C. Svammonia, D. W.
Goodman, Catal. Lett., 72, 197 (2001).
13. M. E. E. Abashar, Y. S. Al-Sughair, I. S. Al-Mutaz,
Appl. Catal. A., 236, 35 (2002).
14. A. Hellman, K. Honkala, I. N. Remediakis, D. A.
Logammonia, A. Carlsson, S. Dahl, H. Christensen,
J. K. Norskov, Surf. Sci., 603, 1731 (2009).
15. S. Dahl, D. A. Logammonia, R. C. Egeberg, J. H.
Larsen, I. Chorkendorff, E. Tornqvist, J. K. Norskov,
Phys. Rev. Lett., 83, 1814 (1999).
16. S. Dahl, E. Tornqvist, I. Chorkendorff, J. Catal., 192,
381 (2000).
17. P. F. Ng, L. Li, S. B. Wang, Z. H. Zhu, G. Q. Lu, Z.
F. Yan, Environ. Sci. Technol., 41, 3758 (2007).
18. A. Klerke, S. K. Klitgaard, R. Fehrmann, Catal. Lett.,
130, 541 (2009).
19. S. R. Deshmukh, A. B. Mhadeshwar, D. G. Vlachos,
Ind. Eng. Chem. Res., 43, 2986 (2004).
20. A. M. Karim, V. Prash, G. Mpourmpakis, W. W.
Lonergan, A. I. Frenkel, J. G. Chen, D. G. Vlachos,
J. Am. Chem. Soc., 131, 12230 (2009).
21. W. Q. Zheng, J. Zhang, H. Y. Xu, W. Z. Li, Catal.
Lett., 119, 311 (2007).
22. C. W. Seabury, T. N. Rhodin, R. J. Purtell, R. P.
Merrill, Surf. Sci., 93, 117 (1980).
23. C. Egawa, T. Nishida, S. Naito, K. Tamaru, J. Chem.
Soc. Faraday Trans. I, 80, 1595 (1984).
24. F. Frechard, R .A. van Santen, A. Siokou, J. W.
Niemantsverdriet, J. Hafner, J. Chem. Phys., 111,
8124 (1999).
25. S. Stolbov, T. S. Rahman, J. Chem. Phys., 123,
204716 (2005).
26. W. P. Krekelberg, J. Greeley, M. Mavrikakis, J.
Phys. Chem. B, 108, 987 (2004).
27. X. Z. Xiao, Y. L. Cao, Y. Y Cai, Surf. Sci., 605, 802
(2012).
28. W. Tsai, W. H. Weinberg, J. Phys. Chem., 91, 5302
(1987).
29. W. Kohn, L. J. Sham, Phys. Rev., 140, A1133 (1965).
30. J. P. Perdew, J. A. Chevary, S. H. Vosko, K. A.
Jackson, M. R. Pederson, D. J. Singh, C. Fiolhais,
Phys. Rev. B, 46, 6671 (1992).
31. A. D. Becke, J. Chem. Phys., 88, 2547 (1988).
S. F. Zaman: A DFT study of ammonia dissociation over Mo3N2 cluster
208
32. J. P. Perdew, Y. Wang, Phys. Rev. B, 45, 13244
(1992).
33. T. A. Halgren, W. N. Lipscomb, Chem. Phys. Lett.,
49, 225 (1977).
34. S. Bell, J. S. Crighton, J. Chem. Phys., 80, 2464 (1983).
35. X. Duan, G. Qian, C. Fan, Y. Zhu, X. Zhou, D. Chen,
W. Yuan, Surf. Sci., 606, 549 (2012).
36. G. Lanzania, K. Laasonen, Int. J. Hydrog. Energy,
35, 6571 (2010).
37. X. Duan, J. Ji, G. Qian, C. Fan, Y. Zhu, X. Zhou, D.
Chen, W. Yuan, J. Mol. Catal. A: Chem., 357, 81
(2012).
38. W. K. Offermans, A. P. J. Jansen, R. A. van Santen,
G. Novell-Leruth, J. M. Ricart, J. Pérez-Ramírez, J.
Phys. Chem. C, 111, 17551 (2007).
39. A. B. Mhadeshwar, J. R. Kitchin, M. A. Barteau, D.
G. Vlachos, Catal. Lett., 96, 13 (2004).
40. A. Logadottir, J. K. Norskov, J. Catal., 220, 273
(2003).
41. P. Rochana, K. Lee, J. Wilcox, J. Phys. Chem. C,
118, 4238 (2014).
42. J. J. Spivey, K. M. Dooley, Catalysis, 19, 84 (2006).
ИЗСЛЕДВАНЕ С ТФП НА ДИСОЦИАЦИЯТА НА АМОНЯК ВЪРХУ КЛЪСТЕР Mo3N2
Ш. Ф. Заман
Chemical and Materials Engineering Department, Faculty of Engineering, King Abdulaziz University, P.O. Box 80204,
Jeddah 21589, Saudi Arabia
Постъпила на: 5 февруари 2018 г.; Преработена на: 4 март 2018 г.
(Резюме)
С метода на ТФП е изследван механизма на процеса на разлагане на амоняк върху Mo3N2 клъстер.
Моделирани са елементарните стадии на повърхностните реакции след адсорбция на NHx (x = 0‒3) частици “on-
top” върху Мо атоми. Тази конфигурация на повърхностните активни комплекси е енергитично най-изгодна.
Скорост определящият стадий на разлагането на амоняка (NH2*ad → NH*ad + H*ad) е с активираща енергия от
41.2 кcal/mol и ендотермична топлина на стадия 28.1 кcal/mol. Енергията на дисоцияция на адсорбирания N2 е
35.19 кcal/mol и е значително по-висока от тази на N2 адсорбиран на Ru(0001).
S. F. Zaman: A DFT study of ammonia dissociation over Mo3N2 cluster
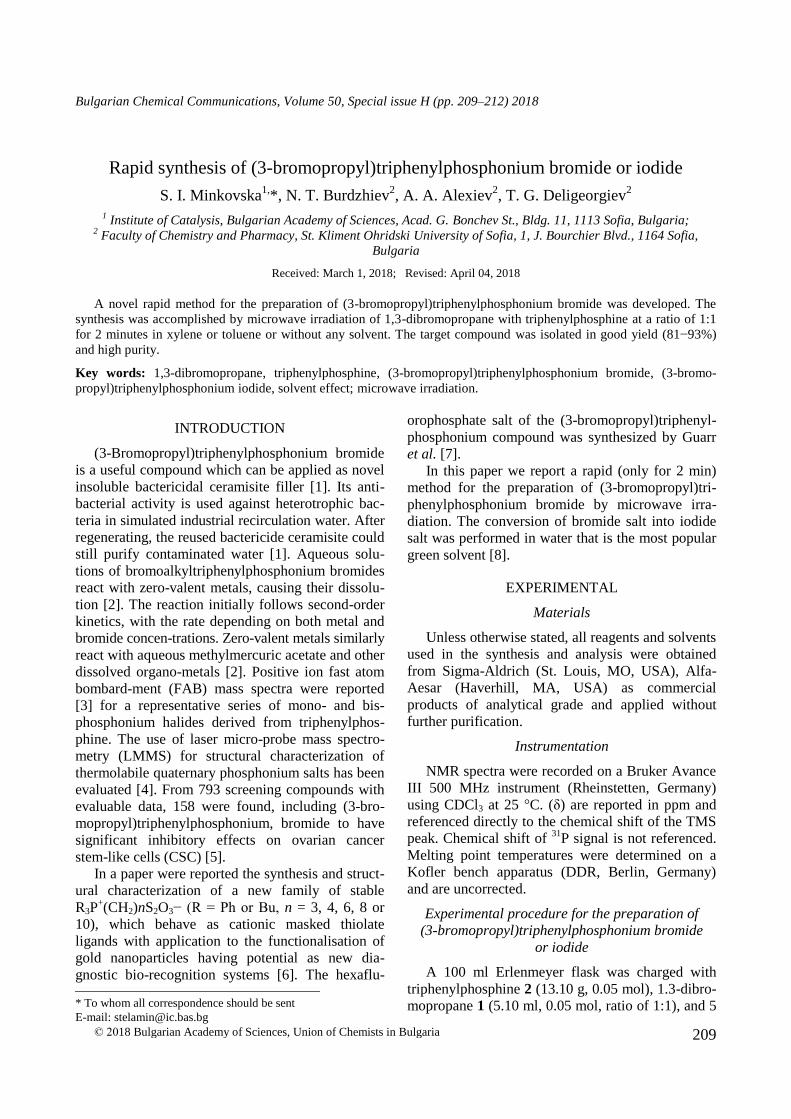
209
Bulgarian Chemical Communications, Volume 50, Special issue H (pp. 209–212) 2018
Rapid synthesis of (3-bromopropyl)triphenylphosphonium bromide or iodide
S. I. Minkovska1,
*, N. T. Burdzhiev2, A. A. Alexiev
2, T. G. Deligeorgiev
2
1 Institute of Catalysis, Bulgarian Academy of Sciences, Acad. G. Bonchev St., Bldg. 11, 1113 Sofia, Bulgaria;
2 Faculty of Chemistry and Pharmacy, St. Kliment Ohridski University of Sofia, 1, J. Bourchier Blvd., 1164 Sofia,
Bulgaria
Received: March 1, 2018; Revised: April 04, 2018
A novel rapid method for the preparation of (3-bromopropyl)triphenylphosphonium bromide was developed. The
synthesis was accomplished by microwave irradiation of 1,3-dibromopropane with triphenylphosphine at a ratio of 1:1
for 2 minutes in xylene or toluene or without any solvent. The target compound was isolated in good yield (81−93%)
and high purity.
Key words: 1,3-dibromopropane, triphenylphosphine, (3-bromopropyl)triphenylphosphonium bromide, (3-bromo-
propyl)triphenylphosphonium iodide, solvent effect; microwave irradiation.
INTRODUCTION
(3-Bromopropyl)triphenylphosphonium bromide
is a useful compound which can be applied as novel
insoluble bactericidal ceramisite filler [1]. Its anti-
bacterial activity is used against heterotrophic bac-
teria in simulated industrial recirculation water. After
regenerating, the reused bactericide ceramisite could
still purify contaminated water [1]. Aqueous solu-
tions of bromoalkyltriphenylphosphonium bromides
react with zero-valent metals, causing their dissolu-
tion [2]. The reaction initially follows second-order
kinetics, with the rate depending on both metal and
bromide concen-trations. Zero-valent metals similarly
react with aqueous methylmercuric acetate and other
dissolved organo-metals [2]. Positive ion fast atom
bombard-ment (FAB) mass spectra were reported
[3] for a representative series of mono- and bis-
phosphonium halides derived from triphenylphos-
phine. The use of laser micro-probe mass spectro-
metry (LMMS) for structural characterization of
thermolabile quaternary phosphonium salts has been
evaluated [4]. From 793 screening compounds with
evaluable data, 158 were found, including (3-bro-
mopropyl)triphenylphosphonium, bromide to have
significant inhibitory effects on ovarian cancer
stem-like cells (CSC) [5].
In a paper were reported the synthesis and struct-
ural characterization of a new family of stable
R3P+(CH2)nS2O3− (R = Ph or Bu, n = 3, 4, 6, 8 or
10), which behave as cationic masked thiolate
ligands with application to the functionalisation of
gold nanoparticles having potential as new dia-
gnostic bio-recognition systems [6]. Тhe hexaflu-
orophosphate salt of the (3-bromopropyl)triphenyl-
phosphonium compound was synthesized by Guarr
et al. [7].
In this paper we report a rapid (only for 2 min)
method for the preparation of (3-bromopropyl)tri-
phenylphosphonium bromide by microwave irra-
diation. The conversion of bromide salt into iodide
salt was performed in water that is the most popular
green solvent [8].
EXPERIMENTAL
Materials
Unless otherwise stated, all reagents and solvents
used in the synthesis and analysis were obtained
from Sigma-Aldrich (St. Louis, MO, USA), Alfa-
Aesar (Haverhill, MA, USA) as commercial
products of analytical grade and applied without
further purification.
Instrumentation
NMR spectra were recorded on a Bruker Avance
III 500 MHz instrument (Rheinstetten, Germany)
using CDCl3 at 25 °C. (δ) are reported in ppm and
referenced directly to the chemical shift of the TMS
peak. Chemical shift of 31
P signal is not referenced.
Melting point temperatures were determined on a
Kofler bench apparatus (DDR, Berlin, Germany)
and are uncorrected.
Experimental procedure for the preparation of
(3-bromopropyl)triphenylphosphonium bromide
or iodide
A 100 ml Erlenmeyer flask was charged with
triphenylphosphine 2 (13.10 g, 0.05 mol), 1.3-dibro-
mopropane 1 (5.10 ml, 0.05 mol, ratio of 1:1), and 5
© 2018 Bulgarian Academy of Sciences, Union of Chemists in Bulgaria
* To whom all correspondence should be sent
E-mail: [email protected]
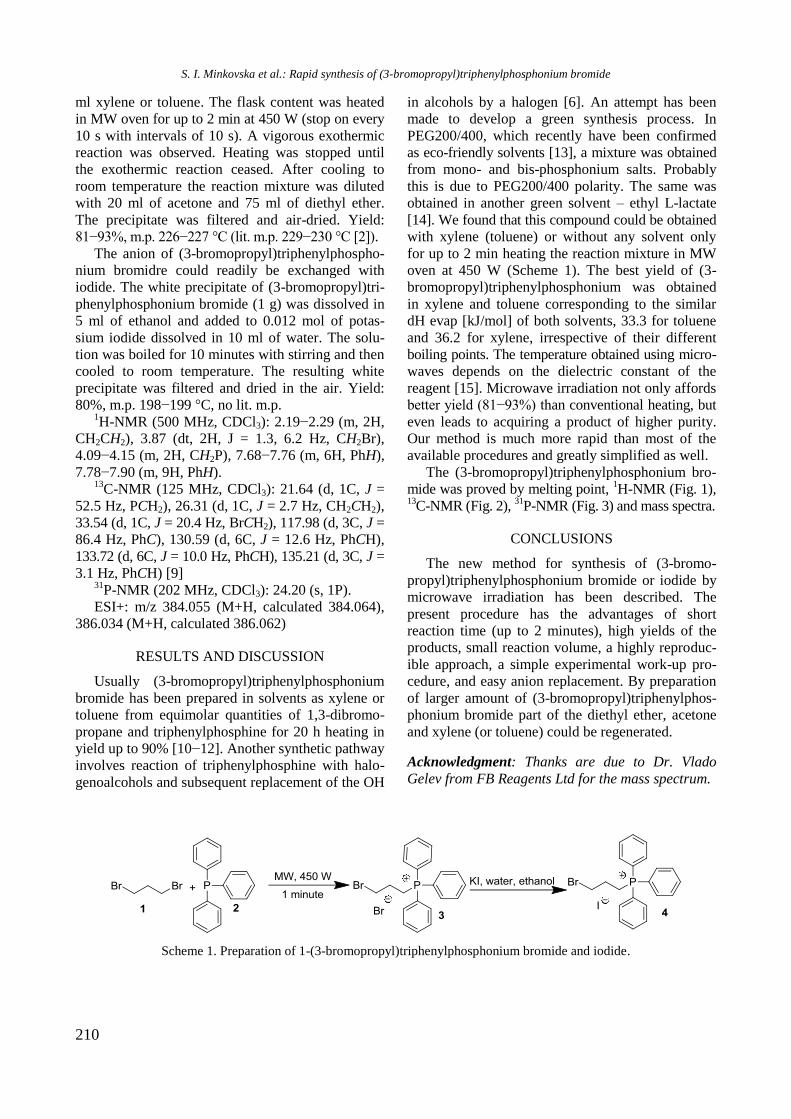
210
ml xylene or toluene. The flask content was heated
in MW oven for up to 2 min at 450 W (stop on every
10 s with intervals of 10 s). A vigorous exothermic
reaction was observed. Heating was stopped until
the exothermic reaction ceased. After cooling to
room temperature the reaction mixture was diluted
with 20 ml of acetone and 75 ml of diethyl ether.
The precipitate was filtered and air-dried. Yield:
81−93%, m.p. 226−227 °C (lit. m.p. 229−230 °C [2]).
The anion of (3-bromopropyl)triphenylphospho-
nium bromidre could readily be exchanged with
iodide. The white precipitate of (3-bromopropyl)tri-
phenylphosphonium bromide (1 g) was dissolved in
5 ml of ethanol and added to 0.012 mol of potas-
sium iodide dissolved in 10 ml of water. The solu-
tion was boiled for 10 minutes with stirring and then
cooled to room temperature. The resulting white
precipitate was filtered and dried in the air. Yield:
80%, m.p. 198−199 °C, no lit. m.p. 1H-NMR (500 MHz, CDCl3): 2.19−2.29 (m, 2H,
CH2CH2), 3.87 (dt, 2H, J = 1.3, 6.2 Hz, CH2Br),
4.09−4.15 (m, 2H, CH2P), 7.68−7.76 (m, 6H, PhH),
7.78−7.90 (m, 9H, PhH). 13
C-NMR (125 MHz, CDCl3): 21.64 (d, 1C, J =
52.5 Hz, PCH2), 26.31 (d, 1C, J = 2.7 Hz, CH2CH2),
33.54 (d, 1C, J = 20.4 Hz, BrCH2), 117.98 (d, 3C, J =
86.4 Hz, PhC), 130.59 (d, 6C, J = 12.6 Hz, PhCH),
133.72 (d, 6C, J = 10.0 Hz, PhCH), 135.21 (d, 3C, J =
3.1 Hz, PhCH) [9] 31
P-NMR (202 MHz, CDCl3): 24.20 (s, 1P).
ESI+: m/z 384.055 (M+H, calculated 384.064),
386.034 (M+H, calculated 386.062)
RESULTS AND DISCUSSION
Usually (3-bromopropyl)triphenylphosphonium
bromide has been prepared in solvents as xylene or
toluene from equimolar quantities of 1,3-dibromo-
propane and triphenylphosphine for 20 h heating in
yield up to 90% [10−12]. Another synthetic pathway
involves reaction of triphenylphosphine with halo-
genoalcohols and subsequent replacement of the OH
in alcohols by a halogen [6]. An attempt has been
made to develop a green synthesis process. In
PEG200/400, which recently have been confirmed
as eco-friendly solvents [13], a mixture was obtained
from mono- and bis-phosphonium salts. Probably
this is due to PEG200/400 polarity. The same was
obtained in another green solvent – ethyl L-lactate
[14]. We found that this compound could be obtained
with xylene (toluene) or without any solvent only
for up to 2 min heating the reaction mixture in MW
oven at 450 W (Scheme 1). The best yield of (3-
bromopropyl)triphenylphosphonium was obtained
in xylene and toluene corresponding to the similar
dH evap [kJ/mol] of both solvents, 33.3 for toluene
and 36.2 for xylene, irrespective of their different
boiling points. The temperature obtained using micro-
waves depends on the dielectric constant of the
reagent [15]. Microwave irradiation not only affords
better yield (81−93%) than conventional heating, but
even leads to acquiring a product of higher purity.
Our method is much more rapid than most of the
available procedures and greatly simplified as well.
The (3-bromopropyl)triphenylphosphonium bro-
mide was proved by melting point, 1H-NMR (Fig. 1),
13C-NMR (Fig. 2),
31P-NMR (Fig. 3) and mass spectra.
CONCLUSIONS
The new method for synthesis of (3-bromo-
propyl)triphenylphosphonium bromide or iodide by
microwave irradiation has been described. The
present procedure has the advantages of short
reaction time (up to 2 minutes), high yields of the
products, small reaction volume, a highly reproduc-
ible approach, a simple experimental work-up pro-
cedure, and easy anion replacement. By preparation
of larger amount of (3-bromopropyl)triphenylphos-
phonium bromide part of the diethyl ether, acetone
and xylene (or toluene) could be regenerated.
Acknowledgment: Thanks are due to Dr. Vlado
Gelev from FB Reagents Ltd for the mass spectrum.
Scheme 1. Preparation of 1-(3-bromopropyl)triphenylphosphonium bromide and iodide.
S. I. Minkovska et al.: Rapid synthesis of (3-bromopropyl)triphenylphosphonium bromide
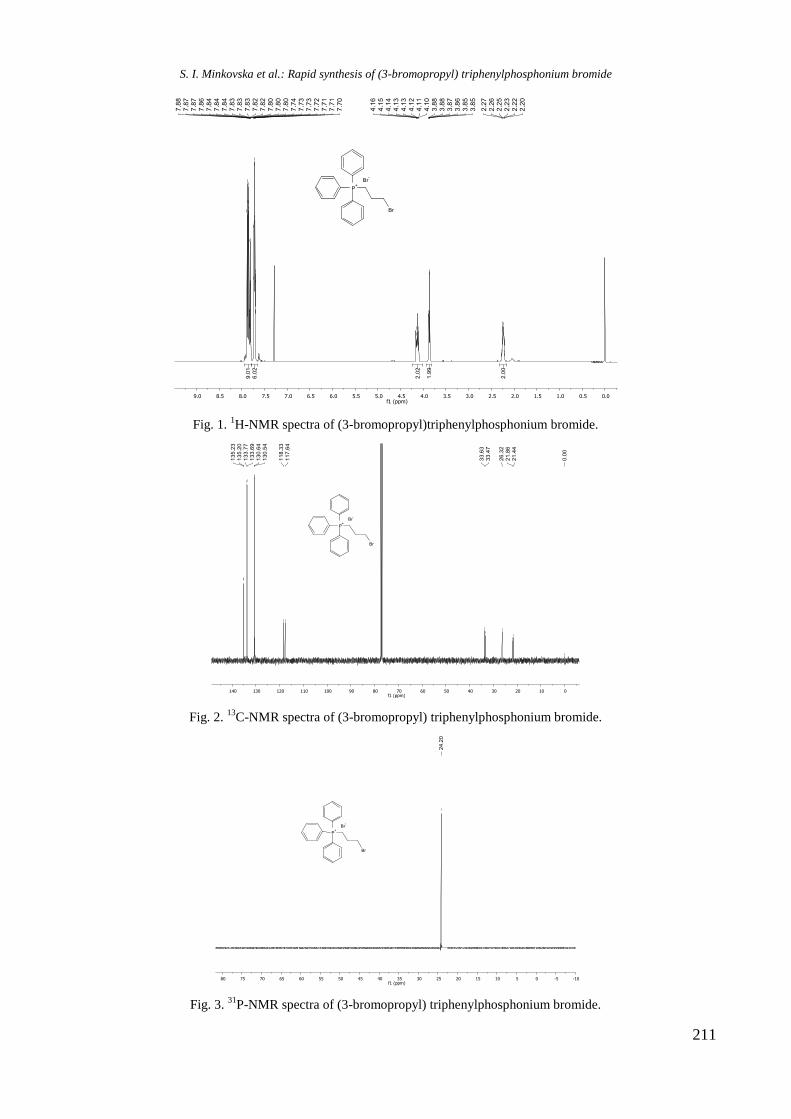
211
Fig. 1. 1H-NMR spectra of (3-bromopropyl)triphenylphosphonium bromide.
Fig. 2. 13
C-NMR spectra of (3-bromopropyl) triphenylphosphonium bromide.
Fig. 3. 31
P-NMR spectra of (3-bromopropyl) triphenylphosphonium bromide.
S. I. Minkovska et al.: Rapid synthesis of (3-bromopropyl) triphenylphosphonium bromide
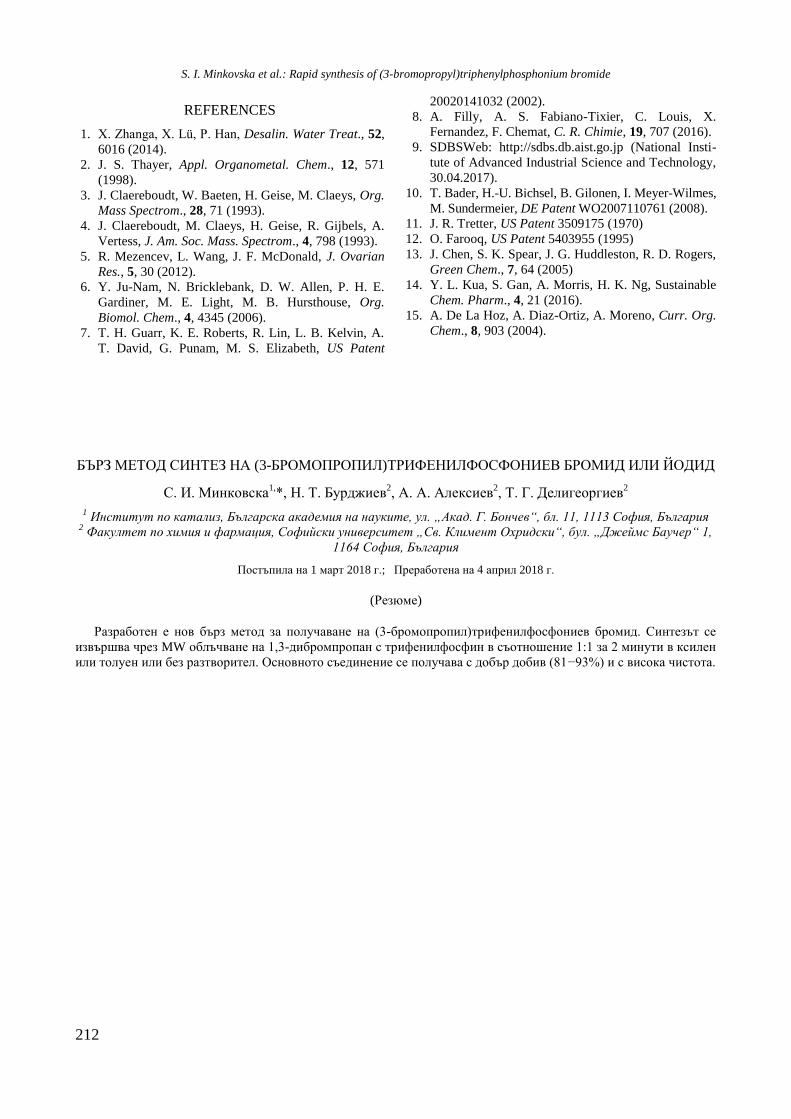
212
REFERENCES
1. X. Zhanga, X. Lü, P. Han, Desalin. Water Treat., 52,
6016 (2014).
2. J. S. Thayer, Appl. Organometal. Chem., 12, 571
(1998).
3. J. Claereboudt, W. Baeten, H. Geise, M. Claeys, Org.
Mass Spectrom., 28, 71 (1993).
4. J. Claereboudt, M. Claeys, H. Geise, R. Gijbels, A.
Vertess, J. Am. Soc. Mass. Spectrom., 4, 798 (1993).
5. R. Mezencev, L. Wang, J. F. McDonald, J. Ovarian
Res., 5, 30 (2012).
6. Y. Ju-Nam, N. Bricklebank, D. W. Allen, P. H. E.
Gardiner, M. E. Light, M. B. Hursthouse, Org.
Biomol. Chem., 4, 4345 (2006).
7. T. H. Guarr, K. E. Roberts, R. Lin, L. B. Kelvin, A.
T. David, G. Punam, M. S. Elizabeth, US Patent
20020141032 (2002).
8. A. Filly, A. S. Fabiano-Tixier, C. Louis, X.
Fernandez, F. Chemat, C. R. Chimie, 19, 707 (2016).
9. SDBSWeb: http://sdbs.db.aist.go.jp (National Insti-
tute of Advanced Industrial Science and Technology,
30.04.2017).
10. T. Bader, H.-U. Bichsel, B. Gilonen, I. Meyer-Wilmes,
M. Sundermeier, DE Patent WO2007110761 (2008).
11. J. R. Tretter, US Patent 3509175 (1970)
12. O. Farooq, US Patent 5403955 (1995)
13. J. Chen, S. K. Spear, J. G. Huddleston, R. D. Rogers,
Green Chem., 7, 64 (2005)
14. Y. L. Kua, S. Gan, A. Morris, H. K. Ng, Sustainable
Chem. Pharm., 4, 21 (2016).
15. A. De La Hoz, A. Diaz-Ortiz, A. Moreno, Curr. Org.
Chem., 8, 903 (2004).
БЪРЗ МЕТОД СИНТЕЗ НА (3-БРОМОПРОПИЛ)ТРИФЕНИЛФОСФОНИЕВ БРОМИД ИЛИ ЙОДИД
С. И. Минковска1,*, Н. Т. Бурджиев
2, А. А. Алексиев
2, Т. Г. Делигеоргиев
2
1 Институт по катализ, Българска академия на науките, ул. „Акад. Г. Бончев“, бл. 11, 1113 София, България
2 Факултет по химия и фармация, Софийски университет „Св. Климент Охридски“, бул. „Джеймс Баучер“ 1,
1164 София, България
Постъпила на 1 март 2018 г.; Преработена на 4 април 2018 г.
(Резюме)
Разработен е нов бърз метод за получаване на (3-бромопропил)трифенилфосфониев бромид. Синтезът се
извършва чрез MW облъчване на 1,3-дибромпропан с трифенилфосфин в съотношение 1:1 за 2 минути в ксилен
или толуен или без разтворител. Основното съединение се получава с добър добив (81−93%) и с висока чистота.
S. I. Minkovska et al.: Rapid synthesis of (3-bromopropyl)triphenylphosphonium bromide
213
Bulgarian Chemical Communications, Volume 50, Special issue H, 2018
CONTENTS
R. Palcheva, I. Shtereva, Y. Karakirova, G. Tyuliev, S. Damyanova, Physicochemical properties of
monometallic Rh and Ni and bimetallic RhNi catalyst materials supported on unmodified and
yttrium-modified alumina …………………………………………………………………………...
3
P. Cv. Petrova, G. Pantaleo, A. M. Venezia, L. F. Liotta, Z. Kaszkur, T. T. Tabakova, L. I. Ilieva, Gold
and palladium mono- and bimetallic catalysts on Y-doped ceria supports for complete propene
oxidation …………………………………………………………………………………………….
9
S. Zh. Todorova, H. G. Kolev, M. G. Shopska, G. B. Kadinov, J. P. Holgado, A. Caballero, Silver-
based catalysts for preferential CO oxidation in hydrogen-rich gases (PROX) …………………….
17
M. V. Gabrovska, D. Crişan,
D. A. Nikolova, I. Z. Shtereva, L. P. Bilyarska, M.
Crişan, R. M. Edreva-
Kardjieva, Structure and activity of M-Al layered double hydroxides in CO2 methanation reaction
as function of the divalent metal ……………………………………………………………………
24
R. N. Ivanova, G. S. Issa, M. D. Dimitrov, T. S. Tsoncheva, Catalytic behaviour of nanostructured
Ce-Mn oxide catalysts in ethyl acetate oxidation ...............................................................................
34
M. Shopska, G. Kadinov, D. Paneva, I. Yordanova, D. Kovacheva, A. Naydenov, S. Todorova, Z.
Cherkezova-Zheleva, I. Mitov, Biogenic iron-containing materials synthesised in modified Lieske
medium: composition, porous structure, and catalytic activity in n-hexane oxidation ……………..
40
T. M. Petrova, D. G. Paneva, S. J. Todorova, Z. P. Cherkezova-Zheleva, D. G. Filkova, M. G.
Shopska, N. I. Velinov, B. N. Kunev, G. B. Kadinov, I. G. Mitov, Modification and characterization
of iron-containing biogenic materials as catalysts for the reaction of CO oxidation ……………….
49
H. I. Lazarova, M. D. Popova, A. Szegedi, B. Likozar, V. Dasireddy, N. Novak-Tusar, Levulinic acid
esterification on SO3H-modified mesoporous silicas ………………………………………………
56
S. G. Stanchovska, D. N. Guergova, G. M. Ivanov, R. K. Stoyanova, E. N. Zhecheva, A. I. Naydenov,
Supported palladium containing perovskite catalysts for methane combustion …………………….
61
E. N. Kolentsova, D. Y. Dimitrov, D. B. Karashanova, Y. G. Karakirova, P. Ts. Petrova, T. T.
Tabakova,, G. V. Avdeev, K. I. Ivanov, Catalytic abatement of CO and VOCs in waste gases over
alumina-supported Cu-Mn catalysts modified by cobal ……………………………………………..
66
M. Markova-Velichkova, Ts. Lazarova, G. Ivanov, A. Naydenov, D. Kovacheva, Hexane and toluene
oxidation on LaCoO3 and YCoO3 perovskite catalysts …………………………………………..…
74
G. S. Issa, M. D. Dimitrov, D. G. Kovacheva, T. S. Tsoncheva, Nanosized mesoporous titania compo-
sites promoted with ceria and zirconia as catalysts for ethyl acetate oxidation: effect of preparation
procedure ……………………………………………………………………………………………
80
K. V. Koleva, N. I. Velinov, I. G. Genova, T. S. Tsoncheva, V. S. Petkova, Synthesis, structure, and
catalytic properties of SrFe12O19 hexaferrite ……………………………………………………..…
87
M. N. Gancheva, P. M. Konova, G. M. Ivanov, L. I. Aleksandrov, R. S. Iordanova, A. I. Naydenov,
Mechanochemically assisted solid state synthesis and catalytic properties of CuWO4 ……………..
93
I. Genova, T. Tsoncheva, M. Dimitrov, D. Kovacheva, Mesoporous nanostructured TixSn1-xO4 mixed
oxides as catalysts for methanol decomposition: effect of Ti/Sn ratio ……………………………..
99
M. K. Milanova, R. S. Iordanova, M. N. Gancheva, Synthesis, characterization and photocatalytic
performance of brannerite-type LiVMoO6 ………………………………………………………….
105
N. G. Kostova, M. Fabian, E. Dutkova, N. Velinov, Y. Karakirova, M. Balaz, Properties of
mechanochemically synthesised N-doped Fe2O3-ZnO mixed oxide ………………………………..
109
N. Kaneva, A. Bojinova, K. Papazova, D. Dimitrov, Mineralization of pharmaceutical drugs by ZnO
photocatalysts under UV light illumination ………………………………………………………...
116
N. G. Kostova, M. Fabian, E. Dutkova, M. Balaz, M. Shipochka, Characterisation of mechanochemi-
cally synthesised N-doped TiO2 …………………………………………………………………..…
122
K. I. Milenova, K. L. Zaharieva, S. V. Vassilev, S. S. Dimova, I. D. Stambolova, V. N. Blaskov,
Synthesis and investigation of composite photocatalysts on the base of nickel and zinc oxides ……
130
K. L. Zaharieva, K. I. Milenova, S. V. Vassilev, S. S. Dimova, I. D. Stambolova, V. N. Blaskov, Photo-
catalytic behaviour of NiMnO3/Mn2O3 materials for degradation of Malachite Green and Methy-
lene Blue dyes under UV irradiation ………………………………………………………………..
135
214
Bulgarian Chemical Communications, Volume 50, Special issue H, 2018
K. L. Zaharieva, M. G. Shopska, K. I. Milenova, R. Angelova, M. Iliev, G. B. Kadinov, Investigations
of abiotic and biotic materials based on iron oxyhydroxides for photocatalytic dеcolourization of
dyes in aqueous solutions ……………………………………………………………………………
140
V. V. Ivanova-Kolcheva, M. K. Stoyanova, Enhancing the PMS activation ability of Co3O4 by doping
with Bi and Mg ………………………………………………………………………………………
144
B. Z. Barbov, Yu. A. Kalvachev, Green seed-assisted fly ash zeolitisation at room temperature ……… 151
M. D. Dimitrov, M. Guncheva, D. G. Kovacheva, Preparation and application of nanosized zeolite as a
carrier for a lipolytic enzyme ……………………………………………………………………….
156
M. V. Gabrovska, D. A. Nikolova, J. B. Krstić, D. R. Loncarević, P. T. Tzvetkov, M. G. Shopska, V. D.
Radonjić, M. V. Stanković, D. M. Jovanović, L. Т. Spasov, D. B. Simeonov, Improved catalyst per-
formance of Ni/SiO2 in vegetable oil hydrogenation: impact of Mg dopant ……………………….
161
H. Penchev, S. S. Dimova, K. L. Zaharieva, F. S. Ublekov, Ch. Novakov, V. Sinigersky, Synthesis of
polyphenylacetylene by iron(III) chloride catalyzed carbonyl olefin metathesis polymerization of
chalcone ……………………………………………………………………………………………..
169
S. A. Uzunova, I. M. Uzunov, I. R. Ivanov, D. B. Angelova, Adsorption of thiophene and its polyaro-
matic derivatives from model fuel on pyrolyzed rice husks: kinetics and equilibrium ……………..
174
S. F. Zaman, L. A. Jolaloso, A. A. Al-Zahrani, Y. A. Alhamed, S. Podila, H. Driss, M. A. Daous, L. A.
Petrov, Study of Fe3Mo3N catalyst for ammonia decomposition …………………………………..
181
A. S. Malik, S. F. Zaman, A. A. Al-Zahrani, M. A. Daous, H. Driss, L. A. Petrov, DRIFT study of the
mechanism of methanol synthesis from CO2 and H2 on CeO2-supported CaPdZn catalyst ………..
189
A. M. Ali, Ionic gold and catalytic activity of gold catalysts for CO oxidation ………………………. 196
S. F. Zaman, A DFT study of ammonia dissociation over Mo3N2 cluster …………………………….. 201
S. I. Minkovska, N. T. Burdzhiev, A. A. Alexiev, T. G. Deligeorgiev, Rapid synthesis of (3-bromo-
propyl)triphenylphosphonium bromide or iodide …………………………………………………..
209
215
Bulgarian Chemical Communications, Volume 50, Special issue H, 2018
СЪДЪРЖАНИЕ
Р. Палчева, И. Щерева, Й. Каракирова, Г. Тюлиев, С. Дамянова, Физикохимични свойства на
монометални Ni и Rh И биметални NiRh каталитични материали, нанесени върху немоди-
фициран и модифициран с итрий алуминиев оксид ……………………………………………..
8
П. Цв. Петрова, Д. Панталео, А. М. Венеция, Л. Ф. Лиота, З. Кашкур, Т. Т. Табакова, Л. И.
Илиева, Монометални (Au, Pd) и биметални Pd-Au катализатори, нанесени върху Y-доти-
рани цериево-оксидни носители за пълно окисление на пропен ……………………………….
16
С. Ж. Тодорова, Х. Г. Колев, М. Г. Шопска, Г. Б. Кадинов, H.-P. Холгадо, А. Кабалеро, Катали-
затори на основата на сребро за селективно окисление на СО в богати на водород смеси …..
23
М. В. Габровска, Д. Кришан, Д. А. Николова, И. Ж. Щерева, Л. П. Билярска, М. Кришан, Р. М.
Едрева-Кърджиева, Структура и активност на М-Аl слоести двойни хидроокиси в реакцията
на метаниране на СО2 като функция на двувалентния метал ………………………………….
33
Р. Н. Иванова, Г. С. Исса, М. Д. Димитров, Т. С. Цончева, Каталитични свойства на нанострук-
турирани Ce-Mn оксидни катализатори за окисление на етилацетат ………………………….
39
М. Шопска, Г. Кадинов, Д. Панева, Ил. Йорданова, Д. Ковачева, Ант. Найденов, С. Тодорова, З.
Черкезова-Желева, Ив. Митов, Биогенни желязо-съдържащи материали синтезирани в
модифицирана среда на Лиске – състав, пориста структура и каталитична активност в окис-
лението на n-хексан ……………………………………………………………………………..…
48
Т. М. Петрова, Д. Г. Панева, С. Ж. Тодорова, З. П. Черкезова-Желева, Д. Г. Филкова, М. Г.
Шопска, Н. И. Велинов, Б. Н. Кунев, Г. Б. Кадинов, Ив. Г. Митов, Модифициране и охарак-
теризиране на желязосъдържащи биогенни материали като катализатори за реакцията на
окисление на СО …………………………………………………………………………………..
55
Хр. Ил. Лазарова, М. Д. Попова, А. Сегеди, Б. Ликозар, В. Дасиреди, Н. Новак-Тушар, Естери-
фикация на левулинова киселина върху SO3H-модифицирани мезопорести силикати ……....
60
С. Г. Станчовска, Д. Н. Гергова, Г. М. Иванов, Р. К. Стоянова, Е. Н. Жечева, А. И. Найденов,
Нанесени паладий съдържащи перовскитови катализатори за пълно окисление на метан …..
65
E. Н. Коленцова, Д. Я. Димитров, Д. Б. Карашанова, Й. Г. Каракирова, П. Цв. Петрова, T. Т.
Табаковa, Г. В. Авдеев, K. И. Иванов, Каталитично очистване на отпадъчни газове от CO и
летливи органични съединения върху Cu-Mn/γ-Al2O3 катализатори модифицирани с кобалт .
73
M. Маркова-Величкова, Ц. Лазаровa, Г. Иванов, A. Найденов, Д. Ковачева, Oкисление на хексан
и толуен върху LaCoO3 и YCoO3 перовскитови катализатори ………………………………….
79
Г. С. Исса, M. Д. Димитров, Д. Г. Ковачева, Т. С. Цончева, Влияние на метода на получаване
върху формирането на наноструктурирани мезопорести CeO2-TiO2 и ZrO2-TiO2 катализатори
за пълно окисление на етилацетат ………………………………………………………………..
86
К. В. Колева, Н. И. Велинов, И. Г. Генова, Т. С. Цончева, В. С. Петкова, Синтез, структура и
каталитични свойства на SrFe12O19 хексаферит …………………………………………………..
92
М. Н. Ганчева, П. М. Конова, Г. М. Иванов, Л. И. Александров, Р. С. Йорданова, А. И. Найденов,
Механохимичен активиран твърдофазен синтез и каталитични свойства на CuWO4 ………..
98
И. Генова, T. Цончева, M. Димитров, Д. Ковачева, Наноструктурирани мезопорести TixSn1-xO4
смесени оксиди като катализатори за разпадане на метанол: Ефект на съотношението Ti/Sn
104
М. К. Миланова, Р. С. Йорданова, М. Н. Ганчева, Синтез, Охарактеризиране и фотокатали-
тични свойства на LiVMoO6 ………………………………………………………………………
108
Н. Г. Костова, М. Фабиан, Е. Дуткова, Н. Велинов, Й. Каракирова, М. Балаж, Свойства на
механохимично синтезиран дотиран с азот Fe2O3-ZnO смесен оксид ………………………….
115
Н. Канева, А. Божинова, К. Папазова, Д. Димитров, минерализация на лекарства с фотоката-
лизатор ZnO и УВ-облъчване ………………………………………………………………………
121
Н. Г. Костова,, М. Фабиан, Е. Дуткова, М. Балаж, М. Шипочка, Охарактеризиране на механо-
химично синтезиран дотиран с азот TiO2 ………………………………………………………….
129
K. И. Миленова, К. Л. Захариева, С. В. Василев, С. С. Димова, И. Д. Стамболова, В. Н. Блъсков,
Синтез и изследване на композитни фотокатализатори на основата на смес от никелов оксид
и цинков оксид …………………………………………………………………………………….
134
216
Bulgarian Chemical Communications, Volume 50, Special issue H, 2018
К. Л. Захариева, K. И. Миленова, С. В. Василев, С. С. Димова, И. Д. Стамболова, В. Н. Блъсков,
Фотокаталитично поведение на NiMnO3/Mn2O3 материали за разграждане на багрилата
малахитово зелено и метиленово синьо под УВ облъчване ……………………………………
139
К. Л. Захариева, М. Г. Шопска, К. И. Миленова, Р. Ангелова, М. Илиев, Г. Б. Кадинов, Изслед-
вания на абиотични и биотични материали на основата на железни оксихидроксиди за фото-
каталитично обезцветяване на багрила във водни разтвори …………………………………….
143
В. В. Иванова-Колчева, М. К. Стоянова, Повишаване на PMS-активационната способност на
Co3O4 чрез дотиране с Bi и Mg …………………………………………………………………….
150
Б. Барбов, Ю. Кълвачев, Зелен синтез на зеолит от въглищна пепел в присъствието на зародиши 155
М. Д. Димитров, М. Гунчева, Д. Г. Ковачева, Получаване и приложение на наноразмерен зеолит
като носител за липаза …………………………………………………………………………….
160
М. В. Габровска, Д. А. Николова, Ю. Б. Кръстич, Д. Р. Лонцаревич, П. Цв. Цветков, М. Г.
Шопска, В. Д. Радонич, М. В. Станкович, Д. M. Йованович, Л. Т. Спасов, Д. Б. Симеонов,
Подобрено каталитично поведение на Ni/SiO2 при хидрогениране на растителни масла:
влияние на добавката от Mg ………………………………………………………………………
168
Хр. П. Пенчев, С. С. Димова, К. Л. Захариева, Ф. С. Ублeков, Хр. Новаков, В. Синигерски,
Cинтез на полифенилацетилени получени чрез карбонил олефинова метатезна полимери-
зация на халкон катализирана от железен(III) хлорид …………………………………………..
173
С. А. Узунова, И. М. Узунов, И. Р. Иванов, Д. Б. Ангелова, Адсорбция на тиофен и негови
ароматни производни от моделно гориво върху пиролизирани оризови люспи: кинетика и
равновесие …………………………………………………………………………………………..
180
Ш. Ф. Заман, Л. А. Жолалозо, А. А. Ал-Захрани, Я. А. Алхамед, С. Подила, Х. Идрис, М. А. Даус,
Л. А. Петров, изследване на катализатор Fe3Mo3N за разлагане на амоняк …………………..
188
А. С. Малик, Ш. Ф. Заман, А. А. Ал-Захрани, М. А. Даус, Х. Идрис, Л. А. Петров, Изследване с
ДОИЧС на механизма на синтез на метанол от СО2 и водород с катализатор CaPdZn/СеО2 ..
195
А. М. Али, Златни йони и каталитична активност на златни катализатори за окисление на СО … 200
Ш. Ф. Заман, Изследване с ТФП на дисоциацията на амоняк върху клъстер Mo3N2 208
С. И. Минковска, Н. Т. Бурджиев, А. А. Алексиев, Т. Г. Делигеоргиев, Бърз метод синтез на
(3-бромопропил)трифенилфосфониев бромид или йодид ………………………………………
212