baseline study for the pineapple processing
TRANSCRIPT
1
BASELINE STUDY FOR THE
PINEAPPLE PROCESSING FOR EXPORT (PINEX) PROJECT IN BENIN FCC-680-2015/012-00
MAY 2016
Cabinet LEADERSHIP & DEVELOPPEMENT, Benin
2
Table of Contents
List of Acronyms ........................................................................................................................ 4
1. INTRODUCTION .......................................................................................................... 5
2. BASELINE STUDY METHODOLOGY .............................................................................. 7
2.1 Formative research ..................................................................................................... 7 2.1.1. Formative data collection method and tools: ......................................................... 7 2.1.2. Data collector recruitment and training: ................................................................. 7 2.1.3 Field data sampling, collection and analysis: ......................................................... 8
2.2 Quantitative data collection .............................................................................................. 8 2.2.1 Quantitative data collection methods and tools: .................................................... 8 2.2.2 Data collector recruitment and training .................................................................. 9 2.2.3 Data sampling, collection and analysis ................................................................ 10
3. PINEAPPLE PRODUCER BASELINE STUDY RESULTS ............................................. 12
3.1 Producer background Information ........................................................................... 12 3.2 Producer qualitative study results ............................................................................ 12
3.2.1 Description of the Producers ................................................................................ 12 3.2.2 Pineapple varieties ................................................................................................ 14 3.2.3 Pineapple production ............................................................................................ 14
3.3 Producers quantitative survey results ....................................................................... 15 3.3.1 Quantitative demographics of the pineapple producers ...................................... 15 3.3.2 Characteristics of pineapple farms ....................................................................... 16 3.3.3 Production labor ................................................................................................... 17 3.3.4 Production costs ................................................................................................... 17 3.3.5 Financing production ............................................................................................ 17 3.3.6 Pineapple production: varieties grown and volume of commodities ................... 18 3.3.7 Production sales .................................................................................................... 18 3.3.8 Production constraints .......................................................................................... 19
4. PROCESSING COMPANIES ............................................................................................. 20
4.1 Processor background Information .......................................................................... 20 4.2 Processor qualitative description .............................................................................. 20
4.2.1 Pineapples used in processing .............................................................................. 21 4.2.2 Processing equipment and methods ..................................................................... 21 4.2.3 Processors markets ............................................................................................... 22
4.3 Processor quantitative data ....................................................................................... 22 4.3.1 Volume of juice production .................................................................................. 22 4.3.2 Certification of processing companies ................................................................. 22 4.3.3 Value of processed commodity sales ................................................................... 23 4.3.4 Processed commodities markets ........................................................................... 23 4.3.5 Processor constraints ............................................................................................ 24
3
5. EXPORTERS AND WHOLESALERS ............................................................................... 24
5.1 Exporter background ................................................................................................ 24 5.2 Exporter and wholesaler qualitative data ................................................................. 25
5.2.1 Wholesaler Export to regional markets ................................................................ 25 5.3 Exporter quantitative data ........................................................................................ 26 5.4 Barriers to exporting fresh fruit to Europe ............................................................... 27
6. ROLE OF WOMEN IN THE PINEAPPLE INDUSTRY ........................................... 28
7. CONCLUSION ............................................................................................................ 28
7.1 Summary of study results ......................................................................................... 28 7.2 Producers .................................................................................................................. 28 7.4 Exporters .................................................................................................................. 30
ANEXES .................................................................................................................................. 30
Annex 1. Terms of Reference for Baseline & Contract with LEADD ................................ 31 Annex 2: Producers focus group discussion guide (French) ................................................ 43 Annex 3: Processors’ focus group discussion guide (French) ............................................. 47 Annex 4: Surveyors’ training guide (French) ...................................................................... 53 Annex 5: Producers’ survey questionnaire (French) ............................................................ 57 Annex 6: Processors and exporters survey questionnaire (French) ..................................... 74 iAnnex 7: Sample size calculation method .......................................................................... 95 Annex 8: Complete list of selected primary sampling units (PSU) ..................................... 96 Annex 9: Labor use by type of pineapple producers ............................................................ 98 Annex 10a: Distribution of producers by techniques, materials and technologies .............. 98 Annex 10b: Micro finance institutions use by producers ..................................................... 99 Annex 11a: Distribution of producers according to pineapple varieties .............................. 99 Annex 11b: Volume of commodities sold by producers and sales value ........................... 100 Annex 12: Figures and Graphs ........................................................................................... 101
12.1. Average productivity of Smooth Cayenne and Sugar Loaf by commune ............. 101 12.2. Cost of soil preparation by commune and category of producers (CFA) ............. 101 12.3. Maintenance costs per hectare by communes and farm size (CFA) ..................... 102 12.4. Distribution of loan beneficiaries .......................................................................... 103 12.5. Average loan amount to producers in the year 2015 (CFA) ................................. 103 12.6. Percent of credit sales by commune and category of producers ........................... 104
4
List of Acronyms ALIDE : Development Initiatives Promotion Association ANATRAB : Association Nationale des Transformateur de l’Ananas du Benin
(National Association of Pineapple Processing Companies of Benin) CAVECA : Village Self-managed Credit and Savings Fund Cl : Centiliter CLCAM : Local Agricultural Credit Fund CV : Coefficient of variation CSFT : Centre de Séchage des Fruits Tropicaux (Tropical Fruit Drying Center) ECOWAS : Economic Community of West African States EU : European Union FCFA : Franc of the African Financial Community GAP : Good Agricultural Practices Ha : Hectare HACCP : Hazard Analysis Critical Control Point ISO : International Organization for Standardization K : Potassium Km : Kilometer KPC : Knowledge Practice Coverage L : Liter LEADD : Leadership and Development LOP : Life of Project MOA : Ministry of Agriculture MT : Metric Ton N : Nitrogen/Azote N/K : Nitrogen to Potassium Ratio NPK : Nitrogen, phosphor and potassium fertilizer ODK : Open Data Kit PADA : Agricultural Diversification Support Project PADME : Association for the Promotion and Support of Small and Medium size
Enterprises PfD : Partners for Development pH : Potential in Hydrogen PINEX : Pineapple Processing for Export Project PSU : Primary Sampling Units REPAB : Reseau des Producteurs d’Ananas du Benin (Pineapple Producer’s
Network of Benin) SPSS : Statistical Package for Social Sciences t/Ha : Ton per hectare USD : United States Dollar USDA : United States Department of Agriculture WAMEU : West African Economic and Monetary Union
5
1. INTRODUCTION
The purpose of this baseline study is to establish indicator baseline information where necessary and to confirm or adjust indicators found in the Partners for Development (PfD)’s September 2015 Grant Agreement with the United States Department of Agriculture (USDA). The baseline information will be a critical tool in assessing the project’s impact, most formally at the mid-term and end points when independent evaluations will be conducted. The baseline is for PfD’s Pineapple Processing for Export (PINEX) project in Benin. It will run for five years and has a budget of $10 million. The three main objectives of PINEX are: Increase agricultural productivity by: building the technical and business management
capacity of pineapple farmers, the Pineapple Producers Network of Benin (French acronym REPAB), and the Ministry of Agriculture (MOA); connecting producers with access to finance; and enabling the private sector to supply improved fertilizer.
Improve agricultural processing by building the technical and business management capacity of pineapple processors and the National Association of Pineapple Processing Companies of Benin (French Acronym ANATRAB), and by connecting processors with access to finance, equipment, and certifications.
Expand agricultural trade by: building the marketing capacity of pineapple processors;
connecting processors with marketing opportunities; establishing a market price and information system; improving border and airport storage and marketing facilities; and supporting innovation and collaboration across the Beninese pineapple value chain.
About 90% of pineapple value chain activities in Benin occur in the southern provinces of Atlantique and Littoral. PINEX will target pineapple producers and processing and export companies in these provinces, implementing activities in the following areas:
a. Training and Capacity Building for pineapple producers and processors; b. Financial Services to facilitate agricultural lending and access to inputs; c. Provision of In-kind grants to support innovations in both processing and production; d. Trade Facilitation through building infrastructure, e. Setting up a market information system and support for marketing activities.
In fall 2015, PfD developed a Terms of Reference for the baseline and then issued a Request for Proposals for the baseline study. Five companies in Benin responded to the RFP. The LEADD Consulting Company scored the highest in the review based on criteria listed in the RFP. PfD and LEADD then executed a contract in late 2015 to complete the baseline in early 2016. LEADD conducted the baseline study in January - March 2016. It used large sample sizes: 768 pineapple producers randomly selected from the 5,200 target of producers; 35 pineapple processors, 60 functioning companies, and all five of the major pineapple exporters in Benin. LEADD collected data primarily through individual interviews and focus group discussions. LEADD gathered both qualitative data, such as social and demographic characteristics of the

6
three targeted populations of the producers, processing companies and exporters, as well as quantitative data, such as the volume of their production and the value of their commodity sales. This report is comprised of four main sections: Introduction, the revised Attachment E from the September 2015 Grant Agreement with recommended target changes and baseline values, narrative and analysis of the baseline, and annexes.
7
BASELINE STUDY METHODOLOGY The baseline study has two main components: formative information that used qualitative research methods and covered pineapple producers, processors, exporters, sellers and transporters, and a quantitative component designed to collect data on the PINEX indicators. The quantitative information collected focused on the producers, processors and exporters. This section describes the methodologies used to collect both the qualitative and quantitative data.
2.1 Formative research
The goal of the formative research was to provide insight into the pineapple industry actors, gaining more understanding of the pineapple farmers, the processing companies, traders, transporters and exporters. By doing this, project managers will be able to understand the capacity building needs of the targeted populations in order to improve production and increase revenues. The study aimed to understand social norms within groups, the role of each actor and their link with others. More specifically, the study was designed to shed light on perceptions about pineapple production and processing, farm management, product marketing, access to financial resources, access to information, opportunities and product prices. A secondary objective of the formative research was to help further develop and refine the data-collection tools for the quantitative baseline study. 2.1.1 Formative data collection method and tools: The formative research was conducted between January 26 and February 14, 2016. Given the nature of the data to be collected, LEADD used the focus group method to get better grasp of patterns and normative behaviors of the respondents. In each of the three focus group sites, five focus group guides were developed by the consultants on the basis of the research objectives of each category of actors (producers, sellers, processors and exporters). These guides were shared with the PfD program team who commented and provided feedback aimed at ensuring that all the project’s components were included. The guides (see Annexes 2-6) were then revised and pilot-tested by the consultants and three data collectors in a two-day training session before finalization. In addition, LEADD-trained data collectors conducted individual interviews to confirm and complete information from focus groups. The individual interviews covered 12 producers, five processors and two exporters in the Atlantic and Littoral States. As there are only five exporters, in-depth individual interviews were conducted with everyone in that group. The individual interview guides were developed, and tested in like manner.
2.1.2 Data collector recruitment and training:
Ten field based data collectors of both genders were recruited by LEADD, with five having at least an undergraduate university degree in social studies and the other five having degrees in agronomy. All the data collectors had at least two previous jobs collecting qualitative data collection, particularly in conducting interviews and in leading focus group discussions. Following an initial day-long training of the data collectors on the tools and followed by having them assist the consultants during the pilot test of the study tools, a second training session was
8
conducted by LEADD with the qualitative data collectors. This training took another full day and focused on understanding the study mission and on the data collection tools and procedures. Five pairs of surveyors were made by LEADD, and arrangements provided by the consulting team to ensure the participants were well organized and had logistics such as the data collection materials and transportation (See Annex 4: Field surveyors training guide).
2.1.3 Field data sampling, collection and analysis:
Qualitative data collection took place from February 1 to 3, 2016. It was conducted simultaneously by the five pairs of surveyors. In each pair, there was one moderator and one note taker; with the social scientist acting as the discussion group moderator or interviewer and the agronomist serving as the note taker. Four group discussions of randomly selected producers were carried out in three different localities of the two states, one group per category of actor, making a total of 12 focus groups. The number of participants per focus group ranged between six and ten, with the number of producers sometimes exceeding ten. Whatever the group size, the discussion group facilitator ensured that everyone had a chance to speak. In addition, 19 randomly selected individual actors were interviewed (12 producers, four processors and three exporters). At the end of each focus group or interview, the moderator reviewed the notes to ensure that the information was complete and reflected the contents of the group discussions, and the individual interview responses. The data collectors were supervised throughout the entire data collection exercise by the LEADD consultants and with an occasional site visit by PfD programming staff. The group discussion and interview notes were collected and typed into Microsoft Word using a pre-determined template. The data was then analyzed based on its content according to the category of respondents. All the answers to the same question were gathered and classified by code and theme. The conclusions were made on the basis of the category’s predominant answers. However, the less predominant answers were also discussed in the analysis in order to present the complete information.
2.2 Quantitative data collection As previously stated, the quantitative survey provides baseline data required for project indicators and confirms or refutes target results as currently presented in Attachment E of the PINEX Agreement. It covered the pineapple producers, processors and exporters.
2.2.1 Quantitative data collection methods and tools: Due to the marked differences in terms of overall numbers within the targeted populations, different methods for data collection were employed. For the pineapple producers, a two-stage sampling scheme was used. To collect the quantitative data of the processors and exporters, a census approach was used. For each of these groups, the consultants developed a data collection tool based on the study objectives. The consultants used information from the formative research to refine and adapt the quantitative survey tools. In particular, for questions related to quantity issues, local measurement instruments were used as suggested by the formative data (such as the local method for delineating the size of a pineapple field, and the methods used to determine production volume and sales). The consultants shared the draft tools with the PfD programing
9
team for input before being piloted and finalized. (See final data collection tools in Annex 5 and 6). The consultants then translated the producers’ and processors’ data collection tools into Open Data Kit (ODK) language to allow for mobile (android-based) data collection. The questionnaire for the pineapple producers covered every aspect of demographic information, such as the number of women farmers, and who cultivated the fields during the crop cycle, the questionnaire included a series of questions about their knowledge and practices related to:
a) Cultivation inputs; b) Use of agricultural methods and technologies; c) Quality of land and water resources; d) Farm management; e) Access to financial services; f) Markets and transactions to sell the pineapple crop; g) Production and market information; h) Volume and value of commodities;
For the pineapple processing companies, as well as company demographic questions, such as the number of women employed in processing, the questionnaire focused on commodity production and sales, including questions on:
a) Type and use of processing equipment; b) Actual processing capacity of the company and business plans; c) Type and volume of commodities sold by processors; d) Targeted markets; e) Types of packaging; f) Value of pineapple juice and dried fruit sold by processors; g) Commodity production issues; h) Company status of food safety certification (HACCP and ISO 22000)
As well as collecting data on the exporter demographics, the questionnaire for the five exporters collected information on the system of exporting and the major barriers to exporting fresh fruit from Benin. Questions included:
a) Procurement of the fresh pineapple; b) Fruit quality (including export quality requirements); c) Pineapple preparation; d) Transportation and shipment preparation; e) Volume and value of commodity sales; f) Product marketing and access to market information;
2.2.2 Data collector recruitment and training In total, LEADD recruited 20 data collectors on a temporary contract basis, and from lists of previously used surveyors. There were 12 men and eight women, all of whom had at least a four-year university degree, with 10 agronomists and the other half social scientists, and in addition to fluent French, they were all native speakers of the local languages found in the PINEX states. In order to ensure continuity and consistency, all data collectors that participated in the formative research were also included in the quantitative survey data collection. The consultants trained the data collectors over a three-day period from February 15 to February 17, 2016. Interviewer training included the following topics, and each training session was followed by questions and practical application tests:
10
- Introduction to the PINEX project - Understanding pineapple production - Understanding pineapple processing and export - Understanding the PINEX baseline study - Sampling strategy - Interview basics - Review of the questionnaires (hard copy and smartphone versions) - Practice and role play in French and local languages.
At each stage of the quantitative data collection training process, time was allocated to discuss translation issues of specific items and ensure that all interviewers agreed on the meaning and translation into the local languages. Also, while all interviewers were trained together for most of the training sessions, two of surveyors separate training to prepare them to conduct interviews with the pineapple processing companies and exporters, which was conducted by specialists in pineapple processing and export. The remaining 18 interviewers collected data from the producers.
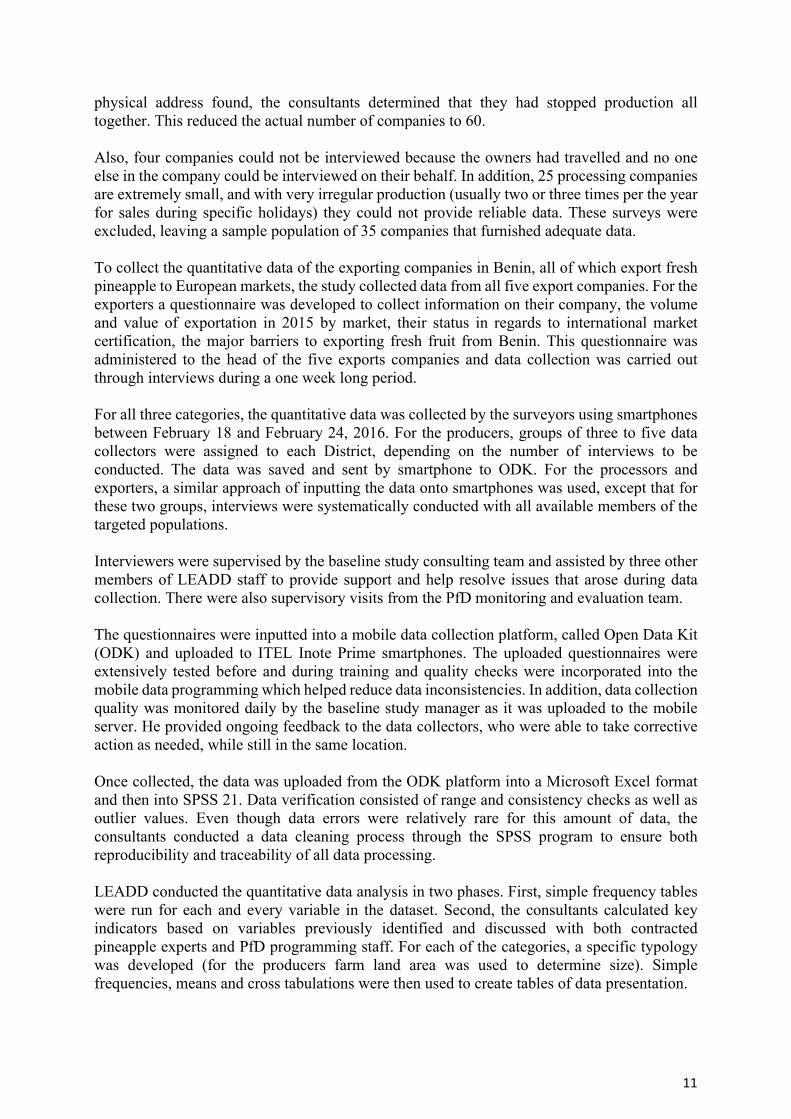
2.2.3 Data sampling, collection and analysis The three categories of targeted populations of pineapple producers, processors and exporters required different sampling methodologies. For the producers, a two-stage random cluster sampling was used. PINEX targets 5,200 pineapple producers and a sample of 768 producers were selected based on guidelines of the study terms of reference for the number and location (see Annex 7 for sample size calculations). To facilitate rapid producer identification, the consultants used information from another recent survey conducted in 2014 by a World Bank supported project of the Ministry of Agriculture called Agriculture Diversification Project (PADA), which sampled over 3,000 pineapple farmers. The PINEX total sample of 768 producers was divided proportionally by district, using the data from the PADA study. To limit the clustering design effect, 12 individual producers were randomly selected in each cluster. The producer sampling is shown in table 1 below. (See Annex 8 for the complete list of the selected primary sampling unit (PSU). Table 1: Number of producers interviewed by district
Districts Number of pineapple producers
% Number of clusters Number of interviewees
ABOMEY-CALAVI 540 17% 10 120
ALLADA 543 17% 10 120
KPOMASSE 49 2% 4 48
OUIDAH 15 0% 3 36
TOFFO 284 9% 7 84
TORI-BOSSITO 837 27% 15 180
ZE 870 28% 15 180
TOTAL 3138 100% 64 768
As stated in the baseline study terms of reference, the initial goal was to collect quantitative data from all 70 processing companies, which are members of the National Association of Pineapple Processing Companies of Benin (ANATRAB). However, though the data collectors visited all 70, only 56 provided information. Seven company owners stated that they no longer process pineapple; as no valid contact information existed for three other companies, with no
11
physical address found, the consultants determined that they had stopped production all together. This reduced the actual number of companies to 60. Also, four companies could not be interviewed because the owners had travelled and no one else in the company could be interviewed on their behalf. In addition, 25 processing companies are extremely small, and with very irregular production (usually two or three times per the year for sales during specific holidays) they could not provide reliable data. These surveys were excluded, leaving a sample population of 35 companies that furnished adequate data. To collect the quantitative data of the exporting companies in Benin, all of which export fresh pineapple to European markets, the study collected data from all five export companies. For the exporters a questionnaire was developed to collect information on their company, the volume and value of exportation in 2015 by market, their status in regards to international market certification, the major barriers to exporting fresh fruit from Benin. This questionnaire was administered to the head of the five exports companies and data collection was carried out through interviews during a one week long period. For all three categories, the quantitative data was collected by the surveyors using smartphones between February 18 and February 24, 2016. For the producers, groups of three to five data collectors were assigned to each District, depending on the number of interviews to be conducted. The data was saved and sent by smartphone to ODK. For the processors and exporters, a similar approach of inputting the data onto smartphones was used, except that for these two groups, interviews were systematically conducted with all available members of the targeted populations. Interviewers were supervised by the baseline study consulting team and assisted by three other members of LEADD staff to provide support and help resolve issues that arose during data collection. There were also supervisory visits from the PfD monitoring and evaluation team. The questionnaires were inputted into a mobile data collection platform, called Open Data Kit (ODK) and uploaded to ITEL Inote Prime smartphones. The uploaded questionnaires were extensively tested before and during training and quality checks were incorporated into the mobile data programming which helped reduce data inconsistencies. In addition, data collection quality was monitored daily by the baseline study manager as it was uploaded to the mobile server. He provided ongoing feedback to the data collectors, who were able to take corrective action as needed, while still in the same location. Once collected, the data was uploaded from the ODK platform into a Microsoft Excel format and then into SPSS 21. Data verification consisted of range and consistency checks as well as outlier values. Even though data errors were relatively rare for this amount of data, the consultants conducted a data cleaning process through the SPSS program to ensure both reproducibility and traceability of all data processing. LEADD conducted the quantitative data analysis in two phases. First, simple frequency tables were run for each and every variable in the dataset. Second, the consultants calculated key indicators based on variables previously identified and discussed with both contracted pineapple experts and PfD programming staff. For each of the categories, a specific typology was developed (for the producers farm land area was used to determine size). Simple frequencies, means and cross tabulations were then used to create tables of data presentation.
12
3. PINEAPPLE PRODUCER BASELINE STUDY RESULTS
3.1 Producer background Information
The pineapple producers are key actors in the pineapple value chain. They supply the raw materials used by the processors to produce the juice and dried pineapple products, as well as the pineapples for the fresh fruit exporters. According to the needs analysis conducted by PfD in preparing the PINEX application, an abundant amount of pineapple is grown in Benin, but the volume of high quality fruit harvested is not sufficient to meet even the current needs of either the pineapple processors or the exporters (PfD PINEX application, January 2015). The baseline study conducted both qualitative and quantitative surveys to gather information about the pineapple producers and their ability to cultivate, manage and sell pineapple crops. As described in the above described survey methodology, the qualitative survey was conducted using the focus group discussions and a limited number interviews, while the quantitative survey was based mainly on questionnaire interviews with a randomly selected sample of 768 producers. Following are the results of the two types of surveys.
3.2 Producer qualitative study results The study found that pineapple is grown solely within the seven Districts of the Atlantique State (Allada, Ze, Toffo, Abomey-Calavi, Tori Bossito, Kpomasse and Ouidah). The Littoral State, which is limited to Cotonou City and surrounding suburbs, is not a pineapple production area. There is variability among the Atlantique Districts in terms of acreages cultivated; history of pineapple production; producers’ experiences and expertise and their targeted markets, including initiatives to link them to European market. The Districts of Allada, Ze and Toffo have the largest pineapple cultivated areas, due to the fact that those Districts were where pineapple production for local and external markets began first in the early 1990s by a government initiative to develop the pineapple industry. The District of Abomey-Calavi, located just outside Cotonou’s city limits was also a major area of pineapple production in the early years, but stopped production all together due to rapid urbanization of the district. The districts of Ouidah, Kpomasse, and Tori Bossito, are all newcomers to pineapple production, and tend to grow it along with other food crops to sell in the nearby cities.
3.2.1 Description of the Pineapple Producers
In the qualitative survey, the pineapple producer groups were first asked about the size of their fields and the dimensions of their pineapple cultivation area. This enabled the surveyors to determine which category (large, medium or small) the farmer belonged to and then collect information on the social and demographic characteristics of the producers within each of the categories. As a result of focus groups discussions about field size and crop cultivation, the consultants classified producers into three categories of: 1. Small producers, who cultivate pineapple in a field from .25 hectares (Ha) to 2 Ha; 2. Medium producers, who cultivate pineapple in one or more fields that total 2.01 Ha to 2.99 Ha; 3. Large producers, who cultivate pineapple in one or more fields totaling more than 3 Ha.
13
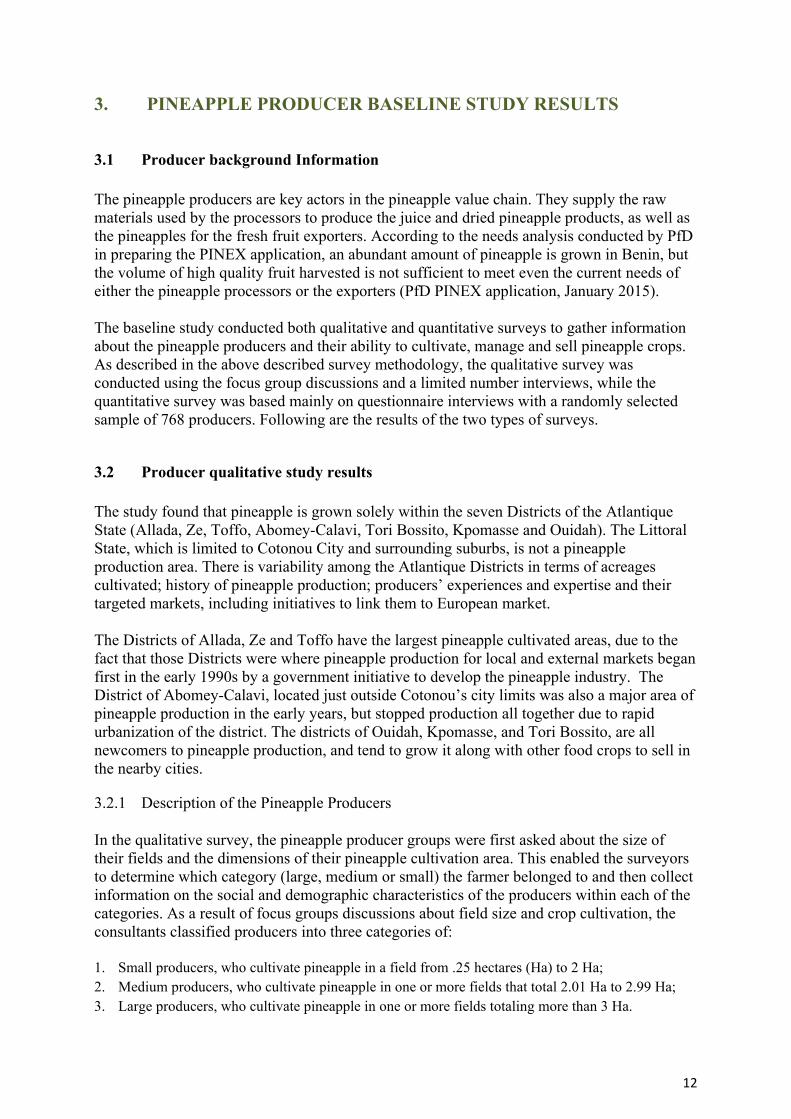
The distribution of producers according to the size of their farm is shown in table 2 below. Table 2: Farm size distribution of beneficiaries
Typology of pineapple farms No %
Small producers (Less than 2 HA) 519 67.6
Medium producers (>=2 HA and < 3 HA) 113 14.7
Large producers (>= 3 HA) 136 17.7
Total 768 100.0
Description of the small pineapple producers: Besides the limited size of the land they cultivate, the study found that small producers are characterized by the rudimentary tools they use, such as hoes, machetes and axes. They are mostly local farmers who started producing pineapples as a secondary activity to augment their income and often grow other food crops for sale on local markets, or also work outside of the farm. Their farm small size is due to lack of access to land and other resources needed to expand their operation. They generally have very low productivity and often lack the technical knowledge and financial means needed to improve production, such as buying inputs and hiring labor to properly cultivate and manage their pineapple farms. Description of medium producers: Medium producers cultivate larger fields (2.1 Ha to 3 Ha) and have more tools than the small producers, but most still use the same type of manual tools as the small producers such as hoes, machetes and axes. However, the mid-size producers generally have access to enough financial resources to hire field laborers and though their production is still usually seasonal, the medium producers are more organized and are able to produce a pineapple crop two or three times a year by having split fields of pineapple planted at different periods during the year. Description of large producers: Besides having the largest fields and acreage cultivated, the large pineapple producers either own or rent motorized equipment such as tractors to prepare the fields and assist in cultivating the pineapple crops. They also have access to more financing opportunities from financial institutions and often stagger the timing of pineapple crops and on multiple sites at the same time. As well, the large producers grow sufficient pineapple seedlings for their own use and at times also sell seedlings to the smaller producers, providing another source of income. Though the large producers cited a number of issues that affect productivity and reduce profit, such as lack of skilled labor, for these large producers, pineapple production is a profitable business. To quote a member of the large producer focus group, “growing pineapple is a profitable business compared to others. It might actually be the most profitable crop after palm tree production.”
14
3.2.2 Pineapple varieties The survey found that two varieties of pineapple are grown within the PINEX targeted geographic areas of the Atlantique and Littoral States: Smooth Cayenne and Sugar Loaf. Following is the description of these two varieties: 1. Smooth Cayenne: The Smooth Cayenne variety of pineapple has yellow fibrous, flesh and
is generally round in shape and grouped by three sizes: (i) Big size fruit, which is very prized on both domestic consumer and juice processors; (ii) Middle size fruit is often exported to the European market as it fits the quality standards of this market; (iii) Small size fruits are usually marketed on the domestic consumer market. Currently, Smooth Cayenne is generally produced for export to the lucrative European markets because its higher production costs, including that the seedlings are more expensive and to produce high quality fruit requires more specific technical knowhow such as fertilizer dosage and application that most producers do not master. However, the Smooth Cayenne variety can yield up to 90 metric tons of fruit per hectare when properly cultivated and managed.
2. Sugar Loaf: The Sugar Loaf pineapple is an elongated bottle shaped fruit and as its name suggests, it is a very sweet and juicy fruit with non-fibrous, whitish flesh. However, it is also more fragile than the Smooth Cayenne variety, and its green peel, even at maturity hampers its export as natural fresh fruit. To export Sugar Loaf to Europe, exporters require that producers color its peel yellow by applying a chemical called Ethephon before harvest. But natural Sugar Loaf is in very high demand by the regional markets, and in particular by Nigeria, which does not produce either sufficient amounts Sugar Loaf or the quality produced in Benin. The processing companies also mainly buy Sugar Loaf because of its high juice and sugar content and pleasant aroma. It is also the preferred variety for fresh fruit consumers, both on the local and regional markets. Currently, Sugar Loaf is the variety predominantly produced by all categories of producers because of high market demand; lower production costs and requires less technical expertise. Even the smaller sized fruits can be marketed on local and regional markets, but at lower prices than good quality fruits. Sugar Loaf fields produce less than Smooth Cayenne; when properly cultivated and managed, according to producers surveyed, Sugar Loaf can yield up to 60 metric tons of fruit per hectare.
3.2.3 Pineapple production
According to the producers’ survey, pineapple does not grow well on heavy clay type soil, nor can it be successfully cultivated on swampy type wetlands. The most suitable soils are the rich red and black soils found in virtually all the Atlantique districts. A pineapple crop takes 18 months from planting the seedlings to harvesting mature fruit, with the cycle usually beginning during the dry seasons of December to February or August to September. The focus groups reiterated the main steps of pineapple production:
1. Preparing the fields, which includes clearing the land of tree stumps and weeds and ploughing the soil;
2. Planting the pineapple seedlings in rows, about six inches apart;
15
3. Weeding four to six times during the 18 month cycle, depending on weed growth; 4. Applying fertilizer four times, at four months intervals beginning at the sixth month
after planting; 5. Applying pesticides if the crop is attacked by insects; 6. Applying flowers stimulation chemical, 12 months after planting; 7. Applying Ethephon coloring agent five days before the fruit is harvested (to color
Sugar Loaf yellow if necessary); 8. Harvesting the pineapples by cutting it off the stock.
The surveyed producers stated that each stage is equally important and requires a lot of care and attention, but that being able to harvest a good crop also depends on a number of factors such as land fertility, pineapple seedling quality, field maintenance, good chemical or natural (manure) fertilizer spreading technique and timing, and the amount and timing of rainfall. After harvest, producers usually cultivate seedlings production for the next planting cycle or to sell. This activity uses the already harvested pineapple plants, leaving the plant in the field to let the small suckers that started to grow around the fruit even before harvesting. Producers have to care for the shoots, as they did the fruit (weeding, fertilizing and applying insecticide if necessary) for four to six months until they reach 500 grams and are ready to be planted for the next crop.
3.3 Producers quantitative survey results
The quantitative survey was conducted with a sample of 768 pineapple producers, as noted in the methodology presentation above and used elements of the qualitative survey results, such as the category of the producers based on field size (i.e., small, medium or large producers). A questionnaire was administered to each sampled producer. Computed analysis of these questionnaires comes up with following findings.
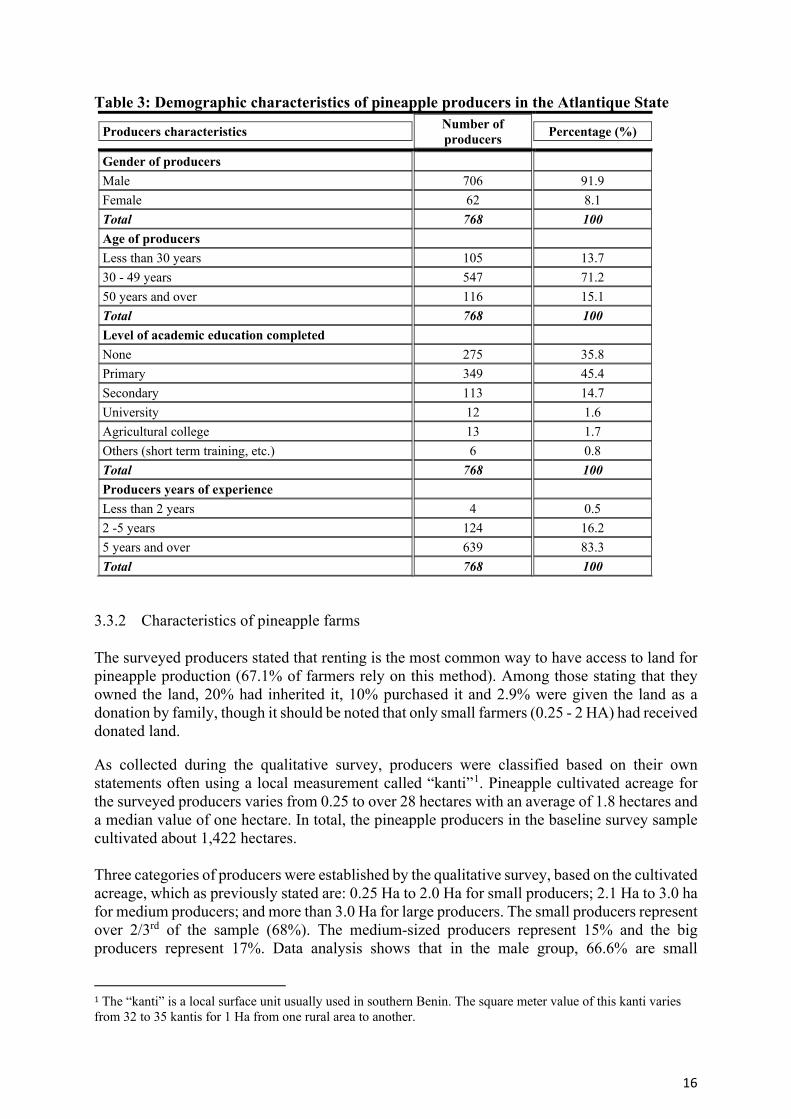
3.3.1 Quantitative demographics of the pineapple producers The quantitative demographic data the surveyors collected related to basic demographic information such as the gender of the pineapple producers, their age, their level of education and specific information related to production, such as their experience cultivating pineapple. According to this study, most of the pineapple producers in the Atlantique State are male (about 91.9%) and only 8.1% of them are female (as shown in Table 3 below). Over 70% of them are between 30 and 49 years of age. Less than 14% are under 30 years of age, confirming that younger men are less interested in agricultural activities. More than one third of the producers had not even attended primary school, but conversely 1.6% had attended university. Most of the producers (83.3%) had cultivated pineapple for more than five years and very few (0.5%) had less than two years of experience in producing pineapple.
16
Table 3: Demographic characteristics of pineapple producers in the Atlantique State
Producers characteristics Number of producers Percentage (%)
Gender of producers Male 706 91.9 Female 62 8.1 Total 768 100 Age of producers Less than 30 years 105 13.7 30 - 49 years 547 71.2 50 years and over 116 15.1 Total 768 100 Level of academic education completed None 275 35.8 Primary 349 45.4 Secondary 113 14.7 University 12 1.6 Agricultural college 13 1.7 Others (short term training, etc.) 6 0.8 Total 768 100 Producers years of experience Less than 2 years 4 0.5 2 -5 years 124 16.2 5 years and over 639 83.3 Total 768 100
3.3.2 Characteristics of pineapple farms
The surveyed producers stated that renting is the most common way to have access to land for pineapple production (67.1% of farmers rely on this method). Among those stating that they owned the land, 20% had inherited it, 10% purchased it and 2.9% were given the land as a donation by family, though it should be noted that only small farmers (0.25 - 2 HA) had received donated land. As collected during the qualitative survey, producers were classified based on their own statements often using a local measurement called “kanti”1. Pineapple cultivated acreage for the surveyed producers varies from 0.25 to over 28 hectares with an average of 1.8 hectares and a median value of one hectare. In total, the pineapple producers in the baseline survey sample cultivated about 1,422 hectares. Three categories of producers were established by the qualitative survey, based on the cultivated acreage, which as previously stated are: 0.25 Ha to 2.0 Ha for small producers; 2.1 Ha to 3.0 ha for medium producers; and more than 3.0 Ha for large producers. The small producers represent over 2/3rd of the sample (68%). The medium-sized producers represent 15% and the big producers represent 17%. Data analysis shows that in the male group, 66.6% are small
1 The “kanti” is a local surface unit usually used in southern Benin. The square meter value of this kanti varies from 32 to 35 kantis for 1 Ha from one rural area to another.
17
producers; 14.9% are medium-sized producers; and 18.5% are large producers. The corresponding percentages in the female group are respectively 79%, 12.9% and, 8.1%. Small pineapple producers account for about 702 hectares, approximately 49.3% of the cultivated area whereas medium-sized producers cover about 12.6% of pineapple farms and large producers 38.1%. Nevertheless, large producers represent only 18% of the sample, but own 38% of the cultivated area of pineapple. Pineapple producers’ farm size varies from one category to another. Farms of small producers average 0.78 ha with high variation (CV=48.08%), the farms of medium-sized producers average 2.07 ha and are more homogenous (CV=9.28%); large producers cultivate an average of 5.8 ha with a very high variation (CV=81.15 %%). When gender is taken into account, male producers average 1.9 ha (CV=146.25%) and female producers 1.1 ha (CV=106.88%). These numbers show a very large variation among male and female pineapple producers.
3.3.3 Production labor
Pineapple farming is labor intense and a time consuming through the production cycle. The data revealed that about 60% of small producers use only family members’ labor; though 40% stated that at labor intense times of the year (i.e., weeding, applying fertilizer, and harvesting) they sometime had to add full time or part time paid labor. The medium-sized producers also use family member labor, but to a less extent (only 40% of these producers). It is to be noted that female producers use more family labor than male producers. Large producers generally use paid labor, but also use more equipment such as tractors for ploughing, which reduces manual labor (See Figure 1 Annex 9). Motorized equipment, however are not generally available to producers and even those of them who can access it, such as the large producers, still use manual labor weeding and harvesting.
3.3.4 Production costs
The pineapple production costs depend on soil fertility and the farming management system used. For instance, if the seedlings are purchased and the producer applies fertilizers as recommended for high quality fruit, the surveyed producers estimated it would cost an average cost of between 2,500,000 FCFA ($4,300) and 3,000,000 FCFA ($5,200 USD) per hectare to produce one crop cycle of Smooth Cayenne and between 1,500,000 FCFA ($2,600) and 1,800,000 FCFA ($3,100) to produce one hectare of the Sugar Loaf variety.
3.3.5 Financing production
Very few pineapple producers are able to finance by their own the entire cycle of pineapple production. The focus group of small producer participants stated that they usually funded crop production through savings from their last sales, small loans from family members, or group contributions called tontines. For the medium and large sized producers, in addition to the personal methods used by the small producer, some finance the inputs and labor needed during the growth cycle through loans from financing institutions such as the Local Agricultural Credit and Saving Fund (called CLCAM), ALIDE, and the Village Self-managed Credit and Savings Fund (called CAVECA). These small to medium sized loans are used to purchase fertilizers and pay hired labor. They are usually short term loans (6-12 months) and medium term loans (12-24 months). Unfortunately, as stated by the survey participants, these institutions charge high interest rates (from 10% to 20% per year), which considerably reduces the producer’s profit margin and often results in difficulties for the producers to reimburse the loan and
18
sometimes causes property seizures. In addition, a number of producers surveyed complained about the delays in receiving the loaned funds (see Figure 2 Annex 10b). Data shows that regardless of the district, almost all producers (99.1%) know of at least one microfinance structure in their area. However, about 80% of producers still finance their own activities. The main reason for this lack of access to credit is because pineapple producers are considered very high risk by the microfinance institutions due to the unusually long production cycle of 18 months. Although their access is still very limited (22.5%), small producers have the highest access to microfinance institutions, because the loans are very small and therefore considered less risky followed by medium-size producers (19%), who also request modest loans. For the large producers, only 1% declared having used formal financing structures during 2015. Annex 12.5 presents how the 20% receiving credit use the funds for various activities during the growth cycle, including that: 84% declared using their loans to purchase fertilizer; 57% for farm maintenance, and 54% for land preparation, which includes clearing the land of tree roots and ploughing; 40% of producers use loans to pay for labor during planting and 26% use a part of their loan to purchase seedlings.
3.3.6 Pineapple production: varieties grown and volume of commodities
Two varieties of pineapple are cultivated in the Atlantique State: Smooth Cayenne and Sugar Loaf. Survey data showed that Sugar Loaf is the main variety produced currently: 72% of producers against 17% for Smooth Cayenne. Approximately 10% of the producers grow both varieties of pineapple (See Annex 11a). The survey found that the total pineapple production for 2015 for the 768 producers sampled was 34,076 Metric tons, with 11,404 MT of Smooth Cayenne and 22,672 MT of Sugar Loaf. It should be noted that the average pineapple cycle takes 18 months, though these figures are estimated for one year, which is 2/3 of one cycle.
3.3.7 Production sales
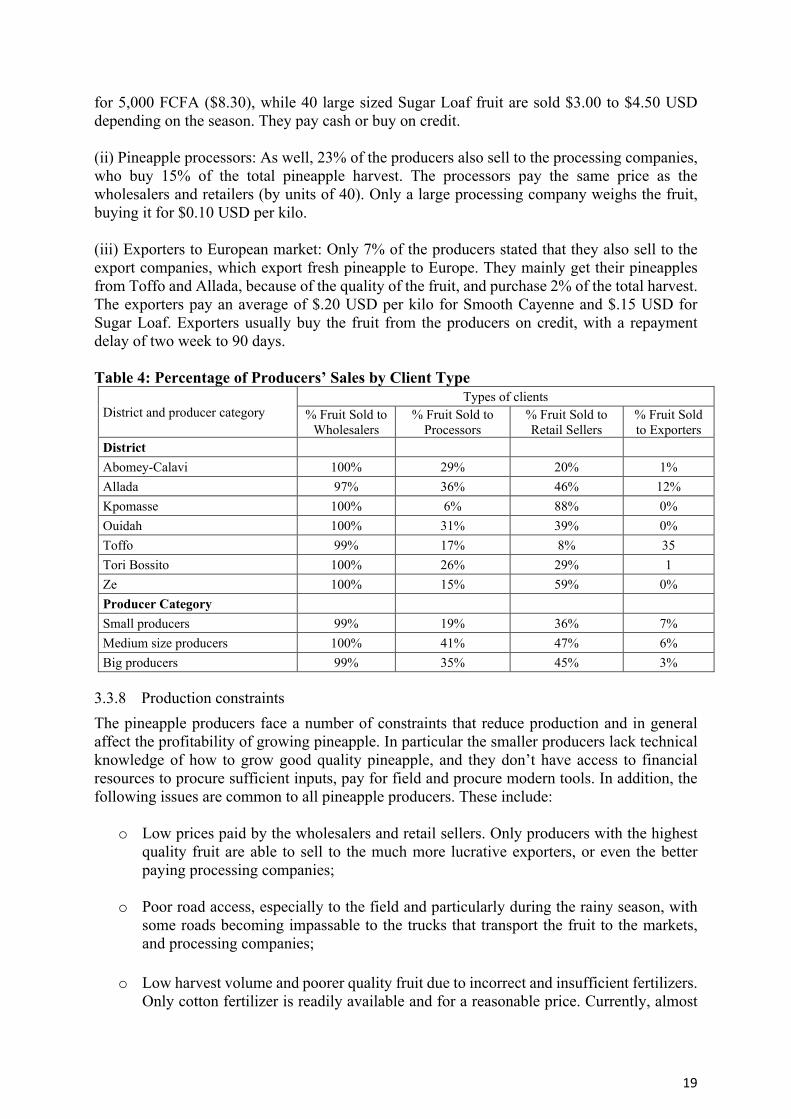
The baseline study survey showed that the average estimated gross production sale for the 768 sampled producers was $.07 ($.04 to $.10) per kilo in 2015 for total estimated production sales of $2,385,320 for the 34,076 MT (See Annex 11b). It should be noted that the average pineapple cycle takes 18 months, though these figures are estimated for one year, which is 2/3 of one cycle. The pineapple harvest is sold to three categories of buyers: (i) Market Wholesaler and Retailers: The baseline study survey showed that virtually all of the producers do business with pineapple wholesalers, who buy 59% of the total harvest, irrespective of the district (Table 4 below). Retail sellers are the second most important clientele with 39% of the producers saying they also do business with retail sellers, who purchase 24% of production. Both the market wholesalers and retailers are estimated at 90% women. The wholesalers and the retailers buy by unit of 40 graded fruits (sorted into large, medium and small sized fruits). For instance, 40 large sized fruits of Smooth Cayenne (weight estimate at 2.5 to 3.0 Kg per fruit) are sold for 2,000, FCFA ($3.33) to 3,000 FCFA ($5) and occasionally
19
for 5,000 FCFA ($8.30), while 40 large sized Sugar Loaf fruit are sold $3.00 to $4.50 USD depending on the season. They pay cash or buy on credit. (ii) Pineapple processors: As well, 23% of the producers also sell to the processing companies, who buy 15% of the total pineapple harvest. The processors pay the same price as the wholesalers and retailers (by units of 40). Only a large processing company weighs the fruit, buying it for $0.10 USD per kilo. (iii) Exporters to European market: Only 7% of the producers stated that they also sell to the export companies, which export fresh pineapple to Europe. They mainly get their pineapples from Toffo and Allada, because of the quality of the fruit, and purchase 2% of the total harvest. The exporters pay an average of $.20 USD per kilo for Smooth Cayenne and $.15 USD for Sugar Loaf. Exporters usually buy the fruit from the producers on credit, with a repayment delay of two week to 90 days. Table 4: Percentage of Producers’ Sales by Client Type
District and producer category Types of clients
% Fruit Sold to Wholesalers
% Fruit Sold to Processors
% Fruit Sold to Retail Sellers
% Fruit Sold to Exporters
District
Abomey-Calavi 100% 29% 20% 1% Allada 97% 36% 46% 12% Kpomasse 100% 6% 88% 0% Ouidah 100% 31% 39% 0% Toffo 99% 17% 8% 35 Tori Bossito 100% 26% 29% 1 Ze 100% 15% 59% 0% Producer Category Small producers 99% 19% 36% 7% Medium size producers 100% 41% 47% 6% Big producers 99% 35% 45% 3%
3.3.8 Production constraints The pineapple producers face a number of constraints that reduce production and in general affect the profitability of growing pineapple. In particular the smaller producers lack technical knowledge of how to grow good quality pineapple, and they don’t have access to financial resources to procure sufficient inputs, pay for field and procure modern tools. In addition, the following issues are common to all pineapple producers. These include:
o Low prices paid by the wholesalers and retail sellers. Only producers with the highest quality fruit are able to sell to the much more lucrative exporters, or even the better paying processing companies;
o Poor road access, especially to the field and particularly during the rainy season, with some roads becoming impassable to the trucks that transport the fruit to the markets, and processing companies;
o Low harvest volume and poorer quality fruit due to incorrect and insufficient fertilizers. Only cotton fertilizer is readily available and for a reasonable price. Currently, almost
20
no one imports the specially formulated fertilizer needed to grow high quality fruit and increase field production;
o Contending with seasonal issues, for example when other fruit such as mango flood the market (May to July), and during the dry seasons when even mature pineapples are still small and have to be sold at a loss.
4. PROCESSING COMPANIES
4.1 Processor background Information
Pineapple processing began in the mid-1990s due to two factors: The first of these factors was the end of massive automatic recruitment by the Benin government as recommended by the International Monetary Funds (IMF). This resulted in large numbers of unemployed young people that tried a number of entrepreneurial initiatives, including processing fruit into juice for the local market. The second factor promoting pineapple juice processing started about the same time. Several private sector companies wanted to start exporting fruit to Europe. However, Benin was not prepared for this type of business venture and consequently produced a high rate of rejected fruits unsuitable for exportation to European markets. This situation created an opportunity for pineapple processing, but with only rudimentary, manual processing tools, no technically trained personnel, and lacking funds to buy packaging other than recycled beer bottles, the juice products could only be sold on the local consumer market. In fact, for the very small companies, they still process juice for the local consumer market using basically the same methods.
4.2 Processor qualitative description While pineapple fruit is almost solely produced in the Atlantique State, the processing companies are located throughout the Atlantique and Littoral States and within the neighboring States, such as the Zou, Mono and Oueme States. Most of the processing companies are members of the pineapple producer association called National Association of Pineapple Processors of Benin (ANATRAB) which has 70 registered members, (though the surveyors discovered that 10 no longer process pineapple juice). ANATRAB started in 2012, with the objective of creating an association for all the pineapple processing companies. All but one of the companies are small scale processors (currently 59). One large processing company has annual juice production that equals the combined production of all the small scale companies. The processing companies are owned primarily by men (45 of the 60 functioning companies), with the remaining 15 being owned by women. Pineapple juice is the most common processed pineapple product; however, most of the small scales processing companies do not process juice on a regular basis, but process juice for specific markets or clients whom place an order. The smallest companies have very irregular production frequency, stopping and starting their juice production to provide processed juice just for the major feasts such as end of year holiday season and the Muslim fastening period, when the demand of juice is at its peak. Only one large company has a modern juice processing system that processes large quantities of juice for both the domestic and regional markets.
21
Beside pineapple juice, a couple of small companies stated they had tried making pineapple jam, but in very small quantities and for only local consumer market. Only one processing company processes pineapple into dry slices for export to Switzerland and France. Some processors also produce pineapple juice cocktail by mixing pineapple with other fruit juice (mainly orange or mango juice).
4.2.1 Pineapples used in processing
Processing companies buy pineapples directly from the farmers, and collect them from the field by truck from the pineapple farmers. They also buy them from wholesalers. The fruit pricing methods are by truck loaded from producers or by unit of 40 fruits from wholesalers. Small scales processors do not generally establish a permanent buyer-seller contract with their suppliers. One processing company has a formal relationship with its producer association, which has about 2,850 pineapple producer members. This company is also the only one which buys its fruit at a fixed price of $0.10/Kg. All the small processing companies negotiate the fruit prices on each load.
4.2.2 Processing equipment and methods
The 34 small companies still process juice using traditional methods, and rudimentary equipment designed and made by local craftsmen. Once the pineapples are washed, peeled and cut up in pieces by hand, they are manually loaded into a gas-powered motorized fruit crusher and then transferred by hand into a manually operated fruit press. The juice is then poured by hand into recycled but washed bottles (beer or soya milk). The bottles are then pasteurized in large cooking pots of boiling water and heated by burning methane gas. If the processors do not use the specialized thermometers needed to control the temperature, it is difficult for them to avoid over heating (which results in juice discoloration) or under heating (which results in juice fermentation). The small processing companies can use about two metric tons of fruit daily into about the same in juice. One of the small processing companies has a bag-in-box filling machine to fill bags with juice for export to France and two of the small scale processors have machines to fill Doypack packages of juice. One small processing comany produces dried slices for export to France. The company’s drying equipment was imported from Burkina Faso, but is a rudimentary wooden and wire structure. The pineapples are washed, peeled and sliced by hand, and the slices are dried in dryer heated with butane gas. Generally, the small processing companies operate out of buildings that are unsuitable for juice processing. They were not really built for food processing, but were built as a house or warehouse and then refurbished into a makeshift factory for juice processing. As they often lack proper ventilation, the exhaust from the gasoline powered motors sometimes contaminates the juice and causes worker health issues. The one large processing company uses modern processing equipment imported from China. This includes an electric fruit washer, automatic crusher, juice extractor, pasteurizer (with automatic heat control) and a package filling machine and finally a cooling machine. The company has packaging machinery which produces both canned and Tetrapack pineapple juice. However, even this large company still peels all the fruit by hand, using mainly women. Another large company, which currently has limited production, is currently building a modern
22
factory to process pineapple juice. This company will be equipped with Italian processing technology and is supposed to be operational sometime in 2016.
4.2.3 Processors markets
The processors generally supply domestic market but according to them, only 10% of the juice is marketed in this market, where there is a high competition with other imported or locally produced soft drinks. The regional markets account for 90% of the produced juice. Major importing countries are Mali, Niger, Burkina Faso, and Senegal. Export to Nigeria is done by the informal route by wholesalers, as NAFDAC registration is required for official trade, but as yet, none of the processing companies succeeded in obtaining the registration, mainly due to not meeting the hygiene and sanitary processing standards.
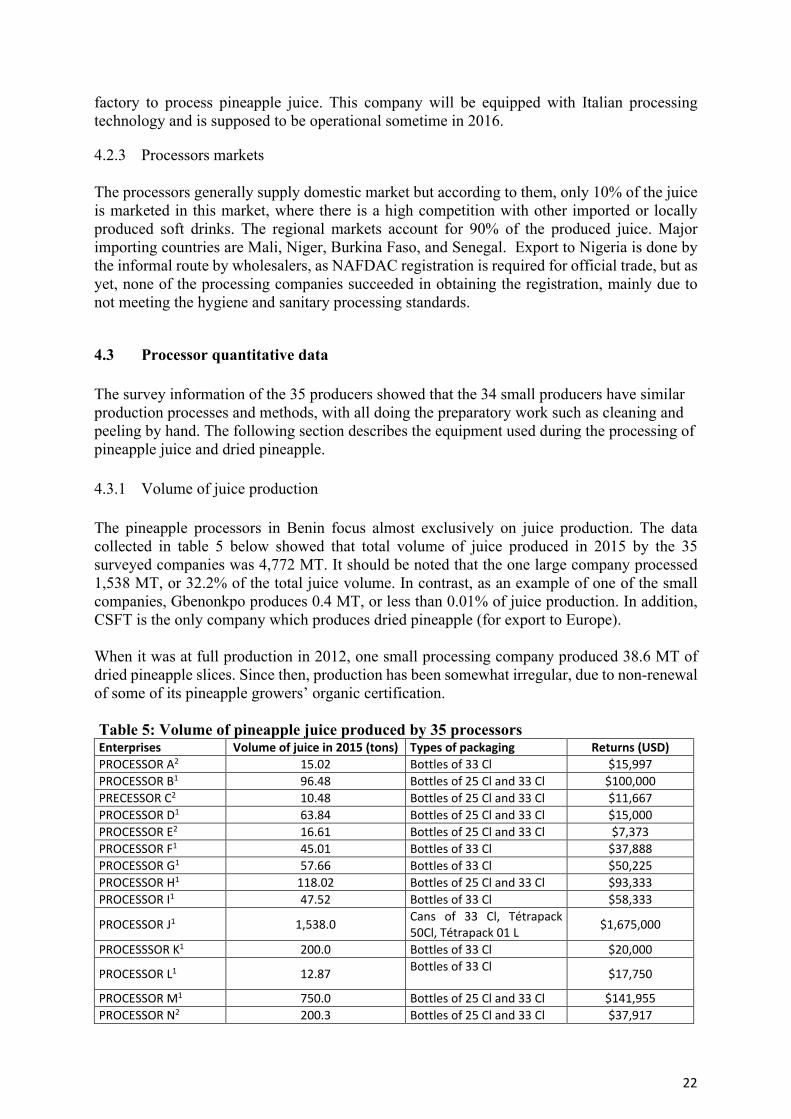
4.3 Processor quantitative data The survey information of the 35 producers showed that the 34 small producers have similar production processes and methods, with all doing the preparatory work such as cleaning and peeling by hand. The following section describes the equipment used during the processing of pineapple juice and dried pineapple. 4.3.1 Volume of juice production The pineapple processors in Benin focus almost exclusively on juice production. The data collected in table 5 below showed that total volume of juice produced in 2015 by the 35 surveyed companies was 4,772 MT. It should be noted that the one large company processed 1,538 MT, or 32.2% of the total juice volume. In contrast, as an example of one of the small companies, Gbenonkpo produces 0.4 MT, or less than 0.01% of juice production. In addition, CSFT is the only company which produces dried pineapple (for export to Europe). When it was at full production in 2012, one small processing company produced 38.6 MT of dried pineapple slices. Since then, production has been somewhat irregular, due to non-renewal of some of its pineapple growers’ organic certification. Table 5: Volume of pineapple juice produced by 35 processors Enterprises Volume of juice in 2015 (tons) Types of packaging Returns (USD) PROCESSOR A2 15.02 Bottles of 33 Cl $15,997 PROCESSOR B1 96.48 Bottles of 25 Cl and 33 Cl $100,000 PRECESSOR C2 10.48 Bottles of 25 Cl and 33 Cl $11,667 PROCESSOR D1 63.84 Bottles of 25 Cl and 33 Cl $15,000 PROCESSOR E2 16.61 Bottles of 25 Cl and 33 Cl $7,373 PROCESSOR F1 45.01 Bottles of 33 Cl $37,888 PROCESSOR G1 57.66 Bottles of 33 Cl $50,225 PROCESSOR H1 118.02 Bottles of 25 Cl and 33 Cl $93,333 PROCESSOR I1 47.52 Bottles of 33 Cl $58,333
PROCESSOR J1 1,538.0 Cans of 33 Cl, Tétrapack 50Cl, Tétrapack 01 L $1,675,000
PROCESSSOR K1 200.0 Bottles of 33 Cl $20,000
PROCESSOR L1 12.87 Bottles of 33 Cl $17,750
PROCESSOR M1 750.0 Bottles of 25 Cl and 33 Cl $141,955 PROCESSOR N2 200.3 Bottles of 25 Cl and 33 Cl $37,917
23
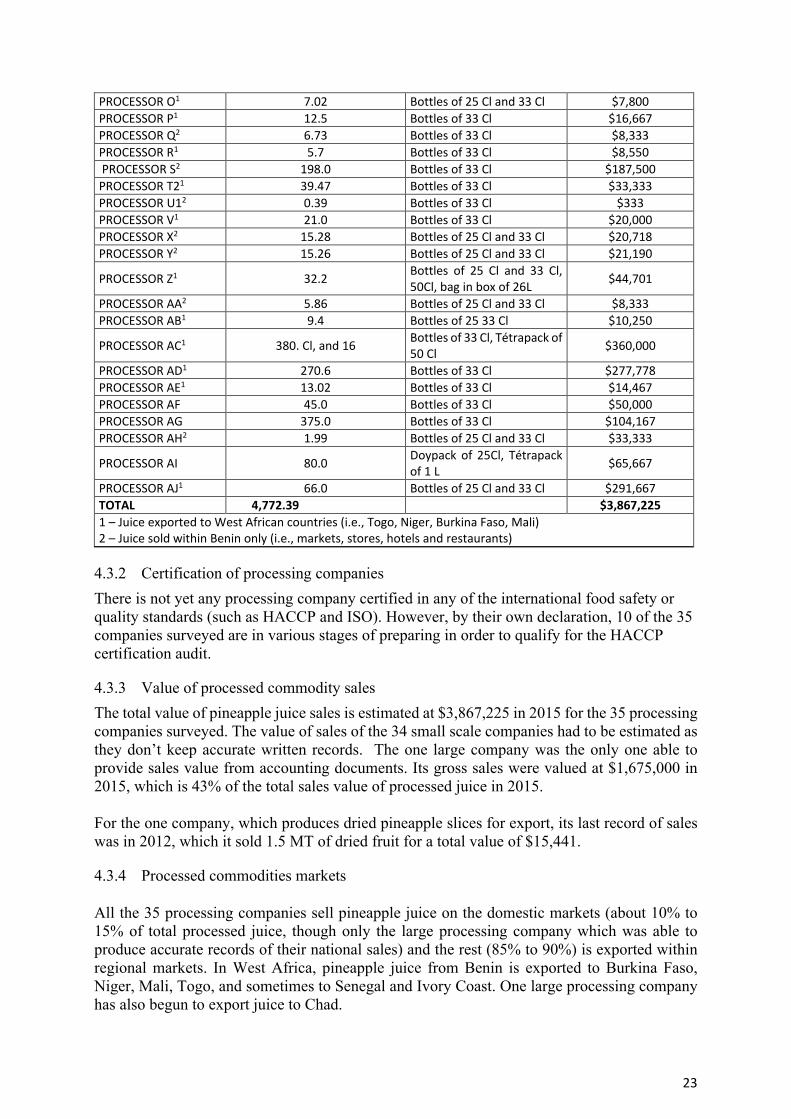
PROCESSOR O1 7.02 Bottles of 25 Cl and 33 Cl $7,800 PROCESSOR P1 12.5 Bottles of 33 Cl $16,667 PROCESSOR Q2 6.73 Bottles of 33 Cl $8,333 PROCESSOR R1 5.7 Bottles of 33 Cl $8,550 PROCESSOR S2 198.0 Bottles of 33 Cl $187,500 PROCESSOR T21 39.47 Bottles of 33 Cl $33,333 PROCESSOR U12 0.39 Bottles of 33 Cl $333 PROCESSOR V1 21.0 Bottles of 33 Cl $20,000 PROCESSOR X2 15.28 Bottles of 25 Cl and 33 Cl $20,718 PROCESSOR Y2 15.26 Bottles of 25 Cl and 33 Cl $21,190
PROCESSOR Z1 32.2 Bottles of 25 Cl and 33 Cl, 50Cl, bag in box of 26L $44,701
PROCESSOR AA2 5.86 Bottles of 25 Cl and 33 Cl $8,333 PROCESSOR AB1 9.4 Bottles of 25 33 Cl $10,250
PROCESSOR AC1 380. Cl, and 16 Bottles of 33 Cl, Tétrapack of 50 Cl $360,000
PROCESSOR AD1 270.6 Bottles of 33 Cl $277,778 PROCESSOR AE1 13.02 Bottles of 33 Cl $14,467 PROCESSOR AF 45.0 Bottles of 33 Cl $50,000 PROCESSOR AG 375.0 Bottles of 33 Cl $104,167 PROCESSOR AH2 1.99 Bottles of 25 Cl and 33 Cl $33,333
PROCESSOR AI 80.0 Doypack of 25Cl, Tétrapack of 1 L $65,667
PROCESSOR AJ1 66.0 Bottles of 25 Cl and 33 Cl $291,667 TOTAL 4,772.39 $3,867,225 1 – Juice exported to West African countries (i.e., Togo, Niger, Burkina Faso, Mali) 2 – Juice sold within Benin only (i.e., markets, stores, hotels and restaurants)
4.3.2 Certification of processing companies There is not yet any processing company certified in any of the international food safety or quality standards (such as HACCP and ISO). However, by their own declaration, 10 of the 35 companies surveyed are in various stages of preparing in order to qualify for the HACCP certification audit.
4.3.3 Value of processed commodity sales The total value of pineapple juice sales is estimated at $3,867,225 in 2015 for the 35 processing companies surveyed. The value of sales of the 34 small scale companies had to be estimated as they don’t keep accurate written records. The one large company was the only one able to provide sales value from accounting documents. Its gross sales were valued at $1,675,000 in 2015, which is 43% of the total sales value of processed juice in 2015. For the one company, which produces dried pineapple slices for export, its last record of sales was in 2012, which it sold 1.5 MT of dried fruit for a total value of $15,441.
4.3.4 Processed commodities markets
All the 35 processing companies sell pineapple juice on the domestic markets (about 10% to 15% of total processed juice, though only the large processing company which was able to produce accurate records of their national sales) and the rest (85% to 90%) is exported within regional markets. In West Africa, pineapple juice from Benin is exported to Burkina Faso, Niger, Mali, Togo, and sometimes to Senegal and Ivory Coast. One large processing company has also begun to export juice to Chad.

24
Two of the processing companies also export bulk juice to France, with the large company just starting in 2015 and one small processing company stating that it had exported 11.7 MT of bulk juice to France in 2012. However, the actual volume is not known for 2015 for either company due to export irregularity caused by frequent breakdown of the bag-in-box equipment.
4.3.5 Processor constraints
The processing companies face a number of production constraints, and in particular the small processers, who lack modern equipment, methods and production systems, and do not have access to finances to procure the needed equipment. Other constraints and issues that limit the volume and quality of processed pineapple products and in particular, juice include:
o Lack of high quality fruit needed to produce higher volume and good quality juice. The basic lack on raw materials negatively affects every aspect of juice (and dried) processing. Even equipment can’t be used to peel the pineapples until a standard size can be maintained;
o The hygiene and food safety standards, which severely limit the export of juice, both in the region and internationally. As yet none of the processing companies having passed the HACCP or ISO standards;
o Without exception, the processing companies have weak or no business plan nor marketing communication strategy. As well, they all lack marketing and product branding knowhow.
5. TRANSPORTERS, EXPORTERS AND WHOLESALERS
5.1 Transporters:
The fresh pineapple is transported from the farms to the urban and border markets by small two-ton pick-up trucks. The individual truck owners are contracted by the wholesalers and processing companies on an informal basis, with payment made once the fruit reaches its destination. The transporters’ objective is to put as much fresh fruit as possible into each of the small, canvas-covered trucks, which damages the outside layer of pineapples. Only Nigeria buyers accept all of the Sugar Loaf pineapples, in whatever condition they arrive at the border, but with price being determined by the size and condition of the fruit. Fortunately for the processing plants, the distance is relatively short and the fruit is processed within 24 hours, minimizing damages losses. However, for the local retail markets, the damaged fruit is discarded.
The pineapple processing companies contract various sizes of trucks to transport cartons of juice to local markets. To reach the regional markets, the processors contract space within the very large transport trucks bringing containers of products from the Cotonou port to buyers in Togo, Niger, Burkina Faso, Nigeria and Mali. To accelerate transport and avoid damage, the exporters have their own transport system and staff, which starts at the farmers’ field by harvesting the best fruit. The pineapples are sorted
25
again before being carefully placed into cartons and then loaded into 10-ton vans, which bring the fruit directly to the air freight reception area for loading as cargo.
5.2 Exporter background
The first companies were started in the late 1980’s, when Benin government started promoting the pineapple sector, based on the model of Ivory Coast, Côte d’Ivoire. The pilot project created large farms in Allada, in the Atlantique State. These farms were subsequently sold to private companies in 1990. It was at this time that the exporters started shipping very small quantities of fresh fruit to France (about two tons per week and only the Smooth Cayenne variety).
5.3 Exporter and wholesaler qualitative data
All five of the currently functioning pineapple export companies in Benin were interviewed. All five companies exclusively export fresh pineapple to European markets with 80% of the total annual fresh fruit volume exported is shipped by two of these companies. The other 20% is shipped by the three other small companies. All five exporting companies are very small, composed of the company owner and only one or two other staff, usually an accountant and/or a secretary. One of the five companies is owned by a woman, while the other four are owned by men. They exclusively deal only in fresh fruit for export to Europe, with the exception of one export company, which also processes pineapple into juice, but for the local and regional markets only. All shipments to Europe are transported via air freight, using Air France, Brussel Airlines, and DHL. The fruit (mainly Smooth Cayenne) is shipped to European wholesalers who receive the fruit at the airport and then transport it to supermarkets and small fruit vendors.
The fresh fruit wholesalers are individual market sellers (majority are women), who buy the fresh pineapples directly from the farmers (usually by units of 40 fruit) and transport it by truck to the domestic markets (Dantokpa and Seme Krake are the two main wholesale markets), and to regional markets in West Africa.
5.3.1 Wholesaler Export to regional markets
The fresh fruit market wholesalers transport the fresh fruit by truck or taxi to mainly regional markets, although they do also sell to retail market sellers from the large domestic markets (Dantokpa and Seme Krake are the two main wholesale markets). Though some fruit is sold to the regional markets of Niger, and Burkina Faso, the Nigerian fresh fruit market is by far the largest, with sales of Benin pineapple (primarily the Sugar Loaf variety) estimated at 40% of total fresh fruit production, or 172,685 MT in 2014. The wholesalers also sell to truckers going to other regional markets of Niger, Mali, and Burkina Faso. The wholesalers stated that sales to the Sahel countries, which are predominantly Muslim, increased during the fasting month of Ramadan (an estimated 24 MT was shipped in 2015 to Niger). The wholesalers go to the fields to negotiate directly with the producers. The fruit is loaded up into two ton pickup trucks and brought to the border markets of Seme Krake and Igolo, which are the two main entrances for Benin pineapple into Nigeria. Sugar Loaf is by far the main variety of pineapple sold to Nigeria, but it is very difficult to determine the actual volume of trade as statistics of Benin pineapple exportation to regional markets lack regularity and
26
consistency, and virtually all exports are conducted in an informal, unwritten manner. In addition, the amount of pineapple going across the border is not weighed before being transported and none of the sellers keep written records. Pineapple to these two countries is loaded into trucks going with other products and sold in their local markets to only consumers.
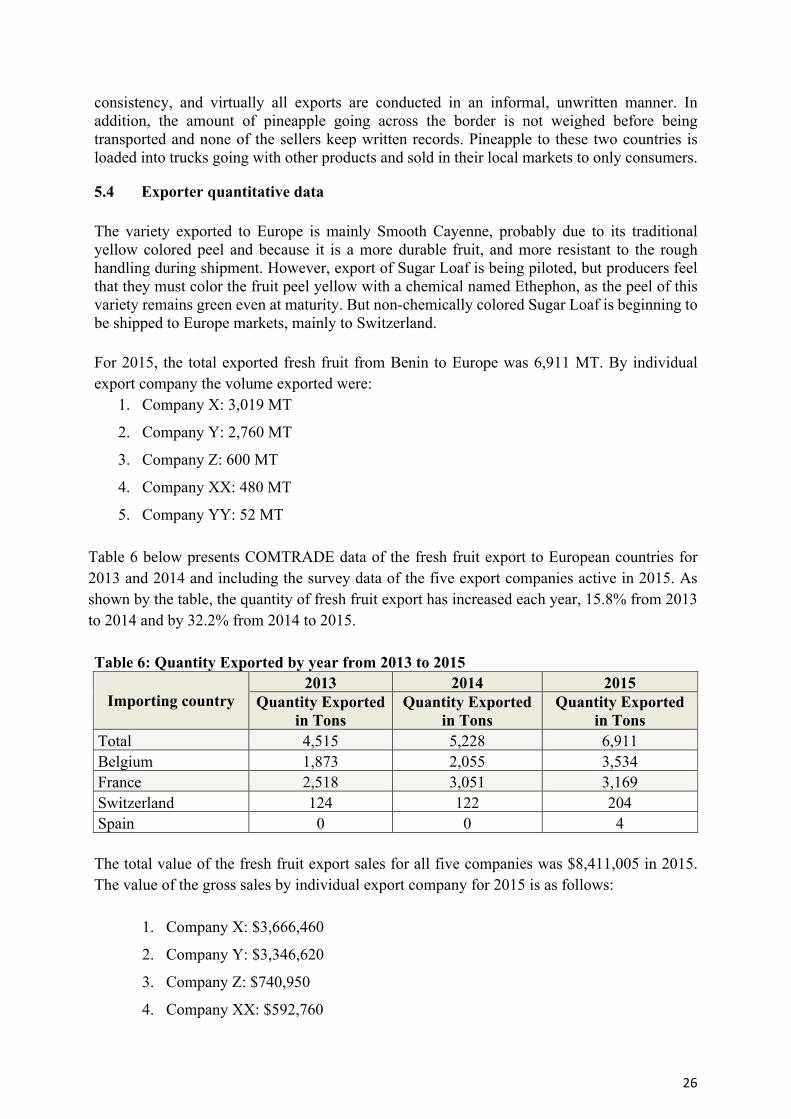
5.4 Exporter quantitative data The variety exported to Europe is mainly Smooth Cayenne, probably due to its traditional yellow colored peel and because it is a more durable fruit, and more resistant to the rough handling during shipment. However, export of Sugar Loaf is being piloted, but producers feel that they must color the fruit peel yellow with a chemical named Ethephon, as the peel of this variety remains green even at maturity. But non-chemically colored Sugar Loaf is beginning to be shipped to Europe markets, mainly to Switzerland. For 2015, the total exported fresh fruit from Benin to Europe was 6,911 MT. By individual export company the volume exported were:
1. Company X: 3,019 MT
2. Company Y: 2,760 MT
3. Company Z: 600 MT
4. Company XX: 480 MT
5. Company YY: 52 MT
Table 6 below presents COMTRADE data of the fresh fruit export to European countries for 2013 and 2014 and including the survey data of the five export companies active in 2015. As shown by the table, the quantity of fresh fruit export has increased each year, 15.8% from 2013 to 2014 and by 32.2% from 2014 to 2015. Table 6: Quantity Exported by year from 2013 to 2015
Importing country 2013 2014 2015
Quantity Exported in Tons
Quantity Exported in Tons
Quantity Exported in Tons
Total 4,515 5,228 6,911 Belgium 1,873 2,055 3,534 France 2,518 3,051 3,169 Switzerland 124 122 204 Spain 0 0 4 The total value of the fresh fruit export sales for all five companies was $8,411,005 in 2015. The value of the gross sales by individual export company for 2015 is as follows:
1. Company X: $3,666,460
2. Company Y: $3,346,620
3. Company Z: $740,950
4. Company XX: $592,760
27
5. Company YY: $64,215
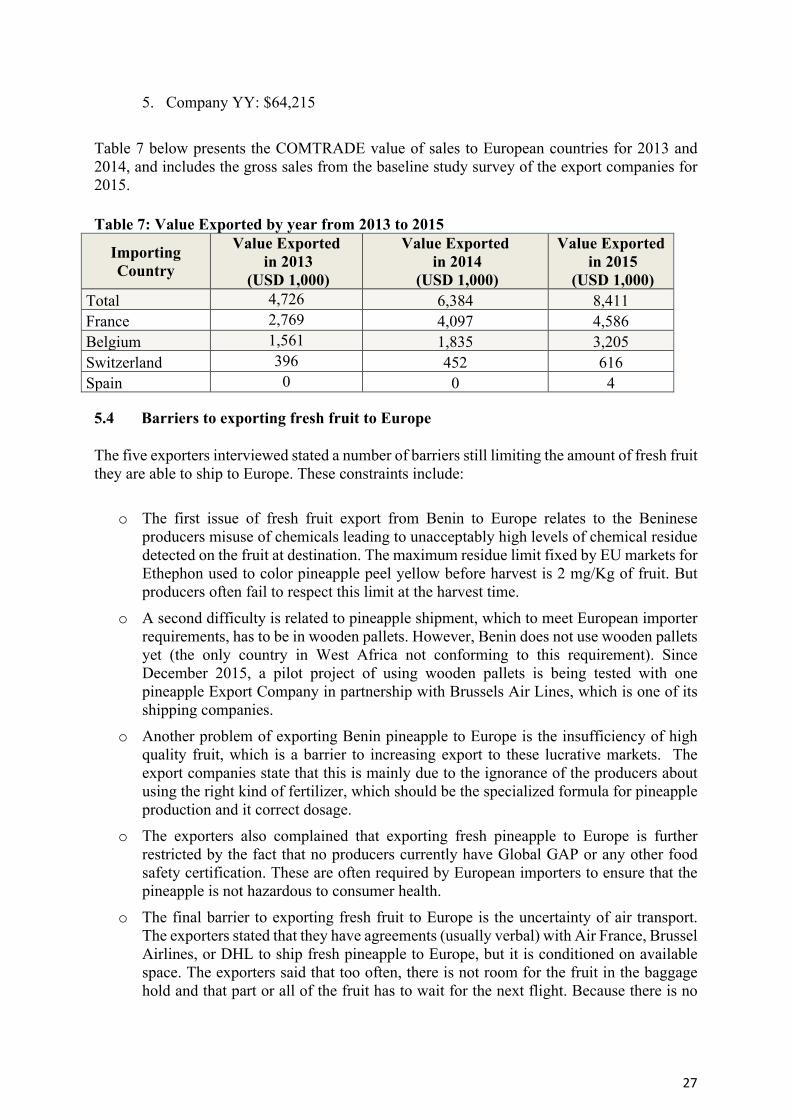
Table 7 below presents the COMTRADE value of sales to European countries for 2013 and 2014, and includes the gross sales from the baseline study survey of the export companies for 2015. Table 7: Value Exported by year from 2013 to 2015
Importing Country
Value Exported in 2013
(USD 1,000)
Value Exported in 2014
(USD 1,000)
Value Exported in 2015
(USD 1,000) Total 4,726 6,384 8,411 France 2,769 4,097 4,586 Belgium 1,561 1,835 3,205 Switzerland 396 452 616 Spain 0 0 4
5.4 Barriers to exporting fresh fruit to Europe
The five exporters interviewed stated a number of barriers still limiting the amount of fresh fruit they are able to ship to Europe. These constraints include:
o The first issue of fresh fruit export from Benin to Europe relates to the Beninese producers misuse of chemicals leading to unacceptably high levels of chemical residue detected on the fruit at destination. The maximum residue limit fixed by EU markets for Ethephon used to color pineapple peel yellow before harvest is 2 mg/Kg of fruit. But producers often fail to respect this limit at the harvest time.
o A second difficulty is related to pineapple shipment, which to meet European importer requirements, has to be in wooden pallets. However, Benin does not use wooden pallets yet (the only country in West Africa not conforming to this requirement). Since December 2015, a pilot project of using wooden pallets is being tested with one pineapple Export Company in partnership with Brussels Air Lines, which is one of its shipping companies.
o Another problem of exporting Benin pineapple to Europe is the insufficiency of high quality fruit, which is a barrier to increasing export to these lucrative markets. The export companies state that this is mainly due to the ignorance of the producers about using the right kind of fertilizer, which should be the specialized formula for pineapple production and it correct dosage.
o The exporters also complained that exporting fresh pineapple to Europe is further restricted by the fact that no producers currently have Global GAP or any other food safety certification. These are often required by European importers to ensure that the pineapple is not hazardous to consumer health.
o The final barrier to exporting fresh fruit to Europe is the uncertainty of air transport. The exporters stated that they have agreements (usually verbal) with Air France, Brussel Airlines, or DHL to ship fresh pineapple to Europe, but it is conditioned on available space. The exporters said that too often, there is not room for the fruit in the baggage hold and that part or all of the fruit has to wait for the next flight. Because there is no
28
storage room, the pineapple quickly rots on the tarmac and is no longer suitable for export.
6. Women’s role in the pineapple industry
As with many agricultural value chains, women are key actors within the pineapple industry, at all stages of the value chain, though primarily as casual field labor on family farms and employees in the pineapple processing companies. However, women own only eight percent of the small farms; 22% of the processing companies; and only one of the five export companies is owned by a woman. During pineapple production, females of all ages represent about 20% of the casual and seasonal workforce (though they are primarily producer family members) and are especially active during field preparation (removing stones, weeding and plowing) and the then again during the 18 month growing cycle to keep the crop free of weeds and to assist with the multiple fertilizer applications. Women also work in the fields during harvesting, though primarily in sorting and grading the pineapple for different markets (smaller for local retail, medium to large for processing and large for export). More women than men work in the pineapple juice processing plants, making up about 72% of hired labor. They women wash, peel and chop up the fruit, as well as clean the recycled bottles and label the finished product. Men take on the tasks of carrying the fruit from the trucks into the plants and the cartons of bottled and canned juice ready for shipping. However, estimated at 90% of all fruit sellers being women, they dominate both the local and regional wholesale and retail markets.
7. CONCLUSION As stated, the primary aim of the baseline study of the Pineapple Processing for Export (PINEX) project was to collect necessary data in order is to establish indicator baseline information and confirm and finalize indicator targets of PfD’s USDA Agreement. And if necessary, request that the indictor targets be updated to incorporate changes as determined by the baseline study results. In fact, the survey results indicate that a relatively small number of performance indicator targets should be changed, and in particular the targets for women (reducing the percentage of female producers from 10% to 8%); the number of currently functioning processing companies (falling from 70 to 60); the volume and value of processed juice sales (increasing both amounts); and the volume and value of fresh pineapple sold by exporters (correct an error in the first year target and increasing the amounts).
7.1 Summary of study results Following are the main findings of the each of the three main categories of targeted populations of the pineapple producers, processors and exporters:
7.2 Producers For the pineapple producers the study data showed that:
29
1. 92% of pineapple producers are male and 8% are female. 2. To work in the fields, 49% of the surveyed pineapple farmers declared using family
members’ labor and 51% use hired labor. 3. The results show that Sugar Loaf constitutes between 72% and 81% of the total
production and covers between 73% and 80% of all cultivated areas. 4. The survey found that the total pineapple production for the 768 producers sampled for
2015 was 34,076 Metric tons, with 11,405 MT of Smooth Cayenne and 22,671 MT of Sugar Loaf.
5. Nearly all surveyed producers (98%) use at least one type of chemical fertilizer. The most used chemical fertilizer is NPK fertilizers formulated for cotton production (97.3%).
6. The baseline study survey showed that the average estimated gross production sale for the 768 sampled producers was $.07 ($.04 to $.10) per kilo in 2015 (taking into account the variation in sales price of the two varieties), for total estimated production sales of $2,385,320 for the 34,076 MT.
7. For access to finances, the data reveal that the majority of producers know of at least one institution that finances agricultural production activities. However, only 20% of producers have benefitted from loans from these institutions. Most small producers pay for production with their savings, and by personal loans from family members, and group lending to each other through tontines, or are pre-financed by buyers.
8. All the producers do business with wholesalers, who buy 59% of the total harvest. Retail sellers are the second most important clientele with is retail sellers, who purchase 24% of production. Processing companies buy 15% of the total pineapple harvest. Only 2% is sold to the export companies, which export fresh pineapple to Europe.
9. Less than 50% of producers declared having access to information on sales prices, places of trading, suppliers or even the organization of the pineapple sector in general.
7.3 Processors: For the pineapple processing companies, the data revealed that:
1. The 34 small companies process juice using traditional methods, and rudimentary equipment designed and made by local craftsmen. Almost all of the processing in the small companies is manual, though most have a gas-powered motorized fruit crusher. Of those surveyed, only the large processing company had modern equipment for most of its operations except for peeling, which is still done by hand.
2. There are no processing companies certified in any of the international food safety or quality standards (such as HACCP and ISO).
3. The pineapple processors in Benin focus almost exclusively on juice production. The data collected showed that total volume of juice produced in 2015 by the 35 surveyed companies was 4,772 MT (80% of all juice produced in Benin).
4. In 2012, one company produced 38.6 MT of dried pineapple slices, valued at of $15,441, and sold to French clientele.
5. The total value of pineapple juice sales is estimated at $3,867,225 in 2015 for the 35 processing companies surveyed.
30
6. All the 35 processing companies sell pineapple juice on the domestic markets (about 10% to 15% of total processed juice), and the rest (85% to 90%) is exported within the regional markets of Burkina Faso, Niger, Mali, Togo, and sometimes to Senegal and Ivory Coast.
7. Two of the processing companies also export bulk juice to France, and one company ships dried pineapple slices to France.
7.4 Exporters For the exporters, the survey data showed that:
1. The five exporting companies are very small, and exclusively sell fresh pineapples to Europe (mainly France and Switzerland).
2. The fresh fruit wholesalers are individuals (majority are women), sell to the regional markets, with the Nigeria market having an estimated at 40% of total fresh fruit production, or 172,685 MT in 2014.
3. The wholesalers also sell to truckers going to other regional markets of Niger, Mali, and Burkina Faso); sales increase during the fasting month of Ramadan (an estimated 24 MT was shipped in 2015 to Niger).
4. None of the producers that sell pineapple to exporter is certified Global GAP. This observation is confirmed through verification from the Global GAP online database2.
5. For 2015, the total exported fresh fruit from Benin to Europe was 6,911 MT. 6. The total 2015 value of fresh fruit export sales for all five companies was $8,411,005. 7. Barriers that limit the amount of fresh fruit shipped to Europe include unacceptably
high levels of chemical residue detected on the fruit at destination; lack of the required wooden pallets for shipping the fruit in air cargo; lack of high quality pineapples; the producers’ lack of the required Global Gap certification; and a lack of storage at the airport for fruit waiting to be loaded.
8. Annexes
2 https://database.globalgap.org/globalgap/search/SearchMain.faces?init=1
31
Annex 1. Terms of Reference for Baseline & Contract with LEADD
TERMS OF REFERENCE FOR AN INDEPENDENT BASELINE STUDY FOR
PINEAPPLE PROCESSING FOR EXPORT (PINEX) PROJECT IN BENIN
FCC-680-2015/012-00 PARTNERS FOR DEVELOPMENT
30 November 2016
1. Introduction and Background:
This is a request for applications from qualified firms, companies, organizations or a consortium of these entities to conduct a baseline study for the above-captioned project, core-funded by the U.S. Department of Agriculture. All applications should be submitted no later than December 21st to the PfD Benin Office, Building No. 1176, Lot K, Hai Vive, Cotonou, Benin by hand delivery or via email to [email protected].
Partners for Development (PfD), is an American non-governmental organization whose mission is to improve quality of life in developing countries, and especially among underserved communities and populations. As of October 2015, PfD operates programs in Cambodia, Nigeria, and Benin, with additional activities in Tanzania. PfD also ran programs in the past in Bosnia & Herzegovina, Somalia, Rwanda, and Liberia
PfD’s core capabilities are in public health, agriculture, and microfinance, all overarched by the goal of working with and through local partners as much as possible. Through this approach, the networks and knowledge of local organizations and businesses can be employed at relatively low cost, and PfD can help build capacity, thus improving chances at sustainability.
The U.S. Department of Agriculture’s (USDA) Food for Progress Program signed a cooperative agreement to PfD on September 24, 2015, and totaling $15,631,458 (including estimated cost of commodities, and freight), to implement the Pineapple Processing for Export (PINEX) project.
The project will be financed through the monetization of 18,150 MT of rice from USDA, and over a period of five years, PfD will use the proceeds from such sale to implement the PINEX project in Benin focused on achieving the following objectives:
• Increase agricultural productivity by: building the technical and business management capacity of pineapple farmers, the Pineapple Producers Network of Benin (PPNB), and the Ministry of Agriculture (MOA); connecting producers with access to finance; and enabling the private sector to supply improved fertilizer.
• Improve agricultural processing by building the technical and business management capacity of pineapple processors and the National Association of Pineapple Processing Companies of Benin (NAPPCB), and by connecting processors with access to finance, equipment, and certifications.
32
• Expand agricultural trade by: building the marketing capacity of pineapple processors; connecting processors with marketing opportunities; establishing a market price and information system; improving border and airport storage and marketing facilities; and supporting innovation and collaboration across the Beninese pineapple value chain.
PINEX will target pineapple producers, and processing and marketing companies in the Atlantique and Littoral states of southern Benin, implementing the following activities:
A. Training and Capacity Building: Pineapple Production: PfD will help strengthen MOA's agricultural training entity, the Regional Agricultural Rural Development Center (RARDC). PfD will train RARDC field staff in improved pineapple growing techniques and additional RARDC staff in Global Good Agricultural Practices (Global GAP) standards, which are necessary for exporting pineapple products. PfD will facilitate this training and assist in the Global Gap certification audits of the targeted producers.
PfD will also strengthen the management and technical capacities of PPNB, a private sector association of pineapple producers, enabling PPNB to support project beneficiaries and provide services to producer members during and after the project. PfD will recruit staff for PPNB's technical training branch and will provide training-of-trainers to PPNB training branch staff. The training topics will focus on pineapple production and business development, such as seedling production, pest control, business plans, and finances. PfD will provide project training materials, motorcycles, and other essential logistical support for the training. To strengthen PPNB business systems and establish independent and long-term funding streams, PfD will conduct training in partnership with SNV -Benin's Agro Business Center (ABC). The training will target PPNB administrative and financial staff and enable PPNB to: increase membership and improve its membership recruitment system; collect annual fees; establish a fee-for-service system; and offer business management, financial, and technical services to producer members.
To train pineapple producers on improved pineapple production, PfD will establish field demonstration plots in partnership with the Songhai Center, a Beninese non-governmental organization focused on practical agricultural training. The demonstration plots will serve as training sites for modern farming techniques and will host Farmer Field Schools (FFS) events. PfD will facilitate FFS events by ensuring that PPNB identifies local "master farmers" that gather neighboring pineapple farmers into groups for training conducted by PPNB and RARDC. The demonstration plots will be located on larger privately owned pineapple farms and on local government property.
B. Training and Capacity Building: Pineapple Processing: PfD will strengthen the management of NAPPCB, a private sector association of pineapple processors, enabling NAPPCB to provide services to processor members during and after the project. To strengthen NAPPCB business systems and establish independent and long-term funding streams, PfD will conduct training in partnership with ABC. The training will target NAPPCB administrative and financial staff and enable NAPPCB to: increase membership and improve its membership recruitment system; collect annual fees; establish a fee-for-service system; and offer business management, financial, and technical services to processor members.
In addition, PfD will contract a processing specialist to conduct needs assessments on selected processors. The needs assessments will determine the equipment and capacity building required to improve and expand processors' operations. PfD will facilitate loans to enable processors to procure the equipment, which may include juicing and packing equipment, and will provide training-of trainers to NAPPCB training branch staff to provide processors with needed training on topics such as processing methods, equipment use, and audit preparation.
33
Some supported processors will be trained to meet Hazard Analysis and Critical Control Points (HACCP) certification standards, necessary for exporting pineapple products regionally. PfD will provide training-of-trainers to NAPPCB staff that will enable NAPPCB to provide HACCP training, implementation, and audit preparation services to processor members. PfD will support two large processors that are already HACCP certified, in obtaining ISO22000 certification that will enable them to export pineapple products to international markets. PfD will fund HACCP and ISO 22000 certification audits performed by independent auditors. PfD will also train the large processing companies on food safety, hygiene, and quality control.
C. Financial Services: Facilitate Agricultural Lending and Access to Inputs: PfD will establish an Overseas Private Investment Corporation (OPIC)-backed loan facility for financial institutions in Benin. The facility will be a series of legally binding agreements among OPIC, PfD, and the participating financial institutions that covers loans that will be given out through the participating financial institution. PfD will support the financial institutions in developing microcredit loan products appropriate for pineapple producers and equipment and business loan products appropriate for processors. Once the OPIC-backed financial institutions are approved, PfD will directly oversee loan applications on a loan-by-loan basis. PfD will ensure that: the facility targets pineapple producers and processors; producers can obtain training and services required for financial access from PPNB; processors can obtain training and services required for financial access from NAPPCB; and the large processing companies will use the loans accessed through the facility to upgrade equipment and meet ISO 22000 standards. With prior approval from CCC, PfD may assume part of the default risk for loans made under the facility or provide loans or loan guarantees outside of the facility. PfD will monitor the use and repayment of loans to pineapple producers and processors.
PfD will also facilitate a triangular funding arrangement between Orabank, targeted pineapple processors, and the Agricultural Input Company (AlC), a local supply company, to supply targeted producers with specialized fertilizer. PfD will ensure that Orabank provides bank loans to the NAPPCB-member processors, and that the processors use the funds to purchase fertilizer wholesale from AIC. PfD will further ensure that the processors provide the fertilizer to their network of producers on credit, with repayments to be taken from the sales of harvested fruit back to the processors. The arrangement will provide the targeted farmers with access to fertilizer at a lower price. Through NAPPCB, PfD will assist the processors in setting up the triangular arrangement and monitor the loan repayments. PfD will support contract negotiations between Orabank, the AIC and producers.
D. In-Kind Grants: Innovation in Processing and Production: PfD will establish an Innovation Fund that provides small grants to support pineapple producer and processor innovations. Awardees will develop ideas for improving the technology, efficiency, environmental impact, or other aspects of pineapple production and processing. PfD will select producer and processor awardees through a competitive process, and ensure the awardees use the funds to develop and test their innovations.
E. Trade Facilitation: Infrastructure: PfD will partner with PPNB to construct community-based facilities to conduct PPNB member meetings, host trainings, and store fertilizer and other inputs. The centers will be simple open air shelters attached to cement storage rooms. PfD will fund some building materials to complete the storage rooms, with land, labor, and additional building materials provided by other stakeholders such as PPNB members, municipal governments, and NAPPCS. PfD will ensure that municipal mayors and PPNB take joint responsibility for the long-term up-keep of these centers.
34
PfD will partner with municipalities to construct four market stalls in key urban and peri-urban markets to protect sellers' pineapples from heavy sun and rain exposure. PfD will fund some building materials and labor to complete the storage rooms, with land and additional building materials and labor provided by other stakeholders such as municipal mayors. PfD will ensure that the municipal mayors take responsibility for managing the market stalls and ensuring their maintenance through affordable user fees levied on sellers.
PfD will complete construction and install cooling equipment at an existing bulk pineapple juice and fresh fruit export storage facility built by NAPPCB at the Nigerian border. PfD will contribute air conditioners and some building materials such as cement and wire, with labor and additional building materials provided by other stakeholders such as NAPPCB and pineapple wholesalers. PfD will ensure that NAPPCB takes responsibility for maintaining the facility, paying the ongoing electrical and maintenance costs through modest user fees.
PfD will partner with the National Civil Aviation Agency (NCAA), a branch of the Ministry of Transport (MoT), to construct a cool storage room within an existing building at the Cotonou Airport in order to preserve the quality of fresh fruits and bulk juice awaiting shipment on passenger and cargo flights. PfD will supervise the construction of the cool room. PfD will ensure that the space for the cool room and the construction funds are provided by a combination of one or more of the following: NCAA, private airlines, pineapple processors, pineapple exporters, and other public and private organizations that are active in the Beninese horticulture sector. PfD will ensure that NCAA takes responsibility for operating and maintaining the unit, and will explore the possibility of providing the room pro-rata to exporters of other agricultural goods. To decrease losses of fresh pineapples and bulk juice, PfD will also collaborate with stakeholders such as pineapple exporters, the airport's Aviation Handling Service (AHC), airlines, shipping companies, and NCAA to improve the shipping pallet system and pilot wooden pallets at the Cotonou Airport.
F. Trade Facilitation: Market Information: PfD will partner with Esoko, a private company, to establish a Pineapple Market Information System (PMIS) that will provide real-time market prices and information to pineapple producers, processors, sellers, and exporters through SMS messages. This information will enable all pineapple value chain actors to rapidly exchange information for negotiating sales. PMIS will disseminate prices for the principal pineapple wholesale and retail markets, and will also send SMS messages with notices of upcoming events to actors throughout the value chain and technical advice specific to producers and processors. PMIS will leverage Esoko's existing internet platform, currently providing market prices to the USDA supported GREEN project vegetable farmers, but under a new licensing agreement.
PfD will establish a Pineapple Stakeholders' Council (PSC) to bring together members of Benin's pineapple value chain, including producers, processors, exporters, financial institutions, local and national governments, and U.S. Government agencies. The PSC will share valuable information related to the pineapple industry, and facilitate collaboration among actors throughout the pineapple value chain to address issues including transportation and competitiveness. The PSC will also lobby the Government of Benin on policies and regulations related to pineapple production, processing, export, and product standards. PfD will hold biannual council meetings and invite participation from key resource persons and stakeholders.
G. Trade Facilitation: Marketing: PfD will train exporters and NAPPCB member processors on the principles of modern marketing: effective marketing strategy development; branding products for different markets; and advertising effectively in various media. PfD will create practical training materials designed for the identified needs of exporters and processors at various capacity levels. The training will instruct small exporters and processors on marketing products nationally and developing
35
partnerships with larger companies, and instruct larger exporters and processors on marketing nationally, regionally, and internationally. Also, PfD will directly assist exporters and processors in developing marketing strategies and materials, and will provide coaching on how to prepare for product fairs and conduct market research trips. PfD will assist the NAPPCB and exporters in developing a pineapple product label to be used by HACCP certified member processors.
PfD will support processors and exporters' participation in national and regional product fairs as well as researching emerging pineapple product markets. PfD will facilitate the large processing companies to participate in overseas product fairs and market prospecting. PfD will fund less than half of the companies' costs related to these trips. Please see the attached Agreement Program Description for further details.
2. Purpose and Scope of the Baseline Study
The main purpose of the Baseline Study is to establish indicator baseline information and confirm and finalize indicator targets found in Annex E of the Agreement. PfD will submit the results of the baseline study to USDA and if necessary, request that Attachment E be updated to incorporate target changes as determined by the baseline study results.
The baseline study will establish the performance baseline information and targets for which the project will regularly measure progress against. Though life of project (LOP) targets were previously established for both outcome and output results indicators and select indicators have annual targets, the baseline study will confirm or refute if established targets are sufficiently ambitious, but also realistic.
The scope of the baseline study is to collect information about all the key actors of the pineapple sector in Benin. This includes a significant sampling of the over 8,000 pineapple producers, the 70 registered processing companies, the five registered pineapple export companies, and a number of the fresh fruit wholesalers and retailers, most of whom operate within the informal market system of Benin
3. Main Study Questions
Main questions to be asked during the PINEX baseline study should be geared to address issues of establishing valid and reliable baseline information, as well as confirming and finalizing indicator targets as found in the Agreement’s Annex E; and/or indicating targets that need adjusting. Study issues include:
How will the information establish valid output and outcome targets for each of the beneficiary categories? - Are the existing indicator targets ambitious yet realistic? - Are there existing indicator targets that need to be revised?
4. Prospective approach and methodology
4.1 Prospect Approach to the Study:
The majority of baseline studies consist of two surveys: a quantitative and a qualitative ethnographic study. The proposed approach is to conduct a Knowledge, Practice and Coverage (KPC) or KPC-like survey representing the quantitative research, and a Formative Study, representing a qualitative research targeting pineapple producers (farmers) and processors (small pineapple processing companies) to help establish baseline values and targets. For producers, a random sampling methodology will be used targeting male and female pineapple farmers age 18-65, living in both Atlantique and Littoral Departments, Benin. The current level of agricultural productivity and food security of farmers will be used as a variable to define the clusters. All of the 70 processors will be sampled to establish baseline information.
36
Comparing mid-term and final evaluation results with baseline values for both producers and processors will help assess progress, and impact and changes as a result of interventions. For example, changes in pineapple producers’ agricultural practices and processors’ manufacturing practices and behaviors as a result of USDA supported interventions. This will be one of the ways the project will be able to attribute PINEX program interventions to the impact and effectiveness observed. The primary advantage of using a randomized cluster sampling and systematic random sampling approach is to reduce the total number of interviews and costs, given the desired accuracy.
4.2 Methodology:
There will be three groups studied in the baseline, one for producers, one for processors, and a third for the sellers, exporters and transporters:
1. For pineapple producers, a KPC survey tool or questionnaire will be adopted or developed to collect baseline estimates. In addition to demographic and sociological data, pineapple farmers and processors will be asked a series of questions about their knowledge and practices with regard to:
a) Agricultural productivity;
b) Improved use of agricultural techniques and technologies;
c) Improved quality of land and water resources;
d) Improved farm management;
e) Increased access to financial services and markets to sell agricultural products;
f) Increased transaction efficiency,
g) Increased access to market information, etc.
The questionnaire will take less than an hour to complete. The data collection tool can be modified to fit specific project needs. For example, extra questions could be added in an effort to tailor the questionnaire more specifically to assess broader intervention goals and performance objectives (i.e., variables on sustainability prospects, efficiency and effectiveness, impact and project relevance issues).
2. For pineapple processors, PINEX has already developed a census, with complete contact information of the entire 70 targeted, small scale processors living in the project catchment areas of Atlantique and Littoral Departments, Benin. A separate questionnaire will be developed and administered to all 70 pineapple processors to establish a baseline profile. Sample of key indicators for data collection include:
a) Proportion or number of private enterprises, producer organizations, water users associations,
Women’s groups trade business associations that applied improved techniques and technologies as a result of USDA assistance;
b) Type of processing equipment used and need for upgrading to fit international market requirements;
c) Processing capacity of the company and capacity actually used;
d) Value of sales by project beneficiaries (i.e., pineapple juice sold by processors);
e) Volume of commodities sold by processors split by targeted markets;
f) Proportion or number of jobs attributed to USDA assistance;
g) Proportion or number of individuals who have received short-term agricultural sector productivity or food security training;
h) Proportion or number of processors trained in business development;
37
i) Proportion or number of individuals trained in processing methods;
j) Proportion or number of processors certified in HACCP;
k) Proportion or number of processors certified in ISO22000, etc.
3. For the pineapple sellers, exporters and transporters, the study employed a census survey, with complete contact information of all sellers, pineapple exporters and transporters in the project targeted areas of Atlantique and Littoral states. A systematic census will then be used to identify the name and location of the target sellers, exporters and transporters from whom baseline data will be collected. Sample of key indicators for data collection include:
a) National, regional and international markets targeted;
b) Means of transporting the fresh fruit, juice and dried fruit;
c) Means of collecting the fresh fruit from the farmers, or products from the manufacturing companies;
d) Access and use of market information
e) Methods of pineapple sorting, grading and repacking, etc.
PINEX is also likely to undertake a separate formative baseline sampling of pineapple farmers as well as small pineapple processing companies concurrently with the population-based baseline survey. This will help fill knowledge gaps where quantitative studies fail to dig deep. Cultural norms, individuals’ beliefs, values and attitudes, farmer traditions, and many other measures of community life are important determinants of the productivity level of the farmer. Focus groups could be used to collect qualitative information.
Because these factors need to be taken into account by PINEX program managers in the planning of intervention strategies, qualitative research and assessment methods are employed. Qualitative methods are rarely used to collect performance indicator data, but they are helpful in the gathering of information that can help explain trends and/or unexpected findings. Qualitative information is also valuable for the design of locally appropriate and acceptable agricultural behavior change messages. At midterm and final evaluations, PINEX will survey these same producers and processors to help assess progress against baseline values.
5. Timing and Work Plan of the Study Baseline study activities shall start in January 2016 and be completed in March 2016. This will allow submission of the results and any recommended changes of existing indicator targets to USDA in accordance with the March 24th deadline (six months after the Agreement signing date). Following is the study activity timetable, with a six-day workweek and within the proposed calendar:
Date Activity Location
Day 1-3: (Monday, Jan. 4th to Wednesday, Jan.6th)
- Submit evaluation work plan; - Review of project documentation, including: project
proposal, and any similar studies conducted by either the USG or others
Cotonou
Day 4-7: (Thursday, Jan. 7th to Monday, Jan. 11th)
- Draft and submit all data collection tools
(Questionnaires, formative interview questions).
Cotonou
Day 8-12: (Tuesday, Jan. 12th to Saturday January 16th)
- Finalize data collection tools, including necessary testing, and translation.
Cotonou
38
Date Activity Location
Day 13 – 16: (Monday, Jan. 18th to Thursday, Jan. 21st)
- Conduct key partner organization (i.e., PPNB and NAPPCB, the sellers, exporters, and transporters) questionnaires.
Cotonou and Field
Day 17 – 32: (Friday, Jan. 22nd to Tuesday, Feb. 9th)
- Conduct interviews of sample pineapple producers and complete consensus indicators of the processing companies;
- Conduct producer and processing company interviews for the formative survey
Field
Day 33 – 40: (Wednesday, Feb.
10th to Thursday, February 18th)
Data entry and analysis
Cotonou
Day 41: (Friday, February 19th)
Submission of the draft study report Cotonou
Days 42 – 44: (Monday, February
22th to Wednesday, February 24th)
Revisions based on PfD feedback Cotonou
Day 45: (Thursday, February 25th) Submission of the study report based on PfD review comments.
Cotonou
6. Selection of the Study Team
Applicants will need to possess proven experience in the implementation of baseline studies for agribusiness development programs in West Africa, and preferably in pineapple. The team may include an external agro-business consultant, an agro-economist, and an agricultural product processing specialist (with focus on fruit processing, preferably pineapple), and a statistician/researcher, with computer-based data processing and analysis skills, and skills with at least one or more of the following statistical packages: SPSS+, CSTAT, and Epi-Info. The Team Leader must be fluent in French and English, and must have at least graduate level training and a solid, demonstrated background in relevant qualitative and quantitative project evaluation of not less than 5 years. Data collectors must speak French and at the principal local language of the region: Fon. It is preferable that the data collectors also speak at least one other local languages of southern Benin (Fon, Aïzo, etc.).
7. Evaluation Deliverables
The firm will deliver the following:
1. Work plan: For each baseline study, a proposed work plan, including detailed activities, methods, time-line, and a Table of Contents will be provided to PfD/Benin for approval.
2. Data collection tools: The data collection tools should include the questionnaires to be used for each study (these tools will include the baseline and formative study with producers and processors, and the baseline study with pineapple sellers, exporters and transporters).
39
3. Draft Study Report: Five draft reports with appropriate attachments in English and French in electronic and hard copies will be provided for review and comments. Attachments may include TOR, work plan, field notes, methods, tools, bibliography and graphic documentation or photos.
a. The draft study reports will include:
i. Quantitative baseline study report for producers;
ii. Quantitative baseline study report for processors;
iii. Formative study report for producers; iv. Formative study report for
processors, and;
v. A baseline study report for sellers, exporters and transporters.
4. Final Report: Final reports in English and French will be submitted to PfD for approval, as well as the original questionnaires, survey indicators and interviews, and all statistical data.
5. Field Notes: Submit any field notes in a draft form for reference purposes.
8. Evaluation Management:
PfD staff in Benin and its USA headquarters shall support the logistical needs as appropriate for the firm conducting the study. This would include provision of briefing materials and providing introductions where necessary. Briefing materials will include the project’s Request for Applications, Proposal, Agreement and studies of the Benin pineapple sector used to inform PfD’s application.
9. Required Resources:
The firm should provide a detailed budget of their costs in conducting this baseline study. This should include personnel, logistics (vehicle rental), material and equipment needed for data collection, analysis and report production.
Annex A
PREFERRED SAMPLING TYPE/METHOD
Randomized Cluster Sampling of PINEX Pineapple Producers, Littoral and
Atlantique Departments, Benin
A two-stage, randomized cluster sampling method will be used to conduct the proposed baseline study
targeting pineapple producers in Littoral and Atlantique Departments, Benin. PINEX targets roughly
5,200 pineapple producers. Only a sub-sample of 768 (n=768) pineapple producers; will however, be
picked for interview. To accomplish this, PINEX will use a four-step process: (a) define the study
population, (b) determine sample size, (c) develop a sampling plan; and (d) collect data.
a) Study population definition: PINEX’s target producer population is roughly 5,200 pineapple
farmers. And they are defined as being ages 18-65, male and/or female, and located in Littoral
40
and Atlantique Departments, Benin. The entire pineapple producer population will define our
sampling frame.
b) Sample size determination: A sample size of 768 has been determined, at a margin of error
of plus or minus 5, with 95% confidence level corresponding to 1.96. The sample size was
calculated using the formula stated below:
n= (Zalpha)2 pq Deff / d2
Where:
Zalpha = 1.96, corresponding to a confidence level of 95%
p = 0.5, corresponding to an estimated level of coverage, when it is unknown q = 1- 0.5 = 0.5
Deff = Design effect of 2 d = Desired accuracy level of 5%
Therefore,
n = (1.96)2 * 0.5 * 0.5 * 2/ (0.05)2
n = 768
a) Sampling plan: A two-stage, randomized cluster sampling method will be employed. The first
stage will help determine the clusters themselves, ensuring a representative sample, and the
second stage will involve random sampling of respondents within the clusters. The producers
are all located in the Atlantique Department (as Littoral consists only of the urban
neighborhoods of Cotonou), which consists of eight municipalities, 74 districts, and 484
villages. To establish the clusters, two districts will be randomly selected from each of the eight
municipalities. Then, four villages will be randomly selected from each of these 16 districts.
The clusters, then, will be at the level of these villages (one cluster per village), with 64 clusters
total.
As the total sample size is 768, 12 households will be randomly selected per each of the 64
clusters and one producer will be surveyed per household. Although an individual pineapple
producer is the sampling unit, the sampling will be done at the household level. If within a
household there is more than one producer, the choice of the person to be interviewed will be
decided by a random draw. If in the selected household there is no producer, then the
investigator will randomly select another household.
41
c) Data collection: In the second stage of the randomized cluster sampling approach, data
collectors or interviewers will randomly chose a sub-set of pineapple producers within each of
the predetermined clusters for interview. Although an individual pineapple producer is the
sampling unit, the sampling will be done at the household level. Every eligible subject in the
household will be selected. 15 teams of two, each with a responsibility of two clusters, will be
trained and supervised as they collect data.
d) Data Treatment and Analysis Plan
The contractor must prepare a data treatment and analysis plan to address the following elements:
a. Indication of how data will be computerized and analyzed and what software (including version) will be used for it;
b. Systematic Data quality checks, examine inconsistencies and edits (data cleaning, checking missing values and outliers and fixing issues) planned to ensure logical consistency and coherence.
Indicator tabulation plan. Estimates should be produced for each stratum and for the overall level in accordance to the initial objectives of the survey.
42
Annex B
TABLE OF PINEX BASELINE STUDY CRITERIA
PINEX Baseline Study: Criteria for Proposal Appraisal
Criterion Designated Value
1. Relevant Experience:
Minimum of three previous similar development project evaluations in agriculture, preferably in West Africa (Benin).
25%
2. Composition of the Evaluation Team:
- Team leader: Qualified evaluation expert with at least five years’ experience as evaluation team leader, fluent in French and English;
- Agro-economist or equivalent (such as horticultural specialist or agro-enterprise development specialist): With appropriate agricultural degrees and at least five year relevant experience, preferably focused on vegetables;
- Statistician: Qualified in statistical analysis software, with at least three years relevant experience in project evaluations;
- Data collectors: Sufficient number and with relevant experience and fluent in French and at least one local language of southern Benin (Fon, Aïzo, Sèto, Tori, etc.).
30%
3. Evaluation Methodology:
Adherence to the methodology section of the evaluation TDRs; following the outline and presenting a detailed plan of procedures, tools and data analysis.
30%
4. Presentation of the Deliverables and Calendar and Timeline
10%
5. Appearance and Organization of the Application
5%
43
Annex 2: Producers focus group discussion guide (French) Identification
Department : ______________________________ Commune de l’entretien : ______________________________
Lieu/Localité _______________________________________
Date entretien : /___/___//___/___/2016 Heure de début : ____________
Liste de présence des participants au focus group
N° Nom et Prénoms Age (année révolue)
Sexe Activité principale du participant
Niveau d'instruction
Contact Emargement
1
2
3
4
5
6
7
8
9
10
(Accueil des participants – Salutations d’usage – Présentation de l’animateur et de ses assistants (s’il en existe) – Présentation des participants – Rappel des objectifs de la discussion et des règles de conduite au cours de la séance) Question introductive
1. Selon vous comment devient-on producteur d'ananas?
- Quelles sont les catégories de producteurs d'ananas?
- Quelle est la particularité de chaque catégorie?
- Quels sont les avantages de chaque catégorie?
44
- Y a t-il des inconvénients d'être dans certaines catégories de producteurs?
Lesquels?
- Pensez-vous que l'ananas est un produit rentable pour les producteurs?
Pourquoi? Quel rang occupe l’ananas parmi les cultures rentables pour ceux qui
font la polyculture ici?
Questions centrales
2. Pouvez-vous nous décrire comment vous produisez, récoltez et vendez l'ananas dans
cette localité?
3. Quelles variétés produisez-vous ? et quels avantages et inconvénients présente
chaque variété ? Pourquoi d’autres variétés ne sont pas produites ici ?
4. En règle générale, combien de tonnes d'ananas récolte t-on pour un hectare de plantation
par variété?
5. Qu'est ce qui peut faire qu'un producteur peut avoir un bon ou un mauvais rendement
dans la même variété?
- Rôle des technologies et techniques culturales
- Qualité du sol et disponibilité des ressources en eau
- Différence des types de fruits (morphotypiques) ? Lesquelles ?
6. Comment les plantations sont-elles organisées d'une manière générale?
- Citez les types de personnes utilisées comme main d’œuvre et pourquoi dans
chaque activité citée, etc.
- Quelles relations existent entre ces différents types d'acteurs?
- Quels sont les nuisibles/maladies à la culture de l’ananas ? Lesquels de ces
nuisibles/maladies sont apparus au cours de ces 10 dernières années ?
7. Comment avez-vous accès à la terre par ordre d’importance ?
- Quels sont les différents acteurs qui interviennent dans l’accès à la terre et que
fait chacun ?
- Qui contrôlent la terre ?
- Pendant combien de temps est-il possible de cultiver l’ananas sur le même
domaine ?
8. Un producteur produit-il sur plusieurs sites ? Quels sont les avantages de la production
sur plusieurs sites ? Quels en sont les inconvénients ?
9. Pouvez-vous donner une estimation du budget nécessaire pour conduire 1 hectare
d’ananas ?
45
10. Comment les gens font-ils ici pour payer tout ce qu'il faut pour produire l'ananas?
10.1. Financement sur fonds propres : quelles sont les activités de production rentrant dans
cette catégorie ? Qui sont capables d’y faire face et pourquoi ?
10.2. Financement sur prêt?
- Quels types de prêts?
- Qui sont les prêteurs?
10.3. Y a t-il des avantages à faire un prêt pour financer sa plantation d'ananas? Citez-les.
10.4. Quels sont les inconvénients?
10.5. Comment pensez-vous qu’on peut réduire ce budget tout en gardant un rendement
élevé ? Par exemple sur quels postes de dépenses peut-on agir et comment ?
11. Comment les producteurs d'ananas vendent-ils leurs produits une fois que c'est
prêt pour la récolte?
- Y a t-il des difficultés pour vendre? Lesquelles ?
- Qui sont les différents acheteurs? (Qui sont les acheteurs qui offrent les
meilleures conditions d’achat ? Citez ces conditions ? Citez devant chaque type
d’acheteur les exigences qu’il pose pour acheter votre ananas ? Arrivez-vous à
satisfaire toutes ces exigences ? Sinon lesquelles ne sont pas satisfaites?
Pourquoi certains producteurs arrivent à satisfaire ces exigences? D’autres
n’arrivent pas à les satisfaire : que doivent-ils faire pour les satisfaire et gagner
des marchés en plus ?)
- Certains producteurs sont-ils affiliés à une ou plusieurs sociétés de
transformation ? Lesquelles ? Quels avantages cette appartenance vous
procure ?
- Quel est le rôle du producteur dans le processus de vente?
- Y a t-il des différences avec les autres produits locaux que vous produisez ici?
- Comment les paiements se font-ils ? (Au champ ou après récolte ? au comptant
ou à crédit de combien de jours ? Quels sont les acheteurs qui offrent l’achat au
comptant et pourquoi vous acceptez aussi les ventes à crédit ? Quels sont les
acheteurs qui offrent les prix d’achat les plus avantageux au producteur et
pourquoi?)
12. Où et de qui avez-vous appris le métier de planteur d'ananas ?
- Savez-vous s'il y a de nouvelles manières de faire la culture de l'ananas ?
Comment l’avez-vous su ?
46
- Comment apprenez-vous ces nouvelles méthodes techniques de production
d’ananas ?
- Y a t-il des structures spécialisées qui vous aident dans ce sens? (Citez ces
structures. Recevez-vous aussi des informations techniques de votre association
de producteurs ? Citez ces informations techniques et les associations de
producteurs qui les fournissent.)
- Comment ces structures vous aident-elles? (Citez les services qu’elles vous
apportent.)
13. Comment les gens ici savent-ils où et à qui vendre pour avoir le meilleur prix?
- Qui vous donnent ces informations?
- Y a t-il des moments particuliers où l'on doit vendre son ananas? (Expliquez les
diverses raisons (avantages ? inconvénients ?) pour lesquelles on doit vendre à
ces moments-là ?)
- Où avez reçu ces informations?
14. Quelles sont, selon vous, les grandes difficultés auxquelles les producteurs d'ananas font
face? (Citez-les par ordre d’importance décroissante (les plus importantes d’abord))
15. Quelles approches de solutions proposez-vous pour résoudre ces difficultés ?
16. Appartenez-vous à des associations de producteurs ?
17. Y a-t-il des producteurs qui appartiennent à plusieurs associations à la fois ?
18. Quels en sont les avantages ? Les inconvénients ?
Question finale
19. Quelqu’un voudrait-il ajouter quelque chose qu’il (qu’elle) n’a pas pu dire ?
Conclusion
Merci pour votre disponibilité
Heure de fin : ____________
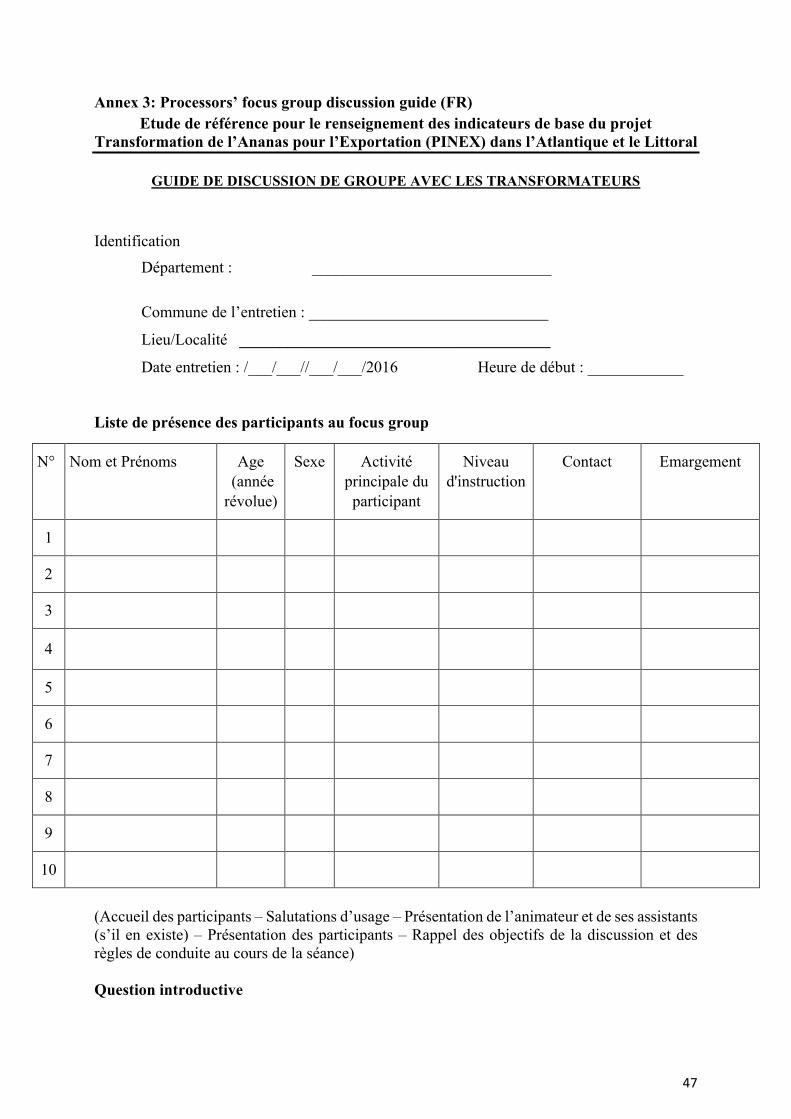
47
Annex 3: Processors’ focus group discussion guide (FR) Etude de référence pour le renseignement des indicateurs de base du projet
Transformation de l’Ananas pour l’Exportation (PINEX) dans l’Atlantique et le Littoral
GUIDE DE DISCUSSION DE GROUPE AVEC LES TRANSFORMATEURS
Identification Département : ______________________________ Commune de l’entretien : ______________________________
Lieu/Localité _______________________________________
Date entretien : /___/___//___/___/2016 Heure de début : ____________
Liste de présence des participants au focus group
N° Nom et Prénoms Age (année révolue)
Sexe Activité principale du participant
Niveau d'instruction
Contact Emargement
1
2
3
4
5
6
7
8
9
10
(Accueil des participants – Salutations d’usage – Présentation de l’animateur et de ses assistants (s’il en existe) – Présentation des participants – Rappel des objectifs de la discussion et des règles de conduite au cours de la séance) Question introductive
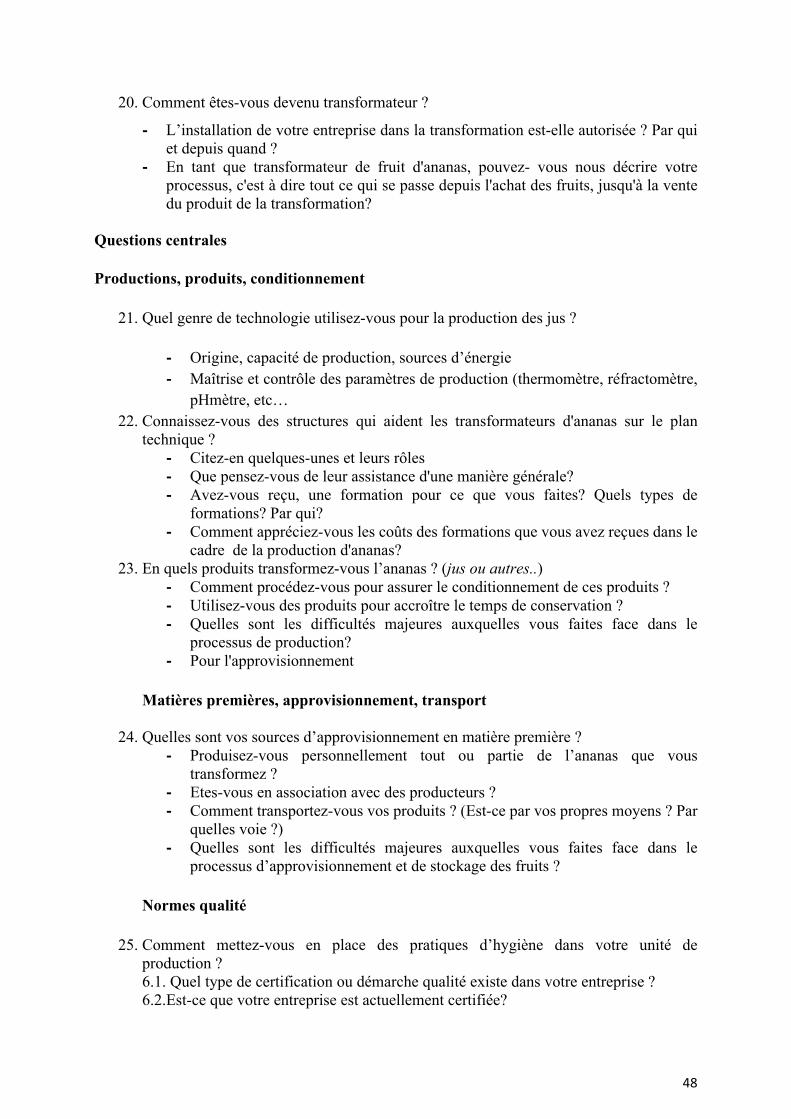
48
20. Comment êtes-vous devenu transformateur ?
- L’installation de votre entreprise dans la transformation est-elle autorisée ? Par qui et depuis quand ?
- En tant que transformateur de fruit d'ananas, pouvez- vous nous décrire votre processus, c'est à dire tout ce qui se passe depuis l'achat des fruits, jusqu'à la vente du produit de la transformation?
Questions centrales
Productions, produits, conditionnement
21. Quel genre de technologie utilisez-vous pour la production des jus ?
- Origine, capacité de production, sources d’énergie - Maîtrise et contrôle des paramètres de production (thermomètre, réfractomètre,
pHmètre, etc… 22. Connaissez-vous des structures qui aident les transformateurs d'ananas sur le plan
technique ? - Citez-en quelques-unes et leurs rôles - Que pensez-vous de leur assistance d'une manière générale? - Avez-vous reçu, une formation pour ce que vous faites? Quels types de
formations? Par qui? - Comment appréciez-vous les coûts des formations que vous avez reçues dans le
cadre de la production d'ananas? 23. En quels produits transformez-vous l’ananas ? (jus ou autres..)
- Comment procédez-vous pour assurer le conditionnement de ces produits ? - Utilisez-vous des produits pour accroître le temps de conservation ? - Quelles sont les difficultés majeures auxquelles vous faites face dans le
processus de production? - Pour l'approvisionnement
Matières premières, approvisionnement, transport
24. Quelles sont vos sources d’approvisionnement en matière première ? - Produisez-vous personnellement tout ou partie de l’ananas que vous
transformez ? - Etes-vous en association avec des producteurs ? - Comment transportez-vous vos produits ? (Est-ce par vos propres moyens ? Par
quelles voie ?) - Quelles sont les difficultés majeures auxquelles vous faites face dans le
processus d’approvisionnement et de stockage des fruits ?
Normes qualité
25. Comment mettez-vous en place des pratiques d’hygiène dans votre unité de production ? 6.1. Quel type de certification ou démarche qualité existe dans votre entreprise ? 6.2.Est-ce que votre entreprise est actuellement certifiée?
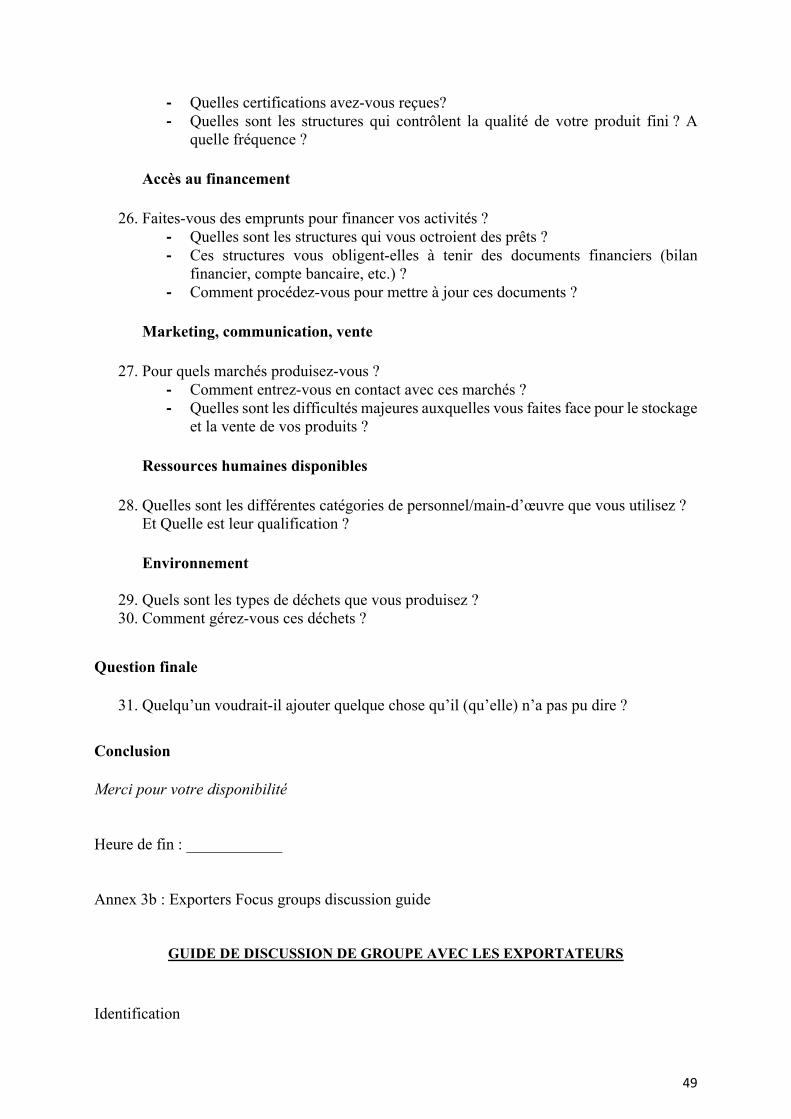
49
- Quelles certifications avez-vous reçues? - Quelles sont les structures qui contrôlent la qualité de votre produit fini ? A
quelle fréquence ?
Accès au financement
26. Faites-vous des emprunts pour financer vos activités ? - Quelles sont les structures qui vous octroient des prêts ? - Ces structures vous obligent-elles à tenir des documents financiers (bilan
financier, compte bancaire, etc.) ? - Comment procédez-vous pour mettre à jour ces documents ?
Marketing, communication, vente
27. Pour quels marchés produisez-vous ? - Comment entrez-vous en contact avec ces marchés ? - Quelles sont les difficultés majeures auxquelles vous faites face pour le stockage
et la vente de vos produits ? Ressources humaines disponibles
28. Quelles sont les différentes catégories de personnel/main-d’œuvre que vous utilisez ? Et Quelle est leur qualification ?
Environnement
29. Quels sont les types de déchets que vous produisez ? 30. Comment gérez-vous ces déchets ?
Question finale
31. Quelqu’un voudrait-il ajouter quelque chose qu’il (qu’elle) n’a pas pu dire ?
Conclusion
Merci pour votre disponibilité
Heure de fin : ____________
Annex 3b : Exporters Focus groups discussion guide
GUIDE DE DISCUSSION DE GROUPE AVEC LES EXPORTATEURS
Identification
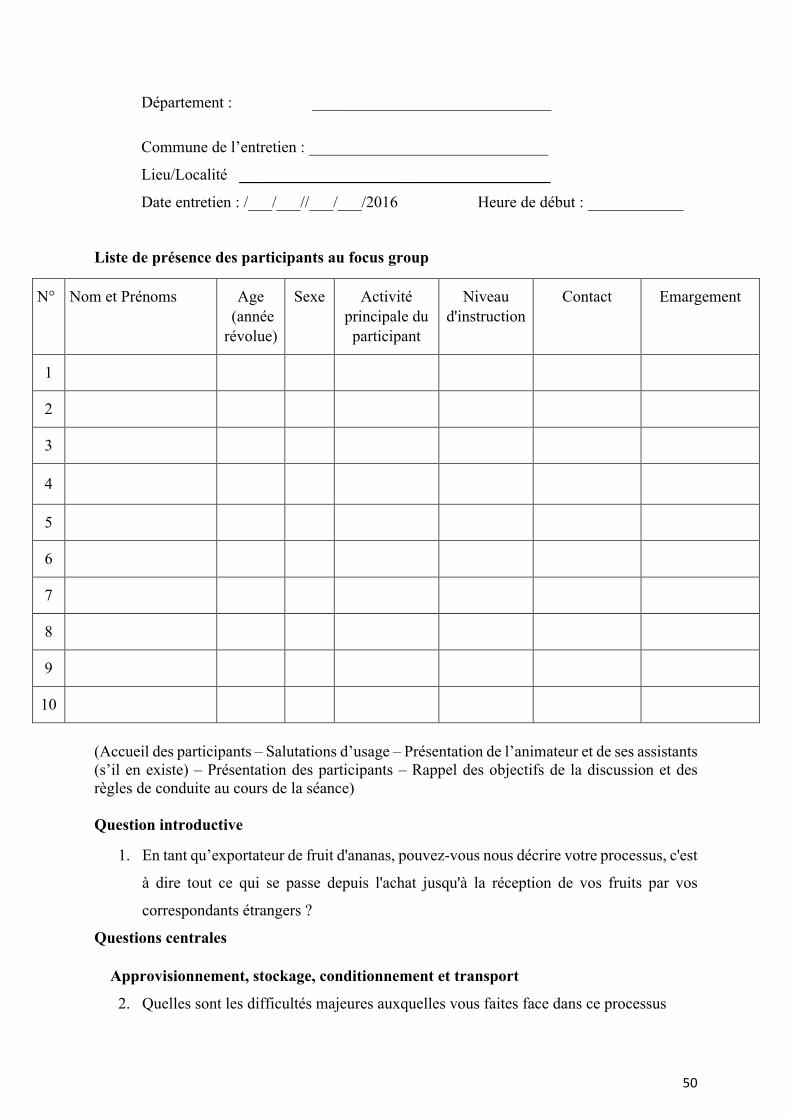
50
Département : ______________________________ Commune de l’entretien : ______________________________
Lieu/Localité _______________________________________
Date entretien : /___/___//___/___/2016 Heure de début : ____________
Liste de présence des participants au focus group
N° Nom et Prénoms Age (année révolue)
Sexe Activité principale du participant
Niveau d'instruction
Contact Emargement
1
2
3
4
5
6
7
8
9
10
(Accueil des participants – Salutations d’usage – Présentation de l’animateur et de ses assistants (s’il en existe) – Présentation des participants – Rappel des objectifs de la discussion et des règles de conduite au cours de la séance) Question introductive
1. En tant qu’exportateur de fruit d'ananas, pouvez-vous nous décrire votre processus, c'est
à dire tout ce qui se passe depuis l'achat jusqu'à la réception de vos fruits par vos
correspondants étrangers ?
Questions centrales
Approvisionnement, stockage, conditionnement et transport
2. Quelles sont les difficultés majeures auxquelles vous faites face dans ce processus
51
- Pour l'approvisionnement
- Pour le stockage des fruits
- Pour l'exportation
- Pour le recouvrement de vos fonds ?
3. Connaissez-vous des structures qui aident les exportateurs d'ananas au plan technique ?
- Citez-en quelques-unes
- Que pensez-vous de leur assistance d'une manière générale?
- Peut-on l'améliorer? Comment ?
Accès aux marchés et normes qualité
4. Quels sont vos marchés ?
5. Comment faites-vous pour répondre aux exigences de vos clients (Global Gap ;
expédition sur palette, emballages cartons etc.)
Financement
6. Connaissez-vous des structures qui aident les exportateurs d'ananas au plan financier?
- Citez-en quelques-unes
- Que pensez-vous de leur assistance d'une manière générale?
- Peut-on l'améliorer? Comment ?
Perception des exportateurs de la filière ananas
7. Exportez-vous des fruits autres que l'ananas?
- Lesquels ?
- Entre l'ananas et ces autres fruits que vous exportez, lesquels préférez-vous (par
ordre) ? Pourquoi?
8. Que pensez-vous du commerce d'ananas d'une manière générale?
- Est-ce une bonne chose pour vous-même? Pourquoi?
- Pour votre localité ? Pourquoi ?
- Pour notre pays le Bénin ? Pourquoi ?
9. Pensez-vous qu'il y a des choses que l'on peut faire pour améliorer ce que vous-même,
votre localité et le pays tout entier tirent comme profit de la production d'ananas?
- Donnez quelques exemples et expliquez pourquoi ?
10. Pensez-vous qu'il y a des choses que l'on peut faire pour faciliter le processus
d'exportation des fruits ou tous autres produits obtenus à partir de l'ananas
- Donnez quelques exemples et expliquez pourquoi ?
Question finale

52
11. Quelqu’un voudrait-il ajouter quelque chose qu’il (qu’elle) n’a pas pu dire ?
Conclusion
Merci pour votre disponibilité
Heure de fin : ____________
53
Annex 4: Surveyors’ training guide (French) RECHERCHE FORMATIVE SUR L’ANANAS AU BENIN
Projet PINEX
LA METHODE DU FOCUS GROUP Qu’est-ce qu’un Focus Group ?
Technique de recherche d’informations qui consiste à sélectionner un nombre représentatif de personnes répondant à des critères d’homogénéité. Ces personnes sont regroupées par petits groupes de 6 à 12, et ce, dans le but de susciter une discussion ouverte à partir d'un guide de discussion de groupe préalablement élaboré.
Quels sont les objectifs d’un focus group ? Recueillir des personnes réunies des informations de nature qualitative (opinions, points de
vue personnels) sur : un thème un sujet une question donnée
Ces informations devant refléter le plus possible l’opinion « générale » de la population-cible
Quels sont les facteurs de réussite d’un focus group ? La réussite de cette méthode repose sur quatre facteurs principaux soit :
la sélection des participants l'animation de groupe l'élaboration du guide de discussion l’analyse et la synthèse des résultats
Chacun de ces facteurs correspondant à une étape du processus
Quelles sont les qualités du modérateur? Le modérateur est l’élément clef de succès. Les qualités recherchées en lui sont les suivantes :
Doit comprendre le sujet ; Avoir de l’expérience ; Savoir gérer le temps ; S’ajuster rapidement à l’évolution de la conversation ; Suivre le guide d’entrevue ; Se rappeler des commentaires faits plus tôt pour les ramener au bon moment ; Excellente écoute, faire des liens entre les idées émises.
Où se déroule la discussion?
Réunir les participants dans un lieu neutre, c'est-à-dire favorisant l'expression la plus libre
54
possible, sans contraintes ni craintes. Disposition des personnes en cercle est de rigueur pour favoriser les échanges sur une base égalitaire . Environnement : composante importante dans la planification et l'organisation d'un groupe.
Comment se déroule la discussion? Introduction (10 min) Mot de bienvenue, réexpliquer le but de la rencontre, expliquer les règles de conduite (rôle
du modérateur, autorisation d’enregistrer, confidentialité, aucune mauvaise réponse, parler un à la fois), question pour briser la glace (nom des participants, et quelques questions générales en lien avec leurs habitudes touchant l’étude).
Discussion sur le sujet (60 min - 90min) 1. Conclusion (5 min) (Derniers commentaires/suggestions, remerciements etc).
FIN DE LA PRESENTATION
PLAN
• CONTEXTE DE LA MISSION
• OBJECTIFS DE L’ETUDE
• METHODOLOGIE
• OUTILS DE COLLECTE CONTEXTE DE LA MISSION La présente étude entre dans le cadre des activités préparatoires à la mise en œuvre des
interventions du projet « Pineaple Processing for Export (PINEX) » financé par le département de l’agriculture du Gouvernement des Etats Unis (USDA) et mis en œuvre par l’ONG Partners for development (PfD).
Elle est composée de cinq (5) activités différentes que sont :
une enquête formative pour les producteurs
une enquête formative pour les transformateurs
une enquête de base quantitative pour les producteurs
une enquête de base quantitative pour les transformateurs
une enquête de base pour les vendeurs, les exportateurs et les transporteur
55
OBJECTIFS DE L’ETUDE
OBJECTIF DE L’ETUDE DE BASE Renseigner les niveaux de base des indicateurs clés d’effet eet d’impact du projet
afin de permettre de savoir si les valeurs de référence et les valeurs cibles proposées lors des négociations du projet sont réalistes et assez ambitieux ou s’il faut les modifier selon les cas.
OBJECTIF DE L’ETUDE FORMATIVE Fournir des information pour comprendre l’environnement de la filière ANANAS en
termes de production, vente, transport, transformation, exportation Analyser les interactions entre différents acteurs Identifier les normes et pratiques Renseigner les outils quantitatifs
METHODOLOGIE(1/7)
CHAMP DE L’ETUDE
Départements couverts: Atlantique et Littoral Zones de collecte : 1. TOFFO – ZE 2. ALLADA 3. CALAVI-TORI- COTONOU METHODOLOGIE(2/7)
CIBLES DE L’ETUDE
Producteurs d’ananas
Vendeurs d’ananas
Transporteurs d’ananas
Transformateurs d’ananas
Exportateurs d’ananas METHODOLOGIE (3/7)
Technique de collecte de données : Focus group Nombre de focus à réaliser : 15 au total soit 5 par zone de collecte dont un par catégorie
d’acteurs METHODOLOGIE (4/7)
OUTILS DE COLLECTE Cinq guide de discussion de groupe :
56
Guide de discussion de groupe à l’endroit des producteurs
Guide de discussion de groupe à l’endroit des vendeurs
Guide de discussion de groupe à l’endroit des transporteurs
Guide de discussion de groupe à l’endroit des transformateurs
Guide de discussion de groupe à l’endroit des exportateurs METHODOLOGIE (5/7)
COLLECTE DES DONNEES
Préparation technique et matérielle Personnel de collecte 10 agents de collecte (2 agents par catégorie d’acteurs)
3 Superviseurs
Durée de la collecte des données : 1er au 3 février 2016 METHODOLOGIE (6/7)
CHRONOGRAMME DE LA COLLECTE Lundi 1er Février : Etape d’Abomey-Calavi
Mardi 2 février : Etape de Ouègbo Mercredi 3 février Etape d’Allada
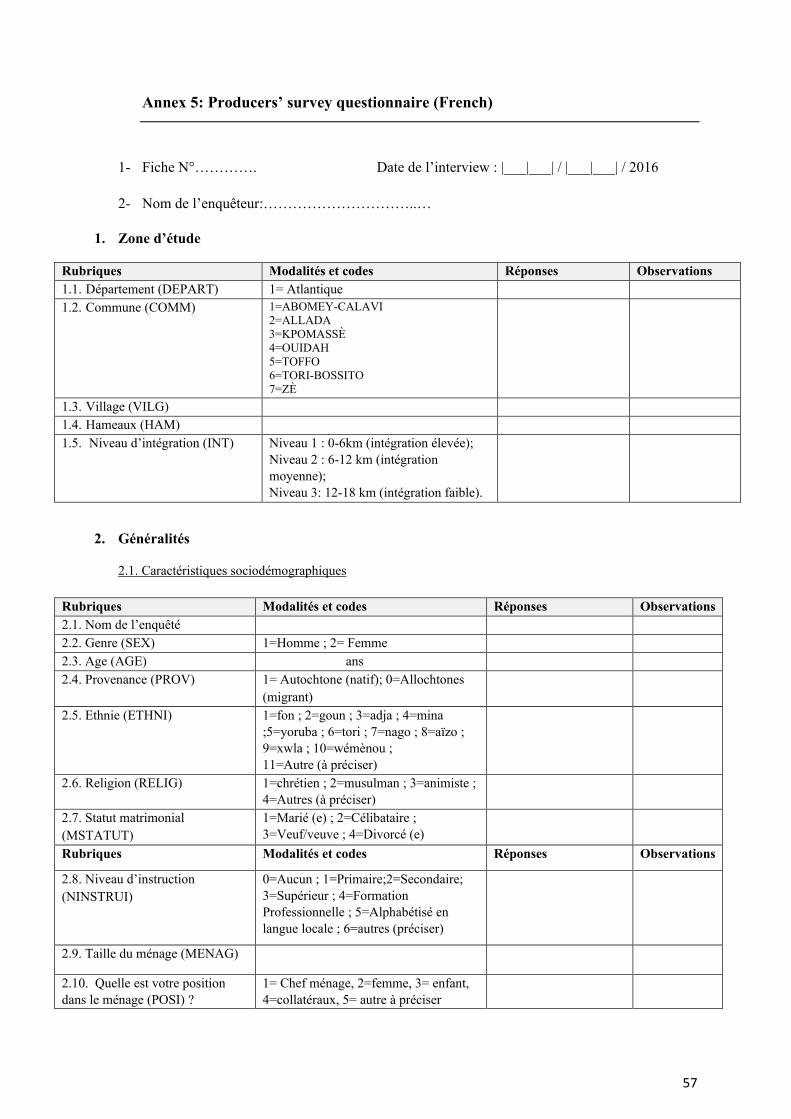
57
Annex 5: Producers’ survey questionnaire (French)
1- Fiche N°…………. Date de l’interview : |___|___| / |___|___| / 2016
2- Nom de l’enquêteur:…………………………..… 1. Zone d’étude
Rubriques Modalités et codes Réponses Observations 1.1. Département (DEPART) 1= Atlantique 1.2. Commune (COMM) 1=ABOMEY-CALAVI
2=ALLADA 3=KPOMASSÈ 4=OUIDAH 5=TOFFO 6=TORI-BOSSITO 7=ZÈ
1.3. Village (VILG) 1.4. Hameaux (HAM) 1.5. Niveau d’intégration (INT)
Niveau 1 : 0-6km (intégration élevée); Niveau 2 : 6-12 km (intégration moyenne); Niveau 3: 12-18 km (intégration faible).
2. Généralités
2.1. Caractéristiques sociodémographiques
Rubriques Modalités et codes Réponses Observations 2.1. Nom de l’enquêté 2.2. Genre (SEX) 1=Homme ; 2= Femme 2.3. Age (AGE) ans 2.4. Provenance (PROV) 1= Autochtone (natif); 0=Allochtones
(migrant)
2.5. Ethnie (ETHNI) 1=fon ; 2=goun ; 3=adja ; 4=mina ;5=yoruba ; 6=tori ; 7=nago ; 8=aïzo ; 9=xwla ; 10=wémènou ; 11=Autre (à préciser)
2.6. Religion (RELIG) 1=chrétien ; 2=musulman ; 3=animiste ; 4=Autres (à préciser)
2.7. Statut matrimonial (MSTATUT)
1=Marié (e) ; 2=Célibataire ; 3=Veuf/veuve ; 4=Divorcé (e)
Rubriques Modalités et codes Réponses Observations
2.8. Niveau d’instruction (NINSTRUI)
0=Aucun ; 1=Primaire;2=Secondaire; 3=Supérieur ; 4=Formation Professionnelle ; 5=Alphabétisé en langue locale ; 6=autres (préciser)
2.9. Taille du ménage (MENAG)
2.10. Quelle est votre position dans le ménage (POSI) ?
1= Chef ménage, 2=femme, 3= enfant, 4=collatéraux, 5= autre à préciser
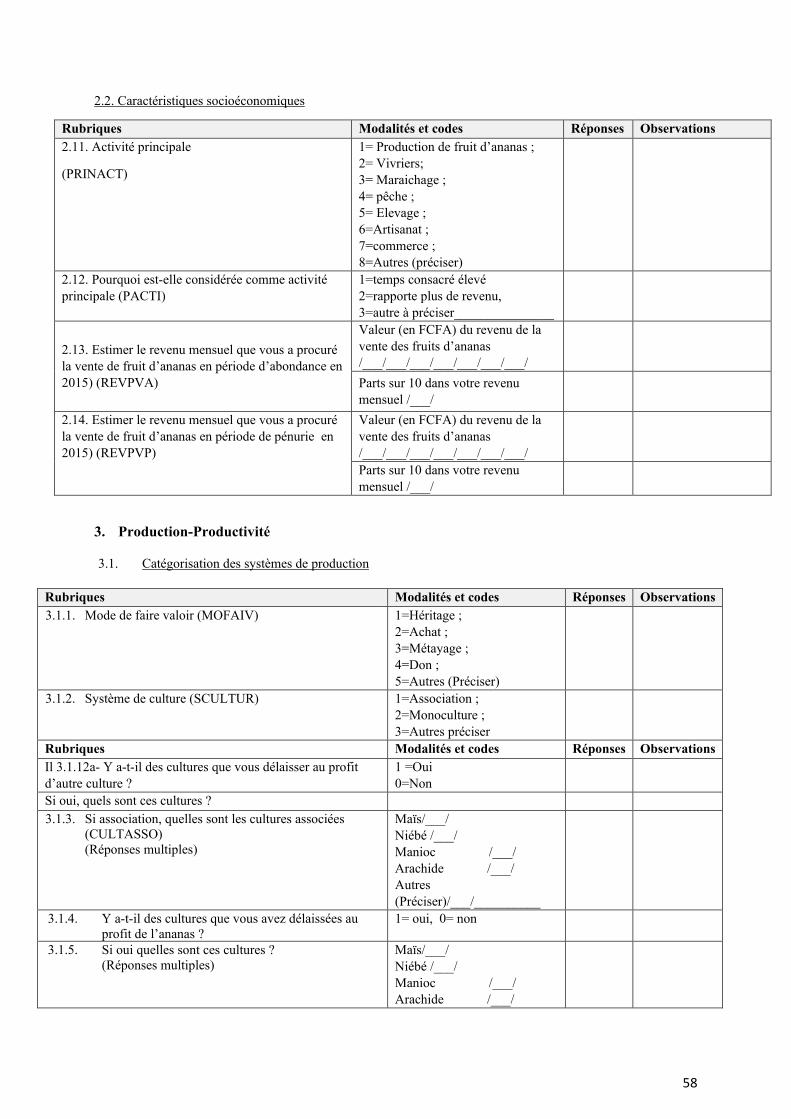
58
2.2. Caractéristiques socioéconomiques
Rubriques Modalités et codes Réponses Observations 2.11. Activité principale
(PRINACT)
1= Production de fruit d’ananas ; 2= Vivriers; 3= Maraichage ; 4= pêche ; 5= Elevage ; 6=Artisanat ; 7=commerce ; 8=Autres (préciser)
2.12. Pourquoi est-elle considérée comme activité principale (PACTI)
1=temps consacré élevé 2=rapporte plus de revenu, 3=autre à préciser_______________
2.13. Estimer le revenu mensuel que vous a procuré la vente de fruit d’ananas en période d’abondance en 2015) (REVPVA)
Valeur (en FCFA) du revenu de la vente des fruits d’ananas /___/___/___/___/___/___/___/
Parts sur 10 dans votre revenu mensuel /___/
2.14. Estimer le revenu mensuel que vous a procuré la vente de fruit d’ananas en période de pénurie en 2015) (REVPVP)
Valeur (en FCFA) du revenu de la vente des fruits d’ananas /___/___/___/___/___/___/___/
Parts sur 10 dans votre revenu mensuel /___/
3. Production-Productivité
3.1. Catégorisation des systèmes de production
Rubriques Modalités et codes Réponses Observations 3.1.1. Mode de faire valoir (MOFAIV) 1=Héritage ;
2=Achat ; 3=Métayage ; 4=Don ; 5=Autres (Préciser)
3.1.2. Système de culture (SCULTUR) 1=Association ; 2=Monoculture ; 3=Autres préciser
Rubriques Modalités et codes Réponses Observations Il 3.1.12a- Y a-t-il des cultures que vous délaisser au profit d’autre culture ?
1 =Oui 0=Non
Si oui, quels sont ces cultures ? 3.1.3. Si association, quelles sont les cultures associées
(CULTASSO) (Réponses multiples)
Maïs/___/ Niébé /___/ Manioc /___/ Arachide /___/ Autres (Préciser)/___/__________
3.1.4. Y a-t-il des cultures que vous avez délaissées au profit de l’ananas ?
1= oui, 0= non
3.1.5. Si oui quelles sont ces cultures ? (Réponses multiples)
Maïs/___/ Niébé /___/ Manioc /___/ Arachide /___/
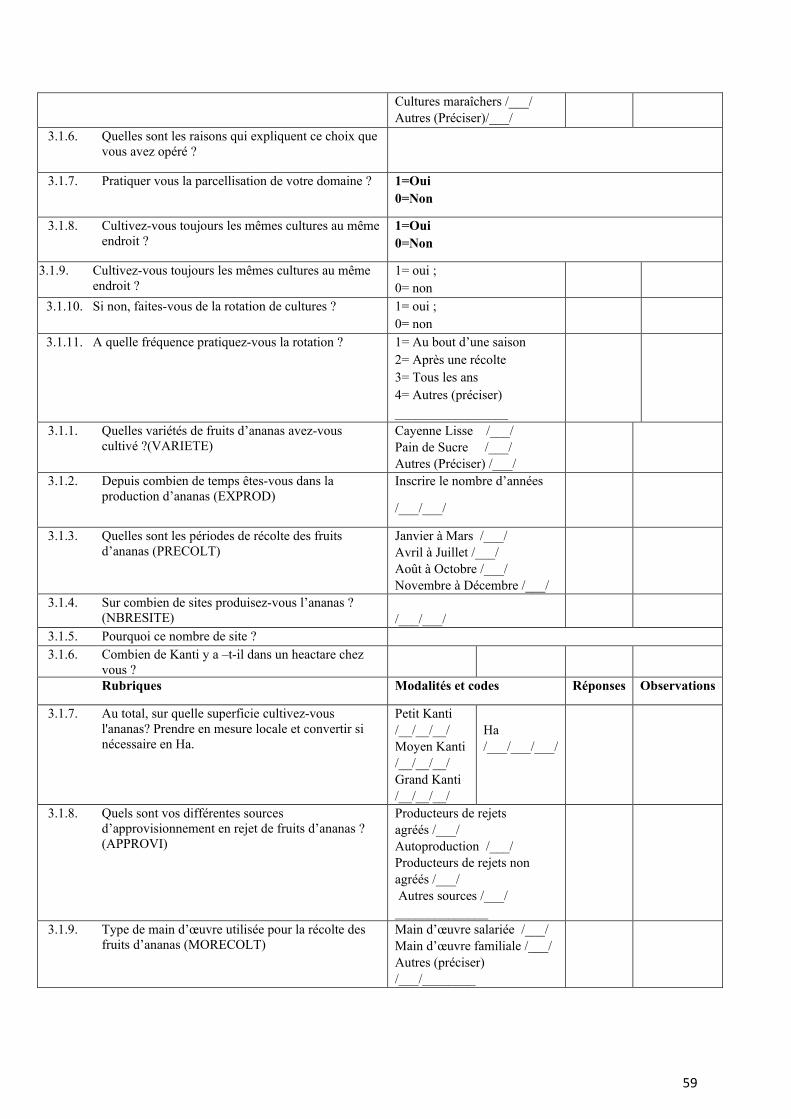
59
Cultures maraîchers /___/ Autres (Préciser)/___/
3.1.6. Quelles sont les raisons qui expliquent ce choix que vous avez opéré ?
3.1.7. Pratiquer vous la parcellisation de votre domaine ? 1=Oui 0=Non
3.1.8. Cultivez-vous toujours les mêmes cultures au même endroit ?
1=Oui 0=Non
3.1.9. Cultivez-vous toujours les mêmes cultures au même endroit ?
1= oui ; 0= non
3.1.10. Si non, faites-vous de la rotation de cultures ? 1= oui ; 0= non
3.1.11. A quelle fréquence pratiquez-vous la rotation ? 1= Au bout d’une saison 2= Après une récolte 3= Tous les ans 4= Autres (préciser) _________________
3.1.1. Quelles variétés de fruits d’ananas avez-vous cultivé ?(VARIETE)
Cayenne Lisse /___/ Pain de Sucre /___/ Autres (Préciser) /___/
3.1.2. Depuis combien de temps êtes-vous dans la production d’ananas (EXPROD)
Inscrire le nombre d’années
/___/___/
3.1.3. Quelles sont les périodes de récolte des fruits d’ananas (PRECOLT)
Janvier à Mars /___/ Avril à Juillet /___/ Août à Octobre /___/ Novembre à Décembre /___/
3.1.4. Sur combien de sites produisez-vous l’ananas ? (NBRESITE)
/___/___/
3.1.5. Pourquoi ce nombre de site ? 3.1.6. Combien de Kanti y a –t-il dans un heactare chez
vous ?
Rubriques Modalités et codes Réponses Observations
3.1.7. Au total, sur quelle superficie cultivez-vous l'ananas? Prendre en mesure locale et convertir si nécessaire en Ha.
Petit Kanti /__/__/__/ Moyen Kanti /__/__/__/ Grand Kanti /__/__/__/
Ha /___/___/___/
3.1.8. Quels sont vos différentes sources d’approvisionnement en rejet de fruits d’ananas ? (APPROVI)
Producteurs de rejets agréés /___/ Autoproduction /___/ Producteurs de rejets non agréés /___/ Autres sources /___/ ______________
3.1.9. Type de main d’œuvre utilisée pour la récolte des fruits d’ananas (MORECOLT)
Main d’œuvre salariée /___/ Main d’œuvre familiale /___/ Autres (préciser) /___/________
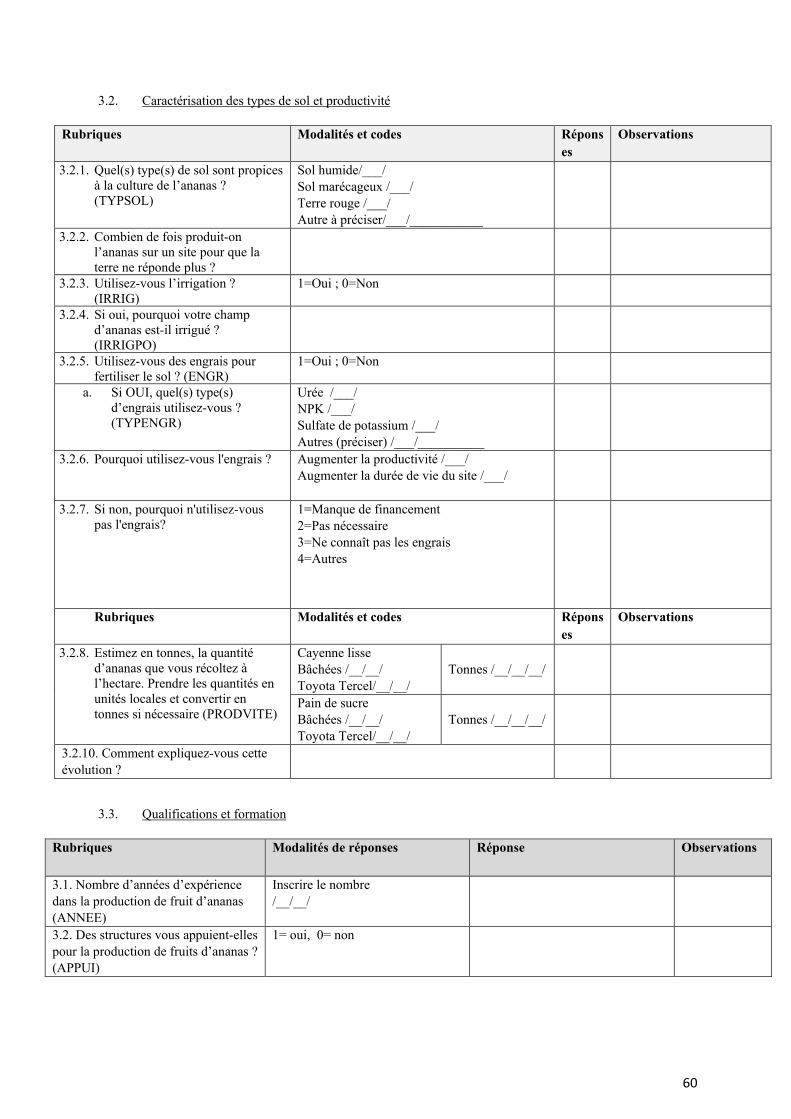
60
3.2. Caractérisation des types de sol et productivité
Rubriques Modalités et codes Réponses
Observations
3.2.1. Quel(s) type(s) de sol sont propices à la culture de l’ananas ? (TYPSOL)
Sol humide/___/ Sol marécageux /___/ Terre rouge /___/ Autre à préciser/___/___________
3.2.2. Combien de fois produit-on l’ananas sur un site pour que la terre ne réponde plus ?
3.2.3. Utilisez-vous l’irrigation ? (IRRIG)
1=Oui ; 0=Non
3.2.4. Si oui, pourquoi votre champ d’ananas est-il irrigué ? (IRRIGPO)
3.2.5. Utilisez-vous des engrais pour fertiliser le sol ? (ENGR)
1=Oui ; 0=Non
a. Si OUI, quel(s) type(s) d’engrais utilisez-vous ? (TYPENGR)
Urée /___/ NPK /___/ Sulfate de potassium /___/ Autres (préciser) /___/__________
3.2.6. Pourquoi utilisez-vous l'engrais ? Augmenter la productivité /___/ Augmenter la durée de vie du site /___/
3.2.7. Si non, pourquoi n'utilisez-vous pas l'engrais?
1=Manque de financement 2=Pas nécessaire 3=Ne connaît pas les engrais 4=Autres
Rubriques Modalités et codes Réponses
Observations
3.2.8. Estimez en tonnes, la quantité d’ananas que vous récoltez à l’hectare. Prendre les quantités en unités locales et convertir en tonnes si nécessaire (PRODVITE)
Cayenne lisse Bâchées /__/__/ Toyota Tercel/__/__/
Tonnes /__/__/__/
Pain de sucre Bâchées /__/__/ Toyota Tercel/__/__/
Tonnes /__/__/__/
3.2.10. Comment expliquez-vous cette évolution ?
3.3. Qualifications et formation
Rubriques Modalités de réponses Réponse Observations
3.1. Nombre d’années d’expérience dans la production de fruit d’ananas (ANNEE)
Inscrire le nombre /__/__/
3.2. Des structures vous appuient-elles pour la production de fruits d’ananas ? (APPUI)
1= oui, 0= non
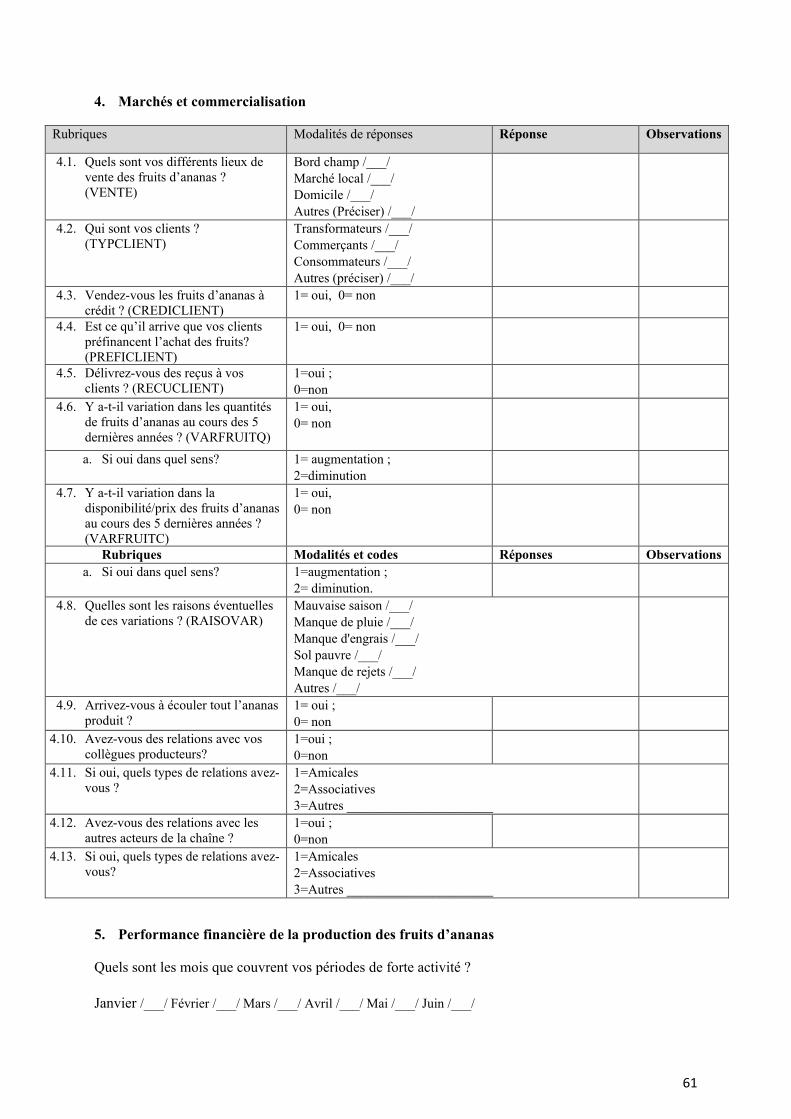
61
4. Marchés et commercialisation
Rubriques Modalités de réponses Réponse Observations
4.1. Quels sont vos différents lieux de vente des fruits d’ananas ? (VENTE)
Bord champ /___/ Marché local /___/ Domicile /___/ Autres (Préciser) /___/
4.2. Qui sont vos clients ? (TYPCLIENT)
Transformateurs /___/ Commerçants /___/ Consommateurs /___/ Autres (préciser) /___/
4.3. Vendez-vous les fruits d’ananas à crédit ? (CREDICLIENT)
1= oui, 0= non
4.4. Est ce qu’il arrive que vos clients préfinancent l’achat des fruits? (PREFICLIENT)
1= oui, 0= non
4.5. Délivrez-vous des reçus à vos clients ? (RECUCLIENT)
1=oui ; 0=non
4.6. Y a-t-il variation dans les quantités de fruits d’ananas au cours des 5 dernières années ? (VARFRUITQ)
1= oui, 0= non
a. Si oui dans quel sens? 1= augmentation ; 2=diminution
4.7. Y a-t-il variation dans la disponibilité/prix des fruits d’ananas au cours des 5 dernières années ? (VARFRUITC)
1= oui, 0= non
Rubriques Modalités et codes Réponses Observations a. Si oui dans quel sens? 1=augmentation ;
2= diminution.
4.8. Quelles sont les raisons éventuelles de ces variations ? (RAISOVAR)
Mauvaise saison /___/ Manque de pluie /___/ Manque d'engrais /___/ Sol pauvre /___/ Manque de rejets /___/ Autres /___/
4.9. Arrivez-vous à écouler tout l’ananas produit ?
1= oui ; 0= non
4.10. Avez-vous des relations avec vos collègues producteurs?
1=oui ; 0=non
4.11. Si oui, quels types de relations avez-vous ?
1=Amicales 2=Associatives 3=Autres ______________________
4.12. Avez-vous des relations avec les autres acteurs de la chaîne ?
1=oui ; 0=non
4.13. Si oui, quels types de relations avez-vous?
1=Amicales 2=Associatives 3=Autres ______________________
5. Performance financière de la production des fruits d’ananas
Quels sont les mois que couvrent vos périodes de forte activité ?
Janvier /___/ Février /___/ Mars /___/ Avril /___/ Mai /___/ Juin /___/
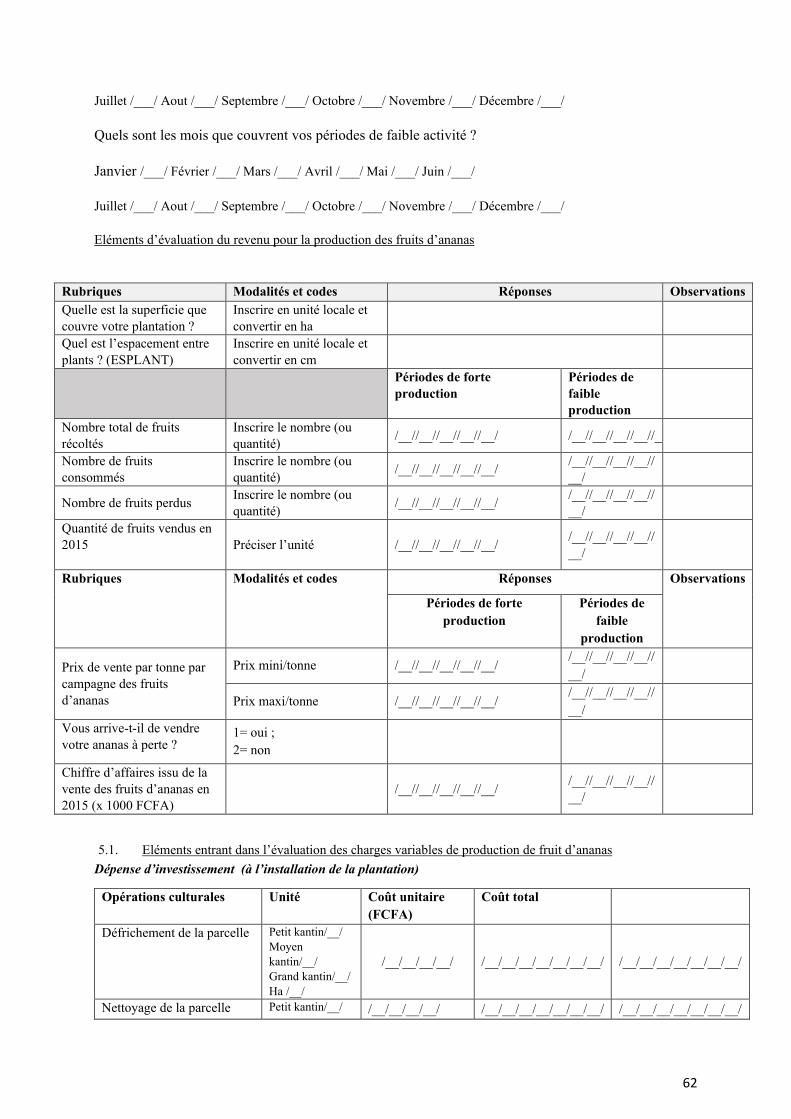
62
Juillet /___/ Aout /___/ Septembre /___/ Octobre /___/ Novembre /___/ Décembre /___/
Quels sont les mois que couvrent vos périodes de faible activité ?
Janvier /___/ Février /___/ Mars /___/ Avril /___/ Mai /___/ Juin /___/
Juillet /___/ Aout /___/ Septembre /___/ Octobre /___/ Novembre /___/ Décembre /___/
Eléments d’évaluation du revenu pour la production des fruits d’ananas
Rubriques Modalités et codes Réponses Observations Quelle est la superficie que couvre votre plantation ?
Inscrire en unité locale et convertir en ha
Quel est l’espacement entre plants ? (ESPLANT)
Inscrire en unité locale et convertir en cm
Périodes de forte production
Périodes de faible production
Nombre total de fruits récoltés
Inscrire le nombre (ou quantité) /__//__//__//__//__/ /__//__//__//__//__
Nombre de fruits consommés
Inscrire le nombre (ou quantité) /__//__//__//__//__/ /__//__//__//__//
__/
Nombre de fruits perdus Inscrire le nombre (ou quantité) /__//__//__//__//__/ /__//__//__//__//
__/
Quantité de fruits vendus en 2015
Préciser l’unité /__//__//__//__//__/ /__//__//__//__//__/
Rubriques Modalités et codes Réponses Observations
Périodes de forte production
Périodes de faible
production
Prix de vente par tonne par campagne des fruits d’ananas
Prix mini/tonne /__//__//__//__//__/ /__//__//__//__//__/
Prix maxi/tonne /__//__//__//__//__/ /__//__//__//__//__/
Vous arrive-t-il de vendre votre ananas à perte ?
1= oui ; 2= non
Chiffre d’affaires issu de la vente des fruits d’ananas en 2015 (x 1000 FCFA)
/__//__//__//__//__/ /__//__//__//__//__/
5.1. Eléments entrant dans l’évaluation des charges variables de production de fruit d’ananas Dépense d’investissement (à l’installation de la plantation)
Opérations culturales Unité Coût unitaire (FCFA)
Coût total
Défrichement de la parcelle Petit kantin/__/ Moyen kantin/__/ Grand kantin/__/ Ha /__/
/__/__/__/__/ /__/__/__/__/__/__/__/ /__/__/__/__/__/__/__/
Nettoyage de la parcelle Petit kantin/__/ /__/__/__/__/ /__/__/__/__/__/__/__/ /__/__/__/__/__/__/__/
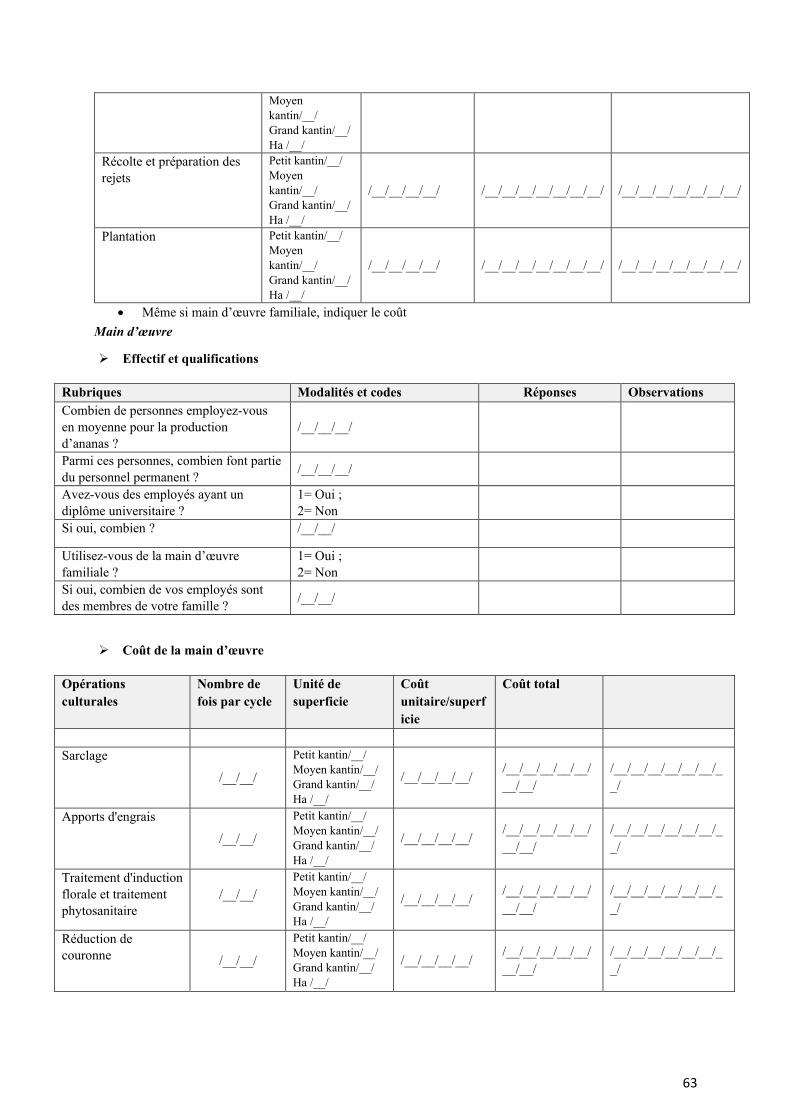
63
Moyen kantin/__/ Grand kantin/__/ Ha /__/
Récolte et préparation des rejets
Petit kantin/__/ Moyen kantin/__/ Grand kantin/__/ Ha /__/
/__/__/__/__/ /__/__/__/__/__/__/__/ /__/__/__/__/__/__/__/
Plantation Petit kantin/__/ Moyen kantin/__/ Grand kantin/__/ Ha /__/
/__/__/__/__/ /__/__/__/__/__/__/__/ /__/__/__/__/__/__/__/
• Même si main d’œuvre familiale, indiquer le coût Main d’œuvre
Effectif et qualifications
Rubriques Modalités et codes Réponses Observations Combien de personnes employez-vous en moyenne pour la production d’ananas ?
/__/__/__/
Parmi ces personnes, combien font partie du personnel permanent ? /__/__/__/
Avez-vous des employés ayant un diplôme universitaire ?
1= Oui ; 2= Non
Si oui, combien ? /__/__/
Utilisez-vous de la main d’œuvre familiale ?
1= Oui ; 2= Non
Si oui, combien de vos employés sont des membres de votre famille ? /__/__/
Coût de la main d’œuvre
Opérations culturales
Nombre de fois par cycle
Unité de superficie
Coût unitaire/superficie
Coût total
Sarclage
/__/__/
Petit kantin/__/ Moyen kantin/__/ Grand kantin/__/ Ha /__/
/__/__/__/__/ /__/__/__/__/__/__/__/
/__/__/__/__/__/__/__/
Apports d'engrais /__/__/
Petit kantin/__/ Moyen kantin/__/ Grand kantin/__/ Ha /__/
/__/__/__/__/ /__/__/__/__/__/__/__/
/__/__/__/__/__/__/__/
Traitement d'induction florale et traitement phytosanitaire
/__/__/ Petit kantin/__/ Moyen kantin/__/ Grand kantin/__/ Ha /__/
/__/__/__/__/ /__/__/__/__/__/__/__/
/__/__/__/__/__/__/__/
Réduction de couronne /__/__/
Petit kantin/__/ Moyen kantin/__/ Grand kantin/__/ Ha /__/
/__/__/__/__/ /__/__/__/__/__/__/__/
/__/__/__/__/__/__/__/
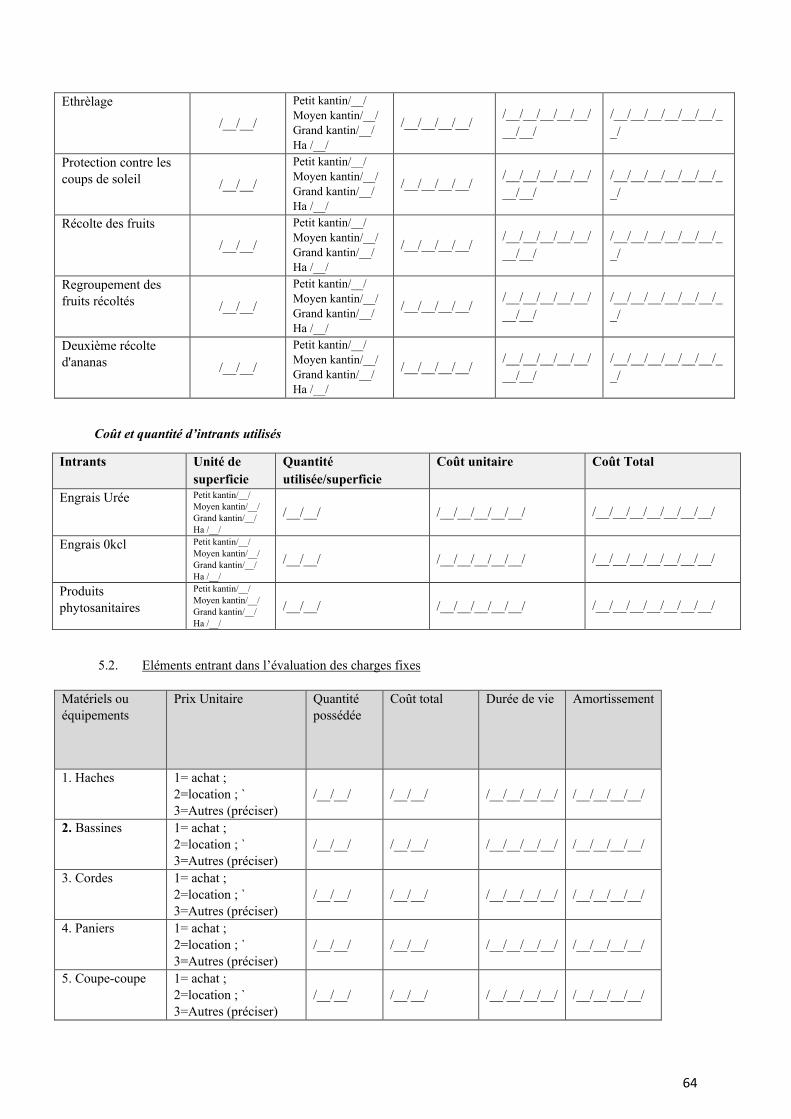
64
Ethrèlage /__/__/
Petit kantin/__/ Moyen kantin/__/ Grand kantin/__/ Ha /__/
/__/__/__/__/ /__/__/__/__/__/__/__/
/__/__/__/__/__/__/__/
Protection contre les coups de soleil /__/__/
Petit kantin/__/ Moyen kantin/__/ Grand kantin/__/ Ha /__/
/__/__/__/__/ /__/__/__/__/__/__/__/
/__/__/__/__/__/__/__/
Récolte des fruits /__/__/
Petit kantin/__/ Moyen kantin/__/ Grand kantin/__/ Ha /__/
/__/__/__/__/ /__/__/__/__/__/__/__/
/__/__/__/__/__/__/__/
Regroupement des fruits récoltés /__/__/
Petit kantin/__/ Moyen kantin/__/ Grand kantin/__/ Ha /__/
/__/__/__/__/ /__/__/__/__/__/__/__/
/__/__/__/__/__/__/__/
Deuxième récolte d'ananas /__/__/
Petit kantin/__/ Moyen kantin/__/ Grand kantin/__/ Ha /__/
/__/__/__/__/ /__/__/__/__/__/__/__/
/__/__/__/__/__/__/__/
Coût et quantité d’intrants utilisés
Intrants Unité de superficie
Quantité utilisée/superficie
Coût unitaire Coût Total
Engrais Urée Petit kantin/__/ Moyen kantin/__/ Grand kantin/__/ Ha /__/
/__/__/ /__/__/__/__/__/ /__/__/__/__/__/__/__/
Engrais 0kcl Petit kantin/__/ Moyen kantin/__/ Grand kantin/__/ Ha /__/
/__/__/ /__/__/__/__/__/ /__/__/__/__/__/__/__/
Produits phytosanitaires
Petit kantin/__/ Moyen kantin/__/ Grand kantin/__/ Ha /__/
/__/__/ /__/__/__/__/__/ /__/__/__/__/__/__/__/
5.2. Eléments entrant dans l’évaluation des charges fixes
Matériels ou équipements
Prix Unitaire Quantité possédée
Coût total Durée de vie Amortissement
1. Haches 1= achat ; 2=location ; ` 3=Autres (préciser)
/__/__/ /__/__/ /__/__/__/__/ /__/__/__/__/
2. Bassines 1= achat ; 2=location ; ` 3=Autres (préciser)
/__/__/ /__/__/ /__/__/__/__/ /__/__/__/__/
3. Cordes 1= achat ; 2=location ; ` 3=Autres (préciser)
/__/__/ /__/__/ /__/__/__/__/ /__/__/__/__/
4. Paniers 1= achat ; 2=location ; ` 3=Autres (préciser)
/__/__/ /__/__/ /__/__/__/__/ /__/__/__/__/
5. Coupe-coupe 1= achat ; 2=location ; ` 3=Autres (préciser)
/__/__/ /__/__/ /__/__/__/__/ /__/__/__/__/
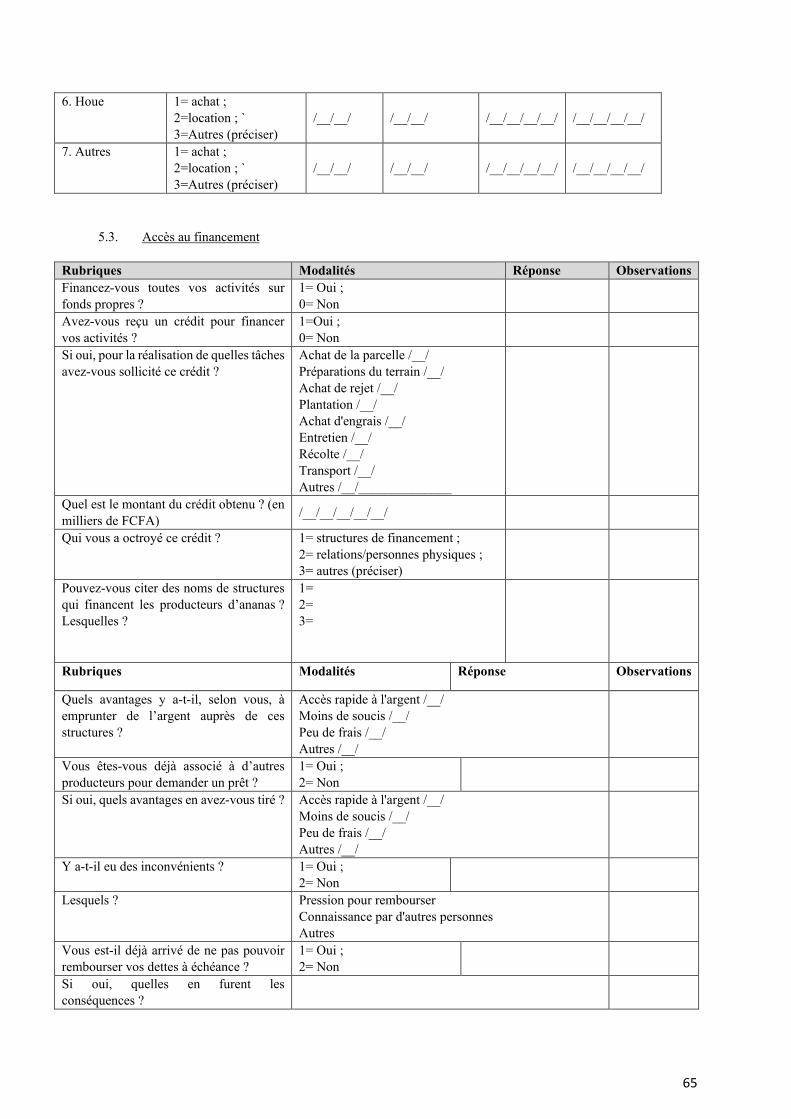
65
6. Houe 1= achat ; 2=location ; ` 3=Autres (préciser)
/__/__/ /__/__/ /__/__/__/__/ /__/__/__/__/
7. Autres 1= achat ; 2=location ; ` 3=Autres (préciser)
/__/__/ /__/__/ /__/__/__/__/ /__/__/__/__/
5.3. Accès au financement
Rubriques Modalités Réponse Observations Financez-vous toutes vos activités sur fonds propres ?
1= Oui ; 0= Non
Avez-vous reçu un crédit pour financer vos activités ?
1=Oui ; 0= Non
Si oui, pour la réalisation de quelles tâches avez-vous sollicité ce crédit ?
Achat de la parcelle /__/ Préparations du terrain /__/ Achat de rejet /__/ Plantation /__/ Achat d'engrais /__/ Entretien /__/ Récolte /__/ Transport /__/ Autres /__/______________
Quel est le montant du crédit obtenu ? (en milliers de FCFA) /__/__/__/__/__/
Qui vous a octroyé ce crédit ? 1= structures de financement ; 2= relations/personnes physiques ; 3= autres (préciser)
Pouvez-vous citer des noms de structures qui financent les producteurs d’ananas ? Lesquelles ?
1= 2= 3=
Rubriques Modalités Réponse Observations
Quels avantages y a-t-il, selon vous, à emprunter de l’argent auprès de ces structures ?
Accès rapide à l'argent /__/ Moins de soucis /__/ Peu de frais /__/ Autres /__/
Vous êtes-vous déjà associé à d’autres producteurs pour demander un prêt ?
1= Oui ; 2= Non
Si oui, quels avantages en avez-vous tiré ? Accès rapide à l'argent /__/ Moins de soucis /__/ Peu de frais /__/ Autres /__/
Y a-t-il eu des inconvénients ? 1= Oui ; 2= Non
Lesquels ? Pression pour rembourser Connaissance par d'autres personnes Autres
Vous est-il déjà arrivé de ne pas pouvoir rembourser vos dettes à échéance ?
1= Oui ; 2= Non
Si oui, quelles en furent les conséquences ?
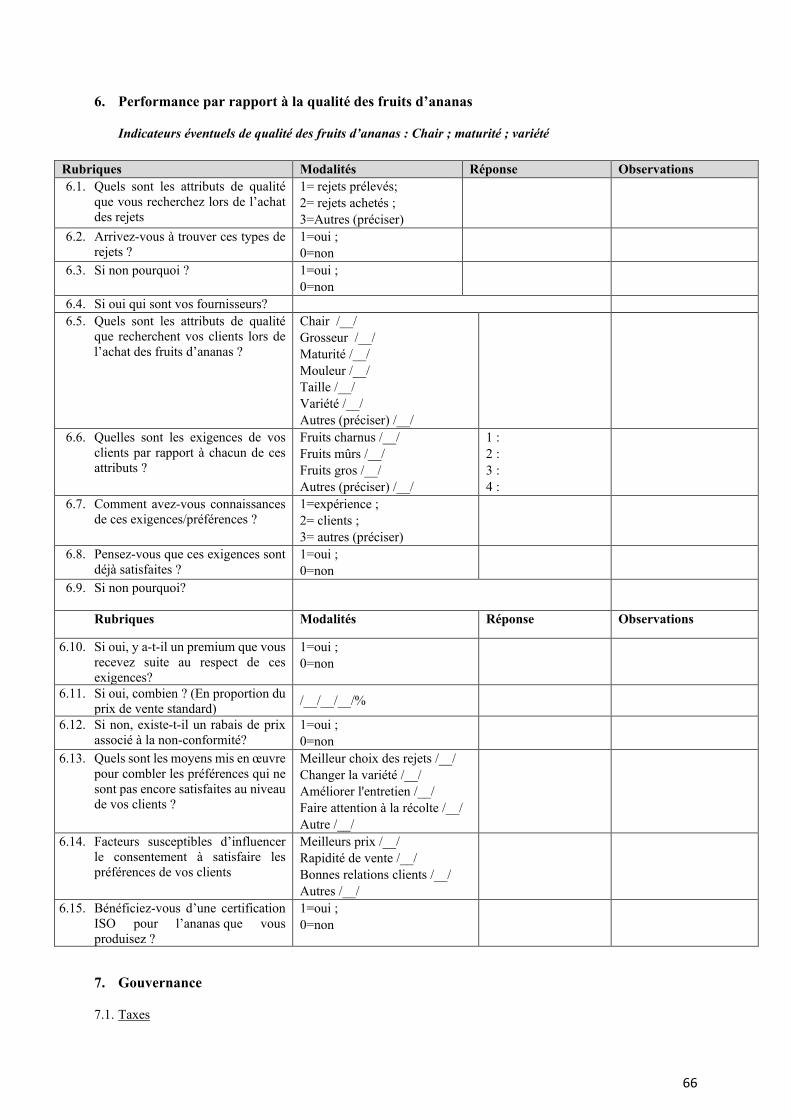
66
6. Performance par rapport à la qualité des fruits d’ananas
Indicateurs éventuels de qualité des fruits d’ananas : Chair ; maturité ; variété
Rubriques Modalités Réponse Observations 6.1. Quels sont les attributs de qualité
que vous recherchez lors de l’achat des rejets
1= rejets prélevés; 2= rejets achetés ; 3=Autres (préciser)
6.2. Arrivez-vous à trouver ces types de rejets ?
1=oui ; 0=non
6.3. Si non pourquoi ? 1=oui ; 0=non
6.4. Si oui qui sont vos fournisseurs? 6.5. Quels sont les attributs de qualité
que recherchent vos clients lors de l’achat des fruits d’ananas ?
Chair /__/ Grosseur /__/ Maturité /__/ Mouleur /__/ Taille /__/ Variété /__/ Autres (préciser) /__/
6.6. Quelles sont les exigences de vos clients par rapport à chacun de ces attributs ?
Fruits charnus /__/ Fruits mûrs /__/ Fruits gros /__/ Autres (préciser) /__/
1 : 2 : 3 : 4 :
6.7. Comment avez-vous connaissances de ces exigences/préférences ?
1=expérience ; 2= clients ; 3= autres (préciser)
6.8. Pensez-vous que ces exigences sont déjà satisfaites ?
1=oui ; 0=non
6.9. Si non pourquoi?
Rubriques Modalités Réponse Observations
6.10. Si oui, y a-t-il un premium que vous recevez suite au respect de ces exigences?
1=oui ; 0=non
6.11. Si oui, combien ? (En proportion du prix de vente standard) /__/__/__/%
6.12. Si non, existe-t-il un rabais de prix associé à la non-conformité?
1=oui ; 0=non
6.13. Quels sont les moyens mis en œuvre pour combler les préférences qui ne sont pas encore satisfaites au niveau de vos clients ?
Meilleur choix des rejets /__/ Changer la variété /__/ Améliorer l'entretien /__/ Faire attention à la récolte /__/ Autre /__/
6.14. Facteurs susceptibles d’influencer le consentement à satisfaire les préférences de vos clients
Meilleurs prix /__/ Rapidité de vente /__/ Bonnes relations clients /__/ Autres /__/
6.15. Bénéficiez-vous d’une certification ISO pour l’ananas que vous produisez ?
1=oui ; 0=non
7. Gouvernance
7.1. Taxes
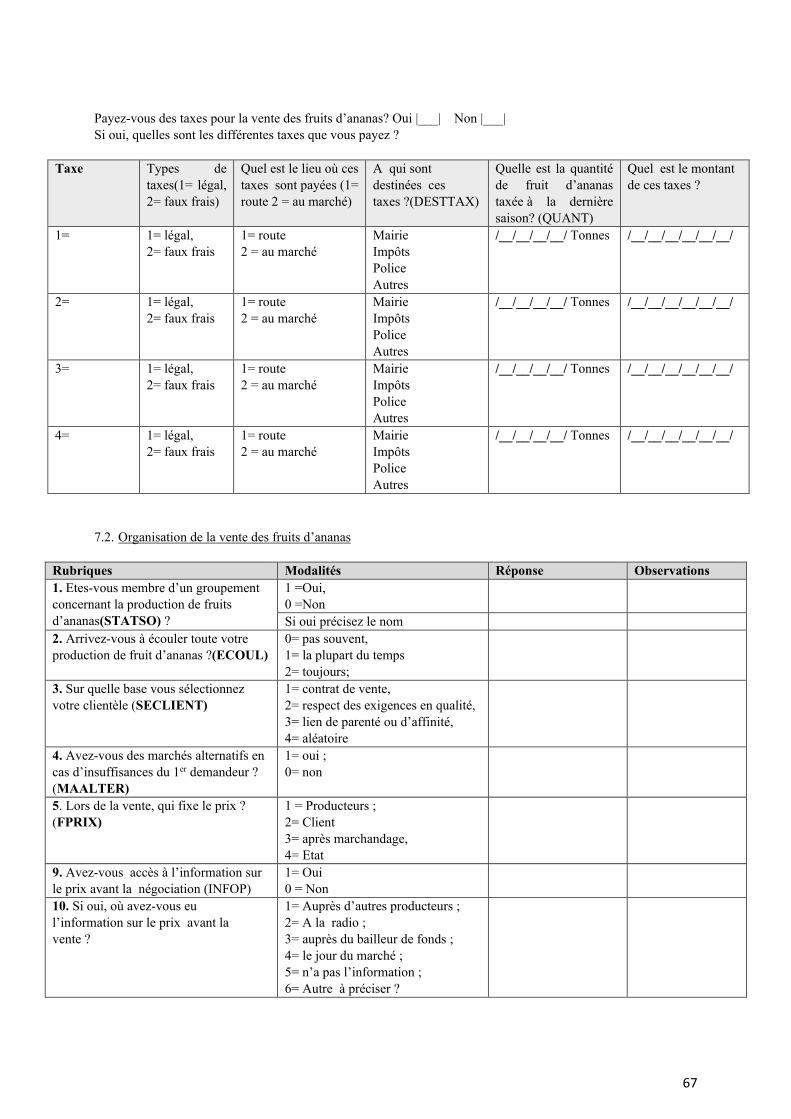
67
Payez-vous des taxes pour la vente des fruits d’ananas? Oui |___| Non |___| Si oui, quelles sont les différentes taxes que vous payez ?
Taxe Types de taxes(1= légal, 2= faux frais)
Quel est le lieu où ces taxes sont payées (1= route 2 = au marché)
A qui sont destinées ces taxes ?(DESTTAX)
Quelle est la quantité de fruit d’ananas taxée à la dernière saison? (QUANT)
Quel est le montant de ces taxes ?
1= 1= légal, 2= faux frais
1= route 2 = au marché
Mairie Impôts Police Autres
/__/__/__/__/ Tonnes /__/__/__/__/__/__/
2= 1= légal, 2= faux frais
1= route 2 = au marché
Mairie Impôts Police Autres
/__/__/__/__/ Tonnes /__/__/__/__/__/__/
3= 1= légal, 2= faux frais
1= route 2 = au marché
Mairie Impôts Police Autres
/__/__/__/__/ Tonnes /__/__/__/__/__/__/
4= 1= légal, 2= faux frais
1= route 2 = au marché
Mairie Impôts Police Autres
/__/__/__/__/ Tonnes /__/__/__/__/__/__/
7.2. Organisation de la vente des fruits d’ananas
Rubriques Modalités Réponse Observations 1. Etes-vous membre d’un groupement concernant la production de fruits d’ananas(STATSO) ?
1 =Oui, 0 =Non
Si oui précisez le nom 2. Arrivez-vous à écouler toute votre production de fruit d’ananas ?(ECOUL)
0= pas souvent, 1= la plupart du temps 2= toujours;
3. Sur quelle base vous sélectionnez votre clientèle (SECLIENT)
1= contrat de vente, 2= respect des exigences en qualité, 3= lien de parenté ou d’affinité, 4= aléatoire
4. Avez-vous des marchés alternatifs en cas d’insuffisances du 1er demandeur ? (MAALTER)
1= oui ; 0= non
5. Lors de la vente, qui fixe le prix ? (FPRIX)
1 = Producteurs ; 2= Client 3= après marchandage, 4= Etat
9. Avez-vous accès à l’information sur le prix avant la négociation (INFOP)
1= Oui 0 = Non
10. Si oui, où avez-vous eu l’information sur le prix avant la vente ?
1= Auprès d’autres producteurs ; 2= A la radio ; 3= auprès du bailleur de fonds ; 4= le jour du marché ; 5= n’a pas l’information ; 6= Autre à préciser ?
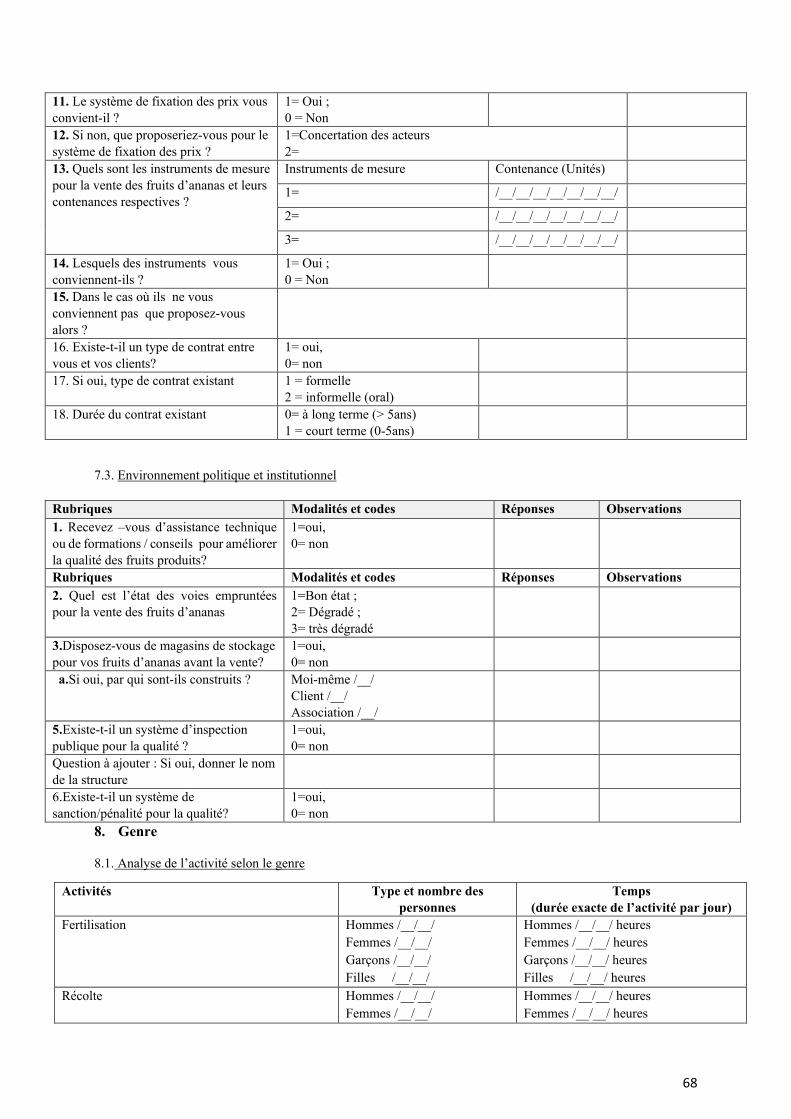
68
11. Le système de fixation des prix vous convient-il ?
1= Oui ; 0 = Non
12. Si non, que proposeriez-vous pour le système de fixation des prix ?
1=Concertation des acteurs 2=
13. Quels sont les instruments de mesure pour la vente des fruits d’ananas et leurs contenances respectives ?
Instruments de mesure Contenance (Unités)
1= /__/__/__/__/__/__/__/
2= /__/__/__/__/__/__/__/
3= /__/__/__/__/__/__/__/
14. Lesquels des instruments vous conviennent-ils ?
1= Oui ; 0 = Non
15. Dans le cas où ils ne vous conviennent pas que proposez-vous alors ?
16. Existe-t-il un type de contrat entre vous et vos clients?
1= oui, 0= non
17. Si oui, type de contrat existant 1 = formelle 2 = informelle (oral)
18. Durée du contrat existant 0= à long terme (> 5ans) 1 = court terme (0-5ans)
7.3. Environnement politique et institutionnel
Rubriques Modalités et codes Réponses Observations 1. Recevez –vous d’assistance technique ou de formations / conseils pour améliorer la qualité des fruits produits?
1=oui, 0= non
Rubriques Modalités et codes Réponses Observations 2. Quel est l’état des voies empruntées pour la vente des fruits d’ananas
1=Bon état ; 2= Dégradé ; 3= très dégradé
3.Disposez-vous de magasins de stockage pour vos fruits d’ananas avant la vente?
1=oui, 0= non
a.Si oui, par qui sont-ils construits ? Moi-même /__/ Client /__/ Association /__/
5.Existe-t-il un système d’inspection publique pour la qualité ?
1=oui, 0= non
Question à ajouter : Si oui, donner le nom de la structure
6.Existe-t-il un système de sanction/pénalité pour la qualité?
1=oui, 0= non
8. Genre
8.1. Analyse de l’activité selon le genre
Activités Type et nombre des personnes
Temps (durée exacte de l’activité par jour)
Fertilisation Hommes /__/__/ Femmes /__/__/ Garçons /__/__/ Filles /__/__/
Hommes /__/__/ heures Femmes /__/__/ heures Garçons /__/__/ heures Filles /__/__/ heures
Récolte Hommes /__/__/ Femmes /__/__/
Hommes /__/__/ heures Femmes /__/__/ heures
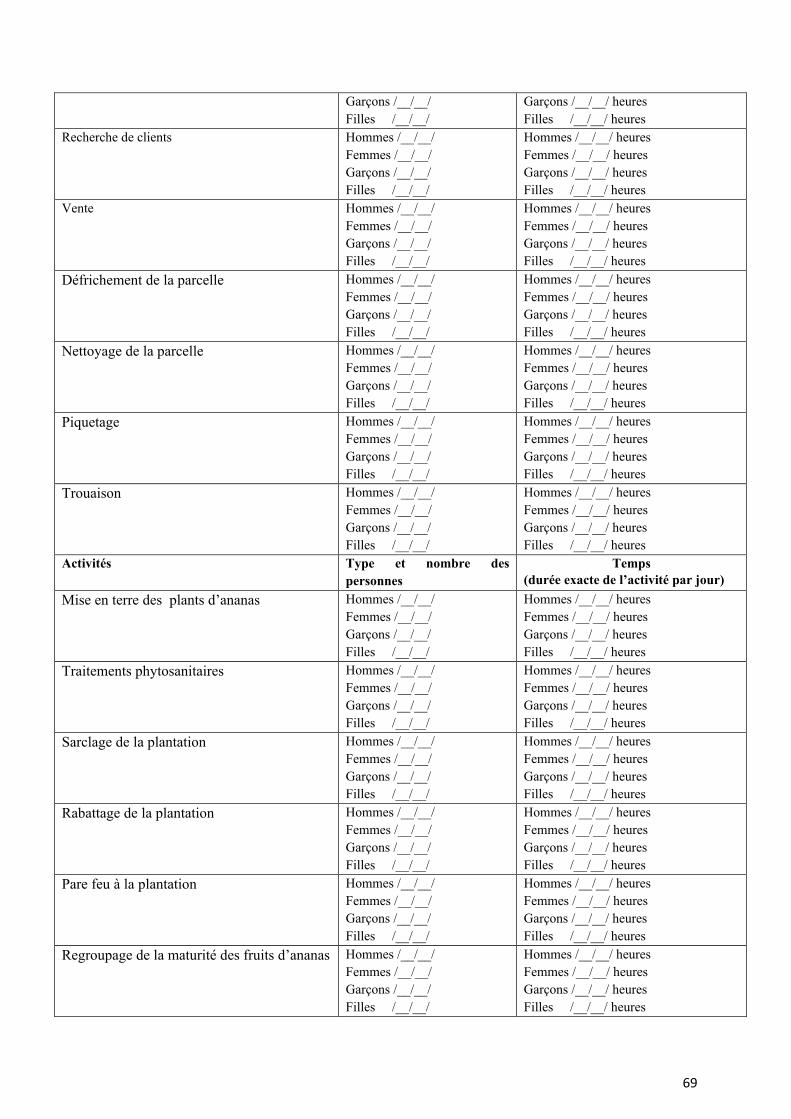
69
Garçons /__/__/ Filles /__/__/
Garçons /__/__/ heures Filles /__/__/ heures
Recherche de clients Hommes /__/__/ Femmes /__/__/ Garçons /__/__/ Filles /__/__/
Hommes /__/__/ heures Femmes /__/__/ heures Garçons /__/__/ heures Filles /__/__/ heures
Vente Hommes /__/__/ Femmes /__/__/ Garçons /__/__/ Filles /__/__/
Hommes /__/__/ heures Femmes /__/__/ heures Garçons /__/__/ heures Filles /__/__/ heures
Défrichement de la parcelle Hommes /__/__/ Femmes /__/__/ Garçons /__/__/ Filles /__/__/
Hommes /__/__/ heures Femmes /__/__/ heures Garçons /__/__/ heures Filles /__/__/ heures
Nettoyage de la parcelle Hommes /__/__/ Femmes /__/__/ Garçons /__/__/ Filles /__/__/
Hommes /__/__/ heures Femmes /__/__/ heures Garçons /__/__/ heures Filles /__/__/ heures
Piquetage Hommes /__/__/ Femmes /__/__/ Garçons /__/__/ Filles /__/__/
Hommes /__/__/ heures Femmes /__/__/ heures Garçons /__/__/ heures Filles /__/__/ heures
Trouaison Hommes /__/__/ Femmes /__/__/ Garçons /__/__/ Filles /__/__/
Hommes /__/__/ heures Femmes /__/__/ heures Garçons /__/__/ heures Filles /__/__/ heures
Activités Type et nombre des personnes
Temps (durée exacte de l’activité par jour)
Mise en terre des plants d’ananas Hommes /__/__/ Femmes /__/__/ Garçons /__/__/ Filles /__/__/
Hommes /__/__/ heures Femmes /__/__/ heures Garçons /__/__/ heures Filles /__/__/ heures
Traitements phytosanitaires Hommes /__/__/ Femmes /__/__/ Garçons /__/__/ Filles /__/__/
Hommes /__/__/ heures Femmes /__/__/ heures Garçons /__/__/ heures Filles /__/__/ heures
Sarclage de la plantation Hommes /__/__/ Femmes /__/__/ Garçons /__/__/ Filles /__/__/
Hommes /__/__/ heures Femmes /__/__/ heures Garçons /__/__/ heures Filles /__/__/ heures
Rabattage de la plantation Hommes /__/__/ Femmes /__/__/ Garçons /__/__/ Filles /__/__/
Hommes /__/__/ heures Femmes /__/__/ heures Garçons /__/__/ heures Filles /__/__/ heures
Pare feu à la plantation Hommes /__/__/ Femmes /__/__/ Garçons /__/__/ Filles /__/__/
Hommes /__/__/ heures Femmes /__/__/ heures Garçons /__/__/ heures Filles /__/__/ heures
Regroupage de la maturité des fruits d’ananas Hommes /__/__/ Femmes /__/__/ Garçons /__/__/ Filles /__/__/
Hommes /__/__/ heures Femmes /__/__/ heures Garçons /__/__/ heures Filles /__/__/ heures
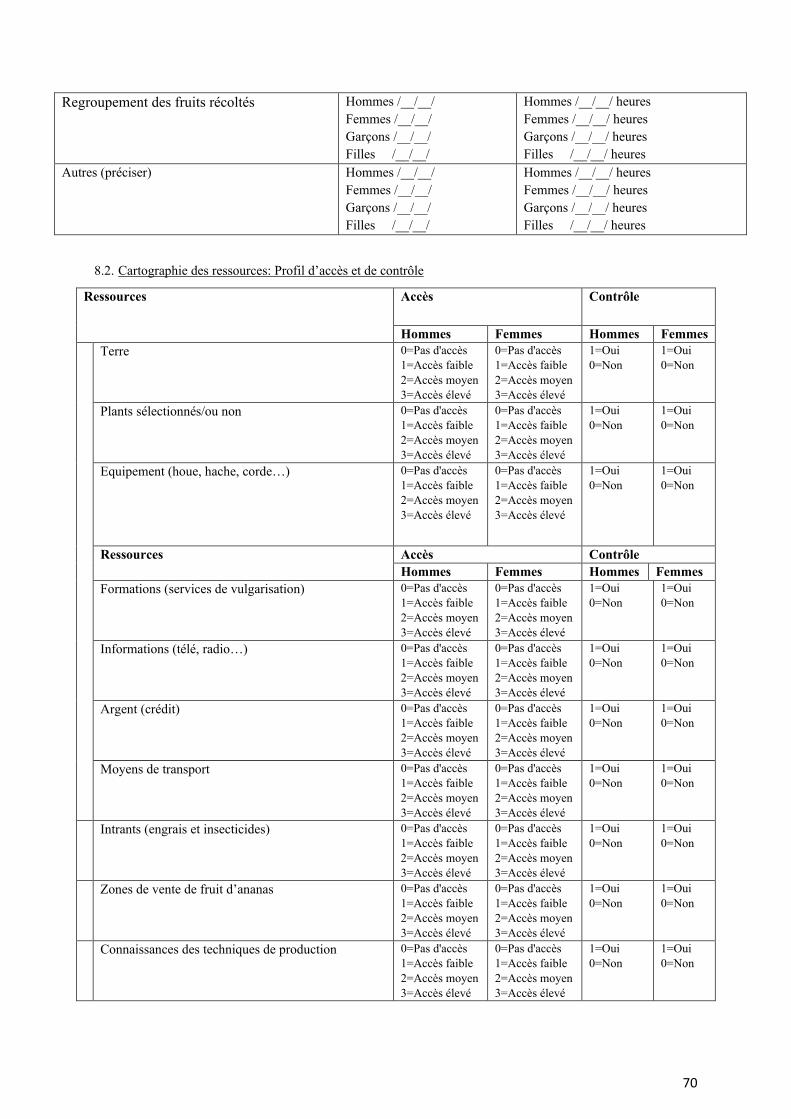
70
Regroupement des fruits récoltés Hommes /__/__/ Femmes /__/__/ Garçons /__/__/ Filles /__/__/
Hommes /__/__/ heures Femmes /__/__/ heures Garçons /__/__/ heures Filles /__/__/ heures
Autres (préciser) Hommes /__/__/ Femmes /__/__/ Garçons /__/__/ Filles /__/__/
Hommes /__/__/ heures Femmes /__/__/ heures Garçons /__/__/ heures Filles /__/__/ heures
8.2. Cartographie des ressources: Profil d’accès et de contrôle
Ressources Accès Contrôle
Hommes Femmes Hommes Femmes
Terre 0=Pas d'accès 1=Accès faible 2=Accès moyen 3=Accès élevé
0=Pas d'accès 1=Accès faible 2=Accès moyen 3=Accès élevé
1=Oui 0=Non
1=Oui 0=Non
Plants sélectionnés/ou non 0=Pas d'accès 1=Accès faible 2=Accès moyen 3=Accès élevé
0=Pas d'accès 1=Accès faible 2=Accès moyen 3=Accès élevé
1=Oui 0=Non
1=Oui 0=Non
Equipement (houe, hache, corde…)
0=Pas d'accès 1=Accès faible 2=Accès moyen 3=Accès élevé
0=Pas d'accès 1=Accès faible 2=Accès moyen 3=Accès élevé
1=Oui 0=Non
1=Oui 0=Non
Ressources Accès Contrôle Hommes Femmes Hommes Femmes
Formations (services de vulgarisation) 0=Pas d'accès 1=Accès faible 2=Accès moyen 3=Accès élevé
0=Pas d'accès 1=Accès faible 2=Accès moyen 3=Accès élevé
1=Oui 0=Non
1=Oui 0=Non
Informations (télé, radio…) 0=Pas d'accès 1=Accès faible 2=Accès moyen 3=Accès élevé
0=Pas d'accès 1=Accès faible 2=Accès moyen 3=Accès élevé
1=Oui 0=Non
1=Oui 0=Non
Argent (crédit) 0=Pas d'accès 1=Accès faible 2=Accès moyen 3=Accès élevé
0=Pas d'accès 1=Accès faible 2=Accès moyen 3=Accès élevé
1=Oui 0=Non
1=Oui 0=Non
Moyens de transport 0=Pas d'accès 1=Accès faible 2=Accès moyen 3=Accès élevé
0=Pas d'accès 1=Accès faible 2=Accès moyen 3=Accès élevé
1=Oui 0=Non
1=Oui 0=Non
Intrants (engrais et insecticides) 0=Pas d'accès 1=Accès faible 2=Accès moyen 3=Accès élevé
0=Pas d'accès 1=Accès faible 2=Accès moyen 3=Accès élevé
1=Oui 0=Non
1=Oui 0=Non
Zones de vente de fruit d’ananas 0=Pas d'accès 1=Accès faible 2=Accès moyen 3=Accès élevé
0=Pas d'accès 1=Accès faible 2=Accès moyen 3=Accès élevé
1=Oui 0=Non
1=Oui 0=Non
Connaissances des techniques de production 0=Pas d'accès 1=Accès faible 2=Accès moyen 3=Accès élevé
0=Pas d'accès 1=Accès faible 2=Accès moyen 3=Accès élevé
1=Oui 0=Non
1=Oui 0=Non
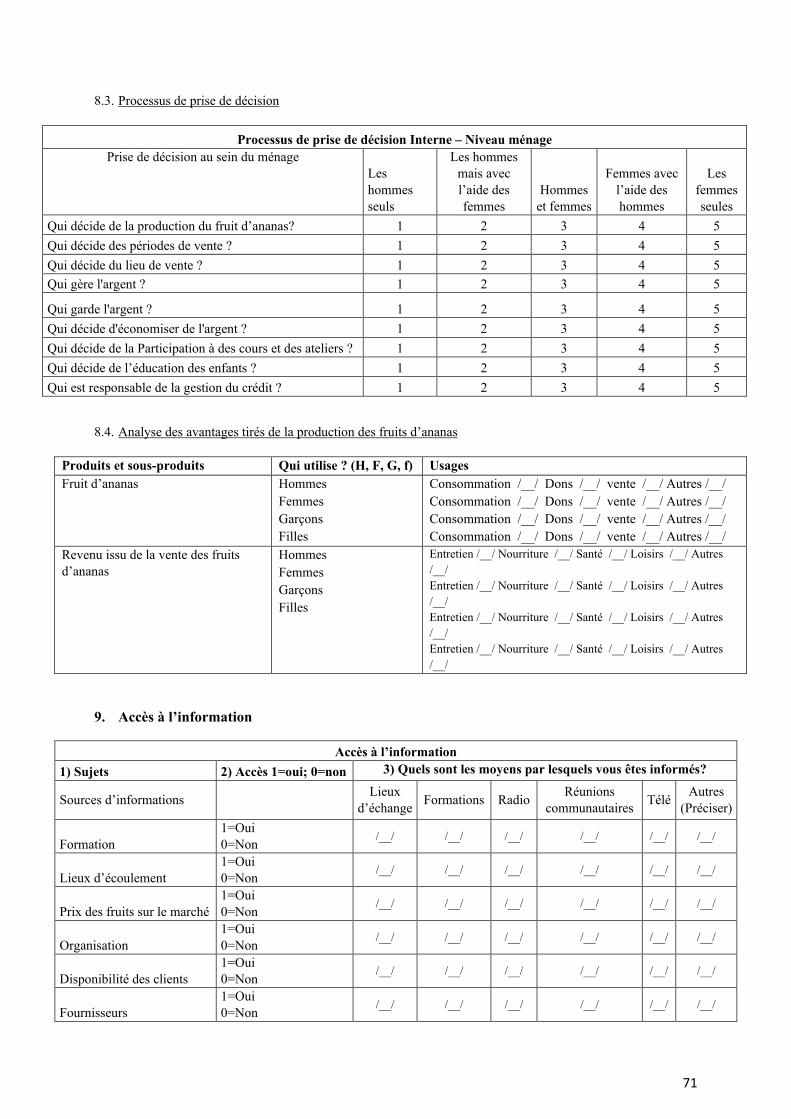
71
8.3. Processus de prise de décision
Processus de prise de décision Interne – Niveau ménage Prise de décision au sein du ménage
Les hommes seuls
Les hommes mais avec l’aide des femmes
Hommes et femmes
Femmes avec l’aide des hommes
Les femmes seules
Qui décide de la production du fruit d’ananas? 1 2 3 4 5 Qui décide des périodes de vente ? 1 2 3 4 5 Qui décide du lieu de vente ? 1 2 3 4 5 Qui gère l'argent ? 1 2 3 4 5
Qui garde l'argent ? 1 2 3 4 5 Qui décide d'économiser de l'argent ? 1 2 3 4 5 Qui décide de la Participation à des cours et des ateliers ? 1 2 3 4 5 Qui décide de l’éducation des enfants ? 1 2 3 4 5 Qui est responsable de la gestion du crédit ? 1 2 3 4 5
8.4. Analyse des avantages tirés de la production des fruits d’ananas
Produits et sous-produits Qui utilise ? (H, F, G, f) Usages Fruit d’ananas Hommes
Femmes Garçons Filles
Consommation /__/ Dons /__/ vente /__/ Autres /__/ Consommation /__/ Dons /__/ vente /__/ Autres /__/ Consommation /__/ Dons /__/ vente /__/ Autres /__/ Consommation /__/ Dons /__/ vente /__/ Autres /__/
Revenu issu de la vente des fruits d’ananas
Hommes Femmes Garçons Filles
Entretien /__/ Nourriture /__/ Santé /__/ Loisirs /__/ Autres /__/ Entretien /__/ Nourriture /__/ Santé /__/ Loisirs /__/ Autres /__/ Entretien /__/ Nourriture /__/ Santé /__/ Loisirs /__/ Autres /__/ Entretien /__/ Nourriture /__/ Santé /__/ Loisirs /__/ Autres /__/
9. Accès à l’information
Accès à l’information 1) Sujets 2) Accès 1=oui; 0=non 3) Quels sont les moyens par lesquels vous êtes informés?
Sources d’informations Lieux d’échange Formations Radio Réunions
communautaires Télé Autres (Préciser)
Formation 1=Oui 0=Non /__/ /__/ /__/ /__/ /__/ /__/
Lieux d’écoulement 1=Oui 0=Non /__/ /__/ /__/ /__/ /__/ /__/
Prix des fruits sur le marché 1=Oui 0=Non /__/ /__/ /__/ /__/ /__/ /__/
Organisation 1=Oui 0=Non /__/ /__/ /__/ /__/ /__/ /__/
Disponibilité des clients 1=Oui 0=Non /__/ /__/ /__/ /__/ /__/ /__/
Fournisseurs 1=Oui 0=Non /__/ /__/ /__/ /__/ /__/ /__/
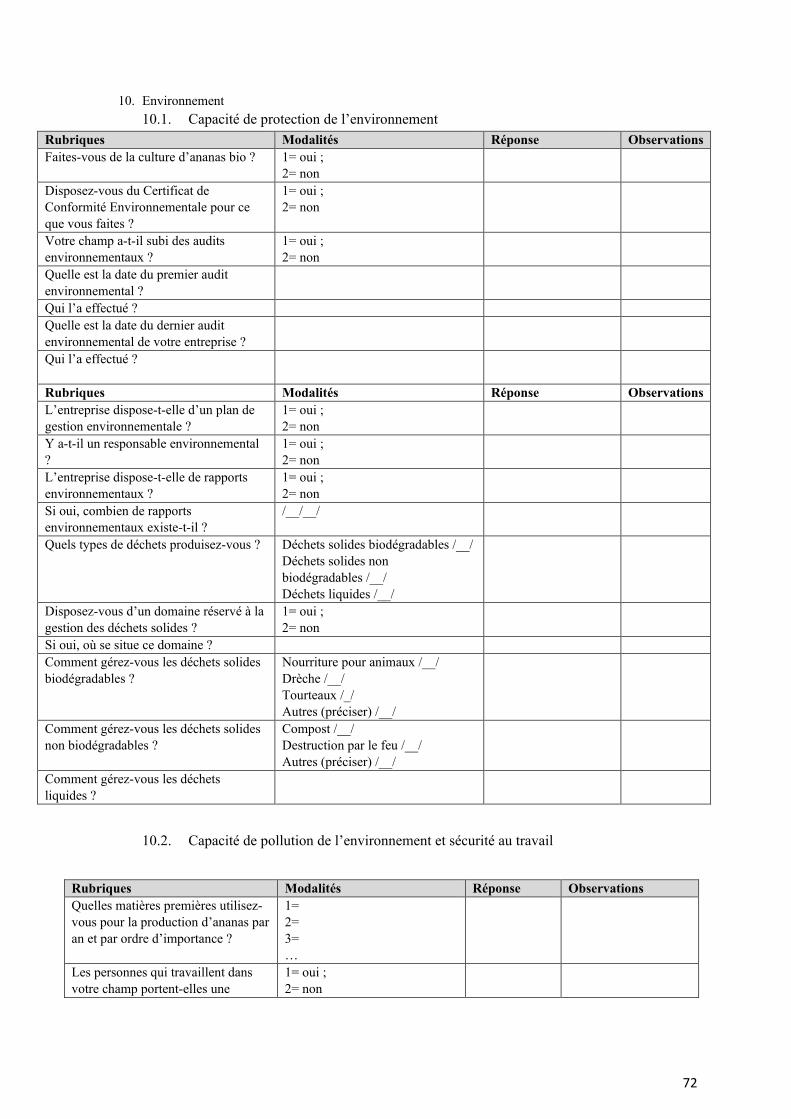
72
10. Environnement 10.1. Capacité de protection de l’environnement
Rubriques Modalités Réponse Observations Faites-vous de la culture d’ananas bio ? 1= oui ;
2= non
Disposez-vous du Certificat de Conformité Environnementale pour ce que vous faites ?
1= oui ; 2= non
Votre champ a-t-il subi des audits environnementaux ?
1= oui ; 2= non
Quelle est la date du premier audit environnemental ?
Qui l’a effectué ? Quelle est la date du dernier audit environnemental de votre entreprise ?
Qui l’a effectué ?
Rubriques Modalités Réponse Observations L’entreprise dispose-t-elle d’un plan de gestion environnementale ?
1= oui ; 2= non
Y a-t-il un responsable environnemental ?
1= oui ; 2= non
L’entreprise dispose-t-elle de rapports environnementaux ?
1= oui ; 2= non
Si oui, combien de rapports environnementaux existe-t-il ?
/__/__/
Quels types de déchets produisez-vous ? Déchets solides biodégradables /__/ Déchets solides non biodégradables /__/ Déchets liquides /__/
Disposez-vous d’un domaine réservé à la gestion des déchets solides ?
1= oui ; 2= non
Si oui, où se situe ce domaine ? Comment gérez-vous les déchets solides biodégradables ?
Nourriture pour animaux /__/ Drèche /__/ Tourteaux /_/ Autres (préciser) /__/
Comment gérez-vous les déchets solides non biodégradables ?
Compost /__/ Destruction par le feu /__/ Autres (préciser) /__/
Comment gérez-vous les déchets liquides ?
10.2. Capacité de pollution de l’environnement et sécurité au travail
Rubriques Modalités Réponse Observations Quelles matières premières utilisez-vous pour la production d’ananas par an et par ordre d’importance ?
1= 2= 3= …
Les personnes qui travaillent dans votre champ portent-elles une
1= oui ; 2= non
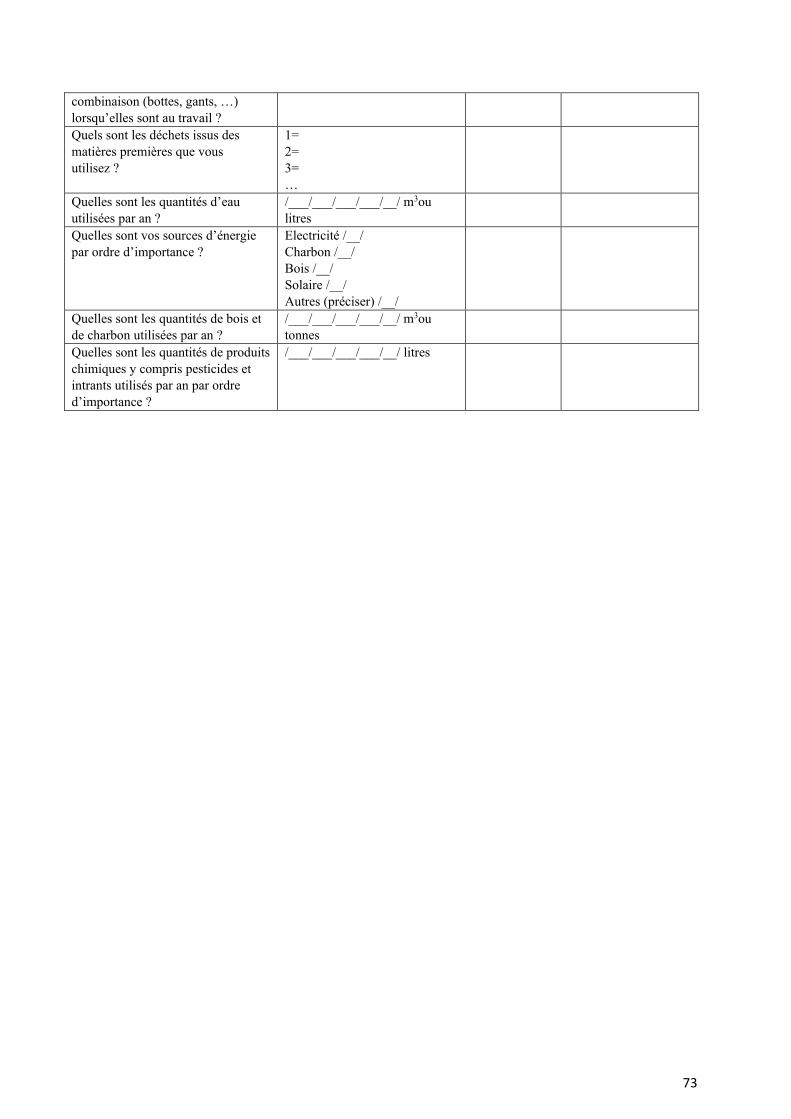
73
combinaison (bottes, gants, …) lorsqu’elles sont au travail ? Quels sont les déchets issus des matières premières que vous utilisez ?
1= 2= 3= …
Quelles sont les quantités d’eau utilisées par an ?
/___/___/___/___/__/ m3ou litres
Quelles sont vos sources d’énergie par ordre d’importance ?
Electricité /__/ Charbon /__/ Bois /__/ Solaire /__/ Autres (préciser) /__/
Quelles sont les quantités de bois et de charbon utilisées par an ?
/___/___/___/___/__/ m3ou tonnes
Quelles sont les quantités de produits chimiques y compris pesticides et intrants utilisés par an par ordre d’importance ?
/___/___/___/___/__/ litres
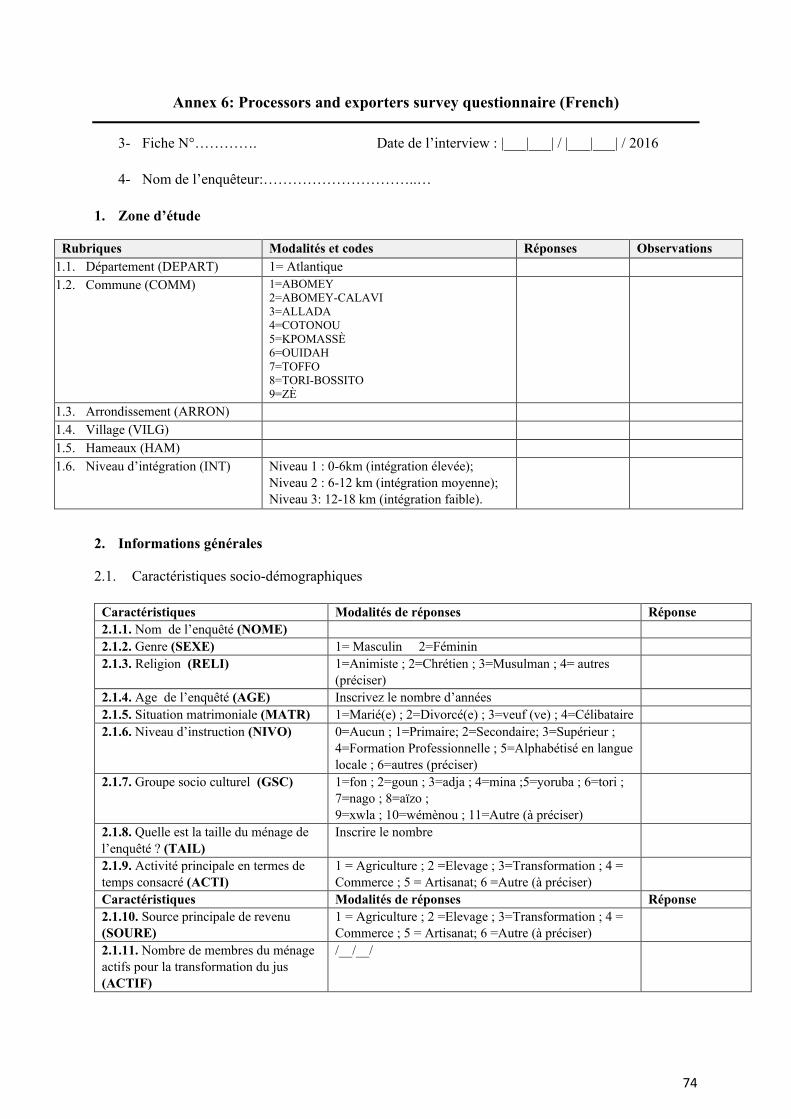
74
Annex 6: Processors and exporters survey questionnaire (French) 3- Fiche N°…………. Date de l’interview : |___|___| / |___|___| / 2016
4- Nom de l’enquêteur:…………………………..…
1. Zone d’étude
Rubriques Modalités et codes Réponses Observations 1.1. Département (DEPART) 1= Atlantique 1.2. Commune (COMM) 1=ABOMEY
2=ABOMEY-CALAVI 3=ALLADA 4=COTONOU 5=KPOMASSÈ 6=OUIDAH 7=TOFFO 8=TORI-BOSSITO 9=ZÈ
1.3. Arrondissement (ARRON) 1.4. Village (VILG) 1.5. Hameaux (HAM) 1.6. Niveau d’intégration (INT) Niveau 1 : 0-6km (intégration élevée);
Niveau 2 : 6-12 km (intégration moyenne); Niveau 3: 12-18 km (intégration faible).
2. Informations générales
2.1. Caractéristiques socio-démographiques
Caractéristiques Modalités de réponses Réponse 2.1.1. Nom de l’enquêté (NOME) 2.1.2. Genre (SEXE) 1= Masculin 2=Féminin 2.1.3. Religion (RELI) 1=Animiste ; 2=Chrétien ; 3=Musulman ; 4= autres
(préciser)
2.1.4. Age de l’enquêté (AGE) Inscrivez le nombre d’années 2.1.5. Situation matrimoniale (MATR) 1=Marié(e) ; 2=Divorcé(e) ; 3=veuf (ve) ; 4=Célibataire 2.1.6. Niveau d’instruction (NIVO) 0=Aucun ; 1=Primaire; 2=Secondaire; 3=Supérieur ;
4=Formation Professionnelle ; 5=Alphabétisé en langue locale ; 6=autres (préciser)
2.1.7. Groupe socio culturel (GSC) 1=fon ; 2=goun ; 3=adja ; 4=mina ;5=yoruba ; 6=tori ; 7=nago ; 8=aïzo ; 9=xwla ; 10=wémènou ; 11=Autre (à préciser)
2.1.8. Quelle est la taille du ménage de l’enquêté ? (TAIL)
Inscrire le nombre
2.1.9. Activité principale en termes de temps consacré (ACTI)
1 = Agriculture ; 2 =Elevage ; 3=Transformation ; 4 = Commerce ; 5 = Artisanat; 6 =Autre (à préciser)
Caractéristiques Modalités de réponses Réponse 2.1.10. Source principale de revenu (SOURE)
1 = Agriculture ; 2 =Elevage ; 3=Transformation ; 4 = Commerce ; 5 = Artisanat; 6 =Autre (à préciser)
2.1.11. Nombre de membres du ménage actifs pour la transformation du jus (ACTIF)
/__/__/
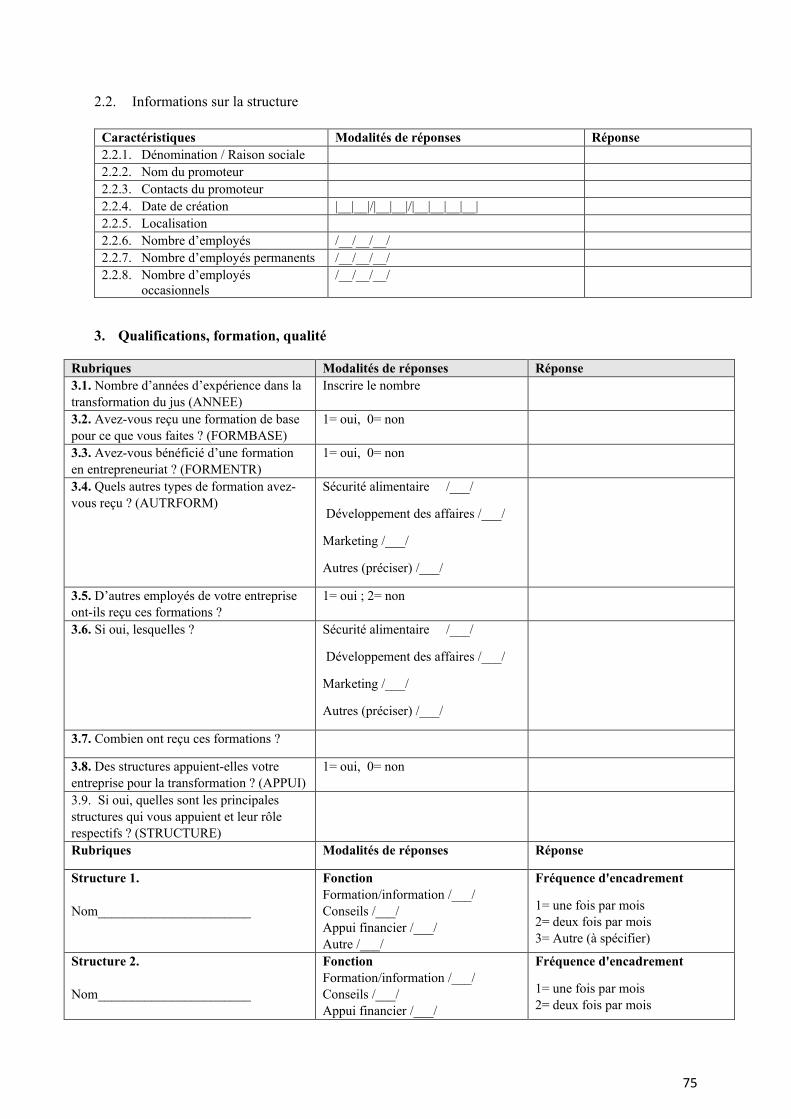
75
2.2. Informations sur la structure
Caractéristiques Modalités de réponses Réponse 2.2.1. Dénomination / Raison sociale 2.2.2. Nom du promoteur 2.2.3. Contacts du promoteur 2.2.4. Date de création |__|__|/|__|__|/|__|__|__|__| 2.2.5. Localisation 2.2.6. Nombre d’employés /__/__/__/ 2.2.7. Nombre d’employés permanents /__/__/__/ 2.2.8. Nombre d’employés
occasionnels /__/__/__/
3. Qualifications, formation, qualité
Rubriques Modalités de réponses Réponse 3.1. Nombre d’années d’expérience dans la transformation du jus (ANNEE)
Inscrire le nombre
3.2. Avez-vous reçu une formation de base pour ce que vous faites ? (FORMBASE)
1= oui, 0= non
3.3. Avez-vous bénéficié d’une formation en entrepreneuriat ? (FORMENTR)
1= oui, 0= non
3.4. Quels autres types de formation avez-vous reçu ? (AUTRFORM)
Sécurité alimentaire /___/
Développement des affaires /___/
Marketing /___/
Autres (préciser) /___/
3.5. D’autres employés de votre entreprise ont-ils reçu ces formations ?
1= oui ; 2= non
3.6. Si oui, lesquelles ? Sécurité alimentaire /___/
Développement des affaires /___/
Marketing /___/
Autres (préciser) /___/
3.7. Combien ont reçu ces formations ?
3.8. Des structures appuient-elles votre entreprise pour la transformation ? (APPUI)
1= oui, 0= non
3.9. Si oui, quelles sont les principales structures qui vous appuient et leur rôle respectifs ? (STRUCTURE)
Rubriques Modalités de réponses Réponse
Structure 1. Nom_______________________
Fonction Formation/information /___/ Conseils /___/ Appui financier /___/ Autre /___/
Fréquence d'encadrement
1= une fois par mois 2= deux fois par mois 3= Autre (à spécifier)
Structure 2. Nom_______________________
Fonction Formation/information /___/ Conseils /___/ Appui financier /___/
Fréquence d'encadrement
1= une fois par mois 2= deux fois par mois
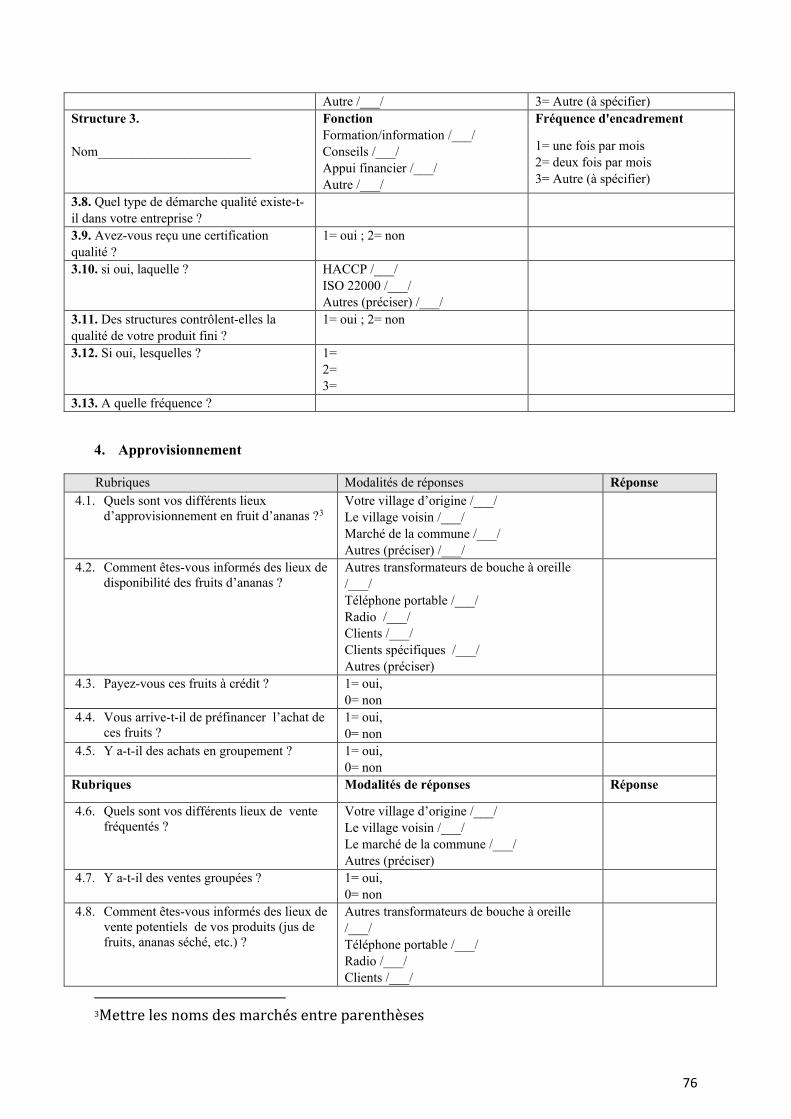
76
Autre /___/ 3= Autre (à spécifier) Structure 3. Nom_______________________
Fonction Formation/information /___/ Conseils /___/ Appui financier /___/ Autre /___/
Fréquence d'encadrement
1= une fois par mois 2= deux fois par mois 3= Autre (à spécifier)
3.8. Quel type de démarche qualité existe-t-il dans votre entreprise ?
3.9. Avez-vous reçu une certification qualité ?
1= oui ; 2= non
3.10. si oui, laquelle ? HACCP /___/ ISO 22000 /___/ Autres (préciser) /___/
3.11. Des structures contrôlent-elles la qualité de votre produit fini ?
1= oui ; 2= non
3.12. Si oui, lesquelles ? 1= 2= 3=
3.13. A quelle fréquence ?
4. Approvisionnement
Rubriques Modalités de réponses Réponse 4.1. Quels sont vos différents lieux
d’approvisionnement en fruit d’ananas ?3 Votre village d’origine /___/ Le village voisin /___/ Marché de la commune /___/ Autres (préciser) /___/
4.2. Comment êtes-vous informés des lieux de disponibilité des fruits d’ananas ?
Autres transformateurs de bouche à oreille /___/ Téléphone portable /___/ Radio /___/ Clients /___/ Clients spécifiques /___/ Autres (préciser)
4.3. Payez-vous ces fruits à crédit ? 1= oui, 0= non
4.4. Vous arrive-t-il de préfinancer l’achat de ces fruits ?
1= oui, 0= non
4.5. Y a-t-il des achats en groupement ? 1= oui, 0= non
Rubriques Modalités de réponses Réponse
4.6. Quels sont vos différents lieux de vente fréquentés ?
Votre village d’origine /___/ Le village voisin /___/ Le marché de la commune /___/ Autres (préciser)
4.7. Y a-t-il des ventes groupées ? 1= oui, 0= non
4.8. Comment êtes-vous informés des lieux de vente potentiels de vos produits (jus de fruits, ananas séché, etc.) ?
Autres transformateurs de bouche à oreille /___/ Téléphone portable /___/ Radio /___/ Clients /___/
3Mettre les noms des marchés entre parenthèses
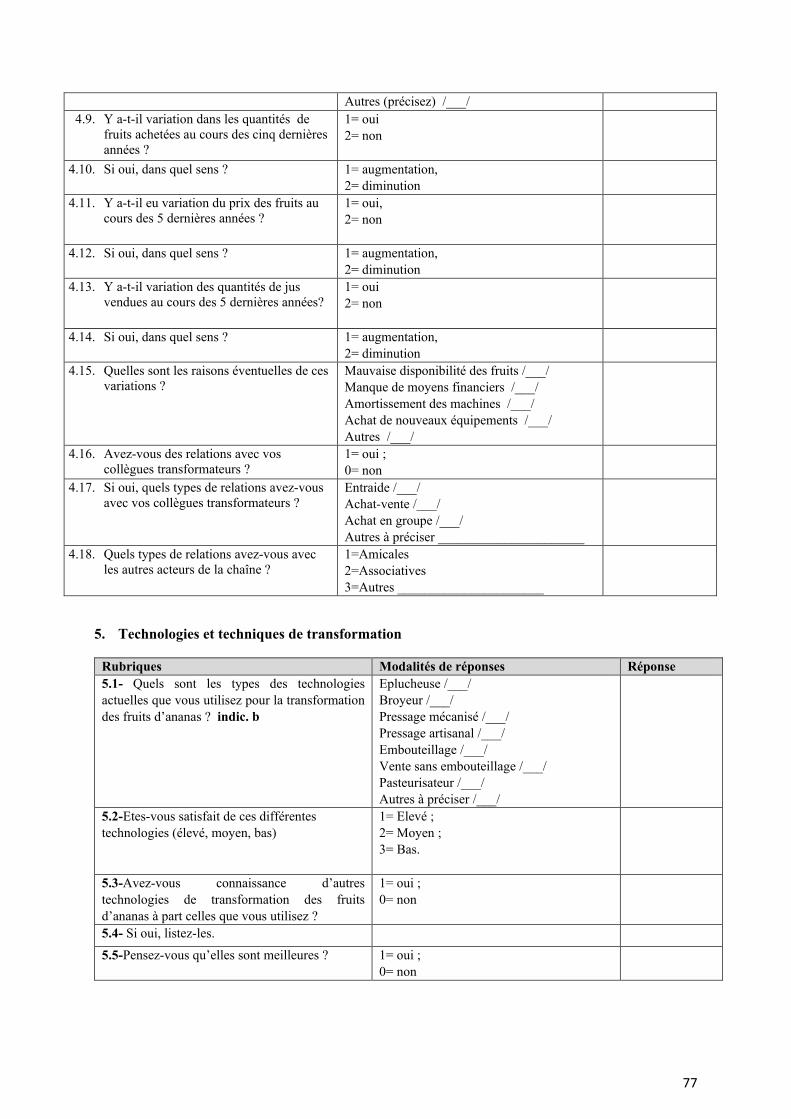
77
Autres (précisez) /___/ 4.9. Y a-t-il variation dans les quantités de
fruits achetées au cours des cinq dernières années ?
1= oui 2= non
4.10. Si oui, dans quel sens ? 1= augmentation, 2= diminution
4.11. Y a-t-il eu variation du prix des fruits au cours des 5 dernières années ?
1= oui, 2= non
4.12. Si oui, dans quel sens ? 1= augmentation, 2= diminution
4.13. Y a-t-il variation des quantités de jus vendues au cours des 5 dernières années?
1= oui 2= non
4.14. Si oui, dans quel sens ? 1= augmentation, 2= diminution
4.15. Quelles sont les raisons éventuelles de ces variations ?
Mauvaise disponibilité des fruits /___/ Manque de moyens financiers /___/ Amortissement des machines /___/ Achat de nouveaux équipements /___/ Autres /___/
4.16. Avez-vous des relations avec vos collègues transformateurs ?
1= oui ; 0= non
4.17. Si oui, quels types de relations avez-vous avec vos collègues transformateurs ?
Entraide /___/ Achat-vente /___/ Achat en groupe /___/ Autres à préciser ______________________
4.18. Quels types de relations avez-vous avec les autres acteurs de la chaîne ?
1=Amicales 2=Associatives 3=Autres ______________________
5. Technologies et techniques de transformation
Rubriques Modalités de réponses Réponse 5.1- Quels sont les types des technologies actuelles que vous utilisez pour la transformation des fruits d’ananas ? indic. b
Eplucheuse /___/ Broyeur /___/ Pressage mécanisé /___/ Pressage artisanal /___/ Embouteillage /___/ Vente sans embouteillage /___/ Pasteurisateur /___/ Autres à préciser /___/
5.2-Etes-vous satisfait de ces différentes technologies (élevé, moyen, bas)
1= Elevé ; 2= Moyen ; 3= Bas.
5.3-Avez-vous connaissance d’autres technologies de transformation des fruits d’ananas à part celles que vous utilisez ?
1= oui ; 0= non
5.4- Si oui, listez-les. 5.5-Pensez-vous qu’elles sont meilleures ? 1= oui ;
0= non
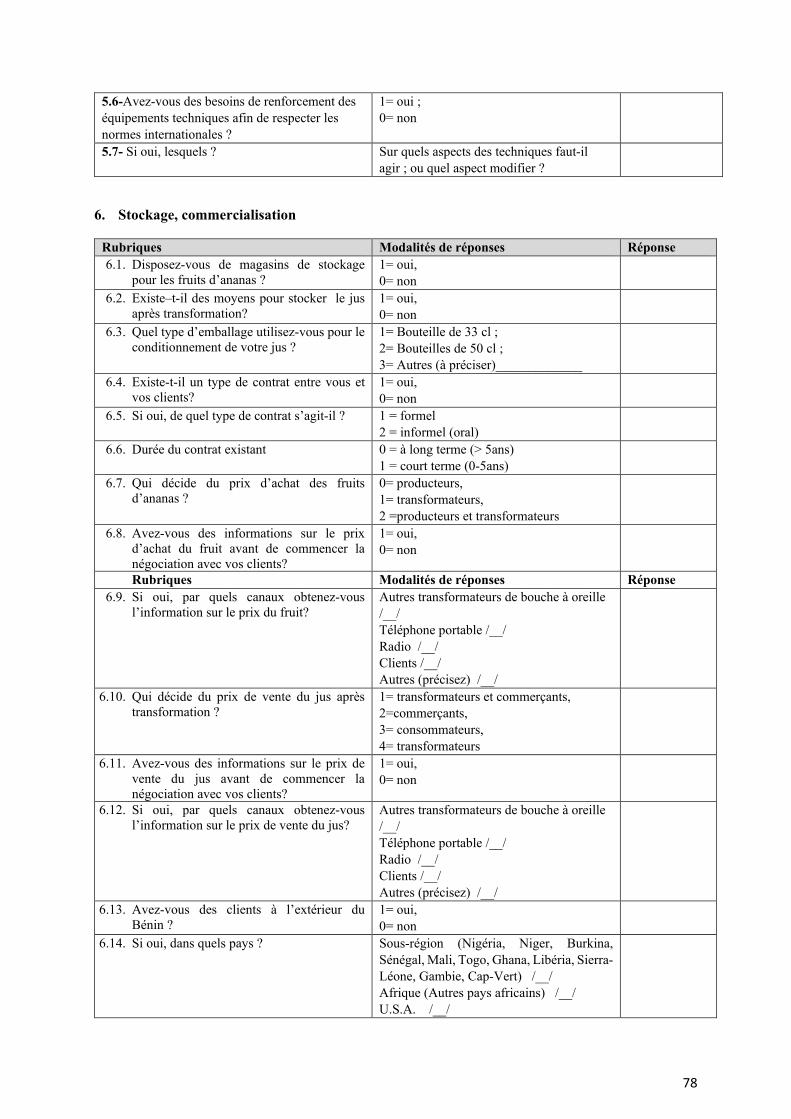
78
5.6-Avez-vous des besoins de renforcement des équipements techniques afin de respecter les normes internationales ?
1= oui ; 0= non
5.7- Si oui, lesquels ? Sur quels aspects des techniques faut-il agir ; ou quel aspect modifier ?
6. Stockage, commercialisation
Rubriques Modalités de réponses Réponse 6.1. Disposez-vous de magasins de stockage
pour les fruits d’ananas ? 1= oui, 0= non
6.2. Existe–t-il des moyens pour stocker le jus après transformation?
1= oui, 0= non
6.3. Quel type d’emballage utilisez-vous pour le conditionnement de votre jus ?
1= Bouteille de 33 cl ; 2= Bouteilles de 50 cl ; 3= Autres (à préciser)_____________
6.4. Existe-t-il un type de contrat entre vous et vos clients?
1= oui, 0= non
6.5. Si oui, de quel type de contrat s’agit-il ? 1 = formel 2 = informel (oral)
6.6. Durée du contrat existant 0 = à long terme (> 5ans) 1 = court terme (0-5ans)
6.7. Qui décide du prix d’achat des fruits d’ananas ?
0= producteurs, 1= transformateurs, 2 =producteurs et transformateurs
6.8. Avez-vous des informations sur le prix d’achat du fruit avant de commencer la négociation avec vos clients?
1= oui, 0= non
Rubriques Modalités de réponses Réponse 6.9. Si oui, par quels canaux obtenez-vous
l’information sur le prix du fruit? Autres transformateurs de bouche à oreille /__/ Téléphone portable /__/ Radio /__/ Clients /__/ Autres (précisez) /__/
6.10. Qui décide du prix de vente du jus après transformation ?
1= transformateurs et commerçants, 2=commerçants, 3= consommateurs, 4= transformateurs
6.11. Avez-vous des informations sur le prix de vente du jus avant de commencer la négociation avec vos clients?
1= oui, 0= non
6.12. Si oui, par quels canaux obtenez-vous l’information sur le prix de vente du jus?
Autres transformateurs de bouche à oreille /__/ Téléphone portable /__/ Radio /__/ Clients /__/ Autres (précisez) /__/
6.13. Avez-vous des clients à l’extérieur du Bénin ?
1= oui, 0= non
6.14. Si oui, dans quels pays ? Sous-région (Nigéria, Niger, Burkina, Sénégal, Mali, Togo, Ghana, Libéria, Sierra-Léone, Gambie, Cap-Vert) /__/ Afrique (Autres pays africains) /__/ U.S.A. /__/
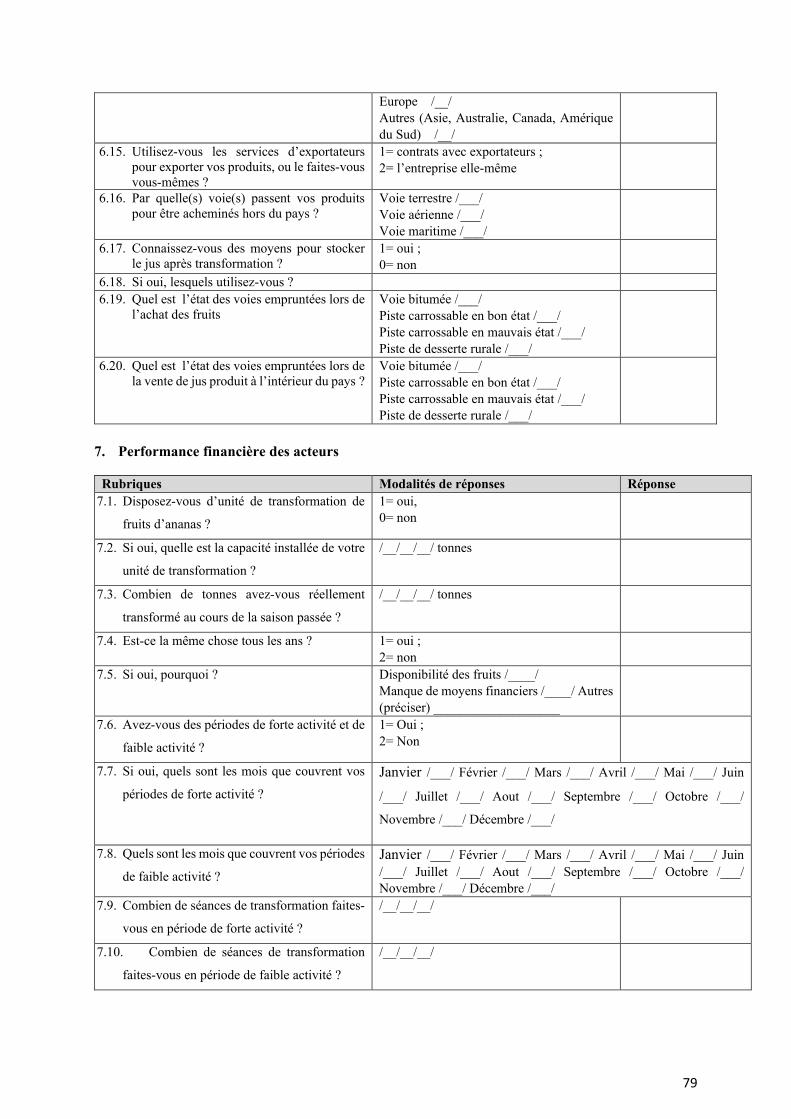
79
Europe /__/ Autres (Asie, Australie, Canada, Amérique du Sud) /__/
6.15. Utilisez-vous les services d’exportateurs pour exporter vos produits, ou le faites-vous vous-mêmes ?
1= contrats avec exportateurs ; 2= l’entreprise elle-même
6.16. Par quelle(s) voie(s) passent vos produits pour être acheminés hors du pays ?
Voie terrestre /___/ Voie aérienne /___/ Voie maritime /___/
6.17. Connaissez-vous des moyens pour stocker le jus après transformation ?
1= oui ; 0= non
6.18. Si oui, lesquels utilisez-vous ? 6.19. Quel est l’état des voies empruntées lors de
l’achat des fruits Voie bitumée /___/ Piste carrossable en bon état /___/ Piste carrossable en mauvais état /___/ Piste de desserte rurale /___/
6.20. Quel est l’état des voies empruntées lors de la vente de jus produit à l’intérieur du pays ?
Voie bitumée /___/ Piste carrossable en bon état /___/ Piste carrossable en mauvais état /___/ Piste de desserte rurale /___/
7. Performance financière des acteurs
Rubriques Modalités de réponses Réponse 7.1. Disposez-vous d’unité de transformation de
fruits d’ananas ?
1= oui, 0= non
7.2. Si oui, quelle est la capacité installée de votre
unité de transformation ?
/__/__/__/ tonnes
7.3. Combien de tonnes avez-vous réellement
transformé au cours de la saison passée ?
/__/__/__/ tonnes
7.4. Est-ce la même chose tous les ans ? 1= oui ; 2= non
7.5. Si oui, pourquoi ? Disponibilité des fruits /____/ Manque de moyens financiers /____/ Autres (préciser) ___________________
7.6. Avez-vous des périodes de forte activité et de
faible activité ?
1= Oui ; 2= Non
7.7. Si oui, quels sont les mois que couvrent vos
périodes de forte activité ? Janvier /___/ Février /___/ Mars /___/ Avril /___/ Mai /___/ Juin
/___/ Juillet /___/ Aout /___/ Septembre /___/ Octobre /___/
Novembre /___/ Décembre /___/
7.8. Quels sont les mois que couvrent vos périodes
de faible activité ? Janvier /___/ Février /___/ Mars /___/ Avril /___/ Mai /___/ Juin /___/ Juillet /___/ Aout /___/ Septembre /___/ Octobre /___/ Novembre /___/ Décembre /___/
7.9. Combien de séances de transformation faites-
vous en période de forte activité ?
/__/__/__/
7.10. Combien de séances de transformation
faites-vous en période de faible activité ?
/__/__/__/
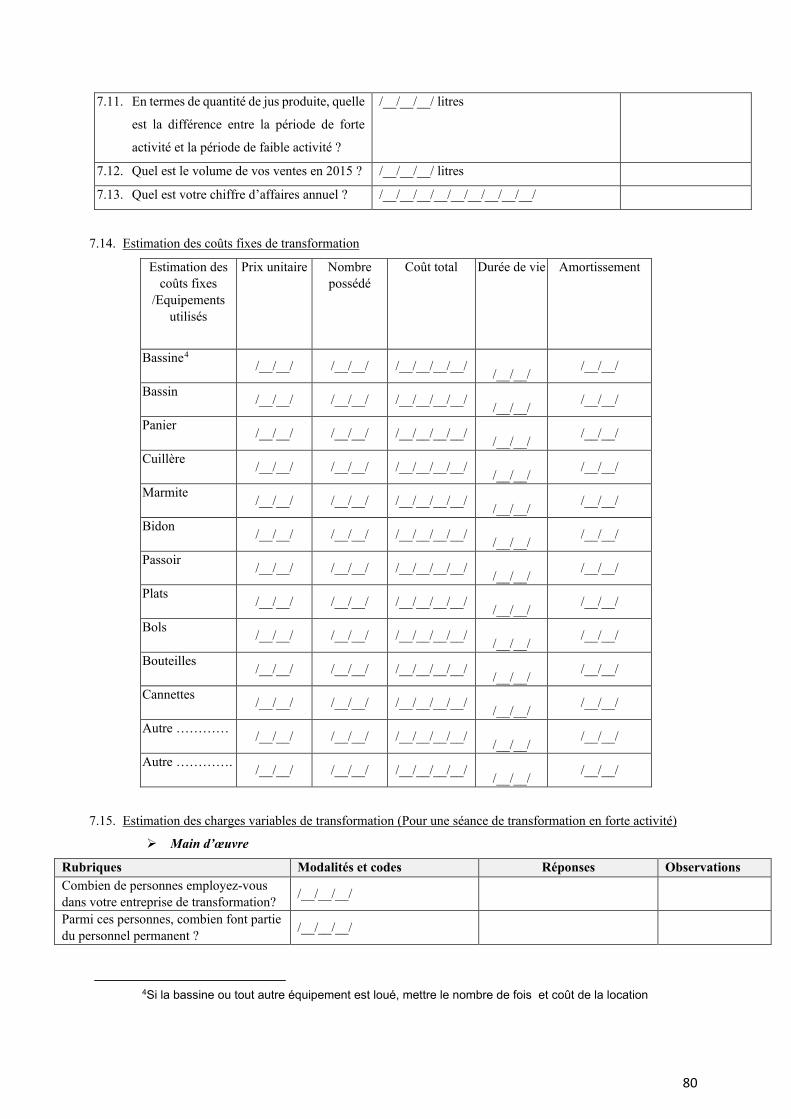
80
7.11. En termes de quantité de jus produite, quelle
est la différence entre la période de forte
activité et la période de faible activité ?
/__/__/__/ litres
7.12. Quel est le volume de vos ventes en 2015 ? /__/__/__/ litres
7.13. Quel est votre chiffre d’affaires annuel ? /__/__/__/__/__/__/__/__/__/
7.14. Estimation des coûts fixes de transformation
Estimation des coûts fixes
/Equipements utilisés
Prix unitaire Nombre possédé
Coût total Durée de vie Amortissement
Bassine4 /__/__/ /__/__/ /__/__/__/__/ /__/__/ /__/__/
Bassin /__/__/ /__/__/ /__/__/__/__/ /__/__/ /__/__/
Panier /__/__/ /__/__/ /__/__/__/__/ /__/__/ /__/__/
Cuillère /__/__/ /__/__/ /__/__/__/__/ /__/__/ /__/__/
Marmite /__/__/ /__/__/ /__/__/__/__/ /__/__/ /__/__/
Bidon /__/__/ /__/__/ /__/__/__/__/ /__/__/ /__/__/
Passoir /__/__/ /__/__/ /__/__/__/__/ /__/__/ /__/__/
Plats /__/__/ /__/__/ /__/__/__/__/ /__/__/ /__/__/
Bols /__/__/ /__/__/ /__/__/__/__/ /__/__/ /__/__/
Bouteilles /__/__/ /__/__/ /__/__/__/__/ /__/__/ /__/__/
Cannettes /__/__/ /__/__/ /__/__/__/__/ /__/__/ /__/__/
Autre ………… /__/__/ /__/__/ /__/__/__/__/ /__/__/ /__/__/
Autre …………. /__/__/ /__/__/ /__/__/__/__/ /__/__/ /__/__/
7.15. Estimation des charges variables de transformation (Pour une séance de transformation en forte activité)
Main d’œuvre
Rubriques Modalités et codes Réponses Observations Combien de personnes employez-vous dans votre entreprise de transformation? /__/__/__/
Parmi ces personnes, combien font partie du personnel permanent ? /__/__/__/
4Si la bassine ou tout autre équipement est loué, mettre le nombre de fois et coût de la location
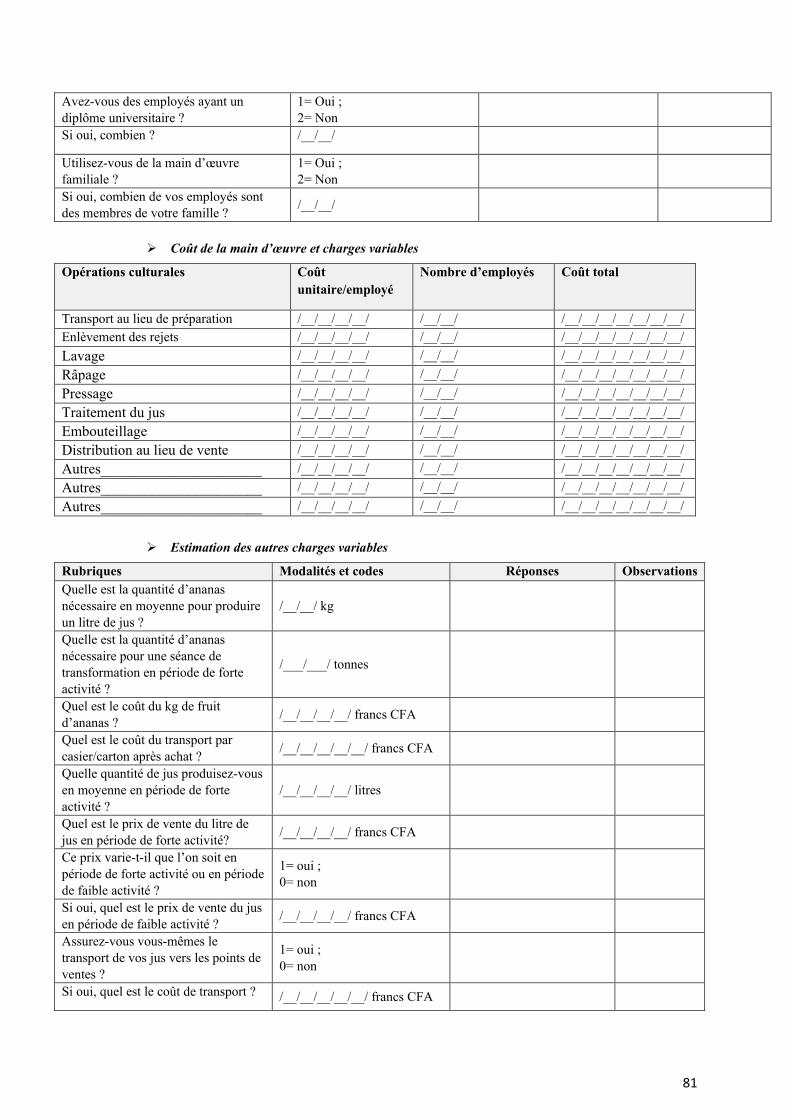
81
Avez-vous des employés ayant un diplôme universitaire ?
1= Oui ; 2= Non
Si oui, combien ? /__/__/
Utilisez-vous de la main d’œuvre familiale ?
1= Oui ; 2= Non
Si oui, combien de vos employés sont des membres de votre famille ? /__/__/
Coût de la main d’œuvre et charges variables
Opérations culturales Coût unitaire/employé
Nombre d’employés Coût total
Transport au lieu de préparation /__/__/__/__/ /__/__/ /__/__/__/__/__/__/__/ Enlèvement des rejets /__/__/__/__/ /__/__/ /__/__/__/__/__/__/__/ Lavage /__/__/__/__/ /__/__/ /__/__/__/__/__/__/__/ Râpage /__/__/__/__/ /__/__/ /__/__/__/__/__/__/__/ Pressage /__/__/__/__/ /__/__/ /__/__/__/__/__/__/__/ Traitement du jus /__/__/__/__/ /__/__/ /__/__/__/__/__/__/__/ Embouteillage /__/__/__/__/ /__/__/ /__/__/__/__/__/__/__/ Distribution au lieu de vente /__/__/__/__/ /__/__/ /__/__/__/__/__/__/__/ Autres______________________ /__/__/__/__/ /__/__/ /__/__/__/__/__/__/__/ Autres______________________ /__/__/__/__/ /__/__/ /__/__/__/__/__/__/__/ Autres______________________ /__/__/__/__/ /__/__/ /__/__/__/__/__/__/__/
Estimation des autres charges variables
Rubriques Modalités et codes Réponses Observations Quelle est la quantité d’ananas nécessaire en moyenne pour produire un litre de jus ?
/__/__/ kg
Quelle est la quantité d’ananas nécessaire pour une séance de transformation en période de forte activité ?
/___/___/ tonnes
Quel est le coût du kg de fruit d’ananas ? /__/__/__/__/ francs CFA
Quel est le coût du transport par casier/carton après achat ? /__/__/__/__/__/ francs CFA
Quelle quantité de jus produisez-vous en moyenne en période de forte activité ?
/__/__/__/__/ litres
Quel est le prix de vente du litre de jus en période de forte activité? /__/__/__/__/ francs CFA
Ce prix varie-t-il que l’on soit en période de forte activité ou en période de faible activité ?
1= oui ; 0= non
Si oui, quel est le prix de vente du jus en période de faible activité ? /__/__/__/__/ francs CFA
Assurez-vous vous-mêmes le transport de vos jus vers les points de ventes ?
1= oui ; 0= non
Si oui, quel est le coût de transport ? /__/__/__/__/__/ francs CFA
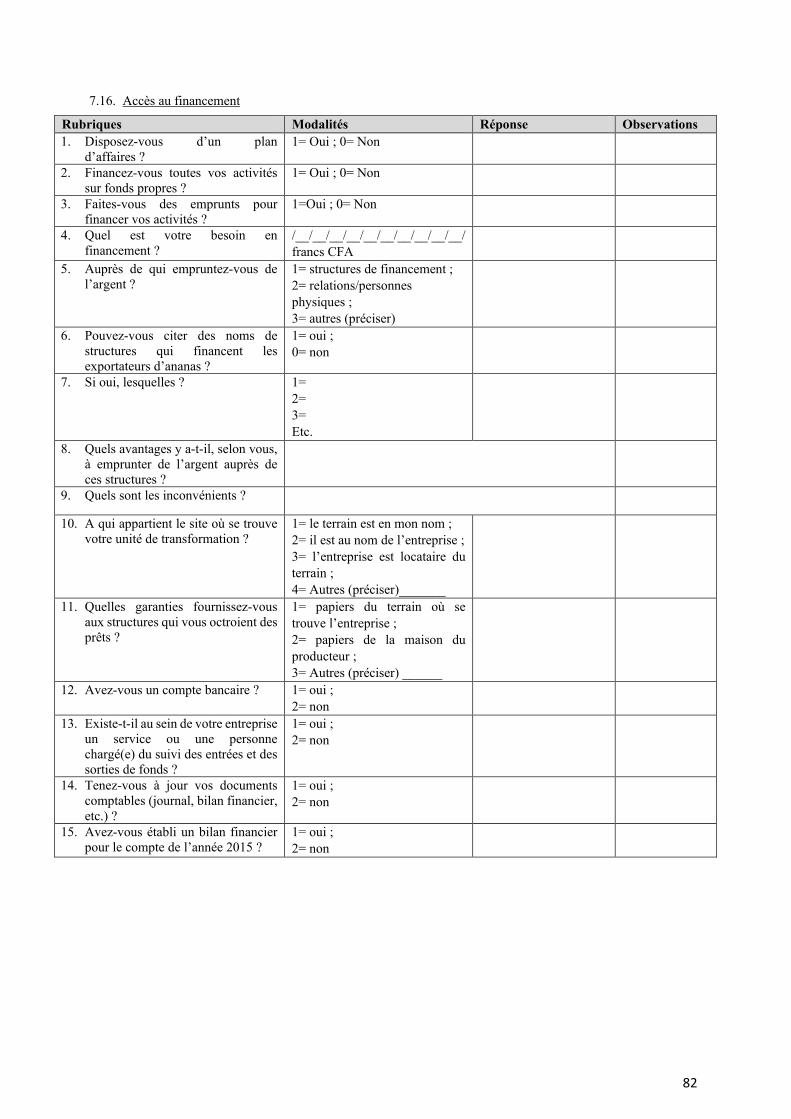
82
7.16. Accès au financement
Rubriques Modalités Réponse Observations 1. Disposez-vous d’un plan
d’affaires ? 1= Oui ; 0= Non
2. Financez-vous toutes vos activités sur fonds propres ?
1= Oui ; 0= Non
3. Faites-vous des emprunts pour financer vos activités ?
1=Oui ; 0= Non
4. Quel est votre besoin en financement ?
/__/__/__/__/__/__/__/__/__/__/ francs CFA
5. Auprès de qui empruntez-vous de l’argent ?
1= structures de financement ; 2= relations/personnes physiques ; 3= autres (préciser)
6. Pouvez-vous citer des noms de structures qui financent les exportateurs d’ananas ?
1= oui ; 0= non
7. Si oui, lesquelles ? 1= 2= 3= Etc.
8. Quels avantages y a-t-il, selon vous, à emprunter de l’argent auprès de ces structures ?
9. Quels sont les inconvénients ?
10. A qui appartient le site où se trouve votre unité de transformation ?
1= le terrain est en mon nom ; 2= il est au nom de l’entreprise ; 3= l’entreprise est locataire du terrain ; 4= Autres (préciser)_______
11. Quelles garanties fournissez-vous aux structures qui vous octroient des prêts ?
1= papiers du terrain où se trouve l’entreprise ; 2= papiers de la maison du producteur ; 3= Autres (préciser) ______
12. Avez-vous un compte bancaire ? 1= oui ; 2= non
13. Existe-t-il au sein de votre entreprise un service ou une personne chargé(e) du suivi des entrées et des sorties de fonds ?
1= oui ; 2= non
14. Tenez-vous à jour vos documents comptables (journal, bilan financier, etc.) ?
1= oui ; 2= non
15. Avez-vous établi un bilan financier pour le compte de l’année 2015 ?
1= oui ; 2= non
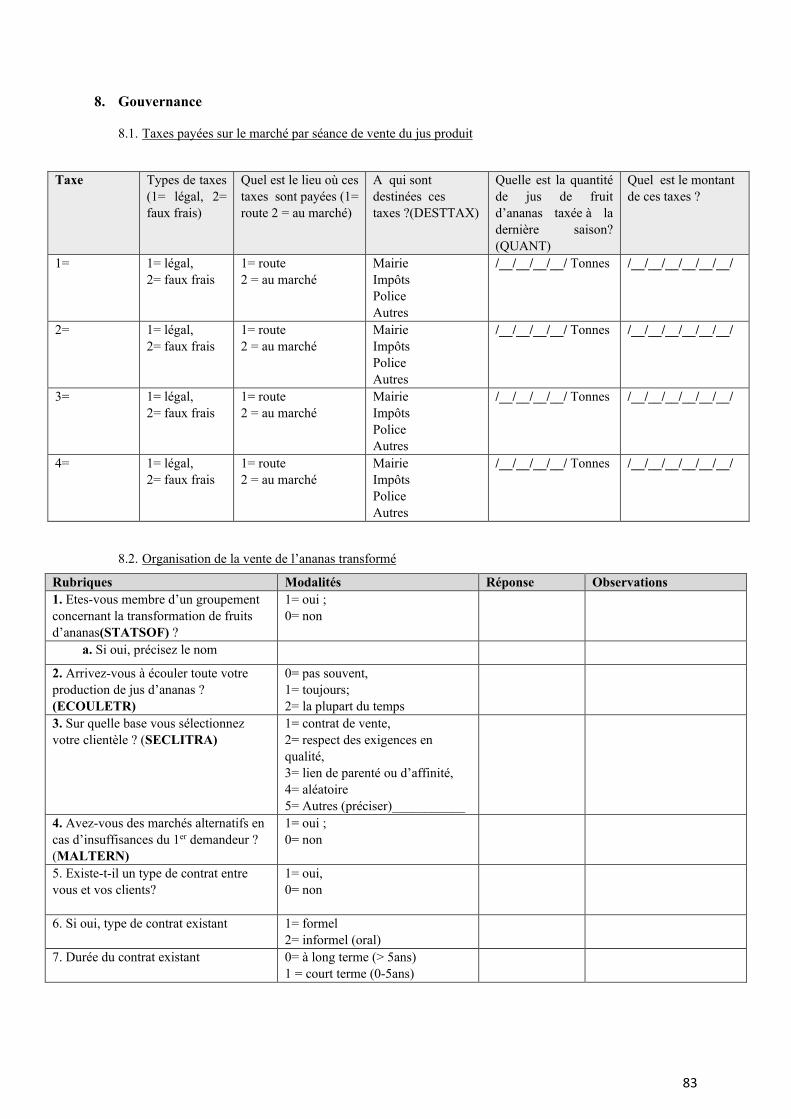
83
8. Gouvernance
8.1. Taxes payées sur le marché par séance de vente du jus produit
Taxe Types de taxes (1= légal, 2= faux frais)
Quel est le lieu où ces taxes sont payées (1= route 2 = au marché)
A qui sont destinées ces taxes ?(DESTTAX)
Quelle est la quantité de jus de fruit d’ananas taxée à la dernière saison? (QUANT)
Quel est le montant de ces taxes ?
1= 1= légal, 2= faux frais
1= route 2 = au marché
Mairie Impôts Police Autres
/__/__/__/__/ Tonnes /__/__/__/__/__/__/
2= 1= légal, 2= faux frais
1= route 2 = au marché
Mairie Impôts Police Autres
/__/__/__/__/ Tonnes /__/__/__/__/__/__/
3= 1= légal, 2= faux frais
1= route 2 = au marché
Mairie Impôts Police Autres
/__/__/__/__/ Tonnes /__/__/__/__/__/__/
4= 1= légal, 2= faux frais
1= route 2 = au marché
Mairie Impôts Police Autres
/__/__/__/__/ Tonnes /__/__/__/__/__/__/
8.2. Organisation de la vente de l’ananas transformé
Rubriques Modalités Réponse Observations 1. Etes-vous membre d’un groupement concernant la transformation de fruits d’ananas(STATSOF) ?
1= oui ; 0= non
a. Si oui, précisez le nom
2. Arrivez-vous à écouler toute votre production de jus d’ananas ? (ECOULETR)
0= pas souvent, 1= toujours; 2= la plupart du temps
3. Sur quelle base vous sélectionnez votre clientèle ? (SECLITRA)
1= contrat de vente, 2= respect des exigences en qualité, 3= lien de parenté ou d’affinité, 4= aléatoire 5= Autres (préciser)___________
4. Avez-vous des marchés alternatifs en cas d’insuffisances du 1er demandeur ? (MALTERN)
1= oui ; 0= non
5. Existe-t-il un type de contrat entre vous et vos clients?
1= oui, 0= non
6. Si oui, type de contrat existant 1= formel 2= informel (oral)
7. Durée du contrat existant 0= à long terme (> 5ans) 1 = court terme (0-5ans)
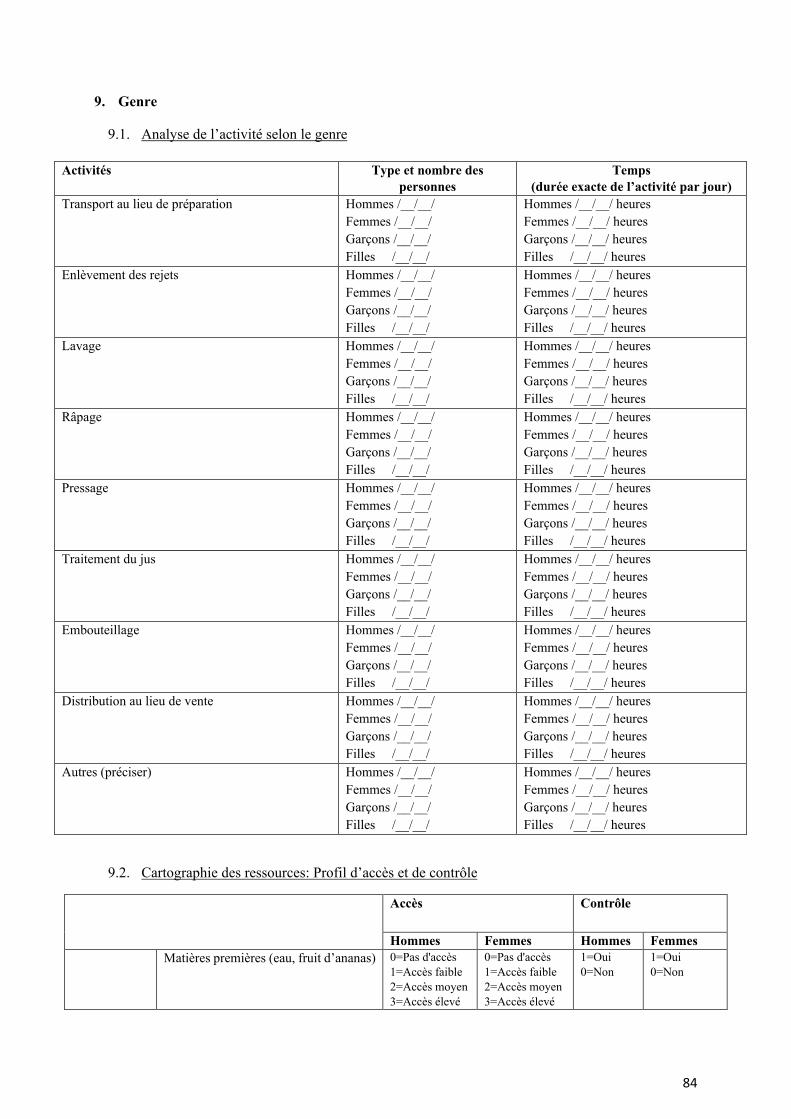
84
9. Genre
9.1. Analyse de l’activité selon le genre
Activités Type et nombre des personnes
Temps (durée exacte de l’activité par jour)
Transport au lieu de préparation Hommes /__/__/ Femmes /__/__/ Garçons /__/__/ Filles /__/__/
Hommes /__/__/ heures Femmes /__/__/ heures Garçons /__/__/ heures Filles /__/__/ heures
Enlèvement des rejets Hommes /__/__/ Femmes /__/__/ Garçons /__/__/ Filles /__/__/
Hommes /__/__/ heures Femmes /__/__/ heures Garçons /__/__/ heures Filles /__/__/ heures
Lavage Hommes /__/__/ Femmes /__/__/ Garçons /__/__/ Filles /__/__/
Hommes /__/__/ heures Femmes /__/__/ heures Garçons /__/__/ heures Filles /__/__/ heures
Râpage Hommes /__/__/ Femmes /__/__/ Garçons /__/__/ Filles /__/__/
Hommes /__/__/ heures Femmes /__/__/ heures Garçons /__/__/ heures Filles /__/__/ heures
Pressage Hommes /__/__/ Femmes /__/__/ Garçons /__/__/ Filles /__/__/
Hommes /__/__/ heures Femmes /__/__/ heures Garçons /__/__/ heures Filles /__/__/ heures
Traitement du jus Hommes /__/__/ Femmes /__/__/ Garçons /__/__/ Filles /__/__/
Hommes /__/__/ heures Femmes /__/__/ heures Garçons /__/__/ heures Filles /__/__/ heures
Embouteillage Hommes /__/__/ Femmes /__/__/ Garçons /__/__/ Filles /__/__/
Hommes /__/__/ heures Femmes /__/__/ heures Garçons /__/__/ heures Filles /__/__/ heures
Distribution au lieu de vente Hommes /__/__/ Femmes /__/__/ Garçons /__/__/ Filles /__/__/
Hommes /__/__/ heures Femmes /__/__/ heures Garçons /__/__/ heures Filles /__/__/ heures
Autres (préciser) Hommes /__/__/ Femmes /__/__/ Garçons /__/__/ Filles /__/__/
Hommes /__/__/ heures Femmes /__/__/ heures Garçons /__/__/ heures Filles /__/__/ heures
9.2. Cartographie des ressources: Profil d’accès et de contrôle
Accès Contrôle
Hommes Femmes Hommes Femmes Matières premières (eau, fruit d’ananas) 0=Pas d'accès
1=Accès faible 2=Accès moyen 3=Accès élevé
0=Pas d'accès 1=Accès faible 2=Accès moyen 3=Accès élevé
1=Oui 0=Non
1=Oui 0=Non
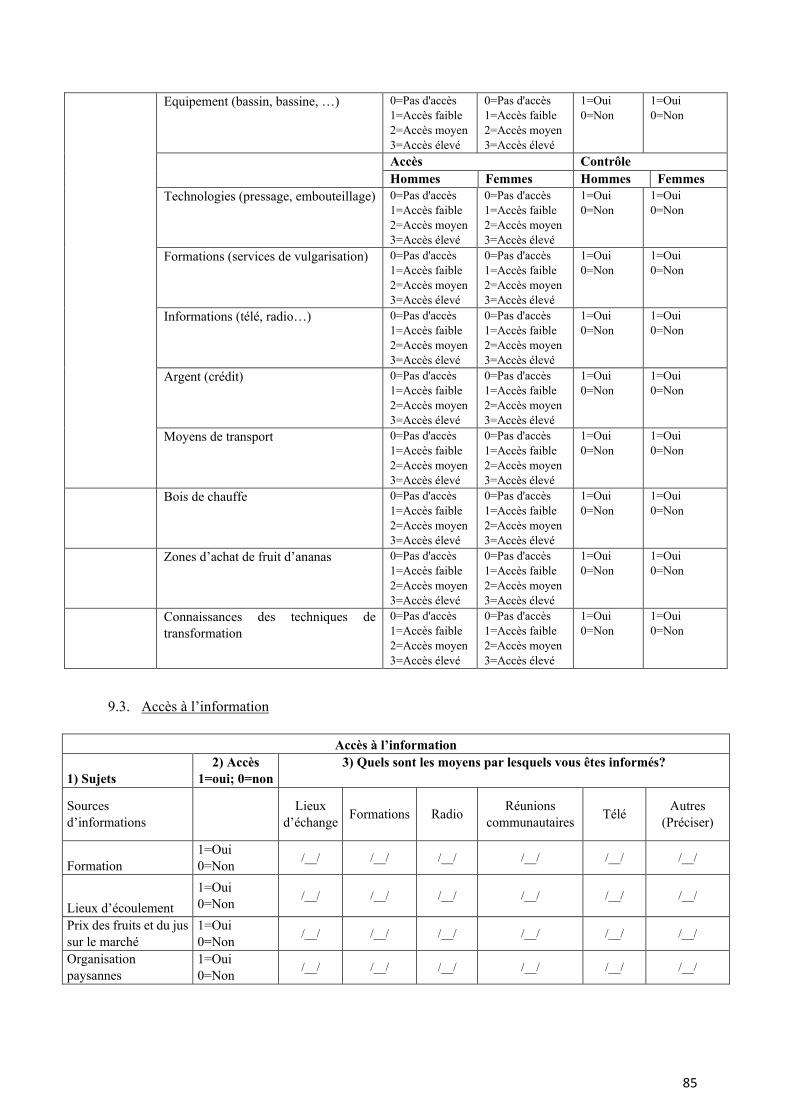
85
9.3. Accès à l’information
Accès à l’information
1) Sujets 2) Accès
1=oui; 0=non 3) Quels sont les moyens par lesquels vous êtes informés?
Sources d’informations Lieux
d’échange Formations Radio Réunions communautaires Télé Autres
(Préciser)
Formation 1=Oui 0=Non /__/ /__/ /__/ /__/ /__/ /__/
Lieux d’écoulement 1=Oui 0=Non /__/ /__/ /__/ /__/ /__/ /__/
Prix des fruits et du jus sur le marché
1=Oui 0=Non /__/ /__/ /__/ /__/ /__/ /__/
Organisation paysannes
1=Oui 0=Non /__/ /__/ /__/ /__/ /__/ /__/
Equipement (bassin, bassine, …) 0=Pas d'accès 1=Accès faible 2=Accès moyen 3=Accès élevé
0=Pas d'accès 1=Accès faible 2=Accès moyen 3=Accès élevé
1=Oui 0=Non
1=Oui 0=Non
Accès Contrôle Hommes Femmes Hommes Femmes
Technologies (pressage, embouteillage) 0=Pas d'accès 1=Accès faible 2=Accès moyen 3=Accès élevé
0=Pas d'accès 1=Accès faible 2=Accès moyen 3=Accès élevé
1=Oui 0=Non
1=Oui 0=Non
Formations (services de vulgarisation) 0=Pas d'accès 1=Accès faible 2=Accès moyen 3=Accès élevé
0=Pas d'accès 1=Accès faible 2=Accès moyen 3=Accès élevé
1=Oui 0=Non
1=Oui 0=Non
Informations (télé, radio…) 0=Pas d'accès 1=Accès faible 2=Accès moyen 3=Accès élevé
0=Pas d'accès 1=Accès faible 2=Accès moyen 3=Accès élevé
1=Oui 0=Non
1=Oui 0=Non
Argent (crédit) 0=Pas d'accès 1=Accès faible 2=Accès moyen 3=Accès élevé
0=Pas d'accès 1=Accès faible 2=Accès moyen 3=Accès élevé
1=Oui 0=Non
1=Oui 0=Non
Moyens de transport 0=Pas d'accès 1=Accès faible 2=Accès moyen 3=Accès élevé
0=Pas d'accès 1=Accès faible 2=Accès moyen 3=Accès élevé
1=Oui 0=Non
1=Oui 0=Non
Bois de chauffe 0=Pas d'accès 1=Accès faible 2=Accès moyen 3=Accès élevé
0=Pas d'accès 1=Accès faible 2=Accès moyen 3=Accès élevé
1=Oui 0=Non
1=Oui 0=Non
Zones d’achat de fruit d’ananas 0=Pas d'accès 1=Accès faible 2=Accès moyen 3=Accès élevé
0=Pas d'accès 1=Accès faible 2=Accès moyen 3=Accès élevé
1=Oui 0=Non
1=Oui 0=Non
Connaissances des techniques de transformation
0=Pas d'accès 1=Accès faible 2=Accès moyen 3=Accès élevé
0=Pas d'accès 1=Accès faible 2=Accès moyen 3=Accès élevé
1=Oui 0=Non
1=Oui 0=Non
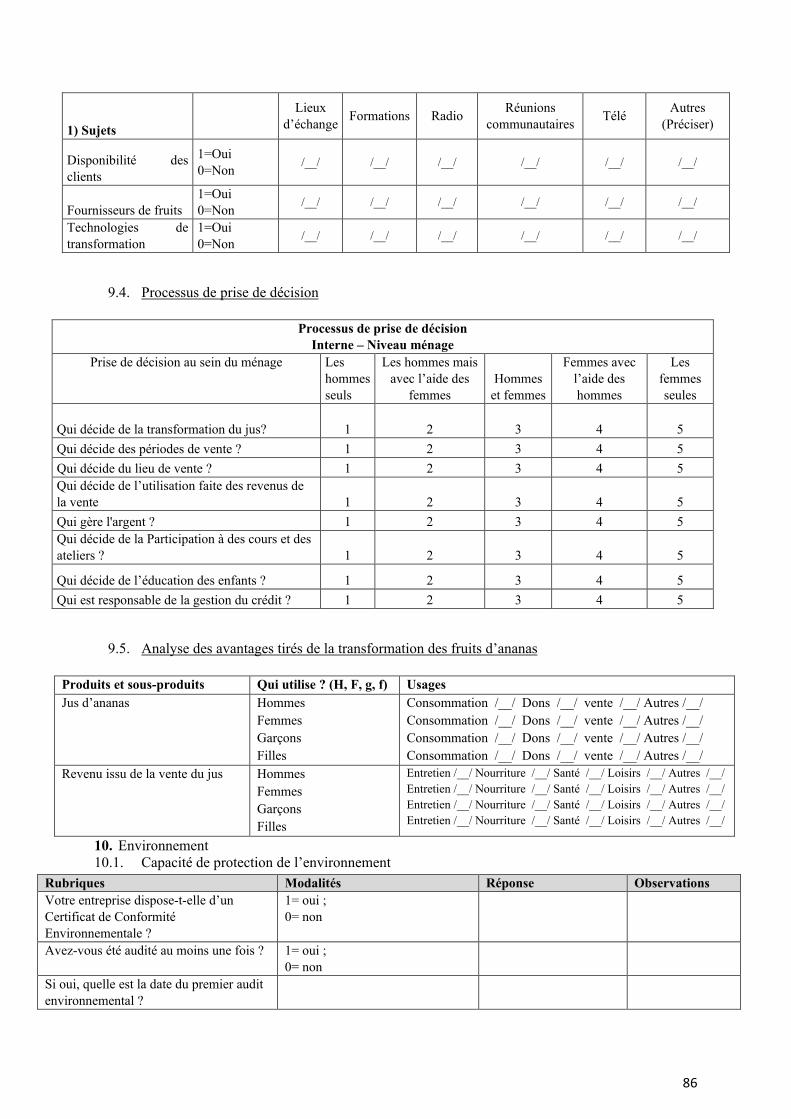
86
1) Sujets Lieux
d’échange Formations Radio
Réunions communautaires
Télé Autres
(Préciser)
Disponibilité des clients
1=Oui 0=Non /__/ /__/ /__/ /__/ /__/ /__/
Fournisseurs de fruits 1=Oui 0=Non /__/ /__/ /__/ /__/ /__/ /__/
Technologies de transformation
1=Oui 0=Non /__/ /__/ /__/ /__/ /__/ /__/
9.4. Processus de prise de décision
Processus de prise de décision Interne – Niveau ménage
Prise de décision au sein du ménage Les hommes seuls
Les hommes mais avec l’aide des
femmes Hommes
et femmes
Femmes avec l’aide des hommes
Les femmes seules
Qui décide de la transformation du jus? 1 2 3 4 5 Qui décide des périodes de vente ? 1 2 3 4 5 Qui décide du lieu de vente ? 1 2 3 4 5 Qui décide de l’utilisation faite des revenus de la vente 1 2 3 4 5 Qui gère l'argent ? 1 2 3 4 5 Qui décide de la Participation à des cours et des ateliers ? 1 2 3 4 5
Qui décide de l’éducation des enfants ? 1 2 3 4 5 Qui est responsable de la gestion du crédit ? 1 2 3 4 5
9.5. Analyse des avantages tirés de la transformation des fruits d’ananas
Produits et sous-produits Qui utilise ? (H, F, g, f) Usages Jus d’ananas Hommes
Femmes Garçons Filles
Consommation /__/ Dons /__/ vente /__/ Autres /__/ Consommation /__/ Dons /__/ vente /__/ Autres /__/ Consommation /__/ Dons /__/ vente /__/ Autres /__/ Consommation /__/ Dons /__/ vente /__/ Autres /__/
Revenu issu de la vente du jus Hommes Femmes Garçons Filles
Entretien /__/ Nourriture /__/ Santé /__/ Loisirs /__/ Autres /__/ Entretien /__/ Nourriture /__/ Santé /__/ Loisirs /__/ Autres /__/ Entretien /__/ Nourriture /__/ Santé /__/ Loisirs /__/ Autres /__/ Entretien /__/ Nourriture /__/ Santé /__/ Loisirs /__/ Autres /__/
10. Environnement 10.1. Capacité de protection de l’environnement
Rubriques Modalités Réponse Observations Votre entreprise dispose-t-elle d’un Certificat de Conformité Environnementale ?
1= oui ; 0= non
Avez-vous été audité au moins une fois ? 1= oui ; 0= non
Si oui, quelle est la date du premier audit environnemental ?
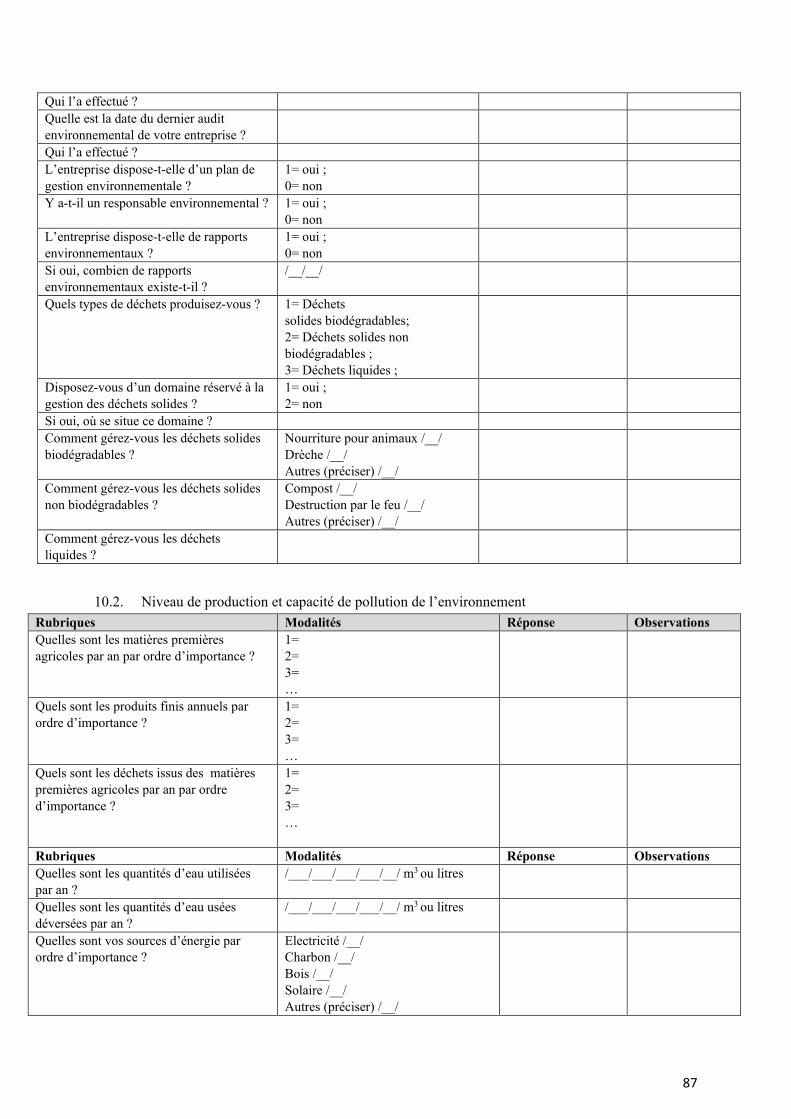
87
Qui l’a effectué ? Quelle est la date du dernier audit environnemental de votre entreprise ?
Qui l’a effectué ? L’entreprise dispose-t-elle d’un plan de gestion environnementale ?
1= oui ; 0= non
Y a-t-il un responsable environnemental ? 1= oui ; 0= non
L’entreprise dispose-t-elle de rapports environnementaux ?
1= oui ; 0= non
Si oui, combien de rapports environnementaux existe-t-il ?
/__/__/
Quels types de déchets produisez-vous ? 1= Déchets solides biodégradables; 2= Déchets solides non biodégradables ; 3= Déchets liquides ;
Disposez-vous d’un domaine réservé à la gestion des déchets solides ?
1= oui ; 2= non
Si oui, où se situe ce domaine ? Comment gérez-vous les déchets solides biodégradables ?
Nourriture pour animaux /__/ Drèche /__/ Autres (préciser) /__/
Comment gérez-vous les déchets solides non biodégradables ?
Compost /__/ Destruction par le feu /__/ Autres (préciser) /__/
Comment gérez-vous les déchets liquides ?
10.2. Niveau de production et capacité de pollution de l’environnement Rubriques Modalités Réponse Observations Quelles sont les matières premières agricoles par an par ordre d’importance ?
1= 2= 3= …
Quels sont les produits finis annuels par ordre d’importance ?
1= 2= 3= …
Quels sont les déchets issus des matières premières agricoles par an par ordre d’importance ?
1= 2= 3= …
Rubriques Modalités Réponse Observations Quelles sont les quantités d’eau utilisées par an ?
/___/___/___/___/__/ m3 ou litres
Quelles sont les quantités d’eau usées déversées par an ?
/___/___/___/___/__/ m3 ou litres
Quelles sont vos sources d’énergie par ordre d’importance ?
Electricité /__/ Charbon /__/ Bois /__/ Solaire /__/ Autres (préciser) /__/
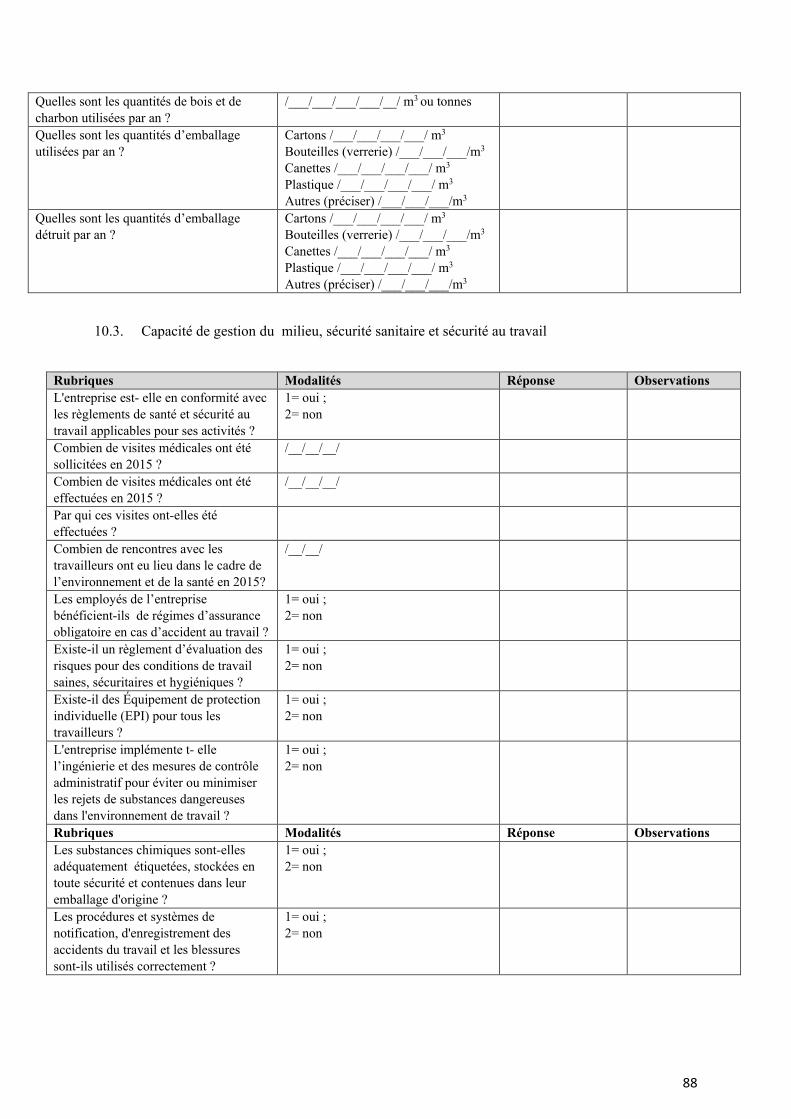
88
Quelles sont les quantités de bois et de charbon utilisées par an ?
/___/___/___/___/__/ m3 ou tonnes
Quelles sont les quantités d’emballage utilisées par an ?
Cartons /___/___/___/___/ m3
Bouteilles (verrerie) /___/___/___/m3
Canettes /___/___/___/___/ m3
Plastique /___/___/___/___/ m3
Autres (préciser) /___/___/___/m3
Quelles sont les quantités d’emballage détruit par an ?
Cartons /___/___/___/___/ m3
Bouteilles (verrerie) /___/___/___/m3
Canettes /___/___/___/___/ m3
Plastique /___/___/___/___/ m3
Autres (préciser) /___/___/___/m3
10.3. Capacité de gestion du milieu, sécurité sanitaire et sécurité au travail
Rubriques Modalités Réponse Observations L'entreprise est- elle en conformité avec les règlements de santé et sécurité au travail applicables pour ses activités ?
1= oui ; 2= non
Combien de visites médicales ont été sollicitées en 2015 ?
/__/__/__/
Combien de visites médicales ont été effectuées en 2015 ?
/__/__/__/
Par qui ces visites ont-elles été effectuées ?
Combien de rencontres avec les travailleurs ont eu lieu dans le cadre de l’environnement et de la santé en 2015?
/__/__/
Les employés de l’entreprise bénéficient-ils de régimes d’assurance obligatoire en cas d’accident au travail ?
1= oui ; 2= non
Existe-il un règlement d’évaluation des risques pour des conditions de travail saines, sécuritaires et hygiéniques ?
1= oui ; 2= non
Existe-il des Équipement de protection individuelle (EPI) pour tous les travailleurs ?
1= oui ; 2= non
L'entreprise implémente t- elle l’ingénierie et des mesures de contrôle administratif pour éviter ou minimiser les rejets de substances dangereuses dans l'environnement de travail ?
1= oui ; 2= non
Rubriques Modalités Réponse Observations Les substances chimiques sont-elles adéquatement étiquetées, stockées en toute sécurité et contenues dans leur emballage d'origine ?
1= oui ; 2= non
Les procédures et systèmes de notification, d'enregistrement des accidents du travail et les blessures sont-ils utilisés correctement ?
1= oui ; 2= non
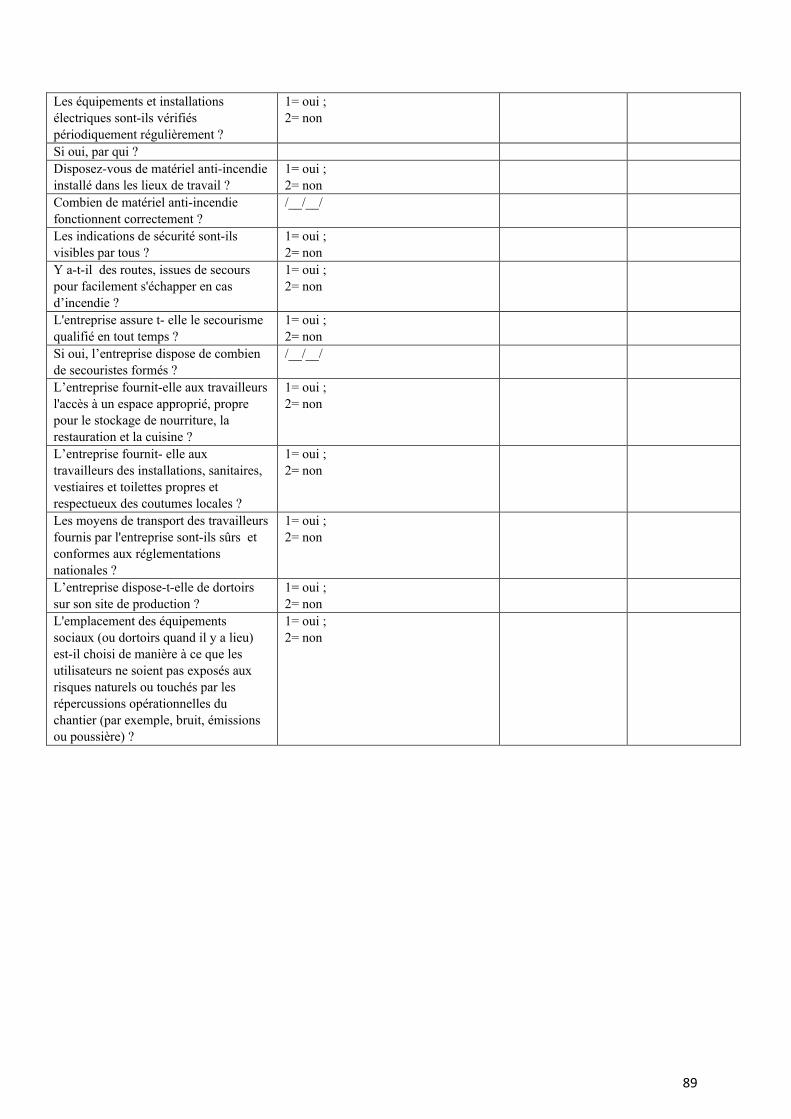
89
Les équipements et installations électriques sont-ils vérifiés périodiquement régulièrement ?
1= oui ; 2= non
Si oui, par qui ? Disposez-vous de matériel anti-incendie installé dans les lieux de travail ?
1= oui ; 2= non
Combien de matériel anti-incendie fonctionnent correctement ?
/__/__/
Les indications de sécurité sont-ils visibles par tous ?
1= oui ; 2= non
Y a-t-il des routes, issues de secours pour facilement s'échapper en cas d’incendie ?
1= oui ; 2= non
L'entreprise assure t- elle le secourisme qualifié en tout temps ?
1= oui ; 2= non
Si oui, l’entreprise dispose de combien de secouristes formés ?
/__/__/
L’entreprise fournit-elle aux travailleurs l'accès à un espace approprié, propre pour le stockage de nourriture, la restauration et la cuisine ?
1= oui ; 2= non
L’entreprise fournit- elle aux travailleurs des installations, sanitaires, vestiaires et toilettes propres et respectueux des coutumes locales ?
1= oui ; 2= non
Les moyens de transport des travailleurs fournis par l'entreprise sont-ils sûrs et conformes aux réglementations nationales ?
1= oui ; 2= non
L’entreprise dispose-t-elle de dortoirs sur son site de production ?
1= oui ; 2= non
L'emplacement des équipements sociaux (ou dortoirs quand il y a lieu) est-il choisi de manière à ce que les utilisateurs ne soient pas exposés aux risques naturels ou touchés par les répercussions opérationnelles du chantier (par exemple, bruit, émissions ou poussière) ?
1= oui ; 2= non
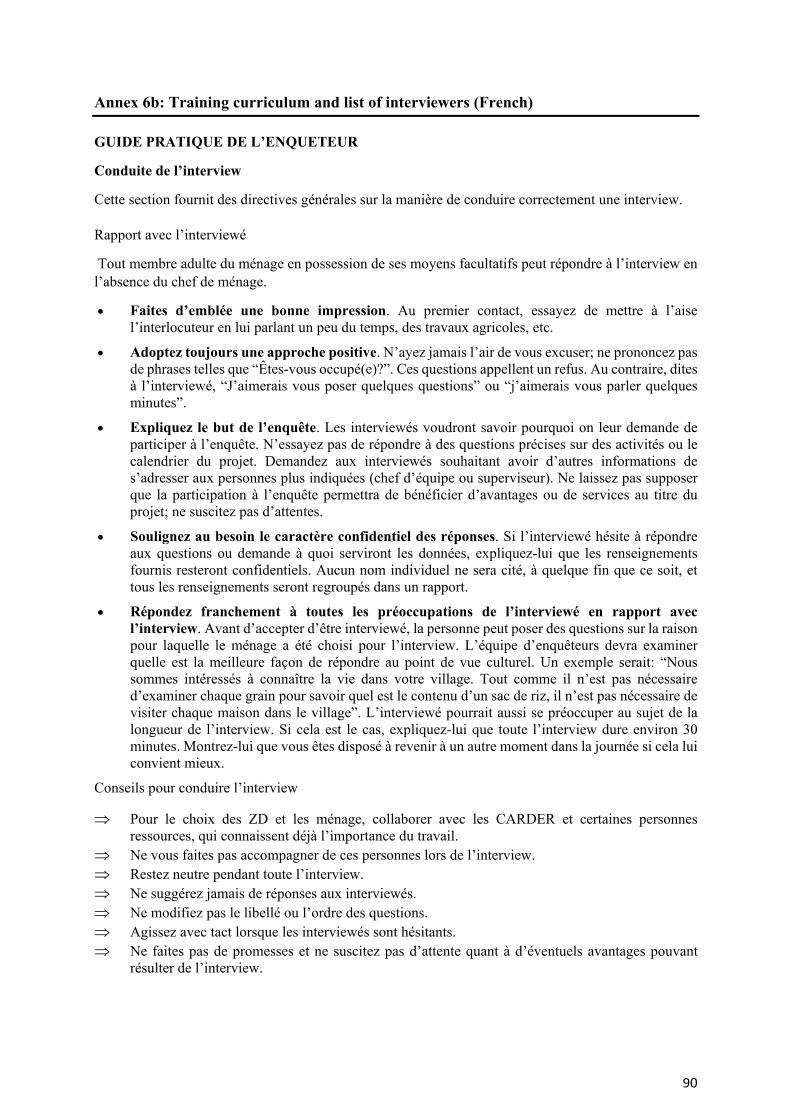
90
Annex 6b: Training curriculum and list of interviewers (French) GUIDE PRATIQUE DE L’ENQUETEUR
Conduite de l’interview
Cette section fournit des directives générales sur la manière de conduire correctement une interview.
Rapport avec l’interviewé
Tout membre adulte du ménage en possession de ses moyens facultatifs peut répondre à l’interview en l’absence du chef de ménage.
• Faites d’emblée une bonne impression. Au premier contact, essayez de mettre à l’aise l’interlocuteur en lui parlant un peu du temps, des travaux agricoles, etc.
• Adoptez toujours une approche positive. N’ayez jamais l’air de vous excuser; ne prononcez pas de phrases telles que “Êtes-vous occupé(e)?”. Ces questions appellent un refus. Au contraire, dites à l’interviewé, “J’aimerais vous poser quelques questions” ou “j’aimerais vous parler quelques minutes”.
• Expliquez le but de l’enquête. Les interviewés voudront savoir pourquoi on leur demande de participer à l’enquête. N’essayez pas de répondre à des questions précises sur des activités ou le calendrier du projet. Demandez aux interviewés souhaitant avoir d’autres informations de s’adresser aux personnes plus indiquées (chef d’équipe ou superviseur). Ne laissez pas supposer que la participation à l’enquête permettra de bénéficier d’avantages ou de services au titre du projet; ne suscitez pas d’attentes.
• Soulignez au besoin le caractère confidentiel des réponses. Si l’interviewé hésite à répondre aux questions ou demande à quoi serviront les données, expliquez-lui que les renseignements fournis resteront confidentiels. Aucun nom individuel ne sera cité, à quelque fin que ce soit, et tous les renseignements seront regroupés dans un rapport.
• Répondez franchement à toutes les préoccupations de l’interviewé en rapport avec l’interview. Avant d’accepter d’être interviewé, la personne peut poser des questions sur la raison pour laquelle le ménage a été choisi pour l’interview. L’équipe d’enquêteurs devra examiner quelle est la meilleure façon de répondre au point de vue culturel. Un exemple serait: “Nous sommes intéressés à connaître la vie dans votre village. Tout comme il n’est pas nécessaire d’examiner chaque grain pour savoir quel est le contenu d’un sac de riz, il n’est pas nécessaire de visiter chaque maison dans le village”. L’interviewé pourrait aussi se préoccuper au sujet de la longueur de l’interview. Si cela est le cas, expliquez-lui que toute l’interview dure environ 30 minutes. Montrez-lui que vous êtes disposé à revenir à un autre moment dans la journée si cela lui convient mieux.
Conseils pour conduire l’interview
⇒ Pour le choix des ZD et les ménage, collaborer avec les CARDER et certaines personnes ressources, qui connaissent déjà l’importance du travail.
⇒ Ne vous faites pas accompagner de ces personnes lors de l’interview. ⇒ Restez neutre pendant toute l’interview. ⇒ Ne suggérez jamais de réponses aux interviewés. ⇒ Ne modifiez pas le libellé ou l’ordre des questions. ⇒ Agissez avec tact lorsque les interviewés sont hésitants. ⇒ Ne faites pas de promesses et ne suscitez pas d’attente quant à d’éventuels avantages pouvant
résulter de l’interview.
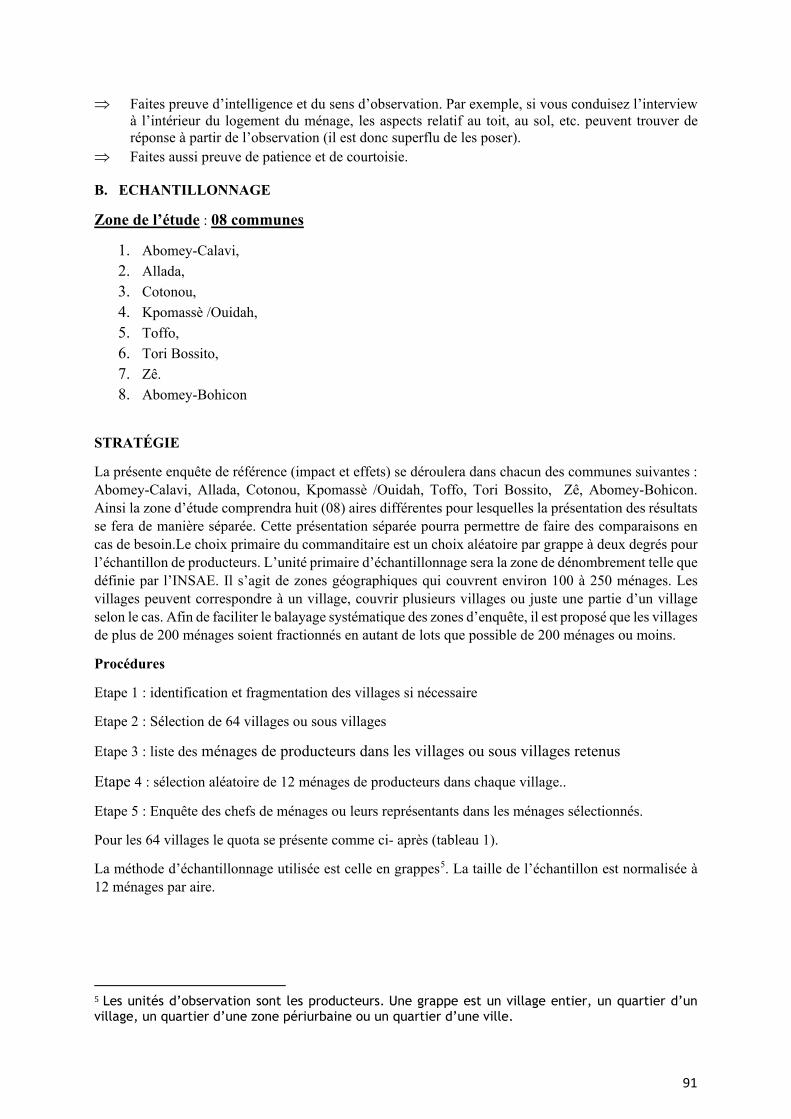
91
⇒ Faites preuve d’intelligence et du sens d’observation. Par exemple, si vous conduisez l’interview à l’intérieur du logement du ménage, les aspects relatif au toit, au sol, etc. peuvent trouver de réponse à partir de l’observation (il est donc superflu de les poser).
⇒ Faites aussi preuve de patience et de courtoisie. B. ECHANTILLONNAGE
Zone de l’étude : 08 communes
1. Abomey-Calavi, 2. Allada, 3. Cotonou, 4. Kpomassè /Ouidah, 5. Toffo, 6. Tori Bossito, 7. Zê. 8. Abomey-Bohicon
STRATÉGIE
La présente enquête de référence (impact et effets) se déroulera dans chacun des communes suivantes : Abomey-Calavi, Allada, Cotonou, Kpomassè /Ouidah, Toffo, Tori Bossito, Zê, Abomey-Bohicon. Ainsi la zone d’étude comprendra huit (08) aires différentes pour lesquelles la présentation des résultats se fera de manière séparée. Cette présentation séparée pourra permettre de faire des comparaisons en cas de besoin.Le choix primaire du commanditaire est un choix aléatoire par grappe à deux degrés pour l’échantillon de producteurs. L’unité primaire d’échantillonnage sera la zone de dénombrement telle que définie par l’INSAE. Il s’agit de zones géographiques qui couvrent environ 100 à 250 ménages. Les villages peuvent correspondre à un village, couvrir plusieurs villages ou juste une partie d’un village selon le cas. Afin de faciliter le balayage systématique des zones d’enquête, il est proposé que les villages de plus de 200 ménages soient fractionnés en autant de lots que possible de 200 ménages ou moins.
Procédures
Etape 1 : identification et fragmentation des villages si nécessaire
Etape 2 : Sélection de 64 villages ou sous villages
Etape 3 : liste des ménages de producteurs dans les villages ou sous villages retenus
Etape 4 : sélection aléatoire de 12 ménages de producteurs dans chaque village..
Etape 5 : Enquête des chefs de ménages ou leurs représentants dans les ménages sélectionnés.
Pour les 64 villages le quota se présente comme ci- après (tableau 1).
La méthode d’échantillonnage utilisée est celle en grappes5. La taille de l’échantillon est normalisée à 12 ménages par aire.
5 Les unités d’observation sont les producteurs. Une grappe est un village entier, un quartier d’un village, un quartier d’une zone périurbaine ou un quartier d’une ville.
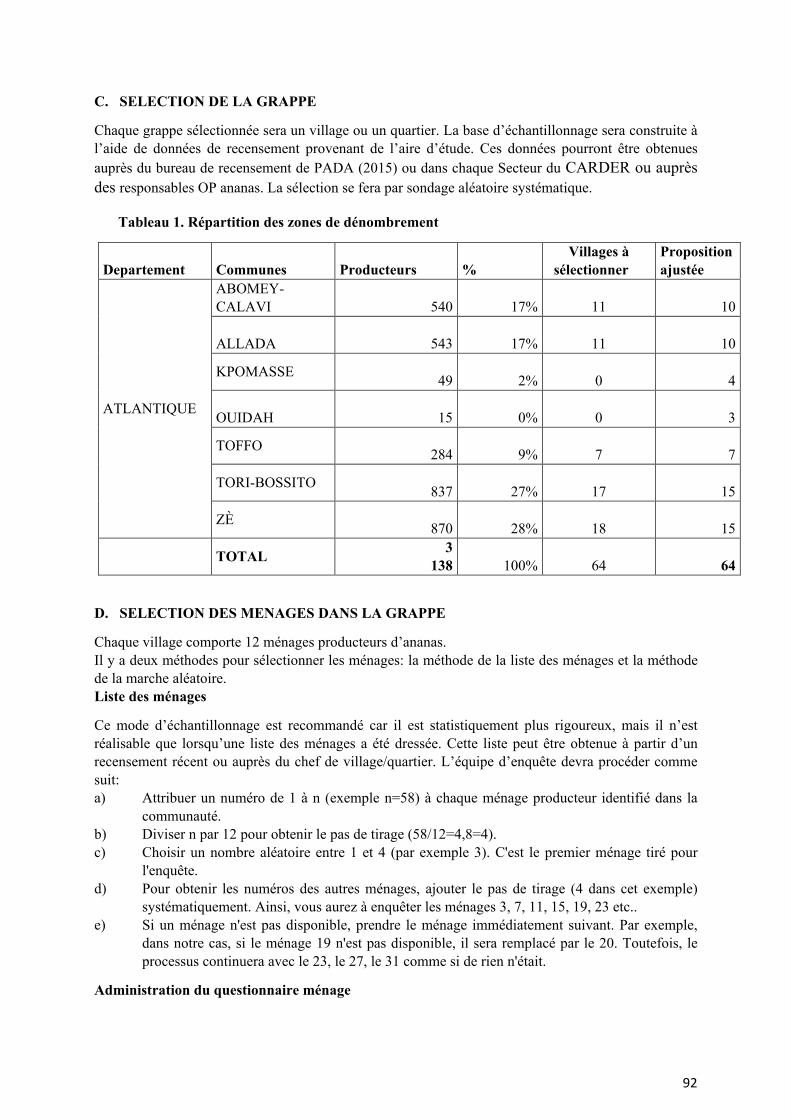
92
C. SELECTION DE LA GRAPPE
Chaque grappe sélectionnée sera un village ou un quartier. La base d’échantillonnage sera construite à l’aide de données de recensement provenant de l’aire d’étude. Ces données pourront être obtenues auprès du bureau de recensement de PADA (2015) ou dans chaque Secteur du CARDER ou auprès des responsables OP ananas. La sélection se fera par sondage aléatoire systématique.
Tableau 1. Répartition des zones de dénombrement
Departement Communes Producteurs % Villages à
sélectionner Proposition ajustée
ATLANTIQUE
ABOMEY-CALAVI
540 17% 11 10
ALLADA
543 17% 11 10
KPOMASSE 49 2% 0 4
OUIDAH
15 0% 0 3
TOFFO 284 9% 7 7
TORI-BOSSITO 837 27% 17 15
ZÈ 870 28% 18 15
TOTAL 3
138 100% 64 64
D. SELECTION DES MENAGES DANS LA GRAPPE
Chaque village comporte 12 ménages producteurs d’ananas. Il y a deux méthodes pour sélectionner les ménages: la méthode de la liste des ménages et la méthode de la marche aléatoire. Liste des ménages
Ce mode d’échantillonnage est recommandé car il est statistiquement plus rigoureux, mais il n’est réalisable que lorsqu’une liste des ménages a été dressée. Cette liste peut être obtenue à partir d’un recensement récent ou auprès du chef de village/quartier. L’équipe d’enquête devra procéder comme suit: a) Attribuer un numéro de 1 à n (exemple n=58) à chaque ménage producteur identifié dans la
communauté. b) Diviser n par 12 pour obtenir le pas de tirage (58/12=4,8=4). c) Choisir un nombre aléatoire entre 1 et 4 (par exemple 3). C'est le premier ménage tiré pour
l'enquête. d) Pour obtenir les numéros des autres ménages, ajouter le pas de tirage (4 dans cet exemple)
systématiquement. Ainsi, vous aurez à enquêter les ménages 3, 7, 11, 15, 19, 23 etc.. e) Si un ménage n'est pas disponible, prendre le ménage immédiatement suivant. Par exemple,
dans notre cas, si le ménage 19 n'est pas disponible, il sera remplacé par le 20. Toutefois, le processus continuera avec le 23, le 27, le 31 comme si de rien n'était.
Administration du questionnaire ménage
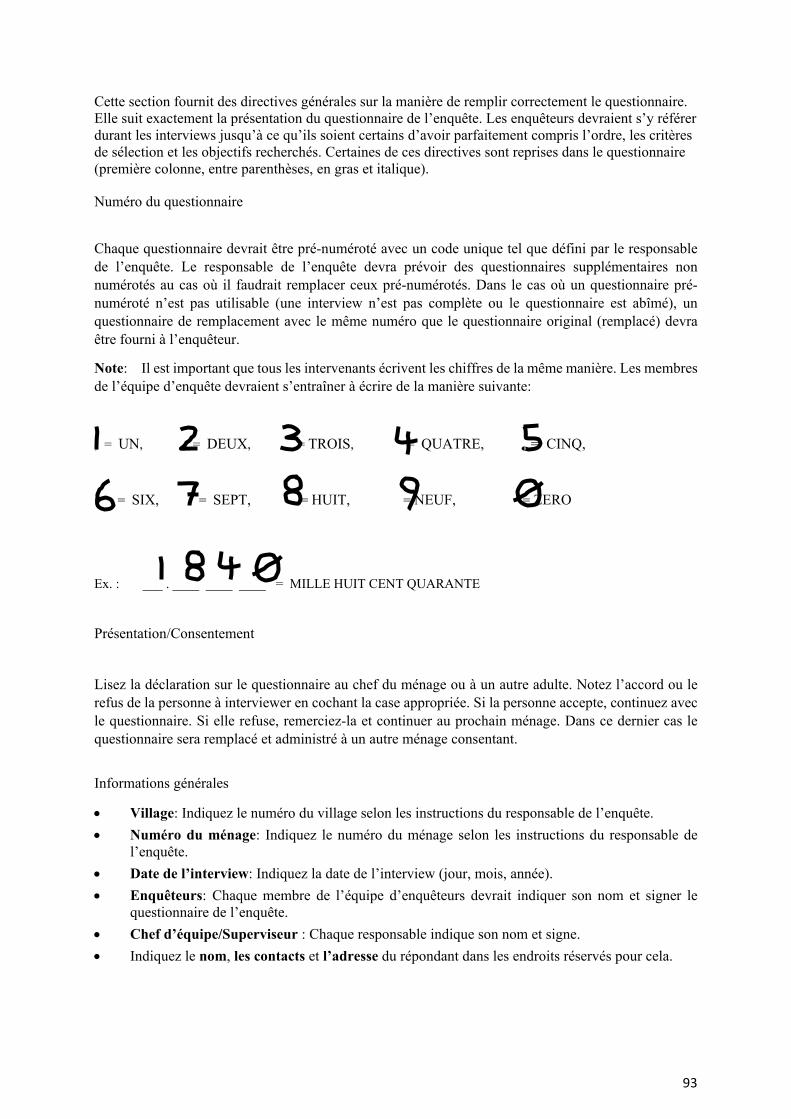
93
Cette section fournit des directives générales sur la manière de remplir correctement le questionnaire. Elle suit exactement la présentation du questionnaire de l’enquête. Les enquêteurs devraient s’y référer durant les interviews jusqu’à ce qu’ils soient certains d’avoir parfaitement compris l’ordre, les critères de sélection et les objectifs recherchés. Certaines de ces directives sont reprises dans le questionnaire (première colonne, entre parenthèses, en gras et italique).
Numéro du questionnaire
Chaque questionnaire devrait être pré-numéroté avec un code unique tel que défini par le responsable de l’enquête. Le responsable de l’enquête devra prévoir des questionnaires supplémentaires non numérotés au cas où il faudrait remplacer ceux pré-numérotés. Dans le cas où un questionnaire pré-numéroté n’est pas utilisable (une interview n’est pas complète ou le questionnaire est abîmé), un questionnaire de remplacement avec le même numéro que le questionnaire original (remplacé) devra être fourni à l’enquêteur.
Note: Il est important que tous les intervenants écrivent les chiffres de la même manière. Les membres de l’équipe d’enquête devraient s’entraîner à écrire de la manière suivante:
, = UN, = DEUX, = TROIS, = QUATRE, = CINQ,
= SIX, = SEPT, = HUIT, = NEUF, = ZERO
Ex. : ___ . ____ ____ ____ = MILLE HUIT CENT QUARANTE
Présentation/Consentement
Lisez la déclaration sur le questionnaire au chef du ménage ou à un autre adulte. Notez l’accord ou le refus de la personne à interviewer en cochant la case appropriée. Si la personne accepte, continuez avec le questionnaire. Si elle refuse, remerciez-la et continuer au prochain ménage. Dans ce dernier cas le questionnaire sera remplacé et administré à un autre ménage consentant. Informations générales
• Village: Indiquez le numéro du village selon les instructions du responsable de l’enquête. • Numéro du ménage: Indiquez le numéro du ménage selon les instructions du responsable de
l’enquête. • Date de l’interview: Indiquez la date de l’interview (jour, mois, année). • Enquêteurs: Chaque membre de l’équipe d’enquêteurs devrait indiquer son nom et signer le
questionnaire de l’enquête. • Chef d’équipe/Superviseur : Chaque responsable indique son nom et signe. • Indiquez le nom, les contacts et l’adresse du répondant dans les endroits réservés pour cela.
94
Méthode de collecte d’information
L’interview se déroulera le plus proche possible de l’activité.
La base est la déclaration de l’interviewé, mais en demandant un support comme preuve. Vérifier les informations par rapport aux documents existants.
L’observation participante permet une vérification rapide des informations (grosseur de fruits, propreté des champs / ateliers, …)
Si lors de l’interview il y a possibilité il faut procéder à des mesures (poids des fruits selon les calibres pour estimer le rendement à l’hectare)
Remplir le questionnaire
5- Questionnaire : PRODUCTEURS de fruits d’ananas
6- Questionnaire : TRANSFORMATEURS de fruits d’ananas
C. Fin de l’interview
Pour terminer l’interview, l’enquêteur devra vérifier qu’il a répondu à toutes les questions. Dans l’affirmative, il remerciera le répondant avant de le prendre congé.
N.B. : Les questions auxquelles une réponse n’a pas été donnée doivent être barrées sous forme de diagonales.
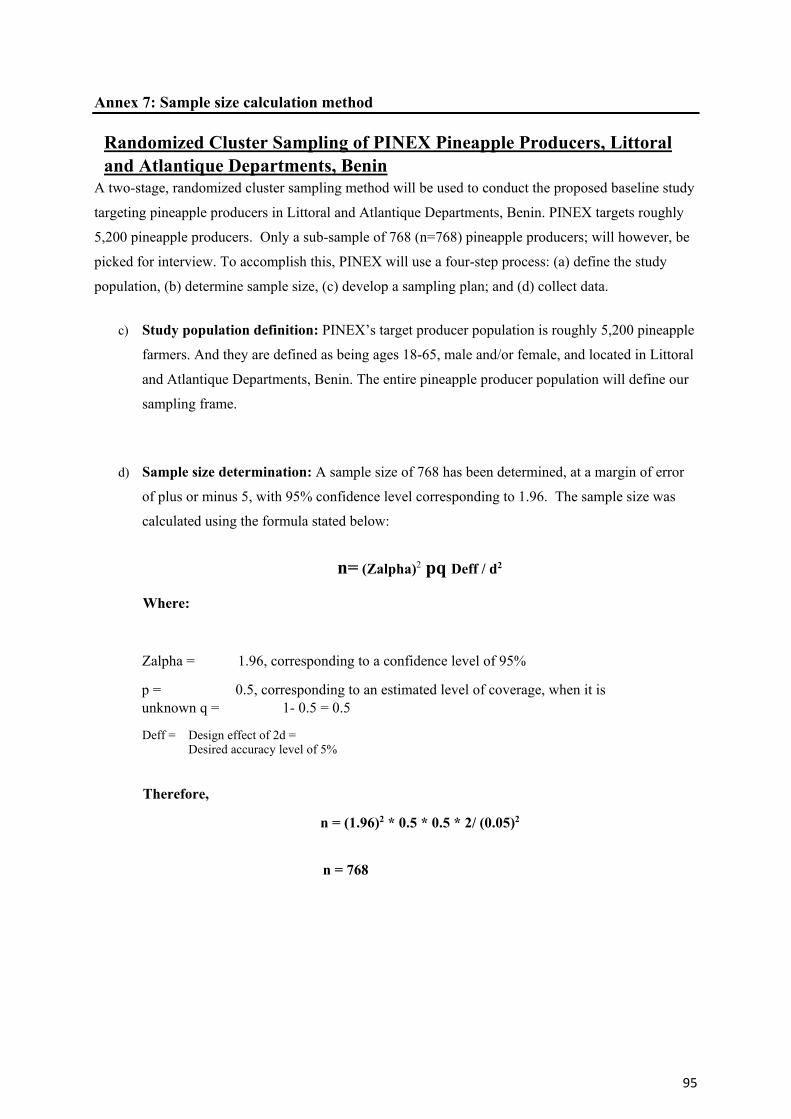
95
Annex 7: Sample size calculation method
Randomized Cluster Sampling of PINEX Pineapple Producers, Littoral and Atlantique Departments, Benin
A two-stage, randomized cluster sampling method will be used to conduct the proposed baseline study
targeting pineapple producers in Littoral and Atlantique Departments, Benin. PINEX targets roughly
5,200 pineapple producers. Only a sub-sample of 768 (n=768) pineapple producers; will however, be
picked for interview. To accomplish this, PINEX will use a four-step process: (a) define the study
population, (b) determine sample size, (c) develop a sampling plan; and (d) collect data.
c) Study population definition: PINEX’s target producer population is roughly 5,200 pineapple
farmers. And they are defined as being ages 18-65, male and/or female, and located in Littoral
and Atlantique Departments, Benin. The entire pineapple producer population will define our
sampling frame.
d) Sample size determination: A sample size of 768 has been determined, at a margin of error
of plus or minus 5, with 95% confidence level corresponding to 1.96. The sample size was
calculated using the formula stated below:
n= (Zalpha)2 pq Deff / d2
Where:
Zalpha = 1.96, corresponding to a confidence level of 95%
p = 0.5, corresponding to an estimated level of coverage, when it is unknown q = 1- 0.5 = 0.5
Deff = Design effect of 2d = Desired accuracy level of 5%
Therefore,
n = (1.96)2 * 0.5 * 0.5 * 2/ (0.05)2
n = 768
96
Annex 8: Complete list of selected primary sampling units (PSU) List of seleted villages (Primary sampling Units)
COMMUNE ARRONDISSEMENT VILLAGE/QUARTIER TOFFO COLLI AGBAME TOFFO SEY LANLONOU TOFFO COLLI BOSSOURI TOFFO SEHOUE AGBOZOUNKPA TOFFO DAME AGON TOFFO DAME AGBOTAGON ZE TANGBO TANGBO-AGA ZE DODJIBATA ADOHONSA ZE KOUNDOKPOE HOUEGNONKPA ZE HEKANMÈ AGBATA ZE TANGBO AGBODJEDO ZE TANGBO AVLESSA ZE YOKPO ADJAKPA ZE ADJAN ADJAN CENTRE ZE ZÊ WAGA ZE DODJI BATA WANKON ZE ADJAN WASSA ZE ADJAN ANAGBO ZE DODJI BATA GBÉTO-FONGBO ZE ZÊ AKPALI ZE ADJAN ZANZOUN ZE DAWE AGONZOUNKPA ZE SEDJE-DENOU SEDJE-KPOTA ZE DAWÈ AHOUALI OUIDAH SAVI SAVI KPOMASSE KPOMASSE DEDOME KPOMASSE SEGBEYA ATCHANKANME ALLADA AHOUANNONZOUN BAWEKANMEY ALLADA TOGOUDO GOVI ALLADA AVAKPA AVAKPA-CENTRE ALLADA ALLADA-CENTRE DONOU ALLADA HINVI ZOUGBOMEY ALLADA ATTOGON ATTOGON CENTRE ALLADA ATTOGON NIAOULI ALLADA SEKOU WIBATIN COMMUNE ARRONDISSEMENT VILLAGE/QUARTIER ALLADA SEKOU DODJI-DANGBAN ALLADA SEKOU ADIMALE ALLADA SEKOU DODJI-ALIHO ABOMEY-CALAVI GLODJIGBE LOHOUSSA
97
COMMUNE ARRONDISSEMENT VILLAGE/QUARTIER ABOMEY-CALAVI GLODJIGBE DOMÈ-GBO ABOMEY-CALAVI GLODJIGBE YEKON AGLA ABOMEY-CALAVI KPANROUN KPÉ ABOMEY-CALAVI KPANROUN AVAGBE ABOMEY-CALAVI KPANROUN ANAGBO ABOMEY-CALAVI KPANROUN KPAVIEDJA ABOMEY-CALAVI WAWATA DANGBODJI ABOMEY-CALAVI ZINVIE ZOUME ABOMEY-CALAVI ZINVIE TODJA ABOMEY-CALAVI AKASSATO AGASSA GODOMEY TORI BOSSITO TORI CADA DOHINONKO TORI BOSSITO TORI CADA ANANVIE TORI BOSSITO TORI CADA HOUEDAGBA TORI BOSSITO TORI CADA ZOUNGODO TORI BOSSITO TORI CADA GLOHOUE TORI BOSSITO TORI CADA SOKLOGBO TORI BOSSITO TORI CADA SOGBE TORI BOSSITO TORI CADA LOKOSSA TORI BOSSITO TORI CADA ZÈBÈ TORI BOSSITO TORI CADA CADA CENTRE TORI BOSSITO TORI CADA GBEGOUDO TORI BOSSITO TORI CADA GBETAGA TORI BOSSITO TORI CADA ADJAHASSA TORI BOSSITO TORI CADA DOKANME TORI BOSSITO AVAME HOUNGO TORI BOSSITO AVAME AVAME CENTRE TORI BOSSITO AVAME GBÉDJOUGOU TORI BOSSITO AVAME HLA
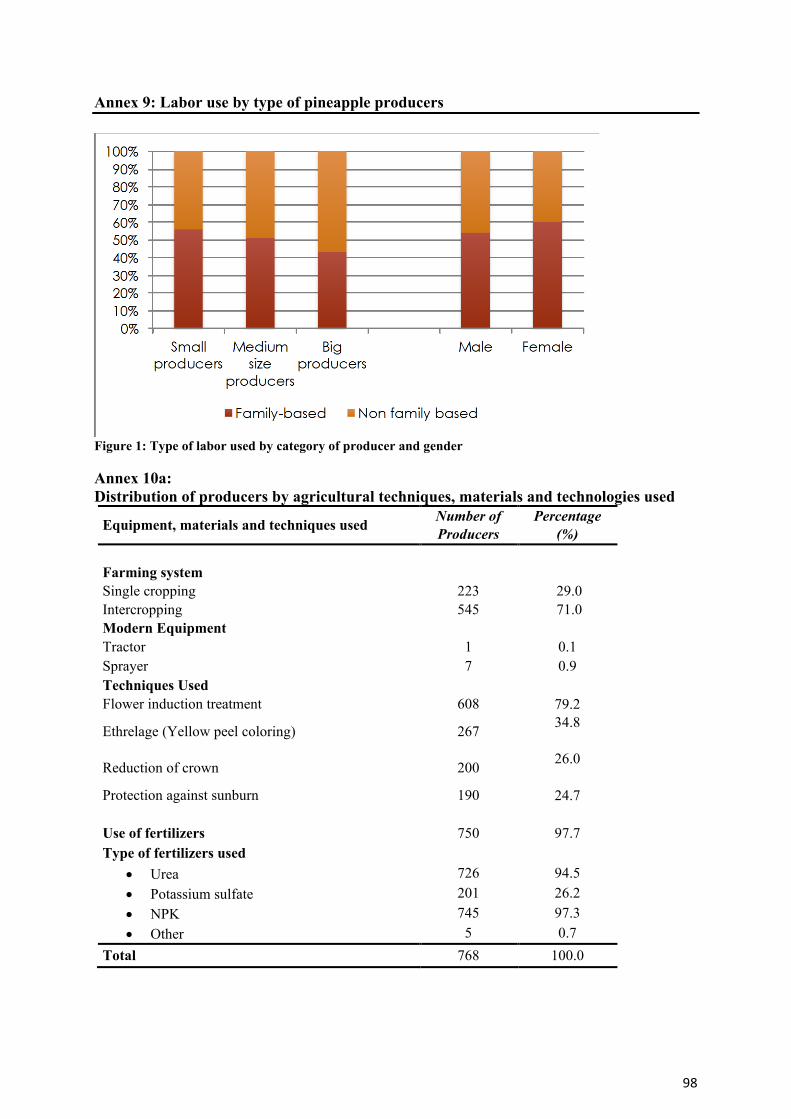
98
Annex 9: Labor use by type of pineapple producers
Figure 1: Type of labor used by category of producer and gender Annex 10a: Distribution of producers by agricultural techniques, materials and technologies used
Equipment, materials and techniques used Number of Producers
Percentage (%)
Farming system
Single cropping 223 29.0 Intercropping 545 71.0 Modern Equipment Tractor 1 0.1 Sprayer 7 0.9 Techniques Used Flower induction treatment 608 79.2
Ethrelage (Yellow peel coloring) 267 34.8
Reduction of crown 200 26.0
Protection against sunburn 190 24.7 Use of fertilizers 750 97.7 Type of fertilizers used
• Urea 726 94.5 • Potassium sulfate 201 26.2 • NPK 745 97.3 • Other 5 0.7
Total 768 100.0
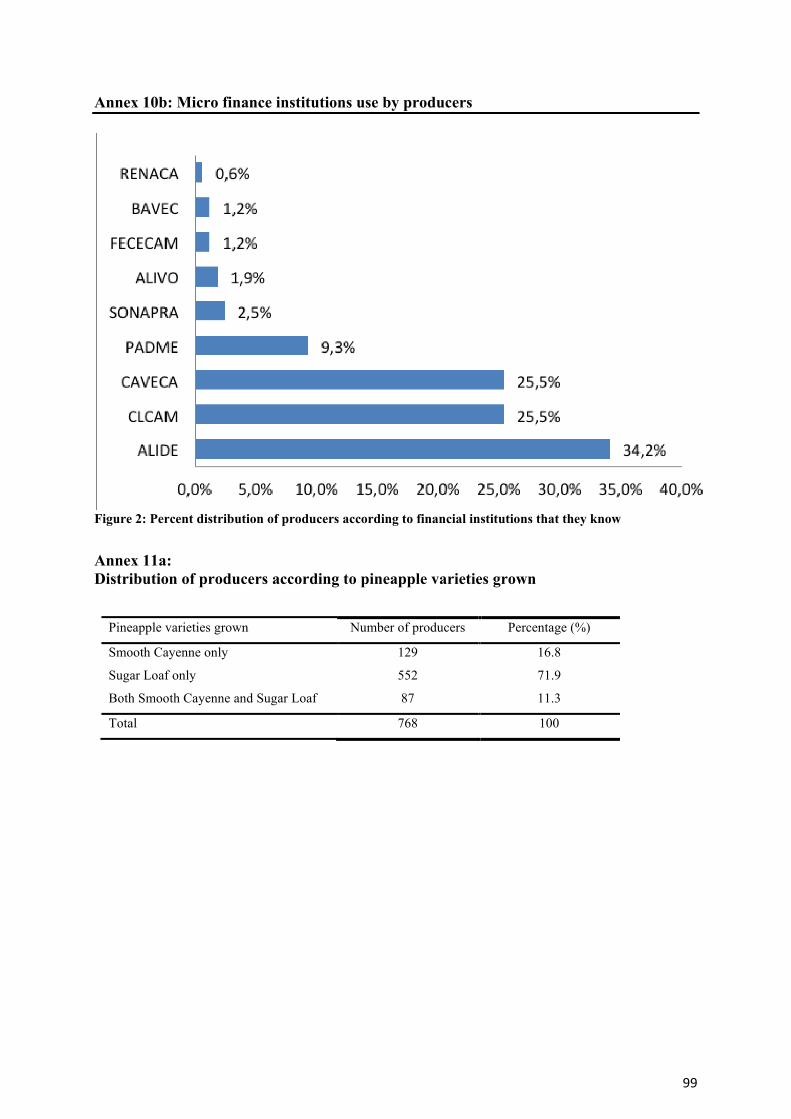
99
Annex 10b: Micro finance institutions use by producers
Figure 2: Percent distribution of producers according to financial institutions that they know
Annex 11a: Distribution of producers according to pineapple varieties grown
Pineapple varieties grown Number of producers Percentage (%)
Smooth Cayenne only 129 16.8
Sugar Loaf only 552 71.9
Both Smooth Cayenne and Sugar Loaf 87 11.3
Total 768 100
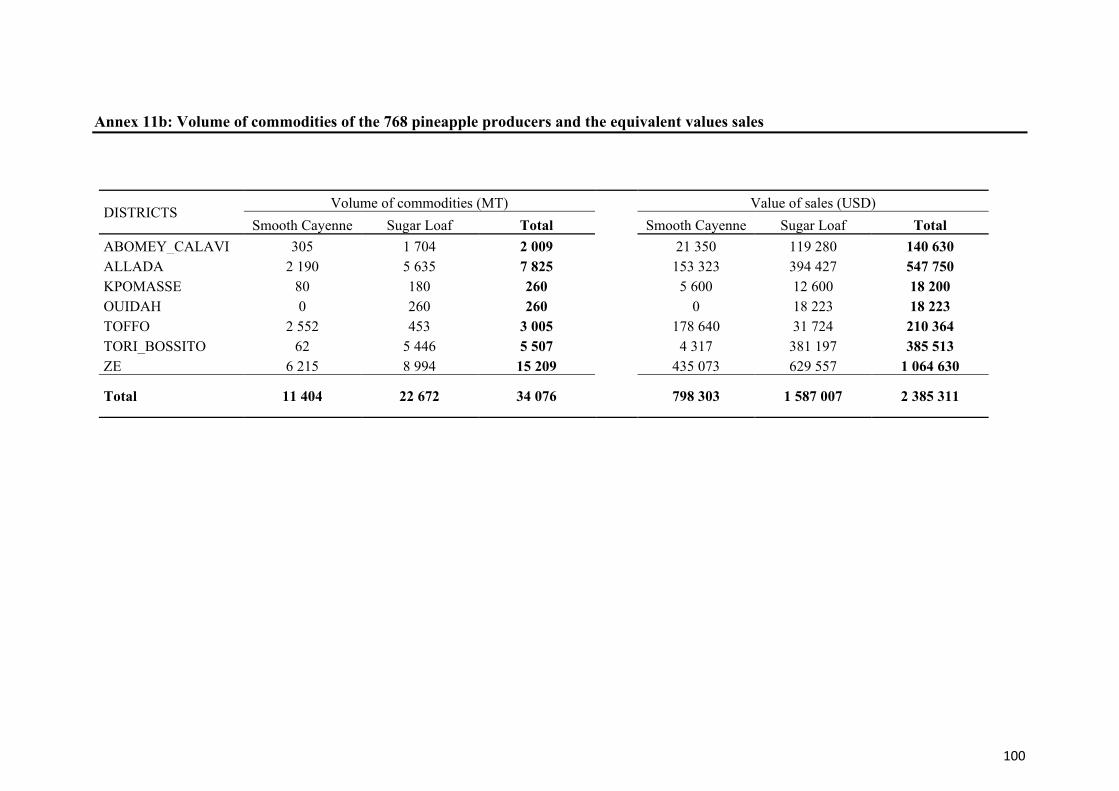
100
Annex 11b: Volume of commodities of the 768 pineapple producers and the equivalent values sales
DISTRICTS Volume of commodities (MT) Value of sales (USD) Smooth Cayenne Sugar Loaf Total Smooth Cayenne Sugar Loaf Total
ABOMEY_CALAVI 305 1 704 2 009 21 350 119 280 140 630 ALLADA 2 190 5 635 7 825 153 323 394 427 547 750 KPOMASSE 80 180 260 5 600 12 600 18 200 OUIDAH 0 260 260 0 18 223 18 223 TOFFO 2 552 453 3 005 178 640 31 724 210 364 TORI_BOSSITO 62 5 446 5 507 4 317 381 197 385 513 ZE 6 215 8 994 15 209 435 073 629 557 1 064 630
Total 11 404 22 672 34 076 798 303 1 587 007 2 385 311
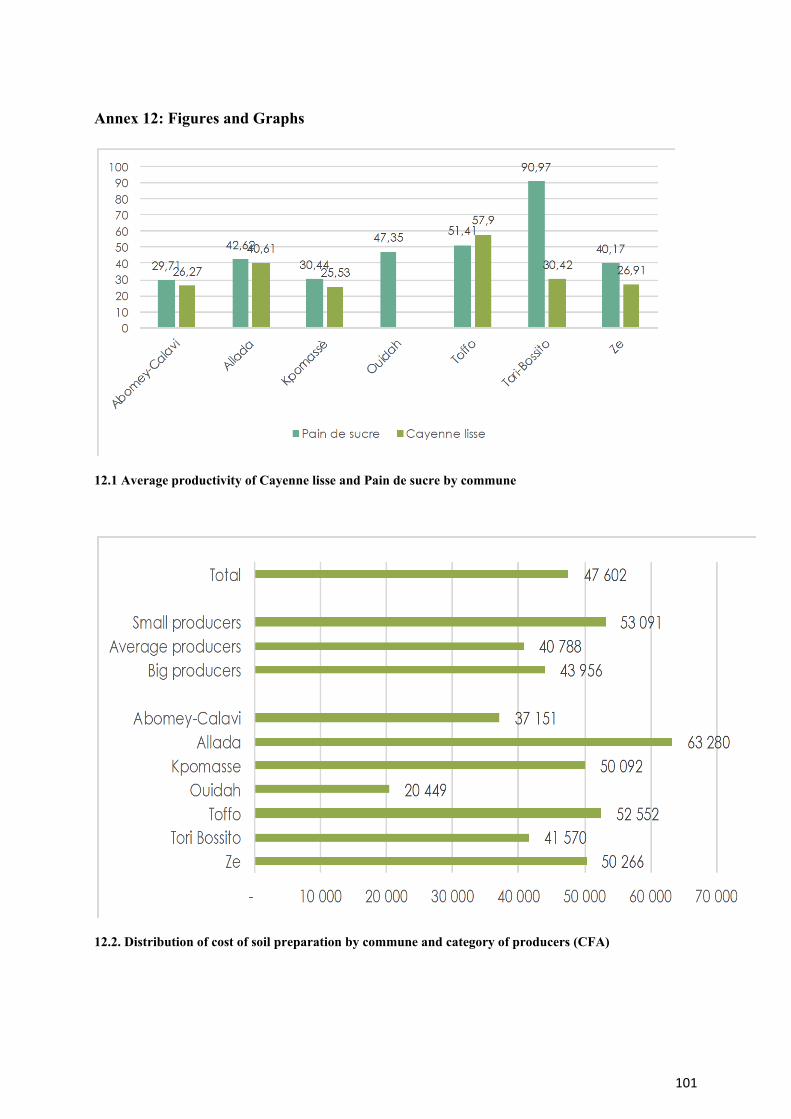
101
Annex 12: Figures and Graphs
12.1 Average productivity of Cayenne lisse and Pain de sucre by commune
12.2. Distribution of cost of soil preparation by commune and category of producers (CFA)
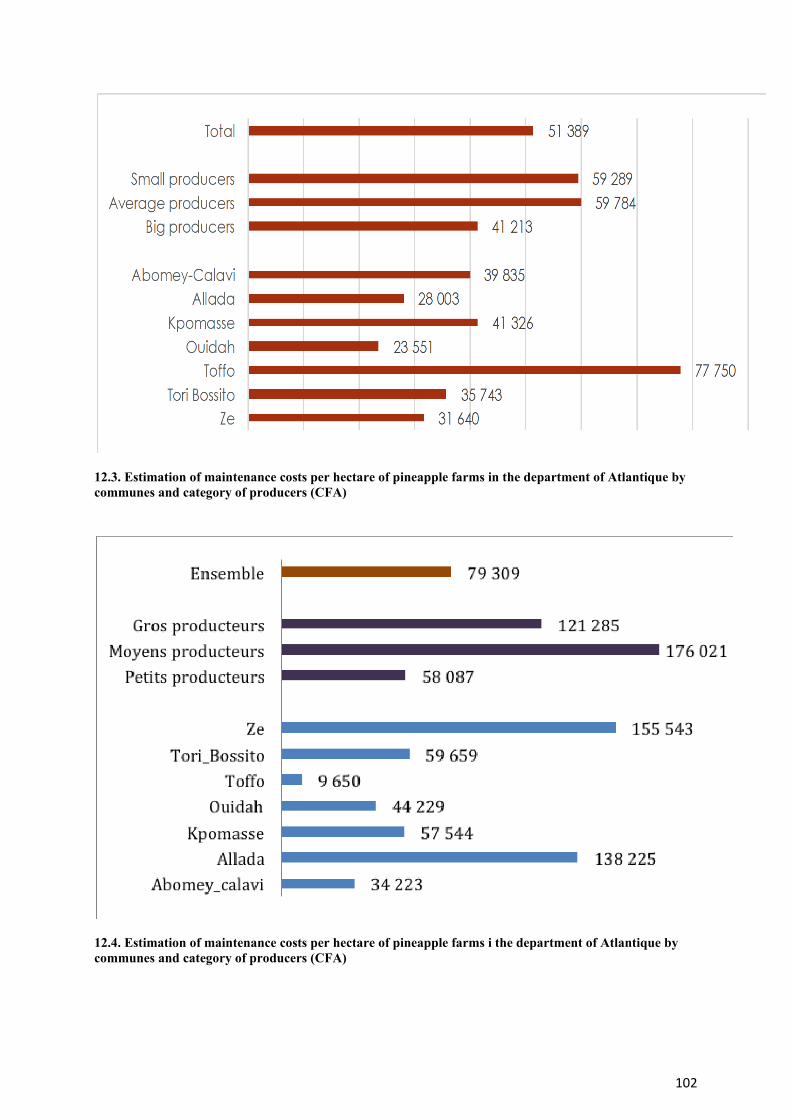
102
12.3. Estimation of maintenance costs per hectare of pineapple farms in the department of Atlantique by communes and category of producers (CFA)
12.4. Estimation of maintenance costs per hectare of pineapple farms i the department of Atlantique by communes and category of producers (CFA)
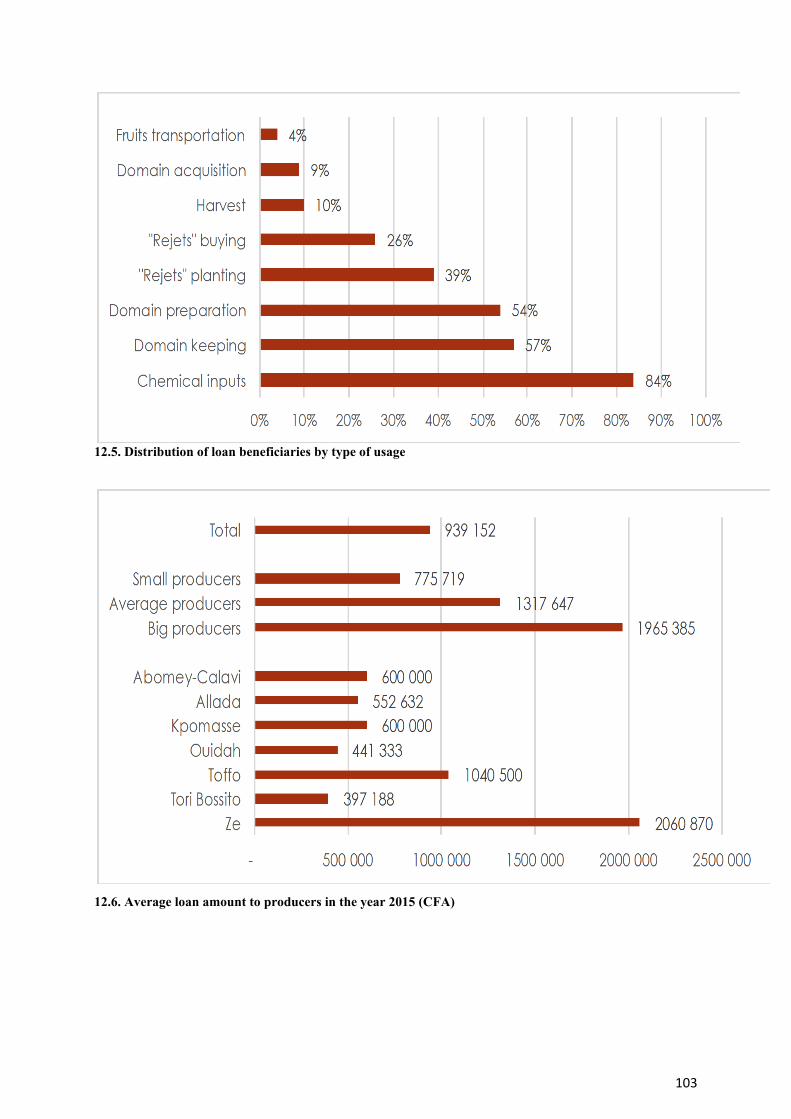
103
12.5. Distribution of loan beneficiaries by type of usage
12.6. Average loan amount to producers in the year 2015 (CFA)
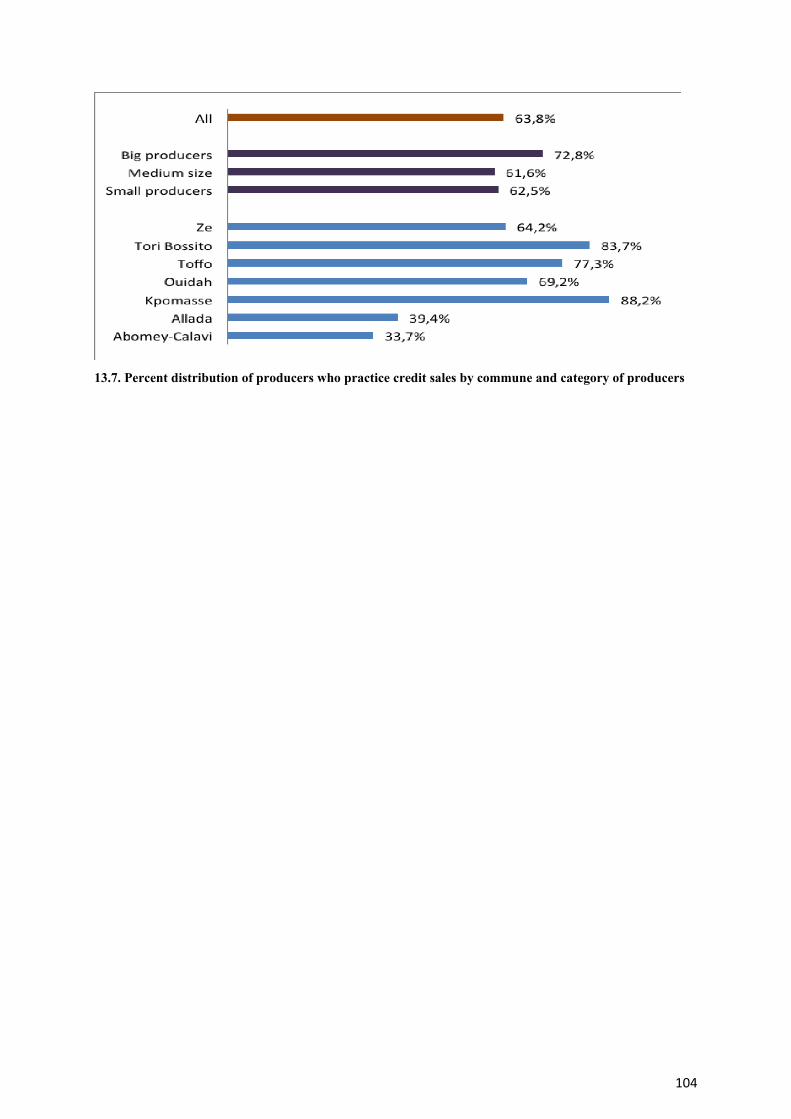
104
13.7. Percent distribution of producers who practice credit sales by commune and category of producers