automatic interpretation techniques for potential fields data
TRANSCRIPT
By Daniela Gerovska and Kathryn Whaler, University of Edinburgh, and Marcos J.Araúzo-Bravo, Max Planck Institute for Molecular Biomedicine
August 1, 2010
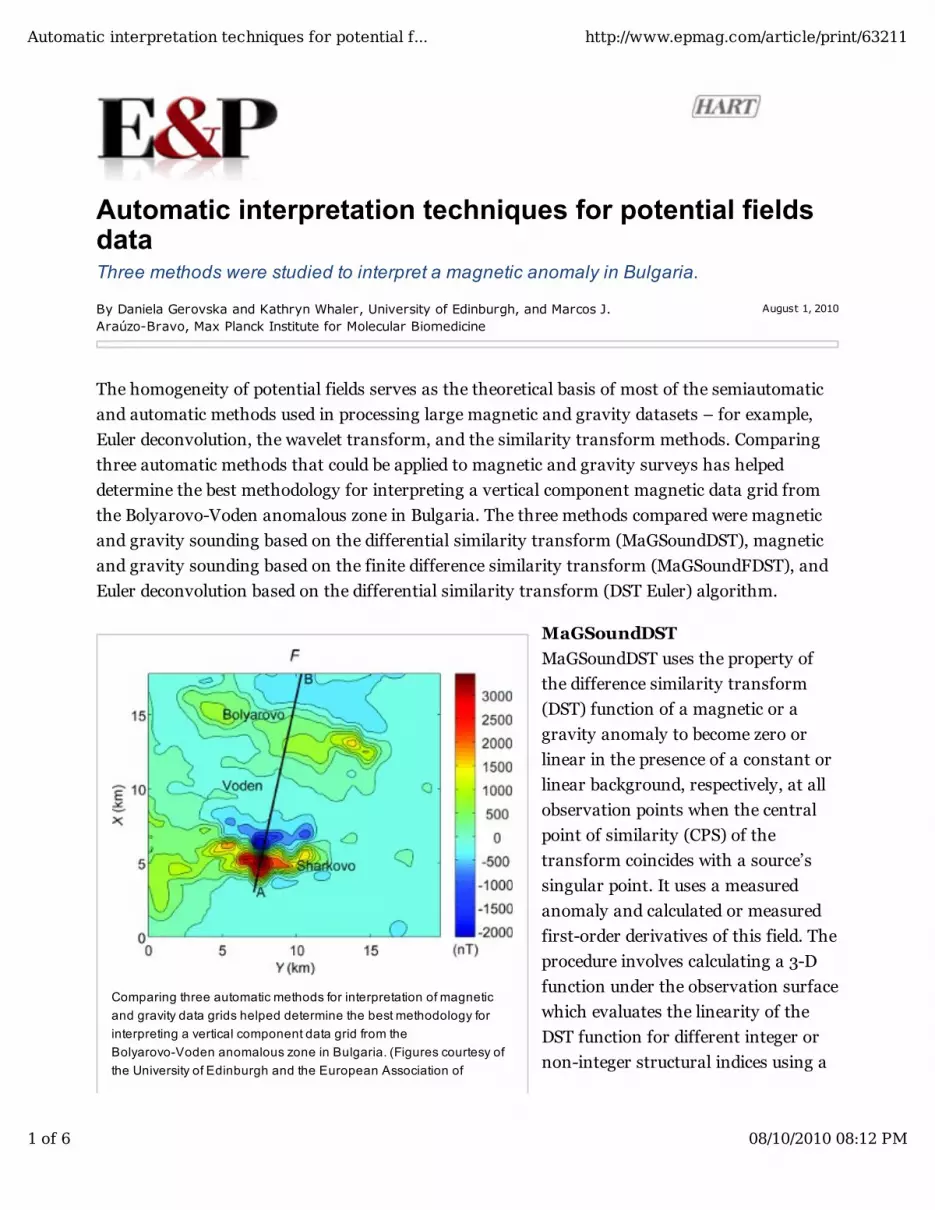
Comparing three automatic methods for interpretation of magnetic
and gravity data grids helped determine the best methodology for
interpreting a vertical component data grid from the
Bolyarovo-Voden anomalous zone in Bulgaria. (Figures courtesy of
the University of Edinburgh and the European Association of
Automatic interpretation techniques for potential fieldsdataThree methods were studied to interpret a magnetic anomaly in Bulgaria.
The homogeneity of potential fields serves as the theoretical basis of most of the semiautomatic
and automatic methods used in processing large magnetic and gravity datasets – for example,
Euler deconvolution, the wavelet transform, and the similarity transform methods. Comparing
three automatic methods that could be applied to magnetic and gravity surveys has helped
determine the best methodology for interpreting a vertical component magnetic data grid from
the Bolyarovo-Voden anomalous zone in Bulgaria. The three methods compared were magnetic
and gravity sounding based on the differential similarity transform (MaGSoundDST), magnetic
and gravity sounding based on the finite difference similarity transform (MaGSoundFDST), and
Euler deconvolution based on the differential similarity transform (DST Euler) algorithm.
MaGSoundDST
MaGSoundDST uses the property of
the difference similarity transform
(DST) function of a magnetic or a
gravity anomaly to become zero or
linear in the presence of a constant or
linear background, respectively, at all
observation points when the central
point of similarity (CPS) of the
transform coincides with a source’s
singular point. It uses a measured
anomaly and calculated or measured
first-order derivatives of this field. The
procedure involves calculating a 3-D
function under the observation surface
which evaluates the linearity of the
DST function for different integer or
non-integer structural indices using a
Automatic interpretation techniques for potential f... http://www.epmag.com/article/print/63211
1 of 6 08/10/2010 08:12 PM
Geoscientists and Engineers) moving window and “sounding” the
subsurface along a vertical line under
each window center for different
structural indices. Then the method combines all the 3-D results into a map to obtain optimum
source depth estimates below each horizontal location. The horizontal positions of the function’s
local minima map determine the horizontal positions of simple sources.
MaGSoundFDST
MaGSoundFDST is based on the property of the finite difference similarity transform (FDST)
function of a magnetic or gravity anomaly to become zero or linear in the presence of a constant
or linear background, respectively, at all observation points when the CPS of the transform
coincides with a source’s field singular point. It uses measured anomalous and upward continued
field data.
MaGSoundFDST is similar to MaGSoundDST in the sense that they both sound the subsurface
for simple magnetic and gravity sources using the theory that a 3-D sounding function has a
minimum at the point where a source exists. In the MaGSoundFDST case, this function is the
estimator of linearity of the FDST function. The estimators of linearity of FDST and DST are
calculated in a similar way as the normalized residual dispersion after linear regression of the
FDST and the DST, respectively. MaGSoundFDST also combines the 3-D functions for different
values into three maps, defining the horizontal location, depth, and structural index of the
sources using the same focusing principle as MaGSoundDST. Though discrete locations of the
subsurface are probed, MaGSoundFDST extrapolates the source locations as in MaGSoundDST to
intermediate points using a refinement procedure. The difference between MaGSoundFDST and
MaGSoundDST lies in the definition and respective calculation of the FDST and DST functions.
Automatic interpretation techniques for potential f... http://www.epmag.com/article/print/63211
2 of 6 08/10/2010 08:12 PM
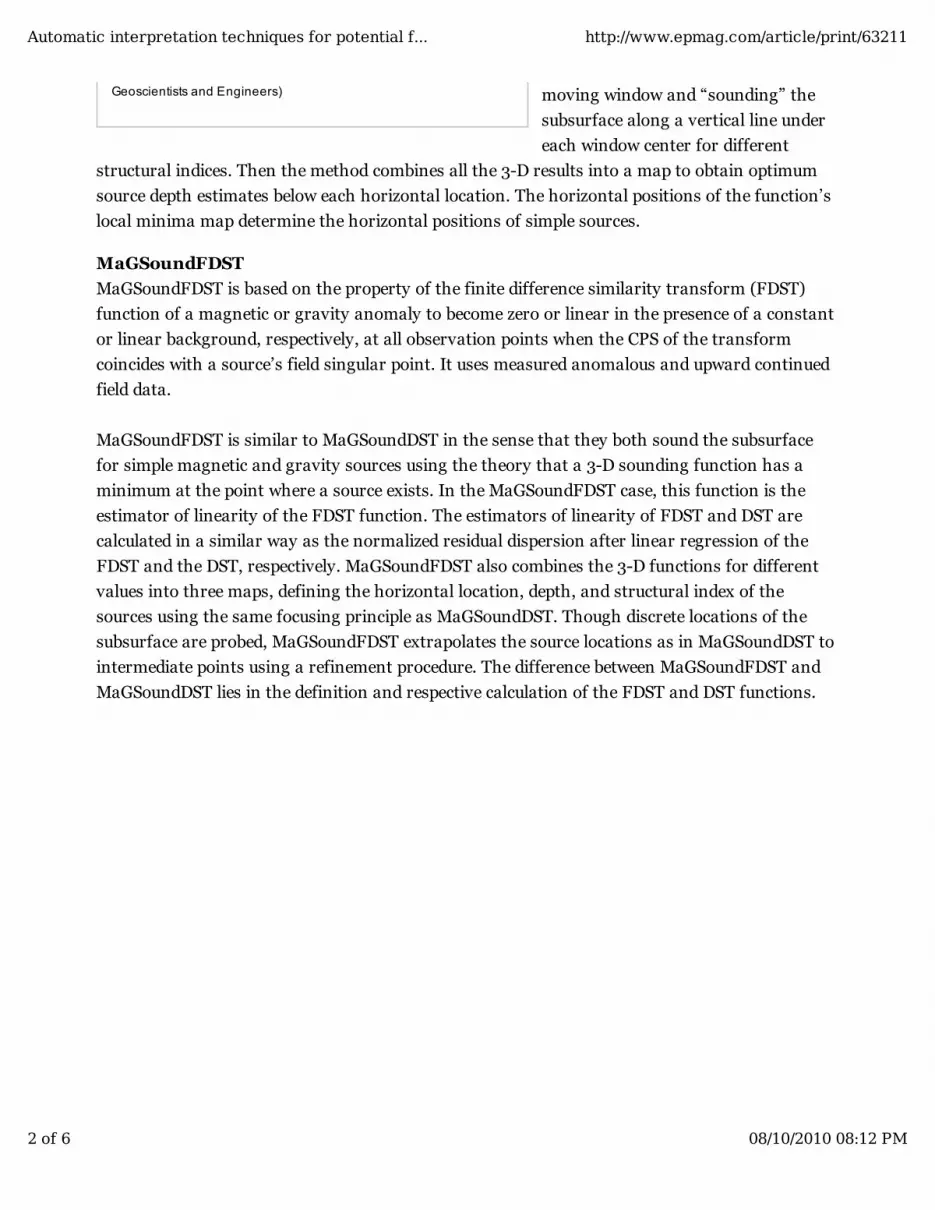
The magnitude magnetic anomaly on a logarithmic scale is shown.
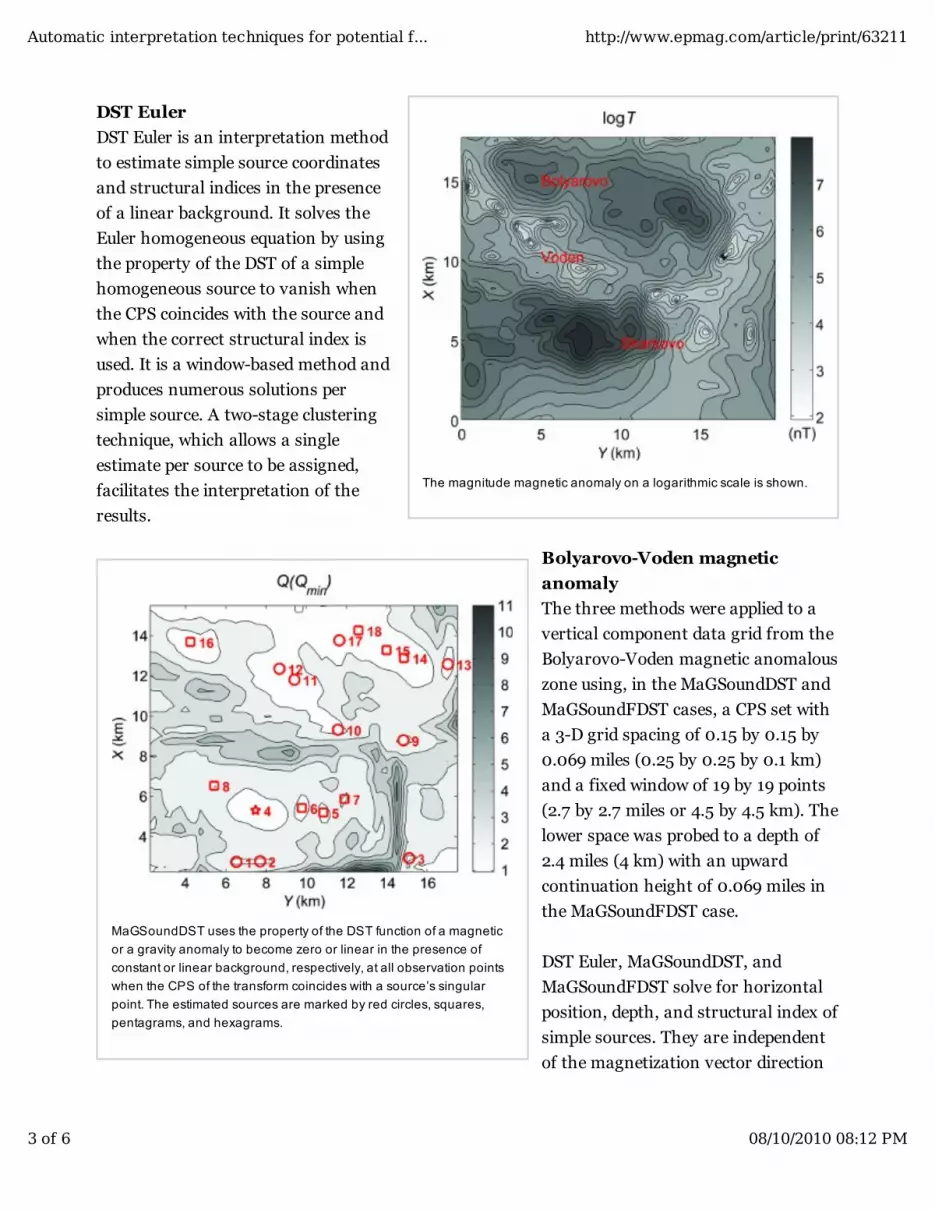
MaGSoundDST uses the property of the DST function of a magnetic
or a gravity anomaly to become zero or linear in the presence of
constant or linear background, respectively, at all observation points
when the CPS of the transform coincides with a source’s singular
point. The estimated sources are marked by red circles, squares,
pentagrams, and hexagrams.
DST Euler
DST Euler is an interpretation method
to estimate simple source coordinates
and structural indices in the presence
of a linear background. It solves the
Euler homogeneous equation by using
the property of the DST of a simple
homogeneous source to vanish when
the CPS coincides with the source and
when the correct structural index is
used. It is a window-based method and
produces numerous solutions per
simple source. A two-stage clustering
technique, which allows a single
estimate per source to be assigned,
facilitates the interpretation of the
results.
Bolyarovo-Voden magnetic
anomaly
The three methods were applied to a
vertical component data grid from the
Bolyarovo-Voden magnetic anomalous
zone using, in the MaGSoundDST and
MaGSoundFDST cases, a CPS set with
a 3-D grid spacing of 0.15 by 0.15 by
0.069 miles (0.25 by 0.25 by 0.1 km)
and a fixed window of 19 by 19 points
(2.7 by 2.7 miles or 4.5 by 4.5 km). The
lower space was probed to a depth of
2.4 miles (4 km) with an upward
continuation height of 0.069 miles in
the MaGSoundFDST case.
DST Euler, MaGSoundDST, and
MaGSoundFDST solve for horizontal
position, depth, and structural index of
simple sources. They are independent
of the magnetization vector direction
Automatic interpretation techniques for potential f... http://www.epmag.com/article/print/63211
3 of 6 08/10/2010 08:12 PM
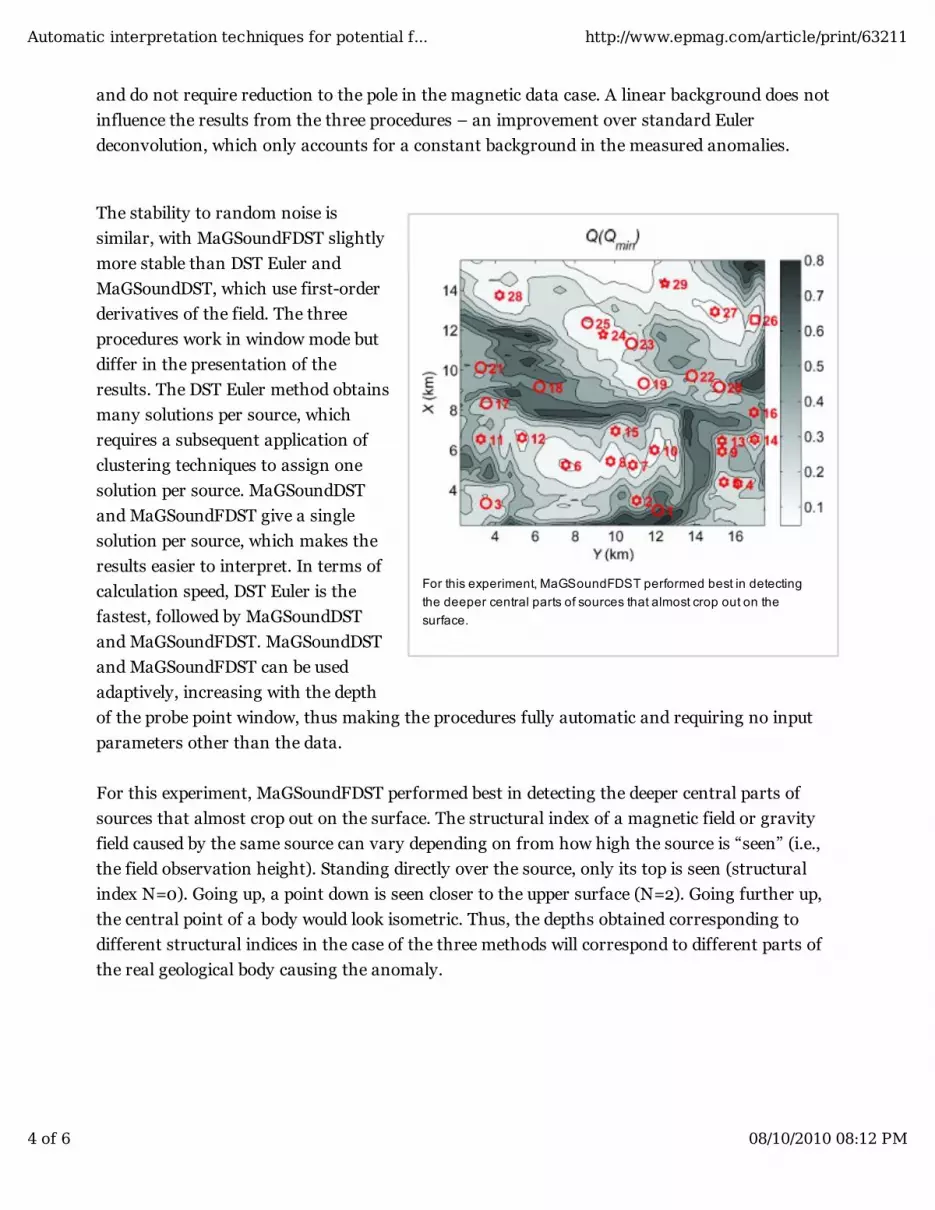
For this experiment, MaGSoundFDST performed best in detecting
the deeper central parts of sources that almost crop out on the
surface.
and do not require reduction to the pole in the magnetic data case. A linear background does not
influence the results from the three procedures – an improvement over standard Euler
deconvolution, which only accounts for a constant background in the measured anomalies.
The stability to random noise is
similar, with MaGSoundFDST slightly
more stable than DST Euler and
MaGSoundDST, which use first-order
derivatives of the field. The three
procedures work in window mode but
differ in the presentation of the
results. The DST Euler method obtains
many solutions per source, which
requires a subsequent application of
clustering techniques to assign one
solution per source. MaGSoundDST
and MaGSoundFDST give a single
solution per source, which makes the
results easier to interpret. In terms of
calculation speed, DST Euler is the
fastest, followed by MaGSoundDST
and MaGSoundFDST. MaGSoundDST
and MaGSoundFDST can be used
adaptively, increasing with the depth
of the probe point window, thus making the procedures fully automatic and requiring no input
parameters other than the data.
For this experiment, MaGSoundFDST performed best in detecting the deeper central parts of
sources that almost crop out on the surface. The structural index of a magnetic field or gravity
field caused by the same source can vary depending on from how high the source is “seen” (i.e.,
the field observation height). Standing directly over the source, only its top is seen (structural
index N=0). Going up, a point down is seen closer to the upper surface (N=2). Going further up,
the central point of a body would look isometric. Thus, the depths obtained corresponding to
different structural indices in the case of the three methods will correspond to different parts of
the real geological body causing the anomaly.
Automatic interpretation techniques for potential f... http://www.epmag.com/article/print/63211
4 of 6 08/10/2010 08:12 PM
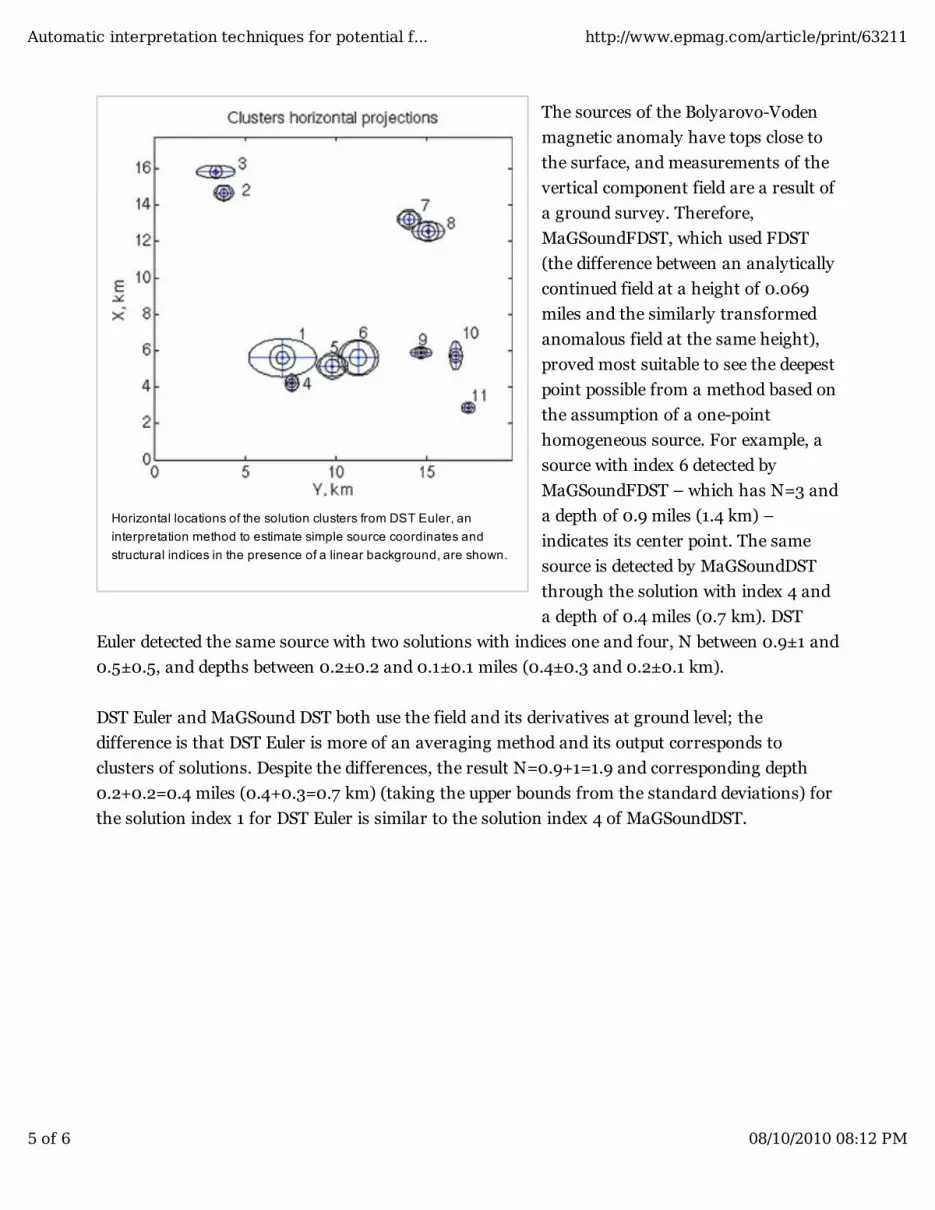
Horizontal locations of the solution clusters from DST Euler, an
interpretation method to estimate simple source coordinates and
structural indices in the presence of a linear background, are shown.
The sources of the Bolyarovo-Voden
magnetic anomaly have tops close to
the surface, and measurements of the
vertical component field are a result of
a ground survey. Therefore,
MaGSoundFDST, which used FDST
(the difference between an analytically
continued field at a height of 0.069
miles and the similarly transformed
anomalous field at the same height),
proved most suitable to see the deepest
point possible from a method based on
the assumption of a one-point
homogeneous source. For example, a
source with index 6 detected by
MaGSoundFDST – which has N=3 and
a depth of 0.9 miles (1.4 km) –
indicates its center point. The same
source is detected by MaGSoundDST
through the solution with index 4 and
a depth of 0.4 miles (0.7 km). DST
Euler detected the same source with two solutions with indices one and four, N between 0.9±1 and
0.5±0.5, and depths between 0.2±0.2 and 0.1±0.1 miles (0.4±0.3 and 0.2±0.1 km).
DST Euler and MaGSound DST both use the field and its derivatives at ground level; the
difference is that DST Euler is more of an averaging method and its output corresponds to
clusters of solutions. Despite the differences, the result N=0.9+1=1.9 and corresponding depth
0.2+0.2=0.4 miles (0.4+0.3=0.7 km) (taking the upper bounds from the standard deviations) for
the solution index 1 for DST Euler is similar to the solution index 4 of MaGSoundDST.
Automatic interpretation techniques for potential f... http://www.epmag.com/article/print/63211
5 of 6 08/10/2010 08:12 PM
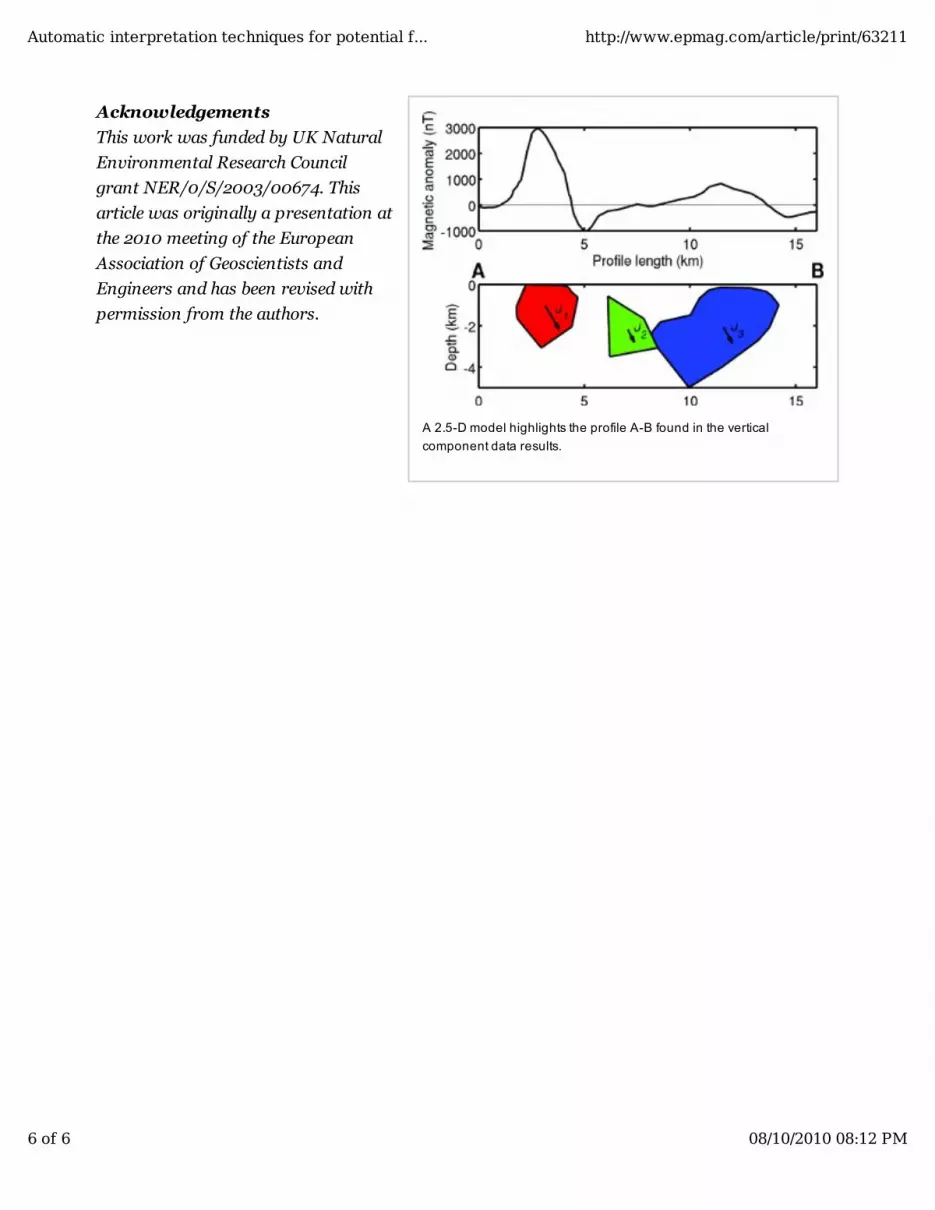
A 2.5-D model highlights the profile A-B found in the vertical
component data results.
Acknowledgements
This work was funded by UK Natural
Environmental Research Council
grant NER/0/S/2003/00674. This
article was originally a presentation at
the 2010 meeting of the European
Association of Geoscientists and
Engineers and has been revised with
permission from the authors.
Automatic interpretation techniques for potential f... http://www.epmag.com/article/print/63211
6 of 6 08/10/2010 08:12 PM