semi-automatic medical image segmentation with adaptive local statistics in conditional random...
TRANSCRIPT

Semi-Automatic Medical Image Segmentation with Adaptive LocalStatistics in Conditional Random Fields Framework
Yu-Chi J. Hu,Medical Physics Department, Memorial Sloan-Kettering Cancer Center, New York, NY 10021, USA.([email protected]).
Michael D. Grossberg, andDepartment of Computer Science, City College of New York, New York, NY 10031, USA.([email protected]).
Gikas S. MagerasMedical Physics Department, Memorial Sloan-Kettering Cancer Center, New York, NY 10021, USA([email protected]).
AbstractPlanning radiotherapy and surgical procedures usually require onerous manual segmentation ofanatomical structures from medical images. In this paper we present a semi-automatic and accuratesegmentation method to dramatically reduce the time and effort required of expert users. This isaccomplished by giving a user an intuitive graphical interface to indicate samples of target and non-target tissue by loosely drawing a few brush strokes on the image. We use these brush strokes toprovide the statistical input for a Conditional Random Field (CRF) based segmentation. Since weextract purely statistical information from the user input, we eliminate the need of assumptions onboundary contrast previously used by many other methods, A new feature of our method is that thestatistics on one image can be reused on related images without registration. To demonstrate this, weshow that boundary statistics provided on a few 2D slices of volumetric medical data, can bepropagated through the entire 3D stack of images without using the geometric correspondencebetween images. In addition, the image segmentation from the CRF can be formulated as a minimums–t graph cut problem which has a solution that is both globally optimal and fast. The combinationof a fast segmentation and minimal user input that is reusable, make this a powerful technique forthe segmentation of medical images.
I. IntroductionThe time required for manual delineation of organ tissues by radiologists and radiationoncologists is a major bottleneck in the treatment planning process. Expert oversight, however,is a necessity due to the legal and moral implications of any error in the process. While reliableautomatic segmentation is a long-term goal, a semiautomatic method can have immediate andsignificant impact by improving productivity and consistency in the tasks. We present a semi-automatic segmentation approach to address these challenges. We focus on the case where thesegmentation task is to separate normal organ tissue, referred to as the target, from non-target(background) tissue. User interactive input is used to extract statistics which determine anenergy (cost) function with regional and boundary terms. The form of the energy function isbased on the probabilistic graphical model: Conditional Random Fields (CRF) [9,10].Maximum-A-Posterior (MAP) estimation inference is given by minimizing this energyfunction. The solution is determined by a graph min s–t cut algorithm that rapidly provides aglobally optimal segmentation. Unlike work that makes simplified assumption on structureboundary (Greig et al. [6], Boykov at el. [2,3] and Wu et al [13]) or work that is prone to
NIH Public AccessAuthor ManuscriptConf Proc IEEE Eng Med Biol Soc. Author manuscript; available in PMC 2010 June 9.
Published in final edited form as:Conf Proc IEEE Eng Med Biol Soc. 2008 ; 2008: 3099–3102. doi:10.1109/IEMBS.2008.4649859.
NIH
-PA Author Manuscript
NIH
-PA Author Manuscript
NIH
-PA Author Manuscript
boundary leakage due to boundary contrast (snakes [1,7,14] and level set [12]) and sensitiveto initialization of a seed point or contour, our work combines interactive expert user guidanceto collect regional and boundary statistics in a probabilistic framework and a fast graph partitionalgorithm that provides a global solution for spatial consistency.
II. MethodsA. User Inputs
Initially the algorithm is provided training information from the expert user via a set of simpleand intuitive brush strokes on one or a few of the images to be segmented trough an interactiveGUI. As the user adjusts interactively and subsequently accepts a given segmentation, thetraining samples with observed image features are progressively collected. For subsequentslices to be segmented, the algorithm estimates the parameters of an energy function containingboth boundary and regional components from the training samples as well as new brush strokes.The users can retrain the model at any time if the statistics is not applicable. The segmentationprocess is shown in Figure 1.
B. Conditional Random Field (CRF)We begin by defining notation. We represent an image by a vector of random variables, Y =(Y1, Y2, …, Yn), where Yi is a random variable for the grey level intensity of the ith pixel. Lety denote an observed instance of Y with yi the measured feature vector at pixel i. We will usea single dimension feature - gray level in this work. The segmentation is described by a vectorX = (X1, X2, …, Xn), Xi ∈ {0, 1} of binary valued random variables. In any segmentation xpixel i must be classified as xi = 0, if it represents the target anatomical structure, and as xi =1 if it is in the complement, a non-target tissue. The labeling sequence of X, given an observedimage Y, can be modeled as a Conditional Random Field (CRF) [10] or more precisely, aDiscriminative Random Field (DRF) [9]. The undirected graphical model is shown in Figure2. CRF is a special type of Markov Random Field (MRF) globally conditional on Y. Using theHammersley-Clifford theorem, the joint distribution over labels X, given image Y, is given by
, where Z is a normalization constant. E(x, y) is an energy function canbe expressed in term of clique (maximum clique) potentials describing the local interactionsin a neighborhood system. Here we use 4-connected neighborhood system in the graphicalmodel and let Ni denote the neighborhood of site i, then
(1)
where ri and uij are unary and pair-wise potentials respectively and β is a constant weight . Wecall ri the regional term for association of a local site i with possible label class and uij theboundary term for potential of assigning xi and xj to different labels (a smoothness energy)when observing image y. Let fi be a function that maps the observed image y to a feature vectorat site i, that is fi(y) = yi. In this work we let the feature vector to be gray level value of image.We then choose
(2)
and
(3)
Hu et al. Page 2
Conf Proc IEEE Eng Med Biol Soc. Author manuscript; available in PMC 2010 June 9.
NIH
-PA Author Manuscript
NIH
-PA Author Manuscript
NIH
-PA Author Manuscript

Here δ is a Kronecker delta function with δ(xi,xj) = 1 if, xi ≠ xj, and δ(xi,xj) = 0 otherwise. Thepair-wise interaction term uij is obtained from well known general Potts Model. Then (1) canbe rewritten to
(4)
C. Graph CutMAP inference is given by minimizing E(x, y). Further, E(x, y) is graph representable [8] andthus we can solve the minimization problem using a graph min-cut/max-flow algorithm inpolynomial time [4,5]. By finding the minimum s–t cut, the cost of the cut (sum of the edges’cost being cut) is the minimum value of the energy function E(x, y). The graph constructionfor solving the minimization is shown in Figure 3 and Figure 4 shows an s–t cut example.
D. Probability estimationThe major contribution of our method is not using a fixed value or any assumption on strengthof the pair-wise interaction (boundary term) in CRF. The boundary term, as well as the regionalterm, is estimated from the observed samples specified by the user. We provide an interactiveuser interface similar to [2,3] and [11.] The user specifies the seed pixels for the target andnon-target by paint brushes.
Once the user determines that an agreeable result is obtained, we first obtain regional statisticsfrom the seeds for both target and non-target regions. For each pixel i, if i is a target seed thenyi is added to the training set for target, otherwise if i is a non-target seed then yi is added tothe training set for non-target. We then sample along the boundary of segmented target acceptedby the user for boundary statistics. Each pair of (yi, yj) where i, j are neighbors and i ∈ target,j ∈ non-target is added to the boundary training set. The sets of regional and boundary trainingsamples are used for estimating the probabilities of ri and ui,j in (2) and (3) for the subsequenceslices unless it is re-trained.
III. ResultsA. Phantom
To show the advantage of our method using estimated probability for the pair-wise potentialfunction ui,j, we synthesize a phantom image and compare our method’s segmentation (referredto as graph cut with probability estimation, GCPE) with a method based on the assumptionthat favors a high contrast boundary (graph cut with high contrast, GCHC). The phantom imagecontains a rectangle target region and various surrounding regions. Some of the surroundingregions have higher contrast boundary than the target region. This design reflects some realsituations in medial images and GCHC will usually mislabel the surrounding regions with highcontrast boundary as target (Figure 5(a), (d)) and extra manual corrections are required (Figure5(b), (e)). Addition of some Gaussian noise to the phantom image shows that, even with regionterms, i.e. likelihoods for intensity of the target and non-target regions, GCHC cannot achievea clean segmentation due to the noise pixels that are picked up by using stronger regional terms(Figure 5(e)). Note that the GCPE requires much fewer seed pixels to obtain good segmentationresults (Figure 5(c), (f)).
B. CT LiverAn experienced physician manually delineated a complete liver of a patient. The delineatedcontours are used as ground truth. There are total of 65 CT slices that intercept the liver. Each
Hu et al. Page 3
Conf Proc IEEE Eng Med Biol Soc. Author manuscript; available in PMC 2010 June 9.
NIH
-PA Author Manuscript
NIH
-PA Author Manuscript
NIH
-PA Author Manuscript
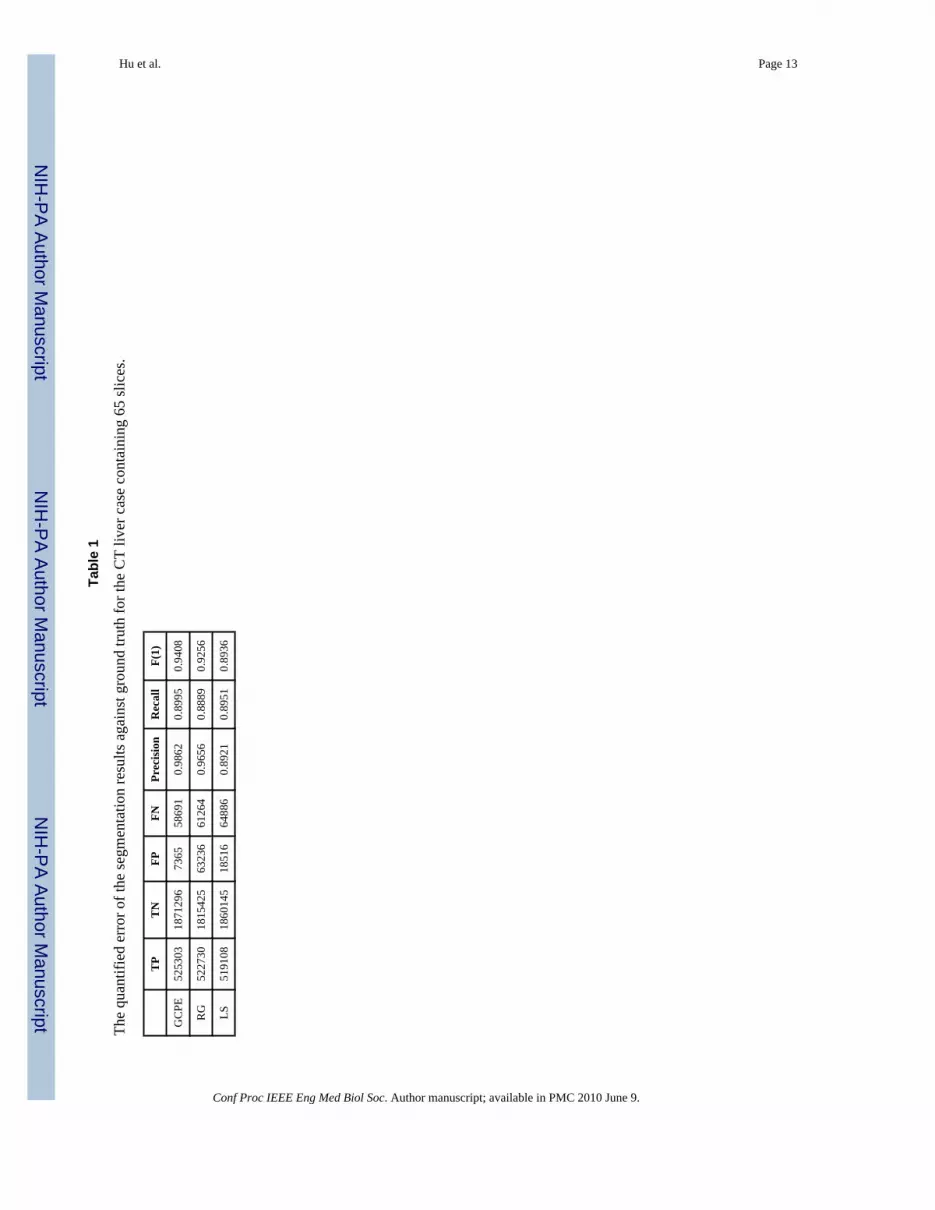
2D slice’s dimension is 512×512. The single middle slice is first segmented with GCHC andthe boundary of the resulting target region is sampled for training. Later this statisticalinformation from this single slice is used by our method GCPE for estimating the cliquepotential for all other slices without retraining during the whole segmentation process for thiscase. Once the training is done, the GCPE segmentation can be done in 6 seconds for eachslice, excluding the time needed for users to specify the seed pixels. For comparison, we alsosegment the liver by our in house application that implements Region Growing (RG) and byLevel Set (LS) methods provided by the MIPAV package from NIH. Precision and Recall ratesand F measure are calculated for each of the methods. The numbers are shown in Table 1 andFigure 7 shows some CT Slices with segmented contours along with the ground truth. Ouranalysis finds that most of the errors are from slices where the liver has several branches. Thephysician’s intent was to draw a contour that contained all the branches, rather than follow theboundary of individual branches, in order to consider the deformation and motion of the organduring the treatment (the lower left image in Figure 6.) In contrast to RG and LS, GCPEperforms well on the slices where the liver boundary is not clearly defined (Figure 7.) On theseslices, the precision is 0.99 and recall rate is 0.93 for GCPE while RG has precision 0.93 andrecall 0.91 and LS has precision 0.79 and recall 0.93. The F-measure on these slices for GCPE,RG and LS are 0.96, 0.92 and 0.85 respectively.
IV. Conclusion and future worksWe have proposed a purely statistical semi-automatic 2.5D medical image segmentationmethod that obtains MAP estimation of segmentation in Conditional Random Field framework.Results of the liver case have shown that the boundary statistics from a single slice can bereused for the entire image stack without retraining to achieve high accuracy. The liver casealso shows that our method is not prone to boundary leakage as is the case with region growingand level set methods. This is due to the global optimal solution in the graph cut and thesmoothness weight in the CRF. By comparing our method to the original graph cut methods,the time required for manual interaction is significantly reduced. This is extremely importantwhen the target anatomy volume is large and fast and accurate segmentation is very muchdesired. In our future work, we will extend our framework to 3D and explore more sophisticatedimage features to proved more accurate classification.
AcknowledgmentsThis work was supported in part by the U.S. National Institution of Health under Grant P20 CA118861-03/P20CA118856-03.
References1. Adams R, Bischof L. Seeded region growing. IEEE Trans. on Pattern Anal. Mach. Intell 1994;16(6):
641–647.2. Boykov Y, Jolly MP. Interactive graph cuts for optimal boundary & region segmentation of objects in
N-D images. Proc. of Intl. Conf. Computer Vision 2001;I:105–112.3. Boykov Y, Funka-Lea G. Graph cuts and efficient N-D image segmentation. Intl. Journal of Computer
Vision 2006;70:109–131.4. Boykov Y, Kolmogorov V. An experimental comparison of min-cut/ max-flow algorithms for energy
minimization in vision. IEEE Trans. Pattern Anal. Mach. Intell 2004;26(9):1124–1137. [PubMed:15742889]
5. Ford LR Jr, Fulkerson DR. Maximal flow through a network. Canadian Journal of Math 1956;8:399–404.
6. Greig D, Porteous B, Seheult A. Exact maximum a posteriori estimation for binary images. Journal ofthe Roy. Stat. Soc., Series B 1989;51:271–279.
Hu et al. Page 4
Conf Proc IEEE Eng Med Biol Soc. Author manuscript; available in PMC 2010 June 9.
NIH
-PA Author Manuscript
NIH
-PA Author Manuscript
NIH
-PA Author Manuscript

7. Kass M, Witkin A, Terzopoulos D. Snakes: active contour models. Intl. Journal of Computer Vision1988;1:321–331.
8. Kolmogorov V, Zabih R. What energy functions can be minimized via graph cuts? IEEE Trans. onPattern Anal. Mach. Intell 2004;26(2):147–159.
9. Kumar S, Hebert M. Discriminative random fields: A discriminative framework for contextualinteraction in classification. Proc. IEEE Intl. Conf. on Computer Vision 2003:1150–1159.
10. Lafferty J, McCallum A, Pereira AF. Conditional random fields: Probabilistic models for segmentingand labeling sequence data. Proc. 18th Intl. Conf. on Machine Learning 2001:282–289.
11. Levin, A.; Lischinski, D.; Weiss, Y. ACM SIGGRAPH 2004. ACM; 2004. Colorization usingoptimization; p. 689-694.
12. Sethian, JA. Level set methods and fast marching methods. Cambridge University Press; 1999.13. Wu Z, Leahy R. An optimal graph theoretic Approach to data clustering: Theory and its application
to image segmentation. IEEE Trans. on Pattern Anal. Mach. Intell 1993;15(13):1101–1113.14. Xu, C.; Prince, JL. Gradient vector flow: A new external force for snakes. Proc. IEEE Conf. on Comp.
Vis. Patt. Recog. (CVPR); Comp. Soc. Press; Los Alamitos. 1997. p. 66-71.
Hu et al. Page 5
Conf Proc IEEE Eng Med Biol Soc. Author manuscript; available in PMC 2010 June 9.
NIH
-PA Author Manuscript
NIH
-PA Author Manuscript
NIH
-PA Author Manuscript
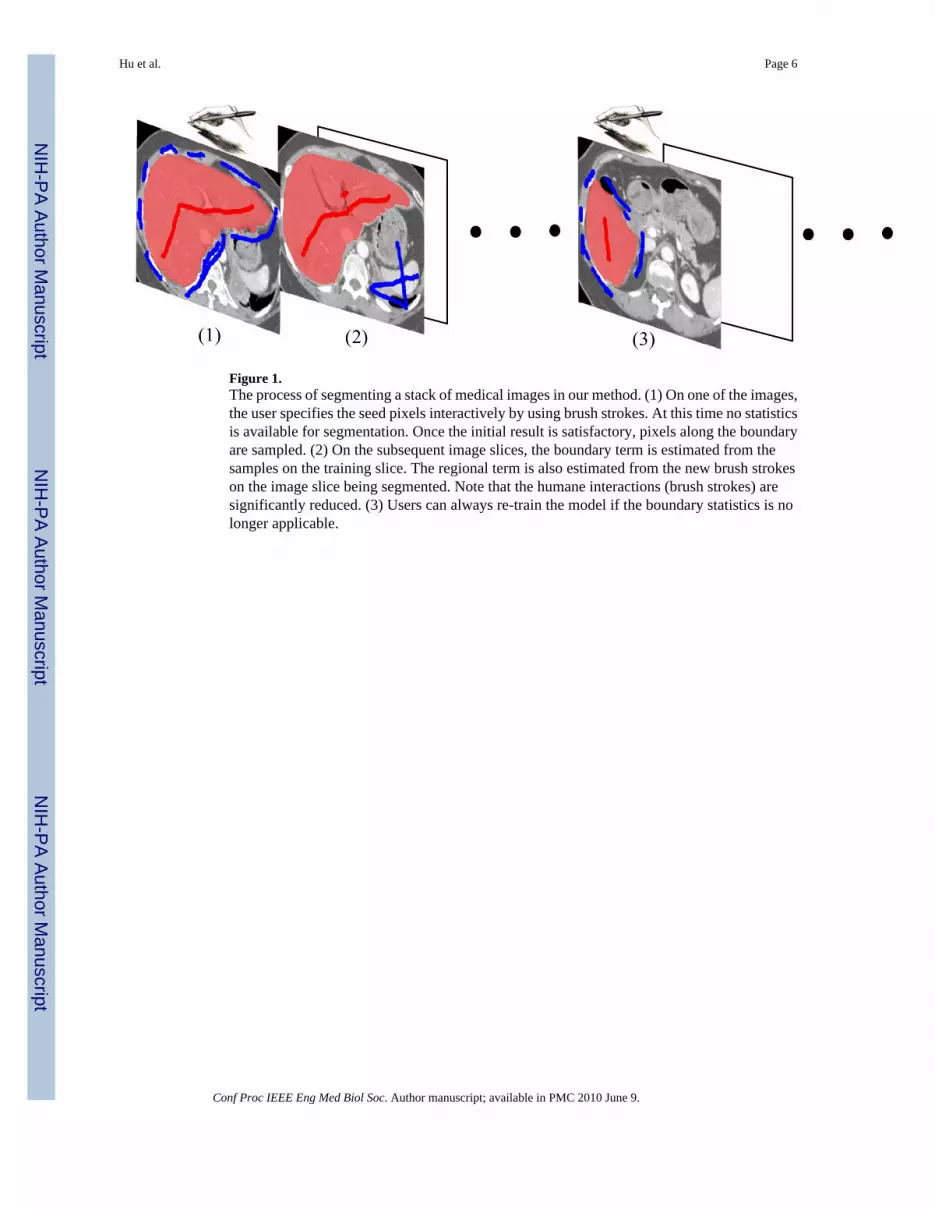
Figure 1.The process of segmenting a stack of medical images in our method. (1) On one of the images,the user specifies the seed pixels interactively by using brush strokes. At this time no statisticsis available for segmentation. Once the initial result is satisfactory, pixels along the boundaryare sampled. (2) On the subsequent image slices, the boundary term is estimated from thesamples on the training slice. The regional term is also estimated from the new brush strokeson the image slice being segmented. Note that the humane interactions (brush strokes) aresignificantly reduced. (3) Users can always re-train the model if the boundary statistics is nolonger applicable.
Hu et al. Page 6
Conf Proc IEEE Eng Med Biol Soc. Author manuscript; available in PMC 2010 June 9.
NIH
-PA Author Manuscript
NIH
-PA Author Manuscript
NIH
-PA Author Manuscript
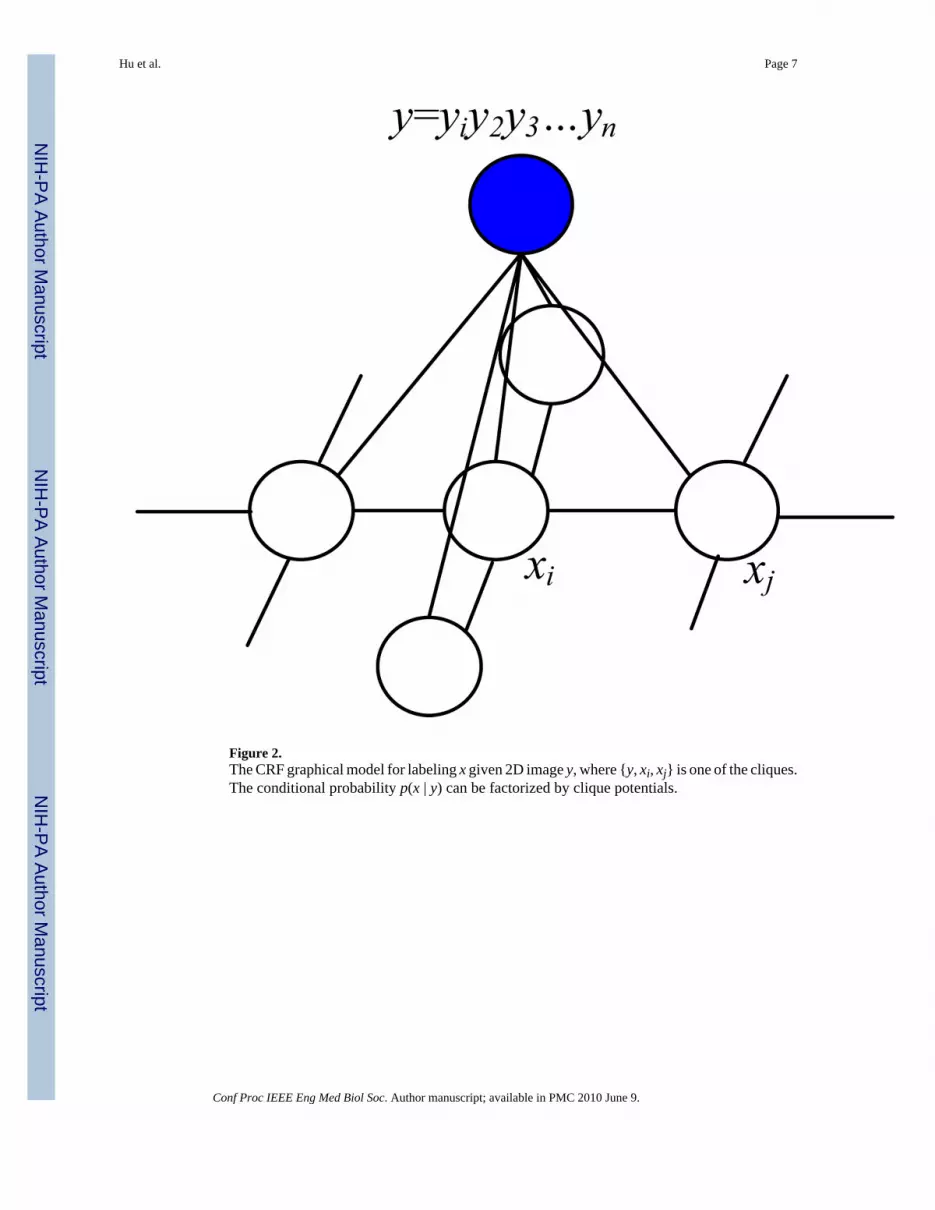
Figure 2.The CRF graphical model for labeling x given 2D image y, where {y, xi, xj} is one of the cliques.The conditional probability p(x | y) can be factorized by clique potentials.
Hu et al. Page 7
Conf Proc IEEE Eng Med Biol Soc. Author manuscript; available in PMC 2010 June 9.
NIH
-PA Author Manuscript
NIH
-PA Author Manuscript
NIH
-PA Author Manuscript

Figure 3.The edge cost assignment. The cost of the min s–t cut in the graph minimizes our energyfunction E in (4).
Hu et al. Page 8
Conf Proc IEEE Eng Med Biol Soc. Author manuscript; available in PMC 2010 June 9.
NIH
-PA Author Manuscript
NIH
-PA Author Manuscript
NIH
-PA Author Manuscript
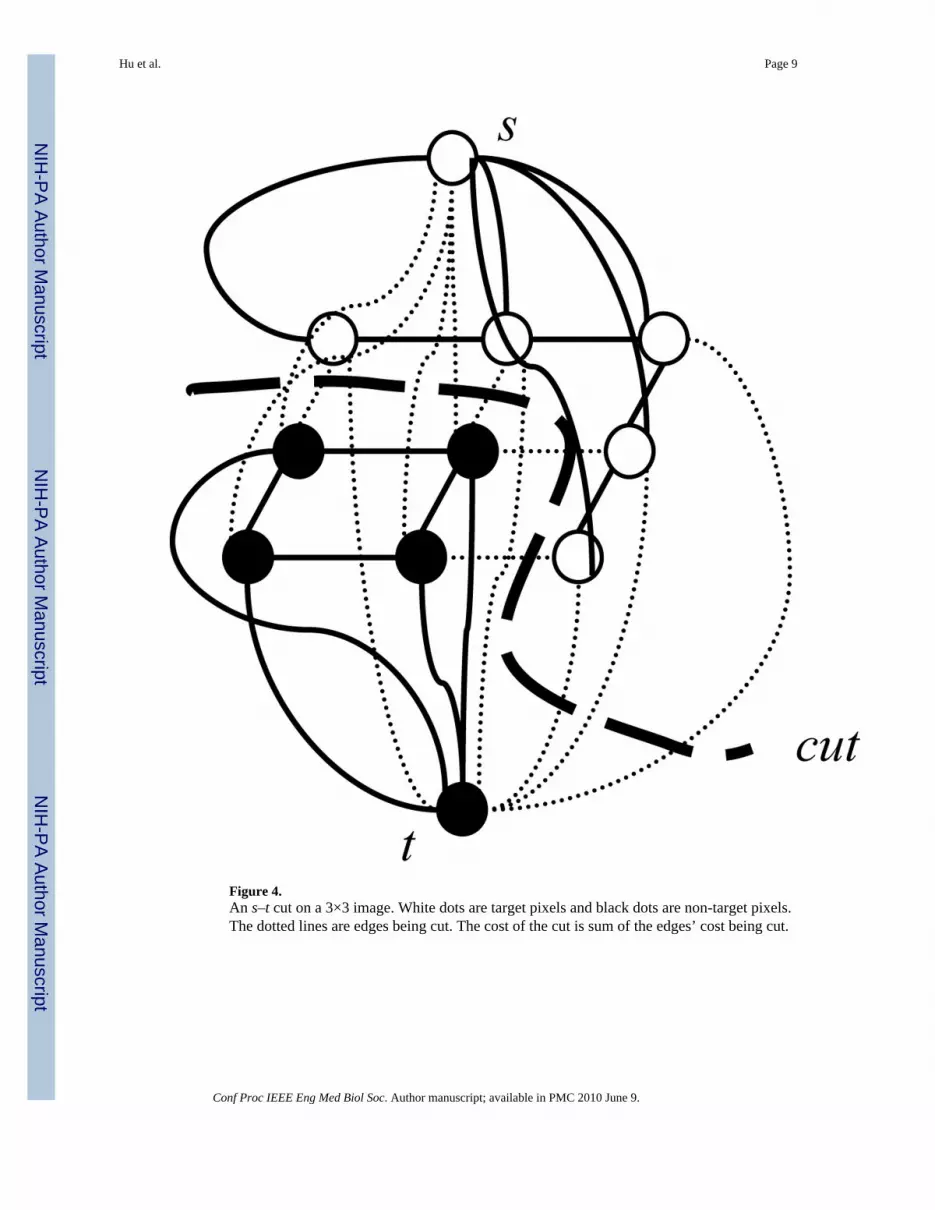
Figure 4.An s–t cut on a 3×3 image. White dots are target pixels and black dots are non-target pixels.The dotted lines are edges being cut. The cost of the cut is sum of the edges’ cost being cut.
Hu et al. Page 9
Conf Proc IEEE Eng Med Biol Soc. Author manuscript; available in PMC 2010 June 9.
NIH
-PA Author Manuscript
NIH
-PA Author Manuscript
NIH
-PA Author Manuscript
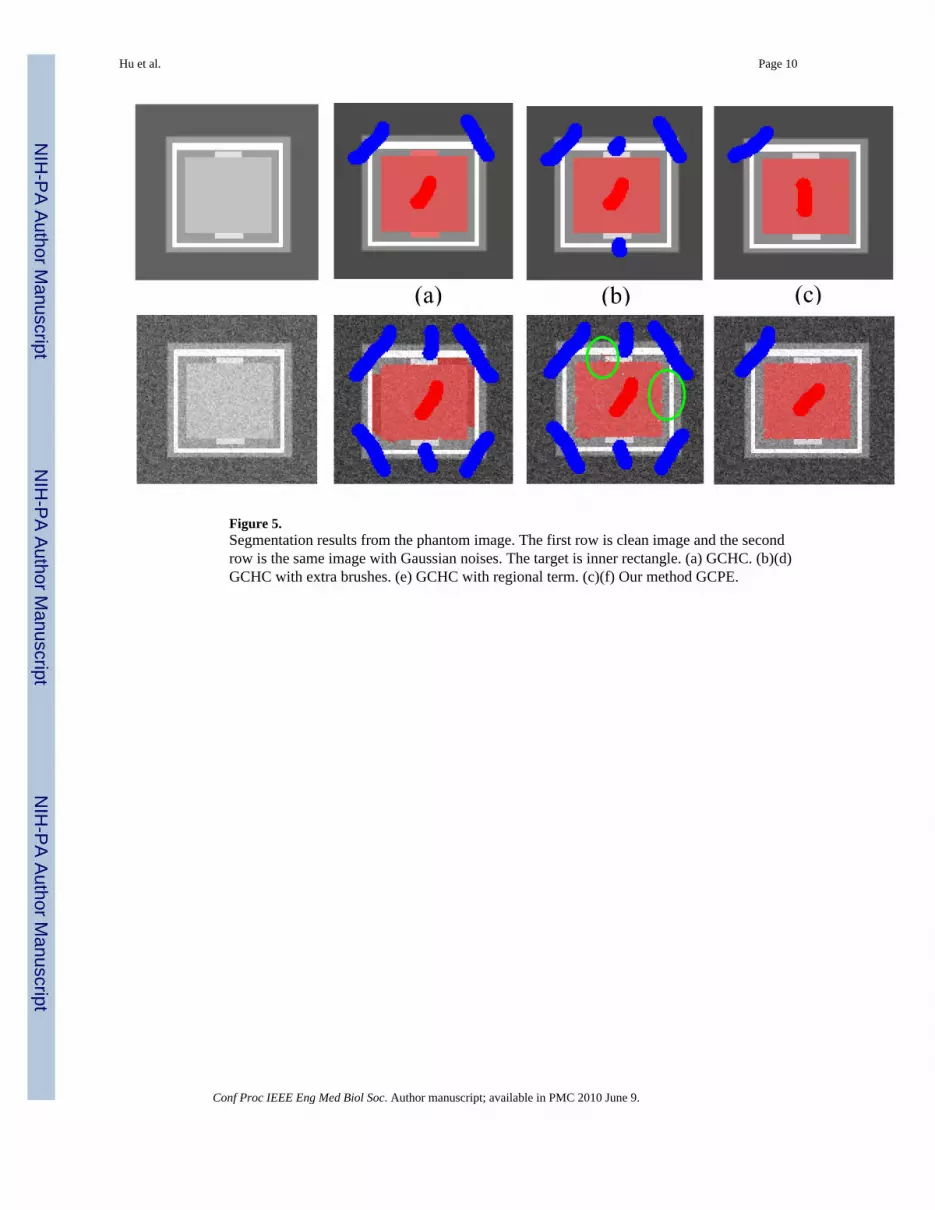
Figure 5.Segmentation results from the phantom image. The first row is clean image and the secondrow is the same image with Gaussian noises. The target is inner rectangle. (a) GCHC. (b)(d)GCHC with extra brushes. (e) GCHC with regional term. (c)(f) Our method GCPE.
Hu et al. Page 10
Conf Proc IEEE Eng Med Biol Soc. Author manuscript; available in PMC 2010 June 9.
NIH
-PA Author Manuscript
NIH
-PA Author Manuscript
NIH
-PA Author Manuscript

Figure 6.The contours extracted from our method (cyan) and the contours drawn by an experiencedphysician (red) from 9 of 65 CT slices segmented. The middle slice in red frame is the sliceused for training and its statistics for boundary is used for all 65 slices.
Hu et al. Page 11
Conf Proc IEEE Eng Med Biol Soc. Author manuscript; available in PMC 2010 June 9.
NIH
-PA Author Manuscript
NIH
-PA Author Manuscript
NIH
-PA Author Manuscript

Figure 7.CT slices where the boundary of liver becomes blurred. Red: ground truth, Orange: RG, Blue:LS, Filled Cyan: GCPE. Boundary leakage is severe in RG and LS.
Hu et al. Page 12
Conf Proc IEEE Eng Med Biol Soc. Author manuscript; available in PMC 2010 June 9.
NIH
-PA Author Manuscript
NIH
-PA Author Manuscript
NIH
-PA Author Manuscript
NIH
-PA Author Manuscript
NIH
-PA Author Manuscript
NIH
-PA Author Manuscript
Hu et al. Page 13
Tabl
e 1
The
quan
tifie
d er
ror o
f the
segm
enta
tion
resu
lts a
gain
st g
roun
d tru
th fo
r the
CT
liver
cas
e co
ntai
ning
65
slic
es.
TP
TN
FPFN
Prec
isio
nR
ecal
lF(
1)
GC
PE52
5303
1871
296
7365
5869
10.
9862
0.89
950.
9408
RG
5227
3018
1542
563
236
6126
40.
9656
0.88
890.
9256
LS51
9108
1860
145
1851
664
886
0.89
210.
8951
0.89
36
Conf Proc IEEE Eng Med Biol Soc. Author manuscript; available in PMC 2010 June 9.