automatic enrolment evaluation report 2018 - gov.uk
TRANSCRIPT
Automatic Enrolment
evaluation report 2018
December 2018
Automatic Enrolment evaluation report 2018
DWP ad hoc research report no. 68
A report of research carried out by the Department for Work and Pensions
© Crown copyright 2018.
You may re-use this information (not including logos) free of charge in any format or medium, under the terms of the Open Government Licence. To view this licence, visit http://www.nationalarchives.gov.uk/doc/open-government-licence/ or write to the Information Policy Team, The National Archives, Kew, London TW9 4DU, or email: [email protected].
This document/publication is also available on our website at: https://www.gov.uk/government/organisations/department-for-work-pensions/about/research#research-publications
If you would like to know more about DWP research, please email: [email protected]
First published December 2018.
ISBN 978-1-78659-117-3
Views expressed in this report are not necessarily those of the Department for Work and Pensions or any other Government Department
Automatic Enrolment evaluation report 2018
3
Executive summary
Background
To support the millions of people not saving enough for retirement, the Government
introduced legislation in Pensions Acts from 2007, with the aim of increasing private
pension saving in the UK. In 2012 automatic enrolment was introduced as part of a
wider set of pension reforms designed to ensure that the UK has a pension system
that enables individuals to save towards achieving the lifestyle they aspire to in
retirement, while minimising the implementation challenges for employers and the
pensions industry.
The reforms require employers to automatically enrol eligible workers into a qualifying
workplace pension scheme and make a minimum contribution. Workers are eligible
provided they: are aged at least 22 and under State Pension age (SPa); earn over
£10,000 per year in 2018/19 terms (these thresholds are reviewed annually);
normally work in the UK and do not currently participate in a qualifying workplace
pension scheme.
The automatic enrolment duties were staged in between October 2012 and February
2018 by employer size, starting with the largest employers. Since October 2017, all
businesses employing someone for the very first time have to provide a workplace
pension from the first day of their service.
In 2018, the first of two planned minimum contribution increases was implemented.
Before April 2018, total minimum contributions were two per cent of a band of
workers’ earnings, of which at least one per cent came from the employer. This rose
to five per cent in April 2018, of which at least two per cent must come from the
employer. It will rise to eight per cent from April 2019, of which at least three per cent
must come from the employer.
Evaluation Strategy
The Department for Work and Pensions (DWP) is committed to fully evaluating the
effects of the workplace pension reforms, as set out in its evaluation strategy1, which
was refreshed in 2017. Evaluation reports have been published annually since 2013,
following a baseline report in 2012 which described the landscape before the
implementation of automatic enrolment.2 This report brings together the latest
evidence, including evidence published within the last 12 months and new analysis
conducted for the report, showing what has happened since automatic enrolment
began.
1 DWP. (2017). Automatic Enrolment Evaluation Strategy 2017. At :
https://www.gov.uk/government/publications/automatic-enrolment-evaluation-strategy-2017
2 At: https://www.gov.uk/government/collections/workplace-pension-participation-and-savings-trends
Automatic Enrolment evaluation report 2018
4
Key findings
Existing evidence from the last 12 months
Since the start of automatic enrolment in 2012, more than 9.9 million workers have
been automatically enrolled, and over 1.4 million employers have met their duties,
with 591,000 workers having been automatically re-enrolled and 73,643 employers
having met their re-enrolment duties.3 The number of compliance notices issued by
The Pensions Regulator (TPR) has risen from nearly 34,000 in 2016/17 to nearly
61,000 in 2017/18, however this is broadly in line with the increased number of
employer declarations of compliance TPR received. The majority of employers
subsequently complied when they were reminded of their duties.4
Levels of awareness and understanding of automatic enrolment are high. In
particular, at least 93 per cent of micro, small and medium-sized employers were
aware of each individual ongoing duty in relation to automatic enrolment.5
Virtually all medium and large employers (97 per cent and 99 per cent respectively),
and the vast majority of small employers (84 per cent), stated that they had
automatically enrolled employees into a qualifying pension scheme by late 2017. In
2017, just under one half (47 per cent) of employers currently had some form of
workplace pension provision, up from 19 per cent in 2013. These organisations
employed 91 per cent of all private sector employees.6
Some employers were contributing more than the minimum required contribution
rate. In around one quarter (24 per cent) of schemes used for automatic enrolment,
employers were contributing at least three per cent in 2017, ahead of the first
planned increase.7
3 TPR. (2018). Automatic enrolment Declaration of compliance report July 2012 – end November
2018. At: https://www.thepensionsregulator.gov.uk/-
/media/thepensionsregulator/files/import/pdf/automatic-enrolment-declaration-of-compliance-monthly-
report.ashx
4 TPR. (2018). Automatic Enrolment Commentary and analysis: April 2017 – March 2018. At:
https://www.thepensionsregulator.gov.uk/-/media/thepensionsregulator/files/import/pdf/automatic-
enrolment-commentary-analysis-2018.ashx
5 TPR. (2018). Ongoing Duties Survey – Summer 2018. At: https://www.thepensionsregulator.gov.uk/-
/media/thepensionsregulator/files/import/pdf/employer-automatic-enrolment-ongoing-duties-survey-
summer-2018.ashx
6 DWP. (2018). Employers’ Pension Provision Survey 2017. At:
https://www.gov.uk/government/publications/employers-pension-provision-survey-2017
7 DWP. (2018). Employers’ Pension Provision Survey 2017. At:
https://www.gov.uk/government/publications/employers-pension-provision-survey-2017
Automatic Enrolment evaluation report 2018
5
Data collected up to 2017 found that the number of eligible employees participating in
a workplace pension has increased to 17.7 million (84 per cent), up from 10.7 million
(55 per cent) in 2012. Overall, eligible employees are continuing to save persistently.8
The annual total amount saved by eligible employees across both sectors stands at
£90.3 billion in 2017, which is an increase of £4.3 billion from 2016. Annual total
amounts increased in both public and private sectors from 2016. The public sector
increased by around £0.3 billion and the private sector by £4.0 billion.9
New analysis within this report
Rates of opt-out and cessation (stopping saving into a pension after the opt-out
period) have at the end June 2018 remained consistent with levels before the first
planned contribution increase in April 2018. Those who are enrolled due to staging
have higher opt-out rates than those enrolled due to starting a job with an employer
who already has ongoing automatic enrolment duties.10
Males and females have the same levels of opt-out, but males have slightly higher
levels of cessation. Generally, older age groups have higher opt-out rates, but those
aged 22 to 29 and 60 to State Pension age have the highest cessation rates –
although these rates are at relatively low levels.11
Higher earners tend to have higher opt-out rates than lower earners, while (with the
exception of the highest earners who have the highest cessation rates) there is not
much variation in cessation rates by earnings level.12
In 2017, over 7 million eligible private sector employees saving into a workplace
pension received an employer contribution of two per cent or above (above the then-
minimum contribution rate); of these, 5.5 million received an employer contribution of
four per cent or above. More than 92 per cent of eligible employees in the private
sector contributing between three and four per cent received a matching (or higher)
employer contribution rate.13
Approximately 5.9 million eligible employees were already meeting the April 2019
minimum contribution rates, based on data from April 2017. However, around 5.1
million eligible employees were still contributing below April 2018 minimums at that
8 DWP. (2018). Official statistics on workplace pension participation and saving trends for eligible
employees. At: https://www.gov.uk/government/statistics/workplace-pension-participation-and-saving-
trends-2007-to-2017
9 DWP. (2018). Official statistics on workplace pension participation and saving trends for eligible
employees. At: https://www.gov.uk/government/statistics/workplace-pension-participation-and-saving-
trends-2007-to-2017
10 See section 4.3.3 and 4.3.6.
11 See section 4.3.3 and 4.3.6.
12 See section 4.3.3 and 4.3.6.
13 See section 4.6.1 and 4.6.2.
Automatic Enrolment evaluation report 2018
6
time, and around 6.1 million will have to increase their contributions by April 2019, if
not earlier.14
The rate of levelling down (reducing the generosity of contributions or outcomes for
existing pension scheme members) has increased slightly since 2012.15 However
findings from the Employers' Pension Provision Survey 2017 suggest that where
employers have experienced increased contribution costs as a result of automatic
enrolment, only one per cent of employers have adopted levelling down as a strategy
to absorb increased contribution costs.
Findings from the DWP’s communications tracking research (June 2018 wave) found
that the majority of individuals interviewed viewed automatic enrolment as a good
thing for them personally (82 per cent); agreed saving into a workplace pension was
normal for them (80 per cent); and knew where to go if they wanted to find more
about workplace pensions (83 per cent).16
The emerging findings from forthcoming DWP research with ‘newborn’ (new)
employers, to be published in 2019, suggest that the reality of implementing
automatic enrolment was usually less burdensome than employers had anticipated.
The financial burden, over and above the ongoing cost of employer contributions,
was either small or even non-existent.17
Next Steps
The latest evidence shows that automatic enrolment remains on track, with millions
more employees enrolled into private pension saving in the UK. The staging of
employers has completed, and evidence to date from the first contribution increase
suggests consistent saving behaviours from prior to the increase.
The next evaluation report will set out further evidence from the first contribution
increase and findings from the second increase in April 2019. Following the
completion of the second increase, we will move from implementation of the reforms
to steady state. The next evaluation report will review progress to date since
implementation started in 2012, and update on future evaluation reporting plans for
steady state.
14 See section 4.6.3.
15 See section 4.6.4.
16 See section 4.4.1, 4.4.2 and 4.4.3.
17 See section 4.7.5.
Automatic Enrolment evaluation report 2018
7
Contents
Acknowledgements .................................................................................................. 14
The Authors .............................................................................................................. 15
List of abbreviations .................................................................................................. 16
Glossary of terms ..................................................................................................... 17
1 Introduction ........................................................................................................ 24
1.1 Evaluation strategy ..................................................................................... 25
1.2 Report structure.......................................................................................... 26
2 Delivery of reforms ............................................................................................ 27
Summary ............................................................................................................. 27
2.1 Role of The Pensions Regulator ................................................................ 27
2.1.1 Communicating reforms to employers and their advisers ................... 27
2.1.2 Declarations of compliance ................................................................. 28
2.1.3 Enforcement ........................................................................................ 29
2.1.4 Employer forecast ............................................................................... 30
2.2 Communicating reforms to individuals ........................................................ 31
2.3 NEST .......................................................................................................... 32
3 Employers’ implementation of reforms .............................................................. 34
Summary ............................................................................................................. 34
3.1 Employer awareness, understanding and activity ...................................... 35
3.1.1 Awareness and understanding of ongoing duties................................ 35
3.1.2 Employers’ pension provision in 2017 ................................................. 36
3.1.3 Influence of employer attitudes to reforms on their behaviour ............. 38
3.1.4 Employers’ awareness and response to TPR’s enforcement powers . 39
3.1.5 Employers going beyond the minimum requirements ......................... 40
4 Impact of automatic enrolment .......................................................................... 42
Summary ............................................................................................................. 42
4.1 Trends in workplace pension participation ................................................. 44
4.1.1 Overall number of savers .................................................................... 44
4.1.2 Employer size ...................................................................................... 45
4.1.3 Earnings .............................................................................................. 46
4.1.4 Gender ................................................................................................ 47
Automatic Enrolment evaluation report 2018
8
4.1.5 Age ...................................................................................................... 48
4.1.6 Economic status .................................................................................. 49
4.1.7 Disability .............................................................................................. 50
4.1.8 Ethnicity .............................................................................................. 51
4.1.9 Persistency of saving .......................................................................... 53
4.2 Trends in occupational pension scheme provision ..................................... 54
4.3 Opt-out, cessation, re-enrolment and non-eligible employee enrolment .... 56
4.3.1 Overall opt-out in 2017 ........................................................................ 56
4.3.2 Using Real Time Information to measure opt-out and cessation ......... 57
4.3.3 RTI analysis of opt-out trends ............................................................. 59
4.3.4 Reasons for opting out ........................................................................ 65
4.3.5 Overall cessation in 2017 .................................................................... 66
4.3.6 RTI analysis of cessation trends ......................................................... 66
4.3.7 Re-enrolment volumes, opt-out and cessation .................................... 71
4.3.8 Enrolment of non-eligible employees .................................................. 72
4.4 Individual attitudes, understanding and activities ....................................... 72
4.4.1 Recognising the benefits of pension saving ........................................ 72
4.4.2 The social norms of workplace pension saving ................................... 73
4.4.3 Individuals’ access and understanding of information on pension saving
73
4.4.4 Employee contributions of eligible employees participating in workplace
pensions ......................................................................................................... 74
4.4.5 Characteristics of eligible employees and employers contributing at
least the minimum .......................................................................................... 76
4.5 Trends in workplace pension saving .......................................................... 79
4.6 Employer contributions ............................................................................... 81
4.6.1 Employer contributions of eligible employees participating in workplace
pensions ......................................................................................................... 81
4.6.2 Employers matching employee contributions ...................................... 83
4.6.3 Preparedness for contribution increases ............................................. 84
4.6.4 Levelling down .................................................................................... 85
4.6.5 Contractual enrolment ......................................................................... 87
4.7 Employer burden and responses................................................................ 88
4.7.1 Administrative costs ............................................................................ 88
4.7.2 Contribution costs ............................................................................... 89
4.7.3 Responses to costs incurred through implementing automatic
enrolment ....................................................................................................... 89
4.7.4 Pension scheme choice ...................................................................... 91
4.7.5 Employer views and attitudes on the level of burden .......................... 93
4.8 Pensions industry ....................................................................................... 94
4.8.1 Protecting the interests of employees and employers ......................... 94
4.8.2 Driving up provider standards ............................................................. 95
Automatic Enrolment evaluation report 2018
9
4.8.3 Guidance from TPR ............................................................................ 96
4.8.4 Intermediaries’ awareness, understanding and activity ....................... 97
5 Next steps ......................................................................................................... 98
5.1 Future evaluation reports ........................................................................... 98
5.2 Forthcoming research ................................................................................ 98
6 Annexes ............................................................................................................ 99
6.1 Real Time Information (RTI) Monitoring of Opt-out and Cessations ........... 99
6.1.1 Her Majesty’s Revenue and Customs (HMRC) RTI Data .................... 99
6.1.2 Methodology...................................................................................... 100
6.1.3 Key assumptions and caveats........................................................... 102
6.1.4 Earnings and age opt-out rate cross tabulations ............................... 104
6.1.5 Earnings and age stopping saving rate cross tabulations ................. 106
6.1.6 Counts of numbers saving into a workplace pension each month on RTI
107
6.1.7 RTI data tables .................................................................................. 109
6.2 Voluntary statement of compliance with the Code of Practice for Statistics
116
6.2.1 Trustworthiness ................................................................................. 116
6.2.2 Quality ............................................................................................... 116
6.2.3 Value ................................................................................................. 117
6.3 Evaluation Questions ............................................................................... 117
List of Figures
Figure 2.1 – Summary of TPR engagement activity in 2017-18 ............................... 28
Figure 2.2 – Quarterly forecast of employers due to comply with automatic enrolment
................................................................................................................................. 31
Figure 2.3 – Information on NEST membership, number of employers using NEST
and assets under management of NEST .................................................................. 33
Figure 3.1 – Declarations of compliance received by TPR, compared with fines
issued by TPR, during 2017/18 ................................................................................ 40
Figure 4.1 – Eligible employees participating in workplace pensions, by sector ....... 45
Figure 4.2 – Eligible employees participating in workplace pensions, by employer
size ........................................................................................................................... 46
Figure 4.3 – Eligible employees participating in workplace pensions, by gross annual
earnings .................................................................................................................... 47
Figure 4.4 – Eligible employees participating in workplace pensions, by gender and
sector ........................................................................................................................ 48
Automatic Enrolment evaluation report 2018
10
Figure 4.5 – Eligible employees participating in workplace pensions, by age band .. 49
Figure 4.6 – Participation in all pensions, by economic status.................................. 50
Figure 4.7 – Participation in all pensions, by disability .............................................. 51
Figure 4.8 – Participation in all pensions, by ethnicity .............................................. 52
Figure 4.9 – Persistency of eligible employees participating in workplace pensions 53
Figure 4.10 – Active membership of occupational pension schemes by sector ........ 55
Figure 4.11 – Active membership of private sector occupational pension scheme by
benefit structure ........................................................................................................ 56
Figure 4.12 – Proportion of those enrolled each period stopping saving within opt-out
window, by reason for stopping saving ..................................................................... 60
Figure 4.13 – Proportion of those starting saving each month making an active
decision to stop saving within opt-out window by financial year ............................... 61
Figure 4.14 – Proportion of those stopping saving within opt-out window, by method
of enrolment .............................................................................................................. 62
Figure 4.15 – Percentage of each cohort who made an active decision to stop
pension saving within six weeks of making their first pension contribution, by gender
................................................................................................................................. 63
Figure 4.16 – Proportion of those enrolled each period stopping saving within opt-out
window, by age group ............................................................................................... 64
Figure 4.17 – Percentage of each cohort who made an active decision to stop
pension saving within six weeks of making their first pension contribution, by
earnings level ........................................................................................................... 65
Figure 4.18 – Stopping saving: the average monthly proportion of workplace pension
savers who stop saving each financial year, by reason. ........................................... 67
Figure 4.19 – Stopping saving: the average monthly proportion of workplace pension
savers who make an active decision to stop pension saving each month (including
opt-outs and cessations)........................................................................................... 68
Figure 4.20 – Stopping saving: the average monthly proportion of workplace pension
savers who make an active decision to stop pension saving each financial year, by
gender ...................................................................................................................... 69
Figure 4.21 – Stopping saving: the average monthly proportion of workplace pension
savers who make an active decision to stop pension saving each financial year, by
age group ................................................................................................................. 70
Figure 4.22 – Stopping saving: the average monthly proportion of workplace pension
savers who make an active decision to stop pension saving each financial year, by
earnings level ........................................................................................................... 71
Figure 4.23 – Percentage of eligible employees with workplace pensions: by banded
rate of employee contribution in the private sector, 2012 to 2017, Great Britain ...... 75
Automatic Enrolment evaluation report 2018
11
Figure 4.24 – Number of eligible employees with workplace pensions (in thousands):
by banded rate of employee contribution in the private sector, 2012 to 2017, Great
Britain ....................................................................................................................... 76
Figure 4.25 – Percentage of eligible employees with workplace pensions: by banded
rate of employer contribution in the private sector, 2012 to 2017, Great Britain ....... 82
Figure 4.26 – Number of eligible employees with workplace pensions (in thousands):
by banded rate of employer contribution in the private sector, 2012 to 2017, Great
Britain ....................................................................................................................... 83
Figure 4.27 – Number of eligible employees, by banded rate of employer and total
contribution, in the private sector, 2017, Great Britain .............................................. 85
Figure 4.28 – Levelling down: Eligible savers’ employer contributions to a workplace
pension in the private sector ..................................................................................... 86
Figure 6.1 – Active decision opt-out rates for those enrolled from August 2015 to July
2016, split by age and income level ........................................................................ 105
Figure 6.2 – New savers: the percentage of new savers in each age category, for
those who started saving between from August 2015 to July 2016 ........................ 105
Figure 6.3 – Active decision stopping saving rate for August 2015 to July 2016, split
by age and earnings level ....................................................................................... 106
Figure 6.4 – Count of the number of employments making employee pension
contributions on RTI each month ............................................................................ 107
Figure 6.5 – Count of the number of employments making employee pension
contributions on RTI each month, by gender .......................................................... 108
Figure 6.6 – Count of the number of employments making employee pension
contributions on RTI each month, by age group ..................................................... 108
Figure 6.7 – Count of the number of employments making employee pension
contributions on RTI each month, by earnings level ............................................... 109
List of Tables
Table 3.1 – Status of automatic enrolment, by size of organisation, 2017 ................ 37
Table 3.2 – Any pension provision, by size of organisation, 2013 and 2017 ............ 38
Table 4.1 – Percentage of eligible employees with workplace pensions: by banded
rate of employee contribution in the private sector, 2010 to 2017, Great Britain ...... 74
Table 4.2 – Number of eligible employees with workplace pensions: by banded rate
of employee contribution in the private sector, 2010 to 2017, Great Britain ............. 75
Table 4.3 – Distribution of eligible employees paying contributions at least the
minimum, by age band, in the private sector, 2010 to 2017, Great Britain ............... 77
Table 4.4 – Number of eligible employees paying contributions at least the minimum,
by age band, in the private sector, 2010 to 2017, Great Britain ................................ 77
Automatic Enrolment evaluation report 2018
12
Table 4.5 – Distribution of eligible employees paying contributions at least the
minimum: by earnings band, in the private sector, 2010 to 2017, Great Britain........ 77
Table 4.6 – Number of eligible employees paying contributions at least the minimum:
by earnings band, in the private sector, 2010 to 2017, Great Britain ........................ 78
Table 4.7 – Distribution of eligible employees paying contributions at least the
minimum, by employer size, in the private sector, 2010 to 2017, Great Britain ........ 78
Table 4.8 – Number of eligible employees paying contributions at least the minimum,
by employer size, in the private sector, 2010 to 2017, Great Britain ......................... 78
Table 4.9 – Trends in workplace pension saving ...................................................... 80
Table 4.10 – Percentage of eligible employees with workplace pensions: by banded
rate of employer contribution in the private sector, 2010 to 2017, Great Britain ....... 81
Table 4.11 – Number of eligible employees with workplace pensions: by banded rate
of employer contribution in the private sector, 2010 to 2017, Great Britain .............. 82
Table 4.12 – Percentage of eligible employees receiving a matching employer
contribution, by banded rate, in the private sector, 2017, Great Britain .................... 84
Table 4.13 – Reasons for enrolment of non-eligible employees, by employer size .. 88
Table 4.14 – Employers’ strategies to absorb increase in total pension contributions,
by size of organisation .............................................................................................. 90
Table 6.1 – Proportion of those starting saving each year who stop saving within the
opt-out window, by reason ...................................................................................... 109
Table 6.2 – Proportion of those starting saving each month making an active decision
to stop saving within the opt-out window, by financial year .................................... 110
Table 6.3 – Stopping saving: the average monthly proportion of workplace pension
savers who stop saving each financial year, by reason for stopping saving ........... 110
Table 6.4 – Stopping saving: the average monthly proportion of workplace pension
savers who make an active decision to stop pension saving each month (including
opt-outs and cessations), by financial year ............................................................. 111
Table 6.5 – Proportion of those enrolled each period stopping saving within opt-out
window, by method of enrolment ............................................................................ 112
Table 6.6 – Proportion of those enrolled each period stopping saving within opt-out
window, by age group ............................................................................................. 112
Table 6.7 – Stopping saving: the average monthly proportion of workplace pension
savers who make an active decision to stop pension saving each financial year, by
age group ............................................................................................................... 112
Table 6.8 – Proportion of those enrolled each period stopping saving within opt-out
window, by gender .................................................................................................. 113
Table 6.9 – Stopping saving: the average monthly proportion of workplace pension
savers who make an active decision to stop pension saving each financial year, by
gender .................................................................................................................... 114

Automatic Enrolment evaluation report 2018
13
Table 6.10 – Proportion of those enrolled each period stopping saving within opt-out
window, by earnings level ....................................................................................... 114
Table 6.11 – Stopping saving: the average monthly proportion of workplace pension
savers who make an active decision to stop pension saving each financial year, by
earnings level ......................................................................................................... 115
Automatic Enrolment evaluation report 2018
14
Acknowledgements
We would like to thank the many contributors to this report from the Department for
Work and Pensions (DWP), The Pensions Regulator (TPR), and HM Revenue and
Customs (HMRC).
We would also like to thank the cross-Government steering group that includes
representatives from DWP, TPR, National Employment Savings Trust (NEST), Her
Majesty’s (HM) Treasury and the Office for National Statistics (ONS) for their support
in producing this report.
Automatic Enrolment evaluation report 2018
15
The Authors
Lucy Allen Research Officer, Department for Work and Pensions
Maisey Hodges Government Social Research Placement Student,
Department for Work and Pensions
Nicolas Kreitmair Assistant Economist, Department for Work and Pensions
Mycroft Leitch Economist Placement Student, Department for Work and
Pensions
Fiona Lynch Higher Statistical Officer, Her Majesty’s Revenue and
Customs
Lorraine Pearson Principal Research Officer, Department for Work and
Pensions
James Rees Principal Scientific Officer, Department for Work and
Pensions
Stephen Stack Assistant Economist, Department for Work and Pensions
Automatic Enrolment evaluation report 2018
16
List of abbreviations
ABI Association of British Insurers
AE Automatic enrolment
ASHE Annual Survey of Hours and Earnings
DB Defined Benefit
DC Defined Contribution
DWP Department for Work and Pensions
EPP Employers’ Pension Provision (Survey)
EQ Evaluation Question
FCA Financial Conduct Authority
FRS Family Resources Survey
HMT Her Majesty’s Treasury
HMRC Her Majesty’s Revenue and Customs
IFA Independent Financial Adviser
KGR Key Governance Requirement
LEL Lower Earnings Limit
NEST National Employment Savings Trust
NI National Insurance
ONS Office for National Statistics
OPSS Occupational Pension Schemes Survey
PAYE Pay As You Earn
PLSA Pensions and Lifetime Savings Association
RTI Real Time Information
SPA State Pension age
TPR The Pensions Regulator (also referred to as ‘the regulator’)
UEL Upper Earnings Limit
WPP Workplace pensions
Automatic Enrolment evaluation report 2018
17
Glossary of terms
Active member Individuals currently contributing to a pension scheme, or having
contributions made on their behalf.
Automatic
enrolment
In 2008, the Government introduced a law designed to help people
save more for their retirement. This requires, from 2012, all
employers to enrol their eligible jobholders into a workplace pension
scheme if they are not already in one. In order to preserve individual
responsibility for the decision to save, workers have the right to opt
out of the scheme.
Career average A Defined Benefit (DB) scheme that gives individuals a pension
based on their salary times the accrual rate in each year of their
working life. Entitlements that are built up each year are revalued in
line with inflation or earnings.
Ceasing active
membership
If an eligible jobholder chooses to stop paying into an automatic
enrolment scheme after the end of the opt-out period, they are said
to cease active membership.
Cessation When a worker has ceased active membership.
Contract-based
pensions
Pensions where the legal contract is between the individual and the
pension provider, usually an insurance company. Also known as
personal pensions.
Contributions The amount (often expressed as a percentage of earnings) that a
worker and/or employer pays into a pension.
Defined Benefit
(DB)
A type of occupational pension scheme. In a DB scheme the amount
the member gets at retirement is based on various factors, but is
predetermined (defined). These could include how long they have
been a member of the pension scheme and earnings. Examples of
DB pension schemes include final salary or career average
earnings-related pension schemes. In most schemes, some of the
pension can be taken as a tax-free lump sum. The rest is then
received as regular income, which might be taxable.
Defined
Contribution (DC)
A type of pension scheme. In a DC scheme a member’s pension pot
is put into various investments such as shares (shares are a stake in
a company). The amount in the pension pot at retirement is based
on how much is paid in and how well the investments have
performed. The pension can usually be accessed from age 55.
These are also known as ‘money purchase’ schemes.
Automatic Enrolment evaluation report 2018
18
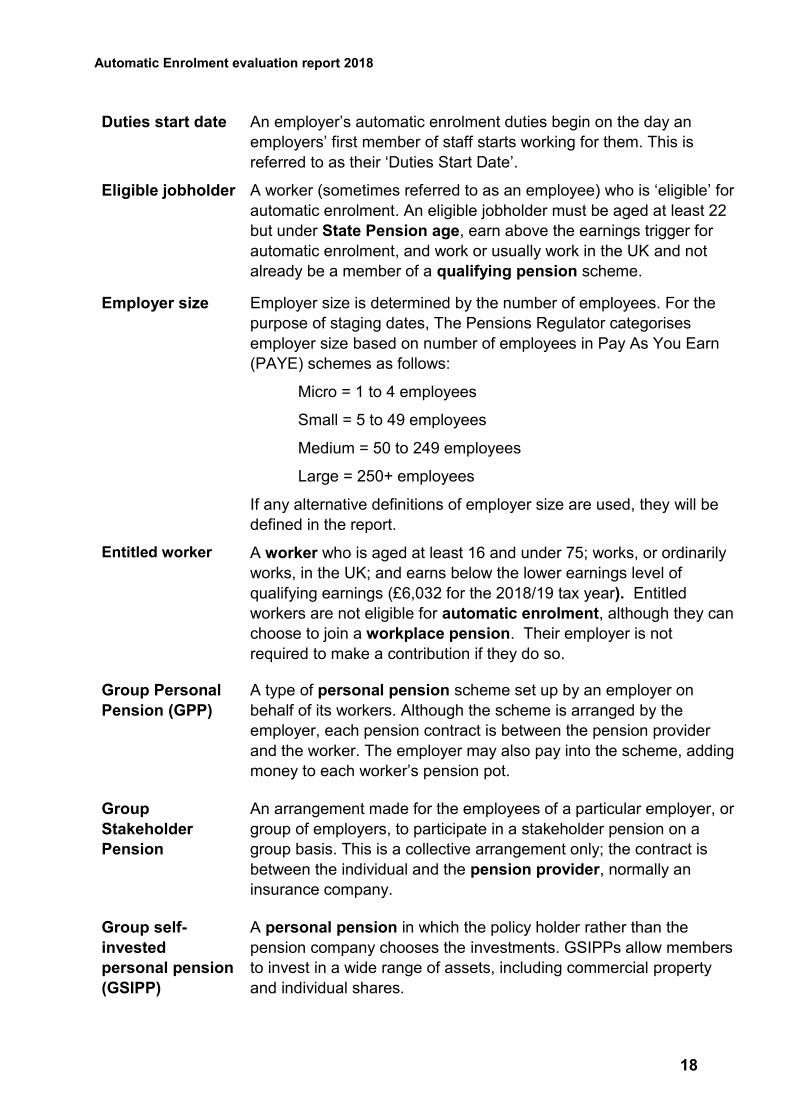
Duties start date An employer’s automatic enrolment duties begin on the day an
employers’ first member of staff starts working for them. This is
referred to as their ‘Duties Start Date’.
Eligible jobholder A worker (sometimes referred to as an employee) who is ‘eligible’ for
automatic enrolment. An eligible jobholder must be aged at least 22
but under State Pension age, earn above the earnings trigger for
automatic enrolment, and work or usually work in the UK and not
already be a member of a qualifying pension scheme.
Employer size Employer size is determined by the number of employees. For the
purpose of staging dates, The Pensions Regulator categorises
employer size based on number of employees in Pay As You Earn
(PAYE) schemes as follows:
Micro = 1 to 4 employees
Small = 5 to 49 employees
Medium = 50 to 249 employees
Large = 250+ employees
If any alternative definitions of employer size are used, they will be
defined in the report.
Entitled worker A worker who is aged at least 16 and under 75; works, or ordinarily
works, in the UK; and earns below the lower earnings level of
qualifying earnings (£6,032 for the 2018/19 tax year). Entitled
workers are not eligible for automatic enrolment, although they can
choose to join a workplace pension. Their employer is not
required to make a contribution if they do so.
Group Personal
Pension (GPP)
A type of personal pension scheme set up by an employer on
behalf of its workers. Although the scheme is arranged by the
employer, each pension contract is between the pension provider
and the worker. The employer may also pay into the scheme, adding
money to each worker’s pension pot.
Group
Stakeholder
Pension
An arrangement made for the employees of a particular employer, or
group of employers, to participate in a stakeholder pension on a
group basis. This is a collective arrangement only; the contract is
between the individual and the pension provider, normally an
insurance company.
Group self-
invested
personal pension
(GSIPP)
A personal pension in which the policy holder rather than the
pension company chooses the investments. GSIPPs allow members
to invest in a wide range of assets, including commercial property
and individual shares.
Automatic Enrolment evaluation report 2018
19
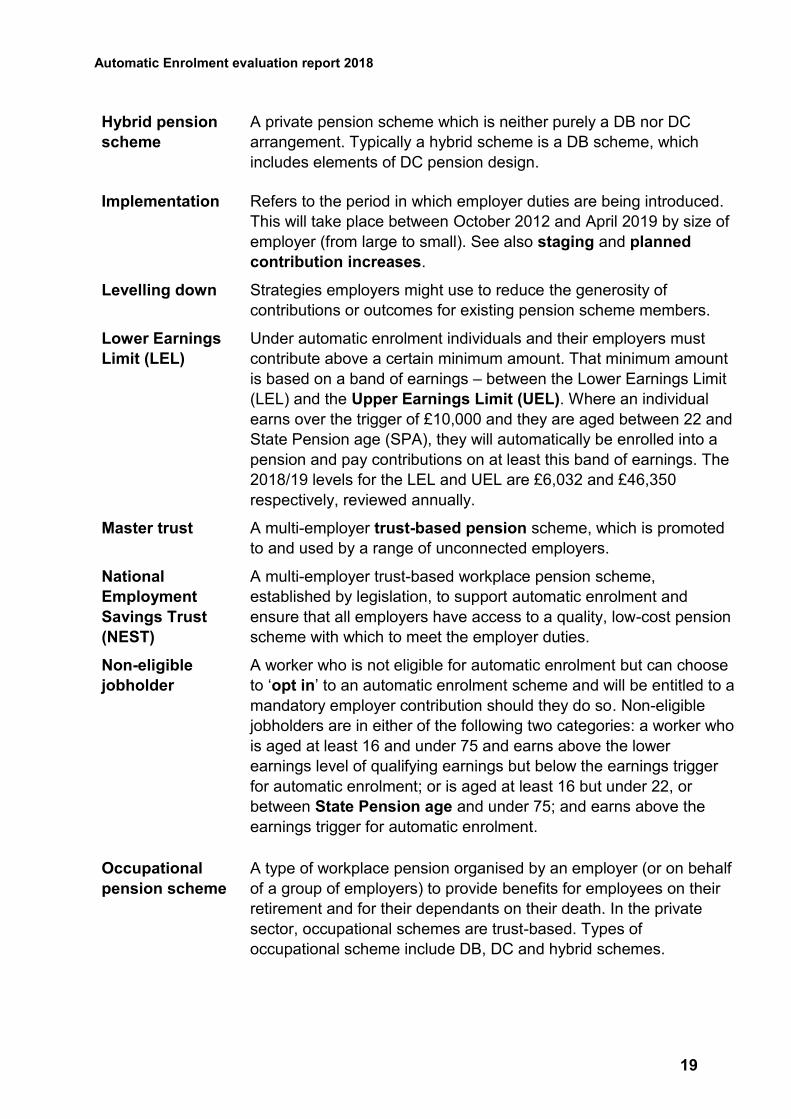
Hybrid pension
scheme
A private pension scheme which is neither purely a DB nor DC
arrangement. Typically a hybrid scheme is a DB scheme, which
includes elements of DC pension design.
Implementation Refers to the period in which employer duties are being introduced.
This will take place between October 2012 and April 2019 by size of
employer (from large to small). See also staging and planned
contribution increases.
Levelling down Strategies employers might use to reduce the generosity of
contributions or outcomes for existing pension scheme members.
Lower Earnings
Limit (LEL)
Under automatic enrolment individuals and their employers must
contribute above a certain minimum amount. That minimum amount
is based on a band of earnings – between the Lower Earnings Limit
(LEL) and the Upper Earnings Limit (UEL). Where an individual
earns over the trigger of £10,000 and they are aged between 22 and
State Pension age (SPA), they will automatically be enrolled into a
pension and pay contributions on at least this band of earnings. The
2018/19 levels for the LEL and UEL are £6,032 and £46,350
respectively, reviewed annually.
Master trust A multi-employer trust-based pension scheme, which is promoted
to and used by a range of unconnected employers.
National
Employment
Savings Trust
(NEST)
A multi-employer trust-based workplace pension scheme,
established by legislation, to support automatic enrolment and
ensure that all employers have access to a quality, low-cost pension
scheme with which to meet the employer duties.
Non-eligible
jobholder
A worker who is not eligible for automatic enrolment but can choose
to ‘opt in’ to an automatic enrolment scheme and will be entitled to a
mandatory employer contribution should they do so. Non-eligible
jobholders are in either of the following two categories: a worker who
is aged at least 16 and under 75 and earns above the lower
earnings level of qualifying earnings but below the earnings trigger
for automatic enrolment; or is aged at least 16 but under 22, or
between State Pension age and under 75; and earns above the
earnings trigger for automatic enrolment.
Occupational
pension scheme
A type of workplace pension organised by an employer (or on behalf
of a group of employers) to provide benefits for employees on their
retirement and for their dependants on their death. In the private
sector, occupational schemes are trust-based. Types of
occupational scheme include DB, DC and hybrid schemes.
Automatic Enrolment evaluation report 2018
20
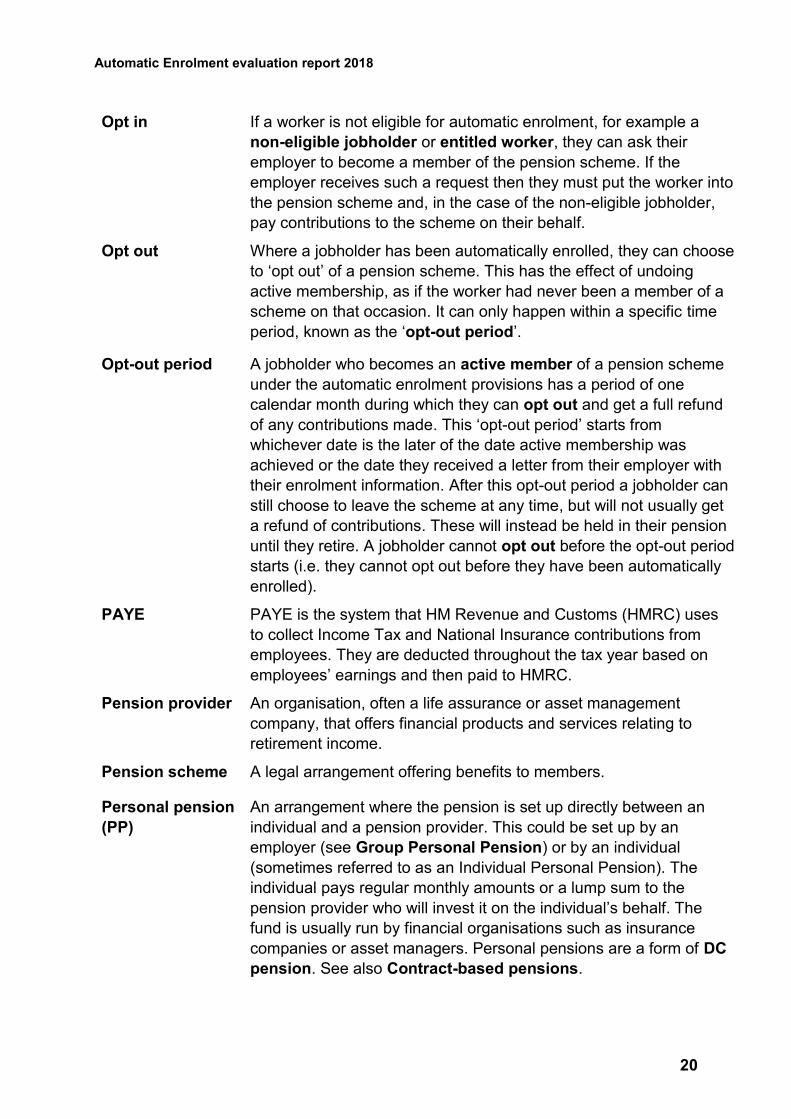
Opt in If a worker is not eligible for automatic enrolment, for example a
non-eligible jobholder or entitled worker, they can ask their
employer to become a member of the pension scheme. If the
employer receives such a request then they must put the worker into
the pension scheme and, in the case of the non-eligible jobholder,
pay contributions to the scheme on their behalf.
Opt out Where a jobholder has been automatically enrolled, they can choose
to ‘opt out’ of a pension scheme. This has the effect of undoing
active membership, as if the worker had never been a member of a
scheme on that occasion. It can only happen within a specific time
period, known as the ‘opt-out period’.
Opt-out period A jobholder who becomes an active member of a pension scheme
under the automatic enrolment provisions has a period of one
calendar month during which they can opt out and get a full refund
of any contributions made. This ‘opt-out period’ starts from
whichever date is the later of the date active membership was
achieved or the date they received a letter from their employer with
their enrolment information. After this opt-out period a jobholder can
still choose to leave the scheme at any time, but will not usually get
a refund of contributions. These will instead be held in their pension
until they retire. A jobholder cannot opt out before the opt-out period
starts (i.e. they cannot opt out before they have been automatically
enrolled).
PAYE PAYE is the system that HM Revenue and Customs (HMRC) uses
to collect Income Tax and National Insurance contributions from
employees. They are deducted throughout the tax year based on
employees’ earnings and then paid to HMRC.
Pension provider An organisation, often a life assurance or asset management
company, that offers financial products and services relating to
retirement income.
Pension scheme A legal arrangement offering benefits to members.
Personal pension
(PP)
An arrangement where the pension is set up directly between an
individual and a pension provider. This could be set up by an
employer (see Group Personal Pension) or by an individual
(sometimes referred to as an Individual Personal Pension). The
individual pays regular monthly amounts or a lump sum to the
pension provider who will invest it on the individual’s behalf. The
fund is usually run by financial organisations such as insurance
companies or asset managers. Personal pensions are a form of DC
pension. See also Contract-based pensions.
Automatic Enrolment evaluation report 2018
21
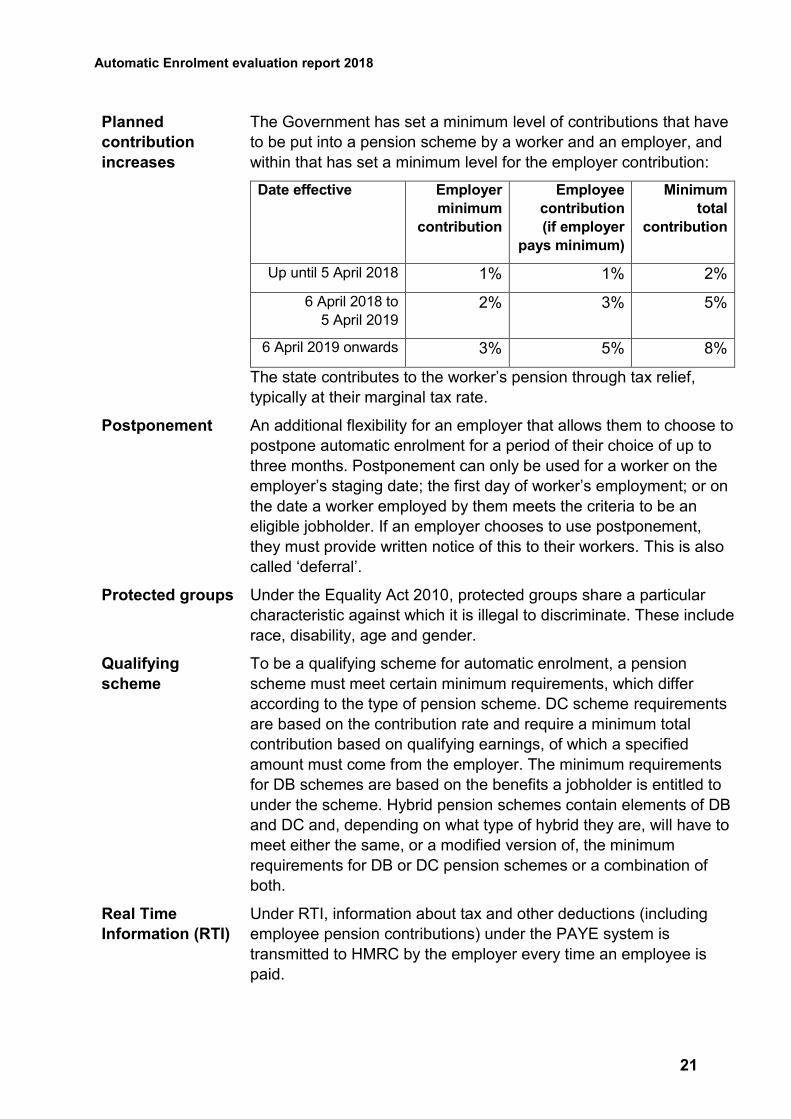
Planned
contribution
increases
The Government has set a minimum level of contributions that have
to be put into a pension scheme by a worker and an employer, and
within that has set a minimum level for the employer contribution:
Date effective Employer
minimum
contribution
Employee
contribution
(if employer
pays minimum)
Minimum
total
contribution
Up until 5 April 2018 1% 1% 2%
6 April 2018 to
5 April 2019 2% 3% 5%
6 April 2019 onwards 3% 5% 8%
The state contributes to the worker’s pension through tax relief,
typically at their marginal tax rate.
Postponement An additional flexibility for an employer that allows them to choose to
postpone automatic enrolment for a period of their choice of up to
three months. Postponement can only be used for a worker on the
employer’s staging date; the first day of worker’s employment; or on
the date a worker employed by them meets the criteria to be an
eligible jobholder. If an employer chooses to use postponement,
they must provide written notice of this to their workers. This is also
called ‘deferral’.
Protected groups Under the Equality Act 2010, protected groups share a particular
characteristic against which it is illegal to discriminate. These include
race, disability, age and gender.
Qualifying
scheme
To be a qualifying scheme for automatic enrolment, a pension
scheme must meet certain minimum requirements, which differ
according to the type of pension scheme. DC scheme requirements
are based on the contribution rate and require a minimum total
contribution based on qualifying earnings, of which a specified
amount must come from the employer. The minimum requirements
for DB schemes are based on the benefits a jobholder is entitled to
under the scheme. Hybrid pension schemes contain elements of DB
and DC and, depending on what type of hybrid they are, will have to
meet either the same, or a modified version of, the minimum
requirements for DB or DC pension schemes or a combination of
both.
Real Time
Information (RTI)
Under RTI, information about tax and other deductions (including
employee pension contributions) under the PAYE system is
transmitted to HMRC by the employer every time an employee is
paid.
Automatic Enrolment evaluation report 2018
22
Re-enrolment Every three years, staff who were automatically enrolled but opted
out of or ceased active membership of a pension scheme more than
12 months before an employer’s re-enrolment date must be
automatically re-enrolled into the scheme. Again, they have the
choice to opt out. This is intended to prompt them to revisit their
initial decision to opt out.
Staging Refers to the staggered introduction of the new employer duties,
starting with the largest employers, based on PAYE scheme size, in
October 2012, to the smallest in 2017. New PAYE schemes from
April 2012 staged last, in 2017 and 2018. Staging has now
completed, following the last staging date in February 2018.
Staging date The date on which an employer was required to begin automatic
enrolment. This date was determined by the total number of
employees in an employer’s largest PAYE scheme on 1 April 2012.
Stakeholder
pension
A type of personal pension arrangement introduced in April 2001
which could be taken out by an individual or facilitated by an
employer. Where an employer had five or more staff and offered no
occupational pension and an employee earned over the lower
earnings limit, the provision of access to a stakeholder scheme,
with contributions deducted from payroll, was compulsory.
Stakeholder pensions are usually a contract-based pension
scheme, subject to government regulations, which limited charges
and allowed individuals flexibility about contributions and transfers,
introduced in April 2001. These ceased to be mandatory after the
workplace pension reforms were introduced.
State Pension
age (SPA)
The earliest age at which an individual can claim their State
Pension.
The Pensions
Regulator (TPR)
Referred to as ‘the regulator’ and is the UK regulator of workplace
pension schemes, including limited aspects of workplace personal
pensions. It is responsible for ensuring employers are aware of their
duties relating to automatic enrolment, how to comply with them and
enforcing compliance. It uses a programme of targeted
communications and a range of information to help employers
understand what they need to do and by when. TPR is also
responsible for regulating occupational pension schemes,
including Master Trusts.
Automatic Enrolment evaluation report 2018
23
Trust-based
pensions
Pension schemes set up under trust law by one or more employers
for the benefit of workers. In a trust-based scheme a board of
trustees is set up to run the scheme. Trustees are accountable for
making decisions about the way the scheme is run, although they
may delegate some of the everyday tasks to a third party. See also
occupational pension scheme and master trust.
Upper Earnings
Limit (UEL)
Under automatic enrolment individuals and their employers must
make contributions above a certain minimum amount. That minimum
amount is based on a band of earnings – between the Lower
Earnings Limit (LEL) and the Upper Earnings Limit (UEL). Where
an individual earns over the trigger of £10,000 and they are aged
between 22 and State Pension age (SPA), they will automatically
be enrolled into a pension and pay contributions on this band of
earnings. The 2018/19 levels for the LEL and UEL are £6,032 and
£46,350 respectively, reviewed annually.
Waiting period
A type of postponement, where new workers or newly eligible
workers may have their automatic enrolment delayed for up to three
months.
Worker An employee or individual who has a contract to provide work or
services personally and is not undertaking the work as part of their
own business.
Workplace
pensions
Any pension scheme provided as part of an arrangement made for
the employees of a particular employer.
Workplace
pension reforms
The reforms introduced as part of the Pensions Acts 2007 and 2008
(and updated as part of the Pensions Act 2011 and 2014). Starting
in 2012, the reforms include a duty on employers to automatically
enrol all eligible jobholders into a qualifying workplace pension
scheme.
Automatic Enrolment evaluation report 2018
24
1 Introduction
To support the millions of people not saving enough for retirement, the Government
introduced legislation in Pensions Acts from 2007, with the aim of increasing private
pension saving in the UK. In 2012 automatic enrolment into workplace pensions was
introduced as part of a wider set of pension reforms designed to ensure that the UK
has a pension system that enables individuals to save towards achieving the lifestyle
they aspire to in retirement, while minimising the implementation challenges for
employers and the pensions industry.
The reforms require employers to automatically enrol eligible workers into a qualifying
workplace pension scheme and make a minimum contribution. Workers are eligible
provided they: are aged at least 22 and under State Pension age (SPa); earn over
£10,000 per year in 2018/19 terms (these thresholds are reviewed annually18);
normally work in the UK and do not currently participate in a qualifying workplace
pension scheme.
The automatic enrolment duties were staged in between October 2012 and February
2018 by employer size, starting with the largest employers. Since October 2017, all
businesses employing someone for the very first time have to provide a workplace
pension for their eligible staff from the first day of their service.
In 2018, the first of two planned minimum contribution increases was implemented.
Before April 2018, total minimum contributions were two per cent of a band of
workers’ earnings, of which at least one per cent came from the employer. This rose
to five per cent in April 2018, of which at least two per cent must come from the
employer. It will rise to eight per cent from April 2019, of which at least three per cent
must come from the employer.
In this evaluation report, the focus is on evaluation of automatic enrolment
implementation to date, in line with the evaluation strategy19 (see section 1.1).
However, it is also worth noting that the 2017 Review of Automatic Enrolment20 set
out the Government’s proposals to build on the success of automatic enrolment for
the future.
This included the Government’s ambition to make changes to the automatic
enrolment framework in the mid-2020s by lowering the age threshold for automatic
18 DWP. (2018). Automatic Enrolment: review of the earnings trigger and qualifying earnings band for
2019/20. At: https://www.gov.uk/government/publications/automatic-enrolment-review-of-the-earnings-
trigger-and-qualifying-earnings-band-for-201920
19 DWP. (2017). Automatic Enrolment Evaluation Strategy 2017. At:
https://www.gov.uk/government/publications/automatic-enrolment-evaluation-strategy-2017
20 DWP. (2017). Automatic Enrolment Review 2017: Maintaining the Momentum. At:
https://www.gov.uk/government/publications/automatic-enrolment-review-2017-maintaining-the-
momentum
Automatic Enrolment evaluation report 2018
25
enrolment from 22 to 18, and removing the lower earnings limit so that contributions
are made from the first pound earned and everyone has access to a workplace
pension with an employer contribution. It committed to continuing to monitor and
evaluate the impact of increased contributions in 2018 and 2019, and to carry out
further analysis to inform a longer-term debate on the right balance between statutory
contribution rises and voluntary additional retirement savings. The Government
continues to work to take forward this agenda, recognising the need to build renewed
consensus to deliver the detailed design and implementation of change.
The 2017 Review also set out how the Government is taking forward the manifesto
commitment to improve pension participation and retirement outcomes among self-
employed people. Government has published a delivery plan setting out how it will
trial a number of savings interventions aimed at the self-employed.21 The pensions
industry has responded to the Review call to take forward work to support individuals’
better engagement with pension saving through development of a best practice
example of a simplified annual benefit statement.
The work in taking forward the 2017 Review recommendations, whilst of relevance to
the future automatic enrolment framework, is beyond the scope of this evaluation
report.
1.1 Evaluation strategy
The Department for Work and Pensions (DWP) is committed to fully evaluating the
effects of the workplace pension reforms, as set out in its evaluation strategy,22 which
was refreshed in 2017. Evaluation reports have been published annually since 2013,
following a baseline report in 2012 which described the landscape before the
implementation of automatic enrolment.23 This report brings together the latest
evidence showing what has happened since automatic enrolment began.
It is important to note that owing to time lags and data availability, the latest research
and analysis in this report will capture different stages of automatic enrolment
implementation (for example, analysis may fall before or after the planned
contribution increase in April 2018). The period being captured is noted in the
supporting commentary.
21 DWP. (2018). Enabling retirement savings for the self-employed: pensions and long term savings
trials. At: https://www.gov.uk/government/publications/automatic-enrolment-review-2017-maintaining-
the-momentum
22 DWP. (2017). Automatic Enrolment Evaluation Strategy 2017. At:
https://www.gov.uk/government/publications/automatic-enrolment-evaluation-strategy-2017
23 At: https://www.gov.uk/government/collections/workplace-pension-participation-and-savings-trends

Automatic Enrolment evaluation report 2018
26
1.2 Report structure
The structure of this year’s report is as follows:
• Delivery of reforms (Chapter 2)
• Employers’ implementation of reforms (Chapter 3)
• Impact of automatic enrolment (Chapter 4)
• Next steps (Chapter 5)
Automatic Enrolment evaluation report 2018
27
2 Delivery of reforms
This chapter updates key findings from research and analysis by the
Department for Work and Pensions (DWP), The Pensions Regulator
(TPR) and the National Employment Savings Trust (NEST). This relates
to the following evaluation strategy question:
Do established delivery mechanisms support automatic enrolment objectives? (EQ1)
Summary
Existing evidence from the last 12 months
Since the start of automatic enrolment in 2012, more than 9.9 million workers
have been automatically enrolled, and over 1.4 million employers have met
their duties, with 591,000 workers having been automatically re-enrolled and
73,643 employers having met their re-enrolment duties.
As of the end of March 2018, National Employment Savings Trust (NEST)
membership stood at 6.4 million members, with over 616,000 employers.
2.1 Role of The Pensions Regulator
The role of The Pensions Regulator (TPR) is to maximise compliance with the
employer duties and safeguards set out in legislation, using a risk-based approach to
deter, prevent or address non-compliance. It is also the UK regulator of workplace
pension schemes, including limited aspects of workplace personal pensions.
2.1.1 Communicating reforms to employers and their advisers
TPR aims to help employers understand what they need to do, and when, in order to
meet their automatic enrolment (AE) duties. For staged employers, TPR operated a
communications strategy based on direct engagement with employers, and through
their intermediaries, which involves writing (via emails and letters) at key intervals in
relation to the date that their automatic enrolment duties start, and their declaration of
compliance deadline.24 In addition, these communications were accompanied by a
24 Employers have a legal duty to complete a declaration of compliance online within five months after
their duties start date, to tell TPR how they have met their duties.
Automatic Enrolment evaluation report 2018
28
multi-channel advertising campaign (including television, radio, and social media
advertising) in order to raise levels of awareness of the workplace pension reforms
among new employers by referring them to the TPR website.
For all new employers, TPR sends them an information pack containing details of
their duties start date and declaration of compliance deadline, based upon the first
day of employment of their first worker. This pack contains guidance on how to
complete their automatic enrolment duties, with links to relevant online tools and
information on the TPR website.
Before the first planned increase in contributions that took place in April 2018, TPR
wrote to every employer to inform them of the changes in contribution rates. TPR’s
research compared levels of awareness between those who had received the letter
and those who were yet to receive it, which showed that the receipt of this letter
significantly increased employers’ awareness of the time and amounts by which the
minimum contributions were planned to increase.25
Figure 2.1 shows that in 2017/18 the regulator’s website received 2.94 million unique
visitors to its automatic enrolment page for employers and 1.1 million unique visitors
to the automatic enrolment webpage for business advisers. 320,000 employers used
the Duties Checker tool, whilst 172 speaking events were conducted across the UK.
Figure 2.1 – Summary of TPR engagement activity in 2017-18
2.1.2 Declarations of compliance
TPR publishes monthly information about the number of employers who have
complied with their duties by completing their declaration of compliance and reporting
on the number of eligible jobholders automatically enrolled.26 Since July 2012, up to
25 TPR. (2018). Automatic Enrolment Commentary and analysis: April 2017 – March 2018. At:
https://www.thepensionsregulator.gov.uk/-/media/thepensionsregulator/files/import/pdf/automatic-
enrolment-commentary-analysis-2018.ashx
26 TPR. (2018). Automatic enrolment Declaration of compliance report July 2012 – end November
2018. At: https://www.thepensionsregulator.gov.uk/-
/media/thepensionsregulator/files/import/pdf/automatic-enrolment-declaration-of-compliance-monthly-
report.ashx
Automatic Enrolment evaluation report 2018
29
the end of November 2018, 1,418,680 employers had declared their compliance with
the duties, with over 9.9 million workers automatically enrolled. Similarly, 73,643
employers had confirmed that they had completed their re-declaration of compliance,
with 591,000 workers having been automatically re-enrolled.
The data also show that 11.45 million workers were not automatically enrolled
because they were already active members of a qualifying workplace pension
scheme or had Defined Benefit (DB) or hybrid scheme transitional arrangements
applied to them. A further 9.24 million workers were not automatically enrolled as
they did not meet either the earnings or age criteria at the time (e.g. a worker who
earned over £10,000 per year, but was aged under 22 years old would not be
automatically enrolled).
Additional detailed analysis of declaration of compliance data is available in the
regulator’s 2018 ‘Automatic enrolment: commentary and analysis’ report.27
2.1.3 Enforcement
TPR’s approach is to tell employers what they must do to comply with the law in the
first instance, but where it encounters non-compliance, TPR uses its powers to
ensure that employers comply with their legal obligations. Its approach to maximising
compliance is set out in its compliance and enforcement strategy28 and policy.29
TPR publishes information on a quarterly basis about its cases and the powers it has
used relating to automatic enrolment and associated employer duties.30 From July
2012 to the end of June 2018, the regulator had concluded 204,680 cases
investigating possible non-compliance by employers. Between July and September
2018, TPR continued to use its powers often: in Q2 2018/19 it served 14,997
compliance notices, with most employers subsequently complying when given this
prompt to remind them of their duties.
27 TPR. (2018). Automatic Enrolment Commentary and analysis: April 2017 – March 2018. At:
https://www.thepensionsregulator.gov.uk/-/media/thepensionsregulator/files/import/pdf/automatic-
enrolment-commentary-analysis-2018.ashx
28 TPR. (2016). Compliance and enforcement strategy for employers subject to automatic enrolment
duties. At: https://www.thepensionsregulator.gov.uk/-
/media/thepensionsregulator/files/import/pdf/pensions-reform-compliance-and-enforcement-
strategy.ashx
29 TPR. (2016). Compliance and enforcement policy for employers subject to automatic enrolment
duties. At: https://www.thepensionsregulator.gov.uk/-
/media/thepensionsregulator/files/import/pdf/pensions-reform-compliance-and-enforcement-
policy.ashx
30 TPR. (2018). Compliance and enforcement: Quarterly bulletin July to September 2018. At:
https://www.thepensionsregulator.gov.uk/-/media/thepensionsregulator/files/import/pdf/compliance-
and-enforcement-quarterly-bulletin-july-to-september-2018.ashx
Automatic Enrolment evaluation report 2018
30
TPR also recently confirmed that it continues to be led by data and intelligence
analysis, and can now more quickly identify individual employers it believes are non-
compliant and take action to ensure compliance.
Since 2016, TPR has embarked on a series of quarterly compliance validation
exercises, or ‘spot checks’. Employers are identified through data and intelligence
analysis and scheduled for either desk-based investigation or an inspection in person
at their place of business.
TPR has now undertaken compliance validation activity against over 3,000
employers suspected of non-compliance with their AE duties. More information can
be found in its 2018 ‘Automatic enrolment: Commentary and analysis’ report.31
Going forward, TPR expects to extend its compliance validation activity into different
regulatory areas of focus. For example, whilst data suggests that the vast majority of
employers are complying with the requirement to increase contributions following the
first increase in contributions in April 2018, TPR will also engage with employers
where there is insufficient data to indicate compliance, in order to evaluate
compliance with the new minimum contribution level.
2.1.4 Employer forecast
To date TPR have largely been focused on compliance amongst large volumes of
staged employers, and re-enrolment for the largest employers. This focus has now
shifted to the steady volumes of new employers, and the re-enrolment of staged
employers.32
TPR published an updated forecast of employers who are expected to have
automatic enrolment duties to the end of 2020/21 in its 2018 ‘Automatic enrolment:
Commentary and analysis’ report.33 This is a forecast, so the data are presented as a
range of how many new employers may have automatic enrolment duties, as
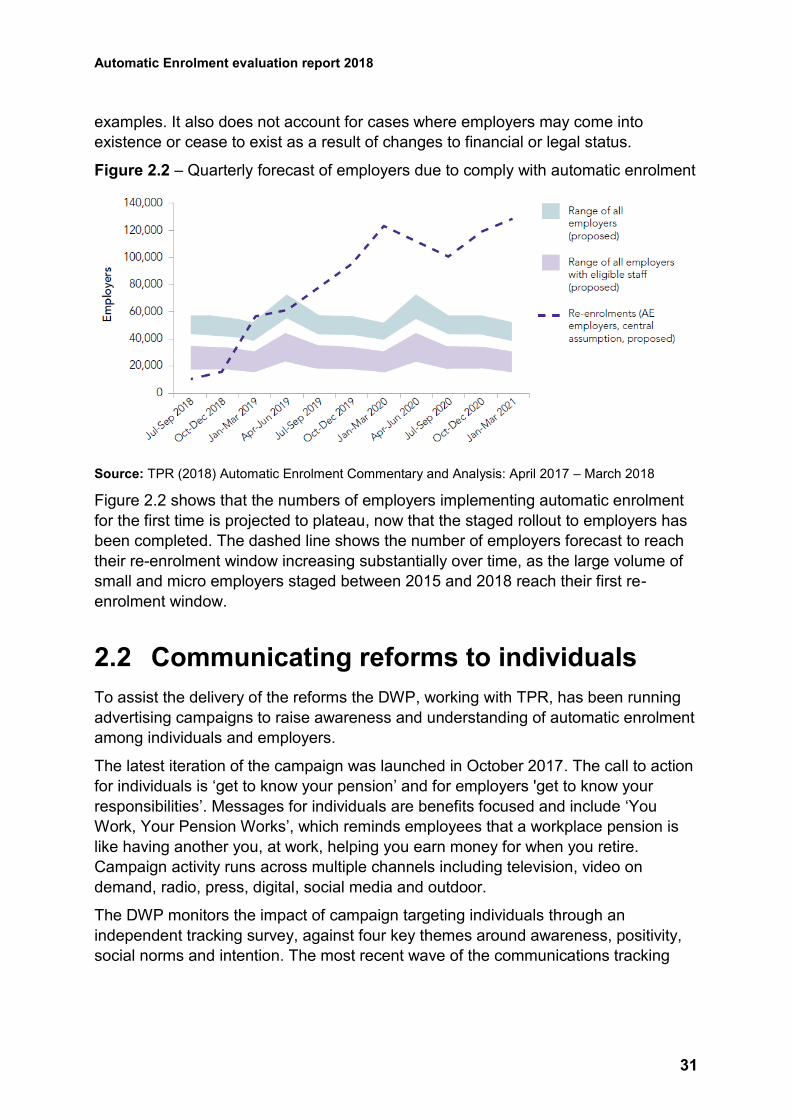
illustrated by Figure 2.2. As an example, the forecast suggests that between April
and June of 2019 (Q1 of 2019/20), there are between 23,000 and 44,000 employers
with eligible staff due to have automatic enrolment duties for the first time.
The forecast is, by its nature, uncertain and it does not account for future economic
factors, threshold changes or the effect of the National Living Wage, to give a few
31 TPR. (2018). Automatic enrolment Commentary and analysis: April 2017 – March 2018. At:
https://www.thepensionsregulator.gov.uk/-/media/thepensionsregulator/files/import/pdf/automatic-
enrolment-commentary-analysis-2018.ashx
32 Every three years, employers are required to assess certain staff and put those deemed eligible
back into their pension scheme (‘re-enrolment’). Employees already automatically enrolled but who
subsequently opted out or ceased saving more than 12 months before their employer’s re-enrolment
date, who meet the earnings and age criteria for automatic enrolment, must be re-enrolled.
33 TPR. (2018). Automatic Enrolment Commentary and analysis: April 2017 – March 2018. At:
https://www.thepensionsregulator.gov.uk/-/media/thepensionsregulator/files/import/pdf/automatic-
enrolment-commentary-analysis-2018.ashx
Automatic Enrolment evaluation report 2018
31
examples. It also does not account for cases where employers may come into
existence or cease to exist as a result of changes to financial or legal status.
Figure 2.2 – Quarterly forecast of employers due to comply with automatic enrolment
Source: TPR (2018) Automatic Enrolment Commentary and Analysis: April 2017 – March 2018
Figure 2.2 shows that the numbers of employers implementing automatic enrolment
for the first time is projected to plateau, now that the staged rollout to employers has
been completed. The dashed line shows the number of employers forecast to reach
their re-enrolment window increasing substantially over time, as the large volume of
small and micro employers staged between 2015 and 2018 reach their first re-
enrolment window.
2.2 Communicating reforms to individuals
To assist the delivery of the reforms the DWP, working with TPR, has been running
advertising campaigns to raise awareness and understanding of automatic enrolment
among individuals and employers.
The latest iteration of the campaign was launched in October 2017. The call to action
for individuals is ‘get to know your pension’ and for employers 'get to know your
responsibilities’. Messages for individuals are benefits focused and include ‘You
Work, Your Pension Works’, which reminds employees that a workplace pension is
like having another you, at work, helping you earn money for when you retire.
Campaign activity runs across multiple channels including television, video on
demand, radio, press, digital, social media and outdoor.
The DWP monitors the impact of campaign targeting individuals through an
independent tracking survey, against four key themes around awareness, positivity,
social norms and intention. The most recent wave of the communications tracking
Automatic Enrolment evaluation report 2018
32
survey, carried out in June 2018, showed that overall campaign recognition was 80
per cent, broadly consistent with previous waves.34
Results from the communications tracker survey are covered in more detail in section
4.4.
2.3 NEST
The National Employment Savings Trust (NEST) is a workplace pension scheme
established in 2010 with a primary purpose to support the introduction of automatic
enrolment. It is a trustee-governed automatic enrolment qualifying scheme. In 2011,
NEST began on a voluntary basis in preparation for the first wave of employer duties
from September 2012. It is subject to a Public Service Obligation (PSO) to accept all
employers wanting to join the scheme to fulfil their AE duties.
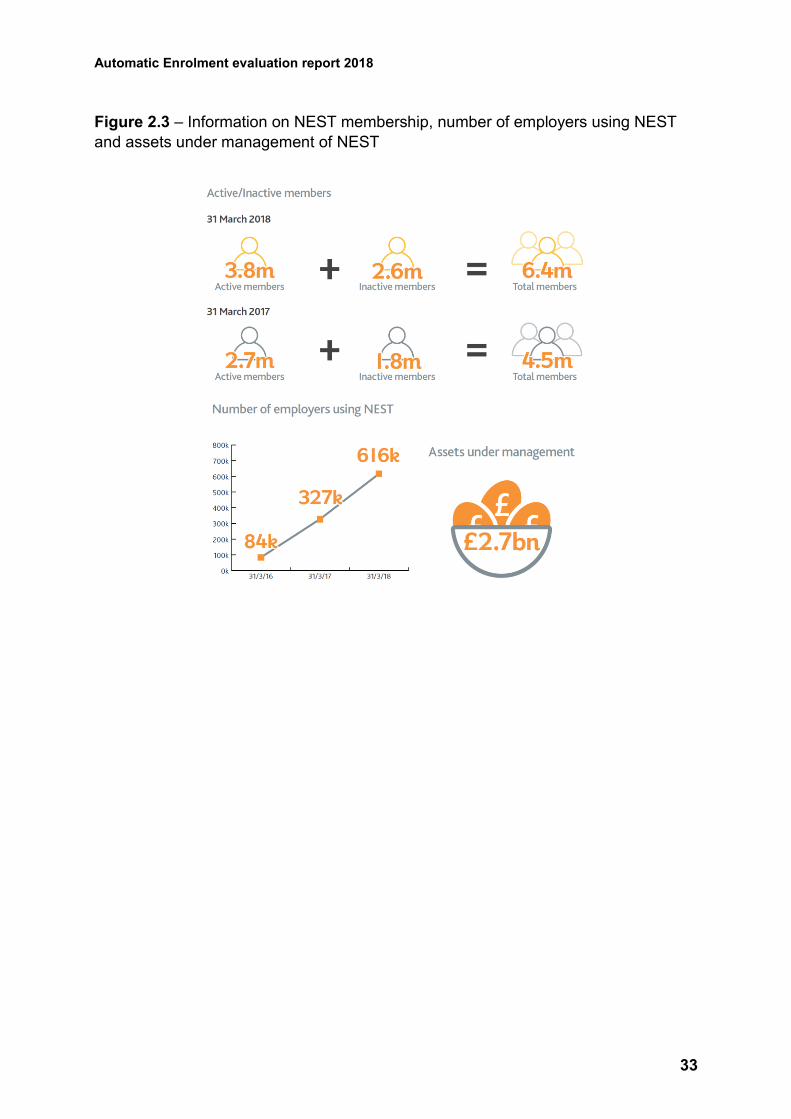
The NEST Corporation’s annual report for 2017/1835 outlined what NEST had
achieved over the year from April 2017 to the end of March 2018 (Figure 2.3).
Significant achievements, correct as at 31 March 2018, included:
NEST’s membership had risen to over 6.4 million members and over 616,000
employers, compared to 4.5 million members and 327,000 employers by the
time of the 2016/17 NEST annual report.
At the end of March 2018, NEST managed around £2.7 billion in assets,
compared to approximately £1.7 billion at the end of March 2017.
34 DWP. (2018). Workplace Pension: research into saving for retirement. At:
https://www.ipsos.com/ipsos-mori/en-uk/workplace-pension-new-research-saving-retirement
35 NEST. (2018). National Employment Savings Trust Corporation annual report and accounts 2017-
18. At: https://www.nestpensions.org.uk/schemeweb/dam/nestlibrary/NEST-CARA-2017-18.pdf
Automatic Enrolment evaluation report 2018
33
Figure 2.3 – Information on NEST membership, number of employers using NEST
and assets under management of NEST
Automatic Enrolment evaluation report 2018
34
3 Employers’ implementation of
reforms
This chapter examines how employers have responded to the
requirement to implement automatic enrolment. This relates to the
following evaluation strategy question:
Do employers know about, understand and comply with their employer duties? (EQ2)
Summary
Existing evidence from the last 12 months
Levels of awareness and understanding of automatic enrolment are high. In
particular, at least 93 per cent of micro, small and medium-sized employers
were aware of each individual ongoing duty in relation to automatic
enrolment.
Virtually all medium and large employers (97 per cent and 99 per cent
respectively), and the vast majority of small employers (84 per cent), stated
that they had automatically enrolled employees into a qualifying pension
scheme by late 2017.
In 2017, just under one half (47 per cent) of employers currently had some
form of workplace pension provision, up from 19 per cent in 2013. These
organisations employed 91 per cent of all private sector employees.
Positive attitudes towards automatic enrolment were associated with
employers being more likely to contribute above the minimum requirements.
Some employers were contributing more than the minimum required
contribution rate. In around one quarter (24 per cent) of schemes used for
automatic enrolment, employers were contributing at least three per cent in
2017.
The number of compliance notices issued by The Pensions Regulator has
risen from nearly 34,000 in 2016/17 to nearly 61,000 in 2017/18, however this
is broadly in line with the increased number of employer declarations of
compliance TPR received. The majority of employers subsequently complied
when they were reminded of their duties.
Automatic Enrolment evaluation report 2018
35
3.1 Employer awareness, understanding and activity
In order to be able to comply with their duties, employers need to be aware of and
understand how to discharge them. Previous evaluation reports focused on
awareness and understanding of the reforms prior to employers’ staging dates. Now
that the staged implementation of automatic enrolment to existing employers has
been completed, key measures have been revised to focus on awareness and
understanding of ongoing duties.
3.1.1 Awareness and understanding of ongoing duties
Employers’ awareness and understanding of automatic enrolment was assessed in a
recent TPR-commissioned report.36 There are five ongoing duties for employers (in
addition to re-enrolment), which are as follows:
Keeping accurate records related to administering the pension scheme;
Assessing workers every time they are paid to check whether they are eligible
for automatic enrolment;
Enrolling staff if they reach the eligibility criteria and writing to them to explain
how automatic enrolment applies to them;
Managing requests from staff to join or leave the pension scheme;
Calculating and paying correct pension contributions for every worker enrolled
in the pension scheme.
Some of the key findings of the report included, as at summer 2018:
At least 93 per cent of micro, small and medium-sized employers were aware
of each individual ongoing duty in relation to automatic enrolment.
Around half of micro employers (46 per cent) and around three-fifths of small
employers (55 per cent) were aware of their re-enrolment duty, a decrease
from previous surveys. However, almost all (95 per cent) were confident in
their ability to comply fully with their re-enrolment duties.
Two-thirds of micro employers (64 per cent), and the large majority of small
(83 per cent) and medium (96 per cent) employers knew that minimum
contributions would increase again in the future. Awareness of the second
increase (April 2019) has risen steadily since the baseline survey in Spring
2017 (+20 percentage points for micro, +19 for small and +28 for medium
employers).
36 TPR. (2018). Ongoing Duties Survey – Summer 2018. At:
https://www.thepensionsregulator.gov.uk/-/media/thepensionsregulator/files/import/pdf/employer-
automatic-enrolment-ongoing-duties-survey-summer-2018.ashx
Automatic Enrolment evaluation report 2018
36
The 2017 Employers’ Pension Provision (EPP) Survey investigated awareness of
specific elements of the reforms.37 EPP 2017 found that nine in ten employers (90
per cent) were aware of the requirement to automatically enrol their eligible workers
into a qualifying pension scheme. Levels of awareness were higher among the larger
employers; 99 per cent of large employers were aware of the reforms, compared with
88 per cent of micro employers.
Awareness about specific aspects of the reforms was lower, with two-thirds of
employers (66 per cent) aware of the minimum contribution requirements. The lower
level of awareness was largely driven by micro employers; 59 per cent were aware of
the minimum contribution requirements, compared with 96 per cent of large
employers. There were similar patterns of awareness of the need to declare
compliance with the regulator, with 91 per cent of large employers aware of this
compared with 60 per cent of micro employers. Levels of awareness were higher
among employers who reported having passed their staging date.
3.1.2 Employers’ pension provision in 2017
EPP 2017 measured the extent and nature of pension provision among private sector
employers in Great Britain in 2017. Virtually all medium and large employers (97 per
cent and 99 per cent respectively), and the vast majority of small employers (84 per
cent), stated that they had automatically enrolled employees into a qualifying pension
scheme by the time of fieldwork for the survey (Table 3.1).38 Micro employers were
less likely to have automatically enrolled staff (31 per cent), reflecting that only
around two-fifths (42 per cent) of micro employers stated they had passed their
staging date at the time of interview.
37 DWP. (2018). Employers’ Pension Provision Survey 2017. At:
https://www.gov.uk/government/publications/employers-pension-provision-survey-2017
38 DWP. (2018). Employers’ Pension Provision Survey 2017. At:
https://www.gov.uk/government/publications/employers-pension-provision-survey-2017
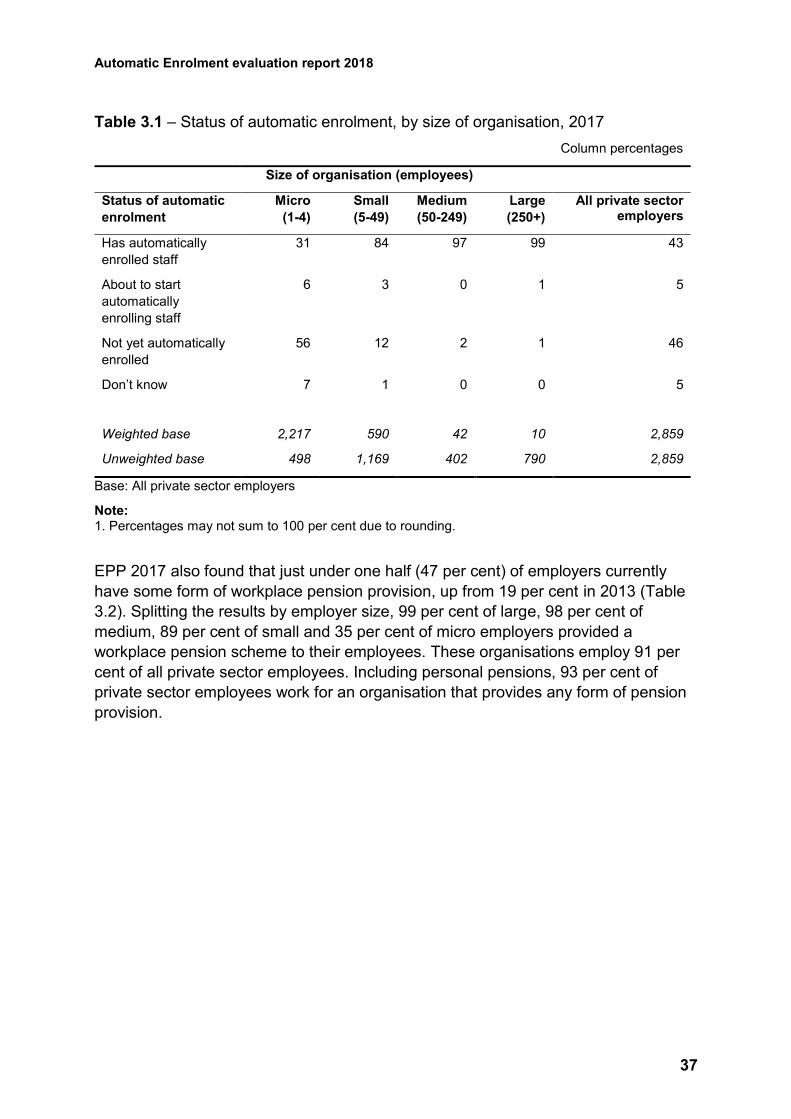
Automatic Enrolment evaluation report 2018
37
Table 3.1 – Status of automatic enrolment, by size of organisation, 2017
Column percentages
Size of organisation (employees)
Status of automatic
enrolment
Micro
(1-4)
Small
(5-49)
Medium
(50-249)
Large
(250+)
All private sector employers
Has automatically
enrolled staff
31 84 97 99 43
About to start
automatically
enrolling staff
6 3 0 1 5
Not yet automatically
enrolled
56 12 2 1 46
Don’t know 7 1 0 0 5
Weighted base 2,217 590 42 10 2,859
Unweighted base 498 1,169 402 790 2,859
Base: All private sector employers
Note: 1. Percentages may not sum to 100 per cent due to rounding.
EPP 2017 also found that just under one half (47 per cent) of employers currently
have some form of workplace pension provision, up from 19 per cent in 2013 (Table
3.2). Splitting the results by employer size, 99 per cent of large, 98 per cent of
medium, 89 per cent of small and 35 per cent of micro employers provided a
workplace pension scheme to their employees. These organisations employ 91 per
cent of all private sector employees. Including personal pensions, 93 per cent of
private sector employees work for an organisation that provides any form of pension
provision.
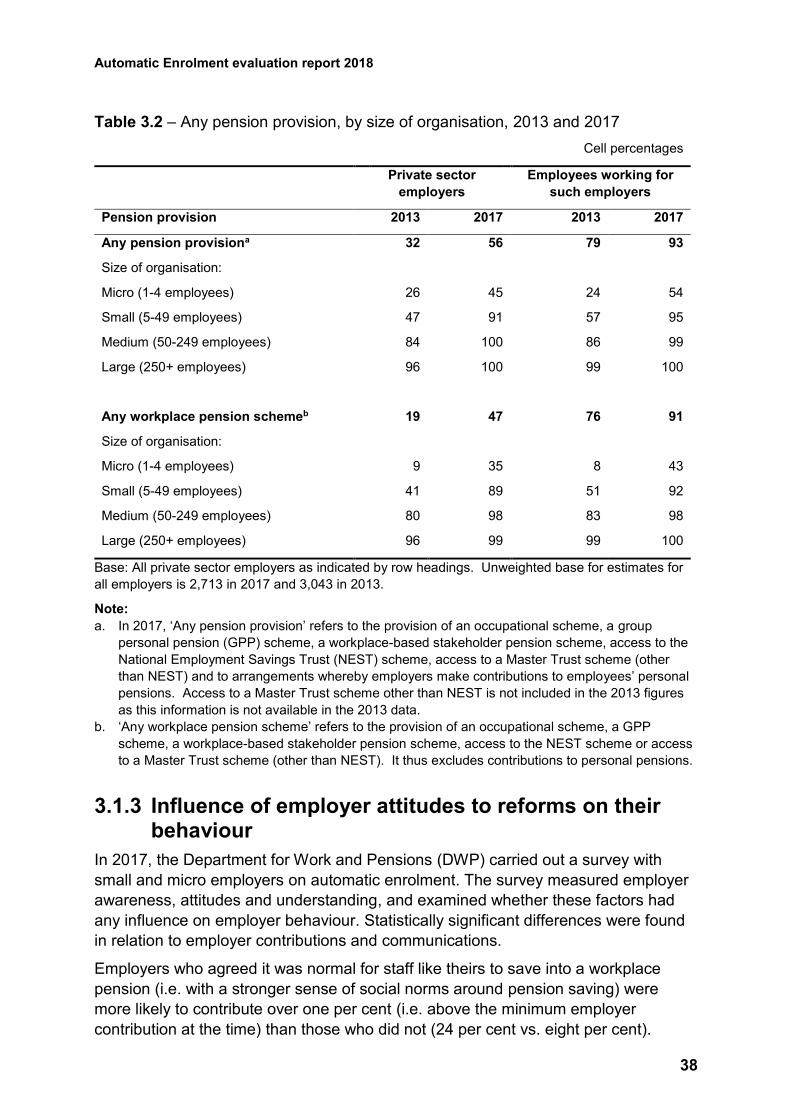
Automatic Enrolment evaluation report 2018
38
Table 3.2 – Any pension provision, by size of organisation, 2013 and 2017
Cell percentages
Private sector
employers
Employees working for
such employers
Pension provision 2013 2017 2013 2017
Any pension provisiona 32 56 79 93
Size of organisation:
Micro (1-4 employees) 26 45 24 54
Small (5-49 employees) 47 91 57 95
Medium (50-249 employees) 84 100 86 99
Large (250+ employees) 96 100 99 100
Any workplace pension schemeb 19 47 76 91
Size of organisation:
Micro (1-4 employees) 9 35 8 43
Small (5-49 employees) 41 89 51 92
Medium (50-249 employees) 80 98 83 98
Large (250+ employees) 96 99 99 100
Base: All private sector employers as indicated by row headings. Unweighted base for estimates for
all employers is 2,713 in 2017 and 3,043 in 2013.
Note:
a. In 2017, ‘Any pension provision’ refers to the provision of an occupational scheme, a group
personal pension (GPP) scheme, a workplace-based stakeholder pension scheme, access to the
National Employment Savings Trust (NEST) scheme, access to a Master Trust scheme (other
than NEST) and to arrangements whereby employers make contributions to employees’ personal
pensions. Access to a Master Trust scheme other than NEST is not included in the 2013 figures
as this information is not available in the 2013 data.
b. ‘Any workplace pension scheme’ refers to the provision of an occupational scheme, a GPP
scheme, a workplace-based stakeholder pension scheme, access to the NEST scheme or access
to a Master Trust scheme (other than NEST). It thus excludes contributions to personal pensions.
3.1.3 Influence of employer attitudes to reforms on their behaviour
In 2017, the Department for Work and Pensions (DWP) carried out a survey with
small and micro employers on automatic enrolment. The survey measured employer
awareness, attitudes and understanding, and examined whether these factors had
any influence on employer behaviour. Statistically significant differences were found
in relation to employer contributions and communications.
Employers who agreed it was normal for staff like theirs to save into a workplace
pension (i.e. with a stronger sense of social norms around pension saving) were
more likely to contribute over one per cent (i.e. above the minimum employer
contribution at the time) than those who did not (24 per cent vs. eight per cent).
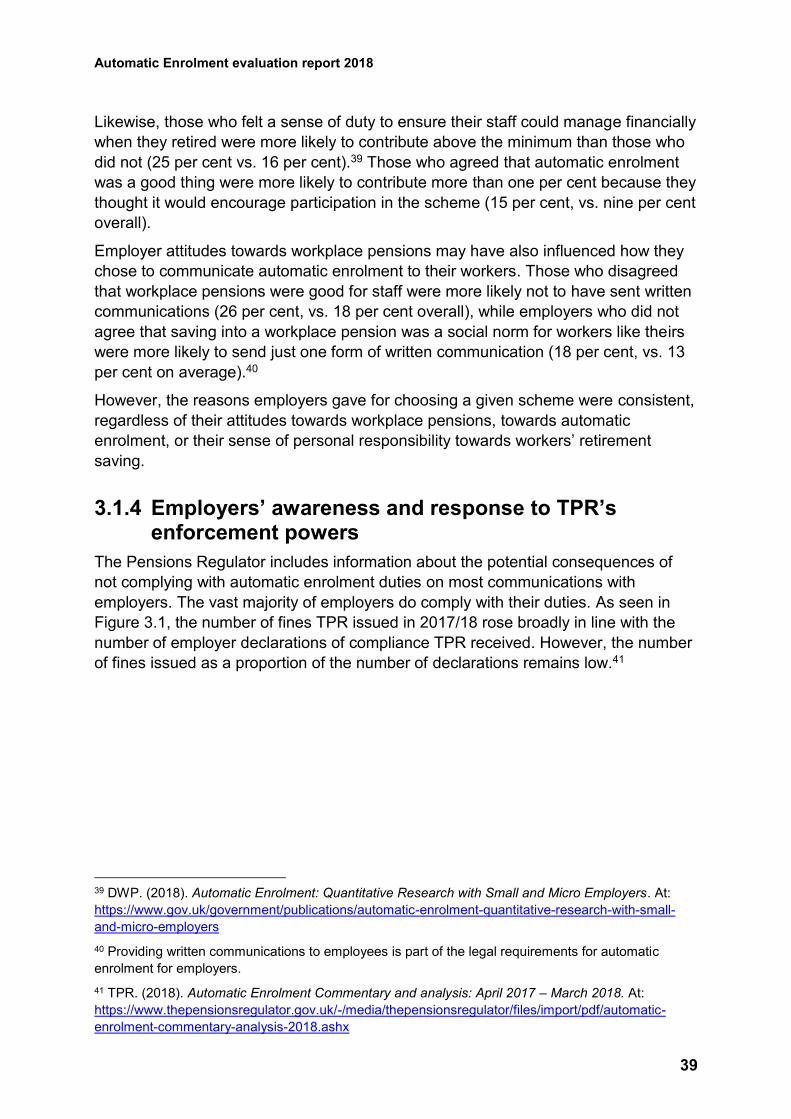
Automatic Enrolment evaluation report 2018
39
Likewise, those who felt a sense of duty to ensure their staff could manage financially
when they retired were more likely to contribute above the minimum than those who
did not (25 per cent vs. 16 per cent).39 Those who agreed that automatic enrolment
was a good thing were more likely to contribute more than one per cent because they
thought it would encourage participation in the scheme (15 per cent, vs. nine per cent
overall).
Employer attitudes towards workplace pensions may have also influenced how they
chose to communicate automatic enrolment to their workers. Those who disagreed
that workplace pensions were good for staff were more likely not to have sent written
communications (26 per cent, vs. 18 per cent overall), while employers who did not
agree that saving into a workplace pension was a social norm for workers like theirs
were more likely to send just one form of written communication (18 per cent, vs. 13
per cent on average).40
However, the reasons employers gave for choosing a given scheme were consistent,
regardless of their attitudes towards workplace pensions, towards automatic
enrolment, or their sense of personal responsibility towards workers’ retirement
saving.
3.1.4 Employers’ awareness and response to TPR’s enforcement powers
The Pensions Regulator includes information about the potential consequences of
not complying with automatic enrolment duties on most communications with
employers. The vast majority of employers do comply with their duties. As seen in
Figure 3.1, the number of fines TPR issued in 2017/18 rose broadly in line with the
number of employer declarations of compliance TPR received. However, the number
of fines issued as a proportion of the number of declarations remains low.41
39 DWP. (2018). Automatic Enrolment: Quantitative Research with Small and Micro Employers. At:
https://www.gov.uk/government/publications/automatic-enrolment-quantitative-research-with-small-
and-micro-employers
40 Providing written communications to employees is part of the legal requirements for automatic
enrolment for employers.
41 TPR. (2018). Automatic Enrolment Commentary and analysis: April 2017 – March 2018. At:
https://www.thepensionsregulator.gov.uk/-/media/thepensionsregulator/files/import/pdf/automatic-
enrolment-commentary-analysis-2018.ashx
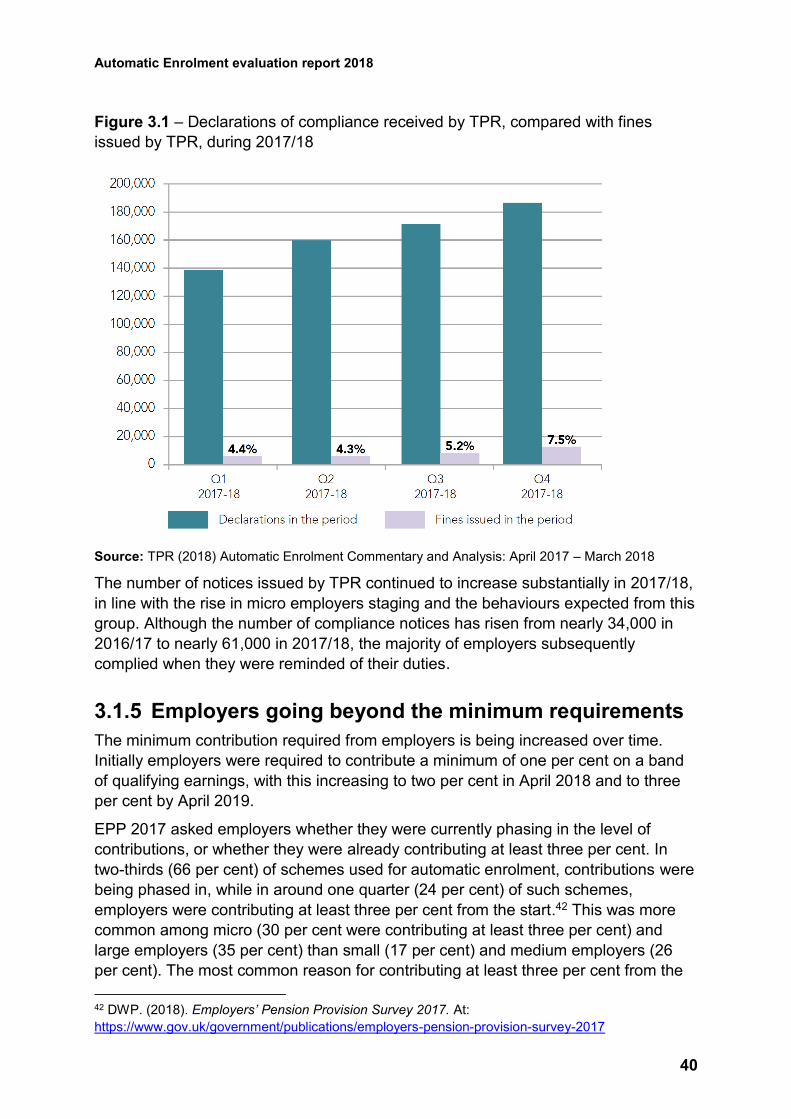
Automatic Enrolment evaluation report 2018
40
Figure 3.1 – Declarations of compliance received by TPR, compared with fines
issued by TPR, during 2017/18
Source: TPR (2018) Automatic Enrolment Commentary and Analysis: April 2017 – March 2018
The number of notices issued by TPR continued to increase substantially in 2017/18,
in line with the rise in micro employers staging and the behaviours expected from this
group. Although the number of compliance notices has risen from nearly 34,000 in
2016/17 to nearly 61,000 in 2017/18, the majority of employers subsequently
complied when they were reminded of their duties.
3.1.5 Employers going beyond the minimum requirements
The minimum contribution required from employers is being increased over time.
Initially employers were required to contribute a minimum of one per cent on a band
of qualifying earnings, with this increasing to two per cent in April 2018 and to three
per cent by April 2019.
EPP 2017 asked employers whether they were currently phasing in the level of
contributions, or whether they were already contributing at least three per cent. In
two-thirds (66 per cent) of schemes used for automatic enrolment, contributions were
being phased in, while in around one quarter (24 per cent) of such schemes,
employers were contributing at least three per cent from the start.42 This was more
common among micro (30 per cent were contributing at least three per cent) and
large employers (35 per cent) than small (17 per cent) and medium employers (26
per cent). The most common reason for contributing at least three per cent from the
42 DWP. (2018). Employers’ Pension Provision Survey 2017. At:
https://www.gov.uk/government/publications/employers-pension-provision-survey-2017
Automatic Enrolment evaluation report 2018
41
start was that employers wanted to offer a better option for their employees, applying
for 44 per cent of such schemes.
The DWP’s survey with small and micro employers, conducted at the same time as
EPP 2017, found that 21 per cent of these employers offered more than the then-
minimum contribution of one per cent.43 The employers who had schemes in place
before automatic enrolment were the ones who tended to have higher contribution
rates (53 per cent offered more than the minimum requirement). Employers in some
sectors were also more likely to offer more than the minimum, including the
information and communications sectors (35 per cent), health, social care and social
work sectors (37 per cent), financial or insurance sectors (37 per cent), and not-for-
profit organisations or charities (42 per cent).
Of the small and micro employers offering more than the then-minimum contribution,
three in ten (28 per cent) said they did this because they viewed higher contribution
rates as a staff benefit or perk.
Further analysis of employer contributions above minimum levels in 2017 is included
in section 4.6.
Recent TPR research, carried out after the first minimum contribution increase in
April 2018, found that 21 per cent of micro, 19 per cent of small, and 34 per cent of
medium employers were paying more than the current minimum employer
contribution of two per cent for all their employees.44
43 DWP. (2018). Automatic Enrolment: Quantitative Research with Small and Micro Employers. At:
https://www.gov.uk/government/publications/automatic-enrolment-quantitative-research-with-small-
and-micro-employers
44 TPR. (2018). Ongoing Duties Survey – Summer 2018. At:
https://www.thepensionsregulator.gov.uk/-/media/thepensionsregulator/files/import/pdf/employer-
automatic-enrolment-ongoing-duties-survey-summer-2018.ashx
Automatic Enrolment evaluation report 2018
42
4 Impact of automatic enrolment
This chapter looks at the impact that automatic enrolment has had on
individuals, employers and the pensions industry. This relates to the
following evaluation strategy questions:
Has automatic enrolment increased the number of individuals saving in workplace
pensions, and if so, how? (EQ3)
Has automatic enrolment increased the amount being saved in workplace pensions,
and if so, how? (EQ4)
To what extent is delivery of automatic enrolment achieved with a minimal burden on
employers? (EQ5)
How has the pensions industry reacted to automatic enrolment? (EQ6)
Summary
Existing evidence from the last 12 months
Data collected up to 2017 found that the number of eligible employees
participating in a workplace pension has increased to 17.7 million (84 per
cent), up from 10.7 million (55 per cent) in 2012. Overall, eligible employees
are continuing to save persistently.
The annual total amount saved by eligible employees across both sectors
(public and private) stands at £90.3 billion in 2017, which is an increase of
£4.3 billion from 2016. Annual total amounts increased in both public and
private sectors from 2016. The public sector increased by around £0.3 billion
and the private sector by £4.0 billion.
New analysis within this report
Rates of opt-out and cessation (stopping saving into a pension after the opt-
out period) have at the end June 2018 remained consistent with levels before
the first planned contribution increase in April 2018.
Those who are enrolled due to staging have higher opt-out rates than those
enrolled due to starting a job with an employer who already has ongoing
automatic enrolment duties.
Males and females have the same levels of opt-out, but males have slightly
higher levels of cessation.
Automatic Enrolment evaluation report 2018
43
Generally, older age groups have higher opt-out rates, but those aged 22 to
29 and 60 to State Pension age have the highest cessation rates – although
these rates are at relatively low levels.
Higher earners tend to have higher opt-out rates than lower earners, while
(with the exception of the highest earners who have the highest cessation
rates) there is not much variation in cessation rates by earnings level.
In 2017, over 7 million eligible private sector employees saving into a
workplace pension received an employer contribution of two per cent or
above (above the then-minimum contribution rate); of these, 5.5 million
received an employer contribution of four per cent or above.
More than 92 per cent of eligible employees in the private sector contributing
between three and four per cent received a matching (or higher) employer
contribution rate.
Approximately 5.9 million eligible employees were already meeting the April
2019 minimum contribution rates, based on data from April 2017. However,
around 5.1 million eligible employees were still contributing below April 2018
minimums at that time, and around 6.1 million will have to increase their
contributions by April 2019, if not earlier.
The rate of levelling down (reducing the generosity of contributions or
outcomes for existing pension scheme members) has increased slightly since
2012. However findings from the Employers' Pension Provision Survey 2017
suggest that where employers have experienced increased contribution costs
as a result of automatic enrolment, only one per cent of employers have
adopted levelling down as a strategy to absorb increased contribution costs.
Findings from the DWP’s communications tracking research (June 2018
wave) found that majority of individuals interviewed viewed automatic
enrolment as a good thing for them personally (82 per cent); agreed saving
into a workplace pension was normal for them (80 per cent); and knew where
to go if they wanted to find more about workplace pensions (83 per cent).
The emerging findings from forthcoming DWP research with ‘newborn’ (new)
employers, to be published in 2019, suggest that the reality of implementing
automatic enrolment was usually less burdensome than employers had
anticipated. The financial burden among those interviewed, over and above
the ongoing cost of employer contributions, was either small or even non-
existent.
Automatic Enrolment evaluation report 2018
44
4.1 Trends in workplace pension participation
This section looks at measures to indicate the effects of automatic enrolment on
increasing the number of savers involved in workplace pensions. The Department for
Work and Pensions’ (DWP) analysis of the Office for National Statistics (ONS)
Annual Survey of Hours and Earnings (ASHE) data estimates the pension
participation trends of eligible employees45 46 over time; this is broken down
according to public and private sector, employer size, employee earnings, and
protected groups (gender, age, disability and ethnicity).47 The DWP Family
Resources Survey (FRS)48 provides specific characteristic breakdowns that are not
accounted for by ASHE.
Together these annual surveys can monitor shifts in workplace pension participation
since the reforms were introduced. The most recent ASHE data including pension
information49 were collected with reference to April 2017, showing significant
increases in participation and pension saving. The FRS data were collected
throughout the 2016/2017 financial year. Therefore any potential impact of automatic
enrolment may be lessened because not all employees will have been automatically
enrolled due to the staged implementation approach.50
4.1.1 Overall number of savers
Between 2007 and 2012 there was a general downward trend in workplace pension
participation, from 60 per cent (12 million eligible employees) to just 55 per cent (10.7
million). However, since the reforms there has been a significant increase in the
number of eligible employees participating in a workplace pension, up to 84 per cent
(17.7 million) in 2017.
45 Throughout this report eligible employees are defined as employees who meet the automatic
enrolment age (currently 22 to SPA) and earnings criteria (currently over £10,000 p.a.), and includes
employees already a member of a workplace pension scheme.
46 ASHE collects information from employers on employee jobs, although they are referred to as
‘employees.'
47 For additional breakdowns consult DWP. (2018). Official statistics on workplace pension
participation and saving trends for eligible employees. At:
https://www.gov.uk/government/statistics/workplace-pension-participation-and-saving-trends-2007-to-
2017
48 FRS data for 2016/17 was collected between April 2016 and March 2017 and published 22 March
2018. At: https://www.gov.uk/government/statistics/family-resources-survey-financial-year-201617
49 Statistical bulletin: 2017 Annual Survey of Hours and Earnings: Summary of Pensions Results
published on 24 October 2017. At:
https://www.ons.gov.uk/employmentandlabourmarket/peopleinwork/earningsandworkinghours/bulletin
s/annualsurveyofhoursandearnings/2017provisionaland2016revisedresults
50 By April 2017 540,919 employers had declared compliance, and 7,787,000 eligible employees had
been automatically enrolled. By November 2018 a further 877,761 employers had declared
compliance and an additional 2,171,000 eligible employees had been enrolled.
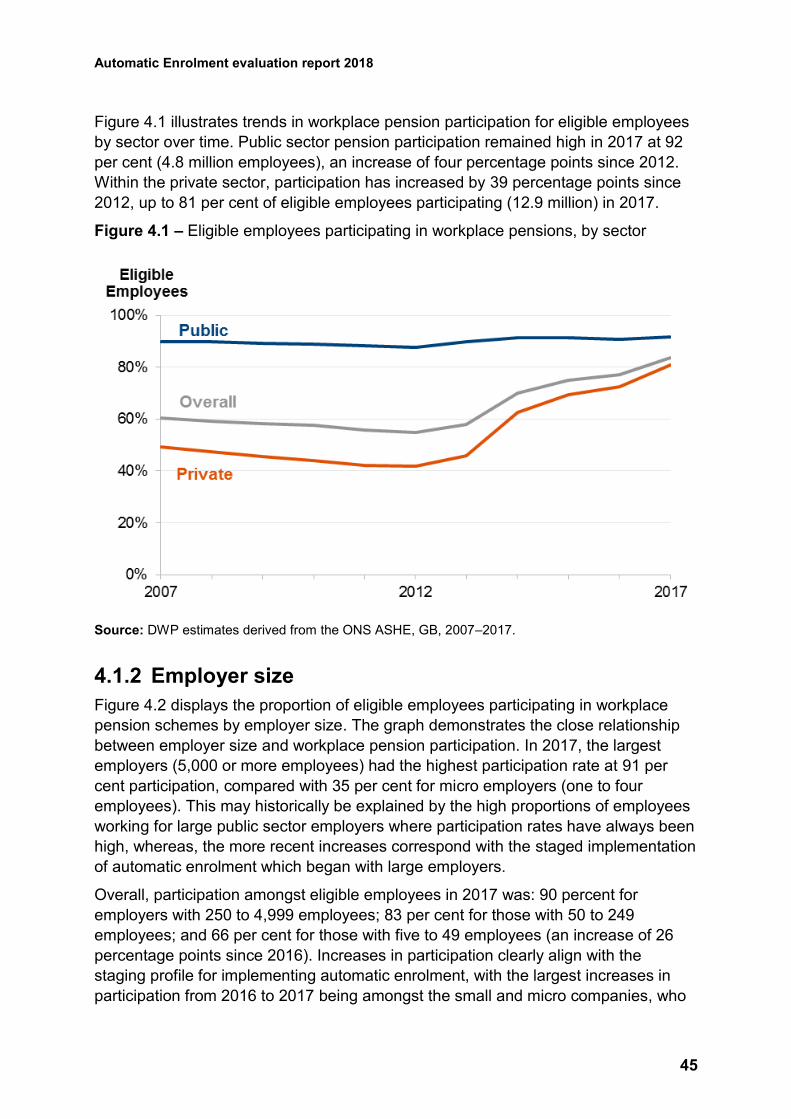
Automatic Enrolment evaluation report 2018
45
Figure 4.1 illustrates trends in workplace pension participation for eligible employees
by sector over time. Public sector pension participation remained high in 2017 at 92
per cent (4.8 million employees), an increase of four percentage points since 2012.
Within the private sector, participation has increased by 39 percentage points since
2012, up to 81 per cent of eligible employees participating (12.9 million) in 2017.
Figure 4.1 – Eligible employees participating in workplace pensions, by sector
Source: DWP estimates derived from the ONS ASHE, GB, 2007–2017.
4.1.2 Employer size
Figure 4.2 displays the proportion of eligible employees participating in workplace
pension schemes by employer size. The graph demonstrates the close relationship
between employer size and workplace pension participation. In 2017, the largest
employers (5,000 or more employees) had the highest participation rate at 91 per
cent participation, compared with 35 per cent for micro employers (one to four
employees). This may historically be explained by the high proportions of employees
working for large public sector employers where participation rates have always been
high, whereas, the more recent increases correspond with the staged implementation
of automatic enrolment which began with large employers.
Overall, participation amongst eligible employees in 2017 was: 90 percent for
employers with 250 to 4,999 employees; 83 per cent for those with 50 to 249
employees; and 66 per cent for those with five to 49 employees (an increase of 26
percentage points since 2016). Increases in participation clearly align with the
staging profile for implementing automatic enrolment, with the largest increases in
participation from 2016 to 2017 being amongst the small and micro companies, who
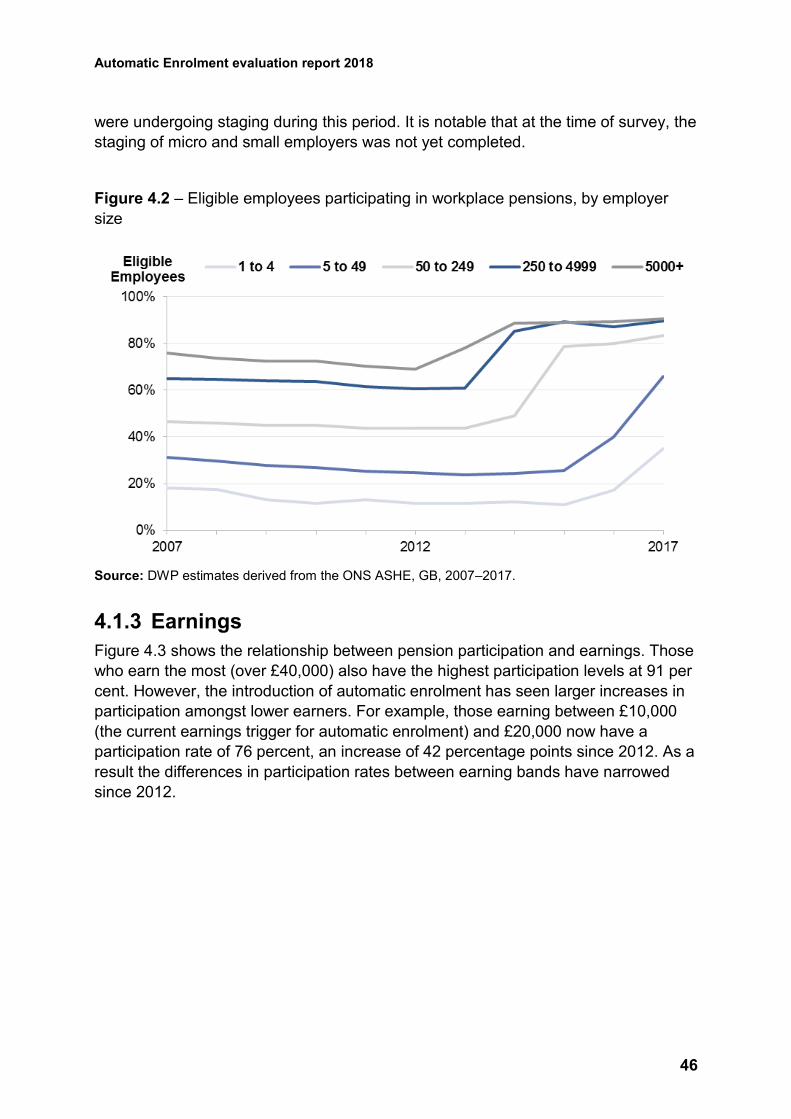
Automatic Enrolment evaluation report 2018
46
were undergoing staging during this period. It is notable that at the time of survey, the
staging of micro and small employers was not yet completed.
Figure 4.2 – Eligible employees participating in workplace pensions, by employer
size
Source: DWP estimates derived from the ONS ASHE, GB, 2007–2017.
4.1.3 Earnings
Figure 4.3 shows the relationship between pension participation and earnings. Those
who earn the most (over £40,000) also have the highest participation levels at 91 per
cent. However, the introduction of automatic enrolment has seen larger increases in
participation amongst lower earners. For example, those earning between £10,000
(the current earnings trigger for automatic enrolment) and £20,000 now have a
participation rate of 76 percent, an increase of 42 percentage points since 2012. As a
result the differences in participation rates between earning bands have narrowed
since 2012.
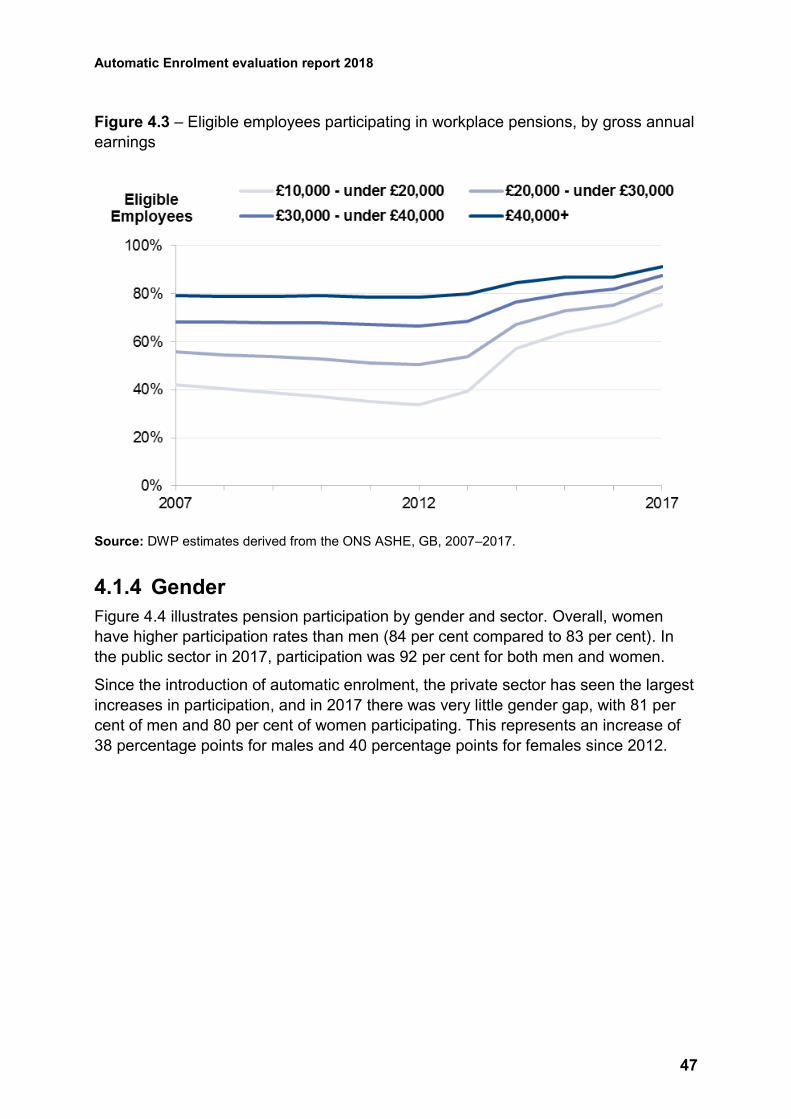
Automatic Enrolment evaluation report 2018
47
Figure 4.3 – Eligible employees participating in workplace pensions, by gross annual
earnings
Source: DWP estimates derived from the ONS ASHE, GB, 2007–2017.
4.1.4 Gender
Figure 4.4 illustrates pension participation by gender and sector. Overall, women
have higher participation rates than men (84 per cent compared to 83 per cent). In
the public sector in 2017, participation was 92 per cent for both men and women.
Since the introduction of automatic enrolment, the private sector has seen the largest
increases in participation, and in 2017 there was very little gender gap, with 81 per
cent of men and 80 per cent of women participating. This represents an increase of
38 percentage points for males and 40 percentage points for females since 2012.
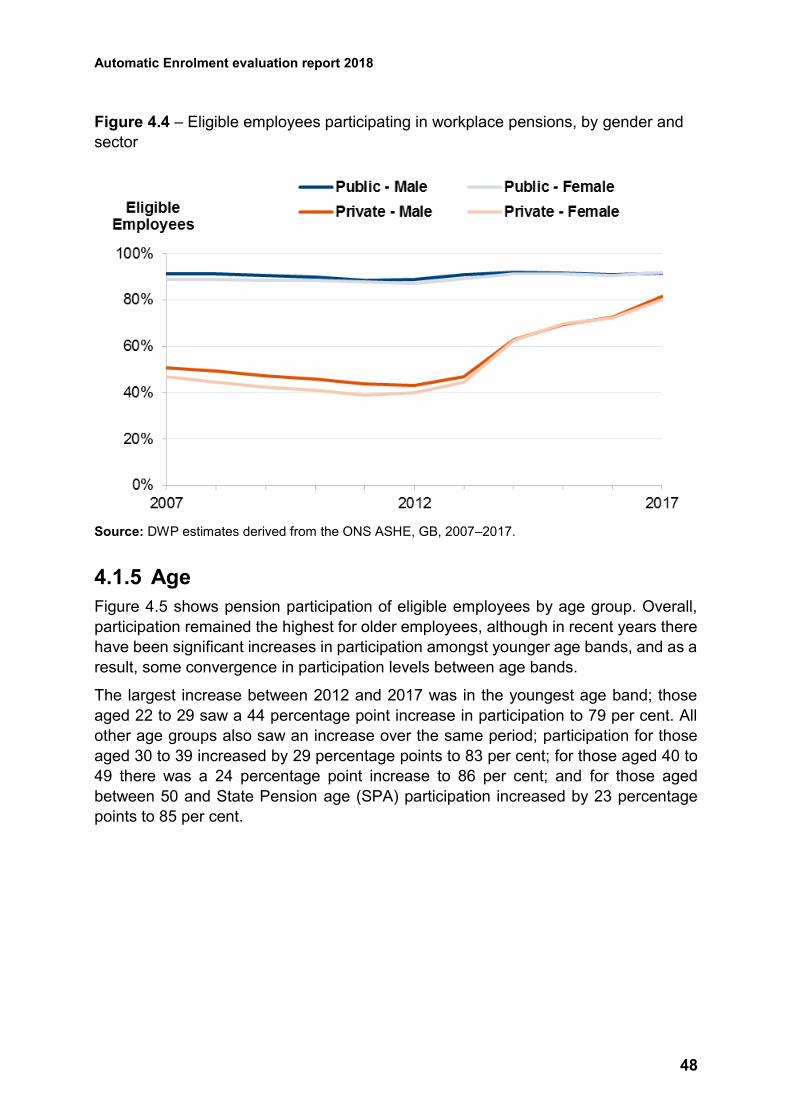
Automatic Enrolment evaluation report 2018
48
Figure 4.4 – Eligible employees participating in workplace pensions, by gender and
sector
Source: DWP estimates derived from the ONS ASHE, GB, 2007–2017.
4.1.5 Age
Figure 4.5 shows pension participation of eligible employees by age group. Overall,
participation remained the highest for older employees, although in recent years there
have been significant increases in participation amongst younger age bands, and as a
result, some convergence in participation levels between age bands.
The largest increase between 2012 and 2017 was in the youngest age band; those
aged 22 to 29 saw a 44 percentage point increase in participation to 79 per cent. All
other age groups also saw an increase over the same period; participation for those
aged 30 to 39 increased by 29 percentage points to 83 per cent; for those aged 40 to
49 there was a 24 percentage point increase to 86 per cent; and for those aged
between 50 and State Pension age (SPA) participation increased by 23 percentage
points to 85 per cent.
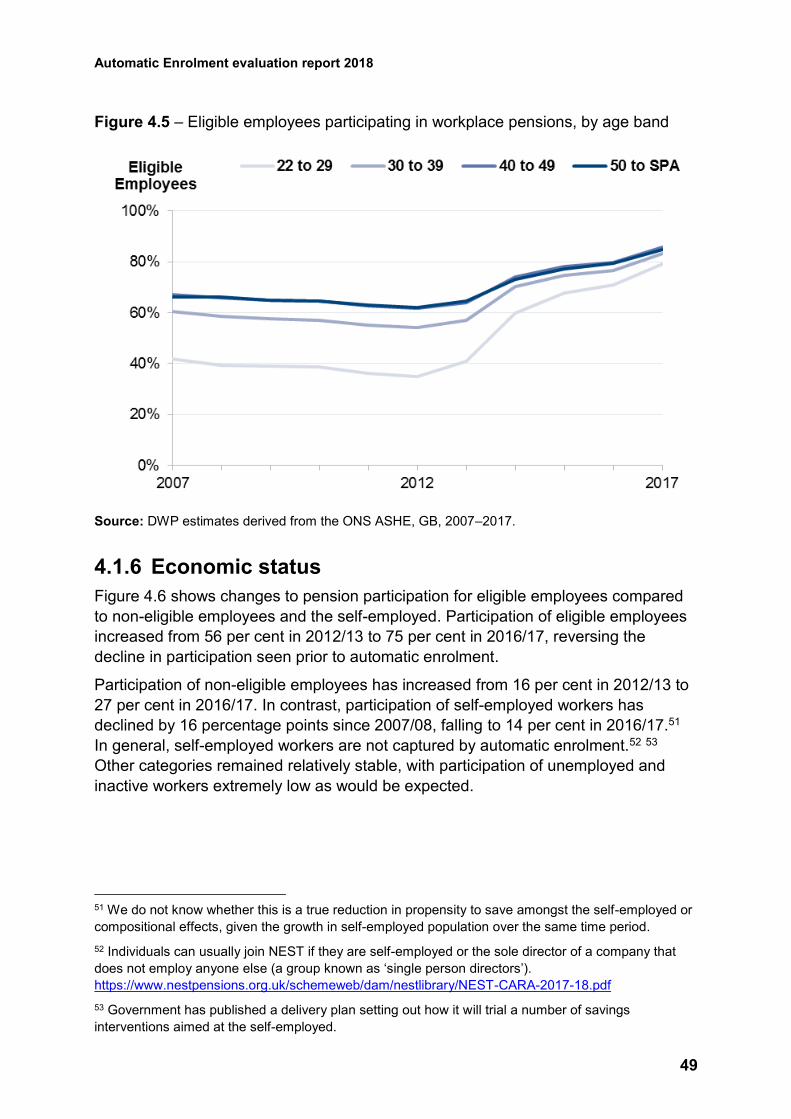
Automatic Enrolment evaluation report 2018
49
Figure 4.5 – Eligible employees participating in workplace pensions, by age band
Source: DWP estimates derived from the ONS ASHE, GB, 2007–2017.
4.1.6 Economic status
Figure 4.6 shows changes to pension participation for eligible employees compared
to non-eligible employees and the self-employed. Participation of eligible employees
increased from 56 per cent in 2012/13 to 75 per cent in 2016/17, reversing the
decline in participation seen prior to automatic enrolment.
Participation of non-eligible employees has increased from 16 per cent in 2012/13 to
27 per cent in 2016/17. In contrast, participation of self-employed workers has
declined by 16 percentage points since 2007/08, falling to 14 per cent in 2016/17.51
In general, self-employed workers are not captured by automatic enrolment.52 53
Other categories remained relatively stable, with participation of unemployed and
inactive workers extremely low as would be expected.
51 We do not know whether this is a true reduction in propensity to save amongst the self-employed or
compositional effects, given the growth in self-employed population over the same time period.
52 Individuals can usually join NEST if they are self-employed or the sole director of a company that
does not employ anyone else (a group known as ‘single person directors’).
https://www.nestpensions.org.uk/schemeweb/dam/nestlibrary/NEST-CARA-2017-18.pdf
53 Government has published a delivery plan setting out how it will trial a number of savings
interventions aimed at the self-employed.
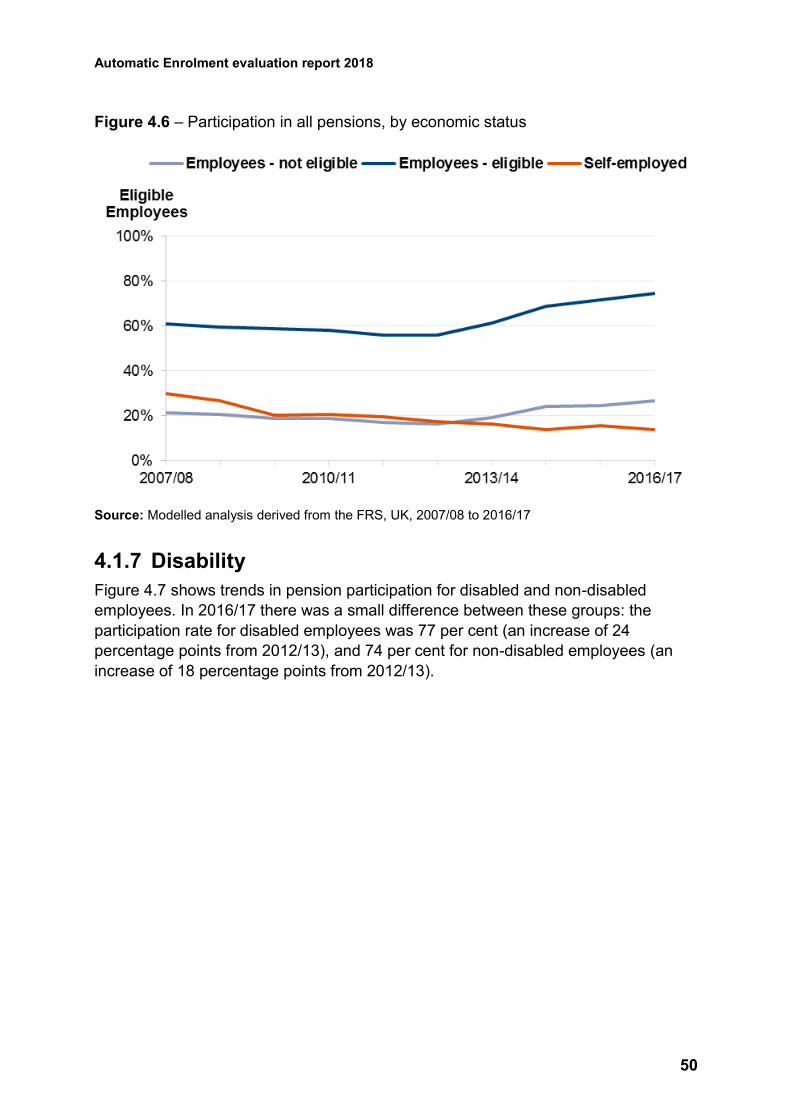
Automatic Enrolment evaluation report 2018
50
Figure 4.6 – Participation in all pensions, by economic status
Source: Modelled analysis derived from the FRS, UK, 2007/08 to 2016/17
4.1.7 Disability
Figure 4.7 shows trends in pension participation for disabled and non-disabled
employees. In 2016/17 there was a small difference between these groups: the
participation rate for disabled employees was 77 per cent (an increase of 24
percentage points from 2012/13), and 74 per cent for non-disabled employees (an
increase of 18 percentage points from 2012/13).
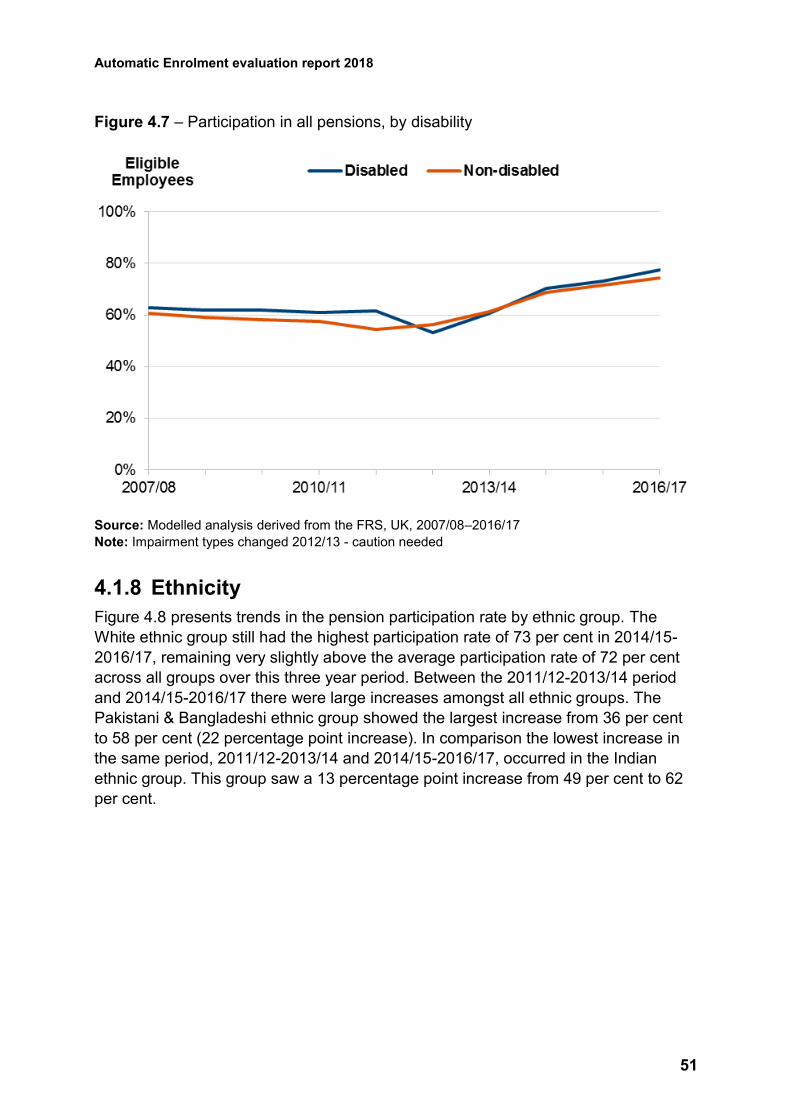
Automatic Enrolment evaluation report 2018
51
Figure 4.7 – Participation in all pensions, by disability
Source: Modelled analysis derived from the FRS, UK, 2007/08–2016/17
Note: Impairment types changed 2012/13 - caution needed
4.1.8 Ethnicity
Figure 4.8 presents trends in the pension participation rate by ethnic group. The
White ethnic group still had the highest participation rate of 73 per cent in 2014/15-
2016/17, remaining very slightly above the average participation rate of 72 per cent
across all groups over this three year period. Between the 2011/12-2013/14 period
and 2014/15-2016/17 there were large increases amongst all ethnic groups. The
Pakistani & Bangladeshi ethnic group showed the largest increase from 36 per cent
to 58 per cent (22 percentage point increase). In comparison the lowest increase in
the same period, 2011/12-2013/14 and 2014/15-2016/17, occurred in the Indian
ethnic group. This group saw a 13 percentage point increase from 49 per cent to 62
per cent.
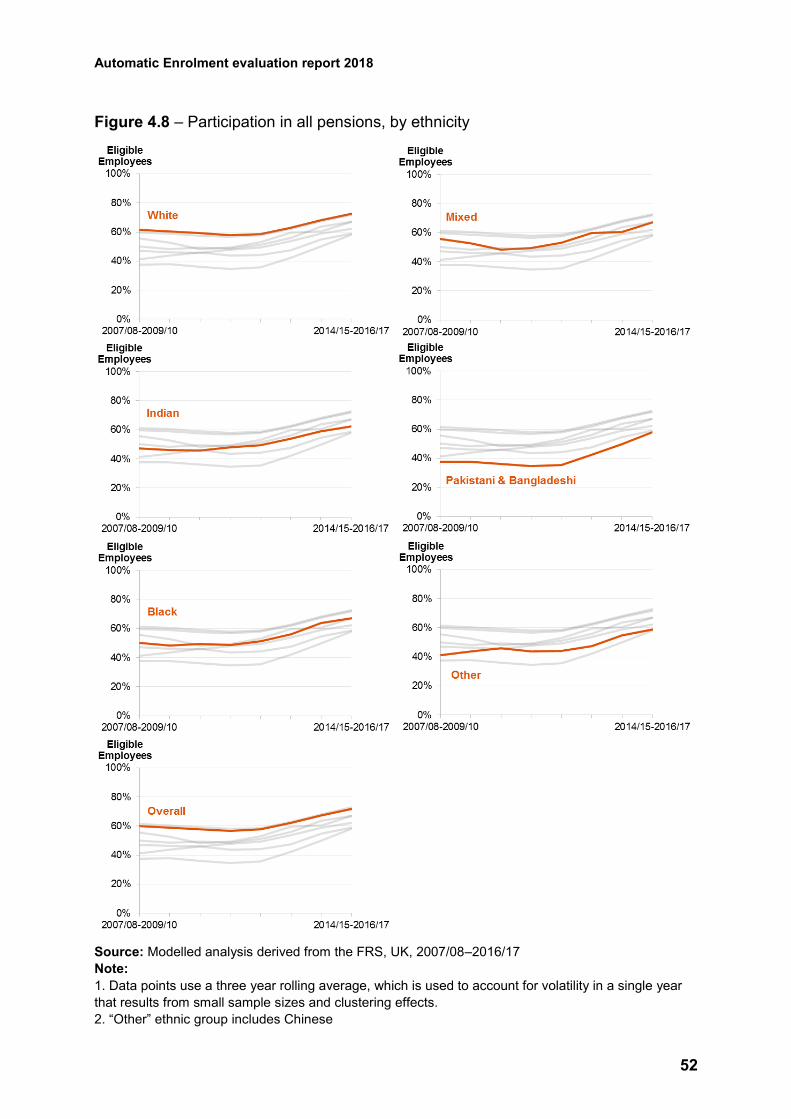
Automatic Enrolment evaluation report 2018
52
Figure 4.8 – Participation in all pensions, by ethnicity
Source: Modelled analysis derived from the FRS, UK, 2007/08–2016/17
Note:
1. Data points use a three year rolling average, which is used to account for volatility in a single year
that results from small sample sizes and clustering effects.
2. “Other” ethnic group includes Chinese
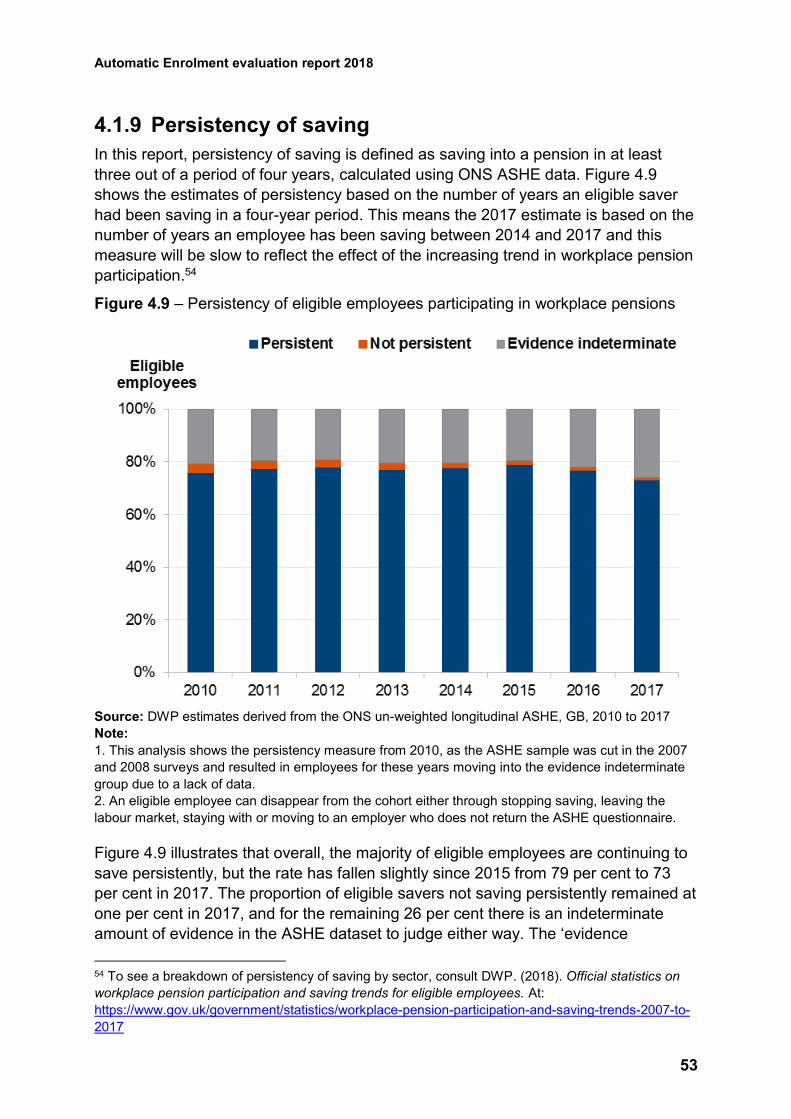
Automatic Enrolment evaluation report 2018
53
4.1.9 Persistency of saving
In this report, persistency of saving is defined as saving into a pension in at least
three out of a period of four years, calculated using ONS ASHE data. Figure 4.9
shows the estimates of persistency based on the number of years an eligible saver
had been saving in a four-year period. This means the 2017 estimate is based on the
number of years an employee has been saving between 2014 and 2017 and this
measure will be slow to reflect the effect of the increasing trend in workplace pension
participation.54
Figure 4.9 – Persistency of eligible employees participating in workplace pensions
Source: DWP estimates derived from the ONS un-weighted longitudinal ASHE, GB, 2010 to 2017
Note:
1. This analysis shows the persistency measure from 2010, as the ASHE sample was cut in the 2007
and 2008 surveys and resulted in employees for these years moving into the evidence indeterminate
group due to a lack of data.
2. An eligible employee can disappear from the cohort either through stopping saving, leaving the
labour market, staying with or moving to an employer who does not return the ASHE questionnaire.
Figure 4.9 illustrates that overall, the majority of eligible employees are continuing to
save persistently, but the rate has fallen slightly since 2015 from 79 per cent to 73
per cent in 2017. The proportion of eligible savers not saving persistently remained at
one per cent in 2017, and for the remaining 26 per cent there is an indeterminate
amount of evidence in the ASHE dataset to judge either way. The ‘evidence
54 To see a breakdown of persistency of saving by sector, consult DWP. (2018). Official statistics on
workplace pension participation and saving trends for eligible employees. At:
https://www.gov.uk/government/statistics/workplace-pension-participation-and-saving-trends-2007-to-
2017
Automatic Enrolment evaluation report 2018
54
indeterminate group’ has been increasing in recent years. The reasons for this are
not clear, although there has been a small decrease in the ASHE response rate since
2014. The growth in this evidence indeterminate group appears to be the driver of the
decrease in those identified as persistent savers.
4.2 Trends in occupational pension scheme provision
The Occupational Pension Schemes Survey (OPSS) is an annual survey of
occupational pension schemes in the UK that is run by the Office for National
Statistics (ONS).55 Unlike much of the analysis in this report, the OPSS covers all
employees and not just those eligible for automatic enrolment.56 Whilst the OPSS
covers all employees, it also differs from other sources in that occupational pensions
are only a subset of the group of pension schemes defined as workplace pensions.
Overall, the survey suggests that the total membership57 of occupational pension
schemes in the UK is at its highest recorded level, with 41.1 million memberships.58
This represents an increase of 4.9 per cent from the previous year’s figure (39.2
million). As illustrated by Figure 4.10, active membership59 of occupational pension
schemes was 15.1 million in 2017, split between the private (8.8 million) and public
sector (6.3 million).
55 ONS. (2018). Occupational Pension Schemes Survey, UK: 2017. At:
https://www.ons.gov.uk/peoplepopulationandcommunity/personalandhouseholdfinances/pensionssavi
ngsandinvestments/bulletins/occupationalpensionschemessurvey/uk2017
56 However, the OPSS does not include state pensions or personal pensions, the latter being based
on individuals entering into a contract with a pension provider. OPSS does not cover group personal
pension (GPP) arrangements, such as stakeholder and group self-invested personal pensions
(GSIPP), where the contract is facilitated by the employer(s). Based on TPR’s 2018 ‘Automatic
enrolment: commentary and analysis’ report, 11 per cent of pension schemes with less than 30
members used for automatic enrolment are contract-based (personal pensions); for pension schemes
with 30 or more members, this proportion is 35 per cent.
57 Total membership of occupational pension schemes consists of: 1) active members (current
employees who are currently contributing to the scheme, or having contributions made on their
behalf); 2) pensioner members (those receiving pension payments); 3) members with preserved
pension entitlements (members who are no longer actively contributing into the scheme but have
accrued rights that will come into payment at some point in the future).
58 Estimates of pension scheme membership are not counts of individuals as an individual may have
more than one type of occupational pension scheme membership. For example, an individual might be
working and contributing to a scheme while being entitled to a preserved pension from a previous
employer’s scheme.
59 Active members of an occupational pension scheme are those who are contributing to the scheme,
or having contributions made on their behalf. They are usually current employees of the sponsoring
employer.
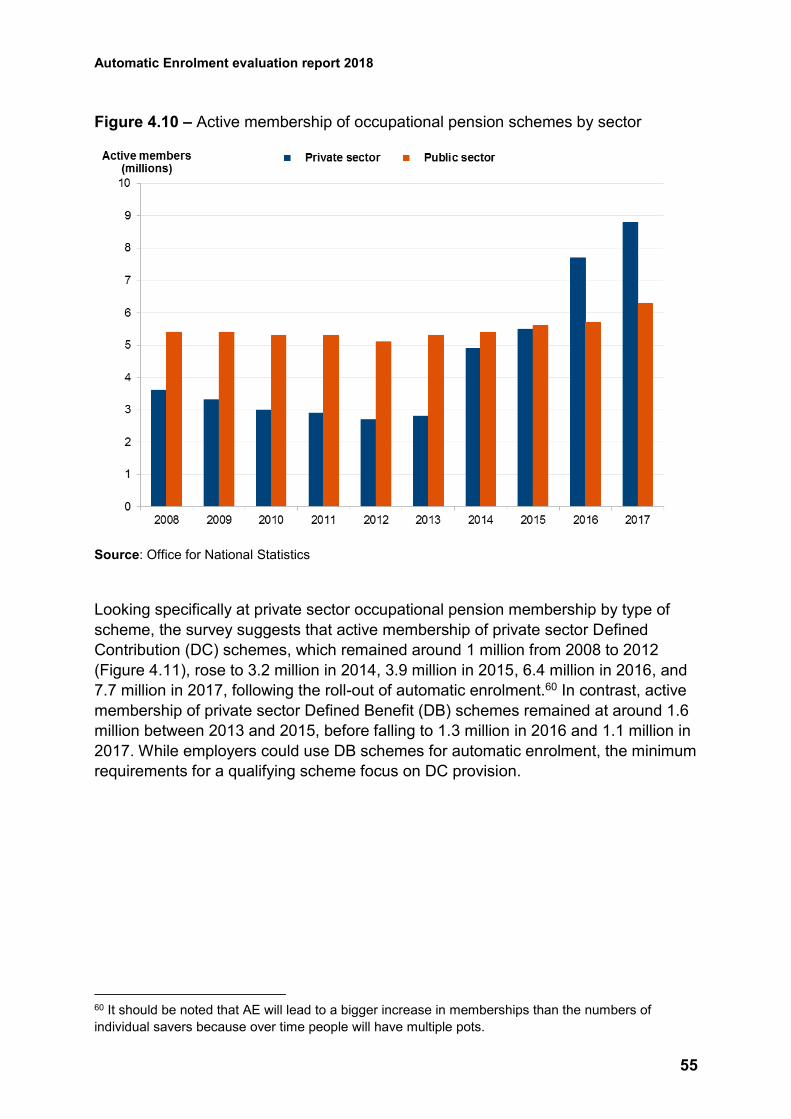
Automatic Enrolment evaluation report 2018
55
Figure 4.10 – Active membership of occupational pension schemes by sector
Source: Office for National Statistics
Looking specifically at private sector occupational pension membership by type of
scheme, the survey suggests that active membership of private sector Defined
Contribution (DC) schemes, which remained around 1 million from 2008 to 2012
(Figure 4.11), rose to 3.2 million in 2014, 3.9 million in 2015, 6.4 million in 2016, and
7.7 million in 2017, following the roll-out of automatic enrolment.60 In contrast, active
membership of private sector Defined Benefit (DB) schemes remained at around 1.6
million between 2013 and 2015, before falling to 1.3 million in 2016 and 1.1 million in
2017. While employers could use DB schemes for automatic enrolment, the minimum
requirements for a qualifying scheme focus on DC provision.
60 It should be noted that AE will lead to a bigger increase in memberships than the numbers of
individual savers because over time people will have multiple pots.
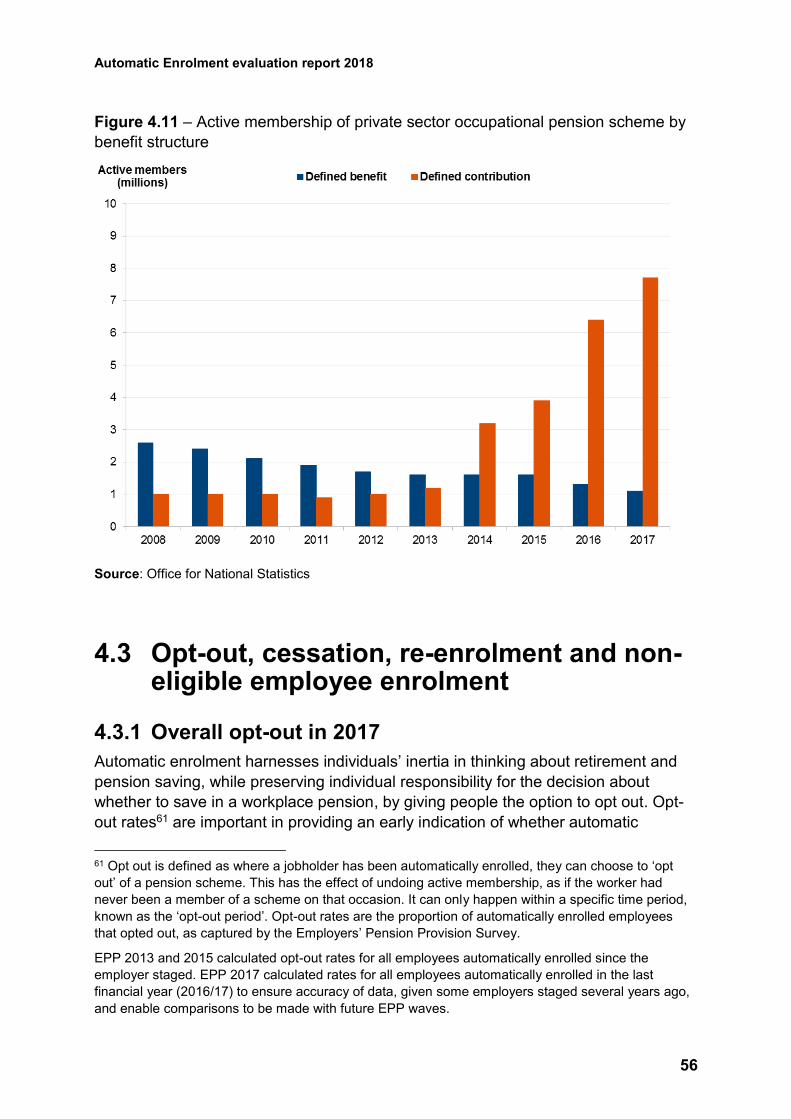
Automatic Enrolment evaluation report 2018
56
Figure 4.11 – Active membership of private sector occupational pension scheme by
benefit structure
Source: Office for National Statistics
4.3 Opt-out, cessation, re-enrolment and non-eligible employee enrolment
4.3.1 Overall opt-out in 2017
Automatic enrolment harnesses individuals’ inertia in thinking about retirement and
pension saving, while preserving individual responsibility for the decision about
whether to save in a workplace pension, by giving people the option to opt out. Opt-
out rates61 are important in providing an early indication of whether automatic
61 Opt out is defined as where a jobholder has been automatically enrolled, they can choose to ‘opt
out’ of a pension scheme. This has the effect of undoing active membership, as if the worker had
never been a member of a scheme on that occasion. It can only happen within a specific time period,
known as the ‘opt-out period’. Opt-out rates are the proportion of automatically enrolled employees
that opted out, as captured by the Employers’ Pension Provision Survey.
EPP 2013 and 2015 calculated opt-out rates for all employees automatically enrolled since the
employer staged. EPP 2017 calculated rates for all employees automatically enrolled in the last
financial year (2016/17) to ensure accuracy of data, given some employers staged several years ago,
and enable comparisons to be made with future EPP waves.
Automatic Enrolment evaluation report 2018
57
enrolment is effective in increasing participation, by monitoring what newly enrolled
employees do at the point of enrolment.
The 2017 Employers’ Pension Provision (EPP) Survey was conducted between July
and October 2017, by which time many small and micro employers who had been
employers prior to 2012 had staged.
Overall, among employers with a scheme used for automatic enrolment, EPP 2017
found that nine per cent of employees who were automatically enrolled in the last
financial year (2016/17) decided to opt out within one month.62 Direct comparisons
with earlier surveys in the EPP series are not possible due to changes in question
wording, but this figure does not suggest any notable increase in average opt-out
rates since 2015.
Opt-out rates varied slightly by employer size (average of ten per cent for employees
of micro employers; 12 per cent for those at small employers; nine per cent for
medium employers; and eight per cent for large employers), however these
differences by employer size were not statistically significant.
4.3.2 Using Real Time Information to measure opt-out and cessation
Real Time Information (RTI) is the reporting system for earnings taxed via Pay As
You Earn (PAYE). Under RTI, employers are required to report to HMRC information
about payments made to their employees through the PAYE system, including details
of tax and other deductions from pay. Since April 2014, employers have been
required to report in real time with around 2.3 million PAYE schemes covering a total
of 45 million employments and pensioners reporting through RTI63 (see Annex 6.1.2
for more details).
RTI is an employment-level dataset, so an individual would appear multiple times in
the data if they had multiple jobs.
RTI collects information on the amount of employee pension contributions deducted
from each payment. By looking longitudinally across payments for a given
employment, we use the presence and absence of employee pension contributions
to identify when an employment starts and stops pension saving. Applying this
method to all employments appearing on RTI, we can count the numbers stopping
saving each month, and calculate opt-out and cessation64 rates.
62 DWP. (2018). Employers’ Pension Provision Survey 2017. At:
https://www.gov.uk/government/publications/employers-pension-provision-survey-2017
63 HMRC. (2018). UK Real Time Information, Experimental Statistics. At:
https://assets.publishing.service.gov.uk/government/uploads/system/uploads/attachment_data/file/727
796/UK_Real_Time_Information_Experimental_Statistics.pdf
64 Cessation is where a jobholder has been automatically enrolled, but stops saving into a pension
after the opt-out window has elapsed.
Automatic Enrolment evaluation report 2018
58
Because RTI does not collect information on employer pension contributions, it
cannot identify employments with employer-only pension contributions. Additionally,
pension contributions made via salary sacrifice65 cannot be identified within RTI as
pension contributions. Evidence from ASHE 2017 suggests that RTI therefore can be
used to identify around 62 per cent of workplace pension savers (see Annex 6.1.1 for
more details). As such, RTI does not give a complete picture of all employments who
have been automatically enrolled.66
There are two important differences to note between RTI and other sources used to
measure opt-out and cessation.
First, using RTI we define the opt-out window differently than the standard definition
set out within this report, and used in the EPP. As a consequence, some
employments who would be classified as cessations in other data sources may be
opt-outs in RTI.
Typically, the opt-out rate window runs one calendar month from when an employee
is enrolled into a pension scheme; if they stop saving after that point it is classified as
a cessation. In RTI, the opt-out window runs six weeks from when an employment
makes a first pension contribution (i.e. starts saving67) (see Annex 6.1.2 for an
explanation of the rationale behind this difference).
Second, RTI cannot identify cases where employments have been enrolled but opt
out before making their first contribution. Since these employments have not made
any pension contributions, we cannot identify that they have been enrolled. This
group is captured in other measures such as those in the EPP.
Given the differences in population coverage, definitions, and methodology, the opt-
out/cessations figures produced by RTI will not be directly comparable with other
data sources. Therefore, the focus of this section is to look for changes in the RTI
measures over time and between groups to evaluate savings behaviour.
The figures presented through section 4.3 are based on employments eligible68 for
automatic enrolment, both in the public and private sector.
65 A salary sacrifice arrangement is an agreement to reduce an employee’s entitlement to cash pay,
usually in return for a non-cash benefit – in this case, employer pension contributions.
66 There is currently no evidence to suggest that savings behaviour differs for employees saving via
salary sacrifice arrangements.
67 We define someone as ‘newly saving’ in a given month if they have made a pension contribution in
that month and had not made a pension contribution in the preceding 12 month period. If they had
made a pension contribution in that period, it is defined as a continuation of saving rather than a new
start.
68 An employment is defined as eligible at the point of a particular payment if they are aged between
22 and State Pension age and their earnings rate is equivalent to £10,000 or higher annually. Annex
6.1.2 has more detail on how earnings variables are calculated.
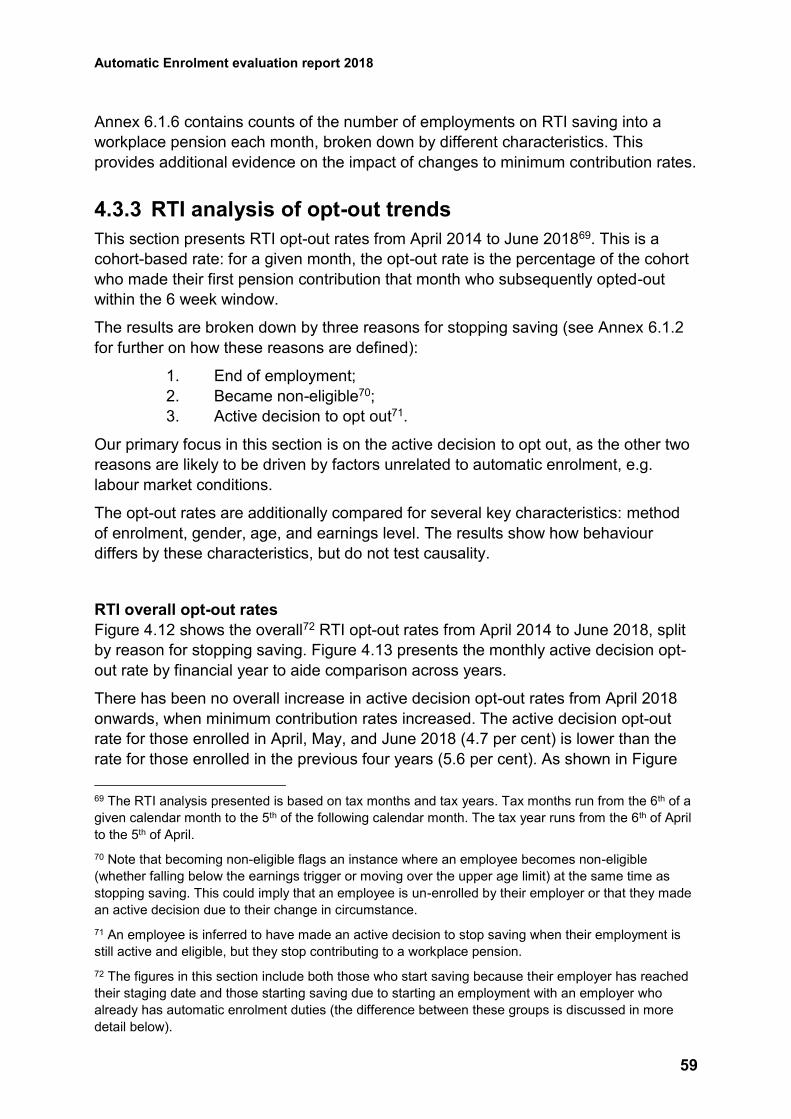
Automatic Enrolment evaluation report 2018
59
Annex 6.1.6 contains counts of the number of employments on RTI saving into a
workplace pension each month, broken down by different characteristics. This
provides additional evidence on the impact of changes to minimum contribution rates.
4.3.3 RTI analysis of opt-out trends
This section presents RTI opt-out rates from April 2014 to June 201869. This is a
cohort-based rate: for a given month, the opt-out rate is the percentage of the cohort
who made their first pension contribution that month who subsequently opted-out
within the 6 week window.
The results are broken down by three reasons for stopping saving (see Annex 6.1.2
for further on how these reasons are defined):
1. End of employment;
2. Became non-eligible70;
3. Active decision to opt out71.
Our primary focus in this section is on the active decision to opt out, as the other two
reasons are likely to be driven by factors unrelated to automatic enrolment, e.g.
labour market conditions.
The opt-out rates are additionally compared for several key characteristics: method
of enrolment, gender, age, and earnings level. The results show how behaviour
differs by these characteristics, but do not test causality.
RTI overall opt-out rates
Figure 4.12 shows the overall72 RTI opt-out rates from April 2014 to June 2018, split
by reason for stopping saving. Figure 4.13 presents the monthly active decision opt-
out rate by financial year to aide comparison across years.
There has been no overall increase in active decision opt-out rates from April 2018
onwards, when minimum contribution rates increased. The active decision opt-out
rate for those enrolled in April, May, and June 2018 (4.7 per cent) is lower than the
rate for those enrolled in the previous four years (5.6 per cent). As shown in Figure
69 The RTI analysis presented is based on tax months and tax years. Tax months run from the 6th of a
given calendar month to the 5th of the following calendar month. The tax year runs from the 6th of April
to the 5th of April.
70 Note that becoming non-eligible flags an instance where an employee becomes non-eligible
(whether falling below the earnings trigger or moving over the upper age limit) at the same time as
stopping saving. This could imply that an employee is un-enrolled by their employer or that they made
an active decision due to their change in circumstance.
71 An employee is inferred to have made an active decision to stop saving when their employment is
still active and eligible, but they stop contributing to a workplace pension.
72 The figures in this section include both those who start saving because their employer has reached
their staging date and those starting saving due to starting an employment with an employer who
already has automatic enrolment duties (the difference between these groups is discussed in more
detail below).
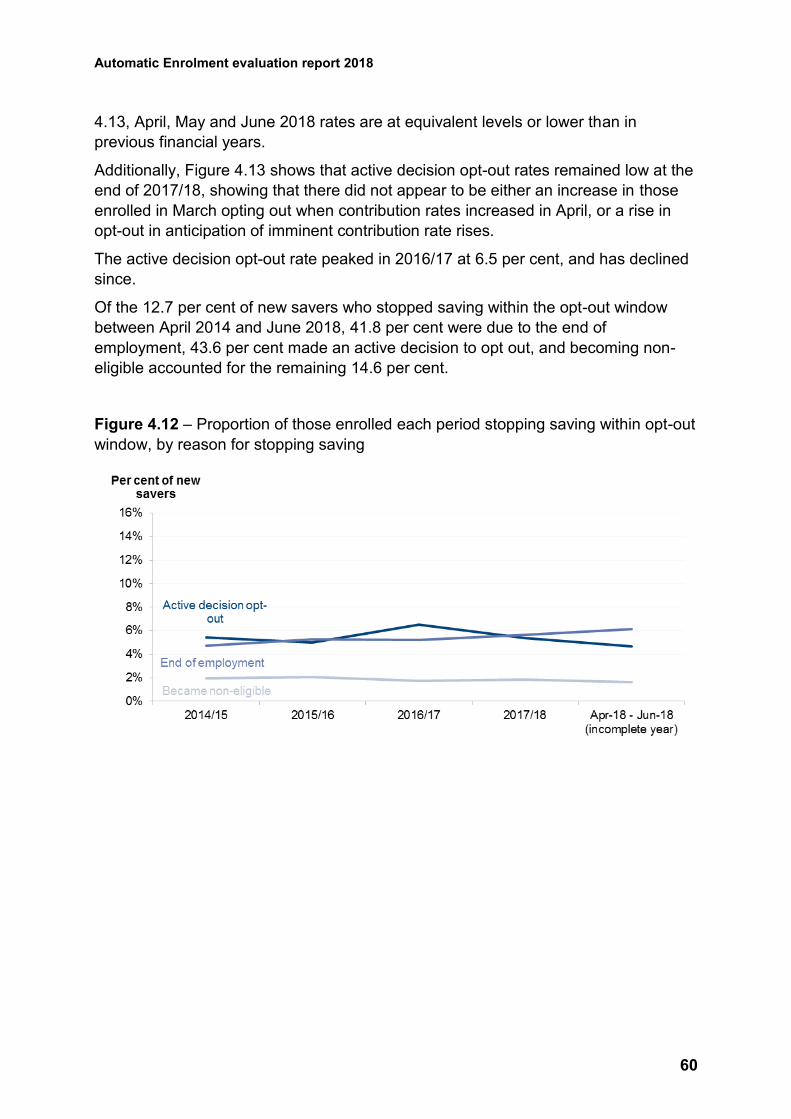
Automatic Enrolment evaluation report 2018
60
4.13, April, May and June 2018 rates are at equivalent levels or lower than in
previous financial years.
Additionally, Figure 4.13 shows that active decision opt-out rates remained low at the
end of 2017/18, showing that there did not appear to be either an increase in those
enrolled in March opting out when contribution rates increased in April, or a rise in
opt-out in anticipation of imminent contribution rate rises.
The active decision opt-out rate peaked in 2016/17 at 6.5 per cent, and has declined
since.
Of the 12.7 per cent of new savers who stopped saving within the opt-out window
between April 2014 and June 2018, 41.8 per cent were due to the end of
employment, 43.6 per cent made an active decision to opt out, and becoming non-
eligible accounted for the remaining 14.6 per cent.
Figure 4.12 – Proportion of those enrolled each period stopping saving within opt-out
window, by reason for stopping saving
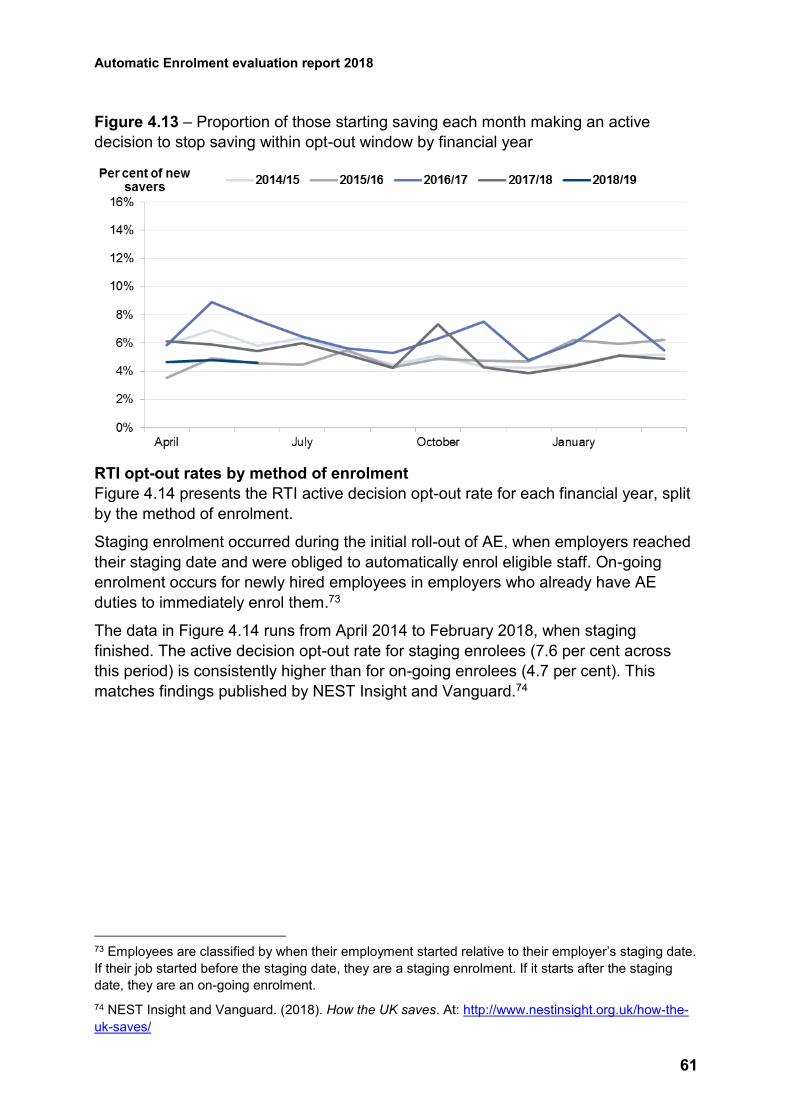
Automatic Enrolment evaluation report 2018
61
Figure 4.13 – Proportion of those starting saving each month making an active
decision to stop saving within opt-out window by financial year
RTI opt-out rates by method of enrolment
Figure 4.14 presents the RTI active decision opt-out rate for each financial year, split
by the method of enrolment.
Staging enrolment occurred during the initial roll-out of AE, when employers reached
their staging date and were obliged to automatically enrol eligible staff. On-going
enrolment occurs for newly hired employees in employers who already have AE
duties to immediately enrol them.73
The data in Figure 4.14 runs from April 2014 to February 2018, when staging
finished. The active decision opt-out rate for staging enrolees (7.6 per cent across
this period) is consistently higher than for on-going enrolees (4.7 per cent). This
matches findings published by NEST Insight and Vanguard.74
73 Employees are classified by when their employment started relative to their employer’s staging date.
If their job started before the staging date, they are a staging enrolment. If it starts after the staging
date, they are an on-going enrolment.
74 NEST Insight and Vanguard. (2018). How the UK saves. At: http://www.nestinsight.org.uk/how-the-
uk-saves/
Automatic Enrolment evaluation report 2018
62
Figure 4.14 – Proportion of those stopping saving within opt-out window, by method
of enrolment75
Since staging is now complete, future opt-out rates are expected to be closer to the
lower, on-going enrolment average.
Several factors could explain a difference in behaviour between these groups,
including potential factors like take-home pay impacts (on-going enrolees should pay
contributions from their first payroll period, meaning they will not notice a fall in pay
following enrolment), or social norm effects, when saving into a pension is
increasingly seen over time as the normal thing to do.
Note two caveats to this measure. First, the above analysis cannot isolate cases of
re-enrolments, which may be classified as staging or on-going depending on their
employment start dates and employer’s staging dates. Second, employers can
postpone enrolling new staff, in which case on-going enrolments would have similar
take home pay impacts to staging enrolments.
RTI opt-out rates by gender
Figure 4.15 shows the active decision opt-out rate from April 2014 to June 2018, split
by gender.
Active decision opt-out rates for males and females enrolled from April 2014 to June
2018 are approximately equal at 5.5 per cent. This result is consistent with previous
75 These figures run to the end of the staging profile, February 2018.
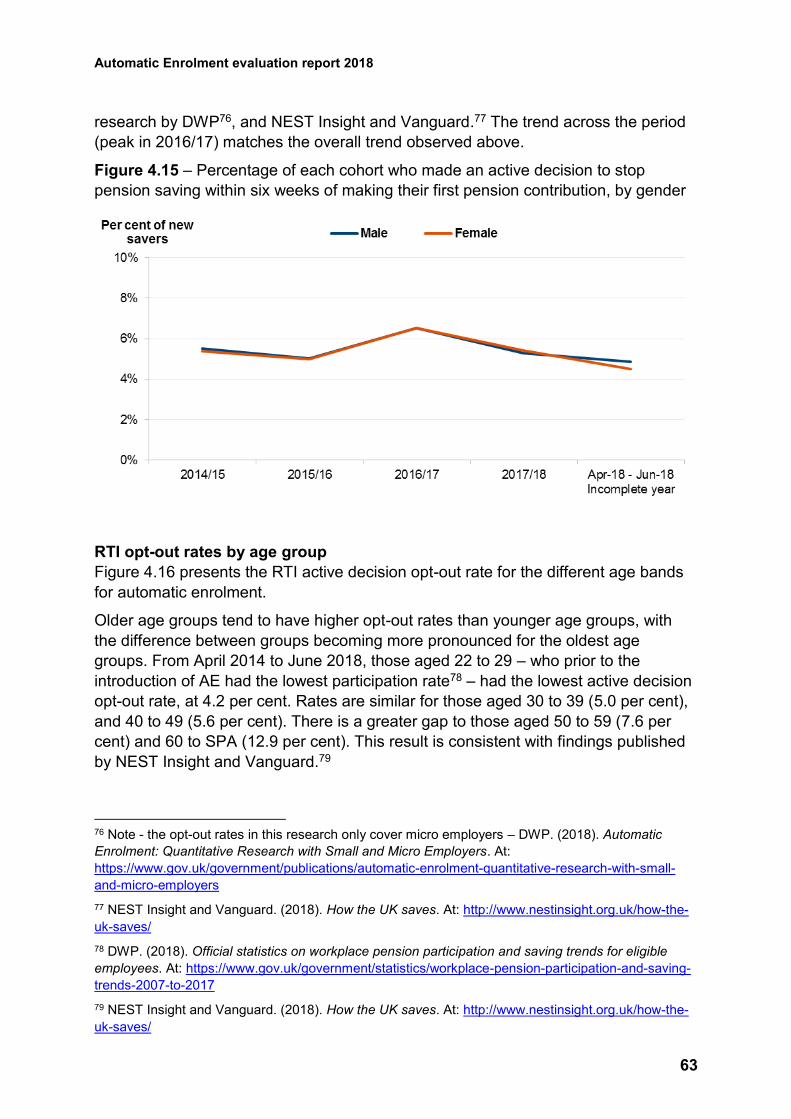
Automatic Enrolment evaluation report 2018
63
research by DWP76, and NEST Insight and Vanguard.77 The trend across the period
(peak in 2016/17) matches the overall trend observed above.
Figure 4.15 – Percentage of each cohort who made an active decision to stop
pension saving within six weeks of making their first pension contribution, by gender
RTI opt-out rates by age group
Figure 4.16 presents the RTI active decision opt-out rate for the different age bands
for automatic enrolment.
Older age groups tend to have higher opt-out rates than younger age groups, with
the difference between groups becoming more pronounced for the oldest age
groups. From April 2014 to June 2018, those aged 22 to 29 – who prior to the
introduction of AE had the lowest participation rate78 – had the lowest active decision
opt-out rate, at 4.2 per cent. Rates are similar for those aged 30 to 39 (5.0 per cent),
and 40 to 49 (5.6 per cent). There is a greater gap to those aged 50 to 59 (7.6 per
cent) and 60 to SPA (12.9 per cent). This result is consistent with findings published
by NEST Insight and Vanguard.79
76 Note - the opt-out rates in this research only cover micro employers – DWP. (2018). Automatic
Enrolment: Quantitative Research with Small and Micro Employers. At:
https://www.gov.uk/government/publications/automatic-enrolment-quantitative-research-with-small-
and-micro-employers
77 NEST Insight and Vanguard. (2018). How the UK saves. At: http://www.nestinsight.org.uk/how-the-
uk-saves/
78 DWP. (2018). Official statistics on workplace pension participation and saving trends for eligible
employees. At: https://www.gov.uk/government/statistics/workplace-pension-participation-and-saving-
trends-2007-to-2017
79 NEST Insight and Vanguard. (2018). How the UK saves. At: http://www.nestinsight.org.uk/how-the-
uk-saves/
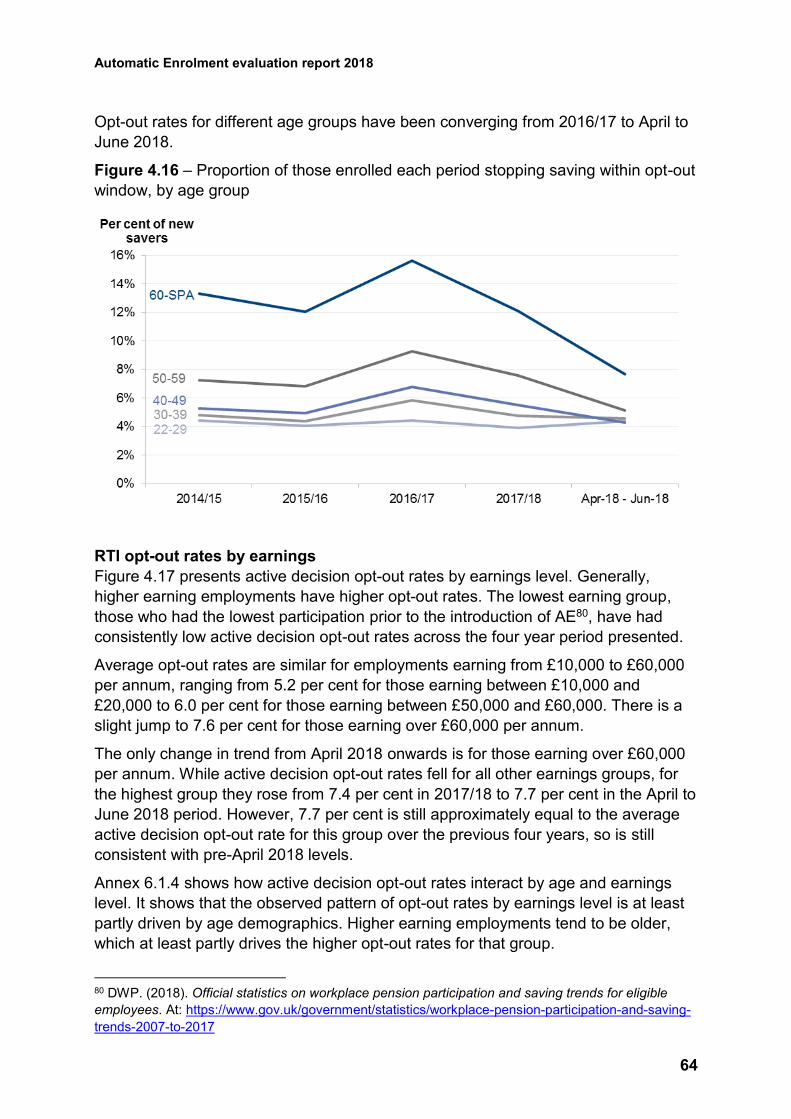
Automatic Enrolment evaluation report 2018
64
Opt-out rates for different age groups have been converging from 2016/17 to April to
June 2018.
Figure 4.16 – Proportion of those enrolled each period stopping saving within opt-out
window, by age group
RTI opt-out rates by earnings
Figure 4.17 presents active decision opt-out rates by earnings level. Generally,
higher earning employments have higher opt-out rates. The lowest earning group,
those who had the lowest participation prior to the introduction of AE80, have had
consistently low active decision opt-out rates across the four year period presented.
Average opt-out rates are similar for employments earning from £10,000 to £60,000
per annum, ranging from 5.2 per cent for those earning between £10,000 and
£20,000 to 6.0 per cent for those earning between £50,000 and £60,000. There is a
slight jump to 7.6 per cent for those earning over £60,000 per annum.
The only change in trend from April 2018 onwards is for those earning over £60,000
per annum. While active decision opt-out rates fell for all other earnings groups, for
the highest group they rose from 7.4 per cent in 2017/18 to 7.7 per cent in the April to
June 2018 period. However, 7.7 per cent is still approximately equal to the average
active decision opt-out rate for this group over the previous four years, so is still
consistent with pre-April 2018 levels.
Annex 6.1.4 shows how active decision opt-out rates interact by age and earnings
level. It shows that the observed pattern of opt-out rates by earnings level is at least
partly driven by age demographics. Higher earning employments tend to be older,
which at least partly drives the higher opt-out rates for that group.
80 DWP. (2018). Official statistics on workplace pension participation and saving trends for eligible
employees. At: https://www.gov.uk/government/statistics/workplace-pension-participation-and-saving-
trends-2007-to-2017
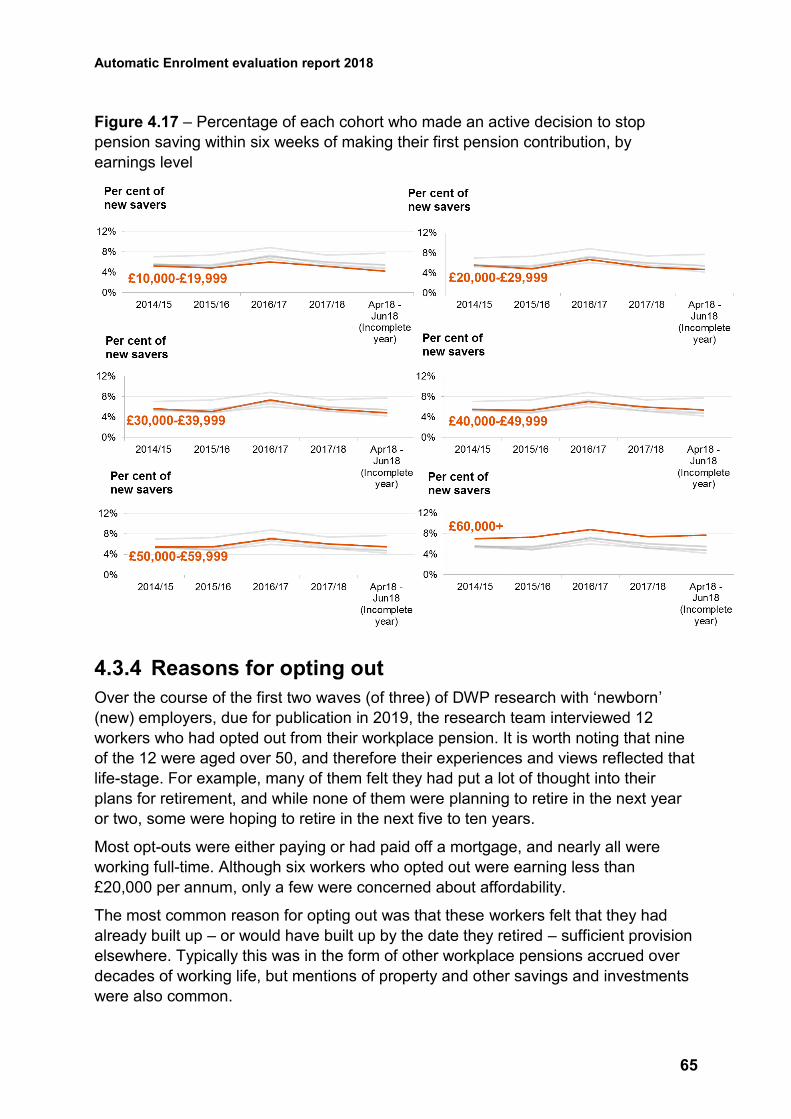
Automatic Enrolment evaluation report 2018
65
Figure 4.17 – Percentage of each cohort who made an active decision to stop
pension saving within six weeks of making their first pension contribution, by
earnings level
4.3.4 Reasons for opting out
Over the course of the first two waves (of three) of DWP research with ‘newborn’
(new) employers, due for publication in 2019, the research team interviewed 12
workers who had opted out from their workplace pension. It is worth noting that nine
of the 12 were aged over 50, and therefore their experiences and views reflected that
life-stage. For example, many of them felt they had put a lot of thought into their
plans for retirement, and while none of them were planning to retire in the next year
or two, some were hoping to retire in the next five to ten years.
Most opt-outs were either paying or had paid off a mortgage, and nearly all were
working full-time. Although six workers who opted out were earning less than
£20,000 per annum, only a few were concerned about affordability.
The most common reason for opting out was that these workers felt that they had
already built up – or would have built up by the date they retired – sufficient provision
elsewhere. Typically this was in the form of other workplace pensions accrued over
decades of working life, but mentions of property and other savings and investments
were also common.
Automatic Enrolment evaluation report 2018
66
A few opt-outs cited affordability as their main reason for leaving the scheme, either
because they needed their take-home pay for immediate day-to-day expenses, or
because they were saving elsewhere.
Older workers tended to suggest that it was ‘too late’ to start a new pension:
whatever the level of provision they had built up elsewhere, they believed they would
not be able to save enough in this pension to make it worthwhile. This was due to the
combination of a relatively low contribution rate and the anticipation that they did not
have many years left of their working life.
4.3.5 Overall cessation in 2017
The cessation rate refers to the proportion of automatically enrolled workers that
have left the scheme following the opt-out period. In EPP 2017, cessation was
calculated as the proportion of employees automatically enrolled into a pension
scheme in the last financial year (2016/17) who have left the scheme, for any reason,
after the one month opt-out period.81 This includes employees who ceased active
membership due to leaving their job.
Overall, employers estimated that 16 per cent of employees who had been
automatically enrolled in the last financial year had ceased active membership by the
time of survey fieldwork (July to October 2017).82 Large and medium-sized
employers reported higher cessation rates (23 and 14 per cent respectively)
compared with small and micro employers with seven and six per cent respectively).
EPP 2017 also found that on average, employers said that around two-thirds (67 per
cent) of employees who had ceased did so due to leaving their job.
4.3.6 RTI analysis of cessation trends
This section presents RTI cessation rates from April 2014 to June 2018. The RTI
cessation rate is calculated as the proportion of all workplace pension savers who
cease pension saving in a particular month83.
The RTI cessation rate differs from the EPP cessation rate in two ways. First, as
discussed in section 4.3.2, the definition of opt-outs and cessations is different, so
some employees who would be cessations in another measure such as the EPP may
be opt-outs within the RTI analysis (see Annex 6.1.2 for more details on this
definition).
81 EPP 2013 and 2015 calculated cessation rates for all employees automatically enrolled since the
employer staged. EPP 2017 calculated rates for all employees automatically enrolled in the last
financial year (2016/17), whether the employer had staged in that year or not, to ensure accuracy of
data and allow comparability with future research.
82 DWP. (2018). Employers’ Pension Provision Survey 2017. At:
https://www.gov.uk/government/publications/employers-pension-provision-survey-2017
83 An employee is defined as stopping saving in the month of their final pension contribution.
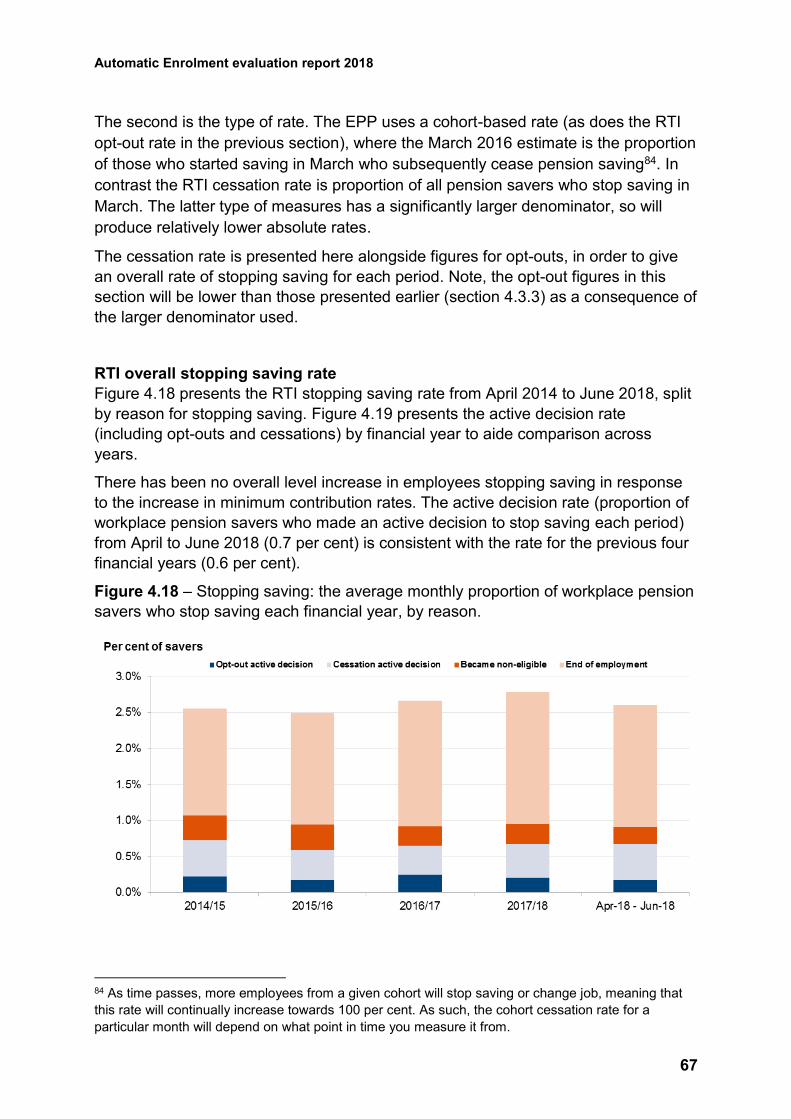
Automatic Enrolment evaluation report 2018
67
The second is the type of rate. The EPP uses a cohort-based rate (as does the RTI
opt-out rate in the previous section), where the March 2016 estimate is the proportion
of those who started saving in March who subsequently cease pension saving84. In
contrast the RTI cessation rate is proportion of all pension savers who stop saving in
March. The latter type of measures has a significantly larger denominator, so will
produce relatively lower absolute rates.
The cessation rate is presented here alongside figures for opt-outs, in order to give
an overall rate of stopping saving for each period. Note, the opt-out figures in this
section will be lower than those presented earlier (section 4.3.3) as a consequence of
the larger denominator used.
RTI overall stopping saving rate
Figure 4.18 presents the RTI stopping saving rate from April 2014 to June 2018, split
by reason for stopping saving. Figure 4.19 presents the active decision rate
(including opt-outs and cessations) by financial year to aide comparison across
years.
There has been no overall level increase in employees stopping saving in response
to the increase in minimum contribution rates. The active decision rate (proportion of
workplace pension savers who made an active decision to stop saving each period)
from April to June 2018 (0.7 per cent) is consistent with the rate for the previous four
financial years (0.6 per cent).
Figure 4.18 – Stopping saving: the average monthly proportion of workplace pension
savers who stop saving each financial year, by reason.
84 As time passes, more employees from a given cohort will stop saving or change job, meaning that
this rate will continually increase towards 100 per cent. As such, the cohort cessation rate for a
particular month will depend on what point in time you measure it from.
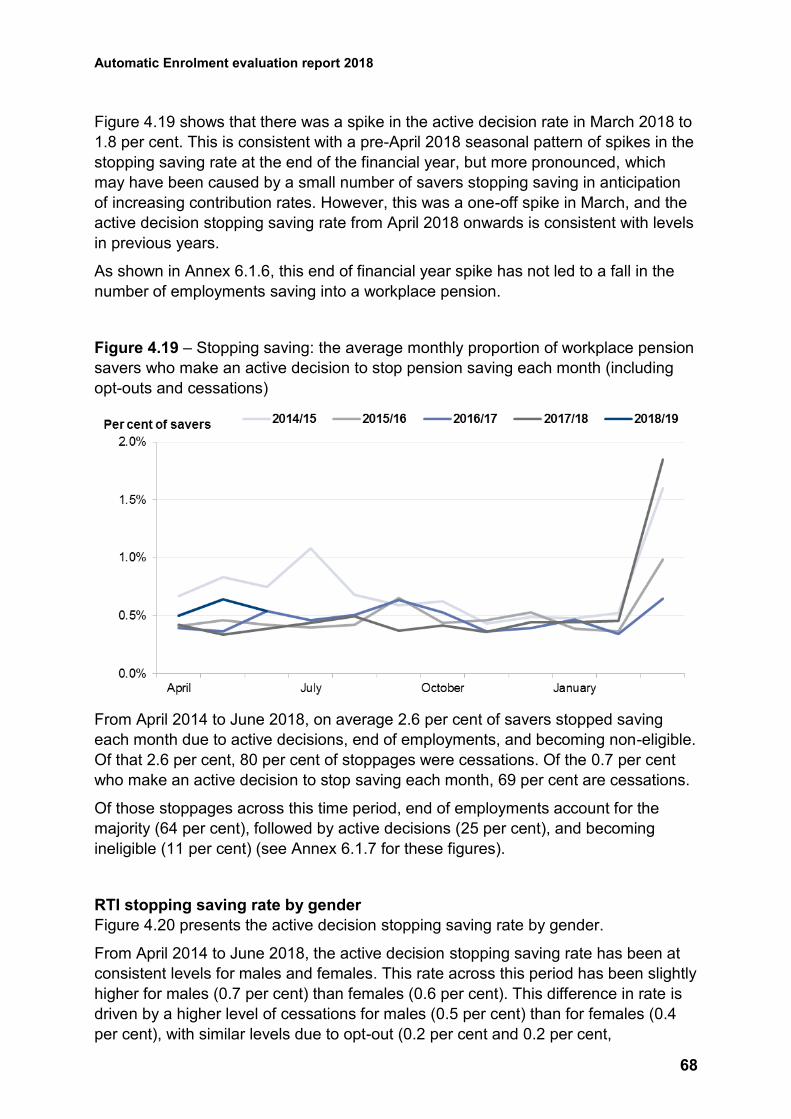
Automatic Enrolment evaluation report 2018
68
Figure 4.19 shows that there was a spike in the active decision rate in March 2018 to
1.8 per cent. This is consistent with a pre-April 2018 seasonal pattern of spikes in the
stopping saving rate at the end of the financial year, but more pronounced, which
may have been caused by a small number of savers stopping saving in anticipation
of increasing contribution rates. However, this was a one-off spike in March, and the
active decision stopping saving rate from April 2018 onwards is consistent with levels
in previous years.
As shown in Annex 6.1.6, this end of financial year spike has not led to a fall in the
number of employments saving into a workplace pension.
Figure 4.19 – Stopping saving: the average monthly proportion of workplace pension
savers who make an active decision to stop pension saving each month (including
opt-outs and cessations)
From April 2014 to June 2018, on average 2.6 per cent of savers stopped saving
each month due to active decisions, end of employments, and becoming non-eligible.
Of that 2.6 per cent, 80 per cent of stoppages were cessations. Of the 0.7 per cent
who make an active decision to stop saving each month, 69 per cent are cessations.
Of those stoppages across this time period, end of employments account for the
majority (64 per cent), followed by active decisions (25 per cent), and becoming
ineligible (11 per cent) (see Annex 6.1.7 for these figures).
RTI stopping saving rate by gender
Figure 4.20 presents the active decision stopping saving rate by gender.
From April 2014 to June 2018, the active decision stopping saving rate has been at
consistent levels for males and females. This rate across this period has been slightly
higher for males (0.7 per cent) than females (0.6 per cent). This difference in rate is
driven by a higher level of cessations for males (0.5 per cent) than for females (0.4
per cent), with similar levels due to opt-out (0.2 per cent and 0.2 per cent,
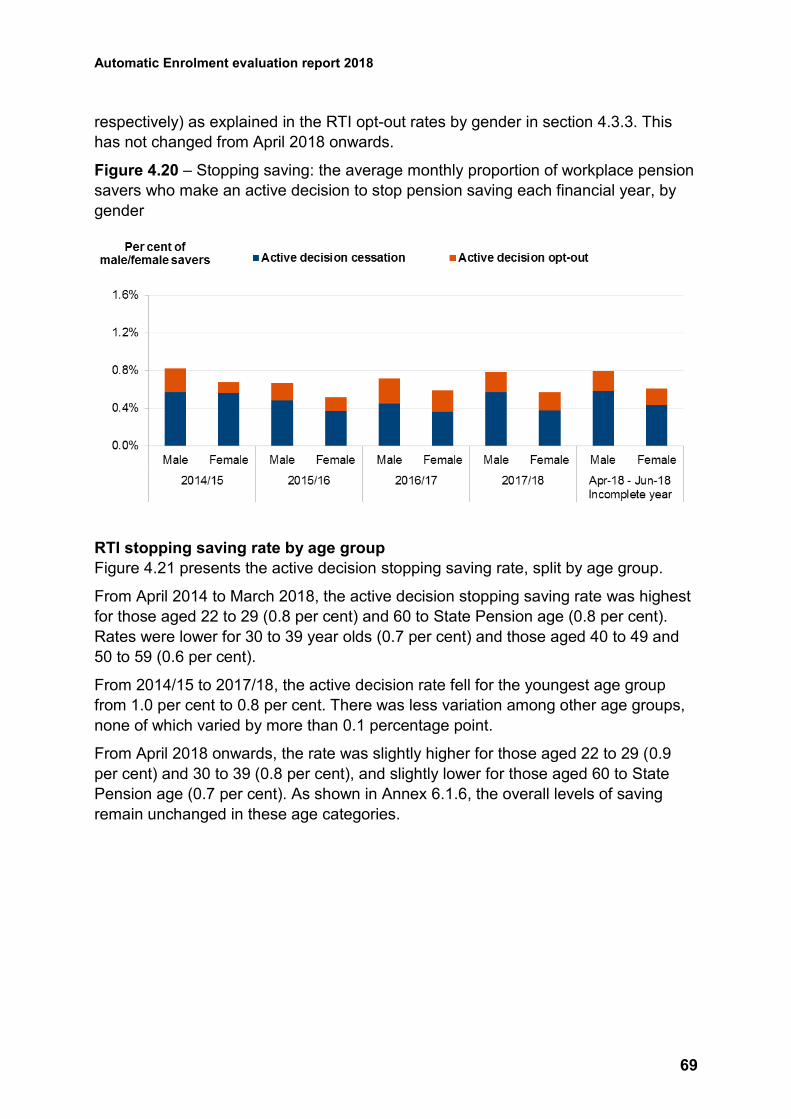
Automatic Enrolment evaluation report 2018
69
respectively) as explained in the RTI opt-out rates by gender in section 4.3.3. This
has not changed from April 2018 onwards.
Figure 4.20 – Stopping saving: the average monthly proportion of workplace pension
savers who make an active decision to stop pension saving each financial year, by
gender
RTI stopping saving rate by age group
Figure 4.21 presents the active decision stopping saving rate, split by age group.
From April 2014 to March 2018, the active decision stopping saving rate was highest
for those aged 22 to 29 (0.8 per cent) and 60 to State Pension age (0.8 per cent).
Rates were lower for 30 to 39 year olds (0.7 per cent) and those aged 40 to 49 and
50 to 59 (0.6 per cent).
From 2014/15 to 2017/18, the active decision rate fell for the youngest age group
from 1.0 per cent to 0.8 per cent. There was less variation among other age groups,
none of which varied by more than 0.1 percentage point.
From April 2018 onwards, the rate was slightly higher for those aged 22 to 29 (0.9
per cent) and 30 to 39 (0.8 per cent), and slightly lower for those aged 60 to State
Pension age (0.7 per cent). As shown in Annex 6.1.6, the overall levels of saving
remain unchanged in these age categories.
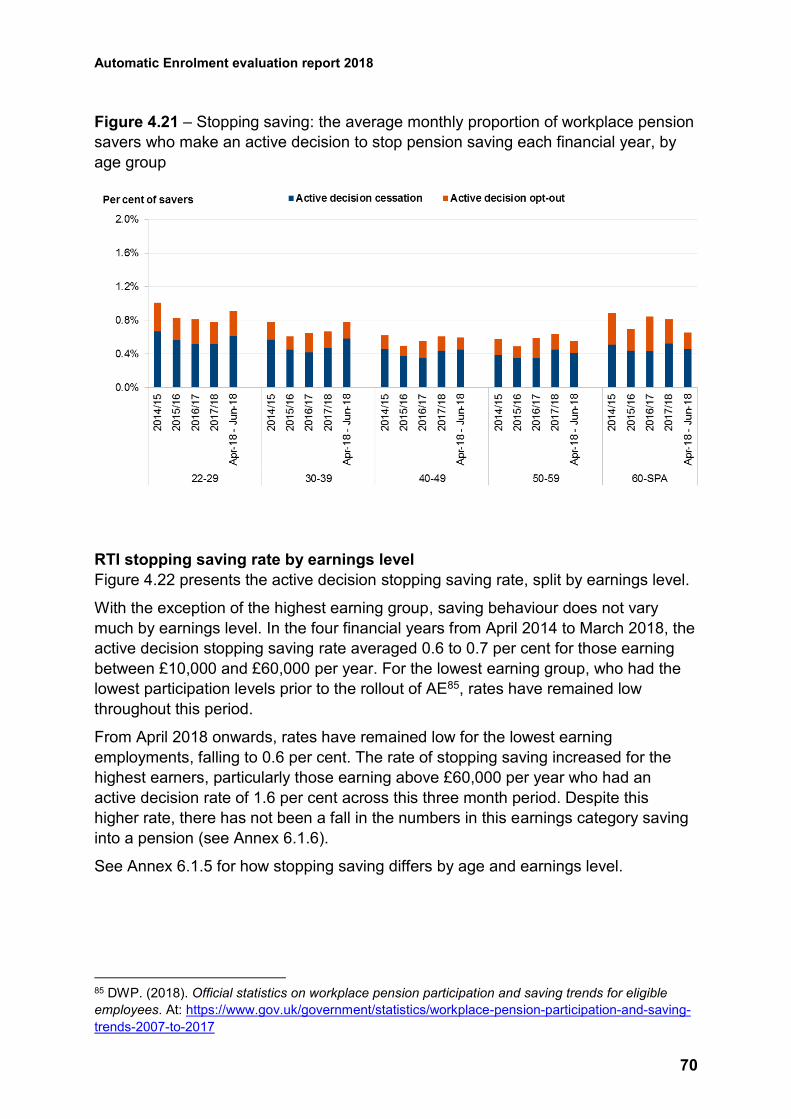
Automatic Enrolment evaluation report 2018
70
Figure 4.21 – Stopping saving: the average monthly proportion of workplace pension
savers who make an active decision to stop pension saving each financial year, by
age group
RTI stopping saving rate by earnings level
Figure 4.22 presents the active decision stopping saving rate, split by earnings level.
With the exception of the highest earning group, saving behaviour does not vary
much by earnings level. In the four financial years from April 2014 to March 2018, the
active decision stopping saving rate averaged 0.6 to 0.7 per cent for those earning
between £10,000 and £60,000 per year. For the lowest earning group, who had the
lowest participation levels prior to the rollout of AE85, rates have remained low
throughout this period.
From April 2018 onwards, rates have remained low for the lowest earning
employments, falling to 0.6 per cent. The rate of stopping saving increased for the
highest earners, particularly those earning above £60,000 per year who had an
active decision rate of 1.6 per cent across this three month period. Despite this
higher rate, there has not been a fall in the numbers in this earnings category saving
into a pension (see Annex 6.1.6).
See Annex 6.1.5 for how stopping saving differs by age and earnings level.
85 DWP. (2018). Official statistics on workplace pension participation and saving trends for eligible
employees. At: https://www.gov.uk/government/statistics/workplace-pension-participation-and-saving-
trends-2007-to-2017
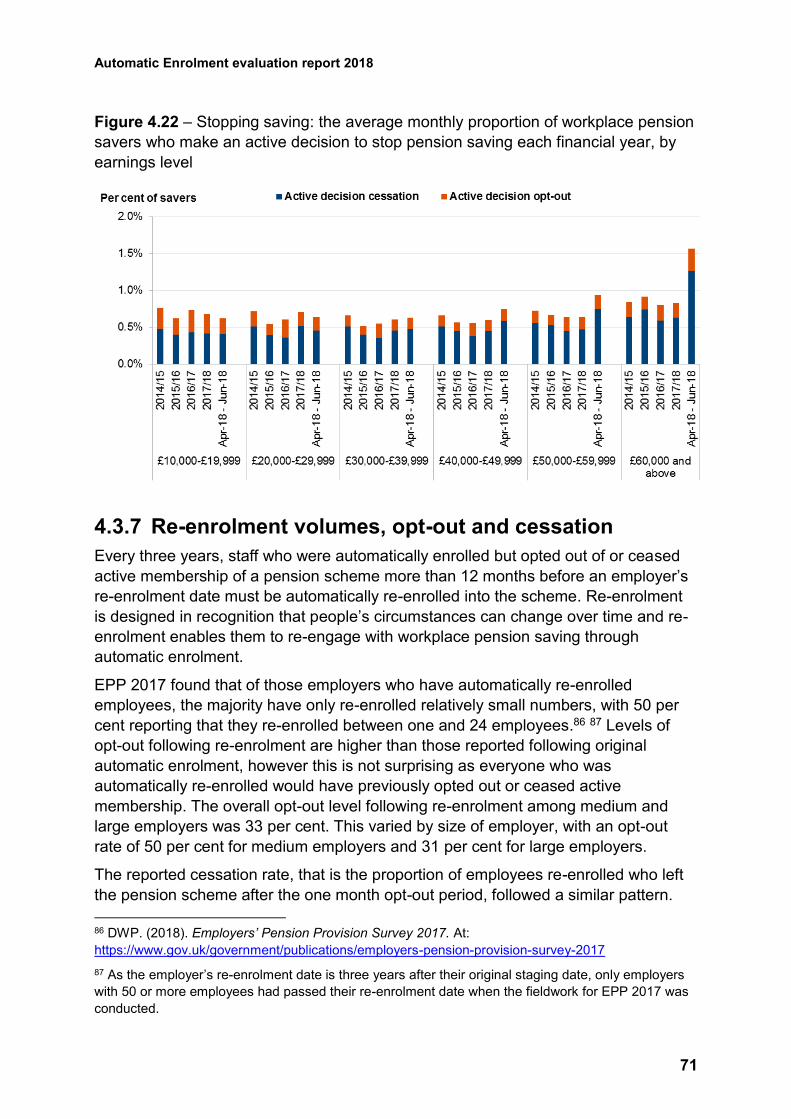
Automatic Enrolment evaluation report 2018
71
Figure 4.22 – Stopping saving: the average monthly proportion of workplace pension
savers who make an active decision to stop pension saving each financial year, by
earnings level
4.3.7 Re-enrolment volumes, opt-out and cessation
Every three years, staff who were automatically enrolled but opted out of or ceased
active membership of a pension scheme more than 12 months before an employer’s
re-enrolment date must be automatically re-enrolled into the scheme. Re-enrolment
is designed in recognition that people’s circumstances can change over time and re-
enrolment enables them to re-engage with workplace pension saving through
automatic enrolment.
EPP 2017 found that of those employers who have automatically re-enrolled
employees, the majority have only re-enrolled relatively small numbers, with 50 per
cent reporting that they re-enrolled between one and 24 employees.86 87 Levels of
opt-out following re-enrolment are higher than those reported following original
automatic enrolment, however this is not surprising as everyone who was
automatically re-enrolled would have previously opted out or ceased active
membership. The overall opt-out level following re-enrolment among medium and
large employers was 33 per cent. This varied by size of employer, with an opt-out
rate of 50 per cent for medium employers and 31 per cent for large employers.
The reported cessation rate, that is the proportion of employees re-enrolled who left
the pension scheme after the one month opt-out period, followed a similar pattern.
86 DWP. (2018). Employers’ Pension Provision Survey 2017. At:
https://www.gov.uk/government/publications/employers-pension-provision-survey-2017
87 As the employer’s re-enrolment date is three years after their original staging date, only employers
with 50 or more employees had passed their re-enrolment date when the fieldwork for EPP 2017 was
conducted.
Automatic Enrolment evaluation report 2018
72
The overall level of cessation following re-enrolment among medium and large
employers was 24 per cent, with medium employers having a higher cessation rate
compared with large employers (51 per cent compared with 18 per cent).88
The staged roll-out of automatic enrolment, and three year cycle of re-enrolment,
means that it is too soon to see the impact of re-enrolment on employees of small
and micro employers.
4.3.8 Enrolment of non-eligible employees
The pension participation rate of non-eligible employees has increased since
automatic enrolment was introduced, in addition to the rate for eligible employees, as
mentioned earlier in Chapter 4.
EPP 2017 measured the extent of employers enrolling non-eligible employees into a
qualifying pension scheme. Overall, in eight per cent of employers with a scheme
used for automatic enrolment, at least some non-eligible employees had been
enrolled into a scheme in the last financial year (2016/17).89 This increased with
employer size; in 34 per cent of large employers at least some non-eligible
employees had been enrolled into a scheme used for automatic enrolment,
compared with two per cent among micro employers.
Reasons for the enrolment of non-eligible employees are explored in section 4.6.5.
4.4 Individual attitudes, understanding and activities
As mentioned in section 2.2, the DWP has been undertaking communication activity
to raise awareness and understanding of automatic enrolment among individuals.
4.4.1 Recognising the benefits of pension saving
Findings from the DWP’s communications tracking research in June 2018 showed
that the vast majority of individuals interviewed viewed automatic enrolment and
workplace pensions in a positive light, with 82 per cent saying that it is a good thing
for them personally (84 per cent for advert recognisers, vs. 74 per cent for non-
recognisers).90 Eighty per cent of employees agreed that they knew what the benefit
88 As cited earlier in the report, this measure of cessation includes employees who ceased saving due
to any reason, for example those who ceased active membership due to leaving their job.
89 DWP. (2018). Employers’ Pension Provision Survey 2017. At:
https://www.gov.uk/government/publications/employers-pension-provision-survey-2017
90 DWP. (2018). Workplace Pension: research into saving for retirement. At:
https://www.ipsos.com/ipsos-mori/en-uk/workplace-pension-new-research-saving-retirement
Automatic Enrolment evaluation report 2018
73
of being in a workplace pension was for them (82 per cent for advert recognisers, vs.
74 per cent for non-recognisers).
4.4.2 The social norms of workplace pension saving
A key indicator of the communication campaign’s success is how much individuals
see pension saving as normal. In the June 2018 DWP communications tracker, the
majority of employees (78 per cent) agreed that ‘saving into a workplace pension is
the normal thing to do if you work for an employer’ (82 per cent for advert recognisers
vs. 75 per cent for non-recognisers).91 A majority (80 per cent) also agreed that
‘saving into a workplace pension is normal for someone like me’ (83 per cent for
advert recognisers vs. 71 per cent for non-recognisers92).
4.4.3 Individuals’ access and understanding of information on pension saving
Findings from the June 2018 communications tracker revealed that the majority of
employees (83 per cent) said they knew where to go if they wanted to find out more
about workplace pensions (85 per cent for advert recognisers, vs. 76 per cent for
non-recognisers).93
Based on findings from the Wealth and Assets Survey, there has been a slight
increase in the number of respondents who agreed with the statement: ‘I feel I know
enough about pensions to make decisions about saving for retirement’ between the
2010/12 and 2014/16 waves (from 43 per cent to 46 per cent).94 Preliminary
estimates from 2016/17 show a slight decrease overall to 42 per cent, however firm
conclusions about whether the level of understanding has changed cannot be drawn
until analysis of the 2016/18 wave has been completed.
91 DWP. (2018). Workplace Pension: research into saving for retirement. At:
https://www.ipsos.com/ipsos-mori/en-uk/workplace-pension-new-research-saving-retirement
92 Statistically significant difference at the 95 per cent confidence level.
93 DWP. (2018). Workplace Pension: research into saving for retirement. At:
https://www.ipsos.com/ipsos-mori/en-uk/workplace-pension-new-research-saving-retirement
94 ONS. (2018). Early indicator estimates from the Wealth and Assets Survey: attitudes towards saving
for retirement, automatic enrolment into workplace pensions and financial situation, July 2016 to
December 2017. At:
https://www.ons.gov.uk/peoplepopulationandcommunity/personalandhouseholdfinances/incomeandwe
alth/articles/earlyindicatorestimatesfromthewealthandassetssurvey/attitudestowardssavingforretiremen
tautomaticenrolmentintoworkplacepensionscreditcommitmentsanddebtburdenjuly2016todecember201
7
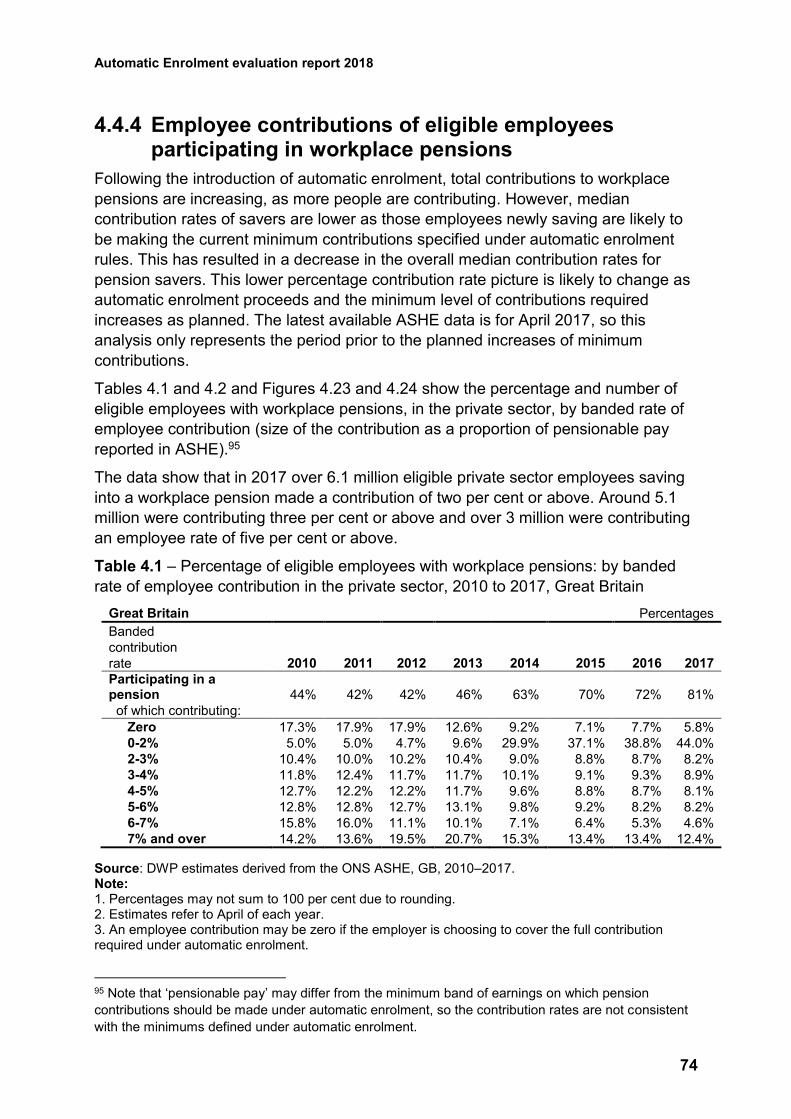
Automatic Enrolment evaluation report 2018
74
4.4.4 Employee contributions of eligible employees participating in workplace pensions
Following the introduction of automatic enrolment, total contributions to workplace
pensions are increasing, as more people are contributing. However, median
contribution rates of savers are lower as those employees newly saving are likely to
be making the current minimum contributions specified under automatic enrolment
rules. This has resulted in a decrease in the overall median contribution rates for
pension savers. This lower percentage contribution rate picture is likely to change as
automatic enrolment proceeds and the minimum level of contributions required
increases as planned. The latest available ASHE data is for April 2017, so this
analysis only represents the period prior to the planned increases of minimum
contributions.
Tables 4.1 and 4.2 and Figures 4.23 and 4.24 show the percentage and number of
eligible employees with workplace pensions, in the private sector, by banded rate of
employee contribution (size of the contribution as a proportion of pensionable pay
reported in ASHE).95
The data show that in 2017 over 6.1 million eligible private sector employees saving
into a workplace pension made a contribution of two per cent or above. Around 5.1
million were contributing three per cent or above and over 3 million were contributing
an employee rate of five per cent or above.
Table 4.1 – Percentage of eligible employees with workplace pensions: by banded
rate of employee contribution in the private sector, 2010 to 2017, Great Britain
Great Britain Percentages
Banded
contribution
rate 2010 2011 2012 2013 2014 2015 2016 2017
Participating in a pension 44% 42% 42% 46% 63% 70% 72% 81%
of which contributing:
Zero 17.3% 17.9% 17.9% 12.6% 9.2% 7.1% 7.7% 5.8%
0-2% 5.0% 5.0% 4.7% 9.6% 29.9% 37.1% 38.8% 44.0%
2-3% 10.4% 10.0% 10.2% 10.4% 9.0% 8.8% 8.7% 8.2%
3-4% 11.8% 12.4% 11.7% 11.7% 10.1% 9.1% 9.3% 8.9%
4-5% 12.7% 12.2% 12.2% 11.7% 9.6% 8.8% 8.7% 8.1%
5-6% 12.8% 12.8% 12.7% 13.1% 9.8% 9.2% 8.2% 8.2%
6-7% 15.8% 16.0% 11.1% 10.1% 7.1% 6.4% 5.3% 4.6%
7% and over 14.2% 13.6% 19.5% 20.7% 15.3% 13.4% 13.4% 12.4%
Source: DWP estimates derived from the ONS ASHE, GB, 2010–2017. Note: 1. Percentages may not sum to 100 per cent due to rounding. 2. Estimates refer to April of each year. 3. An employee contribution may be zero if the employer is choosing to cover the full contribution required under automatic enrolment.
95 Note that ‘pensionable pay’ may differ from the minimum band of earnings on which pension
contributions should be made under automatic enrolment, so the contribution rates are not consistent
with the minimums defined under automatic enrolment.
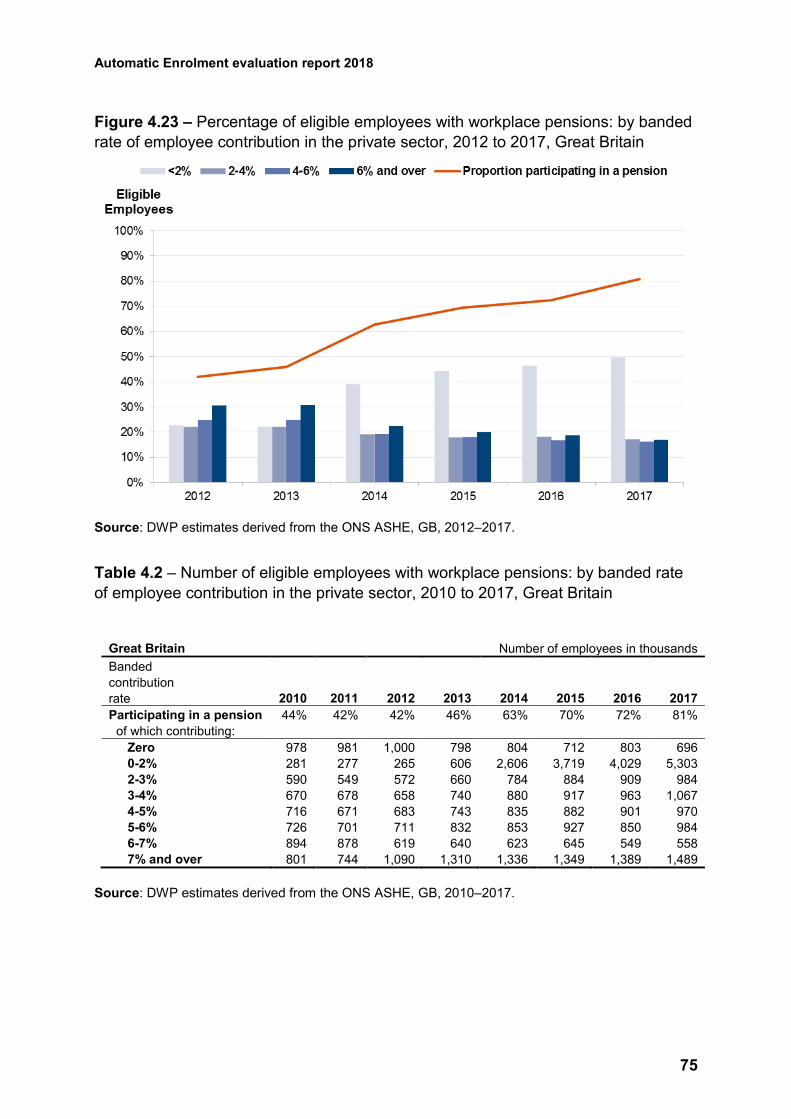
Automatic Enrolment evaluation report 2018
75
Figure 4.23 – Percentage of eligible employees with workplace pensions: by banded
rate of employee contribution in the private sector, 2012 to 2017, Great Britain
Source: DWP estimates derived from the ONS ASHE, GB, 2012–2017.
Table 4.2 – Number of eligible employees with workplace pensions: by banded rate
of employee contribution in the private sector, 2010 to 2017, Great Britain
Great Britain Number of employees in thousands
Banded
contribution
rate 2010 2011 2012 2013 2014 2015 2016 2017
Participating in a pension 44% 42% 42% 46% 63% 70% 72% 81%
of which contributing:
Zero 978 981 1,000 798 804 712 803 696
0-2% 281 277 265 606 2,606 3,719 4,029 5,303
2-3% 590 549 572 660 784 884 909 984
3-4% 670 678 658 740 880 917 963 1,067
4-5% 716 671 683 743 835 882 901 970
5-6% 726 701 711 832 853 927 850 984
6-7% 894 878 619 640 623 645 549 558
7% and over 801 744 1,090 1,310 1,336 1,349 1,389 1,489
Source: DWP estimates derived from the ONS ASHE, GB, 2010–2017.
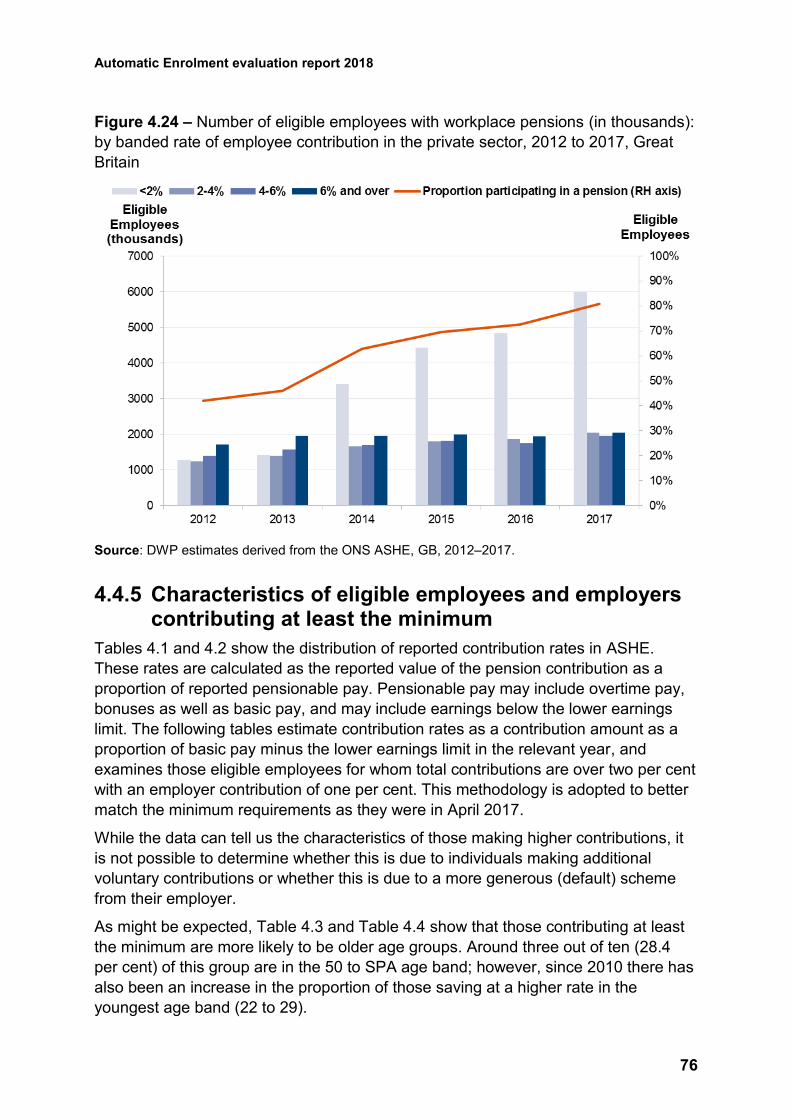
Automatic Enrolment evaluation report 2018
76
Figure 4.24 – Number of eligible employees with workplace pensions (in thousands):
by banded rate of employee contribution in the private sector, 2012 to 2017, Great
Britain
Source: DWP estimates derived from the ONS ASHE, GB, 2012–2017.
4.4.5 Characteristics of eligible employees and employers contributing at least the minimum
Tables 4.1 and 4.2 show the distribution of reported contribution rates in ASHE.
These rates are calculated as the reported value of the pension contribution as a
proportion of reported pensionable pay. Pensionable pay may include overtime pay,
bonuses as well as basic pay, and may include earnings below the lower earnings
limit. The following tables estimate contribution rates as a contribution amount as a
proportion of basic pay minus the lower earnings limit in the relevant year, and
examines those eligible employees for whom total contributions are over two per cent
with an employer contribution of one per cent. This methodology is adopted to better
match the minimum requirements as they were in April 2017.
While the data can tell us the characteristics of those making higher contributions, it
is not possible to determine whether this is due to individuals making additional
voluntary contributions or whether this is due to a more generous (default) scheme
from their employer.
As might be expected, Table 4.3 and Table 4.4 show that those contributing at least
the minimum are more likely to be older age groups. Around three out of ten (28.4
per cent) of this group are in the 50 to SPA age band; however, since 2010 there has
also been an increase in the proportion of those saving at a higher rate in the
youngest age band (22 to 29).
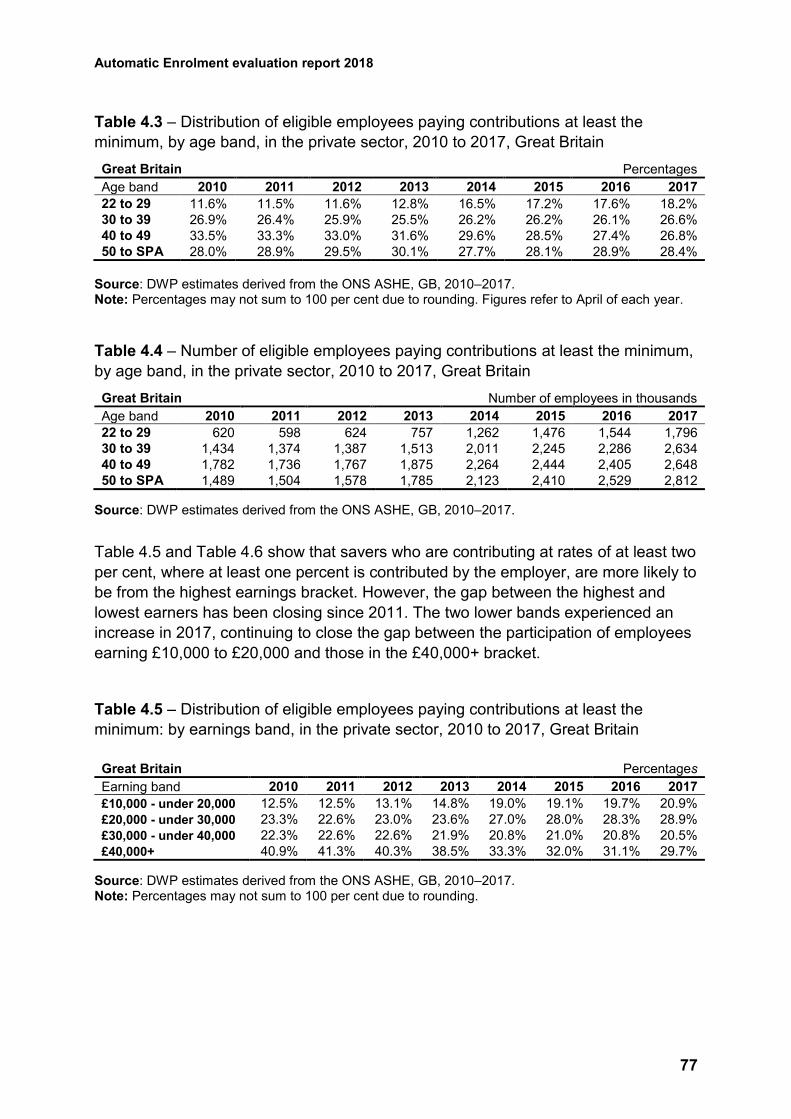
Automatic Enrolment evaluation report 2018
77
Table 4.3 – Distribution of eligible employees paying contributions at least the
minimum, by age band, in the private sector, 2010 to 2017, Great Britain
Great Britain Percentages
Age band 2010 2011 2012 2013 2014 2015 2016 2017
22 to 29 11.6% 11.5% 11.6% 12.8% 16.5% 17.2% 17.6% 18.2%
30 to 39 26.9% 26.4% 25.9% 25.5% 26.2% 26.2% 26.1% 26.6%
40 to 49 33.5% 33.3% 33.0% 31.6% 29.6% 28.5% 27.4% 26.8%
50 to SPA 28.0% 28.9% 29.5% 30.1% 27.7% 28.1% 28.9% 28.4%
Source: DWP estimates derived from the ONS ASHE, GB, 2010–2017. Note: Percentages may not sum to 100 per cent due to rounding. Figures refer to April of each year.
Table 4.4 – Number of eligible employees paying contributions at least the minimum,
by age band, in the private sector, 2010 to 2017, Great Britain
Great Britain Number of employees in thousands
Age band 2010 2011 2012 2013 2014 2015 2016 2017
22 to 29 620 598 624 757 1,262 1,476 1,544 1,796
30 to 39 1,434 1,374 1,387 1,513 2,011 2,245 2,286 2,634
40 to 49 1,782 1,736 1,767 1,875 2,264 2,444 2,405 2,648
50 to SPA 1,489 1,504 1,578 1,785 2,123 2,410 2,529 2,812
Source: DWP estimates derived from the ONS ASHE, GB, 2010–2017.
Table 4.5 and Table 4.6 show that savers who are contributing at rates of at least two
per cent, where at least one percent is contributed by the employer, are more likely to
be from the highest earnings bracket. However, the gap between the highest and
lowest earners has been closing since 2011. The two lower bands experienced an
increase in 2017, continuing to close the gap between the participation of employees
earning £10,000 to £20,000 and those in the £40,000+ bracket.
Table 4.5 – Distribution of eligible employees paying contributions at least the
minimum: by earnings band, in the private sector, 2010 to 2017, Great Britain
Great Britain Percentages
Earning band 2010 2011 2012 2013 2014 2015 2016 2017
£10,000 - under 20,000 12.5% 12.5% 13.1% 14.8% 19.0% 19.1% 19.7% 20.9%
£20,000 - under 30,000 23.3% 22.6% 23.0% 23.6% 27.0% 28.0% 28.3% 28.9%
£30,000 - under 40,000 22.3% 22.6% 22.6% 21.9% 20.8% 21.0% 20.8% 20.5%
£40,000+ 40.9% 41.3% 40.3% 38.5% 33.3% 32.0% 31.1% 29.7%
Source: DWP estimates derived from the ONS ASHE, GB, 2010–2017. Note: Percentages may not sum to 100 per cent due to rounding.
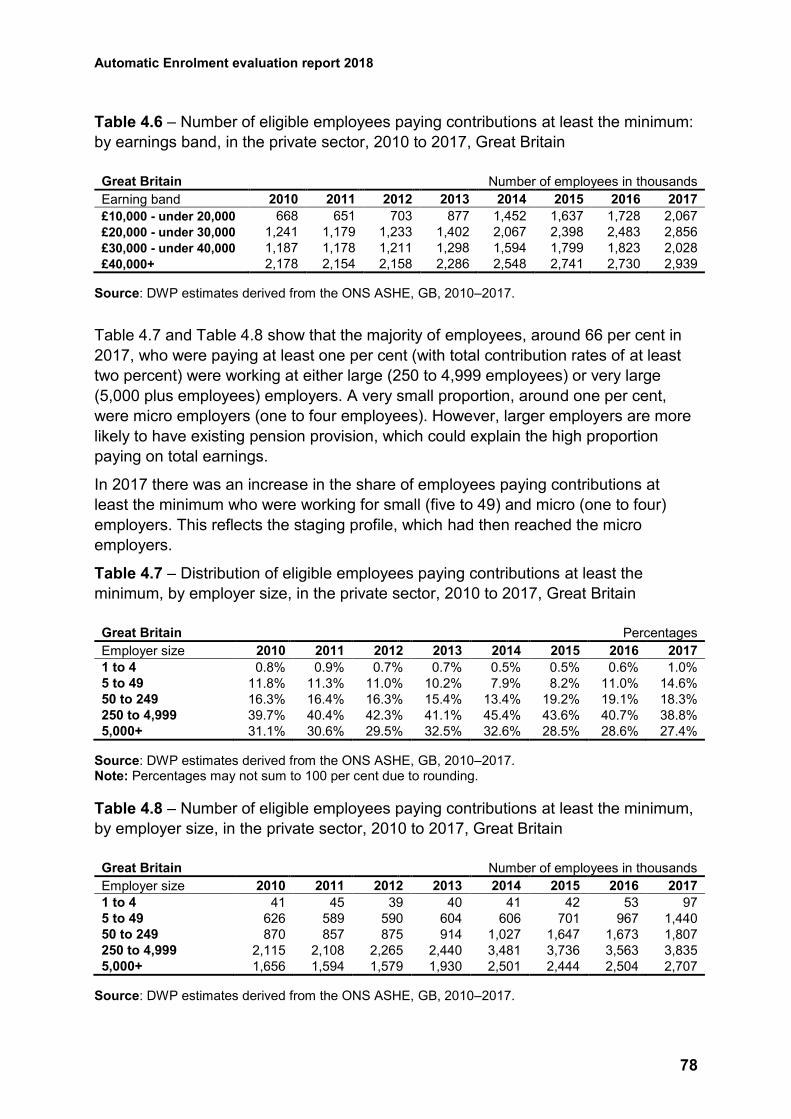
Automatic Enrolment evaluation report 2018
78
Table 4.6 – Number of eligible employees paying contributions at least the minimum:
by earnings band, in the private sector, 2010 to 2017, Great Britain
Great Britain Number of employees in thousands
Earning band 2010 2011 2012 2013 2014 2015 2016 2017
£10,000 - under 20,000 668 651 703 877 1,452 1,637 1,728 2,067
£20,000 - under 30,000 1,241 1,179 1,233 1,402 2,067 2,398 2,483 2,856
£30,000 - under 40,000 1,187 1,178 1,211 1,298 1,594 1,799 1,823 2,028
£40,000+ 2,178 2,154 2,158 2,286 2,548 2,741 2,730 2,939
Source: DWP estimates derived from the ONS ASHE, GB, 2010–2017.
Table 4.7 and Table 4.8 show that the majority of employees, around 66 per cent in
2017, who were paying at least one per cent (with total contribution rates of at least
two percent) were working at either large (250 to 4,999 employees) or very large
(5,000 plus employees) employers. A very small proportion, around one per cent,
were micro employers (one to four employees). However, larger employers are more
likely to have existing pension provision, which could explain the high proportion
paying on total earnings.
In 2017 there was an increase in the share of employees paying contributions at
least the minimum who were working for small (five to 49) and micro (one to four)
employers. This reflects the staging profile, which had then reached the micro
employers.
Table 4.7 – Distribution of eligible employees paying contributions at least the
minimum, by employer size, in the private sector, 2010 to 2017, Great Britain
Great Britain Percentages
Employer size 2010 2011 2012 2013 2014 2015 2016 2017
1 to 4 0.8% 0.9% 0.7% 0.7% 0.5% 0.5% 0.6% 1.0%
5 to 49 11.8% 11.3% 11.0% 10.2% 7.9% 8.2% 11.0% 14.6%
50 to 249 16.3% 16.4% 16.3% 15.4% 13.4% 19.2% 19.1% 18.3%
250 to 4,999 39.7% 40.4% 42.3% 41.1% 45.4% 43.6% 40.7% 38.8%
5,000+ 31.1% 30.6% 29.5% 32.5% 32.6% 28.5% 28.6% 27.4%
Source: DWP estimates derived from the ONS ASHE, GB, 2010–2017. Note: Percentages may not sum to 100 per cent due to rounding.
Table 4.8 – Number of eligible employees paying contributions at least the minimum,
by employer size, in the private sector, 2010 to 2017, Great Britain
Great Britain Number of employees in thousands
Employer size 2010 2011 2012 2013 2014 2015 2016 2017
1 to 4 41 45 39 40 41 42 53 97
5 to 49 626 589 590 604 606 701 967 1,440
50 to 249 870 857 875 914 1,027 1,647 1,673 1,807
250 to 4,999 2,115 2,108 2,265 2,440 3,481 3,736 3,563 3,835
5,000+ 1,656 1,594 1,579 1,930 2,501 2,444 2,504 2,707
Source: DWP estimates derived from the ONS ASHE, GB, 2010–2017.
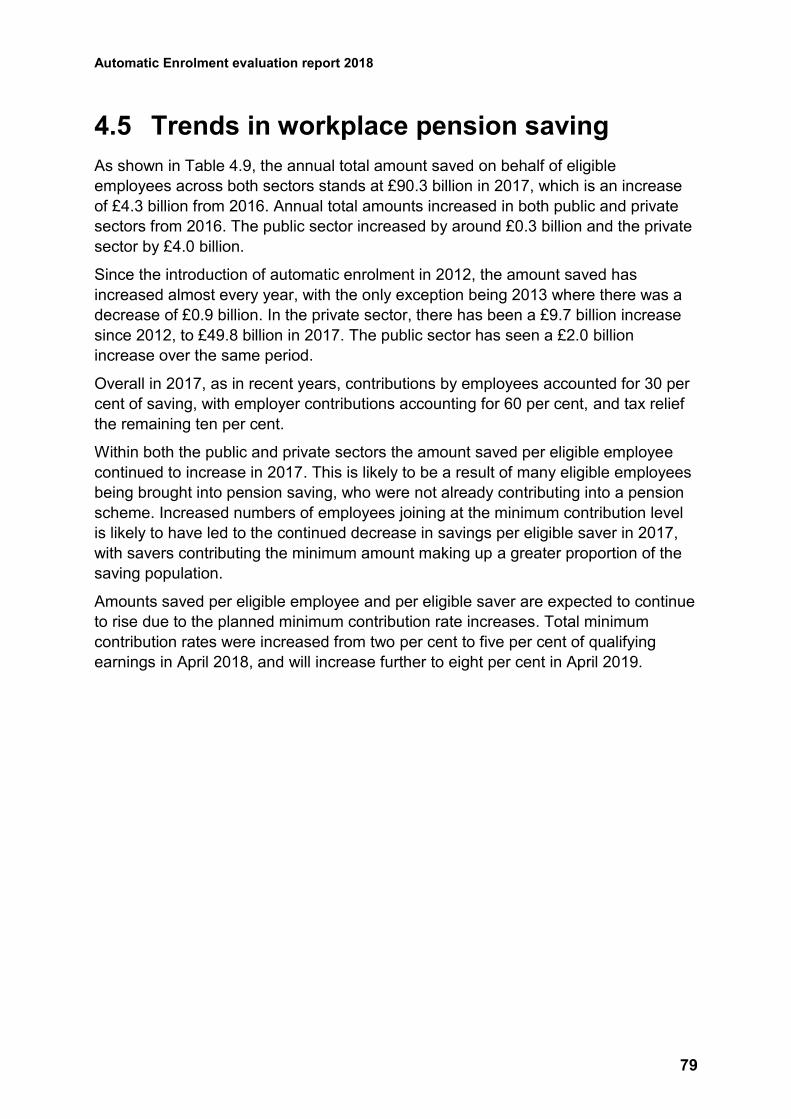
Automatic Enrolment evaluation report 2018
79
4.5 Trends in workplace pension saving
As shown in Table 4.9, the annual total amount saved on behalf of eligible
employees across both sectors stands at £90.3 billion in 2017, which is an increase
of £4.3 billion from 2016. Annual total amounts increased in both public and private
sectors from 2016. The public sector increased by around £0.3 billion and the private
sector by £4.0 billion.
Since the introduction of automatic enrolment in 2012, the amount saved has
increased almost every year, with the only exception being 2013 where there was a
decrease of £0.9 billion. In the private sector, there has been a £9.7 billion increase
since 2012, to £49.8 billion in 2017. The public sector has seen a £2.0 billion
increase over the same period.
Overall in 2017, as in recent years, contributions by employees accounted for 30 per
cent of saving, with employer contributions accounting for 60 per cent, and tax relief
the remaining ten per cent.
Within both the public and private sectors the amount saved per eligible employee
continued to increase in 2017. This is likely to be a result of many eligible employees
being brought into pension saving, who were not already contributing into a pension
scheme. Increased numbers of employees joining at the minimum contribution level
is likely to have led to the continued decrease in savings per eligible saver in 2017,
with savers contributing the minimum amount making up a greater proportion of the
saving population.
Amounts saved per eligible employee and per eligible saver are expected to continue
to rise due to the planned minimum contribution rate increases. Total minimum
contribution rates were increased from two per cent to five per cent of qualifying
earnings in April 2018, and will increase further to eight per cent in April 2019.
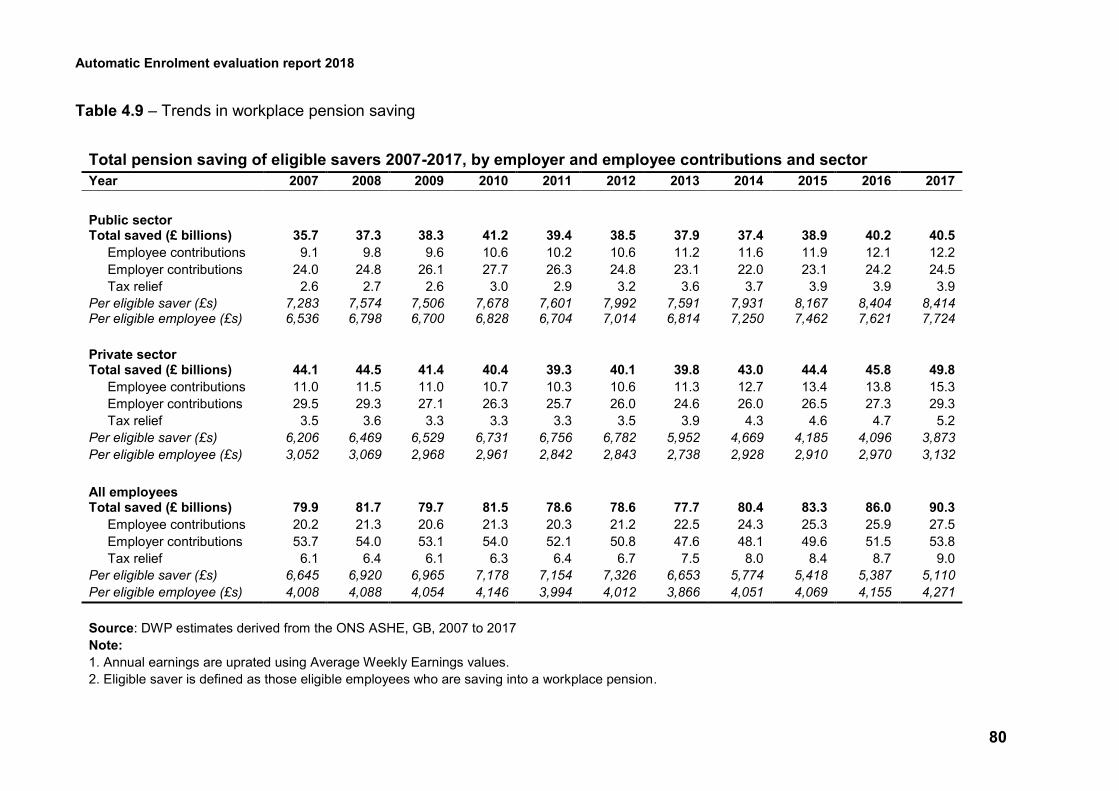
Automatic Enrolment evaluation report 2018
80
Table 4.9 – Trends in workplace pension saving
Total pension saving of eligible savers 2007-2017, by employer and employee contributions and sector
Year 2007 2008 2009 2010 2011 2012 2013 2014 2015 2016 2017
Public sector Total saved (£ billions) 35.7 37.3 38.3 41.2 39.4 38.5 37.9 37.4 38.9 40.2 40.5
Employee contributions 9.1 9.8 9.6 10.6 10.2 10.6 11.2 11.6 11.9 12.1 12.2
Employer contributions 24.0 24.8 26.1 27.7 26.3 24.8 23.1 22.0 23.1 24.2 24.5
Tax relief 2.6 2.7 2.6 3.0 2.9 3.2 3.6 3.7 3.9 3.9 3.9
Per eligible saver (£s) 7,283 7,574 7,506 7,678 7,601 7,992 7,591 7,931 8,167 8,404 8,414 Per eligible employee (£s) 6,536 6,798 6,700 6,828 6,704 7,014 6,814 7,250 7,462 7,621 7,724
Private sector Total saved (£ billions) 44.1 44.5 41.4 40.4 39.3 40.1 39.8 43.0 44.4 45.8 49.8
Employee contributions 11.0 11.5 11.0 10.7 10.3 10.6 11.3 12.7 13.4 13.8 15.3
Employer contributions 29.5 29.3 27.1 26.3 25.7 26.0 24.6 26.0 26.5 27.3 29.3
Tax relief 3.5 3.6 3.3 3.3 3.3 3.5 3.9 4.3 4.6 4.7 5.2
Per eligible saver (£s) 6,206 6,469 6,529 6,731 6,756 6,782 5,952 4,669 4,185 4,096 3,873
Per eligible employee (£s) 3,052 3,069 2,968 2,961 2,842 2,843 2,738 2,928 2,910 2,970 3,132
All employees Total saved (£ billions) 79.9 81.7 79.7 81.5 78.6 78.6 77.7 80.4 83.3 86.0 90.3
Employee contributions 20.2 21.3 20.6 21.3 20.3 21.2 22.5 24.3 25.3 25.9 27.5
Employer contributions 53.7 54.0 53.1 54.0 52.1 50.8 47.6 48.1 49.6 51.5 53.8
Tax relief 6.1 6.4 6.1 6.3 6.4 6.7 7.5 8.0 8.4 8.7 9.0
Per eligible saver (£s) 6,645 6,920 6,965 7,178 7,154 7,326 6,653 5,774 5,418 5,387 5,110
Per eligible employee (£s) 4,008 4,088 4,054 4,146 3,994 4,012 3,866 4,051 4,069 4,155 4,271
Source: DWP estimates derived from the ONS ASHE, GB, 2007 to 2017
Note:
1. Annual earnings are uprated using Average Weekly Earnings values.
2. Eligible saver is defined as those eligible employees who are saving into a workplace pension.
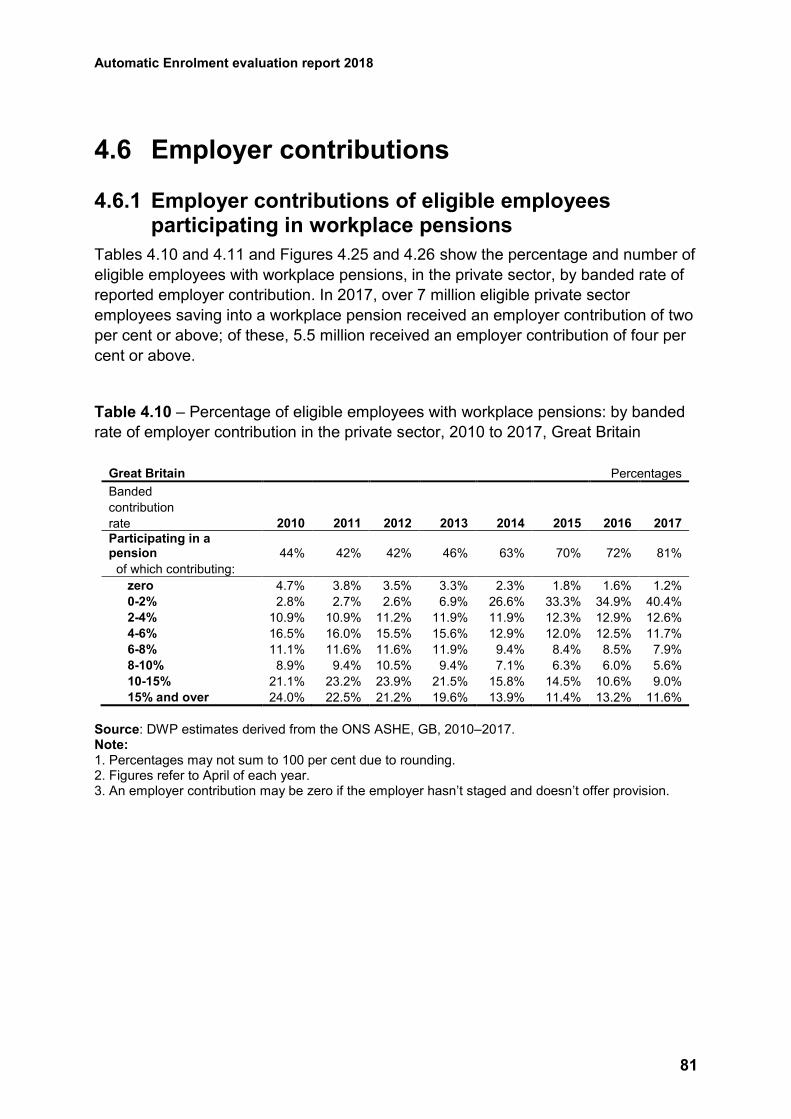
Automatic Enrolment evaluation report 2018
81
4.6 Employer contributions
4.6.1 Employer contributions of eligible employees participating in workplace pensions
Tables 4.10 and 4.11 and Figures 4.25 and 4.26 show the percentage and number of
eligible employees with workplace pensions, in the private sector, by banded rate of
reported employer contribution. In 2017, over 7 million eligible private sector
employees saving into a workplace pension received an employer contribution of two
per cent or above; of these, 5.5 million received an employer contribution of four per
cent or above.
Table 4.10 – Percentage of eligible employees with workplace pensions: by banded
rate of employer contribution in the private sector, 2010 to 2017, Great Britain
Great Britain Percentages
Banded
contribution
rate 2010 2011 2012 2013 2014 2015 2016 2017
Participating in a pension 44% 42% 42% 46% 63% 70% 72% 81%
of which contributing:
zero 4.7% 3.8% 3.5% 3.3% 2.3% 1.8% 1.6% 1.2%
0-2% 2.8% 2.7% 2.6% 6.9% 26.6% 33.3% 34.9% 40.4%
2-4% 10.9% 10.9% 11.2% 11.9% 11.9% 12.3% 12.9% 12.6%
4-6% 16.5% 16.0% 15.5% 15.6% 12.9% 12.0% 12.5% 11.7%
6-8% 11.1% 11.6% 11.6% 11.9% 9.4% 8.4% 8.5% 7.9%
8-10% 8.9% 9.4% 10.5% 9.4% 7.1% 6.3% 6.0% 5.6%
10-15% 21.1% 23.2% 23.9% 21.5% 15.8% 14.5% 10.6% 9.0%
15% and over 24.0% 22.5% 21.2% 19.6% 13.9% 11.4% 13.2% 11.6%
Source: DWP estimates derived from the ONS ASHE, GB, 2010–2017. Note: 1. Percentages may not sum to 100 per cent due to rounding. 2. Figures refer to April of each year. 3. An employer contribution may be zero if the employer hasn’t staged and doesn’t offer provision.
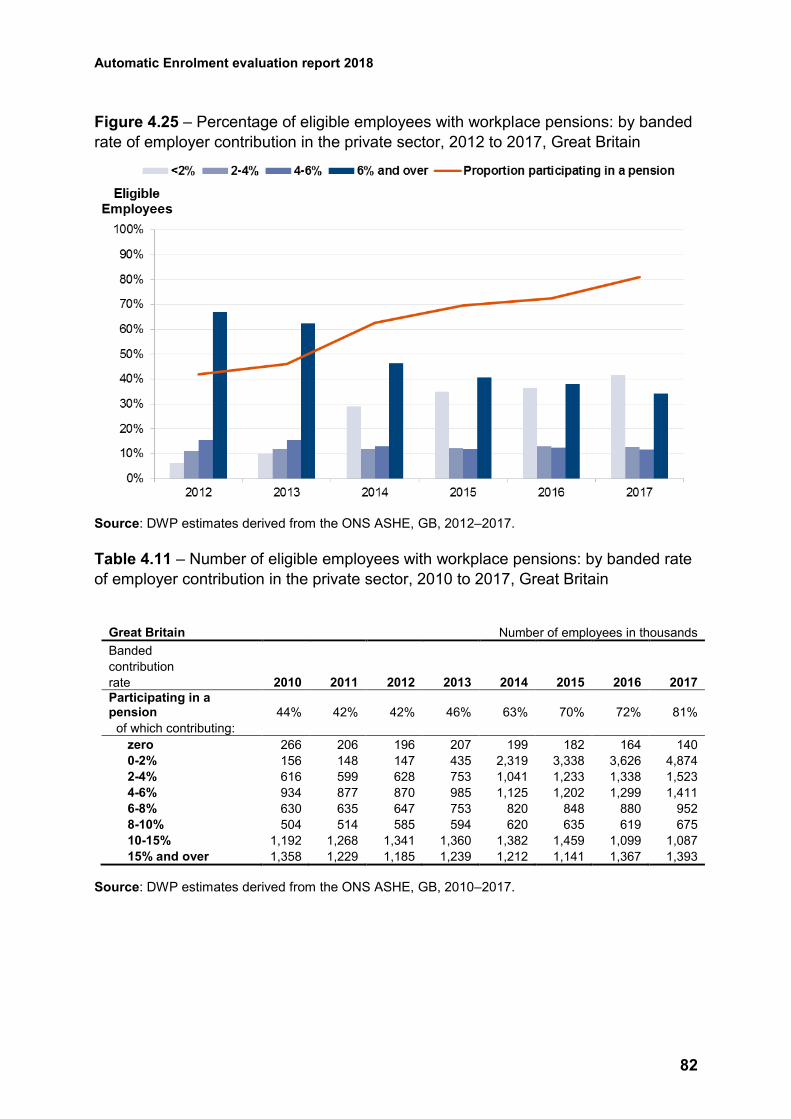
Automatic Enrolment evaluation report 2018
82
Figure 4.25 – Percentage of eligible employees with workplace pensions: by banded
rate of employer contribution in the private sector, 2012 to 2017, Great Britain
Source: DWP estimates derived from the ONS ASHE, GB, 2012–2017.
Table 4.11 – Number of eligible employees with workplace pensions: by banded rate
of employer contribution in the private sector, 2010 to 2017, Great Britain
Great Britain Number of employees in thousands
Banded
contribution
rate 2010 2011 2012 2013 2014 2015 2016 2017
Participating in a pension 44% 42% 42% 46% 63% 70% 72% 81%
of which contributing:
zero 266 206 196 207 199 182 164 140
0-2% 156 148 147 435 2,319 3,338 3,626 4,874
2-4% 616 599 628 753 1,041 1,233 1,338 1,523
4-6% 934 877 870 985 1,125 1,202 1,299 1,411
6-8% 630 635 647 753 820 848 880 952
8-10% 504 514 585 594 620 635 619 675
10-15% 1,192 1,268 1,341 1,360 1,382 1,459 1,099 1,087
15% and over 1,358 1,229 1,185 1,239 1,212 1,141 1,367 1,393
Source: DWP estimates derived from the ONS ASHE, GB, 2010–2017.
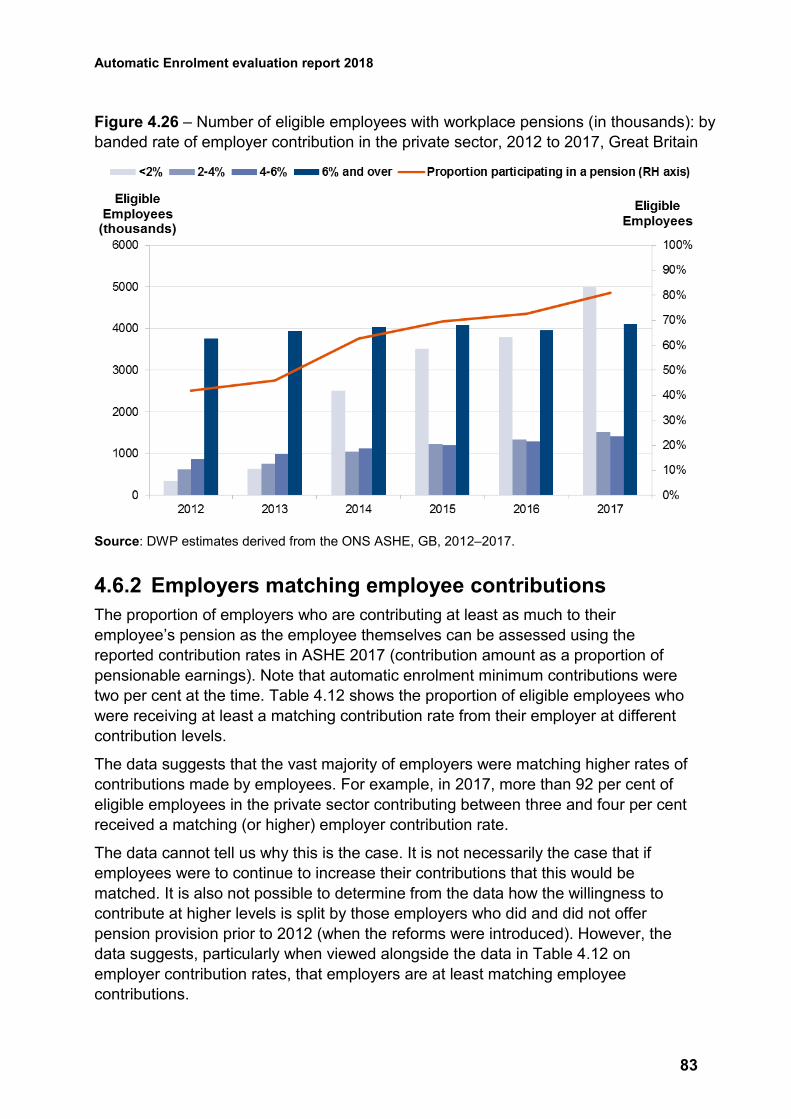
Automatic Enrolment evaluation report 2018
83
Figure 4.26 – Number of eligible employees with workplace pensions (in thousands): by
banded rate of employer contribution in the private sector, 2012 to 2017, Great Britain
Source: DWP estimates derived from the ONS ASHE, GB, 2012–2017.
4.6.2 Employers matching employee contributions
The proportion of employers who are contributing at least as much to their
employee’s pension as the employee themselves can be assessed using the
reported contribution rates in ASHE 2017 (contribution amount as a proportion of
pensionable earnings). Note that automatic enrolment minimum contributions were
two per cent at the time. Table 4.12 shows the proportion of eligible employees who
were receiving at least a matching contribution rate from their employer at different
contribution levels.
The data suggests that the vast majority of employers were matching higher rates of
contributions made by employees. For example, in 2017, more than 92 per cent of
eligible employees in the private sector contributing between three and four per cent
received a matching (or higher) employer contribution rate.
The data cannot tell us why this is the case. It is not necessarily the case that if
employees were to continue to increase their contributions that this would be
matched. It is also not possible to determine from the data how the willingness to
contribute at higher levels is split by those employers who did and did not offer
pension provision prior to 2012 (when the reforms were introduced). However, the
data suggests, particularly when viewed alongside the data in Table 4.12 on
employer contribution rates, that employers are at least matching employee
contributions.
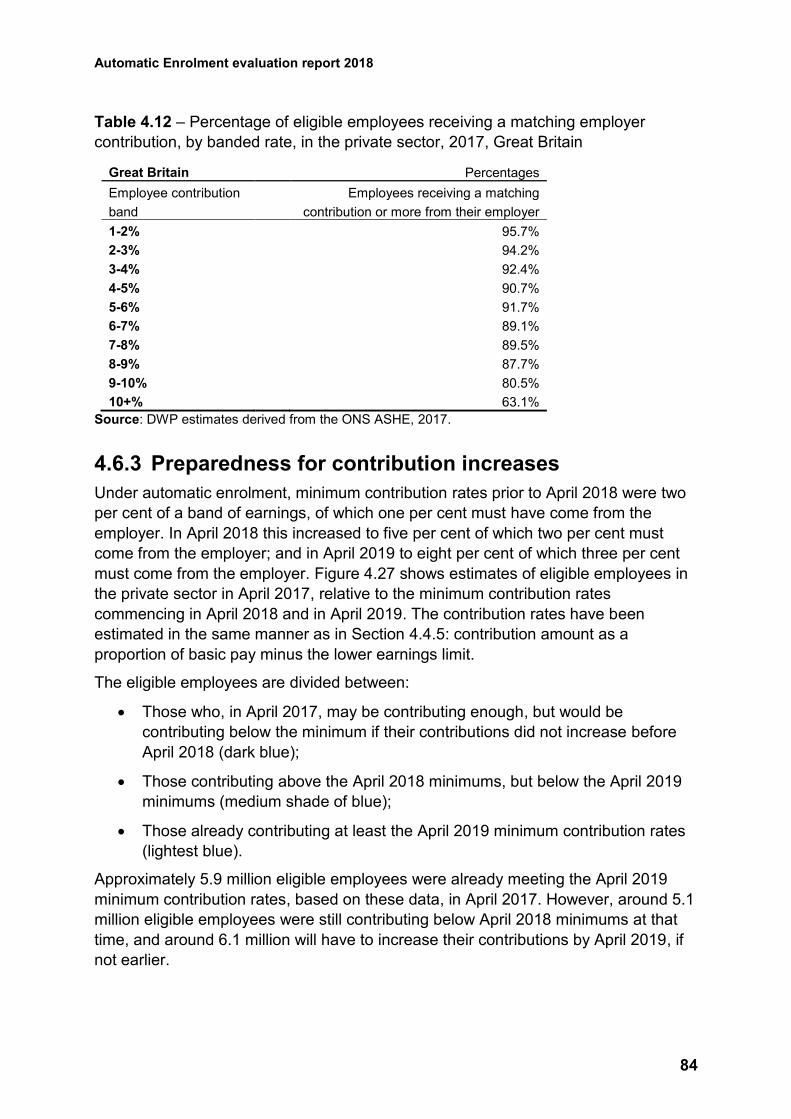
Automatic Enrolment evaluation report 2018
84
Table 4.12 – Percentage of eligible employees receiving a matching employer
contribution, by banded rate, in the private sector, 2017, Great Britain
Great Britain Percentages
Employee contribution Employees receiving a matching
band contribution or more from their employer
1-2% 95.7%
2-3% 94.2%
3-4% 92.4%
4-5% 90.7%
5-6% 91.7%
6-7% 89.1%
7-8% 89.5%
8-9% 87.7%
9-10% 80.5%
10+% 63.1%
Source: DWP estimates derived from the ONS ASHE, 2017.
4.6.3 Preparedness for contribution increases
Under automatic enrolment, minimum contribution rates prior to April 2018 were two
per cent of a band of earnings, of which one per cent must have come from the
employer. In April 2018 this increased to five per cent of which two per cent must
come from the employer; and in April 2019 to eight per cent of which three per cent
must come from the employer. Figure 4.27 shows estimates of eligible employees in
the private sector in April 2017, relative to the minimum contribution rates
commencing in April 2018 and in April 2019. The contribution rates have been
estimated in the same manner as in Section 4.4.5: contribution amount as a
proportion of basic pay minus the lower earnings limit.
The eligible employees are divided between:
Those who, in April 2017, may be contributing enough, but would be
contributing below the minimum if their contributions did not increase before
April 2018 (dark blue);
Those contributing above the April 2018 minimums, but below the April 2019
minimums (medium shade of blue);
Those already contributing at least the April 2019 minimum contribution rates
(lightest blue).
Approximately 5.9 million eligible employees were already meeting the April 2019
minimum contribution rates, based on these data, in April 2017. However, around 5.1
million eligible employees were still contributing below April 2018 minimums at that
time, and around 6.1 million will have to increase their contributions by April 2019, if
not earlier.
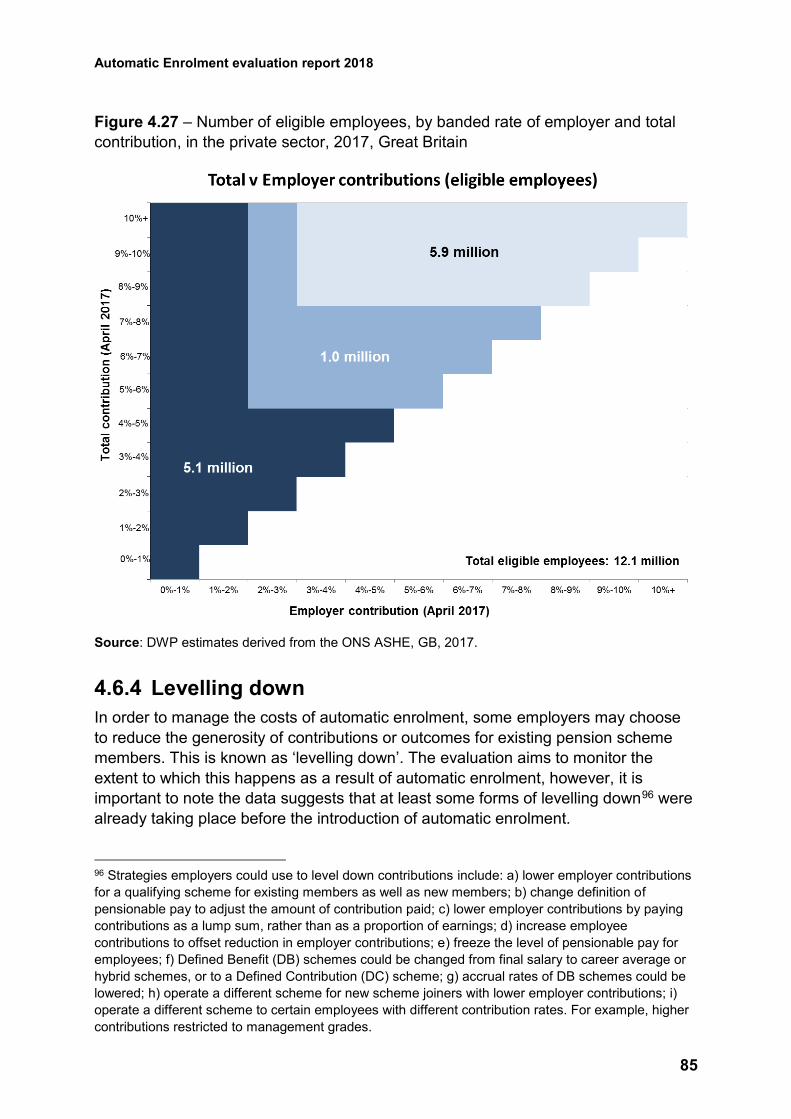
Automatic Enrolment evaluation report 2018
85
Figure 4.27 – Number of eligible employees, by banded rate of employer and total
contribution, in the private sector, 2017, Great Britain
Source: DWP estimates derived from the ONS ASHE, GB, 2017.
4.6.4 Levelling down
In order to manage the costs of automatic enrolment, some employers may choose
to reduce the generosity of contributions or outcomes for existing pension scheme
members. This is known as ‘levelling down’. The evaluation aims to monitor the
extent to which this happens as a result of automatic enrolment, however, it is
important to note the data suggests that at least some forms of levelling down96 were
already taking place before the introduction of automatic enrolment.
96 Strategies employers could use to level down contributions include: a) lower employer contributions
for a qualifying scheme for existing members as well as new members; b) change definition of
pensionable pay to adjust the amount of contribution paid; c) lower employer contributions by paying
contributions as a lump sum, rather than as a proportion of earnings; d) increase employee
contributions to offset reduction in employer contributions; e) freeze the level of pensionable pay for
employees; f) Defined Benefit (DB) schemes could be changed from final salary to career average or
hybrid schemes, or to a Defined Contribution (DC) scheme; g) accrual rates of DB schemes could be
lowered; h) operate a different scheme for new scheme joiners with lower employer contributions; i)
operate a different scheme to certain employees with different contribution rates. For example, higher
contributions restricted to management grades.
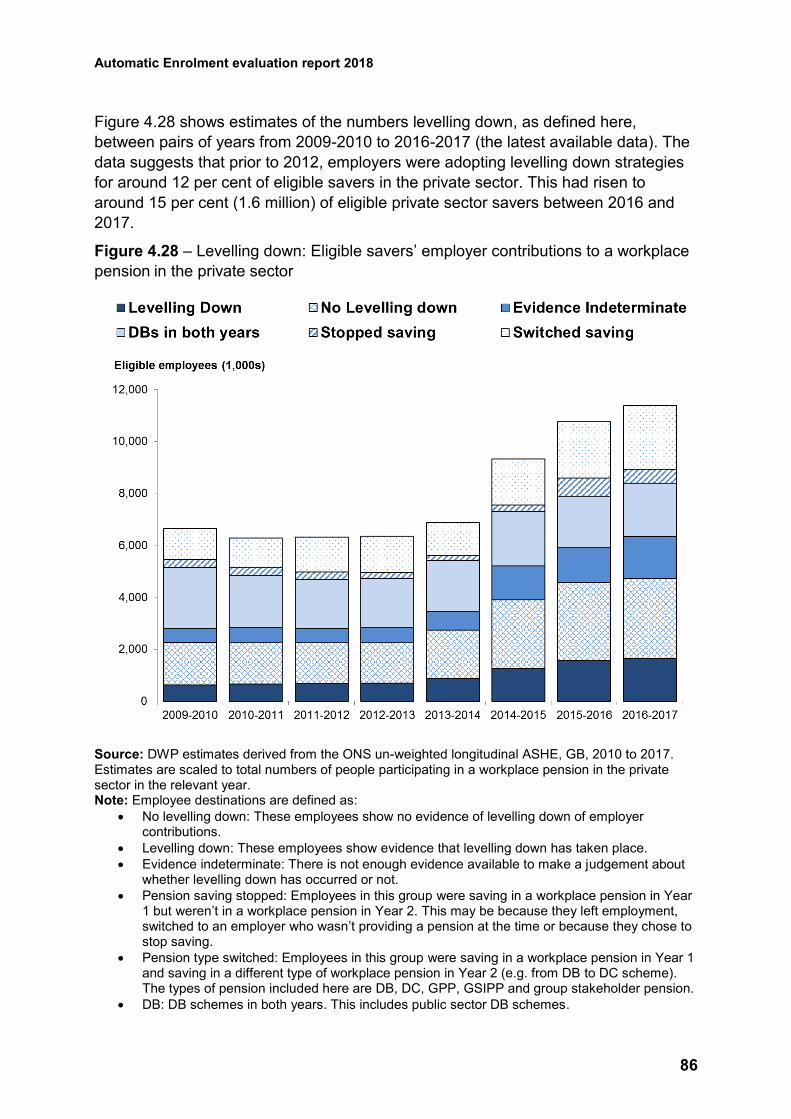
Automatic Enrolment evaluation report 2018
86
Figure 4.28 shows estimates of the numbers levelling down, as defined here,
between pairs of years from 2009-2010 to 2016-2017 (the latest available data). The
data suggests that prior to 2012, employers were adopting levelling down strategies
for around 12 per cent of eligible savers in the private sector. This had risen to
around 15 per cent (1.6 million) of eligible private sector savers between 2016 and
2017.
Figure 4.28 – Levelling down: Eligible savers’ employer contributions to a workplace
pension in the private sector
Source: DWP estimates derived from the ONS un-weighted longitudinal ASHE, GB, 2010 to 2017. Estimates are scaled to total numbers of people participating in a workplace pension in the private sector in the relevant year. Note: Employee destinations are defined as:
No levelling down: These employees show no evidence of levelling down of employer contributions.
Levelling down: These employees show evidence that levelling down has taken place.
Evidence indeterminate: There is not enough evidence available to make a judgement about whether levelling down has occurred or not.
Pension saving stopped: Employees in this group were saving in a workplace pension in Year 1 but weren’t in a workplace pension in Year 2. This may be because they left employment, switched to an employer who wasn’t providing a pension at the time or because they chose to stop saving.
Pension type switched: Employees in this group were saving in a workplace pension in Year 1 and saving in a different type of workplace pension in Year 2 (e.g. from DB to DC scheme). The types of pension included here are DB, DC, GPP, GSIPP and group stakeholder pension.
DB: DB schemes in both years. This includes public sector DB schemes.
Automatic Enrolment evaluation report 2018
87
Whilst this analysis shows that the rate of levelling down has increased slightly since
2012, findings from EPP 2017 suggest that where employers have experienced
increased contribution costs as a result of automatic enrolment, only one per cent of
employers have adopted levelling down as a strategy to absorb these costs.97
Further detail on the strategies used can be found in section 4.7.3.
4.6.5 Contractual enrolment
A worker who is not eligible for automatic enrolment can choose to ‘opt in’ to an
automatic enrolment scheme, and is entitled to a mandatory employer contribution
should they do so.98
Given that the pension participation rate of non-eligible employees has increased
since automatic enrolment was introduced, EPP 2017 for the first time measured the
extent to which this was due to non-eligible employees being contractually enrolled99
versus these employees making an active choice to opt in to pension saving, or
some other reason.
In 63 per cent of pension schemes used for automatic enrolment where at least some
non-eligible employees had been enrolled, the employees had actively asked to join,
while in 29 per cent the employer stated that it was company policy to enrol everyone
(Table 4.13).100 For nine per cent of schemes, employers stated this was due to
some other reason. Small employers were more likely to say that it was company
policy to enrol everyone; this was given as the reason for 28 per cent of schemes
that had enrolled non-eligible employees among small employers, compared with 14
per cent of schemes provided by large employers. Micro employers also enrolled
non-eligible employees (see section 4.3.8), however there were too few responses to
be able to estimate accurately the split between active opt-in and contractual
enrolment at these employers.
97 DWP. (2018). Employers’ Pension Provision Survey 2017. At:
https://www.gov.uk/government/publications/employers-pension-provision-survey-2017
98 Non-eligible jobholders are in either of the following two categories: a worker who is aged at least 16
and under 75 and earns above the lower earnings level of qualifying earnings but below the earnings
trigger for automatic enrolment; or is aged at least 16 but under 22, or between State Pension age and
under 75; and earns above the earnings trigger for automatic enrolment.
99 Contractual enrolment is where an employer chooses to include enrolment into a pension scheme
as part of a worker’s employment contract. This is not classified as automatic enrolment because the
worker is considered to have consented to active membership of the scheme and to having
deductions made from their pay, whereas automatic enrolment does not require the worker’s consent.
100 DWP. (2018). Employers’ Pension Provision Survey 2017. At:
https://www.gov.uk/government/publications/employers-pension-provision-survey-2017
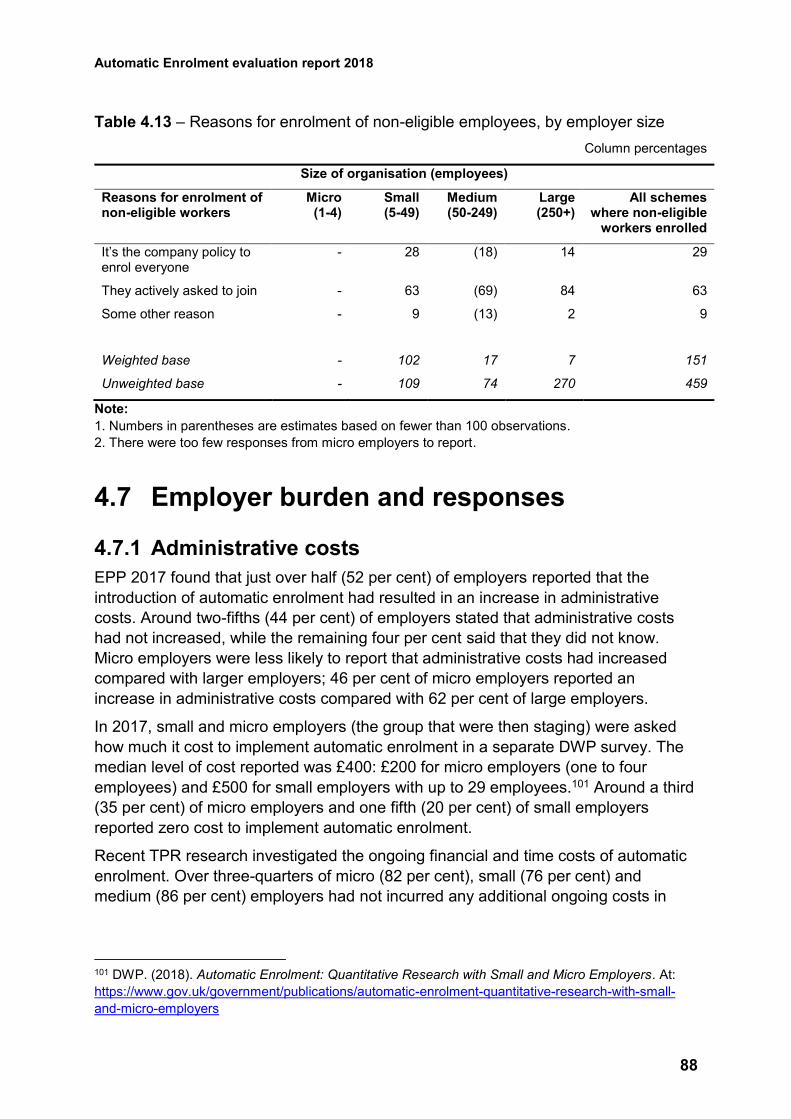
Automatic Enrolment evaluation report 2018
88
Table 4.13 – Reasons for enrolment of non-eligible employees, by employer size
Column percentages
Size of organisation (employees)
Reasons for enrolment of non-eligible workers
Micro (1-4)
Small (5-49)
Medium (50-249)
Large (250+)
All schemes where non-eligible
workers enrolled
It’s the company policy to enrol everyone
- 28 (18) 14 29
They actively asked to join - 63 (69) 84 63
Some other reason - 9 (13) 2 9
Weighted base - 102 17 7 151
Unweighted base - 109 74 270 459
Note:
1. Numbers in parentheses are estimates based on fewer than 100 observations.
2. There were too few responses from micro employers to report.
4.7 Employer burden and responses
4.7.1 Administrative costs
EPP 2017 found that just over half (52 per cent) of employers reported that the
introduction of automatic enrolment had resulted in an increase in administrative
costs. Around two-fifths (44 per cent) of employers stated that administrative costs
had not increased, while the remaining four per cent said that they did not know.
Micro employers were less likely to report that administrative costs had increased
compared with larger employers; 46 per cent of micro employers reported an
increase in administrative costs compared with 62 per cent of large employers.
In 2017, small and micro employers (the group that were then staging) were asked
how much it cost to implement automatic enrolment in a separate DWP survey. The
median level of cost reported was £400: £200 for micro employers (one to four
employees) and £500 for small employers with up to 29 employees.101 Around a third
(35 per cent) of micro employers and one fifth (20 per cent) of small employers
reported zero cost to implement automatic enrolment.
Recent TPR research investigated the ongoing financial and time costs of automatic
enrolment. Over three-quarters of micro (82 per cent), small (76 per cent) and
medium (86 per cent) employers had not incurred any additional ongoing costs in
101 DWP. (2018). Automatic Enrolment: Quantitative Research with Small and Micro Employers. At:
https://www.gov.uk/government/publications/automatic-enrolment-quantitative-research-with-small-
and-micro-employers
Automatic Enrolment evaluation report 2018
89
meeting their duties.102 For those who did pay for support, the median monthly cost
varied from £28 for micro employers, £50 for small employers and £176 for medium
employers.
This TPR research also found that employers reported that meeting their ongoing
duties took up no more than two hours per month (93 per cent of micro, 85 per cent
of small and 60 per cent of medium employers). While medium employers were more
likely to spend over two hours on their duties, 94 per cent indicated that this was no
more than ten hours per month. The DWP small and micro employer research found
similarly that 72 per cent of small and micro employers (with up to 29 employees)
spent less than half a day a month on administration of their workplace pension
scheme, with 91 per cent needing less than one day a month.103
4.7.2 Contribution costs
EPP 2017 found that two-thirds (65 per cent) of employers who had begun automatic
enrolment stated that its introduction had resulted in an increase in the total pension
contributions that their organisation had to make.104 Some variation was apparent by
employer size; just over half (54 per cent) of micro employers who had begun
automatic enrolment reported experiencing an increase in total pension contributions,
compared with 83 per cent of large employers. This applied for 78 per cent of small
employers and 80 per cent of medium-sized employers.
4.7.3 Responses to costs incurred through implementing automatic enrolment
EPP 2017 investigated what actions employers had taken to absorb increased
contribution costs, if they reported that these costs had increased as a result of
automatic enrolment. The most common action reported was that the cost had been
absorbed as part of other overheads, stated by 71 per cent of respondents (Table
4.14).105 Just under half (47 per cent) of employers reported they had absorbed this
through a reduction in profits. Around one in ten stated that they had increased prices
(11 per cent) or implemented lower wage increases (ten per cent), while five per cent
had changed their existing pension scheme or re-structured or reduced their
workforce. Just one per cent of employers had reduced contribution levels for
102 TPR. (2018). Ongoing Duties Survey – Summer 2018. At:
https://www.thepensionsregulator.gov.uk/-/media/thepensionsregulator/files/import/pdf/employer-
automatic-enrolment-ongoing-duties-survey-summer-2018.ashx
103 DWP. (2018). Automatic Enrolment: Quantitative Research with Small and Micro Employers. At:
https://www.gov.uk/government/publications/automatic-enrolment-quantitative-research-with-small-
and-micro-employers
104 DWP. (2018). Employers’ Pension Provision Survey 2017. At:
https://www.gov.uk/government/publications/employers-pension-provision-survey-2017
105 DWP. (2018). Employers’ Pension Provision Survey 2017. At:
https://www.gov.uk/government/publications/employers-pension-provision-survey-2017
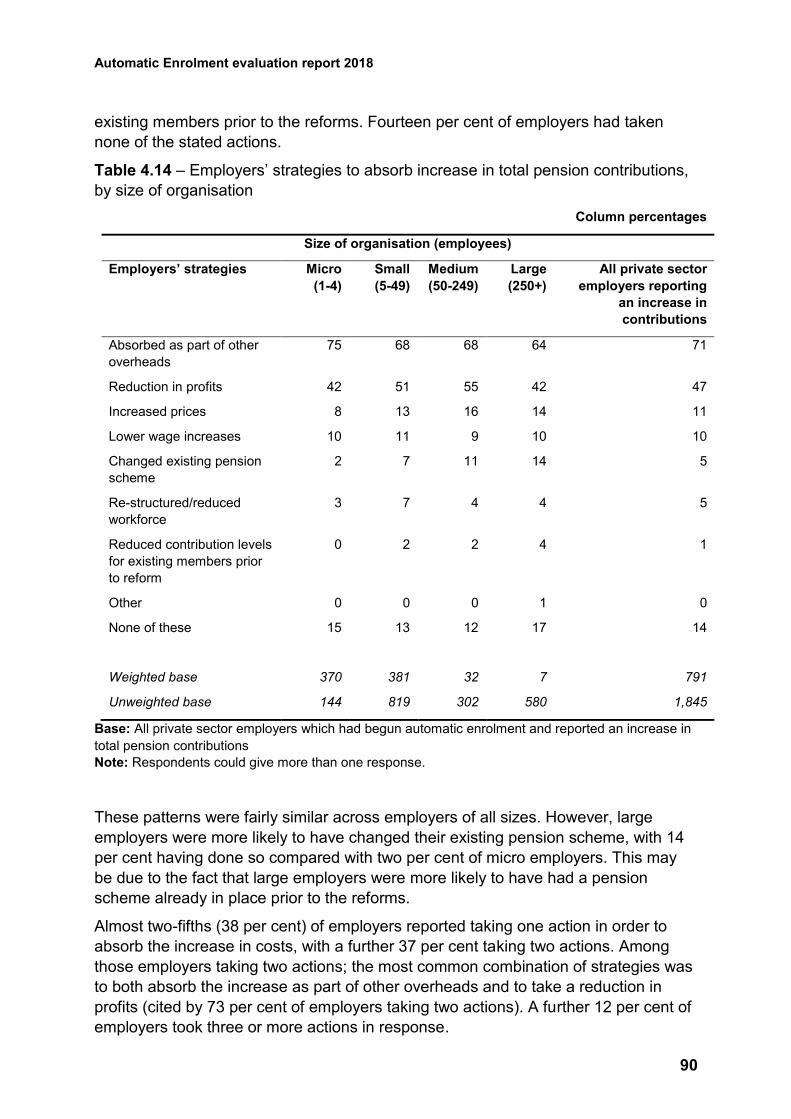
Automatic Enrolment evaluation report 2018
90
existing members prior to the reforms. Fourteen per cent of employers had taken
none of the stated actions.
Table 4.14 – Employers’ strategies to absorb increase in total pension contributions,
by size of organisation
Column percentages
Size of organisation (employees)
Employers’ strategies Micro
(1-4)
Small
(5-49)
Medium
(50-249)
Large
(250+)
All private sector
employers reporting
an increase in
contributions
Absorbed as part of other
overheads
75 68 68 64 71
Reduction in profits 42 51 55 42 47
Increased prices 8 13 16 14 11
Lower wage increases 10 11 9 10 10
Changed existing pension
scheme
2 7 11 14 5
Re-structured/reduced
workforce
3 7 4 4 5
Reduced contribution levels
for existing members prior
to reform
0 2 2 4 1
Other 0 0 0 1 0
None of these 15 13 12 17 14
Weighted base 370 381 32 7 791
Unweighted base 144 819 302 580 1,845
Base: All private sector employers which had begun automatic enrolment and reported an increase in
total pension contributions
Note: Respondents could give more than one response.
These patterns were fairly similar across employers of all sizes. However, large
employers were more likely to have changed their existing pension scheme, with 14
per cent having done so compared with two per cent of micro employers. This may
be due to the fact that large employers were more likely to have had a pension
scheme already in place prior to the reforms.
Almost two-fifths (38 per cent) of employers reported taking one action in order to
absorb the increase in costs, with a further 37 per cent taking two actions. Among
those employers taking two actions; the most common combination of strategies was
to both absorb the increase as part of other overheads and to take a reduction in
profits (cited by 73 per cent of employers taking two actions). A further 12 per cent of
employers took three or more actions in response.
Automatic Enrolment evaluation report 2018
91
The DWP’s recent survey with small and micro employers found that these
employers responded similarly when asked how they absorbed increased
administration costs. Seventy per cent of those employers who incurred increased
administration costs reported that they had taken a reduction in profits or absorbed
the cost as part of overheads, nine per cent said they implemented lower wage
increases, nine per cent said they increased prices, five per cent had restructured or
reduced their workforce, three per cent had reduced other employee benefits, and
just one per cent each said they had reduced contribution levels for existing
workplace pension members, or changed their existing workplace pension scheme in
another way.106
4.7.4 Pension scheme choice
The DWP survey with small and micro employers in 2017 found that 90 per cent of
these employers had sought advice or guidance on choosing their new workplace
pension scheme.107 Most commonly, they approached an accountant or financial
services firm (49 per cent), TPR (28 per cent), pension providers (27 per cent),
payroll providers (22 per cent), Independent Financial Advisers (IFAs) (18 per cent)
or pensions advisers (12 per cent). The National Employment Savings Trust (NEST)
was the most popular pension provider amongst small and micro employers (chosen
by 58 per cent), followed by The People’s Pension (11 per cent) and a range of other
providers (each chosen by three per cent of employers or fewer).108
The survey found that employers most commonly chose schemes that had been
externally recommended to them (36 per cent), schemes that were simple (26 per
cent) or were linked to Government (15 per cent). Simplicity also featured in other
common reasons employers gave, in terms of being able to manage schemes online
(six per cent) or having a low administrative burden (five per cent).
Nine in ten (89 per cent) of those employers who said they picked a scheme because
it was Government-linked had chosen NEST. Earlier DWP qualitative research with
small and micro employers109 indicated that, in some of these instances, employers
106 DWP. (2018). Automatic Enrolment: Quantitative Research with Small and Micro Employers. At:
https://www.gov.uk/government/publications/automatic-enrolment-quantitative-research-with-small-
and-micro-employers
107 DWP. (2018). Automatic Enrolment: Quantitative Research with Small and Micro Employers. At:
https://www.gov.uk/government/publications/automatic-enrolment-quantitative-research-with-small-
and-micro-employers
108 These proportions were based only on small and micro employers who had automatically enrolled
their staff into a qualifying workplace pension scheme between September 2016 and March 2017, so
may not match figures from other sources.
109 DWP. (2017). Automatic Enrolment: Qualitative Research with Small and Micro Employers. At:
https://www.gov.uk/government/publications/automatic-enrolment-qualitative-research-with-small-and-
micro-employers
Automatic Enrolment evaluation report 2018
92
may have had a misconception that NEST was the Government’s recommended
scheme (which is not the case).110
The emerging findings from the forthcoming DWP research with ‘newborn’ (new)
employers, to be published in 2019, suggest that it was rare for employers to engage
in extensive information seeking: they usually found enough information to become
compliant, but sought little beyond this. The letter that employers received from TPR
notifying them that they needed to set up automatic enrolment almost always
prompted them to go to the regulator’s website to review the guidance about how to
comply with their duties. Even the employers who decided to outsource the process
tended to check the TPR’s website to get a sense of what was involved.
It was also common for employers to visit the website of the pension provider they
had decided to use. Typically they spent a short amount of time on a single visit to
the website before deciding to use the provider in question. Occasionally the
employer also made a phone call to the provider with a query about potential fees or
how to go about setting up the pension.
Unless prompted otherwise by some external factor, employers typically chose NEST
as their provider:
• NEST was widely perceived to be ‘the Government-endorsed pension scheme
for automatic enrolment’.111 It was often seen as the safest option, and
appealed to newborns’ inclination to ensure compliance by sticking to a pre-
defined process.
• There are no employer set-up fees attached to a NEST pension, which
appealed to those concerned about maintaining cash-flow in the early days of
their business.
• NEST was well-known to the employers interviewed. Many had encountered
NEST in a previous workplace.
• Some employers also felt that NEST integrates well with certain payroll
software. This was particularly relevant to those administering both company
payroll and automatic enrolment internally.
Where employers considered an alternative provider to NEST, this was usually
triggered by a recommendation from a third party. It was common for employers to
speak to people they knew whom they believed to be already familiar with automatic
enrolment. Employers who had an ongoing professional relationship with an
accountant, payroll provider or adviser who was external to their organisation almost
always spoke to them to find out if they had any helpful advice.
A few employers also sought information through personal connections. For instance,
some spoke to family members who they knew had prior experience with
implementing automatic enrolment at another workplace. A small number spoke to
110 Although the NEST Corporation is a public body, originally set up by the Government, the
Government does not in fact advertise NEST above other schemes.
111 Although the NEST Corporation is a public body, originally set up by the Government, the
Government does not in fact advertise NEST above other schemes.
Automatic Enrolment evaluation report 2018
93
other small business owners through local professional networking groups, or
attended external training on automatic enrolment that was provided by their
accountant or payroll provider. Like employers who sought guidance from a
professional, these employers would typically be looking for a recommendation for a
provider to use, as well as any tips on saving on time or costs.
These recommendations given were generally based on the following principles:
• The recommended provider was easy to use and/or integrated best with their
own or their accountant’s payroll software.
• A particular provider was thought to be particularly helpful for small businesses
with little knowledge of the automatic enrolment process.
• The provider was believed to provide better returns for workers once they
begin to draw their pension than NEST.
4.7.5 Employer views and attitudes on the level of burden
EPP 2017 looked at employer perceptions of the level of burden they faced as a
result of implementing automatic enrolment. Employers were asked to rate different
aspects of their duties from one to ten, where one represented no extra work at all,
and ten representing a lot of extra work.
For communicating automatic enrolment to employees, assessing the workforce for
eligibility, declaring compliance with The Pensions Regulator (TPR), ongoing
administration of the scheme and processing opt-ins, the mean score reported by
employers was four out of ten.112 For processing opt-outs, the mean score reported
was three. This pattern was generally also reflected in the median scores, although
the median score for processing opt-outs was equal to one, with the implication that
the majority of employers (predominantly micro employers) actually experienced no
additional work as a result of processing opt-outs.
Based on the 2017 DWP small and micro employer survey, there were mixed
perceptions on how easy or difficult it was to comply with automatic enrolment. Over
half of small and micro employers (54 per cent) viewed compliance as easy, whereas
three in ten (28 per cent) found it difficult.113 Despite this, the majority (70 per cent)
said they found the ongoing administration of their workplace pension scheme or
schemes easy to cope with. Recent TPR research found similar attitudes: the
majority of employers (76 per cent of micro, 78 per cent of small and 82 per cent of
medium employers) stated that they did not have any difficulty keeping up with their
112 DWP. (2018). Employers’ Pension Provision Survey 2017. At:
https://www.gov.uk/government/publications/employers-pension-provision-survey-2017
113 DWP. (2018). Automatic Enrolment: Quantitative Research with Small and Micro Employers. At:
https://www.gov.uk/government/publications/automatic-enrolment-quantitative-research-with-small-
and-micro-employers
Automatic Enrolment evaluation report 2018
94
ongoing duties.114 Around two-thirds (67 per cent of micro, 63 per cent of small and
60 per cent of medium employers) found their ongoing duties less onerous than
expected.
Employers of all three sizes generally judged the process of implementing the
increased contributions that came into effect in April 2018 as ‘easy’ (72 per cent of
micro, 75 per cent of small and 71 per cent of medium employers).
The forthcoming DWP research with ‘newborn’ (new) employers indicates that the
reality of implementing automatic enrolment was usually less burdensome than
employers had anticipated.115 Typically, the amount of time given over to becoming
compliant was measured in hours, rather than days or weeks. Outsourcing the
process, or having prior relevant experience, typically reduced the amount of time
spent setting up automatic enrolment. Those with the lowest level of financial
confidence typically invested more time in becoming compliant.
The financial burden, over and above the ongoing cost of employer contributions,
was either small or even non-existent. While a handful of employers had paid one-off
fees for ad hoc help with administration, additional training or as a set-up fee
attached to the pension provider, this was not the norm among those interviewed.
Employers were generally aware that the minimum contribution rate would rise in
April 2019, and were relaxed about the rise. They accepted the increase as part and
parcel of being an employer and, since it typically affected a small number of
workers, they normally anticipated that the effect on their overall costs would be
minimal. Occasionally employers were concerned about how the rise might impact
their overall wage bill.
4.8 Pensions industry
4.8.1 Protecting the interests of employees and employers
During 2018, Government has delivered new pension regulations that aim to improve
outcomes for members of Defined Contribution (DC) schemes, including members of
schemes used for automatic enrolment, through a renewed focus on value for money
and governance. Alongside, industry has responded to the call in the 2017 Review of
Automatic Enrolment to build on and develop new initiatives to support engagement.
New regulations clarify for trustees that they need to take into account all financially
material considerations, including risks and opportunities arising from environmental,
social and governance considerations, in setting an investment strategy. These have
the potential to improve member returns and nudge trustees to develop and adopt an
investment strategy which better reflects the needs of their members. A simpler
114 TPR. (2018). Ongoing Duties Survey – Summer 2018. At:
https://www.thepensionsregulator.gov.uk/-/media/thepensionsregulator/files/import/pdf/employer-
automatic-enrolment-ongoing-duties-survey-summer-2018.ashx
115 Findings to be published in 2019.
Automatic Enrolment evaluation report 2018
95
regulatory framework for transfers without consent between DC schemes will enable
further consolidation of schemes, improving efficiency and governance whilst also
reducing costs. Following the approach introduced for occupational DC pension
schemes, the Financial Conduct Authority (FCA) will consult on requirements for the
governance bodies of workplace personal pensions to publish details of charges and
transaction costs imposed on members, with members informed of where this
information can be obtained.
An industry initiative, led by Ruston Smith116, has developed an example of an
annual benefit statement designed to better engage scheme members and this work
will be further developed by the Pensions and Lifetime Savings Association (PLSA)
and the Association of British Insurers (ABI). PLSA are developing retirement income
targets, following their consultation ‘Hitting the Target’, to be launched in 2019.
Putting individuals in control of how and when they access their information can help
to increase awareness and understanding of saving for retirement. DWP is consulting
on the detailed design for pensions dashboards, and its proposals for facilitating an
industry-led delivery.117 Dashboards will offer people the opportunity to securely
access their pensions information online, all in one place and at a time of their
choosing. An industry-led approach will harness the best of industry innovation.
Government will work with the regulators and industry to help ensure that industry
meets its responsibilities to protect consumers.
4.8.2 Driving up provider standards
With over 9.9 million people automatically enrolled into a workplace pension, the
continued success of automatic enrolment relies to a large degree on ensuring that
contributions due are paid in full and on time. In August 2018, TPR published findings
from its thematic review into the systems, process and resources used by pension
scheme providers.118 The aim of the review is to ensure that appropriate standards
around contributions and reporting material payment failures are met and maintained.
The review of 14 key pension scheme providers indicated that providers’ systems
and processes for receiving and maintaining contributions generally matched the
116 Ruston Smith (Chair of the Tesco Pension Fund and Tesco Pension Investment Ltd.), one of three
co-chairs of an independent Expert Advisory Group, led on the strengthening personal engagement
theme within the 2017 Automatic Enrolment Review.
117 DWP. (2018). Pensions Dashboards: working together for the consumer. At:
https://www.gov.uk/government/consultations/pensions-dashboards-feasibility-report-and-consultation
118 TPR. (2018). A thematic review report: How pension scheme providers maintain contributions and
report material payment failures. At: https://www.thepensionsregulator.gov.uk/-
/media/thepensionsregulator/files/import/pdf/thematic-review-maintaining-contributions.ashx
Automatic Enrolment evaluation report 2018
96
standards of conduct and practice TPR expects as set out in their codes of
practice119 120 and some good examples of best practice were found.
However, a number of risk areas were uncovered, as well as some discrepancies in
the quality and effectiveness of the providers’ processes and procedures. TPR has
intervened in some cases, using its enforcement powers where it considered it
appropriate. TPR will continue to intervene where issues and breaches are identified
that suggest a scheme is not meeting its expectations or standards.
4.8.3 Guidance from TPR
The large number of savers being automatically enrolled into DC pension schemes
means that the standards of governance and administration of these arrangements is
very important for savers’ outcomes. TPR’s revised code of practice for DC schemes
came into force in July 2016.121 To support trustees, TPR provided further practical
guidance in a series of ‘how to’ guides that were published alongside the code.122
The regulator has been measuring the extent to which these schemes are meeting
five key governance requirements (KGRs) through their annual survey of trust-based
occupational DC schemes.123 Some of the key findings of the 2018 report included:
Over half of DC members were in schemes meeting all their KGRs, which was
an increase from 2017. At least 95 per cent of members were in schemes
meeting KGR 1 (trustee knowledge and understanding), KGR 4 (master trust
independence requirements) and KGR 5 (suitable design of default investment
strategy).124
The proportion of schemes meeting the expectations set out in the DC code
tended to increase with scheme size, with investment governance and
administration the weakest areas for most schemes.
119 TPR. (2013). Reporting late payment of contributions to occupational pension schemes. At:
https://www.thepensionsregulator.gov.uk/en/document-library/codes-of-practice/code-5-reporting-late-
payment-of-contributions-to-occupational-pension-schemes
120 TPR. (2013). Reporting late payment of contributions to personal pension schemes. At:
https://www.thepensionsregulator.gov.uk/en/document-library/codes-of-practice/code-6-reporting-late-
payment-of-contributions-to-personal-pension-schemes
121 At: https://www.thepensionsregulator.gov.uk/en/document-library/codes-of-practice/code-13-
governance-and-administration-of-occupational-trust-based-schemes-providing-money-purchase
122 At: https://www.thepensionsregulator.gov.uk/en/document-library/code-related-guidance
123 TPR. (2018). Defined Contribution trust-based pension schemes research. At:
https://www.thepensionsregulator.gov.uk/-/media/thepensionsregulator/files/import/pdf/dc-research-
summary-report-2018.ashx
124 The other KGRs are KGR 2 (value for members assessment) and KGR 3 (core scheme financial
transactions).
Automatic Enrolment evaluation report 2018
97
4.8.4 Intermediaries’ awareness, understanding and activity
The regulator published research in December 2017 measuring awareness and
understanding of automatic enrolment among key intermediaries who support
employers, namely financial advisers, payroll administrators, accountants and
bookkeepers.125 Key findings included:
Over 90 per cent of intermediaries were supporting their small business clients
with automatic enrolment. More than half of accountants, payroll
administrators and bookkeepers expected their clients to rely on them
completely to fulfil their ongoing automatic enrolment duties (52 per cent, 55
per cent and 56 per cent respectively).
Awareness of new employers having instant automatic enrolment duties
increased among all of the intermediary types compared with the autumn 2016
survey. It was highest among IFAs (91 per cent), followed by accountants (73
per cent), payroll administrators (69 per cent) and bookkeepers (67 per cent).
Awareness of postponement was near universal, ranging from 94 to 97 per
cent. However, knowledge about the details of postponement (determined by
correctly identifying one false and three true statements) ranged from 25 to 48
per cent.
Awareness of re-enrolment was near universal amongst IFAs (99 per cent)
and payroll administrators (94 per cent) and had increased among
accountants (from 77 to 89 per cent) and bookkeepers (from 72 to 85 per
cent) since autumn 2016.
Awareness of the minimum contribution increases was near-universal and
knowledge of the dates and amounts had risen, with awareness of the 2018
increase ranging from 96 per cent to 100 per cent. Awareness of the second
increase in 2019 was also high ranging from 92 to 99 per cent.
125 TPR. (2017). Intermediaries’ understanding and activity relating to automatic enrolment and
ongoing duties, December 2017. At: https://www.thepensionsregulator.gov.uk/-
/media/thepensionsregulator/files/import/pdf/intermediaries-automatic-enrolment-research-report-
2017.ashx
Automatic Enrolment evaluation report 2018
98
5 Next steps
5.1 Future evaluation reports
The latest evidence shows that automatic enrolment remains on track, with millions
more employees enrolled into private pension saving in the UK. The staging of
employers is complete, and evidence to date from the first contribution increase
suggests no change in opt-out or cessation behaviour following the increase.
The next evaluation report will set out further evidence from the first contribution
increase and findings from the second increase in April 2019. Following the
completion of the second increase, we will move from implementation of the reforms
to steady state. The next evaluation report will review progress to date since
implementation started in 2012, and update on future evaluation reporting plans for
steady state.
5.2 Forthcoming research
In 2018, we have begun a new programme of research which includes a focus on the
implementation of automatic enrolment amongst ‘newborn’ (new) employers. Since
October 2017, all businesses employing someone for the very first time have to
provide a workplace pension from the first day of their service.
We have commissioned qualitative research with newborn employers who have
declared compliance with their duties to explore their experiences, views and
behaviours relating to automatic enrolment. As part of this, we are speaking to their
employees, including both those who stayed in the scheme and those who opted out,
to explore drivers of behaviour. This study follows on from similar previous qualitative
research with small and micro employers.126
We are also commissioning the 2019 Employers’ Pension Provision survey, which
will update key measures from the most recent (2017) Employers’ Pension Provision
survey.127
126 DWP. (2017). Automatic Enrolment: Qualitative Research with Small and Micro Employers. At:
https://www.gov.uk/government/publications/automatic-enrolment-qualitative-research-with-small-and-
micro-employers
127 DWP. (2018). Employers’ Pension Provision Survey 2017. At:
https://www.gov.uk/government/publications/employers-pension-provision-survey-2017
Automatic Enrolment evaluation report 2018
99
6 Annexes
6.1 Real Time Information (RTI) Monitoring of Opt-out and Cessations
6.1.1 Her Majesty’s Revenue and Customs (HMRC) RTI Data
RTI is HMRC’s reporting system for income taxed via Pay As You Earn (PAYE).
Employers and pension providers are required to report to HMRC payments to
employees (or recipients of occupational pensions) on or before each payment date
where it is practical to do so. Within RTI, each submission relates to a payment to an
employee (or occupational pension recipient) and when they are submitted to HMRC
by the PAYE scheme, they are contained within a Full Payment Submission (FPS).
RTI includes information about the PAYE scheme, the employee (or occupational
pension recipient), and the payment.
However:
If all employments of one employer are paid less than the Lower Earnings
Limit (LEL) (£116 a week or £503 a month in 2018/19) a PAYE scheme is not
needed, and the employer is not required to submit RTI. However, if any
single employee earns more than this, is in receipt of a pension, has another
job, or receives expenses or benefits from the employer, the employer is
required to report RTI for all employees.128
Employers who are exempt from online payroll reporting do not need to submit
RTI electronically. This may be due to religious beliefs, where care services
must be provided to the employer or a member of their family, or for other
reasons.129
RTI only holds information on employments and pensions that are reported through
the payroll reporting process. RTI does not include information about both Self-
Employment and pensions which are not paid via PAYE (e.g. State Pension and
income from other sources that is seen as pension income by the individual).
Coverage
As RTI cannot identify pension contributions made via salary sacrifice and
information about employer pension contributions is not collected through RTI, it
cannot identify all employees saving into a workplace pension (e.g. an employee with
128 Please see https://www.gov.uk/paye-for-employers for further details.
129 Please see https://www.gov.uk/guidance/find-out-which-employers-are-exempt-from-online-payroll-
reporting for further details.
Automatic Enrolment evaluation report 2018
100
employer-only contributions will be indistinguishable from an employee who is not
saving into a pension, as both will have no employee pension contributions).
From comparison with the Annual Survey of Hours and Earnings (ASHE), we
estimate that RTI covers about 62 per cent of those saving into a workplace pension.
ASHE 2017 reports that 38 per cent of employees saving in April 2017 were saving
with employer-only contributions or via salary sacrifice.
In April 2017, 10.89 million eligible employees made employee pension contributions
on RTI; this represents 61.6 per cent of the 17.67 million eligible employees reported
as saving that month in the Workplace Pension Participation and Savings Trends130
Report, which is based on ASHE.
6.1.2 Methodology
The aim of the analysis was to identify the number of employments that have
stopped paying pension contributions each tax month (tax months run from 6th of the
calendar month to the 5th of the following calendar month).
Our methodology has three steps;
The first step is to identify spells of pension saving.
The second step classifies whether an employee has stopped pension saving
in a particular month, and if yes the reason for stopping.
The third step is to break down the analysis with several classification
variables. The below section will outline these steps in more detail.
It is important to note that this analysis was produced on a five tax month rolling
period, which will be referred to as the interest period. To estimate stoppages in a
particular month, the interest period covers that month and the four tax months that
follow. If we were estimating opt-outs or cessations for October 2016, the interest
period would include the five months from October 2016 to February 2017.
To identify whether someone who was pension saving in the first month of the
interest period stopped or continued saving, we would look at all their payment
records in the interest period. The payment records in the last four months of the
interest period will determine if we identify the employee as stopping pension saving
in the first month of the interest period or if they continued to pension save. For
example, if an employee who was saving in October did not make any pension
contributions on any of their subsequent payments in November to February, we
would classify them as having stopped pension saving in October.
130 DWP. (2018). Official statistics on workplace pension participation and saving trends for eligible
employees. At: https://www.gov.uk/government/statistics/workplace-pension-participation-and-saving-
trends-2007-to-2017
Automatic Enrolment evaluation report 2018
101
Opt-out and cessation rates for each month are calculated using this methodology,
looking at the subsequent four months of payment records to identify whether an
employee has stopped pension saving in that month.
Identifying spells of pension saving
The first step was to identify employments that had spells of pension saving. This
was done by identifying records that had employee pension contributions. If, on any
payment date in a tax month, an employment was found to have employee pension
contributions greater than £0 exactly, they were classed as paying employee pension
contributions.
All records for an employment in the last 17 complete tax months at the point of
analysis, including the interest period, were analysed to find spells of pension saving.
This then identified tax months when the employment was making employee pension
contributions. Of those identified as pension saving, only employments with
employee pension contributions in the interest period were included in the analysis.
The volume of employments with employee pension contributions in each tax month
of the interest period were calculated. This figure is used to estimate the level of
participation in workplace pension saving per month.
Of the most recent spell of pension saving, the last payment with employee pension
contributions was identified.
Classifying stoppages of saving
Once the most recent employee pension contribution has been identified, we identify
whether an employee has stopped pension saving, and if yes, the reason for
stopping pension saving. We consider an employee as having stopped saving in the
following three circumstances:
Employment ended – The reason there are no further employee pension
contributions is that the employment has ended. This is identified when there
are more than 90 days between the final payment for the employment and the
last day of the interest period.
Become non-eligible – The reason the employee stopped pension saving is
due to becoming non-eligible for automatic enrolment. This is identified when,
on the next payment after the final pension contribution, the employment was
no longer eligible, and there were no subsequent pension contributions. These
employments must be eligible at the point of the final employee pension
contribution. Becoming non-eligible could be due to changes in either age or
earnings. This category captures both those who are unenrolled by their
employer at the point of becoming non-eligible, and those who decide to stop
saving at the point of becoming non-eligible.
Active decision – The employee made an active decision to stop saving into
a pension. This is identified when the employment is still active and eligible,
but stops contributing to a workplace pension. It is therefore inferred to be an
active decision to stop pension saving.
Automatic Enrolment evaluation report 2018
102
For the three reasons above, these were then split into opt-outs and cessations. As
established, the difference between these are the length of time of pension saving.
We have classified opt-outs as having up to and including 42 days between the first
and last employee pension contributions.
This differs from the legislated definition (one calendar month) as RTI records are
based on payment frequencies. With RTI, we do not directly observe enrolment or
opt-out/cessations; rather, we infer that an employee has started or stopped pension
saving through the presence and absence of pension contributions. Since we can
only observe pension saving through payment records, we define the opt-out window
on the basis of payment frequencies. Six weeks was selected as the longest amount
of time an employee with a regular pay pattern could go between payments.
If the employee died within a close proximity to the last pension contribution (up to
and including 29 days before or up to and including 59 days after the final employee
pension contribution), the stoppage was classed as deceased.
If the employment was paid in the last 42 days of the interest period and had up to
and including 35 days between the last employee pension contribution and the last
payment for the employment, the employment was classed as still being active and
saving (i.e. it does not fit in any of the three above categories nor has the employee
been identified as deceased).
Analysis breakdowns
To provide more insight, the analysis was broken down with several classification
variables. Some of these classification variables required matching to other datasets
whilst some were derived.
Age classifications were created by joining to date of births held on central HMRC
systems using National Insurance numbers. Age was then calculated using this date
of birth and payment date for the final employee pension contribution. Ages were
then grouped together into age bands.
Gender classifications were created by joining to central HMRC systems using
National Insurance numbers.
Annual income was derived by calculating the daily earnings rate for the payment
with the final employee pension contributions. This was then converted into income
bands based on the expected annual earnings.
6.1.3 Key assumptions and caveats
The assumptions used in this analysis were as follows:
The volumes of employments stopping saving and other figures estimated
using HMRC’s RTI data may differ from other estimates (e.g. survey and
sampled data) because of differences in counting methodologies etc.
Months referred to tax months, e.g. the tax month of April 2018 was 6th April
2018 to 5th May 2018.
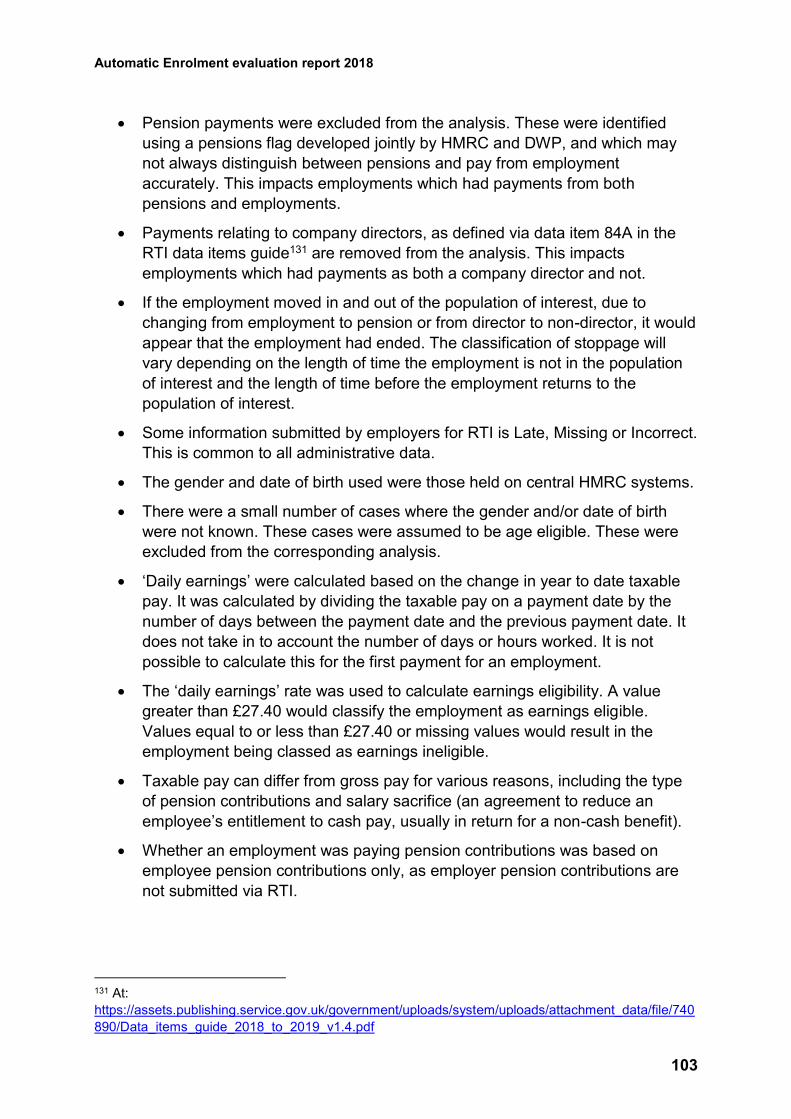
Automatic Enrolment evaluation report 2018
103
Pension payments were excluded from the analysis. These were identified
using a pensions flag developed jointly by HMRC and DWP, and which may
not always distinguish between pensions and pay from employment
accurately. This impacts employments which had payments from both
pensions and employments.
Payments relating to company directors, as defined via data item 84A in the
RTI data items guide131 are removed from the analysis. This impacts
employments which had payments as both a company director and not.
If the employment moved in and out of the population of interest, due to
changing from employment to pension or from director to non-director, it would
appear that the employment had ended. The classification of stoppage will
vary depending on the length of time the employment is not in the population
of interest and the length of time before the employment returns to the
population of interest.
Some information submitted by employers for RTI is Late, Missing or Incorrect.
This is common to all administrative data.
The gender and date of birth used were those held on central HMRC systems.
There were a small number of cases where the gender and/or date of birth
were not known. These cases were assumed to be age eligible. These were
excluded from the corresponding analysis.
‘Daily earnings’ were calculated based on the change in year to date taxable
pay. It was calculated by dividing the taxable pay on a payment date by the
number of days between the payment date and the previous payment date. It
does not take in to account the number of days or hours worked. It is not
possible to calculate this for the first payment for an employment.
The ‘daily earnings’ rate was used to calculate earnings eligibility. A value
greater than £27.40 would classify the employment as earnings eligible.
Values equal to or less than £27.40 or missing values would result in the
employment being classed as earnings ineligible.
Taxable pay can differ from gross pay for various reasons, including the type
of pension contributions and salary sacrifice (an agreement to reduce an
employee’s entitlement to cash pay, usually in return for a non-cash benefit).
Whether an employment was paying pension contributions was based on
employee pension contributions only, as employer pension contributions are
not submitted via RTI.
131 At:
https://assets.publishing.service.gov.uk/government/uploads/system/uploads/attachment_data/file/740
890/Data_items_guide_2018_to_2019_v1.4.pdf
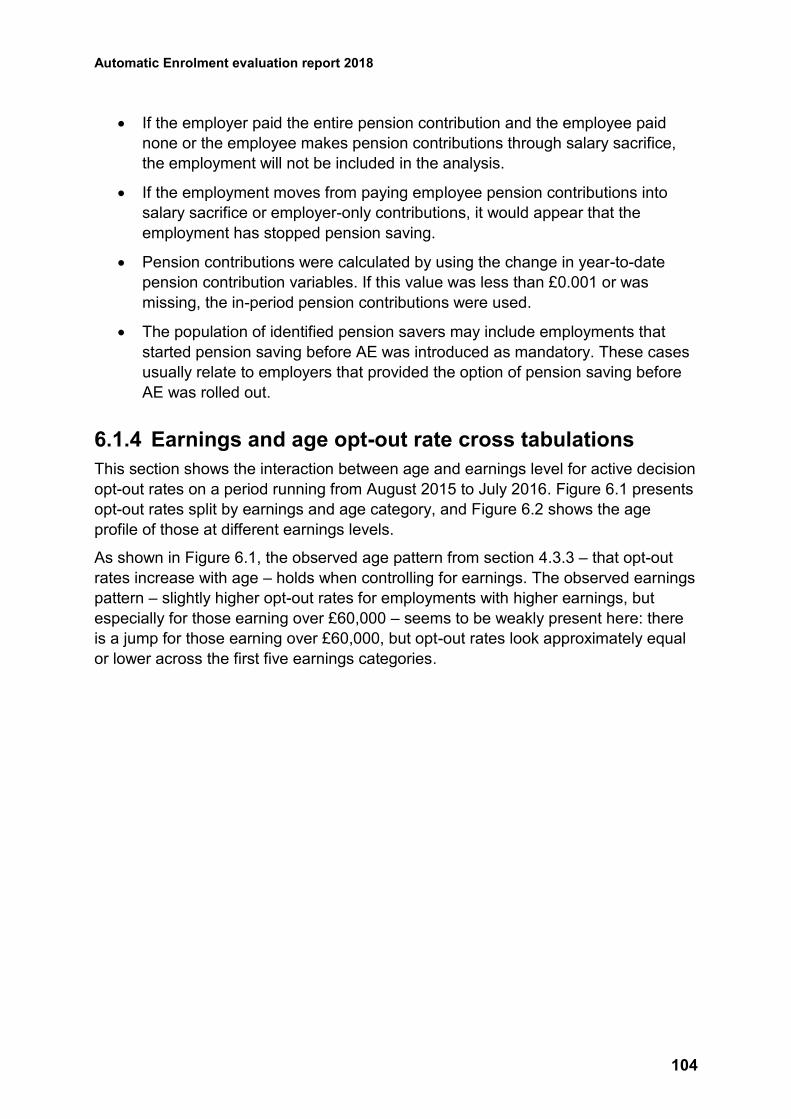
Automatic Enrolment evaluation report 2018
104
If the employer paid the entire pension contribution and the employee paid
none or the employee makes pension contributions through salary sacrifice,
the employment will not be included in the analysis.
If the employment moves from paying employee pension contributions into
salary sacrifice or employer-only contributions, it would appear that the
employment has stopped pension saving.
Pension contributions were calculated by using the change in year-to-date
pension contribution variables. If this value was less than £0.001 or was
missing, the in-period pension contributions were used.
The population of identified pension savers may include employments that
started pension saving before AE was introduced as mandatory. These cases
usually relate to employers that provided the option of pension saving before
AE was rolled out.
6.1.4 Earnings and age opt-out rate cross tabulations
This section shows the interaction between age and earnings level for active decision
opt-out rates on a period running from August 2015 to July 2016. Figure 6.1 presents
opt-out rates split by earnings and age category, and Figure 6.2 shows the age
profile of those at different earnings levels.
As shown in Figure 6.1, the observed age pattern from section 4.3.3 – that opt-out
rates increase with age – holds when controlling for earnings. The observed earnings
pattern – slightly higher opt-out rates for employments with higher earnings, but
especially for those earning over £60,000 – seems to be weakly present here: there
is a jump for those earning over £60,000, but opt-out rates look approximately equal
or lower across the first five earnings categories.
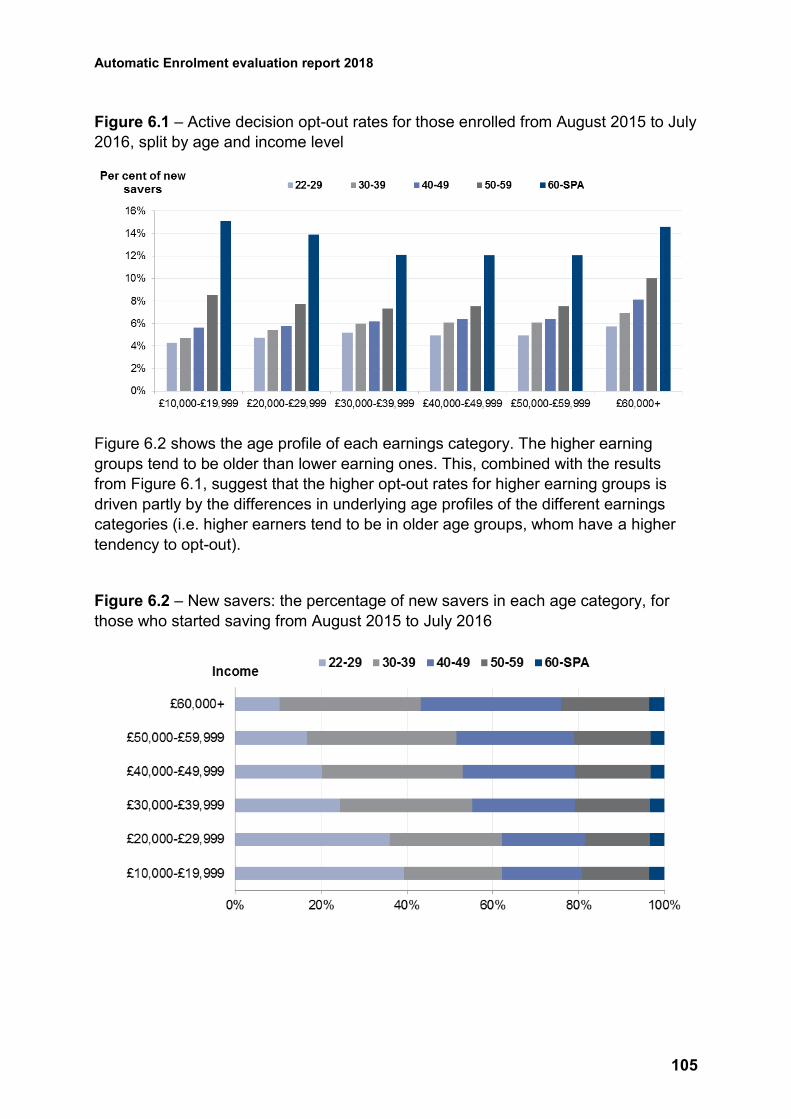
Automatic Enrolment evaluation report 2018
105
Figure 6.1 – Active decision opt-out rates for those enrolled from August 2015 to July
2016, split by age and income level
Figure 6.2 shows the age profile of each earnings category. The higher earning
groups tend to be older than lower earning ones. This, combined with the results
from Figure 6.1, suggest that the higher opt-out rates for higher earning groups is
driven partly by the differences in underlying age profiles of the different earnings
categories (i.e. higher earners tend to be in older age groups, whom have a higher
tendency to opt-out).
Figure 6.2 – New savers: the percentage of new savers in each age category, for
those who started saving from August 2015 to July 2016
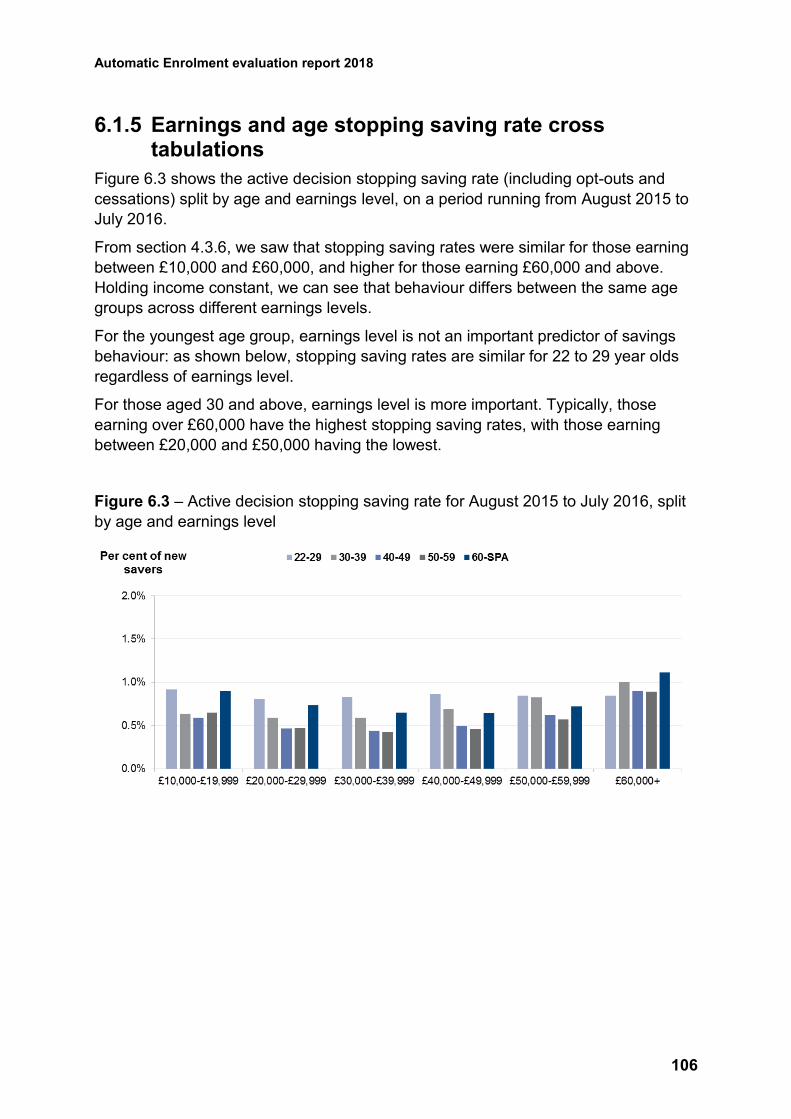
Automatic Enrolment evaluation report 2018
106
6.1.5 Earnings and age stopping saving rate cross tabulations
Figure 6.3 shows the active decision stopping saving rate (including opt-outs and
cessations) split by age and earnings level, on a period running from August 2015 to
July 2016.
From section 4.3.6, we saw that stopping saving rates were similar for those earning
between £10,000 and £60,000, and higher for those earning £60,000 and above.
Holding income constant, we can see that behaviour differs between the same age
groups across different earnings levels.
For the youngest age group, earnings level is not an important predictor of savings
behaviour: as shown below, stopping saving rates are similar for 22 to 29 year olds
regardless of earnings level.
For those aged 30 and above, earnings level is more important. Typically, those
earning over £60,000 have the highest stopping saving rates, with those earning
between £20,000 and £50,000 having the lowest.
Figure 6.3 – Active decision stopping saving rate for August 2015 to July 2016, split
by age and earnings level
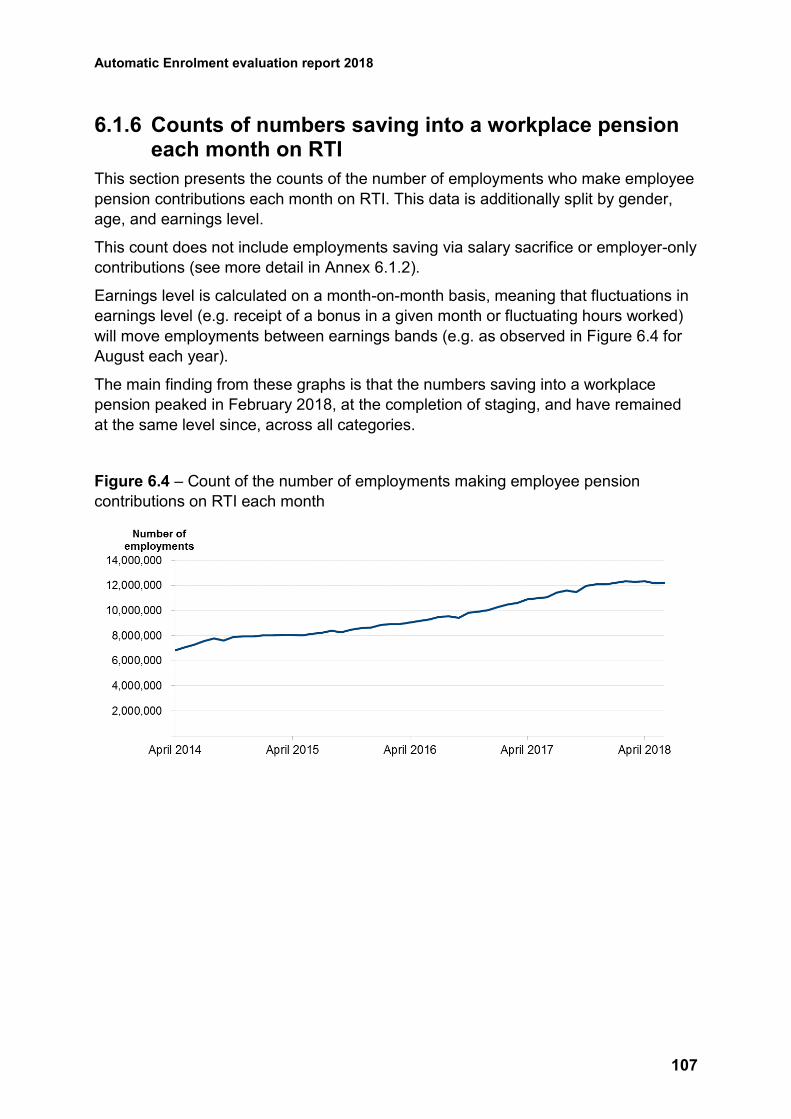
Automatic Enrolment evaluation report 2018
107
6.1.6 Counts of numbers saving into a workplace pension each month on RTI
This section presents the counts of the number of employments who make employee
pension contributions each month on RTI. This data is additionally split by gender,
age, and earnings level.
This count does not include employments saving via salary sacrifice or employer-only
contributions (see more detail in Annex 6.1.2).
Earnings level is calculated on a month-on-month basis, meaning that fluctuations in
earnings level (e.g. receipt of a bonus in a given month or fluctuating hours worked)
will move employments between earnings bands (e.g. as observed in Figure 6.4 for
August each year).
The main finding from these graphs is that the numbers saving into a workplace
pension peaked in February 2018, at the completion of staging, and have remained
at the same level since, across all categories.
Figure 6.4 – Count of the number of employments making employee pension
contributions on RTI each month
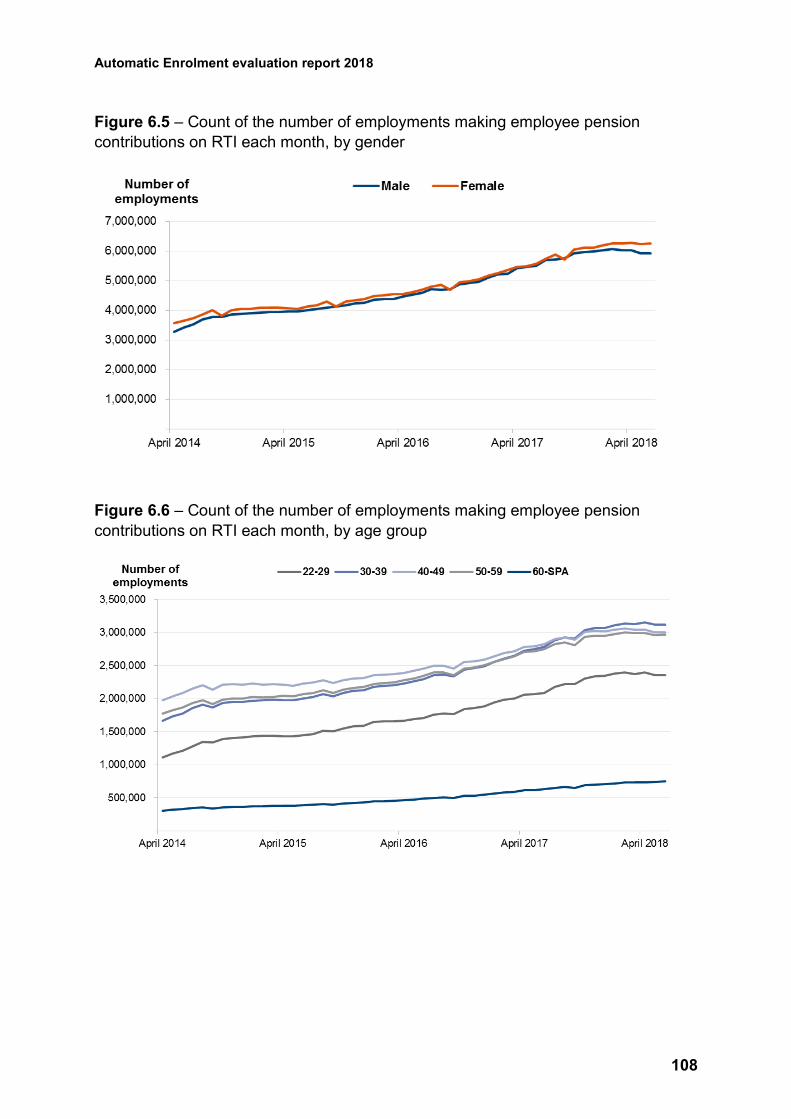
Automatic Enrolment evaluation report 2018
108
Figure 6.5 – Count of the number of employments making employee pension
contributions on RTI each month, by gender
Figure 6.6 – Count of the number of employments making employee pension
contributions on RTI each month, by age group
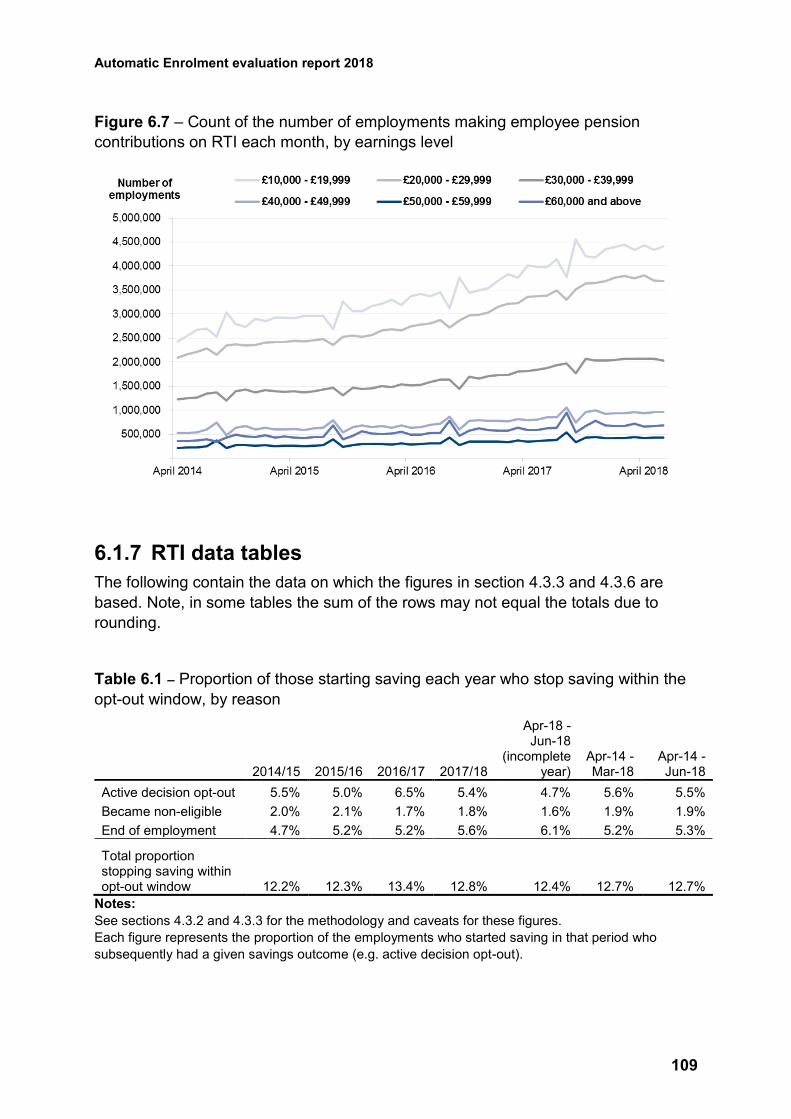
Automatic Enrolment evaluation report 2018
109
Figure 6.7 – Count of the number of employments making employee pension
contributions on RTI each month, by earnings level
6.1.7 RTI data tables
The following contain the data on which the figures in section 4.3.3 and 4.3.6 are
based. Note, in some tables the sum of the rows may not equal the totals due to
rounding.
Table 6.1 – Proportion of those starting saving each year who stop saving within the
opt-out window, by reason
2014/15 2015/16 2016/17 2017/18
Apr-18 - Jun-18
(incomplete year)
Apr-14 - Mar-18
Apr-14 - Jun-18
Active decision opt-out 5.5% 5.0% 6.5% 5.4% 4.7% 5.6% 5.5%
Became non-eligible 2.0% 2.1% 1.7% 1.8% 1.6% 1.9% 1.9%
End of employment 4.7% 5.2% 5.2% 5.6% 6.1% 5.2% 5.3%
Total proportion stopping saving within opt-out window 12.2% 12.3% 13.4% 12.8% 12.4% 12.7% 12.7%
Notes:
See sections 4.3.2 and 4.3.3 for the methodology and caveats for these figures.
Each figure represents the proportion of the employments who started saving in that period who
subsequently had a given savings outcome (e.g. active decision opt-out).
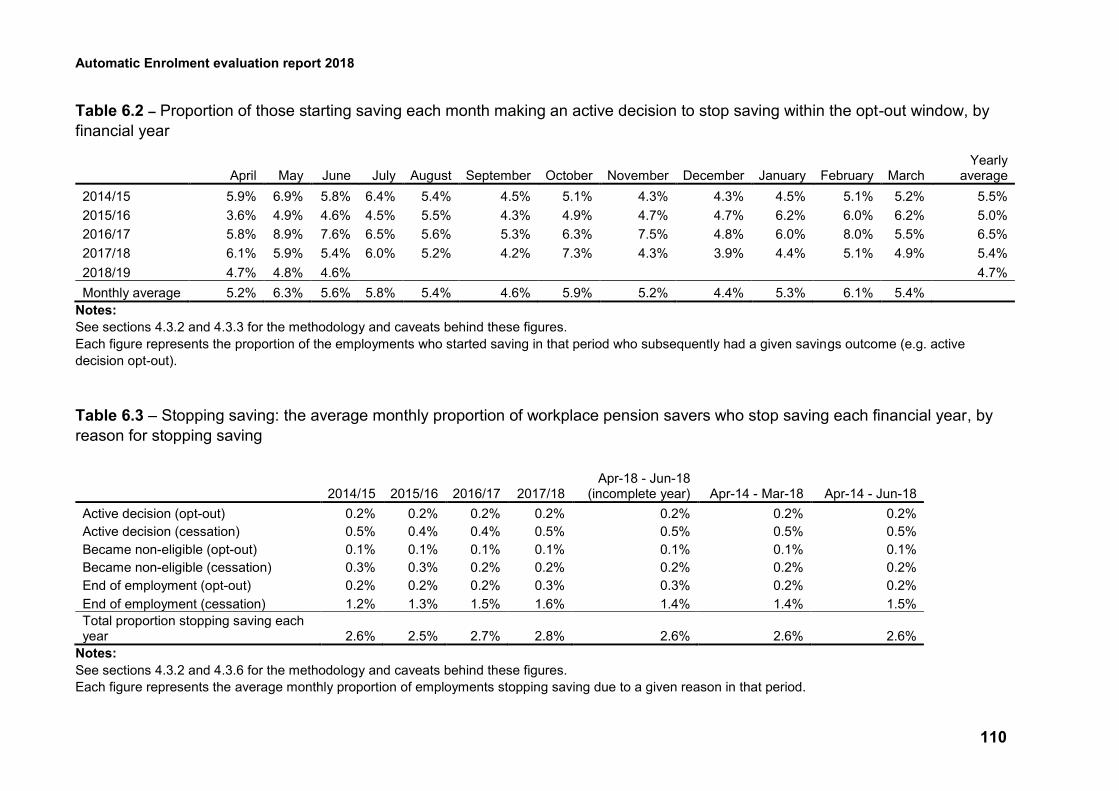
Automatic Enrolment evaluation report 2018
110
Table 6.2 – Proportion of those starting saving each month making an active decision to stop saving within the opt-out window, by
financial year
April May June July August September October November December January February March
Yearly average
2014/15 5.9% 6.9% 5.8% 6.4% 5.4% 4.5% 5.1% 4.3% 4.3% 4.5% 5.1% 5.2% 5.5%
2015/16 3.6% 4.9% 4.6% 4.5% 5.5% 4.3% 4.9% 4.7% 4.7% 6.2% 6.0% 6.2% 5.0%
2016/17 5.8% 8.9% 7.6% 6.5% 5.6% 5.3% 6.3% 7.5% 4.8% 6.0% 8.0% 5.5% 6.5%
2017/18 6.1% 5.9% 5.4% 6.0% 5.2% 4.2% 7.3% 4.3% 3.9% 4.4% 5.1% 4.9% 5.4%
2018/19 4.7% 4.8% 4.6% 4.7%
Monthly average 5.2% 6.3% 5.6% 5.8% 5.4% 4.6% 5.9% 5.2% 4.4% 5.3% 6.1% 5.4%
Notes:
See sections 4.3.2 and 4.3.3 for the methodology and caveats behind these figures.
Each figure represents the proportion of the employments who started saving in that period who subsequently had a given savings outcome (e.g. active
decision opt-out).
Table 6.3 – Stopping saving: the average monthly proportion of workplace pension savers who stop saving each financial year, by
reason for stopping saving
2014/15 2015/16 2016/17 2017/18 Apr-18 - Jun-18
(incomplete year) Apr-14 - Mar-18 Apr-14 - Jun-18
Active decision (opt-out) 0.2% 0.2% 0.2% 0.2% 0.2% 0.2% 0.2%
Active decision (cessation) 0.5% 0.4% 0.4% 0.5% 0.5% 0.5% 0.5%
Became non-eligible (opt-out) 0.1% 0.1% 0.1% 0.1% 0.1% 0.1% 0.1%
Became non-eligible (cessation) 0.3% 0.3% 0.2% 0.2% 0.2% 0.2% 0.2%
End of employment (opt-out) 0.2% 0.2% 0.2% 0.3% 0.3% 0.2% 0.2%
End of employment (cessation) 1.2% 1.3% 1.5% 1.6% 1.4% 1.4% 1.5%
Total proportion stopping saving each year 2.6% 2.5% 2.7% 2.8% 2.6% 2.6% 2.6%
Notes:
See sections 4.3.2 and 4.3.6 for the methodology and caveats behind these figures.
Each figure represents the average monthly proportion of employments stopping saving due to a given reason in that period.
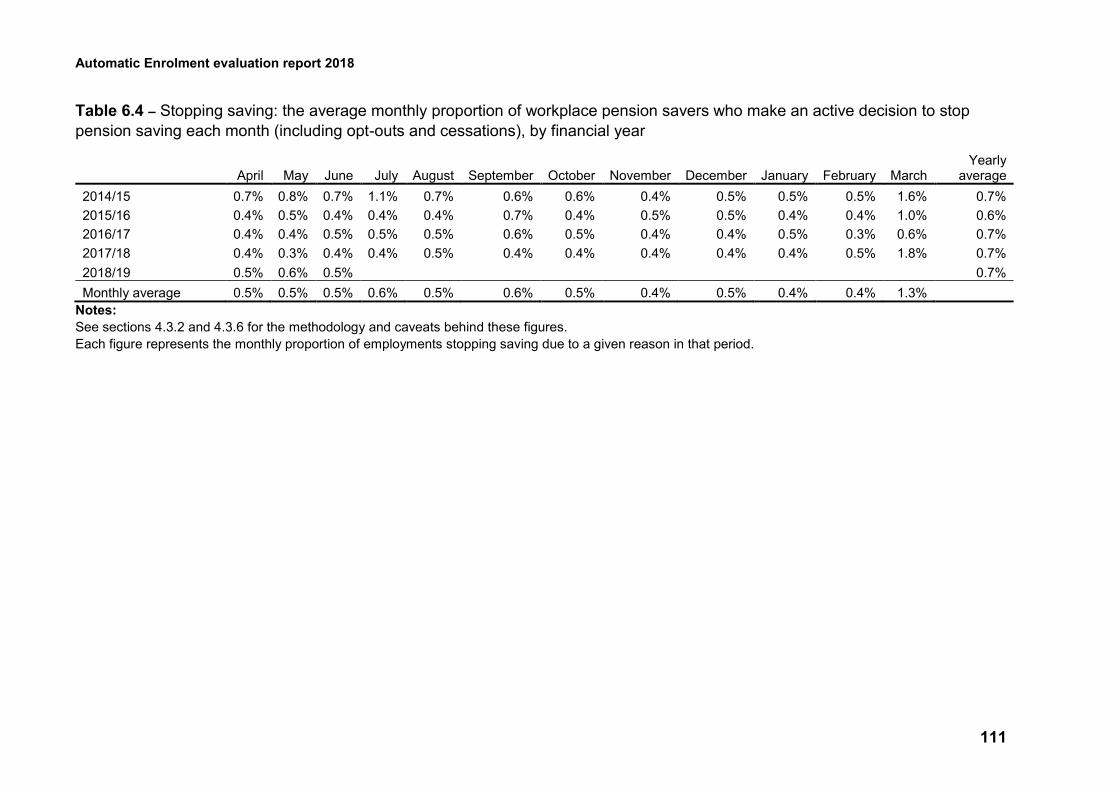
Automatic Enrolment evaluation report 2018
111
Table 6.4 – Stopping saving: the average monthly proportion of workplace pension savers who make an active decision to stop
pension saving each month (including opt-outs and cessations), by financial year
April May June July August September October November December January February March
Yearly average
2014/15 0.7% 0.8% 0.7% 1.1% 0.7% 0.6% 0.6% 0.4% 0.5% 0.5% 0.5% 1.6% 0.7%
2015/16 0.4% 0.5% 0.4% 0.4% 0.4% 0.7% 0.4% 0.5% 0.5% 0.4% 0.4% 1.0% 0.6%
2016/17 0.4% 0.4% 0.5% 0.5% 0.5% 0.6% 0.5% 0.4% 0.4% 0.5% 0.3% 0.6% 0.7%
2017/18 0.4% 0.3% 0.4% 0.4% 0.5% 0.4% 0.4% 0.4% 0.4% 0.4% 0.5% 1.8% 0.7%
2018/19 0.5% 0.6% 0.5% 0.7%
Monthly average 0.5% 0.5% 0.5% 0.6% 0.5% 0.6% 0.5% 0.4% 0.5% 0.4% 0.4% 1.3%
Notes:
See sections 4.3.2 and 4.3.6 for the methodology and caveats behind these figures.
Each figure represents the monthly proportion of employments stopping saving due to a given reason in that period.
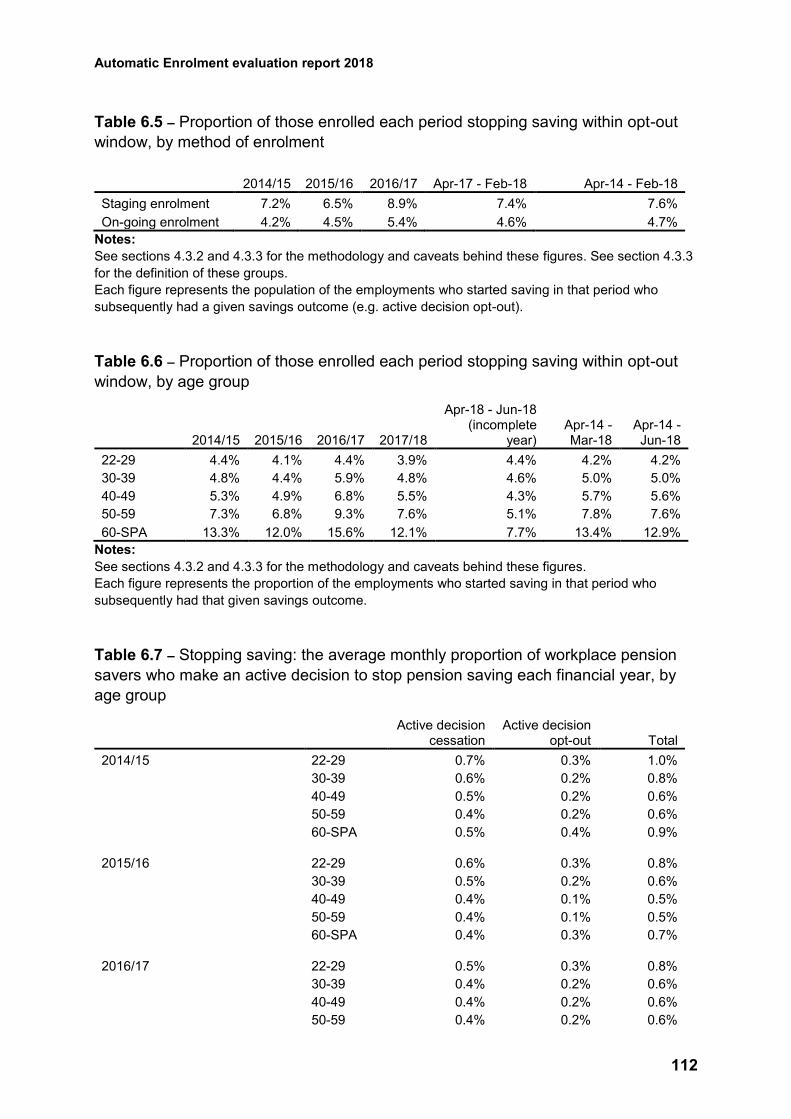
Automatic Enrolment evaluation report 2018
112
Table 6.5 – Proportion of those enrolled each period stopping saving within opt-out
window, by method of enrolment
2014/15 2015/16 2016/17 Apr-17 - Feb-18 Apr-14 - Feb-18
Staging enrolment 7.2% 6.5% 8.9% 7.4% 7.6%
On-going enrolment 4.2% 4.5% 5.4% 4.6% 4.7%
Notes:
See sections 4.3.2 and 4.3.3 for the methodology and caveats behind these figures. See section 4.3.3
for the definition of these groups.
Each figure represents the population of the employments who started saving in that period who
subsequently had a given savings outcome (e.g. active decision opt-out).
Table 6.6 – Proportion of those enrolled each period stopping saving within opt-out
window, by age group
2014/15 2015/16 2016/17 2017/18
Apr-18 - Jun-18 (incomplete
year) Apr-14 - Mar-18
Apr-14 - Jun-18
22-29 4.4% 4.1% 4.4% 3.9% 4.4% 4.2% 4.2%
30-39 4.8% 4.4% 5.9% 4.8% 4.6% 5.0% 5.0%
40-49 5.3% 4.9% 6.8% 5.5% 4.3% 5.7% 5.6%
50-59 7.3% 6.8% 9.3% 7.6% 5.1% 7.8% 7.6%
60-SPA 13.3% 12.0% 15.6% 12.1% 7.7% 13.4% 12.9%
Notes:
See sections 4.3.2 and 4.3.3 for the methodology and caveats behind these figures.
Each figure represents the proportion of the employments who started saving in that period who
subsequently had that given savings outcome.
Table 6.7 – Stopping saving: the average monthly proportion of workplace pension
savers who make an active decision to stop pension saving each financial year, by
age group
Active decision cessation
Active decision opt-out Total
2014/15 22-29 0.7% 0.3% 1.0%
30-39 0.6% 0.2% 0.8%
40-49 0.5% 0.2% 0.6%
50-59 0.4% 0.2% 0.6%
60-SPA 0.5% 0.4% 0.9%
2015/16 22-29 0.6% 0.3% 0.8%
30-39 0.5% 0.2% 0.6%
40-49 0.4% 0.1% 0.5%
50-59 0.4% 0.1% 0.5%
60-SPA 0.4% 0.3% 0.7%
2016/17 22-29 0.5% 0.3% 0.8%
30-39 0.4% 0.2% 0.6%
40-49 0.4% 0.2% 0.6%
50-59 0.4% 0.2% 0.6%
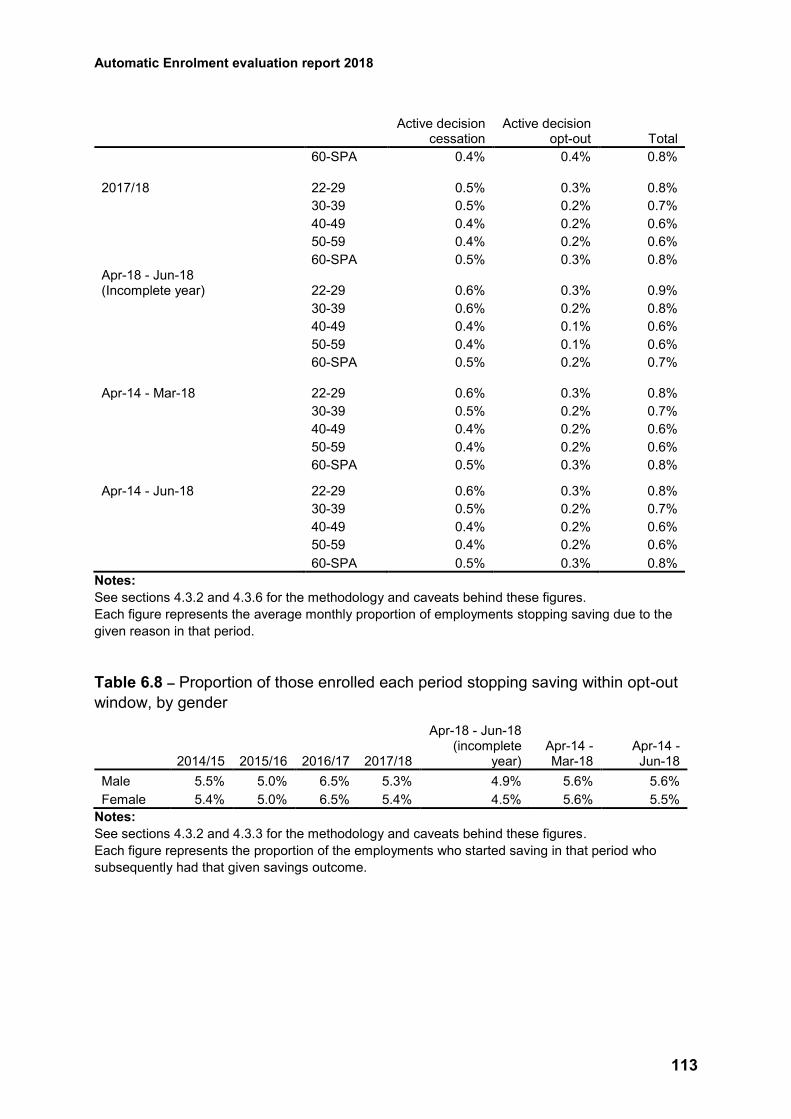
Automatic Enrolment evaluation report 2018
113
Active decision cessation
Active decision opt-out Total
60-SPA 0.4% 0.4% 0.8%
2017/18 22-29 0.5% 0.3% 0.8%
30-39 0.5% 0.2% 0.7%
40-49 0.4% 0.2% 0.6%
50-59 0.4% 0.2% 0.6%
60-SPA 0.5% 0.3% 0.8% Apr-18 - Jun-18 (Incomplete year) 22-29 0.6% 0.3% 0.9%
30-39 0.6% 0.2% 0.8%
40-49 0.4% 0.1% 0.6%
50-59 0.4% 0.1% 0.6%
60-SPA 0.5% 0.2% 0.7%
Apr-14 - Mar-18 22-29 0.6% 0.3% 0.8%
30-39 0.5% 0.2% 0.7%
40-49 0.4% 0.2% 0.6%
50-59 0.4% 0.2% 0.6%
60-SPA 0.5% 0.3% 0.8%
Apr-14 - Jun-18 22-29 0.6% 0.3% 0.8%
30-39 0.5% 0.2% 0.7%
40-49 0.4% 0.2% 0.6%
50-59 0.4% 0.2% 0.6%
60-SPA 0.5% 0.3% 0.8%
Notes:
See sections 4.3.2 and 4.3.6 for the methodology and caveats behind these figures.
Each figure represents the average monthly proportion of employments stopping saving due to the
given reason in that period.
Table 6.8 – Proportion of those enrolled each period stopping saving within opt-out
window, by gender
2014/15 2015/16 2016/17 2017/18
Apr-18 - Jun-18 (incomplete
year) Apr-14 - Mar-18
Apr-14 - Jun-18
Male 5.5% 5.0% 6.5% 5.3% 4.9% 5.6% 5.6%
Female 5.4% 5.0% 6.5% 5.4% 4.5% 5.6% 5.5%
Notes:
See sections 4.3.2 and 4.3.3 for the methodology and caveats behind these figures.
Each figure represents the proportion of the employments who started saving in that period who
subsequently had that given savings outcome.
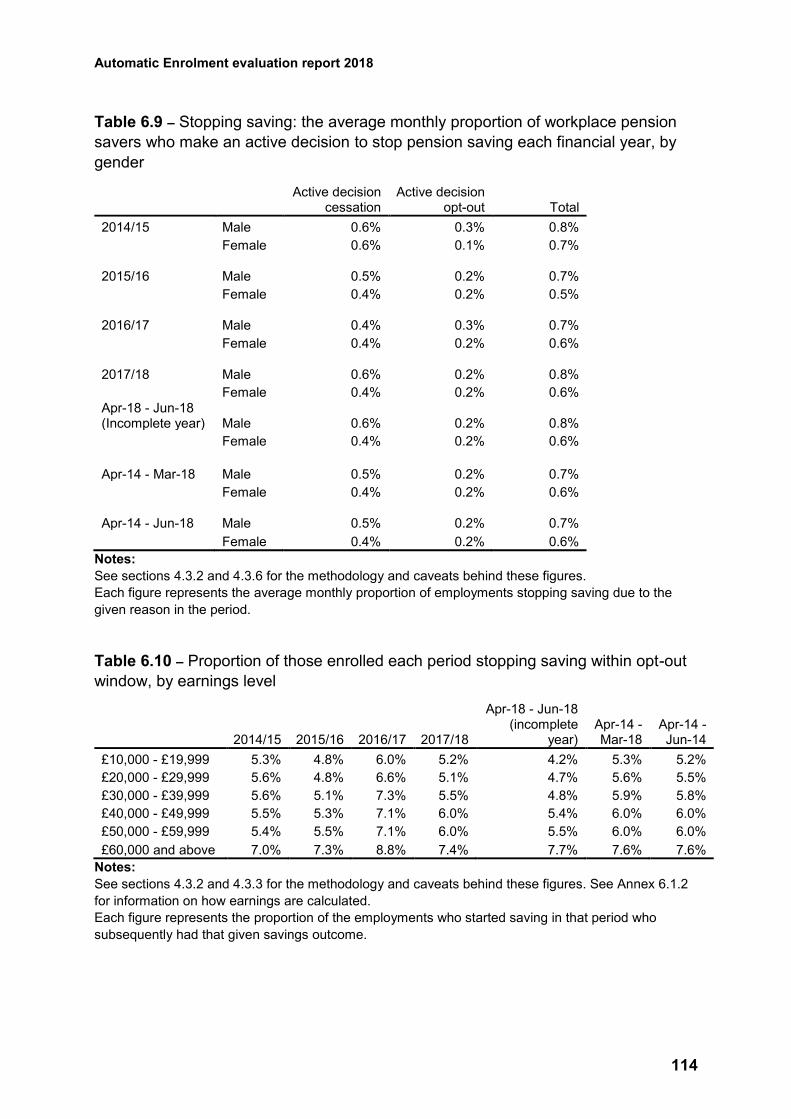
Automatic Enrolment evaluation report 2018
114
Table 6.9 – Stopping saving: the average monthly proportion of workplace pension
savers who make an active decision to stop pension saving each financial year, by
gender
Notes:
See sections 4.3.2 and 4.3.6 for the methodology and caveats behind these figures.
Each figure represents the average monthly proportion of employments stopping saving due to the
given reason in the period.
Table 6.10 – Proportion of those enrolled each period stopping saving within opt-out
window, by earnings level
2014/15 2015/16 2016/17 2017/18
Apr-18 - Jun-18 (incomplete
year) Apr-14 - Mar-18
Apr-14 - Jun-14
£10,000 - £19,999 5.3% 4.8% 6.0% 5.2% 4.2% 5.3% 5.2%
£20,000 - £29,999 5.6% 4.8% 6.6% 5.1% 4.7% 5.6% 5.5%
£30,000 - £39,999 5.6% 5.1% 7.3% 5.5% 4.8% 5.9% 5.8%
£40,000 - £49,999 5.5% 5.3% 7.1% 6.0% 5.4% 6.0% 6.0%
£50,000 - £59,999 5.4% 5.5% 7.1% 6.0% 5.5% 6.0% 6.0%
£60,000 and above 7.0% 7.3% 8.8% 7.4% 7.7% 7.6% 7.6%
Notes:
See sections 4.3.2 and 4.3.3 for the methodology and caveats behind these figures. See Annex 6.1.2
for information on how earnings are calculated.
Each figure represents the proportion of the employments who started saving in that period who
subsequently had that given savings outcome.
Active decision cessation
Active decision opt-out Total
2014/15 Male 0.6% 0.3% 0.8%
Female 0.6% 0.1% 0.7%
2015/16 Male 0.5% 0.2% 0.7%
Female 0.4% 0.2% 0.5%
2016/17 Male 0.4% 0.3% 0.7%
Female 0.4% 0.2% 0.6%
2017/18 Male 0.6% 0.2% 0.8%
Female 0.4% 0.2% 0.6%
Apr-18 - Jun-18 (Incomplete year) Male 0.6% 0.2% 0.8%
Female 0.4% 0.2% 0.6%
Apr-14 - Mar-18 Male 0.5% 0.2% 0.7%
Female 0.4% 0.2% 0.6%
Apr-14 - Jun-18 Male 0.5% 0.2% 0.7%
Female 0.4% 0.2% 0.6%
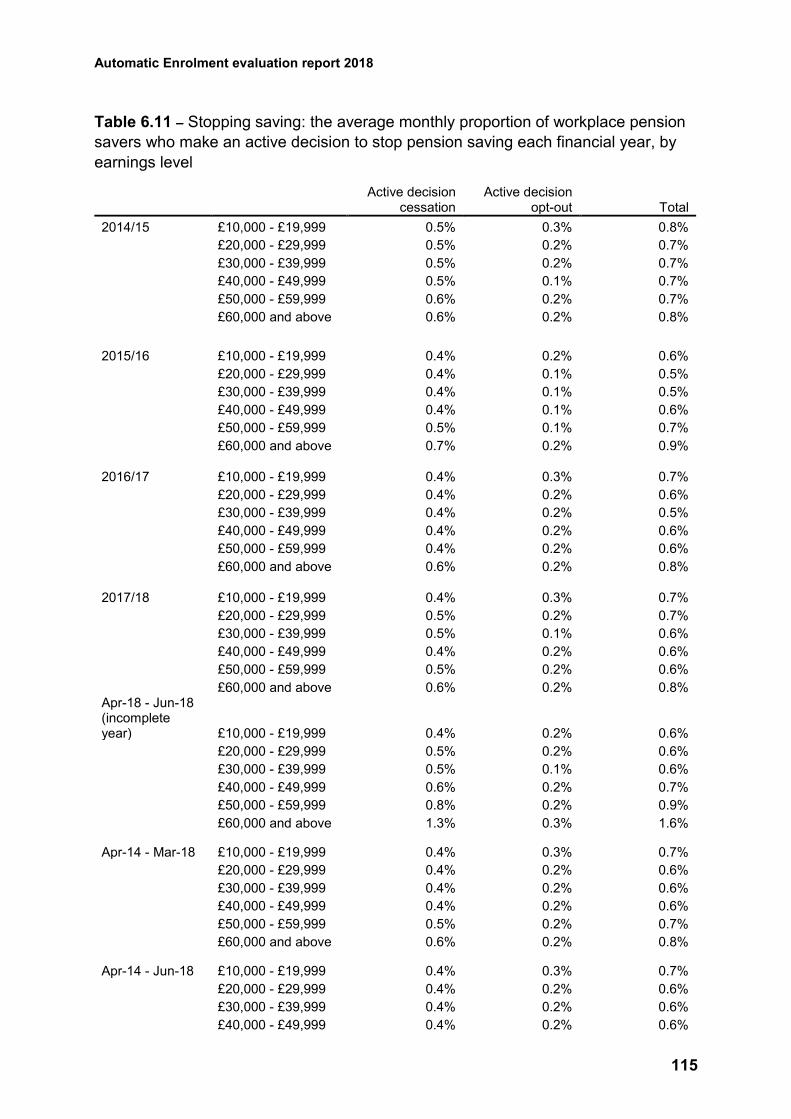
Automatic Enrolment evaluation report 2018
115
Table 6.11 – Stopping saving: the average monthly proportion of workplace pension
savers who make an active decision to stop pension saving each financial year, by
earnings level
Active decision cessation
Active decision opt-out Total
2014/15 £10,000 - £19,999 0.5% 0.3% 0.8%
£20,000 - £29,999 0.5% 0.2% 0.7%
£30,000 - £39,999 0.5% 0.2% 0.7%
£40,000 - £49,999 0.5% 0.1% 0.7%
£50,000 - £59,999 0.6% 0.2% 0.7%
£60,000 and above 0.6% 0.2% 0.8%
2015/16 £10,000 - £19,999 0.4% 0.2% 0.6%
£20,000 - £29,999 0.4% 0.1% 0.5%
£30,000 - £39,999 0.4% 0.1% 0.5%
£40,000 - £49,999 0.4% 0.1% 0.6%
£50,000 - £59,999 0.5% 0.1% 0.7%
£60,000 and above 0.7% 0.2% 0.9%
2016/17 £10,000 - £19,999 0.4% 0.3% 0.7%
£20,000 - £29,999 0.4% 0.2% 0.6%
£30,000 - £39,999 0.4% 0.2% 0.5%
£40,000 - £49,999 0.4% 0.2% 0.6%
£50,000 - £59,999 0.4% 0.2% 0.6%
£60,000 and above 0.6% 0.2% 0.8%
2017/18 £10,000 - £19,999 0.4% 0.3% 0.7%
£20,000 - £29,999 0.5% 0.2% 0.7%
£30,000 - £39,999 0.5% 0.1% 0.6%
£40,000 - £49,999 0.4% 0.2% 0.6%
£50,000 - £59,999 0.5% 0.2% 0.6%
£60,000 and above 0.6% 0.2% 0.8% Apr-18 - Jun-18 (incomplete year) £10,000 - £19,999 0.4% 0.2% 0.6%
£20,000 - £29,999 0.5% 0.2% 0.6%
£30,000 - £39,999 0.5% 0.1% 0.6%
£40,000 - £49,999 0.6% 0.2% 0.7%
£50,000 - £59,999 0.8% 0.2% 0.9%
£60,000 and above 1.3% 0.3% 1.6%
Apr-14 - Mar-18 £10,000 - £19,999 0.4% 0.3% 0.7%
£20,000 - £29,999 0.4% 0.2% 0.6%
£30,000 - £39,999 0.4% 0.2% 0.6%
£40,000 - £49,999 0.4% 0.2% 0.6%
£50,000 - £59,999 0.5% 0.2% 0.7%
£60,000 and above 0.6% 0.2% 0.8%
Apr-14 - Jun-18 £10,000 - £19,999 0.4% 0.3% 0.7%
£20,000 - £29,999 0.4% 0.2% 0.6%
£30,000 - £39,999 0.4% 0.2% 0.6%
£40,000 - £49,999 0.4% 0.2% 0.6%
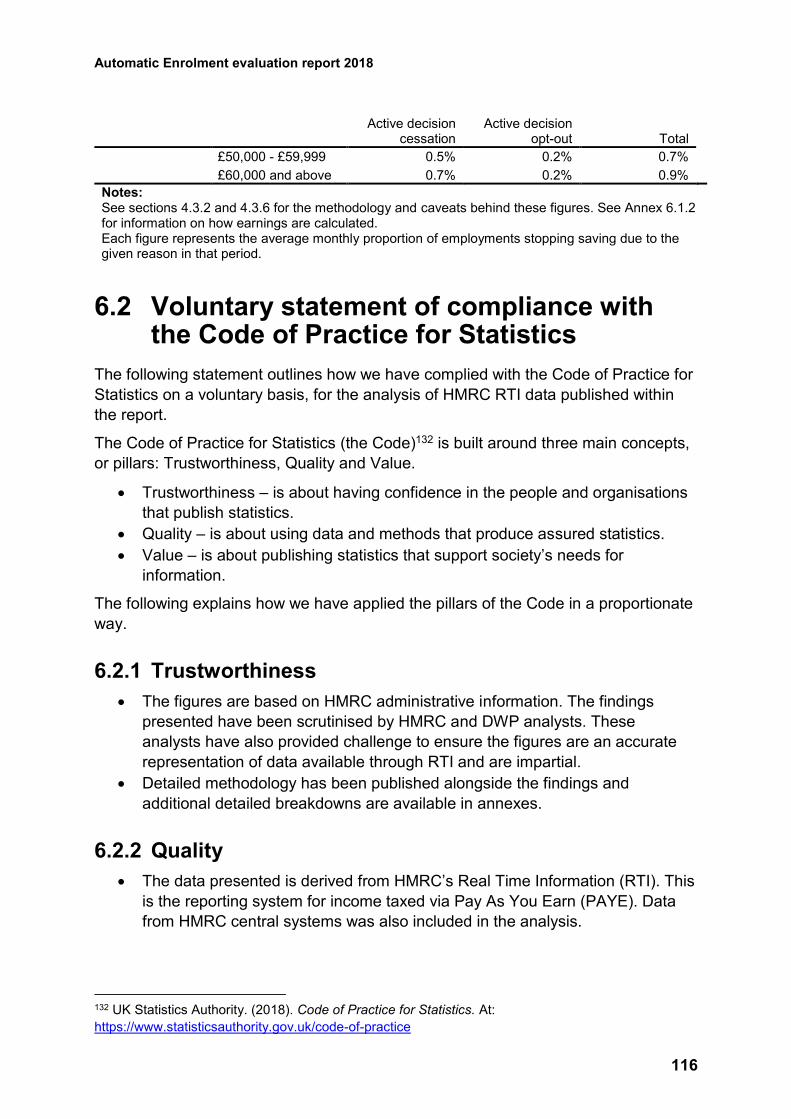
Automatic Enrolment evaluation report 2018
116
Active decision cessation
Active decision opt-out Total
£50,000 - £59,999 0.5% 0.2% 0.7%
£60,000 and above 0.7% 0.2% 0.9%
Notes: See sections 4.3.2 and 4.3.6 for the methodology and caveats behind these figures. See Annex 6.1.2 for information on how earnings are calculated. Each figure represents the average monthly proportion of employments stopping saving due to the given reason in that period.
6.2 Voluntary statement of compliance with the Code of Practice for Statistics
The following statement outlines how we have complied with the Code of Practice for
Statistics on a voluntary basis, for the analysis of HMRC RTI data published within
the report.
The Code of Practice for Statistics (the Code)132 is built around three main concepts,
or pillars: Trustworthiness, Quality and Value.
Trustworthiness – is about having confidence in the people and organisations
that publish statistics.
Quality – is about using data and methods that produce assured statistics.
Value – is about publishing statistics that support society’s needs for
information.
The following explains how we have applied the pillars of the Code in a proportionate
way.
6.2.1 Trustworthiness
The figures are based on HMRC administrative information. The findings
presented have been scrutinised by HMRC and DWP analysts. These
analysts have also provided challenge to ensure the figures are an accurate
representation of data available through RTI and are impartial.
Detailed methodology has been published alongside the findings and
additional detailed breakdowns are available in annexes.
6.2.2 Quality
The data presented is derived from HMRC’s Real Time Information (RTI). This
is the reporting system for income taxed via Pay As You Earn (PAYE). Data
from HMRC central systems was also included in the analysis.
132 UK Statistics Authority. (2018). Code of Practice for Statistics. At:
https://www.statisticsauthority.gov.uk/code-of-practice
Automatic Enrolment evaluation report 2018
117
To ensure accuracy, estimates have been compared to findings from other
sources, where possible, including those published by DWP and from publicly
available data.
The process to produce the findings and the figures provided are compiled by
professional analysts taking account of the latest data and applying methods
using their professional judgement. They have been quality assured by
analysts within both HMRC and DWP.
6.2.3 Value
This data provides an overview of pension saving behaviour, in particular
around employees that stop pension saving. It is used to monitor whether
there has been a change over time in the number of employees that stop
pension saving. This provides important new evidence for ministers, policy
makers and external stakeholders on how the automatic enrolment policy is
working.
These figures are complementary to other sources as they are able to provide
insights on each tax month and different characteristics, which would be
difficult to do with other sources.
6.3 Evaluation Questions
EQ1: Do established delivery mechanisms support automatic enrolment
objectives?
EQ1.1. Does NEST accept all employers who choose the scheme, while offering low
costs to members and remaining financially viable?
EQ1.2. How has The Pensions Regulator helped to maximise employer compliance
with their automatic enrolment duties?
EQ1.3. How do automatic enrolment communications support the objectives of
automatic enrolment?
EQ2: Do employers know about, understand and comply with their employer
duties?
EQ2.1. To what extent are employers aware of their duties and know how to
discharge them?
EQ2.2. How many employees are treated in a ‘compliant way’ by their employer?
EQ2.3. To what extent do employers have arrangements with a qualifying scheme?
EQ2.4. To what extent is employer behaviour influenced by their attitudes,
awareness and levels of understanding of the reforms?
EQ2.5. To what extent are employers aware of the enforcement powers available to
deal with non-compliance and the approach The Pensions Regulator takes?
Automatic Enrolment evaluation report 2018
118
EQ2.6. To what extent do detection and enforcement activities result in non-
compliant employers becoming compliant and do they support a broader culture of
compliance?
EQ2.7. To what extent do employers go beyond their minimum duties, for example
by paying above minimum contribution rates? Which employers do this, and why?
EQ3: Has automatic enrolment increased the number of individuals saving in
workplace pensions, and if so, how?
EQ3.1. To what extent are individuals saving persistently in a workplace pension?
EQ3.2. How many individuals that were automatically enrolled or re-enrolled have
opted out of a qualifying scheme?
EQ3.3. How many individuals that were automatically enrolled or re-enrolled have
ceased saving in a qualifying scheme?
EQ3.4. Why do individuals opt out or cease saving in a qualifying scheme, and how
does this relate to their characteristics and circumstances?
EQ3.5. How many individuals who are not eligible for automatic enrolment have been
automatically enrolled, and why?
EQ3.6. To what extent do individuals accept the need, and/or recognise the benefits
of, saving into a workplace pension?
EQ3.7. To what extent do individuals perceive workplace pension saving as normal,
both for employees in general and for employees like themselves?
EQ3.8. To what extent can individuals access information on automatic enrolment
and workplace pension saving?
EQ3.9. To what extent can individuals understand information they are given on
automatic enrolment and workplace pension saving?
EQ3.10. Which individuals are contributing more than the minimum employee
contributions, and why?
EQ4: Has automatic enrolment increased the amount being saved in workplace
pensions, and if so, how?
EQ4.1. How has automatic enrolment changed how much employers contribute to
workplace pensions?
EQ4.2. How has automatic enrolment changed how much employees contribute to
workplace pensions?
EQ4.3. Do contributions to pension saving impact on other forms of household
saving or spending, and if so, how?
Automatic Enrolment evaluation report 2018
119
EQ5: To what extent is delivery of automatic enrolment achieved with a
minimal burden on employers?
EQ5.1. What are the contribution costs for employers of complying with their duty?
EQ5.2. What are the administrative costs for employers of complying with their duty?
EQ5.3. How do employers respond to the costs incurred as a result of the employer
duty?
EQ5.4. How do employers make decisions around which qualifying scheme to enrol
members into, and how much to contribute?
EQ5.5. What are the views and attitudes of employers to the level of burden resulting
from the reforms?
EQ6: How has the pensions industry reacted to automatic enrolment?
EQ6.1. What is the industry doing to protect the interests of employers, and
employees and their savings?
EQ6.2. What challenges have providers faced in providing pensions for automatically
enrolled employees?
EQ6.3. To what extent do providers follow The Pensions Regulator’s guidance on the
reforms?
EQ6.4. Do intermediaries have the knowledge to be able to support the delivery of
automatic enrolment to new employers?
EQ7: What are the wider impacts of automatic enrolment?
EQ7.1. What are the wider impacts of automatic enrolment on individuals, including
any benefits and unintended consequences?
EQ7.2. What are the wider impacts of automatic enrolment on employers, including
any benefits and unintended consequences?
EQ7.3. What are the wider impacts of automatic enrolment on industry, including any
benefits and unintended consequences?
EQ7.4. What are the wider impacts of automatic enrolment on Government, including
any benefits and unintended consequences?