automatic breast parenchymal density classification integrated into a cade system
TRANSCRIPT

Int J CARS (2011) 6:309–318DOI 10.1007/s11548-010-0510-z
ORIGINAL ARTICLE
Automatic breast parenchymal density classification integratedinto a CADe system
G. Bueno · N. Vállez · O. Déniz · P. Esteve ·M. A. Rienda · M. Arias · C. Pastor
Received: 12 January 2010 / Accepted: 19 June 2010 / Published online: 5 August 2010© CARS 2010
AbstractPurpose Breast parenchymal density is an important riskfactor for breast cancer. It is known that mammogram inter-pretation is more difficult where dense tissue is involved.Therefore, automated breast density classification may aidin breast lesion detection and analysis.Methods Several image pattern classification techniquesfor screen-film (SFM) mammography datasets were testedand classified according to BIRADS categories using knowncases. A hierarchical classification procedure based on k-NN,SVM and LBN combined with principal component analysison texture features uses the breast density features. The clas-sification techniques have been incorporated into a CADesystem to drive the detection algorithms.Results The results obtained on 322 mammograms demon-strate that up to 84% of samples were correctly classified.The results of the lesion detection algorithms were obtainedfrom modules integrated within the CADe system developedby the authors.Conclusions The ability to detect suspicious lesions ondense and heterogeneous tissue has been tested. The toolsenhance the detectability of lesions and they are able to dis-tinguish their local attenuation without local tissue densityconstraints.
Keywords Breast tissue classification · CADe system ·Texture analysis · Lesion detection
G. Bueno (B) · N. Vállez · O. DénizUniversidad de Castilla-La Mancha, E.T.S. Ingenieros Industriales,Avda. Camilo José Cela, 3, 13071 Ciudad Real, Spaine-mail: [email protected]
P. Esteve · M. A. Rienda · M. Arias · C. PastorDpt. Radiología, Hospital General de Ciudad Real,Tomelloso s/n, 13005 Ciudad Real, Spain
Introduction
Breast cancer continues to be an important health problem.Early detection can potentially improve breast cancer prog-nosis and significantly reduce female mortality. And com-puter-aided diagnosis (CAD) systems can be of tremendoushelp to radiologists in the detection and classification ofbreast lesions, [1]. Therefore, the development of reliableCAD systems is an important and challenging task. The auto-mated interpretation of mammogram lesions remains a diffi-cult task, however. The presence of dense breast tissue is oneof the potential problems. Dense tissue may cause suspiciousareas to be almost invisible and may be easily misinterpretedas calcification [2–4]. Since the discovery by Wolfe [5]of therelation between mammographic parenchymal patterns andthe risk of developing breast cancer in 1976, there has beena heightened interest in investigating breast tissue. A goodreview of the work done on breast tissue classification sincethat time can be found in [6].
Our research has been prompted by this need to classifybreast tissue and drive the development of CAD algorithmsfor the automated analysis of breast lesions. This paper isnot intended to be applied to the classification of benignor malignant lesions associated with tissue types [4,7] butonly to drive the CAD algorithms, as mentioned previously.Several classification methods have been presented in theliterature to classify different types of abnormalities, i.e.,masses, micro calcification and distortions. The best resultsare reported with support vector machine (SVM) using bothindependent and principal component analysis [8–13]. In ourstudy, several classification methods have been compared,and a hierarchical classification procedure combined withprincipal component analysis (PCA) on texture features isproposed as the best solution. Experimental results have beengiven on different mammograms with various densities and
123
310 Int J CARS (2011) 6:309–318
(a) (b) (c) (d)
(h)(g)(f)(e)
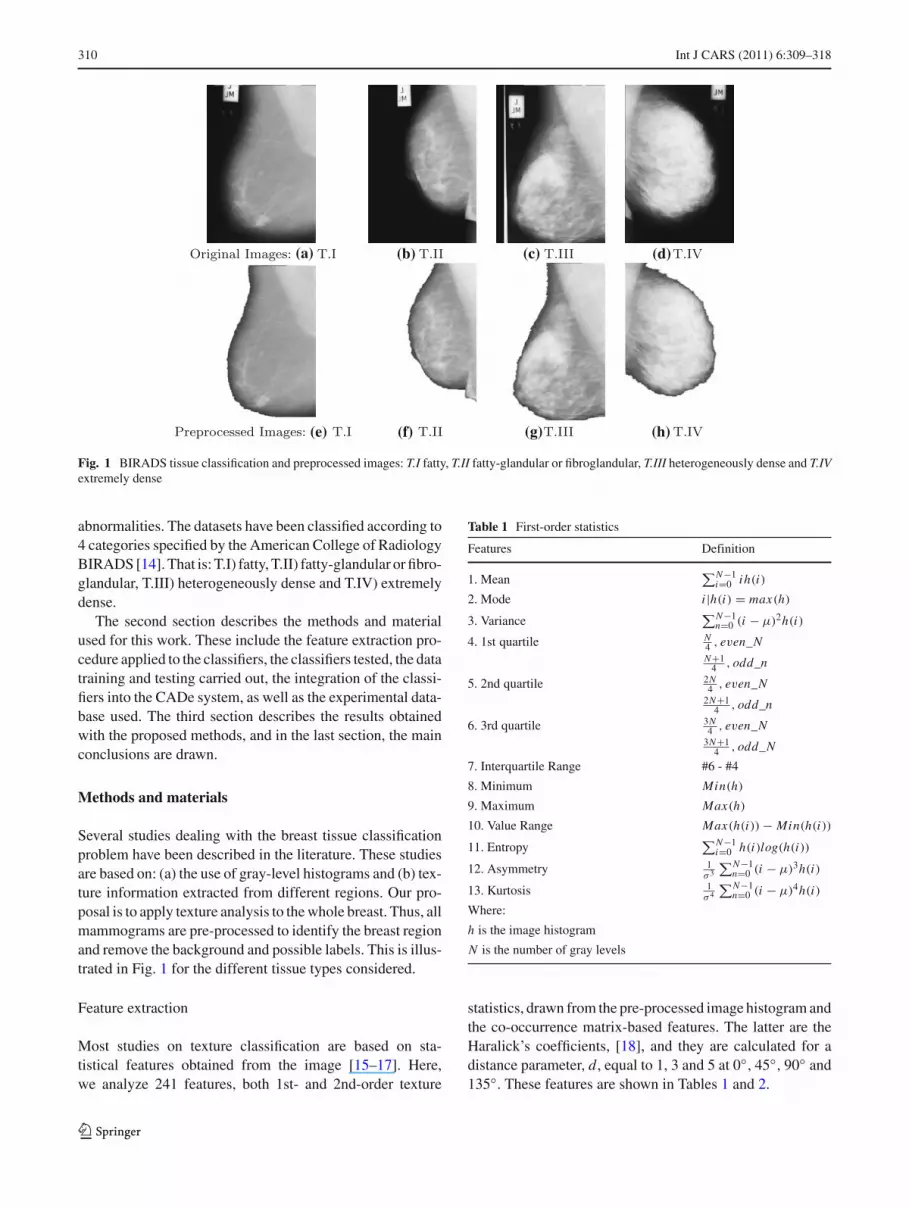
Fig. 1 BIRADS tissue classification and preprocessed images: T.I fatty, T.II fatty-glandular or fibroglandular, T.III heterogeneously dense and T.IVextremely dense
abnormalities. The datasets have been classified according to4 categories specified by the American College of RadiologyBIRADS [14]. That is: T.I) fatty, T.II) fatty-glandular or fibro-glandular, T.III) heterogeneously dense and T.IV) extremelydense.
The second section describes the methods and materialused for this work. These include the feature extraction pro-cedure applied to the classifiers, the classifiers tested, the datatraining and testing carried out, the integration of the classi-fiers into the CADe system, as well as the experimental data-base used. The third section describes the results obtainedwith the proposed methods, and in the last section, the mainconclusions are drawn.
Methods and materials
Several studies dealing with the breast tissue classificationproblem have been described in the literature. These studiesare based on: (a) the use of gray-level histograms and (b) tex-ture information extracted from different regions. Our pro-posal is to apply texture analysis to the whole breast. Thus, allmammograms are pre-processed to identify the breast regionand remove the background and possible labels. This is illus-trated in Fig. 1 for the different tissue types considered.
Feature extraction
Most studies on texture classification are based on sta-tistical features obtained from the image [15–17]. Here,we analyze 241 features, both 1st- and 2nd-order texture
Table 1 First-order statistics
Features Definition
1. Mean∑N−1
i=0 ih(i)
2. Mode i |h(i) = max(h)
3. Variance∑N−1
n=0 (i − μ)2h(i)
4. 1st quartile N4 , even_NN+1
4 , odd_n
5. 2nd quartile 2N4 , even_N
2N+14 , odd_n
6. 3rd quartile 3N4 , even_N
3N+14 , odd_N
7. Interquartile Range #6 - #4
8. Minimum Min(h)
9. Maximum Max(h)
10. Value Range Max(h(i)) − Min(h(i))
11. Entropy∑N−1
i=0 h(i)log(h(i))
12. Asymmetry 1σ 3
∑N−1n=0 (i − μ)3h(i)
13. Kurtosis 1σ 4
∑N−1n=0 (i − μ)4h(i)
Where:
h is the image histogram
N is the number of gray levels
statistics, drawn from the pre-processed image histogram andthe co-occurrence matrix-based features. The latter are theHaralick’s coefficients, [18], and they are calculated for adistance parameter, d, equal to 1, 3 and 5 at 0◦, 45◦, 90◦ and135◦. These features are shown in Tables 1 and 2.
123

Int J CARS (2011) 6:309–318 311
Table 2 Second-order statistics Features Definition
1. Energy∑N−1
i=0∑N−1
j=0 p(i, j)2
2. Contrast∑N−1
n=0 n2(∑N−1
i=0∑N−1
j=0 p(i, j))
, |i − j | = n
3. Correlation∑N−1
i=0∑N−1
j=0 (i j)p(i, j)−μx μy
σx σy
4. Variance∑N−1
i=0∑N−1
j=0 (i − μ)2 p(i, j)
5. Sum average∑2(N−1)
i=0 i px+y(i)
6. Sum entropy∑2(N−1)
i=0 px+y(i)log(px+y(i, j))
7. Sum variance − ∑2(N−1)i=0 (i − Sum Entropy)2 px+y(i)
8. Entropy − ∑N−1i=0
∑N−1j=0 p(i, j)log(p(i, j))
9. Difference variance∑N−1
i=0 i2 px−y(i)
10. Difference entropy − ∑N−1i=0 px−y(i)log(px−y(i, j))
11. Correlation information 1 H XY−H XY 1max(H X,HY )
12. Correlation information 2√
1 − exp(−2(H XY 2 − H XY )
13. Homogeneity 1∑N−1
i=0∑N−1
j=0p(i, j)
1+(i− j)2
14. Homogeneity 2∑N−1
i=0∑N−1
j=0p(i, j)
1+|i− j |15. Cluster shade
∑N−1i=0
∑N−1j=0 (i + j − μx − μy)
3 p(i, j)
16. Cluster prominence∑N−1
i=0∑N−1
j=0 (i + j − μx − μy)4 p(i, j)
17. Autocorrelation∑N−1
i=0∑N−1
j=0 (i j)p(i, j)
18. Dissimilarity∑N−1
i=0∑N−1
j=0 |i − j |p(i, j)
19. Maximum probability max(p(i, j)), i = 0 . . . N − 1, j = 0 . . . N − 1
Where:
p is the image co-occurrence matrix
N is the number of gray levels
μx = ∑N−1i=0
∑N−1j=0 i p(i, j) px (i) = ∑N−1
j=0 p(i, j)
μy = ∑N−1i=0
∑N−1j=0 j p(i, j) py( j) = ∑N−1
i=0 p(i, j)
σx =√∑N−1
i=0 px (i)(i − μx )2 σy =√∑N−1
j=0 py(i)(i − μy)2
px+y(k) = ∑N−1i=0
∑N−1j=0 p(i, j), i + j = k, k = 0 . . . 2(N − 1)
px−y(k) = ∑N−1i=0
∑N−1j=0 p(i, j), |i − j | = k, k = 0 . . . N − 1
H XY = − ∑N−1i=0
∑N−1j=0 p(i, j)log(p(i, j))
H XY 1 = − ∑N−1i=0
∑N−1j=0 p(i, j)log(px (i)py( j))
H XY 1 = − ∑N−1i=0
∑N−1j=0 px (i)py( j)log(px (i)py( j))
Moreover, to reduce and select the feature space, a princi-pal component analysis (PCA) was applied. This mathemat-ical procedure transforms a number of variables that can becorrelated into a smaller set of uncorrelated variables calledprincipal components.
Different tests were performed by varying the number ofcomponents from the space reduced by the PCA. This numberof components varies between 10 and 240 at intervals of 10.
The average error rates for all classifiers were measured ateach interval. These rates range between 42% and 45% withthe best improvement of 12% in some cases. The minimumerror corresponds to the reduction of the space to 20 compo-nents by means of the PCA. Results are shown in Table 4.
The eigenvectors and eigenvalues obtained were analyzedin order to find the most representative features according tothe PCA. The discriminatory power of these features was also
123

312 Int J CARS (2011) 6:309–318
Table 3 Selected featuresFeatures PCA selected Feature ranking
Variance d = 5 and 135◦, 90◦, 0◦ d = 5, 3 and 45◦, 135◦, 0◦
3rd quartile d = 5 and 45◦
Entropy d = 5 and 135◦
Kurtosis d = 5 and 0◦
Energy d = 5 and 90◦
Contrast d = 5 and 135◦ d = 5 and 45◦, 135◦, 0◦
Sum variance d = 5 and 45◦ d = 5 and 135◦
Sum average d = 5 and 45◦, 90◦
Difference variance d = 5 and 90◦ d = 5 and 135◦
Difference entropy d = 5 and 135◦, 90◦
Correlation information 1 d = 5 and 135◦
Correlation information 2 d = 5 and 135◦
Homogeneity 1 d = 5 and 45◦
Homogeneity 2 d = 5 and 90◦, 0◦
Cluster shade d = 1, 3 and 0◦, 90◦, 135◦, 45◦
Autocorrelation d = 5 and 135◦, 45◦, 0◦
Maximum probability d = 5 and 90◦, 0◦
analyzed using a feature ranking of individual performancefor each classification method. This evaluation is based on theresults from intra-cluster and inter-cluster distances betweenthe four tissue types. These distances measure the variabil-ity within and between different classes. This identifies thefeatures that maximize these values. The twenty most sig-nificant features for the PCA and for the feature ranking areindicated in Table 3.
Classifiers, data training and testing
Different classification methods were tested on the selectedfeatures. These are the following: support vector machine(SVM) with polynomial, Minkowski distance, exponential,radial_basis and sigmoid kernels, neural networks (feedfor-ward, backpropagation, perceptron and radial basis) (NN),k-NN with k equal to 1, linear Bayes normal (LBN), qua-dratic (QD), loglinear classifier (LOGL), naive Bayes clas-sifier (NAIVEB) and tree classifier with two layers ({T.I ∪T.II, T.III ∪ T.IV} and {{T.I, T.II}; {T.III, T.IV}}), [19,20].The best results obtained for the SVM are with a polynomialkernel and for the NN are with the backpropagation (BPNN),and these are shown here.
To train and test classifiers, two methods were used: (1)A combination of hold-out and re-substitution methods and(2) the k-fold cross-validation method with k = 10. There-substitution method designs the classifier on the completedataset and tests it on the complete dataset too. This is anoptimistically biased method. The hold-out method on thecontrary is a pessimistically biased method that splits thedataset into halves and then uses one half for training and
the other half for testing [19]. The combination proposed isaccomplished in two stages. In the first stage, the data arerandomly divided into two groups containing the same num-ber of samples. One of these groups is randomly selected totrain the classifiers. Once the classifiers are trained, the testsare performed on the complete dataset.
The k-fold cross-validation method consists of randomlydividing the data into k different groups containing approx-imately the same number of samples. One of these groupsis selected to train the classifier, and tests are performed onthe rest of the groups. The process is then repeated with theother k-1 groups of the dataset, and an average error of clas-sification is obtained.
The performance of these classifiers is shown and dis-cussed in “Results and discussion”.
Integration into a CADe system
The automatic tissue classification method has been inte-grated into a CADe system developed by the authors. Dif-ferent detection methods for the different lesions have beenintegrated into the CAD system. The methods may poten-tially be applied to all lesions and tissues. However, afterrunning the tests, we concluded that their efficiency was tis-sue and lesion type dependent. The methods implementedhave been B-splines, wavelet, adaptive filtering and fuzzyk-means [1,21].
Thus, prior to the detection algorithm, the tissue classifica-tion is applied. It is necessary to adjust the input parameters tocontrol the sensitivity of the algorithm depending on the tis-sue type, especially in areas of high density, in order to reduce
123

Int J CARS (2011) 6:309–318 313
Fig. 2 B-spline Filtering. a–d 1st column: Selected region obtained from the original images corresponding to a mammography with T.I (a) andT.III (d) tissues. b–e 2nd column: highlighted contrast by B-splines applied to X -axis. c–f 3rd column: highlighted contrast by B-splines appliedto Y -axis
false positive detections in these areas. These input parame-ters are the number of clusters in the fuzzy k-means, the num-ber of iterations in the wavelet method and the angular rate inthe adaptive filtering. These parameters should be increasedwhen processing T.IV and proportionally decreased with theother types. Also in the case of T.III and T.IV, wavelets andB-spline algorithms are applied in conjunction with the fuzzyand the adaptive filtering, respectively. In terms of lesions,adaptive filtering and B-splines are best used for microcal-cifications, wavelets for distortions and fuzzy k-means formass lesions.
One of the detection algorithms is based on B-spline filter-ing. The images have been processed with the first derivativeof a cubic spline model. It is applied to both X and Y -axisdirections obtaining new coefficients that are re-scaled from0 to 255 for visualization purposes. The results are shownin Fig. 2 for both axes. It is possible to see how the outputsimulates a relief of the image. This is due to the intensitychanges produced on the image when converting from dis-crete to continuous coefficients with the B-spline transform.
The method has also been compared to wavelet analysis.Several wavelet transforms were tested, and the Debauchiestransform was found to give the best results, with 20 coeffi-cients (DB20) over high frequencies, after 3 iterations for T.Iand T.II, and 7 iterations for T.III and T.IV. The next sectionillustrates these results.
Experimental database
A dataset composed of 322 SFM obtained from the MIASpublic database was considered. Another dataset composedof 1418 full-field digital mammography (FFDM) provided
by local hospitals is being considered. However, the SFMdataset was used to compare our results with those of otherauthors and results shown on this paper are based on thisone. Both datasets were labeled according to the BIRADScategories by expert clinicians from the General Hospital ofCiudad Real. The image sizes are 3328 ∗ 4084 and 1024 ∗1024, respectively for the FFDM and SFM datasets.
The MIAS database contains images from right and leftmedial-lateral projections (RMLO, LMLO) of 161 differentcases.
Results and discussion
Tables 4 and 5 show the results of the classifiers with andwithout PCA for the SFM dataset using: (a) a combined hold-out and re-substitution method and (b) a 10-fold cross-valida-
Table 4 Agreement of classifiers using combined hold-out andRe-substitution method
(a)
(b)
123
314 Int J CARS (2011) 6:309–318
Table 5 Agreement of classifiers using 10-fold cross-validationmethod
(a)
(b)
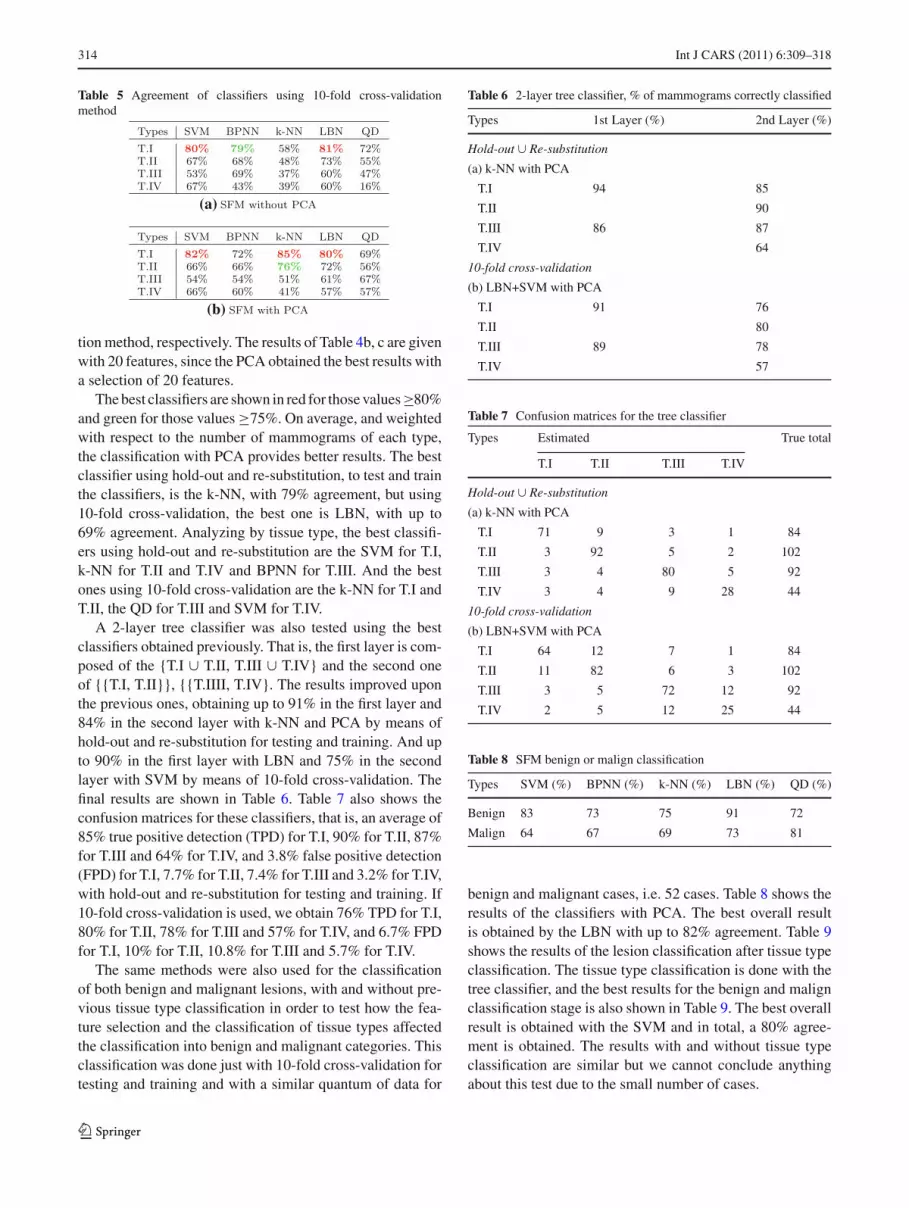
tion method, respectively. The results of Table 4b, c are givenwith 20 features, since the PCA obtained the best results witha selection of 20 features.
The best classifiers are shown in red for those values≥80%and green for those values ≥75%. On average, and weightedwith respect to the number of mammograms of each type,the classification with PCA provides better results. The bestclassifier using hold-out and re-substitution, to test and trainthe classifiers, is the k-NN, with 79% agreement, but using10-fold cross-validation, the best one is LBN, with up to69% agreement. Analyzing by tissue type, the best classifi-ers using hold-out and re-substitution are the SVM for T.I,k-NN for T.II and T.IV and BPNN for T.III. And the bestones using 10-fold cross-validation are the k-NN for T.I andT.II, the QD for T.III and SVM for T.IV.
A 2-layer tree classifier was also tested using the bestclassifiers obtained previously. That is, the first layer is com-posed of the {T.I ∪ T.II, T.III ∪ T.IV} and the second oneof {{T.I, T.II}}, {{T.IIII, T.IV}. The results improved uponthe previous ones, obtaining up to 91% in the first layer and84% in the second layer with k-NN and PCA by means ofhold-out and re-substitution for testing and training. And upto 90% in the first layer with LBN and 75% in the secondlayer with SVM by means of 10-fold cross-validation. Thefinal results are shown in Table 6. Table 7 also shows theconfusion matrices for these classifiers, that is, an average of85% true positive detection (TPD) for T.I, 90% for T.II, 87%for T.III and 64% for T.IV, and 3.8% false positive detection(FPD) for T.I, 7.7% for T.II, 7.4% for T.III and 3.2% for T.IV,with hold-out and re-substitution for testing and training. If10-fold cross-validation is used, we obtain 76% TPD for T.I,80% for T.II, 78% for T.III and 57% for T.IV, and 6.7% FPDfor T.I, 10% for T.II, 10.8% for T.III and 5.7% for T.IV.
The same methods were also used for the classificationof both benign and malignant lesions, with and without pre-vious tissue type classification in order to test how the fea-ture selection and the classification of tissue types affectedthe classification into benign and malignant categories. Thisclassification was done just with 10-fold cross-validation fortesting and training and with a similar quantum of data for
Table 6 2-layer tree classifier, % of mammograms correctly classified
Types 1st Layer (%) 2nd Layer (%)
Hold-out ∪ Re-substitution
(a) k-NN with PCA
T.I 94 85
T.II 90
T.III 86 87
T.IV 64
10-fold cross-validation
(b) LBN+SVM with PCA
T.I 91 76
T.II 80
T.III 89 78
T.IV 57
Table 7 Confusion matrices for the tree classifier
Types Estimated True total
T.I T.II T.III T.IV
Hold-out ∪ Re-substitution
(a) k-NN with PCA
T.I 71 9 3 1 84
T.II 3 92 5 2 102
T.III 3 4 80 5 92
T.IV 3 4 9 28 44
10-fold cross-validation
(b) LBN+SVM with PCA
T.I 64 12 7 1 84
T.II 11 82 6 3 102
T.III 3 5 72 12 92
T.IV 2 5 12 25 44
Table 8 SFM benign or malign classification
Types SVM (%) BPNN (%) k-NN (%) LBN (%) QD (%)
Benign 83 73 75 91 72
Malign 64 67 69 73 81
benign and malignant cases, i.e. 52 cases. Table 8 shows theresults of the classifiers with PCA. The best overall resultis obtained by the LBN with up to 82% agreement. Table 9shows the results of the lesion classification after tissue typeclassification. The tissue type classification is done with thetree classifier, and the best results for the benign and malignclassification stage is also shown in Table 9. The best overallresult is obtained with the SVM and in total, a 80% agree-ment is obtained. The results with and without tissue typeclassification are similar but we cannot conclude anythingabout this test due to the small number of cases.
123

Int J CARS (2011) 6:309–318 315
Table 9 SFM benign or malignclassification with a previoustissue type classification
Types True True Estimated Estimated TPD TPD Classifier Totalbenign malign benign malign benign malign (%)
T.I. 14 14 13 15 10 11 SVM 75
T.II. 20 20 25 15 18 13 LOGL 77
T.III. 11 11 9 13 8 10 SVM 82
T.IV. 7 7 9 5 7 5 SVM 86
Fig. 3 Selected regionsobtained from the originalimages to illustrate a wrongselection of parameters in theCADe algorithms and theB-spline. a Adaptive filteringγ = 5; b wavelet DB20,iter=3; c B-spline filtering
(a) (b) (c)
(a) (b) (c) (d)
Fig. 4 Lesion detection for different tissue type with Fuzzy k-means algorithm
There are just three works in the literature presentingbreast tissue classification according to BIRADS categorieson SFM. Their overall correct classification is about 71%[15], 76% [22] without tissue segmentation and 82% [6] withit. Our approach reflects up to 84% of samples correctly clas-sified by means of the 2-Layer Tree Classifier using k-NNwith PCA and hold-out and re-substitution combined method
for training and testing. Using 10-fold cross-validation andLBN+SVM with PCA classifiers, the 75% of samples arecorrectly classified.
These classification methods have been integrated into aCADe system and applied prior to the detection algorithms.Figures 4, 5 and 6 illustrate the result of the detection algo-rithms after tissue type classification. The figures show the
123

316 Int J CARS (2011) 6:309–318
(a) (b) (c) (d)
Fig. 5 Lesion detection for different tissue type with wavelet processing
original image with the spatial location of the lesion or dis-tortion, the lesion type, the tissue type, the detected, markedin black, and the parameters used for each algorithm, thoseare, the number of clusters, c, in the fuzzy k-means, the num-ber of iterations, i ter in the wavelet method and the angularrate γ in the adaptive filtering. A wrong selection of γ inthe adaptive filtering can give a high number of FPD, and awrong number of iterations in the wavelet algorithm preventfor visualizing the lesion. This is illustrated in Fig. 3a, b,respectively, for a selected area of the mammography.Figure 3c illustrates the result of the B-spline algorithm usedin conjunction with the adaptive filtering when processingT.III and T.IV tissues. Table 10 shows the detection perfor-mance with and without breast tissue classification. Thus, thepercent of TPD and FPD for the dataset used are shown withthe different breast tissue types and the implemented CADealgorithms, where only a fully detected lesion count as trulydetected. The fuzzy k-means has been used for masses, theadaptive filtering for calcifications and the wavelets for archi-tectural distortion and asymmetries.
In Table 10, it is possible to see how in general the TPDincreases and the FPD decreases with tissue type classifica-tion, where the main differences are in the adaptive filteringand wavelet processing for T.III and T.IV. The fuzzy k-meansalgorithm does not perform differently with or without tis-sue type classification for T.I, increasing with tissue typeclassification 2% the TPD for T.II, 10% for T.III and 6% for
T.IV. It decreases 2% the FPD for T.II, 1% for T.III and 8%for T.IV. The wavelet processing increases with tissue typeclassification 5% the TPD for T.I, 1% for T.II, 69% for T.IIIand 73% for T.IV. It decreases 8% the FPD for T.I, 21%.The adaptive filtering does not perform differently for T.I,increasing with tissue type classification 3% the TPD forT.II and decreases 2% for T.III and 5% for T.IV. It decreases9% the FPD for T.II, 56% for T.III and 60% for T.IV.
It is worth mentioning the comments made by the cli-nicians: The tools improve the resolution, in terms of thedetectability of lesions, and additionally, they are able to dis-tinguish their degrees of attenuation. The ability of waveletsto homogenize the background and of B-spline filtering toprovide contrast and relief were judged to be quite useful.Both wavelets and B-spline work well in analyzing the reso-lution, which means that they properly characterize the bor-der of the region of interest without being constrained by thedensity level of the tissue. They project the image onto a graybackground that throws into relief and highlights the spicules,distortions and parenchyma. The B-spline transform keepsthe original size of the calcium nodes.
Conclusions
In this work, a hierarchical procedure based on k-NN,LBN and SVM together with PCA on texture features has
123

Int J CARS (2011) 6:309–318 317
(a) (b) (c) (d)
Fig. 6 Lesion detection for different tissue type with adaptive filtering
Table 10 TPD and FPD for the CADe algorithms with and withoutbreast tissue classification
Types T.I (%) T.II (%) T.III (%) T.IV (%)
(a) % TPD without breast tissue classificationFuzzy k-Means 89 78 10 4
Wavelets 65 64 10 5
Adaptive filtering 85 85 82 75
(b) % FPD without breast tissue classification
Fuzzy k-Means 8 9 6 10
Wavelets 11 23 7 4
Adaptive filtering 10 25 73 62
(c) % TPD with breast tissue classification
Fuzzy k-Means 89 80 20 10
Wavelets 70 65 79 78
Adaptive filtering 85 82 80 70
(d) % FPD with breast tissue classificationFuzzy k-Means 8 7 5 2
Wavelets 3 2 4 5
Adaptive filtering 10 16 17 15
been proposed for breast tissue classification. Our approachreflects up to 84% of samples correctly classified for a SFMdataset, which improve previous results reported in the liter-ature.
The method has been integrated within a CADe systemdeveloped by the authors. The tissue type classification prior
to the detection is used to choose the right algorithm to carryout the lesion segmentation and to properly tune the parame-ters of the algorithms. The tissue type classification increasesthe performance mainly for T.III and T.IV lesion detection.
The processing tools implemented into the CADe systemhave been tested and validated by expert clinicians at Hospi-tal General de Ciudad Real. The filtering presented has beenshown to be successful in highlighting breast lesions on dif-ferent types of tissues. The ability to detect suspicious lesionson dense and heterogeneous tissues, a continuing problem forradiologists due to the low contrast of these tissues, has beentested by several clinicians.
Further tests are being carried out to improve the classifi-cation results for all tissue types and datasets and to extendthe CAD system. These tests include using a FFDM datasetand further statistical analysis of the features considered.
Acknowledgments The authors acknowledge partial financial sup-port from the Spanish Research Ministry and Junta de Comunidadesde Castilla-La Mancha through projects RETIC COMBIOMED andPI-2006/01.1.
References
1. Bueno G (2008) In: Fuzzy systems and deformable models. Seriesin medical physics and biomedical engineering. Taylor and Francisgroup, London, pp 305–329 (Intelligent and Adaptive Systems inMedicine)
123

318 Int J CARS (2011) 6:309–318
2. Boyd N, Dite G, Stone J et al (2002) Reliability of mammo-graphic density, a risk factor for breast cancer. New Engl J Med347(12):886–894
3. Ursin G, Hovanessian-Larsen L, Parisky YR et al (2005) Greatlyincreased occurrence of breast cancers in areas of mammographi-cally dense tissue. Breast Cancer Res 7(5):605–608
4. Brem R, Hoffmeister J, Rapelyea J et al (2005) Impact of breastdensity on computer-aided detection for breast cancer. Am J Roent-genol 184:439–444
5. Wolfe JN (1976) Risk for breast cancer development determinedby mammographic parenchymal pattern. Cancer 37:2486–2492
6. Oliver A, Freixenet J, Martí R et al (2008) A novel breast tissuedensity classification methodology. IEEE Trans Info Tech Biomed12:55–65
7. Yafee M, Boyd N (2005) Mammographic breast density and can-cer risk: the radiological view. Gynecol Endocrinol 21(Supplement1):6–11
8. Koutras A, Christoyianni I, Georgoulas G, Dermatas E (2006)Computer aided classification of mammographic tissue using inde-pendent component analysis and support vector machines. LectNotes Comput Sci 4132(1):568–577
9. Gorgel P, Sertbas A, Kilic N, Ucan O, Osman O (2009) Mam-mographic mass classification using wavelet based support vectormachine. J Electr Electron Eng 9(1):867–875
10. Chang R, Wu W, Moon WK, Chou Y, Chen D (2003) Supportvector machines for diagnosis of breast tumors on us images. AcadRadiol 10(2):189–197
11. Mavroforakis M, Georgios H, Dimitropoulos N, Cavouras D,Theodoridis S (2006) Mammographic masses characterizationbased on localized texture and dataset fractal analysis using lin-ear, neural and support vector machine classifiers. Artif Intell Med37(2):145–162
12. Fu JC, Lee SK, Wong STC, Yeh JY, Wang AH, Wu HK (2005)Image segmentation feature selection and pattern classification formammographic microcalcifications. Comput Med Imaging Graph29:419–429
13. Christoyianni I, Koutras A, Dermatas E, Kokkinakis G (2001)Breast tissue classification in mammograms using ica mixture mod-els. Lect Notes Comput Sci 2130(1):554–560
14. American College of Radiology (2003) Breast imaging reportingand data system atlas (BIRADS). ACR, Reston, Va
15. Bovis K, Singh S (2002) Classification of mammographic breastdensity using a combined classifier paradigm. In: 4th internationalworkshop on digital mammography, pp 177–180
16. Bosch A, Munoz X, Oliver A, Marti J (2006) Modeling and classi-fying breast tissue density in mammograms. In: Proceedings IEEEcomputer society conference on computer vision and pattern rec-ognition, vol 21, pp 1552–1558
17. Oliver A, Lladó X, Martí R, Freixenet J, Zwiggelaar R (2007) Clas-sifying mammograms using texture information. In: Proceedingsmedical image understanding and analysis, pp 223–227
18. Haralick R, Sternberg S, Zhuang X (1987) Image analysis usingmathematical morphology. IEEE Trans Pattern Anal Mach Intell9(4):532–550
19. Kuncheva Ludmila I (2004) Combining pattern classifiers. Wiley,New York
20. Duda RO, Hart PE, Stork DG (2001) Pattern Classification. Wiley,New York
21. Bueno G, Ruiz M, Sánchez S (2006) B-spline filtering for auto-matic detection of calcification lesions in mammograms. In: Pro-ceedings of the Intern. conference on information optics, WIO’06.pp 60–70
22. Petroudi S, Kadir T, Brady M (2003) Automatic classificationof mammographic parenchymal patterns: a statistical approach.In: Proceedings IEEE conference engineering medicine BiologySociety vol 1, pp 798–801
123