automated noise reduction in hrsc mars dtms
TRANSCRIPT
AUTOMATED NOISE REDUCTION IN HRSC MARS DTMS
Shih-Yuan Lin*, Jung-Rack Kim, Jan-Peter Muller
Mullard Space Science Laboratory, University College London, Holmbury St. Mary, Dorking, RH5 6NT, UK – (syl, jk2, jpm)@mssl.ucl.ac.uk
KEY WORDS: Extra-terrestrial, Mapping, DTM, Surface, Matching, Geology, Noise, Detection
ABSTRACT: Since the European Space Agency Mars Express spacecraft entered an orbit around Mars, the High Resolution Stereo Camera (HRSC) placed onboard has been imaging the Martian surface. Due to the characteristics of high resolution and stereo imaging capability of the HRSC, the construction of high resolution digital terrain models (DTMs) representing Mars surface topography has been achieved. However, during the process of DTM creation, errors will occur which may lead to incorrect interpretation. Therefore, the certification of DTM quality is required before any geological investigation is performed. This paper describes a new method to detect and remove noise existing in Martian terrain models produced from HRSC stereo imagery. The proposed method is here demonstrated using HRSC h1011 orbital images and positive results were achieved, in which the number and position of the noisy heights were extracted. Furthermore the method proved of great potential in reducing vertical discontinuities between adjacent DTMs when DTM mosaicing was performed. This solution for automated noise reduction has demonstrated the capability for refining Mars DTMs produced from HRSC stereo imagery, which will be helpful in improving hydrological analysis and geological investigations of the Martian surface.
* Corresponding author.
1. INTRODUCTION
A fundamental scientific question in the exploration of the planets within our Solar System is whether conditions favourable to the development and presence of life exist or have existed in the past. Central to this issue is the search for evidence of past (and present) water, including the determination of how much water was present at or near the surface. Of all the planets in the Solar System, Mars is perhaps the best (and nearest) candidate for addressing these questions, and hence is the focus of significant planetary exploration at present. Determining the inventory of water reservoirs and morphological parameters on outflow channels on Mars provides critical information for understanding the geological, climatic and potentially exobiological evolution of the planet. However, previous studies of the role of water on Mars have been limited by the spatial resolution of topographic data available to study Martian landforms. Whilst extensive but low resolution Viking and MOC-WA (MOC-Wide Angle) imagery, and high resolution, but spatially restricted, imagery taken from MOC-NA (MOC-Narrow Angle) and Thermal Emission Imaging System (THEMIS) have been available, the lack of high resolution topographic data with which to investigate meso-scale (10m-100 km scale) landforms in detail has restricted the analysis and interpretation of Martian surface features. A detailed investigation of landscape formation and evolution requires high resolution (<<200m) and accurate topographic data (Zrm≤30m) from which fine-scale clues to the origin of landforms can be resolved and quantitative measurements of landscape properties determined. Since the European Space Agency (ESA) Mars Express spacecraft entered an elliptical orbit around Mars on the 25th of December 2003, the High Resolution Stereo Camera (HRSC)
placed onboard has been imaging the Martian surface. Due to the characteristics of high resolution and stereo imaging capability of the HRSC, the construction of Digital Terrain Model (DTM) of Mars surface topography with grid spacing of 30-75 metres is feasible (Albertz et al., 2005; Heipke et al., 2007). By visualising the Martian terrain in a high resolution three-dimensional model, the evolution of the Martian surface and the geological processes involved can be effectively analysed. In order to select an area for future exploration, DTM data quality is a very important aspect of the geological investigation of the Martian surface. Errors/blunders and artefacts occurring in any DTM will lead to incorrect interpretation and understanding of the underlying physical processes. This paper therefore aims to detect and remove such noise existing in any Martian terrain model produced from HRSC stereo imagery. Moreover, we deal with errors appearing in the final DTM product, rather than the ones generated in the intermediate steps in the process of DTM generation. The strategy of noise reduction follows a two-stage process. Surface matching is the technique first applied to determine noisy DTM points and remove them in the DTMs. Subsequently, the points removed are further examined using the corresponding pixels in the ortho-image. Their colour digital number (DN) values are inspected to determine if there is any point being removed improperly. After extensive testing, the overall solution for automated noise reduction, proposed in the paper, is shown to be an efficient method for refining Mars DTMs produced from HRSC stereo imagery. The method is of great potential value for improving hydrological analysis and geological investigations of the Martian surface. The details of the method, as well as its implementation, results, quality
1055
The International Archives of the Photogrammetry, Remote Sensing and Spatial Information Sciences. Vol. XXXVII. Part B4. Beijing 2008
assessment, and a summary of the current work will be described in the following sections.
2. METHODS
2.1 Surface Matching
Surface matching is a technique used to carry out co-registration of point clouds and has been applied broadly in the fields of computer vision and geomatics. Its applications can be characterised as (i) registration of objects or surfaces comprised of 2½- or three-dimensional point feature data, (ii) detection of differences between objects or surfaces, and (iii) integration of datasets generated from different sources (Mitchell and Chadwick, 1999). By far the most common algorithms used in surface matching have been based on some form of least-squares adjustment, minimising the differences in position between the surfaces during iterative computation. Once the matching is finished the transformation parameters are computed and the surface is re-aligned to match more closely the reference surface. In addition, one of the by-products of surface matching is the ability to detect differences, as the residuals from the least squares calculation are the surface separations. Examination of these differences may reveal actual differences that may have occurred between the surfaces produced due to the use of different techniques (Pilgrim, 1996). Based on this concept, a surface matching technique is proposed to determine noise occurring in Mars DTMs. To implement the surface matching algorithm, the “3D Surf” program was employed. This program was originally developed at the University of Newcastle, Australia (Pilgrim, 1991; Mitchell, 1994) and was further modified by Buckley (2003) for the use of irregular datasets. The detailed algorithm was described in Mills et al. (2003). In this paper two point clouds, one from 3D intersection points derived from HRSC stereo images and the other from a point set from the corresponding area measured by the Mars Orbiter Laser Altimeter (MOLA), were input into 3D Surf. The former dataset was computed using the Video Image Communication and Retrieval (VICAR) software (Scholten et al., 2005) while the latter point cloud was collected from the MOLA points whose absolute vertical accuracy is on the order of 10 m (Ebner et al., 2004). MOLA was deemed as the “true” terrain model of Mars and was thus input as the reference surface during the matching. To perform the comparison, the MOLA points were firstly triangulated using a Delaunay triangulation and then a least squares minimisation of vertical differences between the HRSC 3D intersection point cloud and the corresponding MOLA triangulated irregular network (TIN) surface was performed. Once the matching is finished, the HRSC point cloud is transformed and the residuals which represent the disparities between the two point clouds are obtained. The points with residuals over a pre-specified tolerance value are flagged as noise and marked for removal from the HRSC point cloud. 2.2 Noise Inspection in Ortho-image
Although suspect noise points were removed during the surface matching, for several reasons (further discussed in Section 3.1) some points being removed are in fact true terrain features. The withdrawal of these points could decrease the density and representativeness of any final DTM. To improve this situation, a method was developed to further examine the points being removed.
The reason most of the terrain features can be seen in the optical image is that their colour digital number (DN) values vary from neighbouring pixels. That is, for clusters of pixels in flat area their DN values should be relatively similar in the absence of any significant albedo changes in the area. Based on this idea, the noise points being removed from the previous stage are reviewed and inspected in the corresponding ortho-image. Firstly, the corresponding noise pixel was found in the ortho-image and the standard deviation of DN values between the pixel and its surrounding pixels was then computed. If a small difference was observed, the pixel was deemed as being located in a flat area. In theory, these points should match well with MOLA TIN after surface matching. Therefore, if the point is located in a flat area but had a large disparity from MOLA after surface matching, the point was confirmed as a noise point. According to this rationale, all points being considered as noise after surface matching were reviewed. Points whose standard deviation of DN values between the surrounding pixels was low remained as noise, whilst others were re-fed into the non-noise point cloud representing the Martian surface. 2.3 Workflow
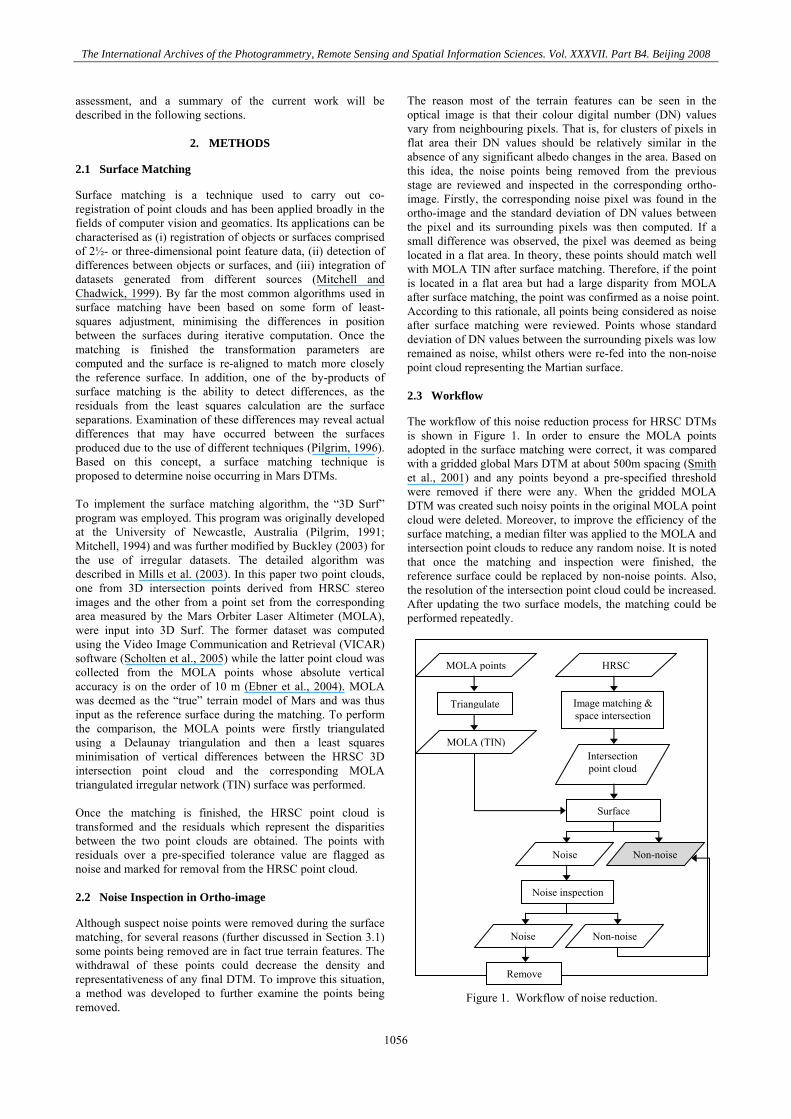
The workflow of this noise reduction process for HRSC DTMs is shown in Figure 1. In order to ensure the MOLA points adopted in the surface matching were correct, it was compared with a gridded global Mars DTM at about 500m spacing (Smith et al., 2001) and any points beyond a pre-specified threshold were removed if there were any. When the gridded MOLA DTM was created such noisy points in the original MOLA point cloud were deleted. Moreover, to improve the efficiency of the surface matching, a median filter was applied to the MOLA and intersection point clouds to reduce any random noise. It is noted that once the matching and inspection were finished, the reference surface could be replaced by non-noise points. Also, the resolution of the intersection point cloud could be increased. After updating the two surface models, the matching could be performed repeatedly.
MOLA points HRSC
Triangulate
MOLA (TIN)
Image matching & space intersection
Intersection point cloud
Surface
Noise Non-noise
Noise Non-noise
Noise inspection
Remove
Figure 1. Workflow of noise reduction.
1056
The International Archives of the Photogrammetry, Remote Sensing and Spatial Information Sciences. Vol. XXXVII. Part B4. Beijing 2008
3. IMPLEMENTATION
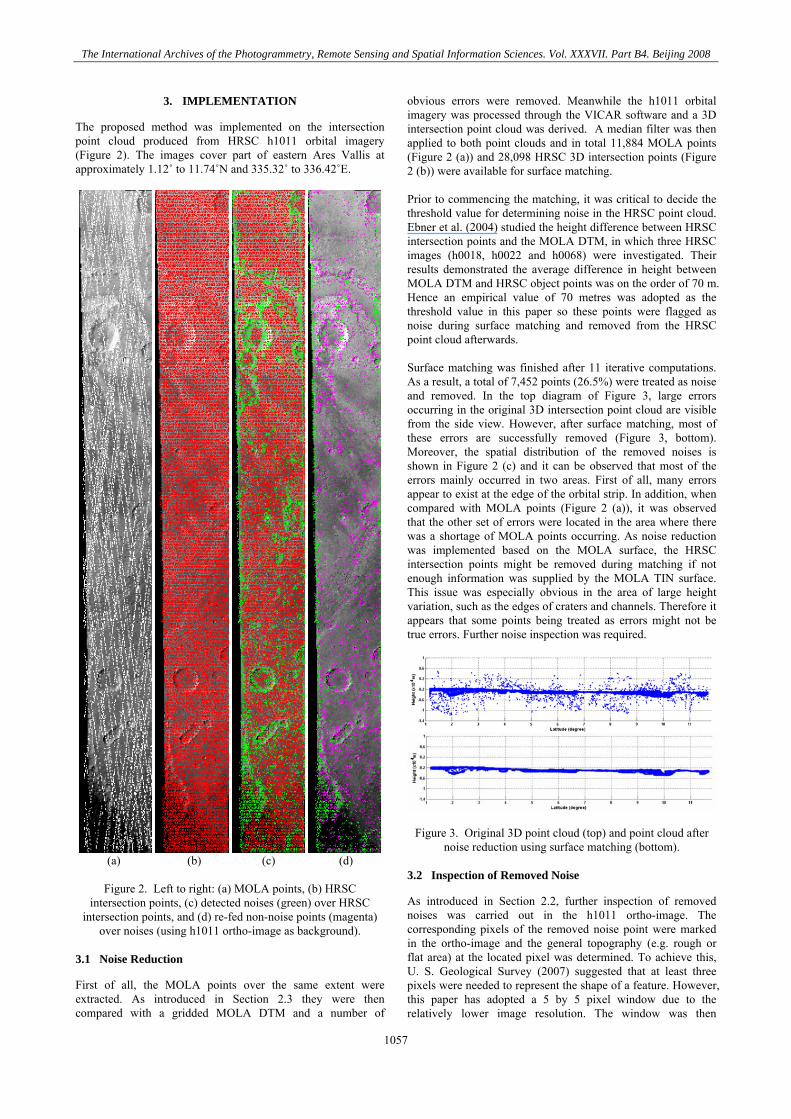
The proposed method was implemented on the intersection point cloud produced from HRSC h1011 orbital imagery (Figure 2). The images cover part of eastern Ares Vallis at approximately 1.12˚ to 11.74˚N and 335.32˚ to 336.42˚E.
(a) (b) (c) (d)
Figure 2. Left to right: (a) MOLA points, (b) HRSC
intersection points, (c) detected noises (green) over HRSC intersection points, and (d) re-fed non-noise points (magenta)
over noises (using h1011 ortho-image as background). 3.1 Noise Reduction
First of all, the MOLA points over the same extent were extracted. As introduced in Section 2.3 they were then compared with a gridded MOLA DTM and a number of
obvious errors were removed. Meanwhile the h1011 orbital imagery was processed through the VICAR software and a 3D intersection point cloud was derived. A median filter was then applied to both point clouds and in total 11,884 MOLA points (Figure 2 (a)) and 28,098 HRSC 3D intersection points (Figure 2 (b)) were available for surface matching. Prior to commencing the matching, it was critical to decide the threshold value for determining noise in the HRSC point cloud. Ebner et al. (2004) studied the height difference between HRSC intersection points and the MOLA DTM, in which three HRSC images (h0018, h0022 and h0068) were investigated. Their results demonstrated the average difference in height between MOLA DTM and HRSC object points was on the order of 70 m. Hence an empirical value of 70 metres was adopted as the threshold value in this paper so these points were flagged as noise during surface matching and removed from the HRSC point cloud afterwards. Surface matching was finished after 11 iterative computations. As a result, a total of 7,452 points (26.5%) were treated as noise and removed. In the top diagram of Figure 3, large errors occurring in the original 3D intersection point cloud are visible from the side view. However, after surface matching, most of these errors are successfully removed (Figure 3, bottom). Moreover, the spatial distribution of the removed noises is shown in Figure 2 (c) and it can be observed that most of the errors mainly occurred in two areas. First of all, many errors appear to exist at the edge of the orbital strip. In addition, when compared with MOLA points (Figure 2 (a)), it was observed that the other set of errors were located in the area where there was a shortage of MOLA points occurring. As noise reduction was implemented based on the MOLA surface, the HRSC intersection points might be removed during matching if not enough information was supplied by the MOLA TIN surface. This issue was especially obvious in the area of large height variation, such as the edges of craters and channels. Therefore it appears that some points being treated as errors might not be true errors. Further noise inspection was required.
Figure 3. Original 3D point cloud (top) and point cloud after noise reduction using surface matching (bottom).
3.2 Inspection of Removed Noise
As introduced in Section 2.2, further inspection of removed noises was carried out in the h1011 ortho-image. The corresponding pixels of the removed noise point were marked in the ortho-image and the general topography (e.g. rough or flat area) at the located pixel was determined. To achieve this, U. S. Geological Survey (2007) suggested that at least three pixels were needed to represent the shape of a feature. However, this paper has adopted a 5 by 5 pixel window due to the relatively lower image resolution. The window was then
1057
The International Archives of the Photogrammetry, Remote Sensing and Spatial Information Sciences. Vol. XXXVII. Part B4. Beijing 2008
scanned across each pixel regarded as noise and the standard deviation of the DN values covered in the window was computed. If a low standard deviation was observed, the pixel was deemed as being located in a flat area, and furthermore, this point was confirmed as noise. As a result 2,418 out of 7,452 points remained as noise while the others were re-fed into the non-noise 3D point cloud. The overall distribution of the re-fed points is shown in Figure 2(d). It is noted most of the re-fed points occurred at the area of large height variation while noise points located at the image edges remained as noise. 3.3 Iterative Noise Reduction
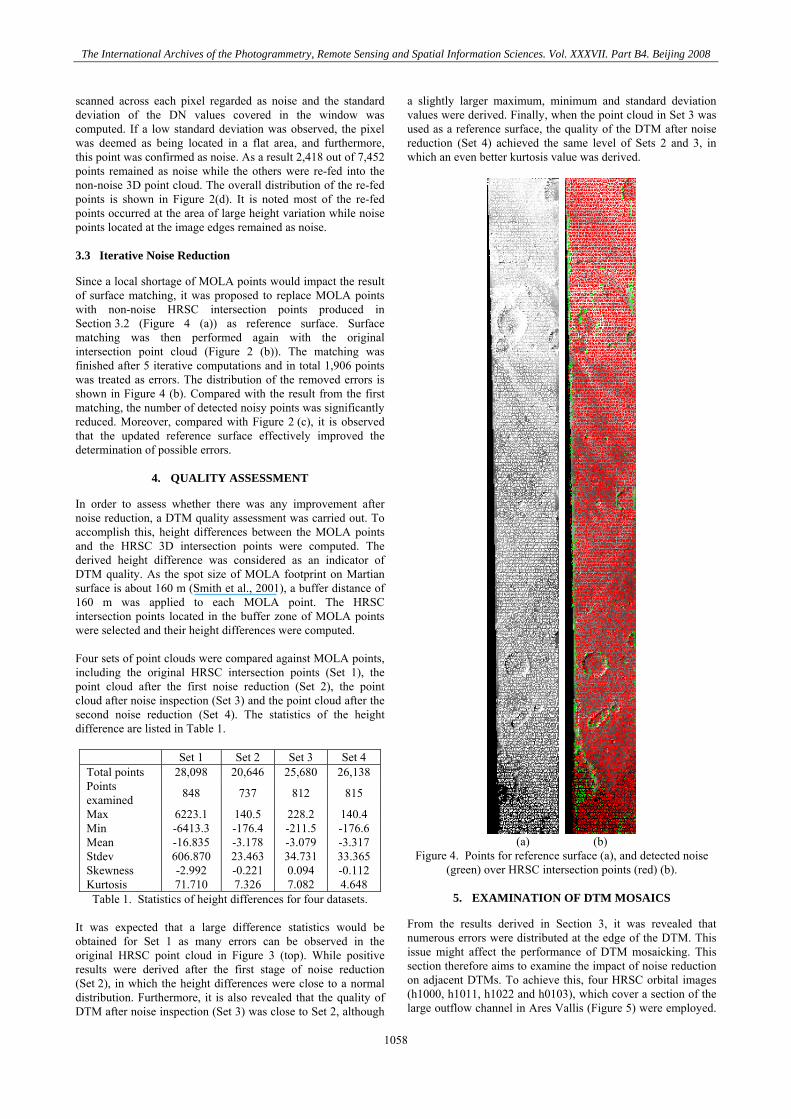
Since a local shortage of MOLA points would impact the result of surface matching, it was proposed to replace MOLA points with non-noise HRSC intersection points produced in Section 3.2 (Figure 4 (a)) as reference surface. Surface matching was then performed again with the original intersection point cloud (Figure 2 (b)). The matching was finished after 5 iterative computations and in total 1,906 points was treated as errors. The distribution of the removed errors is shown in Figure 4 (b). Compared with the result from the first matching, the number of detected noisy points was significantly reduced. Moreover, compared with Figure 2 (c), it is observed that the updated reference surface effectively improved the determination of possible errors.
4. QUALITY ASSESSMENT
In order to assess whether there was any improvement after noise reduction, a DTM quality assessment was carried out. To accomplish this, height differences between the MOLA points and the HRSC 3D intersection points were computed. The derived height difference was considered as an indicator of DTM quality. As the spot size of MOLA footprint on Martian surface is about 160 m (Smith et al., 2001), a buffer distance of 160 m was applied to each MOLA point. The HRSC intersection points located in the buffer zone of MOLA points were selected and their height differences were computed. Four sets of point clouds were compared against MOLA points, including the original HRSC intersection points (Set 1), the point cloud after the first noise reduction (Set 2), the point cloud after noise inspection (Set 3) and the point cloud after the second noise reduction (Set 4). The statistics of the height difference are listed in Table 1.
Set 1 Set 2 Set 3 Set 4 Total points 28,098 20,646 25,680 26,138Points examined 848 737 812 815
Max 6223.1 140.5 228.2 140.4 Min -6413.3 -176.4 -211.5 -176.6Mean -16.835 -3.178 -3.079 -3.317Stdev 606.870 23.463 34.731 33.365Skewness -2.992 -0.221 0.094 -0.112Kurtosis 71.710 7.326 7.082 4.648 Table 1. Statistics of height differences for four datasets.
It was expected that a large difference statistics would be obtained for Set 1 as many errors can be observed in the original HRSC point cloud in Figure 3 (top). While positive results were derived after the first stage of noise reduction (Set 2), in which the height differences were close to a normal distribution. Furthermore, it is also revealed that the quality of DTM after noise inspection (Set 3) was close to Set 2, although
a slightly larger maximum, minimum and standard deviation values were derived. Finally, when the point cloud in Set 3 was used as a reference surface, the quality of the DTM after noise reduction (Set 4) achieved the same level of Sets 2 and 3, in which an even better kurtosis value was derived.
(a) (b)
Figure 4. Points for reference surface (a), and detected noise (green) over HRSC intersection points (red) (b).
5. EXAMINATION OF DTM MOSAICS
From the results derived in Section 3, it was revealed that numerous errors were distributed at the edge of the DTM. This issue might affect the performance of DTM mosaicking. This section therefore aims to examine the impact of noise reduction on adjacent DTMs. To achieve this, four HRSC orbital images (h1000, h1011, h1022 and h0103), which cover a section of the large outflow channel in Ares Vallis (Figure 5) were employed.
1058
The International Archives of the Photogrammetry, Remote Sensing and Spatial Information Sciences. Vol. XXXVII. Part B4. Beijing 2008
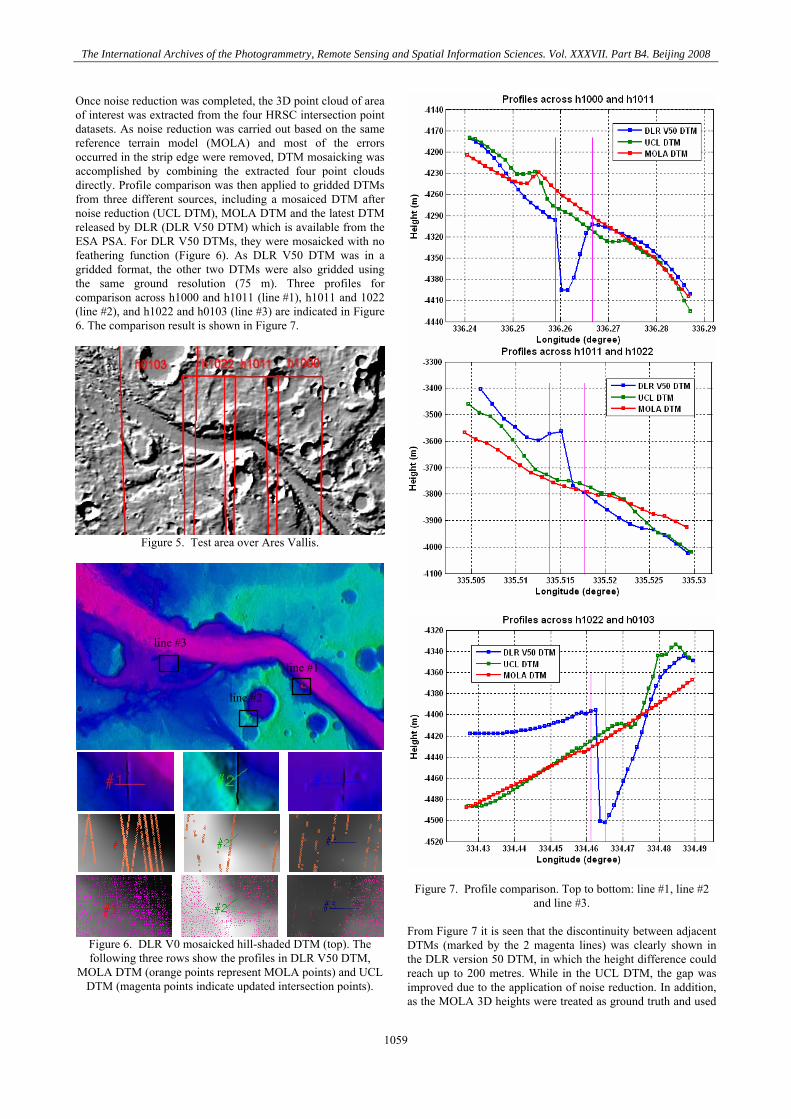
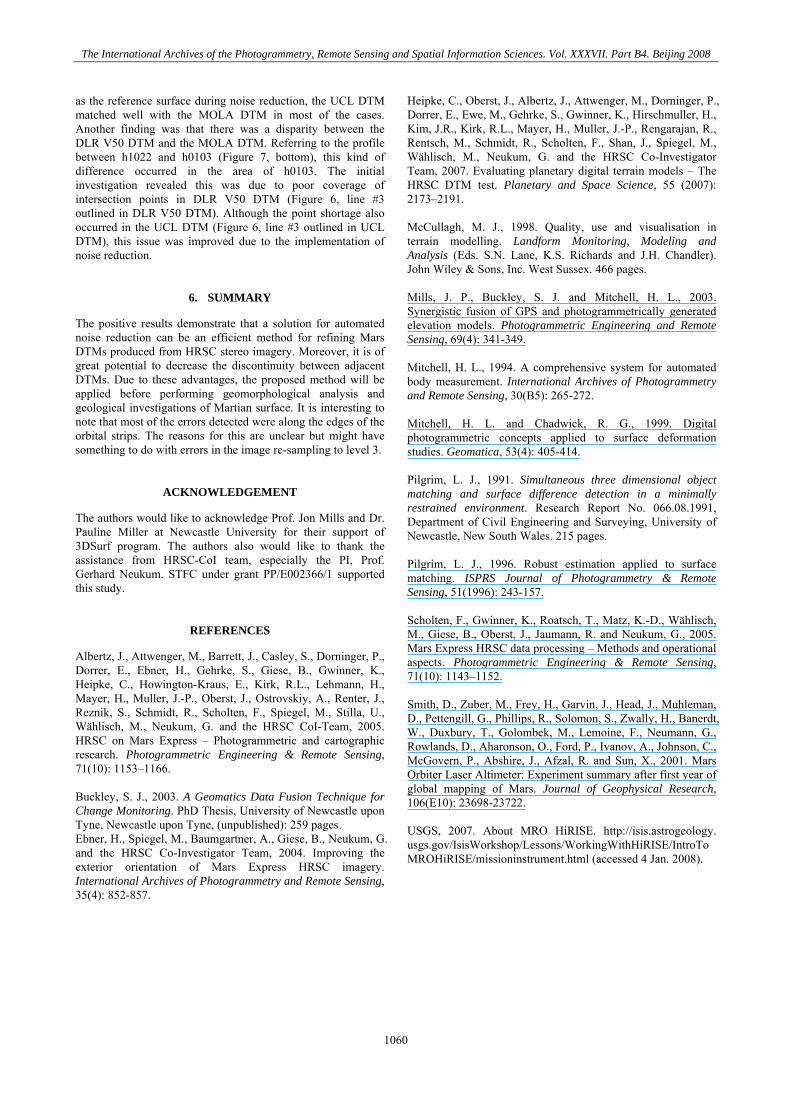
Once noise reduction was completed, the 3D point cloud of area of interest was extracted from the four HRSC intersection point datasets. As noise reduction was carried out based on the same reference terrain model (MOLA) and most of the errors occurred in the strip edge were removed, DTM mosaicking was accomplished by combining the extracted four point clouds directly. Profile comparison was then applied to gridded DTMs from three different sources, including a mosaiced DTM after noise reduction (UCL DTM), MOLA DTM and the latest DTM released by DLR (DLR V50 DTM) which is available from the ESA PSA. For DLR V50 DTMs, they were mosaicked with no feathering function (Figure 6). As DLR V50 DTM was in a gridded format, the other two DTMs were also gridded using the same ground resolution (75 m). Three profiles for comparison across h1000 and h1011 (line #1), h1011 and 1022 (line #2), and h1022 and h0103 (line #3) are indicated in Figure 6. The comparison result is shown in Figure 7.
Figure 5. Test area over Ares Vallis.
Figure 6. DLR V0 mosaicked hill-shaded DTM (top). The following three rows show the profiles in DLR V50 DTM,
MOLA DTM (orange points represent MOLA points) and UCL DTM (magenta points indicate updated intersection points).
line #3
line #1
line #2
Figure 7. Profile comparison. Top to bottom: line #1, line #2
and line #3. From Figure 7 it is seen that the discontinuity between adjacent DTMs (marked by the 2 magenta lines) was clearly shown in the DLR version 50 DTM, in which the height difference could reach up to 200 metres. While in the UCL DTM, the gap was improved due to the application of noise reduction. In addition, as the MOLA 3D heights were treated as ground truth and used
1059
The International Archives of the Photogrammetry, Remote Sensing and Spatial Information Sciences. Vol. XXXVII. Part B4. Beijing 2008
as the reference surface during noise reduction, the UCL DTM matched well with the MOLA DTM in most of the cases. Another finding was that there was a disparity between the DLR V50 DTM and the MOLA DTM. Referring to the profile between h1022 and h0103 (Figure 7, bottom), this kind of difference occurred in the area of h0103. The initial investigation revealed this was due to poor coverage of intersection points in DLR V50 DTM (Figure 6, line #3 outlined in DLR V50 DTM). Although the point shortage also occurred in the UCL DTM (Figure 6, line #3 outlined in UCL DTM), this issue was improved due to the implementation of noise reduction.
6. SUMMARY
The positive results demonstrate that a solution for automated noise reduction can be an efficient method for refining Mars DTMs produced from HRSC stereo imagery. Moreover, it is of great potential to decrease the discontinuity between adjacent DTMs. Due to these advantages, the proposed method will be applied before performing geomorphological analysis and geological investigations of Martian surface. It is interesting to note that most of the errors detected were along the edges of the orbital strips. The reasons for this are unclear but might have something to do with errors in the image re-sampling to level 3.
ACKNOWLEDGEMENT
The authors would like to acknowledge Prof. Jon Mills and Dr. Pauline Miller at Newcastle University for their support of 3DSurf program. The authors also would like to thank the assistance from HRSC-CoI team, especially the PI, Prof. Gerhard Neukum. STFC under grant PP/E002366/1 supported this study.
REFERENCES
Albertz, J., Attwenger, M., Barrett, J., Casley, S., Dorninger, P., Dorrer, E., Ebner, H., Gehrke, S., Giese, B., Gwinner, K., Heipke, C., Howington-Kraus, E., Kirk, R.L., Lehmann, H., Mayer, H., Muller, J.-P., Oberst, J., Ostrovskiy, A., Renter, J., Reznik, S., Schmidt, R., Scholten, F., Spiegel, M., Stilla, U., Wählisch, M., Neukum, G. and the HRSC CoI-Team, 2005. HRSC on Mars Express – Photogrammetric and cartographic research. Photogrammetric Engineering & Remote Sensing, 71(10): 1153–1166. Buckley, S. J., 2003. A Geomatics Data Fusion Technique for Change Monitoring. PhD Thesis, University of Newcastle upon Tyne, Newcastle upon Tyne, (unpublished): 259 pages. Ebner, H., Spiegel, M., Baumgartner, A., Giese, B., Neukum, G. and the HRSC Co-Investigator Team, 2004. Improving the exterior orientation of Mars Express HRSC imagery. International Archives of Photogrammetry and Remote Sensing, 35(4): 852-857.
Heipke, C., Oberst, J., Albertz, J., Attwenger, M., Dorninger, P., Dorrer, E., Ewe, M., Gehrke, S., Gwinner, K., Hirschmuller, H., Kim, J.R., Kirk, R.L., Mayer, H., Muller, J.-P., Rengarajan, R., Rentsch, M., Schmidt, R., Scholten, F., Shan, J., Spiegel, M., Wählisch, M., Neukum, G. and the HRSC Co-Investigator Team, 2007. Evaluating planetary digital terrain models – The HRSC DTM test. Planetary and Space Science, 55 (2007): 2173–2191. McCullagh, M. J., 1998. Quality, use and visualisation in terrain modelling. Landform Monitoring, Modeling and Analysis (Eds. S.N. Lane, K.S. Richards and J.H. Chandler). John Wiley & Sons, Inc. West Sussex. 466 pages. Mills, J. P., Buckley, S. J. and Mitchell, H. L., 2003. Synergistic fusion of GPS and photogrammetrically generated elevation models. Photogrammetric Engineering and Remote Sensing, 69(4): 341-349. Mitchell, H. L., 1994. A comprehensive system for automated body measurement. International Archives of Photogrammetry and Remote Sensing, 30(B5): 265-272. Mitchell, H. L. and Chadwick, R. G., 1999. Digital photogrammetric concepts applied to surface deformation studies. Geomatica, 53(4): 405-414. Pilgrim, L. J., 1991. Simultaneous three dimensional object matching and surface difference detection in a minimally restrained environment. Research Report No. 066.08.1991, Department of Civil Engineering and Surveying, University of Newcastle, New South Wales. 215 pages. Pilgrim, L. J., 1996. Robust estimation applied to surface matching. ISPRS Journal of Photogrammetry & Remote Sensing, 51(1996): 243-157. Scholten, F., Gwinner, K., Roatsch, T., Matz, K.-D., Wählisch, M., Giese, B., Oberst, J., Jaumann, R. and Neukum, G., 2005. Mars Express HRSC data processing – Methods and operational aspects. Photogrammetric Engineering & Remote Sensing, 71(10): 1143–1152. Smith, D., Zuber, M., Frey, H., Garvin, J., Head, J., Muhleman, D., Pettengill, G., Phillips, R., Solomon, S., Zwally, H., Banerdt, W., Duxbury, T., Golombek, M., Lemoine, F., Neumann, G., Rowlands, D., Aharonson, O., Ford, P., Ivanov, A., Johnson, C., McGovern, P., Abshire, J., Afzal, R. and Sun, X., 2001. Mars Orbiter Laser Altimeter: Experiment summary after first year of global mapping of Mars. Journal of Geophysical Research, 106(E10): 23698-23722. USGS, 2007. About MRO HiRISE. http://isis.astrogeology. usgs.gov/IsisWorkshop/Lessons/WorkingWithHiRISE/IntroToMROHiRISE/missioninstrument.html (accessed 4 Jan. 2008).
1060