attachment 5: training guideline
TRANSCRIPT
Attachment 5: Training guideline

Training Guideline
1. Leak Detection
a. Underground LeakageSurvey
A5-1
Table of contents
1 Outline ........................................................................................................................................... 1
1.1 Purpose ................................................................................................................................... 1
1.2 Flow of training with time schedule ........................................................................................ 2
1.3 Safety notice ........................................................................................................................... 3
2 Knowledge acquisition ................................................................................................................... 4
2.1 Type of leakage ...................................................................................................................... 4
2.2 Influence of Leakage .............................................................................................................. 5
2.3 Characteristic of Leakage ....................................................................................................... 7
2.4 Equipment & flow of leak detection ........................................................................................ 8
2.4.1 Equipment & flow for service pipe survey ........................................................................ 8
2.4.2 Equipment & flow for distribution pipe survey ................................................................ 10
2.4.3 Flow for identification of leak point ................................................................................. 14
3 Practice ........................................................................................................................................ 15
A5-2
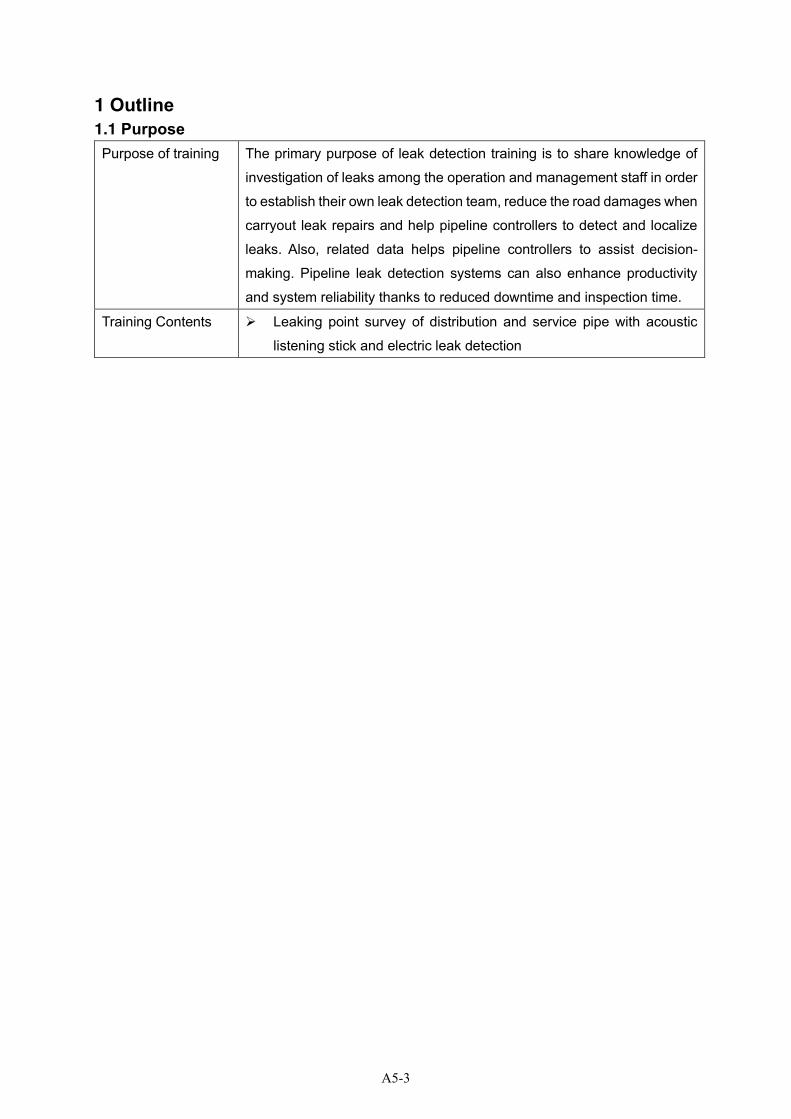
1 Outline
1.1 Purpose
Purpose of training The primary purpose of leak detection training is to share knowledge of
investigation of leaks among the operation and management staff in order
to establish their own leak detection team, reduce the road damages when
carryout leak repairs and help pipeline controllers to detect and localize
leaks. Also, related data helps pipeline controllers to assist decision-
making. Pipeline leak detection systems can also enhance productivity
and system reliability thanks to reduced downtime and inspection time.
Training Contents ➢ Leaking point survey of distribution and service pipe with acoustic
listening stick and electric leak detection
A5-3
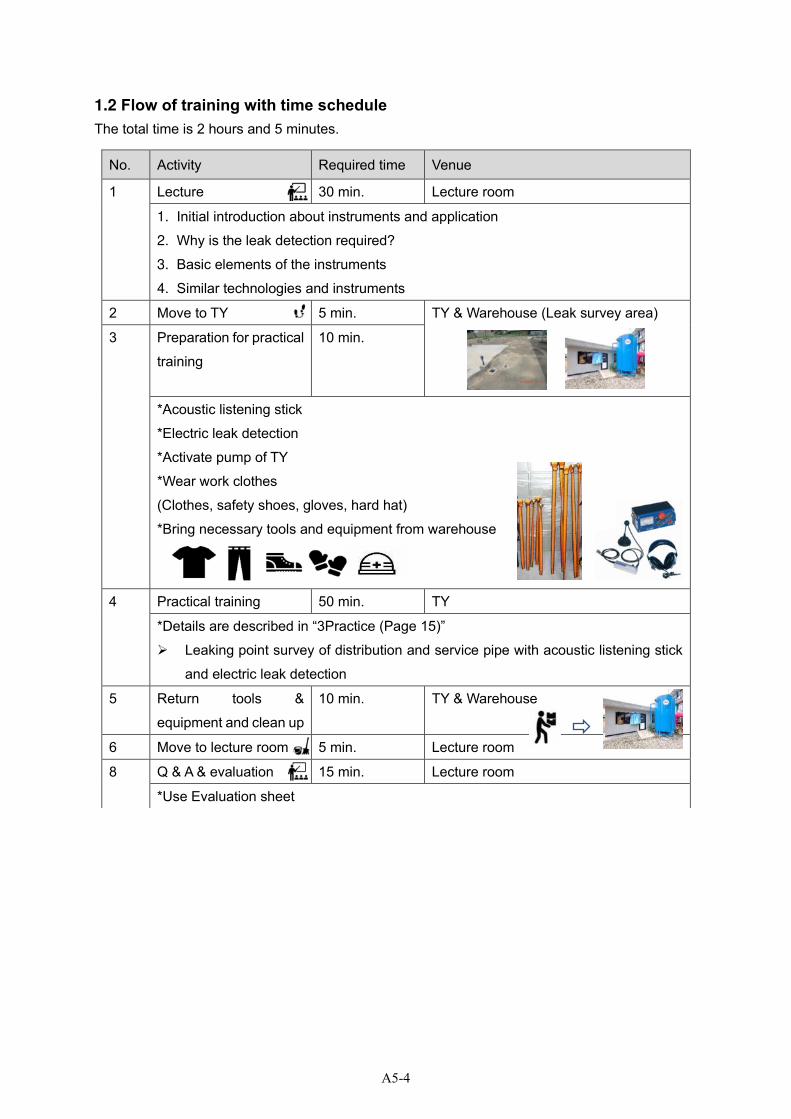
1.2 Flow of training with time schedule
The total time is 2 hours and 5 minutes.
No. Activity Required time Venue
1 Lecture 30 min. Lecture room
1. Initial introduction about instruments and application
2. Why is the leak detection required?
3. Basic elements of the instruments
4. Similar technologies and instruments
2 Move to TY 5 min. TY & Warehouse (Leak survey area)
3 Preparation for practical
training
10 min.
*Acoustic listening stick
*Electric leak detection
*Activate pump of TY
*Wear work clothes
(Clothes, safety shoes, gloves, hard hat)
*Bring necessary tools and equipment from warehouse
4 Practical training 50 min. TY
*Details are described in “3Practice (Page 15)”
➢ Leaking point survey of distribution and service pipe with acoustic listening stick
and electric leak detection
5 Return tools &
equipment and clean up
10 min. TY & Warehouse
6 Move to lecture room 5 min. Lecture room
8 Q & A & evaluation 15 min. Lecture room
*Use Evaluation sheet
A5-4

1.3 Safety notice
➢ All members must wear safety equipment in TY. RP should order to participants wearing
suitable item
➢ Do not sit on the pipes or put your foot on.
➢ Do not touch the installed equipment unnecessarily.
➢ Do not eat food in the TY.
A5-5
2 Knowledge acquisition
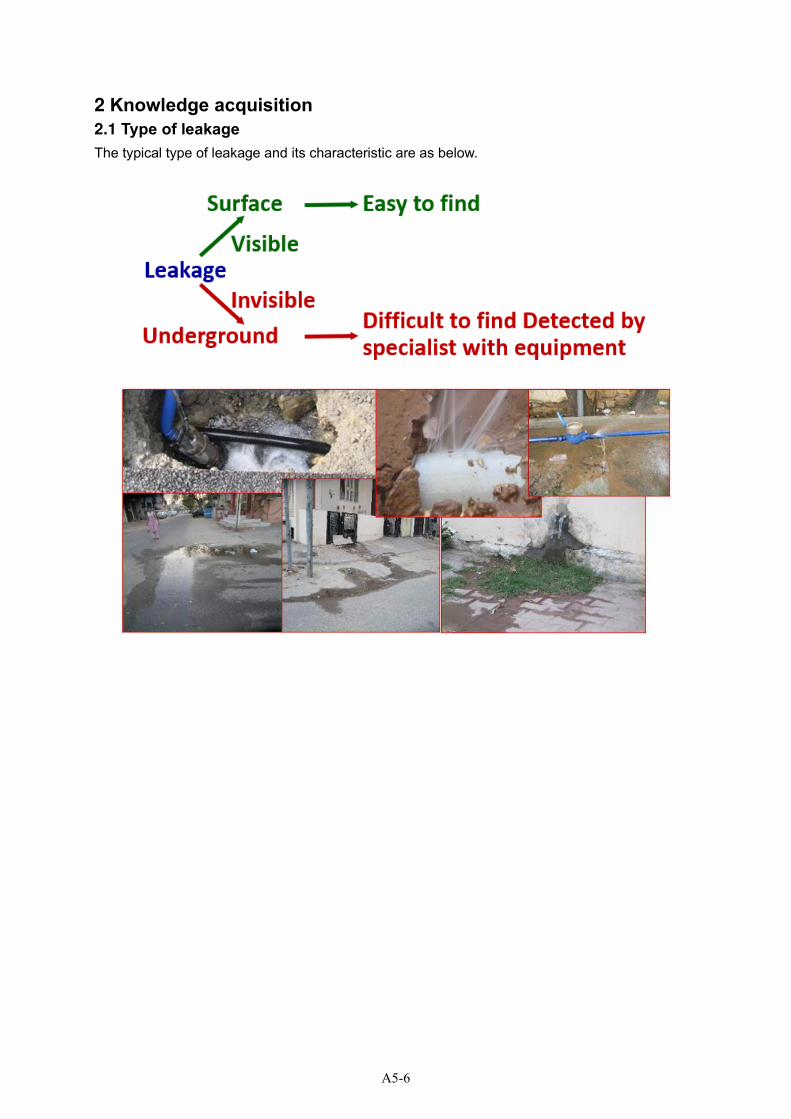
2.1 Type of leakage
The typical type of leakage and its characteristic are as below.
A5-6
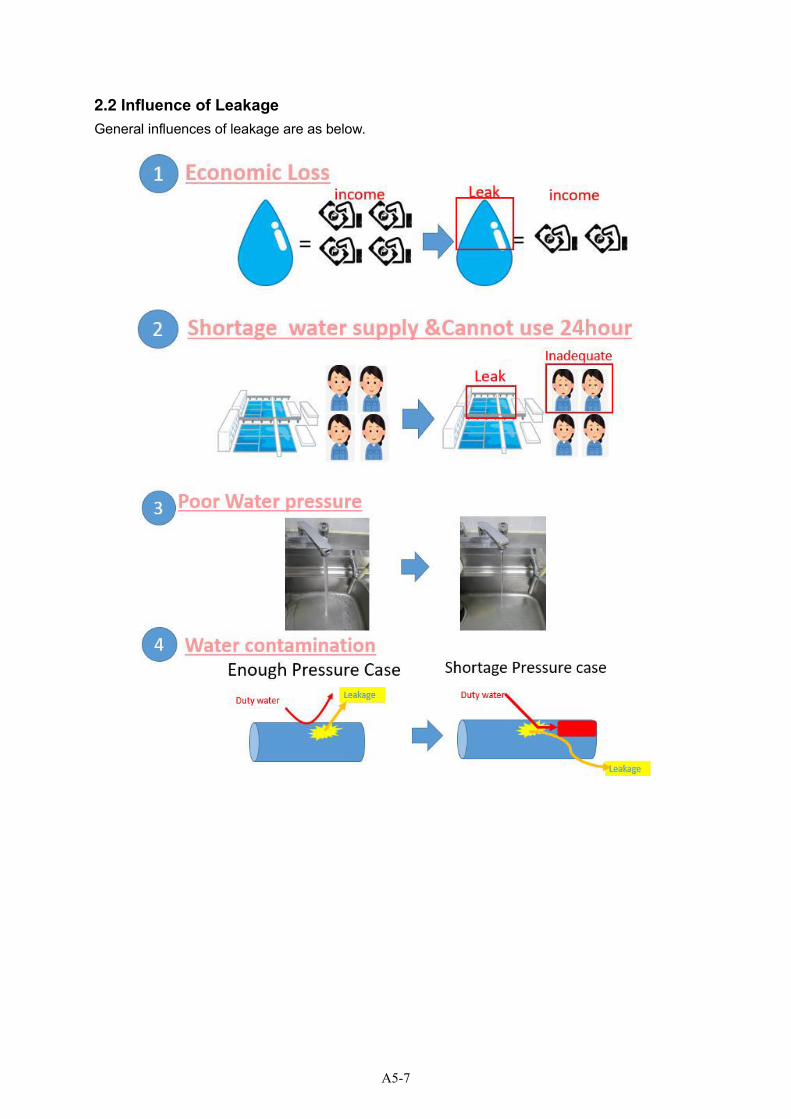
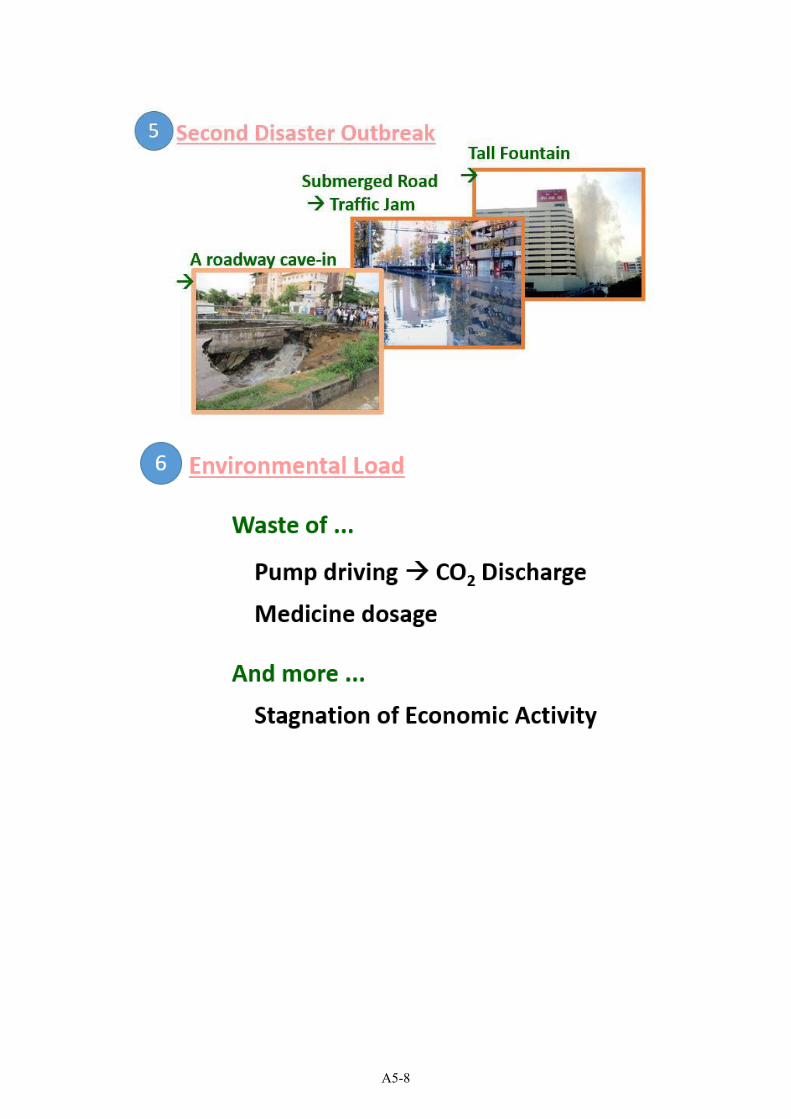
2.2 Influence of Leakage
General influences of leakage are as below.
A5-7
A5-8
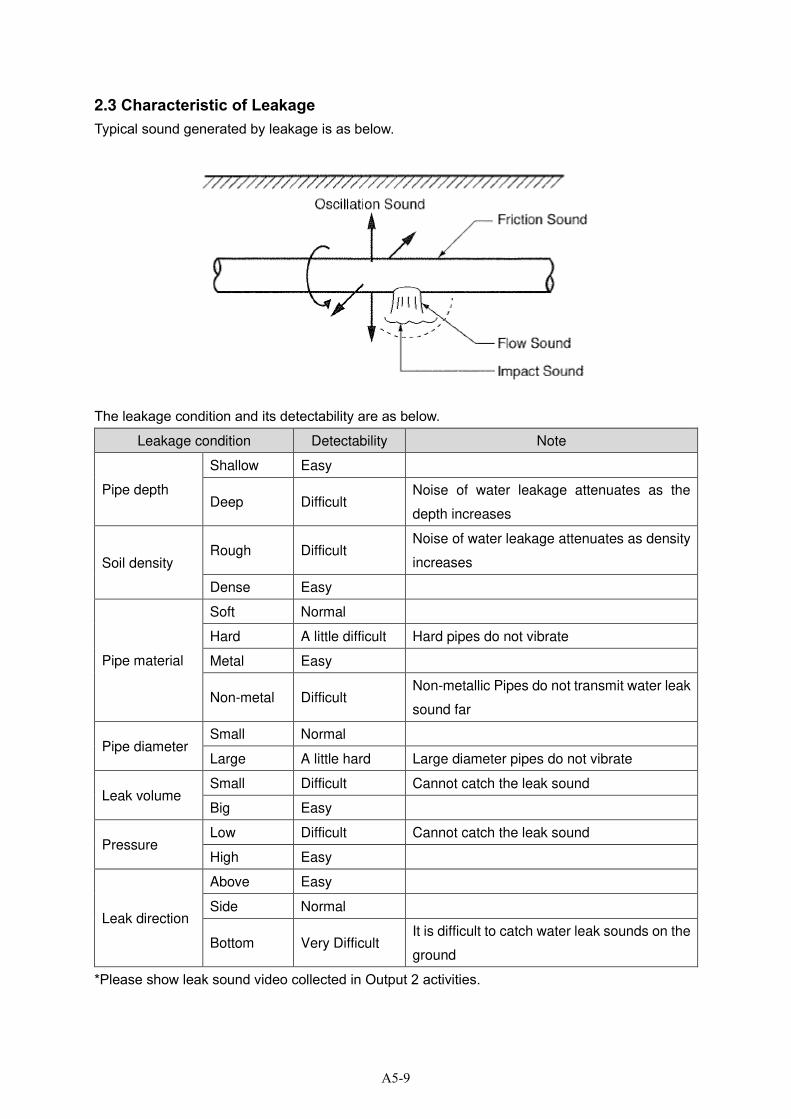
2.3 Characteristic of Leakage
Typical sound generated by leakage is as below.
The leakage condition and its detectability are as below.
Leakage condition Detectability Note
Pipe depth
Shallow Easy
Deep Difficult Noise of water leakage attenuates as the
depth increases
Soil density Rough Difficult
Noise of water leakage attenuates as density
increases
Dense Easy
Pipe material
Soft Normal
Hard A little difficult Hard pipes do not vibrate
Metal Easy
Non-metal Difficult Non-metallic Pipes do not transmit water leak
sound far
Pipe diameter Small Normal
Large A little hard Large diameter pipes do not vibrate
Leak volume Small Difficult Cannot catch the leak sound
Big Easy
Pressure Low Difficult Cannot catch the leak sound
High Easy
Leak direction
Above Easy
Side Normal
Bottom Very Difficult It is difficult to catch water leak sounds on the
ground
*Please show leak sound video collected in Output 2 activities.
A5-9
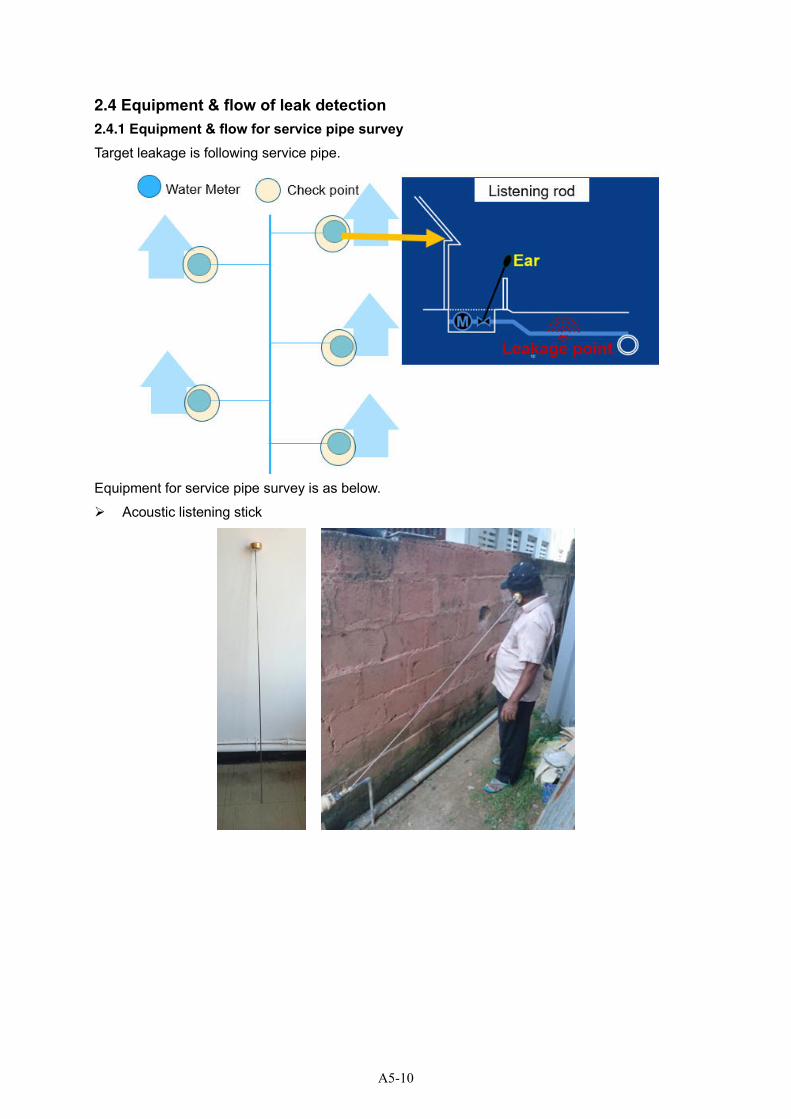
2.4 Equipment & flow of leak detection
2.4.1 Equipment & flow for service pipe survey
Target leakage is following service pipe.
Equipment for service pipe survey is as below.
➢ Acoustic listening stick
A5-10

Flow of leakage survey for service pipes is as below.
i. Visit each house to check whether leakage
sound exists or not with acoustic bar.
ii. Before leakage survey, confirm that the
consumer is not using water and water tank
is not filled. If necessary, stop valve should
be closed.
iii. In case that leakage sound exists or
doubtful, guess the leakage location or the
distance from the sounding point by the
sound volume. If not, move to next house.
Notes:
➢ Do not grip a bar of acoustic listening stick
➢ Put the tip of the rod on the metal part of
upstream side of the meter
The result of survey must be recorded as below.
A5-11
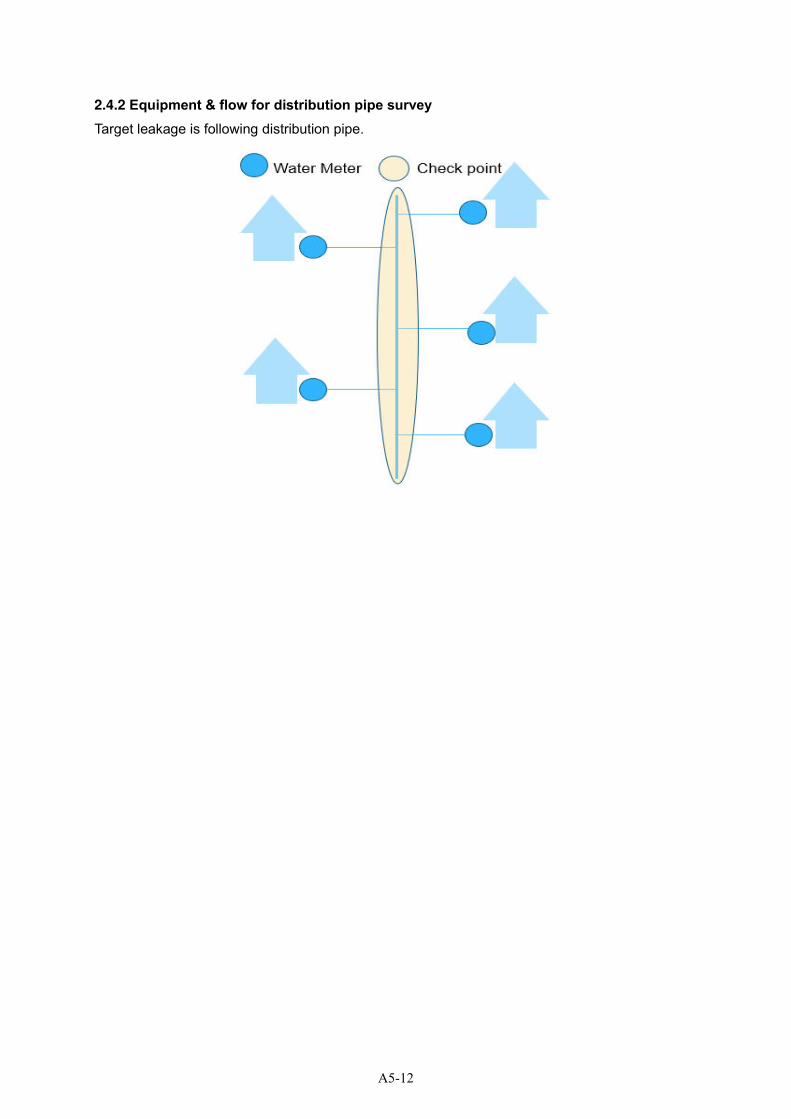
2.4.2 Equipment & flow for distribution pipe survey
Target leakage is following distribution pipe.
A5-12
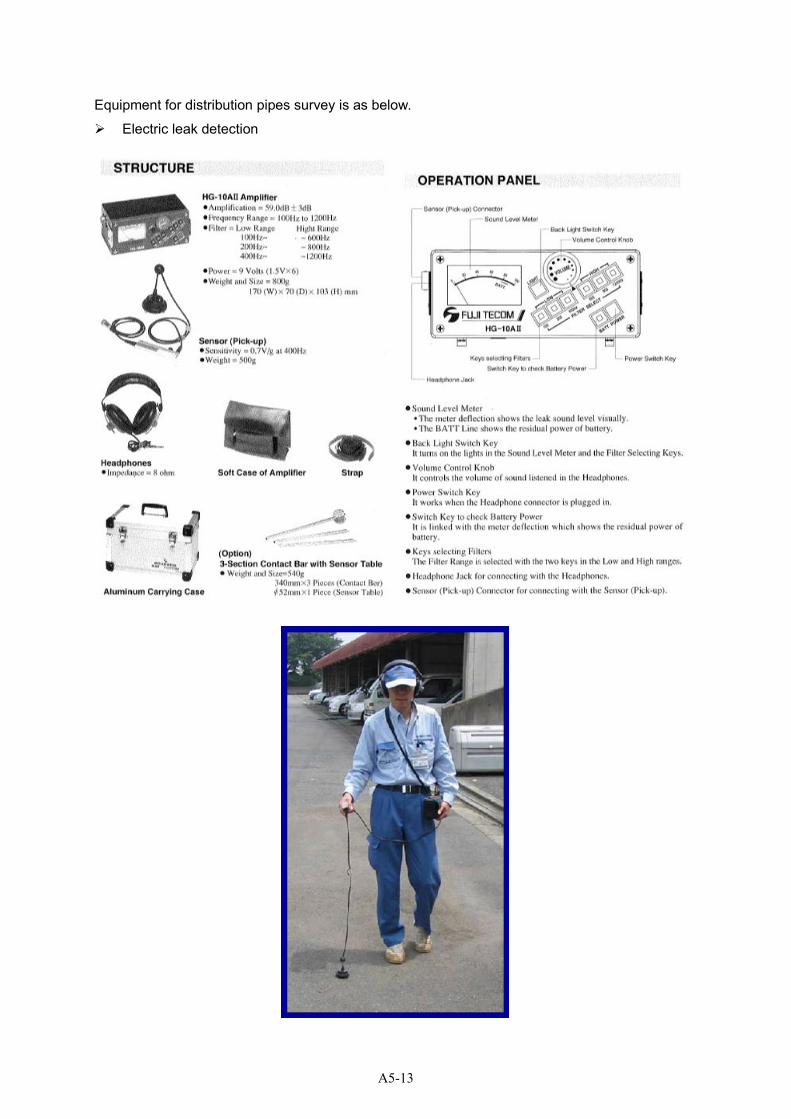
Equipment for distribution pipes survey is as below.
➢ Electric leak detection
A5-13
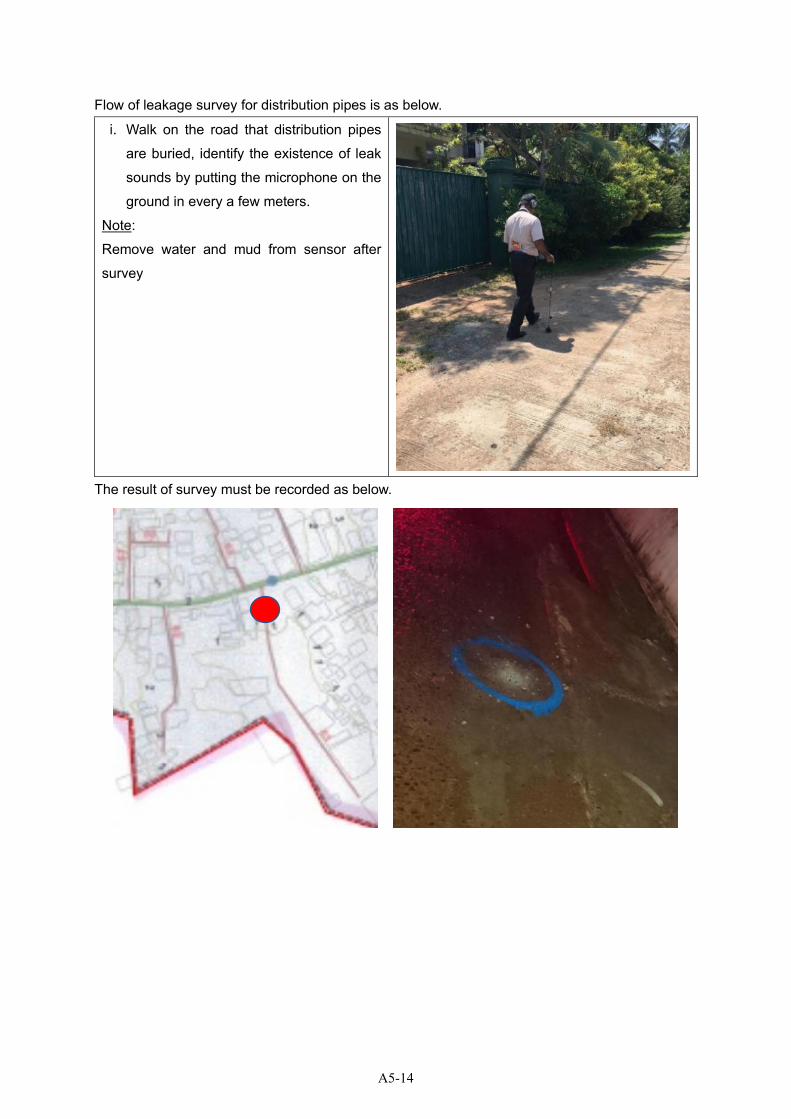
Flow of leakage survey for distribution pipes is as below.
i. Walk on the road that distribution pipes
are buried, identify the existence of leak
sounds by putting the microphone on the
ground in every a few meters.
Note:
Remove water and mud from sensor after
survey
The result of survey must be recorded as below.
A5-14
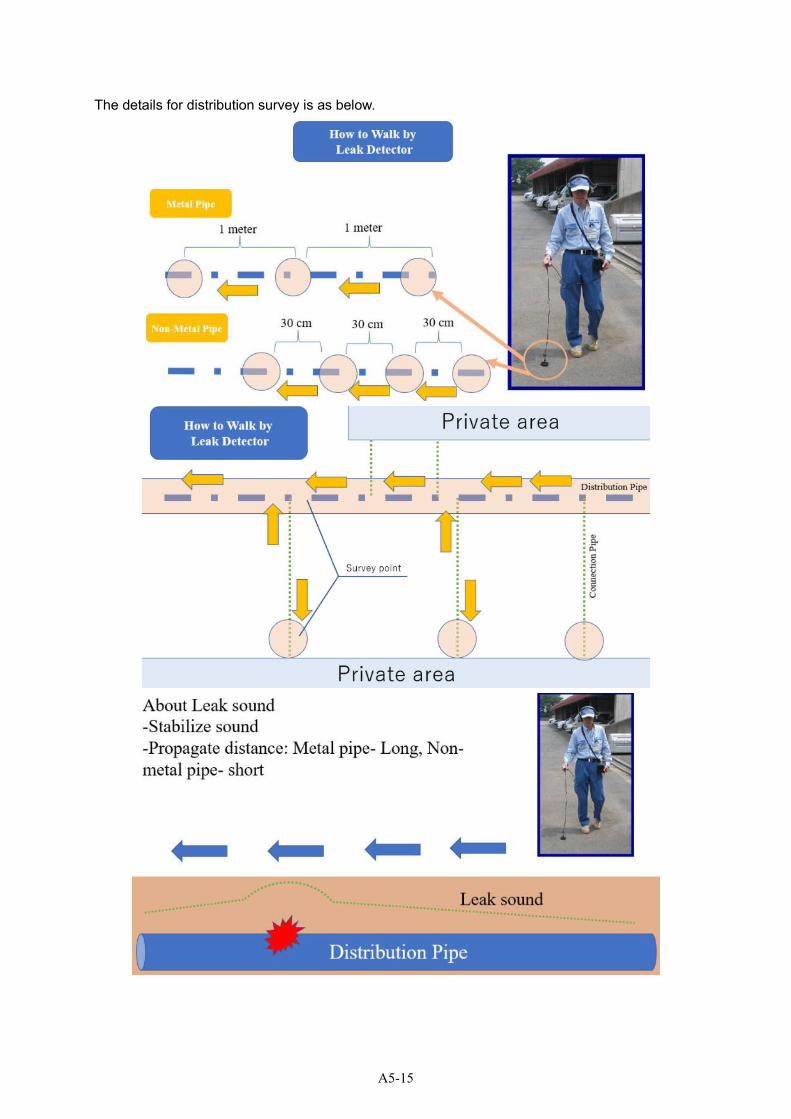
The details for distribution survey is as below.
A5-15
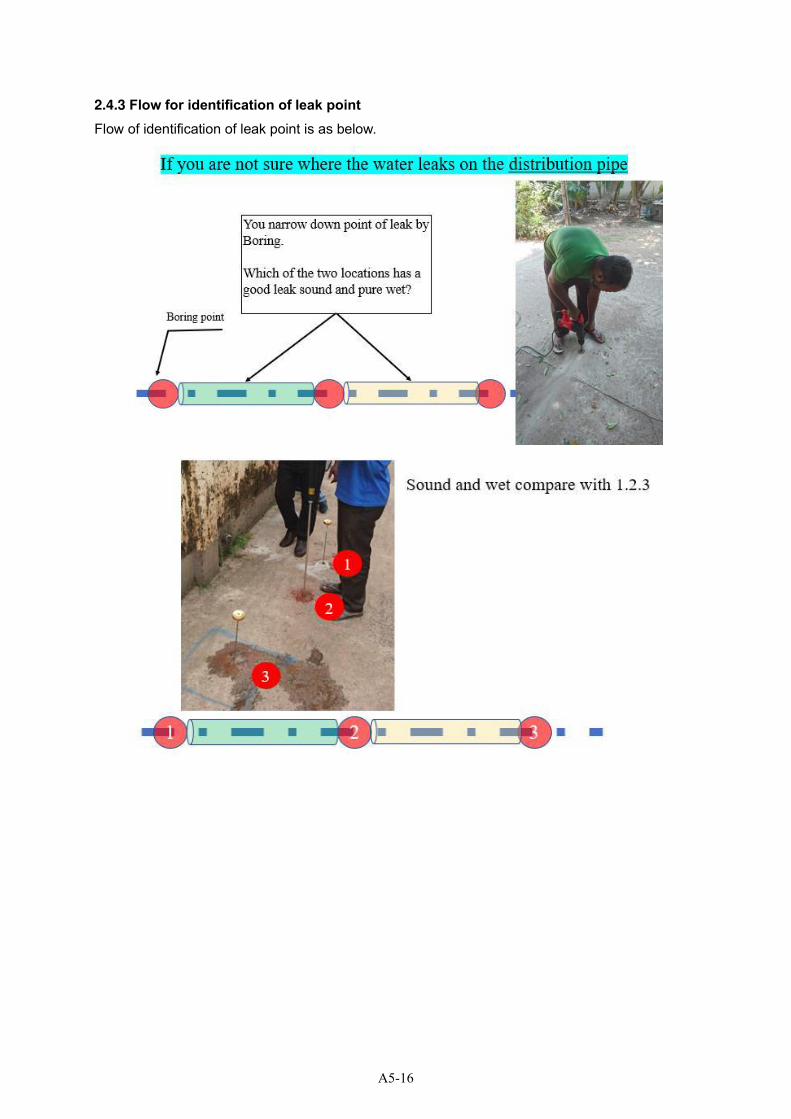
2.4.3 Flow for identification of leak point Flow of identification of leak point is as below.
A5-16
3 Practice
Practical training is conducted for distribution pipe and service pipe in TY.
The flow of training is as below.
Step Target Check point Purpose Bar
1 Service
pipe
Meter & Stop
Valve
Listen & Memorize leak sound
(Trainees know which pipe is leaking)
4
2 Service
pipe
Meter & Stop
Valve
Find out which pipe is leaking
(Trainees do not know which pipe is leaking)
4
3 Distribution
pipe
Pipeline Listen & Memorize leak sound
(Trainees know which pipe is leaking)
4
4 Distribution
pipe
Pipeline Find out which pipe is leaking
(Trainees do not know which pipe is leaking)
4
5 Repeat step 1-4 Learn the difference in water leak noise due
to the difference in water pressure
2
6 Repeat step 1-4 1
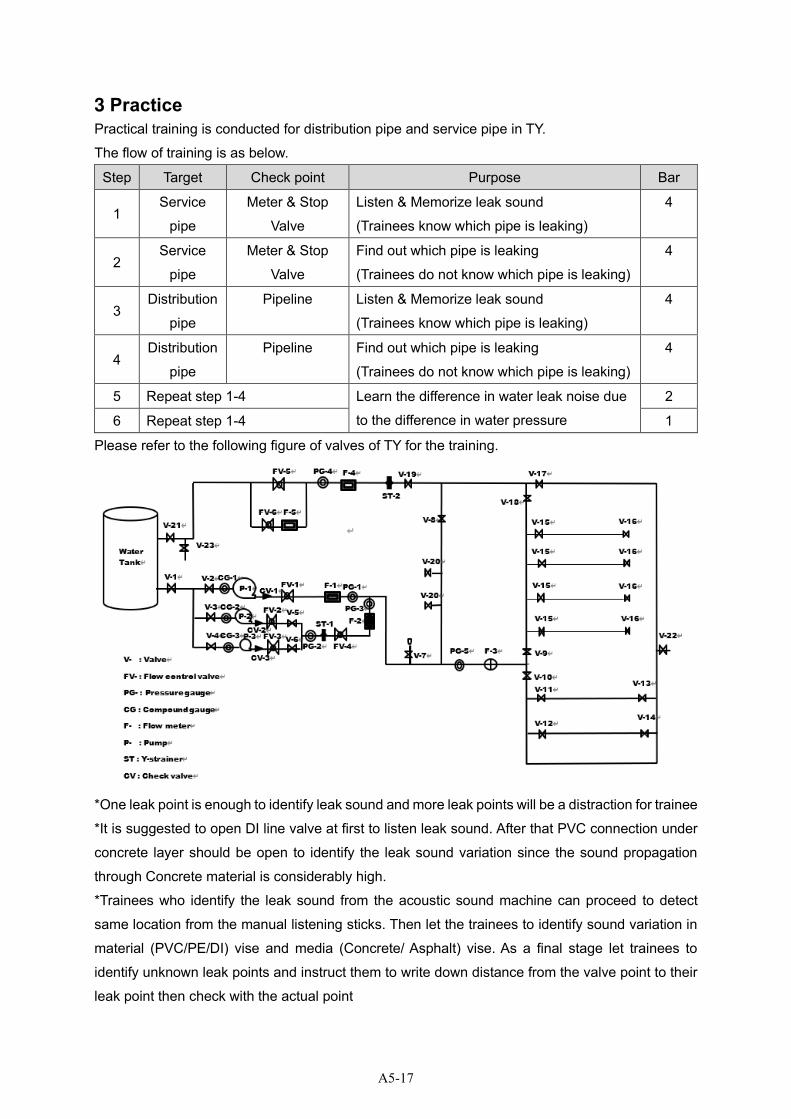
Please refer to the following figure of valves of TY for the training.
*One leak point is enough to identify leak sound and more leak points will be a distraction for trainee
*It is suggested to open DI line valve at first to listen leak sound. After that PVC connection under
concrete layer should be open to identify the leak sound variation since the sound propagation
through Concrete material is considerably high.
*Trainees who identify the leak sound from the acoustic sound machine can proceed to detect
same location from the manual listening sticks. Then let the trainees to identify sound variation in
material (PVC/PE/DI) vise and media (Concrete/ Asphalt) vise. As a final stage let trainees to
identify unknown leak points and instruct them to write down distance from the valve point to their
leak point then check with the actual point
A5-17
Training Guideline
1. Leak Detection
b. Valve, Metal Pipe & Non-Metal Pipe Locating
A5-18

Table of contents
1 Outline ........................................................................................................................................... 1
1.1 Purpose ................................................................................................................................... 1
1.2 Flow of training with time schedule ........................................................................................ 2
1.3 Safety notice ........................................................................................................................... 3
2 Knowledge acquisition ................................................................................................................... 4
2.1 Valve locating .......................................................................................................................... 4
2.1.1 Detail of equipment .......................................................................................................... 4
2.1.2 Procedures of survey ....................................................................................................... 5
2.2 Pipe and non-metal pipe locating ........................................................................................... 6
2.2.1 Details of equipment ........................................................................................................ 6
2.2.2 Procedures of survey ....................................................................................................... 9
2.2.3 Other method for pipe locating ...................................................................................... 16
(1) Magnetic wave method .................................................................................................. 16
(2) Dowsing method ............................................................................................................ 17
3 Practice ........................................................................................................................................ 18
3.1 Valve locating ........................................................................................................................ 18
3.2 Pipe locating ......................................................................................................................... 21
A5-19

1 Outline
1.1 Purpose
Purpose of training The primary purpose of Valve and pipe training is to share knowledge of
tracing underground utility services which are covered by asphalt or other
surface cover. You can learn the way to find out buried valves or pipes to
maintain proper distribution system and reduce the unnecessary
excavation works of road surface.
Training Contents ➢ Valve and leakage pit locating
➢ Service pipe & Distribution pipe locating
A5-20
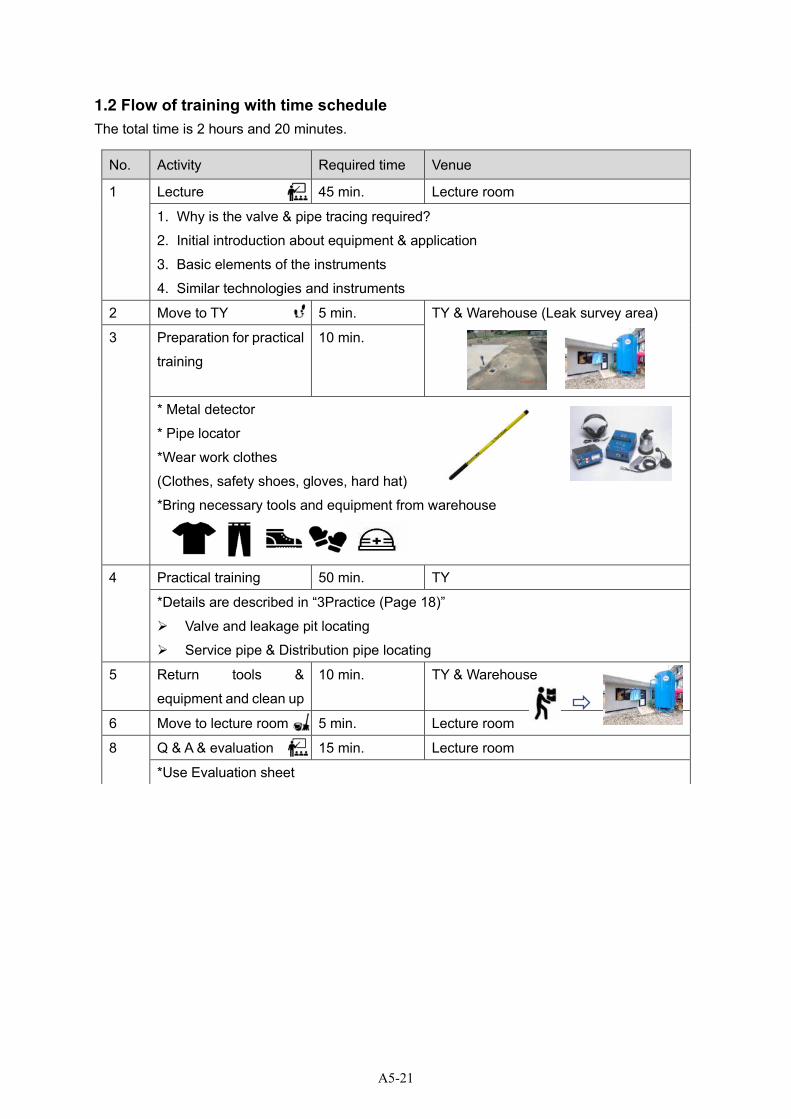
1.2 Flow of training with time schedule
The total time is 2 hours and 20 minutes.
No. Activity Required time Venue
1 Lecture 45 min. Lecture room
1. Why is the valve & pipe tracing required?
2. Initial introduction about equipment & application
3. Basic elements of the instruments
4. Similar technologies and instruments
2 Move to TY 5 min. TY & Warehouse (Leak survey area)
3 Preparation for practical
training
10 min.
* Metal detector
* Pipe locator
*Wear work clothes
(Clothes, safety shoes, gloves, hard hat)
*Bring necessary tools and equipment from warehouse
4 Practical training 50 min. TY
*Details are described in “3Practice (Page 18)”
➢ Valve and leakage pit locating
➢ Service pipe & Distribution pipe locating
5 Return tools &
equipment and clean up
10 min. TY & Warehouse
6 Move to lecture room 5 min. Lecture room
8 Q & A & evaluation 15 min. Lecture room
*Use Evaluation sheet
A5-21

1.3 Safety notice
➢ All members must wear safety equipment in TY. RP should order to participants wearing
suitable item
➢ Do not sit on the pipes or put your foot on.
➢ Do not touch the installed equipment unnecessarily.
➢ Do not eat food in the TY.
A5-22
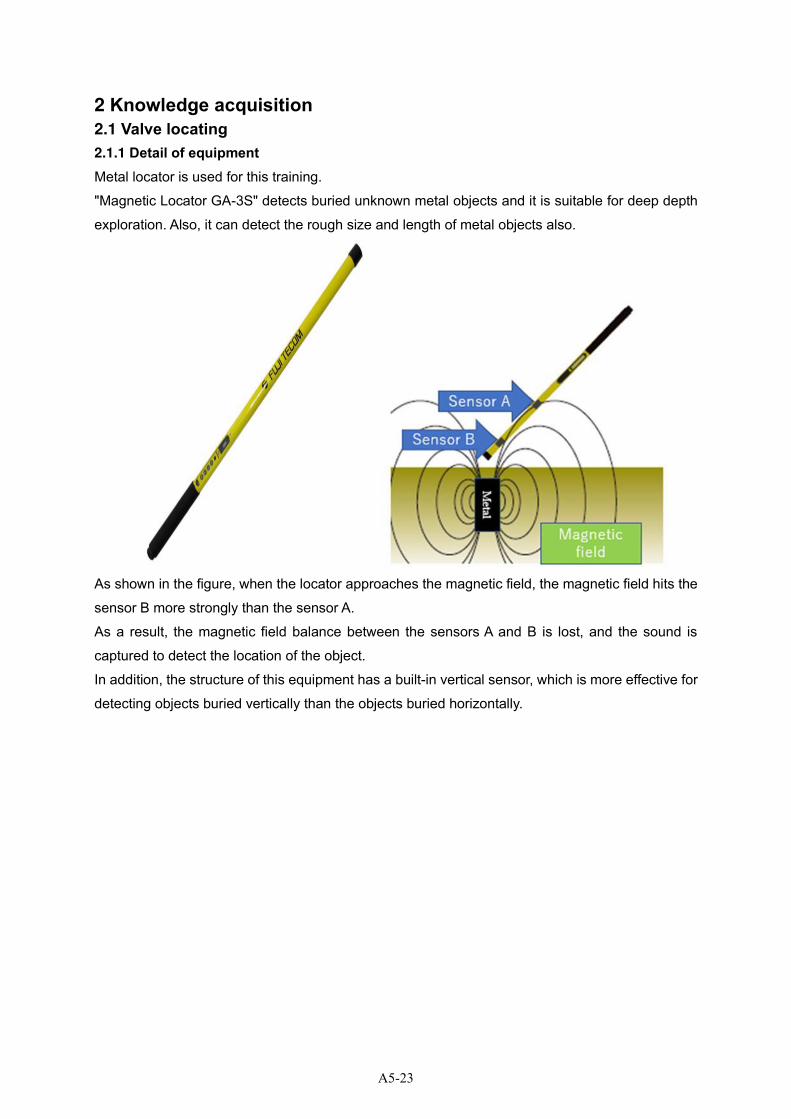
2 Knowledge acquisition
2.1 Valve locating
2.1.1 Detail of equipment Metal locator is used for this training.
"Magnetic Locator GA-3S" detects buried unknown metal objects and it is suitable for deep depth
exploration. Also, it can detect the rough size and length of metal objects also.
As shown in the figure, when the locator approaches the magnetic field, the magnetic field hits the
sensor B more strongly than the sensor A.
As a result, the magnetic field balance between the sensors A and B is lost, and the sound is
captured to detect the location of the object.
In addition, the structure of this equipment has a built-in vertical sensor, which is more effective for
detecting objects buried vertically than the objects buried horizontally.
A5-23
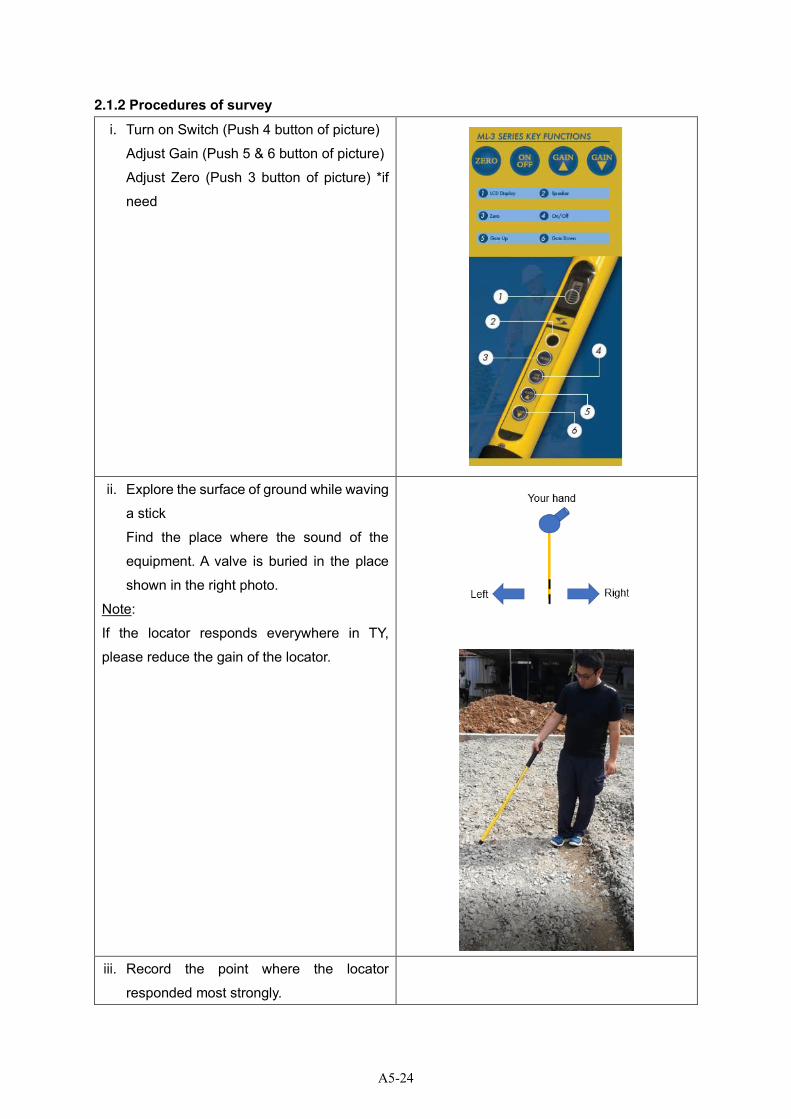
2.1.2 Procedures of survey
i. Turn on Switch (Push 4 button of picture)
Adjust Gain (Push 5 & 6 button of picture)
Adjust Zero (Push 3 button of picture) *if
need
ii. Explore the surface of ground while waving
a stick
Find the place where the sound of the
equipment. A valve is buried in the place
shown in the right photo.
Note:
If the locator responds everywhere in TY,
please reduce the gain of the locator.
iii. Record the point where the locator
responded most strongly.
A5-24
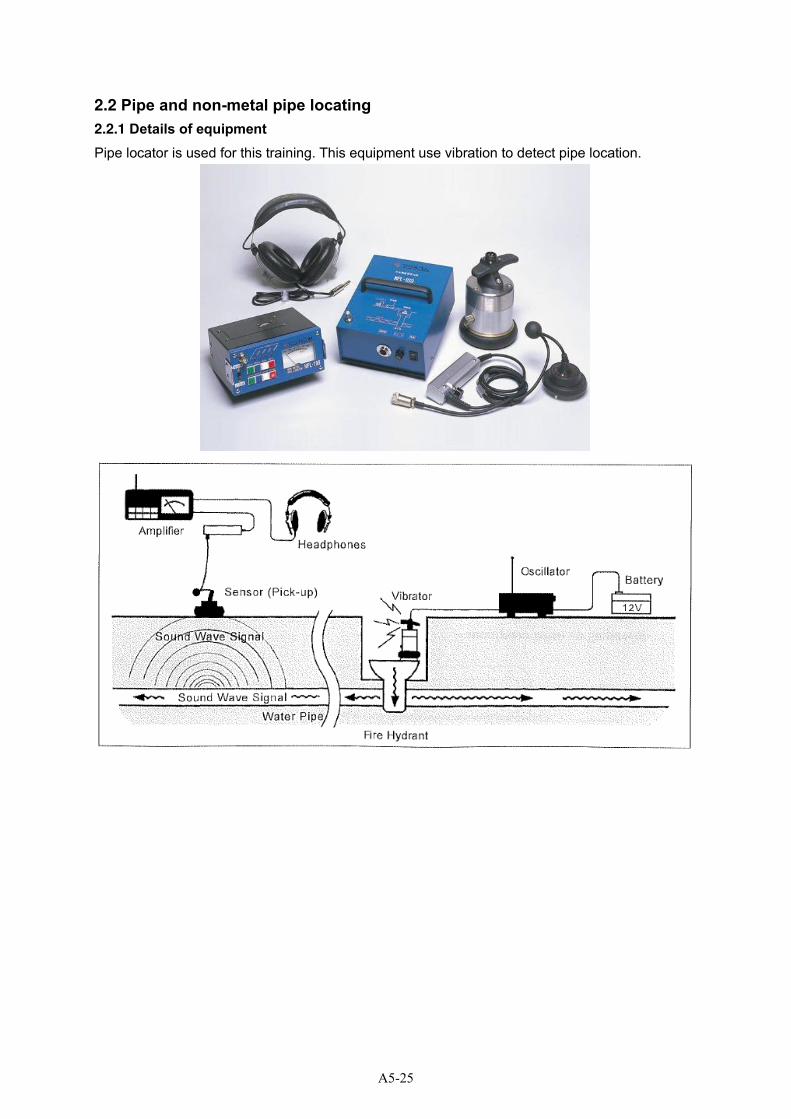
2.2 Pipe and non-metal pipe locating
2.2.1 Details of equipment Pipe locator is used for this training. This equipment use vibration to detect pipe location.
A5-25
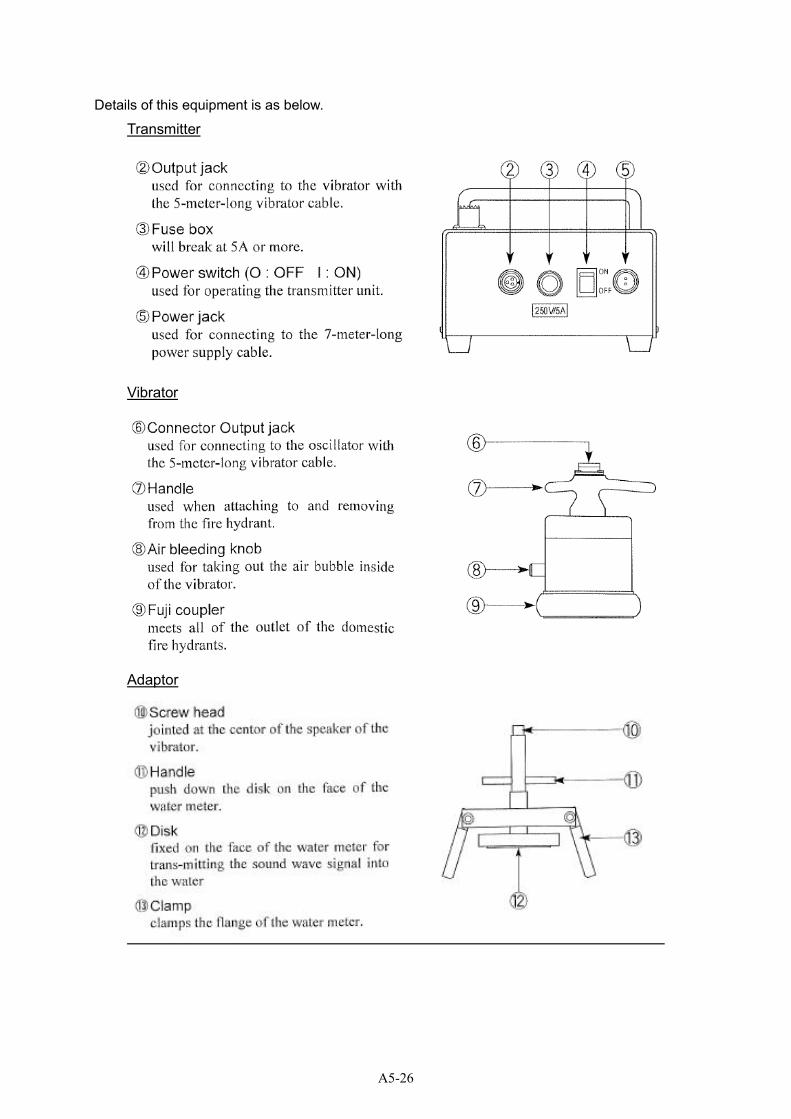
Details of this equipment is as below.
Transmitter
Vibrator
Adaptor
A5-26
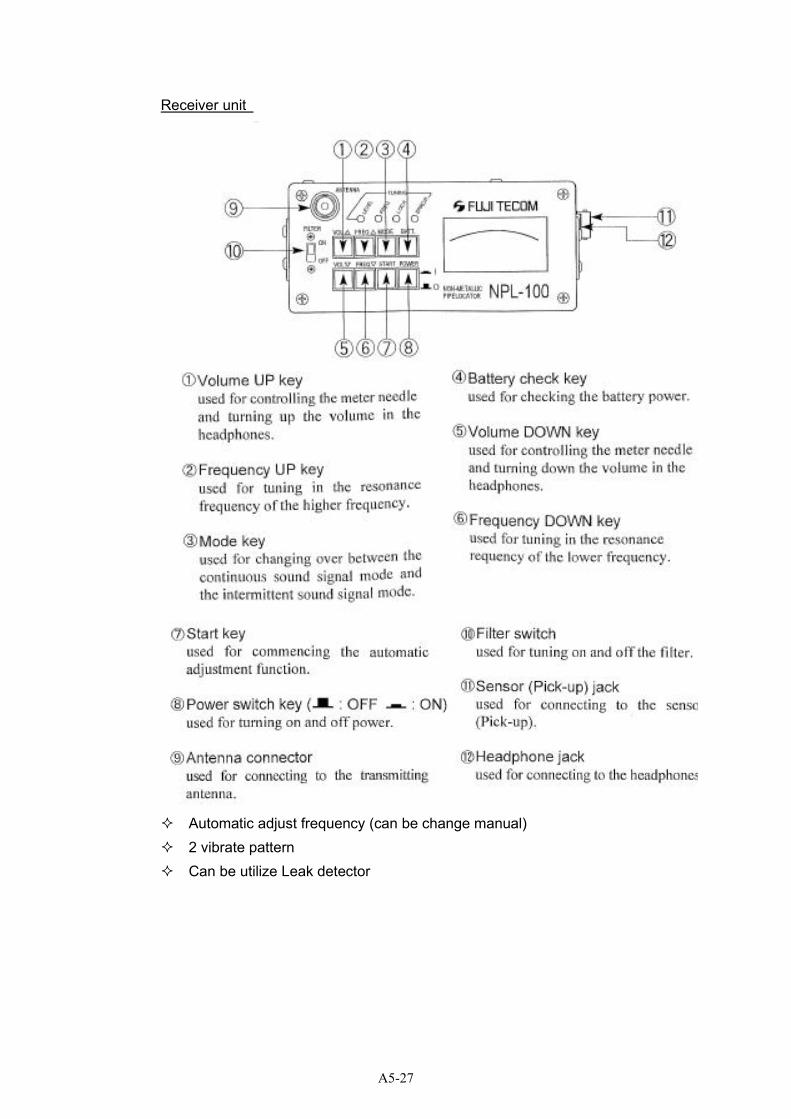
Receiver unit
Automatic adjust frequency (can be change manual) 2 vibrate pattern
Can be utilize Leak detector
A5-27
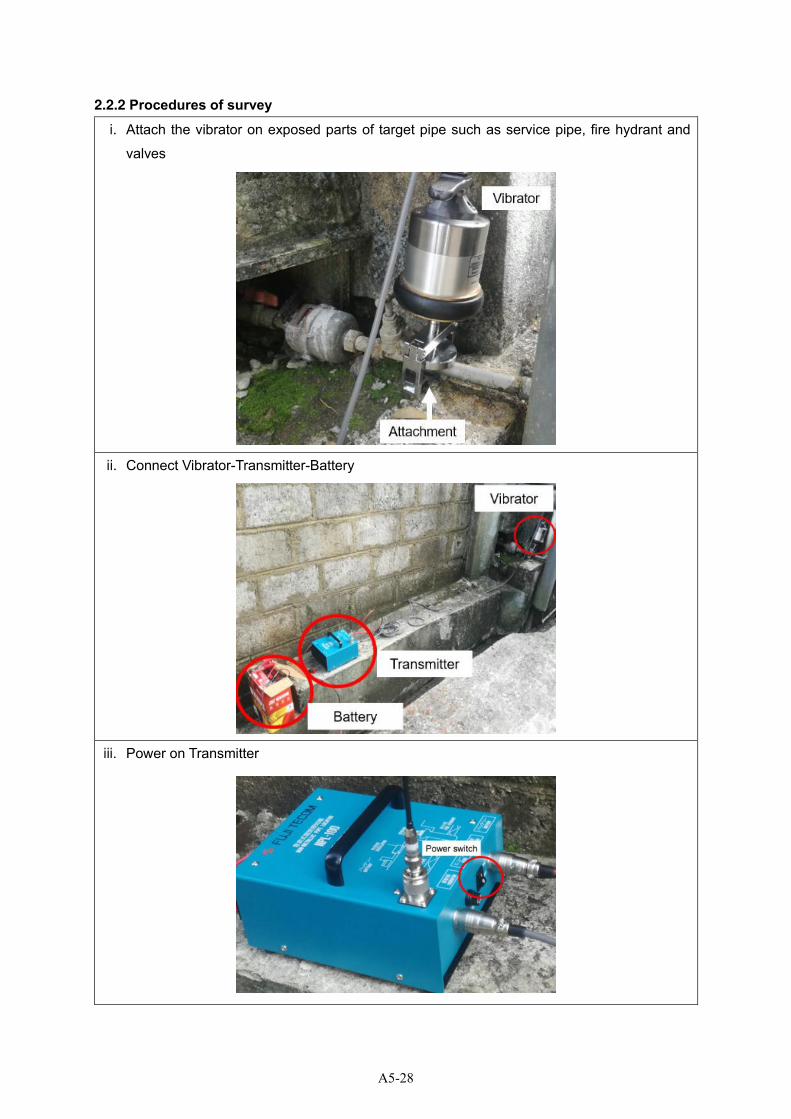
2.2.2 Procedures of survey
i. Attach the vibrator on exposed parts of target pipe such as service pipe, fire hydrant and
valves
ii. Connect Vibrator-Transmitter-Battery
iii. Power on Transmitter
A5-28
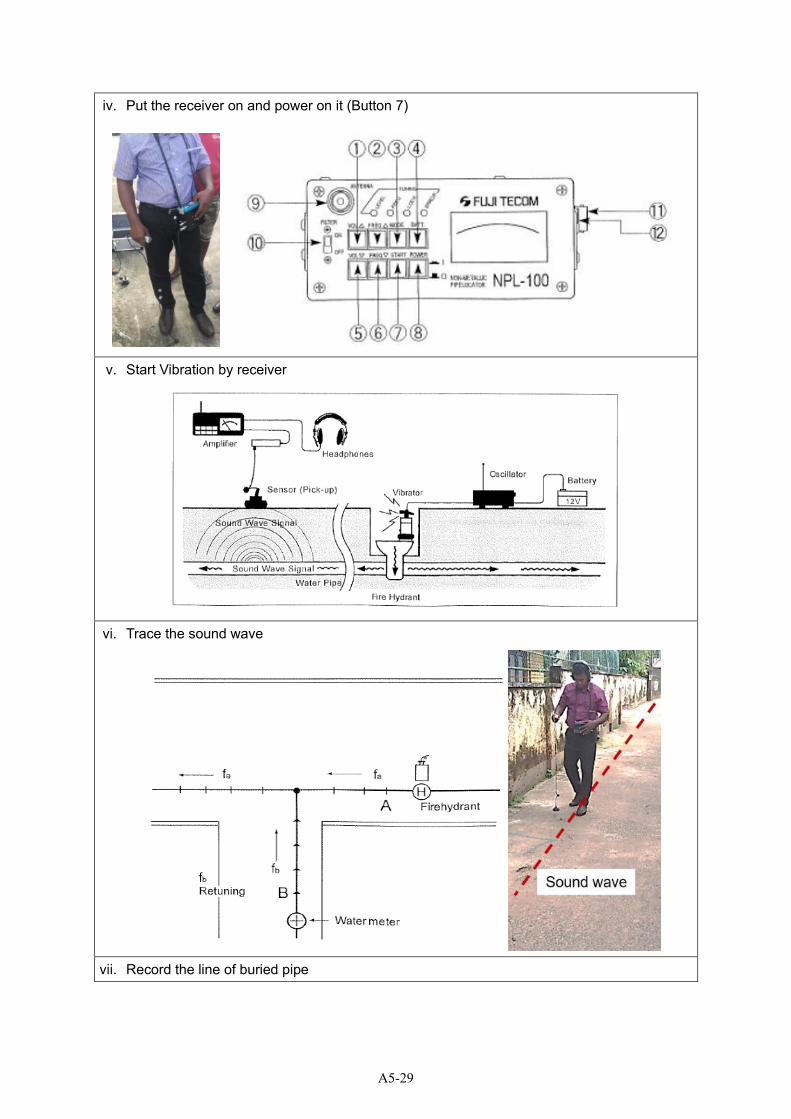
iv. Put the receiver on and power on it (Button 7)
v. Start Vibration by receiver
vi. Trace the sound wave
vii. Record the line of buried pipe
A5-29
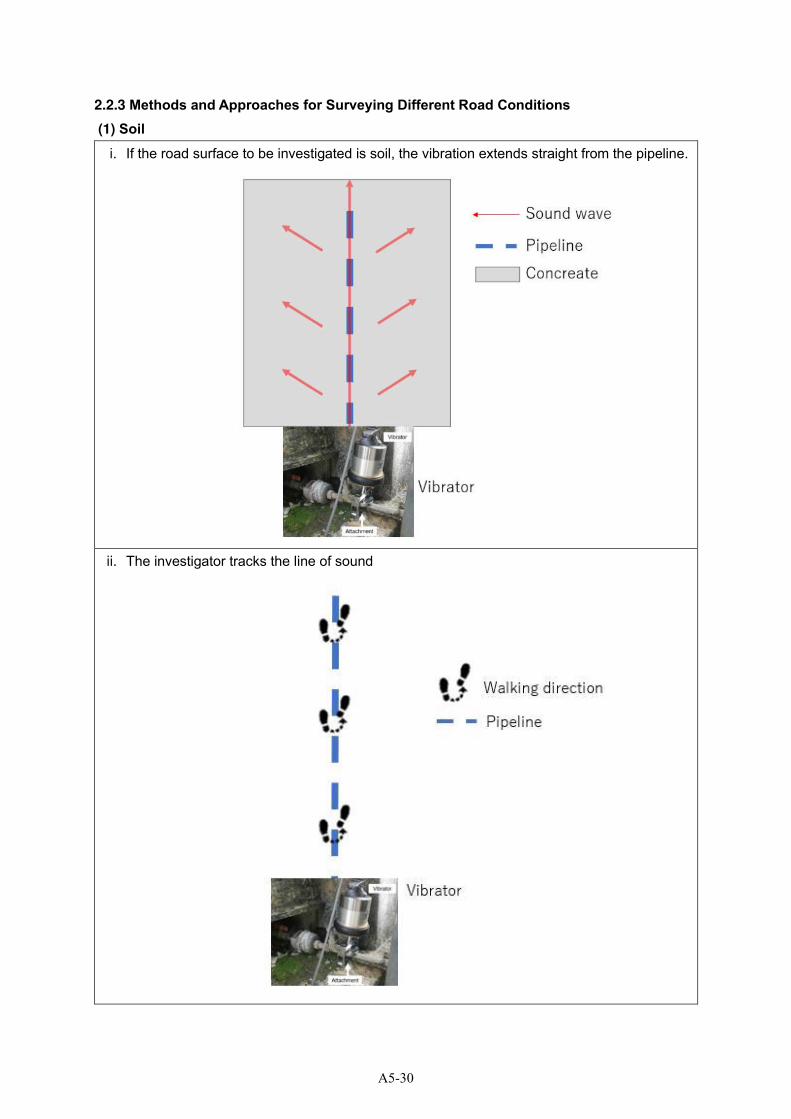
2.2.3 Methods and Approaches for Surveying Different Road Conditions
(1) Soil i. If the road surface to be investigated is soil, the vibration extends straight from the pipeline.
ii. The investigator tracks the line of sound
A5-30
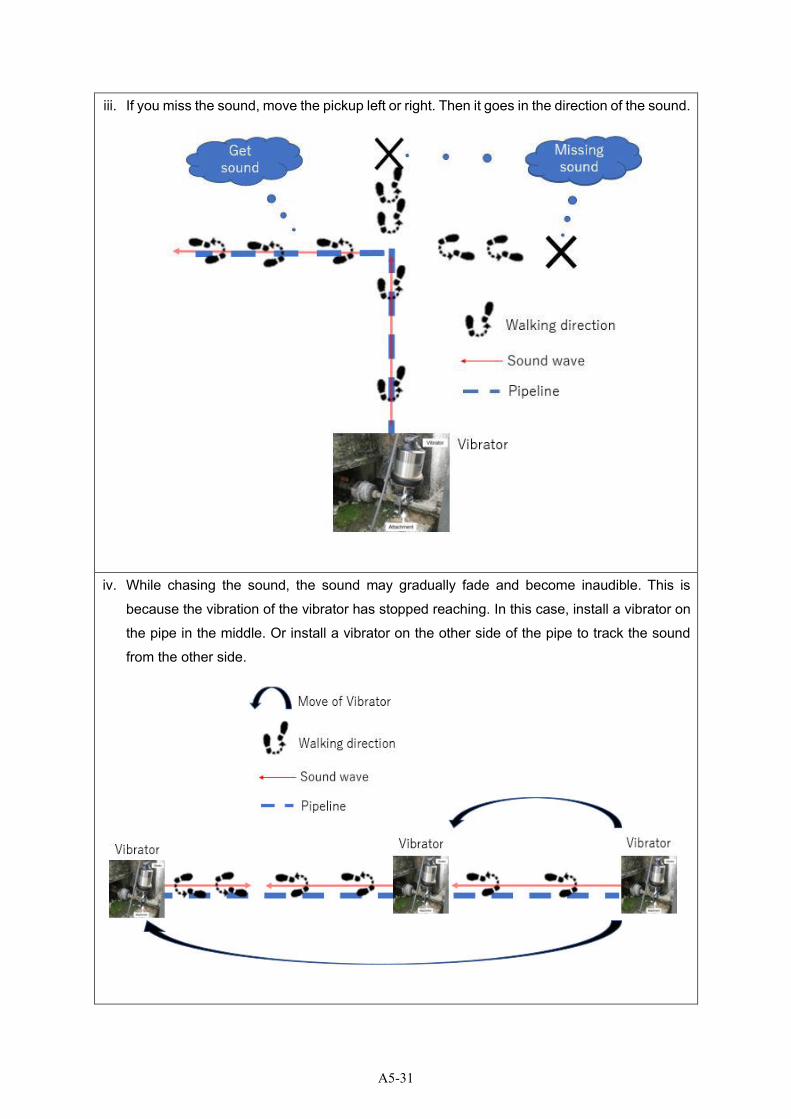
iii. If you miss the sound, move the pickup left or right. Then it goes in the direction of the sound.
iv. While chasing the sound, the sound may gradually fade and become inaudible. This is
because the vibration of the vibrator has stopped reaching. In this case, install a vibrator on
the pipe in the middle. Or install a vibrator on the other side of the pipe to track the sound
from the other side.
A5-31
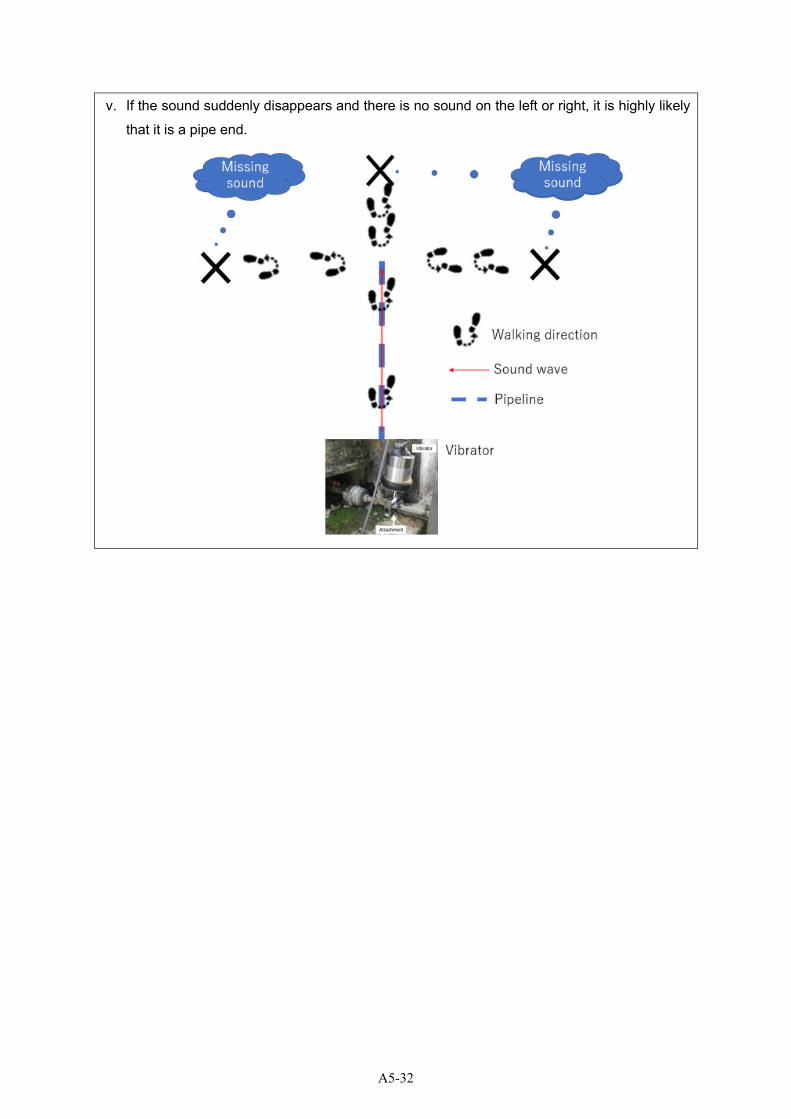
v. If the sound suddenly disappears and there is no sound on the left or right, it is highly likely
that it is a pipe end.
A5-32
(2) Concreate
i. When survey on concrete pavement, the difficulty of surveying is high. The sound wave
propagate to the concrete pavement and diffuses through it.Therefore, in order to find a pipe
line, the sound on the pipe line must be compared to the sound diffused on the concrete to
determine which sound is on the pipe..
ii. In this case, sound propagates as shown in the image below. The deep color part is the area
where the sound propagates strongly.
A5-33
iii. When investigating on concrete pavement, walk in a zig-zag fashion based on where the
sound is strongest, as shown in the figure below. Then, when the sound gets quiet, return to
the center of the pavement and repeat the process.
iv. The idea when there is no sound is the same as for soil.
A5-34
2.2.4 Other method for pipe locating
(1) Magnetic wave method
A5-35

(2) Dowsing method
A5-36
3 Practice
Practical training is conducted for buried valve and pipes in TY.
3.1 Valve locating
The target point of valve locating is as the figure of next page. A valve is buried in the target point.
The flow of training is as below.
Step Target Check point Purpose
1 Leakage pit Blue circle Detect buried leakage pits
2 Valve Yellow circle Detect buried valves
Step1:
Blue places are easy to detect. Initially, this is where you will learn how to use the equipment and
investigate.
Step:2
After gaining experience in the blue area, train in the yellow area.
A5-37
V-18
V-16
V-16
V-15
V-15
V-5
F-4
F-5
V-1
V-3 P-2
V-16
V-17
V-15 V-8
P-1 F-1
V-15 V-16 F-2
V-19
Water Tank
V-2
V-4
V-20
V-20
F-3
PG-1
PG-4
FV-1
FV-5
FV-6
PG-3 FV-2
P-3 V-6 PG-5 PG-2
FV-3 FV-4
V-9 V: Valve
FV: Flow control valve
PG: Pressure gauge
CG: Compound gauge
F: Flow meter
P: Pump
ST: Y-strainer
CV: Check valve
V-7
V-10 V-11
V-12
V-13
V-14
V-21
CG-2
CG-3
CG-1
V-22
ST-2
2221
CV-1
ST-1
2221
CV-3
CV-2
Pump room
Simple Drawing
Blue: Step1 Leakage pit Yellow: Step2 Valve
A5-38
Blue: Step1 Leakage pit Yellow: Step2 Valve
A5-39

3.2 Pipe locating
The target line locating is as the figure of next page.
The flow of training is as below.
Step Target Check point Purpose
1 Metal pipe Line where V-11
locates
Learn the way of metal pipe tracing
2 Non-metal Other lines Learn the way of non-metal pipe tracing
A5-40
= Target line
V-18
V-16
V-16
V-15
V-15
V-5
F-4
F-5
V-1
V-3 P-2
V-16
V-17
V-15 V-8
P-1 F-1
V-15 V-16 F-2
V-19
Water Tank
V-2
V-4
V-20
V-20
F-3
PG-1
PG-4
FV-1
FV-5
FV-6
PG-3 FV-2
P-3 V-6 PG-5 PG-2
FV-3 FV-4
V-9 V: Valve
FV: Flow control valve
PG: Pressure gauge
CG: Compound gauge
F: Flow meter
P: Pump
ST: Y-strainer
CV: Check valve
V-7
V-10 V-11
V-12
V-13
V-14
V-21
CG-2
CG-3
CG-1
V-22
ST-2
2221
CV-1
ST-1
2221
CV-3
CV-2
Pump room
A5-41
Result of the Leak detection & Line Trace training.
(1) Leak detection on concrete surface
Issue The sound of the leak is too difficult to identify the point of the leak, especially under
high pressure.
Suggestion Turn the volume of the Leak Detector down during the survey. In this way, you will hear
the leak only near the pinpoint location.
However, in the actual site survey, you must detect for leaks that we do not know where
they are. At that time, if the volume is reduced from the beginning, it may not be
possible to detect the leakage.
Therefore, at the actual site, the survey is conducted according to the following
procedure.
JET recommend that you follow the same procedure at TY.
Result • NWSDB R/P followed the recommended methods.
• But the issue is the same as previous, because R/P said that they can easily identified the leak area but it very hard to pinpoint the leakage.
Step 1 Survey starts away from the leak point and identify leaking pipe
A5-42
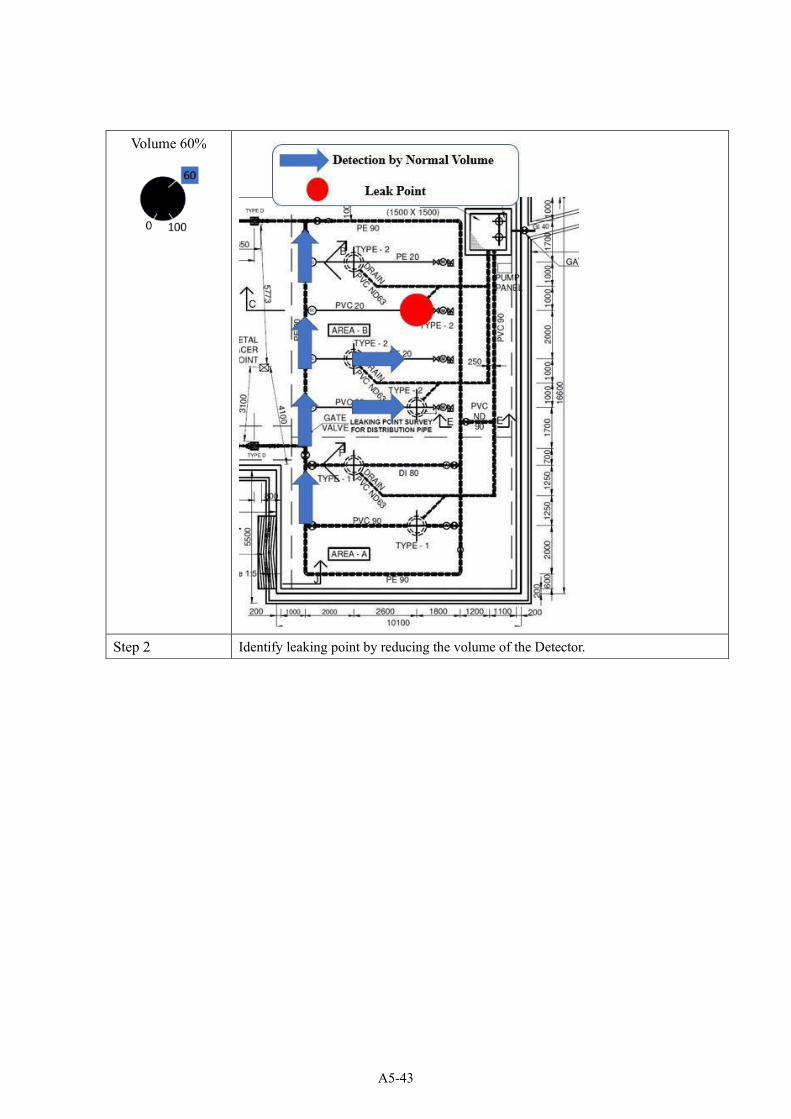
Volume 60%
Step 2 Identify leaking point by reducing the volume of the Detector.
A5-43
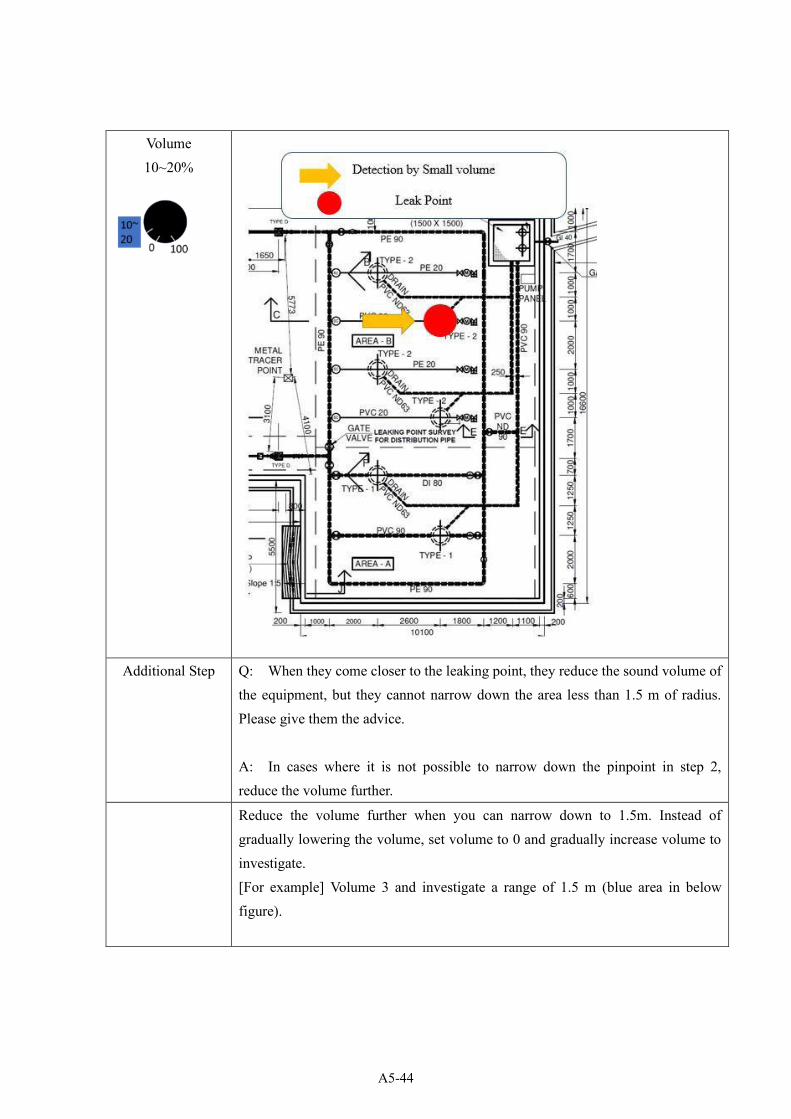
Volume
10~20%
Additional Step Q: When they come closer to the leaking point, they reduce the sound volume of the equipment, but they cannot narrow down the area less than 1.5 m of radius. Please give them the advice.
A: In cases where it is not possible to narrow down the pinpoint in step 2, reduce the volume further.
Reduce the volume further when you can narrow down to 1.5m. Instead of gradually lowering the volume, set volume to 0 and gradually increase volume to investigate. [For example] Volume 3 and investigate a range of 1.5 m (blue area in below figure).
A5-44
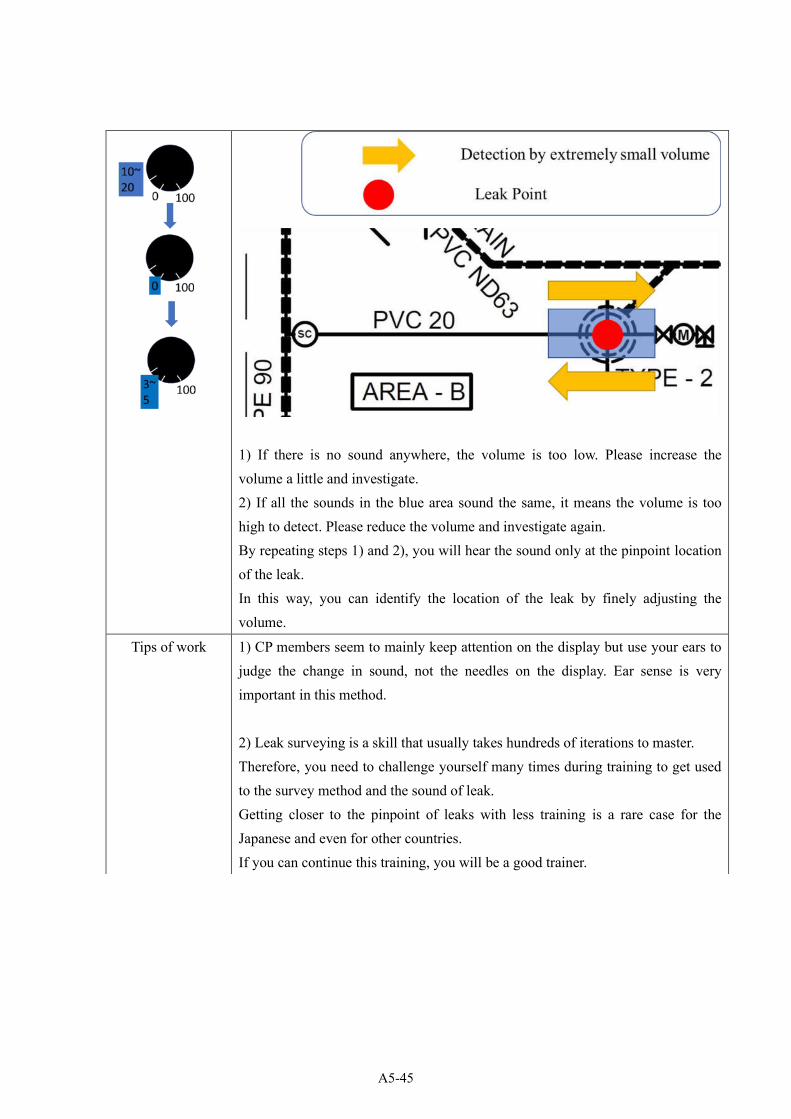
1) If there is no sound anywhere, the volume is too low. Please increase the volume a little and investigate. 2) If all the sounds in the blue area sound the same, it means the volume is too high to detect. Please reduce the volume and investigate again. By repeating steps 1) and 2), you will hear the sound only at the pinpoint location of the leak. In this way, you can identify the location of the leak by finely adjusting the volume.
Tips of work 1) CP members seem to mainly keep attention on the display but use your ears to judge the change in sound, not the needles on the display. Ear sense is very important in this method.
2) Leak surveying is a skill that usually takes hundreds of iterations to master. Therefore, you need to challenge yourself many times during training to get used to the survey method and the sound of leak. Getting closer to the pinpoint of leaks with less training is a rare case for the Japanese and even for other countries. If you can continue this training, you will be a good trainer.
A5-45
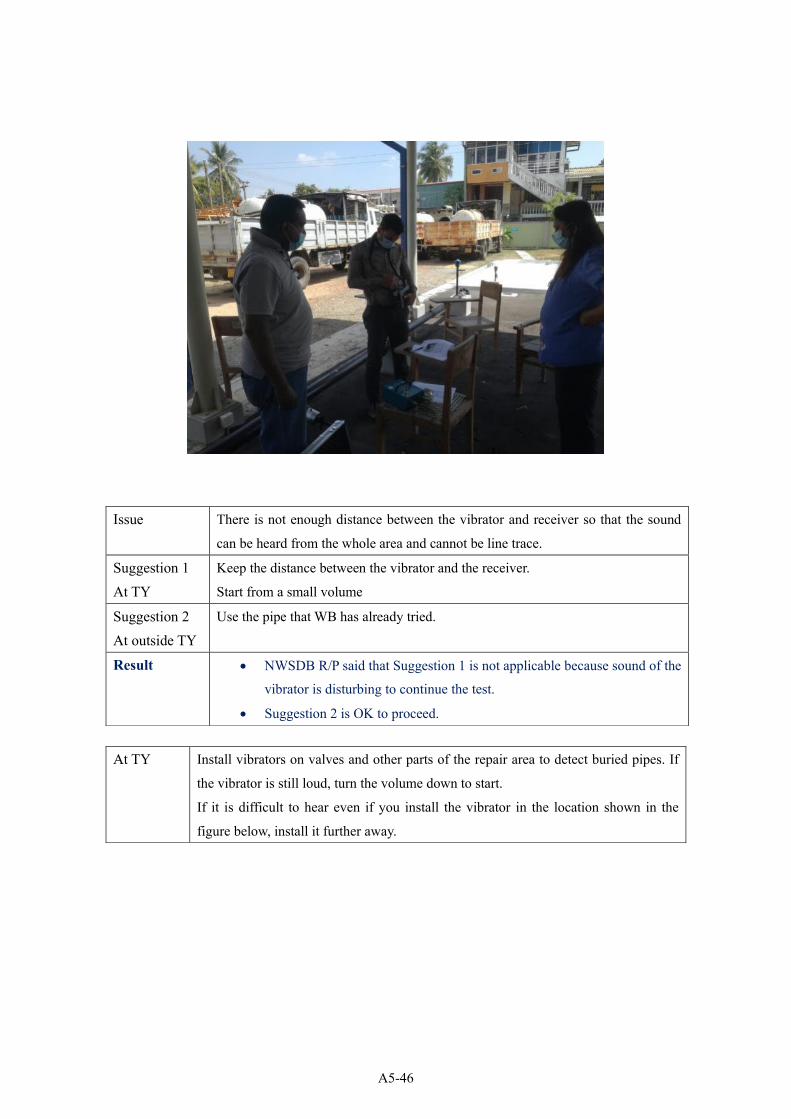
Issue There is not enough distance between the vibrator and receiver so that the sound
can be heard from the whole area and cannot be line trace.
Suggestion 1
At TY
Keep the distance between the vibrator and the receiver.
Start from a small volume
Suggestion 2
At outside TY
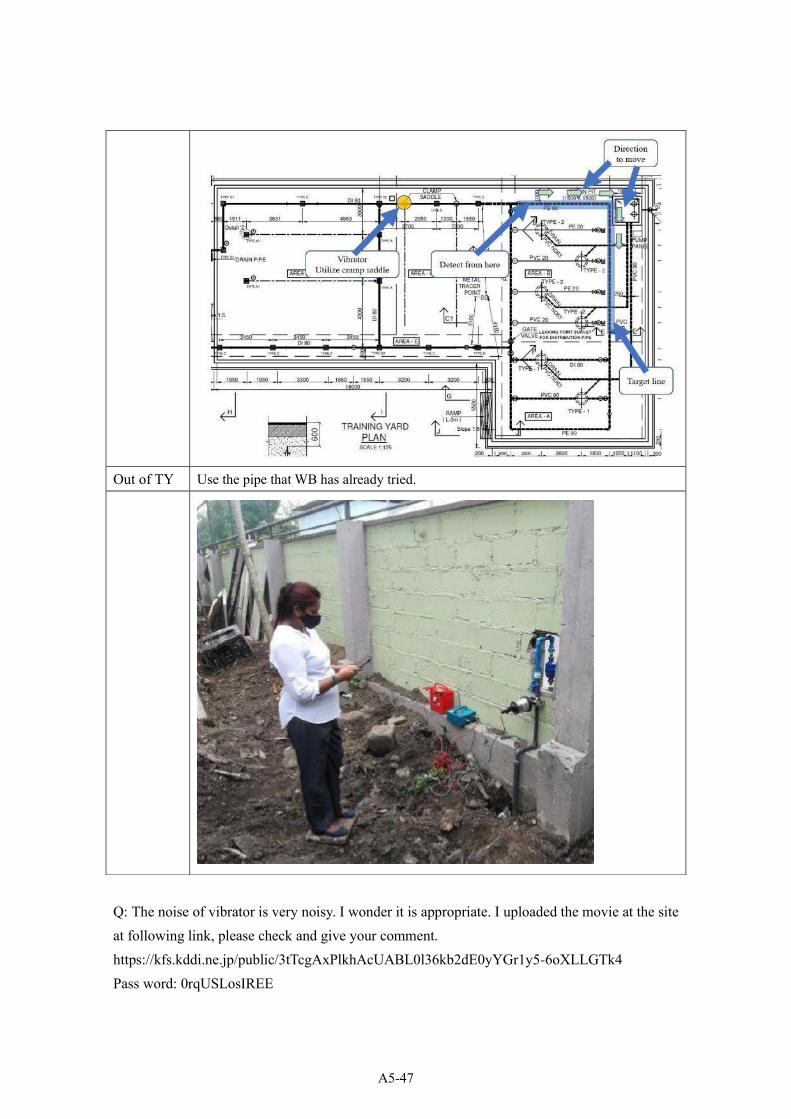
Use the pipe that WB has already tried.
Result • NWSDB R/P said that Suggestion 1 is not applicable because sound of the vibrator is disturbing to continue the test.
• Suggestion 2 is OK to proceed.
At TY Install vibrators on valves and other parts of the repair area to detect buried pipes. If
the vibrator is still loud, turn the volume down to start.
If it is difficult to hear even if you install the vibrator in the location shown in the
figure below, install it further away.
A5-46
Q: The noise of vibrator is very noisy. I wonder it is appropriate. I uploaded the movie at the site at following link, please check and give your comment. https://kfs.kddi.ne.jp/public/3tTcgAxPlkhAcUABL0l36kb2dE0yYGr1y5-6oXLLGTk4
Pass word: 0rqUSLosIREE
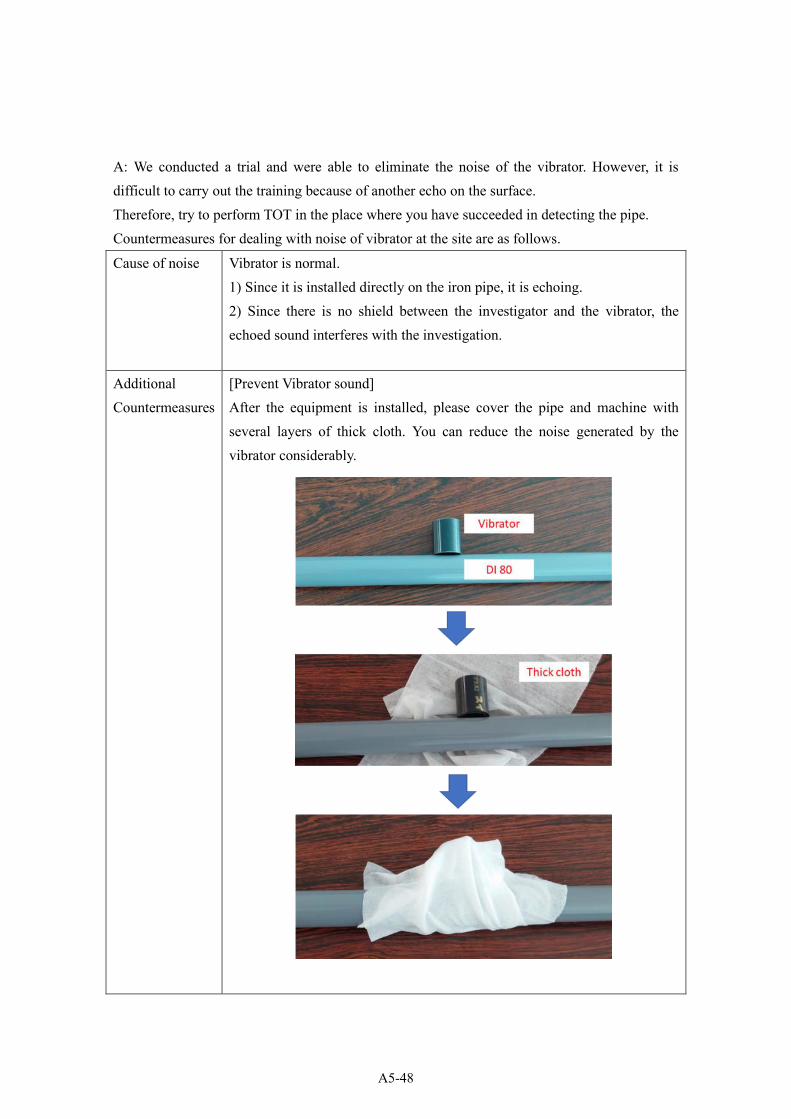
Out of TY Use the pipe that WB has already tried.
A5-47
A: We conducted a trial and were able to eliminate the noise of the vibrator. However, it is difficult to carry out the training because of another echo on the surface. Therefore, try to perform TOT in the place where you have succeeded in detecting the pipe. Countermeasures for dealing with noise of vibrator at the site are as follows. Cause of noise Vibrator is normal.
1) Since it is installed directly on the iron pipe, it is echoing. 2) Since there is no shield between the investigator and the vibrator, the echoed sound interferes with the investigation.
Additional Countermeasures
[Prevent Vibrator sound] After the equipment is installed, please cover the pipe and machine with several layers of thick cloth. You can reduce the noise generated by the vibrator considerably.
A5-48
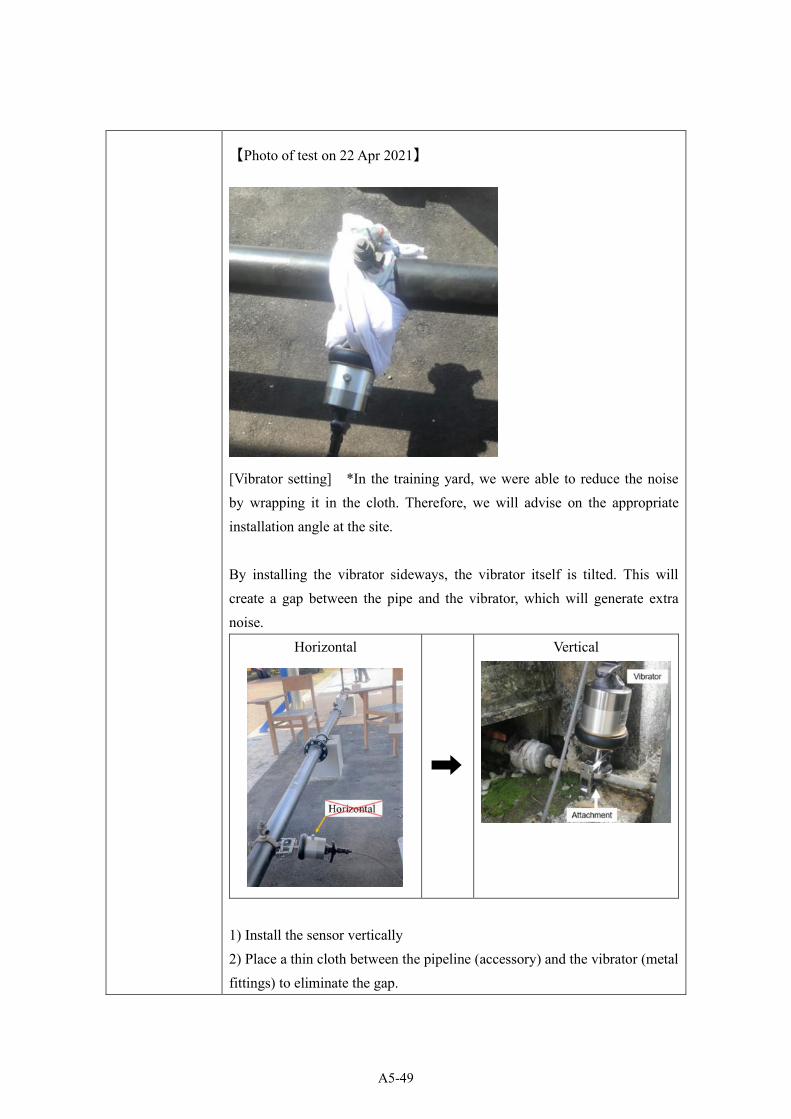
【Photo of test on 22 Apr 2021】
[Vibrator setting] *In the training yard, we were able to reduce the noise by wrapping it in the cloth. Therefore, we will advise on the appropriate installation angle at the site.
By installing the vibrator sideways, the vibrator itself is tilted. This will create a gap between the pipe and the vibrator, which will generate extra noise.
Horizontal
➡
Vertical
1) Install the sensor vertically
2) Place a thin cloth between the pipeline (accessory) and the vibrator (metal fittings) to eliminate the gap.
A5-49
[Others] The engine of the truck is running beside at TY in the video. When conducting a listening survey, make sure that there is no other noise. Please turn off the engine next time.
Tips of work There is also a lot of noise in the field. It is important to reduce the sound other than that heard from the detector.
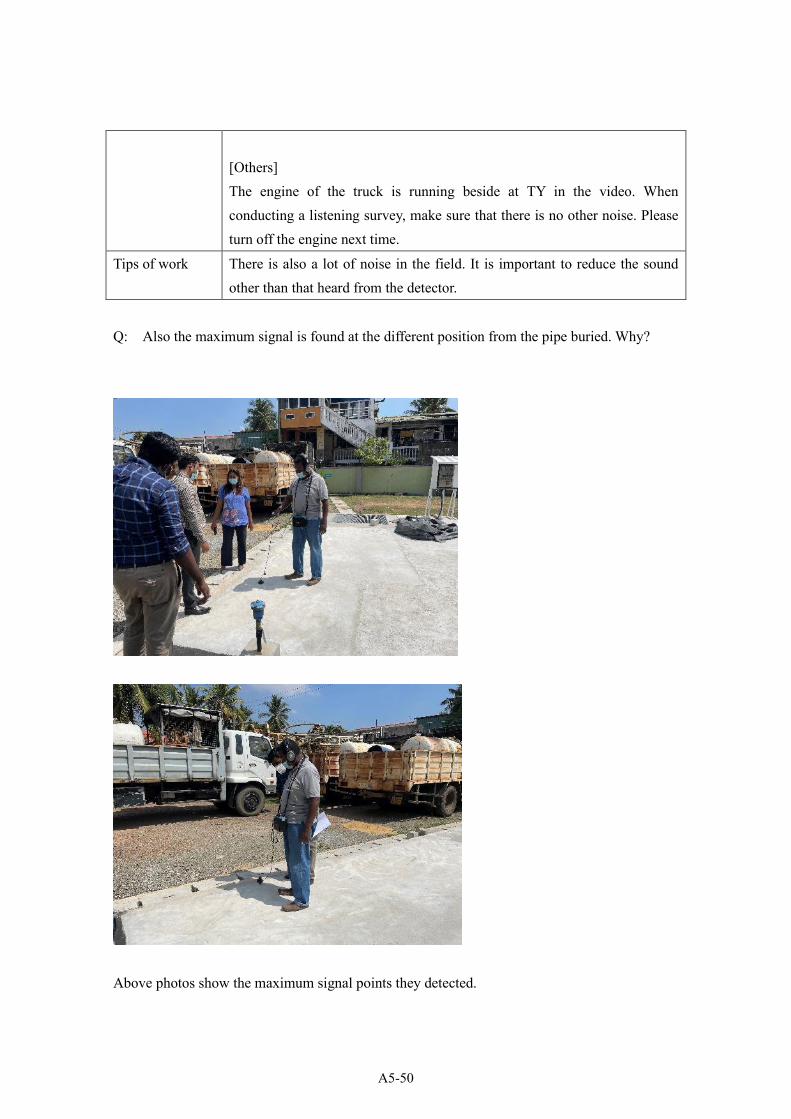
Q: Also the maximum signal is found at the different position from the pipe buried. Why?
Above photos show the maximum signal points they detected.
A5-50

Investigation of the cause
The noise of the vibrator may affect it. After reducing the noise of the vibrator, I investigated it again. As a result, the sound was reduced, but it was found to be a little higher than the location on the nearby pipeline.
Cause of Peak sound (Possibility)
A1: Sound is echoing in the side gutter A2: Sound echoing in the buried rebar A3: Some of the above factors mixed.
A5-51
Training Guideline
2. Distribution Pipe Installation
a. HDPE Distribution Pipe Installation
A5-52
Table of contents
1 Outline ........................................................................................................................................... 1
1.1 Purpose ................................................................................................................................... 1
1.2 Flow of training with time schedule ........................................................................................ 2
1.3 Safety notice ........................................................................................................................... 3
2 Knowledge acquisition ................................................................................................................... 4
2.1 Outline of HDPE ..................................................................................................................... 4
2.2 Jointing method ...................................................................................................................... 5
2.2.1 Butt fusion joint ................................................................................................................. 5
2.2.2 Flange joint ....................................................................................................................... 6
2.2.3 Electro fusion joint ............................................................................................................ 6
2.3 Construction management ..................................................................................................... 6
3 Practice .......................................................................................................................................... 7
3.1 Butt fusion joint ....................................................................................................................... 7
3.2 Flange joint ............................................................................................................................. 7
3.3 Tapping ................................................................................................................................... 9
3.4 Pressure test ........................................................................................................................... 9
A5-53
1 Outline
1.1 Purpose
Purpose of training The purpose of this training is to provide a practical training on installation
of HDPE distribution pipes, pressure Tapping and pressure test. Also, it is
important to share the knowledge of this training with not only the staff of
NWSDB but also contractors.
Training Contents ➢ Butt fusion joint
➢ Flange joint
➢ Under Pressure Tapping
➢ Pressure test
A5-54

1.2 Flow of training with time schedule
The total time is 3 hours and 30 minutes.
No. Activity Required time Venue
1 Lecture 45 min. Lecture room
2 Move to TY 5 min. TY & Warehouse
(Distribution pipe or Service pipe
connection area)
3 Preparation for practical
training
10 min.
*Details are described in “3 Practice (Page 7)”
*Activate pump of TY
*Wear work clothes
(Clothes, safety shoes, gloves, hard hat)
*Bring necessary tools and equipment from warehouse
4 Practical training 120 min TY
*Details are described in “3 Practice (Page 7)”
➢ Butt fusion joint
➢ Flange joint
➢ Under Pressure Tapping
➢ Pressure test
5 Return tools &
equipment and clean up
10 min. TY & Warehouse
6 Move to lecture room 5 min. Lecture room
7 Q & A & evaluation 15 min. Lecture room
*Use Evaluation sheet
A5-55

1.3 Safety notice
➢ All members must wear safety equipment in TY. RP should order to participants wearing
suitable item
➢ Do not sit on the pipes or put your foot on.
➢ Do not touch the installed equipment unnecessarily.
➢ Do not eat food in the TY.
A5-56
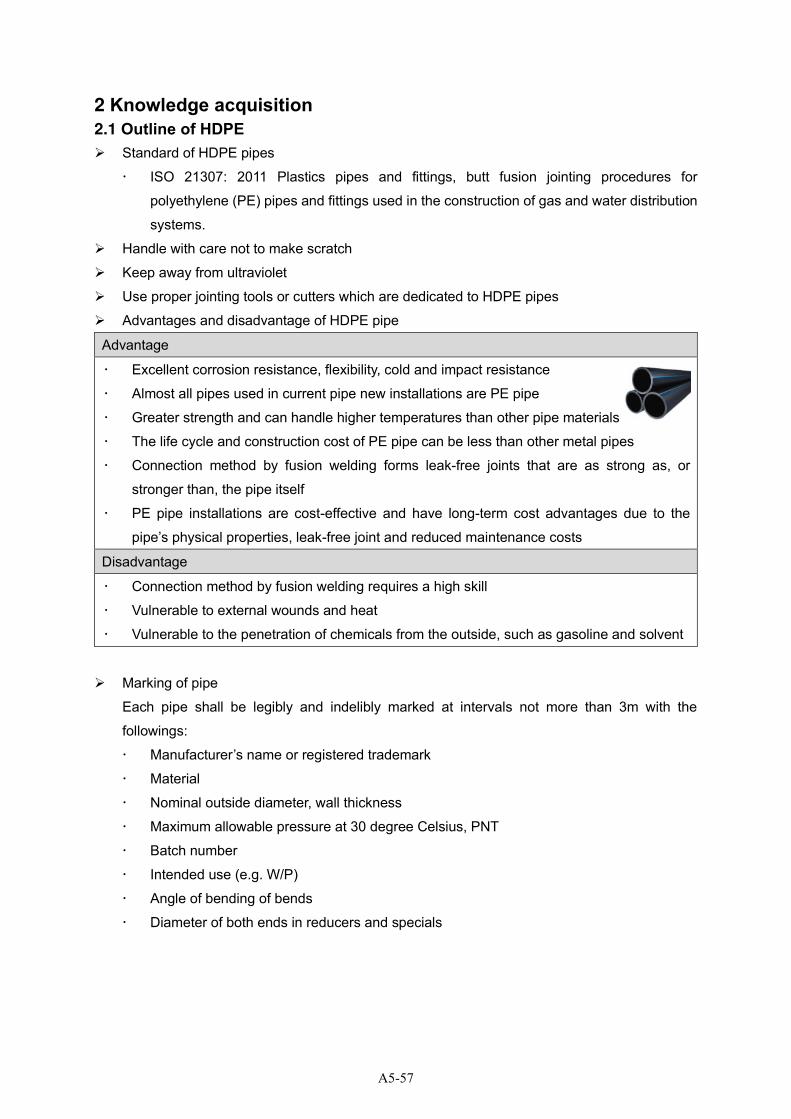
2 Knowledge acquisition
2.1 Outline of HDPE
➢ Standard of HDPE pipes
ISO 21307: 2011 Plastics pipes and fittings, butt fusion jointing procedures for
polyethylene (PE) pipes and fittings used in the construction of gas and water distribution
systems.
➢ Handle with care not to make scratch
➢ Keep away from ultraviolet
➢ Use proper jointing tools or cutters which are dedicated to HDPE pipes
➢ Advantages and disadvantage of HDPE pipe
Advantage
Excellent corrosion resistance, flexibility, cold and impact resistance
Almost all pipes used in current pipe new installations are PE pipe
Greater strength and can handle higher temperatures than other pipe materials
The life cycle and construction cost of PE pipe can be less than other metal pipes
Connection method by fusion welding forms leak-free joints that are as strong as, or
stronger than, the pipe itself
PE pipe installations are cost-effective and have long-term cost advantages due to the
pipe’s physical properties, leak-free joint and reduced maintenance costs
Disadvantage
Connection method by fusion welding requires a high skill
Vulnerable to external wounds and heat
Vulnerable to the penetration of chemicals from the outside, such as gasoline and solvent
➢ Marking of pipe
Each pipe shall be legibly and indelibly marked at intervals not more than 3m with the
followings:
Manufacturer’s name or registered trademark
Material
Nominal outside diameter, wall thickness
Maximum allowable pressure at 30 degree Celsius, PNT
Batch number
Intended use (e.g. W/P)
Angle of bending of bends
Diameter of both ends in reducers and specials
A5-57
2.2 Jointing method
There are mainly three jointing method for HDPE distribution pipes: Butt fusion, Flange joint and
Electro fusion joint.
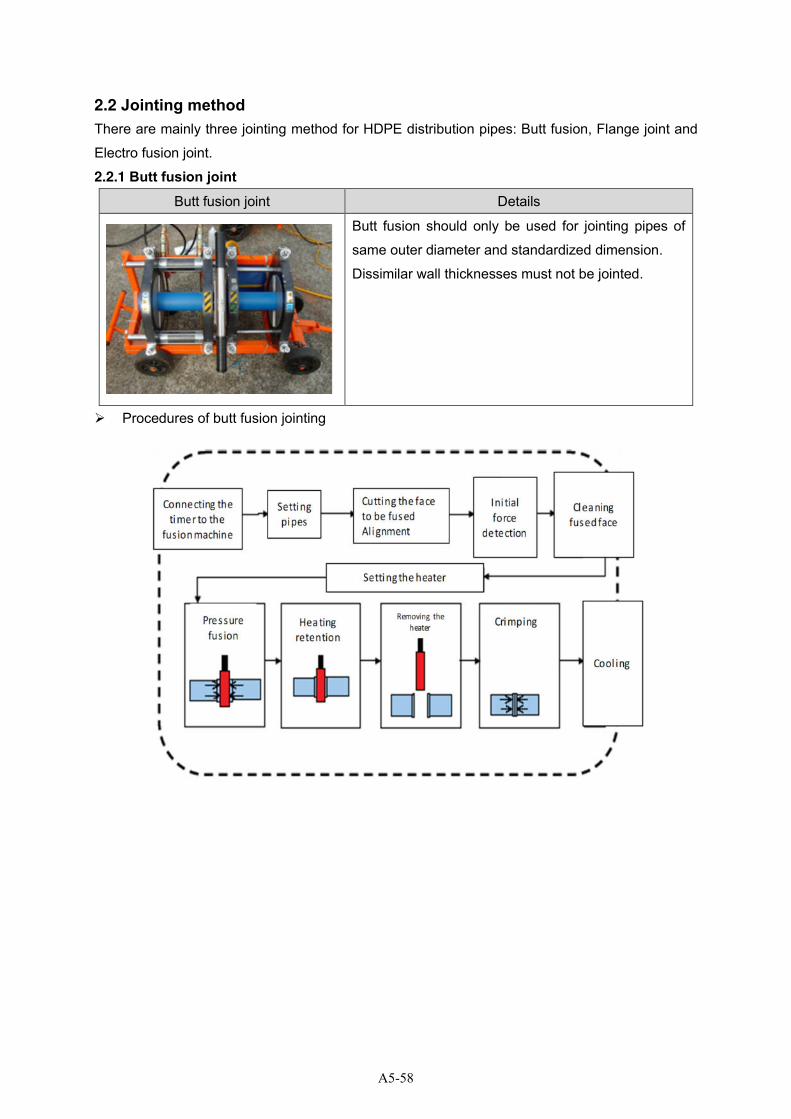
2.2.1 Butt fusion joint Butt fusion joint Details
Butt fusion should only be used for jointing pipes of
same outer diameter and standardized dimension.
Dissimilar wall thicknesses must not be jointed.
➢ Procedures of butt fusion jointing
A5-58
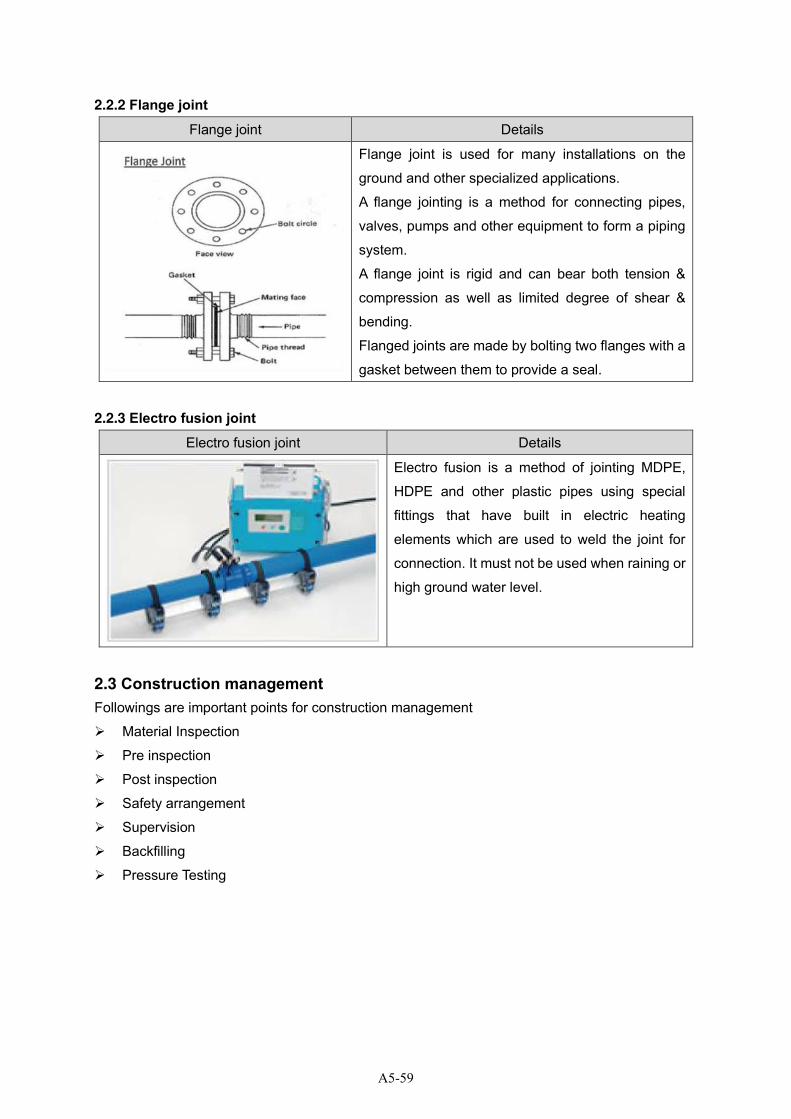
2.2.2 Flange joint Flange joint Details
Flange joint is used for many installations on the
ground and other specialized applications.
A flange jointing is a method for connecting pipes,
valves, pumps and other equipment to form a piping
system.
A flange joint is rigid and can bear both tension &
compression as well as limited degree of shear &
bending.
Flanged joints are made by bolting two flanges with a
gasket between them to provide a seal.
2.2.3 Electro fusion joint Electro fusion joint Details
Electro fusion is a method of jointing MDPE,
HDPE and other plastic pipes using special
fittings that have built in electric heating
elements which are used to weld the joint for
connection. It must not be used when raining or
high ground water level.
2.3 Construction management Followings are important points for construction management
➢ Material Inspection
➢ Pre inspection
➢ Post inspection
➢ Safety arrangement
➢ Supervision
➢ Backfilling
➢ Pressure Testing
A5-59
3 Practice
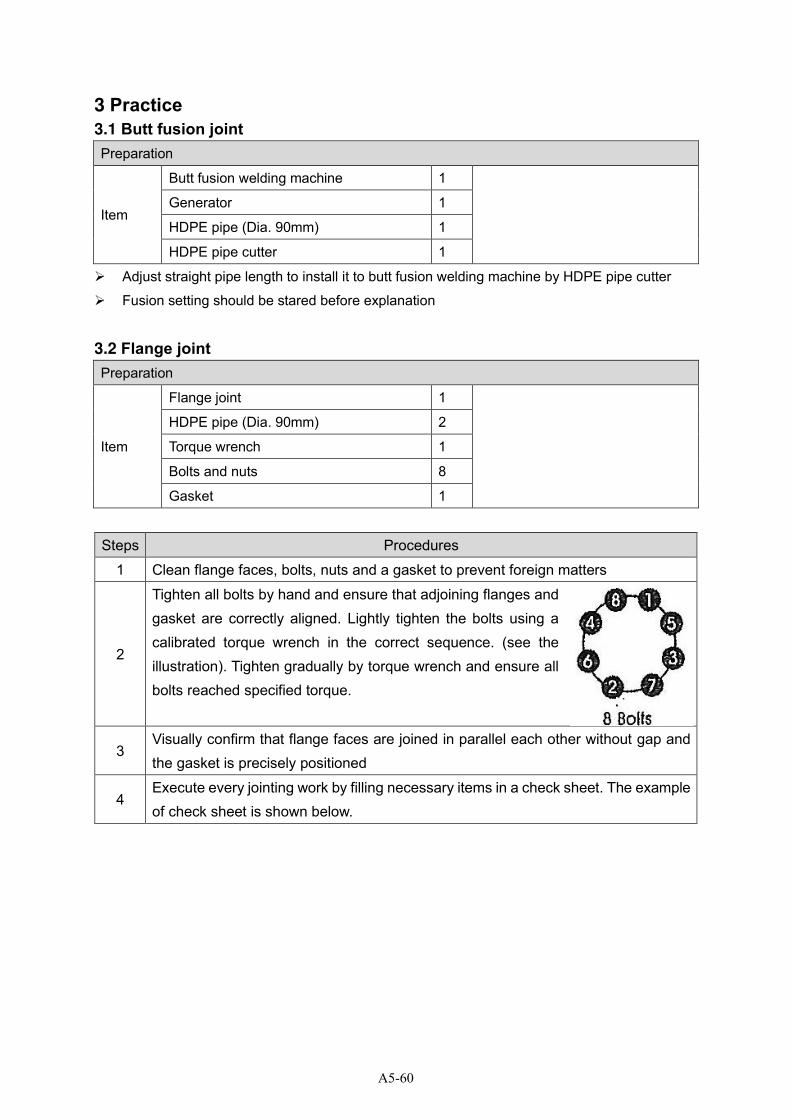
3.1 Butt fusion joint Preparation
Item
Butt fusion welding machine 1
Generator 1
HDPE pipe (Dia. 90mm) 1
HDPE pipe cutter 1
➢ Adjust straight pipe length to install it to butt fusion welding machine by HDPE pipe cutter
➢ Fusion setting should be stared before explanation
3.2 Flange joint Preparation
Item
Flange joint 1
HDPE pipe (Dia. 90mm) 2
Torque wrench 1
Bolts and nuts 8
Gasket 1
Steps Procedures
1 Clean flange faces, bolts, nuts and a gasket to prevent foreign matters
2
Tighten all bolts by hand and ensure that adjoining flanges and gasket are correctly aligned. Lightly tighten the bolts using a calibrated torque wrench in the correct sequence. (see the illustration). Tighten gradually by torque wrench and ensure all bolts reached specified torque.
3 Visually confirm that flange faces are joined in parallel each other without gap and the gasket is precisely positioned
4 Execute every jointing work by filling necessary items in a check sheet. The example of check sheet is shown below.
A5-60
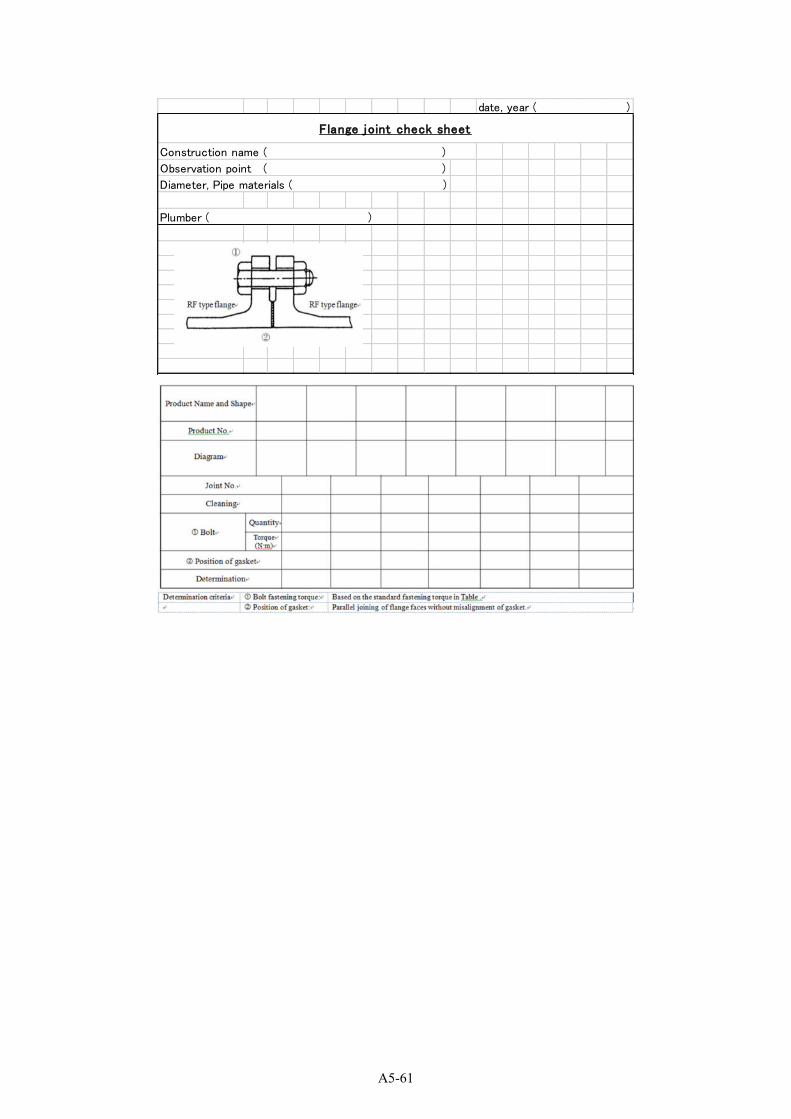
date, year ( )
Construction name ( )
Observation point ( )
Diameter, Pipe materials ( )
Plumber ( )
※ Used by Nagoya water works
②
①
Flange joint check sheet
A5-61
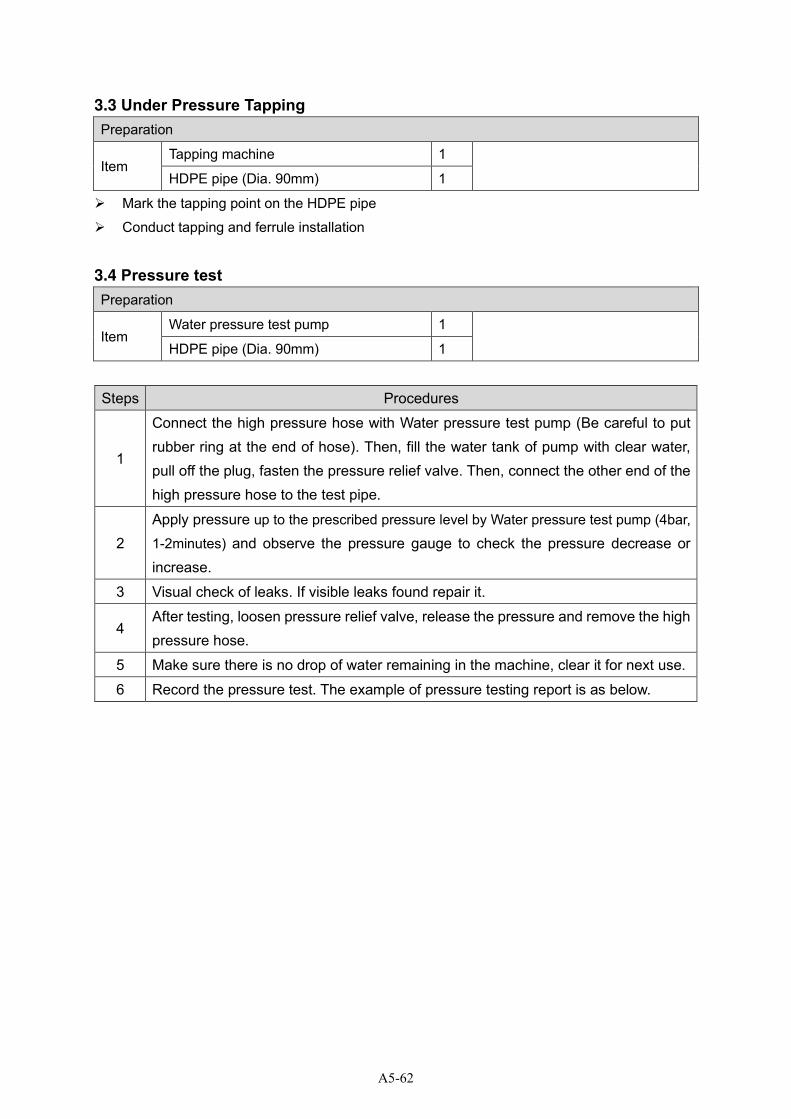
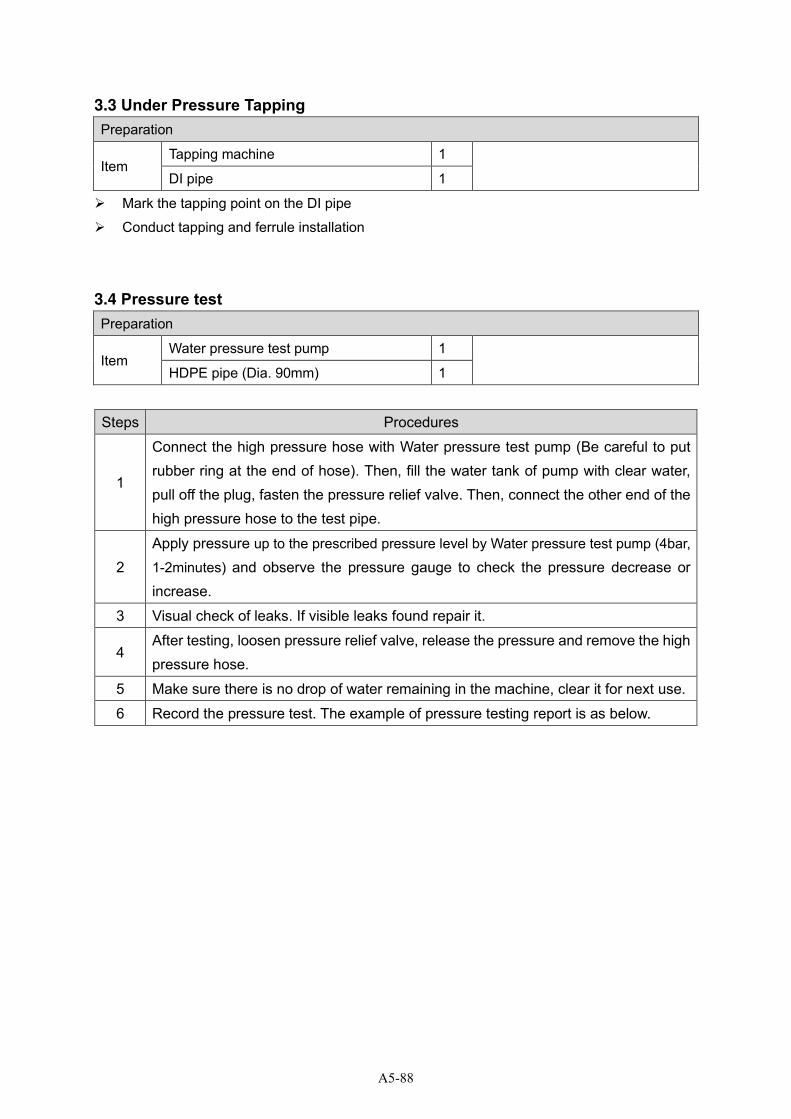
3.3 Under Pressure Tapping
Preparation
Item Tapping machine 1
HDPE pipe (Dia. 90mm) 1
➢ Mark the tapping point on the HDPE pipe
➢ Conduct tapping and ferrule installation
3.4 Pressure test Preparation
Item Water pressure test pump 1
HDPE pipe (Dia. 90mm) 1
Steps Procedures
1
Connect the high pressure hose with Water pressure test pump (Be careful to put rubber ring at the end of hose). Then, fill the water tank of pump with clear water, pull off the plug, fasten the pressure relief valve. Then, connect the other end of the high pressure hose to the test pipe.
2
Apply pressure up to the prescribed pressure level by Water pressure test pump (4bar,
1-2minutes) and observe the pressure gauge to check the pressure decrease or increase.
3 Visual check of leaks. If visible leaks found repair it.
4 After testing, loosen pressure relief valve, release the pressure and remove the high pressure hose.
5 Make sure there is no drop of water remaining in the machine, clear it for next use. 6 Record the pressure test. The example of pressure testing report is as below.
A5-62

A5-63
Training Guideline
2. Distribution Pipe Installation
b. PVC Distribution Pipe Installation
A5-64
Table of contents
1 Outline ........................................................................................................................................... 1
1.1 Purpose ................................................................................................................................... 1
1.2 Flow of training with time schedule ........................................................................................ 2
1.3 Safety notice ........................................................................................................................... 3
2 Knowledge acquisition ................................................................................................................... 4
2.1 Outline of PVC ........................................................................................................................ 4
2.2 Jointing method ...................................................................................................................... 6
2.2.1 Rubber ring joint ............................................................................................................... 6
2.2.2 Solvent cement joint ......................................................................................................... 6
2.3 Construction management ..................................................................................................... 6
3 Practice .......................................................................................................................................... 7
3.1 Rubber ring joint ..................................................................................................................... 7
3.2 Solvent cement joint ............................................................................................................... 9
A5-65

1 Outline
1.1 Purpose
Purpose of training To reconfirm the uPVC pipe connection procedures through a practical
training program and utilize the experience and knowledge in providing
guidance to the contractors at the time of supervising distribution pipe
laying.
Training Contents ➢ Rubber ring joint
➢ Solvent cement joint
A5-66
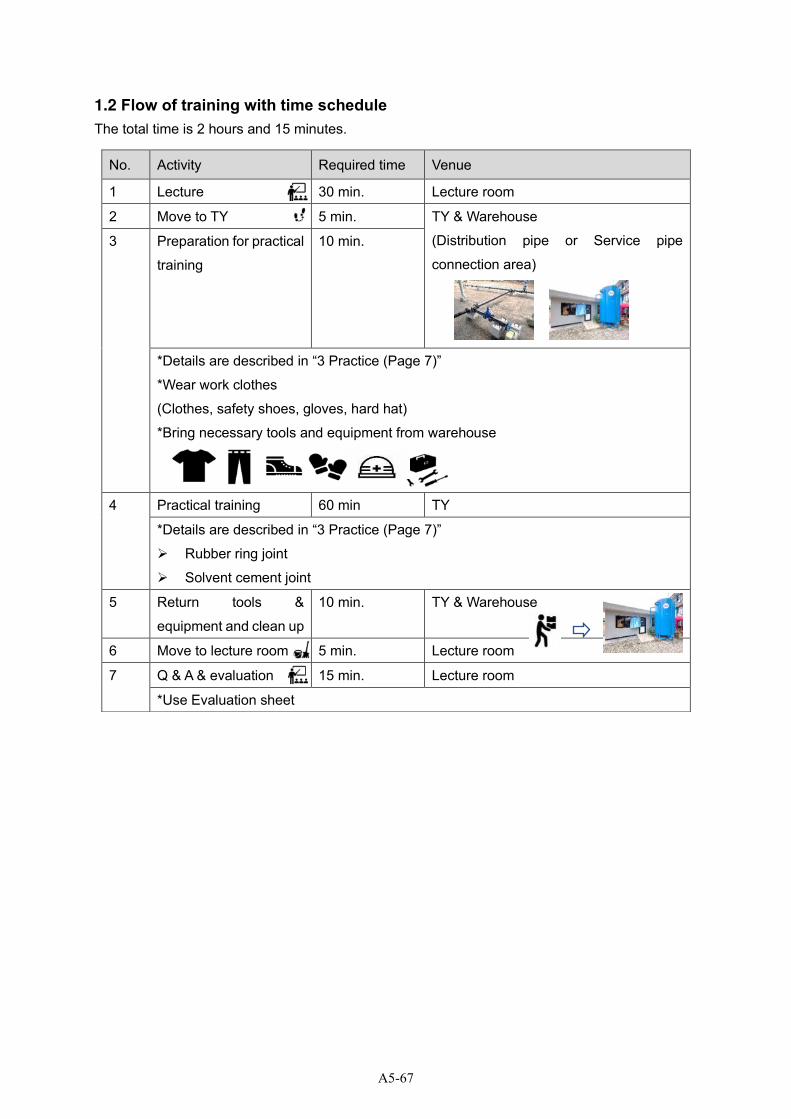
1.2 Flow of training with time schedule
The total time is 2 hours and 15 minutes.
No. Activity Required time Venue
1 Lecture 30 min. Lecture room
2 Move to TY 5 min. TY & Warehouse
(Distribution pipe or Service pipe
connection area)
3 Preparation for practical
training
10 min.
*Details are described in “3 Practice (Page 7)”
*Wear work clothes
(Clothes, safety shoes, gloves, hard hat)
*Bring necessary tools and equipment from warehouse
4 Practical training 60 min TY
*Details are described in “3 Practice (Page 7)”
➢ Rubber ring joint
➢ Solvent cement joint
5 Return tools &
equipment and clean up
10 min. TY & Warehouse
6 Move to lecture room 5 min. Lecture room
7 Q & A & evaluation 15 min. Lecture room
*Use Evaluation sheet
A5-67

1.3 Safety notice
➢ All members must wear safety equipment in TY. RP should order to participants wearing
suitable item
➢ Do not sit on the pipes or put your foot on.
➢ Do not touch the installed equipment unnecessarily.
➢ Do not eat food in the TY.
A5-68
2 Knowledge acquisition
2.1 Outline of PVC
➢ Standard of PVC pipes
SLS 147:2013 - Unplasticized poly (vinyl chloride) pipes for water supply and for buried
and above ground drainage and sewerage under pressure
ISO 1452:2009 - Plastic piping systems for water supply and for buried and above ground
drainage and sewerage under pressure—Unplasticized poly (vinyl chloride) (UPVC-U)
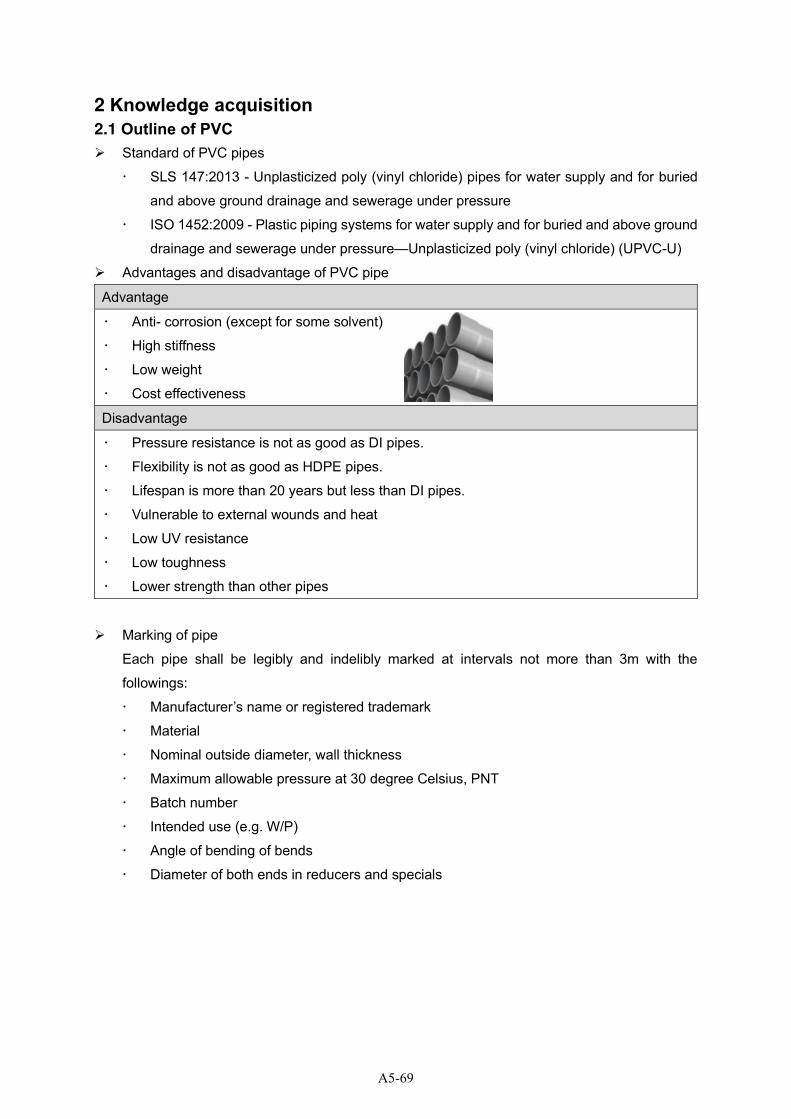
➢ Advantages and disadvantage of PVC pipe
Advantage
Anti- corrosion (except for some solvent)
High stiffness
Low weight
Cost effectiveness
Disadvantage
Pressure resistance is not as good as DI pipes.
Flexibility is not as good as HDPE pipes.
Lifespan is more than 20 years but less than DI pipes.
Vulnerable to external wounds and heat
Low UV resistance
Low toughness
Lower strength than other pipes
➢ Marking of pipe
Each pipe shall be legibly and indelibly marked at intervals not more than 3m with the
followings:
Manufacturer’s name or registered trademark
Material
Nominal outside diameter, wall thickness
Maximum allowable pressure at 30 degree Celsius, PNT
Batch number
Intended use (e.g. W/P)
Angle of bending of bends
Diameter of both ends in reducers and specials
A5-69
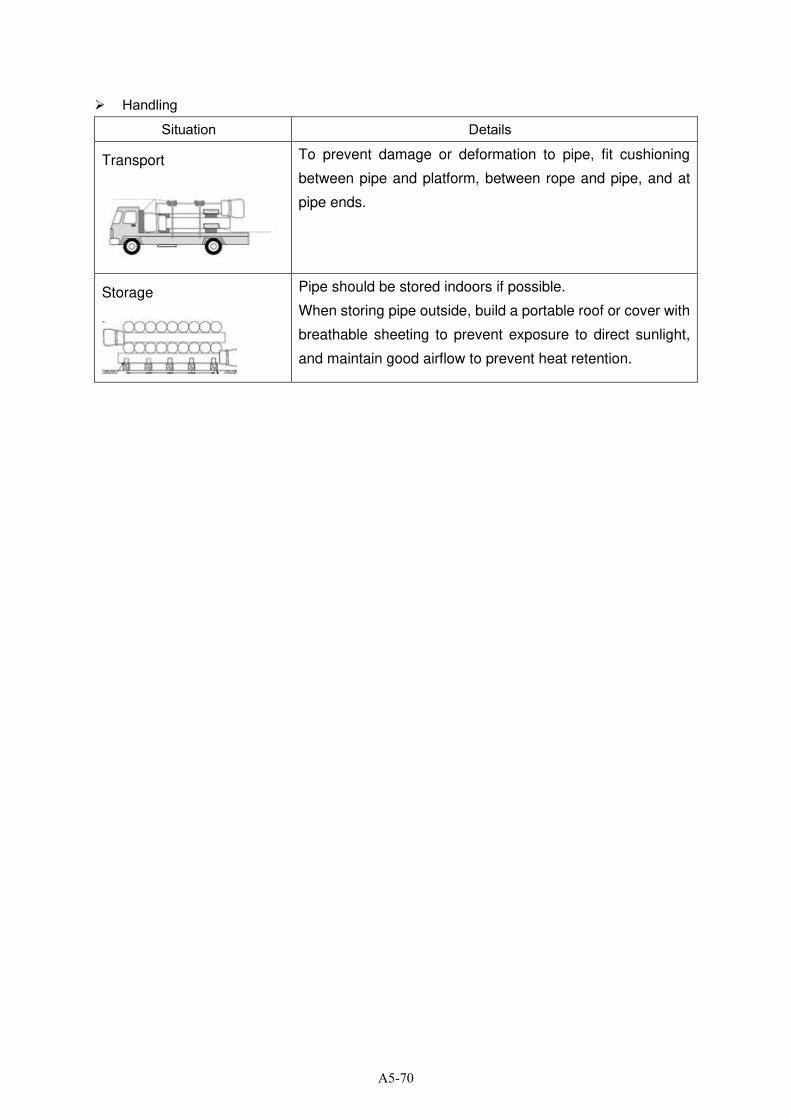
➢ Handling
Situation Details
Transport
To prevent damage or deformation to pipe, fit cushioning
between pipe and platform, between rope and pipe, and at
pipe ends.
Storage
Pipe should be stored indoors if possible.
When storing pipe outside, build a portable roof or cover with
breathable sheeting to prevent exposure to direct sunlight,
and maintain good airflow to prevent heat retention.
A5-70
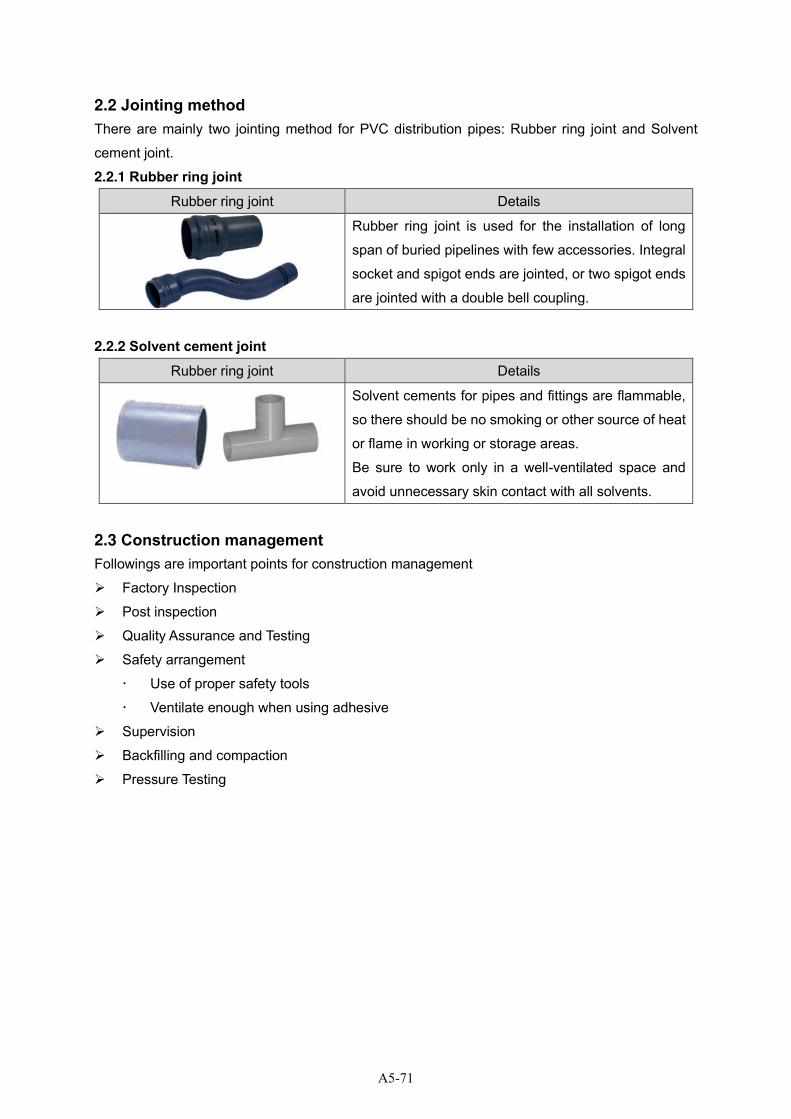
2.2 Jointing method
There are mainly two jointing method for PVC distribution pipes: Rubber ring joint and Solvent
cement joint.
2.2.1 Rubber ring joint Rubber ring joint Details
Rubber ring joint is used for the installation of long
span of buried pipelines with few accessories. Integral
socket and spigot ends are jointed, or two spigot ends
are jointed with a double bell coupling.
2.2.2 Solvent cement joint Rubber ring joint Details
Solvent cements for pipes and fittings are flammable,
so there should be no smoking or other source of heat
or flame in working or storage areas.
Be sure to work only in a well-ventilated space and
avoid unnecessary skin contact with all solvents.
2.3 Construction management Followings are important points for construction management
➢ Factory Inspection
➢ Post inspection
➢ Quality Assurance and Testing
➢ Safety arrangement
Use of proper safety tools
Ventilate enough when using adhesive
➢ Supervision
➢ Backfilling and compaction
➢ Pressure Testing
A5-71
3 Practice
3.1 Rubber ring joint Preparation
Item
Socket end pipe 1
PVC pipe 1
Pipe cutter 1
Lubricant 1
Chamfer 1
Marker 1
Dry cloth 1
Check gauge 1
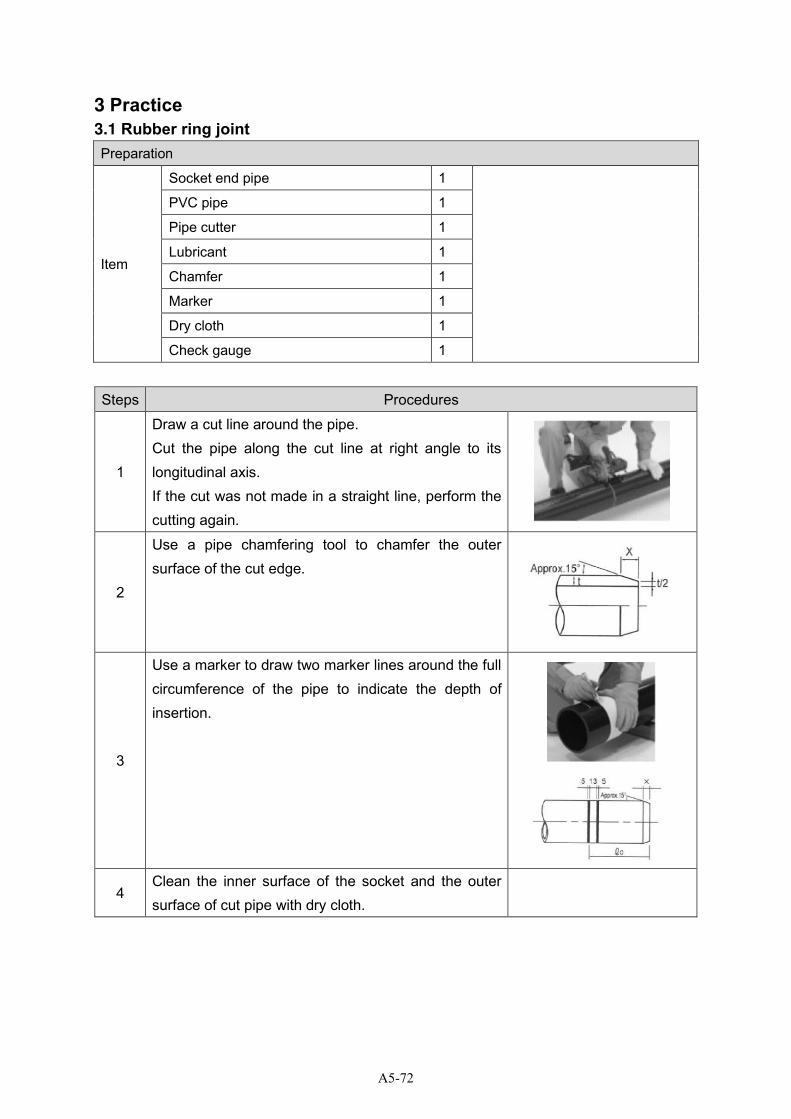
Steps Procedures
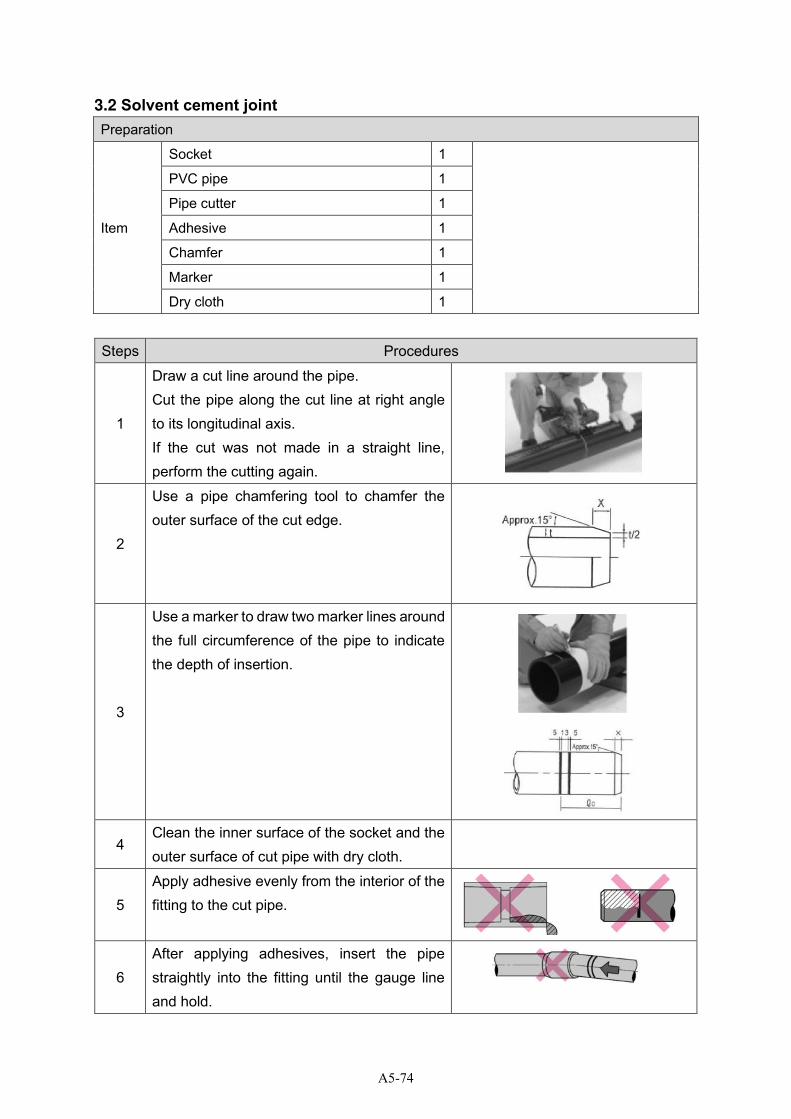
1
Draw a cut line around the pipe. Cut the pipe along the cut line at right angle to its longitudinal axis. If the cut was not made in a straight line, perform the cutting again.
2
Use a pipe chamfering tool to chamfer the outer surface of the cut edge.
3
Use a marker to draw two marker lines around the full circumference of the pipe to indicate the depth of insertion.
4 Clean the inner surface of the socket and the outer surface of cut pipe with dry cloth.
A5-72
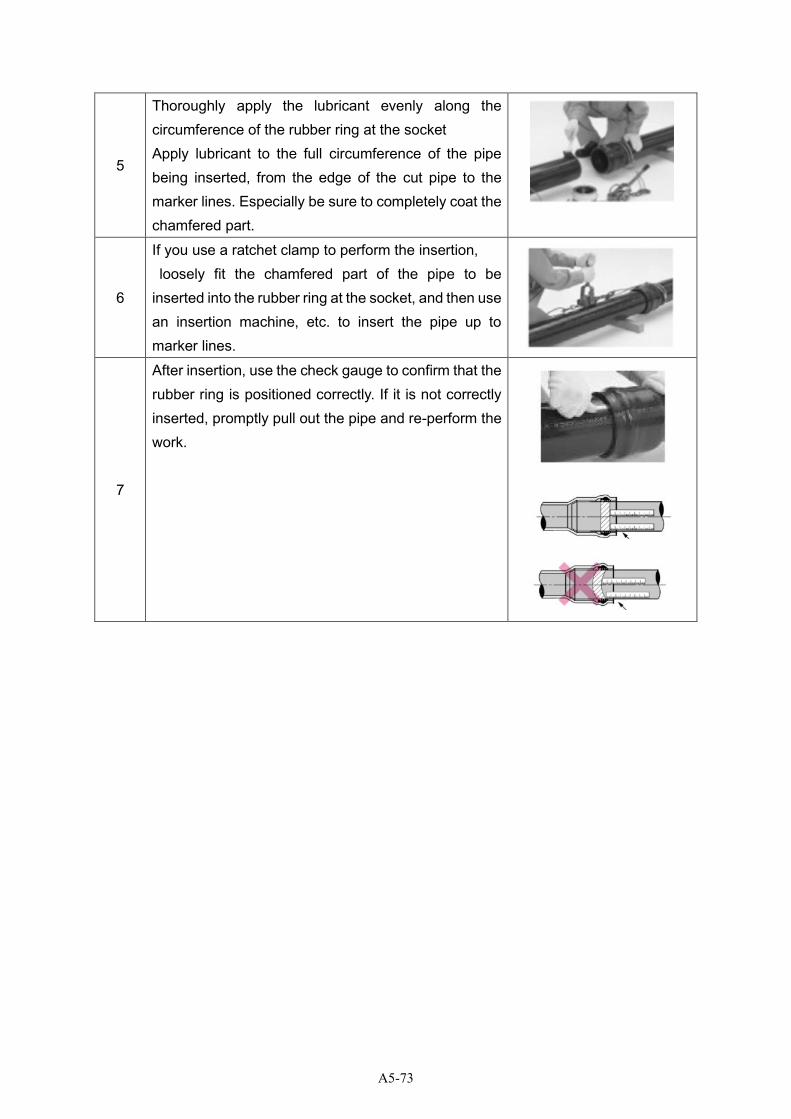
5
Thoroughly apply the lubricant evenly along the circumference of the rubber ring at the socket Apply lubricant to the full circumference of the pipe being inserted, from the edge of the cut pipe to the marker lines. Especially be sure to completely coat the chamfered part.
6
If you use a ratchet clamp to perform the insertion, loosely fit the chamfered part of the pipe to be inserted into the rubber ring at the socket, and then use an insertion machine, etc. to insert the pipe up to marker lines.
7
After insertion, use the check gauge to confirm that the rubber ring is positioned correctly. If it is not correctly inserted, promptly pull out the pipe and re-perform the work.
A5-73
3.2 Solvent cement joint Preparation
Item
Socket 1
PVC pipe 1
Pipe cutter 1
Adhesive 1
Chamfer 1
Marker 1
Dry cloth 1
Steps Procedures
1
Draw a cut line around the pipe. Cut the pipe along the cut line at right angle to its longitudinal axis. If the cut was not made in a straight line, perform the cutting again.
2
Use a pipe chamfering tool to chamfer the outer surface of the cut edge.
3
Use a marker to draw two marker lines around the full circumference of the pipe to indicate the depth of insertion.
4 Clean the inner surface of the socket and the outer surface of cut pipe with dry cloth.
5
Apply adhesive evenly from the interior of the fitting to the cut pipe.
6
After applying adhesives, insert the pipe straightly into the fitting until the gauge line and hold.
A5-74

7
Remove excess adhesive from the pipe immediately after jointing, and do not apply pressure to the jointed area.
A5-75
Training Guideline
2. Distribution Pipe Installation
c. DI Distribution Pipe Installation
A5-76
Table of contents
1 Outline ........................................................................................................................................... 1
1.1 Purpose ................................................................................................................................... 1
1.2 Flow of training with time schedule ........................................................................................ 2
1.3 Safety notice ........................................................................................................................... 3
2 Knowledge acquisition ................................................................................................................... 4
2.1 Outline of DI ............................................................................................................................ 4
2.2 Jointing method ...................................................................................................................... 5
2.2.1 Push fit joint ...................................................................................................................... 5
2.2.2 Flange joint ....................................................................................................................... 5
3 Practice .......................................................................................................................................... 6
3.1 Push fit joint ............................................................................................................................ 6
3.2 Flange joint ............................................................................................................................. 9
3.3 Tapping .................................................................................................................................. 11
3.4 Pressure test .......................................................................................................................... 11
A5-77
1 Outline
1.1 Purpose
Purpose of training The purpose of this training is to provide a practical training on installation
of DI distribution pipes, pressure tapping and pressure test. Also, it is
important to share the knowledge of this training with not only the staff of
NWSDB but also contractors.
Training Contents ➢ Push fit joint
➢ Flange joint
➢ Under Pressure Tapping
➢ Pressure test
A5-78
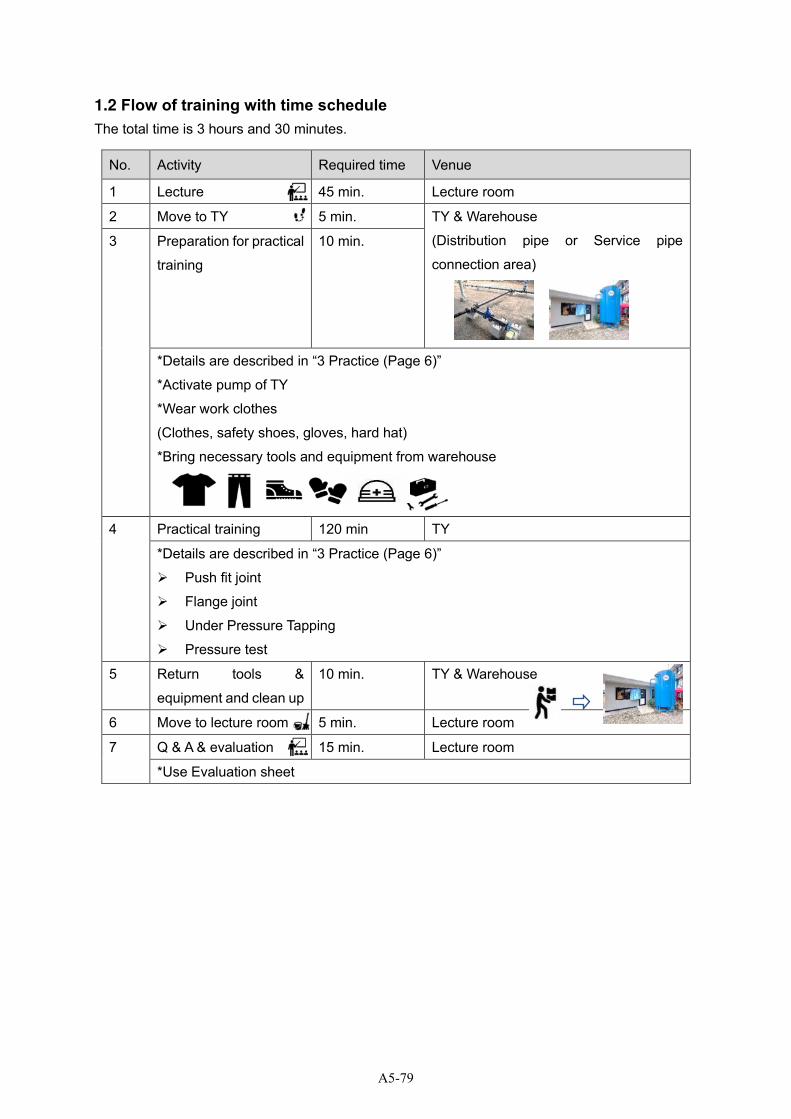
1.2 Flow of training with time schedule
The total time is 3 hours and 30 minutes.
No. Activity Required time Venue
1 Lecture 45 min. Lecture room
2 Move to TY 5 min. TY & Warehouse
(Distribution pipe or Service pipe
connection area)
3 Preparation for practical
training
10 min.
*Details are described in “3 Practice (Page 6)”
*Activate pump of TY
*Wear work clothes
(Clothes, safety shoes, gloves, hard hat)
*Bring necessary tools and equipment from warehouse
4 Practical training 120 min TY
*Details are described in “3 Practice (Page 6)”
➢ Push fit joint
➢ Flange joint
➢ Under Pressure Tapping
➢ Pressure test
5 Return tools &
equipment and clean up
10 min. TY & Warehouse
6 Move to lecture room 5 min. Lecture room
7 Q & A & evaluation 15 min. Lecture room
*Use Evaluation sheet
A5-79

1.3 Safety notice
➢ All members must wear safety equipment in TY. RP should order to participants wearing
suitable item
➢ Do not sit on the pipes or put your foot on.
➢ Do not touch the installed equipment unnecessarily.
➢ Do not eat food in the TY.
A5-80
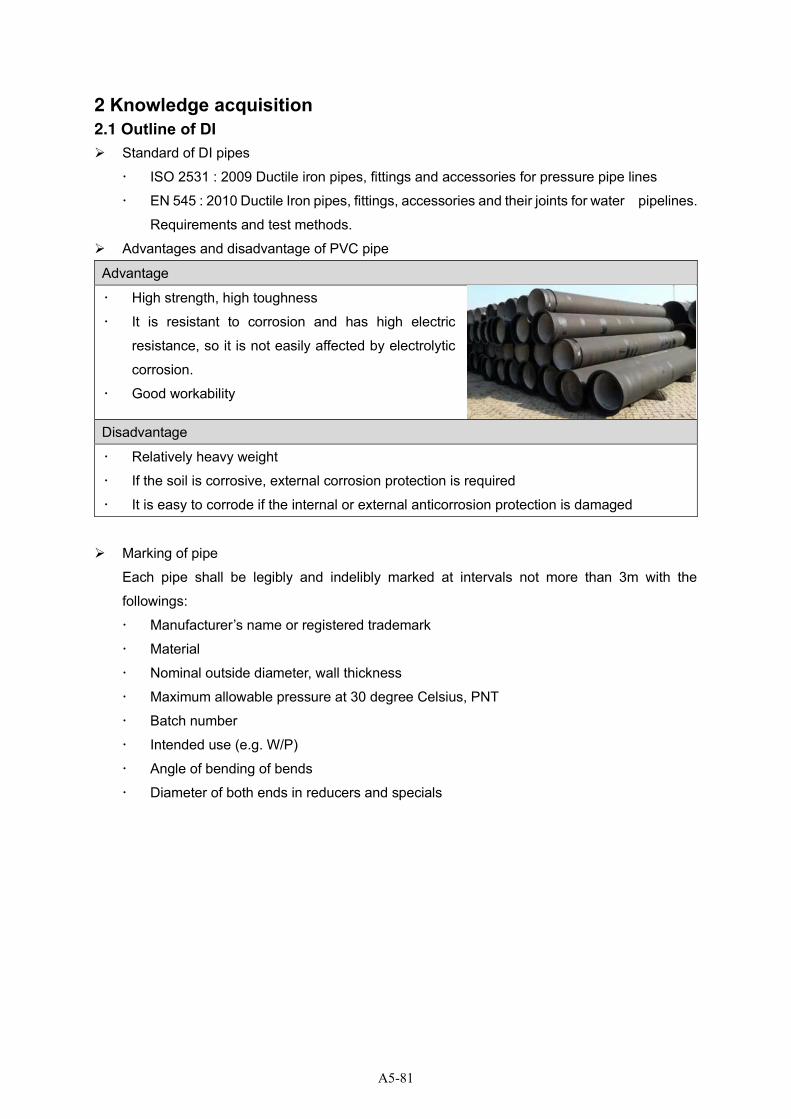
2 Knowledge acquisition
2.1 Outline of DI ➢ Standard of DI pipes
ISO 2531 : 2009 Ductile iron pipes, fittings and accessories for pressure pipe lines
EN 545 : 2010 Ductile Iron pipes, fittings, accessories and their joints for water pipelines.
Requirements and test methods.
➢ Advantages and disadvantage of PVC pipe
Advantage
High strength, high toughness
It is resistant to corrosion and has high electric
resistance, so it is not easily affected by electrolytic
corrosion.
Good workability
Disadvantage
Relatively heavy weight
If the soil is corrosive, external corrosion protection is required
It is easy to corrode if the internal or external anticorrosion protection is damaged
➢ Marking of pipe
Each pipe shall be legibly and indelibly marked at intervals not more than 3m with the
followings:
Manufacturer’s name or registered trademark
Material
Nominal outside diameter, wall thickness
Maximum allowable pressure at 30 degree Celsius, PNT
Batch number
Intended use (e.g. W/P)
Angle of bending of bends
Diameter of both ends in reducers and specials
A5-81
2.2 Jointing method
➢ There are mainly two jointing method for DI distribution pipes: Push fit joint and Flange joint.
2.2.1 Push fit joint Push fit joint Details
The most popular, quickest and easiest to assemble
joint for DI pipe and fittings in underground applications
is the push fit joint.
Assembly of the push fit joint is simple, more
economical, faster to install, more trouble-free, and
offers better service than mechanical joints.
Push fit joint of modern DI pipe systems are particularly
effective in preventing problems of infiltration and
leakage.
2.2.2 Flange joint Flange joint Details
Flange joint is used for many plant installations on the
ground and other specialized applications. A flange
jointing is a method for connecting pipes, valves,
pumps and other equipment to form a piping system.
A flange joint is rigid and can bear both tension &
compression as well as limited degree of shear &
bending.
Flange joints are made by bolting two flanges with a
gasket between them to provide a seal.
2.3 Construction management Followings are important points for construction management
➢ Material Inspection
➢ Pre inspection
➢ Post inspection
➢ Safety arrangement
➢ Supervision
➢ Backfilling
➢ Pressure Testing
A5-82
3 Practice
3.1 Push fit joint Preparation
Item
Socket end pipe 1
DI pipe 1
Pipe cutter 1
Lubricant 1
Chamfer 1
Marker 1
Dry cloth 1
Check gauge 1
Steps Procedures
1
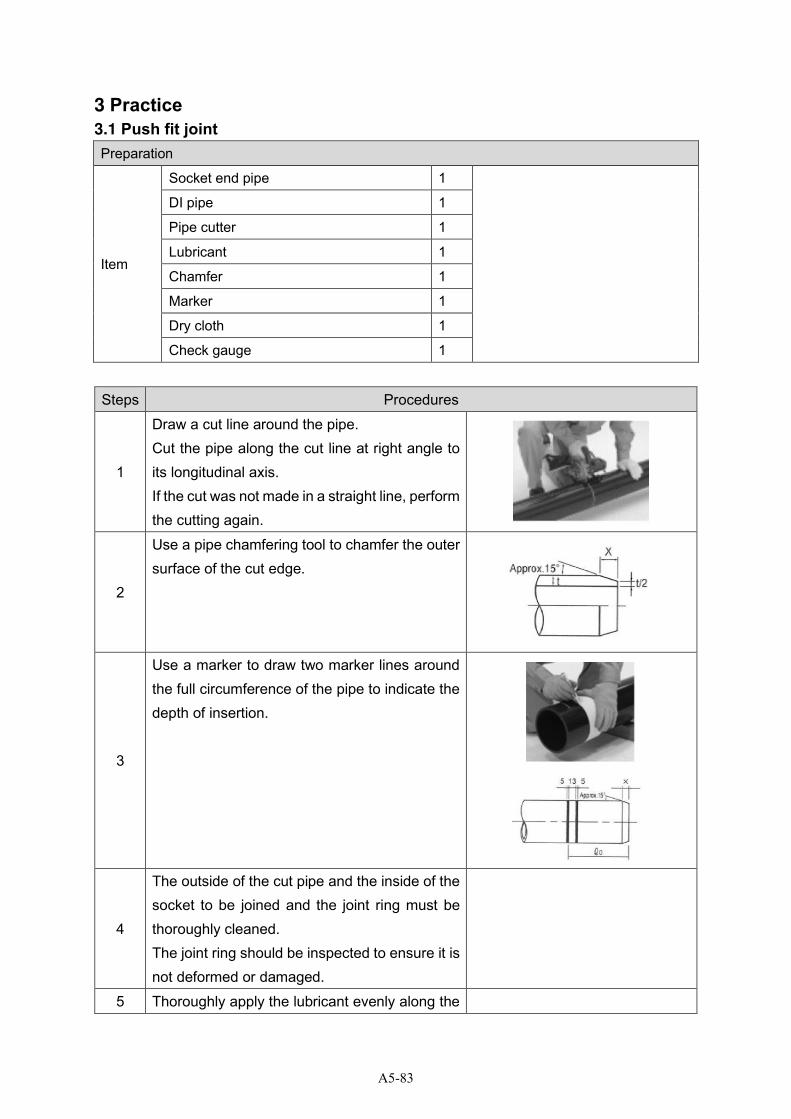
Draw a cut line around the pipe. Cut the pipe along the cut line at right angle to its longitudinal axis. If the cut was not made in a straight line, perform the cutting again.
2
Use a pipe chamfering tool to chamfer the outer surface of the cut edge.
3
Use a marker to draw two marker lines around the full circumference of the pipe to indicate the depth of insertion.
4
The outside of the cut pipe and the inside of the socket to be joined and the joint ring must be thoroughly cleaned. The joint ring should be inspected to ensure it is not deformed or damaged.
5 Thoroughly apply the lubricant evenly along the
A5-83
circumference of the rubber ring at the socket Apply lubricant to the full circumference of the pipe being inserted, from the edge of the cut pipe to the marker lines. Especially be sure to completely coat the chamfered part.
6
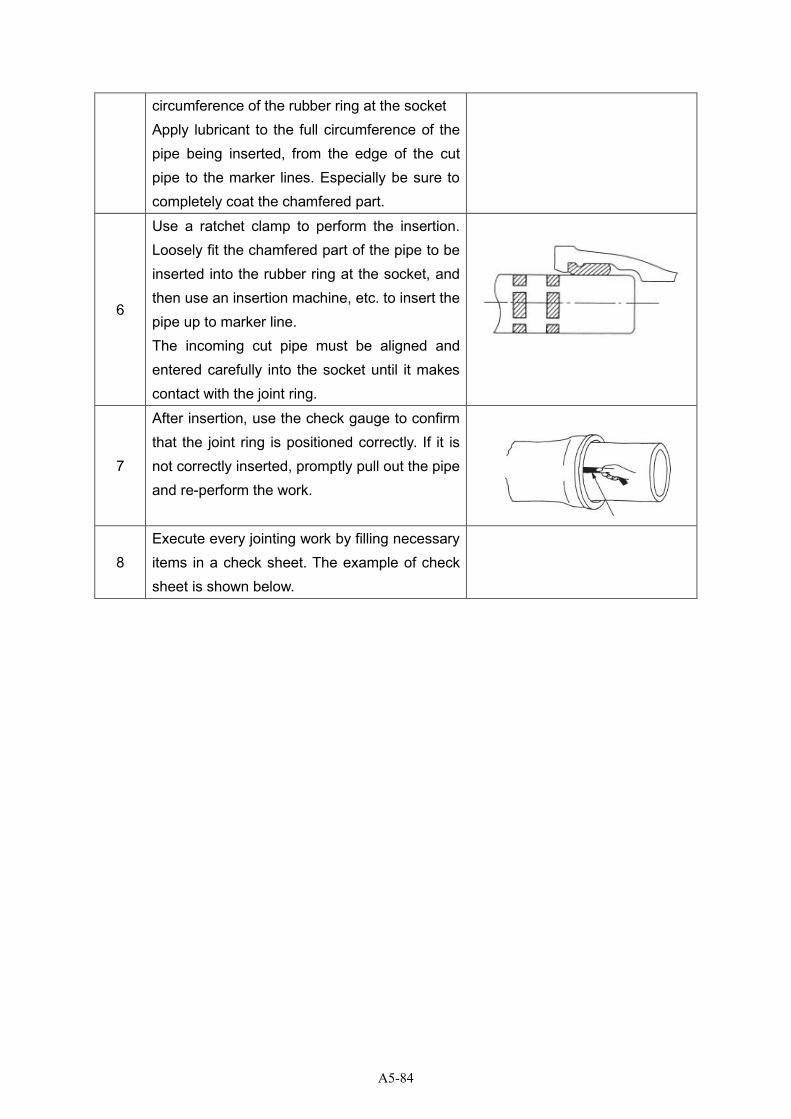
Use a ratchet clamp to perform the insertion. Loosely fit the chamfered part of the pipe to be inserted into the rubber ring at the socket, and then use an insertion machine, etc. to insert the pipe up to marker line. The incoming cut pipe must be aligned and entered carefully into the socket until it makes contact with the joint ring.
7
After insertion, use the check gauge to confirm that the joint ring is positioned correctly. If it is not correctly inserted, promptly pull out the pipe and re-perform the work.
8
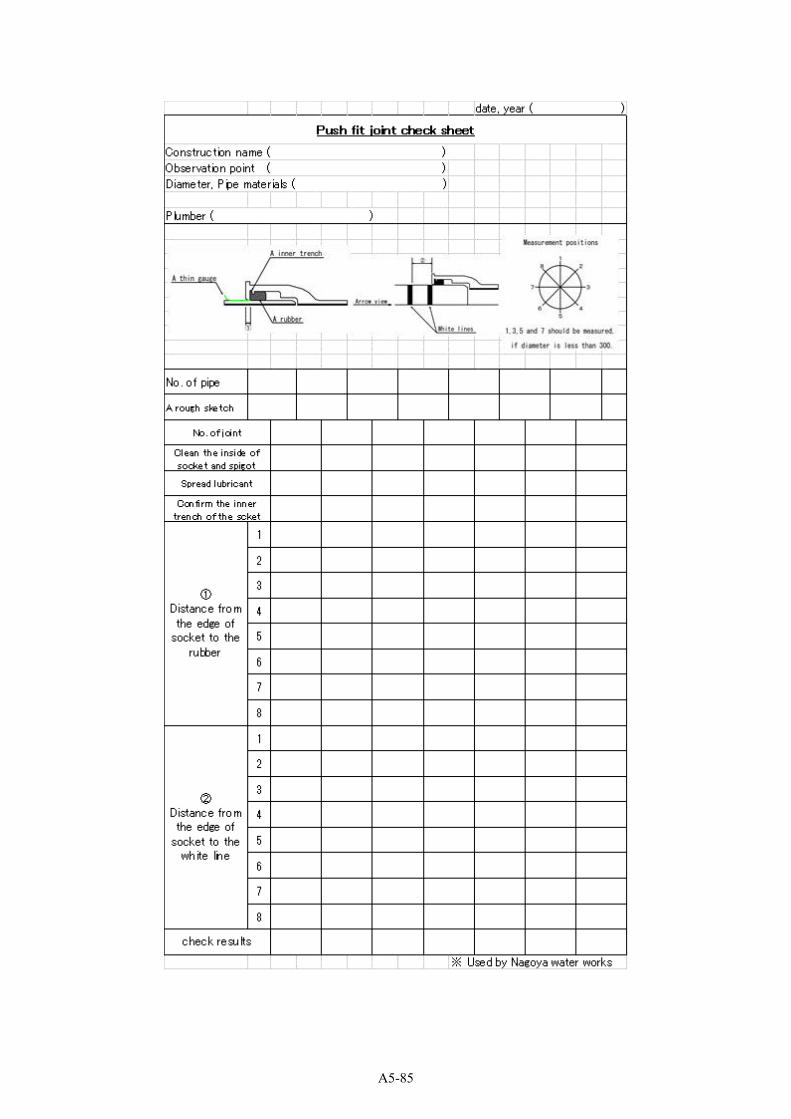
Execute every jointing work by filling necessary items in a check sheet. The example of check sheet is shown below.
A5-84
A5-85
3.2 Flange joint Preparation
Item
Flange joint 1
DI pipe 2
Torque wrench 1
Bolts and nuts 8
Gasket 1
Steps Procedures
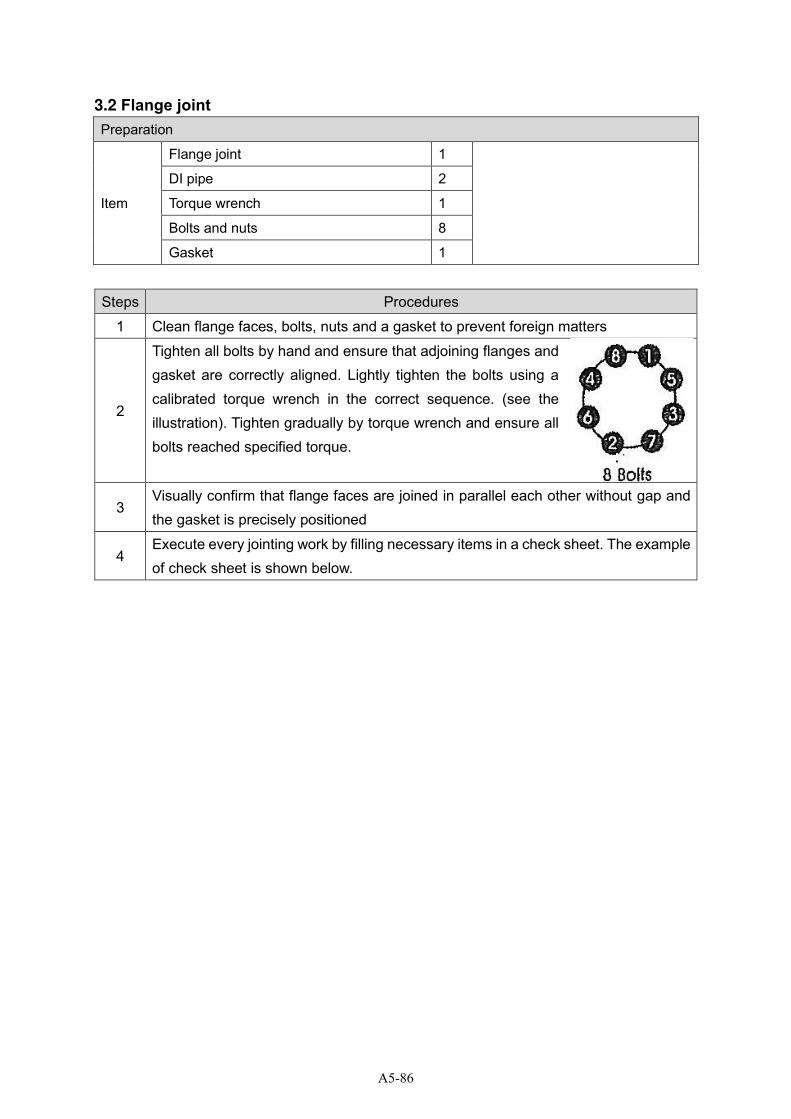
1 Clean flange faces, bolts, nuts and a gasket to prevent foreign matters
2
Tighten all bolts by hand and ensure that adjoining flanges and gasket are correctly aligned. Lightly tighten the bolts using a calibrated torque wrench in the correct sequence. (see the illustration). Tighten gradually by torque wrench and ensure all bolts reached specified torque.
3 Visually confirm that flange faces are joined in parallel each other without gap and the gasket is precisely positioned
4 Execute every jointing work by filling necessary items in a check sheet. The example of check sheet is shown below.
A5-86

date, year ( )
Construction name ( )
Observation point ( )
Diameter, Pipe materials ( )
Plumber ( )
※ Used by Nagoya water works
②
①
Flange joint check sheet
A5-87
3.3 Under Pressure Tapping
Preparation
Item Tapping machine 1
DI pipe 1
➢ Mark the tapping point on the DI pipe
➢ Conduct tapping and ferrule installation
3.4 Pressure test Preparation
Item Water pressure test pump 1
HDPE pipe (Dia. 90mm) 1
Steps Procedures
1
Connect the high pressure hose with Water pressure test pump (Be careful to put rubber ring at the end of hose). Then, fill the water tank of pump with clear water, pull off the plug, fasten the pressure relief valve. Then, connect the other end of the high pressure hose to the test pipe.
2
Apply pressure up to the prescribed pressure level by Water pressure test pump (4bar,
1-2minutes) and observe the pressure gauge to check the pressure decrease or increase.
3 Visual check of leaks. If visible leaks found repair it.
4 After testing, loosen pressure relief valve, release the pressure and remove the high pressure hose.
5 Make sure there is no drop of water remaining in the machine, clear it for next use. 6 Record the pressure test. The example of pressure testing report is as below.
A5-88

A5-89
Training Guideline
3. Service Pipe Installation
a. HDPE Service Pipe Installation
A5-90
Table of contents
1 Outline ........................................................................................................................................... 1
1.1 Purpose ................................................................................................................................... 1
1.2 Flow of training with time schedule ........................................................................................ 2
1.3 Safety notice ........................................................................................................................... 3
2 Knowledge acquisition ................................................................................................................... 4
2.1 Outline of HDPE ..................................................................................................................... 4
2.2 Jointing method ...................................................................................................................... 5
2.2.1 Socket fusion joint ............................................................................................................ 5
2.2.2 Thread joint ...................................................................................................................... 5
2.3 Construction management ..................................................................................................... 5
3 Practice .......................................................................................................................................... 6
3.1 Socket fusion joint ................................................................................................................... 6
3.2 Thread joint ............................................................................................................................. 7
3.3 Pressure test ........................................................................................................................... 7
A5-91

1 Outline
1.1 Purpose
Purpose of training The purpose of this training is to provide a practical training on installation
of HDPE service pipes. Also, it is important to share the knowledge of this
training with not only the staff of NWSDB but also contractors.
Training Contents ➢ Socket fusion joint
➢ Thread joint
➢ Pressure test
A5-92
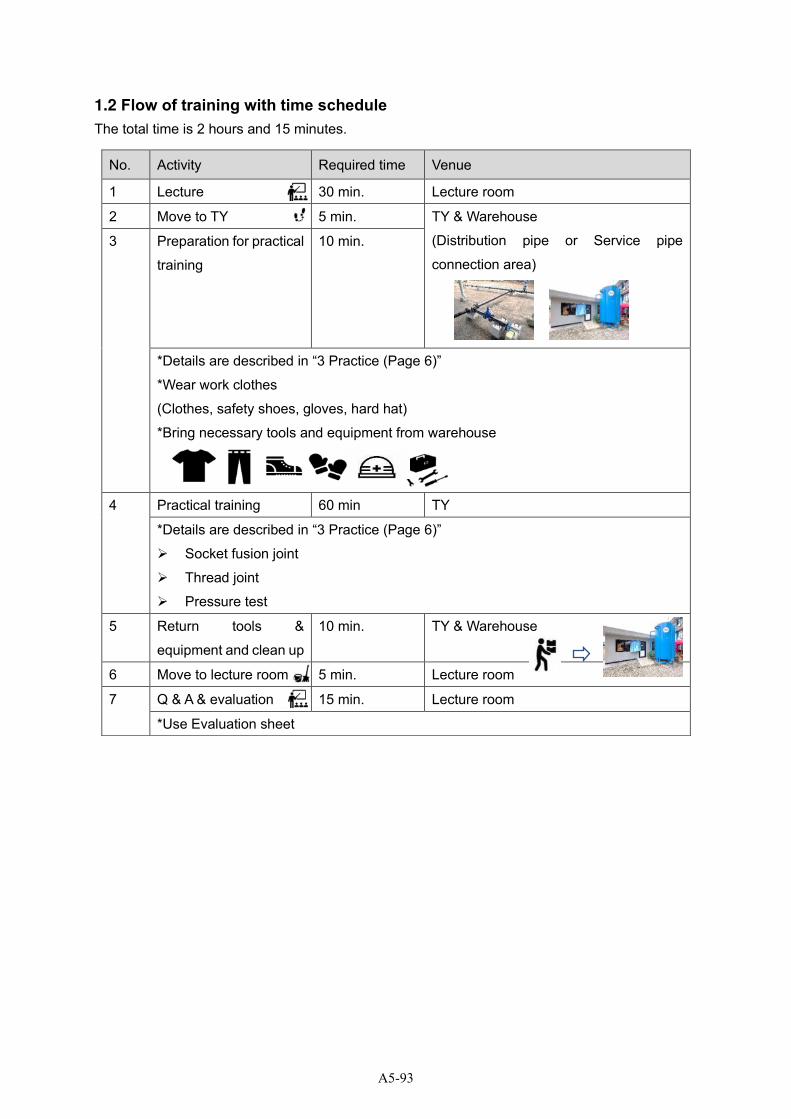
1.2 Flow of training with time schedule
The total time is 2 hours and 15 minutes.
No. Activity Required time Venue
1 Lecture 30 min. Lecture room
2 Move to TY 5 min. TY & Warehouse
(Distribution pipe or Service pipe
connection area)
3 Preparation for practical
training
10 min.
*Details are described in “3 Practice (Page 6)”
*Wear work clothes
(Clothes, safety shoes, gloves, hard hat)
*Bring necessary tools and equipment from warehouse
4 Practical training 60 min TY
*Details are described in “3 Practice (Page 6)”
➢ Socket fusion joint
➢ Thread joint
➢ Pressure test
5 Return tools &
equipment and clean up
10 min. TY & Warehouse
6 Move to lecture room 5 min. Lecture room
7 Q & A & evaluation 15 min. Lecture room
*Use Evaluation sheet
A5-93

1.3 Safety notice
➢ All members must wear safety equipment in TY. RP should order to participants wearing
suitable item
➢ Do not sit on the pipes or put your foot on.
➢ Do not touch the installed equipment unnecessarily.
➢ Do not eat food in the TY.
A5-94

2 Knowledge acquisition
2.1 Outline of HDPE
➢ Standard of HDPE pipes
ISO 21307: 2011 Plastics pipes and fittings, butt fusion jointing procedures for
polyethylene (PE) pipes and fittings used in the construction of gas and water distribution
systems.
➢ Handle with care not to make scratch
➢ Keep away from ultraviolet
➢ Use proper jointing tools or cutters which are dedicated to HDPE pipes
➢ Advantages and disadvantage of HDPE pipe
Advantage
Excellent corrosion resistance, flexibility, cold and impact resistance
Almost all pipes used in current pipe new installations are PE pipe
Greater strength and can handle higher temperatures than other pipe materials
The life cycle and construction cost of PE pipe can be less than other metal pipes
Connection method by fusion welding forms leak-free joints that are as strong as, or
stronger than, the pipe itself
PE pipe installations are cost-effective and have long-term cost advantages due to the
pipe’s physical properties, leak-free joint and reduced maintenance costs
Disadvantage
Connection method by fusion welding requires a high skill
Vulnerable to external wounds and heat
Vulnerable to the penetration of chemicals from the outside, such as gasoline and solvent
➢ Marking of pipe
Each pipe shall be legibly and indelibly marked at intervals not more than 3m with the
followings:
Manufacturer’s name or registered trademark
Material
Nominal outside diameter, wall thickness
Maximum allowable pressure at 30 degree Celsius, PNT
Batch number
Intended use (e.g. W/P)
Angle of bending of bends
Diameter of both ends in reducers and specials
A5-95
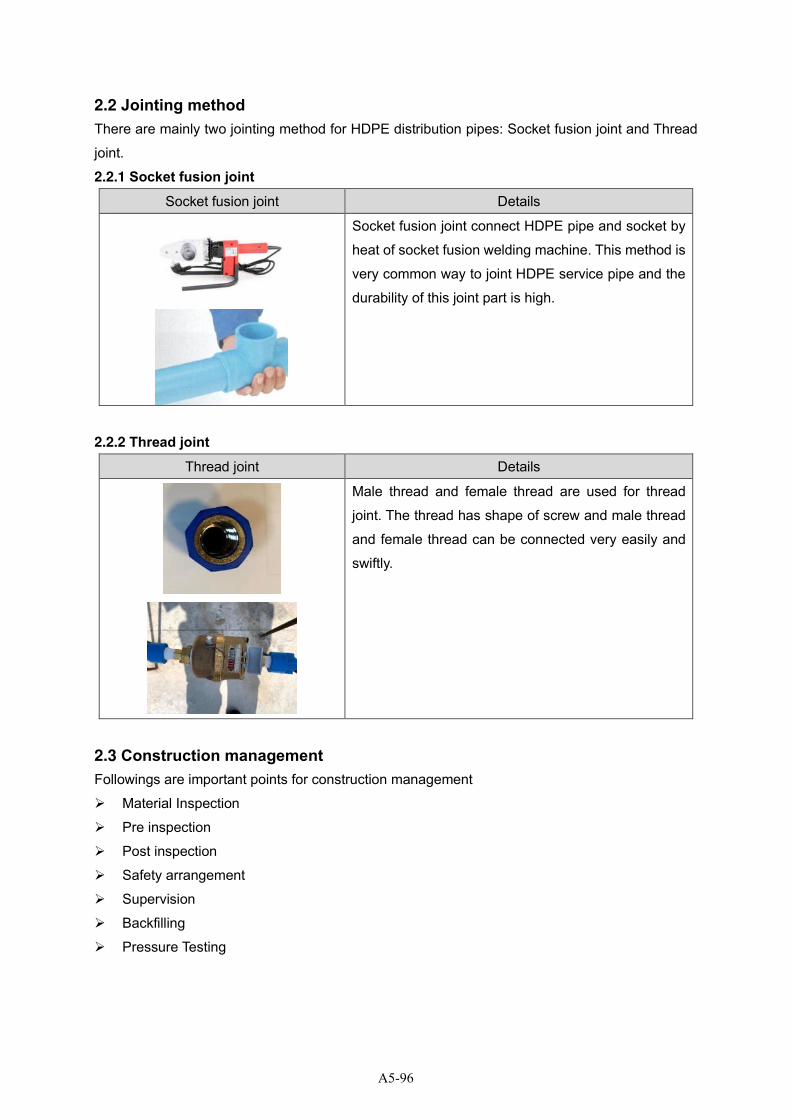
2.2 Jointing method
There are mainly two jointing method for HDPE distribution pipes: Socket fusion joint and Thread
joint.
2.2.1 Socket fusion joint Socket fusion joint Details
Socket fusion joint connect HDPE pipe and socket by
heat of socket fusion welding machine. This method is
very common way to joint HDPE service pipe and the
durability of this joint part is high.
2.2.2 Thread joint Thread joint Details
Male thread and female thread are used for thread
joint. The thread has shape of screw and male thread
and female thread can be connected very easily and
swiftly.
2.3 Construction management Followings are important points for construction management
➢ Material Inspection
➢ Pre inspection
➢ Post inspection
➢ Safety arrangement
➢ Supervision
➢ Backfilling
➢ Pressure Testing
A5-96
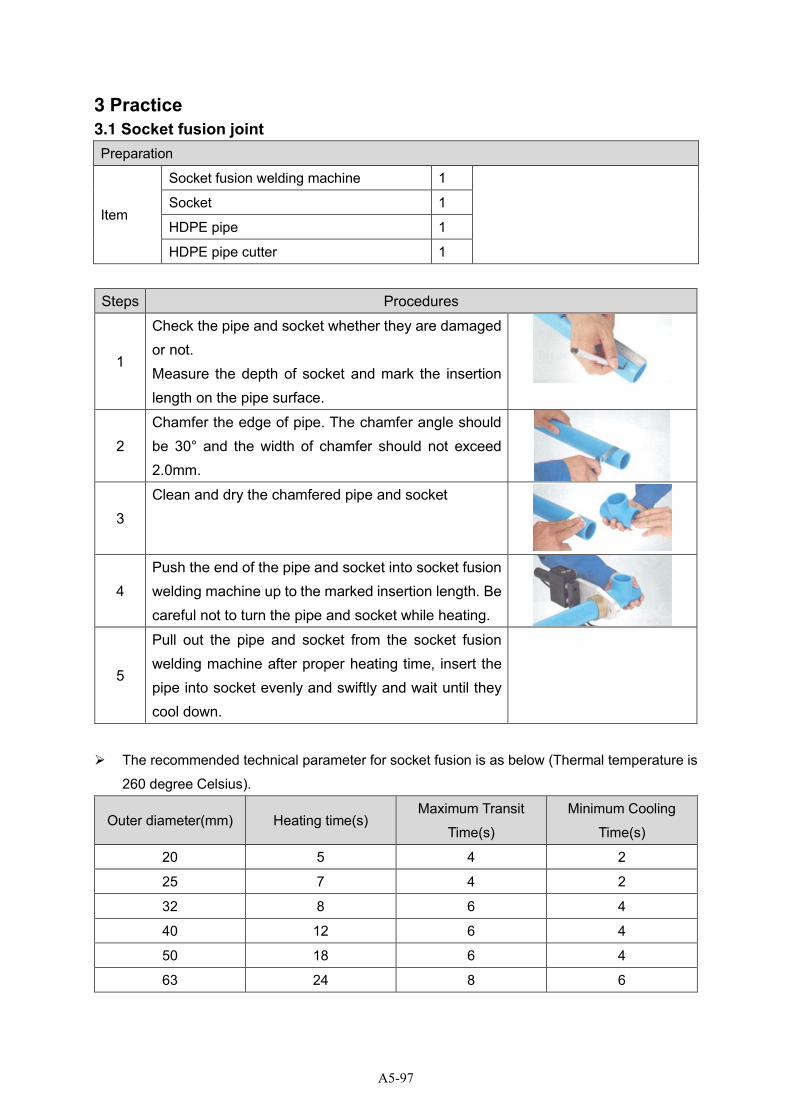
3 Practice
3.1 Socket fusion joint Preparation
Item
Socket fusion welding machine 1
Socket 1
HDPE pipe 1
HDPE pipe cutter 1
Steps Procedures
1
Check the pipe and socket whether they are damaged or not. Measure the depth of socket and mark the insertion length on the pipe surface.
2
Chamfer the edge of pipe. The chamfer angle should be 30° and the width of chamfer should not exceed 2.0mm.
3
Clean and dry the chamfered pipe and socket
4
Push the end of the pipe and socket into socket fusion welding machine up to the marked insertion length. Be careful not to turn the pipe and socket while heating.
5
Pull out the pipe and socket from the socket fusion welding machine after proper heating time, insert the pipe into socket evenly and swiftly and wait until they cool down.
➢ The recommended technical parameter for socket fusion is as below (Thermal temperature is
260 degree Celsius).
Outer diameter(mm) Heating time(s) Maximum Transit
Time(s)
Minimum Cooling
Time(s)
20 5 4 2
25 7 4 2
32 8 6 4
40 12 6 4
50 18 6 4
63 24 8 6
A5-97
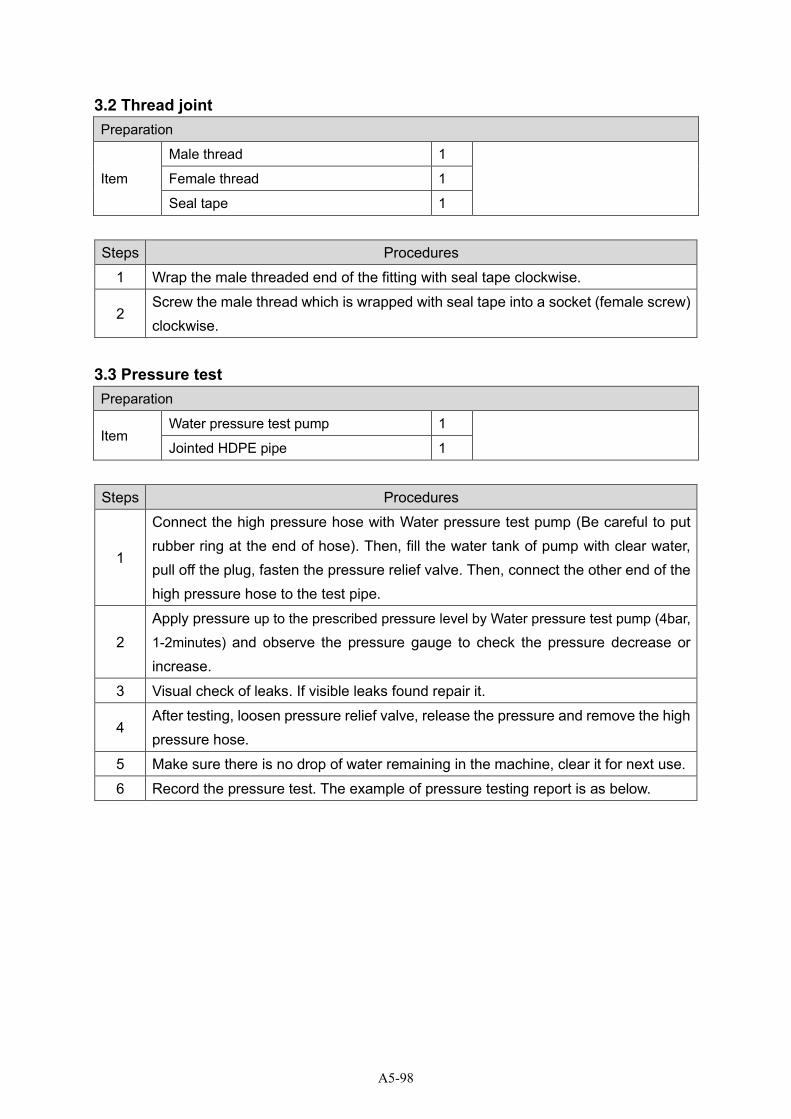
3.2 Thread joint Preparation
Item
Male thread 1
Female thread 1
Seal tape 1
Steps Procedures
1 Wrap the male threaded end of the fitting with seal tape clockwise.
2 Screw the male thread which is wrapped with seal tape into a socket (female screw) clockwise.
3.3 Pressure test Preparation
Item Water pressure test pump 1
Jointed HDPE pipe 1
Steps Procedures
1
Connect the high pressure hose with Water pressure test pump (Be careful to put rubber ring at the end of hose). Then, fill the water tank of pump with clear water, pull off the plug, fasten the pressure relief valve. Then, connect the other end of the high pressure hose to the test pipe.
2
Apply pressure up to the prescribed pressure level by Water pressure test pump (4bar,
1-2minutes) and observe the pressure gauge to check the pressure decrease or increase.
3 Visual check of leaks. If visible leaks found repair it.
4 After testing, loosen pressure relief valve, release the pressure and remove the high pressure hose.
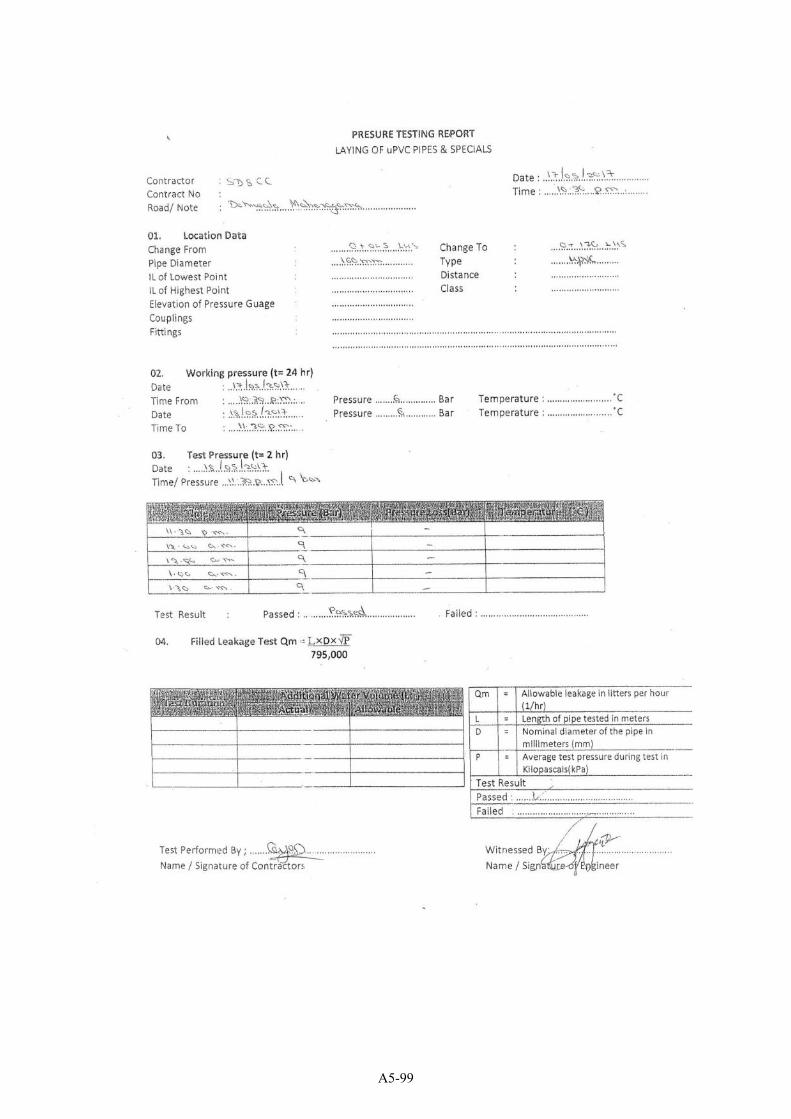
5 Make sure there is no drop of water remaining in the machine, clear it for next use. 6 Record the pressure test. The example of pressure testing report is as below.
A5-98
A5-99
Training Guideline
3. Service Pipe Installation
b. PVC Service Pipe Installation
A5-100
Table of contents
1 Outline ........................................................................................................................................... 1
1.1 Purpose ................................................................................................................................... 1
1.2 Flow of training with time schedule ........................................................................................ 2
1.3 Safety notice ........................................................................................................................... 3
2 Knowledge acquisition ................................................................................................................... 4
2.1 Outline of HDPE ..................................................................................................................... 4
2.2 Jointing method ...................................................................................................................... 5
2.2.1 Socket fusion joint ............................................................................................................ 5
2.2.2 Thread joint ...................................................................................................................... 5
2.3 Construction management ..................................................................................................... 5
3 Practice .......................................................................................................................................... 6
3.1 Socket fusion joint ................................................................................................................... 6
3.2 Thread joint ............................................................................................................................. 8
3.3 Pressure test ........................................................................................................................... 8
A5-101

1 Outline
1.1 Purpose
Purpose of training The purpose of this training is to provide a practical training on installation
of PVC service pipes. Also, it is important to share the knowledge of this
training with not only the staff of NWSDB but also contractors.
Training Contents ➢ Solvent cement joint
➢ Thread joint
➢ Pressure test
A5-102
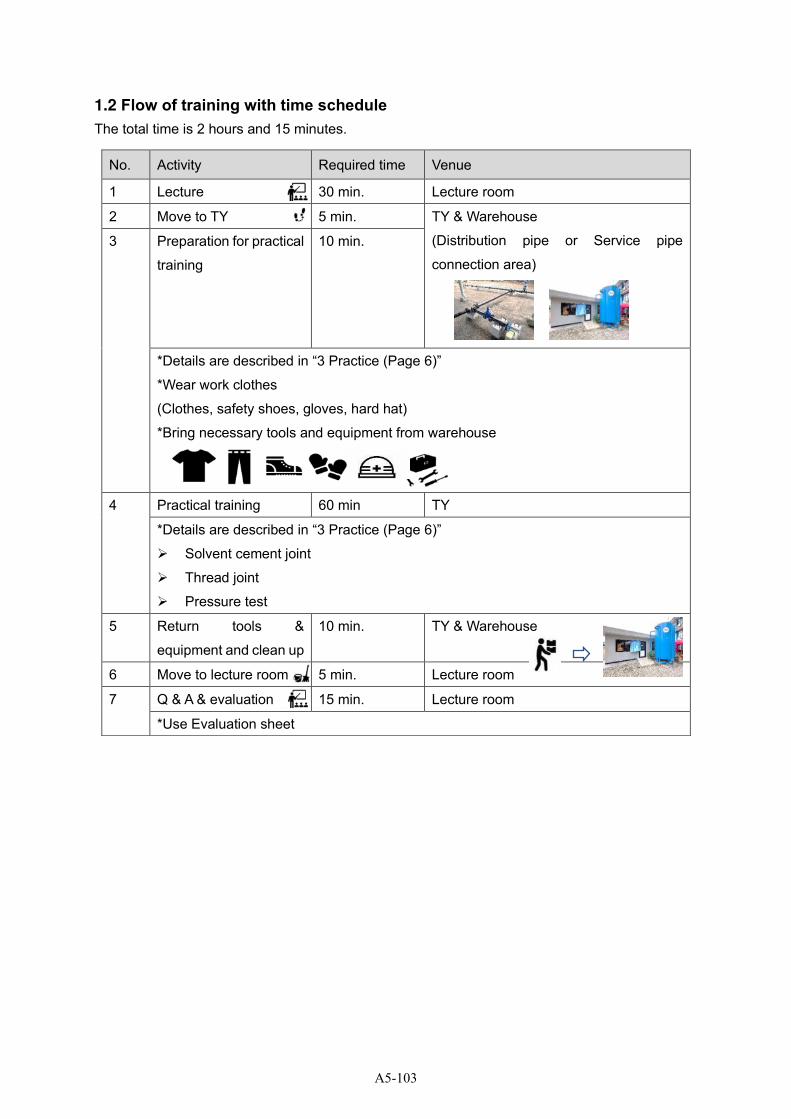
1.2 Flow of training with time schedule
The total time is 2 hours and 15 minutes.
No. Activity Required time Venue
1 Lecture 30 min. Lecture room
2 Move to TY 5 min. TY & Warehouse
(Distribution pipe or Service pipe
connection area)
3 Preparation for practical
training
10 min.
*Details are described in “3 Practice (Page 6)”
*Wear work clothes
(Clothes, safety shoes, gloves, hard hat)
*Bring necessary tools and equipment from warehouse
4 Practical training 60 min TY
*Details are described in “3 Practice (Page 6)”
➢ Solvent cement joint
➢ Thread joint
➢ Pressure test
5 Return tools &
equipment and clean up
10 min. TY & Warehouse
6 Move to lecture room 5 min. Lecture room
7 Q & A & evaluation 15 min. Lecture room
*Use Evaluation sheet
A5-103

1.3 Safety notice
➢ All members must wear safety equipment in TY. RP should order to participants wearing
suitable item
➢ Do not sit on the pipes or put your foot on.
➢ Do not touch the installed equipment unnecessarily.
➢ Do not eat food in the TY.
A5-104
2 Knowledge acquisition
2.1 Outline of HDPE
➢ Standard of PVC pipes
SLS 147:2013 - Unplasticized poly (vinyl chloride) pipes for water supply and for buried
and above ground drainage and sewerage under pressure
ISO 1452:2009 - Plastic piping systems for water supply and for buried and above ground
drainage and sewerage under pressure—Unplasticized poly (vinyl chloride) (UPVC-U)
➢ Advantages and disadvantage of PVC pipe
Advantage
Anti- corrosion (except for some solvent)
High stiffness
Low weight
Cost effectiveness
Disadvantage
Pressure resistance is not as good as DI pipes.
Flexibility is not as good as HDPE pipes.
Lifespan is more than 20 years but less than DI pipes.
Vulnerable to external wounds and heat
Low UV resistance
Low toughness
Lower strength than other pipes
➢ Marking of pipe
Each pipe shall be legibly and indelibly marked at intervals not more than 3m with the
followings:
Manufacturer’s name or registered trademark
Material
Nominal outside diameter, wall thickness
Maximum allowable pressure at 30 degree Celsius, PNT
Batch number
Intended use (e.g. W/P)
Angle of bending of bends
Diameter of both ends in reducers and specials
A5-105
2.2 Jointing method
There are mainly two jointing method for HDPE distribution pipes: Solvent cement joint and Thread
joint.
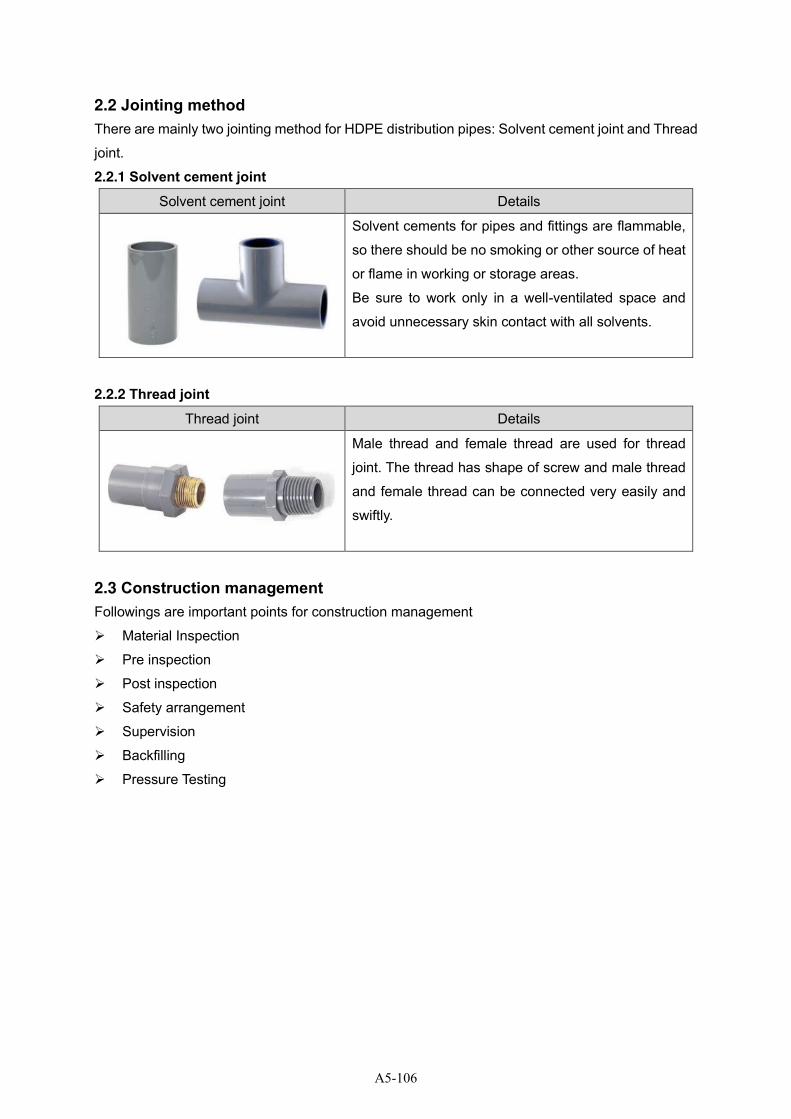
2.2.1 Solvent cement joint Solvent cement joint Details
Solvent cements for pipes and fittings are flammable,
so there should be no smoking or other source of heat
or flame in working or storage areas.
Be sure to work only in a well-ventilated space and
avoid unnecessary skin contact with all solvents.
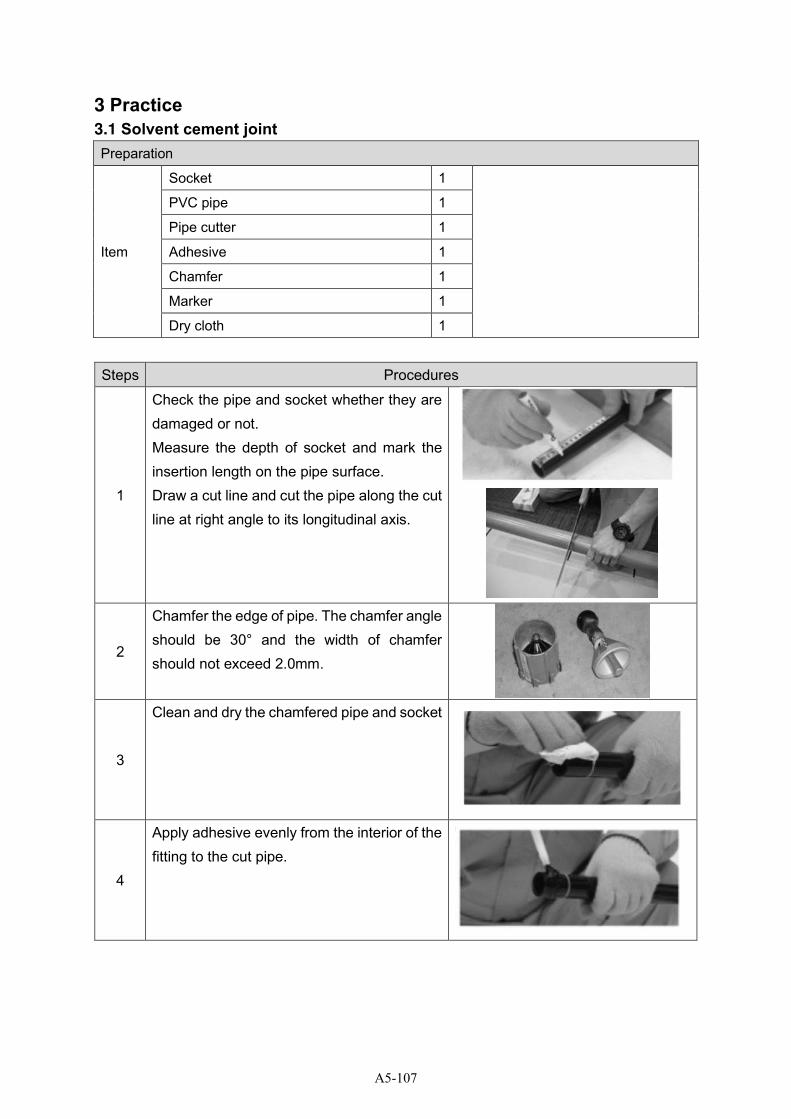
2.2.2 Thread joint Thread joint Details
Male thread and female thread are used for thread
joint. The thread has shape of screw and male thread
and female thread can be connected very easily and
swiftly.
2.3 Construction management Followings are important points for construction management
➢ Material Inspection
➢ Pre inspection
➢ Post inspection
➢ Safety arrangement
➢ Supervision
➢ Backfilling
➢ Pressure Testing
A5-106
3 Practice
3.1 Solvent cement joint Preparation
Item
Socket 1
PVC pipe 1
Pipe cutter 1
Adhesive 1
Chamfer 1
Marker 1
Dry cloth 1
Steps Procedures
1
Check the pipe and socket whether they are damaged or not. Measure the depth of socket and mark the insertion length on the pipe surface. Draw a cut line and cut the pipe along the cut line at right angle to its longitudinal axis.
2
Chamfer the edge of pipe. The chamfer angle should be 30° and the width of chamfer should not exceed 2.0mm.
3
Clean and dry the chamfered pipe and socket
4
Apply adhesive evenly from the interior of the fitting to the cut pipe.
A5-107

5
After applying adhesives, insert the pipe straightly into the fitting until the gauge line and hold.
6
Remove excess adhesive from the pipe immediately after jointing, and do not apply pressure to the jointed area.
A5-108

3.2 Thread joint Preparation
Item
Male thread 1
Female thread 1
Seal tape 1
Steps Procedures
1 Wrap the male threaded end of the fitting with seal tape clockwise.
2 Screw the male thread which is wrapped with seal tape into a socket (female screw) clockwise.
3.3 Pressure test Preparation
Item Water pressure test pump 1
Jointed HDPE pipe 1
Steps Procedures
1
Connect the high pressure hose with Water pressure test pump (Be careful to put rubber ring at the end of hose). Then, fill the water tank of pump with clear water, pull off the plug, fasten the pressure relief valve. Then, connect the other end of the high pressure hose to the test pipe.
2
Apply pressure up to the prescribed pressure level by Water pressure test pump (4bar,
1-2minutes) and observe the pressure gauge to check the pressure decrease or increase.
3 Visual check of leaks. If visible leaks found repair it.
4 After testing, loosen pressure relief valve, release the pressure and remove the high pressure hose.
5 Make sure there is no drop of water remaining in the machine, clear it for next use. 6 Record the pressure test. The example of pressure testing report is as below.
A5-109

A5-110
Training Guideline
4. Leak Repair
a. HDPE Distribution & Service Pipe Repair
A5-111
Table of contents
1 Outline ........................................................................................................................................... 1
1.1 Purpose ................................................................................................................................... 1
1.2 Flow of training with time schedule ........................................................................................ 2
1.3 Safety notice ........................................................................................................................... 3
2 Knowledge acquisition ................................................................................................................... 4
2.1 Characteristic of HDPE ........................................................................................................... 4
2.2 Type, cause and preventive measure of leakage ................................................................... 4
2.3 Repair method ........................................................................................................................ 6
2.3.1 Covering ........................................................................................................................... 7
2.3.2 Replacement .................................................................................................................... 8
(1) Coupling method .............................................................................................................. 8
(2) Socket fusion method ...................................................................................................... 9
(3) Compression joint .......................................................................................................... 10
(4) Hack joint method ........................................................................................................... 11
3 Practice ........................................................................................................................................ 12
3.1 Distribution pipe .................................................................................................................... 12
3.2 Service pipe .......................................................................................................................... 13
4 Keep repair record ....................................................................................................................... 14
A5-112
1 Outline
1.1 Purpose
Purpose of training Water leaks have a significant impact on water supply business.
Water leaks from the distribution lines not only affect the revenue of the
water utilities but also cause accidents on a road and its surrounding, so
it should be repaired immediately when it is detected.
Also, the amount of leakage from the service pipe is relatively small,
however, it will be large amounts if the leakage is left for a long time.
Therefore, service pipe leaks must be repaired as soon as they are
detected.
Pipe fitters typically gain their experience and skills through field works
and training programs. This training aims to acquire theoretical knowledge
and practical skills of HDPE pipe repair through a practical training.
Training Contents ➢ Leak repair of HDPE distribution pipe with repair clamp and coupling
➢ Leak repair of HDPE service pipe with repair clamp, socket fusion,
compression joint and hack joint
A5-113

1.2 Flow of training with time schedule
The total time is 3 hours and 40 minutes.
No. Activity Required time Venue
1 Lecture 45 min. Lecture room
2 Move to TY 5 min. TY & Warehouse
(Distribution pipe or Service pipe
connection area)
3 Preparation for practical
training
20 min.
*Details are described in “3 Practice (Page 12)”
*Wear work clothes
(Clothes, safety shoes, gloves, hard hat)
*Bring necessary tools and equipment from warehouse
4 Practical training 120 min. each TY
*Details are described in “3 Practice (Page 12)”
<HDPE Distribution pipe>
➢ Leak repair of HDPE distribution pipe with repair clamp and coupling
<HDPE Service pipe>
➢ Leak repair of HDPE service pipe with repair clamp, socket fusion, compression
joint and hack joint
5 Return tools &
equipment and clean up
10 min. TY & Warehouse
6 Move to lecture room 5 min. Lecture room
7 Q & A & evaluation 15 min. Lecture room
*Use Evaluation sheet
A5-114

1.3 Safety notice
➢ All members must wear safety equipment in TY. RP should order to participants wearing
suitable item
➢ Do not sit on the pipes or put your foot on.
➢ Do not touch the installed equipment unnecessarily.
➢ Do not eat food in the TY.
A5-115
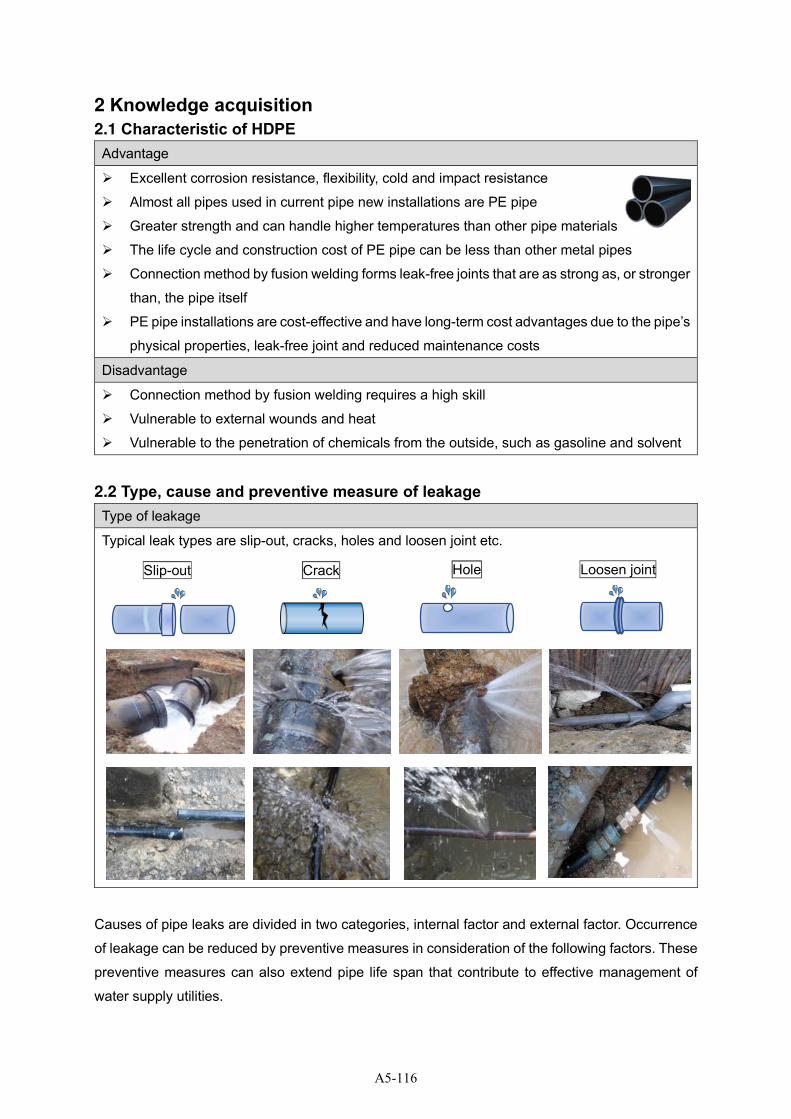
2 Knowledge acquisition
2.1 Characteristic of HDPE
Advantage
➢ Excellent corrosion resistance, flexibility, cold and impact resistance
➢ Almost all pipes used in current pipe new installations are PE pipe
➢ Greater strength and can handle higher temperatures than other pipe materials
➢ The life cycle and construction cost of PE pipe can be less than other metal pipes
➢ Connection method by fusion welding forms leak-free joints that are as strong as, or stronger
than, the pipe itself
➢ PE pipe installations are cost-effective and have long-term cost advantages due to the pipe’s
physical properties, leak-free joint and reduced maintenance costs
Disadvantage
➢ Connection method by fusion welding requires a high skill
➢ Vulnerable to external wounds and heat
➢ Vulnerable to the penetration of chemicals from the outside, such as gasoline and solvent
2.2 Type, cause and preventive measure of leakage
Type of leakage
Typical leak types are slip-out, cracks, holes and loosen joint etc.
Causes of pipe leaks are divided in two categories, internal factor and external factor. Occurrence
of leakage can be reduced by preventive measures in consideration of the following factors. These
preventive measures can also extend pipe life span that contribute to effective management of
water supply utilities.
Crack Hole Slip-out Loosen joint
A5-116
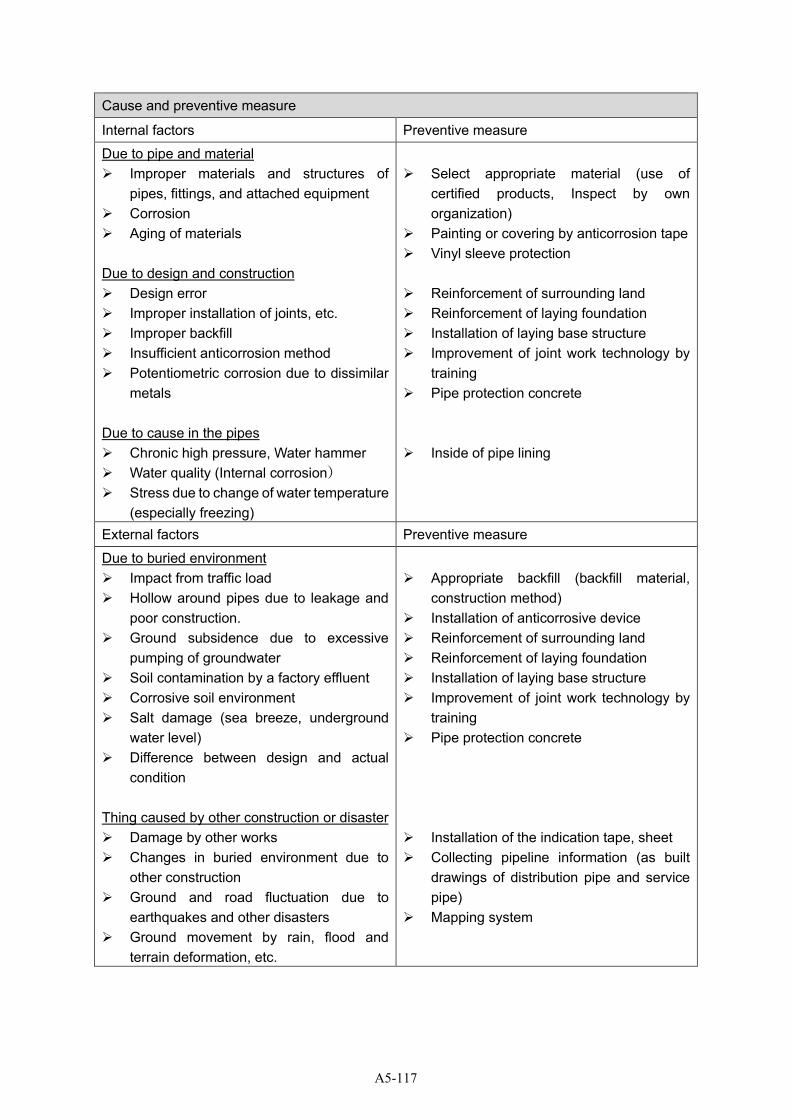
Cause and preventive measure
Internal factors Preventive measure
Due to pipe and material ➢ Improper materials and structures of
pipes, fittings, and attached equipment ➢ Corrosion
➢ Aging of materials
Due to design and construction
➢ Design error ➢ Improper installation of joints, etc. ➢ Improper backfill ➢ Insufficient anticorrosion method
➢ Potentiometric corrosion due to dissimilar metals
Due to cause in the pipes
➢ Chronic high pressure, Water hammer ➢ Water quality (Internal corrosion)
➢ Stress due to change of water temperature (especially freezing)
➢ Select appropriate material (use of certified products, Inspect by own organization)
➢ Painting or covering by anticorrosion tape
➢ Vinyl sleeve protection
➢ Reinforcement of surrounding land
➢ Reinforcement of laying foundation
➢ Installation of laying base structure
➢ Improvement of joint work technology by training
➢ Pipe protection concrete
➢ Inside of pipe lining
External factors Preventive measure
Due to buried environment ➢ Impact from traffic load
➢ Hollow around pipes due to leakage and poor construction.
➢ Ground subsidence due to excessive pumping of groundwater
➢ Soil contamination by a factory effluent ➢ Corrosive soil environment ➢ Salt damage (sea breeze, underground
water level) ➢ Difference between design and actual
condition
Thing caused by other construction or disaster ➢ Damage by other works
➢ Changes in buried environment due to other construction
➢ Ground and road fluctuation due to earthquakes and other disasters
➢ Ground movement by rain, flood and terrain deformation, etc.
➢ Appropriate backfill (backfill material, construction method)
➢ Installation of anticorrosive device
➢ Reinforcement of surrounding land
➢ Reinforcement of laying foundation
➢ Installation of laying base structure
➢ Improvement of joint work technology by training
➢ Pipe protection concrete
➢ Installation of the indication tape, sheet ➢ Collecting pipeline information (as built
drawings of distribution pipe and service pipe)
➢ Mapping system
A5-117

2.3 Repair method
Followings should be considered for repair work:
➢ Pipe material
➢ Leaking condition (leak position, leak volume, damage condition, etc.)
➢ Space of repair work
➢ Time of suspension of water supply
Repair method shall be mainly divided in two type, ‘Covering’ and ‘Replacement’. And depending
on pipe material and joint types, tightening and welding are also appropriate.
Note:
Although the method using adhesive tape is often introduced as the repair of the pipe, the water
supply authority should, in principle, carry out permanent repairs. It should be used for only
temporal repair.
Confirmation
Leakage situation
Selection
of repair method
Covering Replacement
Replacement of rubbering and gasket
Retightening of screw and bolts
A5-118

2.3.1 Covering
The leakage part of distribution and service pipe is covered by repair clamp.
Required parts and equipment
➢ HDPE
Distribution &
Service pipe
➢ Repair clamp
The main method is to cover the entire pipe with a repair clamp which
has rubber plates divided into 2 or 3.
Repair clamp for HDPE pipes are mostly made of stainless steel.
Procedures
i. Check the diameter of the pipe, proper repair clamp size for each diameter must be used.
ii. Clean up the surface of the pipe
iii. Mark the size of the repair clamp on the pipe so that the damaged part will come to the center
of the repair clamp.
iv. Set the repair clamp. Please be careful not to set the seam of repair clamp on the damaged
part
v. Tighten all bolts with proper torque and following proper tightening sequence.
A5-119
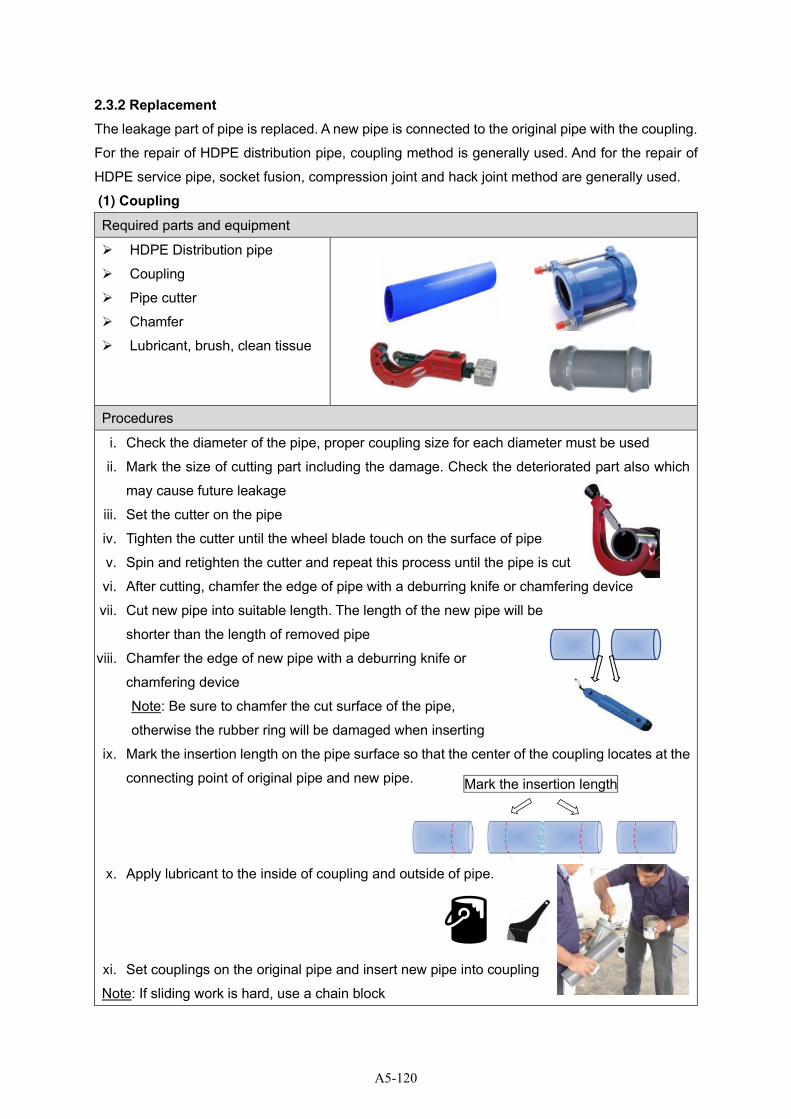
2.3.2 Replacement The leakage part of pipe is replaced. A new pipe is connected to the original pipe with the coupling.
For the repair of HDPE distribution pipe, coupling method is generally used. And for the repair of
HDPE service pipe, socket fusion, compression joint and hack joint method are generally used.
(1) Coupling
Required parts and equipment
➢ HDPE Distribution pipe
➢ Coupling
➢ Pipe cutter
➢ Chamfer
➢ Lubricant, brush, clean tissue
Procedures
i. Check the diameter of the pipe, proper coupling size for each diameter must be used
ii. Mark the size of cutting part including the damage. Check the deteriorated part also which
may cause future leakage
iii. Set the cutter on the pipe
iv. Tighten the cutter until the wheel blade touch on the surface of pipe
v. Spin and retighten the cutter and repeat this process until the pipe is cut
vi. After cutting, chamfer the edge of pipe with a deburring knife or chamfering device
vii. Cut new pipe into suitable length. The length of the new pipe will be
shorter than the length of removed pipe
viii. Chamfer the edge of new pipe with a deburring knife or
chamfering device
Note: Be sure to chamfer the cut surface of the pipe,
otherwise the rubber ring will be damaged when inserting
ix. Mark the insertion length on the pipe surface so that the center of the coupling locates at the
connecting point of original pipe and new pipe.
x. Apply lubricant to the inside of coupling and outside of pipe.
xi. Set couplings on the original pipe and insert new pipe into coupling
Note: If sliding work is hard, use a chain block
Mark the insertion length
A5-120
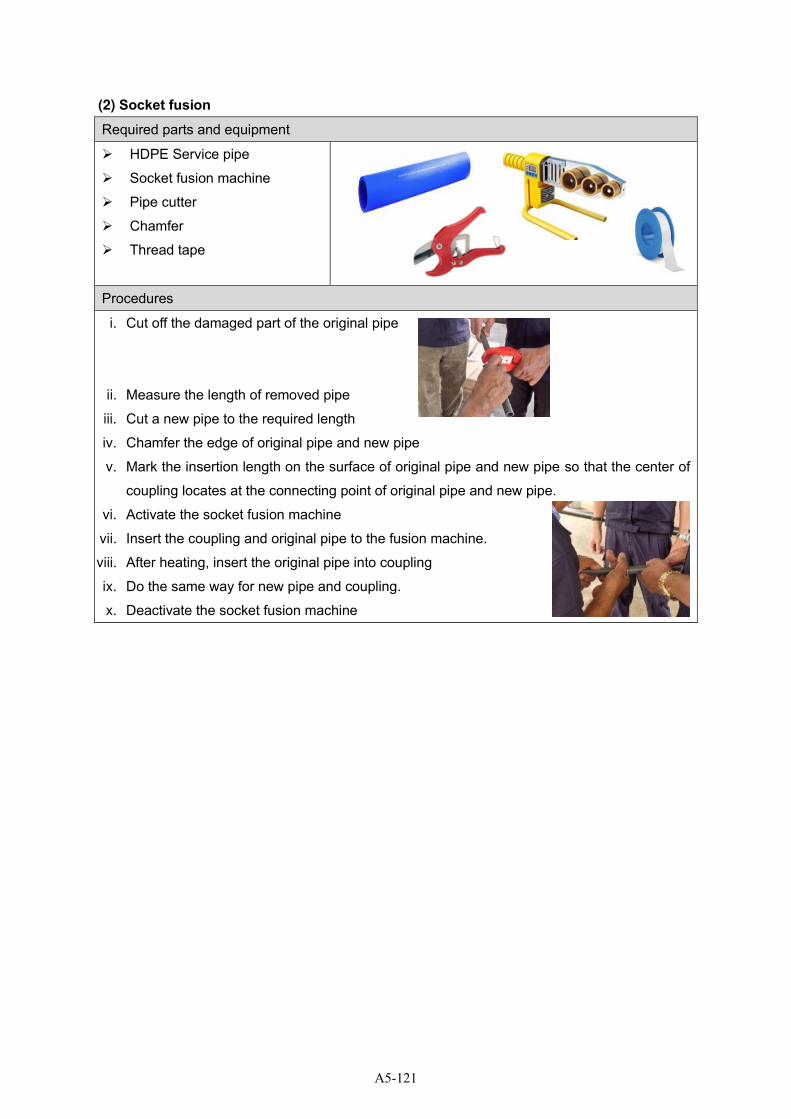
(2) Socket fusion
Required parts and equipment
➢ HDPE Service pipe
➢ Socket fusion machine
➢ Pipe cutter
➢ Chamfer
➢ Thread tape
Procedures
i. Cut off the damaged part of the original pipe
ii. Measure the length of removed pipe
iii. Cut a new pipe to the required length
iv. Chamfer the edge of original pipe and new pipe
v. Mark the insertion length on the surface of original pipe and new pipe so that the center of
coupling locates at the connecting point of original pipe and new pipe.
vi. Activate the socket fusion machine
vii. Insert the coupling and original pipe to the fusion machine.
viii. After heating, insert the original pipe into coupling
ix. Do the same way for new pipe and coupling.
x. Deactivate the socket fusion machine
A5-121
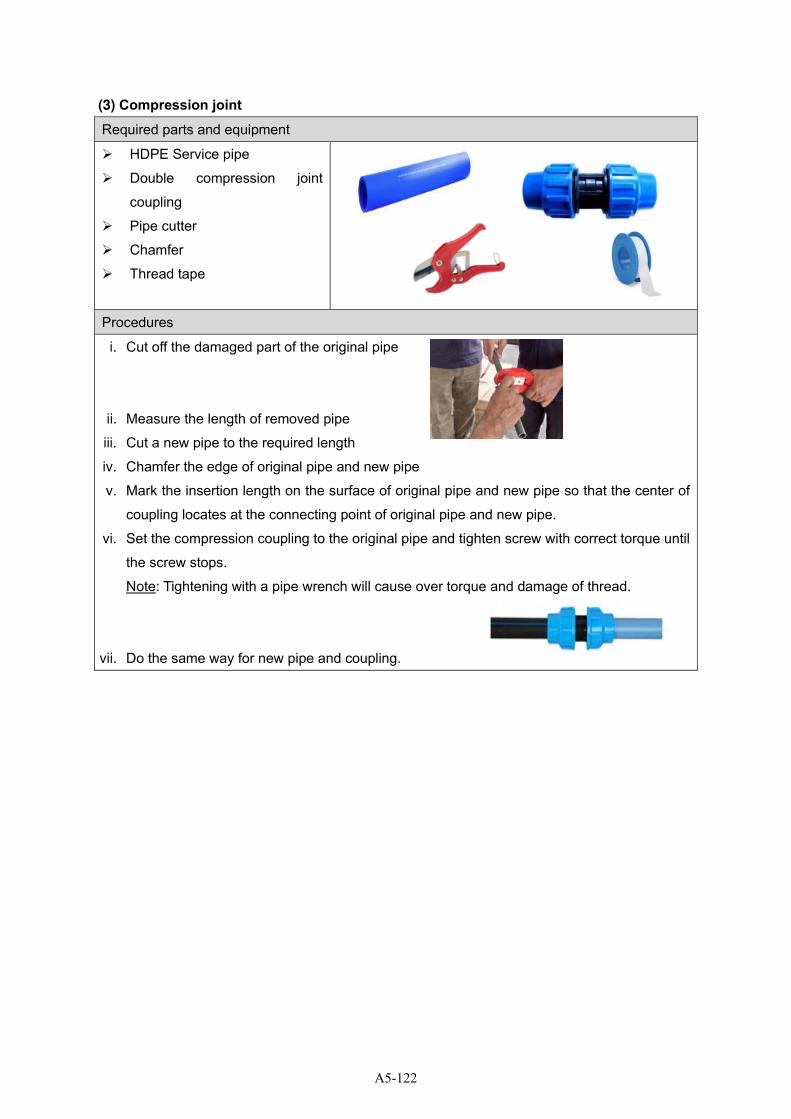
(3) Compression joint Required parts and equipment
➢ HDPE Service pipe
➢ Double compression joint
coupling
➢ Pipe cutter
➢ Chamfer
➢ Thread tape
Procedures
i. Cut off the damaged part of the original pipe
ii. Measure the length of removed pipe
iii. Cut a new pipe to the required length
iv. Chamfer the edge of original pipe and new pipe
v. Mark the insertion length on the surface of original pipe and new pipe so that the center of
coupling locates at the connecting point of original pipe and new pipe.
vi. Set the compression coupling to the original pipe and tighten screw with correct torque until
the screw stops.
Note: Tightening with a pipe wrench will cause over torque and damage of thread.
vii. Do the same way for new pipe and coupling.
A5-122
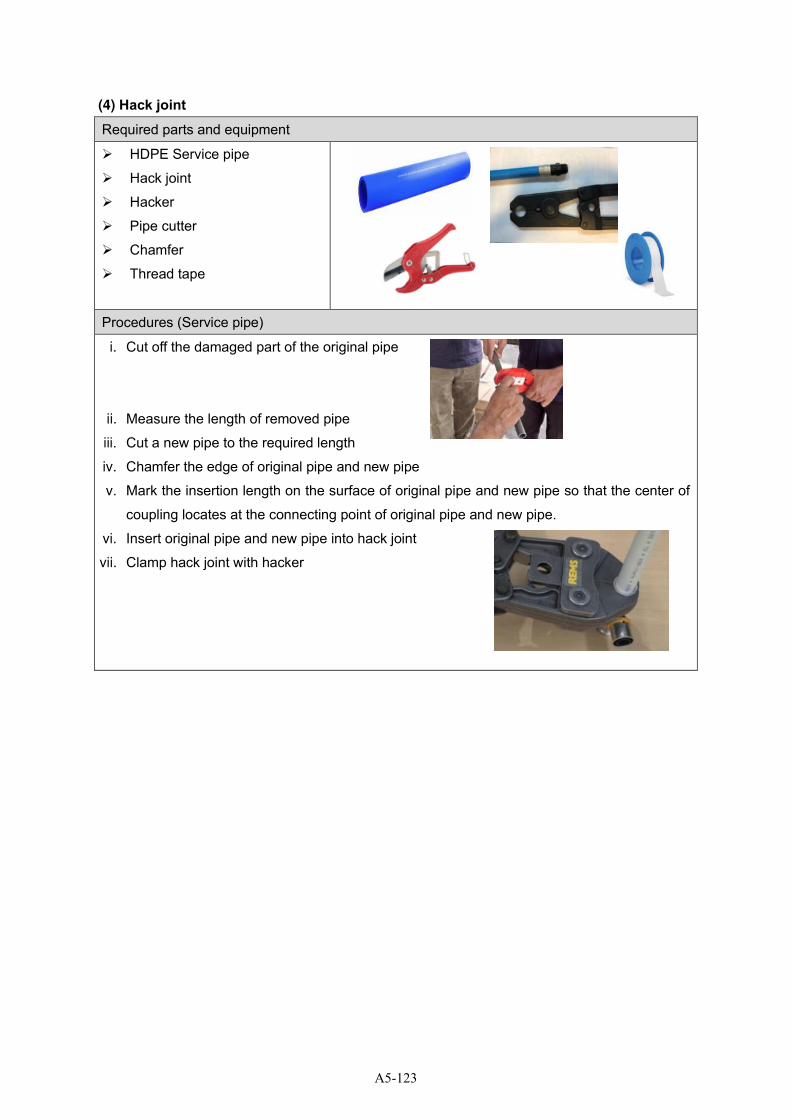
(4) Hack joint Required parts and equipment
➢ HDPE Service pipe
➢ Hack joint
➢ Hacker
➢ Pipe cutter
➢ Chamfer
➢ Thread tape
Procedures (Service pipe)
i. Cut off the damaged part of the original pipe
ii. Measure the length of removed pipe
iii. Cut a new pipe to the required length
iv. Chamfer the edge of original pipe and new pipe
v. Mark the insertion length on the surface of original pipe and new pipe so that the center of
coupling locates at the connecting point of original pipe and new pipe.
vi. Insert original pipe and new pipe into hack joint
vii. Clamp hack joint with hacker
A5-123
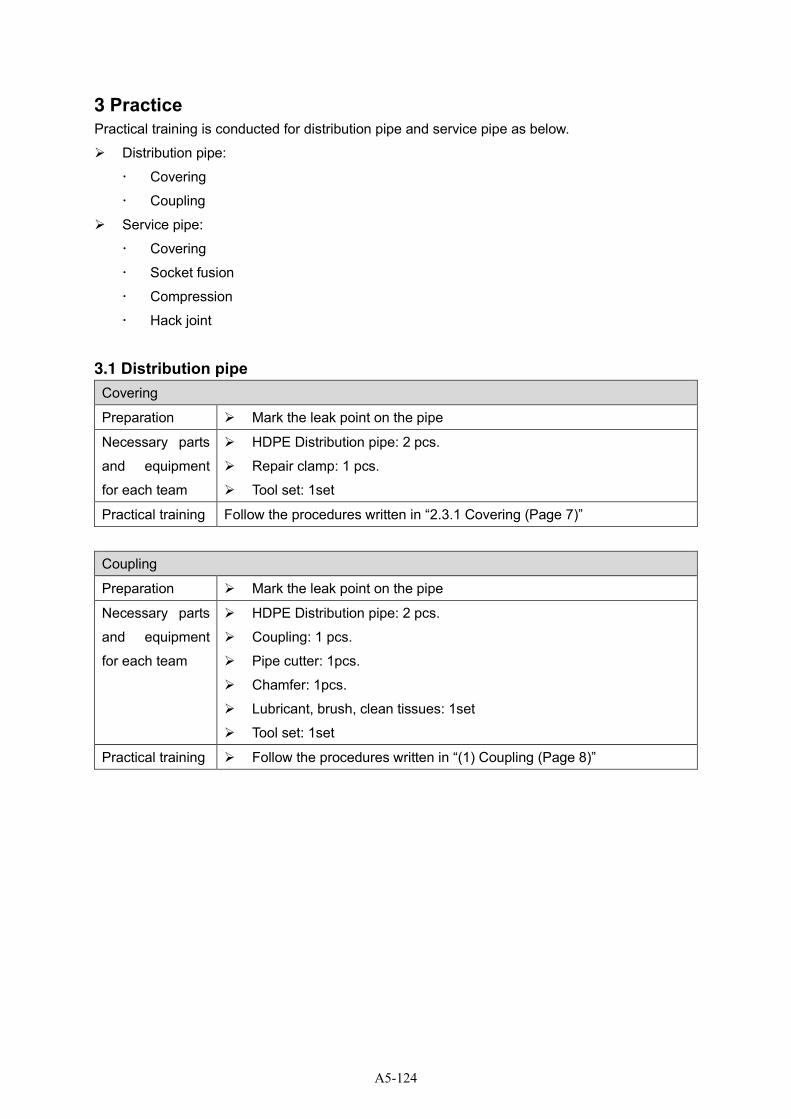
3 Practice
Practical training is conducted for distribution pipe and service pipe as below.
➢ Distribution pipe:
Covering
Coupling
➢ Service pipe:
Covering
Socket fusion
Compression
Hack joint
3.1 Distribution pipe
Covering
Preparation ➢ Mark the leak point on the pipe
Necessary parts
and equipment
for each team
➢ HDPE Distribution pipe: 2 pcs.
➢ Repair clamp: 1 pcs.
➢ Tool set: 1set
Practical training Follow the procedures written in “2.3.1 Covering (Page 7)”
Coupling
Preparation ➢ Mark the leak point on the pipe
Necessary parts
and equipment
for each team
➢ HDPE Distribution pipe: 2 pcs.
➢ Coupling: 1 pcs.
➢ Pipe cutter: 1pcs.
➢ Chamfer: 1pcs.
➢ Lubricant, brush, clean tissues: 1set
➢ Tool set: 1set
Practical training ➢ Follow the procedures written in “(1) Coupling (Page 8)”
A5-124
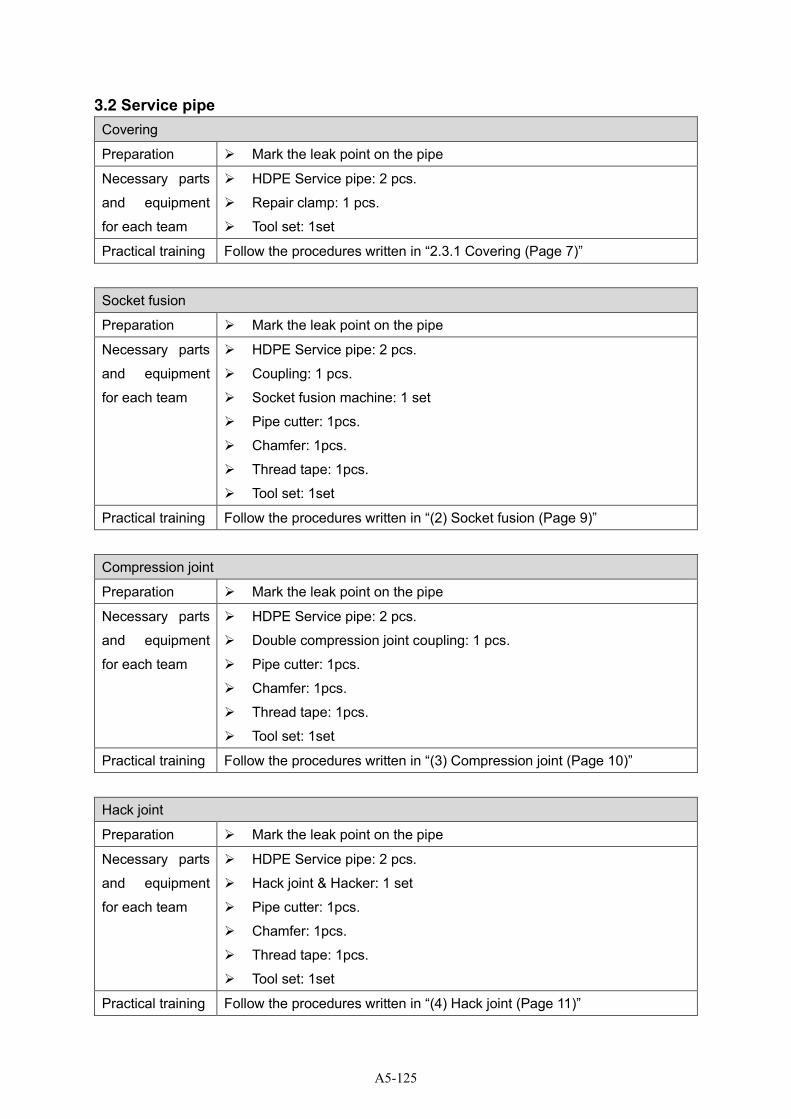
3.2 Service pipe
Covering
Preparation ➢ Mark the leak point on the pipe
Necessary parts
and equipment
for each team
➢ HDPE Service pipe: 2 pcs.
➢ Repair clamp: 1 pcs.
➢ Tool set: 1set
Practical training Follow the procedures written in “2.3.1 Covering (Page 7)”
Socket fusion
Preparation ➢ Mark the leak point on the pipe
Necessary parts
and equipment
for each team
➢ HDPE Service pipe: 2 pcs.
➢ Coupling: 1 pcs.
➢ Socket fusion machine: 1 set
➢ Pipe cutter: 1pcs.
➢ Chamfer: 1pcs.
➢ Thread tape: 1pcs.
➢ Tool set: 1set
Practical training Follow the procedures written in “(2) Socket fusion (Page 9)”
Compression joint
Preparation ➢ Mark the leak point on the pipe
Necessary parts
and equipment
for each team
➢ HDPE Service pipe: 2 pcs.
➢ Double compression joint coupling: 1 pcs.
➢ Pipe cutter: 1pcs.
➢ Chamfer: 1pcs.
➢ Thread tape: 1pcs.
➢ Tool set: 1set
Practical training Follow the procedures written in “(3) Compression joint (Page 10)”
Hack joint
Preparation ➢ Mark the leak point on the pipe
Necessary parts
and equipment
for each team
➢ HDPE Service pipe: 2 pcs.
➢ Hack joint & Hacker: 1 set
➢ Pipe cutter: 1pcs.
➢ Chamfer: 1pcs.
➢ Thread tape: 1pcs.
➢ Tool set: 1set
Practical training Follow the procedures written in “(4) Hack joint (Page 11)”
A5-125
4 Keep repair record
When water leakage is found at the site, it is necessary to keep a record. Based on the records, it
is possible to understand the deterioration status of pipes, determine the necessary frequency of
detailed inspections and the make a standard for renewal.
The repair record has to include following information.
➢ Leakage location: address, hose number, road name etc.
➢ Pipe information: pipe material, size, installed year, part of leakage
➢ Leakage information: type of damage, size of damage, leakage volume
➢ Repair work information: materials used for repairs, number of staff, time taken to complete
the repair work, used machine, volume of excavation, road type
➢ Water outage information for repair work, such as affected area of water supply, operated
valves, water volume for cleaning the pipe
The repair record sheet is shown below.
A5-126

A5-127
Training Guideline
4. Leak Repair
b. PVC Distribution & Service Pipe Repair
A5-128
Table of contents
1 Outline ........................................................................................................................................... 1
1.1 Purpose ................................................................................................................................... 1
1.2 Flow of training with time schedule ........................................................................................ 2
1.3 Safety notice ........................................................................................................................... 3
2 Knowledge acquisition ................................................................................................................... 4
2.1 Characteristic of PVC ............................................................................................................. 4
2.2 Type, cause and preventive measure of leakage ................................................................... 4
2.3 Repair method ........................................................................................................................ 6
2.3.1 Covering ........................................................................................................................... 7
2.3.2 Replacement .................................................................................................................... 8
(1) Coupling with lubricant ..................................................................................................... 8
(2) Coupling with adhesive .................................................................................................... 9
3 Practice ........................................................................................................................................ 10
3.1 Distribution pipe .................................................................................................................... 10
3.2 Service pipe ........................................................................................................................... 11
4 Keep repair record ....................................................................................................................... 12
A5-129
1 Outline
1.1 Purpose
Purpose of training Water leaks have a significant impact on water supply business.
Water leaks from the distribution lines not only affect the revenue of the
water utilities but also cause accidents on a road and its surrounding, so
it should be repaired immediately when it is detected.
Also, the amount of leakage from the service pipe is relatively small,
however, it will be large amounts if the leakage is left for a long time.
Therefore, service pipe leaks must be repaired as soon as they are
detected.
Pipe fitters typically gain their experience and skills through field works
and training programs. This training aims to acquire theoretical knowledge
and practical skills of PVC pipe repair through a practical training.
Training Contents ➢ Leak repair of PVC distribution pipe with repair clamp and coupling
➢ Leak repair of PVC service pipe with repair clamp and coupling
A5-130
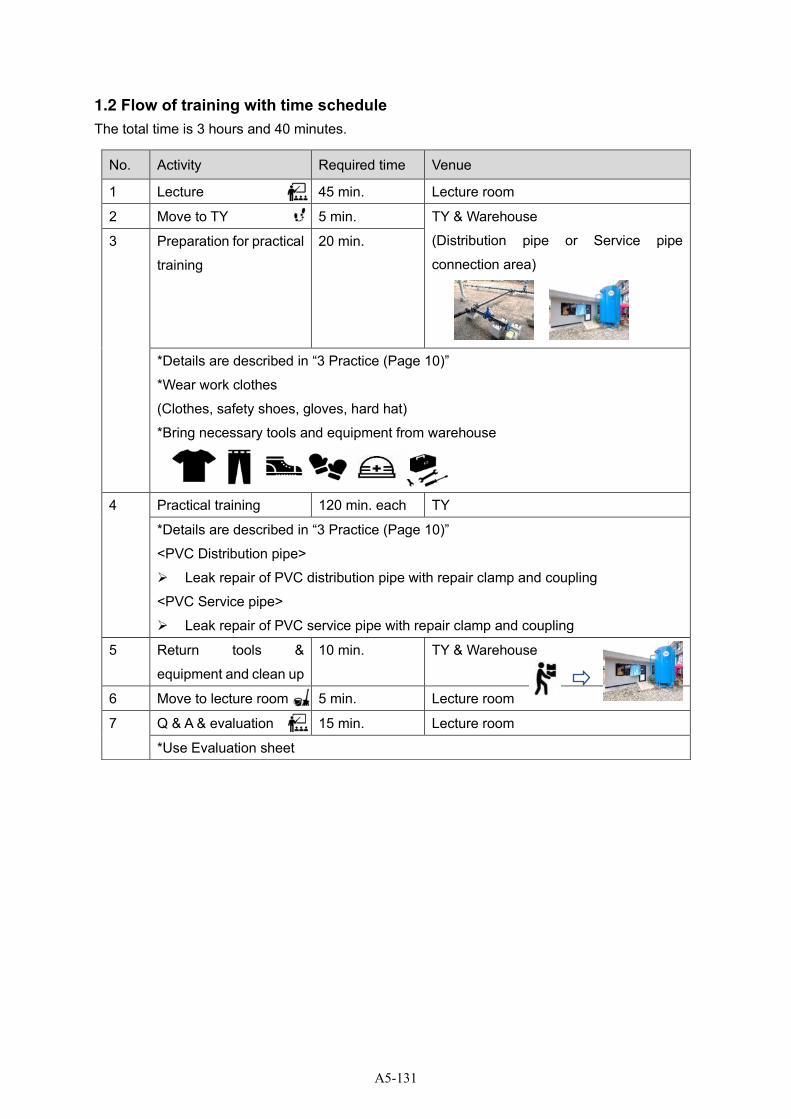
1.2 Flow of training with time schedule
The total time is 3 hours and 40 minutes.
No. Activity Required time Venue
1 Lecture 45 min. Lecture room
2 Move to TY 5 min. TY & Warehouse
(Distribution pipe or Service pipe
connection area)
3 Preparation for practical
training
20 min.
*Details are described in “3 Practice (Page 10)”
*Wear work clothes
(Clothes, safety shoes, gloves, hard hat)
*Bring necessary tools and equipment from warehouse
4 Practical training 120 min. each TY
*Details are described in “3 Practice (Page 10)”
<PVC Distribution pipe>
➢ Leak repair of PVC distribution pipe with repair clamp and coupling
<PVC Service pipe>
➢ Leak repair of PVC service pipe with repair clamp and coupling
5 Return tools &
equipment and clean up
10 min. TY & Warehouse
6 Move to lecture room 5 min. Lecture room
7 Q & A & evaluation 15 min. Lecture room
*Use Evaluation sheet
A5-131

1.3 Safety notice
➢ All members must wear safety equipment in TY. RP should order to participants wearing
suitable item
➢ Do not sit on the pipes or put your foot on.
➢ Do not touch the installed equipment unnecessarily.
➢ Do not eat food in the TY.
A5-132
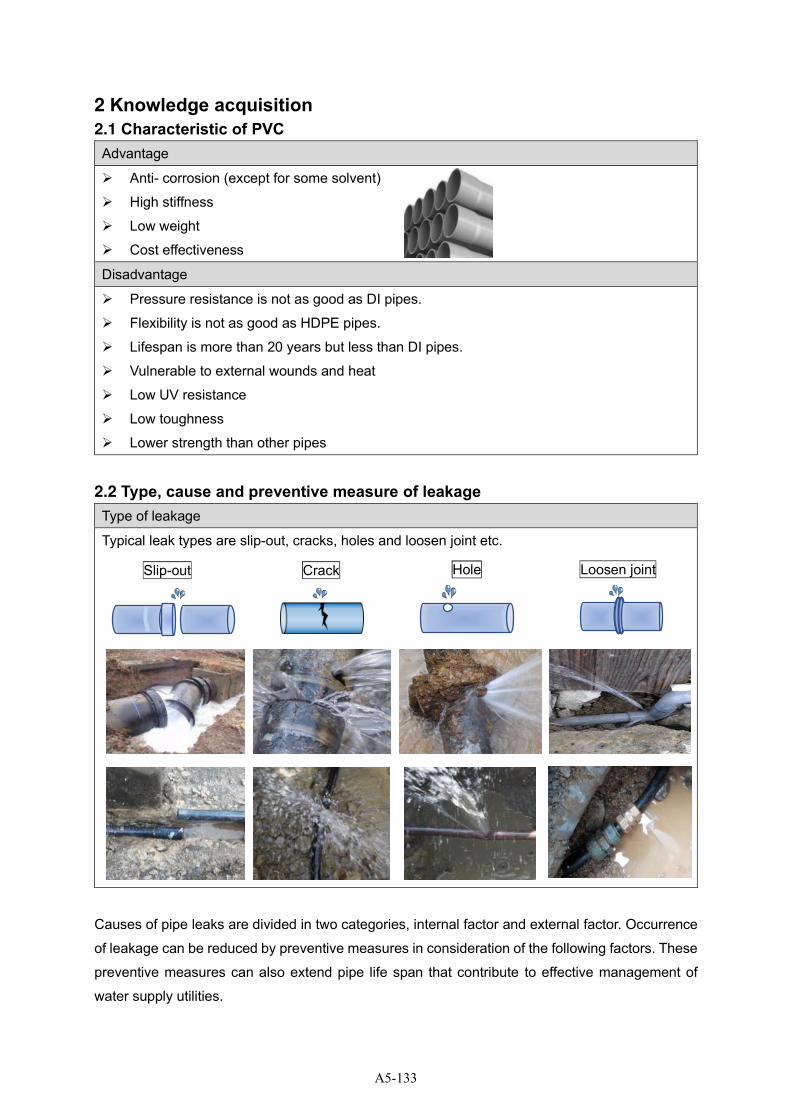
2 Knowledge acquisition
2.1 Characteristic of PVC
Advantage
➢ Anti- corrosion (except for some solvent)
➢ High stiffness
➢ Low weight
➢ Cost effectiveness
Disadvantage
➢ Pressure resistance is not as good as DI pipes.
➢ Flexibility is not as good as HDPE pipes.
➢ Lifespan is more than 20 years but less than DI pipes.
➢ Vulnerable to external wounds and heat
➢ Low UV resistance
➢ Low toughness
➢ Lower strength than other pipes
2.2 Type, cause and preventive measure of leakage
Type of leakage
Typical leak types are slip-out, cracks, holes and loosen joint etc.
Causes of pipe leaks are divided in two categories, internal factor and external factor. Occurrence
of leakage can be reduced by preventive measures in consideration of the following factors. These
preventive measures can also extend pipe life span that contribute to effective management of
water supply utilities.
Crack Hole Slip-out Loosen joint
A5-133

Cause and preventive measure
Internal factors Preventive measure
Due to pipe and material ➢ Improper materials and structures of
pipes, fittings, and attached equipment ➢ Corrosion
➢ Aging of materials
Due to design and construction
➢ Design error ➢ Improper installation of joints, etc. ➢ Improper backfill ➢ Insufficient anticorrosion method
➢ Potentiometric corrosion due to dissimilar metals
Due to cause in the pipes
➢ Chronic high pressure, Water hammer ➢ Water quality (Internal corrosion)
➢ Stress due to change of water temperature (especially freezing)
➢ Select appropriate material (use of certified products, Inspect by own organization)
➢ Painting or covering by anticorrosion tape
➢ Vinyl sleeve protection
➢ Reinforcement of surrounding land
➢ Reinforcement of laying foundation
➢ Installation of laying base structure
➢ Improvement of joint work technology by training
➢ Pipe protection concrete
➢ Inside of pipe lining
External factors Preventive measure
Due to buried environment ➢ Impact from traffic load
➢ Hollow around pipes due to leakage and poor construction.
➢ Ground subsidence due to excessive pumping of groundwater
➢ Soil contamination by a factory effluent ➢ Corrosive soil environment ➢ Salt damage (sea breeze, underground
water level) ➢ Difference between design and actual
condition
Thing caused by other construction or disaster ➢ Damage by other works
➢ Changes in buried environment due to other construction
➢ Ground and road fluctuation due to earthquakes and other disasters
➢ Ground movement by rain, flood and terrain deformation, etc.
➢ Appropriate backfill (backfill material, construction method)
➢ Installation of anticorrosive device
➢ Reinforcement of surrounding land
➢ Reinforcement of laying foundation
➢ Installation of laying base structure
➢ Improvement of joint work technology by training
➢ Pipe protection concrete
➢ Installation of the indication tape, sheet ➢ Collecting pipeline information (as built
drawings of distribution pipe and service pipe)
➢ Mapping system
A5-134

2.3 Repair method
Followings should be considered for repair work:
➢ Pipe material
➢ Leaking condition (leak position, leak volume, damage condition, etc.)
➢ Space of repair work
➢ Time of suspension of water supply
Repair method shall be mainly divided in two type, ‘Covering’ and ‘Replacement’. And depending
on pipe material and joint types, tightening and welding are also appropriate.
Note:
Although the method using adhesive tape is often introduced as the repair of the pipe, the water
supply authority should, in principle, carry out permanent repairs. It should be used for only
temporal repair.
Confirmation
Leakage situation
Selection
of repair method
Covering Replacement
Replacement of rubbering and gasket
Retightening of screw and bolts
A5-135
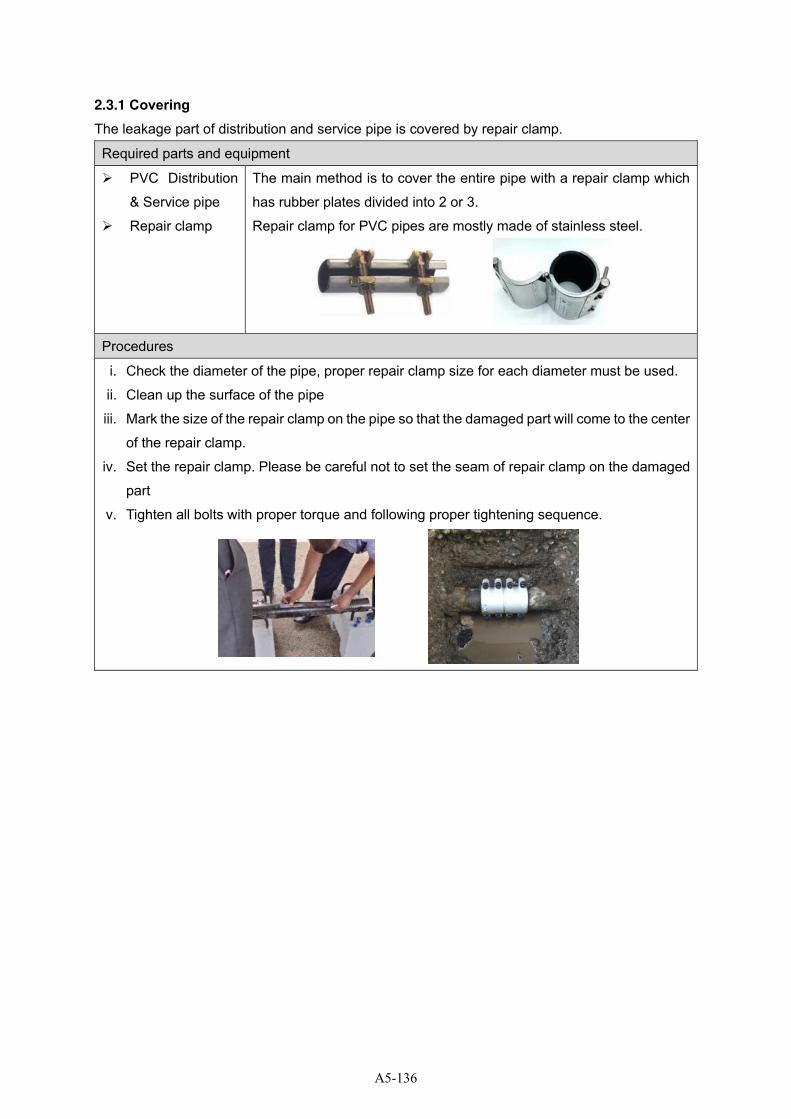
2.3.1 Covering
The leakage part of distribution and service pipe is covered by repair clamp.
Required parts and equipment
➢ PVC Distribution
& Service pipe
➢ Repair clamp
The main method is to cover the entire pipe with a repair clamp which
has rubber plates divided into 2 or 3.
Repair clamp for PVC pipes are mostly made of stainless steel.
Procedures
i. Check the diameter of the pipe, proper repair clamp size for each diameter must be used.
ii. Clean up the surface of the pipe
iii. Mark the size of the repair clamp on the pipe so that the damaged part will come to the center
of the repair clamp.
iv. Set the repair clamp. Please be careful not to set the seam of repair clamp on the damaged
part
v. Tighten all bolts with proper torque and following proper tightening sequence.
A5-136

2.3.2 Replacement The leakage part of pipe is replaced. A new pipe is connected to the original pipe with the coupling.
For the repair of PVC distribution pipe, coupling with lubricant is generally used. And for the repair
of PVC service pipe, coupling with adhesive (solvent cement) is generally used.
(1) Coupling with lubricant Required parts and equipment
➢ PVC Distribution pipe
➢ Coupling
➢ Pipe cutter
➢ Chamfer
➢ Lubricant, brush, clean tissue
Procedures
i. Check the diameter of the pipe, proper coupling size for each diameter must be used
ii. Mark the size of cutting part including the damage. Check the deteriorated part also which
may cause future leakage
iii. Set the cutter on the pipe
iv. Tighten the cutter until the wheel blade touch on the surface of pipe
v. Spin and retighten the cutter and repeat this process until the pipe is cut
vi. After cutting, chamfer the edge of pipe with a deburring knife or chamfering device
vii. Cut new pipe into suitable length. The length of the new pipe will be
shorter than the length of removed pipe
viii. Chamfer the edge of new pipe with a deburring knife or
chamfering device
Note: Be sure to chamfer the cut surface of the pipe,
otherwise the rubber ring will be damaged when inserting
ix. Mark the insertion length on the pipe surface so that the center of the coupling locates at the
connecting point of original pipe and new pipe.
x. Apply lubricant to the inside of coupling and outside of pipe.
xi. Set couplings on the original pipe and insert new pipe into coupling
Note: If sliding work is hard, use a chain block
Mark the insertion length
A5-137
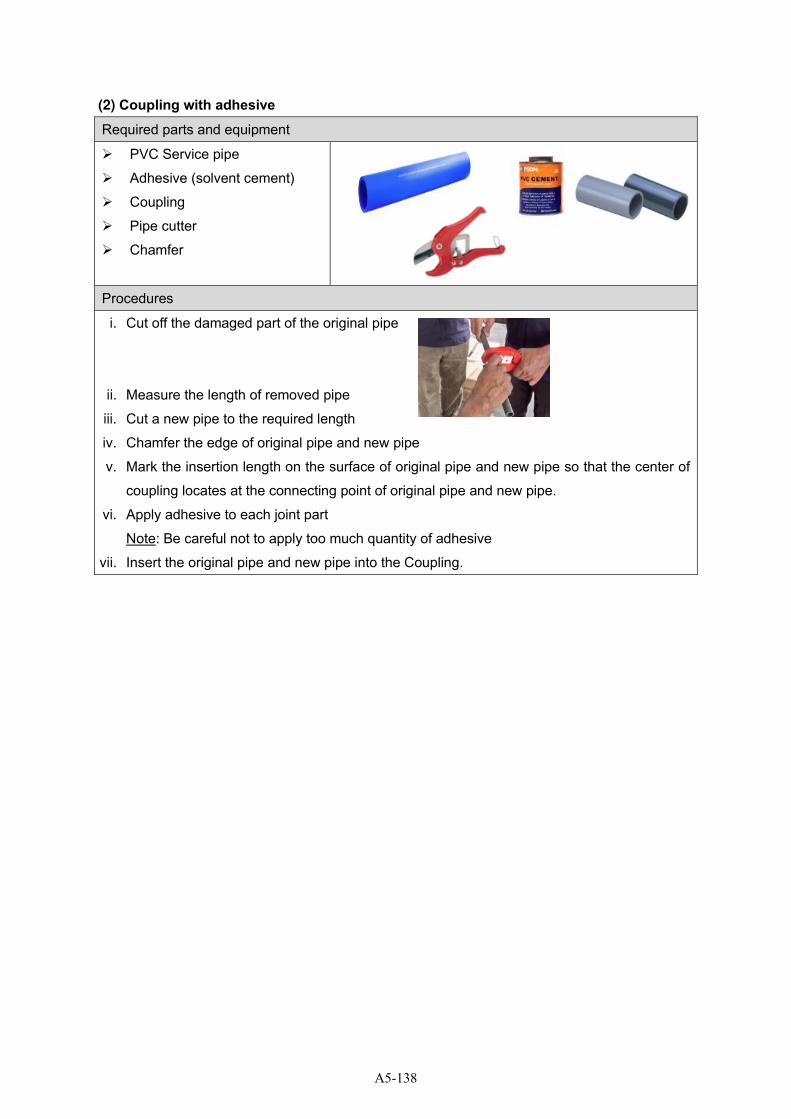
(2) Coupling with adhesive
Required parts and equipment
➢ PVC Service pipe
➢ Adhesive (solvent cement)
➢ Coupling
➢ Pipe cutter
➢ Chamfer
Procedures
i. Cut off the damaged part of the original pipe
ii. Measure the length of removed pipe
iii. Cut a new pipe to the required length
iv. Chamfer the edge of original pipe and new pipe
v. Mark the insertion length on the surface of original pipe and new pipe so that the center of
coupling locates at the connecting point of original pipe and new pipe.
vi. Apply adhesive to each joint part
Note: Be careful not to apply too much quantity of adhesive
vii. Insert the original pipe and new pipe into the Coupling.
A5-138
3 Practice
Practical training is conducted for distribution pipe and service pipe as below.
➢ Distribution pipe:
Covering
Coupling with lubricant
➢ Service pipe:
Covering
Coupling with adhesive
3.1 Distribution pipe
Covering
Preparation ➢ Mark the leak point on the pipe
Necessary parts
and equipment
for each team
➢ PVC Distribution pipe: 2 pcs.
➢ Repair clamp: 1 pcs.
➢ Tool set: 1set
Practical training Follow the procedures written in “2.3.1 Covering (Page 7)”
Coupling
Preparation ➢ Mark the leak point on the pipe
Necessary parts
and equipment
for each team
➢ PVC Distribution pipe: 2 pcs.
➢ Coupling: 1 pcs.
➢ Pipe cutter: 1pcs.
➢ Chamfer: 1pcs.
➢ Lubricant, brush, clean tissues: 1set
➢ Tool set: 1set
Practical training ➢ Follow the procedures written in “(1) Coupling with lubricant (Page 8)”
A5-139
3.2 Service pipe
Covering
Preparation ➢ Mark the leak point on the pipe
Necessary parts
and equipment
for each team
➢ PVC Service pipe: 2 pcs.
➢ Repair clamp: 1 pcs.
➢ Tool set: 1set
Practical training Follow the procedures written in “2.3.1 Covering (Page 7)”
Coupling with adhesive
Preparation ➢ Mark the leak point on the pipe
Necessary parts
and equipment
for each team
➢ PVC Service pipe: 2 pcs.
➢ Adhesive: 1 pcs.
➢ Coupling: 1 pcs.
➢ Pipe cutter: 1pcs.
➢ Chamfer: 1pcs.
➢ Tool set: 1set
Practical training Follow the procedures written in “(2) Coupling with adhesive (Page 9)”
A5-140

4 Keep repair record
When water leakage is found at the site, it is necessary to keep a record. Based on the records, it
is possible to understand the deterioration status of pipes, determine the necessary frequency of
detailed inspections and the make a standard for renewal.
The repair record has to include following information.
➢ Leakage location: address, hose number, road name etc.
➢ Pipe information: pipe material, size, installed year, part of leakage
➢ Leakage information: type of damage, size of damage, leakage volume
➢ Repair work information: materials used for repairs, number of staff, time taken to complete
the repair work, used machine, volume of excavation, road type
➢ Water outage information for repair work, such as affected area of water supply, operated
valves, water volume for cleaning the pipe
The repair record sheet is shown below.
A5-141

A5-142
Training Guideline
4. Leak Repair
c. DI Distribution Pipe Repair
A5-143

Table of contents
1 Outline ........................................................................................................................................... 1
1.1 Purpose ................................................................................................................................... 1
1.2 Flow of training with time schedule ........................................................................................ 1
1.3 Safety notice ........................................................................................................................... 2
2 Knowledge acquisition ................................................................................................................... 3
2.1 Characteristic of DI ................................................................................................................. 3
2.2 Type, cause and preventive measure of leakage ................................................................... 3
2.3 Repair method ........................................................................................................................ 5
2.3.1 Covering ........................................................................................................................... 6
2.3.2 Replacement .................................................................................................................... 7
(1) Coupling with lubricant ..................................................................................................... 7
3 Practice .......................................................................................................................................... 8
3.1 Distribution pipe ...................................................................................................................... 8
4 Keep repair record ......................................................................................................................... 9
A5-144
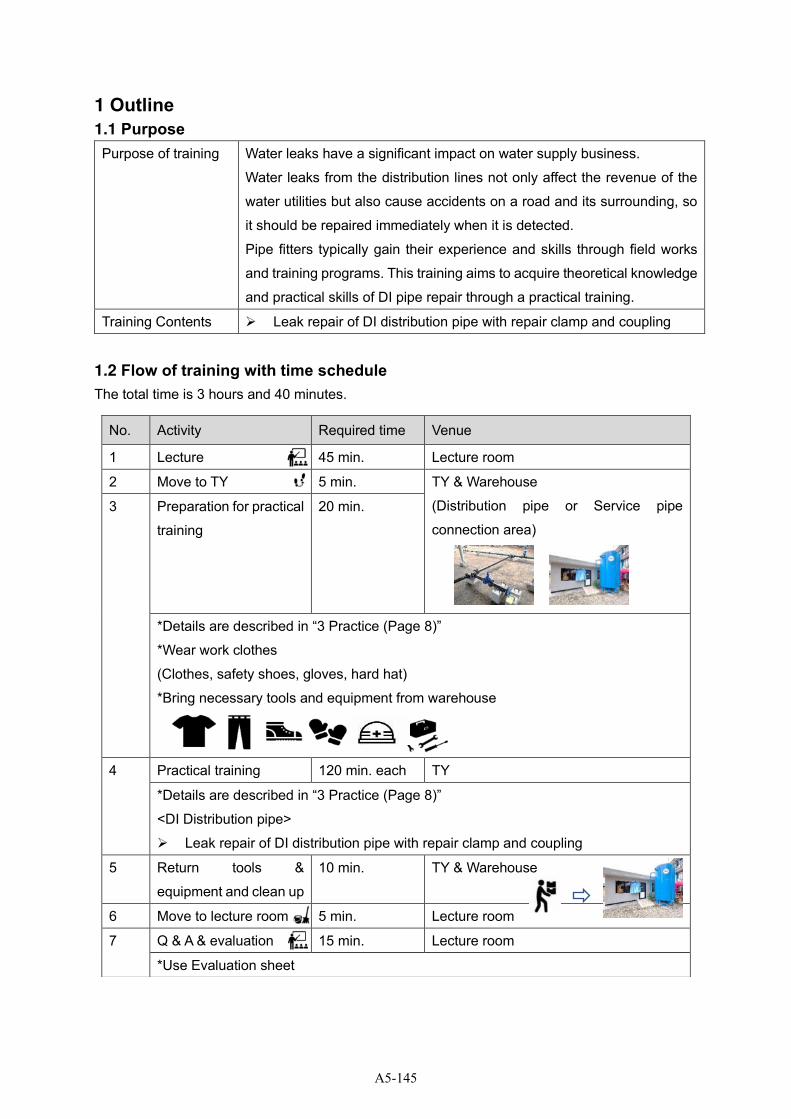
1 Outline
1.1 Purpose
Purpose of training Water leaks have a significant impact on water supply business.
Water leaks from the distribution lines not only affect the revenue of the
water utilities but also cause accidents on a road and its surrounding, so
it should be repaired immediately when it is detected.
Pipe fitters typically gain their experience and skills through field works
and training programs. This training aims to acquire theoretical knowledge
and practical skills of DI pipe repair through a practical training.
Training Contents ➢ Leak repair of DI distribution pipe with repair clamp and coupling
1.2 Flow of training with time schedule
The total time is 3 hours and 40 minutes.
No. Activity Required time Venue
1 Lecture 45 min. Lecture room
2 Move to TY 5 min. TY & Warehouse
(Distribution pipe or Service pipe
connection area)
3 Preparation for practical
training
20 min.
*Details are described in “3 Practice (Page 8)”
*Wear work clothes
(Clothes, safety shoes, gloves, hard hat)
*Bring necessary tools and equipment from warehouse
4 Practical training 120 min. each TY
*Details are described in “3 Practice (Page 8)”
<DI Distribution pipe>
➢ Leak repair of DI distribution pipe with repair clamp and coupling
5 Return tools &
equipment and clean up
10 min. TY & Warehouse
6 Move to lecture room 5 min. Lecture room
7 Q & A & evaluation 15 min. Lecture room
*Use Evaluation sheet
A5-145

1.3 Safety notice
➢ All members must wear safety equipment in TY. RP should order to participants wearing
suitable item
➢ Do not sit on the pipes or put your foot on.
➢ Do not touch the installed equipment unnecessarily.
➢ Do not eat food in the TY.
A5-146
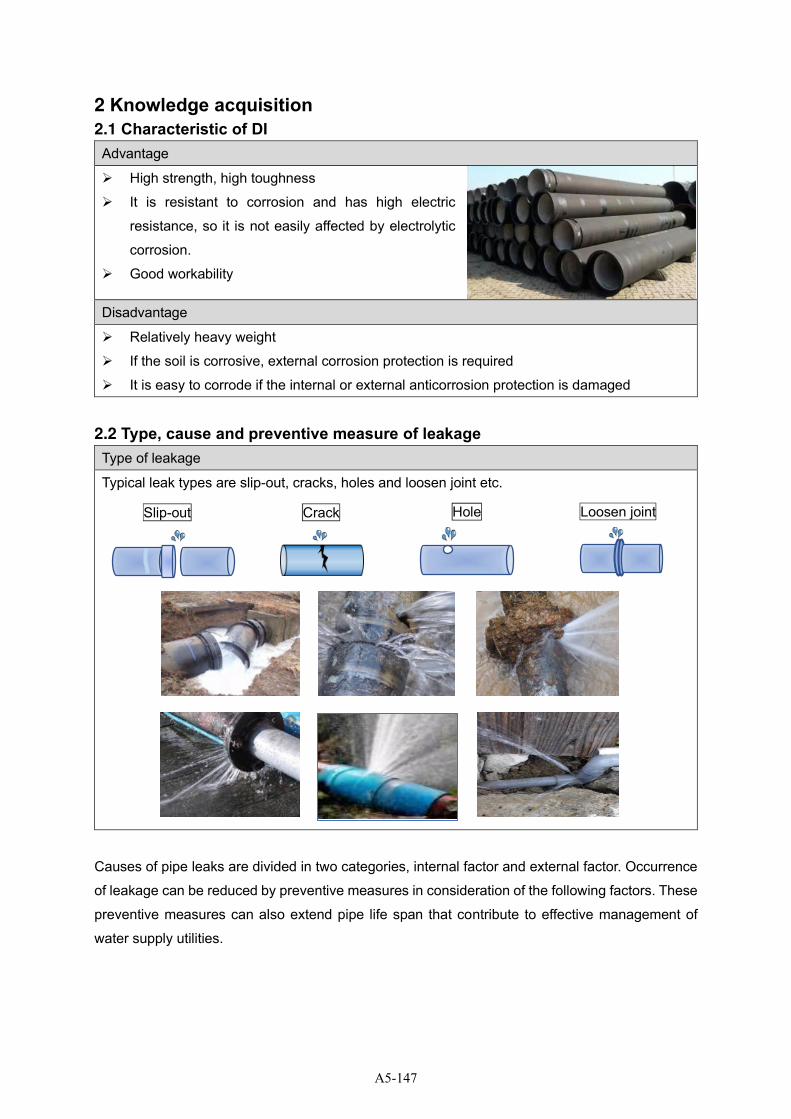
2 Knowledge acquisition
2.1 Characteristic of DI Advantage
➢ High strength, high toughness
➢ It is resistant to corrosion and has high electric
resistance, so it is not easily affected by electrolytic
corrosion.
➢ Good workability
Disadvantage
➢ Relatively heavy weight
➢ If the soil is corrosive, external corrosion protection is required
➢ It is easy to corrode if the internal or external anticorrosion protection is damaged
2.2 Type, cause and preventive measure of leakage
Type of leakage
Typical leak types are slip-out, cracks, holes and loosen joint etc.
Causes of pipe leaks are divided in two categories, internal factor and external factor. Occurrence
of leakage can be reduced by preventive measures in consideration of the following factors. These
preventive measures can also extend pipe life span that contribute to effective management of
water supply utilities.
Crack Hole Slip-out Loosen joint
A5-147
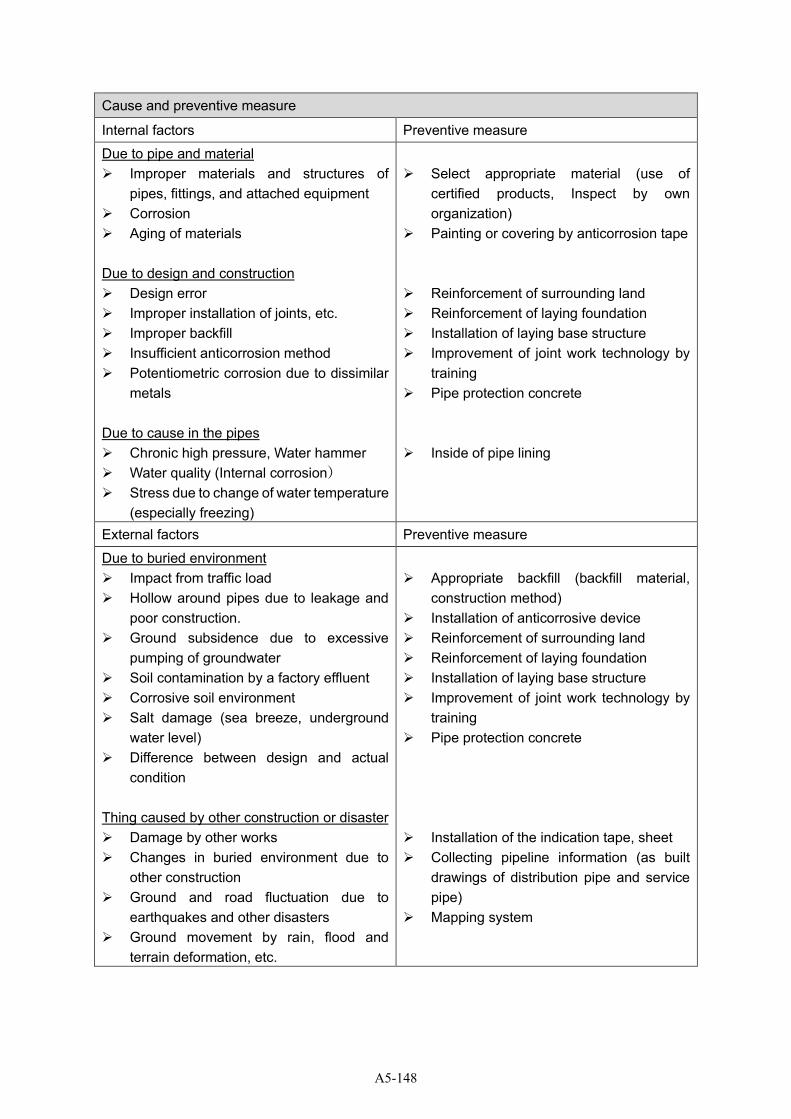
Cause and preventive measure
Internal factors Preventive measure
Due to pipe and material ➢ Improper materials and structures of
pipes, fittings, and attached equipment ➢ Corrosion
➢ Aging of materials
Due to design and construction
➢ Design error ➢ Improper installation of joints, etc. ➢ Improper backfill ➢ Insufficient anticorrosion method
➢ Potentiometric corrosion due to dissimilar metals
Due to cause in the pipes
➢ Chronic high pressure, Water hammer ➢ Water quality (Internal corrosion)
➢ Stress due to change of water temperature (especially freezing)
➢ Select appropriate material (use of certified products, Inspect by own organization)
➢ Painting or covering by anticorrosion tape
➢ Reinforcement of surrounding land
➢ Reinforcement of laying foundation
➢ Installation of laying base structure
➢ Improvement of joint work technology by training
➢ Pipe protection concrete
➢ Inside of pipe lining
External factors Preventive measure
Due to buried environment ➢ Impact from traffic load
➢ Hollow around pipes due to leakage and poor construction.
➢ Ground subsidence due to excessive pumping of groundwater
➢ Soil contamination by a factory effluent ➢ Corrosive soil environment ➢ Salt damage (sea breeze, underground
water level) ➢ Difference between design and actual
condition
Thing caused by other construction or disaster ➢ Damage by other works
➢ Changes in buried environment due to other construction
➢ Ground and road fluctuation due to earthquakes and other disasters
➢ Ground movement by rain, flood and terrain deformation, etc.
➢ Appropriate backfill (backfill material, construction method)
➢ Installation of anticorrosive device
➢ Reinforcement of surrounding land
➢ Reinforcement of laying foundation
➢ Installation of laying base structure
➢ Improvement of joint work technology by training
➢ Pipe protection concrete
➢ Installation of the indication tape, sheet ➢ Collecting pipeline information (as built
drawings of distribution pipe and service pipe)
➢ Mapping system
A5-148
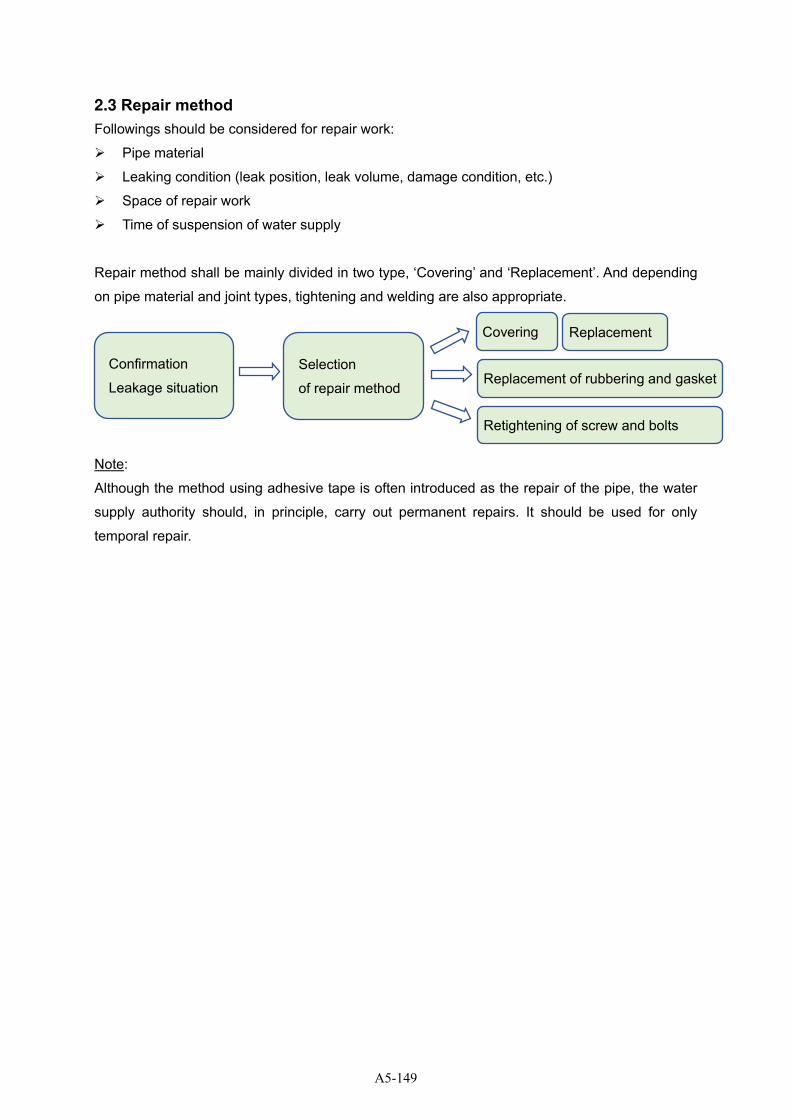
2.3 Repair method
Followings should be considered for repair work:
➢ Pipe material
➢ Leaking condition (leak position, leak volume, damage condition, etc.)
➢ Space of repair work
➢ Time of suspension of water supply
Repair method shall be mainly divided in two type, ‘Covering’ and ‘Replacement’. And depending
on pipe material and joint types, tightening and welding are also appropriate.
Note:
Although the method using adhesive tape is often introduced as the repair of the pipe, the water
supply authority should, in principle, carry out permanent repairs. It should be used for only
temporal repair.
Confirmation
Leakage situation
Selection
of repair method
Covering Replacement
Replacement of rubbering and gasket
Retightening of screw and bolts
A5-149
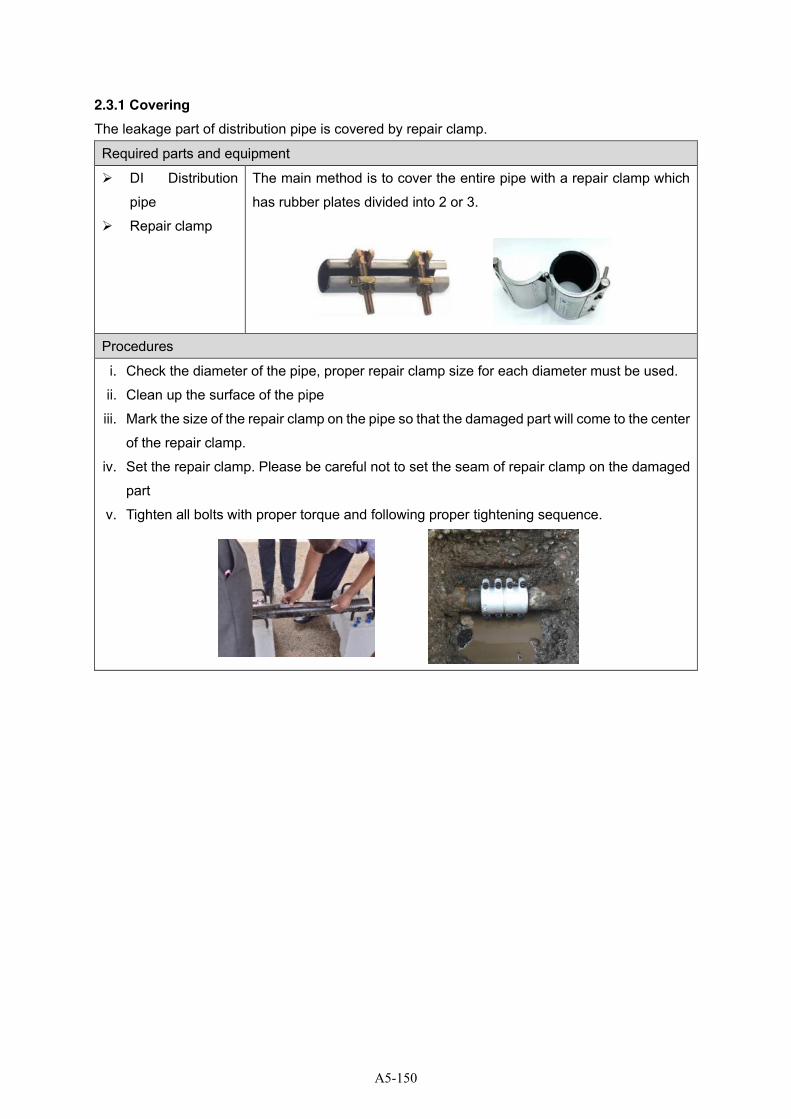
2.3.1 Covering
The leakage part of distribution pipe is covered by repair clamp.
Required parts and equipment
➢ DI Distribution
pipe
➢ Repair clamp
The main method is to cover the entire pipe with a repair clamp which
has rubber plates divided into 2 or 3.
Procedures
i. Check the diameter of the pipe, proper repair clamp size for each diameter must be used.
ii. Clean up the surface of the pipe
iii. Mark the size of the repair clamp on the pipe so that the damaged part will come to the center
of the repair clamp.
iv. Set the repair clamp. Please be careful not to set the seam of repair clamp on the damaged
part
v. Tighten all bolts with proper torque and following proper tightening sequence.
A5-150
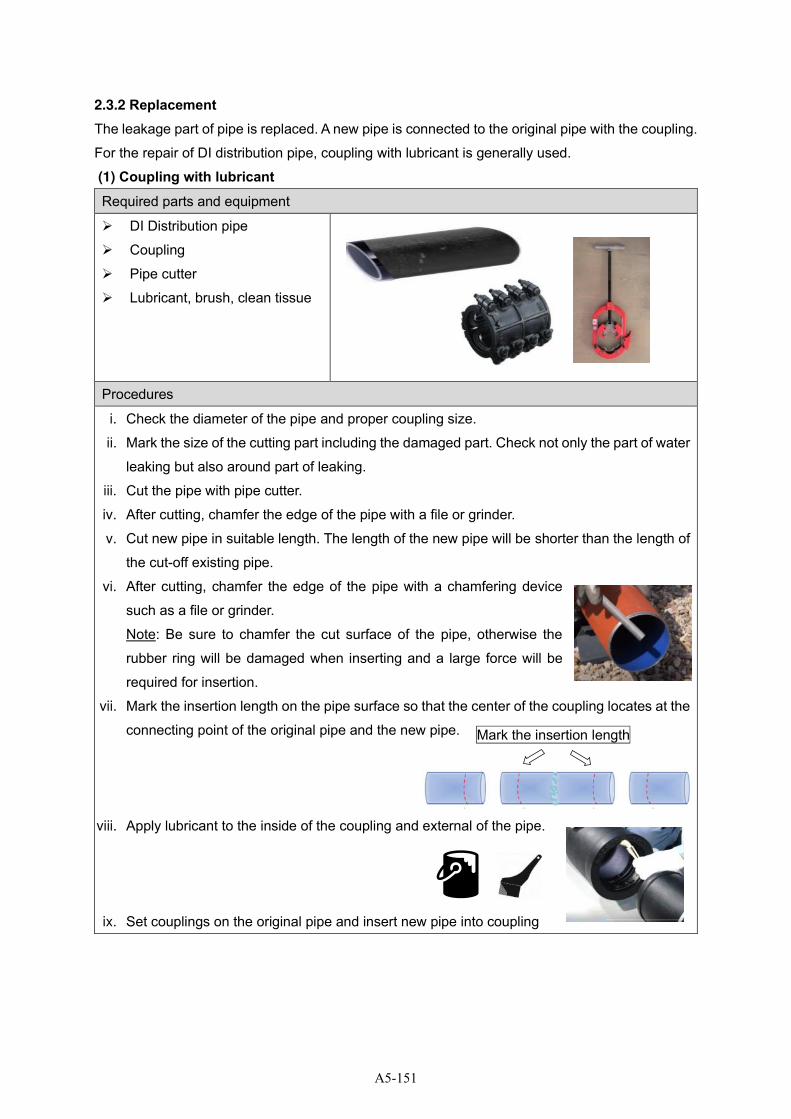
2.3.2 Replacement The leakage part of pipe is replaced. A new pipe is connected to the original pipe with the coupling.
For the repair of DI distribution pipe, coupling with lubricant is generally used.
(1) Coupling with lubricant Required parts and equipment
➢ DI Distribution pipe
➢ Coupling
➢ Pipe cutter
➢ Lubricant, brush, clean tissue
Procedures
i. Check the diameter of the pipe and proper coupling size.
ii. Mark the size of the cutting part including the damaged part. Check not only the part of water
leaking but also around part of leaking.
iii. Cut the pipe with pipe cutter.
iv. After cutting, chamfer the edge of the pipe with a file or grinder.
v. Cut new pipe in suitable length. The length of the new pipe will be shorter than the length of
the cut-off existing pipe.
vi. After cutting, chamfer the edge of the pipe with a chamfering device
such as a file or grinder.
Note: Be sure to chamfer the cut surface of the pipe, otherwise the
rubber ring will be damaged when inserting and a large force will be
required for insertion.
vii. Mark the insertion length on the pipe surface so that the center of the coupling locates at the
connecting point of the original pipe and the new pipe.
viii. Apply lubricant to the inside of the coupling and external of the pipe.
ix. Set couplings on the original pipe and insert new pipe into coupling
Mark the insertion length
A5-151
3 Practice
Practical training is conducted for distribution pipe as below.
➢ Distribution pipe:
Covering
Coupling with lubricant
3.1 Distribution pipe
Covering
Preparation ➢ Mark the leak point on the pipe
Necessary parts
and equipment
for each team
➢ DI Distribution pipe: 2 pcs.
➢ Repair clamp: 1 pcs.
➢ Tool set: 1set
Practical training Follow the procedures written in “2.3.1 Covering (Page 6)”
Coupling
Preparation ➢ Mark the leak point on the pipe
Necessary parts
and equipment
for each team
➢ DI Distribution pipe: 2 pcs.
➢ Coupling: 1 pcs.
➢ Pipe cutter: 1pcs.
➢ Chamfer: 1pcs.
➢ Lubricant, brush, clean tissues: 1set
➢ Tool set: 1set
Practical training ➢ Follow the procedures written in “(1) Coupling with lubricant (Page 7)”
A5-152

4 Keep repair record
When water leakage is found at the site, it is necessary to keep a record. Based on the records, it
is possible to understand the deterioration status of pipes, determine the necessary frequency of
detailed inspections and the make a standard for renewal.
The repair record has to include following information.
➢ Leakage location: address, hose number, road name etc.
➢ Pipe information: pipe material, size, installed year, part of leakage
➢ Leakage information: type of damage, size of damage, leakage volume
➢ Repair work information: materials used for repairs, number of staff, time taken to complete
the repair work, used machine, volume of excavation, road type
➢ Water outage information for repair work, such as affected area of water supply, operated
valves, water volume for cleaning the pipe
The repair record sheet is shown below.
A5-153
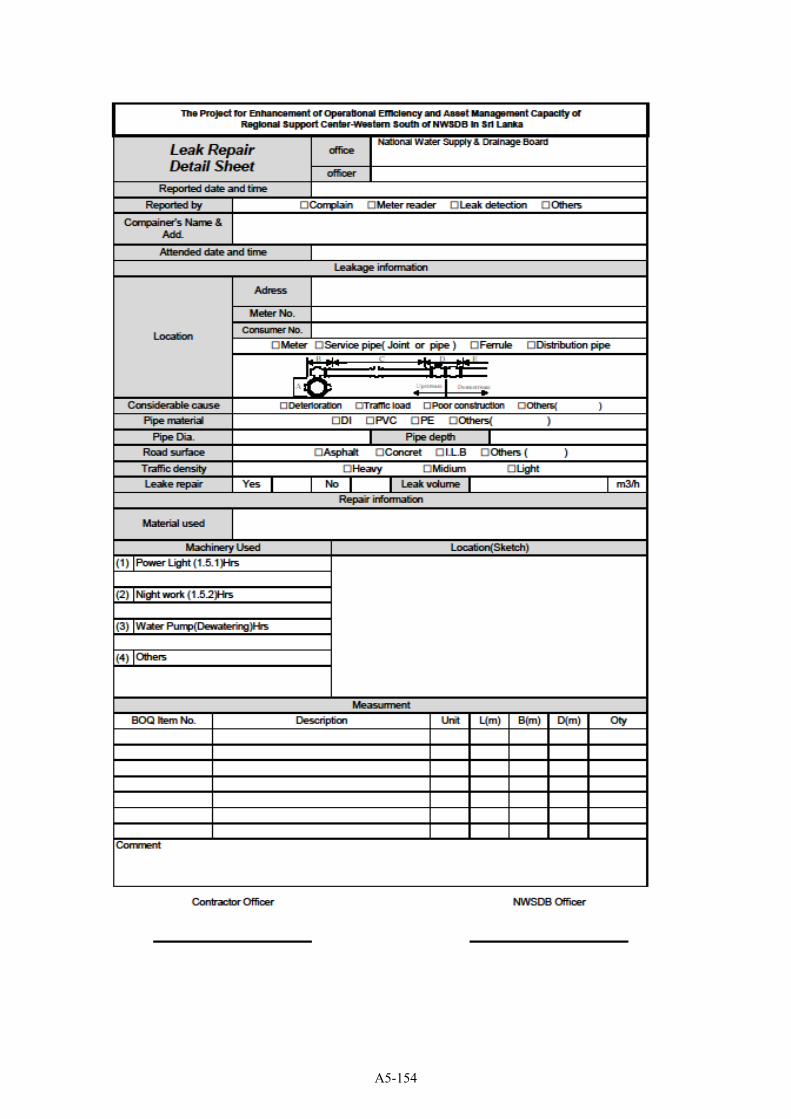
A5-154
Training Guideline
4. Leak Repair
d. Valve and Accessory
A5-155
Table of contents
1 Outline ........................................................................................................................................... 1
1.1 Purpose ................................................................................................................................... 1
1.2 Flow of training with time schedule ........................................................................................ 2
1.3 Safety notice ........................................................................................................................... 3
2 Knowledge acquisition ................................................................................................................... 4
2.1 Type of accessories ................................................................................................................ 4
2.1.1 Valve ................................................................................................................................. 4
(1) Shut-off valve ................................................................................................................... 4
(2) Control valve .................................................................................................................... 6
(3) Air valve ............................................................................................................................ 6
2.1.2 Fire hydrant and other equipment .................................................................................... 7
2.2 Cause of leakage .................................................................................................................... 8
2.3 Type of leakage ...................................................................................................................... 8
2.3.1 Valve ................................................................................................................................. 8
2.3.2 Air valve ............................................................................................................................ 9
2.3.3 Fire hydrant ...................................................................................................................... 9
2.4 Repair method ...................................................................................................................... 10
2.4.1 Valve ............................................................................................................................... 10
2.4.2 Air valve ........................................................................................................................... 11
2.4.3 Fire hydrant .................................................................................................................... 12
2.5 Maintenance of accessories ................................................................................................. 12
3 Practice ........................................................................................................................................ 13
3.1 Preparation ........................................................................................................................... 13
3.1.1 Gate valve ...................................................................................................................... 13
3.1.2 Air valve .......................................................................................................................... 13
3.1.3 Fire hydrant .................................................................................................................... 13
3.2 Procedures of training .......................................................................................................... 14
3.2.1 Gate valve ...................................................................................................................... 14
(1) Leakage from valve joint gasket .................................................................................... 14
(2) Leakage from gland packing .......................................................................................... 15
3.2.2 Air valve .......................................................................................................................... 16
3.2.3 Fire hydrant .................................................................................................................... 17
4 Keep repair record ....................................................................................................................... 19
A5-156
1 Outline
1.1 Purpose
Purpose of training In order to maintain stable water supply, it is necessary to properly manage
not only water pipes but also accessories such as valves and air valves,
etc. and repair any water leaks as soon as possible. Accessories are more
complicated structure than pipes, and it may not be simple to identify and
repair leaks. In this program, we learn the structure of the accessories,
locations where water leakage may occur, and learn how to repair them
depending on the leak location.
Training Contents ➢ Leak repair of gate valve
➢ Leak repair of air valve
➢ Leak repair of fire hydrant
A5-157
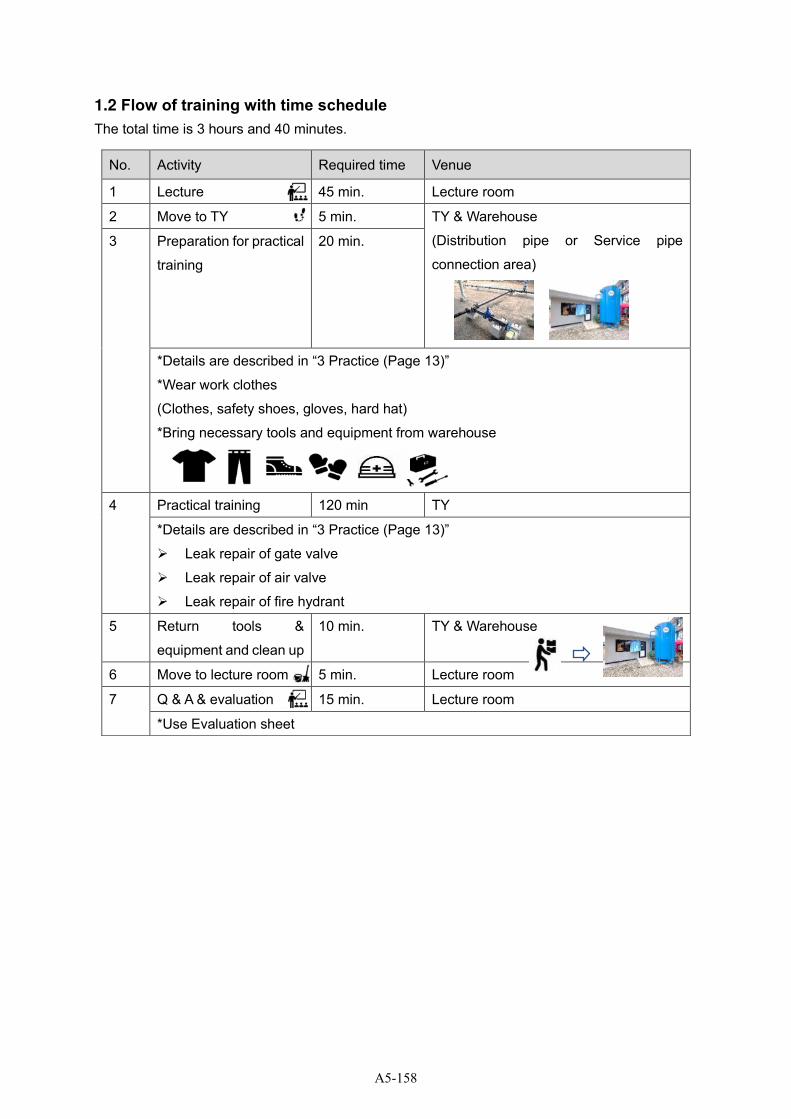
1.2 Flow of training with time schedule
The total time is 3 hours and 40 minutes.
No. Activity Required time Venue
1 Lecture 45 min. Lecture room
2 Move to TY 5 min. TY & Warehouse
(Distribution pipe or Service pipe
connection area)
3 Preparation for practical
training
20 min.
*Details are described in “3 Practice (Page 13)”
*Wear work clothes
(Clothes, safety shoes, gloves, hard hat)
*Bring necessary tools and equipment from warehouse
4 Practical training 120 min TY
*Details are described in “3 Practice (Page 13)”
➢ Leak repair of gate valve
➢ Leak repair of air valve
➢ Leak repair of fire hydrant
5 Return tools &
equipment and clean up
10 min. TY & Warehouse
6 Move to lecture room 5 min. Lecture room
7 Q & A & evaluation 15 min. Lecture room
*Use Evaluation sheet
A5-158

1.3 Safety notice
➢ All members must wear safety equipment in TY. RP should order to participants wearing
suitable item
➢ Do not sit on the pipes or put your foot on.
➢ Do not touch the installed equipment unnecessarily.
➢ Do not eat food in the TY.
A5-159
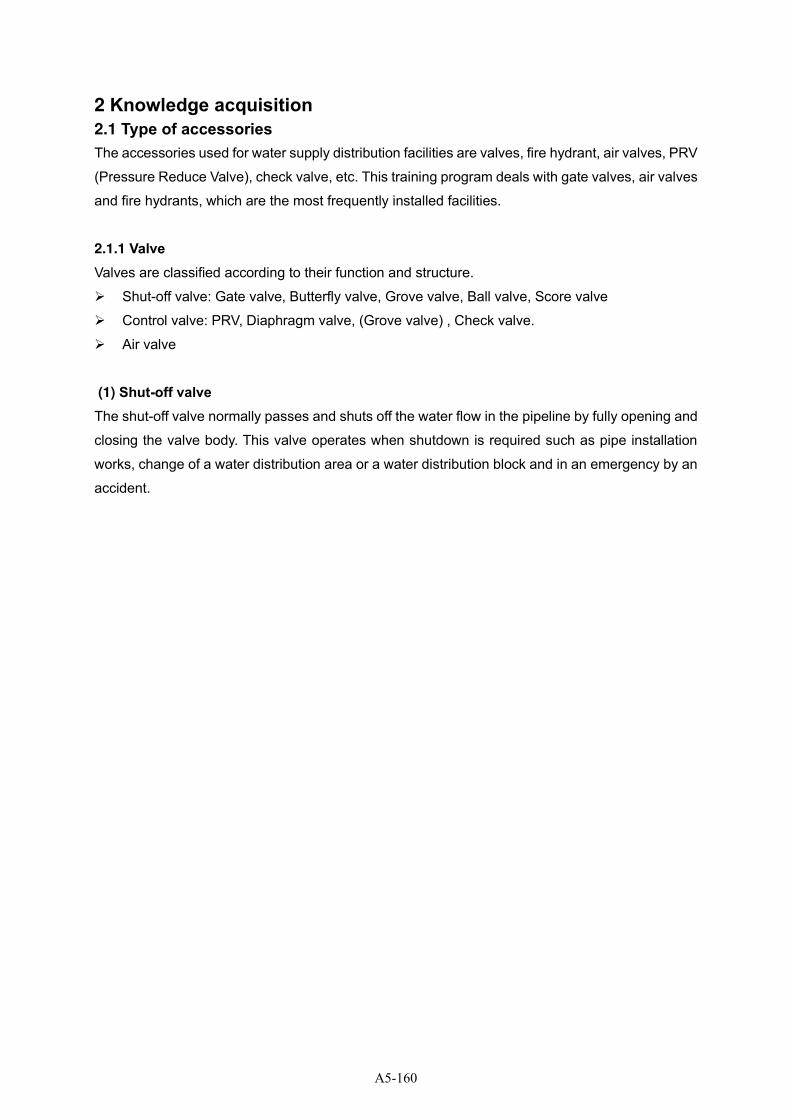
2 Knowledge acquisition
2.1 Type of accessories
The accessories used for water supply distribution facilities are valves, fire hydrant, air valves, PRV
(Pressure Reduce Valve), check valve, etc. This training program deals with gate valves, air valves
and fire hydrants, which are the most frequently installed facilities.
2.1.1 Valve
Valves are classified according to their function and structure.
➢ Shut-off valve: Gate valve, Butterfly valve, Grove valve, Ball valve, Score valve
➢ Control valve: PRV, Diaphragm valve, (Grove valve) , Check valve.
➢ Air valve
(1) Shut-off valve
The shut-off valve normally passes and shuts off the water flow in the pipeline by fully opening and
closing the valve body. This valve operates when shutdown is required such as pipe installation
works, change of a water distribution area or a water distribution block and in an emergency by an
accident.
A5-160
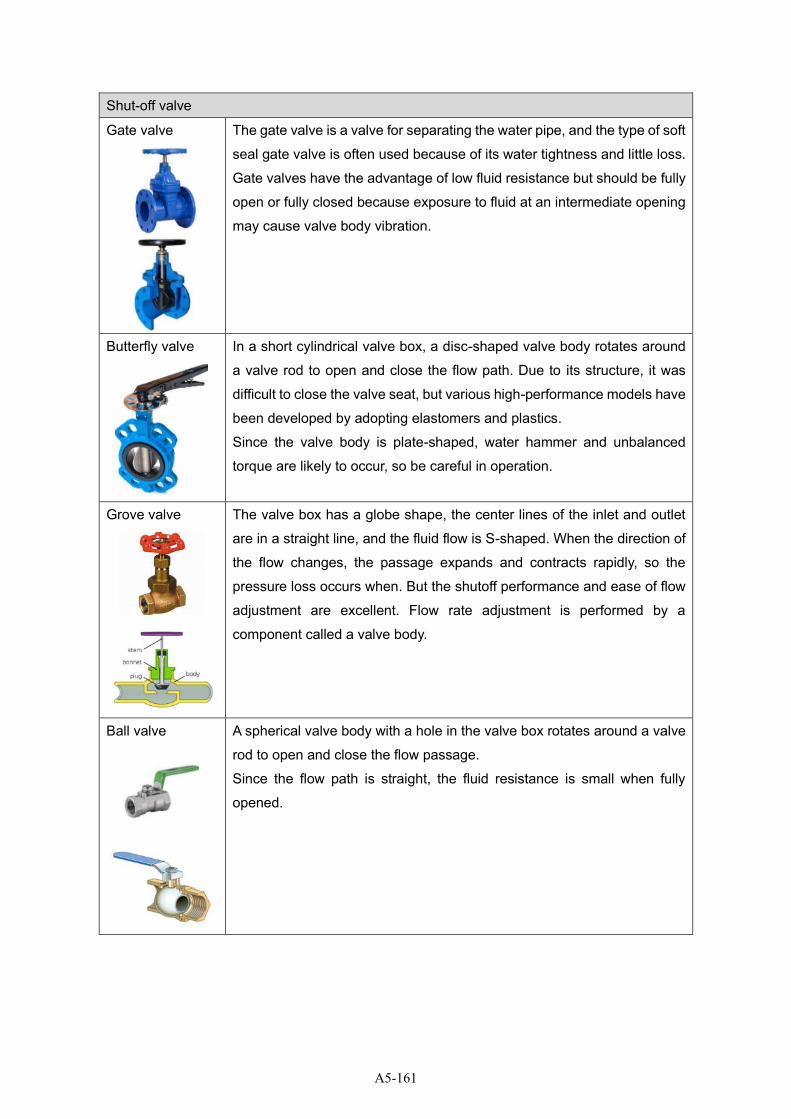
Shut-off valve
Gate valve
The gate valve is a valve for separating the water pipe, and the type of soft
seal gate valve is often used because of its water tightness and little loss.
Gate valves have the advantage of low fluid resistance but should be fully
open or fully closed because exposure to fluid at an intermediate opening
may cause valve body vibration.
Butterfly valve
In a short cylindrical valve box, a disc-shaped valve body rotates around
a valve rod to open and close the flow path. Due to its structure, it was
difficult to close the valve seat, but various high-performance models have
been developed by adopting elastomers and plastics.
Since the valve body is plate-shaped, water hammer and unbalanced
torque are likely to occur, so be careful in operation.
Grove valve
The valve box has a globe shape, the center lines of the inlet and outlet
are in a straight line, and the fluid flow is S-shaped. When the direction of
the flow changes, the passage expands and contracts rapidly, so the
pressure loss occurs when. But the shutoff performance and ease of flow
adjustment are excellent. Flow rate adjustment is performed by a
component called a valve body.
Ball valve
A spherical valve body with a hole in the valve box rotates around a valve
rod to open and close the flow passage.
Since the flow path is straight, the fluid resistance is small when fully
opened.
A5-161

(2) Control valve
Control valve
Pressure
reduce valve
Pressure Reduce Valve (PRV) protects pipes and other facilities from high
water pressure, reduces water leak volume, and enables more comfortable
water supply to the consumer.
The operation of the PRV is performed by adjusting the opening area of the
water path in the valve. The throttle opens when the secondary pressure
increases and decreases. For that purpose, there is a diaphragm that moves
by receiving the secondary pressure, and a mechanism that pushes back the
pressure by providing a spring.
PRV reduces the water pressure and sustain high pressure exceeding the
control range of the water pressure control valve to maintain an appropriate
dynamic water pressure in the water distribution area.
Check valve
Check valve protects pumps, meters and other equipment for water supply
from accidents and water contamination caused by backflow.
The back pressure of the fluid activates the valve body to prevent backflow.
(3) Air valve
Air valve
Air valve
The air valve is installed at a high position in the pipeline, such as
pipes over a river or the water pipe bridge and has the function of
automatically drawing in and discharging the air accumulated in
the pipe. Since the air valve is susceptible to tilt, it is necessary to
adopt a construction method that can eliminate tilts.
Mechanism of air valve is as below.
1. Normal condition.
2. When a small amount of air is accumulated.
3. When a large amount of air is accumulated.
4. When a negative pressure is reached.
A5-162
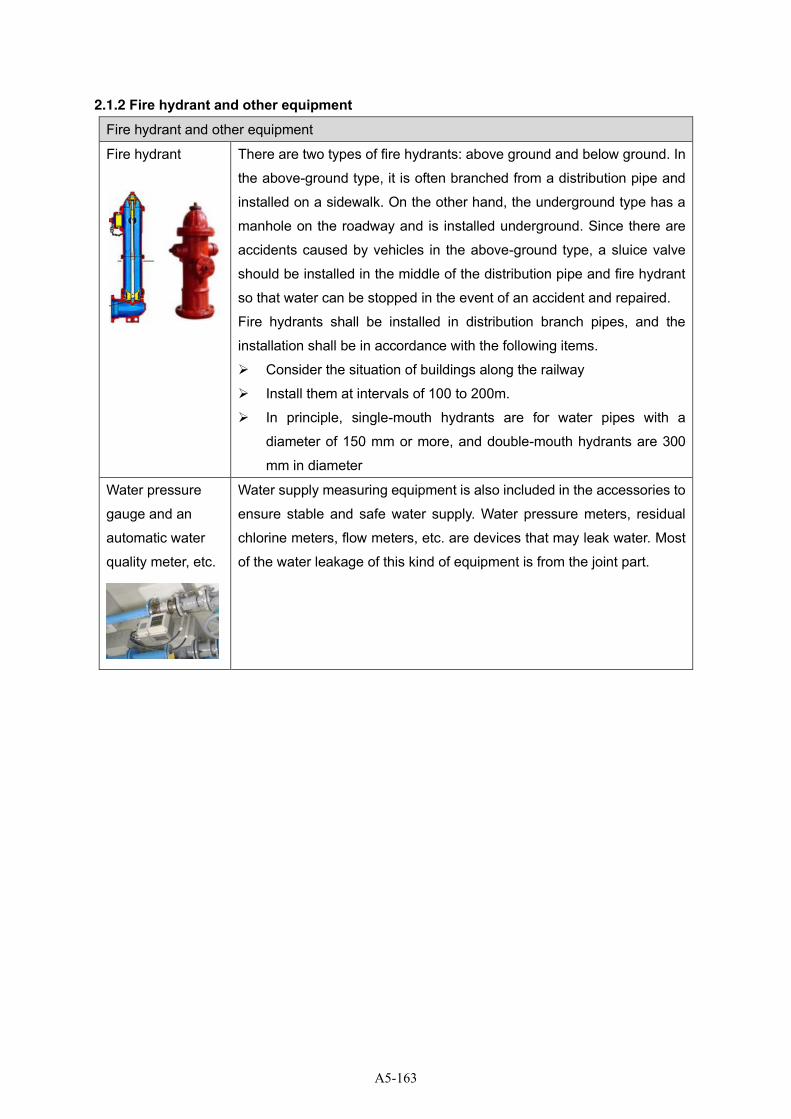
2.1.2 Fire hydrant and other equipment Fire hydrant and other equipment
Fire hydrant
There are two types of fire hydrants: above ground and below ground. In
the above-ground type, it is often branched from a distribution pipe and
installed on a sidewalk. On the other hand, the underground type has a
manhole on the roadway and is installed underground. Since there are
accidents caused by vehicles in the above-ground type, a sluice valve
should be installed in the middle of the distribution pipe and fire hydrant
so that water can be stopped in the event of an accident and repaired.
Fire hydrants shall be installed in distribution branch pipes, and the
installation shall be in accordance with the following items.
➢ Consider the situation of buildings along the railway
➢ Install them at intervals of 100 to 200m.
➢ In principle, single-mouth hydrants are for water pipes with a
diameter of 150 mm or more, and double-mouth hydrants are 300
mm in diameter
Water pressure
gauge and an
automatic water
quality meter, etc.
Water supply measuring equipment is also included in the accessories to
ensure stable and safe water supply. Water pressure meters, residual
chlorine meters, flow meters, etc. are devices that may leak water. Most
of the water leakage of this kind of equipment is from the joint part.
A5-163
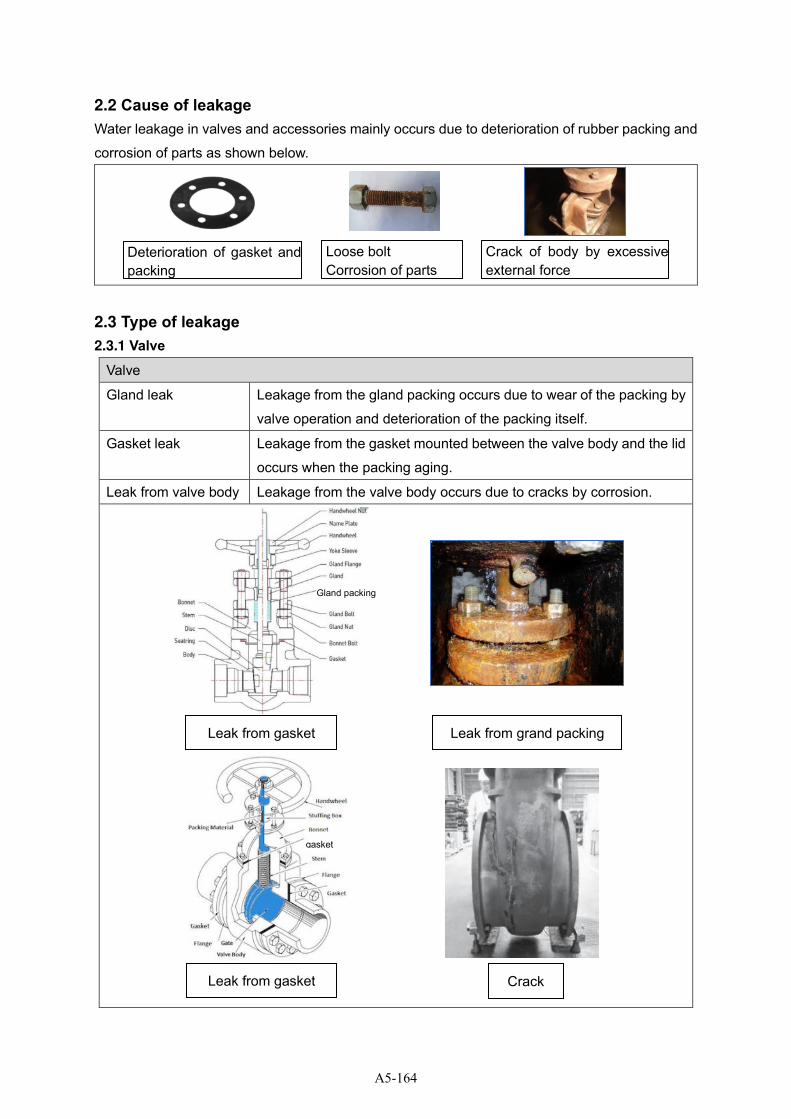
2.2 Cause of leakage
Water leakage in valves and accessories mainly occurs due to deterioration of rubber packing and
corrosion of parts as shown below.
2.3 Type of leakage
2.3.1 Valve
Valve
Gland leak Leakage from the gland packing occurs due to wear of the packing by
valve operation and deterioration of the packing itself.
Gasket leak Leakage from the gasket mounted between the valve body and the lid
occurs when the packing aging.
Leak from valve body Leakage from the valve body occurs due to cracks by corrosion.
Loose bolt Corrosion of parts
Deterioration of gasket and packing
Crack of body by excessive external force
gasket
Gland packing
Leak from gasket
Leak from gasket
Crack
Leak from grand packing
A5-164
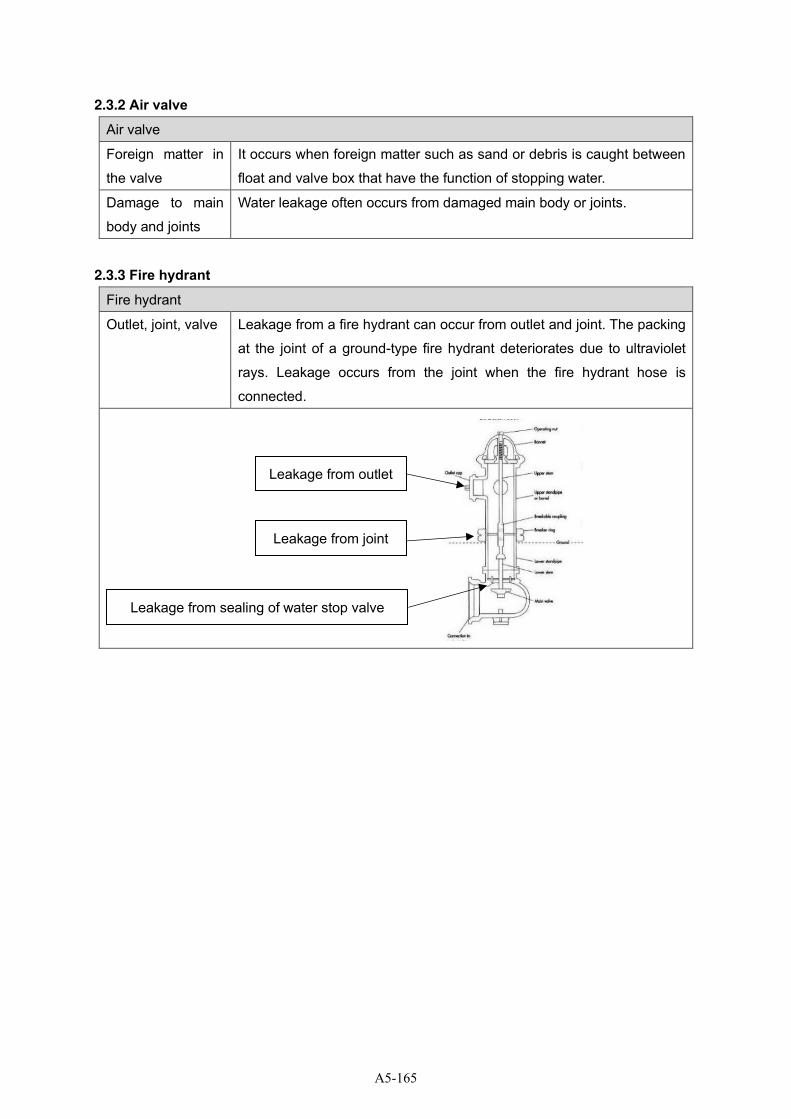
2.3.2 Air valve
Air valve
Foreign matter in
the valve
It occurs when foreign matter such as sand or debris is caught between
float and valve box that have the function of stopping water.
Damage to main
body and joints
Water leakage often occurs from damaged main body or joints.
2.3.3 Fire hydrant Fire hydrant
Outlet, joint, valve Leakage from a fire hydrant can occur from outlet and joint. The packing
at the joint of a ground-type fire hydrant deteriorates due to ultraviolet
rays. Leakage occurs from the joint when the fire hydrant hose is
connected.
Leakage from outlet
Leakage from joint
Leakage from sealing of water stop valve
A5-165
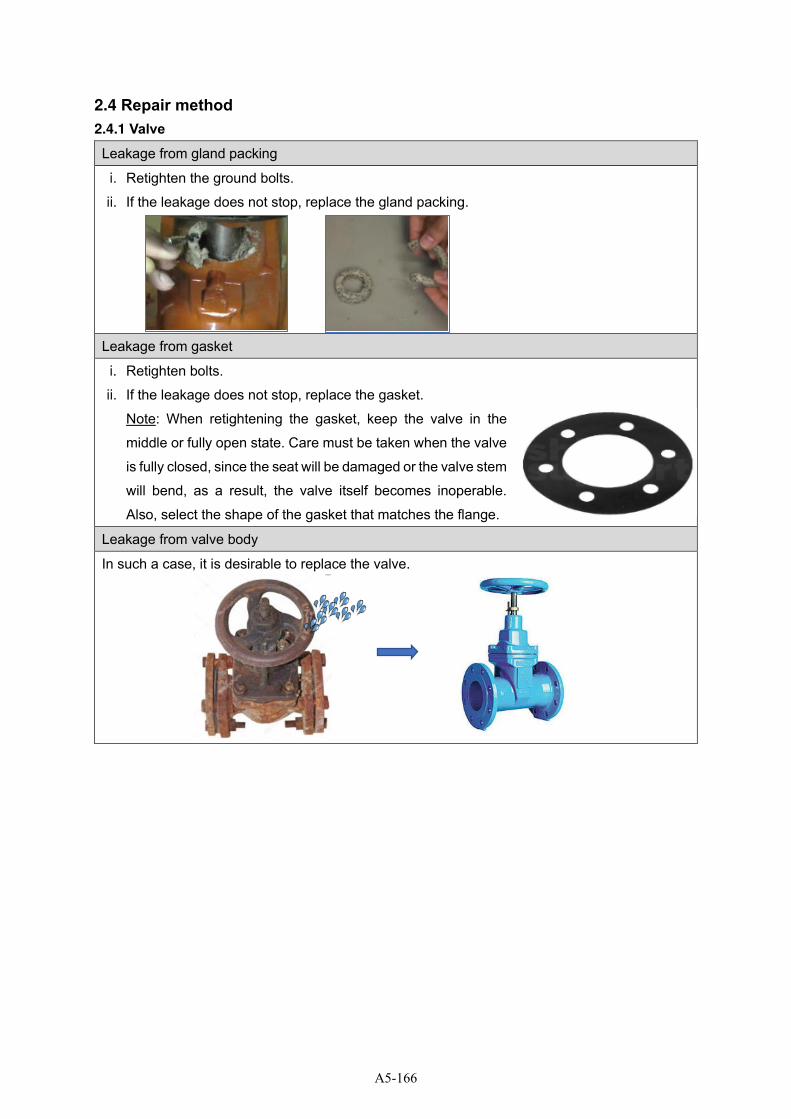
2.4 Repair method
2.4.1 Valve
Leakage from gland packing
i. Retighten the ground bolts.
ii. If the leakage does not stop, replace the gland packing.
Leakage from gasket
i. Retighten bolts.
ii. If the leakage does not stop, replace the gasket.
Note: When retightening the gasket, keep the valve in the
middle or fully open state. Care must be taken when the valve
is fully closed, since the seat will be damaged or the valve stem
will bend, as a result, the valve itself becomes inoperable.
Also, select the shape of the gasket that matches the flange.
Leakage from valve body
In such a case, it is desirable to replace the valve.
A5-166
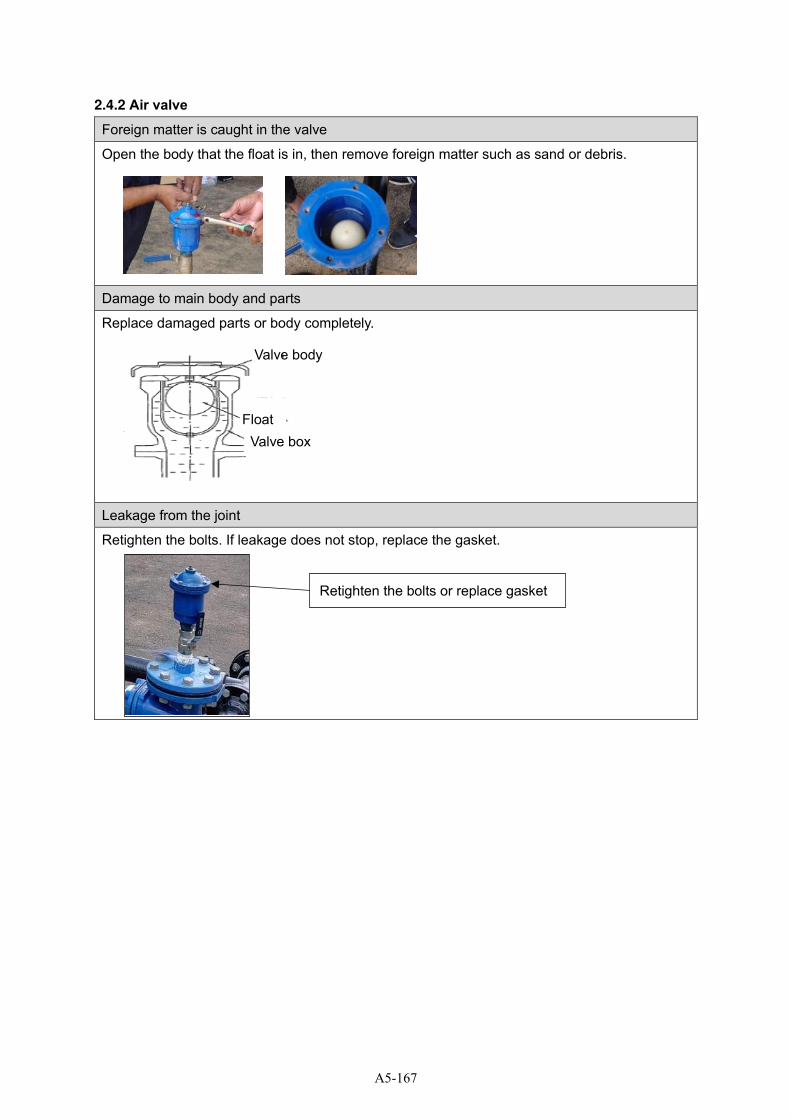
2.4.2 Air valve
Foreign matter is caught in the valve
Open the body that the float is in, then remove foreign matter such as sand or debris.
Damage to main body and parts
Replace damaged parts or body completely.
Leakage from the joint
Retighten the bolts. If leakage does not stop, replace the gasket.
Valve body
Float Valve box
Retighten the bolts or replace gasket
A5-167
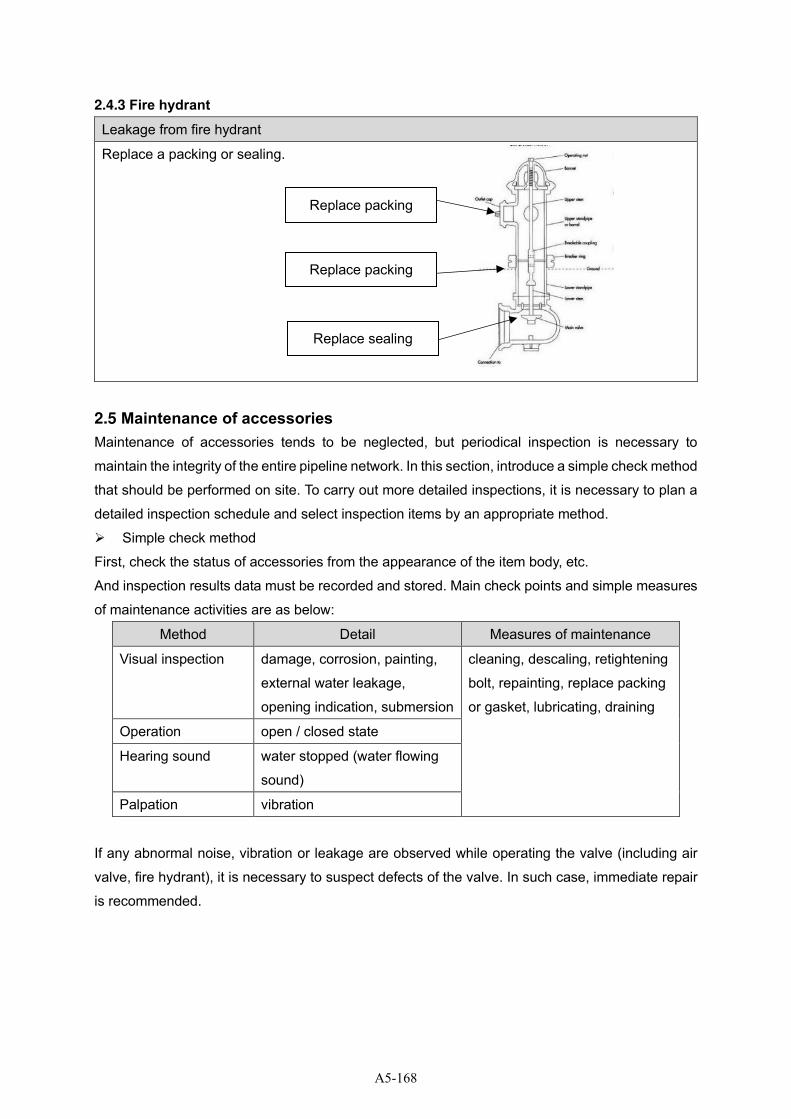
2.4.3 Fire hydrant Leakage from fire hydrant
Replace a packing or sealing.
2.5 Maintenance of accessories
Maintenance of accessories tends to be neglected, but periodical inspection is necessary to
maintain the integrity of the entire pipeline network. In this section, introduce a simple check method
that should be performed on site. To carry out more detailed inspections, it is necessary to plan a
detailed inspection schedule and select inspection items by an appropriate method.
➢ Simple check method
First, check the status of accessories from the appearance of the item body, etc.
And inspection results data must be recorded and stored. Main check points and simple measures
of maintenance activities are as below:
Method Detail Measures of maintenance
Visual inspection damage, corrosion, painting,
external water leakage,
opening indication, submersion
cleaning, descaling, retightening
bolt, repainting, replace packing
or gasket, lubricating, draining
Operation open / closed state
Hearing sound water stopped (water flowing
sound)
Palpation vibration
If any abnormal noise, vibration or leakage are observed while operating the valve (including air
valve, fire hydrant), it is necessary to suspect defects of the valve. In such case, immediate repair
is recommended.
Replace packing
Replace packing
Replace sealing
A5-168
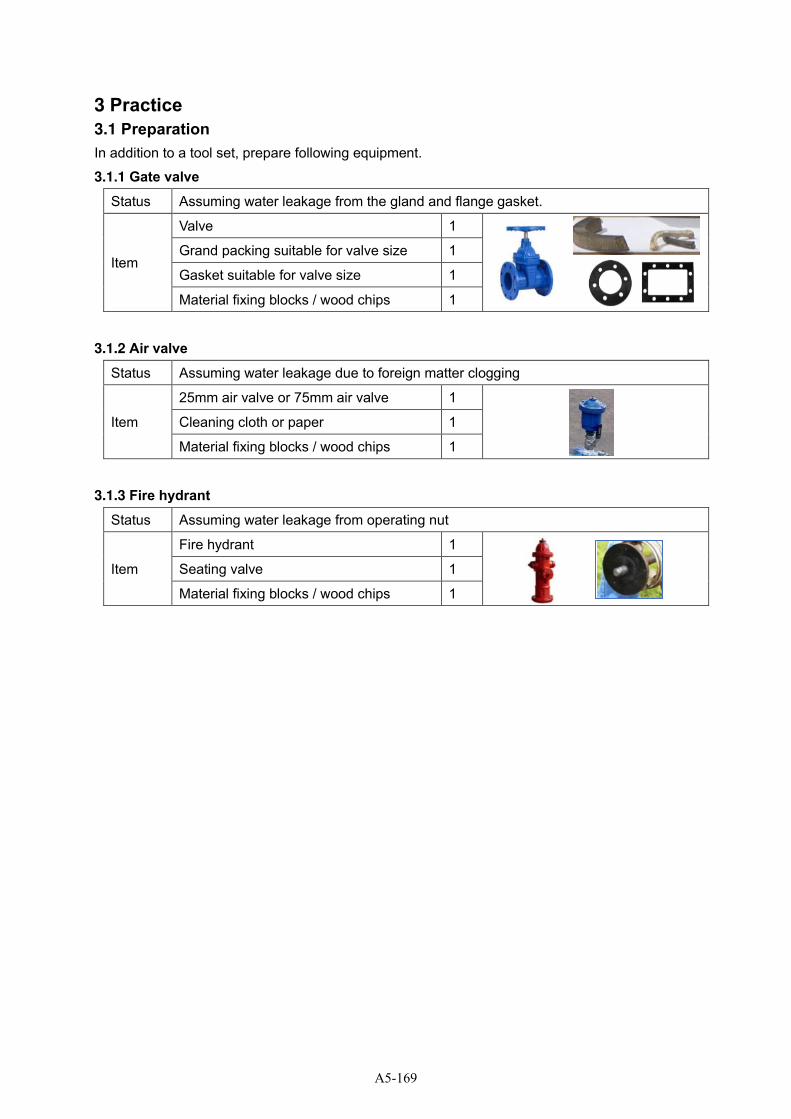
3 Practice
3.1 Preparation
In addition to a tool set, prepare following equipment.
3.1.1 Gate valve
Status Assuming water leakage from the gland and flange gasket.
Item
Valve 1
Grand packing suitable for valve size 1
Gasket suitable for valve size 1
Material fixing blocks / wood chips 1
3.1.2 Air valve
Status Assuming water leakage due to foreign matter clogging
Item
25mm air valve or 75mm air valve 1
Cleaning cloth or paper 1
Material fixing blocks / wood chips 1
3.1.3 Fire hydrant Status Assuming water leakage from operating nut
Item
Fire hydrant 1
Seating valve 1
Material fixing blocks / wood chips 1
A5-169
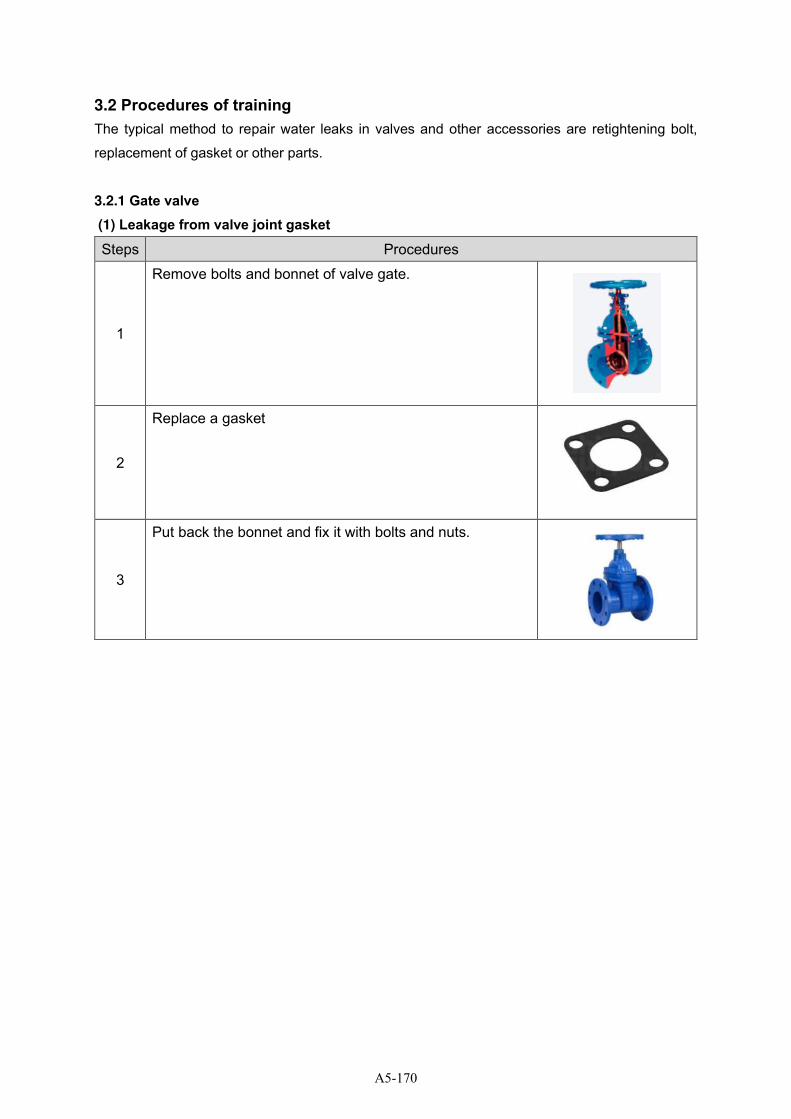
3.2 Procedures of training
The typical method to repair water leaks in valves and other accessories are retightening bolt,
replacement of gasket or other parts.
3.2.1 Gate valve
(1) Leakage from valve joint gasket Steps Procedures
1
Remove bolts and bonnet of valve gate.
2
Replace a gasket
3
Put back the bonnet and fix it with bolts and nuts.
A5-170
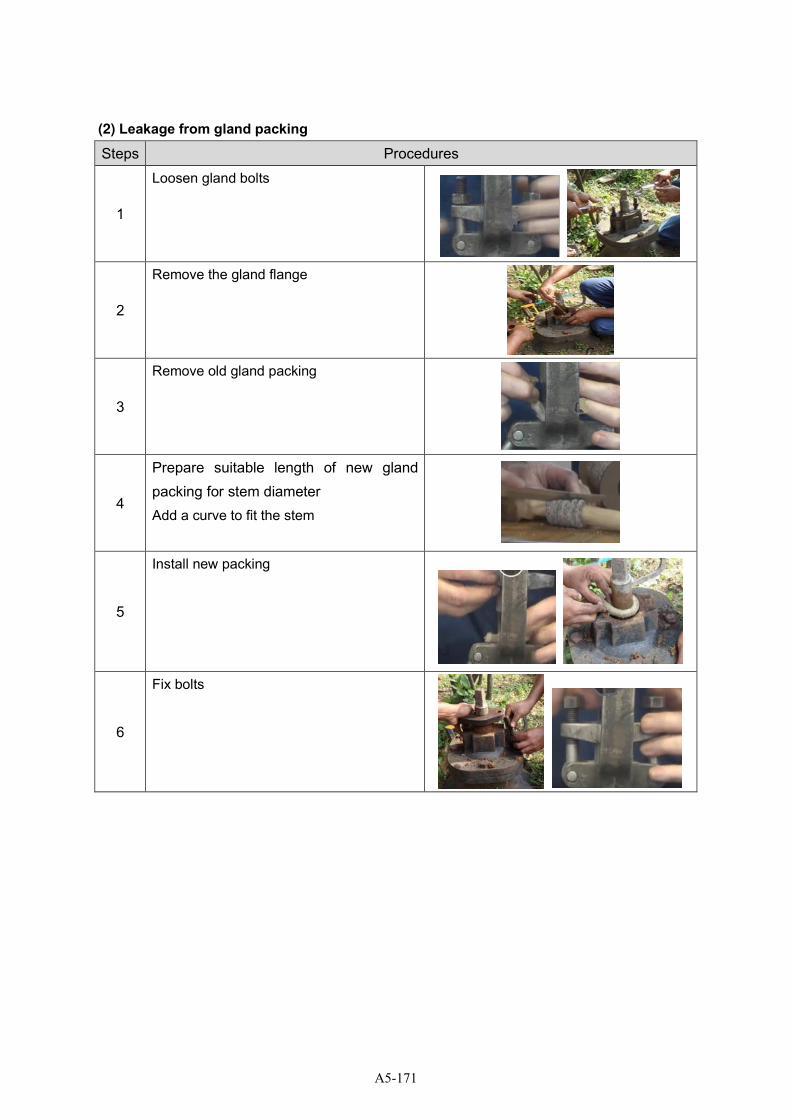
(2) Leakage from gland packing
Steps Procedures
1
Loosen gland bolts
2
Remove the gland flange
3
Remove old gland packing
4
Prepare suitable length of new gland packing for stem diameter Add a curve to fit the stem
5
Install new packing
6
Fix bolts
A5-171
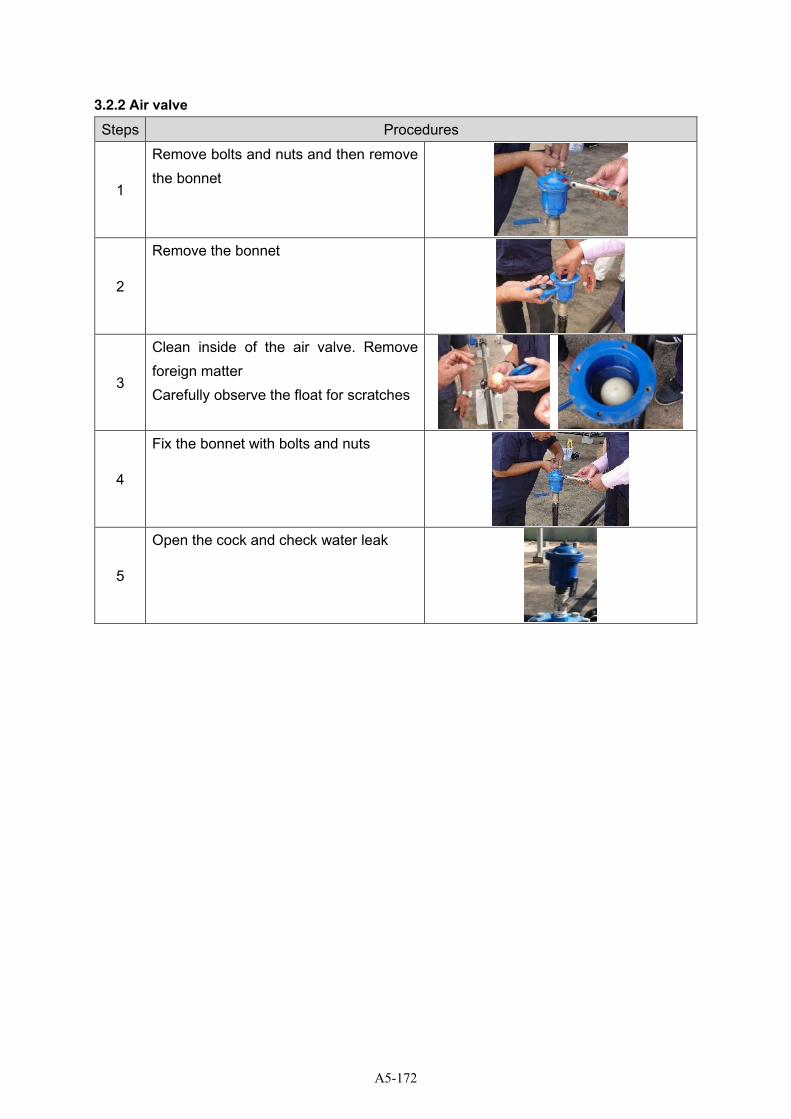
3.2.2 Air valve
Steps Procedures
1
Remove bolts and nuts and then remove the bonnet
2
Remove the bonnet
3
Clean inside of the air valve. Remove foreign matter Carefully observe the float for scratches
4
Fix the bonnet with bolts and nuts
5
Open the cock and check water leak
A5-172
3.2.3 Fire hydrant Steps Procedures
1
Remove nuts and bolts from the joint at the base of the top bonnet
2
Turn the operation nut to the direction of opening until the bonnet stops its upward movement
3
Insert seat wrench on the stem
4
Remove all parts including main brass valve seat
5
Remove lower valve plate from the stem by turning counterclockwise
6
Seating valve or other parts can now be easily replaced as needed
Reassemble valve and stem with new material
7
Tighten lower valve plate clockwise.
8
Apply appropriate food grade anti-seize to threads of bronze valve seat
9
Re-insert valve mechanism with seat wrench into standpipe
Tighten clockwise and check for leak around
A5-173
10
Turn operating nut to the direction of closing until top bonnet stops downward movement and is tight
11
Replace four flange bolts and nuts.
12
Turn on isolation valve, let the hydrant flow, and check to see if the hydrant is working properly
A5-174
4 Keep repair record When there is a leak from an accessory at the site, it is necessary to keep a record as well as a
pipeline leak. From the accumulated records, it is possible to understand the deterioration status
of accessories and determine the necessary frequency of detailed inspections and the standard for
renewal.
The repair record has to include following information.
➢ Name of accessory
➢ Cause of leakage (If not clear, assuming)
➢ Part of leakage
➢ Materials used for repairs
➢ Time taken to complete the repair
➢ Address, leakage volume, etc.
➢ Type of connected pipe
➢ Diameter
➢ Installed year
➢ Mapped the point of leaking
The repair record sheet is shown below.
A5-175
□Complain □Meter reader □Leak detection □Others
Pipe Dia.
Manufacture
Location(Map copy or Sketch)
Address
Accessory Leakage Record Sheet
Officer
Office
Leak location
Leakage information
Considerable
cause
Accessory □Valve □Air valve □Fire hydrant □Meter □Other[ ]
□Deterioration: □Body, □Bolt & nuts, □ Gasket, □Packing□Clack □Things get caught inside □Others( )
Installation
Location
□In the room □In the chamber □Outside of chamber □Above ground □Other[ ]
NWSDB OfficerContractor Officer
Comment or Photograph
m3/hYes NoLeak repair Leak volume
Material used
Machinery used
Power Light: Hrs
Water Pump(Dewatering): Hrs
Excavation: m₃
Others
No. of workers and
Activity time
Repair information
Part□Flange Joint □Gland □Fire hydrant outlet □ Air outlet □ Body □Other [ ]
Installation year
Pipe materialPipe information
Road surface
Pipe depth
Pipe Installation yearConcrete, Asphalt, Bare ground, Turf, Grassland
Complainer's Name & Add.
Reported date and time
Reported byInformation provider of
leak information
Attended date and time
Repair date & time
A5-176
Training Guideline
5. Measurement
a. Water Meter
A5-177
Table of contents
1 Outline ........................................................................................................................................... 1
1.1 Purpose ................................................................................................................................... 1
1.2 Flow of training with time schedule ........................................................................................ 2
1.3 Safety notice ........................................................................................................................... 3
2 Knowledge acquisition ................................................................................................................... 4
2.1 Meter reading .......................................................................................................................... 4
2.2 Type of meter .......................................................................................................................... 5
2.3 Metrology, Meter classes and other requirements ............................................................... 10
2.3.1 Definition of meter accuracy .......................................................................................... 10
2.3.2 Meter error curve............................................................................................................ 10
2.3.3 Conventional meter classes ............................................................................................ 11
2.4 Operation and maintenance ................................................................................................. 12
2.4.1 Introduction .................................................................................................................... 12
2.4.2 Installation ...................................................................................................................... 12
2.4.3 Maintenance ................................................................................................................... 13
2.5 Meter accuracy test method ................................................................................................. 14
2.6 Meter reliability evaluation .................................................................................................... 15
3 Practice ........................................................................................................................................ 16
3.1 Outline ................................................................................................................................... 16
3.1.1 Meter accuracy test ........................................................................................................ 16
3.1.2 Bulk meter installation .................................................................................................... 16
3.2 Preparation ........................................................................................................................... 16
3.2.1 Meter accuracy test ........................................................................................................ 16
3.2.2 Bulk meter installation & accuracy test .......................................................................... 16
3.3 Operation .............................................................................................................................. 17
3.4 Procedures of training .......................................................................................................... 18
3.4.1 Meter accuracy test ........................................................................................................ 18
3.5 Meter error test record sheet ................................................................................................ 19
3.5.1 Bulk meter installation & accuracy test .......................................................................... 20
A5-178

1 Outline
1.1 Purpose
Purpose of training ➢ Understand meter reading, type of meters, meter accuracy & class,
maintenance.
➢ Measure the accuracy of customer meters with the test meter kit
(reference meter) and learn how to do it easily on site.
Training contents ➢ Customer meter accuracy test
A5-179
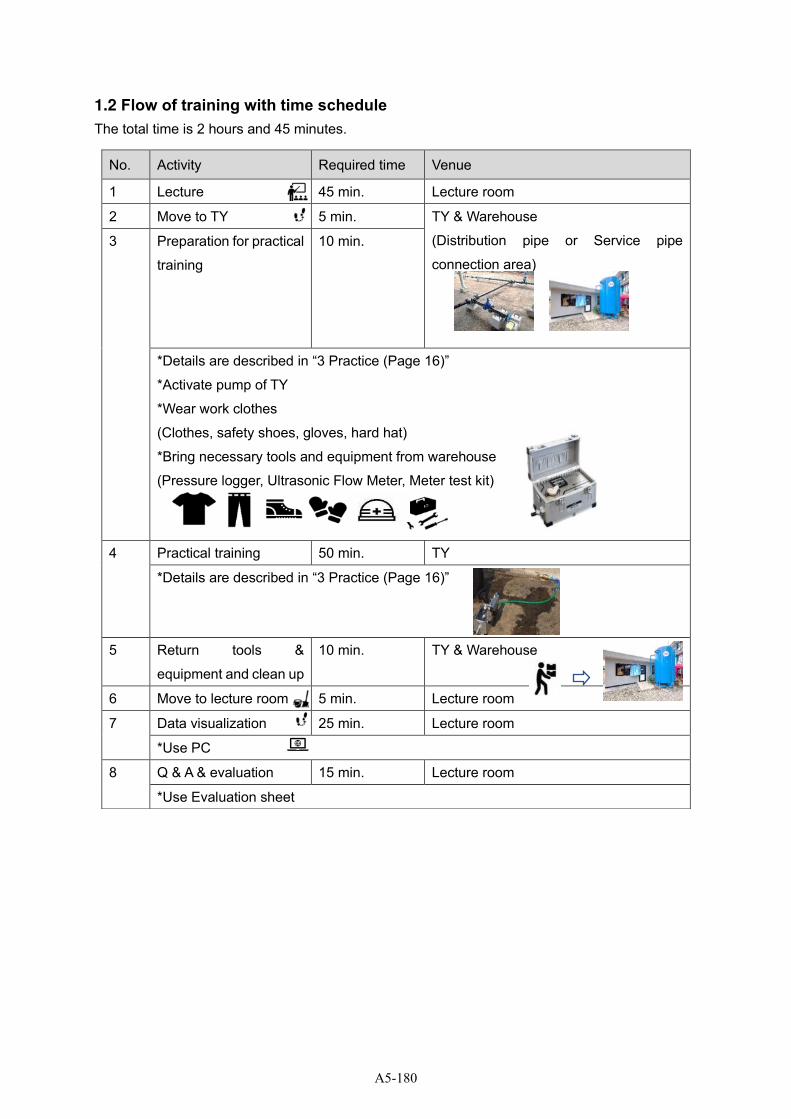
1.2 Flow of training with time schedule
The total time is 2 hours and 45 minutes.
No. Activity Required time Venue
1 Lecture 45 min. Lecture room
2 Move to TY 5 min. TY & Warehouse
(Distribution pipe or Service pipe
connection area)
3 Preparation for practical
training
10 min.
*Details are described in “3 Practice (Page 16)”
*Activate pump of TY
*Wear work clothes
(Clothes, safety shoes, gloves, hard hat)
*Bring necessary tools and equipment from warehouse
(Pressure logger, Ultrasonic Flow Meter, Meter test kit)
4 Practical training 50 min. TY
*Details are described in “3 Practice (Page 16)”
5 Return tools &
equipment and clean up
10 min. TY & Warehouse
6 Move to lecture room 5 min. Lecture room
7 Data visualization 25 min. Lecture room
*Use PC
8 Q & A & evaluation 15 min. Lecture room
*Use Evaluation sheet
A5-180

1.3 Safety notice
➢ All members must wear safety equipment in TY.RP should order to participants wearing
suitable item
➢ Do not sit on the pipes or put your foot on.
➢ Do not touch the installed equipment unnecessarily.
➢ Do not eat food in the TY.
A5-181
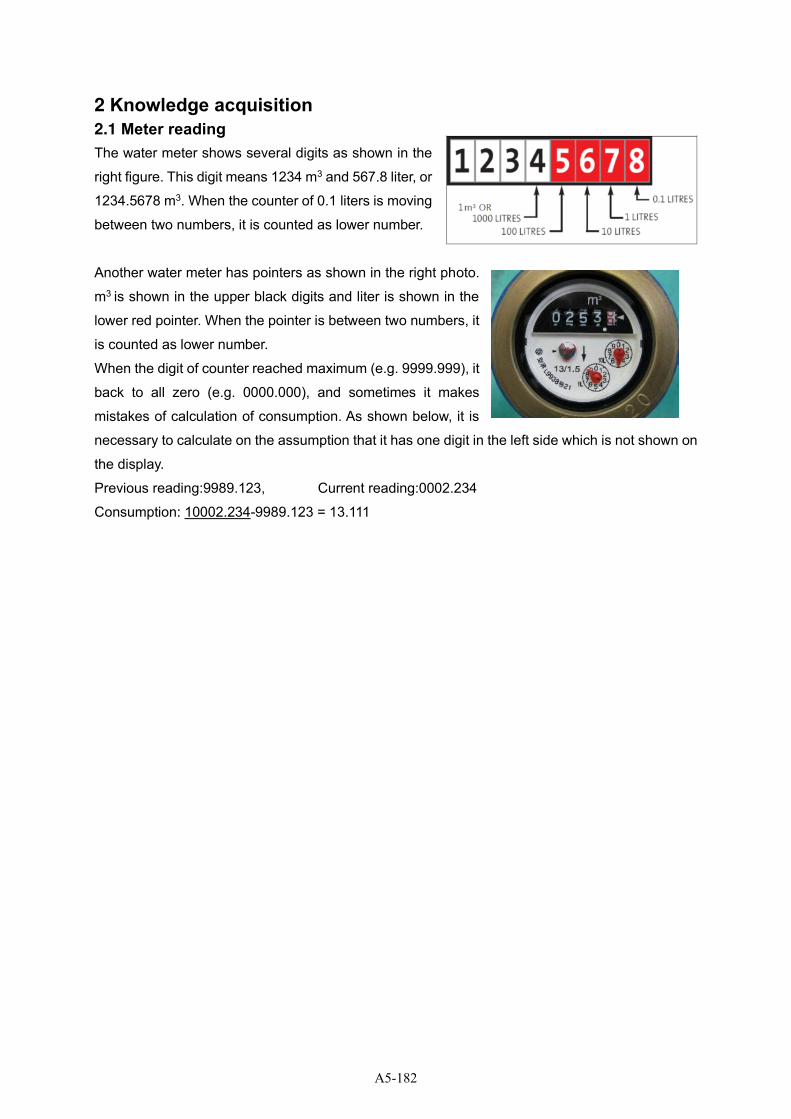
2 Knowledge acquisition
2.1 Meter reading
The water meter shows several digits as shown in the
right figure. This digit means 1234 m3 and 567.8 liter, or
1234.5678 m3. When the counter of 0.1 liters is moving
between two numbers, it is counted as lower number.
Another water meter has pointers as shown in the right photo.
m3 is shown in the upper black digits and liter is shown in the
lower red pointer. When the pointer is between two numbers, it
is counted as lower number.
When the digit of counter reached maximum (e.g. 9999.999), it
back to all zero (e.g. 0000.000), and sometimes it makes
mistakes of calculation of consumption. As shown below, it is
necessary to calculate on the assumption that it has one digit in the left side which is not shown on
the display.
Previous reading:9989.123, Current reading:0002.234
Consumption: 10002.234-9989.123 = 13.111
A5-182
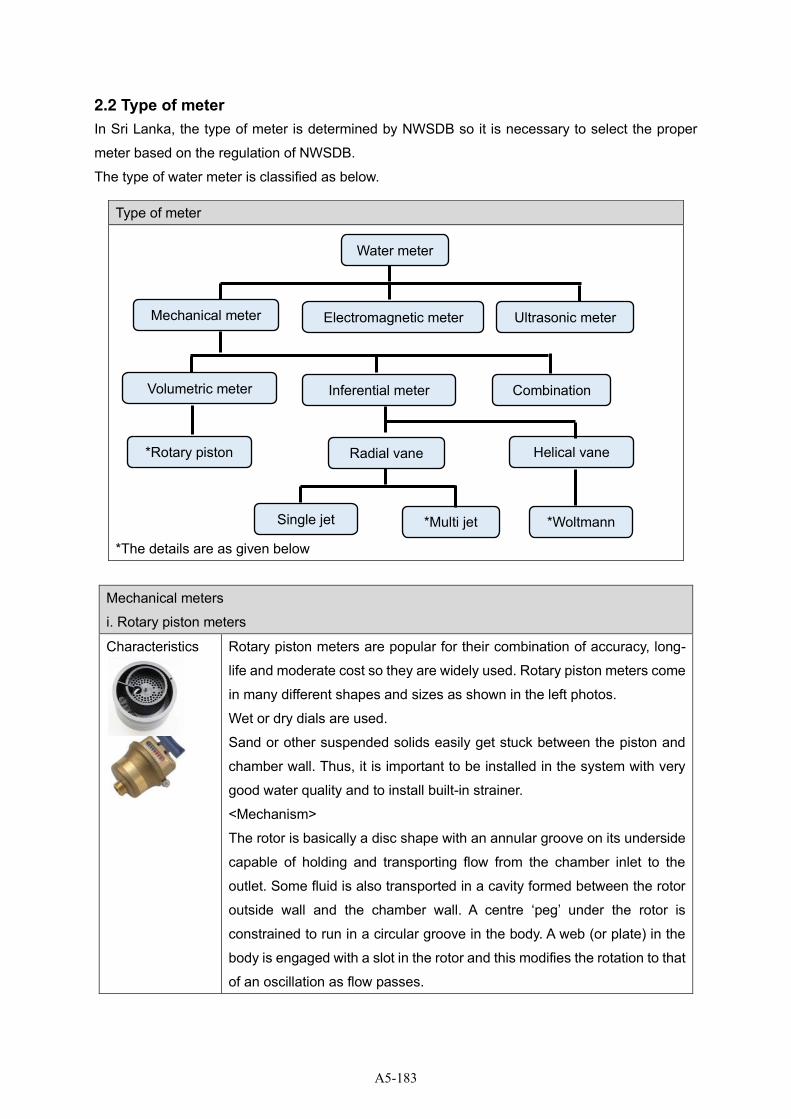
2.2 Type of meter In Sri Lanka, the type of meter is determined by NWSDB so it is necessary to select the proper
meter based on the regulation of NWSDB.
The type of water meter is classified as below.
Mechanical meters
i. Rotary piston meters
Characteristics
Rotary piston meters are popular for their combination of accuracy, long-
life and moderate cost so they are widely used. Rotary piston meters come
in many different shapes and sizes as shown in the left photos.
Wet or dry dials are used.
Sand or other suspended solids easily get stuck between the piston and
chamber wall. Thus, it is important to be installed in the system with very
good water quality and to install built-in strainer.
<Mechanism>
The rotor is basically a disc shape with an annular groove on its underside
capable of holding and transporting flow from the chamber inlet to the
outlet. Some fluid is also transported in a cavity formed between the rotor
outside wall and the chamber wall. A centre ‘peg’ under the rotor is
constrained to run in a circular groove in the body. A web (or plate) in the
body is engaged with a slot in the rotor and this modifies the rotation to that
of an oscillation as flow passes.
Type of meter
*The details are as given below
Water meter
Mechanical meter Electromagnetic meter Ultrasonic meter
Single jet
*Rotary piston Radial vane Helical vane
*Multi jet *Woltmann
Volumetric meter Inferential meter Combination
A5-183
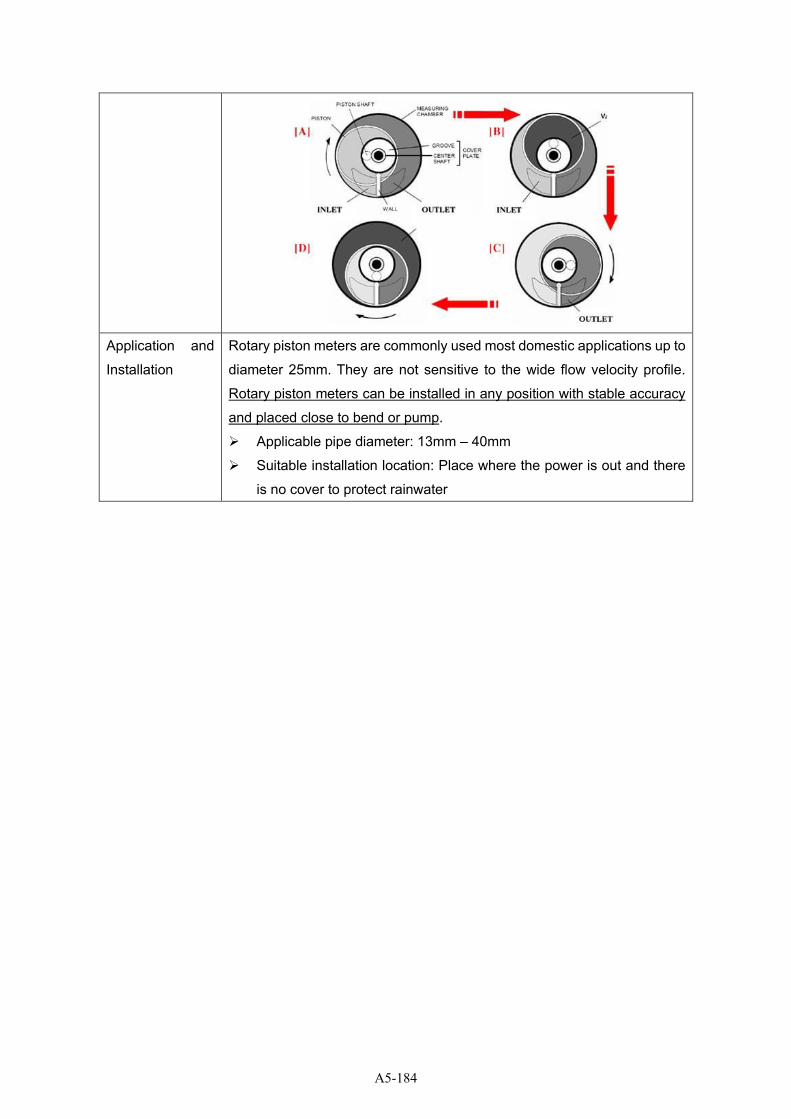
Application and
Installation
Rotary piston meters are commonly used most domestic applications up to
diameter 25mm. They are not sensitive to the wide flow velocity profile.
Rotary piston meters can be installed in any position with stable accuracy
and placed close to bend or pump.
➢ Applicable pipe diameter: 13mm – 40mm
➢ Suitable installation location: Place where the power is out and there
is no cover to protect rainwater
A5-184
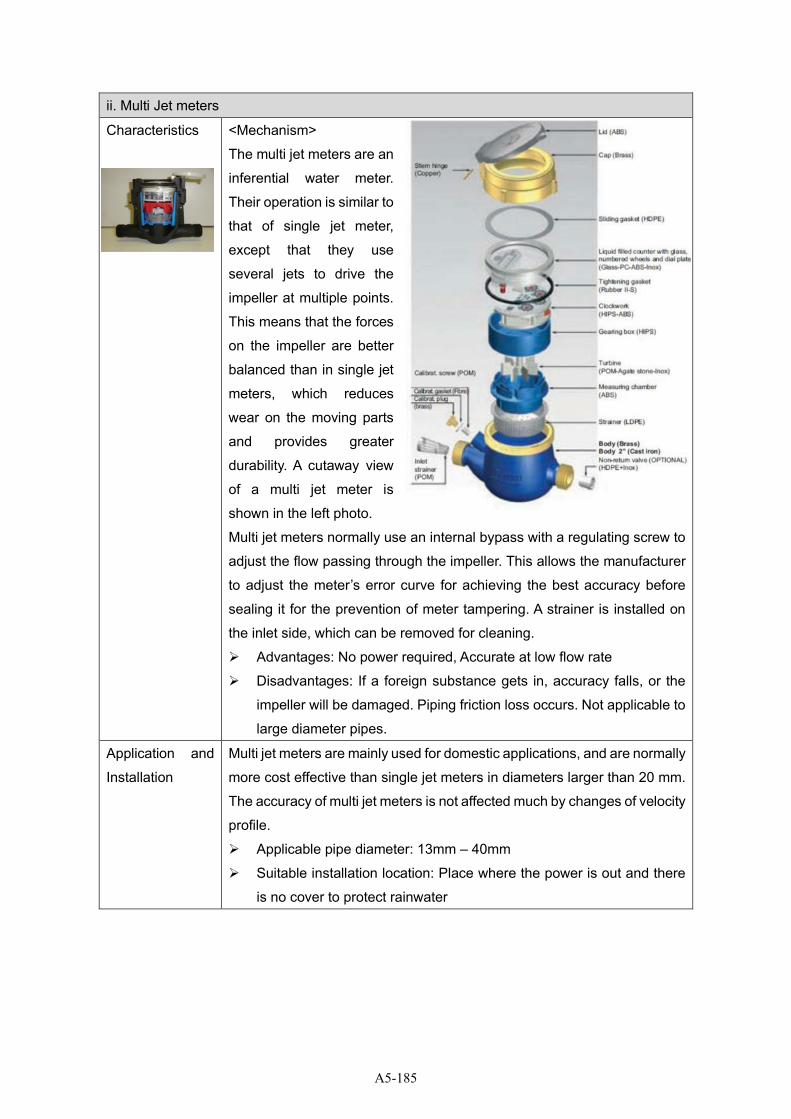
ii. Multi Jet meters
Characteristics
<Mechanism>
The multi jet meters are an
inferential water meter.
Their operation is similar to
that of single jet meter,
except that they use
several jets to drive the
impeller at multiple points.
This means that the forces
on the impeller are better
balanced than in single jet
meters, which reduces
wear on the moving parts
and provides greater
durability. A cutaway view
of a multi jet meter is
shown in the left photo.
Multi jet meters normally use an internal bypass with a regulating screw to
adjust the flow passing through the impeller. This allows the manufacturer
to adjust the meter’s error curve for achieving the best accuracy before
sealing it for the prevention of meter tampering. A strainer is installed on
the inlet side, which can be removed for cleaning.
➢ Advantages: No power required, Accurate at low flow rate
➢ Disadvantages: If a foreign substance gets in, accuracy falls, or the
impeller will be damaged. Piping friction loss occurs. Not applicable to
large diameter pipes.
Application and
Installation
Multi jet meters are mainly used for domestic applications, and are normally
more cost effective than single jet meters in diameters larger than 20 mm.
The accuracy of multi jet meters is not affected much by changes of velocity
profile.
➢ Applicable pipe diameter: 13mm – 40mm
➢ Suitable installation location: Place where the power is out and there
is no cover to protect rainwater
A5-185
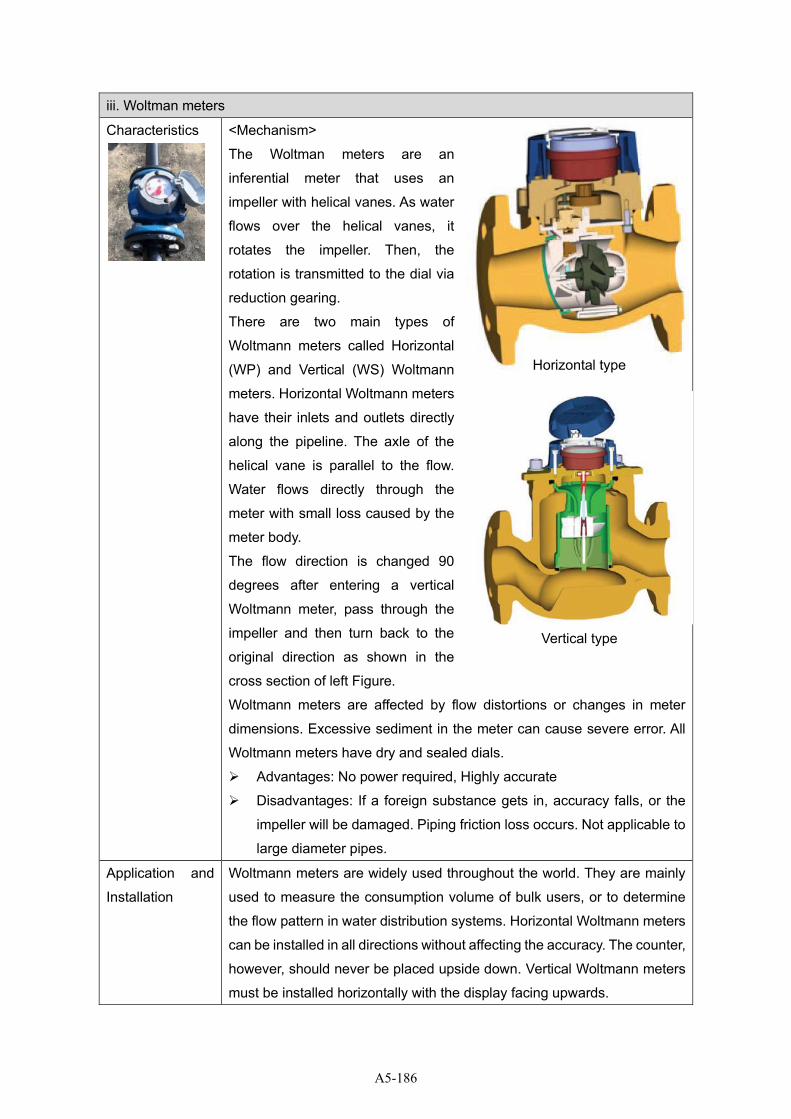
iii. Woltman meters
Characteristics
<Mechanism>
The Woltman meters are an
inferential meter that uses an
impeller with helical vanes. As water
flows over the helical vanes, it
rotates the impeller. Then, the
rotation is transmitted to the dial via
reduction gearing.
There are two main types of
Woltmann meters called Horizontal
(WP) and Vertical (WS) Woltmann
meters. Horizontal Woltmann meters
have their inlets and outlets directly
along the pipeline. The axle of the
helical vane is parallel to the flow.
Water flows directly through the
meter with small loss caused by the
meter body.
The flow direction is changed 90
degrees after entering a vertical
Woltmann meter, pass through the
impeller and then turn back to the
original direction as shown in the
cross section of left Figure.
Woltmann meters are affected by flow distortions or changes in meter
dimensions. Excessive sediment in the meter can cause severe error. All
Woltmann meters have dry and sealed dials.
➢ Advantages: No power required, Highly accurate
➢ Disadvantages: If a foreign substance gets in, accuracy falls, or the
impeller will be damaged. Piping friction loss occurs. Not applicable to
large diameter pipes.
Application and
Installation
Woltmann meters are widely used throughout the world. They are mainly
used to measure the consumption volume of bulk users, or to determine
the flow pattern in water distribution systems. Horizontal Woltmann meters
can be installed in all directions without affecting the accuracy. The counter,
however, should never be placed upside down. Vertical Woltmann meters
must be installed horizontally with the display facing upwards.
Horizontal type
Vertical type
A5-186

➢ Applicable pipe diameter: 40mm – 400mm
➢ Suitable installation location: Place where the power is out and there
is no cover to protect rainwater
A5-187
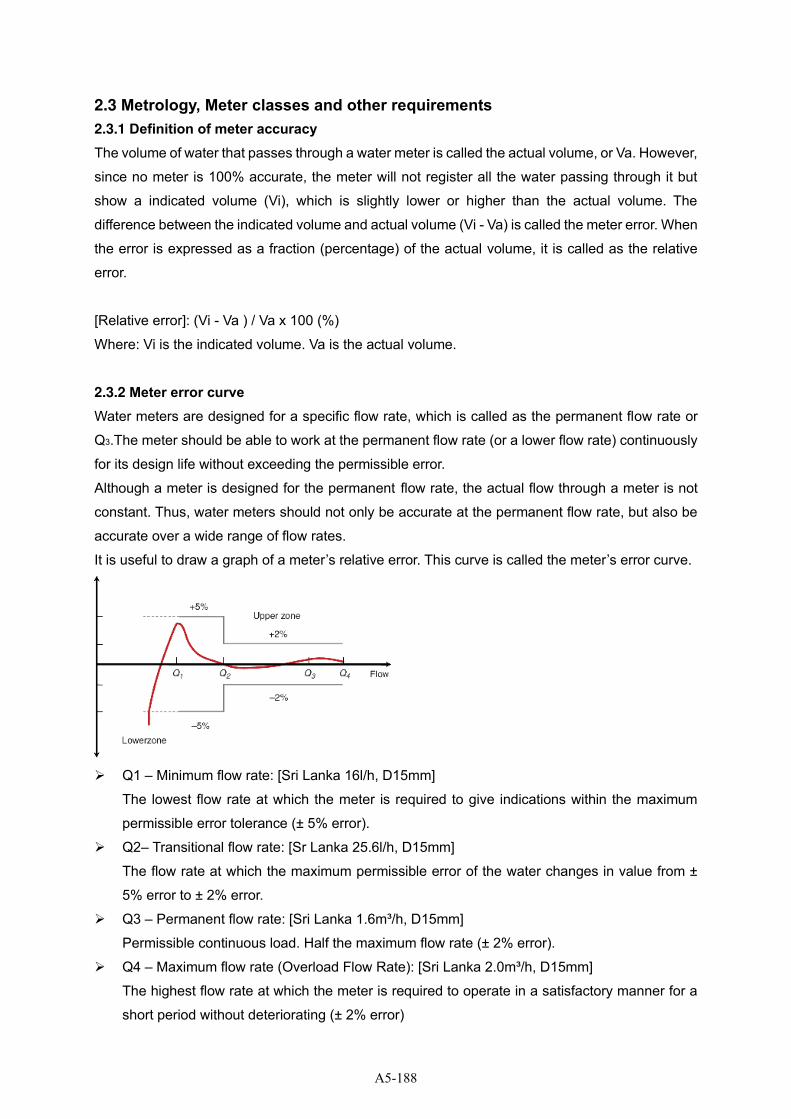
2.3 Metrology, Meter classes and other requirements
2.3.1 Definition of meter accuracy
The volume of water that passes through a water meter is called the actual volume, or Va. However,
since no meter is 100% accurate, the meter will not register all the water passing through it but
show a indicated volume (Vi), which is slightly lower or higher than the actual volume. The
difference between the indicated volume and actual volume (Vi - Va) is called the meter error. When
the error is expressed as a fraction (percentage) of the actual volume, it is called as the relative
error.
[Relative error]: (Vi - Va ) / Va x 100 (%)
Where: Vi is the indicated volume. Va is the actual volume.
2.3.2 Meter error curve
Water meters are designed for a specific flow rate, which is called as the permanent flow rate or
Q3.The meter should be able to work at the permanent flow rate (or a lower flow rate) continuously
for its design life without exceeding the permissible error.
Although a meter is designed for the permanent flow rate, the actual flow through a meter is not
constant. Thus, water meters should not only be accurate at the permanent flow rate, but also be
accurate over a wide range of flow rates.
It is useful to draw a graph of a meter’s relative error. This curve is called the meter’s error curve.
➢ Q1 – Minimum flow rate: [Sri Lanka 16l/h, D15mm]
The lowest flow rate at which the meter is required to give indications within the maximum
permissible error tolerance (± 5% error).
➢ Q2– Transitional flow rate: [Sr Lanka 25.6l/h, D15mm]
The flow rate at which the maximum permissible error of the water changes in value from ±
5% error to ± 2% error.
➢ Q3 – Permanent flow rate: [Sri Lanka 1.6m³/h, D15mm]
Permissible continuous load. Half the maximum flow rate (± 2% error).
➢ Q4 – Maximum flow rate (Overload Flow Rate): [Sri Lanka 2.0m³/h, D15mm]
The highest flow rate at which the meter is required to operate in a satisfactory manner for a
short period without deteriorating (± 2% error)
A5-188
2.3.3 Conventional meter classes
Conventionally four classes of meters are defined and denoted by the letters A, B, C(V100) and D.
The accuracy requirements are the same for all four classes, namely a maximum permissible error
of ±5% in the lower flow zone and ±2% in the upper flow zone.
The differences between the classes lie in how high the transitional and minimum flow rates are
allowed to be in relation to the permanent flow rate. Class A has the lowest performance and class
D has the highest performance. Class C and D normally used for customer meter.
NWSDB regulates the quality of meters. Some of them are listed below.
<The regulation of meters by NWSDB>
[SPECIFICATION FOR VOLUMETRIC DISPLACEMENT TYPE WATER METERS AND SPARE
PARTS]
Materials
Water meters may only be constructed of copper alloy. Woltmann meters are allowed to use
other ferrous materials.
Meter type
All domestic water meters and spare parts to be supplied shall be of volumetric type with
threaded end connections.
Single or multi jet type meters class C accuracy will not be accepted for volumetric type meter.
Seals and markings
Meters must be sealed in the factory after assembly and verification so that it is impossible to
tamper with the meter without visible damage to the meter or seal.
The following markings should be added on the meter body:
01. Model number
02. Name or Trademark
03. Permanent Flow Rate
04. Size in DN
05. Pressure Loss in bars
06. Year of Manufacture
07. Serial Number
08. An arrow indicating the direction of flow
09. The letter “NWS&DB” of height not less than 5 mm
10. Measuring Range
11. Class of the meter (Instead of ‘C’ = V100)
12. Other Markings
A5-189
2.4 Operation and maintenance
2.4.1 Introduction
It is important for operating water meter to keep a good operating condition and comply with the
legal metrological requirements. Also It needs a carefully planned systematic meter management
system.
2.4.2 Installation
Once a meter has been selected it has to be installed in the system. Correct installation is critical
since it will affect the performance of the meter for its full-service life. Incorrect installation may lead
to high under-registration losses and shorten the service life of a meter.
Before the meter is installed, the connecting pipe work must be thoroughly flushed to remove any
dirt that may block the meter strainer or damage the meter. Regarding plumbing work, it is
necessary to take care not to use too much adhesive. The solidified adhesive may clog the filter or
be caught in the meter and cause a failure.
Meters installed outside of the private land are easier to access by meter readers.
A meter installation should comply fully with the following requirements:
➢ Correct direction of flow through the meter – an arrow on the meter indicates the correct flow
direction.
➢ Correct orientation of the pipe work (e.g. horizontal or vertical).
➢ Securing minimum straight length of pipe upstream and downstream of the meter.
➢ Some meters require the installation of a separate strainer upstream of the meter.
➢ Isolating valves should be installed on both the upstream and downstream side of the meter.
➢ Electrical meters need protection against lightning and electrical surges.
A5-190
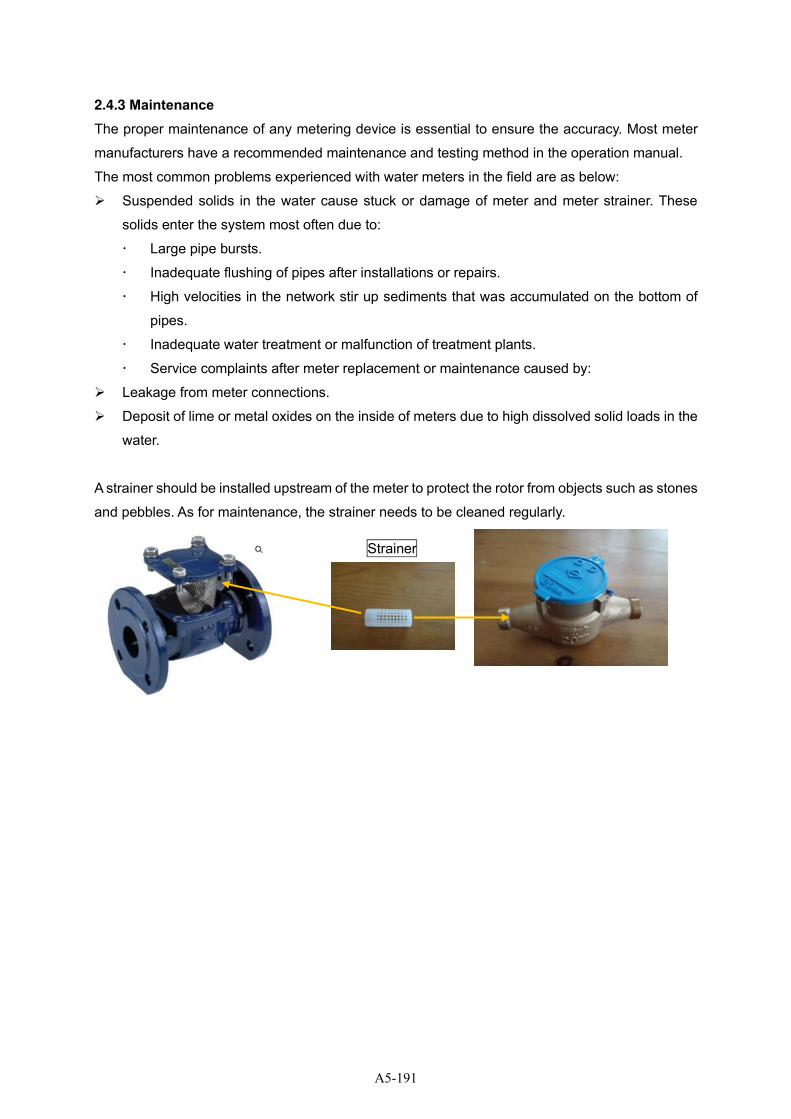
2.4.3 Maintenance
The proper maintenance of any metering device is essential to ensure the accuracy. Most meter
manufacturers have a recommended maintenance and testing method in the operation manual.
The most common problems experienced with water meters in the field are as below:
➢ Suspended solids in the water cause stuck or damage of meter and meter strainer. These
solids enter the system most often due to:
Large pipe bursts.
Inadequate flushing of pipes after installations or repairs.
High velocities in the network stir up sediments that was accumulated on the bottom of
pipes.
Inadequate water treatment or malfunction of treatment plants.
Service complaints after meter replacement or maintenance caused by:
➢ Leakage from meter connections.
➢ Deposit of lime or metal oxides on the inside of meters due to high dissolved solid loads in the
water.
A strainer should be installed upstream of the meter to protect the rotor from objects such as stones
and pebbles. As for maintenance, the strainer needs to be cleaned regularly.
Strainer
A5-191
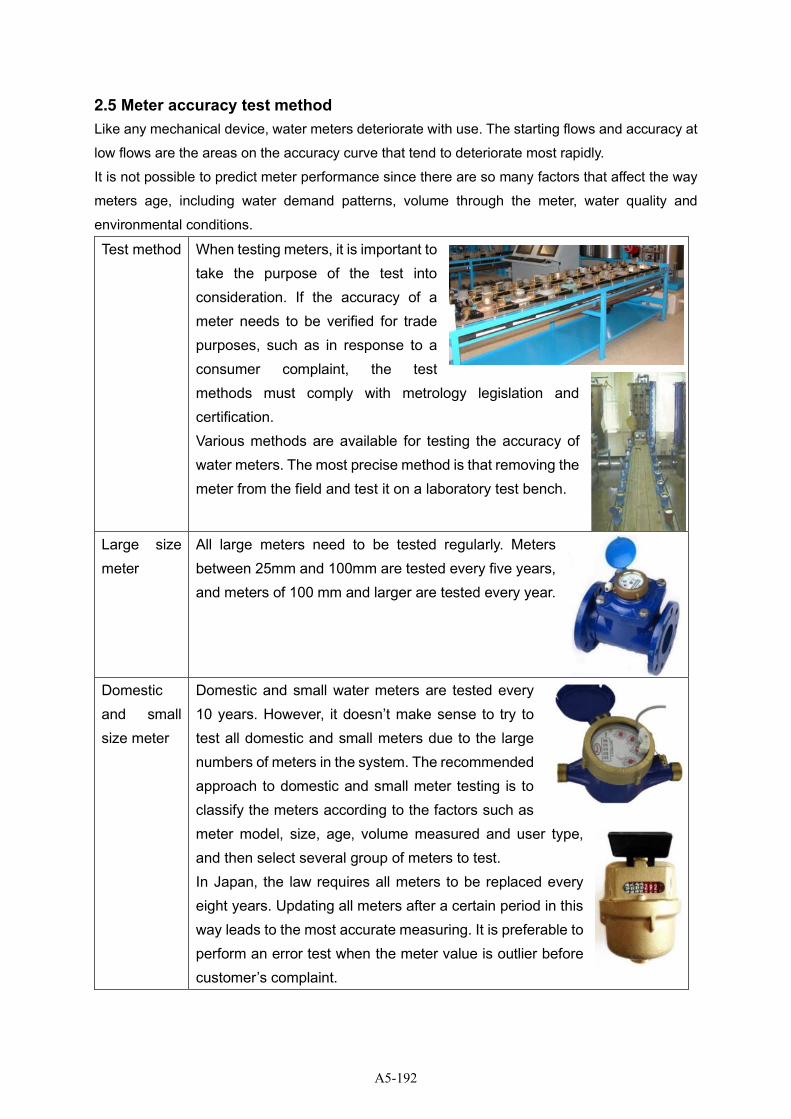
2.5 Meter accuracy test method
Like any mechanical device, water meters deteriorate with use. The starting flows and accuracy at
low flows are the areas on the accuracy curve that tend to deteriorate most rapidly.
It is not possible to predict meter performance since there are so many factors that affect the way
meters age, including water demand patterns, volume through the meter, water quality and
environmental conditions.
Test method When testing meters, it is important to take the purpose of the test into consideration. If the accuracy of a meter needs to be verified for trade purposes, such as in response to a consumer complaint, the test methods must comply with metrology legislation and certification. Various methods are available for testing the accuracy of water meters. The most precise method is that removing the meter from the field and test it on a laboratory test bench.
Large size meter
All large meters need to be tested regularly. Meters between 25mm and 100mm are tested every five years, and meters of 100 mm and larger are tested every year.
Domestic and small size meter
Domestic and small water meters are tested every 10 years. However, it doesn’t make sense to try to test all domestic and small meters due to the large numbers of meters in the system. The recommended approach to domestic and small meter testing is to classify the meters according to the factors such as meter model, size, age, volume measured and user type, and then select several group of meters to test. In Japan, the law requires all meters to be replaced every eight years. Updating all meters after a certain period in this way leads to the most accurate measuring. It is preferable to perform an error test when the meter value is outlier before customer’s complaint.
A5-192

2.6 Meter reliability evaluation
Generally, the larger the cumulative value of the meter, the longer the years of use, so that it tends
to be aged and malfunction. By plotting the cumulative water volume of the meter on the horizontal
axis and the meter instrument error on the vertical axis, you can read the accumulated meter value
of the meter and the tendency of the generator difference.
If there is a high correlation between the accumulated flow rate value and the occurrence of
instrumental error, it is possible to determine when it is desirable to update the existing
meter.
< Relation between cumulative water volume and instrumental error >
A5-193
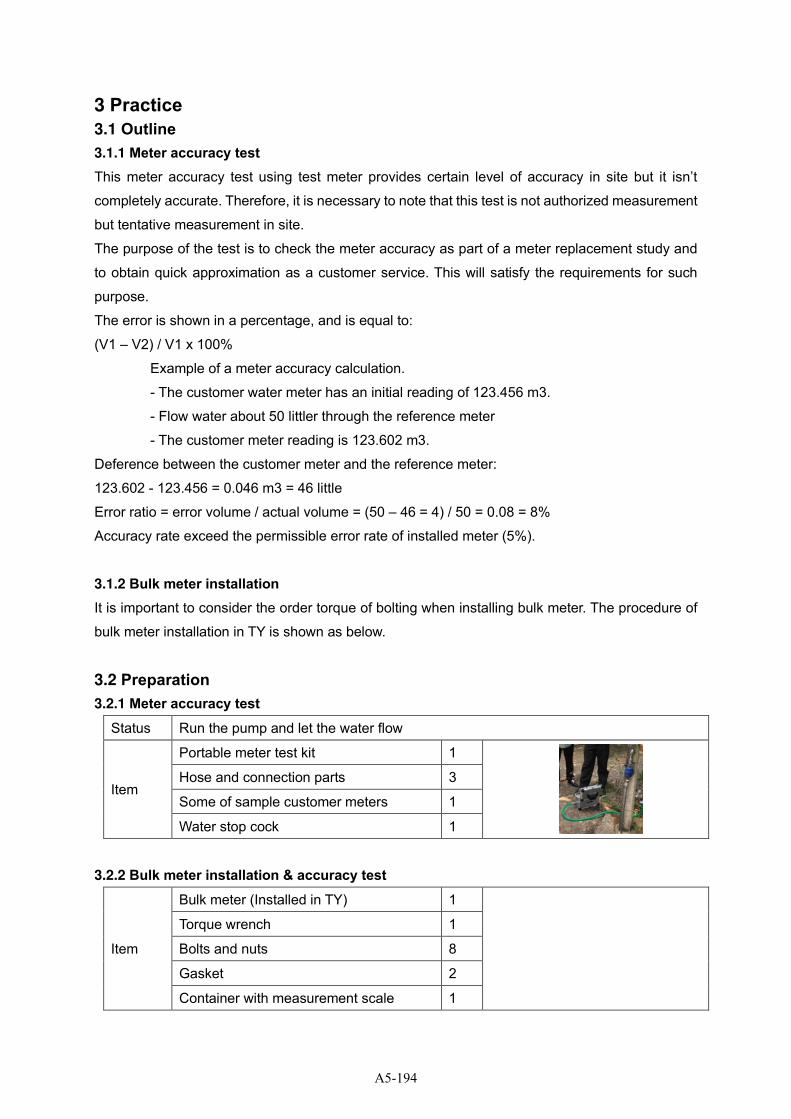
3 Practice
3.1 Outline
3.1.1 Meter accuracy test This meter accuracy test using test meter provides certain level of accuracy in site but it isn’t
completely accurate. Therefore, it is necessary to note that this test is not authorized measurement
but tentative measurement in site.
The purpose of the test is to check the meter accuracy as part of a meter replacement study and
to obtain quick approximation as a customer service. This will satisfy the requirements for such
purpose.
The error is shown in a percentage, and is equal to:
(V1 – V2) / V1 x 100%
Example of a meter accuracy calculation.
- The customer water meter has an initial reading of 123.456 m3.
- Flow water about 50 littler through the reference meter
- The customer meter reading is 123.602 m3.
Deference between the customer meter and the reference meter:
123.602 - 123.456 = 0.046 m3 = 46 little
Error ratio = error volume / actual volume = (50 – 46 = 4) / 50 = 0.08 = 8%
Accuracy rate exceed the permissible error rate of installed meter (5%).
3.1.2 Bulk meter installation
It is important to consider the order torque of bolting when installing bulk meter. The procedure of
bulk meter installation in TY is shown as below.
3.2 Preparation
3.2.1 Meter accuracy test Status Run the pump and let the water flow
Item
Portable meter test kit 1
Hose and connection parts 3
Some of sample customer meters 1
Water stop cock 1
3.2.2 Bulk meter installation & accuracy test
Item
Bulk meter (Installed in TY) 1
Torque wrench 1
Bolts and nuts 8
Gasket 2
Container with measurement scale 1
A5-194
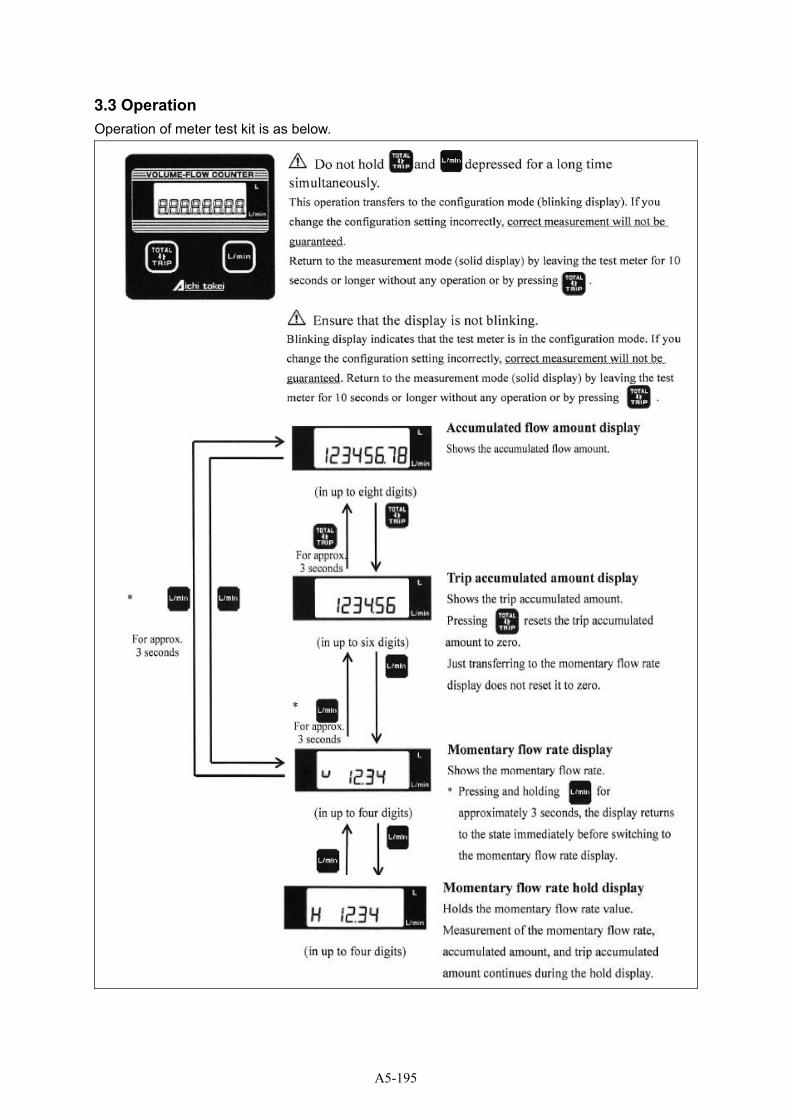
3.3 Operation
Operation of meter test kit is as below.
A5-195
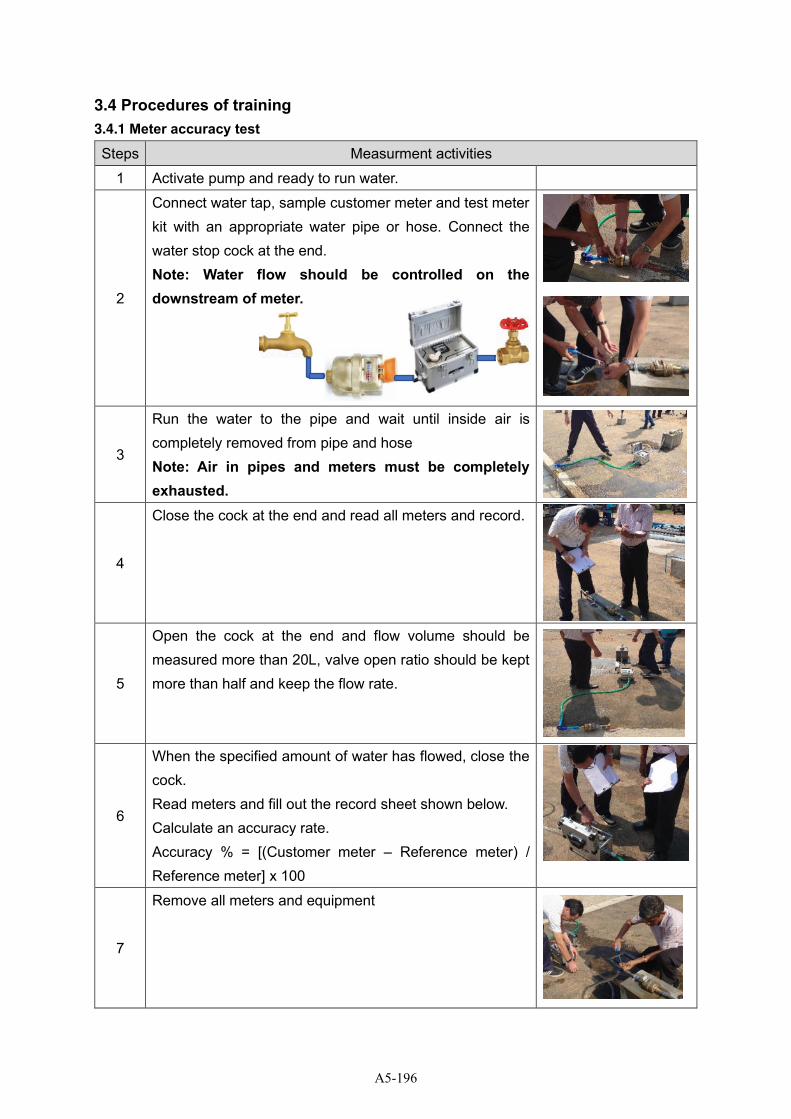
3.4 Procedures of training
3.4.1 Meter accuracy test Steps Measurment activities
1 Activate pump and ready to run water.
2
Connect water tap, sample customer meter and test meter kit with an appropriate water pipe or hose. Connect the water stop cock at the end. Note: Water flow should be controlled on the downstream of meter.
3
Run the water to the pipe and wait until inside air is completely removed from pipe and hose
Note: Air in pipes and meters must be completely exhausted.
4
Close the cock at the end and read all meters and record.
5
Open the cock at the end and flow volume should be measured more than 20L, valve open ratio should be kept more than half and keep the flow rate.
6
When the specified amount of water has flowed, close the cock. Read meters and fill out the record sheet shown below. Calculate an accuracy rate. Accuracy % = [(Customer meter – Reference meter) / Reference meter] x 100
7
Remove all meters and equipment
A5-196
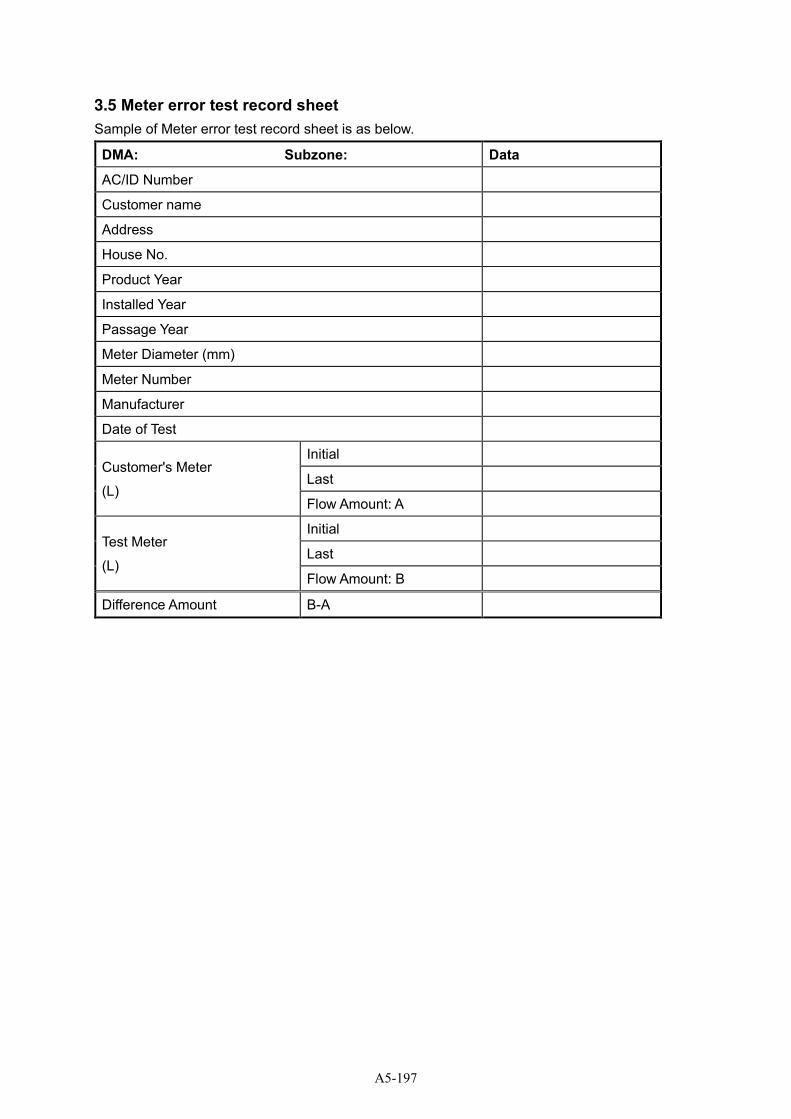
3.5 Meter error test record sheet Sample of Meter error test record sheet is as below.
DMA: Subzone: Data
AC/ID Number
Customer name
Address
House No.
Product Year
Installed Year
Passage Year
Meter Diameter (mm)
Meter Number
Manufacturer
Date of Test
Customer's Meter
(L)
Initial
Last
Flow Amount: A
Test Meter
(L)
Initial
Last
Flow Amount: B
Difference Amount B-A
A5-197
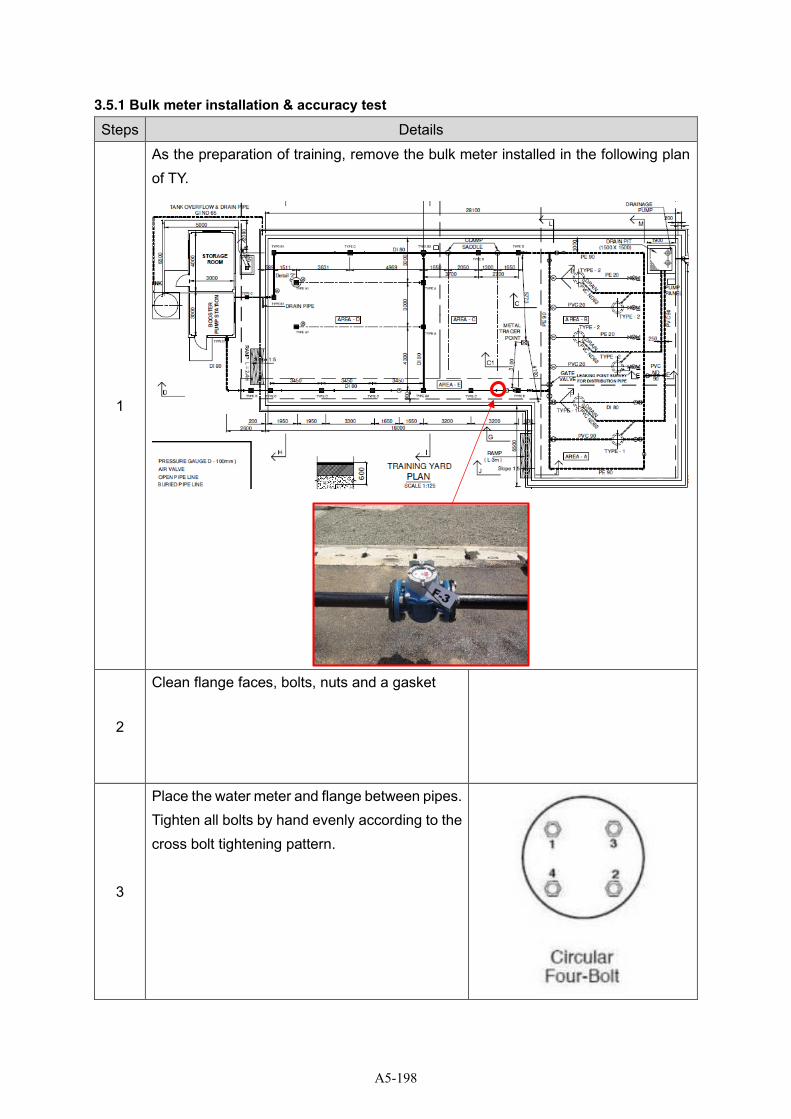
3.5.1 Bulk meter installation & accuracy test Steps Details
1
As the preparation of training, remove the bulk meter installed in the following plan of TY.
2
Clean flange faces, bolts, nuts and a gasket
3
Place the water meter and flange between pipes. Tighten all bolts by hand evenly according to the cross bolt tightening pattern.
A5-198
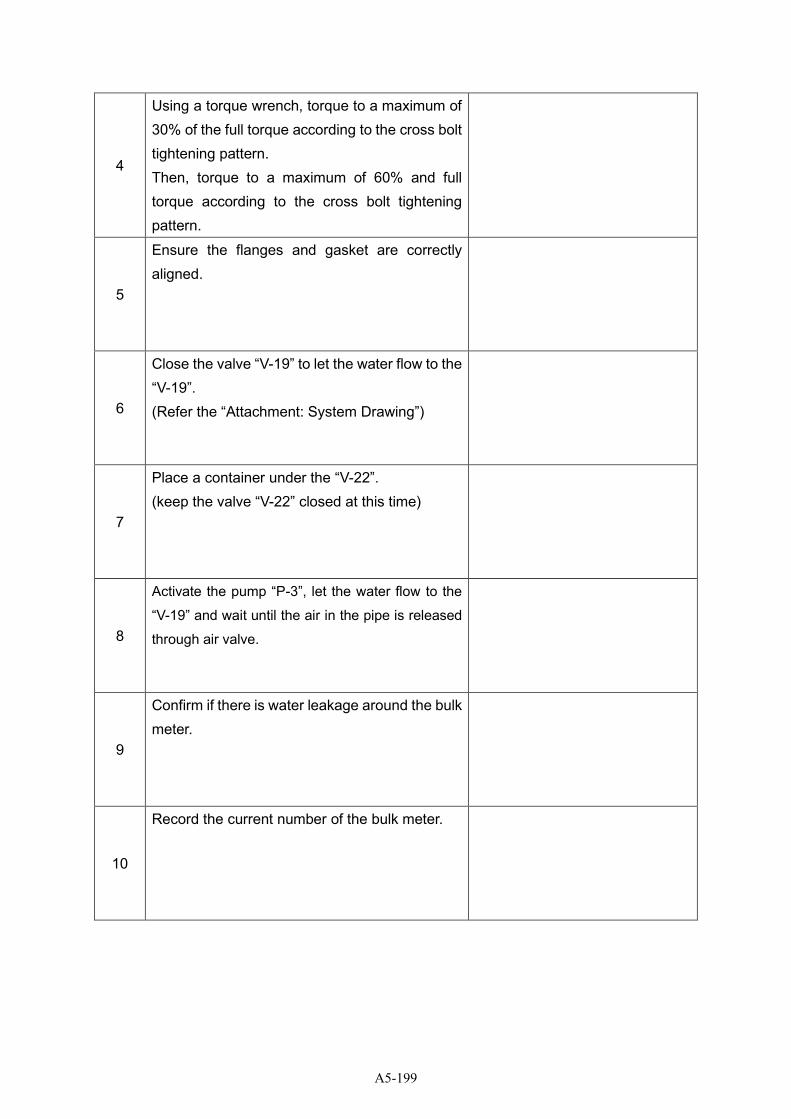
4
Using a torque wrench, torque to a maximum of 30% of the full torque according to the cross bolt tightening pattern. Then, torque to a maximum of 60% and full torque according to the cross bolt tightening pattern.
5
Ensure the flanges and gasket are correctly aligned.
6
Close the valve “V-19” to let the water flow to the “V-19”. (Refer the “Attachment: System Drawing”)
7
Place a container under the “V-22”. (keep the valve “V-22” closed at this time)
8
Activate the pump “P-3”, let the water flow to the
“V-19” and wait until the air in the pipe is released
through air valve.
9
Confirm if there is water leakage around the bulk meter.
10
Record the current number of the bulk meter.
A5-199
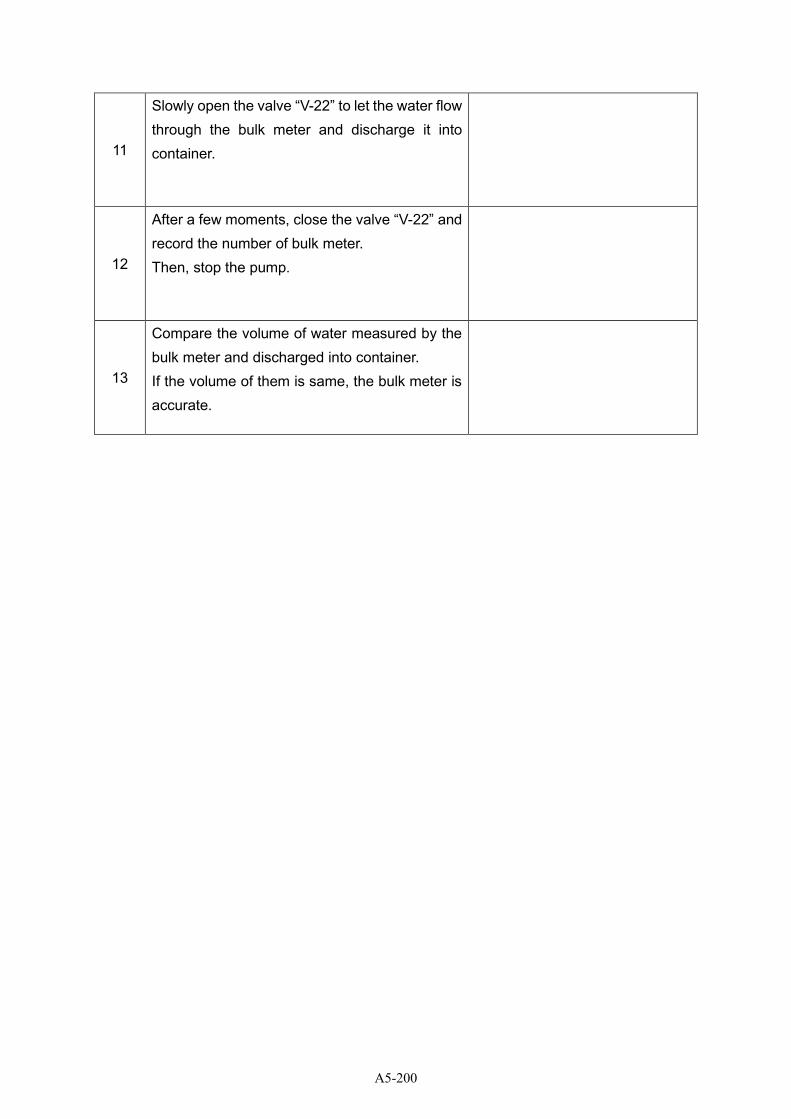
11
Slowly open the valve “V-22” to let the water flow through the bulk meter and discharge it into container.
12
After a few moments, close the valve “V-22” and record the number of bulk meter. Then, stop the pump.
13
Compare the volume of water measured by the bulk meter and discharged into container. If the volume of them is same, the bulk meter is accurate.
A5-200
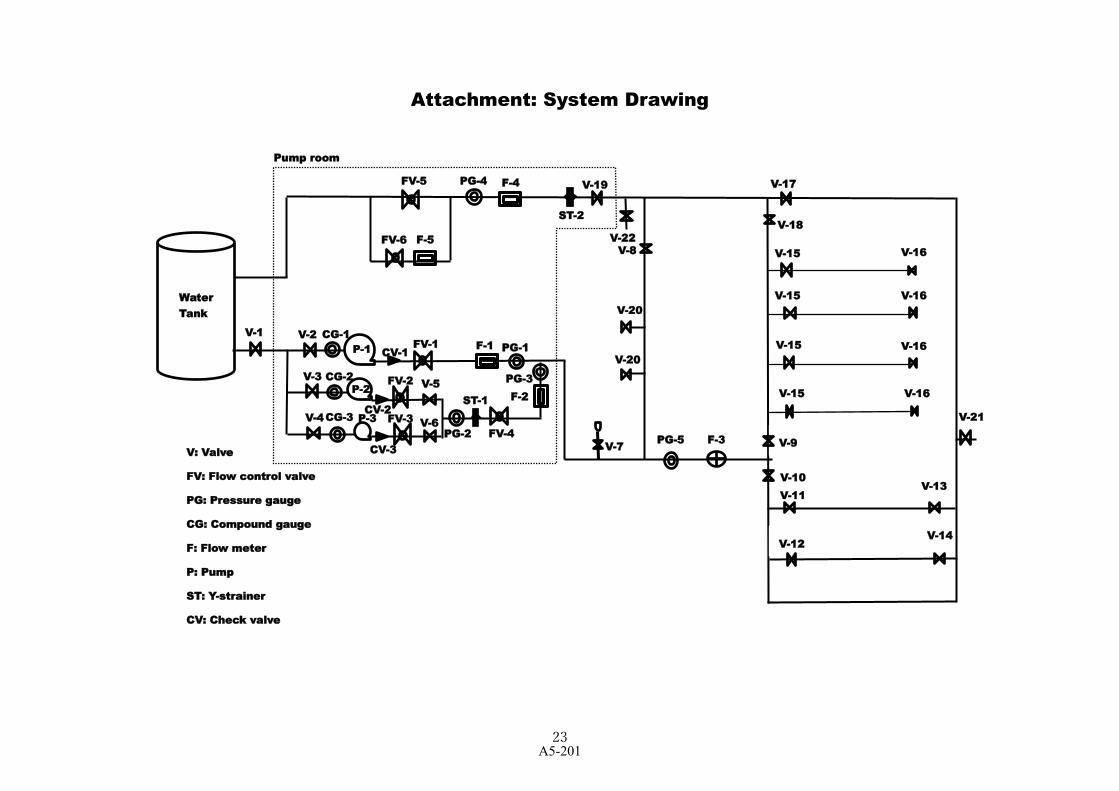
23
Attachment: System Drawing
V-18
V-16
V-16
V-15
V-15
V-5
F-4
F-5
V-1
V-3 P-2
V-16
V-17
V-15 V-8
P-1 F-1
V-15 V-16 F-2
V-19
Water Tank
V-2
V-4
V-20
V-20
F-3
PG-1
PG-4
FV-1
FV-5
FV-6
PG-3 FV-2
P-3 V-6 PG-5 PG-2
FV-3 FV-4
V-9 V: Valve
FV: Flow control valve
PG: Pressure gauge
CG: Compound gauge
F: Flow meter
P: Pump
ST: Y-strainer
CV: Check valve
V-7
V-10 V-11
V-12
V-13
V-14
V-21
CG-2
CG-3
CG-1
V-22
ST-2
2221
CV-1
ST-1
2221
CV-3
CV-2
Pump room
A5-201
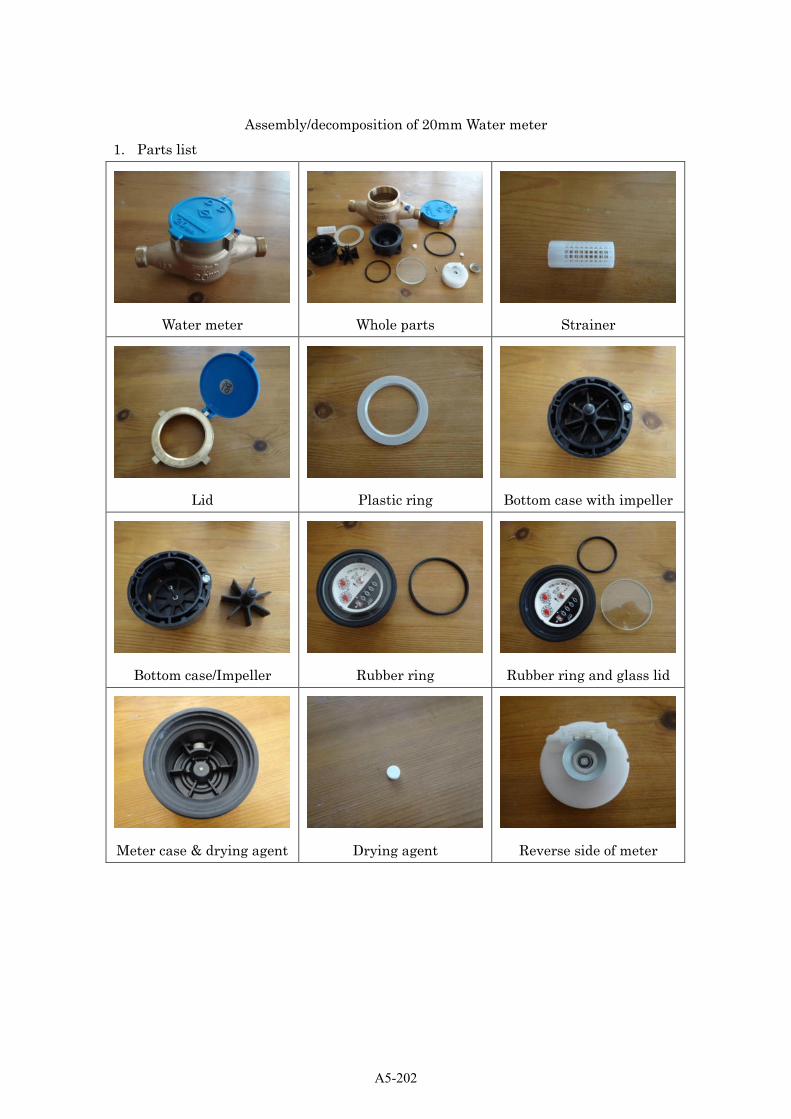
Assembly/decomposition of 20mm Water meter
1. Parts list
Water meter
Whole parts
Strainer
Lid
Plastic ring
Bottom case with impeller
Bottom case/Impeller
Rubber ring
Rubber ring and glass lid
Meter case & drying agent
Drying agent
Reverse side of meter
A5-202
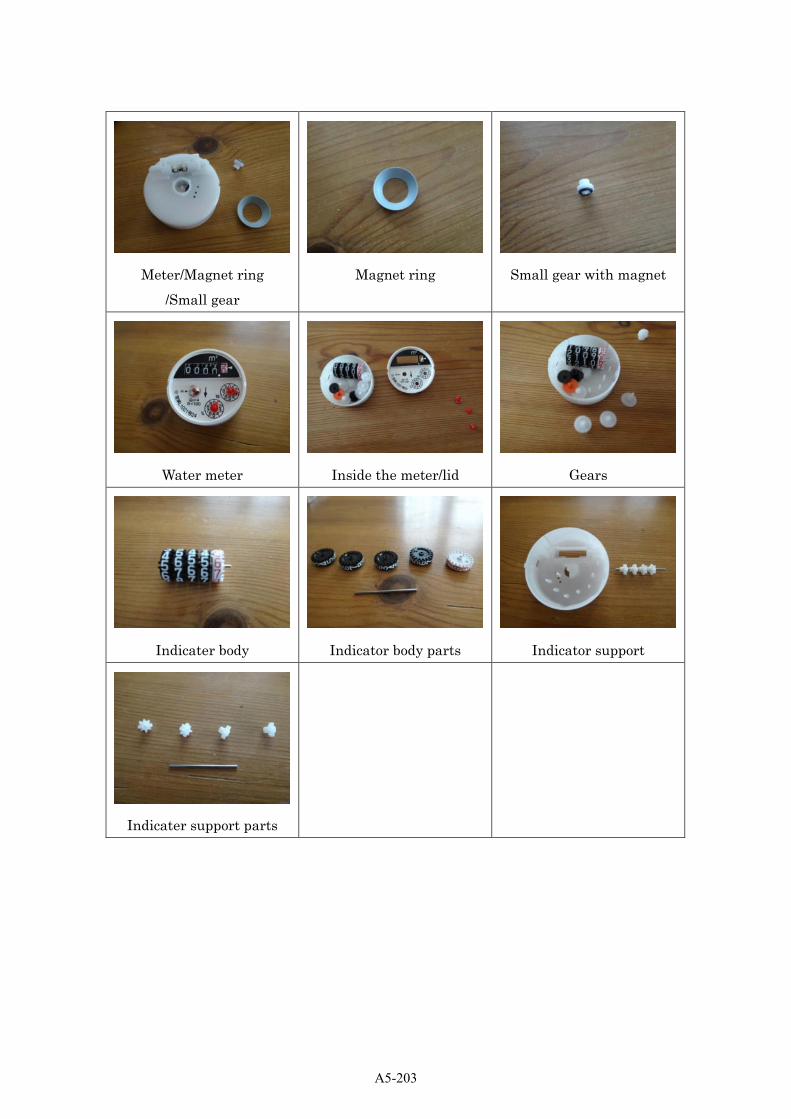
Meter/Magnet ring
/Small gear
Magnet ring
Small gear with magnet
Water meter
Inside the meter/lid
Gears
Indicater body
Indicator body parts
Indicator support
Indicater support parts
A5-203
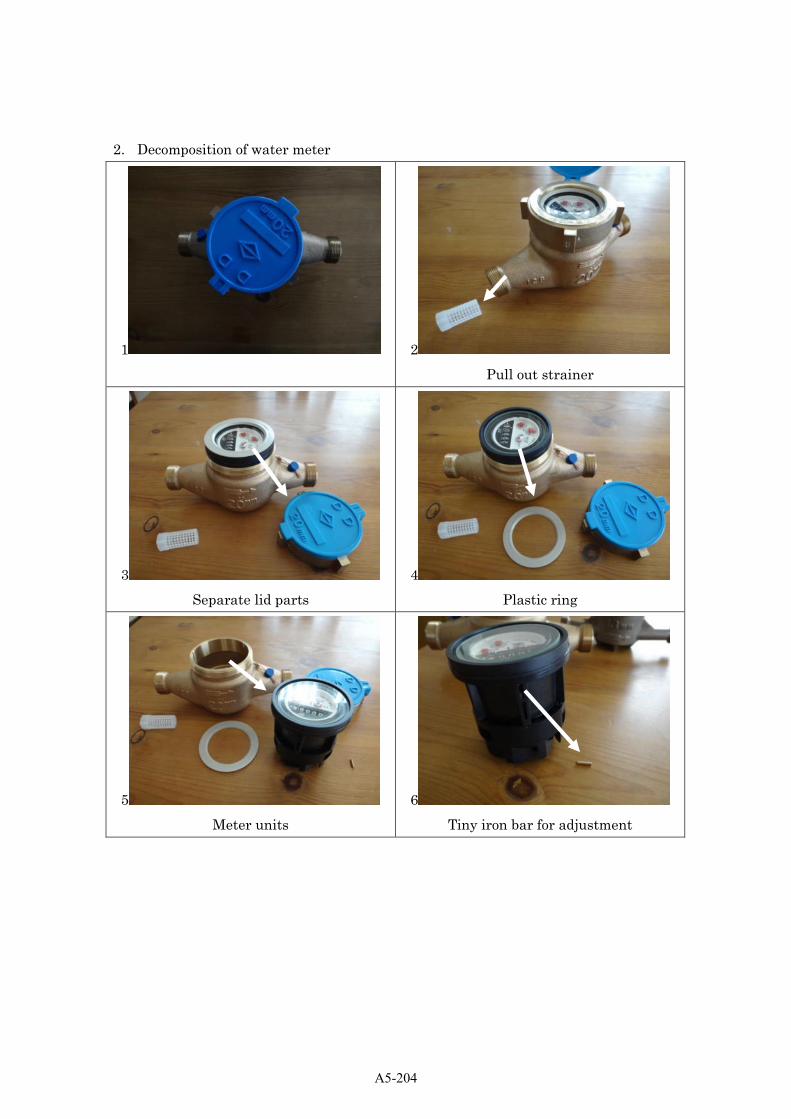
2. Decomposition of water meter
1 2
Pull out strainer
3
Separate lid parts
4
Plastic ring
5
Meter units
6
Tiny iron bar for adjustment
A5-204
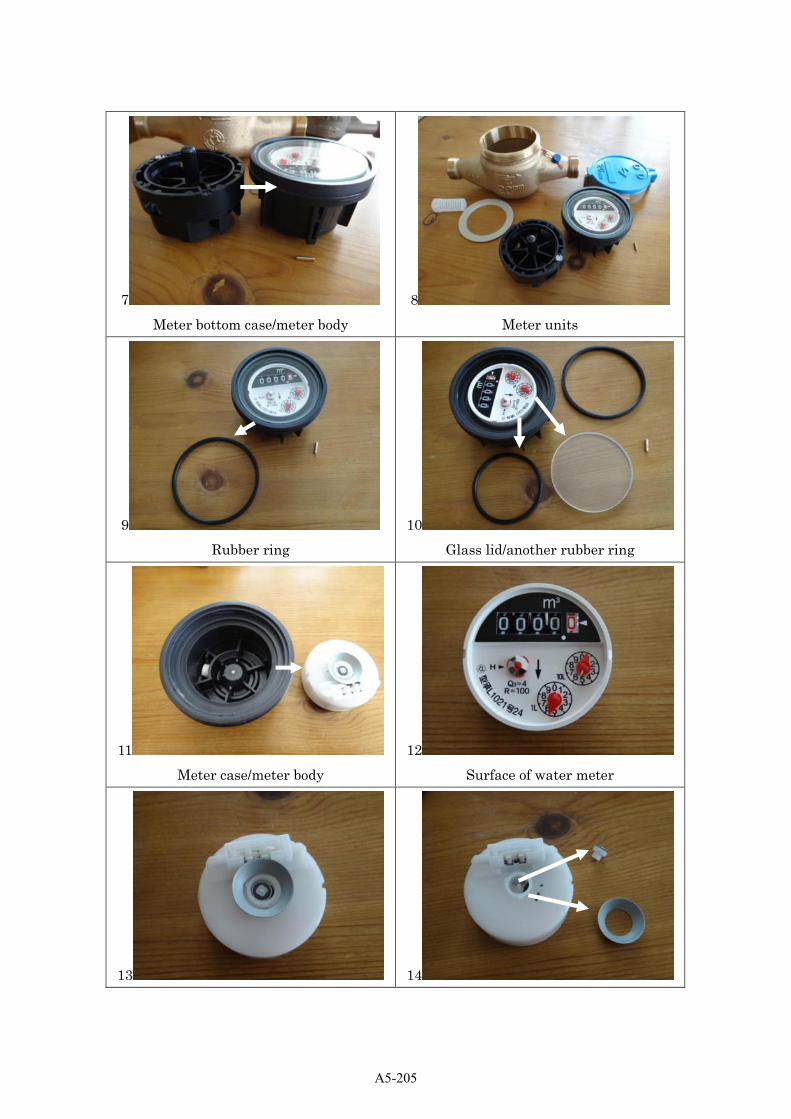
7
Meter bottom case/meter body
8
Meter units
9
Rubber ring
10
Glass lid/another rubber ring
11
Meter case/meter body
12
Surface of water meter
13 14
A5-205
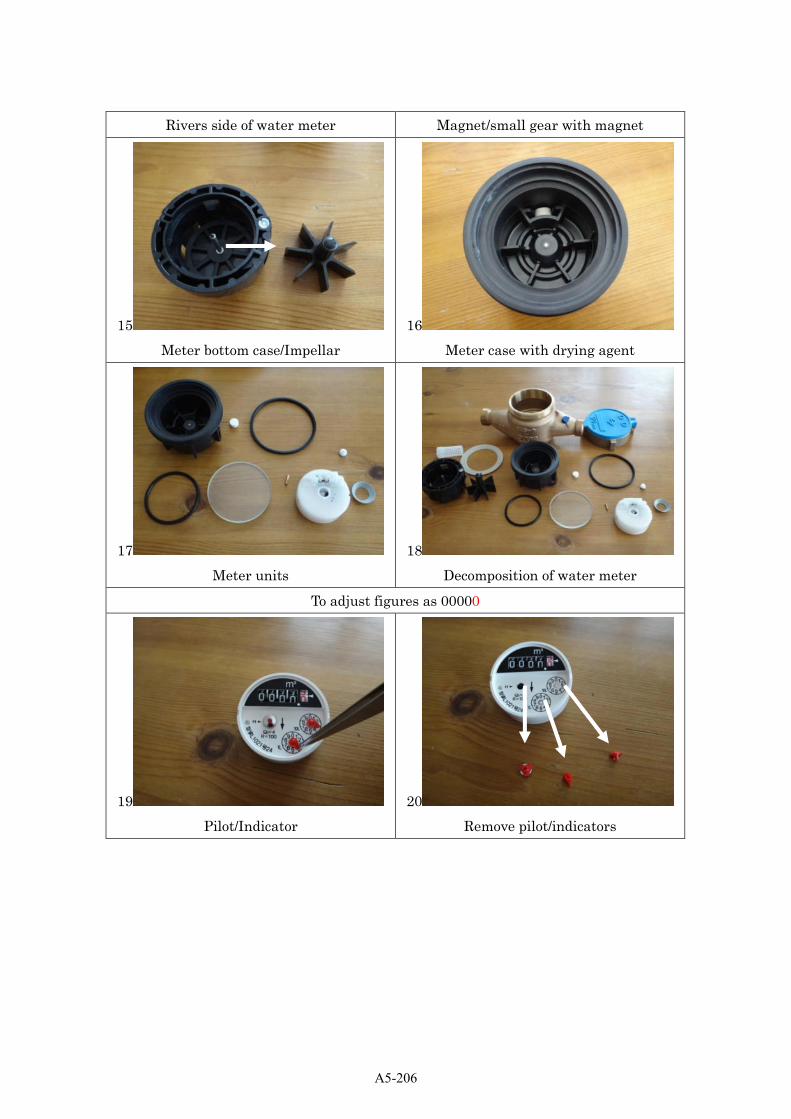
Rivers side of water meter Magnet/small gear with magnet
15
Meter bottom case/Impellar
16
Meter case with drying agent
17
Meter units
18
Decomposition of water meter
To adjust figures as 00000
19
Pilot/Indicator
20
Remove pilot/indicators
A5-206
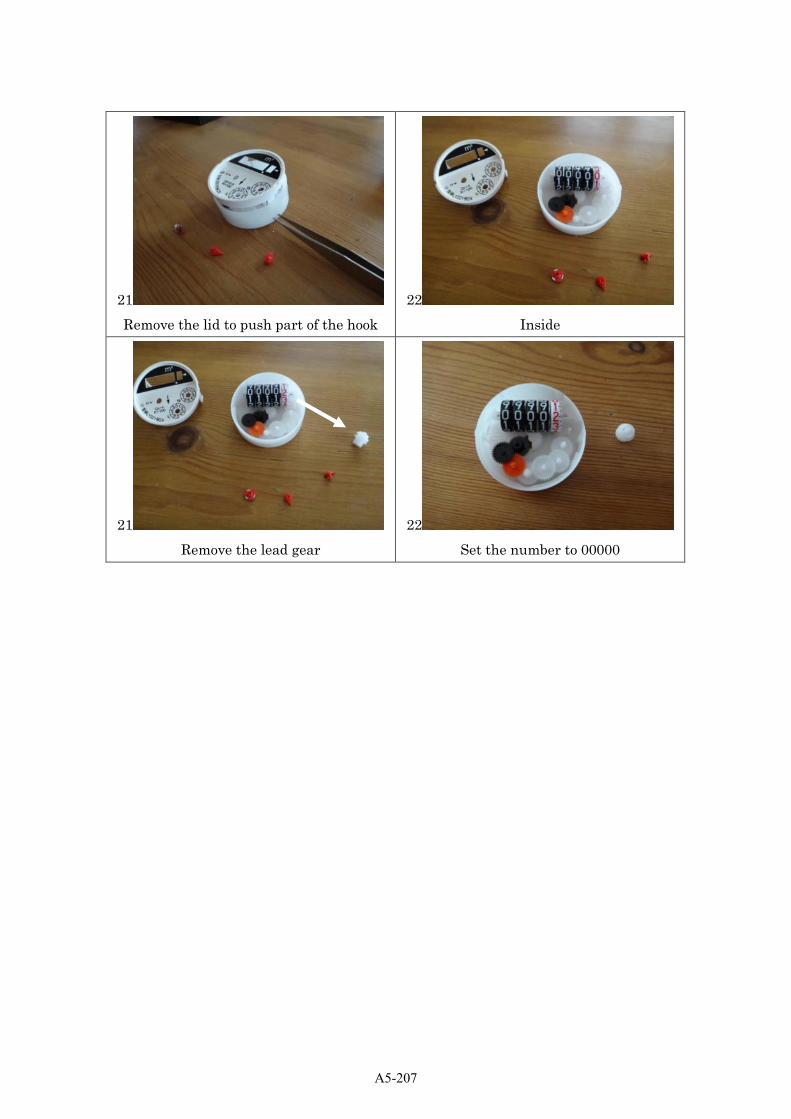
21
Remove the lid to push part of the hook
22
Inside
21
Remove the lead gear
22
Set the number to 00000
A5-207
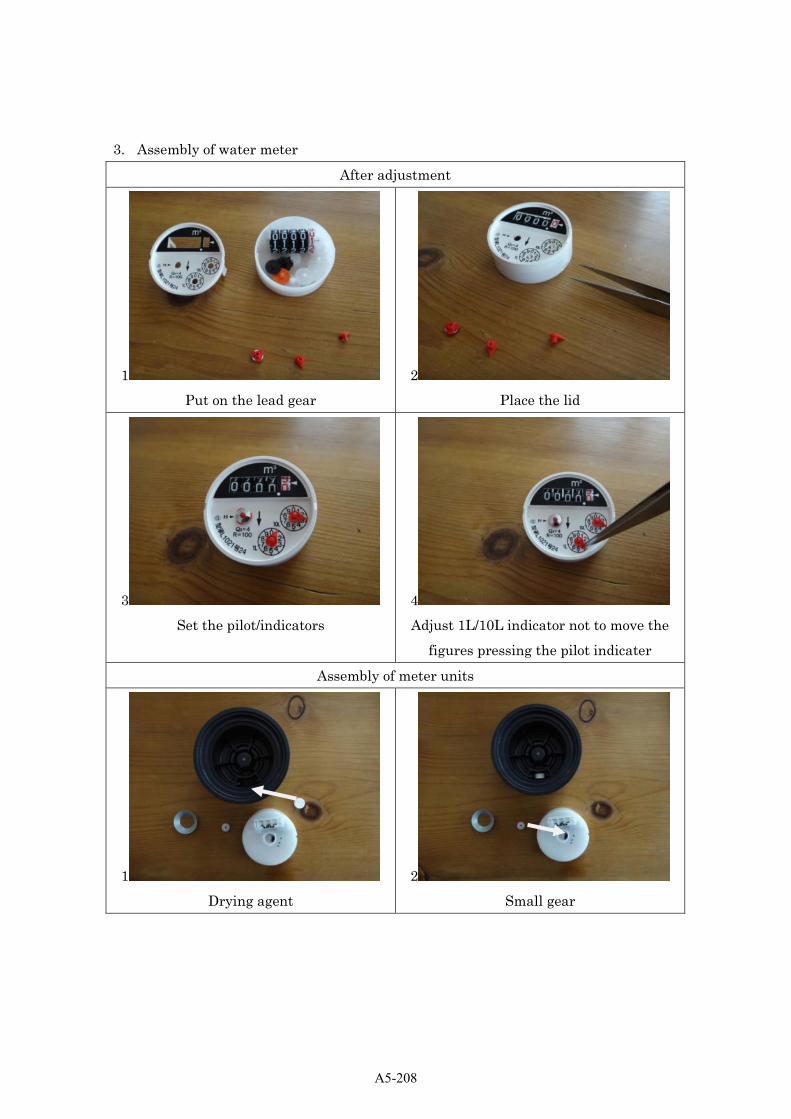
3. Assembly of water meter
After adjustment
1
Put on the lead gear
2
Place the lid
3
Set the pilot/indicators
4
Adjust 1L/10L indicator not to move the
figures pressing the pilot indicater
Assembly of meter units
1
Drying agent
2
Small gear
A5-208
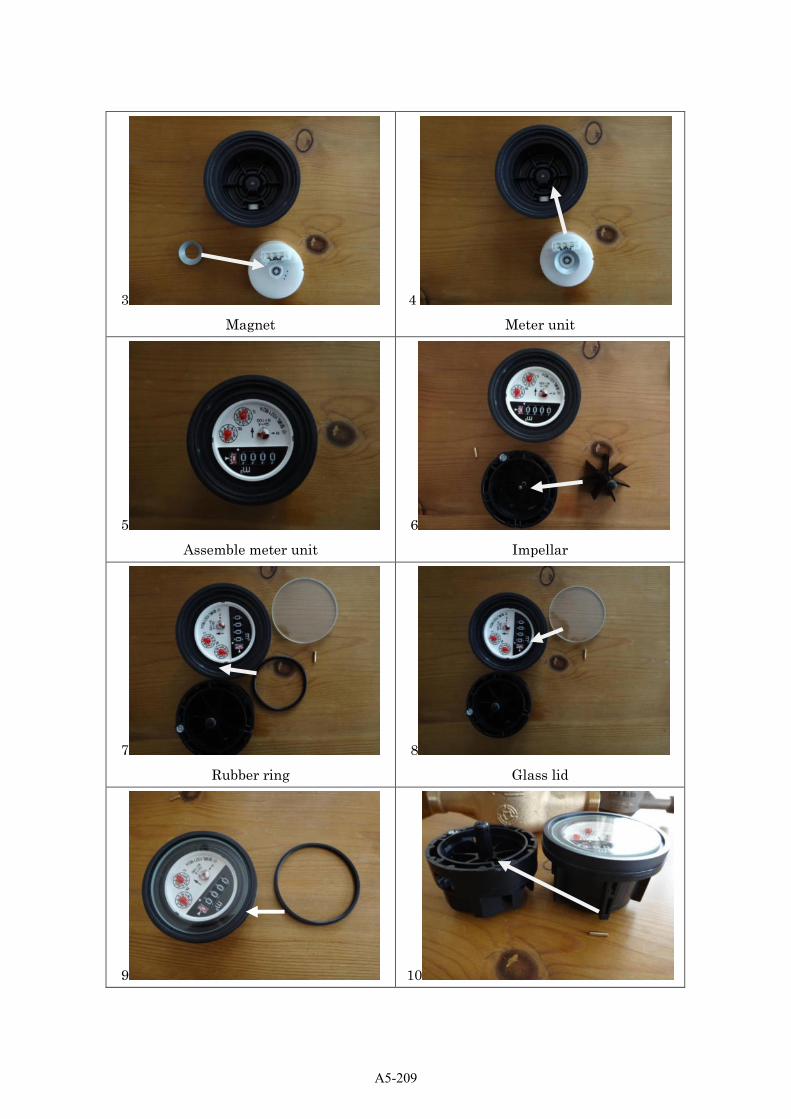
3
Magnet
4
Meter unit
5
Assemble meter unit
6
Impellar
7
Rubber ring
8
Glass lid
9 10
A5-209
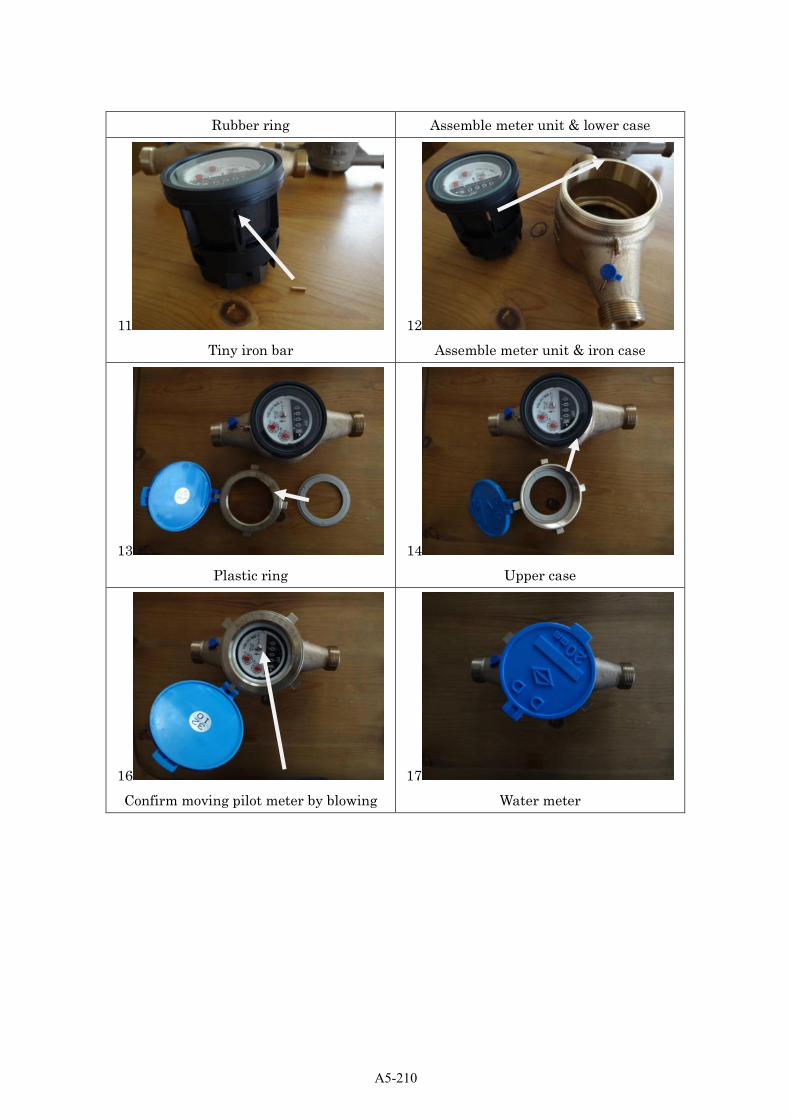
Rubber ring Assemble meter unit & lower case
11
Tiny iron bar
12
Assemble meter unit & iron case
13
Plastic ring
14
Upper case
16
Confirm moving pilot meter by blowing
17
Water meter
A5-210
Training Guideline
5. Measurement
b. Flow Measurement
A5-211
Table of contents
1 Outline ........................................................................................................................................... 1
1.1 Purpose ................................................................................................................................... 1
1.2 Flow of training with time schedule ........................................................................................ 2
1.3 Safety notice ........................................................................................................................... 3
2 Knowledge acquisition ................................................................................................................... 4
2.1 Meter reading .......................................................................................................................... 4
2.2 Type of meter .......................................................................................................................... 5
2.3 Maintenance ........................................................................................................................... 6
3 Practice .......................................................................................................................................... 7
3.1 Ultrasonic Flow Meter (UFM) .................................................................................................. 7
3.1.1 Preparation ....................................................................................................................... 7
3.1.2 Measurement procedures ................................................................................................ 8
3.1.3 Preparation of materials & pre-assembling ..................................................................... 8
3.1.4 Practice by trainee ........................................................................................................... 9
3.2 Insert type electromagnetic flow meter (ITEFM) .................................................................. 10
3.2.1 Preparation ..................................................................................................................... 10
3.2.2 Preparation of materials & pre-assembling .................................................................... 11
3.2.3 Practice by trainee (To Be Revised) ............................................................................... 11
Appendix ......................................................................................................................................... 12
[Appendix-1] ................................................................................................................................... 12
UFM (Ultrasonic Flow Meter) Setting ......................................................................................... 12
A5-212

1 Outline
1.1 Purpose
Purpose of training ➢ Learn how to measure water flow through Ultrasonic Flow Meter
(UFM) & Insert type Electromagnetic Flow Meter (IEMFM)). These
two types of flow meters are not used for measuring the water
consumption of the customer but are often used to measure the water
flow temporarily when the meter is not installed as a balk meter.
Training contents ➢ Flow measurement by ‘Ultrasonic flow meter (UFM)’ and ‘Insert type
electromagnetic flow meter (IEMFM)’, and visualization of data by PC.
A5-213
1.2 Flow of training with time schedule
The total time is 2 hours and 45 minutes.
No. Activity Required time Venue
1 Lecture 45 min. Lecture room
2 Move to TY 5 min. TY & Warehouse
(Distribution pipe or Service pipe
connection area)
3 Preparation for practical
training
10 min.
*Details are described in “3 Practice (Page 7)”
*Activate pump of TY
*Wear work clothes
(Clothes, safety shoes, gloves, hard hat)
*Bring necessary tools and equipment from warehouse
(Pressure logger, Ultrasonic Flow Meter, Meter test kit)
4 Practical training 50 min. TY
*Details are described in “3 Practice (Page 7)”
5 Return tools &
equipment and clean up
10 min. TY & Warehouse
6 Move to lecture room 5 min. Lecture room
7 Data visualization 25 min. Lecture room
*Use PC
8 Q & A & evaluation 15 min. Lecture room
*Use Evaluation sheet
A5-214
1.3 Safety notice
➢ All members must wear safety equipment in TY.RP should order to participants wearing
suitable item
➢ Do not sit on the pipes or put your foot on.
➢ Do not touch the installed equipment unnecessarily.
➢ Do not eat food in the TY.
A5-215

2 Knowledge acquisition
2.1 Meter reading
The water meter shows several digits as shown in the
right figure. This digit means 1234 m3 and 567.8 liter, or
1234.5678 m3. When the counter of 0.1 liters is moving
between two numbers, it is counted as lower number.
Another water meter has pointers as shown in the right photo.
m3 is shown in the upper black digits and liter is shown in the
lower red pointer. When the pointer is between two numbers, it
is counted as lower number.
When the digit of counter reached maximum (e.g. 9999.999), it
back to all zero (e.g. 0000.000), and sometimes it makes
mistakes of calculation of consumption. As shown below, it is
necessary to calculate on the assumption that it has one digit in the left side which is not shown on
the display.
Previous reading:9989.123, Current reading:0002.234
Consumption: 10002.234-9989.123 = 13.111
A5-216
2.2 Type of meter In Sri Lanka, the type of meter is determined by NWSDB so it is necessary to select the proper
meter based on the regulation of NWSDB.
The type of water meter is classified as below.
i. Ultrasonic Flow Meters (UFM)
Characteristics
UFM has some good advantages such as no head loss by no
moving parts and cheaper than electromagnetic flow meter for
large pipes. On the other hand, it requires long straight section for
installation. Turbulences and bubbles in liquid affects its accuracy.
Thickness of pipe wall and lining are necessary for accurate
measurement.
➢ Required length of straight pipe: Upstream 10D, Downstream
5D
(Refer to the manufacturer manual for more details)
➢ Applicable pipe diameter: 13mm – Large diameter
➢ Advantages: Piping work is not necessary (ultrasonic
transducers are installed on the surface of pipe), Applicable
pipe diameter is wide, No head loss.
➢ Disadvantages: Air intrusion decreases accuracy.
Type of meter
*The details are as given below
Water meter
Mechanical meter *Electromagnetic meter *Ultrasonic meter
Single jet
Rotary piston Radial vane Helical vane
Multi jet Woltmann
Volumetric meter Inferential meter Combination
A5-217
ii. Electromagnetic meters
Characteristics Electromagnetic meters have high accuracy from small to large
flow rate, and they are not affected by liquid temperature,
pressure, density, viscosity and corrosive liquid. They have no
moving parts, so there is no head loss. Both-way, forward and
reverse, measurement is possible. Electromagnetic meters for
large diameter are more expensive than other meters.
➢ Applicable pipe diameter: 13mm – Large diameter (Battery
type: up to 350mm)
➢ Advantages: High measurement accuracy, No head loss
➢ Disadvantages: Electromagnetic meters for large diameter
are expensive
Note: Sometimes lightning damages the flowmeter, so
earthing/grounding is necessary
2.3 Maintenance
Maintenance of Ultrasonic flowmeter
The following items are important for maintenance.
➢ Appearance inspection and cleaning
➢ Indicator value check
➢ Detector installation status check
➢ Inundation status check of the flowmeter chamber
Meintenance of electromagnetic flow meter
The following items are important points for maintenance.
➢ Appearance inspection and cleaning
➢ Indicator value check
➢ Confirmation of water in the chamber to avoid submerging of the sensor
A5-218
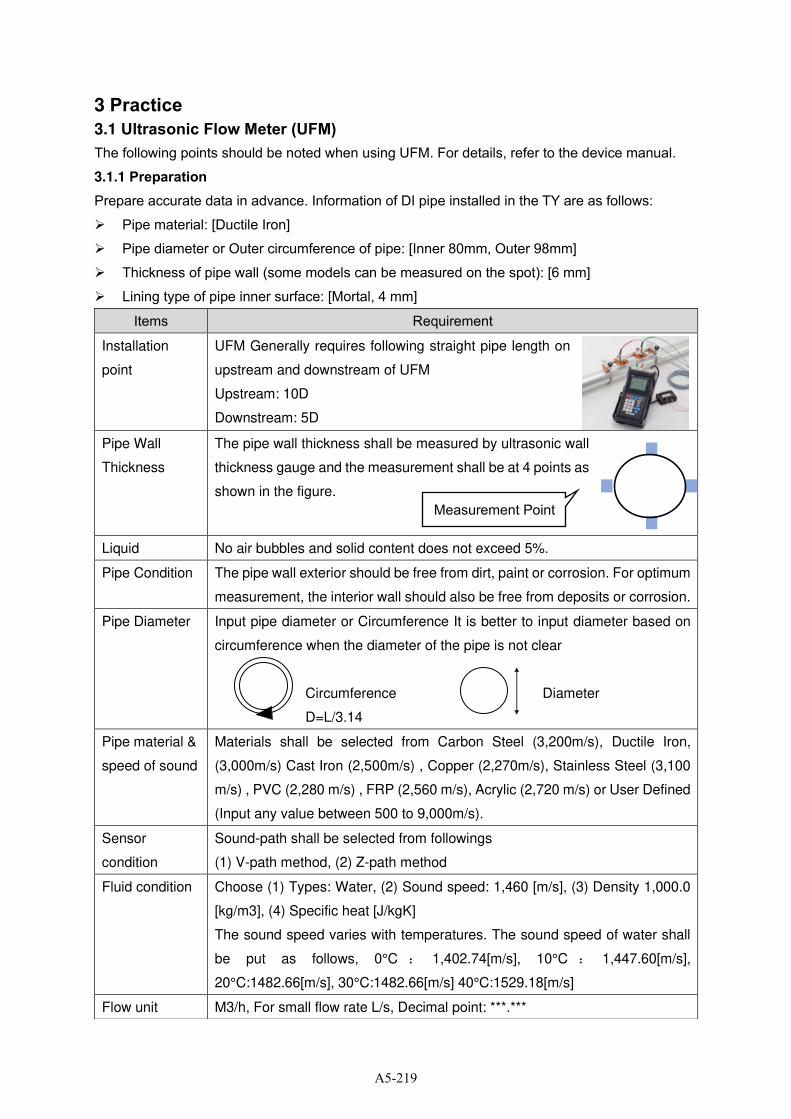
3 Practice
3.1 Ultrasonic Flow Meter (UFM) The following points should be noted when using UFM. For details, refer to the device manual.
3.1.1 Preparation
Prepare accurate data in advance. Information of DI pipe installed in the TY are as follows:
➢ Pipe material: [Ductile Iron]
➢ Pipe diameter or Outer circumference of pipe: [Inner 80mm, Outer 98mm]
➢ Thickness of pipe wall (some models can be measured on the spot): [6 mm]
➢ Lining type of pipe inner surface: [Mortal, 4 mm]
Items Requirement
Installation
point
UFM Generally requires following straight pipe length on
upstream and downstream of UFM
Upstream: 10D
Downstream: 5D
Pipe Wall
Thickness
The pipe wall thickness shall be measured by ultrasonic wall
thickness gauge and the measurement shall be at 4 points as
shown in the figure.
Liquid No air bubbles and solid content does not exceed 5%.
Pipe Condition The pipe wall exterior should be free from dirt, paint or corrosion. For optimum
measurement, the interior wall should also be free from deposits or corrosion.
Pipe Diameter Input pipe diameter or Circumference It is better to input diameter based on
circumference when the diameter of the pipe is not clear
Circumference Diameter
D=L/3.14
Pipe material &
speed of sound
Materials shall be selected from Carbon Steel (3,200m/s), Ductile Iron,
(3,000m/s) Cast Iron (2,500m/s) , Copper (2,270m/s), Stainless Steel (3,100
m/s) , PVC (2,280 m/s) , FRP (2,560 m/s), Acrylic (2,720 m/s) or User Defined
(Input any value between 500 to 9,000m/s).
Sensor
condition
Sound-path shall be selected from followings
(1) V-path method, (2) Z-path method
Fluid condition Choose (1) Types: Water, (2) Sound speed: 1,460 [m/s], (3) Density 1,000.0
[kg/m3], (4) Specific heat [J/kgK]
The sound speed varies with temperatures. The sound speed of water shall
be put as follows, 0°C : 1,402.74[m/s], 10°C : 1,447.60[m/s],
20°C:1482.66[m/s], 30°C:1482.66[m/s] 40°C:1529.18[m/s]
Flow unit M3/h, For small flow rate L/s, Decimal point: ***.***
Measurement Point
A5-219
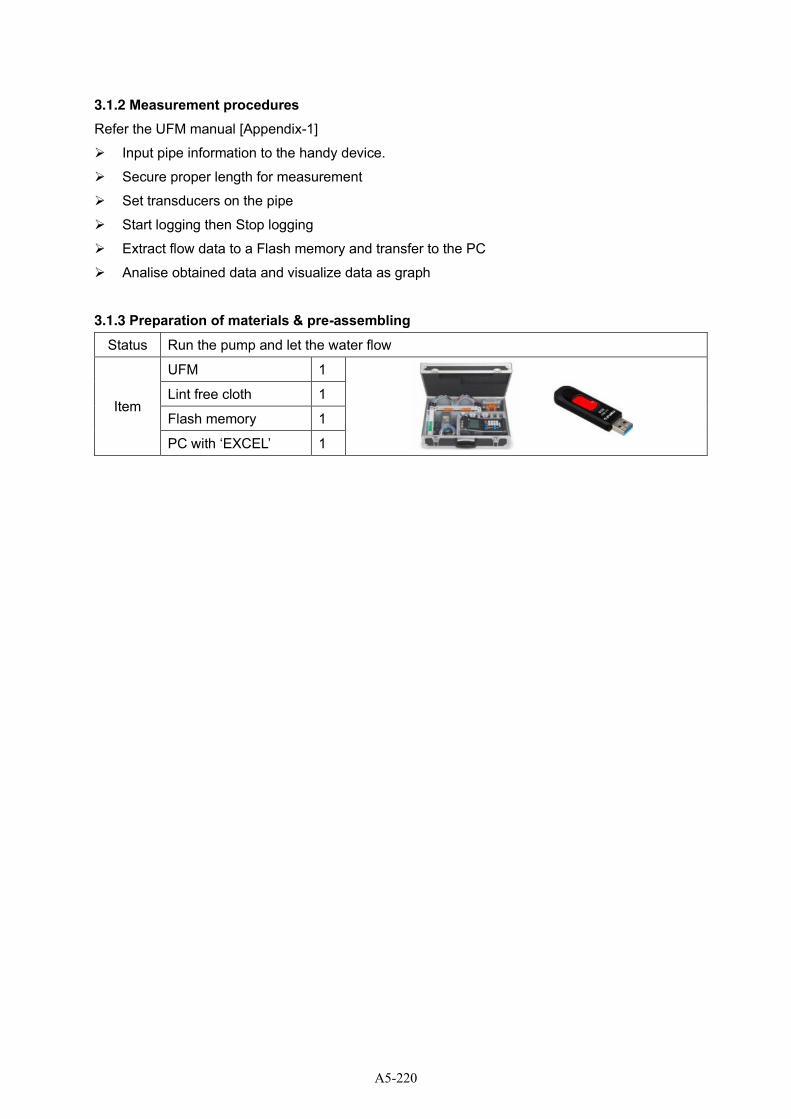
3.1.2 Measurement procedures
Refer the UFM manual [Appendix-1]
➢ Input pipe information to the handy device.
➢ Secure proper length for measurement
➢ Set transducers on the pipe
➢ Start logging then Stop logging
➢ Extract flow data to a Flash memory and transfer to the PC
➢ Analise obtained data and visualize data as graph
3.1.3 Preparation of materials & pre-assembling
Status Run the pump and let the water flow
Item
UFM 1
Lint free cloth 1
Flash memory 1
PC with ‘EXCEL’ 1
A5-220
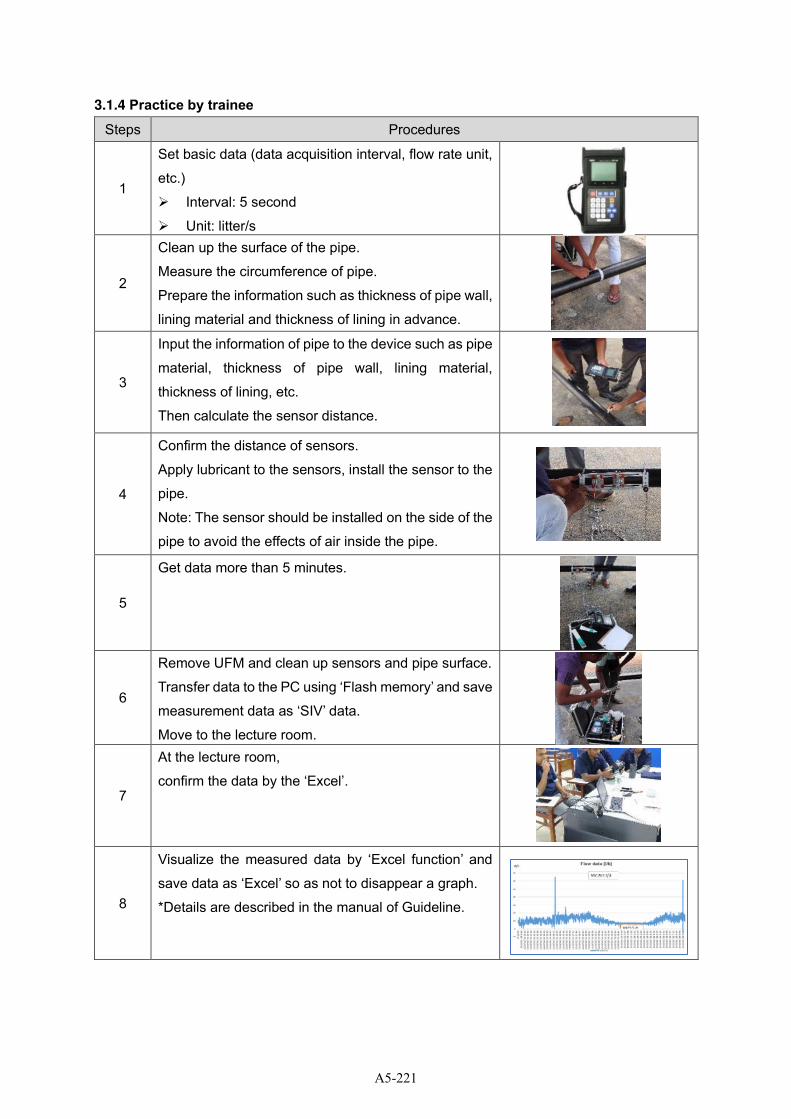
3.1.4 Practice by trainee
Steps Procedures
1
Set basic data (data acquisition interval, flow rate unit,
etc.)
➢ Interval: 5 second
➢ Unit: litter/s
2
Clean up the surface of the pipe.
Measure the circumference of pipe.
Prepare the information such as thickness of pipe wall,
lining material and thickness of lining in advance.
3
Input the information of pipe to the device such as pipe
material, thickness of pipe wall, lining material,
thickness of lining, etc.
Then calculate the sensor distance.
4
Confirm the distance of sensors.
Apply lubricant to the sensors, install the sensor to the
pipe.
Note: The sensor should be installed on the side of the
pipe to avoid the effects of air inside the pipe.
5
Get data more than 5 minutes.
6
Remove UFM and clean up sensors and pipe surface.
Transfer data to the PC using ‘Flash memory’ and save
measurement data as ‘SIV’ data.
Move to the lecture room.
7
At the lecture room,
confirm the data by the ‘Excel’.
8
Visualize the measured data by ‘Excel function’ and
save data as ‘Excel’ so as not to disappear a graph.
*Details are described in the manual of Guideline.
A5-221
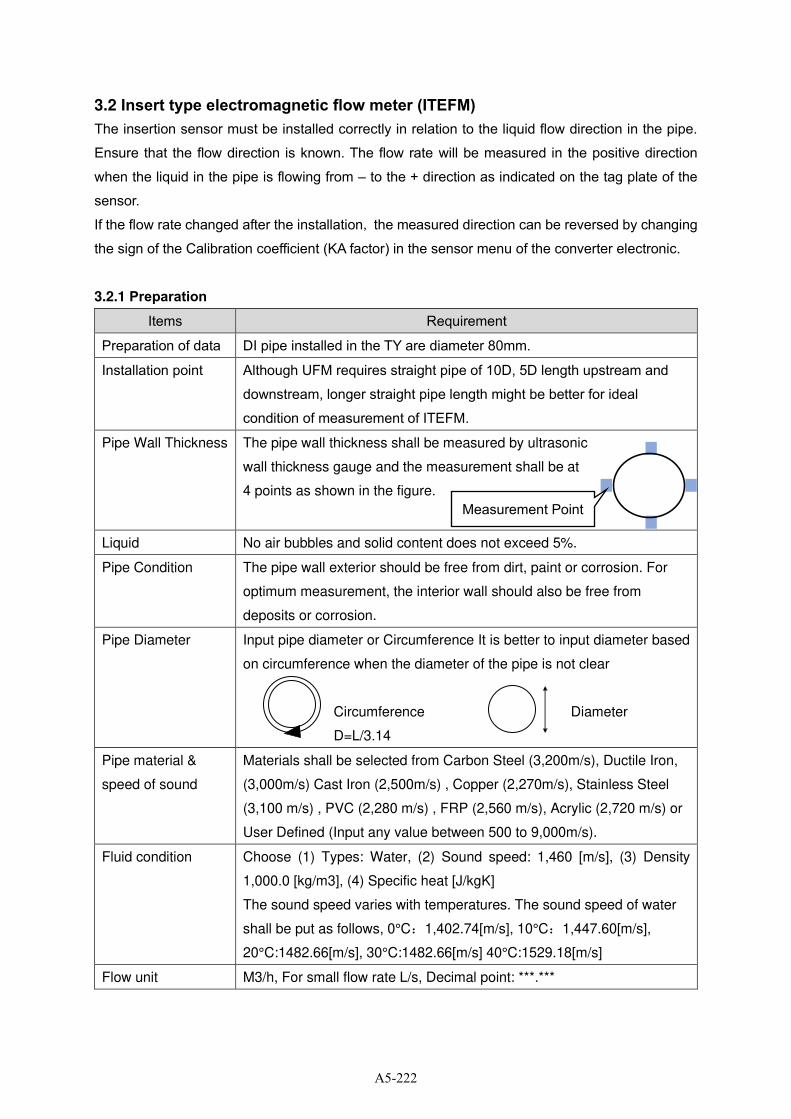
3.2 Insert type electromagnetic flow meter (ITEFM) The insertion sensor must be installed correctly in relation to the liquid flow direction in the pipe.
Ensure that the flow direction is known. The flow rate will be measured in the positive direction
when the liquid in the pipe is flowing from – to the + direction as indicated on the tag plate of the
sensor.
If the flow rate changed after the installation, the measured direction can be reversed by changing
the sign of the Calibration coefficient (KA factor) in the sensor menu of the converter electronic.
3.2.1 Preparation
Items Requirement
Preparation of data DI pipe installed in the TY are diameter 80mm.
Installation point Although UFM requires straight pipe of 10D, 5D length upstream and
downstream, longer straight pipe length might be better for ideal
condition of measurement of ITEFM.
Pipe Wall Thickness The pipe wall thickness shall be measured by ultrasonic
wall thickness gauge and the measurement shall be at
4 points as shown in the figure.
Liquid No air bubbles and solid content does not exceed 5%.
Pipe Condition The pipe wall exterior should be free from dirt, paint or corrosion. For
optimum measurement, the interior wall should also be free from
deposits or corrosion.
Pipe Diameter Input pipe diameter or Circumference It is better to input diameter based
on circumference when the diameter of the pipe is not clear
Circumference Diameter
D=L/3.14
Pipe material &
speed of sound
Materials shall be selected from Carbon Steel (3,200m/s), Ductile Iron,
(3,000m/s) Cast Iron (2,500m/s) , Copper (2,270m/s), Stainless Steel
(3,100 m/s) , PVC (2,280 m/s) , FRP (2,560 m/s), Acrylic (2,720 m/s) or
User Defined (Input any value between 500 to 9,000m/s).
Fluid condition Choose (1) Types: Water, (2) Sound speed: 1,460 [m/s], (3) Density
1,000.0 [kg/m3], (4) Specific heat [J/kgK]
The sound speed varies with temperatures. The sound speed of water
shall be put as follows, 0°C:1,402.74[m/s], 10°C:1,447.60[m/s],
20°C:1482.66[m/s], 30°C:1482.66[m/s] 40°C:1529.18[m/s]
Flow unit M3/h, For small flow rate L/s, Decimal point: ***.***
Measurement Point
A5-222
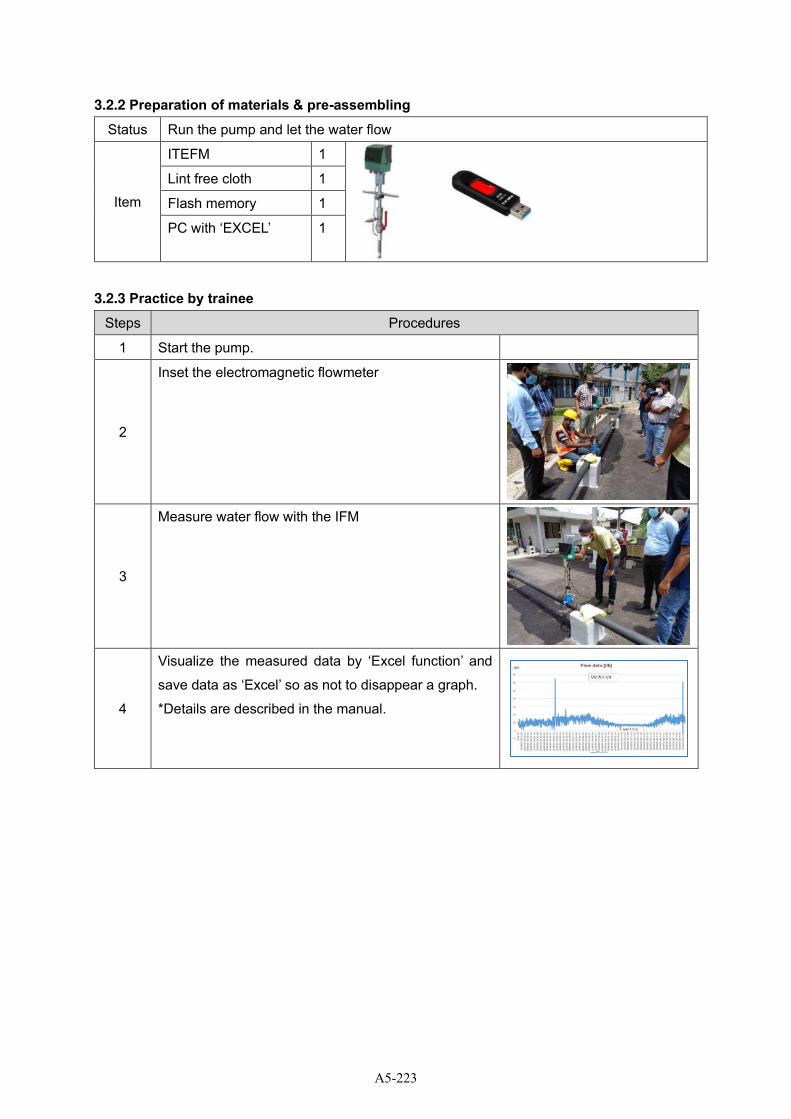
3.2.2 Preparation of materials & pre-assembling
Status Run the pump and let the water flow
Item
ITEFM 1
Lint free cloth 1
Flash memory 1
PC with ‘EXCEL’ 1
3.2.3 Practice by trainee
Steps Procedures
1 Start the pump.
2
Inset the electromagnetic flowmeter
3
Measure water flow with the IFM
4
Visualize the measured data by ‘Excel function’ and
save data as ‘Excel’ so as not to disappear a graph.
*Details are described in the manual.
A5-223
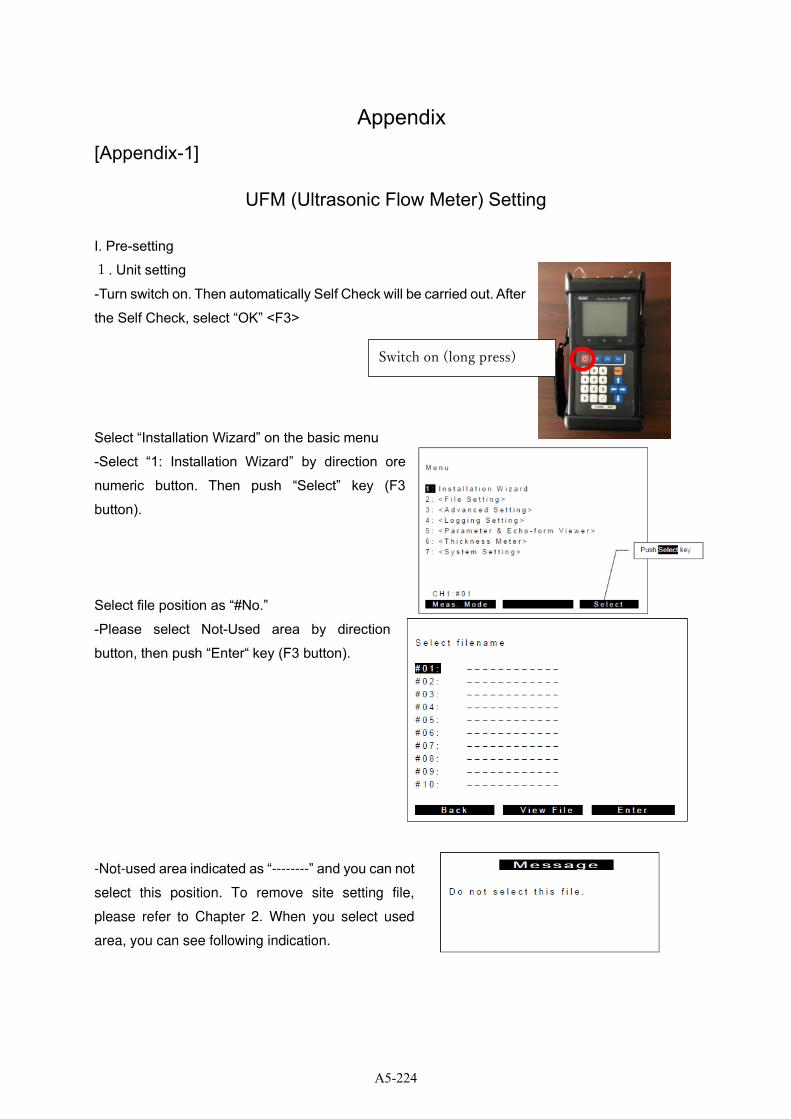
Appendix
[Appendix-1]
UFM (Ultrasonic Flow Meter) Setting
I. Pre-setting
1. Unit setting
-Turn switch on. Then automatically Self Check will be carried out. After
the Self Check, select “OK” <F3>
Select “Installation Wizard” on the basic menu
-Select “1: Installation Wizard” by direction ore
numeric button. Then push “Select” key (F3
button).
Select file position as “#No.”
-Please select Not-Used area by direction
button, then push “Enter“ key (F3 button).
-Not-used area indicated as “--------” and you can not
select this position. To remove site setting file,
please refer to Chapter 2. When you select used
area, you can see following indication.
Switch on (long press)
A5-224
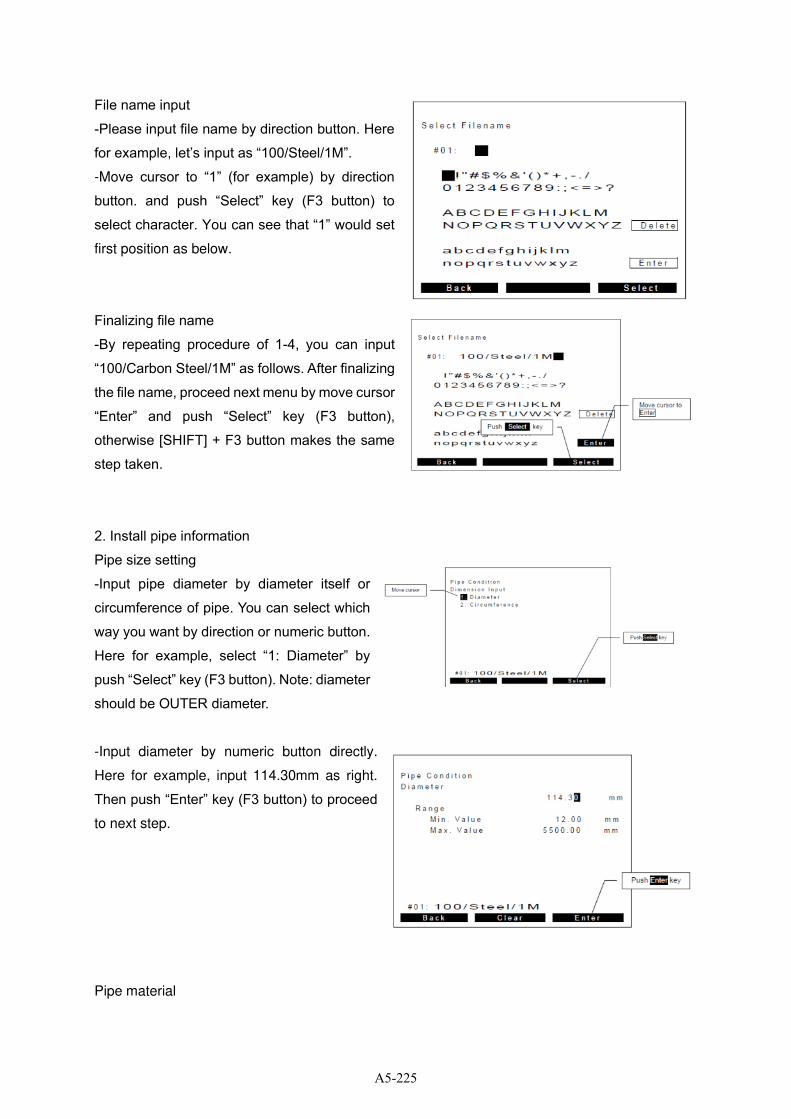
File name input
-Please input file name by direction button. Here
for example, let’s input as “100/Steel/1M”.
-Move cursor to “1” (for example) by direction
button. and push “Select” key (F3 button) to
select character. You can see that “1” would set
first position as below.
Finalizing file name
-By repeating procedure of 1-4, you can input
“100/Carbon Steel/1M” as follows. After finalizing
the file name, proceed next menu by move cursor
“Enter” and push “Select” key (F3 button),
otherwise [SHIFT] + F3 button makes the same
step taken.
2. Install pipe information
Pipe size setting
-Input pipe diameter by diameter itself or
circumference of pipe. You can select which
way you want by direction or numeric button.
Here for example, select “1: Diameter” by
push “Select” key (F3 button). Note: diameter
should be OUTER diameter.
-Input diameter by numeric button directly.
Here for example, input 114.30mm as right.
Then push “Enter” key (F3 button) to proceed
to next step.
Pipe material
A5-225
-Select material of the pipe from default choices or User Defined by direction or numeric button.
Here for example, select “1: Carbon Steel”, then push “Select” key (F3 button) to proceed next step.
-After you select material, you will see predefined sound speed, normally just proceed to next. If
you would like to select any un-listed materials, please select “User Defined” then enter actual
sound speed of the material at the next extra menu.
Thickness of pipe
-Input pipe thickness by numeric button directly. Here for example, input “4.50mm”, then push
“Enter” key (F3 button) to proceed to next step.
Lining material
-Select material of the lining from default choices or User Defined by direction or numeric button.
Here for example, select “2: Epoxy”, then push “Select” key (F3 button) to proceed next step.
- After you select material, you will see predefined sound speed, normally just proceed to next. If
you would like to select any un-listed materials, please select “User Defined” then enter actual
sound speed of the material later at the next extra menu.
Thickness of lining
-Input lining thickness by numeric button directly. Here for example, input “1.00mm”, then push
“Enter” key (F3 button) to proceed to next step.
Fluid Selection
-Select fluid from default choices or User Defined by direction or numeric button. Here for example,
select “1: Water”, then push “Select” key (F3 button) to proceed next step.
- After you select material, you will see predefined sound speed and viscosity, normally just proceed
to next. If you would like to select any un-listed fluid, please select “User Defined” then enter actual
sound speed of the fluid later at the next extra menu.
Transducer type
Select transducer type from default choices by direction or numeric button. Here for example, select
“2: UP10AST”, then push “Select” key (F3 button) to proceed next step.
Sound-path selection
-Select sound-path method from default choices by direction or numeric button. Here for example,
select “2: V-Path method”, then push “Select” key (F3 button) to proceed next step.
A5-226
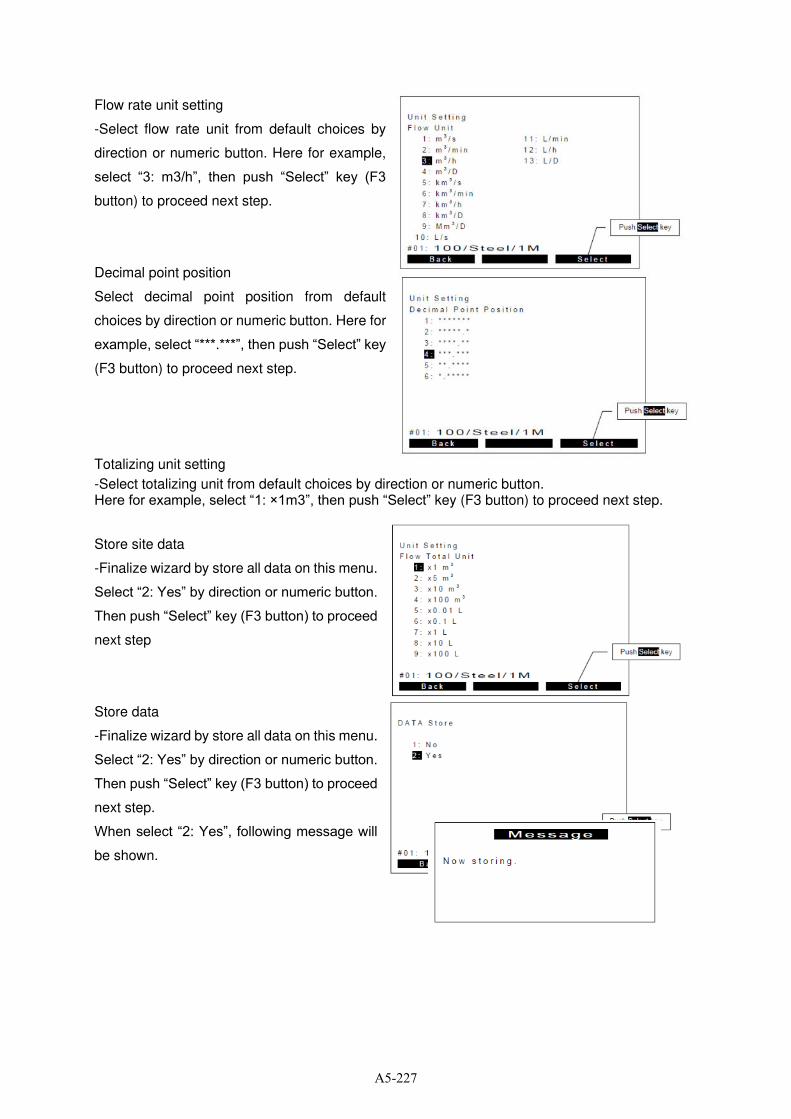
Flow rate unit setting
-Select flow rate unit from default choices by
direction or numeric button. Here for example,
select “3: m3/h”, then push “Select” key (F3
button) to proceed next step.
Decimal point position
Select decimal point position from default
choices by direction or numeric button. Here for
example, select “***.***”, then push “Select” key
(F3 button) to proceed next step.
Totalizing unit setting
-Select totalizing unit from default choices by direction or numeric button. Here for example, select “1: ×1m3”, then push “Select” key (F3 button) to proceed next step.
Store site data
-Finalize wizard by store all data on this menu.
Select “2: Yes” by direction or numeric button.
Then push “Select” key (F3 button) to proceed
next step
Store data
-Finalize wizard by store all data on this menu.
Select “2: Yes” by direction or numeric button.
Then push “Select” key (F3 button) to proceed
next step.
When select “2: Yes”, following message will
be shown.
A5-227
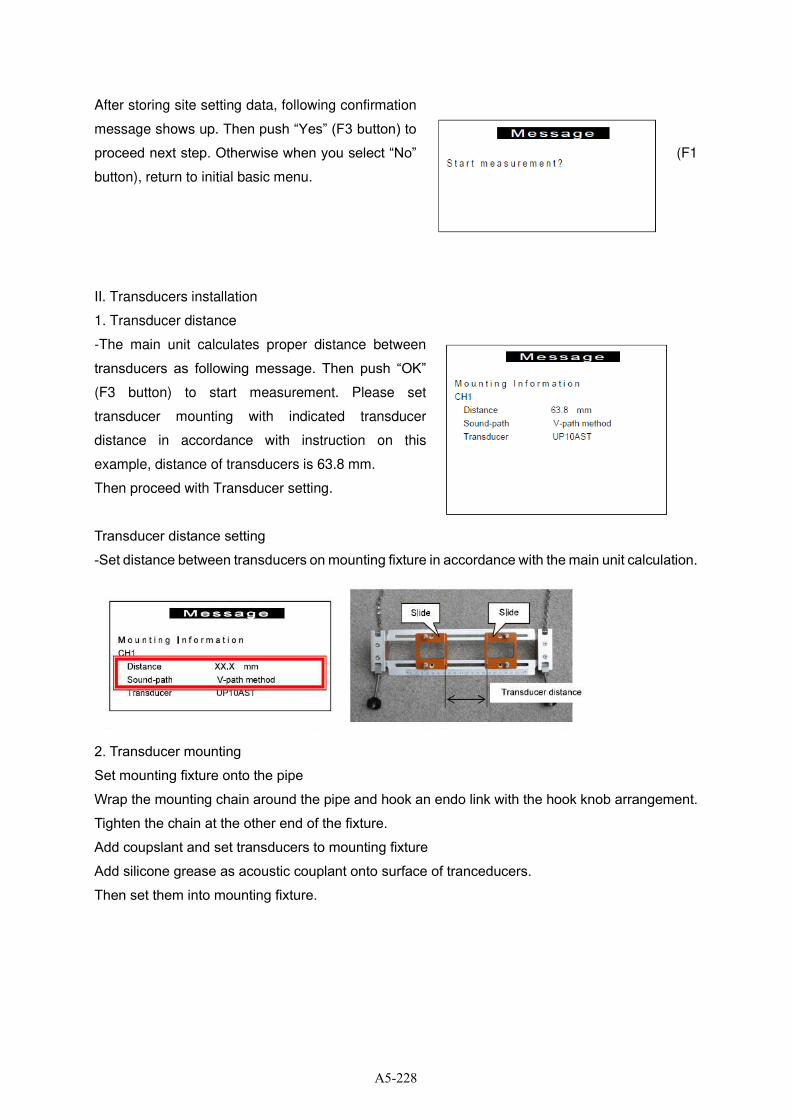
After storing site setting data, following confirmation
message shows up. Then push “Yes” (F3 button) to
proceed next step. Otherwise when you select “No” (F1
button), return to initial basic menu.
II. Transducers installation
1. Transducer distance
-The main unit calculates proper distance between
transducers as following message. Then push “OK”
(F3 button) to start measurement. Please set
transducer mounting with indicated transducer
distance in accordance with instruction on this
example, distance of transducers is 63.8 mm.
Then proceed with Transducer setting.
Transducer distance setting
-Set distance between transducers on mounting fixture in accordance with the main unit calculation.
2. Transducer mounting
Set mounting fixture onto the pipe
Wrap the mounting chain around the pipe and hook an endo link with the hook knob arrangement.
Tighten the chain at the other end of the fixture.
Add coupslant and set transducers to mounting fixture
Add silicone grease as acoustic couplant onto surface of tranceducers.
Then set them into mounting fixture.
A5-228
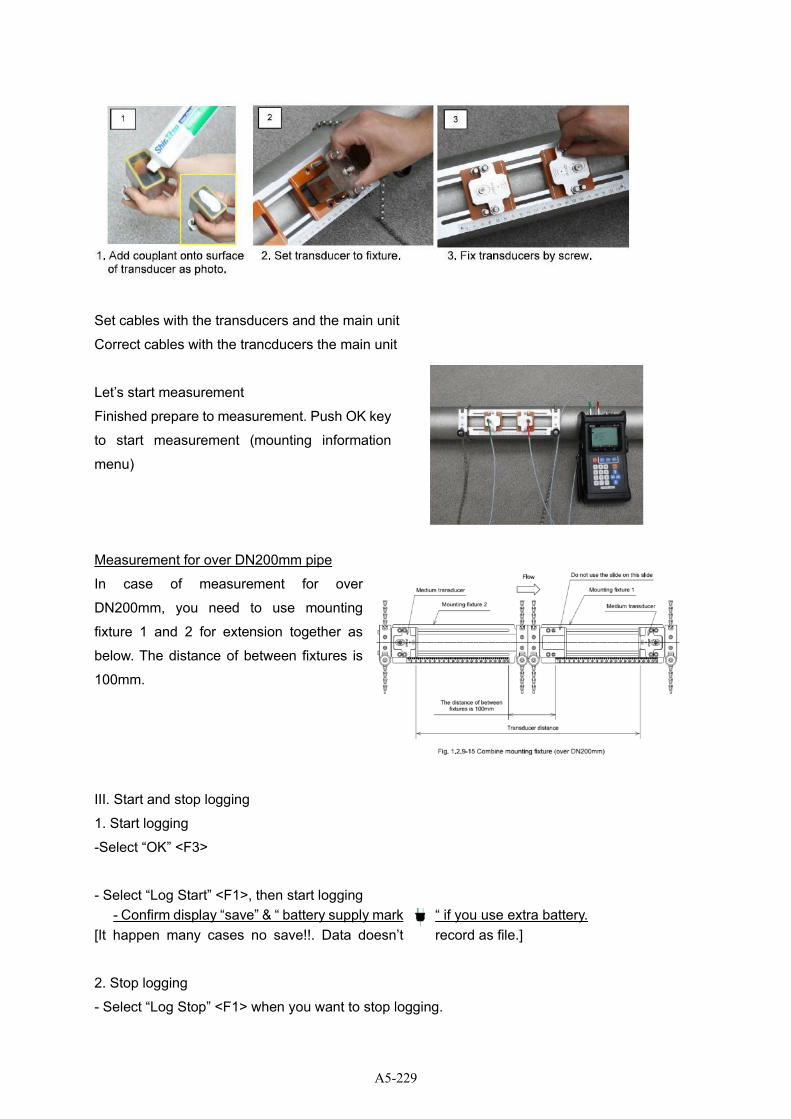
Set cables with the transducers and the main unit
Correct cables with the trancducers the main unit
Let’s start measurement
Finished prepare to measurement. Push OK key
to start measurement (mounting information
menu)
Measurement for over DN200mm pipe
In case of measurement for over
DN200mm, you need to use mounting
fixture 1 and 2 for extension together as
below. The distance of between fixtures is
100mm.
III. Start and stop logging
1. Start logging
-Select “OK” <F3>
- Select “Log Start” <F1>, then start logging
- Confirm display “save” & “ battery supply mark “ if you use extra battery. [It happen many cases no save!!. Data doesn’t record as file.]
2. Stop logging
- Select “Log Stop” <F1> when you want to stop logging.
A5-229

3. Logged data download to USB memory
-When you stopped logging, select “MENU” <F3>.
- Select “Logging Setting” from the menu list<F3>.
-Select “1 : Log File List”
The logging filename is defined automatically. [ DDMMYY.csv ]
-Connect USB memory to the unit.
-Choose a certain file, then select “To USB” <F3>.
IV. Data saving and visualization
1. Data Transfer to PC’ s “Excel” [Without this procedure, after save the data, graph will
disappear]
1. Insert USB
2. Find the Folder name like “ LOG170412_DIR” this folder include file such as [DDMMYY -
oooooCH1.CSV]
3. Open Folder, the chose file [DDMMYY -oooooCH1.CSV]
4. Save this file by change the file extension from “csv” to “exe”. Chose “save as” then put
your favorite file name. Then chose file style “save as type” [ ::::exe], and save place such
as PC’s desktop or other data folder. Then return.
A5-230
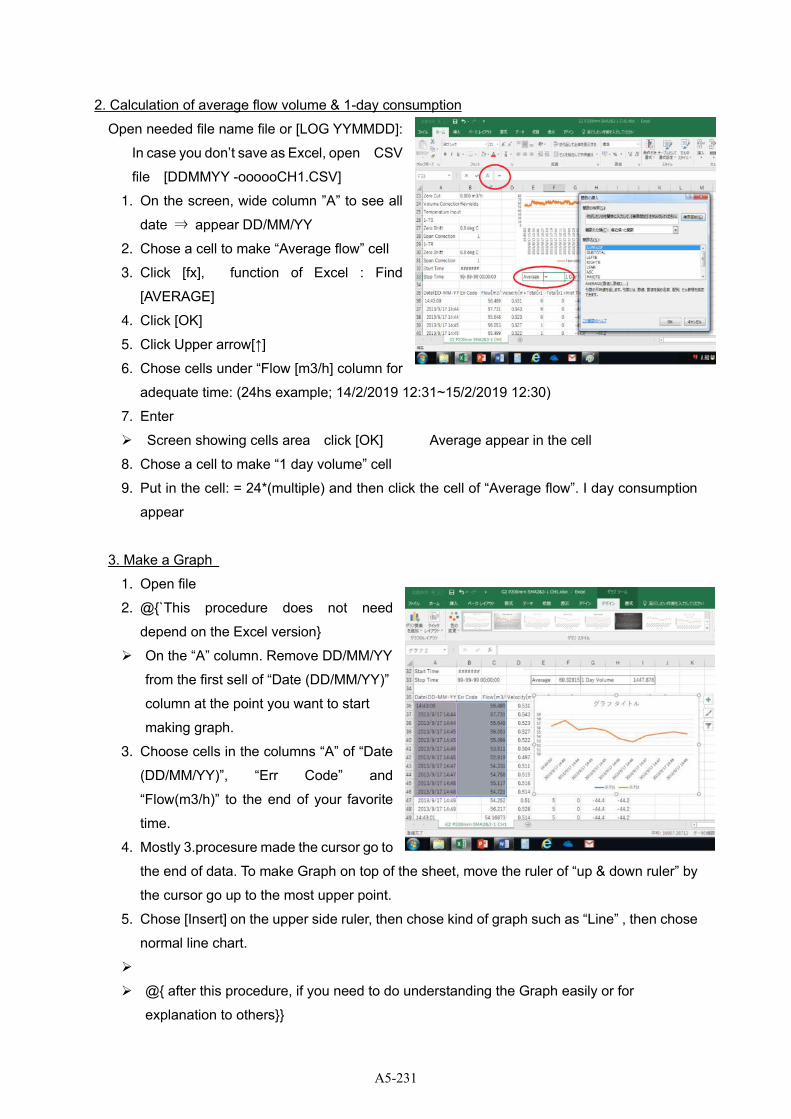
2. Calculation of average flow volume & 1-day consumption
Open needed file name file or [LOG YYMMDD]:
In case you don’t save as Excel, open CSV
file [DDMMYY -oooooCH1.CSV]
1. On the screen, wide column ”A” to see all
date ⇒ appear DD/MM/YY
2. Chose a cell to make “Average flow” cell
3. Click [fx], function of Excel : Find
[AVERAGE]
4. Click [OK]
5. Click Upper arrow[↑]
6. Chose cells under “Flow [m3/h] column for
adequate time: (24hs example; 14/2/2019 12:31~15/2/2019 12:30)
7. Enter
➢ Screen showing cells area click [OK] Average appear in the cell
8. Chose a cell to make “1 day volume” cell
9. Put in the cell: = 24*(multiple) and then click the cell of “Average flow”. I day consumption
appear
3. Make a Graph
1. Open file
2. @{`This procedure does not need
depend on the Excel version}
➢ On the “A” column. Remove DD/MM/YY
from the first sell of “Date (DD/MM/YY)”
column at the point you want to start
making graph.
3. Choose cells in the columns “A” of “Date
(DD/MM/YY)”, “Err Code” and
“Flow(m3/h)” to the end of your favorite
time.
4. Mostly 3.procesure made the cursor go to
the end of data. To make Graph on top of the sheet, move the ruler of “up & down ruler” by
the cursor go up to the most upper point.
5. Chose [Insert] on the upper side ruler, then chose kind of graph such as “Line” , then chose
normal line chart.
➢
➢ @{ after this procedure, if you need to do understanding the Graph easily or for
explanation to others}}
A5-231

6. Edit the regent: Chose [Select data], Look “Legend entries”, Click “Series 1” and remove it.
Then click “Series 2” and click “Edit”, find “Series name”. Put name such as {Water volume
m3/h} as its graph showing.
7. Renew the Graph title: Click graph title (name is same as Series 2 at the moment), then out
your favorite name such as { Panadra flow volume 20/04/2017}
8. Save: Save file just “save” or “as save” put new name.
➢ Don’t forget save as “Excel” file!!
End
A5-232
Training Guideline
5. Measurement
c. Pressure Measurement
A5-233
Table of contents
1 Outline ........................................................................................................................................... 1
1.1 Purpose ................................................................................................................................... 1
1.2 Flow of training with time schedule ........................................................................................ 1
1.3 Safety notice ........................................................................................................................... 2
2 Knowledge acquisition ................................................................................................................... 3
2.1 Pressure measurement .......................................................................................................... 3
2.1.1 Outline .............................................................................................................................. 3
2.1.2 Pressure unit .................................................................................................................... 3
2.1.3 Pressure gauge & logger ................................................................................................. 3
3 Practice .......................................................................................................................................... 4
3.1 Basic information .................................................................................................................... 4
3.2 Procedures.............................................................................................................................. 4
A5-234
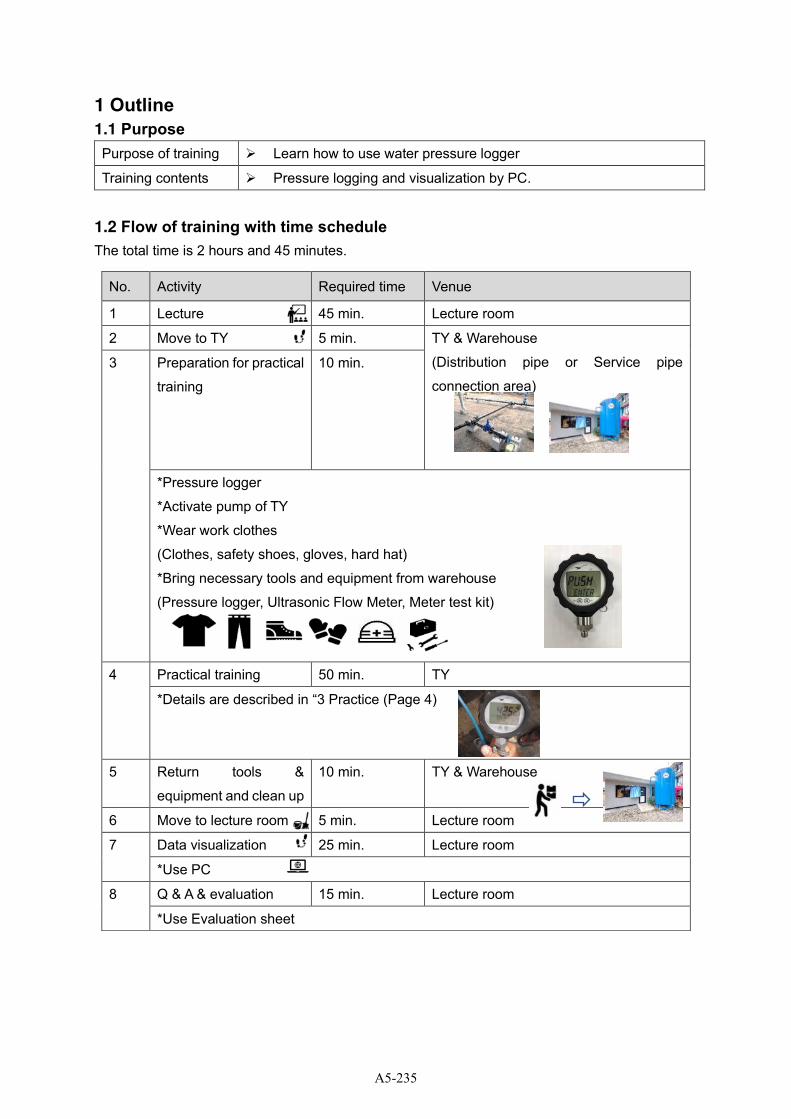
1 Outline
1.1 Purpose
Purpose of training ➢ Learn how to use water pressure logger
Training contents ➢ Pressure logging and visualization by PC.
1.2 Flow of training with time schedule
The total time is 2 hours and 45 minutes.
No. Activity Required time Venue
1 Lecture 45 min. Lecture room
2 Move to TY 5 min. TY & Warehouse
(Distribution pipe or Service pipe
connection area)
3 Preparation for practical
training
10 min.
*Pressure logger
*Activate pump of TY
*Wear work clothes
(Clothes, safety shoes, gloves, hard hat)
*Bring necessary tools and equipment from warehouse
(Pressure logger, Ultrasonic Flow Meter, Meter test kit)
4 Practical training 50 min. TY
*Details are described in “3 Practice (Page 4)
5 Return tools &
equipment and clean up
10 min. TY & Warehouse
6 Move to lecture room 5 min. Lecture room
7 Data visualization 25 min. Lecture room
*Use PC
8 Q & A & evaluation 15 min. Lecture room
*Use Evaluation sheet
A5-235

1.3 Safety notice
➢ All members must wear safety equipment in TY.RP should order to participants wearing
suitable item
➢ Do not sit on the pipes or put your foot on.
➢ Do not touch the installed equipment unnecessarily.
➢ Do not eat food in the TY.
A5-236
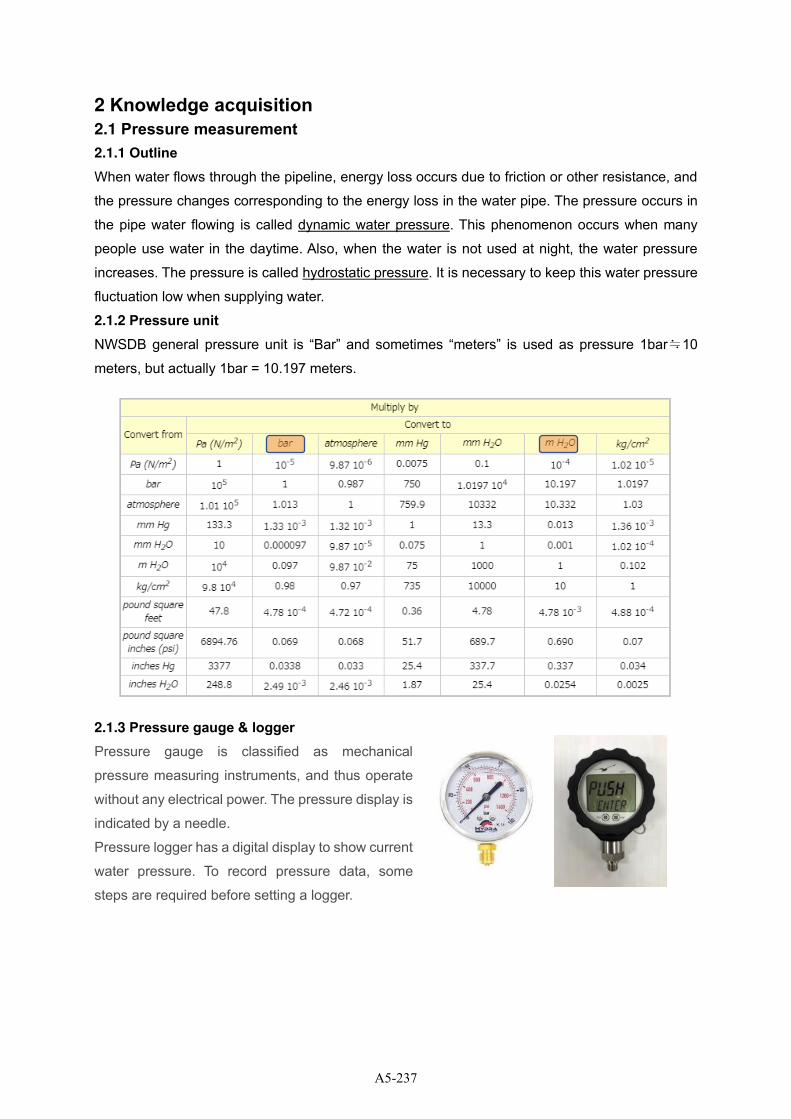
2 Knowledge acquisition
2.1 Pressure measurement 2.1.1 Outline
When water flows through the pipeline, energy loss occurs due to friction or other resistance, and
the pressure changes corresponding to the energy loss in the water pipe. The pressure occurs in
the pipe water flowing is called dynamic water pressure. This phenomenon occurs when many
people use water in the daytime. Also, when the water is not used at night, the water pressure
increases. The pressure is called hydrostatic pressure. It is necessary to keep this water pressure
fluctuation low when supplying water.
2.1.2 Pressure unit NWSDB general pressure unit is “Bar” and sometimes “meters” is used as pressure 1bar≒10
meters, but actually 1bar = 10.197 meters.
2.1.3 Pressure gauge & logger Pressure gauge is classified as mechanical
pressure measuring instruments, and thus operate
without any electrical power. The pressure display is
indicated by a needle.
Pressure logger has a digital display to show current
water pressure. To record pressure data, some
steps are required before setting a logger.
A5-237
3 Practice
3.1 Basic information
Atmospheric pressure affects water pressure, so it needs calibration before use. When a pressure
logger is installed, the pressure should be checked with a calibrated pressure gauge. If there are
leaks on the hydrant or tap coupling, pressure logging will be affected.
3.2 Procedures
i. Input the necessary information to the device through PC, such as start and stop time, recording
interval, etc.
ii. Set the logger then start and stop from menu screen.
iii. Connect with PC by USB connecting cable.
iv. Analyze data and visualize data as graph.
v. Save data into PC.
A5-238
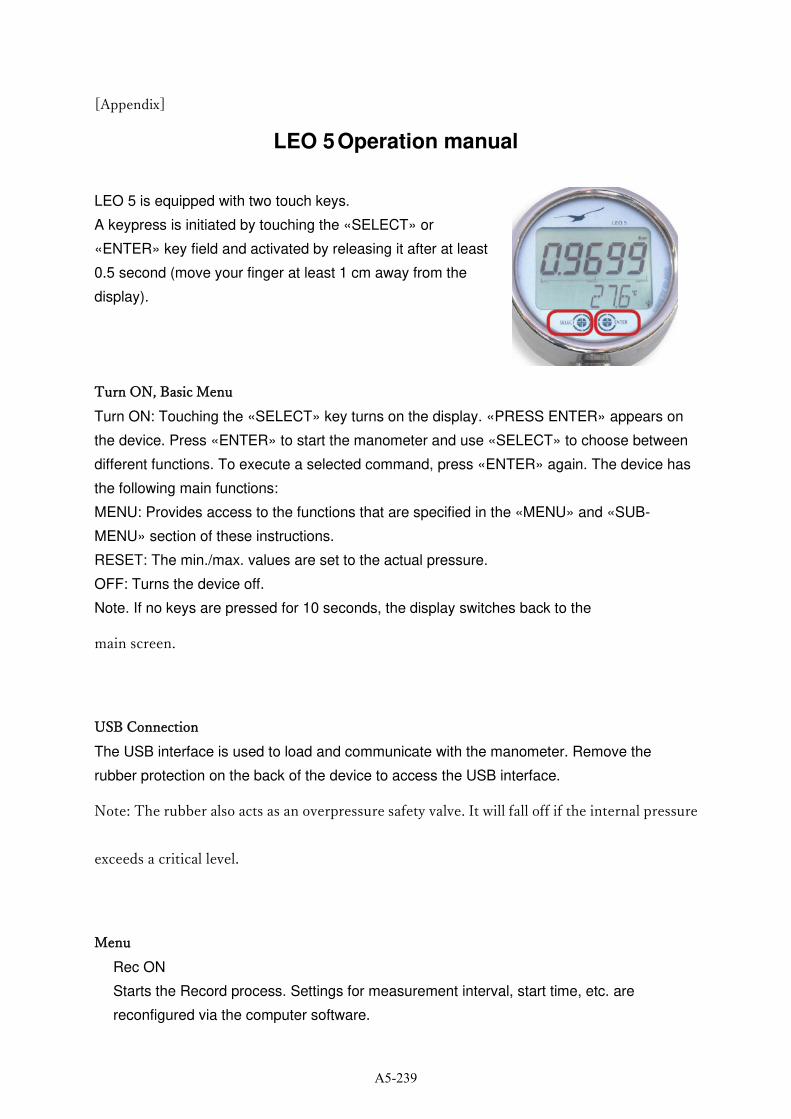
[Appendix]
LEO 5 Operation manual
LEO 5 is equipped with two touch keys.
A keypress is initiated by touching the «SELECT» or
«ENTER» key field and activated by releasing it after at least
0.5 second (move your finger at least 1 cm away from the
display).
Turn ON, Basic Menu
Turn ON: Touching the «SELECT» key turns on the display. «PRESS ENTER» appears on
the device. Press «ENTER» to start the manometer and use «SELECT» to choose between
different functions. To execute a selected command, press «ENTER» again. The device has
the following main functions:
MENU: Provides access to the functions that are specified in the «MENU» and «SUB-
MENU» section of these instructions.
RESET: The min./max. values are set to the actual pressure.
OFF: Turns the device off.
Note. If no keys are pressed for 10 seconds, the display switches back to the
main screen.
USB Connection
The USB interface is used to load and communicate with the manometer. Remove the
rubber protection on the back of the device to access the USB interface.
Note: The rubber also acts as an overpressure safety valve. It will fall off if the internal pressure
exceeds a critical level.
Menu
Rec ON
Starts the Record process. Settings for measurement interval, start time, etc. are
reconfigured via the computer software.
A5-239
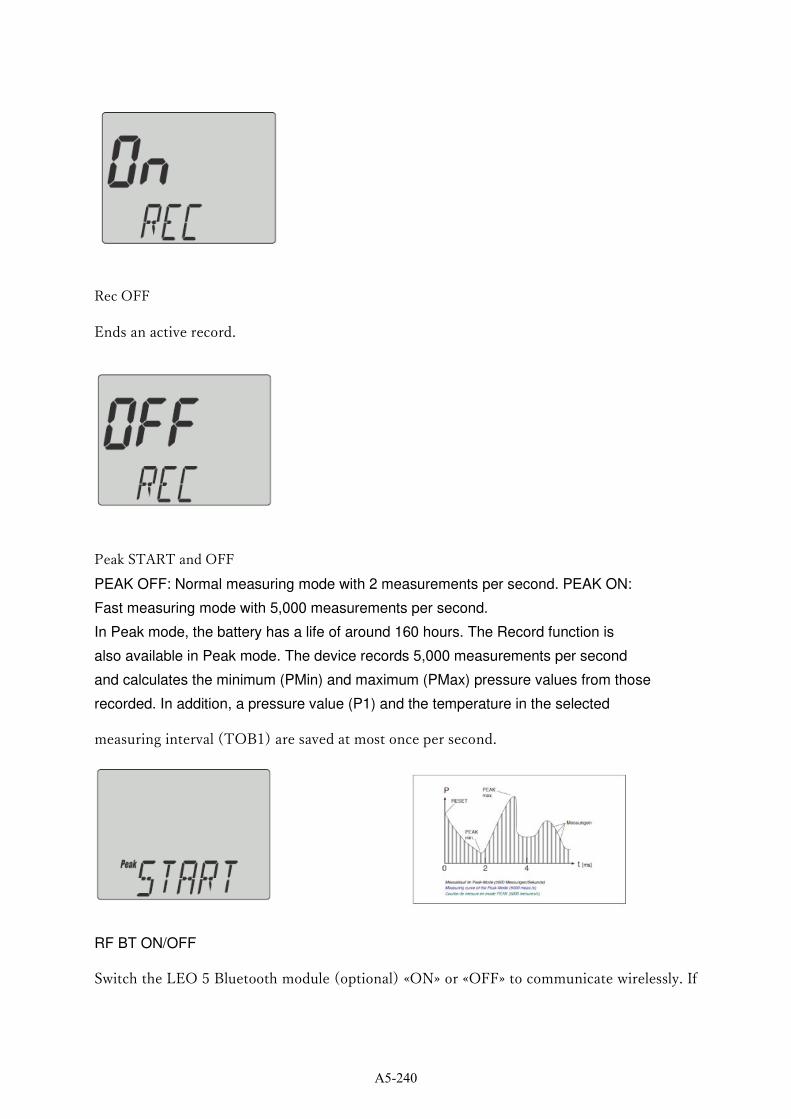
Rec OFF
Ends an active record.
Peak START and OFF
PEAK OFF: Normal measuring mode with 2 measurements per second. PEAK ON:
Fast measuring mode with 5,000 measurements per second.
In Peak mode, the battery has a life of around 160 hours. The Record function is
also available in Peak mode. The device records 5,000 measurements per second
and calculates the minimum (PMin) and maximum (PMax) pressure values from those
recorded. In addition, a pressure value (P1) and the temperature in the selected
measuring interval (TOB1) are saved at most once per second.
RF BT ON/OFF
Switch the LEO 5 Bluetooth module (optional) «ON» or «OFF» to communicate wirelessly. If
A5-240

turned «ON», one battery charge lasts for about 40 hours.
ZERO SET .
Sets a new zero reference point.
ZERO RESET
Sets the zero pressure point to its factory setting.
Submenu
EXIT
Each sub-menu can be left by pressing «ENTER» while «EXIT» is displayed. The display will
switch back to the main menu.
A5-241
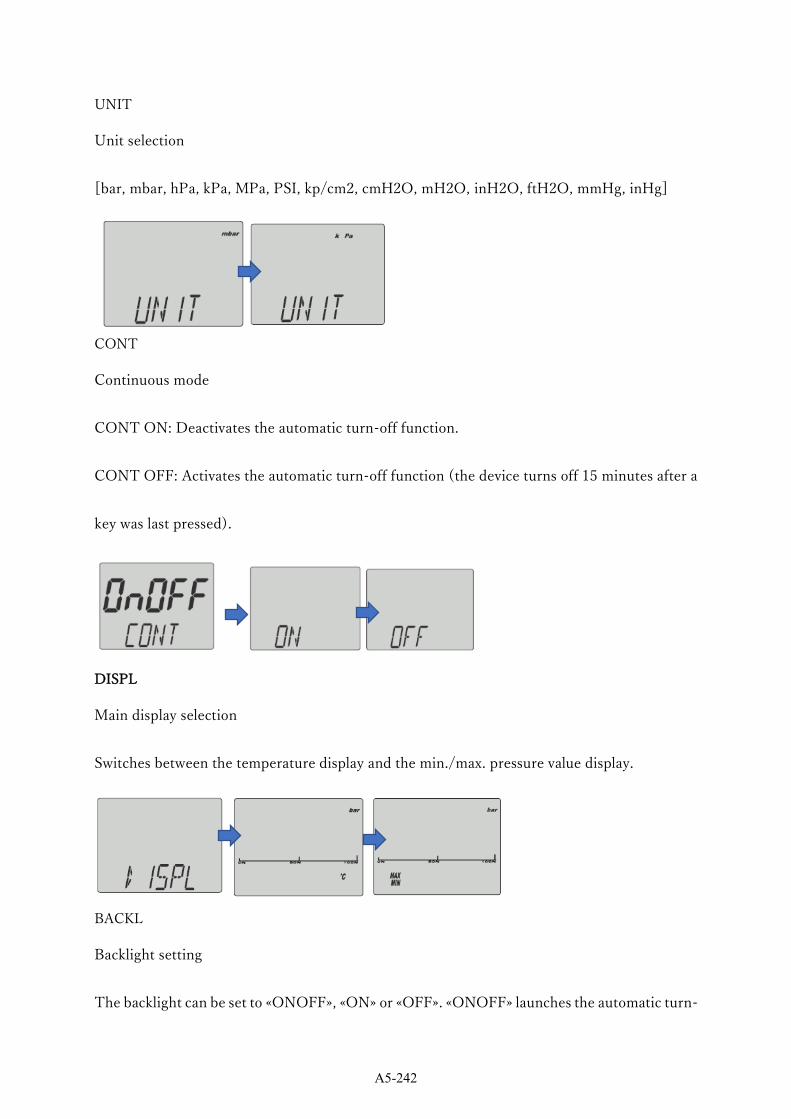
UNIT
Unit selection
[bar, mbar, hPa, kPa, MPa, PSI, kp/cm2, cmH2O, mH2O, inH2O, ftH2O, mmHg, inHg]
CONT
Continuous mode
CONT ON: Deactivates the automatic turn-off function.
CONT OFF: Activates the automatic turn-off function (the device turns off 15 minutes after a
key was last pressed).
DISPL
Main display selection
Switches between the temperature display and the min./max. pressure value display.
BACKL
Backlight setting
The backlight can be set to «ONOFF», «ON» or «OFF». «ONOFF» launches the automatic turn-
A5-242
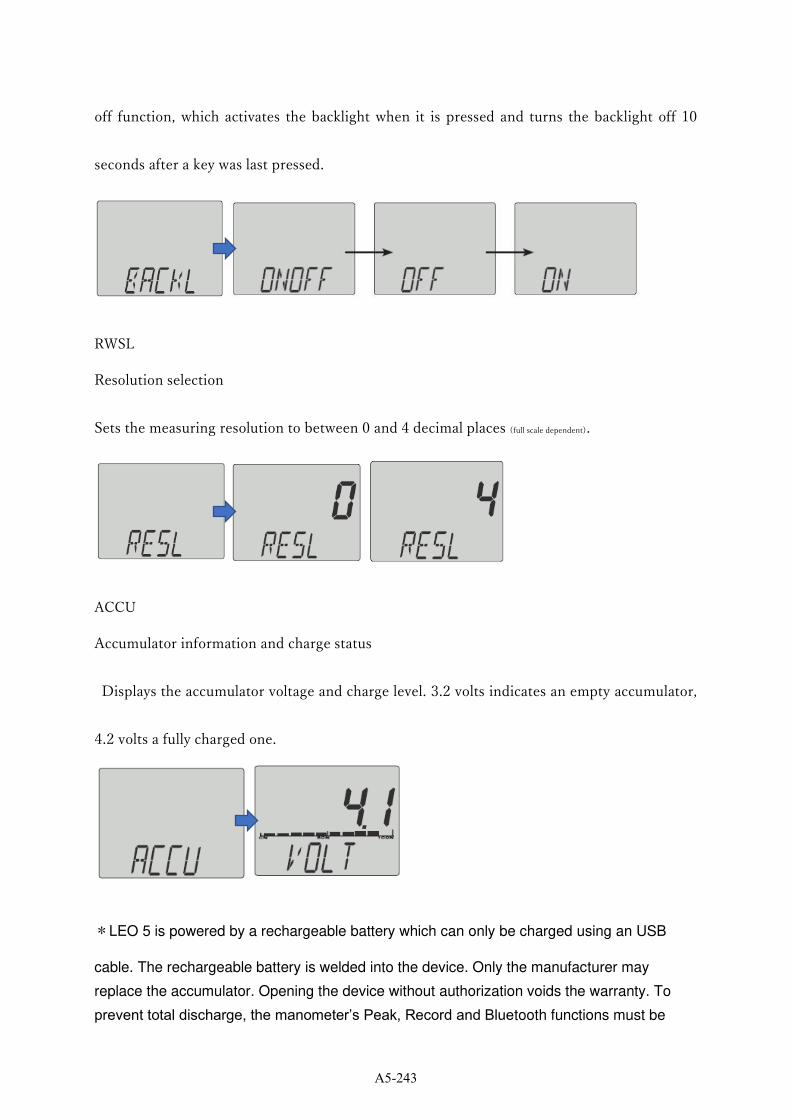
off function, which activates the backlight when it is pressed and turns the backlight off 10
seconds after a key was last pressed.
RWSL
Resolution selection
Sets the measuring resolution to between 0 and 4 decimal places (full scale dependent).
ACCU
Accumulator information and charge status
Displays the accumulator voltage and charge level. 3.2 volts indicates an empty accumulator,
4.2 volts a fully charged one.
*LEO 5 is powered by a rechargeable battery which can only be charged using an USB
cable. The rechargeable battery is welded into the device. Only the manufacturer may
replace the accumulator. Opening the device without authorization voids the warranty. To
prevent total discharge, the manometer’s Peak, Record and Bluetooth functions must be
A5-243

deactivated when it is not in use and the accumulator must be recharged once a year.
Batteries must never be disposed of in normal household waste. To prevent possible
damage to the environment or to health due to uncontrolled waste disposal, this
product must be separated from other waste and recycled correctly in order to ensure
sustainable use of the raw materials.
A5-244
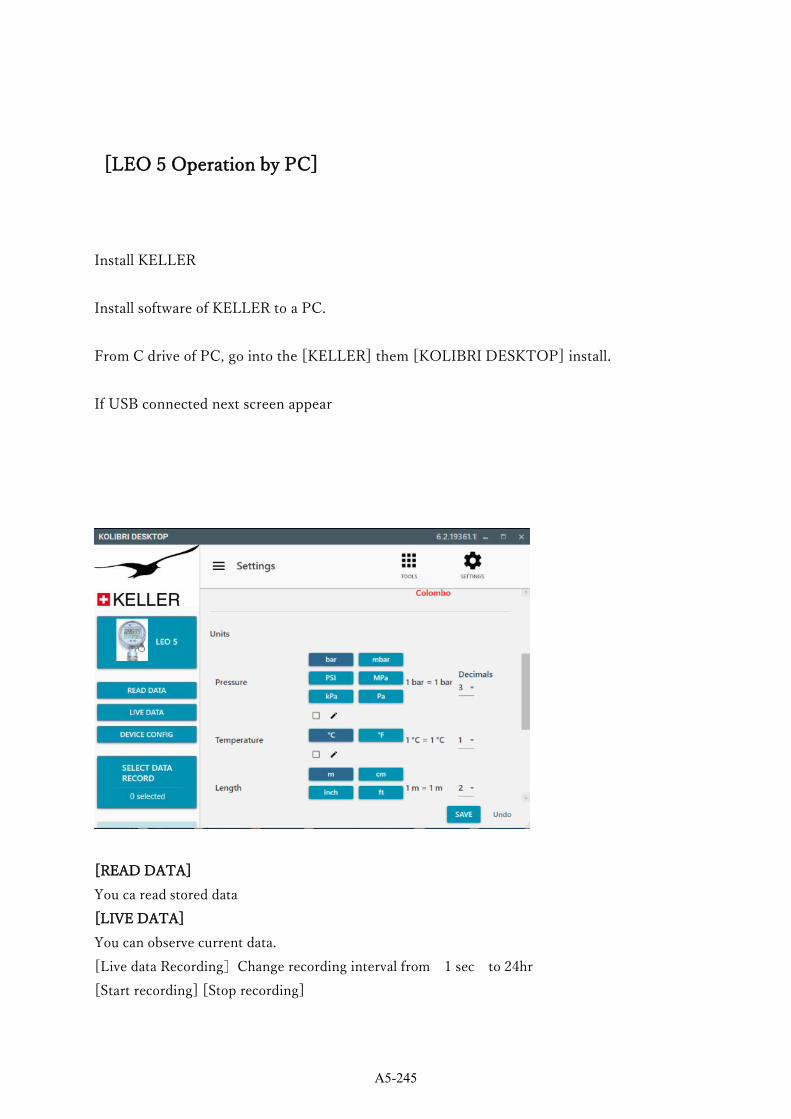
[LEO 5 Operation by PC]
Install KELLER
Install software of KELLER to a PC.
From C drive of PC, go into the [KELLER] them [KOLIBRI DESKTOP] install.
If USB connected next screen appear
[READ DATA]
You ca read stored data
[LIVE DATA]
You can observe current data.
[Live data Recording]Change recording interval from 1 sec to 24hr
[Start recording] [Stop recording]
A5-245
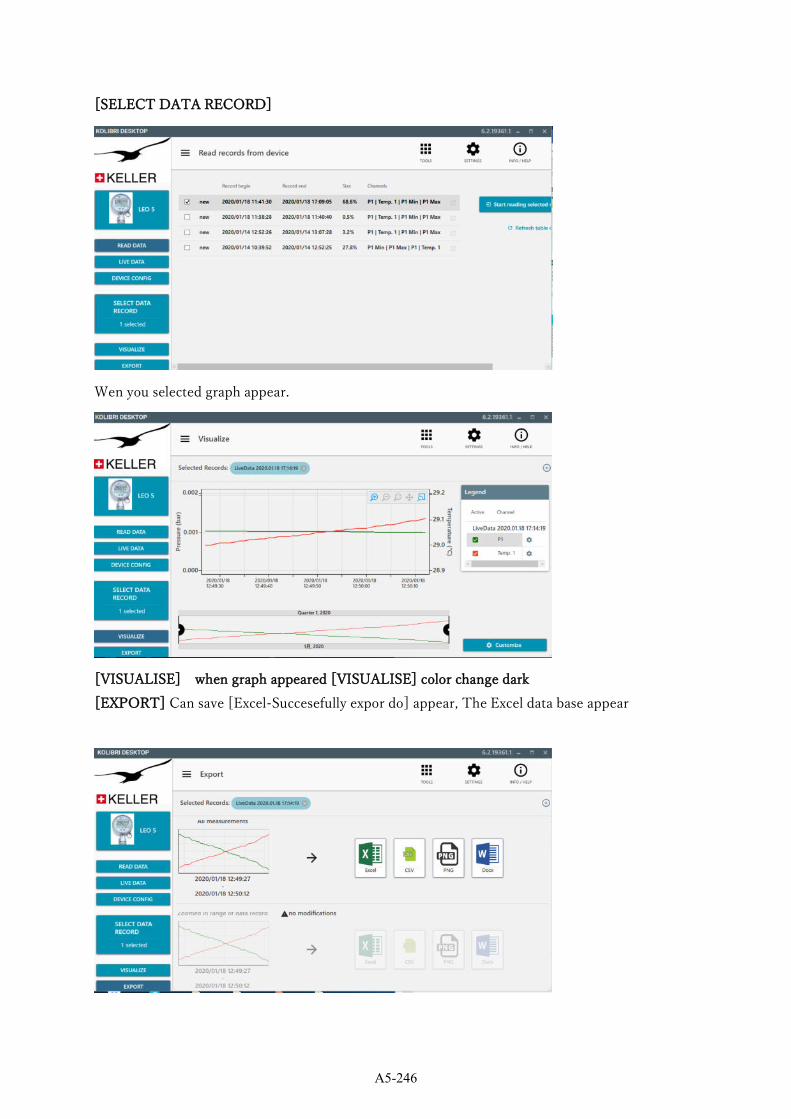
[SELECT DATA RECORD]
Wen you selected graph appear.
[VISUALISE] when graph appeared [VISUALISE] color change dark
[EXPORT] Can save [Excel-Succesefully expor do] appear, The Excel data base appear
A5-246

Training Guideline
6. DMA
DMA Creation & Step Test
A5-247
Table of contents
1 Outline ........................................................................................................................................... 1
1.1 Purpose ................................................................................................................................... 1
1.2 Flow of training with time schedule ........................................................................................ 2
1.3 Safety notice ........................................................................................................................... 3
2 Knowledge acquisition ................................................................................................................... 4
2.1 DMA creation .......................................................................................................................... 4
2.1.1 Step-1 Planning of DMA .................................................................................................. 5
(1) Size of DMA ..................................................................................................................... 5
(2) Schedule .......................................................................................................................... 5
(3) Stuff allocation for DMA ................................................................................................... 5
(4) Selection of type of flow meter for measuring inflows and outflows ................................ 5
(5) Decision of measurement period ..................................................................................... 5
(6) Selection of DMA ............................................................................................................. 5
2.1.2 Step-2 Preparation of pipe network map ......................................................................... 6
2.1.3 Step-3 Pipe location survey ............................................................................................. 6
2.1.4 Step-4 Isolation ................................................................................................................ 7
2.1.5 Step-5 Isolation test ......................................................................................................... 7
2.1.6 Step-6 Verification of flow meters .................................................................................... 7
2.2 Step test .................................................................................................................................. 8
2.2.1 Step-1 Planning of sub-zone ........................................................................................... 8
2.2.2 Step-2 System Input Volume (SIV) measurement ........................................................... 8
2.2.3 Step-3 Sub-zone creation ................................................................................................ 8
2.2.4 Step-4 Drop test ............................................................................................................... 8
2.2.5 Step-5 Flow meter installation ......................................................................................... 9
2.2.6 Step-6 Step test ............................................................................................................... 9
2.2.7 Step-6 Record flow data .................................................................................................. 9
2.2.8 Analyze recorded data & Visualization ............................................................................ 9
3 Practice ........................................................................................................................................ 10
A5-248

1 Outline
1.1 Purpose
Purpose of training It is necessary to grasp the water flow in the water distribution system to
survey water leakage. However, water distribution pipes spread
complicatedly, and it makes difficult to grasp water flow in a certain area
of distribution system. Districted Metered Area (DMA) and step test can
solve this problem by measuring inflow and outflow in districted area.
Training Contents ➢ How to find leakage by DMA and step test.
A5-249
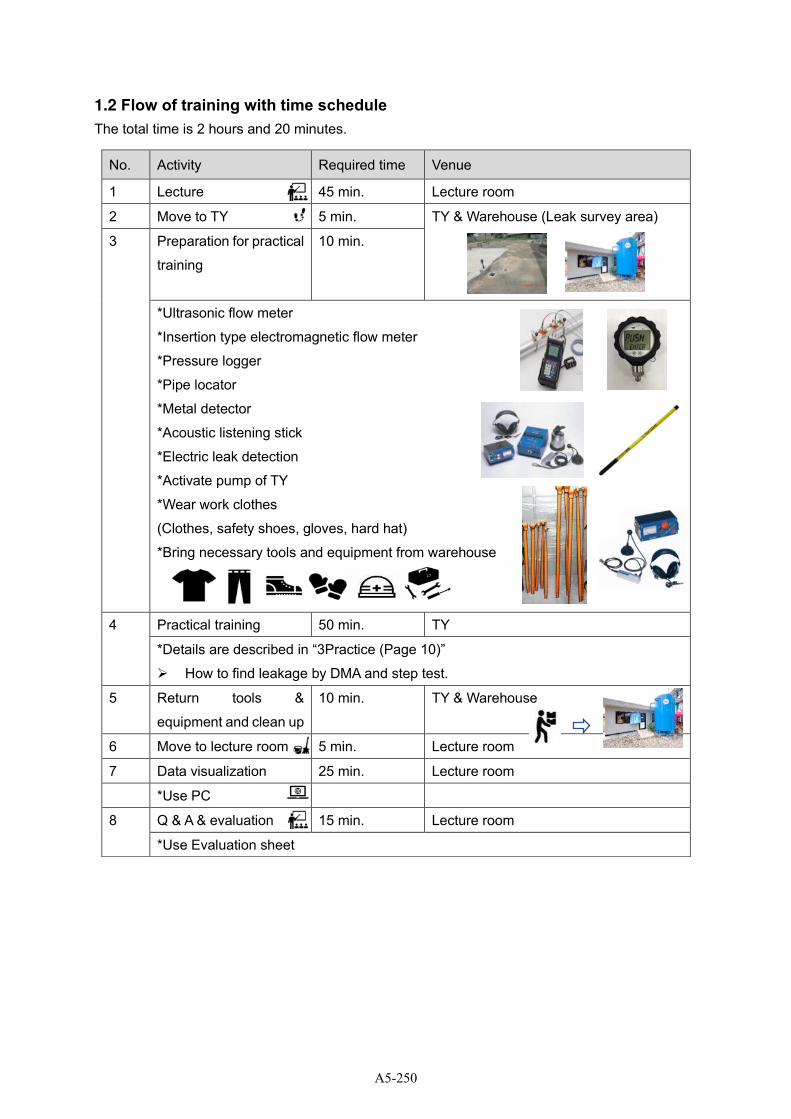
1.2 Flow of training with time schedule
The total time is 2 hours and 20 minutes.
No. Activity Required time Venue
1 Lecture 45 min. Lecture room
2 Move to TY 5 min. TY & Warehouse (Leak survey area)
3 Preparation for practical
training
10 min.
*Ultrasonic flow meter
*Insertion type electromagnetic flow meter
*Pressure logger
*Pipe locator
*Metal detector
*Acoustic listening stick
*Electric leak detection
*Activate pump of TY
*Wear work clothes
(Clothes, safety shoes, gloves, hard hat)
*Bring necessary tools and equipment from warehouse
4 Practical training 50 min. TY
*Details are described in “3Practice (Page 10)”
➢ How to find leakage by DMA and step test.
5 Return tools &
equipment and clean up
10 min. TY & Warehouse
6 Move to lecture room 5 min. Lecture room
7 Data visualization 25 min. Lecture room
*Use PC
8 Q & A & evaluation 15 min. Lecture room
*Use Evaluation sheet
A5-250

1.3 Safety notice
➢ All members must wear safety equipment in TY. RP should order to participants wearing
suitable item
➢ Do not sit on the pipes or put your foot on.
➢ Do not touch the installed equipment unnecessarily.
➢ Do not eat food in the TY.
A5-251
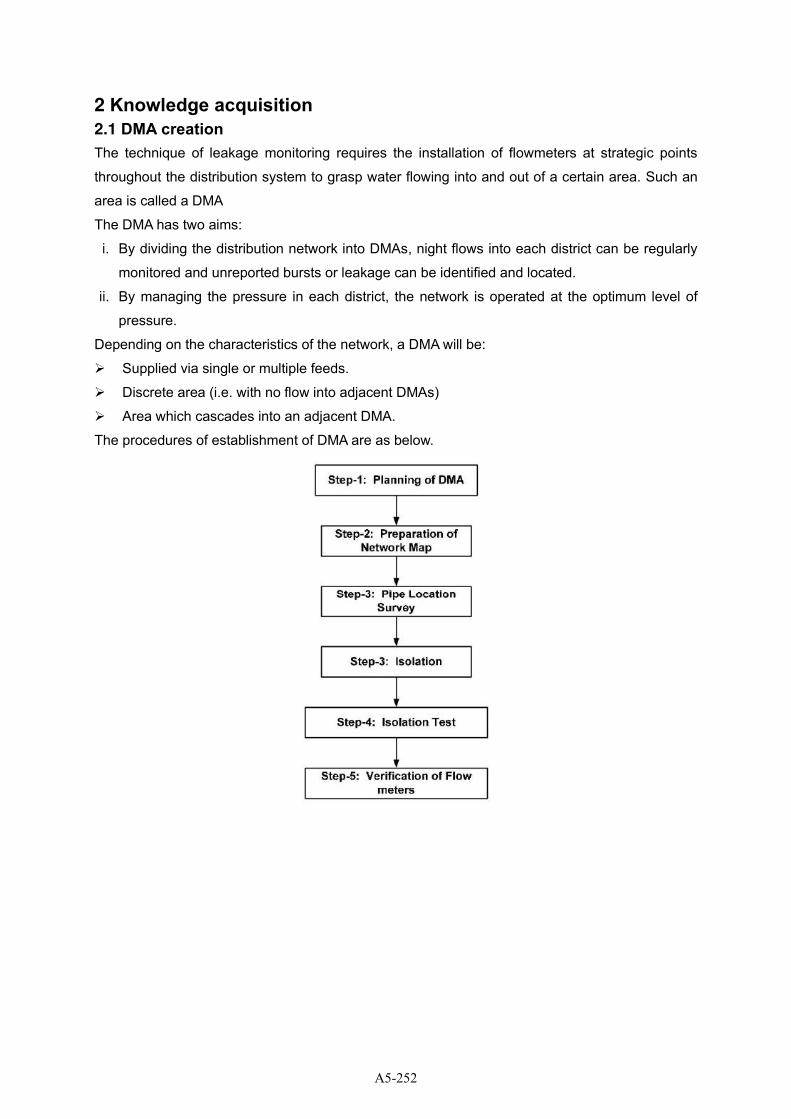
2 Knowledge acquisition
2.1 DMA creation
The technique of leakage monitoring requires the installation of flowmeters at strategic points
throughout the distribution system to grasp water flowing into and out of a certain area. Such an
area is called a DMA
The DMA has two aims:
i. By dividing the distribution network into DMAs, night flows into each district can be regularly
monitored and unreported bursts or leakage can be identified and located.
ii. By managing the pressure in each district, the network is operated at the optimum level of
pressure.
Depending on the characteristics of the network, a DMA will be:
➢ Supplied via single or multiple feeds.
➢ Discrete area (i.e. with no flow into adjacent DMAs)
➢ Area which cascades into an adjacent DMA.
The procedures of establishment of DMA are as below.
A5-252
2.1.1 Step-1 Planning of DMA
(1) Size of DMA
The number of connections should be generally established between 1,000 and 2,500. However,
for the DMA with high NRW ratio, it’s better to subdivide them into sub-DMA of 1000 or fewer
connection.
The distribution map is the main information source for considering size of DMA. The tips for
confirming the distribution map are as below.
➢ Compare the distribution maps with GIS layer and AutoCAD layer and identify the difference.
➢ Identification of features and types of distribution system and their types (e.g. pipes, valves,
washouts, ferrules, water meters etc.)
➢ Identification of facility structures of DMA (Towers, Reservoirs, Sumps and Storage tanks)
➢ Source of water flowing into and out of the DMA
➢ Difference between feeder line and distribution line
➢ Identification of natural and man-made boundaries, pipe dead ends of distribution system
➢ House connections and priority connections
➢ Identification of important parameters of DMA (ex- MNF/ Critical pressure etc.)
The tips for considering the boundary of DMA are as below.
➢ Importance of definition of DMA boundary
➢ Special features to be considered (Natural or man-made)
➢ Available number of connections within the DMA
➢ Type of connections and its characteristics of water usage
➢ Prediction of demands/demand categories
(2) Schedule
Schedule which includes periods of making schematic of the pipe network and route survey is
necessary.
(3) Stuff allocation for DMA
(4) Selection of type of flow meter for measuring inflows and outflows
(5) Decision of measurement period
(6) Selection of DMA
The tips for DMA selection are as below.
➢ Ease of boundary isolation
➢ Number of family units
➢ Number of valves that must be closed to isolate the DMA
➢ Number of flow meters to measure the inflows and outflows
➢ Ground level variation within the DMA
A5-253
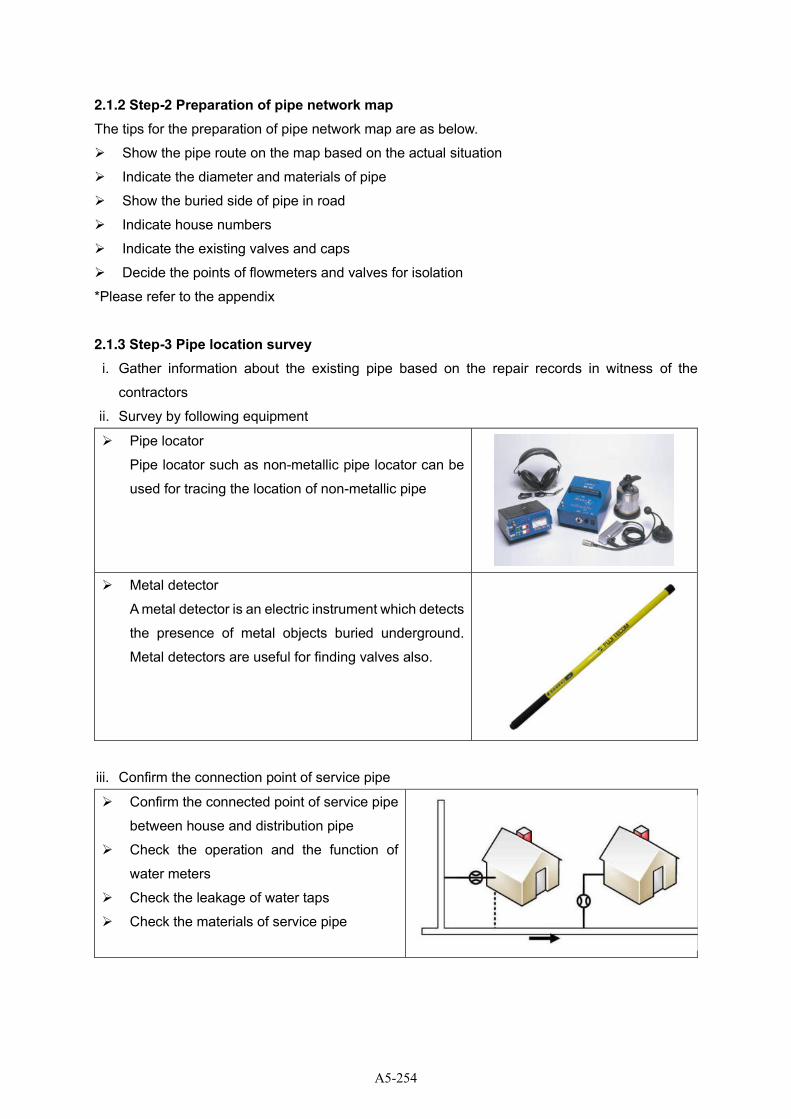
2.1.2 Step-2 Preparation of pipe network map
The tips for the preparation of pipe network map are as below.
➢ Show the pipe route on the map based on the actual situation
➢ Indicate the diameter and materials of pipe
➢ Show the buried side of pipe in road
➢ Indicate house numbers
➢ Indicate the existing valves and caps
➢ Decide the points of flowmeters and valves for isolation
*Please refer to the appendix
2.1.3 Step-3 Pipe location survey
i. Gather information about the existing pipe based on the repair records in witness of the
contractors
ii. Survey by following equipment
➢ Pipe locator
Pipe locator such as non-metallic pipe locator can be
used for tracing the location of non-metallic pipe
➢ Metal detector
A metal detector is an electric instrument which detects
the presence of metal objects buried underground.
Metal detectors are useful for finding valves also.
iii. Confirm the connection point of service pipe
➢ Confirm the connected point of service pipe
between house and distribution pipe
➢ Check the operation and the function of
water meters
➢ Check the leakage of water taps
➢ Check the materials of service pipe
A5-254
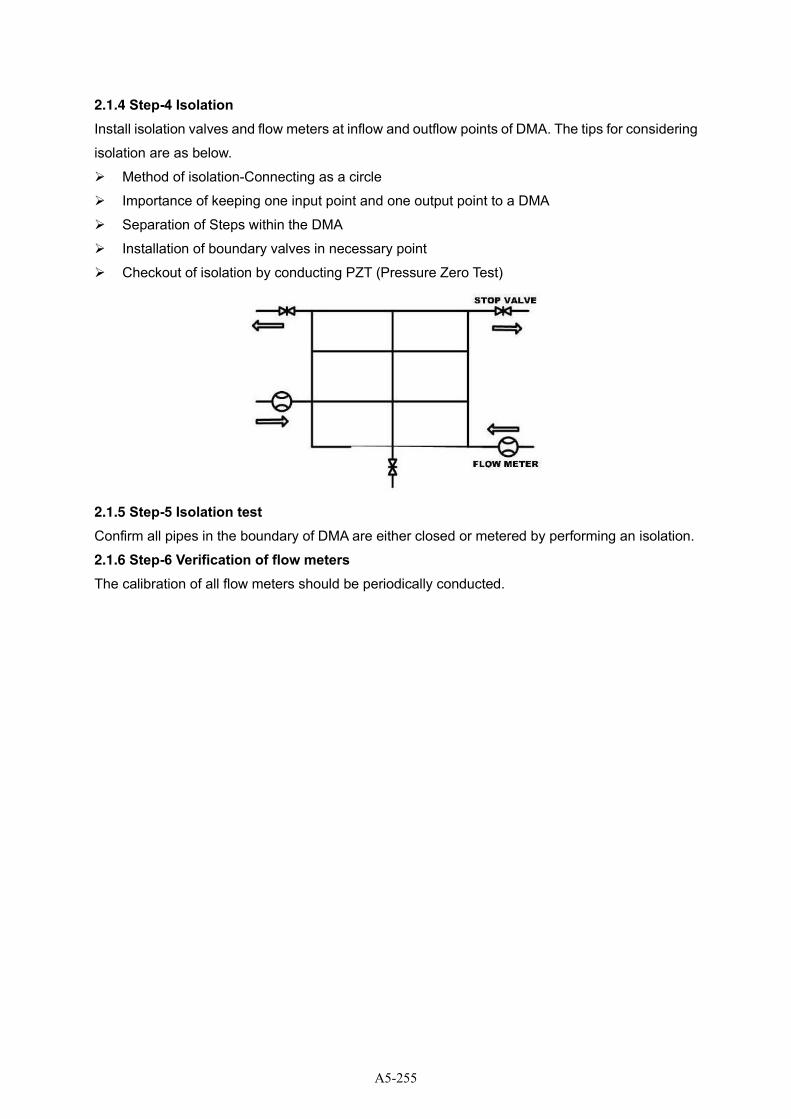
2.1.4 Step-4 Isolation
Install isolation valves and flow meters at inflow and outflow points of DMA. The tips for considering
isolation are as below.
➢ Method of isolation-Connecting as a circle
➢ Importance of keeping one input point and one output point to a DMA
➢ Separation of Steps within the DMA
➢ Installation of boundary valves in necessary point
➢ Checkout of isolation by conducting PZT (Pressure Zero Test)
2.1.5 Step-5 Isolation test Confirm all pipes in the boundary of DMA are either closed or metered by performing an isolation.
2.1.6 Step-6 Verification of flow meters
The calibration of all flow meters should be periodically conducted.
A5-255
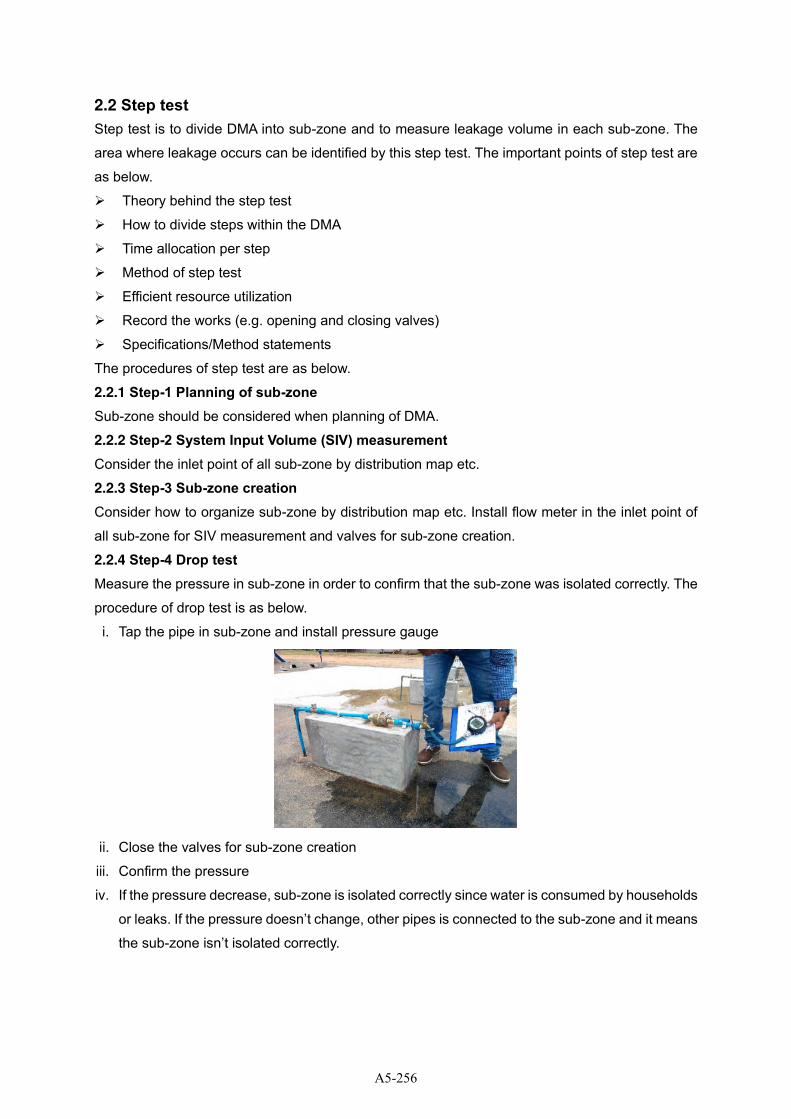
2.2 Step test Step test is to divide DMA into sub-zone and to measure leakage volume in each sub-zone. The
area where leakage occurs can be identified by this step test. The important points of step test are
as below.
➢ Theory behind the step test
➢ How to divide steps within the DMA
➢ Time allocation per step
➢ Method of step test
➢ Efficient resource utilization
➢ Record the works (e.g. opening and closing valves)
➢ Specifications/Method statements
The procedures of step test are as below.
2.2.1 Step-1 Planning of sub-zone
Sub-zone should be considered when planning of DMA.
2.2.2 Step-2 System Input Volume (SIV) measurement Consider the inlet point of all sub-zone by distribution map etc.
2.2.3 Step-3 Sub-zone creation
Consider how to organize sub-zone by distribution map etc. Install flow meter in the inlet point of
all sub-zone for SIV measurement and valves for sub-zone creation.
2.2.4 Step-4 Drop test Measure the pressure in sub-zone in order to confirm that the sub-zone was isolated correctly. The
procedure of drop test is as below.
i. Tap the pipe in sub-zone and install pressure gauge
ii. Close the valves for sub-zone creation
iii. Confirm the pressure
iv. If the pressure decrease, sub-zone is isolated correctly since water is consumed by households
or leaks. If the pressure doesn’t change, other pipes is connected to the sub-zone and it means
the sub-zone isn’t isolated correctly.
A5-256
2.2.5 Step-5 Flow meter installation
Install ultrasonic flow meter or insertion type electromagnetic flow meter in the inlet point of all sub-
zone in order to measure the inflow (minimum night flow) of all sub-zone.
2.2.6 Step-6 Step test Close the installed valves for sub-zone creation in the order of distance from the inlet point, from
farthest to nearest, to prevent water hammer. Record the time when closing each valve. It is
important to wait around 10 minutes after closing valve until water flow stabilize.
2.2.7 Step-6 Record flow data
Record flow data of installed meter in SIV, ultrasonic meter and insertion type magnetic flow meter
during step test. After step test, open the valves from nearest one to farthest one to prevent water
hammer.
2.2.8 Analyze recorded data & Visualization
Transfer the recorded data to PC, analyze and visualize it to grasp the area where the water leaks
occur. It is important to consider the followings.
➢ Graphing methods
➢ Characteristics of each step in the graph
➢ Method of identification of leakage areas
➢ How to calculate MNF (Minimum Night Flow)
➢ Calculation procedure of other parameters (T factor/ LNF (Legitimated Night Flow) etc.
➢ Method of calculation of leakage volume using graph or Excel
A5-257
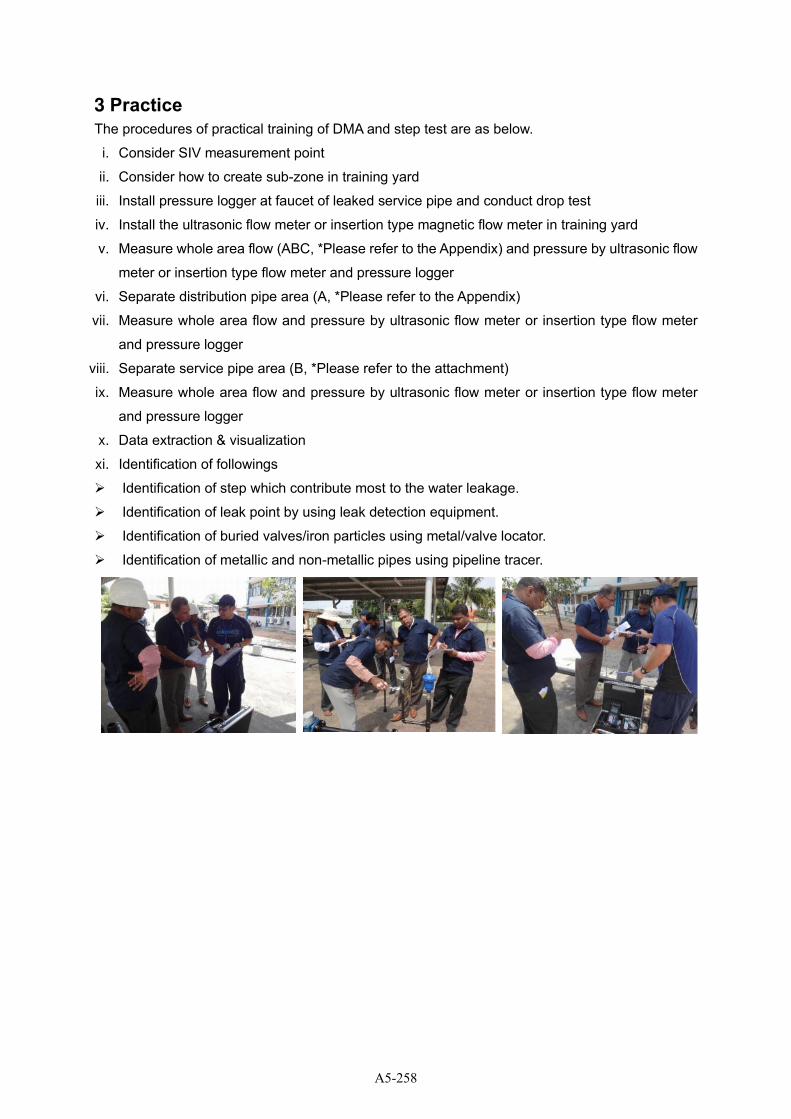
3 Practice
The procedures of practical training of DMA and step test are as below.
i. Consider SIV measurement point
ii. Consider how to create sub-zone in training yard
iii. Install pressure logger at faucet of leaked service pipe and conduct drop test
iv. Install the ultrasonic flow meter or insertion type magnetic flow meter in training yard
v. Measure whole area flow (ABC, *Please refer to the Appendix) and pressure by ultrasonic flow
meter or insertion type flow meter and pressure logger
vi. Separate distribution pipe area (A, *Please refer to the Appendix)
vii. Measure whole area flow and pressure by ultrasonic flow meter or insertion type flow meter
and pressure logger
viii. Separate service pipe area (B, *Please refer to the attachment)
ix. Measure whole area flow and pressure by ultrasonic flow meter or insertion type flow meter
and pressure logger
x. Data extraction & visualization
xi. Identification of followings
➢ Identification of step which contribute most to the water leakage.
➢ Identification of leak point by using leak detection equipment.
➢ Identification of buried valves/iron particles using metal/valve locator.
➢ Identification of metallic and non-metallic pipes using pipeline tracer.
A5-258
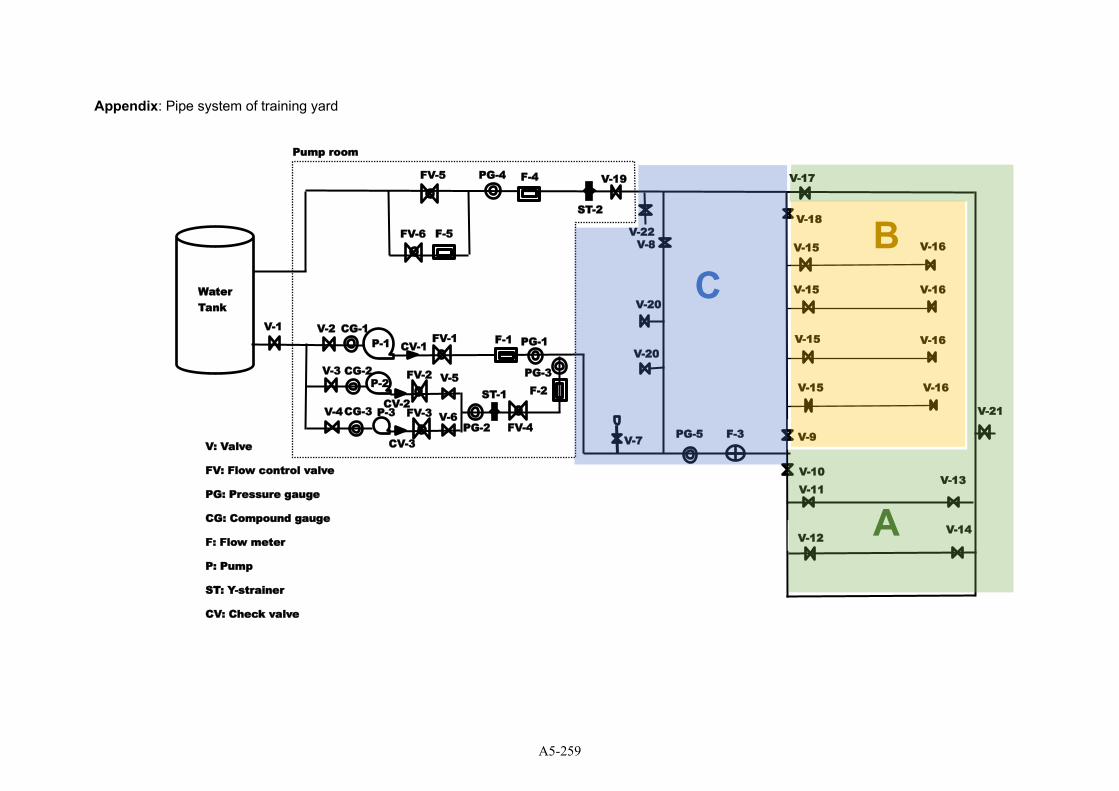
Appendix: Pipe system of training yard
V-18
V-16
V-16
V-15
V-15
V-5
F-4
F-5
V-1
V-3 P-2
V-16
V-17
V-15 V-8
P-1 F-1
V-15 V-16 F-2
V-19
Water Tank
V-2
V-4
V-20
V-20
F-3
PG-1
PG-4
FV-1
FV-5
FV-6
PG-3 FV-2
P-3 V-6 PG-5 PG-2
FV-3 FV-4
V-9 V: Valve
FV: Flow control valve
PG: Pressure gauge
CG: Compound gauge
F: Flow meter
P: Pump
ST: Y-strainer
CV: Check valve
V-7
V-10 V-11
V-12
V-13
V-14
V-21
CG-2
CG-3
CG-1
V-22
ST-2
2221
CV-1
ST-1
2221
CV-3
CV-2
Pump room
C
B
A
A5-259

Training Guideline
7. Data
How to use the data obtained from pilot activity
May 28th, 2021
A5-260
Table of contents
1 Outline of this training session ...................................................................................................... 1
1.1 Background ............................................................................................................................. 1
1.2 Purpose of this training session ............................................................................................. 1
1.3 Flow of training with time schedule ........................................................................................ 2
2 Strategy of Pilot Activity ................................................................................................................. 3
2.1 Basic knowledge about Non-Revenue Water (NRW) ............................................................ 3
2.1.1 Definition of NRW ............................................................................................................. 3
2.1.2 Evaluation of NRW ........................................................................................................... 3
2.1.3 Water Balance defined by International Water Association (IWA)................................... 4
2.1.4 Unavoidable Annual Real Losses (UARL) ....................................................................... 5
2.1.5 Infrastructure Leakage Index (ILI) and Target Value of Real Losses .............................. 6
2.2 Implementation Steps of Pilot Activities for Leakage Reduction ............................................ 8
2.3 Implementation Procedure of Pilot Activity ............................................................................. 9
2.3.1 Selection of Target Area ................................................................................................... 9
2.3.2 Measurement of Baseline Data ..................................................................................... 10
2.3.3 Creation of District Metered Area (DMA) ....................................................................... 12
2.3.4 Example of DMA creation in Panadura Area ................................................................. 17
2.3.5 Monitoring of NRW in DMA ............................................................................................ 22
2.3.6 Steps of Leakage Reduction Activity ............................................................................. 24
2.3.7 Confirmation of Hydraulic Isolation of DMA ................................................................... 25
2.3.8 Measurement of Minimum Night Flow (MNF) ................................................................ 26
2.3.9 Understanding the Mechanism of Ultrasonic Flow Meter (UFM) .................................. 35
2.3.10 Procedure of Step Test ................................................................................................ 45
2.3.11 Calculation of amount of leaked water ......................................................................... 48
2.3.12 Measurement of Water Supply Pressure ..................................................................... 49
2.3.13 Relation between pressure and leakage volume ........................................................ 52
2.4 Type of Evaluation Indicators ............................................................................................... 54
2.4.1 Necessary basic data ..................................................................................................... 54
2.4.2 Types of indicators and how to use them ...................................................................... 56
2.5 Case Study from Activities in DMA 5 .................................................................................... 59
2.5.1 Location of DMA 5 .......................................................................................................... 59
2.5.2 Sub-zoning Plan of DMA 5 ............................................................................................. 60
2.5.3 Result of Step Test ......................................................................................................... 62
2.5.4 Evaluation of distribution network on subzone basis ..................................................... 65
2.6 Data storage and update ...................................................................................................... 67
A5-261

2.6.1 Necessary basic data ..................................................................................................... 67
2.6.2 Data storage and update ............................................................................................... 67
2.7 Data collection of leakage repair .......................................................................................... 69
2.7.1 Purpose of collection of leakage repair data ................................................................. 69
2.7.2 Asset management ........................................................................................................ 69
2.8 Sustainable Use of Created DMA ........................................................................................ 71
2.8.1 Setting the target level of leakage management ........................................................... 71
2.8.2 Monitoring of Leakage Recurrence Speed .................................................................... 72
2.9 Accuracy Inspection of Customer Meter............................................................................... 73
2.9.1 Survey Plan and Equipment Preparation ...................................................................... 73
2.9.2 Type of inspection method ............................................................................................. 73
2.9.3 Test Procedure ............................................................................................................... 75
2.9.4 Aggregate meter accuracy inspection results ................................................................ 77
2.9.5 Meter reliability evaluation ............................................................................................. 78
2.9.6 Estimation of apparent losses ........................................................................................ 79
2.9.7 Determination of sample size ........................................................................................ 80
2.9.8 Example of Simple Test of Customer Meter .................................................................. 81
3 Practice of Pulse Signal Measurement ....................................................................................... 82
3.1 Importance of Long-term Monitoring of Water Flow ............................................................. 82
3.2 Mechanism of Remote Monitoring System .......................................................................... 84
3.3 Use of Pulse Signal .............................................................................................................. 86
3.3.1 Basic Calculation Method of Pulse Signal ..................................................................... 86
3.3.2 Test Kit for Pulse Measurement Practice ....................................................................... 90
A5-262
1 Outline of this training session
1.1 Background
National Water Supply and Drainage Board (NWSDB) was established in 1975 as a principal
authority providing safe drinking water and facilitating the provision of sanitation in Sri Lanka,
presently under the Ministry of Urban Development. NWSDB has been improving water supply
facilities throughout the country for the realization of a stable water supply. Currently, although
coverage of the water supply system of densely populated Colombo district has reached 94.5 %,
that of the whole country is still 48.1 %. Therefore, NWSDB will continue to enhance water supply
capacity and improve its service.
Enhancement of its capacity for leakage control as that of their daily O&M work directly leads to
reduction of non-revenue water (NRW) and an improvement of business operation and finance.
The pilot activity was implemented through Japanese Cooperation Project named Project for
Enhancement of Operational Efficiency and Asset Management Capacity of Regional Support
Center Western-South, so that staff of NWSDB RSC W-S acquire the knowledge, technology, and
skills necessary for leakage control through practical On-the-Job Training in the actual water
distribution network.
1.2 Purpose of this training session
Table 1.2.1 Outling of Training Session
Items Descriptions
Purpose of training With daily water supply service, a huge and varied amount of data is
generated. Many kinds of the data are related to the NRW as an
indicator to measure the efficiency of the water supply management.
As one of the methods to reduce NRW, there is a DMA method which
create isolated area in water distribution system. This training aims to
learn how to collect data from DMA and analyze them to get the
information which contribute to the decrease of NRW.
*This training program is conducted in the lecture room, so you don’t
need to use TY.
Training Contents [First Session]
1. Basic knowledge about Non-Revenue Water (NRW)
2. Implementation Steps of Pilot Activities for Leakage Reduction
3. Implementation Procedure of Pilot Activity
4. Evaluation of DMA using indicator and making strategy for leakage
A5-263
reduction
5. Type of Evaluation Indicators
6. Data storage and update
7. Data collection of leakage repair
8. Sustainable Use of Created DMA
9. Accuracy Inspection of Customer Meter
[Second Session]
10. Theory of Pulse Signal Measurement for Water Flow Monitoring
11. Practice of Pulse Signal Measurement using Test Kit
1.3 Flow of training with time schedule
The total time is 2 hours and 15 minutes.
Table 1.3.1 Time Schedule of Training Session
No. Activity Required time Venue
1 Lecture (1st Session) 90 min. Lecture room
2 Lecture (2nd Session) and
Practice of pulse signal
measurement
30 min Lecture room
3 Q & A 15 min. Lecture room
A5-264
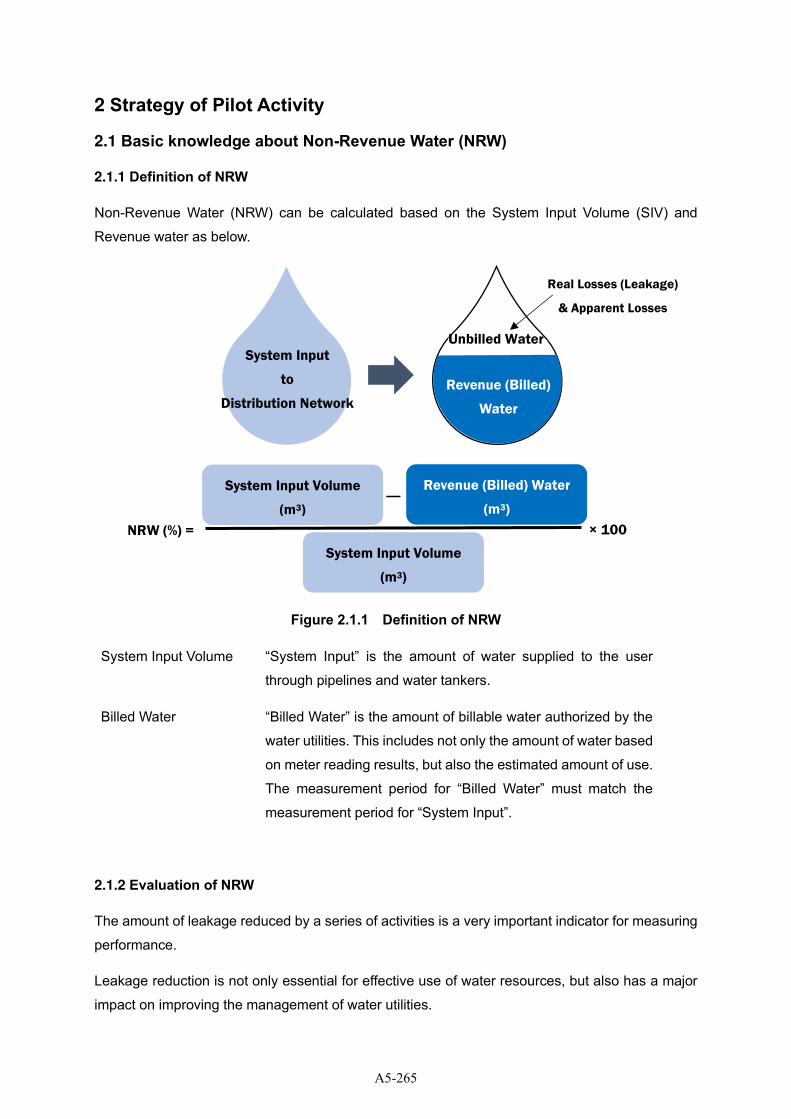
2 Strategy of Pilot Activity
2.1 Basic knowledge about Non-Revenue Water (NRW)
2.1.1 Definition of NRW
Non-Revenue Water (NRW) can be calculated based on the System Input Volume (SIV) and
Revenue water as below.
Figure 2.1.1 Definition of NRW
System Input Volume “System Input” is the amount of water supplied to the user
through pipelines and water tankers.
Billed Water “Billed Water” is the amount of billable water authorized by the
water utilities. This includes not only the amount of water based
on meter reading results, but also the estimated amount of use.
The measurement period for “Billed Water” must match the
measurement period for “System Input”.
2.1.2 Evaluation of NRW
The amount of leakage reduced by a series of activities is a very important indicator for measuring
performance.
Leakage reduction is not only essential for effective use of water resources, but also has a major
impact on improving the management of water utilities.
Unbilled Water
Revenue (Billed)
Water
System Input
to
Distribution Network
NRW (%) =
Revenue (Billed) Water
(m3)
System Input Volume
(m3)
× 100
System Input Volume
(m3) -
Unbilled Water
Real Losses (Leakage)
& Apparent Losses
A5-265
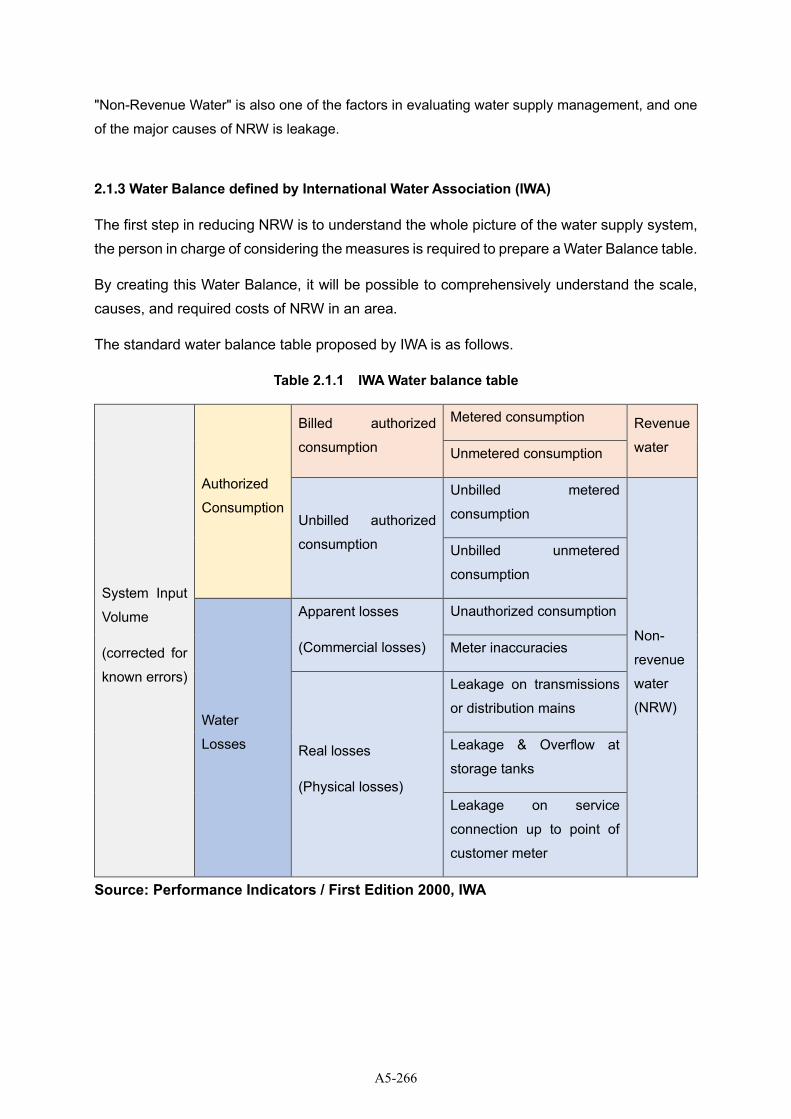
"Non-Revenue Water" is also one of the factors in evaluating water supply management, and one
of the major causes of NRW is leakage.
2.1.3 Water Balance defined by International Water Association (IWA)
The first step in reducing NRW is to understand the whole picture of the water supply system, the person in charge of considering the measures is required to prepare a Water Balance table.
By creating this Water Balance, it will be possible to comprehensively understand the scale, causes, and required costs of NRW in an area.
The standard water balance table proposed by IWA is as follows.
Table 2.1.1 IWA Water balance table
System Input
Volume
(corrected for
known errors)
Authorized
Consumption
Billed authorized
consumption
Metered consumption Revenue
water Unmetered consumption
Unbilled authorized
consumption
Unbilled metered
consumption
Non-
revenue
water
(NRW)
Unbilled unmetered
consumption
Water
Losses
Apparent losses
(Commercial losses)
Unauthorized consumption
Meter inaccuracies
Real losses
(Physical losses)
Leakage on transmissions
or distribution mains
Leakage & Overflow at
storage tanks
Leakage on service
connection up to point of
customer meter
Source: Performance Indicators / First Edition 2000, IWA
A5-266
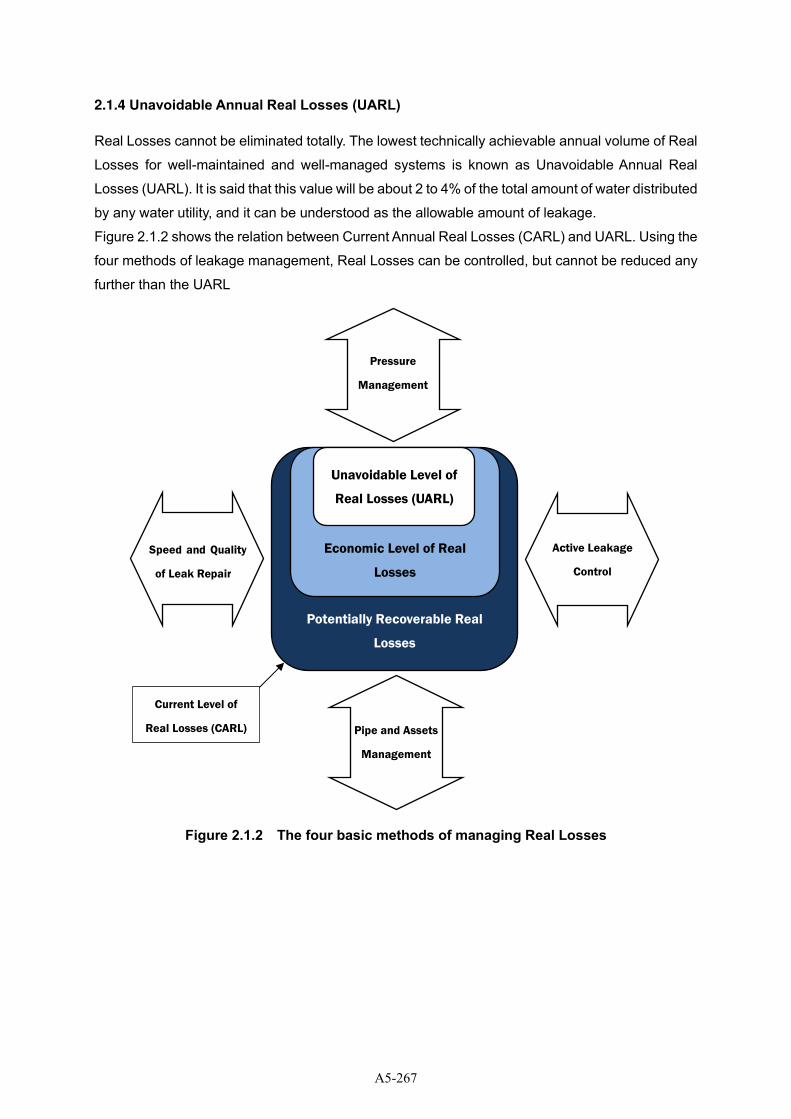
2.1.4 Unavoidable Annual Real Losses (UARL)
Real Losses cannot be eliminated totally. The lowest technically achievable annual volume of Real
Losses for well-maintained and well-managed systems is known as Unavoidable Annual Real
Losses (UARL). It is said that this value will be about 2 to 4% of the total amount of water distributed
by any water utility, and it can be understood as the allowable amount of leakage.
Figure 2.1.2 shows the relation between Current Annual Real Losses (CARL) and UARL. Using the
four methods of leakage management, Real Losses can be controlled, but cannot be reduced any
further than the UARL
Figure 2.1.2 The four basic methods of managing Real Losses
Potentially Recoverable Real
Losses
Economic Level of Real
Losses
Unavoidable Level of
Real Losses (UARL)
Speed and Quality
of Leak Repair
Active Leakage
Control
Pipe and Assets
Management
Pressure
Management
Current Level of
Real Losses (CARL)
A5-267
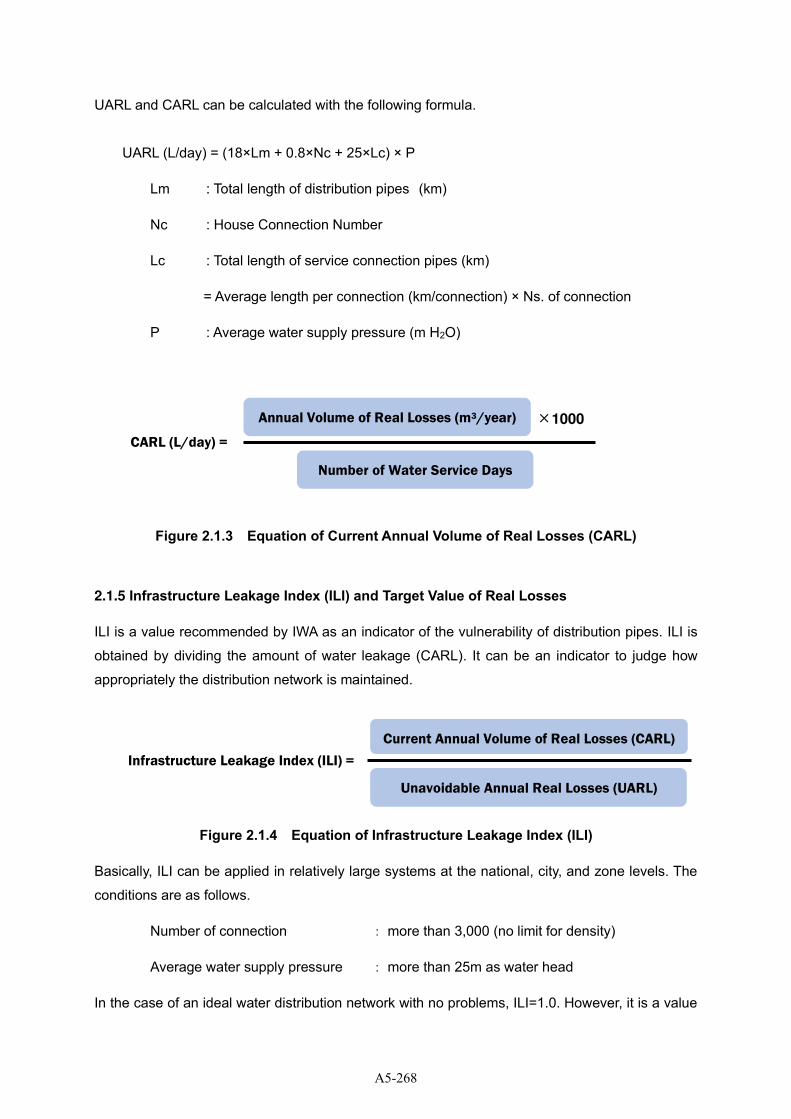
UARL and CARL can be calculated with the following formula.
UARL (L/day) = (18×Lm + 0.8×Nc + 25×Lc) × P
Lm : Total length of distribution pipes (km)
Nc : House Connection Number
Lc : Total length of service connection pipes (km)
= Average length per connection (km/connection) × Ns. of connection
P : Average water supply pressure (m H2O)
Figure 2.1.3 Equation of Current Annual Volume of Real Losses (CARL)
2.1.5 Infrastructure Leakage Index (ILI) and Target Value of Real Losses
ILI is a value recommended by IWA as an indicator of the vulnerability of distribution pipes. ILI is
obtained by dividing the amount of water leakage (CARL). It can be an indicator to judge how
appropriately the distribution network is maintained.
Figure 2.1.4 Equation of Infrastructure Leakage Index (ILI)
Basically, ILI can be applied in relatively large systems at the national, city, and zone levels. The
conditions are as follows.
Number of connection : more than 3,000 (no limit for density)
Average water supply pressure : more than 25m as water head
In the case of an ideal water distribution network with no problems, ILI=1.0. However, it is a value
Number of Water Service Days
CARL (L/day) =
×1000 Annual Volume of Real Losses (m3/year)
Infrastructure Leakage Index (ILI) =
Current Annual Volume of Real Losses (CARL)
Unavoidable Annual Real Losses (UARL)
A5-268
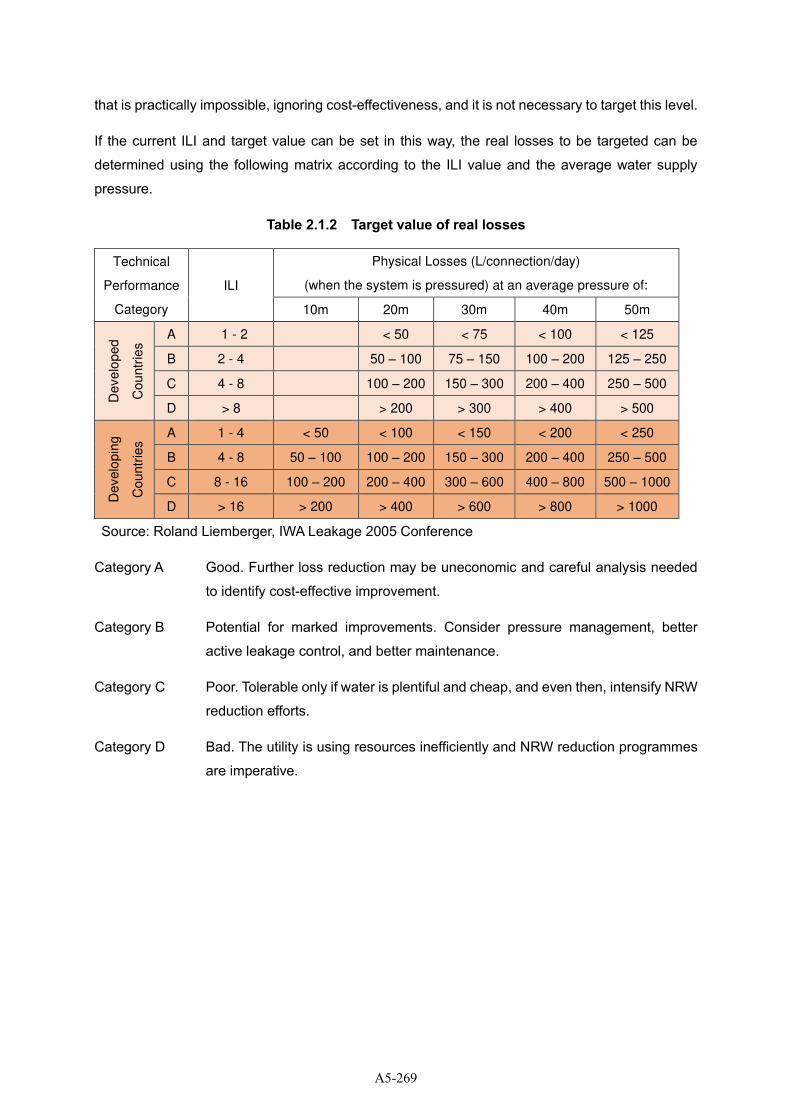
that is practically impossible, ignoring cost-effectiveness, and it is not necessary to target this level.
If the current ILI and target value can be set in this way, the real losses to be targeted can be
determined using the following matrix according to the ILI value and the average water supply
pressure.
Table 2.1.2 Target value of real losses
Technical
Performance
Category
ILI
Physical Losses (L/connection/day)
(when the system is pressured) at an average pressure of:
10m 20m 30m 40m 50m
Develo
ped
Countr
ies A 1 - 2 < 50 < 75 < 100 < 125
B 2 - 4 50 – 100 75 – 150 100 – 200 125 – 250
C 4 - 8 100 – 200 150 – 300 200 – 400 250 – 500
D > 8 > 200 > 300 > 400 > 500
Develo
pin
g
Countr
ies A 1 - 4 < 50 < 100 < 150 < 200 < 250
B 4 - 8 50 – 100 100 – 200 150 – 300 200 – 400 250 – 500
C 8 - 16 100 – 200 200 – 400 300 – 600 400 – 800 500 – 1000
D > 16 > 200 > 400 > 600 > 800 > 1000
Source: Roland Liemberger, IWA Leakage 2005 Conference
Category A Good. Further loss reduction may be uneconomic and careful analysis needed
to identify cost-effective improvement.
Category B Potential for marked improvements. Consider pressure management, better
active leakage control, and better maintenance.
Category C Poor. Tolerable only if water is plentiful and cheap, and even then, intensify NRW
reduction efforts.
Category D Bad. The utility is using resources inefficiently and NRW reduction programmes
are imperative.
A5-269
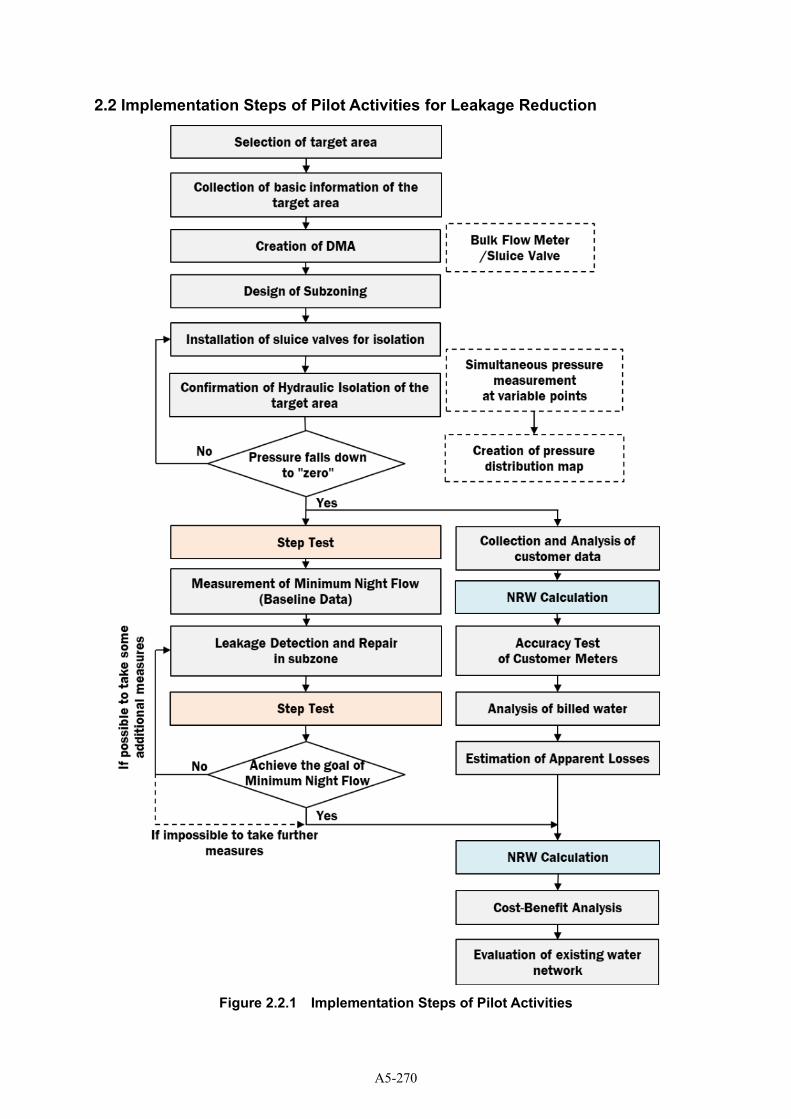
2.2 Implementation Steps of Pilot Activities for Leakage Reduction
Figure 2.2.1 Implementation Steps of Pilot Activities
A5-270
2.3 Implementation Procedure of Pilot Activity
2.3.1 Selection of Target Area
In implementing the leak reduction plan, candidate areas to be targeted for activities must be
selected and identified. The method of DMA creation is only one of various methods of leak
management.
Construction a DMA is not a cure-all to reduce leakage and is not required in all water distribution
networks. Constructing a DMA, especially in an existing complex water network, requires
considerable effort, materials and time.
In addition, effective activities cannot be carried out without understanding the utilization method
after constructing the DMA and the procedure for reducing water leakage.
When applying the DMA method to an existing distribution network, it is of utmost importance to
limit it to areas where NRW, water leakage is significant, or the risk of water leakage is high.
The first factor to be considered is NRW in the area under the jurisdiction of OICs.
It is important to grasp not only the NRW of the entire jurisdiction area but also the NRW in each
zone and divide it into three ranks to identify the areas that require countermeasures. As a result,
there may be cases where it is not desirable to apply the DMA method.
For example, in an area where pipes have been laid for more than 50 years and the amount of non-
revenue water is 40% or more, the pipes should be completely renewed without considering the
application of DMA method.
Major Factors to be considered
when selecting water supply scheme for DMA creation
➢ Non-Revenue Water
➢ Historical record of leakage occurrence and repair
➢ Age of pipe and pipe installation year
➢ Type of pipe (Asbestos Cement, Galvanized Iron, PVC, Polyethylene, Ductile)
➢ Water Supply Pressure
➢ Topographical condition and land use
➢ Variation in nodal elevation
➢ Water demand and number of customers
➢ Water quality
➢ Number of sources that feed water to the area
A5-271
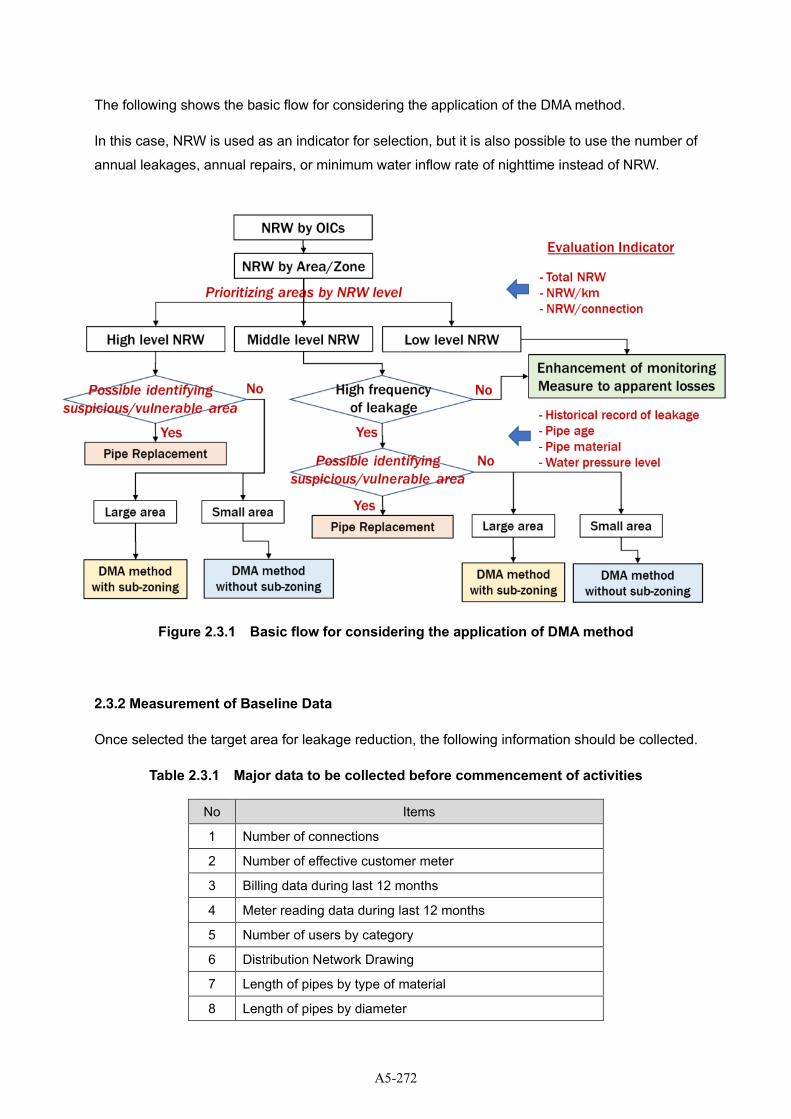
The following shows the basic flow for considering the application of the DMA method.
In this case, NRW is used as an indicator for selection, but it is also possible to use the number of
annual leakages, annual repairs, or minimum water inflow rate of nighttime instead of NRW.
Figure 2.3.1 Basic flow for considering the application of DMA method
2.3.2 Measurement of Baseline Data
Once selected the target area for leakage reduction, the following information should be collected.
Table 2.3.1 Major data to be collected before commencement of activities
No Items
1 Number of connections
2 Number of effective customer meter
3 Billing data during last 12 months
4 Meter reading data during last 12 months
5 Number of users by category
6 Distribution Network Drawing
7 Length of pipes by type of material
8 Length of pipes by diameter
A5-272
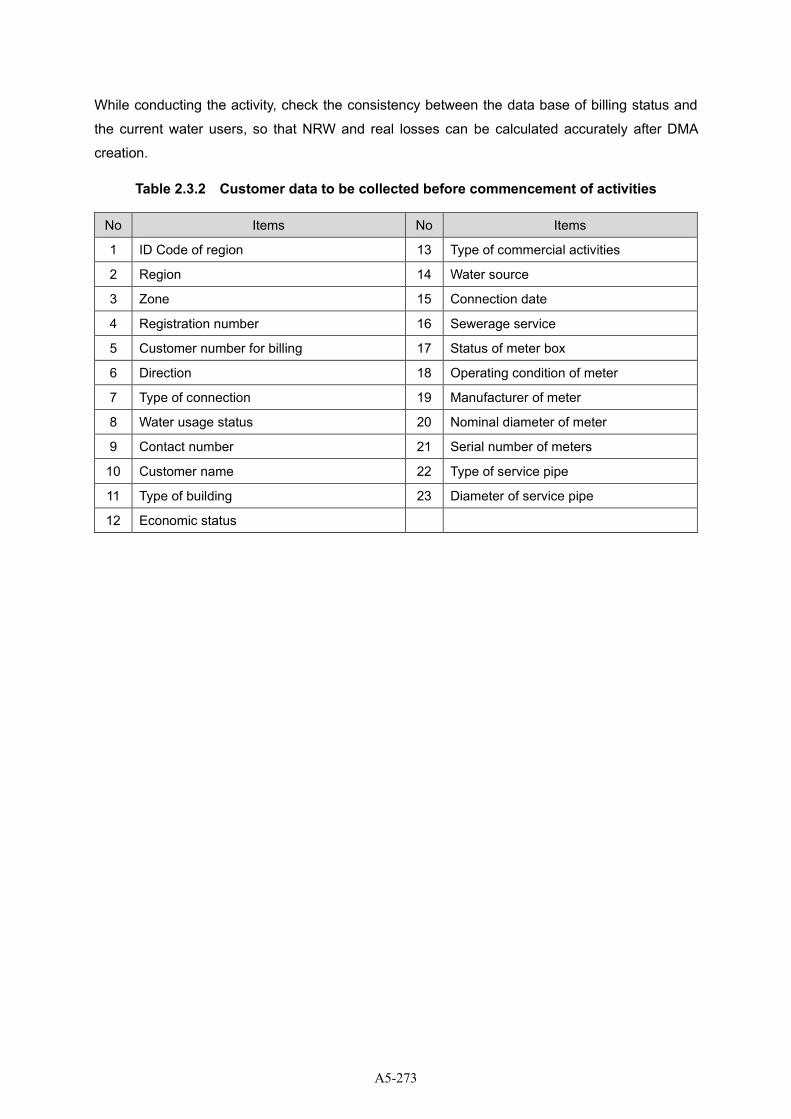
While conducting the activity, check the consistency between the data base of billing status and
the current water users, so that NRW and real losses can be calculated accurately after DMA
creation.
Table 2.3.2 Customer data to be collected before commencement of activities
No Items No Items
1 ID Code of region 13 Type of commercial activities
2 Region 14 Water source
3 Zone 15 Connection date
4 Registration number 16 Sewerage service
5 Customer number for billing 17 Status of meter box
6 Direction 18 Operating condition of meter
7 Type of connection 19 Manufacturer of meter
8 Water usage status 20 Nominal diameter of meter
9 Contact number 21 Serial number of meters
10 Customer name 22 Type of service pipe
11 Type of building 23 Diameter of service pipe
12 Economic status
A5-273
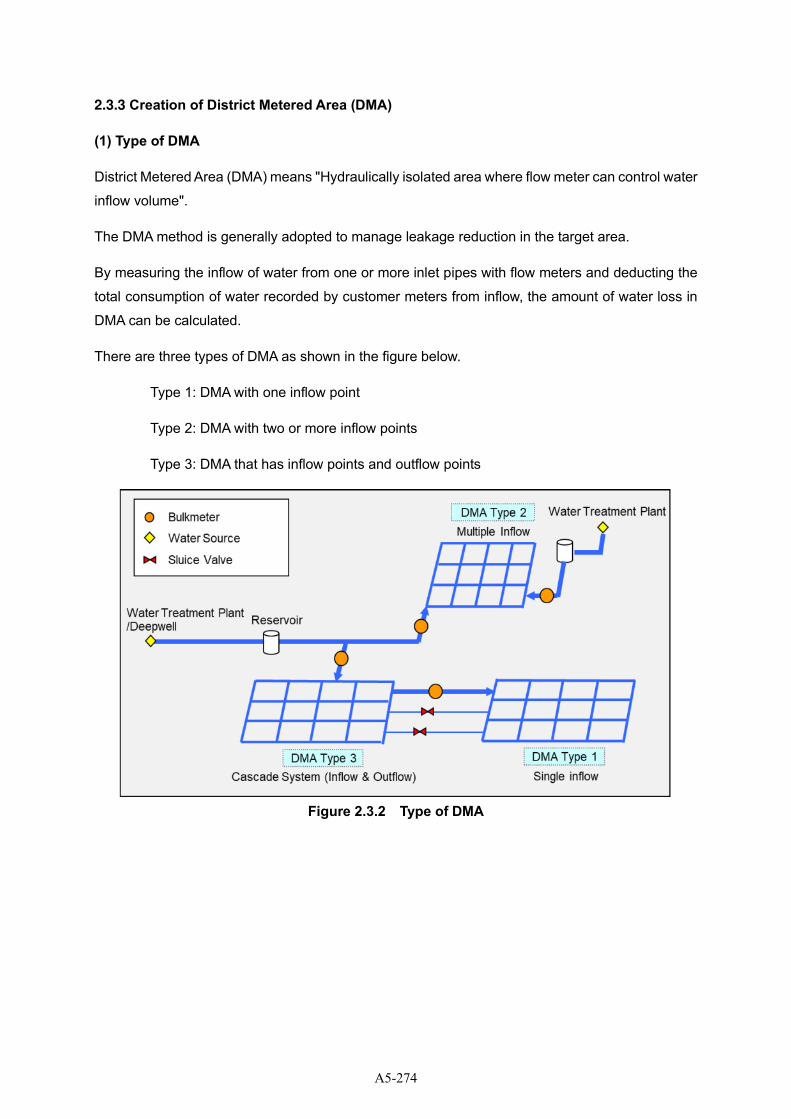
2.3.3 Creation of District Metered Area (DMA)
(1) Type of DMA
District Metered Area (DMA) means "Hydraulically isolated area where flow meter can control water
inflow volume".
The DMA method is generally adopted to manage leakage reduction in the target area.
By measuring the inflow of water from one or more inlet pipes with flow meters and deducting the
total consumption of water recorded by customer meters from inflow, the amount of water loss in
DMA can be calculated.
There are three types of DMA as shown in the figure below.
Type 1: DMA with one inflow point
Type 2: DMA with two or more inflow points
Type 3: DMA that has inflow points and outflow points
Figure 2.3.2 Type of DMA
A5-274
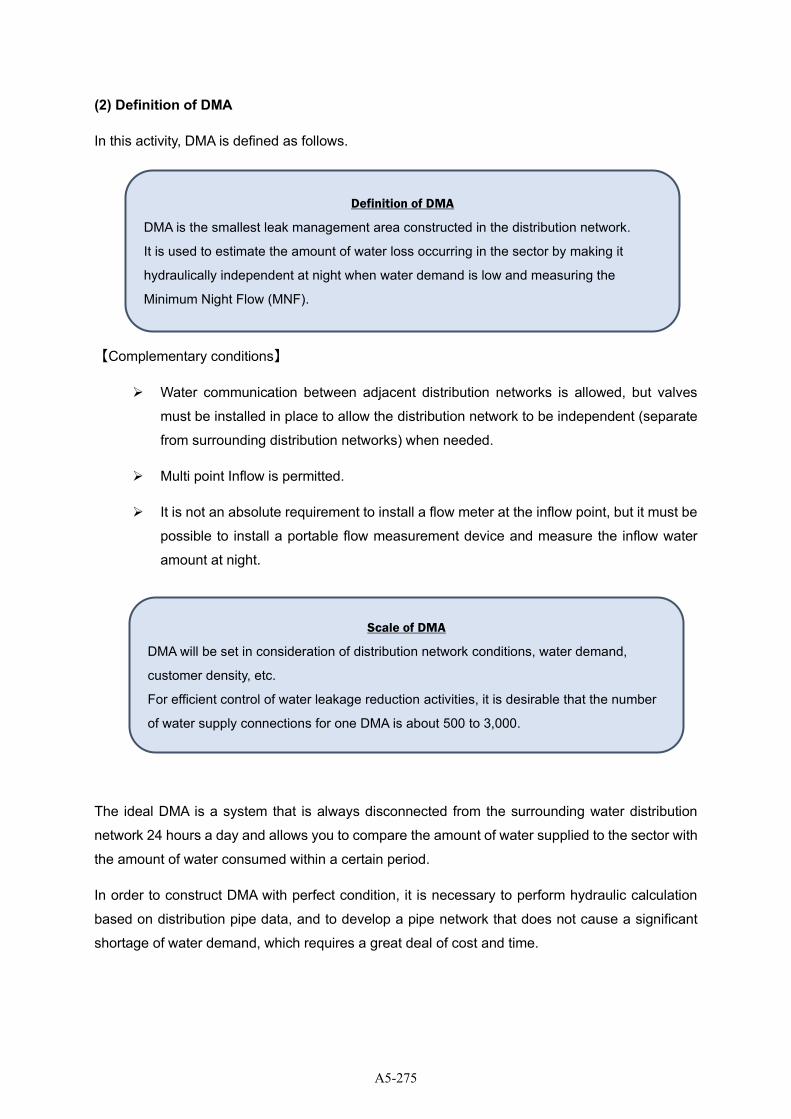
(2) Definition of DMA
In this activity, DMA is defined as follows.
【Complementary conditions】
➢ Water communication between adjacent distribution networks is allowed, but valves
must be installed in place to allow the distribution network to be independent (separate
from surrounding distribution networks) when needed.
➢ Multi point Inflow is permitted.
➢ It is not an absolute requirement to install a flow meter at the inflow point, but it must be
possible to install a portable flow measurement device and measure the inflow water
amount at night.
The ideal DMA is a system that is always disconnected from the surrounding water distribution
network 24 hours a day and allows you to compare the amount of water supplied to the sector with
the amount of water consumed within a certain period.
In order to construct DMA with perfect condition, it is necessary to perform hydraulic calculation
based on distribution pipe data, and to develop a pipe network that does not cause a significant
shortage of water demand, which requires a great deal of cost and time.
Definition of DMA
DMA is the smallest leak management area constructed in the distribution network.
It is used to estimate the amount of water loss occurring in the sector by making it
hydraulically independent at night when water demand is low and measuring the
Minimum Night Flow (MNF).
Scale of DMA
DMA will be set in consideration of distribution network conditions, water demand,
customer density, etc.
For efficient control of water leakage reduction activities, it is desirable that the number
of water supply connections for one DMA is about 500 to 3,000.
A5-275
(3) Purpose of creating DMA
The purpose of constructing a DMA is as follows.
➢ After limiting the boundary of distribution network from the surroundings at night, measure
the Minimum Night Flow (MNF) to roughly understand the level of water leakage occurring
in the area.
➢ Divide MNF by the number of customers existing in the area to calculate the Minimum
Night Flow rate per connection (MNF/connection).
➢ Divide MNF by the pipeline extension in the area to calculate the Minimum Night Flow
rate per km (MNF/km).
➢ Compare the MNF of different DMAs to identify areas with high levels of water leakage
and NRW, and take efficient and effective water leakage reduction measures considering
priority.
➢ It is recommended that the effect of the measures should be regularly confirmed in the
DMA that has taken measures against water leakage, at least once a month.
➢ By installing a remote monitoring system in DMA, we can monitor daily inflow water
volume and water pressure and respond to sudden leaks and water distribution network
accidents.
(4) Information needed for DMA design
The following information needs to be confirmed when designing a DMA.
➢ Location, diameter and actual status of existing valves and its diameter
➢ Location and diameter of Inlet pipe of a target area
➢ Information of distribution pipes near the expected boundary
➢ In case of sub-zoning, detail of pipeline of its boundary
➢ Water supply pressure
(5) Design Criteria of DMA
Several factors should be taken into consideration when designing a DMA.
➢ Size
➢ Boundary
A5-276
➢ Hydraulic modeling
➢ Number of flowmeters
➢ Variation of ground level
1) Size
DMA size is usually determined by the number of connections or the length of distribution pipeline
within a DMA. In practical situation, smaller DMAs have several advantages compared to larger
DMA as follows:
➢ Smaller leaks can be identified against the legitimate night use
➢ Survey time can be reduced
➢ Survey cost can be reduced
After all smaller DMA can be maintained in lower level of leakage. If a DMA is larger than 5,000
connections, it becomes difficult to identify occurrence of small bursts from night flow data, and
it takes longer to locate it.
On the other hand, the constructing small DMAs will tend to cost since it requires larger number
of DMAs divide out existing distribution network system.
In practice, the size of an individual DMA will vary, depending on how boundary can be set
actually. Also, hydraulic conditions and economic factors, in general, are the significant key
factors to determine the size of DMAs.
2) Boundary
Individual DMA has to be independent from other DMAs hydraulically, so that the DMA should be
disconnected from the network except feeding points. Physical discontinuity points of the network
can be traced as a boundary to avoid any repercussions to the existing service. Otherwise, the
closing valve will be needed for making boundary. Normally, it is better to limit the number of
closing valves. Hence, a boundary should be designed to cross as few mains as possible.
In any cases, influences should be checked whether decrease of water pressure and increase
of travel time of water would be acceptable or not. Testing by hydraulic modelling is always useful
for this matter. Or if possible, it can be tested by creating the situation in actual site on a trial
basis.
3) Number of flow meter
Flow meter should be installed at feeding point. If a DMA have inlet and outlet, several flowmeters
will be needed at respective points. Generally, the lesser number of meters is recommended
A5-277
from the viewpoints of accuracy of flow measuring and maintenance cost. If a DMA contains
several flow meters, measuring flows into/out of the district could result in misleading leakage
levels because of compounding errors in flow calculation.
Therefore, it is better to reduce the number of flow meter, limiting the number of feeding points
in minimum.
4) Hydraulic analysis
As mentioned above, closure of valves and limiting of feeder points will influence the existing
network system. Hydraulic analysis can simulate and show how the creation of DMA will influence
the existing network. It must be simulated how much water pressure will drop, how long travel
time of water will extend.
Furthermore, they should be simulated in adverse condition. Then, water pressure should be
simulated in the condition of peak time when many people use water service. Travel time should
be simulated in the condition of average time.
5) Ground level variation
Minimum variation in ground level across the DMA is recommended. Furthermore, it would be
better to take into consideration High/Low pressure problems that certain areas may have, to
that those can be managed by installing booster pumps, or pressure reducing valves into inlet
points.
A5-278
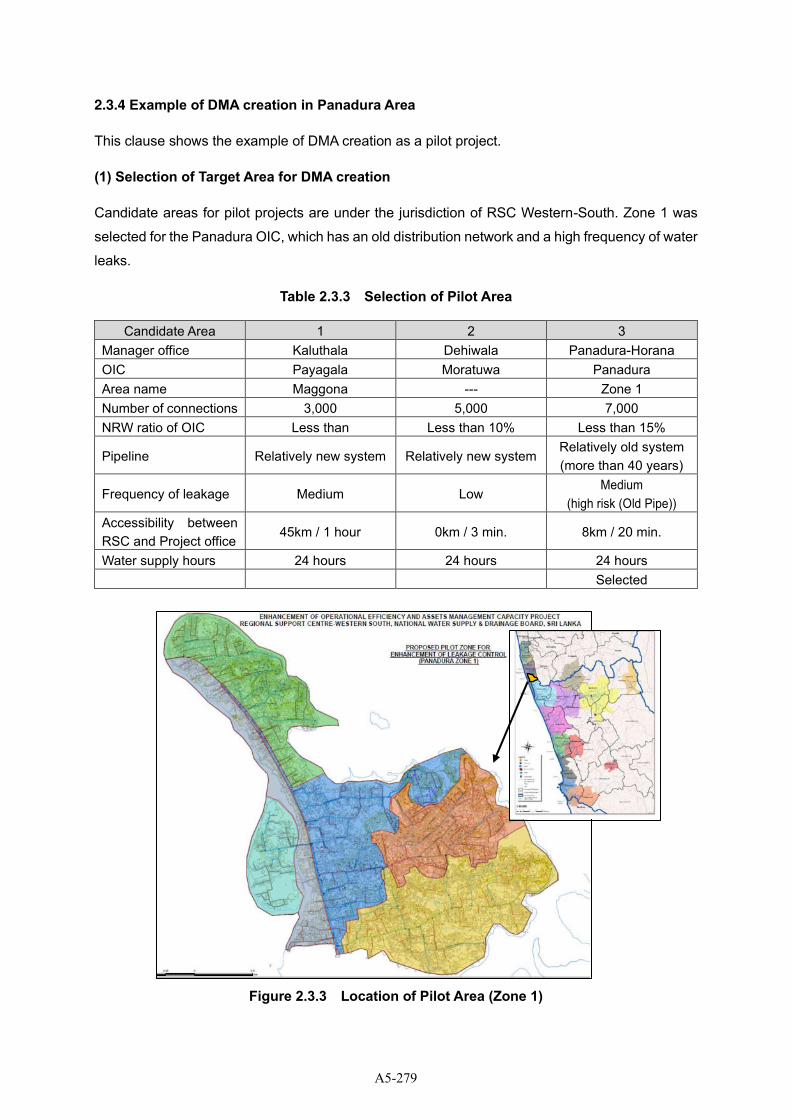
2.3.4 Example of DMA creation in Panadura Area
This clause shows the example of DMA creation as a pilot project.
(1) Selection of Target Area for DMA creation
Candidate areas for pilot projects are under the jurisdiction of RSC Western-South. Zone 1 was
selected for the Panadura OIC, which has an old distribution network and a high frequency of water
leaks.
Table 2.3.3 Selection of Pilot Area
Candidate Area 1 2 3
Manager office Kaluthala Dehiwala Panadura-Horana
OIC Payagala Moratuwa Panadura
Area name Maggona --- Zone 1
Number of connections 3,000 5,000 7,000
NRW ratio of OIC Less than Less than 10% Less than 15%
Pipeline Relatively new system Relatively new system Relatively old system
(more than 40 years)
Frequency of leakage Medium Low Medium
(high risk (Old Pipe)) Accessibility between RSC and Project office
45km / 1 hour 0km / 3 min. 8km / 20 min.
Water supply hours 24 hours 24 hours 24 hours
Selected
Figure 2.3.3 Location of Pilot Area (Zone 1)
A5-279
(2) Baseline data of Pilot Area for DMA creation
The data collected before dividing the area into DMA is as follows:
Table 2.3.4 Pipeline information of Zone 1, OIC Panadura
Diameter Normal Material Pipe Length Proportion
50mm PVC 911 m 2.7%
63mm PVC 3,012 m 8.8%
90mm PVC 18,561 m 53.9%
110mm PVC 2,528 m 7.4%
160mm PVC 4,232 m 12.2%
225mm PVC 1,056 m 3.1%
250mm DI 886 m 2.6%
400mm DI 705 m 2.1%
450mm DI 311 m 0.9%
500mm DI 1,942 m 5.6%
DN not specified 236 m 0.7%
Total 34,380 m 100.0%
Table 2.3.5 Connection per Category of Zone 1, OIC Panadura
Category Connection Proportion
Domestic 6,378 93.4%
Poverty house 117 1.7%
School 6 0.1%
Commercial facility 300 0.1%
Religious facility 10 0.2%
Government institution 12 0.1%
Other 5 100.0%
Total 6,828
Population 63,952 person
Population/Household 9.85 person
To implement the leakage reduction activities efficiently and effectively, it is necessary to divide a
large pilot area into small sections, considering geological condition, number of customers, location
and condition of pipeline and valves.
A5-280
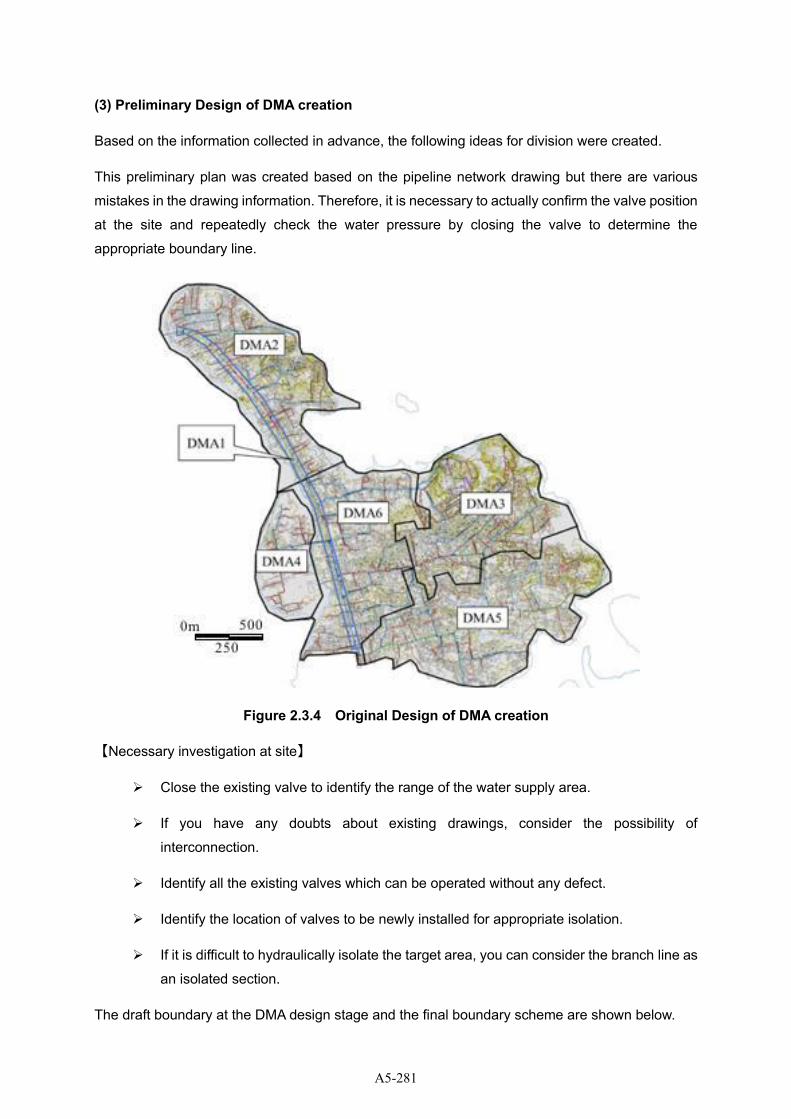
(3) Preliminary Design of DMA creation
Based on the information collected in advance, the following ideas for division were created.
This preliminary plan was created based on the pipeline network drawing but there are various
mistakes in the drawing information. Therefore, it is necessary to actually confirm the valve position
at the site and repeatedly check the water pressure by closing the valve to determine the
appropriate boundary line.
Figure 2.3.4 Original Design of DMA creation
【Necessary investigation at site】
➢ Close the existing valve to identify the range of the water supply area.
➢ If you have any doubts about existing drawings, consider the possibility of
interconnection.
➢ Identify all the existing valves which can be operated without any defect.
➢ Identify the location of valves to be newly installed for appropriate isolation.
➢ If it is difficult to hydraulically isolate the target area, you can consider the branch line as
an isolated section.
The draft boundary at the DMA design stage and the final boundary scheme are shown below.
A5-281
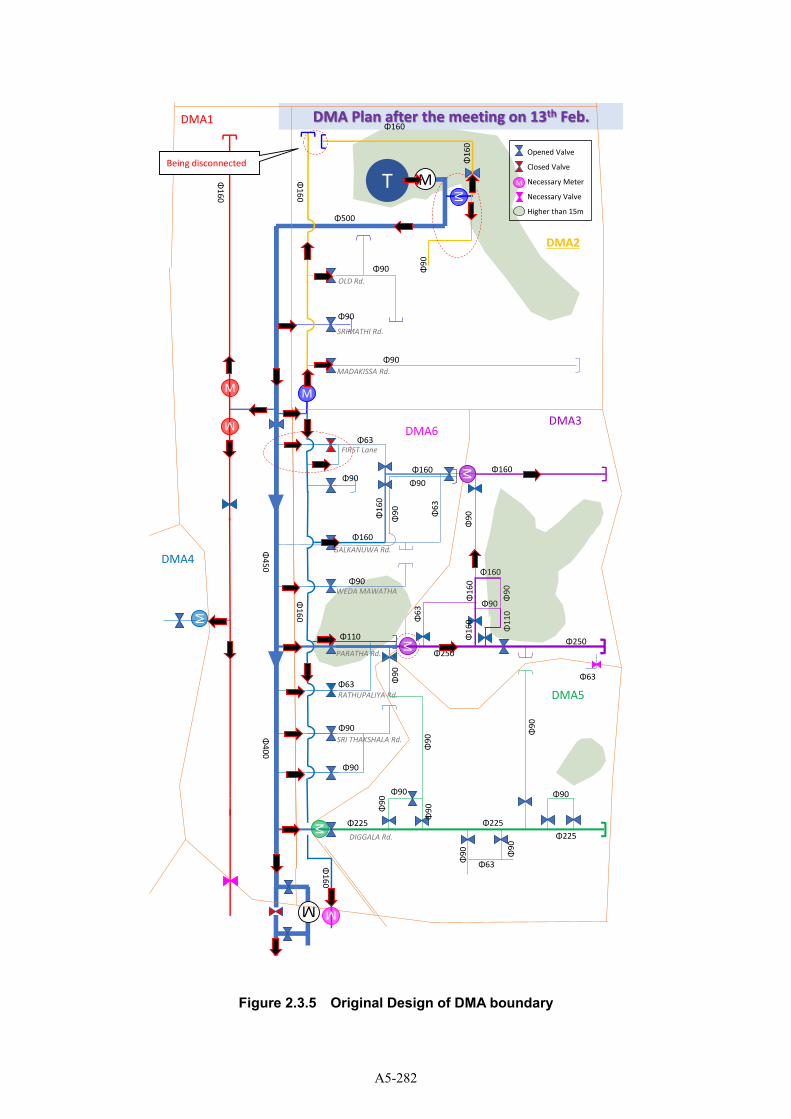
Figure 2.3.5 Original Design of DMA boundary
Φ63 FIRST Lane
SRI THAKSHALA Rd.
Φ90
WEDA MAWATHA
Φ90
Φ9
0
Φ90
Φ1
60
OLD Rd.
SRIMATHI Rd.
Φ90
Φ90
Φ9
0
Φ6
3
Φ90
GALKANUWA Rd.
Φ160
Φ1
60
RATHUPALIYA Rd.
Φ63
Φ90
Φ9
0
Φ9
0
Φ9
0
Φ63
Φ90
Φ9
0
Φ90
Φ1
10
Φ160
PARATHA Rd.
DMA Plan after the meeting on 13th Feb.Φ160
T
Φ500
Φ1
60
Φ4
50
Φ
40
0
Φ250
Φ225
Φ1
60
Φ250
Φ225
M
MADAKISSA Rd.
DIGGALA Rd.
DMA2
DMA4
DMA3
DMA5
DMA6
DMA1
MM
M
M
MM
Φ63
M
Opened Valve
Closed Valve
Necessary Meter
Necessary Valve
Higher than 15m
M
Φ1
60
Φ90
Φ160 Φ160
Φ1
60
Φ1
60
Φ
90
Φ6
3
Φ90
Φ9
0
Φ9
0
Φ9
0
Φ9
0
Φ1
60
Φ225
Φ110
M
M M
Being disconnected
A5-282
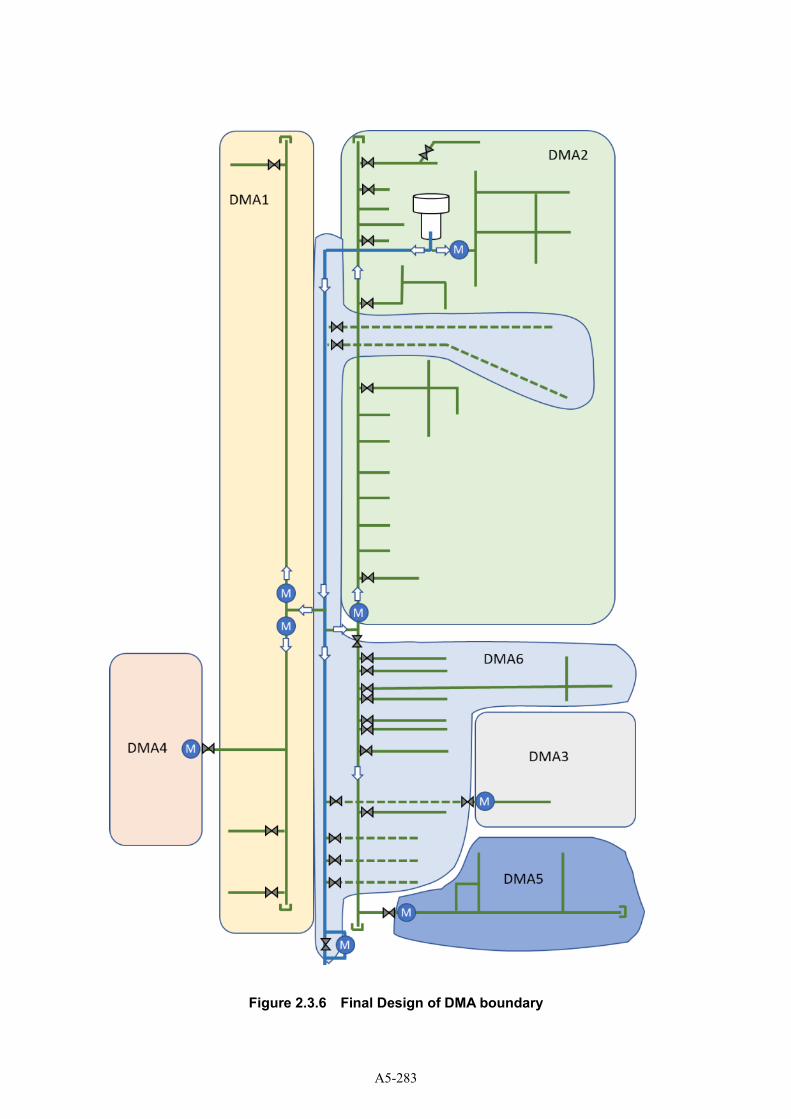
Figure 2.3.6 Final Design of DMA boundary
A5-283
2.3.5 Monitoring of NRW in DMA
If the DMA is completely isolated from the surrounding water distribution network, the NRW per
DMA can be calculated by comparing the amount of distributed water into the DMA with the amount
of water used by customers.
(1) Collection of Billing Data
Once determined the boundarie of DMA, we should make a list of the customers that exist within
it. The customer list can be obtained through the meter reading and billing departments.
However, the routes and areas that the meter reader is in charge of do not always coincide with
the DMA boundaries. Therefore, one billing data list may include customers other than the target
DMA.
In carrying out the DMA activity, it is important to extract and list the customers in the DMA based
on the billing data, and it is desirable to confirm the following points.
➢ Identify users of large amount of water and historical billing data for the past 12 months
➢ Classify users per category, diameter of meter
➢ Identify the existence of abnormal water use from billing data
(2) Installation of Bulk Mater
To record water inflow of DMA, the bulk meters should be installed at feeding points.
For selecting the size of balk meter, required flow range (minimum and maximum) and head loss
should be taken into account. The manual “Leakage Management and Control” compiled by WHO
2001 shows the following reference table for selection of meter size.
Table 2.3.6 Meter size and flow range (Turbine Meter Helix 4000 Kent)
Meter size (mm) 80 100 150 200
Maximum Flow (m3/h) 200 250 600 1000
Recommended Continuous Flow (m3/h) 120 180 450 700
Minimum Flow (m3/h) 0.5 0.6 2 4
Table 2.3.7 Standard meter size by number of connections
Number of connections Meter size (mm)
Less than 1000 80
1000 to 1500 100
More than 1500 150
A5-284
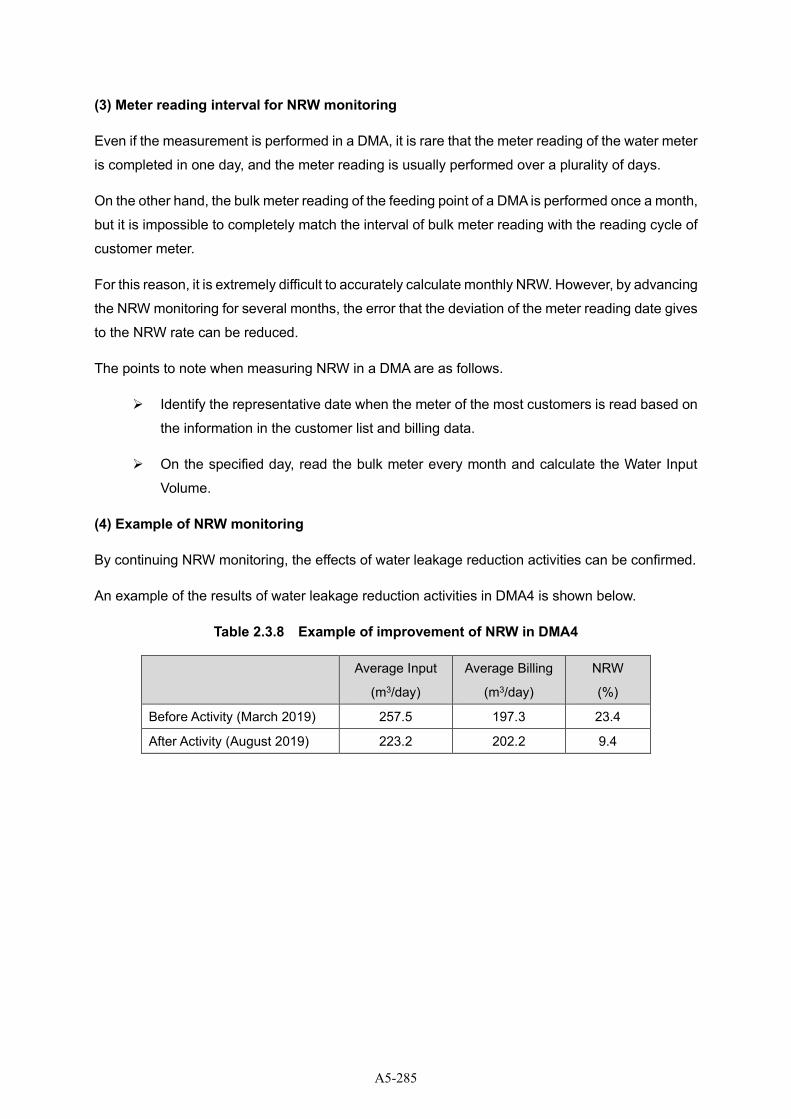
(3) Meter reading interval for NRW monitoring
Even if the measurement is performed in a DMA, it is rare that the meter reading of the water meter
is completed in one day, and the meter reading is usually performed over a plurality of days.
On the other hand, the bulk meter reading of the feeding point of a DMA is performed once a month,
but it is impossible to completely match the interval of bulk meter reading with the reading cycle of
customer meter.
For this reason, it is extremely difficult to accurately calculate monthly NRW. However, by advancing
the NRW monitoring for several months, the error that the deviation of the meter reading date gives
to the NRW rate can be reduced.
The points to note when measuring NRW in a DMA are as follows.
➢ Identify the representative date when the meter of the most customers is read based on
the information in the customer list and billing data.
➢ On the specified day, read the bulk meter every month and calculate the Water Input
Volume.
(4) Example of NRW monitoring
By continuing NRW monitoring, the effects of water leakage reduction activities can be confirmed.
An example of the results of water leakage reduction activities in DMA4 is shown below.
Table 2.3.8 Example of improvement of NRW in DMA4
Average Input
(m3/day)
Average Billing
(m3/day)
NRW
(%)
Before Activity (March 2019) 257.5 197.3 23.4
After Activity (August 2019) 223.2 202.2 9.4
A5-285
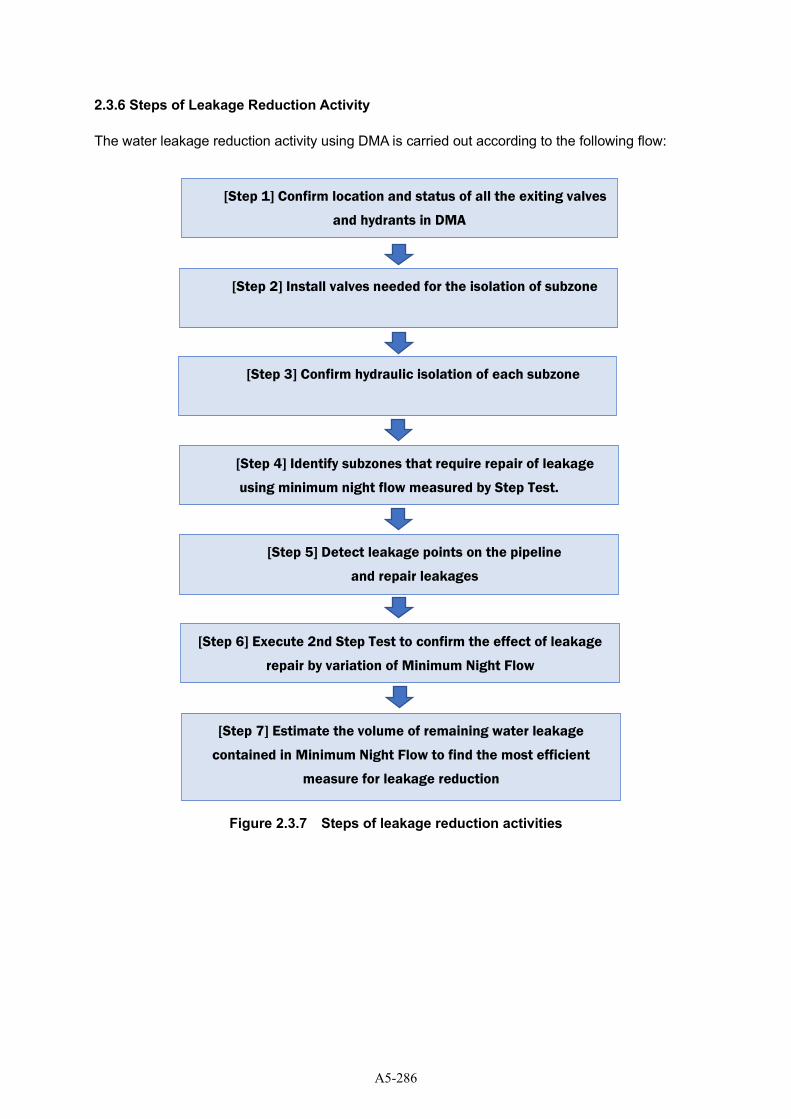
2.3.6 Steps of Leakage Reduction Activity
The water leakage reduction activity using DMA is carried out according to the following flow:
Figure 2.3.7 Steps of leakage reduction activities
[Step 1] Confirm location and status of all the exiting valves
and hydrants in DMA
[Step 2] Install valves needed for the isolation of subzone
[Step 3] Confirm hydraulic isolation of each subzone
[Step 4] Identify subzones that require repair of leakage
using minimum night flow measured by Step Test.
[Step 5] Detect leakage points on the pipeline
and repair leakages
[Step 6] Execute 2nd Step Test to confirm the effect of leakage
repair by variation of Minimum Night Flow
[Step 7] Estimate the volume of remaining water leakage
contained in Minimum Night Flow to find the most efficient
measure for leakage reduction
A5-286
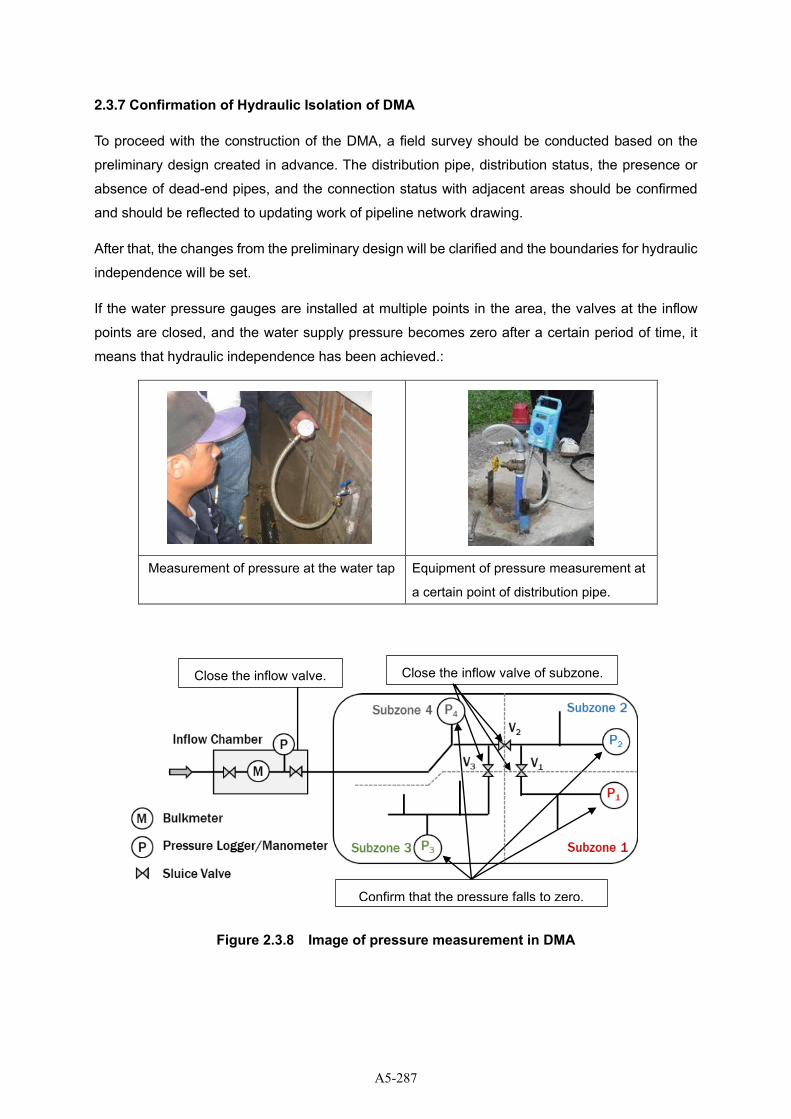
2.3.7 Confirmation of Hydraulic Isolation of DMA
To proceed with the construction of the DMA, a field survey should be conducted based on the
preliminary design created in advance. The distribution pipe, distribution status, the presence or
absence of dead-end pipes, and the connection status with adjacent areas should be confirmed
and should be reflected to updating work of pipeline network drawing.
After that, the changes from the preliminary design will be clarified and the boundaries for hydraulic
independence will be set.
If the water pressure gauges are installed at multiple points in the area, the valves at the inflow
points are closed, and the water supply pressure becomes zero after a certain period of time, it
means that hydraulic independence has been achieved.:
Measurement of pressure at the water tap Equipment of pressure measurement at
a certain point of distribution pipe.
Figure 2.3.8 Image of pressure measurement in DMA
Close the inflow valve.
Confirm that the pressure falls to zero.
Close the inflow valve of subzone.
A5-287
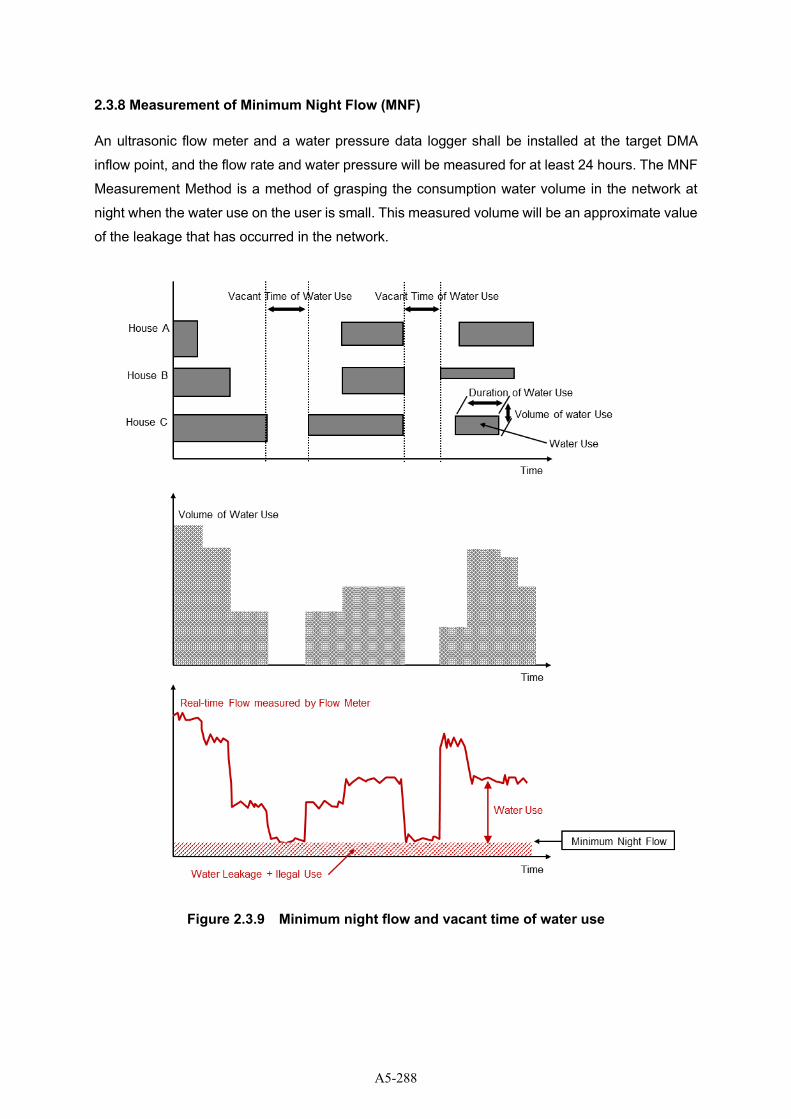
2.3.8 Measurement of Minimum Night Flow (MNF)
An ultrasonic flow meter and a water pressure data logger shall be installed at the target DMA
inflow point, and the flow rate and water pressure will be measured for at least 24 hours. The MNF
Measurement Method is a method of grasping the consumption water volume in the network at
night when the water use on the user is small. This measured volume will be an approximate value
of the leakage that has occurred in the network.
Figure 2.3.9 Minimum night flow and vacant time of water use
A5-288
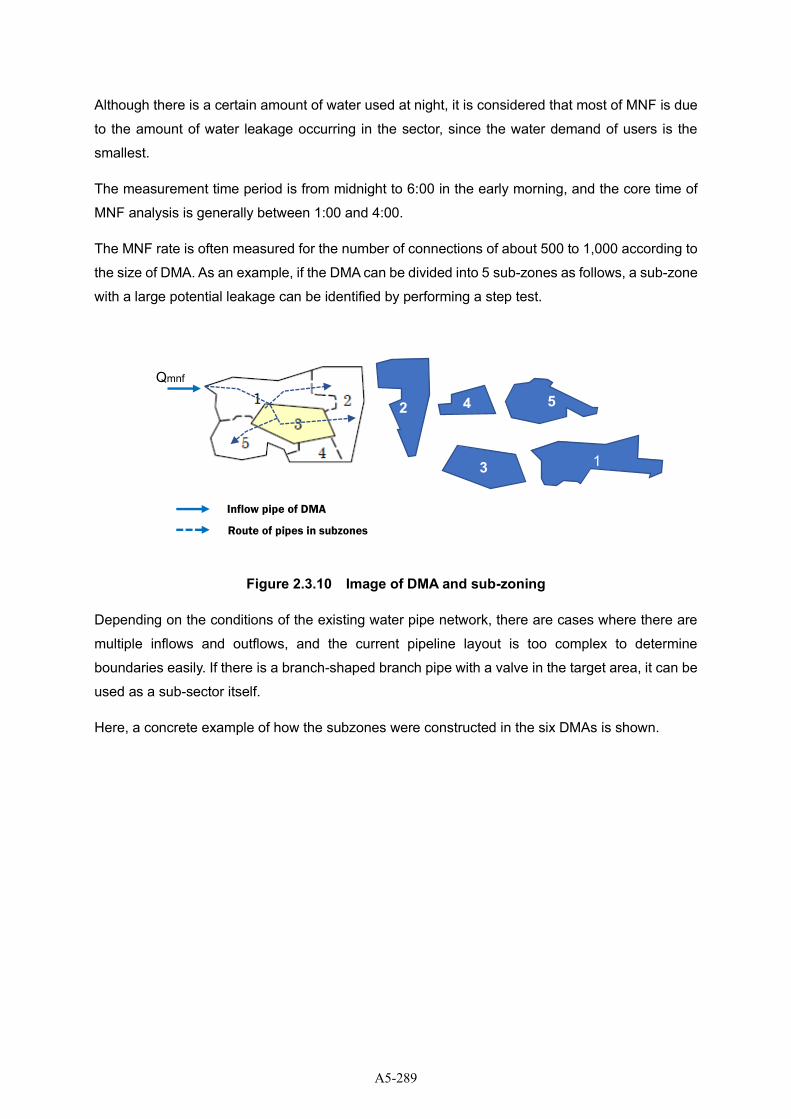
Although there is a certain amount of water used at night, it is considered that most of MNF is due
to the amount of water leakage occurring in the sector, since the water demand of users is the
smallest.
The measurement time period is from midnight to 6:00 in the early morning, and the core time of
MNF analysis is generally between 1:00 and 4:00.
The MNF rate is often measured for the number of connections of about 500 to 1,000 according to
the size of DMA. As an example, if the DMA can be divided into 5 sub-zones as follows, a sub-zone
with a large potential leakage can be identified by performing a step test.
Figure 2.3.10 Image of DMA and sub-zoning
Depending on the conditions of the existing water pipe network, there are cases where there are
multiple inflows and outflows, and the current pipeline layout is too complex to determine
boundaries easily. If there is a branch-shaped branch pipe with a valve in the target area, it can be
used as a sub-sector itself.
Here, a concrete example of how the subzones were constructed in the six DMAs is shown.
Qmnf
2
1 3
4 5
Inflow pipe of DMA
Route of pipes in subzones
A5-289
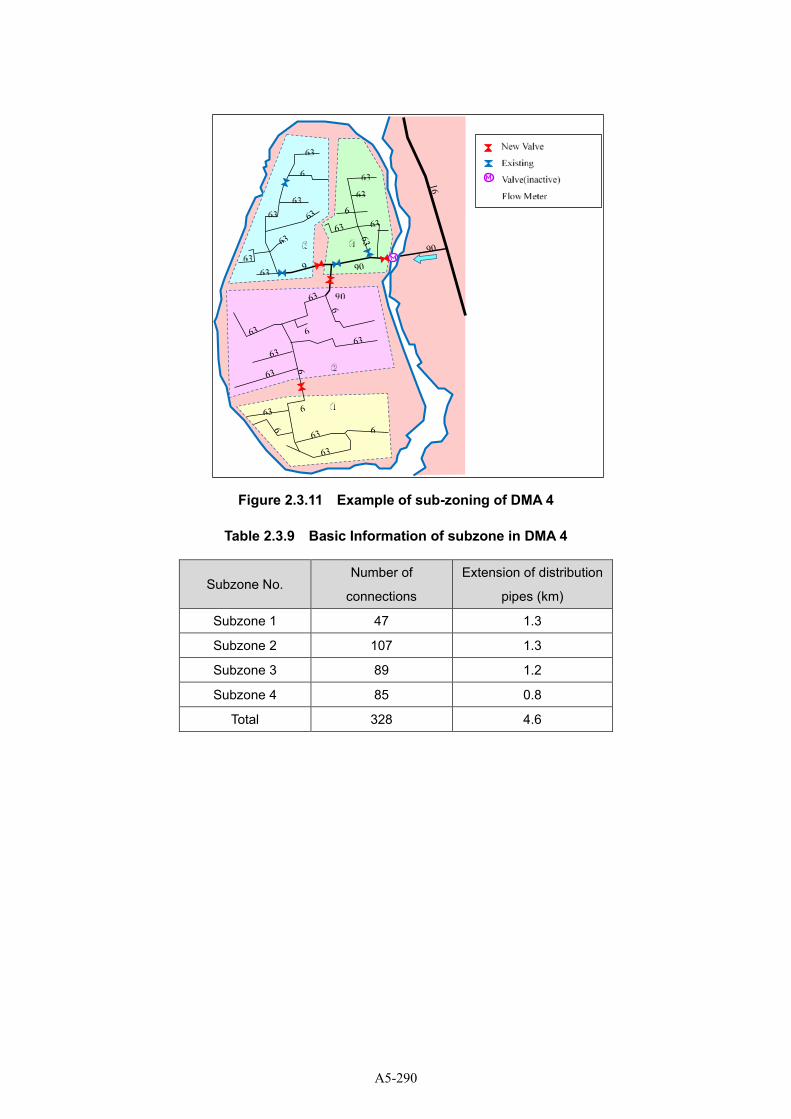
Figure 2.3.11 Example of sub-zoning of DMA 4
Table 2.3.9 Basic Information of subzone in DMA 4
Subzone No. Number of
connections
Extension of distribution
pipes (km)
Subzone 1 47 1.3
Subzone 2 107 1.3
Subzone 3 89 1.2
Subzone 4 85 0.8
Total 328 4.6
A5-290

Figure 2.3.12 Example of sub-zoning of DMA 5
Table 2.3.10 Basic Information of subzone in DMA 5
Subzone No. Number of
connections
Extension of
distribution pipes (km)
Subzone 1 159 1.9
Subzone 2 184 2.1
Subzone 3 721
2.5
Subzone 5 1.3
Subzone 4 299 1.7
Subzone 6 316 1.9
Subzone 7 197 1.0
Subzone 8 365 2.5
Total 2,241 14.9
A5-291
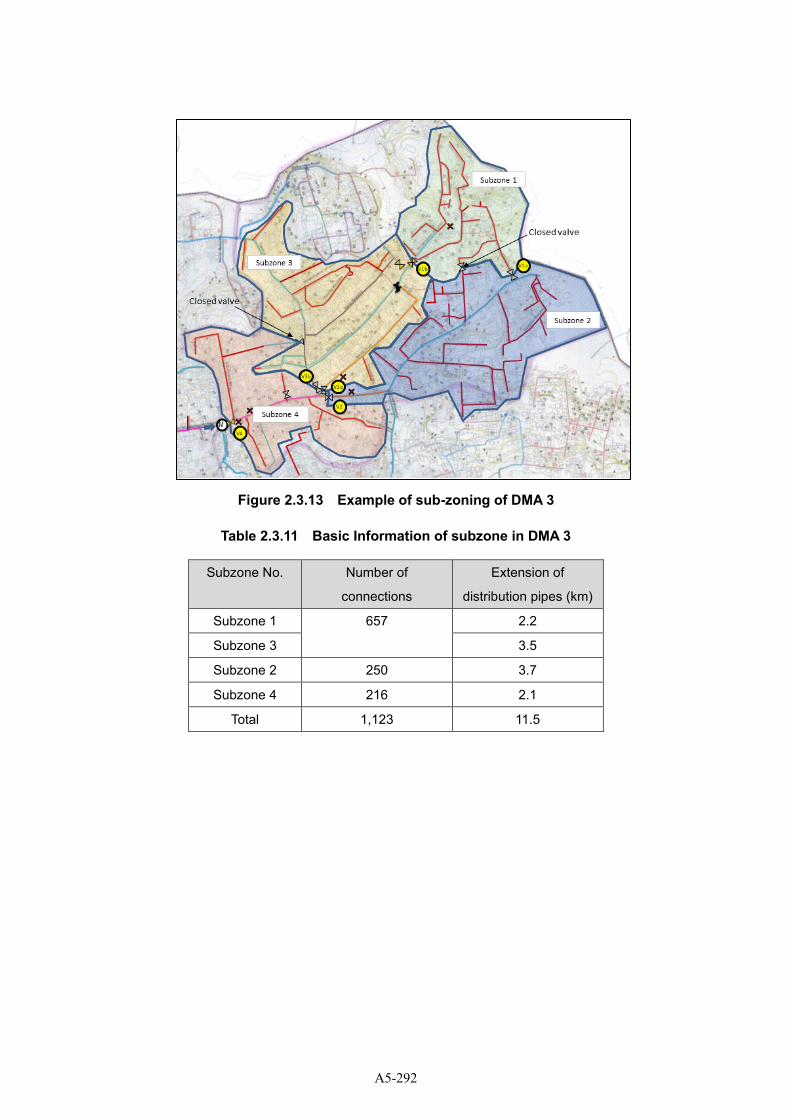
Figure 2.3.13 Example of sub-zoning of DMA 3
Table 2.3.11 Basic Information of subzone in DMA 3
Subzone No. Number of
connections
Extension of
distribution pipes (km)
Subzone 1 657 2.2
Subzone 3 3.5
Subzone 2 250 3.7
Subzone 4 216 2.1
Total 1,123 11.5
A5-292
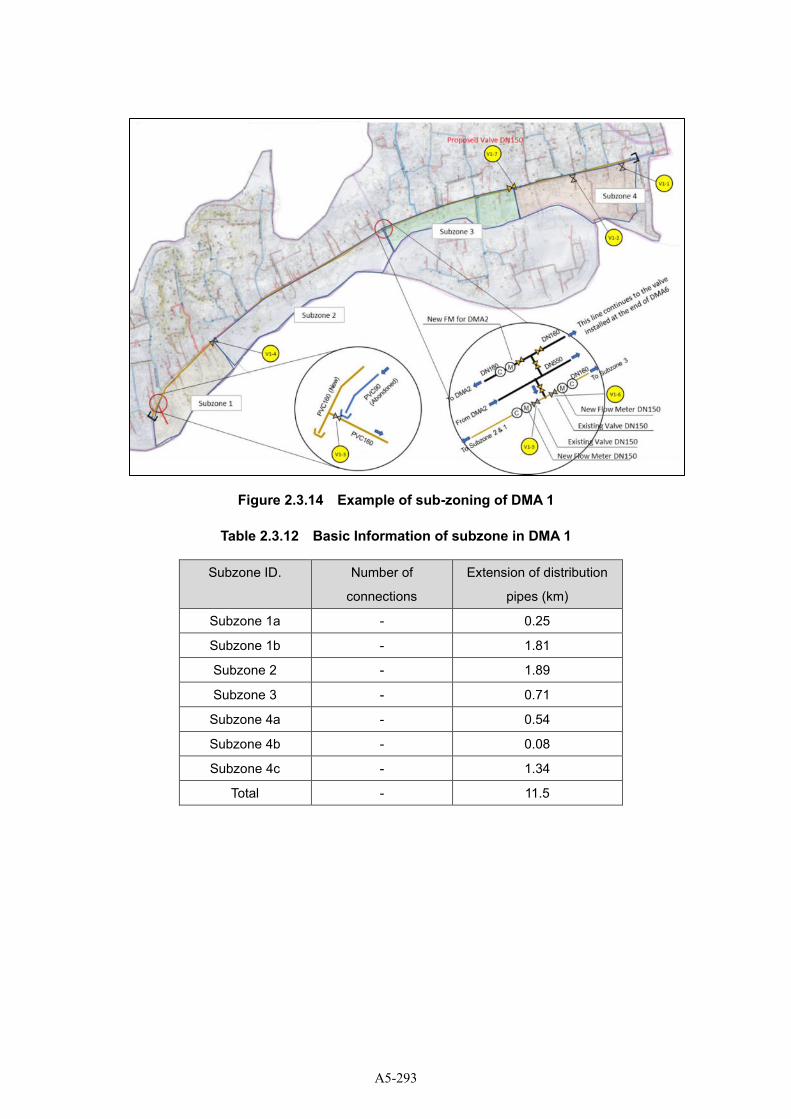
Figure 2.3.14 Example of sub-zoning of DMA 1
Table 2.3.12 Basic Information of subzone in DMA 1
Subzone ID. Number of
connections
Extension of distribution
pipes (km)
Subzone 1a - 0.25
Subzone 1b - 1.81
Subzone 2 - 1.89
Subzone 3 - 0.71
Subzone 4a - 0.54
Subzone 4b - 0.08
Subzone 4c - 1.34
Total - 11.5
A5-293
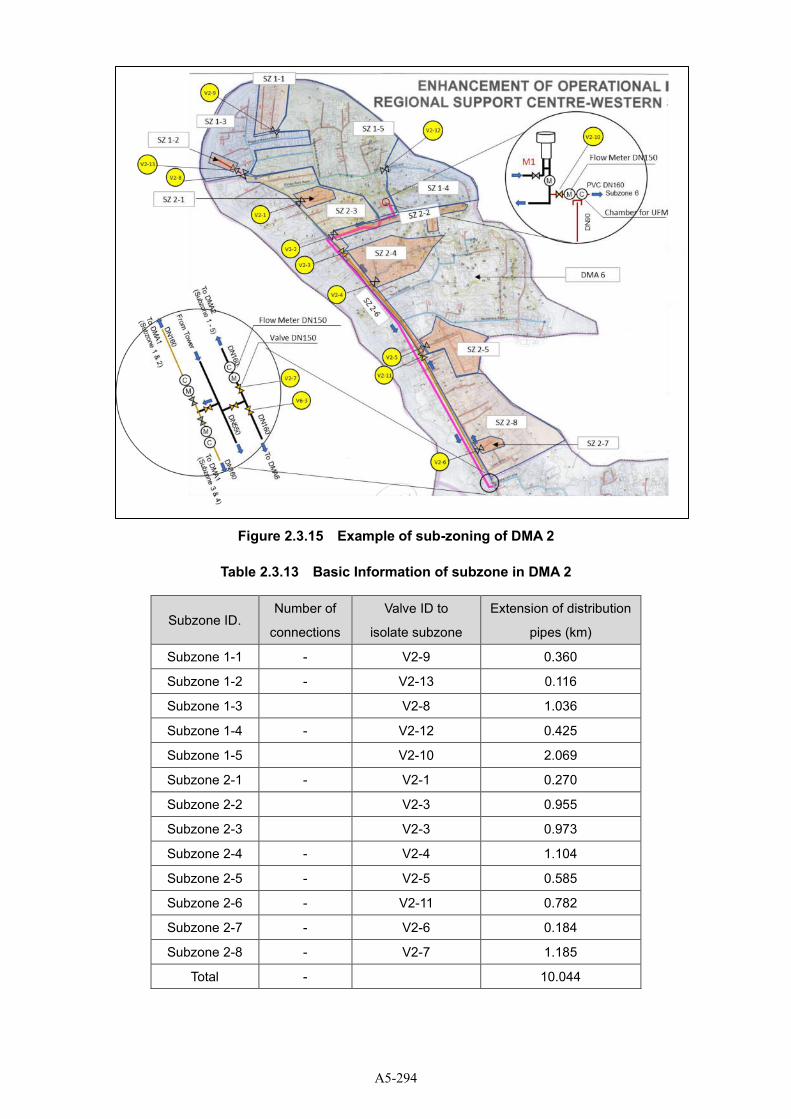
Figure 2.3.15 Example of sub-zoning of DMA 2
Table 2.3.13 Basic Information of subzone in DMA 2
Subzone ID. Number of
connections
Valve ID to
isolate subzone
Extension of distribution
pipes (km)
Subzone 1-1 - V2-9 0.360
Subzone 1-2 - V2-13 0.116
Subzone 1-3 V2-8 1.036
Subzone 1-4 - V2-12 0.425
Subzone 1-5 V2-10 2.069
Subzone 2-1 - V2-1 0.270
Subzone 2-2 V2-3 0.955
Subzone 2-3 V2-3 0.973
Subzone 2-4 - V2-4 1.104
Subzone 2-5 - V2-5 0.585
Subzone 2-6 - V2-11 0.782
Subzone 2-7 - V2-6 0.184
Subzone 2-8 - V2-7 1.185
Total - 10.044
A5-294
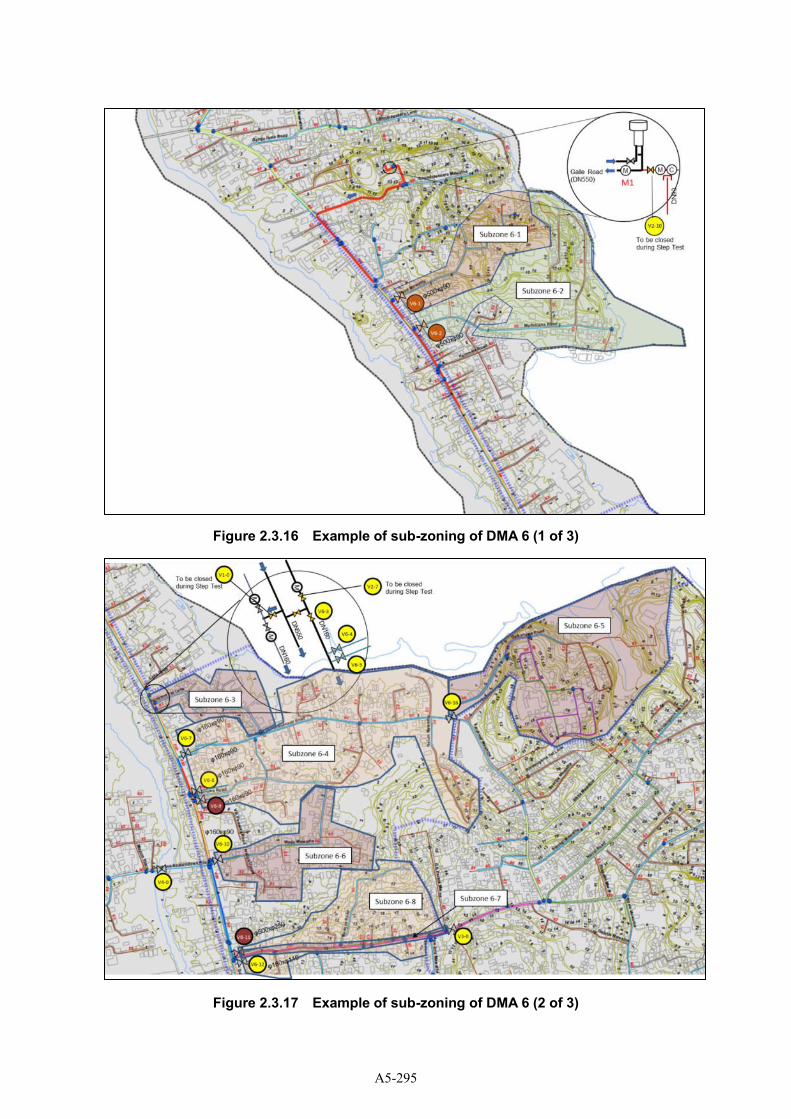
Figure 2.3.16 Example of sub-zoning of DMA 6 (1 of 3)
Figure 2.3.17 Example of sub-zoning of DMA 6 (2 of 3)
A5-295
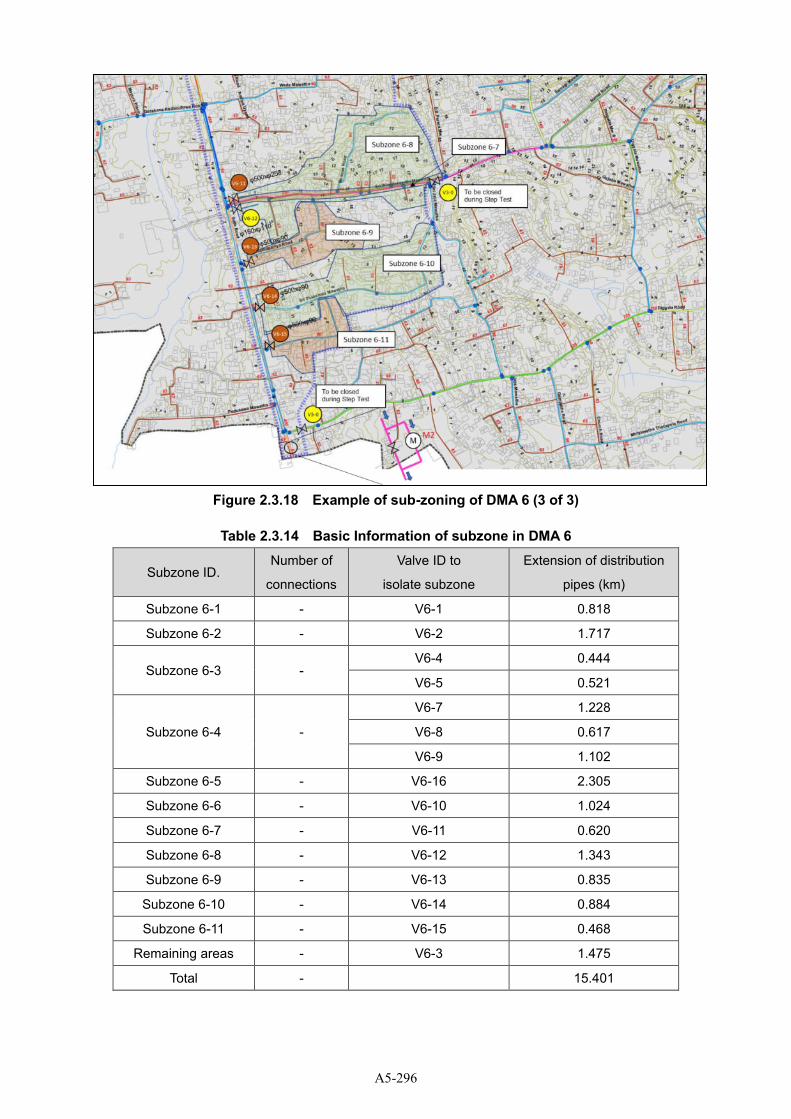
Figure 2.3.18 Example of sub-zoning of DMA 6 (3 of 3)
Table 2.3.14 Basic Information of subzone in DMA 6
Subzone ID. Number of
connections
Valve ID to
isolate subzone
Extension of distribution
pipes (km)
Subzone 6-1 - V6-1 0.818
Subzone 6-2 - V6-2 1.717
Subzone 6-3 - V6-4 0.444
V6-5 0.521
Subzone 6-4 -
V6-7 1.228
V6-8 0.617
V6-9 1.102
Subzone 6-5 - V6-16 2.305
Subzone 6-6 - V6-10 1.024
Subzone 6-7 - V6-11 0.620
Subzone 6-8 - V6-12 1.343
Subzone 6-9 - V6-13 0.835
Subzone 6-10 - V6-14 0.884
Subzone 6-11 - V6-15 0.468
Remaining areas - V6-3 1.475
Total - 15.401
A5-296
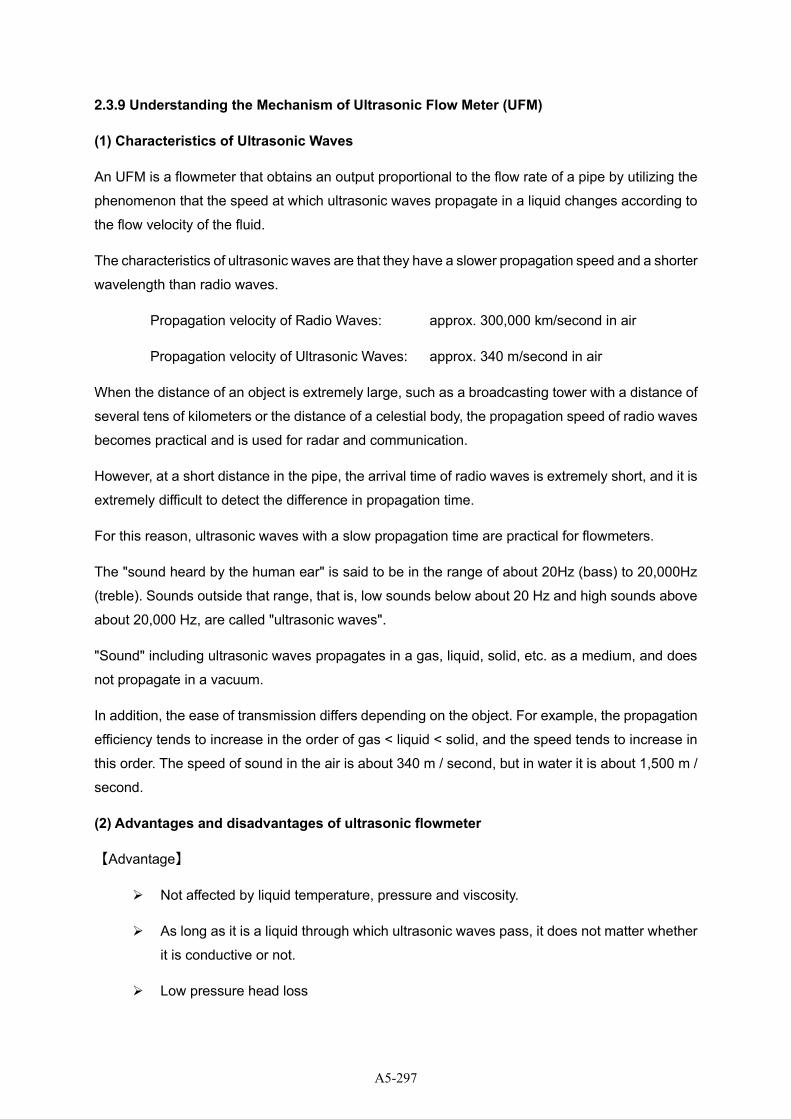
2.3.9 Understanding the Mechanism of Ultrasonic Flow Meter (UFM)
(1) Characteristics of Ultrasonic Waves
An UFM is a flowmeter that obtains an output proportional to the flow rate of a pipe by utilizing the
phenomenon that the speed at which ultrasonic waves propagate in a liquid changes according to
the flow velocity of the fluid.
The characteristics of ultrasonic waves are that they have a slower propagation speed and a shorter
wavelength than radio waves.
Propagation velocity of Radio Waves: approx. 300,000 km/second in air
Propagation velocity of Ultrasonic Waves: approx. 340 m/second in air
When the distance of an object is extremely large, such as a broadcasting tower with a distance of
several tens of kilometers or the distance of a celestial body, the propagation speed of radio waves
becomes practical and is used for radar and communication.
However, at a short distance in the pipe, the arrival time of radio waves is extremely short, and it is
extremely difficult to detect the difference in propagation time.
For this reason, ultrasonic waves with a slow propagation time are practical for flowmeters.
The "sound heard by the human ear" is said to be in the range of about 20Hz (bass) to 20,000Hz
(treble). Sounds outside that range, that is, low sounds below about 20 Hz and high sounds above
about 20,000 Hz, are called "ultrasonic waves".
"Sound" including ultrasonic waves propagates in a gas, liquid, solid, etc. as a medium, and does
not propagate in a vacuum.
In addition, the ease of transmission differs depending on the object. For example, the propagation
efficiency tends to increase in the order of gas < liquid < solid, and the speed tends to increase in
this order. The speed of sound in the air is about 340 m / second, but in water it is about 1,500 m /
second.
(2) Advantages and disadvantages of ultrasonic flowmeter
【Advantage】
➢ Not affected by liquid temperature, pressure and viscosity.
➢ As long as it is a liquid through which ultrasonic waves pass, it does not matter whether
it is conductive or not.
➢ Low pressure head loss
A5-297
➢ One flow meter can measure a wide range of flow rates.
➢ In the case of the clamp-on type that can be set on the outside of the pipe, pipe cutting
work is not required.
➢ Since the structure is symmetrical upstream and downstream, it is possible to measure
the flow in the opposite direction.
➢ The response speed is fast and it can follow the pulsatile flow.
【Disadvantage】
➢ If air bubbles, foreign substances, etc. are mixed in the liquid, an error will occur.
➢ Rust and deterioration of the inner surface of the pipe affect the measurement accuracy.
➢ Straight sections are required in the upstream and downstream parts.
➢ Clamp-on type measurement accuracy is about 2 to 3% of full scale.
(3) Measurement principle of ultrasonic flowmeter
The type of ultrasonic flowmeter currently on the market is mainly the " Transit Time" type.
【Transit Time Method】
Figure 2.3.19 Principle of UFM
Several transducers (ultrasonic sensors) are placed in a pipe at a predetermined position to
alternately transmit and receive ultrasonic waves.
When there is no flow, the time for ultrasonic waves to propagate from upstream A to
downstream B (Tab) is equal to the time for ultrasonic waves to propagate from B to A (Tba).
When there is a flow in the tube, the ultrasonic waves transmitted from A to B are in the forward
direction of the flow, so they propagate faster than when there is no flow. On the contrary, when
A5-298
it travels from B to A, it opposes the flow, so the propagation time is slower than when there is
no flow.
The ultrasonic flowmeter detects such a difference in propagation time and calculates the flow
velocity of the fluid by the principle formula. The calculated value is the average flow velocity,
and the flow rate is calculated by multiplying this by the cross-sectional area in the pipe.
【Calculation Formla】
V: Flow velocity of liquid
Tab: Transit time of ultrasonic waves from upstream to downstream
Tba: Transit time of ultrasonic waves from downstream to upstream
L: Transit Distance
C: Velocity of sound in liquid
θ: Angle between the flow direction and the propagation direction of ultrasonic waves
With above-mentioned factors, we can get the following formula:
Tab=L/(C+V・cosθ) and Tba=L/(C – V・cosθ)
From these two formula, we can get “V” value as follows:
V=(L / 2・cosθ)・(1/Tab – 1/Tba)
When we set Q as flow volume, and D as diameter, we can get a following formula:
Q=(π・D2/4)・V
A5-299
Figure 2.3.20 Calculation of velocity with difference of transit times (ΔT)
It should be noted that the above-mentioned calculation formula is a simplification and is not
strictly correct.
The flow velocity V for converting to the flow rate must be the average flow velocity of the entire
pipe cross section.
However, the flow velocity measured by the ultrasonic flowmeter is the average flow velocity
on the path through which the ultrasonic waves propagate (called the line average flow
velocity), not the average flow velocity of the surface.
Therefore there is an error between “Line Average Flow Velocity” and “Surface Average Flow
Velocity”.
In an actual flow meter, the detected flow velocity value is corrected to the surface average
flow velocity by the "flow rate correction coefficient", and then the flow velocity is calculated by
multiplying the cross-sectional area.
A5-300
(4) How to install the transducers
【V Method】
Figure 2.3.21 Setting of transducers in V method
This is the most basic and simple installation method, and is called the reflect mode.
Since the transducer (sensor) can be fixed to one guide rail and attached to the pipe, it is easy
to set the distance between the sensors accurately.
If the resin pipe (PVC or PE), large-diameter pipe, or inner surface is treated with mortar lining,
the V method may not be able to receive the signal well.
Normally, the V method is selected, but in the following cases, the Z method, etc. is applied.
➢ When the installation space is small
➢ When the turbidity of the liquid is high
➢ When the received wave signal is weak
➢ When the scale is thickly attached to the inner surface of the pipe
【Z Method】
Figure 2.3.22 Setting of transducers in Z method
The Z method is known as direct mode.
Since the propagation path of ultrasonic waves can be shortened, it can be applied to flow rate
measurement under fluid or pipe conditions where ultrasonic wave propagation conditions are
not good.
Since synthetic resins such as PVC or PE are less likely to propagate ultrasonic waves than
metal pipes, it is recommended to use the Z method if the material of the tube to be measured
A5-301
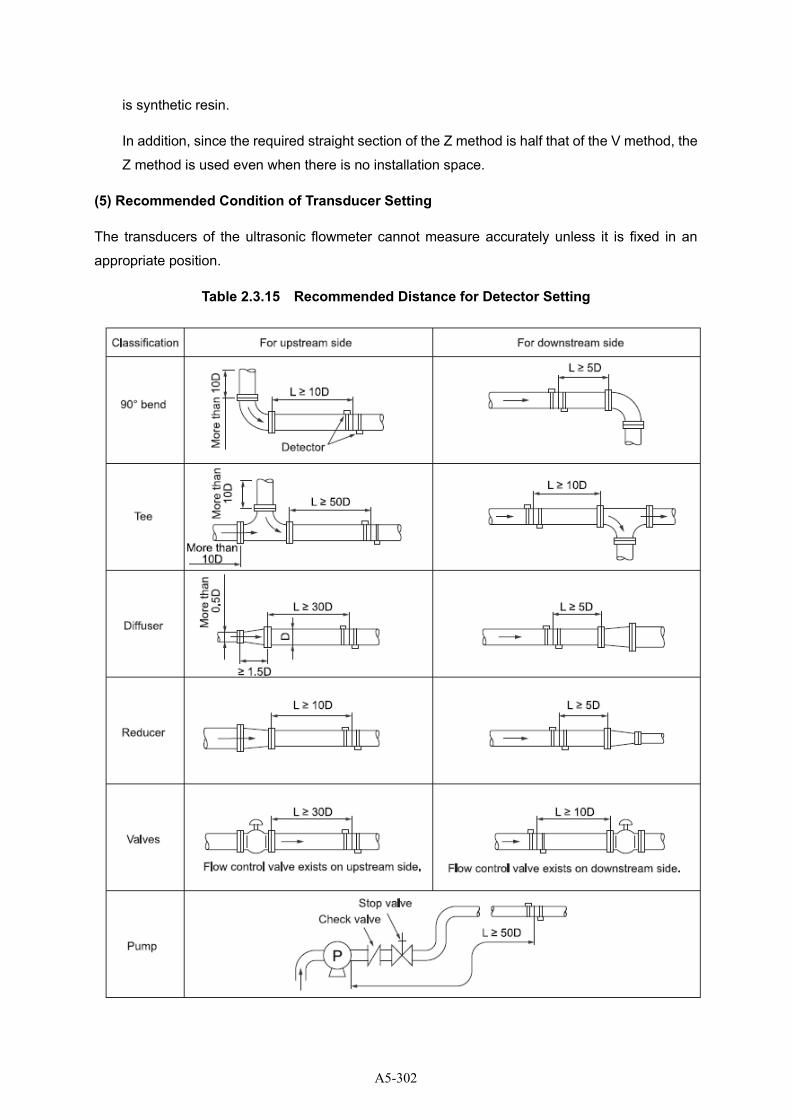
is synthetic resin.
In addition, since the required straight section of the Z method is half that of the V method, the
Z method is used even when there is no installation space.
(5) Recommended Condition of Transducer Setting
The transducers of the ultrasonic flowmeter cannot measure accurately unless it is fixed in an
appropriate position.
Table 2.3.15 Recommended Distance for Detector Setting
A5-302
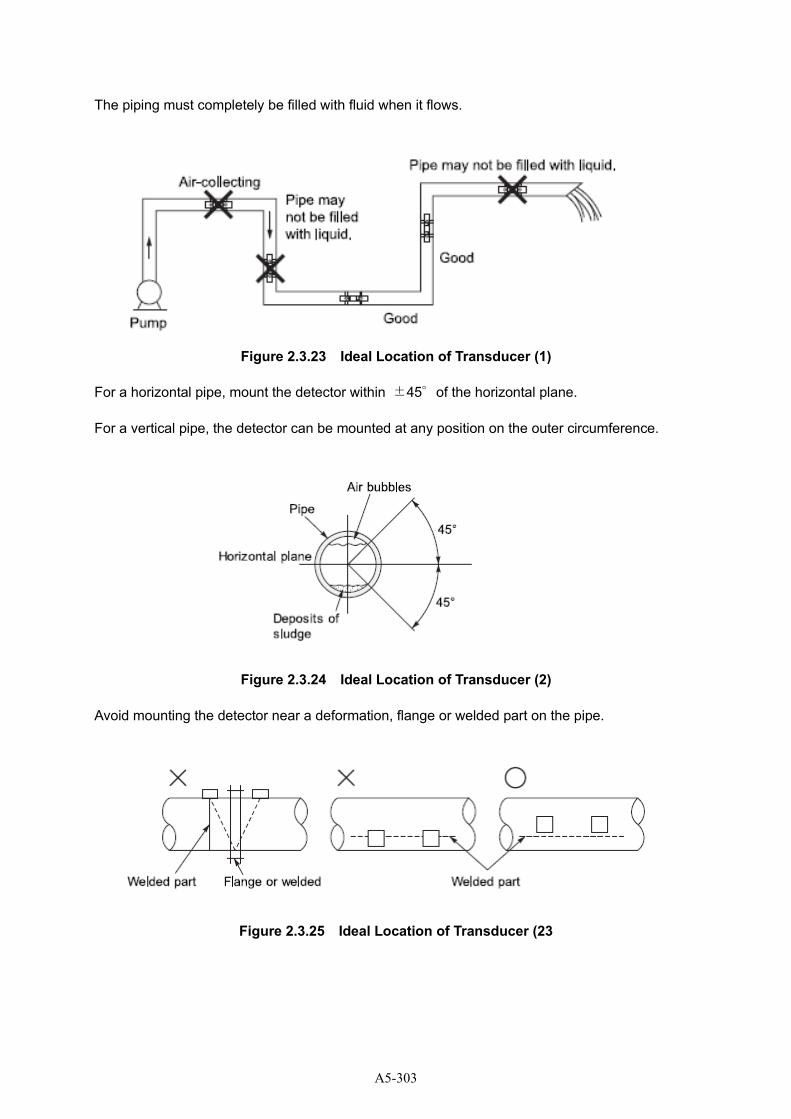
The piping must completely be filled with fluid when it flows.
Figure 2.3.23 Ideal Location of Transducer (1)
For a horizontal pipe, mount the detector within ±45°of the horizontal plane.
For a vertical pipe, the detector can be mounted at any position on the outer circumference.
Figure 2.3.24 Ideal Location of Transducer (2)
Avoid mounting the detector near a deformation, flange or welded part on the pipe.
Figure 2.3.25 Ideal Location of Transducer (23
A5-303
(6) Understanding Accuracy of UFM
All flow meters have an error in the equipment itself and it also applies to the ultrasonic flowmeter.
Since the transducer is installed by a human, the position and accuracy of its installation greatly
affect the error.
1) Influence of flow velocity
Since the ultrasonic flowmeter measures the flow velocity in principle, the guaranteed accuracy
differs depending on the flow velocity of the flowing water.
Normally, if the flow velocity is 2 m / second or more, the measurement accuracy is very stable,
but it should be noted that the slower the flow velocity, the larger the error.
Table 2.3.16 Guaranteed accuracy of ultrasonic flowmeter
Diameter Range of velocity Accuracy
13mm ~ 90mm 1 m/sec or more +/-2.5% of reading value
Less than 1 m/sec +/-0.02 m/sec (*1)
100mm ~ 250mm 1 m/sec or more +/-1.5% of reading value
Less than 1 m/sec +/-0.015 m/sec
300mm ~ 5000mm 1 m/sec or more +/-1.0% of reading value
Less than 1 m/sec +/-0.01 m/sec
Source: Instruction Manual of UFP 20, Tokyo Keiki
【Example of accuracy calculation(*1)】
In case of Pipe of DN 50mm
Accuracy is ±0.02 m/sec under 0.9 m/sec of velocity
±0.02 = 0.9 m/sec × E/100
E = ±0.02×100/0.9 = ±2.2 (%)
Accuracy is ±0.02 m/sec under 0.5 m/sec of velocity
±0.02 = 0.5 m/sec × E/100
E = ±0.02×100/0.5 = ±4.0 (%)
2) Influence of error of diameter
It the diameter of the pipe to be input is not correct. It affects the measuring result. As a rough calculation, if the difference of diameter is 1%, the reading flow rate will have about 3% of error after conversion of flow rate.
A5-304
Table 2.3.17 Comparison of area value under difference diameter
Inner Diameter
99mm
(Area: 0.007694m2)
100mm
(Area: 0.007850m2)
101mm
Area: 0.008008m2)
V=0.5m/sec 0.003847 m3/sec 0.003925 m3/sec 0.004004 m3/sec
The following example shows the flow rate error when the inner diameter values differ by 1 mm.
Figure 2.3.26 Influence of 1 mm of difference of inner diameter on flow rate error
3) Influence of transducer mounting interval
As a rough calculation, an error of +/- 1mm of distance between two transducers will result in a flow rate error of less than 1%.
Figure 2.3.27 Influence of 1 mm of difference of transducer spacing on flow rate error
(7) Comparison with the measured value of the bulk meter
Thermometers and pressure gauges are easy to calibrate on-site, but flowmeters are difficult to
calibrate. When using an ultrasonic flowmeter to check the accuracy of other flowmeters, the
Pipe Diameter
Erro
r
Pipe Diameter
Erro
r
A5-305
following points must be carefully considered.
➢ Consider each other's errors in the flowmeters.
Estimate the calibration error by paying attention to the accuracy notation (FS%, RS%)
of each flow meter.
➢ Collect and consider systematic data if there are differences
Instead of comparing with the flow rate of only one point, write the measurement data in
multiple flow rate ranges on a graph and evaluate it.
➢ Check the piping system thoroughly.
Even if you think that the piping system is the same, the evaluation may be wrong if it
flows in or out from a branch pipe in the middle.
➢ It is difficult to compare two flow meters
Normally, if there is a difference between the measured values of the two flow meters, it
is difficult to determine which is correct on site. It is necessary to confirm the standard
criteria such as the water flow capacity of the pump and the change in the tank water
level for which the capacity is known.
A5-306
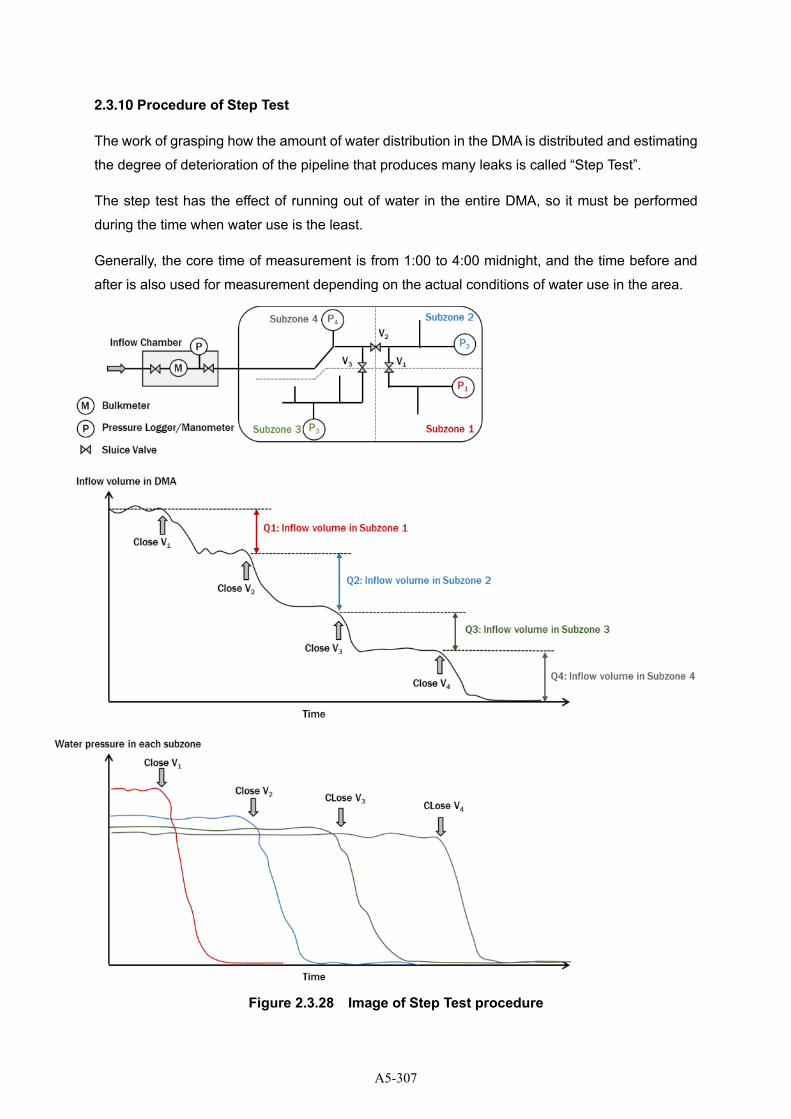
2.3.10 Procedure of Step Test
The work of grasping how the amount of water distribution in the DMA is distributed and estimating
the degree of deterioration of the pipeline that produces many leaks is called “Step Test”.
The step test has the effect of running out of water in the entire DMA, so it must be performed
during the time when water use is the least.
Generally, the core time of measurement is from 1:00 to 4:00 midnight, and the time before and
after is also used for measurement depending on the actual conditions of water use in the area.
Figure 2.3.28 Image of Step Test procedure
A5-307
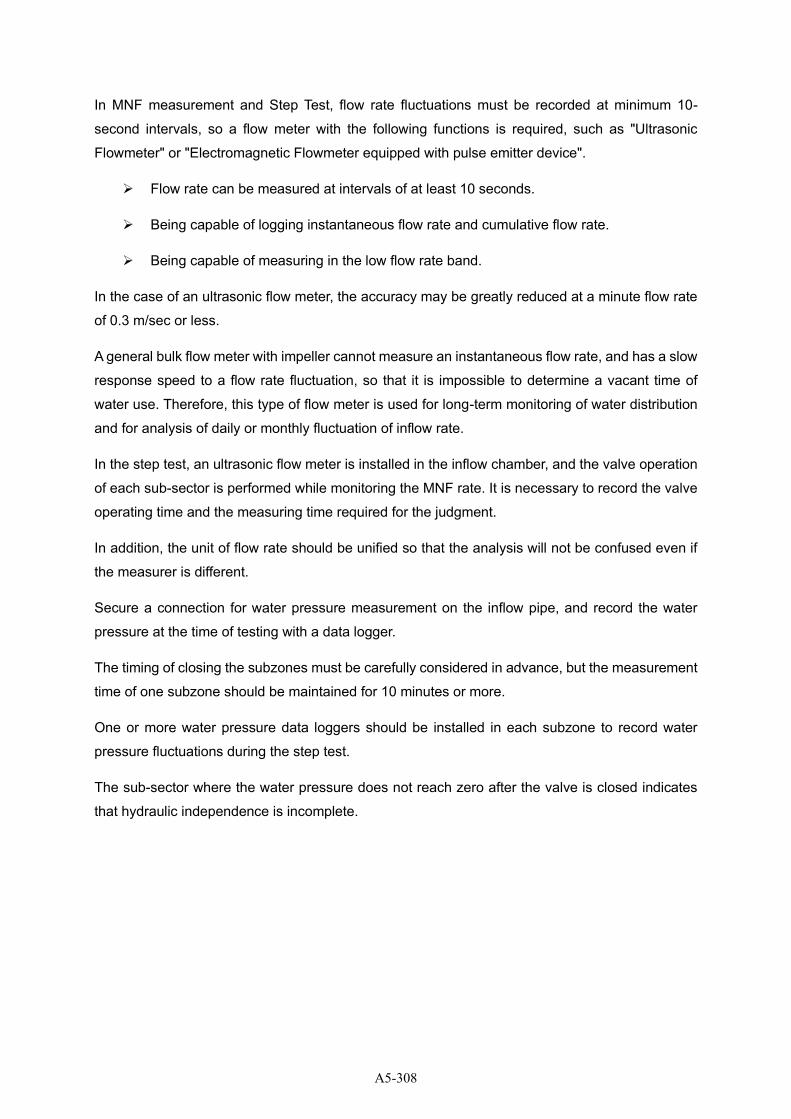
In MNF measurement and Step Test, flow rate fluctuations must be recorded at minimum 10-
second intervals, so a flow meter with the following functions is required, such as "Ultrasonic
Flowmeter" or "Electromagnetic Flowmeter equipped with pulse emitter device".
➢ Flow rate can be measured at intervals of at least 10 seconds.
➢ Being capable of logging instantaneous flow rate and cumulative flow rate.
➢ Being capable of measuring in the low flow rate band.
In the case of an ultrasonic flow meter, the accuracy may be greatly reduced at a minute flow rate
of 0.3 m/sec or less.
A general bulk flow meter with impeller cannot measure an instantaneous flow rate, and has a slow
response speed to a flow rate fluctuation, so that it is impossible to determine a vacant time of
water use. Therefore, this type of flow meter is used for long-term monitoring of water distribution
and for analysis of daily or monthly fluctuation of inflow rate.
In the step test, an ultrasonic flow meter is installed in the inflow chamber, and the valve operation
of each sub-sector is performed while monitoring the MNF rate. It is necessary to record the valve
operating time and the measuring time required for the judgment.
In addition, the unit of flow rate should be unified so that the analysis will not be confused even if
the measurer is different.
Secure a connection for water pressure measurement on the inflow pipe, and record the water
pressure at the time of testing with a data logger.
The timing of closing the subzones must be carefully considered in advance, but the measurement
time of one subzone should be maintained for 10 minutes or more.
One or more water pressure data loggers should be installed in each subzone to record water
pressure fluctuations during the step test.
The sub-sector where the water pressure does not reach zero after the valve is closed indicates
that hydraulic independence is incomplete.
A5-308
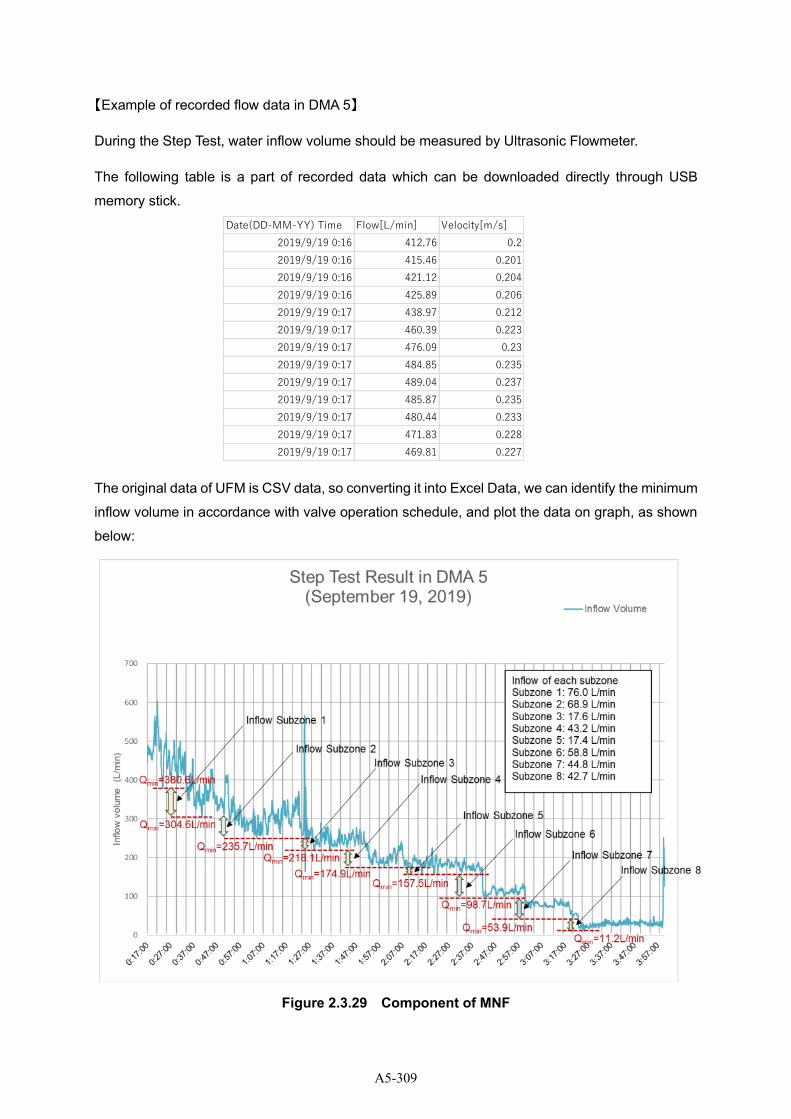
【Example of recorded flow data in DMA 5】
During the Step Test, water inflow volume should be measured by Ultrasonic Flowmeter.
The following table is a part of recorded data which can be downloaded directly through USB
memory stick.
The original data of UFM is CSV data, so converting it into Excel Data, we can identify the minimum
inflow volume in accordance with valve operation schedule, and plot the data on graph, as shown
below:
Figure 2.3.29 Component of MNF
Date(DD-MM-YY) Time Flow[L/min] Velocity[m/s]
2019/9/19 0:16 412.76 0.2
2019/9/19 0:16 415.46 0.201
2019/9/19 0:16 421.12 0.204
2019/9/19 0:16 425.89 0.206
2019/9/19 0:17 438.97 0.212
2019/9/19 0:17 460.39 0.223
2019/9/19 0:17 476.09 0.23
2019/9/19 0:17 484.85 0.235
2019/9/19 0:17 489.04 0.237
2019/9/19 0:17 485.87 0.235
2019/9/19 0:17 480.44 0.233
2019/9/19 0:17 471.83 0.228
2019/9/19 0:17 469.81 0.227
A5-309
2.3.11 Calculation of amount of leaked water
The MNF rate measured in DMA includes the amount of water used at night and the amount of
illegal water used in addition to water leakage.
Especially when each household has a water storage tank and water is continuously stored at night,
MNF contains a considerable amount of water used, it is necessary to notify residents in advance
or secure closure of meter valves.
The component of the amount of water contained in the MNF is shown below.
Figure 2.3.30 Component of MNF
The value of MNF will be gradually lowered by the leak detection and repair.
The reduced amount of water leakage can be calculated by performing MNF measurement and
step test again when all the measures for water leakage have been completed.
Figure 2.3.31 Monitoring of Minimum Night Flow
1st Test Before Repair
2nd. Test After Repair
MNF=59.3 L/min (3.6 m3/h)
MNF=35.2 L/min (2.1 m3/h) Consume & others
Remaining leakage
Consume & others
Remaining leakage
-1.5 m3/h
A5-310
2.3.12 Measurement of Water Supply Pressure
(1) Purpose of Pressure Measurement
Water pressure is an important factor to consider the potential area of leakage or proper water
supply etc. The examples which can be evaluated by water pressure are as below.
➢ Area of high water pressure and high risk of leakage
➢ Area of where the water pressure is less than 10 bar during daytime
➢ Area of water pressure fluctuation between daytime and nighttime is large
It is necessary to measure water pressure at multiple points to evaluate whole target area. The
example of multiple measurement of water pressure and the visualization of water pressure in
target area are shown below.
Figure 2.3.32 Multiple measurement of water pressure
A5-311
Figure 2.3.33 Visualization of water pressure
The pressure distribution map allows us to understand the following situation:
➢ Where is the water pressure during the daytime less than 10 bar?
➢ Which route has a high maximum water pressure and a high risk of water leakage?
➢ Where is the area where the water pressure is low even though the pipe diameter is
sufficient?
➢ Where is the area where the water pressure fluctuation during daytime and nighttime is
large and the water supply demand is large?
(2) Use of Pressure Datalogger
A port for pressure measurement should be provided in the DMA inflow pipe using a tapping saddle
and a ball valve (incorporation valve).
Figure 2.3.34 Installation of pressure data logger
A5-312
(2) Log Sampling Interval
Since the water pressure fluctuates according to changes in the amount of water in the distribution
network, it is necessary to set an appropriate interval according to the purpose of measurement.
Table 2.3.18 Recommended interval for each purpose
Logging Interval Purpose
1 second Suitable for observing instantaneous water pressure fluctuations. Especially
analysis of water pressure fluctuations and water hammer pressure in pump water
pipes, etc. There is also a high-precision Logger that can record in 1/100 second.
10 seconds Suitable for detailed analysis of water supply pressure in DMA. It is also possible
to estimate the household use hours and usage patterns from water pressure
fluctuations, and it will be the basic data for considering the renewal of the pipe
network.
1 minute Suitable for monitoring water pressure fluctuations in the distribution network.
If there is a large fluctuation in units of 1 min, shorten the interval and measure
again.
Using the measured water pressure data, the water pressure fluctuation for each time zone is
summarized as follows.
This is the key data used to estimate the actual amount of leak reduction.
Figure 2.3.35 Water fluctuation pattern
25.85
6.73 7.43
10.58
0
5
10
15
20
25
30
35
40
45
0:00-6:00 6:00-12:00 12:00-18:00 18:00-24:00
m-H2O
Time range
Average Water Supply Pressure in DMA 3
(DMA Inlet on August 29, 2020)
0
5
10
15
20
25
30
35
40
45
m-H2O
Time
Water Supply Pressure in DMA 3
(DMA Inlet on August 29, 2020)DMA Inlet
A5-313
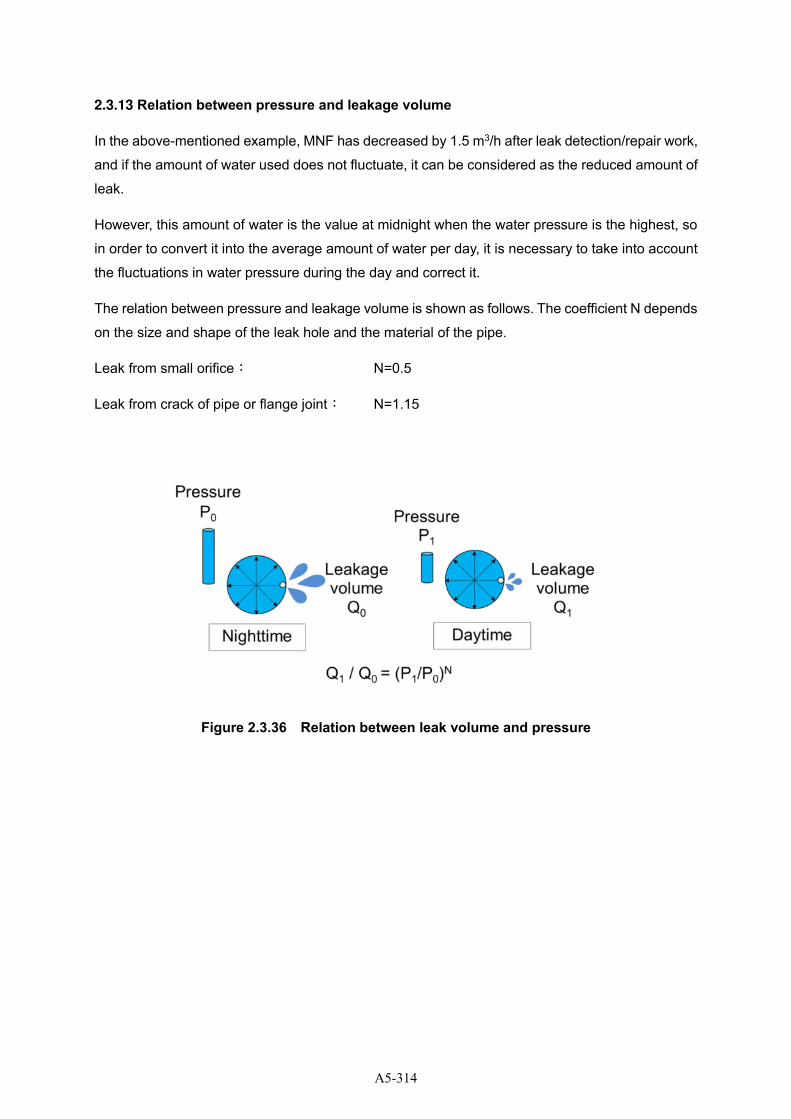
2.3.13 Relation between pressure and leakage volume
In the above-mentioned example, MNF has decreased by 1.5 m3/h after leak detection/repair work,
and if the amount of water used does not fluctuate, it can be considered as the reduced amount of
leak.
However, this amount of water is the value at midnight when the water pressure is the highest, so
in order to convert it into the average amount of water per day, it is necessary to take into account
the fluctuations in water pressure during the day and correct it.
The relation between pressure and leakage volume is shown as follows. The coefficient N depends
on the size and shape of the leak hole and the material of the pipe.
Leak from small orifice: N=0.5
Leak from crack of pipe or flange joint: N=1.15
Figure 2.3.36 Relation between leak volume and pressure
A5-314
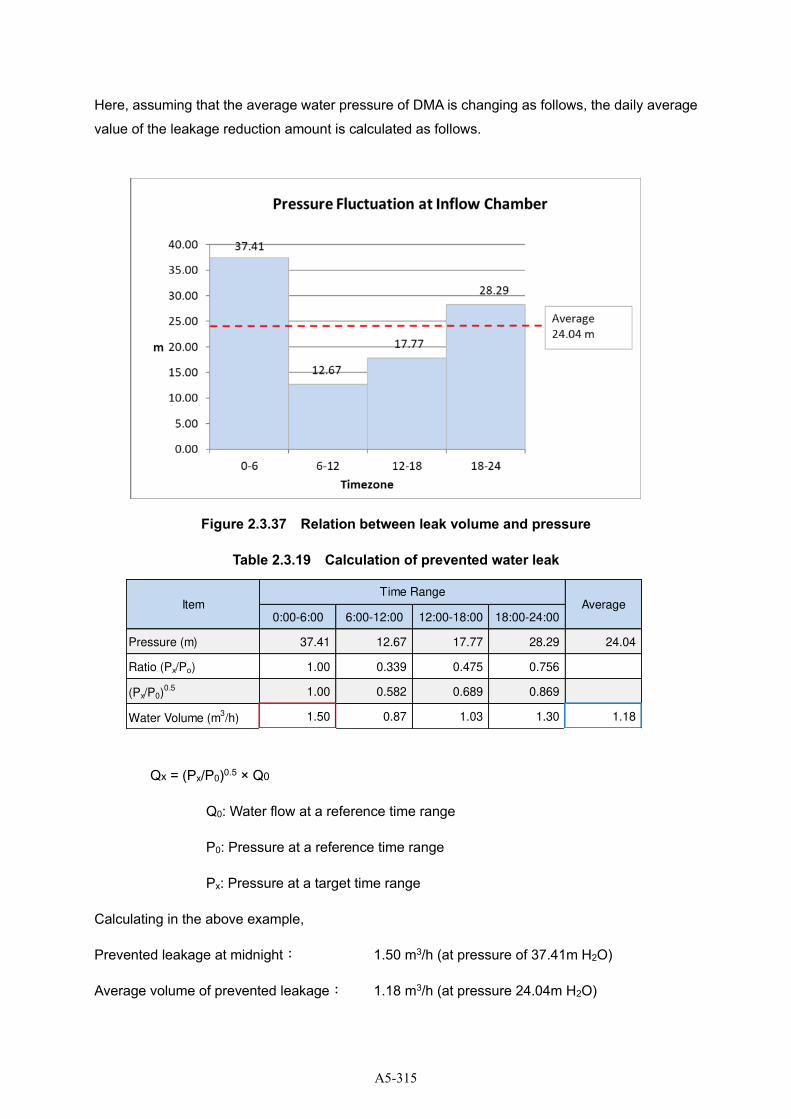
Here, assuming that the average water pressure of DMA is changing as follows, the daily average
value of the leakage reduction amount is calculated as follows.
Figure 2.3.37 Relation between leak volume and pressure
Table 2.3.19 Calculation of prevented water leak
Qx = (Px/P0)0.5 × Q0
Q0: Water flow at a reference time range
P0: Pressure at a reference time range
Px: Pressure at a target time range
Calculating in the above example,
Prevented leakage at midnight: 1.50 m3/h (at pressure of 37.41m H2O)
Average volume of prevented leakage: 1.18 m3/h (at pressure 24.04m H2O)
0:00-6:00 6:00-12:00 12:00-18:00 18:00-24:00
Pressure (m) 37.41 12.67 17.77 28.29 24.04
Ratio (Px/Po) 1.00 0.339 0.475 0.756
(Px/P0)0.5 1.00 0.582 0.689 0.869
Water Volume (m3/h) 1.50 0.87 1.03 1.30 1.18
ItemTime Range
Average
A5-315
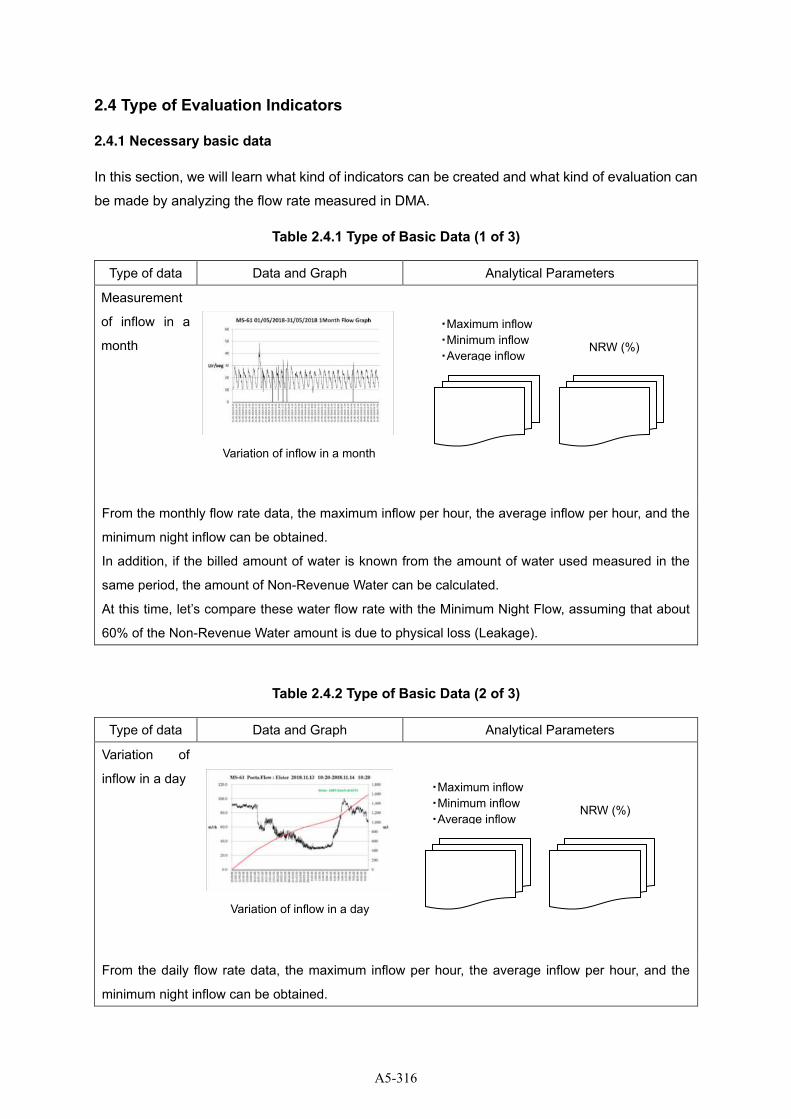
2.4 Type of Evaluation Indicators
2.4.1 Necessary basic data
In this section, we will learn what kind of indicators can be created and what kind of evaluation can
be made by analyzing the flow rate measured in DMA.
Table 2.4.1 Type of Basic Data (1 of 3)
Type of data Data and Graph Analytical Parameters
Measurement
of inflow in a
month
From the monthly flow rate data, the maximum inflow per hour, the average inflow per hour, and the
minimum night inflow can be obtained.
In addition, if the billed amount of water is known from the amount of water used measured in the
same period, the amount of Non-Revenue Water can be calculated.
At this time, let’s compare these water flow rate with the Minimum Night Flow, assuming that about
60% of the Non-Revenue Water amount is due to physical loss (Leakage).
Table 2.4.2 Type of Basic Data (2 of 3)
Type of data Data and Graph Analytical Parameters
Variation of
inflow in a day
From the daily flow rate data, the maximum inflow per hour, the average inflow per hour, and the
minimum night inflow can be obtained.
・Maximum inflow
・Minimum inflow
・Average inflow NRW (%)
Variation of inflow in a month
Variation of inflow in a day
・Maximum inflow
・Minimum inflow
・Average inflow NRW (%)
A5-316
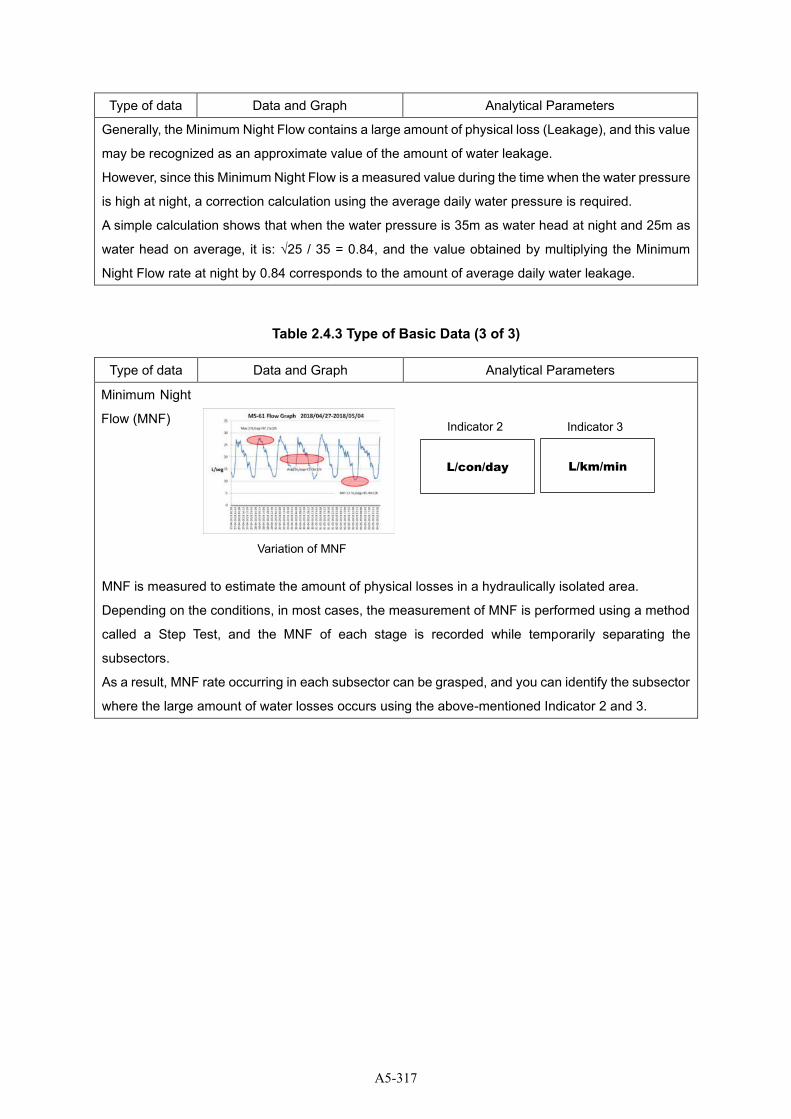
Type of data Data and Graph Analytical Parameters
Generally, the Minimum Night Flow contains a large amount of physical loss (Leakage), and this value
may be recognized as an approximate value of the amount of water leakage.
However, since this Minimum Night Flow is a measured value during the time when the water pressure
is high at night, a correction calculation using the average daily water pressure is required.
A simple calculation shows that when the water pressure is 35m as water head at night and 25m as
water head on average, it is: √25 / 35 = 0.84, and the value obtained by multiplying the Minimum
Night Flow rate at night by 0.84 corresponds to the amount of average daily water leakage.
Table 2.4.3 Type of Basic Data (3 of 3)
Type of data Data and Graph Analytical Parameters
Minimum Night
Flow (MNF)
MNF is measured to estimate the amount of physical losses in a hydraulically isolated area.
Depending on the conditions, in most cases, the measurement of MNF is performed using a method
called a Step Test, and the MNF of each stage is recorded while temporarily separating the
subsectors.
As a result, MNF rate occurring in each subsector can be grasped, and you can identify the subsector
where the large amount of water losses occurs using the above-mentioned Indicator 2 and 3.
L/con/day
Indicator 2
L/km/min
Indicator 3
Variation of MNF
A5-317
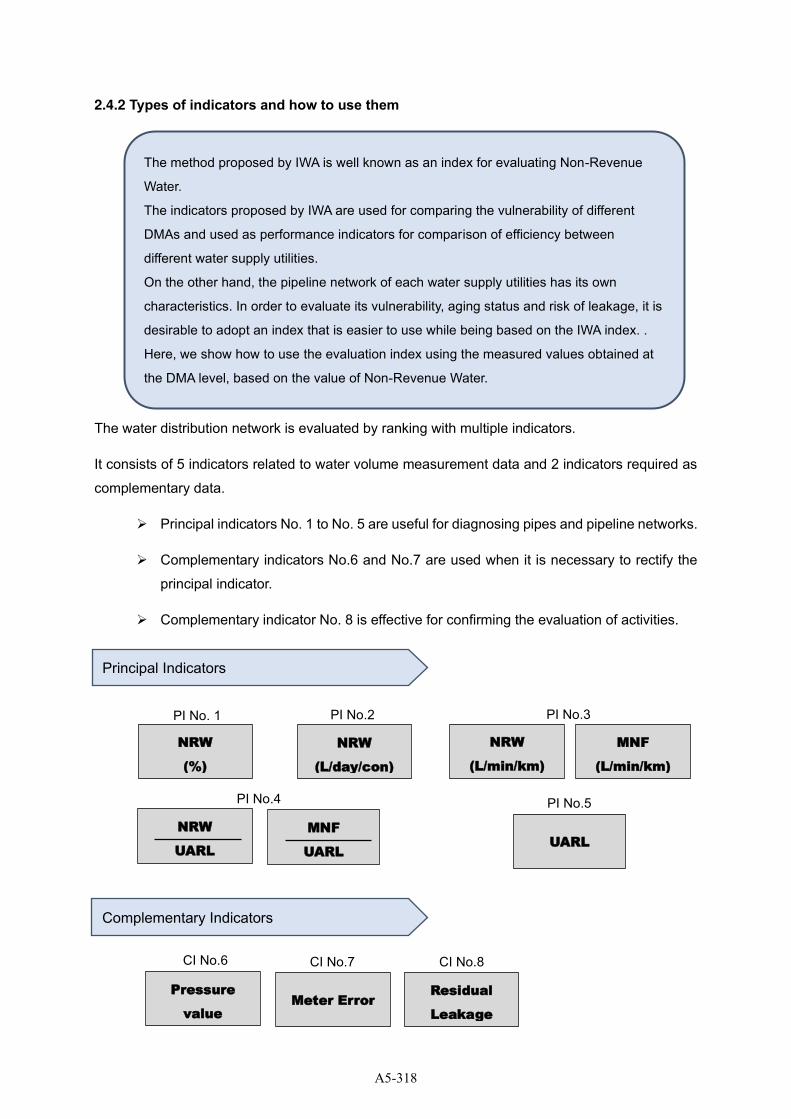
2.4.2 Types of indicators and how to use them
The water distribution network is evaluated by ranking with multiple indicators.
It consists of 5 indicators related to water volume measurement data and 2 indicators required as
complementary data.
➢ Principal indicators No. 1 to No. 5 are useful for diagnosing pipes and pipeline networks.
➢ Complementary indicators No.6 and No.7 are used when it is necessary to rectify the
principal indicator.
➢ Complementary indicator No. 8 is effective for confirming the evaluation of activities.
Complementary Indicators
Principal Indicators
Pressure
value
CI No.6
Meter Error
CI No.7
Residual
Leakage
CI No.8
NRW
(L/min/km)
PI No.3
NRW
(%)
PI No. 1
NRW
(L/day/con)
PI No.2
NRW
UARL
PI No.4
UARL
PI No.5
MNF
(L/min/km)
MNF
UARL
The method proposed by IWA is well known as an index for evaluating Non-Revenue
Water.
The indicators proposed by IWA are used for comparing the vulnerability of different
DMAs and used as performance indicators for comparison of efficiency between
different water supply utilities.
On the other hand, the pipeline network of each water supply utilities has its own
characteristics. In order to evaluate its vulnerability, aging status and risk of leakage, it is
desirable to adopt an index that is easier to use while being based on the IWA index. .
Here, we show how to use the evaluation index using the measured values obtained at
the DMA level, based on the value of Non-Revenue Water.
A5-318
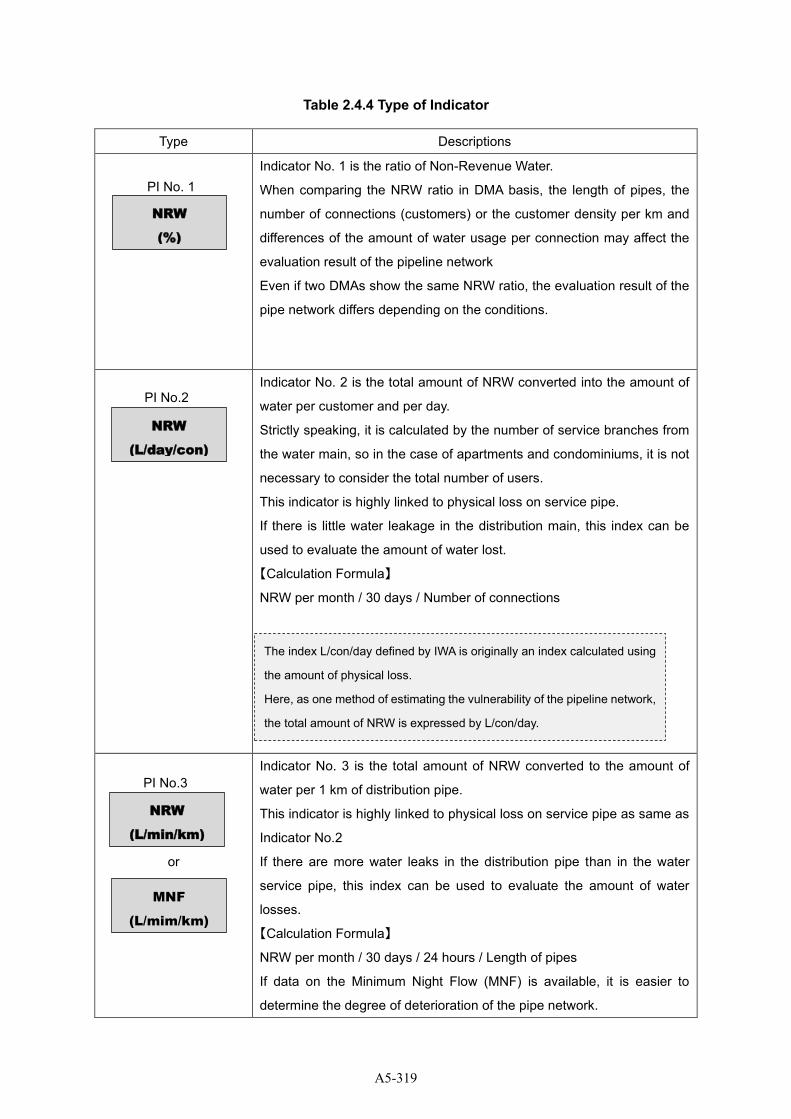
Table 2.4.4 Type of Indicator
Type Descriptions
Indicator No. 1 is the ratio of Non-Revenue Water.
When comparing the NRW ratio in DMA basis, the length of pipes, the
number of connections (customers) or the customer density per km and
differences of the amount of water usage per connection may affect the
evaluation result of the pipeline network
Even if two DMAs show the same NRW ratio, the evaluation result of the
pipe network differs depending on the conditions.
Indicator No. 2 is the total amount of NRW converted into the amount of
water per customer and per day.
Strictly speaking, it is calculated by the number of service branches from
the water main, so in the case of apartments and condominiums, it is not
necessary to consider the total number of users.
This indicator is highly linked to physical loss on service pipe.
If there is little water leakage in the distribution main, this index can be
used to evaluate the amount of water lost.
【Calculation Formula】
NRW per month / 30 days / Number of connections
or
Indicator No. 3 is the total amount of NRW converted to the amount of
water per 1 km of distribution pipe.
This indicator is highly linked to physical loss on service pipe as same as
Indicator No.2
If there are more water leaks in the distribution pipe than in the water
service pipe, this index can be used to evaluate the amount of water
losses.
【Calculation Formula】
NRW per month / 30 days / 24 hours / Length of pipes
If data on the Minimum Night Flow (MNF) is available, it is easier to
determine the degree of deterioration of the pipe network.
The index L/con/day defined by IWA is originally an index calculated using
the amount of physical loss.
Here, as one method of estimating the vulnerability of the pipeline network,
the total amount of NRW is expressed by L/con/day.
NRW
(%)
PI No. 1
NRW
(L/day/con)
PI No.2
NRW
(L/min/km)
PI No.3
MNF
(L/mim/km)
A5-319
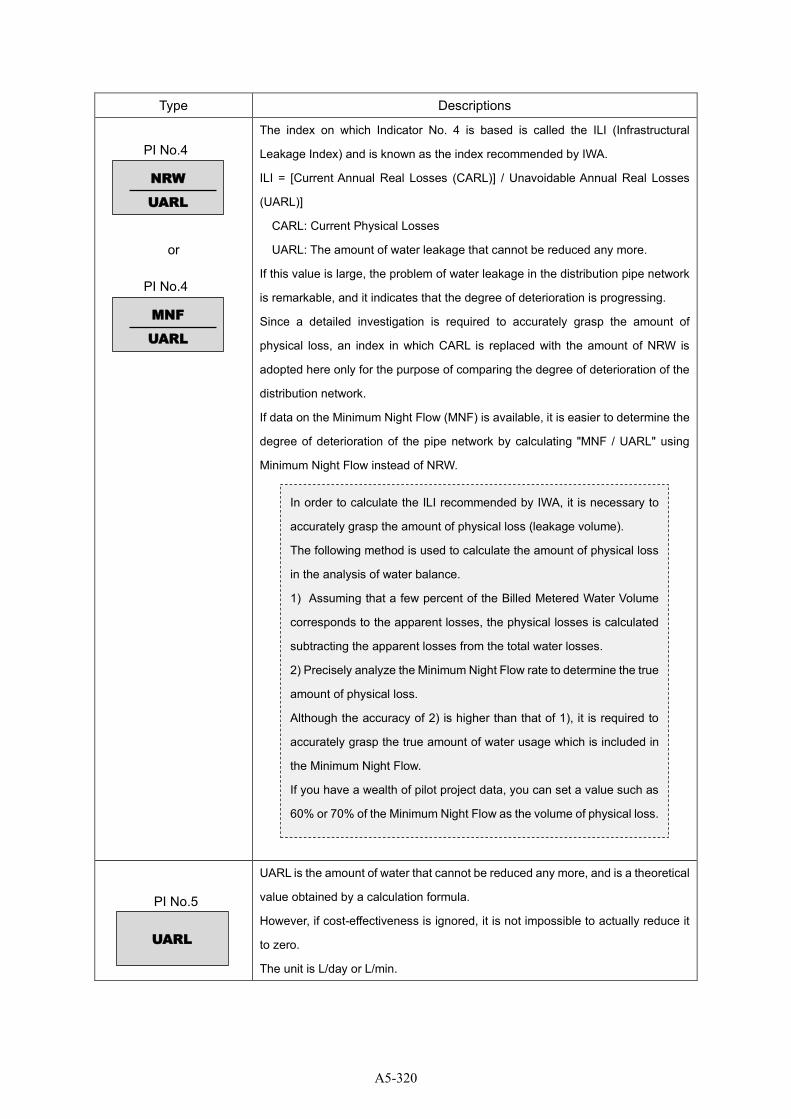
Type Descriptions
or
The index on which Indicator No. 4 is based is called the ILI (Infrastructural
Leakage Index) and is known as the index recommended by IWA.
ILI = [Current Annual Real Losses (CARL)] / Unavoidable Annual Real Losses
(UARL)]
CARL: Current Physical Losses
UARL: The amount of water leakage that cannot be reduced any more.
If this value is large, the problem of water leakage in the distribution pipe network
is remarkable, and it indicates that the degree of deterioration is progressing.
Since a detailed investigation is required to accurately grasp the amount of
physical loss, an index in which CARL is replaced with the amount of NRW is
adopted here only for the purpose of comparing the degree of deterioration of the
distribution network.
If data on the Minimum Night Flow (MNF) is available, it is easier to determine the
degree of deterioration of the pipe network by calculating "MNF / UARL" using
Minimum Night Flow instead of NRW.
UARL is the amount of water that cannot be reduced any more, and is a theoretical
value obtained by a calculation formula.
However, if cost-effectiveness is ignored, it is not impossible to actually reduce it
to zero.
The unit is L/day or L/min.
In order to calculate the ILI recommended by IWA, it is necessary to
accurately grasp the amount of physical loss (leakage volume).
The following method is used to calculate the amount of physical loss
in the analysis of water balance.
1) Assuming that a few percent of the Billed Metered Water Volume
corresponds to the apparent losses, the physical losses is calculated
subtracting the apparent losses from the total water losses.
2) Precisely analyze the Minimum Night Flow rate to determine the true
amount of physical loss.
Although the accuracy of 2) is higher than that of 1), it is required to
accurately grasp the true amount of water usage which is included in
the Minimum Night Flow.
If you have a wealth of pilot project data, you can set a value such as
60% or 70% of the Minimum Night Flow as the volume of physical loss.
NRW
UARL
PI No.4
MNF
UARL
PI No.4
UARL
PI No.5
A5-320

2.5 Case Study from Activities in DMA 5
2.5.1 Location of DMA 5
Using DMA 5 in the OIC Panadura area as a case study, the concept and usage of indicators are
shown below.
The number of house connection of DMA5 is 2,241, and the length of the water pipe is about
14.9km.
The features of DMA 5 are as follows.
➢ There is only one inflow pipe to the area.
➢ Since there are many existing valves in the area, it is easy to set the DMA boundary.
➢ There are multiple types of road pavement.
➢ There is a difference in elevation, and it is necessary to select an appropriate leak detection
method according to the water pressure condition for each subzone.
➢ The number of house connection of DMA5 is 2,241 in total.
➢ The length of the distribution pipe is about 14.9km.
Figure 2.5.1 Location of DMA 5
DMA5
A5-321
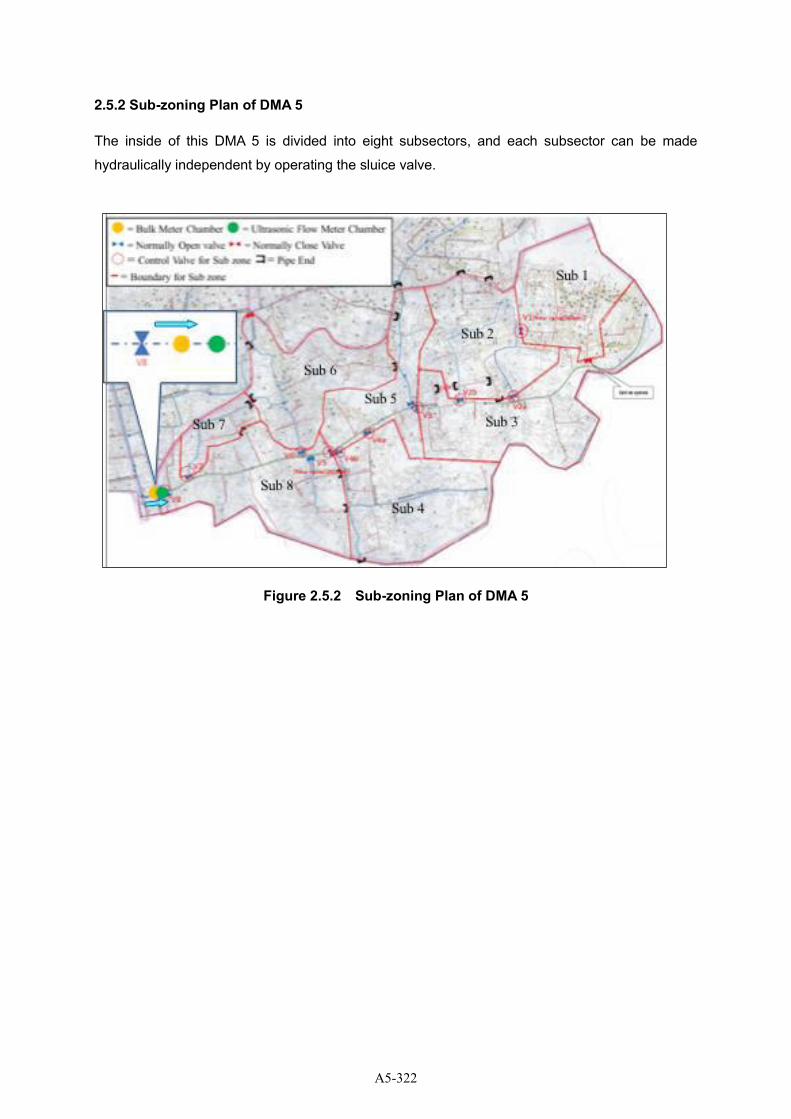
2.5.2 Sub-zoning Plan of DMA 5
The inside of this DMA 5 is divided into eight subsectors, and each subsector can be made
hydraulically independent by operating the sluice valve.
Figure 2.5.2 Sub-zoning Plan of DMA 5
A5-322
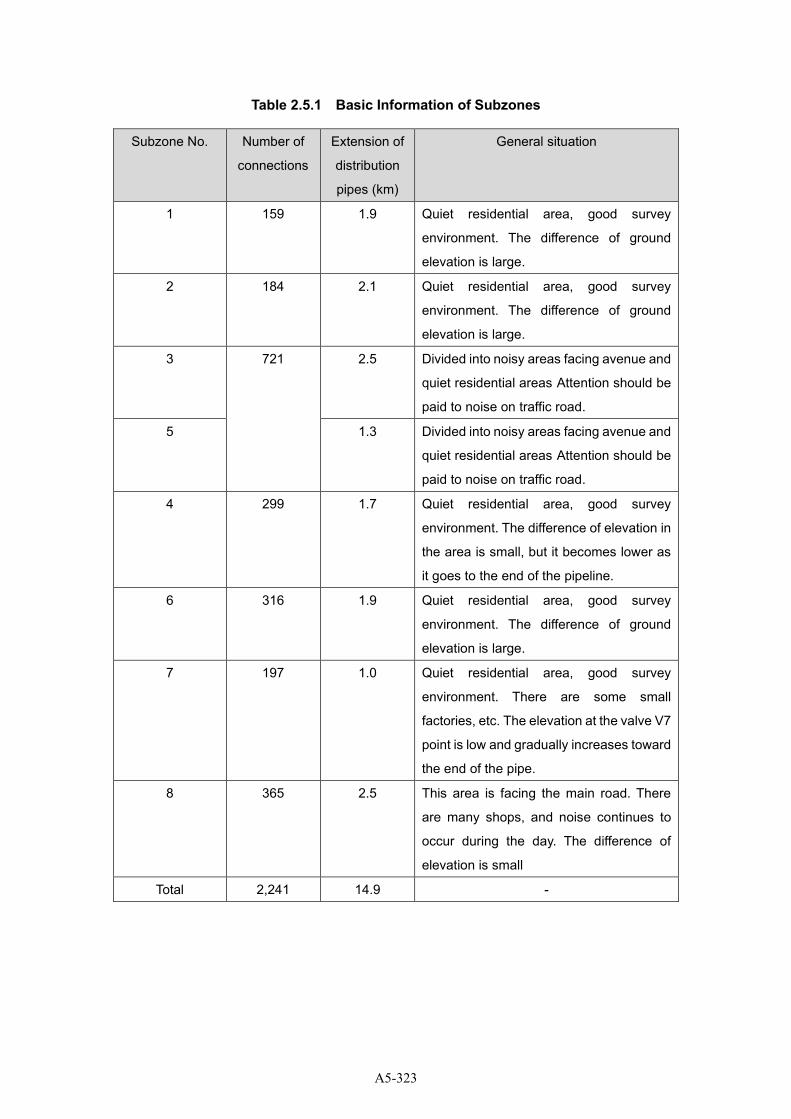
Table 2.5.1 Basic Information of Subzones
Subzone No. Number of
connections
Extension of
distribution
pipes (km)
General situation
1 159 1.9 Quiet residential area, good survey
environment. The difference of ground
elevation is large.
2 184 2.1 Quiet residential area, good survey
environment. The difference of ground
elevation is large.
3 721 2.5 Divided into noisy areas facing avenue and
quiet residential areas Attention should be
paid to noise on traffic road.
5 1.3 Divided into noisy areas facing avenue and
quiet residential areas Attention should be
paid to noise on traffic road.
4 299 1.7 Quiet residential area, good survey
environment. The difference of elevation in
the area is small, but it becomes lower as
it goes to the end of the pipeline.
6 316 1.9 Quiet residential area, good survey
environment. The difference of ground
elevation is large.
7 197 1.0 Quiet residential area, good survey
environment. There are some small
factories, etc. The elevation at the valve V7
point is low and gradually increases toward
the end of the pipe.
8 365 2.5 This area is facing the main road. There
are many shops, and noise continues to
occur during the day. The difference of
elevation is small
Total 2,241 14.9 -
A5-323
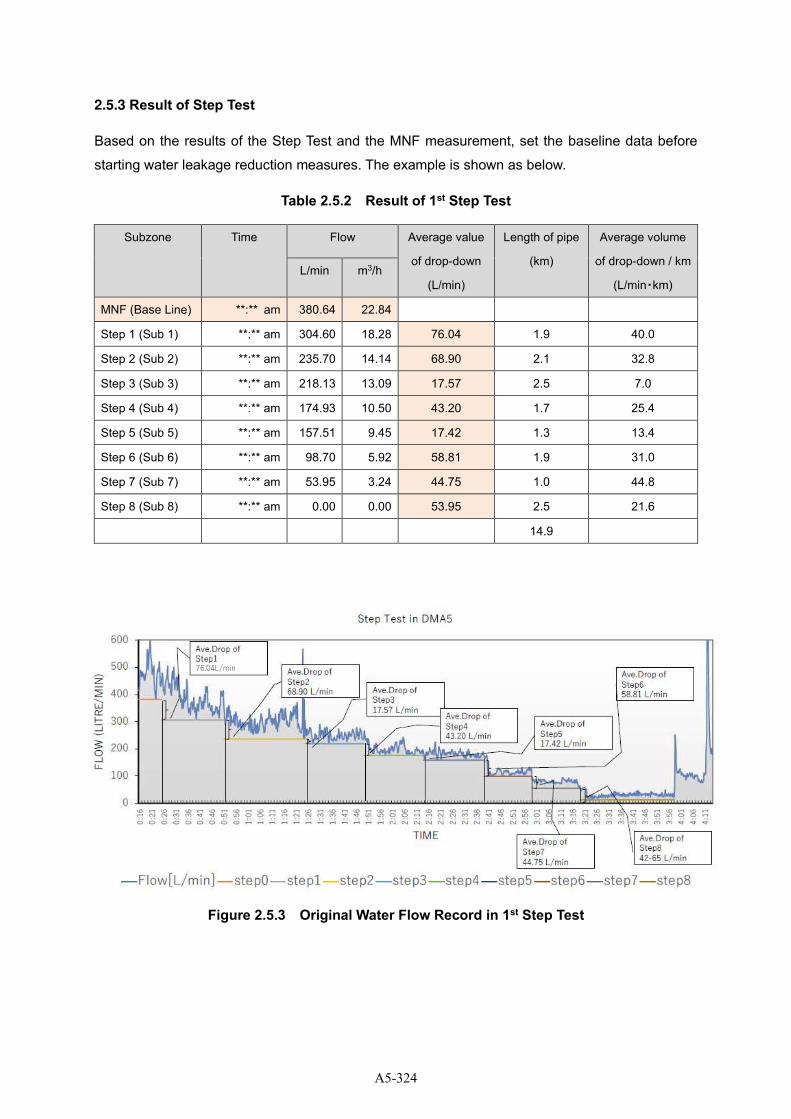
2.5.3 Result of Step Test
Based on the results of the Step Test and the MNF measurement, set the baseline data before
starting water leakage reduction measures. The example is shown as below.
Table 2.5.2 Result of 1st Step Test
Subzone Time Flow Average value
of drop-down
(L/min)
Length of pipe
(km)
Average volume
of drop-down / km
(L/min・km) L/min m3/h
MNF (Base Line) **:** am 380.64 22.84
Step 1 (Sub 1) **:** am 304.60 18.28 76.04 1.9 40.0
Step 2 (Sub 2) **:** am 235.70 14.14 68.90 2.1 32.8
Step 3 (Sub 3) **:** am 218.13 13.09 17.57 2.5 7.0
Step 4 (Sub 4) **:** am 174.93 10.50 43.20 1.7 25.4
Step 5 (Sub 5) **:** am 157.51 9.45 17.42 1.3 13.4
Step 6 (Sub 6) **:** am 98.70 5.92 58.81 1.9 31.0
Step 7 (Sub 7) **:** am 53.95 3.24 44.75 1.0 44.8
Step 8 (Sub 8) **:** am 0.00 0.00 53.95 2.5 21.6
14.9
Figure 2.5.3 Original Water Flow Record in 1st Step Test
76.04L/min
A5-324
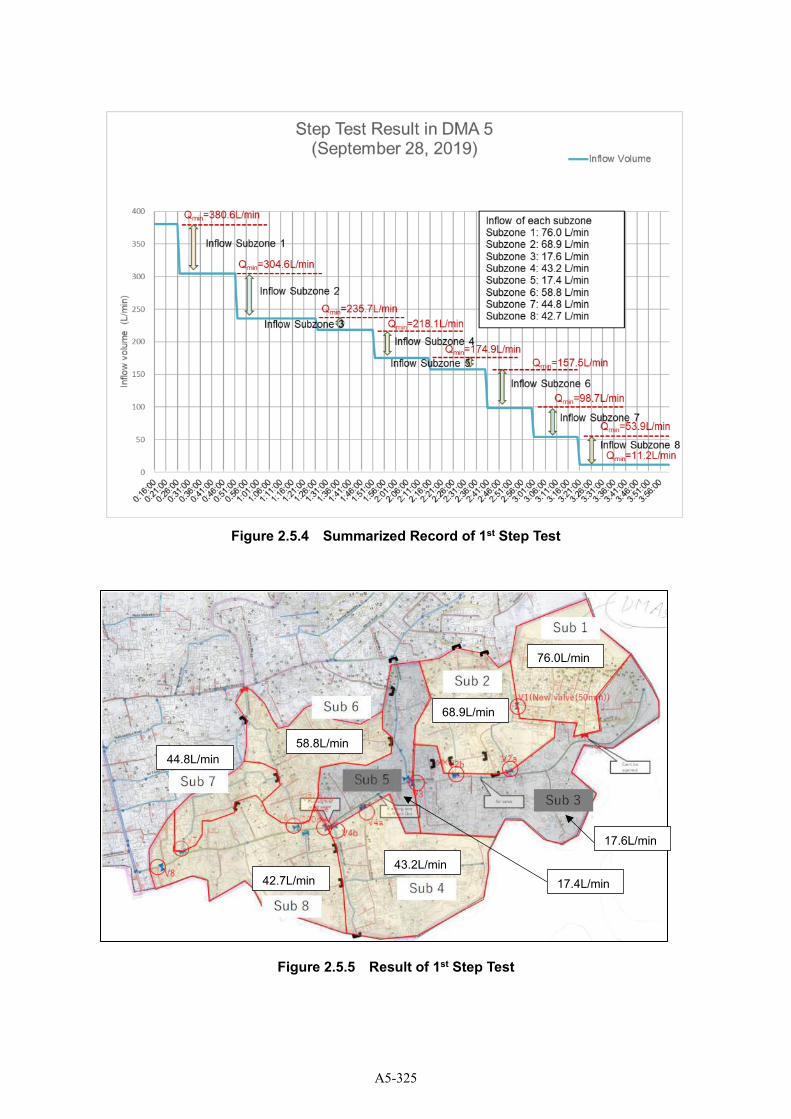
Figure 2.5.4 Summarized Record of 1st Step Test
Figure 2.5.5 Result of 1st Step Test
76.0L/min
68.9L/min
58.8L/min
44.8L/min
43.2L/min
42.7L/min
17.6L/min
17.4L/min
A5-325

From this change of inflow rate, the amount of water flowing into each subzone can be grasped.
However, in order to estimate the status of subzones and the existence of water leaks, it is
necessary to evaluate using the following indicators.
A5-326
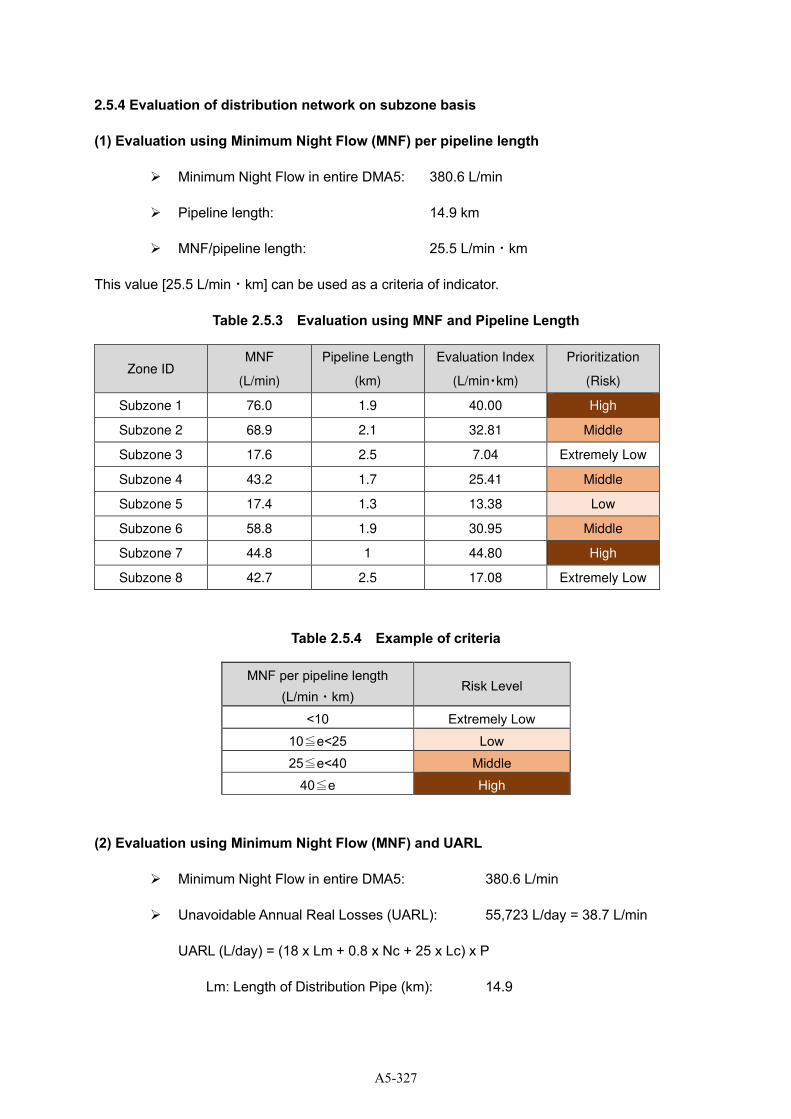
2.5.4 Evaluation of distribution network on subzone basis
(1) Evaluation using Minimum Night Flow (MNF) per pipeline length
➢ Minimum Night Flow in entire DMA5: 380.6 L/min
➢ Pipeline length: 14.9 km
➢ MNF/pipeline length: 25.5 L/min・km
This value [25.5 L/min・km] can be used as a criteria of indicator.
Table 2.5.3 Evaluation using MNF and Pipeline Length
Zone ID MNF
(L/min)
Pipeline Length
(km)
Evaluation Index
(L/min・km)
Prioritization
(Risk)
Subzone 1 76.0 1.9 40.00 High
Subzone 2 68.9 2.1 32.81 Middle
Subzone 3 17.6 2.5 7.04 Extremely Low
Subzone 4 43.2 1.7 25.41 Middle
Subzone 5 17.4 1.3 13.38 Low
Subzone 6 58.8 1.9 30.95 Middle
Subzone 7 44.8 1 44.80 High
Subzone 8 42.7 2.5 17.08 Extremely Low
Table 2.5.4 Example of criteria
MNF per pipeline length
(L/min・km) Risk Level
<10 Extremely Low
10≦e<25 Low
25≦e<40 Middle
40≦e High
(2) Evaluation using Minimum Night Flow (MNF) and UARL
➢ Minimum Night Flow in entire DMA5: 380.6 L/min
➢ Unavoidable Annual Real Losses (UARL): 55,723 L/day = 38.7 L/min
UARL (L/day) = (18 x Lm + 0.8 x Nc + 25 x Lc) x P
Lm: Length of Distribution Pipe (km): 14.9
A5-327
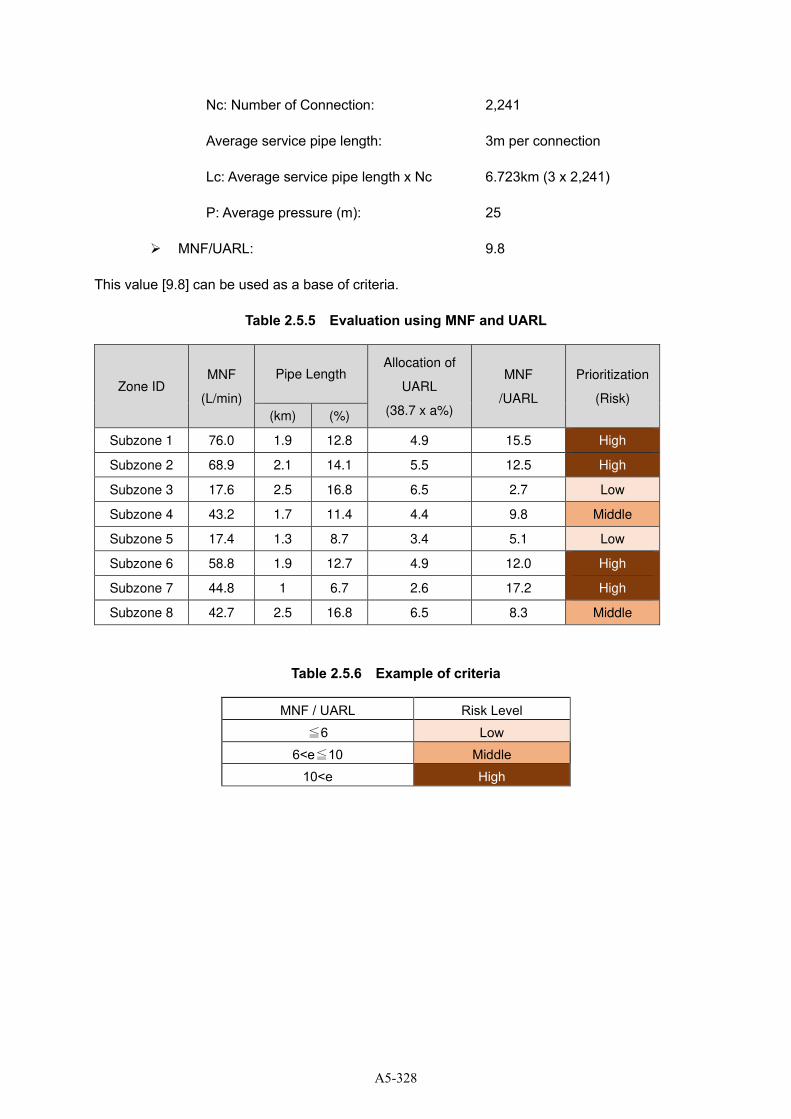
Nc: Number of Connection: 2,241
Average service pipe length: 3m per connection
Lc: Average service pipe length x Nc 6.723km (3 x 2,241)
P: Average pressure (m): 25
➢ MNF/UARL: 9.8
This value [9.8] can be used as a base of criteria.
Table 2.5.5 Evaluation using MNF and UARL
Zone ID MNF
(L/min)
Pipe Length Allocation of
UARL
(38.7 x a%)
MNF
/UARL
Prioritization
(Risk)
(km) (%)
Subzone 1 76.0 1.9 12.8 4.9 15.5 High
Subzone 2 68.9 2.1 14.1 5.5 12.5 High
Subzone 3 17.6 2.5 16.8 6.5 2.7 Low
Subzone 4 43.2 1.7 11.4 4.4 9.8 Middle
Subzone 5 17.4 1.3 8.7 3.4 5.1 Low
Subzone 6 58.8 1.9 12.7 4.9 12.0 High
Subzone 7 44.8 1 6.7 2.6 17.2 High
Subzone 8 42.7 2.5 16.8 6.5 8.3 Middle
Table 2.5.6 Example of criteria
MNF / UARL Risk Level ≦6 Low
6<e≦10 Middle
10<e High
A5-328
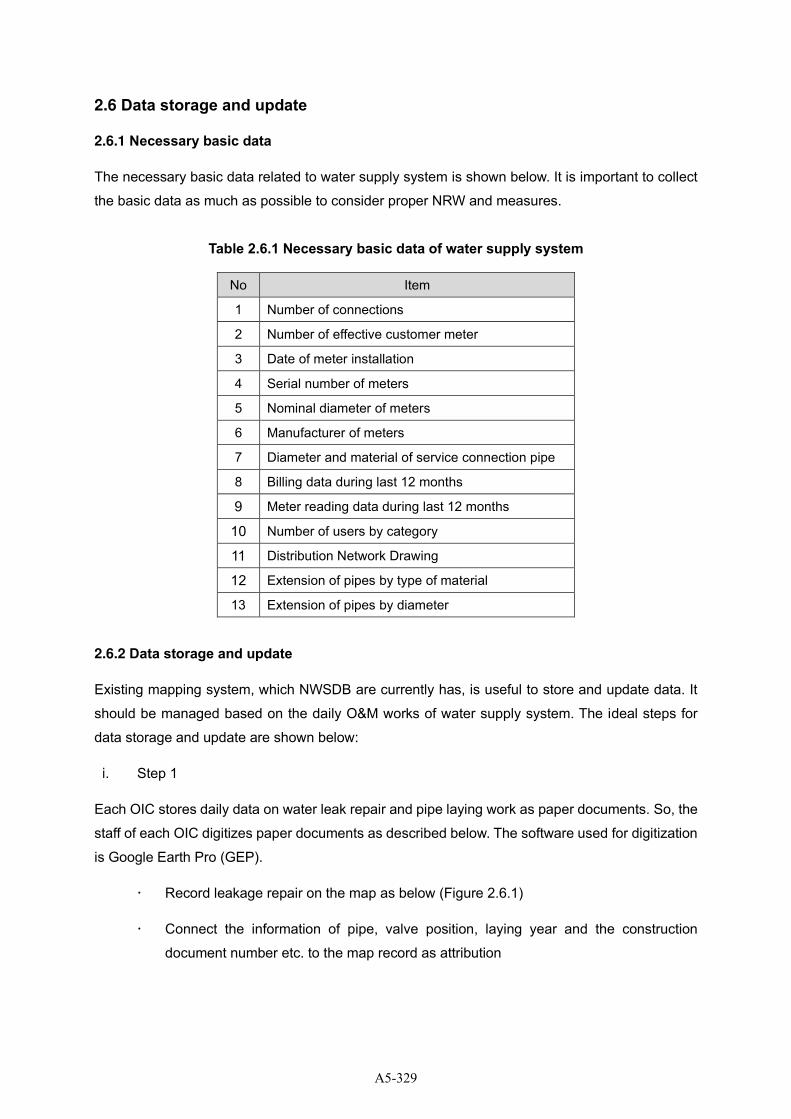
2.6 Data storage and update
2.6.1 Necessary basic data
The necessary basic data related to water supply system is shown below. It is important to collect
the basic data as much as possible to consider proper NRW and measures.
Table 2.6.1 Necessary basic data of water supply system
No Item
1 Number of connections
2 Number of effective customer meter
3 Date of meter installation
4 Serial number of meters
5 Nominal diameter of meters
6 Manufacturer of meters
7 Diameter and material of service connection pipe
8 Billing data during last 12 months
9 Meter reading data during last 12 months
10 Number of users by category
11 Distribution Network Drawing
12 Extension of pipes by type of material
13 Extension of pipes by diameter
2.6.2 Data storage and update
Existing mapping system, which NWSDB are currently has, is useful to store and update data. It
should be managed based on the daily O&M works of water supply system. The ideal steps for
data storage and update are shown below:
i. Step 1
Each OIC stores daily data on water leak repair and pipe laying work as paper documents. So, the
staff of each OIC digitizes paper documents as described below. The software used for digitization
is Google Earth Pro (GEP).
Record leakage repair on the map as below (Figure 2.6.1)
Connect the information of pipe, valve position, laying year and the construction
document number etc. to the map record as attribution
A5-329
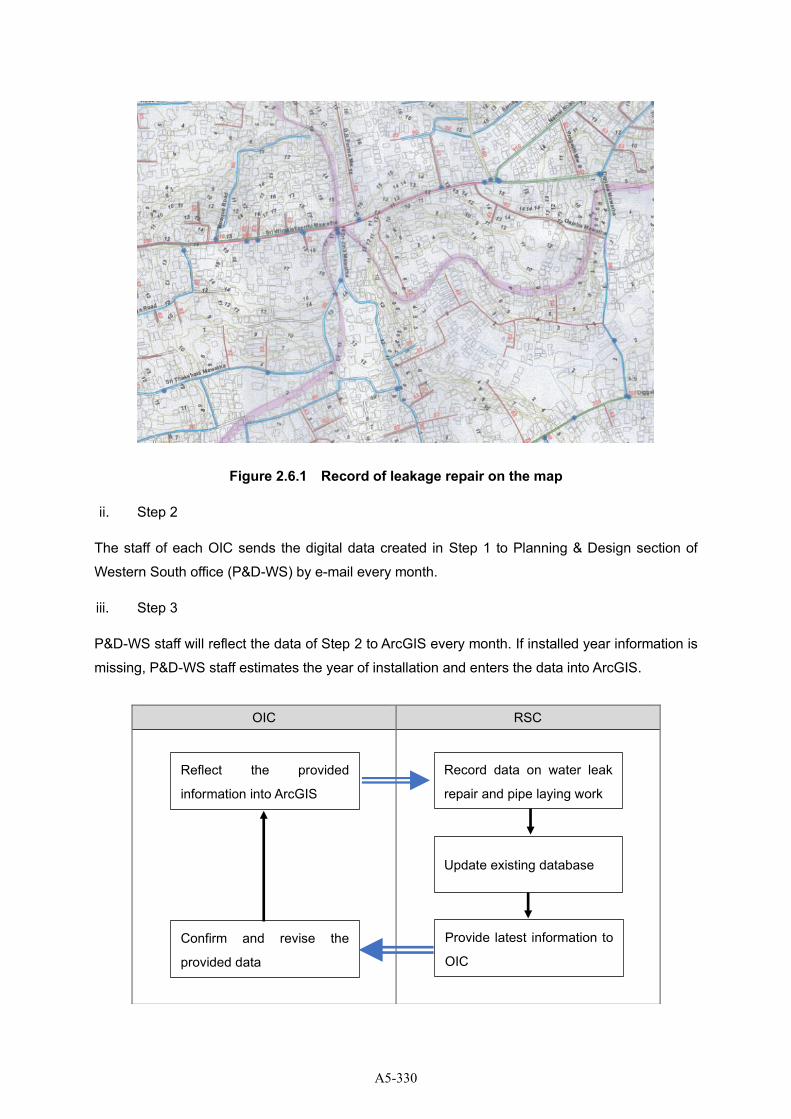
Figure 2.6.1 Record of leakage repair on the map
ii. Step 2
The staff of each OIC sends the digital data created in Step 1 to Planning & Design section of
Western South office (P&D-WS) by e-mail every month.
iii. Step 3
P&D-WS staff will reflect the data of Step 2 to ArcGIS every month. If installed year information is
missing, P&D-WS staff estimates the year of installation and enters the data into ArcGIS.
OIC RSC
Reflect the provided
information into ArcGIS
Record data on water leak
repair and pipe laying work
Update existing database
Provide latest information to
OIC
Confirm and revise the
provided data
A5-330
2.7 Data collection of leakage repair
2.7.1 Purpose of collection of leakage repair data
Water leakage from the pipe is a main factor to evaluate pipe deterioration. Accumulated leakage
data is inevitable for asset management that suggest us the timing of pipe replace. Information that
should be kept on the leakage repair record sheet is as shown below. A model leakage repair record
sheet is shown in Appendix.
➢ Address of leak point and actual point
➢ Date of repair work and
➢ Date when water leakage was first confirmed
➢ Pipe material, diameter, part of leaking point on the pipe(strait, bend, joint, saddle, etc.)
➢ Rode surface form (asphalt, concrete gravel, etc.)
➢ Leak volume
➢ Required material for repairing
➢ Required time, number of staff, type of equipment and machine
2.7.2 Asset management
Leakage repair works data are required for Asset Management System (AMS). Since the
occurrence of water leakage is an indicator of deterioration of pipelines, it is possible to know which
pipeline has a large number of faults by collecting leakage records. Even if the water authority tries
to keep the pipeline soundly, the cost of keeping it will increase due to frequent leaks. These
pipelines must be given a higher priority of renewal, and renewing can maintain stable water supply.
A5-331
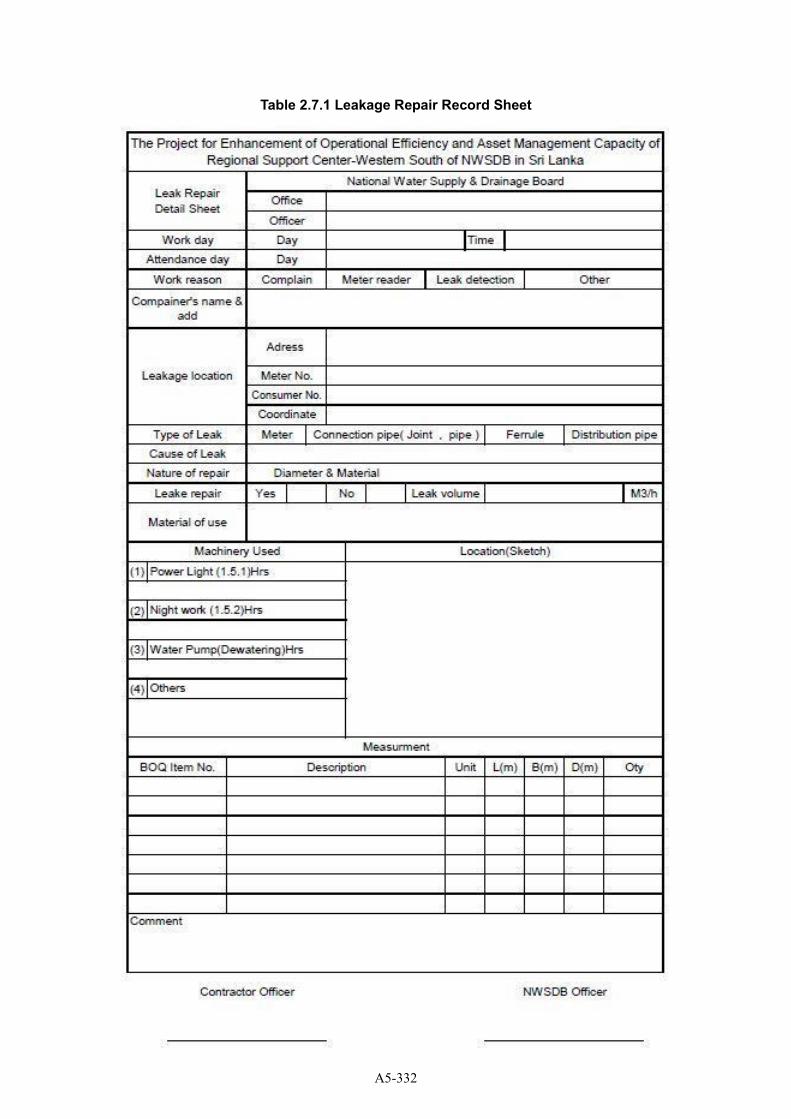
Table 2.7.1 Leakage Repair Record Sheet
A5-332
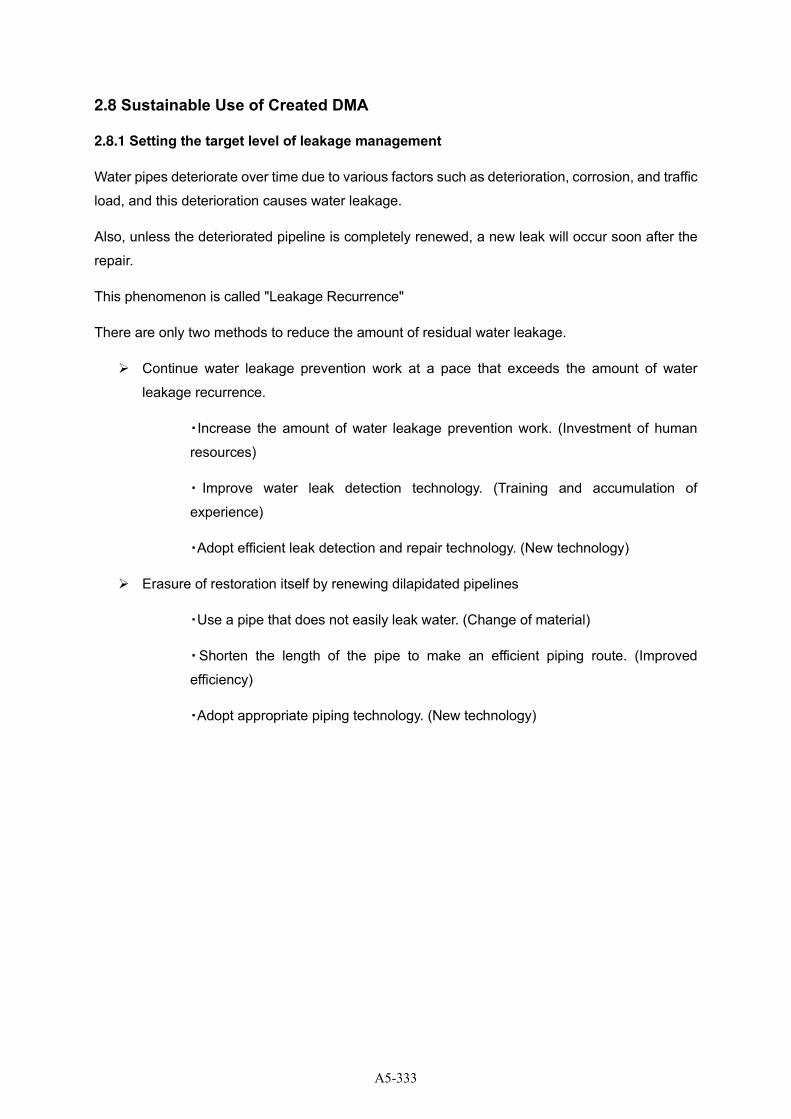
2.8 Sustainable Use of Created DMA
2.8.1 Setting the target level of leakage management
Water pipes deteriorate over time due to various factors such as deterioration, corrosion, and traffic
load, and this deterioration causes water leakage.
Also, unless the deteriorated pipeline is completely renewed, a new leak will occur soon after the
repair.
This phenomenon is called "Leakage Recurrence"
There are only two methods to reduce the amount of residual water leakage.
➢ Continue water leakage prevention work at a pace that exceeds the amount of water
leakage recurrence.
・Increase the amount of water leakage prevention work. (Investment of human
resources)
・ Improve water leak detection technology. (Training and accumulation of
experience)
・Adopt efficient leak detection and repair technology. (New technology)
➢ Erasure of restoration itself by renewing dilapidated pipelines
・Use a pipe that does not easily leak water. (Change of material)
・Shorten the length of the pipe to make an efficient piping route. (Improved
efficiency)
・Adopt appropriate piping technology. (New technology)
A5-333
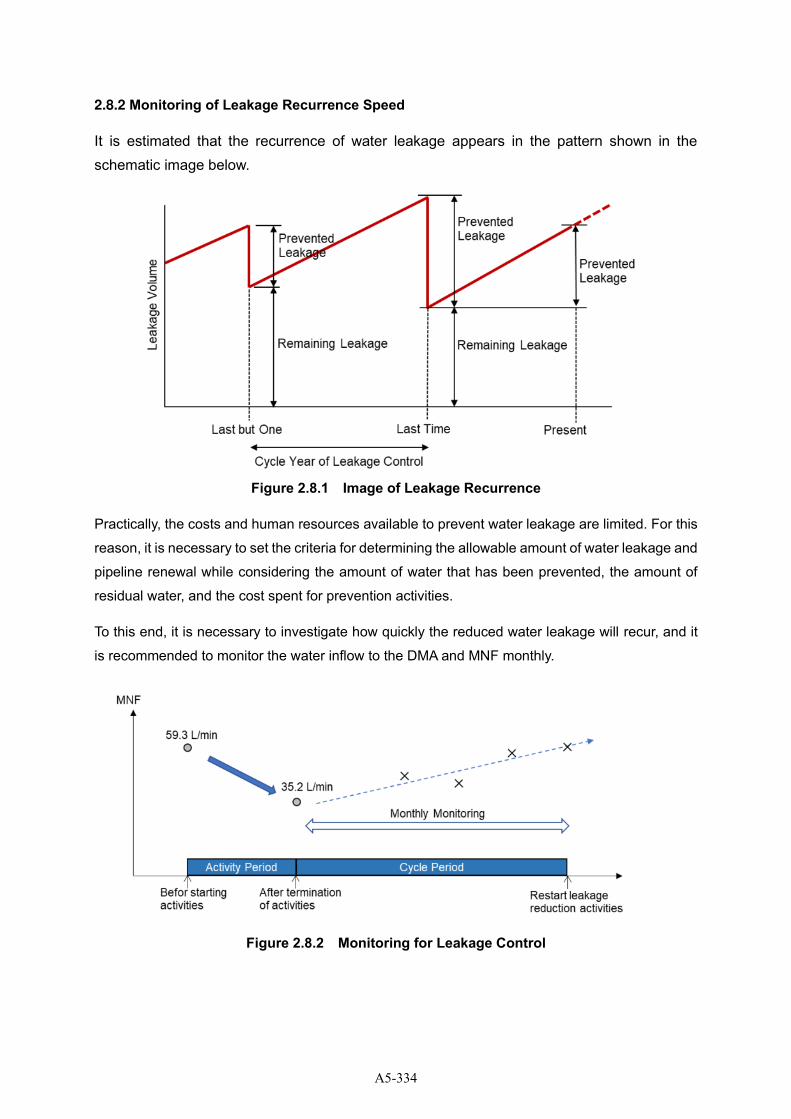
2.8.2 Monitoring of Leakage Recurrence Speed
It is estimated that the recurrence of water leakage appears in the pattern shown in the schematic image below.
Figure 2.8.1 Image of Leakage Recurrence
Practically, the costs and human resources available to prevent water leakage are limited. For this
reason, it is necessary to set the criteria for determining the allowable amount of water leakage and
pipeline renewal while considering the amount of water that has been prevented, the amount of
residual water, and the cost spent for prevention activities.
To this end, it is necessary to investigate how quickly the reduced water leakage will recur, and it
is recommended to monitor the water inflow to the DMA and MNF monthly.
Figure 2.8.2 Monitoring for Leakage Control
A5-334
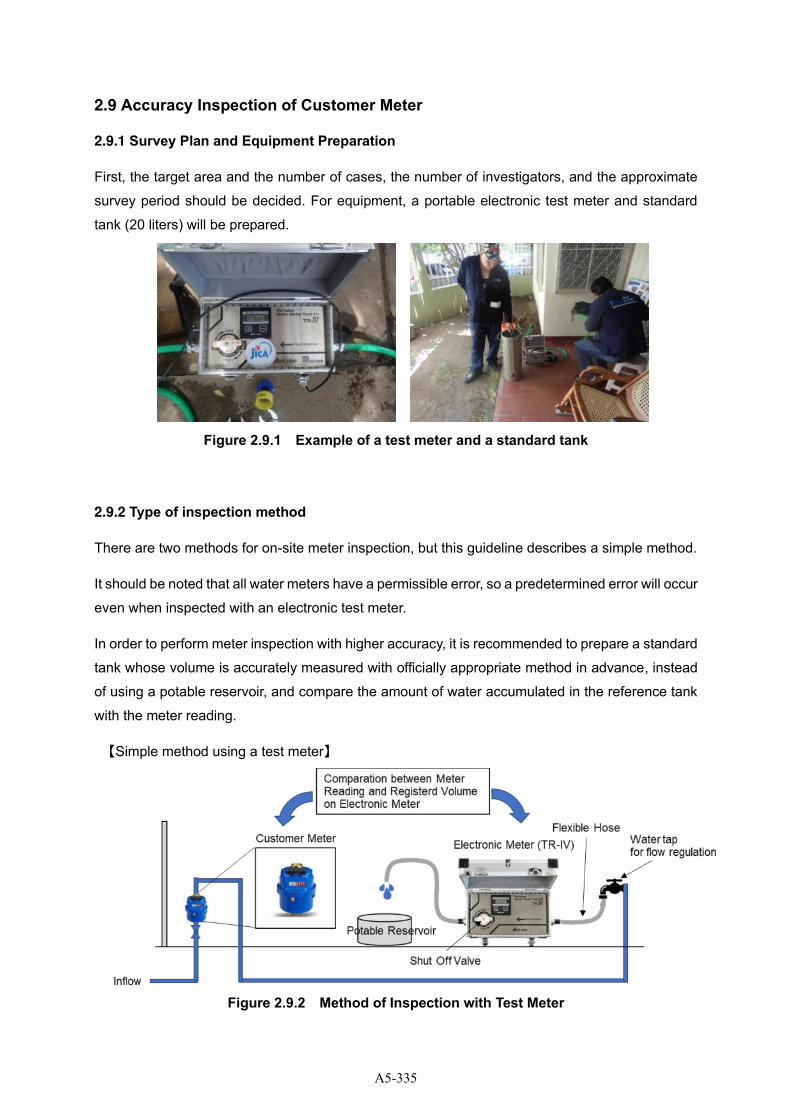
2.9 Accuracy Inspection of Customer Meter
2.9.1 Survey Plan and Equipment Preparation
First, the target area and the number of cases, the number of investigators, and the approximate
survey period should be decided. For equipment, a portable electronic test meter and standard
tank (20 liters) will be prepared.
Figure 2.9.1 Example of a test meter and a standard tank
2.9.2 Type of inspection method
There are two methods for on-site meter inspection, but this guideline describes a simple method.
It should be noted that all water meters have a permissible error, so a predetermined error will occur
even when inspected with an electronic test meter.
In order to perform meter inspection with higher accuracy, it is recommended to prepare a standard
tank whose volume is accurately measured with officially appropriate method in advance, instead
of using a potable reservoir, and compare the amount of water accumulated in the reference tank
with the meter reading.
【Simple method using a test meter】
Figure 2.9.2 Method of Inspection with Test Meter
A5-335
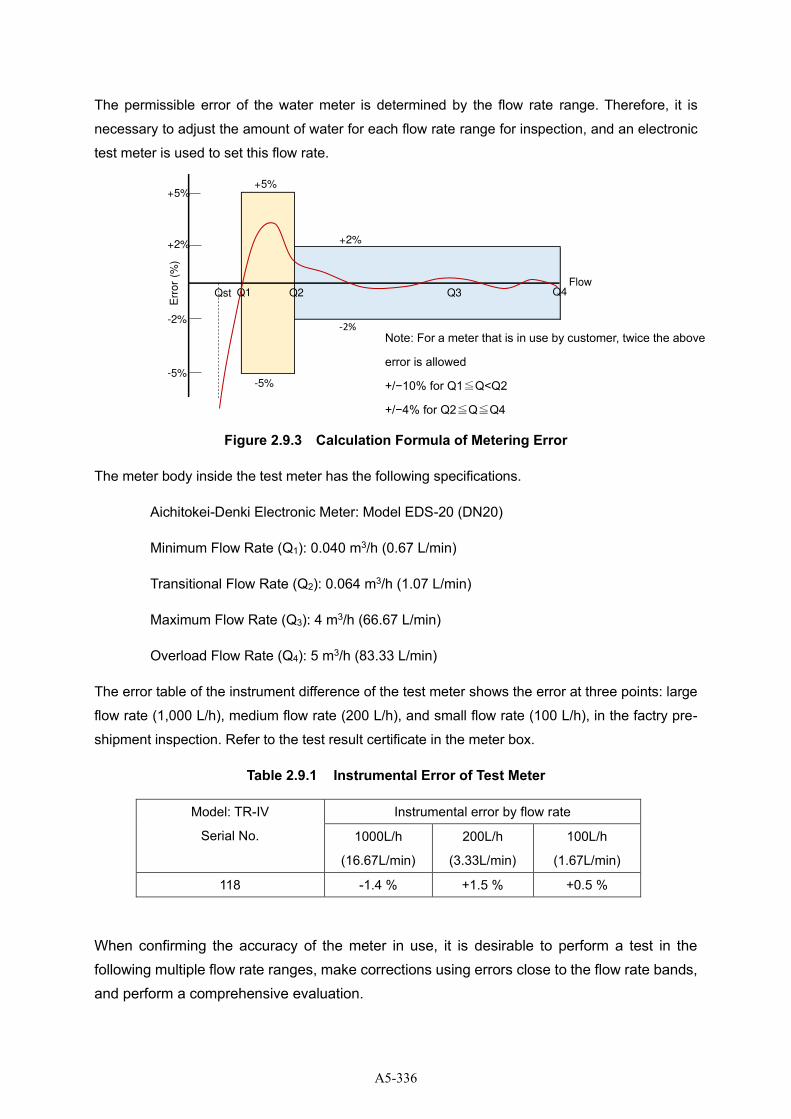
The permissible error of the water meter is determined by the flow rate range. Therefore, it is
necessary to adjust the amount of water for each flow rate range for inspection, and an electronic
test meter is used to set this flow rate.
Figure 2.9.3 Calculation Formula of Metering Error
The meter body inside the test meter has the following specifications.
Aichitokei-Denki Electronic Meter: Model EDS-20 (DN20)
Minimum Flow Rate (Q1): 0.040 m3/h (0.67 L/min)
Transitional Flow Rate (Q2): 0.064 m3/h (1.07 L/min)
Maximum Flow Rate (Q3): 4 m3/h (66.67 L/min)
Overload Flow Rate (Q4): 5 m3/h (83.33 L/min)
The error table of the instrument difference of the test meter shows the error at three points: large
flow rate (1,000 L/h), medium flow rate (200 L/h), and small flow rate (100 L/h), in the factry pre-
shipment inspection. Refer to the test result certificate in the meter box.
Table 2.9.1 Instrumental Error of Test Meter
Model: TR-IV
Serial No.
Instrumental error by flow rate
1000L/h
(16.67L/min)
200L/h
(3.33L/min)
100L/h
(1.67L/min)
118 -1.4 % +1.5 % +0.5 %
When confirming the accuracy of the meter in use, it is desirable to perform a test in the following multiple flow rate ranges, make corrections using errors close to the flow rate bands, and perform a comprehensive evaluation.
Err
or
(%)
Q1 Q2 Q3 Q4Flow
+5%
+2%
-2%
-5%
Qst
+5%
+2%
-2%
-5%
Note: For a meter that is in use by customer, twice the above
error is allowed
+/−10% for Q1≦Q<Q2
+/−4% for Q2≦Q≦Q4
A5-336
Table 2.9.2 Example of meter test pattern
Step 1
Starting Flow
Qst
Step 2
Between Q1
& 1.1*Q1
Step 3
Between Q2
& 1.1*Q2
Step 4
Approx. Q3
Step 5
Between 0.9*Q3
& Q3
Image
Flow rate 3L/h~10L/h 27~33 L/h 108~132 L/h Approx.600L/h 1350~1500 L/h
0.05~
1.66L/min
0.45~0.55L
/min
1.8~2.2 L /min Approx.10 L /min 22.5~25 L /min
Total Test
Volume
5L 10L 20L 20L
2.9.3 Test Procedure
(1) Preparation of the Test Meter
1a. Remove the air from the meter so that the meter is filled with water.
1b. Secure a higher place than the main body in the middle of the outlet hose so that air does
not enter the hose when water is stopped.
1c. Close the test meter valve and check that there is no water leakage from the piping or
hose joint.
1d. Switch the LCD counter display to "Instantaneous Flow Rate Mode".
In instantaneous flow mode, a U is displayed to the left of the number. 4-digit display, unit
is L/min
A5-337
1e. Fully open the Shut Off Valve of the test meter body and adjust it so that it is within the
flow rate range of the inspection target while changing the opening of the Water Tap.
1f. After adjusting the flow rate to the specified range, fully close the Shut Off Valve on the
test meter body.
1g. Use of water from other taps in the residential area is prohibited during the inspection.
(2) Test procedure
Since the counter display was set to ”Instantaneous Flow Rate Mode” during flow rate adjustment
in the preparation stage, change the display mode to “Trip Mode” or “Cumulation Mode” before
starting the test.
➢ The display of the counter changes when the L/min button is pressed for about 3 seconds.
➢ Press the Total/Trip button to display zero reset in Trip Mode.
2a. Record the reading on the water meter before starting the test.
2b. Determine the amount of test water for each flow rate band. (Small flow: 10 Lts, Medium
flow: 10 Lts, Large flow: 20 Lts).
2c. Set the counter of the test meter to “Cumulation Mode” and reset to zero
2d. Simultaneously with the start of the test, open the valve of the test meter body and start
passing water.
2e. While checking the display on the test meter, close the valve on the test meter main body
at the moment when the predetermined amount of test water is reached to stop water flow.
2f. Record the amount of water passing through with a test meter.
2g. Check the instrumental error (%) in the flow rate range indicated in the test meter
instrumental error report.。
2h. Check the reading on the water meter and record the amount of water measured within
the above time.
2i. Calculate the instrumental error of the water meter by the following formula.
A5-338
Figure 2.9.4 Calculation Formula of Metering Error
2.9.4 Aggregate meter accuracy inspection results
The test results are recorded in the table below.
Table 2.9.3 Format of test record
Meter ID
Step 1 2 3 4 5
Target test flow rate Starting Flow 30 L/h
(0.5 L/min)
120 L/h
(2.0 L/min)
600 L/h
(10 L/min)
100%
Total test volume Variable 5 L 10 L 20 L 20 L
Initial reading of customer
meter
Final reading of customer
meter
Registered volume of
customer meter “A” (L)
Registered volume of
Electrical Test Meter “B” (L)
Test time (min)
Test flow rate of TR-IV
(L/min)
Difference of volume
between A & B (“A”-“B”)
Error
((A-B)-B)*100 (%)
Error (%) = ×100
Water Volume measured
by Customer Meter
Water Volume registered by Test Meter
Water Volume registered
by Test Meter -
+ Instrumental Error of Test Meter
A5-339
2.9.5 Meter reliability evaluation
Generally, the larger the cumulative cumulative value of the meter, the longer the years of use, so
that it tends to be aged and malfunction. By plotting the cumulative water volume of the meter on
the horizontal axis and the meter instrument error on the vertical axis, you can read the
accumulated meter value of the meter and the tendency of the generator difference.
If there is a high correlation between the accumulated flow rate value and the occurrence of
instrumental error, it is possible to determine when it is desirable to update the existing meter.
Figure 2.9.5 Relation between cumulative reading value and instrumental error
y = -0.0012xR² = 0.2057
-30
-20
-10
0
10
20
30
0 3000 6000 9000
%
Accumulated Volume of Meter Reading
Distribution of Instrumental Error of Existing Cusomer Meter (on Q1)
Medidor Lineal
y = -0.0004xR² = 0.1013
-20
-15
-10
-5
0
5
10
15
20
0 3000 6000 9000
%
Accumulated Volume of Meter Reading
Distribution of Instrumental Error of Existing Cusomer Meter (on Q2)
Meter Linea
A5-340
2.9.6 Estimation of apparent losses
If all test results are plotted on a graph, it can be shown as follows.
Figure 2.9.6 Distribution of instrumental error of customer meter
The error of the existing meter differs depending on each flow rate band.
For households that use water in a large flow rate, the error near Q3 has a large effect on the
amount of billed water. On the other hand, for low-income households who often use water in a
small flow rate, the error near Q1 to Q2 greatly affects the billed water.
As mentioned above, since the measurement error occurs depending on the band and frequency
of the actual water consumption of the household, it is necessary to investigate the water
consumption band of the household in order to estimate the influence of the meter error on the
billed water amount.
Therefore, when calculating the apparent loss of water due to meter error using a simple method,
use an error in the vicinity of Q2 (100 to 120 L/h), which is the band, for the typical amount of water
usage flow band.
Once the monthly NRW is calculated, the ratio of apparent loss and actual loss can be estimated
by the following formula.
By comparing the calculated actual water loss and the MNF rate, it becomes possible to grasp the
amount of water leakage remaining more accurately in the DMA.
Err
or
(%)
Q1 Q2 Q3 Q4Flow
+10%
+4%
-4%
-10%
Qst
+10%
+4%
-4%
-10%
A5-341
Figure 2.9.7 Calculation Formula of Apparent Losses
2.9.7 Determination of sample size
When considering the sample size under the following conditions, the statistical size is as shown
in the table below.
➢ Allowable error: 5%
➢ Confidence level: 95%
Table 2.9.4 Table of sample size
Total number of
customer meter in DMA
Sample size
(Number of meter)
Percentage against
total number of meters
250 152 60.8%
300 169 56.3%
400 196 49.0%
500 220 44.0%
800 260 32.5%
1,000 280 28.0%
2,000 325 16.3%
3,000 345 11.5%
5,000 360 7.2%
10,000 370 3.7%
25,000 380 1.5%
50,000 385 0.8%
> 100,000 385 < 0.4%
Apparent Losses (L/min)
Billed Water (m3/month)
Billing Interval (days)
Non-Revenue Water (L/min) Real Losses (L/min)
×Error (%) /100
×24×60×1000
=
Apparent Losses (L/min) - =
A5-342
2.9.8 Example of Simple Test of Customer Meter
As mentioned earlier, the tolerance of the meter depends on the flow band, so when checking the
accuracy of the meter, it is necessary to test in multiple flow ranges, such as Q1, Q2 and Q3.
However, in some cases, a test is also conducted to show the correctness of the billed water
amount in the field in response to the customer's complaint.
The following are the test results conducted on 16 meters in DMA4. This test was performed in
only one flow rate between Q1 and Q2.
The average error rate was + 0.077%, which was found to be within the permissible range of error (+/- 5% for the Q1 to Q2 bands).
Table 2.9.5 Test Result of Customer Meter of DMA 4
A5-343
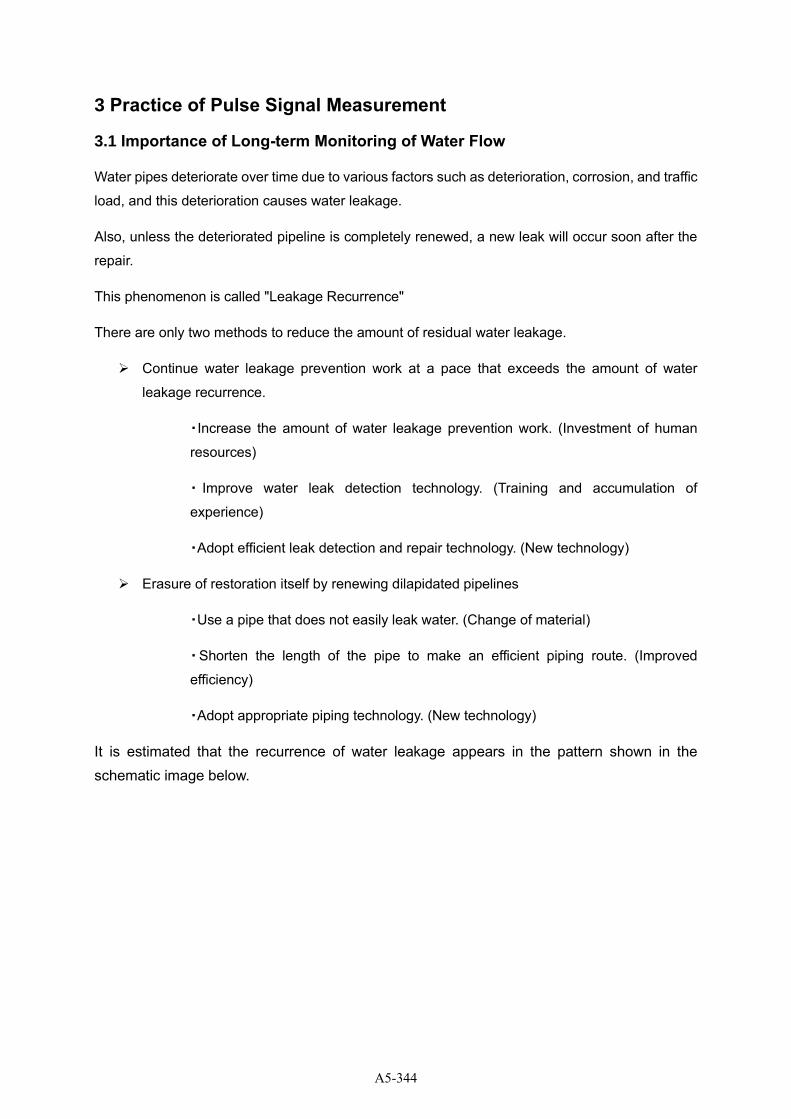
3 Practice of Pulse Signal Measurement
3.1 Importance of Long-term Monitoring of Water Flow
Water pipes deteriorate over time due to various factors such as deterioration, corrosion, and traffic
load, and this deterioration causes water leakage.
Also, unless the deteriorated pipeline is completely renewed, a new leak will occur soon after the
repair.
This phenomenon is called "Leakage Recurrence"
There are only two methods to reduce the amount of residual water leakage.
➢ Continue water leakage prevention work at a pace that exceeds the amount of water
leakage recurrence.
・Increase the amount of water leakage prevention work. (Investment of human
resources)
・ Improve water leak detection technology. (Training and accumulation of
experience)
・Adopt efficient leak detection and repair technology. (New technology)
➢ Erasure of restoration itself by renewing dilapidated pipelines
・Use a pipe that does not easily leak water. (Change of material)
・Shorten the length of the pipe to make an efficient piping route. (Improved
efficiency)
・Adopt appropriate piping technology. (New technology)
It is estimated that the recurrence of water leakage appears in the pattern shown in the
schematic image below.
A5-344
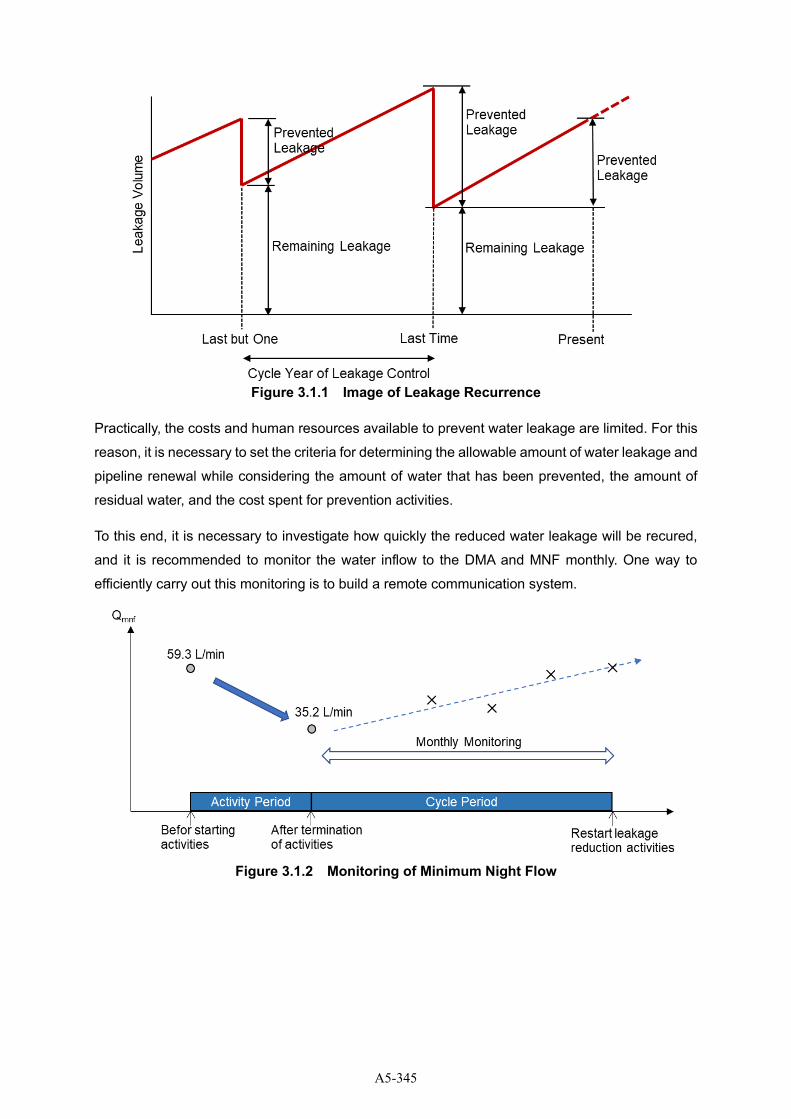
Figure 3.1.1 Image of Leakage Recurrence
Practically, the costs and human resources available to prevent water leakage are limited. For this
reason, it is necessary to set the criteria for determining the allowable amount of water leakage and
pipeline renewal while considering the amount of water that has been prevented, the amount of
residual water, and the cost spent for prevention activities.
To this end, it is necessary to investigate how quickly the reduced water leakage will be recured,
and it is recommended to monitor the water inflow to the DMA and MNF monthly. One way to
efficiently carry out this monitoring is to build a remote communication system.
Figure 3.1.2 Monitoring of Minimum Night Flow
A5-345
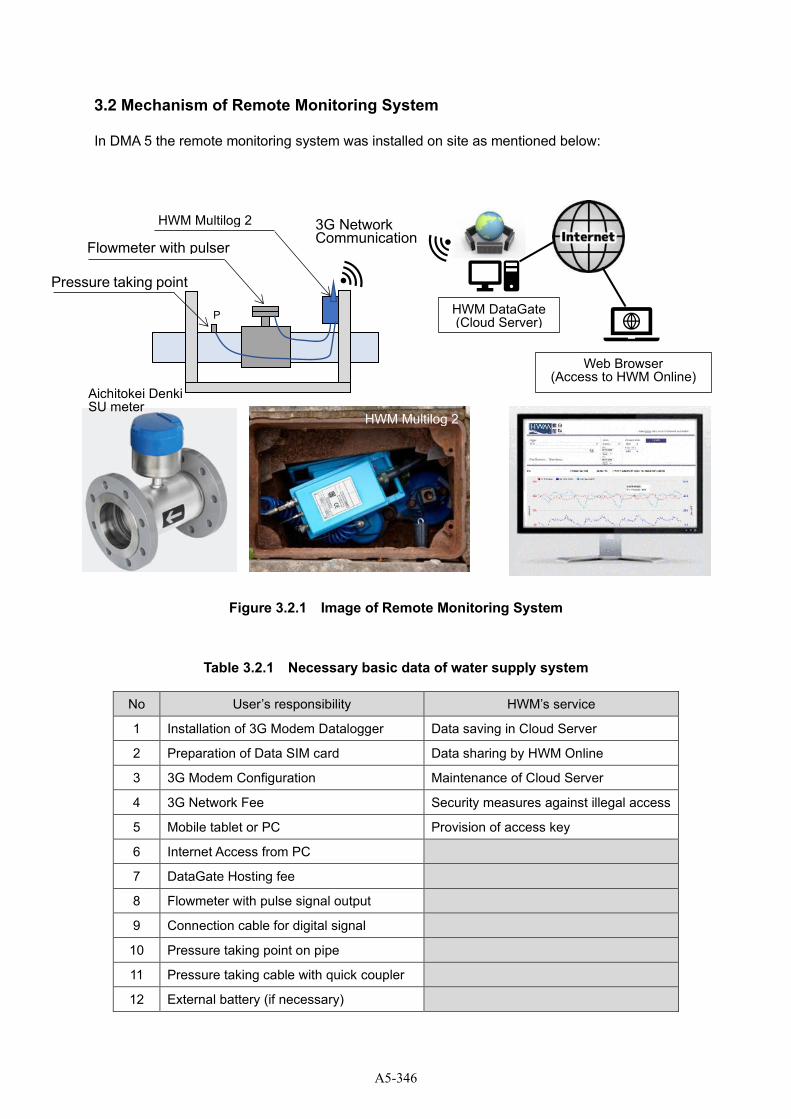
3.2 Mechanism of Remote Monitoring System
In DMA 5 the remote monitoring system was installed on site as mentioned below:
Figure 3.2.1 Image of Remote Monitoring System
Table 3.2.1 Necessary basic data of water supply system
No User’s responsibility HWM’s service
1 Installation of 3G Modem Datalogger Data saving in Cloud Server
2 Preparation of Data SIM card Data sharing by HWM Online
3 3G Modem Configuration Maintenance of Cloud Server
4 3G Network Fee Security measures against illegal access
5 Mobile tablet or PC Provision of access key
6 Internet Access from PC
7 DataGate Hosting fee
8 Flowmeter with pulse signal output
9 Connection cable for digital signal
10 Pressure taking point on pipe
11 Pressure taking cable with quick coupler
12 External battery (if necessary)
Flowmeter with pulser
Pressure taking point
HWM Multilog 2
P HWM DataGate (Cloud Server)
Web Browser (Access to HWM Online)
3G Network Communication
HWM Multilog 2
Aichitokei Denki SU meter
A5-346

The monitoring system introduced on a trial basis this time is a service provided by a data logger
manufacturer (Halma Water Management). The user can easily check the measurement data
anywhere on the earth simply by preparing a SIM card using the mobile phone communication
network and paying the service usage fee.
Data can be viewed in graphical or table format from any internet enabled device using web
viewer HWM Online or seamlessly integrated into a third-party corporate system.
On receipt of an alarm DataGate can send automatic alerts to multiple users to enable action to
be taken promptly. The system will even store data from loggers it does not recognize, and then
add this information to the logger’s history when it is registered on the system.
Multiple accounts can be set up and configured to ensure that users only see data from the
specific loggers they require.
Figure 3.2.2 Monitoring Screen on Web Browser
A5-347
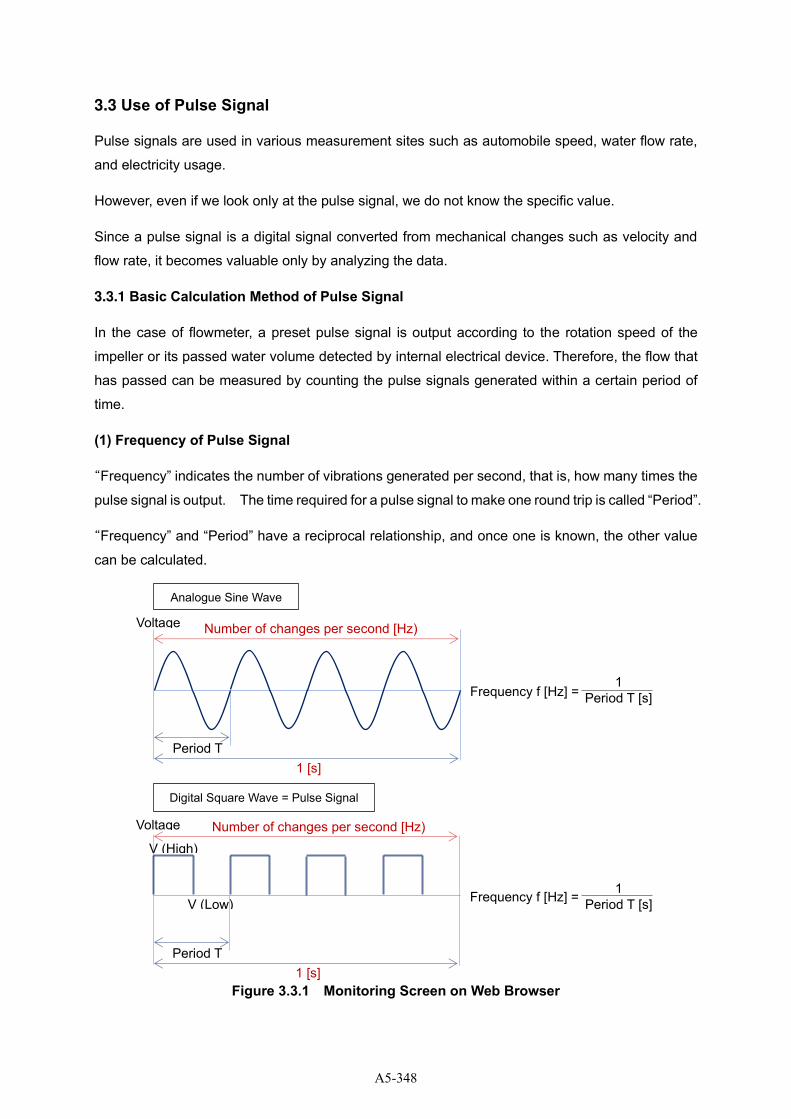
3.3 Use of Pulse Signal
Pulse signals are used in various measurement sites such as automobile speed, water flow rate,
and electricity usage.
However, even if we look only at the pulse signal, we do not know the specific value.
Since a pulse signal is a digital signal converted from mechanical changes such as velocity and
flow rate, it becomes valuable only by analyzing the data.
3.3.1 Basic Calculation Method of Pulse Signal
In the case of flowmeter, a preset pulse signal is output according to the rotation speed of the
impeller or its passed water volume detected by internal electrical device. Therefore, the flow that
has passed can be measured by counting the pulse signals generated within a certain period of
time.
(1) Frequency of Pulse Signal
“Frequency” indicates the number of vibrations generated per second, that is, how many times the
pulse signal is output. The time required for a pulse signal to make one round trip is called “Period”.
“Frequency” and “Period” have a reciprocal relationship, and once one is known, the other value
can be calculated.
Figure 3.3.1 Monitoring Screen on Web Browser
Number of changes per second [Hz)
1 [s] Period T
[s]
1
Period T [s] Frequency f [Hz] =
Voltage
Analogue Sine Wave
Number of changes per second [Hz)
1 [s] Period T
[s]
1
Period T [s] Frequency f [Hz] =
Voltage
V (High)
V (Low)
Digital Square Wave = Pulse Signal
A5-348
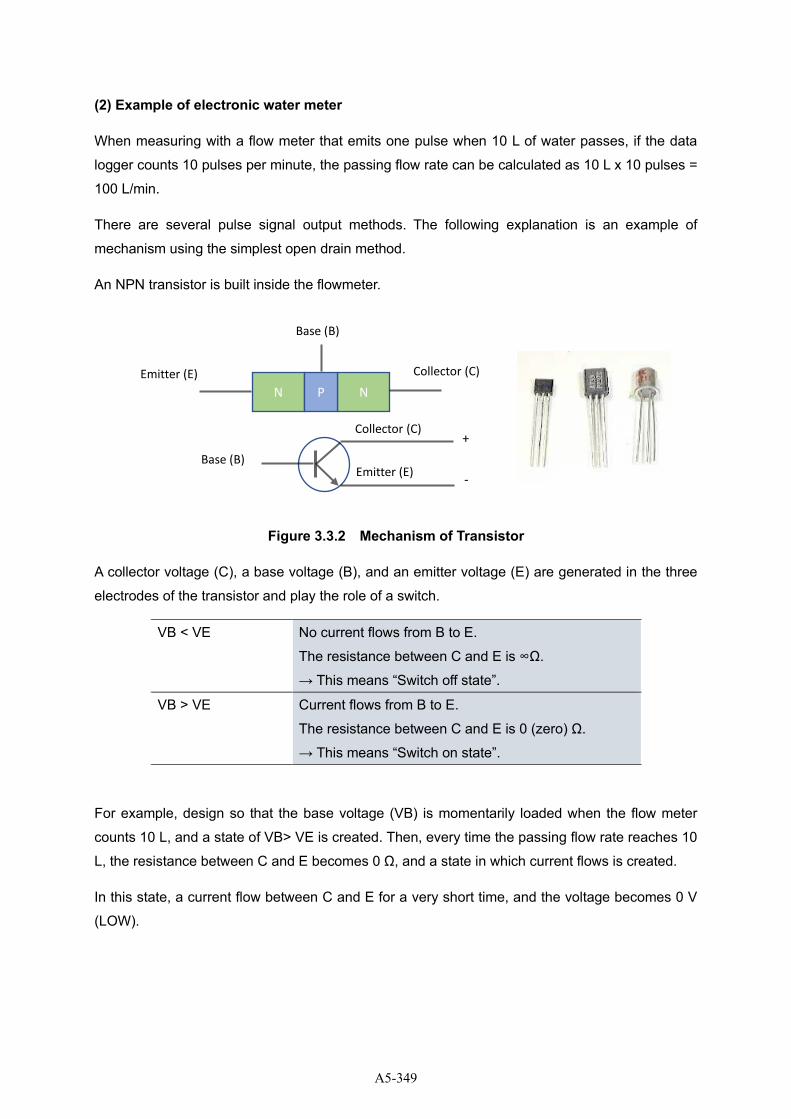
(2) Example of electronic water meter
When measuring with a flow meter that emits one pulse when 10 L of water passes, if the data
logger counts 10 pulses per minute, the passing flow rate can be calculated as 10 L x 10 pulses =
100 L/min.
There are several pulse signal output methods. The following explanation is an example of
mechanism using the simplest open drain method.
An NPN transistor is built inside the flowmeter.
Figure 3.3.2 Mechanism of Transistor
A collector voltage (C), a base voltage (B), and an emitter voltage (E) are generated in the three
electrodes of the transistor and play the role of a switch.
VB < VE No current flows from B to E.
The resistance between C and E is ∞Ω.
→ This means “Switch off state”.
VB > VE Current flows from B to E.
The resistance between C and E is 0 (zero) Ω.
→ This means “Switch on state”.
For example, design so that the base voltage (VB) is momentarily loaded when the flow meter
counts 10 L, and a state of VB> VE is created. Then, every time the passing flow rate reaches 10
L, the resistance between C and E becomes 0 Ω, and a state in which current flows is created.
In this state, a current flow between C and E for a very short time, and the voltage becomes 0 V
(LOW).
Collector (C)
Emitter (E)
Base (B)
Emitter (E) Collector (C)
Base (B) +
-
N N P
A5-349
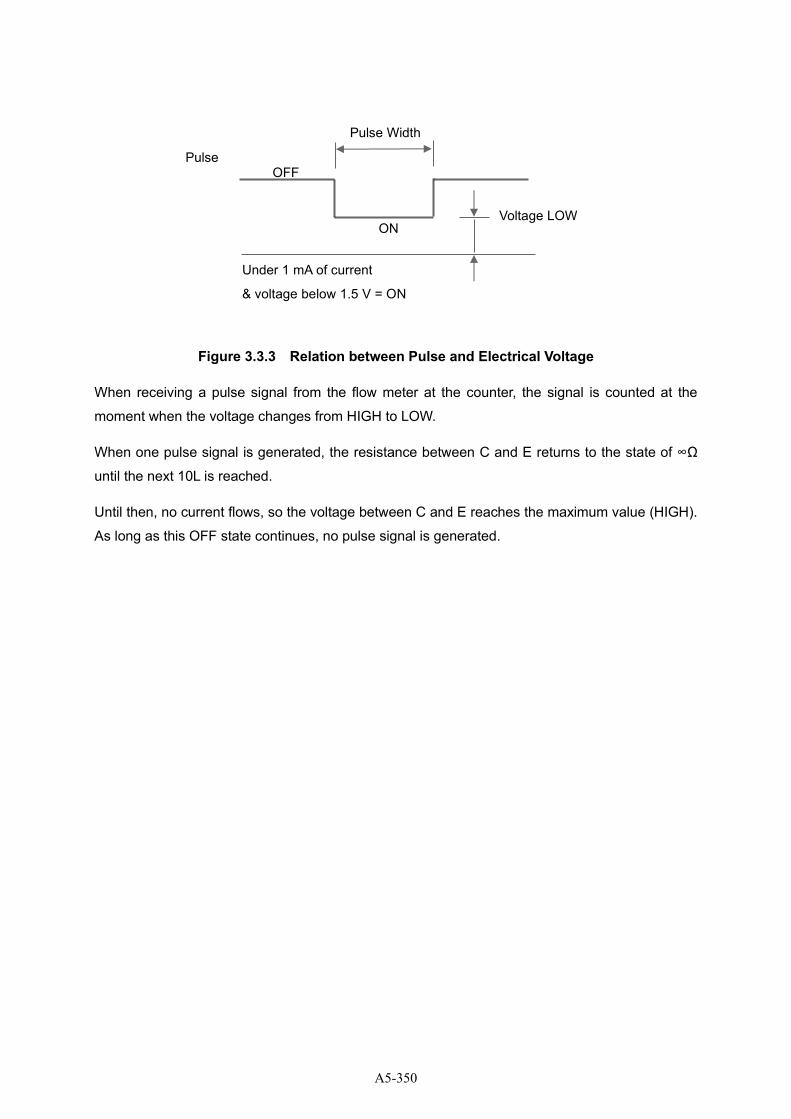
Figure 3.3.3 Relation between Pulse and Electrical Voltage
When receiving a pulse signal from the flow meter at the counter, the signal is counted at the
moment when the voltage changes from HIGH to LOW.
When one pulse signal is generated, the resistance between C and E returns to the state of ∞Ω
until the next 10L is reached.
Until then, no current flows, so the voltage between C and E reaches the maximum value (HIGH).
As long as this OFF state continues, no pulse signal is generated.
ON
OFF
Voltage LOW
Pulse
Under 1 mA of current
& voltage below 1.5 V = ON
Pulse Width
A5-350
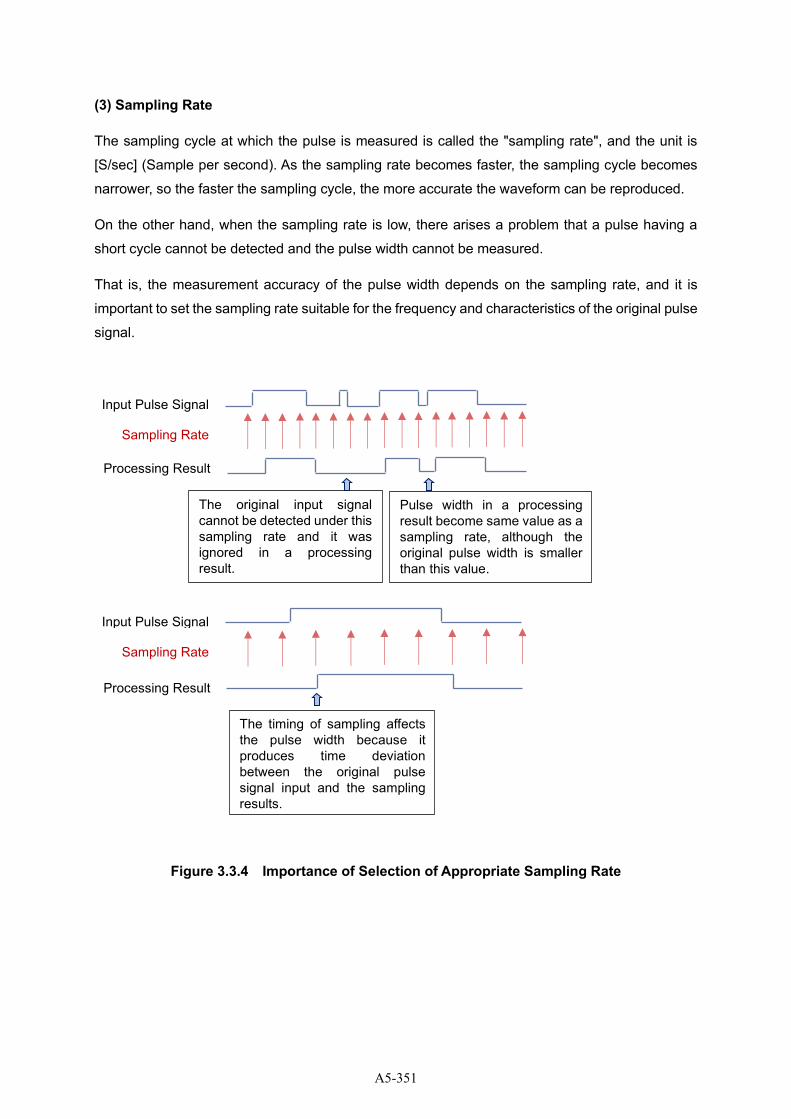
(3) Sampling Rate
The sampling cycle at which the pulse is measured is called the "sampling rate", and the unit is
[S/sec] (Sample per second). As the sampling rate becomes faster, the sampling cycle becomes
narrower, so the faster the sampling cycle, the more accurate the waveform can be reproduced.
On the other hand, when the sampling rate is low, there arises a problem that a pulse having a
short cycle cannot be detected and the pulse width cannot be measured.
That is, the measurement accuracy of the pulse width depends on the sampling rate, and it is
important to set the sampling rate suitable for the frequency and characteristics of the original pulse
signal.
Figure 3.3.4 Importance of Selection of Appropriate Sampling Rate
Input Pulse Signal
Sampling Rate
Processing Result
The original input signal cannot be detected under this sampling rate and it was ignored in a processing result.
Pulse width in a processing result become same value as a sampling rate, although the original pulse width is smaller than this value.
Input Pulse Signal
Sampling Rate
Processing Result
The timing of sampling affects the pulse width because it produces time deviation between the original pulse signal input and the sampling results.
A5-351
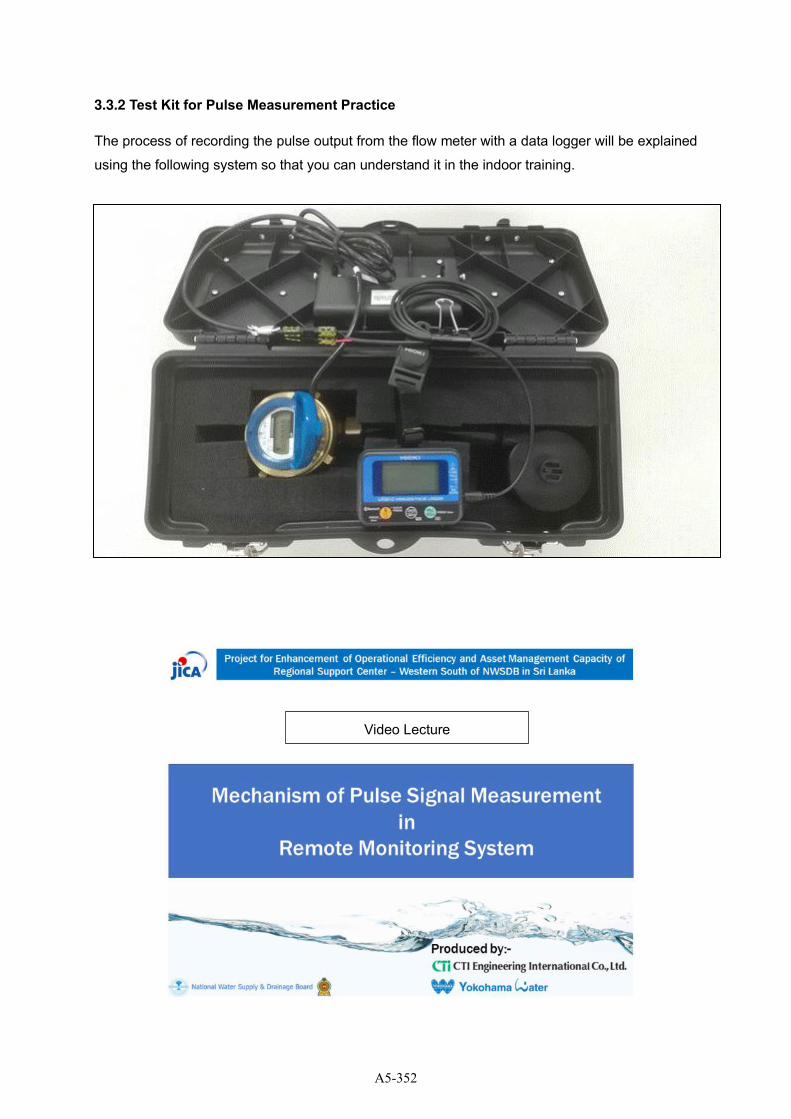
3.3.2 Test Kit for Pulse Measurement Practice
The process of recording the pulse output from the flow meter with a data logger will be explained
using the following system so that you can understand it in the indoor training.
Video Lecture
A5-352
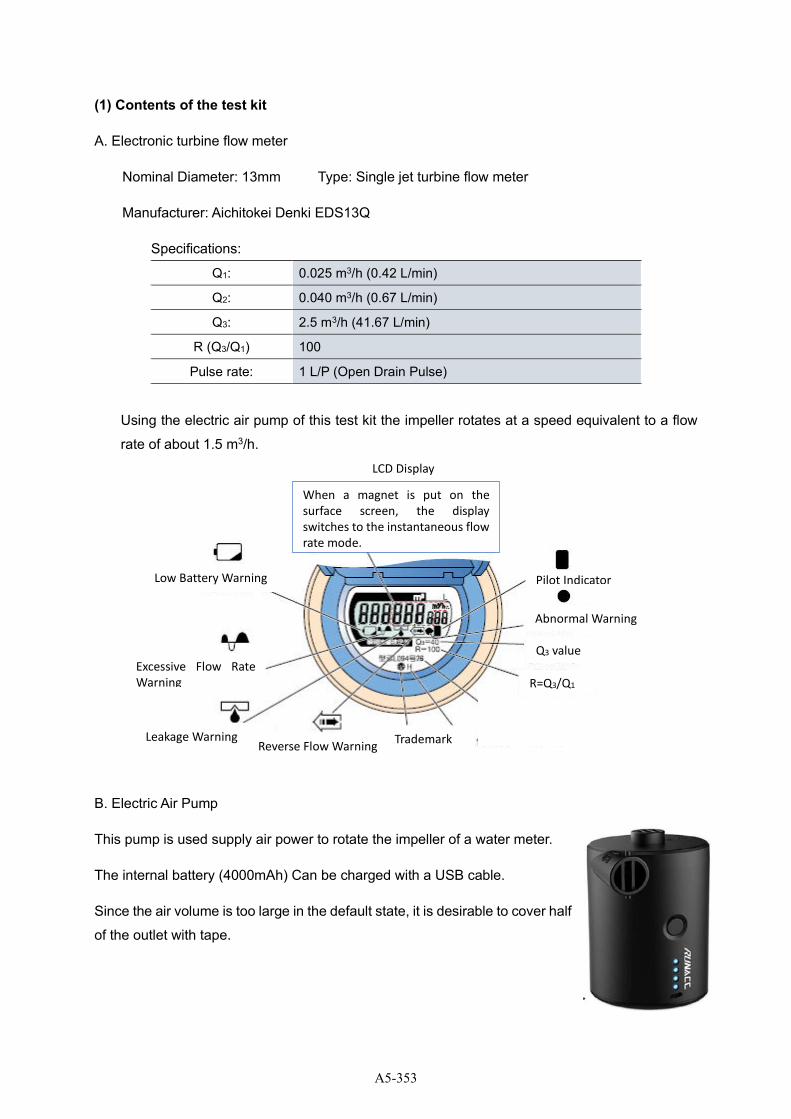
(1) Contents of the test kit
A. Electronic turbine flow meter
Nominal Diameter: 13mm Type: Single jet turbine flow meter
Manufacturer: Aichitokei Denki EDS13Q
Specifications:
Q1: 0.025 m3/h (0.42 L/min)
Q2: 0.040 m3/h (0.67 L/min)
Q3: 2.5 m3/h (41.67 L/min)
R (Q3/Q1) 100
Pulse rate: 1 L/P (Open Drain Pulse)
Using the electric air pump of this test kit the impeller rotates at a speed equivalent to a flow
rate of about 1.5 m3/h.
B. Electric Air Pump
This pump is used supply air power to rotate the impeller of a water meter.
The internal battery (4000mAh) Can be charged with a USB cable.
Since the air volume is too large in the default state, it is desirable to cover half
of the outlet with tape.
LCD Display
Low Battery Warning
Excessive Flow Rate Warning
Leakage Warning Reverse Flow Warning
Trademark
R=Q3/Q1
Q3 value
Abnormal Warning
Pilot Indicator
When a magnet is put on the surface screen, the display switches to the instantaneous flow rate mode.
A5-353
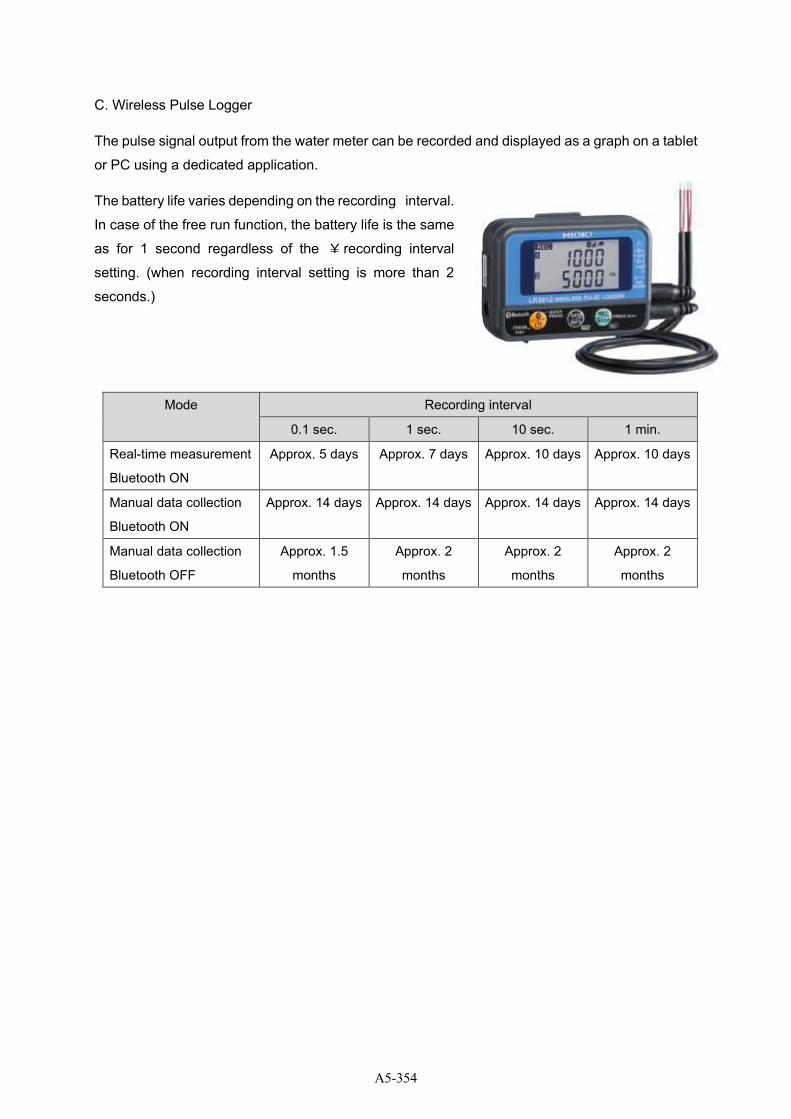
C. Wireless Pulse Logger
The pulse signal output from the water meter can be recorded and displayed as a graph on a tablet
or PC using a dedicated application.
The battery life varies depending on the recording interval.
In case of the free run function, the battery life is the same
as for 1 second regardless of the ¥ recording interval
setting. (when recording interval setting is more than 2
seconds.)
Mode Recording interval
0.1 sec. 1 sec. 10 sec. 1 min.
Real-time measurement
Bluetooth ON
Approx. 5 days Approx. 7 days Approx. 10 days Approx. 10 days
Manual data collection
Bluetooth ON
Approx. 14 days Approx. 14 days Approx. 14 days Approx. 14 days
Manual data collection
Bluetooth OFF
Approx. 1.5
months
Approx. 2
months
Approx. 2
months
Approx. 2
months
A5-354
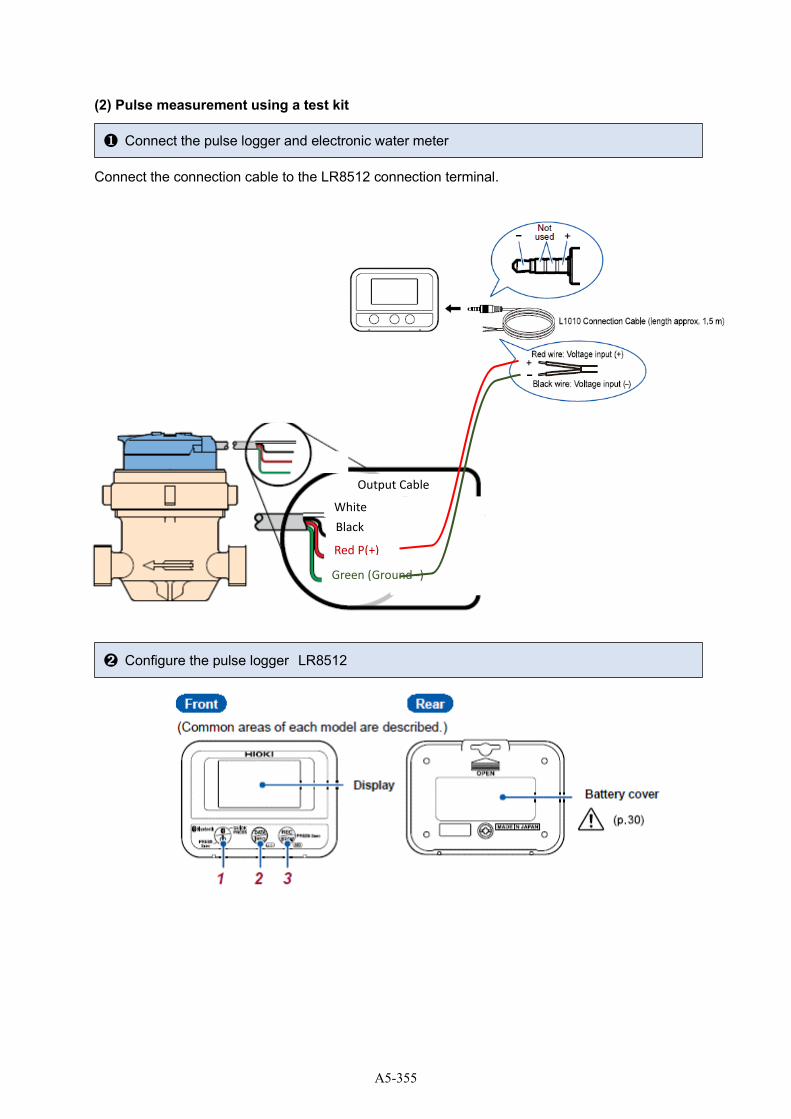
(2) Pulse measurement using a test kit
Connect the connection cable to the LR8512 connection terminal.
❶ Connect the pulse logger and electronic water meter
➋ Configure the pulse logger LR8512
Red P(+)
White
Black
Output Cable
Green (Ground -)
A5-355
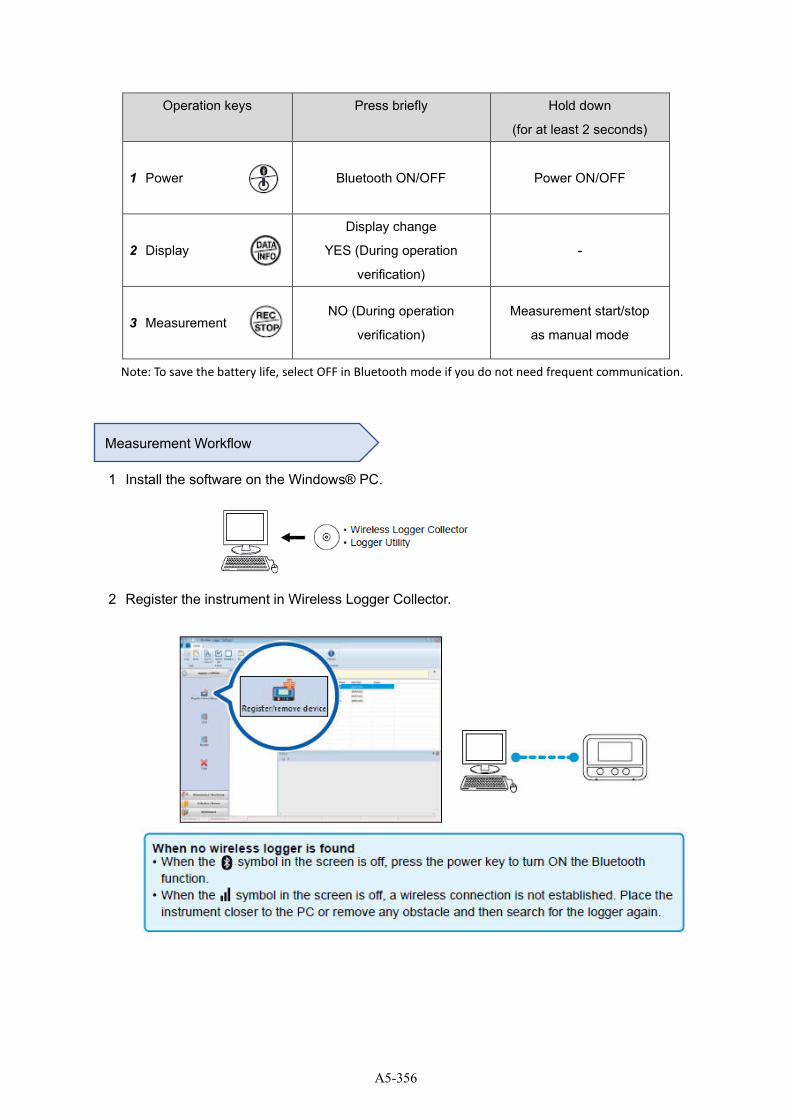
Operation keys Press briefly Hold down
(for at least 2 seconds)
1 Power
Bluetooth ON/OFF Power ON/OFF
2 Display
Display change
YES (During operation
verification)
-
3 Measurement
NO (During operation
verification)
Measurement start/stop
as manual mode
Note: To save the battery life, select OFF in Bluetooth mode if you do not need frequent communication.
[Measurement Workflow]
1 Install the software on the Windows® PC.
2 Register the instrument in Wireless Logger Collector.
Measurement Workflow
A5-356
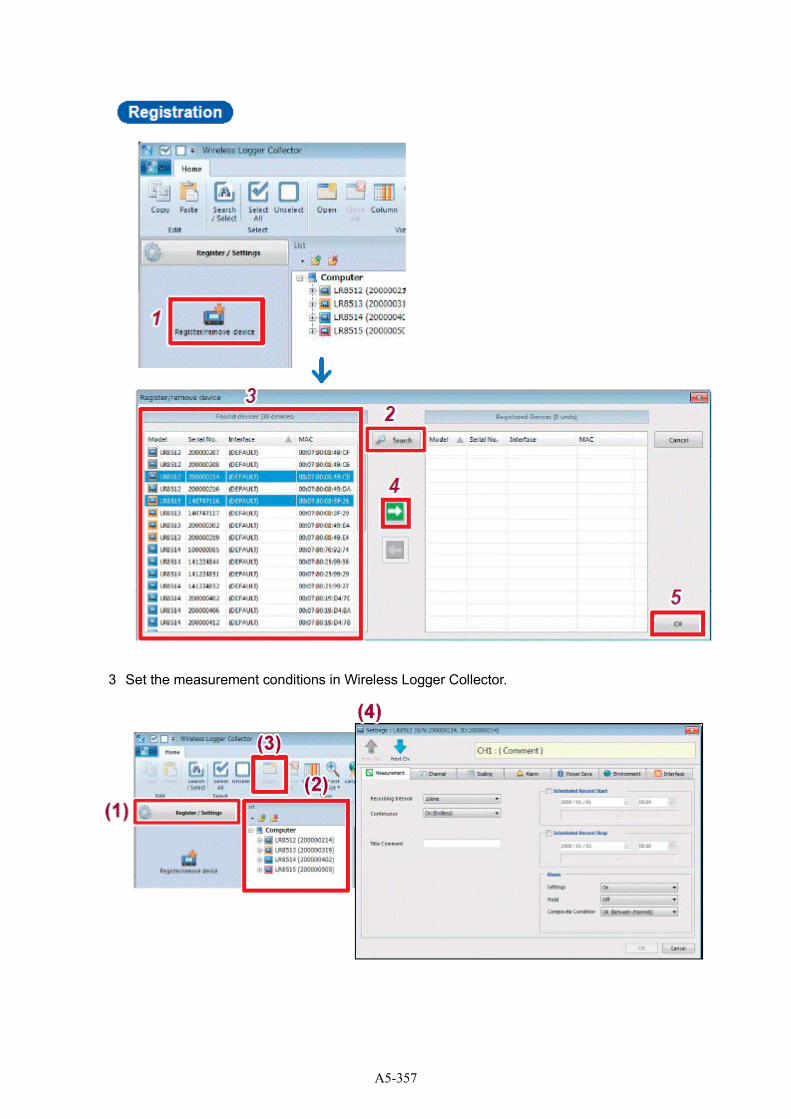
3 Set the measurement conditions in Wireless Logger Collector.
A5-357
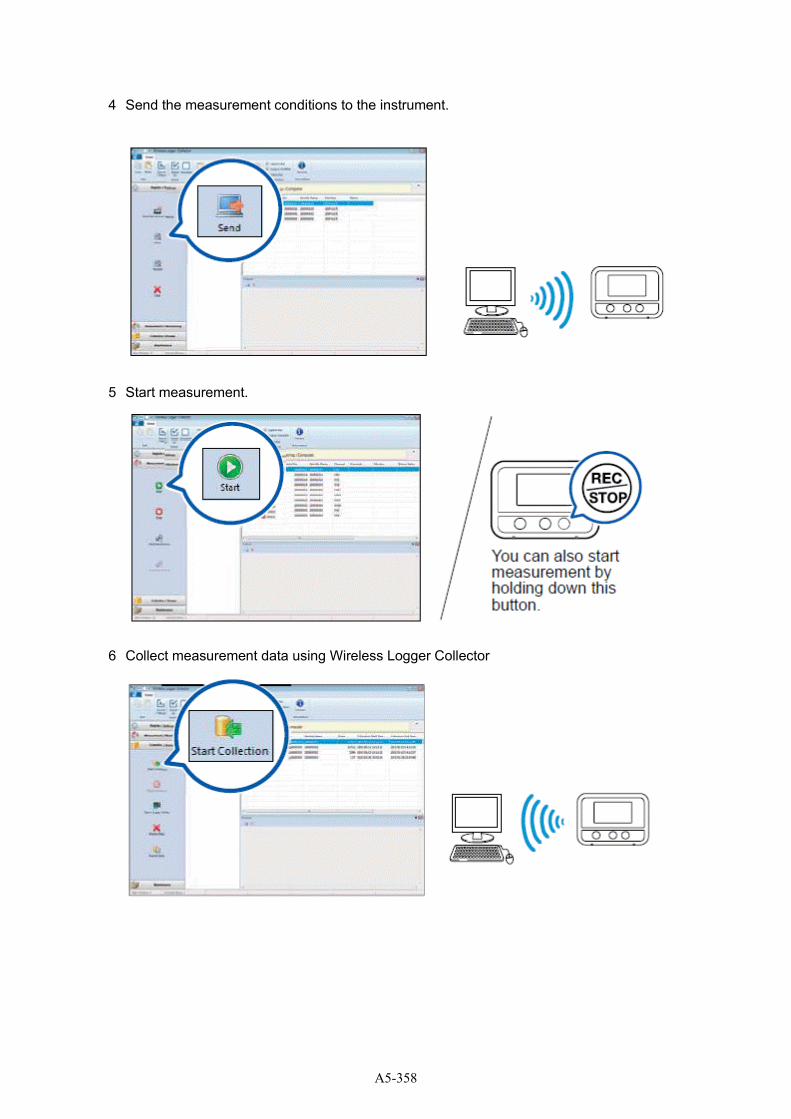
4 Send the measurement conditions to the instrument.
5 Start measurement.
6 Collect measurement data using Wireless Logger Collector
A5-358
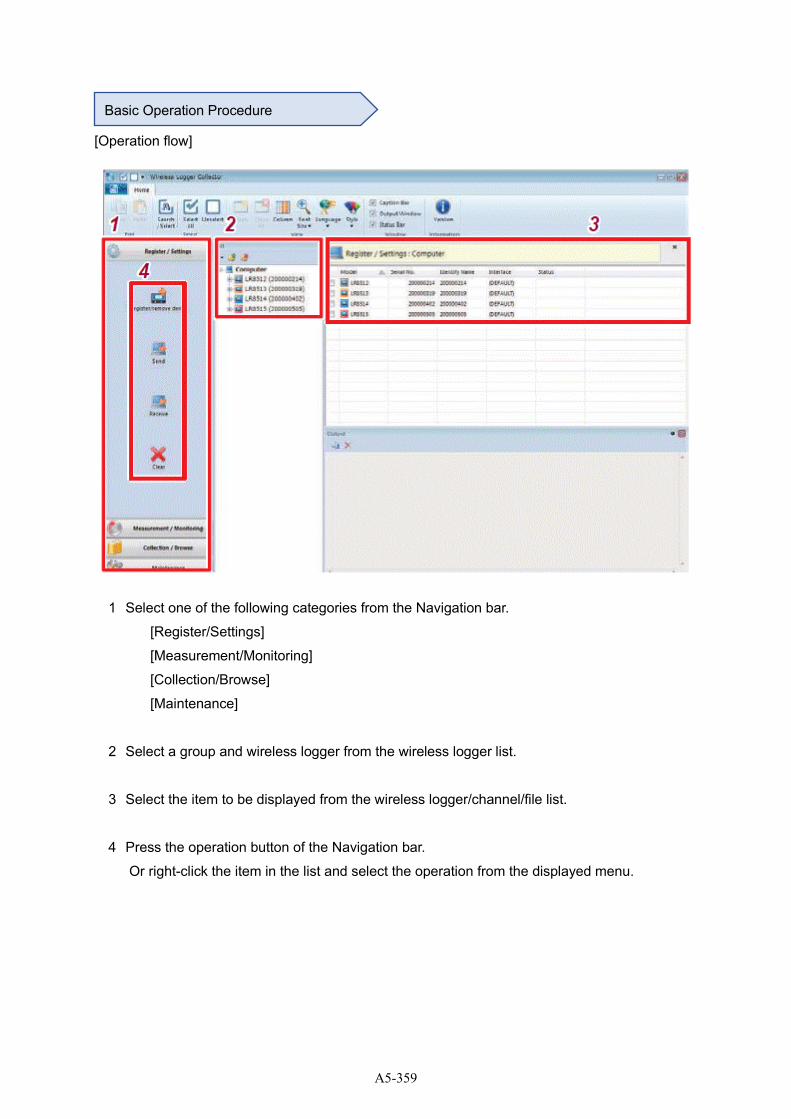
[Operation flow]
1 Select one of the following categories from the Navigation bar.
[Register/Settings]
[Measurement/Monitoring]
[Collection/Browse]
[Maintenance]
2 Select a group and wireless logger from the wireless logger list.
3 Select the item to be displayed from the wireless logger/channel/file list.
4 Press the operation button of the Navigation bar.
Or right-click the item in the list and select the operation from the displayed menu.
Basic Operation Procedure
A5-359
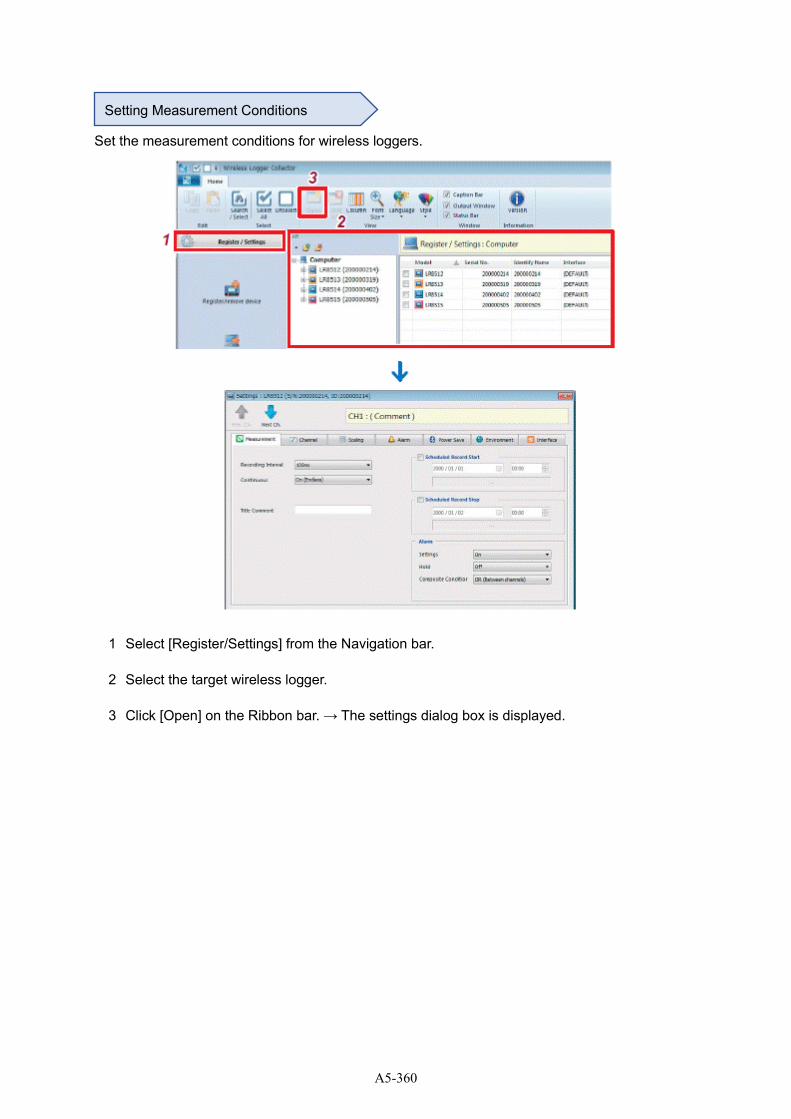
[Setting Measurement Conditions]
Set the measurement conditions for wireless loggers.
1 Select [Register/Settings] from the Navigation bar.
2 Select the target wireless logger.
3 Click [Open] on the Ribbon bar. → The settings dialog box is displayed.
Setting Measurement Conditions
A5-360
Setting measurement
[Recording Interval]
Allows you to set the interval to import data.
Setting options:
0.1 sec., 0.2 sec., 0.5 sec., 1 sec., 2 sec., 5 sec., 10 sec., 20 sec., 30 sec., 1 min., 2 min., 5 min.,
10 min., 20 min., 30 min., 1 hour
In this trial system with EDS13Q, the air pump blows between 1 and 2 m3/h of air into the meter,
so the meter will emit about 20 pulses per minute.
Therefore, in this trial work with HIOKI LR8512, select “1 min”.
[Continuous Recording]
Allows you to set a processing method when the memory is full.
Setting options:
Off (One-time): Stops recording when the memory is full.
On (Endless): Overwrites old data when the memory is full.
In this trial work with HIOKI LR8512, select “On (Endless)”.
[Title Comment]
Allows you to set the title comment. (Up to 40 single-byte characters)
The characters entered are converted to the following symbols.
^2 2 (Superscript)
^3 3 (Superscript)
~u μ
~c °
~e ℇ
In this trial work with HIOKI LR8512, input “Trial” as a title comment.
A5-361
[Scheduled Record Start]
Measurement can be started at the specified time.
If the current time has passed the preset time, measurement is not started.
Setting options:
☑ OFF (The preset start function is disabled.)
□ Starts recording at the preset time.
In this trial work with HIOKI LR8512, select “OFF”, because we use manual operation
mode.
[Scheduled Record Stop]
Measurement can be stopped at the specified time.
If the current time has passed the preset time, measurement is not stopped.
Setting options:
☑ OFF (The preset start function is disabled.)
□ Stops recording at the preset time.
In this trial work with HIOKI LR8512, select “OFF”, because we use manual operation
mode.
The instrument enters the recording start standby state at the same time as
the Scheduled Record Start ON setting is sent. Measurement start by signal
communications cannot be accepted in this state.
A5-362
Setting the channel
The channel to be set is switched.
In this trial work with HIOKI LR8512, no need setting for CH2 and delete the check from
CH2 measurement.
[Measurement]
Allows you to set measurement to ON/OFF.
Setting options:
□ Does not perform measurement
☑ Performs measurement
After updating the firmware of Wireless Logger Collector, this selection mode will not
appear.
[Comment]
Allows you to set the channel comment. (Up to 40 single-byte characters)
The characters entered are converted to the following symbols.
^2 2 (Superscript)
^3 3 (Superscript)
~u μ
~c °
~e ℇ
In this trial work with HIOKI LR8512, remain this part blank
LR8512 Wireless Pulse Logger
A5-363
Making setting for integrated measurement
The number of integrated pulse output from the integrated power meter or flow meter is measured.
1 Select the channel to be set and check the Measurement checkbox [☑] (ON).
2 Select the input type.
Setting options:
Instantaneous Measures the number of pulses input to the instrument
within the recording interval.
The number of pulses is reset for each recording
interval.
Add Measures the number of integrated pulses after
measurement starts.
In this trial work with HIOKI LR8512, select “Instantaneous” mode.
A5-364
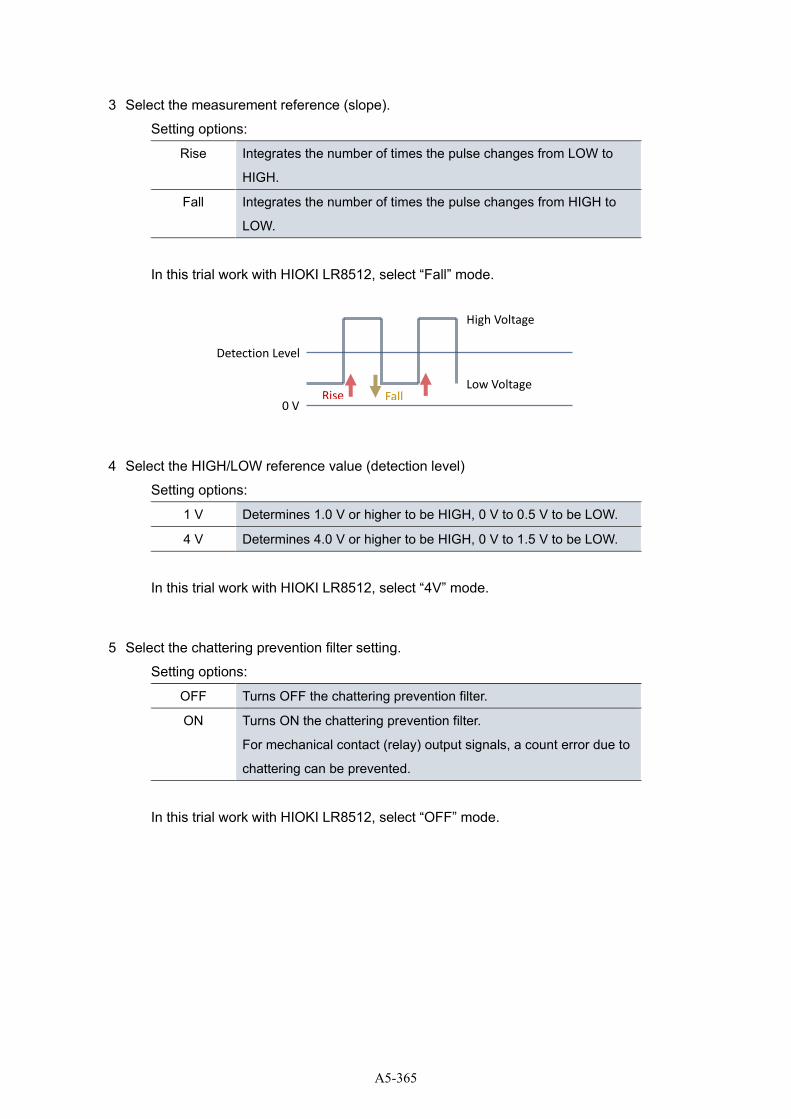
3 Select the measurement reference (slope).
Setting options:
Rise Integrates the number of times the pulse changes from LOW to
HIGH.
Fall Integrates the number of times the pulse changes from HIGH to
LOW.
In this trial work with HIOKI LR8512, select “Fall” mode.
4 Select the HIGH/LOW reference value (detection level)
Setting options:
1 V Determines 1.0 V or higher to be HIGH, 0 V to 0.5 V to be LOW.
4 V Determines 4.0 V or higher to be HIGH, 0 V to 1.5 V to be LOW.
In this trial work with HIOKI LR8512, select “4V” mode.
5 Select the chattering prevention filter setting.
Setting options:
OFF Turns OFF the chattering prevention filter.
ON Turns ON the chattering prevention filter.
For mechanical contact (relay) output signals, a count error due to
chattering can be prevented.
In this trial work with HIOKI LR8512, select “OFF” mode.
High Voltage
Low Voltage
Detection Level
0 V Rise Fall
A5-365
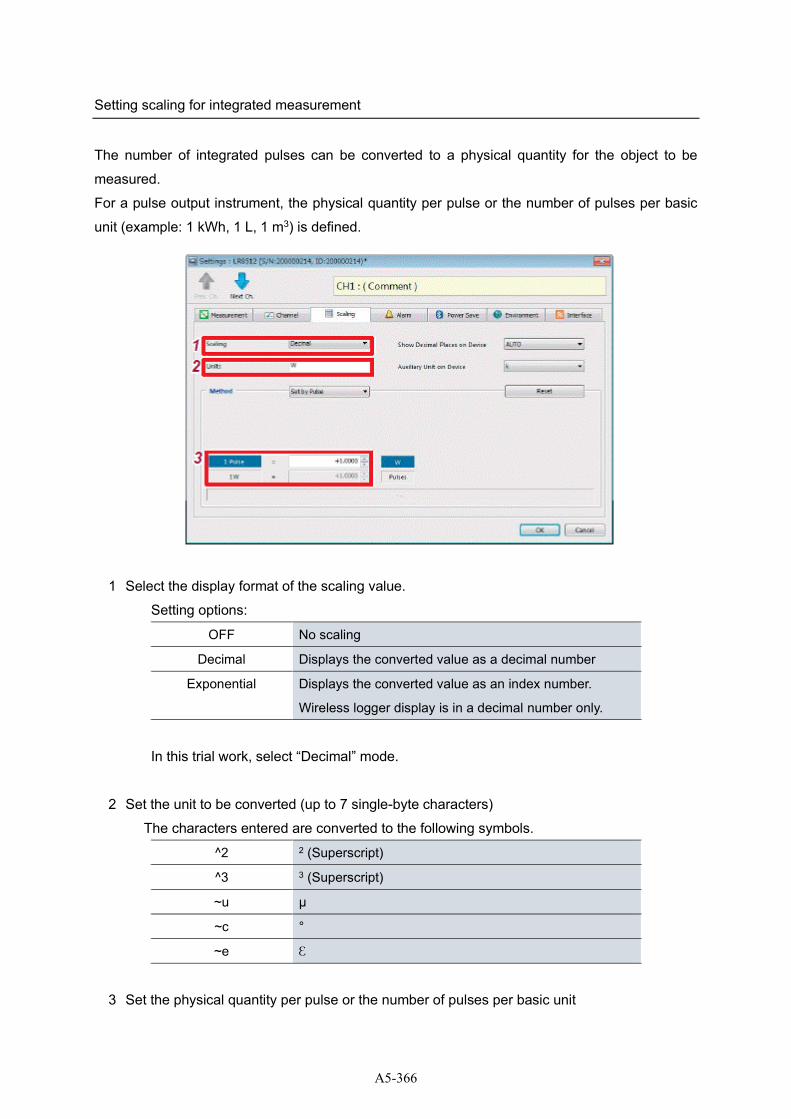
Setting scaling for integrated measurement
The number of integrated pulses can be converted to a physical quantity for the object to be
measured.
For a pulse output instrument, the physical quantity per pulse or the number of pulses per basic
unit (example: 1 kWh, 1 L, 1 m3) is defined.
1 Select the display format of the scaling value.
Setting options:
OFF No scaling
Decimal Displays the converted value as a decimal number
Exponential Displays the converted value as an index number.
Wireless logger display is in a decimal number only.
In this trial work, select “Decimal” mode.
2 Set the unit to be converted (up to 7 single-byte characters)
The characters entered are converted to the following symbols.
^2 2 (Superscript)
^3 3 (Superscript)
~u μ
~c °
~e ℇ
3 Set the physical quantity per pulse or the number of pulses per basic unit
A5-366
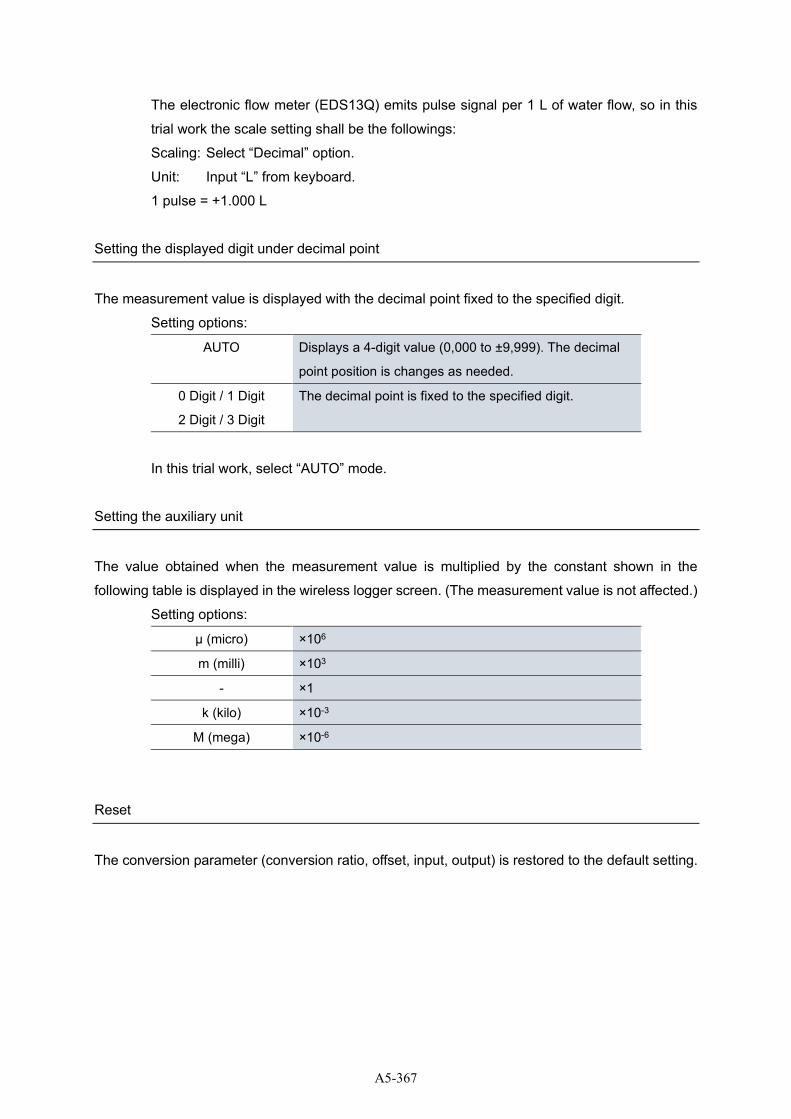
The electronic flow meter (EDS13Q) emits pulse signal per 1 L of water flow, so in this
trial work the scale setting shall be the followings:
Scaling: Select “Decimal” option.
Unit: Input “L” from keyboard.
1 pulse = +1.000 L
Setting the displayed digit under decimal point
The measurement value is displayed with the decimal point fixed to the specified digit.
Setting options:
AUTO Displays a 4-digit value (0,000 to ±9,999). The decimal
point position is changes as needed.
0 Digit / 1 Digit
2 Digit / 3 Digit
The decimal point is fixed to the specified digit.
In this trial work, select “AUTO” mode.
Setting the auxiliary unit
The value obtained when the measurement value is multiplied by the constant shown in the
following table is displayed in the wireless logger screen. (The measurement value is not affected.)
Setting options:
μ (micro) ×106
m (milli) ×103
- ×1
k (kilo) ×10-3
M (mega) ×10-6
Reset
The conversion parameter (conversion ratio, offset, input, output) is restored to the default setting.
A5-367
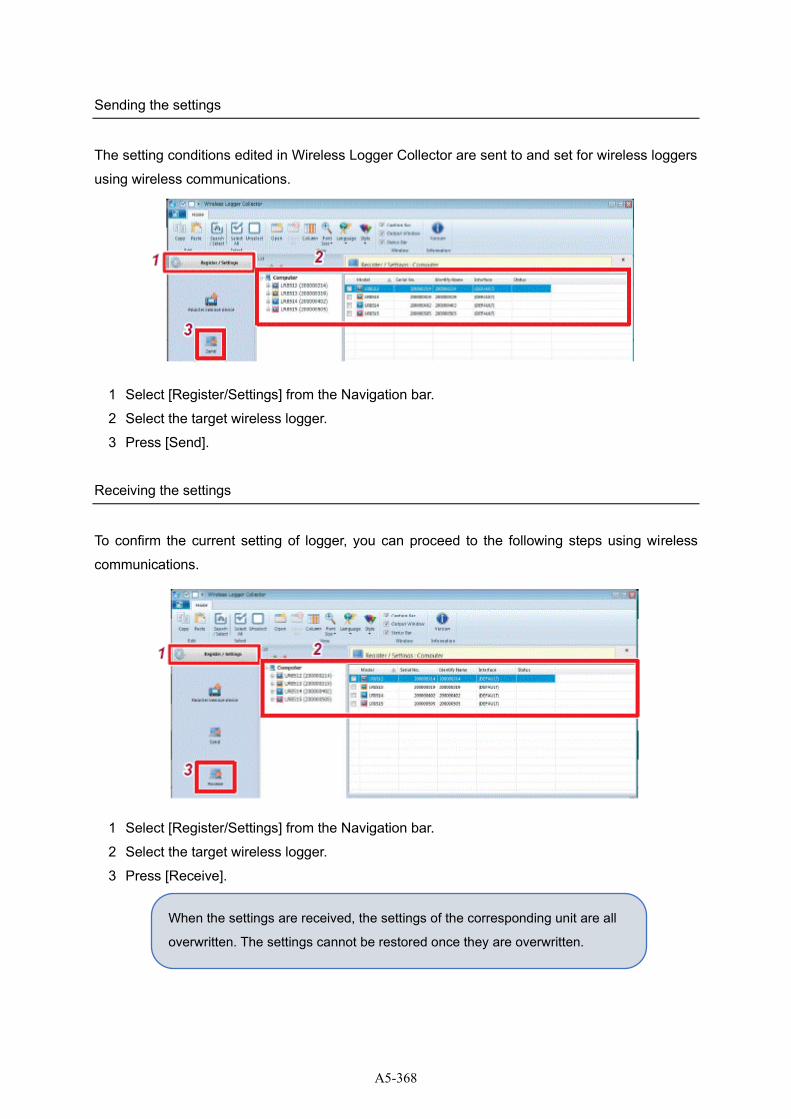
Sending the settings
The setting conditions edited in Wireless Logger Collector are sent to and set for wireless loggers
using wireless communications.
1 Select [Register/Settings] from the Navigation bar.
2 Select the target wireless logger.
3 Press [Send].
Receiving the settings
To confirm the current setting of logger, you can proceed to the following steps using wireless
communications.
1 Select [Register/Settings] from the Navigation bar.
2 Select the target wireless logger.
3 Press [Receive].
When the settings are received, the settings of the corresponding unit are all
overwritten. The settings cannot be restored once they are overwritten.
A5-368
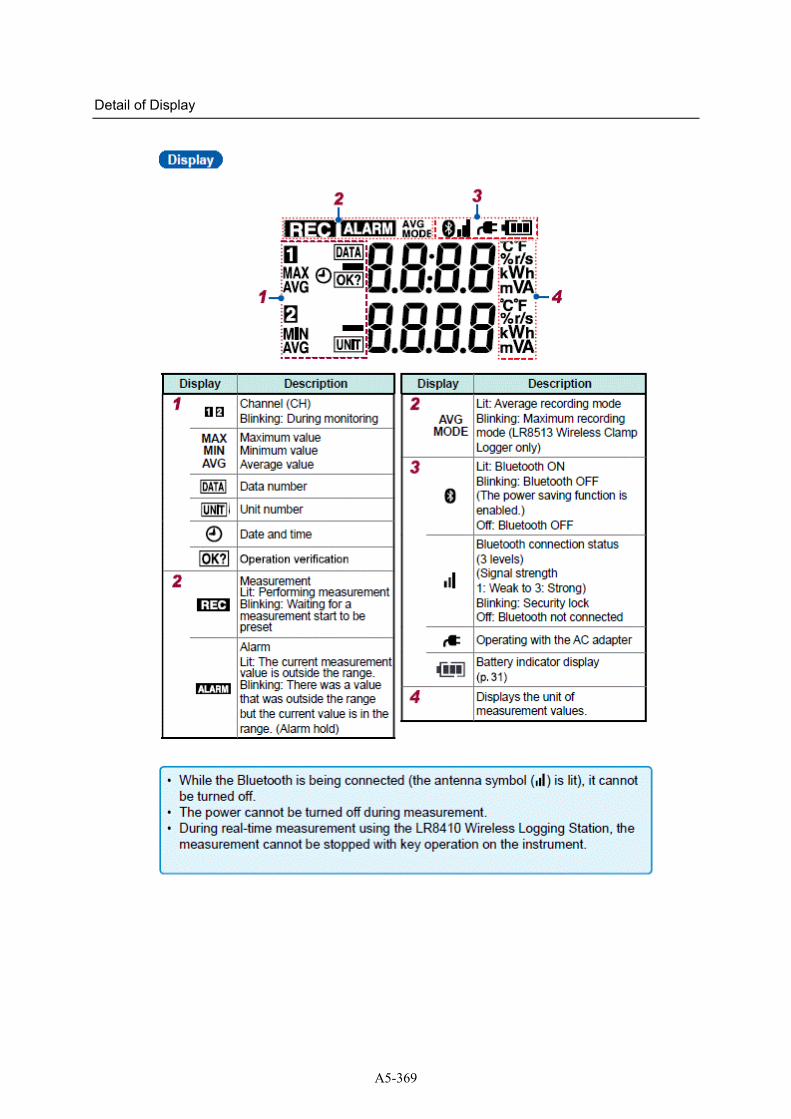
Detail of Display
A5-369
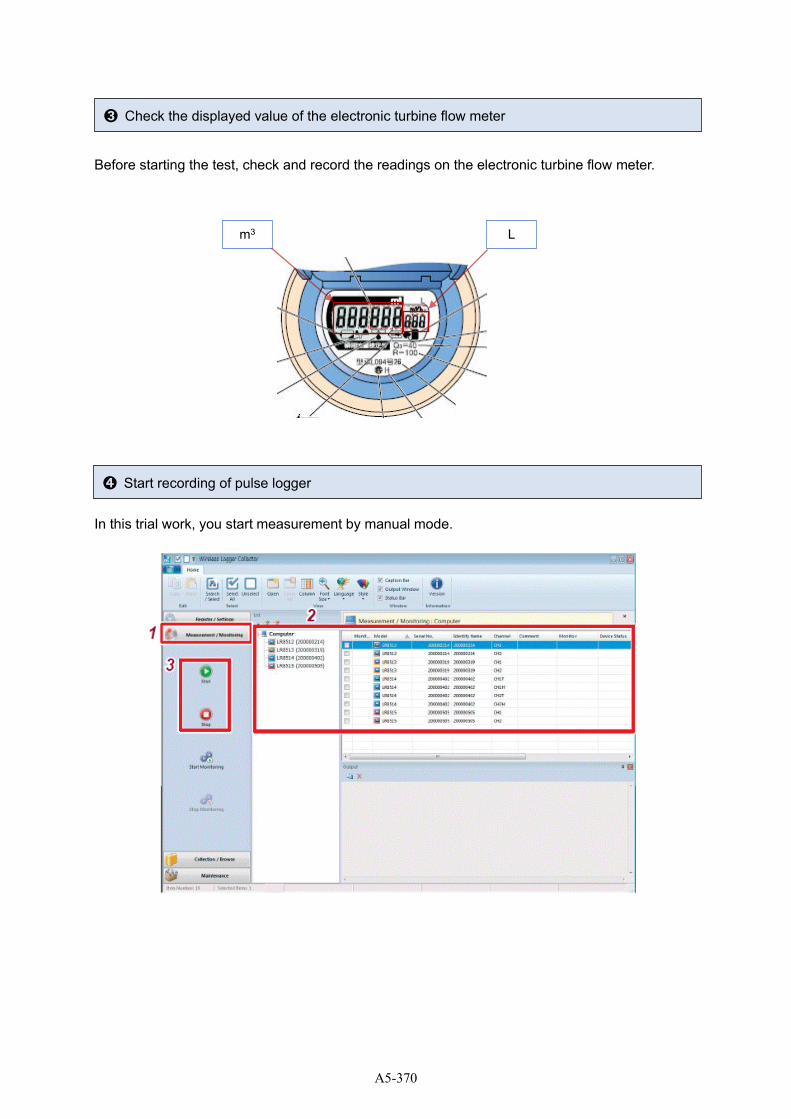
Before starting the test, check and record the readings on the electronic turbine flow meter.
In this trial work, you start measurement by manual mode.
➌ Check the displayed value of the electronic turbine flow meter
➍ Start recording of pulse logger
m3
L
A5-370
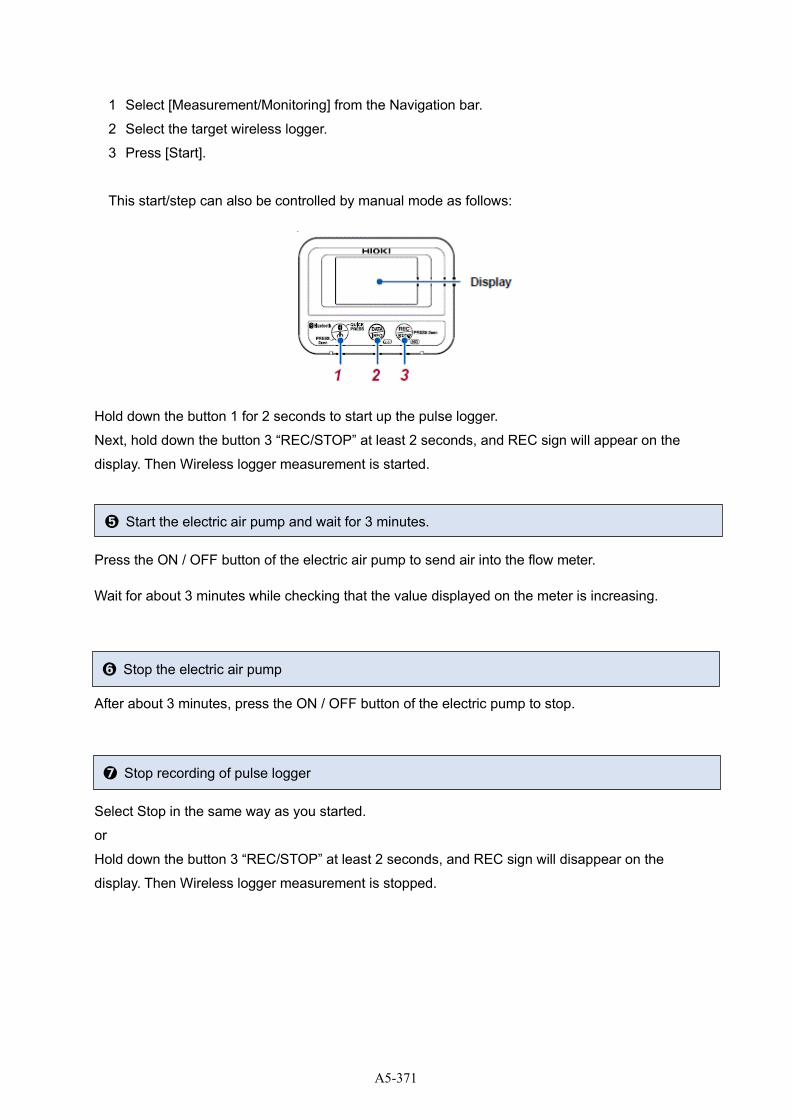
1 Select [Measurement/Monitoring] from the Navigation bar.
2 Select the target wireless logger.
3 Press [Start].
This start/step can also be controlled by manual mode as follows:
Hold down the button 1 for 2 seconds to start up the pulse logger.
Next, hold down the button 3 “REC/STOP” at least 2 seconds, and REC sign will appear on the
display. Then Wireless logger measurement is started.
Press the ON / OFF button of the electric air pump to send air into the flow meter.
Wait for about 3 minutes while checking that the value displayed on the meter is increasing.
After about 3 minutes, press the ON / OFF button of the electric pump to stop.
Select Stop in the same way as you started.
or
Hold down the button 3 “REC/STOP” at least 2 seconds, and REC sign will disappear on the
display. Then Wireless logger measurement is stopped.
➎ Start the electric air pump and wait for 3 minutes.
➏ Stop the electric air pump
➐ Stop recording of pulse logger
A5-371
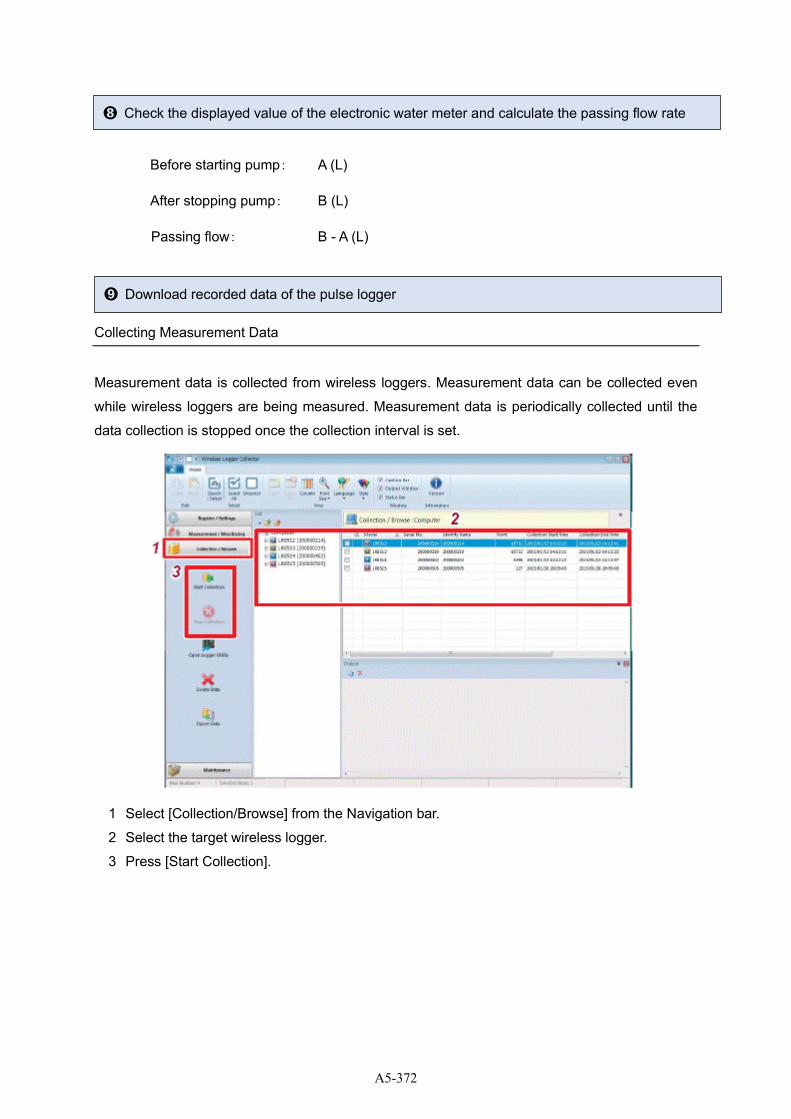
Before starting pump: A (L)
After stopping pump: B (L)
Passing flow: B - A (L)
Collecting Measurement Data
Measurement data is collected from wireless loggers. Measurement data can be collected even
while wireless loggers are being measured. Measurement data is periodically collected until the
data collection is stopped once the collection interval is set.
1 Select [Collection/Browse] from the Navigation bar.
2 Select the target wireless logger.
3 Press [Start Collection].
➑ Check the displayed value of the electronic water meter and calculate the passing flow rate
➒ Download recorded data of the pulse logger
A5-372
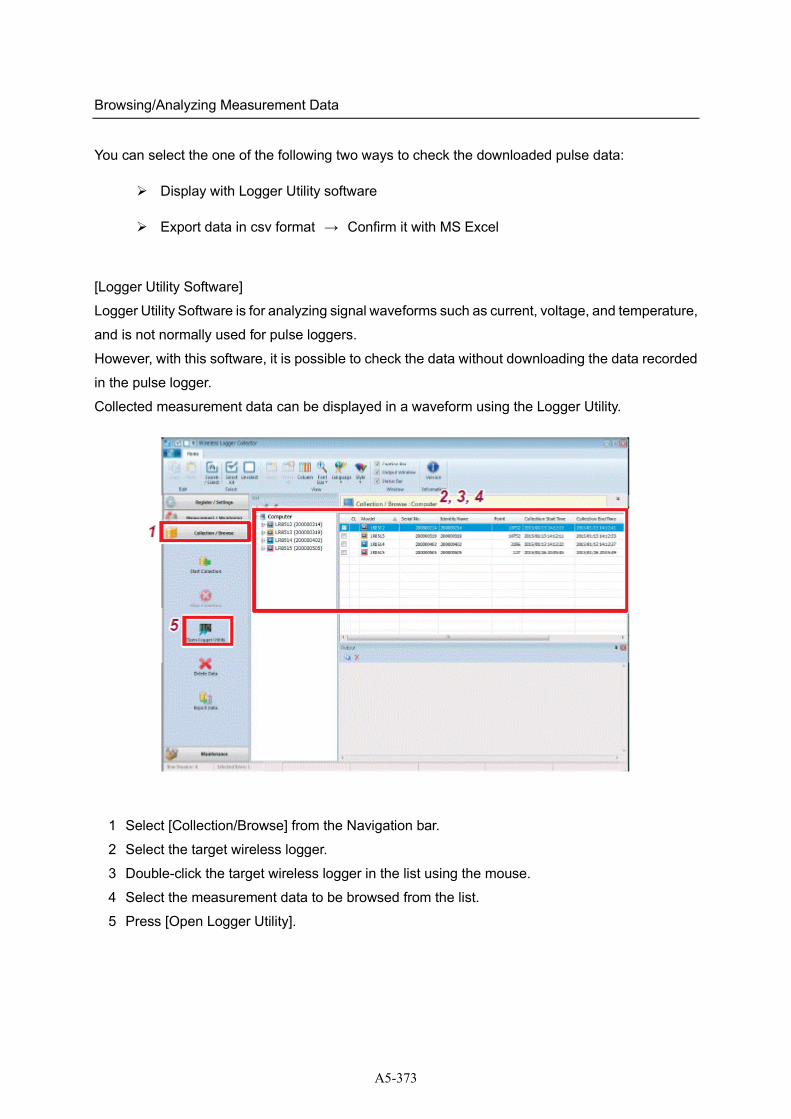
Browsing/Analyzing Measurement Data
You can select the one of the following two ways to check the downloaded pulse data:
➢ Display with Logger Utility software
➢ Export data in csv format → Confirm it with MS Excel
[Logger Utility Software]
Logger Utility Software is for analyzing signal waveforms such as current, voltage, and temperature,
and is not normally used for pulse loggers.
However, with this software, it is possible to check the data without downloading the data recorded
in the pulse logger.
Collected measurement data can be displayed in a waveform using the Logger Utility.
1 Select [Collection/Browse] from the Navigation bar.
2 Select the target wireless logger.
3 Double-click the target wireless logger in the list using the mouse.
4 Select the measurement data to be browsed from the list.
5 Press [Open Logger Utility].
A5-373
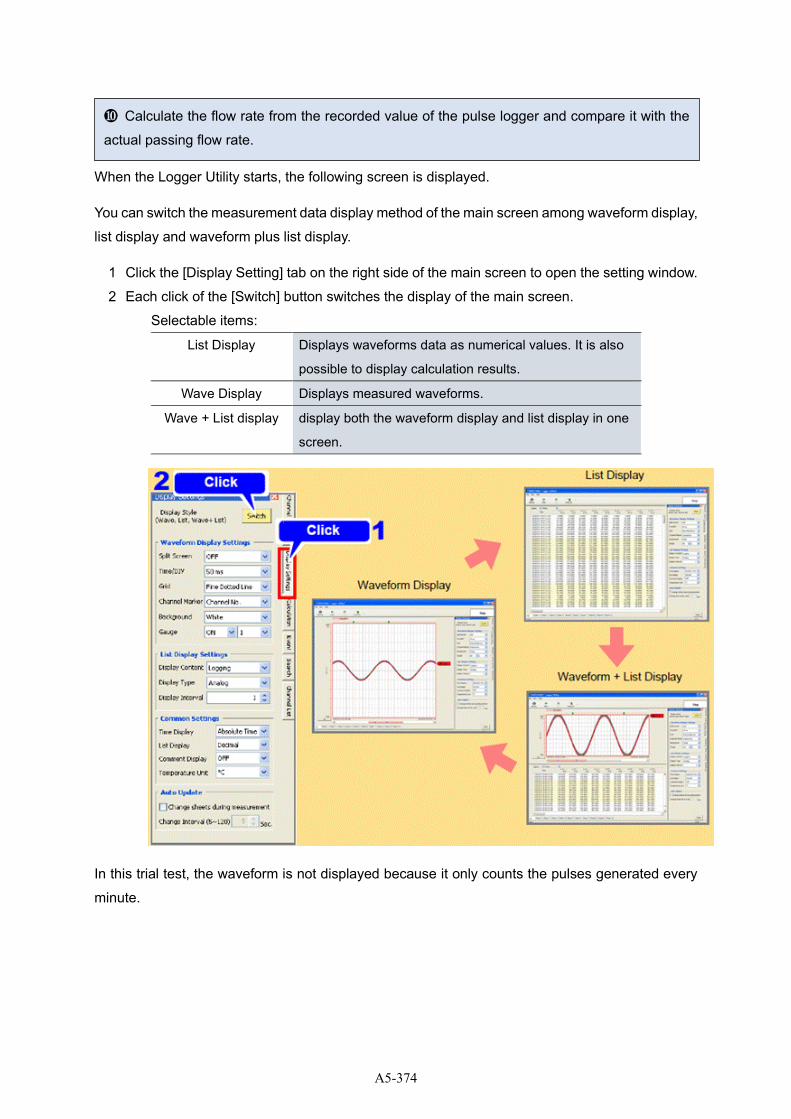
When the Logger Utility starts, the following screen is displayed.
You can switch the measurement data display method of the main screen among waveform display,
list display and waveform plus list display.
1 Click the [Display Setting] tab on the right side of the main screen to open the setting window.
2 Each click of the [Switch] button switches the display of the main screen.
Selectable items:
List Display Displays waveforms data as numerical values. It is also
possible to display calculation results.
Wave Display Displays measured waveforms.
Wave + List display display both the waveform display and list display in one
screen.
In this trial test, the waveform is not displayed because it only counts the pulses generated every
minute.
❿ Calculate the flow rate from the recorded value of the pulse logger and compare it with the
actual passing flow rate.
A5-374
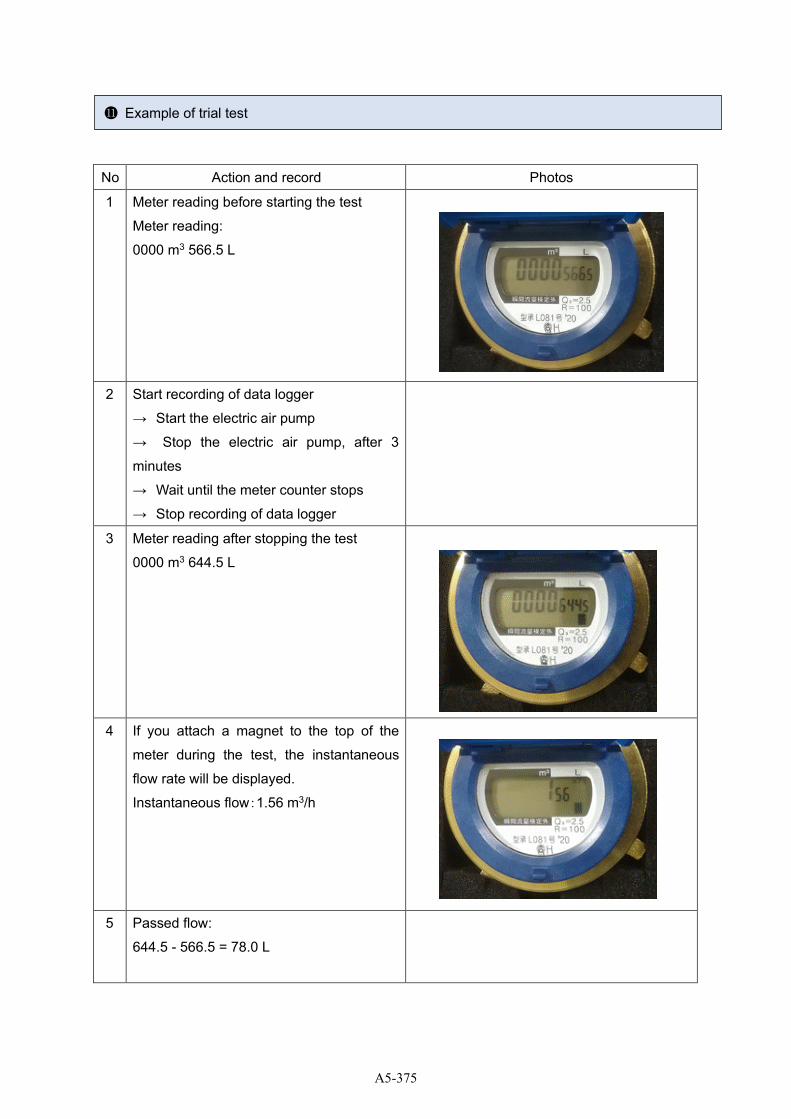
No Action and record Photos
1 Meter reading before starting the test
Meter reading:
0000 m3 566.5 L
2 Start recording of data logger
→ Start the electric air pump
→ Stop the electric air pump, after 3
minutes
→ Wait until the meter counter stops
→ Stop recording of data logger
3 Meter reading after stopping the test
0000 m3 644.5 L
4 If you attach a magnet to the top of the
meter during the test, the instantaneous
flow rate will be displayed.
Instantaneous flow:1.56 m3/h
5 Passed flow:
644.5 - 566.5 = 78.0 L
⓫ Example of trial test
A5-375
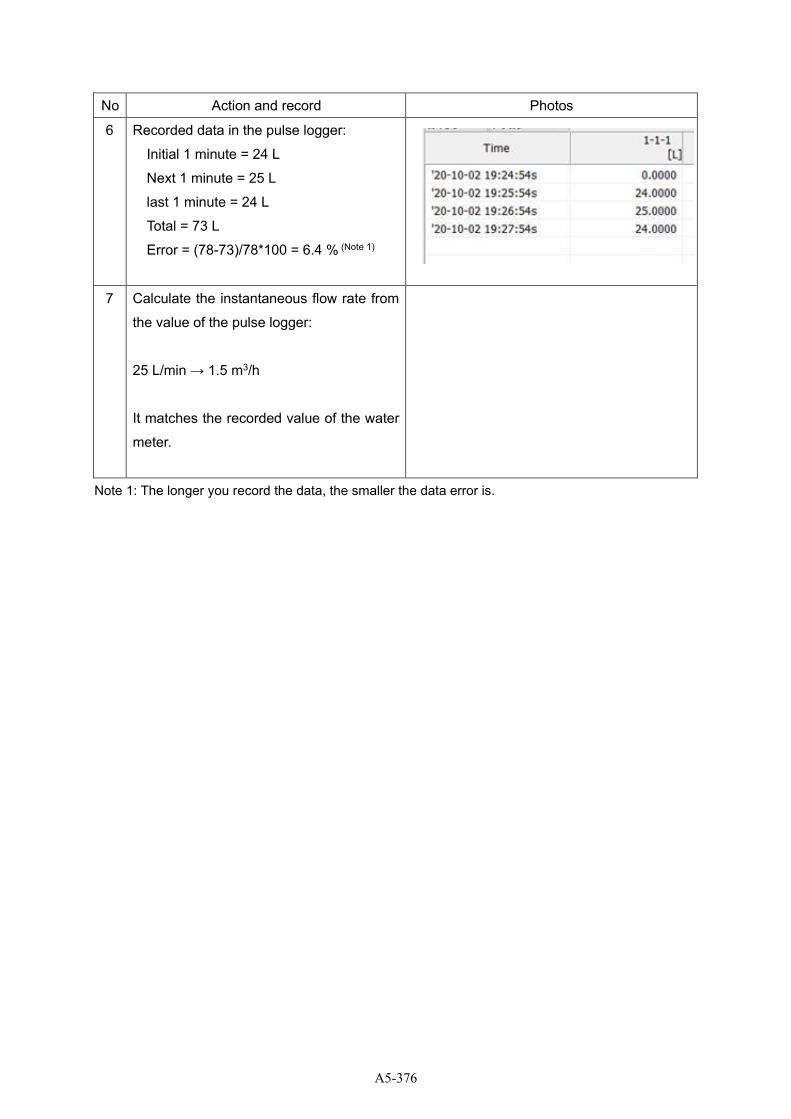
No Action and record Photos
6 Recorded data in the pulse logger:
Initial 1 minute = 24 L
Next 1 minute = 25 L
last 1 minute = 24 L
Total = 73 L
Error = (78-73)/78*100 = 6.4 % (Note 1)
7 Calculate the instantaneous flow rate from
the value of the pulse logger:
25 L/min → 1.5 m3/h
It matches the recorded value of the water
meter.
Note 1: The longer you record the data, the smaller the data error is.
A5-376

Supporting Document for TOT No.7
Basic Knowledge of Remote Monitoring System
and Technical Guideline
April 2021
A5-377
Contents
Chapter 1. Mechanism of pulse measurement 1
1.1 What is Pulse Signal? 1
1.2 Pulse Signal and Rotation Speed 3
1.3 Mechanism of pulse measurement 5
Chapter 2. Mechanism of the remote monitoring system 11
2.1 System utilizing cloud server 11
2.2 Component of the monitoring system 14
2.3 Configuration of HWM Multilog 2 20
Annex 1:
Multilog 2 Basic User Manual for DataGateTM / HWM OnlineTM Instruction (Version 1.3)
Annex 2:
Installation and Diagnostic Tool – IDT (Version 1.0)
A5-378
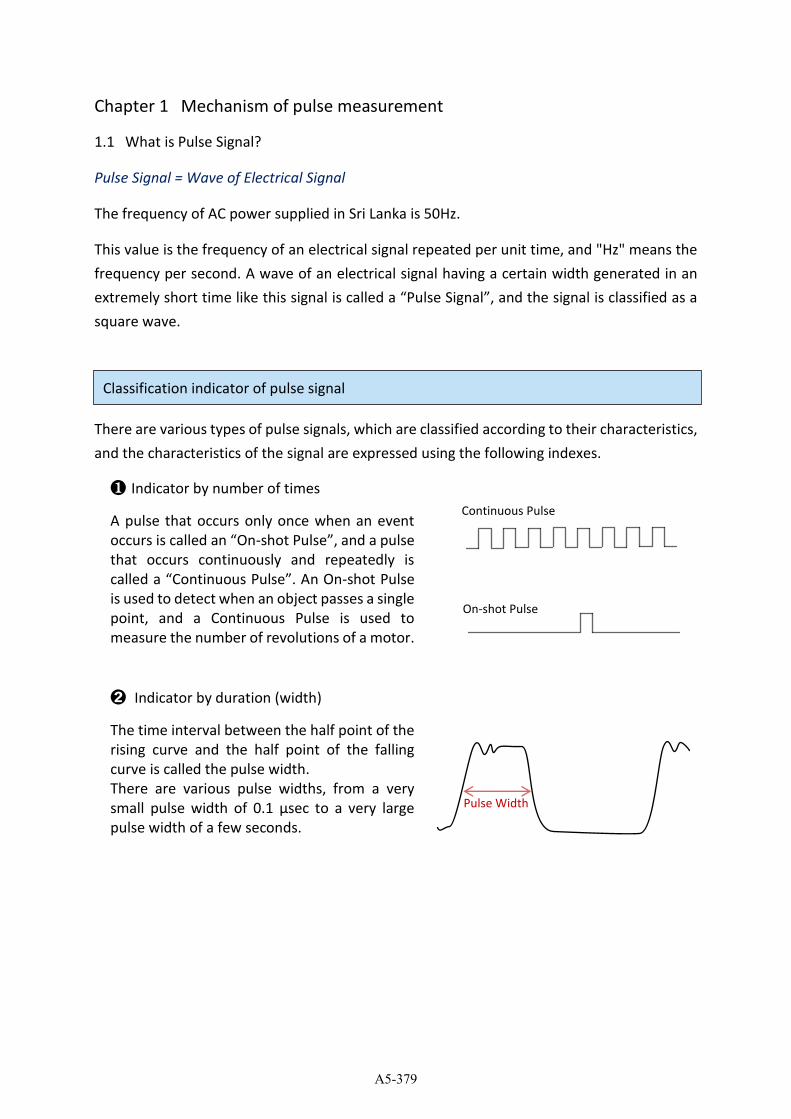
Chapter 1 Mechanism of pulse measurement
1.1 What is Pulse Signal?
Pulse Signal = Wave of Electrical Signal
The frequency of AC power supplied in Sri Lanka is 50Hz.
This value is the frequency of an electrical signal repeated per unit time, and "Hz" means the
frequency per second. A wave of an electrical signal having a certain width generated in an
extremely short time like this signal is called a “Pulse Signal”, and the signal is classified as a square wave.
There are various types of pulse signals, which are classified according to their characteristics,
and the characteristics of the signal are expressed using the following indexes.
❶ Indicator by number of times
A pulse that occurs only once when an event
occurs is called an “On-shot Pulse”, and a pulse that occurs continuously and repeatedly is
called a “Continuous Pulse”. An On-shot Pulse
is used to detect when an object passes a single
point, and a Continuous Pulse is used to
measure the number of revolutions of a motor.
➋ Indicator by duration (width)
The time interval between the half point of the
rising curve and the half point of the falling
curve is called the pulse width.
There are various pulse widths, from a very
small pulse width of 0.1 μsec to a very large pulse width of a few seconds.
Classification indicator of pulse signal
Pulse Width
On-shot Pulse
Continuous Pulse
A5-379
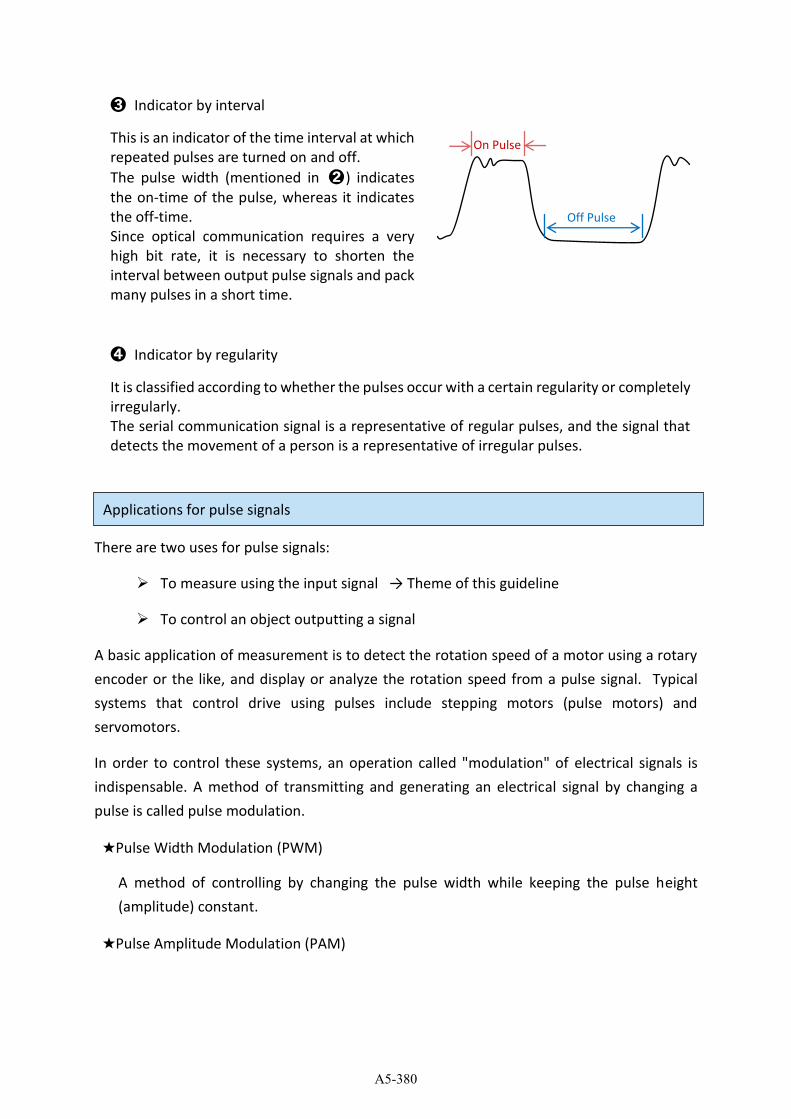
➌ Indicator by interval
This is an indicator of the time interval at which
repeated pulses are turned on and off.
The pulse width (mentioned in ➋) indicates
the on-time of the pulse, whereas it indicates
the off-time.
Since optical communication requires a very
high bit rate, it is necessary to shorten the
interval between output pulse signals and pack
many pulses in a short time.
➍ Indicator by regularity
It is classified according to whether the pulses occur with a certain regularity or completely
irregularly.
The serial communication signal is a representative of regular pulses, and the signal that
detects the movement of a person is a representative of irregular pulses.
There are two uses for pulse signals:
➢ To measure using the input signal → Theme of this guideline
➢ To control an object outputting a signal
A basic application of measurement is to detect the rotation speed of a motor using a rotary
encoder or the like, and display or analyze the rotation speed from a pulse signal. Typical
systems that control drive using pulses include stepping motors (pulse motors) and
servomotors.
In order to control these systems, an operation called "modulation" of electrical signals is
indispensable. A method of transmitting and generating an electrical signal by changing a
pulse is called pulse modulation.
★Pulse Width Modulation (PWM)
A method of controlling by changing the pulse width while keeping the pulse height
(amplitude) constant.
★Pulse Amplitude Modulation (PAM)
On Pulse
Off Pulse
Applications for pulse signals
A5-380
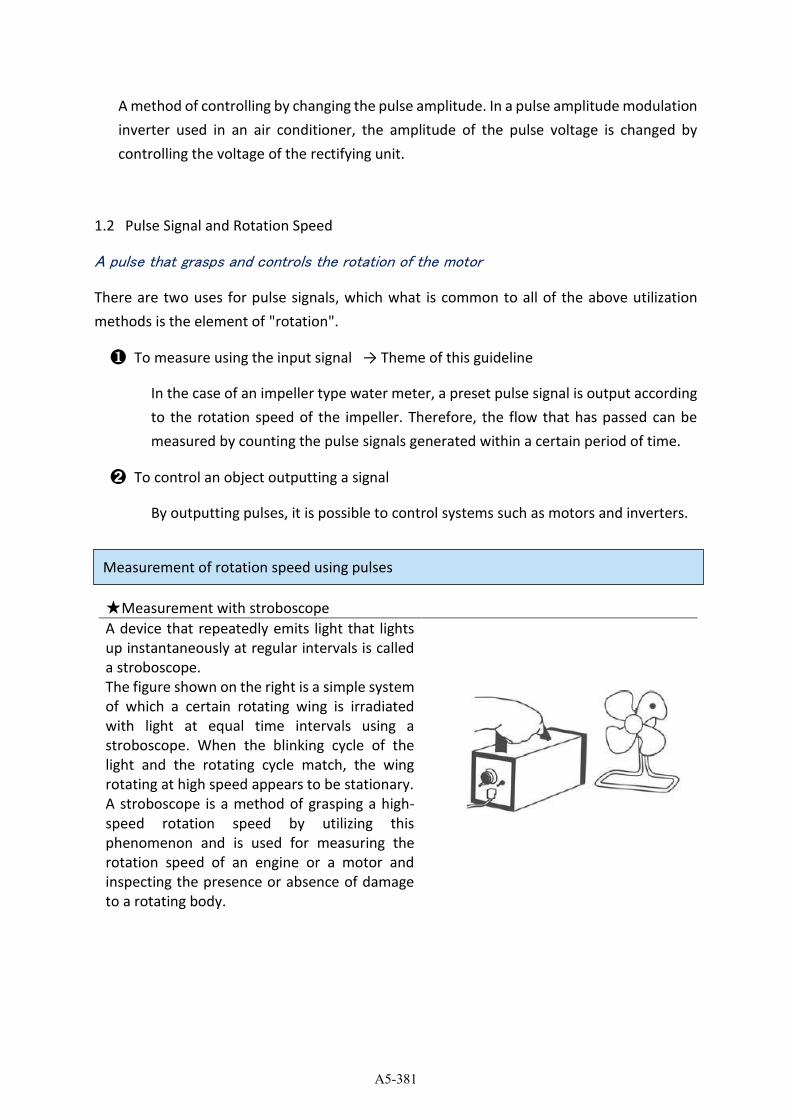
A method of controlling by changing the pulse amplitude. In a pulse amplitude modulation
inverter used in an air conditioner, the amplitude of the pulse voltage is changed by
controlling the voltage of the rectifying unit.
1.2 Pulse Signal and Rotation Speed
A pulse that grasps and controls the rotation of the motor
There are two uses for pulse signals, which what is common to all of the above utilization
methods is the element of "rotation".
❶ To measure using the input signal → Theme of this guideline
In the case of an impeller type water meter, a preset pulse signal is output according
to the rotation speed of the impeller. Therefore, the flow that has passed can be
measured by counting the pulse signals generated within a certain period of time.
➋ To control an object outputting a signal
By outputting pulses, it is possible to control systems such as motors and inverters.
★Measurement with stroboscope
A device that repeatedly emits light that lights
up instantaneously at regular intervals is called
a stroboscope.
The figure shown on the right is a simple system
of which a certain rotating wing is irradiated
with light at equal time intervals using a
stroboscope. When the blinking cycle of the
light and the rotating cycle match, the wing
rotating at high speed appears to be stationary.
A stroboscope is a method of grasping a high-
speed rotation speed by utilizing this
phenomenon and is used for measuring the
rotation speed of an engine or a motor and
inspecting the presence or absence of damage
to a rotating body.
Measurement of rotation speed using pulses
A5-381
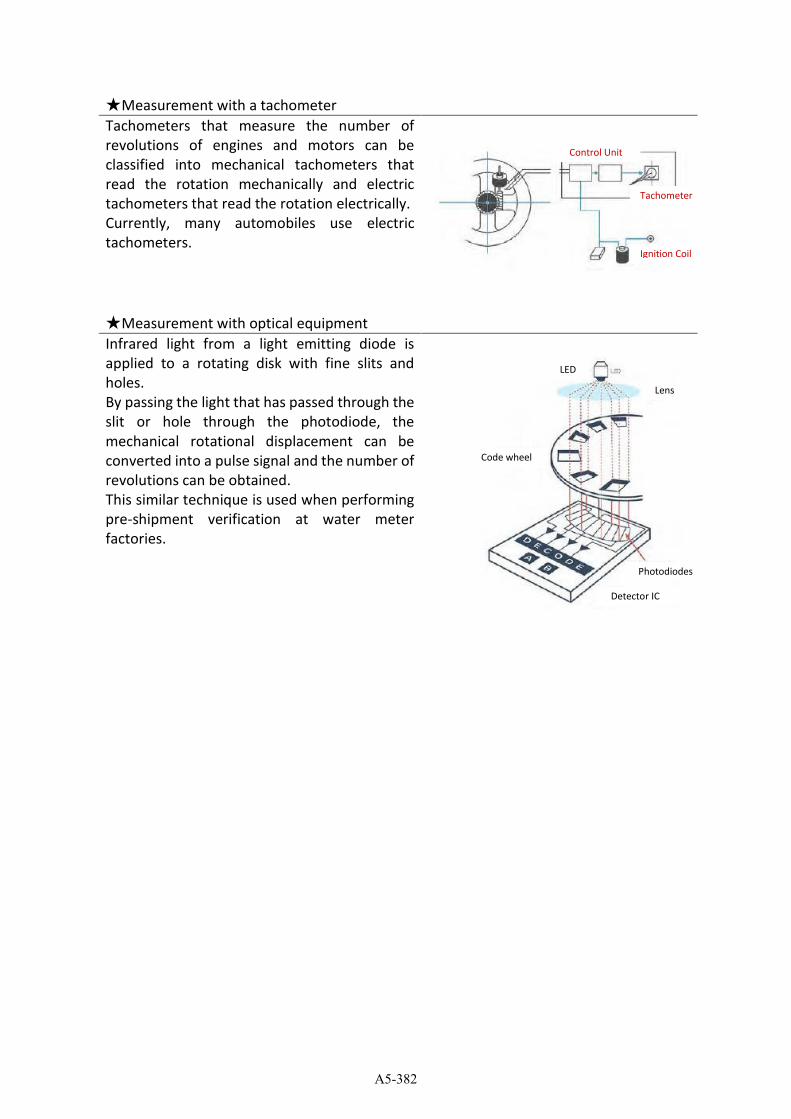
★Measurement with a tachometer
Tachometers that measure the number of
revolutions of engines and motors can be
classified into mechanical tachometers that
read the rotation mechanically and electric
tachometers that read the rotation electrically.
Currently, many automobiles use electric
tachometers.
★Measurement with optical equipment
Infrared light from a light emitting diode is
applied to a rotating disk with fine slits and
holes.
By passing the light that has passed through the
slit or hole through the photodiode, the
mechanical rotational displacement can be
converted into a pulse signal and the number of
revolutions can be obtained.
This similar technique is used when performing
pre-shipment verification at water meter
factories.
Control Unit
Tachometer
Ignition Coil
LED
Code wheel
Photodiodes
Detector IC
Lens
A5-382
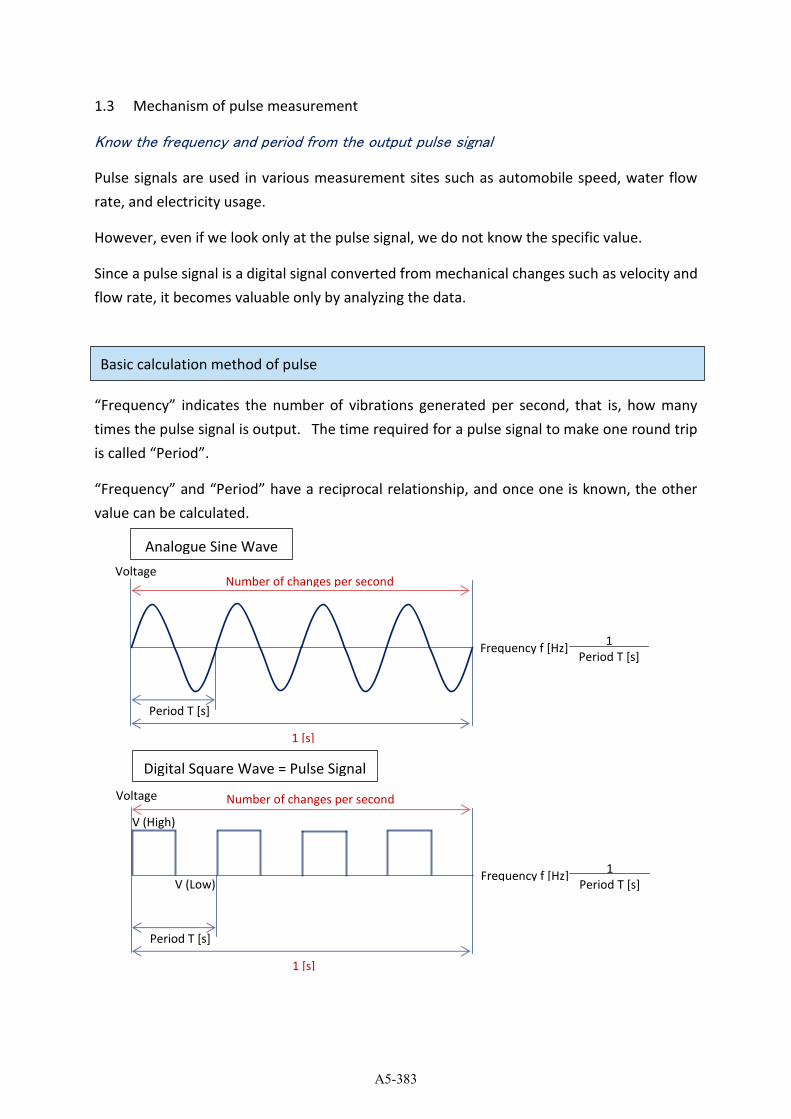
1.3 Mechanism of pulse measurement
Know the frequency and period from the output pulse signal
Pulse signals are used in various measurement sites such as automobile speed, water flow
rate, and electricity usage.
However, even if we look only at the pulse signal, we do not know the specific value.
Since a pulse signal is a digital signal converted from mechanical changes such as velocity and
flow rate, it becomes valuable only by analyzing the data.
“Frequency” indicates the number of vibrations generated per second, that is, how many
times the pulse signal is output. The time required for a pulse signal to make one round trip
is called “Period”.
“Frequency” and “Period” have a reciprocal relationship, and once one is known, the other
value can be calculated.
Basic calculation method of pulse
Number of changes per second
1 [s]
Period T [s]
1
Period T [s] Frequency f [Hz]
Voltage
Analogue Sine Wave
Number of changes per second
[Hz)
1 [s]
Period T [s]
1
Period T [s] Frequency f [Hz]
Voltage
V (High)
V (Low)
Digital Square Wave = Pulse Signal
A5-383
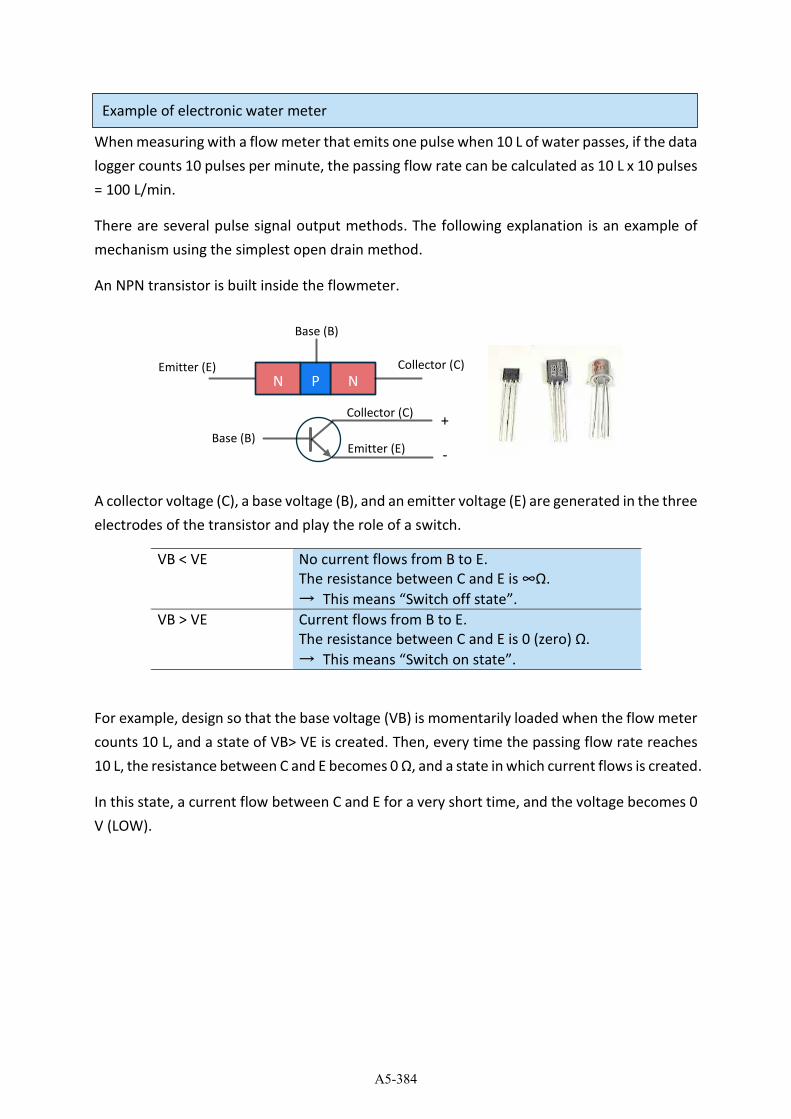
When measuring with a flow meter that emits one pulse when 10 L of water passes, if the data
logger counts 10 pulses per minute, the passing flow rate can be calculated as 10 L x 10 pulses
= 100 L/min.
There are several pulse signal output methods. The following explanation is an example of
mechanism using the simplest open drain method.
An NPN transistor is built inside the flowmeter.
A collector voltage (C), a base voltage (B), and an emitter voltage (E) are generated in the three
electrodes of the transistor and play the role of a switch.
VB < VE No current flows from B to E.
The resistance between C and E is ∞Ω.
→ This means “Switch off state”. VB > VE Current flows from B to E.
The resistance between C and E is 0 (zero) Ω.
→ This means “Switch on state”.
For example, design so that the base voltage (VB) is momentarily loaded when the flow meter
counts 10 L, and a state of VB> VE is created. Then, every time the passing flow rate reaches
10 L, the resistance between C and E becomes 0 Ω, and a state in which current flows is created.
In this state, a current flow between C and E for a very short time, and the voltage becomes 0
V (LOW).
Example of electronic water meter
Collector (C)
Emitter (E)
Base (B)
Emitter (E) Collector (C)
Base (B)
+
-
N N P
A5-384
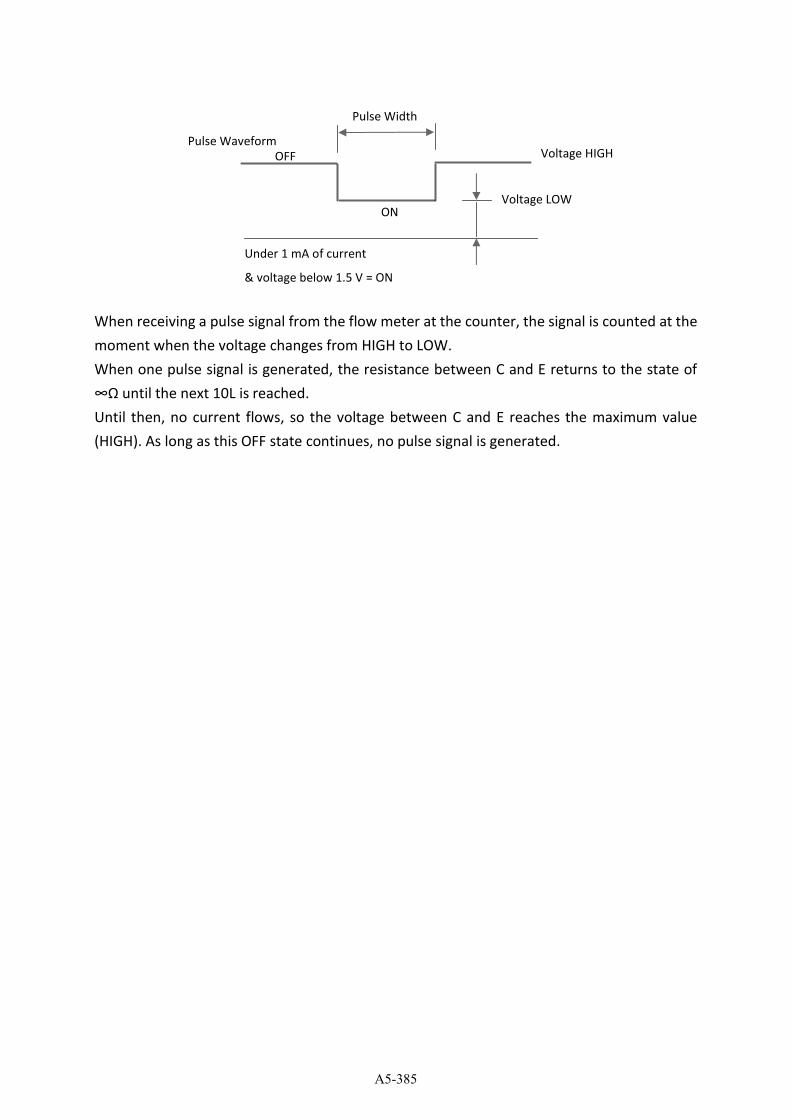
When receiving a pulse signal from the flow meter at the counter, the signal is counted at the
moment when the voltage changes from HIGH to LOW.
When one pulse signal is generated, the resistance between C and E returns to the state of
∞Ω until the next 10L is reached.
Until then, no current flows, so the voltage between C and E reaches the maximum value
(HIGH). As long as this OFF state continues, no pulse signal is generated.
ON
OFF
Voltage LOW
Pulse Waveform
Under 1 mA of current
& voltage below 1.5 V = ON
Pulse Width
Voltage HIGH
A5-385
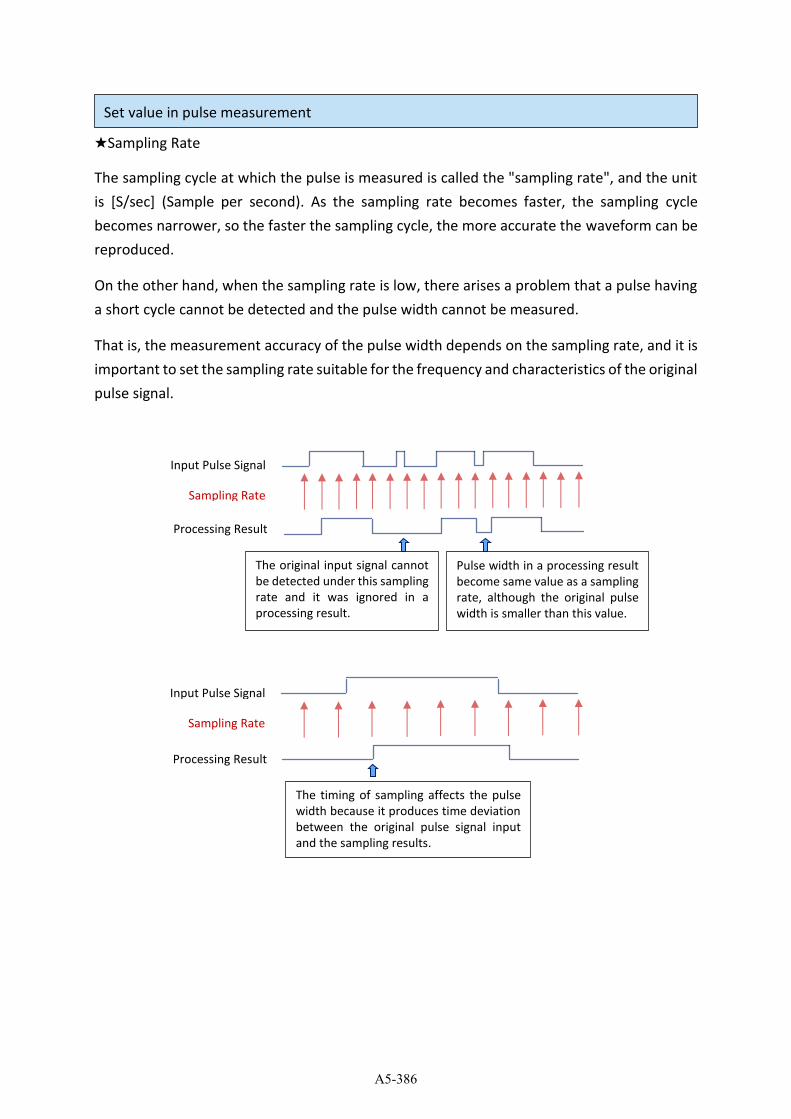
★Sampling Rate
The sampling cycle at which the pulse is measured is called the "sampling rate", and the unit
is [S/sec] (Sample per second). As the sampling rate becomes faster, the sampling cycle
becomes narrower, so the faster the sampling cycle, the more accurate the waveform can be
reproduced.
On the other hand, when the sampling rate is low, there arises a problem that a pulse having
a short cycle cannot be detected and the pulse width cannot be measured.
That is, the measurement accuracy of the pulse width depends on the sampling rate, and it is
important to set the sampling rate suitable for the frequency and characteristics of the original
pulse signal.
Set value in pulse measurement
Input Pulse Signal
Sampling Rate
Processing Result
The original input signal cannot
be detected under this sampling
rate and it was ignored in a
processing result.
Pulse width in a processing result
become same value as a sampling
rate, although the original pulse
width is smaller than this value.
Input Pulse Signal
Sampling Rate
Processing Result
The timing of sampling affects the pulse
width because it produces time deviation
between the original pulse signal input
and the sampling results.
A5-386
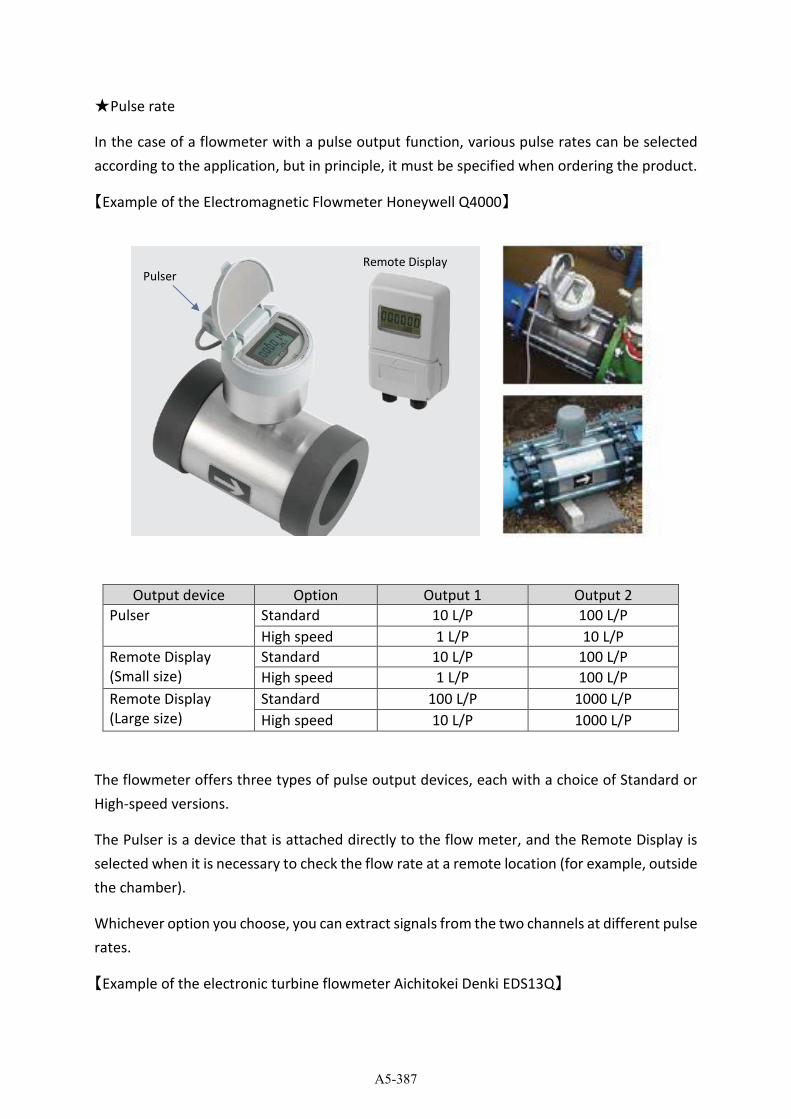
★Pulse rate
In the case of a flowmeter with a pulse output function, various pulse rates can be selected
according to the application, but in principle, it must be specified when ordering the product.
【Example of the Electromagnetic Flowmeter Honeywell Q4000】
Output device Option Output 1 Output 2
Pulser Standard 10 L/P 100 L/P
High speed 1 L/P 10 L/P
Remote Display
(Small size)
Standard 10 L/P 100 L/P
High speed 1 L/P 100 L/P
Remote Display
(Large size)
Standard 100 L/P 1000 L/P
High speed 10 L/P 1000 L/P
The flowmeter offers three types of pulse output devices, each with a choice of Standard or
High-speed versions.
The Pulser is a device that is attached directly to the flow meter, and the Remote Display is
selected when it is necessary to check the flow rate at a remote location (for example, outside
the chamber).
Whichever option you choose, you can extract signals from the two channels at different pulse
rates.
【Example of the electronic turbine flowmeter Aichitokei Denki EDS13Q】
Pulser Remote Display
A5-387
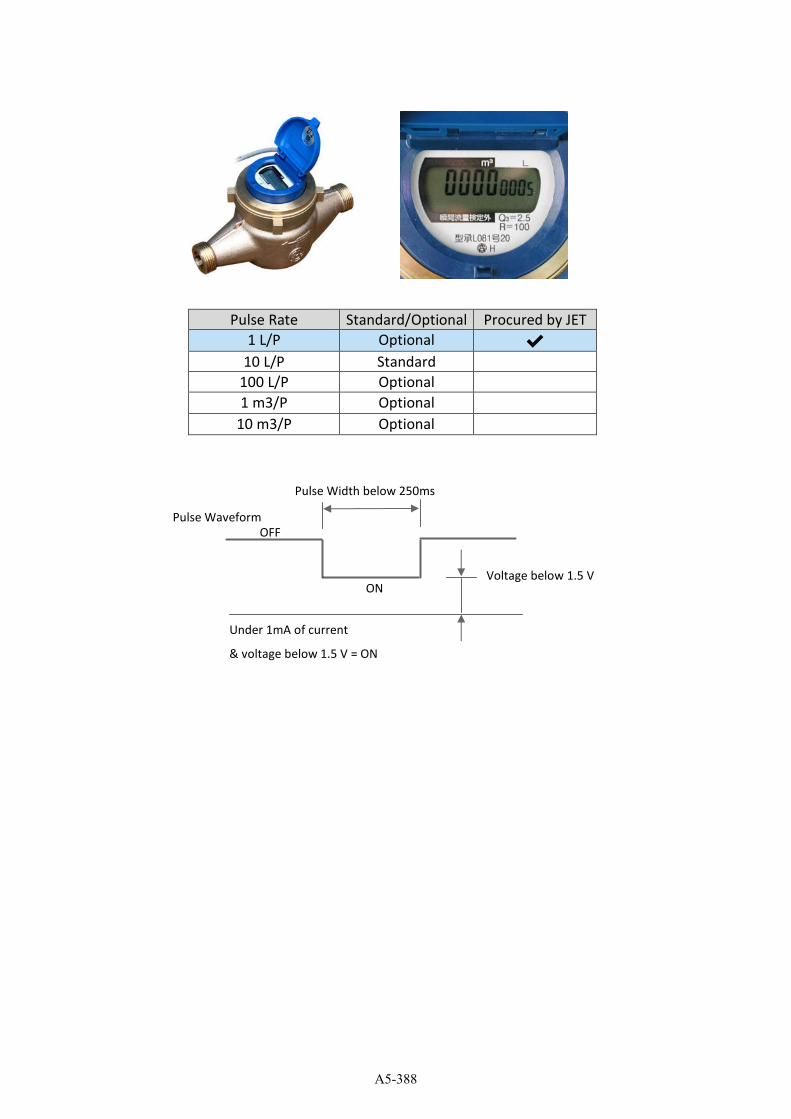
Pulse Rate Standard/Optional Procured by JET
1 L/P Optional ✔
10 L/P Standard
100 L/P Optional
1 m3/P Optional
10 m3/P Optional
ON
OFF
Voltage below 1.5 V
Pulse Waveform
Under 1mA of current
& voltage below 1.5 V = ON
Pulse Width below 250ms
A5-388
Chapter 2 Mechanism of the remote monitoring system
2.1 System utilizing cloud server
In recent years, the term IoT has rapidly become widespread, but in order to monitor the flow
meters and water pressure gauges installed in the distribution network, users need to secure
communication lines, maintain servers, and also required appropriate knowledge and human
resources.
In particular, the server that stores the huge amount of data measured every day needs to be
operated 24 hours a day, security measures are required to prevent illegal access from the
outside, and daily maintenance costs are a heavy burden for water service provider.
The monitoring system introduced on a trial basis this time is a service provided by a data
logger manufacturer (Halma Water Management). The user can easily check the
measurement data anywhere on the earth simply by preparing a SIM card using the mobile
phone communication network and paying the service usage fee.
[HWM DataGateTM]
HWM DataGateTM is the WWM secure data warehouse and id the data storage system behind
the HWM OnlineTM viewing platform. DataGateTM stores the data messages from the logger
and the information required for displaying all the logger details on HWM OnlineTM.
When you orderd your logger(s) with your HWM account manager, you will have been
supplied with a Username and Password to the HWM systems. You can use DataGateTM to
view your logger information and add additional information such as a mieningful site name,
GPS location details, useful notes about the site, etc.
[HWM OnlineTM]
HWM OnlineTM is a web viewing and management package for viewing the data for your fleet
of loggers.
HWM OnlineTM uses the data stored in the DataGateTM data warehouse to display charts for
the data recorded by the loggers and other useful information like the location of the loggers.
If you have HWM OnlineTM as part of your package, you will use the same username and
password that was provide to you by your HWM account manager.
HWM OnlineTM and HWM DataGateTM
A5-389
Data can be viewed in graphical or table format from any internet enabled device using web
viewer HWM Online or seamlessly integrated into a third-party corporate system.
On receipt of an alarm DataGate can send automatic alerts to multiple users to enable action
to be taken promptly. The system will even store data from loggers it does not recognize, and
then add this information to the logger’s history when it is registered on the system.
Multiple accounts can be set up and configured to ensure that users only see data from the
specific loggers they require.
The DataGate service for remote monitoring system introduced by the JICA Project will be
valid until the end of December 2021 according to the private contract between CTII and the
distributor (Optima Ingenieria S.A).
The NWSDB needs to NWSDB needs to follow the procedure below.
➢ Contact the person in charge of HWM.
Ing. Paul Harrison
[email protected] Tel: (+44) 0 1633 489479
➢ What to be informed to HWM
1. Serial Number of Multilog 2 donated by CTII
Device 1: 0008265
Device 2: 0008273
2. Change of owner of Multilog 2
Previous owner: CTI Engineering International
New owner: NWSDB RSC W-S
➢ Contract and Payment with HWM for DataGate Hosting fee
5 years hosting fee per logger will be £80 approx. (LKR 22,000).
➢ Change of logger setting according to instruction by HWM
1. Tel Number of Logger
Benefits of Applications
Special Attention
A5-390
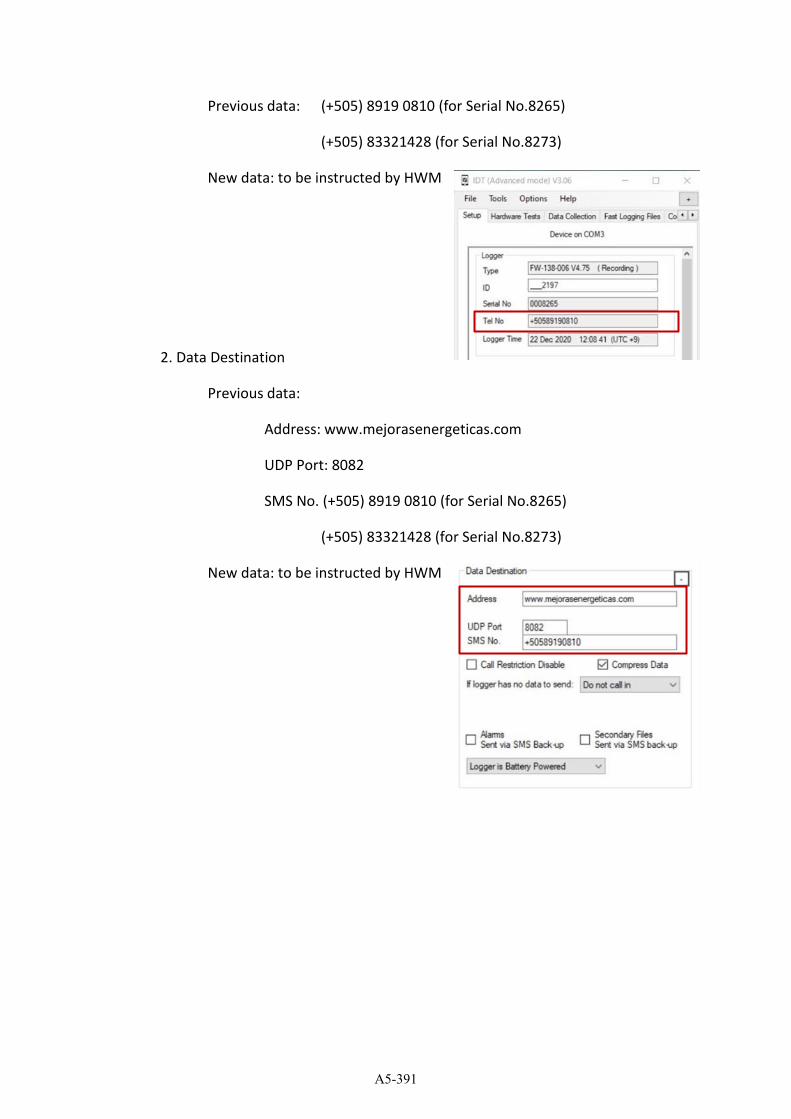
Previous data: (+505) 8919 0810 (for Serial No.8265)
(+505) 83321428 (for Serial No.8273)
New data: to be instructed by HWM
2. Data Destination
Previous data:
Address: www.mejorasenergeticas.com
UDP Port: 8082
SMS No. (+505) 8919 0810 (for Serial No.8265)
(+505) 83321428 (for Serial No.8273)
New data: to be instructed by HWM
A5-391
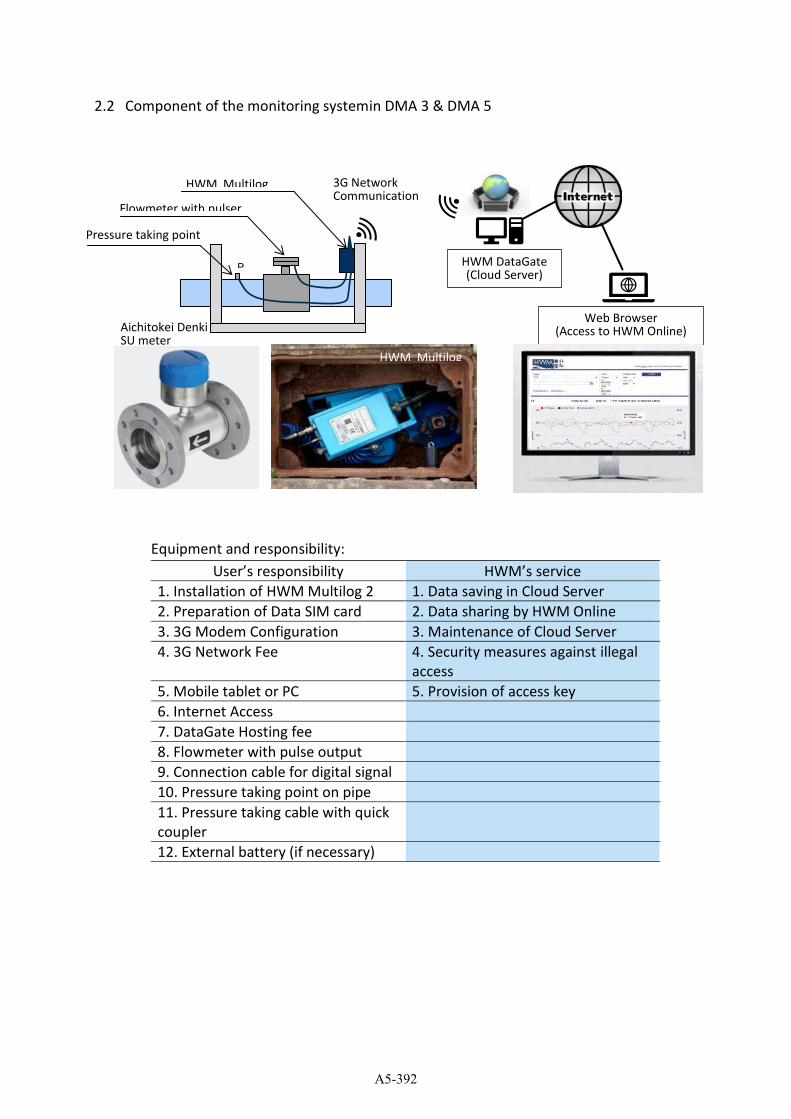
2.2 Component of the monitoring systemin DMA 3 & DMA 5
Equipment and responsibility:
User’s responsibility HWM’s service
1. Installation of HWM Multilog 2 1. Data saving in Cloud Server
2. Preparation of Data SIM card 2. Data sharing by HWM Online
3. 3G Modem Configuration 3. Maintenance of Cloud Server
4. 3G Network Fee 4. Security measures against illegal
access
5. Mobile tablet or PC 5. Provision of access key
6. Internet Access
7. DataGate Hosting fee
8. Flowmeter with pulse output
9. Connection cable for digital signal
10. Pressure taking point on pipe
11. Pressure taking cable with quick
coupler
12. External battery (if necessary)
Flowmeter with pulser
Pressure taking point
HWM Multilog 2
P HWM DataGate (Cloud Server)
Web Browser (Access to HWM Online)
3G Network Communication
HWM Multilog 2
Aichitokei Denki SU meter
A5-392

[Bulk Meter for DMA 5]
Aichitokei Denki SU200-KF-C
Meter for DMA 5
A5-393
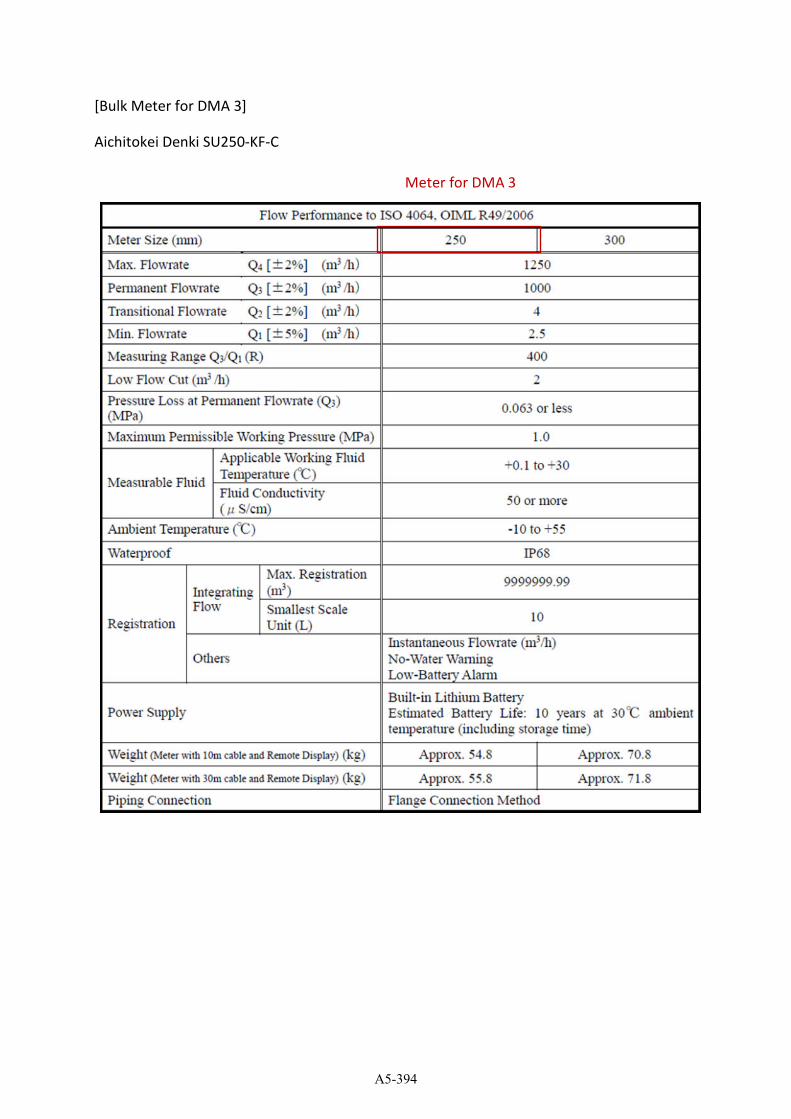
[Bulk Meter for DMA 3]
Aichitokei Denki SU250-KF-C
Meter for DMA 3
A5-394
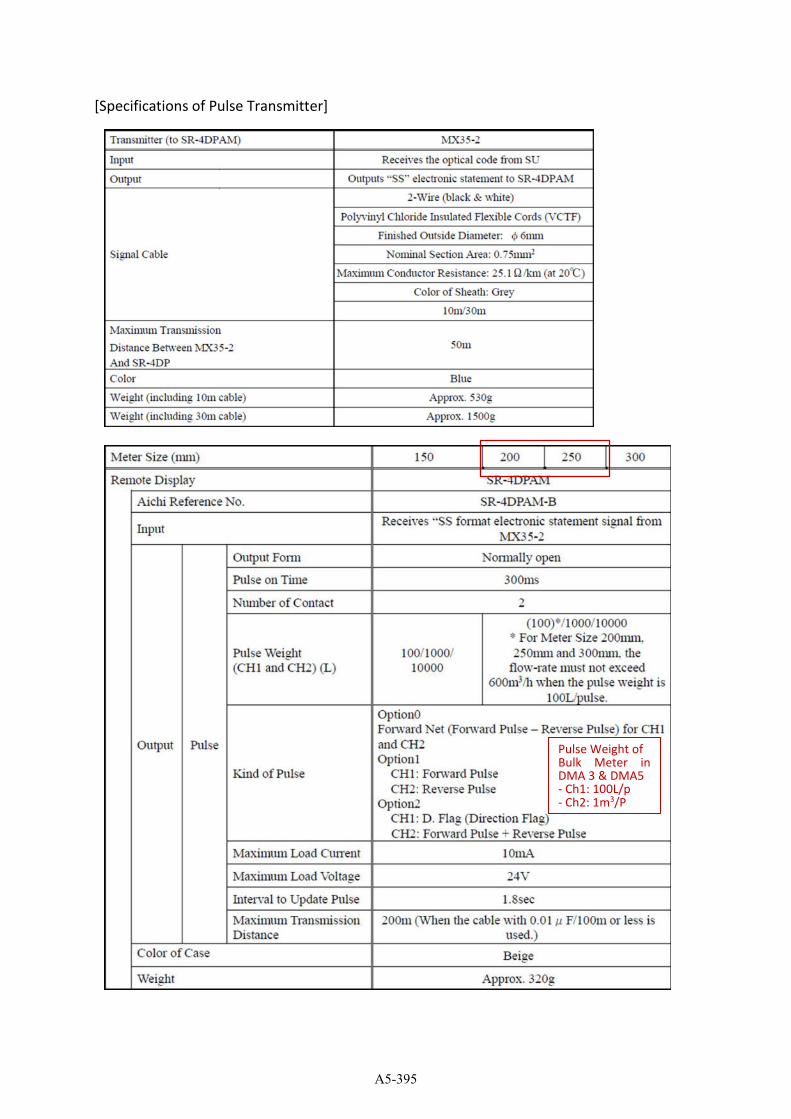
[Specifications of Pulse Transmitter]
Pulse Weight of Bulk Meter in DMA 3 & DMA5 - Ch1: 100L/p - Ch2: 1m3/P
A5-395
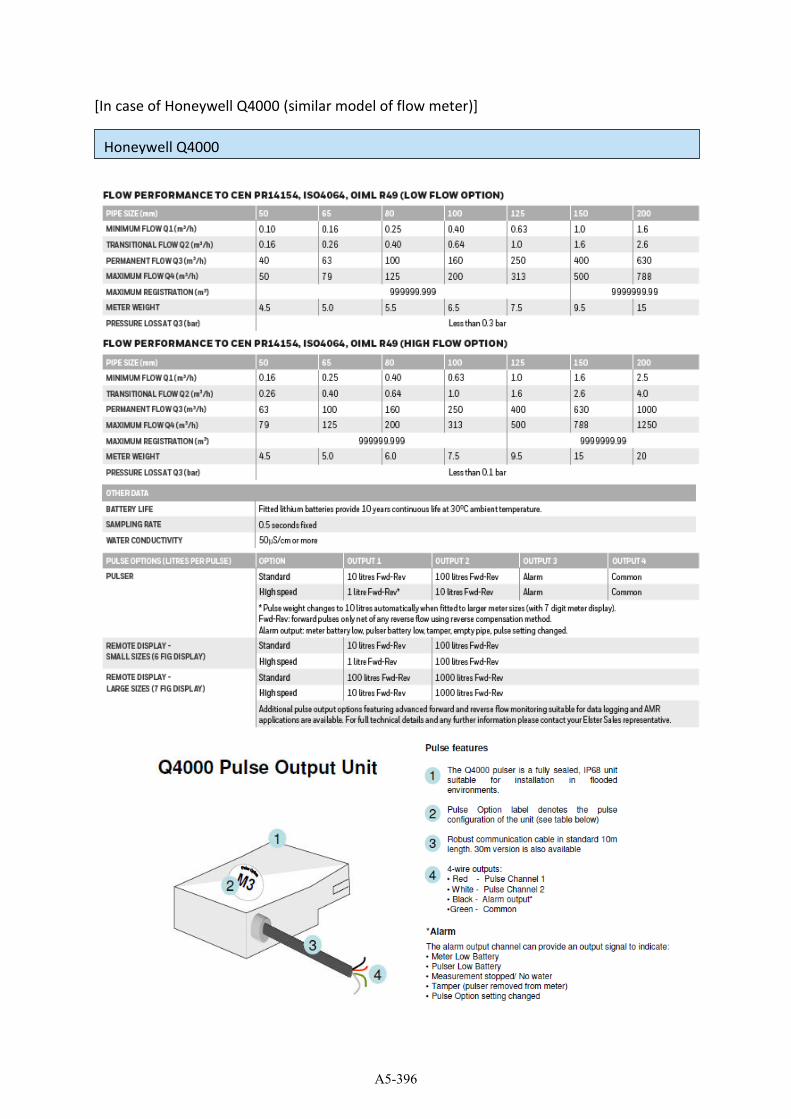
[In case of Honeywell Q4000 (similar model of flow meter)]
Honeywell Q4000
A5-396
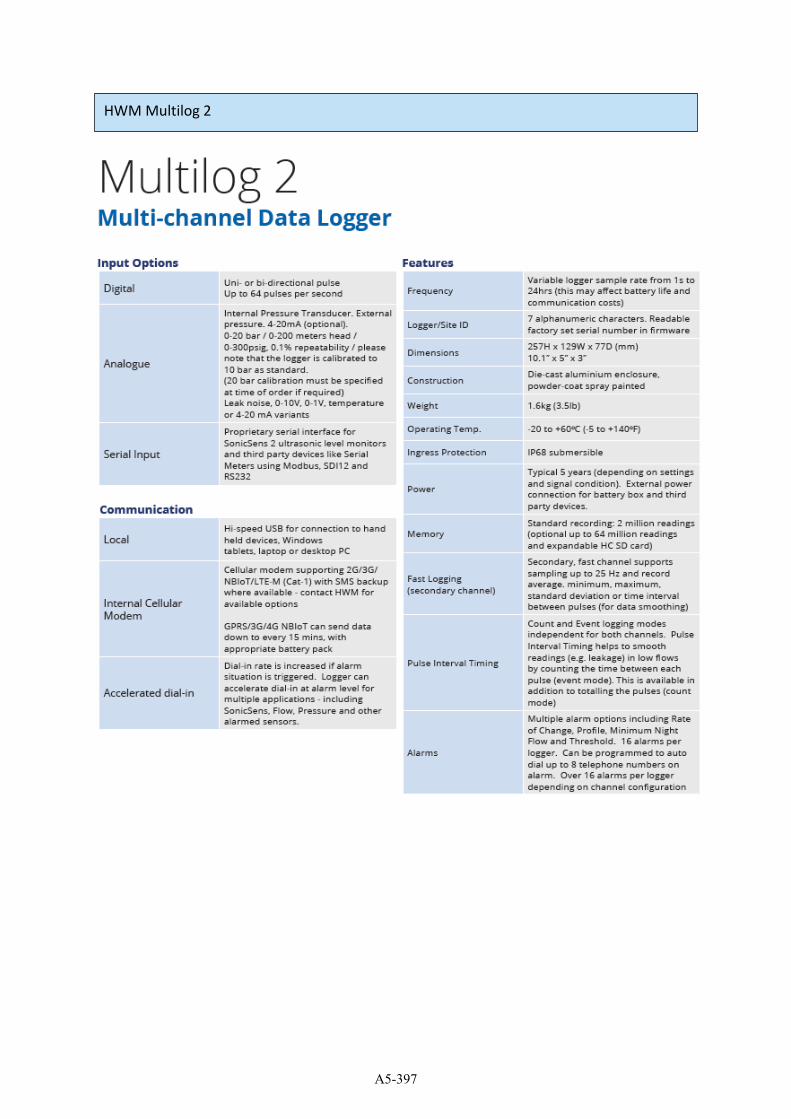
HWM Multilog 2
A5-397
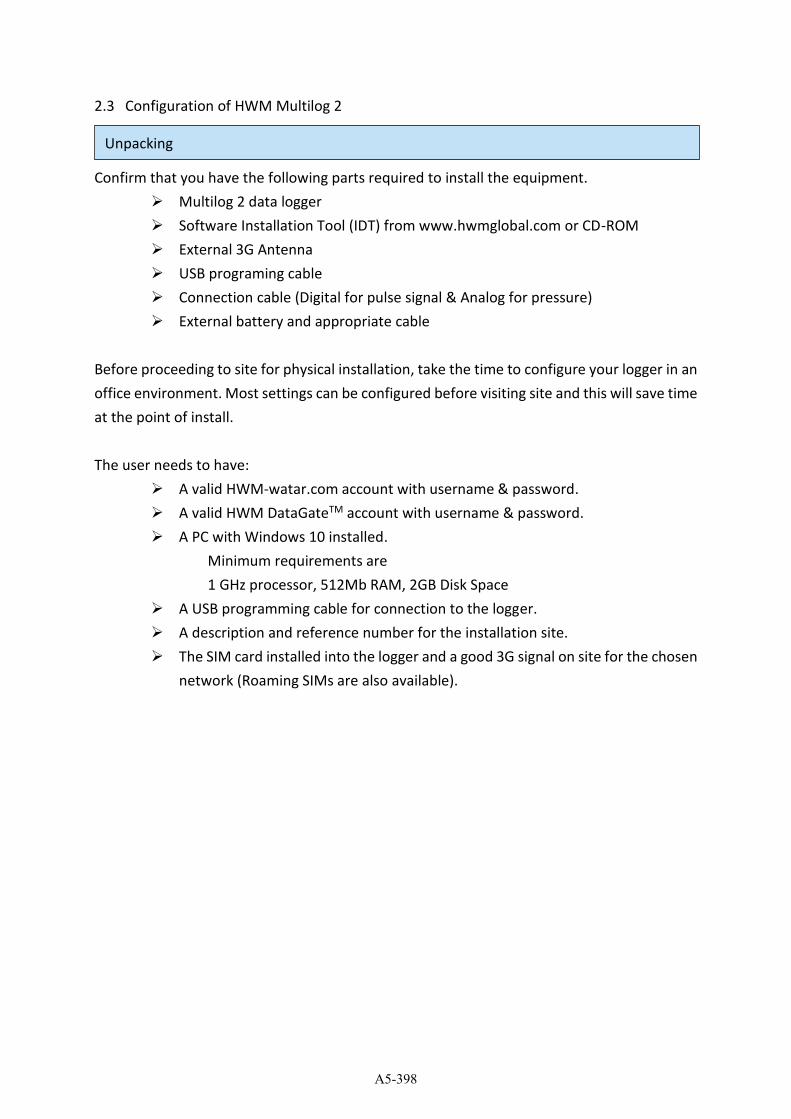
2.3 Configuration of HWM Multilog 2
Confirm that you have the following parts required to install the equipment.
➢ Multilog 2 data logger
➢ Software Installation Tool (IDT) from www.hwmglobal.com or CD-ROM
➢ External 3G Antenna
➢ USB programing cable
➢ Connection cable (Digital for pulse signal & Analog for pressure)
➢ External battery and appropriate cable
Before proceeding to site for physical installation, take the time to configure your logger in an
office environment. Most settings can be configured before visiting site and this will save time
at the point of install.
The user needs to have:
➢ A valid HWM-watar.com account with username & password.
➢ A valid HWM DataGateTM account with username & password.
➢ A PC with Windows 10 installed.
Minimum requirements are
1 GHz processor, 512Mb RAM, 2GB Disk Space
➢ A USB programming cable for connection to the logger.
➢ A description and reference number for the installation site.
➢ The SIM card installed into the logger and a good 3G signal on site for the chosen
network (Roaming SIMs are also available).
Unpacking
A5-398
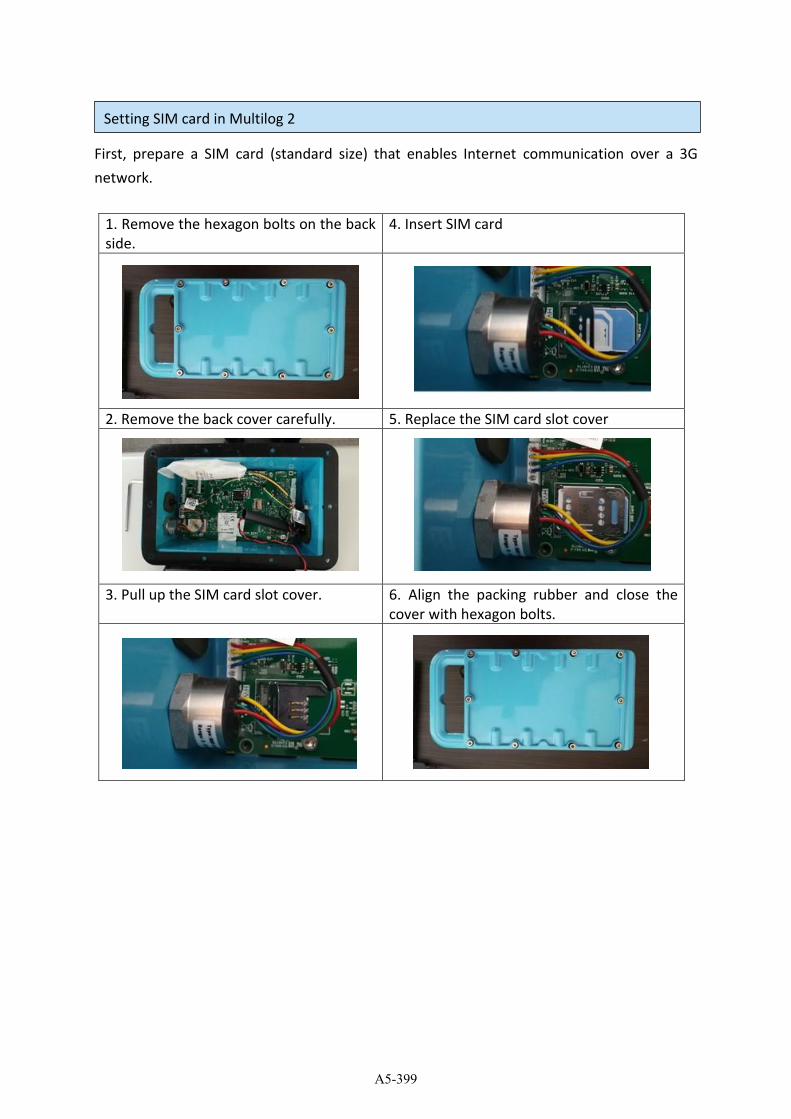
First, prepare a SIM card (standard size) that enables Internet communication over a 3G
network.
1. Remove the hexagon bolts on the back
side.
4. Insert SIM card
2. Remove the back cover carefully. 5. Replace the SIM card slot cover
3. Pull up the SIM card slot cover. 6. Align the packing rubber and close the
cover with hexagon bolts.
Setting SIM card in Multilog 2
A5-399
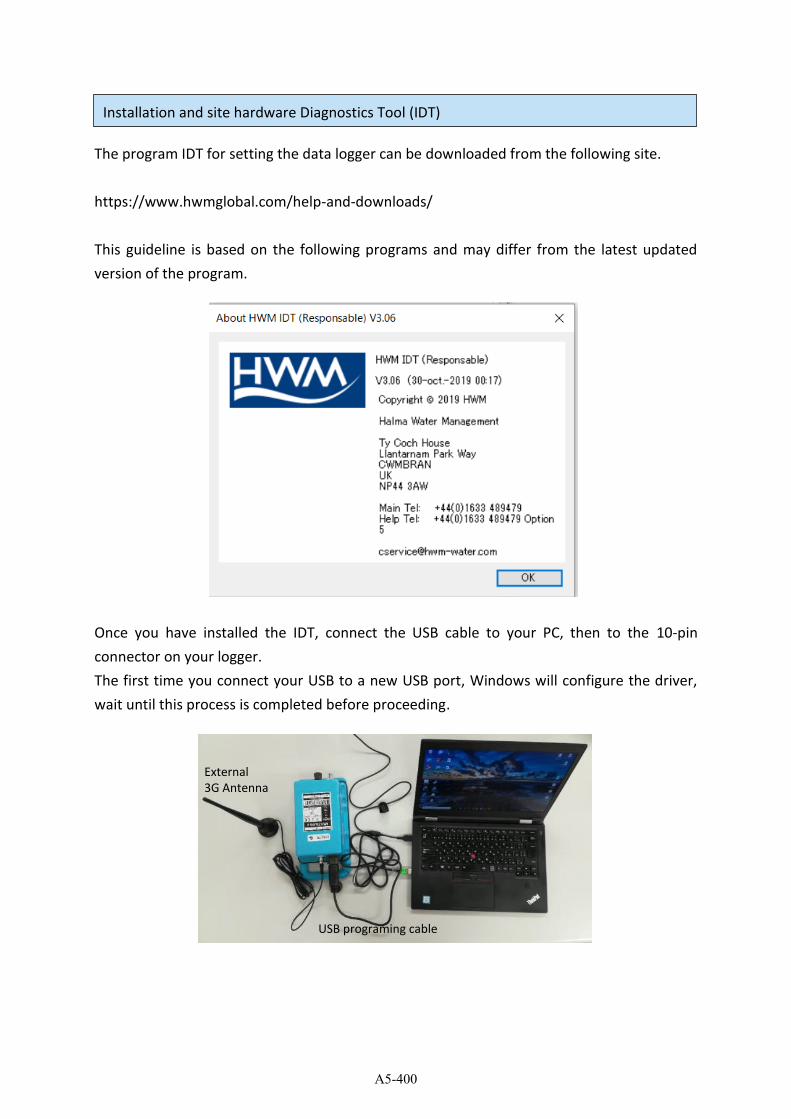
The program IDT for setting the data logger can be downloaded from the following site.
https://www.hwmglobal.com/help-and-downloads/
This guideline is based on the following programs and may differ from the latest updated
version of the program.
Once you have installed the IDT, connect the USB cable to your PC, then to the 10-pin
connector on your logger.
The first time you connect your USB to a new USB port, Windows will configure the driver,
wait until this process is completed before proceeding.
Installation and site hardware Diagnostics Tool (IDT)
External
3G Antenna
USB programing cable
A5-400
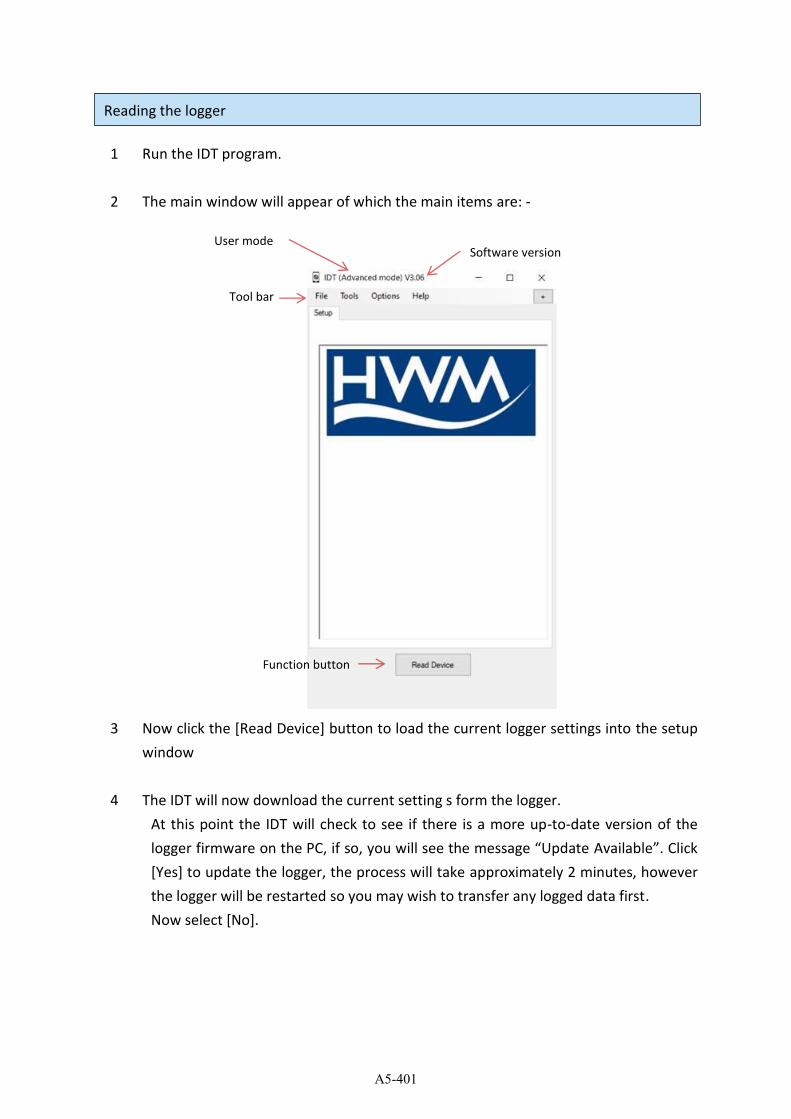
1 Run the IDT program.
2 The main window will appear of which the main items are: -
3 Now click the [Read Device] button to load the current logger settings into the setup
window
4 The IDT will now download the current setting s form the logger.
At this point the IDT will check to see if there is a more up-to-date version of the
logger firmware on the PC, if so, you will see the message “Update Available”. Click [Yes] to update the logger, the process will take approximately 2 minutes, however
the logger will be restarted so you may wish to transfer any logged data first.
Now select [No].
Reading the logger
User mode
Tool bar
Software version
Function button
A5-401
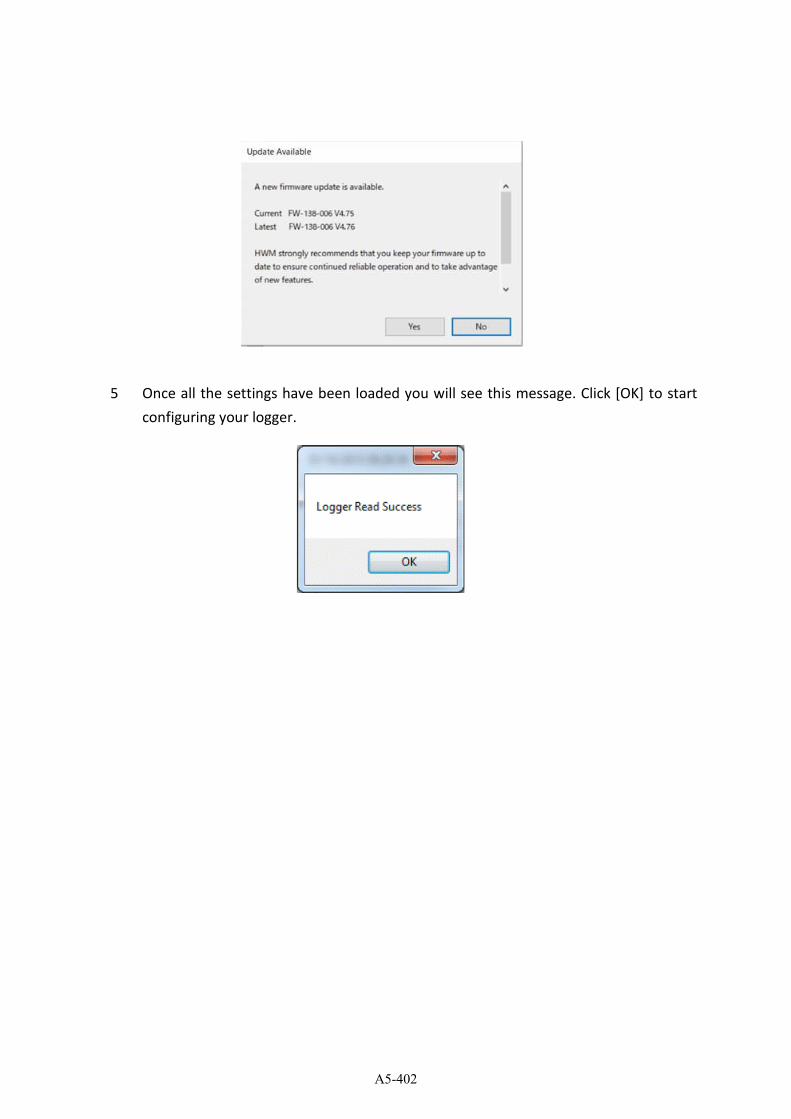
5 Once all the settings have been loaded you will see this message. Click [OK] to start
configuring your logger.
A5-402
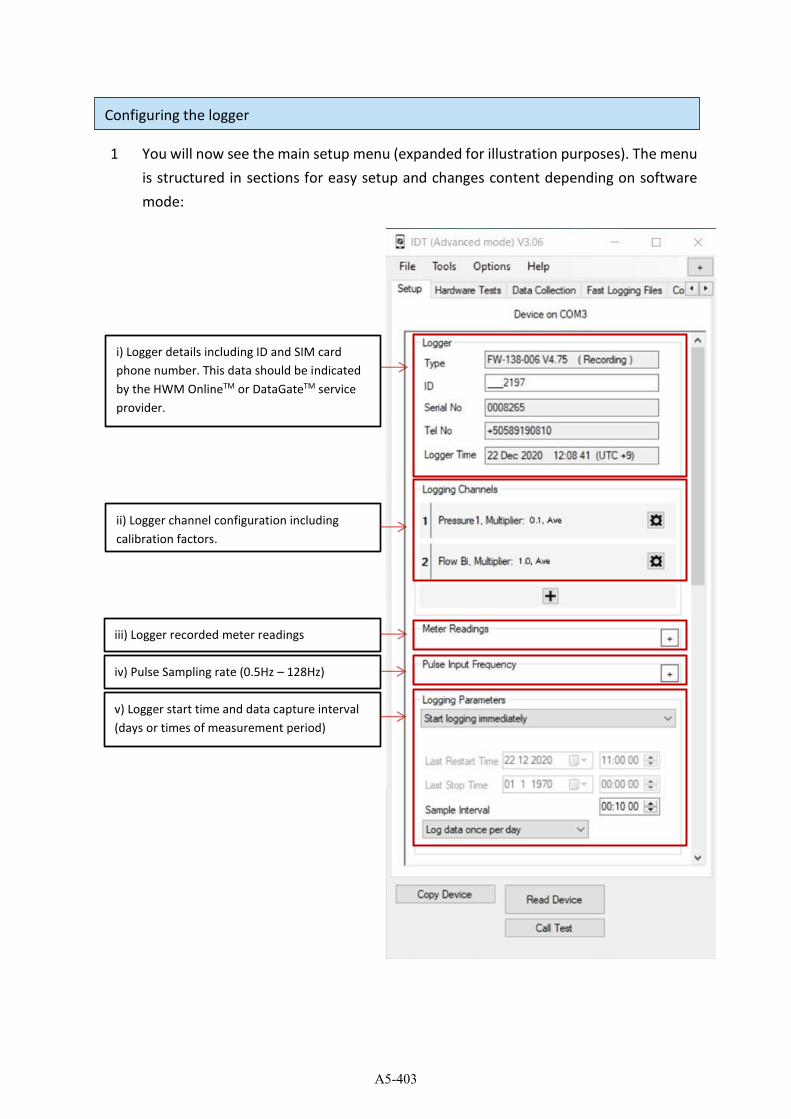
1 You will now see the main setup menu (expanded for illustration purposes). The menu
is structured in sections for easy setup and changes content depending on software
mode:
Configuring the logger
i) Logger details including ID and SIM card
phone number. This data should be indicated
by the HWM OnlineTM or DataGateTM service
provider.
ii) Logger channel configuration including
calibration factors.
iii) Logger recorded meter readings
iv) Pulse Sampling rate (0.5Hz – 128Hz)
v) Logger start time and data capture interval
(days or times of measurement period)
A5-403
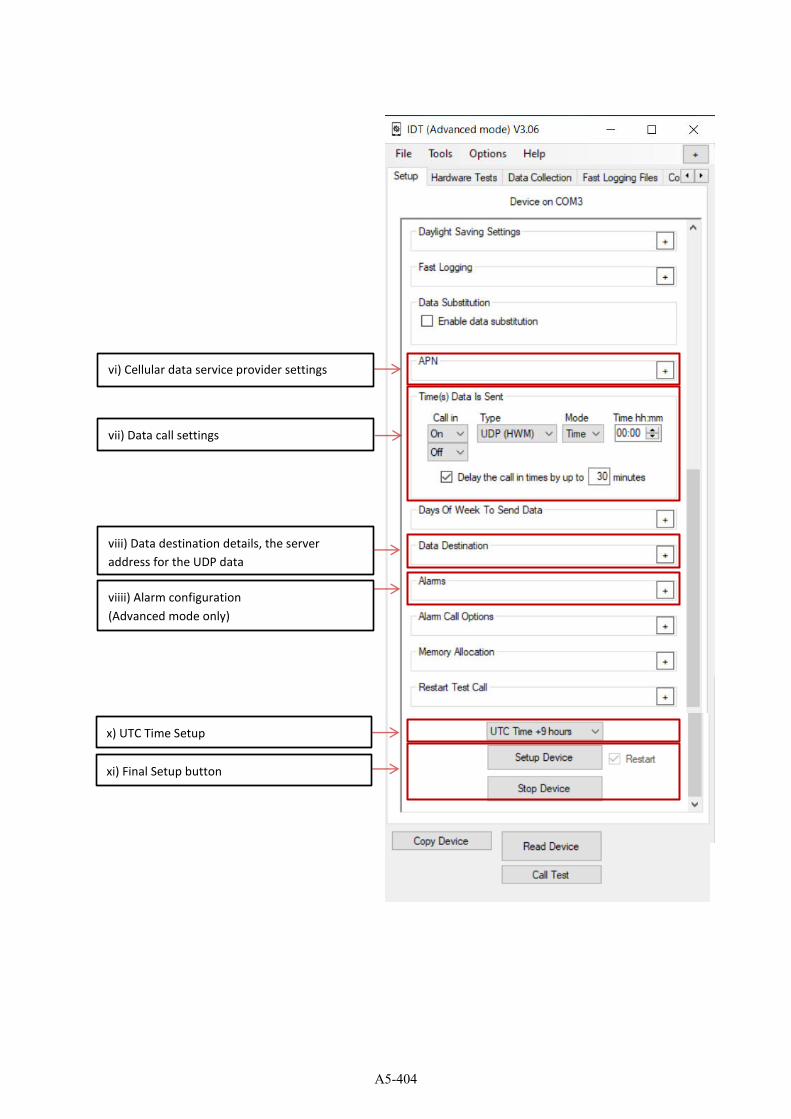
vi) Cellular data service provider settings
vii) Data call settings
viii) Data destination details, the server
address for the UDP data
viiii) Alarm configuration
(Advanced mode only)
x) UTC Time Setup
xi) Final Setup button
A5-404
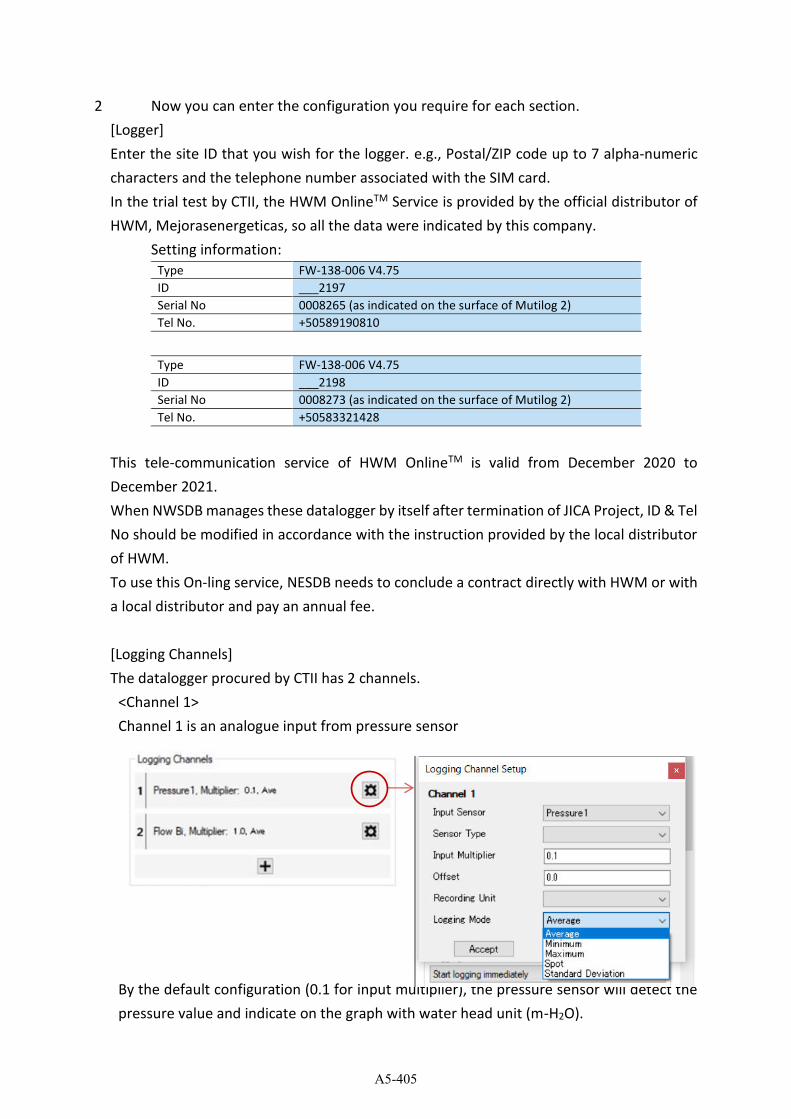
2 Now you can enter the configuration you require for each section.
[Logger]
Enter the site ID that you wish for the logger. e.g., Postal/ZIP code up to 7 alpha-numeric
characters and the telephone number associated with the SIM card.
In the trial test by CTII, the HWM OnlineTM Service is provided by the official distributor of
HWM, Mejorasenergeticas, so all the data were indicated by this company.
Setting information:
Type FW-138-006 V4.75
ID ___2197
Serial No 0008265 (as indicated on the surface of Mutilog 2)
Tel No. +50589190810
Type FW-138-006 V4.75
ID ___2198
Serial No 0008273 (as indicated on the surface of Mutilog 2)
Tel No. +50583321428
This tele-communication service of HWM OnlineTM is valid from December 2020 to
December 2021.
When NWSDB manages these datalogger by itself after termination of JICA Project, ID & Tel
No should be modified in accordance with the instruction provided by the local distributor
of HWM.
To use this On-ling service, NESDB needs to conclude a contract directly with HWM or with
a local distributor and pay an annual fee.
[Logging Channels]
The datalogger procured by CTII has 2 channels.
<Channel 1>
Channel 1 is an analogue input from pressure sensor
By the default configuration (0.1 for input multiplier), the pressure sensor will detect the
pressure value and indicate on the graph with water head unit (m-H2O).
A5-405
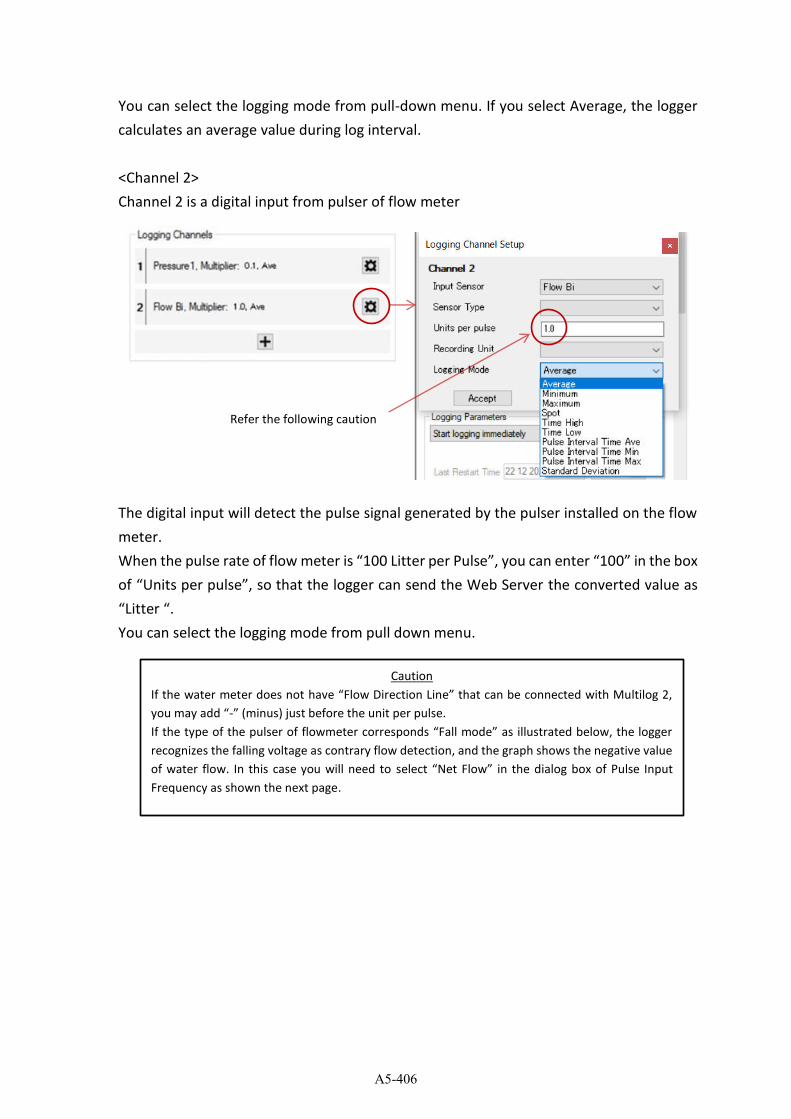
You can select the logging mode from pull-down menu. If you select Average, the logger
calculates an average value during log interval.
<Channel 2>
Channel 2 is a digital input from pulser of flow meter
The digital input will detect the pulse signal generated by the pulser installed on the flow
meter.
When the pulse rate of flow meter is “100 Litter per Pulse”, you can enter “100” in the box of “Units per pulse”, so that the logger can send the Web Server the converted value as
“Litter “.
You can select the logging mode from pull down menu.
Refer the following caution
Caution
If the water meter does not have “Flow Direction Line” that can be connected with Multilog 2, you may add “-” (minus) just before the unit per pulse.
If the type of the pulser of flowmeter corresponds “Fall mode” as illustrated below, the logger recognizes the falling voltage as contrary flow detection, and the graph shows the negative value
of water flow. In this case you will need to select “Net Flow” in the dialog box of Pulse Input
Frequency as shown the next page.
A5-406
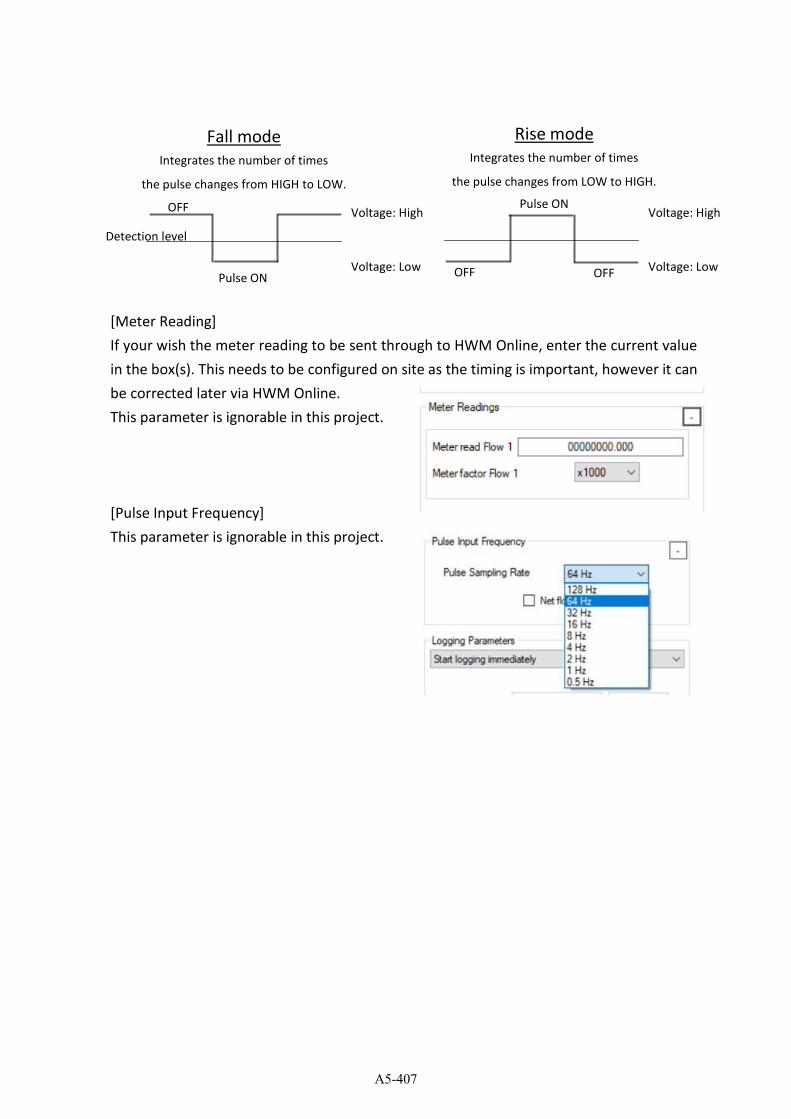
[Meter Reading]
If your wish the meter reading to be sent through to HWM Online, enter the current value
in the box(s). This needs to be configured on site as the timing is important, however it can
be corrected later via HWM Online.
This parameter is ignorable in this project.
[Pulse Input Frequency]
This parameter is ignorable in this project.
OFF
Pulse ON Voltage: Low
Detection level
Voltage: High
Fall mode
Integrates the number of times
the pulse changes from HIGH to LOW.
Rise mode
Integrates the number of times
the pulse changes from LOW to HIGH.
Pulse ON
OFF Voltage: Low
Voltage: High
OFF
A5-407
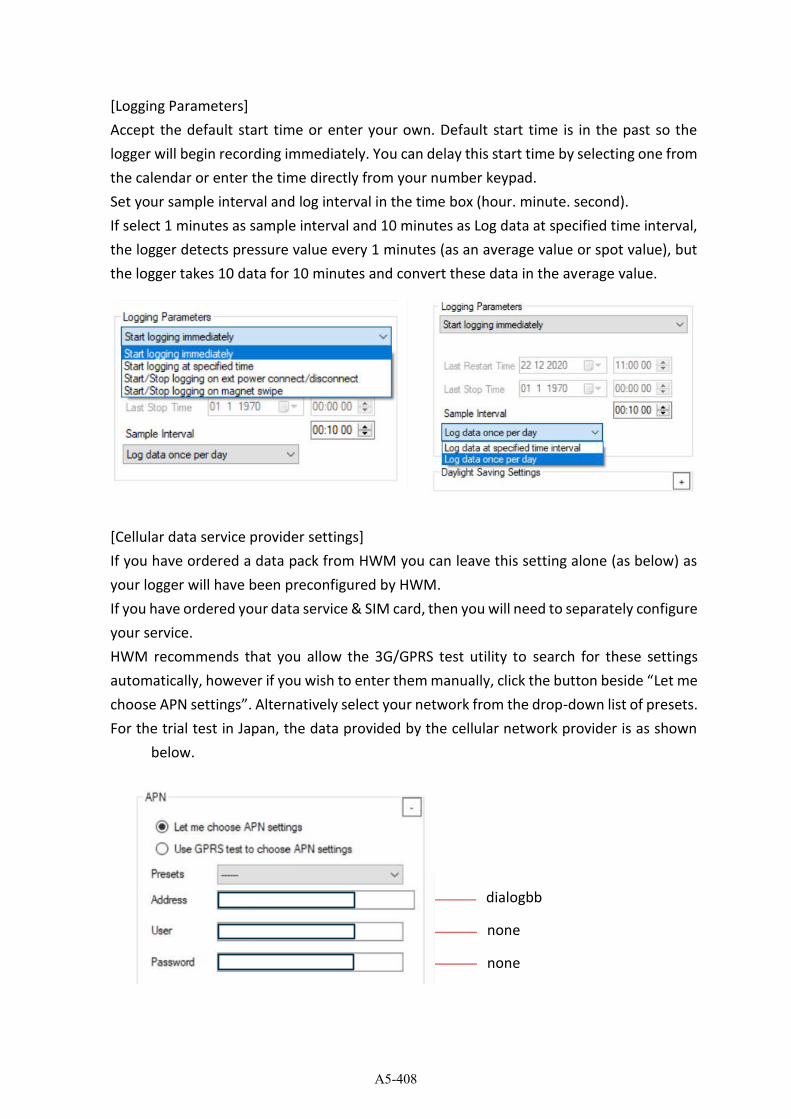
[Logging Parameters]
Accept the default start time or enter your own. Default start time is in the past so the
logger will begin recording immediately. You can delay this start time by selecting one from
the calendar or enter the time directly from your number keypad.
Set your sample interval and log interval in the time box (hour. minute. second).
If select 1 minutes as sample interval and 10 minutes as Log data at specified time interval,
the logger detects pressure value every 1 minutes (as an average value or spot value), but
the logger takes 10 data for 10 minutes and convert these data in the average value.
[Cellular data service provider settings]
If you have ordered a data pack from HWM you can leave this setting alone (as below) as
your logger will have been preconfigured by HWM.
If you have ordered your data service & SIM card, then you will need to separately configure
your service.
HWM recommends that you allow the 3G/GPRS test utility to search for these settings
automatically, however if you wish to enter them manually, click the button beside “Let me
choose APN settings”. Alternatively select your network from the drop-down list of presets.
For the trial test in Japan, the data provided by the cellular network provider is as shown
below.
dialog dialogbb
dialog none
dialog none
A5-408
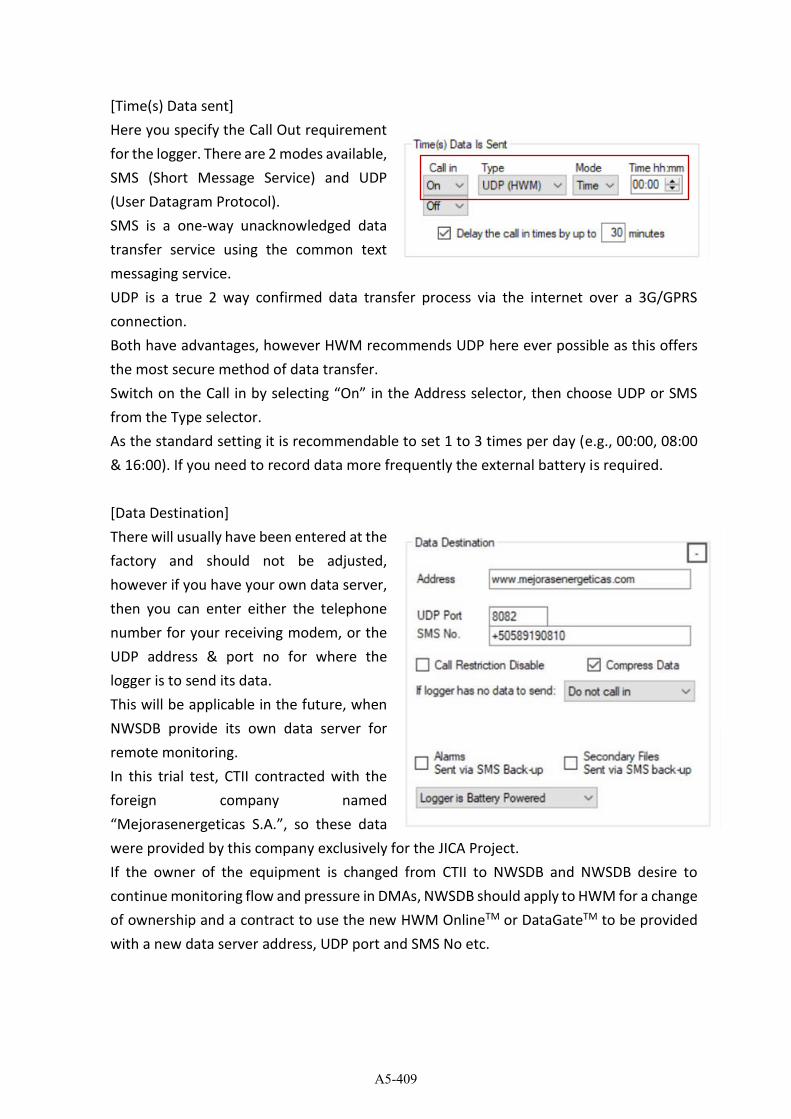
[Time(s) Data sent]
Here you specify the Call Out requirement
for the logger. There are 2 modes available,
SMS (Short Message Service) and UDP
(User Datagram Protocol).
SMS is a one-way unacknowledged data
transfer service using the common text
messaging service.
UDP is a true 2 way confirmed data transfer process via the internet over a 3G/GPRS
connection.
Both have advantages, however HWM recommends UDP here ever possible as this offers
the most secure method of data transfer.
Switch on the Call in by selecting “On” in the Address selector, then choose UDP or SMS from the Type selector.
As the standard setting it is recommendable to set 1 to 3 times per day (e.g., 00:00, 08:00
& 16:00). If you need to record data more frequently the external battery is required.
[Data Destination]
There will usually have been entered at the
factory and should not be adjusted,
however if you have your own data server,
then you can enter either the telephone
number for your receiving modem, or the
UDP address & port no for where the
logger is to send its data.
This will be applicable in the future, when
NWSDB provide its own data server for
remote monitoring.
In this trial test, CTII contracted with the
foreign company named
“Mejorasenergeticas S.A.”, so these data were provided by this company exclusively for the JICA Project.
If the owner of the equipment is changed from CTII to NWSDB and NWSDB desire to
continue monitoring flow and pressure in DMAs, NWSDB should apply to HWM for a change
of ownership and a contract to use the new HWM OnlineTM or DataGateTM to be provided
with a new data server address, UDP port and SMS No etc.
A5-409
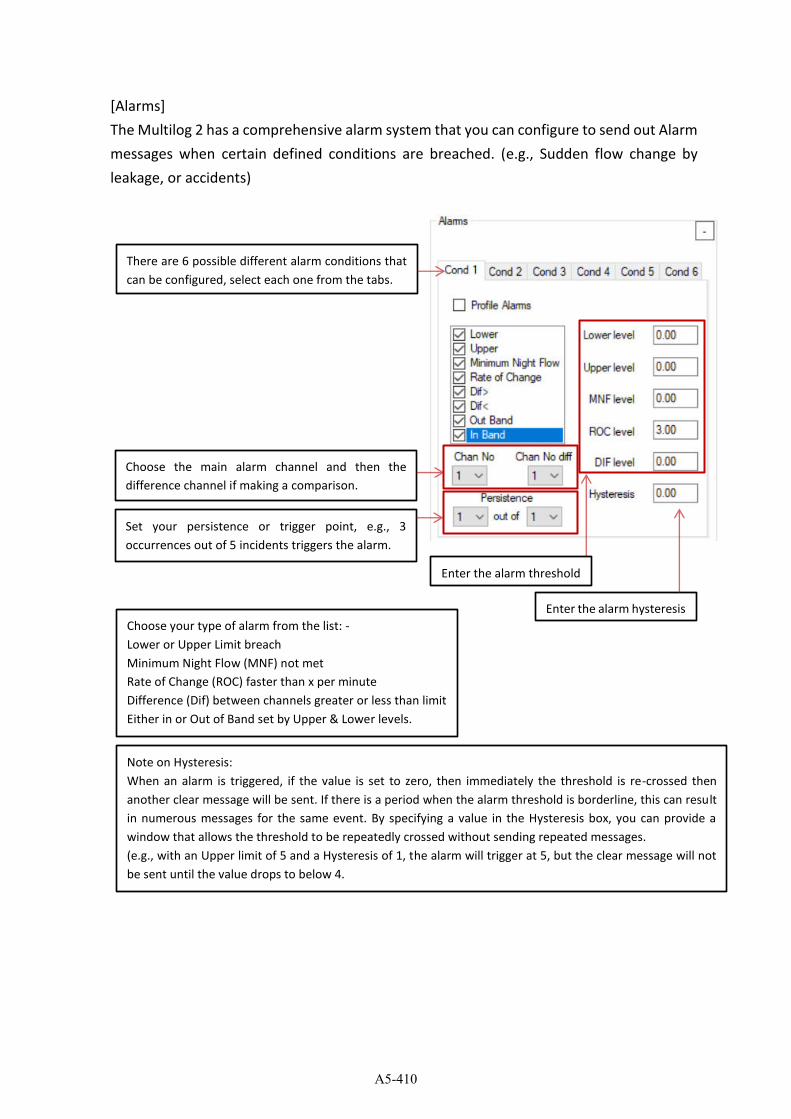
[Alarms]
The Multilog 2 has a comprehensive alarm system that you can configure to send out Alarm
messages when certain defined conditions are breached. (e.g., Sudden flow change by
leakage, or accidents)
Choose the main alarm channel and then the
difference channel if making a comparison.
Set your persistence or trigger point, e.g., 3
occurrences out of 5 incidents triggers the alarm.
Enter the alarm threshold
Enter the alarm hysteresis
There are 6 possible different alarm conditions that
can be configured, select each one from the tabs.
Choose your type of alarm from the list: -
Lower or Upper Limit breach
Minimum Night Flow (MNF) not met
Rate of Change (ROC) faster than x per minute
Difference (Dif) between channels greater or less than limit
Either in or Out of Band set by Upper & Lower levels.
Note on Hysteresis:
When an alarm is triggered, if the value is set to zero, then immediately the threshold is re-crossed then
another clear message will be sent. If there is a period when the alarm threshold is borderline, this can result
in numerous messages for the same event. By specifying a value in the Hysteresis box, you can provide a
window that allows the threshold to be repeatedly crossed without sending repeated messages.
(e.g., with an Upper limit of 5 and a Hysteresis of 1, the alarm will trigger at 5, but the clear message will not
be sent until the value drops to below 4.
A5-410
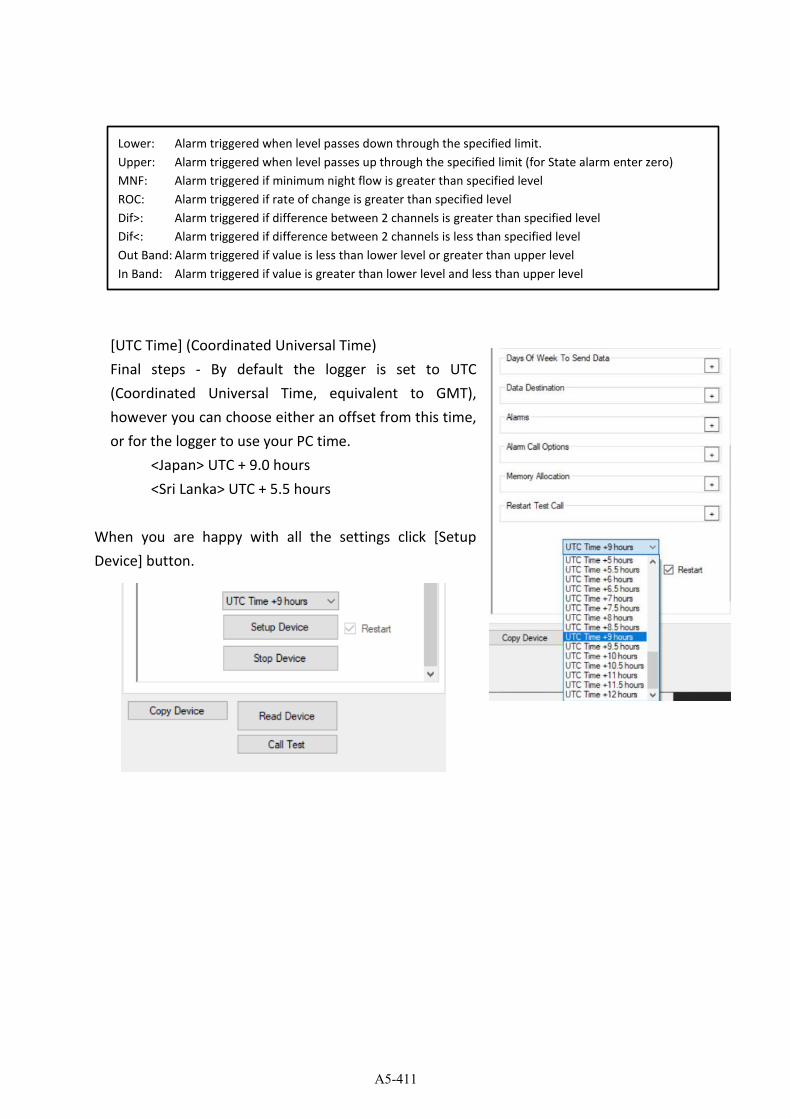
[UTC Time] (Coordinated Universal Time)
Final steps - By default the logger is set to UTC
(Coordinated Universal Time, equivalent to GMT),
however you can choose either an offset from this time,
or for the logger to use your PC time.
<Japan> UTC + 9.0 hours
<Sri Lanka> UTC + 5.5 hours
When you are happy with all the settings click [Setup
Device] button.
Lower: Alarm triggered when level passes down through the specified limit.
Upper: Alarm triggered when level passes up through the specified limit (for State alarm enter zero)
MNF: Alarm triggered if minimum night flow is greater than specified level
ROC: Alarm triggered if rate of change is greater than specified level
Dif>: Alarm triggered if difference between 2 channels is greater than specified level
Dif<: Alarm triggered if difference between 2 channels is less than specified level
Out Band: Alarm triggered if value is less than lower level or greater than upper level
In Band: Alarm triggered if value is greater than lower level and less than upper level
A5-411
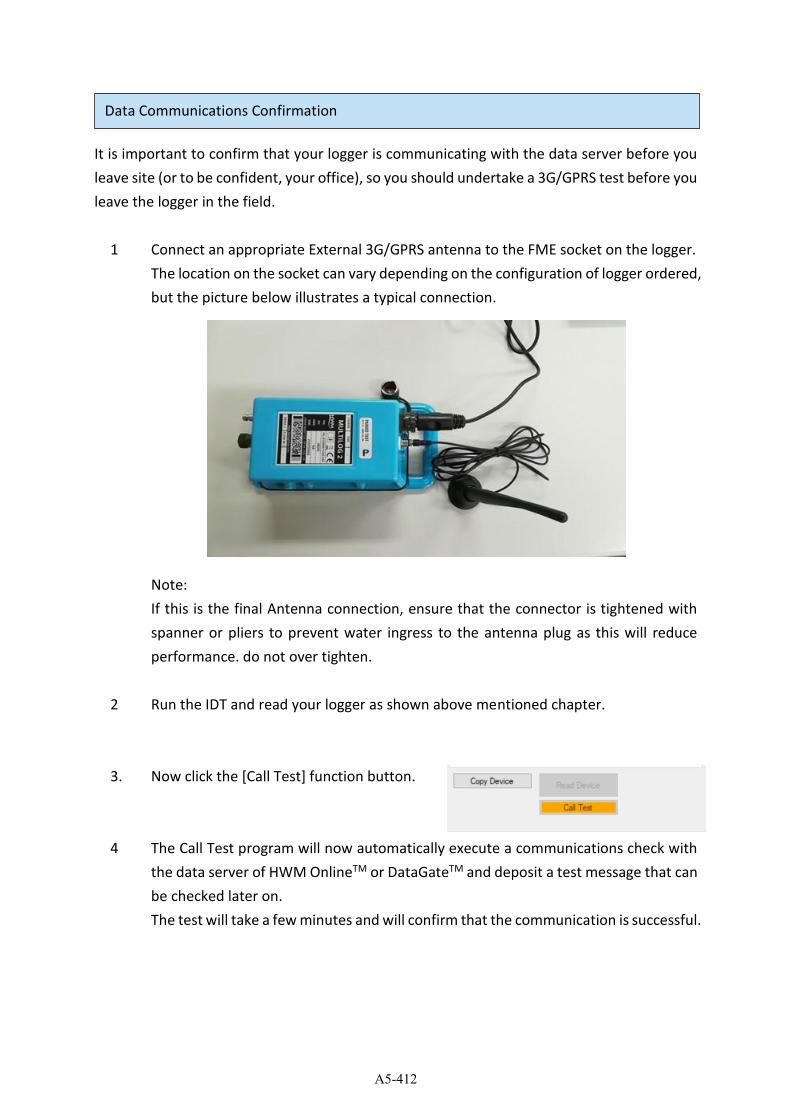
It is important to confirm that your logger is communicating with the data server before you
leave site (or to be confident, your office), so you should undertake a 3G/GPRS test before you
leave the logger in the field.
1 Connect an appropriate External 3G/GPRS antenna to the FME socket on the logger.
The location on the socket can vary depending on the configuration of logger ordered,
but the picture below illustrates a typical connection.
Note:
If this is the final Antenna connection, ensure that the connector is tightened with
spanner or pliers to prevent water ingress to the antenna plug as this will reduce
performance. do not over tighten.
2 Run the IDT and read your logger as shown above mentioned chapter.
3. Now click the [Call Test] function button.
4 The Call Test program will now automatically execute a communications check with
the data server of HWM OnlineTM or DataGateTM and deposit a test message that can
be checked later on.
The test will take a few minutes and will confirm that the communication is successful.
Data Communications Confirmation
A5-412
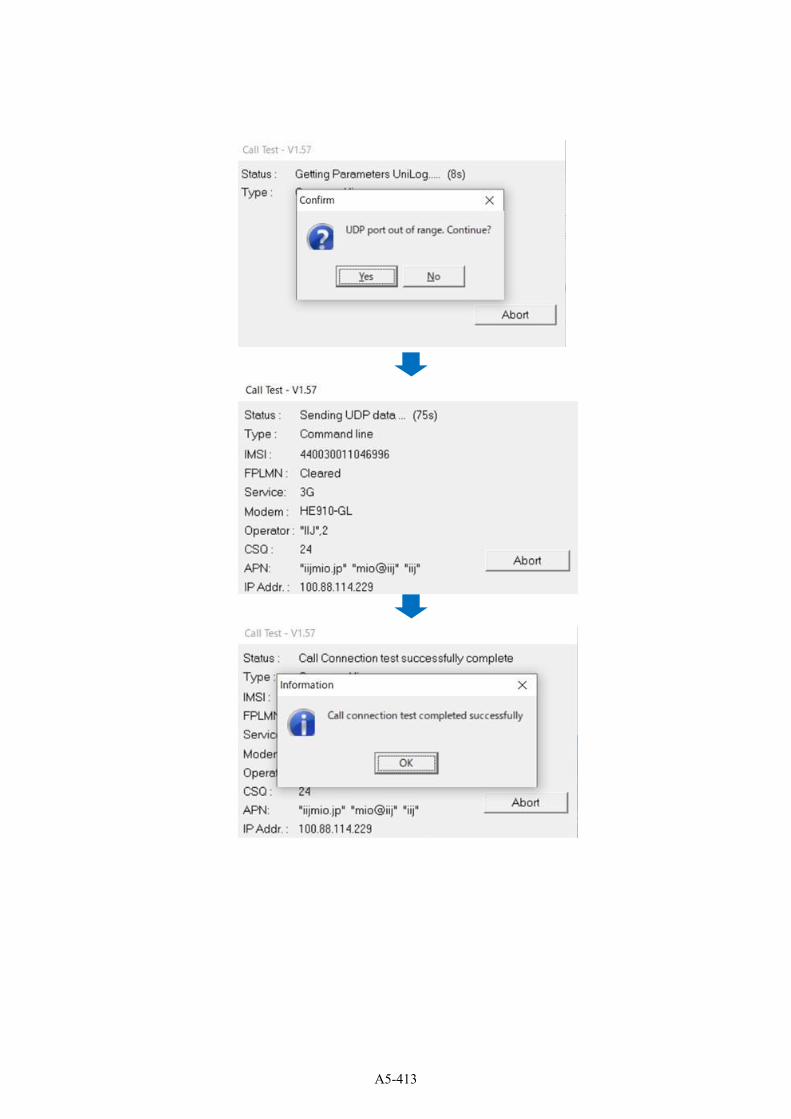
A5-413
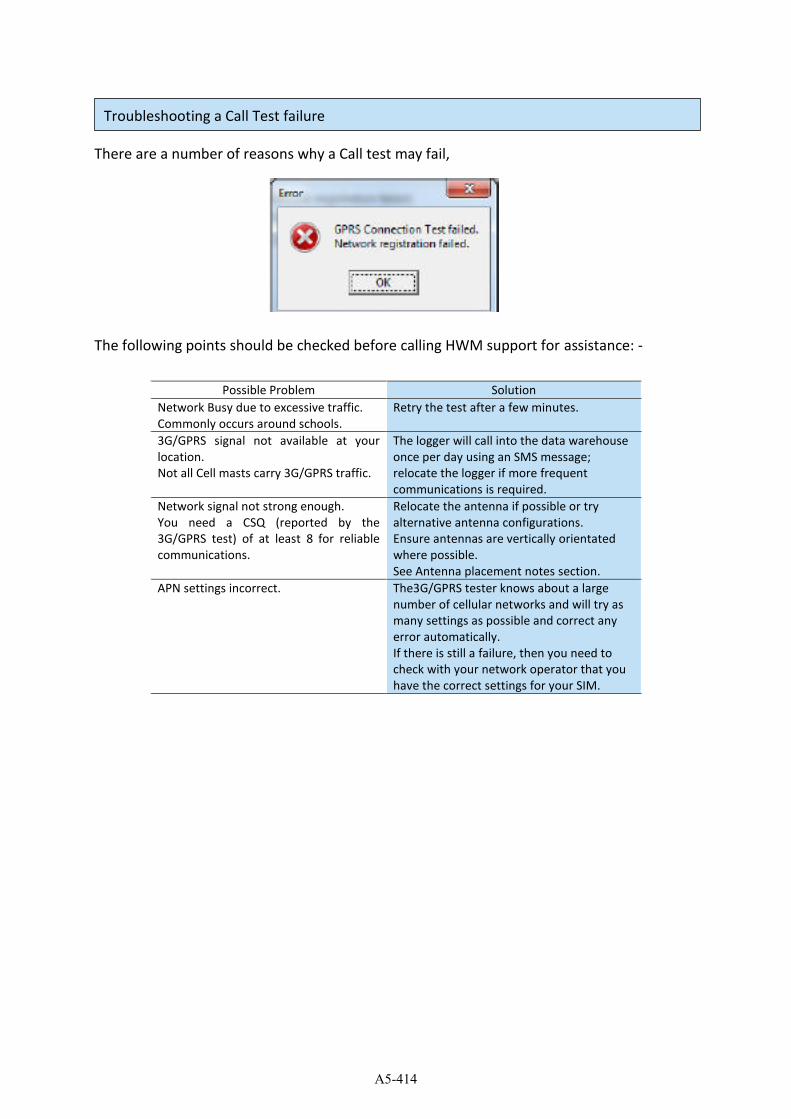
There are a number of reasons why a Call test may fail,
The following points should be checked before calling HWM support for assistance: -
Possible Problem Solution
Network Busy due to excessive traffic.
Commonly occurs around schools.
Retry the test after a few minutes.
3G/GPRS signal not available at your
location.
Not all Cell masts carry 3G/GPRS traffic.
The logger will call into the data warehouse
once per day using an SMS message;
relocate the logger if more frequent
communications is required.
Network signal not strong enough.
You need a CSQ (reported by the
3G/GPRS test) of at least 8 for reliable
communications.
Relocate the antenna if possible or try
alternative antenna configurations.
Ensure antennas are vertically orientated
where possible.
See Antenna placement notes section.
APN settings incorrect. The3G/GPRS tester knows about a large
number of cellular networks and will try as
many settings as possible and correct any
error automatically.
If there is still a failure, then you need to
check with your network operator that you
have the correct settings for your SIM.
Troubleshooting a Call Test failure
A5-414
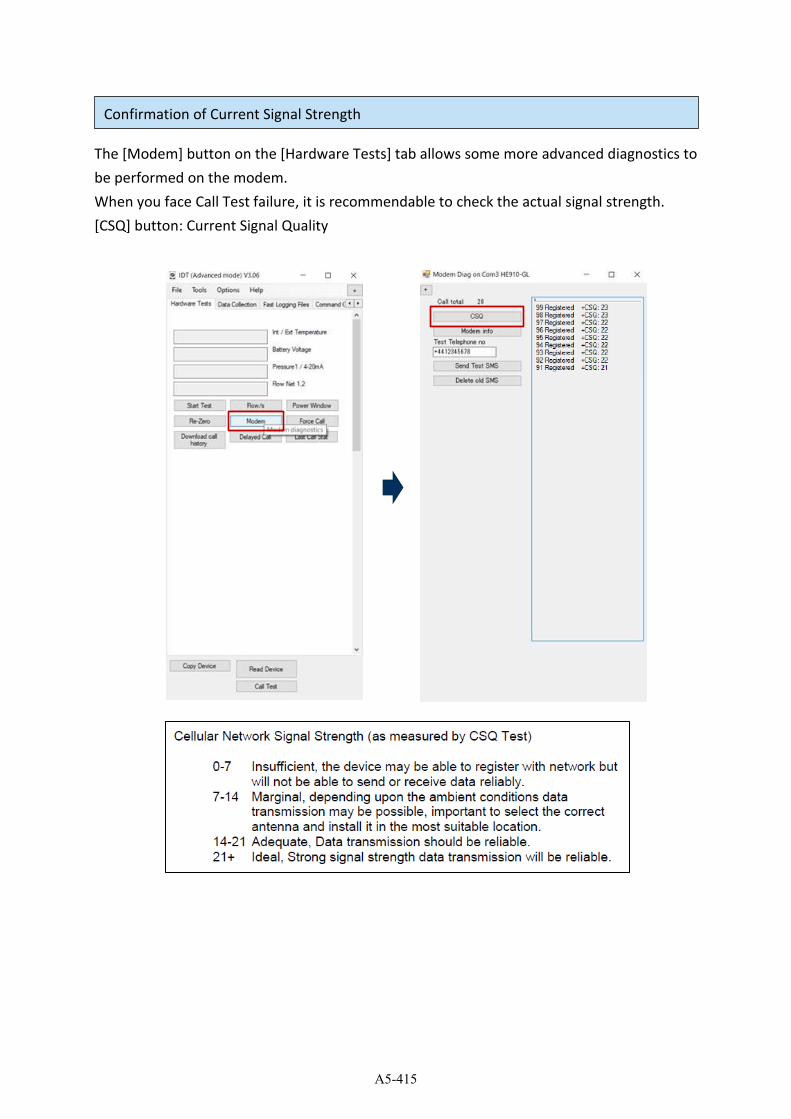
The [Modem] button on the [Hardware Tests] tab allows some more advanced diagnostics to
be performed on the modem.
When you face Call Test failure, it is recommendable to check the actual signal strength.
[CSQ] button: Current Signal Quality
Confirmation of Current Signal Strength
A5-415
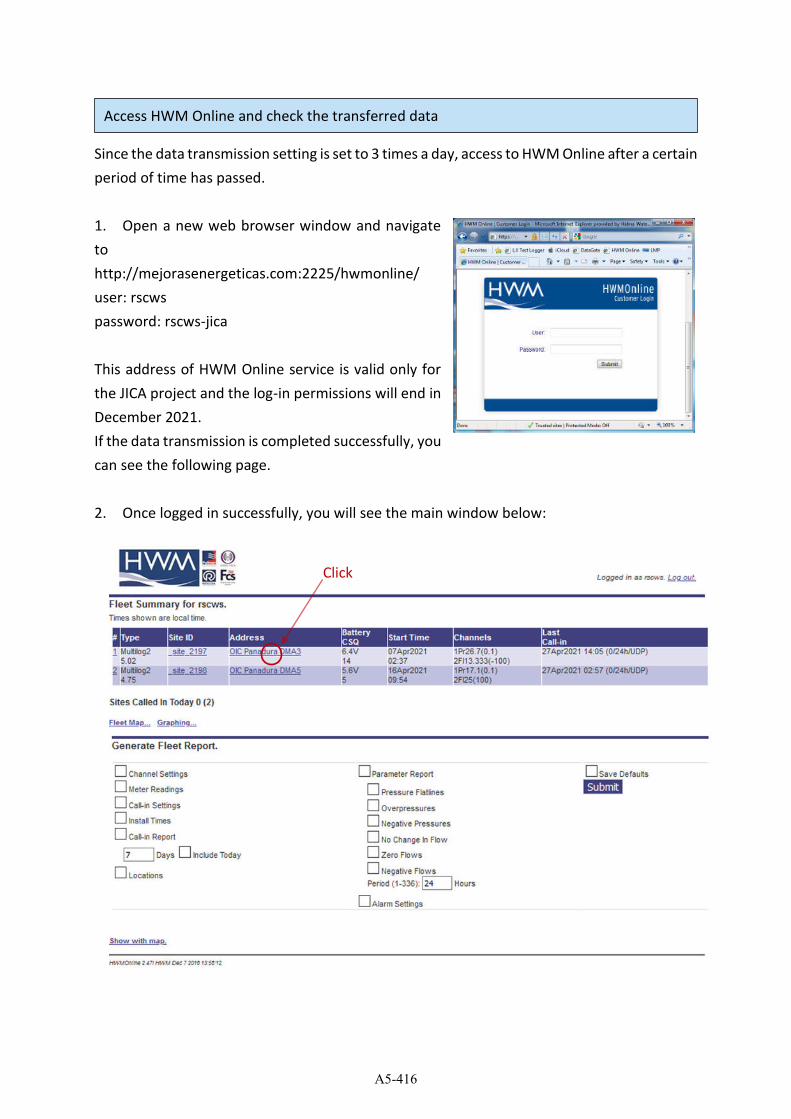
Since the data transmission setting is set to 3 times a day, access to HWM Online after a certain
period of time has passed.
1. Open a new web browser window and navigate
to
http://mejorasenergeticas.com:2225/hwmonline/
user: rscws
password: rscws-jica
This address of HWM Online service is valid only for
the JICA project and the log-in permissions will end in
December 2021.
If the data transmission is completed successfully, you
can see the following page.
2. Once logged in successfully, you will see the main window below:
Access HWM Online and check the transferred data
Click
A5-416
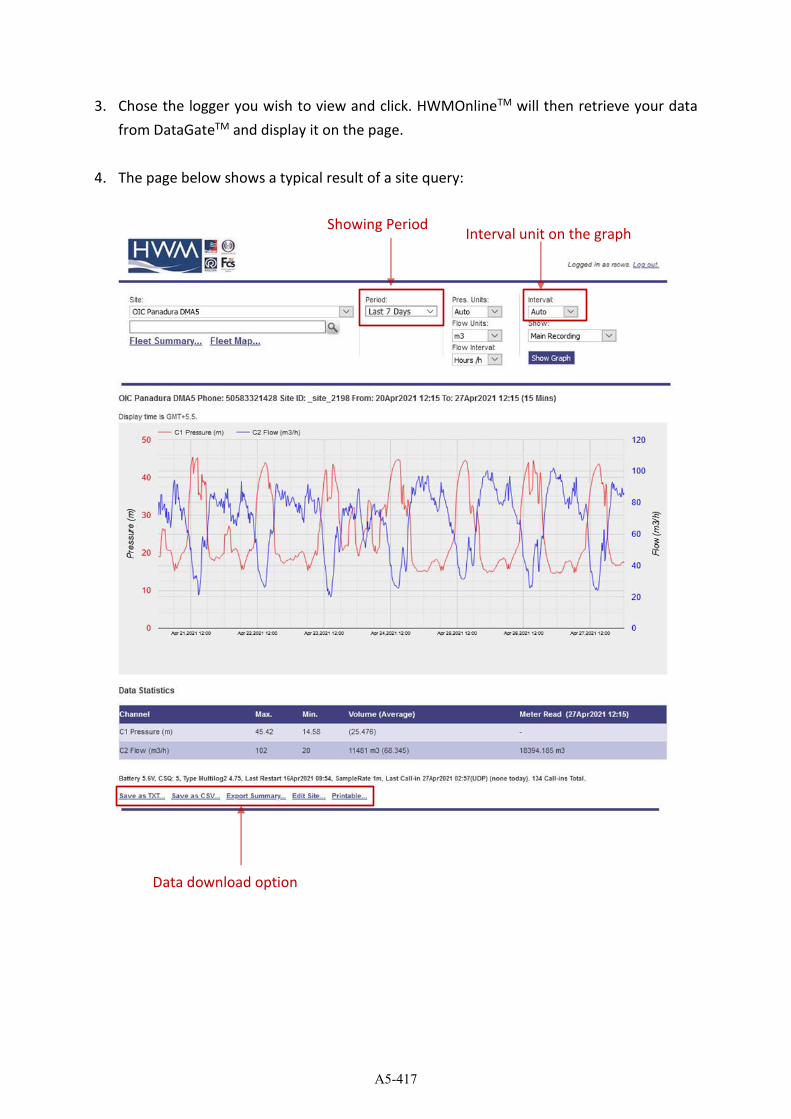
3. Chose the logger you wish to view and click. HWMOnlineTM will then retrieve your data
from DataGateTM and display it on the page.
4. The page below shows a typical result of a site query:
Interval unit on the graph Showing Period
Data download option
A5-417

Attachment 6: Output 3 Capacity assessment
sheet

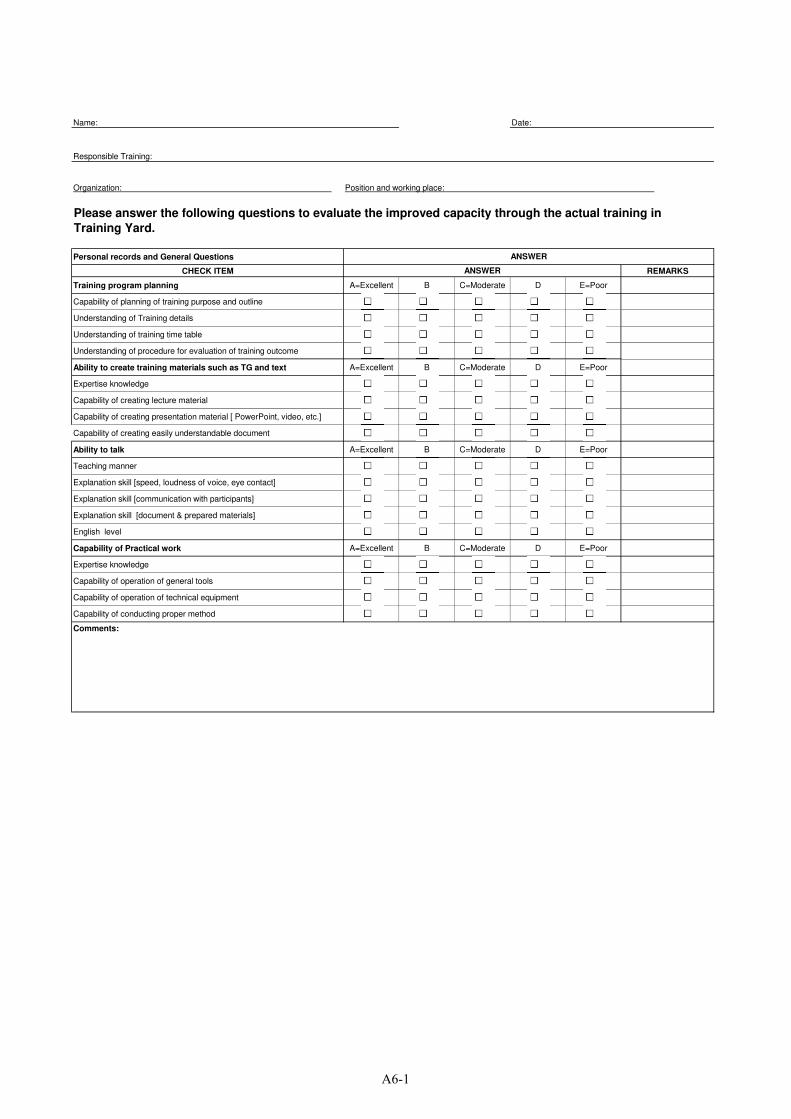
Name: Date:
Responsible Training:
Organization: Position and working place:
Personal records and General Questions
CHECK ITEM REMARKS
Training program planning A=Excellent B C=Moderate D E=Poor
Capability of planning of training purpose and outline
Understanding of Training details
Understanding of training time table
Understanding of procedure for evaluation of training outcome
Ability to create training materials such as TG and text A=Excellent B C=Moderate D E=Poor
Expertise knowledge
Capability of creating lecture material
Capability of creating presentation material [ PowerPoint, video, etc.]
Capability of creating easily understandable document
Ability to talk A=Excellent B C=Moderate D E=Poor
Teaching manner
Explanation skill [speed, loudness of voice, eye contact]
Explanation skill [communication with participants]
Explanation skill [document & prepared materials]
English level
Capability of Practical work A=Excellent B C=Moderate D E=Poor
Expertise knowledge
Capability of operation of general tools
Capability of operation of technical equipment
Capability of conducting proper method
Comments:
Please answer the following questions to evaluate the improved capacity through the actual training inTraining Yard.
ANSWER
ANSWER
6