boiler reliability optimization guideline
TRANSCRIPT
Boiler Reliability Optimization Guideline
Technical Report

EPRI Project Manager P. Abbot
EPRI • 3412 Hillview Avenue, Palo Alto, California 94304 • PO Box 10412, Palo Alto, California 94303 • USA 800.313.3774 • 650.855.2121 • [email protected] • www.epri.com
Boiler Reliability Optimization Guideline
1004018
Final Report, September 2001
DISCLAIMER OF WARRANTIES AND LIMITATION OF LIABILITIES
THIS DOCUMENT WAS PREPARED BY THE ORGANIZATION(S) NAMED BELOW AS AN ACCOUNT OF WORK SPONSORED OR COSPONSORED BY THE ELECTRIC POWER RESEARCH INSTITUTE, INC. (EPRI). NEITHER EPRI, ANY MEMBER OF EPRI, ANY COSPONSOR, THE ORGANIZATION(S) BELOW, NOR ANY PERSON ACTING ON BEHALF OF ANY OF THEM:
(A) MAKES ANY WARRANTY OR REPRESENTATION WHATSOEVER, EXPRESS OR IMPLIED, (I) WITH RESPECT TO THE USE OF ANY INFORMATION, APPARATUS, METHOD, PROCESS, OR SIMILAR ITEM DISCLOSED IN THIS DOCUMENT, INCLUDING MERCHANTABILITY AND FITNESS FOR A PARTICULAR PURPOSE, OR (II) THAT SUCH USE DOES NOT INFRINGE ON OR INTERFERE WITH PRIVATELY OWNED RIGHTS, INCLUDING ANY PARTY'S INTELLECTUAL PROPERTY, OR (III) THAT THIS DOCUMENT IS SUITABLE TO ANY PARTICULAR USER'S CIRCUMSTANCE; OR
(B) ASSUMES RESPONSIBILITY FOR ANY DAMAGES OR OTHER LIABILITY WHATSOEVER (INCLUDING ANY CONSEQUENTIAL DAMAGES, EVEN IF EPRI OR ANY EPRI REPRESENTATIVE HAS BEEN ADVISED OF THE POSSIBILITY OF SUCH DAMAGES) RESULTING FROM YOUR SELECTION OR USE OF THIS DOCUMENT OR ANY INFORMATION, APPARATUS, METHOD, PROCESS, OR SIMILAR ITEM DISCLOSED IN THIS DOCUMENT.
ORGANIZATION(S) THAT PREPARED THIS DOCUMENT
Eskom
ORDERING INFORMATION
Requests for copies of this report should be directed to EPRI Customer Fulfillment, 1355 Willow Way, Suite 278, Concord, CA 94520, (800) 313-3774, press 2.
Electric Power Research Institute and EPRI are registered service marks of the Electric Power Research Institute, Inc. EPRI. ELECTRIFY THE WORLD is a service mark of the Electric Power Research Institute, Inc.
Copyright © 2001 Electric Power Research Institute, Inc. All rights reserved.
iii
CITATIONS
This report was prepared by
Eskom Megawatt Park P. O. Box 1091 Johannesburg, 2000 South Africa
Principal Investigator D. McGhee
This report describes research sponsored by EPRI.
The report is a corporate document that should be cited in the literature in the following manner:
Boiler Reliability Optimization Guideline, EPRI, Palo Alto, CA: 2001. 1004018.

v
REPORT SUMMARY
The Boiler Reliability Optimization Guideline was designed to help utility owners and operators succeed in a competitive market by increasing the reliability and maintainability and, therefore, availability of the boiler and all its auxiliaries.
Background
In the last decade, the business environment in which the utility industry operates has undergone a significant change. To remain competitive, utility owners and operators must learn how to realize maximum long-term value for their shareholders by efficiently managing assets and risks. Plant operators must use more cost-effective operating and maintenance strategies to remain viable, without compromising safety and environmental standards. Costs and revenue are both directly affected by plant availability. Boilers remain the major cause of plant unavailability and are the prime focus of this guideline.
Objective • To improve and sustain the reliability of boilers and their auxiliaries in order to reduce maintenance costs.
• To help achieve reliability and efficiency targets for maximizing long-term value through world class risk management, life-cycle management, optimal renewal, and capital deployment strategies.
Approach EPRI has developed a number of programs that address plant availability and performance issues. Due to industry-wide staff reductions and turnover, utility personnel need assistance in applying available EPRI technologies to enhance their capabilities in the field of asset management. With these needs in mind, the Boiler Reliability Optimization program, which makes use of a number of applicable EPRI technologies, was developed in 1998 to assess, create, and implement an effective boiler maintenance strategy. In 1999, an Interim guideline was published. The Boiler Reliability Optimization Guideline is an updated version of that interim guideline and is intended to provide members with insights into maximizing boiler reliability and maintainability.
Results This report first shows how to assess and benchmark an organization’s capabilities against industry best practices together with the principals and practices identified in EPRI’s Predictive Maintenance (TR-103374-V1-3) and Predictive Maintenance Assessment Guideline (TR-109241). Before any detailed technical assessment can take place, a boiler’s material condition
vi
needs to be evaluated. EPRI’s Boiler Condition Assessment Guideline (TR-111559) is used to accomplish this. Findings and recommendations from the assessment together with appropriate nondestructive evaluation (NDE) techniques form the basis of a Boiler Failure Defense Plan for the pressure parts. Failure Modes and Effects Analysis (FMEA) identifies what causes failure and, more importantly, what happens when certain types of failure occur. EPRI’s Streamlined Reliability Centered Maintenance Implementation Guideline (TR–109795-V2) is used to determine optimum maintenance strategies for all boiler auxiliaries and a second methodology for prioritizing outage maintenance tasks, thus optimizing the extent and duration of a periodic outage. Finally, a Proactive Maintenance strategy is discussed for sustaining continuous process and technological improvements.
EPRI Perspective This guideline is focused on improving boiler reliability and maintainability. Reliability is a measure of maintenance effectiveness as opposed to availability, which—in its simplest form—is up-time divided by total time. The relationship between reliability and maintainability is synergetic. Reliability is the probability that equipment will perform its prescribed function without failure for a given time when operated correctly in a specific environment. Maintainability describes the time required to carry out the required maintenance/repair to keep this equipment functioning. Therefore, improving either reliability or maintainability will improve performance. This guideline is about just that—managing risk of failure and shortening the time to do maintenance.
Keywords Streamlined reliability-centered maintenance Predictive maintenance Fossil boilers Maintenance optimization Failure modes effects analysis Outage task prioritization Long-term boiler health indices
vii
CONTENTS
1 INTRODUCTION AND OVERVIEW..................................................................................... 1-1
2 BOILER RELIABILITY OPTIMIZATION ASSESSMENT..................................................... 2-1
Introduction ........................................................................................................................ 2-1
Definition of Reliability.................................................................................................... 2-3
Definition of Availability .................................................................................................. 2-3
Definition of Risk............................................................................................................ 2-4
Assessment Methodology .................................................................................................. 2-4
Purpose ......................................................................................................................... 2-4
Scope of Assessment .................................................................................................... 2-4
Objectives of the Assessment........................................................................................ 2-5
Code of Conduct............................................................................................................ 2-5
Methodology of the Assessment .................................................................................... 2-5
Preparation ............................................................................................................... 2-5
The Assessment ....................................................................................................... 2-5
Interviews.................................................................................................................. 2-6
Direct Observations................................................................................................... 2-6
Plant Inspection......................................................................................................... 2-6
Evaluation Criteria ......................................................................................................... 2-7
Recommendation ...................................................................................................... 2-7
Suggestion ................................................................................................................ 2-7
Reporting....................................................................................................................... 2-8
Technical/Root Cause “Gap” Analysis....................................................................... 2-8
Data Source ”Gap” Analysis .....................................................................................2-10
Organizational “Gap” Analysis..................................................................................2-10
Key Elements of an Assessment .......................................................................................2-12
Preventive Maintenance Base/Program........................................................................2-13
Work Flow Process.......................................................................................................2-14
viii
Technical and Interpersonal Training ............................................................................2-15
Maintenance Management ...........................................................................................2-16
Computerized Maintenance Management System........................................................2-18
Computerized Maintenance Management System ............................................................2-18
Predictive Maintenance.................................................................................................2-19
Predictive Maintenance .....................................................................................................2-19
Operations Involvement ................................................................................................2-19
Operations Involvement.....................................................................................................2-20
Reliability Management.................................................................................................2-21
Reliability Management .....................................................................................................2-21
Data Integration ............................................................................................................2-22
Data Integration.................................................................................................................2-22
Boiler Material Condition...............................................................................................2-23
Boiler Material Condition ..................................................................................................2-23
Continuous Improvement..............................................................................................2-24
Continuous Improvement ..................................................................................................2-24
3 BOILER CONDITION ASSESSMENT ................................................................................. 3-1
Introduction ........................................................................................................................ 3-1
Failure Analysis .................................................................................................................. 3-1
Causes of Component Failures .......................................................................................... 3-2
Root Causes of Component Failure.................................................................................... 3-3
Condition Assessment Fundamentals ................................................................................ 3-3
Tracking Down Failure Cause ............................................................................................ 3-4
Boiler Tubes .................................................................................................................. 3-4
Corrosion Fatigue...................................................................................................... 3-6
Fly Ash Erosion......................................................................................................... 3-7
Hydrogen Damage .................................................................................................... 3-7
Caustic Gouging Corrosion ....................................................................................... 3-7
Acid Phosphate Corrosion......................................................................................... 3-7
High Temperature Creep........................................................................................... 3-7
Short Term Overheat ................................................................................................ 3-8
Sootblower Erosion ................................................................................................... 3-8
Fireside Corrosion..................................................................................................... 3-8
Falling Slag Erosion .................................................................................................. 3-8
ix
Wastage.................................................................................................................... 3-8
Pitting........................................................................................................................ 3-9
Liquid Ash Corrosion................................................................................................. 3-9
Fretting...................................................................................................................... 3-9
Dissimilar Metal Weld (DMW) Failures ...................................................................... 3-9
Intergranular Stress Corrosion Cracking (IGSCC) ..................................................... 3-9
Cracking at Attachment Welds .................................................................................. 3-9
Thermal-mechanical Fatigue..................................................................................... 3-9
Weld-Related Failures..............................................................................................3-10
Graphitization...........................................................................................................3-10
Carbonization...........................................................................................................3-10
Headers and Drums......................................................................................................3-10
Superheater Headers....................................................................................................3-11
Economizer Headers ....................................................................................................3-12
Inspection Techniques..................................................................................................3-12
Visual Testing (VT) .......................................................................................................3-12
Ultrasonic Inspection (UT) ............................................................................................3-12
Electromagnetic Acoustic Transducer System (EMATS)...............................................3-12
Liquid Penetrant Testing (PT) .......................................................................................3-13
Magnetic Testing (MT) ..................................................................................................3-13
Eddy Current Testing (ET) ............................................................................................3-13
Infrared Thermography .................................................................................................3-13
Replication....................................................................................................................3-13
Headers and Drums Inspections .......................................................................................3-14
4 RELIABILITY CENTERED MAINTENANCE ....................................................................... 4-1
Introduction ........................................................................................................................ 4-1
Preparation......................................................................................................................... 4-1
System Selection ........................................................................................................... 4-2
Documentation Requirements........................................................................................ 4-2
Assumptions .................................................................................................................. 4-2
Critical Evaluation Criteria.............................................................................................. 4-3
Non-Critical Evaluation Criteria ...................................................................................... 4-3
Analysis Reviews........................................................................................................... 4-4
Analysis.............................................................................................................................. 4-4
x
System Boundaries........................................................................................................ 4-5
Functions....................................................................................................................... 4-5
Functional Failures Analysis (FFA) ................................................................................ 4-6
Criticality Analysis/Failure Modes and Effects Analysis (FMEA)..................................... 4-6
Analysis Reviews........................................................................................................... 4-7
Task Selection.................................................................................................................... 4-7
Critical Task Selection ..................................................................................................4-10
Non-Critical Task Selection...........................................................................................4-12
Maintenance Interviews.....................................................................................................4-14
Task Comparison ..............................................................................................................4-14
Implementation..................................................................................................................4-15
5 FAILURE MODES EFFECTS ANALYSIS ........................................................................... 5-1
Introduction ........................................................................................................................ 5-1
What is FMEA? .................................................................................................................. 5-1
Step-by-Step FMEA Analysis Procedure ............................................................................ 5-2
System, Subsystem and Component Identification (1) ................................................... 5-2
Prepared by (2).............................................................................................................. 5-2
FMEA Date – Original (3)............................................................................................... 5-4
FMEA Revision Number (4) ........................................................................................... 5-4
Function (5) ................................................................................................................... 5-4
Potential Failure Mode (6).............................................................................................. 5-4
Potential Effect(s) of Failure (7) ..................................................................................... 5-5
Severity of Effect (8) ...................................................................................................... 5-5
Potential Cause(s) of Failure (9) .................................................................................... 5-7
Frequency (10) .............................................................................................................. 5-8
Detection Method (11) ................................................................................................... 5-9
Detection (12) ...............................................................................................................5-10
Risk Priority Number (RPN) (13)...................................................................................5-10
Recommended Action (14) ...........................................................................................5-11
Interpreting the FMEA .......................................................................................................5-11
6 TASK RISK EVALUATION AND PRIORITIZATION............................................................ 6-1
Introduction ........................................................................................................................ 6-1
Methodology....................................................................................................................... 6-1
xi
Determination of Value on Risk Coverage of the PM task.............................................. 6-3
Determination of Relative Cost of Performing PM Task ................................................. 6-3
Analysis Process ................................................................................................................ 6-3
7 PROACTIVE MAINTENANCE............................................................................................. 7-1
8 REFERENCES .................................................................................................................... 8-1

xiii
LIST OF FIGURES
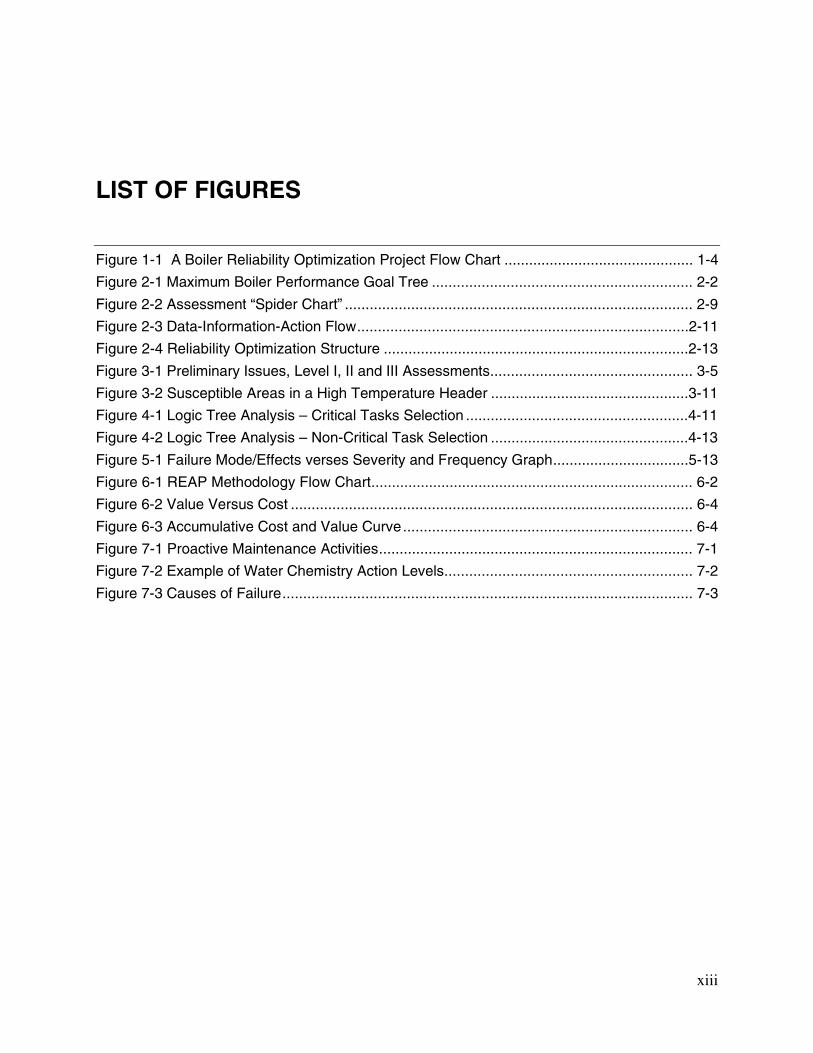
Figure 1-1 A Boiler Reliability Optimization Project Flow Chart .............................................. 1-4 Figure 2-1 Maximum Boiler Performance Goal Tree ............................................................... 2-2 Figure 2-2 Assessment “Spider Chart” .................................................................................... 2-9 Figure 2-3 Data-Information-Action Flow................................................................................2-11 Figure 2-4 Reliability Optimization Structure ..........................................................................2-13 Figure 3-1 Preliminary Issues, Level I, II and III Assessments................................................. 3-5 Figure 3-2 Susceptible Areas in a High Temperature Header ................................................3-11 Figure 4-1 Logic Tree Analysis – Critical Tasks Selection ......................................................4-11 Figure 4-2 Logic Tree Analysis – Non-Critical Task Selection ................................................4-13 Figure 5-1 Failure Mode/Effects verses Severity and Frequency Graph.................................5-13 Figure 6-1 REAP Methodology Flow Chart.............................................................................. 6-2 Figure 6-2 Value Versus Cost ................................................................................................. 6-4 Figure 6-3 Accumulative Cost and Value Curve...................................................................... 6-4 Figure 7-1 Proactive Maintenance Activities............................................................................ 7-1 Figure 7-2 Example of Water Chemistry Action Levels............................................................ 7-2 Figure 7-3 Causes of Failure................................................................................................... 7-3

xv
LIST OF TABLES
Table 2-1 Assessment Scoring Criteria ................................................................................... 2-7 Table 2-2 Key Elements of a Boiler Reliability Assessment....................................................2-12 Table 2-3 Preventive Maintenance Base Assessment Criteria ...............................................2-14 Table 2-4 Work Process Assessment Criteria ........................................................................2-15 Table 2-5 Technical and Interpersonal Training Assessment Criteria.....................................2-16 Table 2-6 Management Assessment Criteria .........................................................................2-17 Table 2-7 CMMS Assessment Criteria ...................................................................................2-18 Table 2-8 Predictive Maintenance Criteria..............................................................................2-19 Table 2-9 Operations Involvement Assessment Criteria.........................................................2-20 Table 2-10 Reliability Management Assessment Criteria .......................................................2-21 Table 2-11 Data integration Criteria .......................................................................................2-22 Table 2-12 Boiler Material Condition Criteria..........................................................................2-23 Table 2-13 Continuous Improvement Criteria.........................................................................2-24 Table 3-1 Boiler tube Failure Mechanisms .............................................................................. 3-6 Table 3-2 Header Damage Mechanisms................................................................................3-11 Table 5-1 FMEA Worksheet .................................................................................................... 5-3 Table 5-2 Severity Ranking Criteria......................................................................................... 5-6 Table 5-3 Frequency Ranking Criteria..................................................................................... 5-9 Table 5-4 Detection Ranking Criteria .....................................................................................5-11 Table 5-5 Failure mode/Effects verses Severity and Frequency.............................................5-12 Table 5-6 Completed FMEA Form..........................................................................................5-14 Table 5-7 Component Maintenance Task Recommendations ................................................5-15

1-1
1 INTRODUCTION AND OVERVIEW
In the past ten years or so, the business environment in which the utility industry is operating has undergone a significant change. In today’s economic environment with all its challenges including sometimes conflicting demands of increased reliability and quality of supply brought on by the competitive pressure to drive costs down. This demand has presented the utility industry with a complex series of questions to answer to remain viable entities in the world market. To achieve this objective to remain viable, utility owners and operators are struggling with the question of: “How to realize maximum long term value for the shareholder through efficient and effective management of the assets and also manage the risks”. Many utilities have looked at other industries with similar risk and competitive profiles to determine how they are meeting their strategic objectives - commercially and at a service level. The trends that have emerged center on three key vital objectives, namely:
1. Achieve reliability and efficiency targets to maximize long term value through world class risk management, plant life cycle management, optimal renewal, and capital deployment strategies.
2. Challenge all work to be performed – thus driving labor cost to a minimum consistent with required timing and quality.
3. Manage human assets separately from the plant assets.
This Boiler Reliability Optimization Guideline is intended to assist utility owners and operators to address all of the above objectives by increasing the reliability and maintainability and therefore availability of the boiler and all its auxiliaries.
Managers of fossil-fired plants in the industry need to change the way a plant is managed and run in response to new evolutionary commercial pressures. Their focus needs to change from one of supply because we have to, to one where the utility has to succeed in a competitive environment.
The major issues that plant operators have had to cope with in their quest to remain competitive are:
• Significant O&M budget constraints
• Reduced capital expenditure
• Reduction in staffing numbers
• Extension between major boiler outages
• Decreasing plant reliability and thermal performance
Introduction and Overview
1-2
• Aging equipment
• Mergers and take-overs between utilities
• Rigorous maneuverability and fuel flexibility
Therefore, plant operators must implement more cost effective operating and maintenance strategies, to achieve the goal of competitiveness, without compromising safety and environmental standards. Costs and, therefore, revenue, are both directly affected by, inter alia, plant availability.
Boilers remain the major cause of plant unavailability and are the prime focus of today’s utility management. EPRI has developed a number of programs that address plant availability and performance issues. Because of staff reductions, the application of a number of these EPRI products is limited. Therefore, utility personnel need assistance in the application of available EPRI technologies, to enhance their capabilities in the fields of asset management.
With these needs in mind, in 1998 the Boiler Reliability Optimization program, which makes use of a number of applicable EPRI technologies, was developed to assess, create and implement an effective boiler maintenance strategy. To date a number of utilities have participated in this program. In 1999 an Interim guideline was published. This guideline was compiled using experience gained during a project undertaken at Commonwealth Edison Joliet Station #9 and documented the process/methodology used at that time. Since 1999 a number of Boiler Reliability Optimizations projects have been successfully implemented using a more appropriate and streamlined process.
A typical Boiler Reliability Optimization project consists of four phases. The first phase is to establish the status of the management support systems and the condition of the boiler components/systems that need improvement. Industry norms are used to benchmark the data sources, work processes used, the organizational structure to manage the data/information collected and the causes of boiler unavailability.
The second phase deals with the development of a Boiler Failure Defense Plan. Various root cause analysis and condition assessment techniques are used to develop the plan. Failure Modes Effects Analysis is used to determine the maintenance strategy for the boiler pressure parts. Auxilliary plant maintenance tasks are reviewed and optimized using EPRI’s Streamlined Reliability Centered Maintenance software package. From this information a boiler failure defense plan is developed which forms the preventive maintenance base for the boiler. A risk-based model for outage task evaluation and prioritization is explained using examples. The model is intended to create a means to make business decision on outage activities associated with the boiler using information on the condition of the various boiler components and the task‘s financial impact.
The third phase deals with the practical aspects of boiler inspections - dirty and clean and the implementation of the boiler failure defense plan. It also discusses the merits of the various predictive maintenance technologies and how they are applied in equipment and technologies matrix and a plant condition status reporting.
Introduction and Overview
1-3
The fourth phase covers a the role of operation achieving low cost reliability, continuous improvement cycle, multi-functional monitoring processes, critical component condition indicators and the evaluation of long term plant health indicators. It focuses on how the operations group can add value to the process by using the additional information presented to them when performing routine monitoring tasks.
This guideline is an updated version of the interim guideline and is intended to provide members with an insight into improving the overall boiler performance, that is maximizing boiler reliability and maintainability. The objective remains the same: to improve and sustain the optimal reliability of the boilers and their auxiliaries and reduce maintenance costs.
This guideline is about improving the performance of the boiler, performance as in improving the reliability and maintainability of the boiler. Reliability is a measure of maintenance effectiveness as opposed to availability, which in its simplest form, is up time divided by total time period. The relationship between reliability and maintainability is synergetic. Reliability is the probability that that equipment will perform its prescribed function without failure for a given time when operated correctly in a specific environment. Maintainability describes the time required to carry out the required maintenance/repair to keep this equipment functioning. Therefore, improving either reliability or maintainability will improve performance. This guideline is about just that – managing risk of failure and shortening the time taken to do maintenance.
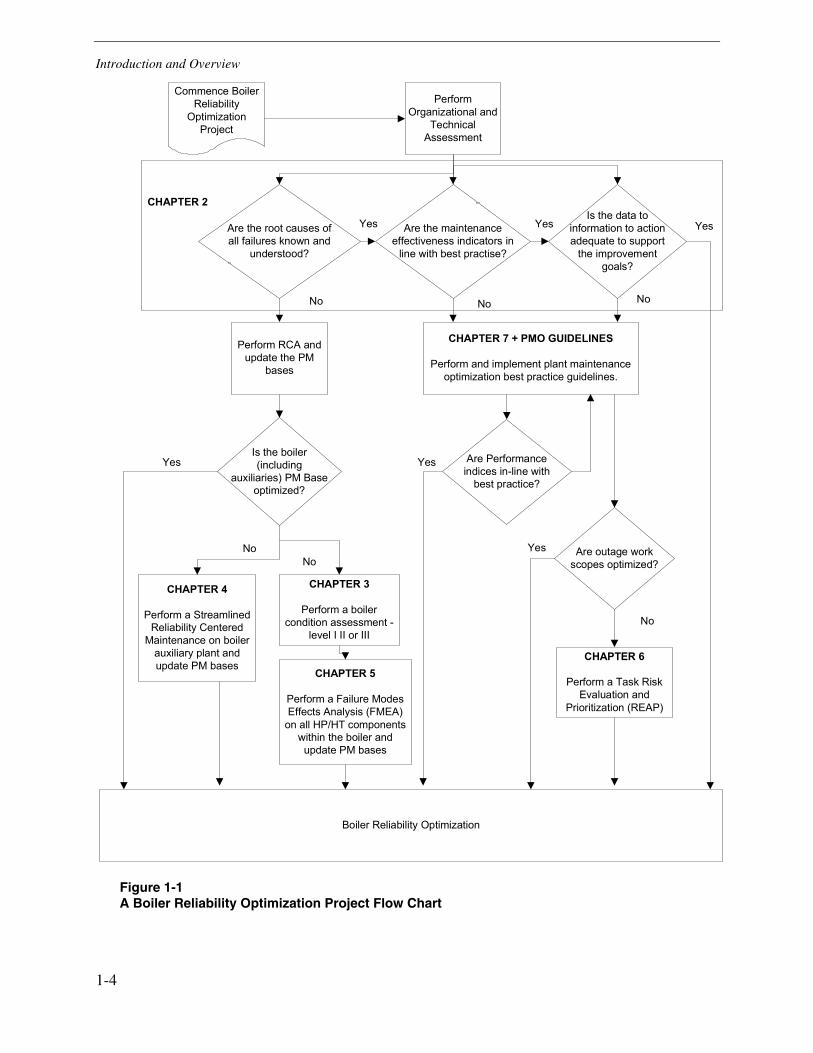
Before any improvement process can commence it is essential that not only the current performance of the boiler is known but also the root causes of any deficiencies that exist. This is the purpose of the first phase of a boiler reliability optimization project: to establish the effectiveness of the management support systems in place to support boiler reliability. Figure 1-1 give a high level schematic of how the various chapters of this guideline relate to each other.
The chapters follow in a logical sequence. First the capabilities of the organizational unit are assessed and benchmarked against industry best practices together with the principals/practices identified in EPRI’s Predictive Maintenance Assessment and Plant Maintenance Assessment guidelines. Before any detail technical assessment can take place the material condition of the boiler needs to be ascertained. This is the subject matter of the next chapter. Here EPRI’s Boiler Condition Assessment Guidelines are used. The findings and recommendations together with appropriate NDE techniques form the basis of a Boiler Failure Defense Plan for the pressure parts. Failure Modes and Effects analysis (FMEA) is used to understand what causes failure and, more importantly, what happens when certain types of failure occur. Many advance maintenance strategies employ this method for thinking through potential problems. EPRI’s Streamlined Reliability Centered Maintenance methodology is used to determine optimum maintenance strategy for all the boiler auxiliaries. Finally, a methodology is presented on prioritizing outage maintenance tasks, thus optimizing the extent and duration of a periodic outage.
The chapters of the guideline are introduced below:
Introduction and Overview
1-4
Figure 1-1 A Boiler Reliability Optimization Project Flow Chart
Boiler Reliability Optimization
Commence BoilerReliability
OptimizationProject
PerformOrganizational and
TechnicalAssessment
Are the root causes ofall failures known and
understood?
Are the maintenanceeffectiveness indicators in
line with best practise?
Is the data toinformation to actionadequate to support
the improvementgoals?
CHAPTER 7 + PMO GUIDELINES
Perform and implement plant maintenanceoptimization best practice guidelines.
Is the boiler(including
auxiliaries) PM Baseoptimized?
CHAPTER 4
Perform a StreamlinedReliability Centered
Maintenance on boilerauxiliary plant andupdate PM bases
CHAPTER 5
Perform a Failure ModesEffects Analysis (FMEA)
on all HP/HT componentswithin the boiler andupdate PM bases
CHAPTER 3
Perform a boilercondition assessment -
level I II or III
Are outage workscopes optimized?
CHAPTER 6
Perform a Task RiskEvaluation and
Prioritization (REAP)
Perform RCA andupdate the PM
bases
Are Performanceindices in-line with
best practice?
No
No
Yes
No
Yes
Yes
Yes
Yes Yes
CHAPTER 2
No No No
Introduction and Overview
1-5
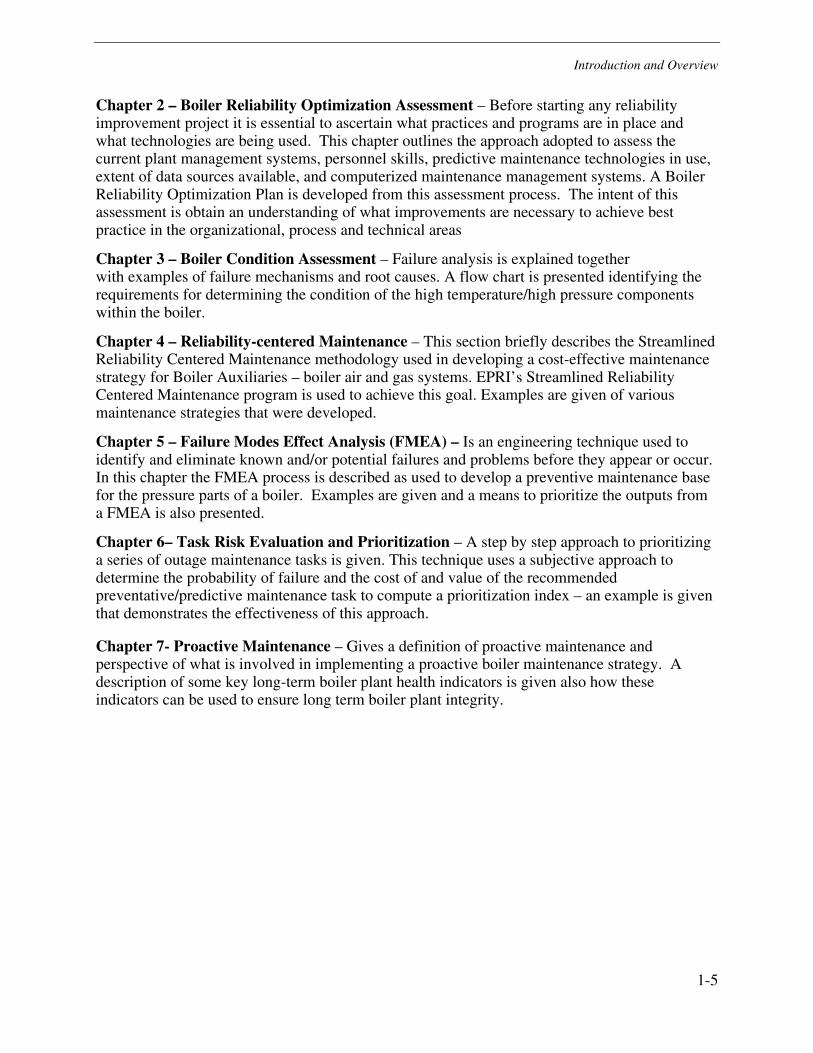
Chapter 2 – Boiler Reliability Optimization Assessment – Before starting any reliability improvement project it is essential to ascertain what practices and programs are in place and what technologies are being used. This chapter outlines the approach adopted to assess the current plant management systems, personnel skills, predictive maintenance technologies in use, extent of data sources available, and computerized maintenance management systems. A Boiler Reliability Optimization Plan is developed from this assessment process. The intent of this assessment is obtain an understanding of what improvements are necessary to achieve best practice in the organizational, process and technical areas
Chapter 3 – Boiler Condition Assessment – Failure analysis is explained together with examples of failure mechanisms and root causes. A flow chart is presented identifying the requirements for determining the condition of the high temperature/high pressure components within the boiler.
Chapter 4 – Reliability-centered Maintenance – This section briefly describes the Streamlined Reliability Centered Maintenance methodology used in developing a cost-effective maintenance strategy for Boiler Auxiliaries – boiler air and gas systems. EPRI’s Streamlined Reliability Centered Maintenance program is used to achieve this goal. Examples are given of various maintenance strategies that were developed.
Chapter 5 – Failure Modes Effect Analysis (FMEA) – Is an engineering technique used to identify and eliminate known and/or potential failures and problems before they appear or occur. In this chapter the FMEA process is described as used to develop a preventive maintenance base for the pressure parts of a boiler. Examples are given and a means to prioritize the outputs from a FMEA is also presented.
Chapter 6– Task Risk Evaluation and Prioritization – A step by step approach to prioritizing a series of outage maintenance tasks is given. This technique uses a subjective approach to determine the probability of failure and the cost of and value of the recommended preventative/predictive maintenance task to compute a prioritization index – an example is given that demonstrates the effectiveness of this approach.
Chapter 7- Proactive Maintenance – Gives a definition of proactive maintenance and perspective of what is involved in implementing a proactive boiler maintenance strategy. A description of some key long-term boiler plant health indicators is given also how these indicators can be used to ensure long term boiler plant integrity.

2-1
2 BOILER RELIABILITY OPTIMIZATION ASSESSMENT
Introduction
Overall performance of a boiler results from the implementation of various programs that ultimately improve the performance of the Boiler. Historically, these programs have been installed through a trial-and-error approach. For example, they are sometimes established based on empirical evidence gathered during investigation of failures. An example of a program is a root-cause failure analysis program. It is worthwhile, at this point, to understand why a well-established reliability analysis program can influence the performance of today’s boilers. For this reason, let us first define what constitutes the performance of the boiler.
The performance of any boiler can be determined by four elements:
• Capability or the boiler’s ability to satisfy functional needs;
• Efficiency or the boiler’s ability to effectively utilize the energy supplied;
• Reliability or the boiler’s ability to start or continue to operate;
• Maintainability or the boiler’s ability to quickly return to service followings its failure.
It is evident that the first two measures are influenced by the design, manufacturing, construction, operation, and maintenance of the boiler. Capability and efficiency reflect how well the boiler is designed and constructed.
On the other hand, reliability is an operations-related issue and is influenced by the boiler’s potential to remain operational. Maintainability is a measure of the efficiency of the repair and return to service process. Based on the above, it would be conceivable to have a boiler that is highly reliable, but does not achieve high performance.
Clearly humans play a major role in the design, manufacture, construction, operation and maintenance of the boiler. This common role can significantly influence the values of the above four performance measures. The role of humans is often determined by various programs and activities that support the four elements of performance, proper implementation of which leads to high boiler performance.
Boiler Reliability Optimization Assessment
2-2
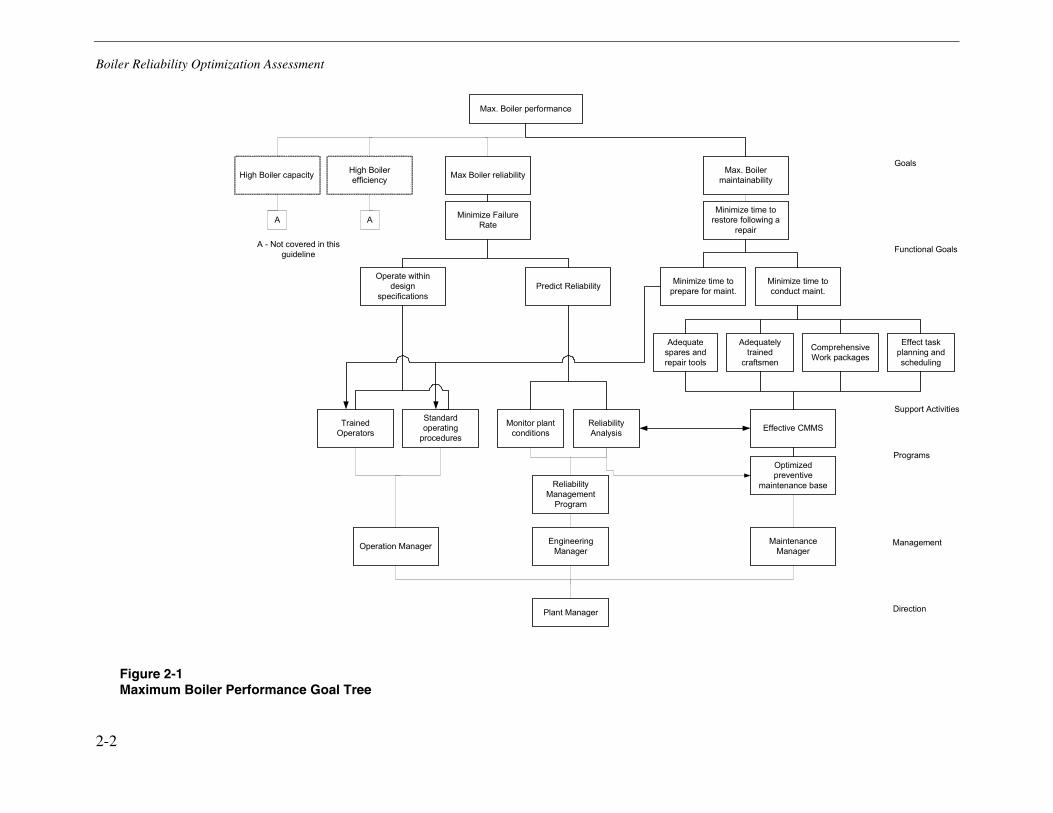
Figure 2-1 Maximum Boiler Performance Goal Tree
Max. Boiler performance
High Boiler capacity High Boilerefficiency Max Boiler reliability Max. Boiler
maintainability
Minimize FailureRate
Minimize time torestore following a
repair
Operate withindesign
specificationsPredict Reliability Minimize time to
prepare for maint.Minimize time toconduct maint.
Adequatespares andrepair tools
Adequatelytrained
craftsmen
ComprehensiveWork packages
Effect taskplanning andscheduling
TrainedOperators
Standardoperating
procedures
Monitor plantconditions
ReliabilityAnalysis Effective CMMS
Optimizedpreventive
maintenance base
Operation Manager EngineeringManager
MaintenanceManager
Plant Manager
Goals
Functional Goals
Support Activities
Programs
Management
Direction
ReliabilityManagement
Program
A A
A - Not covered in thisguideline
Boiler Reliability Optimization Assessment
2-3
To put all of these factors into perspective, consider the development of an integrated framework reflecting maximum performance from the boiler. For this purpose, consider the so-called “goal” tree conceptually shown in Figure 2.1. In this tree, the top goal of “Maximum Performance” during the life cycle of a boiler is hierarchically sub-divided into various goals and sub-goals. By looking downwards from the top of this structure, one can describe how various goals and subgoals are achieved, and by looking upwards, one can identify why a goal needs to be achieved. Figure 2.1 shows only some goals, but also reflects the general goals involved in designing and operating a high performance boiler. The role of reliability and maintainability in the overall framework shown in Figure 2.1 is clear. From this one can put into a proper context the role of reliability and availability analysis.
Clearly, reliability is an important element in achieving high performance, since it directly and significantly influences the boiler’s performance and ultimately its life-cycle cost. Poor reliability during operation, results in high maintenance costs. Therefore, a high quality operation program leads to low failures, effective maintenance and repair, and ultimately high performance.
Definition of Reliability
Reliability has two connotations. One is probabilistic in nature; the other is deterministic. In this guideline, we generally deal with the deterministic aspect. Let us first define what we mean by reliability. The most widely accepted definition of reliability is “the ability of an item, product, system, etc., to operate under designated operating conditions for a designated period of time or number of cycles” The ability of an item can be designated through a probability (the probabilistic connotation), or can be designated deterministically. The deterministic approach, in essence, deals with understanding how and why an item fails, and how it can be designed and tested to prevent such failure from occurrence or recurrence. This includes such analyses as deterministic analysis and review of field failure reports, understanding physics of failure, the role and degree of test and inspection, performing redesign, or performing reconfiguration. In practice, this is an important aspect of reliability analysis.
Definition of Availability
Availability analysis is performed to verify that an item has a satisfactory probability of being operational so that it can achieve its intended objective. A boiler’s availability can be considered as a combination of its reliability and maintainability. Accordingly, when no maintenance or repair is performed, reliability can be considered as instantaneous availability.
Mathematically, the availability of a boiler is a measure of the fraction of time that the boiler is in operating condition in relation to total or calendar time. There are several measures of availability, namely inherent availability, achieved availability, and operational availability. In this guideline the focus is on operational availability.
A more formal definition of availability is “the probability that an item, when used under stated conditions in an ideal support environment (i.e. ideal spare parts, personnel, diagnostic equipment, procedures, etc.), will be operational at a given time”.
Boiler Reliability Optimization Assessment
2-4
Definition of Risk
Risk can be viewed both qualitatively, which is the focus of this guideline, and quantitatively. Qualitatively speaking, when there is a source of danger (hazard), and when there are no safeguards against exposure to the hazard, then there is a possibility of loss or injury. This possibility is referred to as risk. The loss or injury could result from business, social or military activities, operation of equipment, investment, etc. Risk can be formally defined as “the potential of loss or injury resulting from exposure to a hazard”.
In complex engineering systems, there are often safeguards against exposure to hazards. The higher the level of safeguards, the lower the risk. This also underlines the importance of highly reliable safeguard systems and shows the roles of and relationship between reliability analysis and risk analysis.
Risk analysis consists of answers to the following questions:
• What can go wrong that could lead to an outcome of hazard exposure?
• How likely is this to happen?
• If it happens, what consequences are expected?
To answer the first question, a list of outcomes (or scenarios of events leading to the outcome) should be defined. The likelihood of these scenarios should be estimated (second question), and the consequence of each scenario should be described (answer to the third question).
Assessment Methodology
Purpose
The assessment is intended to provide:
• A basic structure and a common reference for boiler reliability assessments.
• Plant management with a basis or framework from which improvements can be achieved and measured.
Scope of Assessment
The scope of the assessment should meet the needs of the plant management. However, cognizance should be taken of the fact that assessments will be done in other plants, so an element of consistency of subject matter and methods needs to be established. Assessments should focus on the plant and how well it is operated and maintained. The assessment should try to establish the impact that people and management processes are having or could have on the plant.
Boiler Reliability Optimization Assessment
2-5
Objectives of the Assessment
The Assessment is conducted by a team of experts with direct experience in the technical areas of evaluation. Judgments of performance are made based on the combined expertise of the team and known best practices in the areas under review. It is a technical exchange of experiences and practices at the working level, aimed at strengthening the programs, procedures and practices being followed.
The key objectives of the assessment are:
• To provide the plant management with an objective assessment of the status of the operational aspects with respect to industry best practice and standards.
• To provide the plant management with recommendations and suggestions for improvement in areas where performance fall short of best practices.
Code of Conduct
• Findings or any part of them shall not be disclosed, verbally or in a written form to any third party unless written authorization to do so is given by the plant management.
• The report submitted on completion of the review remains the property of the plant that was reviewed and may only be distributed with prior approval of that plant.
• Sanitized versions of identified good practices will be available to all plants, to maximize the effectiveness of those practices.
Methodology of the Assessment
Preparation
On receipt of the notification, the nominated plant coordinator arranges the following:
• Assembles the data and information as highlighted in the notification, and
• Compiles an interview schedule.
The Assessment
The assessment team uses the following methods to acquire the information needed to develop their recommendations. These are:
• Reviews of written material
• Interviews with personnel
• Direct observation of performance, status and on-site activities
• Plant inspection (as appropriate)
Boiler Reliability Optimization Assessment
2-6
Experts are expected to sufficiently cover each topic to enable them to make an informed judgment of the item. Identified weaknesses should be adequately addressed to enable the concerns to be documented in the experts’ technical notes, with sufficient facts necessary to make the concern understandable and accurate. Formulation of recommendations and suggestions should be based on the identified weaknesses. Similarly, good practices discovered during the assessment should be documented.
Interviews
Interviews with plant personnel are used to: • Provide additional information not covered by the documentation.
• Answer questions, and perhaps satisfy concerns arising out of the documentation review.
• Judge their understanding of their roles and responsibilities
• Judge their core competence.
The interviews are also used to provide the opportunity for important information to be exchanged between experts and plant staff. These interviews should be a give and take discussion and not an interrogation of the counterparts by the experts. Properly conducted, These interviews are possibly the most important part of the review if properly conducted.
Direct Observations
Direct observation of work activities is an important aspect of this process. A substantial part of the assessment period is spent at the plant reviewing practices in use. The observation of work should include the use of procedures, drawings and instructions, quality control measures in use, and control of work management. From the observation, the reviewer will form a view of:
• The way the arrangements are put into effect at the point of work.
• The technical knowledge and skills of the work force.
• The attitude and morale of the work force.
• The extent of commitment to performance objectives.
Based on the interviews and observation, the reviewer can then, if necessary, modify his preliminary view (which was based on the formal arrangements) to judge performance. More than one interaction through document review, interview and observation may be necessary to gain sufficient facts on which to base a judgment.
Plant Inspection
Conduct a thorough walk down of the boiler. Plant cleanliness and good housekeeping should be evident. Observe the following items: condition of components and thermal insulation, the presence and control of steam and water and oil leaks, etc.
Boiler Reliability Optimization Assessment
2-7
The purpose is to identify defects on a pre-selected section of plant, and to compare results to the station records. This provides a measure of how well the operating staff are reporting plant defects.
Evaluation Criteria
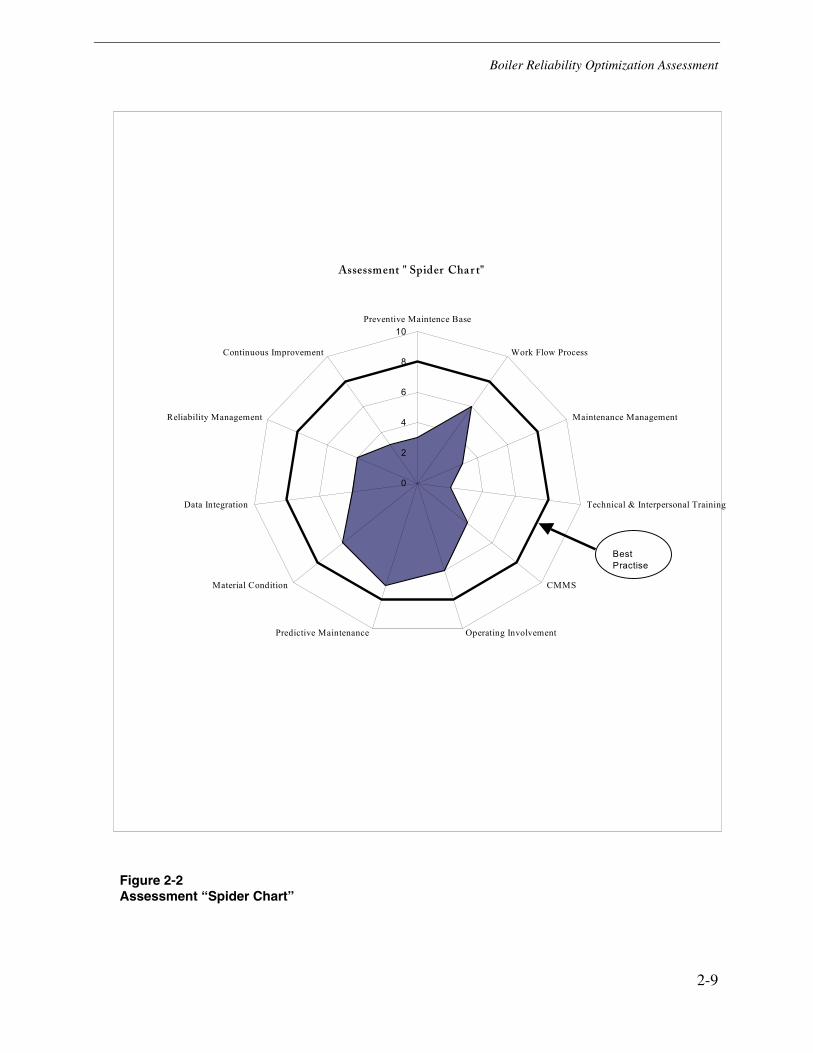
The team compares the practices, programs in place, and performance indicators in each key element to best practice criteria. Each element is rated using a simple scoring system. Table 2-1 gives the approach taken. From the gaps identified a number of recommendations and/or suggestions are made, in accordance with the following definitions. These recommendations or suggestions, when implemented would bring the plant’s practices and programs in line with the “best in class”. The review thus compares observed plant performance with successful and cost-effective practices found at other utilities. The results are presented in the form of a “spider chart”. Figure 2-2 shows a typical example of a “Spider Chart” drawn up for a plant.
Table 2-1 Assessment Scoring Criteria
Score Criteria
0 - 2 Little to no evidence that any of the best practice criteria have been met
> 2 - < 4 Some criteria have been met however the majority of the more significant criteria have not been met
> 4 - < 6 Majority of the criteria has been met. Some minor deviation exist
> 6 - < 8 Meets all the best practice criteria
> 8 - <10 Exceeds all best practice criteria
Recommendation
A recommendation is advice on how improvements can be made. The advice is based on proven practices and addresses the root causes, rather than the symptoms of the concerns raised. Recommendations are specific, realistic, and designed to result in tangible improvements. If no recommendations are offered this can be interpreted as an indication of performance corresponding with proven practices.
Suggestion
A suggestion is either an additional proposal in conjunction with a recommendation, or may stand on its own following a discussion of the associated background. It may indirectly contribute to improvements, but is primarily intended to make a good practice more effective, to indicate useful expansions of existing programs, and to point out possibly superior alternatives to ongoing work. In general, it should stimulate the plant management and supporting staff to
Boiler Reliability Optimization Assessment
2-8
continue consideration of ways and means for enhanced performance. If no suggestions are offered this can be interpreted as indicative of performance corresponding with proven practices.
Reporting
The legacy of a thorough assessment is a professional report that adds measurable value to the plant. It is essential that the contents of the report be concise, clear and objective. During the course of the assessment, the team writes detailed technical notes on their findings, conclusions, and recommendations and suggestions for improvements. These notes also form the basis of an oral presentation at the exit meeting.
The findings are grouped into three “Gap” analysis categories, namely technical/root cause, organizational and data sources. These findings are then analyzed and recommendations developed. The recommendations form the basis of a boiler failure defense plan. Before finalizing the report, the plant management is given an opportunity to comment on the report. The report is then finalized and handed over to the Plant Manager at a presentation of the assessment results.
Technical/Root Cause “Gap” Analysis
The ability to determine the Root-Cause of failure is one of the most important requirements when developing a Boiler Reliability Optimization Program Implementation Plan. Without a clear understanding of “how” and “why” components fail, it is impossible to accurately direct the proper operations and maintenance activities. The purpose of the Root-Cause “Gap” Analysis is to determine the capability that exists to compile a cost effective Preventive Maintenance (PM) tasks to mitigate against known and potential failure mechanisms. This is accomplished by reviewing and analyzing the in-house process and failure causes. The results of the Root-Cause “Gap” Analysis form the documented basis for the boiler failure defense plan.
Boiler Reliability Optimization Assessment
2-9
Figure 2-2 Assessment “Spider Chart”
Assessment " Spider Cha r t"
0
2
4
6
8
10Preventive Maintence Base
Work Flow Process
Maintenance Management
Technical & Interpersonal Training
CMMS
Operating InvolvementPredictive Maintenance
Material Condition
Data Integration
Reliability Management
Continuous Improvement
Best Practise
Boiler Reliability Optimization Assessment
2-10
Data Source ”Gap” Analysis
Comprehensive and accurate data and information is key when developing or changing an existing maintenance strategy. The foundation of a successful program is to have technologies that yield reliable and timely data. For this data to be of optimal use it must be focused on problems. It must be collected, analyzed, integrated and formatted so that it provides the necessary condition-based information. This will facilitate the trending of conditions to assist with the control component failures.
The purpose of the Data Source “Gap” Analysis is to determine:
• What data is collected and trended to monitor the condition of the boiler and it’s auxiliaries;
• How the data is being utilized by plant and support personnel
• How frequently data is being collected and analyzed/integrated and trended to determine component “health”.
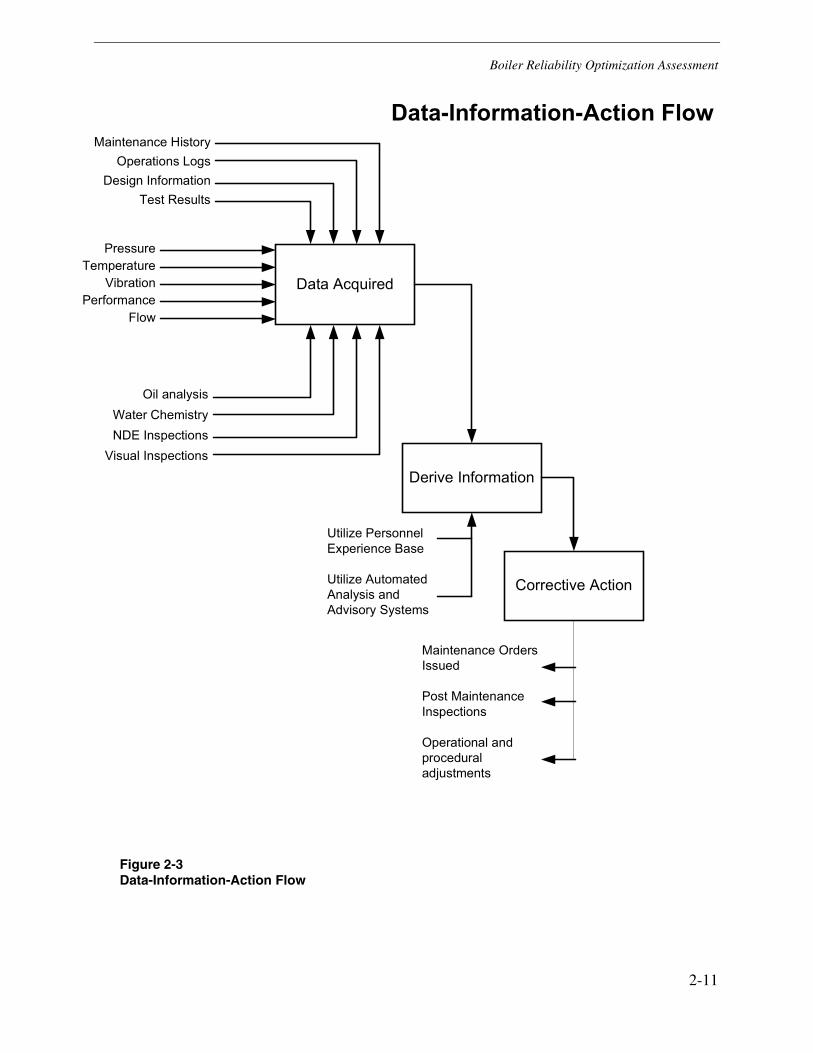
Figure 2-3 shows the data-information-action flow and the types of data reviewed during the assessment. The results from this analysis are a series of recommendations on ways to more effectively use the data available in a formalized and structured manner.
Organizational “Gap” Analysis
The success of any program is highly dependent on the commitment from management and staff. Without this it will be difficult to implement a program. Organizational goals as well as functional performance indices are reviewed. Roles and responsibilities are studied. The purpose of this analysis is to determine how the organization works together to achieve its goals
Boiler Reliability Optimization Assessment
2-11
Figure 2-3 Data-Information-Action Flow
Data Acquired
Derive Information
Corrective Action
Maintenance HistoryOperations Logs
Test ResultsDesign Information
PressureTemperature
VibrationPerformance
Flow
Oil analysisWater ChemistryNDE Inspections
Visual Inspections
Utilize PersonnelExperience Base
Utilize AutomatedAnalysis andAdvisory Systems
Maintenance OrdersIssued
Post MaintenanceInspections
Operational andproceduraladjustments
Data-Information-Action Flow
Boiler Reliability Optimization Assessment
2-12
Key Elements of an Assessment
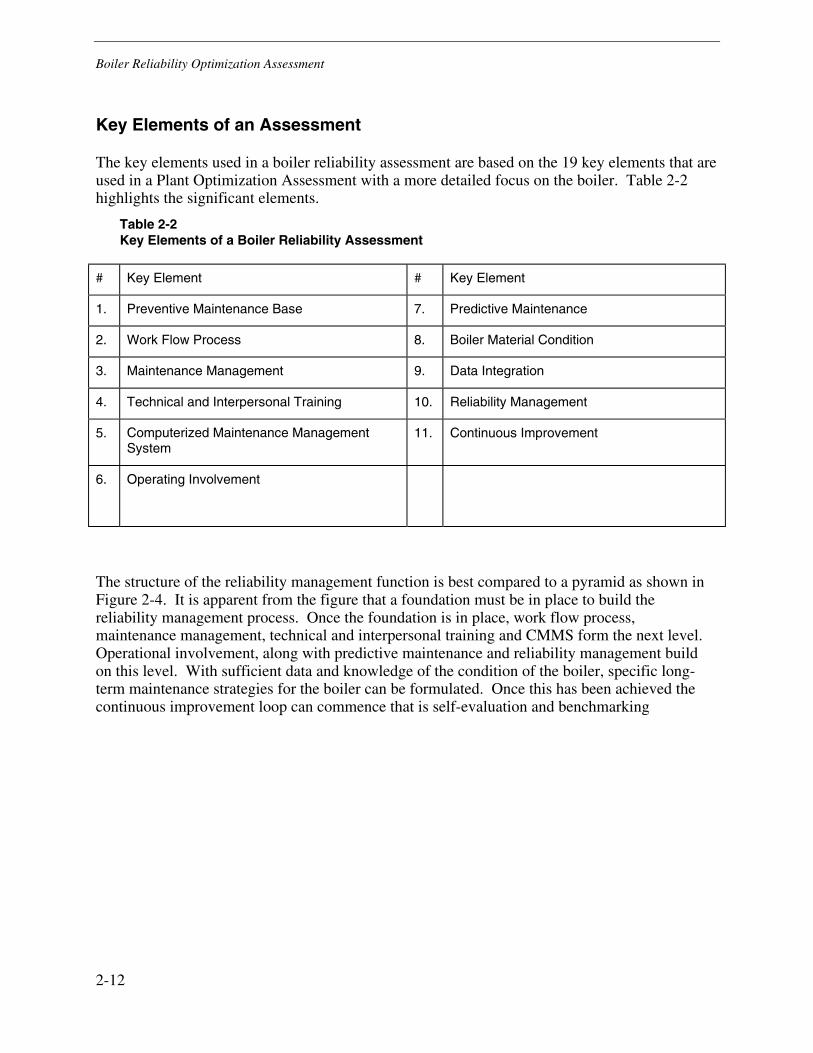
The key elements used in a boiler reliability assessment are based on the 19 key elements that are used in a Plant Optimization Assessment with a more detailed focus on the boiler. Table 2-2 highlights the significant elements.
Table 2-2 Key Elements of a Boiler Reliability Assessment
# Key Element # Key Element
1. Preventive Maintenance Base 7. Predictive Maintenance
2. Work Flow Process 8. Boiler Material Condition
3. Maintenance Management 9. Data Integration
4. Technical and Interpersonal Training 10. Reliability Management
5. Computerized Maintenance Management System
11. Continuous Improvement
6. Operating Involvement
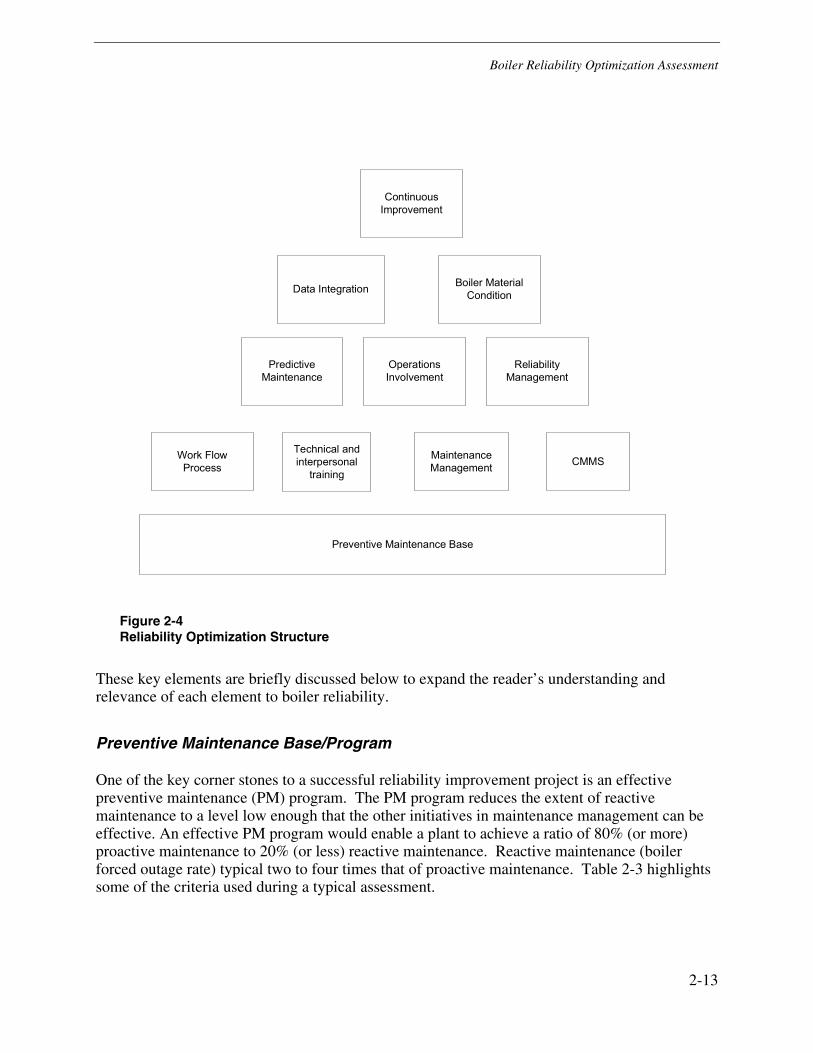
The structure of the reliability management function is best compared to a pyramid as shown in Figure 2-4. It is apparent from the figure that a foundation must be in place to build the reliability management process. Once the foundation is in place, work flow process, maintenance management, technical and interpersonal training and CMMS form the next level. Operational involvement, along with predictive maintenance and reliability management build on this level. With sufficient data and knowledge of the condition of the boiler, specific long- term maintenance strategies for the boiler can be formulated. Once this has been achieved the continuous improvement loop can commence that is self-evaluation and benchmarking
Boiler Reliability Optimization Assessment
2-13
Figure 2-4 Reliability Optimization Structure
These key elements are briefly discussed below to expand the reader’s understanding and relevance of each element to boiler reliability.
Preventive Maintenance Base/Program
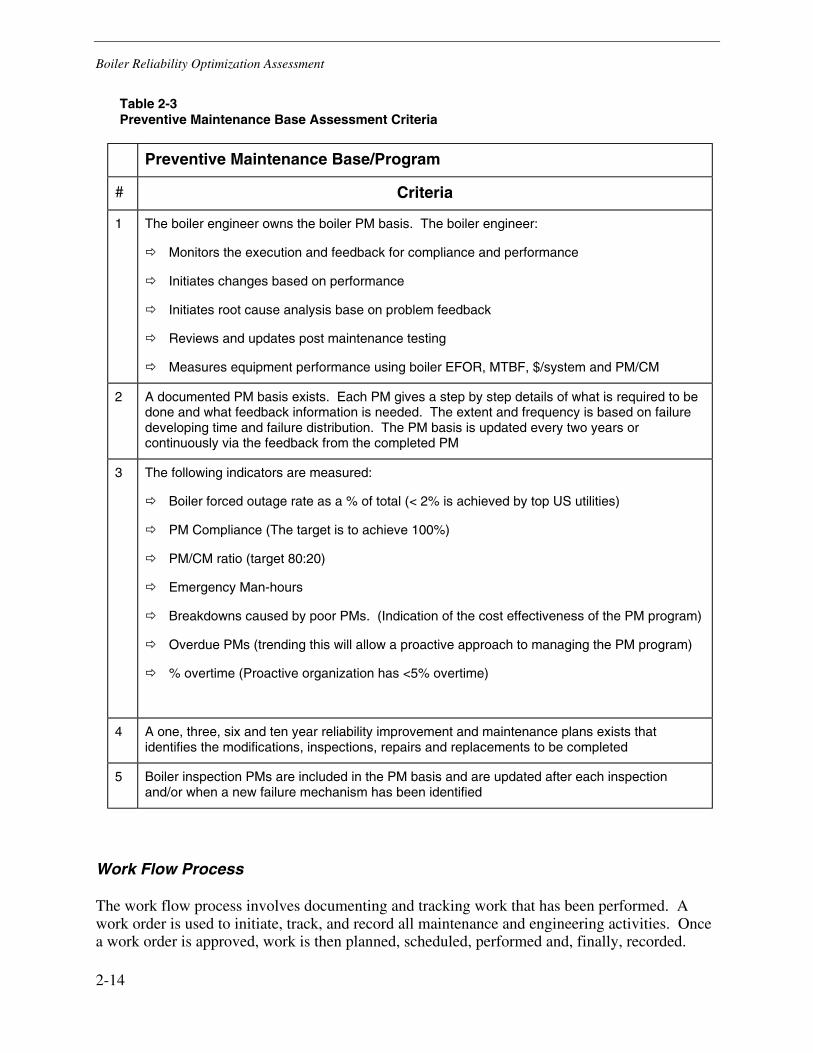
One of the key corner stones to a successful reliability improvement project is an effective preventive maintenance (PM) program. The PM program reduces the extent of reactive maintenance to a level low enough that the other initiatives in maintenance management can be effective. An effective PM program would enable a plant to achieve a ratio of 80% (or more) proactive maintenance to 20% (or less) reactive maintenance. Reactive maintenance (boiler forced outage rate) typical two to four times that of proactive maintenance. Table 2-3 highlights some of the criteria used during a typical assessment.
ContinuousImprovement
Data Integration Boiler MaterialCondition
PredictiveMaintenance
OperationsInvolvement
ReliabilityManagement
Work FlowProcess
Technical andinterpersonal
training
MaintenanceManagement CMMS
Preventive Maintenance Base
Boiler Reliability Optimization Assessment
2-14
Table 2-3 Preventive Maintenance Base Assessment Criteria
Preventive Maintenance Base/Program
# Criteria
1 The boiler engineer owns the boiler PM basis. The boiler engineer:
Monitors the execution and feedback for compliance and performance
Initiates changes based on performance
Initiates root cause analysis base on problem feedback
Reviews and updates post maintenance testing
Measures equipment performance using boiler EFOR, MTBF, $/system and PM/CM
2 A documented PM basis exists. Each PM gives a step by step details of what is required to be done and what feedback information is needed. The extent and frequency is based on failure developing time and failure distribution. The PM basis is updated every two years or continuously via the feedback from the completed PM
3 The following indicators are measured:
Boiler forced outage rate as a % of total (< 2% is achieved by top US utilities)
PM Compliance (The target is to achieve 100%)
PM/CM ratio (target 80:20)
Emergency Man-hours
Breakdowns caused by poor PMs. (Indication of the cost effectiveness of the PM program)
Overdue PMs (trending this will allow a proactive approach to managing the PM program)
% overtime (Proactive organization has <5% overtime)
4 A one, three, six and ten year reliability improvement and maintenance plans exists that identifies the modifications, inspections, repairs and replacements to be completed
5 Boiler inspection PMs are included in the PM basis and are updated after each inspection and/or when a new failure mechanism has been identified
Work Flow Process
The work flow process involves documenting and tracking work that has been performed. A work order is used to initiate, track, and record all maintenance and engineering activities. Once a work order is approved, work is then planned, scheduled, performed and, finally, recorded.
Boiler Reliability Optimization Assessment
2-15
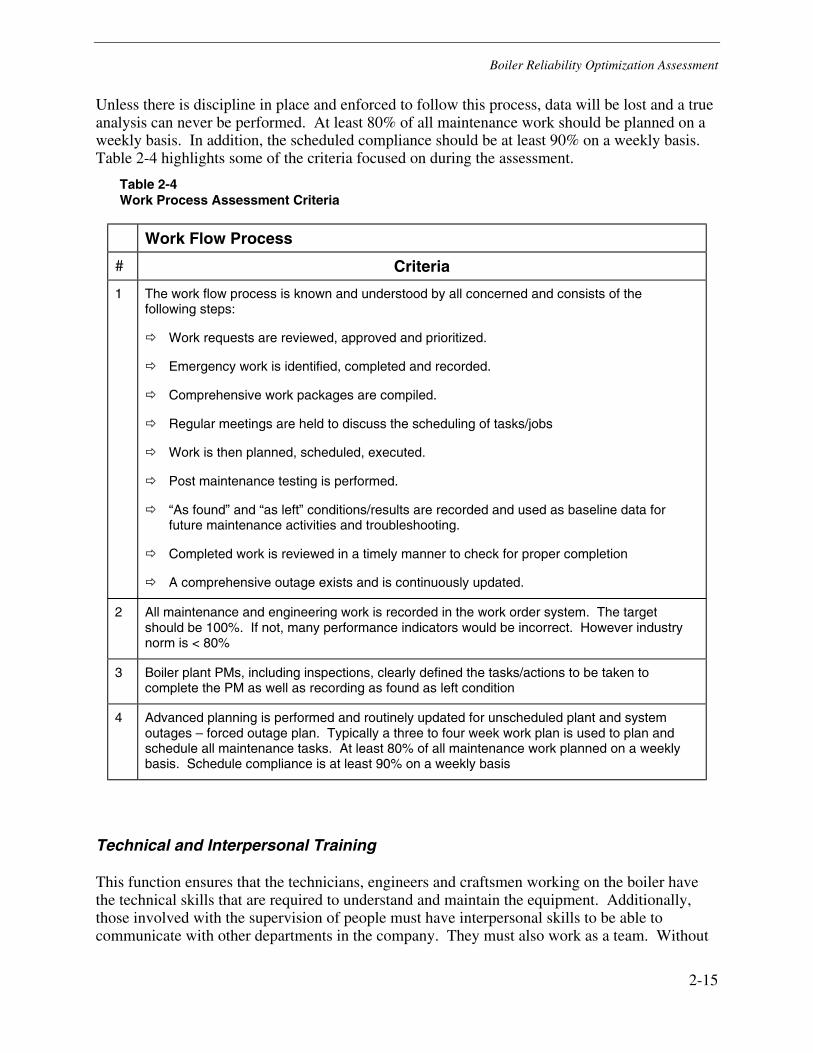
Unless there is discipline in place and enforced to follow this process, data will be lost and a true analysis can never be performed. At least 80% of all maintenance work should be planned on a weekly basis. In addition, the scheduled compliance should be at least 90% on a weekly basis. Table 2-4 highlights some of the criteria focused on during the assessment.
Table 2-4 Work Process Assessment Criteria
Work Flow Process
# Criteria
1 The work flow process is known and understood by all concerned and consists of the following steps:
Work requests are reviewed, approved and prioritized.
Emergency work is identified, completed and recorded.
Comprehensive work packages are compiled.
Regular meetings are held to discuss the scheduling of tasks/jobs
Work is then planned, scheduled, executed.
Post maintenance testing is performed.
“As found” and “as left” conditions/results are recorded and used as baseline data for future maintenance activities and troubleshooting.
Completed work is reviewed in a timely manner to check for proper completion
A comprehensive outage exists and is continuously updated.
2 All maintenance and engineering work is recorded in the work order system. The target should be 100%. If not, many performance indicators would be incorrect. However industry norm is < 80%
3 Boiler plant PMs, including inspections, clearly defined the tasks/actions to be taken to complete the PM as well as recording as found as left condition
4 Advanced planning is performed and routinely updated for unscheduled plant and system outages – forced outage plan. Typically a three to four week work plan is used to plan and schedule all maintenance tasks. At least 80% of all maintenance work planned on a weekly basis. Schedule compliance is at least 90% on a weekly basis
Technical and Interpersonal Training
This function ensures that the technicians, engineers and craftsmen working on the boiler have the technical skills that are required to understand and maintain the equipment. Additionally, those involved with the supervision of people must have interpersonal skills to be able to communicate with other departments in the company. They must also work as a team. Without
Boiler Reliability Optimization Assessment
2-16
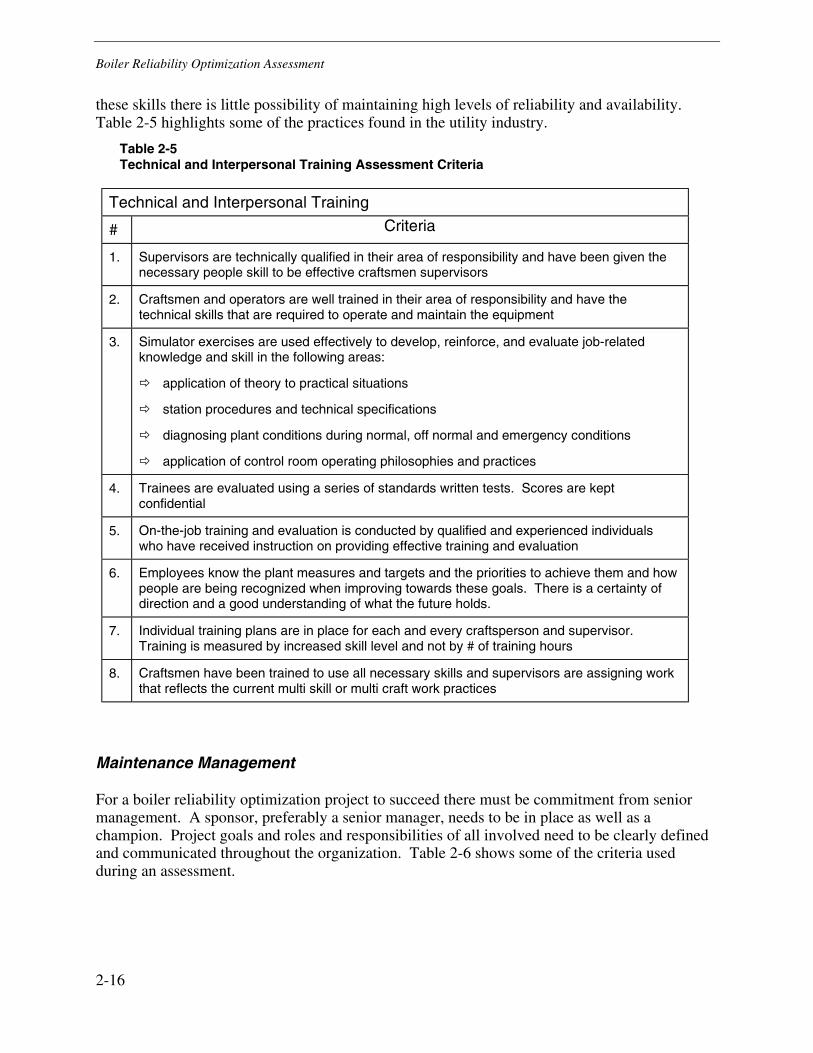
these skills there is little possibility of maintaining high levels of reliability and availability. Table 2-5 highlights some of the practices found in the utility industry.
Table 2-5 Technical and Interpersonal Training Assessment Criteria
Technical and Interpersonal Training
# Criteria
1. Supervisors are technically qualified in their area of responsibility and have been given the necessary people skill to be effective craftsmen supervisors
2. Craftsmen and operators are well trained in their area of responsibility and have the technical skills that are required to operate and maintain the equipment
3. Simulator exercises are used effectively to develop, reinforce, and evaluate job-related knowledge and skill in the following areas:
application of theory to practical situations
station procedures and technical specifications
diagnosing plant conditions during normal, off normal and emergency conditions
application of control room operating philosophies and practices
4. Trainees are evaluated using a series of standards written tests. Scores are kept confidential
5. On-the-job training and evaluation is conducted by qualified and experienced individuals who have received instruction on providing effective training and evaluation
6. Employees know the plant measures and targets and the priorities to achieve them and how people are being recognized when improving towards these goals. There is a certainty of direction and a good understanding of what the future holds.
7. Individual training plans are in place for each and every craftsperson and supervisor. Training is measured by increased skill level and not by # of training hours
8. Craftsmen have been trained to use all necessary skills and supervisors are assigning work that reflects the current multi skill or multi craft work practices
Maintenance Management
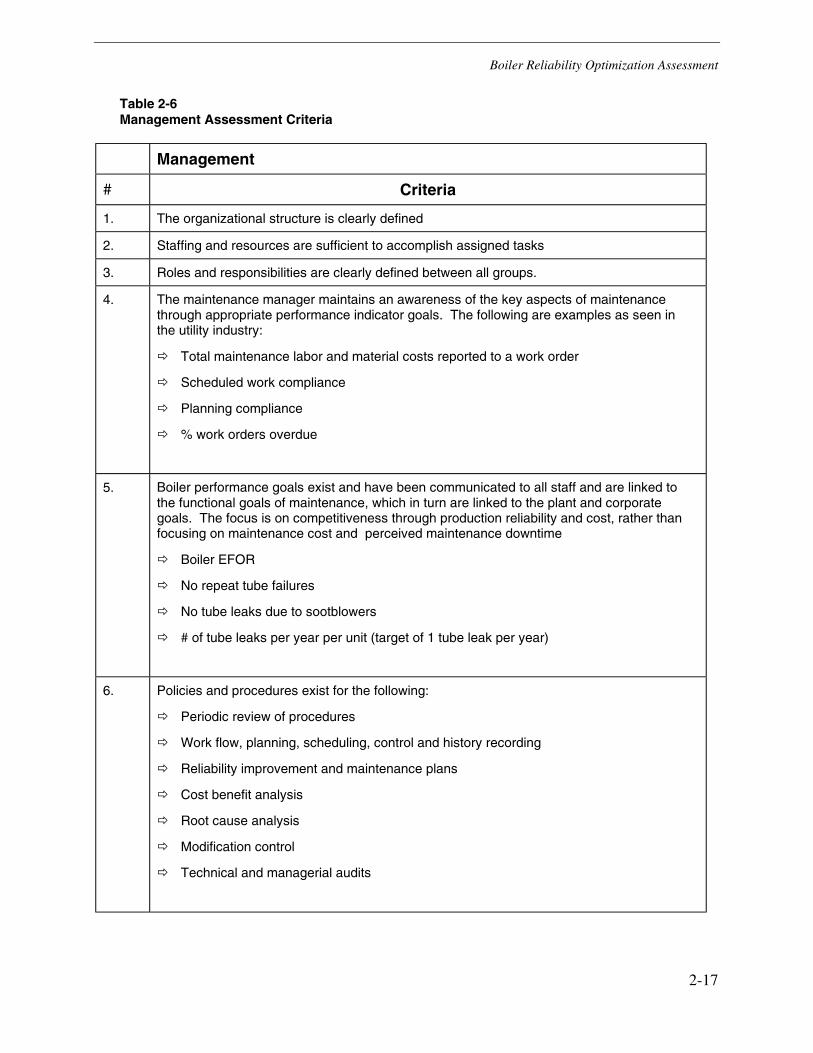
For a boiler reliability optimization project to succeed there must be commitment from senior management. A sponsor, preferably a senior manager, needs to be in place as well as a champion. Project goals and roles and responsibilities of all involved need to be clearly defined and communicated throughout the organization. Table 2-6 shows some of the criteria used during an assessment.
Boiler Reliability Optimization Assessment
2-17
Table 2-6 Management Assessment Criteria
Management
# Criteria
1. The organizational structure is clearly defined
2. Staffing and resources are sufficient to accomplish assigned tasks
3. Roles and responsibilities are clearly defined between all groups.
4. The maintenance manager maintains an awareness of the key aspects of maintenance through appropriate performance indicator goals. The following are examples as seen in the utility industry:
Total maintenance labor and material costs reported to a work order
Scheduled work compliance
Planning compliance
% work orders overdue
5. Boiler performance goals exist and have been communicated to all staff and are linked to the functional goals of maintenance, which in turn are linked to the plant and corporate goals. The focus is on competitiveness through production reliability and cost, rather than focusing on maintenance cost and perceived maintenance downtime
Boiler EFOR
No repeat tube failures
No tube leaks due to sootblowers
# of tube leaks per year per unit (target of 1 tube leak per year)
6. Policies and procedures exist for the following:
Periodic review of procedures
Work flow, planning, scheduling, control and history recording
Reliability improvement and maintenance plans
Cost benefit analysis
Root cause analysis
Modification control
Technical and managerial audits
Boiler Reliability Optimization Assessment
2-18
Computerized Maintenance Management System
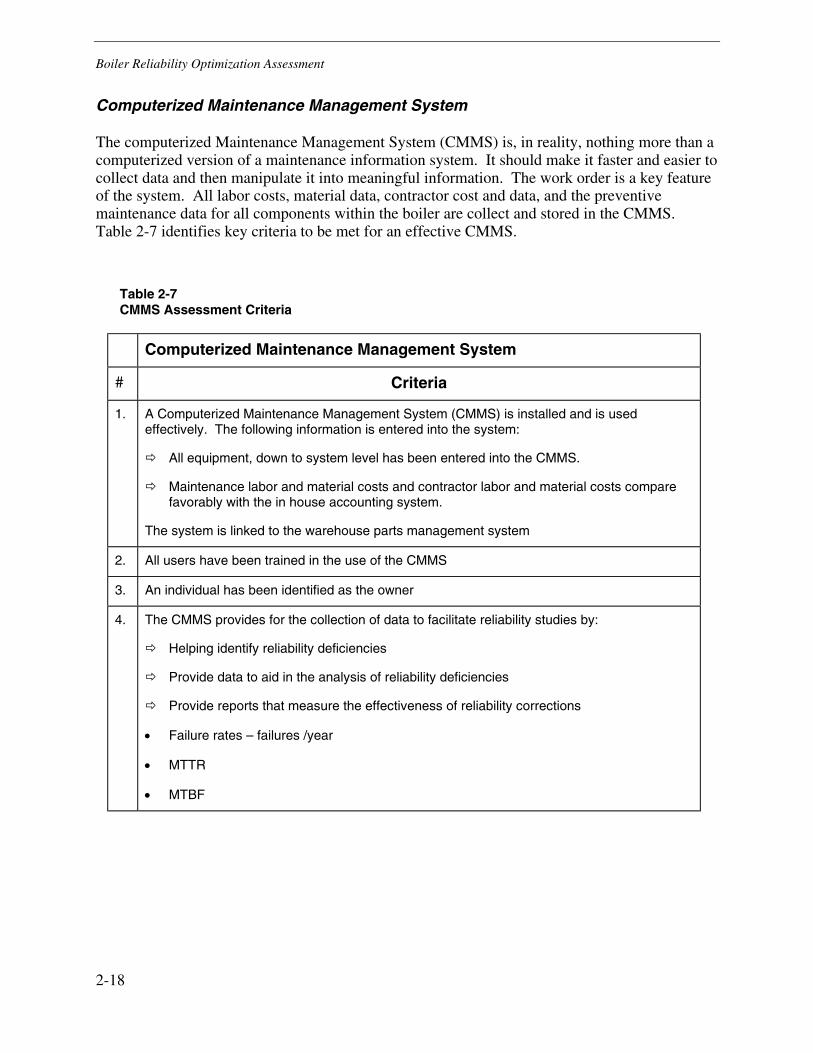
The computerized Maintenance Management System (CMMS) is, in reality, nothing more than a computerized version of a maintenance information system. It should make it faster and easier to collect data and then manipulate it into meaningful information. The work order is a key feature of the system. All labor costs, material data, contractor cost and data, and the preventive maintenance data for all components within the boiler are collect and stored in the CMMS. Table 2-7 identifies key criteria to be met for an effective CMMS.
Table 2-7 CMMS Assessment Criteria
Computerized Maintenance Management System
# Criteria
1. A Computerized Maintenance Management System (CMMS) is installed and is used effectively. The following information is entered into the system:
All equipment, down to system level has been entered into the CMMS.
Maintenance labor and material costs and contractor labor and material costs compare favorably with the in house accounting system.
The system is linked to the warehouse parts management system
2. All users have been trained in the use of the CMMS
3. An individual has been identified as the owner
4. The CMMS provides for the collection of data to facilitate reliability studies by:
Helping identify reliability deficiencies
Provide data to aid in the analysis of reliability deficiencies
Provide reports that measure the effectiveness of reliability corrections
• Failure rates – failures /year
• MTTR
• MTBF
Boiler Reliability Optimization Assessment
2-19
Predictive Maintenance
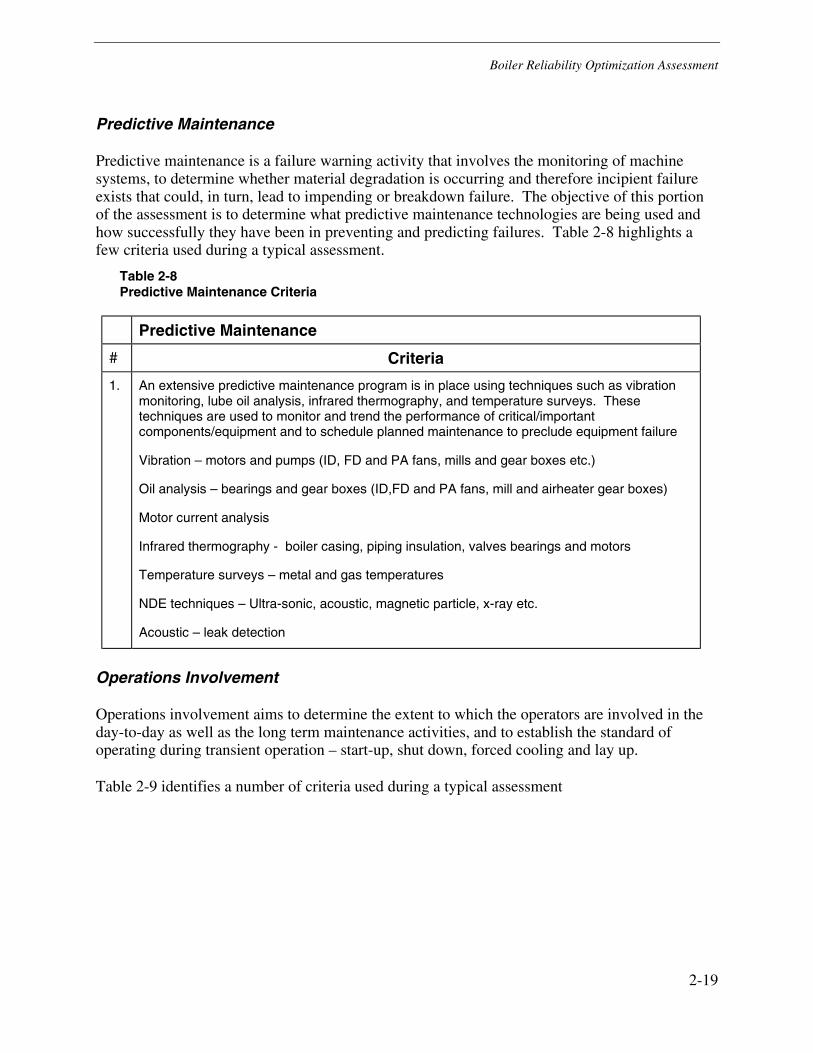
Predictive maintenance is a failure warning activity that involves the monitoring of machine systems, to determine whether material degradation is occurring and therefore incipient failure exists that could, in turn, lead to impending or breakdown failure. The objective of this portion of the assessment is to determine what predictive maintenance technologies are being used and how successfully they have been in preventing and predicting failures. Table 2-8 highlights a few criteria used during a typical assessment.
Table 2-8 Predictive Maintenance Criteria
Predictive Maintenance
# Criteria
1. An extensive predictive maintenance program is in place using techniques such as vibration monitoring, lube oil analysis, infrared thermography, and temperature surveys. These techniques are used to monitor and trend the performance of critical/important components/equipment and to schedule planned maintenance to preclude equipment failure
Vibration – motors and pumps (ID, FD and PA fans, mills and gear boxes etc.)
Oil analysis – bearings and gear boxes (ID,FD and PA fans, mill and airheater gear boxes)
Motor current analysis
Infrared thermography - boiler casing, piping insulation, valves bearings and motors
Temperature surveys – metal and gas temperatures
NDE techniques – Ultra-sonic, acoustic, magnetic particle, x-ray etc.
Acoustic – leak detection
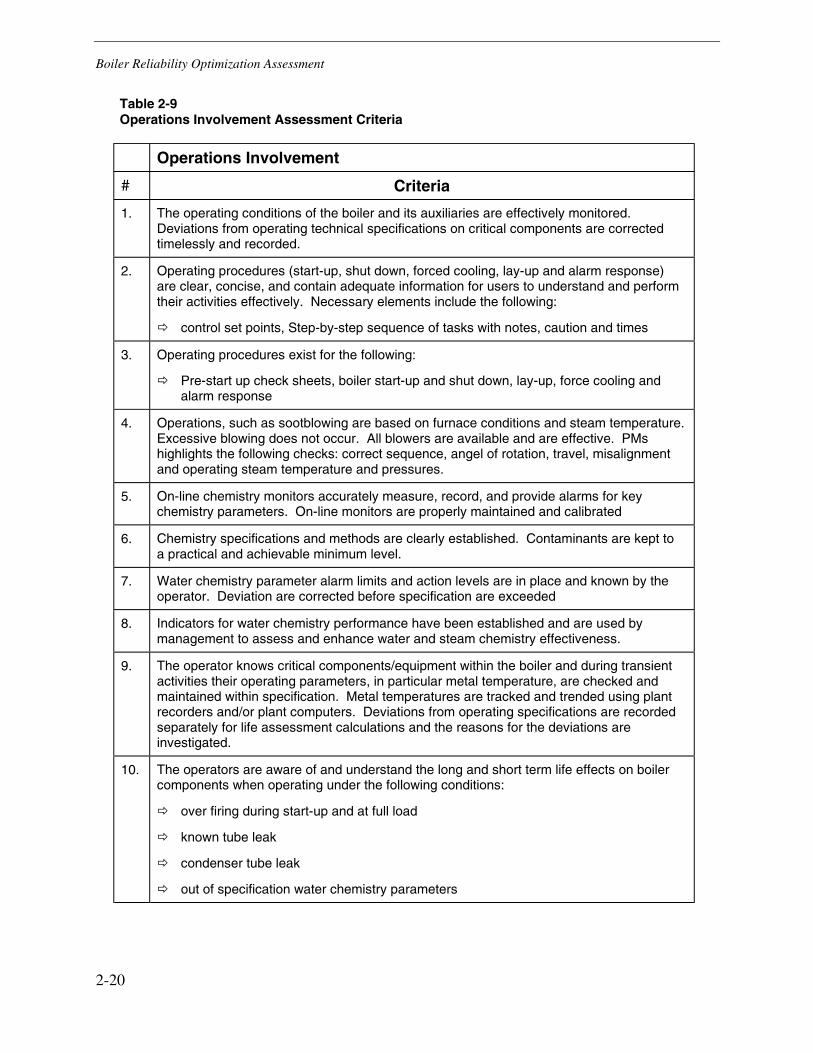
Operations Involvement
Operations involvement aims to determine the extent to which the operators are involved in the day-to-day as well as the long term maintenance activities, and to establish the standard of operating during transient operation – start-up, shut down, forced cooling and lay up.
Table 2-9 identifies a number of criteria used during a typical assessment
Boiler Reliability Optimization Assessment
2-20
Table 2-9 Operations Involvement Assessment Criteria
Operations Involvement
# Criteria
1. The operating conditions of the boiler and its auxiliaries are effectively monitored. Deviations from operating technical specifications on critical components are corrected timelessly and recorded.
2. Operating procedures (start-up, shut down, forced cooling, lay-up and alarm response) are clear, concise, and contain adequate information for users to understand and perform their activities effectively. Necessary elements include the following:
control set points, Step-by-step sequence of tasks with notes, caution and times
3. Operating procedures exist for the following:
Pre-start up check sheets, boiler start-up and shut down, lay-up, force cooling and alarm response
4. Operations, such as sootblowing are based on furnace conditions and steam temperature. Excessive blowing does not occur. All blowers are available and are effective. PMs highlights the following checks: correct sequence, angel of rotation, travel, misalignment and operating steam temperature and pressures.
5. On-line chemistry monitors accurately measure, record, and provide alarms for key chemistry parameters. On-line monitors are properly maintained and calibrated
6. Chemistry specifications and methods are clearly established. Contaminants are kept to a practical and achievable minimum level.
7. Water chemistry parameter alarm limits and action levels are in place and known by the operator. Deviation are corrected before specification are exceeded
8. Indicators for water chemistry performance have been established and are used by management to assess and enhance water and steam chemistry effectiveness.
9. The operator knows critical components/equipment within the boiler and during transient activities their operating parameters, in particular metal temperature, are checked and maintained within specification. Metal temperatures are tracked and trended using plant recorders and/or plant computers. Deviations from operating specifications are recorded separately for life assessment calculations and the reasons for the deviations are investigated.
10. The operators are aware of and understand the long and short term life effects on boiler components when operating under the following conditions:
over firing during start-up and at full load
known tube leak
condenser tube leak
out of specification water chemistry parameters
Boiler Reliability Optimization Assessment
2-21
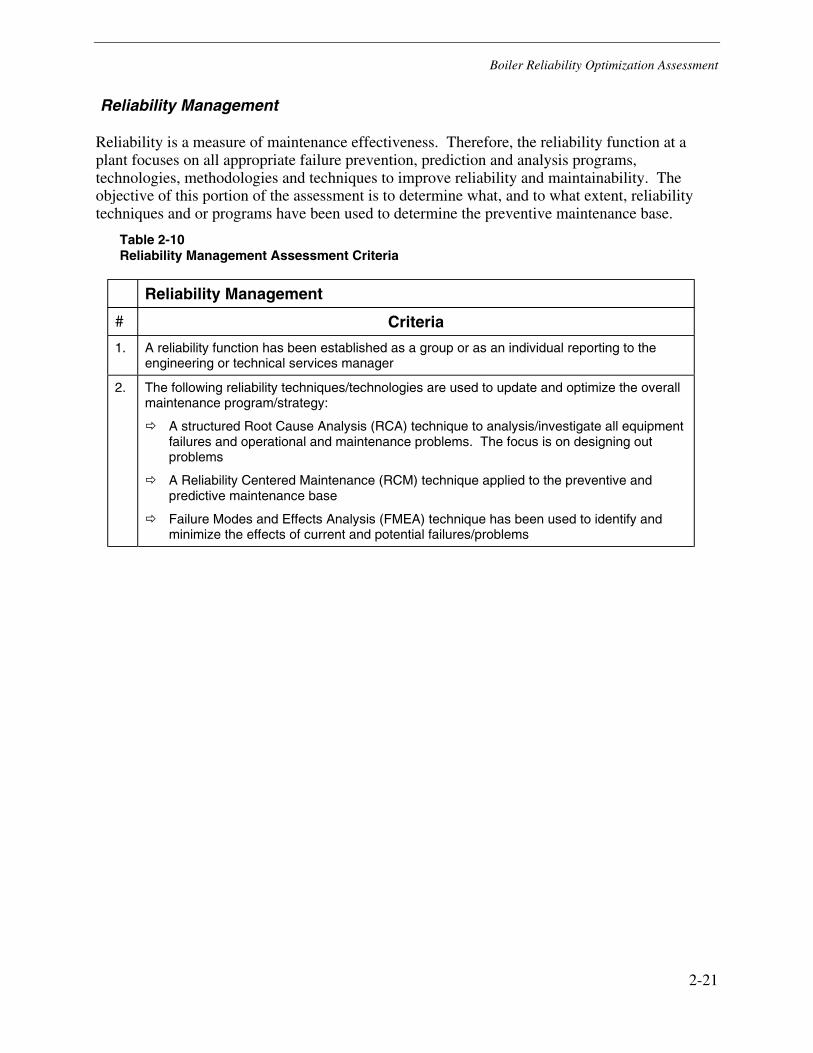
Reliability Management
Reliability is a measure of maintenance effectiveness. Therefore, the reliability function at a plant focuses on all appropriate failure prevention, prediction and analysis programs, technologies, methodologies and techniques to improve reliability and maintainability. The objective of this portion of the assessment is to determine what, and to what extent, reliability techniques and or programs have been used to determine the preventive maintenance base.
Table 2-10 Reliability Management Assessment Criteria
Reliability Management
# Criteria
1. A reliability function has been established as a group or as an individual reporting to the engineering or technical services manager
2. The following reliability techniques/technologies are used to update and optimize the overall maintenance program/strategy:
A structured Root Cause Analysis (RCA) technique to analysis/investigate all equipment failures and operational and maintenance problems. The focus is on designing out problems
A Reliability Centered Maintenance (RCM) technique applied to the preventive and predictive maintenance base
Failure Modes and Effects Analysis (FMEA) technique has been used to identify and minimize the effects of current and potential failures/problems
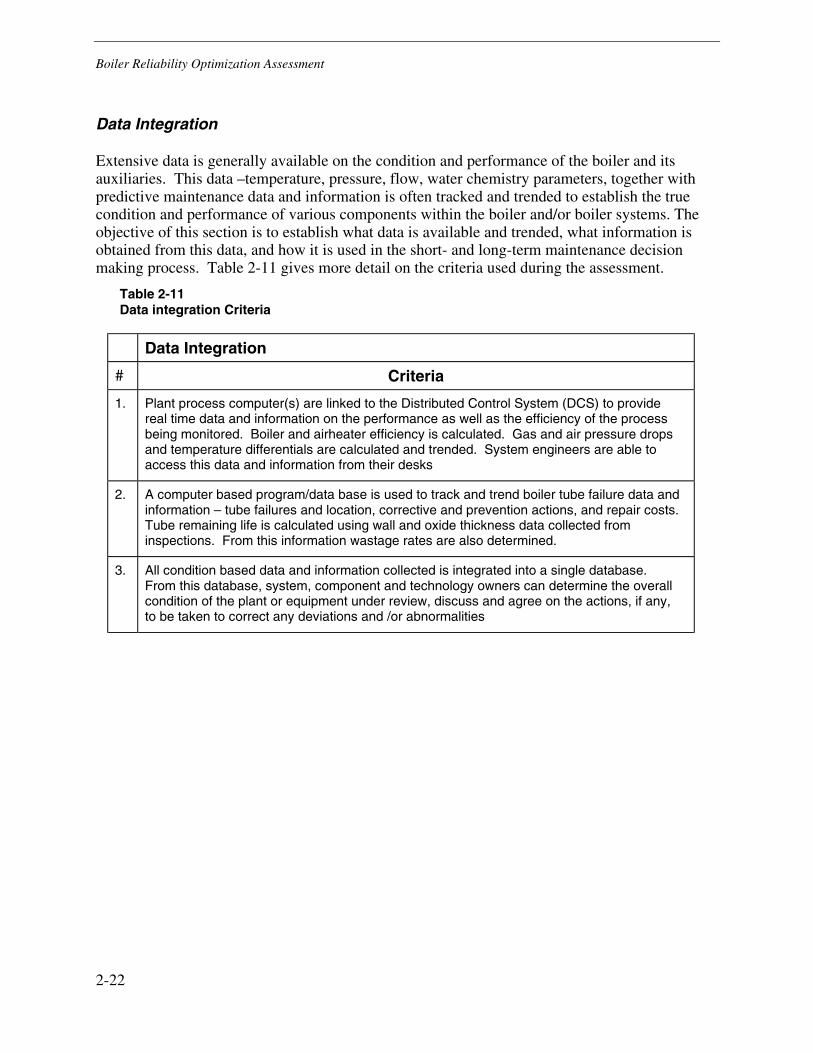
Boiler Reliability Optimization Assessment
2-22
Data Integration
Extensive data is generally available on the condition and performance of the boiler and its auxiliaries. This data –temperature, pressure, flow, water chemistry parameters, together with predictive maintenance data and information is often tracked and trended to establish the true condition and performance of various components within the boiler and/or boiler systems. The objective of this section is to establish what data is available and trended, what information is obtained from this data, and how it is used in the short- and long-term maintenance decision making process. Table 2-11 gives more detail on the criteria used during the assessment.
Table 2-11 Data integration Criteria
Data Integration
# Criteria
1. Plant process computer(s) are linked to the Distributed Control System (DCS) to provide real time data and information on the performance as well as the efficiency of the process being monitored. Boiler and airheater efficiency is calculated. Gas and air pressure drops and temperature differentials are calculated and trended. System engineers are able to access this data and information from their desks
2. A computer based program/data base is used to track and trend boiler tube failure data and information – tube failures and location, corrective and prevention actions, and repair costs. Tube remaining life is calculated using wall and oxide thickness data collected from inspections. From this information wastage rates are also determined.
3. All condition based data and information collected is integrated into a single database. From this database, system, component and technology owners can determine the overall condition of the plant or equipment under review, discuss and agree on the actions, if any, to be taken to correct any deviations and /or abnormalities
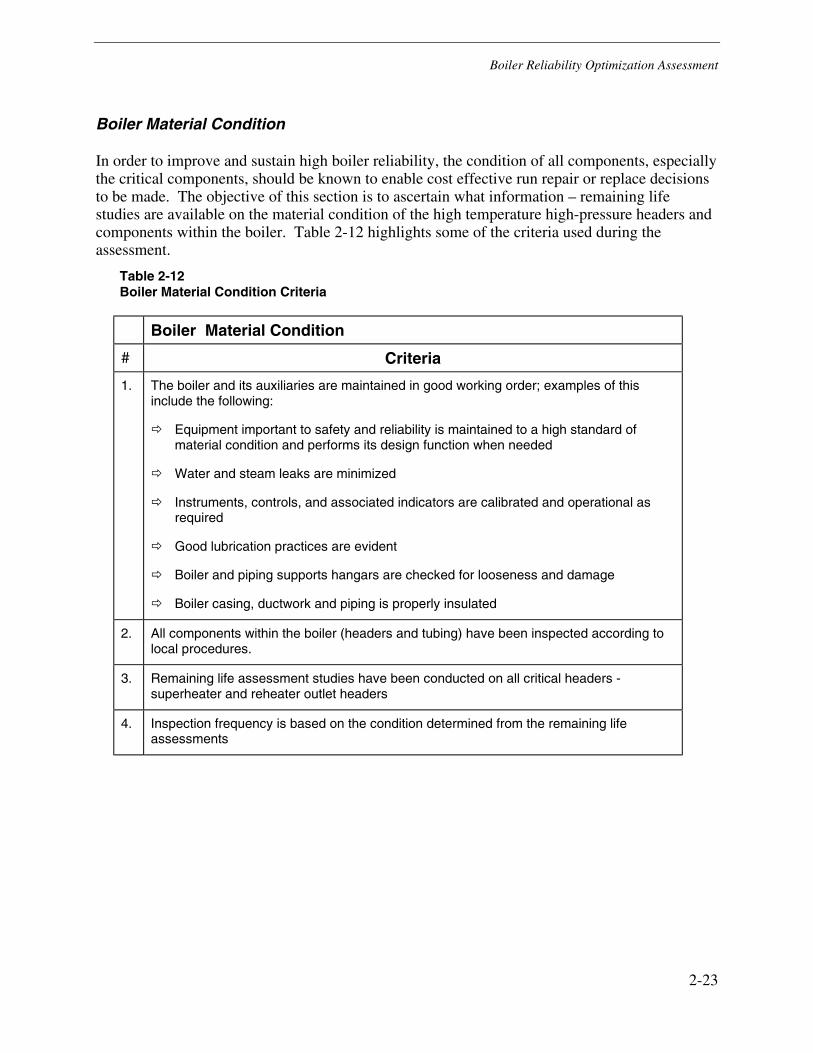
Boiler Reliability Optimization Assessment
2-23
Boiler Material Condition
In order to improve and sustain high boiler reliability, the condition of all components, especially the critical components, should be known to enable cost effective run repair or replace decisions to be made. The objective of this section is to ascertain what information – remaining life studies are available on the material condition of the high temperature high-pressure headers and components within the boiler. Table 2-12 highlights some of the criteria used during the assessment.
Table 2-12 Boiler Material Condition Criteria
Boiler Material Condition
# Criteria
1. The boiler and its auxiliaries are maintained in good working order; examples of this include the following:
Equipment important to safety and reliability is maintained to a high standard of material condition and performs its design function when needed
Water and steam leaks are minimized
Instruments, controls, and associated indicators are calibrated and operational as required
Good lubrication practices are evident
Boiler and piping supports hangars are checked for looseness and damage
Boiler casing, ductwork and piping is properly insulated
2. All components within the boiler (headers and tubing) have been inspected according to local procedures.
3. Remaining life assessment studies have been conducted on all critical headers - superheater and reheater outlet headers
4. Inspection frequency is based on the condition determined from the remaining life assessments
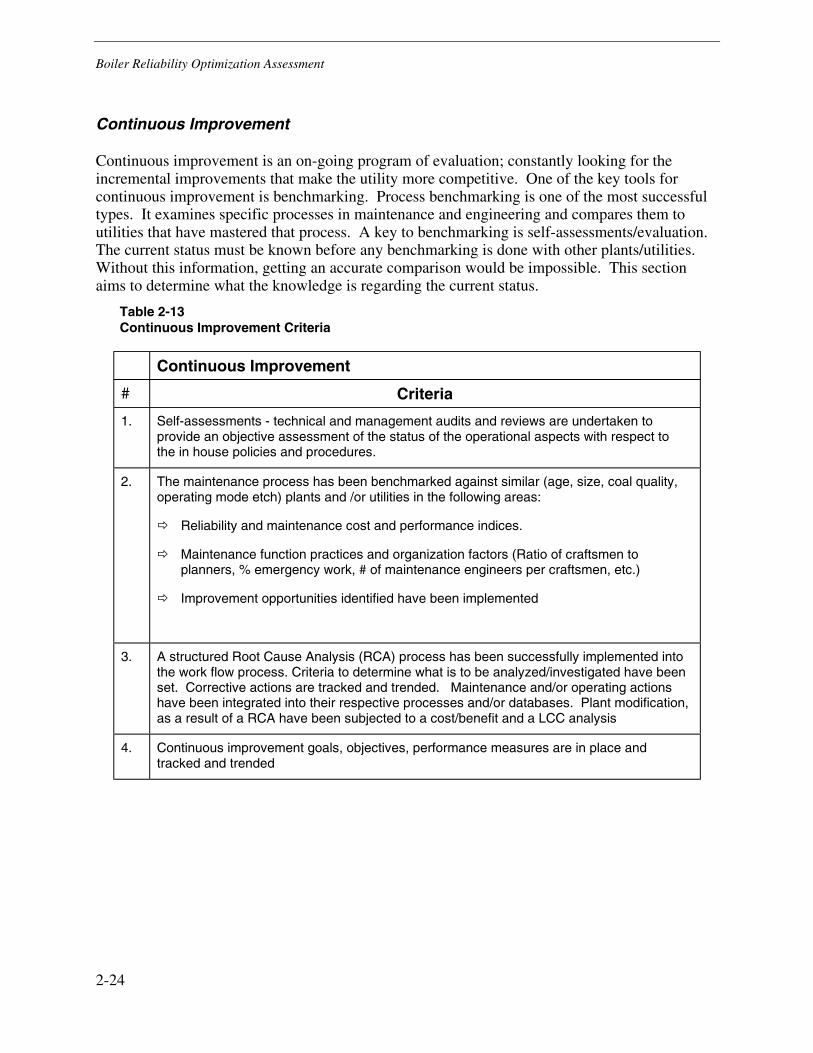
Boiler Reliability Optimization Assessment
2-24
Continuous Improvement
Continuous improvement is an on-going program of evaluation; constantly looking for the incremental improvements that make the utility more competitive. One of the key tools for continuous improvement is benchmarking. Process benchmarking is one of the most successful types. It examines specific processes in maintenance and engineering and compares them to utilities that have mastered that process. A key to benchmarking is self-assessments/evaluation. The current status must be known before any benchmarking is done with other plants/utilities. Without this information, getting an accurate comparison would be impossible. This section aims to determine what the knowledge is regarding the current status.
Table 2-13 Continuous Improvement Criteria
Continuous Improvement
# Criteria
1. Self-assessments - technical and management audits and reviews are undertaken to provide an objective assessment of the status of the operational aspects with respect to the in house policies and procedures.
2. The maintenance process has been benchmarked against similar (age, size, coal quality, operating mode etch) plants and /or utilities in the following areas:
Reliability and maintenance cost and performance indices.
Maintenance function practices and organization factors (Ratio of craftsmen to planners, % emergency work, # of maintenance engineers per craftsmen, etc.)
Improvement opportunities identified have been implemented
3. A structured Root Cause Analysis (RCA) process has been successfully implemented into the work flow process. Criteria to determine what is to be analyzed/investigated have been set. Corrective actions are tracked and trended. Maintenance and/or operating actions have been integrated into their respective processes and/or databases. Plant modification, as a result of a RCA have been subjected to a cost/benefit and a LCC analysis
4. Continuous improvement goals, objectives, performance measures are in place and tracked and trended
3-1
3 BOILER CONDITION ASSESSMENT
Introduction
The main objective for performing the component condition assessment is the need to manage component life to achieve plant operating safety, reliability, and economic objectives. Today there is a greater emphasis on the economic objective because of deregulation and competition. This has increased the importance of managing operating and maintenance costs to their lowest possible level and optimizes commercial availability. Boilers, in the United States, are the major cause of forced outages and consumes a significant portion of the maintenance budget. It is essential that utility staff have detailed information on the critical components within the boiler, an understanding of component failure mechanisms and their causes. This will enable them to develop short- and long-term preventative measures to manage the operation of the unit effectively and efficiently.
This chapter is intended to aid member utilities to prepare and maintain such information for their fossil units. The chapter first explains what failure analysis principles are and gives typical examples of the failure mechanisms and causes. Condition Assessment fundamentals are discussed, using EPRI’s Level I – III assessment criteria, as well as typical boiler tube and header failure mechanisms and their causes. Various inspection techniques are explained. All this information is used in the Failure Modes Effects Analysis (FMEA) – Chapter 5 to develop a specific boiler component failure defense plan.
Failure Analysis
In recent years, reliability engineering has come to the forefront. The most successful plant operators have aggressively embraced the wisdom of prevention. They have learned that operating and maintaining reliable equipment requires new skills, new tools, and new knowledge - knowledge that includes predictive tools like Weibull analysis and effective failure analysis.
The term “failure analysis” has a specific meaning concerning fracture mechanics and corrosion failure analysis activities carried out by reliability engineers. Here, failure analysis is the determination of failure modes of boiler steam and water touched components and their most probable causes.
Very often, boiler component failures reveal a cause and effect reaction chain. The end of the chain is usually a performance deficiency that is commonly referred to simply as “the problem”. Failure analysis defines elements of the cause and effect chain and then proceeds to link the most probable failure causes, based on component appearance, to root causes of the problem.
Boiler Condition Assessment
3-2
The objectives of any failure analysis are:
1. To prevent or minimize recurrence of the event.
2. To assure the safe and reliable operation of the component as it passes through its life cycle.
Causes of Component Failures
In its simplest form, failure can be defined as any change in a component that causes it to be unable to satisfactorily perform its intended function.
Basic categories of failure causes are:
1. Inadequate design
2. Material defects
3. Manufacturing deficiencies
4. Assembly or installation deficiencies
5. Out of specification operating conditions
6. Maintenance deficiencies (neglect, procedure non-compliance)
7. Incorrect operation
This assumes all failures, without exception, belong to one or more of the above categories.
Failure causes are usually determined by relating them to one or more specific failure modes. This becomes the central idea of any failure analysis activity. Failure mode (FM) in this chapter is the appearance, manner, or form in which a component or unit failure manifests itself. Failure mode should not be confused with failure cause, as the former is the effect and the latter is the cause of a failure event. Failure mode can also be the result of a long chain of causes and effects, ultimately leading to a functional failure, i.e. a symptom, trouble, or operational complaint pertaining to a piece of equipment as an entity.
Other terms frequently used in the preceding context are “defect”, or “failure mechanism”. The term “failure mechanism” is often described as the metallurgical, chemical, and tribological process leading to a particular failure mode. For example, failure mechanisms have been developed to describe the chain of cause and effect for erosion corrosion (FM) in economizer headers. Failures by erosion/corrosion will be manifested as tube wastage on the inside surface. Progressive wall thinning leads eventually to failure because of ductile overload. The surface appearance is that of an “orange peel”. The mechanism is a combination of flow-induced corrosion (erosion/corrosion) caused by the flow of water turning into the tubes from the inlet header, and corrosion caused by reducing feedwater conditions. Factors that influence the extent of erosion/corrosion are pH, flow effects, temperature, material and dissolved oxygen.
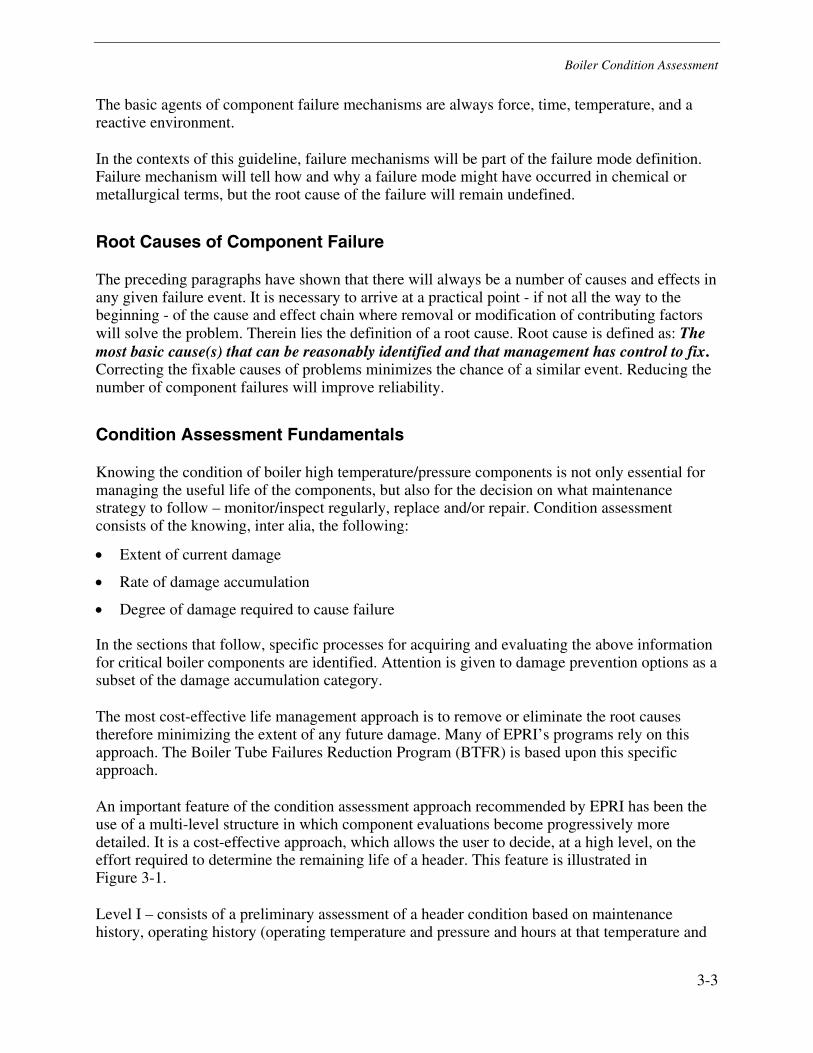
Boiler Condition Assessment
3-3
The basic agents of component failure mechanisms are always force, time, temperature, and a reactive environment.
In the contexts of this guideline, failure mechanisms will be part of the failure mode definition. Failure mechanism will tell how and why a failure mode might have occurred in chemical or metallurgical terms, but the root cause of the failure will remain undefined.
Root Causes of Component Failure
The preceding paragraphs have shown that there will always be a number of causes and effects in any given failure event. It is necessary to arrive at a practical point - if not all the way to the beginning - of the cause and effect chain where removal or modification of contributing factors will solve the problem. Therein lies the definition of a root cause. Root cause is defined as: The most basic cause(s) that can be reasonably identified and that management has control to fix. Correcting the fixable causes of problems minimizes the chance of a similar event. Reducing the number of component failures will improve reliability.
Condition Assessment Fundamentals
Knowing the condition of boiler high temperature/pressure components is not only essential for managing the useful life of the components, but also for the decision on what maintenance strategy to follow – monitor/inspect regularly, replace and/or repair. Condition assessment consists of the knowing, inter alia, the following:
• Extent of current damage
• Rate of damage accumulation
• Degree of damage required to cause failure
In the sections that follow, specific processes for acquiring and evaluating the above information for critical boiler components are identified. Attention is given to damage prevention options as a subset of the damage accumulation category.
The most cost-effective life management approach is to remove or eliminate the root causes therefore minimizing the extent of any future damage. Many of EPRI’s programs rely on this approach. The Boiler Tube Failures Reduction Program (BTFR) is based upon this specific approach.
An important feature of the condition assessment approach recommended by EPRI has been the use of a multi-level structure in which component evaluations become progressively more detailed. It is a cost-effective approach, which allows the user to decide, at a high level, on the effort required to determine the remaining life of a header. This feature is illustrated in Figure 3-1.
Level I – consists of a preliminary assessment of a header condition based on maintenance history, operating history (operating temperature and pressure and hours at that temperature and
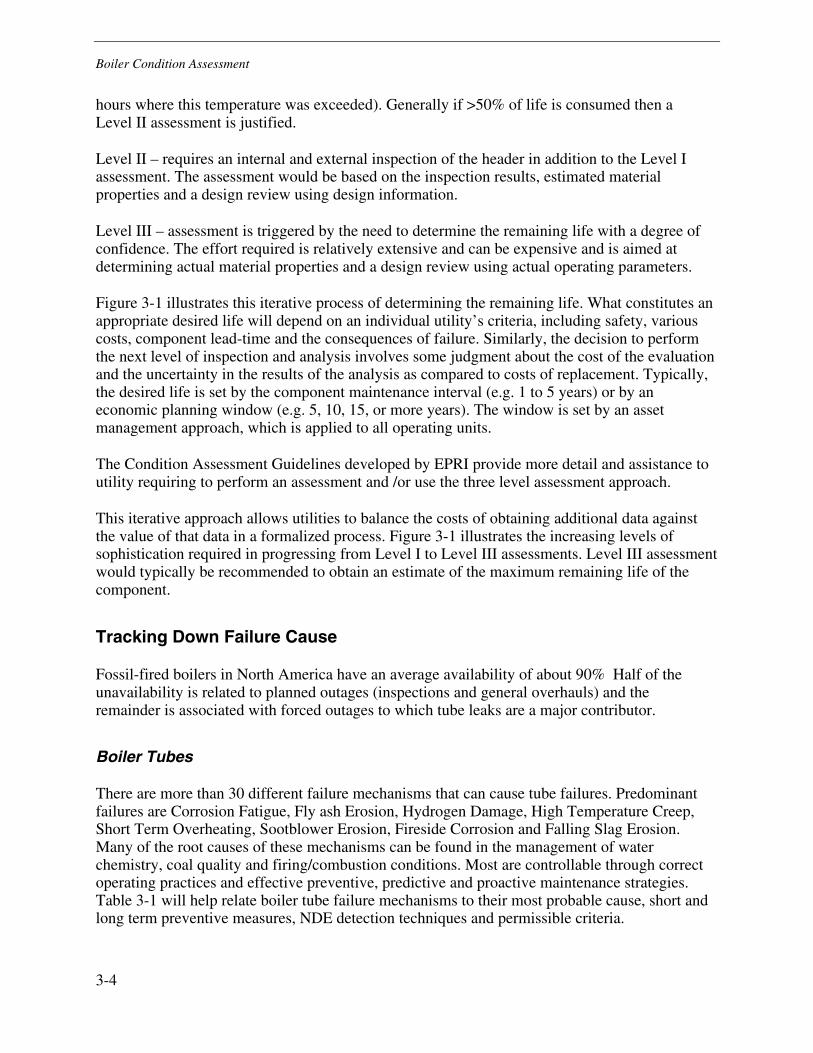
Boiler Condition Assessment
3-4
hours where this temperature was exceeded). Generally if >50% of life is consumed then a Level II assessment is justified.
Level II – requires an internal and external inspection of the header in addition to the Level I assessment. The assessment would be based on the inspection results, estimated material properties and a design review using design information.
Level III – assessment is triggered by the need to determine the remaining life with a degree of confidence. The effort required is relatively extensive and can be expensive and is aimed at determining actual material properties and a design review using actual operating parameters.
Figure 3-1 illustrates this iterative process of determining the remaining life. What constitutes an appropriate desired life will depend on an individual utility’s criteria, including safety, various costs, component lead-time and the consequences of failure. Similarly, the decision to perform the next level of inspection and analysis involves some judgment about the cost of the evaluation and the uncertainty in the results of the analysis as compared to costs of replacement. Typically, the desired life is set by the component maintenance interval (e.g. 1 to 5 years) or by an economic planning window (e.g. 5, 10, 15, or more years). The window is set by an asset management approach, which is applied to all operating units.
The Condition Assessment Guidelines developed by EPRI provide more detail and assistance to utility requiring to perform an assessment and /or use the three level assessment approach.
This iterative approach allows utilities to balance the costs of obtaining additional data against the value of that data in a formalized process. Figure 3-1 illustrates the increasing levels of sophistication required in progressing from Level I to Level III assessments. Level III assessment would typically be recommended to obtain an estimate of the maximum remaining life of the component.
Tracking Down Failure Cause
Fossil-fired boilers in North America have an average availability of about 90% Half of the unavailability is related to planned outages (inspections and general overhauls) and the remainder is associated with forced outages to which tube leaks are a major contributor.
Boiler Tubes
There are more than 30 different failure mechanisms that can cause tube failures. Predominant failures are Corrosion Fatigue, Fly ash Erosion, Hydrogen Damage, High Temperature Creep, Short Term Overheating, Sootblower Erosion, Fireside Corrosion and Falling Slag Erosion. Many of the root causes of these mechanisms can be found in the management of water chemistry, coal quality and firing/combustion conditions. Most are controllable through correct operating practices and effective preventive, predictive and proactive maintenance strategies. Table 3-1 will help relate boiler tube failure mechanisms to their most probable cause, short and long term preventive measures, NDE detection techniques and permissible criteria.
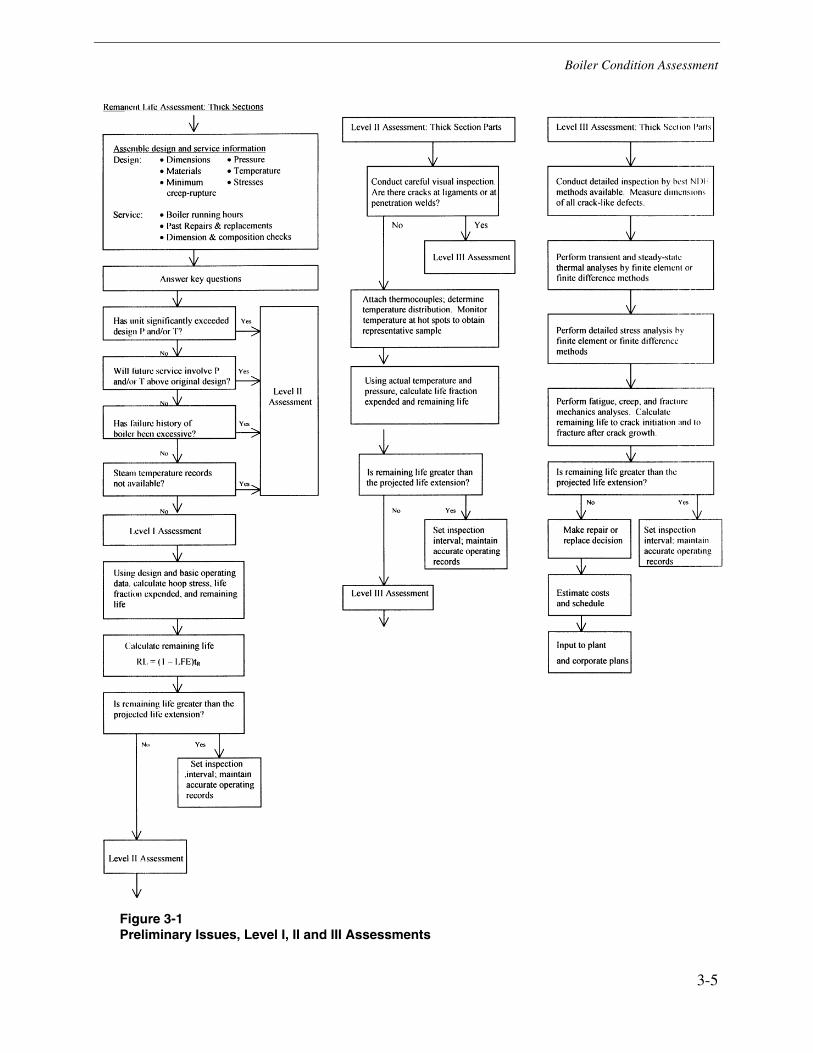
Boiler Condition Assessment
3-5
Figure 3-1 Preliminary Issues, Level I, II and III Assessments
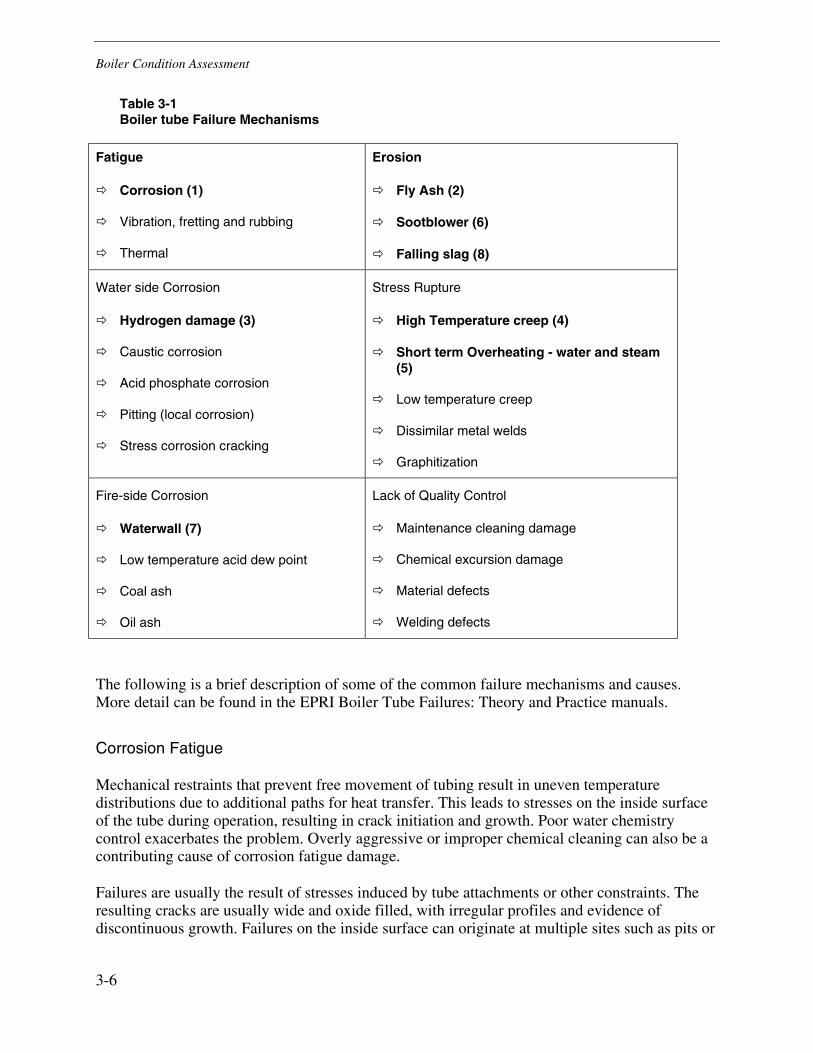
Boiler Condition Assessment
3-6
Table 3-1 Boiler tube Failure Mechanisms
Fatigue
Corrosion (1)
Vibration, fretting and rubbing
Thermal
Erosion
Fly Ash (2)
Sootblower (6)
Falling slag (8)
Water side Corrosion
Hydrogen damage (3)
Caustic corrosion
Acid phosphate corrosion
Pitting (local corrosion)
Stress corrosion cracking
Stress Rupture
High Temperature creep (4)
Short term Overheating - water and steam (5)
Low temperature creep
Dissimilar metal welds
Graphitization
Fire-side Corrosion
Waterwall (7)
Low temperature acid dew point
Coal ash
Oil ash
Lack of Quality Control
Maintenance cleaning damage
Chemical excursion damage
Material defects
Welding defects
The following is a brief description of some of the common failure mechanisms and causes. More detail can be found in the EPRI Boiler Tube Failures: Theory and Practice manuals.
Corrosion Fatigue
Mechanical restraints that prevent free movement of tubing result in uneven temperature distributions due to additional paths for heat transfer. This leads to stresses on the inside surface of the tube during operation, resulting in crack initiation and growth. Poor water chemistry control exacerbates the problem. Overly aggressive or improper chemical cleaning can also be a contributing cause of corrosion fatigue damage.
Failures are usually the result of stresses induced by tube attachments or other constraints. The resulting cracks are usually wide and oxide filled, with irregular profiles and evidence of discontinuous growth. Failures on the inside surface can originate at multiple sites such as pits or
Boiler Condition Assessment
3-7
other discontinuities. Outside tube surface damage can appear as a pinhole, a thick edge crack that is usually axial but may be circumferential, or a thick-edge section “blow-out”.
Fly Ash Erosion
High velocity fly ash particles are a leading source of tube erosion in superheater and reheater pendants, and economizers. Poor design, such as spacing between elements or over firing and/or poor combustion conditions increases the local velocity through the gas lanes. The rate of erosion is an exponential function of the local gas velocity in the affected region. The surface of the tube is smooth and polished with no ash deposits.
Hydrogen Damage
Hydrogen damage is one of three similar corrosion mechanisms that occur in similar locations in waterwalls. The other two are Caustic Gouging and Acid Phosphate Corrosion. All are waterside mechanisms initiated on the fireside of the inner surface. They initiate in locations where a deposit of feedwater corrosion product has occurred as a result of one or more flow disruptions, for example at welded joints or bends around burners. Hydrogen damage usually occurs in the presence of low pH water. Hydrogen, as a by-product generated by the corrosive environment, reacts with the carbon in the steel to form methane gas. This reaction causes de-carbonization, weakening the steel. The gas generated collects at the grain boundaries within the metal; as the pressure builds up, small fissures are formed. These link together and cause through wall tube failures. Prevention of scale on the waterside of the tube as well as tight control of water chemistry can prevent hydrogen damage.
Caustic Gouging Corrosion
The concentration of sodium hydroxide (NAOH) in deposits results in caustic corrosion that attacks the tube wall non-uniformly and perforates local areas. Continued reaction can reduce wall thickness to the extent that wall failure occurs. Damage is related to the use of sodium hydroxide in normal treatment or to correct pH in all-volatile treatment.
Acid Phosphate Corrosion
In areas with low pH, such as those that have undergone improper chemical cleaning, corrosion products can combine with phosphates attacking the tube material. Damage is usually caused by phosphate hideout problems in units where mono- or di-sodium phosphate additions are used.
High Temperature Creep
Formation of an oxide layer, as well as other deposits that may form on the inside surface of a tube, can reduce heat transfer. As a result, the outside tubes’ surface temperature opposite those deposits is higher than in other locations where heat transfer is unimpeded. The higher temperature increases oxidation of the outer surface of the tube, increasing the rate of metal loss, which results in a thinner wall and higher stresses. Both processes accelerate with time,
Boiler Condition Assessment
3-8
eventually leading to creep failure in the thinnest section of the tube. Other causes of creep damage are overheating of tube surfaces because of departure from nucleate boiling, steam blanketing, improper burner alignment and internal restrictions of steam flow.
Short Term Overheat
Short Term overheating occurs when there is a reduction in steam flow through the tubes. The main cause is blockages associated with accumulation of debris in the tubes. Sources of debris can include loose scale, attemperator liner failure, and weld splatter left in tubes following repairs. Other causes of reductions in flow can include plugging of orifices by feedwater corrosion products, denting of tubes during outage, and mechanical damage from attempts at slag removal.
Sootblower Erosion
Operational problems with sootblowers are a significant cause of tube erosion at locations directly impacted by a sootblower stream. The causes of damage include incorrect setting of blowing temperature (insufficient superheat), condensate in blowing media, improper operation of moisture traps, excessive sootblowing pressures, misalignment of sootblower, etc.
Fireside Corrosion
Circumferential cracks can result from a combination of the actions of deposits on both the inside and outside of tubes and thermal expansion/contraction of the surface. Fireside corrosion can also result from poor combustion together with flame impingement and high sulphur fuels that result in a local reducing environment. Significant wall thinning of a number of adjacent tubes with longitudinal cracking is evidence of this type of damage. Typical fireside deposits tend to be hard sintered layers on the tube that are rich in unburned carbon, iron oxides and iron.
Falling Slag Erosion
Slag breaking away from tube surfaces often results in major damage to tubes with which it comes into contact. Poor combustion conditions are usually the cause of large amounts of slag adhering to the tubes.
Wastage
Oxidation of external tubing surfaces under normal operating conditions results in nominal losses of wall thickness, which are in the range of 0.002-0.005 inches (0.05-0.125 mm) per year. This rate can significantly increase to levels of 0.12 inches (3 mm) per year where local transient reducing conditions have been created by improper adjustment of low NOx burners.
Boiler Condition Assessment
3-9
Pitting
Pitting results when the protective oxide scale breaks away from the wall. The exposed metal acts as an anode while the oxide covered surface acts as the cathode. Loss of metal occurs at the metal surface.
Liquid Ash Corrosion
Low ash fusion temperatures and high furnace gas outlet temperature can result in molten ash adhering to superheater and reheater tubes. These molten ash deposits can cause corrosion, particularly if the coal is high in sulphur and chlorine.
Fretting
Fretting is accelerated surface damage that occurs at the interface of contacting surfaces that are subjected to small oscillatory displacement. One important effect of fretting wear is its contribution to fatigue failures. Examinations of surface fractures have shown that fatigue cracks originate in or at the edge of fretted areas.
Dissimilar Metal Weld (DMW) Failures
Stainless steels are often employed in the highest temperature areas of superheater and reheater pendants. The remainder of the tube material is low alloy steel. Because of the difference in the coefficient of thermal expansion of these materials, stresses develop at the weld interface, resulting in creep and fatigue cracking. Failure is often at the ferritic weld interface, and may be a particular problem if the filler metal is stainless steel.
Intergranular Stress Corrosion Cracking (IGSCC)
Water, when contaminated with impurities such as chlorides and left in horizontal sections or bends of stainless steel tubing during downtime, can result in IGSCC.
Cracking at Attachment Welds
These occur at locations affected by DMWs austenitic clips and thin-walled reheater tubes.
Thermal-mechanical Fatigue
This occurs at the weld joints to the headers, and is caused by two-shifting, load cycling and restraint of the tubing by the drum or lower waterwall headers.
Boiler Condition Assessment
3-10
Weld-Related Failures
Non-adherence to or an incorrect welding procedure is often the cause of many weld-related tube problems.
Graphitization
Conversion of iron carbide in steel to almost pure carbon in the range of 850-1000 °F (450-540 °C) can embrittle the steel.
Carbonization
Carbon from unburned coal or carbon dioxide sensitizes the surface of superheater and reheater tubing that has had its protective layer partially dissolved by coal ash species. Wastage of the tubing is caused by a carbonization reaction that reduces the chromium content of the steel through formation of chromium carbides. This reduces the corrosion resistance of the steel and increases the overall wastage rate.
Headers and Drums
High temperature boiler headers in the United States are manufactured from low alloy steels, typically 1 1/4Cr - 1/ 2 Mo (P11) or 2 1/4Cr - 1 Mo (P22). Recently a stronger material, P91, has been used for thick wall components such as headers, particularly for new units. For older plants, careful inspection, grinding and re-welding of cracks, is needed.
Although minor cracking periodically occurs with headers and drums, significant cracks and/or failure are infrequent. Because of the large sizes of these components, repairs are time consuming and require long outages. A typical high temperature boiler header is presented in Figure 3-2 indicating specific locations where maintenance and inspection personnel should concentrate their efforts. Areas of particular concern are around the tube penetrations.
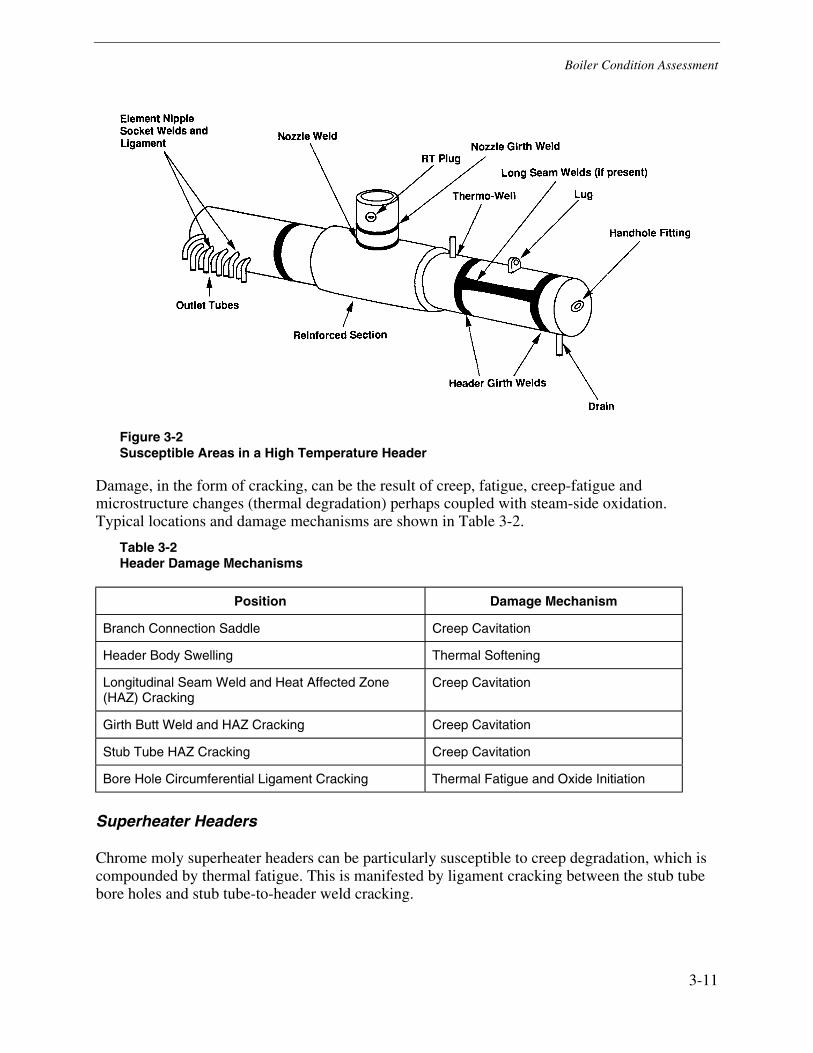
Boiler Condition Assessment
3-11
Figure 3-2 Susceptible Areas in a High Temperature Header
Damage, in the form of cracking, can be the result of creep, fatigue, creep-fatigue and microstructure changes (thermal degradation) perhaps coupled with steam-side oxidation. Typical locations and damage mechanisms are shown in Table 3-2.
Table 3-2 Header Damage Mechanisms
Position Damage Mechanism
Branch Connection Saddle Creep Cavitation
Header Body Swelling Thermal Softening
Longitudinal Seam Weld and Heat Affected Zone (HAZ) Cracking
Creep Cavitation
Girth Butt Weld and HAZ Cracking Creep Cavitation
Stub Tube HAZ Cracking Creep Cavitation
Bore Hole Circumferential Ligament Cracking Thermal Fatigue and Oxide Initiation
Superheater Headers
Chrome moly superheater headers can be particularly susceptible to creep degradation, which is compounded by thermal fatigue. This is manifested by ligament cracking between the stub tube bore holes and stub tube-to-header weld cracking.
Boiler Condition Assessment
3-12
Economizer Headers
Economizers are critical to efficient boiler operation as they recover heat from the flue gas and are not typically high maintenance items. Failures of economizer inlet headers are rare - the consequences are not as severe as repairing or replacing a steam drum or primary superheater header, since welds can be fully stress-relieved outside the boiler. In the past ten years, a problem has occurred with economizer headers in cycling units that are “boxed-up” overnight for a hot start the next morning. As the temperature inside the boiler decreases, water must be introduced to maintain drum level. As the water supplied to the economizer can be substantially cooler than the header, a thermal/corrosion fatigue mechanism can occur resulting in cracks around the inlet to the header. There are several solutions to the problem, including treating the root cause by limiting the severity and number of thermal/corrosion fatigue cycles.
Inspection Techniques
The techniques, briefly described below, can be used to detect one or more of the possible failure mechanisms or combination of mechanisms that have resulted in damage to tubes and/or headers. It is important to note that once a mechanism has been detected, understood and its causes identified, then only should the operating and/or maintenance procedures be revised. That is, a thorough root cause analysis must be undertaken before changing any procedures. It is also important to select the correct repair methodology so that the likelihood of recurrence of the problem can be minimized.
Visual Testing (VT)
Visual inspection is one of the most basic and important means of damage evaluation especially with increasing periods between outages. Visual examination can be conducted using fiber optics devices inserted through manholes, access ports and fittings.
Ultrasonic Inspection (UT)
Used for flaw detection and thickness measurement. It is based on the principles that:
• a sonic pulse travels through a uniform material at a fixed velocity, and
• the response from any flaw or discontinuity varies with the characteristics of the transmitted beam, the material through which it propagates and the characteristics of the flaw.
Measurement of the recorded time difference between the emission of a sonar pulse and the receipt of a reflection, permits the calculation of the distance between the emitter and reflector. In addition, characteristics of a flaw, such as size, can often be estimated.
Electromagnetic Acoustic Transducer System (EMATS)
A variation of ultrasonic testing. It uses electromagnetic acoustic interaction for elastic wave generation. In this way, it avoids the use of a fluid couplant that is required for conventional
Boiler Condition Assessment
3-13
ultrasonic testing. It is used primarily for mapping boiler tube thickness in areas subject to corrosion and/or erosion. EMAT inspection of boiler water walls permits rapid scanning of tubing. Currently hand-held scanners are used, although research is underway to investigate automation of the process so that the data can be recorded from a remote site.
Liquid Penetrant Testing (PT)
Used for the detection of discontinuities that are open to the surface. Special dyes are drawn into these discontinuities by capillary action. The presence of liquids in these discontinuities can also be detected by means of a developer that has a highly visible, contrasting appearance.
Magnetic Testing (MT)
Used for the detection of surface and near-surface discontinuities in ferromagnetic materials. The flaws deflect magnetic lines of force and can be observed visually using highly visible, magnetic particles which are scattered on the surface.
Eddy Current Testing (ET)
Used to inspect the surface and near surface for flaws of electrically conducting materials. An applied magnetic field will induce an eddy current into the surface. Any defect or crack will disturb the flow of eddy currents. This produces a back emf that can be measured by the eddy current probe.
Infrared Thermography
Used to detect temperature changes on visible surfaces by the resulting infrared radiation. It is very useful for remotely detecting abnormal operations that result in heat flows that raise the surface temperatures of equipment. This technique can be used in a transient mode. When steam is flashed through a cold tube with flaws, the tube heats up at different rates through the material. An infrared camera can pick up these transient differences.
Replication
Plastic replication is used principally for reproducing surface features such as creep cavities, cracks, and microstructure features. It involves placing a coating of a resin on the prepared surface to be examined, which, after hardening, is backed with a softened cellulose acetate. The resulting film can then be stripped off and examined by a scanning electron microscope combined with energy-dispersive x-ray analysis.
Boiler Condition Assessment
3-14
Headers and Drums Inspections
Although the loss of availability due to problems with headers and drums has not been significant, there is concern that if any major repairs are required, a lengthy outage will be necessary. It is, therefore, important to inspect these components routinely to detect cracks, damage etc. before they become major issues. Based on industry experience, there are certain areas that require inspection more frequently than others. These are listed below.
The following is the rank order of the nine most inspected areas of a header:
1. Ligament Regions
2. Girth Welds and Saddle Welds
3. Seam Welds
4. Stub Tubes and Stub Tube Welds
5. Body Spool Pieces
6. Tee Body
7. Supports
8. Drain Line Penetrations
9. RT Plug and Thermopile pocket Welds
Headers and drums rarely need replacing. Repairs can be undertaken. However, deep flaws require careful metallurgical analysis to assure suitability for service. In such cases, replacement, perhaps with an improved material such as P91 steel, may be the more economical solution.
4-1
4 RELIABILITY CENTERED MAINTENANCE
Introduction
Reliability Centered Maintenance (RCM) is a logical, systematic, functionally based methodology used in the evaluation of a facility’s system or unit. The evaluation includes a step-by-step consideration of the functions that are integral to the operation of the system or unit. The mechanisms of failure of each of these functions, the effects of failure and finally the selection of appropriate and effective maintenance tasks to mitigate these identified failures are defined. The goal is to develop a cost effective maintenance program, based on system functionality that will enhance system reliability. This will make optimum use of available maintenance resources and provide a documented base for future additions/revisions to the maintenance program. For an RCM analysis to yield benefits a great deal of commitment is required from all levels throughout the organization.
This chapter gives an overview of the RCM technique as applied to the boiler and auxiliaries. It describes in detail what RCM is about and gives the steps to be taken to accomplish an optimized maintenance strategy. EPRI’s Streamlined Reliability Centered Maintenance software package was used to accomplish this task. It was applied to the boiler air and gas systems. Results of some of the steps are given at the end of the chapter for illustration purposes only.
Preparation
Prior to performing a RCM analysis, a significant amount of documentation and administrative work needs to be documented, e.g.
• The systems or unit to be analyzed must be selected
• The mechanism for conducting analysis reviews and interviews must be developed
• Data and information about the system must be identified and gathered
• The criteria to be used in the decision making process must be developed and agreed upon.
All of the above require the active participation of not only the analyst, but the facility personnel as well. It is vital that communication flows in both directions between the analyst and site personnel for the analysis to yield significant results.
Reliability Centered Maintenance
4-2
System Selection
There are a variety of factors that should be considered in the process of selecting a particular system for analysis. “Is there value to be added by performing the analysis on this system?” should be one of the first questions asked. For example, the potential unit may have a sizeable allocation of resources for Preventive Maintenance (PM) and/or Corrective Maintenance (CM) which the facility finds difficult to justify. RCM will enable the facility to:
• introducing PM and PDM to reduce cost of recurring CM;
• reduce costs by eliminating unnecessary PM tasks;
• increase the interval at which PM tasks are performed; or
• utilize Predictive Maintenance (PdM) technologies to identify imminent failure and thereby allow scheduling of maintenance prior to failure
In contrast, a system, which by its nature is maintenance-intensive, may not produce added value with an RCM analysis. For example, if the system’s maintenance is driven by regulatory or insurance requirements, there may be very little benefit in performing an RCM analysis.
In summary, when selecting a system for analysis, consideration should be given to the type of service, importance to the overall operation of the facility, the number of PM and CM performed, insurance and regulatory requirements.
Documentation Requirements
Once the system has been selected, all of the documents that describe the system’s functions and equipment needs to be collected. These will include:
• a system or process description i.e. operating philosophy;
• “as-built” Piping and Instrument Drawings (P&IDs), general layout drawings, logic diagrams, electrical drawings, etc.;
• complete equipment lists with identification numbers (mechanical, electrical, instrumentation), a list and description of the applicable PMs and Surveillance Tests (STs), vendor drawings and manuals, and maintenance history (CM) of the system;
• regulatory and insurance requirements/commitments, operating instructions, alarm response procedures and operator log sheets.
Although some of this material may not be readily available, every effort should be made to obtain this documentation, to ensure an optimal results. In the absence of some of the above, information can be obtained through interviews with plant personnel.
Assumptions
When performing an analysis, it is important to establish “ground rules” to ensure that the analyst makes best use of all resources. Assumptions that could be made are that:
Reliability Centered Maintenance
4-3
• Some equipment types are of minor operational significance and are typically excluded from the analysis, e.g. manual switches and manually-operated valves. Exceptions to this are manual valves required for a safety function or operated as part of the daily plant operation.
• The process interfaces are in place and always available. For example, an instrument is typically not included in the analysis but may be required for the system equipment to operate properly.
• Control power, instrument/control air and electrical power up to the breaker are all available.
• Acceptable plant operating and maintenance risks will be obtained from interviews with plant operations and maintenance personnel, e.g. increased interval between intrusive inspections on the boiler or maintenance based on the results of condition monitoring activities?
• The overall operational philosophy (base or cycling load) of the plant is understood. This includes factors such as power commitments, availability requirements, replacement power costs and plant objectives, all of which are variables that must be considered while performing the analysis.
Critical Evaluation Criteria
In order to assign importance to a system function and equipment, agreement must be reached on the criteria to be used. The term used to imply the significance of a piece of equipment is “Criticality”. Equipment is defined as critical if its failure is unacceptable. Typically, if a component’s failure results in any one of the following, it will be deemed critical:
• a unit trip or immediate shutdown;
• a reduction in power or production;
• an increased personnel or equipment safety hazard;
• a violation of regulatory or some other operational constraints.
These criteria are intended to be broad in order to facilitate their use in various applications. It is easy to see that in each of the above criteria, there is room for interpretation (e.g. How long before the unit must be shutdown to correct a failure - hours? days? How much of a reduction in power is unacceptable?). In order to maintain consistency throughout the analysis, it is imperative that agreement is reached on what the important effects are, plus their definitions.
Non-Critical Evaluation Criteria
This section discusses the equipment that is determined to be non-critical (i.e. failure of this equipment can be tolerated by the plant management).
Once a piece of equipment is deemed non-critical, it must be evaluated against some criteria to identify any PM tasks. In order to ensure that this evaluation is thorough and consistent with RCM principles and plant philosophy, the criteria to perform this evaluation must be established. The following are some basic questions asked regarding each non-critical component.
Reliability Centered Maintenance
4-4
• Is there a high repair or replacement cost if the component is run to failure?
• Is there a simple PM task that will prevent severe degradation of the component’s inherent reliability? (e.g., bearing lubrication, filter cleaning)
• Will the component’s failure induce other failures, reduce system reliability, or prevent the performance of a recommended critical maintenance activity?
• Will the component’s failure cause a potential personnel hazard if the component is run to failure? (Hazard from a PM task may be less than the hazard from a corrective action upon failure or the actual failure itself)
• Is there excessive CM performed on the equipment that should be eliminated? Does the CM history imply that a PM task may be less costly than repeated failures in terms of manpower and materials?
These questions, though general in nature, establish the conditions that determine if there is a need to maintain a non-critical piece of equipment. An affirmative answer to any of these questions implies that a PM task should be selected for the component.
Analysis Reviews
The final item of the preparatory work is to establish a process for reviewing the analysis. This includes ensuring that the facility personnel most familiar with the daily operation and maintenance of the system are involved in reviewing the analysis. This ensures completeness and accuracy in decisions and assumptions, foster a team spirit, and instill a sense of ownership and project direction on the part of plant personnel. In addition, facility personnel need to be empowered to make decisions/changes during the analysis process.
Analysis
It is in this phase of the assessment process that functional importance, or criticality, is made. There are several steps to determine criticality, each step building on the previous step. They are discussed below.
1. Define system boundaries, that is what is to be included in the analysis.
2. Identify the functions of the system.
3. List the failure mechanisms or functional failures for each function.
4. Evaluate the system equipment in terms of the effect equipment failure has on system operation.
5. Review the analysis for completeness and correctness.
Using the Critical Evaluation Criteria discussed above, each component is then labeled Critical or Non-critical. The following is a more detailed discussion of these four steps.
Reliability Centered Maintenance
4-5
System Boundaries
In order to focus the analysis while affording adequate documentation, the boundaries of the system need to be determined. In most instances, the system boundaries will be consistent with the facility’s tag numbering system as documented in the plant work tracking or maintenance management system. However, in order to ensure thoroughness, care must be taken to verify the boundaries, since quite often tag numbering systems are incomplete or erroneous. Therefore, some guidelines are useful in establishing the boundaries for a system analysis.
First – define mechanical boundaries. All of the mechanical (rotating and stationary) equipment in the system will be included in the analysis. A good practice is to walk-down/verify the mechanical equipment with the latest revision of the Piping and Instrument Diagram (P&ID). This will give a clearer picture of the system in terms of size, environment and accessibility.
Second – define electrical boundaries. As stated earlier, it is assumed that control power and electrical power are always available. Typically, then, the breaker through which power is supplied to a system component is included in the analysis, but the cable and busbar are not.
Third – ensure that system boundaries include relevant instrumentation. The entire instrument loop is included in the analysis, although outputs may be directed to points outside of the system under analysis. This is important to remember, especially later in the analysis, when considering the effects of an instrument’s failure. The local effect on the system may be negligible. However there may be significant effects outside the system.
Fourth – consider air supplies when determining boundaries. In a manner similar to electrical and control power, instrument and control air is assumed to be available. The system boundary for the analysis will then typically include only the solenoid through which air is supplied to a component/equipment.
Correctly defining the boundaries of the system will minimize the number of components inadvertently omitted. Equipment that does not “fit” into any system may still benefit from an RCM analysis.
Functions
The next step is to determine the functions of the system. In order to identify the system functions the system description and appropriate drawings must be reviewed to trace the process flowpath and identify all of the system interfaces. A system could have any number of functions, therefore a mechanism is needed to limit the number to a reasonable level, while capturing all of the actions that takes place in the system. The following are some guidelines for developing the functions of a system to be used.
First – use the process flowpath as the basis for the most important system functions. Evaluate the process from its beginning as input, include the actions performed upon the fluid, and then consider the fluid as an output.
Reliability Centered Maintenance
4-6
Second – list components under one function to avoid confusion and reduce repetitiveness without sacrificing necessary detail. This is not always possible, since there may be overlapping activities for a given component (production, safety, etc.). In order to do this, evaluate and prioritize the functions of each component.
Third – evaluate all of the functions of the individual component to determine the most important functions of the system.
It may be appropriate to include specifications in the wording of the function. Generally, it is unnecessary to do so, but in some instances, the system design may be questionable or the operating requirements may be very stringent. In this case, it is justifiable to include a range (100 – 300 gpm, 50 – 50 ppm, etc.) as further quantification of a particular parameter.
Functional Failures Analysis (FFA)
Developing functional failures is the following step. For each function listed, there should be at least one, invariably two, functional failures. Functional failures are typically phrased as the converse of the corresponding function. For example, if the function is “Provide adequate feed flow to the boiler”, the functional failure could be worded “Fails to provide adequate feed flow to the boiler”. Using this example, questions that could be posed are “What would prevent adequate feed flow to the boiler?” or “What would cause a failure such that there would not be adequate feed flow to the boiler?” Equipment failure that would contribute to or cause functional failure needs to be identified. Using the flow path would identify the pump, its motor, the check valve, the flow control valve, limit switches etc. as this equipment.
This process of identifying the functions and the corresponding functional failures enables the analysis to focus on what is truly important to the system and the facility.
From the above, it may seem that it is simply a matter of restating the functions and adding “Fails to” to the beginning of each function. This may suffice for most applications, for complex functions it may be necessary to break down the functional failure by the different demands, which take place.
Criticality Analysis/Failure Modes and Effects Analysis (FMEA)
Upon completing the Functional Failure Analysis, the systematic evaluation of each component in the unit can begin, utilizing the Criticality Analysis/Failure Modes and Effects Analysis. For the purpose of this guideline, the two are the same and will be referred to as FMEA. The FMEA is organized by functional failure and each individual component is analyzed in terms of the effects of the component’s failure. It is a logical, systematic approach to evaluate equipment’s failure mode, effects of failure and ultimately, its criticality. It is in this part of the system study that the component failures and their effects are documented, and the components and failure modes that will result in the failure of a function determined. The FMEA also provides a means (with appropriate justification) to focus on the equipment that could result in function failure and an aid to prioritizing tasks to mitigate failure.
Reliability Centered Maintenance
4-7
Analysis Reviews
Two sections require facility review: the FFA and FMEA. The review of the FFA is necessary to ensure that all important system functions are included. Operations personnel typically perform this review.
The review of the FMEA is an important part of the SRCM methodology. It should be verified that:
• all functionally important equipment has been included in the analysis;
• the correct failure modes have been selected for each analyzed component;
• identified failure effects for each component analyzed are confirmed; and
• criticality of all equipment in the analysis has been established.
To maximize the benefit of the analysis, experienced personnel must conduct the reviews. These personnel must have a thorough knowledge of the system operation (normal, abnormal and emergency operations), operating procedures, valve line-ups, etc., as well as the effects of equipment failures on other systems. Often this entails including a senior operator and/or the system engineer. This review process will highlight any inaccurate assumptions made and modifications to the system or equipment that are not reflected in the documentation being utilized. This review is both necessary and an integral part of the SRCM analysis; the time spent in a thorough review is extremely beneficial.
Task Selection
Once the Criticality Analysis and the review have been completed, the process of identifying applicable and cost-effective predictive and/or preventative maintenance tasks for the system equipment can begin. A Logic Tree Analysis is used to develop PM tasks as it:
• provides a consistent and systematic approach in identifying tasks;
• promotes condition monitoring tasks over any other types of PM tasks;
• focuses the selected task on the identified failure mechanism (failure mechanism is the failure mode and applicable cause/s);
• facilitates the documentation of the decision to accept a component failure (the failure can be managed/tolerated during operation if there is no applicable and effective PM task); and
• assists in identifying failure finding tasks for hidden failures.
The Logic Tree Analysis (LTA) consists of a series of questions that guide the selection of the most applicable and cost effective task for the equipment.
It should be noted that the goal of the analysis is to develop a well-documented maintenance program. In order to achieve this goal, task selection should proceed within a framework that incorporates the following guidelines:
Reliability Centered Maintenance
4-8
• Identify tasks that specifically address the failure mechanisms that make the equipment unreliable.
• Identify existing reliability issues.
• Identify approaches to resolve existing reliability issues and intolerable failure mechanisms.
• Do not use task selection to justify the existing maintenance program.
• Do not assume that the frequencies of existing maintenance tasks are correct/optimum because few failures have been experienced.
• Do not recommend tasks that will not prevent the effects of equipment failure, extend the mean time between failures or identify a hidden failure.
Performing the task selection phase of the analysis within these guidelines will ensure that the PM program will be based on maintaining reliability.
When selecting tasks, there is a hierarchy of task types and responsible personnel categories which should be followed. This hierarchy is based on minimizing overall maintenance costs while maintaining plant reliability and availability. Task types should be selected from the following, listed in order of preference:
1. Condition Monitoring (monitored process parameters such as temperature, pressure, flow, etc.)
2. Predictive Maintenance (vibration monitoring, thermography, lube oil analysis, etc.)
3. Non-Intrusive Maintenance (oil change, grease, etc.)
4. Intrusive Maintenance (internal inspection, etc.)
5. Renewal (bearing replacement, complete overhaul, etc.)
Responsible personnel-based tasks should be selected from the following, also listed in order of preference:
1. Actions operators may perform as part of normal rounds (visual inspection)
2. Actions operators may perform that are not a part of normal rounds (functional test)
3. Actions requiring minimal craft skill (simple lubrication)
4. Actions requiring skilled craft work (detailed inspection)
5. Time-based intrusive maintenance (complete rebuild by craftsman or contractor)
Both of the above lists are founded on the same principle of selecting tasks preferentially from least to most intrusive, from least to most manpower intensive and from least to most costly. It is more cost effective to utilize an operator to perform simple monitoring tasks or component functional testing, than to assign the same task to a craftsperson who could be more effectively
Reliability Centered Maintenance
4-9
used doing maintenance type activities. By reducing the number of intrusive inspections, there is less chance of introducing failures due to human error and infant mortality of new parts. General maintenance cost is also reduced (rebuilds and overhauls are costly in terms of labor, materials and downtime). There are some criteria to be considered prior to deciding the type of task (condition directed, time based, failure finding) to selected.
For condition-directed tasks to be applicable, it must be possible to detect reduced failure resistance for a specific failure mechanism. A specific task must be able to detect a potential failure condition, and there must be a reasonable, consistent amount of time between the first indication of potential failure and the actual failure.
For time-based tasks to be applicable there must be an identifiable age at which the component displays a rapid increase in the probability of failure. A large proportion of the same equipment type must survive to that age, and it must be possible to restore the original failure resistance to the component through rebuild or overhaul (otherwise the component must be replaced periodically).
Finally, for failure-finding tasks to be applicable, the component must be subject to a failure mechanism that is not evident to personnel during normal operation of the equipment and there is no other applicable and effective type of task.
Also part of the task selection process is the assignment of frequencies for the selected tasks. Frequency considerations vary with the type of task, but, in general, the issues that must be addressed concerning task frequency can be summarized in the following questions:
• How frequently does the failure mechanism that the task addresses occur?
• How much time elapses between equipment failure initiation and functional failure?
• Is there an adequate mechanism to measure the failure progression or component degradation?
These questions, used as guidelines, can be the basis for determining optimum frequency for the selected tasks. More specifically, however, when determining the frequency for condition monitoring tasks, the frequency should be consistent with the time interval between the first indication of potential failure (a “threshold value”) and the actual time of failure. Scheduling should be a consideration for monitoring multiple pieces of equipment (vibration rounds, lube oil sampling, etc.). Existing operator rounds should also be considered to enable packaging of tasks (checks daily, weekly, etc.), and there may be a required phasing-in period to establish baseline data and build confidence, after which there may be a frequency revision.
In determining frequency for time-based tasks, past failure history should be reviewed and experienced maintenance staff should be consulted, as should vendor recommendations if the equipment is operated in a manner consistent with vendor assumptions. Normally, the frequency will be based on the expected mean time between failures and the time between incidences of unacceptable degradation.
Reliability Centered Maintenance
4-10
Finally, when determining frequency for failure finding tasks, consideration should be given to the expected demand, failure rate and tolerability of failure. In addition, it must be remembered that performing the failure finding task may increase the amount of wear or degradation in the component, and/or may place the system in an unsafe or abnormal condition.
In summary, for all equipment in the SRCM analysis, there is a definite list of criteria to be used while determining the most applicable and effective preventive maintenance tasks and periodicity. These criteria must be incorporated into the decision making process to ensure that the PM program that has been developed is complete and effective, while being firmly reliability-based.
Critical Task Selection
For each critical component, appropriate preventative maintenance and failure finding tasks which best address the failure modes and effects identified in the FMEA need to be determined. To accomplish this the causes of the failure modes, deemed significant in the FMEA, need to be identified. The failure causes should be based on knowledge of the equipment and operating history. For example, the dominant failure modes for a critical pump might be external leakage and failure to run. Seal or packing leakage, corrosion or erosion may cause external leakage. Failure to run may be caused by bearing seizure, loss of lubrication or coupling failure. These failure causes would be used to determine the most appropriate tasks for the component. Following the Logic Tree Analysis (LTA) as illustrated in Figure 4-1 and answering the questions will identify these tasks.
The LTA focuses first on preventing the failure. Secondly, managing and finding the failure, and thirdly modifying the system to remove the unmanageable failure.
The LTA and task selection should be reviewed to ensure that all dominant failure mechanisms have been addressed by the selected tasks and the task frequency is optimal.
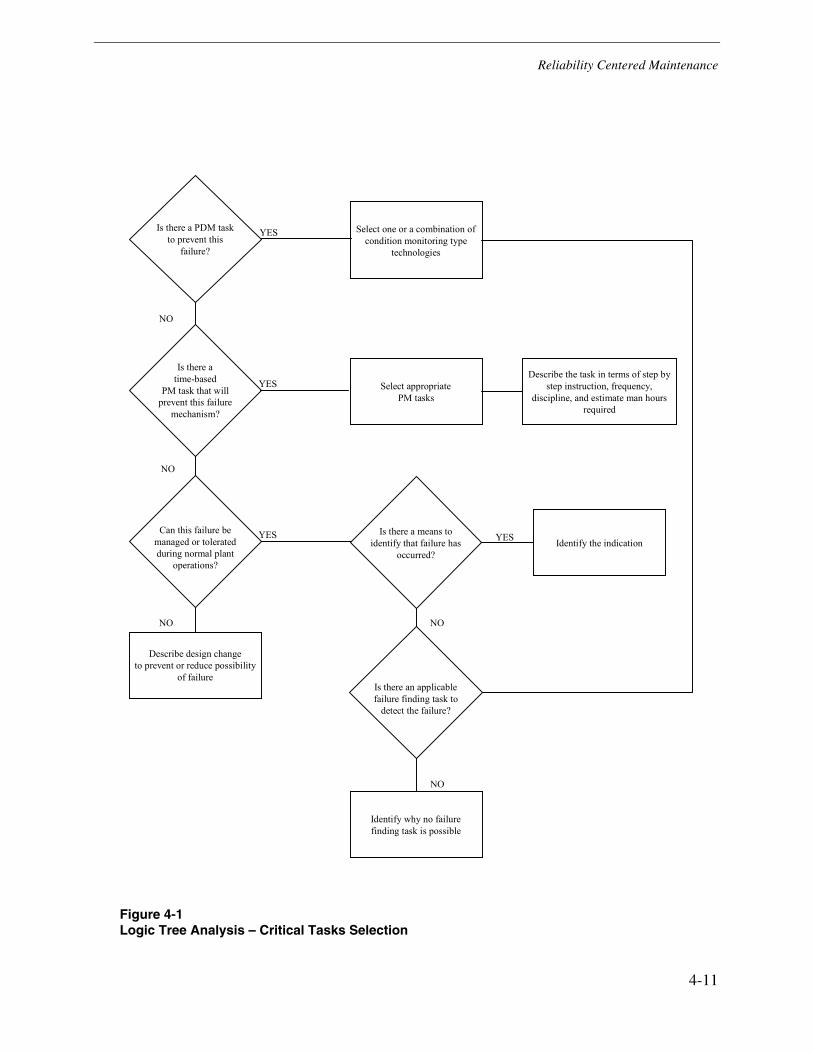
Reliability Centered Maintenance
4-11
Select one or a combination ofcondition monitoring type
technologies
Describe design changeto prevent or reduce possibility
of failure
Select appropriatePM tasks
Describe the task in terms of step bystep instruction, frequency,
discipline, and estimate man hoursrequired
Identify the indication
Identify why no failurefinding task is possible
Is there atime-based
PM task that willprevent this failure
mechanism?
Is there a PDM taskto prevent this
failure?
Can this failure bemanaged or toleratedduring normal plant
operations?
Is there a means toidentify that failure has
occurred?
Is there an applicablefailure finding task to
detect the failure?
YES
NO
YES
NO
YES
NO
YES
NO
NO
Figure 4-1 Logic Tree Analysis – Critical Tasks Selection
Reliability Centered Maintenance
4-12
Non-Critical Task Selection
In the Criticality Analysis, components are identified as Critical or Non-Critical based upon the effects of failure. In order to ensure completeness of the analysis and the Preventative Maintenance program, the components identified as non-critical need to be evaluated. The non-critical task selection LTA as illustrated in Figure 4-2 identifies the actions/tasks to be taken regarding non-critical components.
It should be noted that the tasks selected are based on cost effectiveness of performing simple PM tasks to ensure intrinsic reliability, minimize costly repairs and minimize personnel/environmental hazards. By following the LTA for non-critical equipment, non-critical equipment is also subjected to a rigorous, formal assessment, and PM tasks are assigned using a logical approach consistent with the methodology used for critical equipment.
Once this evaluation and selection is completed and documented, a thorough PM program will have been developed for all of the system equipment analyzed.
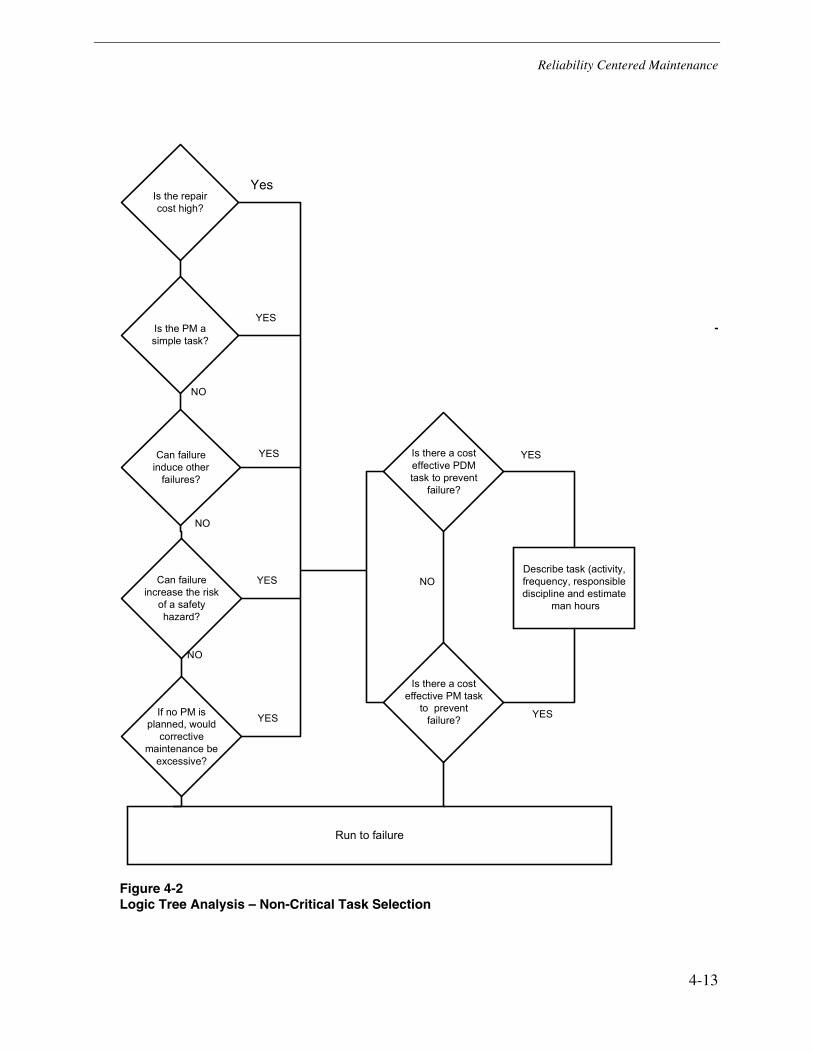
Reliability Centered Maintenance
4-13
Is the PM asimple task?
Can failureincrease the risk
of a safetyhazard?
Can failureinduce other
failures?
If no PM isplanned, would
correctivemaintenance be
excessive?
Is there a costeffective PDMtask to prevent
failure?
Is the repaircost high?
Is there a costeffective PM task
to preventfailure?
Run to failure
Describe task (activity,frequency, responsiblediscipline and estimate
man hours
YES
NO
YES
YES
YES
YES
YES
YES
NO
NO
NO
���
Figure 4-2 Logic Tree Analysis – Non-Critical Task Selection
Reliability Centered Maintenance
4-14
Maintenance Interviews
To gauge the effectiveness of current maintenance tasks performed on system equipment, interview those personnel most knowledgeable in the operation and maintenance of the equipment. Important information about failure rates and mechanisms is often unavailable or undocumented and can only be obtained this way. Interviews, correctly conducted, can result in “buy-in” from key personnel to the analysis, which in turn assures the quality of information. Fresh perspectives and ideas on the current maintenance program may also be gleaned through the interview process. This process provides a vital link to connect plant experience to the SRCM analysis.
Information obtained is used to
• verify assumptions regarding failure mechanisms and failure rates that were made in the Criticality Analysis, and
• select applicable and effective task in the LTA.
Prior to implementation, the next step in the SRCM methodology is a comparison of these selected tasks with the current maintenance program, the subject of the next section.
Task Comparison
After Task Selection has been completed and reviewed, the final phase of the analysis is the comparison of the selected or recommended tasks with the facility’s current preventive maintenance program. The purpose of this comparison is to identify changes to the existing program, to optimize the facility’s PM program. The comparison also provides another check of the analysis to ensure completeness and validity of assumptions.
To perform the Task Comparison, all of the relevant system preventive maintenance information must be gathered for each component, i.e. actual PM tasks, surveillance or functional tests, performance tests and operator rounds activities. The information obtained in the maintenance interviews should be included, especially in the case of undocumented maintenance activities that are routinely performed. This ensures the thoroughness of the analysis and provides the most accurate picture of the current PM program.
The task comparison is performed on a component basis, and is a comparison of the SRCM-derived PM tasks with the plant’s existing PM tasks, surveillance tests and operator rounds. These results are then categorized in the following manner:
• RETAIN the existing tasks if there is an exact match with the recommended tasks.
• MODIFY the existing tasks to align them with the recommended task and frequency.
• DELETE tasks where the recommended task is more applicable than the existing tasks for the components. In addition, delete tasks for redundant components. Delete the existing tasks on non-critical components where run to failure has been recommended.
Reliability Centered Maintenance
4-15
• ADD new PM tasks for the components whose existing tasks should be replaced by the new recommended tasks. Add new tasks for all of those components for which there are no existing PM tasks.
This comparison should be reviewed by the facility. It is important that this review is thorough, as the comparison results are the final product of the analysis. This final product is the new PM program for that system, and as such, should accurately reflect the maintenance strategy and operating philosophy of the facility for that system (critical vs. non-critical tasks and frequencies, safety concerns, important indications, etc.). Once the comparison is complete and has been approved the plant staff should take ownership of the analysis and its recommendations and begin implementation.
Implementation
The implementation of the SRCM recommendations can be time consuming and labor intensive. It is important that the implementation plan be realistic, yet aggressive enough, so that the necessary changes are made to the existing PM program while the analysis and the bases are known and understood.
Implementation may include the purchase of new technology (vibration, thermography, oil analysis), developing work packages and procedures, plant/equipment/component design changes, training, developing a feedback mechanism, tracking the progress of implementation and maintaining the program in as current a form as possible. All of these activities are central to the successful implementation of the SRCM recommendations and therefore require facility-wide commitment.
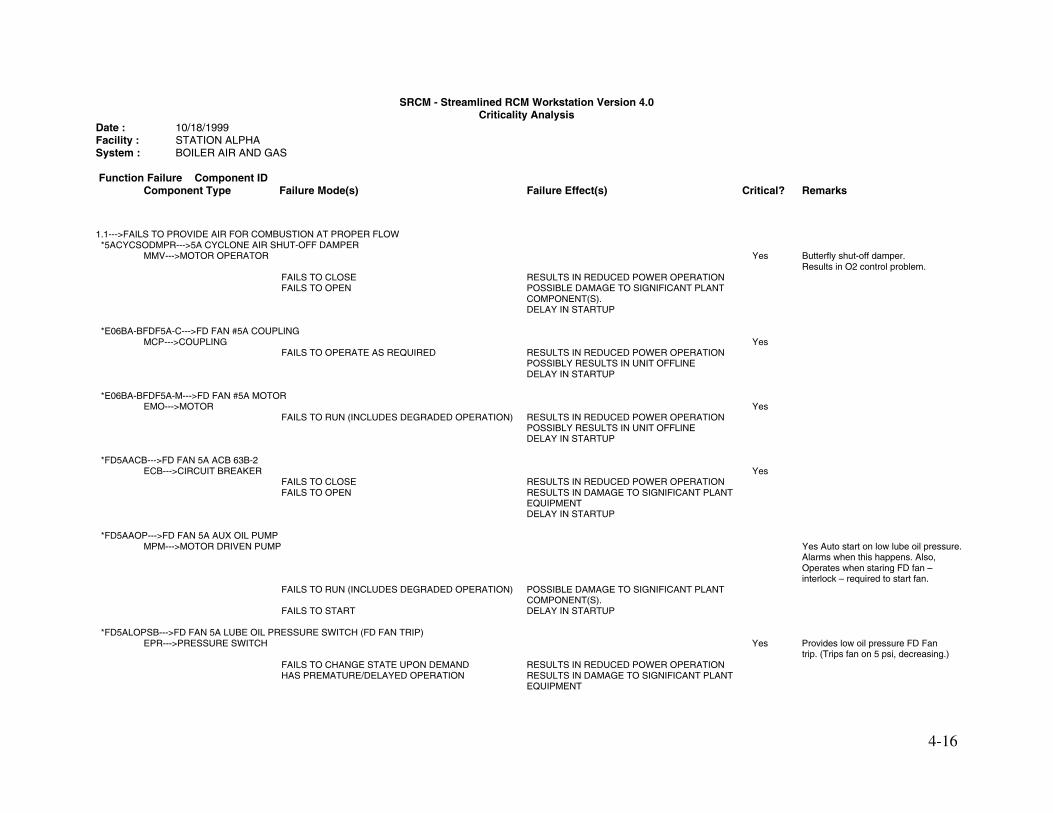
4-16
SRCM - Streamlined RCM Workstation Version 4.0 Criticality Analysis
Date : 10/18/1999 Facility : STATION ALPHA System : BOILER AIR AND GAS Function Failure Component ID Component Type Failure Mode(s) Failure Effect(s) Critical? Remarks
1.1--->FAILS TO PROVIDE AIR FOR COMBUSTION AT PROPER FLOW *5ACYCSODMPR--->5A CYCLONE AIR SHUT-OFF DAMPER MMV--->MOTOR OPERATOR Yes Butterfly shut-off damper. Results in O2 control problem. FAILS TO CLOSE RESULTS IN REDUCED POWER OPERATION FAILS TO OPEN POSSIBLE DAMAGE TO SIGNIFICANT PLANT COMPONENT(S). DELAY IN STARTUP *E06BA-BFDF5A-C--->FD FAN #5A COUPLING MCP--->COUPLING Yes FAILS TO OPERATE AS REQUIRED RESULTS IN REDUCED POWER OPERATION POSSIBLY RESULTS IN UNIT OFFLINE DELAY IN STARTUP *E06BA-BFDF5A-M--->FD FAN #5A MOTOR EMO--->MOTOR Yes FAILS TO RUN (INCLUDES DEGRADED OPERATION) RESULTS IN REDUCED POWER OPERATION POSSIBLY RESULTS IN UNIT OFFLINE DELAY IN STARTUP *FD5AACB--->FD FAN 5A ACB 63B-2 ECB--->CIRCUIT BREAKER Yes FAILS TO CLOSE RESULTS IN REDUCED POWER OPERATION FAILS TO OPEN RESULTS IN DAMAGE TO SIGNIFICANT PLANT EQUIPMENT DELAY IN STARTUP *FD5AAOP--->FD FAN 5A AUX OIL PUMP MPM--->MOTOR DRIVEN PUMP Yes Auto start on low lube oil pressure. Alarms when this happens. Also, Operates when staring FD fan – interlock – required to start fan. FAILS TO RUN (INCLUDES DEGRADED OPERATION) POSSIBLE DAMAGE TO SIGNIFICANT PLANT COMPONENT(S). FAILS TO START DELAY IN STARTUP *FD5ALOPSB--->FD FAN 5A LUBE OIL PRESSURE SWITCH (FD FAN TRIP) EPR--->PRESSURE SWITCH Yes Provides low oil pressure FD Fan trip. (Trips fan on 5 psi, decreasing.) FAILS TO CHANGE STATE UPON DEMAND RESULTS IN REDUCED POWER OPERATION HAS PREMATURE/DELAYED OPERATION RESULTS IN DAMAGE TO SIGNIFICANT PLANT EQUIPMENT
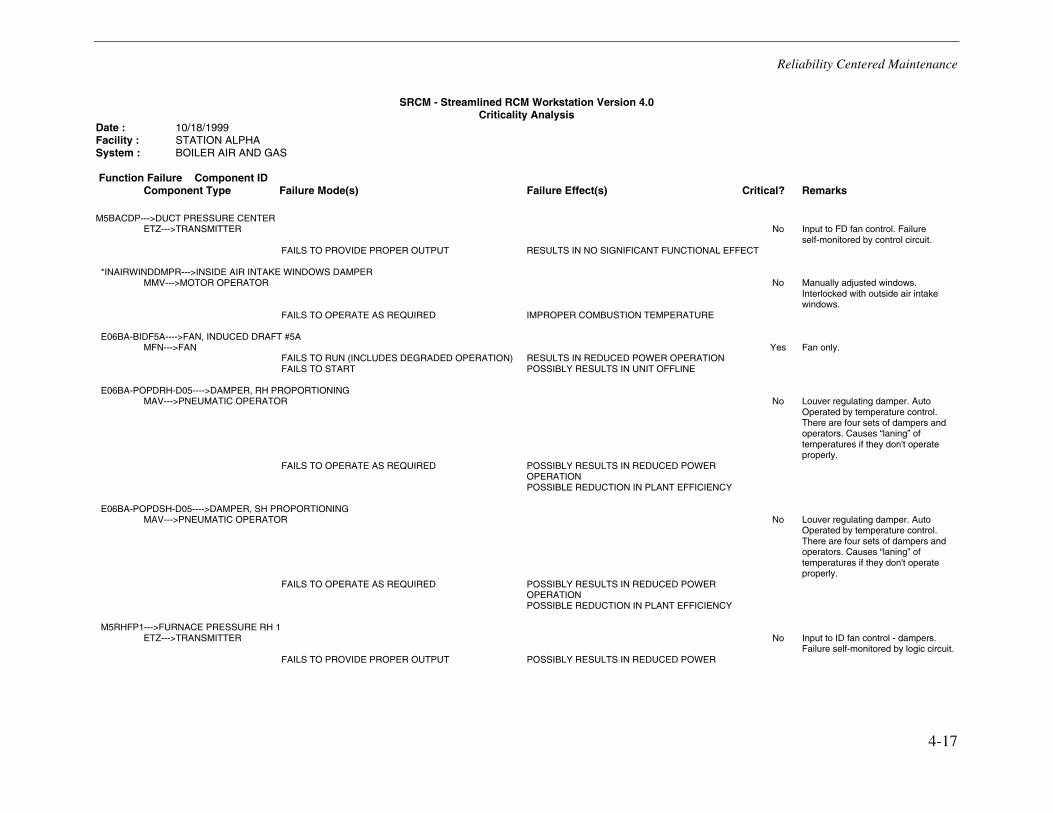
Reliability Centered Maintenance
4-17
SRCM - Streamlined RCM Workstation Version 4.0 Criticality Analysis
Date : 10/18/1999 Facility : STATION ALPHA System : BOILER AIR AND GAS Function Failure Component ID Component Type Failure Mode(s) Failure Effect(s) Critical? Remarks M5BACDP--->DUCT PRESSURE CENTER ETZ--->TRANSMITTER No Input to FD fan control. Failure self-monitored by control circuit. FAILS TO PROVIDE PROPER OUTPUT RESULTS IN NO SIGNIFICANT FUNCTIONAL EFFECT *INAIRWINDDMPR--->INSIDE AIR INTAKE WINDOWS DAMPER MMV--->MOTOR OPERATOR No Manually adjusted windows. Interlocked with outside air intake windows. FAILS TO OPERATE AS REQUIRED IMPROPER COMBUSTION TEMPERATURE E06BA-BIDF5A---->FAN, INDUCED DRAFT #5A MFN--->FAN Yes Fan only. FAILS TO RUN (INCLUDES DEGRADED OPERATION) RESULTS IN REDUCED POWER OPERATION FAILS TO START POSSIBLY RESULTS IN UNIT OFFLINE E06BA-POPDRH-D05---->DAMPER, RH PROPORTIONING MAV--->PNEUMATIC OPERATOR No Louver regulating damper. Auto Operated by temperature control. There are four sets of dampers and operators. Causes “laning” of temperatures if they don't operate properly. FAILS TO OPERATE AS REQUIRED POSSIBLY RESULTS IN REDUCED POWER OPERATION POSSIBLE REDUCTION IN PLANT EFFICIENCY E06BA-POPDSH-D05---->DAMPER, SH PROPORTIONING MAV--->PNEUMATIC OPERATOR No Louver regulating damper. Auto Operated by temperature control. There are four sets of dampers and operators. Causes “laning” of temperatures if they don't operate properly. FAILS TO OPERATE AS REQUIRED POSSIBLY RESULTS IN REDUCED POWER OPERATION POSSIBLE REDUCTION IN PLANT EFFICIENCY M5RHFP1--->FURNACE PRESSURE RH 1 ETZ--->TRANSMITTER No Input to ID fan control - dampers. Failure self-monitored by logic circuit. FAILS TO PROVIDE PROPER OUTPUT POSSIBLY RESULTS IN REDUCED POWER
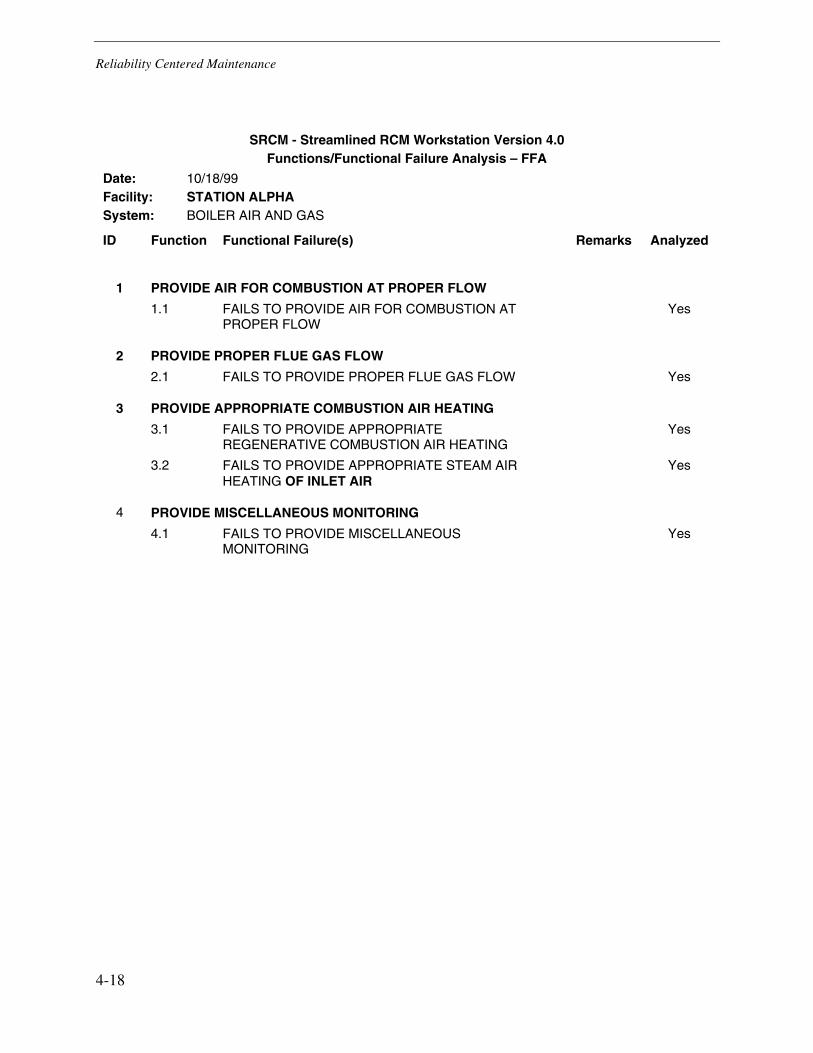
Reliability Centered Maintenance
4-18
SRCM - Streamlined RCM Workstation Version 4.0 Functions/Functional Failure Analysis – FFA
Date: 10/18/99 Facility: STATION ALPHA System: BOILER AIR AND GAS ID Function Functional Failure(s) Remarks Analyzed
1 PROVIDE AIR FOR COMBUSTION AT PROPER FLOW
1.1 FAILS TO PROVIDE AIR FOR COMBUSTION AT PROPER FLOW
Yes
2 PROVIDE PROPER FLUE GAS FLOW
2.1 FAILS TO PROVIDE PROPER FLUE GAS FLOW Yes
3 PROVIDE APPROPRIATE COMBUSTION AIR HEATING
3.1 FAILS TO PROVIDE APPROPRIATE REGENERATIVE COMBUSTION AIR HEATING
Yes
3.2 FAILS TO PROVIDE APPROPRIATE STEAM AIR HEATING OF INLET AIR
Yes
4 PROVIDE MISCELLANEOUS MONITORING
4.1 FAILS TO PROVIDE MISCELLANEOUS MONITORING
Yes
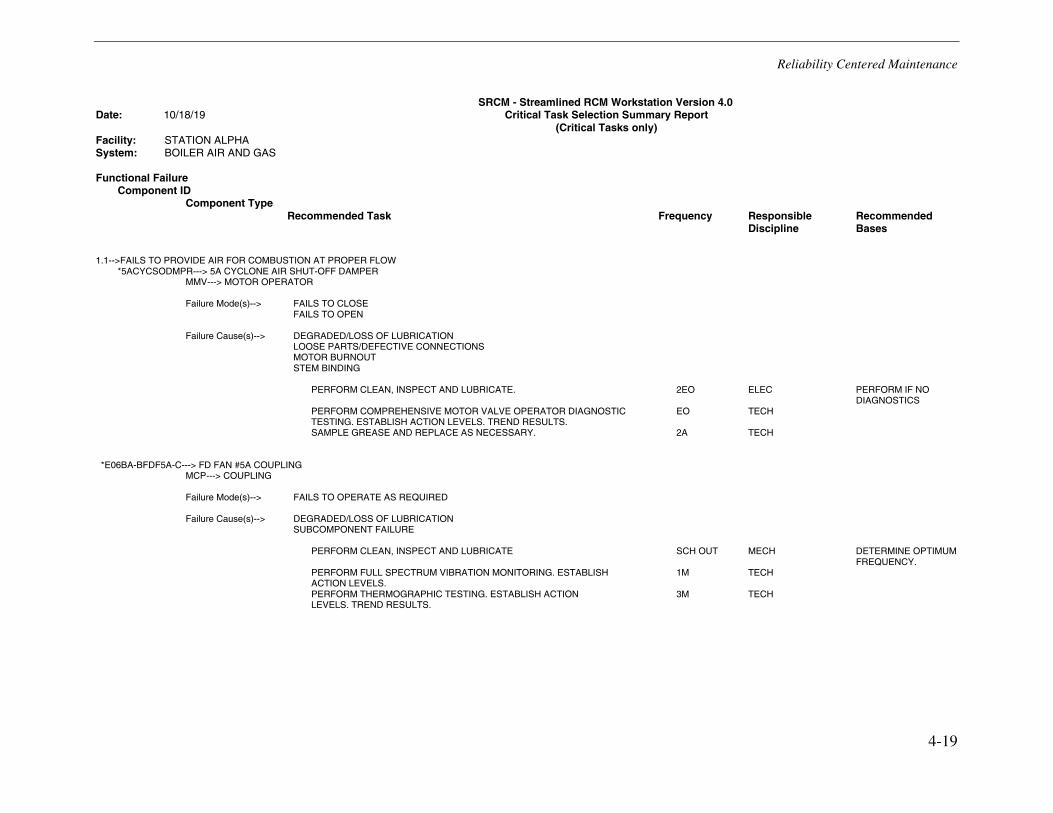
Reliability Centered Maintenance
4-19
SRCM - Streamlined RCM Workstation Version 4.0 Date: 10/18/19 Critical Task Selection Summary Report (Critical Tasks only) Facility: STATION ALPHA System: BOILER AIR AND GAS Functional Failure Component ID Component Type Recommended Task Frequency Responsible Recommended Discipline Bases
1.1-->FAILS TO PROVIDE AIR FOR COMBUSTION AT PROPER FLOW *5ACYCSODMPR---> 5A CYCLONE AIR SHUT-OFF DAMPER MMV---> MOTOR OPERATOR Failure Mode(s)--> FAILS TO CLOSE FAILS TO OPEN Failure Cause(s)--> DEGRADED/LOSS OF LUBRICATION LOOSE PARTS/DEFECTIVE CONNECTIONS MOTOR BURNOUT STEM BINDING PERFORM CLEAN, INSPECT AND LUBRICATE. 2EO ELEC PERFORM IF NO DIAGNOSTICS PERFORM COMPREHENSIVE MOTOR VALVE OPERATOR DIAGNOSTIC EO TECH TESTING. ESTABLISH ACTION LEVELS. TREND RESULTS. SAMPLE GREASE AND REPLACE AS NECESSARY. 2A TECH *E06BA-BFDF5A-C---> FD FAN #5A COUPLING MCP---> COUPLING Failure Mode(s)--> FAILS TO OPERATE AS REQUIRED Failure Cause(s)--> DEGRADED/LOSS OF LUBRICATION SUBCOMPONENT FAILURE PERFORM CLEAN, INSPECT AND LUBRICATE SCH OUT MECH DETERMINE OPTIMUM FREQUENCY. PERFORM FULL SPECTRUM VIBRATION MONITORING. ESTABLISH 1M TECH ACTION LEVELS. PERFORM THERMOGRAPHIC TESTING. ESTABLISH ACTION 3M TECH LEVELS. TREND RESULTS.
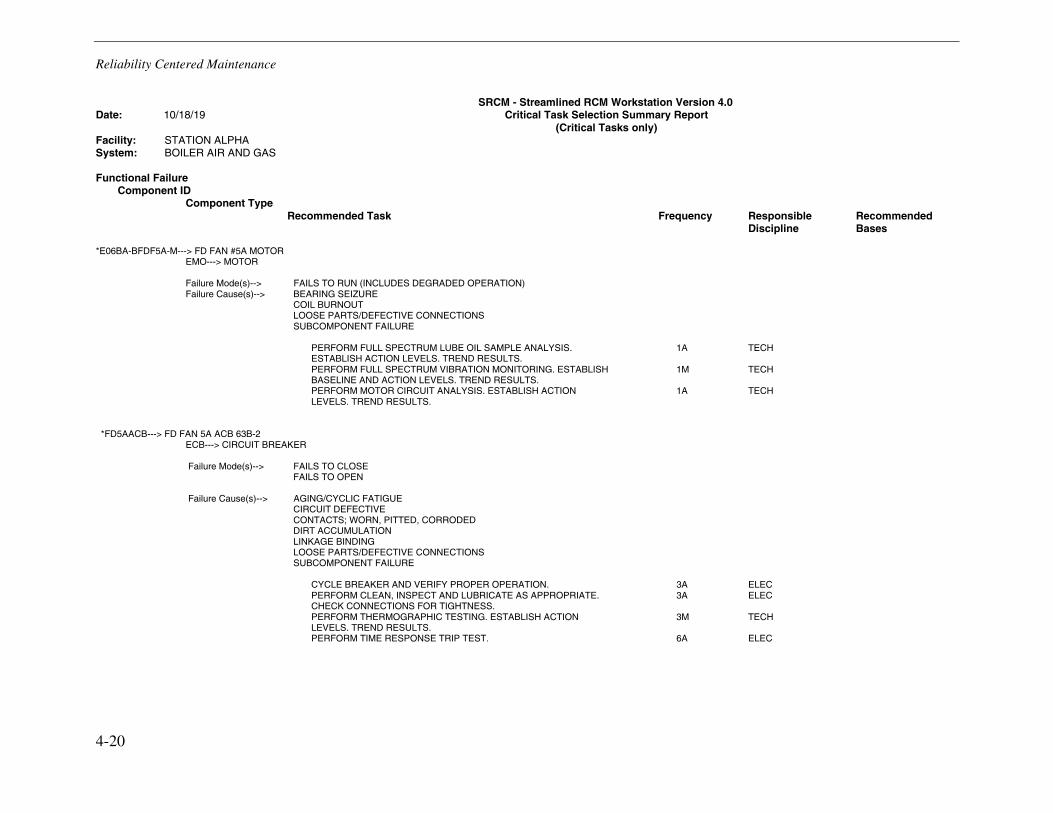
Reliability Centered Maintenance
4-20
SRCM - Streamlined RCM Workstation Version 4.0 Date: 10/18/19 Critical Task Selection Summary Report (Critical Tasks only) Facility: STATION ALPHA System: BOILER AIR AND GAS Functional Failure Component ID Component Type Recommended Task Frequency Responsible Recommended Discipline Bases *E06BA-BFDF5A-M---> FD FAN #5A MOTOR EMO---> MOTOR Failure Mode(s)--> FAILS TO RUN (INCLUDES DEGRADED OPERATION) Failure Cause(s)--> BEARING SEIZURE COIL BURNOUT LOOSE PARTS/DEFECTIVE CONNECTIONS SUBCOMPONENT FAILURE PERFORM FULL SPECTRUM LUBE OIL SAMPLE ANALYSIS. 1A TECH ESTABLISH ACTION LEVELS. TREND RESULTS. PERFORM FULL SPECTRUM VIBRATION MONITORING. ESTABLISH 1M TECH BASELINE AND ACTION LEVELS. TREND RESULTS. PERFORM MOTOR CIRCUIT ANALYSIS. ESTABLISH ACTION 1A TECH LEVELS. TREND RESULTS. *FD5AACB---> FD FAN 5A ACB 63B-2 ECB---> CIRCUIT BREAKER Failure Mode(s)--> FAILS TO CLOSE FAILS TO OPEN Failure Cause(s)--> AGING/CYCLIC FATIGUE CIRCUIT DEFECTIVE CONTACTS; WORN, PITTED, CORRODED DIRT ACCUMULATION LINKAGE BINDING LOOSE PARTS/DEFECTIVE CONNECTIONS SUBCOMPONENT FAILURE CYCLE BREAKER AND VERIFY PROPER OPERATION. 3A ELEC PERFORM CLEAN, INSPECT AND LUBRICATE AS APPROPRIATE. 3A ELEC CHECK CONNECTIONS FOR TIGHTNESS. PERFORM THERMOGRAPHIC TESTING. ESTABLISH ACTION 3M TECH LEVELS. TREND RESULTS. PERFORM TIME RESPONSE TRIP TEST. 6A ELEC
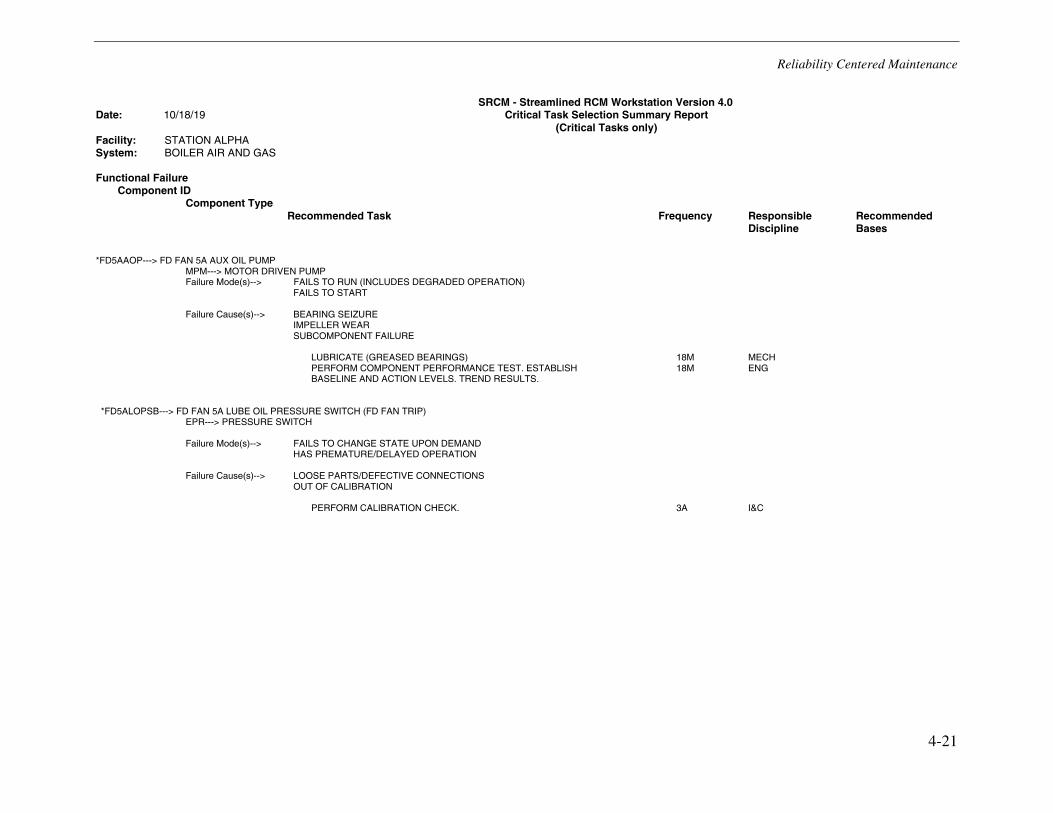
Reliability Centered Maintenance
4-21
SRCM - Streamlined RCM Workstation Version 4.0 Date: 10/18/19 Critical Task Selection Summary Report (Critical Tasks only) Facility: STATION ALPHA System: BOILER AIR AND GAS Functional Failure Component ID Component Type Recommended Task Frequency Responsible Recommended Discipline Bases
*FD5AAOP---> FD FAN 5A AUX OIL PUMP MPM---> MOTOR DRIVEN PUMP Failure Mode(s)--> FAILS TO RUN (INCLUDES DEGRADED OPERATION) FAILS TO START Failure Cause(s)--> BEARING SEIZURE IMPELLER WEAR SUBCOMPONENT FAILURE LUBRICATE (GREASED BEARINGS) 18M MECH PERFORM COMPONENT PERFORMANCE TEST. ESTABLISH 18M ENG BASELINE AND ACTION LEVELS. TREND RESULTS. *FD5ALOPSB---> FD FAN 5A LUBE OIL PRESSURE SWITCH (FD FAN TRIP) EPR---> PRESSURE SWITCH Failure Mode(s)--> FAILS TO CHANGE STATE UPON DEMAND HAS PREMATURE/DELAYED OPERATION Failure Cause(s)--> LOOSE PARTS/DEFECTIVE CONNECTIONS OUT OF CALIBRATION PERFORM CALIBRATION CHECK. 3A I&C
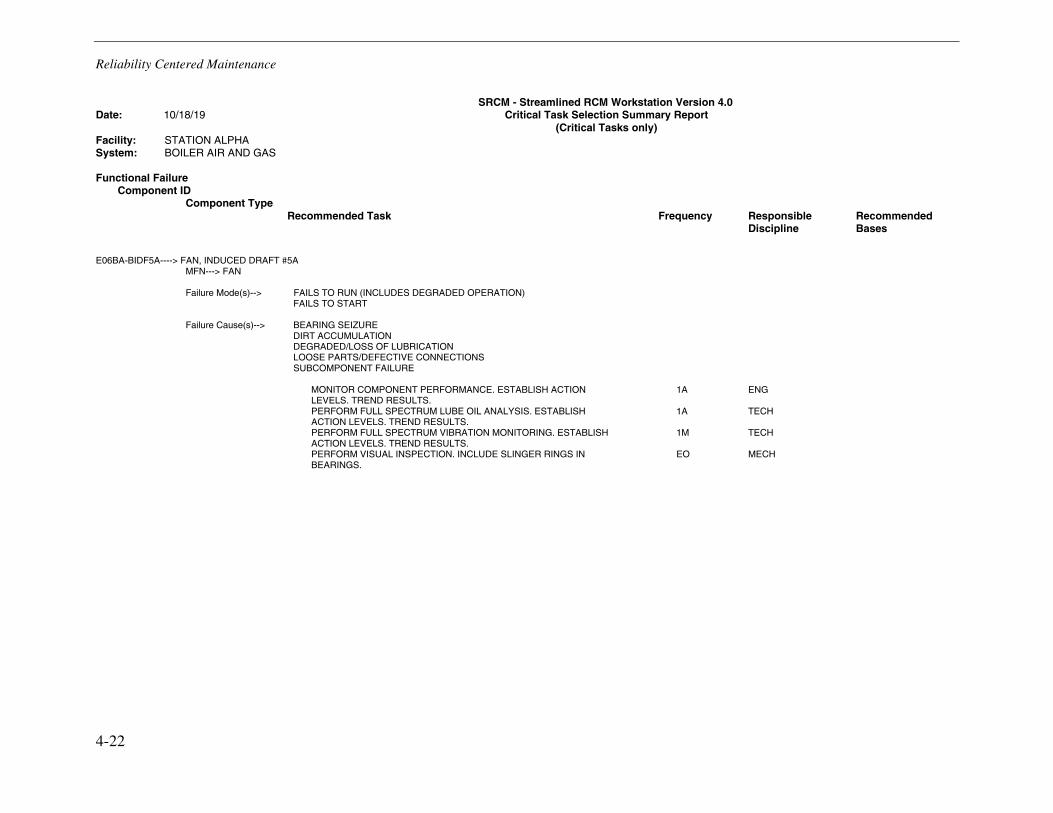
Reliability Centered Maintenance
4-22
SRCM - Streamlined RCM Workstation Version 4.0 Date: 10/18/19 Critical Task Selection Summary Report (Critical Tasks only) Facility: STATION ALPHA System: BOILER AIR AND GAS Functional Failure Component ID Component Type Recommended Task Frequency Responsible Recommended Discipline Bases
E06BA-BIDF5A----> FAN, INDUCED DRAFT #5A MFN---> FAN Failure Mode(s)--> FAILS TO RUN (INCLUDES DEGRADED OPERATION) FAILS TO START Failure Cause(s)--> BEARING SEIZURE DIRT ACCUMULATION DEGRADED/LOSS OF LUBRICATION LOOSE PARTS/DEFECTIVE CONNECTIONS SUBCOMPONENT FAILURE MONITOR COMPONENT PERFORMANCE. ESTABLISH ACTION 1A ENG LEVELS. TREND RESULTS. PERFORM FULL SPECTRUM LUBE OIL ANALYSIS. ESTABLISH 1A TECH ACTION LEVELS. TREND RESULTS. PERFORM FULL SPECTRUM VIBRATION MONITORING. ESTABLISH 1M TECH ACTION LEVELS. TREND RESULTS. PERFORM VISUAL INSPECTION. INCLUDE SLINGER RINGS IN EO MECH BEARINGS.
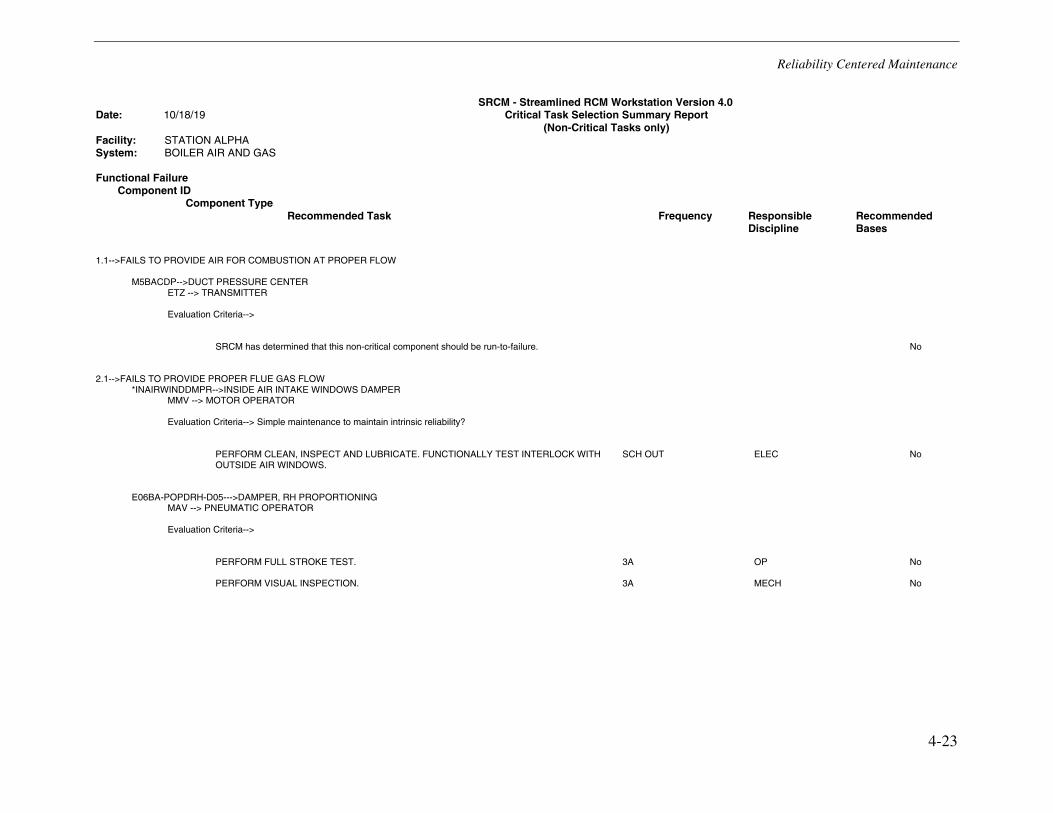
Reliability Centered Maintenance
4-23
SRCM - Streamlined RCM Workstation Version 4.0 Date: 10/18/19 Critical Task Selection Summary Report (Non-Critical Tasks only) Facility: STATION ALPHA System: BOILER AIR AND GAS Functional Failure Component ID Component Type Recommended Task Frequency Responsible Recommended Discipline Bases
1.1-->FAILS TO PROVIDE AIR FOR COMBUSTION AT PROPER FLOW M5BACDP-->DUCT PRESSURE CENTER ETZ --> TRANSMITTER Evaluation Criteria--> SRCM has determined that this non-critical component should be run-to-failure. No 2.1-->FAILS TO PROVIDE PROPER FLUE GAS FLOW *INAIRWINDDMPR-->INSIDE AIR INTAKE WINDOWS DAMPER MMV --> MOTOR OPERATOR Evaluation Criteria--> Simple maintenance to maintain intrinsic reliability? PERFORM CLEAN, INSPECT AND LUBRICATE. FUNCTIONALLY TEST INTERLOCK WITH SCH OUT ELEC No OUTSIDE AIR WINDOWS. E06BA-POPDRH-D05--->DAMPER, RH PROPORTIONING MAV --> PNEUMATIC OPERATOR Evaluation Criteria--> PERFORM FULL STROKE TEST. 3A OP No PERFORM VISUAL INSPECTION. 3A MECH No
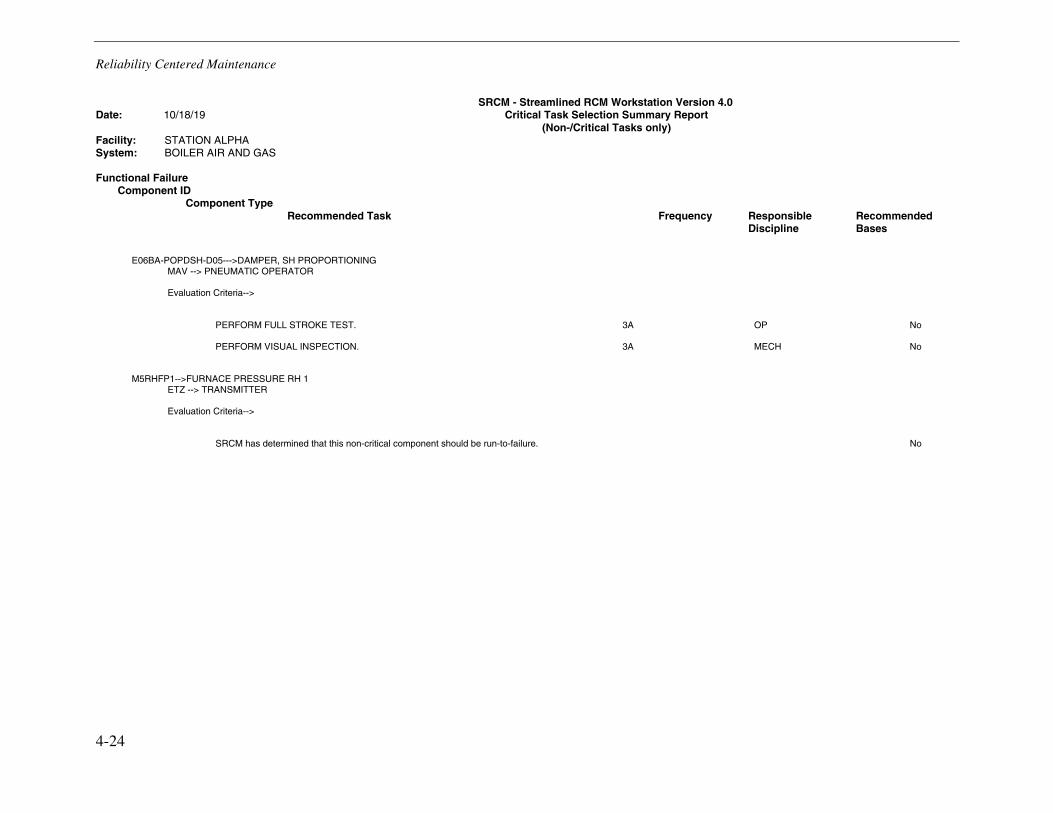
Reliability Centered Maintenance
4-24
SRCM - Streamlined RCM Workstation Version 4.0 Date: 10/18/19 Critical Task Selection Summary Report (Non-/Critical Tasks only) Facility: STATION ALPHA System: BOILER AIR AND GAS Functional Failure Component ID Component Type Recommended Task Frequency Responsible Recommended Discipline Bases
E06BA-POPDSH-D05--->DAMPER, SH PROPORTIONING MAV --> PNEUMATIC OPERATOR Evaluation Criteria--> PERFORM FULL STROKE TEST. 3A OP No PERFORM VISUAL INSPECTION. 3A MECH No M5RHFP1-->FURNACE PRESSURE RH 1 ETZ --> TRANSMITTER Evaluation Criteria--> SRCM has determined that this non-critical component should be run-to-failure. No
5-1
5 FAILURE MODES EFFECTS ANALYSIS
Introduction
Failure modes effect analysis (FMEA) is an engineering technique used to define, identify, and eliminate known and/or potential failures and problems before they appear or occur. Its goal is to assist in structuring the preventive maintenance base by systematically considering each failure mode within a complex electrical or mechanical system.
There are two approaches to performing an analysis. Firstly, using historical data on the component or from another plant that has similar components to define the failures. Secondly, inferential statistics, mathematical modeling, simulation and reliability engineering may be used to identify and define the failures. Either approach, if done properly, will provide useful information that can reduce the risk of failure. FMEA is one of the most important early preventives in system maintenance that will prevent failures from occurring.
This chapter focuses, generically on what FMEA is, what it means and how to conduct it.
What is FMEA?
Failure modes and effects analysis is a technique that has three distinct functions:
• FMEA is a tool for preventing problems.
• FMEA is a procedure for developing and implementing new or revised designs, processes or maintenance tasks.
• FMEA is the diary of the design, process or maintenance strategy.
As a tool, FMEA is one of the most effective low-risk techniques for predicting failures and identifying the most cost effective solutions for preventing these failures. As a procedure, FMEA provides a structured approach for evaluating, tracking and updating a maintenance strategy. As a diary, FMEA is initiated at the concept of the design and is maintained throughout the operational life of the component.
An FMEA, when completed:
• Identifies known and potential failure modes
• Identifies the causes and effects of each failure mode
• Prioritizes the identified failure modes according to their frequency and severity
• Provides for corrective action and follow-up.
Failure Modes Effects Analysis
5-2
Step-by-Step FMEA Analysis Procedure
The procedure is straightforward. However, the first step in developing a FMEA is to understand what is meant by failure. Mechanical failure may be defined as any change in size, shape, or material properties of a structure, machine or machine component/part that renders it incapable of satisfactorily performing its intended function.
To perform a FMEA there are two requirements. The first requirement is the identification of the appropriate form. Table 5-1 is an example of a typical form used. The second is identification of the ranking guidelines. Tables 5-2, 5-3, and 5-4 are examples of ranking guidelines used.
The forms and ranking guidelines represented here are generic and should be customized to meet the specific requirements of a plant/utility. Generally there are two ways that the ranking guidelines can be formulated. The first method is qualitative; the second quantitative. In either case the numerical values of 1 to 10 are used in the ranking. The ranking of 1 to 10 is used because it provides ease of interpretation, accuracy, and precision in the quantification because it represents a normal distribution.
This chapter addresses a generic form, displaying generally accepted items that should be addressed as part of a FMEA. The FMEA form – Table 5-1 is divided into two parts. The first part, items 1 through 4, reflects the introduction of the form and provides essential information required in the course of writing the FMEA. The second part of the form includes items 5 through 14. They reflect the mandatory items for any FMEA. The order of the columns may be changed; more columns may be added, but none of the columns presented should be removed. Items 5 through 14 may be viewed as the core of a FMEA.
The following gives a brief overview of the various sections to be completed on the form. The numbers in parentheses correspond to the numbers shown on the form –shown in Table 5-1.
System, Subsystem and Component Identification (1)
Identifies the system, subsystem and component name or the identification title and number of the item to be analyzed.
Prepared by (2)
Generally, the name of the system engineer responsible for the FMEA is identified. Sometimes, additional information is also recorded, such as
• Telephone number, e-mail address, etc. of the system design engineer
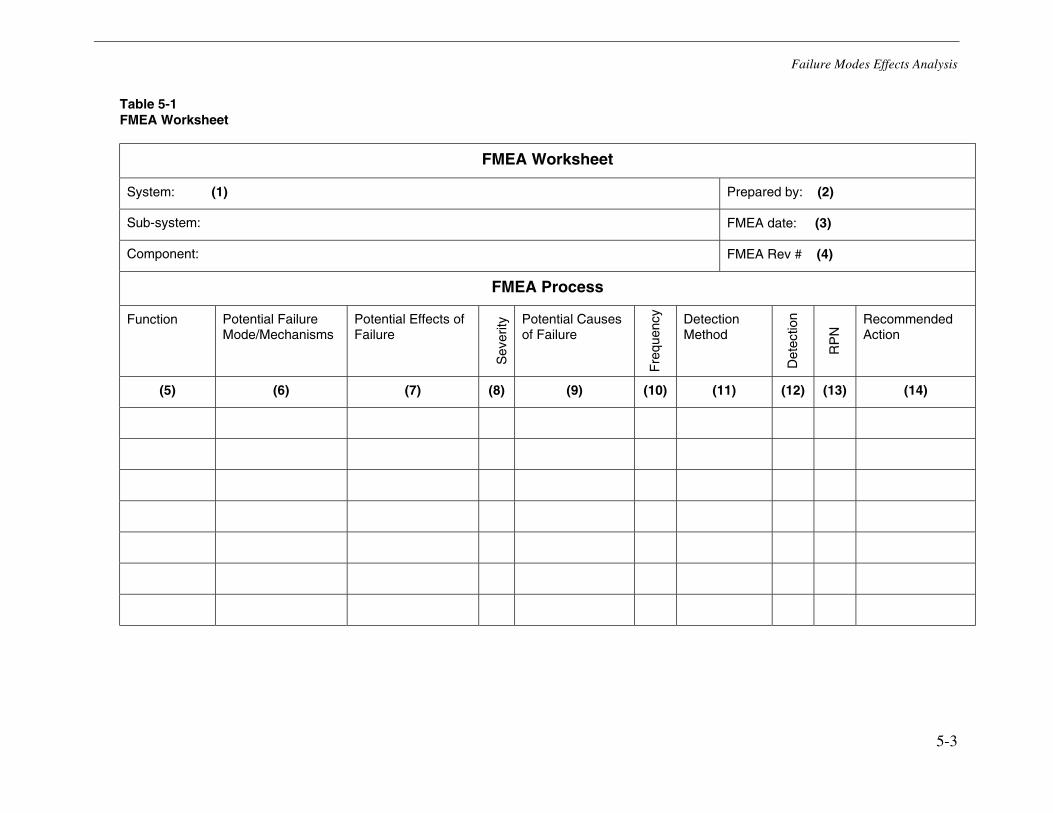
Failure Modes Effects Analysis
5-3
Table 5-1 FMEA Worksheet
FMEA Worksheet
System: (1) Prepared by: (2)
Sub-system: FMEA date: (3)
Component: FMEA Rev # (4)
FMEA Process
Function Potential Failure Mode/Mechanisms
Potential Effects of Failure
Sev
erity
Potential Causes of Failure
Fre
quen
cy
Detection Method
Det
ectio
n
RP
N Recommended
Action
(5) (6) (7) (8) (9) (10) (11) (12) (13) (14)
Failure Modes Effects Analysis
5-4
FMEA Date – Original (3)
Record the date (Mo-Day-Yr) of the initiation of the FMEA.
FMEA Revision Number (4)
Record the date (Mo-Day-Yr) and revision number of the latest revision.
Function (5)
The system engineer writes the intent, purpose, goal, or objective of the system, subsystem or component being analyzed. It must be identified in detail through a statement that is concise, exact and easy to understand (no jargon), using active verbs and appropriate nouns. The active verbs define performance and performance defines function. The combination of the active verb with the noun defines the relationship; consequently, the identification process becomes much easier. It can also be identified through a functional block diagram, which will show the system elements as functional blocks into which the system may be sub-divided. It is important to note that the objective of the functional block diagram is to show the major elements of the system, and to understand how the interaction of those elements affects the system itself or the other external system(s).
Failure to identify all the functions of the system, subsystem, component or part is likely to result in an incomplete list of failure modes.
Examples of functions include
• Provide superheated steam
• Remove impurities
Potential Failure Mode (6)
The problem. The concern. The opportunity to improve. The failure. The defect. When considering the potential failure mode one must think of the loss of the function – a specific failure. The more specific the better the opportunity to identify the effects and causes of the failure. For each function identified in item 5, the corresponding failure of the function must be listed. There can be more than one failure from one function. To help identify the potential failure mode one may think of the failure or loss of the function.
Examples of corresponding failures include
• Fails to open
• Corroded
Failure Modes Effects Analysis
5-5
Another way to identify the failure mode is to ask the question “How could this system, subsystem, component, or part fail?” “Can it break, wear, bind, and so on?” The emphasis should be how the system, subsystem, component, or part being considered could possibly fail, rather than whether or not it will fail.
Still another way of identifying failure mode it through a fault tree analysis (FTA). In the FTA structure the top level is the loss of the part function and then progressively on the lower levels the failure modes are identified.
Potential Effect(s) of Failure (7)
A potential effect of the failure is the consequence of the failure on the next higher level – subsystem or system. The questions usually asked are: “What does the operator/end user experience as a result of the failure mode described?” or “What happens or what is (are) the ramification(s) of this problem or failure?”
No matter how the potential effect(s) is (are) identified, the ramifications of the loss to the function must be determined.
Severity of Effect (8)
Severity is a ranking indicating the seriousness of the effect of the potential failure mode. The severity always applies to the effect of a failure mode. In fact, there is a direct correlation between effect and severity. If the effect is critical, the severity is high. Conversely, if the effect is a nuisance, the severity is very low.
Severity is reviewed from the perspective of the system and the end user. For evaluation purposes, there is usually a ranking table that reflects the issues of the organization. An example of such a ranking may be seen in Table 5-2.
In the FMEA, the severity ranking should be based on the worst effect of the failure mode. When complete, rank the failure modes on the basis of the severity of their effects. At this point the FMEA is identical to the FMCA.
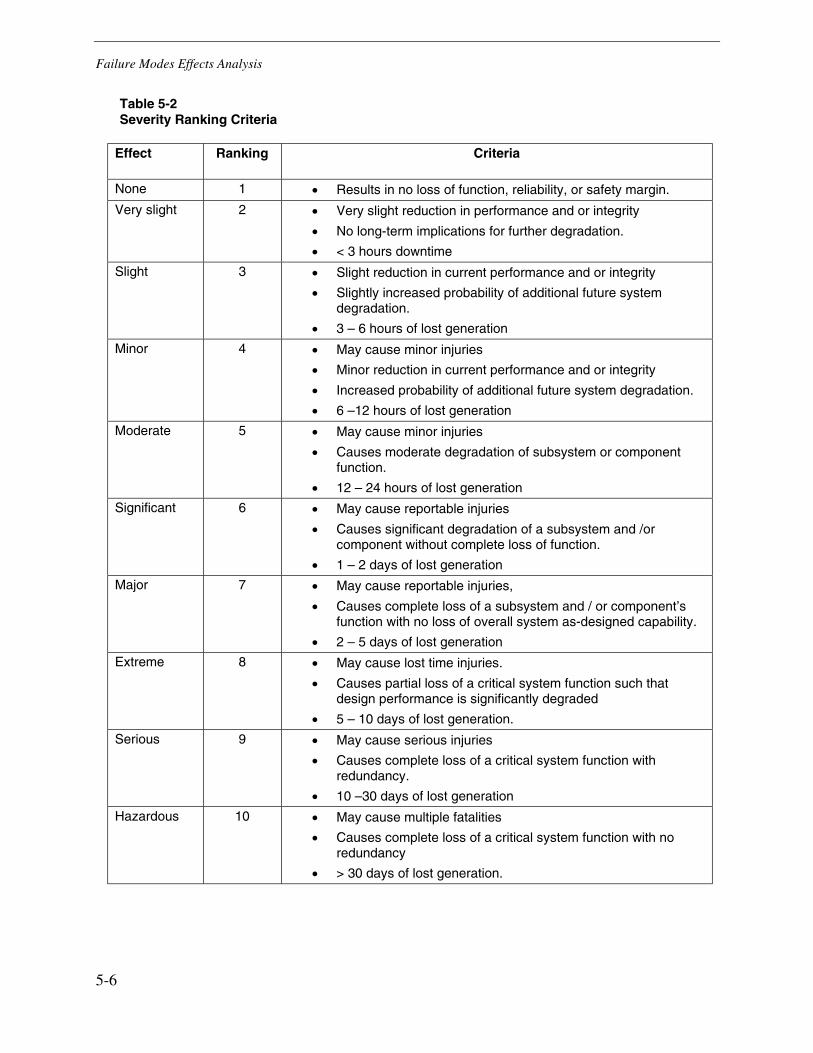
Failure Modes Effects Analysis
5-6
Table 5-2 Severity Ranking Criteria
Effect Ranking Criteria
None 1 • Results in no loss of function, reliability, or safety margin.
Very slight 2 • Very slight reduction in performance and or integrity
• No long-term implications for further degradation.
• < 3 hours downtime
Slight 3 • Slight reduction in current performance and or integrity
• Slightly increased probability of additional future system degradation.
• 3 – 6 hours of lost generation
Minor 4 • May cause minor injuries
• Minor reduction in current performance and or integrity
• Increased probability of additional future system degradation.
• 6 –12 hours of lost generation
Moderate 5 • May cause minor injuries
• Causes moderate degradation of subsystem or component function.
• 12 – 24 hours of lost generation
Significant 6 • May cause reportable injuries
• Causes significant degradation of a subsystem and /or component without complete loss of function.
• 1 – 2 days of lost generation
Major 7 • May cause reportable injuries,
• Causes complete loss of a subsystem and / or component’s function with no loss of overall system as-designed capability.
• 2 – 5 days of lost generation
Extreme 8 • May cause lost time injuries.
• Causes partial loss of a critical system function such that design performance is significantly degraded
• 5 – 10 days of lost generation.
Serious 9 • May cause serious injuries
• Causes complete loss of a critical system function with redundancy.
• 10 –30 days of lost generation
Hazardous 10 • May cause multiple fatalities
• Causes complete loss of a critical system function with no redundancy
• > 30 days of lost generation.
Failure Modes Effects Analysis
5-7
Potential Cause(s) of Failure (9)
The cause of a failure mode is a deficiency that results in the failure mode. It must be emphasized repeatedly that when one focuses on the cause(s), one must look at the root cause, not the symptom of the failure.
To do a good job of proper potential cause(s) of failure identification, one must understand both the system and design, and ask appropriate questions. Being specific is of paramount importance. The more one zooms in on the root cause, the better one understands the failure. Some of the techniques that may be used are brainstorming, cause-and-effect analysis, fault tree analysis diagrams and affinity charts.
The basic question to ask is “In what way can this system fail to perform its intended function?” Another way is to ask five “why’s” in a row. The rationale for this is that it becomes a progressively more difficult and thought-provoking assignment to identify the why’s. The early “why’s” are superficial, where the later ones are more substantive. Other questions that may be asked are: “What circumstances could cause the failure?” “How or why can the part fail to meet its engineering specifications?”
A failure mode can be caused by one or more of the individual components or by (partial list):
• Inadequate component design
• Improper installation or maintenance
• Improper selection of component parts
• Improper use of processes
• Inadequate control procedures
It is imperative that the focus in performing the FMEA should be to identify all potential failures.
At this point, it must be emphasized that a major benefit of the FMEA is identification and removal of potential failure modes caused by system and/or component interactions. These interactions may also involve human factors and must be reviewed thoroughly.
The relationship between the failure mode and the cause(s) is not linear or one-to-one. Do not be surprised if there are several if not many causes for one failure mode. (Only sometimes a one-to-one relationship exists). List all the possible causes.
Examples of failure causes include:
• Torque too high or low
• Hardness
• Viscosity too high or low
• Porosity
Failure Modes Effects Analysis
5-8
Note: If the effect of the failure is rated 8 through 10, special effort should be made to identify as many root causes as possible.
Frequency (10)
Frequency is the ranking value corresponding to the estimated number of and/or cumulative number of failures that could occur for a given cause over the life of the component. To identify the frequency for each of the causes one may use reliability mathematics (which is beyond the scope of this guideline), past experience – history of failures, or a cumulative number of component failures.
If expected frequencies and/or cumulative numbers of failures cannot be estimated, it is acceptable for the FMEA to examine similar or surrogate systems and/or components for similar information.
Generally, the FMEA operates under the assumption of a single-point failure (in other words, if the component fails, the system fails). A single-point failure is defined as a component failure, which would cause the system failure and is not compensated by redundancy or an alternative method.
When frequency is calculated it must be for every single cause of the failure. If it cannot be estimated, then the frequency should be entered as 10. A typical frequency guideline is shown in Table 5-3.
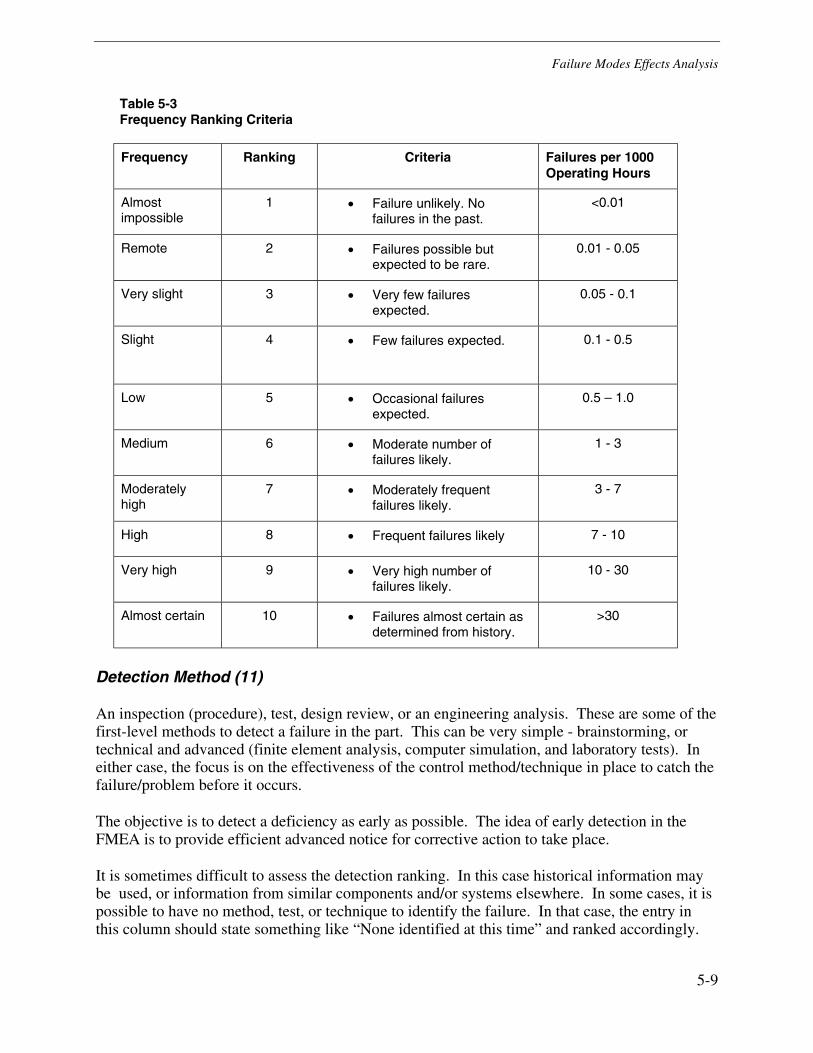
Failure Modes Effects Analysis
5-9
Table 5-3 Frequency Ranking Criteria
Frequency Ranking Criteria Failures per 1000 Operating Hours
Almost impossible
1 • Failure unlikely. No failures in the past.
<0.01
Remote 2 • Failures possible but expected to be rare.
0.01 - 0.05
Very slight 3 • Very few failures expected.
0.05 - 0.1
Slight 4
• Few failures expected. 0.1 - 0.5
Low 5 • Occasional failures expected.
0.5 – 1.0
Medium 6 • Moderate number of failures likely.
1 - 3
Moderately high
7 • Moderately frequent failures likely.
3 - 7
High 8 • Frequent failures likely 7 - 10
Very high 9 • Very high number of failures likely.
10 - 30
Almost certain 10 • Failures almost certain as determined from history.
>30
Detection Method (11)
An inspection (procedure), test, design review, or an engineering analysis. These are some of the first-level methods to detect a failure in the part. This can be very simple - brainstorming, or technical and advanced (finite element analysis, computer simulation, and laboratory tests). In either case, the focus is on the effectiveness of the control method/technique in place to catch the failure/problem before it occurs.
The objective is to detect a deficiency as early as possible. The idea of early detection in the FMEA is to provide efficient advanced notice for corrective action to take place.
It is sometimes difficult to assess the detection ranking. In this case historical information may be used, or information from similar components and/or systems elsewhere. In some cases, it is possible to have no method, test, or technique to identify the failure. In that case, the entry in this column should state something like “None identified at this time” and ranked accordingly.
Failure Modes Effects Analysis
5-10
Another way to focus on the detection is to use the brainstorming technique to identify new methods and tests as they apply to the task at hand. Two of the leading questions in the brainstorming process should be
• How can this failure be discovered?
• In what way can this failure be recognized?
The majority of items in detecting failures are quantifiable. The design review, however, is also an important tool that is used to review the appropriateness of the component. It can be quantifiable, but it can also be a qualitative and systematic methodology of questioning the component design.
Detection (12)
Detection is a ranking corresponding to the likelihood that the controls in place will detect a specific root cause of a failure mode. To identify a detection ranking one must estimate the ability of each of the controls identified in item 11 to detect the failure. In other words, are the controls identified in item 11 above effective?
If the ability of the controls to detect failure is unknown, or the detection cannot be estimated, then the detection ranking should be 10. A typical detection guideline is shown in Table 5-4.
Risk Priority Number (RPN) (13)
This number is the product of severity, frequency and detection. The RPN defines the priority of the failure. On its own the RPNs has no value or meaning. It is only used to rank (define) the potential deficiencies.
A goal of FMEA is to reduce the RPN, in a specific way. The specific way is through a reduction in severity, frequency and detection. Preferably in that order.
The severity can be reduced through a change in design, configuration and/or through a change in how it is operated. The frequency can be reduced by changing or imposing operating restriction and/or requirements with the intent of preventing causes or reducing their frequency. The detection can be reduced by adding or improving the evaluation technique, inspections or increasing sample size, and/or adding detection equipment. The results will be improvement in the ability to detect the failure before it occurs.
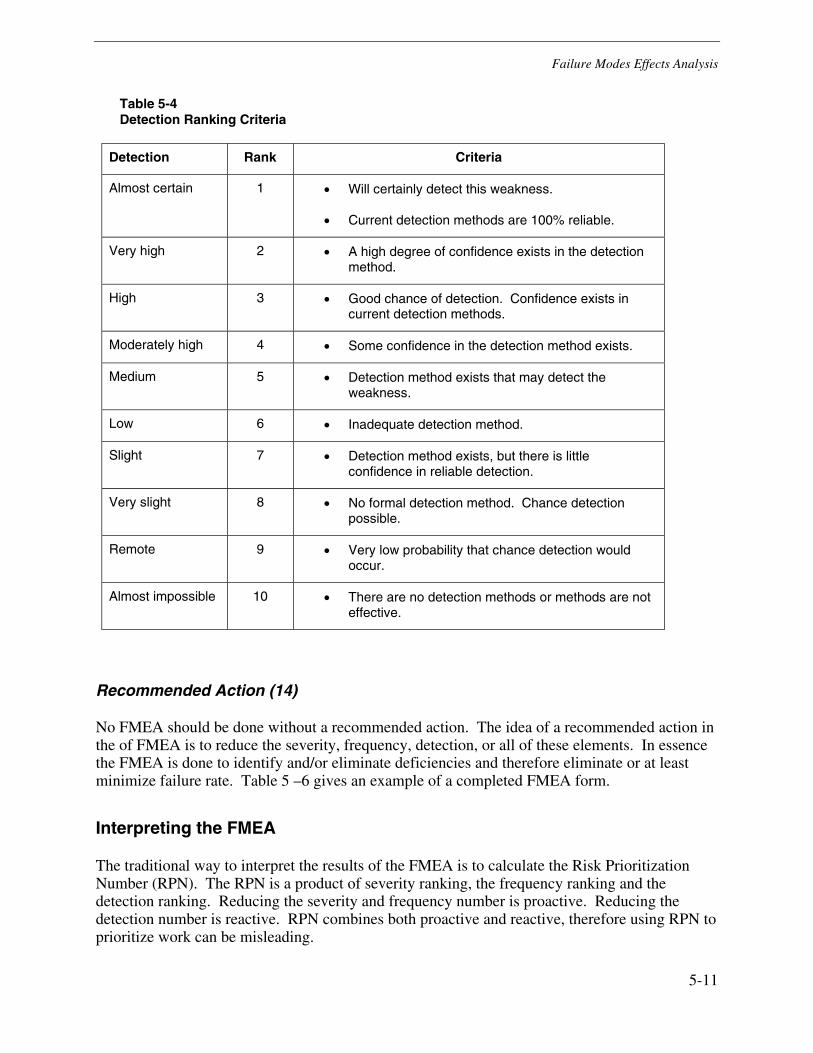
Failure Modes Effects Analysis
5-11
Table 5-4 Detection Ranking Criteria
Detection Rank Criteria
Almost certain 1 • Will certainly detect this weakness.
• Current detection methods are 100% reliable.
Very high 2 • A high degree of confidence exists in the detection method.
High 3 • Good chance of detection. Confidence exists in current detection methods.
Moderately high 4 • Some confidence in the detection method exists.
Medium 5 • Detection method exists that may detect the weakness.
Low 6 • Inadequate detection method.
Slight 7 • Detection method exists, but there is little confidence in reliable detection.
Very slight 8 • No formal detection method. Chance detection possible.
Remote 9 • Very low probability that chance detection would occur.
Almost impossible 10 • There are no detection methods or methods are not effective.
Recommended Action (14)
No FMEA should be done without a recommended action. The idea of a recommended action in the of FMEA is to reduce the severity, frequency, detection, or all of these elements. In essence the FMEA is done to identify and/or eliminate deficiencies and therefore eliminate or at least minimize failure rate. Table 5 –6 gives an example of a completed FMEA form.
Interpreting the FMEA
The traditional way to interpret the results of the FMEA is to calculate the Risk Prioritization Number (RPN). The RPN is a product of severity ranking, the frequency ranking and the detection ranking. Reducing the severity and frequency number is proactive. Reducing the detection number is reactive. RPN combines both proactive and reactive, therefore using RPN to prioritize work can be misleading.
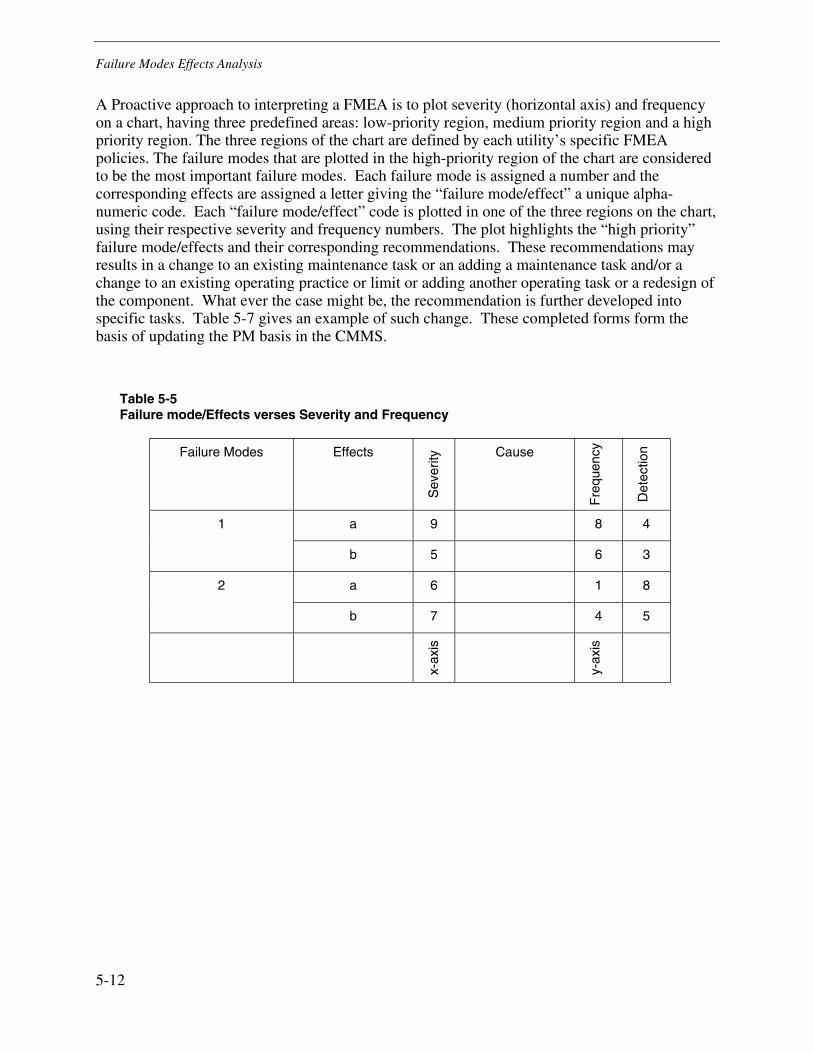
Failure Modes Effects Analysis
5-12
A Proactive approach to interpreting a FMEA is to plot severity (horizontal axis) and frequency on a chart, having three predefined areas: low-priority region, medium priority region and a high priority region. The three regions of the chart are defined by each utility’s specific FMEA policies. The failure modes that are plotted in the high-priority region of the chart are considered to be the most important failure modes. Each failure mode is assigned a number and the corresponding effects are assigned a letter giving the “failure mode/effect” a unique alpha-numeric code. Each “failure mode/effect” code is plotted in one of the three regions on the chart, using their respective severity and frequency numbers. The plot highlights the “high priority” failure mode/effects and their corresponding recommendations. These recommendations may results in a change to an existing maintenance task or an adding a maintenance task and/or a change to an existing operating practice or limit or adding another operating task or a redesign of the component. What ever the case might be, the recommendation is further developed into specific tasks. Table 5-7 gives an example of such change. These completed forms form the basis of updating the PM basis in the CMMS.
Table 5-5 Failure mode/Effects verses Severity and Frequency
Failure Modes Effects S
ever
ity Cause
Fre
quen
cy
Det
ectio
n
a 9 8 4 1
b 5 6 3
a 6 1 8 2
b 7 4 5
x-ax
is
y-ax
is
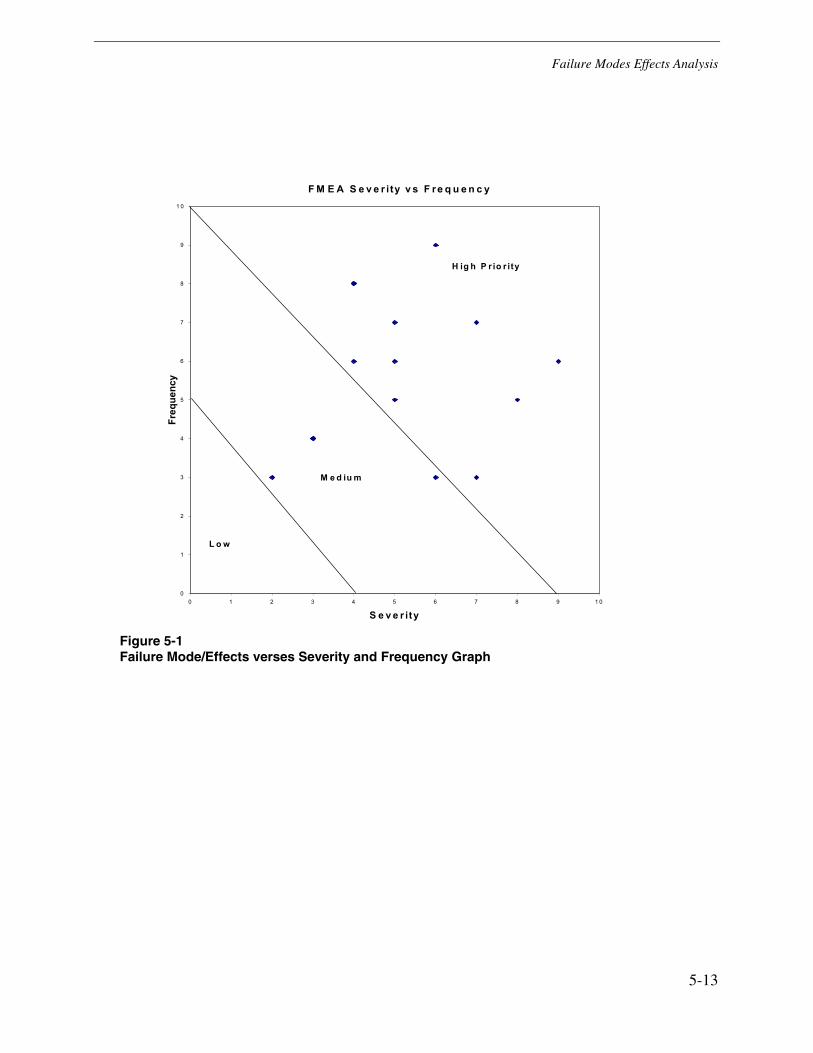
Failure Modes Effects Analysis
5-13
Figure 5-1 Failure Mode/Effects verses Severity and Frequency Graph
F M E A S e v e r ity v s F re q u e n c y
0
1
2
3
4
5
6
7
8
9
1 0
0 1 2 3 4 5 6 7 8 9 1 0
S e v e r ity
Freq
uenc
y
H ig h P r io r ity
M e d iu m
L o w
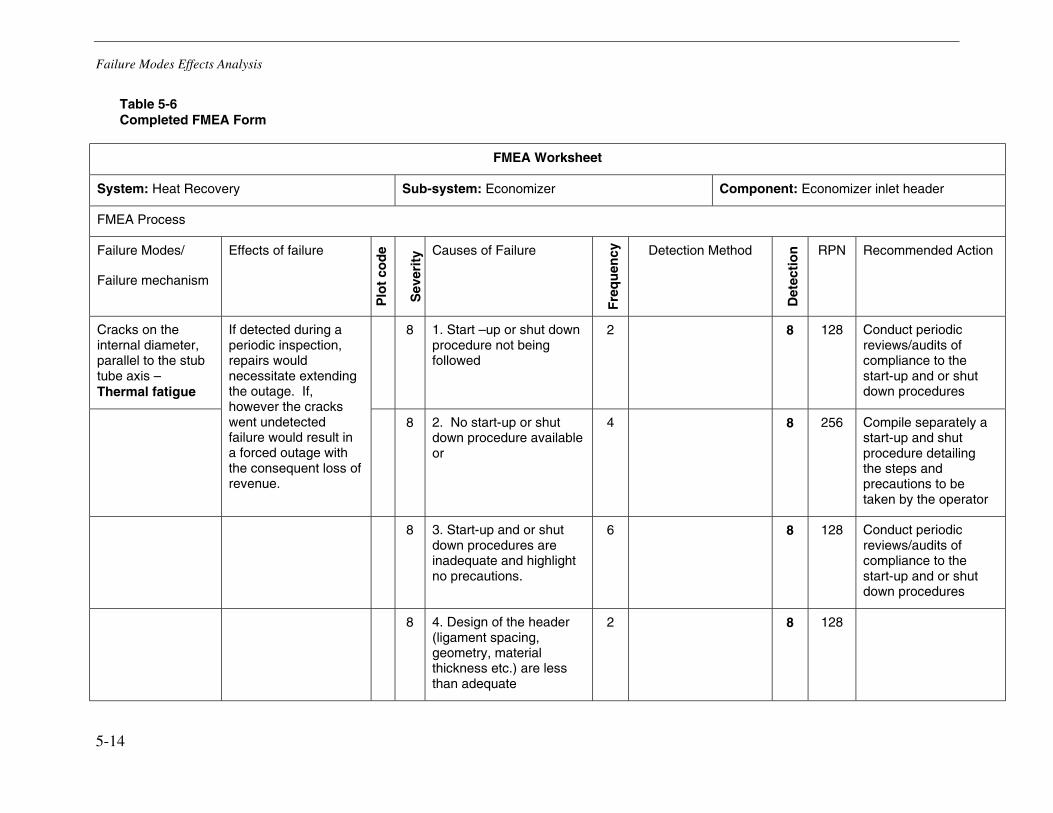
Failure Modes Effects Analysis
5-14
Table 5-6 Completed FMEA Form
FMEA Worksheet
System: Heat Recovery Sub-system: Economizer Component: Economizer inlet header
FMEA Process
Failure Modes/
Failure mechanism
Effects of failure
Plo
t co
de
Sev
erit
y Causes of Failure
Fre
qu
ency
Detection Method
Det
ecti
on
RPN Recommended Action
Cracks on the internal diameter, parallel to the stub tube axis – Thermal fatigue
8 1. Start –up or shut down procedure not being followed
2 8 128 Conduct periodic reviews/audits of compliance to the start-up and or shut down procedures
If detected during a periodic inspection, repairs would necessitate extending the outage. If, however the cracks went undetected failure would result in a forced outage with the consequent loss of revenue.
8 2. No start-up or shut down procedure available or
4 8 256 Compile separately a start-up and shut procedure detailing the steps and precautions to be taken by the operator
8 3. Start-up and or shut down procedures are inadequate and highlight no precautions.
6 8 128 Conduct periodic reviews/audits of compliance to the start-up and or shut down procedures
8 4. Design of the header (ligament spacing, geometry, material thickness etc.) are less than adequate
2 8 128
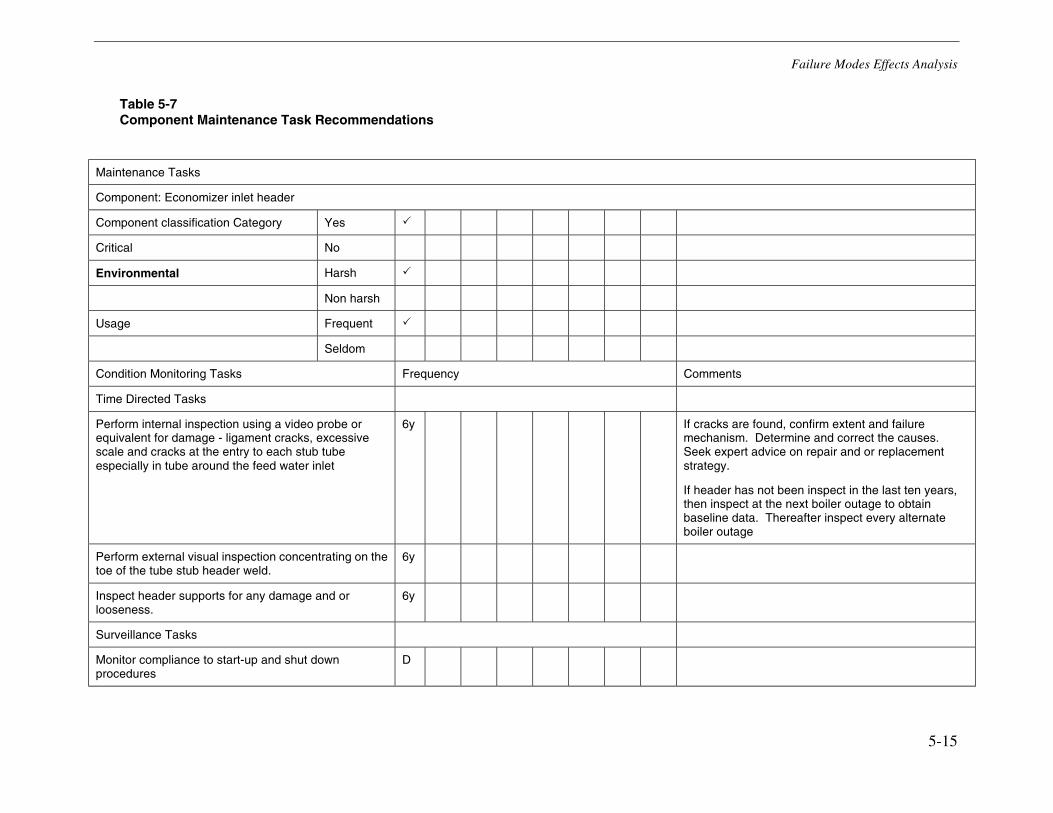
Failure Modes Effects Analysis
5-15
Table 5-7 Component Maintenance Task Recommendations
Maintenance Tasks
Component: Economizer inlet header
Component classification Category Yes
Critical No
Environmental Harsh
Non harsh
Usage Frequent
Seldom
Condition Monitoring Tasks Frequency Comments
Time Directed Tasks
Perform internal inspection using a video probe or equivalent for damage - ligament cracks, excessive scale and cracks at the entry to each stub tube especially in tube around the feed water inlet
6y If cracks are found, confirm extent and failure mechanism. Determine and correct the causes. Seek expert advice on repair and or replacement strategy.
If header has not been inspect in the last ten years, then inspect at the next boiler outage to obtain baseline data. Thereafter inspect every alternate boiler outage
Perform external visual inspection concentrating on the toe of the tube stub header weld.
6y
Inspect header supports for any damage and or looseness.
6y
Surveillance Tasks
Monitor compliance to start-up and shut down procedures
D

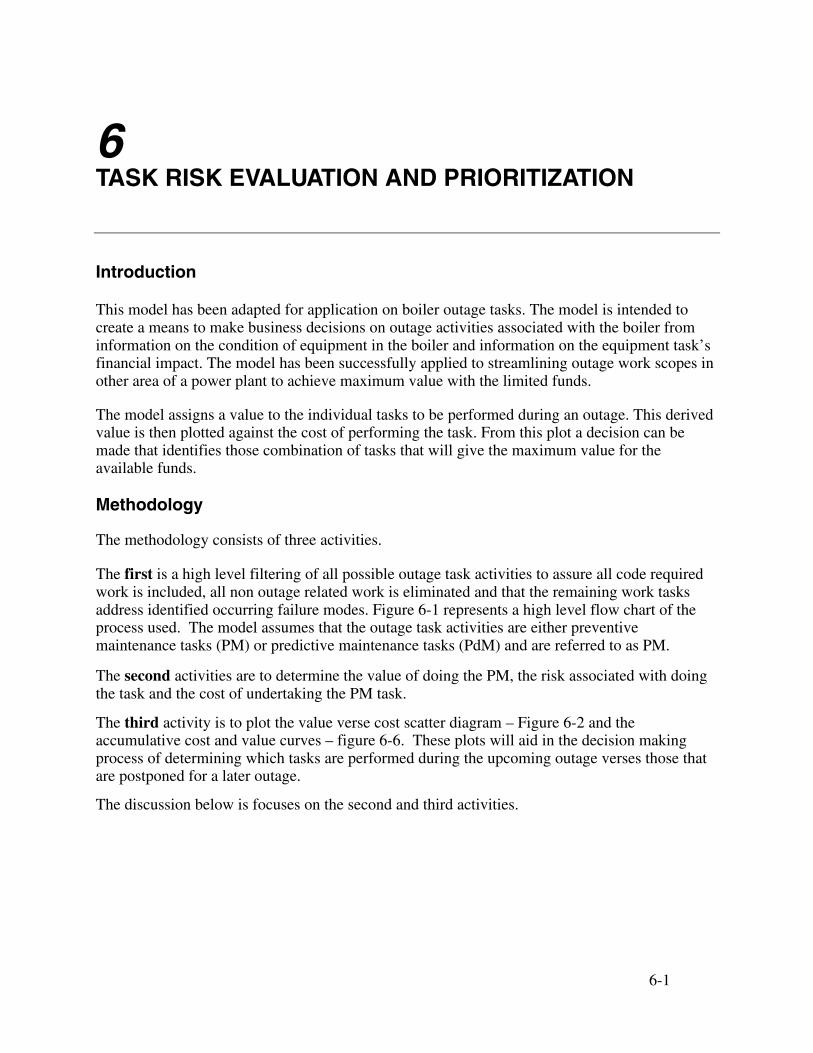
6-1
6 TASK RISK EVALUATION AND PRIORITIZATION
Introduction
This model has been adapted for application on boiler outage tasks. The model is intended to create a means to make business decisions on outage activities associated with the boiler from information on the condition of equipment in the boiler and information on the equipment task’s financial impact. The model has been successfully applied to streamlining outage work scopes in other area of a power plant to achieve maximum value with the limited funds.
The model assigns a value to the individual tasks to be performed during an outage. This derived value is then plotted against the cost of performing the task. From this plot a decision can be made that identifies those combination of tasks that will give the maximum value for the available funds.
Methodology
The methodology consists of three activities.
The first is a high level filtering of all possible outage task activities to assure all code required work is included, all non outage related work is eliminated and that the remaining work tasks address identified occurring failure modes. Figure 6-1 represents a high level flow chart of the process used. The model assumes that the outage task activities are either preventive maintenance tasks (PM) or predictive maintenance tasks (PdM) and are referred to as PM.
The second activities are to determine the value of doing the PM, the risk associated with doing the task and the cost of undertaking the PM task.
The third activity is to plot the value verse cost scatter diagram – Figure 6-2 and the accumulative cost and value curves – figure 6-6. These plots will aid in the decision making process of determining which tasks are performed during the upcoming outage verses those that are postponed for a later outage.
The discussion below is focuses on the second and third activities.
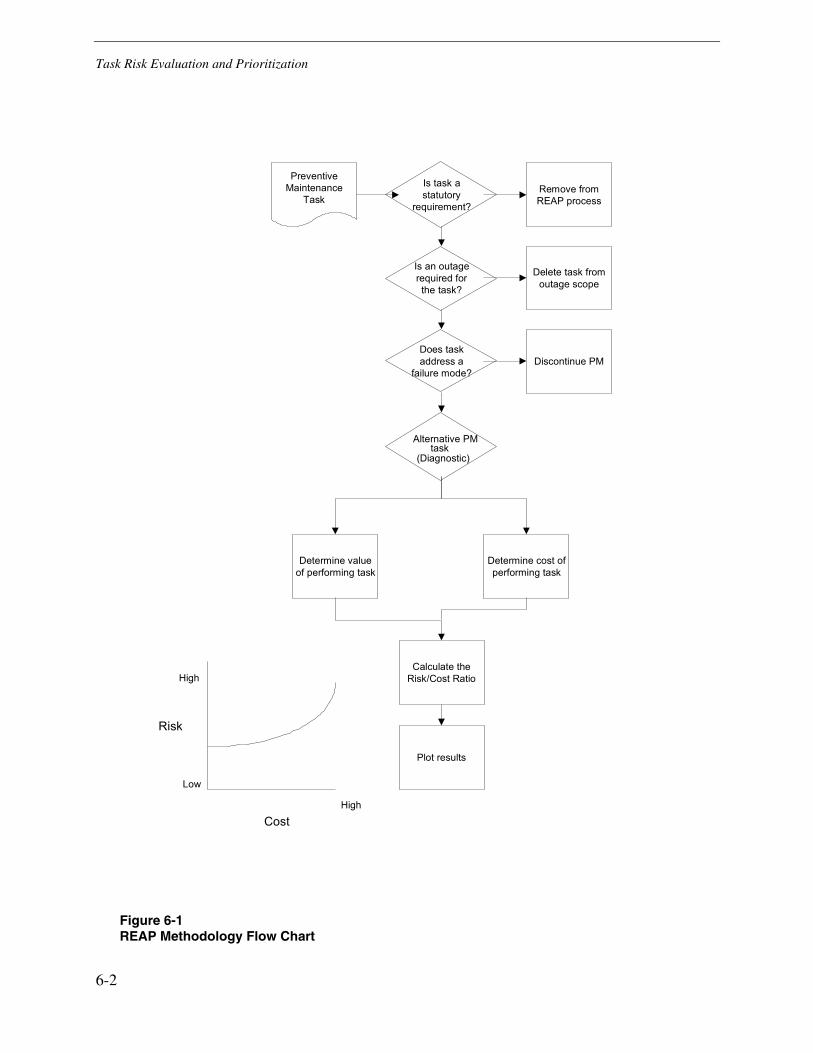
Task Risk Evaluation and Prioritization
6-2
PreventiveMaintenance
TaskIs task astatutory
requirement?
Is an outagerequired forthe task?
Does taskaddress a
failure mode?
Alternative PMtask
(Diagnostic)
Remove fromREAP process
Delete task fromoutage scope
Discontinue PM
Determine valueof performing task
Determine cost ofperforming task
Calculate theRisk/Cost Ratio
Plot results
Risk
High
Low
CostHigh
Figure 6-1 REAP Methodology Flow Chart
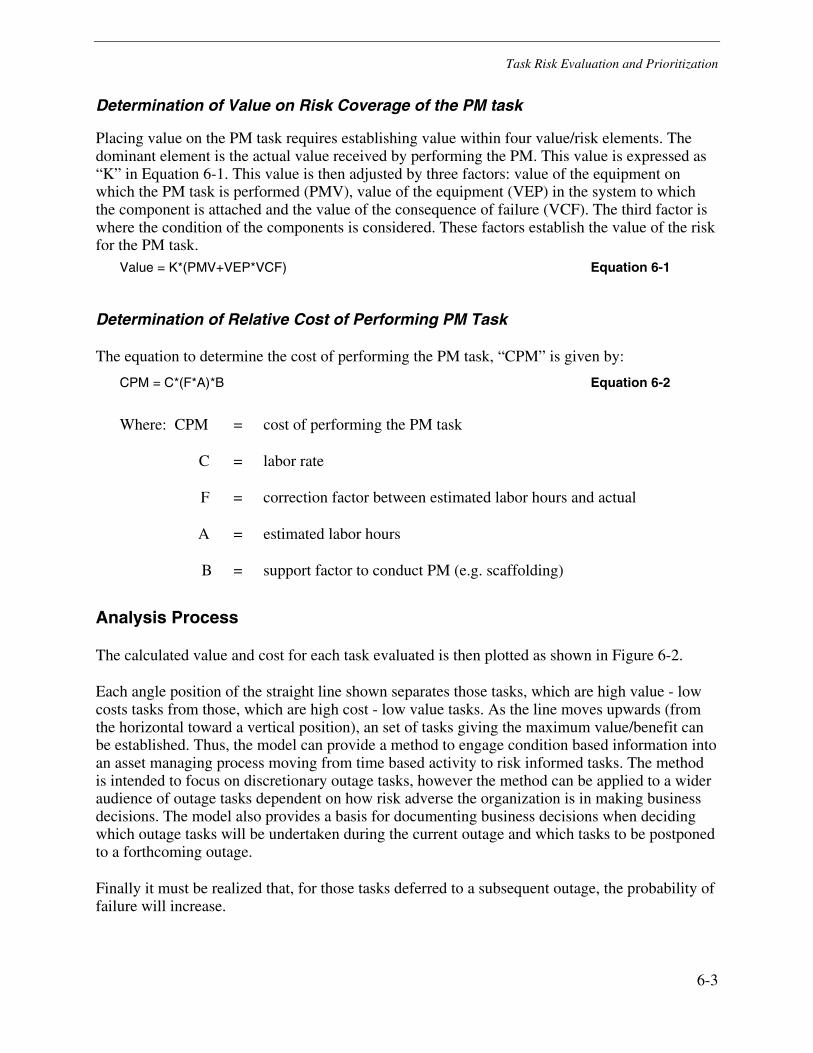
Task Risk Evaluation and Prioritization
6-3
Determination of Value on Risk Coverage of the PM task
Placing value on the PM task requires establishing value within four value/risk elements. The dominant element is the actual value received by performing the PM. This value is expressed as “K” in Equation 6-1. This value is then adjusted by three factors: value of the equipment on which the PM task is performed (PMV), value of the equipment (VEP) in the system to which the component is attached and the value of the consequence of failure (VCF). The third factor is where the condition of the components is considered. These factors establish the value of the risk for the PM task.
Value = K*(PMV+VEP*VCF) Equation 6-1
Determination of Relative Cost of Performing PM Task
The equation to determine the cost of performing the PM task, “CPM” is given by:
CPM = C*(F*A)*B Equation 6-2
Where: CPM = cost of performing the PM task
C = labor rate
F = correction factor between estimated labor hours and actual
A = estimated labor hours
B = support factor to conduct PM (e.g. scaffolding)
Analysis Process
The calculated value and cost for each task evaluated is then plotted as shown in Figure 6-2.
Each angle position of the straight line shown separates those tasks, which are high value - low costs tasks from those, which are high cost - low value tasks. As the line moves upwards (from the horizontal toward a vertical position), an set of tasks giving the maximum value/benefit can be established. Thus, the model can provide a method to engage condition based information into an asset managing process moving from time based activity to risk informed tasks. The method is intended to focus on discretionary outage tasks, however the method can be applied to a wider audience of outage tasks dependent on how risk adverse the organization is in making business decisions. The model also provides a basis for documenting business decisions when deciding which outage tasks will be undertaken during the current outage and which tasks to be postponed to a forthcoming outage.
Finally it must be realized that, for those tasks deferred to a subsequent outage, the probability of failure will increase.
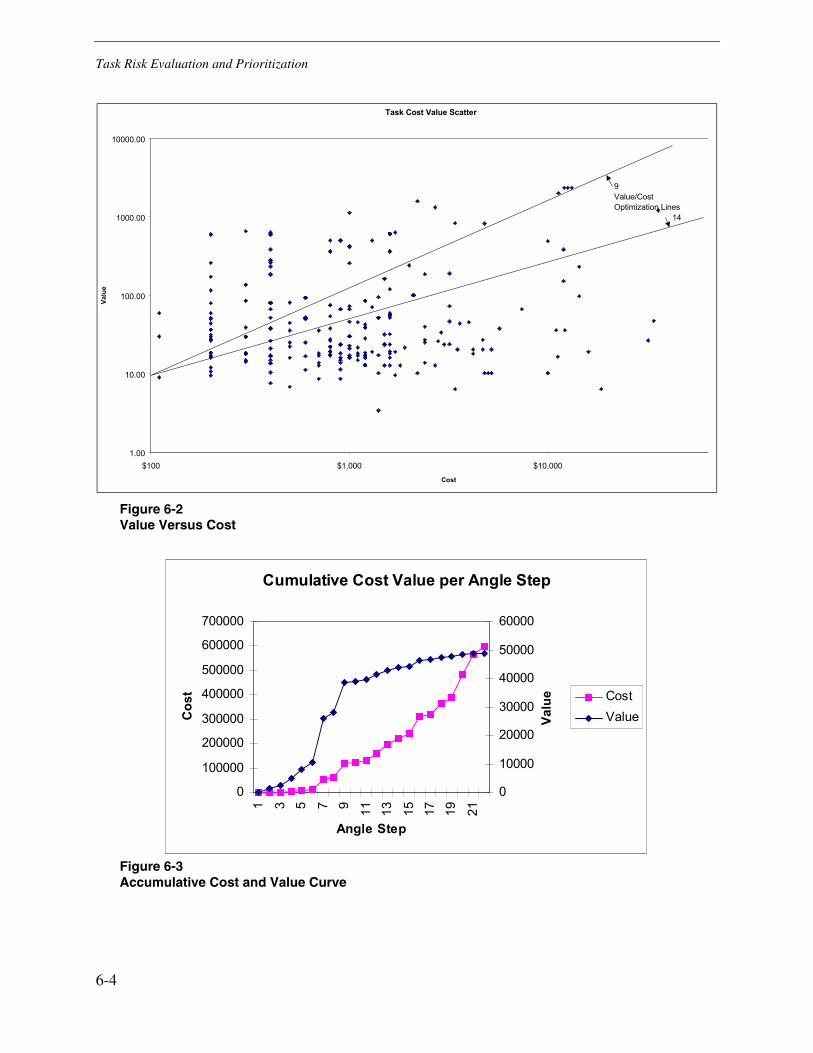
Task Risk Evaluation and Prioritization
6-4
Task Cost Value Scatter
1.00
10.00
100.00
1000.00
10000.00
$100 $1,000 $10,000Cost
Valu
e
9 Value/Cost Optimization Lines 14
Figure 6-2 Value Versus Cost
Figure 6-3 Accumulative Cost and Value Curve
Cumulative Cost Value per Angle Step
0
100000
200000
300000
400000
500000
600000
700000
1 3 5 7 9 11 13 15 17 19 21
Angle Step
Cos
t
0
10000
20000
30000
40000
50000
60000
Valu
e CostValue
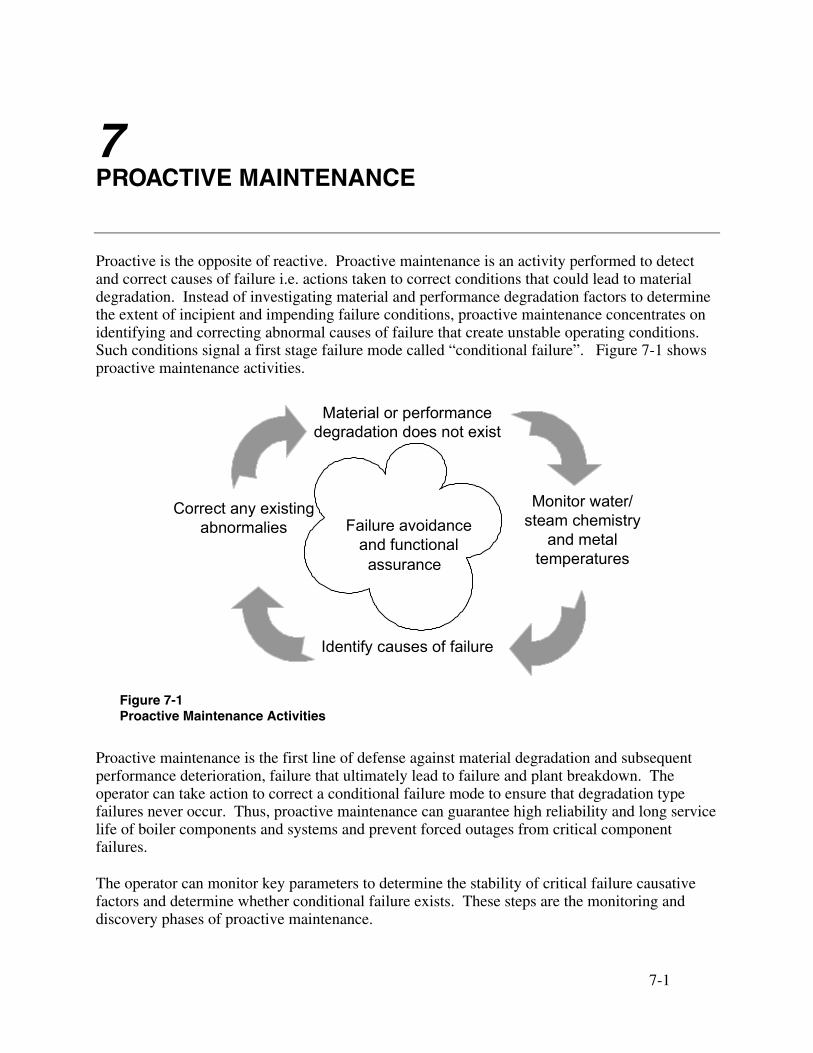
7-1
7 PROACTIVE MAINTENANCE
Proactive is the opposite of reactive. Proactive maintenance is an activity performed to detect and correct causes of failure i.e. actions taken to correct conditions that could lead to material degradation. Instead of investigating material and performance degradation factors to determine the extent of incipient and impending failure conditions, proactive maintenance concentrates on identifying and correcting abnormal causes of failure that create unstable operating conditions. Such conditions signal a first stage failure mode called “conditional failure”. Figure 7-1 shows proactive maintenance activities.
Failure avoidanceand functional
assirance
Material or performancedegradation does not exist
Correct any existingabnormalies
Monitor water/steam chemistry
and metaltemperatures
Identify causes of failure
assurance
Figure 7-1 Proactive Maintenance Activities
Proactive maintenance is the first line of defense against material degradation and subsequent performance deterioration, failure that ultimately lead to failure and plant breakdown. The operator can take action to correct a conditional failure mode to ensure that degradation type failures never occur. Thus, proactive maintenance can guarantee high reliability and long service life of boiler components and systems and prevent forced outages from critical component failures.
The operator can monitor key parameters to determine the stability of critical failure causative factors and determine whether conditional failure exists. These steps are the monitoring and discovery phases of proactive maintenance.
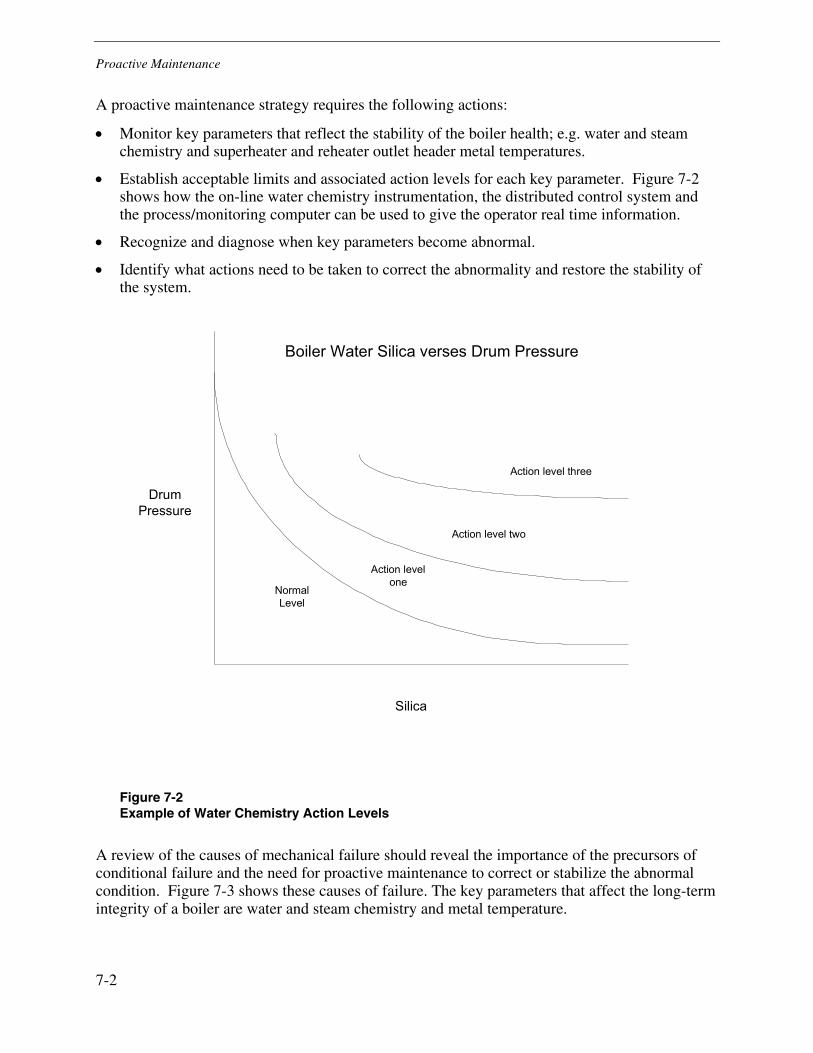
Proactive Maintenance
7-2
A proactive maintenance strategy requires the following actions:
• Monitor key parameters that reflect the stability of the boiler health; e.g. water and steam chemistry and superheater and reheater outlet header metal temperatures.
• Establish acceptable limits and associated action levels for each key parameter. Figure 7-2 shows how the on-line water chemistry instrumentation, the distributed control system and the process/monitoring computer can be used to give the operator real time information.
• Recognize and diagnose when key parameters become abnormal.
• Identify what actions need to be taken to correct the abnormality and restore the stability of the system.
Figure 7-2 Example of Water Chemistry Action Levels
A review of the causes of mechanical failure should reveal the importance of the precursors of conditional failure and the need for proactive maintenance to correct or stabilize the abnormal condition. Figure 7-3 shows these causes of failure. The key parameters that affect the long-term integrity of a boiler are water and steam chemistry and metal temperature.
Boiler Water Silica verses Drum Pressure
Silica
DrumPressure
NormalLevel
Action levelone
Action level two
Action level three
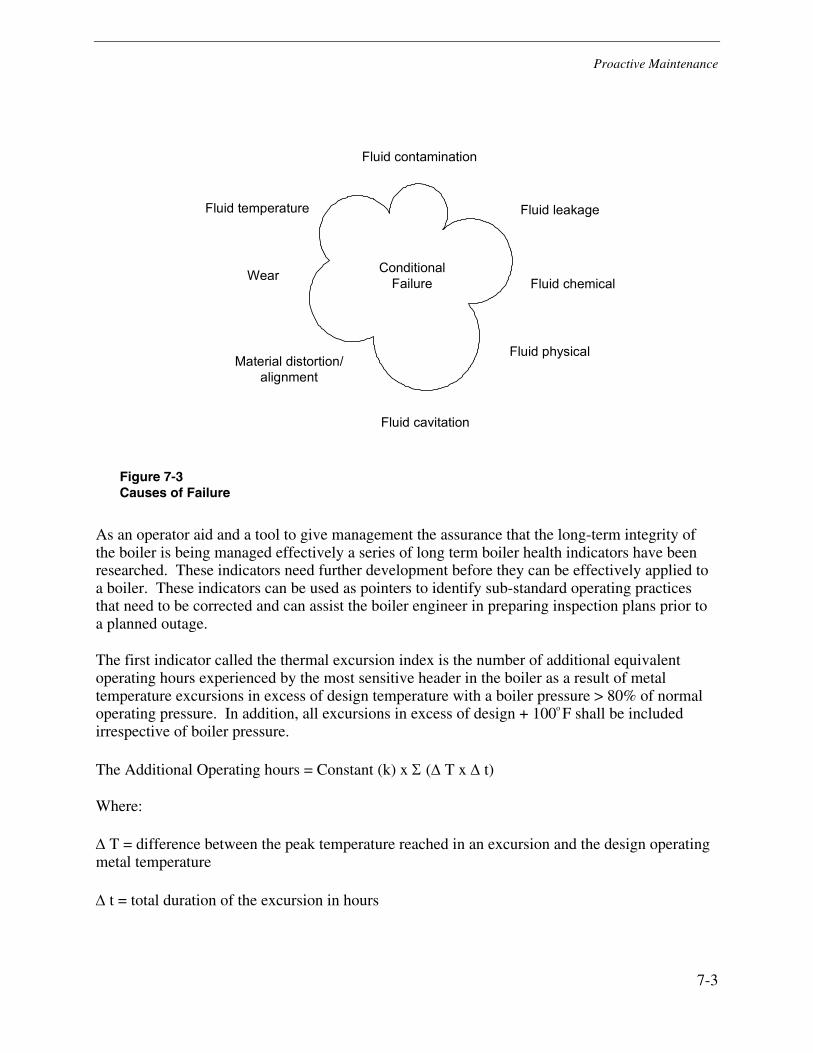
Proactive Maintenance
7-3
Figure 7-3 Causes of Failure
As an operator aid and a tool to give management the assurance that the long-term integrity of the boiler is being managed effectively a series of long term boiler health indicators have been researched. These indicators need further development before they can be effectively applied to a boiler. These indicators can be used as pointers to identify sub-standard operating practices that need to be corrected and can assist the boiler engineer in preparing inspection plans prior to a planned outage.
The first indicator called the thermal excursion index is the number of additional equivalent operating hours experienced by the most sensitive header in the boiler as a result of metal temperature excursions in excess of design temperature with a boiler pressure > 80% of normal operating pressure. In addition, all excursions in excess of design + 100o F shall be included irrespective of boiler pressure.
The Additional Operating hours = Constant (k) x Σ (∆ T x ∆ t)
Where:
∆ T = difference between the peak temperature reached in an excursion and the design operating metal temperature
∆ t = total duration of the excursion in hours
Fluid contamination
Fluid physical
Fluid cavitation
Material distortion/alignment
Wear
Fluid temperature Fluid leakage
Fluid chemicalConditional
Failure
Proactive Maintenance
7-4
Constant (k) = approximation, assuming a straight-line relationship between elevated temperatures and equivalent operating hours.
Thermal index = Additional Operating hours x Total hours in month divided by Σ of unit operating hours for that month.
The second indicator is called the chemical excursion index is a set of indices in which on-line measurements are taken of chemical conditions of feedwater and steam are normalized. The actual values are manipulated mathematically to give a result that is of the order of one. A result of 0.5 is excellent and greater than 0.9 is considered unacceptable. Results of between 0.6 and 0.9 indicate chemical condition under control and no risk to long term health. Results between 0.9 and 1 are acceptable for short duration only. Results greater than 1 require immediate action by the operator. These results can be represented in a bar chart and displayed to the operator
Therefore, the chemical index = Σ of all incidents of unit parameters > 0.9 for current month x total hours in month divided by Σ of operating hours for the current month
The above two indices are operator aids in implementing a proactive maintenance strategy.
Another index relevant to the long term integrity of the boiler is the trip index – the trip index is the accumulative total number of automatic and manual trips of the unit. This will give an indication of the number of stress cycles the plant has been subjected to no matter what was the cause
Trip Index = Σ of all trips for current month x total hours in the month divided by sum of unit operating hours for the month
Further research and development needs to be undertaken to verify and validate these indices.
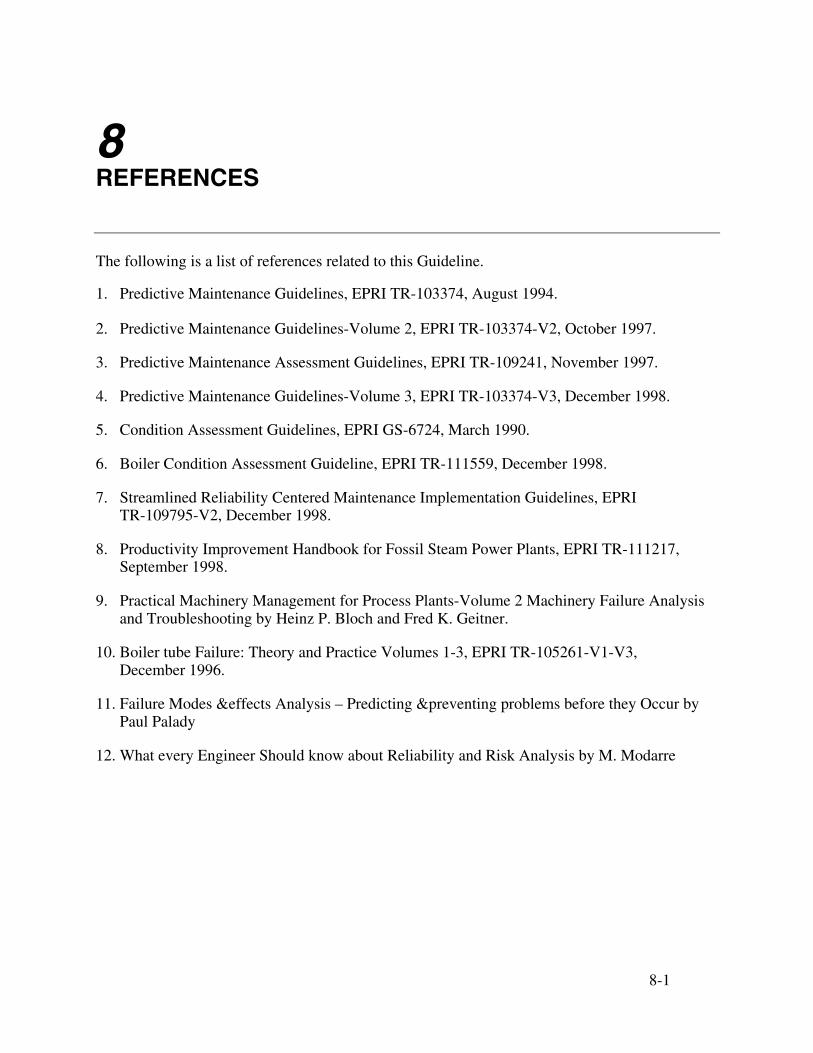
8-1
8 REFERENCES
The following is a list of references related to this Guideline.
1. Predictive Maintenance Guidelines, EPRI TR-103374, August 1994.
2. Predictive Maintenance Guidelines-Volume 2, EPRI TR-103374-V2, October 1997.
3. Predictive Maintenance Assessment Guidelines, EPRI TR-109241, November 1997.
4. Predictive Maintenance Guidelines-Volume 3, EPRI TR-103374-V3, December 1998.
5. Condition Assessment Guidelines, EPRI GS-6724, March 1990.
6. Boiler Condition Assessment Guideline, EPRI TR-111559, December 1998.
7. Streamlined Reliability Centered Maintenance Implementation Guidelines, EPRI TR-109795-V2, December 1998.
8. Productivity Improvement Handbook for Fossil Steam Power Plants, EPRI TR-111217, September 1998.
9. Practical Machinery Management for Process Plants-Volume 2 Machinery Failure Analysis and Troubleshooting by Heinz P. Bloch and Fred K. Geitner.
10. Boiler tube Failure: Theory and Practice Volumes 1-3, EPRI TR-105261-V1-V3, December 1996.
11. Failure Modes &effects Analysis – Predicting &preventing problems before they Occur by Paul Palady
12. What every Engineer Should know about Reliability and Risk Analysis by M. Modarre


© 2001 Electric Power Research Institute (EPRI), Inc.All rightsreserved. Electric Power Research Institute and EPRI are registeredservice marks of the Electric Power Research Institute, Inc.EPRI. ELECTRIFY THE WORLD is a service mark of the ElectricPower Research Institute, Inc.
Printed on recycled paper in the United States of America
1004018
Target:
Predictive Maintenance Program Developmentand Diagnostic Tools
EPRI • 3412 Hillview Avenue, Palo Alto, California 94304 • PO Box 10412, Palo Alto, California 94303 • USA800.313.3774 • 650.855.2121 • [email protected] • www.epri.com
About EPRI
EPRI creates science and technology solutions for
the global energy and energy services industry. U.S.
electric utilities established the Electric Power
Research Institute in 1973 as a nonprofit research
consortium for the benefit of utility members, their
customers, and society. Now known simply as EPRI,
the company provides a wide range of innovative
products and services to more than 1000 energy-
related organizations in 40 countries. EPRI’s
multidisciplinary team of scientists and engineers
draws on a worldwide network of technical and
business expertise to help solve today’s toughest
energy and environmental problems.
EPRI. Electrify the World