atomistic simulations of fatigue crack growth and the associated fatigue crack tip stress evolution...
TRANSCRIPT
Computational Materials Science 50 (2011) 2977–2986
Contents lists available at ScienceDirect
Computational Materials Science
journal homepage: www.elsevier .com/locate /commatsci
Atomistic simulations of fatigue crack growth and the associated fatiguecrack tip stress evolution in magnesium single crystals
Tian Tang a,⇑, Sungho Kim a, J.B. Jordon b, M.F. Horstemeyer a, Paul T. Wang a
a Center for Advanced Vehicular System, Mississippi State University, Box 5405, Mississippi State, MS 39762, USAb Department of Mechanical Engineering, The University of Alabama, Tuscaloosa, AL 35487, USA
a r t i c l e i n f o a b s t r a c t
Article history:Received 20 January 2011Received in revised form 6 April 2011Accepted 9 May 2011Available online 11 June 2011
Keywords:Atomistic simulationAtomic stress fieldFatigue crack growthMagnesium single crystalsEAMCrystal orientations
0927-0256/$ - see front matter � 2011 Elsevier B.V. Adoi:10.1016/j.commatsci.2011.05.016
⇑ Corresponding author. Tel.: +1 662 3259222.E-mail address: [email protected] (T. Ta
Using Large-scale Atomic Molecular Massively Parallel Simulator (LAMMPS), a classical moleculardynamics code, atomistic simulations were performed to investigate the fatigue crack growth rate andthe evolution of the associated atomic stress fields near the crack tip during fatigue crack growth in mag-nesium single crystals. The interatomic bonds of atoms were described using the EAM potential. Thespecimens with initial edge cracks were subjected to uniaxial Mode I cyclic loading. For the sake ofrevealing the influence of the initial cracks’ crystal orientations, three different orientations were consid-ered. The fatigue growth rate can be expressed by da/dN = cCTOD, where the values of constant c aredetermined by the atomistic simulations. Notably, the values of the constant c are much larger for mag-nesium single crystals than for FCC single crystals and vary widely from one orientation to another. Thesimulation results show that the evolution of atomic stress fields was highly dependent on the crystalorientations due to anisotropy and magnesium single crystals’ HCP structure. Interestingly, the von Misesstress or normal stress around the crack tip controlled the fatigue crack growth behaviors.
� 2011 Elsevier B.V. All rights reserved.
1. Introduction
Since the last century, large research efforts have been devotedto the area of fatigue fracture, which is the primary cause of failurefor nearly all mechanical structures under cyclic loading (seeSuresh [1] and the cited references therein). The continuum theo-retical framework of fatigue fracture has been well established atthe macroscale, and therein macroscopic fracture phenomena arevisible. However, the essence of fatigue fracture emerges fromthe details of interatomic bond rupture as well as plastic deforma-tion and the associated defects (e.g., dislocations, twins, and slipbands) that are generated in the vicinity of the crack tip [2–6]. Inlight of fracture behavior similarities at both the macroscale andnanoscale, atomistic simulations of fatigue fracture at the nano-scale can provide helpful descriptions and anticipate implicationsfor macroscopic fracture events. In fact, with rapid developmentin recent years of massively parallel computers, Molecular Dynam-ics (MD) has become the preferred method to investigate materialfracture events [7–17].
MD simulations [18,19] have revealed that atomic stress nearthe crack tip, rather than surface energy, controls crack propaga-tion behavior. Thus, a better understanding of this phenomenoncan enhance our understanding of fracture behaviors at the nano-scale. Krull and Yuan [20] derived their suggested additions to the
ll rights reserved.
ng).
cohesive traction–separation law from atomistic simulations ofcrack growth in a nano-cracked ductile single crystal specimen.Furthermore, the simulation results of Xu and Deng [18] and Krulland Yuan [20] imply that von Mises stress does not play a role inthe ductile material failure at the nanoscale. Most MD simulationsof fatigue fracture or fracture behaviors under uniaxial tensionloading have been carried out on FCC metals; although very re-cently, Tang et al. [21] used MD simulations to investigate the fa-tigue crack propagation behavior of an HCP magnesium singlecrystal, showing fatigue crack growth’s strong dependence on thecrystal orientations.
In this paper, the atomic stress near the fatigue crack tip in anHCP magnesium single crystal was analyzed using MD simulationswith LAMMPS (Large-scale Atomic Molecular Massively ParallelSimulator). Edge crack specimens were used to obtain the fatiguecrack growth rates and the atomic stress fields, and implicationsof atomic stress fields on the fatigue crack growth behavior wereexamined.
2. Simulation details
2.1. Interatomic potential and stress definition
The interatomic potential used in this study is an EmbeddedAtom Method (EAM) potential developed by Sun et al. [22]. Thisform of EAM consists of two contributions to the total potential
z (periodic)
x
y
w
H
Thickness t
a
fixed layer
fixed layer
0
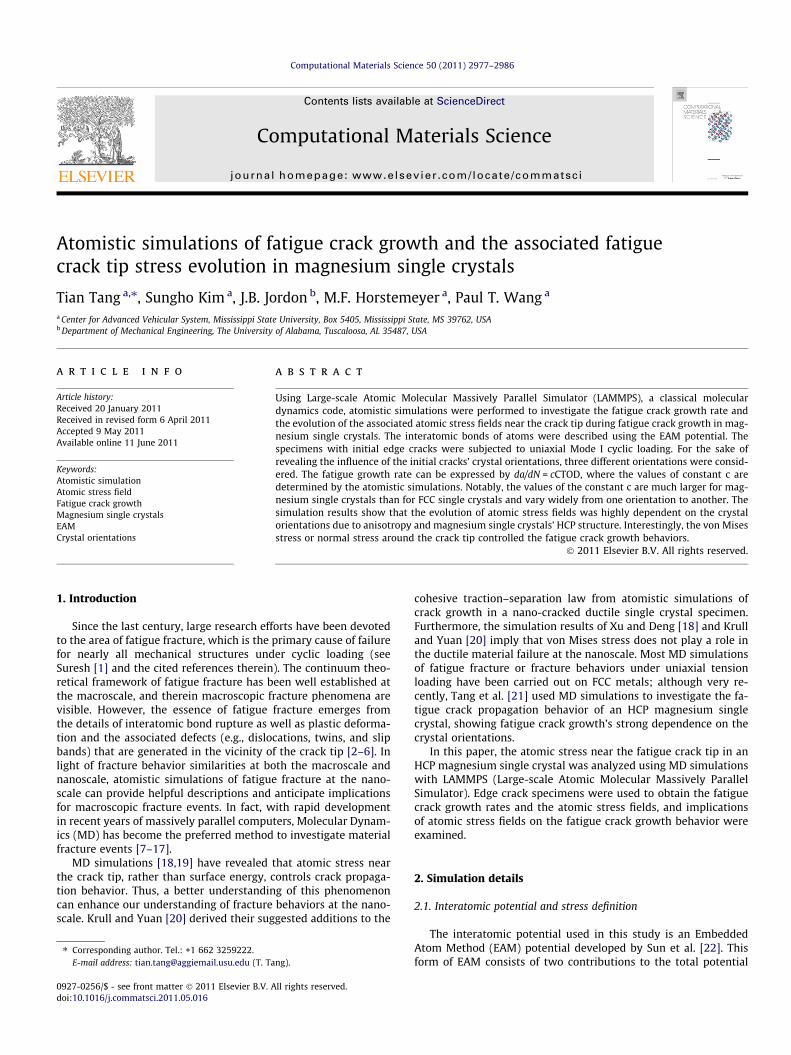
Fig. 1. Edge crack specimen used for the simulation of fatigue crack growth.
2978 T. Tang et al. / Computational Materials Science 50 (2011) 2977–2986
energy E of the entire system composed of N atoms. The functionalform of the total embedded energy can be expressed as
E ¼X
i
Gi
Xj–i
qaj ðrijÞ
!þ 1
2
Xij
UijðrijÞ ð1Þ
where Gi is the embedding energy as a function of the local electrondensity, qa
j is the spherically-averaged atomic electron density, Uij isthe pair potential, and rij is the distance between atoms i and j.Many examples have demonstrated that EAM can be an accuraterepresentation of interatomic forces in a metallic lattice. In MD,the energy is employed to determine the forces acting on eachatom. At each atom the dipole force tensor bij, is given by
bikm ¼
1
Xi
XN
jð–iÞf ikðrijÞrij
m ð2Þ
where fk is the force vector between atoms, rm is the displacementvector between atoms i and j, N is the number of nearest neighboratoms, and Xi is the atomic volume. If stress could be defined atom-ically, then bij would be the stress tensor at that point. Since stress isdefined at a continuum point, the stress tensor can be determinedas a volume average over the block of material, similar to Horste-meyer et al. [28–30]:
rmk ¼1
N�XN�
i
bimk ð3Þ
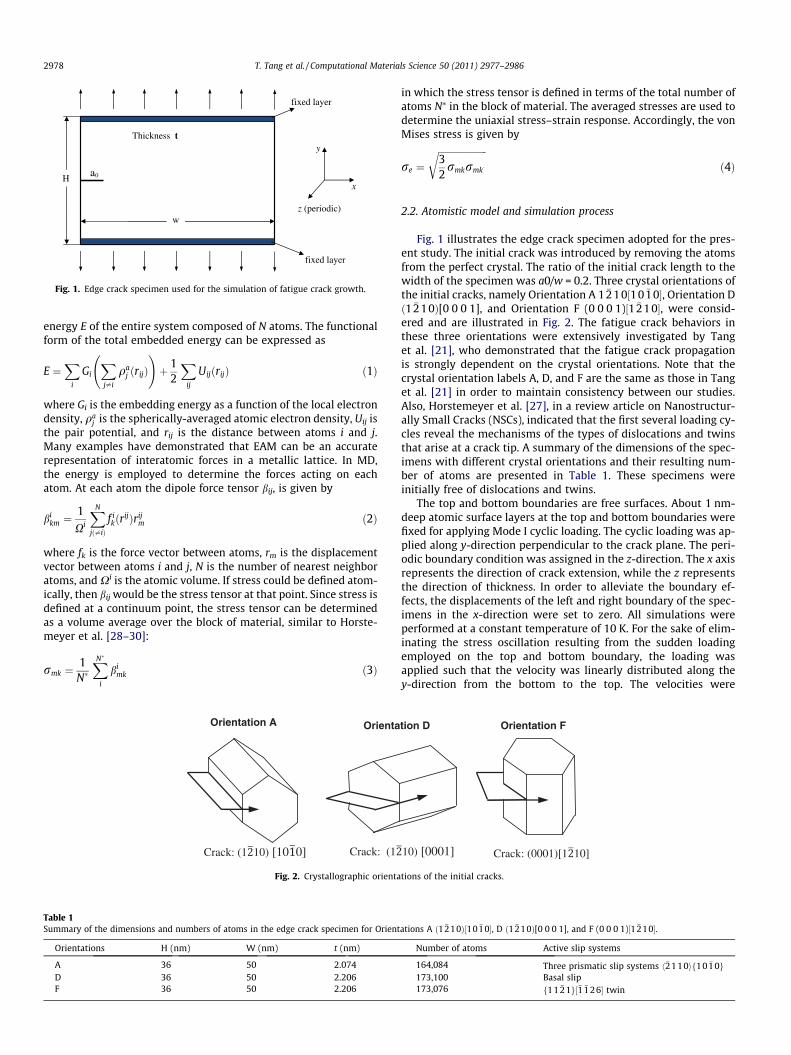
Fig. 2. Crystallographic orienta
Table 1Summary of the dimensions and numbers of atoms in the edge crack specimen for Orient
Orientations H (nm) W (nm) t (nm)
A 36 50 2.074D 36 50 2.206F 36 50 2.206
in which the stress tensor is defined in terms of the total number ofatoms N⁄ in the block of material. The averaged stresses are used todetermine the uniaxial stress–strain response. Accordingly, the vonMises stress is given by
re ¼ffiffiffiffiffiffiffiffiffiffiffiffiffiffiffiffiffiffiffiffiffi32rmkrmk�
rð4Þ
2.2. Atomistic model and simulation process
Fig. 1 illustrates the edge crack specimen adopted for the pres-ent study. The initial crack was introduced by removing the atomsfrom the perfect crystal. The ratio of the initial crack length to thewidth of the specimen was a0/w = 0.2. Three crystal orientations ofthe initial cracks, namely Orientation A 1 �210½10 �10�, Orientation Dð1 �210Þ[0 0 0 1], and Orientation F (0 0 0 1)½1 �210�, were consid-ered and are illustrated in Fig. 2. The fatigue crack behaviors inthese three orientations were extensively investigated by Tanget al. [21], who demonstrated that the fatigue crack propagationis strongly dependent on the crystal orientations. Note that thecrystal orientation labels A, D, and F are the same as those in Tanget al. [21] in order to maintain consistency between our studies.Also, Horstemeyer et al. [27], in a review article on Nanostructur-ally Small Cracks (NSCs), indicated that the first several loading cy-cles reveal the mechanisms of the types of dislocations and twinsthat arise at a crack tip. A summary of the dimensions of the spec-imens with different crystal orientations and their resulting num-ber of atoms are presented in Table 1. These specimens wereinitially free of dislocations and twins.
The top and bottom boundaries are free surfaces. About 1 nm-deep atomic surface layers at the top and bottom boundaries werefixed for applying Mode I cyclic loading. The cyclic loading was ap-plied along y-direction perpendicular to the crack plane. The peri-odic boundary condition was assigned in the z-direction. The x axisrepresents the direction of crack extension, while the z representsthe direction of thickness. In order to alleviate the boundary ef-fects, the displacements of the left and right boundary of the spec-imens in the x-direction were set to zero. All simulations wereperformed at a constant temperature of 10 K. For the sake of elim-inating the stress oscillation resulting from the sudden loadingemployed on the top and bottom boundary, the loading wasapplied such that the velocity was linearly distributed along they-direction from the bottom to the top. The velocities were
tions of the initial cracks.
ations A ð1 �210Þ½10 �10�, D ð1 �210Þ[0 0 0 1], and F (0 0 0 1)½1 �210�.
Number of atoms Active slip systems
164,084 Three prismatic slip systems h�2110if10 �10g173,100 Basal slip173,076 f11 �21g½�1 �1 26� twin
Dislocations emitted from the crack tip
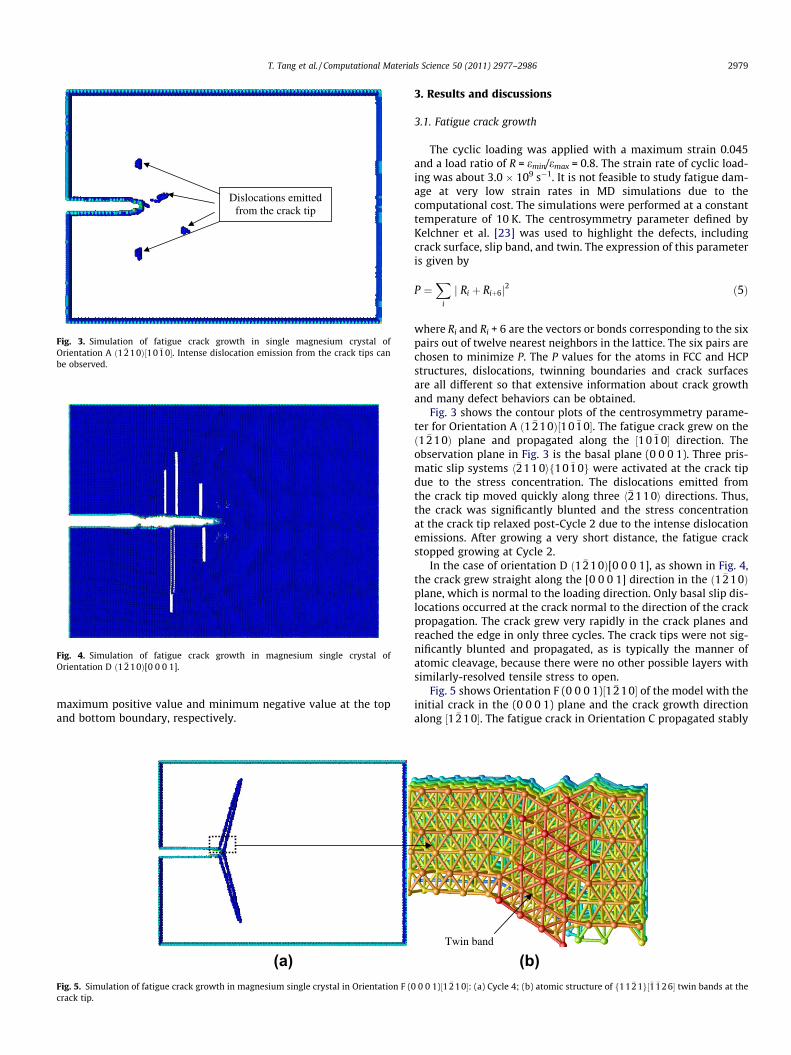
Fig. 3. Simulation of fatigue crack growth in single magnesium crystal ofOrientation A ð1 �21 0Þ½10 �10�. Intense dislocation emission from the crack tips canbe observed.
Fig. 4. Simulation of fatigue crack growth in magnesium single crystal ofOrientation D ð1 �210Þ[0 0 0 1].
T. Tang et al. / Computational Materials Science 50 (2011) 2977–2986 2979
maximum positive value and minimum negative value at the topand bottom boundary, respectively.
Fig. 5. Simulation of fatigue crack growth in magnesium single crystal in Orientation F (0crack tip.
3. Results and discussions
3.1. Fatigue crack growth
The cyclic loading was applied with a maximum strain 0.045and a load ratio of R = emin/emax = 0.8. The strain rate of cyclic load-ing was about 3.0 � 109 s�1. It is not feasible to study fatigue dam-age at very low strain rates in MD simulations due to thecomputational cost. The simulations were performed at a constanttemperature of 10 K. The centrosymmetry parameter defined byKelchner et al. [23] was used to highlight the defects, includingcrack surface, slip band, and twin. The expression of this parameteris given by
P ¼X
i
j Ri þ Riþ6j2 ð5Þ
where Ri and Ri + 6 are the vectors or bonds corresponding to the sixpairs out of twelve nearest neighbors in the lattice. The six pairs arechosen to minimize P. The P values for the atoms in FCC and HCPstructures, dislocations, twinning boundaries and crack surfacesare all different so that extensive information about crack growthand many defect behaviors can be obtained.
Fig. 3 shows the contour plots of the centrosymmetry parame-ter for Orientation A ð1 �210Þ½10 �10�. The fatigue crack grew on theð1 �210Þ plane and propagated along the ½10 �10� direction. Theobservation plane in Fig. 3 is the basal plane (0 0 0 1). Three pris-matic slip systems h�2110if10 �10g were activated at the crack tipdue to the stress concentration. The dislocations emitted fromthe crack tip moved quickly along three h�2110i directions. Thus,the crack was significantly blunted and the stress concentrationat the crack tip relaxed post-Cycle 2 due to the intense dislocationemissions. After growing a very short distance, the fatigue crackstopped growing at Cycle 2.
In the case of orientation D ð1 �210Þ[0 0 0 1], as shown in Fig. 4,the crack grew straight along the [0 0 0 1] direction in the ð1 �210Þplane, which is normal to the loading direction. Only basal slip dis-locations occurred at the crack normal to the direction of the crackpropagation. The crack grew very rapidly in the crack planes andreached the edge in only three cycles. The crack tips were not sig-nificantly blunted and propagated, as is typically the manner ofatomic cleavage, because there were no other possible layers withsimilarly-resolved tensile stress to open.
Fig. 5 shows Orientation F (0 0 0 1)½1 �210� of the model with theinitial crack in the (0 0 0 1) plane and the crack growth directionalong ½1 �210�. The fatigue crack in Orientation C propagated stably
Twin band
0 0 1)½1 �2 10�: (a) Cycle 4; (b) atomic structure of f11 �2 1g½�1 �12 6� twin bands at the
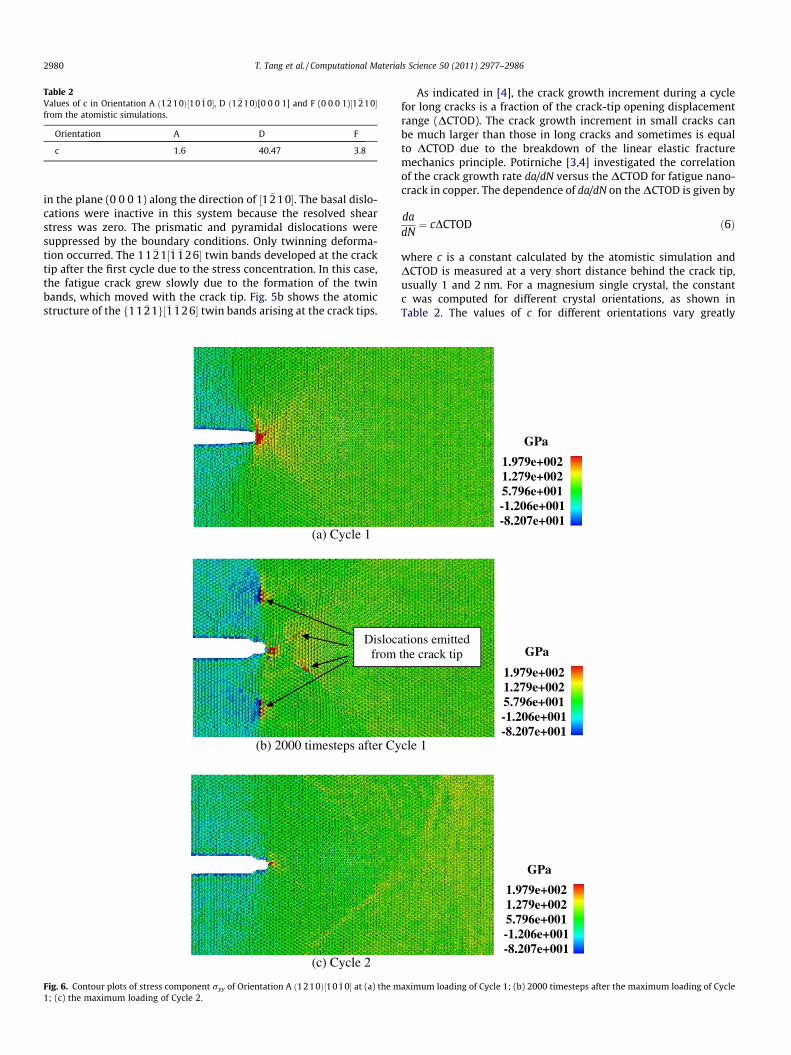
Table 2Values of c in Orientation A ð1 �210Þ½10 �10�, D ð1 �210Þ[0 0 0 1] and F (0 0 0 1)½1 �210�from the atomistic simulations.
Orientation A D F
c 1.6 40.47 3.8
2980 T. Tang et al. / Computational Materials Science 50 (2011) 2977–2986
in the plane (0 0 0 1) along the direction of ½1 �210�. The basal dislo-cations were inactive in this system because the resolved shearstress was zero. The prismatic and pyramidal dislocations weresuppressed by the boundary conditions. Only twinning deforma-tion occurred. The 11 �21½�1 �126� twin bands developed at the cracktip after the first cycle due to the stress concentration. In this case,the fatigue crack grew slowly due to the formation of the twinbands, which moved with the crack tip. Fig. 5b shows the atomicstructure of the f11 �21g½�1 �126� twin bands arising at the crack tips.
(a) Cycle 1
(b) 2000 timesteps after Cy
Dislocafrom
(c) Cycle 2
Fig. 6. Contour plots of stress component ryy of Orientation A ð1 �210Þ½1 0 �10� at (a) the m1; (c) the maximum loading of Cycle 2.
As indicated in [4], the crack growth increment during a cyclefor long cracks is a fraction of the crack-tip opening displacementrange (DCTOD). The crack growth increment in small cracks canbe much larger than those in long cracks and sometimes is equalto DCTOD due to the breakdown of the linear elastic fracturemechanics principle. Potirniche [3,4] investigated the correlationof the crack growth rate da/dN versus the DCTOD for fatigue nano-crack in copper. The dependence of da/dN on the DCTOD is given by
dadN¼ cDCTOD ð6Þ
where c is a constant calculated by the atomistic simulation andDCTOD is measured at a very short distance behind the crack tip,usually 1 and 2 nm. For a magnesium single crystal, the constantc was computed for different crystal orientations, as shown inTable 2. The values of c for different orientations vary greatly
GPa
1.979e+002 1.279e+002 5.796e+001 -1.206e+001 -8.207e+001
cle 1
tions emitted the crack tip GPa
1.979e+002 1.279e+002 5.796e+001 -1.206e+001 -8.207e+001
GPa
1.979e+002 1.279e+002 5.796e+001 -1.206e+001 -8.207e+001
aximum loading of Cycle 1; (b) 2000 timesteps after the maximum loading of Cycle
(a) Cycle 1
GPa
4.987e+002 3.750e+002 2.512e+002 1.273e+002 3.548e+000
(b) 2000 timesteps after Cycle 1
Dislocations emitted from the crack tip GPa
4.987e+002 3.750e+002 2.512e+002 1.273e+002 3.548e+000
(c) Cycle 2
GPa
4.987e+002 3.750e+002 2.512e+002 1.273e+002 3.548e+000
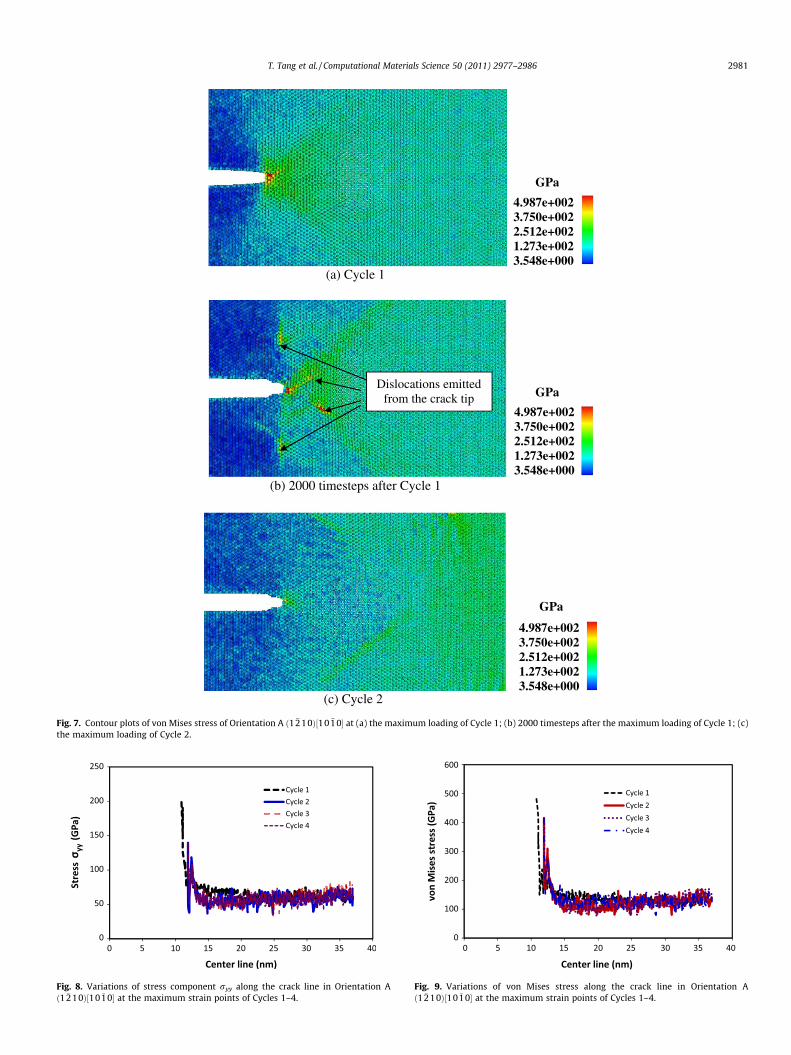
Fig. 7. Contour plots of von Mises stress of Orientation A ð1 �210Þ½10 �1 0� at (a) the maximum loading of Cycle 1; (b) 2000 timesteps after the maximum loading of Cycle 1; (c)the maximum loading of Cycle 2.
Fig. 8. Variations of stress component ryy along the crack line in Orientation Að1 �210Þ½10 �10� at the maximum strain points of Cycles 1–4.
Fig. 9. Variations of von Mises stress along the crack line in Orientation Að1 �2 10Þ½10 �10� at the maximum strain points of Cycles 1–4.
T. Tang et al. / Computational Materials Science 50 (2011) 2977–2986 2981
(a) Cycle 1
GPa
2.253e+002 7.012e+001 -8.507e+001 -2.403e+002 -3.956e+002
(b) Cycle 2
GPa
2.253e+002 7.012e+001 -8.507e+001 -2.403e+002 -3.956e+002
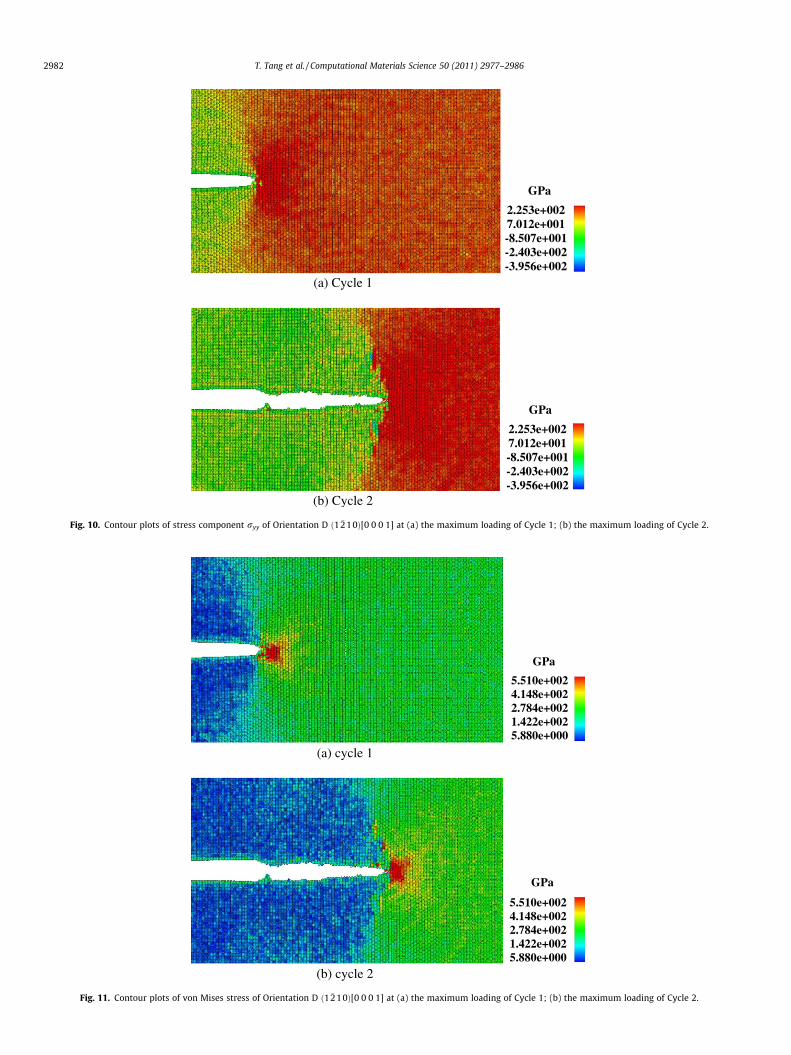
Fig. 10. Contour plots of stress component ryy of Orientation D ð1 �210Þ[0 0 0 1] at (a) the maximum loading of Cycle 1; (b) the maximum loading of Cycle 2.
(a) cycle 1
GPa
5.510e+002 4.148e+002 2.784e+002 1.422e+002 5.880e+000
(b) cycle 2
GPa
5.510e+002 4.148e+002 2.784e+002 1.422e+002 5.880e+000
Fig. 11. Contour plots of von Mises stress of Orientation D ð1 �210Þ[0 0 0 1] at (a) the maximum loading of Cycle 1; (b) the maximum loading of Cycle 2.
2982 T. Tang et al. / Computational Materials Science 50 (2011) 2977–2986
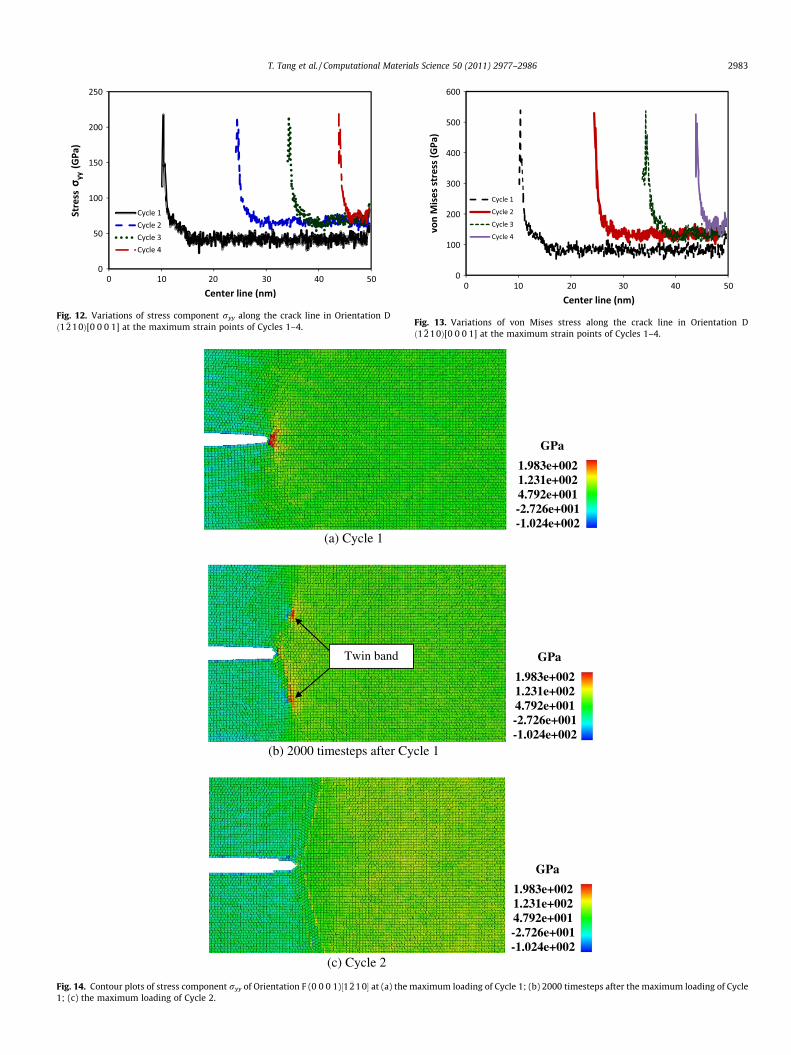
Fig. 12. Variations of stress component ryy along the crack line in Orientation Dð1 �210Þ[0 0 0 1] at the maximum strain points of Cycles 1–4. Fig. 13. Variations of von Mises stress along the crack line in Orientation D
ð1 �2 10Þ[0 0 0 1] at the maximum strain points of Cycles 1–4.
(a) Cycle 1
GPa
1.983e+002 1.231e+002 4.792e+001 -2.726e+001 -1.024e+002
(b) 2000 timesteps after Cycle 1
Twin band GPa
1.983e+002 1.231e+002 4.792e+001 -2.726e+001 -1.024e+002
(c) Cycle 2
GPa
1.983e+002 1.231e+002 4.792e+001 -2.726e+001 -1.024e+002
Fig. 14. Contour plots of stress component ryy of Orientation F (0 0 0 1)½1 �21 0� at (a) the maximum loading of Cycle 1; (b) 2000 timesteps after the maximum loading of Cycle1; (c) the maximum loading of Cycle 2.
T. Tang et al. / Computational Materials Science 50 (2011) 2977–2986 2983
(a) Cycle 1
GPa
3.764e+002 2.904 e+002 2.044e+002 9.837e+001 2.655e+000
(b) 2000 timesteps after Cycle 1
Twin band GPa
3.764e+002 2.904 e+002 2.044e+002 9.837e+001 2.655e+000
(c) Cycle 2
GPa
3.764e+002 2.904 e+002 2.044e+002 9.837e+001 2.655e+000
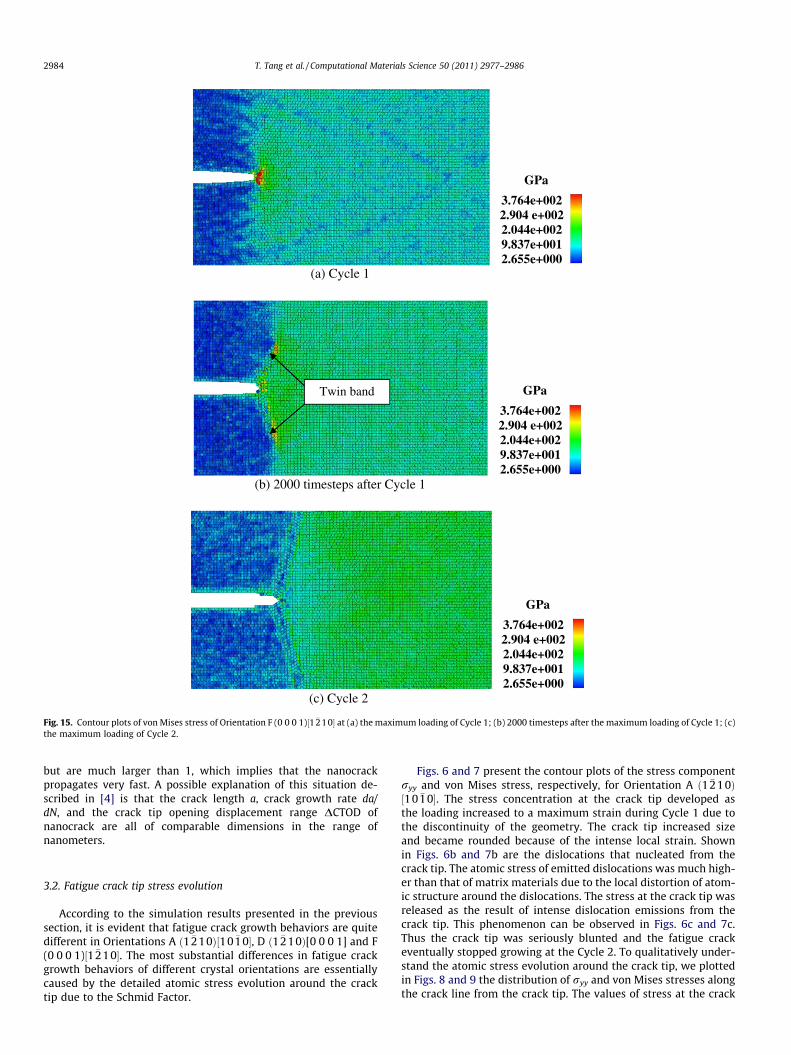
Fig. 15. Contour plots of von Mises stress of Orientation F (0 0 0 1)½1 �210� at (a) the maximum loading of Cycle 1; (b) 2000 timesteps after the maximum loading of Cycle 1; (c)the maximum loading of Cycle 2.
2984 T. Tang et al. / Computational Materials Science 50 (2011) 2977–2986
but are much larger than 1, which implies that the nanocrackpropagates very fast. A possible explanation of this situation de-scribed in [4] is that the crack length a, crack growth rate da/dN, and the crack tip opening displacement range DCTOD ofnanocrack are all of comparable dimensions in the range ofnanometers.
3.2. Fatigue crack tip stress evolution
According to the simulation results presented in the previoussection, it is evident that fatigue crack growth behaviors are quitedifferent in Orientations A ð1 �210Þ½10 �10�, D ð1 �210Þ[0 0 0 1] and F(0 0 0 1)½1 �210�. The most substantial differences in fatigue crackgrowth behaviors of different crystal orientations are essentiallycaused by the detailed atomic stress evolution around the cracktip due to the Schmid Factor.
Figs. 6 and 7 present the contour plots of the stress componentryy and von Mises stress, respectively, for Orientation A ð1 �210Þ½10 �10�. The stress concentration at the crack tip developed asthe loading increased to a maximum strain during Cycle 1 due tothe discontinuity of the geometry. The crack tip increased sizeand became rounded because of the intense local strain. Shownin Figs. 6b and 7b are the dislocations that nucleated from thecrack tip. The atomic stress of emitted dislocations was much high-er than that of matrix materials due to the local distortion of atom-ic structure around the dislocations. The stress at the crack tip wasreleased as the result of intense dislocation emissions from thecrack tip. This phenomenon can be observed in Figs. 6c and 7c.Thus the crack tip was seriously blunted and the fatigue crackeventually stopped growing at the Cycle 2. To qualitatively under-stand the atomic stress evolution around the crack tip, we plottedin Figs. 8 and 9 the distribution of ryy and von Mises stresses alongthe crack line from the crack tip. The values of stress at the crack
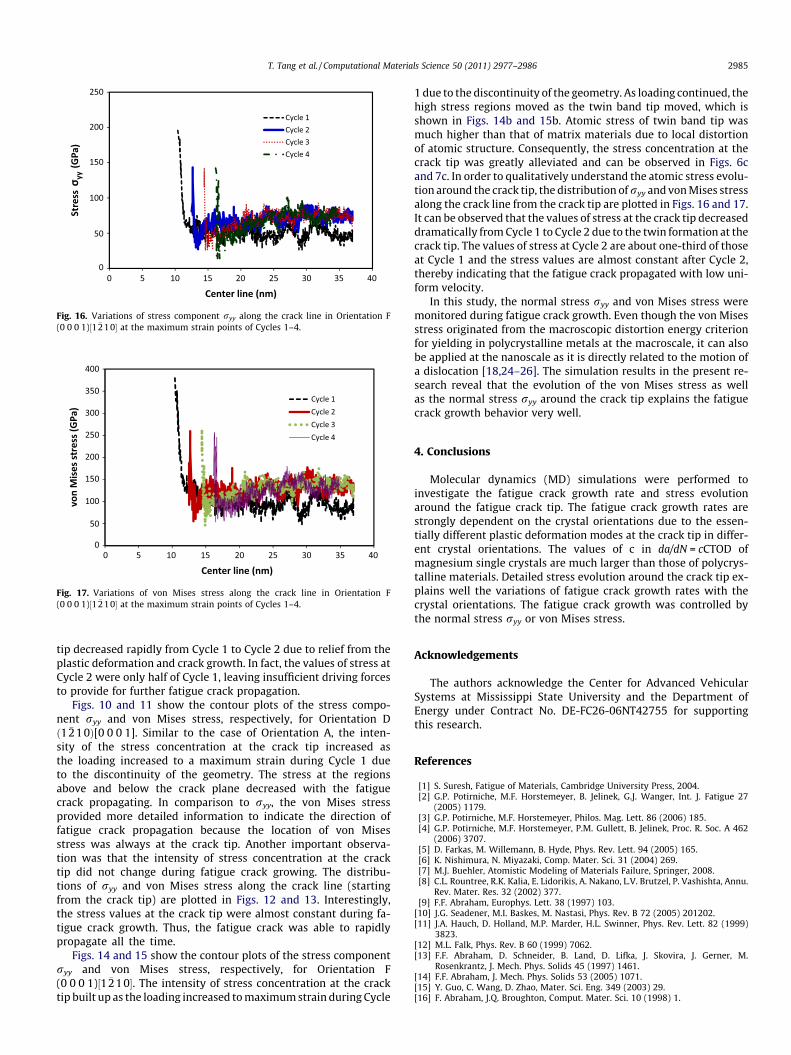
Fig. 16. Variations of stress component ryy along the crack line in Orientation F(0 0 0 1)½1 �210� at the maximum strain points of Cycles 1–4.
Fig. 17. Variations of von Mises stress along the crack line in Orientation F(0 0 0 1)½1 �210� at the maximum strain points of Cycles 1–4.
T. Tang et al. / Computational Materials Science 50 (2011) 2977–2986 2985
tip decreased rapidly from Cycle 1 to Cycle 2 due to relief from theplastic deformation and crack growth. In fact, the values of stress atCycle 2 were only half of Cycle 1, leaving insufficient driving forcesto provide for further fatigue crack propagation.
Figs. 10 and 11 show the contour plots of the stress compo-nent ryy and von Mises stress, respectively, for Orientation Dð1 �210Þ[0 0 0 1]. Similar to the case of Orientation A, the inten-sity of the stress concentration at the crack tip increased asthe loading increased to a maximum strain during Cycle 1 dueto the discontinuity of the geometry. The stress at the regionsabove and below the crack plane decreased with the fatiguecrack propagating. In comparison to ryy, the von Mises stressprovided more detailed information to indicate the direction offatigue crack propagation because the location of von Misesstress was always at the crack tip. Another important observa-tion was that the intensity of stress concentration at the cracktip did not change during fatigue crack growing. The distribu-tions of ryy and von Mises stress along the crack line (startingfrom the crack tip) are plotted in Figs. 12 and 13. Interestingly,the stress values at the crack tip were almost constant during fa-tigue crack growth. Thus, the fatigue crack was able to rapidlypropagate all the time.
Figs. 14 and 15 show the contour plots of the stress componentryy and von Mises stress, respectively, for Orientation F(0 0 0 1)½1 �210�. The intensity of stress concentration at the cracktip built up as the loading increased to maximum strain during Cycle
1 due to the discontinuity of the geometry. As loading continued, thehigh stress regions moved as the twin band tip moved, which isshown in Figs. 14b and 15b. Atomic stress of twin band tip wasmuch higher than that of matrix materials due to local distortionof atomic structure. Consequently, the stress concentration at thecrack tip was greatly alleviated and can be observed in Figs. 6cand 7c. In order to qualitatively understand the atomic stress evolu-tion around the crack tip, the distribution of ryy and von Mises stressalong the crack line from the crack tip are plotted in Figs. 16 and 17.It can be observed that the values of stress at the crack tip decreaseddramatically from Cycle 1 to Cycle 2 due to the twin formation at thecrack tip. The values of stress at Cycle 2 are about one-third of thoseat Cycle 1 and the stress values are almost constant after Cycle 2,thereby indicating that the fatigue crack propagated with low uni-form velocity.
In this study, the normal stress ryy and von Mises stress weremonitored during fatigue crack growth. Even though the von Misesstress originated from the macroscopic distortion energy criterionfor yielding in polycrystalline metals at the macroscale, it can alsobe applied at the nanoscale as it is directly related to the motion ofa dislocation [18,24–26]. The simulation results in the present re-search reveal that the evolution of the von Mises stress as wellas the normal stress ryy around the crack tip explains the fatiguecrack growth behavior very well.
4. Conclusions
Molecular dynamics (MD) simulations were performed toinvestigate the fatigue crack growth rate and stress evolutionaround the fatigue crack tip. The fatigue crack growth rates arestrongly dependent on the crystal orientations due to the essen-tially different plastic deformation modes at the crack tip in differ-ent crystal orientations. The values of c in da/dN = cCTOD ofmagnesium single crystals are much larger than those of polycrys-talline materials. Detailed stress evolution around the crack tip ex-plains well the variations of fatigue crack growth rates with thecrystal orientations. The fatigue crack growth was controlled bythe normal stress ryy or von Mises stress.
Acknowledgements
The authors acknowledge the Center for Advanced VehicularSystems at Mississippi State University and the Department ofEnergy under Contract No. DE-FC26-06NT42755 for supportingthis research.
References
[1] S. Suresh, Fatigue of Materials, Cambridge University Press, 2004.[2] G.P. Potirniche, M.F. Horstemeyer, B. Jelinek, G.J. Wanger, Int. J. Fatigue 27
(2005) 1179.[3] G.P. Potirniche, M.F. Horstemeyer, Philos. Mag. Lett. 86 (2006) 185.[4] G.P. Potirniche, M.F. Horstemeyer, P.M. Gullett, B. Jelinek, Proc. R. Soc. A 462
(2006) 3707.[5] D. Farkas, M. Willemann, B. Hyde, Phys. Rev. Lett. 94 (2005) 165.[6] K. Nishimura, N. Miyazaki, Comp. Mater. Sci. 31 (2004) 269.[7] M.J. Buehler, Atomistic Modeling of Materials Failure, Springer, 2008.[8] C.L. Rountree, R.K. Kalia, E. Lidorikis, A. Nakano, L.V. Brutzel, P. Vashishta, Annu.
Rev. Mater. Res. 32 (2002) 377.[9] F.F. Abraham, Europhys. Lett. 38 (1997) 103.
[10] J.G. Seadener, M.I. Baskes, M. Nastasi, Phys. Rev. B 72 (2005) 201202.[11] J.A. Hauch, D. Holland, M.P. Marder, H.L. Swinner, Phys. Rev. Lett. 82 (1999)
3823.[12] M.L. Falk, Phys. Rev. B 60 (1999) 7062.[13] F.F. Abraham, D. Schneider, B. Land, D. Lifka, J. Skovira, J. Gerner, M.
Rosenkrantz, J. Mech. Phys. Solids 45 (1997) 1461.[14] F.F. Abraham, J. Mech. Phys. Solids 53 (2005) 1071.[15] Y. Guo, C. Wang, D. Zhao, Mater. Sci. Eng. 349 (2003) 29.[16] F. Abraham, J.Q. Broughton, Comput. Mater. Sci. 10 (1998) 1.

2986 T. Tang et al. / Computational Materials Science 50 (2011) 2977–2986
[17] A. Latapie, D. Farkas, Model. Simul. Mater. Sci. Eng. 11 (2003) 745.[18] S. Xu, X. Deng, Nanotechnology 19 (2008) 115705.[19] F.F. Abraham, Phys. Rev. Lett. 77 (1996) 869.[20] H. Krull, H. Yuan, Eng. Fract. Mech., in press.[21] T. Tang, S. Kim, M.F. Horstemeyer, Comp. Mater. Sci. 48 (2010) 426.[22] D.Y. Sun, M.I. Mendelev, C.A. Becker, K. Kudin, T. Haxhimali, M. Asta, J.J. Hoyt,
Phys. Rev. B 73 (2006) 024116.[23] C. Kelchner, S. Plimpton, J. Hamilton, Phys. Rev. B 58 (1998) 11085.[24] J.B. Markus, H. Gao, Y. Huang, Theor. Appl. Fract. Mech. 41 (2004) 21.[25] S.S. Terdalkar, S. Huang, H. Yuan, J.J. Rencis, T. Zhu, S. Zhang, Chem. Phys. Lett.
494 (2010) 218.
[26] D.J. Bammann, E.C. Aifantis, Mechanics of structured media, in: Proceedings ofInternational Symposium on Mechanical Behavior of Structured Media,Elsevier Scientific Publishing Co., Amsterdam-Oxford-New York, 1981.
[27] M.F. Horstemeyer, T. Tang, S. Kim, G. Potirniche, D. Farkas, Int. J. Fatigue 32 (9)(2010) 1473–1502.
[28] M.F. Horstemeyer, M.I. Baskes, J. Eng. Mater. Technol. Trans. ASME 121 (1999)114–119.
[29] M.F. Horstemeyer, S.J. Plimpton, M.I. Baskes, Acta Mater. 49 (2001) 4363–4374.[30] M.F. Horstemeyer, M.I. Baskes, S.J. Plimpton, Prospects in mesomechanics, in:
Sih. George (Ed.), Theoretical and Applied Fracture Mechanics, vol. 37 (1–3),2001, pp. 49–98.