atomic force microscopy of complex dna knots
TRANSCRIPT

June 17, 2005 0:3 WSPC/Trim Size: 9in x 6in for Review Volume ”20050617AFM complex DNA knots”
CHAPTER 9
ATOMIC FORCE MICROSCOPY OF COMPLEX DNAKNOTS
F. Valle1,∗, M. Favre1, J. Roca2 and G. Dietler1
1Laboratoire de Physique de la Matiere Vivante - IPMC,Faculte des Sciences de Base,
Ecole Polytechnique Federale de Lausanne,CH-1015 Lausanne, Switzerland.
2Instituto de Biologia Molecular de Barcelona, CID-CSIC,Jordi Girona 18-26,
08034 Bercelona, Spain.
E-mail: [email protected]
Complex knots on circular closed DNA molecules extracted from viruscapsids have been observed by Atomic Force Microscopy after beingadsorbed onto a surface. A characterization of the knot conformationaccording to the adsorption procedure is presented. The adsorption pro-cedure has been previously characterized by measuring the scaling prop-erties of a linear DNA molecule belonging to a different virus. The highresolution of the AFM images has allowed us to identify the chirality ofsome DNA crossings without any specific sample treatment. The highcomplexity of the knot population prevents us from identifying the knottypes. The present results concern the determination of the three dimen-sional knot conformation from the two dimensional images.
1. Introduction
Knotted DNA appears frequently both in nature and in laboratory1,2,3.DNA recombinases 4,5 and topoisomerases 6,7 produce distinct type ofknots when acting on circular DNA. Ligation of DNA free-ends also resultsin different degrees of knotting when carried under specific conditions8,9.The characterization and analysis of the knots produced in all these pro-cesses is a tool to infer physical properties of the duplex DNA, and to recon-struct the architecture of the complexes that enzymes or subcellular struc-tures form with DNA. So far, two main techniques were used to identify and
161

June 17, 2005 0:3 WSPC/Trim Size: 9in x 6in for Review Volume ”20050617AFM complex DNA knots”
162 F. Valle et al.
quantify the types of knots: electron microscopy (EM) and gel electrophore-sis. EM was the first technique able to visualize DNA knots and allowedto identify their chirality but upon a laborious sample preparation10. Theprocedure consists in coating the double stranded DNA with RecA pro-tein to make it thicker but conserving the knot’s topology. Electrophoretictechniques have been recently improved allowing to separate individual pop-ulations of knots within complex mixtures of knotted, unknotted and linearmolecules11. The highest separation is achieved by exploiting the differentrelative mobility of knots according to the voltage applied to the gel12,13.Atomic Force Microscope (AFM), first introduced by Binnig, Quate andGerber14 in 1986, is a scanning probe microscopy technique. A probe, con-sisting in a very soft cantilever with a tip at its end, is scanned over asurface. The interaction forces between the tip and the sample lead to thedeflection of the cantilever. Changes of the deflection parameters allow toreconstruct the topography of the scanned surface. More recently, due tothe softness of most biological samples, the imaging technique has been im-proved by the so called dynamic mode of operation. In this case the tip isnot in contact with the sample but is oscillated over it, touching the surfaceonly at the end of its oscillation. In this way, the load applied by the tipto the sample is strongly reduced15. In this work we used AFM to get im-ages of DNA knots adsorbed onto a surface to see their conformations. Asa source of knots we used DNA isolated from bacteriophage P4 capsids16.Most of these DNA molecules are knotted closed circles that result fromcohesive end-joining of the 11.6 kb phage genome. The P4 phage DNA ishighly suitable for this study for two reasons. First, these DNA knots arecomplex and heterogeneous16. Secondly, these knotted molecules are closedin a non-covalent way and therefore contain no confounding supercoiling,so they can be analyzed directly by gel electrophoresis without requiringenzymatic nicking. All the samples used for these experiments were nakedDNA molecules not subject to any preliminary treatment.
2. Methods
Knotted DNA was obtained by infecting the E.coli strain C-8001 with P4vir1 del22 phages, following the procedure described by Isaksen et al.17
with minor modifications. After bacterial lysis the released capsids wereprecipitated with PEG 8000, and then solubilized in a buffer containing10 mM MgCl2, 10 mM Tris-HCl pH 7.2 and 130 mM ammonium acetate.P4 tailless capsids were banded by cesium chloride centrifugation in an

June 17, 2005 0:3 WSPC/Trim Size: 9in x 6in for Review Volume ”20050617AFM complex DNA knots”
Atomic Force Microscopy of Complex DNA Knots 163
NVT65 rotor for 14 h at 45 000 r.p.m. The banded particles were dialyzedagainst P buffer. DNA was extracted twice with phenol, once with phe-nol/chloroform, precipitated with ethanol, and resuspended in TE buffer(10 mM Tris-HCl pH 8, 1 mM EDTA) to a concentration of 1 mg/ml. Lin-ear Lambda-Mix DNA was purchased from Fermentas Gmbh (Nunningen,Switzerland) and it has been supplied as a stock solution with 0.5 mg/mlnominal concentration; it contains 14 fragments of different lengths (from1503 up to 48502 base pairs) obtained by restriction enzymes cleavage of thewhole DNA of the bacteriophage Lambda. For AFM imaging, the samplewas diluted in the same buffer to a final DNA concentration of 0.5 µg/ml.According to the deposition protocol the solution could be adjusted withdifferent ion concentrations to achieve the desired ionic strength. A smalldroplet (10 µl) of sample was then placed onto the appropriate surface andleft to adsorb for approximately 10 minutes at room temperature; the sam-ple was then rinsed with nanopure (Ultra High Quality) water (USF Elga,High Wycombe, England) and blown dry with clean air. The surface usedfor DNA imaging is AP-mica. This surface consists in freshly cleaved micawhich has been exposed to the vapor of 3-Aminopropyl-triethoxysilane.This amino terminating molecule binds to the mica surface, exposing theamino groups which are positively charged at physiological pH. The sur-face is thus able to bind DNA by its highly negatively charged phosphatebackbone. To achieve a good silanization of the mica surface a protocoldeveloped in the Lyubchenko laboratory was used18. Images were collectedusing a Nanoscope IIIa (Veeco Inc, Woodbury, NY, USA) operated in tap-ping mode in air. The ultrasharp non-contact silicon cantilevers (NT-MDTCo., Zelenograd, Moskow, Russia) used had a nominal tip radius of <10nm and were driven at oscillation frequencies in the range of 150 to 300kHz. During imaging, the mica surface was scanned at a rate of one lineper second. Images were simply flattened using the Nanoscope III softwareand no further processing was done.
3. Characterization of the conformation of a DNA moleculebound to a surface
As described in sections 1 and 2 the AFM is a surface technique, thus toobtain images of macromolecules one has to put them onto a surface. Conse-quently, the first task to accomplish in order to understand AFM images ofa DNA molecule is to examine the effects of the surface-binding procedureon the DNA conformation. To this end we performed an analysis of linear

June 17, 2005 0:3 WSPC/Trim Size: 9in x 6in for Review Volume ”20050617AFM complex DNA knots”
164 F. Valle et al.
DNA molecules adsorbed on to mica surface in terms of Flory exponents.Linear DNA molecules were chosen because the end-to-end distance can beused to evaluate the scaling behavior and this is a quantity easily accessiblefrom AFM images. We proceeded as follow: 1) long linear and heteroge-neous DNA molecules (Lambda Mix DNA) were bound onto AP-mica, 2)we digitized the contour of the DNA molecules from images obtained byAFM (Fig. 1, left panel), 3) for each contour length the corresponding endto end distance was determined, 4) we analyzed the scaling behavior of theend-to-end distance vs the DNA contour length by averaging the valuesobtained over many molecules. Then the averaged end-to-end distance vscontour length was plotted on a log-log plot. We obtained a double powerlaw. A first regime, for short distances is followed by a second one with asmaller exponent after a certain cross-over length19. Figure 1 depicts thegraph fitted using the equation
f(x) = c
(x
�o
)ν1(
1 +x
�o
)ν2−ν1
(1)
corresponding to a double power law (with exponents ν1 and ν2) witha cross over length (l); c is a normalization constant. The values obtainedfrom the fit are: ν1=1.03±0.02, ν2=0.589±0.006 , l=44±6 nm and c= 49±5nm. This relation means that for contour lengths shorter than l, the DNAbehaves as a rigid molecule (exponent ν1=1.03±0.02), for longer values themolecule is described by a Self Avoiding Random Walk (SAW) with thethree-dimensional exponent (ν2=0.589±0.006)20. From the point of viewof our experiments this means that DNA molecules, upon binding ontoAP-mica, do not equilibrate on the surface but conserve a conformationcorresponding to the two-dimensional ”projection” of the three-dimensionalDNA.
The value of the cross-over length is in good agreement with the persis-tence length measured in other studies, under the same ionic conditions, us-ing microscopy techniques21,22. The measured three-dimensional exponentfor a molecule bound on a surface can be explained by the conservationof the fractal dimension of an object upon its projection into a space witha larger space dimension23. This kind of analysis allows us to characterizethe conformation on the surface and, in this case, to draw some conclu-sion about the conformation that the same molecules assume in the bulksolution before adsorption. In fact it has been shown that, under condi-tions of strong adsorption used in this work, the DNA molecules do notequilibrate. Therefore the adsorbed molecules trace a path resulting from

June 17, 2005 0:3 WSPC/Trim Size: 9in x 6in for Review Volume ”20050617AFM complex DNA knots”
Atomic Force Microscopy of Complex DNA Knots 165
1 10 100 1000 10000-8
-6
-4
-2
0
2
4
6
8
erre
ur d
u fit
[%]
longueur [nm]contour length [nm]
fit e
rro
r [%
]
ν
ν
fen
d-t
o-e
nd
[nm
]
Fig. 1. On the left an AFM image of a long Lambda DNA molecule bound onto anAP-mica surface. On the same image, near the molecule has been reported a digitizationof a part of the DNA chain; this is the kind of objects which are then analyzed. Onthe right a plot of the end to end distance vs the contour length averaged over manymolecules. The fit is reported with the two exponents measured.
a ”projection” of the three-dimensional conformation. This rules out thepossibility that the observed conformations are the consequence of a rear-rangement on the surface. The detailed characterization performed usinglinear DNA molecules allows us to interpret the conformation of the closedcircular knotted DNA molecules adsorbed under the same conditions.
4. Images of knotted DNA.
DNA molecules extracted from the bacteriophage P4 are knotted with highprobability. Differences in knot mobility by gel electrophoresis reflected abroad and very high knot complexity. So far, little direct visualization ofthese molecules was available24. We deposed on AP-mica different aliquotsof the sample containing the whole DNA extracted from the virus capsids.Based on the electrophoresis analysis this sample should contain a mixtureof linear molecules (less than 10%) and circular closed ones, both unknottedand knotted, the last representing the large majority of the sample. WhenDNA molecules are adsorbed on the surface under conditions of strong bind-ing, as it has been previously shown, their conformation reflects the one as-sumed in the bulk solution. In the AFM images under these conditions thelarge majority of the molecules found on the surface were highly knotted,as seen in figure 2. This is in agreement with previous estimations25. Be-
June 17, 2005 0:3 WSPC/Trim Size: 9in x 6in for Review Volume ”20050617AFM complex DNA knots”
166 F. Valle et al.
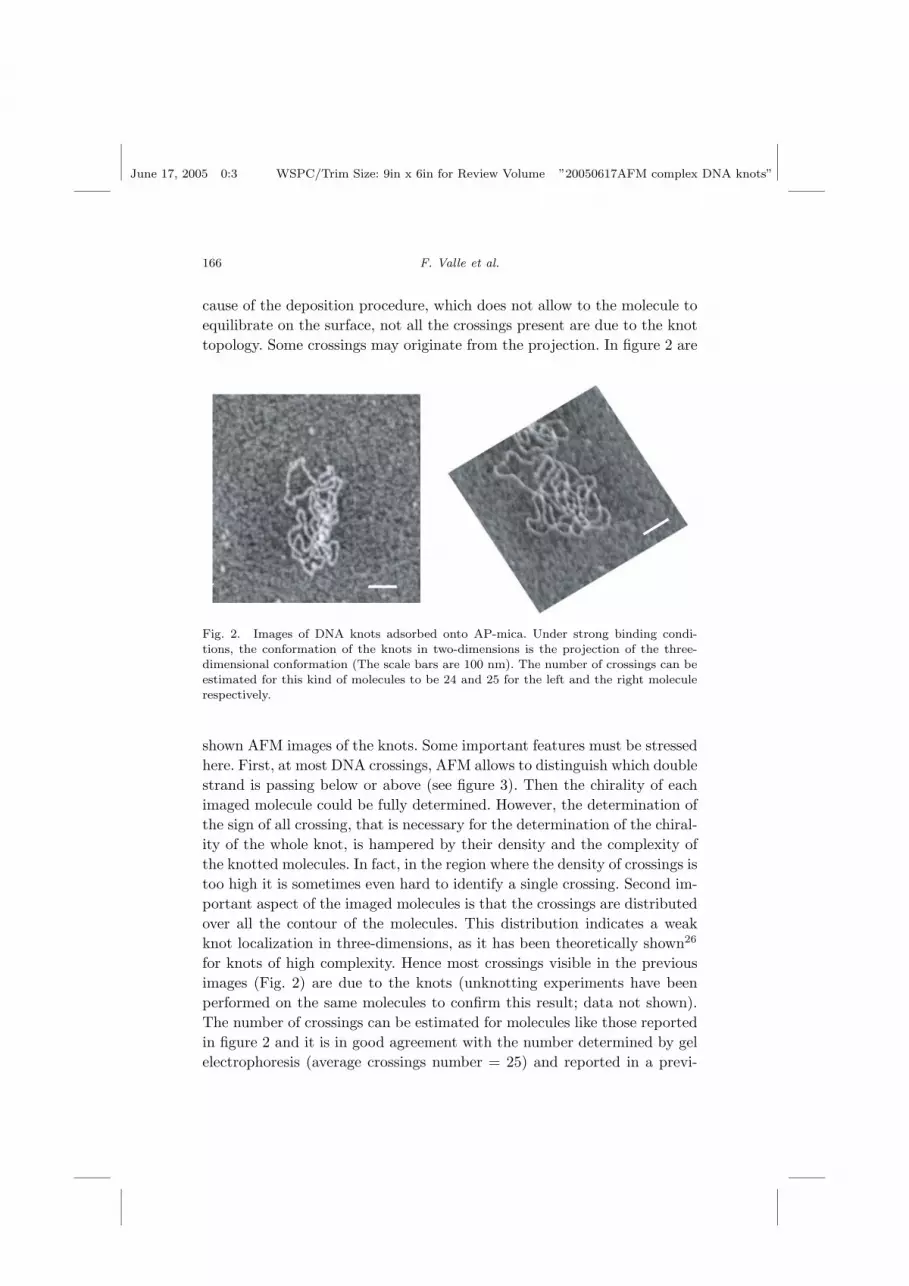
cause of the deposition procedure, which does not allow to the molecule toequilibrate on the surface, not all the crossings present are due to the knottopology. Some crossings may originate from the projection. In figure 2 are
Fig. 2. Images of DNA knots adsorbed onto AP-mica. Under strong binding condi-tions, the conformation of the knots in two-dimensions is the projection of the three-dimensional conformation (The scale bars are 100 nm). The number of crossings can beestimated for this kind of molecules to be 24 and 25 for the left and the right moleculerespectively.
shown AFM images of the knots. Some important features must be stressedhere. First, at most DNA crossings, AFM allows to distinguish which doublestrand is passing below or above (see figure 3). Then the chirality of eachimaged molecule could be fully determined. However, the determination ofthe sign of all crossing, that is necessary for the determination of the chiral-ity of the whole knot, is hampered by their density and the complexity ofthe knotted molecules. In fact, in the region where the density of crossings istoo high it is sometimes even hard to identify a single crossing. Second im-portant aspect of the imaged molecules is that the crossings are distributedover all the contour of the molecules. This distribution indicates a weakknot localization in three-dimensions, as it has been theoretically shown26
for knots of high complexity. Hence most crossings visible in the previousimages (Fig. 2) are due to the knots (unknotting experiments have beenperformed on the same molecules to confirm this result; data not shown).The number of crossings can be estimated for molecules like those reportedin figure 2 and it is in good agreement with the number determined by gelelectrophoresis (average crossings number = 25) and reported in a previ-

June 17, 2005 0:3 WSPC/Trim Size: 9in x 6in for Review Volume ”20050617AFM complex DNA knots”
Atomic Force Microscopy of Complex DNA Knots 167
ous work25. The analysis of the Flory exponents performed on few linear
Fig. 3. Three dimensional rendering of the AFM image of a knotted DNA moleculeadsorbed onto AP-mica. In the figure it is possible to see how, in AFM images, onecan distinguish the orientation of some crossing, by identifying which double strand ispassing above and which one below. This kind of identification is possible only for theregions where the density of crossings is not too high.
molecules found in this sample gave the same results as presented in sec-tion 2. It is then interesting to see how the knotted DNA molecules behavewhen adsorbed under conditions that allow them to partially equilibrateon the surface. We observed that under such conditions knotted moleculeslooked like having less crossings and the remaining crossings confined in arelatively small portion of the DNA chain. In figure 4 are shown two ex-

June 17, 2005 0:3 WSPC/Trim Size: 9in x 6in for Review Volume ”20050617AFM complex DNA knots”
168 F. Valle et al.
Fig. 4. AFM images of DNA knots which were weakly bound to the AP-mica. This effectwas achieved by increasing the ionic strength of the solution (following the additionof increasing concentrations of NaCl up to concentrations of 300 mM) to screen theelectrostatic interaction between the DNA and the surface. It can be seen that thecrossing are usually concentrated in a relatively small region of the chain, a phenomenoncalled ”knot localization”. (Scale bar 100 nm)
amples of this behavior. It is likely that the equilibration process removesthe non-topological crossings and, while this process takes place, the topo-logical crossings are concentrated. The resulting molecules are almost fullyrelaxed with a small portion where the knot is relatively tight. One canobserve that the sizes of these molecules, although smaller than the un-knotted ones, are larger than those strongly bound onto AP-mica withoutequilibration (Fig. 2). The concentration of the crossings along the DNAchain is in good agreement with the theoretical studies of Metzler et al.27.
The use of naked molecules is critical for this kind of studies, becausethe main parameters of the DNA double helix are not altered by any prepa-ration technique. Thus, the effects on the conformation can be ascribed onlyto the different level of equilibration on the surface achieved by differentadsorption protocols. The ability to see the details of each crossing willallow us to correlate these studies with the chirality of each knot (figure 3);a step that has not yet been done because, due to the high complexity ofthe available knot population, as explained before in this section, it is notpossible to distinguish the orientation of all the crossings in these molecules.

June 17, 2005 0:3 WSPC/Trim Size: 9in x 6in for Review Volume ”20050617AFM complex DNA knots”
Atomic Force Microscopy of Complex DNA Knots 169
Acknowledgments
The authors wish to thank Dr. Andrzej Stasiak (University of Lausanne) forthe useful discussions and suggestions. A preliminary version of this paperwas presented at the conference Knots, random walks and biomolecules (co-organized by J.H. Maddocks and A. Stasiak and sponsored by the BernoulliCentre of the Swiss Federal Institute of Technology in Lausanne) held in LesDiablerets, Switzerland during 14-17 July 2003. This work was supportedby the Swiss Natural Science Foundation (project 2100-063746.00/1) andpartly by the Roche Research Foundation.
References
*. Corresponding author: Francesco Valle, presently at Department of Bio-chemistry, University of Bologna, Via Irnerio 48, 40126 Bologna, Italy. Tel:(+39)0512094388 Fax: (+39)0512094387, email: [email protected]
1. Liu L. F., Perkocha L., Calendar R. & Wang J .C., (1981) Proc. Natl. Acad.Sci. USA 78, 5498-5502 .
2. Menissier J., de Murcia G., Lebeurier G. & Hirth L., (1983) Embo J. 2,1067-71
3. Ryan K. A., Shapiro T. A., Rauch C. A., Griffith J. D. & Englund P. T.,(1988) Proc. Natl. Acad. Sci. USA 85, 5844-8.
4. Wasserman S. A., Dungan J. M. & Cozzarelli N. R., (1985) Science 229,171-4.
5. Spengler S. J., Stasiak A. & Cozzarelli N. R., (1985) Cell 42, 325-34.6. Wasserman S. A. & Cozzarelli N. R., (1991) J. Biol. Chem. 266, 20567-737. Roca J., Berger J. M. & Wang J. C., (1993) J. Biol. Chem. 268, 14250-5.8. Rybenkov V. V., Cozzarelli N. R. & Vologodskii A. V., (1993) Proc. Natl.
Acad Sci USA 90, 5307-11.9. Shaw S. Y. & Wang J. C., (1993) it Science 260, 533-6.
10. Krasnow M. A., Stasiak A., Spengler S. J., Dean F., Koller T. & CozzarelliN. R., (1983) Nature 304, 559-60.
11. Vologodskii A. V., Crisona N. J., Laurie B., Pieranski P., Katrich V., Dubo-chet J. & Stasiak A., (1998) J. Mol. Biol. 278, 1-3.
12. Trigueros S., Arsuaga J., Vazquez M. E., Sumners D.W. & Roca J., (2001)Nucl. Acids Res 29, e67.
13. Sogo J. M., Stasiak A., Martinez-Robles M. L., Krimer D. B., Hernandez P.& Schvartzman J. B., (1999) J. Mol. Biol. 286, 637-43.
14. Binnig G., Quate C. F. & Gerber C., (1986) Phys. Rev. Lett. 56, 930-933.15. Garcia R. & Prez R., (2002) Surf. Sci. Rep. 47, 197-.30116. Liu L. F., Davis J. L. & Calendar R., (1981) Nucl. Acids Res. 9, 3979-89.17. Isaksen M., Julien B., Calendar R. & Lindqvist B. H., in Methods in Molecular
Biology:DNA Topoisomerase Protocol Vol. 1 (Humana Press, Totowa, 1999),p. 69.
18. Lyubchenko Y. L. & Shlyakhtenko L. S., (1997) Proc. Natl. Acad Sci USA

June 17, 2005 0:3 WSPC/Trim Size: 9in x 6in for Review Volume ”20050617AFM complex DNA knots”
170 F. Valle et al.
94, 496-501.19. Favre M., Valle F., De Los Rios P., Rosa A. & Dietler G. (submitted)20. Le Guillou J. C. & Zinn-Justin J., (1977) Phys. Rev. Lett. 39, 95-98.21. Bednar J., Furrer P., Katrich V., Stasiak A. Z., Dubochet J. & Stasiak A.,
(1995) J. Mol. Biol. 254, 579-94.22. Berge T., Jenkins N. S., Hopkirk R. B., Waring M. J., Edwardson J. M. &
Henderson R. M., (2002) Nucleic Acids Res. 30, 2980-6.23. Mandelbrot B. B., in The Fractal Geometry of Nature (W. H. Freeman and
Company, Oxford, 1982), p. 9124. Wolfson J. S., McHugh G. L., Hooper D. C. & Swartz M. N., (1985) Nucl.
Acids Res. 13, 6695-702.25. Arsuaga, J., Vazquez, M., Trigueros, S., Sumners, D., & Roca, J., (2002)
PNAS 99, 5373-5377.26. Metzler R., (2002) New J. Phys. 4, 91.1-91.10.27. Metzler R., Hanke A., Dommersnes P.G., Kantor Y. & Kardar M., (2002)
Phys. Rev. Lett. 88, 188101.