atmospheric chemistry, sources, and sinks of carbon ... - doi
TRANSCRIPT
1
Atmospheric Chemistry, Sources, and Sinks of Carbon Suboxide,
C3O2
Stephan Keßel,1 David Cabrera-Perez,1 Abraham Horowitz,1 Patrick R, Veres,1,2 Rolf Sander,1 Domenico
Taraborrelli,1,3 Maria Tucceri,1 John Crowley,1 Andrea Pozzer,1 Luc Vereecken,1,3 Jos Lelieveld,1
Jonathan Williams1 5
1Max Planck Institute for Chemistry, Hahn-Meitner-Weg 1, Mainz, Germany
2now at: NOAA ESRL Chemical Sciences Division, Boulder, USA and Cooperative Institute for Research in Environmental
Sciences, University of Colorado, Boulder, CO, USA 3now at: Institute of Energy and Climate Research, IEK-8: Troposphere, Forschungszentrum Jülich, Germany
Correspondence to: J. Williams ([email protected]) 10
Abstract. Carbon suboxide, O=C=C=C=O, has been detected in ambient air samples and has the potential to be a noxious
pollutant and oxidant precursor; however, its lifetime and fate in the atmosphere is largely unknown. In this work, we collect
an extensive set of studies on the atmospheric chemistry of C3O2. Rate coefficients for the reactions of C3O2 with OH radicals
and ozone were determined using relative rate techniques as k4 = (2.6 ± 0.5) × 10-12 cm3 molecule-1 s-1 at 295 K (independent
of pressure between ~25 and 1000 mbar) and k6 < 1.5 × 10⁻²¹ cm3 molecule-1 s-1 at 295 K. A theoretical study on the mechanisms 15
of these reactions indicates that the sole products are CO and CO2, as observed experimentally. The UV absorption spectrum
and the interaction of C3O2 with water were also investigated, enabling photodissociation and hydrolysis rates to be assessed.
The role of C3O2 in the atmosphere was examined using in-situ measurements, an analysis of the atmospheric sources and
sinks, and simulation with the EMAC atmospheric chemistry – general circulation model. The results indicate sub-pptv levels
at the Earth's surface, up to about 10 pptv in regions with relatively strong sources, e.g. by biomass burning, and a mean 20
lifetime of ~3.2 days. These predictions carry considerable uncertainty, as more measurement data are needed to determine
ambient concentrations and constrain the source strengths.
1 Introduction
Carbon suboxide was synthesized for the first time in 1906 by Diels and Wolf (1906), though it is thought to have played a
role in experiments at the end of the 19th century by Brodie (1872). It is reported as a poisonous gas at room temperature 25
(boiling point 279.9 K) with a noxious smell that can irritate eyes, nose and airways (Reyerson and Kobe, 1930). The structure
of C3O2 (IUPAC: propadiene-1,3-dione) is a quasi-linear cumulene, O=C=C=C=O, with a shallow W-shape which readily
deforms by bending vibrations, and a weak dipole moment (Karyakin et al., 1982; Winnewisser et al., 2006). Experimental
and theoretical work has considered the photochemical properties of this molecule (Bayes, 1961; Smith et al., 1966; Masiello
et al., 2005; Vander Auwera et al., 1991), as well as its thermodynamic and chemical properties (Winnewisser et al., 2006; 30
Atmos. Chem. Phys. Discuss., doi:10.5194/acp-2017-49, 2017Manuscript under review for journal Atmos. Chem. Phys.Published: 26 January 2017c© Author(s) 2017. CC-BY 3.0 License.
2
McDougall and Kilpatrick, 1965; Koput, 2000; Ramasami, 2007; Kolbanovskii et al., 2014), and carbon suboxide has found
some uses in organic synthesis (Kappe and Ziegler, 1974) and polymers (Carofiglio et al., 1986). It has also been shown to
occur as an intermediate in abiotic degradation of aromatics in soils (Huber et al., 2007), is emitted by incomplete combustion
of biofuels and biomass (Hucknall, 1985; Roblee et al., 1961), and could occur in extra-terrestrial environments (Bennett et
al., 2008; Huntress et al., 1991; Oyama and Berdahl, 1979). 5
Due to its hydrolysis to malonic acid (Diels and Meyerheim, 1907; Diels and Wolf, 1906), C3O2 was not expected to be present
in the atmosphere at measurable concentrations, and its relevant chemistry has therefore not been studied extensively. The
only pertinent study we are aware of is by Faubel et al. (1977), who measured the rate coefficient of C3O2 with OH radicals
between 295 and 480K, obtaining a rate coefficient of k(T) = (1.1±0.5)×10-11 × exp(-(620±160)K/T) cm3 molecule-1 s-1.
In this work, we investigate the atmospheric chemistry of carbon suboxide. Its spectroscopic properties are studied at infra-red 10
and ultraviolet wavelengths, to assess its greenhouse potential and to obtain the photolysis rates in the atmosphere. The reaction
with OH radicals and, for the first time, O3, is examined, quantifying the rate coefficients, and identifying the products in a
theory-based analysis. We also present the first determination of its Henry's law constant, KH, and its hydrolysis rate coefficient,
khyd. Additionally, in-situ mass-spectrometric studies show the presence of C3O2 in the atmosphere. Finally, these
characteristics are incorporated in a global chemistry - general circulation model, examining the C3O2 budget in the 15
atmosphere.
2 Methodologies
2.1 Chemicals
C3O2 was prepared by the low temperature dehydration of malonic acid by P4O10 in a similar manner to described previously
(Diels and Meyerheim, 1907; Long et al., 1954), and diluted with nitrogen bath gas (Westfalen, N2 5.0) to atmospheric pressure; 20
yielding 20.0 to 26.7 mbar C3O2 in 1000 mbar N2. No efforts were undertaken to increase the yield of C3O2 by careful drying
of the reactants as performed previously (Diels and Lalin, 1908), as only small concentrations were needed. This method of
synthesis also yields CO2 as we show later. The dilute carbon suboxide mixture thus obtained proved to be stable at room
temperature, and no polymerisation products were observed even after months of storage.
O3 was made by electrical discharge through oxygen (Westfalen, 5.0) and trapped and stored at dry-ice temperature on silica-25
gel. CH3ONO was made by the dropwise addition of 50 % H2SO4 to a saturated solution of NaNO2 and CH3OH, vacuum
distilled and stored at -40 °C.
2.2 Henry's law constant and hydrolysis rate
A 50 cm3 min-1 flow of synthetic air was directed over the malonic acid + phosphorus pentoxide synthesis mixture (see above),
mixed with different flows of moistened air (20, 50, 70, 100, 150, 200 and 250 cm3 min-1 (STP)) to create a flow with different 30
Atmos. Chem. Phys. Discuss., doi:10.5194/acp-2017-49, 2017Manuscript under review for journal Atmos. Chem. Phys.Published: 26 January 2017c© Author(s) 2017. CC-BY 3.0 License.
3
C3O2 concentrations, and finally bubbled through a 10 mL buffer solution (Alfa Aesar) with pH values (±0.01) of 2.00, 4.00,
6.00, and 8.00. The bubbler efficiently mixes the airstream with the buffer solution, allowing the carbon suboxide to interact
fully with the solution. The remaining airflow was routed through the PTR-TOF-MS (see below) to measure the resulting loss
of C3O2.
2.3 Reaction of C3O2 with OH and O3 5
The rate constant for the reaction of OH with C3O2 was investigated by the relative-rate method in an apparatus that has
previously been described in detail (Crowley et al., 1999; Raber and Moortgat, 2000). The reaction took place in a 44 L
cylindrical quartz reaction chamber equipped with fluorescent lamps (Phillips, TL12) to provide UV radiation (~270–380 nm)
to initiate OH formation. The air around the lamps was ventilated in order to avoid temperature increases in the reactor during
photolysis. Gas-phase concentration determination of C3O2 and the reference reactant (ethene, see below) was by infrared 10
absorption spectroscopy using a Bomem DA 008 FTIR spectrometer with an MCT detector. The IR analysis light passed
through the reactor 24 times to give a total optical path-length of ~29 m. Absorption spectra were recorded at a resolution
(Hamm apodized) of 0.5 cm-1. Generally, 32 scans (254 for reference spectra) were co-added to achieve a good signal-to-noise
ratio. The infra-red (IR) absorption spectrum (at 0.5 cm-1 resolution) of C3O2 is available in the supplementary information.
The rate constant for reaction of C3O2 with O3 was measured in the same apparatus. In this case, the rate of decay of C3O2 in 15
a large excess of O3 was monitored by IR absorption as was the formation of reaction products.
2.4 UV Absorption spectrum of C3O2
The UV absorption spectrum of C3O2 was measured in an optical set up that has been described previously (Dillon et al., 2006).
Briefly, flowing samples of C3O2 passed through a 110 cm long optical absorption cell equipped with external, multi-pass
white optics aligned to give a total absorption path length of 880 cm. Analysis light from a D2 lamp was collimated and 20
transmitted (through quartz windows) along the axis of the cell before being detected by a 0.5 m monochromator / diode array
spectrometer with an effective resolution of 1 nm. Pressures in the cell were monitored with a 13.3 mbar (10 Torr) capacitance
manometer. Wavelength calibration and measurement of the spectral resolution were achieved using lines from a low-pressure
Hg lamp.
2.5 PTR-TOF-MS measurements 25
The PTR-TOF-MS (Proton Transfer Reaction Time of Flight Mass Spectrometer, Ionicon Analytik GmbH, Innsbruck, Austria)
has been described in detail elsewhere (Graus et al., 2010). Briefly, this measurement technique is based on the protonation of
molecules by H3O+ ions that are generated in a hollow cathode discharge. Within the time of flight mass spectrometer, the
reagent ions are accelerated through ambient air and the resulting molecular ions brought to an equivalent kinetic energy level,
such that their subsequent velocity in the flight tube depends on the mass-to-charge ratio (m/z). By measuring the “time-of-30
flight”, the mass-to-charge ratio can be calculated at high mass resolution. The mass resolution was approximately 3700 m/∆m.
Atmos. Chem. Phys. Discuss., doi:10.5194/acp-2017-49, 2017Manuscript under review for journal Atmos. Chem. Phys.Published: 26 January 2017c© Author(s) 2017. CC-BY 3.0 License.
4
The instrument was operated with a drift pressure of 2.20 hPa (E/N 140 Td) and a drift voltage of 600 V. 1,3,5-trichlorobenzene
was used as internal standard for mass calibration. Data post-processing and analysis was performed by using the program
“PTR-TOF data analyzer”, which is described elsewhere (Müller et al., 2013). Since the measured mixing ratios of C3O2 were
low it was necessary to integrate the signal over extended periods of time (e.g. 1 hour).
The mass resolution of this instrument is essential to separate the protonated carbon suboxide signal (m/z = 68.998) from other 5
compound signals with the same nominal mass, such as furan (m/z = 69.034) and isoprene (m/z = 69.070). To ensure these
compounds could be separated, a synthetic mixture of furan (Acros Organics, 99%), isoprene (Air Liquide), and carbon
suboxide in synthetic air (Westfalen, 20.5% O2, 79.5% N2) was analyzed (see Figure 1), showing clear peak separation. In-situ
sampling was made through Teflon tubing. The inertness of the Teflon surfaces was verified by varying the tubing length and
observing no change in the carbon suboxide signal. 10
2.6 Theoretical calculations
To further explore the reactions of carbon suboxide, we employed quantum chemical calculations, mainly using the M05-2X
DFT and M06-2X density functionals (Zhao et al., 2006; Zhao and Truhlar, 2008) with the aug-cc-pVTZ basis set (Dunning,
1989), supplemented by CBS-QB3 (Montgomery et al., 1999) or ROHF-UCCSD(T)/aug-cc-pVTZ single point energy
calculations for a subset of the intermediates. The DFT and CBS calculations were performed with Gaussian-09 (Frisch et al., 15
2010), the ROHF-CCSD(T) calculation with Molpro-2010.1 (Werner et al., 2010). These levels of theory are expected to be
accurate within ~2 kcal mol-1 for relative energies; this is sufficient to identify the main reaction channels in the atmospheric
oxidation of C3O2. If smaller uncertainty intervals are needed in a future study, the geometries listed in the supporting
information are expected to be of sufficient quality for more accurate single-point energy calculations. Rate coefficient
predictions were performed using Transition State Theory in a harmonic oscillator rigid rotor approximation (Pilling and 20
Seakins, 2007; Truhlar et al., 1996; Vereecken et al., 2015), and exploratory master equation calculations were performed
using the URESAM software (Vereecken et al., 1997).
2.7 Global model simulations
In this work, the ECHAM/MESSy Atmospheric Chemistry (EMAC) model was used to numerically simulate the C3O2
distribution in the atmosphere, and to estimate its budget. The EMAC model is a numerical chemistry and climate simulation 25
system that includes sub-models describing tropospheric and middle atmosphere processes and their interaction with oceans,
land and human influences (Jöckel et al., 2010). It uses the second version of the Modular Earth Submodel System (MESSy2
version 2.42) to link multi-institutional computer codes. The core atmospheric model is the 5th generation European Centre
Hamburg general circulation model (ECHAM5 version 5.3.02) (Roeckner et al., 2006). For the present study we applied
EMAC at the T42L31 resolution, i.e. with a spherical truncation of T42 (corresponding to a quadratic Gaussian grid of approx. 30
2.8 by 2.8 degrees in latitude and longitude) with 31 vertical hybrid pressure levels up to 10 hPa. In this study the same set-up
evaluated in previous studies was used (Yoon and Pozzer, 2014; Pozzer et al., 2015), and only the following submodels were
Atmos. Chem. Phys. Discuss., doi:10.5194/acp-2017-49, 2017Manuscript under review for journal Atmos. Chem. Phys.Published: 26 January 2017c© Author(s) 2017. CC-BY 3.0 License.
5
modified for the simulation of C3O2 : MECCA (Sander et al., 2011), JVAL (Sander et al., 2014), SCAV (Tost et al., 2006),
DRYDEP (Kerkweg et al., 2006a, 2009), and OFFEMIS (Kerkweg et al., 2006b). The numerical simulation performed covers
the years 2005-2006, with the first year used as spin-up. The results presented here are representative for the meteorology and
emissions (e.g. biomass burning) for the year 2006. The prescribed biomass burning emissions used were those based on The
Global Fire Assimilation System (GFASv3.0) (Kaiser et al., 2012), with daily resolution and 0.5° × 0.5° spatial resolution. 5
The emissions factors (in g/kg) for carbon suboxide are those from literature (Yokelson et al., 2013) where available. The
emission factor provided by Yokelson et al. for semiarid shrublands (1.2×10⁻³ g/kg), coniferous canopy (1.2×10⁻³ g/kg) and
organic soil (3.75×10⁻³ g/kg) are assumed to also be representative for savanna, extra-tropical forest and peat, respectively. For
agricultural and tropical forest emission factors, no values are available, and we selected an emission factor of 1.0×10⁻³ g/kg,
of similar magnitude as the other factors. Further emissions from anthropogenic biofuel consumption were added using the 10
EDGARv4.3 database (Crippa et al., 2016). The amount of consumed biofuel was obtained by dividing the emissions of non-
methane volatile organic hydrocarbons (NMVOC) from biofuel usage by the emission factor for NMVOC as listed in Yokelson
et al. (2013), i.e. 26.44 g/kg. The emissions of C3O2 from this consumption were then again estimated using the previously
mentioned factor (1.0×10⁻³ g/kg). This could be a low estimate as biofuel combustion may resemble the burning of peat more
than of vegetation, but this will need to be tested experimentally. 15
3 Results
3.1 UV Absorption spectrum of C3O2
The UV absorption (230 to 309 nm) at various pressures of C3O2 was measured in the optical absorption cell (892 cm path
length) described above. According to the Beer-Lambert law, for a given optical path length (l, cm) the optical density (OD)
of an absorbing sample is proportional to its concentration [C] (in molecule cm-3): 20
OD = ln (I0/I) = σ(λ)l[C] (1)
where σ(λ) is the wavelength dependent absorption cross section (cm2 molecule-1). Thus, knowledge of the absolute
concentration of C3O2 was necessary to derive its absorption spectrum. Our experiments using the FTIR apparatus revealed
(see below) that substantial levels (up to 80 %) of CO2 impurity are present in the C3O2 samples prepared as described above.
Mass spectrometer analysis (electron impact, 70 eV) revealed no further impurities. 25
Whilst CO2 impurities do not represent a problem for the relative rate constant measurements described below, it does mean
that sample pressure cannot be directly converted to a concentration. For this reason, each sample for which the UV absorption
was to be measured was first analysed for its CO2 impurity using the FTIR apparatus described earlier. For a given pressure
(P) of the C3O2 / CO2 sample introduced into the UV absorption apparatus, the fractional contribution of C3O2 was calculated
and then converted to a concentration [C] using Boyles law ([C] = PNA/RT). As CO2 does not absorb light between 230 and 30
309 nm, it does not contribute to the overall optical density. The dependence of the measured optical density at 264.8 nm on
Atmos. Chem. Phys. Discuss., doi:10.5194/acp-2017-49, 2017Manuscript under review for journal Atmos. Chem. Phys.Published: 26 January 2017c© Author(s) 2017. CC-BY 3.0 License.
6
the C3O2 concentration is plotted in Figure 2. The expected Beer-Lambert linearity is observed, the slope of the plot, σ(264.8
nm)⋅l, yielding an absorption cross section at this wavelength of σ(264.8 nm) = 3.08 × 10⁻¹⁹ cm2 molecule-1. The total
uncertainty for these experiments is related to the uncertainty associated with the correction applied for the large CO2 impurity,
which was 80 ± 5 %. The contribution of C3O2 was thus 20 ± 5 %, i.e. with an error of 25 %. We therefore quote a final value
of σ(264.8 nm) = 3.1 ± 0.8 cm2 molecule-1. In order to accurately measure optical absorption on the long wavelength wing of 5
the C3O2 spectrum (i.e. at λ> 310 nm, where tropospheric, actinic radiation starts to become important) absorption spectra
were measured using large amounts of C3O2. The absorption spectrum (black line) presented in Figure 3 is thus a composite
of three different, overlapping measurements of optical density (230-293, 293-299 and 299-330 nm), normalized to the cross
section derived at 264.8 nm; the underlying data is available in the supporting information.
Figure 3 also plots the previously reported spectrum of C3O2, where Bayes (1962) reports a value of σmax = 3.59× 10⁻¹⁹ cm2 10
molecule-1 at 265 nm, which is ~ 17 % larger than the value obtained in this work. Indeed, at all wavelengths longer than 250
nm, a scaling factor of 1.17 brings our data into very good agreement with the spectrum reported by Bayes. At shorter
wavelengths, especially less than 245 nm, there is substantial disagreement and our cross sections are larger. The difference
may be explained by additional, absorbing impurities in our sample, or are due to working with low light intensities resulting
from the multiple-reflection optical set-up. However, these wavelengths are not relevant for the tropospheric chemistry of 15
C3O2. Bayes performed multiple distillations of his sample, which was therefore presumably purer. We therefore choose to
scale our spectrum by a factor 1.17 which results in the thin black line in Figure 3 and extends the wavelength range out to
330 nm.
3.2 The reaction of C3O2 with OH radicals
3.2.1 Experimental relative rate study 20
OH radicals were generated by photolysing CH3ONO (270-380 nm) in air in the presence of NO:
CH3ONO + hν → CH3O + NO (R1)
CH3O + O2 → HCHO + HO2 (R2)
HO2 + NO → OH + NO2 (R3)
OH thus formed reacted with C3O2 and C2H4, both of which were present in the initial reaction mixture: 25
OH + C3O2 → products (R4)
OH + C2H4 → products (R5)
Typical concentrations of C3O2 and C2H4 were 2-3 × 10¹³ molecule cm-3 and 5-12 × 1014 molecule cm-3, respectively. We note
that, for the kinetic analysis described below, knowledge of absolute concentrations is not necessary. Rather, the relative rate
technique relies only on accurate measurement of depletion factors for both C3O2 and C2H4. When adopted for the present 30
reactions, the expression for deriving the relative rate constant (k4 / k5) is (Pilling and Seakins, 2007) :
Atmos. Chem. Phys. Discuss., doi:10.5194/acp-2017-49, 2017Manuscript under review for journal Atmos. Chem. Phys.Published: 26 January 2017c© Author(s) 2017. CC-BY 3.0 License.
7
[ ][ ]
[ ][ ]
t
t
t
t
k
k
42
042
5
4
23
023
HC
HCln
OC
OCln == ⋅= (2)
where k4 and k5 are the bimolecular rate constants for reaction of OH with C3O2 (R4) and C2H4 (R5) respectively, at the selected
temperature and pressure. [X]0 and [X]t represent concentrations of the non-radical reactants X at time zero (i.e. before OH is
generated) and reaction time t, respectively. Figure 4 shows the change in absorption due to C3O2 and C2H4 following several
photolysis periods, intermediate to which the FTIR spectra were obtained. C3O2 was monitored via its strongest vibrational 5
feature, the asymmetric stretch (υ3) at ~2260 cm-1 (Miller and Fateley, 1964). The reaction was allowed to proceed until C2H4
was depleted to ≤ 45 % of its original concentration, whereby C3O2 was depleted to ≤ 77 % of its original concentration. In
Figure 4, the depletion of C3O2 and C2H4 is seen to be accompanied by formation of both CO (fine rotational structure around
2200 cm-1) and CO2 (fine rotational structure around 2300 cm-1). Typically, the photolysis lamps were powered for 2 minute
periods, the FTIR spectra (32 scans at 0.5 cm-1 resolution) took about 1.5 minutes. Without illumination by the TL12 lamps, 10
no depletion of C3O2 or C2H4 could be observed so that significant reaction with e.g. surfaces or CH3ONO or NO or radicals
formed in the dark could be ruled out. In addition, illumination of a gas-mixture containing C3O2 and C2H4, without CH3ONO,
did not lead to observable depletion of the reactants. Accurate analysis of relative depletion factors requires that the infra-red
absorption features used are linear with concentration and that no products absorb significantly at the same wavelength. Figure
5 shows the results of an experiment in which both C3O2 and C2H4 were depleted by reaction with OH. The depletion factor 15
after 8 minutes of reaction was then derived by least squares fitting of the C3O2 and C2H4 spectra obtained after reaction to the
spectra obtained before. As indicated by the lack of structure in the residuals, there is no evidence for infra-red active products
in the narrow spectral regions used to analyse the data.
The C3O2 and C2H4 depletion factors are plotted against each other in Figure 6 for experiments carried out at 295 ± 2 K and
pressures of 25, 399 and 1003 mbar. The excellent linearity confirms that the experimental procedure is appropriate, the slopes 20
of the fit lines providing the relative rate constant (k4 / k5) at each pressure, which are listed in Table 1. The rate constant k4
obtained by using the recommended value of k5 (IUPAC Subcommittee on Atmospheric Chemical Kinetic Data Evaluation,
2015) displays no significant dependence on pressure. The slightly lower value at 25.3 mbar may be the result of a weak non-
linearity in the absorbance of C2H4 at low pressure where the vibrational features narrow in comparison to the instrumental
resolution. This was not observed at the higher pressures where pressure broadening increases the line widths. For this reason, 25
we prefer to quote a final, pressure independent, rate constant at 295 K of (2.6 ± 0.5) × 10-12 cm3 molecule-1 s-1.
This value can be compared to the single previous determination of k4 that we are aware of (Faubel et al., 1977), in which k4 =
(1.2 ± 0.5) × 10-12 exp(-620K/T) cm3 molecule-1 s-1 was reported, resulting in a value of (1.4 ± 0.6) × 10-12 cm3 molecule-1 s-1
at 295 K. Even within the combined uncertainty, this result disagrees with our larger value of 2.6 ± 0.5 × 10⁻¹² cm3 molecule-1
s-1. Faubel et al. (1977) used an absolute method (detection of OH using ESR) to measure the rate constant at low pressure 30
(2.7-4 mbar He). They did not vary the reaction time (fixed at 16 ms) in their experiments, but monitored the change in OH
concentration as various amounts of C3O2 were added. Errors in this measurement will be associated with the fact that wall
Atmos. Chem. Phys. Discuss., doi:10.5194/acp-2017-49, 2017Manuscript under review for journal Atmos. Chem. Phys.Published: 26 January 2017c© Author(s) 2017. CC-BY 3.0 License.
8
losses of OH could not be accurately assessed by varying the contact time, and that by using high concentrations of OH, the
self-reaction (to form O and H atoms) could also take place to a significant extent. They also observed that the depletion of
C3O2 (measured using mass spectrometry) relative to OH was only a factor of 0.5 and used this factor to scale the rate constant
derived from observation of OH loss only, which was 2.8 × 10⁻¹² cm3 molecule-1 s-1 at 295 K. Without this scaling factor, the
results would be in excellent agreement. While the factors above may play a role, it is difficult to rigorously assess the causes 5
of the disagreement. We note, however, that the relative-rate method has significant advantages over absolute methods when
reactant concentrations are difficult to define accurately. In the case of Faubel et al. (1977) this is especially true as both OH
and C3O2 concentrations needed to be known. For the purposes of atmospheric modelling of the reaction between OH and
C3O2, the rate constant obtained using the relative rate technique (at atmospheric pressure) is preferred.
The only (IR-active) products observed in the present study of OH + C3O2 were CO and CO2. As both CO (directly) and CO2 10
(indirectly) are also products of the photolysis of HCHO (formed in reaction R2) we did not attempt an analysis of the product
yields. We note that the formation of only CO and CO2 as products is consistent with the observations of Faubel et al. (1977)
and with our theoretical analysis of this reaction (see below).
3.2.2 Theoretical study of the reaction mechanism
Two distinct addition sites exist for the OH radical on carbon suboxide (see Figure 7). Addition on the central carbon, forming 15
an acyl radical, has the lowest entrance barrier of ~1 kcal mol-1, though it leads to the least stable adduct INT1 with an
exoergicity of only 17.8 kcal mol-1, compared to the 31.1 kcal mol-1 potential energy release for addition on the outer carbons
to INT7 with an entrance barrier of ~ 4 kcal mol-1. The underlying reason is that INT7 is stabilized mostly by resonance, which
only becomes active after the TS is traversed and the radical electron is freed to delocalize. Both reaction channels pass through
a shallow pre-reactive complex, approximately 1.5 kcal mol-1 below the reactants. Based on ROHF-CCSD(T)//M06-2X/aug-20
cc-pVTZ data, we obtain a high-pressure rate coefficient of 5.6× 10⁻¹² cm3 molecule-1 s-1 at 295 K, in agreement with the
experimental value within the expected uncertainty on the theoretical result. Here, the reaction proceeds nearly exclusively
(>99% at 295K) by addition to the central carbon. We have attempted to investigate the pressure-dependence of this reaction
using exploratory Master Equation analysis. Using a well depth equal to the stability of INT1, we obtain a pressure dependence
that far exceeds the experimental data. Using an energy well depth for addiction equal to INT7, on the other hand, leads to 25
results that are fully compatible with the experimental data; in this scenario, the differences in rate coefficient of Faubel et al.
(1977) at 2.7 mbar, and the current results at pressures between 25.3 and 1003 mbar is due solely to fall-off. Unfortunately,
this latter scenario does not match our current understanding of the reaction mechanism, and we are unable to reconcile the
theoretical mechanism against the experimental fall-off without computational cost-limiting additional calculations. As such,
we do not make a recommendation for the pressure-dependence of this reaction, and state only that the reaction is near the 30
high-pressure limit at atmospheric pressures.
In the atmosphere, the acyl radical INT1, formed from addition of OH on the central carbon, readily adds an O2 molecule to
form acetylperoxy radical INT2 (see Figure 7), which is expected to react similar to other acetylperoxy radicals. In a NOx-
Atmos. Chem. Phys. Discuss., doi:10.5194/acp-2017-49, 2017Manuscript under review for journal Atmos. Chem. Phys.Published: 26 January 2017c© Author(s) 2017. CC-BY 3.0 License.
9
rich environment, this peroxy radical is oxidized to an acyloxy radical INT3, which loses a CO2 molecule to form the α-OH-
vinoxy radical INT4. The dominant resonance structure of this radical is the alkyl radical, which can undergo an addition-
elimination reaction with O2 to form an HO2 molecule and INT5. This latter product is unstable on the singlet PES,
decomposing to 2 CO molecules. On the triplet surface INT5 is very short-lived, and will undergo an intersystem crossing to
the singlet surface where it decomposes. A fraction of INT4 could undergo an O2 addition to INT6, followed by reaction with 5
NO to form acyl radical INT12, which oxidizes further to 2 CO2 and HO2.
The addition on the outer carbon forms a carboxylic acid INT7, with an ethynoxy-resonance stabilized radical site (see Figure
7). Decomposition to C2O + HOCO or H-migration in INT7 have high barriers of 90 and 42 kcal mol-1, respectively, leaving
O2 addition as the dominant atmospheric reaction channel, with an exoergicity of 25.1 kcal mol-1. The resulting peroxy radical
INT8, OCC(OO•)COOH, has a fairly mobile hydrogen atom, which can temporarily migrate to the oxygen radical site; this 10
H-shift is endothermic by 11 to 12 kcal mol-1. The resulting hydroperoxide acyloxy radical, OCC(OOH)C(O•)O, is not an
energetic minimum at the chosen level of theory, spontaneously reforming the carboxylic acid peroxy radical; this is contrary
to similar reactions in aliphatic carboxylic acid atmospheric oxidation where CO2 is preferentially eliminated (da Silva, 2010).
All reactions of the transient hydroperoxide examined, including CO2 elimination and cyclisation, appear to have relatively
high barriers exceeding 20 kcal mol-1 relative to the peroxy radical. We propose that the INT8 alkylperoxy radical 15
predominantly undergoes the traditional atmospheric RO2 reaction, i.e. bimolecular reactions with NO, HO2 and RO2; we will
focus here on a more polluted environment, where reaction with NO is the dominant fate, forming an oxy radical INT9.
Unimolecular reaction in this oxy radical, i.e. HOCO or CO elimination, and H-migration, all show barriers in excess of 17
kcal mol-1, again leaving O2 addition as the dominant reaction channel, forming the INT10 acetylperoxy radical. This radical
will undergo the reaction traditional for acetylperoxy radicals in the atmospheric, i.e. in a NOx-rich environment INT10 will 20
be oxidized to 3 CO2 + HO2. When considering competing reactions of the peroxy radical with RO2 and HO2, highly oxidized
compounds bearing multiple carbonyl and carboxylic acid functionalities can be formed instead.
We conclude that the OH-initiated oxidation of C3O2 leads mainly to CO and CO2, with regeneration of a HO2 radical;
depending on the reaction conditions, some OVOC can be formed in cross-reactions of RO2 intermediates with HO2 or RO2.
The chemistry of some intermediates in the current oxidation scheme receives further attention in the supporting information. 25
3.3 The reaction of C3O2 with O3
3.3.1 Experimental study of the rate coefficient
The rate constant for reaction of C3O2 with O3 (k6) was measured in the same apparatus as used for the OH + C3O2 study.
O3 + C3O2 → products (R6)
In this case, a large concentration of O3 was eluted into the reactor from its storage vessel (O3 was stored on silica gel at 196 30
K, see above) and its concentration monitored using calibrated absorption features (2001-2112 cm-1, 901-995 cm-1 and 702-
798 cm-1). O3 concentrations were varied between 0.1 and 2.1 mbar. C3O2 was subsequently added and the mixture brought
Atmos. Chem. Phys. Discuss., doi:10.5194/acp-2017-49, 2017Manuscript under review for journal Atmos. Chem. Phys.Published: 26 January 2017c© Author(s) 2017. CC-BY 3.0 License.
10
up to atmospheric pressure with synthetic air. The mixture was then allowed to stand in the dark, the relative C3O2 concentration
change being monitored at regular intervals by FTIR. The rate constant is low, so long reaction times and high concentrations
of O3 were used.
Figure 8 displays the results of an experiment in which ~ 2.7×10⁻³ mbar C3O2 was mixed with 1 mbar of O3. The spectra shown
were referenced to the spectrum obtained directly after C3O2 was added to the mixture so that, if reaction takes place, reactants 5
should display increasingly negative absorptions and products increasingly positive absorptions as time progresses. It is readily
seen that, following reaction times exceeding ~30 mins, significant depletion of C3O2 was observed (negative absorption
feature centered at 2260 cm-1) and at the same time CO and CO2 were formed (positive absorption features centered at ~2140
and 2350 cm-1, respectively. No changes were observed at the O3 absorption features owing to the fact that, as O3 was present
in large excess over C3O2, its concentration did not change significantly over the course of the reaction. In the absence of O3, 10
C3O2 concentrations did not change significantly over a period of several hours.
Given that O3 is in large excess, and that C3O2 does not react in the absence of O3, a simple expression can be used to analyse
the data:
[ ][ ] [ ] tk
t
⋅= 36
23
023 OOC
OCln (3)
Where k6 is the rate constant for reaction R6, t is the reaction time, [O3] is the ozone concentration and [C3O2]0 / [C3O2]t is the 15
time-dependent, relative change in C3O2 concentration.
In Figure 9 we plot the relative change in C3O2 concentration versus reaction time for several experiments using different
amounts of O3. All results were obtained at 295 ± 2 K and at 1 atm total pressure of air. The good linearity of [C3O2]0 / [C3O2]t
versus reaction time suggests that a pseudo-first order analysis is appropriate to analyse the data; the slope of each fit line is
then equal to k6[O3]. By plotting the values of k6[O3] thus obtained against [O3] we derive the bimolecular rate constant, k6 as 20
shown in Figure 10. The value obtained is k6 = (1.5 ± 0.3) × 10-21 cm3 molecule-1 s-1 where the uncertainty contains an
assessment of both statistical and systematic errors. As often the case in absolute kinetic studies conducted in pseudo-first-
order conditions, the main source of error is the derivation of the concentration of the excess reagent, in this case O3. Based
on differences in derived concentrations using the three O3 absorption features listed above, we estimate that the uncertainty
in the O3 concentration is < 12 %. 25
We also note that the extrapolated fit to the data in Figure 10 (i.e. the C3O2 loss rate in the absence of O3) is larger than that
experimentally observed. This is potentially due to the dark formation of radicals (e.g. OH) that may react with C3O2. Indeed,
evidence for the formation of small amounts of OH when adding O3 to quartz reactors has been observed previously (Finlayson-
Pitts and Pitts, 1999). Taking a value of k4 = 2.6 × 10⁻¹² cm3 molecule-1 s-1, we can show that a steady-state OH concentration
of 3 × 10⁶ molecule cm-3 would be required to (positively) bias the rate constant by ~ 10 %. Whilst we have no evidence for 30
this in our reactor, we recognise that such effects are difficult to eliminate for very slow reactions and thus consider the value
Atmos. Chem. Phys. Discuss., doi:10.5194/acp-2017-49, 2017Manuscript under review for journal Atmos. Chem. Phys.Published: 26 January 2017c© Author(s) 2017. CC-BY 3.0 License.
11
of k6 obtained as an upper limit. In any case, as we show later, the rate constant is too low for it to represent a significant sink
of atmospheric C3O2.
The only IR-active products observed from the reaction of C3O2 with O3 were CO and CO2 as seen in Figure 8. Attempts to
derive the yields of CO and CO2 experimentally were unsuccessful as variable amounts of both were formed when (in the
absence of C3O2) O3 and synthetic air were allowed to stand in the reactor for a few hours, presumably resulting from surface 5
reactions of O3 on the quartz / metal surfaces in the reactor. The amount of CO and CO2 formed in this surface reaction were
comparable to those observed when C3O2 was present.
There is no previous experimental data with which to compare our rate constant, but note that the low value of k6 and the
observation of only CO and CO2 as stable products are consistent with the theoretical investigation of this reaction (see below).
3.3.2 Theoretical study of the reaction mechanism 10
The reaction of carbon suboxide with O3 proceeds by a cycloaddition of ozone across one of the equivalent C=C bonds (see
Figure 11), with a barrier calculated at 11.4 (M05-2X) to 11.9 kcal mol-1 (CBS-QB3). The TST rate coefficient predicted for
the addition at room temperature is 6.7×10⁻²⁴ cm3 molecule-1 s-1, based on M05-2X data, in fair agreement with the experimental
value considering the low level of theory used. The primary ozonide (POZ) is formed with an internal excess energy of 62.5
kcal mol-1, and has access to two dissociation channels. The first channel, with a barrier of 27.7 kcal mol-1 breaks an O−O 15
bond in the five-membered ring, leading to the formation of CO2 and the OOC=C=O Criegee intermediate (CI, carbonyl
oxide) in either the syn or anti conformer. The lowest dissociation channel of the POZ, with a barrier of 20.2 kcal mol-1, breaks
the other O−O bond in the POZ; however, rather than forming the expected OOC=O Criegee intermediate, the molecule
rearranges into a dicarbonyl cyclic peroxide INT1 (see Figure 11), splitting of the extracyclic CO moiety. A visualisation of
this unusual rearrangement is available in the supporting information. This reaction is exoenergetic by 72.2 kcal mol-1; the 20
high internal energy content of INT1 leads to facile decomposition to 2 CO2 molecules. The chemistry of OOC=C=O depends
on its conformation; note that CI have a high barrier for syn/anti isomerisation (Vereecken and Francisco, 2012), such that the
conformers need to be considered as separate chemical species. The syn conformer readily undergoes a 1,4-ring closure
reaction, with a negligible barrier. The resulting four-membered ring is not a true minimum at the DFT level of theory, falling
apart into CO + CO2. The anti-CI conformer has a stronger biradical character, and follows the more traditional CI chemistry, 25
first by cyclising to a dioxirane DIO, 17.0 kcal mol-1 more stable than the CI, followed by ring opening to the singlet bisoxy
(SBO) biradical, which is found to be unstable and decomposes without barrier to CO + CO2. The chemistry of some related
carbon oxides is discussed briefly in the supporting information.
From these calculations, we conclude that the ozonolysis of carbon suboxide leads to 2 CO2 + CO, irrespective of the channel;
the high exothermicity of the reactions combined with low intermediate reaction barriers suggests a chemically activated 30
decomposition process, with no collisional thermalization of the intermediates at ambient pressure.
Atmos. Chem. Phys. Discuss., doi:10.5194/acp-2017-49, 2017Manuscript under review for journal Atmos. Chem. Phys.Published: 26 January 2017c© Author(s) 2017. CC-BY 3.0 License.
12
3.4 Determination of the Henry's law and hydration constants
After passing a flow of C3O2 through water for about two minutes an equilibrium was reached, such that no more C3O2 was
taken up by the solution. The 50 cm3 min-1 carbon suboxide flow was then diverted, allowing the solution to degas with a rate
that depends on its Henry's law constant KH and the hydrolysis constant khyd. The time dependent concentration ct at time t
depends on the gas flow φ, the (constant) volume V of the solution, and the temperature (here T = 296K) as follows (Roberts, 5
2005) :
+
⋅⋅⋅⋅=
hyd
Ht
o kVTRk
tc
c φln (4)
The slope of the plot of ln(c0/ct) versus time equals a point on a linear function of gas flow φ with intercept khyd and slope
(KH⋅R⋅T⋅V)-1, such that the series of flows φ described above allows the determination of both khyd and KH. This entire procedure
was repeated for multiple pH values of the solution. Changes in the volume V due to evaporation or physical transport after 10
e.g. bubble bursting is considered negligible. Figure 12 shows the PTR-TOF-MS measurements of the carbon suboxide signal
in the air flow as a function of time, showing the adsorption and subsequent evacuation of carbon suboxide from the water
volume. Figure 12 also shows a more detailed plot of the evacuation of carbon suboxide from the water volume and the ln(c0/ct)
values derived from the C3O2 concentration. Different synthetic air flows, i.e. different amounts of C3O2, φ/V, yield different
slopes which were then used through Eq. (4) to determine KH from the slope φ⋅( KH⋅R⋅T⋅V)-1, and khyd from the intercept; this 15
procedure was repeated for a set of pHs. Table 2 shows the results of this analysis, as a function of the pH value of the aqueous
solution. From these values, it is clear that carbon suboxide absorbs better, and hydrolyses significantly faster, in basic solutions
compared to acid solutions.
3.5 Photodissociation of C3O2 in the atmosphere
Photodissociation of carbon suboxide in the atmosphere depends on the wavelength-specific absorption cross section σ(λ,T) 20
(see above), quantum yield Φ(λ,T) for dissociation, and actinic flux Fα(λ):
( ) ( ) ( ) ( )∫ ⋅⋅Φ⋅=λ
α λλλλσ dFTTTJ OCOCOC ,,232323
(5)
The photolysis rate was determined using the Landgraf and Crutzen (1998) method, using the following approximations: (i)
over the photochemically active spectral range from 178.6 to 752.5 nm, only the measured absorption cross sections (listed in
the supporting information) between 230 and 309 nm are used; all other values are set to zero; (ii) based on the lack of structure 25
in the UV absorption spectrum (indicative of excitation at energies beyond the dissociation limit) a quantum yield of 1 is
assumed; (iii) an atmosphere without clouds is assumed, where the actinic flux and the relative humidity were averaged over
their values at 19 different heights; (iv) an albedo of 0.07 is assumed. In the calculation, the vertical temperature changes were
Atmos. Chem. Phys. Discuss., doi:10.5194/acp-2017-49, 2017Manuscript under review for journal Atmos. Chem. Phys.Published: 26 January 2017c© Author(s) 2017. CC-BY 3.0 License.
13
accounted for. Under these assumptions, for a zenith angle of 50 degrees, photodissociation rate constants ranging from
1.2×10⁻⁶ to 4.0×10⁻⁶ s-1 were obtained.
3.6 In-situ measurements of C3O2
PTR-MS-ToF measurements were performed in several locations with a view to identifying potential C3O2 sources. These
included near the MPI-Chemistry building in Mainz, Germany (anthropogenically influenced continental air), in a tropical 5
greenhouse (strong biogenic source), direct measurement from diesel and gasoline car exhaust, and in volcanic gas emissions
(geogenic source). Measurements from the green-house (in-situ) and volcanic air samples (metal canisters of pressurized air)
showed no significant peak on m/z = 68.995 of protonated C3O2, Likewise, flue gases from a petrol (gasoline) and a diesel
vehicle, analyzed after dilution, showed no clear signal in either case. However, the ambient air measurement at the MPIC
building (in-situ) showed a small peak (Figure 1) indicating the presence of carbon suboxide in ambient air. The measurements 10
therefore show that carbon suboxide can be observed with current technology, and separated effectively from other peaks in
the mass spectrum. Earlier work by Jordan et al. (2009) also showed a signal at the C3O2 mass in ambient air, though these
authors did not identify the compound as carbon suboxide. Although the C3O2 signal was not quantified through species-
specific calibration, assuming a calibration factor similar to that of isoprene gives a mixing ratio in ambient air close to the
instrument detection limit of about 10 pptv when integrated for one hour. At this time, we do not propose atmospheric C3O2 15
sources, but adhere to the single source category described in the literature (biomass burning), discussed in more detail below.
Future measurements using PTR-MS-ToF technology should with time reveal whether further sources of C3O2 exist.
3.7 Atmospheric model for C3O2
In the numerical simulation of carbon suboxide global distribution, we assume that its main sources into the atmosphere are
biomass burning and biofuel consumption (see Sec. 2.7). For atmospheric carbon suboxide, the three possible chemical 20
removal paths, discussed earlier in this paper, were implemented. The first reaction is with OH, with a rate constant of 2.5×10⁻¹²
cm3 molecule-1 s-1, the second is photolysis, and the third, minor reaction is with ozone that has a low rate coefficient of
1.5×10⁻²¹ cm3 molecule-1 s-1. In addition to these chemical transformations, two possible physical sinks, i.e. wet and dry
deposition, are included. Wet deposition follows dissolution into cloud droplets that form precipitation and rain out; the
Henry’s law constant of carbon suboxide is very low, 1.4 M atm-1. Subsequent to uptake into the aqueous phase the molecule 25
is hydrolyzed and forms a carboxylic acid ketene with a rate constant of 4×10⁻² s-1 (see above). Further hydrolysis yields
malonic acid, with a rate constant of 44 s-1, as determined for ketene hydrolysis (Bothe et al., 1980). This reaction chain is rate
limited by the first hydrolysis step, and the hydrolysis system was implemented as a single lumped process. Overall, since only
a small fraction of carbon suboxide partitions into hydrometeors, wet deposition is expected to be of less significance than
chemical conversion by OH in the gas phase. 30
Table 3 quantifies annual fluxes of carbon suboxide emissions and sinks in Gg/year. Potential underestimation of the emissions
may be related to small undetected fires. The main sink of carbon suboxide is reaction with OH, which accounts for more than
Atmos. Chem. Phys. Discuss., doi:10.5194/acp-2017-49, 2017Manuscript under review for journal Atmos. Chem. Phys.Published: 26 January 2017c© Author(s) 2017. CC-BY 3.0 License.
14
the 59 % of the loss. Conversion of carbon suboxide to malonic acid in the aqueous phase is the second major process,
contributing 36 %. The remaining 7 % is due the wet and dry deposition, reaction with ozone, and photolysis. The budget is
not perfectly closed because the model output frequency (10h) limits the accuracy of the chemical loss calculation, leaving 4
% of sink overestimation within the given simulation year. Lifetimes of carbon suboxide with respect to different chemical
processes are shown in Table 4. It can be seen that reaction with OH is the major sink, followed by cloud droplet uptake and 5
conversion to malonic acid, while reaction with ozone and photolysis play only a minor role.
Simulated mixing ratio distributions are presented in Figure 13 and Figure 14. In general carbon suboxide is below pptv levels,
although it can build up to tens of pptv locally. Relatively high mixing ratios occur in Africa, South America, China, and India,
where the largest emissions take place. Figure 14 shows the zonal and annual averaged mixing ratios, where the highest values
are close to the surface emissions regions and rapidly declining during transport, mostly due to the fast removal of carbon 10
suboxide by OH. In the southern-equatorial band, carbon suboxide reaches the highest altitudes, in agreement with the strong
surface emissions and transport by deep convection. Higher mixing ratios are localized in the southern hemisphere (see Figure
13), due to the major sources being located there. Weak northern sources are situated north of 40°N in Russia, corresponding
to the locations of summer boreal forest fires (Kaiser et al., 2012). Carbon suboxide shows intra-annual variability mostly
related to the seasonal cycle of biomass burning. 15
4 Conclusions
In this work, we have studied many aspects of the impact of carbon suboxide, C3O2, in the atmosphere. The IR and UV spectra
of carbon suboxide were measured, showing good agreement with earlier work (Bayes, 1961; Long et al., 1954; Miller and
Fateley, 1964; Vander Auwera et al., 1991). The atmospheric photolysis rate constants obtained from the UV spectrum and
assuming a photo-dissociation quantum yield of unity, range from 1×10⁻⁶ to 4.0×10⁻⁶ s-1, depending on the altitude, for a zenith 20
angle of 50 degrees.
The reactions of C3O2 with OH radicals and O3 molecules were studied using relative and absolute methods, as well as
theoretically. The rate coefficient for C3O2 + OH was determined by a relative rate method to be k4 = 2.6 ± 0.5 × 10⁻¹² cm3
molecule-1 s-1 at 295 K, in good agreement with earlier work by Faubel et al. (1977) and supported by theoretical work. The
reaction is predicted to proceed predominantly by OH-addition on the inner carbon atoms, where the final products of this 25
reaction in oxidative conditions are CO and CO2, with the hydroxy radical H-atom converted to an HO2 radical. The rate
coefficient for C3O2 + O3 at 295 K was measured for the first time as k6 < 1.5 × 10⁻²¹ cm3 molecule-1 s-1, a low value that is
supported by theoretical kinetic analysis of the initiation channel. The products of the reaction are predicted to be 2 CO2 + CO,
by chemically-activated multi-step decomposition reactions of oxide intermediates.
The Henry's law constant, KH, and the hydration constant, khyd, were measured for the first time. For an acidic aqueous phase, 30
pH < 5, a KH of 1.08 ± 0.01 M atm-1 was obtained at 296 K, while for a near-neutral solution, pH = 6-8, a value of 1.56 ± 0.01
Atmos. Chem. Phys. Discuss., doi:10.5194/acp-2017-49, 2017Manuscript under review for journal Atmos. Chem. Phys.Published: 26 January 2017c© Author(s) 2017. CC-BY 3.0 License.
15
M atm-1 was measured. The hydration rate coefficient ranges from 0.033 s-1 for acidic solutions, to 0.043 s-1 in near-neutral
solution.
The experimental results were incorporated into the EMAC atmospheric chemistry model, simulating the C3O2 distribution
and budget in the atmosphere. It was found that the lifetime of carbon suboxide was determined predominantly by the reaction
with OH, accounting for ~60% of its removal. The remainder is nearly exclusively lost to the aqueous phase by conversion to 5
malonic acid and subsequent rainout. The model predicts that malonic acid formed by carbon suboxide hydrolysis remains at
sub-pptv levels. This contrasts the interpretation of experimental data by Chebbi and Carlier (1996), who suggest a total source
strength leading to tens of pptv of malonic acid being formed in this way. In this work the yield of malonic acid through
hydration of carbon suboxide is negligible on the global scale. Wet and dry deposition (as C3O2), photolysis, and the reaction
with O3 have very small contributions. The average lifetime of C3O2 in the atmosphere is thus found to be around 3 days. 10
While the current work greatly extends our knowledge on the ambient loss processes of C3O2, insufficient data is available at
this time to determine the tropospheric concentration of carbon suboxide, or its dominant sources, with confidence. The
atmospheric model simulations suggest concentrations of the order of pptv, although further sources may yet be discovered.
These concentration predictions are compatible with the tentative in-situ measurements.
5 Data availability 15
Additional theoretical calculations for reaction of C3O2 with OH and O3; the full set of quantum chemical characteristics of all
compounds discussed in the theoretical work; the FTIR and UV spectra of C3O2.
6 Competing interests
The authors declare that they have no conflict of interest.
7 Acknowledgements 20
LV was supported by the Max Planck Graduate Center with the Johannes Gutenberg-Universität Mainz (MPGC).
References
Atkinson, R., Baulch, D. L., Cox, R. A., Crowley, J. N., Hampson, R. F., Hynes, R. G., Jenkin, M. E., Rossi, M. J., Troe, J.
and IUPAC Subcommittee: Evaluated kinetic and photochemical data for atmospheric chemistry: Volume II - gas
phase reactions of organic species, Atmospheric Chem. Phys., 6(11), 3625–4055, doi:10.5194/acp-6-3625-2006, 25
2006.
Bayes, K.: Photolysis of Carbon Suboxide, J. Am. Chem. Soc., 83(17), 3712–3713, doi:10.1021/ja01478a033, 1961.
Atmos. Chem. Phys. Discuss., doi:10.5194/acp-2017-49, 2017Manuscript under review for journal Atmos. Chem. Phys.Published: 26 January 2017c© Author(s) 2017. CC-BY 3.0 License.
16
Bayes, K. D.: Photolysis of Carbon Suboxide. 1. Reaction with Ethylene, J. Am. Chem. Soc., 84(21), 4077–4080,
doi:10.1021/ja00880a022, 1962.
Bennett, C. J., Jamieson, C. S. and Kaiser, R. I.: Mechanistic studies on the decomposition of carbon suboxide in a cometary
ice analog, Planet. Space Sci., 56(9), 1181–1189, doi:10.1016/j.pss.2008.05.001, 2008.
Bothe, E., Dessouki, A. and Schultefrohlinde, D.: Rate and Mechanism of the Ketene Hydrolysis in Aqueous-Solution, J. 5
Phys. Chem., 84(24), 3270–3272, doi:10.1021/j100461a027, 1980.
Brodie, B. C.: Note on the Synthesis of Marsh-Gas and Formic Acid, and on the Electric Decomposition of Carbonic Oxide,
Proc. R. Soc. Lond. A, 21(139–147), 245–247, doi:10.1098/rspl.1872.0052, 1872.
Carofiglio, T., Pandolfo, L. and Paiaro, G.: Carbon Suboxide Polymers, Eur. Polym. J., 22(6), 491–497, doi:10.1016/0014-
3057(86)90011-X, 1986. 10
Chebbi, A. and Carlier, P.: Carboxylic acids in the troposphere, occurrence, sources, and sinks: A review, Atmos. Environ.,
30(24), 4233–4249, doi:10.1016/1352-2310(96)00102-1, 1996.
Cleary, P. A., Romero, M. T. B., Blitz, M. A., Heard, D. E., Pilling, M. J., Seakins, P. W. and Wang, L.: Determination of
the temperature and pressure dependence of the reaction OH + C2H4 from 200-400 K using experimental and
master equation analyses, Phys. Chem. Chem. Phys., 8, 5633–5642, doi:10.1039/b612127f, 2006. 15
Crippa, M., Janssens-Maenhout, G., Dentener, F., Guizzardi, D., Sindelarova, K., Muntean, M., Van Dingenen, R. and
Granier, C.: Forty years of improvements in European air quality: regional policy-industry interactions with global
impacts, Atmospheric Chem. Phys., 16(6), 3825–3841, doi:10.5194/acp-16-3825-2016, 2016.
Crowley, J. N., Saueressig, G., Bergamaschi, P., Fischer, H. and Harris, G. W.: Carbon kinetic isotope effect in the reaction
CH4+Cl: a relative rate study using FTIR spectroscopy, Chem. Phys. Lett., 303(3–4), 268–274, doi:10.1016/S0009-20
2614(99)00243-2, 1999.
Diels, O. and Lalin, L.: Uber das Carbon sub-oxide., Berichte Dtsch. Chem. Ges., 41, 3426–3434,
doi:10.1002/cber.19080410321, 1908.
Diels, O. and Meyerheim, G.: On the carbon suboxyde (II)., Berichte Dtsch. Chem. Ges., 40, 355–363,
doi:10.1002/cber.19070400154, 1907. 25
Diels, O. and Wolf, B.: Carbonaceous suboxide. I, Berichte Dtsch. Chem. Ges., 39, 689–697,
doi:10.1002/cber.190603901103, 1906.
Dillon, T. J., Karunanandan, R. and Crowley, J. N.: The reaction of IO with CH3SCH3: products and temperature dependent
rate coefficients by laser induced fluorescence, Phys. Chem. Chem. Phys., 8(7), 847–855, doi:10.1039/b514718b,
2006. 30
Dunning, T. H.: Gaussian basis sets for use in correlated molecular calculations. I. The atoms boron through neon and
hydrogen, J. Chem. Phys., 90(2), 1007–1023, doi:10.1063/1.456153, 1989.
Faubel, C., Wagner, H. G. and Hack, W.: Reactions of Carbon Suboxide .2. Reaction of Hydroxyl Radicals with Carbon
Sub-Oxide and with Ketene, Berichte Bunsen-Ges. - Phys. Chem. Chem. Phys., 81(7), 689–692, 1977.
Finlayson-Pitts, B. J. and Pitts, J. N.: Chemistry of the Upper and Lower Atmosphere: Theory, Experiments, and 35
Applications, Academic Press, San Diego., 1999.
Frisch, M. J., Trucks, G. W., Schlegel, H. B., Scuseria, G. E., Robb, M. A., Cheeseman, J. R., Scalmani, G., Barone, V.,
Mennucci, B., Petersson, G. A., Nakatsuji, H., Caricato, M., Li, X., Hratchian, H. P., Izmaylov, A. F., Bloino, J.,
Zheng, G., Sonnenberg, J. L., Hada, M., Ehara, M., Toyota, K., Fukuda, R., Hasegawa, J., Ishida, M., Nakajima, T.,
Honda, Y., Kitao, O., Nakai, H., Vreven, T., Montgomery Jr., J. A., Peralta, J. E., Ogliaro, F., Bearpark, M., Heyd, 40
J. J., Brothers, E., Kudin, K. N., Staroverov, V. N., Keith, T., Kobayashi, R., Normand, J., Normand, J.,
Raghavachari, K., Rendell, A., Burant, J. C., Iyengar, S. S., Tomasi, J., Cossi, M., Rega, N., Millam, J. M., Klene,
Atmos. Chem. Phys. Discuss., doi:10.5194/acp-2017-49, 2017Manuscript under review for journal Atmos. Chem. Phys.Published: 26 January 2017c© Author(s) 2017. CC-BY 3.0 License.
17
M., Knox, J. E., Cross, J. B., Bakken, V., Adamo, C., Jaramillo, J., Gomperts, R., Stratmann, R. E., Yazyev, O.,
Austin, A. J., Cammi, R., Pomelli, C., Ochterski, J. W., Martin, R. L., Morokuma, K., Zakrzewski, V. G., Voth, G.
A., Salvador, P., Dannenberg, J. J., Dapprich, S., Daniels, A. D., Farkas, O., Foresman, J. B., Ortiz, J. V.,
Cioslowski, J., Fox, D. J. and Pople, J. A.: Gaussian 09, Revision B.01, Gaussian Inc., Wallington CT., 2010.
Fulle, D., Hamann, H. F., Hippler, H. and Jansch, C. P.: The high pressure range of the addition of OH to C2H2 and C2H4, 5
Berichte Bunsen-Ges.-Phys. Chem. Chem. Phys., 101(10), 1433–1442, 1997.
Graus, M., Mueller, M. and Hansel, A.: High Resolution PTR-TOF: Quantification and Formula Confirmation of VOC in
Real Time, J. Am. Soc. Mass Spectrom., 21(6), 1037–1044, doi:10.1016/j.jasms.2010.02.006, 2010.
Huber, S. G., Kilian, G. and Scholer, H. F.: Carbon suboxide, a highly reactive intermediate from the abiotic degradation of
aromatic compounds in soil, Environ. Sci. Technol., 41(22), 7802–7806, doi:10.1021/es071530z, 2007. 10
Hucknall, D. J.: Chemistry of Hydrocarbon Combustion, Springer Netherlands, Dordrecht. [online] Available from:
http://dx.doi.org/10.1007/978-94-009-4852-5 (Accessed 16 August 2016), 1985.
Huntress, W. T., Allen, M. and Delitsky, M.: Carbon Suboxide in Comet Halley, Nature, 352(6333), 316–318,
doi:10.1038/352316a0, 1991.
IUPAC Subcommittee on Atmospheric Chemical Kinetic Data Evaluation: Evaluated Kinetic Data, English, IUPAC. 15
[online] Available from: http://iupac.pole-ether.fr/index.html, 2015.
Jöckel, P., Kerkweg, A., Pozzer, A., Sander, R., Tost, H., Riede, H., Baumgaertner, A., Gromov, S. and Kern, B.:
Development cycle 2 of the Modular Earth Submodel System (MESSy2), Geosci. Model Dev., 3(2), 717–752,
doi:10.5194/gmd-3-717-2010, 2010.
Jordan, A., Haidacher, S., Hanel, G., Hartungen, E., Maerk, L., Seehauser, H., Schottkowsky, R., Sulzer, P. and Maerk, T. 20
D.: A high resolution and high sensitivity proton-transfer-reaction time-of-flight mass spectrometer (PTR-TOF-
MS), Int. J. Mass Spectrom., 286(2–3), 122–128, doi:10.1016/j.ijms.2009.07.005, 2009.
Kaiser, J. W., Heil, A., Andreae, M. O., Benedetti, A., Chubarova, N., Jones, L., Morcrette, J.-J., Razinger, M., Schultz, M.
G., Suttie, M. and van der Werf, G. R.: Biomass burning emissions estimated with a global fire assimilation system
based on observed fire radiative power, Biogeosciences, 9(1), 527–554, doi:10.5194/bg-9-527-2012, 2012. 25
Kappe, T. and Ziegler, E.: Carbon Suboxide in Preparative Organic-Chemistry, Angew. Chem.-Int. Ed. Engl., 13(8), 491–
504, doi:10.1002/anie.197404911, 1974.
Karyakin, E. N., Krupnov, A. F. and Shapin, S. M.: Microwave Study of Vibration-Rotation Spectrum of Carbon Suboxide
C3O2, J. Mol. Spectrosc., 94(2), 283–301, doi:10.1016/0022-2852(82)90005-4, 1982.
Kerkweg, A., Buchholz, J., Ganzeveld, L., Pozzer, A., Tost, H. and Jöckel, P.: Technical Note: An implementation of the dry 30
removal processes DRY DEPosition and SEDImentation in the Modular Earth Submodel System (MESSy),
Atmospheric Chem. Phys., 6(12), 4617–4632, doi:10.5194/acp-6-4617-2006, 2006a.
Kerkweg, A., Sander, R., Tost, H. and Jöckel, P.: Technical note: Implementation of prescribed (OFFLEM), calculated
(ONLEM), and pseudo-emissions (TNUDGE) of chemical species in the Modular Earth Submodel System
(MESSy), Atmospheric Chem. Phys., 6(11), 3603–3609, doi:10.5194/acp-6-3603-2006, 2006b. 35
Kerkweg, A., Buchholz, J., Ganzeveld, L., Pozzer, A., Tost, H. and Jöckel, P.: Corrigendum to “Technical Note: An
implementation of the dry removal processes DRY DEPosition and SEDImentation in the Modular Earth Submodel
System (MESSy)” published in Atmos. Chem. Phys., 6, 4617–4632, 2006, Atmospheric Chem. Phys., 9(24), 9569–
9569, doi:10.5194/acp-9-9569-2009, 2009.
Kolbanovskii, Y. A., Tsedilin, A. M. and Borisov, Y. A.: A Theoretical Study of the Role of Carbenes in the Kinetics and 40
Mechanism of the Reactions of Synthesis and Pyrolysis of Carbon Suboxide, Russ. J. Phys. Chem. B, 8(6), 829–
840, doi:10.1134/S1990793114110050, 2014.
Atmos. Chem. Phys. Discuss., doi:10.5194/acp-2017-49, 2017Manuscript under review for journal Atmos. Chem. Phys.Published: 26 January 2017c© Author(s) 2017. CC-BY 3.0 License.
18
Koput, J.: An ab initio study on the equilibrium structure and CCC bending energy levels of carbon suboxide, Chem. Phys.
Lett., 320(3–4), 237–244, doi:10.1016/S0009-2614(00)00237-2, 2000.
Landgraf, J. and Crutzen, P. J.: An efficient method for online calculations of photolysis and heating rates, J. Atmospheric
Sci., 55(5), 863–878, doi:10.1175/1520-0469(1998)055<0863:AEMFOC>2.0.CO;2, 1998.
Long, D. A., Murfin, F. S. and Williams, R. I.: The Raman and Infra-Red Spectra of Carbon Suboxide, Proc. R. Soc. Lond. 5
Ser. A, 223(1153), 251–266, doi:10.1098/rspa.1954.0113, 1954.
Masiello, T., Voorhees, A. J., Abel, M. J. and Nibler, J. W.: Coherent Raman spectra of the v(1) mode of carbon suboxide, J.
Phys. Chem. A, 109(14), 3139–3145, doi:10.1021/jp044358j, 2005.
McDougall, L. A. and Kilpatrick, J. E.: Entropy and Related Thermodynamic Properties of Carbon Suboxide, J. Chem.
Phys., 42(7), 2311–2321, doi:10.1063/1.1696294, 1965. 10
Miller, F. A. and Fateley, W. G.: The Infrared Spectrum of Carbon Suboxide, Spectrochim. Acta, 20(3), 253–266,
doi:10.1016/0371-1951(64)80021-7, 1964.
Montgomery, J. A., Frisch, M. J., Ochterski, J. W. and Petersson, G. A.: A complete basis set model chemistry. VI. Use of
density functional geometries and frequencies, J. Chem. Phys., 110(6), 2822–2827, doi:10.1063/1.477924, 1999.
Müller, M., Mikoviny, T., Jud, W., D’Anna, B. and Wisthaler, A.: A new software tool for the analysis of high resolution 15
PTR-TOF mass spectra, Chemom. Intell. Lab. Syst., 127, 158–165, doi:10.1016/j.chemolab.2013.06.011, 2013.
Oyama, V. I. and Berdahl, B. J.: Model of Martian Surface-Chemistry, J. Mol. Evol., 14(1–3), 199–210,
doi:10.1007/BF01732378, 1979.
Pilling, M. and Seakins, P. W.: Reaction kinetics, 2nd ed., Oxford Univ. Press, Oxford., 2007.
Pozzer, A., de Meij, A., Yoon, J., Tost, H., Georgoulias, A. K. and Astitha, M.: AOD trends during 2001-2010 from 20
observations and model simulations, Atmospheric Chem. Phys., 15(10), 5521–5535, doi:10.5194/acp-15-5521-
2015, 2015.
Raber, W. H. and Moortgat, G. K.: Photooxidation of selected carbonyl compounds in air, in Problems and Progress in
Atmospheric Chemistry, edited by J. R. Barker, World Scientific Publishing Co. Pte. Ltd., Singapore., 2000.
Ramasami, P.: Density functional study of the molecular structures, infrared and Raman spectra of carbon suboxide, its 25
sulfur and selenium analogues, Mol. Phys., 105(8), 1067–1072, doi:10.1080/00268970701283773, 2007.
Reyerson, L. H. and Kobe, K.: Carbon suboxide, Chem. Rev., 7(4), 479–492, doi:10.1021/cr60028a002, 1930.
Roberts, J. M.: Measurement of the Henry’s law coefficient and first order loss rate of PAN in n-octanol, Geophys. Res.
Lett., 32(8), L08803, doi:10.1029/2004GL022327, 2005.
Roblee, L. H. S., Agnew, J. T. and Wark, K.: Evidence for Carbon Suboxide, C3O2, as an Intermediate Product in the Cool 30
Flame Oxidation Products of Diethyl Ether, Combust. Flame, 5(1), 65–70, doi:10.1016/0010-2180(61)90074-8,
1961.
Roeckner, E., Brokopf, R., Esch, M., Giorgetta, M., Hagemann, S., Kornblueh, L., Manzini, E., Schlese, U. and
Schulzweida, U.: Sensitivity of simulated climate to horizontal and vertical resolution in the ECHAM5 atmosphere
model, J. Clim., 19(16), 3771–3791, doi:10.1175/JCLI3824.1, 2006. 35
Sander, R., Baumgaertner, A., Gromov, S., Harder, H., Jöckel, P., Kerkweg, A., Kubistin, D., Regelin, E., Riede, H., Sandu,
A., Taraborrelli, D., Tost, H. and Xie, Z.-Q.: The atmospheric chemistry box model CAABA/MECCA-3.0, Geosci.
Model Dev., 4(2), 373–380, doi:10.5194/gmd-4-373-2011, 2011.
Sander, R., Jöckel, P., Kirner, O., Kunert, A. T., Landgraf, J. and Pozzer, A.: The photolysis module JVAL-14, compatible
with the MESSy standard, and the JVal PreProcessor (JVPP), Geosci. Model Dev., 7(6), 2653–2662, 40
doi:10.5194/gmd-7-2653-2014, 2014.
Atmos. Chem. Phys. Discuss., doi:10.5194/acp-2017-49, 2017Manuscript under review for journal Atmos. Chem. Phys.Published: 26 January 2017c© Author(s) 2017. CC-BY 3.0 License.
19
da Silva, G.: Hydroxyl radical regeneration in the photochemical oxidation of glyoxal: kinetics and mechanism of the
HC(O)CO + O2 reaction, Phys. Chem. Chem. Phys., 12(25), 6698, doi:10.1039/b927176g, 2010.
Smith, R. ., Smith, R. A. and Young, D. A.: Photolysis of Carbon Suboxide, Inorg. Chem., 5(1), 145–148,
doi:10.1021/ic50035a035, 1966.
Tost, H., Jöckel, P., Kerkweg, A., Sander, R. and Lelieveld, J.: Technical note: A new comprehensive SCAVenging 5
submodel for global atmospheric chemistry modelling, Atmospheric Chem. Phys., 6(3), 565–574, doi:10.5194/acp-
6-565-2006, 2006.
Truhlar, D. G., Garrett, B. C. and Klippenstein, S. J.: Current Status of Transition-State Theory, J. Phys. Chem., 100(31),
12771–12800, doi:10.1021/jp953748q, 1996.
Vakhtin, A. B., Murphy, J. E. and Leone, S. R.: Low-temperature kinetics of reactions of OH radical with ethene, propene, 10
and 1-butene, J. Phys. Chem. A, 107(47), 10055–10062, doi:10.1021/jp030230a, 2003.
Vander Auwera, J., Johns, J. W. C. and Polyansky, O. L.: The Far Infrared-Spectrum of C3O2, J. Chem. Phys., 95(4), 2299–
2316, doi:10.1063/1.460938, 1991.
Vereecken, L. and Francisco, J. S.: Theoretical studies of atmospheric reaction mechanisms in the troposphere, Chem. Soc.
Rev., 41(19), 6259–6293, doi:10.1039/c2cs35070j, 2012. 15
Vereecken, L., Huyberechts, G. and Peeters, J.: Stochastic simulation of chemically activated unimolecular reactions, J.
Chem. Phys., 106(16), 6564–6573, doi:10.1063/1.473656, 1997.
Vereecken, L., Glowacki, D. R. and Pilling, M. J.: Theoretical Chemical Kinetics in Tropospheric Chemistry: Methodologies
and Applications, Chem. Rev., 115(10), 4063–4114, doi:10.1021/cr500488p, 2015.
Werner, H.-J., Knowles, P. J., Knizia, G., Manby, F. R., Schütz, M., Celani, P., Korona, T., Lindh, R., Mitrushenkov, A., 20
Rauhut, G., Shamasundar, K. R., Adler, T. B., Amos, R. D., Bernhardsson, A., Berning, A., Cooper, D. L., Deegan,
M. J. O., Dobbyn, A. J., Eckert, F., Goll, E., Hampel, C., Hesselmann, A., Hetzer, G., Hrenar, T., Jansen, G., Köppl,
C., Liu, Y., Lloyd, A. W., Mata, R. A., May, A. J., McNicholas, S. J., Meyer, W., Mura, M. E., Nicklass, A.,
O’Neill, D. P., Palmieri, P., Pflüger, K., Pitzer, R., Reiher, M., Shiozaki, T., Stoll, H., Stone, A. J., Tarroni, R.,
Thorsteinsson, T., Wang, M. and Wolf, A.: MOLPRO, version 2010.1, a package of ab initio programs, molpro. 25
[online] Available from: www.molpro.net, 2010.
Winnewisser, M., Winnewisser, B. P., Medvedev, I. R., De Lucia, F. C., Ross, S. C. and Bates, L. M.: The hidden kernel of
molecular quasi-linearity: Quantum monodromy, J. Mol. Struct., 798(1–3), 1–26,
doi:10.1016/j.molstruc.2006.06.036, 2006.
Yokelson, R. J., Burling, I. R., Gilman, J. B., Warneke, C., Stockwell, C. E., de Gouw, J., Akagi, S. K., Urbanski, S. P., 30
Veres, P., Roberts, J. M., Kuster, W. C., Reardon, J., Griffith, D. W. T., Johnson, T. J., Hosseini, S., Miller, J. W.,
Cocker, D. R., Jung, H. and Weise, D. R.: Coupling field and laboratory measurements to estimate the emission
factors of identified and unidentified trace gases for prescribed fires, Atmospheric Chem. Phys., 13(1), 89–116,
doi:10.5194/acp-13-89-2013, 2013.
Yoon, J. and Pozzer, A.: Model-simulated trend of surface carbon monoxide for the 2001-2010 decade, Atmospheric Chem. 35
Phys., 14(19), 10465–10482, doi:10.5194/acp-14-10465-2014, 2014.
Zhao, Y. and Truhlar, D. G.: The M06 suite of density functionals for main group thermochemistry, thermochemical
kinetics, noncovalent interactions, excited states, and transition elements: two new functionals and systematic
testing of four M06-class functionals and 12 other functionals, Theor. Chem. Acc., 120(1–3), 215–241,
doi:10.1007/s00214-007-0310-x, 2008. 40
Zhao, Y., Schultz, N. E. and Truhlar, D. G.: Design of Density Functionals by Combining the Method of Constraint
Satisfaction with Parametrization for Thermochemistry, Thermochemical Kinetics, and Noncovalent Interactions, J.
Chem. Theory Comput., 2(2), 364–382, doi:10.1021/ct0502763, 2006.
Atmos. Chem. Phys. Discuss., doi:10.5194/acp-2017-49, 2017Manuscript under review for journal Atmos. Chem. Phys.Published: 26 January 2017c© Author(s) 2017. CC-BY 3.0 License.
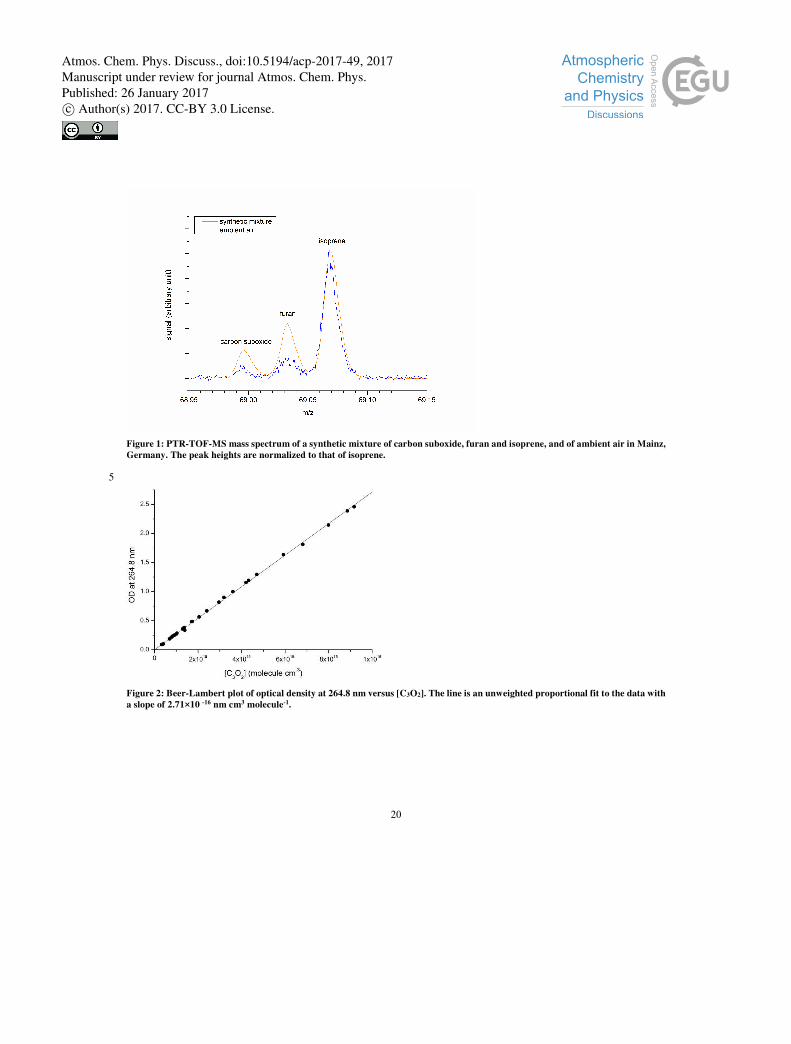
Figure 1: PTR-TOF-MS mass spectrum of a synthetic mixture of carbon suboxide, furan and isoprene, and of ambient air in Mainz,
Germany. The peak heights are normalized to that of isoprene.
5
Figure 2: Beer-Lambert plot of optical density at 264.8 nm versus [C3O2]. The line is an unweighted proportional fit to the data with
a slope of 2.71×10 -16 nm cm3 molecule-1.
20
Atmos. Chem. Phys. Discuss., doi:10.5194/acp-2017-49, 2017Manuscript under review for journal Atmos. Chem. Phys.Published: 26 January 2017c© Author(s) 2017. CC-BY 3.0 License.
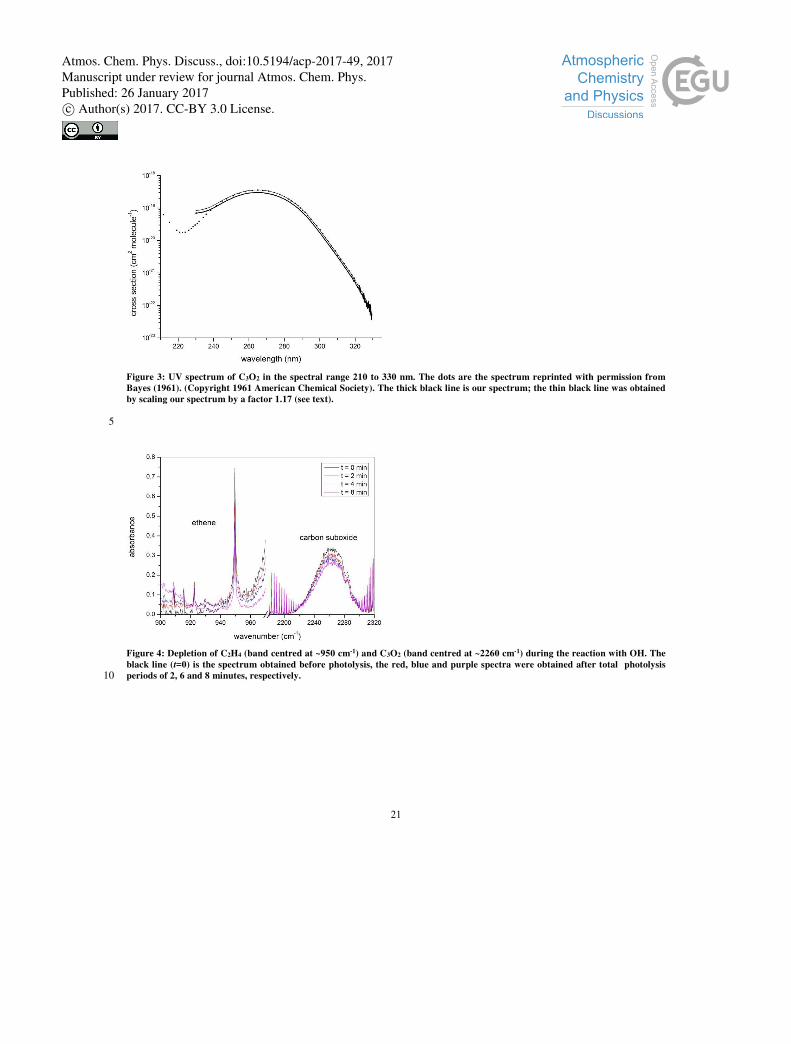
Figure 3: UV spectrum of C3O2 in the spectral range 210 to 330 nm. The dots are the spectrum reprinted with permission from
Bayes (1961). (Copyright 1961 American Chemical Society). The thick black line is our spectrum; the thin black line was obtained
by scaling our spectrum by a factor 1.17 (see text).
5
Figure 4: Depletion of C2H4 (band centred at ~950 cm-1) and C3O2 (band centred at ~2260 cm-1) during the reaction with OH. The
black line (t=0) is the spectrum obtained before photolysis, the red, blue and purple spectra were obtained after total photolysis
periods of 2, 6 and 8 minutes, respectively. 10
21
Atmos. Chem. Phys. Discuss., doi:10.5194/acp-2017-49, 2017Manuscript under review for journal Atmos. Chem. Phys.Published: 26 January 2017c© Author(s) 2017. CC-BY 3.0 License.
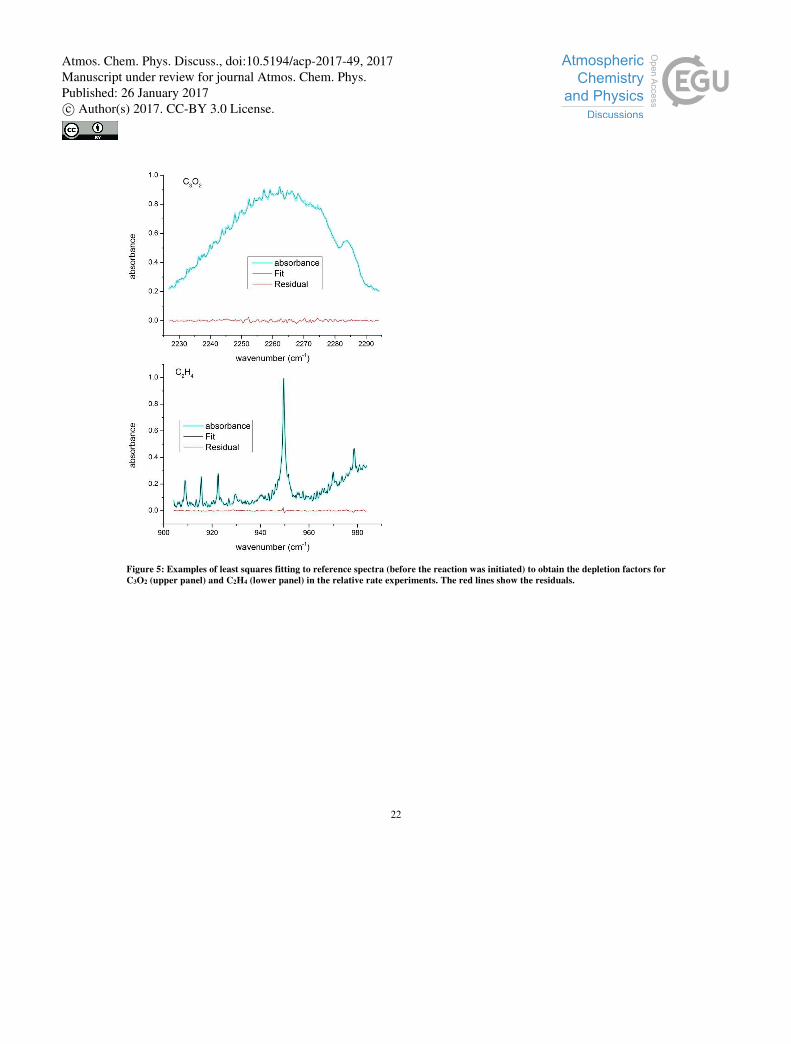
Figure 5: Examples of least squares fitting to reference spectra (before the reaction was initiated) to obtain the depletion factors for
C3O2 (upper panel) and C2H4 (lower panel) in the relative rate experiments. The red lines show the residuals.
22
Atmos. Chem. Phys. Discuss., doi:10.5194/acp-2017-49, 2017Manuscript under review for journal Atmos. Chem. Phys.Published: 26 January 2017c© Author(s) 2017. CC-BY 3.0 License.
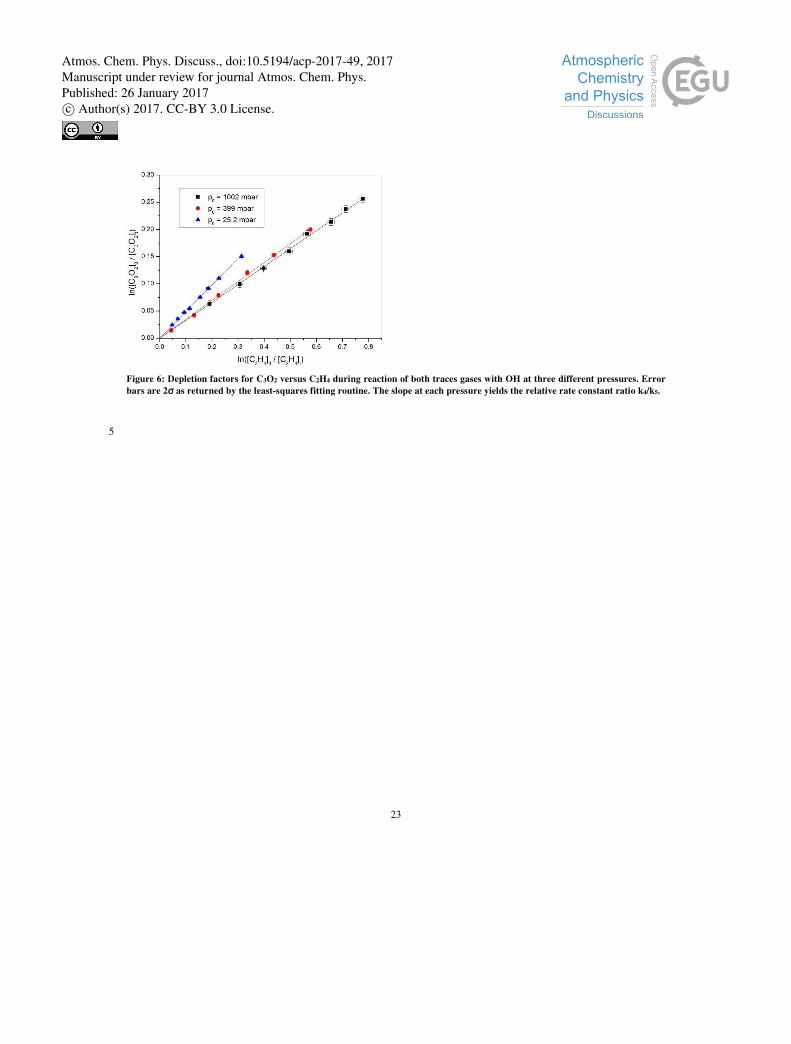
Figure 6: Depletion factors for C3O2 versus C2H4 during reaction of both traces gases with OH at three different pressures. Error
bars are 2σ as returned by the least-squares fitting routine. The slope at each pressure yields the relative rate constant ratio k4/k5.
5
23
Atmos. Chem. Phys. Discuss., doi:10.5194/acp-2017-49, 2017Manuscript under review for journal Atmos. Chem. Phys.Published: 26 January 2017c© Author(s) 2017. CC-BY 3.0 License.
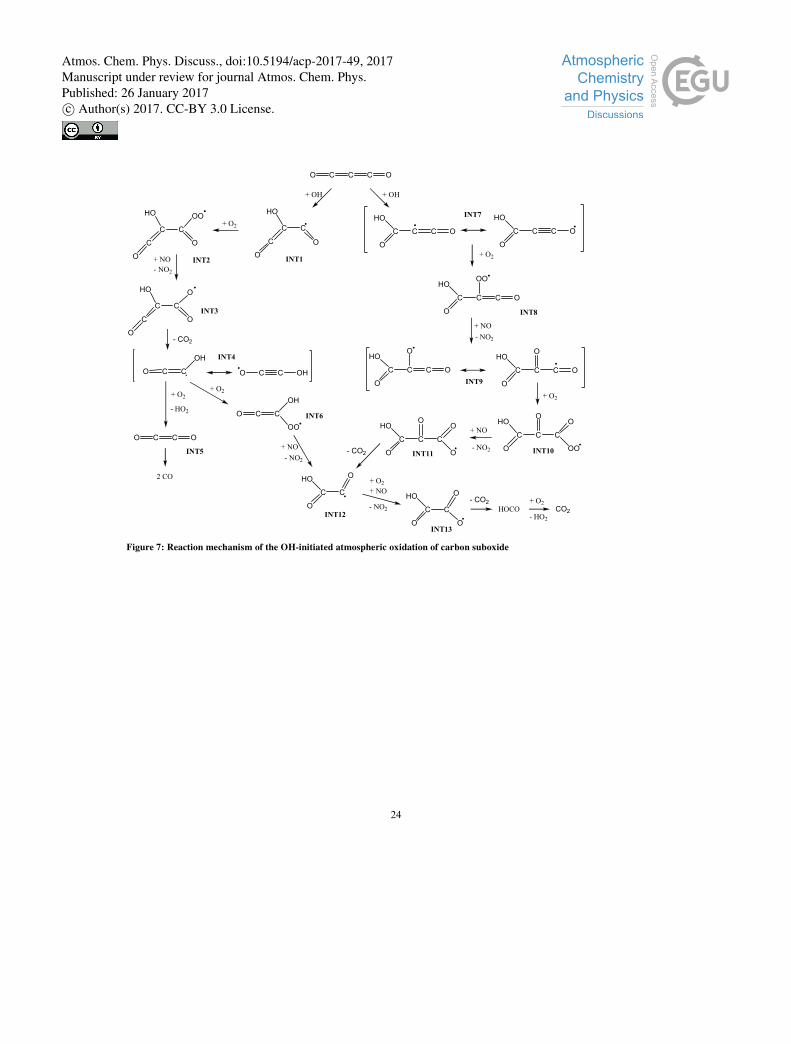
Figure 7: Reaction mechanism of the OH-initiated atmospheric oxidation of carbon suboxide
O C C C O
O
C C C O
HO
O
C C C O
HO
+ OH
+ O2
O
C C C O
HOOO
O
C C C O
HOO
+ NO
- NO2
O
C C C O
HOO
+ O2
O
C C C
OHOO
O
O
C C
HOO
+ O2
+ NO
- NO2
O
C C
HOO
O
- CO2
- CO2
HOCO
+ O2
- HO2
CO2
INT1INT2
INT3
O
C C C
OHOO
OO
+ NO
- NO2
INT4
O
CC
HO
C
O
+ O2
O
CC
HO
C
O
OO
+ NO
- NO2
O
CC
HO
C
O
O
- CO2
+ OH
C
OH
CO C OHCO
+ O2
+ O2
C
OH
CO
OO
- HO2
O C C O
2 CO
+ NO
- NO2
INT5
INT6
INT7
INT8
INT9
INT10INT11
INT12
INT13
24
Atmos. Chem. Phys. Discuss., doi:10.5194/acp-2017-49, 2017Manuscript under review for journal Atmos. Chem. Phys.Published: 26 January 2017c© Author(s) 2017. CC-BY 3.0 License.
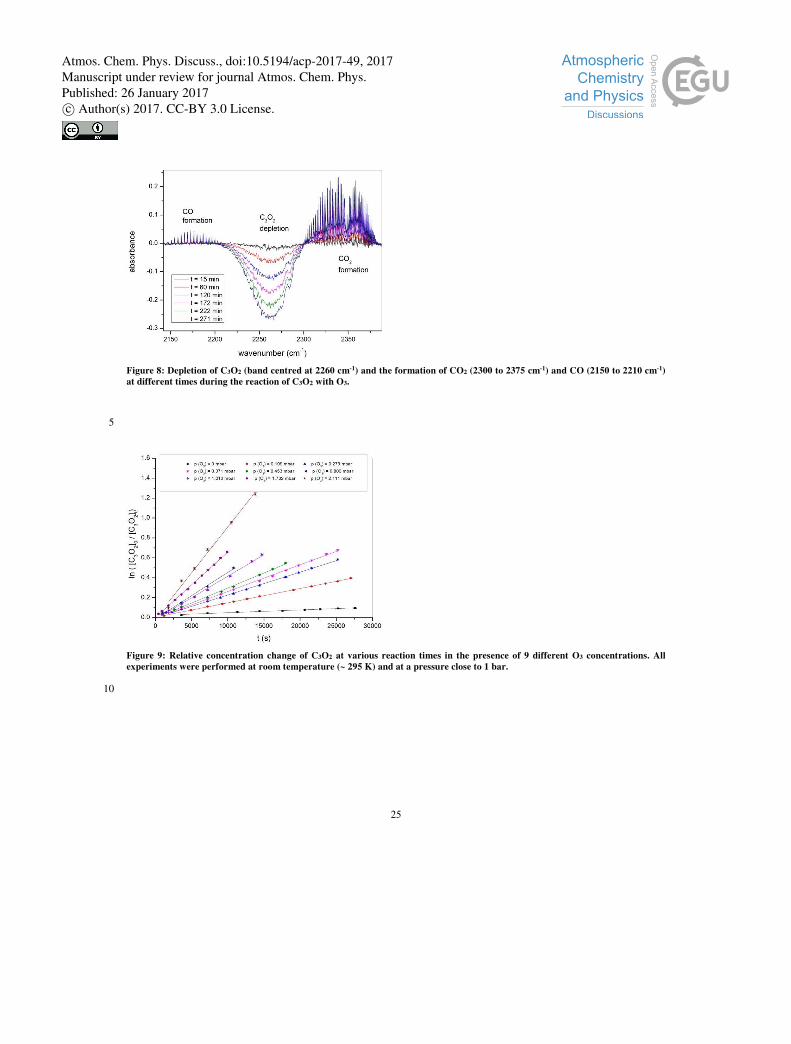
Figure 8: Depletion of C3O2 (band centred at 2260 cm-1) and the formation of CO2 (2300 to 2375 cm-1) and CO (2150 to 2210 cm-1)
at different times during the reaction of C3O2 with O3.
5
Figure 9: Relative concentration change of C3O2 at various reaction times in the presence of 9 different O3 concentrations. All
experiments were performed at room temperature (~ 295 K) and at a pressure close to 1 bar.
10
25
Atmos. Chem. Phys. Discuss., doi:10.5194/acp-2017-49, 2017Manuscript under review for journal Atmos. Chem. Phys.Published: 26 January 2017c© Author(s) 2017. CC-BY 3.0 License.
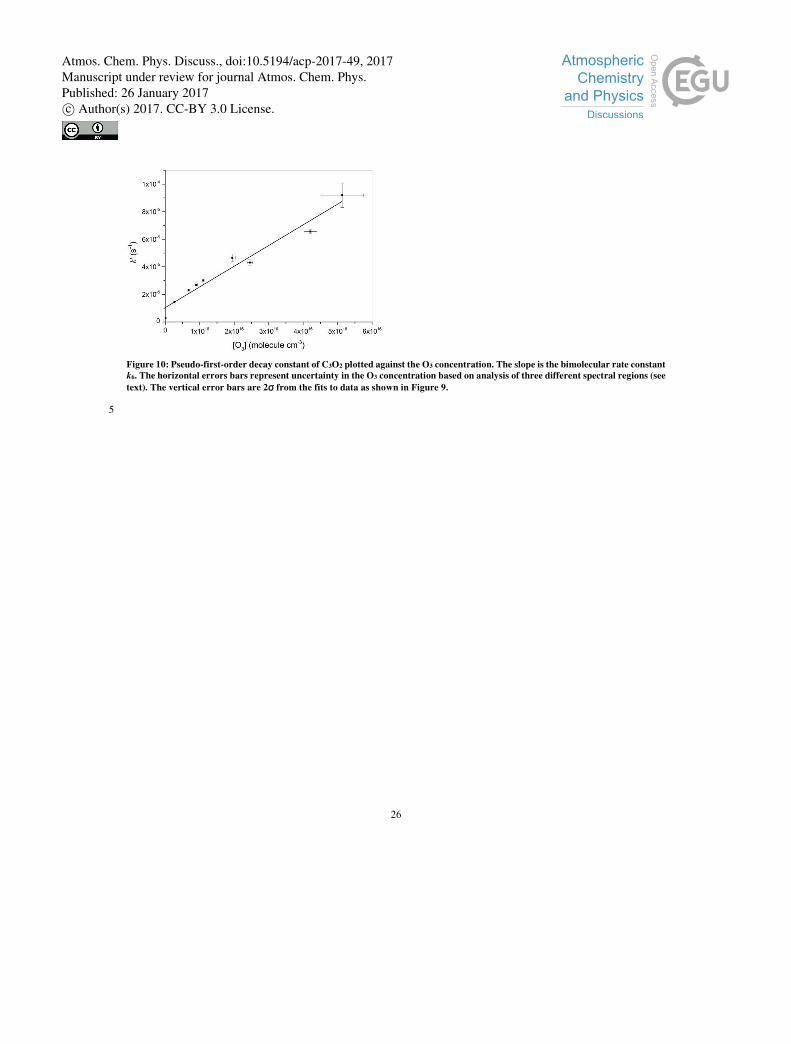
Figure 10: Pseudo-first-order decay constant of C3O2 plotted against the O3 concentration. The slope is the bimolecular rate constant
k6. The horizontal errors bars represent uncertainty in the O3 concentration based on analysis of three different spectral regions (see
text). The vertical error bars are 2σ from the fits to data as shown in Figure 9.
5
26
Atmos. Chem. Phys. Discuss., doi:10.5194/acp-2017-49, 2017Manuscript under review for journal Atmos. Chem. Phys.Published: 26 January 2017c© Author(s) 2017. CC-BY 3.0 License.
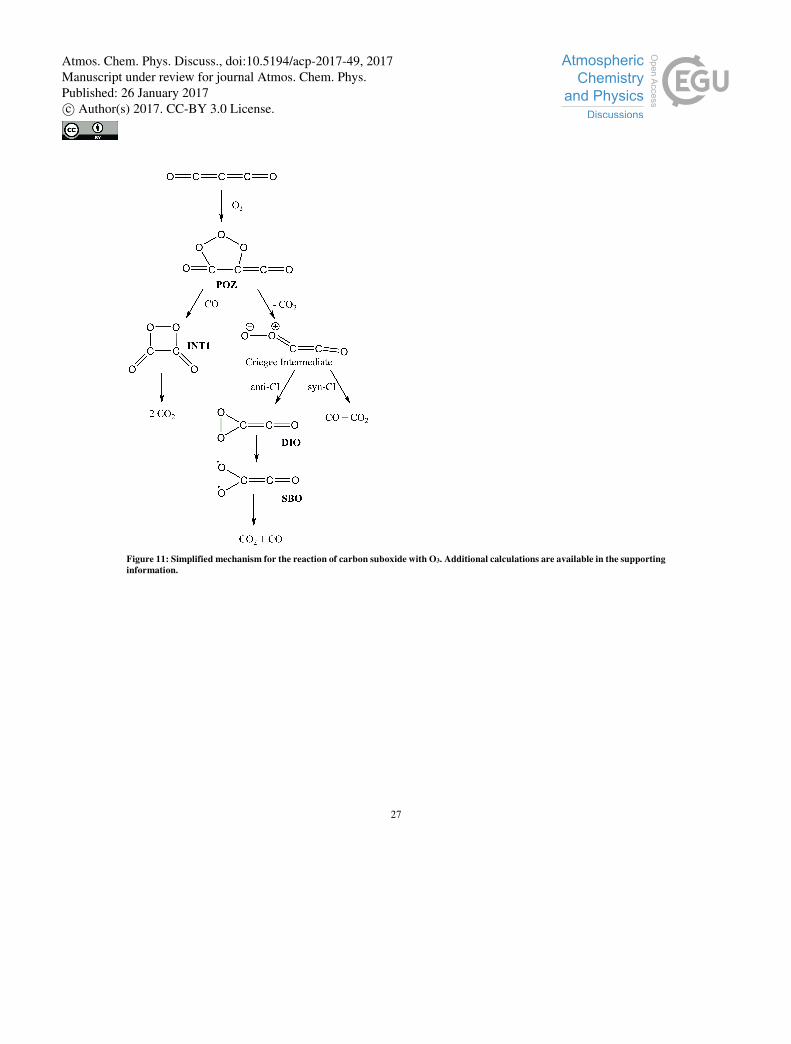
Figure 11: Simplified mechanism for the reaction of carbon suboxide with O3. Additional calculations are available in the supporting
information.
27
Atmos. Chem. Phys. Discuss., doi:10.5194/acp-2017-49, 2017Manuscript under review for journal Atmos. Chem. Phys.Published: 26 January 2017c© Author(s) 2017. CC-BY 3.0 License.
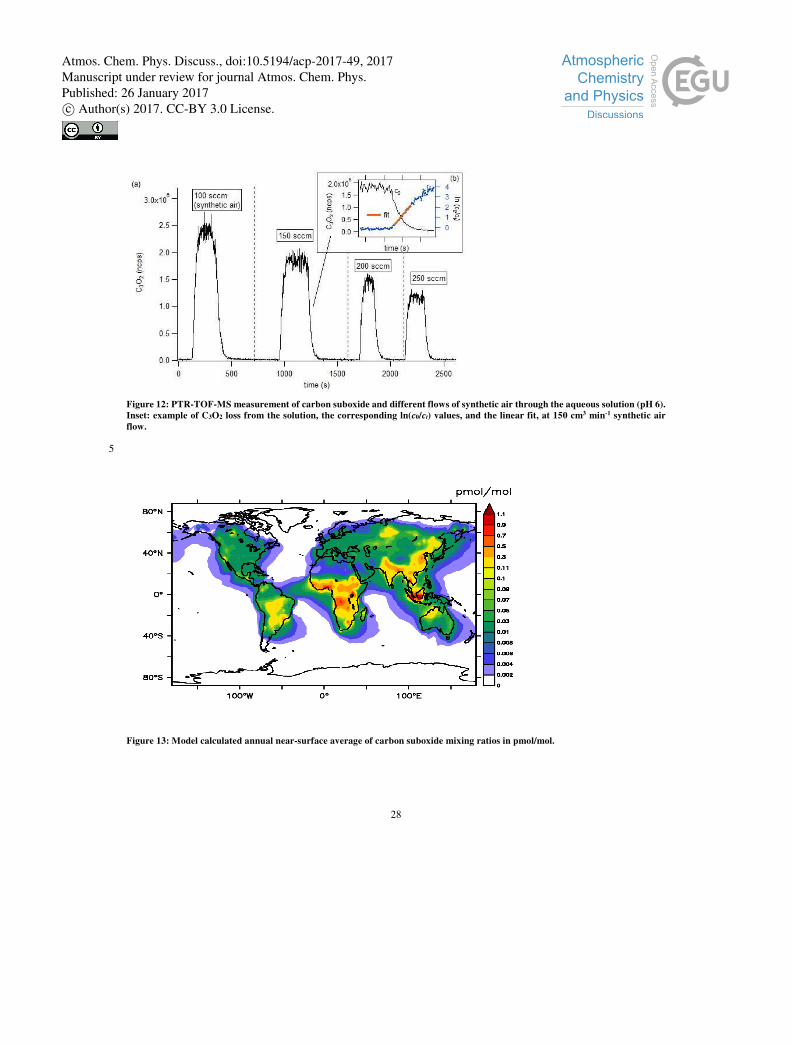
Figure 12: PTR-TOF-MS measurement of carbon suboxide and different flows of synthetic air through the aqueous solution (pH 6).
Inset: example of C3O2 loss from the solution, the corresponding ln(c0/ct) values, and the linear fit, at 150 cm3 min-1 synthetic air
flow.
5
Figure 13: Model calculated annual near-surface average of carbon suboxide mixing ratios in pmol/mol.
28
Atmos. Chem. Phys. Discuss., doi:10.5194/acp-2017-49, 2017Manuscript under review for journal Atmos. Chem. Phys.Published: 26 January 2017c© Author(s) 2017. CC-BY 3.0 License.
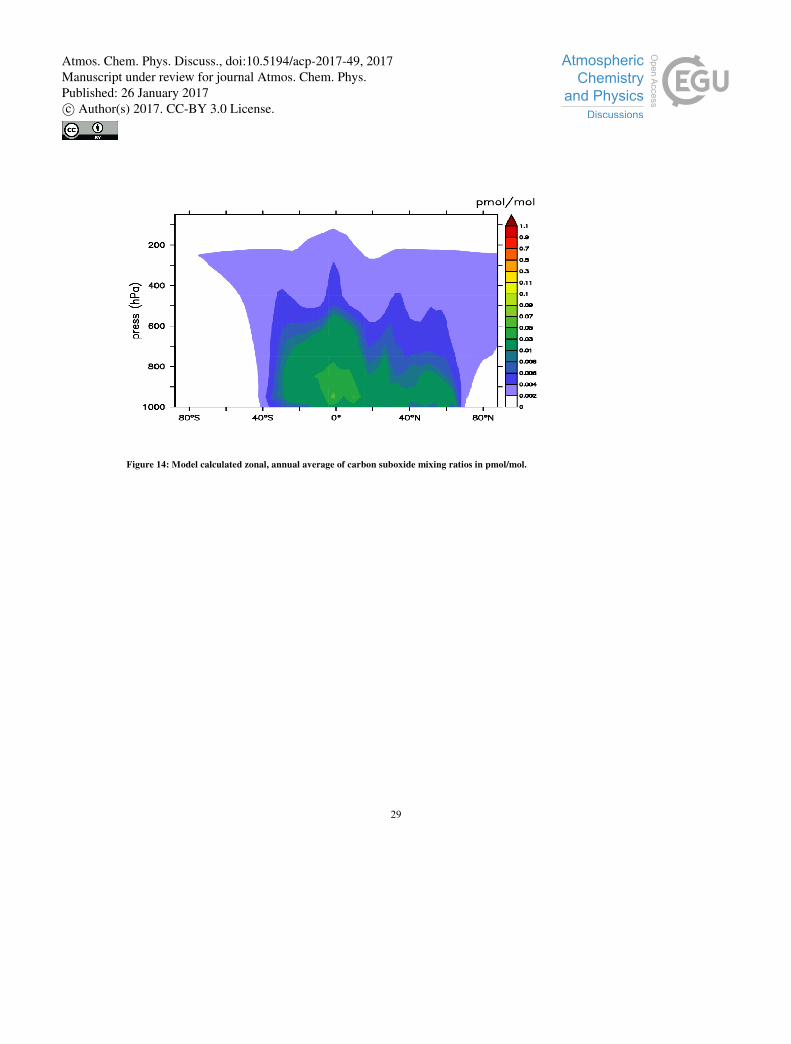
Figure 14: Model calculated zonal, annual average of carbon suboxide mixing ratios in pmol/mol.
29
Atmos. Chem. Phys. Discuss., doi:10.5194/acp-2017-49, 2017Manuscript under review for journal Atmos. Chem. Phys.Published: 26 January 2017c© Author(s) 2017. CC-BY 3.0 License.
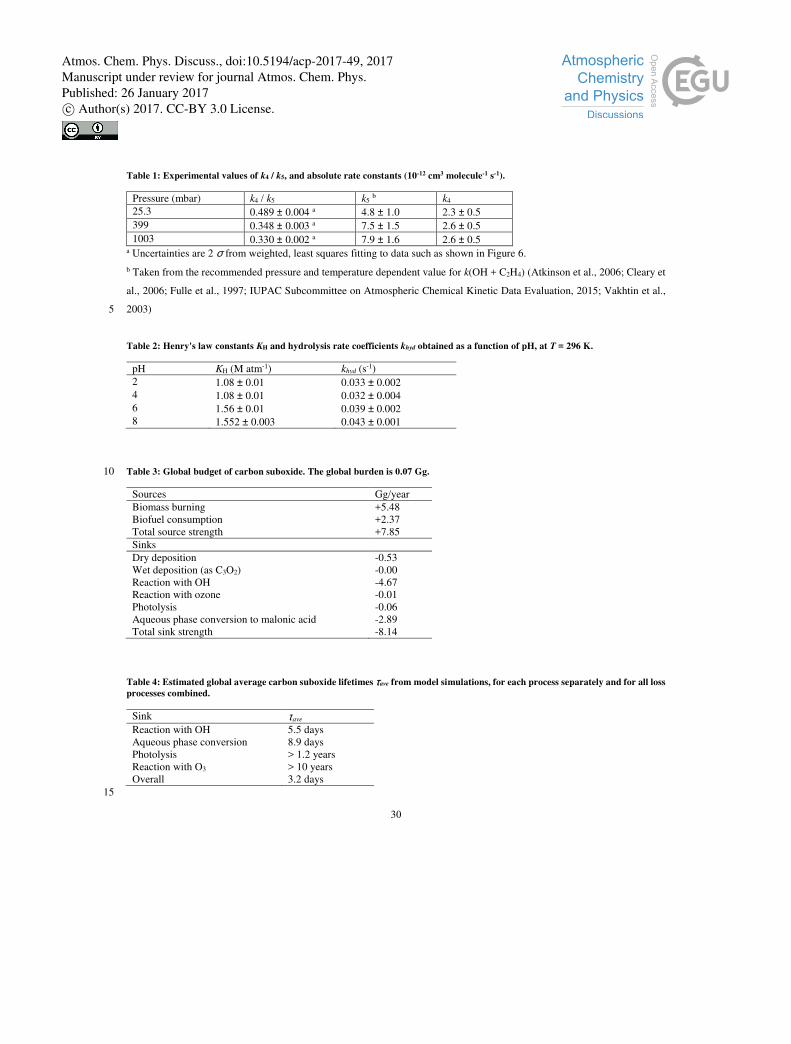
Table 1: Experimental values of k4 / k5, and absolute rate constants (10-12 cm3 molecule-1 s-1).
Pressure (mbar) k4 / k5 k5 b k4
25.3 0.489 ± 0.004 a 4.8 ± 1.0 2.3 ± 0.5
399 0.348 ± 0.003 a 7.5 ± 1.5 2.6 ± 0.5
1003 0.330 ± 0.002 a 7.9 ± 1.6 2.6 ± 0.5 a Uncertainties are 2 σ from weighted, least squares fitting to data such as shown in Figure 6.
b Taken from the recommended pressure and temperature dependent value for k(OH + C2H4) (Atkinson et al., 2006; Cleary et
al., 2006; Fulle et al., 1997; IUPAC Subcommittee on Atmospheric Chemical Kinetic Data Evaluation, 2015; Vakhtin et al.,
2003) 5
Table 2: Henry's law constants KH and hydrolysis rate coefficients khyd obtained as a function of pH, at T = 296 K.
pH KH (M atm-1) khyd (s-1)
2 1.08 ± 0.01 0.033 ± 0.002
4 1.08 ± 0.01 0.032 ± 0.004
6 1.56 ± 0.01 0.039 ± 0.002
8 1.552 ± 0.003 0.043 ± 0.001
Table 3: Global budget of carbon suboxide. The global burden is 0.07 Gg. 10
Sources Gg/year
Biomass burning +5.48
Biofuel consumption +2.37
Total source strength +7.85
Sinks
Dry deposition -0.53
Wet deposition (as C3O2) -0.00
Reaction with OH -4.67
Reaction with ozone -0.01
Photolysis -0.06
Aqueous phase conversion to malonic acid -2.89
Total sink strength -8.14
Table 4: Estimated global average carbon suboxide lifetimes τave from model simulations, for each process separately and for all loss
processes combined.
Sink τave
Reaction with OH 5.5 days
Aqueous phase conversion 8.9 days
Photolysis > 1.2 years
Reaction with O3 > 10 years
Overall 3.2 days
15
30
Atmos. Chem. Phys. Discuss., doi:10.5194/acp-2017-49, 2017Manuscript under review for journal Atmos. Chem. Phys.Published: 26 January 2017c© Author(s) 2017. CC-BY 3.0 License.