carbon sinks in temperate forests
TRANSCRIPT

3 Oct 2001 9:30 AR AR143-15-mar.tex AR143-15-mar.SGM ARv2(2001/05/10) P1: GJB
Annu. Rev. Energy Environ. 2001. 26:435–65
CARBON SINKS IN TEMPERATE FORESTS1
Philippe H. Martin,2 Gert-Jan Nabuurs,3 Marc Aubinet,4
Timo Karjalainen,5 Edward L. Vine,6 John Kinsman,7 andLinda S. Heath82European Commission, Research Directorate General, B-1049 Brussels, Belgium,3ALTERRA, Wageningen University and Research Center, NL-6700 AA Wageningen, TheNetherlands, 4Unit of Physics, Faculte Universitaire des Sciences Agronomiques, B-5030Gembloux, Belgium, 5European Forest Institute, Joensuu, Finland, 6Energy AnalysisDepartment, Environmental Energy Technologies Division, Lawrence Berkeley NationalLaboratory, Berkeley, California 94720, 7Edison Electric Institute, Washington DC20004, and 8USDA Forest Service, Northeastern Research Station, Durham, NewHampshire 03824; e-mail: [email protected], [email protected],[email protected], [email protected], [email protected], [email protected],[email protected]
Key Words carbon dioxide, climate, climate change, emissions, greenhouse gas,Kyoto protocol, negotiation
■ Abstract In addition to being scientifically exciting, commercially important,and environmentally essential, temperate forests have also become a key diplomaticitem in international climate negotiations as potential sinks for carbon. This reviewpresents the methods used to estimate carbon sequestration, identifies the constraintsand opportunities for carbon sequestration in temperate forests, addresses the issuesraised by the monitoring of carbon sequestration, and analyzes uncertainties pertainingto the sequestration of carbon by temperate forests. This review serves a dual purpose:It aims at informing policy makers about carbon sequestration in temperate forestsand at making forest ecologists, biogeochemists, and atmospheric scientists aware ofthe structure of an international agreement to reduce CO2 and other greenhouse gasemissions and some of the real, still answered scientific questions that it poses.
CONTENTS
1. TEMPERATE FORESTS AND INTERNATIONAL CARBONDIPLOMACY . . . . . . . . . . . . . . . . . . . . . . . . . . . . . . . . . . . . . . . . . . . . . . . . . . . . . . . 4362. ESTIMATION METHODS FOR CARBON SEQUESTRATION INTEMPERATE FORESTS . . . . . . . . . . . . . . . . . . . . . . . . . . . . . . . . . . . . . . . . . . . . . . 438
1The US Government has the right to retain a nonexclusive, royalty-free license in and toany copyright covering this paper.
435
Ann
u. R
ev. E
nerg
y. E
nviro
n. 2
001.
26:4
35-4
65. D
ownl
oade
d fro
m a
rjour
nals.
annu
alre
view
s.org
by L
AW
REN
CE B
ERK
ELEY
NA
TIO
NA
L LA
BORA
TORY
on
05/2
4/10
. For
per
sona
l use
onl
y.

3 Oct 2001 9:30 AR AR143-15-mar.tex AR143-15-mar.SGM ARv2(2001/05/10) P1: GJB
436 MARTIN ET AL.
3. AN EXAMPLE OF INVENTORY-BASED CARBON BUDGETCALCULATION . . . . . . . . . . . . . . . . . . . . . . . . . . . . . . . . . . . . . . . . . . . . . . . . . . . . . 4444. CONSTRAINTS ON AND OPPORTUNITIES FOR CARBONSEQUESTRATION IN TEMPERATE FORESTS . . . . . . . . . . . . . . . . . . . . . . . . . . . 4454.1. Estimates of Potential Carbon Sequestration byAnthropogenic Activities . . . . . . . . . . . . . . . . . . . . . . . . . . . . . . . . . . . . . . . . . . . . . 4454.2. Key Issues . . . . . . . . . . . . . . . . . . . . . . . . . . . . . . . . . . . . . . . . . . . . . . . . . . . . . . 446
5. MONITORING, EVALUATING, REPORTING, VERIFYING, ANDCERTIFYING AREAL CARBON SEQUESTRATION INTEMPERATE FORESTS: CONCEPTS AND OPERATIONALREQUIREMENTS . . . . . . . . . . . . . . . . . . . . . . . . . . . . . . . . . . . . . . . . . . . . . . . . . . . 4485.1. Monitoring and Evaluation of Carbon Sequestration . . . . . . . . . . . . . . . . . . . . . 4495.2. Baseline Use: Reestimating the Baseline . . . . . . . . . . . . . . . . . . . . . . . . . . . . . . 4515.3. Project Leakage and Project Spillover . . . . . . . . . . . . . . . . . . . . . . . . . . . . . . . . 4525.4. Environmental and Socioeconomic Impacts . . . . . . . . . . . . . . . . . . . . . . . . . . . 4545.5. Reporting . . . . . . . . . . . . . . . . . . . . . . . . . . . . . . . . . . . . . . . . . . . . . . . . . . . . . . 4545.6. Verification and Certification . . . . . . . . . . . . . . . . . . . . . . . . . . . . . . . . . . . . . . . 454
6. DISCUSSION OF UNCERTAINTIES . . . . . . . . . . . . . . . . . . . . . . . . . . . . . . . . . . . 4556.1. Uncertainties in a Stationary Environment . . . . . . . . . . . . . . . . . . . . . . . . . . . . . 4556.2. Uncertainties in a Changing Environment . . . . . . . . . . . . . . . . . . . . . . . . . . . . . 4576.3. Uncertainties About Virtuous and Vicious Carbon Cycles . . . . . . . . . . . . . . . . 458
7. CLOSING REMARKS . . . . . . . . . . . . . . . . . . . . . . . . . . . . . . . . . . . . . . . . . . . . . . . 4588. EPILOGUE . . . . . . . . . . . . . . . . . . . . . . . . . . . . . . . . . . . . . . . . . . . . . . . . . . . . . . . . 459
1. TEMPERATE FORESTS AND INTERNATIONALCARBON DIPLOMACY
The 1997 Kyoto Protocol to the United Nations (UN) Framework Convention onClimateChange (FCCC), if it enters into force or if the principles uponwhich it restsunderlie a new agreement, will establish limits to human-induced greenhouse gas(GHG) emissions—particularly carbon dioxide (CO2)—with consequences for theglobal atmosphere, for the global biosphere in general, and for temperate forestsin particular. The Kyoto Protocol (1, 2) defines national and international GHGemission-reduction targets to be achieved by reductions in GHG emissions, by anincrease in GHG sinks, or by both.The Protocol requires a commitment, comparing 1990 GHG emission levels
to a 2008–2012 “first commitment period” (CP) for 38 signatory nations. TheProtocol addresses forestry actions taken (a) domestically (Article 3), (b) jointlywith other developed-nation treaty signatories vis-a-vis emissions trading (Article17) or “joint implementation” (JI) projects (Article 6), and finally (c) jointly withdeveloping-country nonsignatories via the clean development mechanism (CDM)(Article 12). Articles 3 and 17 are generally based at the national level, whereasArticles 6 and 12 are based more at the project level. Article 3.3 includes determi-nation of net national emissions “afforestation, reforestation and deforestation.”Article 3.3 states that “[t]he net changes in greenhouse gas emissions by sources
Ann
u. R
ev. E
nerg
y. E
nviro
n. 2
001.
26:4
35-4
65. D
ownl
oade
d fro
m a
rjour
nals.
annu
alre
view
s.org
by L
AW
REN
CE B
ERK
ELEY
NA
TIO
NA
L LA
BORA
TORY
on
05/2
4/10
. For
per
sona
l use
onl
y.

3 Oct 2001 9:30 AR AR143-15-mar.tex AR143-15-mar.SGM ARv2(2001/05/10) P1: GJB
CARBON SINKS IN TEMPERATE FORESTS 437
and removals by sinks resulting from direct human-induced land-use change andforestry activities, limited to afforestation, reforestation, and deforestation since1990, measured as verifiable changes in carbon stocks in each commitment pe-riod, shall be used.” (Forests that meet the definition spelled out in Article 3.3 areoften referred to as Kyoto forests.) After the Protocol enters into force, Article3.4 considers the possibility of “which additional human induced activities relatedto changes in greenhouse gas emissions and removal in the land-use change andforestry categories, shall be added to, or subtracted from the assigned amountfor Parties” (to the convention). In addition, via CDM and JI, developed coun-tries could use certified emissions reductions from project activities in developingcountries to contribute to their compliance with GHG targets. In short, the KyotoProtocol highlights the global biogeochemical nature of and, implicitly, assigns anew economic value to forests. Hence, the highly charged political context of thecurrent scientific review.Temperate forests spread over more than ten million square kilometers, mak-
ing up 25% of all forest area. They cover 8% of continental area and 2% of theEarth surface. Temperate forests favor the climatic conditions that characterize thehumid midlatitude regions of western and central Europe, eastern North America,and eastern Asia (3). Climate in those regions exhibits a marked seasonality. Italternates between warm moist summers and mild winters. The growing season oftemperate forests lasts 120–250 days. Temperate trees assimilate carbon by the C3pathway. Tree photosynthesis takes place during the 4–6 frost-free months over atemperature range of 5◦–25◦C. Forest growth resumes in the spring in responseto increases in temperature and day length. Growth ends as temperature and daylength decrease. Trees and other perennial forest plants enter dormancy and over-winter in that state, whereas annuals die. Daily temperatures tend to range from−30◦ to +30◦C. Local distribution of precipitation throughout the year dependson latitude, topography, and continentality. It generally ranges between 500 and1500 mm of rainfall—with exceptional record values like 9670 mm on the south-west coast of the South Island of New Zealand. Soil is fertile, more often than notenriched with a decaying litter. The characteristic soils of temperate forests arebrown earth in Europe, sometimes on calcareous material resembling inceptisols;alfisols, inceptisols, and ultisols in North America; alfisols, entisols, ultisols,and podsols in Asia; and highly podsolized material in the southern hemisphere.The moderately dense canopy of temperate forests allows light to penetrate. Thisresults in well-developed and richly diversified understory vegetation. Canopy clo-sure depends on three interdependent factors: the geometry of the dominant trees,forest succession, and the disturbance regime. Finally, 40% of temperate forestsqualify as evergreen and 60% as deciduous.Temperate forests fix carbon through photosynthesis by reducing carbon diox-
ide. Growing plants accumulate carbon in their biomass and lose carbon throughthe oxidation processes of photorespiration and autotrophic respiration. Fire andmortality, respectively, release carbon through fast—combustion—and slow—heterotrophic respiration—oxidation processes. Fire releases carbon not only as
Ann
u. R
ev. E
nerg
y. E
nviro
n. 2
001.
26:4
35-4
65. D
ownl
oade
d fro
m a
rjour
nals.
annu
alre
view
s.org
by L
AW
REN
CE B
ERK
ELEY
NA
TIO
NA
L LA
BORA
TORY
on
05/2
4/10
. For
per
sona
l use
onl
y.

3 Oct 2001 9:30 AR AR143-15-mar.tex AR143-15-mar.SGM ARv2(2001/05/10) P1: GJB
438 MARTIN ET AL.
carbon dioxide into the atmosphere but also as graphitic or “black” carbon intothe soil. Carbon is also removed from forests by harvesting, which transfers car-bon into pools of products. Temperate forests total some 6.7 Pg(C) per annum inprimary production and 175 Pg(C) stored in plant material (4), which yields amean residence time of carbon in temperate forest plants on the order of 25 years.Temperate forests have a mean primary productivity of 560 g(C) m−2 a−1 and amean plant biomass of 15 kg(C) m−2 (4).How can one go beyond ballpark estimates? The two sections that follow try
to answer this question, first by looking at the various methods available andthen by providing examples. The review then considers the constraints on, andopportunities for, carbon sequestration. After that, it examines how one monitors,evaluates, reports, verifies, and certifies carbon sequestration in forests. The reviewcloses with a discussion and conclusions.
2. ESTIMATION METHODS FOR CARBONSEQUESTRATION IN TEMPERATE FORESTS
Over the past two decades many methods have been developed and applied toquantify terrestrial carbon sources and sinks. Each method has its strengths andweaknesses. These methods include inversions based on atmospheric transport(5, 6), biogeochemical models (7), land-use bookkeeping models (8), flux towers(9–11), and forest inventories (12, 13).Although atmospheric inversions provide an indication of the magnitude of
terrestrial carbon sinks, they have limited ability to pick out the responsible mech-anisms or delineate the exact location of the observed sink. Taking the work of Fanet al. (6) as an example, while claiming a large North American CO2 sink and, asa result, a modest Eurasian sink, these authors also indicate that “the magnituderemains uncertain and its cause unknown” (p. 445). Two kinds of reasons—somefundamental, others circumstantial—explain this statement. First, incomplete datacause atmospheric inversions to suffer from indetermination.As a result, inversionsgenerate a family of solutions, and the solution singled out is merely a plausibleanswer (14). Second, specifically, the work of Fan et al. suffers from a lack ofvalidation of the whole, an incomplete verification of data and model components,the absence of precise geographical (longitudinal) boundaries, a minimalist repre-sentation of the terrestrial biosphere, and an initialization value for the CO2 uptakein North America that seems too high because it matches previously publishedestimates for the terrestrial biosphere as a whole, after adjustments for disturbanceand uncertainty.Global biogeochemical models can explore the importance of ecosystem phys-
iological responses to climate variability or increasing CO2, but they do not yetconsider natural or human-induced disturbances. In contrast, methods that focuson the effects of human land-use changes have been used to examine predictedeffects on ecosystem physiology.
Ann
u. R
ev. E
nerg
y. E
nviro
n. 2
001.
26:4
35-4
65. D
ownl
oade
d fro
m a
rjour
nals.
annu
alre
view
s.org
by L
AW
REN
CE B
ERK
ELEY
NA
TIO
NA
L LA
BORA
TORY
on
05/2
4/10
. For
per
sona
l use
onl
y.
3 Oct 2001 9:30 AR AR143-15-mar.tex AR143-15-mar.SGM ARv2(2001/05/10) P1: GJB
CARBON SINKS IN TEMPERATE FORESTS 439
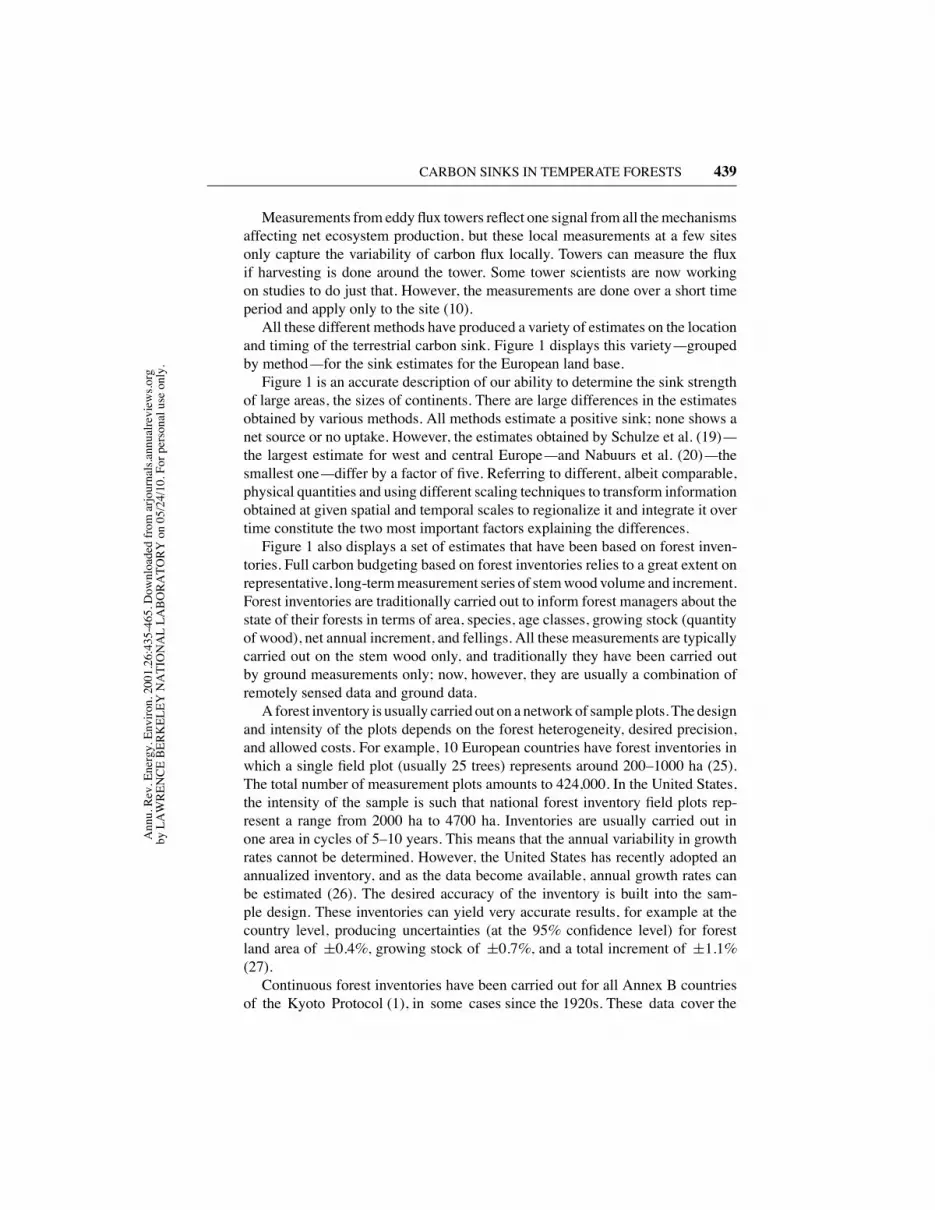
Measurements from eddy flux towers reflect one signal from all themechanismsaffecting net ecosystem production, but these local measurements at a few sitesonly capture the variability of carbon flux locally. Towers can measure the fluxif harvesting is done around the tower. Some tower scientists are now workingon studies to do just that. However, the measurements are done over a short timeperiod and apply only to the site (10).All these different methods have produced a variety of estimates on the location
and timing of the terrestrial carbon sink. Figure 1 displays this variety—groupedby method—for the sink estimates for the European land base.Figure 1 is an accurate description of our ability to determine the sink strength
of large areas, the sizes of continents. There are large differences in the estimatesobtained by various methods. All methods estimate a positive sink; none shows anet source or no uptake. However, the estimates obtained by Schulze et al. (19)—the largest estimate for west and central Europe—and Nabuurs et al. (20)—thesmallest one—differ by a factor of five. Referring to different, albeit comparable,physical quantities and using different scaling techniques to transform informationobtained at given spatial and temporal scales to regionalize it and integrate it overtime constitute the two most important factors explaining the differences.Figure 1 also displays a set of estimates that have been based on forest inven-
tories. Full carbon budgeting based on forest inventories relies to a great extent onrepresentative, long-termmeasurement series of stemwood volume and increment.Forest inventories are traditionally carried out to inform forest managers about thestate of their forests in terms of area, species, age classes, growing stock (quantityof wood), net annual increment, and fellings. All these measurements are typicallycarried out on the stem wood only, and traditionally they have been carried outby ground measurements only; now, however, they are usually a combination ofremotely sensed data and ground data.A forest inventory is usually carried out on a network of sample plots. The design
and intensity of the plots depends on the forest heterogeneity, desired precision,and allowed costs. For example, 10 European countries have forest inventories inwhich a single field plot (usually 25 trees) represents around 200–1000 ha (25).The total number of measurement plots amounts to 424,000. In the United States,the intensity of the sample is such that national forest inventory field plots rep-resent a range from 2000 ha to 4700 ha. Inventories are usually carried out inone area in cycles of 5–10 years. This means that the annual variability in growthrates cannot be determined. However, the United States has recently adopted anannualized inventory, and as the data become available, annual growth rates canbe estimated (26). The desired accuracy of the inventory is built into the sam-ple design. These inventories can yield very accurate results, for example at thecountry level, producing uncertainties (at the 95% confidence level) for forestland area of ±0.4%, growing stock of ±0.7%, and a total increment of ±1.1%(27).Continuous forest inventories have been carried out for all Annex B countries
of the Kyoto Protocol (1), in some cases since the 1920s. These data cover the
Ann
u. R
ev. E
nerg
y. E
nviro
n. 2
001.
26:4
35-4
65. D
ownl
oade
d fro
m a
rjour
nals.
annu
alre
view
s.org
by L
AW
REN
CE B
ERK
ELEY
NA
TIO
NA
L LA
BORA
TORY
on
05/2
4/10
. For
per
sona
l use
onl
y.
3 Oct 2001 9:30 AR AR143-15-mar.tex AR143-15-mar.SGM ARv2(2001/05/10) P1: GJB
440 MARTIN ET AL.
Ann
u. R
ev. E
nerg
y. E
nviro
n. 2
001.
26:4
35-4
65. D
ownl
oade
d fro
m a
rjour
nals.
annu
alre
view
s.org
by L
AW
REN
CE B
ERK
ELEY
NA
TIO
NA
L LA
BORA
TORY
on
05/2
4/10
. For
per
sona
l use
onl
y.

3 Oct 2001 9:30 AR AR143-15-mar.tex AR143-15-mar.SGM ARv2(2001/05/10) P1: GJB
CARBON SINKS IN TEMPERATE FORESTS 441
complete northern hemispheric temperate and boreal forests. However, betweenthese countries there are differences in precision and definitions. Variables reportedby one country cannot always be compared with the same variable for anothercountry (17). A UN-ECE assessment (13) seeks to encourage data gathering basedon a harmonized set of definitions.An enormous set of data on stem wood from forest inventories, utilization
studies, commerce data on wood use, and other survey data on waste woodprovides a unique opportunity for assessing a full forest-sector carbon balance(Figure 2). Methods exist to scale all these data up to a full forest-sector car-bon balance. The non–stem wood tree components are generally added based onconversion coefficients. For the litter and soil compartments, usually a model-ing tool is used, although a newly adopted forest inventory design in the UnitedStates will sample both litter and soil (26). The harvesting and wood productscompartments are usually modeled based on felling statistics and life-spanestimates.Wood products are an integral part of the managed forest ecosystem/forest-
sector carbon cycle. They play three roles in this cycle: as a physical pool ofcarbon, as a substitute for more energy-intensive materials that would requirehigher fossil-fuel emissions for production, as a raw material to generate energy,saving CO2 emissions from burning of fossil fuels (30, 33–36). If an existing forestis permanently maintained so that harvest equals net growth, the forest can be asource of wood and still retain captured carbon. The sequestration phase is finite,lasting decades to centuries. However, the substitution phase, which begins atthe onset of the first harvest, can continue indefinitely. Each timber crop, in acumulative manner, can substitute fossil resources. The managed forest can thusindefinitely protect fossil reserves.Wood harvested from a forest by thinning or clear-cutting can be viewed as
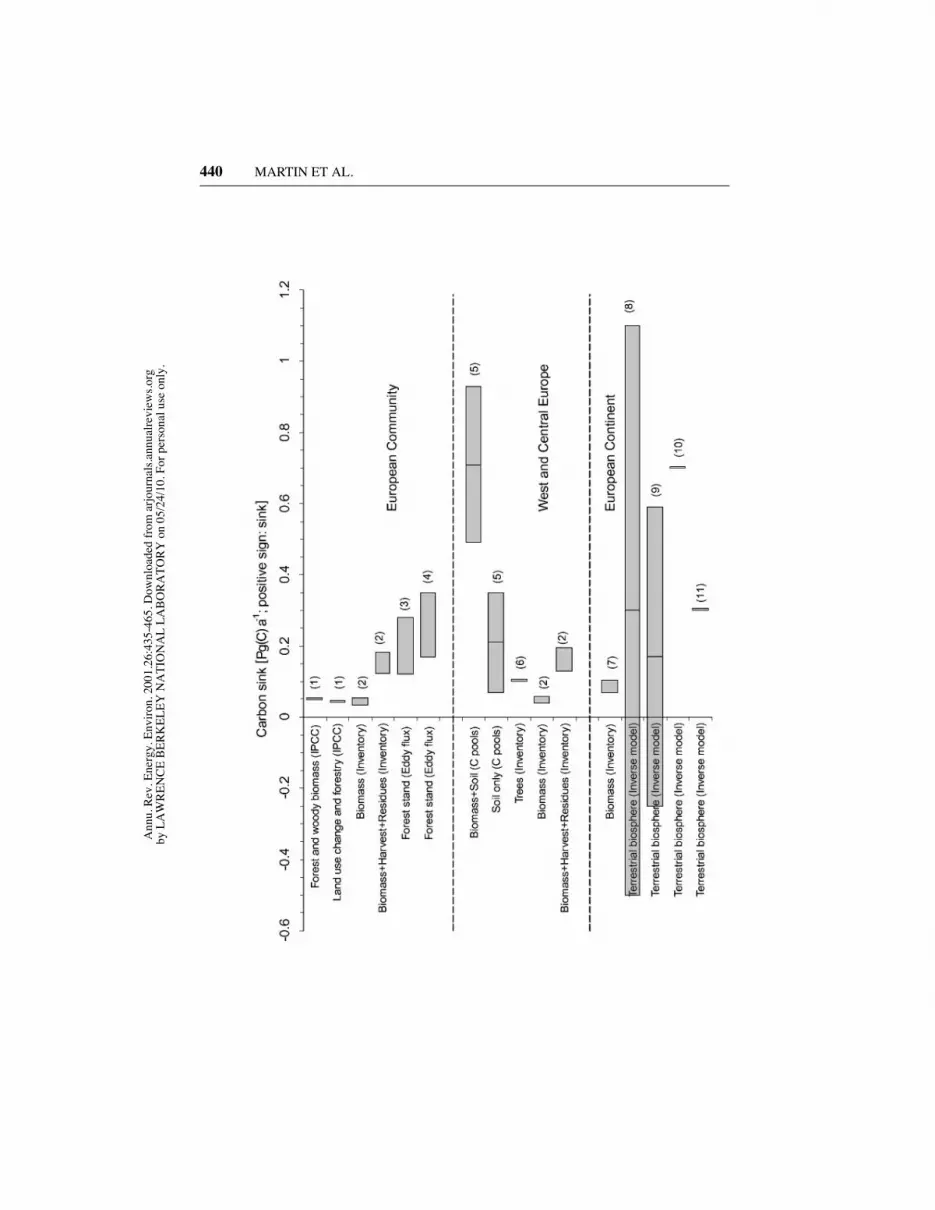
replacing the natural mortality that would otherwise occur. These products arerenewable raw materials that provide fuel and building materials as well as in-come and employment for rural populations. Globally, about 3.4 billion m3 ofwood are harvested per year, excluding wood burned on site (37), and harvest ratesare expected to increase at 0.5% per year (Figure 3). Of the total harvest, about1.8 billion m3 is fuel wood, mainly used in the tropics.Assessing the magnitude of carbon in forest products, considered secondary
for a long time, turned out to be a critical consideration in evaluating the forestcarbon sink in the context of the Sixth Conference of the Parties (COP-6) to the
←−−−−−−−−−−−−−−−−−−−−−−−−−−−−−−−−−−−−−−−−−−−−−−−−−−−−−−−−−Figure 1 Estimates (AJ Dolman, GJ Nabuurs, P Kuikman, RWA Hutjes, J Huygen,et al., manuscript in preparation) of the carbon sink in European forests. [From (1)Ritter (16); (2) Kauppi & Tomppo (17); (3) Martin (18); (4) Martin et al. (9); (5)Schulze et al. (19); (6) Nabuurs et al. (20); (7) Kauppi et al. (21); (8) Bousquet et al.(5); (9) Kaminski et al. (22); (10) Rayner et al. (23); (11) Ciais et al. (24).]
Ann
u. R
ev. E
nerg
y. E
nviro
n. 2
001.
26:4
35-4
65. D
ownl
oade
d fro
m a
rjour
nals.
annu
alre
view
s.org
by L
AW
REN
CE B
ERK
ELEY
NA
TIO
NA
L LA
BORA
TORY
on
05/2
4/10
. For
per
sona
l use
onl
y.

3 Oct 2001 9:30 AR AR143-15-mar.tex AR143-15-mar.SGM ARv2(2001/05/10) P1: GJB
442 MARTIN ET AL.
Figure2
Componentsofafullforest-sectorcarbonbalancebasedonforestinventories(13,28–32).
Ann
u. R
ev. E
nerg
y. E
nviro
n. 2
001.
26:4
35-4
65. D
ownl
oade
d fro
m a
rjour
nals.
annu
alre
view
s.org
by L
AW
REN
CE B
ERK
ELEY
NA
TIO
NA
L LA
BORA
TORY
on
05/2
4/10
. For
per
sona
l use
onl
y.
3 Oct 2001 9:30 AR AR143-15-mar.tex AR143-15-mar.SGM ARv2(2001/05/10) P1: GJB
CARBON SINKS IN TEMPERATE FORESTS 443
Figure 3 Development of total European forest increment in terms of stemwood andtotal European harvest of wood since 1950. The figure shows that the increment hasincreased steadily since 1950, whereas the harvest has stayed approximately the same(see 13). The difference is the buildup of biomass in the forest and, indirectly, showsan increasing sink in the forest biomass of European forests. The future dynamics ofthis sink depends on growing conditions, disturbance regimes, and human use of theforest.
UN FCCC held 13–25 November 2000. According to the Intergovernmental Panelon Climate Change (IPCC) Second Assessment Report, the current global pool ofcarbon in products is about 4.2 Pg and the sink is 0.026 Pg a−1 (38). Other sourcessuggest a pool of 10–20 Pg and a global sink of 0.139 Pg a−1 (39). In preparationfor COP-6, the US Department of State released a document claiming a net carbonsink of 0.235–0.331 Pg a−1 with an estimate of central tendency of 0.288 Pg a−1for US-managed forests (40, p. 15). The projected “total carbon stored in productsin use and in landfills” in the United States was estimated at 0.110 Pg a−1 (40,p. 53). These figures reveal large uncertainties in stock and flux estimates. Evenif the high end of the range is applied, wood products appear to be a small sinkof carbon compared with the rate of carbon sequestration in boreal and temperateforest ecosystems. Clearly, at issue here is whether one focuses on forest productsas a means of complying with an international agreement or whether one considerstheir global biogeochemical significance.In conclusion, all these components together provide a full forest-sector carbon
balance. This forest-sector carbon balance can be used either as a static conversionfor a base year or as a dynamic modeling tool for providing projections underalternative management regimes. This method is converging across studies. How-ever, adding components in general, and adding in particular components thatare not part of a statistically designed inventory, increases the uncertainty of theestimates.
Ann
u. R
ev. E
nerg
y. E
nviro
n. 2
001.
26:4
35-4
65. D
ownl
oade
d fro
m a
rjour
nals.
annu
alre
view
s.org
by L
AW
REN
CE B
ERK
ELEY
NA
TIO
NA
L LA
BORA
TORY
on
05/2
4/10
. For
per
sona
l use
onl
y.
3 Oct 2001 9:30 AR AR143-15-mar.tex AR143-15-mar.SGM ARv2(2001/05/10) P1: GJB
444 MARTIN ET AL.
3. AN EXAMPLE OF INVENTORY-BASED CARBONBUDGET CALCULATION
At this time, inventory-based methods constitute the favored means to estimatecarbon sequestration. This section provides an informative example of such a cal-culation in the Temperate and Boreal Forest Resource Assessment 2000 (TBFRA-2000) (13). As its full name indicates, it concerns temperate and boreal forests.No equivalent, current inventory-based assessment is available that singles outtemperate forests.For TBFRA-2000, countries were requested to report the drymass of the woody
parts, i.e., wood, bark, branches, twigs, stumps, and roots, of all trees alive anddead as well as the dry mass of all shrubs and bushes on their forest and otherwooded land.To obtain the carbon store of this woody biomass, it was assumed that 50%
of it was carbon, as has become common practice in carbon studies after thepublication of the Intergovernmental Panel on Climate Change/Organization forEconomic Cooperation and Development/International Energy Agency guidelines(41, 41a). Consequently, reported values were multiplied by 0.5. This conversionwas considered appropriate because the carbon concentration in dry biomass—which consists of more than cellulose—varies only slightly between different treesand tree parts, between 0.46 and 0.52. Complete biomass data were available for45 countries but missing for 10 countries.The rate of change in the carbon store of woody biomass was calculated as the
difference between the net annual increment and annual fellings of growing trees(i.e., annual fellings excluding fellings of natural losses, such as fellings of deadtrees). The calculation was done after converting these figures—initially given asthe volume of stem wood—to biomass and carbon. Country-specific net annualincrement was used as the increment measure instead of the difference betweengross annual increment and natural losses, because it was available for all countriesbut three.In the calculations of the carbon balance, net annual increment, annual fellings,
and annual fellings of natural losses given as the volume of stem wood wereconverted to woody biomass by multiplying them by the conversion factors. Thebiomasswas converted to carbon bymultiplying by 0.5. For forests, this conversionwas easily done both for conifers and broad-leaved trees. On other wooded land,net annual increment and annual fellings were not given separately for the speciesgroups.The TBFRA-2000 authors assumed that the share of conifers was the same on
other wooded land as on forest. This simple assumption was considered appro-priate in these calculations although the share of broad-leaved trees was actuallysomewhat higher on other wooded land than on forest. Biomass was assumed tohave a fixed carbon concentration equal to 50%of drymass. The conversion factorsof above-stump biomass calculated for forest were also applied on other woodedland. The share of conifers and broad-leaved trees of net annual increment and an-nual fellings was assumed similar on other wooded land as on forest. In addition,
Ann
u. R
ev. E
nerg
y. E
nviro
n. 2
001.
26:4
35-4
65. D
ownl
oade
d fro
m a
rjour
nals.
annu
alre
view
s.org
by L
AW
REN
CE B
ERK
ELEY
NA
TIO
NA
L LA
BORA
TORY
on
05/2
4/10
. For
per
sona
l use
onl
y.

3 Oct 2001 9:30 AR AR143-15-mar.tex AR143-15-mar.SGM ARv2(2001/05/10) P1: GJB
CARBON SINKS IN TEMPERATE FORESTS 445
TABLE 1 Carbon store in the TBFRA regiona
Increase inC store of
Increase woodyShare of Share of in C store biomass as
Share Woody woody Anthropogenic anthropogenic of woody share ofArea of area biomass biomass CO2 emissions CO2 emissions biomass emissions(Mha) (%) [Pg(C)] (%) [Pg(C) a−1] (%) [Pg(C) a−1] (%)
Europe 215 8.68 8.4 9.53 1.09 27.39 0.110 10
Of which EU15 136 5.49 5.0 5.68 0.88 22.11 0.063 7
CIS 934 37.69 41.0 46.54 0.92 23.12 0.450 49
North America 716 28.89 31.0 35.19 1.55 38.94 0.260 17
Other TBFRA 613 24.74 7.7 8.74 0.42 10.55 0.061 15
Total 2478 100.00 88.1 100.00 3.98 100.00 0.881 22
aFrom Reference 12. TBFRA, Temperate and Boreal Forest Resource Assessment; CIS, Confederation of IndependentStates, i.e., former Soviet Union.
various assumptions were needed to complete the calculations of countries forwhich the information was incomplete.The TBFRA assessment summarized in Table 1 confirms the role played by
temperate and boreal forests with respect to carbon sequestration.Based on the fact that temperate forests are estimated to contain 60% of the
volume of boreal and temperate forests, temperate forests should be storing 60%of the biomass and making up 60% of the carbon uptake.
4. CONSTRAINTS ON AND OPPORTUNITIES FORCARBON SEQUESTRATION IN TEMPERATE FORESTS
Forestry activities can yield large carbon benefits, be among the most economicalways to address CO2 emissions (42), contribute to sustainable development goals,and create secondary environmental (43) and social benefits unrelated to carbon.These secondary benefits include restoration of degraded lands; habitat improve-mentwith benefits for biodiversity,wildlife and birds; and reduced erosion, reducedsoil compaction, improved stream quality, and fisheries improvement. Notably,these issues were explicitly mentioned at the Third Ministerial Conference on theprotection of Forests in Europe in the list of European criteria and indicators forsustainable forest management (44).
4.1. Estimates of Potential Carbon Sequestrationby Anthropogenic Activities
The technical potential for forest carbon management appears significant. It mightcompensate for a meaningful portion of human contribution to CO2 in the at-mosphere. The IPCC (45) estimated that during 1995–2050, slowing deforesta-tion, promoting natural forest regeneration, and global reforestation could offset
Ann
u. R
ev. E
nerg
y. E
nviro
n. 2
001.
26:4
35-4
65. D
ownl
oade
d fro
m a
rjour
nals.
annu
alre
view
s.org
by L
AW
REN
CE B
ERK
ELEY
NA
TIO
NA
L LA
BORA
TORY
on
05/2
4/10
. For
per
sona
l use
onl
y.
3 Oct 2001 9:30 AR AR143-15-mar.tex AR143-15-mar.SGM ARv2(2001/05/10) P1: GJB
446 MARTIN ET AL.
220–320 billion tons (12%–15%) of fossil-fuel–related CO2 emissions, but threequarters of this would be in the tropics (46). Deforestation-related CO2 emissionsare especially important because these emissions currently represent 20% of man-made CO2 emissions and have made up one third of man-made emissions since1850 (45).The temperate region countries of the world, during the first CP, will most likely
be a net source of carbon through afforestation, reforestation, and deforestation inArticle 3.3 (1), with temperate regions being, at the same time, as large a sourceas 99 million tons of carbon per annum and a sink of 41 million tons of carbon perannum (45). In August 2000, many nations submitted data on the expected nationalcarbon consequences of Articles 3.3 and 3.4 in the first CP. The United Statesreported a large potential for Article 3.4 activities (47), which caused controversyamong those who would prefer a lower level of land use, land-use change, andforestry “credits” and greater reduction of sources (48). Regarding efforts relatedto the CDM, the IPCC (45) found that trial forestry JI projects, mostly with tropicalpartner nations, exist in about 20 nations.Forests can be managed to produce renewable energy in the form of biomass,
which can be used as a direct substitute for fossil fuel (49). In addition, carbon canbe sequestered in wood products for long, albeit clearly finite, periods. However,forestry activities will probably not be the only tool for permanently mitigatingGHG emissions because of the large energy demands of the human populationfor fossil fuels. For example, replacing unmanaged old-growth forest by youngKyoto stands might, at first sight, appear like a good option. In fact, in the short-term, depending on the utilization of the wood, it could lead to massive carbonlosses into the atmosphere. Such a management decision could in effect replacea large pool of carbon with a minute pool of regrowth and reduce the flux ofcarbon from litter into a permanent pool of soil organic matter (50). There is afinite amount of land available to be protected or reforested because of populationgrowth, agricultural needs, etc. Furthermore, the “carrying capacity” for carbon islimited, and undisturbed ecosystems eventually can become saturated with regardto absorbing carbon. The IPCC (45) reported that newly planted or regeneratingforests in the absence of major disturbances would continue to uptake carbon for20–50 years or more after reestablishment.Forestry activities can help, especially in the near-term, to slow the increase of
atmospheric CO2, at a reasonable cost andwith secondary environmental and otherbenefits. They also can allow more time for developing new energy technologiesthat require long lead times and for avoiding the premature retirement (at highcosts) of existing energy infrastructure.
4.2. Key Issues
Although the technical potential for forest carbonmanagement appears significant,a number of accounting issues need to be addressed to assure that the carbon se-questration is indeed occurring underArticles 3.3 and 3.4 of theKyoto Protocol (1).The issues include clear definitions and interpretation of the Protocol, addressing
Ann
u. R
ev. E
nerg
y. E
nviro
n. 2
001.
26:4
35-4
65. D
ownl
oade
d fro
m a
rjour
nals.
annu
alre
view
s.org
by L
AW
REN
CE B
ERK
ELEY
NA
TIO
NA
L LA
BORA
TORY
on
05/2
4/10
. For
per
sona
l use
onl
y.
3 Oct 2001 9:30 AR AR143-15-mar.tex AR143-15-mar.SGM ARv2(2001/05/10) P1: GJB
CARBON SINKS IN TEMPERATE FORESTS 447
duration/permanence, possible negative environmental consequences of someactivities, and additionality.
4.2.1. DEFINITIONS OF FOREST , REFORESTATION , AND DIRECT HUMAN-INDUCED
ACTIVITY The definitions of some of the phrases in the Protocol are notuniversally agreed on. Lund (51) found at least 130 different definitions of forest,which were based on land or canopy cover, legal criteria, land use, etc. The choiceof definition determines what can be accounted for. For example, suppose an areais defined as forest if it has 75% canopy cover. An area with a 74% canopy cover,i.e., just below the 75% threshold, will be left out.Similarly, there can be many different interpretations of reforestation. The most
controversial reforestation issue relates to the inclusion of the harvest-regenerationcycle as deforestation and reforestation. Unless both are fully accounted for, re-sulting major credits or debits will be misleading. Specific rules to address thesesituations, which might be relevant only during the first CP, are being consid-ered. As a general rule, it is easier to account for the local, managed activitiesof afforestation and reforestation than to estimate deforestation, which varies inintensity, is often unplanned and uncontrolled, is distributed over large areas, and,therefore, requires global monitoring. Hence, these considerations reveal a biastoward overestimating net carbon storage.Article 3.3 of the Protocol only allows “direct human-induced” activities since
1990 to count toward mitigating emissions. It is difficult to distinguish the portionof observed carbon stock change that is directly human-induced from that causedby indirect and natural factors (45).
4.2.2. ARTICLE 3.4 OF THE KYOTO PROTOCOL Because Article 3.3 by itself willaddress only a small portion of lands through direct human-induced afforestation,reforestation, and deforestation activities, thus resulting in emissions/removalsthat are much different from those experienced by the atmosphere, it is crucial thatfull carbon accounting joining Articles 3.3 and 3.4 be designed from the outset.Although it will be a challenge for many nations to collect the information on theirforests, this should not justify restricting those nations that can from doing so. Tocreate this complete accounting system requires Article 3.4 to address numerousactivities in categories such as forest management, agroforestry, and urban landmanagement (45). For the developed-nation signatory parties, forest managementand agroforestry were estimated in 2010 to have the potential to increase carbonstock by 100 and 12 million tons of carbon per year, respectively (45).
4.2.3. DURATION/PERMANENCE Critics of using forests as carbon sinks observethat they do not provide the same long-term benefits as reducing energy-relatedemissions. This can be true if stored carbon is released within a few decadeswithout producing energy, owing to natural disaster, land ownership changes, etc.This is largely an issue unique to biotic projects. However, there also are ways ofaddressing the issue of duration or permanence. Ton-year accounting is difficultand arbitrary, disadvantaging forestry projects.What is preferable is risk reduction,
Ann
u. R
ev. E
nerg
y. E
nviro
n. 2
001.
26:4
35-4
65. D
ownl
oade
d fro
m a
rjour
nals.
annu
alre
view
s.org
by L
AW
REN
CE B
ERK
ELEY
NA
TIO
NA
L LA
BORA
TORY
on
05/2
4/10
. For
per
sona
l use
onl
y.
3 Oct 2001 9:30 AR AR143-15-mar.tex AR143-15-mar.SGM ARv2(2001/05/10) P1: GJB
448 MARTIN ET AL.
through such practices as project pooling, buffers and contingency credits (i.e.,making the project larger as a safety margin), and external insurance. The bestapproach, scientifically, is full carbon accounting, the complete accounting of allchanges in carbon stocks in all important carbon pools on all lands. In this approach,any shortfall can be addressed by purchasing credits or undertaking other projects.It should be kept in mind that even if a forestry activity is short-lived, e.g., a fewdecades, it could be valuable because it may serve as a bridge to future measures.
4.2.4. ACTIVITIES IN ARTICLE 12 (CLEAN DEVELOPMENT MECHANISM) Article 12does not explicitly include or exclude forestry projects, but a group of 14 Centraland SouthAmerican nations has rejected claims that forestry projects are ineligibleunder Article 12 (52). Reducing deforestation, primarily in the tropics, is one of thegreatest environmental challenges theworld faces, and forest conservation projectsare a valuable supplement to reducing fossil-fuel emissions. The cleandevelopmentmechanism (CDM) can help developing nations achieve sustainable developmentand provide non-GHG environmental benefits. Although some observers worryabout possible adverse environmental impacts of some land use, land-use change,and forestry projects in the CDM, any such impacts could be avoided if sustainabledevelopment criteria are required.
4.2.5. ADDITIONALITY For JI (Article 6) and CDM (Article 12) projects imple-mented under the Kyoto Protocol (1), the emissions reductions from each projectactivity must be “additional to any that would otherwise occur,” also referred toas additionality criteria (Articles 6.1b and 12.5c). In other words, additionalityrequires that efforts result in carbon benefits beyond what would have happenedin the absence of the activity. As is discussed in greater depth in the next section,determining additionality requires a baseline and reference cases for the calcula-tion of carbon sequestered, i.e., a description of what would have happened to thecarbon stock had the project not been implemented (53).Another key aspect of additionality is its financing,which could become an issue
for government assistance. In those nations that choose to encourage it, private-sector investment in forestry activities will further increase mitigation efforts indeveloping nations.
5. MONITORING, EVALUATING, REPORTING,VERIFYING, AND CERTIFYING AREAL CARBONSEQUESTRATION IN TEMPERATE FORESTS: CONCEPTSAND OPERATIONAL REQUIREMENTS
Monitoring, evaluating, reporting, verifying, and certifying (MERVC) arborealcarbon sequestration are needed, especially for JI and CDM projects (54). Imple-mentation of MERVC should also (a) increase the reliability of data for estimatingGHG impacts, (b) provide real-time data so programs and plans can be revised
Ann
u. R
ev. E
nerg
y. E
nviro
n. 2
001.
26:4
35-4
65. D
ownl
oade
d fro
m a
rjour
nals.
annu
alre
view
s.org
by L
AW
REN
CE B
ERK
ELEY
NA
TIO
NA
L LA
BORA
TORY
on
05/2
4/10
. For
per
sona
l use
onl
y.

3 Oct 2001 9:30 AR AR143-15-mar.tex AR143-15-mar.SGM ARv2(2001/05/10) P1: GJB
CARBON SINKS IN TEMPERATE FORESTS 449
Figure 4 Evaluation overview of carbon sequestration.
midcourse, (c) introduce consistency and transparency across project types, sec-tors, and reporters, (d ) enhance the credibility of the projects with stakeholders,(e) reduce costs by providing an international consensus approach and methodolo-gies, and finally ( f ) reduce financing costs, allowing project bundling and pooledproject financing.
5.1. Monitoring and Evaluation of Carbon Sequestration
As an example of the type of monitoring and evaluation that is needed, Figure 4presents an overview of one approach used in evaluating changes in the carbonstock (55). Before a project is implemented, information needs to be collectedon the reference case (or baseline) for that particular area or region where theforestry project is to be conducted. For example, one would want to know the
Ann
u. R
ev. E
nerg
y. E
nviro
n. 2
001.
26:4
35-4
65. D
ownl
oade
d fro
m a
rjour
nals.
annu
alre
view
s.org
by L
AW
REN
CE B
ERK
ELEY
NA
TIO
NA
L LA
BORA
TORY
on
05/2
4/10
. For
per
sona
l use
onl
y.
3 Oct 2001 9:30 AR AR143-15-mar.tex AR143-15-mar.SGM ARv2(2001/05/10) P1: GJB
450 MARTIN ET AL.
carbon stock under current land conditions and the expected changes in theseamounts over time. Once a project has been initiated, gross changes in the carbonstock are measured, using one or more of the following monitoring and evaluationmethods: modeling, remote sensing, and/or field/site measurements. (An exampleof a field/site measurement is shown in Section 5.1.1.) Assuming policy continuity,the baseline is also reestimated, accounting for free riders (see below). The netchange in the carbon stock is equal to the gross change in the carbon stock minusthe reestimated baseline. This amount represents the change in carbon stock dueto the forestry project.It is unclear how uncertainties will be treated in the calculation and crediting
of reduced carbon emissions and increased carbon sequestration. At a minimum,the most conservative figures should be used at every stage of calculation (e.g., thelower boundary of a confidence interval). The qualitative assessment of uncertaintyis more problematic; however, some type of discounting or debiting could be usedto adjust the amount of carbon sequestered in situations where there is a great dealof uncertainty. Where there is substantial uncertainty, project developers need todesign higher-quality forestry projects to make impacts more certain.
5.1.1. FIELD/SITE MEASUREMENT EXAMPLE The Reduced-Impact Logging (RIL)Project, a pilot carbon offset project in Sabah,Malaysia, was initiated in 1992whena power company provided funds to a timber concessionaire to implement timber-harvesting guidelines in a commercial forest reserve (56–59). The rationale for theoffset is that when logging damage is reduced, more carbon is retained in livingtrees and, because soil damage is minimized, forest productivity remains high. Itis estimated that logging damage to the remaining biomass can be reduced by asmuch as 50% through precutting vines, directional felling, and planned extractionof timber on properly constructed and utilized skid trails. Other benefits includethe preservation of biodiversity and reduced susceptibility to weed infestations anddestructive fires.
5.1.1.1. Evaluation method To estimate the carbon benefit associated with im-plementation of harvesting guidelines, a monitoring programwas developed basedon computer modeling and simulation, as well as on field studies for measuringcarbon stocks and flows. Prior to logging, four logging units (30–50 ha each)were randomly selected from the 450-ha pilot project area; four additional loggingunits were randomly selected from an adjacent area to be logged conventionally.Within each unit, 20–40 permanent plots (1600 m2) were established for pre- andpostharvest measurements. Trees within the plots were tagged, mapped, measured[diameter at breast height (dbh)], and identified as to species or timber speciesgroup. Above-ground tree biomass was estimated allometrically using tree inven-tory data and stem volume/dbh relations and a biomass expansion factor. Below-ground biomass was measured using pits for coarse roots and cores for fine roots.After logging, permanent plots were revisited, and tagged trees were classifiedby type and degree of damage. From the damage assessment data, the following
Ann
u. R
ev. E
nerg
y. E
nviro
n. 2
001.
26:4
35-4
65. D
ownl
oade
d fro
m a
rjour
nals.
annu
alre
view
s.org
by L
AW
REN
CE B
ERK
ELEY
NA
TIO
NA
L LA
BORA
TORY
on
05/2
4/10
. For
per
sona
l use
onl
y.
3 Oct 2001 9:30 AR AR143-15-mar.tex AR143-15-mar.SGM ARv2(2001/05/10) P1: GJB
CARBON SINKS IN TEMPERATE FORESTS 451
parameters were estimated: timber volume extracted; necromass produced fromharvested trees; necromass produced from trees destroyed during harvesting; andnecromass produced from damaged trees that died within the first 8–12 monthsafter logging. Soil disturbance was mapped and measured in the eight loggingunits that contained permanent plots. Trees in permanent plots were remeasured3 years after logging and are scheduled to be remeasured every 5 years.
5.1.1.2. Evaluation concerns The models chosen for calculating biomass wereexpected to provide reasonable predictions for trees up to 300 cm in dbh, but fewdata were available for large-diameter trees: Additional biomass data for largetrees from tropical wet and moist forests are needed to improve biomass estimatesfor old-growth forests. For the purposes of monitoring carbon-offset projects innatural forest, direct sampling of coarse roots, unless conducted at a relatively highintensity, may not provide a biomass estimate with the desired level of precision.In this study, coarse roots contributed disproportionately to the variance in theestimate for preharvest biomass and, consequently, to the difference between thetwo methods in necromass produced.
5.1.1.3. Findings Prior to logging, total plant biomass was about 400 Mg ha−1;root biomass represented 17% of the above-ground biomass. During the first yearafter logging, the mean difference between RIL and conventional logging areas innecromass produced per hectare was 86 Mg; about 62% of the difference was duetomore trees killed in conventional comparedwith RIL areas. Of the total biomass,59%was in trees (60 cm in dbh), placing particular importance on reliability of theestimates of variables related to big trees. The use of a simple factor adjustmentto convert above-ground biomass to total biomass may be a reasonable approachto estimating carbon benefits for offset projects when resources for monitoringare limited and below-ground biomass is unlikely to be a major contributor to thecarbon benefit.
5.2. Baseline Use: Reestimating the Baseline
Section 4.2.5 highlighted the critical need for the establishment of realistic andcredible baselines (see also Section 5.1.1). The baseline is estimated at the projectdesign stage and needs to be reestimated during the evaluation stage.
5.2.1. FREE RIDERS It is possible that forestry projects are undertaken by partici-pants who would have conducted the same activities had there been no project, andtherefore, the carbon sequestered by these “free riders” would not be perceivedas “additional” to what otherwise would have occurred (60). Although free ridersmay be regarded as an unintended consequence of a forestry project, free ridershipneeds to be measured during the evaluation phase.The most common method of developing an estimate of free riders is to ask
project developers what they would have done in the absence of the project (alsoreferred to as but-for-the-project discussions). Based on answers to carefully
Ann
u. R
ev. E
nerg
y. E
nviro
n. 2
001.
26:4
35-4
65. D
ownl
oade
d fro
m a
rjour
nals.
annu
alre
view
s.org
by L
AW
REN
CE B
ERK
ELEY
NA
TIO
NA
L LA
BORA
TORY
on
05/2
4/10
. For
per
sona
l use
onl
y.

3 Oct 2001 9:30 AR AR143-15-mar.tex AR143-15-mar.SGM ARv2(2001/05/10) P1: GJB
452 MARTIN ET AL.
designed survey questions—for example, whether there would have been con-struction of an energy-efficient sawmill without a JI project—project developersare classified as either free riders or not. There are at least two problems with thisapproach: (a) Because of questionnaire wording, inaccurate levels of free ridershipmay be estimated, and (b) there is no estimate of the level of inaccuracy for ad-justing confidence levels. Nevertheless, some interviewing of project developersneeds to be conducted for deriving estimates of free ridership.5.2.2. COMPARISON GROUPS For some projects, the comparison of the amount ofcarbon storage achieved under a project with the amount that would have beenachieved without the project requires monitoring the project area as well as non-project comparison sites prior to project startup. One can have comparison plotswithin the project area or outside the project area to supplement the sites withinthe project area.
5.3. Project Leakage and Project Spillover
Leakage occurs because the project boundary within which a project’s benefits arecalculated may not be able to encompass all potential indirect project effects. Inthis review, negative indirect effects are referred to as project leakage (“negativeexternalities”) whereas positive indirect effects are referred to as positive projectspillover (“positive externalities”).For example, leakage can occur when a forest preservation project involves
protecting land that was previously harvested by the local population for theirpersonal consumption as fuel wood (61, 62). Although this area is now protectedfrom harvesting, people from the surrounding communities still require wood forfuel and construction. Preserving this forest area has shifted their demand forfuel wood to a nearby site, leading to increased deforestation there. This off-sitedeforestation will, at least partially, negate some of the carbon sequestration at theproject site.Leakage is an issue for all types of projects, including energy projects (63–
65). Leakage can be avoided or minimized by proper project design, such as (a)maintaining needed resources and providing socioeconomic benefits, includingalternative economic opportunities, to local populations, (b) monitoring key prod-ucts, such as timber extraction, to quantify and reduce carbon benefits if necessary,and (c) monitoring deforestation rates during the project life and quantifying themto determine actual project carbon benefits. In any event, project leakage needsto be monitored and evaluated. Many small projects clearly present no leakageconcern to begin with; for example, the UtiliTree Carbon Company’s reforestationprojects in the Mississippi River Valley of the United States do not significantlyalter the millions of acres of agricultural land in the region and do not contain acommercial forestry aspect that would alter forest product markets (66).
5.3.1. PROJECT SPILLOVER When measuring changes in carbon stock, it is possiblethat the actual increases in carbon storage are greater than measured because ofchanges in participant behavior not directly related to the project, as well as to
Ann
u. R
ev. E
nerg
y. E
nviro
n. 2
001.
26:4
35-4
65. D
ownl
oade
d fro
m a
rjour
nals.
annu
alre
view
s.org
by L
AW
REN
CE B
ERK
ELEY
NA
TIO
NA
L LA
BORA
TORY
on
05/2
4/10
. For
per
sona
l use
onl
y.

3 Oct 2001 9:30 AR AR143-15-mar.tex AR143-15-mar.SGM ARv2(2001/05/10) P1: GJB
CARBON SINKS IN TEMPERATE FORESTS 453
changes in the behavior of other individuals not participating in the project. Thesesecondary impacts stemming from a forestry project are commonly referred to asproject spillover. In the beginning stages of a project, project leakage and projectspillover are likely to be modest, so that the MERVC of such impacts may not be apriority. These effects are also likely to be insignificant or small for small projectsand for certain types of projects. Under these circumstances, it may be justified todisregard these impacts. This would help reduce MERVC costs. As the projectsbecome larger or are more targeted to market transformation, these impacts shouldbe evaluated.
5.3.2. MARKET TRANSFORMATION Project spillover is related to the more generalconcept of “market transformation,” defined as “the reduction in market barriersdue to a market intervention, as evidenced by a set of market effects, that lastsafter the intervention has been withdrawn, reduced or changed” (67). Two exam-ples in the forestry sector show the beginnings of market transformation: (a) Theavailability of improved biomass cook stoves, an important technology for reduc-ing deforestation, has influenced many nonparticipants to purchase cook stoves asthese programs develop (68); and (b) a reduced-impact logging project inMalaysiais being replicated in Brazil and in parts of Indonesia (59; P. Poura-Costa, personalcommunication).Most evaluations of market transformation projects focus on market effects
(67, 70): the effects of forestry projects on the structure of the market or thebehavior of market actors that lead to increases in the adoption of forestry pro-ducts, services, or practices. To implement an evaluation system focused onmarketeffects, one needs to describe carefully the scope of the market, the indicators ofsuccess, the intended indices of market effects and reductions in market barri-ers, and the methods used to evaluate market effects and reductions in marketbarriers (70). Evaluation activities will include one or more of the following:(a) measuring the market baseline, (b) tracking attitudes and values, (c) trackingsales, (d ) modeling of market processes, and (e) assessing the persistence of mar-ket changes (71). As one can see, these evaluation activities will rely on a largeand diverse group of data collection and analysis methods, such as (a) surveysof customers, forestry companies, furniture manufacturers, government organiza-tions, etc., (b) analytical and econometric studies of cost data and sales data, and(c) process evaluations. These activities have not been conducted for forestryprojects but are starting to be conducted in the energy sector.
5.3.3. QUALITY ASSURANCE Implementing data collection and analysis methods isboth an art and a science, and there are known problems associated with thesemethods. Thus, simply adhering to minimal standards is no guarantee that mon-itoring and evaluation experts are doing a professional job. Accordingly, qualityassurance guidelines are needed that require evaluators and verifiers to indicate spe-cifically how basic methodological issues and potentially difficult issues were ad-dressed. The quality assurance guidelines simply require evaluators to describehow certain key issues were addressed rather than requiring them to address these
Ann
u. R
ev. E
nerg
y. E
nviro
n. 2
001.
26:4
35-4
65. D
ownl
oade
d fro
m a
rjour
nals.
annu
alre
view
s.org
by L
AW
REN
CE B
ERK
ELEY
NA
TIO
NA
L LA
BORA
TORY
on
05/2
4/10
. For
per
sona
l use
onl
y.
3 Oct 2001 9:30 AR AR143-15-mar.tex AR143-15-mar.SGM ARv2(2001/05/10) P1: GJB
454 MARTIN ET AL.
issues in a specific way. For example, what sampling methodology was used toconduct field measurement? Was a comparison group used for collecting and an-alyzing data? Adherence to such guidelines still allows the methods to be shapedby the interaction of the situation, the data, and the evaluator.
5.4. Environmental and Socioeconomic Impacts
The Kyoto Protocol (1) exhorts developed countries, in fulfilling their obligations,to minimize negative social, environmental, and economic impacts, particularlyon developing countries (Articles 2.3 and 3.14). Furthermore, one of the primarygoals of the CDM is sustainable development. At this time, it is unclear whichindicators of sustainable development need to be addressed in the evaluation offorestry projects. At a minimum, forestry projects should meet current countryguidelines for non-CDM projects.Forestry projects have widespread and diverse environmental impacts that go
beyondGHG impacts. The environmental benefits associatedwith forestry projectscan be just as important as the global warming benefits. Direct and indirect projectimpacts need to be examined, as well as “avoided negative environmental impacts”(e.g., avoided loss of habitat). Both gross and net impacts need to be evaluated.After a project has been implemented,MERVC activities should assess whether
the project led to any social and economic impacts and whether any mitigationwas done. Direct and indirect project impacts need to be examined, as well as theavoided negative socioeconomic impacts (e.g., the preservation of an archaeologi-cal site as a result of the deferral of the construction of a new power plant or thecancellation of a dam to create a reservoir). It is unclear at this time how effort willbe spent in addressing these impacts. It is possible that some type of discountingor debiting could be used to adjust the amount of carbon sequestered in situationswhere there is a great deal of interest in reducing negative social and economicimpacts. Where there is substantial concern, project developers need to designhigher-quality forestry projects so these impacts are reduced or do not occur.
5.5. Reporting
Reporting refers to measured GHG and non-GHG impacts of a project. Reportingoccurs throughout the MERVC process (e.g., periodic reporting of monitored re-sults and a final report once the project has ended). An example of aMonitoring andEvaluation Reporting Form that evaluators may follow when reporting changes incarbon stock is available (55).
5.6. Verification and Certification
If carbon credits become an internationally traded commodity, then verifying theamount of carbon benefit by projects will become a critical component of anytrading system. Investors and host countries may have an incentive to overstatethe GHG emissions reductions from a given project because their earnings will
Ann
u. R
ev. E
nerg
y. E
nviro
n. 2
001.
26:4
35-4
65. D
ownl
oade
d fro
m a
rjour
nals.
annu
alre
view
s.org
by L
AW
REN
CE B
ERK
ELEY
NA
TIO
NA
L LA
BORA
TORY
on
05/2
4/10
. For
per
sona
l use
onl
y.

3 Oct 2001 9:30 AR AR143-15-mar.tex AR143-15-mar.SGM ARv2(2001/05/10) P1: GJB
CARBON SINKS IN TEMPERATE FORESTS 455
increase if excessive credits are granted; as an example, these parties may overstatebaseline emissions or understate the project’s emissions. To resolve this problem,there is a need for external (third party) verification.Verifying baseline and postproject conditions may involve inspections, spot
measurement tests, or assessments, as well as requesting documentation on keyaspects of the project. In addition, the following three general questions need tobe asked. Have the monitoring and evaluation methods been well documentedand reproducible? Have the results been checked against other methods? Haveresults been compared for reasonableness with outside or independently publishedestimates?
6. DISCUSSION OF UNCERTAINTIES
6.1. Uncertainties in a Stationary Environment
Currently, national-level forest inventories provide the most precise approach forestimating countrywide forest carbon budgets. However, these inventory-basedcarbon budgetingmethods have known limitations. Traditionally, forest inventorieshave been designed to estimate live tree stemwood to a specified level of precision,but comprehensive forest carbon sequestration estimates also require informationon other forest components, such as dead trees, down dead wood, litter, and soilcarbon. Inventories quantify the effects of diverse mechanisms, but they yield lim-ited information about the function of individual mechanisms. Furthermore, theyhave been carried out on specific land areas over cycles of 5–10 years becausethey were designed to provide information on long-term timber supply, not annualvariability. An inventory designed specifically to estimate forest carbon seques-tration would provide more precise estimates than the current inventory design.Inventorymethods differ in details and intensity between countries, but inventoriescan evolve over time. For instance, the United States has adopted an annualizedinventory that additionally surveys soil and litter. Although differences exist, theinventory-based carbon budgeting methods do have similarities and provide anobjective methodology that builds upon an accurate data set consisting of billionsof individual tree measurements.Instead of relying on qualitative expressions of uncertainty, data from invento-
ries, coupledwith amodeling approach, can be used to investigate the uncertaintiesassociated with forest carbon sequestration in a systematic, quantitative fashion.For example, Heath& Smith (72) appliedMonte Carlo simulation within an uncer-tainty analysis framework (73) to forest ecosystem components of a forest carbonbudget model based on forest inventories and projections of forest inventory datafor the United States (28, 74). Uncertainty analysis is a flexible technique that canbe applied to other approaches. Results indicated that the uncertainty in forestcarbon pools on private timberlands in the United States was approximately ±9%(2 Pg) in the year 2000, with the range covering 95% of the distribution. Flux
Ann
u. R
ev. E
nerg
y. E
nviro
n. 2
001.
26:4
35-4
65. D
ownl
oade
d fro
m a
rjour
nals.
annu
alre
view
s.org
by L
AW
REN
CE B
ERK
ELEY
NA
TIO
NA
L LA
BORA
TORY
on
05/2
4/10
. For
per
sona
l use
onl
y.
3 Oct 2001 9:30 AR AR143-15-mar.tex AR143-15-mar.SGM ARv2(2001/05/10) P1: GJB
456 MARTIN ET AL.
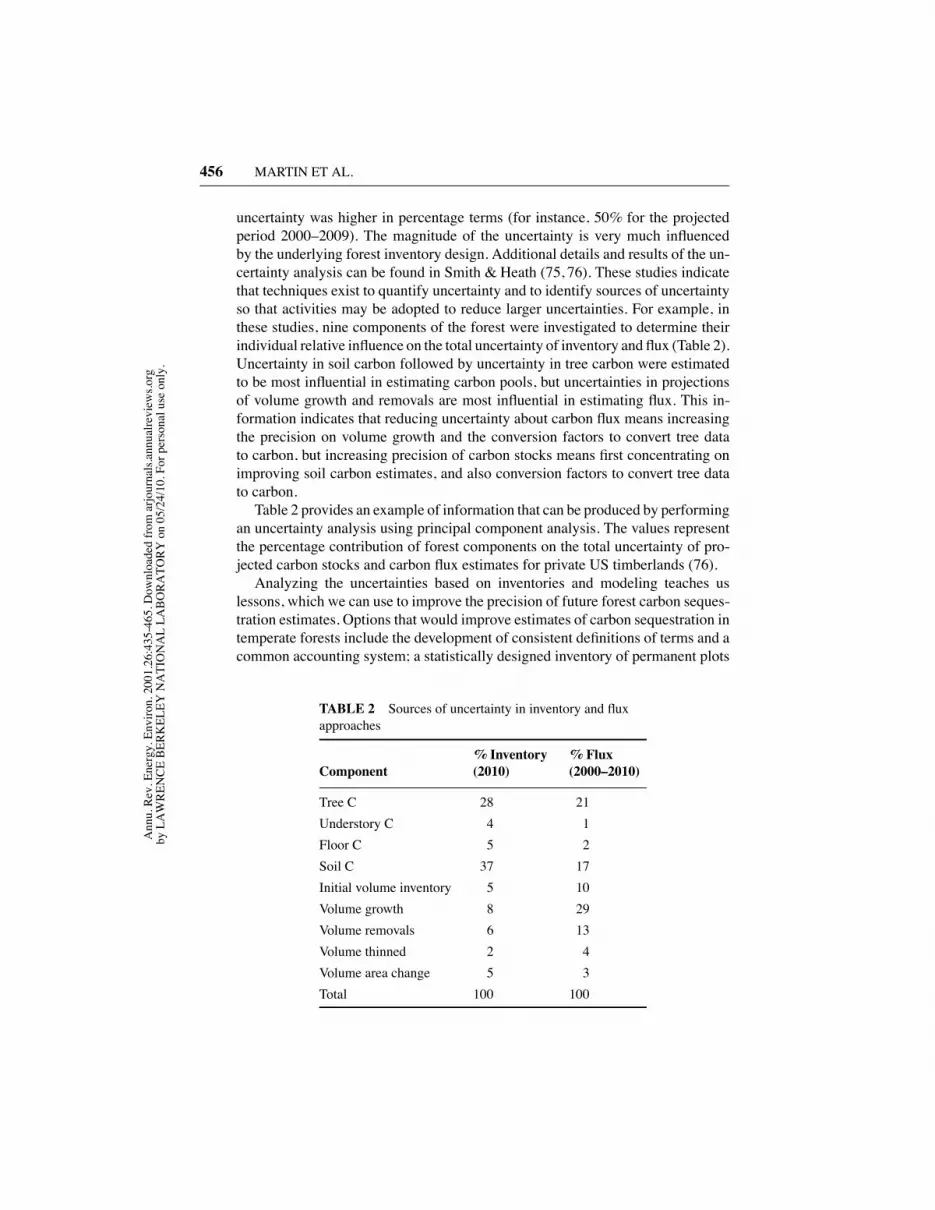
uncertainty was higher in percentage terms (for instance, 50% for the projectedperiod 2000–2009). The magnitude of the uncertainty is very much influencedby the underlying forest inventory design. Additional details and results of the un-certainty analysis can be found in Smith & Heath (75, 76). These studies indicatethat techniques exist to quantify uncertainty and to identify sources of uncertaintyso that activities may be adopted to reduce larger uncertainties. For example, inthese studies, nine components of the forest were investigated to determine theirindividual relative influence on the total uncertainty of inventory and flux (Table 2).Uncertainty in soil carbon followed by uncertainty in tree carbon were estimatedto be most influential in estimating carbon pools, but uncertainties in projectionsof volume growth and removals are most influential in estimating flux. This in-formation indicates that reducing uncertainty about carbon flux means increasingthe precision on volume growth and the conversion factors to convert tree datato carbon, but increasing precision of carbon stocks means first concentrating onimproving soil carbon estimates, and also conversion factors to convert tree datato carbon.Table 2 provides an example of information that can be produced by performing
an uncertainty analysis using principal component analysis. The values representthe percentage contribution of forest components on the total uncertainty of pro-jected carbon stocks and carbon flux estimates for private US timberlands (76).Analyzing the uncertainties based on inventories and modeling teaches us
lessons, which we can use to improve the precision of future forest carbon seques-tration estimates. Options that would improve estimates of carbon sequestration intemperate forests include the development of consistent definitions of terms and acommon accounting system; a statistically designed inventory of permanent plots
TABLE 2 Sources of uncertainty in inventory and fluxapproaches
% Inventory % FluxComponent (2010) (2000–2010)
Tree C 28 21Understory C 4 1Floor C 5 2Soil C 37 17Initial volume inventory 5 10Volume growth 8 29Volume removals 6 13Volume thinned 2 4Volume area change 5 3Total 100 100
Ann
u. R
ev. E
nerg
y. E
nviro
n. 2
001.
26:4
35-4
65. D
ownl
oade
d fro
m a
rjour
nals.
annu
alre
view
s.org
by L
AW
REN
CE B
ERK
ELEY
NA
TIO
NA
L LA
BORA
TORY
on
05/2
4/10
. For
per
sona
l use
onl
y.

3 Oct 2001 9:30 AR AR143-15-mar.tex AR143-15-mar.SGM ARv2(2001/05/10) P1: GJB
CARBON SINKS IN TEMPERATE FORESTS 457
that include soil carbon anddead-woodmeasurements, designed to estimate changevariables (e.g., growth, mortality, harvesting) with high precision; and improve-ments in allometric relationships.Uncertainty in forest carbon sequestrationmay also be reducedwith information
based on other approaches, such as remote sensing and flux towers (77). Remotesensing has generally been used in the first phase of the inventories to determinethe area. Flux towers provide data about CO2 exchange with great accuracy, butthe area they monitor is small. Their cost and site requirements effectively limittheir application across a range of forest types and sites. Models have becomesophisticated in describing forest processes of a site (78), and a number of recentand current studies on modeling disturbance will advance the field in the next5 years (79).A promising approach for reducing uncertainty in the next 5 years consists
of combining inventories, remote sensing, flux towers, and modeling. Studies onscaling up flux tower data to a regional level using remote sensing, modeling,and inventory data are being explored (9, 10, 11). Flux towers provide detailedinformation about annual details, and remote sensing provides detailed spatialinformation. Inventory data provide realistic, verifiable estimates of carbon thatcan be used to check remote sensing and flux tower data as well as to parameterize,calibrate, validate, and run models. Modeling provides a framework to explorehypotheses. It can also be used to link accepted concepts and measured data. Theadvantages of each of the approaches, used in combination with the other ones,will allow not only for more accurate estimates but also for a better understandingof forest carbon dynamics.
6.2. Uncertainties in a Changing Environment
Achanging environment compounds the uncertainties associatedwith the account-ing of carbon sequestration in temperate forests in a stationary environment. It doesso in two ways. First, in the short-term, changes in the environment of temperateforests—including changes in the plant microclimate, in the root environment, andin the ambient concentration of CO2—will affect temperate forest physiology andcarbon sequestration directly. Second, in the longer term, changes in the environ-ment will impact the distribution of vegetation, in general, and the location of andarea covered by temperate forests.The most recent results obtained from general circulation models of the climate
system, e.g., by Cox et al. (80), suggest a temperature increase of up to 5.5◦C inresponse to an equivalent CO2 doubling. Feedbacks within the global carbon cycleaccount for 1.5◦C of the 5.5◦C total temperature increase. The publication of theseresults not only brings us back to the uncertainties associated with estimates madealmost two decades ago (81) but also reveals the potential detrimental effects ofterrestrial biosphere feedbacks on atmospheric concentrations of GHGs.Looking at the variance and other higher statisticalmoments of climate variables
that can be expected toward the end of the twenty-first century, Easterling et al.
Ann
u. R
ev. E
nerg
y. E
nviro
n. 2
001.
26:4
35-4
65. D
ownl
oade
d fro
m a
rjour
nals.
annu
alre
view
s.org
by L
AW
REN
CE B
ERK
ELEY
NA
TIO
NA
L LA
BORA
TORY
on
05/2
4/10
. For
per
sona
l use
onl
y.

3 Oct 2001 9:30 AR AR143-15-mar.tex AR143-15-mar.SGM ARv2(2001/05/10) P1: GJB
458 MARTIN ET AL.
(82) single out different types of climate extremes and assess their likelihood.These authors identify as “very likely” “highermaximum temperatures,” “more hotsummer days,” “increase in heat index,” “higher minimum temperatures,” “moreheavy 1-day precipitation events,” “more heavy multiday precipitation events,”“more heat waves,” “fewer cold waves,” and “more drought.” All nine climateextremes would significantly affect temperate forests and, especially, those relatedto soil moisture availability (83, 84). These very likely climate extremes increaseuncertainties in ways that are difficult to quantify.
6.3. Uncertainties About Virtuous and Vicious Carbon Cycles
The carbon cycle itself plays a part as far as concerns the estimation of uncertainties,in at least three possible ways. The first is via ecophysiology: the net, short-termresult of the CO2 fertilization effect on ecosystems made up of different mixesof plants with the C3 and C4 photosynthetic pathways, in general, and temperateforests, in particular, remains uncertain.The second is through changes in vegetation assemblages. The scientific/tech-
nical analysis of the IPCC (85) indicates that possible changes in temperature andwater availability under equivalent CO2 doubling conditions could trigger changesaffecting on average one third of the terrestrial biosphere and ranging between oneseventh and two thirds of it (86, 87). Notably, the largest changes are expected inthe boreal and temperate regions. The net effect in terms of carbon sequestrationis difficult to estimate with accuracy over the short-, medium-, and long-term.Estimates of carbon release due to change in vegetation range between 0 and200 Pg (85).The third role carbon cycles play is through global feedbacks. Over thousands of
years, strong feedbacks appear to constrain the sink in terrestrial ecosystems (88).Currently, it is not fully known how and when these strong feedbacks come intoplay as well as what their net effect actually is. The numerical model simulationsby Cox et al. (80) suggest that the carbon dioxide and methane released intothe atmosphere because of change in vegetation could accelerate global warmingsignificantly. In essence, these results point to the possibility that, at least overa hundred-year period, climate change could cause the terrestrial biosphere tobecome an additional source of CO2 in the atmosphere.
7. CLOSING REMARKS
First, considering TBFRA estimates and the fraction stored in the biomass of, andtaken up as carbon by, temperate forests, themagnitudes of the stocks and the flowsof carbon associated with the temperate forests qualify as significant, relative toatmospheric CO2 and emissions of CO2 from fossil-fuel burning. The arithmeticof the “back-of-the-envelop” calculation that these numbers suggest qualifies astrivial. Nonetheless, we refrain from including an estimate in the conclusion forfear of anchoring the reader on a specific number. This would provide a false sense
Ann
u. R
ev. E
nerg
y. E
nviro
n. 2
001.
26:4
35-4
65. D
ownl
oade
d fro
m a
rjour
nals.
annu
alre
view
s.org
by L
AW
REN
CE B
ERK
ELEY
NA
TIO
NA
L LA
BORA
TORY
on
05/2
4/10
. For
per
sona
l use
onl
y.
3 Oct 2001 9:30 AR AR143-15-mar.tex AR143-15-mar.SGM ARv2(2001/05/10) P1: GJB
CARBON SINKS IN TEMPERATE FORESTS 459
of certainty, when the large uncertainty range surrounding such a number alsoremains difficult to estimate. Having stated this caveat, because of the significantmagnitude of the stocks and flows of carbon associated with the temperate forests,we argue that scientists and climate negotiators alike cannot ignore them.Second, looking at orders of magnitude reveals that temperate forests cannot
counter CO2 emissions from fossil-fuel burning. The “Kyoto forests” defined underArticle 3.3 cover a small area compared with national and global forest areas, and“Kyoto temperate forests” an even smaller one. The good management of forestsdoes one good thing: It buys us precious time. However, it does not fix the problem(89, 90).Third and finally, the primary goal of climate negotiations resides with meeting
the ultimate objective of the UN FCCC as stated in its Article 2, namely preservingthe integrity of the climate system. Secondary goals, as implied by the text of theKyoto Protocol (1), concern satisfying the “triple bottom line” of environmentalquality, economic prosperity, and social justice (91). Only reducing anthropogenicemissions can produce the type of change required under the UN FCCC. In otherwords, one must address the source of the problem—the anthropogenic loadingof GHGs into the atmosphere. Nevertheless, carbon sequestration in temperateforests remains a valid tool for achieving the Article 2 goal and should remain anobjective of scientific research. The biogeochemical and climatic role played bytemperate forests locally, regionally, and globally warrants their most careful andintelligent management.
8. EPILOGUE
Unable to reach agreement on some of the key outstanding issues, the parties toCOP-6 concluded with a decision to suspend COP-6 and to reconvene for COP-6Part 2 in July 2001. Over 7000 participants from 182 governments, 323 intergov-ernmental and nongovernmental organizations, and 443 media outlets attendedCOP-6, demonstrating the high level of interest and concern over climate change.“In their speeches, the US and EU negotiators noted that the key outstanding
issues include sinks, compliance, and supplementarity” (92). And, indeed, the UNFCCC secretariat confirms “an international emissions trading system, a ‘cleandevelopmentmechanism,’ the rules for counting emissions reductions from carbon‘sinks’ such as forests, and a compliance regime” as the key political issues in itsfirst postconference media release (93).On March 28, 2001, Christie Todd Whitman, head of the US Environmental
Protection Agency, confirmed that the United States—which accounts for about25% of Earth’s GHG emissions—will not implement the Kyoto Protocol. With theUnited States stepping out of UN-mediated climate change talks, climate negoti-ations reach an impasse.The accounting for carbon sequestration in forests in general, and in temper-
ate forests in particular, is at the heart of climate negotiations, some of the most
Ann
u. R
ev. E
nerg
y. E
nviro
n. 2
001.
26:4
35-4
65. D
ownl
oade
d fro
m a
rjour
nals.
annu
alre
view
s.org
by L
AW
REN
CE B
ERK
ELEY
NA
TIO
NA
L LA
BORA
TORY
on
05/2
4/10
. For
per
sona
l use
onl
y.
3 Oct 2001 9:30 AR AR143-15-mar.tex AR143-15-mar.SGM ARv2(2001/05/10) P1: GJB
460 MARTIN ET AL.
important, most complex, and toughest current international negotiations. Scien-tific progress on carbon sequestration should increase chances of reopening talkswithin or without UN fora, provide a stronger basis for future agreements, and, wehope, make it possible to move away from a hard, competitive climate negotiationstyle toward a more cooperative, problem-solving mode.
DISCLAIMER
The views expressed in this review result from an international, transcontinentalcollaborative scientific effort and may not, in any circumstances, be regarded asstating an official position of any of the institutions to which the authors areaffiliated.
Visit the Annual Reviews home page at www.AnnualReviews.org
LITERATURE CITED
1. Kyoto Protocol to the United NationsFramework Convention on ClimateChange. 1997. http://www.unfccc.int/resource/docs/convkp/kpeng.pdf
2. GrubbM, Vrolijk C, Brack D. 1999. TheKyoto Protocol: A Guide and Assessment.London: R. Inst. Int. Aff./Earthscan. 384pp.
3. Archibold OW. 1994. Ecology of WorldVegetation. New York: Chapman & Hall.510 pp. 1st ed.
4. Whittaker RH, Likens GE. 1973. Carbonin the biota. InCarbon and the Biosphere,ed. GM Woodwell, EV Pecan, pp. 281–302. Springfield,VA:Natl. Tech. Inf. Serv.
5. Bousquet P, Ciais P, Peylin P, RamonetM, Monfray P. 1999. Inverse modelingof annual atmospheric CO2 sources andsinks. 1. Method and control inversion. J.Geophys. Res. Atmos. 104(D21):26161–78
6. Fan S, Gloor M, Mahlman J, Pacala S,Sarmiento J, et al. 1998. A large terrestrialcarbon sink in North America implied byatmospheric and oceanic carbon dioxidedata and models. Science 282:442–46
7. Schimel D, Melillo J, Tian H, McGuireAD, Kicklighter D, et al. 2000. Contribu-tion of increasing CO2 and climate to car-
bon storage by ecosystems in the UnitedStates. Science 287:2004–6
8. HoughtonRA, Hackler JL, LawrenceKT.1999. The U.S. carbon budget: contribu-tions from land-use change. Science 285:574–78
9. Martin PH, Valentini R, JacquesM, Fab-bri K, Galati D, et al. 1998. A new esti-mate of the carbon sink strength of EUforests integrating flux measurements,field surveys, and space observations:0.17–0.35 Gt(C). Ambio 27(7):582–84
10. Martin PH, Jacques M. 2000. Estimat-ing the CO2 forest/atmosphere exchangeover theEU fromfluxmeasurements, fieldsurveys, and space observations: a de-tailed description of the calculation thatled to 0.17–0.35 Pg(C). In Forest Ecosys-tem Modelling, Upscaling and RemoteSensing, ed. RJM Ceulemans, F Verous-traete, V Gond, J Van Rensbergen, pp.155–77. The Hague, Netherlands: SPBAcad.
11. Valentini R, Matteucci G, Dolman AJ,Schulze E-D, Rebmann C, et al. 2000.Respiration as the main determinant ofcarbon balance in European forests. Na-ture 404:861–65
12. Dixon RK, Brown S, Houghton RA,
Ann
u. R
ev. E
nerg
y. E
nviro
n. 2
001.
26:4
35-4
65. D
ownl
oade
d fro
m a
rjour
nals.
annu
alre
view
s.org
by L
AW
REN
CE B
ERK
ELEY
NA
TIO
NA
L LA
BORA
TORY
on
05/2
4/10
. For
per
sona
l use
onl
y.
3 Oct 2001 9:30 AR AR143-15-mar.tex AR143-15-mar.SGM ARv2(2001/05/10) P1: GJB
CARBON SINKS IN TEMPERATE FORESTS 461
Solomon AM, Trexler MC, WisniewskiJ. 1994. Carbon pools and flux of globalforest ecosystems. Science 263:185–90
13. UN-ECE/FAO. 2000. Temperate and Bo-real Forest Resource A, Vol. 1. Geneva/Rome: UN Econ. Comm. Eur., FoodAgric. Org.
14. PressWH, Teukolsky SA, VetterlingWT,Flannery BP. 1992. Numerical Recipes:The Art of Scientific Computing. Cam-bridge, UK: Cambridge Univ. Press. 963pp. 2nd ed.
15. Deleted in proof16. Ritter M. 1999. Annual European Com-
munity Greenhouse Gas Inventory 1990–1996. ETC Air Emissions, UBA Vienna,Tech. Rep. 19. Copenhagen: Eur. Environ.Agency. 80 pp.
17. Kauppi PE, Tomppo E. 1993. Impact offorests on net national emissions of car-bon dioxide in West Europe. Water AirSoil Pollut. 70:187–96
18. Martin PH. 1998. Estimating the CO2 up-take in Europe. Science 281:1806
19. Schulze E-D, Hogborg P, van Oene O,Persson T, Harrison AF, et al. 2000. Inter-actions between the carbon and nitrogencycle and the role of biodiversity: a synop-sis of a study along a north-south transectthrough Europe. In Carbon and NitrogenCycling in European Forest Ecosystems,ed. E-D Schulze, pp. 468–91. Heidelberg:Springer-Verlag
20. Nabuurs G-J, Paivinen R, Sikkema R,MohrenGMJ. 1997. The role of Europeanforests in the global carbon cycle—a re-view. Biomass Bioenergy 13(6):345–58
21. Kauppi PE, Mielikainen K, Kuusela K.1992. Biomass and carbon budget of Eu-ropean forests, 1971 to 1990. Science 256:70–74
22. Kaminski T, Heimann M, Giering R.1999. A coarse grid three dimensionalglobal inverse model of the atmospherictransport. 1. Adjoint model and Jacobianmatrix. J. Geophys. Res. 104(D15):18535–53
23. Rayner PJ, Law RM. 1999. The interan-
nual variability of the global carbon cycle.Tellus B 51:210–12
24. Ciais P, Tan PP, Trolier M, White JWC,Francy RJ. 1995. A large northern hemis-phere terrestrial CO2 sink indicated by13C/12C of atmospheric CO2. Science269:1098–102
25. KohlM, PaıvinenR. 1997.Study onEuro-pean Forestry Information and Communi-cation Systems, Vols. 1, 2. Brussels, Belg:Eur. Union. 1382 pp.
26. USDAForest Service. 2001.Forest Inven-tory & Analysis. http://www.fs.fed.us/fia
27. Tomppo E. 1996. Multi source nationalforest inventory of Finland. In NewThrusts in Forest Inventory, EFI Proc.No. 7, ed. R Paivinen, J Vanclay, S Miina,pp. 27–41. Joensu, Finland: Eur. ForestInst.
28. Heath LS, Birdsey RA. 1993. Carbontrends of productive temperate forests ofthe conterminousUnited States.Water AirSoil Pollut. 70(1–4):279–93
29. KurzWA, Apps MJ. 1999. A 70-year ret-rospective analysis of carbon fluxes in theCanadian forest sector.Ecol. Appl. 9:526–47
30. Karjalainen T. 1996. Dynamics and po-tentials of carbon sequestration in man-aged stands and wood products in Finlandunder changing climatic conditions. For.Ecol. Manage. 80:113–32
31. KarjalainenT, PussinenA, Liski J, Nabu-urs G-J, Erhard M, et al. 2001. An ap-proach towards an estimate of the impactof forest management and climate changeon the European forest sector carbon bud-get: Germany as a case study. Forest Ecol.In press
32. Nabuurs G-J, Paivinen R, Sikkema R,MohrenGMJ. 1997. The role of Europeanforests in the global carbon cycle—a re-view. Biomass Bioenergy 13(6):345–58
33. Matthews R, Nabuurs G-J, Alexeyev V,Birdsey RA, Fischlin A, et al. 1996.WG3summary: evaluating the role of forestmanagement and forest products in thecarbon cycle. See Ref. 94, pp. 293–301
Ann
u. R
ev. E
nerg
y. E
nviro
n. 2
001.
26:4
35-4
65. D
ownl
oade
d fro
m a
rjour
nals.
annu
alre
view
s.org
by L
AW
REN
CE B
ERK
ELEY
NA
TIO
NA
L LA
BORA
TORY
on
05/2
4/10
. For
per
sona
l use
onl
y.

3 Oct 2001 9:30 AR AR143-15-mar.tex AR143-15-mar.SGM ARv2(2001/05/10) P1: GJB
462 MARTIN ET AL.
34. Nabuurs G-J, Sikkema R. 2001. Interna-tional trade in wood products: its role inthe land use change and forestry carboncycle. Clim. Change 49:377–95
35. Burschel P, KuerstenE, LarsonBC, 1993.Die Rolle von Wald und Forstwirtschaftim Kohlenstoffhaushalt. Eine Betrach-tung fuer die Bundesrepublik Deutsch-land. Forstl. Vers. Forsch. Anst. 126:1–135
36. AppsMJ, KurzWA, Beukema SJ, BhattiJS. 1999. Carbon budget of the Canadianforest product sector. Environ. Sci. Policy2:25–41
37. FAO. 1997. State of the World’s Forests.Rome: Food Agric. Org. 200 pp.
38. Houghton JT, Meira Filho LG, CallenderBA, Harris N, Kattenberg A, MaskellK, eds. 1995. The Science of ClimateChange: Contribution of Working GroupI to the Second Assessment of the Inter-governmental Panel on Climate Change.Cambridge, UK: Cambridge Univ. Press.572 pp.
39. Winjum JK, Brown S, Schlamadinger B.1998. Forest harvests and wood products:sources and sinks of atmospheric carbondioxide. For. Sci. 44(2):272–84
40. US Dep. State. 2000. United States Sub-mission on Land-Use, Land-Use Change,and Forestry. http://www.state.gov/www/global/global issues/climate/000801 unfccc1 subm.pdf
41. IPCC/OECD/IEA. 1996. IPCC guide-lines for national greenhouse gas inven-tories. Module. Land use change andforestry. In IPCC Guidelines. Ref. Man.,Vol. 3. Work. Group I. Cambridge, UK:Cambridge Univ. Press. 74 pp. Rev. ed.
41a. IPCC/OECD/IEA. 1996. IPCC guide-lines for national greenhouse gas inven-tories. Module. Land use change andforestry. In IPCC Guidelines. Workbook,Vol. 2. Work. Group I. TSU Cambridge,UK:Cambridge Univ. Press. 54 pp.
42. Sedjo RA, Wisniewski J, Sample AV,Kinsman JD. 1995. The economics ofmanaging carbon via forestry: assessment
of existing studies. Environ. ResourceEcon. 6:139–65
43. SchlamadingerB, MarlandG. 2000.Landuse and global climate change: forests,land use and the Kyoto Protocol. Arling-ton, VA: Pew Cent. Global Clim. Changehttp://www.pewcenter.org/projects/land-use.pdf
44. Third Minist. Conf. Protect. For. Eur.1998. Follow-Up Reports on the Minis-terial Conferences on the Protection ofForests in Europe, Vol. 2. 274 pp. Min-ist. Conf. Protect. For. Eur. Liason Unit,Vienna, Austria
45. Watson RT, Noble IR, Bolin B, Ravin-dranathNH, VerardoDJ, DokkenDJ, eds.2000. Land Use, Land-Use Change, andForestry 2000. Sp. Rep. Intergov. PanelClim. Change. Cambridge, UK: Cam-bridge Univ. Press. 375 pp.
46. Brown S, Sathaye J, Cannell M, KauppiP. 1996. Management of forests for mit-igation of greenhouse gas emissions. InClimate Change 1995, Impacts, Adapta-tions and Mitigations of Climate Change:Scientific-Technical Analyses, ed. RTWatson, MC Zinyowera, RH Moss, pp.773–97. Cambridge, UK: CambridgeUniv. Press.
47. US Dep. State. 2000. Paper 9: Land-Use, Land-Use Change and Forestry. UNFramework Conv. Clim. Change Sub-sidiary Body for Sci. Technol. Advice,4 Sept. FCCC/SBSTA/2999/ MISC.6/Add.1. http://www.unfccc.int/resource/docs/2000/sbsta/misc06a01.pdf
48. Baer P, Harte J, Haya B, Herzog AV,Holdren JP, et al. 2000. Climate change:equity and greenhouse gas responsibility.Science 289:2287
49. Sampson RN, Wright LL, Winjum JK,Kinsman JD, Benneman J, et al. 1993.Biomass management and energy. WaterAir Soil Pollut. 70:139–59
50. Schulze E-D, Wirth C, Heimann M.2000. Managing forests after Kyoto. Sci-ence 289:2058–59
51. Lund HG. 2000. Definitions of Forest,
Ann
u. R
ev. E
nerg
y. E
nviro
n. 2
001.
26:4
35-4
65. D
ownl
oade
d fro
m a
rjour
nals.
annu
alre
view
s.org
by L
AW
REN
CE B
ERK
ELEY
NA
TIO
NA
L LA
BORA
TORY
on
05/2
4/10
. For
per
sona
l use
onl
y.

3 Oct 2001 9:30 AR AR143-15-mar.tex AR143-15-mar.SGM ARv2(2001/05/10) P1: GJB
CARBON SINKS IN TEMPERATE FORESTS 463
Deforestation, Afforestation, and Re-forestation. http://home.att.net/∼gklund/DEFpaper.html
52. Costa Rica. 2000. Land Use, Land UseChange and Forestry Projects under theClean Development Mechanism. FCCC/SB/2000/MISC.1/Add.2.http://www.unfccc.int/resource/docs/2000/sb/misc01a02.htm
53. Violette D, Ragland S, Stern F. 1998.Evaluating Greenhouse Gas MitigationThrough DSM Projects: Lessons Learnedfrom DSM Evaluation in the UnitedStates. Boulder, CO: Hagler Bailly Con-sult.
54. Vine E, Sathaye J. 1997. TheMonitoring,Evaluation,Reporting, and Verification ofClimateChangeMitigation Projects:Dis-cussion of Issues and Methodologies andReview of Existing Protocols and Guide-lines. LBNL-40316. Lawrence BerkeleyNatl. Lab. Berkeley, CA. http://eetd.lbl.gov/ea/ccm/ccPubs.html
55. Vine E, Sathaye J, Makundi W. 1999.Guidelines for the Monitoring, Evalu-ation,Reporting,Verification, andCertifi-cation of Forestry Projects for ClimateChange Mitigation. LBNL-41877. Law-rence Berkeley Natl. Lab., Berkeley, CA.http://eetd.lbl.gov/ea/ccm/ccPubs.html
56. Pinard M, Putz F. 1997. Monitoringcarbon sequestration benefits associatedwith a reduced-impact logging projectin Malaysia. Mitig. Adapt. Strat. GlobalChange 2(2/3):203–15
57. Pinard M, Putz F, Tay J, Sullivan T.1995. Creating timber harvesting guide-lines for a reduced-impact logging projectin Malaysia. J. For. 93:41–45
58. Pinard M, Putz F. 1996. Retaining for-est biomass by reducing logging damage.Biotropica 28:278–95
59. Jepma C. 1997. Reduced-impact loggingin Indonesia. Jt. Implement. Q. 3(2):1–16
60. Vine E. 1994. The human dimension ofprogram evaluation. Energy Int. J. 19:165–78
61. MacDicken K. 1998. AGuide to Monitor-ing Carbon Storage in Forestry and Agro-forestry Projects. Arlington, VA:WinrockInt. Inst. Agric. Dev.
62. Watt E, Sathaye J, de BuenO, Masera O,Gelil I, et al. 1995.The Institutional Needsof Joint Implementation Projects, LBL-36453. Berkeley, CA: Lawrence BerkeleyNatl. Lab.
63. Trexler & Assoc. 1997. Final Reportof the Biotics Offsets Assessment Work-shop. Trexler & Assoc., Portland, Ore.http://www.climateservices.com/
64. Chomitz KM. 2000. Evaluating Car-bon Offsets from Forestry and EnergyProjects: How Do They Compare?Wash-ington, DC:Dev. Res. Group,World Bank
65. Danish K, Rotter J. 2001. Forest car-bon and the Kyoto Protocol’s clean de-velopment mechanism. J. For. 98(5):38–47
66. Kinsman JD, KasterG, KuhnEC, Smith-son JA, Brown G. 2000. Forest carbonmanagement, the greenhouse effect andelectric utilities. Environ. Sci. Policy 3:115–23
67. Eto J, Prahl R, Schlegel J. 1996. A Scop-ing Study on Energy-Efficiency MarketTransformation by California UtilityDSM Programs. LBNL-39058. Berkeley,CA: Lawrence Berkeley Natl. Lab.
68. Bialy J. 1991. Improved cookstove pro-grams in Sri Lanka: perceptions of suc-cess. In Improved Biomass CookstovePrograms: A Global Evaluation. Hono-lulu, HI: East-West Cent.
69. Deleted in proof70. Schlegel J, Prahl R, Raab J. 1997.
Next steps for evaluation of markettransformation initiatives: an update tothe NARUC Guidebook. In EvaluatingEnergy-Efficiency Programs in a Restruc-tured Industry Environment: A Handbookfor PUCStaff, ed. J Schlegel,MGoldberg,J Raab, R Prahl, M Keneipp, D Violette,pp. 29–42. Washington, DC: Natl. Assoc.Regul. Utility Comm.
71. Prahl R, Schlegel J. 1993. Evaluating
Ann
u. R
ev. E
nerg
y. E
nviro
n. 2
001.
26:4
35-4
65. D
ownl
oade
d fro
m a
rjour
nals.
annu
alre
view
s.org
by L
AW
REN
CE B
ERK
ELEY
NA
TIO
NA
L LA
BORA
TORY
on
05/2
4/10
. For
per
sona
l use
onl
y.
3 Oct 2001 9:30 AR AR143-15-mar.tex AR143-15-mar.SGM ARv2(2001/05/10) P1: GJB
464 MARTIN ET AL.
market transformation. In Proc. 1993 Int.Energy Progr. Eval. Conf., pp. 469–77.Chicago: Natl. Energy Progr. Eval. Conf.
72. Heath LS, Smith JE. 2000. An assess-ment of uncertainty in forest carbon bud-get projections. Environ. Sci. Policy 3:73–82
73. Morgan MG, Henrion M. 1990. Uncer-tainty: A Guide to the Treatment of Un-certainty in Quantitative Policy and RiskAnalysis. New York: Cambridge Univ.Press. 344 pp.
74. HeathLS, BirdseyRA, RowC, PlantingaAJ. 1996. Carbon pools and fluxes in USforest products. See Ref. 94, pp. 271–78
75. Smith JE, Heath LS. 2000. Consider-ations for interpreting probabilistic esti-mates of uncertainty of forest carbon. InThe Impact of Climate Change on Amer-ica’s Forests, Gen. Tech. Rep. RMRS-GTR-59, ed. LA Joyce, RA Birdsey, pp.102–11. Ft. Collins, CO: USDA For.Serv., Rocky Mt. Res. Stn. 133 pp.
76. Smith JE, Heath LS. 2001. Identifying in-fluences on model uncertainty: an appli-cation using a forest carbon budgetmodel.Environ. Manage. 27(2):253–67
77. Tenhunen JD, Valentini R, Kostner B,Zimmermann R, Granier A. 1998. Vari-ation in forest gas exchange at landscapeto continental scales. Ann. For. Sci. 55:1–11
78. Pan Y, Melillo JM, McGuire AD, Kick-lighter DW, Pitelka LF, et al. 1998.Modeled responses of terrestrial ecosys-tems to elevated atmospheric CO2: acomparison of simulation by the bio-geochemistry models of the Vegeta-tion/Ecosystem Modeling and AnalysisProject (VEMAP). Oecologia 114:389–404
79. Mladenoff DJ, He HS. 1999. Spatiallyexplicit and stochastic simulation of for-est landscape fire disturbance and succes-sion. Ecology 80:81–99
80. Cox PM, Betts RA, Jones CD, SpallSA, Totterdell IJ. 2000. Acceleration of
global warming due to carbon-cycle feed-backs in a coupled climate model. Nature408:184–87
81. Dickinson RE. 1986. Impact of human ac-tivities on climate—a framework. In Sus-tainable Development of the Biosphere,ed. WC Clark, RE Munn, pp. 252–89.New York: Cambridge Univ. Press
82. Easterling DR, Meehl GA, Parmesan C,Changnon SA, Karl TR, Mearns LO.2000. Climate extremes: observations,modeling, and impacts. Science 289:2068–74
83. Martin PH. 1992. EXE: a climatically sen-sitive model to study climate change andCO2 enrichment effects on forests. Aust.J. Bot. 40:717–35
84. Martin PH. 1996. Climate change, waterstress, and fast forest response: a sensitiv-ity study. Clim. Change 34:223–30
85. Watson RT, Zinyowera MC, Moss RH,eds. 1997. The Regional Impacts of Cli-mate Change: An Assessment of Vulnera-bility. Sp. Rep. IPCCWork.Group2. Cam-bridge, UK: Cambridge Univ. Press. 517pp.
86. Neilson RP, Marks D. 1994. A global per-spective of regional vegetation and hydro-logic sensitivities from climatic change. J.Veg. Sci. 5:715–30
87. KingGA, NeilsonRP. 1992. The transientresponse of vegetation to climate change:a potential source of CO2 to the atmo-sphere. Water Air Soil Pollut. 64:365–83
88. Falkowski P, Scholes RJ, Boyle E,Canadell J, Canfield D, et al. 2000. Theglobal carbon cycle: a test of our knowl-edge of Earth as a system. Science 290:291–96
89. SaugierB. 2000. Planter des arbres permetseulement de gagner du temps. Monde,Nov. 10, pp. 29
90. IGBP Terr. Carbon Work. Group. 1998.The terrestrial carbon cycle: implica-tions for the Kyoto Protocol. Science280:1393–94
91. Elkington J. 1998. Cannibals with Forks:The Triple Bottom Line of 21st Century
Ann
u. R
ev. E
nerg
y. E
nviro
n. 2
001.
26:4
35-4
65. D
ownl
oade
d fro
m a
rjour
nals.
annu
alre
view
s.org
by L
AW
REN
CE B
ERK
ELEY
NA
TIO
NA
L LA
BORA
TORY
on
05/2
4/10
. For
per
sona
l use
onl
y.
3 Oct 2001 9:30 AR AR143-15-mar.tex AR143-15-mar.SGM ARv2(2001/05/10) P1: GJB
CARBON SINKS IN TEMPERATE FORESTS 465
Business. Stony Creek, CT: New Soc. 407pp.
92. Int. Inst. Sustain. Dev. 2000. 6th Con-ference of the Parties to the UN Frame-work Convention on Climate Changehttp://www.iisd.ca/linkages/climate/cop6/24nov.html
93. UN FCCC. 2000. Press Release: Climate
Change Talks Suspended, Negotiations toResume During 2001. http://cop6.unfccc.int/pdf/pressreloutcome1.pdf
94. Apps MJ, Price DT, eds. 1996. For-est Ecosystems, Forest Management andthe Global Carbon Cycle. NATO ASI Ser.I: Global Environmental Change. Berlin:Springer-Verlag. 451 pp.
Ann
u. R
ev. E
nerg
y. E
nviro
n. 2
001.
26:4
35-4
65. D
ownl
oade
d fro
m a
rjour
nals.
annu
alre
view
s.org
by L
AW
REN
CE B
ERK
ELEY
NA
TIO
NA
L LA
BORA
TORY
on
05/2
4/10
. For
per
sona
l use
onl
y.

P1: FDS
September 28, 2001 10:24 Annual Reviews AR143-FM
Annual Review of Energy and the EnvironmentVolume 26, 2001
CONTENTS
PREFATORY BIOGRAPHY
Frontispiece—Robert W. Kates xivQueries on the Human Use of the Earth, Robert W. Kates 1
Frontispiece—Harvey Brooks 28
Autonomous Science and Socially Responsive Science:A Search for Resolution, Harvey Brooks 29
ENERGY END-USE AND CONVERSION
Indicators of Energy Use and Carbon Emissions:Explaining the Energy Economy Link, Lee Schipper, FridtjofUnander, Scott Murtishaw, and Mike Ting 49
Energy Conservation in Chinese Residential Buildings: Progressand Opportunities in Design and Policy, Leon R. Glicksman,Leslie K. Norford, and Lara V. Greden 83
Policy Modeling for Energy Efficiency Improvement in USIndustry, Ernst Worrell, Lynn Price, and Michael Ruth 117
RESOURCES AND TECHNOLOGIES
Storage of Fossil Fuel-Derived Carbon Dioxide Beneath the Surface ofthe Earth, Sam Holloway 145
Historical and Future Trends in Aircraft Performance, Cost, andEmissions, Joosung J. Lee, Stephen P. Lukachko, Ian A. Waitz,and Andreas Schafer 167
RISKS AND IMPACTS
Interim Storage of Spent Fuel in the United States, Allison Macfarlane 201
Protecting Agricultural Crops from the Effects of TroposphericOzone Exposure: Reconciling Science and Standard Settingin the United States, Europe, and Asia, Denise L. Mauzeralland Xiaoping Wang 237
Human Exposure to Volatile Organic Pollutants: Implications forIndoor Air Studies, Lance A. Wallace 269
ix
Ann
u. R
ev. E
nerg
y. E
nviro
n. 2
001.
26:4
35-4
65. D
ownl
oade
d fro
m a
rjour
nals.
annu
alre
view
s.org
by L
AW
REN
CE B
ERK
ELEY
NA
TIO
NA
L LA
BORA
TORY
on
05/2
4/10
. For
per
sona
l use
onl
y.
P1: FDS
September 28, 2001 10:24 Annual Reviews AR143-FM
x CONTENTS
Carbon Dioxide Emissions from the Global Cement Industry,Ernst Worrell, Lynn Price, Nathan Martin, Chris Hendriks, andLeticia Ozawa Meida 303
ECONOMICS
Global Electric Power Reform, Privatization, and Liberalization ofthe Electric Power Industry in Developing Countries, R. W. Baconand J. Besant-Jones 331
POLICY
Federal Fossil Fuel Subsidies and Greenhouse Gas Emissions:A Case Study of Increasing Transparency for Fiscal Policy,Doug Koplow and John Dernbach 361
The PCAST Energy Studies: Toward a National Consensus onEnergy Research, Development, Demonstration, and DeploymentPolicy, John P. Holdren and Samuel F. Baldwin 391
ENVIRONMENTAL SCIENCE
Carbon Sinks in Temperate Forests, Philippe H. Martin, Gert-JanNabuurs, Marc Aubinet, Timo Karjalainen, Edward L. Vine, JohnKinsman, and Linda S. Heath 435
INDEXES
Subject Index 467Cumulative Index of Contributing Authors, Volumes 1–26 491Cumulative Index of Chapter Titles, Volumes 1–26 497
ERRATA
An online log of corrections to Annual Review of Energy and theEnvironment chapters (if any, 1997 to the present) may befound at http://energy.AnnualReviews.org
Ann
u. R
ev. E
nerg
y. E
nviro
n. 2
001.
26:4
35-4
65. D
ownl
oade
d fro
m a
rjour
nals.
annu
alre
view
s.org
by L
AW
REN
CE B
ERK
ELEY
NA
TIO
NA
L LA
BORA
TORY
on
05/2
4/10
. For
per
sona
l use
onl
y.