asset and liability price tables as of march 31, 2011
TRANSCRIPT
Office of Thrift Supervision
Selected Asset and Liability Price Tables As of March 31, 2011
Instrument Page Section 1: Mortgage Securities, Price Indications and Prepayment Rates Fixed-Rate Mortgage Pool Security Prices ........................................................................... 1 Treasury ARM Mortgage Security Prices .............................................................................. 5 COFI ARM Mortgage Security Prices ................................................................................... 8 Fixed-Rate MBS Price Indications ........................................................................................ 10 ARM Securities Price Indications .......................................................................................... 11 Prepayment Rate Estimates for Fixed-Rate Mortgages ....................................................... 12 Section 2: Mortgage Servicing Costs/Fees - Fixed and Adjustable Rate Mortgages Conventional FRM Servicing Costs and Fees ...................................................................... 14 FHA/VA FRM Servicing Costs and Fees ............................................................................. 16 Treasury ARM Servicing Costs and Fees ............................................................................ 18 COFI ARM Servicing Costs and Fees ................................................................................... 19 Section 3: Retail CD, Transaction, MMDA and Passbook Accounts Retail CD Prices ................................................................................................................... 20 Retail CD Intangible Values ................................................................................................. 22 Transaction Account Intangible Values ................................................................................. 23 Money Market Account Intangible Values ............................................................................. 24 Passbook Account/ Non-interest Bearing Account Intangible Values ................................... 25 Section 4: Interest Rate Caps Interest Rate Cap Prices ...................................................................................................... 27 Section 5: Yield Curves and Selected Interest Rates Yield Curves ......................................................................................................................... 29 Selected Interest Rates ........................................................................................................ 32 This is a quarterly publication of the Office of Thrift Supervision, Risk Modeling & Analysis Division, Washington, D.C. 20552
ii
Selected Asset and Liability Price Tables
Selected Asset and Liability Price Tables consist of "price tables” that report the estimated economic values of selected assets, liabilities, and off-balance sheet instruments in various interest rate scenarios. The economic values are estimated by the OTS Net Portfolio Value Model. In addition to the price tables, the publication reports the following data (see the OTS Net Portfolio Value Model manual for more information on how the data are used by the NPV Model):
The quarter-end Treasury zero-coupon curve used by the NPV Model to create discount factors for assets, and yield curves for interest rate swaps and wholesale CDs.
Quarter-end interest rates that are used by the NPV Model to calculate discount factors for a variety of assets.
Four tables listing estimated prepayments for the following types of single-family mortgages: 30-year conventional FRMs, 30-year FHA/VA FRMs, 15-year FRMs, and 7-year balloon mortgages.
One-month implied forward rates for the following interest rate series: Treasury, LIBOR, secondary market CDs, and retail CD rates.
Price indications for a set of benchmark fixed-rate and adjustable-rate mortgage securities. The price indications are assumed to represent reasonable approximations of the quarter-end market prices of the securities.
In the first quarter of 2011, OTS changed the source for determining the remaining time until balloon payment for Fannie Mae 7-year Balloon MBS to better reflect balloon periods reported on Schedule CMR. Fannie Mae 7-year Balloon MBS are used for benchmarking purposes for fixed-rate, single-family balloon loans and securities within the OTS NPV Model. In general, reporting institutions can expect lower economic values and higher effective durations for fixed-rate, single-family balloon loans and securities as a result of this change. If you have any questions, please call either Drew Carayiannis at (202) 906-6919 or Scott Ciardi at (202) 906-6960. Due to the low interest rate environment, results for the minus 200 and minus 300 basis point scenarios have been eliminated.
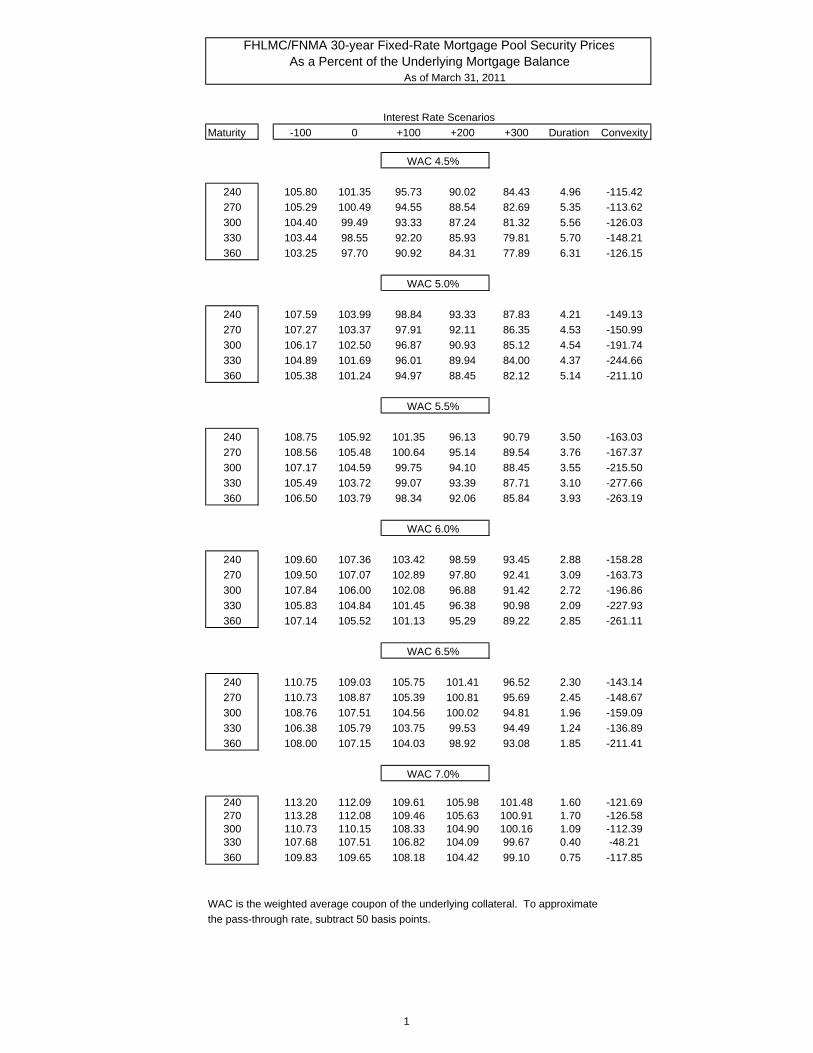
FHLMC/FNMA 30-year Fixed-Rate Mortgage Pool Security PricesAs a Percent of the Underlying Mortgage Balance
As of March 31, 2011
11 12 13 14 15 16 17Interest Rate Scenarios
Maturity -100 0 +100 +200 +300 Duration Convexity
WAC 4.5%
240 105.80 101.35 95.73 90.02 84.43 4.96 -115.42
270 105.29 100.49 94.55 88.54 82.69 5.35 -113.62
300 104.40 99.49 93.33 87.24 81.32 5.56 -126.03
330 103.44 98.55 92.20 85.93 79.81 5.70 -148.21
360 103.25 97.70 90.92 84.31 77.89 6.31 -126.15
WAC 5.0%
240 107.59 103.99 98.84 93.33 87.83 4.21 -149.13
270 107.27 103.37 97.91 92.11 86.35 4.53 -150.99
300 106.17 102.50 96.87 90.93 85.12 4.54 -191.74
330 104.89 101.69 96.01 89.94 84.00 4.37 -244.66
360 105.38 101.24 94.97 88.45 82.12 5.14 -211.10
WAC 5.5%
240 108.75 105.92 101.35 96.13 90.79 3.50 -163.03
270 108.56 105.48 100.64 95.14 89.54 3.76 -167.37
300 107.17 104.59 99.75 94.10 88.45 3.55 -215.50
330 105.49 103.72 99.07 93.39 87.71 3.10 -277.66
360 106.50 103.79 98.34 92.06 85.84 3.93 -263.19
WAC 6.0%
240 109.60 107.36 103.42 98.59 93.45 2.88 -158.28
270 109.50 107.07 102.89 97.80 92.41 3.09 -163.73
300 107.84 106.00 102.08 96.88 91.42 2.72 -196.86
330 105.83 104.84 101.45 96.38 90.98 2.09 -227.93
360 107.14 105.52 101.13 95.29 89.22 2.85 -261.11
WAC 6.5%
240 110.75 109.03 105.75 101.41 96.52 2.30 -143.14
270 110.73 108.87 105.39 100.81 95.69 2.45 -148.67
300 108.76 107.51 104.56 100.02 94.81 1.96 -159.09
330 106.38 105.79 103.75 99.53 94.49 1.24 -136.89
360 108.00 107.15 104.03 98.92 93.08 1.85 -211.41
WAC 7.0%
240 113.20 112.09 109.61 105.98 101.48 1.60 -121.69270 113.28 112.08 109.46 105.63 100.91 1.70 -126.58300 110.73 110.15 108.33 104.90 100.16 1.09 -112.39330 107.68 107.51 106.82 104.09 99.67 0.40 -48.21
360 109.83 109.65 108.18 104.42 99.10 0.75 -117.85
WAC is the weighted average coupon of the underlying collateral. To approximate
the pass-through rate, subtract 50 basis points.
1
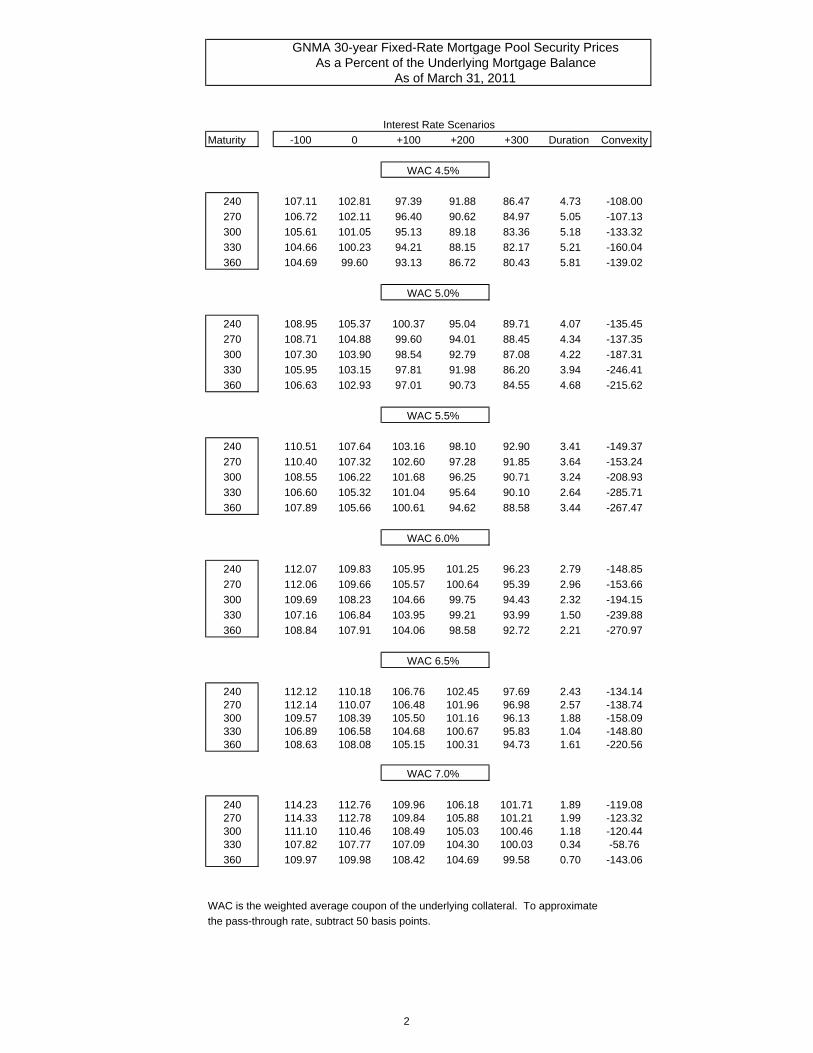
GNMA 30-year Fixed-Rate Mortgage Pool Security PricesAs a Percent of the Underlying Mortgage Balance
As of March 31, 2011
Interest Rate Scenarios
Maturity -100 0 +100 +200 +300 Duration Convexity
WAC 4.5%
240 107.11 102.81 97.39 91.88 86.47 4.73 -108.00
270 106.72 102.11 96.40 90.62 84.97 5.05 -107.13
300 105.61 101.05 95.13 89.18 83.36 5.18 -133.32
330 104.66 100.23 94.21 88.15 82.17 5.21 -160.04
360 104.69 99.60 93.13 86.72 80.43 5.81 -139.02
WAC 5.0%
240 108.95 105.37 100.37 95.04 89.71 4.07 -135.45
270 108.71 104.88 99.60 94.01 88.45 4.34 -137.35
300 107.30 103.90 98.54 92.79 87.08 4.22 -187.31
330 105.95 103.15 97.81 91.98 86.20 3.94 -246.41
360 106.63 102.93 97.01 90.73 84.55 4.68 -215.62
WAC 5.5%
240 110.51 107.64 103.16 98.10 92.90 3.41 -149.37
270 110.40 107.32 102.60 97.28 91.85 3.64 -153.24
300 108.55 106.22 101.68 96.25 90.71 3.24 -208.93
330 106.60 105.32 101.04 95.64 90.10 2.64 -285.71
360 107.89 105.66 100.61 94.62 88.58 3.44 -267.47
WAC 6.0%
240 112.07 109.83 105.95 101.25 96.23 2.79 -148.85
270 112.06 109.66 105.57 100.64 95.39 2.96 -153.66
300 109.69 108.23 104.66 99.75 94.43 2.32 -194.15
330 107.16 106.84 103.95 99.21 93.99 1.50 -239.88
360 108.84 107.91 104.06 98.58 92.72 2.21 -270.97
WAC 6.5%
240 112.12 110.18 106.76 102.45 97.69 2.43 -134.14270 112.14 110.07 106.48 101.96 96.98 2.57 -138.74300 109.57 108.39 105.50 101.16 96.13 1.88 -158.09330 106.89 106.58 104.68 100.67 95.83 1.04 -148.80360 108.63 108.08 105.15 100.31 94.73 1.61 -220.56
WAC 7.0%
240 114.23 112.76 109.96 106.18 101.71 1.89 -119.08270 114.33 112.78 109.84 105.88 101.21 1.99 -123.32300 111.10 110.46 108.49 105.03 100.46 1.18 -120.44330 107.82 107.77 107.09 104.30 100.03 0.34 -58.76
360 109.97 109.98 108.42 104.69 99.58 0.70 -143.06
WAC is the weighted average coupon of the underlying collateral. To approximate
the pass-through rate, subtract 50 basis points.
2
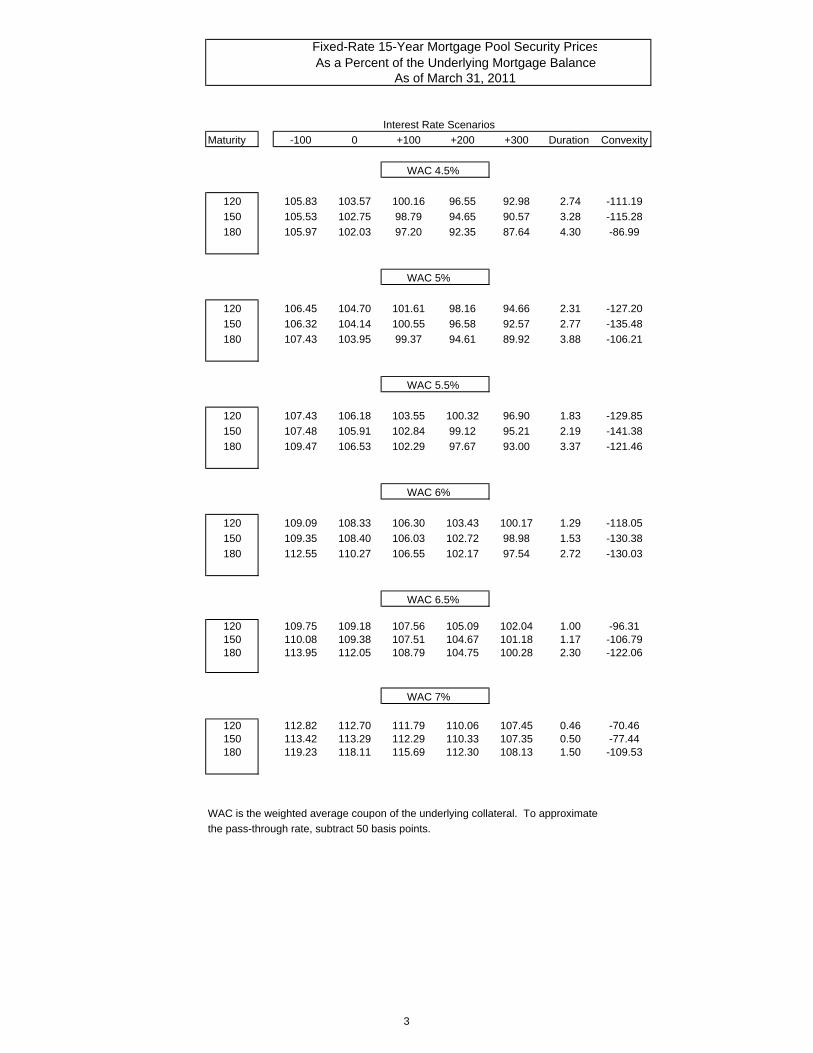
Fixed-Rate 15-Year Mortgage Pool Security PricesAs a Percent of the Underlying Mortgage Balance
As of March 31, 2011
Interest Rate Scenarios
Maturity -100 0 +100 +200 +300 Duration Convexity
WAC 4.5%
120 105.83 103.57 100.16 96.55 92.98 2.74 -111.19
150 105.53 102.75 98.79 94.65 90.57 3.28 -115.28
180 105.97 102.03 97.20 92.35 87.64 4.30 -86.99
WAC 5%
120 106.45 104.70 101.61 98.16 94.66 2.31 -127.20
150 106.32 104.14 100.55 96.58 92.57 2.77 -135.48
180 107.43 103.95 99.37 94.61 89.92 3.88 -106.21
WAC 5.5%
120 107.43 106.18 103.55 100.32 96.90 1.83 -129.85
150 107.48 105.91 102.84 99.12 95.21 2.19 -141.38
180 109.47 106.53 102.29 97.67 93.00 3.37 -121.46
WAC 6%
120 109.09 108.33 106.30 103.43 100.17 1.29 -118.05
150 109.35 108.40 106.03 102.72 98.98 1.53 -130.38
180 112.55 110.27 106.55 102.17 97.54 2.72 -130.03
WAC 6.5%
120 109.75 109.18 107.56 105.09 102.04 1.00 -96.31150 110.08 109.38 107.51 104.67 101.18 1.17 -106.79180 113.95 112.05 108.79 104.75 100.28 2.30 -122.06
WAC 7%
120 112.82 112.70 111.79 110.06 107.45 0.46 -70.46150 113.42 113.29 112.29 110.33 107.35 0.50 -77.44180 119.23 118.11 115.69 112.30 108.13 1.50 -109.53
WAC is the weighted average coupon of the underlying collateral. To approximate
the pass-through rate, subtract 50 basis points.
3
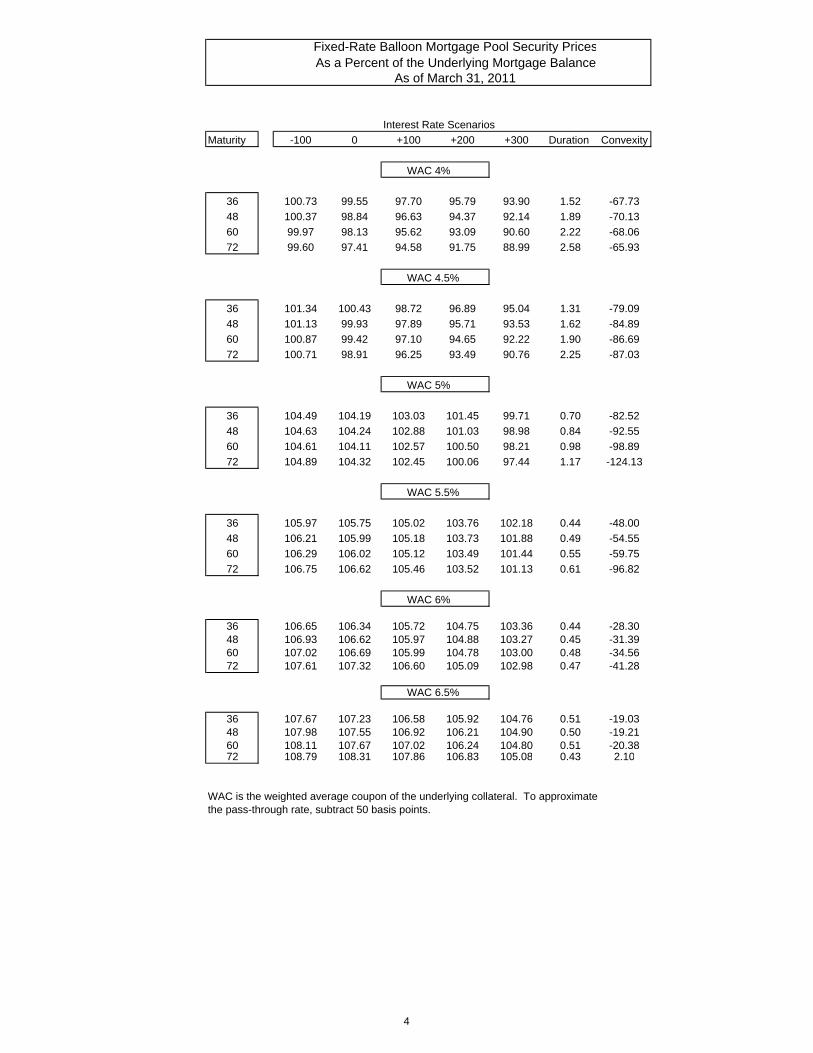
Fixed-Rate Balloon Mortgage Pool Security PricesAs a Percent of the Underlying Mortgage Balance
As of March 31, 2011
Interest Rate Scenarios
Maturity -100 0 +100 +200 +300 Duration Convexity
WAC 4%
36 100.73 99.55 97.70 95.79 93.90 1.52 -67.73
48 100.37 98.84 96.63 94.37 92.14 1.89 -70.13
60 99.97 98.13 95.62 93.09 90.60 2.22 -68.06
72 99.60 97.41 94.58 91.75 88.99 2.58 -65.93
WAC 4.5%
36 101.34 100.43 98.72 96.89 95.04 1.31 -79.09
48 101.13 99.93 97.89 95.71 93.53 1.62 -84.89
60 100.87 99.42 97.10 94.65 92.22 1.90 -86.69
72 100.71 98.91 96.25 93.49 90.76 2.25 -87.03
WAC 5%
36 104.49 104.19 103.03 101.45 99.71 0.70 -82.52
48 104.63 104.24 102.88 101.03 98.98 0.84 -92.55
60 104.61 104.11 102.57 100.50 98.21 0.98 -98.89
72 104.89 104.32 102.45 100.06 97.44 1.17 -124.13
WAC 5.5%
36 105.97 105.75 105.02 103.76 102.18 0.44 -48.00
48 106.21 105.99 105.18 103.73 101.88 0.49 -54.55
60 106.29 106.02 105.12 103.49 101.44 0.55 -59.75
72 106.75 106.62 105.46 103.52 101.13 0.61 -96.82
WAC 6%
36 106.65 106.34 105.72 104.75 103.36 0.44 -28.3048 106.93 106.62 105.97 104.88 103.27 0.45 -31.3960 107.02 106.69 105.99 104.78 103.00 0.48 -34.5672 107.61 107.32 106.60 105.09 102.98 0.47 -41.28
WAC 6.5%
36 107.67 107.23 106.58 105.92 104.76 0.51 -19.0348 107.98 107.55 106.92 106.21 104.90 0.50 -19.2160 108.11 107.67 107.02 106.24 104.80 0.51 -20.3872 108.79 108.31 107.86 106.83 105.08 0.43 2.10
WAC is the weighted average coupon of the underlying collateral. To approximate the pass-through rate, subtract 50 basis points.
4
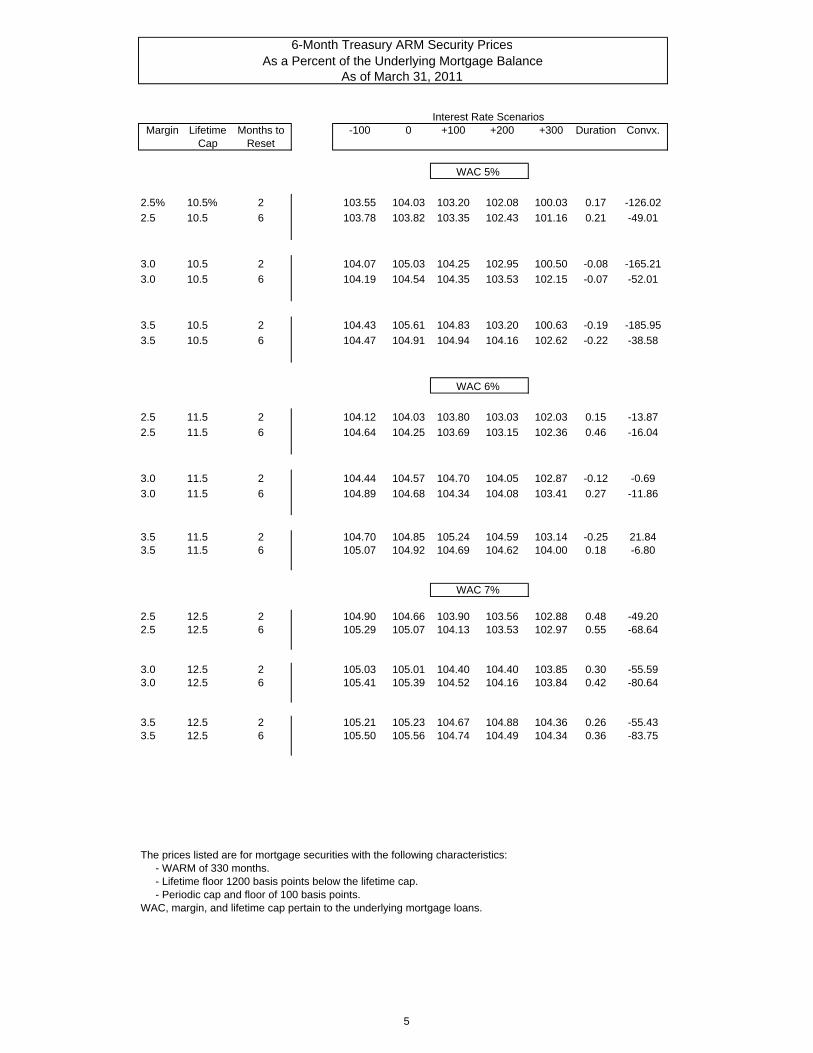
6-Month Treasury ARM Security PricesAs a Percent of the Underlying Mortgage Balance
As of March 31, 201111 12 13 14 15 16 17
Interest Rate ScenariosMargin Lifetime Months to -100 0 +100 +200 +300 Duration Convx.
Cap Reset
WAC 5%
2.5% 10.5% 2 103.55 104.03 103.20 102.08 100.03 0.17 -126.02
2.5 10.5 6 103.78 103.82 103.35 102.43 101.16 0.21 -49.01
3.0 10.5 2 104.07 105.03 104.25 102.95 100.50 -0.08 -165.21
3.0 10.5 6 104.19 104.54 104.35 103.53 102.15 -0.07 -52.01
3.5 10.5 2 104.43 105.61 104.83 103.20 100.63 -0.19 -185.95
3.5 10.5 6 104.47 104.91 104.94 104.16 102.62 -0.22 -38.58
WAC 6%
2.5 11.5 2 104.12 104.03 103.80 103.03 102.03 0.15 -13.87
2.5 11.5 6 104.64 104.25 103.69 103.15 102.36 0.46 -16.04
3.0 11.5 2 104.44 104.57 104.70 104.05 102.87 -0.12 -0.69
3.0 11.5 6 104.89 104.68 104.34 104.08 103.41 0.27 -11.86
3.5 11.5 2 104.70 104.85 105.24 104.59 103.14 -0.25 21.843.5 11.5 6 105.07 104.92 104.69 104.62 104.00 0.18 -6.80
WAC 7%
2.5 12.5 2 104.90 104.66 103.90 103.56 102.88 0.48 -49.202.5 12.5 6 105.29 105.07 104.13 103.53 102.97 0.55 -68.64
3.0 12.5 2 105.03 105.01 104.40 104.40 103.85 0.30 -55.593.0 12.5 6 105.41 105.39 104.52 104.16 103.84 0.42 -80.64
3.5 12.5 2 105.21 105.23 104.67 104.88 104.36 0.26 -55.433.5 12.5 6 105.50 105.56 104.74 104.49 104.34 0.36 -83.75
The prices listed are for mortgage securities with the following characteristics: - WARM of 330 months. - Lifetime floor 1200 basis points below the lifetime cap. - Periodic cap and floor of 100 basis points.WAC, margin, and lifetime cap pertain to the underlying mortgage loans.
5
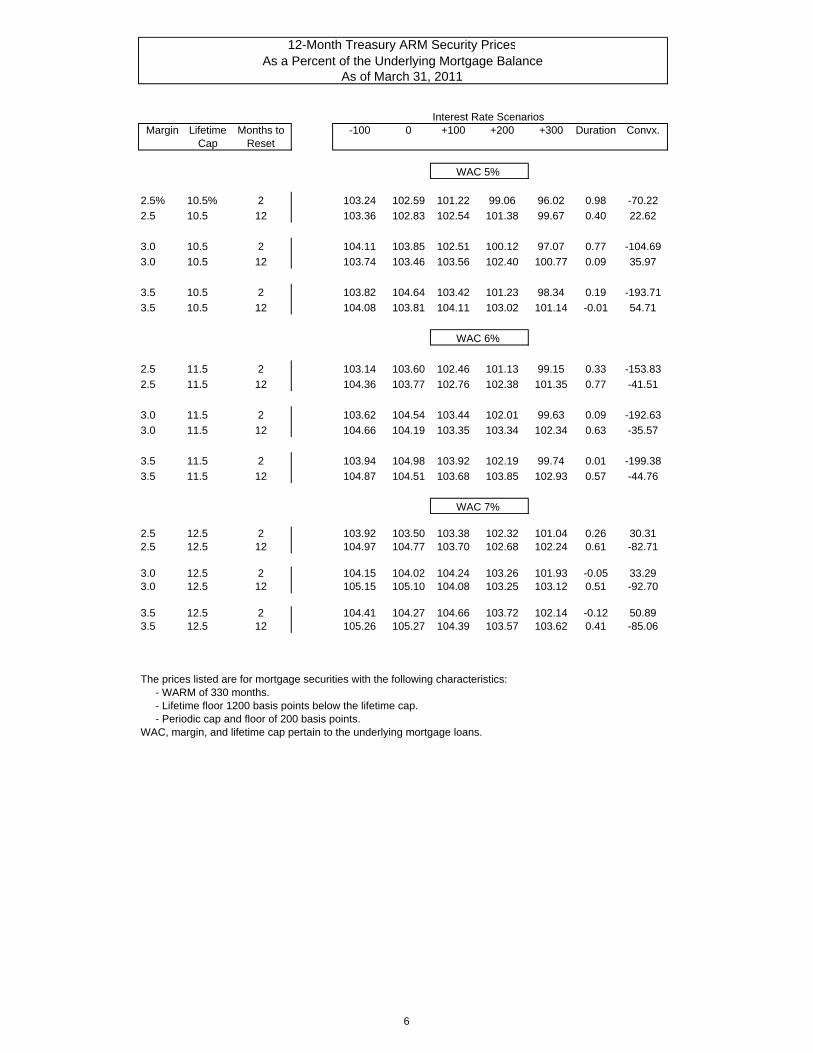
12-Month Treasury ARM Security PricesAs a Percent of the Underlying Mortgage Balance
As of March 31, 2011
Interest Rate ScenariosMargin Lifetime Months to -100 0 +100 +200 +300 Duration Convx.
Cap Reset
WAC 5%
2.5% 10.5% 2 103.24 102.59 101.22 99.06 96.02 0.98 -70.22
2.5 10.5 12 103.36 102.83 102.54 101.38 99.67 0.40 22.62
3.0 10.5 2 104.11 103.85 102.51 100.12 97.07 0.77 -104.69
3.0 10.5 12 103.74 103.46 103.56 102.40 100.77 0.09 35.97
3.5 10.5 2 103.82 104.64 103.42 101.23 98.34 0.19 -193.71
3.5 10.5 12 104.08 103.81 104.11 103.02 101.14 -0.01 54.71
WAC 6%
2.5 11.5 2 103.14 103.60 102.46 101.13 99.15 0.33 -153.83
2.5 11.5 12 104.36 103.77 102.76 102.38 101.35 0.77 -41.51
3.0 11.5 2 103.62 104.54 103.44 102.01 99.63 0.09 -192.63
3.0 11.5 12 104.66 104.19 103.35 103.34 102.34 0.63 -35.57
3.5 11.5 2 103.94 104.98 103.92 102.19 99.74 0.01 -199.38
3.5 11.5 12 104.87 104.51 103.68 103.85 102.93 0.57 -44.76
WAC 7%
2.5 12.5 2 103.92 103.50 103.38 102.32 101.04 0.26 30.312.5 12.5 12 104.97 104.77 103.70 102.68 102.24 0.61 -82.71
3.0 12.5 2 104.15 104.02 104.24 103.26 101.93 -0.05 33.293.0 12.5 12 105.15 105.10 104.08 103.25 103.12 0.51 -92.70
3.5 12.5 2 104.41 104.27 104.66 103.72 102.14 -0.12 50.893.5 12.5 12 105.26 105.27 104.39 103.57 103.62 0.41 -85.06
The prices listed are for mortgage securities with the following characteristics: - WARM of 330 months. - Lifetime floor 1200 basis points below the lifetime cap. - Periodic cap and floor of 200 basis points.WAC, margin, and lifetime cap pertain to the underlying mortgage loans.
6
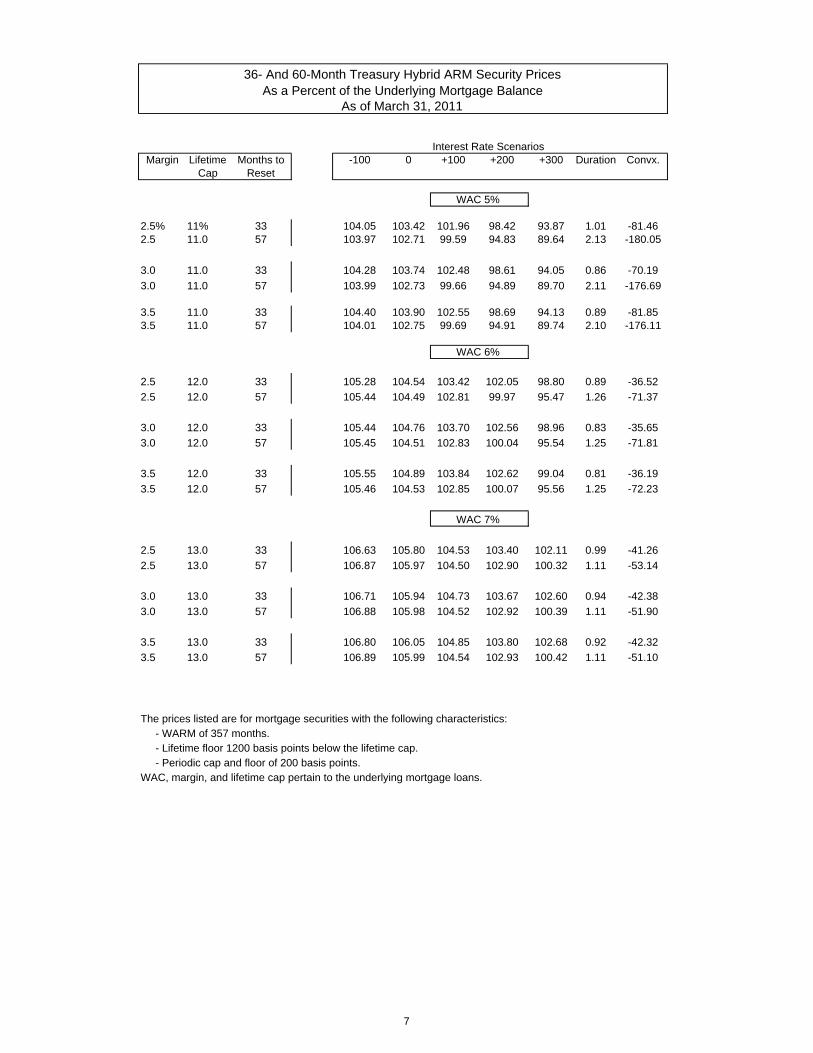
36- And 60-Month Treasury Hybrid ARM Security PricesAs a Percent of the Underlying Mortgage Balance
As of March 31, 2011
Interest Rate ScenariosMargin Lifetime Months to -100 0 +100 +200 +300 Duration Convx.
Cap Reset
WAC 5%
2.5% 11% 33 104.05 103.42 101.96 98.42 93.87 1.01 -81.462.5 11.0 57 103.97 102.71 99.59 94.83 89.64 2.13 -180.05
3.0 11.0 33 104.28 103.74 102.48 98.61 94.05 0.86 -70.19
3.0 11.0 57 103.99 102.73 99.66 94.89 89.70 2.11 -176.69
3.5 11.0 33 104.40 103.90 102.55 98.69 94.13 0.89 -81.853.5 11.0 57 104.01 102.75 99.69 94.91 89.74 2.10 -176.11
WAC 6%
2.5 12.0 33 105.28 104.54 103.42 102.05 98.80 0.89 -36.52
2.5 12.0 57 105.44 104.49 102.81 99.97 95.47 1.26 -71.37
3.0 12.0 33 105.44 104.76 103.70 102.56 98.96 0.83 -35.65
3.0 12.0 57 105.45 104.51 102.83 100.04 95.54 1.25 -71.81
3.5 12.0 33 105.55 104.89 103.84 102.62 99.04 0.81 -36.19
3.5 12.0 57 105.46 104.53 102.85 100.07 95.56 1.25 -72.23
WAC 7%
2.5 13.0 33 106.63 105.80 104.53 103.40 102.11 0.99 -41.26
2.5 13.0 57 106.87 105.97 104.50 102.90 100.32 1.11 -53.14
3.0 13.0 33 106.71 105.94 104.73 103.67 102.60 0.94 -42.38
3.0 13.0 57 106.88 105.98 104.52 102.92 100.39 1.11 -51.90
3.5 13.0 33 106.80 106.05 104.85 103.80 102.68 0.92 -42.32
3.5 13.0 57 106.89 105.99 104.54 102.93 100.42 1.11 -51.10
The prices listed are for mortgage securities with the following characteristics: - WARM of 357 months. - Lifetime floor 1200 basis points below the lifetime cap. - Periodic cap and floor of 200 basis points.WAC, margin, and lifetime cap pertain to the underlying mortgage loans.
7
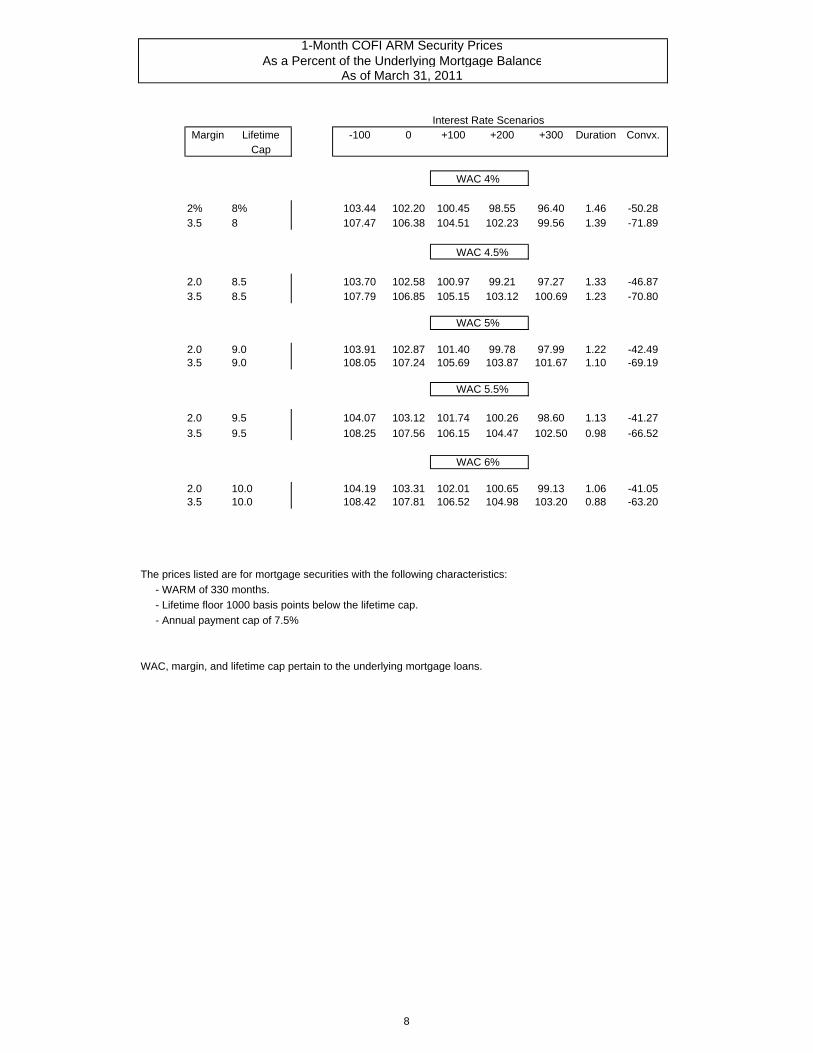
1-Month COFI ARM Security PricesAs a Percent of the Underlying Mortgage Balance
As of March 31, 2011
Interest Rate ScenariosMargin Lifetime -100 0 +100 +200 +300 Duration Convx.
Cap
WAC 4%
2% 8% 103.44 102.20 100.45 98.55 96.40 1.46 -50.283.5 8 107.47 106.38 104.51 102.23 99.56 1.39 -71.89
WAC 4.5%
2.0 8.5 103.70 102.58 100.97 99.21 97.27 1.33 -46.873.5 8.5 107.79 106.85 105.15 103.12 100.69 1.23 -70.80
WAC 5%
2.0 9.0 103.91 102.87 101.40 99.78 97.99 1.22 -42.493.5 9.0 108.05 107.24 105.69 103.87 101.67 1.10 -69.19
WAC 5.5%
2.0 9.5 104.07 103.12 101.74 100.26 98.60 1.13 -41.27
3.5 9.5 108.25 107.56 106.15 104.47 102.50 0.98 -66.52
WAC 6%
2.0 10.0 104.19 103.31 102.01 100.65 99.13 1.06 -41.053.5 10.0 108.42 107.81 106.52 104.98 103.20 0.88 -63.20
The prices listed are for mortgage securities with the following characteristics:
- WARM of 330 months.
- Lifetime floor 1000 basis points below the lifetime cap.
- Annual payment cap of 7.5%
WAC, margin, and lifetime cap pertain to the underlying mortgage loans.
8
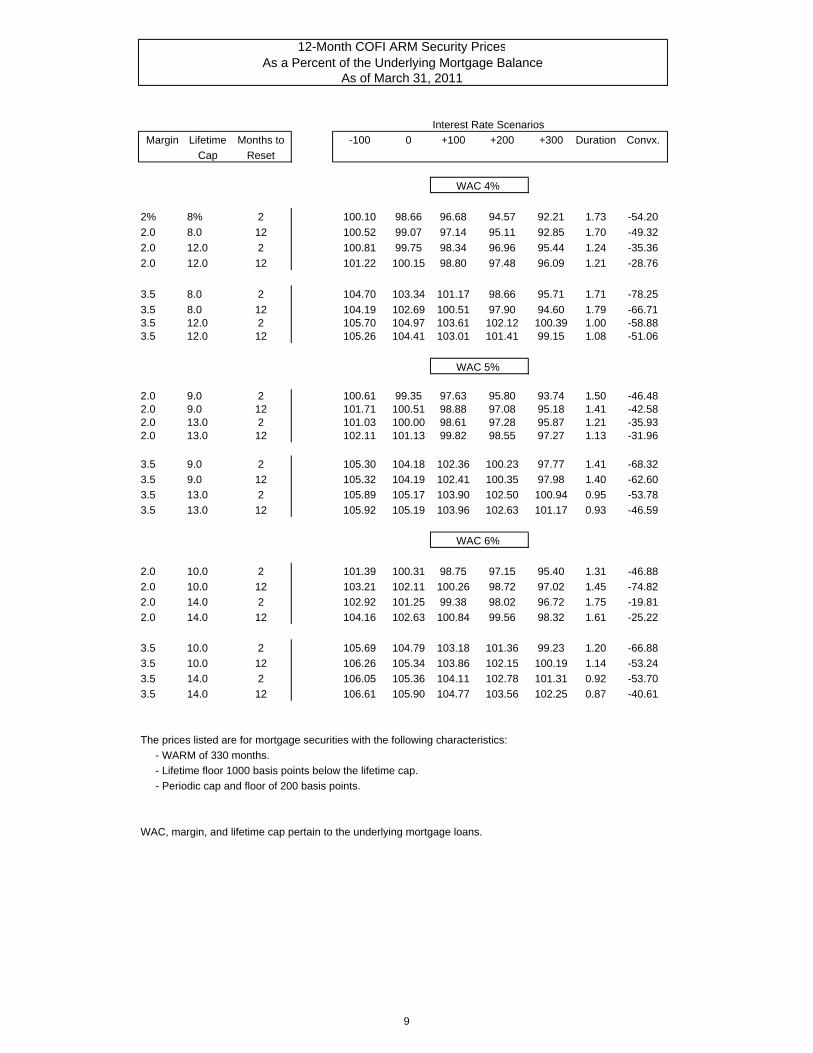
12-Month COFI ARM Security PricesAs a Percent of the Underlying Mortgage Balance
As of March 31, 2011
Interest Rate Scenarios
Margin Lifetime Months to -100 0 +100 +200 +300 Duration Convx.
Cap Reset
WAC 4%
2% 8% 2 100.10 98.66 96.68 94.57 92.21 1.73 -54.20
2.0 8.0 12 100.52 99.07 97.14 95.11 92.85 1.70 -49.32
2.0 12.0 2 100.81 99.75 98.34 96.96 95.44 1.24 -35.36
2.0 12.0 12 101.22 100.15 98.80 97.48 96.09 1.21 -28.76
3.5 8.0 2 104.70 103.34 101.17 98.66 95.71 1.71 -78.25
3.5 8.0 12 104.19 102.69 100.51 97.90 94.60 1.79 -66.713.5 12.0 2 105.70 104.97 103.61 102.12 100.39 1.00 -58.883.5 12.0 12 105.26 104.41 103.01 101.41 99.15 1.08 -51.06
WAC 5%
2.0 9.0 2 100.61 99.35 97.63 95.80 93.74 1.50 -46.482.0 9.0 12 101.71 100.51 98.88 97.08 95.18 1.41 -42.582.0 13.0 2 101.03 100.00 98.61 97.28 95.87 1.21 -35.932.0 13.0 12 102.11 101.13 99.82 98.55 97.27 1.13 -31.96
3.5 9.0 2 105.30 104.18 102.36 100.23 97.77 1.41 -68.32
3.5 9.0 12 105.32 104.19 102.41 100.35 97.98 1.40 -62.60
3.5 13.0 2 105.89 105.17 103.90 102.50 100.94 0.95 -53.78
3.5 13.0 12 105.92 105.19 103.96 102.63 101.17 0.93 -46.59
WAC 6%
2.0 10.0 2 101.39 100.31 98.75 97.15 95.40 1.31 -46.88
2.0 10.0 12 103.21 102.11 100.26 98.72 97.02 1.45 -74.82
2.0 14.0 2 102.92 101.25 99.38 98.02 96.72 1.75 -19.81
2.0 14.0 12 104.16 102.63 100.84 99.56 98.32 1.61 -25.22
3.5 10.0 2 105.69 104.79 103.18 101.36 99.23 1.20 -66.88
3.5 10.0 12 106.26 105.34 103.86 102.15 100.19 1.14 -53.24
3.5 14.0 2 106.05 105.36 104.11 102.78 101.31 0.92 -53.70
3.5 14.0 12 106.61 105.90 104.77 103.56 102.25 0.87 -40.61
The prices listed are for mortgage securities with the following characteristics:
- WARM of 330 months.
- Lifetime floor 1000 basis points below the lifetime cap.
- Periodic cap and floor of 200 basis points.
WAC, margin, and lifetime cap pertain to the underlying mortgage loans.
9
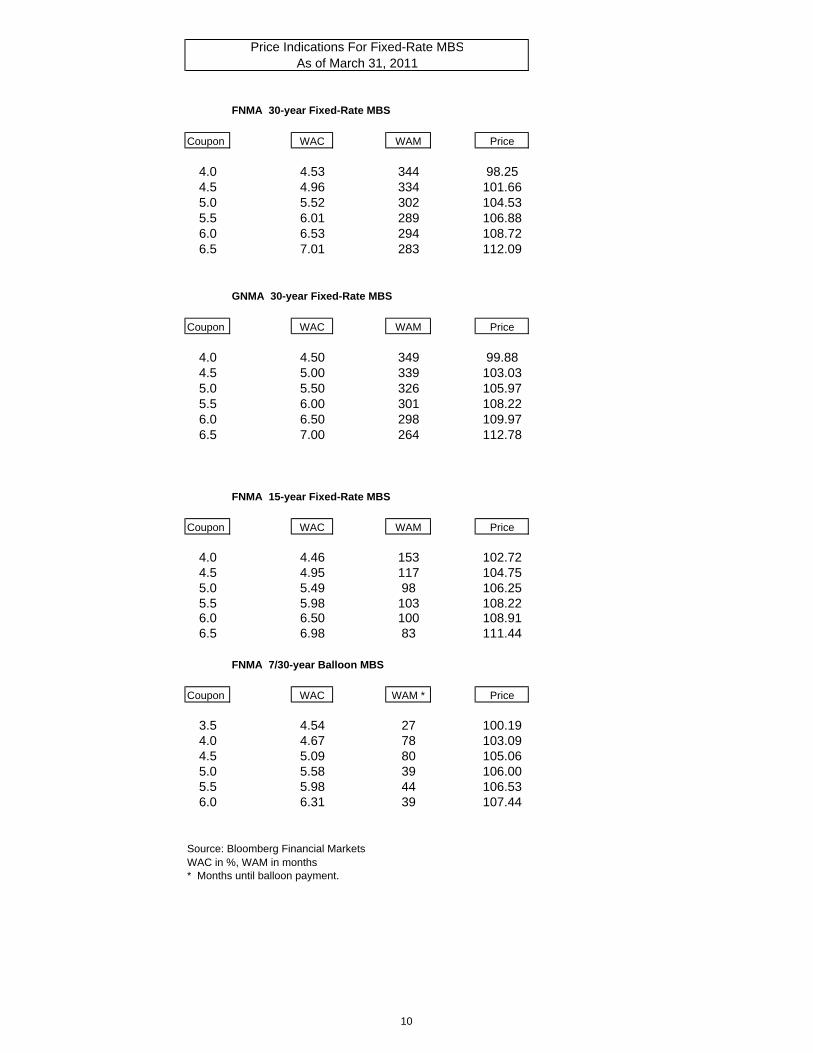
Price Indications For Fixed-Rate MBSAs of March 31, 2011
FNMA 30-year Fixed-Rate MBS
Coupon WAC WAM Price
4.0 4.53 344 98.254.5 4.96 334 101.665.0 5.52 302 104.535.5 6.01 289 106.886.0 6.53 294 108.726.5 7.01 283 112.09
GNMA 30-year Fixed-Rate MBS
Coupon WAC WAM Price
4.0 4.50 349 99.884.5 5.00 339 103.035.0 5.50 326 105.975.5 6.00 301 108.226.0 6.50 298 109.976.5 7.00 264 112.78
FNMA 15-year Fixed-Rate MBS
Coupon WAC WAM Price
4.0 4.46 153 102.724.5 4.95 117 104.755.0 5.49 98 106.255.5 5.98 103 108.226.0 6.50 100 108.916.5 6.98 83 111.44
FNMA 7/30-year Balloon MBS
Coupon WAC WAM * Price
3.5 4.54 27 100.194.0 4.67 78 103.094.5 5.09 80 105.065.0 5.58 39 106.005.5 5.98 44 106.536.0 6.31 39 107.44
Source: Bloomberg Financial MarketsWAC in %, WAM in months* Months until balloon payment.
10
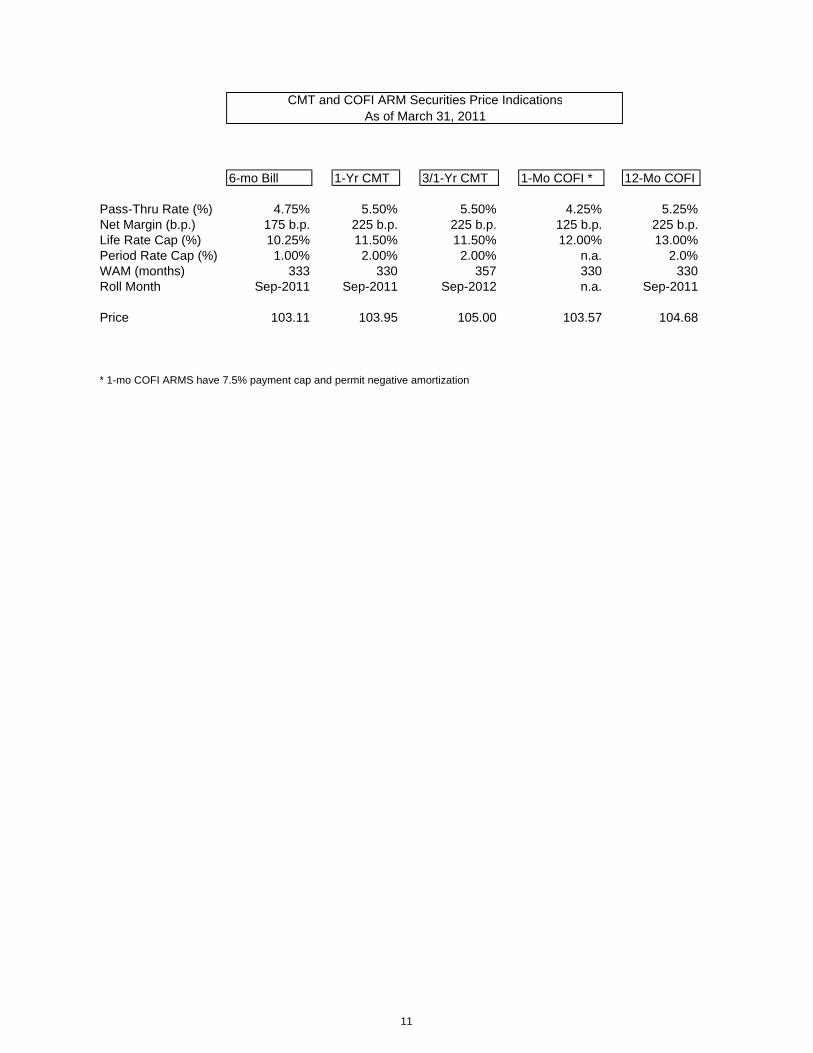
CMT and COFI ARM Securities Price IndicationsAs of March 31, 2011
6-mo Bill 1-Yr CMT 3/1-Yr CMT 1-Mo COFI * 12-Mo COFI
Pass-Thru Rate (%) 4.75% 5.50% 5.50% 4.25% 5.25%Net Margin (b.p.) 175 b.p. 225 b.p. 225 b.p. 125 b.p. 225 b.p.Life Rate Cap (%) 10.25% 11.50% 11.50% 12.00% 13.00%Period Rate Cap (%) 1.00% 2.00% 2.00% n.a. 2.0%WAM (months) 333 330 357 330 330Roll Month Sep-2011 Sep-2011 Sep-2012 n.a. Sep-2011
Price 103.11 103.95 105.00 103.57 104.68
* 1-mo COFI ARMS have 7.5% payment cap and permit negative amortization
11
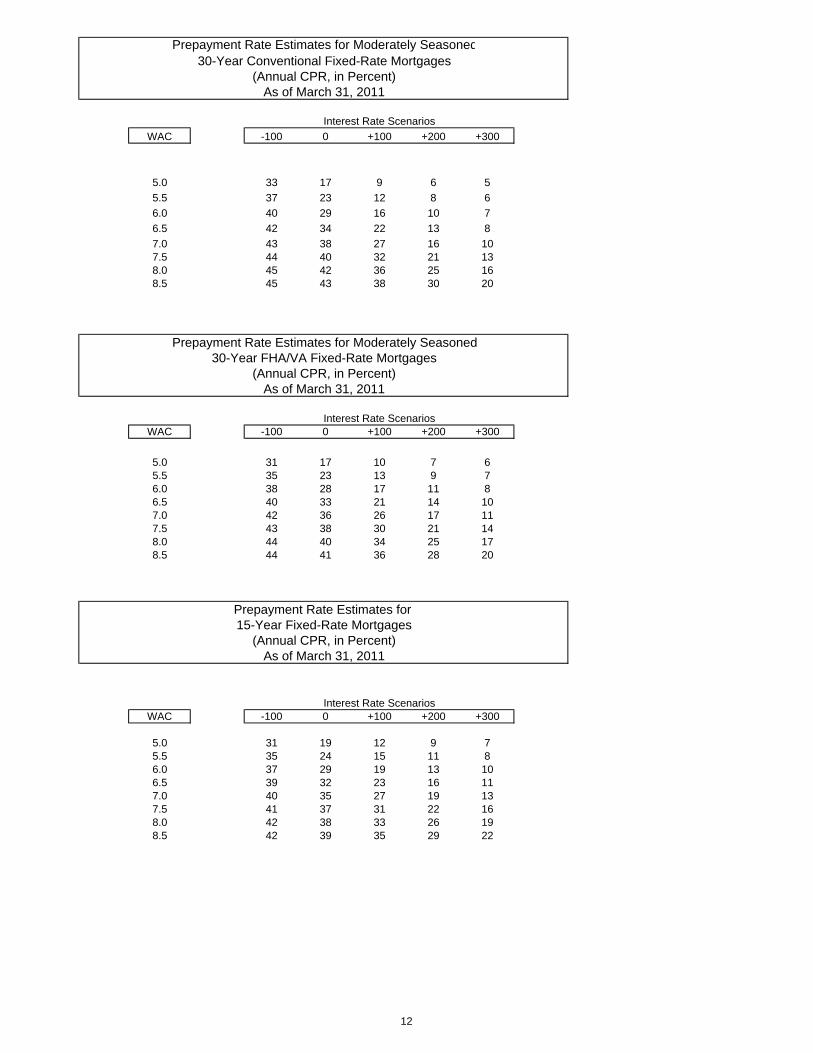
Prepayment Rate Estimates for Moderately Seasoned30-Year Conventional Fixed-Rate Mortgages
(Annual CPR, in Percent)As of March 31, 2011
12 13 14 15 16 17 18
WAC -100 0 +100 +200 +300
5.0 33 17 9 6 5
5.5 37 23 12 8 6
6.0 40 29 16 10 7
6.5 42 34 22 13 8
7.0 43 38 27 16 107.5 44 40 32 21 138.0 45 42 36 25 168.5 45 43 38 30 20
Prepayment Rate Estimates for Moderately Seasoned30-Year FHA/VA Fixed-Rate Mortgages
(Annual CPR, in Percent)As of March 31, 2011
WAC -100 0 +100 +200 +300
5.0 31 17 10 7 65.5 35 23 13 9 76.0 38 28 17 11 86.5 40 33 21 14 107.0 42 36 26 17 117.5 43 38 30 21 148.0 44 40 34 25 178.5 44 41 36 28 20
Prepayment Rate Estimates for 15-Year Fixed-Rate Mortgages
(Annual CPR, in Percent)As of March 31, 2011
WAC -100 0 +100 +200 +300
5.0 31 19 12 9 75.5 35 24 15 11 86.0 37 29 19 13 106.5 39 32 23 16 117.0 40 35 27 19 137.5 41 37 31 22 168.0 42 38 33 26 198.5 42 39 35 29 22
Interest Rate Scenarios
Interest Rate Scenarios
Interest Rate Scenarios
12
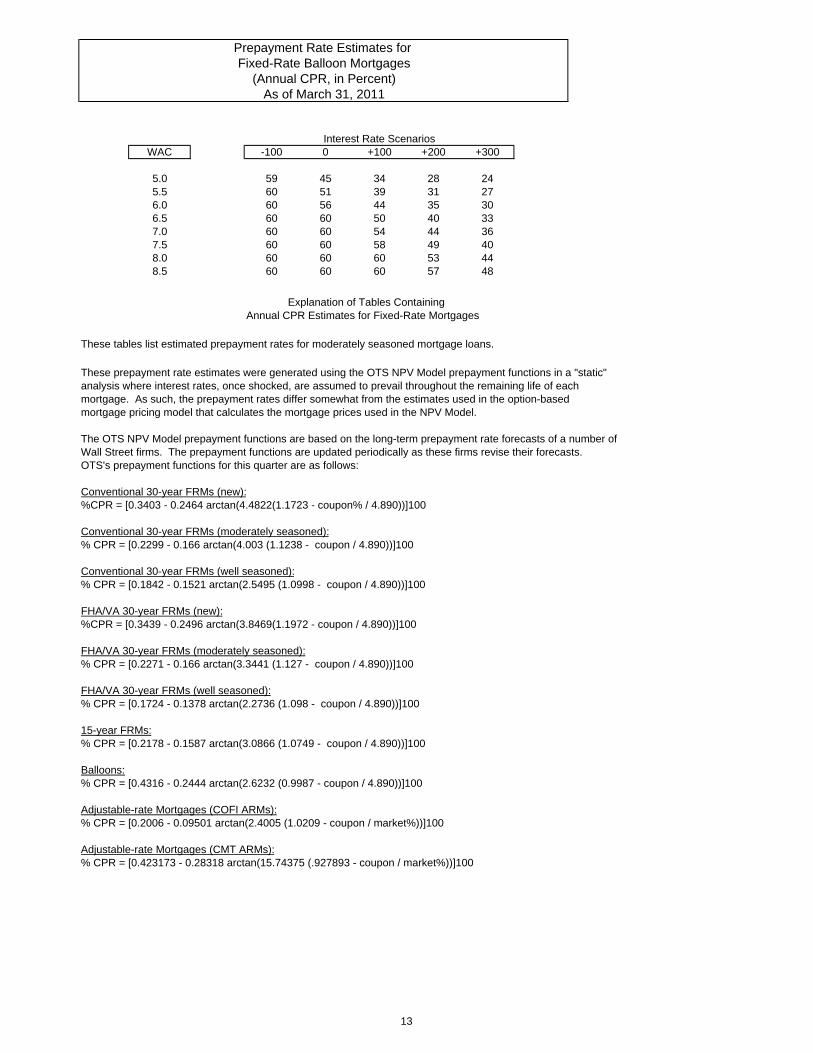
Prepayment Rate Estimates for Fixed-Rate Balloon Mortgages
(Annual CPR, in Percent)As of March 31, 2011
WAC -100 0 +100 +200 +300
5.0 59 45 34 28 245.5 60 51 39 31 276.0 60 56 44 35 306.5 60 60 50 40 337.0 60 60 54 44 367.5 60 60 58 49 408.0 60 60 60 53 448.5 60 60 60 57 48
Explanation of Tables ContainingAnnual CPR Estimates for Fixed-Rate Mortgages
These tables list estimated prepayment rates for moderately seasoned mortgage loans.
These prepayment rate estimates were generated using the OTS NPV Model prepayment functions in a "static"analysis where interest rates, once shocked, are assumed to prevail throughout the remaining life of each mortgage. As such, the prepayment rates differ somewhat from the estimates used in the option-based mortgage pricing model that calculates the mortgage prices used in the NPV Model.
The OTS NPV Model prepayment functions are based on the long-term prepayment rate forecasts of a number of Wall Street firms. The prepayment functions are updated periodically as these firms revise their forecasts. OTS's prepayment functions for this quarter are as follows:
Conventional 30-year FRMs (new):%CPR = [0.3403 - 0.2464 arctan(4.4822(1.1723 - coupon% / 4.890))]100
Conventional 30-year FRMs (moderately seasoned):% CPR = [0.2299 - 0.166 arctan(4.003 (1.1238 - coupon / 4.890))]100
Conventional 30-year FRMs (well seasoned):% CPR = [0.1842 - 0.1521 arctan(2.5495 (1.0998 - coupon / 4.890))]100
FHA/VA 30-year FRMs (new):%CPR = [0.3439 - 0.2496 arctan(3.8469(1.1972 - coupon / 4.890))]100
FHA/VA 30-year FRMs (moderately seasoned):% CPR = [0.2271 - 0.166 arctan(3.3441 (1.127 - coupon / 4.890))]100
FHA/VA 30-year FRMs (well seasoned):% CPR = [0.1724 - 0.1378 arctan(2.2736 (1.098 - coupon / 4.890))]100
15-year FRMs:% CPR = [0.2178 - 0.1587 arctan(3.0866 (1.0749 - coupon / 4.890))]100
Balloons:% CPR = [0.4316 - 0.2444 arctan(2.6232 (0.9987 - coupon / 4.890))]100 Adjustable-rate Mortgages (COFI ARMs):% CPR = [0.2006 - 0.09501 arctan(2.4005 (1.0209 - coupon / market%))]100
Adjustable-rate Mortgages (CMT ARMs):% CPR = [0.423173 - 0.28318 arctan(15.74375 (.927893 - coupon / market%))]100
Interest Rate Scenarios
13
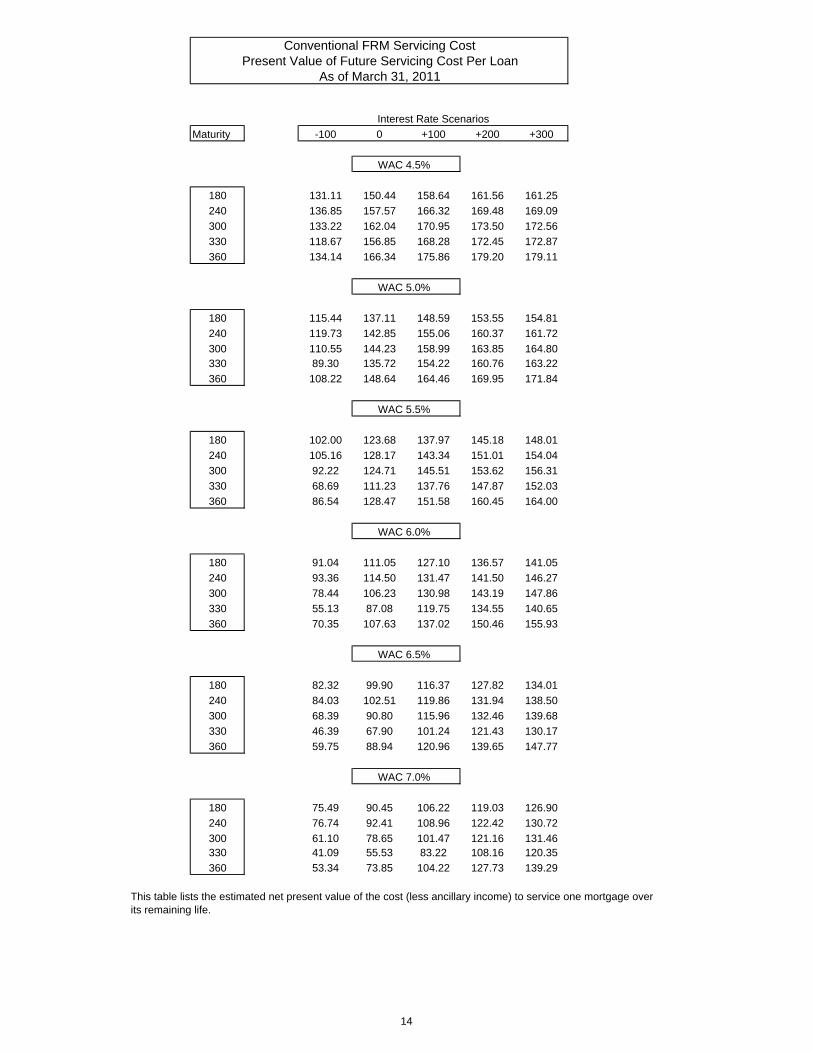
Conventional FRM Servicing CostPresent Value of Future Servicing Cost Per Loan
As of March 31, 2011
Maturity -100 0 +100 +200 +300
WAC 4.5%
180 131.11 150.44 158.64 161.56 161.25
240 136.85 157.57 166.32 169.48 169.09
300 133.22 162.04 170.95 173.50 172.56
330 118.67 156.85 168.28 172.45 172.87
360 134.14 166.34 175.86 179.20 179.11
WAC 5.0%
180 115.44 137.11 148.59 153.55 154.81
240 119.73 142.85 155.06 160.37 161.72
300 110.55 144.23 158.99 163.85 164.80330 89.30 135.72 154.22 160.76 163.22
360 108.22 148.64 164.46 169.95 171.84
WAC 5.5%
180 102.00 123.68 137.97 145.18 148.01
240 105.16 128.17 143.34 151.01 154.04
300 92.22 124.71 145.51 153.62 156.31
330 68.69 111.23 137.76 147.87 152.03
360 86.54 128.47 151.58 160.45 164.00
WAC 6.0%
180 91.04 111.05 127.10 136.57 141.05
240 93.36 114.50 131.47 141.50 146.27
300 78.44 106.23 130.98 143.19 147.86
330 55.13 87.08 119.75 134.55 140.65
360 70.35 107.63 137.02 150.46 155.93
WAC 6.5%
180 82.32 99.90 116.37 127.82 134.01
240 84.03 102.51 119.86 131.94 138.50
300 68.39 90.80 115.96 132.46 139.68
330 46.39 67.90 101.24 121.43 130.17
360 59.75 88.94 120.96 139.65 147.77
WAC 7.0%
180 75.49 90.45 106.22 119.03 126.90
240 76.74 92.41 108.96 122.42 130.72
300 61.10 78.65 101.47 121.16 131.46330 41.09 55.53 83.22 108.16 120.35
360 53.34 73.85 104.22 127.73 139.29
This table lists the estimated net present value of the cost (less ancillary income) to service one mortgage overits remaining life.
Interest Rate Scenarios
14
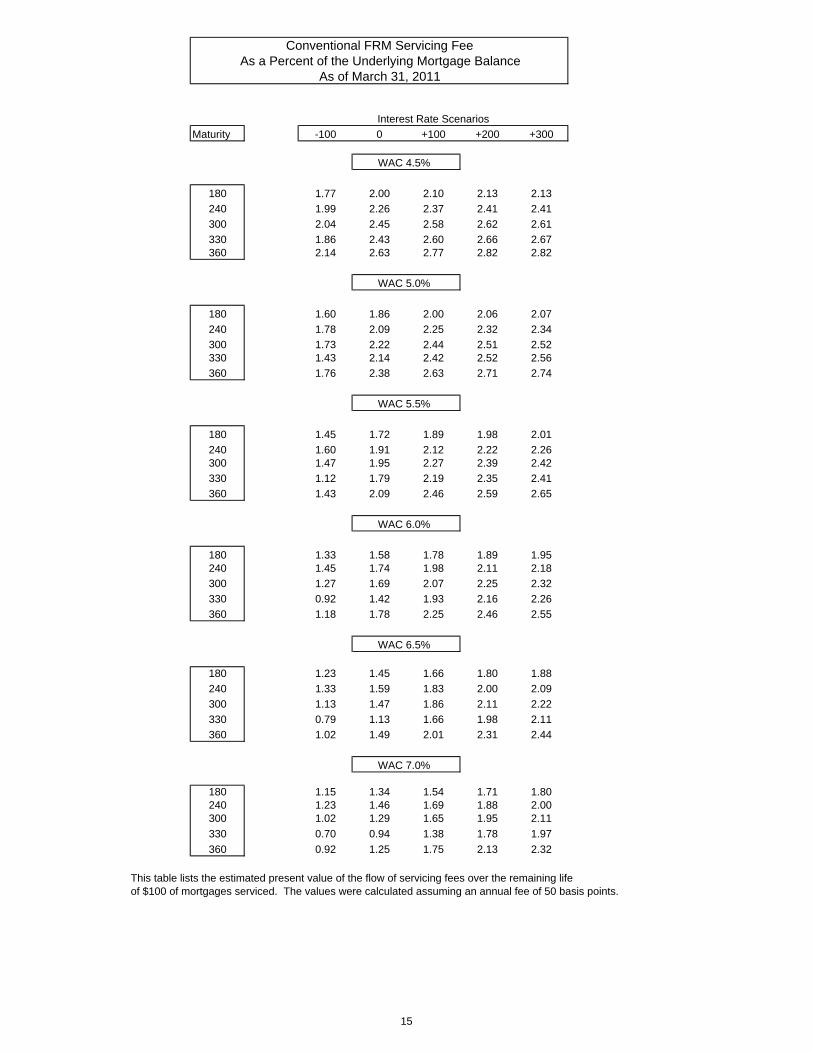
Conventional FRM Servicing FeeAs a Percent of the Underlying Mortgage Balance
As of March 31, 2011
Maturity -100 0 +100 +200 +300
WAC 4.5%
180 1.77 2.00 2.10 2.13 2.13
240 1.99 2.26 2.37 2.41 2.41
300 2.04 2.45 2.58 2.62 2.61
330 1.86 2.43 2.60 2.66 2.67360 2.14 2.63 2.77 2.82 2.82
WAC 5.0%
180 1.60 1.86 2.00 2.06 2.07
240 1.78 2.09 2.25 2.32 2.34
300 1.73 2.22 2.44 2.51 2.52330 1.43 2.14 2.42 2.52 2.56
360 1.76 2.38 2.63 2.71 2.74
WAC 5.5%
180 1.45 1.72 1.89 1.98 2.01
240 1.60 1.91 2.12 2.22 2.26300 1.47 1.95 2.27 2.39 2.42
330 1.12 1.79 2.19 2.35 2.41
360 1.43 2.09 2.46 2.59 2.65
WAC 6.0%
180 1.33 1.58 1.78 1.89 1.95240 1.45 1.74 1.98 2.11 2.18
300 1.27 1.69 2.07 2.25 2.32
330 0.92 1.42 1.93 2.16 2.26
360 1.18 1.78 2.25 2.46 2.55
WAC 6.5%
180 1.23 1.45 1.66 1.80 1.88
240 1.33 1.59 1.83 2.00 2.09
300 1.13 1.47 1.86 2.11 2.22
330 0.79 1.13 1.66 1.98 2.11
360 1.02 1.49 2.01 2.31 2.44
WAC 7.0%
180 1.15 1.34 1.54 1.71 1.80240 1.23 1.46 1.69 1.88 2.00300 1.02 1.29 1.65 1.95 2.11
330 0.70 0.94 1.38 1.78 1.97
360 0.92 1.25 1.75 2.13 2.32
This table lists the estimated present value of the flow of servicing fees over the remaining lifeof $100 of mortgages serviced. The values were calculated assuming an annual fee of 50 basis points.
Interest Rate Scenarios
15
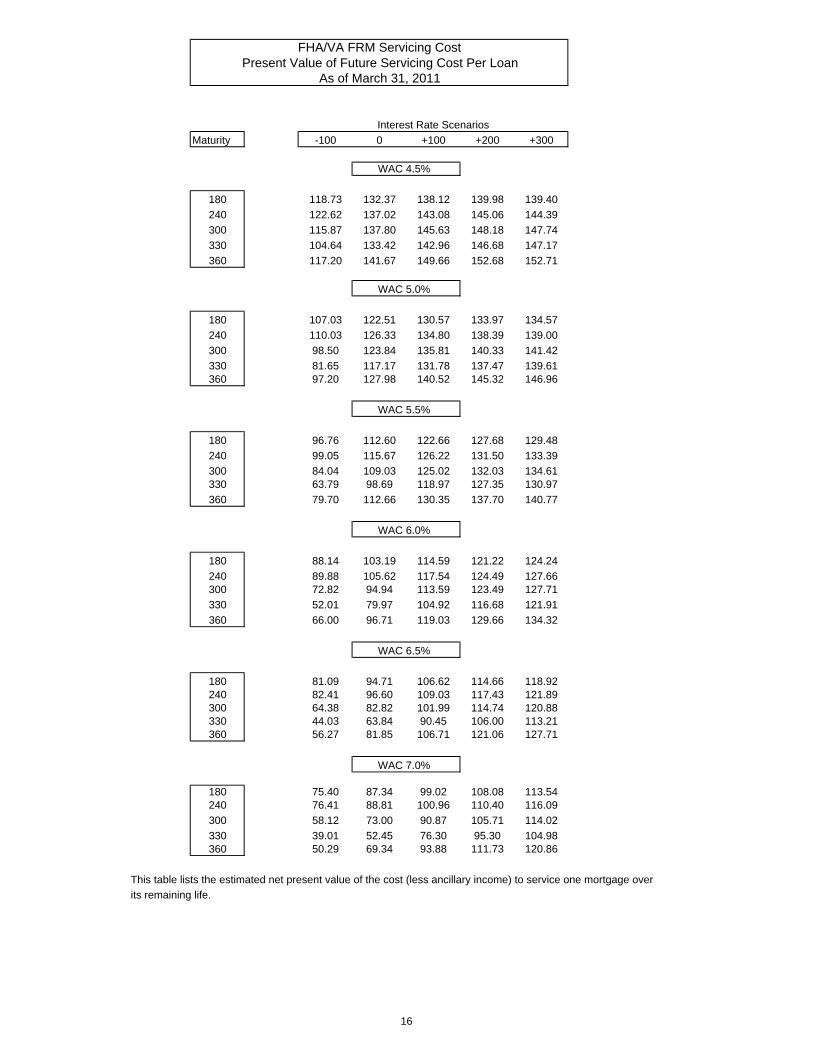
FHA/VA FRM Servicing CostPresent Value of Future Servicing Cost Per Loan
As of March 31, 2011
Maturity -100 0 +100 +200 +300
WAC 4.5%
180 118.73 132.37 138.12 139.98 139.40
240 122.62 137.02 143.08 145.06 144.39
300 115.87 137.80 145.63 148.18 147.74
330 104.64 133.42 142.96 146.68 147.17
360 117.20 141.67 149.66 152.68 152.71
WAC 5.0%
180 107.03 122.51 130.57 133.97 134.57
240 110.03 126.33 134.80 138.39 139.00
300 98.50 123.84 135.81 140.33 141.42
330 81.65 117.17 131.78 137.47 139.61360 97.20 127.98 140.52 145.32 146.96
WAC 5.5%
180 96.76 112.60 122.66 127.68 129.48
240 99.05 115.67 126.22 131.50 133.39
300 84.04 109.03 125.02 132.03 134.61330 63.79 98.69 118.97 127.35 130.97
360 79.70 112.66 130.35 137.70 140.77
WAC 6.0%
180 88.14 103.19 114.59 121.22 124.24
240 89.88 105.62 117.54 124.49 127.66300 72.82 94.94 113.59 123.49 127.71
330 52.01 79.97 104.92 116.68 121.91
360 66.00 96.71 119.03 129.66 134.32
WAC 6.5%
180 81.09 94.71 106.62 114.66 118.92240 82.41 96.60 109.03 117.43 121.89300 64.38 82.82 101.99 114.74 120.88330 44.03 63.84 90.45 106.00 113.21360 56.27 81.85 106.71 121.06 127.71
WAC 7.0%
180 75.40 87.34 99.02 108.08 113.54240 76.41 88.81 100.96 110.40 116.09
300 58.12 73.00 90.87 105.71 114.02
330 39.01 52.45 76.30 95.30 104.98360 50.29 69.34 93.88 111.73 120.86
This table lists the estimated net present value of the cost (less ancillary income) to service one mortgage over
its remaining life.
Interest Rate Scenarios
16
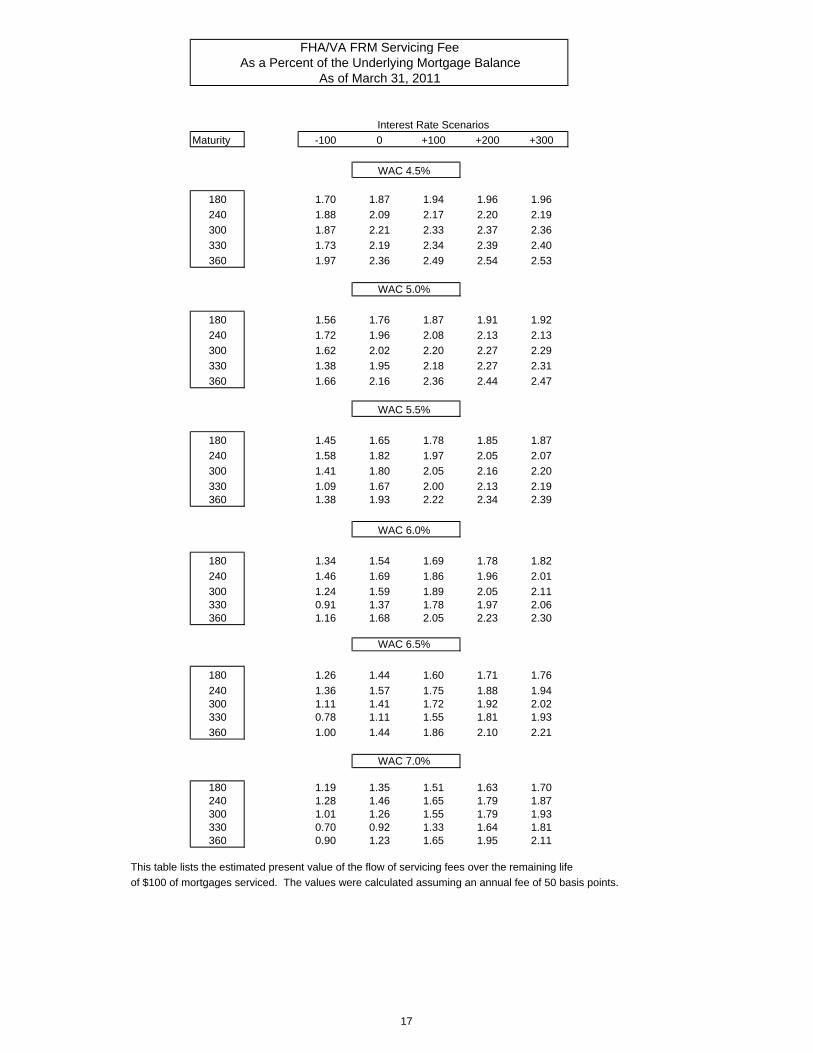
FHA/VA FRM Servicing FeeAs a Percent of the Underlying Mortgage Balance
As of March 31, 2011
Maturity -100 0 +100 +200 +300
WAC 4.5%
180 1.70 1.87 1.94 1.96 1.96
240 1.88 2.09 2.17 2.20 2.19
300 1.87 2.21 2.33 2.37 2.36
330 1.73 2.19 2.34 2.39 2.40
360 1.97 2.36 2.49 2.54 2.53
WAC 5.0%
180 1.56 1.76 1.87 1.91 1.92
240 1.72 1.96 2.08 2.13 2.13
300 1.62 2.02 2.20 2.27 2.29
330 1.38 1.95 2.18 2.27 2.31
360 1.66 2.16 2.36 2.44 2.47
WAC 5.5%
180 1.45 1.65 1.78 1.85 1.87
240 1.58 1.82 1.97 2.05 2.07
300 1.41 1.80 2.05 2.16 2.20
330 1.09 1.67 2.00 2.13 2.19360 1.38 1.93 2.22 2.34 2.39
WAC 6.0%
180 1.34 1.54 1.69 1.78 1.82
240 1.46 1.69 1.86 1.96 2.01
300 1.24 1.59 1.89 2.05 2.11330 0.91 1.37 1.78 1.97 2.06360 1.16 1.68 2.05 2.23 2.30
WAC 6.5%
180 1.26 1.44 1.60 1.71 1.76
240 1.36 1.57 1.75 1.88 1.94300 1.11 1.41 1.72 1.92 2.02330 0.78 1.11 1.55 1.81 1.93
360 1.00 1.44 1.86 2.10 2.21
WAC 7.0%
180 1.19 1.35 1.51 1.63 1.70240 1.28 1.46 1.65 1.79 1.87300 1.01 1.26 1.55 1.79 1.93330 0.70 0.92 1.33 1.64 1.81360 0.90 1.23 1.65 1.95 2.11
This table lists the estimated present value of the flow of servicing fees over the remaining life
of $100 of mortgages serviced. The values were calculated assuming an annual fee of 50 basis points.
Interest Rate Scenarios
17
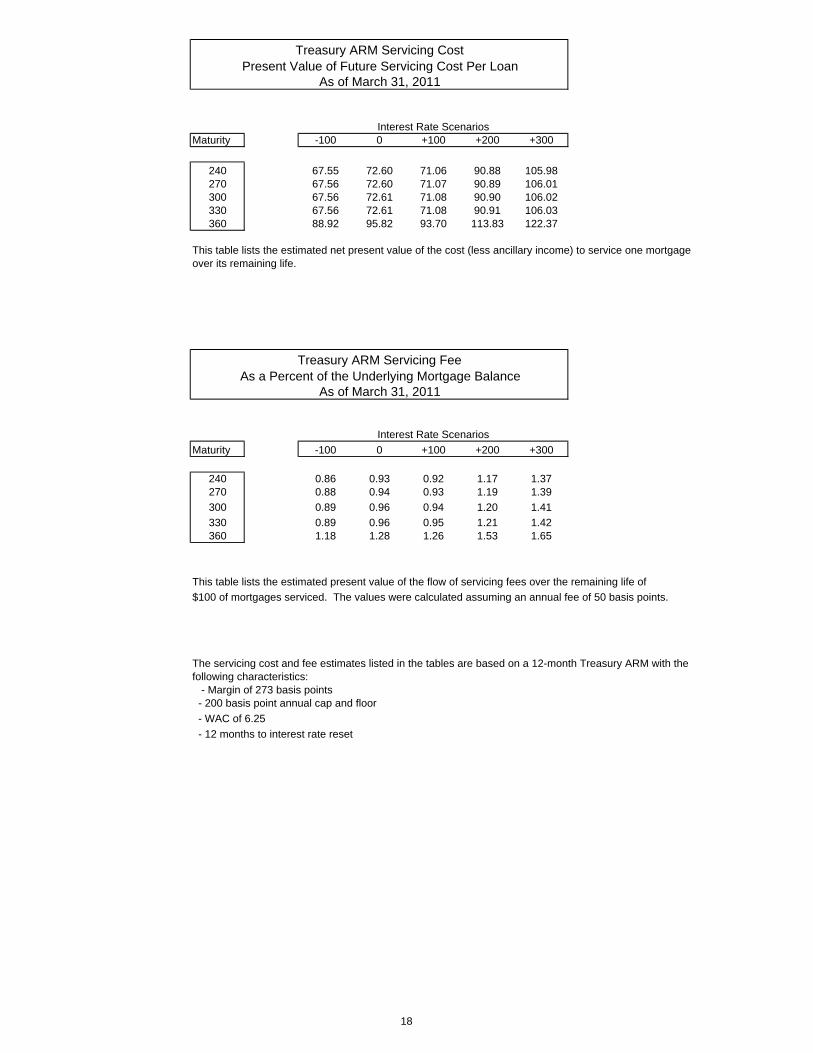
Maturity -100 0 +100 +200 +300
240 67.55 72.60 71.06 90.88 105.98270 67.56 72.60 71.07 90.89 106.01300 67.56 72.61 71.08 90.90 106.02330 67.56 72.61 71.08 90.91 106.03360 88.92 95.82 93.70 113.83 122.37
This table lists the estimated net present value of the cost (less ancillary income) to service one mortgageover its remaining life.
Maturity -100 0 +100 +200 +300
240 0.86 0.93 0.92 1.17 1.37270 0.88 0.94 0.93 1.19 1.39
300 0.89 0.96 0.94 1.20 1.41
330 0.89 0.96 0.95 1.21 1.42360 1.18 1.28 1.26 1.53 1.65
This table lists the estimated present value of the flow of servicing fees over the remaining life of
$100 of mortgages serviced. The values were calculated assuming an annual fee of 50 basis points.
The servicing cost and fee estimates listed in the tables are based on a 12-month Treasury ARM with the following characteristics: - Margin of 273 basis points - 200 basis point annual cap and floor
- WAC of 6.25
- 12 months to interest rate reset
Interest Rate Scenarios
As a Percent of the Underlying Mortgage BalanceTreasury ARM Servicing Fee
As of March 31, 2011
Treasury ARM Servicing CostPresent Value of Future Servicing Cost Per Loan
As of March 31, 2011
Interest Rate Scenarios
18
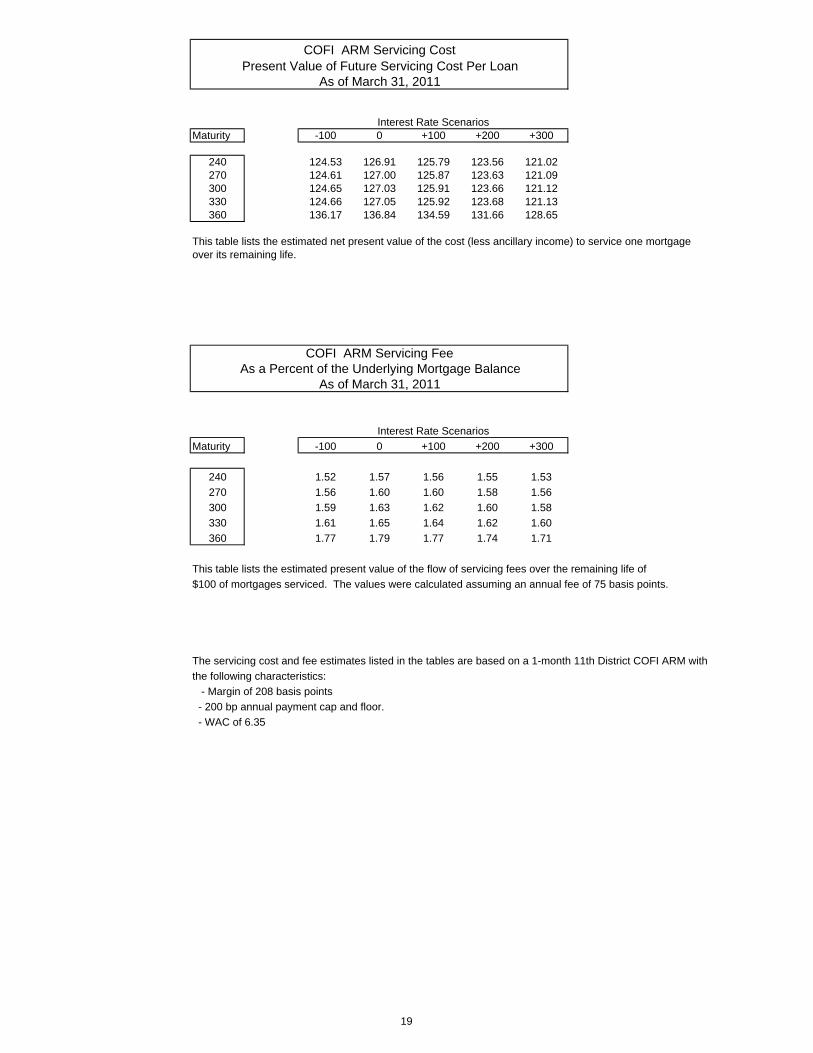
Maturity -100 0 +100 +200 +300
240 124.53 126.91 125.79 123.56 121.02270 124.61 127.00 125.87 123.63 121.09300 124.65 127.03 125.91 123.66 121.12330 124.66 127.05 125.92 123.68 121.13360 136.17 136.84 134.59 131.66 128.65
This table lists the estimated net present value of the cost (less ancillary income) to service one mortgageover its remaining life.
Maturity -100 0 +100 +200 +300
240 1.52 1.57 1.56 1.55 1.53
270 1.56 1.60 1.60 1.58 1.56
300 1.59 1.63 1.62 1.60 1.58
330 1.61 1.65 1.64 1.62 1.60
360 1.77 1.79 1.77 1.74 1.71
This table lists the estimated present value of the flow of servicing fees over the remaining life of
$100 of mortgages serviced. The values were calculated assuming an annual fee of 75 basis points.
The servicing cost and fee estimates listed in the tables are based on a 1-month 11th District COFI ARM with
the following characteristics:
- Margin of 208 basis points
- 200 bp annual payment cap and floor.
- WAC of 6.35
As of March 31, 2011
COFI ARM Servicing FeeAs a Percent of the Underlying Mortgage Balance
As of March 31, 2011
Interest Rate Scenarios
Interest Rate Scenarios
COFI ARM Servicing CostPresent Value of Future Servicing Cost Per Loan
19
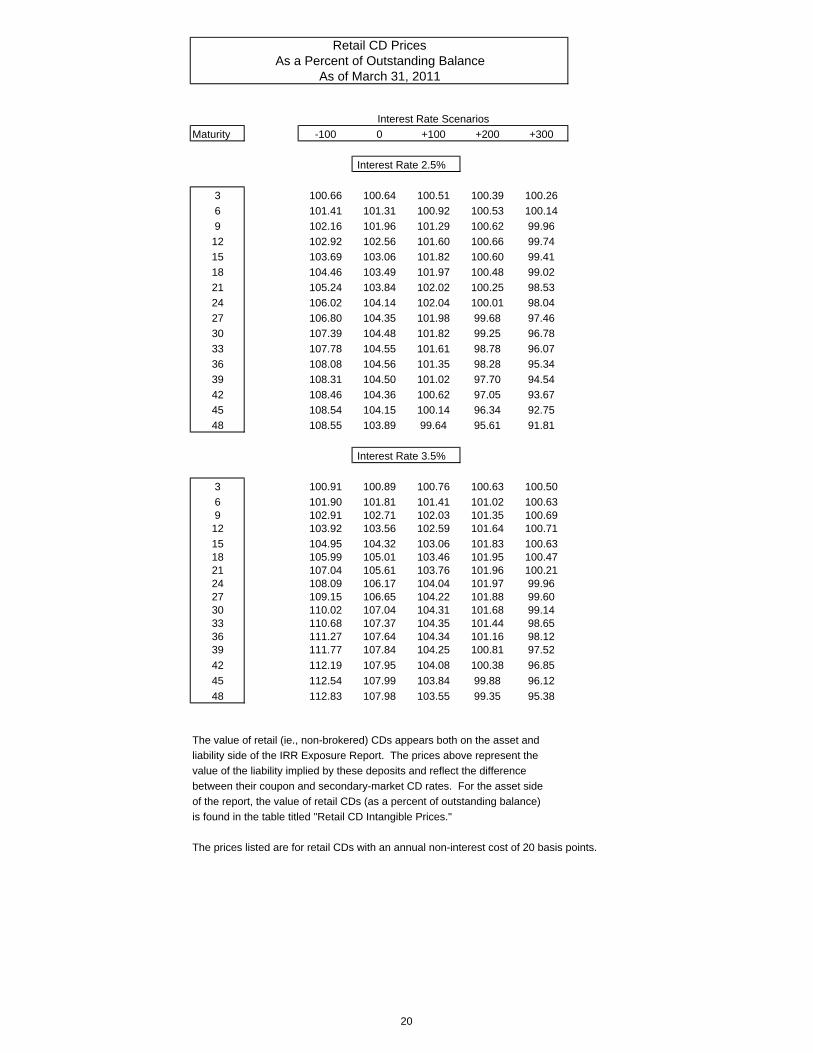
Maturity -100 0 +100 +200 +300
Interest Rate 2.5%
3 100.66 100.64 100.51 100.39 100.26
6 101.41 101.31 100.92 100.53 100.14
9 102.16 101.96 101.29 100.62 99.96
12 102.92 102.56 101.60 100.66 99.74
15 103.69 103.06 101.82 100.60 99.41
18 104.46 103.49 101.97 100.48 99.02
21 105.24 103.84 102.02 100.25 98.53
24 106.02 104.14 102.04 100.01 98.04
27 106.80 104.35 101.98 99.68 97.46
30 107.39 104.48 101.82 99.25 96.78
33 107.78 104.55 101.61 98.78 96.07
36 108.08 104.56 101.35 98.28 95.34
39 108.31 104.50 101.02 97.70 94.54
42 108.46 104.36 100.62 97.05 93.67
45 108.54 104.15 100.14 96.34 92.75
48 108.55 103.89 99.64 95.61 91.81
Interest Rate 3.5%
3 100.91 100.89 100.76 100.63 100.50
6 101.90 101.81 101.41 101.02 100.639 102.91 102.71 102.03 101.35 100.6912 103.92 103.56 102.59 101.64 100.71
15 104.95 104.32 103.06 101.83 100.6318 105.99 105.01 103.46 101.95 100.4721 107.04 105.61 103.76 101.96 100.2124 108.09 106.17 104.04 101.97 99.9627 109.15 106.65 104.22 101.88 99.6030 110.02 107.04 104.31 101.68 99.1433 110.68 107.37 104.35 101.44 98.6536 111.27 107.64 104.34 101.16 98.1239 111.77 107.84 104.25 100.81 97.52
42 112.19 107.95 104.08 100.38 96.85
45 112.54 107.99 103.84 99.88 96.12
48 112.83 107.98 103.55 99.35 95.38
The value of retail (ie., non-brokered) CDs appears both on the asset and
liability side of the IRR Exposure Report. The prices above represent the
value of the liability implied by these deposits and reflect the difference
between their coupon and secondary-market CD rates. For the asset side
of the report, the value of retail CDs (as a percent of outstanding balance)
is found in the table titled "Retail CD Intangible Prices."
The prices listed are for retail CDs with an annual non-interest cost of 20 basis points.
Retail CD PricesAs a Percent of Outstanding Balance
As of March 31, 2011
Interest Rate Scenarios
20
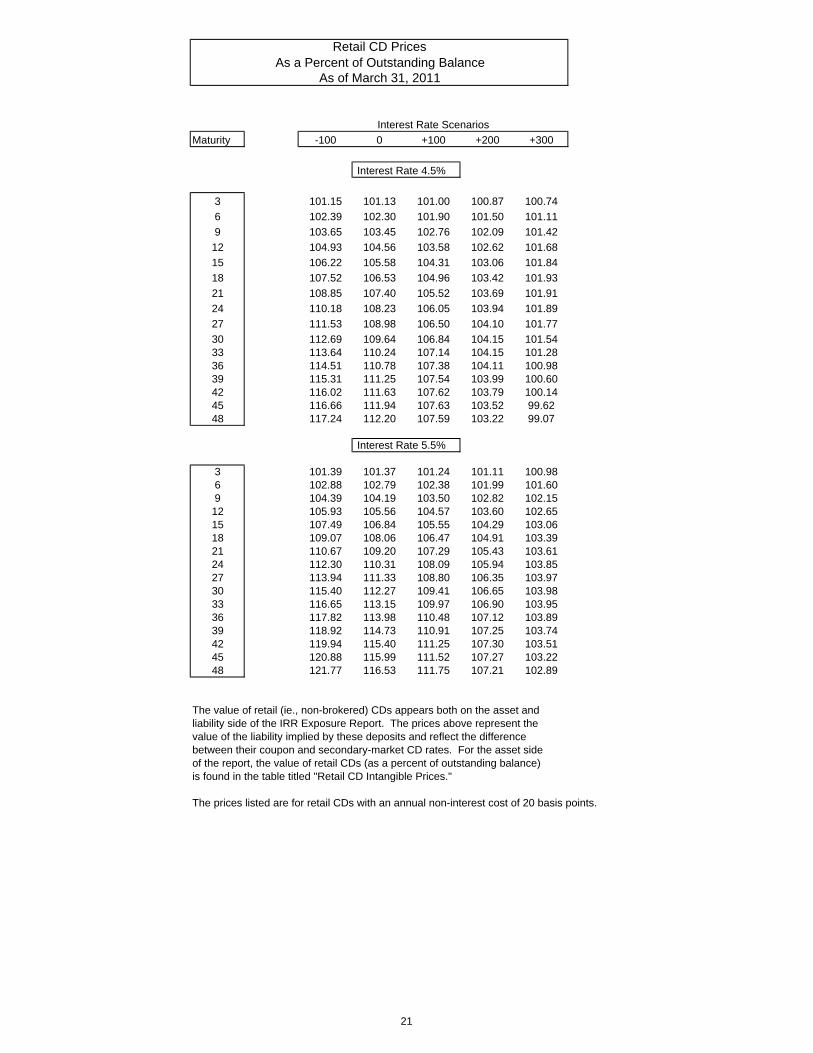
Maturity -100 0 +100 +200 +300
Interest Rate 4.5%
3 101.15 101.13 101.00 100.87 100.74
6 102.39 102.30 101.90 101.50 101.11
9 103.65 103.45 102.76 102.09 101.42
12 104.93 104.56 103.58 102.62 101.68
15 106.22 105.58 104.31 103.06 101.84
18 107.52 106.53 104.96 103.42 101.93
21 108.85 107.40 105.52 103.69 101.91
24 110.18 108.23 106.05 103.94 101.89
27 111.53 108.98 106.50 104.10 101.77
30 112.69 109.64 106.84 104.15 101.5433 113.64 110.24 107.14 104.15 101.2836 114.51 110.78 107.38 104.11 100.9839 115.31 111.25 107.54 103.99 100.6042 116.02 111.63 107.62 103.79 100.1445 116.66 111.94 107.63 103.52 99.6248 117.24 112.20 107.59 103.22 99.07
Interest Rate 5.5%
3 101.39 101.37 101.24 101.11 100.986 102.88 102.79 102.38 101.99 101.609 104.39 104.19 103.50 102.82 102.1512 105.93 105.56 104.57 103.60 102.6515 107.49 106.84 105.55 104.29 103.0618 109.07 108.06 106.47 104.91 103.3921 110.67 109.20 107.29 105.43 103.6124 112.30 110.31 108.09 105.94 103.8527 113.94 111.33 108.80 106.35 103.9730 115.40 112.27 109.41 106.65 103.9833 116.65 113.15 109.97 106.90 103.9536 117.82 113.98 110.48 107.12 103.8939 118.92 114.73 110.91 107.25 103.7442 119.94 115.40 111.25 107.30 103.5145 120.88 115.99 111.52 107.27 103.2248 121.77 116.53 111.75 107.21 102.89
The value of retail (ie., non-brokered) CDs appears both on the asset andliability side of the IRR Exposure Report. The prices above represent thevalue of the liability implied by these deposits and reflect the difference between their coupon and secondary-market CD rates. For the asset sideof the report, the value of retail CDs (as a percent of outstanding balance)is found in the table titled "Retail CD Intangible Prices."
The prices listed are for retail CDs with an annual non-interest cost of 20 basis points.
Interest Rate Scenarios
As a Percent of Outstanding BalanceRetail CD Prices
As of March 31, 2011
21
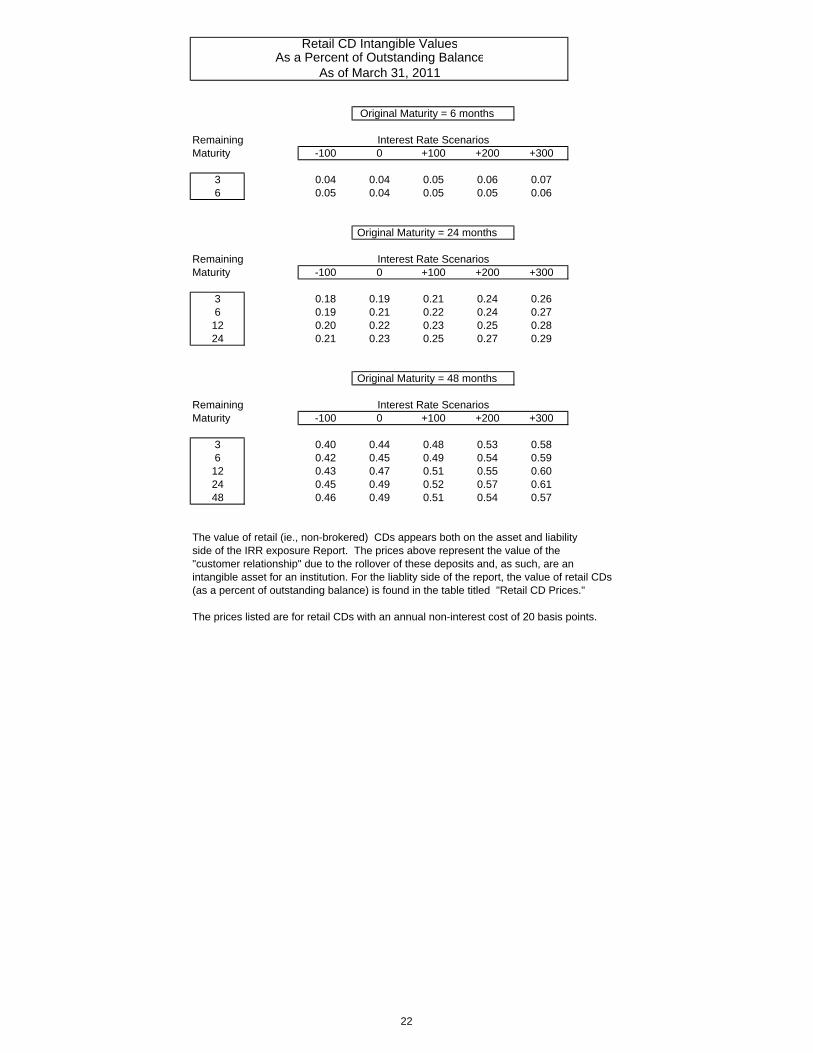
Original Maturity = 6 months
RemainingMaturity -100 0 +100 +200 +300
3 0.04 0.04 0.05 0.06 0.076 0.05 0.04 0.05 0.05 0.06
Original Maturity = 24 months
RemainingMaturity -100 0 +100 +200 +300
3 0.18 0.19 0.21 0.24 0.266 0.19 0.21 0.22 0.24 0.2712 0.20 0.22 0.23 0.25 0.2824 0.21 0.23 0.25 0.27 0.29
Original Maturity = 48 months
RemainingMaturity -100 0 +100 +200 +300
3 0.40 0.44 0.48 0.53 0.586 0.42 0.45 0.49 0.54 0.5912 0.43 0.47 0.51 0.55 0.6024 0.45 0.49 0.52 0.57 0.6148 0.46 0.49 0.51 0.54 0.57
The value of retail (ie., non-brokered) CDs appears both on the asset and liabilityside of the IRR exposure Report. The prices above represent the value of the "customer relationship" due to the rollover of these deposits and, as such, are an intangible asset for an institution. For the liablity side of the report, the value of retail CDs(as a percent of outstanding balance) is found in the table titled "Retail CD Prices."
The prices listed are for retail CDs with an annual non-interest cost of 20 basis points.
Retail CD Intangible Values
Interest Rate Scenarios
Interest Rate Scenarios
As a Percent of Outstanding BalanceAs of March 31, 2011
Interest Rate Scenarios
22
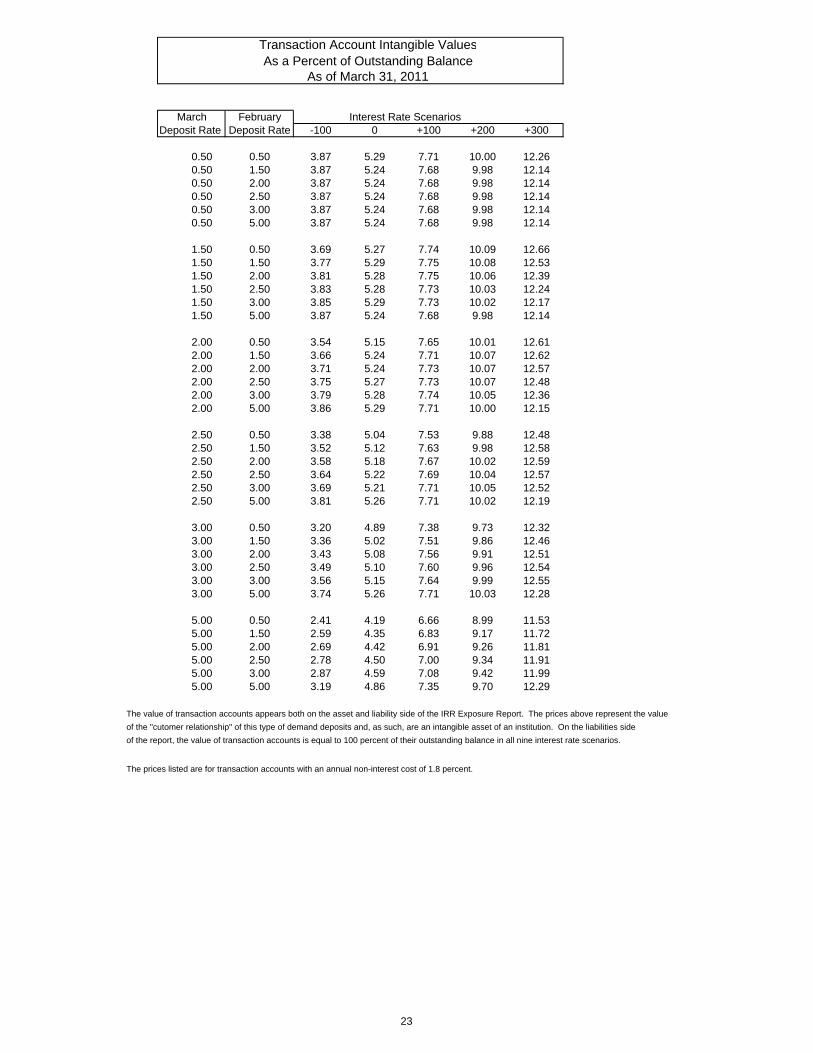
Transaction Account Intangible ValuesAs a Percent of Outstanding Balance
As of March 31, 201114 15 16 17 18
March February Interest Rate ScenariosDeposit Rate Deposit Rate -100 0 +100 +200 +300
0.50 0.50 3.87 5.29 7.71 10.00 12.260.50 1.50 3.87 5.24 7.68 9.98 12.140.50 2.00 3.87 5.24 7.68 9.98 12.140.50 2.50 3.87 5.24 7.68 9.98 12.140.50 3.00 3.87 5.24 7.68 9.98 12.140.50 5.00 3.87 5.24 7.68 9.98 12.14
1.50 0.50 3.69 5.27 7.74 10.09 12.661.50 1.50 3.77 5.29 7.75 10.08 12.531.50 2.00 3.81 5.28 7.75 10.06 12.391.50 2.50 3.83 5.28 7.73 10.03 12.241.50 3.00 3.85 5.29 7.73 10.02 12.171.50 5.00 3.87 5.24 7.68 9.98 12.14
2.00 0.50 3.54 5.15 7.65 10.01 12.612.00 1.50 3.66 5.24 7.71 10.07 12.622.00 2.00 3.71 5.24 7.73 10.07 12.572.00 2.50 3.75 5.27 7.73 10.07 12.482.00 3.00 3.79 5.28 7.74 10.05 12.362.00 5.00 3.86 5.29 7.71 10.00 12.15
2.50 0.50 3.38 5.04 7.53 9.88 12.482.50 1.50 3.52 5.12 7.63 9.98 12.582.50 2.00 3.58 5.18 7.67 10.02 12.592.50 2.50 3.64 5.22 7.69 10.04 12.572.50 3.00 3.69 5.21 7.71 10.05 12.522.50 5.00 3.81 5.26 7.71 10.02 12.19
3.00 0.50 3.20 4.89 7.38 9.73 12.323.00 1.50 3.36 5.02 7.51 9.86 12.463.00 2.00 3.43 5.08 7.56 9.91 12.513.00 2.50 3.49 5.10 7.60 9.96 12.543.00 3.00 3.56 5.15 7.64 9.99 12.553.00 5.00 3.74 5.26 7.71 10.03 12.28
5.00 0.50 2.41 4.19 6.66 8.99 11.535.00 1.50 2.59 4.35 6.83 9.17 11.725.00 2.00 2.69 4.42 6.91 9.26 11.815.00 2.50 2.78 4.50 7.00 9.34 11.915.00 3.00 2.87 4.59 7.08 9.42 11.995.00 5.00 3.19 4.86 7.35 9.70 12.29
The value of transaction accounts appears both on the asset and liability side of the IRR Exposure Report. The prices above represent the value
of the "cutomer relationship" of this type of demand deposits and, as such, are an intangible asset of an institution. On the liabilities side
of the report, the value of transaction accounts is equal to 100 percent of their outstanding balance in all nine interest rate scenarios.
The prices listed are for transaction accounts with an annual non-interest cost of 1.8 percent.
23
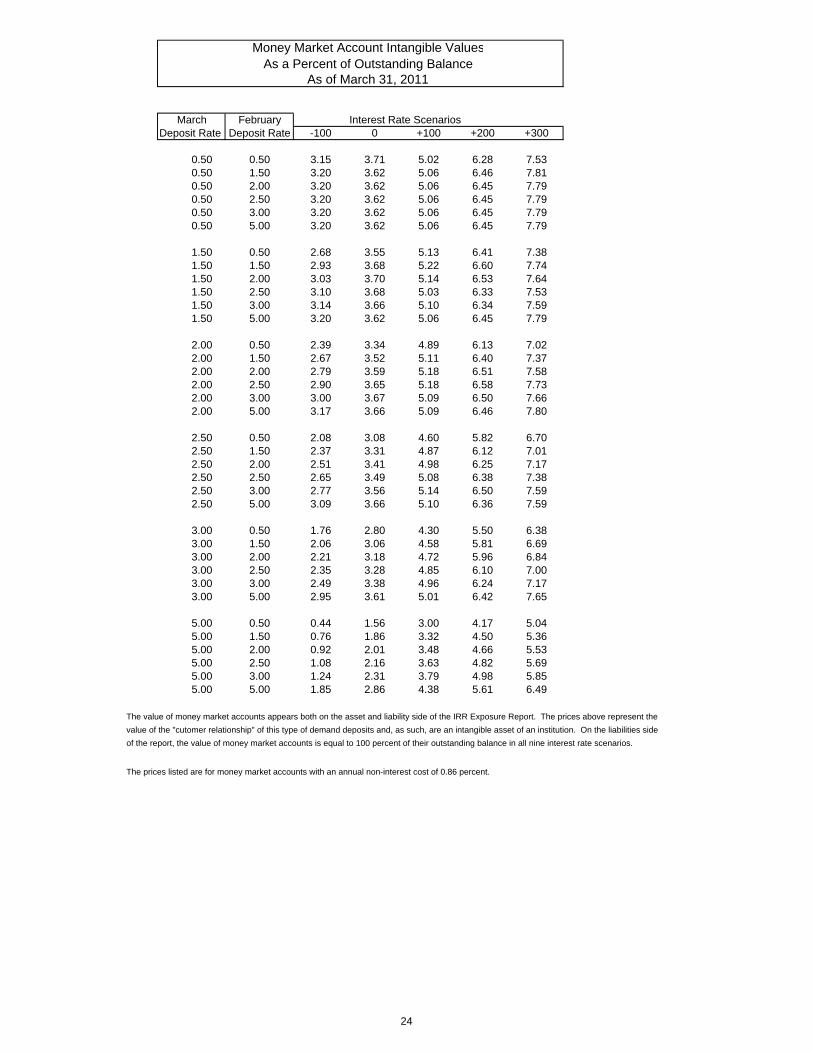
Money Market Account Intangible ValuesAs a Percent of Outstanding Balance
As of March 31, 2011
March February Interest Rate ScenariosDeposit Rate Deposit Rate -100 0 +100 +200 +300
0.50 0.50 3.15 3.71 5.02 6.28 7.530.50 1.50 3.20 3.62 5.06 6.46 7.810.50 2.00 3.20 3.62 5.06 6.45 7.790.50 2.50 3.20 3.62 5.06 6.45 7.790.50 3.00 3.20 3.62 5.06 6.45 7.790.50 5.00 3.20 3.62 5.06 6.45 7.79
1.50 0.50 2.68 3.55 5.13 6.41 7.381.50 1.50 2.93 3.68 5.22 6.60 7.741.50 2.00 3.03 3.70 5.14 6.53 7.641.50 2.50 3.10 3.68 5.03 6.33 7.531.50 3.00 3.14 3.66 5.10 6.34 7.591.50 5.00 3.20 3.62 5.06 6.45 7.79
2.00 0.50 2.39 3.34 4.89 6.13 7.022.00 1.50 2.67 3.52 5.11 6.40 7.372.00 2.00 2.79 3.59 5.18 6.51 7.582.00 2.50 2.90 3.65 5.18 6.58 7.732.00 3.00 3.00 3.67 5.09 6.50 7.662.00 5.00 3.17 3.66 5.09 6.46 7.80
2.50 0.50 2.08 3.08 4.60 5.82 6.702.50 1.50 2.37 3.31 4.87 6.12 7.012.50 2.00 2.51 3.41 4.98 6.25 7.172.50 2.50 2.65 3.49 5.08 6.38 7.382.50 3.00 2.77 3.56 5.14 6.50 7.592.50 5.00 3.09 3.66 5.10 6.36 7.59
3.00 0.50 1.76 2.80 4.30 5.50 6.383.00 1.50 2.06 3.06 4.58 5.81 6.693.00 2.00 2.21 3.18 4.72 5.96 6.843.00 2.50 2.35 3.28 4.85 6.10 7.003.00 3.00 2.49 3.38 4.96 6.24 7.173.00 5.00 2.95 3.61 5.01 6.42 7.65
5.00 0.50 0.44 1.56 3.00 4.17 5.045.00 1.50 0.76 1.86 3.32 4.50 5.365.00 2.00 0.92 2.01 3.48 4.66 5.535.00 2.50 1.08 2.16 3.63 4.82 5.695.00 3.00 1.24 2.31 3.79 4.98 5.855.00 5.00 1.85 2.86 4.38 5.61 6.49
The value of money market accounts appears both on the asset and liability side of the IRR Exposure Report. The prices above represent the
value of the "cutomer relationship" of this type of demand deposits and, as such, are an intangible asset of an institution. On the liabilities side
of the report, the value of money market accounts is equal to 100 percent of their outstanding balance in all nine interest rate scenarios.
The prices listed are for money market accounts with an annual non-interest cost of 0.86 percent.
24
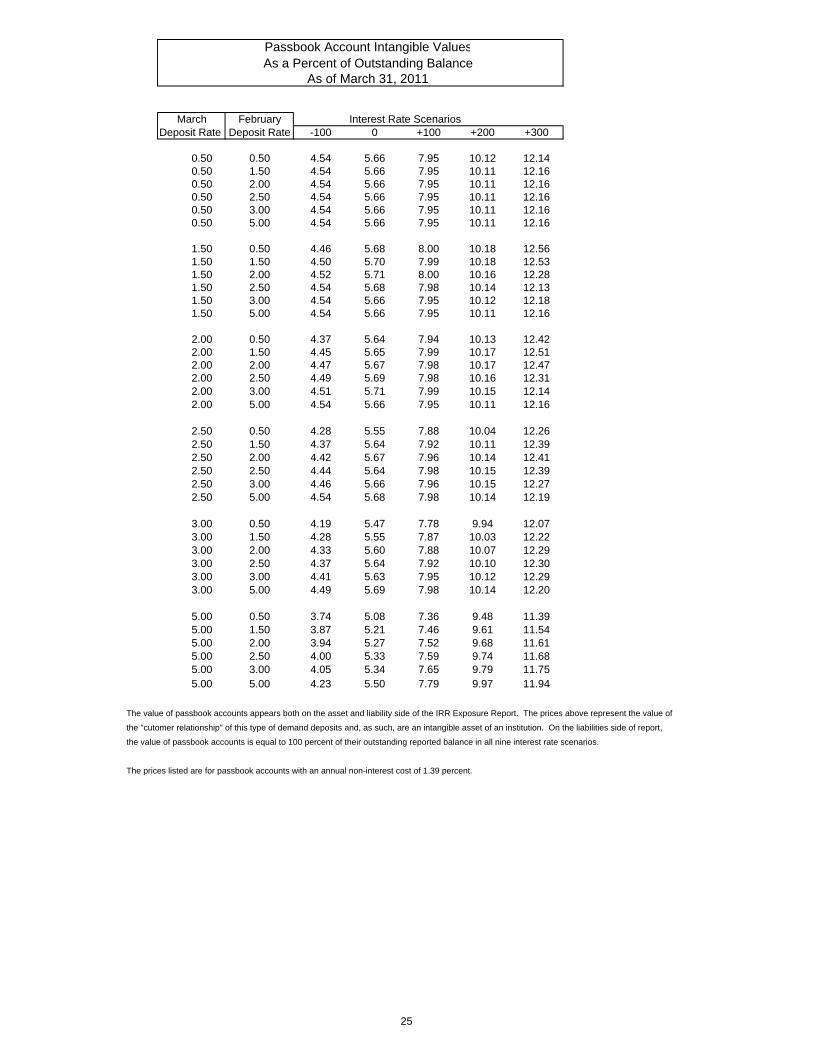
Passbook Account Intangible ValuesAs a Percent of Outstanding Balance
As of March 31, 2011
March February Interest Rate ScenariosDeposit Rate Deposit Rate -100 0 +100 +200 +300
0.50 0.50 4.54 5.66 7.95 10.12 12.140.50 1.50 4.54 5.66 7.95 10.11 12.160.50 2.00 4.54 5.66 7.95 10.11 12.160.50 2.50 4.54 5.66 7.95 10.11 12.160.50 3.00 4.54 5.66 7.95 10.11 12.160.50 5.00 4.54 5.66 7.95 10.11 12.16
1.50 0.50 4.46 5.68 8.00 10.18 12.561.50 1.50 4.50 5.70 7.99 10.18 12.531.50 2.00 4.52 5.71 8.00 10.16 12.281.50 2.50 4.54 5.68 7.98 10.14 12.131.50 3.00 4.54 5.66 7.95 10.12 12.181.50 5.00 4.54 5.66 7.95 10.11 12.16
2.00 0.50 4.37 5.64 7.94 10.13 12.422.00 1.50 4.45 5.65 7.99 10.17 12.512.00 2.00 4.47 5.67 7.98 10.17 12.472.00 2.50 4.49 5.69 7.98 10.16 12.312.00 3.00 4.51 5.71 7.99 10.15 12.142.00 5.00 4.54 5.66 7.95 10.11 12.16
2.50 0.50 4.28 5.55 7.88 10.04 12.262.50 1.50 4.37 5.64 7.92 10.11 12.392.50 2.00 4.42 5.67 7.96 10.14 12.412.50 2.50 4.44 5.64 7.98 10.15 12.392.50 3.00 4.46 5.66 7.96 10.15 12.272.50 5.00 4.54 5.68 7.98 10.14 12.19
3.00 0.50 4.19 5.47 7.78 9.94 12.073.00 1.50 4.28 5.55 7.87 10.03 12.223.00 2.00 4.33 5.60 7.88 10.07 12.293.00 2.50 4.37 5.64 7.92 10.10 12.303.00 3.00 4.41 5.63 7.95 10.12 12.293.00 5.00 4.49 5.69 7.98 10.14 12.20
5.00 0.50 3.74 5.08 7.36 9.48 11.395.00 1.50 3.87 5.21 7.46 9.61 11.545.00 2.00 3.94 5.27 7.52 9.68 11.615.00 2.50 4.00 5.33 7.59 9.74 11.685.00 3.00 4.05 5.34 7.65 9.79 11.755.00 5.00 4.23 5.50 7.79 9.97 11.94
The value of passbook accounts appears both on the asset and liability side of the IRR Exposure Report. The prices above represent the value of
the "cutomer relationship" of this type of demand deposits and, as such, are an intangible asset of an institution. On the liabilities side of report,
the value of passbook accounts is equal to 100 percent of their outstanding reported balance in all nine interest rate scenarios.
The prices listed are for passbook accounts with an annual non-interest cost of 1.39 percent.
25
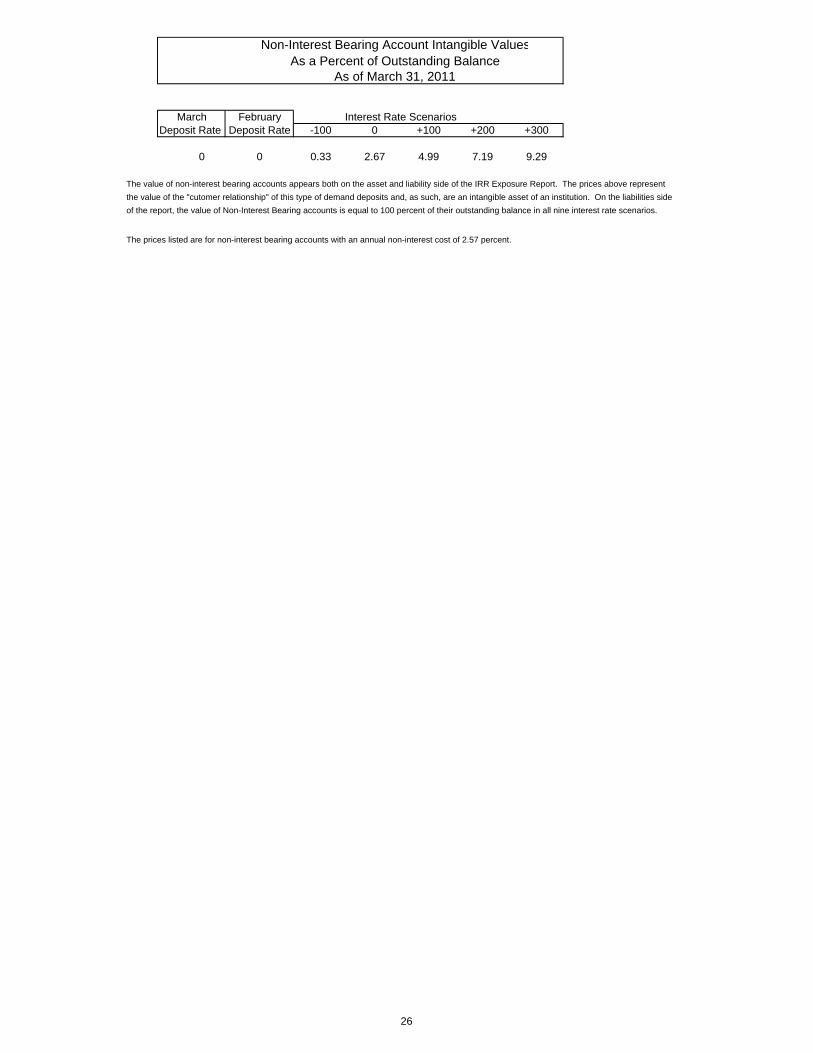
Non-Interest Bearing Account Intangible ValuesAs a Percent of Outstanding Balance
As of March 31, 2011
March February Interest Rate ScenariosDeposit Rate Deposit Rate -100 0 +100 +200 +300
0 0 0.33 2.67 4.99 7.19 9.29
The value of non-interest bearing accounts appears both on the asset and liability side of the IRR Exposure Report. The prices above represent
the value of the "cutomer relationship" of this type of demand deposits and, as such, are an intangible asset of an institution. On the liabilities side
of the report, the value of Non-Interest Bearing accounts is equal to 100 percent of their outstanding balance in all nine interest rate scenarios.
The prices listed are for non-interest bearing accounts with an annual non-interest cost of 2.57 percent.
26
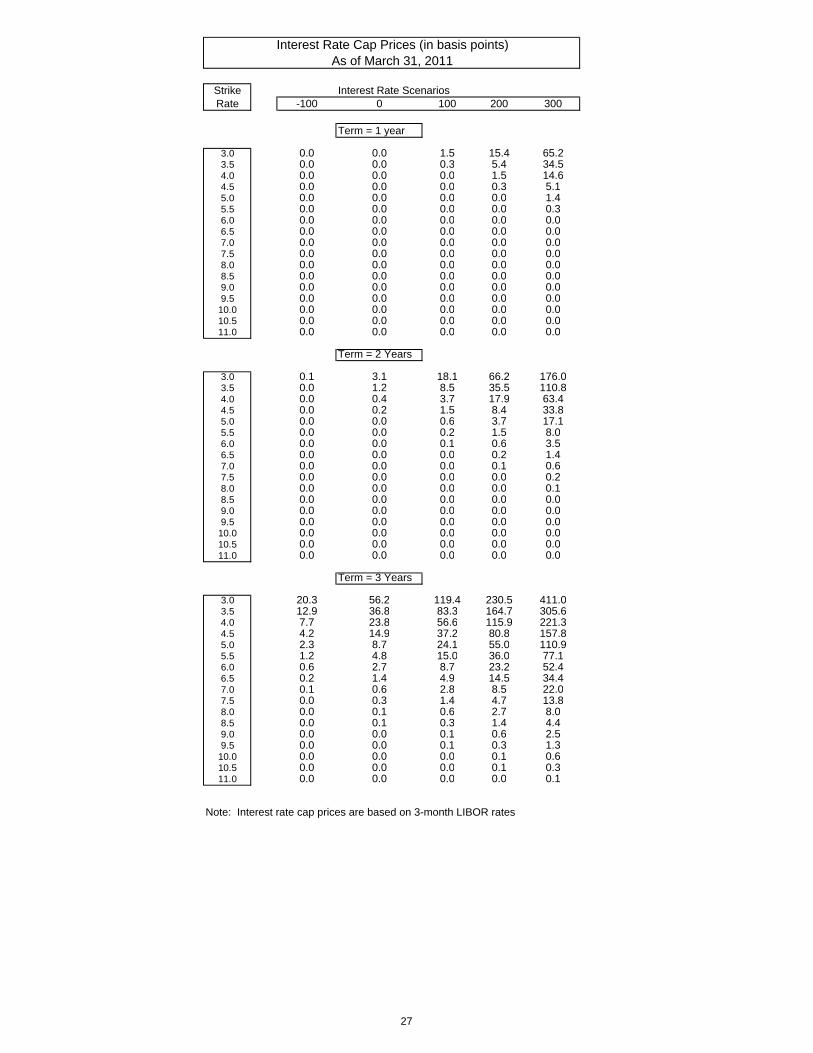
14 15 16 17 18Strike Interest Rate ScenariosRate -100 0 100 200 300
Term = 1 year
3.0 0.0 0.0 1.5 15.4 65.23.5 0.0 0.0 0.3 5.4 34.54.0 0.0 0.0 0.0 1.5 14.64.5 0.0 0.0 0.0 0.3 5.15.0 0.0 0.0 0.0 0.0 1.45.5 0.0 0.0 0.0 0.0 0.36.0 0.0 0.0 0.0 0.0 0.06.5 0.0 0.0 0.0 0.0 0.07.0 0.0 0.0 0.0 0.0 0.07.5 0.0 0.0 0.0 0.0 0.08.0 0.0 0.0 0.0 0.0 0.08.5 0.0 0.0 0.0 0.0 0.09.0 0.0 0.0 0.0 0.0 0.09.5 0.0 0.0 0.0 0.0 0.0
10.0 0.0 0.0 0.0 0.0 0.010.5 0.0 0.0 0.0 0.0 0.011.0 0.0 0.0 0.0 0.0 0.0
Term = 2 Years
3.0 0.1 3.1 18.1 66.2 176.03.5 0.0 1.2 8.5 35.5 110.84.0 0.0 0.4 3.7 17.9 63.44.5 0.0 0.2 1.5 8.4 33.85.0 0.0 0.0 0.6 3.7 17.15.5 0.0 0.0 0.2 1.5 8.06.0 0.0 0.0 0.1 0.6 3.56.5 0.0 0.0 0.0 0.2 1.47.0 0.0 0.0 0.0 0.1 0.67.5 0.0 0.0 0.0 0.0 0.28.0 0.0 0.0 0.0 0.0 0.18.5 0.0 0.0 0.0 0.0 0.09.0 0.0 0.0 0.0 0.0 0.09.5 0.0 0.0 0.0 0.0 0.0
10.0 0.0 0.0 0.0 0.0 0.010.5 0.0 0.0 0.0 0.0 0.011.0 0.0 0.0 0.0 0.0 0.0
Term = 3 Years
3.0 20.3 56.2 119.4 230.5 411.03.5 12.9 36.8 83.3 164.7 305.64.0 7.7 23.8 56.6 115.9 221.34.5 4.2 14.9 37.2 80.8 157.85.0 2.3 8.7 24.1 55.0 110.95.5 1.2 4.8 15.0 36.0 77.16.0 0.6 2.7 8.7 23.2 52.46.5 0.2 1.4 4.9 14.5 34.47.0 0.1 0.6 2.8 8.5 22.07.5 0.0 0.3 1.4 4.7 13.88.0 0.0 0.1 0.6 2.7 8.08.5 0.0 0.1 0.3 1.4 4.49.0 0.0 0.0 0.1 0.6 2.59.5 0.0 0.0 0.1 0.3 1.3
10.0 0.0 0.0 0.0 0.1 0.610.5 0.0 0.0 0.0 0.1 0.311.0 0.0 0.0 0.0 0.0 0.1
Note: Interest rate cap prices are based on 3-month LIBOR rates
Interest Rate Cap Prices (in basis points)As of March 31, 2011
27
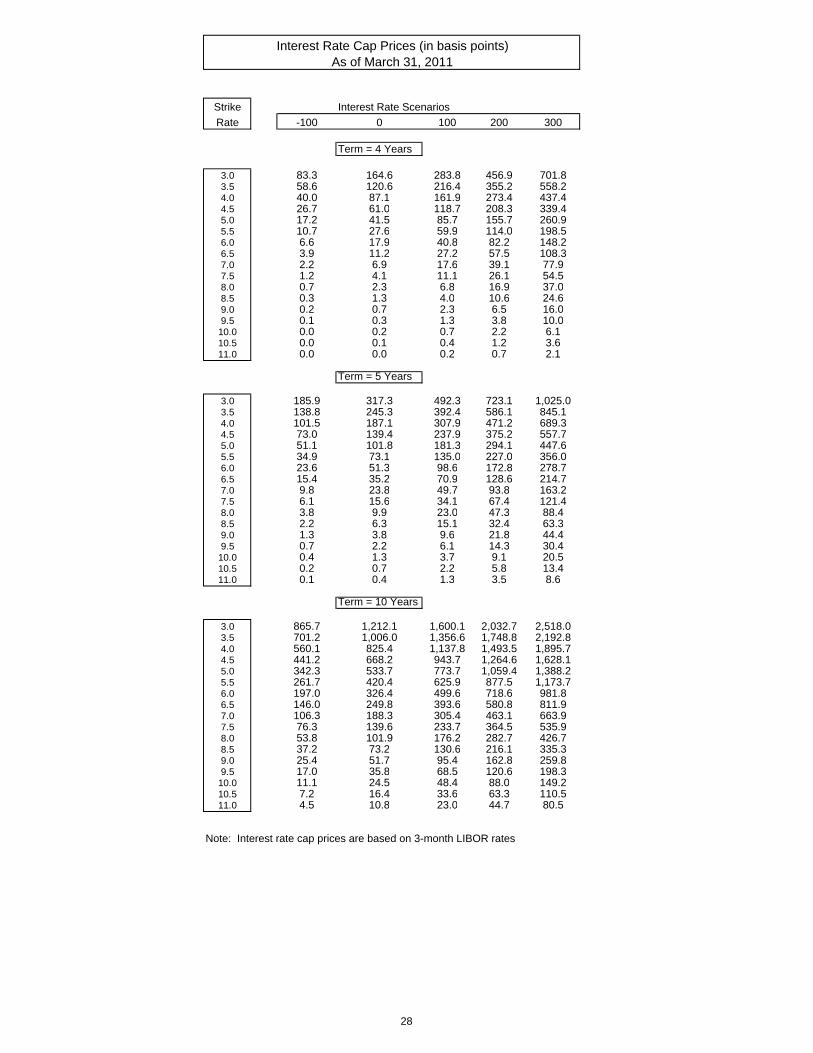
Strike Interest Rate Scenarios
Rate -100 0 100 200 300
Term = 4 Years
3.0 83.3 164.6 283.8 456.9 701.83.5 58.6 120.6 216.4 355.2 558.24.0 40.0 87.1 161.9 273.4 437.44.5 26.7 61.0 118.7 208.3 339.45.0 17.2 41.5 85.7 155.7 260.95.5 10.7 27.6 59.9 114.0 198.56.0 6.6 17.9 40.8 82.2 148.26.5 3.9 11.2 27.2 57.5 108.37.0 2.2 6.9 17.6 39.1 77.97.5 1.2 4.1 11.1 26.1 54.58.0 0.7 2.3 6.8 16.9 37.08.5 0.3 1.3 4.0 10.6 24.69.0 0.2 0.7 2.3 6.5 16.09.5 0.1 0.3 1.3 3.8 10.0
10.0 0.0 0.2 0.7 2.2 6.110.5 0.0 0.1 0.4 1.2 3.611.0 0.0 0.0 0.2 0.7 2.1
Term = 5 Years
3.0 185.9 317.3 492.3 723.1 1,025.03.5 138.8 245.3 392.4 586.1 845.14.0 101.5 187.1 307.9 471.2 689.34.5 73.0 139.4 237.9 375.2 557.75.0 51.1 101.8 181.3 294.1 447.65.5 34.9 73.1 135.0 227.0 356.06.0 23.6 51.3 98.6 172.8 278.76.5 15.4 35.2 70.9 128.6 214.77.0 9.8 23.8 49.7 93.8 163.27.5 6.1 15.6 34.1 67.4 121.48.0 3.8 9.9 23.0 47.3 88.48.5 2.2 6.3 15.1 32.4 63.39.0 1.3 3.8 9.6 21.8 44.49.5 0.7 2.2 6.1 14.3 30.4
10.0 0.4 1.3 3.7 9.1 20.510.5 0.2 0.7 2.2 5.8 13.411.0 0.1 0.4 1.3 3.5 8.6
Term = 10 Years
3.0 865.7 1,212.1 1,600.1 2,032.7 2,518.03.5 701.2 1,006.0 1,356.6 1,748.8 2,192.84.0 560.1 825.4 1,137.8 1,493.5 1,895.74.5 441.2 668.2 943.7 1,264.6 1,628.15.0 342.3 533.7 773.7 1,059.4 1,388.25.5 261.7 420.4 625.9 877.5 1,173.76.0 197.0 326.4 499.6 718.6 981.86.5 146.0 249.8 393.6 580.8 811.97.0 106.3 188.3 305.4 463.1 663.97.5 76.3 139.6 233.7 364.5 535.98.0 53.8 101.9 176.2 282.7 426.78.5 37.2 73.2 130.6 216.1 335.39.0 25.4 51.7 95.4 162.8 259.89.5 17.0 35.8 68.5 120.6 198.3
10.0 11.1 24.5 48.4 88.0 149.210.5 7.2 16.4 33.6 63.3 110.511.0 4.5 10.8 23.0 44.7 80.5
Note: Interest rate cap prices are based on 3-month LIBOR rates
Interest Rate Cap Prices (in basis points)As of March 31, 2011
28
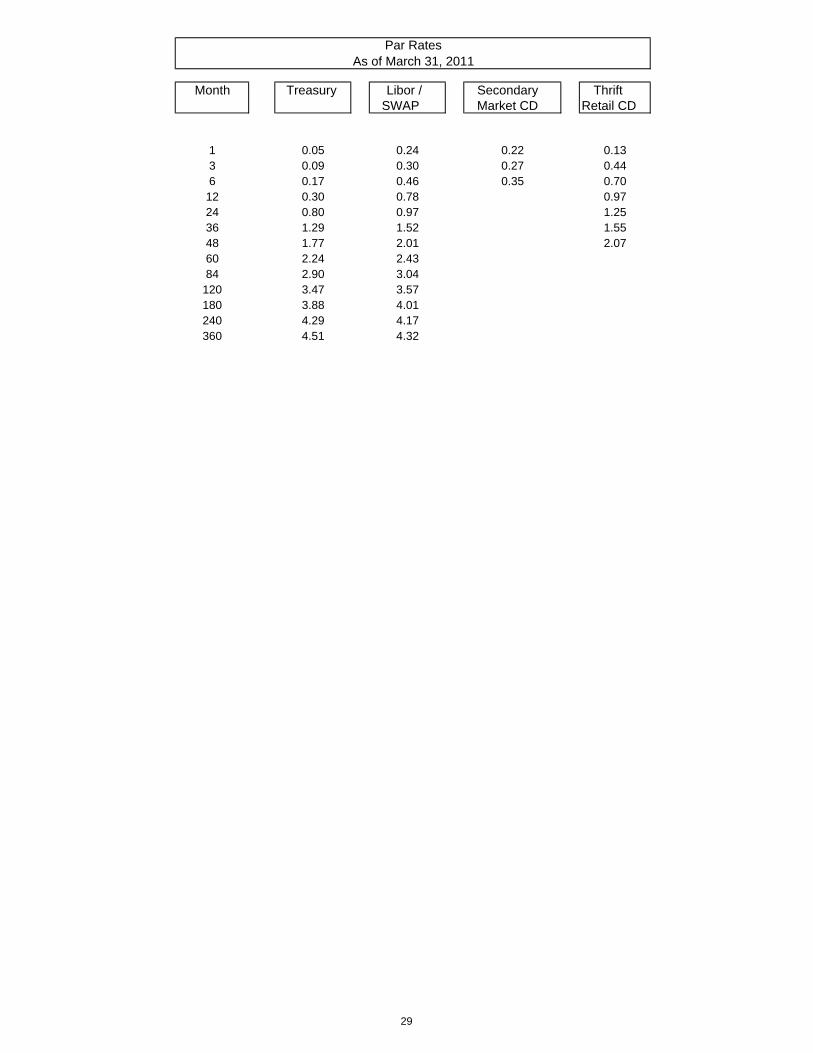
Month Treasury Libor / Secondary Thrift SWAP Market CD Retail CD
1 0.05 0.24 0.22 0.133 0.09 0.30 0.27 0.446 0.17 0.46 0.35 0.7012 0.30 0.78 0.9724 0.80 0.97 1.2536 1.29 1.52 1.5548 1.77 2.01 2.0760 2.24 2.4384 2.90 3.04
120 3.47 3.57180 3.88 4.01240 4.29 4.17360 4.51 4.32
Par RatesAs of March 31, 2011
29
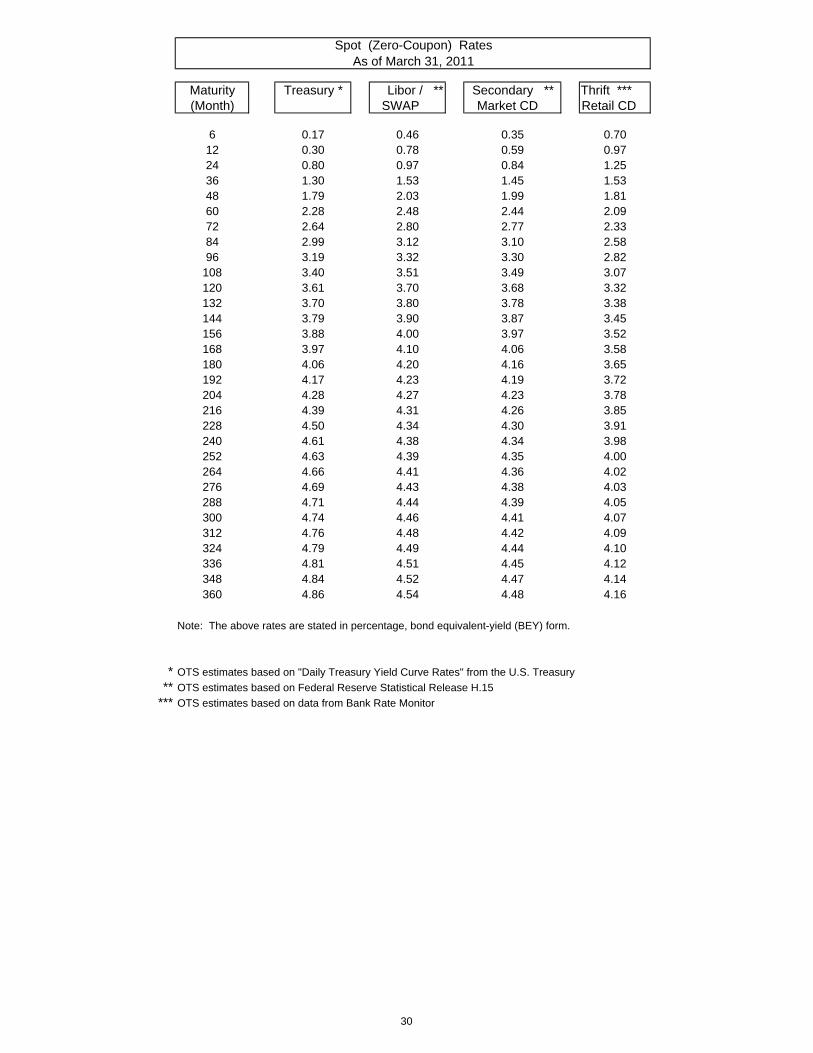
Maturity Treasury * Libor / ** Secondary ** Thrift *** (Month) SWAP Market CD Retail CD
6 0.17 0.46 0.35 0.7012 0.30 0.78 0.59 0.9724 0.80 0.97 0.84 1.2536 1.30 1.53 1.45 1.5348 1.79 2.03 1.99 1.8160 2.28 2.48 2.44 2.0972 2.64 2.80 2.77 2.3384 2.99 3.12 3.10 2.5896 3.19 3.32 3.30 2.82
108 3.40 3.51 3.49 3.07120 3.61 3.70 3.68 3.32132 3.70 3.80 3.78 3.38144 3.79 3.90 3.87 3.45156 3.88 4.00 3.97 3.52168 3.97 4.10 4.06 3.58180 4.06 4.20 4.16 3.65192 4.17 4.23 4.19 3.72204 4.28 4.27 4.23 3.78216 4.39 4.31 4.26 3.85228 4.50 4.34 4.30 3.91240 4.61 4.38 4.34 3.98252 4.63 4.39 4.35 4.00264 4.66 4.41 4.36 4.02276 4.69 4.43 4.38 4.03288 4.71 4.44 4.39 4.05300 4.74 4.46 4.41 4.07312 4.76 4.48 4.42 4.09324 4.79 4.49 4.44 4.10336 4.81 4.51 4.45 4.12348 4.84 4.52 4.47 4.14360 4.86 4.54 4.48 4.16
Note: The above rates are stated in percentage, bond equivalent-yield (BEY) form.
* OTS estimates based on "Daily Treasury Yield Curve Rates" from the U.S. Treasury
** OTS estimates based on Federal Reserve Statistical Release H.15
*** OTS estimates based on data from Bank Rate Monitor
Spot (Zero-Coupon) RatesAs of March 31, 2011
30
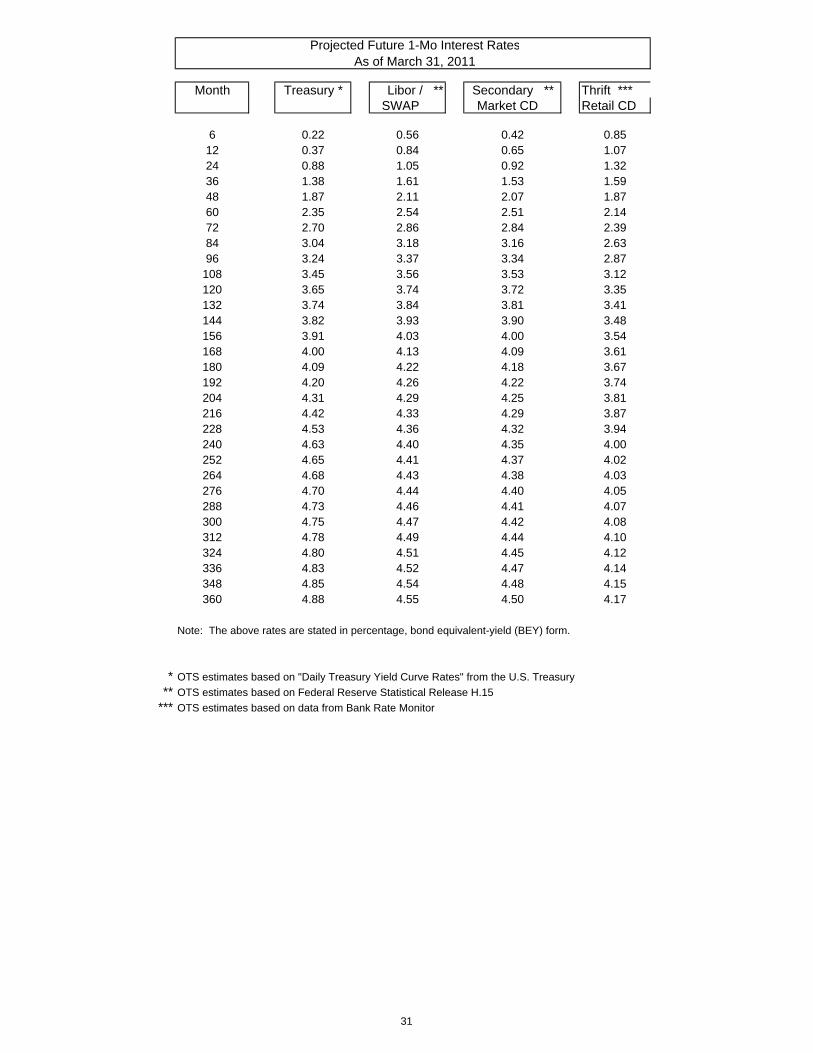
Projected Future 1-Mo Interest RatesAs of March 31, 2011
Month Treasury * Libor / ** Secondary ** Thrift *** SWAP Market CD Retail CD
6 0.22 0.56 0.42 0.8512 0.37 0.84 0.65 1.0724 0.88 1.05 0.92 1.3236 1.38 1.61 1.53 1.5948 1.87 2.11 2.07 1.8760 2.35 2.54 2.51 2.1472 2.70 2.86 2.84 2.3984 3.04 3.18 3.16 2.6396 3.24 3.37 3.34 2.87
108 3.45 3.56 3.53 3.12120 3.65 3.74 3.72 3.35132 3.74 3.84 3.81 3.41144 3.82 3.93 3.90 3.48156 3.91 4.03 4.00 3.54168 4.00 4.13 4.09 3.61180 4.09 4.22 4.18 3.67192 4.20 4.26 4.22 3.74204 4.31 4.29 4.25 3.81216 4.42 4.33 4.29 3.87228 4.53 4.36 4.32 3.94240 4.63 4.40 4.35 4.00252 4.65 4.41 4.37 4.02264 4.68 4.43 4.38 4.03276 4.70 4.44 4.40 4.05288 4.73 4.46 4.41 4.07300 4.75 4.47 4.42 4.08312 4.78 4.49 4.44 4.10324 4.80 4.51 4.45 4.12336 4.83 4.52 4.47 4.14348 4.85 4.54 4.48 4.15360 4.88 4.55 4.50 4.17
Note: The above rates are stated in percentage, bond equivalent-yield (BEY) form.
* OTS estimates based on "Daily Treasury Yield Curve Rates" from the U.S. Treasury
** OTS estimates based on Federal Reserve Statistical Release H.15
*** OTS estimates based on data from Bank Rate Monitor
31
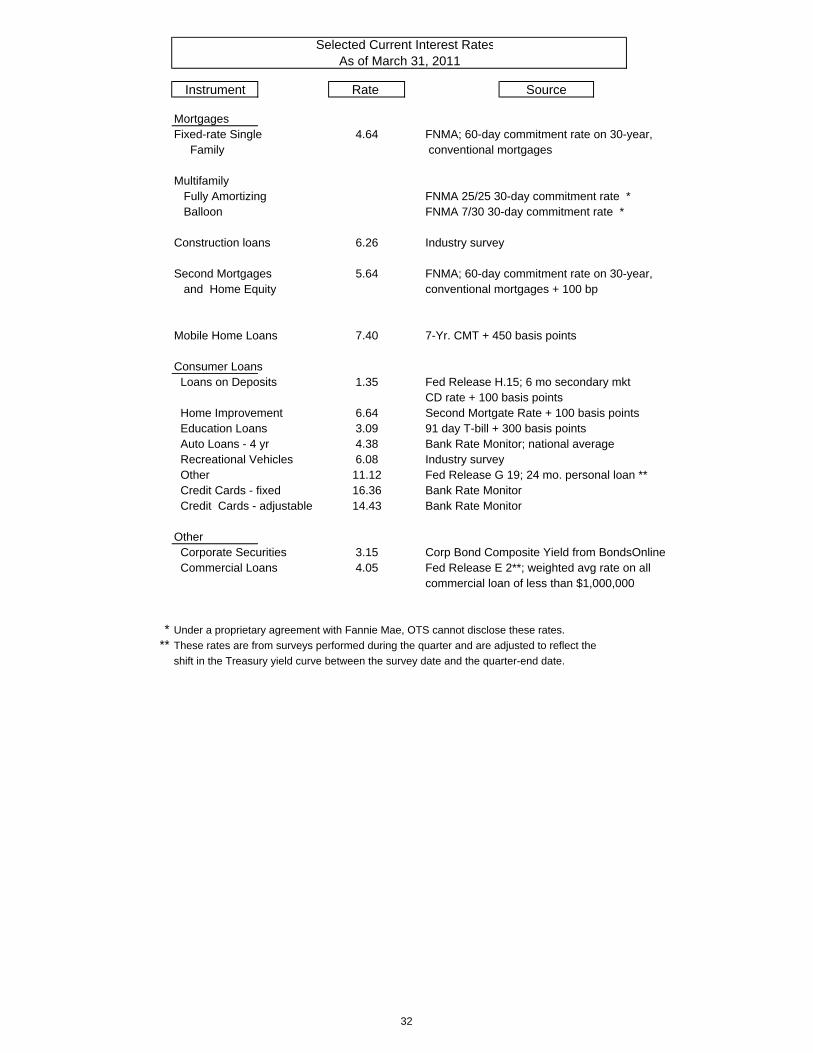
Selected Current Interest RatesAs of March 31, 2011
Instrument Rate Source
MortgagesFixed-rate Single 4.64 FNMA; 60-day commitment rate on 30-year, Family conventional mortgages
Multifamily Fully Amortizing FNMA 25/25 30-day commitment rate * Balloon FNMA 7/30 30-day commitment rate *
Construction loans 6.26 Industry survey
Second Mortgages 5.64 FNMA; 60-day commitment rate on 30-year, and Home Equity conventional mortgages + 100 bp
Mobile Home Loans 7.40 7-Yr. CMT + 450 basis points
Consumer Loans Loans on Deposits 1.35 Fed Release H.15; 6 mo secondary mkt
CD rate + 100 basis points Home Improvement 6.64 Second Mortgate Rate + 100 basis points Education Loans 3.09 91 day T-bill + 300 basis points Auto Loans - 4 yr 4.38 Bank Rate Monitor; national average Recreational Vehicles 6.08 Industry survey Other 11.12 Fed Release G 19; 24 mo. personal loan ** Credit Cards - fixed 16.36 Bank Rate Monitor Credit Cards - adjustable 14.43 Bank Rate Monitor
Other Corporate Securities 3.15 Corp Bond Composite Yield from BondsOnline Commercial Loans 4.05 Fed Release E 2**; weighted avg rate on all
commercial loan of less than $1,000,000
* Under a proprietary agreement with Fannie Mae, OTS cannot disclose these rates.
** These rates are from surveys performed during the quarter and are adjusted to reflect the
shift in the Treasury yield curve between the survey date and the quarter-end date.
32