assessment of multifunctionality and jointness of production
TRANSCRIPT
1
Chapter 2
Assessment of multifunctionality and
jointness of production
Nadine Turpin, Lee Stapleton, Eric Perret, C. Martijn van der Heide, Guy Garrod, Floor
Brouwer, Vaclav Voltr and Dominique Cairol
Abstract
Multifunctionality is one way to reconcile agriculture with sustainable development:
agriculture, beyond the production of food and fibre, also provides important social,
environmental and economic functions to society. In general, much of the current literature on
agricultural multifunctionality is qualitative and narrative, and focuses on demonstrating the
existence of social and/or environmental functions. In this chapter, we start with the existence
of these multiple functions and we seek to measure the relationships between them through
the design of indicators of multifunctionality. We present a structured sequential framework
to guide the development of multifunctionality indicators based on the concept of joint
production. The three stages articulated in this framework are:
- identification of jointness;
- qualitative assessment of jointness;
- quantitative assessment of jointness.
2
Using data from Empirical evidence suggests that multifunctionality in agriculture is far from
being negligible.
Keywords:
multifunctionality, rural landscape, farming
Introduction
The concept of multifunctional agriculture (MFA) arose after implementation of
commitments under the Uruguay Round trade negotiations that started in 1995. Countries that
advocated the concept of multifunctional agriculture were Switzerland, Norway, Japan, Korea
as well as the European Union (EU). Dissenters included a coalition of countries known as the
Cairns Group (a 17 strong alliance composed of Australia, New Zealand, Canada and 14 less
developed countries).
Usually a distinction is made between the multifunctionality of agriculture (MFA),
which has been extensively propounded in Europe (both on political and scientific grounds),
and multifunctionality of the rural space. This chapter focuses on the former and addresses
multifunctionality of agriculture both at the farm and regional levels. Considering
multifunctionality as a paradigm for rural development, which emphasises the increasing
importance of multifunctional enterprises that link the rural with the urban (OECD 2006),
goes beyond the objective of the SEAMLESS project.
There are many definitions of MFA in circulation. The original definition, which was
espoused by the advocate countries mentioned above, refers to the joint production of
commodity and non-commodity outputs (Sakuyama 2005): agriculture, beyond the production
of food and fibre (i.e. commodities), provides important social, environmental and economic
3
functions to society. But these functions manifest themselves in products and services that are
usually not marketable (i.e. non-commodities) because most often, they exhibit public good or
quasi-public good characteristics whereby no individual or organisation can easily control the
use of or access to these products and services (Stapleton et al. 2004). However, as pointed
out by Vatn (2002), it does not mean that the notion of multifunctionality only includes a mix
of private goods and various public goods. Strictly speaking, it also comprises public bads:
effects that may have negative consequences for welfare. Furthermore, and most importantly,
the production of commodity and non-commodity outputs are mutually dependent to some
degree so that the provision of the latter cannot be decoupled or considered in isolation from
the former without risking sub-optimal provision.
Most of the multifunctionality literature is theoretical rather than empirical; refer for
example to the articles provided in Brouwer (2004) as well as Van Huylenbroek and Durand
(2003). The lack of empirical evidence that supports the theoretical ideas and insights has
already been clearly stated by the OECD (2001a, 2003). Nevertheless, there are, of course,
exceptions. Quantitative work on multifunctionality which has focused on the issue of joint
production of commodity and non-commodity outputs can be found in Belletti et al. (2003),
Bontems et al. (2005a, 2005b), OECD (2001b) and Wiggering et al. (2006). Quantitative
work on multifunctionality has also focused, for example, on how tourists value the
contribution to landscape made by farmers (Vanslembrouck and Van Huylenbroeck 2003) and
analysis of Dutch farmers’ motivation for multifunctionality (Jongeneel and Slangen 2004).
Moreover, Van der Heide et al. (2007) use a land use change model – with field survey data
as an input – to simulate multifunctional land use by applying it to a case-study area in the
Netherlands. But most of the time, the quantitative work focuses on the assessment of several
"functions" from farming activities (see Waarts 2005 for recent examples).
4
In this chapter, we propose an alternative approach: instead of assessing environmental
or social "functions" from the farming activities, we assume that agriculture provides non-
commodity outputs and we aim at designing indicators that measure the degree of
multifunctionality involved in the co-production of commodity and non-commodity outputs
by farms. It is important that decision makers can measure the sustainable development
implications of a given policy intervention in terms of how this affects the multifunctional
attributes of a given area. Policy formulation that aims at supplying commodity and non-
commodity outputs separately will lead to higher implementation costs than when the policy
considers multifunctionality and encourages farmers to supply these outputs jointly (Brunstad
et al. 2005, OECD 2001a) More specifically, measuring the degree of jointness will provide
insights into the possible ramifications of any potential decrease in the use of public funds to
support agriculture and its associated amenities in the context of the Common Agricultural
Policy (CAP). By placing multifunctionality in this prescriptive or normative context –
because it prescribes multifunctionality as an alternative strategy to land use segregation – the
focus is on the demand for and supply of the multiple functions of agriculture at both the
individual farm and regional level.
Multifunctionality has strong links to the concept of sustainability. For example,
different functions of the rural landscape – in the sense of different types of land use and
related land covers – can be of mutual benefit, for example agro-biodiversity, and generate
economic sustainability among rural entrepreneurs and promote and support ecological
sustainability in the local area. Multifunctionality is then an important element in the
paradigm of sustainability. On the other hand, the various functions can also be conflicting,
such as in the case of intensive agriculture versus water storage. We return to this point.
The relationship between multifunctionality and sustainability is not always clear-cut or
without conflict. However, SEAMLESS attempts to assess contributions of agriculture to
5
sustainable development of the rural area and therefore is inherently driven by concerns of
multifunctionality.
Therein lies the rationale and motivation for the work presented below whereby we
present a theoretical framework for joint supply based on the assumption that the degree of
jointness has consequences both in terms of commodity production costs and non-commodity
production. Based on this framework, we next derive a design for indicators of
multifunctionality based on three sequential stages with assessment of this approach
undertaken on data from Auvergne, France: a Nomenclature of Territorial Units for Statistics
(NUTS) 2 region according to Eurostat before, finally, drawing some conclusions from this
analysis.
Joint supply, theoretical framework
As noted above, we are focusing our analysis of multifunctionality in terms of the joint supply
of commodity and non-commodity outputs. Methodologically this is perhaps the most
challenging definition to analyse and operationalise in terms of the formalised economics it
requires. However couching multifunctionality in different terms such as the independent
coexistence of commodity and non-commodity outputs would be largely self-evident and as
such not require the level of analysis presented here.
Etymologically, the word ‘joint’ was originally used to describe where two bones meet
and move in contact with each other (from Old French joint and Latin junctus). This is a
reasonable metaphor for describing how this word is now being used to emphasise the
relationship between commodity and non-commodity outputs in agriculture in the sense that
their production is interdependent. Indeed, the notion of jointness is not unique to agriculture
6
and prior to its emergence in this field it had already been used to explain the existence of
firms selling multiple products (Baumol et al. 1981).
The nature of commodity outputs is unambiguous in the sense that they are economic in
nature with values determined by the market. Key agricultural commodities include crops,
livestock, flowers and raw materials for secondary production. Non-commodities refer to
environmental and social characteristics which are usually public goods; society deems non-
commodity outputs as desirable but markets do not exist to ensure a convergence between
supply and demand1. Here De Groot's (2006) classification is of interest because when there is
a market, this one is related with the services and goods provided, not to the specific functions
involved in the supply of these goods and services.
A recurrent problem associated with multifunctional attributes is that providing non-
commodities (or, non-food services) is complicated by the fact that multiple and non-
unilateral links exist between the different functions fulfilled by agriculture, the ecosystem
processes and components involved in fulfilling these functions and the sets of goods and
services provided. To the best of our knowledge, only a very recent addition to the literature
makes a clear distinction between these very different things: functions, processes and
components involved one the one side can be distinguished from the goods and services
provided, on the other side (see De Groot 2006). This distinction is important: usually a given
component of the landscape (a vegetation root matrix for example) can provide several
functions (in our case: soil retention; water regulation and filtering; nutrient regulation) and it
can be involved in the supply of several non-commodity outputs and so even the simple
description of the relationships between components, functions and services provided is often
confused. But the classification proposed by De Groot enables simplifying such a description
1 This definition of jointness is not universal: other definitions of jointness couch non-commodity outputs solely in terms of environmental characteristics, excluding the social dimension (e.g. Nowicki 2004) which could in part reflect the fact that assessment of social non-commodity outputs is hampered by a lack of available data.
7
because each function provides only one type of good and service. Of course, De Groot's
classification was elaborated first for natural and semi-natural landscapes and requires some
modification for the man-made components of landscapes.
If we take the example of rural landscapes, such landscapes have an important role to
play in the maintenance of regulation functions1 from De Groot (2006). One of these concerns
is climate regulation; fulfilling this function involves biologically mediated processes that
influence climate. Furthermore, fulfilling this function provides services, such as the
maintenance of a favourable climate for human habitation, health and cultivation. The most
important thing to recognise from De Groot’s classification, from our perspective at least, is
that the analysis of jointness should be performed only at coherent levels: jointness between
functions fulfilled, or between processes involved, or between goods and services provided.
Trying to identify relationships between the supply of a commodity and the provision of
several non-market functions will lead to conceptual difficulties that will hamper analysis and
risk producing results that are spurious.
One important point of the analysis of multifunctionality is the connection of the
various activities that take place in a landscape. In the context of this chapter, we consider that
multifunctional landscapes support different activities in the same plot of land (e.g. both
agriculture and tourism). This position is different from the literature of rural sociologists
(Van der Ploeg and Roep 2003, for example) who consider that several activities can take
place at landscape scales but are distinct on each plot of land (for us, this would be pluri-
activity).
To elaborate, a given area can be devoted to diverse but single-function land use types,
like croplands, woodlands, recreational areas; in this area, several activities are possible, like
1 Regulation functions: 'this group of functions relates to the capacity of natural and semi-natural ecosystems to regulate essential ecological processes and life support systems through bio-geochemical cycles and other biospheric processes. Regulation functions maintain a "healthy" ecosytem at different scale levels and, at the biosphere level, provide and maintain the conditions for life on Earth' (De Groot 2006).
8
farming, wood production or tourism (in the recreation areas). But the large paths that cross
the productive woods are built for trucks where tourism would prefer networks of small lanes.
In the farmland area, the fields are fenced, the old lanes have been ploughed and the hedges
are not part of the productive system and thus poorly kept. The recreational areas look like
tourists would derive amenity value from them but are not related to the cultural heritage of
the area and their access is controlled. The different activities are not connected to each other:
this is pluri-activity. By contrast, a multifunctional landscape may supply farm outputs along
with tourism services on multifunctional farms. Of course, tourism services can also be
supplied by activities other than farming, wood and genetic biodiversity in multifunctional
forests and have a cultural value because of the scenery that includes fields amidst diverse
forests, along with the existence of animal species that need forests margins close to open
fields.
Thus, we focused our analysis on multifunctionality (and not on pluri-activity) and we
argue that the analysis of jointness has to be performed either between functions, or processes
or goods and services produced but without crossing these different levels. As a consequence,
the analysis of jointness at the farm level will consider jointness between the supply of
commodity and non-commodity outputs.
Towards indicators of multifunctionality
Determining indicators of multifunctionality (based on the jointness definition) includes three
important and sequential steps:
- step 1: identification of jointness;
- step 2: qualitative assessment of jointness;
- step 3: quantitative assessment of jointness.
9
We need to identify the existence of jointness to assess whether the observed levels of
commodity outputs are produced along with joint non-commodity outputs or according to a
more classical profit function (with separable commodity and non-commodity outputs). This
identification can be performed in two stages:
- identification of multifunctionality at the appropriate scale: does the farm, or the area,
fulfil several functions in the three pillars of sustainable development? The presence of
multifunctionality can be identified through existing indicators along the economic,
environmental and social dimensions of sustainable development;
- in the case where multifunctionality is identified, there is a need to assess whether there
is a joint supply of commodity and non-commodity outputs, or whether jointness occurs
between processes (for example, the agricultural activity can mobilise biota for storage
and recycling of nutrients, along with the conversion of solar energy to edible plants and
provide a large variety in landscapes with potential recreational and cultural value).
The qualitative assessment of jointness is necessary to determine if the degree of
jointness is strong or weak and to determine whether the provision of non-commodity output
increases with the commodity output. Finally, the quantitative assessment should provide the
functions describing the relationship between commodity and non-commodity outputs at the
farm level. This understanding leads to three main areas of investigation:
- does the evaluated policy improve sustainability through a development of
multifunctional features of agriculture in the targeted areas? In other words is the ex-
ante impact of policies positive along the three dimensions of sustainable development
(economy, environment, social)?
10
- does the degree of multifunctionality increase? A regulator may wish to sustain the
development of the area she manages through the increase of multifunctional
agriculture. Thus we have to estimate the extent to which this multifunctionality
increases, or to provide measurements: in places where the multifunctionality increases
(or simply develops) is it possible to determine the extent of this increase (i.e. can we at
least rank different policies according to their multifunctionality credentials?);
- does the nature of multifunctionality evolve because of the evaluated policy? The non-
commodity outputs of agriculture are non conventional products, but intuitively
according to the concept of joint production, most of them result from specific aspects
of the agricultural production process. Some of these outputs are closely tied to
agricultural production and others1 compete with agricultural production for land or
other resources. In this sense, any policy dealing with agricultural production is likely to
modify the nature of the multifunctional features in a region.
Step 1: Identification of jointness
De Groot's (2006) classification of functions from natural and semi-natural landscapes
distinguishes five categories of functions: regulation, habitat, production, information and
carrier functions2. What is particularly appealing in this approach is that:
- the function categories are independent from each other. The functions provided by the
farms can be depicted in a coordinate system with categories of function as axes;
because these categories of functions are independent, the axes are orthogonal, and thus
distances can be measured between farms in this coordinate system;
1 Like the establishment or restoration of wetlands, or the creation of wildlife habitat on farmland. 2 De Groot (2006) proposes to 'translate the ecological complexity into a more limited number of ecosystem functions. These functions, in turn, provide the goods and services that are valued by humans. (...) ecosystem functions are defined as "the capacity of natural processes and components to provide goods and services that satisfy human needs, directly or indirectly'''.
11
- there is a clear distinction between the functions, the ecosystems and components
involved in these functions, and the goods and services provided by these functions
(such a clear distinction is often ignored in the literature).
Jointness at the farm gate
At the farm level, starting from De Groot's work to identify the existence of
multifunctionality, the identification of jointness focuses on the supply of goods and services
at the farm level. We relied on studies that aim at assessing functions from Farm Accountancy
Data Network (FADN) data and expertise (Perret 2006). Using this expertise, identification of
multifunctionality between an array of different economic, environmental and social outputs
can be systematically undertaken (Table 2.1).
12
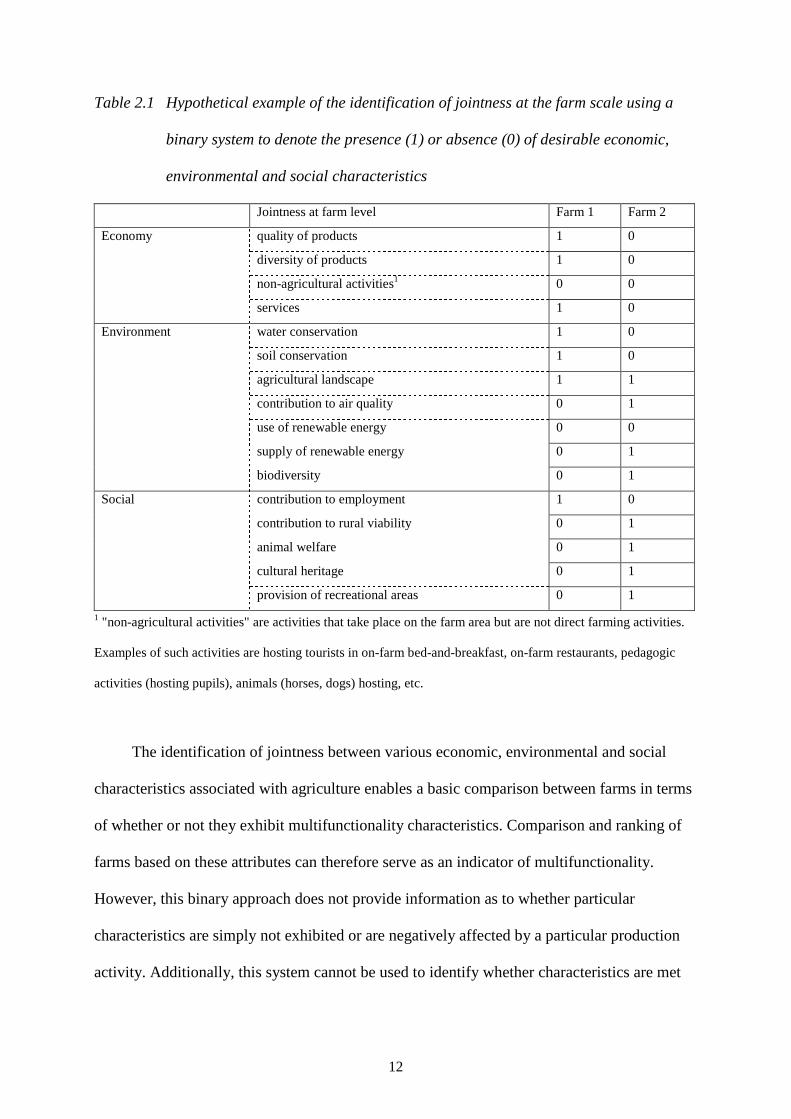
Table 2.1 Hypothetical example of the identification of jointness at the farm scale using a
binary system to denote the presence (1) or absence (0) of desirable economic,
environmental and social characteristics
Jointness at farm level Farm 1 Farm 2
quality of products 1 0
diversity of products 1 0
non-agricultural activities1 0 0
Economy
services 1 0
water conservation 1 0
soil conservation 1 0
agricultural landscape 1 1
contribution to air quality 0 1
use of renewable energy 0 0
supply of renewable energy 0 1
Environment
biodiversity 0 1
contribution to employment 1 0
contribution to rural viability 0 1
animal welfare 0 1
cultural heritage 0 1
Social
provision of recreational areas 0 1
1 "non-agricultural activities" are activities that take place on the farm area but are not direct farming activities.
Examples of such activities are hosting tourists in on-farm bed-and-breakfast, on-farm restaurants, pedagogic
activities (hosting pupils), animals (horses, dogs) hosting, etc.
The identification of jointness between various economic, environmental and social
characteristics associated with agriculture enables a basic comparison between farms in terms
of whether or not they exhibit multifunctionality characteristics. Comparison and ranking of
farms based on these attributes can therefore serve as an indicator of multifunctionality.
However, this binary approach does not provide information as to whether particular
characteristics are simply not exhibited or are negatively affected by a particular production
activity. Additionally, this system cannot be used to identify whether characteristics are met
13
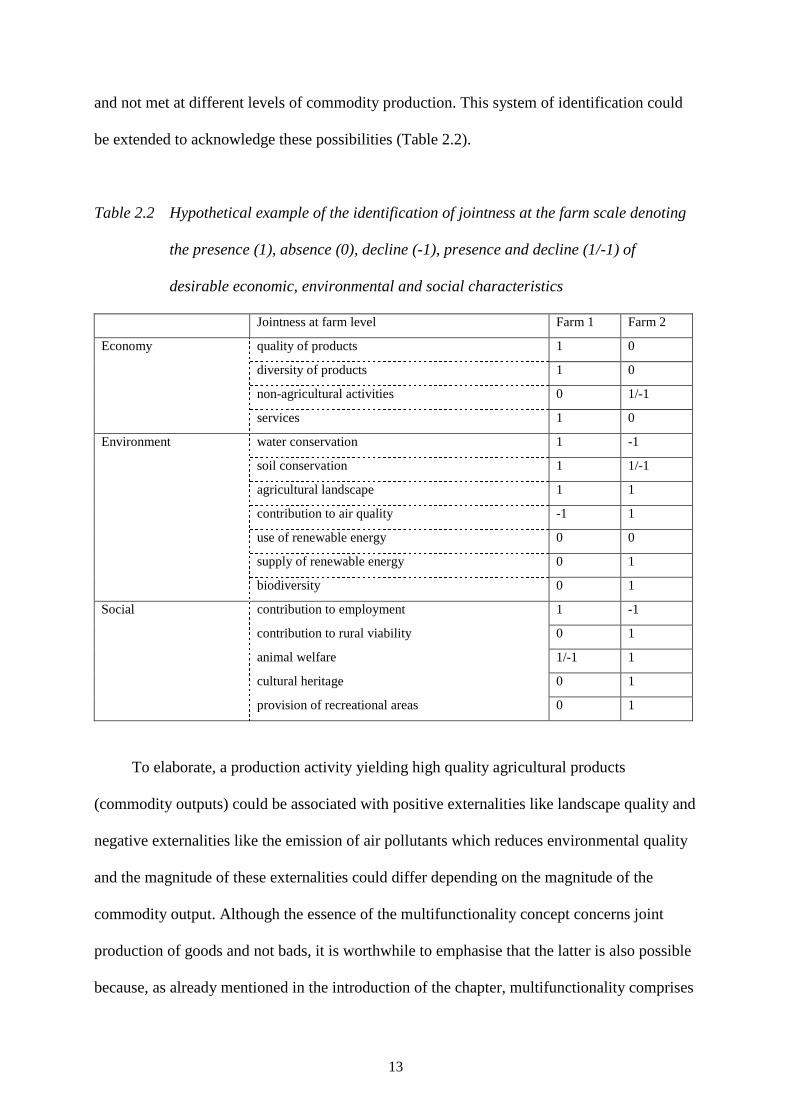
and not met at different levels of commodity production. This system of identification could
be extended to acknowledge these possibilities (Table 2.2).
Table 2.2 Hypothetical example of the identification of jointness at the farm scale denoting
the presence (1), absence (0), decline (-1), presence and decline (1/-1) of
desirable economic, environmental and social characteristics
Jointness at farm level Farm 1 Farm 2
quality of products 1 0
diversity of products 1 0
non-agricultural activities 0 1/-1
Economy
services 1 0
water conservation 1 -1
soil conservation 1 1/-1
agricultural landscape 1 1
contribution to air quality -1 1
use of renewable energy 0 0
supply of renewable energy 0 1
Environment
biodiversity 0 1
contribution to employment 1 -1
contribution to rural viability 0 1
animal welfare 1/-1 1
cultural heritage 0 1
Social
provision of recreational areas 0 1
To elaborate, a production activity yielding high quality agricultural products
(commodity outputs) could be associated with positive externalities like landscape quality and
negative externalities like the emission of air pollutants which reduces environmental quality
and the magnitude of these externalities could differ depending on the magnitude of the
commodity output. Although the essence of the multifunctionality concept concerns joint
production of goods and not bads, it is worthwhile to emphasise that the latter is also possible
because, as already mentioned in the introduction of the chapter, multifunctionality comprises
14
not only public goods, but also public bads. Such a system could be used in either an ex-post
or ex-ante context i.e. based on available data or forecasting potential implications of a given
policy intervention (such as liberalization of European agricultural markets). Of course,
assessment here relies still only on expertise.
Jointness at the regional level
Preliminary experiments in five zones of the Rhône-Alpes region (France) emphasized that
aggregating individual data concerning multifunctionality from the farm level to a larger area
is far from being evident (Gillette et al. 2005a). Aggregating individual information about
jointness enabled the authors to design a representation of the multifunctionality of agriculture
in a larger zone (groups of municipalities or a small region). This representation was
consistent with the common knowledge of the history of the different areas but when
compared with local surveys of the relevant areas, it was incomplete because synergies
between various farms enhanced the regional multifunctionality (Gillette et al. 2005b).
At the regional level, multifunctionality of agriculture relies on two different concepts:
the variety of combinations of commodity and non-commodity outputs in the farms and the
synergies and antagonisms between these combinations. As such, the farms can combine the
provision of commodity and non-commodity outputs in very different ways. For example,
some farms can breed sheep and maintain pastures that contribute to the local cultural heritage
but other farms in the same area can choose to restore traditional buildings for hosting tourists
and contribute in a different manner to this local cultural heritage. Other examples involve the
provision of specific landscape patterns that favour the persistence of particular animals or
plants; these specific patterns may be the consequence of maintenance of some hedges by
small cattle farms that need trees for their animals, along with mosaics of pastures and cereals
fields by mixed farms and specific phytosanitary protection practices in large intensive farms.
15
Moreover, identifying the various ways of combining commodity and non-commodity outputs
in a population of farms is of importance when the ecological or social processes exhibit
threshold effects1, because there is a need to determine whether the farms that produce them
jointly are numerous enough for the global provision of the ecological (or social service) or
whether their efforts are lost because they are too few to do so.
The second concept is related to the fact that the various ways of combining commodity
and non-commodity outputs in a given region can exhibit synergies or be competitors.
Intensive farms selling high quality products at the farm-gate along with improvement of the
surrounding scenery may benefit from the preservation of hedges by neighbouring low-
intensity dairy farms and at the same time compete with them for land because the latter need
large areas to be profitable. Moreover, the average water quality in the area may be good only
because the two types of farms are present and the intensive farms may need that the less-
intensive ones keep their activity despite competition (otherwise they would be forced to
lower their own pressure on water quality).
Step 2: Qualitative assessment of jointness
Identification of jointness, discussed above, is an important first step but as an indicator of
multifunctionality it is limited in terms of the information it presents to stakeholders.
Qualitative assessment of jointness can extend such an analysis by providing answers to two
different questions which are not addressed above:
- Is the degree of jointness strong or weak?
- What is the origin of jointness? Jointness can be due to: technical interdependencies in
the production process; the existence of a non-allocable production factor i.e. when
different products are obtained from a single input such as the case of wheat and straw 1 Threshold effects on ecological discontinuities have been defined by Muradian (2001) as sudden modifications of a given system property, resulting from the soft and continuous variation of an independent variable.
16
production or of ovine meat and wool from sheep; outputs competing for an allocable
and fixed input so that any increase in the production of one output reduces the quantity
of the fixed input available for the production of the other product (OECD 2001a).
Furthermore, a contribution to qualitative assessment of jointness may result from
surveys aiming at measuring the public demand for different functions. In an interesting work
on public demand for rural landscapes, Hall et al. (2004) have tried to capture information
about public preferences for goods and services that are provided by agriculture and the
countryside. Rather than looking at the production side, at the services and goods that a
system offers, the authors decided to look at the consumption side, at the goods and services
that are demanded and valued by consumers. The methods they distinguish as being mostly
used to measure consumer preferences consist basically of three types of survey instruments:
- pools and surveys conducted by conservation organisations, government departments
and the EU;
- more rigorous surveys trying to quantify public preferences through structured trade-off
methods using willingness-to-pay approaches;
- deliberative survey methods as a compromise between polls and valuation methods.
All three methods have their drawbacks which they suggest can possibly be (partially)
overcome by a combination of multicriteria analysis and choice experiments. Interviews with
specific key stakeholders could also be applied as a complement to the other methods.
Another approach would be based on spatial analysis of the land use pattern. The basic
idea is to visualize the land cover and use of a certain territory and to associate each class or
combination of classes with functions provided, or the related goods and services. Spatial
analysis can help to create the maps of land cover and use. Expert knowledge, (participative)
17
surveys or interviews and field visits can then help to ´fill in´ these maps with the functions
that can be found. It is possible to combine or overlap several maps at different levels
covering, for example: land cover, land use and landscape as well as maps revealing more
socio-economic data such as population density, activities in certain sectors and fluxes of
people and goods and services (networks). This approach is suggested but not tested by
Brandt and Vejre (2004) and Vejre et al. (2006). Knickel et al. (2004) refer to
multifunctionality schemes as a way to directly ´map´ the interrelated functions associated
with a certain territory or activity. A promising method is interactive mapping that can be
useful as a complementary method to (open) interviews and field visits, or other participatory
research methods – questions as to the goods and services provided are directly related to the
maps with the representation of the land cover mosaic.
Qualitative assessment of jointness could be particularly important to ex-ante analyses:
for example, if a particular commodity and non-commodity output are competing for an
allocable fixed input then as one output increases, the other necessarily declines and it is
unlikely that any change in policy would alter this underlying property.
Step 3: Quantitative assessment of jointness
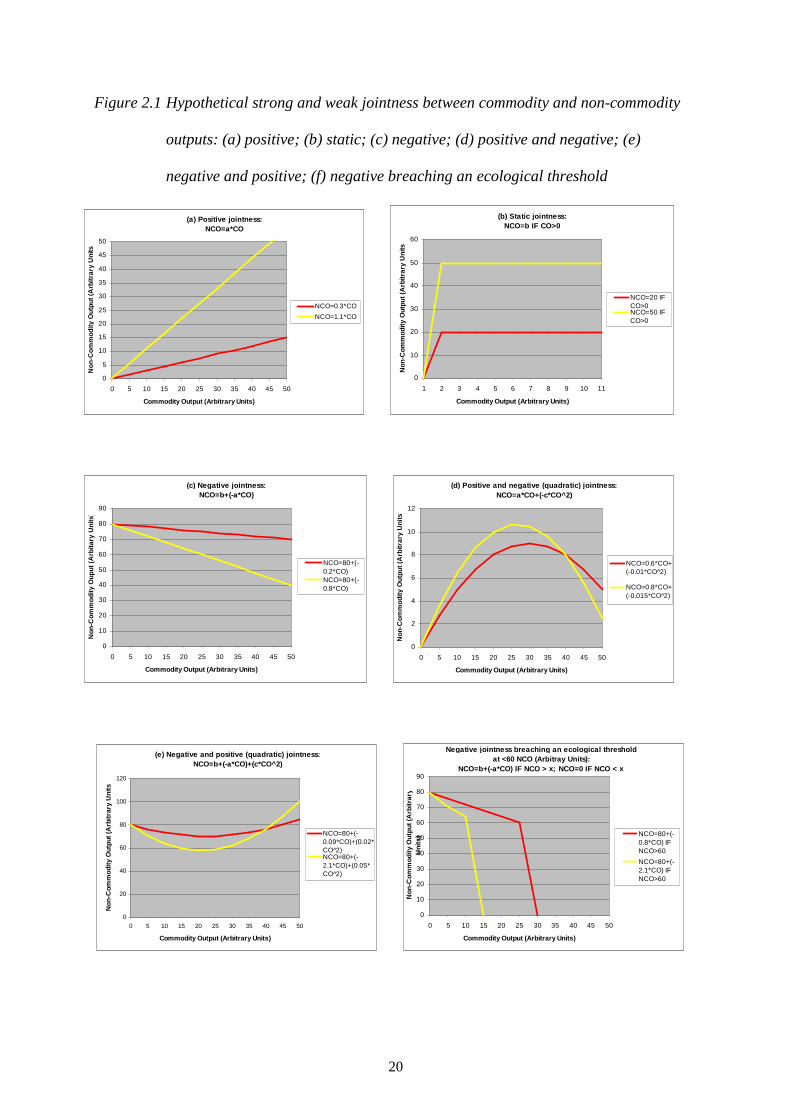
The final, and most difficult, stage is quantitative assessment of jointness which involves
specifying the magnitude of the coefficient(s) in each particular jointness function. Graphical
examples of these different types of jointness including their most basic underlying equations
(functional forms) are provided; the magnitudes of these coefficients are illustrative to reflect
the fact that jointness can be strong or weak (Figure 2.1). This is an extension of work
currently available in the literature on jointness which has tended not to explore these
underlying equations or a range of potential functional forms. The case of positive jointness
(Figure 2.1a) could be associated with rural development policies in the EU, specifically the
18
introduction of the second pillar to the CAP; this theoretical relationship has been articulated
by Belletti et al. (2003) for example. Where increases in commodity outputs are associated
with increases in non-commodity outputs (Figure 2.1a) this could be denoted as true
multifunctionality. The policy implication of such positive jointness, ceteris paribus, is,
simply, dual maximisation of both commodity and non-commodity outputs. As an alternative,
Van Huylenbroeck (2003) suggests that agriculture is in most cases a necessary condition to
obtain the non-commodity output, but the yield in itself is not as important. This could be
termed as static jointness or static multifunctionality and it is possible to express Van
Huylenbroek’s idea graphically (Figure 2.1b). Although increases in the commodity output do
not increase levels of the non-commodity output, neither do they decrease this output.
Therefore, the policy implication of such static jointness, ceteris paribus, is maximisation of
the commodity output.
Negative jointness (Figure 2.1c) is associated with an agricultural modernisation agenda
where non-commodity outputs are secondary considerations compared to agricultural
production (Belletti et al. 2003); in the context of EU agriculture this could tally with the
historical emphasis on supporting agricultural production through price support measures.
However, in the case of negative jointness the production of a commodity output, forsaking a
given amount of the non-commodity output could illustrate a) the existence of a negative
externality i.e. the non-commodity output is a non-market good which is not internalised in
production decisions b) the non-commodity output is wholly or partially internalised by the
market but its marginal value is lower than the commodity output resulting in a rational trade-
off. Determining the optimal production of the commodity output versus the non-commodity
output where the latter is an externality requires some assessment of the value of the non-
commodity output, perhaps using a ‘stated preference’ valuation technique like surveying
individuals to determine their willingness to pay for the non-commodity output. The case of
19
positive and negative jointness (Figure 2.1d) has been articulated graphically in OECD
(2001b). Going further, we can note that if the marginal value of the commodity and non
commodity output are equal then the optimal solution is the turning point of the function.
Mathematically:
dCO
dNCO = a+(-2c*CO) = 0
CO = c2
a
−−
2
2
dCO
NCOd = -2c (2.1)
In the case of negative to positive jointness (Figure 2.1e) dual maximisation of
commodity and non-commodity outputs is only a viable option if the reductions in non-
commodity output at low levels of commodity output, before the turning point is reached and
both outputs start to rise together, is not associated with the breaching of any ecological
thresholds i.e. we need a priori knowledge that environmental degradation and pollution are
occurring in a linear fashion. In reality, many important environmental non-commodity
outputs have critical ranges and thresholds which, if breached, could result in drastic and
uncontrollable loss of that non-commodity output and thus, potentially, the commodity
depending on the interaction between the two outputs (Figure 2.1f).
20
Figure 2.1 Hypothetical strong and weak jointness between commodity and non-commodity
outputs: (a) positive; (b) static; (c) negative; (d) positive and negative; (e)
negative and positive; (f) negative breaching an ecological threshold
(a) Positive jointness:NCO=a*CO
0
5
10
15
20
25
30
35
40
45
50
0 5 10 15 20 25 30 35 40 45 50
Commodity Output (Arbitrary Units)
Non
-Com
mod
ity O
utpu
t (A
rbitr
ary
Uni
ts)
NCO=0.3*CO
NCO=1.1*CO
(b) Static jointness: NCO=b IF CO>0
0
10
20
30
40
50
60
1 2 3 4 5 6 7 8 9 10 11
Commodity Output (Arbitrary Units)N
on-C
omm
odity
Out
put (
Arb
itrar
y U
nits
)
NCO=20 IFCO>0NCO=50 IFCO>0
(c) Negative jointness: NCO=b+(-a*CO)
0
10
20
30
40
50
60
70
80
90
0 5 10 15 20 25 30 35 40 45 50
Commodity Output (Arbitrary Units)
Non
-Com
mod
ity O
uput
(Arb
itary
Uni
ts)
NCO=80+(-0.2*CO)NCO=80+(-0.8*CO)
(d) Positive and negative (quadratic) jointness: NCO=a*CO+(-c*CO^2)
0
2
4
6
8
10
12
0 5 10 15 20 25 30 35 40 45 50
Commodity Output (Arbitrary Units)
Non
-Com
mod
ity O
utpu
t (A
rbitr
ary
Uni
ts)
NCO=0.6*CO+(-0.01*CO^2)
NCO=0.8*CO+(-0.015*CO^2)
(e) Negative and positive (quadratic) jointness:NCO=b+(-a*CO)+(c*CO^2)
0
20
40
60
80
100
120
0 5 10 15 20 25 30 35 40 45 50
Commodity Output (Arbitrary Units)
Non
-Com
mod
ity O
utpu
t (A
rbitr
ary
Uni
ts)
NCO=80+(-0.09*CO)+(0.02*CO^2)NCO=80+(-2.1*CO)+(0.05*CO^2)
Negative jointness breaching an ecological threshold at <60 NCO (Arbitray Units):
NCO=b+(-a*CO) IF NCO > x; NCO=0 IF NCO < x
0
10
20
30
40
50
60
70
80
90
0 5 10 15 20 25 30 35 40 45 50
Commodity Output (Arbitrary Units)
Non
-Com
mod
ity O
utpu
t (A
rbitr
ary
U
nits
) NCO=80+(-0.8*CO) IFNCO>60
NCO=80+(-2.1*CO) IFNCO>60
21
An ex-post empirical investigation of the magnitudes of non-commodity outputs at
different levels of commodity output could elucidate a number of relationships; from an ex-
ante perspective it is important to understand whether a particular policy will:
- shift the commodity/non-commodity relationship from one trajectory to another (alter
the underlying functional form of the relationship) e.g. from negative jointness (Figure
2.1c) to positive jointness (Figure 2.1a);
- shift the commodity/non-commodity relationship off one trajectory into a mutual
decline because of the breaching of an ecological threshold (relevant to Figure 2.1c and
Figure 2.1e);
- make no alteration to the commodity/non-commodity trajectory but alter the position on
that trajectory e.g. concomitant increases in commodity and non-commodity output in
Figure 2.1a;
- alter the strength of the association between commodity and non-commodity outputs
e.g. from weak positive jointness to strong positive jointness.
An ex-ante analysis such as this obviously depends critically on a case-by-case ex-post
empirical investigation of an array of different commodity and non-commodity output
relationships i.e. it’s important to understand past relationships between commodity and non-
commodity outputs in order to predict future relationships in response to policy changes.
Furthermore, the origin of jointness as discussed above is particularly important to aiding an
ex-ante analysis. For example, if particular commodity and non-commodity outputs compete
for an allocable fixed input, an increase in one output could only be achieved by a decline of
the other. In the short run, farms will adapt to policy changes by altering their position on a
trajectory. In the long run, they can alter that linkage, for example by achieving a more
22
rational use of labour through the adoption of labour saving technologies but this would
require time and investment.
Testing against data in Europe
Identification of jointness
Jointness at the farm gate
Some drivers of farm income are drawn from the FADN database and the variables selected
include outputs supplied, inputs used, as well as compensatory payments for participation in
agri-environment programmes and other farm-support programmes. These data concern only
values for commodity outputs and their drivers, because no data is available from FADN for
the provision of non-commodity outputs. Nevertheless, these data enable a rough comparison
of the evolution of the production structure of the farms and provide insights into how they
combine their different activities.
We analyse the drivers for farm income on a per hectare basis to enable consistent
comparison between farms with quite different sizes. Table 2.3 depicts the regression
coefficients for equation (2.2):
farm income = β0 + β1 O + β2 I + β3 IC + β4 S + β5 ES + β6 ES.O + β7 ES.I + β8 ES.IC + β9 ES.S + ε (2.2)
where O is the outputs (in euros/ha), I the inputs used, IC the intermediate consumption, S the
amount of subsidies received (excluding environmental subsidies), ES the amount of
environmental subsidies and ES.O, ES.I, ES.IC, ES.S are interaction terms (environmental
subsidies crossed with outputs, inputs, intermediate consumptions and subsidies respectively).
23
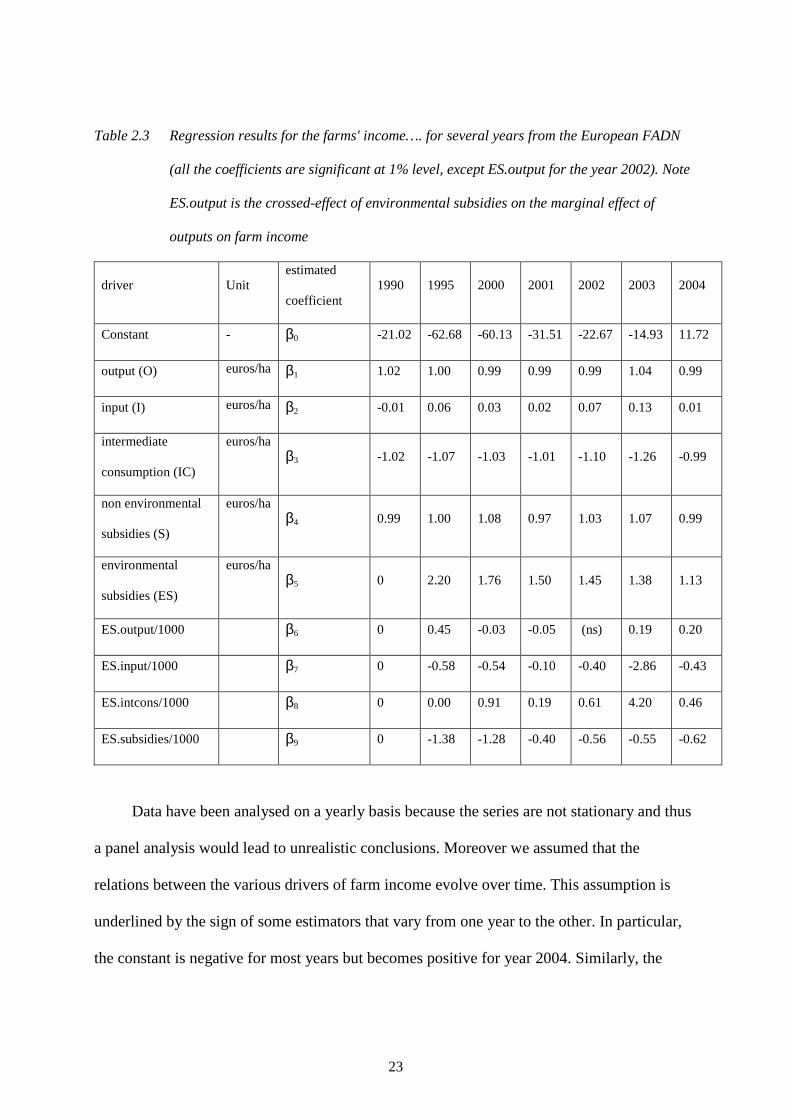
Table 2.3 Regression results for the farms' income…. for several years from the European FADN
(all the coefficients are significant at 1% level, except ES.output for the year 2002). Note
ES.output is the crossed-effect of environmental subsidies on the marginal effect of
outputs on farm income
driver Unit estimated
coefficient 1990 1995 2000 2001 2002 2003 2004
Constant - β0 -21.02 -62.68 -60.13 -31.51 -22.67 -14.93 11.72
output (O) euros/ha β1 1.02 1.00 0.99 0.99 0.99 1.04 0.99
input (I) euros/ha β2 -0.01 0.06 0.03 0.02 0.07 0.13 0.01
intermediate
consumption (IC)
euros/ha β3 -1.02 -1.07 -1.03 -1.01 -1.10 -1.26 -0.99
non environmental
subsidies (S)
euros/ha β4 0.99 1.00 1.08 0.97 1.03 1.07 0.99
environmental
subsidies (ES)
euros/ha β5 0 2.20 1.76 1.50 1.45 1.38 1.13
ES.output/1000 β6 0 0.45 -0.03 -0.05 (ns) 0.19 0.20
ES.input/1000 β7 0 -0.58 -0.54 -0.10 -0.40 -2.86 -0.43
ES.intcons/1000 β8 0 0.00 0.91 0.19 0.61 4.20 0.46
ES.subsidies/1000 β9 0 -1.38 -1.28 -0.40 -0.56 -0.55 -0.62
Data have been analysed on a yearly basis because the series are not stationary and thus
a panel analysis would lead to unrealistic conclusions. Moreover we assumed that the
relations between the various drivers of farm income evolve over time. This assumption is
underlined by the sign of some estimators that vary from one year to the other. In particular,
the constant is negative for most years but becomes positive for year 2004. Similarly, the
24
marginal effect of the environmental subsidies on the output is negative or positive depending
on the year considered. Analysis of regression (2.2) suggests that:
- the effect of output and subsidies on farm income does not vary much from one year to
the other, although the output price and the producer support subsidies rates are totally
different from the early 1990s to the mid 2000s: in the early 1990s, agricultural products
have rather high prices that were drastically decreased in 1992 and then in 2000, while
subsidies greatly increased (producer support shifted from price support to direct
income support);
- there are significant differences for the effect of the inputs and intermediate
consumptions drivers between the years. This suggests that there has been an evolution
of the farms' combination of means and we can assume a modification in the jointness
rates between commodity and non-commodity outputs within the farms;
- some environmental outputs are subsidised, but the influence of the agri-environmental
support programmes reduced since the mid 1990s, although the payments increased
during that period. This suggest that despite environment is more and more subsidised
along time (on our sample data, the environmental payments increased by a factor of 2.3
between 1995 and 2004), the reorganisation of the other drivers compensate their
relative effect on farm income over time;
- more important is the effect of the environmental subsidies on the marginal effect of
output, input, intermediate consumption and non-environmental subsidies on the farm
income: the environmental subsidies moderate the marginal effect of the input,
intermediate consumption and non-environmental ones on the farm income. Moreover,
the environmental subsidies moderate the marginal effect of the outputs on the farm
income in the early 2000s, but this effect reverses in 2003 and 2004, just as if after
several years of environmental programmes, some of the farms have been able to
25
reorganise themselves to take advantage of a higher degree of jointness between
commodity and non-commodity outputs.
Even restricted to economic data, it is possible to conclude that the EU environmental
policies have modified the way the farms combine their intermediate consumptions and the
inputs they use in their profit function: there are links between the provision of environmental
outputs and the evolution of the farm profit function. The characterisation of these links
deserves further investigation that can be performed at the regional level only because it
requires a description of the non-commodity outputs supplied (and thus more precision in the
data used).
Jointness at the farm gate in a region
From a set of FADN farms in the Auvergne NUTS 2 region, we used the method developed
by Perret (2006) to assess whether farms fulfil different functions. Once the existence of
multifunctionality was determined, we analysed the origin of jointness in these farms and
performed a qualitative assessment of jointness between commodity and non-commodity
outputs at the farm scale. Using only expertise and FADN data it is was not possible to
analyse all the functions depicted in Table 2.3 at the farm scale. These functions were
approached by a set of indicators:
- F2: farm-gate food provider:
- ind 02 This indicator has the value 1 if the farm processes agricultural products
into ready-to-sell food (and 0 otherwise).
- F4: contribution to rural viability:
- ind 7-1 Contribution to the maintenance of rural viability when the farm is located
in a low density rural area. This indicator has the value 1 when the number of on-
26
farm households is greater than 2 and the farm is located in a low-density area and
the value 0 when the number of on-farm households is less than 2 or if the
information is not precise enough so that this indicator cannot be assessed.
- ind 7-2 Contribution to the maintenance of rural viability when the farm is located
in an area frequented by tourists. In this case, the role of farms is more important
to the maintenance of scenery rather than in terms of providing employment (that
already exist through tourism). This indicator has the value 1 when the farm,
located in an area frequented by tourists, breeds cattle and the value 0 if this is not
the case or if the information is not precise enough so that this indicator cannot be
assessed.
- F5: employment:
- ind 9 Family employment. This indicator has the value 1 if total family
employment on the farm exceeds 1 unit of farm employment, and the value 0 if
this is not the case.
- ind 10 Farm employment. This indicator has the value 1 when paid labour minus
seasonal employment is greater than 0.5 units of farm employment, and the value
0 if this is not the case.
- ind 11 Seasonal employment. This indicator has the value 1 when seasonal
employment exceeds 0.2 units of farm employment and the value 0 if this is not
the case.
- F6: landscape:
- ind 12-1 Contribution to open space. This indicator is a function of several
variables, and has the value 1 when the share of on-farm forests, moors and low
productive areas in total on-farm area and grazed land is below 5%.
27
- ind12-3 Contribution to landscape patchwork. This indicator is derived using a
scoring mechanism: the main crops are grouped together (cereals, corn, oil seeds,
etc.) and each group is given a value of 1 when its area is greater than 10% of the
total area, and a percentage of points for lower areas (for example, a group sharing
5% of the total area is assessed a score of 0.5 point). This indicator has the value 1
when the total score is greater than 2 and the value 0 if less than 2.
- F7: water quality:
- ind 13 Water quality. The farm is considered to be contributing to good water
quality when the total amount of organic nitrogen spread is lower than 70 kgN/ha
and either (a) the share of agricultural area with bare soils in winter if lower than
30% or (b) for a share of bare soils in winter comprised between 30 and 60%, the
farmer joins a programme of nitrate or pesticides management or (c) the share of
organic farming is greater than 75% or (d). for a share of bare soils greater than
60%, the share of organic farming is greater than 75%. When one of these
conditions is met this indicator is given a value of 1, otherwise a value of 0.
- F8: biodiversity.
- ind 16 Management of ecologically rich habitats. This indicator has the value 1
when the farmer’s share of low productive grassland is greater than 12.5% (when
he uses collective pastures) and 25% when he does not use collective pastures.
- ind 17 Diversity of crops. This indicator is derived using a scoring mechanism:
each crop is assessed a score (see ind12-3 for details of calculation). When the
total score is greater than 3, ind 17 = 1.
28
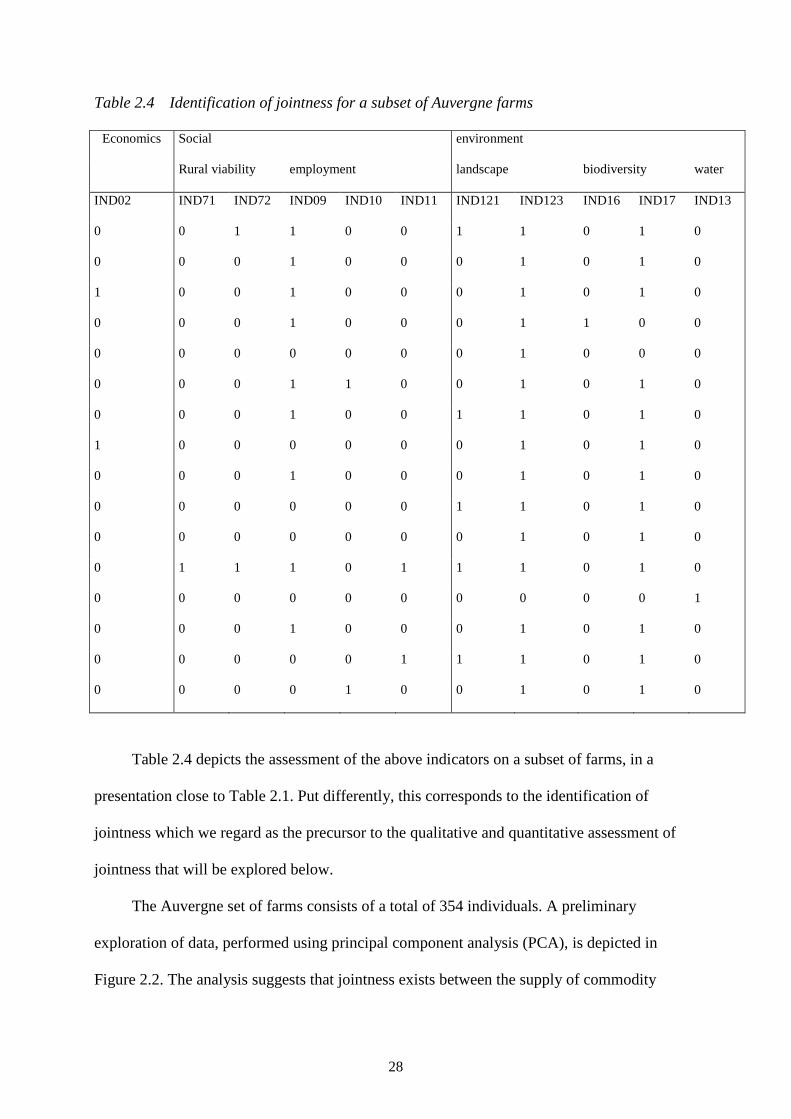
Table 2.4 Identification of jointness for a subset of Auvergne farms
Economics Social environment
Rural viability employment landscape biodiversity water
IND02 IND71 IND72 IND09 IND10 IND11 IND121 IND123 IND16 IND17 IND13
0 0 1 1 0 0 1 1 0 1 0
0 0 0 1 0 0 0 1 0 1 0
1 0 0 1 0 0 0 1 0 1 0
0 0 0 1 0 0 0 1 1 0 0
0 0 0 0 0 0 0 1 0 0 0
0 0 0 1 1 0 0 1 0 1 0
0 0 0 1 0 0 1 1 0 1 0
1 0 0 0 0 0 0 1 0 1 0
0 0 0 1 0 0 0 1 0 1 0
0 0 0 0 0 0 1 1 0 1 0
0 0 0 0 0 0 0 1 0 1 0
0 1 1 1 0 1 1 1 0 1 0
0 0 0 0 0 0 0 0 0 0 1
0 0 0 1 0 0 0 1 0 1 0
0 0 0 0 0 1 1 1 0 1 0
0 0 0 0 1 0 0 1 0 1 0
Table 2.4 depicts the assessment of the above indicators on a subset of farms, in a
presentation close to Table 2.1. Put differently, this corresponds to the identification of
jointness which we regard as the precursor to the qualitative and quantitative assessment of
jointness that will be explored below.
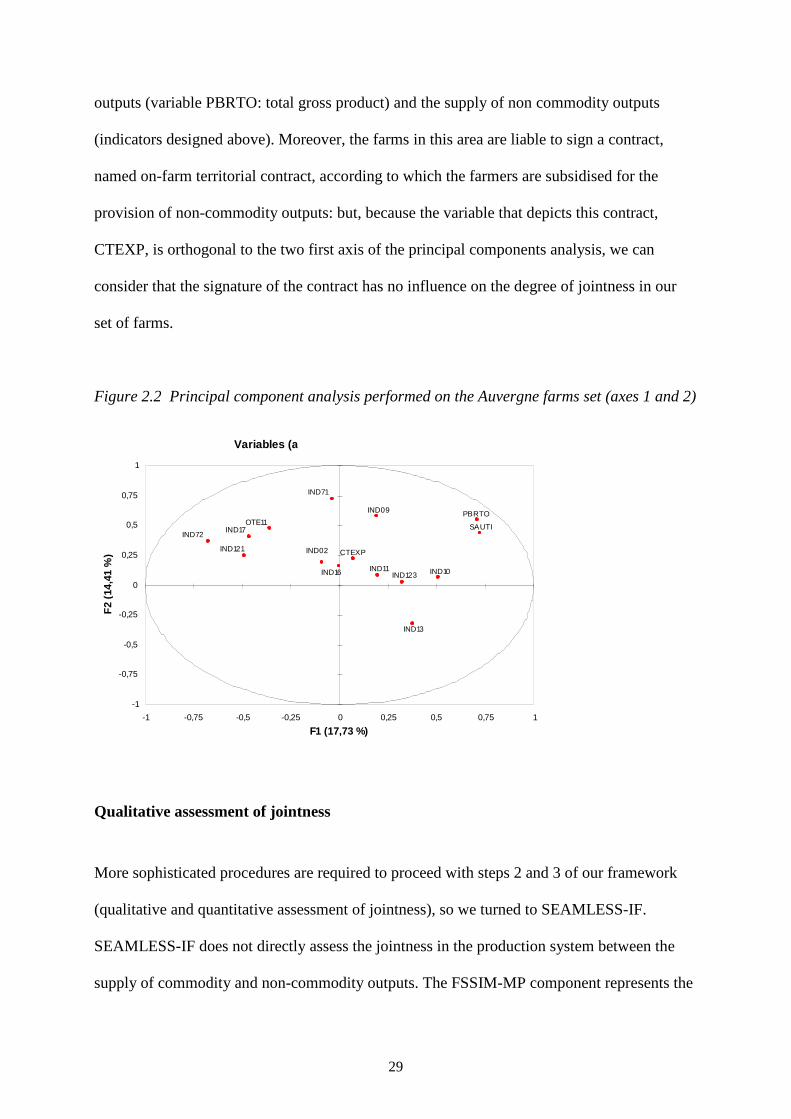
The Auvergne set of farms consists of a total of 354 individuals. A preliminary
exploration of data, performed using principal component analysis (PCA), is depicted in
Figure 2.2. The analysis suggests that jointness exists between the supply of commodity
29
outputs (variable PBRTO: total gross product) and the supply of non commodity outputs
(indicators designed above). Moreover, the farms in this area are liable to sign a contract,
named on-farm territorial contract, according to which the farmers are subsidised for the
provision of non-commodity outputs: but, because the variable that depicts this contract,
CTEXP, is orthogonal to the two first axis of the principal components analysis, we can
consider that the signature of the contract has no influence on the degree of jointness in our
set of farms.
Figure 2.2 Principal component analysis performed on the Auvergne farms set (axes 1 and 2)
Variables (axes F1 et F2 : 32,14 %)
PBRTOOTE11
SAUTI
CTEXPIND02
IND71
IND72
IND09
IND10IND11
IND121
IND123
IND13
IND16
IND17
-1
-0,75
-0,5
-0,25
0
0,25
0,5
0,75
1
-1 -0,75 -0,5 -0,25 0 0,25 0,5 0,75 1
F1 (17,73 %)
F2
(14,
41 %
)
Qualitative assessment of jointness
More sophisticated procedures are required to proceed with steps 2 and 3 of our framework
(qualitative and quantitative assessment of jointness), so we turned to SEAMLESS-IF.
SEAMLESS-IF does not directly assess the jointness in the production system between the
supply of commodity and non-commodity outputs. The FSSIM-MP component represents the
30
farmer's behaviour with regard to the possible relations between the production factors inside
the production process of commodity outputs. Environmental non-commodity outputs are
modelled as externalities (their supply is non-volunteer) or as constraints in the production
process of commodity outputs (see chapter 5 for more details).
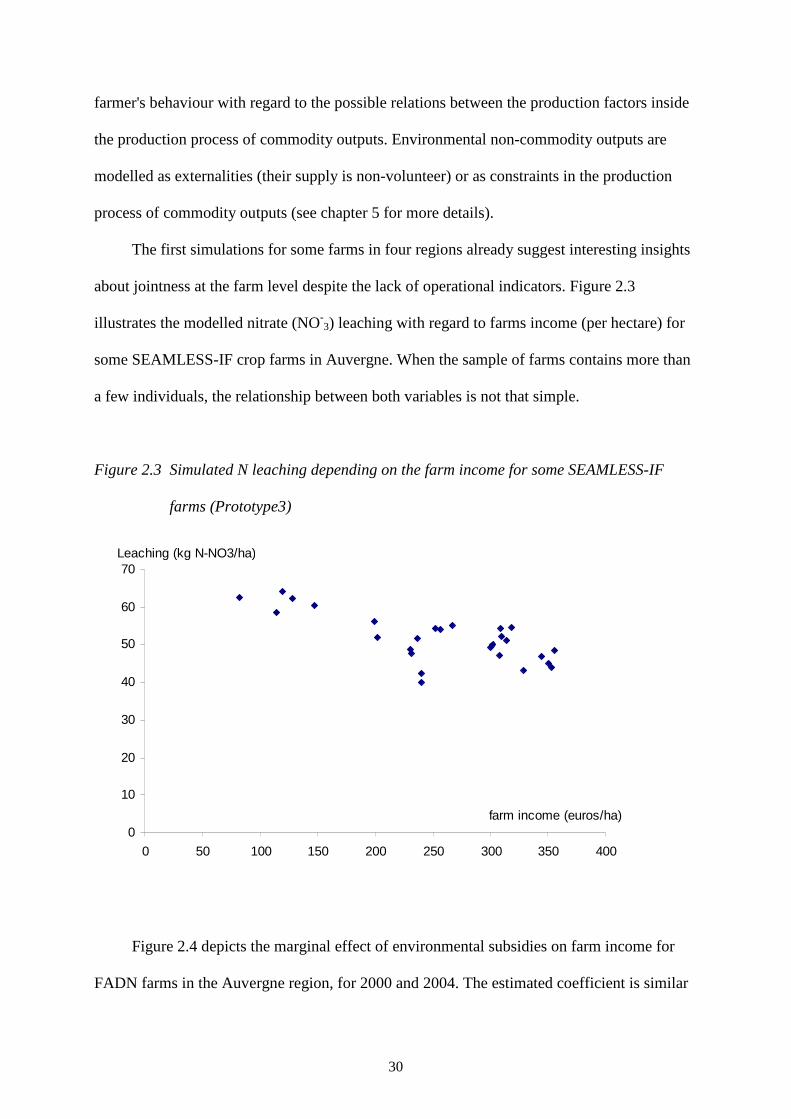
The first simulations for some farms in four regions already suggest interesting insights
about jointness at the farm level despite the lack of operational indicators. Figure 2.3
illustrates the modelled nitrate (NO-3) leaching with regard to farms income (per hectare) for
some SEAMLESS-IF crop farms in Auvergne. When the sample of farms contains more than
a few individuals, the relationship between both variables is not that simple.
Figure 2.3 Simulated N leaching depending on the farm income for some SEAMLESS-IF
farms (Prototype3)
0
10
20
30
40
50
60
70
0 50 100 150 200 250 300 350 400
farm income (euros/ha)
Leaching (kg N-NO3/ha)
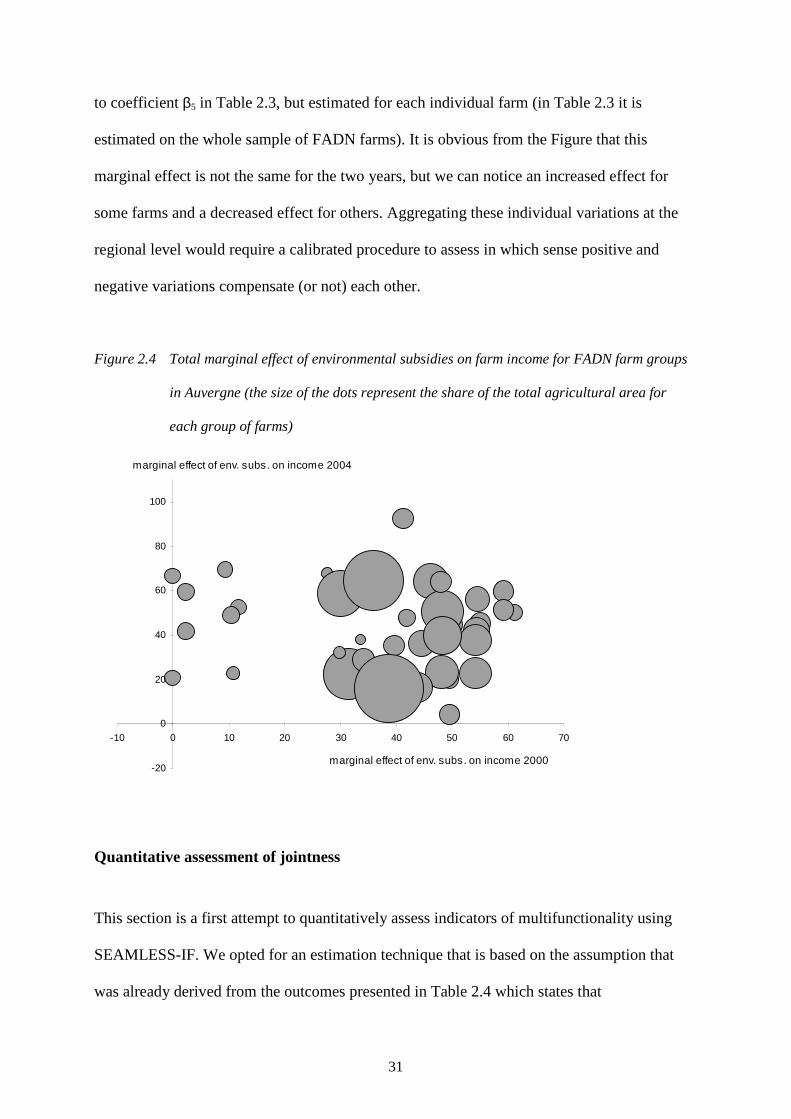
Figure 2.4 depicts the marginal effect of environmental subsidies on farm income for
FADN farms in the Auvergne region, for 2000 and 2004. The estimated coefficient is similar
31
to coefficient β5 in Table 2.3, but estimated for each individual farm (in Table 2.3 it is
estimated on the whole sample of FADN farms). It is obvious from the Figure that this
marginal effect is not the same for the two years, but we can notice an increased effect for
some farms and a decreased effect for others. Aggregating these individual variations at the
regional level would require a calibrated procedure to assess in which sense positive and
negative variations compensate (or not) each other.
Figure 2.4 Total marginal effect of environmental subsidies on farm income for FADN farm groups
in Auvergne (the size of the dots represent the share of the total agricultural area for
each group of farms)
-20
0
20
40
60
80
100
-10 0 10 20 30 40 50 60 70
marginal effect of env. subs. on income 2000
marginal effect of env. subs. on income 2004
Quantitative assessment of jointness
This section is a first attempt to quantitatively assess indicators of multifunctionality using
SEAMLESS-IF. We opted for an estimation technique that is based on the assumption that
was already derived from the outcomes presented in Table 2.4 which states that
32
environmental subsidies are an estimator for the value of the subsidised non-commodity
outputs. Unfortunately, such a proxy could not be found for non-commodity outputs that are
not subsidized because of a lack of simulation results. The assumption that environmental
subsidies are an estimator for the value of the subsidized non-commodity outputs enabled us
to measure the share of modelled income that is due to the environmental subsidies (direct
effect plus cross-effects on output, input and intermediate consumptions), for the years 2000
and 2004.
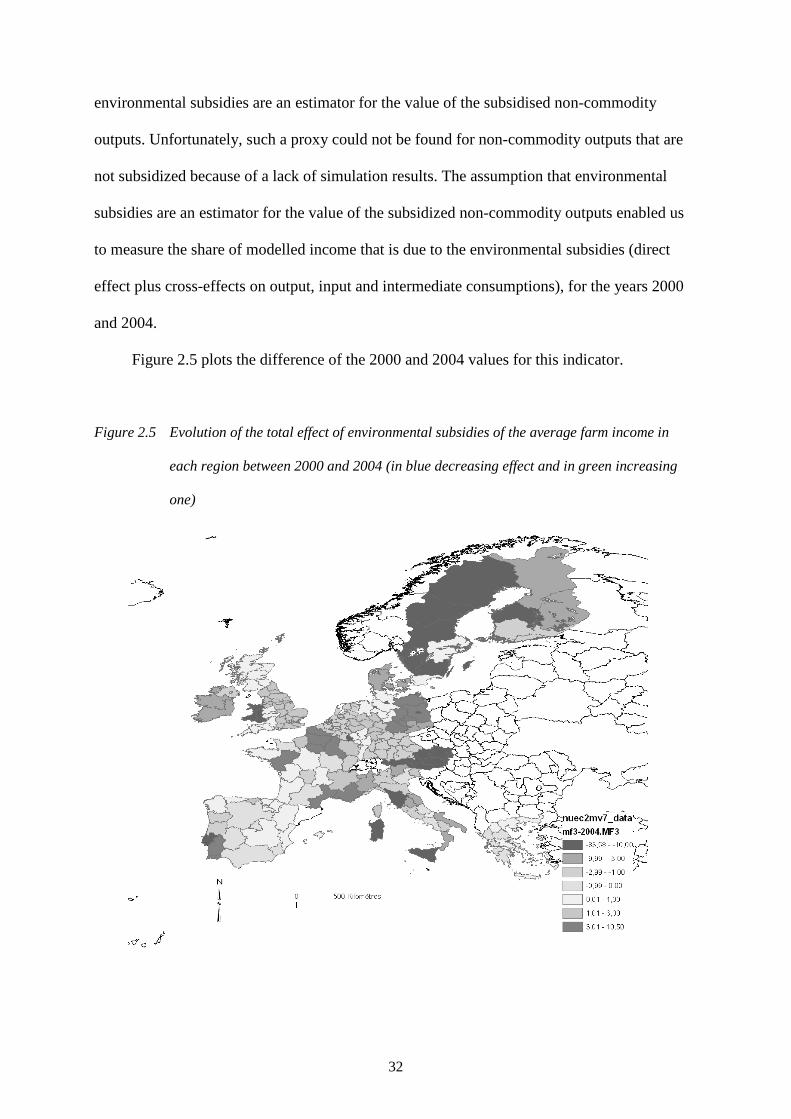
Figure 2.5 plots the difference of the 2000 and 2004 values for this indicator.
Figure 2.5 Evolution of the total effect of environmental subsidies of the average farm income in
each region between 2000 and 2004 (in blue decreasing effect and in green increasing
one)
33
Analysing Figure 2.5 emphasises that regions that receive relatively high environmental
subsidies on a per hectare basis (Finland, Austria, East-Germany) experience a relative
decrease between 2000 and 2004 in the way these subsidies share their farm income, because
of cross-effects with outputs, and mostly inputs and intermediate consumptions.
Conclusions
Although the concepts associated with the multifunctionality of agriculture are far from being
consensual (see Cairol et al. 2006 for a description of the main concepts), we focussed in this
chapter on one concept only, the joint supply of commodity and non-commodity outputs by
farms. This is the definition of multifunctionality generally espoused by the EU; many other
definitions of multifunctionality are self evident to some degree.
Based on this jointness definition, our novel assessment of indicators of
multifunctionality relied on three sequential stages: identification of jointness, qualitative
assessment of jointness, quantitative assessment of jointness. Identification of jointness was
carried out at the level of the farm gate for both an EU sample and using a regional case study
of Auvergne, France. FADN data for the EU sample covered only values for commodity
outputs and their drivers and thus enabled only a rough comparison of the evolution of the
production structure of the farms including insights on how they combine their different
activities. By comparison, using FADN data for the regional case study permitted the
assessment of which functions different farms fulfil using De Groot's (2006) classification of
functions fulfilled by natural and semi-natural ecosystems. Qualitative assessment of jointness
examined the relationship between farm income and nitrogen leaching for a subset of farms in
four regions but problems with data availability make it difficult to authoritatively comment
on the degree of jointness. However, for the Auvergne case-study it was possible to show how
34
the marginal effect of environmental subsidies on farm income is not constant over time.
Moving to assessing the final stage in our framework, quantitative assessment of jointness
extended the approach used to identify jointness at the farm gate level for an EU sample,
constrained by problems of data availability already noted with this sample. However, under
the assumption that environmental subsidies are an estimator for the value of subsidised non-
commodity outputs it was possible to show that regions that receive relatively high
environmental subsidies on a per hectare basis experience a relative decrease between 2000
and 2004 in the way these subsidies share their farm income, because of cross-effects with
outputs, and mostly inputs and intermediate consumptions.
Although the results outlined in this chapter serve to illustrate that multifunctionality of
agriculture is far from being negligible, a comprehensive assessment of this phenomenon in
terms of both functions and spatial scales covered by such an analysis is still beyond the
bounds of possibility because of problems with data availability and model capabilities. Given
the prominence placed on the multifunctionality concept by the European Commission, it is
imperative that this situation improves in order to more fully and robustly assess this concept.
Nevertheless, and as noted in the introduction to this chapter, because the current state-of-the-
art in terms of multifunctionality research is limited, from a quantitative point of view the
work presented here is an important contributor to this research area.
35
References
Baumol, W., Panzar, J. & Willig, R. (1981). Contestable markets and the theory of market
structure. New York: Harcout, Brace & Jovanovich.
Belletti, G., Brunori, G., Marescotti, A. & Rossi, A. (2003). Multifunctionality and rural
development: a multilevel approach. In G. van Huylenbroeck & G. Durand (Eds.),
Multifunctional agriculture: A new paradigm for european agriculture and rural development
(pp. 55-80). Ashgate: Hampshire.
Bontems, P., Rotillon, G., & Turpin, N. (2005a). Acceptable reforms of agri-environmental
policies (paper presented at the American Agricultural Economics Association Annual
Meeting, Providence, Rhode Island, 24-27 July 2005).
Bontems, P., Rotillon, G. & Turpin, N. (2005b). Self-selecting agri-environmental policies
with an application to the Don watershed. Environmental & Resource Economics, 31, 275-
301.
Brandt, J & Vejre, H. (2004). Multifunctional landscapes - motives, concepts and
perspectives. In J. Brandt & H.Vejre (Eds.), Multifunctional landscapes - theory, values and
history (pp. 3-31). London: WitPress.
Brouwer, F. (Ed.) (2004). Sustaining agriculture and the rural environment: Governance,
policy and multifunctionality. Cheltenham: Edward Elgar.
36
Brunstad, R.J., Gaasland, I. & Vårdal, E. (2005). Multifunctionality of agriculture: an inquiry
into the complementarity between landscape preservation and food security. European Review
of Agricultural Economics, 32 (4), 469-488.
Cairol, D., Perret, E. & Turpin, N. (2006). A report on results of the Multagri project
concerning indicators of multifunctionality and their relevance for SEAMLESS-IF, PD 2.3.1,
SEAMLESS integrated project, EU 6th Framework Programme (contract n°. 010036-2),
www.SEAMLESS-IP.org, 80 p. Retrieved from http://www.seamless-ip.org.
De Groot, R. S. (2006), Function-analysis and valuation as a tool to assess land use conflicts
in planning for sustainable, multi-functional landscapes. Landscape and Urban Planning,
75(3-4), 175-186.
Gillette, C., Merchez, L. & Perret, E. (2005a). Indicateurs territoriaux de multifonctionnalité
agricole pour un développement durable plus fonctionnel. (paper presented at the Colloque
international Indicateurs territoriaux du développement durable, Aix-en-Provence, December
1 and 2, 2005).
Gillette, C., Merchez, L. & Perret, E. (2005b). Agricultures multifonctionnelles et
constructions territoriales en Rhöne-Alpes: regards croisés entre statistiques et dires
d'acteurs. (Paper presented at the Symposium international Territoires et enjeux du
développement régional : résultats de recherche en partenariat avec cinq régions, Lyon, March
9-11, 2005).
37
Hall, C., McVittie, A. & Moran, D. (2004). What does the public want from agriculture and
the countryside? A review of evidence and methods. Journal of Rural Studies, 20, 211-225.
Jongeneel, R.A. & Slangen, L. (2003). Multifunctionality in agriculture and the contestable
public domain in the Netherlands. In F. Brouwer (Ed.), Sustaining agriculture and the rural
environment: Governance, policy and multifunctionality (pp. 183-203). Cheltenham: Edward
Elgar.
Knickel, K., Renting, H. & van der Ploeg, J.D. (2004). Multifunctionality in European
agriculture. In F. Brouwer (Ed.), Sustaining agriculture and the rural environment:
Governance, policy and multifunctionality (pp. 81-103). Cheltenham: Edward Elgar.
Muradian R. (2001). Ecological thresholds: a survey. Ecological Economics, 38 (1), 7-24.
Nowicki, P. L. (2004). Jointness of production as a market concept. In F. Brouwer (Ed.),
Sustaining agriculture and the rural environment: Governance, policy and multifunctionality
(pp. 36-55). Cheltenham, UK: Edward Elgar.
Nuppenau, E.-A. (2005). How multifunctionality can translate into non-trade concerns in the
WTO: on price transmission and competition between constituencies. International Journal of
Agricultural Resources Governance and Ecology, 4, 306-326.
OECD (2001a). Multifunctionality: Towards an analytical framework. Paris: Organisation for
Economic Co-operation and Development.
38
OECD (2001b). Multifunctionality: Applying the OECD analytical framework. Guiding
policy design. Paris: Organisation for Economic Co-operation and Development.
OECD (2003). Multifunctionality: The policy implications. Paris: Organisation for Economic
Co-operation and Development.
OECD (2006). The new rural paradigm, policies and governance. Paris: Organisation for
Economic Co-operation and Development.
Perret, E. (2006). La multifonctionnalité de l'agriculture: regards sur les exploitations
agricoles de Rhône-Alpes. Agreste Rhône-Alpes - Coup d'oeil, 87, 4.
Sakuyama, T. (2005). A decade of debate over non-trade concerns and agricultural trade
liberalisation: convergences, remaining conflicts and a way forward. International Journal of
Agricultural Resources, Governance and Ecology, 4, 203-215.
Stapleton, L.M., Young, S.D. & Crout, N.M.J. (2004). Have missing markets for ecological
goods and services affected modelling of terrestrial C and N fluxes? Ecological Modelling,
179, 569-574.
Van der Heide, C.M., Overmars, K.P. & Jongeneel, R.A. (2007). Land use modelling for
sustaining multiple functions in the rural countryside with an application in the Achterhoek
region, the Netherlands. In Ü. Mander, H. Wiggering & K. Helming (Eds.). Multifunctional
land use; Meeting future demands for landscape goods and services (pp. 251-268). Berlin and
Heidelberg: Springer Verlag.
39
Van Huylenbroeck, G. (2003). Multifunctional agriculture: how to provide incentives to
farmers? 13th International IFMA Congress of Farm Management, August 2003, Australia.
Van der Molen, D.T., Breeuwsma, A. & Boers, P.C.M. (1998). Agricultural nutrient losses to
surface water in the Netherlands: impact, strategies and perspectives. Journal of
Environmental Quality, 27, 4-11.
Van der Ploeg, J.D. & Roep, D. (2003). Multifunctionality and rural development, the actual
situation in Europe. In G. van Huylenbroeck & G. Durand (Eds.), Multifunctional agriculture:
A new paradigm for European agriculture and rural development (pp. 37-55). Hampshire:
Ashgate.
Van Huylenbroeck, G. & Durand, G. (Eds.) (2003). Multifunctional agriculture: A new
paradigm for European agriculture and rural development. Hampshire: Ashgate.
Vanslembrouck, I. & van Huylenbroeck, G. (2003). The demand for landscape amenities by
rural tourists. In G. van Huylenbroeck & G. Durand (Eds.), Multifunctional agriculture: A
new paradigm for European agriculture and rural development (pp. 83-100). Hampshire:
Ashgate.
Vatn, A. (2002). Multifunctional agriculture: some consequences for international trade
regimes. European Review of Agricultural Economics, 29 (3), 309-327.
40
Vejre, H., Abildtrup, J., Andersen, J., Andersen, P.S., Brandt, J., Busck, A., Dalgaard, T.,
Hasler, B., Huusom, H., Kristensen, L.S., Kristensen, S.P. & Praestholm, S. (2006).
Multifunctional agriculture and multifunctional landscapes - land use as interface. In Ü.
Mander, H. Wiggering, & K. Helming (Eds.), Multifunctional land use – meeting future
demands for landscape goods and services (93-104). Berlin: Springer.
Waarts, Y. (2005). Indicators for the quantification of multifunctionality impacts, Research
report MEASCOPE, deliverable 2.4, European Centre for Nature Conservation, 107 pp.
Wiggering, H., Dalchow, C., Glemmitz, M., Helming, K., Müller, K., Schultz, A., Stachow,
U. & Zander, P. (2006). Indicators for multifunctional land use – Linking socio-economic
requirements with landscape potentials. Ecological Indicators, 6, 238-249.