assessment of mechanical properties, residual stresses and
TRANSCRIPT
Manufacturing andMaterials Processing
Journal of
Article
Assessment of Mechanical Properties, ResidualStresses and Diffusible Hydrogen of LongitudinalWeld in Electric Water Heater Tanks
Julius Caesar Puoza 1,2,* ID , Xijun Hua 1, Adams Moro 3, Anthony Akayeti 1 and Philip Baidoo 1
1 School of Mechanical Engineering, Jiangsu University, Zhenjiang 212013, Jiangsu, China;[email protected] (X.H.); [email protected] (A.A.); [email protected] (P.B.)
2 Department of Mechanical Engineering, Sunyani Technical University, P.O. Box 206, Sunyani, Ghana3 School of Automotive and Traffic Engineering, Jiangsu University, Zhenjiang 212013, Jiangsu, China;
[email protected]* Correspondence: [email protected]; Tel.: +86-156-0610-2187
Received: 23 October 2017; Accepted: 13 November 2017; Published: 15 November 2017
Abstract: The core technique of electric storage water heaters is the manufacture of the tanks, and thewelding technique is the key technology of the tank manufacture. A company producing waterheaters received feedback from its after-sales that a large quantity of water leakage from the tankswas found in the market. A follow-up on the manufacturing site by the researchers showed that theposition of the water leakage defects mostly happens in the welds of the tanks. Series of experimentswere conducted to investigate the mechanical properties, residual stress, and diffusible hydrogencontent of the longitudinal weld of the tank. Results of the mechanical properties showed that boththe micro-hardness and the tensile strength of the welds are higher than the base metal. There arehigher residual compressive stresses in the weld center and the adjacent-weld zone. Vertical residualcompressive stress decreases first and then increases (149 MPa–28 MPa–134 MPa) from the weld endsto the middle, whilst the transversal stress decreases continuously (332 MPa~240 MPa) from the weldcenter to the heat affected zone. After enameling, the longitudinal welds’ peak micro-hardness ofcoarse grained region reduces by 30.9 HV1, and the average micro-hardness of the HAZ reduces by5 HV1. The average vertical residual compressive stress difference of the same test points reducesfrom 270.6 MPa to 20.4 MPa. It proves that enameling can improve the mechanical property of thelongitudinal welds.
Keywords: plasma arc welding; weld properties; thin sheet metal; stress; micro-hardness
1. Introduction
With the development of modern industry, more and more thin plate structures are used inmanufacturing/production due to their light-weight and energy saving nature. However, there manydifficulties associated with the application of sheet metal components in manufacturing,especially welding. In some cases, the welding of thin plate structure is even more difficult thanthat of the plate structure because it involves a different welding technique to ensure not to blowingthrough the metal. At present, it has become a typical welding technology problem because the thinplate is very sensitive to heat input during welding. It is therefore easy to produce deformation,warping, and penetration through the thermal effect, which seriously affects the manufacturingprecision of thin plate and reduces the service life. There are many deformation factors that affect thewelding structure, such as the structure and stiffness of the weldment, the constraint conditions of theworkpiece, the welding sequence, and the welding specification parameters. Welding deformationof thin plate is inevitable, however, measures can be taken to reduce the deformation after weldingthrough the manufacturing process, material selection, and other aspects.
J. Manuf. Mater. Process. 2017, 1, 19; doi:10.3390/jmmp1020019 www.mdpi.com/journal/jmmp
J. Manuf. Mater. Process. 2017, 1, 19 2 of 18
The most widely used arc welding method for thin sheet are gas metal arc welding and gastungsten arc welding (GMAW and GTAW), more popularly known metal inert gas (MIG) and tungsteninert gas (TIG) [1,2]. TIG and MIG welding machines are less costly, easy to handle and operate,capable of a wide range of current levels, have a high adaptability to various welding positions foreasier full penetration, and improved welding arc quality. The weld surface is smooth and has excellentcorrosion and fatigue resistance. The main drawback of these welding methods is that the weldingspeed is fairly low with a single electrode torch, affecting the production efficiency and it is not easy forproduction line automation. Tseng and Lin [3] compared the effects of micro and nano oxide particleson the welding of stainless steel using TIG welding. The results show that, when compared with themicro SiO2 particles, the TIG welding with nano SiO2 particles has better penetration and smallerangular deformation in the weldment. However, TIG welding with nano Al2O3 particles does notlead to substantial increase in penetration or deformation reduction. The influence of active flux andwelding parameters on penetration and depth-to-width ratio (DWR) on Inconel 718 alloy using theTIG welding process was investigated by Lin and Wu [3]. Both the single and mixed component fluxesof the TIG welding such as SiO2, NiO, MoS2, MoO3, 50% SiO2 + 50% MoO3, and 50% SiO2 + 50% NiOsignificantly increased the penetration and depth-to-width ratio (DWR) of the Inconel 718 alloy welds.
Plasma Arc Welding (PAW) is an urbanized arc welding method of joining thin sheet metalsby heating them with a constricted nozzle arc between non consumable tungsten electrode and thinsheet metals [4–6]. PAW’s main advantage is that it can reach a higher production rate due to a highconcentration of heat input. The heat input distribution is even, which leads to a smaller weld heataffected zone with more accurate weld beads, which is beneficial to the properties of base metal.Moreover, the electrode in PAW is not directly in contacted with the molten pool, so the possibilityof tungsten inclusion is reduced to the minimum and the life of the electrode is also increased [7].In addition, due to its advantages of large energy density, narrow penetration depth, deep penetrationdepth, and good arc stability, it is superior to other conventional processes. It has been widely used inaerospace, chemical, naval, nuclear industries, and other fields [8]. Rao et al. [9] discussed the weldingof Inconel 625 by pulsed micro plasma arc welding. The welding quality characteristics, such as weldpool geometry parameters, microstructure, grain size, hardness, and tensile properties at differentwelding speeds were investigated. The results show that better welding quality characteristics can beobtained under the welding speed of 260 mm/min. The welding quality characteristics of austeniticstainless steel by pulsed current plasma arc welding were studied by Prasada et al. [10]. The weldingquality characteristics, including weld pool geometry, microstructure, grain size, hardness, and tensileproperties were taken into account. It was established that SS 304L achieves better welding qualitycharacteristics as compared with SS 316L, SS 316Ti, and SS 321 at the same welding conditions.
Laser Beam Welding (LBW) is an advanced welding process that is capable of joining multiplepieces of metallic and non-metallic materials together using a laser beam. Laser welding is based onthe interaction of laser light with material, and the processes consist of the following four major steps:(i) absorption of focused laser on the material surface; (ii) transfer of absorbed laser energy into the bulkmaterial by conduction; (iii) heating and melting of the material; and (iv) instant solidification of themelt material to form a weld pool [11]. Laser beam welding has high-potential advantage in welding ofheat sensitive components with precision control of heat input, minimal thermal distortion, small HAZ,good mechanical properties, and excellent repeatability [12,13]. Furthermore, laser welding is wellknown for its deep penetration capability, although it can be successfully used in conduction mode forthin sheet metal welding [14]. As a consequence of these advantages, laser welding offers a higherwelding speed when compared to conventional arc welding. Marashi et al. [15] investigated on theinfluence of laser spot welding parameters on the joint quality of low carbon steel sheets by the Taguchidesign of the experiment method. The optimum process parameters in the studied range were found,which ensured desirable pull-out failure mode and thus maximum failure energy. Yilbas et al. [16]carried out Laser welding of mild steel sheets under ambient nitrogen assisting gas and computed thetemperature and stress fields in the welding region through the finite element method for comparison
J. Manuf. Mater. Process. 2017, 1, 19 3 of 18
with XRD technique. The results showed that the von Mises stress attains high values in the coolingcycle after the solidification of the molten regions and the predicted residual stress agreed well withthe XRD results. The temperature decay rate in the molten zone was lower than in the solid dueto absorption and dissipation of the laser energy in the molten zone, which was generated in thesurface region.
The formation of residual stresses during manufacturing can also cause unwanted and awkwarddeformations, which may be too expensive to correct. During the welding process, there are alarge number of non-uniform heat inputs resulting in the distribution of residual stress, which oftenproduce adverse mechanical effects. This leads to the frequent cause of tensile residual stressesproblem in welding engineering practice [17]. Alternatively, the deliberate introduction of compressivestress sometimes by shot peening mechanical treatment is used to improve some benefits [18,19].The development of residual stress is closely related to the welding process. Therefore, it is veryimportant to understand the nature and size of the residual stress at the end of the welding becauseit can directly affect the service life of parts. Dias [20] et al. analyze the residual stresses resultingfrom laser beam welding and plasma arc welding processes by X-ray diffraction technique, with sin2ψmethod in Interstitial free (IF) steel butt joints. The result indicated that the residual stresses at thetop and root of the welded joint are very similar in magnitude for both of the welding processes.The longitudinal tensile residual stresses in the welding heat affected zone (~170 MPa) and fusion zone(~300 MPa) were verified in the upper part for the two welding processes. The effects of welding speedon microstructure and mechanical characterization of welded joint of AISI316L austenitic stainlesssteel and EH36 ship steels using fiber laser welding were investigated by Cao et al. [21]. It was foundthat the micro-hardness of the joint is about 350 HV1 and fluctuates slightly along the weld acrosssection, which is two times higher than that of base materials (it is about 180 HV1) that are caused bythe formation of lath martensite. The tensile strength of the joint with full penetration is better than thedissimilar metals.
Generally, the electric water heater consists of five parts: shell, liner, insulation layer, heating,and temperature control system. The manufacturing technology of the inner tank is the core technologyof the electric water heater. In order to prolong the life of the electric water heater, it is necessary tomake the inner tank with higher manufacturing quality and better service performance. To achievethese capabilities, the key lies in the selection of bladder material and the manufacturing process of thebladder. The inner liner of the electric water heater belongs to a thin-wall pressure vessel and the mainproduction process thereof is welding. The welding process comprises of longitudinal seam weldingof the cylinder body, welding of the two ring welds of the barrel and the two heads end, and thewelding of the three micro saddle shaped welds of the magnesium bar seat, the water pipe seat andthe inner cylinder body of the inner container. After-sales service feedback report from clients of anelectric water heater tank manufacturing company indicates a high rate of water leakage from thetank. Field tests conducted by the researchers on the manufacturing site showed that the longitudinalseam of the inner liner is more prone to fatigue delayed crack than the ring joint. This is because thelongitudinal joint of the liner is more difficult to weld than the ring joint. In addition, many otherdefects, such as burn-through, incomplete fusion, and deformation were also easily discovered inthe welds of the tanks. These imperfections had a negative effect on production quality of the waterheater. It is therefore very significance to ensure quality welding of the inner tank during production.This research paper mainly focuses on how to improve the longitudinal seam weld quality of the innerliner of the electric water heater tank. The residual stress and diffusible hydrogen in the longitudinaljoint fatigue crack are investigated. The tensile strength and micro-hardness of the longitudinal jointare also tested and the influence of enamel on the welding seam is analyzed.
J. Manuf. Mater. Process. 2017, 1, 19 4 of 18
2. Materials and Methods
2.1. Materials
The material used for producing the electric water heater tank is 1.8 × 1090 × 470 BTC330Rhigh degree hot rolling pickled enamel sheet produced by Steel Corp. The chemical composition andmechanical properties are shown in Tables 1 and 2 are respectively.
Table 1. Chemical Constituents of hot rolled and high-strength pickling enamel steel BTC330R.
Chemical Composition a/% C Si Mn P S Alt
Standard regulation b ≤0.16 ≤0.05 ≤0.90 ≤0.07 ≤0.05 ≥0.020Actual supply 0.08 0.01 0.68 0.013 0.004 0.038
a Smelting analysis as required can be added to other alloy elements; b implementation standards: BZJ 308-2009.
Table 2. Mechanical properties of hot rolled and high-strength pickling enamel steel BTC330R.
Lower Yield Strength b/MPa Tensile Strength/MPa Elongation/%
≥330 ≥400 ≥22a Tensile test (L0 = 50 mm, B = 12.5 mm), specified value for longitudinal specimen; b yield phenomenon is notobvious, using Rp0.2.
High strength hot rolled pickled enamel sheet has certain strength and stamping performance,and it is also necessary to ensure good weldability and a good coating performance. To this end,some alloying elements (such as RE, Ti, Ni, etc.) were added to the steel during the manufacturing.These alloy elements combine with C, N, and other elements in steel to form the second phase particlesand control the size and distribution of these second phase particles. The steel plate has excellentformability and excellent enamel property. By estimating the carbon equivalent, the sensitivity of coldcracking of low alloy high strength steel can be measured preliminarily. It has an important guidingrole in the determination of welding process conditions. The carbon equivalent formula recommendedby the International Welding Society (IIW) [22]
Ceq = C +Mn6
+Cr + Mo + V
5+
Ni + Cu15
(1)
The calculated carbon equivalent of BTC330R steel, Ceq (IIW) = 0.19%. It showed that theweldability of BTC330R steel was good and no preheating was needed before welding. The weldingwire used for the inner liner of the hot water heater tank was Lincoln welding wire. The brand is JM-53and the diameter of the welding wire used in the longitudinal seam was 1.0 mm. In addition, a smallamount of S-6 welding wire with the same diameters as JM-53 was adopted for the manufacturingprocess. The chemical composition and mechanical properties of the weld metals of JM-53 and S-6welding wire are listed in Tables 3 and 4.
Table 3. Chemical Constituents of weld wire JM-53 and S-6 (%).
Welding Wire C Mn Si S P Cu
JM-53 0.081 1.29 0.55 0.013 0.013 0.095S-6 0.08 1.40–1.85 0.80–1.15 0.035 0.025 —
J. Manuf. Mater. Process. 2017, 1, 19 5 of 18
Table 4. Mechanical properties of weld wire JM-53 and S-6.
Welding Wire Yield Strength(MPa)
TensileStrength (MPa)
ElongationRate (%)
CVN Impact Toughness
Temperature/◦C Impact Value
JM-53 455 555 ≥22 20 110S-6 460 565 ≥30 −30 85
As shown in Table 3, the carbon contents of JM-53 and S-6 wires were approximately the same asthat of the parent metal BTC330R in Table 1. The contents of Mn and Si for the two types of weldingwire were relatively high as compared to the base metal. In order to achieve a certain joint deoxidationeffect, the contents of S and P were controlled to a lower level. When comparing the mechanicalproperties of the base metal to the welding wire in Tables 2 and 4 respectively, the tensile strength ofthe two welding wires were much higher than the tensile strength of the BTC330R steel. This showedthat, the matching of the weld and base metal is high strength matching.
2.2. Plasma Arc Welding
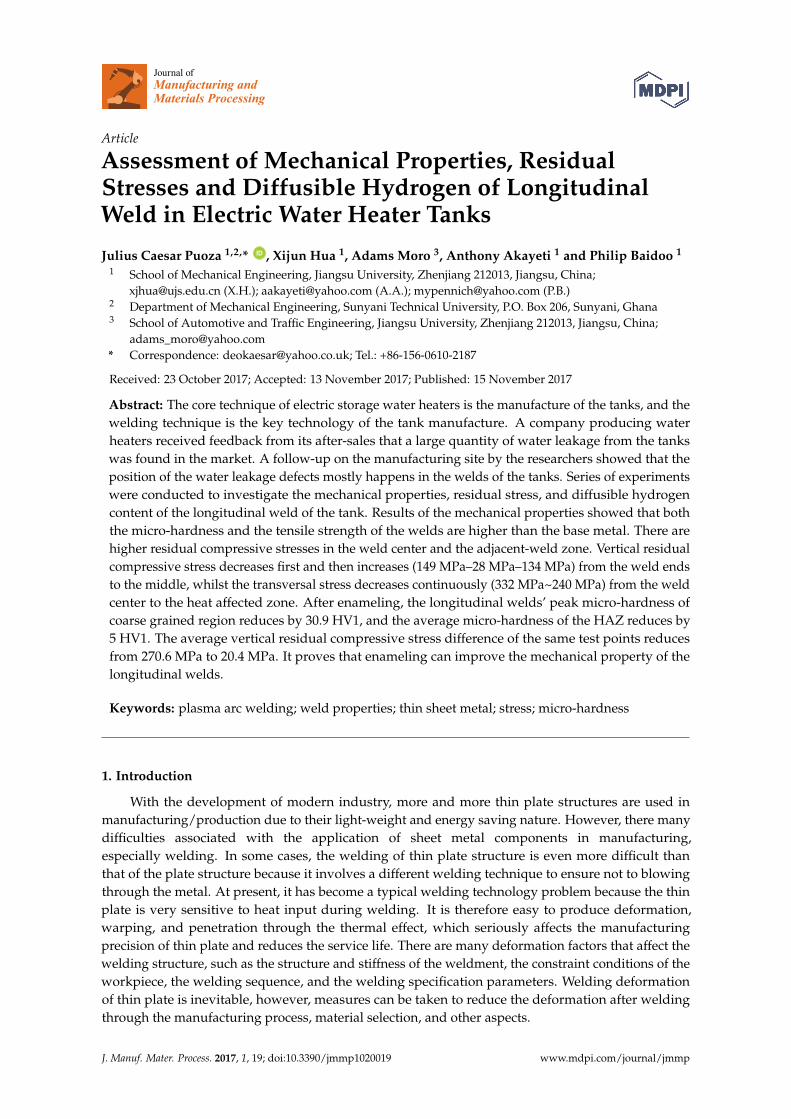
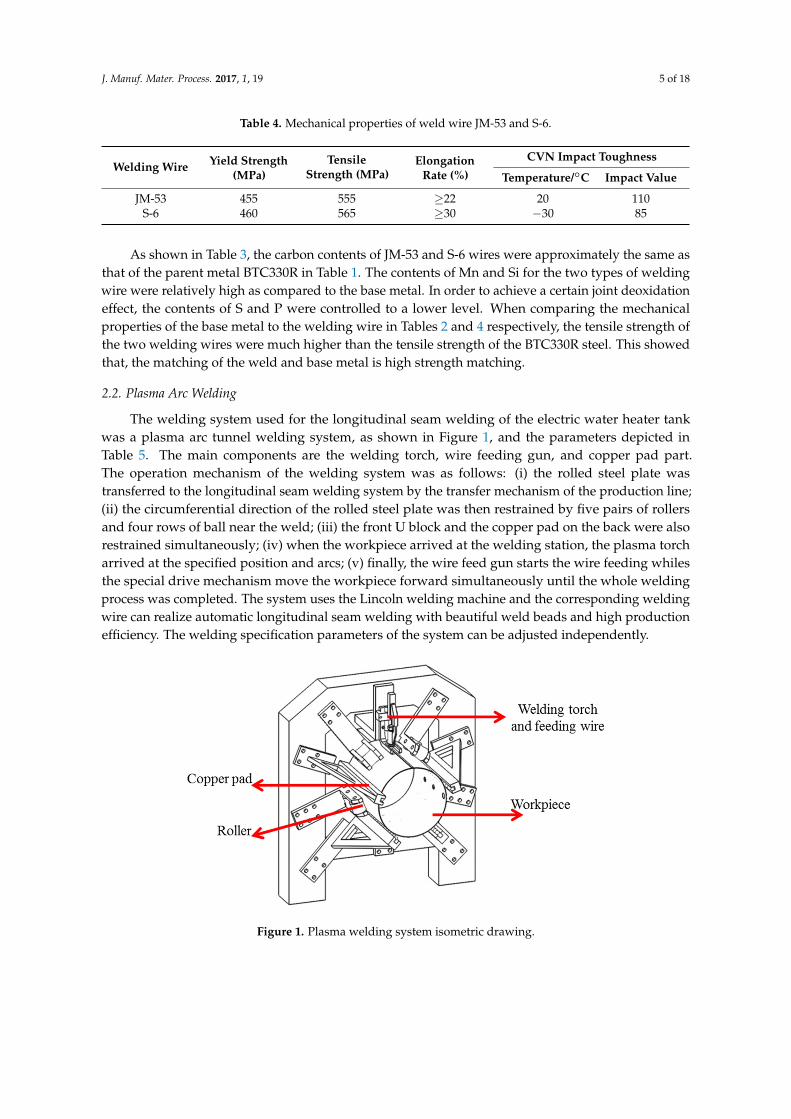
The welding system used for the longitudinal seam welding of the electric water heater tankwas a plasma arc tunnel welding system, as shown in Figure 1, and the parameters depicted inTable 5. The main components are the welding torch, wire feeding gun, and copper pad part.The operation mechanism of the welding system was as follows: (i) the rolled steel plate wastransferred to the longitudinal seam welding system by the transfer mechanism of the production line;(ii) the circumferential direction of the rolled steel plate was then restrained by five pairs of rollersand four rows of ball near the weld; (iii) the front U block and the copper pad on the back were alsorestrained simultaneously; (iv) when the workpiece arrived at the welding station, the plasma torcharrived at the specified position and arcs; (v) finally, the wire feed gun starts the wire feeding whilesthe special drive mechanism move the workpiece forward simultaneously until the whole weldingprocess was completed. The system uses the Lincoln welding machine and the corresponding weldingwire can realize automatic longitudinal seam welding with beautiful weld beads and high productionefficiency. The welding specification parameters of the system can be adjusted independently.
J. Manuf. Mater. Process. 2017, 1, 19 5 of 17
Table 4. Mechanical properties of weld wire JM-53 and S-6.
Welding Wire
Yield Strength (MPa)
Tensile Strength (MPa)
Elongation Rate (%)
CVN Impact Toughness Temperature/°C Impact Value
JM-53 455 555 ≥22 20 110 S-6 460 565 ≥30 −30 85
As shown in Table 3, the carbon contents of JM-53 and S-6 wires were approximately the same as that of the parent metal BTC330R in Table 1. The contents of Mn and Si for the two types of welding wire were relatively high as compared to the base metal. In order to achieve a certain joint deoxidation effect, the contents of S and P were controlled to a lower level. When comparing the mechanical properties of the base metal to the welding wire in Tables 2 and 4 respectively, the tensile strength of the two welding wires were much higher than the tensile strength of the BTC330R steel. This showed that, the matching of the weld and base metal is high strength matching.
2.2. Plasma Arc Welding
The welding system used for the longitudinal seam welding of the electric water heater tank was a plasma arc tunnel welding system, as shown in Figure 1, and the parameters depicted in Table 5. The main components are the welding torch, wire feeding gun, and copper pad part. The operation mechanism of the welding system was as follows: (i) the rolled steel plate was transferred to the longitudinal seam welding system by the transfer mechanism of the production line; (ii) the circumferential direction of the rolled steel plate was then restrained by five pairs of rollers and four rows of ball near the weld; (iii) the front U block and the copper pad on the back were also restrained simultaneously; (iv) when the workpiece arrived at the welding station, the plasma torch arrived at the specified position and arcs; (v) finally, the wire feed gun starts the wire feeding whiles the special drive mechanism move the workpiece forward simultaneously until the whole welding process was completed. The system uses the Lincoln welding machine and the corresponding welding wire can realize automatic longitudinal seam welding with beautiful weld beads and high production efficiency. The welding specification parameters of the system can be adjusted independently.
Figure 1. Plasma welding system isometric drawing.
Table 5. Welding parameters of Plasma Arc Welding (PAW) for longitudinal weld.
Welding Current (A)
Welding Voltage (V)
Welding Speed (mm/s)
Wire Feed Rate (cm/min)
Ionic Gas Flow (L/min)
Protective Gas Flow (L/min)
200 20 10 103 0.9 15
Figure 1. Plasma welding system isometric drawing.
J. Manuf. Mater. Process. 2017, 1, 19 6 of 18
Table 5. Welding parameters of Plasma Arc Welding (PAW) for longitudinal weld.
WeldingCurrent (A)
WeldingVoltage (V)
WeldingSpeed (mm/s)
Wire FeedRate (cm/min)
Ionic GasFlow (L/min)
Protective GasFlow (L/min)
200 20 10 103 0.9 15
2.3. Hardness and Tensile Property Test
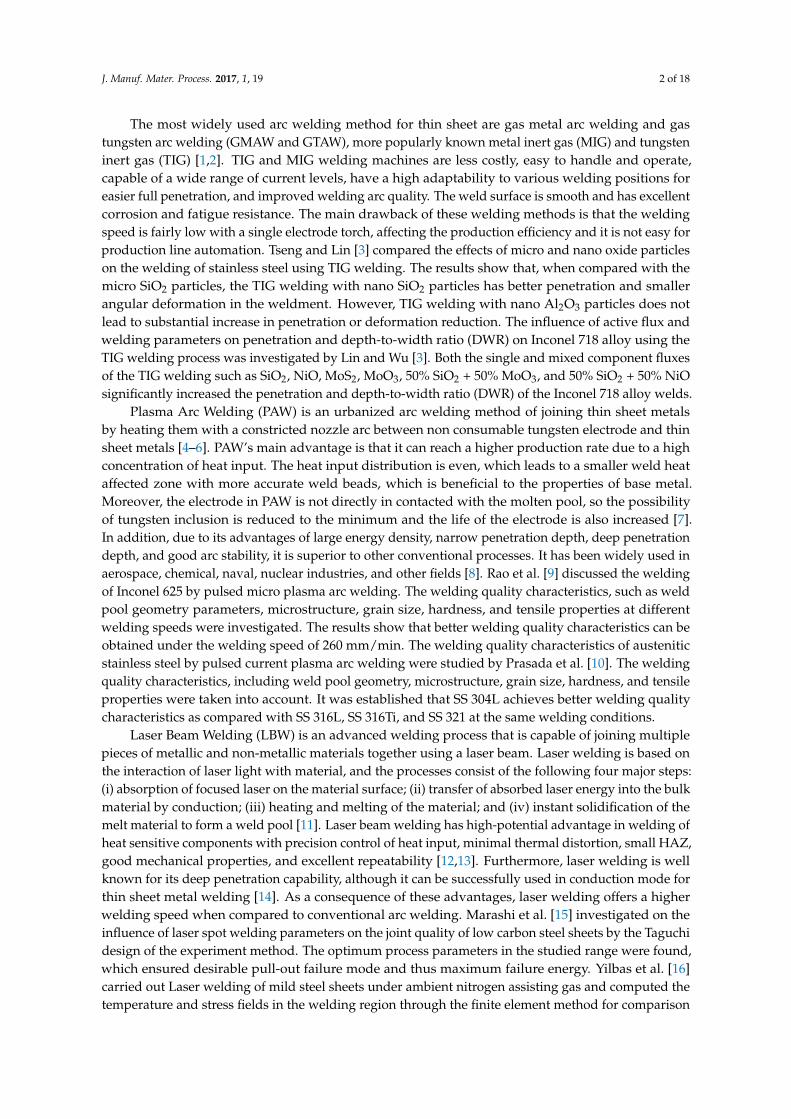
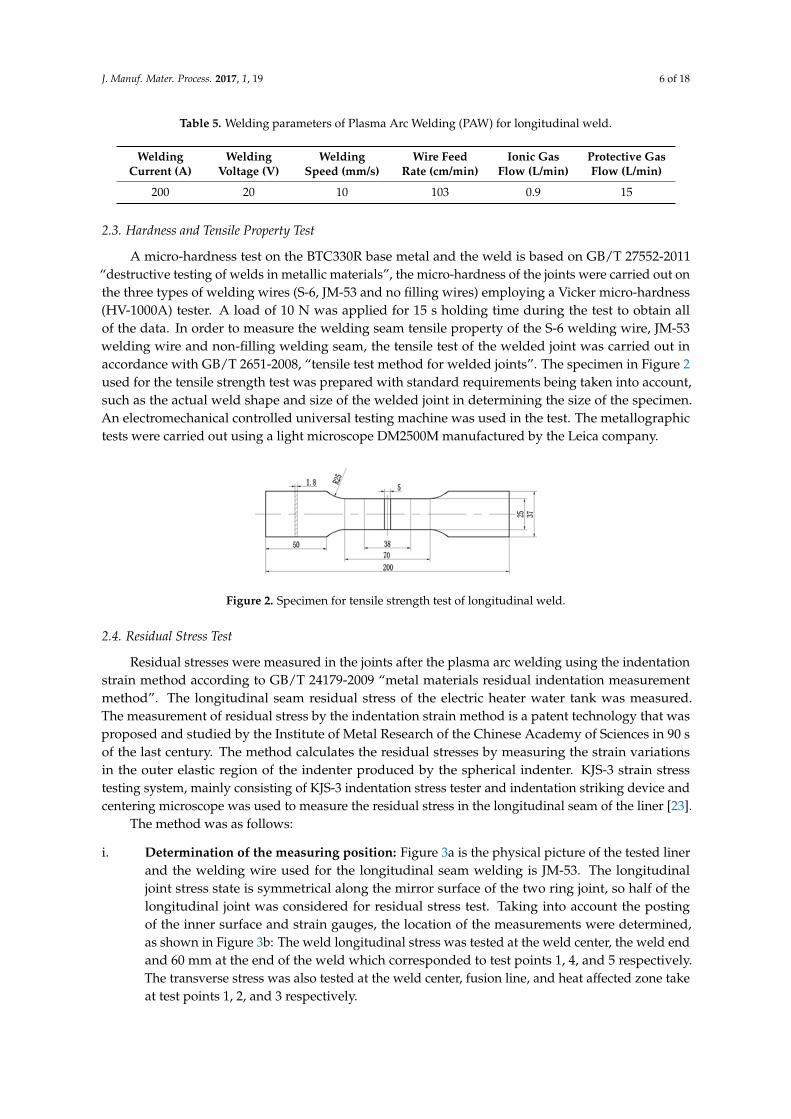
A micro-hardness test on the BTC330R base metal and the weld is based on GB/T 27552-2011“destructive testing of welds in metallic materials”, the micro-hardness of the joints were carried out onthe three types of welding wires (S-6, JM-53 and no filling wires) employing a Vicker micro-hardness(HV-1000A) tester. A load of 10 N was applied for 15 s holding time during the test to obtain allof the data. In order to measure the welding seam tensile property of the S-6 welding wire, JM-53welding wire and non-filling welding seam, the tensile test of the welded joint was carried out inaccordance with GB/T 2651-2008, “tensile test method for welded joints”. The specimen in Figure 2used for the tensile strength test was prepared with standard requirements being taken into account,such as the actual weld shape and size of the welded joint in determining the size of the specimen.An electromechanical controlled universal testing machine was used in the test. The metallographictests were carried out using a light microscope DM2500M manufactured by the Leica company.
J. Manuf. Mater. Process. 2017, 1, 19 6 of 17
2.3. Hardness and Tensile Property Test
A micro-hardness test on the BTC330R base metal and the weld is based on GB/T 27552-2011 “destructive testing of welds in metallic materials”, the micro-hardness of the joints were carried out on the three types of welding wires (S-6, JM-53 and no filling wires) employing a Vicker micro-hardness (HV-1000A) tester. A load of 10 N was applied for 15 s holding time during the test to obtain all of the data. In order to measure the welding seam tensile property of the S-6 welding wire, JM-53 welding wire and non-filling welding seam, the tensile test of the welded joint was carried out in accordance with GB/T 2651-2008, “tensile test method for welded joints”. The specimen in Figure 2 used for the tensile strength test was prepared with standard requirements being taken into account, such as the actual weld shape and size of the welded joint in determining the size of the specimen. An electromechanical controlled universal testing machine was used in the test. The metallographic tests were carried out using a light microscope DM2500M manufactured by the Leica company.
Figure 2. Specimen for tensile strength test of longitudinal weld.
2.4. Residual Stress Test
Residual stresses were measured in the joints after the plasma arc welding using the indentation strain method according to GB/T 24179-2009 “metal materials residual indentation measurement method”. The longitudinal seam residual stress of the electric heater water tank was measured. The measurement of residual stress by the indentation strain method is a patent technology that was proposed and studied by the Institute of Metal Research of the Chinese Academy of Sciences in 90 s of the last century. The method calculates the residual stresses by measuring the strain variations in the outer elastic region of the indenter produced by the spherical indenter. KJS-3 strain stress testing system, mainly consisting of KJS-3 indentation stress tester and indentation striking device and centering microscope was used to measure the residual stress in the longitudinal seam of the liner [23].
The method was as follows:
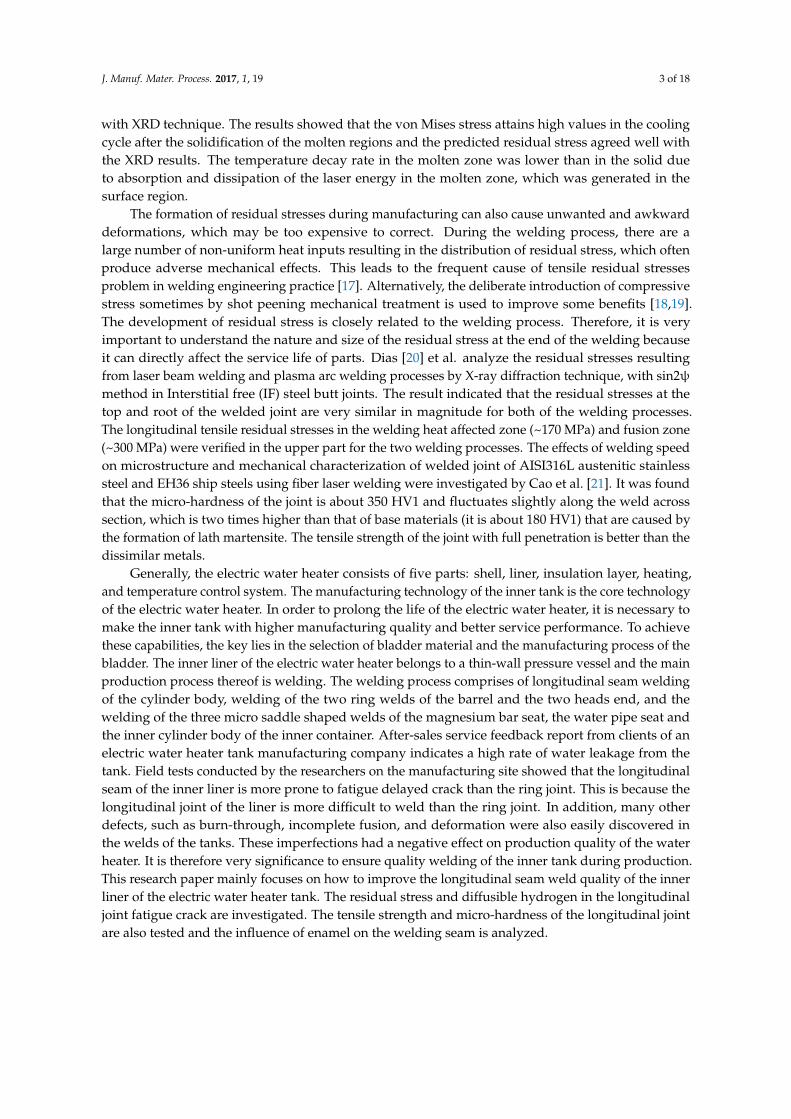
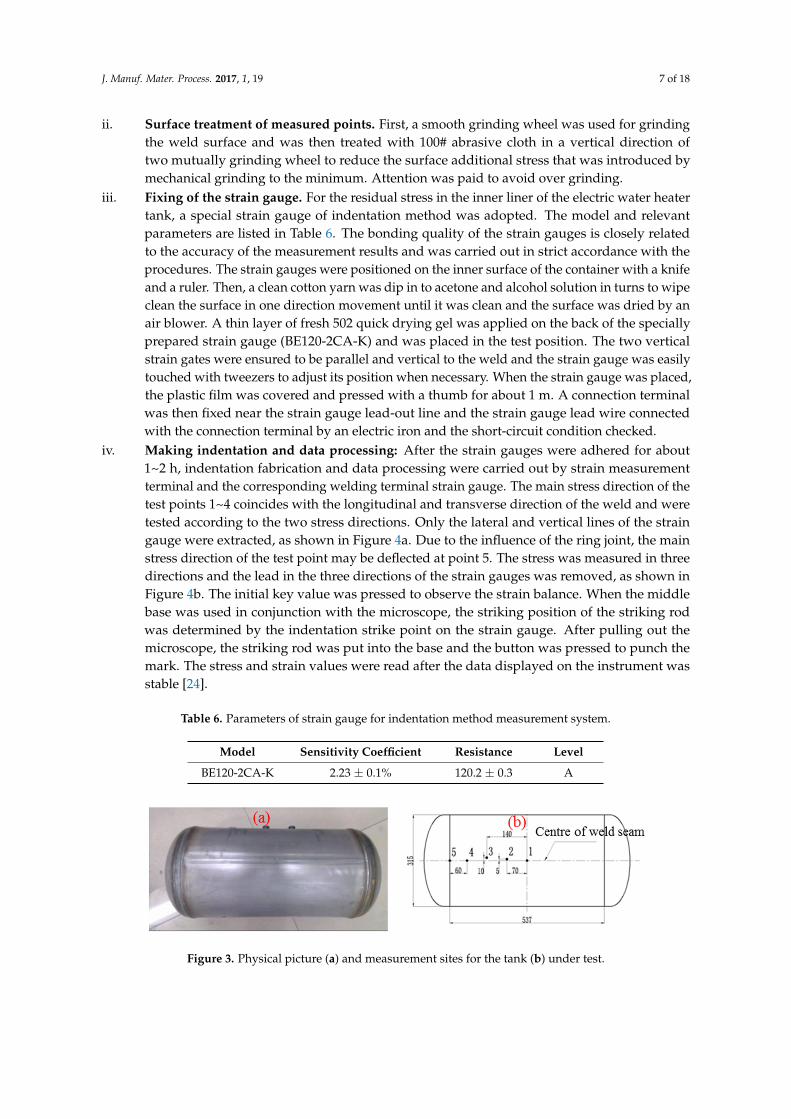
i. Determination of the measuring position: Figure 3a is the physical picture of the tested liner and the welding wire used for the longitudinal seam welding is JM-53. The longitudinal joint stress state is symmetrical along the mirror surface of the two ring joint, so half of the longitudinal joint was considered for residual stress test. Taking into account the posting of the inner surface and strain gauges, the location of the measurements were determined, as shown in Figure 3b: The weld longitudinal stress was tested at the weld center, the weld end and 60 mm at the end of the weld which corresponded to test points 1, 4, and 5 respectively. The transverse stress was also tested at the weld center, fusion line, and heat affected zone take at test points 1, 2, and 3 respectively.
ii. Surface treatment of measured points. First, a smooth grinding wheel was used for grinding the weld surface and was then treated with 100# abrasive cloth in a vertical direction of two mutually grinding wheel to reduce the surface additional stress that was introduced by mechanical grinding to the minimum. Attention was paid to avoid over grinding.
iii. Fixing of the strain gauge. For the residual stress in the inner liner of the electric water heater tank, a special strain gauge of indentation method was adopted. The model and relevant parameters are listed in Table 6. The bonding quality of the strain gauges is closely related to the accuracy of the measurement results and was carried out in strict accordance with the procedures. The strain gauges were positioned on the inner surface of the container with a knife and a ruler. Then, a clean cotton yarn was dip in to acetone and alcohol solution in turns to wipe
Figure 2. Specimen for tensile strength test of longitudinal weld.
2.4. Residual Stress Test
Residual stresses were measured in the joints after the plasma arc welding using the indentationstrain method according to GB/T 24179-2009 “metal materials residual indentation measurementmethod”. The longitudinal seam residual stress of the electric heater water tank was measured.The measurement of residual stress by the indentation strain method is a patent technology that wasproposed and studied by the Institute of Metal Research of the Chinese Academy of Sciences in 90 sof the last century. The method calculates the residual stresses by measuring the strain variationsin the outer elastic region of the indenter produced by the spherical indenter. KJS-3 strain stresstesting system, mainly consisting of KJS-3 indentation stress tester and indentation striking device andcentering microscope was used to measure the residual stress in the longitudinal seam of the liner [23].
The method was as follows:
i. Determination of the measuring position: Figure 3a is the physical picture of the tested linerand the welding wire used for the longitudinal seam welding is JM-53. The longitudinaljoint stress state is symmetrical along the mirror surface of the two ring joint, so half of thelongitudinal joint was considered for residual stress test. Taking into account the postingof the inner surface and strain gauges, the location of the measurements were determined,as shown in Figure 3b: The weld longitudinal stress was tested at the weld center, the weld endand 60 mm at the end of the weld which corresponded to test points 1, 4, and 5 respectively.The transverse stress was also tested at the weld center, fusion line, and heat affected zone takeat test points 1, 2, and 3 respectively.
J. Manuf. Mater. Process. 2017, 1, 19 7 of 18
ii. Surface treatment of measured points. First, a smooth grinding wheel was used for grindingthe weld surface and was then treated with 100# abrasive cloth in a vertical direction oftwo mutually grinding wheel to reduce the surface additional stress that was introduced bymechanical grinding to the minimum. Attention was paid to avoid over grinding.
iii. Fixing of the strain gauge. For the residual stress in the inner liner of the electric water heatertank, a special strain gauge of indentation method was adopted. The model and relevantparameters are listed in Table 6. The bonding quality of the strain gauges is closely relatedto the accuracy of the measurement results and was carried out in strict accordance with theprocedures. The strain gauges were positioned on the inner surface of the container with a knifeand a ruler. Then, a clean cotton yarn was dip in to acetone and alcohol solution in turns to wipeclean the surface in one direction movement until it was clean and the surface was dried by anair blower. A thin layer of fresh 502 quick drying gel was applied on the back of the speciallyprepared strain gauge (BE120-2CA-K) and was placed in the test position. The two verticalstrain gates were ensured to be parallel and vertical to the weld and the strain gauge was easilytouched with tweezers to adjust its position when necessary. When the strain gauge was placed,the plastic film was covered and pressed with a thumb for about 1 m. A connection terminalwas then fixed near the strain gauge lead-out line and the strain gauge lead wire connectedwith the connection terminal by an electric iron and the short-circuit condition checked.
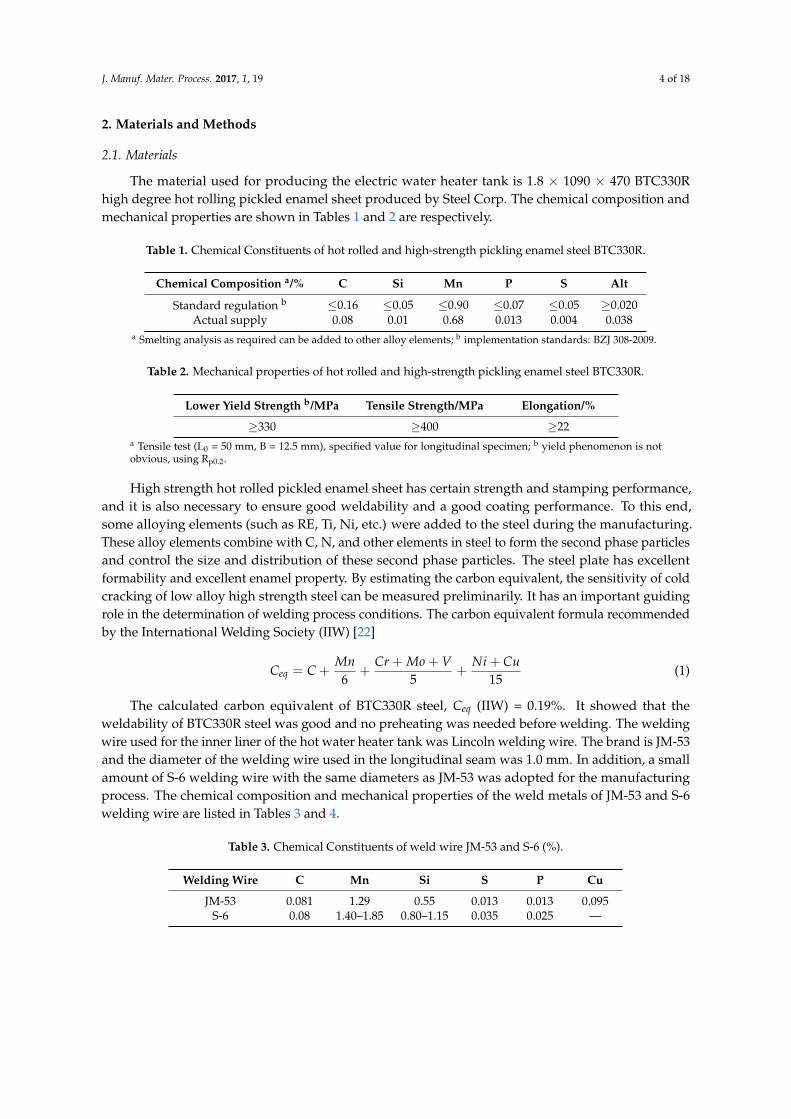
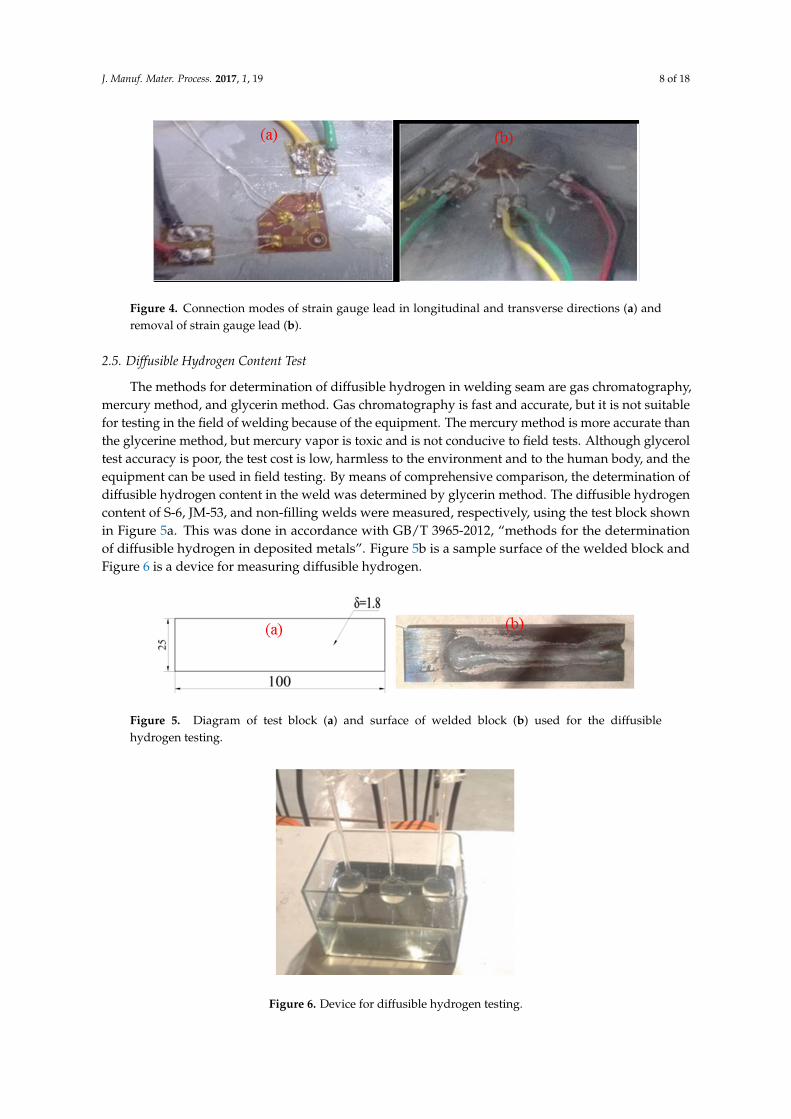
iv. Making indentation and data processing: After the strain gauges were adhered for about1~2 h, indentation fabrication and data processing were carried out by strain measurementterminal and the corresponding welding terminal strain gauge. The main stress direction of thetest points 1~4 coincides with the longitudinal and transverse direction of the weld and weretested according to the two stress directions. Only the lateral and vertical lines of the straingauge were extracted, as shown in Figure 4a. Due to the influence of the ring joint, the mainstress direction of the test point may be deflected at point 5. The stress was measured in threedirections and the lead in the three directions of the strain gauges was removed, as shown inFigure 4b. The initial key value was pressed to observe the strain balance. When the middlebase was used in conjunction with the microscope, the striking position of the striking rodwas determined by the indentation strike point on the strain gauge. After pulling out themicroscope, the striking rod was put into the base and the button was pressed to punch themark. The stress and strain values were read after the data displayed on the instrument wasstable [24].
Table 6. Parameters of strain gauge for indentation method measurement system.
Model Sensitivity Coefficient Resistance Level
BE120-2CA-K 2.23 ± 0.1% 120.2 ± 0.3 A
J. Manuf. Mater. Process. 2017, 1, 19 7 of 17
clean the surface in one direction movement until it was clean and the surface was dried by an air blower. A thin layer of fresh 502 quick drying gel was applied on the back of the specially prepared strain gauge (BE120-2CA-K) and was placed in the test position. The two vertical strain gates were ensured to be parallel and vertical to the weld and the strain gauge was easily touched with tweezers to adjust its position when necessary. When the strain gauge was placed, the plastic film was covered and pressed with a thumb for about 1 m. A connection terminal was then fixed near the strain gauge lead-out line and the strain gauge lead wire connected with the connection terminal by an electric iron and the short-circuit condition checked.
iv. Making indentation and data processing: After the strain gauges were adhered for about 1~2 h, indentation fabrication and data processing were carried out by strain measurement terminal and the corresponding welding terminal strain gauge. The main stress direction of the test points 1~4 coincides with the longitudinal and transverse direction of the weld and were tested according to the two stress directions. Only the lateral and vertical lines of the strain gauge were extracted, as shown in Figure 4a. Due to the influence of the ring joint, the main stress direction of the test point may be deflected at point 5. The stress was measured in three directions and the lead in the three directions of the strain gauges was removed, as shown in Figure 4b. The initial key value was pressed to observe the strain balance. When the middle base was used in conjunction with the microscope, the striking position of the striking rod was determined by the indentation strike point on the strain gauge. After pulling out the microscope, the striking rod was put into the base and the button was pressed to punch the mark. The stress and strain values were read after the data displayed on the instrument was stable [24].
Table 6. Parameters of strain gauge for indentation method measurement system.
Model Sensitivity Coefficient Resistance Level BE120-2CA-K 2.23 ± 0.1% 120.2 ± 0.3 A
Figure 3. Physical picture (a) and measurement sites for the tank (b) under test.
Figure 4. Connection modes of strain gauge lead in longitudinal and transverse directions (a) and removal of strain gauge lead (b).
2.5. Diffusible Hydrogen Content Test
The methods for determination of diffusible hydrogen in welding seam are gas chromatography, mercury method, and glycerin method. Gas chromatography is fast and accurate, but it is not suitable for testing in the field of welding because of the equipment. The mercury method is more accurate
Figure 3. Physical picture (a) and measurement sites for the tank (b) under test.
J. Manuf. Mater. Process. 2017, 1, 19 8 of 18
J. Manuf. Mater. Process. 2017, 1, 19 7 of 17
clean the surface in one direction movement until it was clean and the surface was dried by an air blower. A thin layer of fresh 502 quick drying gel was applied on the back of the specially prepared strain gauge (BE120-2CA-K) and was placed in the test position. The two vertical strain gates were ensured to be parallel and vertical to the weld and the strain gauge was easily touched with tweezers to adjust its position when necessary. When the strain gauge was placed, the plastic film was covered and pressed with a thumb for about 1 m. A connection terminal was then fixed near the strain gauge lead-out line and the strain gauge lead wire connected with the connection terminal by an electric iron and the short-circuit condition checked.
iv. Making indentation and data processing: After the strain gauges were adhered for about 1~2 h, indentation fabrication and data processing were carried out by strain measurement terminal and the corresponding welding terminal strain gauge. The main stress direction of the test points 1~4 coincides with the longitudinal and transverse direction of the weld and were tested according to the two stress directions. Only the lateral and vertical lines of the strain gauge were extracted, as shown in Figure 4a. Due to the influence of the ring joint, the main stress direction of the test point may be deflected at point 5. The stress was measured in three directions and the lead in the three directions of the strain gauges was removed, as shown in Figure 4b. The initial key value was pressed to observe the strain balance. When the middle base was used in conjunction with the microscope, the striking position of the striking rod was determined by the indentation strike point on the strain gauge. After pulling out the microscope, the striking rod was put into the base and the button was pressed to punch the mark. The stress and strain values were read after the data displayed on the instrument was stable [24].
Table 6. Parameters of strain gauge for indentation method measurement system.
Model Sensitivity Coefficient Resistance Level BE120-2CA-K 2.23 ± 0.1% 120.2 ± 0.3 A
Figure 3. Physical picture (a) and measurement sites for the tank (b) under test.
Figure 4. Connection modes of strain gauge lead in longitudinal and transverse directions (a) and removal of strain gauge lead (b).
2.5. Diffusible Hydrogen Content Test
The methods for determination of diffusible hydrogen in welding seam are gas chromatography, mercury method, and glycerin method. Gas chromatography is fast and accurate, but it is not suitable for testing in the field of welding because of the equipment. The mercury method is more accurate
Figure 4. Connection modes of strain gauge lead in longitudinal and transverse directions (a) andremoval of strain gauge lead (b).
2.5. Diffusible Hydrogen Content Test
The methods for determination of diffusible hydrogen in welding seam are gas chromatography,mercury method, and glycerin method. Gas chromatography is fast and accurate, but it is not suitablefor testing in the field of welding because of the equipment. The mercury method is more accurate thanthe glycerine method, but mercury vapor is toxic and is not conducive to field tests. Although glyceroltest accuracy is poor, the test cost is low, harmless to the environment and to the human body, and theequipment can be used in field testing. By means of comprehensive comparison, the determination ofdiffusible hydrogen content in the weld was determined by glycerin method. The diffusible hydrogencontent of S-6, JM-53, and non-filling welds were measured, respectively, using the test block shownin Figure 5a. This was done in accordance with GB/T 3965-2012, “methods for the determinationof diffusible hydrogen in deposited metals”. Figure 5b is a sample surface of the welded block andFigure 6 is a device for measuring diffusible hydrogen.
J. Manuf. Mater. Process. 2017, 1, 19 8 of 17
than the glycerine method, but mercury vapor is toxic and is not conducive to field tests. Although glycerol test accuracy is poor, the test cost is low, harmless to the environment and to the human body, and the equipment can be used in field testing. By means of comprehensive comparison, the determination of diffusible hydrogen content in the weld was determined by glycerin method. The diffusible hydrogen content of S-6, JM-53, and non-filling welds were measured, respectively, using the test block shown in Figure 5a. This was done in accordance with GB/T 3965-2012, “methods for the determination of diffusible hydrogen in deposited metals”. Figure 5b is a sample surface of the welded block and Figure 6 is a device for measuring diffusible hydrogen.
Figure 5. Diagram of test block (a) and surface of welded block (b) used for the diffusible hydrogen testing.
Figure 6. Device for diffusible hydrogen testing.
3. Results and Discussion
3.1. Microstructure and Crack Analysis of the Longitudinal Weld
Figure 7 shows the optical micrograph of the longitudinal weld joint structure. The weld zone (Figure 7a) is columnar crystal with obvious orientation, as depicted in Figure 7b. The white flaky pre eutectoid ferrite are distributes along the columnar grain boundaries with the acicular ferrite and granular bainite in the crystal, while the isolated point is the inclusion. The inclusion is due to the reaction during the welding process. The appearance of acicular ferrite and bainite is due to high cooling rate after welding. The morphology of the fusion zone (Figure 7c) is different from the weld zone and the heat affected zone (Figure 7e). The microstructure of the fusion zone is mainly coarse eutectoid ferrite with good plasticity and toughness. However, the strength and hardness are not too high. From micrographs in Figure 7c, there is a sudden change in the fusion zone morphology at the root of weld joint where the stress is concentrated. Under alternating working stress and residual stress, the fusion line of the weld root is the most prone to cracks. The microstructure of the heat affected zone was characterized as an overheated zone with small black pearlite and normalizing zone with white equiaxed grain ferrite, as shown in Figure 7d,e, respectively. Significant grain growth was observed in this zone and this result is similar with that found by Bayraktar et al. [25].
Figure 5. Diagram of test block (a) and surface of welded block (b) used for the diffusiblehydrogen testing.
J. Manuf. Mater. Process. 2017, 1, 19 8 of 17
than the glycerine method, but mercury vapor is toxic and is not conducive to field tests. Although glycerol test accuracy is poor, the test cost is low, harmless to the environment and to the human body, and the equipment can be used in field testing. By means of comprehensive comparison, the determination of diffusible hydrogen content in the weld was determined by glycerin method. The diffusible hydrogen content of S-6, JM-53, and non-filling welds were measured, respectively, using the test block shown in Figure 5a. This was done in accordance with GB/T 3965-2012, “methods for the determination of diffusible hydrogen in deposited metals”. Figure 5b is a sample surface of the welded block and Figure 6 is a device for measuring diffusible hydrogen.
Figure 5. Diagram of test block (a) and surface of welded block (b) used for the diffusible hydrogen testing.
Figure 6. Device for diffusible hydrogen testing.
3. Results and Discussion
3.1. Microstructure and Crack Analysis of the Longitudinal Weld
Figure 7 shows the optical micrograph of the longitudinal weld joint structure. The weld zone (Figure 7a) is columnar crystal with obvious orientation, as depicted in Figure 7b. The white flaky pre eutectoid ferrite are distributes along the columnar grain boundaries with the acicular ferrite and granular bainite in the crystal, while the isolated point is the inclusion. The inclusion is due to the reaction during the welding process. The appearance of acicular ferrite and bainite is due to high cooling rate after welding. The morphology of the fusion zone (Figure 7c) is different from the weld zone and the heat affected zone (Figure 7e). The microstructure of the fusion zone is mainly coarse eutectoid ferrite with good plasticity and toughness. However, the strength and hardness are not too high. From micrographs in Figure 7c, there is a sudden change in the fusion zone morphology at the root of weld joint where the stress is concentrated. Under alternating working stress and residual stress, the fusion line of the weld root is the most prone to cracks. The microstructure of the heat affected zone was characterized as an overheated zone with small black pearlite and normalizing zone with white equiaxed grain ferrite, as shown in Figure 7d,e, respectively. Significant grain growth was observed in this zone and this result is similar with that found by Bayraktar et al. [25].
Figure 6. Device for diffusible hydrogen testing.
J. Manuf. Mater. Process. 2017, 1, 19 9 of 18
3. Results and Discussion
3.1. Microstructure and Crack Analysis of the Longitudinal Weld
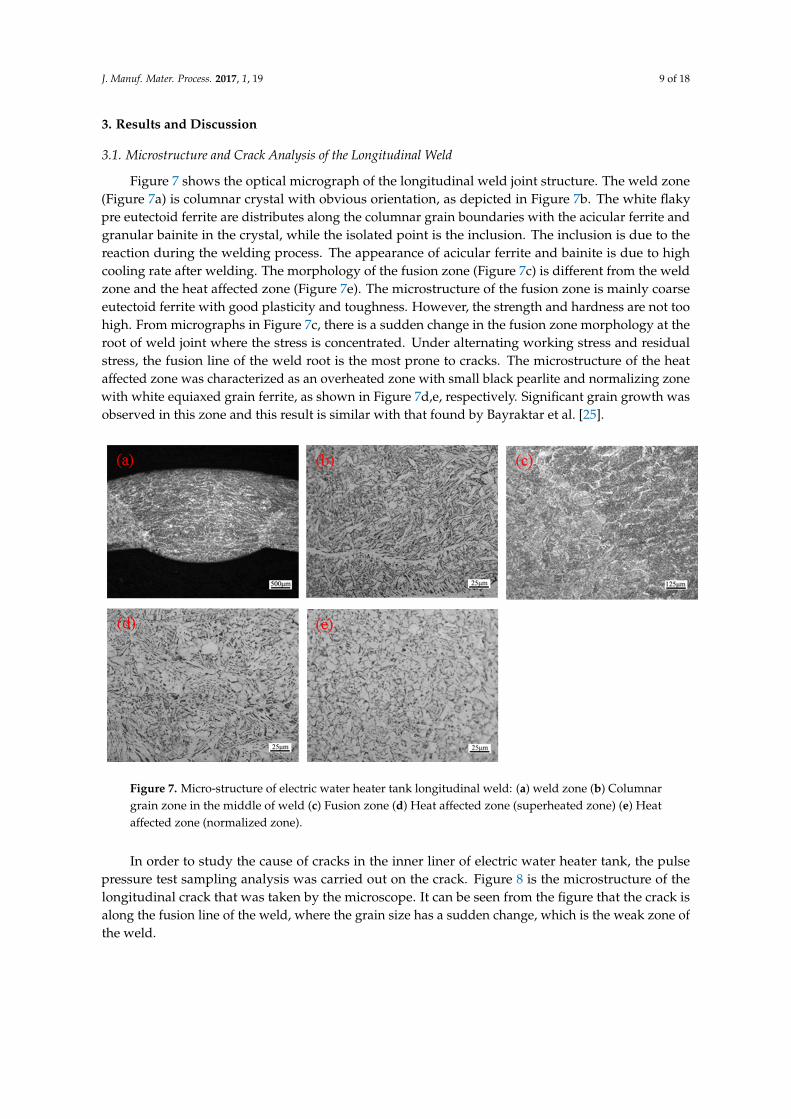
Figure 7 shows the optical micrograph of the longitudinal weld joint structure. The weld zone(Figure 7a) is columnar crystal with obvious orientation, as depicted in Figure 7b. The white flakypre eutectoid ferrite are distributes along the columnar grain boundaries with the acicular ferrite andgranular bainite in the crystal, while the isolated point is the inclusion. The inclusion is due to thereaction during the welding process. The appearance of acicular ferrite and bainite is due to highcooling rate after welding. The morphology of the fusion zone (Figure 7c) is different from the weldzone and the heat affected zone (Figure 7e). The microstructure of the fusion zone is mainly coarseeutectoid ferrite with good plasticity and toughness. However, the strength and hardness are not toohigh. From micrographs in Figure 7c, there is a sudden change in the fusion zone morphology at theroot of weld joint where the stress is concentrated. Under alternating working stress and residualstress, the fusion line of the weld root is the most prone to cracks. The microstructure of the heataffected zone was characterized as an overheated zone with small black pearlite and normalizing zonewith white equiaxed grain ferrite, as shown in Figure 7d,e, respectively. Significant grain growth wasobserved in this zone and this result is similar with that found by Bayraktar et al. [25].J. Manuf. Mater. Process. 2017, 1, 19 9 of 17
Figure 7. Micro-structure of electric water heater tank longitudinal weld: (a) weld zone (b) Columnar grain zone in the middle of weld (c) Fusion zone (d) Heat affected zone (superheated zone) (e) Heat affected zone (normalized zone).
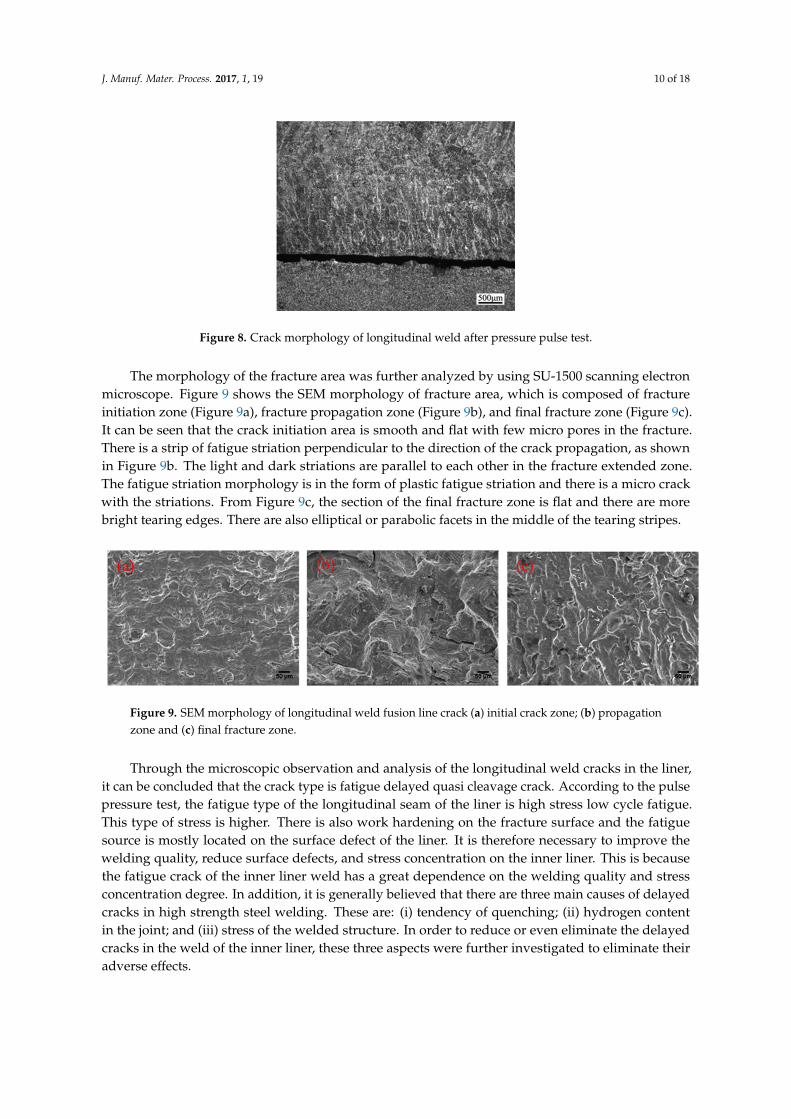
In order to study the cause of cracks in the inner liner of electric water heater tank, the pulse pressure test sampling analysis was carried out on the crack. Figure 8 is the microstructure of the longitudinal crack that was taken by the microscope. It can be seen from the figure that the crack is along the fusion line of the weld, where the grain size has a sudden change, which is the weak zone of the weld.
Figure 8. Crack morphology of longitudinal weld after pressure pulse test.
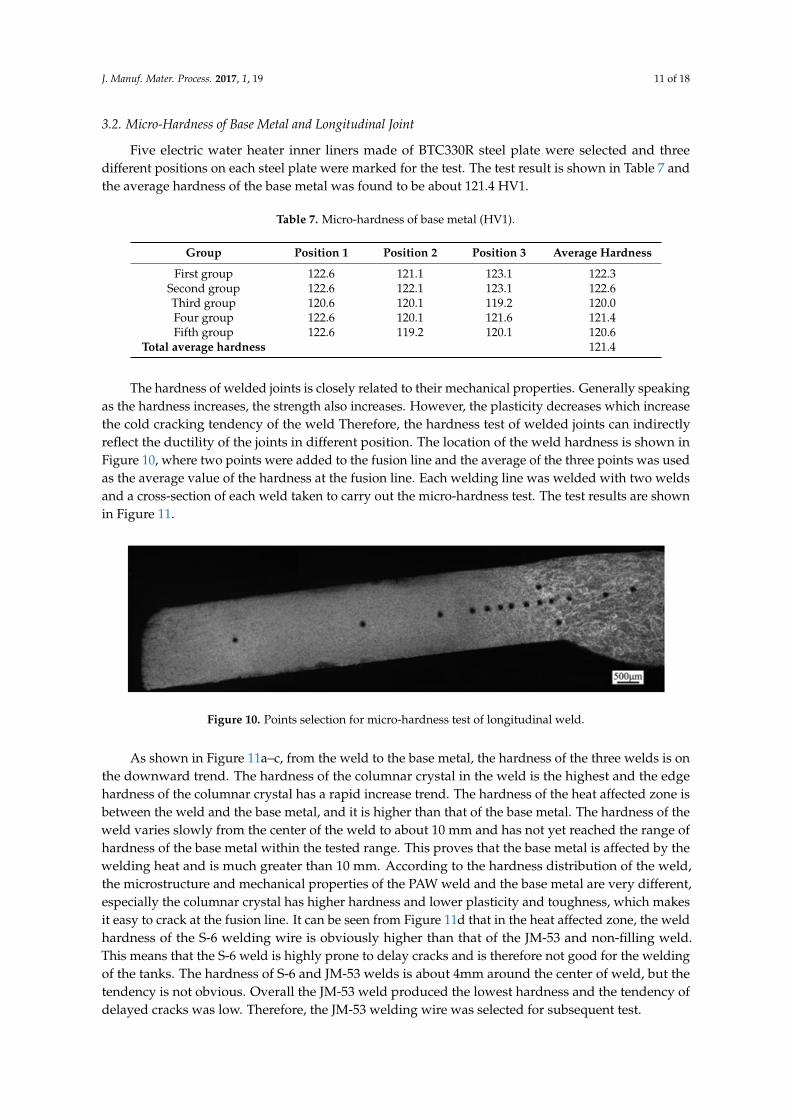
The morphology of the fracture area was further analyzed by using SU-1500 scanning electron microscope. Figure 9 shows the SEM morphology of fracture area, which is composed of fracture initiation zone (Figure 9a), fracture propagation zone (Figure 9b), and final fracture zone (Figure 9c). It can be seen that the crack initiation area is smooth and flat with few micro pores in the fracture. There is a strip of fatigue striation perpendicular to the direction of the crack propagation, as shown in Figure 9b. The light and dark striations are parallel to each other in the fracture extended zone. The fatigue striation morphology is in the form of plastic fatigue striation and there is a micro crack with the striations. From Figure 9c, the section of the final fracture zone is flat and there are more bright tearing edges. There are also elliptical or parabolic facets in the middle of the tearing stripes.
Figure 7. Micro-structure of electric water heater tank longitudinal weld: (a) weld zone (b) Columnargrain zone in the middle of weld (c) Fusion zone (d) Heat affected zone (superheated zone) (e) Heataffected zone (normalized zone).
In order to study the cause of cracks in the inner liner of electric water heater tank, the pulsepressure test sampling analysis was carried out on the crack. Figure 8 is the microstructure of thelongitudinal crack that was taken by the microscope. It can be seen from the figure that the crack isalong the fusion line of the weld, where the grain size has a sudden change, which is the weak zone ofthe weld.
J. Manuf. Mater. Process. 2017, 1, 19 10 of 18
J. Manuf. Mater. Process. 2017, 1, 19 9 of 17
Figure 7. Micro-structure of electric water heater tank longitudinal weld: (a) weld zone (b) Columnar grain zone in the middle of weld (c) Fusion zone (d) Heat affected zone (superheated zone) (e) Heat affected zone (normalized zone).
In order to study the cause of cracks in the inner liner of electric water heater tank, the pulse pressure test sampling analysis was carried out on the crack. Figure 8 is the microstructure of the longitudinal crack that was taken by the microscope. It can be seen from the figure that the crack is along the fusion line of the weld, where the grain size has a sudden change, which is the weak zone of the weld.
Figure 8. Crack morphology of longitudinal weld after pressure pulse test.
The morphology of the fracture area was further analyzed by using SU-1500 scanning electron microscope. Figure 9 shows the SEM morphology of fracture area, which is composed of fracture initiation zone (Figure 9a), fracture propagation zone (Figure 9b), and final fracture zone (Figure 9c). It can be seen that the crack initiation area is smooth and flat with few micro pores in the fracture. There is a strip of fatigue striation perpendicular to the direction of the crack propagation, as shown in Figure 9b. The light and dark striations are parallel to each other in the fracture extended zone. The fatigue striation morphology is in the form of plastic fatigue striation and there is a micro crack with the striations. From Figure 9c, the section of the final fracture zone is flat and there are more bright tearing edges. There are also elliptical or parabolic facets in the middle of the tearing stripes.
Figure 8. Crack morphology of longitudinal weld after pressure pulse test.
The morphology of the fracture area was further analyzed by using SU-1500 scanning electronmicroscope. Figure 9 shows the SEM morphology of fracture area, which is composed of fractureinitiation zone (Figure 9a), fracture propagation zone (Figure 9b), and final fracture zone (Figure 9c).It can be seen that the crack initiation area is smooth and flat with few micro pores in the fracture.There is a strip of fatigue striation perpendicular to the direction of the crack propagation, as shownin Figure 9b. The light and dark striations are parallel to each other in the fracture extended zone.The fatigue striation morphology is in the form of plastic fatigue striation and there is a micro crackwith the striations. From Figure 9c, the section of the final fracture zone is flat and there are morebright tearing edges. There are also elliptical or parabolic facets in the middle of the tearing stripes.J. Manuf. Mater. Process. 2017, 1, 19 10 of 17
Figure 9. SEM morphology of longitudinal weld fusion line crack (a) initial crack zone; (b) propagation zone and (c) final fracture zone.
Through the microscopic observation and analysis of the longitudinal weld cracks in the liner, it can be concluded that the crack type is fatigue delayed quasi cleavage crack. According to the pulse pressure test, the fatigue type of the longitudinal seam of the liner is high stress low cycle fatigue. This type of stress is higher. There is also work hardening on the fracture surface and the fatigue source is mostly located on the surface defect of the liner. It is therefore necessary to improve the welding quality, reduce surface defects, and stress concentration on the inner liner. This is because the fatigue crack of the inner liner weld has a great dependence on the welding quality and stress concentration degree. In addition, it is generally believed that there are three main causes of delayed cracks in high strength steel welding. These are: (i) tendency of quenching; (ii) hydrogen content in the joint; and (iii) stress of the welded structure. In order to reduce or even eliminate the delayed cracks in the weld of the inner liner, these three aspects were further investigated to eliminate their adverse effects.
3.2. Micro-Hardness of Base Metal and Longitudinal Joint
Five electric water heater inner liners made of BTC330R steel plate were selected and three different positions on each steel plate were marked for the test. The test result is shown in Table 7 and the average hardness of the base metal was found to be about 121.4 HV1.
Table 7. Micro-hardness of base metal (HV1).
Group Position 1 Position 2 Position 3 Average HardnessFirst group 122.6 121.1 123.1 122.3
Second group 122.6 122.1 123.1 122.6 Third group 120.6 120.1 119.2 120.0 Four group 122.6 120.1 121.6 121.4 Fifth group 122.6 119.2 120.1 120.6
Total average hardness 121.4
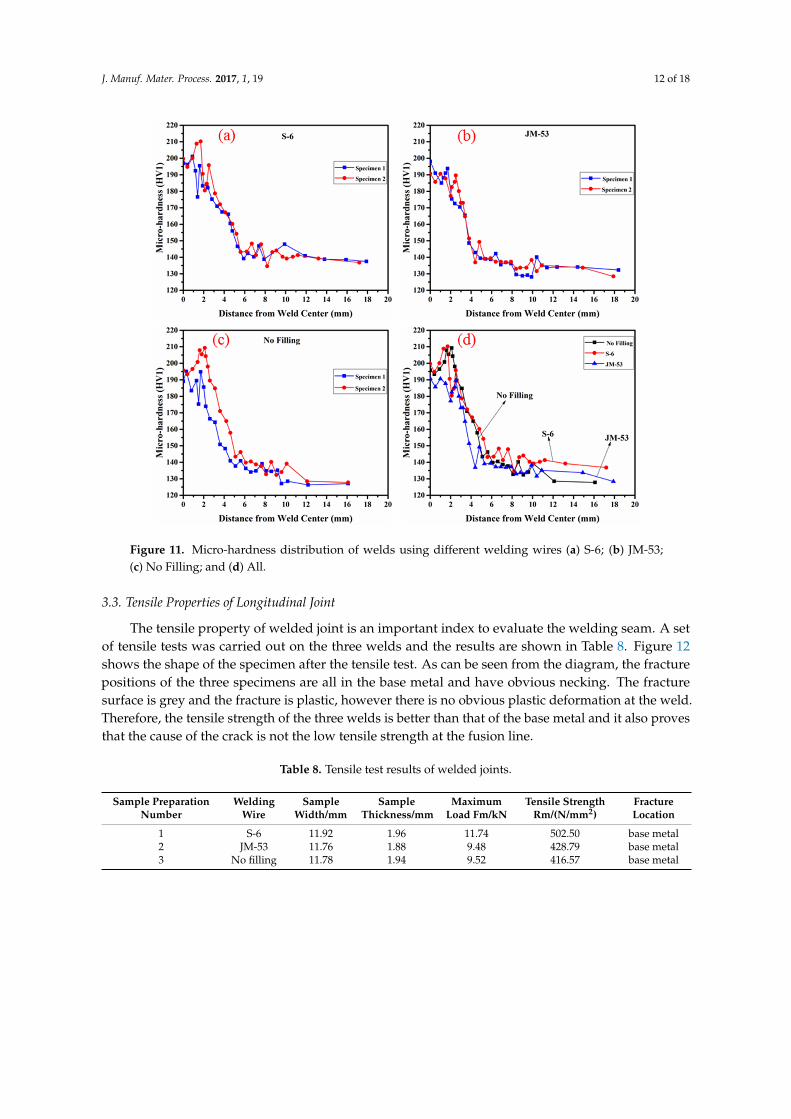
The hardness of welded joints is closely related to their mechanical properties. Generally speaking as the hardness increases, the strength also increases. However, the plasticity decreases which increase the cold cracking tendency of the weld Therefore, the hardness test of welded joints can indirectly reflect the ductility of the joints in different position. The location of the weld hardness is shown in Figure 10, where two points were added to the fusion line and the average of the three points was used as the average value of the hardness at the fusion line. Each welding line was welded with two welds and a cross-section of each weld taken to carry out the micro-hardness test. The test results are shown in Figure 11.
Figure 9. SEM morphology of longitudinal weld fusion line crack (a) initial crack zone; (b) propagationzone and (c) final fracture zone.
Through the microscopic observation and analysis of the longitudinal weld cracks in the liner,it can be concluded that the crack type is fatigue delayed quasi cleavage crack. According to the pulsepressure test, the fatigue type of the longitudinal seam of the liner is high stress low cycle fatigue.This type of stress is higher. There is also work hardening on the fracture surface and the fatiguesource is mostly located on the surface defect of the liner. It is therefore necessary to improve thewelding quality, reduce surface defects, and stress concentration on the inner liner. This is becausethe fatigue crack of the inner liner weld has a great dependence on the welding quality and stressconcentration degree. In addition, it is generally believed that there are three main causes of delayedcracks in high strength steel welding. These are: (i) tendency of quenching; (ii) hydrogen contentin the joint; and (iii) stress of the welded structure. In order to reduce or even eliminate the delayedcracks in the weld of the inner liner, these three aspects were further investigated to eliminate theiradverse effects.
J. Manuf. Mater. Process. 2017, 1, 19 11 of 18
3.2. Micro-Hardness of Base Metal and Longitudinal Joint
Five electric water heater inner liners made of BTC330R steel plate were selected and threedifferent positions on each steel plate were marked for the test. The test result is shown in Table 7 andthe average hardness of the base metal was found to be about 121.4 HV1.
Table 7. Micro-hardness of base metal (HV1).
Group Position 1 Position 2 Position 3 Average Hardness
First group 122.6 121.1 123.1 122.3Second group 122.6 122.1 123.1 122.6Third group 120.6 120.1 119.2 120.0Four group 122.6 120.1 121.6 121.4Fifth group 122.6 119.2 120.1 120.6
Total average hardness 121.4
The hardness of welded joints is closely related to their mechanical properties. Generally speakingas the hardness increases, the strength also increases. However, the plasticity decreases which increasethe cold cracking tendency of the weld Therefore, the hardness test of welded joints can indirectlyreflect the ductility of the joints in different position. The location of the weld hardness is shown inFigure 10, where two points were added to the fusion line and the average of the three points was usedas the average value of the hardness at the fusion line. Each welding line was welded with two weldsand a cross-section of each weld taken to carry out the micro-hardness test. The test results are shownin Figure 11.J. Manuf. Mater. Process. 2017, 1, 19 11 of 17
Figure 10. Points selection for micro-hardness test of longitudinal weld.
As shown in Figure 11a–c, from the weld to the base metal, the hardness of the three welds is on the downward trend. The hardness of the columnar crystal in the weld is the highest and the edge hardness of the columnar crystal has a rapid increase trend. The hardness of the heat affected zone is between the weld and the base metal, and it is higher than that of the base metal. The hardness of the weld varies slowly from the center of the weld to about 10 mm and has not yet reached the range of hardness of the base metal within the tested range. This proves that the base metal is affected by the welding heat and is much greater than 10 mm. According to the hardness distribution of the weld, the microstructure and mechanical properties of the PAW weld and the base metal are very different, especially the columnar crystal has higher hardness and lower plasticity and toughness, which makes it easy to crack at the fusion line. It can be seen from Figure 11d that in the heat affected zone, the weld hardness of the S-6 welding wire is obviously higher than that of the JM-53 and non-filling weld. This means that the S-6 weld is highly prone to delay cracks and is therefore not good for the welding of the tanks. The hardness of S-6 and JM-53 welds is about 4mm around the center of weld, but the tendency is not obvious. Overall the JM-53 weld produced the lowest hardness and the tendency of delayed cracks was low. Therefore, the JM-53 welding wire was selected for subsequent test.
Figure 11. Micro-hardness distribution of welds using different welding wires (a) S-6; (b) JM-53; (c) No Filling; and (d) All.
Figure 10. Points selection for micro-hardness test of longitudinal weld.
As shown in Figure 11a–c, from the weld to the base metal, the hardness of the three welds is onthe downward trend. The hardness of the columnar crystal in the weld is the highest and the edgehardness of the columnar crystal has a rapid increase trend. The hardness of the heat affected zone isbetween the weld and the base metal, and it is higher than that of the base metal. The hardness of theweld varies slowly from the center of the weld to about 10 mm and has not yet reached the range ofhardness of the base metal within the tested range. This proves that the base metal is affected by thewelding heat and is much greater than 10 mm. According to the hardness distribution of the weld,the microstructure and mechanical properties of the PAW weld and the base metal are very different,especially the columnar crystal has higher hardness and lower plasticity and toughness, which makesit easy to crack at the fusion line. It can be seen from Figure 11d that in the heat affected zone, the weldhardness of the S-6 welding wire is obviously higher than that of the JM-53 and non-filling weld.This means that the S-6 weld is highly prone to delay cracks and is therefore not good for the weldingof the tanks. The hardness of S-6 and JM-53 welds is about 4mm around the center of weld, but thetendency is not obvious. Overall the JM-53 weld produced the lowest hardness and the tendency ofdelayed cracks was low. Therefore, the JM-53 welding wire was selected for subsequent test.
J. Manuf. Mater. Process. 2017, 1, 19 12 of 18
J. Manuf. Mater. Process. 2017, 1, 19 11 of 17
Figure 10. Points selection for micro-hardness test of longitudinal weld.
As shown in Figure 11a–c, from the weld to the base metal, the hardness of the three welds is on the downward trend. The hardness of the columnar crystal in the weld is the highest and the edge hardness of the columnar crystal has a rapid increase trend. The hardness of the heat affected zone is between the weld and the base metal, and it is higher than that of the base metal. The hardness of the weld varies slowly from the center of the weld to about 10 mm and has not yet reached the range of hardness of the base metal within the tested range. This proves that the base metal is affected by the welding heat and is much greater than 10 mm. According to the hardness distribution of the weld, the microstructure and mechanical properties of the PAW weld and the base metal are very different, especially the columnar crystal has higher hardness and lower plasticity and toughness, which makes it easy to crack at the fusion line. It can be seen from Figure 11d that in the heat affected zone, the weld hardness of the S-6 welding wire is obviously higher than that of the JM-53 and non-filling weld. This means that the S-6 weld is highly prone to delay cracks and is therefore not good for the welding of the tanks. The hardness of S-6 and JM-53 welds is about 4mm around the center of weld, but the tendency is not obvious. Overall the JM-53 weld produced the lowest hardness and the tendency of delayed cracks was low. Therefore, the JM-53 welding wire was selected for subsequent test.
Figure 11. Micro-hardness distribution of welds using different welding wires (a) S-6; (b) JM-53; (c) No Filling; and (d) All. Figure 11. Micro-hardness distribution of welds using different welding wires (a) S-6; (b) JM-53;(c) No Filling; and (d) All.
3.3. Tensile Properties of Longitudinal Joint
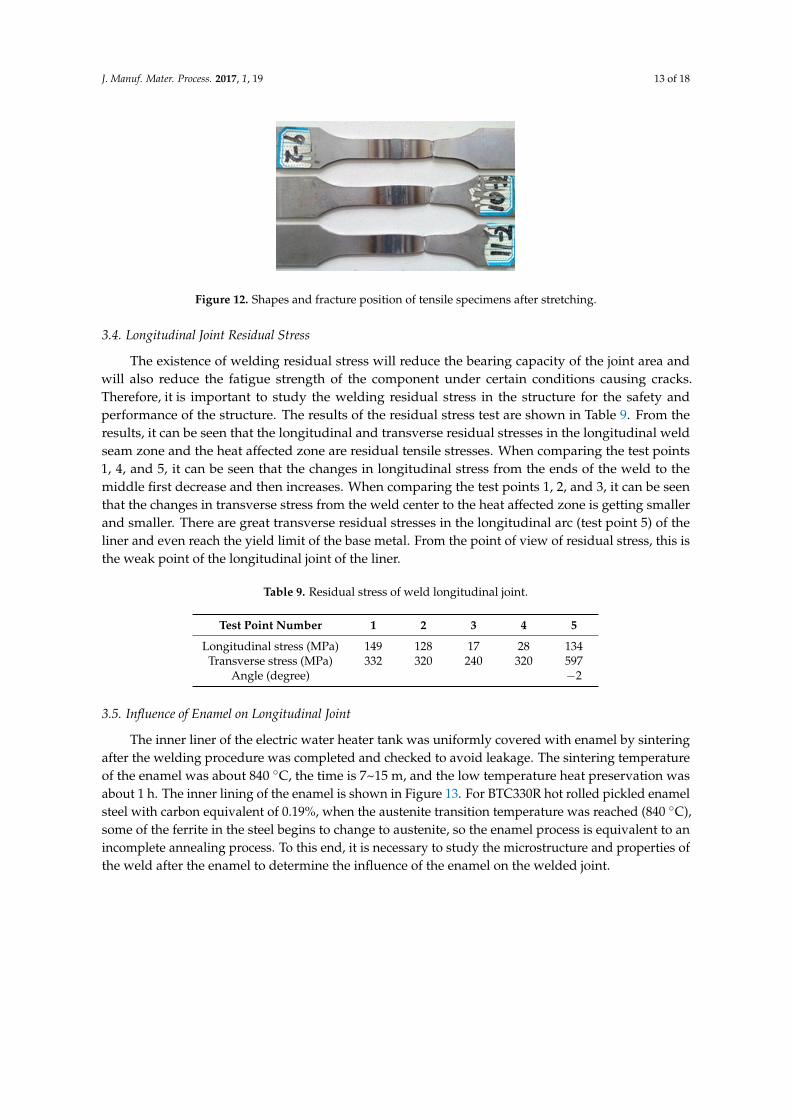
The tensile property of welded joint is an important index to evaluate the welding seam. A setof tensile tests was carried out on the three welds and the results are shown in Table 8. Figure 12shows the shape of the specimen after the tensile test. As can be seen from the diagram, the fracturepositions of the three specimens are all in the base metal and have obvious necking. The fracturesurface is grey and the fracture is plastic, however there is no obvious plastic deformation at the weld.Therefore, the tensile strength of the three welds is better than that of the base metal and it also provesthat the cause of the crack is not the low tensile strength at the fusion line.
Table 8. Tensile test results of welded joints.
Sample PreparationNumber
WeldingWire
SampleWidth/mm
SampleThickness/mm
MaximumLoad Fm/kN
Tensile StrengthRm/(N/mm2)
FractureLocation
1 S-6 11.92 1.96 11.74 502.50 base metal2 JM-53 11.76 1.88 9.48 428.79 base metal3 No filling 11.78 1.94 9.52 416.57 base metal
J. Manuf. Mater. Process. 2017, 1, 19 13 of 18
J. Manuf. Mater. Process. 2017, 1, 19 12 of 17
3.3. Tensile Properties of Longitudinal Joint
The tensile property of welded joint is an important index to evaluate the welding seam. A set of tensile tests was carried out on the three welds and the results are shown in Table 8. Figure 12 shows the shape of the specimen after the tensile test. As can be seen from the diagram, the fracture positions of the three specimens are all in the base metal and have obvious necking. The fracture surface is grey and the fracture is plastic, however there is no obvious plastic deformation at the weld. Therefore, the tensile strength of the three welds is better than that of the base metal and it also proves that the cause of the crack is not the low tensile strength at the fusion line.
Table 8. Tensile test results of welded joints.
Sample Preparation
Number
Welding Wire
Sample Width /mm
Sample Thickness /mm
Maximum Load Fm/kN
Tensile Strength
Rm/(N/mm2)
Fracture Location
1 S-6 11.92 1.96 11.74 502.50 base metal 2 JM-53 11.76 1.88 9.48 428.79 base metal 3 No filling 11.78 1.94 9.52 416.57 base metal
Figure 12. Shapes and fracture position of tensile specimens after stretching.
3.4. Longitudinal Joint Residual Stress
The existence of welding residual stress will reduce the bearing capacity of the joint area and will also reduce the fatigue strength of the component under certain conditions causing cracks. Therefore, it is important to study the welding residual stress in the structure for the safety and performance of the structure. The results of the residual stress test are shown in Table 9. From the results, it can be seen that the longitudinal and transverse residual stresses in the longitudinal weld seam zone and the heat affected zone are residual tensile stresses. When comparing the test points 1, 4, and 5, it can be seen that the changes in longitudinal stress from the ends of the weld to the middle first decrease and then increases. When comparing the test points 1, 2, and 3, it can be seen that the changes in transverse stress from the weld center to the heat affected zone is getting smaller and smaller. There are great transverse residual stresses in the longitudinal arc (test point 5) of the liner and even reach the yield limit of the base metal. From the point of view of residual stress, this is the weak point of the longitudinal joint of the liner.
Table 9. Residual stress of weld longitudinal joint.
Test Point Number 1 2 3 4 5Longitudinal stress (MPa) 149 128 17 28 134 Transverse stress (MPa) 332 320 240 320 597
Angle (degree) −2
3.5. Influence of Enamel on Longitudinal Joint
The inner liner of the electric water heater tank was uniformly covered with enamel by sintering after the welding procedure was completed and checked to avoid leakage. The sintering temperature
Figure 12. Shapes and fracture position of tensile specimens after stretching.
3.4. Longitudinal Joint Residual Stress
The existence of welding residual stress will reduce the bearing capacity of the joint area andwill also reduce the fatigue strength of the component under certain conditions causing cracks.Therefore, it is important to study the welding residual stress in the structure for the safety andperformance of the structure. The results of the residual stress test are shown in Table 9. From theresults, it can be seen that the longitudinal and transverse residual stresses in the longitudinal weldseam zone and the heat affected zone are residual tensile stresses. When comparing the test points1, 4, and 5, it can be seen that the changes in longitudinal stress from the ends of the weld to themiddle first decrease and then increases. When comparing the test points 1, 2, and 3, it can be seenthat the changes in transverse stress from the weld center to the heat affected zone is getting smallerand smaller. There are great transverse residual stresses in the longitudinal arc (test point 5) of theliner and even reach the yield limit of the base metal. From the point of view of residual stress, this isthe weak point of the longitudinal joint of the liner.
Table 9. Residual stress of weld longitudinal joint.
Test Point Number 1 2 3 4 5
Longitudinal stress (MPa) 149 128 17 28 134Transverse stress (MPa) 332 320 240 320 597
Angle (degree) −2
3.5. Influence of Enamel on Longitudinal Joint
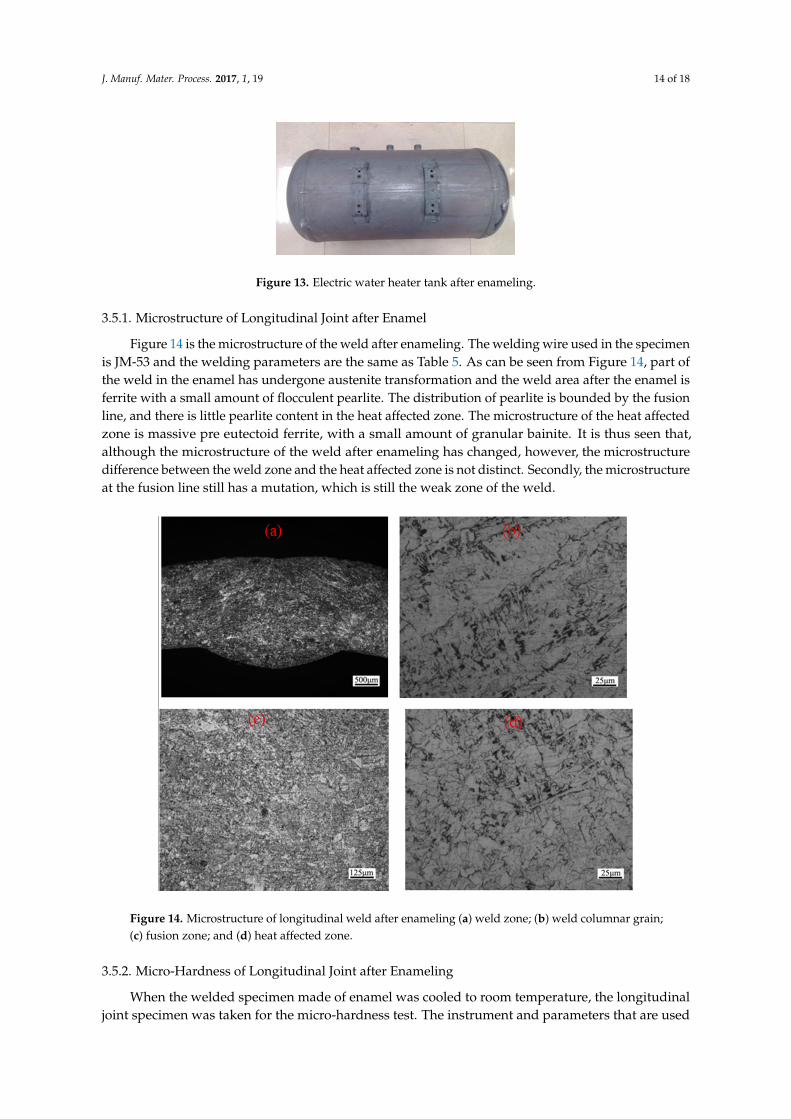
The inner liner of the electric water heater tank was uniformly covered with enamel by sinteringafter the welding procedure was completed and checked to avoid leakage. The sintering temperatureof the enamel was about 840 ◦C, the time is 7~15 m, and the low temperature heat preservation wasabout 1 h. The inner lining of the enamel is shown in Figure 13. For BTC330R hot rolled pickled enamelsteel with carbon equivalent of 0.19%, when the austenite transition temperature was reached (840 ◦C),some of the ferrite in the steel begins to change to austenite, so the enamel process is equivalent to anincomplete annealing process. To this end, it is necessary to study the microstructure and properties ofthe weld after the enamel to determine the influence of the enamel on the welded joint.
J. Manuf. Mater. Process. 2017, 1, 19 14 of 18
J. Manuf. Mater. Process. 2017, 1, 19 13 of 17
of the enamel was about 840 °C, the time is 7~15 m, and the low temperature heat preservation was about 1 h. The inner lining of the enamel is shown in Figure 13. For BTC330R hot rolled pickled enamel steel with carbon equivalent of 0.19%, when the austenite transition temperature was reached (840 °C), some of the ferrite in the steel begins to change to austenite, so the enamel process is equivalent to an incomplete annealing process. To this end, it is necessary to study the microstructure and properties of the weld after the enamel to determine the influence of the enamel on the welded joint.
Figure 13. Electric water heater tank after enameling.
3.5.1. Microstructure of Longitudinal Joint after Enamel
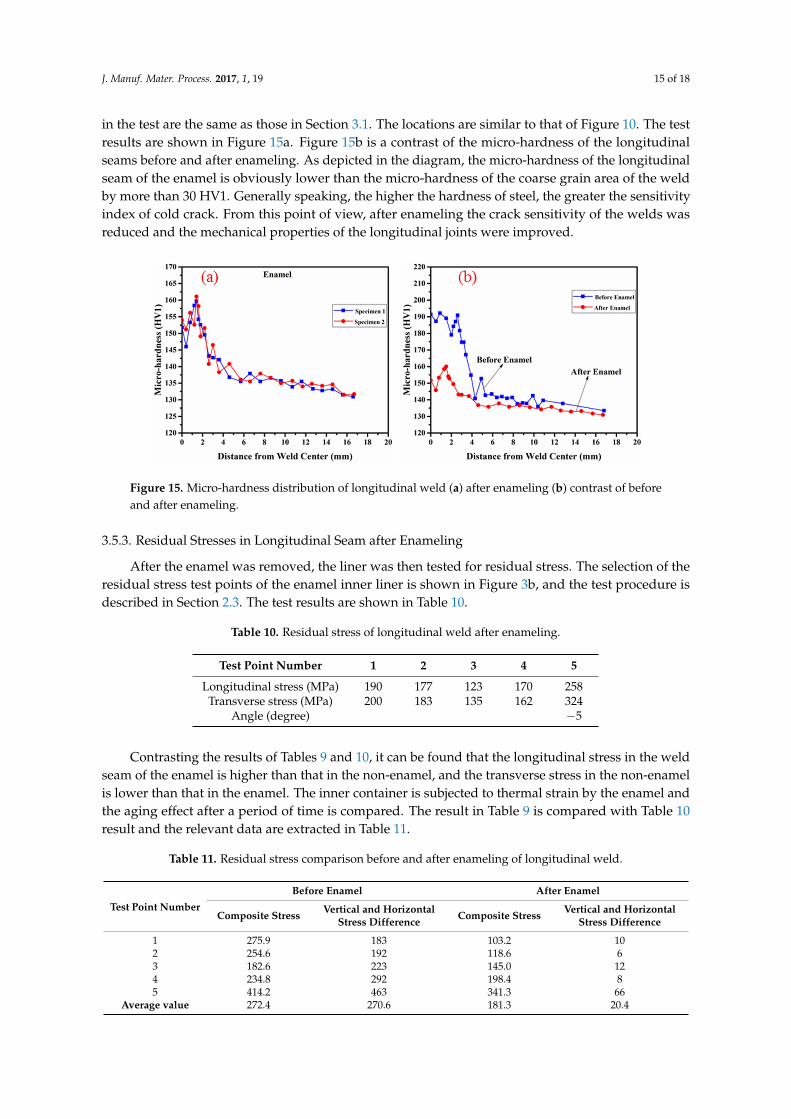
Figure 14 is the microstructure of the weld after enameling. The welding wire used in the specimen is JM-53 and the welding parameters are the same as Table 5. As can be seen from Figure 14, part of the weld in the enamel has undergone austenite transformation and the weld area after the enamel is ferrite with a small amount of flocculent pearlite. The distribution of pearlite is bounded by the fusion line, and there is little pearlite content in the heat affected zone. The microstructure of the heat affected zone is massive pre eutectoid ferrite, with a small amount of granular bainite. It is thus seen that, although the microstructure of the weld after enameling has changed, however, the microstructure difference between the weld zone and the heat affected zone is not distinct. Secondly, the microstructure at the fusion line still has a mutation, which is still the weak zone of the weld.
Figure 14. Microstructure of longitudinal weld after enameling (a) weld zone; (b) weld columnar grain; (c) fusion zone; and (d) heat affected zone.
Figure 13. Electric water heater tank after enameling.
3.5.1. Microstructure of Longitudinal Joint after Enamel
Figure 14 is the microstructure of the weld after enameling. The welding wire used in the specimenis JM-53 and the welding parameters are the same as Table 5. As can be seen from Figure 14, part ofthe weld in the enamel has undergone austenite transformation and the weld area after the enamel isferrite with a small amount of flocculent pearlite. The distribution of pearlite is bounded by the fusionline, and there is little pearlite content in the heat affected zone. The microstructure of the heat affectedzone is massive pre eutectoid ferrite, with a small amount of granular bainite. It is thus seen that,although the microstructure of the weld after enameling has changed, however, the microstructuredifference between the weld zone and the heat affected zone is not distinct. Secondly, the microstructureat the fusion line still has a mutation, which is still the weak zone of the weld.
J. Manuf. Mater. Process. 2017, 1, 19 13 of 17
of the enamel was about 840 °C, the time is 7~15 m, and the low temperature heat preservation was about 1 h. The inner lining of the enamel is shown in Figure 13. For BTC330R hot rolled pickled enamel steel with carbon equivalent of 0.19%, when the austenite transition temperature was reached (840 °C), some of the ferrite in the steel begins to change to austenite, so the enamel process is equivalent to an incomplete annealing process. To this end, it is necessary to study the microstructure and properties of the weld after the enamel to determine the influence of the enamel on the welded joint.
Figure 13. Electric water heater tank after enameling.
3.5.1. Microstructure of Longitudinal Joint after Enamel
Figure 14 is the microstructure of the weld after enameling. The welding wire used in the specimen is JM-53 and the welding parameters are the same as Table 5. As can be seen from Figure 14, part of the weld in the enamel has undergone austenite transformation and the weld area after the enamel is ferrite with a small amount of flocculent pearlite. The distribution of pearlite is bounded by the fusion line, and there is little pearlite content in the heat affected zone. The microstructure of the heat affected zone is massive pre eutectoid ferrite, with a small amount of granular bainite. It is thus seen that, although the microstructure of the weld after enameling has changed, however, the microstructure difference between the weld zone and the heat affected zone is not distinct. Secondly, the microstructure at the fusion line still has a mutation, which is still the weak zone of the weld.
Figure 14. Microstructure of longitudinal weld after enameling (a) weld zone; (b) weld columnar grain; (c) fusion zone; and (d) heat affected zone. Figure 14. Microstructure of longitudinal weld after enameling (a) weld zone; (b) weld columnar grain;(c) fusion zone; and (d) heat affected zone.
3.5.2. Micro-Hardness of Longitudinal Joint after Enameling
When the welded specimen made of enamel was cooled to room temperature, the longitudinaljoint specimen was taken for the micro-hardness test. The instrument and parameters that are used
J. Manuf. Mater. Process. 2017, 1, 19 15 of 18
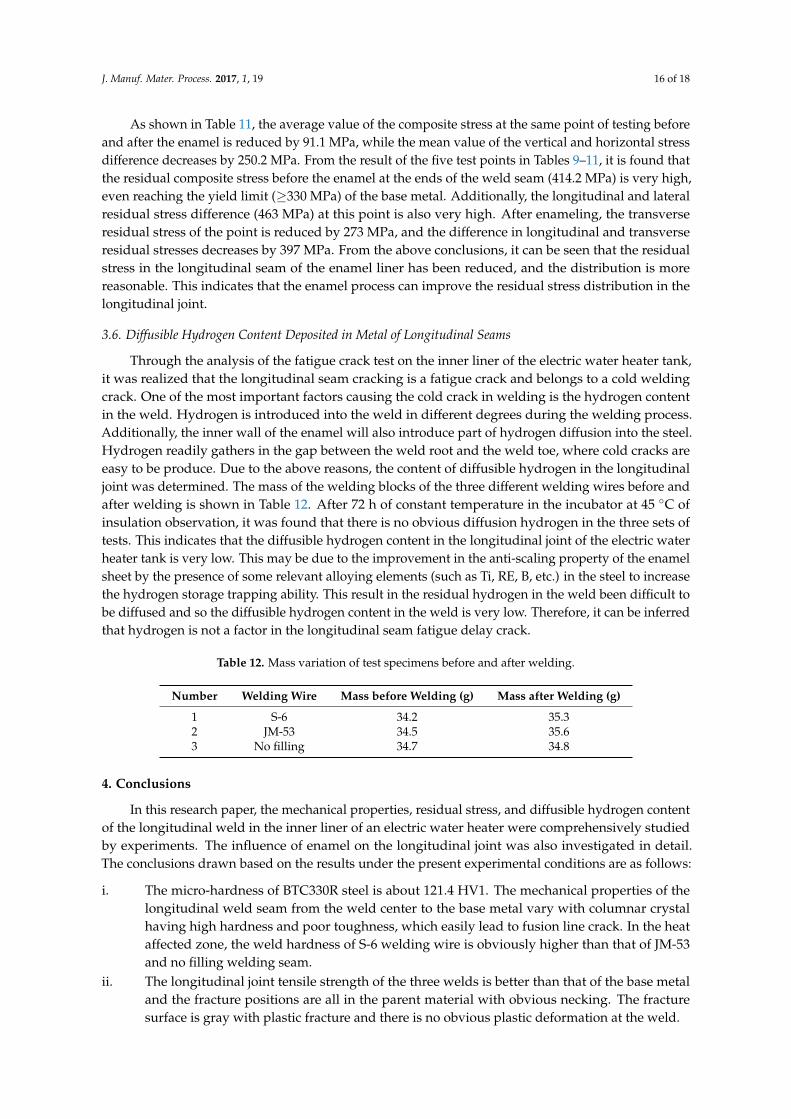
in the test are the same as those in Section 3.1. The locations are similar to that of Figure 10. The testresults are shown in Figure 15a. Figure 15b is a contrast of the micro-hardness of the longitudinalseams before and after enameling. As depicted in the diagram, the micro-hardness of the longitudinalseam of the enamel is obviously lower than the micro-hardness of the coarse grain area of the weldby more than 30 HV1. Generally speaking, the higher the hardness of steel, the greater the sensitivityindex of cold crack. From this point of view, after enameling the crack sensitivity of the welds wasreduced and the mechanical properties of the longitudinal joints were improved.
J. Manuf. Mater. Process. 2017, 1, 19 14 of 17
3.5.2. Micro-Hardness of Longitudinal Joint after Enameling
When the welded specimen made of enamel was cooled to room temperature, the longitudinal joint specimen was taken for the micro-hardness test. The instrument and parameters that are used in the test are the same as those in Section 3.1. The locations are similar to that of Figure 10. The test results are shown in Figure 15a. Figure 15b is a contrast of the micro-hardness of the longitudinal seams before and after enameling. As depicted in the diagram, the micro-hardness of the longitudinal seam of the enamel is obviously lower than the micro-hardness of the coarse grain area of the weld by more than 30 HV1. Generally speaking, the higher the hardness of steel, the greater the sensitivity index of cold crack. From this point of view, after enameling the crack sensitivity of the welds was reduced and the mechanical properties of the longitudinal joints were improved.
Figure 15. Micro-hardness distribution of longitudinal weld (a) after enameling (b) contrast of before and after enameling.
3.5.3. Residual Stresses in Longitudinal Seam after Enameling
After the enamel was removed, the liner was then tested for residual stress. The selection of the residual stress test points of the enamel inner liner is shown in Figure 3b, and the test procedure is described in Section 2.3. The test results are shown in Table 10.
Table 10. Residual stress of longitudinal weld after enameling.
Test Point Number 1 2 3 4 5 Longitudinal stress (MPa) 190 177 123 170 258 Transverse stress (MPa) 200 183 135 162 324
Angle (degree) −5
Contrasting the results of Tables 9 and 10, it can be found that the longitudinal stress in the weld seam of the enamel is higher than that in the non-enamel, and the transverse stress in the non-enamel is lower than that in the enamel. The inner container is subjected to thermal strain by the enamel and the aging effect after a period of time is compared. The result in Table 9 is compared with Table 10 result and the relevant data are extracted in Table 11.
Table 11. Residual stress comparison before and after enameling of longitudinal weld.
Test Point Number
Before Enamel After Enamel Composite
Stress Vertical and Horizontal
Stress Difference Composite
Stress Vertical and Horizontal
Stress Difference 1 275.9 183 103.2 10 2 254.6 192 118.6 6 3 182.6 223 145.0 12 4 234.8 292 198.4 8 5 414.2 463 341.3 66
Average value 272.4 270.6 181.3 20.4
Figure 15. Micro-hardness distribution of longitudinal weld (a) after enameling (b) contrast of beforeand after enameling.
3.5.3. Residual Stresses in Longitudinal Seam after Enameling
After the enamel was removed, the liner was then tested for residual stress. The selection of theresidual stress test points of the enamel inner liner is shown in Figure 3b, and the test procedure isdescribed in Section 2.3. The test results are shown in Table 10.
Table 10. Residual stress of longitudinal weld after enameling.
Test Point Number 1 2 3 4 5
Longitudinal stress (MPa) 190 177 123 170 258Transverse stress (MPa) 200 183 135 162 324
Angle (degree) −5
Contrasting the results of Tables 9 and 10, it can be found that the longitudinal stress in the weldseam of the enamel is higher than that in the non-enamel, and the transverse stress in the non-enamelis lower than that in the enamel. The inner container is subjected to thermal strain by the enamel andthe aging effect after a period of time is compared. The result in Table 9 is compared with Table 10result and the relevant data are extracted in Table 11.
Table 11. Residual stress comparison before and after enameling of longitudinal weld.
Test Point Number
Before Enamel After Enamel
Composite Stress Vertical and HorizontalStress Difference Composite Stress Vertical and Horizontal
Stress Difference
1 275.9 183 103.2 102 254.6 192 118.6 63 182.6 223 145.0 124 234.8 292 198.4 85 414.2 463 341.3 66
Average value 272.4 270.6 181.3 20.4
J. Manuf. Mater. Process. 2017, 1, 19 16 of 18
As shown in Table 11, the average value of the composite stress at the same point of testing beforeand after the enamel is reduced by 91.1 MPa, while the mean value of the vertical and horizontal stressdifference decreases by 250.2 MPa. From the result of the five test points in Tables 9–11, it is found thatthe residual composite stress before the enamel at the ends of the weld seam (414.2 MPa) is very high,even reaching the yield limit (≥330 MPa) of the base metal. Additionally, the longitudinal and lateralresidual stress difference (463 MPa) at this point is also very high. After enameling, the transverseresidual stress of the point is reduced by 273 MPa, and the difference in longitudinal and transverseresidual stresses decreases by 397 MPa. From the above conclusions, it can be seen that the residualstress in the longitudinal seam of the enamel liner has been reduced, and the distribution is morereasonable. This indicates that the enamel process can improve the residual stress distribution in thelongitudinal joint.
3.6. Diffusible Hydrogen Content Deposited in Metal of Longitudinal Seams
Through the analysis of the fatigue crack test on the inner liner of the electric water heater tank,it was realized that the longitudinal seam cracking is a fatigue crack and belongs to a cold weldingcrack. One of the most important factors causing the cold crack in welding is the hydrogen contentin the weld. Hydrogen is introduced into the weld in different degrees during the welding process.Additionally, the inner wall of the enamel will also introduce part of hydrogen diffusion into the steel.Hydrogen readily gathers in the gap between the weld root and the weld toe, where cold cracks areeasy to be produce. Due to the above reasons, the content of diffusible hydrogen in the longitudinaljoint was determined. The mass of the welding blocks of the three different welding wires before andafter welding is shown in Table 12. After 72 h of constant temperature in the incubator at 45 ◦C ofinsulation observation, it was found that there is no obvious diffusion hydrogen in the three sets oftests. This indicates that the diffusible hydrogen content in the longitudinal joint of the electric waterheater tank is very low. This may be due to the improvement in the anti-scaling property of the enamelsheet by the presence of some relevant alloying elements (such as Ti, RE, B, etc.) in the steel to increasethe hydrogen storage trapping ability. This result in the residual hydrogen in the weld been difficult tobe diffused and so the diffusible hydrogen content in the weld is very low. Therefore, it can be inferredthat hydrogen is not a factor in the longitudinal seam fatigue delay crack.
Table 12. Mass variation of test specimens before and after welding.
Number Welding Wire Mass before Welding (g) Mass after Welding (g)
1 S-6 34.2 35.32 JM-53 34.5 35.63 No filling 34.7 34.8
4. Conclusions
In this research paper, the mechanical properties, residual stress, and diffusible hydrogen contentof the longitudinal weld in the inner liner of an electric water heater were comprehensively studiedby experiments. The influence of enamel on the longitudinal joint was also investigated in detail.The conclusions drawn based on the results under the present experimental conditions are as follows:
i. The micro-hardness of BTC330R steel is about 121.4 HV1. The mechanical properties of thelongitudinal weld seam from the weld center to the base metal vary with columnar crystalhaving high hardness and poor toughness, which easily lead to fusion line crack. In the heataffected zone, the weld hardness of S-6 welding wire is obviously higher than that of JM-53and no filling welding seam.
ii. The longitudinal joint tensile strength of the three welds is better than that of the base metaland the fracture positions are all in the parent material with obvious necking. The fracturesurface is gray with plastic fracture and there is no obvious plastic deformation at the weld.
J. Manuf. Mater. Process. 2017, 1, 19 17 of 18
iii. There is a high residual tensile stress in the center of the longitudinal joint and the near thejoint. The transverse stress of the weld seam is from the weld center to the heat affected zone,and the residual stress decreases from 332 MPa~240 MPa. The longitudinal direction of thewelding seam is from the center of the weld to both ends and the direction of the principalstress is slightly different from the longitudinal direction of the weld (−2 degrees).
iv. The microstructure of BTC330R steel after enameling is ferrite with a small amount of flocculentpearlite and the micro-hardness of the longitudinal joint of the enamel is obviously lower.The peak micro-hardness of the coarse grain zone of the weld decreases by 30.9 HV1, and thehardness of the heat affected zone decreases by about 5 HV1. After enameling, the residualstress level of the weld has been reduced, and the mean stress difference between the same testpoints is reduced by 270.6 MPa to 20.4 MPa. It shows that the overall distribution of residualstress of enamel is more balanced than that of the non-enamel.
v. The determination of diffusible hydrogen content shows that the content of diffusible hydrogenin longitudinal seam deposited metal is very low. This is due to the addition of some alloyingelements (such as Ti, RE, B, etc.) in the steel to increase the hydrogen storage trap in the steel.
vi. The cracks in the weld line of the longitudinal seam are fatigue delayed cracks caused byexcessive thermal gradient. This phenomena result in large columnar structure and highrestraint stress in the welding process, leading to high residual stress after welding. The fatiguestrength of the weld joint is decreased under the action of the columnar crystal structure andthe residual stress.
Acknowledgments: The author(s) disclosed receipt of the following financial support for the research, authorship,and/or publication of this article: This study was supported by the National Natural Science Foundation ofChina (Nos. 51375211 and 51375213). The authors also would like to thank the anonymous referees for theirvaluable comments.
Author Contributions: Julius Caesar Puoza conceived and designed the experiments with Adams Moro underthe supervision of Xijun Hua; all authors performed the experiments, analyzed the data and discussed the results;Xijun Hua, Anthony Akayeti and Philip Baido contributed with reagents/materials/analysis tools; Julius CaesarPuoza wrote the paper; Xijun Hua and Adams Moro revised the paper.
Conflicts of Interest: The authors declare no conflict of interest.
References
1. Kah, P.; Suoranta, R.; Martikainen, J. Joining of sheet metals using different welding processes. Mechanika2011, 158–163. [CrossRef]
2. Singh, A.K.; Dey, V.; Rai, R.N. Techniques to improveweld penetration in tig welding (a review).Mater. Today Proc. 2017, 4, 1252–1259. [CrossRef]
3. Lin, H.-L.; Wu, T.-M. Effects of activating flux on weld bead geometry of inconel 718 alloy TIG welds.Mater. Manuf. Proc. 2012, 27, 1457–1461. [CrossRef]
4. Srinivas, K.; Vundavilli, P.R.; Hussain, M.M.; Saiteja, M. Prediction of Welded Joint Strength in Plasma ArcWelding: A Comparative Study Using Back-Propagation and Radial Basis Neural Networks. In Proceedingsof the IOP Conference Series: Materials Science and Engineering, Bangalore, India, 14–16 July 2016; IOP Publishing:Bristol, UK, 2016; p. 12033.
5. Wu, C.; Wang, L.; Ren, W.; Zhang, X. Plasma arc welding: Process, sensing, control and modeling.J. Manuf. Proc. 2014, 16, 74–85. [CrossRef]
6. Liu, Z.; Wu, C.; Chen, M. Experimental sensing of the keyhole exit deviation from the torch axis in plasmaarc welding. Int. J. Adv. Manuf. Technol. 2014, 71, 1209–1219. [CrossRef]
7. Zhang, P.; Xie, J.; Wang, Y.; Chen, J. Effects of welding parameters on mechanical properties andmicrostructure of resistance spot welded DP600 joints. Sci. Technol. Weld. Join. 2011, 16, 567–574. [CrossRef]
8. Fatima, S.; Khan, M.; Jaffery, S.H.I.; Ali, L.; Mujahid, M.; Butt, S.I. Optimization of process parameters forplasma arc welding of austenitic stainless steel (304 L) with low carbon steel (A-36). Proc. Inst. Mech. Eng.Part L J. Mater. Des. Appl. 2016, 230, 640–653. [CrossRef]
J. Manuf. Mater. Process. 2017, 1, 19 18 of 18
9. Rao, C.S.; Prasad, K.S.; Rao, D.N. Study on effect of welding speed on micro structure and mechanicalproperties of pulsed current micro plasma arc welded inconel 625 sheets. J. Miner. Mater. Charact. Eng. 2012,11, 1027–1033. [CrossRef]
10. Prasada, K.S.; Rao, S.; Rao, D.N. An investigation on weld quality characteristics of pulsed current microplasma arc welded austenitic stainless steels. Int. J. Eng. Sci. Technol. 2012, 4, 159–168. [CrossRef]
11. Dubey, A.K.; Yadava, V. Laser beam machining—A review. Int. J. Mach. Tools Manuf. 2008, 48, 609–628.[CrossRef]
12. Sokolov, M.; Salminen, A. Improving laser beam welding efficiency. Engineering 2014, 6, 559–571. [CrossRef]13. Ribolla, A.; Damoulis, G.L.; Batalha, G.F. The use of Nd: YAG laser weld for large scale volume assembly of
automotive body in white. J. Mater. Process. Technol. 2005, 164, 1120–1127. [CrossRef]14. Chen, W.; Ackerson, P.; Molian, P. CO2 laser welding of galvanized steel sheets using vent holes. Mate. Des.
2009, 30, 245–251. [CrossRef]15. Marashi, M.M.S.; Pouranvari, M.; Sabbaghzadeh, J.; Torkamany, M. Assessment of the effect of laser spot
welding parameters on the joint quality using taguchi method. In Proceedings of the 18th InternationalMetallurgy and Materials Conference Metal 2009, Hradec nad Moravici, Czech Republic, 19–21 May 2009.
16. Yilbas, B.; Arif, A.; Aleem, B.A. Laser welding of low carbon steel and thermal stress analysis.Opt. Laser Technol. 2010, 42, 760–768. [CrossRef]
17. Coules, H. Contemporary approaches to reducing weld induced residual stress. Mater. Sci. Technol. 2013, 29,4–18. [CrossRef]
18. Withers, P.; Bhadeshia, H. Residual stress. Part 1–Measurement techniques. Mater. Sci. Technol. 2001, 17,355–365. [CrossRef]
19. Coelho, R.; Corpas, M.; Moreto, J.; Jahn, A.; Standfuß, J.; Kaysser-Pyzalla, A.; Pinto, H. Induction-assistedlaser beam welding of a thermomechanically rolled HSLA S500MC steel: A microstructure and residualstress assessment. Mater. Sci. Eng. A 2013, 578, 125–133. [CrossRef]
20. Dias, J.S.; Chuvas, T.C.; Fonseca, M.D.P.C. Evaluation of residual stresses and mechanical properties of ifsteel welded joints by laser and plasma processes. Mater. Res. 2016, 19, 721–727. [CrossRef]
21. Cao, L.; Shao, X.; Jiang, P.; Zhou, Q.; Rong, Y.; Geng, S.; Mi, G. Effects of welding speed on microstructureand mechanical property of fiber laser welded dissimilar butt joints between AISI316L and EH36. Metals2017, 7, 270. [CrossRef]
22. Hinton, R.; Wiswesser, R. Estimating welding preheat requirements for unknown grades of carbon andlow-alloy steels. Weld. J. 2008, 87, 273–278.
23. Huang, C.; Li, H.; Li, J.; Luo, C.; Ni, Y. Residual stress measurement on propellant tank of 2219 aluminumalloy and study on its weak spot. J. Mech. Sci. Technol. 2017, 31, 2213–2220. [CrossRef]
24. Paradowska, A.; Price, J.; Dayawansa, P.; Kerezsi, B.; Zhao, X.; Ibrahim, R. Measurement of residual stressdistribution in tubular joints considering post weld heat treatment. Mater. Forum 2006, 30, 30–38.
25. Bayraktar, E.; Kaplan, D.; Devillers, L.; Chevalier, J. Grain growth mechanism during the welding ofinterstitial free (IF) steels. J. Mater. Proc. Technol. 2007, 189, 114–125. [CrossRef]
© 2017 by the authors. Licensee MDPI, Basel, Switzerland. This article is an open accessarticle distributed under the terms and conditions of the Creative Commons Attribution(CC BY) license (http://creativecommons.org/licenses/by/4.0/).