assessment for learning explored in grade 9 applied ... - qspace
TRANSCRIPT

ASSESSMENT FOR LEARNING EXPLORED IN GRADE 9 APPLIED MATHEMATICS
CLASSROOMS
By
Allison Elizabeth Anne Chapman
A thesis submitted to the Faculty of Education
in conformity with the requirements for the
Degree of Doctor of Philosophy
Queen’s University
Kingston, Ontario, Canada
July, 2017
Copyright © ALLISON ELIZABETH ANNE CHAPMAN, 2017
This work is licensed under a Creative Commons Attribution 4.0 International License.

ii
Abstract
Despite the focus on assessment for learning (AfL) across Canada, the use of AfL across
classrooms is not routine practice. Existing literature has found that secondary mathematics
teachers implement AfL strategies along a continuum, from no implementation to deep
integration in the classroom. AfL is valuable for all students, and in particular, struggling
students may be the strongest beneficiaries of AfL. As a result, my dissertation explored
secondary mathematics teachers’ use of AfL strategies with students who may struggle in
mathematics, and the extent that there exist systematic differences in the integration of these
strategies across classrooms of varying school-achievement results. Three research questions
guided this study: (a) What is the nature of teachers’ AfL strategies? (b) What are the
relationships between teachers’ AfL strategies and AfL conceptions? and (c) What are the
relationships between teachers’ AfL strategies and mathematical knowledge for teaching
(MKT)?
Across Southern Ontario, a teacher questionnaire was administered (N = 131) and case
studies (N = 4) were conducted with teachers of Grade 9 applied mathematics (G9APM). The
schools in which these teachers taught were categorized as one of three achievement
categories—high, average, or low—based on their school-achievement results. School-
achievement results were either determined by a school’s average Education Quality and
Accountability Office result for students in G9APM or a self-reported measure. Data analyses
included the use of descriptive and inferential statistics, correlational-based analyses, and
deductive and inductive qualitative thematic analyses.
Research findings illustrate: (a) no differences in teachers' AfL strategies, AfL
conceptions, or MKT, across school-achievement results; (b) teachers commonly implemented

iii
the letter of AfL and had a teacher-centric conception of AfL; and (c) AfL strategies are
connected to MKT. Specifically, MKT supported AfL practices, namely identifying and sharing
success criteria, engineering effective classroom discussions and tasks that elicit evidence of
learning, and providing feedback that moves learners forward. Findings highlighted that teachers
require domain specific pedagogical support in implementing the spirit of AfL.
iv
Acknowledgements
I dedicate this dissertation to my parents, family, and friends, as without you this would
not be possible. This was a journey, like no other, that brought times of happiness and self-doubt,
and your words of encouragement, laughter, and wisdom carried me through. You made a
journey that looked insurmountable, attainable and for that I am ever so thankful. A special thank
you to Dave who joined me in this journey and who always knew it was within me.
Thank you to the teachers who kindly shared their insights on teaching and assessment
with me as I observed and asked questions to understand more deeply the various factors
surrounding the integration of assessment for learning practices.
Thank you to the school boards, principals, parents, and Ontario Association for
Mathematics Education for seeing value in this research.
Thank you to the Educational Quality and Accountability Office (EQAO) for providing
the Grade 9 Assessment of Mathematics school-achievement and student questionnaire data for
students enrolled in Grade 9 applied mathematics. The opinions presented in this dissertation are
solely those of myself and do not necessarily reflect the opinions of EQAO.
Thank you to my supervisor and committee members, Drs. Don Klinger, Christopher
DeLuca, and Jamie Pyper for your guidance and support along this journey. Your support in both
my academics and personal life has been invaluable.
Thank you to my chair and external examining committee members, Drs. Monique
Dufresne, Christine Suurtamm, Andy Leger, and Pamela Beach, for your thoughtful questions to
extend my thinking.
v
Finally, I would like to thank the Social Sciences and Humanities Research Council,
Ontario Graduate Scholarship Program, and Faculty of Education and School of Graduate
Studies at Queen’s University for providing financial support to conduct this research.
“Focus on what you love and anything is possible.”
— Barbara Schramm (Wild Pacific Trail Society)
vi
Table of Contents
Abstract ........................................................................................................................................... ii
Acknowledgements ........................................................................................................................ iv
Table of Contents ........................................................................................................................... vi
List of Tables ................................................................................................................................. xi
List of Figures .............................................................................................................................. xiv
List of Abbreviations .................................................................................................................... xv
Chapter 1 Introduction ................................................................................................................... 1
Purpose and Research Questions ................................................................................................ 4
Rationale ..................................................................................................................................... 4
Context ........................................................................................................................................ 9
Overview of Dissertation .......................................................................................................... 10
Chapter 2 Literature and Theoretical Framework ........................................................................ 12
Overview of High School Mathematics .................................................................................... 12
High school mathematics in Canada. .................................................................................... 13
High school mathematics in Ontario................................................................................. 14
AfL Strategies ........................................................................................................................... 15
Teachers’ use of AfL strategies. ............................................................................................ 20
Identifying and sharing learning goals and success criteria. ............................................. 21
Engineering effective classroom discussions and tasks that elicit evidence of learning. . 23
Providing feedback that moves learners forward. ............................................................. 28
Engaging learners as instructional resources for one another and as the owners of their
own learning...................................................................................................................... 30
vii
Implications of AfL Strategies with Struggling Students ......................................................... 31
Factors Impacting Teacher’s Use of AfL Strategies ................................................................. 34
Teachers’ AfL conceptions. .................................................................................................. 35
Mathematical knowledge for teaching. ................................................................................. 38
Domains of MKT. ............................................................................................................. 42
Specialized content knowledge. .................................................................................... 44
Knowledge of content and students. ............................................................................. 45
Knowledge of content and teaching. ............................................................................. 46
Chapter 3 Methodology ............................................................................................................... 48
Data Sources ............................................................................................................................. 48
School-achievement results. ................................................................................................. 49
Questionnaire. ....................................................................................................................... 50
Case studies. .......................................................................................................................... 52
Data Collection ......................................................................................................................... 54
School boards. ....................................................................................................................... 54
OAME conferences. .............................................................................................................. 55
Data Preparation........................................................................................................................ 56
Data Analysis ............................................................................................................................ 57
Quantitative data. .................................................................................................................. 57
Qualitative data. .................................................................................................................... 59
Chapter 4 Research Findings ....................................................................................................... 63
Context ...................................................................................................................................... 63
Questionnaire. ....................................................................................................................... 63

viii
Case Studies. ......................................................................................................................... 68
High-achievement schools. ............................................................................................... 68
Mr. Hayes. ..................................................................................................................... 69
Ms. Hadwin. .................................................................................................................. 71
Low-achievement schools. ................................................................................................ 72
Ms. LeBlanc. ................................................................................................................. 73
Mr. Lewis. ..................................................................................................................... 75
Teachers’ Use of AfL Strategies ............................................................................................... 76
Identifying and sharing learning goals. ................................................................................. 91
Identifying and sharing success criteria. ............................................................................... 92
Engineering effective classroom discussions and tasks that elicit evidence of learning. ..... 92
Providing feedback that moves learners forward. ................................................................. 95
Engaging learners as instructional resources for one another. .............................................. 98
Engaging learners as the owners of their own learning. ....................................................... 99
Challenges. ............................................................................................................................ 99
Summary. ............................................................................................................................ 100
Relationship between Teachers’ AfL Strategies and AfL Conceptions .................................. 101
Everyday practices by teachers. .......................................................................................... 106
AfL strategies. ..................................................................................................................... 108
Everyday practices by students. .......................................................................................... 110
Summary. ............................................................................................................................ 111
Relationships between Teachers’ AfL Strategies and MKT ................................................... 112
Identifying and sharing learning goals. ............................................................................... 118

ix
Identifying and sharing success criteria. ............................................................................. 119
Engineering effective classroom discussions and tasks that elicit evidence of learning. ... 119
Providing feedback that moves learners forward. ............................................................... 123
Engaging learners as instructional resources for one another. ............................................ 127
Engaging learners as the owners of their own learning. ..................................................... 127
Summary. ............................................................................................................................ 127
Chapter 5 Discussion ................................................................................................................. 129
Key Research Findings ........................................................................................................... 132
Teachers’ use of AfL strategies. .......................................................................................... 132
Relationship between teachers’ AfL strategies and AfL conceptions. ................................ 135
Relationships between teachers' AfL strategies and MKT. ................................................ 136
Limitations .............................................................................................................................. 140
Implications............................................................................................................................. 142
Future Research ...................................................................................................................... 145
Conclusion .............................................................................................................................. 146
References ................................................................................................................................... 148
Appendix A: Data Sources.......................................................................................................... 168
Questionnaire Distributed Through Teachers’ School Board Emails..................................... 172
Questionnaire Distributed Through a School Board’s Broadcast Webpage ........................... 178
Questionnaire Distributed at OAME Conferences ................................................................. 184
Interview Guide ...................................................................................................................... 191
Demographic questions. ...................................................................................................... 191
Initial interview. .................................................................................................................. 191
x
Follow-up interview. ........................................................................................................... 192
Classroom Observation Template ........................................................................................... 193
Appendix B: Data Collection ...................................................................................................... 194
General Research Ethics Board Approval .............................................................................. 194
Sample Principal Recruitment Email ...................................................................................... 195
Sample Principal Letter of Information .................................................................................. 197
Sample Teacher Recruitment Email ....................................................................................... 199
Sample Teacher Letter of Information .................................................................................... 201
Sample Combined Letter of Information/Consent Form for Questionnaire ........................... 203
Sample Combined Letter of Information/Consent Form for Case Study ............................... 205
Parent/Guardian Letter of Information ................................................................................... 208
Debrief .................................................................................................................................... 209
Appendix C: Data Analysis ........................................................................................................ 211
Appendix D: Context .................................................................................................................. 219
Appendix E: Classroom Observations ........................................................................................ 229
Appendix F: Item Descriptives ................................................................................................... 241
Appendix G: Factor Loadings ..................................................................................................... 245

xi
List of Tables
Table 1. Connecting AfL Strategies to Instructional Processes and Classroom Agents
Adapted from “Growing Success: Assessment, Evaluation, and Reporting in Ontario
Schools,” by Ontario Ministry of Education, 2010, p. 32. Copyright 2010 by Queen’s
Printer for Ontario. Adapted with permission. Also adapted from “Integrating
Assessment with Learning: What Will it Take to Make it Work?,” by D. Wiliam and
M. Thompson, 2008, in C. A. Dwyer (Ed.), The Future of Assessment: Shaping
Teaching and Learning, p. 63. Copyright 2008 by Taylor and Francis Group, LLC, a
division of Informa plc. Adapted with permission.. ..................................................... 18
Table 2. Definitions for the Domains of MKT .......................................................................... 40
Table 3. Research Questions and Data Sources ........................................................................ 49
Table 4. A Priori Categories and Codes for AfL ........................................................................ 61
Table 5. A Priori Categories and Codes for MKT ..................................................................... 62
Table 6. Percentages of Partially or Fully Completed Questionnaires ....................................... 65
Table 7. AfL Strategies Frequently Used by Teachers across Questionnaire Participants ........ 79
Table 8. The Frequency and Use of AfL Practices Reflecting the Letter of AfL in Two High-
Achievement Case Study Teachers’ Classrooms ......................................................... 81
Table 9. The Frequency and Use of AfL Practices Reflecting the Spirit of AfL in Two High-
Achievement Case Study Teachers’ Classrooms ......................................................... 83
Table 10. The Frequency and Use of AfL Practices Reflecting the Letter of AfL in Two Low-
Achievement Case Study Teachers’ Classrooms ......................................................... 85
Table 11. The Frequency and Use of AfL Practices Reflecting the Spirit of AfL in Two Low-
Achievement Case Study Teachers’ Classrooms ......................................................... 88

xii
Table 12. Means for Factor Analysis Subscales across Questionnaire Participants .................... 91
Table 13. The Alignment of Teachers’ AfL Conceptions with Principles of AfL across
Questionnaire Participants ...........................................................................................103
Table 14. The Alignment of the Identified Benefits of AfL with Principles of AfL across
Questionnaire Participants ...........................................................................................104
Table 15. The Alignment of Teachers’ AfL Conceptions with Principles of AfL across Case
Study Teachers ............................................................................................................105
Table 16. Means for Factor Analysis Subscales across Questionnaire Participants ...................111
Table 17. The Frequency of AfL Strategies and the Domains of MKT Co-Occurring across
Questionnaire Participants ...........................................................................................115
Table 18. The Frequency of AfL Strategies and the Domains of MKT Co-Occurring in the Two
High-Achievement Case Study Teachers’ Classrooms ...............................................116
Table 19. The Frequency of AfL Strategies and the Domains of MKT Co-Occurring in the Two
Low-Achievement Case Study Teachers’ Classrooms ...............................................117
Table 20. Connections between AfL Strategies and MKT ..........................................................138
Table A1. Used or Adapted Questionnaire Items ........................................................................168
Table C1. Examples for AfL Strategies .......................................................................................211
Table C2. Examples for AfL Definition ......................................................................................213
Table C3. Examples for MKT .....................................................................................................215
Table C4. Examples for Inductive Coding ..................................................................................217
Table D1. Contingency Table for School-Achievement Results .................................................219
Table D2. Number of Years Teaching across Questionnaire Participants...................................220
Table D3. Mathematics Courses Taught in the Last Two Years across Questionnaire
xiii
Participants ..................................................................................................................221
Table D4. Number of G9APM Classes Taught over the Current School Year across
Questionnaire Participants ...........................................................................................221
Table D5. Post-Secondary Education across Questionnaire Participants ....................................222
Table D6. Advanced Educational Training across Questionnaire Participants ...........................223
Table D7. Professional Development in the Last Five Years across Questionnaire
Participants ..................................................................................................................223
Table D8. EQAO Student Questionnaire Results for Schools with a Case Study Teacher and for
the Province (2009–2014) ...........................................................................................224
Table E1. Classroom Observations for Mr. Hayes ......................................................................229
Table E2. Classroom Observations for Ms. Hadwin ...................................................................232
Table E3. Classroom Observations for Ms. LeBlanc ..................................................................235
Table E4. Classroom Observations for Mr. Lewis ......................................................................238
Table F1. Means (and Standard Deviations) for AfL Strategies and Related Pedagogical
Practices.......................................................................................................................241
Table F2. Means (and Standard Deviations) for Classroom Assessment Practices ....................242
Table F3. Means (and Standard Deviations) for MKT ................................................................243
Table F4. Means (and Standard Deviations) for MKT and Beliefs .............................................244
Table G1. Factor Loadings for AfL Strategies and Related Pedagogical Practices.....................245
Table G2. Factor Loadings for Classroom Assessment Practices ...............................................246
Table G3. Factor Loadings for MKT and Beliefs ........................................................................247
xiv
List of Figures
Figure 1. Domains of Mathematical Knowledge for Teaching. Reprinted from “Content
Knowledge for Teaching: What Makes it Special?” by D. L. Ball, M. H. Thames, and
G. Phelps, 2008, Journal of Teacher Education, 59(5), p. 407. Copyright 2008 by
SAGE Publications, Inc. Reprinted with permission. .................................................. 39
xv
List of Abbreviations
A Average
AfL Assessment for learning
CCK Common content knowledge
EA Educational assistant
EQAO Education Quality and Accountability Office
G9ACM Grade 9 academic mathematics
G9APM Grade 9 applied mathematics
H High
HCK Horizon content knowledge
KCC Knowledge of content and curriculum
KCS Knowledge of content and students
KCT Knowledge of content and teaching
I Interview
L Low
MKT Mathematical knowledge for teaching
O Observation
OAME Ontario Association for Mathematics Education
OME Ontario Ministry of Education
SCK Specialized content knowledge
SES Socio-economic status
Q Questionnaire
1
Chapter 1
Introduction
Within the past three decades, assessment for learning (AfL) has been highly promoted as
a highly valuable teaching and assessment practice to support students’ learning (e.g., Black &
Wiliam, 1998a, 1998b; Earl, 2013; DeLuca, Klinger, Pyper, & Woods, 2015; Jonsson, Lundahl,
& Holmgren, 2015; Shepard, 2008; Stiggins, 2002, 2005; Thompson & Wiliam, 2007). AfL is
the use “of everyday practice by students, teachers and peers that seeks, reflects upon and
responds to information . . . in ways that enhance ongoing learning” (Klenowski, 2009, p. 264).
Specifically, AfL entails teachers and students actively using assessment strategies to provide
teacher-, self-, and peer-feedback on students’ learning progress (Broadfoot et al., 2002). Support
for AfL is due to its potential positive impact on students’ learning, both across subject domains
and student groups (e.g., Black & Wiliam, 1998a, 1998b; Hattie & Timperley, 2007; Hughes,
2010; Stiggins, 2002, 2005). Research indicates that AfL supports students becoming active and
autonomous learners, through: (a) setting and co-constructing learning goals and success criteria,
(b) receiving and using descriptive feedback to support learning, (c) peer-and self-assessing, and
(d) developing metacognitive skills (Earl, 2013; Shepard, 2008).
The benefits of AfL are expansive, such that, there is now a consistent expectation to
integrate AfL with instruction. All Canadian Ministries of Education promote the use of
assessment to support students’ learning (Birenbaum et al., 2015; Gouvernement du Québec
Ministère de l’Éducation, du Loisir et du Sport, 2007b; New Brunswick Department of
Education and Early Childhood Development, 2013; Newfoundland and Labrador Education and
Early Childhood Development, 2016; Nova Scotia Department of Education and Early
Childhood Development, 2015; Ontario Ministry of Education [OME], 2010; Prince Edward

2
Island Department of Education and Early Childhood Development, 2011; Western and Northern
Canadian Protocol for Collaboration in Education, 2006). Even though there is an expectation for
teachers to integrate AfL strategies with instruction, across teachers, the use of AfL is not routine
practice. Teachers implement AfL strategies along a continuum, from no implementation to deep
integration in the classroom (e.g., Earl, 2013; Klinger et al., 2013; Marshall & Drummond, 2006;
Suurtamm & Koch, 2014; Suurtamm, Koch, & Arden, 2010).
Furthermore, it is not clear if teachers know how to use AfL strategies with students
across achievement levels. For example, Klinger et al. (2013) found that principals and teachers,
who were working to implement AfL strategies in their schools and classrooms, believed
struggling students—learners who are more likely to be unsuccessful at school—benefited less
from AfL strategies than non-struggling students. Specifically, Klinger and colleagues reported
that struggling students did not appreciate the value of AfL in improving their work and “were
less able to use AfL to monitor and support their learning” (p. 20). In contrast, Black and Wiliam
(1998a) found studies that illustrated AfL strategies increased positive benefits for struggling
students (see also Stiggins, 2002, 2005). However, the empirical studies included in Black and
Wiliam’s review were completed prior to contemporary conceptualizations of formative
assessment, and often lacked important implementation details (e.g., quality of feedback).
Challenges exist with the implementation of AfL strategies with struggling students. There is a
continuing need for research focused on these struggling students.
The integration of AfL strategies into instructional practice is complex, largely due to a
multitude of factors including the generality of the AfL strategies; student ability levels; and
teachers’ knowledge, skills, and conceptions of assessment (e.g., Bennett, 2011; Black &
Wiliam, 2009; Brown, 2004; DeLuca et al., 2015; Earl, 2013; Heritage, Kim, Vendlinski, &

3
Herman, 2009; Klinger et al., 2013; McGatha & Bush, 2013; Otero, 2006; Ruiz-Primo, 2011;
Suurtamm & Graves, 2007; Thompson & Wiliam, 2007). In Bennett’s (2011) critical review of
AfL, he argued, using logical reasoning, that general assessment skills and domain specific
knowledge are required for AfL strategies to be effective (see also Wiliam, 2011).
The province of Ontario has identified improving students’ mathematics achievement as
a central focus in order to prepare students to be “successful, economically productive and
actively engaged citizens” (OME, 2014, p. 1). However, students enrolled in Grade 9 applied
mathematics (G9APM) continue to have low success rates on the Ontario provincial mathematics
assessment (Education Quality and Accountability Office [EQAO], 2016c; People for Education,
2012) and often struggle in mathematics. Commonly, these struggling students are defined by
their lack of achievement (defined in this study as those below the provincial standard [i.e., Level
2 or below] on the EQAO assessments) and those who may also have high learning needs (e.g.,
English as a Second Language, low family socio-economic status [SES]). Combined, the focus
on mathematics education in Ontario and the number of struggling students in G9APM, highlight
the need for deeper understanding of the forms of teaching and assessment occurring in G9APM
classrooms.
Domain specific knowledge can support the effective implementation of AfL strategies
(Bennett, 2011) and the potential positive benefits of AfL with struggling students. Within
mathematics, teachers’ subject matter knowledge and pedagogical content knowledge is called
mathematical knowledge for teaching (MKT; Ball, Thames, & Phelps, 2008; Hill, Ball, &
Schilling, 2008). MKT positively shapes the teaching, learning, and assessment environment
(Baumert et al., 2010; Hill, Rowan, & Ball, 2005). Research suggests that MKT influences
teachers’ assessment practices as MKT includes the knowledge that supports effective
4
implementation of AfL strategies. For example, teachers with high MKT have a repertoire of
possible approaches for resolving common student misconceptions, and this repertoire is useful
when interpreting and responding to students’ learning needs. A study exploring AfL in
secondary mathematics classrooms needs to consider MKT, as teachers’ use of AfL strategies are
informed by their MKT. My research is part of a new recognition that acknowledges our need to
understand and support the learning needs of struggling students and provides important insights
into how to better support their teachers in implementing AfL strategies.
Purpose and Research Questions
The purpose of my research is to explore mathematics teachers’ use of AfL strategies
with students who may struggle in mathematics, and the extent to which there exist systematic
differences in the integration of these strategies across G9APM classrooms of varying school-
achievement results. I hypothesize that differences in AfL integration will be related to the
variation in school-achievement results. With respect to this principle purpose, the following
research questions will be addressed to provide insight into AfL strategies in G9APM
classrooms: (a) What is the nature of teachers’ AfL strategies? (b) What are the relationships
between teachers’ AfL strategies and AfL conceptions? and (c) What are the relationships
between teachers’ AfL strategies and MKT?
Rationale
Each year, over half of the students enrolled in G9APM in Ontario perform significantly
below the provincial standard on their end of year EQAO Grade 9 Assessment of Mathematics
(EQAO, 2016c). Since the introduction of this assessment in 2000–2001, the proportion of
students achieving the provincial standard or higher has increased; but on the 2015–2016
assessment administration this corresponded to only 45% of the students achieving the provincial

5
standard or higher (EQAO, 2005, 2009, 2014b, 2016c). Overall, students in G9APM tend to
struggle to achieve the provincial standard. This low student success rate drastically contrasts
with the high proportion of students in the Grade 9 academic mathematics (G9ACM) course who
achieved the provincial standard or higher (e.g., 83% on the 2015–2016 assessment
administration) on the EQAO Grade 9 Assessment of Mathematics (EQAO, 2016c).
Additionally, students who perform below the provincial standard on the EQAO Grade 9
Assessment of Mathematics are more likely to be unsuccessful on the Ontario Secondary School
Literacy Test and students in G9APM are less likely to graduate or enrol in college compared to
students in G9ACM (People for Education, 2014; Zheng, 2006). Therefore, students in G9APM
are likely to have lower achievement compared to students in G9ACM.
To explain some of the variance in student achievement on the 2011 EQAO Grade 9
Assessment of Mathematics, Pang and Rogers (2013) used student and teacher/school related
predictors from the EQAO student and teacher questionnaires and the EQAO Grade 6
Assessment of Mathematics. They found some teacher/school related variables that were
significantly related to student achievement on the EQAO Grade 9 Assessment of Mathematics
for students in G9APM but not for students in G9ACM. For example, contacting parents to
discuss a child’s behaviour and the number of years teaching mathematics at secondary level
were associated with student achievement in G9APM but not with G9ACM. Overall the student
and teacher/school related predictors explained 41.0% and 33.3%, respectively, of the variance
for students’ scores in G9APM, and 54.4% and 66.7%, respectively, of the variance for students’
scores in G9ACM. Thus, after accounting for the student and teacher/school related predictors, a
large amount of unexplained variance remained. This unexplained variance is particularly large
for G9APM, such that more than half of the variance for students’ scores at both levels (student
6
and teacher/school) could not be accounted for. Researchers need to learn more about what is
happening in G9APM classrooms in order to better understand this variance in student
achievement.
We know that students in G9APM often have several learning challenges, diverse sets of
skills in math, and they experience home challenges that are associated with lower achievement
(EQAO, 2016b; Hunter, 2011; Pang & Rogers, 2013; People for Education, 2013). For example,
the G9APM course has a higher proportion of students with special education needs, who
perform poorly on multiple-step problems, and who do not like mathematics compared to those
students in the G9ACM course (EQAO, 2016a, 2016b; Hunter, 2011; Pang & Rogers, 2013).
Further, students in G9APM have higher rates of challenging home contextual factors (e.g.,
lower SES) compared to students in G9ACM (People for Education, 2013). Also, students in
G9APM are more likely to perform less well on the EQAO Grade 9 Assessment of Mathematics
and are less likely to graduate or enrol in college compared to students in G9ACM (People for
Education, 2014). Therefore, students in G9APM likely have greater learning needs;
accordingly, G9APM classes are comprised of a higher proportion of struggling students
compared to G9ACM classes.
Teachers of G9APM need to be responsive to the needs of their students. Research
illustrates the importance of teachers differentiating learning activities, understanding routine
and diverse approaches to mathematical problems, and maintaining high expectations for all
students (Ball et al., 2008; Bryan & Dorrington, 2004; Dunn, 2004; Hughes, 2010; Petty, Wang,
& Harbaugh, 2013). For example, teacher expectations of students are positively related to
students’ achievement (Petty et al., 2013). Specifically, Petty et al. (2013) found secondary
students with lower teacher anticipated course grades scored lower on their algebra end of course
7
test (𝜂2 = .06) after controlling for student demographic variables (gender, ethnicity, parents’
education level, SES). However, teachers of G9APM often have many challenges themselves,
including all not being very comfortable with the course content or using concrete materials to
teach; and broadly associating negative characteristics (e.g., behavioural challenges, Individual
Education Plan identification, learning gaps, and poor attendance) to all students in this course
(Suurtamm & Graves, 2007). Further, over the past several years, just under one third of the
teachers of G9APM obtained their bachelor degree in a major unrelated to mathematics (EQAO,
2011, 2012, 2013, 2014a). This suggests that some teachers of G9APM lack the subject matter
and pedagogical content knowledge required to effectively instruct G9APM.
In addition to these challenges and demands on teachers of G9APM, all teachers are
required to use AfL to support student learning as outlined in Ontario’s assessment and
evaluation document, Growing success: Assessment, evaluation and reporting in Ontario schools
(OME, 2010). It is unknown the extent to which teachers of G9APM implement AfL strategies.
Klinger et al. (2013), in an evaluation completed of a South Eastern Ontario school board’s
professional learning approach, found teachers struggled to implement AfL strategies that
engaged struggling students, and teachers saw fewer benefits for the use of AfL strategies in the
sciences compared to in the social sciences and humanities subjects. However, others argue that
AfL has the potential to contribute to narrowing the achievement gap between struggling and
non-struggling students (Black & Wiliam, 1998a; Stiggins, 2002, 2005), or in Ontario between
students in applied and academic courses. Given that the benefits of AfL have inconclusively
been linked to struggling students, this research explores teachers’ use of AfL strategies with
students who may struggle in mathematics.
8
Low success rates of students in G9APM on the EQAO Grade 9 Assessment of
Mathematics sparked concern from educational stakeholders (OME 2014; People for Education,
2012). The OME funds mathematics initiatives (e.g., Collaborative Inquiry for Learning –
Mathematics, Renewed Math Strategy) to support these students, yet limited empirical studies
have been conducted in this context. For example, few studies or reports explore teachers of
G9APM (Egodawatte, McDougall, & Stoilescu, 2011; Pang & Rogers, 2013; Suurtamm &
Graves, 2007), differentiate students across course pathways or ability levels in secondary
mathematics (Chen, Crockett, Namikawa, Zilimu, & Lee, 2012; Dunn, 2004; Expert Panel on
Student Success in Ontario, 2004; Pang & Rogers, 2013; Suurtamm et al., 2010), or explore the
use of AfL strategies in secondary mathematics classrooms (Black, Harrison, Lee, Marshall, &
Wiliam, 2004; Chen et al., 2012; Harrison, 2005; Li, Yin, Ruiz-Primo, & Morozov, 2011;
McGatha & Bush, 2013; Noonan & Duncan, 2005; Panizzon & Pegg, 2008; Sato, Wei, &
Darling-Hammond, 2008; Suurtamm, 2004; Suurtamm & Koch, 2014; Suurtamm et al., 2010;
Wylie & Lyon, 2015). Pursuing research into teachers’ AfL practices with students who struggle
in mathematics is important to raise students’ mathematics achievement. This research will
highlight AfL practices that engage students who may struggle in mathematics, and teachers’
AfL conceptions and knowledge that facilitate teachers’ use of these practices.
More empirical studies exploring this context are crucial to support teachers and
struggling students in our schools. The vitality of this research is highlighted in the fact that
students’ mathematics success predicts career aspirations and educational attainment, and assists
students in achieving their full potential (Expert Panel on Student Success in Ontario, 2004;
Gottfried, Marcoulides, Gottfried, & Oliver, 2013; Shapka, Domene, & Keating, 2006).
Specifically, Gottfried et al. (2013) showed, through a longitudinal study, that students who have

9
higher mathematics intrinsic motivation and achievement in elementary through high school
usually have more advanced mathematics course accomplishments and higher educational
attainment.
Context
The Ontario curriculum in Grades 9 and 10 offers two types of mathematics courses,
academic and applied; as well school boards may choose to offer another type of mathematics
course, specifically locally developed courses (OME, 2005b). Each course type prepares students
for a different course pathway in Grades 11 and 12, with the different course pathways
corresponding to their postsecondary goals, i.e., university, college, or the workplace (OME,
2007). Academic courses are intended for students preparing for university or college, applied
courses are intended for students preparing for college or the workplace, and locally developed
courses are intended for students preparing for the workplace post high school (OME, 2007).
As this research is situated in the G9APM context, an overview of the focus of applied
courses, G9APM mathematics strands, and assessments and evaluations are provided. Applied
courses:
focus on the essential concepts of a subject, and develop students’ knowledge and skills
through practical applications and concrete examples. Familiar situations are used to
illustrate ideas, and students are given more opportunities to experience hands-on
applications of the concepts and theories they study. (OME, 2005b, p. 6)
These courses emphasize practical applications, and use multiple hands-on activities and prior
experiences to illustrate and explain new concepts. Applied mathematics courses tend to include
the use of instructional resources, such that over the past several years, slightly over 60% of the
teachers of G9APM indicated they sometimes or frequently had their students use concrete

10
manipulatives, as well slightly over 80% of the teachers of G9APM indicated they sometimes or
frequently had their students use measuring devices (EQAO, 2016b). While G9APM is designed
to include practical applications, just over one third of the students in G9APM agreed or strongly
agreed that the mathematics they learn now is useful for everyday life (EQAO, 2016b). Three
mathematics strands are discussed in G9APM: number sense and algebra, linear relations, and
measurement and geometry (OME, 2005b). Towards the end of the G9APM course, students
complete the EQAO Grade 9 Assessment of Mathematics based on the G9APM curriculum
expectations. Students’ EQAO Grade 9 Assessment of Mathematics score, on average,
contributes 10% or less to their final mark (EQAO, 2016b). In accordance with Ontario’s
assessment and evaluation document, Growing success: Assessment, evaluation and reporting in
Ontario schools (OME, 2010), teachers are also required to implement their own summative
assessments (i.e., assessment of learning), and use formative assessments (i.e., assessment as and
for learning) frequently over the course of an instructional unit.
Overview of Dissertation
This dissertation is divided into five chapters. Chapter 1 introduced the research study by
presenting the purpose and research questions, rationale, and context. Chapter 2 provides the
literature and theoretical framework; this includes an overview of high school mathematics
courses, teachers’ use of AfL strategies within secondary mathematics classrooms, implications
of AfL strategies with struggling students, and concludes with factors that may impact teachers’
use of AfL strategies. Chapter 3 outlines the methodology used to explore teachers’ use of AfL
strategies and factors that may impact their use in G9APM classes. Chapter 4 presents the results
of the study organized by the three research questions: nature of teachers’ AfL strategies,
relationships between teachers’ AfL strategies and AfL conceptions, and relationships between

11
teachers’ AfL strategies and MKT. Chapter 5 concludes with an overview of the study, key
research findings, a discussion on the limitations and implications of the research study, and
directions for future research.
12
Chapter 2
Literature and Theoretical Framework
This chapter is organized into three main sections. The first section provides an overview
of high school mathematics courses, with a close examination of the Canadian context, and
specifically the province of Ontario. The second section explores assessment for learning (AfL)
strategies, first by reviewing teachers’ use of AfL strategies within the secondary mathematics
context, and then the implications of these strategies with struggling students, primarily how AfL
strategies can serve as a mechanism to support students’ educational needs. The last section
explores factors that impact teachers’ use of AfL strategies. In particular, two factors, teachers’
AfL conceptions and mathematical knowledge for teaching (MKT), are discussed. It is the
intersection of these two domains of literature, AfL and MKT, which form my theoretical
framework.
Overview of High School Mathematics
Commonly, high schools offer multiple mathematics courses designed to meet diverse
students’ needs and prepare students explicitly for their desired pathway, namely university,
college, or the workplace. Enrolment in a particular high school mathematics course can depend
on several factors, including but not limited to, prior mathematics achievement, previous
mathematics course completed, interest, postsecondary goals, teacher recommendations, and
parents’ expectations (Burris & Garrity, 2008; Ontario Ministry of Education [OME], 2005b). As
a result, groups of students emerge in these courses that have similar attributes, for example in
terms of mathematics ability or motivation. The grouping of students with similar attributes is
called tracking, ability grouping, or streaming (Burris & Garrity, 2008; People for Education,
2013, 2014). Streaming facilitates inequity in education as patterns in ethnicity and socio-
13
economic status (SES) often emerge, and increases the achievement gap between students due to
differences in expectations and curricula across courses (Burris & Garrity, 2008; People for
Education, 2013). Moreover, school data across several countries (i.e., Canada, England, Poland,
and United States) are beginning to illustrate the positive impact of destreaming on student
achievement and student relationships (Boaler, 2008; Organisation for Economic Co-operation
and Development, 2013a; People for Education, 2014;Venkatakrishnan & Wiliam, 2003).
High school mathematics in Canada. Across all provinces and territories in Canada,
with the exclusion of Ontario, students typically receive a common mathematics curriculum until
Grade 10, and in New Brunswick, students receive a common mathematics curriculum until
Grade 11 (Alberta Education, 2016; British Columbia Ministry of Education, 2016;
Gouvernement du Québec Ministère de l’Éducation, du Loisir et du Sport, 2007a, 2007b;
Manitoba Education and Advanced Learning, 2014; New Brunswick Department of Education
and Early Childhood Development, 2015; Newfoundland and Labrador Education and Early
Childhood Development, 2016; Northwest Territories Department of Education, Culture, and
Employment, n.d.; Nova Scotia Department of Education and Early Childhood Development,
2015; Nunavut Department of Education, 2014; OME, 2005a, 2005b; Prince Edward Island
Department of Education and Early Childhood Development, 2011; Saskatchewan Ministry of
Education, 2012; Yukon Department of Education, 2017). For example, in Alberta, the majority
of students take common mathematics courses until Grade 10, and then in Grade 10, students
choose their subsequent mathematics course sequence (Alberta Education, 2008). Three
mathematics course sequences are available, one for students planning to attend a post-secondary
institution in a program requiring calculus, one for students planning to attend a post-secondary
institution in a program not requiring calculus, and one for students planning to enter into a trade
14
or the workforce after high school (Alberta Education, 2008). In addition, for “students in Grades
8 to 12 [in Alberta] who demonstrate . . . levels of achievement two to three grade levels below
their age-appropriate grade” (Alberta Education, 2017, K&E courses, para. 2) can enrol in
Knowledge and Employability courses. These courses prepare students to enter the workforce
after high school (Alberta Education, 2006). Similarly, in British Columbia, students take
common mathematics courses until Grade 10, and then in Grade 10, students choose their
subsequent mathematics course pathway “to build a comprehensive program based on their
interests and strengths” (British Columbia Ministry of Education, 2016, Draft Grades 10–12
curriculum, para. 2). Multiple course pathways are available that depend on “whether students
choose to pursue deeper or broader study in mathematics” (British Columbia Ministry of
Education, 2016, Draft Grades 10–12 curriculum, para. 2).
In contrast, the province of New Brunswick provides students with common mathematics
courses until Grade 11, and then in Grade 11, students choose their subsequent mathematics
course pathway (New Brunswick Department of Education and Early Childhood Development,
2015). Three mathematics course pathways are available, one for students planning to attend a
post-secondary institution in a program requiring calculus, one for students planning to attend a
post-secondary institution in a program not requiring calculus, and one for students planning to
attend select colleges or enter the workforce after high school (New Brunswick Department of
Education and Early Childhood Development, 2015). New Brunswick’s curriculum
acknowledges students’ “developmental stages in such areas as physical, social/emotional,
cognitive and language development” (New Brunswick Department of Education, 2000, p. 32).
High school mathematics in Ontario. The Ontario mathematics curriculum is inquiry-
oriented (OME, 2005a, 2005b; Suurtamm & Graves, 2007). This inquiry-orientation towards
15
mathematics instruction involves students’ problem solving, investigating, and questioning to
understand mathematical concepts and relationships. Students in Ontario receive a common
mathematics curriculum from kindergarten to Grade 8, choose a mathematics course in Grades 9
and 10, and then a course pathway in Grades 11 and 12 (OME, 2005a, 2005b, 2007). In an effort
to reduce ability grouping in high school, in 2000, the Ontario curriculum departed from offering
basic, general, and advanced level mathematics courses to applied and academic courses in
Grades 9 and 10, with some school boards also offering locally developed courses (OME, 2000,
2005b). Students can take a combination of academic, applied, and locally developed courses
and transfer between course types. However, students who successfully complete the Grade 9
applied mathematics (G9APM) course and wish to enrol in the Grade 10 academic mathematics
course are required to successfully complete a transfer course; such that, the majority of students
enrol in one type of course and do not transfer between course types (OME, 2005b; People for
Education, 2014). This results in streaming continuing to be prominent in Ontario high schools
(Hamlin & Cameron, 2015). Students across provinces and territories in Canada may also
experience streaming, one to two years later than students in Ontario, as students in these other
jurisdictions choose their mathematics course pathway later.
AfL Strategies
Conceptualizations of the ongoing assessment practice, formative assessment, have
evolved since the term’s introduction in the late 1960s. Contemporary conceptualizations of
formative assessment include an explicit role of the teacher and student in interpreting
assessment information to monitor and improve current students’ learning (e.g., Black & Wiliam,
1998a, 2009; Brookhart, 2011; DeLuca & Volante, 2016; Leahy, Lyon, Thompson, & Wiliam,
2005; O’Leary, Lysaght, & Ludlow, 2013; OME, 2010; Popham, 2011; Swaffield, 2011;
16
Wiliam, 2011). Black and Wiliam (1998a) initially described formative assessment as “all those
activities undertaken by teachers, and/or by their students, which provide information to be used
as feedback to modify the teaching and learning activities in which they are engaged” (p. 7–8).
To emphasize the role of the learner and the assessment purpose, formative assessment was
reconceptualised and AfL was introduced. The Assessment Reform Group (Broadfoot et al.,
2002) define AfL to be: “the process of seeking and interpreting evidence for use by learners and
their teachers to decide where the leaners are in their learning, where they need to go and how
best to get there” (p. 2). This definition involves the main classroom agents—teachers and
learners—in the instructional actions of seeking and interpreting information to support the three
main instructional processes (where the learner is going, where the learner is right now, and how
to get there [Hattie & Timperley, 2007; OME, 2010; Ramaprasad, 1983; Sadler, 1989]).
Several AfL models exist (e.g., Cowie & Bell, 1999; Wiliam & Thompson, 2008); in this
study I adapt Wiliam and Thompson’s (2008) formative assessment model, as it complements
the fluidity in the Assessment Reform Group’s (Broadfoot et al., 2002) AfL definition. Wiliam
and Thompson’s model connects the three main instructional processes and classroom agents to
the five key AfL strategies—identifying and sharing learning goals and success criteria,
engineering effective classroom discussions and tasks that elicit evidence of learning, providing
feedback that moves learners forward, and engaging learners as instructional resources for one
another and as the owners of their own learning (Black & Wiliam, 1998a; OME, 2010; Wiliam &
Thompson, 2008). As well, the OME (2010) adapted Wiliam and Thompson’s model in their
assessment and evaluation document, Growing success: Assessment, evaluation and reporting in
Ontario schools. In Wiliam and Thompson’s model, OME revised the text describing the roles of
the classroom agents from largely a teacher point of view to a collaborative point of view
17
between teachers and learners. For example, to describe the role of the learner in assessing where
they are right now, Wiliam and Thompson wrote, “activating students as the owners of their own
learning” (p. 63) and the OME revised this to, “engaging in self-assessment and goal setting” (p.
32), writing the AfL strategy in terms of the learners’ actions. As well, the OME made slight
modifications to Wiliam and Thompson’s text but maintained the text’s original meaning. In this
review, I integrated Wiliam and Thompson’s and the OME’s model in order to succinctly
describe how it is expected AfL can be implemented in classrooms (see Table 1). For example, to
describe the role of the teacher in assessing where the learner is right now, Wiliam and
Thompson wrote, “engineering effective classroom discussions and other learning tasks that
elicit evidence of student understanding” (p. 63) and the OME wrote, “engineering effective
classroom discussions and other learning tasks that elicit information about student learning” (p.
32). In the integrated model presented in Table 1, I combined these descriptions, i.e., engineering
effective classroom discussions and tasks to elicit evidence of learning. The AfL model identifies
the instructional roles of each agent. From the teachers’ perspective, teachers involve students in
co-constructing and internalizing learning goals and success criteria, engage students in
instructional activities to elicit assessment information, interpret this information to determine
their students’ levels of understanding, and then provide feedback to move students’ learning
forward (OME, 2010; Wiliam & Thompson, 2008). Lastly in the AfL model, teachers scaffold
and support the involvement of students in peer- and self-assessments; students can use these
assessments to determine their level of understanding, and then, if necessary, adjust their
knowledge, beliefs, and/or strategies to support continued growth towards their learning goals
(OME, 2010; Wiliam & Thompson, 2008). By connecting AfL strategies to instructional
processes and classroom agents, the AfL model proposed by Wiliam and Thompson (2008), and
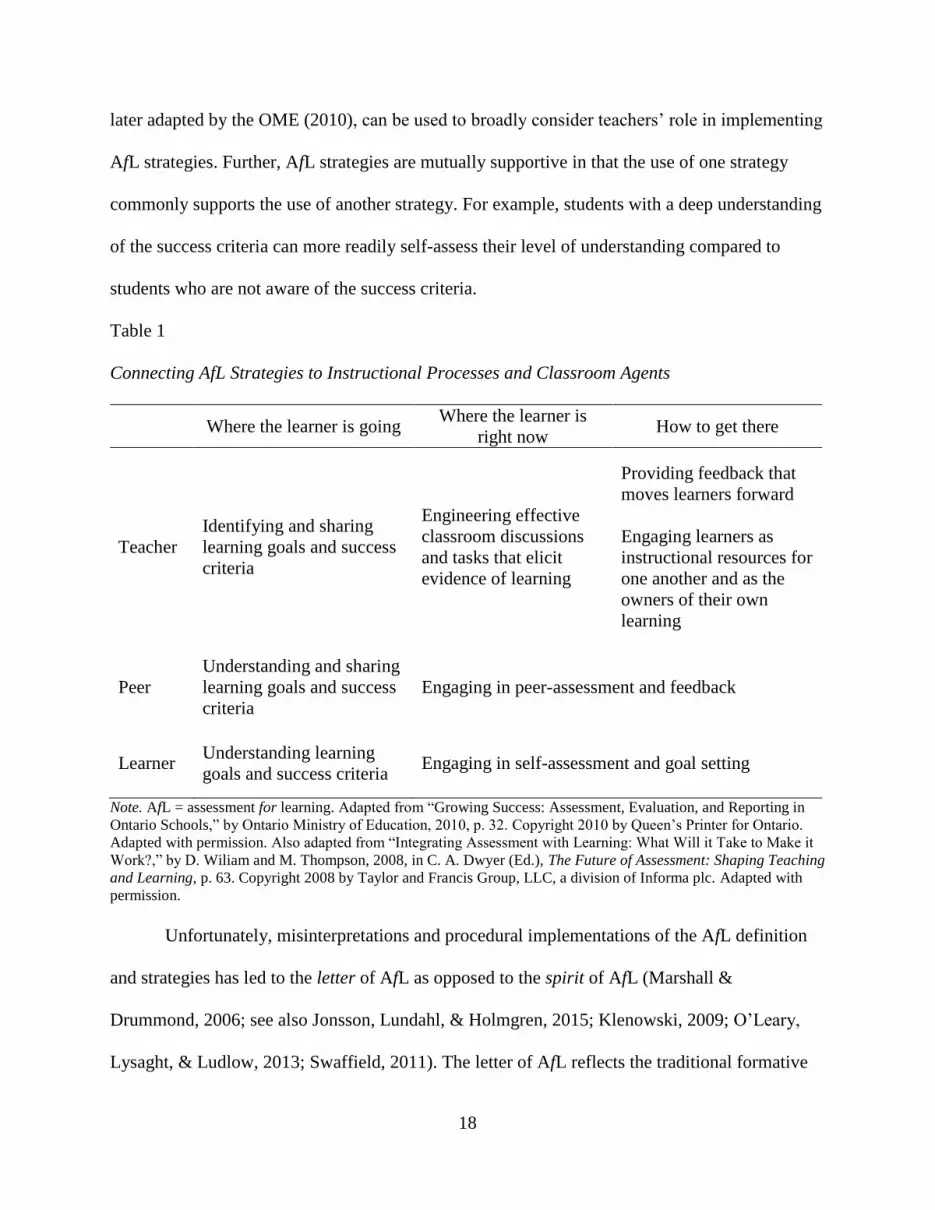
18
later adapted by the OME (2010), can be used to broadly consider teachers’ role in implementing
AfL strategies. Further, AfL strategies are mutually supportive in that the use of one strategy
commonly supports the use of another strategy. For example, students with a deep understanding
of the success criteria can more readily self-assess their level of understanding compared to
students who are not aware of the success criteria.
Table 1
Connecting AfL Strategies to Instructional Processes and Classroom Agents
Where the learner is going Where the learner is
right now How to get there
Teacher
Identifying and sharing
learning goals and success
criteria
Engineering effective
classroom discussions
and tasks that elicit
evidence of learning
Providing feedback that
moves learners forward
Engaging learners as
instructional resources for
one another and as the
owners of their own
learning
Peer
Understanding and sharing
learning goals and success
criteria
Engaging in peer-assessment and feedback
Learner Understanding learning
goals and success criteria Engaging in self-assessment and goal setting
Note. AfL = assessment for learning. Adapted from “Growing Success: Assessment, Evaluation, and Reporting in
Ontario Schools,” by Ontario Ministry of Education, 2010, p. 32. Copyright 2010 by Queen’s Printer for Ontario.
Adapted with permission. Also adapted from “Integrating Assessment with Learning: What Will it Take to Make it
Work?,” by D. Wiliam and M. Thompson, 2008, in C. A. Dwyer (Ed.), The Future of Assessment: Shaping Teaching
and Learning, p. 63. Copyright 2008 by Taylor and Francis Group, LLC, a division of Informa plc. Adapted with
permission.
Unfortunately, misinterpretations and procedural implementations of the AfL definition
and strategies has led to the letter of AfL as opposed to the spirit of AfL (Marshall &
Drummond, 2006; see also Jonsson, Lundahl, & Holmgren, 2015; Klenowski, 2009; O’Leary,
Lysaght, & Ludlow, 2013; Swaffield, 2011). The letter of AfL reflects the traditional formative

19
assessment practices initiated by the teacher, in which the teacher sets learning goals and success
criteria, collects and analyzes student work, and provides and uses feedback to direct the learning
content and pace. These practices have the teacher as the driving force in the classroom and are
often concentrated on discrete AfL strategies. Jonsson et al. (2015) found teachers commonly
implemented teacher-centred AfL practices; specifically, teachers frequently used assessment
tasks and provided feedback and less frequently used learning goals, success criteria, and peer-
and self-assessments.
In contrast, the spirit of AfL entails practices that are much more inclusive between the
teacher and the students, with a higher and deeper level of student involvement and autonomy in
the assessment process. These practices have teachers and students co-construct learning goals
and success criteria, reflect on student work, and provide and use feedback to improve students’
learning. O’Leary et al. (2013) found these practices that involved students in the assessment
process more difficult for teachers to implement. This finding is not surprising, as these practices
are not typical classroom assessment practices; they require teachers to use classroom assessment
practices “in a more purposeful way” (O’Leary et al., 2013, p. 51) and “share responsibility for
assessment” (O’Leary et al., 2013, p. 51) with students.
In order to clarify teachers’ and students’ roles in AfL, researchers at the Third
International Conference on Assessment for Learning in 2009 developed a second-generation
definition of AfL: “Assessment for Learning is part of everyday practice by students, teachers
and peers that seeks, reflects upon and responds to information from dialogue, demonstration and
observation in ways that enhance ongoing learning” (Klenowski, 2009, p. 264). This definition
highlights the need for the continuous and frequent nature of AfL practices, the classroom agents
involved, and the desired level of their involvement. Further, assessment as learning (AaL), a

20
subset of AfL, was introduced to support autonomous student learning. AaL promotes the
explicit use of assessment information by the learner; it involves goal setting, self-monitoring
and then using feedback resources to extend or modify (if necessary) thinking (Earl, 2013).
As a result of contemporary conceptualizations of formative assessment and the
introduction of AfL, there has not been a consistent use of either one of the terms by researchers,
educators, or policy makers (Swaffield, 2011). In the subsequent sections, I include empirical
and conceptual papers that use either formative assessment or AfL. I use the term formative
assessment or AfL as employed by the authors when reviewing their studies, and when
presenting my central thesis I use the term AfL. I use Klenowski’s (2009) AfL definition because
its focus on teachers and students using everyday practices, to provide assessment information on
students’ levels of understanding and guidance on next steps, strongly portrays current practices
on how to support student learning. Next, I use the AfL strategies as the organizing structure to
review teachers’ use of AfL strategies—identifying and sharing learning goals and success
criteria, engineering effective classroom discussions and tasks that elicit evidence of learning,
providing feedback that moves learners forward, and engaging learners as instructional resources
for one another and as the owners of their own learning—in secondary mathematics classrooms.
Teachers’ use of AfL strategies. For each AfL strategy, I provide examples that
illustrate its use. I limit the empirical and conceptual papers reviewed and discussed to current
and relevant articles pertaining to AfL in secondary mathematics classrooms because
implementation of AfL strategies may differ across domains and educational levels due to
teaching, learning, and assessment domain values and organizational distinctions (Jacobs et al.,
2006; Suurtamm & Graves, 2007; Topping, 2013). Throughout, I use the term AfL strategies
when referring to the five general AfL strategies (i.e., identifying and sharing learning goals and

21
success criteria, engineering effective classroom discussions and tasks that elicit evidence of
learning, providing feedback that moves learners forward, and engaging learners as instructional
resources for one another and as the owners of their own learning). In contrast, I use the term AfL
practices when referring to the specific AfL classroom practices implemented by teachers (e.g.,
traffic light).
Identifying and sharing learning goals and success criteria. The first strategy involves
teachers clearly identifying and sharing the learning goals and success criteria of each lesson
with students, and students internalizing and being able to communicate these goals and success
criteria prior to completing the associated assignment (Wylie & Lyon, 2015). Currently, there are
limited studies (Sato et al., 2008; Suurtamm, 2004; Wylie & Lyon, 2015) that report on teachers’
AfL practices to identify and share learning goals and success criteria with their students.
Sato and her colleagues (2008) illustrated teachers’ varying abilities in clearly
communicating learning goals. In a three-year longitudinal quasi-experimental study in the
United States, they investigated changes in 16 middle and high school mathematics and science
teachers’ classroom assessment practices who were National Board Certification or non-National
Board Certification candidates. They developed a formative assessment rubric to track changes
in teachers’ use and quality of formative assessment practices. Videotapes of teaching, lesson
plans, teachers’ reflections and interviews, student work, and teacher and student surveys were
collected and analyzed each year using the rubric to calculate a teacher’s formative assessment
score. Students of National Board Certification candidates were more likely to indicate that they
were aware of the learning goals compared to students of non-National Board Certification
candidates. Thus it appears that National Board Certification candidates were more likely to
22
clearly communicate the learning goals with students compared to non-National Board
Certification candidates.
Wylie and Lyon (2015) specifically explored the extent and quality of teachers’ formative
assessment practices used to identify and share learning goals and success criteria. Using three
self-reported instruments (survey, logs, and reflections), they discussed the extent and quality of
202 secondary mathematics and science teachers’ formative assessment practices in the United
States. These teachers participated in a two-year professional development program that focused
on building their capacity in formative assessment. As a result of the professional development,
Wylie and Lyon found no significant change in teachers’ use of success criteria. As well,
teachers only frequently implemented one formative assessment practice associated with learning
goals and the teachers scored significantly lower on the quality of implementation scale for this
AfL strategy compared to the other formative assessment practices implemented. Overall, Wylie
and Lyon found teachers routinely focused the learning goals on an activity instead of the desired
learning outcomes.
Using a case study approach, Suurtamm (2004) explored five secondary mathematics
teachers’ authentic assessment practices in Ontario. These teachers appreciated the value of
authentic assessments and purposefully included these practices with students. Through
interviews, classroom observations, and focus groups, Suurtamm found most teachers in the
study discussed success criteria with their class prior to an activity. In one class, this was
expressed as the teacher and students brainstorming the types of characteristics of a good,
satisfactory, and bad assignment. These five teachers were the exceptions, as teachers in this
study noted that other teachers in their schools continued to use traditional forms of assessments.
These empirical studies illustrate that identifying and sharing learning goals and success criteria
23
are not typically a part of most teachers’ classroom assessment practices, and when implemented
a critical feature of the strategy was routinely absent.
Engineering effective classroom discussions and tasks that elicit evidence of learning.
The second strategy involves teachers engineering and orchestrating classroom activities based
on the learning goals in order to facilitate the collection of accurate learning evidence from all
students and provide valid interpretations of students’ understandings (e.g., Bennett, 2011;
Campbell, 2013; McGatha & Bush, 2013; Shepard, 2000). To increase the validity of
interpretations, teachers need to use a collection of activities to inform and re-inform their
interpretations about students’ understandings (P. A. Moss, 2003). The degree of specificity of
collected evidence ranges from very detailed instructional diagnostic evidence informing the
next learning progression to broad evidence about a learner’s proficiency on a topic. The specific
purpose for using AfL (e.g., to check students’ understandings) informs the type of AfL practice
to implement in order to obtain relevant assessment information. As an example, a teacher may
use individual whiteboards to check which students in their class may need more support with
the application of a particular concept. Previous studies (Black, Harrison, Lee, Marshall, &
Wiliam, 2004; Chen et al., 2012; Harrison, 2005; Panizzon & Pegg, 2008; Sato et al., 2008;
Suurtamm, 2004; Suurtamm & Koch, 2014; Suurtamm et al., 2010; Wylie & Lyon, 2015)
illustrated teachers’ AfL practices to elicit students’ understandings.
The King’sMedwayOxfordshire Project in the United Kingdom included 24 teachers
in science and mathematics involved in an 18-month study designed to develop their AfL
practices (Black et al., 2004; Harrison, 2005). Teachers attended professional development
sessions and in groups developed an action plan of AfL practices they sought to implement in
their classrooms. Through lesson observations, teacher meetings and interviews, teachers’

24
reflections, and student focus groups, researchers found teachers’ AfL practices changed as a
result of the professional development. For example, teachers noted devoting more preparation
time to planning questions and instructional activities that encouraged the visibility of student
thinking, and to anticipating students’ misconceptions so potential remedial instructional
activities were readily available.
Sato et al. (2008) also found professional development increased teachers’ use of AfL
practices. Sato and colleagues found National Board Certification candidates scored higher over
the three years on formative assessment practices compared to non-National Board Certification
candidates. Most notable, teacher changes occurred in the variety of formative assessments
employed and the use of assessment information to guide instruction. For example, National
Board Certification candidates were more likely to administer diagnostic assessments to guide
their unit instruction.
The teachers in Suurtamm et al.'s (2010) study also used a variety of formative
assessments. The researchers documented a variety of formative assessment practices from three
illustrative case studies of intermediate mathematics classrooms in Ontario. Each case study
teacher supported student learning by implementing multiple formative assessment practices
(e.g., math forum, clicker quizzes, questioning) that included differentiation for students at
different ability levels (e.g., scaffolding, colour groups). For example, the math forum involved
students working in pairs to solve a problem, pairs presenting a solution, other students in class
summarizing solution, and other students questioning the presenters for clarification. In addition
to this practice visibly presenting multiple problem-solving approaches to students and
supporting clearer understandings, it allowed the teacher to observe and assess students engaging
in a range of processes throughout the activity. As a further example from the study, a teacher

25
used a clicker quiz composed of two multiple-choice questions to assess students’ levels of
understanding. The quiz showed that students’ responses varied across the possible solutions.
After a class discussion of the various solutions, students revisited the questions with a partner
before resubmitting a response. As expected, the revised responses showed less variation across
students. This activity allowed the teacher to uncover students’ conceptions and misconceptions,
provide feedback, and for students to use this feedback to revise their responses. In a previous
study, Suurtamm (2004) found secondary mathematics teachers (N = 5), who valued authentic
assessments, routinely had students working in groups on open-ended problems and then
presenting their solutions to the class. Additionally, Suurtamm and Koch (2014) explored the
assessment dilemmas of 42 elementary and secondary mathematics teachers; the authors
attended 17 meetings across two years within two professional learning communities in Ontario.
The research provides examples of teachers’ formative assessment practices. For example, one
secondary mathematics teacher discussed the benefits of using interviews to “determine the
extent of [students’] understanding[s]” (p. 279), while another secondary mathematics teacher
discussed students’ uncomfortableness with initiating the use of manipulatives to support their
problem solving.
Wylie and Lyon (2015) specifically explored the extent and quality of teachers’ formative
assessment practices used to elicit evidence of learning. Of the five formative assessment
strategies, Wylie and Lyon found that teachers most commonly implemented questions or tasks
to elicit evidence of learning and these questions or tasks often focused on the collection of data
from students. Further, even in the presence of relevant professional development, Wylie and
Lyon found no significant difference in the process of “how teachers developed questions” (p.
150) but found a significant difference in “how they approached asking questions” (p. 151). For

26
example, teachers more often selected students randomly to answer questions and used practices
that allowed all students to respond, e.g., “student polling devices and individual student
whiteboards” (Wylie & Lyon, 2015, p. 151).
Panizzon and Pegg (2008) also explored teachers’ questioning practices. Panizzon and
Pegg conducted a two-year study with 25 secondary mathematics and science teachers in
Australia. Their report focused on how teachers’ assessment practices changed over time.
Teachers participated in professional development workshops and collaborated to develop school
action plans outlining formative assessment practices they sought to implement. Interviews and
workshops revealed how substantial changes in teacher questioning practices, such as their
perceived value of using open-ended, problem solving questions, contributed to supporting
teachers in understanding students’ levels of understanding and identifying misconceptions.
Making students’ thinking visible facilitates teachers implementing activities that build new
knowledge onto students’ prior knowledge. The professional development workshops supported
teachers with the use of a cognitive structural model—Structure of the Observed Learning
Outcome (SOLO) taxonomy. This model provided teachers with a cognitive developmental
framework that helped them reflect on the quality of students’ responses and assess their levels
of understanding. As well, the framework helped teachers recognize the types of questions they
routinely asked students; for example, several mathematics teachers noted that they often asked
questions focusing on procedural understanding over conceptual understanding. The types of
questions teachers commonly asked provide insight into the richness of the classroom dialogue.
C. M. Moss and Brookhart (2009) noted that “in most classrooms, teachers are still using low-
level, rapid-fire recall questions that require a quick response and minimize student engagement
with important content and modes of reasoning” ( p. 113).

27
Chen et al. (2012) found similar low-level questioning practices and distinguished
teachers’ questioning practices across student ability levels. Exploring three eighth-grade Taiwan
mathematics teachers’ extended questioning sequences, Chen et al. found teachers used
questions with various degrees of difficulty across student ability levels. Extended questioning
sequences involve teachers prompting, repeating, simplifying, and providing feedback until
desired response is obtained. The three teachers in the study had similar years of teaching
experience and taught at schools with disparities in SES and achievement. Case studies
completed with each teacher consisted of data from lesson observations, teacher interviews,
questionnaires, and policy documents. For a parsimonious approach to coding, Chen et al.
collapsed the initial themes that emerged from the teachers’ extended questioning sequences into
three categories: low-level, high-level, or rhetorical. Low-level questions included questions
requiring one-word responses (e.g., yes or no) or the recalling of facts. High-level questions
included questions requiring students to explain, while rhetorical questions often emphasized
facts. Interestingly, all three teachers in the study used a high frequency of rhetorical questions,
which was indicative of low teacher-student interaction. The teacher in the highest SES school
posed more high-level questions compared to the two teachers in lower SES schools who posed
more low-level questions; however, the high-level questions were only used when a student
responded correctly, not incorrectly. The infrequent use of high-level questions limits students’
opportunities to hear what other students are thinking and to make explicit their own
understandings, and does not support the social construction of knowledge. Generally, the
teachers had different purposes for asking questions; the teachers in the low SES schools were
most interested in obtaining the correct response, while the teacher in the high SES school was
more interested in eliciting students’ thinking to provide students with appropriate feedback.

28
Also, teachers’ follow-up questions in the low SES schools were less likely to be based on
students’ incorrect responses compared to the teacher in the high SES school; therefore, the
teachers in the low SES schools were less likely to adjust their instruction which is a key part of
formative assessment. These empirical studies illustrate that engineering effective classroom
discussions and tasks that elicit evidence of learning is a common AfL strategy used by teachers,
and teachers frequently use questioning practices to assess students’ levels of understanding.
Providing feedback that moves learners forward. The third strategy involves teachers
providing students with feedback to support their learning. Feedback provided may be: (a) given
to an individual, small group, or entire class; (b) expressed in a positive, negative, or neutral
tone; (c) aimed at the cognitive, affective, or meta-cognitive level; and (d) referenced to self,
peers, or standard (Li et al., 2011). It is recommended that feedback be connected to one of the
three instructional processes (i.e., where the learner is going, where the learner is right now, and
how to get there) and be at the task, process, or self-regulation level depending on its purpose
(Hattie & Timperley, 2007). The purposes of feedback may include correcting a miscalculation,
misconception, or lack of understanding (Bennett, 2011).
Descriptive feedback has contributed to increased student achievement and higher levels
of intrinsic motivation compared to evaluative-only feedback or using a combination of
evaluative and descriptive feedback (Andrade, 2013; Hattie & Timperley, 2007; Wiliam, 2007).
Descriptive feedback identifies if discrepancies exist between a student’s understanding and the
learning goal, and what adjustments (if necessary) to make to meet the learning goal. Effective
descriptive feedback is aligned with learning goals and success criteria; this helps students learn
how to self-assess (C. M. Moss & Brookhart, 2009). However, descriptive feedback is not
traditionally used in mathematics classrooms; commonly evaluative feedback is used (Li et al.,
29
2011). Evaluative feedback provides students with a summary (e.g., score, correct or incorrect)
on their performance. Moreover, descriptive feedback tends to be less effective at supporting
student learning when provided alongside evaluative feedback (Black & Wiliam, 1998a; Hattie
& Timperley, 2007). Consequently, only a couple of empirical studies (Suurtamm & Koch,
2014; Wylie & Lyon, 2015) within the secondary mathematics context reported on the quality of
teachers’ descriptive feedback.
Suurtamm and Koch (2014) provided examples of teachers’ assessment practices. They
described one descriptive feedback practice shared by a Grade 9 mathematics teacher; this
mathematics teacher discussed how he supported students in making their thinking visible. The
teacher had students rewrite their solutions with a focus on communication; he then provided
students with feedback on their depth of understanding and the clarity of their explanations. He
also discussed how he used this activity to support peer-feedback. Wylie and Lyon (2015)
specifically explored the extent and quality of teachers’ formative assessment practices used to
provide feedback. Wylie and Lyon found teachers infrequently provided descriptive feedback.
This is not surprising since Li et al. (2011) found only five of the 33 studies reviewed, in their
synthesis of effective feedback practices on mathematics learning, explored descriptive feedback.
Wylie and Lyon also noted that when descriptive feedback was provided it was unlikely to be
used formatively because teachers often provided scores in addition to the descriptive feedback.
As a result of professional development, teachers in Wylie and Lyon’s study significantly
improved their descriptive feedback practices; however, frequency and quality of
implementation of this practice remained low. Hence these empirical studies illustrate that
providing descriptive feedback is not common across classrooms.

30
Engaging learners as instructional resources for one another and as the owners of
their own learning. The fourth and fifth strategies involve teachers engaging learners in
providing peer- or self-assessments. Teachers can support students in these strategies through
sharing and co-constructing learning goals and success criteria, providing guidance, and
incorporating routines for collaborative work into their teaching practice (Wylie & Lyon, 2015).
Everyday practices, such as students asking for help, is an example of a self-assessment practice
(C. M. Moss & Brookhart, 2009). While researchers have noted many useful benefits of peer-
and self-assessments in supporting students’ learning (Black et al., 2004; Brown & Harris, 2013;
Nicol & Macfarlane-Dick, 2006; Topping, 2013), peer- and self-assessments are not commonly
used in secondary mathematics classrooms (Noonan & Duncan, 2005; Suurtamm, 2004;
Suurtamm et al., 2010; Wylie & Lyon, 2015).
In a study exploring the nature and frequency of peer- and self-assessments use in
Canadian high schools, Noonan and Duncan (2005) surveyed 118 high school teachers and found
that fewer mathematics or science teachers used peer-and self-assessments compared to teachers
in other subjects. Suurtamm (2004) found secondary mathematics teachers in Ontario (N = 5)
used peer- and self-assessments, but noted that the use of peer- and self-assessments were not
common across teachers in their schools and that their colleagues did not understand the purpose
of these strategies. Suurtamm et al. (2010) surveyed intermediate mathematics teachers in
Ontario (N = 1096) and found that less than 20% of the teachers used self-assessments, and even
fewer used peer-assessments. Similarly, Wylie and Lyon (2015) found teachers implemented
peer- and self-assessments with low frequency, as well as with a low to moderate quality of
implementation. Specifically, teachers displayed a “lack of planning or structure” (p. 155) when
using peer-assessments and sometimes “underestimate[d] the amount of support that students

31
require[d]” (p. 155) for self-assessments. Further, teachers in Wylie and Lyon’s study
demonstrated no significant changes in peer- and self-assessments as a result of professional
development. These empirical studies illustrate that peer- and self-assessments are not commonly
used across classrooms, and when implemented critical features to support students with these
strategies are absent.
The review of teachers’ use of AfL strategies in secondary mathematics classrooms
highlights three main points: (a) the range in use and quality of teachers’ AfL practices; (b) the
limited amount of empirical studies (especially evident within the AfL strategy, providing
feedback that moves learners forward); and (c) the infrequent use of all AfL strategies except
engineering effective classroom discussions and tasks that elicit evidence of learning.
Implications of AfL Strategies with Struggling Students
Struggling students may be described as at-risk, disadvantaged, or lower-achieving.
These students, as summarized by Vatter (1992), commonly have low self-concept, academic
performance, ambitions, and family SES (see also Petty et al., 2013). In addition, these students
frequently have high absenteeism and discipline problems, and a non-traditional family with
parent(s)/guardian(s) who have low expectations (Vatter, 1992). The At-risk Working Group
(2003), comprised of Ontario educators, define secondary students to be at-risk if they perform
significantly below the provincial standard (i.e., low Level 2 or below) and/or are disengaged
with poor attendance. In the Grade 9 applied mathematics (G9APM) context, this corresponds to
more than 18% of the students to be considered at-risk as measured by the EQAO Grade 9
Assessment of Mathematics (EQAO, 2016c). The Expert Panel on Student Success in Ontario
(2004), comprised of education and community leaders in Ontario, suggest the use of additional
statistics to identify at-risk students, including credit accumulation, use of

32
intervention/support/alternative programs, suspension and expulsion data, and success rate in
applied and/or locally developed courses.
Limited literature exists on implementing AfL strategies with struggling students.
However, within the existent literature on this topic, researchers recommend the use of AfL
practices (and other related pedagogical practices) with struggling students (Dunn, 2004; Expert
Panel on Student Success in Ontario, 2004; Johannessen, 2004; Margolis & McCabe, 2003). The
Expert Panel on Student Success in Ontario (2004) reviewed Canadian and international
literature on mathematics learning strategies effective for struggling students. They highlighted
three teaching and assessment strategies beneficial for all students, and essential for struggling
students, namely: (a) creating a positive classroom climate, (b) planning and implementing
effective teaching and assessment, and (c) giving targeted support. The first two strategies
incorporate practices associated with AfL strategies. For example, creating a positive classroom
climate includes implementing cooperative learning tasks; peer-assessments are one such
example of these tasks. As well, planning and implementing effective teaching and assessment
explicitly includes using AfL strategies. In this last section, I describe connections between the
five AfL strategies and teaching and assessment recommendations for struggling students.
Identifying and sharing learning goals and success criteria provide students with explicit
learning goals and the criteria required to demonstrate competency. As noted by the Expert Panel
on Student Success in Ontario (2004), struggling students need focused lessons, and this is
exactly what the use of learning goals and success criteria support. Engineering effective
classroom discussions and tasks that elicit evidence of learning provides teachers with
information to determine students’ levels of understanding. Rich meaningful tasks and student-
to-student discussions can be used to elicit this information, which work well with struggling
33
students (Dunn, 2004; Expert Panel on Student Success in Ontario, 2004; Johannessen, 2004).
For example, Johannessen (2004) discussed the use of problem-solving tasks connected to
students’ prior experiences to support critical thinking and facilitate class discussions. Also,
researchers (e.g., Johannessen, 2004; Margolis & McCabe, 2003) have stated the importance of
teachers ensuring activities are at the appropriate level of difficulty, connecting activities to
students’ prior knowledge and experiences, and linking new activities to previous students’
successes. These teaching and assessment strategies are precisely the result of using assessment
information to inform instructional tasks. Providing feedback that moves learners forward gives
students explicit direction on how to improve. With struggling students, Margolis and McCabe
(2003) mentioned the importance of reinforcing effort and persistence, and helping these
students correctly identify attributions. This strategy encourages providing feedback about
students’ understandings and not feedback about the self. As Hattie and Timperley (2007) noted
in their review, feedback about the self is most often ineffective. Lastly, engaging learners as
instructional resources for one another and as the owners of their own learning provide students
with peer models—exemplars from peers that students can identify with—and support personal
goal setting (Margolis & McCabe, 2003). Both of these practices have been noted to support
struggling students (Margolis & McCabe, 2003). In addition, engaging learners as instructional
resources for one another can support positive student-student relationships. These examples
illustrate how AfL strategies can serve as a mechanism to support struggling students. As
students continue to struggle in G9APM, as indicated by the low provincial average on the
EQAO Grade 9 Assessment, it is of interest to explore G9APM teachers’ use of AfL strategies.
34
Factors Impacting Teacher’s Use of AfL Strategies
AfL is “about much more than the application of certain procedures—questioning,
feedback, sharing the criteria with the learner and peer and self-assessment—but about the
realization of certain principles of teaching and learning” (Marshall & Drummond, 2006, p. 135).
These principles of teaching and learning that affect the implementation of AfL strategies are
most certainly influenced by a multitude of factors. For example, traditional beliefs about how
mathematics is learned, the mathematics knowledge valued, and classroom assessment methods
teachers experienced are some of the factors that impact teachers’ use of AfL strategies (Jacobs
et al., 2006; Stipek, Givvin, Salmon, & MacGyvers, 2001; Suurtamm & Graves, 2007).
Teachers’ AfL conceptions and teachers’ subject matter knowledge and pedagogical
content knowledge are two other factors that impact teachers’ use of AfL strategies (Bray, 2011;
Dixon & Haigh, 2009; Heritage, Kim, Vendlinski, & Herman, 2009; Herman, Osmundson, Dai,
Ringstaff, & Timms, 2015; Klinger, DeLuca, & Chapman, 2016; C. M. Moss & Brookhart,
2009; Ogan-Bekiroglu, 2009; Otero, 2006; Ruiz-Primo, 2011; Wylie & Lyon, 2015). Previous
research has described the strong relationship between teachers’ beliefs and their instructional
practices (e.g., Bray, 2011; Marshall & Drummond, 2006; Pajares, 1992; Stipek et al., 2001) and
more recently connected teachers’ AfL conceptions to their AfL practices (Klinger et al., 2016).
Ruiz-Primo (2011) stated the importance of teachers’ content knowledge and pedagogical
content knowledge for effective AfL conversations (see also Bennett, 2011; Wiliam, 2011). This
knowledge supports the analysis and interpretation of students’ mathematical thinking. As noted
by Heritage and colleagues (2009):
The analysis and interpretation of evidence is pivotal for the effectiveness of formative
assessment. Inaccurate analyses or inappropriate inference about the students’ learning

35
status can lead to errors in what the instructional next steps will be, with the result that the
teacher and the learner fail to close the gap. (p. 24)
Exploring teachers’ AfL conceptions and subject matter knowledge and pedagogical content
knowledge—within mathematics this is called mathematical knowledge for teaching (MKT)—in
connection to their AfL practices is valuable. These two factors are discussed in the next section.
Teachers’ AfL conceptions. A limited number of research studies have examined
teachers’ AfL conceptions. Specifically, researchers have examined general conceptions of
assessment (e.g., Brown, 2004; Brown, Kennedy, Fok, Chan, & Yu, 2009; Brown, Lake, &
Matters, 2011; Remesal, 2011), early conceptions of formative assessment (Otero, 2006), and
more recent conceptions of AfL (DeLuca, LaPointe-McEwan, & Luhanga, 2016; Dixon &
Haigh, 2009; Klinger et al., 2016). Using quantitative research methods, Brown and colleagues
(2004, 2009, 2011) found differences exist in teachers’ general conceptions of assessment due to
educational policies, grade levels, and cultural values. For example, Brown (2004) measured
New Zealand primary school teachers’ and leaders’ (N = 525) general conceptions of assessment
using the Teachers’ Conceptions of Assessment questionnaire. Participants’ conceptions of
assessment aligned with common understandings of assessment, with respect to their agreement
that assessments are used for improvement of teaching and learning and school accountability
purposes, and disagreement that assessments are irrelevant. However, participants disagreed that
assessments are used for student accountability purposes; this belief is not aligned with common
understandings of assessment but is congruent with New Zealand’s primary school context
where externally mandated assessments are not administered (see Brown et al., 2011 for small
differences in beliefs with Queensland secondary teachers). Further, Brown found no significant
36
differences in teachers’ general conceptions of assessment as a function of gender, role, years of
training, years of experience, or types of classroom assessment practices.
Using qualitative research methods, Remesal (2011) also explored teachers’ general
conceptions of assessment. Remesal (2011) interviewed primary and secondary mathematics
teachers (N = 50) in Spain, and viewed their classroom assessment materials in order to explore
teachers’ general conceptions of assessment. She classified these teachers’ conceptions into four
categories: extreme pedagogical, mixed pedagogical, extreme societal, and mixed societal.
Extreme pedagogical conceptions of assessment align with AfL, while extreme societal
conceptions of assessment align with assessment of learning. Many teachers (44%) in this study
had a mixed societal conception of assessment, such that they had “societal beliefs concerning
the effects of assessment on learning, accountability of teaching, and accreditation of
achievement” (Remesal, 2011, p. 476) and “pedagogical beliefs about assessment effects on
teaching” (Remesal, 2011, p. 476).
While multiple researchers have explored teachers’ general conceptions of assessments,
Otero (2006) focused solely on teachers’ formative assessment conceptions. Otero examined
early formative assessment conceptions and found many teachers had incorrect conceptions. In a
three-year study in the United States with preservice teachers (N = 61), Otero found some
teachers understood formative assessment as a process of eliciting students’ prior knowledge
(both academic- and experience-based knowledge) in order to identify goals, provide feedback,
and implement next instructional steps. However, a greater proportion of preservice teachers in
Otero's study had misconceptions of the formative assessment process.
More recently DeLuca and coauthors (2016), Dixon and Haigh (2009), and Klinger and
colleagues (2016) explored teachers’ AfL conceptions. Dixon and Haigh interviewed four

37
secondary school teachers involved in a two-year professional research project in New Zealand
and reviewed their final reports to explore their AfL conceptions. Over the course of the study,
three of the four teachers to differing degrees realized students’ central role in AfL, while the
fourth teacher continued to implement AfL practices with the teacher as the sole user of
assessment information. DeLuca et al. (2016) developed the Approaches to Classroom
Assessment Instrument to measure teachers’ approaches to classroom assessment, confidence in
assessment, and learning priorities and preferences in assessment. With respect to teachers’
approaches to classroom assessment, in a sample with preservice and practicing Canadian
teachers (N = 404), DeLuca et al. found teachers commonly prioritized an AfL approach (over
assessment as and of learning), assessment design and communication (over assessment scoring),
differentiated approaches (over standard and equitable treatment), and reliable and valid
assessments. In another study based in Canada, Klinger et al. (2016) interviewed, administered
questionnaires, and collected observational data and artifacts over a two-year period from
teachers (N = 88) who were engaged in a professional learning program to support teacher
capacity in AfL. Findings from this study described teachers’ AfL conceptions and practices
along a AfL professional learning continuum—learning the letter, practicing the letter,
responding to the letter, adopting the spirit, and leading the spirit. Learning the letter includes
understanding the pedagogy of AfL; making connections between teaching, learning, and
assessment; and beginning to shift from a teacher-centric conception to a student- and teacher-
centric conception of AfL. In practicing the letter, teachers ask procedural questions and
implement AfL practices that are disconnected from other implemented AfL and instructional
practices. Responding to the letter includes teachers reflecting on their AfL practices and
conducting research inquiries into how to navigate through their pedagogical challenges. In

38
classrooms where teachers are adopting the spirit, students are active participants in collecting
and analysing assessment information and in providing feedback to inform next steps. Lastly
teachers who are leading the spirit are supporting capacity building in AfL. This may include
such practises as modeling AfL practices and initiating informal and formal discussions with
colleagues. The AfL professional learning continuum provides a framework for categorizing
teachers’ AfL conceptions.
Mathematical knowledge for teaching. Content knowledge and pedagogical content
knowledge support teacher effectiveness (Shulman, 1986). Shulman (1986) identified three types
of required teacher knowledge: subject matter content knowledge, pedagogical content
knowledge, and curricular knowledge. Researchers (Ball, Thames, & Phelps, 2008; Hill, Ball, &
Schilling, 2008; Hill, Rowan, & Ball, 2005; Hill, Schilling, & Ball, 2004) extended and
delineated Shulman's work on the multidimensionality of teacher knowledge to the teaching of
elementary mathematics, using the term MKT. MKT is related to improved teaching (Baumert et
al., 2010; Hill et al., 2005). After accounting for student-level variables, Hill and coauthors
(2005) found elementary teachers’ MKT was the largest teacher-level predictor of students’
gains in mathematics achievement. Further, within secondary mathematics, Baumert et al. (2010)
found teachers’ pedagogical content knowledge, after accounting for student-level variables, to
be a greater predictor of students’ mathematics achievement compared to teachers’ subject
matter knowledge.
MKT involves both subject matter knowledge and pedagogical content knowledge (Ball
et al., 2008; Hill et al., 2008). Subject matter knowledge is divided into three domains: common
content knowledge (CCK), specialized content knowledge (SCK), and horizon content knowledge
(HCK); and pedagogical content knowledge is divided into three domains: knowledge of content

39
and students (KCS), knowledge of content and teaching (KCT), and knowledge of content and
curriculum (KCC), see Figure 1 for an overview of MKT and Table 2 for definitions. These
domains describe the required knowledge for teaching elementary mathematics.
Figure 1. Domains of Mathematical Knowledge for Teaching. Reprinted from “Content
Knowledge for Teaching: What Makes it Special?” by D. L. Ball, M. H. Thames, and G. Phelps,
2008, Journal of Teacher Education, 59(5), p. 407. Copyright 2008 by SAGE Publications, Inc.
Reprinted with permission.
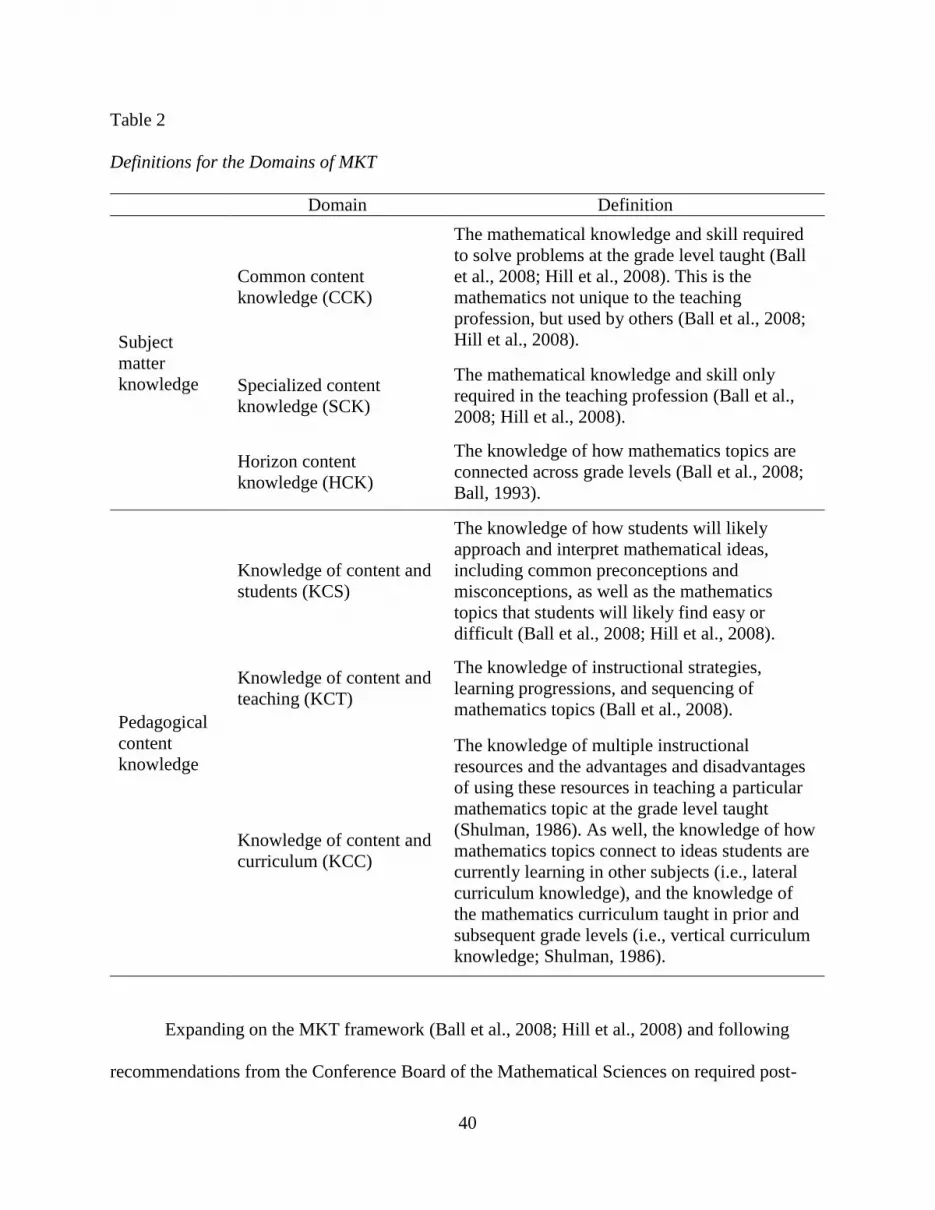
40
Table 2
Definitions for the Domains of MKT
Domain Definition
Subject
matter
knowledge
Common content
knowledge (CCK)
The mathematical knowledge and skill required
to solve problems at the grade level taught (Ball
et al., 2008; Hill et al., 2008). This is the
mathematics not unique to the teaching
profession, but used by others (Ball et al., 2008;
Hill et al., 2008).
Specialized content
knowledge (SCK)
The mathematical knowledge and skill only
required in the teaching profession (Ball et al.,
2008; Hill et al., 2008).
Horizon content
knowledge (HCK)
The knowledge of how mathematics topics are
connected across grade levels (Ball et al., 2008;
Ball, 1993).
Pedagogical
content
knowledge
Knowledge of content and
students (KCS)
The knowledge of how students will likely
approach and interpret mathematical ideas,
including common preconceptions and
misconceptions, as well as the mathematics
topics that students will likely find easy or
difficult (Ball et al., 2008; Hill et al., 2008).
Knowledge of content and
teaching (KCT)
The knowledge of instructional strategies,
learning progressions, and sequencing of
mathematics topics (Ball et al., 2008).
Knowledge of content and
curriculum (KCC)
The knowledge of multiple instructional
resources and the advantages and disadvantages
of using these resources in teaching a particular
mathematics topic at the grade level taught
(Shulman, 1986). As well, the knowledge of how
mathematics topics connect to ideas students are
currently learning in other subjects (i.e., lateral
curriculum knowledge), and the knowledge of
the mathematics curriculum taught in prior and
subsequent grade levels (i.e., vertical curriculum
knowledge; Shulman, 1986).
Expanding on the MKT framework (Ball et al., 2008; Hill et al., 2008) and following
recommendations from the Conference Board of the Mathematical Sciences on required post-
41
secondary mathematics knowledge for secondary mathematics teachers, McCrory, Floden,
Ferrini-Mundy, Reckase, and Senk (2012) developed a two dimensional framework of the
knowledge (school, advanced, and teaching) and practices (decompressing, trimming, and
bridging) required for the teaching of algebra at the secondary-level. Specifically, knowledge of
school algebra includes curriculum content taught in algebra courses. Knowledge of advanced
mathematics includes “perspective on the trajectory and growth of mathematical ideas beyond
school algebra” (McCrory et al., 2012, p. 597). Further, “according to Usiskin and colleagues
(Usiskin, Peressini, Marchisotto, & Stanley, 2003), knowing alternate definitions, extensions and
generalizations of familiar theorems, and a wide variety of applications of high school
mathematics also are characteristics of advanced mathematical knowledge” (McCrory et al.,
2012, p. 597). Mathematics-for-teaching knowledge is similar to SCK as defined by Ball and
colleagues (Ball et al., 2008; Hill et al., 2008), for example this term includes knowing different
“ways of thinking about mathematics” (McCrory et al., 2012, p. 599) and communicating
mathematical ideas, and knowing “the different definitions of a particular mathematical object,
and the affordances of those definitions for mathematics that follow” (McCrory et al., 2012, p.
598).
The categories related to the second dimension, practices, in McCrory and colleagues’
(2012) framework are applications of teachers’ mathematical knowledge. Decompressing
involves breaking down content and procedures to facilitate conceptual understanding. It is used
when supporting students with “misunderstandings and questions, as well as in the design of
lessons and choice and sequencing of algebra tasks” (McCrory et al., 2012, p. 604). Trimming
includes “knowledge of what is fundamental and what is derivative in algebraic concepts,
algorithms, and processes” (McCrory et al., 2012, p. 604), as it involves modifying content in
42
order for it to be cognitively appropriate. For example, teachers trim when “adapting a
textbook’s treatment of an idea, modifying textbook problems, revoicing students’ questions or
comments, responding to student thinking about particular mathematical ideas, or creating new
examples and problems” (McCrory et al., 2012, p. 604). Lastly, bridging involves an
understanding of the broad mathematics curriculum in order to facilitate instruction of the big
ideas and the connections between topics. McCrory and colleagues’ two dimensional framework
of the knowledge and practices required for the teaching of algebra is relevant at the secondary-
level; however, for the purposes of this study, I elected to use Ball and colleagues’ MKT
framework (Ball et al., 2008; Hill et al., 2008) as this framework is well-accepted within the
teaching mathematics literature (e.g., Charalambous, 2015; Herbst & Kosko, 2014; Steele &
Rogers, 2012). Next, using examples from Ontario’s G9APM course, I clarify the domain
definitions for Ball and colleagues’ (Ball et al., 2008; Hill et al., 2008) MKT framework—CCK,
SCK, HCK, KCS, KCT, KCC.
Domains of MKT. CCK is the mathematical knowledge and skill required to solve
G9APM problems (Ball et al., 2008; Hill et al., 2008). For example, it is the knowledge that 𝑥 =
9 in the equation 2𝑥 − 5 = 13 or that 2𝑥 and 5 are unlike terms. In contrast, SCK is the
mathematical knowledge and skill only required by teachers (Ball et al., 2008; Hill et al., 2008).
As an example, it is understanding “why” one might solve 2𝑥 − 5 = 13 by adding five on both
sides of the equation or knowing multiple methods to solve linear equations. HCK is the
knowledge of how G9APM topics are connected across grade levels (Ball, 1993; Ball et al.,
2008). Examples include the knowledge of how polynomial expressions are extensions of real
numbers or how factoring a binomial is similar to factoring an integer. KCS is the knowledge of
how students will likely approach and interpret mathematical ideas (Ball et al., 2008; Hill et al.,
43
2008). For example, it is the knowledge of typical student errors such as not taking into account
the meaning of the equal sign when solving equations or challenges with understanding like and
unlike terms when simplifying expressions. KCT is the knowledge of instructional strategies,
learning progressions, and sequencing of mathematics topics (Ball et al., 2008). As an example,
it is the knowledge of instructional strategies to introduce evaluating square roots or the learning
progressions for solving proportions. Lastly, KCC is the knowledge of multiple instructional
resources and the advantages and disadvantages of using these resources in teaching a particular
mathematics topic in G9APM (Shulman, 1986). Examples include the knowledge of advantages
and disadvantages of existent resources for teaching and assessing such topics as rate of change
or Pythagorean theorem. From the description of MKT, one can imagine the expansive breadth
and depth of knowledge mathematics teachers require for the teaching and assessment of the
mathematics courses they teach.
Researchers (Black et al., 2012; Charalambous, 2015; C. M. Moss & Brookhart, 2009;
Heritage et al., 2009; Herman et al., 2015; Ogan-Bekiroglu, 2009; Ruiz-Primo, 2011; Shepard,
2000; Wylie & Lyon, 2015) have noted connections between subject matter knowledge and
teaching practices, and/or between pedagogical content knowledge and teaching practices. As an
example, Ogan-Bekiroglu (2009) connected preservice physics teachers’ subject-matter
knowledge to their propensity to implement AfL practices. In another study, Herman and
colleagues (2015) hypothesized a positive relationship between teachers’ content and
pedagogical knowledge and their AfL practices; however, they found mixed results. Specifically,
using regression analysis, Herman et al. found that elementary science teachers in the treatment
group (n = 20) used more AfL practices and subsequently significantly increased in their content
and pedagogical knowledge compared to teachers in the control group (n = 19). However, using
44
path analysis, the authors found no significant relationship between teachers’ content and
pedagogical knowledge and their use of AfL practices. Teachers in both treatment and control
groups received a similar amount of professional development; however, the teachers in the
treatment group received focused training on a revised curriculum with embedded assessments
and on the analysis of student work. Hence previous research suggests a connection between
teachers’ AfL strategies and MKT. To explore the importance of the domains of MKT for
effective implementation of AfL strategies, the next several paragraphs discuss three domains of
MKT, specifically SCK, KCS, and KCT; and I demonstrate how these domains involve similar
knowledge to that knowledge required of teachers to implement AfL strategies.
Specialized content knowledge. SCK is the content knowledge uniquely required by
mathematics teachers (Ball et al., 2008; Hill et al., 2008), and to effectively use AfL strategies,
engineering effective classroom discussions and tasks that elicit evidence of learning and
providing feedback that moves learners forward, this knowledge is required. Teachers asking
different levels of questions elicit evidence of learning; this practice requires teachers to have
deep mathematical content knowledge in order to be able to formulate in real time different
levels of questions that stimulate and extend a range of students’ mathematical thinking and
uncover misconceptions, both conceptual and procedural (Swaffield, 2011; see also Dunn, 2004).
Once teachers elicit and receive the assessment information, teachers need to be able to
interpret it and use it, for example by providing feedback (Swaffield, 2011). Teachers require
multiple interpretations of a concept to evaluate the correctness of students’ responses and
understand their misconceptions (McCrory et al., 2012; National Research Council, 2001).
Further, this knowledge needs to be flexible, as students’ solutions to mathematical problems
may not always be similar, for example, standard and nonstandard products or processes (Ball et

45
al., 2008). As well, SCK supports teachers in developing questions and determining next
instructional steps that build off of students’ knowledge (both academic- and experience-based
knowledge; see Otero, 2006). As McCrory and colleagues (2012) described,
Teachers also need to be able to use their knowledge in the ebb and flow of practice
[emphasis added], responding quickly and accurately to student thinking, to unexpected
mathematics, and to materials that may not be quite right for the circumstances of the
classroom. (p. 600–601)
Knowledge of content and students. KCS is the knowledge of how students approach and
likely interpret mathematical ideas (Ball et al., 2008; Hill et al., 2008). This knowledge is similar
to the knowledge required of teachers when identifying and sharing learning goals and success
criteria, and engineering effective classroom discussions and tasks that elicit evidence of
learning. Knowledge in this domain provides teachers with awareness of which mathematical
concepts are cognitively demanding for students. This knowledge is required when teachers
break apart expectations into appropriate learning goals for students (Brookhart, 2011). Further
C. M. Moss and Brookhart (2009) noted:
For formative assessment, teachers not only must be clear about what they want students
to learn . . . they also must know typical student steps and missteps toward this goal
[emphasis added] . . . This knowledge is necessary because what the teacher is looking
for in formative assessment is evidence of where students are on their journey toward
mastery of the learning outcome. To interpret student work that is on the way toward
mastery, teachers need to be able to recognize typical and not-so-typical progress
[emphasis added]. (p. 24)
46
This supports the identification of students who are on track and those who require extra support.
Also, KCS supports teachers in developing learning goals that use accessible language for
students, as teachers need to use “proper language to unpack the [mathematics] content to
support student understanding” (Charalambous, 2015, p. 442).
Selecting, modifying, and developing appropriate activities (e.g., differentiate across
student ability levels, encourage student participation, identify misconceptions) to elicit evidence
of learning also requires KCS (see Swaffield, 2011). For example, Bray (2011) found teachers’
knowledge of misconceptions supported the facilitation of class discussions on student errors.
Further, Wylie and Lyon (2015) explicitly commented on the critical features of engineering
effective classroom discussions and tasks that elicit evidence of learning which included the
“priori identification of potential student misconceptions or misunderstandings” (p. 141–142) to
inform the development of questions (see also National Council of Teachers of Mathematics,
2000). KCS aids teachers in implementing activities that encourage student discussions in order
to reveal students’ levels of understanding.
Knowledge of content and teaching. KCT is the knowledge of instructional strategies,
learning progressions, and sequencing of mathematics topics (Ball et al., 2008). This is similar to
the knowledge required of teachers when identifying and sharing learning goals and success
criteria, and engaging learners as instructional resources for one another and as the owners of
their own learning. Curriculum documents outline overall and specific unit expectations (e.g.,
OME, 2005b). These specific unit expectations provide teachers with precise concepts that
students need to learn; however, most often these are still too broad. KCT can support teachers in
identifying appropriate learning goals, as knowledge in this domain provides teachers with
awareness of the essential elements of a mathematics concept and how these elements connect

47
(C. M. Moss & Brookhart, 2009). Heritage and colleagues (2009) illustrated that teachers have
more difficulty determining next instructional steps compared to identifying mathematics
principles and analyzing students’ understandings. They noted that:
To know what to do next instructionally in response to formative assessment evidence,
teachers need clear conceptions of how learning progresses [emphasis added] in a
domain; they need to know what the precursor skills and understandings [emphasis
added] are for a specific instructional goal, what a good performance of the desired goal
looks like, and how the skill or understanding increases in sophistication [emphasis
added] from the current level students have reached. (Heritage et al., 2009, p. 29)
This is precisely what is included as part of KCT. Lastly, knowledge of instructional strategies
can support engaging learners as instructional resources for one another and as the owners of
their own learning. For example, strategies that provide structure to the student-feedback process
can facilitate an effective student dialogue (see Wylie & Lyon, 2015).
The examples above discussed three of the six domains of MKT required to support the
implementation of the five AfL strategies. These examples suggest that the domains of MKT
converge with AfL strategies, in the demands placed on teachers in terms of required subject
matter knowledge and pedagogical content knowledge to implement AfL strategies. This
potential connection suggests that teachers’ MKT can support responsive AfL practices. Hence a
better understanding of the relationship between AfL strategies and MKT is needed, as it could
provide insight into explaining the range of AfL practices teachers implement. Teachers’ AfL
conceptions could also provide insight into this observation.
48
Chapter 3
Methodology
Data for this research were obtained from the provincial Educational Quality and
Accountability Office (EQAO) and through questionnaire and case studies to provide both an
overview and in-depth understanding of the forms of teaching and assessment occurring in Grade
9 applied mathematics (G9APM) classrooms. These multiple methods supported triangulation of
the research findings, as results were compared across methods to strengthen findings. It is
important to note this study was not an evaluation of teachers; rather it was an exploration of the
use of assessment for learning (AfL) strategies across G9APM classrooms. Data sources, as well
as data collection, preparation, and analysis procedures are described in this chapter.
Data Sources
All data sources—school-achievement results (provincial EQAO Grade 9 Assessment of
Mathematics results or a self-reported measure), questionnaire, and case studies (interviews,
classroom observations, and EQAO student questionnaires)—provided insights into the three
research questions and the extent to which teachers’ AfL strategies, AfL conceptions, and
mathematical knowledge for teaching (MKT) varied based on school-achievement results (see
Table 3).
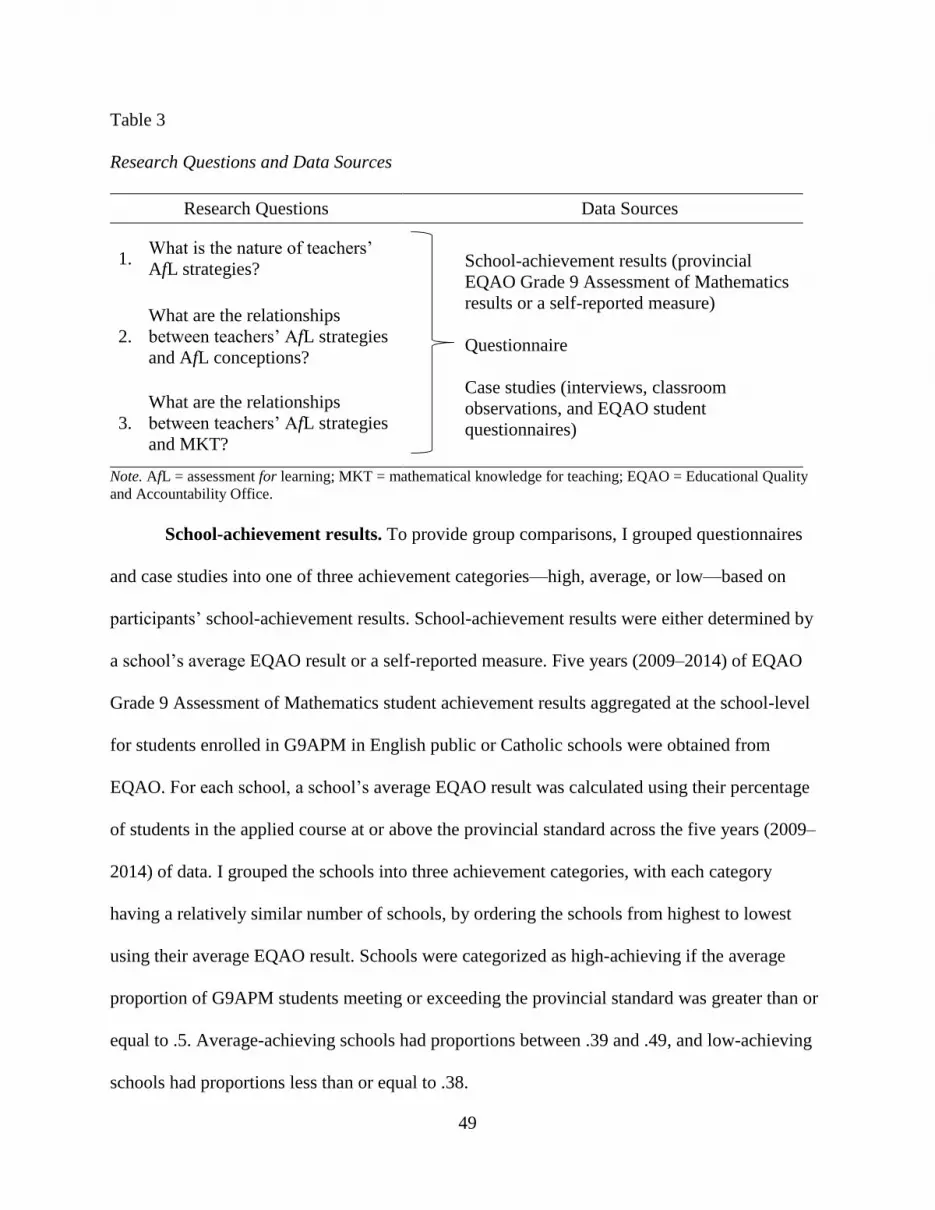
49
Table 3
Research Questions and Data Sources
Research Questions Data Sources
1. What is the nature of teachers’
AfL strategies?
School-achievement results (provincial
EQAO Grade 9 Assessment of Mathematics
results or a self-reported measure)
Questionnaire
Case studies (interviews, classroom
observations, and EQAO student
questionnaires)
2.
What are the relationships
between teachers’ AfL strategies
and AfL conceptions?
3.
What are the relationships
between teachers’ AfL strategies
and MKT?
Note. AfL = assessment for learning; MKT = mathematical knowledge for teaching; EQAO = Educational Quality
and Accountability Office.
School-achievement results. To provide group comparisons, I grouped questionnaires
and case studies into one of three achievement categories—high, average, or low—based on
participants’ school-achievement results. School-achievement results were either determined by
a school’s average EQAO result or a self-reported measure. Five years (2009–2014) of EQAO
Grade 9 Assessment of Mathematics student achievement results aggregated at the school-level
for students enrolled in G9APM in English public or Catholic schools were obtained from
EQAO. For each school, a school’s average EQAO result was calculated using their percentage
of students in the applied course at or above the provincial standard across the five years (2009–
2014) of data. I grouped the schools into three achievement categories, with each category
having a relatively similar number of schools, by ordering the schools from highest to lowest
using their average EQAO result. Schools were categorized as high-achieving if the average
proportion of G9APM students meeting or exceeding the provincial standard was greater than or
equal to .5. Average-achieving schools had proportions between .39 and .49, and low-achieving
schools had proportions less than or equal to .38.
50
The self-reported measure of G9APM school-achievement result was used with teachers
whose school’s average EQAO result was not known. These data were not known for those
teachers who participated in the questionnaire through their school board broadcast webpage or
at an Ontario Association for Mathematics Education (OAME) conference. For the self-reported
measure on the questionnaire, teachers were asked to rate the average academic achievement of
students in their G9APM class or school on a 5-point scale (1 = far above the provincial average
to 5 = far below the provincial average). These data were recoded onto a 3-point scale, such that
scale-points 1 and 2 were recoded as high-achieving, 3 was recoded as average-achieving, and 4
and 5 were recoded as low-achieving. For teachers whom I had both their school’s average
EQAO result as well as their self-reported school-achievement result, I calculated the degree of
agreement between these two achievement measures using the accuracy coefficient, ρ0, and
Cohen’s Kappa, κ. Schools’ average EQAO results and self-reported school-achievement results
were used as a proxy for student achievement.
Questionnaire. A questionnaire was used to survey teachers of G9APM. Questionnaires
facilitate the sampling of a large number of teachers from the population in order to make
generalizations (McMillan & Schumacher, 2010). In order to increase the number of teachers
who completed the questionnaire, teachers were invited to participate in the questionnaire
through their school board email, through a school board’s broadcast webpage, or at an OAME
conference. The questionnaire was available online from mid-October 2014 to mid-June 2015
using FluidSurveys and took approximately 15 minutes to complete. Teachers at OAME
conferences could also complete the questionnaire on a provided iPad or paper-based copy.
Multiple items on the questionnaire were used or adapted from the Curriculum
Implementation in Intermediate Mathematics: Research Report (Suurtamm & Graves, 2007), the

51
Evaluation Report for the Building Capacity in Assessment for Learning Professional Learning
Project (DeLuca et al., 2014), and the Grade 9 Assessment of Mathematics, 2012–2013, Teacher
Questionnaire: Applied Course (EQAO, 2013; see Appendix A, Table A1). All quantitative
questions on classroom assessment practices used, the majority of the quantitative questions on
mathematics pedagogy, and one quantitative question related to MKT (i.e., comfortable with the
content) were used or adapted from Suurtamm and Graves' (2007) research report. All
quantitative questions on AfL practices (and other related pedagogical practices) were used or
adapted from DeLuca et al.’s (2014) evaluation report. The majority of the demographic
questions were adapted from EQAO’s (2013) teacher questionnaire (i.e., years teaching, post-
secondary education, advanced educational training, and professional development) and from
DeLuca et al.’s (2014) evaluation report (i.e., advanced educational training, socio-economic,
and academic achievement). Lastly, the majority of the quantitative questions on MKT, one
quantitative question on mathematics pedagogy (i.e., learn mathematics most effectively when
link new concepts to prior knowledge), and the qualitative questions were informed from
literature (e.g., Ball, Thames, & Phelps, 2008; Hill, Ball, & Schilling, 2008; Marshall &
Drummond, 2006; Suurtamm, Koch, & Arden, 2010). The questionnaire was pilot tested with six
teachers, and revised based on their feedback regarding the clarity of instructions and questions.
Three versions of the questionnaire were created, each having 15 questions. The three
versions only differed in their demographic questions and these variations were small (see
Appendix A for the three versions). The version a teacher received depended on how he/she was
invited to participate in the questionnaire. All questionnaire versions included quantitative
questions (with multiple items) on the frequency of AfL practices (and other related pedagogical
practices) and classroom assessment practices used, as well as on mathematics pedagogy and

52
MKT. Additionally, all questionnaire versions included qualitative questions on the important
aspects and benefits/challenges of AfL, examples of frequently used AfL practices, and
mathematics pedagogy. While questionnaire versions differed in their demographic questions, all
questionnaire versions included quantitative questions on the number of years teaching (in total
and at the secondary level), mathematics courses recently taught (last two years), post-secondary
education, advanced educational training, and recent professional development (last five years).
The questionnaire distributed through teachers’ school board emails only invited G9APM
teachers. This questionnaire included three unique quantitative demographic questions regarding
G9APM, namely questions on the, average academic achievement of students in teachers’
G9APM classes, number of G9APM classes teachers will teach this school year, and number of
years teaching G9APM. Similarly, the questionnaire distributed through a school board’s
broadcast webpage and at OAME conferences included one unique quantitative demographic
question, on the average academic achievement of students in teachers’ schools. As well, the
questionnaire distributed at OAME conferences included an item to distinguish between
secondary mathematics teachers who had and had not instructed G9APM.
Case studies. Case studies are a valuable research method to explore a contemporary
phenomenon within its real-world context (Yin, 2014). I conducted four case studies with
G9APM teachers between November 2014 and April 2015. One criterion was used to select the
case study teachers: teachers needed to be in schools with either high or low consistent G9APM
EQAO results. Five years (2009–2014) of EQAO school-level data were used to determine the
stability of a school’s average EQAO result (a mean square difference of less than or equal to .20
was required for a consistent result; see Chapman & Klinger, 2014).

53
Each case study included two semi-structured interviews with teachers and five
classroom observations. Interview guides were pilot tested with six teachers and revised based on
their feedback regarding the clarity of its questions. Interviews were conducted over the phone or
at a teacher’s school, depending on the preference of each participating teacher. All interviews
were recorded in digital audio files on two devices. To provide teachers an opportunity to reflect
on their practices prior to the interview, initial interview questions were emailed to teachers in
advance. Initial interviews, approximately 40 minutes each, focused on the important aspects and
benefits/challenges of AfL, examples of frequently used AfL practices, mathematics pedagogy,
and instructional strategies. Follow-up interviews after the classroom observations,
approximately 20 minutes each, focused on AfL practices observed, instructional materials used,
and successful strategies with students in G9APM. These questions were informed from
literature (e.g., Expert Panel on Student Success in Ontario, 2004; Marshall & Drummond, 2006;
Suurtamm et al., 2010). The five classroom observations, for each case study, were conducted
over consecutive class periods when possible and included a minimum of five hours of
observation. Field notes included a description of the classroom (e.g., instructional posters,
arrangement of desks) and running records of the classroom observations. Running records
focused on AfL practices (and other related pedagogical practices) used, noting both teachers and
students’ roles, instructional strategies, and teacher feedback. See Appendix A for interview
guides and classroom observation template.
Additionally, EQAO student questionnaires at the school-level across five years (2009–
2014) of data for students enrolled in G9APM provided context for each of the case studies.
These student questionnaires provided data on the number of G9APM students who participated
in the assessment, demographic information, prior mathematics achievement, use of the
54
assessment in class mark, attitudes toward mathematics, confidence in mathematics strands,
doing mathematics, homework completion, and out-of-school activities.
Data Collection
Across Southern Ontario, G9APM teachers were invited to participate in the
questionnaire and case studies through their school board; and to increase the sample size for the
questionnaire, secondary mathematics teachers were also invited to participate in the
questionnaire at three OAME conferences. To conduct this research, I obtained ethical clearance
from Queen’s University General Research Ethics Board and school boards where research was
conducted, as well as completed a vulnerable sector check (see Appendix B for the General
Research Ethics Board approval).
School boards. Twenty-one Southern Ontario district school boards were invited to
participate in the research study and approval was received from 16 school boards. Of these 16
school boards, all school boards agreed to participate in both parts of the research study—
questionnaire and case study—with the exception of three school boards who agreed to only the
questionnaire. Depending on the school board’s protocol, either I or school board personnel
informed secondary school principals within the 16 school boards of the research study.
A recruitment email was distributed to principals that described the purpose of the study,
involvement of teachers, benefits, and included their school board approval letter and a letter of
information. For principals who were informed of the study by me, there were five versions of
the principal recruitment email, in order to invite teachers to participate in one or both parts of
the research study and provide the applicable questionnaire link based on their school-
achievement results (i.e., questionnaire [three versions] and questionnaire and case study [two
versions]; see Appendix B for a sample principal recruitment email and letter of information).

55
Principals, who did not respond to this recruitment email, received either a follow-up email or
phone call. For principals who were informed of the study by their school board personnel, these
principals received at most one reminder about the research study. One school board also
included an invitation to participate in the research study on their broadcast webpage.
Interested principals forwarded the invitation to G9APM teachers at their school or
provided their emails. All G9APM teachers were invited to complete the questionnaire, and
those whose schools satisfied the case study criteria, were also invited to participate in a case
study. The teacher recruitment email described the purpose of the study, involvement
opportunities, benefits, and included a letter of information. There were five versions of the
teacher invitation email, in order to invite teachers to participate in one or both parts of the
research study and provide the applicable questionnaire link based on their school-achievement
results (i.e., questionnaire [three versions] and questionnaire and case study [two versions]; see
Appendix B for a sample teacher recruitment email, letter of information, and combined letter of
information consent form for questionnaire and case studies). Teachers, who did not respond to
this recruitment email, received a maximum of two reminder emails. A letter of information, if
required by a school board, was also provided to parents/guardians of students of participating
case study teachers (see Appendix B). Following participation in the questionnaire and/or case
studies, participants received a debrief document describing previous literature (see Appendix
B).
OAME conferences. Secondary mathematics teachers were also invited to participate in
the research study at three OAME conferences (two Fall 2014 regional conferences and the
Spring 2015 provincial conference). At each conference, a vendor booth was set-up to provide
information about the research study and invite teachers to complete the questionnaire.
56
Data Preparation
Prior to data analyses, the EQAO student questionnaires, teacher questionnaire, and
interview data were prepared. First, the 2009–2014 EQAO student questionnaires were imported
into the Statistical Package for the Social Sciences (SPSS), version 22. Six questions on the
2009–2010 EQAO student questionnaire that focused on attitudes toward mathematics were
reverse coded to match the subsequent years of data. Teacher questionnaires completed online, in
FluidSurveys, were exported into Excel; teacher questionnaires completed offline with iPads, in
FluidSurveys, were uploaded and then exported into Excel; and teacher questionnaires completed
on paper were entered into Excel and data entry was checked to ensure accuracy. Some
questionnaires completed by teachers on paper had unclear or unexpected responses.
Specifically, for difficult to read qualitative responses, a second opinion was sought for
consensus. For quantitative responses, one teacher on the questionnaire recorded a mid-point
value (i.e., 3.5) when asked to rate the average academic achievement of students in their school
on a 5-point scale; a response of three was entered in for this question. Three other teachers
recorded two responses on the post-secondary education question. For example, one teacher
checked off “mathematics major or specialist” and “area of study unrelated to mathematics” this
was only coded as “mathematics major or specialist.” In these instances, I recorded if their post-
secondary education included a focus on mathematics and if so, to what extent. After all
questionnaire data were in Excel, a variable was added to all cases to indicate where the data
were collected (e.g., school board semester 1, OAME provincial conference, etc.). Next, the data
across data collection methods were combined and uploaded into SPSS. Questionnaires were
removed if teachers had not completed the questionnaire with respect to G9APM (n = 34), taught
G9APM prior to the publication of Ontario’s 2010 assessment and evaluation document (n = 1),
57
or had 75% missing data (n = 1). All interviews, initial and follow-up, for each case study were
transcribed; transcripts were put into Excel to facilitate data analyses.
Data Analysis
Data analyses varied across the methods used. The EQAO student questionnaire were
analyzed through descriptive statistics; and the teacher quantitative questionnaire data were
analyzed through descriptive and inferential statistics and correlational-based analyses. All
statistical analyses were conducted using an alpha level of .05 to provide sufficient balance
against Type I and Type II errors. Qualitative data from the teacher questionnaire and case
studies were largely analyzed deductively, with the exception of two questions on the teacher
questionnaire and in the initial interview that were analyzed inductively.
Quantitative data. Descriptive statistics (frequency, mean, standard deviation) were
computed to provide contextual information about the EQAO student questionnaire data. Only
descriptive statistics were computed for this data, as this data was solely used to provide context
for the case studies. For each secondary school, when calculating the average proportion of
students who were at or above the provincial standard on the Grade 3 and Grade 6 assessments,
students with the following EQAO codes were coded as missing data and not included in a
school’s proportion: assessment not completed, exempt from assessment, results are pending,
and results withheld. These decisions were made because these students did not complete the
assessment, or their assessment results were unknown or likely inaccurate. Students with the
EQAO code, “not enough information to score,” had their results included in a school’s
proportion because these students completed the assessment but did not respond to enough
questions.

58
Descriptive statistics (frequency, mean, standard deviation) were initially computed to
provide contextual information about the teacher questionnaire participants and general trends in
their responses. Chi-square tests were conducted to determine if there were differences with
respect to contextual information across school-achievement results. Factor analyses, using
principal axis factoring with direct oblimin rotation (delta = 0), were conducted separately for
four questions with multiple items to determine if it was appropriate to group these items into
subscales. If subscales were appropriate, mean scores for the subscales were calculated at each
achievement category and across all achievement categories. Mean scores were calculated by
finding each teacher’s average score of all items that loaded on a subscale, and then taking the
total average of these scores. Missing values were excluded using pairwise deletion in order to
include participants in the factor analyses who only answered the first four quantitative
questions. I conducted factor analyses on questions that explored AfL strategies (and other
related pedagogical practices), classroom assessment practices, mathematics pedagogy, and
MKT. Using the subscales, paired t-test and analysis of variance were conducted to determine if
there were differences in these mean scores across school-achievement results. Further, for two
items that did not load onto a subscale, chi-square tests were conducted. Specifically, for the
items, “I have students working independently when learning” and “homework performance,”
chi-square tests were conducted to see if there were differences in teachers’ use across school-
achievement results. For this analysis, participants’ responses on the 5-point scale (1 = never to 5
= often) were recoded (0 = 1, 2, or 3; and 1= 4 or 5). A chi-square test was not conducted for the
item, “all students do not learn mathematics in the same way,” because half of the cells in the
contingency table had an expected count less than five.

59
Qualitative data. An iterative qualitative data analysis approach was used to ensure
consistency in coding. Codes and subsequent findings were supported with teachers’ quotations
from questionnaire and case study data. Qualitative questionnaire and case study data were
largely analyzed deductively. The deductive analyses used the following set of a priori categories
derived from previous research: AfL strategy (Black & Wiliam, 1998a; Ontario Ministry of
Education [OME], 2010; Wiliam & Thompson, 2008), teachers’ and students’ levels of
involvement in AfL (Marshall & Drummond, 2006; see also Jonsson, Lundahl, & Holmgren,
2015; Klenowski, 2009; O’Leary, Lysaght, & Ludlow, 2013; Swaffield, 2011), Klenowski’s
(2009) AfL definition, and/or the domains of MKT (Ball et al., 2008; Hill et al., 2008), see
Tables 4 and 5 for the specific codes. Some data were coded with more than one code. The
frequencies of these codes were recorded and compared across school-achievement results; with
the exception of when exploring the relationship between teachers’ AfL strategies and MKT in
questionnaire responses, in this instance, frequencies of these codes were not separated across
school-achievement results due to the small number of co-occurrences. See Appendix C, Tables
C1–C3 for examples of coding using deductive analysis.
In coding the domains of MKT, the definitions of these domains outlined in Table 2
provided clarity to distinguish amongst these domains. However, in the coding of common
content knowledge (CCK) and specialized content knowledge (SCK), it was not always easy to
distinguish between the two. As an example, a question a teacher asked could be the result of
general content curriculum-level knowledge (i.e., CCK) or it could be specific knowledge
required to model the thought process involved in solving curriculum-level problems (i.e., SCK).
Generally, teachers’ questions and feedback were coded as CCK.
60
Lastly, two qualitative questions on the teacher questionnaire and in the initial interview,
“How does the mathematics curriculum hinder your ability to implement AfL practices?” and
“What challenges have you found implementing AfL in your class?” were analyzed using an
inductive thematic analysis approach (Corbin & Strauss, 2008). These questions were first coded
using initial coding, followed by focused coding to identify larger categories (Saldaña, 2013).
The frequencies of these categories were recorded. See Appendix C, Tables C4 for examples of
coding using inductive analysis.
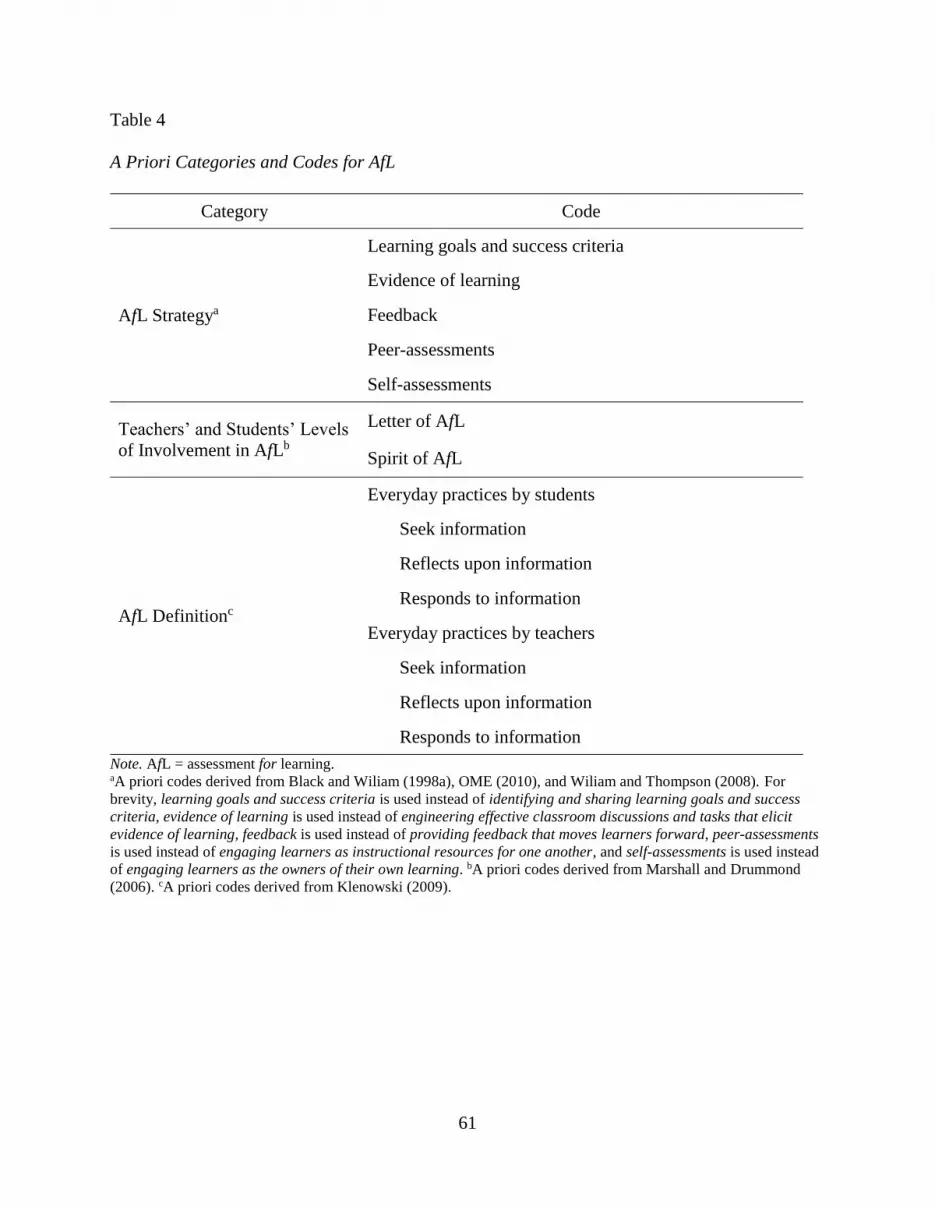
61
Table 4
A Priori Categories and Codes for AfL
Category Code
AfL Strategya
Learning goals and success criteria
Evidence of learning
Feedback
Peer-assessments
Self-assessments
Teachers’ and Students’ Levels
of Involvement in AfLb
Letter of AfL
Spirit of AfL
AfL Definitionc
Everyday practices by students
Seek information
Reflects upon information
Responds to information
Everyday practices by teachers
Seek information
Reflects upon information
Responds to information
Note. AfL = assessment for learning. aA priori codes derived from Black and Wiliam (1998a), OME (2010), and Wiliam and Thompson (2008). For
brevity, learning goals and success criteria is used instead of identifying and sharing learning goals and success
criteria, evidence of learning is used instead of engineering effective classroom discussions and tasks that elicit
evidence of learning, feedback is used instead of providing feedback that moves learners forward, peer-assessments
is used instead of engaging learners as instructional resources for one another, and self-assessments is used instead
of engaging learners as the owners of their own learning. bA priori codes derived from Marshall and Drummond
(2006). cA priori codes derived from Klenowski (2009).
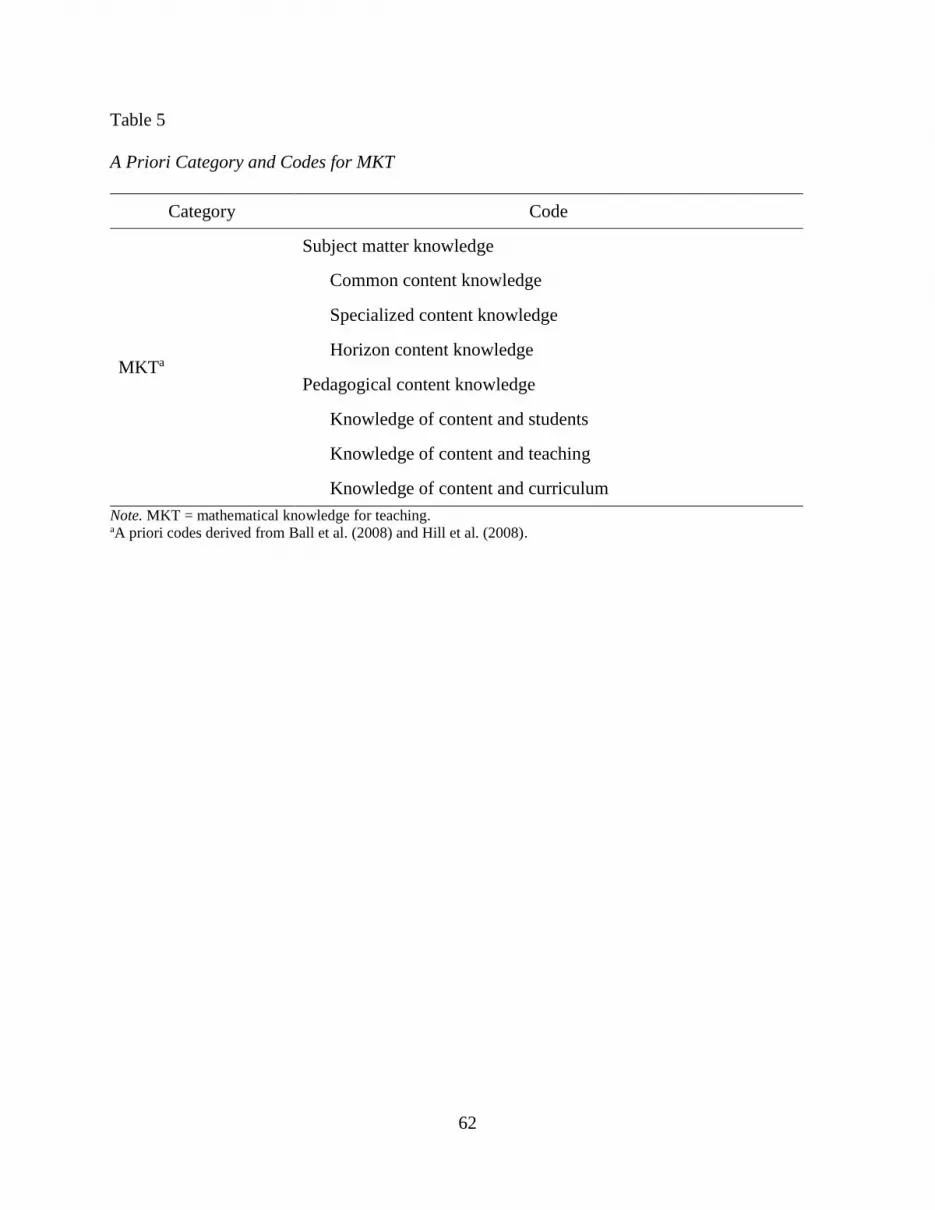
62
Table 5
A Priori Category and Codes for MKT
Category Code
MKTa
Subject matter knowledge
Common content knowledge
Specialized content knowledge
Horizon content knowledge
Pedagogical content knowledge
Knowledge of content and students
Knowledge of content and teaching
Knowledge of content and curriculum
Note. MKT = mathematical knowledge for teaching. aA priori codes derived from Ball et al. (2008) and Hill et al. (2008).
63
Chapter 4
Research Findings
The research findings are presented in four sections. The first section describes the
teachers who participated in the questionnaire and case studies, and their professional contexts.
The remaining sections bring together the questionnaire and case study results to address the
three research questions. Specifically, the second section describes the nature of mathematics
teachers’ AfL strategies. The third section describes the relationships between teachers’ AfL
strategies and AfL conceptions. The final section provides insight into the relationships between
teachers’ AfL strategies and mathematical knowledge for teaching (MKT).
In the presentation of findings, the questionnaire data are referenced using the school-
achievement results—high (H), average (A), or low (L)—along with a number specific to each
teacher; and the case study data are referenced using the classroom teachers’ pseudonyms (Ms.
Hadwin, Mr. Hayes, Ms. LeBlanc, and Mr. Lewis). Pseudonyms that begin with H are for
teachers at high-achieving schools and pseudonyms that begin with L are for teachers at low-
achieving schools. Lastly, the classroom teachers’ pseudonyms are followed by the data
collection method—questionnaire (Q), interview (I), observation (O)—and then the interview or
observation number where applicable.
Context
Questionnaire. In total, 131 Grade 9 applied mathematics (G9APM) teachers or recent
G9APM teachers partially or fully completed the teacher questionnaire (see Table 6). Of all the
teachers, 84 teachers participated in the questionnaire through their school board and the
remainder participated in the questionnaire through attending an Ontario Association for
Mathematics Education (OAME) conference. Teachers were grouped by their school-

64
achievement results (high, average, or low). In total, half of the teachers taught at schools with
average school-achievement results, a third with high school-achievement results, and the
remainder with low school-achievement results.
School-achievement results were either determined by a school’s average Education
Quality and Accountability Office (EQAO) result on the Grade 9 Assessment of Mathematics for
students in G9APM or self-reported by a teacher. Across participants, a school’s average EQAO
result was known for 80 teachers; a self-reported measure was used for the remainder of the
teachers. Of these 80 teachers, 72 teachers completed the question that asked teachers to rate the
average academic achievement of students in their G9APM class or school on a 5-point scale (1
= far above the provincial average to 5 = far below the provincial average). These data were
used to measure the degree of agreement between the two achievement measures (i.e., a school’s
average EQAO result and a teacher’s reported school-achievement result).
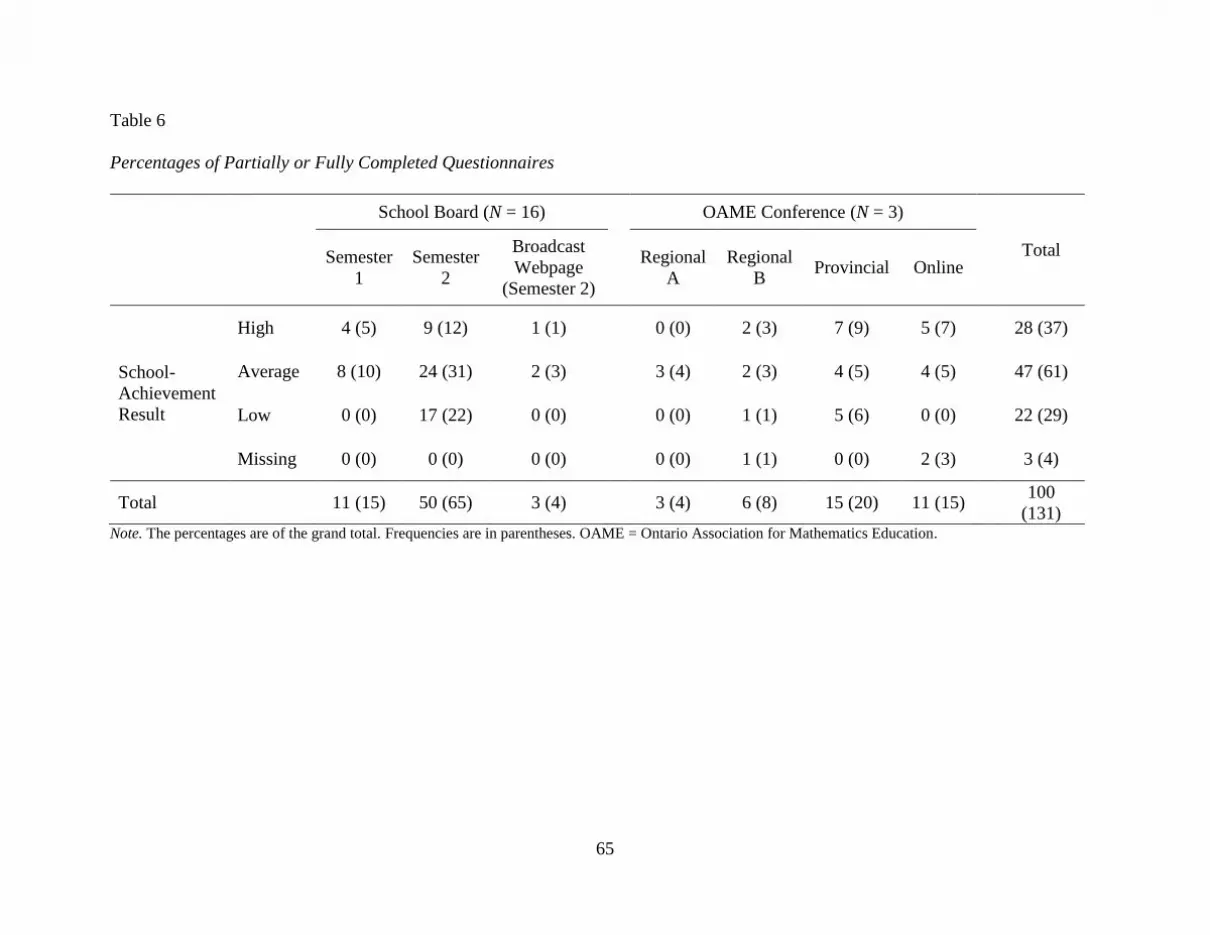
65
Table 6
Percentages of Partially or Fully Completed Questionnaires
School Board (N = 16) OAME Conference (N = 3)
Total
Semester
1
Semester
2
Broadcast
Webpage
(Semester 2)
Regional
A
Regional
B Provincial Online
School-
Achievement
Result
High 4 (5) 9 (12) 1 (1) 0 (0) 2 (3) 7 (9) 5 (7) 28 (37)
Average 8 (10) 24 (31) 2 (3) 3 (4) 2 (3) 4 (5) 4 (5) 47 (61)
Low 0 (0) 17 (22) 0 (0) 0 (0) 1 (1) 5 (6) 0 (0) 22 (29)
Missing 0 (0) 0 (0) 0 (0) 0 (0) 1 (1) 0 (0) 2 (3) 3 (4)
Total 11 (15) 50 (65) 3 (4) 3 (4) 6 (8) 15 (20) 11 (15) 100
(131) Note. The percentages are of the grand total. Frequencies are in parentheses. OAME = Ontario Association for Mathematics Education.
66
Generally, teachers were found to underestimate average achievement if, on average,
their school was average-achieving, and overestimate if, on average, their school was low-
achieving (see Appendix D, Table D1). For example, achievement, as determined by a school’s
average EQAO result, indicated that 26% of the schools were low-achieving while teachers
classified 36% of the schools as low-achieving. The accuracy coefficient, ρ0, and Cohen’s
Kappa, κ, between the two achievement measures were ρ0 = 0.46 and κ = .16. These results
indicate that school-achievement results when self-reported by a teacher correctly classified
school’s achievement about 46% of the time, and this self-reported measure only accurately
classified school’s achievement about 16% of the time above random chance. We can extrapolate
this finding to the teachers who participated in the questionnaire through either a school board’s
broadcast webpage or an OAME conference (a school’s average EQAO result is not known for
these participants), suggesting that these teachers were also likely inaccurate in predicting their
school-achievement results.
The majority of the teachers responded to each of the demographic questions (90%).
Generally, these teachers were not beginning teachers. Approximately 88% of the teachers had
six years or more of teaching experience and most of these experiences were at the secondary
mathematics level (see Appendix D, Table D2). Further, in the last two years, these teachers
taught, on average, between two and four different mathematics courses. In addition to applied
mathematics courses, these courses often were academic, college preparation, or university
preparation mathematics courses (see Appendix D, Table D3). No significant differences were
found with respect to teaching experience and courses taught across school-achievement results.
The teachers who completed the questionnaire through their school board were asked two
additional questions about the mathematics courses they taught. Approximately half of these
67
teachers had taught G9APM for six years or more (see Appendix D, Table D2). A similar
proportion reported that they taught one G9APM class over the current school year, a third
reported that they taught two G9APM classes over the current school year, and the remaining
teachers reported that they taught three or more G9APM classes over the current school year (see
Appendix D, Table D4). No significant differences were found with respect to number of
G9APM classes taught over the current school year across school-achievement results.
Predominately, the participating teachers completed their post-secondary education in a
mathematics or mathematics-related major or specialist (74%), another major with a mathematics
or mathematics-related minor (17%), with 9% of the teachers in an area of study unrelated to
mathematics (see Appendix D, Table D5). No significant differences were found with respect to
post-secondary education across school-achievement results. Beyond their post-secondary
education, these teachers also completed or were enrolled in advanced educational training and
participated in professional development. Over half the teachers completed or were currently
enrolled in Intermediate or Senior Additional Basic Qualifications in Mathematics (see Appendix
D, Table D6). No significant differences were found with respect to participation in additional
qualification courses across school-achievement results. Lastly, most teachers had participated in
professional development (leading or taking workshops) in classroom assessment and
mathematics pedagogy or instruction over the past five years. Further, over half the teachers had
participated in professional development in mathematics content knowledge (see Appendix D,
Table D7). Slightly more teachers in low-achieving schools (81%) participated in professional
development in mathematics content knowledge compared to teachers at average- and high-
achieving schools (55% and 61%, respectively) but this observed difference was not significant,
2 (2, N = 113) = 5.00, p = .08.
68
Case Studies. The four case studies were based on two teachers at high-achieving
schools, Mr. Hayes and Ms. Hadwin, and two teachers at low-achieving schools, Ms. LeBlanc
and Mr. Lewis. Schools were categorized as high- or low-achieving based on a school’s average
EQAO result for students in G9APM. The next several paragraphs describe the case study
teachers’ classrooms and are grouped according to the type of schools in which these teachers
taught (i.e., high- versus low-achievement schools). Within each grouping, before providing
demographic information on each case study teacher and describing their classroom and a typical
classroom observation, EQAO student questionnaires for students in G9APM are used to
describe the typical characteristics of students in these schools (see Appendix D, Table D8 for
EQAO student questionnaire data for students in G9APM including provincial averages; and
Appendix E, Tables E1–E4 for all the classroom observations). Overall, the high-achieving
schools in the case studies had a larger proportion of students who performed at or above the
provincial standard (Levels 3 and 4) on the EQAO Grade 6 Assessment of Mathematics and had
fewer students enrolled in G9APM compared to low-achieving schools. Further, the high-
achieving schools were associated with more positive characteristics, including no students who
identified as English as a Second Language/English Literacy Development (ESL/ELD), a larger
proportion of students who spoke only or mostly English at home, and a smaller proportion of
students who changed schools from kindergarten to Grade 8.
High-achievement schools. Within the two high-achievement schools between 2009 and
2014, an average of 43 and 75 students in G9APM, respectively, participated yearly in the
EQAO Grade 9 Assessment of Mathematics. The profile of these students was as follows: 47 and
50% were male, none identified as ESL/ELD, 32 and 45% had an Individualized Education Plan
(IEP), 88 and 94% spoke only or mostly English at home, and 34 and 35% attended three or more
69
elementary schools from kindergarten to Grade 8. Thirty-five and 63% of the students performed
at or above the provincial standard (Levels 3 and 4) on the EQAO Grade 6 Assessment of
Mathematics. Over half of the students in both schools reported that their teacher counted some
or all parts of the EQAO Grade 9 Assessment of Mathematics towards their class mark. Forty-
three and 60% of the students reported that they agree or strongly agree with the statement, “I
like mathematics”; as well, 56 to 83% of the students reported being confident or very confident
in the mathematics strands (i.e., number sense, algebra, linear relations, measurement, and
geometry). With regards to doing mathematics, 4 to 30% of the students reported to very often
engage in positive mathematics habits, and 49 and 59% reported that they always or often
complete their homework. Lastly, 71 and 76% of the students reported to use the Internet every
day or almost every day.
Mr. Hayes. Mr. Hayes worked at a secondary school located within a small town. The
school offered Grades 8 through 12 and had a student population of approximately 400 students.
Mr. Hayes received a Bachelor of Education with basic qualifications in the primary, junior, and
intermediate divisions, and in English. He also received an additional qualification in special
education. He had 20 years of teaching experience, with eight years teaching at his current
school and five years teaching G9APM. This school year (2014–2015) he taught two classes of
G9APM. Between 2012 and 2014, Mr. Hayes also taught the Grade 10 applied mathematics
course, Grade 9 and 10 locally developed mathematics courses, and hockey. Between 2009–
2014, one example of his recent professional development included a workshop on supporting
algebraic thinking. Mr. Hayes was also involved in a professional learning community, and
through this community he often had teachers visiting his classes to observe his teaching.

70
At the end of November 2014, I observed Mr. Hayes’ G9APM class across five
consecutive lessons. In his class, students’ desks were arranged in columns and rows. Mr. Hayes’
desk was at the front of the classroom, along with a Smart Board and the current anchor chart
posted. Anchor charts from previous units were also posted on a side chalkboard. The classroom
had a bench at the back of the classroom and numerous posters lining the walls of the class. The
posters were largely instructional including posters on using the traffic light to self-assess, a
four-step problem solving process, order of operations, multiplying integers, definitions of key
vocabulary commonly used in questions, and synonyms for basic operations. Other posters were
of the classroom rules, mathematics jokes, and pictures from a Pi Day celebration. Also, one side
of the classroom contained cabinets with supplies for students.
Mr. Hayes’ class was at the beginning of the Investigating Relationships unit. During
each observation, approximately 20 students were present. Mr. Hayes regularly had two peer
helpers and an educational assistant (EA) to assist with providing feedback. The peer helpers
were upper year students who had strong mathematics foundations. The EA, who also
understood the mathematics concepts, had worked with Mr. Hayes over the past four years,
almost every semester, and as such was familiar with the instructional activities that Mr. Hayes
implemented. The peer helpers and EA were involved in multiple tasks to support students, such
as marking quizzes and assignments, notifying students of any missing classwork, and
responding to students’ questions as they worked on problems. The observed classes often
started with Mr. Hayes recapping the previous day’s lesson, followed by students writing a short
quiz; quizzes took students two to five minutes to complete. Quizzes were marked and returned
with evaluative feedback the same class period; as well, Mr. Hayes used quizzes formatively to
provide descriptive feedback to the entire class on problems multiple students incorrectly
71
answered and to inform instruction. Following the quiz, Mr. Hayes frequently switched between
instructional activities, for example between the use of whole class instruction and guided
practice, to keep students engaged. Instructional activities included frequent checks for
understanding with the entire class, to identify struggling students and provide necessary
supports. As well, Mr. Hayes often had students working with partners for part of the class.
Ms. Hadwin. Ms. Hadwin worked at a secondary school located within a small city. The
school offered Grades 9 through 12 and had a student population of a little over a thousand
students. Ms. Hadwin received an Honours Bachelor of Science with a major in biology and
psychology, and a minor in mathematics. She received a Bachelor of Education with basic
qualifications in the primary, junior, intermediate, and senior divisions, and in biology and
mathematics. As well, she received additional qualifications in guidance and religious education.
She had 10 years of teaching experience, with all 10 years teaching at her current school and two
years teaching G9APM. This school year (2014–2015) she taught two classes of G9APM.
Between 2012 and 2014, Ms. Hadwin also taught Grade 11 and 12 university preparation
mathematics courses and the Grade 11 college preparation mathematics course. In addition, Ms.
Hadwin was a cheerleading coach. Between 2009–2014, some examples of her recent
professional development she led included workshops on making mathematics fun and e-
learning. Ms. Hadwin had also been involved in some collaborative inquiry initiatives.
At the beginning of December 2014, I observed Ms. Hadwin’s G9APM class across five
consecutive lessons. In her class, students’ desks were arranged in columns and rows, with the
two columns of desks in the middle right next to each other. Ms. Hadwin’s desk was at the front
of the classroom, along with a Smart Board, chalkboard, and a couple of bulletin boards. Bulletin
boards, at the front of the classroom and along one side, included advertisements for extra help

72
sessions and online homework help, pamphlets on productive study habits, student assignments,
and school announcements. As well, there was a space for test solutions, but no test solutions
were posted during the observation period.
Ms. Hadwin’s class was in the middle of the Investigating Linear Relations unit. During
each observation, approximately 15 students were present. The observed classes often started
with the learning goal displayed on the Smart Board and Ms. Hadwin checking homework while
students worked, independently or in pairs, on a Minds-On activity. For the Minds-On activity,
students solved problems, wrote their solutions on the Smart Board, and then explained their
solutions to the class. After discussing the Minds-On activity and the homework problems, Ms.
Hadwin taught a new lesson. This included Ms. Hadwin modelling a couple of solutions on the
Smart Board followed by guided practice. During guided practice, students completed two to
four questions independently and then discussed as a class. These discussions frequently entailed
students writing and explaining their solutions on the Smart Board. Afterwards, students often
worked on their homework and Ms. Hadwin walked around, checked students’ work, responded
to questions, asked prompting questions, and provided evaluative and descriptive feedback.
Low-achievement schools. Within the two low-achievement schools between 2009 and
2014, an average of 124 and 129 students in G9APM, respectively, participated yearly in the
EQAO Grade 9 Assessment of Mathematics. The profile of these students was as follows: 54 and
57% were male, 18 and 23% identified as ESL/ELD, 31 and 36% had an IEP, 51 and 62% spoke
only or mostly English at home, and 44 and 48% attended three or more elementary schools from
kindergarten to Grade 8. Sixteen percent of the students in both schools performed at or above
the provincial standard (Levels 3 and 4) on the EQAO Grade 6 Assessment of Mathematics.
Thirty-six and 41% of the students reported that their teacher counted some or all parts of the

73
EQAO Grade 9 Assessment of Mathematics towards their class mark. Thirty-seven and 45% of
the students reported that they agree or strongly agree with the statement, “I like mathematics”;
as well, 43 to 70% of the students reported being confident or very confident in the mathematics
strands (i.e., number sense, algebra, linear relations, measurement, and geometry). With regards
to doing mathematics, 5 to 25% of the students reported to very often engage in positive
mathematics habits, and approximately half reported that they always or often complete their
homework. Lastly, 62 and 71% of the students reported to use the Internet every day or almost
every day.
Ms. LeBlanc. Ms. LeBlanc worked at a secondary school located within a large city. The
school offered Grades 9 through 12 and had a student population of approximately 700 students.
Ms. LeBlanc received a Bachelor of Arts with a major in commerce; a Bachelor of
Administrative Studies with a major in accounting; and a Bachelor of Education with basic
qualifications in the junior, intermediate, and senior divisions, and in accounting, economics, and
mathematics. She received additional qualifications in teaching and learning through e-learning,
and principal’s qualification. Additionally, Ms. LeBlanc had a Master of Education. She had 12
years of teaching experience, with all 12 years teaching at her current school and teaching
G9APM. This school year (2014–2015) she taught one class of G9APM. Between 2012 and
2015, Ms. LeBlanc also taught Grade 12 university preparation mathematics courses, the Grade
11 university/college preparation mathematics course, the Grade 11 college preparation
mathematics course, the Grade 10 applied mathematics course, and the Grade 9 academic
mathematics course. Between 2009–2015, some examples of her recent professional
development that she led or took included workshops on EQAO assessments, differentiated

74
instruction, and e-learning. Ms. LeBlanc was also on the student success school support initiative
team.
Over two months, March and April 2015, I observed Ms. LeBlanc’s G9APM class across
five lessons. In her class, students’ desks were arranged in columns and rows. Ms. LeBlanc’s
desk was at the front of the classroom along with a Smart Board and chalkboard. One sidewall
also had had a chalkboard that covered the length of the wall; on top of this chalkboard’s ledge
were medium-size whiteboards that displayed student work for solving a volume composite
problem involving tennis balls and their containers. The other sidewall and back wall had
bulletin boards. The bulletin boards displayed several instructional posters; posters included an
integer number line, three-dimensional shapes, problem solving steps, ways to represent linear
relationships, and vocabulary for solving equations and simplifying polynomials. As well,
student assignments, student grades, answer keys to assignments with full solutions, formula
sheets, advertisements for extra help sessions, and school announcements were posted on the
bulletin boards. Lastly, at the back of the class was a bookshelf where students’ individual
whiteboards, markers, and cleaning cloths were kept.
Ms. LeBlanc’s class was at the end of the Solving Equations unit when observed in
March and at the beginning of the Proportional Reasoning unit when observed in April. During
each observation, approximately 13 students were present. The observed classes often started
with Ms. LeBlanc checking homework followed by a discussion of any of the homework
problems students found challenging. Next, Ms. LeBlanc taught the new lesson. This included
Ms. LeBlanc modelling how to solve the first couple of problems on the Smart Board followed
by guided practice. Guided practice frequently included students trying problems on their
individual whiteboards, Ms. LeBlanc providing individual and class feedback, and Ms. LeBlanc
75
modelling how to solve the problems on the board. After the lesson, students often worked
independently on their homework, and Ms. LeBlanc walked around, checked students’ work,
responded to questions, and provided evaluative and descriptive feedback
Mr. Lewis. Mr. Lewis worked at a secondary school located within a large city. The
school offered Grades 9 through 12 and had a student population of approximately 1000
students. Mr. Lewis received an Honours Bachelor of Science with a major in biology and a
minor in mathematics; and a Bachelor of Education with basic qualifications in the intermediate
and senior divisions, and in biology and mathematics. Additionally, Mr. Lewis was close to
completing a Master of Education. He had seven years of teaching experience, with two years
teaching at his current school and all seven years teaching G9APM. This school year (2014–
2015) he taught four classes of G9APM. Between 2012 and 2015, Mr. Lewis also taught a Grade
12 university preparation mathematics course and the Grade 9 academic mathematics course.
Between 2009–2015, some examples of his recent professional development that he led or took
included workshops on EQAO assessments, assessment as learning, improving achievement of
students of African descent, and Africentric Grade 9 mathematics curriculum development.
Over two months, March and April 2015, I observed Mr. Lewis’ G9APM class across
five lessons. In his class, students’ desks were arranged in groups of four and there were three
large circle tables at the back of the classroom where several students sat. Mr. Lewis’ desk was
at the front of the classroom along with a chalkboard. Two other walls also had a chalkboard that
covered the length of the walls. Numerous student-made posters outlining classroom rules were
posted above the chalkboards. Other posters around the classroom focused on mobile
mathematics applications, advertisements for extra help sessions, school announcements,

76
learning goals, success criteria, words of encouragement, new vocabulary, student assignments,
and fixed and growth mindsets.
Mr. Lewis’ class was in the middle and then at the end of the Proportional Reasoning unit
when observed in March and at the beginning of the Rate of Change unit when observed in
April. During each observation, approximately 15 students were present in total; however,
several students often arrived late to class. During the observed classes, Mr. Lewis often
introduced a new lesson by reading the learning goals. The learning goals were on the
PowerPoint notes that Mr. Lewis provided to students and Mr. Lewis projected these notes onto
an overhead screen. He used the technology, MobiView, to complete the notes with students.
This technology allowed Mr. Lewis to complete the notes projected onto the overhead screen
from anywhere in the classroom. After the learning goals, the next slide often contained a review
problem followed by practice problems on the new lesson. Mr. Lewis asked prompting questions
and modelled how to solve these new problems. This was followed by guided practice where
students worked independently or in pairs on problems and Mr. Lewis walked around, checked
students’ work, and worked with students one-on-one.
Teachers’ Use of AfL Strategies
Generally, as evidenced by questionnaire and case study data, across school-achievement
results, there were no differences in teachers’ AfL strategies used. Teachers implemented AfL
practices that reflected more the letter of AfL compared to the spirit of AfL. Since this section
describes the nature of teachers’ AfL strategies, a large part of the results for this section are
based on classroom observations. However, both the questionnaire and interview data provided
supporting evidence for these research findings. Next, I present the three questions on the
questionnaire that explored teachers’ AfL practices. This is followed by examples of AfL
77
practices used by the case study teachers, and then a description of the nature of AfL practices
across school-achievement results.
On the questionnaire, three questions explored teachers’ AfL practices: two questions
were quantitative and contained multiple items, and the third question was qualitative. The first
quantitative question contained 14 items. Teachers were asked to indicate the frequency they
implemented AfL strategies and related pedagogical practices on a 5-point scale (1 = never to 5 =
often; see Appendix F, Table F1 for item descriptives). Most teachers responded to all of the
items in this question (97%). Using principal axis factoring with direct oblimin rotation, parallel
analysis and subscale correlations suggested the items in this question grouped into two
subscales, while the scree plot suggested four subscales. Further analyses and interpretability
supported a solution with two subscales, namely AfL Strategy and Collaborative Learning. These
subscales were weakly correlated (.31). All items loaded onto either subscale with factor
loadings greater than .30; the only exception was the item, “I have students working
independently when learning,” which was excluded from either subscale (see Appendix G, Table
G1). The two subscales explained 51% of the total variance. The subscales, AfL Strategy and
Collaborative Learning, had an internal consistency of .88 and .65, respectively.
The second quantitative question contained 15 items. Teachers were asked to identify the
frequency they used different forms of classroom assessment practices to monitor their students’
learning on a 5-point scale (1 = never to 5 = often; see Appendix F, Table F2 for item
descriptives). Most teachers responded to all of the items in this question (95%). Using principal
axis factoring with direct oblimin rotation, parallel analysis and subscale correlations suggested
the items in this question grouped into two subscales, while the scree plot suggested three
subscales. Further analyses and interpretability supported a solution with two subscales, namely

78
Contemporary Classroom Assessments and Traditional Classroom Assessments. These subscales
were not correlated (−.13). All items loaded onto either subscale with factor loadings greater
than .30 (see Appendix G, Table G2). The two subscales explained 44% of the total variance.
The subscales, Contemporary Classrooms Assessments and Traditional Classrooms
Assessments, had an internal consistency of .84 and .73, respectively. The item, “homework
performance,” loaded onto the subscale, Traditional Classrooms Assessments, but was not
included in this subscale because it lowered its internal consistency to .53.
The qualitative question asked teachers to list two examples of AfL practices that they
frequently used with students in their class. Most teachers who participated in the questionnaire
responded to this item (97%). A small number of teachers misunderstood the question, as these
teachers mentioned summative assessment tasks (e.g., projects, tests) or other teaching strategies
(e.g., use technology, chunk tasks). The majority (82%) of the teachers identified AfL practices
and these practices were coded with the corresponding AfL strategy (see Table 7). Also, some
AfL practices were double coded. For example, teachers often used individual whiteboards to
elicit evidence of learning and to provide feedback. However, checking homework was only
coded as eliciting evidence of learning unless a teacher explicitly mentioned how the homework
was used to provide feedback. Further, a number of these teachers mentioned more than two AfL
practices.

79
Table 7
AfL Strategies Frequently Used by Teachers across Questionnaire Participants
AfL Strategya
School-Achievement Result Total
(n = 104b) High
(n = 33)
Average
(n = 49)
Low
(n = 20)
Learning goals 0 (0) 0 (0) 2 (1) 0 (1)
Success criteria 1 (1) 2 (2) 0 (0) 1 (3)
Evidence of learning 58 (52) 59 (76) 53 (29) 58 (161)
Feedback 31 (28) 27 (35) 33 (18) 29 (82)
Peer-assessments 4 (4) 5 (7) 9 (5) 6 (17)
Self-assessments 6 (5) 7 (9) 4 (2) 6 (16)
Note. Proportion of the total number of coded strategies are given; here, total refers to column total. Frequencies are
in parentheses. Column frequencies do not add to the total number of teachers because some teachers mentioned a
couple of examples of evidence of learning and/or feedback. AfL = assessment for learning. aA priori codes derived from Black and Wiliam (1998a), Ontario Ministry of Education (OME; 2010), and Wiliam
and Thompson (2008). bThere is a discrepancy between the number of teachers who responded to this question and
the sum of teachers in the high-, average-, and low-achievement categories because two teachers did not indicate
their school-achievement results.
The next four tables (see Tables 8–11) include examples and evidence across case study
teachers for the frequency and use of AfL strategies grouped by school-achievement results (high
and low), and teachers’ and students’ levels of involvement (letter and spirit of AfL). In the
tables, single Xs indicate that the AfL strategy was discussed by one teacher or was observed in
one classroom; correspondingly the double XXs indicate that the AfL strategy was discussed by
both teachers or was observed in both classrooms. As well, the frequency that each AfL strategy
was observed is differentiated in the tables, either as sometimes (observed one to three days out
of the five classroom observations) or often (observed four to five days out of the five classroom
observations). Additionally, the six AfL strategies discussed relate closely to the five traditional
AfL strategies presented in the literature. In the literature, identifying and sharing learning goals
and success criteria are grouped as one strategy but participants in this study did not always

80
discuss or implement these practices together. The converse was also observed with some AfL
strategies presented as distinct strategies in the literature being combined together in practice.
For clarity and accuracy in the descriptions, AfL strategies are represented in the tables and
discussed, in this section and later sections, as distinct strategies, specifically the AfL strategy
most prominent in an observed teacher’s practice. The four tables provide an illustration of how
the AfL strategies emerged in these G9APM classrooms, the array of AfL practices implemented
by teachers, and the level of AfL integration.
Specifically, Tables 8 and 10 provide examples of AfL practices reflecting the letter of
AfL in the high-and low-achievement case study teachers’ classrooms. These practices were
often implemented to identify and share success criteria, engineer effective classroom
discussions and tasks that elicit evidence of learning, and provide feedback that moves learners
forward. For example, teachers often modelled how to solve problems, checked students’ work,
asked closed and/or prompting questions, and responded to questions. Tables 9 and 11 provide
examples of AfL practices reflecting the spirit of AfL in the high-and low-achievement case
study teachers’ classrooms. These practices were not implemented as frequently as AfL practices
that reflected the letter of AfL, but when implemented, they tended to be practices to engineer
effective classroom discussions and tasks that elicit evidence of learning, and engage learners as
instructional resources for one another and as the owners of their own learning. For example,
teachers asked open questions and had students explain how they obtained their solution, work in
partners or groups on problems, discuss or rate their level of understanding, and/or select
problems to try based on their level of understanding. The AfL practices implemented by case
study teachers typically reflected the letter of AfL, such that teachers directed the pace, content,
and the AfL strategies used in their classrooms.
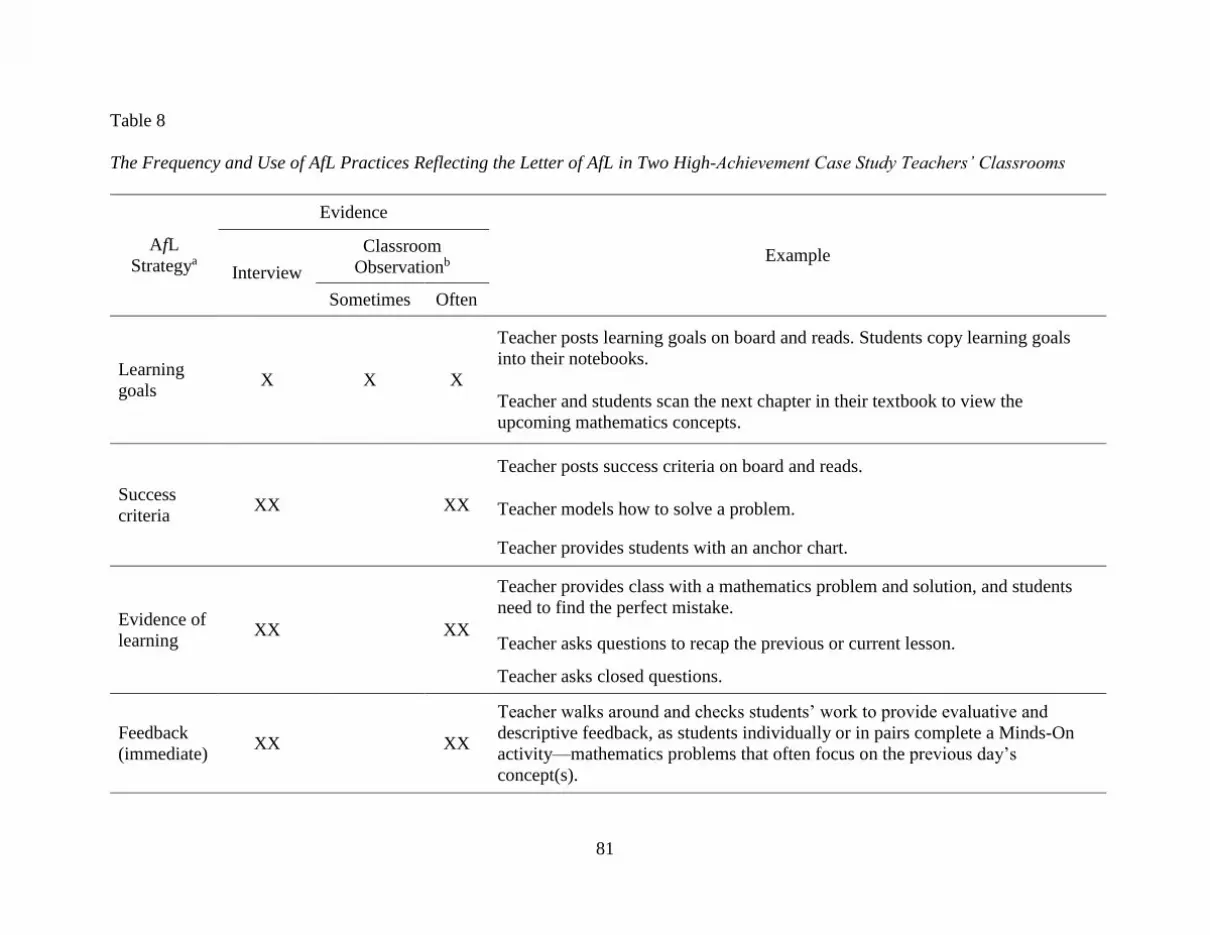
81
Table 8
The Frequency and Use of AfL Practices Reflecting the Letter of AfL in Two High-Achievement Case Study Teachers’ Classrooms
AfL
Strategya
Evidence
Example Interview
Classroom
Observationb
Sometimes Often
Learning
goals X X X
Teacher posts learning goals on board and reads. Students copy learning goals
into their notebooks.
Teacher and students scan the next chapter in their textbook to view the
upcoming mathematics concepts.
Success
criteria XX XX
Teacher posts success criteria on board and reads.
Teacher models how to solve a problem.
Teacher provides students with an anchor chart.
Evidence of
learning XX XX
Teacher provides class with a mathematics problem and solution, and students
need to find the perfect mistake.
Teacher asks questions to recap the previous or current lesson.
Teacher asks closed questions.
Feedback
(immediate) XX XX
Teacher walks around and checks students’ work to provide evaluative and
descriptive feedback, as students individually or in pairs complete a Minds-On
activity—mathematics problems that often focus on the previous day’s
concept(s).
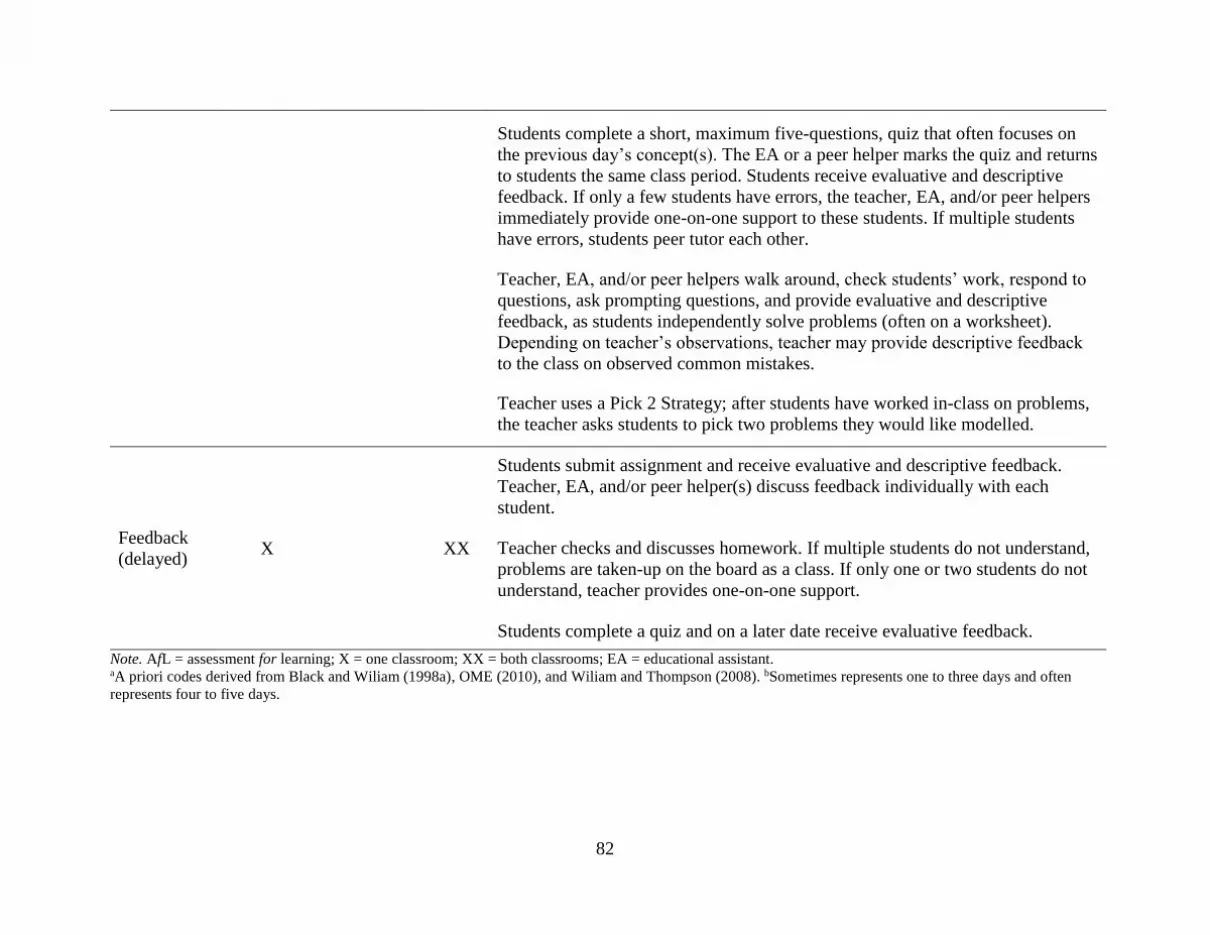
82
Students complete a short, maximum five-questions, quiz that often focuses on
the previous day’s concept(s). The EA or a peer helper marks the quiz and returns
to students the same class period. Students receive evaluative and descriptive
feedback. If only a few students have errors, the teacher, EA, and/or peer helpers
immediately provide one-on-one support to these students. If multiple students
have errors, students peer tutor each other.
Teacher, EA, and/or peer helpers walk around, check students’ work, respond to
questions, ask prompting questions, and provide evaluative and descriptive
feedback, as students independently solve problems (often on a worksheet).
Depending on teacher’s observations, teacher may provide descriptive feedback
to the class on observed common mistakes.
Teacher uses a Pick 2 Strategy; after students have worked in-class on problems,
the teacher asks students to pick two problems they would like modelled.
Feedback
(delayed) X XX
Students submit assignment and receive evaluative and descriptive feedback.
Teacher, EA, and/or peer helper(s) discuss feedback individually with each
student.
Teacher checks and discusses homework. If multiple students do not understand,
problems are taken-up on the board as a class. If only one or two students do not
understand, teacher provides one-on-one support.
Students complete a quiz and on a later date receive evaluative feedback.
Note. AfL = assessment for learning; X = one classroom; XX = both classrooms; EA = educational assistant. aA priori codes derived from Black and Wiliam (1998a), OME (2010), and Wiliam and Thompson (2008). bSometimes represents one to three days and often
represents four to five days.
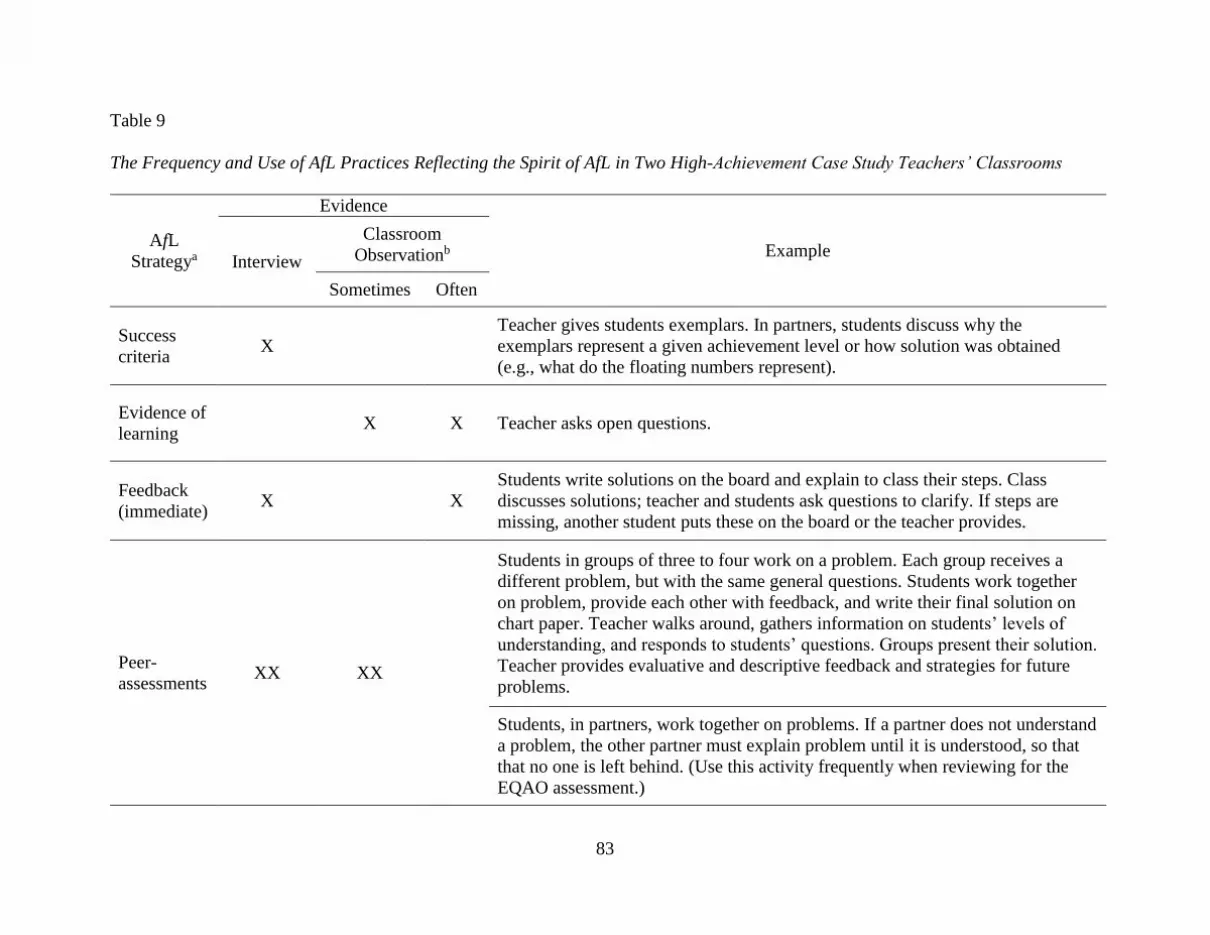
83
Table 9
The Frequency and Use of AfL Practices Reflecting the Spirit of AfL in Two High-Achievement Case Study Teachers’ Classrooms
AfL
Strategya
Evidence
Example Interview
Classroom
Observationb
Sometimes Often
Success
criteria X
Teacher gives students exemplars. In partners, students discuss why the
exemplars represent a given achievement level or how solution was obtained
(e.g., what do the floating numbers represent).
Evidence of
learning X X Teacher asks open questions.
Feedback
(immediate) X X
Students write solutions on the board and explain to class their steps. Class
discusses solutions; teacher and students ask questions to clarify. If steps are
missing, another student puts these on the board or the teacher provides.
Peer-
assessments XX XX
Students in groups of three to four work on a problem. Each group receives a
different problem, but with the same general questions. Students work together
on problem, provide each other with feedback, and write their final solution on
chart paper. Teacher walks around, gathers information on students’ levels of
understanding, and responds to students’ questions. Groups present their solution.
Teacher provides evaluative and descriptive feedback and strategies for future
problems.
Students, in partners, work together on problems. If a partner does not understand
a problem, the other partner must explain problem until it is understood, so that
that no one is left behind. (Use this activity frequently when reviewing for the
EQAO assessment.)
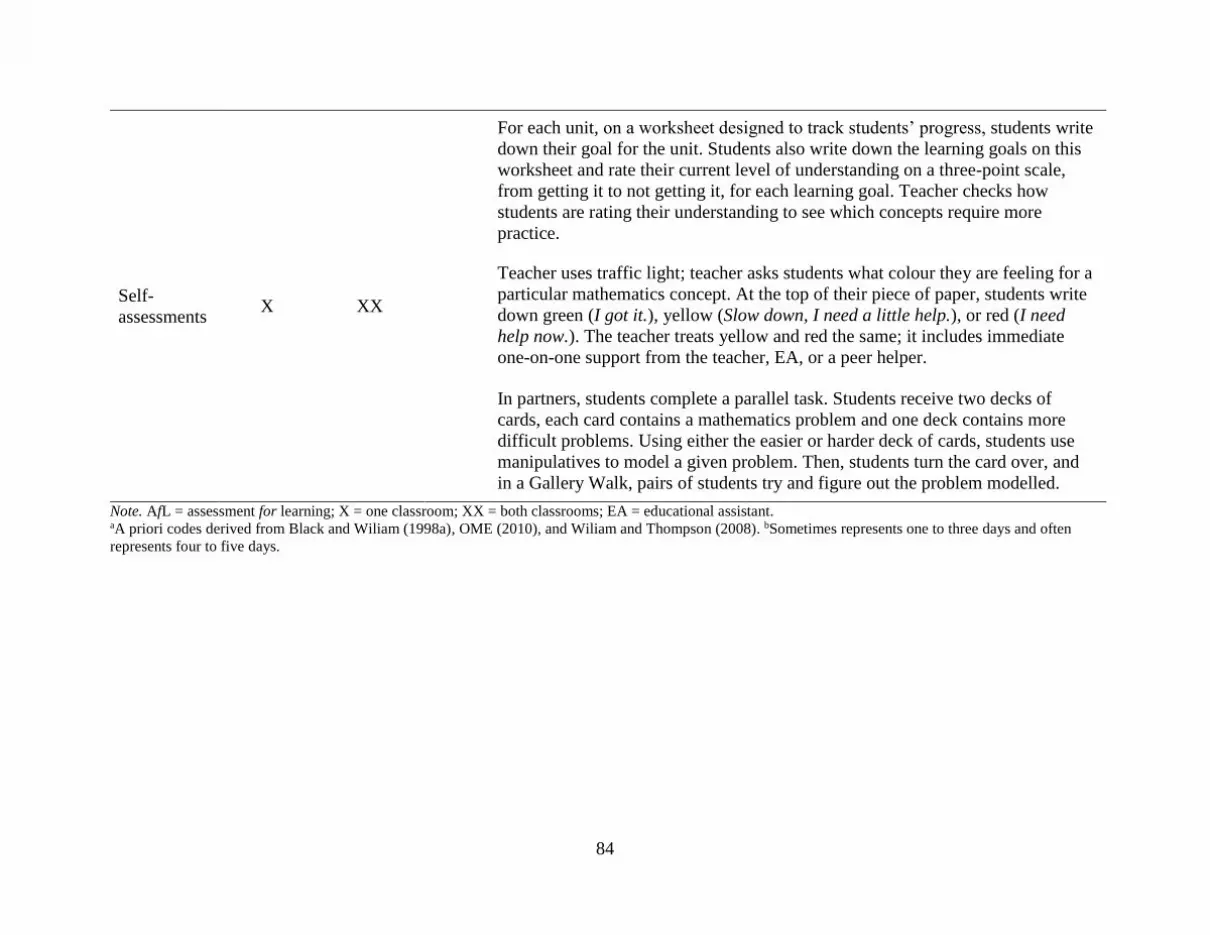
84
Self-
assessments X XX
For each unit, on a worksheet designed to track students’ progress, students write
down their goal for the unit. Students also write down the learning goals on this
worksheet and rate their current level of understanding on a three-point scale,
from getting it to not getting it, for each learning goal. Teacher checks how
students are rating their understanding to see which concepts require more
practice.
Teacher uses traffic light; teacher asks students what colour they are feeling for a
particular mathematics concept. At the top of their piece of paper, students write
down green (I got it.), yellow (Slow down, I need a little help.), or red (I need
help now.). The teacher treats yellow and red the same; it includes immediate
one-on-one support from the teacher, EA, or a peer helper.
In partners, students complete a parallel task. Students receive two decks of
cards, each card contains a mathematics problem and one deck contains more
difficult problems. Using either the easier or harder deck of cards, students use
manipulatives to model a given problem. Then, students turn the card over, and
in a Gallery Walk, pairs of students try and figure out the problem modelled.
Note. AfL = assessment for learning; X = one classroom; XX = both classrooms; EA = educational assistant. aA priori codes derived from Black and Wiliam (1998a), OME (2010), and Wiliam and Thompson (2008). bSometimes represents one to three days and often
represents four to five days.
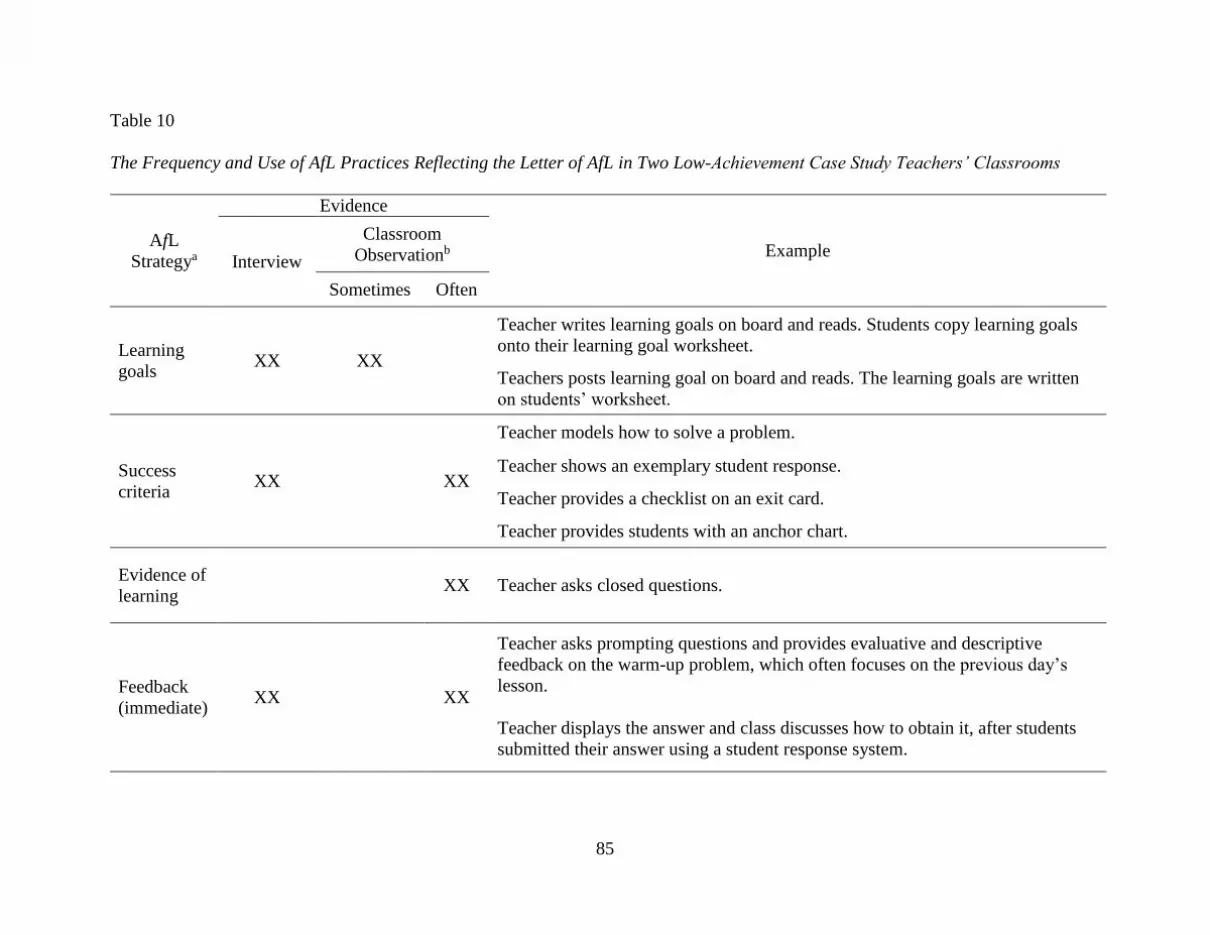
85
Table 10
The Frequency and Use of AfL Practices Reflecting the Letter of AfL in Two Low-Achievement Case Study Teachers’ Classrooms
AfL
Strategya
Evidence
Example Interview
Classroom
Observationb
Sometimes Often
Learning
goals XX XX
Teacher writes learning goals on board and reads. Students copy learning goals
onto their learning goal worksheet.
Teachers posts learning goal on board and reads. The learning goals are written
on students’ worksheet.
Success
criteria XX XX
Teacher models how to solve a problem.
Teacher shows an exemplary student response.
Teacher provides a checklist on an exit card.
Teacher provides students with an anchor chart.
Evidence of
learning XX Teacher asks closed questions.
Feedback
(immediate) XX XX
Teacher asks prompting questions and provides evaluative and descriptive
feedback on the warm-up problem, which often focuses on the previous day’s
lesson.
Teacher displays the answer and class discusses how to obtain it, after students
submitted their answer using a student response system.
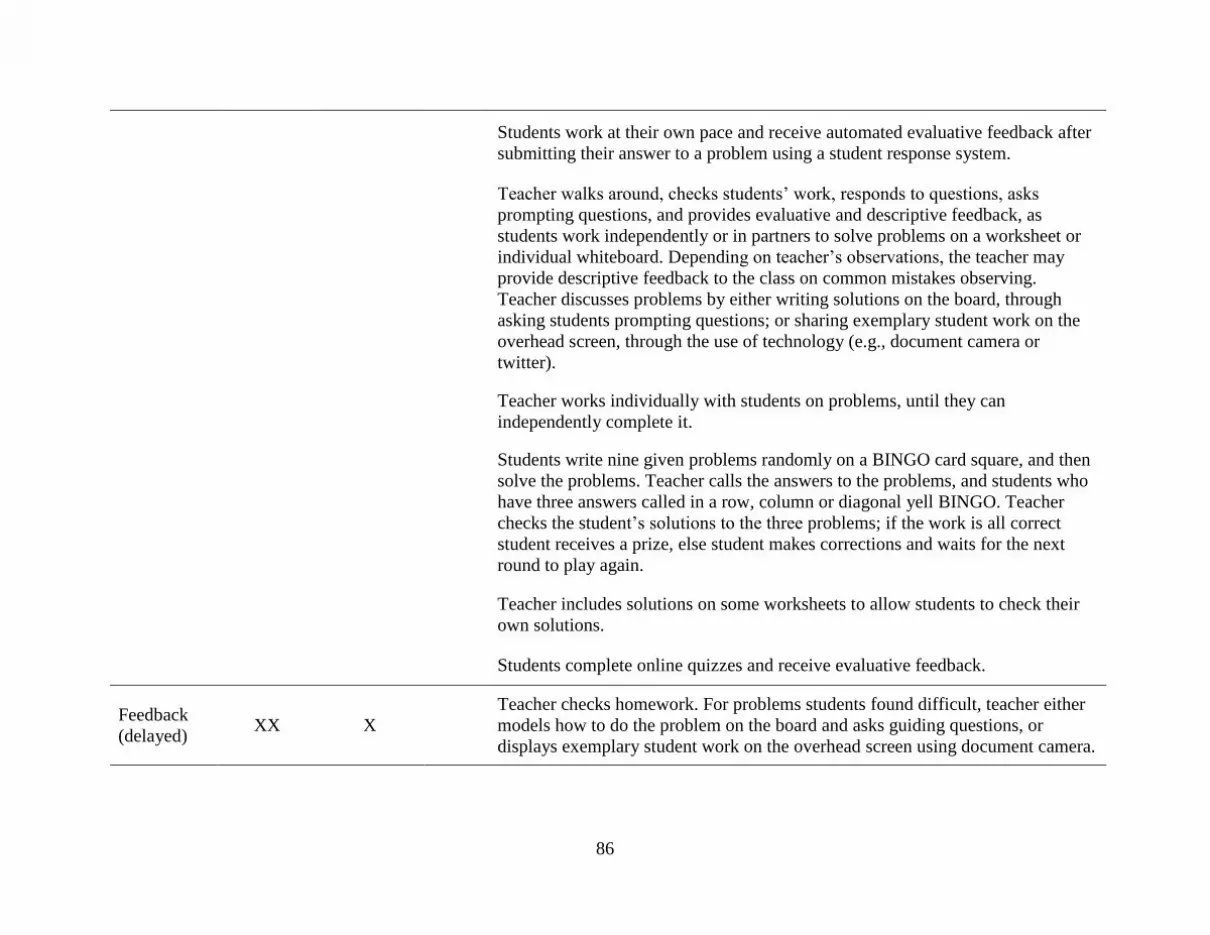
86
Students work at their own pace and receive automated evaluative feedback after
submitting their answer to a problem using a student response system.
Teacher walks around, checks students’ work, responds to questions, asks
prompting questions, and provides evaluative and descriptive feedback, as
students work independently or in partners to solve problems on a worksheet or
individual whiteboard. Depending on teacher’s observations, the teacher may
provide descriptive feedback to the class on common mistakes observing.
Teacher discusses problems by either writing solutions on the board, through
asking students prompting questions; or sharing exemplary student work on the
overhead screen, through the use of technology (e.g., document camera or
twitter).
Teacher works individually with students on problems, until they can
independently complete it.
Students write nine given problems randomly on a BINGO card square, and then
solve the problems. Teacher calls the answers to the problems, and students who
have three answers called in a row, column or diagonal yell BINGO. Teacher
checks the student’s solutions to the three problems; if the work is all correct
student receives a prize, else student makes corrections and waits for the next
round to play again.
Teacher includes solutions on some worksheets to allow students to check their
own solutions.
Students complete online quizzes and receive evaluative feedback.
Feedback
(delayed) XX X
Teacher checks homework. For problems students found difficult, teacher either
models how to do the problem on the board and asks guiding questions, or
displays exemplary student work on the overhead screen using document camera.
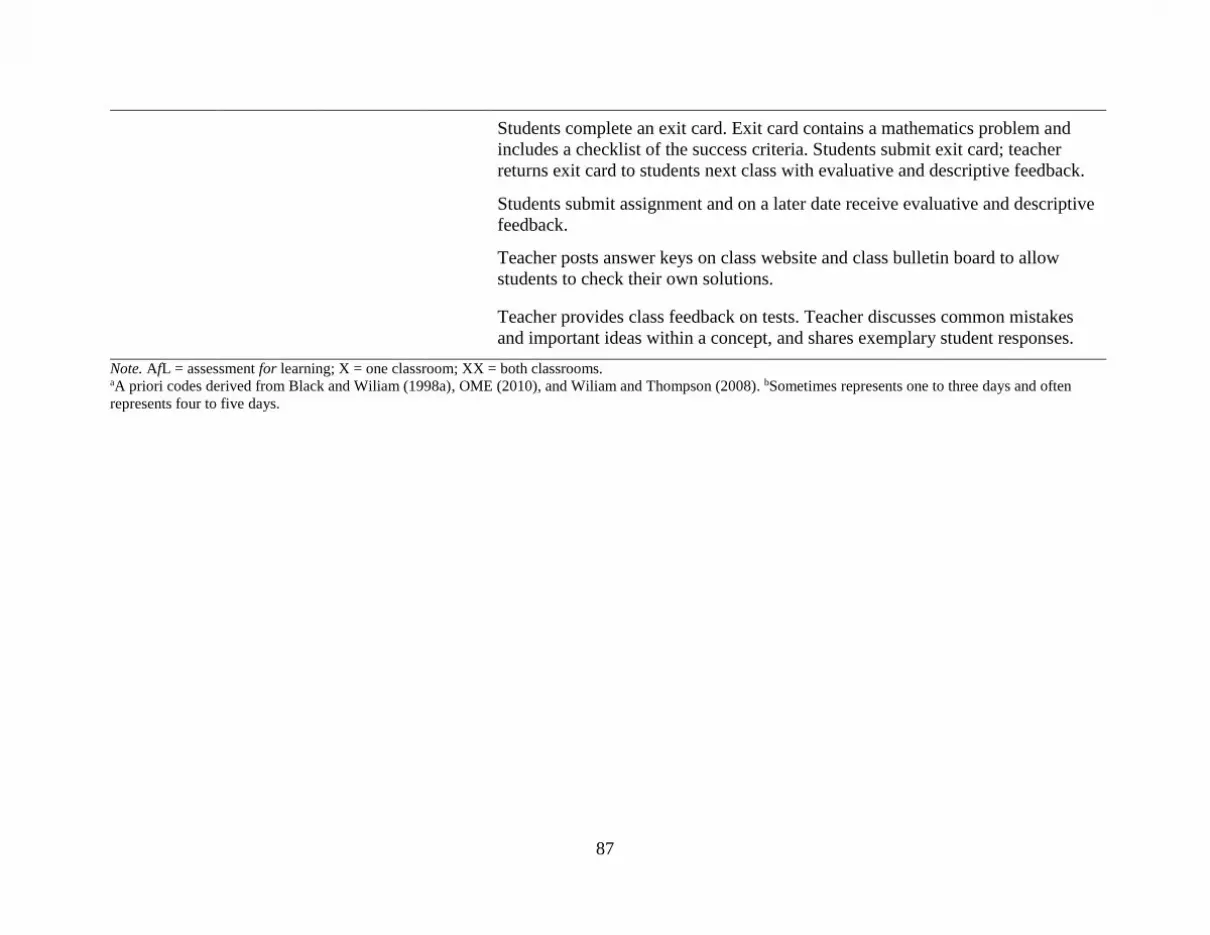
87
Students complete an exit card. Exit card contains a mathematics problem and
includes a checklist of the success criteria. Students submit exit card; teacher
returns exit card to students next class with evaluative and descriptive feedback.
Students submit assignment and on a later date receive evaluative and descriptive
feedback.
Teacher posts answer keys on class website and class bulletin board to allow
students to check their own solutions.
Teacher provides class feedback on tests. Teacher discusses common mistakes
and important ideas within a concept, and shares exemplary student responses.
Note. AfL = assessment for learning; X = one classroom; XX = both classrooms. aA priori codes derived from Black and Wiliam (1998a), OME (2010), and Wiliam and Thompson (2008). bSometimes represents one to three days and often
represents four to five days.

88
Table 11
The Frequency and Use of AfL Practices Reflecting the Spirit of AfL in Two Low-Achievement Case Study Teachers’ Classrooms
AfL
Strategya
Evidence
Example Interview
Classroom
Observationb
Sometimes Often
Success
criteria X
Teacher and students co-construct success criteria by teacher asking prompting
questions. Then, teacher writes the success criteria on the board and students
copy it onto their worksheet.
Evidence of
learning X XX
Teacher scaffolds the development of a formula through engaging students in a
class discussion by asking prompting questions.
Students explain to class or peers how they obtained their solution.
Teacher asks open questions.
Teacher completes informal interviews; working one-on-one with students,
teacher asks them to explain how they obtained their solution. Teacher provides
evaluative and descriptive feedback.
Peer-
assessments X X X
Students work in pairs or groups on a mathematics problem.
Students, in groups, work on a mathematics problem and each group writes their
solution on a medium-size whiteboard. Whiteboards get displayed around the
classroom; students walk around and look at other groups’ solutions to see
different ways of solving the same problem. (During the observations, these
whiteboards were on display.)
Self-
assessments XX XX
Students complete a goal-setting worksheet after a test. Students write one thing
they did well to prepare for the test and two things they need to improve.
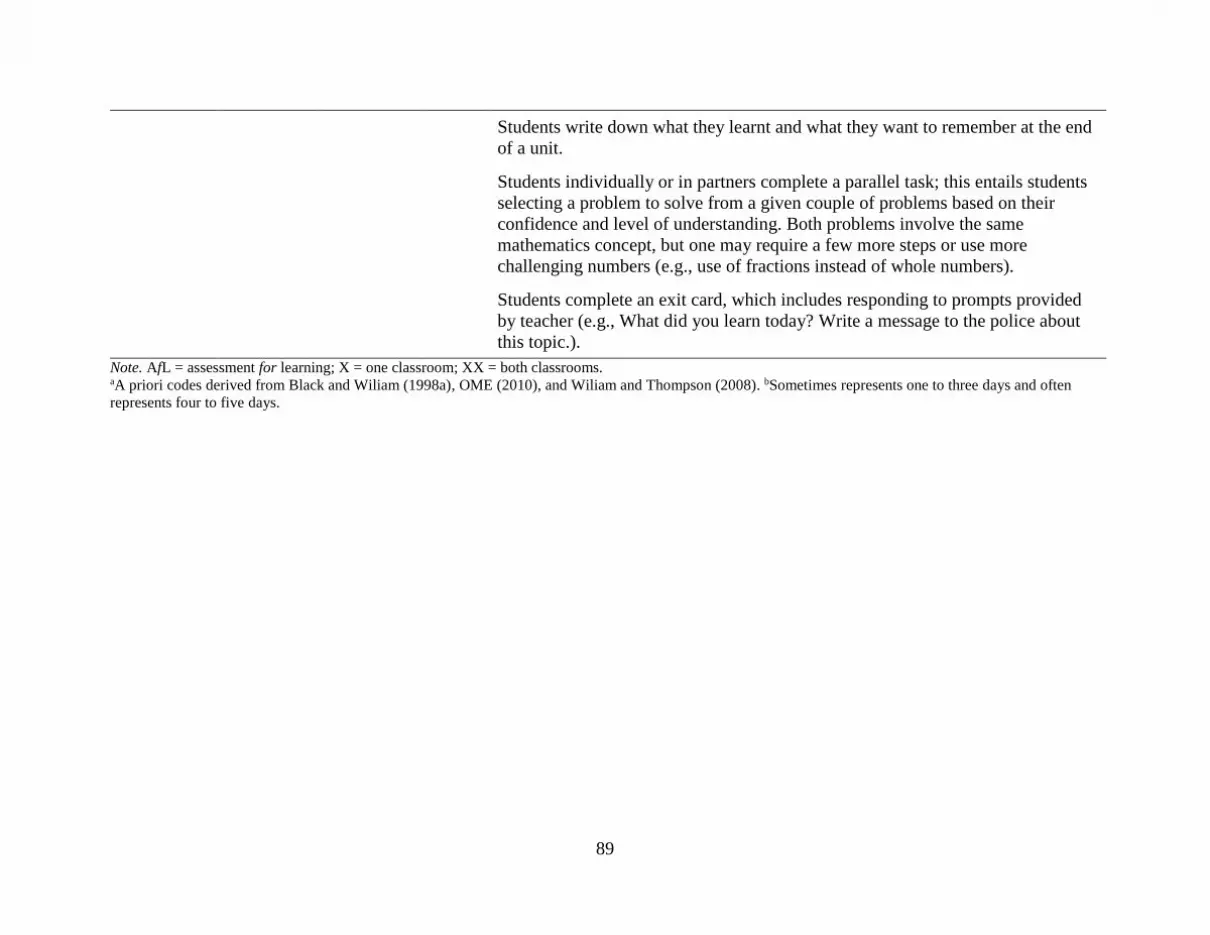
89
Students write down what they learnt and what they want to remember at the end
of a unit.
Students individually or in partners complete a parallel task; this entails students
selecting a problem to solve from a given couple of problems based on their
confidence and level of understanding. Both problems involve the same
mathematics concept, but one may require a few more steps or use more
challenging numbers (e.g., use of fractions instead of whole numbers).
Students complete an exit card, which includes responding to prompts provided
by teacher (e.g., What did you learn today? Write a message to the police about
this topic.).
Note. AfL = assessment for learning; X = one classroom; XX = both classrooms. aA priori codes derived from Black and Wiliam (1998a), OME (2010), and Wiliam and Thompson (2008). bSometimes represents one to three days and often
represents four to five days.

90
Overall, teachers reported they regularly used AfL strategies, M = 3.62, SD = .74, and
collaborative learning practices, M = 3.80, SD = .88 (see Table 12). No significant differences
were found with respect to the implementation of AfL strategies and collaborative learning
practices across school-achievement results, ps > .10. Further, no significant differences were
found with respect to the item, “I have students working independently when learning,” across
school-achievement results, 2 (2, N = 127) = .28, p = .87. Also, teachers reported they regularly
used contemporary classroom assessments, M = 2.94, SD = .71, but to a significantly greater
extent, they reported the use of traditional classroom assessments, M = 4.35, SD = .80; t(130) =
−14.46, p < .001 (see Table 12). No significant differences were found with respect to the
implementation of contemporary and traditional classroom assessments across school-achievement
results, ps > .20. Further, no significant differences were found with respect to the item,
“homework performance,” across school-achievement results, 2 (2, N = 126) = 1.78, p = .41.
When AfL strategies were used, six distinct AfL strategies were discussed or observed
across classrooms: (a) identifying and sharing learning goals, (b) identifying and sharing success
criteria, (c) engineering effective classroom discussions and tasks that elicit evidence of learning,
(d) providing feedback that moves learners forward, (e) engaging learners as instructional
resources for one another, and (f) engaging learners as the owners of their own learning.
Identifying and sharing success criteria, engineering effective classroom discussions and tasks that
elicit evidence of learning, and providing feedback that moves learners forward were the most
reportedly used AfL strategies, and these strategies were closely connected in practice (see Tables
7–11). The next several paragraphs describe the AfL practices used across school-achievement
results.
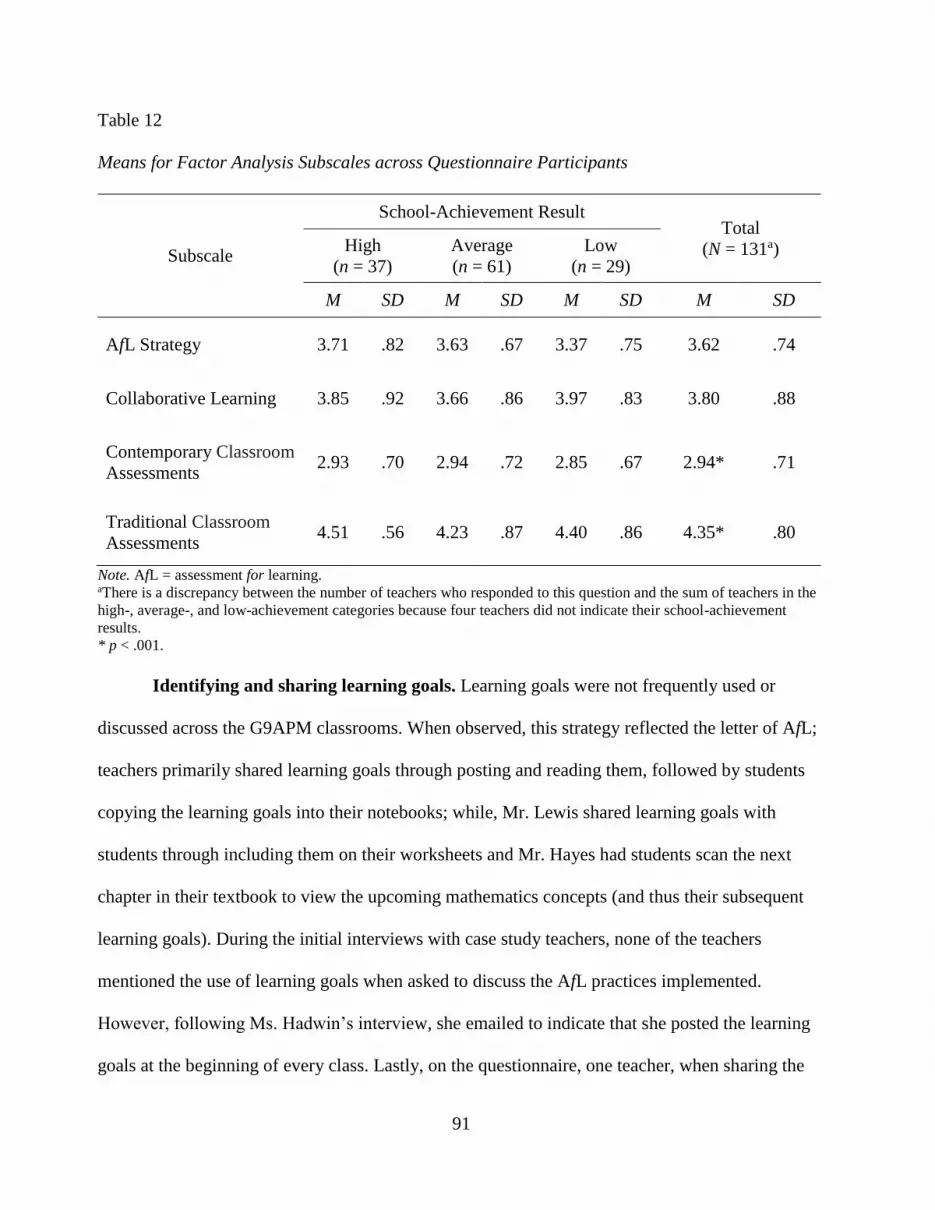
91
Table 12
Means for Factor Analysis Subscales across Questionnaire Participants
Subscale
School-Achievement Result Total
(N = 131a) High
(n = 37)
Average
(n = 61)
Low
(n = 29)
M SD M SD M SD M SD
AfL Strategy 3.71 .82 3.63 .67 3.37 .75 3.62 .74
Collaborative Learning 3.85 .92 3.66 .86 3.97 .83 3.80 .88
Contemporary Classroom
Assessments 2.93 .70 2.94 .72 2.85 .67 2.94* .71
Traditional Classroom
Assessments 4.51 .56 4.23 .87 4.40 .86 4.35* .80
Note. AfL = assessment for learning. aThere is a discrepancy between the number of teachers who responded to this question and the sum of teachers in the
high-, average-, and low-achievement categories because four teachers did not indicate their school-achievement
results.
* p < .001.
Identifying and sharing learning goals. Learning goals were not frequently used or
discussed across the G9APM classrooms. When observed, this strategy reflected the letter of AfL;
teachers primarily shared learning goals through posting and reading them, followed by students
copying the learning goals into their notebooks; while, Mr. Lewis shared learning goals with
students through including them on their worksheets and Mr. Hayes had students scan the next
chapter in their textbook to view the upcoming mathematics concepts (and thus their subsequent
learning goals). During the initial interviews with case study teachers, none of the teachers
mentioned the use of learning goals when asked to discuss the AfL practices implemented.
However, following Ms. Hadwin’s interview, she emailed to indicate that she posted the learning
goals at the beginning of every class. Lastly, on the questionnaire, one teacher, when sharing the
92
AfL practices frequently used, discussed how he/she linked achievement on review questions to
learning goals for students to see their progress and where more work was required (L035, Q).
Identifying and sharing success criteria. The use of success criteria was often implicitly
shared across the G9APM classrooms, and this strategy typically reflected the letter of AfL. AfL
practices coded as identifying and sharing success criteria included the use of modelling,
exemplars, anchor charts, and checklists. Teachers routinely shared success criteria through
modelling and showing exemplars. For example, Mr. Lewis shared the success criteria for
calculating the total cost of a sale item through outlining the required steps, modelling how to
solve the problem, and sharing an exemplary student response (O1, O2). Mr. Hayes shared success
criteria through posting and reading them, and Ms. LeBlanc shared success criteria through
checklists included on exit cards (exit cards are discussed in the AfL strategy, engineering
effective classroom discussions and tasks that elicit evidence of learning). In one classroom
observation, there was an example in which the use of success criteria was considered to reflect the
spirit of AfL (Lewis, O5). In this class, after group practice, Mr. Lewis and the students co-
constructed success criteria as the teacher asked prompting questions. Subsequently, Mr. Lewis
wrote the success criteria on the board and students copied these criteria onto their worksheet.
During the initial interviews with case study teachers, none of the teachers explicitly mentioned
the use of success criteria when asked to discuss implemented AfL practices.
Engineering effective classroom discussions and tasks that elicit evidence of learning.
Eliciting evidence of learning was routinely used across the G9APM classrooms, and this strategy
commonly reflected the letter of AfL. AfL practices coded as engineering effective classroom
discussions and tasks that elicit evidence of learning included the use of practices such as quizzes,
assignments, homework checks, oral questioning, observations, warm-up questions, EQAO
93
questions, exit cards, presentations, whiteboards, discussions, and interviews. At the beginning of
class, eliciting evidence of learning often included teachers checking students’ homework and
students solving similar types of problems from previous lessons to identify areas of difficulty.
This practice often reflected the letter of AfL. In Mr. Hayes’ classroom, this entailed the teacher
administering a short daily quiz with students receiving evaluative and descriptive feedback, and
Mr. Hayes using the results to inform subsequent instruction. “If the results are low, it tells me
wow, I’ve got to slow down, I’ve got to reteach. If the results are good, we move on” (Hayes, I1).
One case study teacher, Ms. Hadwin, regularly implemented an AfL practice to check students’
understandings that reflected more the spirit of AfL. In this class, students, individually or in pairs,
solved problems; Ms. Hadwin checked students’ work, and then students volunteered or were
asked to present their solutions and explain to the class (I1; O1–O5). The latter part of this activity,
students explaining their solutions to the class, required a higher level of student involvement.
While students were not initiating the interactions, student-teacher or student-student, this activity
reflected more the spirit of AfL than other observed AfL practices because students had a role in
leading the class discussion.
The majority of class time entailed students working individually and/or in pairs on
worksheets with the teacher walking around and checking students’ understandings to identify
who understood and who needed more support. Ms. Hadwin routinely collected an assignment
halfway through each unit to highlight and discuss any problem areas with students prior to the
end-of-unit summative assessment (I1; O3). Several teachers also discussed the use and value of
whiteboards to elicit evidence of learning: “The goal for this [individual whiteboards] is to expose
student thinking. These whiteboards allow students to explore their own thoughts and ideas. And it
allows me to see what they are” (A022, Q). The whiteboards allowed teachers to “quickly

94
identif[y] where everyone is to start the next lesson” (H019, Q). As discussed in the next section,
whiteboards were also a tool used to provide feedback. Other examples used to elicit evidence of
learning included the use of a student response system. With a student response system, students
selected and submitted their answers to problems. As one teacher noted, the use of a student
response system allows all students to “answer questions and see how they are progressing. It also
allows me to assess how well the class is doing as a whole, as well as who is struggling
individually” (L035, Q). Also, teachers across classrooms sometimes required students to orally
explain their solutions: “I have regular and frequent one-on-one conferences with students to give
descriptive feedback” (A029, Q). One case study teacher, Mr. Lewis, was frequently heard
encouraging students’ oral explanations, such as “Tell me what you did” (O2). Further, during the
initial interview, Mr. Lewis discussed the use of informal student interviews to get a better
understanding of students’ learning:
Once in a while I do kind of like very informal interviews. So I will sit with somebody
[student] and ask them to go through an entire solution with me. So I guess it is a bit more
in-depth instead of kind of circulating and kind of popping my head in. (I1)
Informal interviews encouraged students’ active involvement. This strategy reflected the spirit of
AfL as students explained their thinking and participated in dialogue with their teacher. Lastly,
multiple teachers mentioned the use of exit cards at the end of class. An exit card contains a
mathematics problem or prompt that students respond to and submit before exiting class. Teachers
used exit cards to identify whether students require more support and if so, where were students
struggling: “If I am not so sure whether everyone is getting it, then I give them an exit card. . . . I
collect and can mark quickly and then return to them the next day” (LeBlanc, I1).

95
Teachers often asked closed questions, observed as the letter of AfL, and periodically asked
open questions, occasionally observed as the spirit of AfL. As an example, a closed question was,
“What do I do to isolate x, divide by what?” (LeBlanc, O4) and an open question was, “What do
you need to consider?” (Lewis, O1). Teachers frequently asked questions to prompt and reveal
students’ thinking and expose misconceptions. As Mr. Lewis noted, “I very rarely tell them
[students] how to do things, it is just leading with good questions so that hopefully they reach
those conclusions themselves” (I1). To expose misconceptions, this teacher gave students
problems on the same mathematics concept with different given information. For example, in
questions on finding the volume of a cylinder that require the radius, he provided students with the
diameter to ensure students knew the difference between diameter and radius (I1). Another
teacher, Ms. Hadwin, helped a student understand the term unlimited, a word used in a word-
problem to describe part of a linear relationship, by asking closed questions such as, “How many
[movies] can you watch for $25? How much would 1 cost?”, until the student responded with the
correct answer (O5).
Providing feedback that moves learners forward. Immediate and delayed feedback were
often provided across the G9APM classrooms, and this strategy typically reflected the letter of
AfL. AfL practices coded as providing feedback that moves learners forward included the use of
practices such as document camera, whiteboards, interviews, discussions, and evaluative and
descriptive feedback. Teacher feedback directed students’ attention to their mistakes and common
student mistakes in order to progress student learning and correct any misconceptions.
Teachers routinely walked around the class, asked questions, and provided immediate
evaluative and descriptive feedback to students, as they worked individually or in pairs/groups.
Teachers believed immediate feedback was essential for their students. For example, Mr. Hayes
96
had an EA and two peer helpers, and he structured his class around maximizing the support his
students received from these adults. Students experiencing difficulties were quickly identified with
the daily quiz. Daily quizzes were marked, returned, and students who were struggling received
one-on-one support the same class period from the teacher, EA, or a peer helper. “We are always
monitoring their learning, and there are interventions that happen on a daily basis” (Hayes, I2) to
support students with misunderstandings. Further, as Mr. Lewis noted:
I’m just trying to just do the right away feedback, that verbal right away, so that they can
fix it now, and then go right away, and then just continue on, instead of I don’t know, them
working and giving me something that doesn’t, that has a lot of errors . . . I feel like maybe
with this group I am worried that they won’t read any of the feedback that I provide,
whereas if I am right there next to them, they will be able to hear it, and then I can sit there,
and watch them try again. (I2)
When this practice included a feedback conversation between the teacher and student, this AfL
practice reflected the spirit of AfL because the teacher was responding in a more dialogic and
responsive manner to the students’ learning needs, and both the student and teacher were listening,
responding to questions and asking questions to clarify areas of confusion or difficulty.
Besides immediate individualized feedback, students also routinely received immediate
class feedback. Class feedback included teachers praising, repeating, clarifying, correcting, and
supplementing students’ responses. Sometimes this feedback was the result of common mistakes
observed across students. As an example, Ms. LeBlanc regularly had students using individual
whiteboards. On the whiteboards, students showed their next step in solving a problem. The
students then received immediate individualized or class feedback from the teacher.
97
We are solving equations now . . . I will say show me the next step. So then they show me
and I’d tell them yes, yes, yes, no, or how I want them, or you need to line up the like terms
and stuff. (LeBlanc, I1)
In this class, several students, when solving a multi-step linear equation on their whiteboard, were
not correctly applying the distributive property to all the terms in the parentheses. Ms. LeBlanc
then provided immediate feedback to the entire class (O1). This AfL practice reflected the letter of
AfL; it supported the teacher in providing immediate evaluative and descriptive feedback for who
was and was not on the right track, and if multiple students were making a similar error, the
teacher provided immediate class feedback. Another case study teacher, Ms. Hadwin, regularly
had her students write their solutions on the Smart Board and then explain their solution to the
class (O1–O5). This followed with questions from peers and the teacher. This AfL practice
required a higher level of student involvement, and therefore reflected more the spirit of AfL.
While teachers noted immediate individualized feedback was preferred, it was not always
feasible. Hence teachers also provided delayed individualized and class feedback. Feedback was
categorized as delayed if students received the feedback a day or more after completing the
activity. Not surprisingly, students commonly received delayed individualized and/or class
feedback on their assignments and homework, and this feedback was commonly designed for
formative purposes. Ms. Hadwin discussed the value of this feedback:
I like to have the opportunity to take stuff up with them individually, like especially the
students that are struggling, like if there is one thing they keep doing wrong with their
form, I like to have that time to discuss it. (I1)
This feedback allowed the teacher to identify errors and provide direction in how to correct them.
Similarly, in delayed class feedback, teachers focused students’ attention on common student

98
mistakes, problems multiple students found difficult, and important ideas within a concept. For
this, teachers either modelled how to solve the problem on the board and asked prompting
questions, had students write their solution on the board, or displayed exemplary student work on
an overhead screen using a document camera or twitter.
Engaging learners as instructional resources for one another. The explicit use or
discussion of peer-assessments was not common across the G9APM classrooms. However, when
used, peer-assessments largely reflected the spirit of AfL because they required students to reflect
on the requirements of a quality solution and then share this feedback. AfL practices coded as
engaging learners as instructional resources for one another included the use of practices such as
group or partner work, peer-assessments, peer-tutoring, peer-feedback, and peer-check. Overall,
this strategy was implemented informally, peer-feedback occurred as part of the natural group
dynamic as students worked together on a problem. As an example, “kids work in groups on
whiteboards or windows and I can give them immediate feedback and other students in the class
also give feedback” (H121, Q) as students work together. This strategy was not explicitly
discussed in the initial interviews with the case study teachers, nor did teachers in the
questionnaire frequently identify it as one of the two AfL practices they frequently used. However,
when teachers engaged learners as instructional resources for one another, teachers were “trying to
get them [students] to learn from each other in pairs and in groups” (Hadwin, I2). For example,
Ms. Hadwin had pairs of students working on different problems, with each set of problems
assessing the same underlying concept (O4). Students were directed to coach one another in
solving their problems. This coaching provided students with peer-feedback. Another case study
teacher, Mr. Lewis, had built a classroom structure that encouraged students to work with a
partner, ask each other questions, and provide feedback to one another:
99
I make sure that I give them [students] opportunities to work in pairs. I sit them in kind of
pods of four so that their facing somebody else, and their also beside somebody else, so it
facilitates that sharing and that feedback I suppose they can give to each other. (I1)
Other examples included pairs of students assessing each other’s homework and providing peer-
feedback, and students discussing their solutions with a peer prior to the presentation of a model
solution.
Engaging learners as the owners of their own learning. Self-assessments were not
frequently used or discussed across the G9APM classrooms; however, when used self-assessments
largely reflected the spirit of AfL because they required students to reflect on the requirements of a
quality solution and their understanding. AfL practices coded as engaging learners as the owners of
their own learning included the use of practices such as self-assessments, journals, reflections,
hand signals, and traffic light. This strategy was not mentioned in initial interviews with case study
teachers, nor did teachers in the questionnaire frequently discuss it as one of the two AfL practices
they frequently used. If observed or discussed, engaging learners as the owners of their own
learning often included students rating themselves on a scale, comparing their work to exemplars,
or choosing between two levels of problems to try. For instance, three teachers discussed the use
of hand signals or the traffic light strategy to have students quickly assess their level of
understanding with the material. In Mr. Hayes’ classroom where the traffic light strategy was used,
students wrote either green (I got it.), yellow (Slow down, I need a little help.), or red (I need help
now.) at the top of their paper (O2). The teacher treated yellow and red the same, and these
students immediately received extra support.
Challenges. While describing their AfL practices, teachers also reported a number of
challenges. Amongst these reported challenges, two main challenges surfaced in the questionnaire

100
and case study data that provide insight into teachers’ use of AfL practices. These challenges
related to students and time. One question on the questionnaire asked teachers what challenges
they found implementing AfL practices. Approximately two thirds of the teachers responded to
this item (69%). Of these teachers, approximately half of them described challenges with students
and time (45% and 52%, respectively). Examples of challenges with students noted by
questionnaire and case study teachers included the required teacher capacity to support a range of
student ability levels, lack of student effort and motivation, and student absences; while examples
of challenges with time included the amount of time needed to implement (e.g., co-create success
criteria or provide descriptive feedback) and teach all the curriculum expectations.
Another question on the questionnaire asked teachers how the mathematics curriculum
hindered their ability to implement AfL practices. A little over half the teachers responded to this
question (54%), of which approximately two thirds of the teachers mentioned a lack of time
(65%). Not surprisingly, a lack of time was connected to the large number of curriculum
expectations. Further, it was connected to the focus of preparing students for the end of year
EQAO assessment. Case study teachers noted that the EQAO assessment impacted classroom
practices through including released or inspired EQAO questions in worksheets, activities, and
unit tests to ensure students’ familiarity with the format and style of EQAO questions.
Summary. Together the results illustrate that across schools, regardless of their school-
achievement results, teachers tended to implement AfL practices that reflected more the letter of
AfL compared to the spirit of AfL. However, the evidence suggests that some teachers were trying
to shift their AfL practices. One case study teacher, Mr. Lewis, explicitly discussed his efforts to
include more AfL practices that reflected the spirit of AfL. “I’m trying to have them [be] more
accountable, not just with doing the work, but feeling that they should be doing the work, that it’s
101
on them to try in order to be successful” (I2). Additionally, identifying and sharing success
criteria, engineering effective classroom discussions and tasks that elicit evidence of learning, and
providing feedback that moves learners forward were the AfL strategies teachers most frequently
implemented.
Relationship between Teachers’ AfL Strategies and AfL Conceptions
Generally, as evidenced by questionnaire and case study data, across school-achievement
results, there was no difference in teachers’ conceptualizations of AfL. The majority of the
research findings for this section come from the questionnaire data and the case study interviews,
as this section focuses on the relationship between teachers’ AfL strategies and AfL conceptions.
Next, I describe the three questions on the questionnaire that explored teachers’ AfL conceptions.
This is followed by questionnaire and case study findings and examples to illustrate teachers’ AfL
conceptions across school-achievement results.
Factor analysis was conducted with two quantitative questions on the questionnaire; one
question had four items related to mathematics pedagogy and both questions contained items
related to MKT. These questions asked teachers to indicate their agreement with 12 items on a 5-
point scale (1 = strongly disagree to 5 = strongly agree; see Appendix F, Tables F3–F4 for item
descriptives). Most teachers responded to all of the items in these questions (98%). Using principal
axis factoring with direct oblimin rotation, parallel analysis suggested the items in these questions
grouped into two subscales, while the subscale correlations and scree plot suggested three
subscales. Further analyses and interpretability supported a solution with three subscales, namely
Learning Mathematics, Subject Matter Knowledge, and Pedagogical Content Knowledge.
Learning Mathematics was not correlated with Subject Matter Knowledge (.02) but was weakly
correlated with Pedagogical Content Knowledge (.34); and Subject Matter Knowledge and
102
Pedagogical Content Knowledge were moderately correlated (.47). All items loaded onto the
subscales with factor loadings greater than .50; the only exception was the item, “all students do
not learn mathematics in the same way,” which had factor loadings less than .30 on all subscales;
this item was excluded from the three subscales (see Appendix G, Table G3). The three subscales
explained 63% of the total variance. The subscales, Learning Mathematics, Subject Matter
Knowledge, and Pedagogical Content Knowledge had an internal consistency of .70, .72, and .80,
respectively. The two subscales, Subject Matter Knowledge and Pedagogical Content Knowledge,
which are related to MKT, are discussed in the next section, Relationships between Teachers’ AfL
Strategies and MKT.
Two qualitative questions on the questionnaire explored teachers’ conceptions of AfL. The
first qualitative question asked teachers to indicate the most important aspects of AfL for them.
More than three quarters of the teachers responded to this item (76%), and many of them indicated
more than one aspect of AfL. The second qualitative question focused on the benefits teachers
found when implementing AfL practices in their class. More than two thirds of the teachers
responded to this item (69%) and many of them indicated more than one benefit. The findings for
these two questions are presented in the next two tables (see Tables 13–14). These tables, along
with Table 15 (findings from case studies), provide insights into the relationships between
teachers’ AfL strategies and AfL conceptions across school-achievement results.
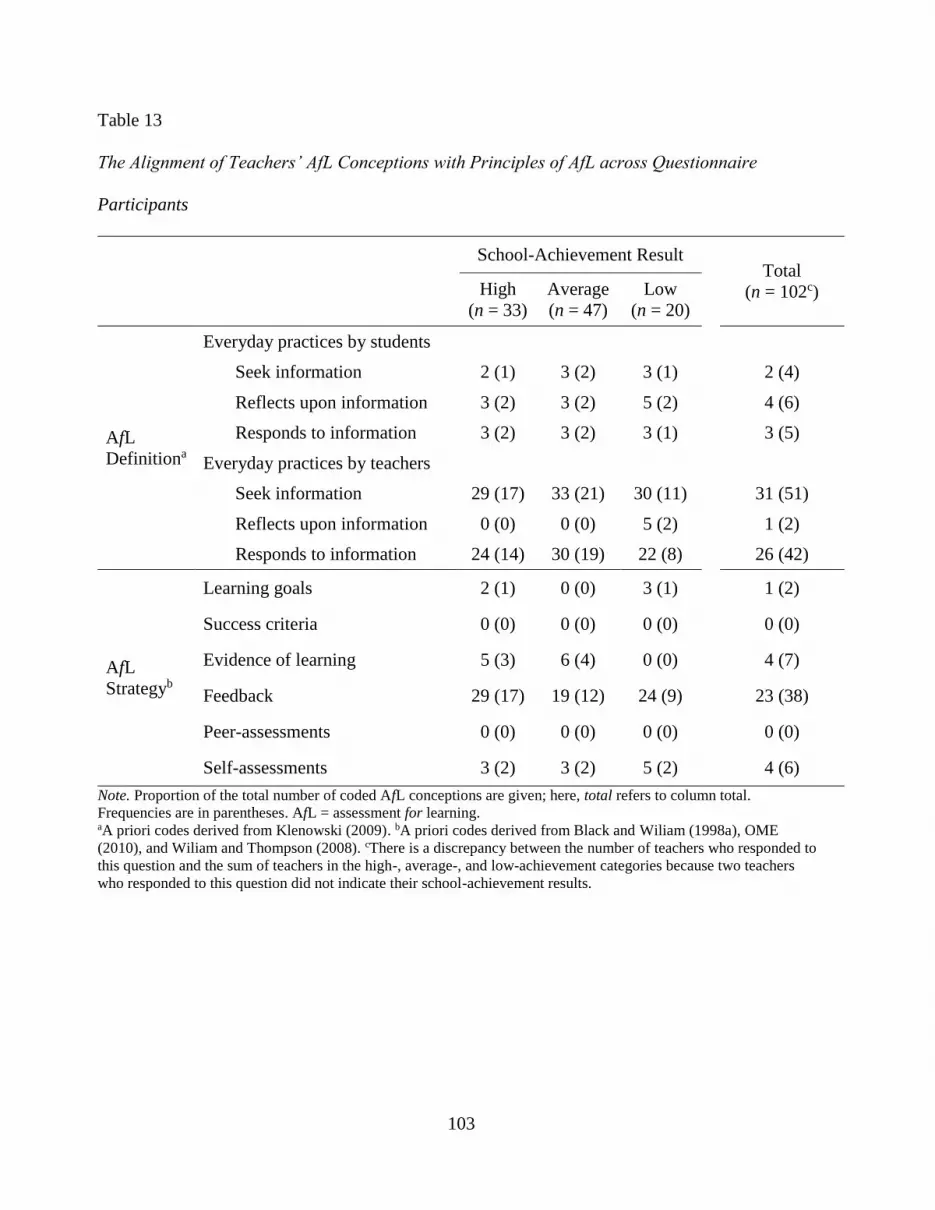
103
Table 13
The Alignment of Teachers’ AfL Conceptions with Principles of AfL across Questionnaire
Participants
School-Achievement Result
Total
(n = 102c) High
(n = 33)
Average
(n = 47)
Low
(n = 20)
AfL
Definitiona
Everyday practices by students
Seek information 2 (1) 3 (2) 3 (1) 2 (4)
Reflects upon information 3 (2) 3 (2) 5 (2) 4 (6)
Responds to information 3 (2) 3 (2) 3 (1) 3 (5)
Everyday practices by teachers
Seek information 29 (17) 33 (21) 30 (11) 31 (51)
Reflects upon information 0 (0) 0 (0) 5 (2) 1 (2)
Responds to information 24 (14) 30 (19) 22 (8) 26 (42)
AfL
Strategyb
Learning goals 2 (1) 0 (0) 3 (1) 1 (2)
Success criteria 0 (0) 0 (0) 0 (0) 0 (0)
Evidence of learning 5 (3) 6 (4) 0 (0) 4 (7)
Feedback 29 (17) 19 (12) 24 (9) 23 (38)
Peer-assessments 0 (0) 0 (0) 0 (0) 0 (0)
Self-assessments 3 (2) 3 (2) 5 (2) 4 (6)
Note. Proportion of the total number of coded AfL conceptions are given; here, total refers to column total.
Frequencies are in parentheses. AfL = assessment for learning. aA priori codes derived from Klenowski (2009). bA priori codes derived from Black and Wiliam (1998a), OME
(2010), and Wiliam and Thompson (2008). cThere is a discrepancy between the number of teachers who responded to
this question and the sum of teachers in the high-, average-, and low-achievement categories because two teachers
who responded to this question did not indicate their school-achievement results.
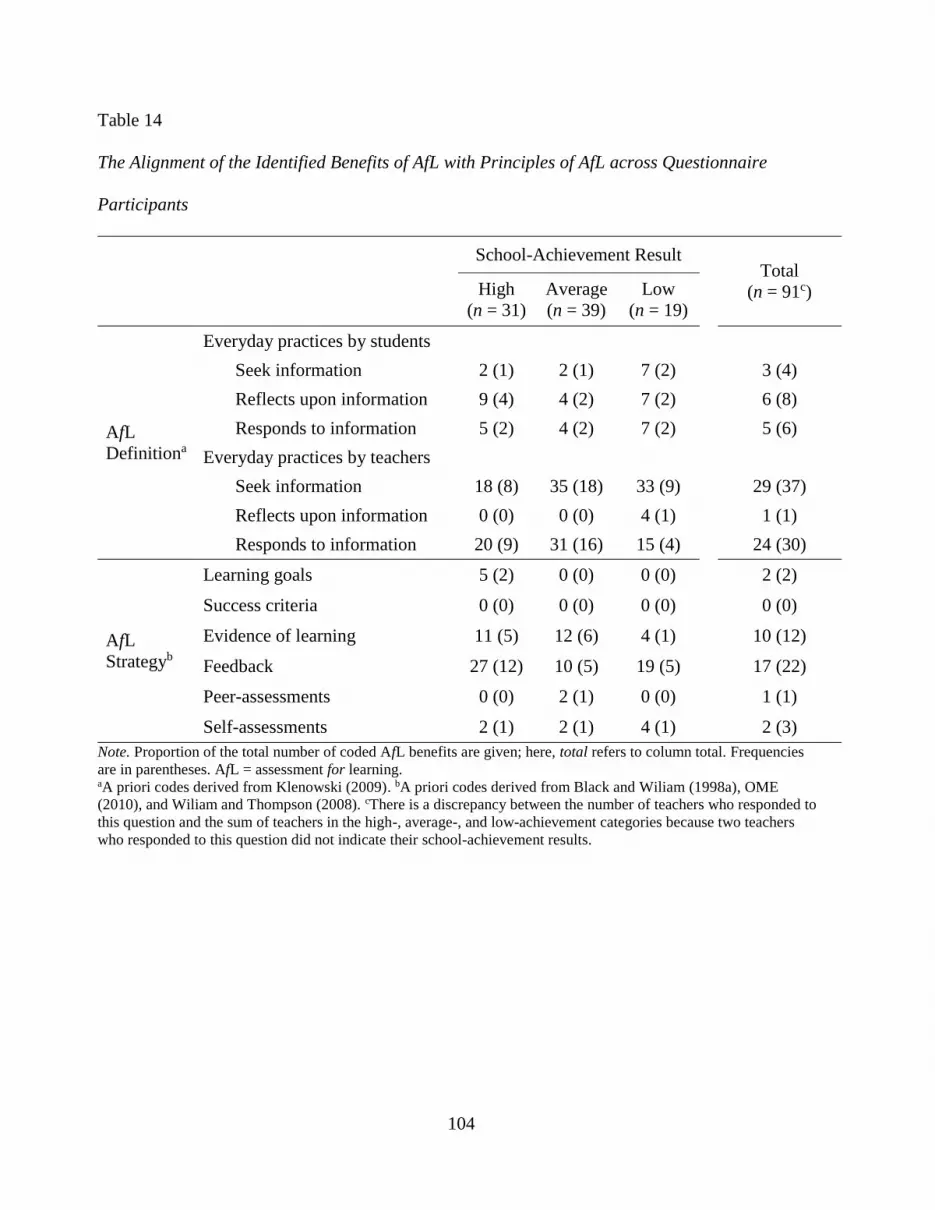
104
Table 14
The Alignment of the Identified Benefits of AfL with Principles of AfL across Questionnaire
Participants
School-Achievement Result
Total
(n = 91c) High
(n = 31)
Average
(n = 39)
Low
(n = 19)
AfL
Definitiona
Everyday practices by students
Seek information 2 (1) 2 (1) 7 (2) 3 (4)
Reflects upon information 9 (4) 4 (2) 7 (2) 6 (8)
Responds to information 5 (2) 4 (2) 7 (2) 5 (6)
Everyday practices by teachers
Seek information 18 (8) 35 (18) 33 (9) 29 (37)
Reflects upon information 0 (0) 0 (0) 4 (1) 1 (1)
Responds to information 20 (9) 31 (16) 15 (4) 24 (30)
AfL
Strategyb
Learning goals 5 (2) 0 (0) 0 (0) 2 (2)
Success criteria 0 (0) 0 (0) 0 (0) 0 (0)
Evidence of learning 11 (5) 12 (6) 4 (1) 10 (12)
Feedback 27 (12) 10 (5) 19 (5) 17 (22)
Peer-assessments 0 (0) 2 (1) 0 (0) 1 (1)
Self-assessments 2 (1) 2 (1) 4 (1) 2 (3)
Note. Proportion of the total number of coded AfL benefits are given; here, total refers to column total. Frequencies
are in parentheses. AfL = assessment for learning. aA priori codes derived from Klenowski (2009). bA priori codes derived from Black and Wiliam (1998a), OME
(2010), and Wiliam and Thompson (2008). cThere is a discrepancy between the number of teachers who responded to
this question and the sum of teachers in the high-, average-, and low-achievement categories because two teachers
who responded to this question did not indicate their school-achievement results.
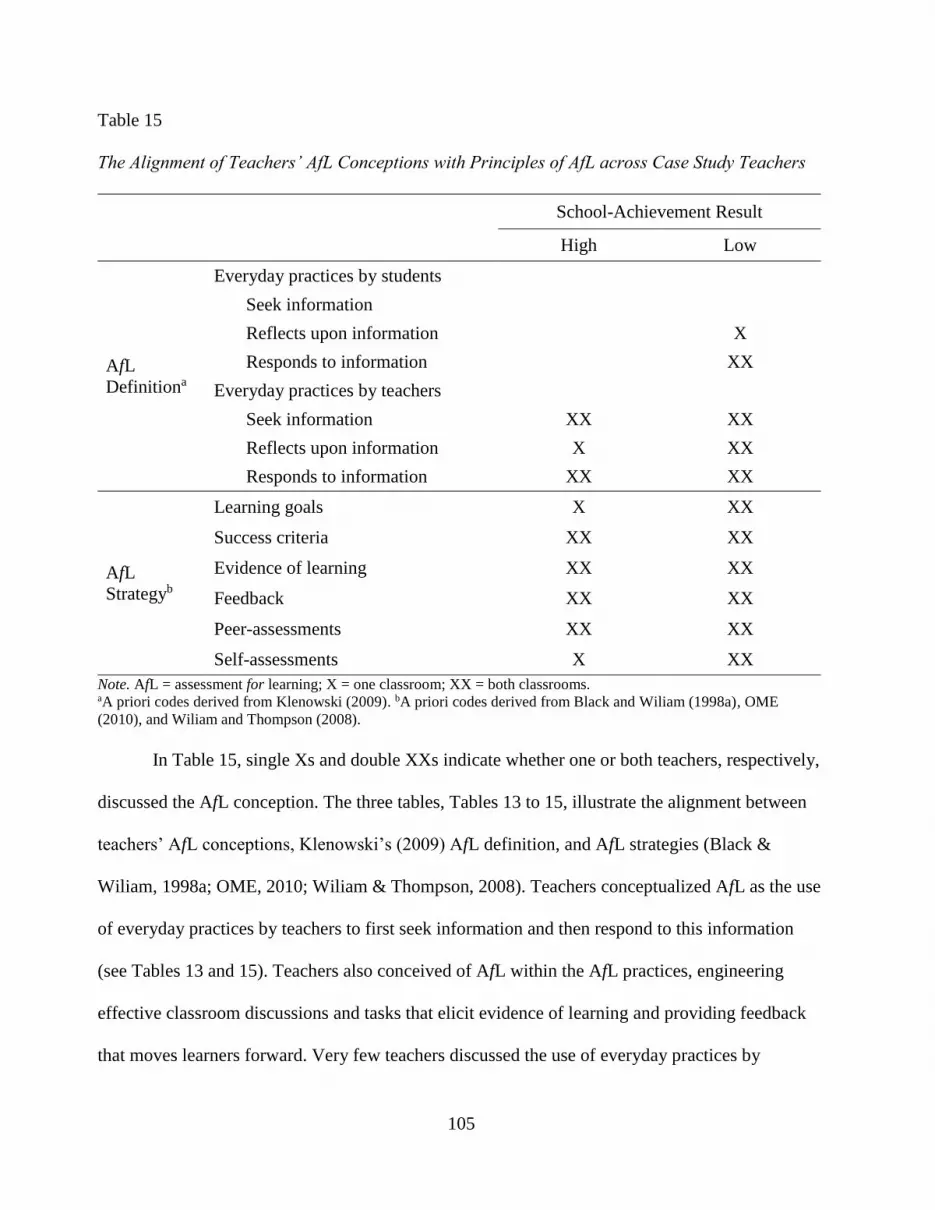
105
Table 15
The Alignment of Teachers’ AfL Conceptions with Principles of AfL across Case Study Teachers
School-Achievement Result
High Low
AfL
Definitiona
Everyday practices by students
Seek information
Reflects upon information X
Responds to information XX
Everyday practices by teachers
Seek information XX XX
Reflects upon information X XX
Responds to information XX XX
AfL
Strategyb
Learning goals X XX
Success criteria XX XX
Evidence of learning XX XX
Feedback XX XX
Peer-assessments XX XX
Self-assessments X XX
Note. AfL = assessment for learning; X = one classroom; XX = both classrooms. aA priori codes derived from Klenowski (2009). bA priori codes derived from Black and Wiliam (1998a), OME
(2010), and Wiliam and Thompson (2008).
In Table 15, single Xs and double XXs indicate whether one or both teachers, respectively,
discussed the AfL conception. The three tables, Tables 13 to 15, illustrate the alignment between
teachers’ AfL conceptions, Klenowski’s (2009) AfL definition, and AfL strategies (Black &
Wiliam, 1998a; OME, 2010; Wiliam & Thompson, 2008). Teachers conceptualized AfL as the use
of everyday practices by teachers to first seek information and then respond to this information
(see Tables 13 and 15). Teachers also conceived of AfL within the AfL practices, engineering
effective classroom discussions and tasks that elicit evidence of learning and providing feedback
that moves learners forward. Very few teachers discussed the use of everyday practices by
106
students, or the use of learning goals, success criteria, and peer- and self-assessments either
procedurally or with deep integration. This further exemplifies that these teachers conceptualized
AfL within the confines of teacher-centred AfL practices. Further, teachers’ AfL conceptions
corresponded to their believed benefits of AfL (see Table 14).
Everyday practices by teachers. Teachers understood AfL to be about seeking
information on students’ learning, and then responding to this information to support growth. For
teachers, AfL was about the teacher uncovering students’ conceptions and misconceptions in order
“to see which students are ‘getting’ it and which students require extra support” (H072, Q).
Teachers used AfL practices regularly to seek information on student learning; AfL “gives me a
diagnostic of what they’re doing, where they are, are they learning, do they get it, can we move
on” (Hayes, I1). Teachers used AfL practices as “check points” (Hayes, I2). Teachers discussed
the value of understanding how students were doing prior to an assessment of learning in order to
provide the necessary supports. They saw AfL practices helpful in determining if students “are on
the right track before . . . the end of the unit” (Hadwin, I2). Teachers discussed the use of AfL
practices to identify struggling students, to “know which students struggle with which concepts”
(A052, Q), “to catch the students who may not ask questions or participate in class discussions”
(A068, Q), and to “quickly key in to misconceptions or problem areas” (L036, Q). As one case
study teacher noted,
I definitely make sure they’ve [students have] submitted something that I can mark and
give them feedback on just to see how they’re doing in the unit so that we can make sure
that if they’re lost and they’re not speaking up when they’re lost, we can catch those guys
before we get further in the unit. (Hadwin, I1)

107
Teachers considered AfL as a method to make students’ conceptions and misconceptions visible.
For example AfL supported “discovering the challenges that students have and . . . . what students
do well in” (A023, Q). Further, Mr. Hayes discussed how he built a class structure that did not
permit students to hide or be passive if they did not understand:
We try and create a culture where the kids don’t have the opportunity to let things slide.
Because of us being on them all the time, usually within a day or two, we know that the jig
is up, we know that this kid is not understanding it and we go at it and we try to help. (I1)
In this class each day, students completed a five-question quiz; this was one of the practices used
to identify those students who required extra support. AfL practices were understood to inform
teachers of students’ levels of understanding.
Teachers understood AfL to be valuable in informing their instruction. Teachers adjusted
their current and future instruction based on their observations of student learning, as teachers
viewed AfL as “an ongoing process that helps to modify teaching approaches to enhance student
learning” (H079, Q). Teachers viewed AfL to be beneficial when determining how to best respond
to student learning, for example what concepts needed to be retaught, reviewed, or reinforced; and
when planning in order to maximize class time on concepts that need clarification. One relevant
example teachers discussed was how they used AfL to adjust their lesson plans to match the
learning needs of their students. For example, AfL “helps me in creating the next lesson in
allocating time to ideas/concepts that need more focus. Help[s] me figure out what tools to use to
help students learn and what learning strategies work best with students” (A023, Q). Or AfL helps
me “make informed instructional decisions based on student progress and curriculum demands”
(L037, Q), or “if I might need to change teaching practices to engage and reach all students”
(H072, Q). Also Mr. Hayes in both interviews emphasized how, for him, the main reason to use

108
AfL was to know students’ levels of understanding in order to inform his teaching and how to best
allocate instructional time:
I use it [AfL] to be as efficient as possible. I won’t spend two to three days on a subject, if
the kids are all getting it, we’re moving on because around the corner will be something
that will take longer than anticipated. (I1)
It’s [AfL] to be fully aware of where the kids are and what they need to do to get on track
or stay on track, and what the teacher needs to do to get them on track. . . . it’s a monitoring
system for me, it gears how I plan my lessons. . . . it helps with my pacing. (I2)
Teachers considered AfL to be a useful tool in informing their lesson planning. Overall, teachers
emphasized their role in AfL and how AfL helped them to be more responsive to learning needs.
As one teacher wrote,
Assessment for learning is most beneficial to me as the teacher. It lets me know what the
students know and can do and allows me to adjust my instruction accordingly. It also helps
me to communicate with parents and make recommendations about how they can help their
children at home. (A078, Q)
AfL strategies. Teachers commonly associated AfL with the AfL strategies engineering
effective classroom discussions and tasks that elicit evidence of learning and providing feedback
that moves learners forward. This aligns with teachers’ conceptions of AfL that AfL is the use of
everyday practices by teachers to first seek information and then respond to this information. With
respect to engineering effective classroom discussions and tasks that elicit evidence of learning,
AfL is about “students demonstrating their skills/understandings” (H115, Q). Teachers checked
students’ understandings daily through informal teacher-student interactions. One example was the
use of guided practice:
109
I incorporate it [AfL] quite regularly and it doesn’t have to be something as very formal as
students you know sitting in rows and doing a quiz. I mean a lot of time it’s just students
you know trying out some questions, and then just walking beside them and looking at
what they’re doing and providing that kind of on the spot feedback. (Lewis, I1)
For teachers, important aspects of AfL focused on the use of “higher level thinking questions”
(A059, Q) and “open ended questions” (A102, Q) in order to reveal students’ depth of
understanding. Also, teachers emphasized the importance of providing students with multiple
opportunities to demonstrate their thinking and learning, and resolve any misunderstandings prior
to an assessment of learning. For example,
I give them [students] a few questions and students try them and I provide feedback, either
written or oral feedback and then I give them another opportunity once they’ve read it or
heard what I’ve said, and . . . that gives them the opportunity to take the feedback, use it,
and then apply it. (Lewis, I1)
Teachers considered providing feedback that moves learners forward to be an important
aspect of AfL and teachers frequently discussed descriptive feedback in the questionnaire and
across the case studies. Teachers used feedback to make students aware of their level of
understanding and provide direction on where to focus next steps. Some exemplary teacher quotes
on the value of AfL to provide feedback on student learning included: “students get a chance to get
feedback about the steps they need to take to improve” (H119, Q); with feedback students could
“better understand their mistakes or gaps and correct them” (A117, Q); and feedback informed
students of “what they [have] done well, and what they need to continue to do or what things that
they need to learn better” (Lewis, I1). Further, one of the teachers noted how AfL practices
provided students with a reality check:

110
For the students, it is kind of their reality check. . . . they [students] sit there, they think
they get it, they go home, they don’t give it another thought and it is gone. So a lot of my
assessment for learning is giving them the reality check. I need to review this. I need more
work. I need help. (Hayes, I1)
In this example, feedback supported students in identifying their learning gaps and determining
their next steps.
Everyday practices by students. While not common, there were instances when teachers
expressed AfL conceptions or identified benefits of AfL that were student- and teacher-centric (see
Tables 13–15). A student- and teacher-centric conception of AfL includes the use of everyday
practices by students and teachers to seek, reflect, and respond to information. This conception of
AfL corresponds with AfL practices that require a higher and deeper level of student and teacher
involvement. A few relevant examples teachers noted that highlighted student involvement are
students giving peer-feedback, monitoring their own learning through applying success criteria or
using teacher-feedback to determine if they are meeting the learning goals, and “realiz[ing] where
they [students] are having difficulties and figur[ing] out what to focus on to improve” (A003, Q).
These teachers recognized the potential of AfL to increase student engagement in learning and
support autonomous learning.
Additionally, teachers reported high levels on learning mathematics, M = 4.16, SD = .63
with no significant differences with respect to learning mathematics across school-achievement
results, p = .98 (see Table 16). This suggests that overall teachers had a constructivist perspective
and valued conceptual understanding in students’ learning of mathematics. As an example, for the
question that asked teachers about the most important aspects of AfL, one teacher as part of their
response wrote, “Marking the learning process is more beneficial than marking for accuracy at this

111
stage in mathematics learning” (L044, Q). This emphasizes the value of focusing on continuous
student learning and effort rather than focusing on the accuracy of student learning. A
constructivist perspective supports the spirit of AfL; however, as mentioned AfL practices that
reflected the spirit of AfL were largely not discussed or observed.
Table 16
Means for Factor Analysis Subscales across Questionnaire Participants
Subscale
School-Achievement Result Total
(n = 129a) High
(n = 37)
Average
(n = 59)
Low
(n = 29)
M SD M SD M SD M SD
Learning Mathematics 4.16 .63 4.15 .59 4.17 .74 4.16 .63
Subject Matter Knowledge 4.96 .14 4.86 .35 4.95 .15 4.91 .26
Pedagogical Content
Knowledge 4.59 .40 4.36 .54 4.61 .44 4.48 .49
aThere is a discrepancy between the number of teachers who responded to this question and the sum of teachers in the
high-, average-, and low-achievement categories because four teachers who responded to this question did not indicate
their school-achievement results.
Summary. Across school-achievement results, teachers had a teacher-centric conception of
AfL. Teachers highlighted the role of the teacher in their AfL conceptions with AfL being part of
teachers’ everyday practices to check students’ understandings and provide feedback in order to
support learning. One teacher succinctly summarized this conception:
Assessment for learning is a way for me to tell what they [students] are still struggling with
so I can modify what I will be teaching in the future. It also helps me to determine what
questions I ask the students to help clarify or direct them to solving the tasks we are
working on. (L041, Q)
112
Correspondingly, these G9APM teachers regularly implemented AfL practices that reflected the
letter of AfL. These teachers’ AfL conceptions were positively related to the AfL practices
implemented.
Relationships between Teachers’ AfL Strategies and MKT
Generally, as evidenced by questionnaire and case study data, across school-achievement
results, teachers reported and were observed to have high levels of MKT. Specifically, two
quantitative questions on the questionnaire and both the interviews and classroom observations
from the case studies provided insights into teachers’ MKT. The two questions on the
questionnaire contained multiple items that related to MKT and mathematics pedagogy (see
previous section, Relationship between Teachers’ AfL Strategies and AfL Conceptions, for more
details on the two questions). As mentioned, analyses and interpretability of these questions
supported a solution with three subscales, namely Learning Mathematics, Subject Matter
Knowledge, and Pedagogical Content Knowledge (see Appendix G, Table G3). The subscale,
Learning Mathematics, will not be discussed further as it was discussed in the previous result
section. Teachers reported high levels in subject matter knowledge, M = 4.91, SD = .26, and
pedagogical content knowledge, M = 4.48, SD = .49 (see Table 16). No significant differences
were found with respect to the subject matter knowledge and pedagogical content knowledge
across school-achievement results, ps > .07.
Similarly, all teachers demonstrated high MKT across the case studies. With respect to
subject matter knowledge, teachers displayed common content knowledge (CCK), for example,
when they explained concepts or provided evaluative and descriptive feedback. Further examples
included illustrations of specialized content knowledge (SCK) and horizon content knowledge
(HCK). One such example of SCK occurred when Ms. LeBlanc described the need to show,
113
“students different ways to solve the problem” (I2) and “think of different ways to explain a
problem if they [students] don’t understand it” (I1). Subsequently, this teacher was observed to be
encouraging students to use the methods (i.e., algebra or scale factor) they liked best when solving
proportion problems (O4). An example of HCK was noted when Mr. Hayes described how his
knowledge of the mathematics connections across grade levels informed his teaching practice (I1).
He recognized that if he were to reteach at the Grades 7 or 8 levels, he would focus his students’
learning on the big ideas that support concepts learnt in later grades: “it’s sort of having that
understanding of not only what you’re teaching, but the purpose of it and where it goes.”
Lastly, teachers illustrated pedagogical content knowledge. Teachers demonstrate
knowledge of content and students (KCS) through knowing what students will likely find easy or
difficult. For example, Ms. LeBlanc mentioned how she uses the up-right method instead of the
sideways method to model solving linear equations, as she noticed students found the former
method conceptually clearer (I2). This likely occurs because the up-right method requires students
to write the same operation on both sides of the equal sign directly underneath the terms they are
applying it to. Further examples included illustrations of knowledge of content and teaching
(KCT) and knowledge of content and curriculum (KCC). One such example of KCT was observed
when Mr. Hayes provided his students with a set of “tools for their tool belt” (O1, O2). The tool
belt gave students many different strategies to choose from when solving a problem. For instance,
to determine if a graph has an upward or downward trend, students could use the pencil or oval
trick (O1, O2). An example of KCC was observed when case study teachers referenced teaching
and learning resources such as the use of websites (e.g., EQAO, EduGAINS) and textbooks (i.e.,
Pearson, Nelson Education, Marian Small) to obtain practice problems.
114
The next three tables (see Tables 17–19), using questionnaire and case study data, provide
evidence for the co-occurrence of the AfL strategies and the domains of MKT. Both the interviews
and classroom observations from the case studies provided evidence. These tables illustrate where
the required knowledge for the AfL strategies converge with the domains of MKT in these
G9APM classrooms. One question on the questionnaire provided insight into this relationship.
This question was qualitative and asked teachers how the mathematics curriculum supported their
ability to implement AfL practices. Approximately one half of the teachers responded to this item
(52%). Of these teachers, several teachers misunderstood the question, were not sure of a response,
or did not think the mathematics curriculum supported AfL practices. However, some teachers
discussed either AfL strategies (34%), and a few teachers discussed MKT (19%) or both AfL
strategies and MKT (15%, see Table 17). In the case study teachers’ classrooms, CCK was
frequently observed in relation to engineering effective classroom discussions and tasks that elicit
evidence of learning and providing feedback that moves learners forward, such that it was not
possible to record all the times this domain was present. In Tables 18 and 19, the greater than
symbol, is used to represent this frequency.
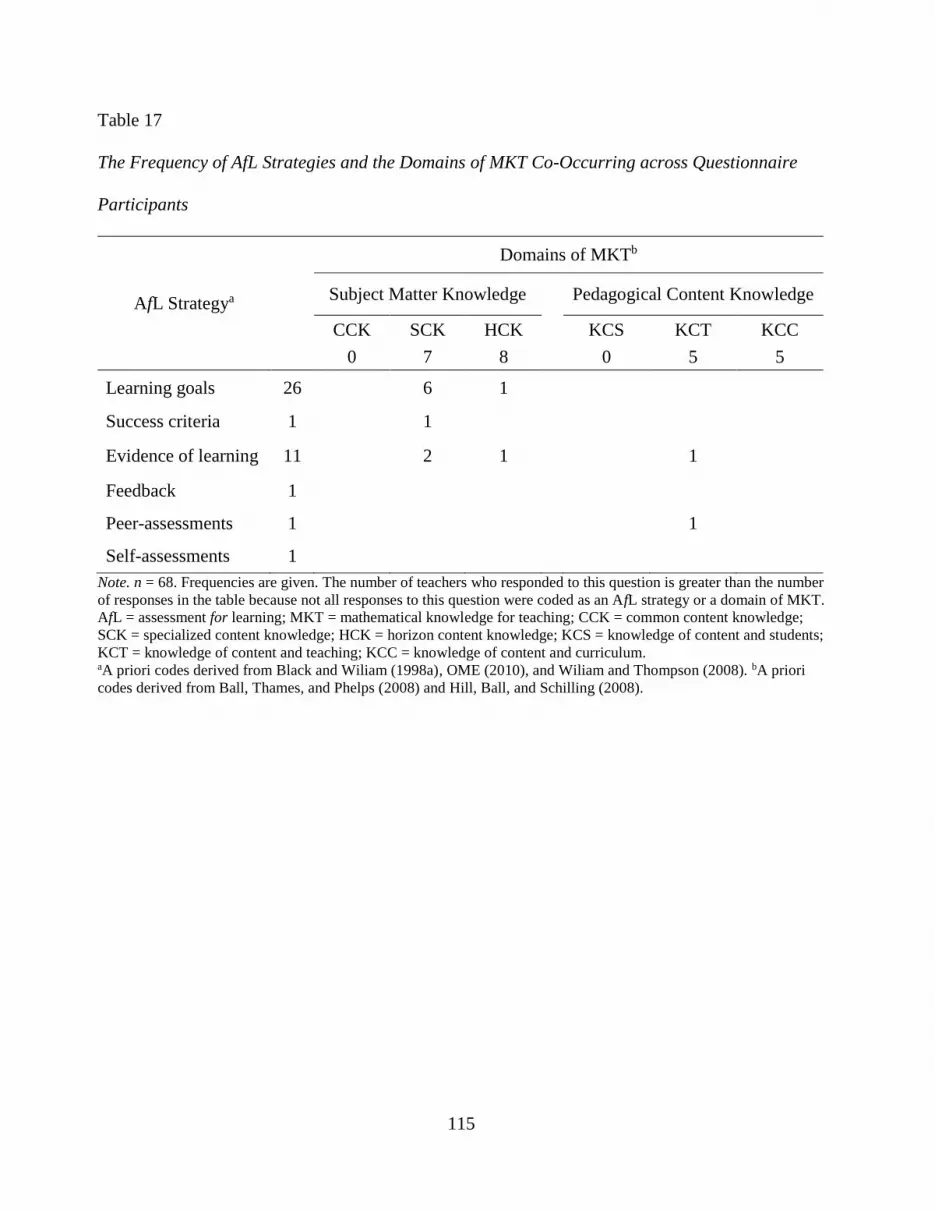
115
Table 17
The Frequency of AfL Strategies and the Domains of MKT Co-Occurring across Questionnaire
Participants
AfL Strategya
Domains of MKTb
Subject Matter Knowledge Pedagogical Content Knowledge
CCK SCK HCK KCS KCT KCC
0 7 8 0 5 5
Learning goals 26 6 1
Success criteria 1 1
Evidence of learning 11 2 1 1
Feedback 1
Peer-assessments 1 1
Self-assessments 1
Note. n = 68. Frequencies are given. The number of teachers who responded to this question is greater than the number
of responses in the table because not all responses to this question were coded as an AfL strategy or a domain of MKT.
AfL = assessment for learning; MKT = mathematical knowledge for teaching; CCK = common content knowledge;
SCK = specialized content knowledge; HCK = horizon content knowledge; KCS = knowledge of content and students;
KCT = knowledge of content and teaching; KCC = knowledge of content and curriculum. aA priori codes derived from Black and Wiliam (1998a), OME (2010), and Wiliam and Thompson (2008). bA priori
codes derived from Ball, Thames, and Phelps (2008) and Hill, Ball, and Schilling (2008).
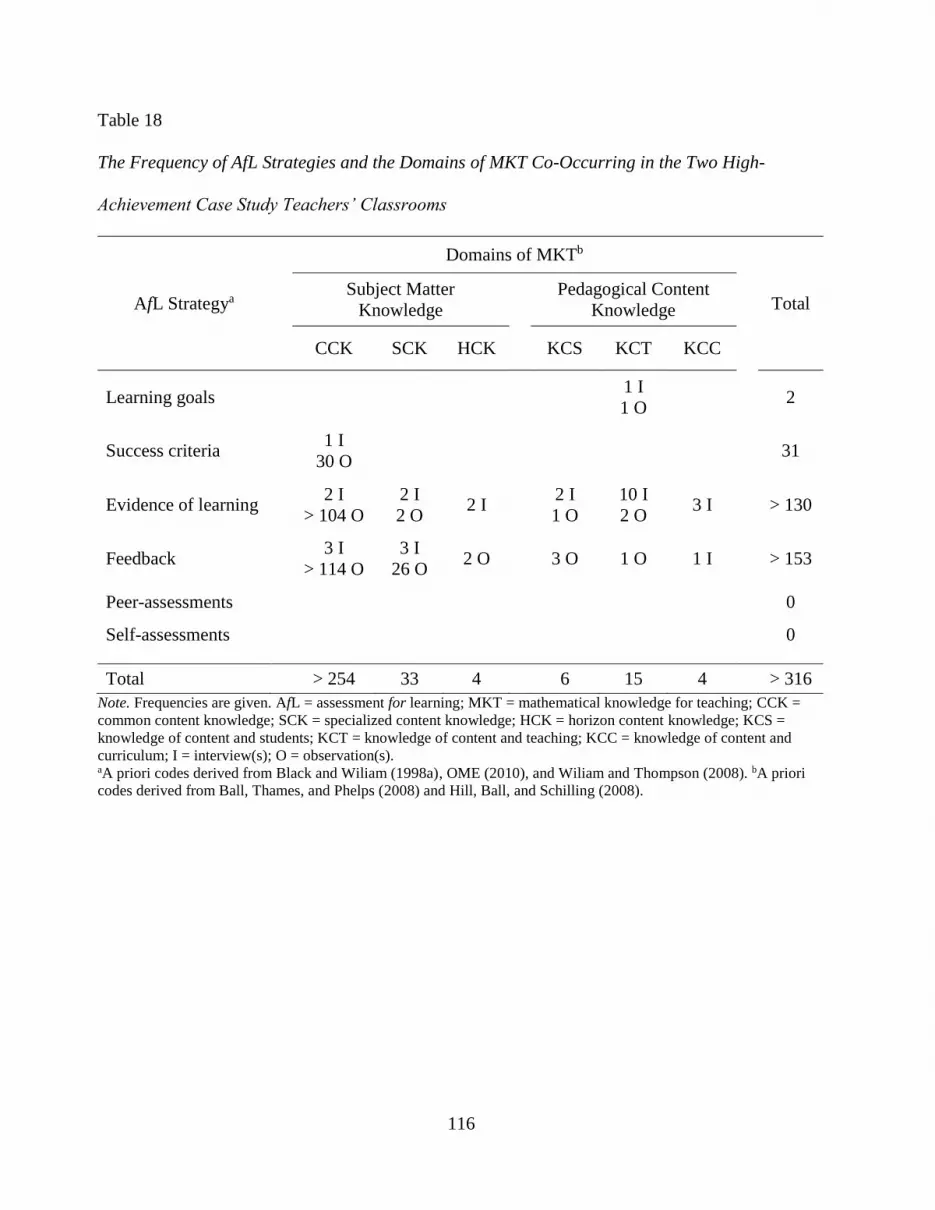
116
Table 18
The Frequency of AfL Strategies and the Domains of MKT Co-Occurring in the Two High-
Achievement Case Study Teachers’ Classrooms
AfL Strategya
Domains of MKTb
Total Subject Matter
Knowledge
Pedagogical Content
Knowledge
CCK SCK HCK KCS KCT KCC
Learning goals 1 I
1 O 2
Success criteria 1 I
30 O 31
Evidence of learning 2 I
> 104 O
2 I
2 O 2 I
2 I
1 O
10 I
2 O 3 I > 130
Feedback 3 I
> 114 O
3 I
26 O 2 O 3 O 1 O 1 I > 153
Peer-assessments 0
Self-assessments 0
Total > 254 33 4 6 15 4 > 316
Note. Frequencies are given. AfL = assessment for learning; MKT = mathematical knowledge for teaching; CCK =
common content knowledge; SCK = specialized content knowledge; HCK = horizon content knowledge; KCS =
knowledge of content and students; KCT = knowledge of content and teaching; KCC = knowledge of content and
curriculum; I = interview(s); O = observation(s). aA priori codes derived from Black and Wiliam (1998a), OME (2010), and Wiliam and Thompson (2008). bA priori
codes derived from Ball, Thames, and Phelps (2008) and Hill, Ball, and Schilling (2008).
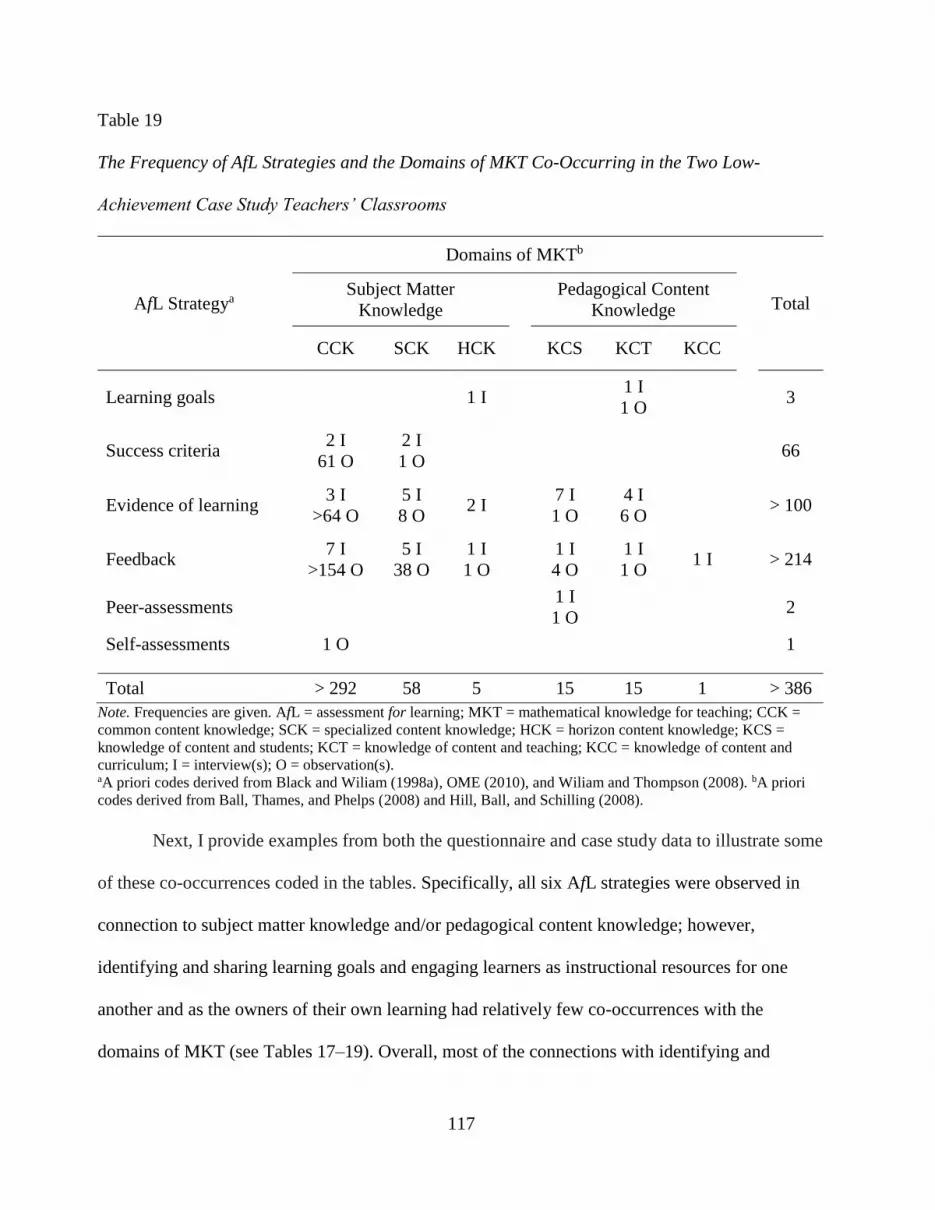
117
Table 19
The Frequency of AfL Strategies and the Domains of MKT Co-Occurring in the Two Low-
Achievement Case Study Teachers’ Classrooms
AfL Strategya
Domains of MKTb
Total Subject Matter
Knowledge
Pedagogical Content
Knowledge
CCK SCK HCK KCS KCT KCC
Learning goals 1 I 1 I
1 O 3
Success criteria 2 I
61 O
2 I
1 O 66
Evidence of learning 3 I
>64 O
5 I
8 O 2 I
7 I
1 O
4 I
6 O > 100
Feedback 7 I
>154 O
5 I
38 O
1 I
1 O
1 I
4 O
1 I
1 O 1 I > 214
Peer-assessments 1 I
1 O 2
Self-assessments 1 O 1
Total > 292 58 5 15 15 1 > 386
Note. Frequencies are given. AfL = assessment for learning; MKT = mathematical knowledge for teaching; CCK =
common content knowledge; SCK = specialized content knowledge; HCK = horizon content knowledge; KCS =
knowledge of content and students; KCT = knowledge of content and teaching; KCC = knowledge of content and
curriculum; I = interview(s); O = observation(s). aA priori codes derived from Black and Wiliam (1998a), OME (2010), and Wiliam and Thompson (2008). bA priori
codes derived from Ball, Thames, and Phelps (2008) and Hill, Ball, and Schilling (2008).
Next, I provide examples from both the questionnaire and case study data to illustrate some
of these co-occurrences coded in the tables. Specifically, all six AfL strategies were observed in
connection to subject matter knowledge and/or pedagogical content knowledge; however,
identifying and sharing learning goals and engaging learners as instructional resources for one
another and as the owners of their own learning had relatively few co-occurrences with the
domains of MKT (see Tables 17–19). Overall, most of the connections with identifying and
118
sharing success criteria, engineering effective classroom discussions and tasks that elicit evidence
of learning, and providing feedback that moves learners forward were with CCK, SCK, KCS,
and/or KCT.
Identifying and sharing learning goals. Teachers provided students with learning goals.
These learning goals weakly co-occurred with subject matter knowledge and pedagogical content
knowledge. However, the use of HCK and KCT can support teachers in the structuring and
developing of learning goals for students. As an example, HCK informed Mr. Lewis of a
meaningful order to teach the G9APM learning goals, as this knowledge made him aware of
connections between G9APM topics and topics taught in earlier grades. Mr. Lewis discussed how
familiarity with the curricula documents assisted in knowing what prior knowledge students
brought to class; informing him on what learning goals to focus on at the start of the school year.
While teachers typically start the school year with number sense and algebra, Mr. Lewis started
with measurement and geometry because although volume, area, and perimeter are Grade 9
concepts, “it’s also Grade 8, it’s also Grade 7 so they’ve seen it before, so it’s bringing that
experience from their middle schools and then . . . Grade 9 math doesn’t seem that different at
first” (I2).
Another relevant example included the use of KCT to know learning progressions; this
knowledge helped Ms. Hadwin to “break the [mathematics] problems down to teach it in a way
that students can follow” (I1). Subsequently, during a classroom observation in Ms. Hadwin’s
class, a student commented on how there were two learning goals that day (O4). Ms. Hadwin
stated that since the class struggled earlier with the larger learning goal, she broke it down into two
separate learning goals. As a result, this simplified the success criteria for each learning goal, as
these goals required fewer steps to obtain a solution.

119
Identifying and sharing success criteria. Teachers shared success criteria with students.
The identifying and sharing of success criteria was connected to subject matter knowledge,
specifically CCK and to a much lesser extent with SCK. This is because teachers often implicitly
provided students with success criteria through modelling, or showing exemplars or anchor charts;
and CCK supports teachers with knowing and understanding how to solve curriculum-level
problems. As an example, CCK informed Ms. Hadwin of the mathematical knowledge required to
model how to complete a table of values (O1, O2, O3, O5). Another teacher, Ms. LeBlanc
discussed how the use of anchor charts showed “students different ways to solve the problem”
(I2), and was observed using CCK when she provided students with an anchor chart for solving
problems involving ratios (O3).
SCK was weakly connected to sharing success criteria because teachers seldom explicitly
provided students with success criteria. When it was explicitly provided, this required SCK
because teachers used this knowledge to identify the steps needed to solve a problem. For
example, Ms. LeBlanc mentioned how she routinely gave students a checklist; the checklist was a
general outline of the required steps to solve the problem (I2). Another teacher was observed co-
constructing success criteria with students (Lewis, O5). Co-constructing success criteria required
the teacher to be aware of multiple ways of solving a problem, in order to be able to respond to the
correctness of students’ responses.
Engineering effective classroom discussions and tasks that elicit evidence of learning.
Teachers elicited evidence of learning through asking questions to students. These questions were
provided to students during group and individual work, warm-up activities, class discussions, and
on worksheets. Engineering effective classroom discussions and tasks that elicit evidence of
learning was connected to both subject matter knowledge and pedagogical content knowledge.
120
Under subject matter knowledge, engineering effective classroom discussions and tasks that elicit
evidence of learning most frequently co-occurred with the domain, CCK, and to a much lesser
extent with SCK and HCK. This could be because a large part of questioning requires teachers to
know and understand mathematics vocabulary and how to solve curriculum-level problems.
Teachers use the mathematics vocabulary to ask questions that guide students’ thought-process. As
an example, while taking up homework, Ms. Hadwin asked her class the following prompting
questions, “What does that mean? Does it mean initial point is lower?” (O5). These questions were
to support students with a problem that asked how a graph changes with a change to either the
slope or y-intercept. Through the use of this teacher’s CCK, she posed prompting questions that
led students through the solution path. Another teacher, Ms. LeBlanc, described how she asked a
student prompting questions to support the student in finding their computational error in a
problem that involved the addition of integers (I1). While, another teacher, Mr. Lewis, discussed
the necessity of understanding the mathematics, so as to be able to hear or observe if students are
understanding: “Sometimes there’s an algorithm or sometimes there’s you know sort of I guess
clear cut approaches to doing certain questions, so I’m kind of listening or watching to see you
know how are they approaching a question” (I1).
Despite the few co-occurrences between engineering effective classroom discussions and
tasks that elicit evidence of learning and SCK, teachers require this knowledge to understand
improper and non-routine problem solving approaches and select and/or design assessment
activities. For example, Ms. LeBlanc checked the exit cards students submitted and noted that
students understood how to compare ratios “even though they don’t really write it properly with
the terms and everything” as she had modelled (I2). SCK supported this teacher in understanding
students’ work. Another teacher described the value of the seven mathematical processes (i.e.,

121
problem solving, reasoning and proving, reflecting, selecting tools and computational strategies,
connecting, representing, and communicating [OME, 2005b]) as a “lens to look at the overall
expectations.” And then how using these processes “exposes their [students] thinking and allows
us to truly engage in conversation about their current learning and understanding” (A022, Q).
Exposing students’ thinking through the mathematical processes requires SCK because teachers
need to select and/or design assessment activities that support students’ entry into these activities
(i.e., responsive to students learning needs) and student engagement in these processes, and allow
students space to illustrate their depth of knowledge. Additionally, with respect to HCK, this
knowledge can support teacher awareness of students’ expected prior mathematics learning in
order to inform the appropriate level of assessment activities to use with students. For example,
Mr. Lewis discussed how he used a parallel task to ensure all students would be challenged at their
ability level because he knew some students had previously learnt the concept (I2).
Under pedagogical content knowledge, engineering effective classroom discussions and
tasks that elicit evidence of learning co-occurred weakly with KCS, KCT, and KCC. However, the
use of KCS can support teachers in determining essential questions to ask students or activities to
use based on common misconceptions. For example, Mr. Hayes discussed a strategy he called
Perfect Mistakes; this strategy involved drawing students’ attention to the mistakes they are likely
to make (I1). During one of the classroom observations, this teacher used a graphing activity to
show students a common mistake—the mistake of not having the unit squares in a scale represent
a constant value (O2). Another teacher, Mr. Lewis, discussed how he identified misconceptions
and then developed questions to illustrate counter examples, to expose and then undo students’
misconceptions.

122
I specifically design questions so that its gets them to undo that [misconception]. . . . like
they [students] always think that if you split something in two that means you’re splitting
something in half, but not necessarily. So sometimes if you split you know something
that’s 100 metres it could be 40 and 60, so you design questions and you provide them that
feedback to say hey you know what it’s not always half. (I1)
Second, KCS can support teachers in developing questions or activities on concepts that students
would likely find difficult, as KCS provides teachers with knowledge of how students would likely
approach concepts. Ms. LeBlanc discussed how students struggled with communicating their
reasoning, and how she designed a worksheet that had students write out the mathematics steps
used in order to provide students with additional practice in this skill (I2). Lastly, Mr. Lewis
discussed how he would use information gained about KCS to inform how he would do things
differently next time (I2). Specifically, this teacher scaffolded the creation of the rate of change
formula for his students. The teacher talked about how next time he would write the ordered pairs
on the board differently; he would write the larger ordered pair on top, so it would be easier for
students to see that they need to subtract the y’s and subtract the x’s to get the rate of change
formula. In this example, KCS informed the teacher on how to better elicit prior knowledge.
Teachers need KCT. This knowledge can support teachers in determining questions to ask
students or activities to use when they consider how topics are broken into cognitively appropriate
and manageable learning progressions. For example, Mr. Hayes noted the purpose of an activity
observed—the input/output activity was to help students understand that the x and y values are
related (O4). He discussed how in the next several lessons he would fade out the use of the terms,
input and output, and would gradually replace these with just x and y. Mr. Hayes considered the
mathematics connections he wanted his students to make and the activities that would support this
123
learning progression. Additionally, KCT can inform the assessment activities that teachers select,
design, and/or modify. Teachers chose problems that increased in difficulty and were meaningful.
As an example, Mr. Hayes discussed the designing of activities to allow students to enter the
problem at their ability level:
It is sort of always leaving the task open so that students, who are getting it, can continue to
be challenged. And even the students who are a little weaker in their skills they are still
achieving success just with simpler questions. (I2)
He provided an example of an open task he had used: the building of linear growth patterns using
algebra tiles. He noted how he would increase the difficulty of this activity for some students in
later lessons as they became proficient with the concept (e.g., create own patterns, use the same
colour algebra tiles for the variable and constant term). Another teacher, Mr. Lewis, connected
mathematics to social justice issues (O4). He introduced disproportionate relationships using
regional police data on police carding. As well, teachers provided hints and paired questions to
give students the opportunity to apply the feedback immediately to a similar problem. Lastly, KCC
can inform teachers of instructional resources to use to engineer effective classroom discussions
and tasks that elicit evidence of learning. As an example, Ms. Hadwin discussed how she used a
range of resources to find relevant and appropriate ability level activities for her students (I2).
Providing feedback that moves learners forward. Teachers routinely checked students’
progress and provided individualized and/or entire class feedback during guided practice, group
practice, and on assignments. Providing feedback that moves learners forward was connected to
both subject matter knowledge and pedagogical content knowledge, but weakly with the latter.
Under subject matter knowledge, providing feedback most frequently co-occurred with the
domain, CCK, SCK, and to a much lesser extent with HCK. Teachers use CCK when they provide
124
feedback on students’ solutions, as teachers need to know and understand the mathematics
vocabulary and how to solve curriculum-level problems. As explained by Ms. LeBlanc, teachers
need to be able to identify “what’s wrong, what went wrong, what should be done, what you
should pay attention to, what’s missing” (I2). For example, in Ms. Hadwin’s classroom, students
were asked to determine the rate of change given its graph; the following two points, (50, 250) and
(20, 100), were labelled on the graph (O3). When the teacher asked, “How much did it go up by?”,
one student responded with 30, 150. This student saw the ordered pairs (50, 250) and (20, 100) as
one quantity, i.e., the numbers 50, 250 and 20, 100. Ms. Hadwin immediately recognized the
student’s misconception and provided descriptive feedback. This feedback required the teacher to
have an understanding of the curriculum-level mathematics in order to quickly respond.
SCK can support teachers in providing feedback when students use non-routine methods,
as SCK includes the knowledge of multiple methods to solve problems and flexible mathematics
knowledge. Students may use different methods to solve a problem, and teachers need to be able to
quickly assess for appropriateness; identify any errors, illogical reasoning, or misconceptions; and
provide constructive feedback to correct errors and reveal misconceptions. For example, Ms.
LeBlanc discussed how one of her students solved a ratio problem using a method other then the
one she instructed students to use (O5). She needed to quickly determine if their method would
also always work in order to provide feedback. Ms. LeBlanc provided a further example when she
identified an error multiple students made in solving a proportion problem:
Most of you [the students] did not figure out what are the parts because the number of
times that they lose, the number of games that they lose is not given, and then they only use
the four, but that is the number of wins . . . . So if you look at four, “Win four games out of
seven, so what is four? Four is what?” And then they say “Oh it is the number of games
125
that they win.” Okay, “So then what is seven?” Some of them say “Okay it’s the total.”. . . .
And then I say, “Now if they play seven games, they win four out of seven, how many
times do they lose?” And them some of them will say now, “Oh three times.” So now three
times, it is three that we have to use not four. Cause most of them use four to calculate so it
is four times four, 16. So they do the process correctly but not with the right information.
(I2)
SCK supported this teacher in knowing that the students understand the mathematics procedure,
but were just not reading the question carefully. Lastly, providing feedback that moves learners
forward required SCK, for teachers to model how to solve and communicate solutions. This
included the regular use of think-alouds to model mathematical processes. For example, when
students were calculating the perimeter of composite figures and not obtaining the correct answer,
Mr. Lewis noted how he broke the problem down and modelled the thought process, this included
asking questions such as, “What shape is this? What shape is that? And then, how do we find the
perimeter of the whole thing?” (I1). Additionally, with respect to HCK, this knowledge can
support teacher awareness of students’ expected prior mathematics learning in order to inform
feedback. For example, Ms. LeBlanc discussed how she identified gaps in her students’
understandings and how this informed feedback and next steps with those students (I1).
Under pedagogical content knowledge, providing feedback that moves learners forward co-
occurred weakly with KCS, KCT, and KCC. The relatively few co-occurrences can help to explain
some of the simple examples of teacher feedback, as pedagogical content knowledge can increase
feedback richness. KCS can inform teachers of what to emphasize in their feedback, as teachers
with this knowledge are aware of common student mistakes and misconceptions. For example, Ms.
LeBlanc shared a common mistake with students (O1)—forgetting to use parentheses when

126
substituting a number in for a variable, e.g., x = 8 in 3x + 5 and calculating 38 + 5 instead of 3(8) +
5. As well, KCT can inform feedback by providing an awareness of instructional strategies. For
example, one instructional strategy is the use of examples in contexts that students will find more
relatable and/or the use of simpler values. As Mr. Lewis described:
Students had trouble figuring out how many dollars, like if I said, “It was $63 for six hours
of work, how much is one hour of work?” And they just didn’t know how to do it, so then I
will just quickly take to pens, and be like, “These two pens are $20, how much is one?”
And they’ll tell me 10. “Well how did you do that?” (I2)
KCT informed the teacher of how to rephrase the problem so that it was easier to understand.
Lastly, KCC can support teacher awareness of multiple resources that provide feedback. For
example, Mr. Hayes discussed how he used exemplars to model communication. In this activity,
students discussed why one solution received a particular achievement level or figured out what
method was used to solve a problem.
I’ll give them exemplars . . . . And I have the students really look at the communication
aspect behind it, and I will have students discuss why is this a Level 1 or could you learn
from this. . . . I say this answer is right, if you look at this, but I want you and your partner
to figure out how they got the answer. So the students are looking at these floating
numbers, etc., and they're talking. The whole point of that is to emphasize the importance
that when you do the math you got to really communicate. . . . There's order to answering
questions, you need to use labels, we have rules, no floating numbers, dividing the page up,
showing formulas/work, circling your answer, concluding sentence. (I1)
KCC supported this teacher in sharing feedback on how to write proper and clear solutions.

127
Engaging learners as instructional resources for one another. The explicit use of peer-
assessments was not a regular practice, such that this AfL strategy practice rarely co-occurred with
MKT. It was only weakly connected to pedagogical content knowledge, specifically KCS. This
knowledge typically informs teachers of what concepts students will likely find difficult. Mr.
Lewis discussed that because of his awareness that a lot of students struggle with algebra, he had
students sit side-by-side so that they could support one another (I1). Subsequently in this
classroom, the following feedback was heard between two students on how to solve a problem,
“Yeah, here you have to minus . . . and then you just add the tax to the sale price” (O1).
Engaging learners as the owners of their own learning. Self-assessments were not a
routine practice. When observed, it was weakly connected to subject matter knowledge,
specifically, CCK. This knowledge is important in providing students with possible examples they
could use in their self-assessments. For example, Ms. LeBlanc asked her students to reflect on
their recent test, and write down one thing they did well, and two things they needed to improve
(O4). This teacher used CCK to provide students with an example of what they could write, “I
know that to add like terms, the term needs to have the same variable and exponent.”
Summary. Combined, results from the questionnaire and case studies indicate that across
school-achievement results, engineering effective classroom discussions and tasks that elicit
evidence of learning and providing feedback that moves learners forward were the AfL strategies
most predominantly identified concurrently with subject matter knowledge (specifically, CCK and
SCK) and to a lesser extent pedagogical content knowledge (specifically, KCS and KCT). Further,
the AfL strategy, identifying and sharing success criteria, was primarily connected to subject
matter knowledge (specifically CCK). This MKT supported the teacher with responsive AfL
practices. As the AfL strategies, identifying and sharing learning goals and engaging learners as

128
instructional resources for one another and as the owners of their own learning were observed less
often in the case studies, there were much fewer opportunities to observe the domains of MKT in
relation to these strategies. While all AfL strategies were not strongly connected to all domains of
MKT, likely due to the frequency of implementation of these practices and limitations with the
questionnaire instrument, it cannot be concluded that these AfL strategies do not require these
domains of MKT. Overall the evidence suggests that MKT provided teachers with supportive
knowledge to more effectively incorporate AfL strategies into their teaching practice and there was
not much difference across schools-achievement results with respect to this relationship.
129
Chapter 5
Discussion
The purpose of this multi-method study was to provide an exploration of the forms of
teaching and assessment occurring in Grade 9 applied mathematics (G9APM) classrooms.
Specifically, this study explored G9APM teachers’ uses of assessment for learning (AfL) strategies,
and the extent that there exist systematic differences in the integration of these strategies across
classrooms of varying student-achievement results. With respect to this overarching purpose, three
research questions guided this study: (a) What is the nature of teachers’ AfL strategies? (b) What
are the relationships between teachers’ AfL strategies and AfL conceptions? and (c) What are the
relationships between teachers’ AfL strategies and mathematical knowledge for teaching (MKT)?
AfL is responsive to students’ learning needs. It “is part of everyday practice by students,
teachers and peers that seeks, reflects upon and responds to information from dialogue,
demonstration and observation in ways that enhance ongoing learning” (Klenowski, 2009, p. 264).
For example, AfL practices can include informal questioning between teacher-student and student-
student to gauge levels of students’ understandings, exemplars or rubrics to develop a shared
understanding of success criteria, or student collaboration on a task where students are providing
peer-feedback that supports not only their peers but also their own learning. AfL practices can
develop students’ metacognitive skills, focus their learning, and extend their thinking (Earl, 2013;
Shepard, 2008). Research further suggests that struggling students may be the strongest
beneficiaries of AfL (Black & Wiliam, 1998a; Stiggins, 2002, 2005). However, the benefits of AfL
practices are not prevalent across all classrooms due to variability in the quality of implementation
(e.g., Klenowski, 2009; Wylie & Lyon, 2015). Each AfL strategy likely has critical features to
adhere to in order to ensure the fidelity of implementation (Wylie & Lyon, 2015). For example,
130
with identifying and sharing learning goals and success criteria, it is important for teachers to
implement this strategy such that it enables students “to internalise the [success] criteria so they
can apply them to their own work” (Wylie & Lyon, 2015, p. 141).
The province of Ontario has identified mathematics education as a central focus to improve
students’ educational outcomes (Ontario Ministry of Education [OME], 2014). Yet over half the
students enrolled in G9APM continue to perform significantly below the provincial standard on
the Education and Quality and Accountability Office (EQAO) Grade 9 Assessment of
Mathematics (EQAO, 2016c). This is a real concern as mathematics is increasingly important
(e.g., Gottfried, Marcoulides, Gottfried, & Oliver, 2013; Organisation for Economic Co-operation
and Development, 2013b) and students in G9APM deserve the opportunity to develop the related
skills and knowledge required for them to be successful after graduation. Studies exploring
secondary mathematics teachers indicate that teachers implement AfL strategies along a
continuum, from no implementation to deep integration in the classroom (e.g., Chen, Crockett,
Namikawa, Zilimu, & Lee, 2012; Noonan & Duncan, 2005; Panizzon & Pegg, 2008; Sato, Wei, &
Darling-Hammond, 2008; Suurtamm & Koch, 2014; Suurtamm, Koch, & Arden, 2010; Wylie &
Lyon, 2015). Further, only a couple of the studies situated in secondary mathematics classrooms
distinguished between AfL practices that are effective or frequently used with students of varying
ability levels (Chen et al., 2012; Suurtamm et al., 2010). It is important to explore the degree to
which AfL is implemented in G9APM classrooms in Ontario due to its potential to positively
support teaching, assessment, and learning. As well, two important factors to explore that may be
related to teachers’ uses of AfL strategies are teachers’ AfL conceptions and MKT, as these are
teacher factors that can be supported and developed through professional development.

131
Quantitative and qualitative data sources were used to explore the nature of teachers’ AfL
strategies and their relationships to AfL conceptions and MKT. Across Southern Ontario, teachers
of G9APM participated in a questionnaire (N = 131) and/or case study (N = 4). To provide group
comparison, teachers were grouped by their school-achievement results (high, average, or low).
Approximately one half of the teachers who participated in the questionnaire taught at schools
with average school-achievement results in G9APM, a third with high school-achievement results,
and the remainder with low school-achievement results. For the teachers who participated in the
case studies, two teachers taught at schools with high school-achievement results in G9APM and
two teachers taught at schools with low school-achievement results. Each case study included two
interviews, five classroom observations, and school-level data from EQAO student questionnaires.
Data analyses varied across the methods used. Quantitative data were analyzed through descriptive
and inferential statistics and correlational-based analyses. Qualitative data were largely analyzed
deductively using a set of a priori categories derived from previous research (Ball, Thames, &
Phelps, 2008; Black & Wiliam, 1998a; Hill, Ball, & Schilling, 2008; Klenowski, 2009; Marshall &
Drummond, 2006; OME, 2010; Wiliam & Thompson, 2008) and two of the questions, specifically
“How does the mathematics curriculum hinder your ability to implement AfL practices?” and
“What challenges have you found implementing AfL in your class?” on the questionnaire and in
the initial interview were analyzed using an inductive thematic analysis approach (Corbin &
Strauss, 2008). Through the triangulation of questionnaire and case study data, research findings
captured the nature of AfL strategies in G9APM classrooms and the supports and challenges in
integrating AfL strategies.

132
Key Research Findings
At the beginning of this study, I hypothesized that variations in AfL integration might be
associated with differences in student achievement; however, my research findings highlighted a
more systematic issue. AfL strategies are not deeply integrated nor routinely implemented across
G9APM classrooms in Southern Ontario, irrespective of school-achievement results, despite its
recognition in the provincial assessment and evaluation document, Growing Success: Assessment,
Evaluation and Reporting in Ontario Schools (OME, 2010), mathematics curriculum (OME,
2005b), and its focus in multiple professional development and collaborative inquiries (e.g.,
DeLuca, Klinger, Pyper, & Woods, 2015; Suurtamm & Koch, 2014).
Teachers’ use of AfL strategies. Teachers of G9APM did not frequently implement all six
AfL strategies. Engineering effective classroom discussions and tasks that elicit evidence of
learning was the most frequently implemented AfL strategy as reported on the questionnaire and
observed in the classrooms, followed by providing feedback that moves learners forward and then
identifying and sharing success criteria. In contrast, identifying and sharing learning goals, and
engaging learners as instructional resources for one another and as the owners of their own
learning were not routinely implemented. This finding is consistent with the AfL literature, as the
majority of the empirical studies in secondary mathematics report on teachers’ AfL practices in
order to elicit evidence of learning (Chen et al., 2012; Panizzon & Pegg, 2008; Sato et al., 2008;
Suurtamm et al., 2010; Wylie & Lyon, 2015). As noted by Wylie and Lyon, (2015), “this [finding]
is not necessarily surprising since classroom questioning is among the most observable aspects of
formative assessment and a practice that is likely to occur during most lessons” (p. 156). Further,
these practices require less change to teachers’ current assessment practices compared to practices
within the other AfL strategies (Wylie & Lyon, 2015). The strategy, engineering effective
133
classroom discussions and tasks that elicit evidence of learning, often included AfL practices that
reflected the letter of AfL. Practices routinely involved the use of class questioning, whiteboards,
exit cards, and individual and/or pair work on worksheets with teacher walking around and
checking students’ understandings.
The next most commonly reported and observed AfL strategy was providing feedback that
moves learners forward and this AfL practice commonly reflected the letter of AfL. However, few
empirical studies within the secondary mathematics context report on formative teachers’
feedback; this is likely because the feedback mathematics teachers tend to provide is evaluative in
nature, not formative, which is more aligned with traditional mathematics teaching and assessment
(Li, Yin, Ruiz-Primo, & Morozov, 2011). For example, secondary mathematics teachers in Wylie
and Lyon’s (2015) study commonly provided feedback that was “non-formative … or unlikely to
produce a formative use of the feedback” (p. 153). Nevertheless, the inclusion of classroom
observations in the current study documented that teachers were frequently observed asking
prompting questions and providing descriptive feedback on common misconceptions, as well as
occasionally initiating feedback and questioning dialogues with students, as the teacher walked
around the classroom and checked students’ work. However, a common challenged reported with
providing descriptive feedback was a lack of time, and this reasoning has been noted elsewhere
(e.g., Wylie & Lyon, 2015).
The next most commonly reported and observed AfL strategy was implicitly identifying
and sharing success criteria through the use of modelling or exemplars and this AfL practice
routinely reflected the letter of AfL. Success criteria were typically not made explicit for students.
However, in order for success criteria to be effective, it is important for students to understand and
internalize the success criteria prior to completing the associated assessment (Wylie & Lyon,

134
2015). Lastly, in comparison to engineering effective classroom discussions and tasks that elicit
evidence of learning, providing feedback that moves learners forward, and identifying and sharing
success criteria, far fewer teachers reported or were observed implementing AfL practices that
involved identifying and sharing learning goals, and engaging learners as instructional resources
for one another and as the owners of their own learning. While it is agreed that effective teaching
of mathematics includes clear learning goals for students (National Council of Teachers of
Mathematics, 2014), there are contrasting views on the effectiveness of an inquiry-orientation
towards instruction (Goos, 2004; Kirschner, Sweller, & Clark, 2006). An inquiry-orientation does
not include the sharing of learning goals, as in this instructional approach students engage in
problem solving to develop these new understandings. Also, when teachers engaged students as
instructional resources for one another, there was a greater focus on group and/or partner work
instead of the explicit use of peer-feedback, similar to findings reported by Wylie and Lyon
(2015). The six AfL strategies were not found to be routinely implemented in G9APM classrooms.
Suurtamm and Koch (2014) suggest this occurs because current “assessment practices [including
AfL practices] may be unfamiliar to teachers and may test their deeply held notions about both the
purpose of assessment and the nature of mathematics teaching and learning (Ball, 2003; Black &
Wiliam, 1998; Shepard 2001)” (p. 265).
When AfL practices were implemented, the practices tended to reflect the letter of AfL.
This result is not surprising as mathematics teaching and learning routinely entails a learning
culture in which the teacher is in explicit control, initiating and directing instruction (Jacobs et al.,
2006; Stipek, Givvin, Salmon, & MacGyvers, 2001). With AfL practices that reflect the letter of
AfL, teachers set the learning goals and success criteria, decided when and for how long to engage
in each task, and provided feedback. As students were not highly or deeply involved in the AfL
135
practices, the potential benefits of AfL strategies were often not realized in this study. This finding
parallels previous reported findings (e.g., Jonsson, Lundahl, & Holmgren, 2015; Klenowski, 2009;
Marshall & Drummond, 2006; Wylie & Lyon, 2015). For example, Wylie and Lyon (2015) found
that when secondary teachers implemented AfL practices, the critical features of the AfL strategy
were not always adhered too, such that the practices were no longer formative in nature. Further, it
is suggested that the high frequency of AfL practices reflecting the letter of AfL may be the result
of students’ resistance to engage in student- and teacher-centred AfL practices (Chapman, DeLuca,
& Klinger, 2015; Jonsson et al., 2015). Additionally, my research suggests that teachers’ AfL
practices were partly due to their AfL conceptions.
Relationship between teachers’ AfL strategies and AfL conceptions. Teachers of
G9APM consistently demonstrated a teacher-centric conception of AfL. Teachers often described
themselves as central to AfL, such that the purpose of AfL was for them to assess students’ levels
of understanding in order to inform their instruction. These teachers’ AfL conceptions were
limited, as they did not see students as key actors in the gathering, analyzing, or interpreting of
assessment information. Teachers’ AfL conceptions were positively correlated to their AfL
strategies, as both teachers’ AfL strategies and AfL conceptions tended to be teacher-centric. This
is not surprising as we know that teachers’ mathematics beliefs are positively associated to their
instructional practices (e.g., Pajares, 1992; Stipek et al., 2001) and teachers’ AfL conceptions are
connected to their implemented AfL practices (Klinger, DeLuca, & Chapman, 2016).
Teachers’ AfL conceptions and AfL practices provide supporting evidence for the early
stages of the AfL professional learning continuum as described by Klinger and colleagues (2016).
Using this continuum, learning the letter, practicing the letter, responding to the letter, adopting
the spirit, and leading the spirit, the majority of teachers in this study could be classified as being

136
in the beginning stages, within learning and practicing the letter. These teachers were learning the
letter because they often focused their description of AfL on the role of the teacher, with little
emphasis on the student in using assessment information. Consistent with being at the learning the
letter stage, these teachers seemed to be starting to recognize where they already implemented AfL
strategies within their teaching practices. For example, Mr. Lewis agreed that the parallel task
activity he implemented was a form of self-assessment (O2). Teachers also demonstrated AfL
conceptions and AfL practices associated with being at the practicing the letter stage. Teachers
asked questions and reflected on the effective implementation of AfL strategies. As an example,
Ms. LeBlanc (I2) had questions on how to implement success criteria: “How detailed do we want
to give it [success criteria] to the student?” or “How can we help students see the value of it
[success criteria] and then use it for their learning?” Admittedly, these questions were teacher-
centered, highlighting that teachers at this stage were primarily interested in how to use AfL to
inform their instruction. Nevertheless, teachers recognized the benefits of AfL for students; this
was operationalized with teachers providing feedback and then opportunities for students to apply
this feedback to demonstrate their learning.
Relationships between teachers' AfL strategies and MKT. Similar to teachers’ AfL
strategies and AfL conceptions, across school-achievement results, there were no systematic
differences in teachers’ MKT. This finding is consistent with Ma and Klinger (2000), who found a
small teaching approach effect in comparison to student background, socio-economic mean of
school, and disciplinary climate. Further, all of the teachers reported or demonstrated high levels
of MKT. This is likely because teachers trained in Canada have received relatively equal amounts
of instruction in their content area. Teacher education programs in Canada typically require
teachers to have a minimum of four to five years of post-secondary education, and teachers in the
137
intermediate-senior division require a number of university-level courses in their first and second
teaching subjects. For example, consecutive teacher education programs commonly require
teachers in the intermediate-senior division to have five full-year university courses in their first
teaching subject and three full-year university courses in their second teaching subject.
Correspondingly, it is not surprising that teachers instructing secondary mathematics in this study
reported or demonstrated high levels of MKT as it is likely that these teachers received a fair
amount of training in their content area.
Across school-achievement results, teachers’ MKT supported their AfL practices. Table 20
summarizes the evidence from this study connecting the AfL strategies to the domains of MKT.
Specifically, teachers’ subject matter knowledge, and to a lesser extent, pedagogical content
knowledge, frequently co-occurred with three AfL strategies: identifying and sharing success
criteria, engineering effective classroom discussions and tasks that elicit evidence of learning, and
providing feedback that moves learners forward. This knowledge, for example, helped inform
teachers on how to respond to assessment information in order to encourage student-teacher and
student-student dialogue. Specifically, common content knowledge (CCK), specialized content
knowledge (SCK), knowledge of content and students (KCS), and/or knowledge of content and
teaching (KCT) frequently co-occurred with the above named AfL strategies. This knowledge
supported teachers with the modelling of solutions, selecting and designing of assessment
activities, analysing of student work, and providing of feedback. Further all six domains of MKT
were observed in connection to two AfL strategies: engineering effective classroom discussions
and tasks that elicit evidence of learning and providing feedback that moves learners forward.
These connections, identified in Table 20, highlight how the domains of MKT support responsive
AfL practices.
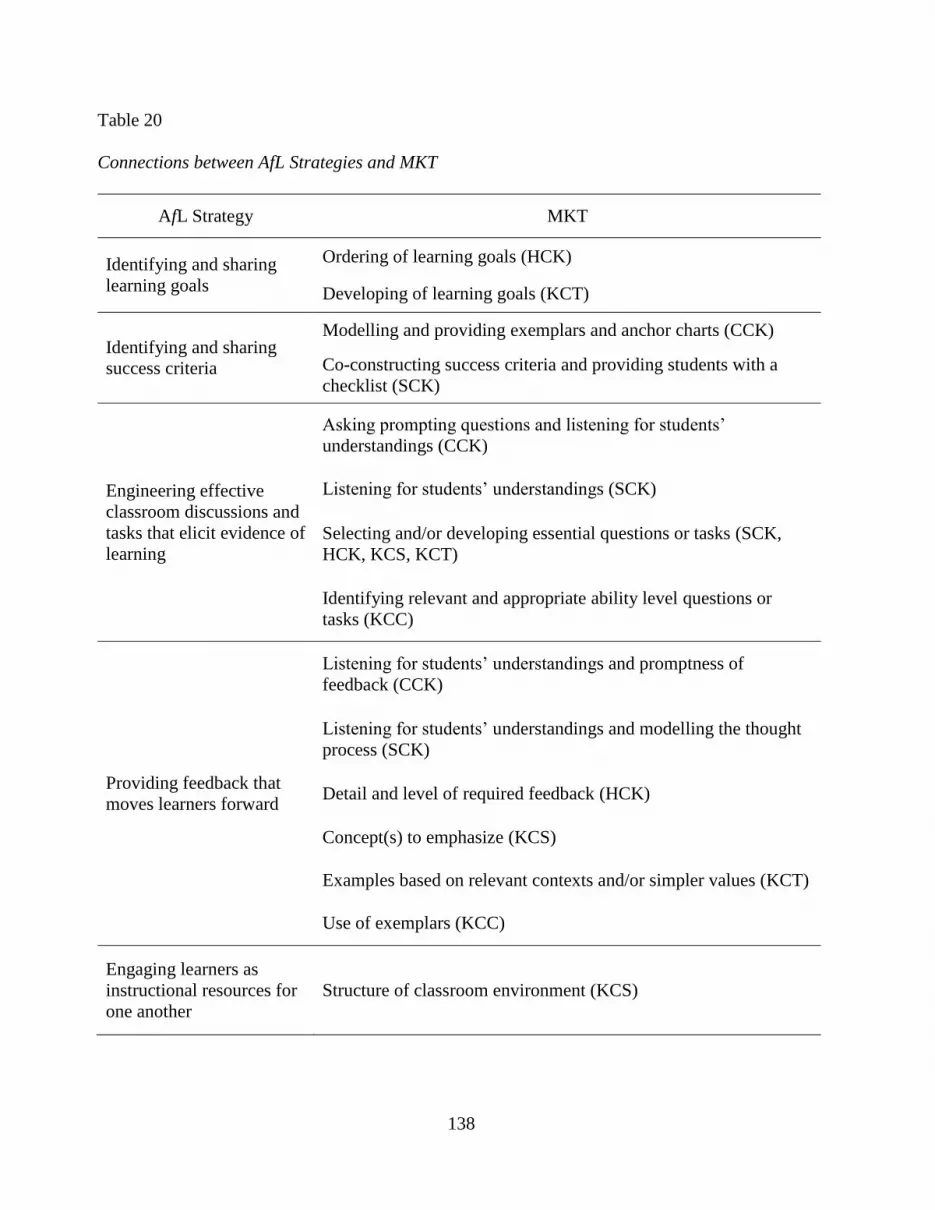
138
Table 20
Connections between AfL Strategies and MKT
AfL Strategy MKT
Identifying and sharing
learning goals
Ordering of learning goals (HCK)
Developing of learning goals (KCT)
Identifying and sharing
success criteria
Modelling and providing exemplars and anchor charts (CCK)
Co-constructing success criteria and providing students with a
checklist (SCK)
Engineering effective
classroom discussions and
tasks that elicit evidence of
learning
Asking prompting questions and listening for students’
understandings (CCK)
Listening for students’ understandings (SCK)
Selecting and/or developing essential questions or tasks (SCK,
HCK, KCS, KCT)
Identifying relevant and appropriate ability level questions or
tasks (KCC)
Providing feedback that
moves learners forward
Listening for students’ understandings and promptness of
feedback (CCK)
Listening for students’ understandings and modelling the thought
process (SCK)
Detail and level of required feedback (HCK)
Concept(s) to emphasize (KCS)
Examples based on relevant contexts and/or simpler values (KCT)
Use of exemplars (KCC)
Engaging learners as
instructional resources for
one another
Structure of classroom environment (KCS)
139
Engaging learners as the
owners of their own
learning
Provide examples (CCK)
Note. AfL = assessment for learning; MKT = mathematical knowledge for teaching; CCK = common content
knowledge; SCK = specialized content knowledge; HCK = horizon content knowledge; KCS = knowledge of content
and students; KCT = knowledge of content and teaching; KCC = knowledge of content and curriculum.
The fewer co-occurrences of pedagogical content knowledge (KCS, KCT, and knowledge
of content and curriculum [KCC]) with the AfL strategies suggest that case study teachers were not
routinely using this knowledge when implementing AfL practices. Thus, while teachers
demonstrated a high level of MKT, their pedagogical content knowledge was not fully used in
supporting AfL strategies. This finding may partially explain the high frequency of AfL practices
reflecting the letter of AfL observed, as case study teachers did not often use their pedagogical
content knowledge to guide their assessment practices. My findings suggest there is a need to
support teachers in using their pedagogical content knowledge in order to increase the
implementation of AfL practices that reflect the spirit of AfL. Further, in order to incorporate AfL
practices reflecting the spirit of AfL, teachers need to be willing to take instructional risks, and
teachers’ confidence in their mathematics knowledge supports their risk taking (Suurtamm, 2004).
Increases in the use of teachers’ pedagogical content knowledge can support increased flexibility
and responsiveness in classroom assessment practices, resulting in a joint ownership of learning
between teacher and students. This conclusion is consistent with Bray (2011) who found that
teachers’ pedagogical content knowledge shaped the quality of their responses. “Knowledge and
beliefs interact in informing teachers’ behaviours, and therefore, both need to be targeted to equip
teachers with the inclination and the toolkit needed for structuring mathematically rich
environments” (Charalambous, 2015, p. 443). Similarly, in my study teachers’ AfL conceptions
influenced their predisposition toward AfL and their MKT influenced the quality of their AfL
practices.

140
Limitations
While findings from this research are valuable to advocates of AfL when considering how
to best support educators in its integration, there were limitations that may have reduced the
potential contributions of the research. These limitations are centred around the data sources,
conception of assessment as learning (AaL), recruitment method, achievement measures,
questionnaire instrument, classroom observations, and qualitative data analyses. Data sources
focused on teachers’ actions and perspectives with the exception of the EQAO student
questionnaires that included students’ perspectives. Exploring students’ perspectives on the use of
AfL practices will likely help to understand more deeply the extent to which AfL practices
reflecting the spirit of AfL were implemented.
Ontario’s assessment and evaluation document, Growing success: Assessment, evaluation
and reporting in Ontario schools (OME, 2010), includes peer- and self-assessments when
discussing AaL practices. Hence it is possible that some teachers when asked to discuss important
aspects of AfL and AfL practices did not include the use of peer- and self-assessments. If so, the
nature of teachers’ AfL strategies and teachers’ AfL conceptions includes more everyday practices
by students than reported in this study.
Teachers from 16 school boards and at three Ontario Association for Mathematics
Education conferences were invited to complete the questionnaire, yet a relatively small sample of
teachers completed the questionnaire. The recruitment of teachers to participate in the
questionnaire at three mathematic conferences likely did not provide a representative sample of
teachers who have taught G9APM since teachers individually choose to attend these conferences.
This may have led to biased research findings; for example, this sample could have resulted in
findings that overestimated the use of AfL strategies or higher levels of MKT than average across
141
teachers of G9APM. If so, the actual implementation of AfL in G9APM classrooms may be even
less than found in this study.
School-achievement results were either determined by a school’s average EQAO result for
students in G9APM across five years (2009–2014) of data or a self-reported measure. Data
analyses examining classification accuracy indicated that this self-reported achievement measure
was not a reliable proxy. This can partly be explained because a school’s average EQAO result is
not directly linked to a teacher participating in this study. A school may have more than one
teacher teaching the G9APM course, and a teacher participating in this study may not have taught
the G9APM course for the past five years at their school. However, the school-achievement results
can provide some context to the research findings.
The structure of the questionnaire instrument may have led to biased research findings. The
questionnaire included self-reported rating measures on AfL practices and MKT. For example, two
quantitative questions measured teachers’ perceived uses of AfL practices using a 5-point scale. To
offset the limitations of these data, the questionnaire included a qualitative question to obtain
examples of the frequently used AfL practices. This gave context to interpret the degree of AfL
implementation. Two of the quantitative questions on the questionnaire contained multiple items
that provided insight into teachers’ MKT. As a validated instrument to measure secondary
teachers’ MKT was not used; it is possible that the MKT measure did not discriminate amongst
levels of MKT, as all teachers were found to report high levels of MKT. Further, there was one
qualitative question on the questionnaire that connected AfL strategies to MKT through asking
teachers how the mathematics curriculum supported their ability to implement AfL practices. This
question could have been strengthened by explicitly asking about the role of subject matter
knowledge and pedagogical content knowledge in supporting AfL practices. Additionally, the last
142
two demographic questions on the questionnaire, specifically regarding teachers’ advanced
educational training and professional development, did not have a “not applicable” option. If a
teacher did not respond to these questions, they were marked as missing data; however, it was not
known whether the teacher skipped one or both of these questions or if they had purposely left one
or both blank because it was not applicable. Nevertheless, this uncertainty in how a teacher
responded corresponds to very few questionnaire participants, as only 11% of all the questionnaire
participants left these questions blank. Additionally, 8% of all the questionnaire participants left
the earlier demographic and the qualitative questions blank, thus it is likely that only 3% of the
questionnaire participants purposely left these last two demographic questions blank because they
were not applicable.
The classroom observations were one of the data sources used to provide evidence for the
co-occurrence of the AfL strategies and the domains of MKT. As the classroom observations were
not video recorded, it is likely that not all instances of the use of MKT were captured in the
research findings. The research findings could underestimate the connections between the AfL
strategies and the domains of MKT. Lastly, a single researcher completed the qualitative analyses
and while it is generally preferable to have another researcher independently analyse qualitative
data, the data were analyzed under the supervision of a doctoral committee. As well, the use of
multiple methods supported the accuracy of findings through triangulation.
Implications
Educational researchers continue to support the tenets of AfL. Teachers participate in
teacher-directed professional learning communities, with discussions driven by teachers’
assessment inquiries (e.g., DeLuca et al., 2015; Suurtamm & Koch, 2014). Suurtamm and Koch
(2014) argued that in order to encourage positive changes in teachers’ assessment practices,
143
teachers must be supported in their conceptual, pedagogical, cultural, and political assessment
dilemmas. This is because current AfL practices may contradict their own assessment beliefs;
beliefs held by other teachers, administrators, parents, or students; or beliefs stated in provincial,
district, or school policies (Suurtamm & Koch, 2014). Further, Bennett (2011) noted, “how tightly
linked formative assessment must be to any given curriculum is unresolved” (p. 16) in order to
support teachers with the domain specific knowledge required for the effective implementation of
AfL strategies. Building on these previous findings, my research suggests the potential of AfL
practices are not yet fully realized in classrooms. At the same time, my research supports the value
of domain specific knowledge in the effective implementation of AfL strategies, and identifies
potential opportunities on how to better support teachers in integrating AfL into their instructional
practice.
Domain specific knowledge supported the mathematics teachers in this study with
implementing effective AfL practices. Specifically, my research connected teachers’ MKT to the
AfL strategies. This relationship illustrated the link between the quality of these strategies to
teachers’ subject matter and pedagogical content knowledge. Similar to Wylie and Lyon (2015),
my research found that teachers may need pedagogical support with implementing the critical
features of AfL strategies. For example, “professional development programmes should focus on
the quality of the learning intentions and the use of success criteria, rather than simply encouraging
teachers to make a statement at the start of the class” (Wylie & Lyon, 2015, p. 157). Furthermore, I
have illustrated that critical features of AfL strategies, such as understanding common student
misconceptions, are supported with MKT. In this study, MKT, especially pedagogical content
knowledge within MKT, supported teachers in implementing AfL practices reflecting the spirit of
AfL (see Table 20). As an example, MKT supported teachers in this study with knowing what
144
questions to ask in order to uncover student thinking and engage students in dialogue. Also, while
not frequently observed in this study, MKT can inform how teachers engage learners as
instructional resources for one another and as the owners of their own learning. Supporting
teachers in their use of MKT can result in supporting the spirit of AfL, as evidenced by the
connections between the two constructs. Thus professional resources in implementing AfL
strategies need to be considered within a specific domain.
While we know students of varying abilities approach tasks differently (e.g., Dunn, 2004),
pedagogical content knowledge, as currently defined in MKT (Ball et al., 2008; Hill et al., 2008),
does not include this knowledge. The ability levels of students need to be an explicit consideration
in KCS within MKT, as this would help make clear the importance of this factor when considering
how students will likely approach and interpret a mathematical idea. The expanded KCS definition
would also highlight the importance of this factor when integrating AfL practices into instruction.
In this study teachers struggled to implement AfL strategies that engaged all students (see also
Klinger et al., 2013) and as one teacher noted, “for certain students, these [AfL] practices work
very well because students are receptive to the practices” (A031, Q), suggesting that AfL practices
need to be tailored to students. For students who struggle in mathematics, AfL practices may need
to look different. Teachers require an understanding of how to apply their MKT across students’
ability levels and this knowledge needs to be added to how KCS is defined within MKT.
Teacher-directed professional learning communities that include an explicit focus on
building teacher capacity in MKT could support mathematics teachers who instruct students across
a range of ability levels, as well as in integrating the spirit of AfL. Such communities could
provide teachers with direction on how to best support students in identifying their strengths and

145
weaknesses, engaging in dialogue to reveal and extend their thinking, and responding to their
assessment data.
Future Research
While it is clear that teachers require support in integrating the spirit of AfL, more research
is needed to understand how to integrate these AfL practices with students who struggle in
mathematics and the extent of the relationship between teachers’ AfL strategies and MKT. My
research recommendations focus on exploring these aspects. First, future research needs to explore
how the spirit of AfL looks with students who struggle in mathematics. For example, is the
structure required for peer-assessments when teaching students who have a strong grasp of
mathematics similar to the structure required for peer-assessments when teaching students who
struggle in mathematics? How can students who struggle in mathematics be effectively involved in
the AfL practices?
Second, future research needs to develop a broader instrument to measure secondary
mathematics teachers’ MKT. Current instruments measure elementary teachers MKT (Hill et al.,
2008) and middle- and high-school mathematics teachers’ knowledge for teaching algebra
(Heritage, Kim, Vendlinski, & Herman, 2009; McCrory, Floden, Ferrini-Mundy, Reckase, &
Senk, 2012), but there is no measure to assess the MKT required to instruct all content areas across
secondary mathematics. This instrument would measure secondary mathematics teachers’ MKT,
and be used to then explore how this knowledge impacts other aspects of teaching, for example
implemented AfL strategies. Similarly, Herman, Osmundson, Dai, Ringstaff, and Timms (2015)
recommended the development of suitable instruments to measure elementary science teachers’
content and pedagogical knowledge and use of AfL practices.
146
Third, my work has connected all the domains of MKT to two AfL strategies: engineering
effective classroom discussions and tasks that elicit evidence of learning and providing feedback
that moves learners forward. Hence to fully identify and understand all the connections between
the domains of MKT and the AfL strategies, research needs to include case studies that explore
teachers who routinely implement the spirit of AfL. Case studies including video or audio
recordings of classroom observations and teacher think-alouds on classroom observations would
provide comprehensive data to support the identification and understanding of what MKT is
accessed when integrating the spirit of AfL. For example, what MKT is used and how in
responsive assessment practices? In this study connections between teachers’ pedagogical content
knowledge and AfL strategies were weak. Research including think-alouds may help to strengthen
these connections. Herman and colleagues (2015) also concluded with inviting more research to
explore the relationship between teachers’ content and pedagogical knowledge and their AfL
practices, specifically, whether teachers’ content and pedagogical knowledge is improved with
AfL practices or if a minimum level of content knowledge is required prior to teachers being able
to effectively implement AfL practices. Furthermore, understanding more deeply the connections
between AfL practices reflecting the spirit of AfL and MKT could inform the MKT emphasized in
professional learning communities.
Conclusion
To better understand the degree of AfL integration in G9APM classrooms across Southern
Ontario and to learn how to better support teachers of G9APM in integrating AfL, my research
explored teachers’ AfL strategies across these classrooms, as well as their AfL conceptions and
MKT using a questionnaire and case studies. Across classrooms, regardless of whether it was at a
high-, average-, or low-achieving school, there was not much difference in teachers’ AfL
147
strategies, AfL conceptions, or MKT. Teachers commonly implemented the letter of AfL and had a
teacher-centric conception of AfL. These findings align with previous research regarding the
infrequent implementation of the spirit of AfL. Furthermore, teachers reported or were observed to
have high levels of MKT, and this knowledge was connected to AfL practices, namely identifying
and sharing success criteria, engineering effective classroom discussions and tasks that elicit
evidence of learning, and providing feedback that moves learners forward. In order to build
mathematics teachers’ capacity in integrating the spirit of AfL into their instructional practice, my
research suggests one aspect of professional development needs to include pedagogical support in
MKT. Overall, my research highlights we still need to do much more to support teachers in
implementing the spirit of AfL and the connections between AfL strategies and MKT.

148
References
Alberta Education. (2006). Knowledge and employability mathematics 10–4, 20–4. Retrieved from
https://education.alberta.ca/media/564027/math10_06-k-and-e.pdf
Alberta Education. (2008). Mathematics grades 10–12. Retrieved from
https://www.education.alberta.ca/media/564028/math10to12.pdf
Alberta Education. (2016). Mathematics kindergarten to grade 9 program of studies. Retrieved
from https://www.education.alberta.ca/media/3115252/2016_k_to_9_math_pos.pdf
Alberta Education. (2017). K&E courses. Retrieved from
https://www.education.alberta.ca/knowledge-and-employability/ke-courses/
Andrade, H. L. (2013). Classroom assessment in the context of learning theory and research. In J.
H. McMillan (Ed.), SAGE handbook of research on classroom assessment (pp. 17–34).
Thousand Oaks, CA: SAGE Publications, Inc.
At-risk Working Group. (2003). “A successful pathway for all students”: Final report of the At-
risk Working Group. Retrieved from
http://www.edu.gov.on.ca/eng/document/reports/atrisk/atrisk.pdf
Ball, D. L. (1993). With an eye on the mathematical horizon: Dilemmas of teaching elementary
school mathematics. The Elementary School Journal, 93(4), 373–397.
Ball, D. L., Thames, M. H., & Phelps, G. (2008). Content knowledge for teaching: What makes it
special? Journal of Teacher Education, 59(5), 389–407. doi:10.1177/0022487108324554
Baumert, J., Kunter, M., Blum, W., Brunner, M., Voss, T., Jordan, A., . . . Tsai, Y.-M. (2010).
Teachers’ mathematical knowledge, cognitive activation in the classroom, and student
progress. American Educational Research Journal, 47(1), 133–180.
doi:10.3102/0002831209345157

149
Bennett, R. E. (2011). Formative assessment: A critical review. Assessment in Education:
Principles, Policy & Practice, 18(1), 5–25. doi:10.1080/0969594X.2010.513678
Birenbaum, M., DeLuca, C., Earl, L., Heritage, M., Klenowski, V., Looney, A., . . . Wyatt-Smith,
C. (2015). International trends in the implementation of assessment for learning: Implications
for policy and practice. Policy Futures in Education, 13(1), 117–140.
doi:10.1177/1478210314566733
Black, P., Burkhardt, H., Daro, P., Jones, I., Lappan, G., Pead, D., & Stephens, M. (2012). High-
stakes examinations to support policy: Design, development and implementation. Educational
Designer, 2(5), 1–31.
Black, P., Harrison, C., Lee, C., Marshall, B., & Wiliam, D. (2004). Working inside the black box:
Assessment for learning in the classroom. Phi Delta Kappan, 86(1), 9–21.
Black, P., & Wiliam, D. (1998a). Assessment and classroom learning. Assessment in Education,
5(1), 7–74. doi:10.1080/0969595980050102
Black, P., & Wiliam, D. (1998b). Inside the black box: Raising standards through classroom
assessment. Phi Delta Kappan, 80(2), 139–148.
Black, P., & Wiliam, D. (2009). Developing the theory of formative assessment. Educational
Assessment, Evaluation and Accountability, 21(1), 5–31. doi:10.1007/s11092-008-9068-5
Boaler, J. (2008). Promoting ‘relational equity’ and high mathematics achievement through an
innovative mixed-ability approach. British Educational Research Journal, 34(2), 167–194.
doi:10.1080/01411920701532145
Bray, W. S. (2011). A collective case study of the influence of teachers’ beliefs and knowledge on
error-handling practices during class discussion of mathematics. Journal for Research in
Mathematics Education, 42(1), 2–38.
150
British Columbia Ministry of Education. (2016, July 19). Mathematics: What’s new? Retrieved
from https://curriculum.gov.bc.ca/curriculum/mathematics/whats-new
Broadfoot, P., Daugherty, R., Gardner, J., Harlen, W., James, M., & Stobart, G. (2002).
Assessment for learning: 10 principles. Cambridge, UK: University of Cambridge School of
Education.
Brookhart, S. M. (2011). Educational assessment knowledge and skills for teachers. Educational
Measurement: Issues and Practice, 30(1), 3–12.
Brown, G. T. L. (2004). Teachers’ conceptions of assessment: Implications for policy and
professional development. Assessment in Education, 11(3), 301–318.
doi:10.1080/0969594042000304609
Brown, G. T. L., & Harris, L. R. (2013). Student self-assessment. In J. H. McMillan (Ed.), SAGE
handbook of research on classroom assessment (pp. 367–393). Thousand Oaks, CA: SAGE
Publications, Inc.
Brown, G. T. L., Kennedy, K. J., Fok, P. K., Chan, J. K. S., & Yu, W. M. (2009). Assessment for
student improvement: Understanding Hong Kong teachers’ conceptions and practices of
assessment. Assessment in Education: Principles, Policy & Practice, 16(3), 347–363.
doi:10.1080/09695940903319737
Brown, G. T. L., Lake, R., & Matters, G. (2011). Queensland teachers’ conceptions of assessment:
The impact of policy priorities on teacher attitudes. Teaching and Teacher Education, 27(1),
210–220. doi:10.1016/j.tate.2010.08.003
Bryan, S. L, & Dorrington, A. E. L. (2004). Improving math achievement of at-risk learners. Phi
Delta Kappa Fastbacks, 518, 7–39.

151
Burris, C. C., & Garrity, D. T. (2008). Detracking for excellence and equity. Alexandria, VA:
Association for Supervision and Curriculum Development.
Campbell, C. (2013). Research on teacher competency in classroom assessment. In J. H. McMillan
(Ed.), SAGE handbook of research on classroom assessment (pp. 71–84). Thousand Oaks,
CA: SAGE Publications, Inc.
Chapman, A. E. A, DeLuca, C., & Klinger, D. A. (2015, June). Assessment for learning in the
classroom: The students’ perspective. Paper presented at the meeting of Canadian Society for
the Study of Education, Ottawa, ON.
Chapman, A. E. A., & Klinger, D. A. (2014, April). Exploring the variability in annual school
rankings. Paper presented at the meeting of National Council on Measurement in Education,
Philadelphia, PA.
Charalambous, C. Y. (2015). Working at the intersection of teacher knowledge, teacher beliefs,
and teaching practice: A multiple-case study. Journal of Mathematics Teacher Education,
18(5), 427–445. doi:10.1007/s10857-015-9318-7
Chen, C.-H., Crockett, M. D., Namikawa, T., Zilimu, J., & Lee, S. H. (2012). Eighth grade
mathematics teachers’ formative assessment practices in SES-different classrooms: A Taiwan
study. International Journal of Science and Mathematics Education, 10, 553–579.
doi:10.1007/s10763-011-9299-7
Corbin, J., & Strauss, A. (2008). Basics of qualitative research: Techniques and procedures for
developing grounded theory (3rd ed.). Thousand Oaks, CA: SAGE Publications, Inc.
Cowie, B., & Bell, B. (1999). A model of formative assessment in science education. Assessment
in Education, 6(1), 101–116.
152
DeLuca, C., Klinger, D. A., Chapman, A. E. A., Woods, J., Zolnierczyk, J. A., & Love, A. (2014).
Evaluation report for the Building Capacity in Assessment for Learning Professional
Learning Project at Kawartha Pine Ridge District School Board—Year 2. Kingston, ON:
Queen’s Assessment and Evaluation Group.
DeLuca, C., Klinger, D., Pyper, J., & Woods, J. (2015). Instructional rounds as a professional
learning model for systemic implementation of assessment for learning. Assessment in
Education: Principles, Policy & Practice, 22(1), 122–139.
doi:10.1080/0969594X.2014.967168
DeLuca, C., LaPointe-McEwan, D., & Luhanga, U. (2016). Approaches to classroom assessment
inventory: A new instrument to support teacher assessment literacy. Educational Assessment,
21(4), 248–266. doi:10.1080/10627197.2016.1236677
DeLuca, C., & Volante, L. (2016). Assessment for learning in teacher education programs:
Navigating the juxtaposition of theory and praxis. Journal of the International Society for
Teacher Education, 20(1), 19–31.
Dixon, H., & Haigh, M. (2009). Changing mathematics teachers’ conceptions of assessment and
feedback. Teacher Development, 13(2), 173–186. doi:10.1080/13664530903044002
Dunn, T. K. (2004). Enhancing mathematics teaching for at-risk students: Influences of a teaching
experience in alternative high school. Journal of Instructional Psychology, 31(1), 46–52.
Earl, L. M. (2013). Assessment as learning: Using classroom assessment to maximize student
learning (2nd ed.). Thousand Oaks, CA: Corwin.
Education Quality and Accountability Office. (2005). Highlights of the provincial results: English-
language students. Retrieved from
153
http://www.eqao.com/en/assessments/results/communication-docs/provincial-report-
highlights-elementary-grade9-2005.pdf#search=2003%20eqao%20grade%209%20
Education Quality and Accountability Office. (2009). Highlights of the provincial results: English-
language students, 2008–2009. Retrieved from
http://www.eqao.com/en/assessments/results/communication-docs/provincial-report-
highlights-elementary-grade9-2009.pdf#search=2009%20eqao%20grade%209
Education Quality and Accountability Office. (2011). Grade 9 Assessment of Mathematics, 2010–
2011, teacher questionnaire: Applied course. Retrieved from
http://www.eqao.com/en/assessments/results/DMA-docs/teacher-questionnaire-results-grade9-
applied-2011.PDF#search=2011%20teacher%20questionnaire
Education Quality and Accountability Office. (2012). Grade 9 Assessment of Mathematics, 2011–
2012, teacher questionnaire: Applied course. Retrieved from
http://www.eqao.com/en/assessments/results/DMA-docs/teacher-questionnaire-results-grade9-
applied-2012.PDF#search=2012%20teacher%20questionnaire
Education Quality and Accountability Office. (2013). Grade 9 Assessment of Mathematics, 2012–
2013, teacher questionnaire: Applied course. Retrieved from
http://www.eqao.com/en/assessments/results/DMA-docs/teacher-questionnaire-results-grade9-
applied-2014.pdf#search=2013%20teacher%20questionnaire
Education Quality and Accountability Office. (2014a). Grade 9 Assessment of Mathematics, 2013–
2014, teacher questionnaire: Applied course. Retrieved from
http://www.eqao.com/en/assessments/results/DMA-docs/teacher-questionnaire-results-grade9-
applied-2014.pdf#search=2014%20teacher%20questionnaire
154
Education Quality and Accountability Office. (2014b). Highlights of the provincial results: Grade
9 Assessment of Mathematics and Ontario Secondary School Literacy Test (OSSLT), English-
language students, 2013–2014. Retrieved from
http://www.eqao.com/en/assessments/results/communication-docs/provincial-report-
highlights-secondary-2014.pdf#search=2014%20eqao%20grade%209%20highlight
Education Quality and Accountability Office. (2016a). Grade 9 academic mathematics course:
Contextual information. Retrieved from
http://www.eqao.com/en/assessments/results/assessment-docs-secondary/provincial-report-
grade9-academic-contextual-2016.pdf
Education Quality and Accountability Office. (2016b). Grade 9 applied mathematics course:
Contextual information. Retrieved from
http://www.eqao.com/en/assessments/results/assessment-docs-secondary/provincial-report-
grade9-applied-contextual-2016.pdf
Education Quality and Accountability Office. (2016c). Highlights of the provincial results: Grade
9 Assessment of Mathematics, 2015–2016, English-language students. Retrieved from
http://www.eqao.com/en/assessments/results/communication-docs/provincial-report-
highlights-grade9-2016.pdf
Egodawatte, G., McDougall, D., & Stoilescu, D. (2011). The effects of teacher collaboration in
grade 9 applied mathematics. Educational Research for Policy and Practice, 10(3), 189–209.
doi:10.1007/s10671-011-9104-y
Expert Panel on Student Success in Ontario. (2004). Leading math success: Mathematical literacy,
grades 7–12, The report of the Expert Panel on Student Success in Ontario. Retrieved from
http://www.edu.gov.on.ca/eng/document/reports/numeracy/numeracyreport.pdf

155
Goos, M. (2004). Learning mathematics in a classroom community of inquiry. Journal for
Research in Mathematics Education, 35(4), 258–291. doi:10.2307/30034810
Gouvernement du Québec Ministère de l’Éducation, du Loisir et du Sport. (2007a). Québec
Education Program Secondary Cycle Two, chapter 1: A curriculum for the 21st century.
Retrieved from
http://www1.education.gouv.qc.ca/sections/programmeFormation/secondaire2/medias/en/1_Q
EP_Chap01.pdf
Gouvernement du Québec Ministère de l’Éducation, du Loisir et du Sport. (2007b). Québec
Education Program Secondary Cycle Two, chapter 6: Mathematics, science and technology.
Retrieved from
http://www1.education.gouv.qc.ca/sections/programmeFormation/secondaire2/medias/en/Mat
hematiqueEN_2016_03_Final.pdf
Gottfried, A. E., Marcoulides, G. A., Gottfried, A. W., & Oliver, P. H. (2013). Longitudinal
pathways from math intrinsic motivation and achievement to math course accomplishments
and educational attainment. Journal of Research on Educational Effectiveness, 6(1), 68–92.
doi:10.1080/19345747.2012.698376
Hamlin, D., & Cameron, D. (2015). Applied or academic: High impact decisions for Ontario
students. Toronto, ON: People for Education.
Harrison, C. (2005). Teachers developing assessment for learning: Mapping teacher change.
Teacher Development, 9(2), 255–263.
Hattie, J. A. C., & Timperley, H. (2007). The power of feedback. Review of Educational Research,
77(1), 81–112. doi:10.3102/003465430298487
156
Herbst, P., & Kosko, K. (2014). Mathematical knowledge for teaching and its specificity to high
school geometry instruction. In J.-J. Lo, K. R. Leatham, & L. R. Van Zoest (Eds.), Research
Trends in Mathematics Teacher Education (pp. 23–46). Cham, Switzerland: Springer
International Publishing.
Heritage, M., Kim, J., Vendlinski, T., & Herman, J. (2009). From evidence to action: A seamless
process in formative assessment? Educational Measurement: Issues and Practice, 28(3), 24–
31.
Herman, J., Osmundson, E., Dai, Y., Ringstaff, C., & Timms, M. (2015). Investigating the
dynamics of formative assessment: Relationships between teacher knowledge, assessment
practice and learning. Assessment in Education: Principles, Policy & Practice, 22(3), 344–
367. doi:10.1080/0969594X.2015.1006521
Hill, H. C., Ball, D. L., & Schilling, S. G. (2008). Unpacking pedagogical content knowledge:
Conceptualizing and measuring teachers’ topic-specific knowledge of students. Journal for
Research in Mathematics Education, 39(4), 372–400.
Hill, H. C., Rowan, B., & Ball, D. L. (2005). Effects of teachers’ mathematical knowledge for
teaching on student achievement. American Educational Research Journal, 42(2), 371–406.
doi:10.3102/00028312042002371
Hill, H. C., Schilling, S. G., & Ball, D. L. (2004). Developing measures of teachers’ mathematics
knowledge for teaching. The Elementary School Journal, 105(1), 11–30.
Hughes, G. B. (2010). Formative assessment practices that maximize learning for students at risk.
In H. L. Andrade & G. J. Cizek (Eds.), Handbook of formative assessment (pp. 212–232).
New York, NY: Routledge.
157
Hunter, J. (2011). Preparing students for the world beyond the classroom: Linking EQAO
assessments to 21st-century skills (EQAO Research Bulletin #7). Retrieved from
http://www.eqao.com/en/research_data/Research_Reports/DMA-docs/bulletin-21st-century-
skills.pdf
Jacobs, J. K., Hiebert, J., Givvin, K. B., Hollingsworth, H., Garnier, H., & Wearne, D. (2006).
Does eighth-grade mathematics teaching in the United States align with the NCTM
Standards? Results from the TIMSS 1995 and 1999 video studies. Journal for Research in
Mathematics Education, 37(1), 5–32.
Johannessen, L. R. (2004). Helping “struggling” students achieve success. Journal of Adolescent
& Adult Literacy, 47(8), 639–647.
Jonsson, A., Lundahl, C., & Holmgren, A. (2015). Evaluating a large-scale implementation of
assessment for learning in Sweden. Assessment in Education: Principles, Policy & Practice,
22(1), 104–121. doi:10.1080/0969594X.2014.970612
Kirschner, P. A., Sweller, J., & Clark, R. E. (2006). Why minimal guidance during instruction
does not work: An analysis of the failure of constructivist, discovery, problem-based,
experiential, and inquiry-based teaching. Educational Psychologist, 41(2), 75–86.
doi:10.1207/s15326985ep4102_1
Klenowski, V. (2009). Assessment for learning revisited: An Asia-Pacific perspective. Assessment
in Education: Principles, Policy & Practice, 16(3), 263–268.
doi:10.1080/09695940903319646
Klinger, D. A., DeLuca, C., & Chapman, A. E. A. (2016, April). Implementing assessment for
learning: A continuum for teacher professional learning. Paper presented at the meeting of
American Educational Research Association, Washington, DC.
158
Klinger, D. A., DeLuca, C., Pyper, J., Shulha, L., Woods, J., & LaPointe, D. (2013). Evaluation
report for the Building Capacity in Assessment for Learning Professional Learning Program
at Peterborough Victoria Northumberland and Clarington Catholic District School Board.
Kingston, ON: Queen’s University Assessment and Evaluation Group.
Leahy, S., Lyon, C., Thompson, M., & Wiliam, D. (2005). Classroom assessment: Minute by
minute, day by day. Educational Leadership, 63(3), 19–24.
Li, M., Yin, Y., Ruiz-Primo, M. A., & Morozov, A. (2011, April). Identifying effective feedback
practices on student mathematics learning: A literature synthesis. Paper presented at the
meeting of American Educational Research Association, New Orleans, LA.
Ma, X., & Klinger, D. A. (2000). Hierarchical linear modelling of student and school effects on
academic achievement. Canadian Journal of Education, 25(1), 41–55.
Manitoba Education and Advanced Learning. (2014). Grades 9 to 12 mathematics: Manitoba
curriculum framework of outcomes. Retrieved from
http://www.edu.gov.mb.ca/k12/cur/math/framework_9-12/full_doc.pdf
Margolis, H., & McCabe, P. P. (2003). Self-efficacy: A key to improving the motivation of
struggling learners. Preventing School Failure, 47(4), 162–169.
Marshall, B., & Drummond, M. J. (2006). How teachers engage with assessment for learning:
Lessons from the classroom. Research Papers in Education, 21(2), 133–149.
doi:10.1080/02671520600615638
McCrory, R., Floden, R., Ferrini-Mundy, J., Reckase, M. D., & Senk, S. L. (2012). Knowledge of
algebra for teaching: A framework of knowledge and practices. Journal for Research in
Mathematics Education, 43(5), 584–615.

159
McGatha, M. B., & Bush, W. S. (2013). Classroom assessment in mathematics. In J. H. McMillan
(Ed.), SAGE handbook of research on classroom assessment (pp. 449–460). Thousand Oaks,
CA: SAGE Publications, Inc.
McMillan, J. H., & Schumacher, S. (2010). Research in education: Evidence-based inquiry (7th
ed.). Upper Saddle River, NJ: Pearson Education, Inc.
Moss, C. M., & Brookhart, S. M. (2009). Advancing formative assessment in every classroom: A
guide for instructional leaders. Alexandria, VA: ASCD.
Moss, P. A. (2003). Reconceptualizing validity for classroom assessment. Educational
Measurement: Issues and Practice, 22(4), 13–25.
National Research Council. (2001). Knowing what students know: The science and design of
educational assessment. Washington, DC: National Academy Press.
National Council of Teachers of Mathematics. (2000). Principles and standards for school
mathematics. Reston, VA: Author.
National Council of Teachers of Mathematics. (2014). Principles to actions: Ensuring
mathematical success for all. Reston, VA: Author.
New Brunswick Department of Education. (2000). Grades 9/10 companion document. Retrieved
from
http://www2.gnb.ca/content/dam/gnb/Departments/ed/pdf/K12/curric/General/CompanionDoc
ument-Grade9-10.pdf
New Brunswick Department of Education and Early Childhood Development. (2013). Framework
for provincial assessments. Retrieved from
http://www.gnb.ca/0000/results/pdf/AssessmentFrameworkDocument.pdf
160
New Brunswick Department of Education and Early Childhood Development. (2015). Financial
and workplace mathematics 120 curriculum. Retrieved from
http://www2.gnb.ca/content/dam/gnb/Departments/ed/pdf/K12/curric/Math/FinancialAndWor
kplaceMathematics120.pdf
Newfoundland and Labrador Education and Early Childhood Development. (2016). Academic
mathematics 3201: Curriculum guide 2016. Retrieved from
http://www.ed.gov.nl.ca/edu/k12/curriculum/guides/mathematics/math3201/Mathematics_320
1_Curriculum_Guide.pdf
Nicol, D. J., & Macfarlane-Dick, D. (2006). Formative assessment and self-regulated learning: A
model and seven principles of good feedback practice. Studies in Higher Education, 31(2),
199–218. doi:10.1080/03075070600572090
Noonan, B., & Duncan, C. R. (2005). Peer and self-assessment in high schools. Practical
Assessment, Research & Evaluation, 10(17), 1–8.
Northwest Territories Department of Education, Culture, and Employment. (n.d.). Mathematics:
Curriculum information and documents. Retrieved from
https://www.ece.gov.nt.ca/en/services/nwt-curriculum-and-school-list/mathematics
Nova Scotia Department of Education and Early Childhood Development. (2015, June).
Mathematics 12: Implementation draft. Retrieved from
http://hrsbstaff.ednet.ns.ca/mpurba/M12_2015_Curric_Draft_June2015.pdf
Nunavut Department of Education. (2014). 2014–2015 Nunavut approved curriculum and
teaching resources. Retrieved from http://www.gov.nu.ca/sites/default/files/2014-
2015_nunavut_approved_curriculum_and_teaching_resources.pdf

161
Ogan-Bekiroglu, F. (2009). Assessing assessment: Examination of pre-service physics teachers’
attitudes towards assessment and factors affecting their attitudes. International Journal of
Science Education, 31(1), 1–39. doi:10.1080/09500690701630448
O’Leary, M., Lysaght, Z., & Ludlow, L. (2013). A measurement instrument to evaluate teachers’
assessment for learning classroom practices. The International Journal of Educational and
Psychological Assessment, 14(2), 40–60. doi:10.13140/2.1.1289.0241
Ontario Ministry of Education. (2000). The Ontario curriculum: Grades 11 and 12 mathematics.
Retrieved from http://www.edu.gov.on.ca/eng/curriculum/secondary/math1112curr.pdf
Ontario Ministry of Education. (2005a). The Ontario curriculum: Grades 1–8 mathematics
(revised). Retrieved from
http://www.edu.gov.on.ca/eng/curriculum/elementary/math18curr.pdf
Ontario Ministry of Education. (2005b). The Ontario curriculum: Grades 9 and 10 mathematics
(revised). Retrieved from
http://www.edu.gov.on.ca/eng/curriculum/secondary/math910curr.pdf
Ontario Ministry of Education. (2007). The Ontario curriculum: Grades 11 and 12 mathematics
(revised). Retrieved from
http://www.edu.gov.on.ca/eng/curriculum/secondary/math1112currb.pdf
Ontario Ministry of Education. (2010). Growing success: Assessment, evaluation, and reporting in
Ontario schools. Retrieved from
http://www.edu.gov.on.ca/eng/policyfunding/growSuccess.pdf
Ontario Ministry of Education. (2014). Achieving excellence: A renewed vision for education in
Ontario. Retrieved from http://www.edu.gov.on.ca/eng/about/renewedVision.pdf

162
Organisation for Economic Co-operation and Development. (2013a). PISA 2012 results: What
makes schools successful? Retrieved from http://www.oecd.org/pisa/keyfindings/pisa-2012-
results-volume-IV.pdf
Organisation for Economic Co-operation and Development. (2013b). PISA 2015: Draft
mathematics framework. Retrieved from
https://www.oecd.org/pisa/pisaproducts/Draft%20PISA%202015%20Mathematics%20Frame
work%20.pdf
Otero, V. K. (2006). Moving beyond the “get it or don’t” conception of formative assessment.
Journal of Teacher Education, 57(3), 247–255. doi:10.1177/0022487105285963
Pajares, M. F. (1992). Teachers’ beliefs and educational research: Cleaning up a messy construct.
Review of Educational Research, 62(3), 307–332.
Pang, X., & Rogers, W. T. (2013). Comparative examination of the influence of selected factors on
achievement in Grade 9 academic and applied mathematics courses in English-language
schools in Ontario. Retrieved from
http://www.eqao.com/Research/pdf/E/Comparative_Examination_Influence_Factors_Achieve
ment_G9Math_en.pdf
Panizzon, D., & Pegg, J. (2008). Assessment practices: Empowering mathematics and science
teachers in rural secondary schools to enhance student learning. International Journal of
Science and Mathematics Education, 6, 417–436.
People for Education. (2012, September 26). EQAO tests show mixed results. Retrieved from
http://www.peopleforeducation.ca/pfe-news/eqao-tests-show-mixed-results/
163
People for Education. (2013). The trouble with course choices in Ontario high schools. Retrieved
from http://www.peopleforeducation.ca/wp-content/uploads/2013/04/trouble-with-course-
choices-in-high-school-2013.pdf
People for Education. (2014). Choosing courses for high school. Retrieved from
http://www.peopleforeducation.ca/wp-content/uploads/2014/02/choosing-courses-for-high-
school-2014.pdf
Petty, T., Wang, C., & Harbaugh, A. P. (2013). Relationships between student, teacher, and school
characteristics and mathematics achievement. School Science and Mathematics, 113(7), 333–
344.
Popham, W. J. (2011). Classroom assessment: What teachers need to know (6th ed.). Boston, MA:
Pearson.
Prince Edward Island Department of Education and Early Childhood Development. (2011). Prince
Edward Island mathematics curriculum: MAT421A. Retrieved from
http://www.gov.pe.ca/photos/original/eecd_MAT421A12.pdf
Ramaprasad, A. (1983). On the definition of feedback. Behavioral Science, 28(1), 4–13.
Remesal, A. (2011). Primary and secondary teachers’ conceptions of assessment: A qualitative
study. Teaching and Teacher Education, 27, 472–482. doi:10.1016/j.tate.2010.09.017
Ruiz-Primo, M. A. (2011). Informal formative assessment: The role of instructional dialogues in
assessing students’ learning. Studies in Educational Evaluation, 37(1), 15–24.
doi:10.1016/j.stueduc.2011.04.003
Sadler, D. R. (1989). Formative assessment and the design of instructional systems. Instructional
Science, 18(2), 119–144.
164
Saldaña, J. (2013). The coding manual for qualitative researchers (2nd ed.). Thousand Oaks, CA:
SAGE Publications, Inc.
Saskatchewan Ministry of Education. (2012). Saskatchewan curriculum: Foundations of
mathematics 30. Retrieved from
https://www.edonline.sk.ca/bbcswebdav/library/curricula/English/Mathematics/Mathematics_
Foundations_Of_30_2012.pdf
Sato, M., Wei, R. C., & Darling-Hammond, L. (2008). Improving teachers’ assessment practices
through professional development: The case of National Board Certification. American
Educational Research Journal, 45(3), 669–700. doi:10.3102/0002831208316955
Shapka, J. D., Domene, J. F., & Keating, D. P. (2006). Trajectories of career aspirations through
adolescence and young adulthood: Early math achievement as a critical filter. Educational
Research and Evaluation, 12(4), 347–358. doi:10.1080/13803610600765752
Shepard, L. A. (2000). The role of assessment in a learning culture. Educational Researcher,
29(7), 4–14.
Shepard, L. A. (2008). Formative assessment: Caveat emptor. In C. A. Dwyer (Ed.), The future of
assessment: Shaping teaching and learning (pp. 279–303). New York, NY: Lawrence
Erlbaum Associates.
Shulman, L. S. (1986). Those who understand: Knowledge growth in teaching. Educational
Researcher, 15(2), 4–14.
Steele, M. D., & Rogers, K. C. (2012). Relationships between mathematical knowledge for
teaching and teaching practice: The case of proof. Journal of Mathematics Teacher Education,
15(2), 159–180. doi:10.1007/s10857-012-9204-5

165
Stiggins, R. J. (2002). Assessment crisis: The absence of assessment for learning. Phi Delta
Kappan, 83(10), 758–765.
Stiggins, R. J. (2005). From formative assessment to assessment for learning: A path to success in
standards-based schools. Phi Delta Kappan, 87(4), 324–328.
Stipek, D. J., Givvin, K. B., Salmon, J. M., & MacGyvers, V. L. (2001). Teachers’ beliefs and
practices related to mathematics instruction. Teaching and Teacher Education, 17(2), 213–
226.
Suurtamm, C. (2004). Developing authentic assessment: Case studies of secondary school
mathematics teachers’ experiences. Canadian Journal of Science, Mathematics and
Technology Education, 4(4), 497–513. doi: 10.1080/14926150409556630
Suurtamm, C., & Graves, B. (2007). Curriculum implementation in intermediate mathematics:
Research report. Retrieved from
http://www.edu.gov.on.ca/eng/studentsuccess/lms/files/CIIMResearchReport2007.pdf
Suurtamm, C., & Koch, M. J. (2014). Navigating dilemmas in transforming assessment practices:
Experiences of mathematics teachers in Ontario, Canada. Educational Assessment, Evaluation
and Accountability, 26(3), 263–287. doi:10.1007/s11092-014-9195-0
Suurtamm, C., Koch, M. J., & Arden, A. (2010). Teachers’ assessment practices in mathematics:
Classrooms in the context of reform. Assessment in Education: Principles, Policy & Practice,
17(4), 399–417. doi:10.1080/0969594X.2010.497469
Swaffield, S. (2011). Getting to the heart of authentic assessment for learning. Assessment in
Education: Principles, Policy & Practice, 18(4), 433–449.
doi:10.1080/0969594X.2011.582838

166
Thompson, M., & Wiliam, D. (2007, April). Tight but loose: A conceptual framework for scaling
up school reforms. Paper presented at the meeting of American Educational Research
Association, Chicago, IL.
Topping, K. J. (2013). Peers as a source of formative and summative assessment. In J. H.
McMillan (Ed.), SAGE handbook of research on classroom assessment (pp. 395–412).
Thousand Oaks, CA: SAGE Publications, Inc.
Vatter, T. (1992). Teaching mathematics to the at-risk secondary school student. The Mathematics
Teacher, 85(4), 292–294.
Venkatakrishnan, H., & Wiliam, D. (2003). Tracking and mixed-ability grouping in secondary
school mathematics classrooms: A case study. British Educational Research Journal, 29(2),
189–204. doi:10.1080/0141192032000060939
Western and Northern Canadian Protocol for Collaboration in Education. (2006). Rethinking
classroom assessment with purpose in mind. Retrieved from
https://www.wncp.ca/media/40539/rethink.pdf
Wiliam, D. (2007). Keeping learning on track: Classroom assessment and the regulation of
learning. In F. K. Lester Jr. (Ed.), Second handbook of mathematics teaching and learning
(pp. 1053–1098). Charlotte, NC: Information Age Publishing.
Wiliam, D. (2011). What is assessment for learning? Studies in Educational Evaluation, 37(1), 3–
14. doi:10.1016/j.stueduc.2011.03.001
Wiliam, D., & Thompson, M. (2008). Integrating assessment with learning: What will it take to
make it work? In C. A. Dwyer (Ed.), The future of assessment: Shaping teaching and learning
(pp. 53–82). New York, NY: Lawrence Erlbaum Associates.

167
Wylie, E. C., & Lyon, C. J. (2015). The fidelity of formative assessment implementation: Issues of
breadth and quality. Assessment in Education: Principles, Policy & Practice, 22(1), 140–160.
doi:10.1080/0969594X.2014.990416
Yin, R. K. (2014). Case study research: Design and methods (5th ed.). Thousand Oaks, CA:
SAGE Publications, Inc.
Yukon Department of Education. (2017, January 23). Education to roll out redesigned
kindergarten to grade 12 curriculum. Retrieved from http://www.gov.yk.ca/news/17-
008.html#.WLHn-xTBE64
Zheng, S. M. (2006). Student cohort tracking studies: Impacts of gender, SES and early
achievement on students’ EQAO performance. Retrieved from York Region District School
Board website:
http://training.compassforsuccess.ca/pluginfile.php/200/mod_resource/content/0/SKGrade3an
dGrade6CohortStudiesFinal.pdf
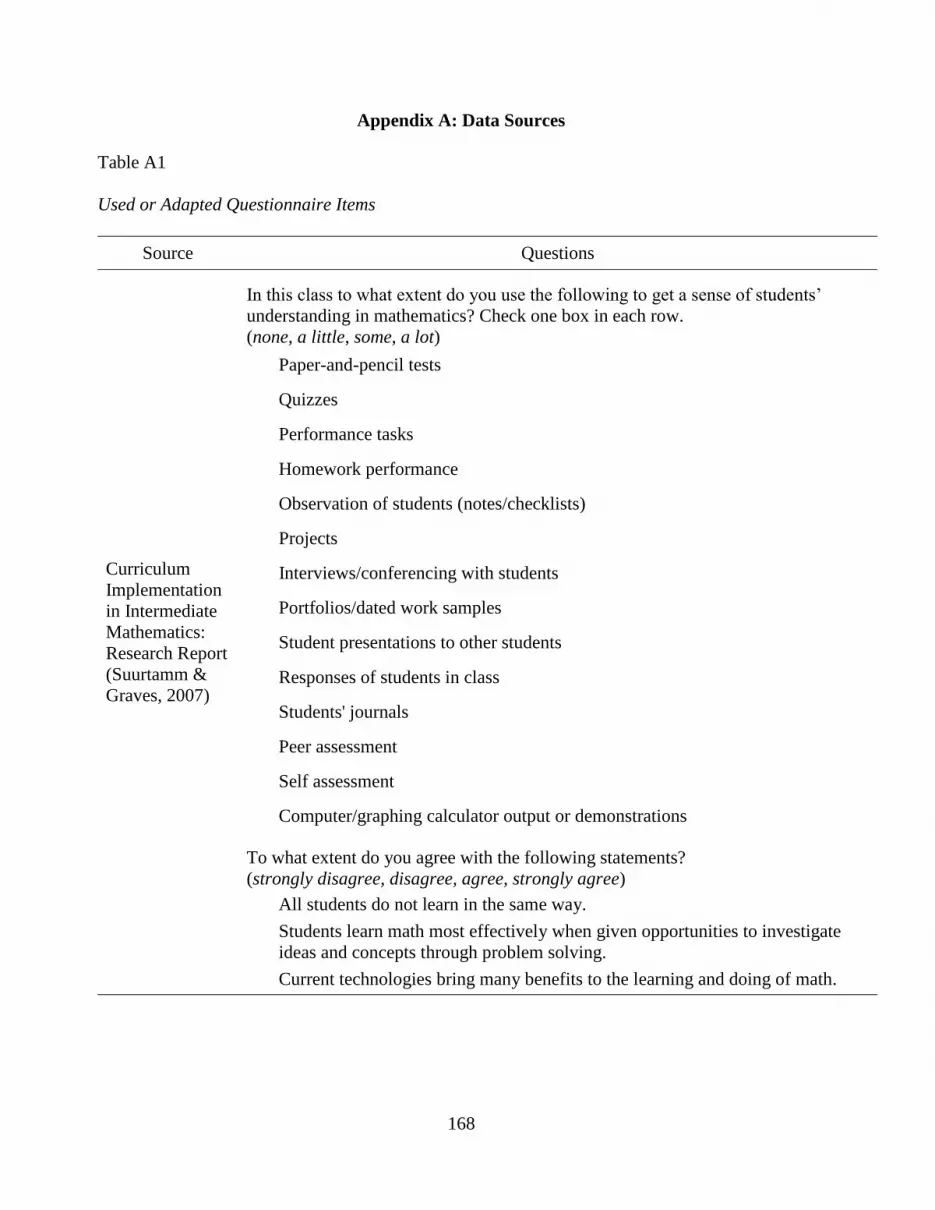
168
Appendix A: Data Sources
Table A1
Used or Adapted Questionnaire Items
Source Questions
Curriculum
Implementation
in Intermediate
Mathematics:
Research Report
(Suurtamm &
Graves, 2007)
In this class to what extent do you use the following to get a sense of students’
understanding in mathematics? Check one box in each row.
(none, a little, some, a lot)
Paper-and-pencil tests
Quizzes
Performance tasks
Homework performance
Observation of students (notes/checklists)
Projects
Interviews/conferencing with students
Portfolios/dated work samples
Student presentations to other students
Responses of students in class
Students' journals
Peer assessment
Self assessment
Computer/graphing calculator output or demonstrations
To what extent do you agree with the following statements?
(strongly disagree, disagree, agree, strongly agree)
All students do not learn in the same way.
Students learn math most effectively when given opportunities to investigate
ideas and concepts through problem solving.
Current technologies bring many benefits to the learning and doing of math.

169
How comfortable are you with the following aspects of the curriculum for this
class?
(not at all, a little, somewhat, very comfortable)
The content of the course
Evaluation
Report for the
Building
Capacity in
Assessment for
Learning
Professional
Learning Project
(DeLuca et al.,
2014)
In my class . . .
(never, rarely, often, always)
I provide my students with learning goals.
I discuss the meaning of learning goals with my students.
I encourage students to set personal learning goals for themselves.
I give students success criteria.
I discuss the meaning of success criteria with my students.
I work with my students to create success criteria.
Students work independently when learning.
Students work in pairs when learning.
Students work in groups when learning.
I provide students with descriptive feedback based on success criteria.
I have my students give each other feedback on their learning with prompts
(i.e., use of a rubric, success criteria, or feedback starters).
I have my students give each other feedback on their learning without feedback
prompts.
I provide exemplars that reflect the success criteria.
I provide exemplars of student work that reflect learning at various achievement
levels.
To what extent do you agree with the following statements? If a statement does not
apply to you, select “N/A”. Over the past year,
(never, rarely, sometimes, often, always, N/A)
I interpret the assessment information I collect on student learning to inform my
instruction.
I use questioning strategies to support my students’ learning.
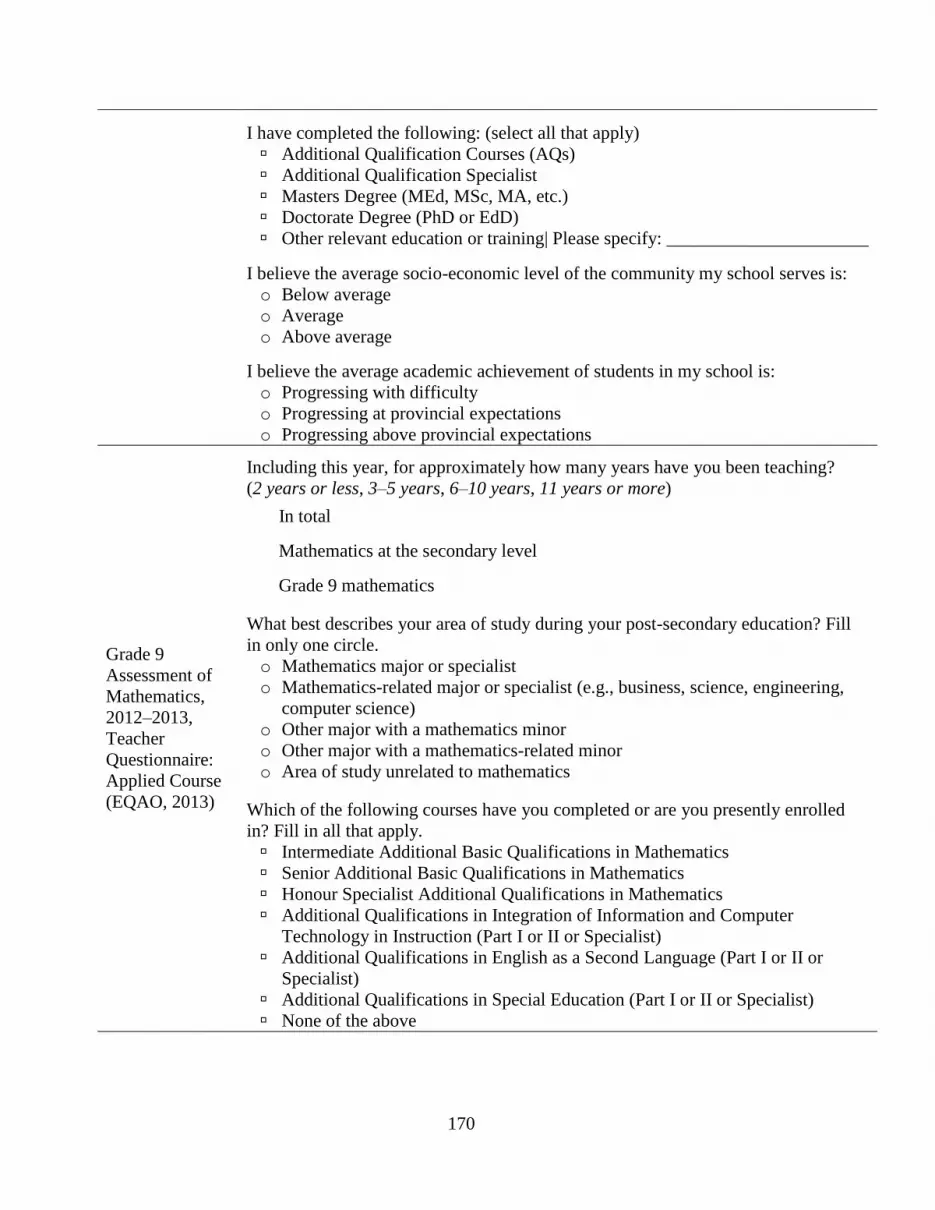
170
I have completed the following: (select all that apply)
Additional Qualification Courses (AQs)
Additional Qualification Specialist
Masters Degree (MEd, MSc, MA, etc.)
Doctorate Degree (PhD or EdD)
Other relevant education or training| Please specify: ______________________
I believe the average socio-economic level of the community my school serves is:
o Below average
o Average
o Above average
I believe the average academic achievement of students in my school is:
o Progressing with difficulty
o Progressing at provincial expectations
o Progressing above provincial expectations
Grade 9
Assessment of
Mathematics,
2012–2013,
Teacher
Questionnaire:
Applied Course
(EQAO, 2013)
Including this year, for approximately how many years have you been teaching?
(2 years or less, 3–5 years, 6–10 years, 11 years or more)
In total
Mathematics at the secondary level
Grade 9 mathematics
What best describes your area of study during your post-secondary education? Fill
in only one circle.
o Mathematics major or specialist
o Mathematics-related major or specialist (e.g., business, science, engineering,
computer science)
o Other major with a mathematics minor
o Other major with a mathematics-related minor
o Area of study unrelated to mathematics
Which of the following courses have you completed or are you presently enrolled
in? Fill in all that apply.
Intermediate Additional Basic Qualifications in Mathematics
Senior Additional Basic Qualifications in Mathematics
Honour Specialist Additional Qualifications in Mathematics
Additional Qualifications in Integration of Information and Computer
Technology in Instruction (Part I or II or Specialist)
Additional Qualifications in English as a Second Language (Part I or II or
Specialist)
Additional Qualifications in Special Education (Part I or II or Specialist)
None of the above
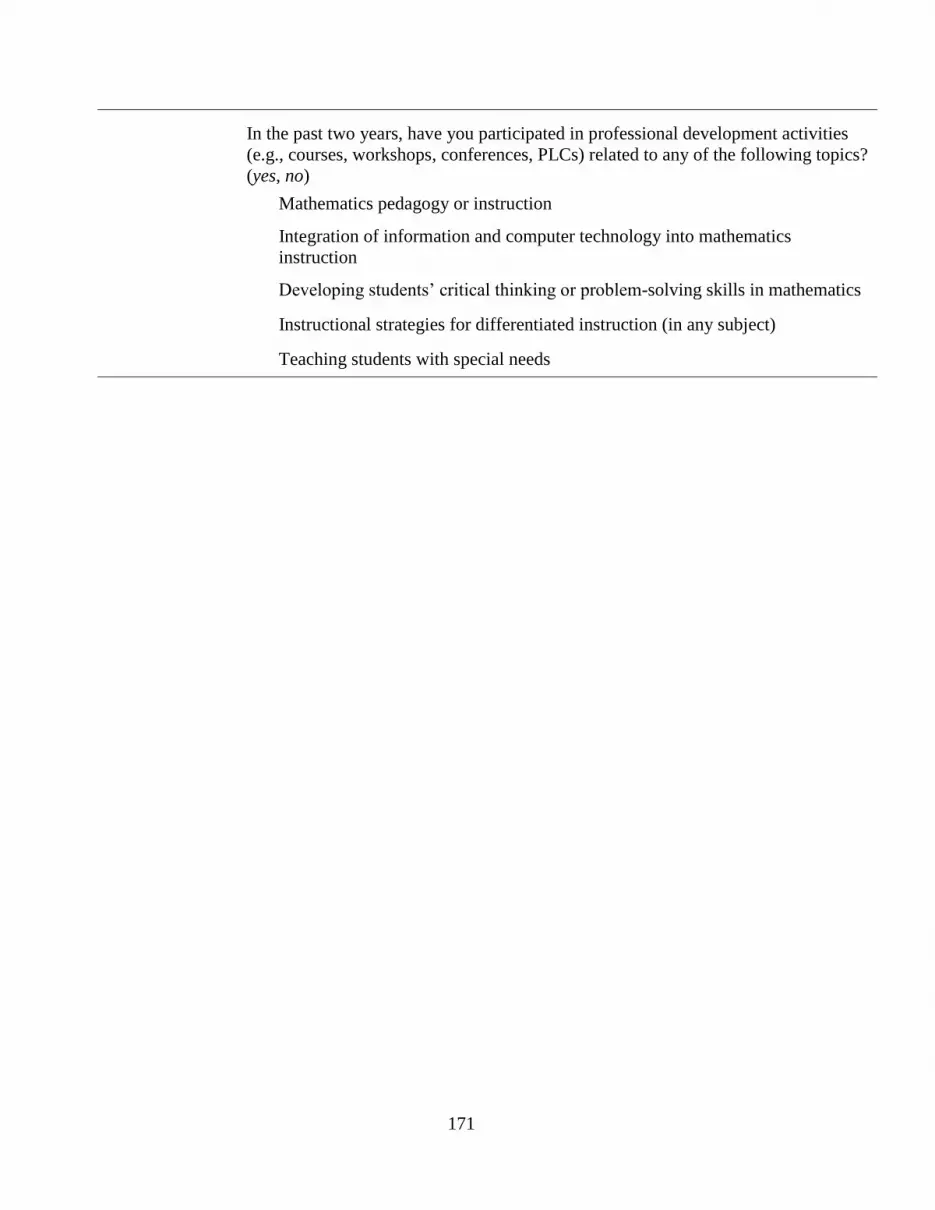
171
In the past two years, have you participated in professional development activities
(e.g., courses, workshops, conferences, PLCs) related to any of the following topics?
(yes, no)
Mathematics pedagogy or instruction
Integration of information and computer technology into mathematics
instruction
Developing students’ critical thinking or problem-solving skills in mathematics
Instructional strategies for differentiated instruction (in any subject)
Teaching students with special needs
172
Questionnaire Distributed Through Teachers’ School Board Emails
Thank you for filling out this questionnaire. You will be asked about your classroom
assessment practices and mathematics pedagogy in your Grade 9 applied mathematics class.
My Professional Practice
1. In my class . . .
Never Often
a. I provide my students with learning goals. O O O O O
b. I discuss the meaning of learning goals with my
students. O O O O O
c. I encourage students to set personal learning goals
for themselves. O O O O O
d. I give students success criteria. O O O O O
e. I discuss the meaning of success criteria with my
students. O O O O O
f. I work with my students to create success criteria. O O O O O
g. I have students working independently when
learning. O O O O O
h. I have students working in pairs when learning. O O O O O
i. I have students working in groups (3 or more)
when learning. O O O O O
j. I use assessment information to inform my
instruction. O O O O O
k. I use different levels of questioning to support my
students’ learning. O O O O O
l. I provide students with descriptive feedback based
on success criteria and/or achievement levels. O O O O O
m. I have my students give each other feedback on
their learning. O O O O O
n. I provide exemplars of student work that reflect
the success criteria and/or achievement levels. O O O O O
173
2. How often do you use the following to monitor students’ learning in your class?
Never Often
a. Paper-and-pencil tests O O O O O
b. Quizzes O O O O O
c. Performance tasks O O O O O
d. Homework performance O O O O O
e. Observation of students (notes/checklists) O O O O O
f. Projects O O O O O
g. Interviews/conferencing with students O O O O O
h. Portfolios/dated work samples O O O O O
i. Student presentations to other students (formal or
informal) O O O O O
j. Class discussions O O O O O
k. Students' journals O O O O O
l. Peer-assessments O O O O O
m. Self-assessments O O O O O
n. Computer/graphing calculator output O O O O O
o. Math problems with multiple solutions O O O O O
174
3. To what extent do you agree with the following statements?
In my class….
Strongly
Disagree Disagree
Neither
Agree Nor
Disagree
Agree Strongly
Agree
a. I am comfortable with the content. O O O O O
b. I know the “why” behind procedural steps
used to solve problems. O O O O O
c. I am familiar with common
misconceptions students have. O O O O O
d. I am aware of the mathematics topics that
students often find easy or difficult. O O O O O
e. I use multiple instructional strategies to
teach topics. O O O O O
f. I know what manipulatives are useful. O O O O O
g. I scaffold topics for students. O O O O O
4. To what extent do you agree with the following statements?
Strongly
Disagree Disagree
Neither
Agree Nor
Disagree
Agree Strongly
Agree
a. All students do not learn mathematics in
the same way. O O O O O
b. Students learn mathematics most
effectively when given opportunities to
investigate ideas and concepts through
problem solving.
O O O O O
c. Students learn mathematics most
effectively when teachers link new
concepts to students’ prior knowledge.
O O O O O
d. Current technologies bring many benefits
to the learning and doing of mathematics. O O O O O
e. I know how the big mathematics ideas are
connected across grade levels. O O O O O

175
5. For you, what are the most important aspects of assessment for learning?
_______________________________________________________________________________
_______________________________________________________________________________
_______________________________________________________________________________
6. Please list 2 examples of assessment for learning practices that you frequently use with
students in your class.
_______________________________________________________________________________
_______________________________________________________________________________
7. How does the mathematics curriculum support and/or hinder your ability to implement
assessment for learning practices?
Support: _______________________________________________________________________
_______________________________________________________________________________
_______________________________________________________________________________
Hinder: ________________________________________________________________________
_______________________________________________________________________________
_______________________________________________________________________________
8. What benefits and/or challenges have you found implementing assessment for learning
practices in your class?
Benefits: _______________________________________________________________________
_______________________________________________________________________________
_______________________________________________________________________________
Challenges: ____________________________________________________________________
_______________________________________________________________________________

176
My Teaching Experience
9. I believe the average academic achievement of students in my Grade 9 applied mathematics
class(es) is:
Far above the
provincial
average
O
Above the
provincial
average
O
Provincial
average
O
Below
provincial
average
O
Far below
provincial
average
O
10. During this school year, I will teach _______ Grade 9 applied mathematics classes.
O 1 O 2 O 3 or more
11. I have _______ years of professional teaching experience.
______ years Total
______ years Mathematics at the secondary level
______ years Grade 9 applied mathematics
12. In the last 2 years, I have taught _____________. (select all that apply)
☐ Locally developed mathematics courses
☐ Academic mathematics courses
☐ Workplace preparation mathematics courses
☐ College preparation mathematics courses
☐ University/college preparation mathematics courses
☐ University preparation mathematics courses
13. During my post-secondary education, I pursued a(n) ____________.
☐ Mathematics major or specialist
☐ Mathematics-related major or specialist (e.g., business, science, engineering, computer
science)
☐ Other major with a mathematics minor
☐ Other major with a mathematics-related minor
☐ Area of study unrelated to mathematics
177
14. I have completed or am enrolled in the following: (select all that apply)
☐ Intermediate or Senior Additional Basic Qualification in Mathematics
☐ Honour Specialist Additional Qualifications in Mathematics
☐ Masters Degree
☐ Doctorate Degree
☐ Other relevant education or training| Please specify:
________________________________
15. In the past five years, I have participated in professional development (leading or taking
workshops) on the following: (select all that apply)
☐ Classroom assessment
☐ Mathematics content knowledge
☐ Mathematics pedagogy or instruction
The questionnaire is now finished. Please submit your responses.
Thank you for your insight about teaching and assessment in a
Grade 9 applied mathematics classroom.
178
Questionnaire Distributed Through a School Board’s Broadcast Webpage
Thank you for filling out this questionnaire. You will be asked about your classroom
assessment practices and mathematics pedagogy in your Grade 9 applied mathematics class.
My Professional Practice
1. In my class . . .
Never Often
a. I provide my students with learning goals. O O O O O
b. I discuss the meaning of learning goals with my
students. O O O O O
c. I encourage students to set personal learning goals
for themselves. O O O O O
d. I give students success criteria. O O O O O
e. I discuss the meaning of success criteria with my
students. O O O O O
f. I work with my students to create success criteria. O O O O O
g. I have students working independently when
learning. O O O O O
h. I have students working in pairs when learning. O O O O O
i. I have students working in groups (3 or more)
when learning. O O O O O
j. I use assessment information to inform my
instruction. O O O O O
k. I use different levels of questioning to support my
students’ learning. O O O O O
l. I provide students with descriptive feedback based
on success criteria and/or achievement levels. O O O O O
m. I have my students give each other feedback on
their learning. O O O O O
n. I provide exemplars of student work that reflect
the success criteria and/or achievement levels. O O O O O

179
2. How often do you use the following to monitor students’ learning in your class?
Never Often
a. Paper-and-pencil tests O O O O O
b. Quizzes O O O O O
c. Performance tasks O O O O O
d. Homework performance O O O O O
e. Observation of students (notes/checklists) O O O O O
f. Projects O O O O O
g. Interviews/conferencing with students O O O O O
h. Portfolios/dated work samples O O O O O
i. Student presentations to other students (formal or
informal) O O O O O
j. Class discussions O O O O O
k. Students' journals O O O O O
l. Peer-assessments O O O O O
m. Self-assessments O O O O O
n. Computer/graphing calculator output O O O O O
o. Math problems with multiple solutions O O O O O

180
3. To what extent do you agree with the following statements?
In my class….
Strongly
Disagree Disagree
Neither
Agree Nor
Disagree
Agree Strongly
Agree
a. I am comfortable with the content. O O O O O
b. I know the “why” behind procedural steps
used to solve problems. O O O O O
c. I am familiar with common
misconceptions students have. O O O O O
d. I am aware of the mathematics topics that
students often find easy or difficult. O O O O O
e. I use multiple instructional strategies to
teach topics. O O O O O
f. I know what manipulatives are useful. O O O O O
g. I scaffold topics for students. O O O O O
4. To what extent do you agree with the following statements?
Strongly
Disagree Disagree
Neither
Agree Nor
Disagree
Agree Strongly
Agree
a. All students do not learn mathematics in
the same way. O O O O O
b. Students learn mathematics most
effectively when given opportunities to
investigate ideas and concepts through
problem solving.
O O O O O
c. Students learn mathematics most
effectively when teachers link new
concepts to students’ prior knowledge.
O O O O O
d. Current technologies bring many benefits
to the learning and doing of mathematics. O O O O O
e. I know how the big mathematics ideas are
connected across grade levels. O O O O O

181
5. For you, what are the most important aspects of assessment for learning?
_______________________________________________________________________________
_______________________________________________________________________________
_______________________________________________________________________________
6. Please list 2 examples of assessment for learning practices that you frequently use with
students in your class.
_______________________________________________________________________________
_______________________________________________________________________________
7. How does the mathematics curriculum support and/or hinder your ability to implement
assessment for learning practices?
Support: _______________________________________________________________________
_______________________________________________________________________________
_______________________________________________________________________________
Hinder: ________________________________________________________________________
_______________________________________________________________________________
_______________________________________________________________________________
8. What benefits and/or challenges have you found implementing assessment for learning
practices in your class?
Benefits: _______________________________________________________________________
_______________________________________________________________________________
_______________________________________________________________________________
Challenges: ____________________________________________________________________
_______________________________________________________________________________
_______________________________________________________________________________

182
My Teaching Experience
9. During this school year, I will teach _______ Grade 9 applied mathematics classes.
O 1 O 2 O 3 or more
10. I have _______ years of professional teaching experience.
______ years Total
______ years Mathematics at the secondary level
______ years Grade 9 applied mathematics
11. In the last 2 years, I have taught _____________. (select all that apply)
☐ Locally developed mathematics courses
☐ Academic mathematics courses
☐ Workplace preparation mathematics courses
☐ College preparation mathematics courses
☐ University/college preparation mathematics courses
☐ University preparation mathematics courses
12. I believe the average academic achievement of students in my school is:
Far above the
provincial
average
O
Above the
provincial
average
O
Provincial
average
O
Below
provincial
average
O
Far below
provincial
average
O
13. During my post-secondary education, I pursued a(n) ____________.
☐ Mathematics major or specialist
☐ Mathematics-related major or specialist (e.g., business, science, engineering, computer
science)
☐ Other major with a mathematics minor
☐ Other major with a mathematics-related minor
☐ Area of study unrelated to mathematics

183
14. I have completed or am enrolled in the following: (select all that apply)
☐ Intermediate or Senior Additional Basic Qualification in Mathematics
☐ Honour Specialist Additional Qualifications in Mathematics
☐ Masters Degree
☐ Doctorate Degree
☐ Other relevant education or training| Please specify:
________________________________
15. In the past five years, I have participated in professional development (leading or taking
workshops) on the following: (select all that apply)
☐ Classroom assessment
☐ Mathematics content knowledge
☐ Mathematics pedagogy or instruction
The questionnaire is now finished. Please submit your responses.
Thank you for your insight about teaching and assessment in a
Grade 9 applied mathematics classroom.
184
Questionnaire Distributed at OAME Conferences
Thank you for filling out this questionnaire.
You will be asked about your classroom assessment practices and mathematics pedagogy.
My Professional Practice
1. Have you taught Grade 9 applied mathematics?
☐ Yes. Please complete this questionnaire referencing this class
☐ No. Please identify the mathematics course you have commonly taught, and complete this
questionnaire referencing this class.
Mathematics course commonly taught: ____________________________________________
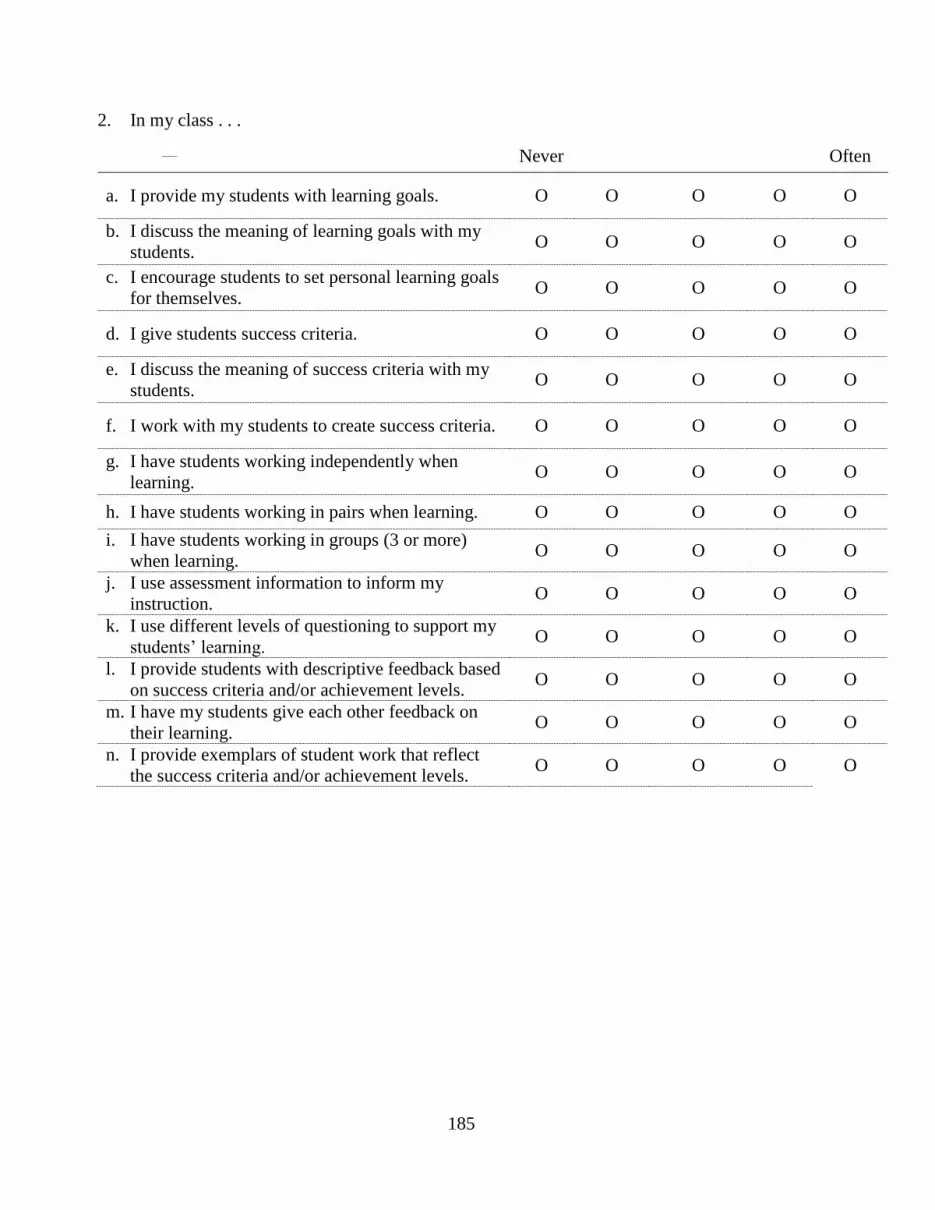
185
2. In my class . . .
Never Often
a. I provide my students with learning goals. O O O O O
b. I discuss the meaning of learning goals with my
students. O O O O O
c. I encourage students to set personal learning goals
for themselves. O O O O O
d. I give students success criteria. O O O O O
e. I discuss the meaning of success criteria with my
students. O O O O O
f. I work with my students to create success criteria. O O O O O
g. I have students working independently when
learning. O O O O O
h. I have students working in pairs when learning. O O O O O
i. I have students working in groups (3 or more)
when learning. O O O O O
j. I use assessment information to inform my
instruction. O O O O O
k. I use different levels of questioning to support my
students’ learning. O O O O O
l. I provide students with descriptive feedback based
on success criteria and/or achievement levels. O O O O O
m. I have my students give each other feedback on
their learning. O O O O O
n. I provide exemplars of student work that reflect
the success criteria and/or achievement levels. O O O O O

186
3. How often do you use the following to monitor students’ learning in your class?
Never Often
a. Paper-and-pencil tests O O O O O
b. Quizzes O O O O O
c. Performance tasks O O O O O
d. Homework performance O O O O O
e. Observation of students (notes/checklists) O O O O O
f. Projects O O O O O
g. Interviews/conferencing with students O O O O O
h. Portfolios/dated work samples O O O O O
i. Student presentations to other students (formal or
informal) O O O O O
j. Class discussions O O O O O
k. Students' journals O O O O O
l. Peer-assessments O O O O O
m. Self-assessments O O O O O
n. Computer/graphing calculator output O O O O O
o. Math problems with multiple solutions O O O O O

187
4. To what extent do you agree with the following statements?
In my class….
Strongly
Disagree Disagree
Neither
Agree Nor
Disagree
Agree Strongly
Agree
a. I am comfortable with the content. O O O O O
b. I know the “why” behind procedural steps
used to solve problems. O O O O O
c. I am familiar with common
misconceptions students have. O O O O O
d. I am aware of the mathematics topics that
students often find easy or difficult. O O O O O
e. I use multiple instructional strategies to
teach topics. O O O O O
f. I know what manipulatives are useful. O O O O O
g. I scaffold topics for students. O O O O O
5. To what extent do you agree with the following statements?
Strongly
Disagree Disagree
Neither
Agree Nor
Disagree
Agree Strongly
Agree
a. All students do not learn mathematics in
the same way. O O O O O
b. Students learn mathematics most
effectively when given opportunities to
investigate ideas and concepts through
problem solving.
O O O O O
c. Students learn mathematics most
effectively when teachers link new
concepts to students’ prior knowledge.
O O O O O
d. Current technologies bring many benefits
to the learning and doing of mathematics. O O O O O
e. I know how the big mathematics ideas are
connected across grade levels. O O O O O
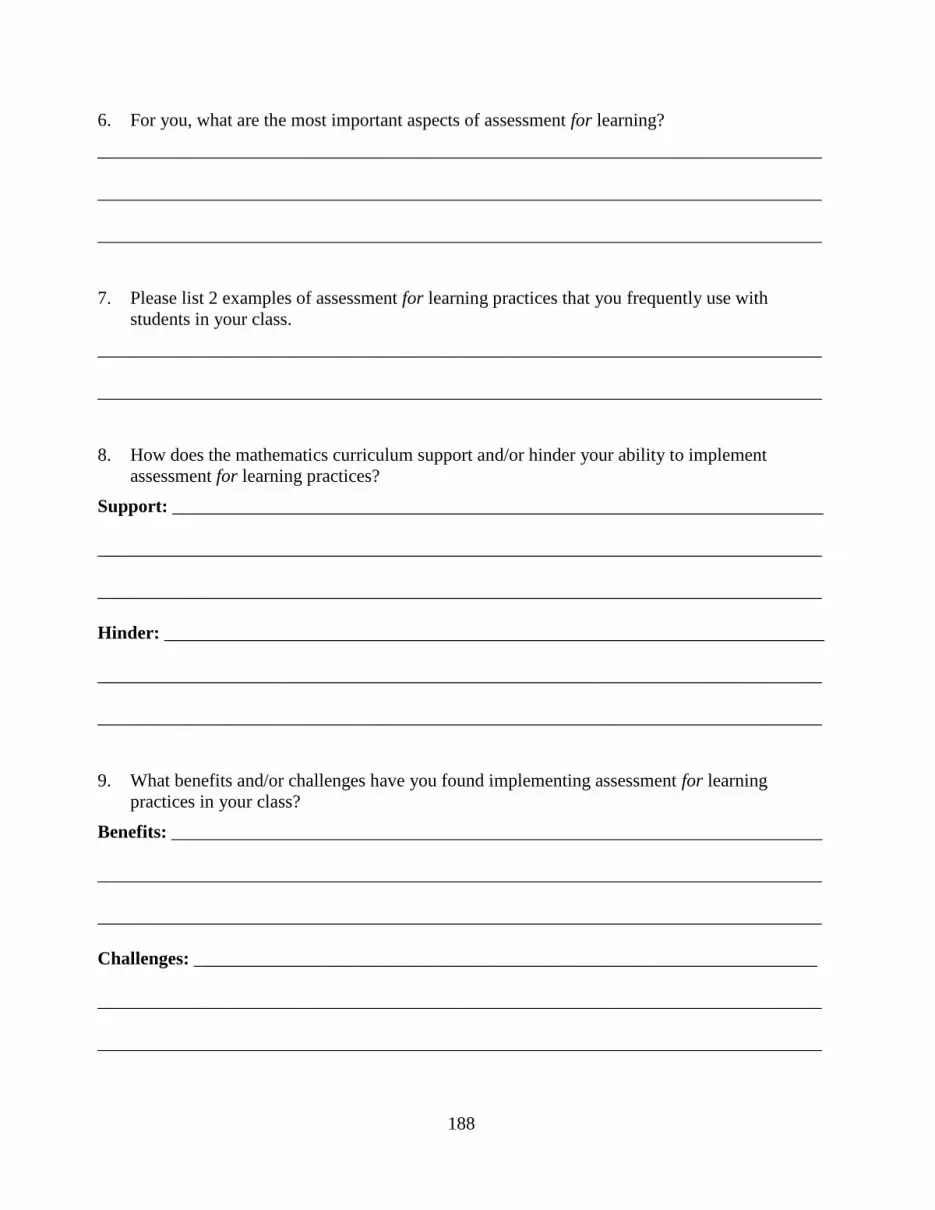
188
6. For you, what are the most important aspects of assessment for learning?
_______________________________________________________________________________
_______________________________________________________________________________
_______________________________________________________________________________
7. Please list 2 examples of assessment for learning practices that you frequently use with
students in your class.
_______________________________________________________________________________
_______________________________________________________________________________
8. How does the mathematics curriculum support and/or hinder your ability to implement
assessment for learning practices?
Support: _______________________________________________________________________
_______________________________________________________________________________
_______________________________________________________________________________
Hinder: ________________________________________________________________________
_______________________________________________________________________________
_______________________________________________________________________________
9. What benefits and/or challenges have you found implementing assessment for learning
practices in your class?
Benefits: _______________________________________________________________________
_______________________________________________________________________________
_______________________________________________________________________________
Challenges: ____________________________________________________________________
_______________________________________________________________________________
_______________________________________________________________________________
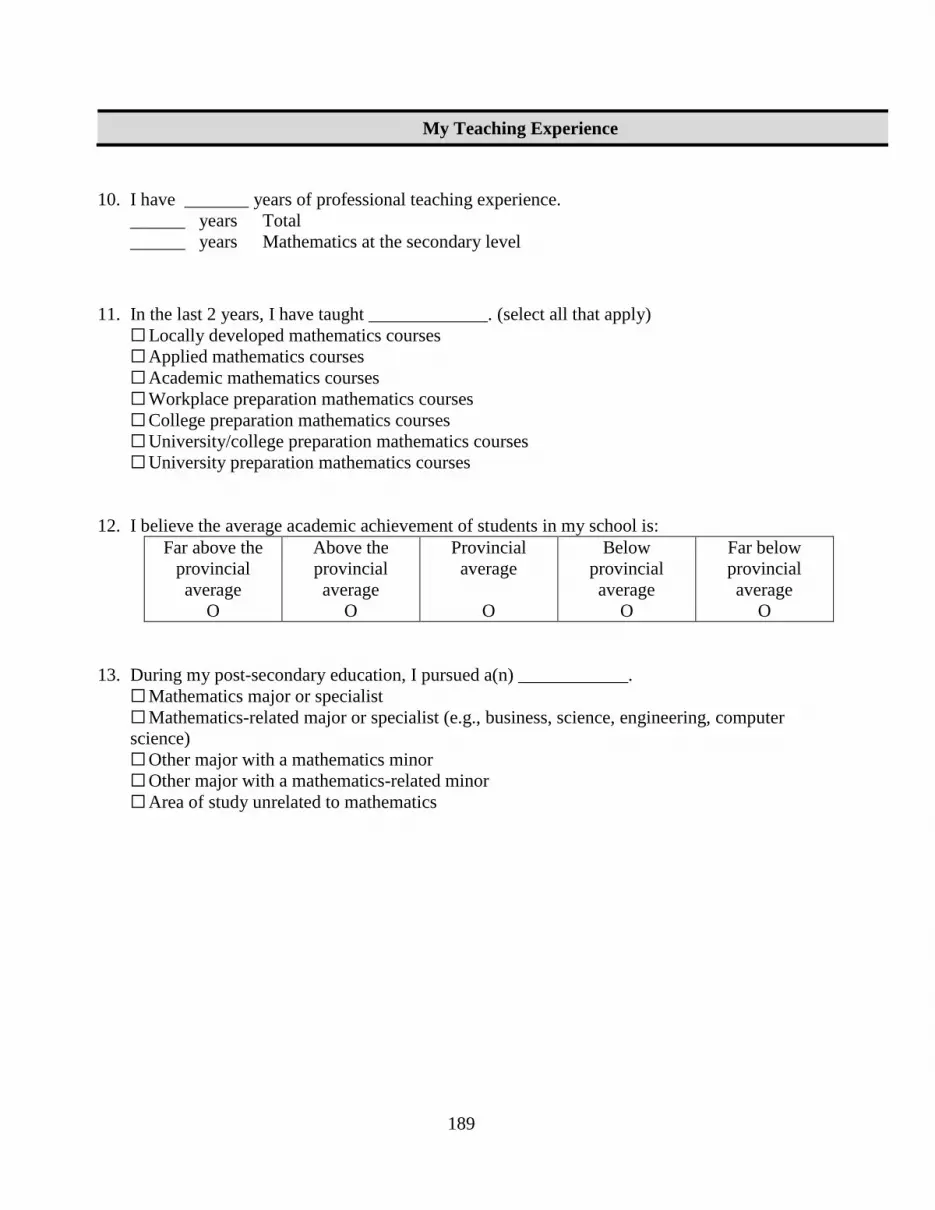
189
My Teaching Experience
10. I have _______ years of professional teaching experience.
______ years Total
______ years Mathematics at the secondary level
11. In the last 2 years, I have taught _____________. (select all that apply)
☐ Locally developed mathematics courses
☐ Applied mathematics courses
☐ Academic mathematics courses
☐ Workplace preparation mathematics courses
☐ College preparation mathematics courses
☐ University/college preparation mathematics courses
☐ University preparation mathematics courses
12. I believe the average academic achievement of students in my school is:
Far above the
provincial
average
O
Above the
provincial
average
O
Provincial
average
O
Below
provincial
average
O
Far below
provincial
average
O
13. During my post-secondary education, I pursued a(n) ____________.
☐ Mathematics major or specialist
☐ Mathematics-related major or specialist (e.g., business, science, engineering, computer
science)
☐ Other major with a mathematics minor
☐ Other major with a mathematics-related minor
☐ Area of study unrelated to mathematics

190
14. I have completed or am enrolled in the following: (select all that apply)
☐ Intermediate or Senior Additional Basic Qualification in Mathematics
☐ Honour Specialist Additional Qualifications in Mathematics
☐ Masters Degree
☐ Doctorate Degree
☐ Other relevant education or training| Please specify:
________________________________
15. In the past five years, I have participated in professional development (leading or taking
workshops) on the following: (select all that apply)
☐ Classroom assessment
☐ Mathematics content knowledge
☐ Mathematics pedagogy or instruction
Thank you for your insight about teaching and assessment in a
secondary mathematics classroom.
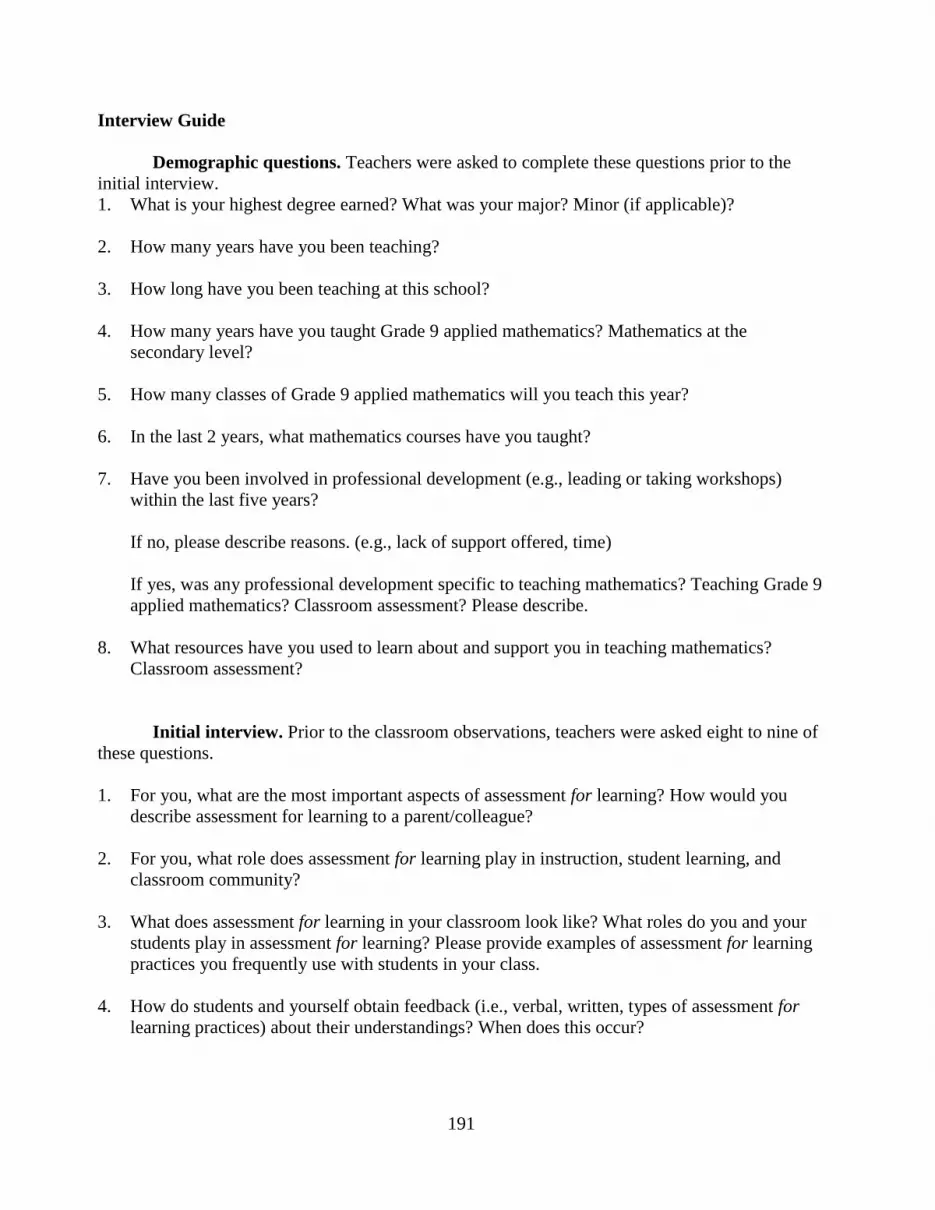
191
Interview Guide
Demographic questions. Teachers were asked to complete these questions prior to the
initial interview.
1. What is your highest degree earned? What was your major? Minor (if applicable)?
2. How many years have you been teaching?
3. How long have you been teaching at this school?
4. How many years have you taught Grade 9 applied mathematics? Mathematics at the
secondary level?
5. How many classes of Grade 9 applied mathematics will you teach this year?
6. In the last 2 years, what mathematics courses have you taught?
7. Have you been involved in professional development (e.g., leading or taking workshops)
within the last five years?
If no, please describe reasons. (e.g., lack of support offered, time)
If yes, was any professional development specific to teaching mathematics? Teaching Grade 9
applied mathematics? Classroom assessment? Please describe.
8. What resources have you used to learn about and support you in teaching mathematics?
Classroom assessment?
Initial interview. Prior to the classroom observations, teachers were asked eight to nine of
these questions.
1. For you, what are the most important aspects of assessment for learning? How would you
describe assessment for learning to a parent/colleague?
2. For you, what role does assessment for learning play in instruction, student learning, and
classroom community?
3. What does assessment for learning in your classroom look like? What roles do you and your
students play in assessment for learning? Please provide examples of assessment for learning
practices you frequently use with students in your class.
4. How do students and yourself obtain feedback (i.e., verbal, written, types of assessment for
learning practices) about their understandings? When does this occur?

192
5. What are some assessment for learning practices that you find to be effective in your class?
What evidence suggests these are effective practices?
6. How do you organize your class/mathematics instruction to support assessment for learning?
7. How do you structure your instruction to support students learning in mathematics? How do
your math skills and knowledge guide your instructional planning?
8. How does the mathematics curriculum support and/or hinder your ability to implement
assessment for learning practices?
9. What benefits and/or challenges have you found implementing assessment for learning in your
class?
10. Describe the strategies you use when you recognize students are misunderstanding a concept?
Follow-up interview. Following the classroom observations, teachers were asked a
minimum of three of these questions.
1. When you developed/used these instructional materials (e.g., lesson plans, assignments) what
were your intentions for students’ learning?
2. Tell me about how these instructional materials were used to scaffold for students’ learning.
3. Talk to me about how the materials differentiate across students.
4. When you realize students are just not getting it what are some strategies you use?
5. What is it that you do that helps your students be successful?

193
Classroom Observation Template
Date: Time in Unit: Beginning Middle End Number of Students:
Description of Classroom Set-up:
Assessment for Learning
Strategy Description Time
Instructional Strategy Description Time
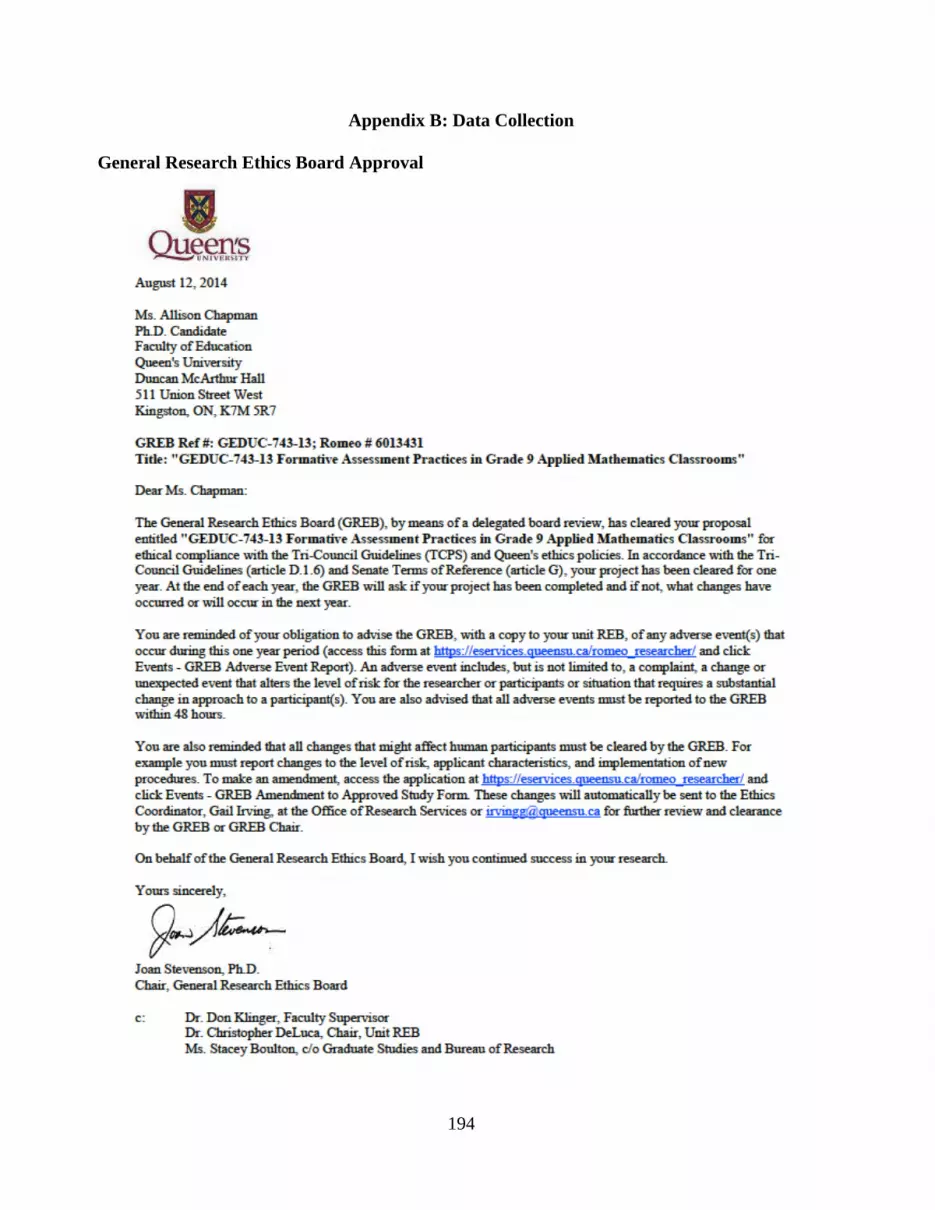
194
Appendix B: Data Collection
General Research Ethics Board Approval
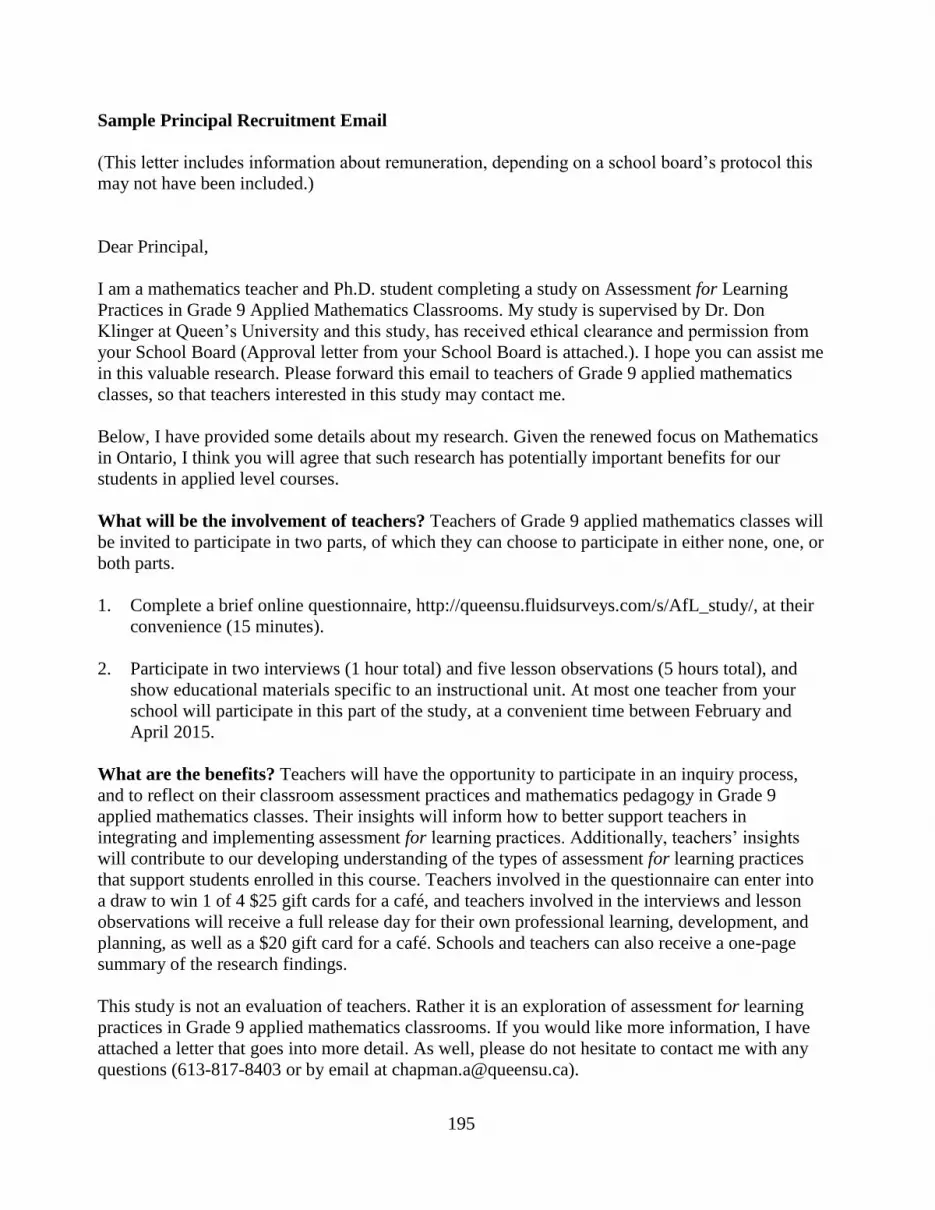
195
Sample Principal Recruitment Email
(This letter includes information about remuneration, depending on a school board’s protocol this
may not have been included.)
Dear Principal,
I am a mathematics teacher and Ph.D. student completing a study on Assessment for Learning
Practices in Grade 9 Applied Mathematics Classrooms. My study is supervised by Dr. Don
Klinger at Queen’s University and this study, has received ethical clearance and permission from
your School Board (Approval letter from your School Board is attached.). I hope you can assist me
in this valuable research. Please forward this email to teachers of Grade 9 applied mathematics
classes, so that teachers interested in this study may contact me.
Below, I have provided some details about my research. Given the renewed focus on Mathematics
in Ontario, I think you will agree that such research has potentially important benefits for our
students in applied level courses.
What will be the involvement of teachers? Teachers of Grade 9 applied mathematics classes will
be invited to participate in two parts, of which they can choose to participate in either none, one, or
both parts.
1. Complete a brief online questionnaire, http://queensu.fluidsurveys.com/s/AfL_study/, at their
convenience (15 minutes).
2. Participate in two interviews (1 hour total) and five lesson observations (5 hours total), and
show educational materials specific to an instructional unit. At most one teacher from your
school will participate in this part of the study, at a convenient time between February and
April 2015.
What are the benefits? Teachers will have the opportunity to participate in an inquiry process,
and to reflect on their classroom assessment practices and mathematics pedagogy in Grade 9
applied mathematics classes. Their insights will inform how to better support teachers in
integrating and implementing assessment for learning practices. Additionally, teachers’ insights
will contribute to our developing understanding of the types of assessment for learning practices
that support students enrolled in this course. Teachers involved in the questionnaire can enter into
a draw to win 1 of 4 $25 gift cards for a café, and teachers involved in the interviews and lesson
observations will receive a full release day for their own professional learning, development, and
planning, as well as a $20 gift card for a café. Schools and teachers can also receive a one-page
summary of the research findings.
This study is not an evaluation of teachers. Rather it is an exploration of assessment for learning
practices in Grade 9 applied mathematics classrooms. If you would like more information, I have
attached a letter that goes into more detail. As well, please do not hesitate to contact me with any
questions (613-817-8403 or by email at [email protected]).

196
Kind regards,
Allison
Allison Chapman, H.B.Sc., B.Ed., M.Ed.
Ph.D. Candidate, Assessment & Evaluation/Cognitive Studies
Faculty of Education, Queen's University
197
Sample Principal Letter of Information
(This letter includes information about remuneration, depending on a school board’s protocol this
may not have been included.)
Assessment for Learning Practices in Grade 9 Applied Mathematics Classrooms
This research is being conducted by Allison Chapman, a doctoral candidate working with Dr. Don
Klinger in the Faculty of Education at Queen’s University in Kingston, Ontario, Canada. This
study has been granted clearance according to the recommended principles of Canadian ethics
guidelines and Queen’s policies. Your School Board has also approved this study.
What is this study about? There is a drive to integrate assessment that support students’ learning
or assessment for learning (AfL) with instruction, as AfL can have a positive impact on students’
learning, both across contexts and students. However, the implementation of AfL strategies in
mathematics is complex, largely due to a multitude of factors including the generality of the AfL
strategies, domain knowledge valued, traditional views of learning mathematics, student ability
levels, and teachers’ conceptions of assessment, knowledge, and skills. This research explores the
forms of teaching and assessment occurring in Ontario’s Grade 9 applied mathematics classes. I
am looking at schools that have a variety of levels of achievement in this course.
What will be the involvement of teachers? Teachers of Grade 9 applied mathematics classes will
be invited to participate in two parts, of which they can choose to participate in either none, one, or
both parts.
1. Complete a brief online questionnaire at their convenience (15 minutes). Some of the areas
addressed in the questionnaire include the frequency of AfL practices used, and the extent to
which teachers agree with certain mathematics pedagogy.
2. Participate in two interviews (1 hour total) and five lesson observations (5 hours total), and
show educational materials specific to an instructional unit. Both interviews will be conducted
over the phone or at your school, depending on the teacher’s preference. Questions will be
emailed to the teacher prior to the interview and will focus on teachers’ conceptions of AfL,
AfL practices, mathematics pedagogy, and educational materials used. Interviews and lesson
observations will occur at a convenient time between February and April 2015. At most one
teacher from your school will participate in this part of the study.
What are the benefits? Teachers will have the opportunity to participate in an inquiry process,
and to reflect on their classroom assessment practices and mathematics pedagogy in Grade 9
applied mathematics classes. Their insights will inform how to better support teachers in
integrating and implementing AfL practices. Additionally, teachers’ insights will contribute to our
developing understanding of the types of AfL practices that support students enrolled in this
course. Teachers involved in the questionnaire can enter into a draw to win 1 of 4 $25 gift cards
for a café, and teachers involved in the interviews and lesson observations will receive a full
release day for their own professional learning, development, and planning, as well as a $20 gift
198
card for a café. Schools and teachers can also receive a one-page summary of the research
findings.
Is participation voluntary? Your school participation is completely voluntary. There are no
known physical, psychological, economic, or social risks associated with this study. Further,
teachers are free to choose, without reason or consequence, to refuse to answer any questions or
withdraw from this study. Also, identifiable information will not be presented or published.
What if I have concerns? Any questions about study participation may be directed to Allison
Chapman at 613-817-8403 & [email protected] or her supervisor Dr. Don Klinger at 613-
533-3028 & [email protected]. Any ethical concerns about the study may be directed to the
Chair of the General Research Ethics Board at 613-533-6081 or [email protected].
199
Sample Teacher Recruitment Email
(This letter includes information about remuneration, depending on a school board’s protocol this
may not have been included.)
Dear Teacher,
I am a mathematics teacher and Ph.D. student completing a study on Assessment for Learning
Practices in Grade 9 Applied Mathematics Classrooms. My study is supervised by Dr. Don
Klinger at Queen’s University and this study, has received ethical clearance and permission from
your School Board. I hope to better understand the forms of teaching and assessment occurring in
Ontario’s Grade 9 applied mathematics classes.
I have reviewed schools’ EQAO Grade 9 assessment results over the past five years. Results at
your school have been interesting. It would be very valuable to explore what teachers and students
are doing in those applied classrooms in which students are performing much better than the
average. I invite you to complete:
1. A brief 15-minute questionnaire at http://queensu.fluidsurveys.com/s/AfL_study/.
As a token of appreciation for your time, you can enter into a draw to win 1 of 4 $25 gift cards
for a café.
AND/OR
2. Could you use a full release day for your own professional learning, development, and
planning, as well as a $20 gift card for a café? If so, consider participating in this second
phase of the research. This part includes participating in an interview (40 minutes) followed
by five lesson observations (5 hours total), showing educational materials specific to an
instructional unit, and participating in a brief follow-up interview (20 minutes) on the
educational materials used. Interviews can be held over the phone or at your school depending
on what is preferable.
Your insight will contribute to our developing understanding of the types of assessment for
learning practices that support students enrolled in Grade 9 applied mathematics. If you wish, you
can receive a one-page summary of the research findings.
This study is not an evaluation of teachers. Rather it is an exploration of assessment for learning
practices in Grade 9 applied mathematics classrooms. If you would like more information, I have
attached a letter that goes into more detail. As well, please do not hesitate to contact me with any
questions (613-817-8403 or by email at [email protected]). Thank you for considering this
request.

200
Kind regards,
Allison
Allison Chapman, H.B.Sc., B.Ed., M.Ed.
Ph.D. Candidate, Assessment & Evaluation/Cognitive Studies
Faculty of Education, Queen's University
201
Sample Teacher Letter of Information
(This letter includes information about remuneration, depending on a school board’s protocol this
may not have been included.)
Assessment for Learning Practices in Grade 9 Applied Mathematics Classrooms
This research is being conducted by Allison Chapman, a doctoral candidate working with Dr. Don
Klinger in the Faculty of Education at Queen’s University in Kingston, Ontario, Canada. This
study has been granted clearance according to the recommended principles of Canadian ethics
guidelines and Queen’s policies. Your School Board has also approved this study.
What is this study about? There is a drive to integrate assessment that support students’ learning
or assessment for learning (AfL) with instruction, as AfL can have a positive impact on students’
learning, both across contexts and students. However, the implementation of AfL strategies in
mathematics is complex, largely due to a multitude of factors including the generality of the AfL
strategies, domain knowledge valued, traditional views of learning mathematics, student ability
levels, and teachers’ conceptions of assessment, knowledge, and skills. This research explores the
forms of teaching and assessment occurring in Ontario’s Grade 9 applied mathematics classes. I
am looking at schools that have a variety of levels of achievement in this course.
What will this study require? I invite you to complete:
1. A brief online questionnaire (15 minutes). It has 15 questions; some of the areas addressed
include the frequency of AfL practices used, and the extent to which you agree with certain
mathematics pedagogy.
AND/OR
2. An interview (40 minutes) followed by five consecutive lesson observations (5 hours total),
the showing of educational materials specific to an instructional unit, and a brief follow-up
interview (20 minutes). Interviews can be held over the phone or at your school depending on
what is preferable, and if agreed to, will be recorded in digital audio files. Questions will be
emailed to you prior to the interview, and will focus on your conceptions of AfL, AfL
practices, mathematics pedagogy, and educational materials used. Participation in this part can
occur at a convenient time for you between February and April 2015.
Is participation voluntary? Your participation is completely voluntary and choosing not to
participate will not result in any adverse consequences. There are no known risks associated with
your participation in this study. Further, you are free to choose, without reason or consequence, to
refuse to answer any questions. You are free to withdraw at any time for whatever reason without
penalty from the questionnaire by just exiting the questionnaire before the end. Once you have
submitted your responses to the questionnaire, you may not withdraw your data as identifiable
information will not be collected. You may withdraw from the interviews and lesson observations
at any time with no negative consequences. If you withdraw from the interviews and lesson
observations, you may choose to have your data removed. To withdraw from the study, please

202
send an email requesting your withdrawal to Allison Chapman at [email protected] or her
supervisor Dr. Don Klinger at [email protected].
What will happen to my responses? Confidentiality will be protected to the extent possible.
None of the data will contain your name or the identity of your place of work; a pseudonym will
replace your name on all data files and in any dissemination of findings. As part of the analysis,
quotations will be used from transcripts to support themes. All data will be stored in a secure,
password-protected computer file accessible only to the principle investigator (A. Chapman) and
her faculty supervisor (D. Klinger). The interview recording will be transcribed and then the
recording will be destroyed. The principle investigator will maintain copies of the transcripts,
lesson observations, educational materials, and questionnaire data for a minimum of 5 years and
may use the data (with names removed) in subsequent research. Any data used for secondary
analysis will contain no identifying information. This research may result in presentations and
publications of various types, including journal articles, other professional publications,
conference presentations, or the doctoral candidate’s dissertation.
What are the benefits? Your participation in this study is very valuable; your insight will
contribute to our developing understanding of the types of AfL practices that support students
enrolled in Grade 9 applied mathematics. Additionally, your insight will inform how to better
support teachers in integrating and implementing AfL practices. If you wish, you can receive a
one-page summary of the research findings. Please send me an email at [email protected],
and once completed, I will email you a copy of the findings.
Is there remuneration? As a token of appreciation for your time, for participating in the online
questionnaire you can enter into a draw to win 1 of 4 $25 gift cards for a café. Also, for
participating in the interviews and lesson observations you will receive a full release day for your
own professional learning, development, and planning, as well as a $20 gift card for a café.
What if I have concerns? Any questions about study participation may be directed to Allison
Chapman at 613-817-8403 & [email protected] or her supervisor Dr. Don Klinger at 613-
533-3028 & [email protected]. Any ethical concerns about the study may be directed to the
Chair of the General Research Ethics Board at 613-533-6081 or [email protected].
203
Sample Combined Letter of Information/Consent Form for Questionnaire
(This combined letter of information/consent form includes information about remuneration,
depending on a school board’s protocol this may not have been included.)
Assessment for Learning Practices in Grade 9 Applied Mathematics Classrooms
This research is being conducted by Allison Chapman, a doctoral candidate working with Dr. Don
Klinger in the Faculty of Education at Queen’s University in Kingston, Ontario, Canada. This
study has been granted clearance according to the recommended principles of Canadian ethics
guidelines and Queen’s policies. Your School Board has also approved this study.
This research is apart of my doctoral dissertation that explores the forms of teaching and
assessment occurring in Ontario’s Grade 9 applied mathematics classes. I am looking at schools
that have a variety of levels of achievement in applied mathematics. There are 15 questions on this
questionnaire, and it will take approximately 15 minutes to complete.
What are the benefits? Your participation in this study is very valuable; your insight will
contribute to our developing understanding of the types of assessment for learning practices that
support students enrolled in Grade 9 applied mathematics. Additionally, your insight will inform
how to better support teachers in integrating and implementing assessment for learning practices.
If you wish, you can receive a one-page summary of the research findings. Please send me an
email at [email protected], and once completed, I will email you a copy of the findings.
Is there remuneration? As a token of appreciation for your time, after submitting the
questionnaire, you can enter into a draw to win 1 of 4 $25 gift cards for a café. Gift cards will be
emailed to winners. Choosing to enter into this draw will not compromise your anonymity in the
study.
Is participation voluntary? Your participation is completely voluntary and choosing not to
participate will not result in any adverse consequences. There are no known risks associated with
your participation in this study. You are not obliged to answer any questions that you find
objectionable. Further, you are free to withdraw at any time for whatever reason without penalty
by just exiting the questionnaire before the end. Once you have submitted your responses, you
may not withdraw your data as identifiable information will not be collected.
What will happen to my responses? Anonymity will be protected to the extent possible. Personal
and identifiable information will not be collected. Data will only be presented or published in
aggregate form. Dissemination of findings may result in presentations and publications of various
types, including journal articles, other professional publications, conference presentations, and the
doctoral candidate’s dissertation. All data will be stored in a secure, password-protected computer
file accessible only to the principle investigator (A. Chapman) and her faculty supervisor (D.
Klinger). The principle investigator will maintain the data for a minimum of 5 years and may use
the data in subsequent research. Any data used for secondary analysis will contain no identifying
information.
204
What if I have concerns? Any questions about study participation may be directed to Allison
Chapman at 613-817-8403 & [email protected] or her supervisor Dr. Don Klinger at 613-
533-3028 & [email protected]. Any ethical concerns about the study may be directed to the
Chair of the General Research Ethics Board at 613-533-6081 or [email protected].
Thank you for your insight about teaching and assessment in a
Grade 9 applied mathematics classroom.
Allison Chapman – Doctoral Candidate
Dr. Don Klinger – Faculty Supervisor
If you consent to participate in this research, please click the "next" button below to begin
the questionnaire.
If you do not wish to participate in this research, please close your browser.

205
Sample Combined Letter of Information/Consent Form for Case Study
(This combined letter of information/consent form includes information about remuneration,
depending on a school board’s protocol this may not have been included.)
Assessment for Learning Practices in Grade 9 Applied Mathematics Classrooms
This research is being conducted by Allison Chapman, a doctoral candidate working with Dr. Don
Klinger in the Faculty of Education at Queen’s University in Kingston, Ontario, Canada. This
study has been granted clearance according to the recommended principles of Canadian ethics
guidelines and Queen’s policies. Your School Board and Principal have also approved this study.
What is this study about? There is a drive to integrate assessment that support students’ learning
or assessment for learning (AfL) with instruction, as AfL can have a positive impact on students’
learning, both across contexts and students. However, the implementation of AfL strategies in
mathematics is complex, largely due to a multitude of factors including the generality of the AfL
strategies, domain knowledge valued, traditional views of learning mathematics, student ability
levels, and teachers’ conceptions of assessment, knowledge, and skills. This research is apart of
my doctoral dissertation that explores the forms of teaching and assessment occurring in Ontario’s
Grade 9 applied mathematics classes. I am looking at schools that have a variety of levels of
achievement in this course.
What will this study require? If you agree to participate in this research, I will first conduct a
phone interview with you (Or if more convenient, the interview may be held at your school.). The
interview will last approximately 40 minutes and if agreed to, will be recorded in digital audio
files. Questions will be emailed to you prior to the interview, and will focus on your conceptions
of AfL, AfL practices, and mathematics pedagogy.
After the interview, I will request the opportunity to visit your Grade 9 applied mathematics class
across five consecutive class periods (5 hours total). I will ask to view and take pictures of
educational materials that are relevant to teaching and learning in your classroom, and specific to
the instructional unit observed. Lastly, I will conduct a brief follow-up interview (20 minutes) on
the educational materials used. Participation in this study can occur at a convenient time for you
between February and April 2015.
Is participation voluntary? Your participation is completely voluntary and choosing not to
participate will not result in any adverse consequences. There are no known physical,
psychological, economic, or social risks associated with this study. Further, you are free to choose,
without reason or consequence, to refuse to answer any questions. You may withdraw from the
study at any time with no negative consequences. If you withdraw from the study, you may choose
to have your data removed. To withdraw from the study, please send an email requesting your
withdrawal to Allison Chapman at [email protected] or her supervisor Dr. Don Klinger at
What will happen to my responses? Confidentiality will be protected to the extent possible.
None of the data will contain your name or the identity of your place of work; a pseudonym will

206
replace your name on all data files and in any dissemination of findings. As part of the analysis,
quotations will be used from transcripts to support themes. All data will be stored in a secure,
password-protected computer file accessible only to the principle investigator (A. Chapman) and
her faculty supervisor (D. Klinger). The interview recording will be transcribed and then the
recording will be destroyed. The principle investigator will maintain copies of the transcripts,
lesson observations, and educational materials data for a minimum of 5 years and may use the data
(with names removed) in subsequent research. Any data used for secondary analysis will contain
no identifying information. This research may result in presentations and publications of various
types, including journal articles, other professional publications, conference presentations, or the
doctoral candidate’s dissertation.
What are the benefits? Your participation in this study is very valuable; your insight will
contribute to our developing understanding of the types of AfL practices that support students
enrolled in Grade 9 applied mathematics. Additionally, your insight will inform how to better
support teachers in integrating and implementing AfL practices. If you wish, you can receive
a one-page summary of the research findings. Please send me an email at [email protected],
and once completed, I will email you a copy of the findings.
Is there remuneration? As this study is part of a larger study that looks at applied and academic
courses, we are able to provide you with a full release day for your own professional learning,
development, and planning. As well, a $20 gift card for a café will be offered after the last
classroom visit as a token of appreciation for your time.
What if I have concerns? Any questions about study participation may be directed to Allison
Chapman at 613-817-8403 & [email protected] or her supervisor Dr. Don Klinger at 613-
533-3028 & [email protected]. Any ethical concerns about the study may be directed to the
Chair of the General Research Ethics Board at 613-533-6081 or [email protected].
Thank you for your insight about teaching and assessment in a
Grade 9 applied mathematics classroom.
207
Please sign one copy of this Letter of Information/Consent Form and return to Allison
Chapman. Retain the second copy for your records.
The information collected for this project is confidential and protected under the Municipal
Freedom of Information and Protection of Privacy Act, 1989.
I have read the statements above and have had any questions answered. I freely consent
to participate in this study.
I freely consent to having the interview recorded in digital audio files.
I freely consent to having pictures taken of educational materials.
Name of Participant: (please print) ___________________________ Date: _______________
Participant’s Signature: ___________________________

208
Parent/Guardian Letter of Information
209
Debrief
Assessment for Learning Practices in Grade 9 Applied Mathematics Classrooms
Thank you for your insight about teaching and assessment in a Grade 9 applied mathematics
classroom. Your time and participation in this study is very valuable; your insight will contribute
to our developing understanding of the types of assessment for learning (AfL) practices that
support students enrolled in this course. Additionally, your insight will inform how to better
support teachers in integrating and implementing AfL practices.
This research study is being conducted by Allison Chapman, a doctoral candidate working with
Dr. Don Klinger in the Faculty of Education at Queen’s University in Kingston, Ontario, Canada.
This study has been granted clearance according to the recommended principles of Canadian ethics
guidelines and Queen’s policies. Your School Board has also approved this study.
What was this study about? This research is a part of my doctoral dissertation that explores
teachers’ use of AfL practices with students who may struggle in mathematics and to what extent
there exists systematic differences in AfL practices.
How does this study relate to educational research? There is a drive to integrate assessment that
support students’ learning or AfL with instruction (Earl, 2013; Thompson & Wiliam, 2007), as
AfL can have a positive impact on students’ learning, both across students and contexts (e.g.,
Black & Wiliam, 1998; Hattie & Timperley, 2007). Five key AfL strategies for teachers to
implement AfL into their instructional practice include identifying and sharing clear learning
intentions and success criteria, eliciting evidence of learning, providing feedback, and engaging
students in peer- and self-assessments (Black & Wiliam, 1998). However, teachers may experience
challenges implementing AfL strategies with students who struggle in mathematics (Klinger et al.,
2013). Secondary mathematics teachers implement AfL strategies along a continuum, from no
implementation to deep integration in the classroom (e.g., Suurtamm & Koch, 2014; Wylie &
Lyon, 2015). The implementation of these strategies is complex, largely due to a multitude of
factors including the generality of the AfL strategies, domain knowledge valued, traditional views
of learning mathematics, student ability levels, and teachers’ conceptions of assessment,
knowledge, and skills (e.g., Bennett, 2011; Black & Wiliam, 2009; Earl, 2013; Klinger et al.,
2013; Otero, 2006; Suurtamm & Graves, 2007). Of these factors, two important ones to explore
are teachers’ conceptions of assessment and knowledge, as these are teacher factors that can be
supported and developed through professional development. Teachers’ conceptions of AfL may
influence the nature of their AfL practices (Otero, 2006). Within mathematics, teachers’ subject
matter knowledge and pedagogical content knowledge is called mathematical knowledge for
teaching (Ball, Thames, & Phelps, 2008; Hill, Ball, & Schilling, 2008). Mathematical knowledge
for teaching is related to improved teaching (Hill, Rowan, & Ball, 2005), and involves similar
knowledge to that knowledge required of teachers for AfL strategies.

210
Where can I obtain more information about this research topic?
1. Earl, L. M. (2013). Assessment as learning: Using classroom assessment to maximize student
learning (2nd ed.). Thousand Oaks, CA: Corwin.
2. Ball, D. L., Thames, M. H., & Phelps, G. (2008). Content knowledge for teaching: What makes
it special? Journal of Teacher Education, 59(5), 389–407. doi:10.1177/0022487108324554
What if I have concerns? Any questions about study participation may be directed to Allison
Chapman at 613-817-8403 & [email protected] or her supervisor Dr. Don Klinger at 613-
533-3028 & [email protected]. Any ethical concerns about the study may be directed to the
Chair of the General Research Ethics Board at 613-533-6081 or [email protected].
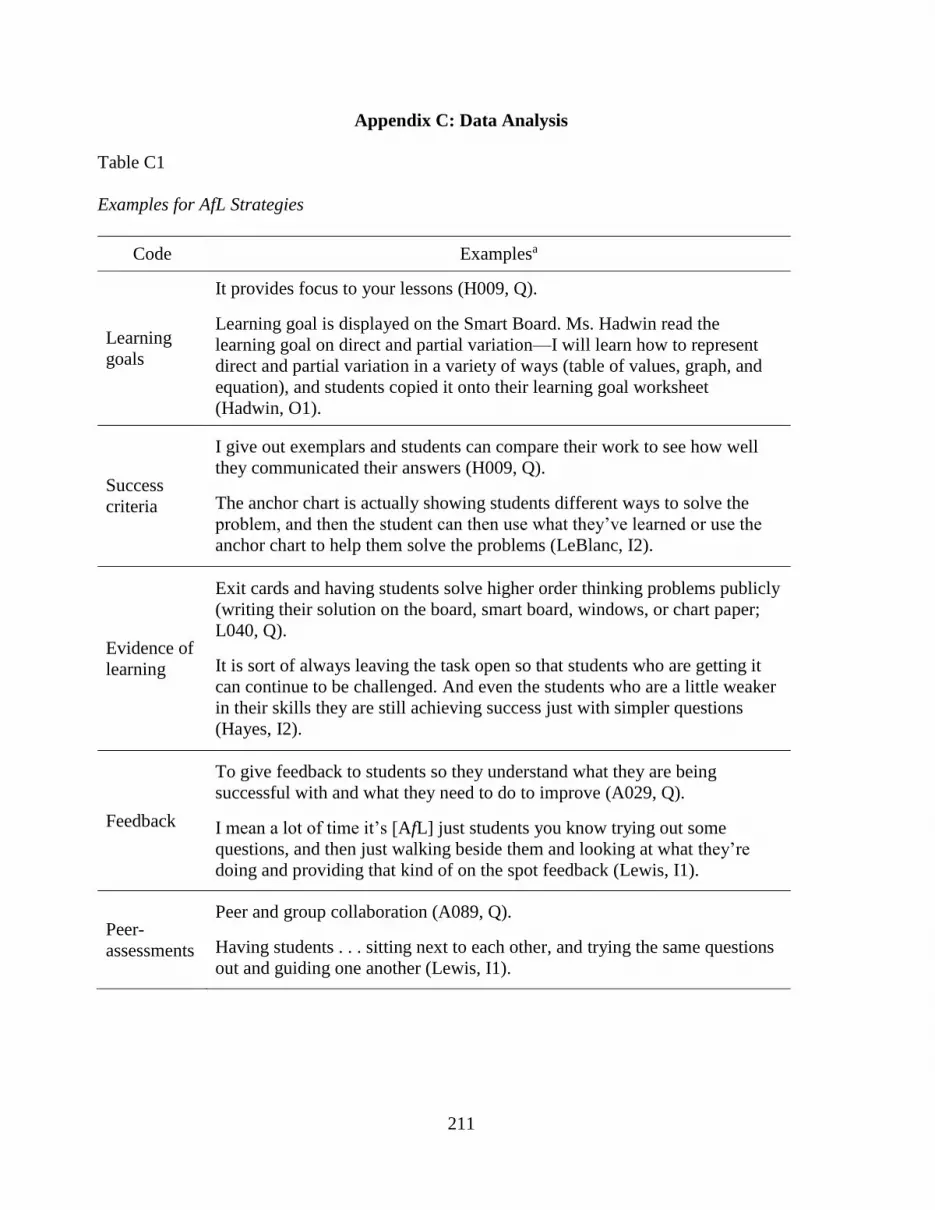
211
Appendix C: Data Analysis
Table C1
Examples for AfL Strategies
Code Examplesa
Learning
goals
It provides focus to your lessons (H009, Q).
Learning goal is displayed on the Smart Board. Ms. Hadwin read the
learning goal on direct and partial variation—I will learn how to represent
direct and partial variation in a variety of ways (table of values, graph, and
equation), and students copied it onto their learning goal worksheet
(Hadwin, O1).
Success
criteria
I give out exemplars and students can compare their work to see how well
they communicated their answers (H009, Q).
The anchor chart is actually showing students different ways to solve the
problem, and then the student can then use what they’ve learned or use the
anchor chart to help them solve the problems (LeBlanc, I2).
Evidence of
learning
Exit cards and having students solve higher order thinking problems publicly
(writing their solution on the board, smart board, windows, or chart paper;
L040, Q).
It is sort of always leaving the task open so that students who are getting it
can continue to be challenged. And even the students who are a little weaker
in their skills they are still achieving success just with simpler questions
(Hayes, I2).
Feedback
To give feedback to students so they understand what they are being
successful with and what they need to do to improve (A029, Q).
I mean a lot of time it’s [AfL] just students you know trying out some
questions, and then just walking beside them and looking at what they’re
doing and providing that kind of on the spot feedback (Lewis, I1).
Peer-
assessments
Peer and group collaboration (A089, Q).
Having students . . . sitting next to each other, and trying the same questions
out and guiding one another (Lewis, I1).

212
Self-
assessments
Thumbs up (put thumbs up when you have it; A078, Q).
So I want them to think about what they have done to do well. Like, do they
think they need to do more so they can do better? So therefore, I used the
One Star, Two Stairs (LeBlanc, I2).
Note. AfL = assessment for learning. aThe questionnaire data are referenced using the school-achievement results—high (H), average (A), or low (L)—
along with a number specific to each teacher; and the case study data are referenced using the classroom teachers’
pseudonyms (Ms. Hadwin, Mr. Hayes, Ms. LeBlanc, and Mr. Lewis) followed by the data collection method—
questionnaire (Q), interview (I), observation (O)—and then the interview or observation number where applicable.
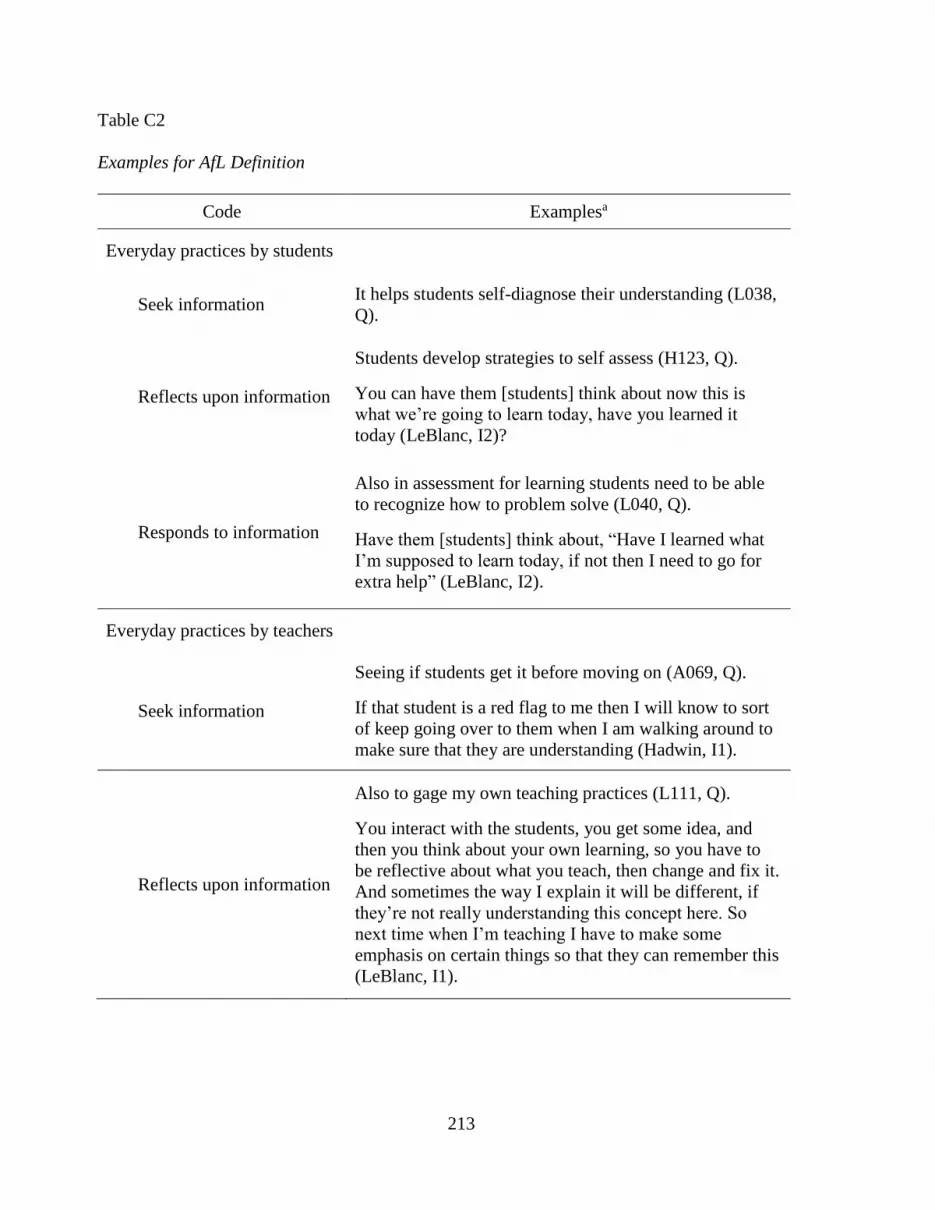
213
Table C2
Examples for AfL Definition
Code Examplesa
Everyday practices by students
Seek information It helps students self-diagnose their understanding (L038,
Q).
Reflects upon information
Students develop strategies to self assess (H123, Q).
You can have them [students] think about now this is
what we’re going to learn today, have you learned it
today (LeBlanc, I2)?
Responds to information
Also in assessment for learning students need to be able
to recognize how to problem solve (L040, Q).
Have them [students] think about, “Have I learned what
I’m supposed to learn today, if not then I need to go for
extra help” (LeBlanc, I2).
Everyday practices by teachers
Seek information
Seeing if students get it before moving on (A069, Q).
If that student is a red flag to me then I will know to sort
of keep going over to them when I am walking around to
make sure that they are understanding (Hadwin, I1).
Reflects upon information
Also to gage my own teaching practices (L111, Q).
You interact with the students, you get some idea, and
then you think about your own learning, so you have to
be reflective about what you teach, then change and fix it.
And sometimes the way I explain it will be different, if
they’re not really understanding this concept here. So
next time when I’m teaching I have to make some
emphasis on certain things so that they can remember this
(LeBlanc, I1).

214
Responds to information
I would use the assessments to direct my teaching (A002,
Q).
It’s [AfL] to be fully aware of where the kids are and
what they need to do to get on track or stay on track, and
what the teacher needs to do to get them on track. . . . it’s
a monitoring system for me, it gears how I plan my
lessons. . . . it helps with my pacing (Hayes, I2)
Note. AfL = assessment for learning. aThe questionnaire data are referenced using the school-achievement results—high (H), average (A), or low (L)—
along with a number specific to each teacher; and the case study data are referenced using the classroom teachers’
pseudonyms (Ms. Hadwin, Mr. Hayes, Ms. LeBlanc, and Mr. Lewis) followed by the data collection method—
questionnaire (Q), interview (I), observation (O)—and then the interview or observation number where applicable.
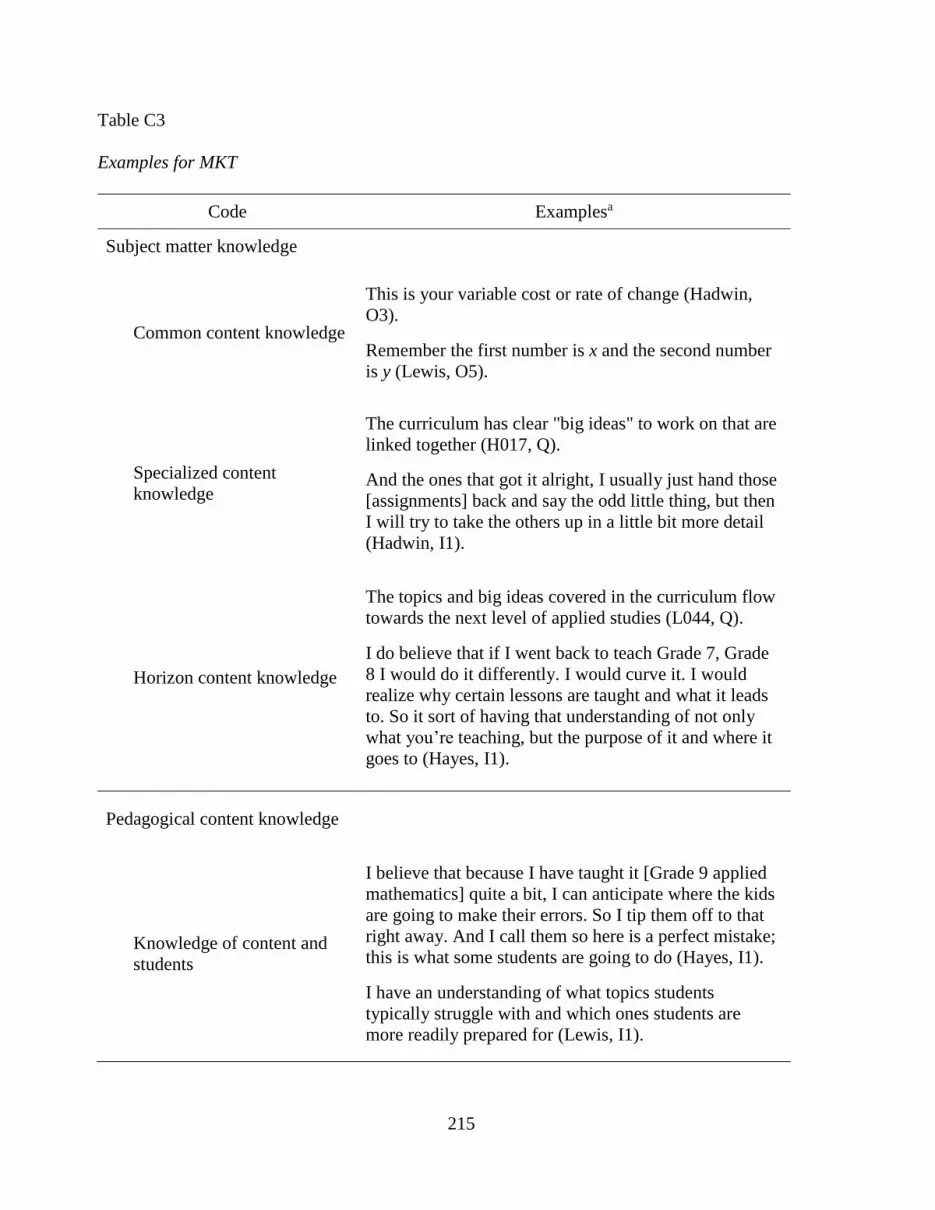
215
Table C3
Examples for MKT
Code Examplesa
Subject matter knowledge
Common content knowledge
This is your variable cost or rate of change (Hadwin,
O3).
Remember the first number is x and the second number
is y (Lewis, O5).
Specialized content
knowledge
The curriculum has clear "big ideas" to work on that are
linked together (H017, Q).
And the ones that got it alright, I usually just hand those
[assignments] back and say the odd little thing, but then
I will try to take the others up in a little bit more detail
(Hadwin, I1).
Horizon content knowledge
The topics and big ideas covered in the curriculum flow
towards the next level of applied studies (L044, Q).
I do believe that if I went back to teach Grade 7, Grade
8 I would do it differently. I would curve it. I would
realize why certain lessons are taught and what it leads
to. So it sort of having that understanding of not only
what you’re teaching, but the purpose of it and where it
goes to (Hayes, I1).
Pedagogical content knowledge
Knowledge of content and
students
I believe that because I have taught it [Grade 9 applied
mathematics] quite a bit, I can anticipate where the kids
are going to make their errors. So I tip them off to that
right away. And I call them so here is a perfect mistake;
this is what some students are going to do (Hayes, I1).
I have an understanding of what topics students
typically struggle with and which ones students are
more readily prepared for (Lewis, I1).
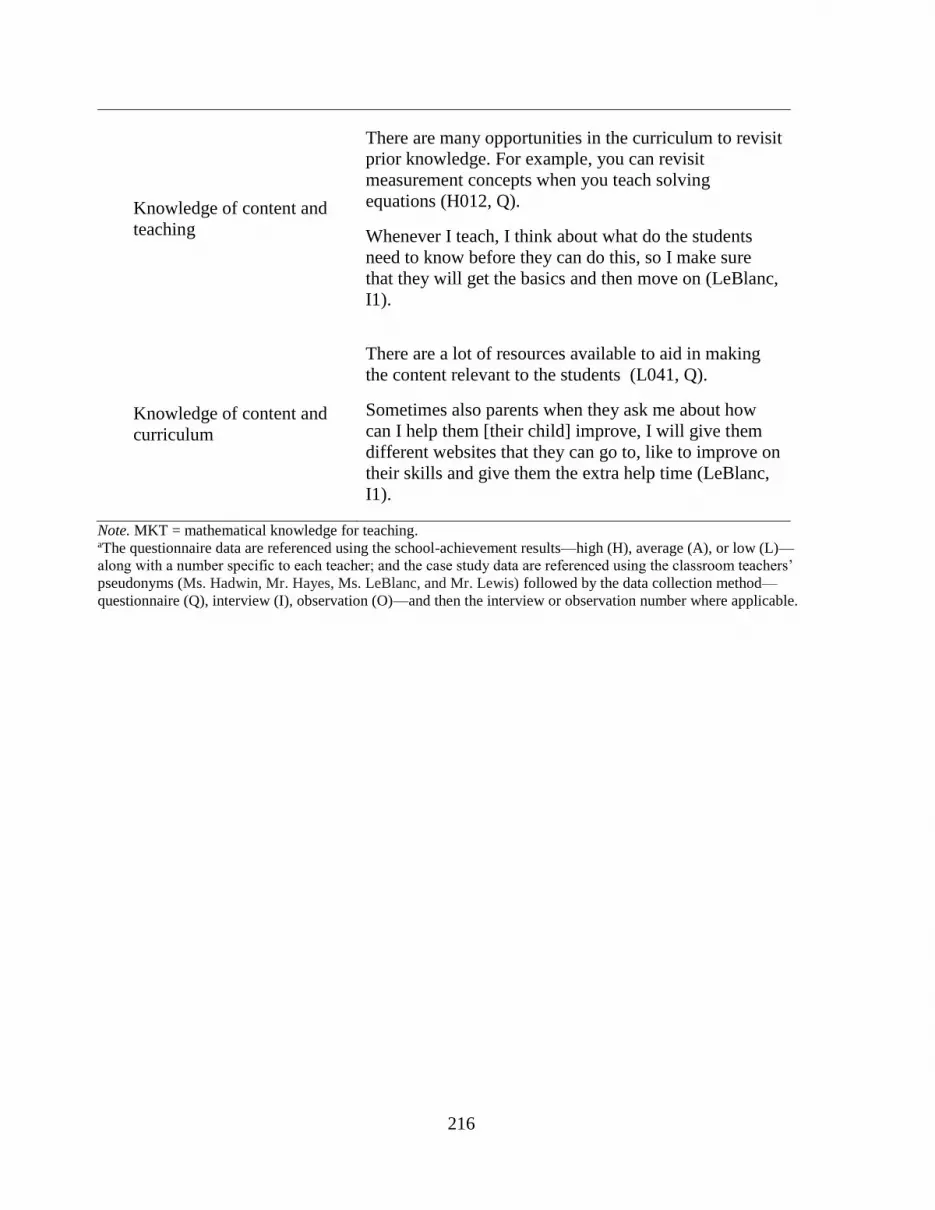
216
Knowledge of content and
teaching
There are many opportunities in the curriculum to revisit
prior knowledge. For example, you can revisit
measurement concepts when you teach solving
equations (H012, Q).
Whenever I teach, I think about what do the students
need to know before they can do this, so I make sure
that they will get the basics and then move on (LeBlanc,
I1).
Knowledge of content and
curriculum
There are a lot of resources available to aid in making
the content relevant to the students (L041, Q).
Sometimes also parents when they ask me about how
can I help them [their child] improve, I will give them
different websites that they can go to, like to improve on
their skills and give them the extra help time (LeBlanc,
I1).
Note. MKT = mathematical knowledge for teaching. aThe questionnaire data are referenced using the school-achievement results—high (H), average (A), or low (L)—
along with a number specific to each teacher; and the case study data are referenced using the classroom teachers’
pseudonyms (Ms. Hadwin, Mr. Hayes, Ms. LeBlanc, and Mr. Lewis) followed by the data collection method—
questionnaire (Q), interview (I), observation (O)—and then the interview or observation number where applicable.

217
Table C4
Examples for Inductive Coding
Focused
Coding
Initial
Coding Examplesa
Time
Curriculum
expectations
There is not enough time to review or redo concept that they do not
understand (L041, Q).
There is too much content to try to cover every topic and provide the
type of meaningful feedback that teachers want to give (H119, Q).
End of year
EQAO
assessment
Not always able to go as in-depth as desired due to EQAO time
deadline (L048, Q)
The idea of having to absolutely cover all the curriculum for Grade 9
due to EQAO (A127, Q).
Implement
AfL
practices
When there are many students in a class, it is often very difficult to
spend time with each student and provide . . . the descriptive feedback
that I believe will move their learning forward (H072, Q).
But the challenges are sometimes, “Do you have the time to do it [co-
create success criteria]?” Consistency, you have to make sure they do it
all the time (LeBlanc, I2).
Students
Ability
levels
Back tracking to fill big gaps in understanding is time consuming and
sometimes the class is very divided some know the diagnostic material
really well and others very poorly (A007, Q).
There are many students in the class that should be in the locally
developed course that I get bogged down trying to help them when
they are in over their heads (A029, Q).
Effort and
motivation
Students may not work at something which will not "count" for marks
(H017, Q).
"Is this for marks?" I don't have to worry about not trying (H018, Q).
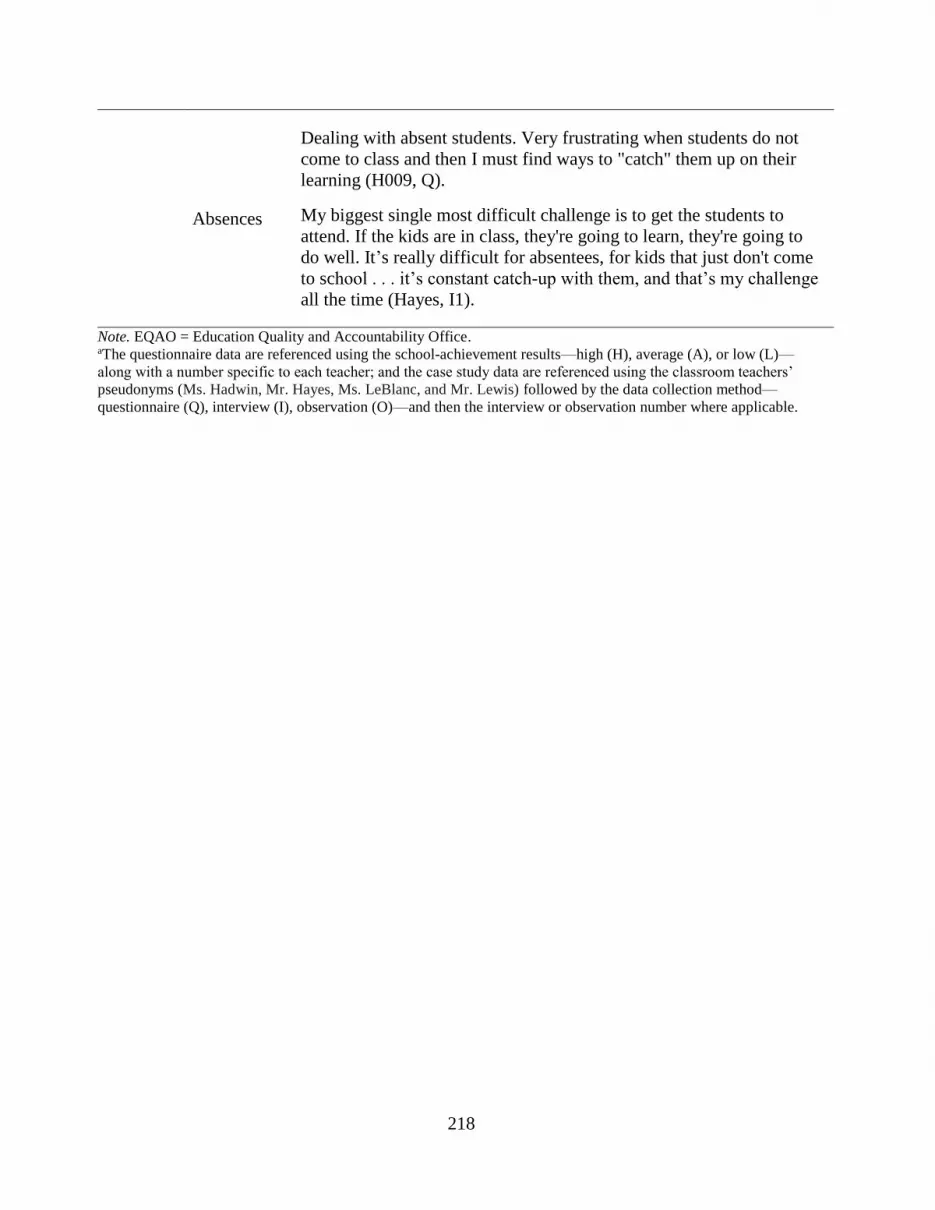
218
Absences
Dealing with absent students. Very frustrating when students do not
come to class and then I must find ways to "catch" them up on their
learning (H009, Q).
My biggest single most difficult challenge is to get the students to
attend. If the kids are in class, they're going to learn, they're going to
do well. It’s really difficult for absentees, for kids that just don't come
to school . . . it’s constant catch-up with them, and that’s my challenge
all the time (Hayes, I1).
Note. EQAO = Education Quality and Accountability Office. aThe questionnaire data are referenced using the school-achievement results—high (H), average (A), or low (L)—
along with a number specific to each teacher; and the case study data are referenced using the classroom teachers’
pseudonyms (Ms. Hadwin, Mr. Hayes, Ms. LeBlanc, and Mr. Lewis) followed by the data collection method—
questionnaire (Q), interview (I), observation (O)—and then the interview or observation number where applicable.
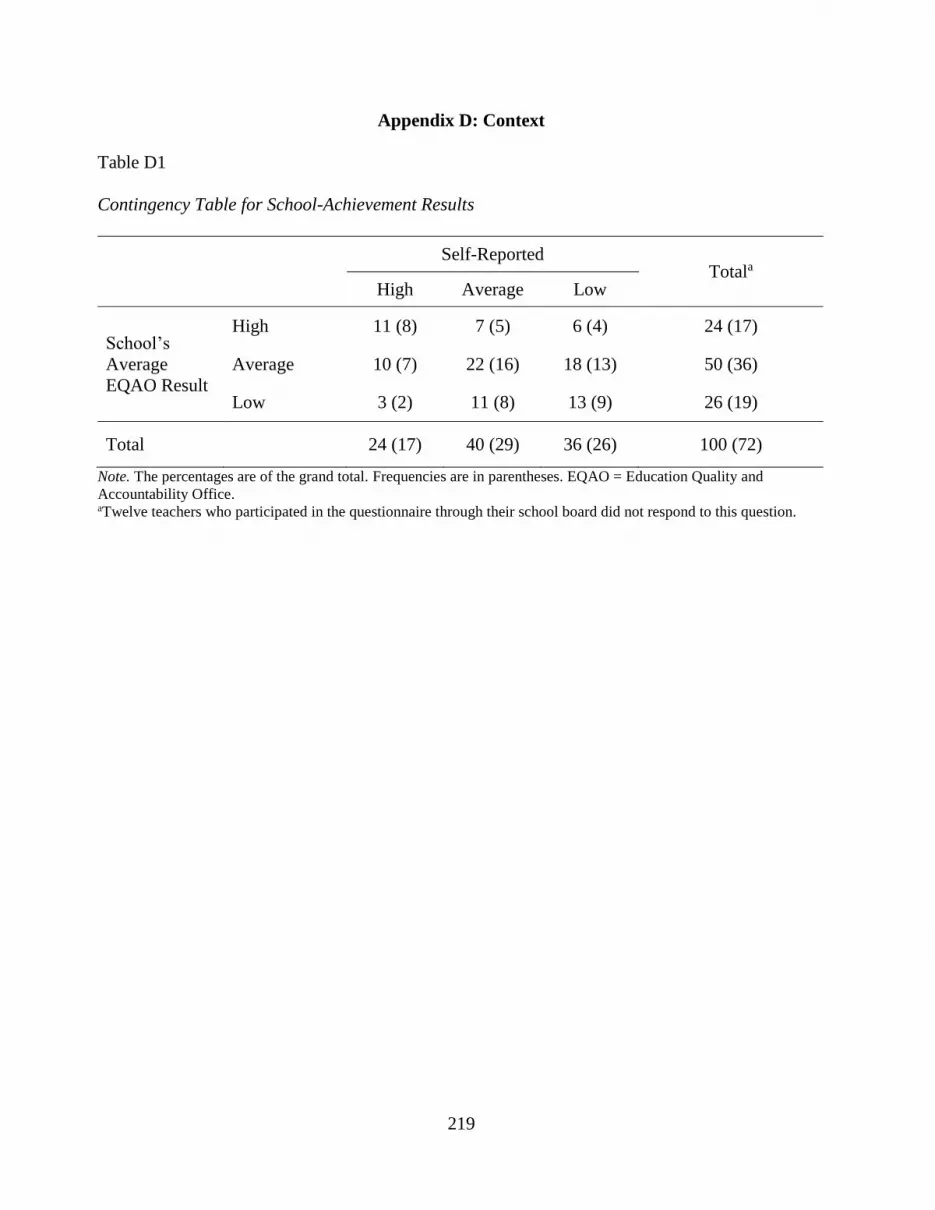
219
Appendix D: Context
Table D1
Contingency Table for School-Achievement Results
Self-Reported Totala
High Average Low
School’s
Average
EQAO Result
High 11 (8) 7 (5) 6 (4) 24 (17)
Average 10 (7) 22 (16) 18 (13) 50 (36)
Low 3 (2) 11 (8) 13 (9) 26 (19)
Total 24 (17) 40 (29) 36 (26) 100 (72)
Note. The percentages are of the grand total. Frequencies are in parentheses. EQAO = Education Quality and
Accountability Office. aTwelve teachers who participated in the questionnaire through their school board did not respond to this question.
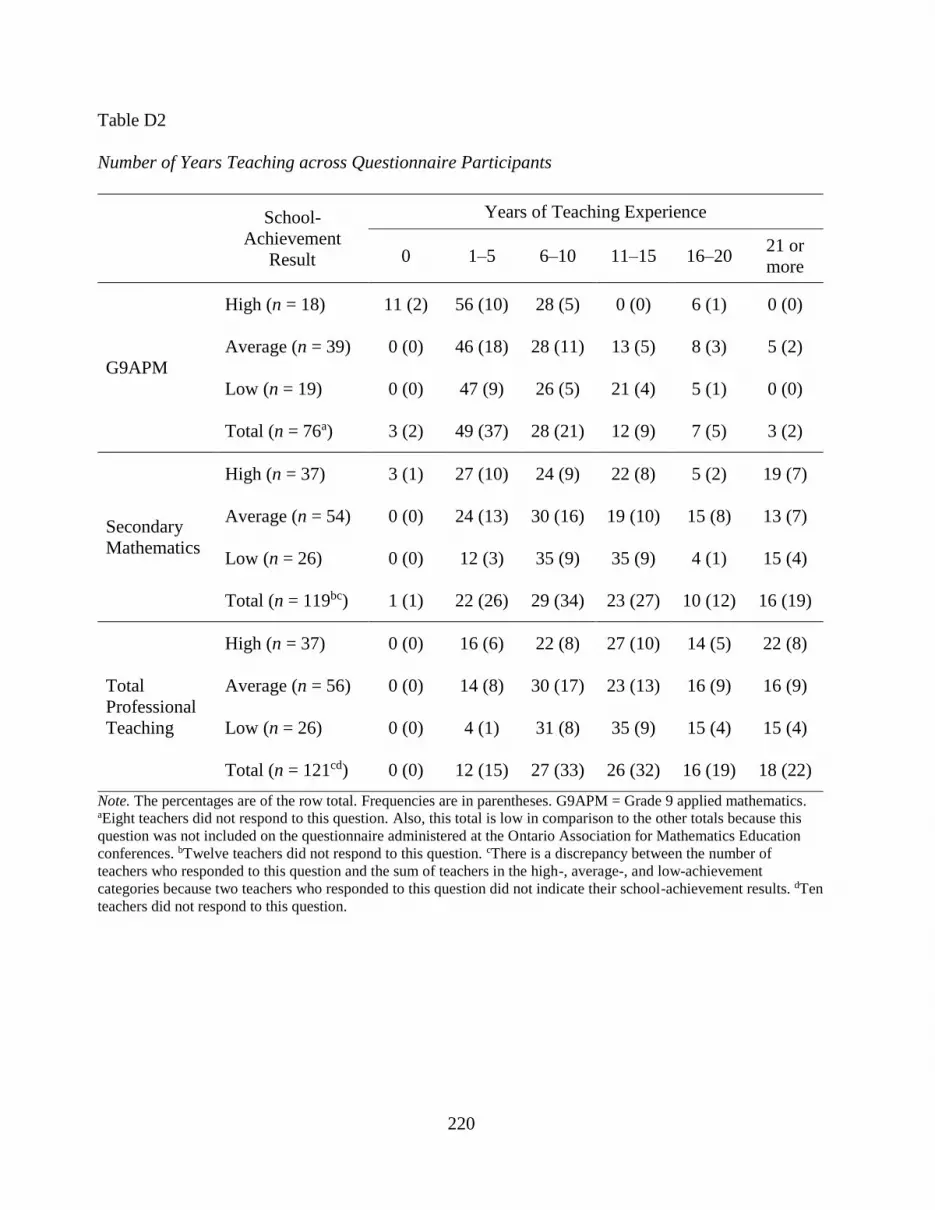
220
Table D2
Number of Years Teaching across Questionnaire Participants
School-
Achievement
Result
Years of Teaching Experience
0 1–5 6–10 11–15 16–20
21 or
more
G9APM
High (n = 18) 11 (2) 56 (10) 28 (5) 0 (0) 6 (1) 0 (0)
Average (n = 39) 0 (0) 46 (18) 28 (11) 13 (5) 8 (3) 5 (2)
Low (n = 19) 0 (0) 47 (9) 26 (5) 21 (4) 5 (1) 0 (0)
Total (n = 76a) 3 (2) 49 (37) 28 (21) 12 (9) 7 (5) 3 (2)
Secondary
Mathematics
High (n = 37) 3 (1) 27 (10) 24 (9) 22 (8) 5 (2) 19 (7)
Average (n = 54) 0 (0) 24 (13) 30 (16) 19 (10) 15 (8) 13 (7)
Low (n = 26) 0 (0) 12 (3) 35 (9) 35 (9) 4 (1) 15 (4)
Total (n = 119bc) 1 (1) 22 (26) 29 (34) 23 (27) 10 (12) 16 (19)
Total
Professional
Teaching
High (n = 37) 0 (0) 16 (6) 22 (8) 27 (10) 14 (5) 22 (8)
Average (n = 56) 0 (0) 14 (8) 30 (17) 23 (13) 16 (9) 16 (9)
Low (n = 26) 0 (0) 4 (1) 31 (8) 35 (9) 15 (4) 15 (4)
Total (n = 121cd) 0 (0) 12 (15) 27 (33) 26 (32) 16 (19) 18 (22)
Note. The percentages are of the row total. Frequencies are in parentheses. G9APM = Grade 9 applied mathematics. aEight teachers did not respond to this question. Also, this total is low in comparison to the other totals because this
question was not included on the questionnaire administered at the Ontario Association for Mathematics Education
conferences. bTwelve teachers did not respond to this question. cThere is a discrepancy between the number of
teachers who responded to this question and the sum of teachers in the high-, average-, and low-achievement
categories because two teachers who responded to this question did not indicate their school-achievement results. dTen
teachers did not respond to this question.
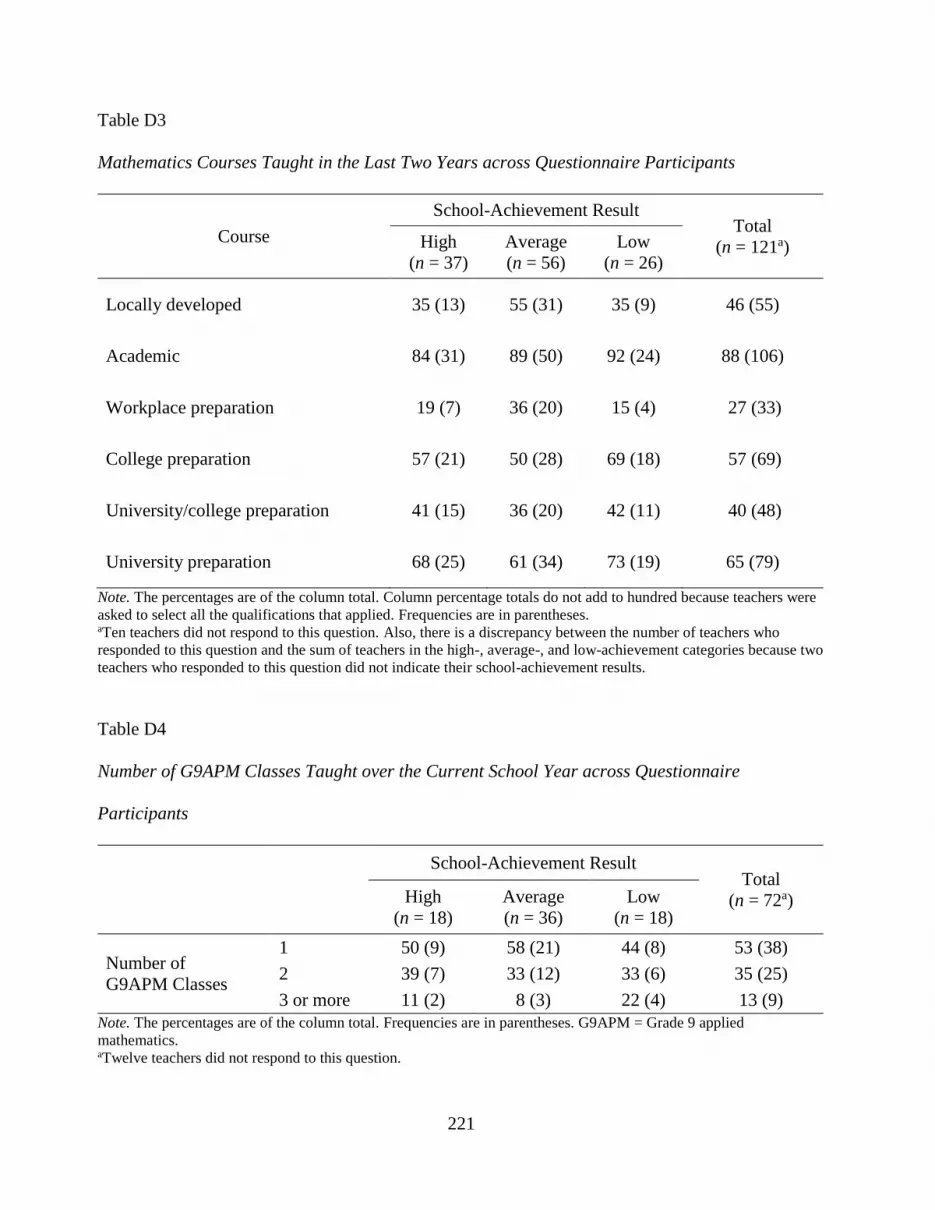
221
Table D3
Mathematics Courses Taught in the Last Two Years across Questionnaire Participants
Course
School-Achievement Result Total
(n = 121a) High
(n = 37)
Average
(n = 56)
Low
(n = 26)
Locally developed 35 (13) 55 (31) 35 (9) 46 (55)
Academic 84 (31) 89 (50) 92 (24) 88 (106)
Workplace preparation 19 (7) 36 (20) 15 (4) 27 (33)
College preparation 57 (21) 50 (28) 69 (18) 57 (69)
University/college preparation 41 (15) 36 (20) 42 (11) 40 (48)
University preparation 68 (25) 61 (34) 73 (19) 65 (79)
Note. The percentages are of the column total. Column percentage totals do not add to hundred because teachers were
asked to select all the qualifications that applied. Frequencies are in parentheses. aTen teachers did not respond to this question. Also, there is a discrepancy between the number of teachers who
responded to this question and the sum of teachers in the high-, average-, and low-achievement categories because two
teachers who responded to this question did not indicate their school-achievement results.
Table D4
Number of G9APM Classes Taught over the Current School Year across Questionnaire
Participants
School-Achievement Result Total
(n = 72a)
High
(n = 18)
Average
(n = 36)
Low
(n = 18)
Number of
G9APM Classes
1 50 (9) 58 (21) 44 (8) 53 (38)
2 39 (7) 33 (12) 33 (6) 35 (25)
3 or more 11 (2) 8 (3) 22 (4) 13 (9)
Note. The percentages are of the column total. Frequencies are in parentheses. G9APM = Grade 9 applied
mathematics. aTwelve teachers did not respond to this question.

222
Table D5
Post-Secondary Education across Questionnaire Participants
Post-Secondary Education
School-Achievement Result Total
(n = 121a) High
(n = 37)
Average
(n = 56)
Low
(n = 26)
Mathematics major or specialist 41 (15) 46 (26) 42 (11) 43 (52)
Mathematics-related major or
specialist 35 (13) 27 (15) 31 (8) 31 (37)
Other major with a mathematics
minor 16 (6) 11 (6) 15 (4) 13 (16)
Other major with a mathematics-
related minor 3 (1) 5 (3) 0 (0) 4 (5)
Area of study unrelated to
mathematics 5 (2) 11 (6) 12 (3) 9 (11)
Note. The percentages are of the column total. Frequencies are in parentheses. aTen teachers did not respond to this question. Also, there is a discrepancy between the number of teachers who
responded to this question and the sum of teachers in the high-, average-, and low-achievement categories because two
teachers who responded to this question did not indicate their school-achievement results.
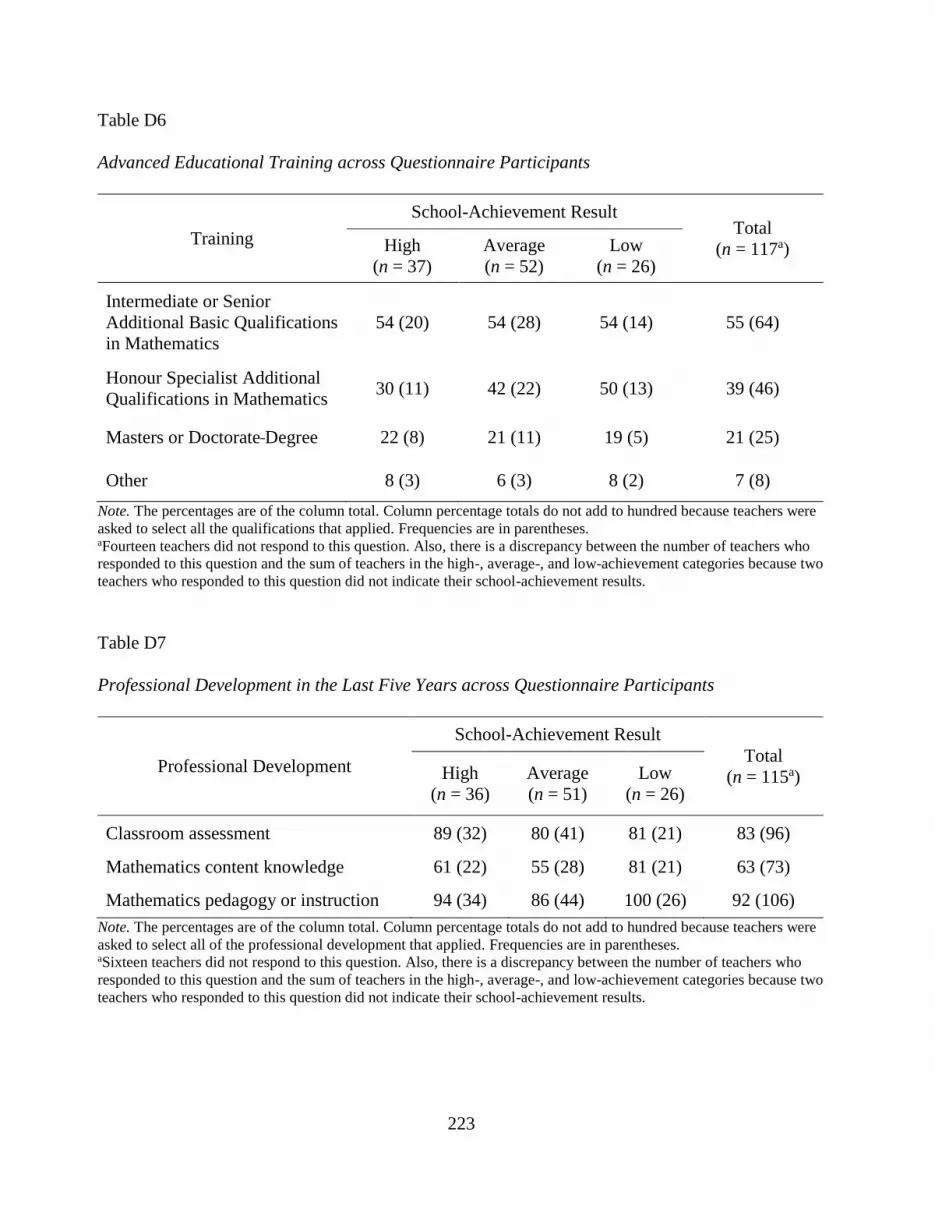
223
Table D6
Advanced Educational Training across Questionnaire Participants
Training
School-Achievement Result Total
(n = 117a) High
(n = 37)
Average
(n = 52)
Low
(n = 26)
Intermediate or Senior
Additional Basic Qualifications
in Mathematics
54 (20) 54 (28) 54 (14) 55 (64)
Honour Specialist Additional
Qualifications in Mathematics 30 (11) 42 (22) 50 (13) 39 (46)
Masters or Doctorate Degree 22 (8) 21 (11) 19 (5) 21 (25)
Other 8 (3) 6 (3) 8 (2) 7 (8)
Note. The percentages are of the column total. Column percentage totals do not add to hundred because teachers were
asked to select all the qualifications that applied. Frequencies are in parentheses. aFourteen teachers did not respond to this question. Also, there is a discrepancy between the number of teachers who
responded to this question and the sum of teachers in the high-, average-, and low-achievement categories because two
teachers who responded to this question did not indicate their school-achievement results.
Table D7
Professional Development in the Last Five Years across Questionnaire Participants
Professional Development
School-Achievement Result
Total
(n = 115a) High
(n = 36)
Average
(n = 51)
Low
(n = 26)
Classroom assessment 89 (32) 80 (41) 81 (21) 83 (96)
Mathematics content knowledge 61 (22) 55 (28) 81 (21) 63 (73)
Mathematics pedagogy or instruction 94 (34) 86 (44) 100 (26) 92 (106)
Note. The percentages are of the column total. Column percentage totals do not add to hundred because teachers were
asked to select all of the professional development that applied. Frequencies are in parentheses. aSixteen teachers did not respond to this question. Also, there is a discrepancy between the number of teachers who
responded to this question and the sum of teachers in the high-, average-, and low-achievement categories because two
teachers who responded to this question did not indicate their school-achievement results.

224
Table D8
EQAO Student Questionnaire Results for Schools with a Case Study Teacher and for the Province (2009–2014)
Case Study Teacher Provincea
Mr. Hayes Ms. Hadwin Ms. LeBlanc Mr. Lewis
M SD M SD M SD M SD M SD
Number of Students who
Participatedb 43 12 75 19 129 27 124 12 40200 2944
Demographic
Gender (male) 47.2 9.6 49.8 4.6 53.6 2.6 57.4 4.7 55.7 0.4
ESL/ELD (yes) 0.0 0.0 0.0 0.0 23.1 2.6 18.1 2.7 7.2 0.8
IEP (yes) 32.3 12.4 44.9 6.7 30.5 7.0 35.7 4.1 34.5 2.0
Speak only or mostly English at
homec 94.2 3.0 87.9 4.5 51.2 7.7 62.2 7.8 79.9 1.6
Three or more elementary schools
from kindergarten to Grade 8d 35.4 7.8 34.3 9.3 44.3 6.9 47.8 6.9 42.7 1.9
Prior Mathematics Achievement
(Percentage at Level 3 or 4)
Grade 3 Assessment of
Mathematics 77.6 10.1 49.4 9.9 43.3 10.5 34.9 7.4 46.4 1.6
Grade 6 Assessment of
Mathematics 62.6 9.5 34.9 3.8 15.6 5.7 15.9 9.0 27.9 2.6

225
Use of the Assessment in Class Mark
Some or all parts of the Grade 9
Assessment of Mathematics counts
as part of class marke
58.7 9.1 57.0 11.7 41.3 5.7 36.3 5.6 43.6 3.0
Attitudes Toward Mathematics
(Agree or Strongly agreef)
I like mathematics. 60.3 7.4 43.3 3.9 37.4 9.2 45.3 2.8 35.3 1.5
I am good at mathematics. 64.0 8.5 44.6 7.4 25.9 3.8 41.0 4.9 36.5 0.9
I am able to answer difficult
mathematics questions.g 42.9 9.0 29.9 2.4 19.6 5.0 23.4 4.0 23.8 0.6
Mathematics is one of my favourite
subjects.g 35.8 7.2 25.1 3.5 21.0 7.5 32.2 3.9 21.7 0.5
I understand most of the
mathematics I am taught. 83.8 5.6 71.7 7.4 58.4 5.0 64.9 2.1 63.1 0.9
Mathematics is an easy subject. 42.7 3.9 26.6 4.1 16.0 4.5 22.7 4.6 20.9 0.9
I try to do my best in mathematics
class.g 84.1 8.6 81.0 8.5 73.0 4.4 76.2 3.5 75.8 5.7
The mathematics I learn now is
useful for everyday life.h 51.7 9.4 42.6 7.2 49.9 9.6 55.7 5.4 39.8 2.0
The mathematics I learn now helps
me do work in other subjects.g 49.6 9.8 46.8 5.5 53.1 8.1 51.1 4.2 46.5 0.7
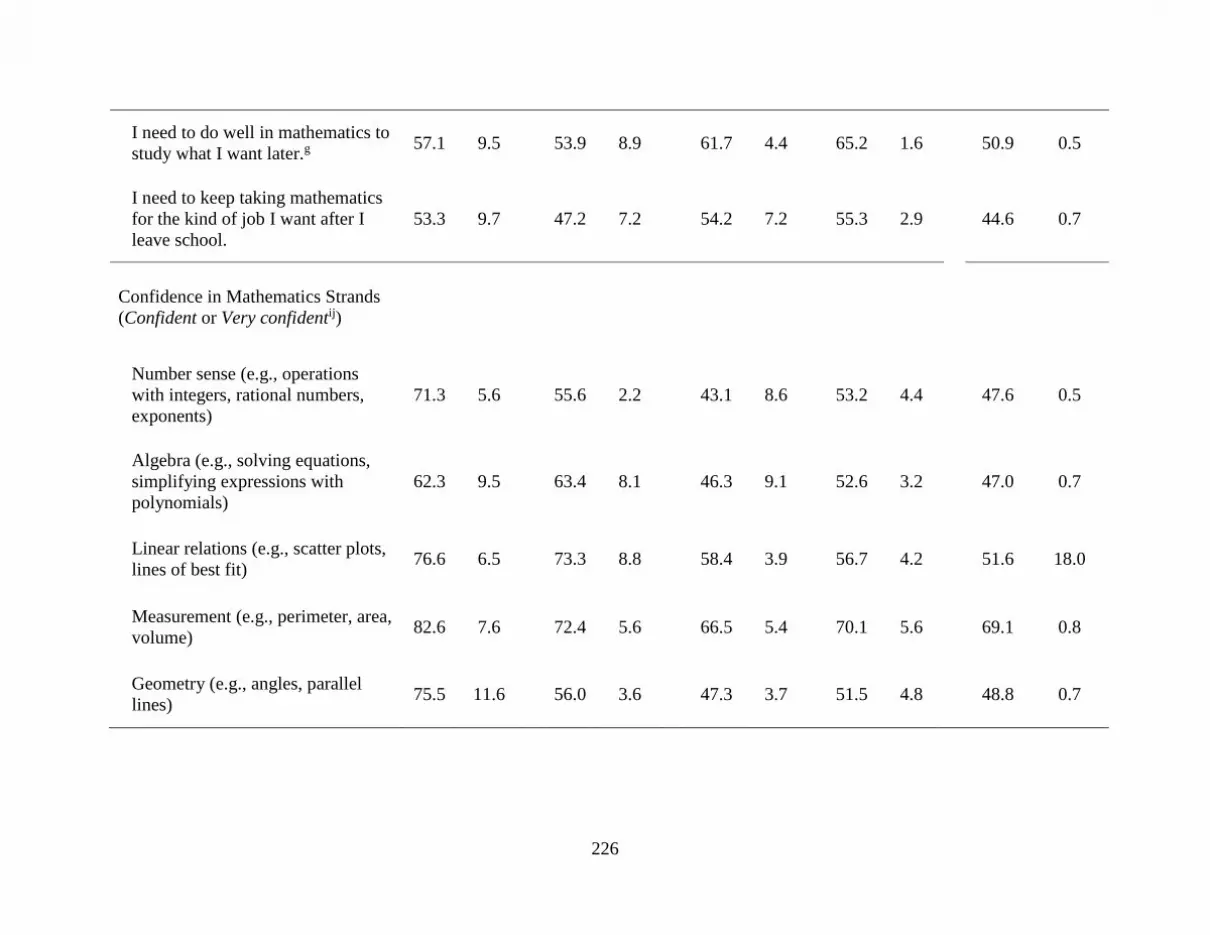
226
I need to do well in mathematics to
study what I want later.g 57.1 9.5 53.9 8.9 61.7 4.4 65.2 1.6 50.9 0.5
I need to keep taking mathematics
for the kind of job I want after I
leave school.
53.3 9.7 47.2 7.2 54.2 7.2 55.3 2.9 44.6 0.7
Confidence in Mathematics Strands
(Confident or Very confidentij)
Number sense (e.g., operations
with integers, rational numbers,
exponents)
71.3 5.6 55.6 2.2 43.1 8.6 53.2 4.4 47.6 0.5
Algebra (e.g., solving equations,
simplifying expressions with
polynomials)
62.3 9.5 63.4 8.1 46.3 9.1 52.6 3.2 47.0 0.7
Linear relations (e.g., scatter plots,
lines of best fit) 76.6 6.5 73.3 8.8 58.4 3.9 56.7 4.2 51.6 18.0
Measurement (e.g., perimeter, area,
volume) 82.6 7.6 72.4 5.6 66.5 5.4 70.1 5.6 69.1 0.8
Geometry (e.g., angles, parallel
lines) 75.5 11.6 56.0 3.6 47.3 3.7 51.5 4.8 48.8 0.7
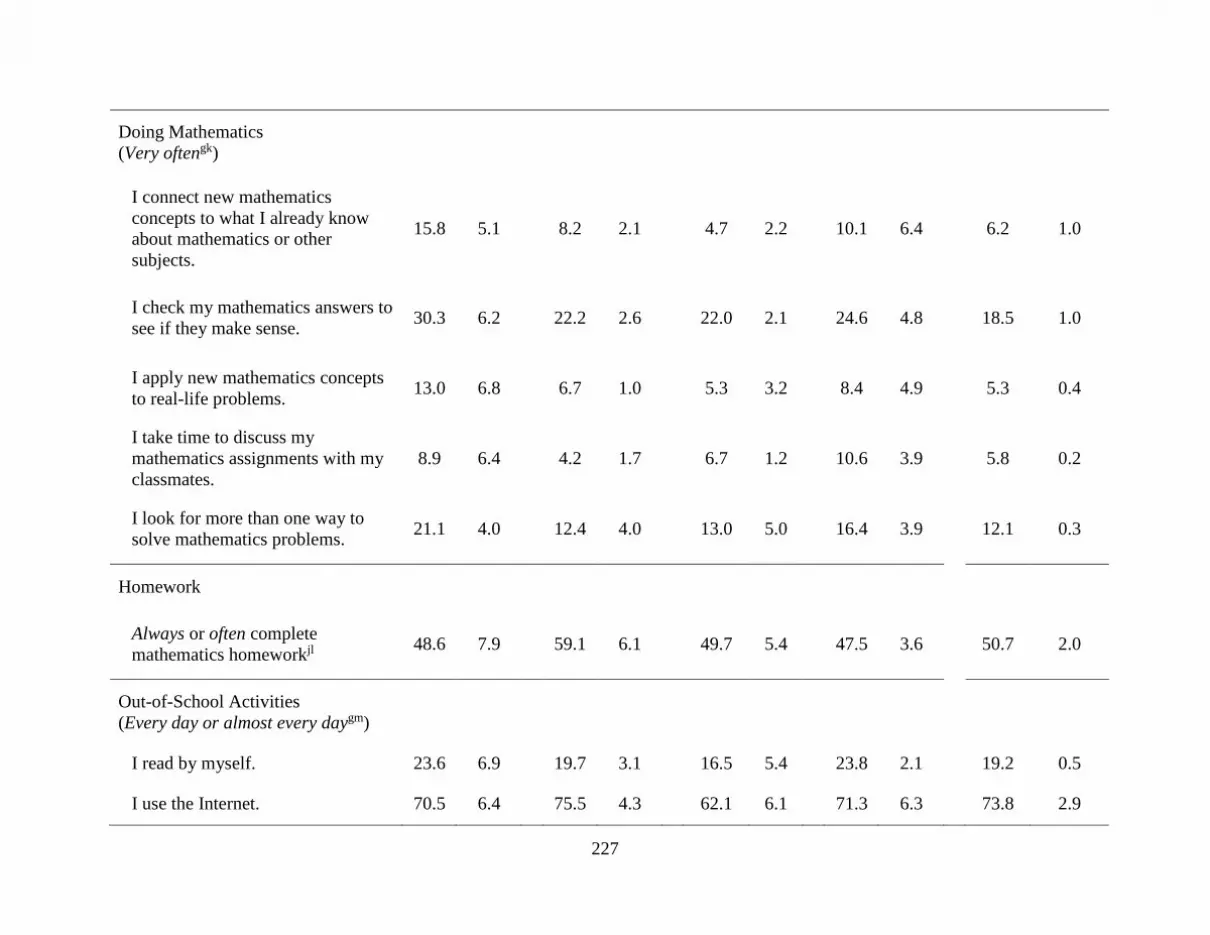
227
Doing Mathematics
(Very oftengk)
I connect new mathematics
concepts to what I already know
about mathematics or other
subjects.
15.8 5.1 8.2 2.1 4.7 2.2 10.1 6.4 6.2 1.0
I check my mathematics answers to
see if they make sense. 30.3 6.2 22.2 2.6 22.0 2.1 24.6 4.8 18.5 1.0
I apply new mathematics concepts
to real-life problems. 13.0 6.8 6.7 1.0 5.3 3.2 8.4 4.9 5.3 0.4
I take time to discuss my
mathematics assignments with my
classmates.
8.9 6.4 4.2 1.7 6.7 1.2 10.6 3.9 5.8 0.2
I look for more than one way to
solve mathematics problems. 21.1 4.0 12.4 4.0 13.0 5.0 16.4 3.9 12.1 0.3
Homework
Always or often complete
mathematics homeworkjl 48.6 7.9 59.1 6.1 49.7 5.4 47.5 3.6 50.7 2.0
Out-of-School Activities
(Every day or almost every daygm)
I read by myself. 23.6 6.9 19.7 3.1 16.5 5.4 23.8 2.1 19.2 0.5
I use the Internet. 70.5 6.4 75.5 4.3 62.1 6.1 71.3 6.3 73.8 2.9
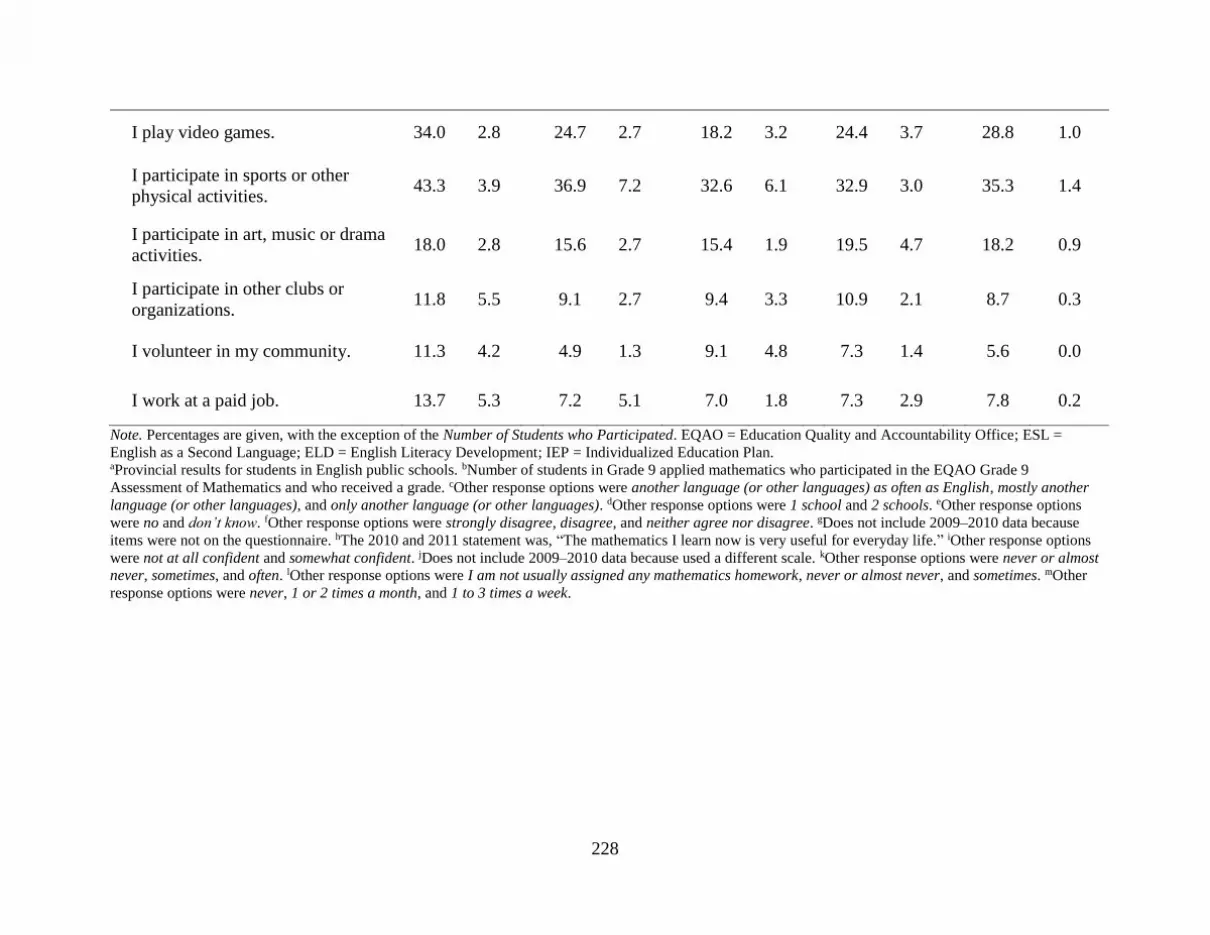
228
I play video games. 34.0 2.8 24.7 2.7 18.2 3.2 24.4 3.7 28.8 1.0
I participate in sports or other
physical activities. 43.3 3.9 36.9 7.2 32.6 6.1 32.9 3.0 35.3 1.4
I participate in art, music or drama
activities. 18.0 2.8 15.6 2.7 15.4 1.9 19.5 4.7 18.2 0.9
I participate in other clubs or
organizations. 11.8 5.5 9.1 2.7 9.4 3.3 10.9 2.1 8.7 0.3
I volunteer in my community. 11.3 4.2 4.9 1.3 9.1 4.8 7.3 1.4 5.6 0.0
I work at a paid job. 13.7 5.3 7.2 5.1 7.0 1.8 7.3 2.9 7.8 0.2
Note. Percentages are given, with the exception of the Number of Students who Participated. EQAO = Education Quality and Accountability Office; ESL =
English as a Second Language; ELD = English Literacy Development; IEP = Individualized Education Plan. aProvincial results for students in English public schools. bNumber of students in Grade 9 applied mathematics who participated in the EQAO Grade 9
Assessment of Mathematics and who received a grade. cOther response options were another language (or other languages) as often as English, mostly another
language (or other languages), and only another language (or other languages). dOther response options were 1 school and 2 schools. eOther response options
were no and don’t know. fOther response options were strongly disagree, disagree, and neither agree nor disagree. gDoes not include 2009–2010 data because
items were not on the questionnaire. hThe 2010 and 2011 statement was, “The mathematics I learn now is very useful for everyday life.” iOther response options
were not at all confident and somewhat confident. jDoes not include 2009–2010 data because used a different scale. kOther response options were never or almost
never, sometimes, and often. lOther response options were I am not usually assigned any mathematics homework, never or almost never, and sometimes. mOther
response options were never, 1 or 2 times a month, and 1 to 3 times a week.
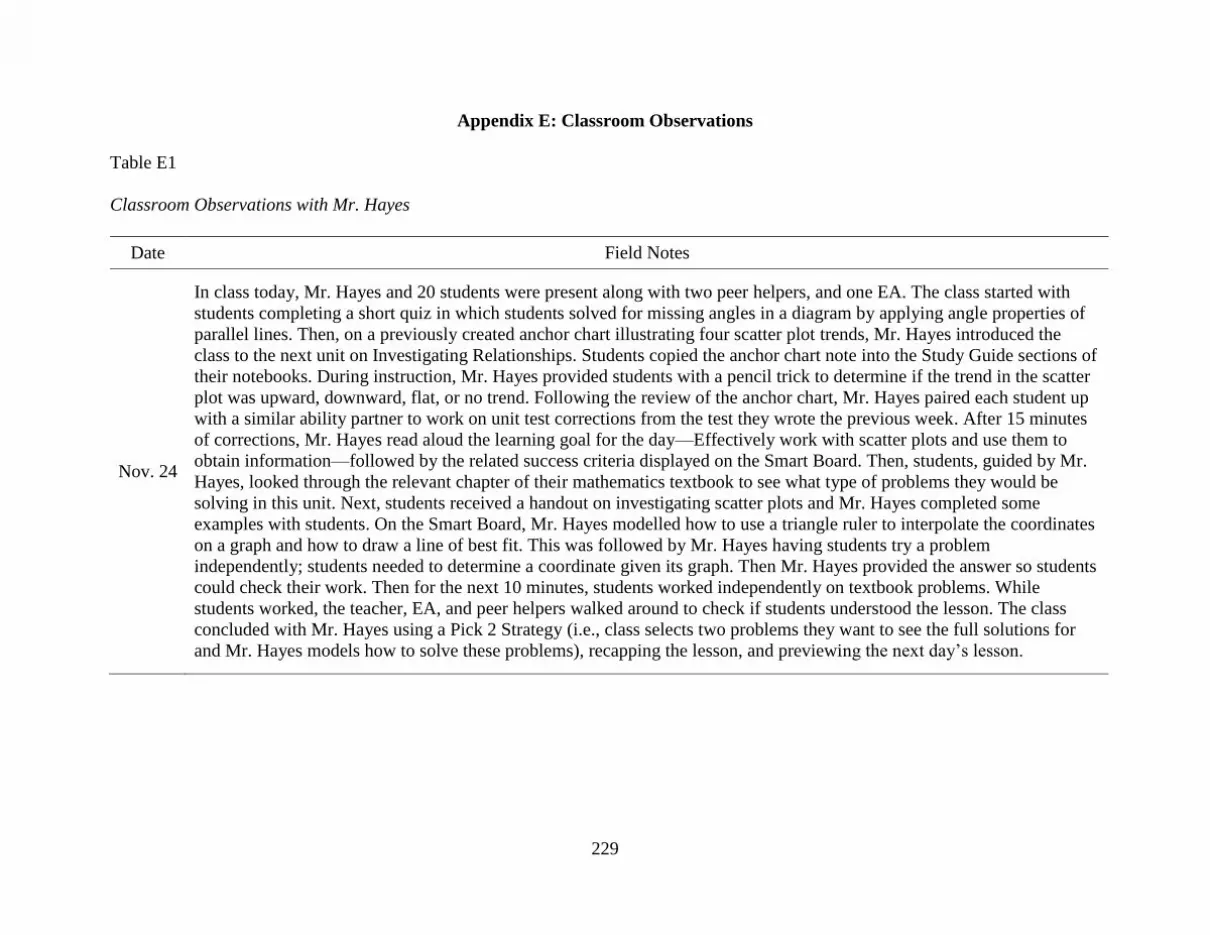
229
Appendix E: Classroom Observations
Table E1
Classroom Observations with Mr. Hayes
Date Field Notes
Nov. 24
In class today, Mr. Hayes and 20 students were present along with two peer helpers, and one EA. The class started with
students completing a short quiz in which students solved for missing angles in a diagram by applying angle properties of
parallel lines. Then, on a previously created anchor chart illustrating four scatter plot trends, Mr. Hayes introduced the
class to the next unit on Investigating Relationships. Students copied the anchor chart note into the Study Guide sections of
their notebooks. During instruction, Mr. Hayes provided students with a pencil trick to determine if the trend in the scatter
plot was upward, downward, flat, or no trend. Following the review of the anchor chart, Mr. Hayes paired each student up
with a similar ability partner to work on unit test corrections from the test they wrote the previous week. After 15 minutes
of corrections, Mr. Hayes read aloud the learning goal for the day—Effectively work with scatter plots and use them to
obtain information—followed by the related success criteria displayed on the Smart Board. Then, students, guided by Mr.
Hayes, looked through the relevant chapter of their mathematics textbook to see what type of problems they would be
solving in this unit. Next, students received a handout on investigating scatter plots and Mr. Hayes completed some
examples with students. On the Smart Board, Mr. Hayes modelled how to use a triangle ruler to interpolate the coordinates
on a graph and how to draw a line of best fit. This was followed by Mr. Hayes having students try a problem
independently; students needed to determine a coordinate given its graph. Then Mr. Hayes provided the answer so students
could check their work. Then for the next 10 minutes, students worked independently on textbook problems. While
students worked, the teacher, EA, and peer helpers walked around to check if students understood the lesson. The class
concluded with Mr. Hayes using a Pick 2 Strategy (i.e., class selects two problems they want to see the full solutions for
and Mr. Hayes models how to solve these problems), recapping the lesson, and previewing the next day’s lesson.
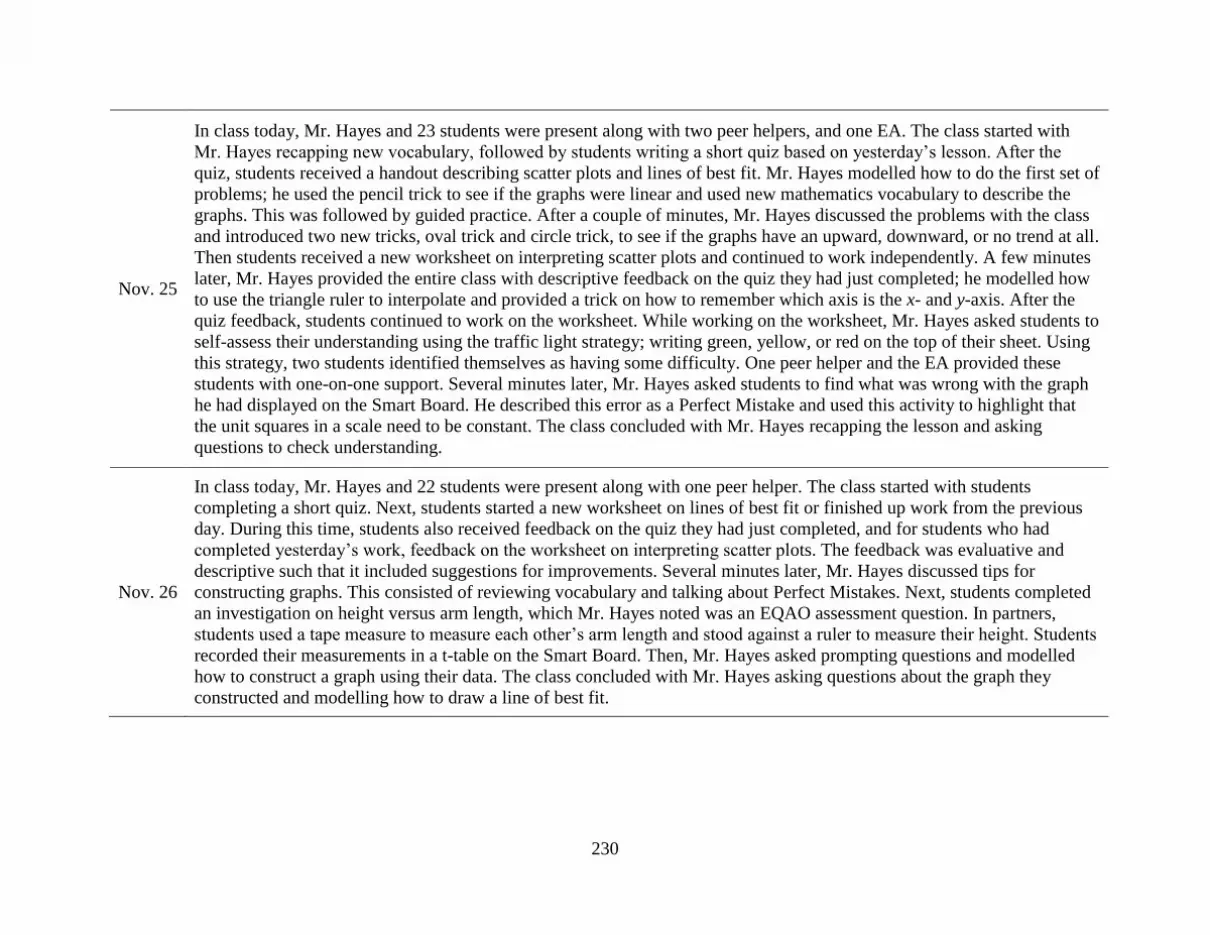
230
Nov. 25
In class today, Mr. Hayes and 23 students were present along with two peer helpers, and one EA. The class started with
Mr. Hayes recapping new vocabulary, followed by students writing a short quiz based on yesterday’s lesson. After the
quiz, students received a handout describing scatter plots and lines of best fit. Mr. Hayes modelled how to do the first set of
problems; he used the pencil trick to see if the graphs were linear and used new mathematics vocabulary to describe the
graphs. This was followed by guided practice. After a couple of minutes, Mr. Hayes discussed the problems with the class
and introduced two new tricks, oval trick and circle trick, to see if the graphs have an upward, downward, or no trend at all.
Then students received a new worksheet on interpreting scatter plots and continued to work independently. A few minutes
later, Mr. Hayes provided the entire class with descriptive feedback on the quiz they had just completed; he modelled how
to use the triangle ruler to interpolate and provided a trick on how to remember which axis is the x- and y-axis. After the
quiz feedback, students continued to work on the worksheet. While working on the worksheet, Mr. Hayes asked students to
self-assess their understanding using the traffic light strategy; writing green, yellow, or red on the top of their sheet. Using
this strategy, two students identified themselves as having some difficulty. One peer helper and the EA provided these
students with one-on-one support. Several minutes later, Mr. Hayes asked students to find what was wrong with the graph
he had displayed on the Smart Board. He described this error as a Perfect Mistake and used this activity to highlight that
the unit squares in a scale need to be constant. The class concluded with Mr. Hayes recapping the lesson and asking
questions to check understanding.
Nov. 26
In class today, Mr. Hayes and 22 students were present along with one peer helper. The class started with students
completing a short quiz. Next, students started a new worksheet on lines of best fit or finished up work from the previous
day. During this time, students also received feedback on the quiz they had just completed, and for students who had
completed yesterday’s work, feedback on the worksheet on interpreting scatter plots. The feedback was evaluative and
descriptive such that it included suggestions for improvements. Several minutes later, Mr. Hayes discussed tips for
constructing graphs. This consisted of reviewing vocabulary and talking about Perfect Mistakes. Next, students completed
an investigation on height versus arm length, which Mr. Hayes noted was an EQAO assessment question. In partners,
students used a tape measure to measure each other’s arm length and stood against a ruler to measure their height. Students
recorded their measurements in a t-table on the Smart Board. Then, Mr. Hayes asked prompting questions and modelled
how to construct a graph using their data. The class concluded with Mr. Hayes asking questions about the graph they
constructed and modelling how to draw a line of best fit.

231
Nov. 27
In class today, Mr. Hayes and 21 students were present along with two peer helpers and an EA. The class started with Mr.
Hayes reviewing yesterday’s lesson by asking questions about the height versus arm length activity and then students
completed a short quiz. Following the quiz, Mr. Hayes passed out a new worksheet that had students graph a curve. Mr.
Hayes asked prompting questions to help students get started. Then, students worked independently on plotting the points,
followed by Mr. Hayes modelling how to plot points on the Smart Board. A few minutes later, Mr. Hayes reviewed the
problem and discussed Perfect Mistakes when drawing a curve of best fit. Mr. Hayes also provided feedback on a common
mistake students made on the worksheet from yesterday. For the next several minutes, students worked independently on a
new worksheet that focused on curves of best fit. Then, Mr. Hayes grouped students with a partner to work on quiz
corrections from the day’s quiz. The class concluded with Mr. Hayes and his students playing a game. Mr. Hayes provided
students with an input and students needed to determine the output. For example, he showed students an input of 6 with an
output of 18, and asked students to predict what an input of 4 might give. Close to the end of the activity, Mr. Hayes gave
students problems that involved applying two operations to the input value.
Nov. 28
In class today, Mr. Hayes and 18 students were present along with two peer helpers and an EA. The class started with Mr.
Hayes recapping yesterday’s lesson and then students writing a short quiz. After the quiz, Mr. Hayes reviewed yesterday
and today’s learning goals and success criteria on scatter plots and curves of best fit. Next, Mr. Hayes played a video of a
car spinning out and explained how it was an example of a non-linear relation. This led to the next problem that involved
calculating the distance it would take a moving car to stop; Mr. Hayes mentioned police officers use the length of skid
marks at car crashes to determine how fast one was travelling. Mr. Hayes modelled how to begin the problem and had
students independently create a scale and plot points. Peer helpers checked to make sure students used a correct scale. A
few minutes later, Mr. Hayes modelled on the Smart Board how to complete the rest of the problem. Next, Mr. Hayes
passed out a worksheet that required students to determine the pattern given several inputs and outputs; Mr. Hayes and
students did a couple problems together. The class concluded with an activity on linear growth patterns: Mr. Hayes put a
linear growth pattern on the Smart Board and used the pattern to introduce the new vocabulary of a constant term and a
variable term. Mr. Hayes asked prompting questions and students determined the given pattern of output = input × 2 + 3.
Then, in pairs, students received algebra tiles and two sets of cards, an easier and a more challenging set of cards. Students
were instructed to create linear growth patterns using the easier set of cards. Peer helpers, the EA, and Mr. Hayes walked
around, checked students’ work, and provided evaluative and descriptive feedback. Once students had tried three problems
using the easier set of cards, Mr. Hayes instructed students to try a problem using the more challenging set of cards. After
about 20 minutes, Mr. Hayes had partners create one more linear growth pattern and then participate in a Gallery Walk
with other pairs of students trying to determine the pattern each group had created.
Note. Classroom observations were conducted in the 2014–2015 school year. EA = educational assistant; EQAO = Education Quality and Accountability Office.

232
Table E2
Classroom Observations with Ms. Hadwin
Date Field Notes
Dec. 8
In class today, Ms. Hadwin and 16 students were present. The class started with the learning goal displayed on the Smart
Board and Ms. Hadwin checking homework. While checking, Ms. Hadwin asked prompting questions on the problems
students did not understand. Next, Ms. Hadwin read the learning goal on direct and partial variation—I will learn how to
represent direct and partial variation in a variety of ways (table of values, graph, and equation), and students copied it onto
their learning goal worksheet. Then for the next 10 minutes, the class completed a Minds-On activity that involved solving
problems on direct and partial variation. Once students had solved the problems, multiple students volunteered to put their
solutions on the Smart Board and to explain their solutions. Ms. Hadwin provided evaluative and descriptive feedback and
expanded on students’ explanations. Next, Ms. Hadwin discussed the homework problems; this took the majority of the
class. Ms. Hadwin asked prompting questions and modelled how to solve the problems. As well, a few students put their
homework solutions on the Smart Board. For example, one student drew a triangle on a graph to show the class how to
find the rate of change for a problem; another student used the slope-intercept form of a linear equation to solve for the
desired variable and explained their solution to the class. The class concluded with Ms. Hadwin assigning five textbook
questions and the remainder of the previous day’s worksheet on representing direct and partial variation in variety of ways
for homework; students had several minutes in class to work independently on the homework.
Dec. 9
In class today, Ms. Hadwin and 15 students were present. The class started with the learning goal displayed on the Smart
Board and Ms. Hadwin checking homework. The learning goal was the same as yesterday. For approximately half the
class, Ms. Hadwin discussed yesterday’s homework. This involved Ms. Hadwin asking prompting questions and modelling
how to solve some of the problems; and a few students putting some of their homework solutions on the Smart Board and
explaining them, with Ms. Hadwin expanding on their responses. As an example, one homework problem required
students to determine if it was partial or direct variation and explain. A student provided an answer, and then Ms. Hadwin
discussed how there are lots of ways to explain why it is partial variation and wrote the different ways on the Smart Board.
Next, for approximately the second half of the class, students in groups of three to four, worked on a partial or direct
variation problem. Each group received a different problem that required students to: classify the problem as direct or
partial variation, find the initial value and explain what it means in the given situation, find the rate of change and explain
what it means in the given situation, and write the linear equation. Ms. Hadwin helped groups of students by asking
prompting questions. Students wrote their solutions on chart paper and presented to class. Ms. Hadwin provided evaluative
and descriptive feedback and suggestions for future problems. The class concluded with Ms. Hadwin assigning a new

233
worksheet for homework that focused on using multiple representations (tables and graphs) to determine the equation of a
line. Ms. Hadwin modelled on the Smart Board how to do the first problem.
Dec. 10
In class today, Ms. Hadwin and 16 students were present. The class started with a Minds-On activity that comprised of
EQAO multiple-choice questions. These questions focused on determining the linear equation, graph, or table of values
based on the given information and classifying problems as partial or direct variation. Students volunteered to present and
explain their solutions on the Smart Board. As well, Ms. Hadwin asked prompting questions and expanded on student
explanations. As an example Ms. Hadwin explained why each of the distractors for a problem were incorrect. Next, Ms.
Hadwin checked students’ homework, while checking she provided extra support to a few students who had difficulty with
the problems. Then Ms. Hadwin discussed the homework problems with the class. Similar to the previous classroom
observations, Ms. Hadwin asked prompting questions and modelled how to solve some of the problems; and a few students
put their solutions on the Smart Board. Then, for the last 30 minutes of class, students worked independently on a mid-
chapter review assignment. Ms. Hadwin walked around, checked students’ understandings, and responded to any
questions.
Dec. 11
In class today, Ms. Hadwin and 13 students were present. The class started with students handing in yesterday’s
assignment and copying two learning goals onto their learning goal worksheet. The learning goals were on writing linear
equations and understanding how changes in slope and y-intercept effects its graph and linear equation—I will learn how
to write the equation, given a situation or graph; and I will learn how the graph and the equation changes when the rate of
change changes or the initial cost changes. While students copied the learning goals, Ms. Hadwin walked around and
checked students’ learning goal worksheet to see what they were having problems with; the learning goal worksheet had a
place for students to assess their level of understanding. Next, for approximately half the class, students participated in a
partner coaching activity. This involved students, in pairs, solving similar problems but with a different set of numbers.
Students needed to write the linear equation for each relationship represented by a statement, graph, or table of values.
After each student had finished their problem, they were instructed to teach their partner how to do it, if they were having
difficulty. Ms. Hadwin walked around, asked prompting questions, and checked students’ understandings. Then, Ms.
Hadwin discussed the problems with the entire class; this involved students writing their solutions on the Smart Board and
explaining, and Ms. Hadwin providing evaluative and descriptive feedback. For the second half of the class, students
completed problems on a worksheet. The worksheet included three scaffolded problems; the problems provided a
statement describing a relationship and students needed to write an equation, graph the relationship, and then determine
how changes to the slope and y-intercept would affect the equation and graph. Ms. Hadwin asked prompting questions and
modelled how to do the problems. The class concluded with Ms. Hadwin assigning a new worksheet for homework that
had more problems requiring students to determine how specific changes to the slope and y-intercept would affect the
graph. Ms. Hadwin modelled how to do the first couple of problems.

234
Dec. 12
In class today, Ms. Hadwin and 14 students were present. The class started with the learning goal projected onto the Smart
Board, and Ms. Hadwin checking homework and providing individual students with descriptive feedback on their
homework. Next, Ms. Hadwin discussed the homework problems. This involved Ms. Hadwin asking prompting questions,
modelling how to solve some of the problems, and providing feedback on common mistakes she saw students had made; as
well as a few students wrote their solutions on the Smart Board and explained them. Ms. Hadwin, when necessary,
provided evaluative and descriptive feedback on students’ solutions. Next, students completed a Minds-On activity
comprised of EQAO multiple-choice questions. After students tried the problems, students shared their answers with the
class and their reasoning. Ms. Hadwin provided evaluative and descriptive feedback and expanded on some answers
through explaining why the distractors were incorrect. Next, for approximately half the class time, students worked on a
worksheet that focused on the point of intersection between two linear equations. On this worksheet, students
independently worked on the first problem, completing the table of values and graphing. Ms. Hadwin walked around,
checked students’ work, and asked prompting questions to students who were having difficulty. Then, Ms. Hadwin
modelled how to complete the table of values and graph the relationship on the Smart Board, and provided class feedback
on common mistakes she observed. Next, the class discussed what the point of intersection represented within the given
situation. Ms. Hadwin assigned the remainder of the worksheet for homework. The class concluded with students working
independently on their homework, and Ms. Hadwin returning the mid-chapter review assignment and providing individual
students with descriptive feedback.
Note. Classroom observations were conducted in the 2014–2015 school year. EQAO = Education Quality and Accountability Office.
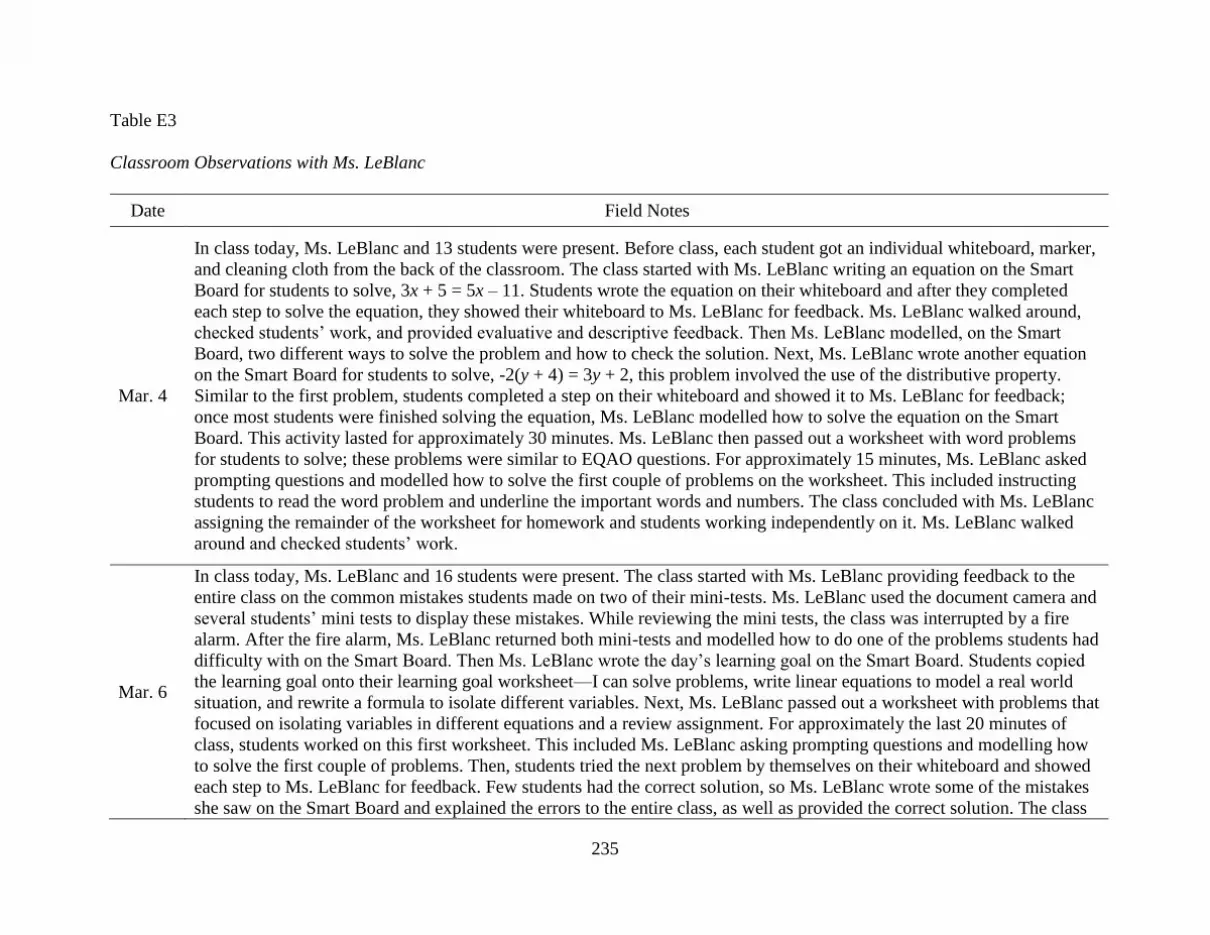
235
Table E3
Classroom Observations with Ms. LeBlanc
Date Field Notes
Mar. 4
In class today, Ms. LeBlanc and 13 students were present. Before class, each student got an individual whiteboard, marker,
and cleaning cloth from the back of the classroom. The class started with Ms. LeBlanc writing an equation on the Smart
Board for students to solve, 3x + 5 = 5x – 11. Students wrote the equation on their whiteboard and after they completed
each step to solve the equation, they showed their whiteboard to Ms. LeBlanc for feedback. Ms. LeBlanc walked around,
checked students’ work, and provided evaluative and descriptive feedback. Then Ms. LeBlanc modelled, on the Smart
Board, two different ways to solve the problem and how to check the solution. Next, Ms. LeBlanc wrote another equation
on the Smart Board for students to solve, -2(y + 4) = 3y + 2, this problem involved the use of the distributive property.
Similar to the first problem, students completed a step on their whiteboard and showed it to Ms. LeBlanc for feedback;
once most students were finished solving the equation, Ms. LeBlanc modelled how to solve the equation on the Smart
Board. This activity lasted for approximately 30 minutes. Ms. LeBlanc then passed out a worksheet with word problems
for students to solve; these problems were similar to EQAO questions. For approximately 15 minutes, Ms. LeBlanc asked
prompting questions and modelled how to solve the first couple of problems on the worksheet. This included instructing
students to read the word problem and underline the important words and numbers. The class concluded with Ms. LeBlanc
assigning the remainder of the worksheet for homework and students working independently on it. Ms. LeBlanc walked
around and checked students’ work.
Mar. 6
In class today, Ms. LeBlanc and 16 students were present. The class started with Ms. LeBlanc providing feedback to the
entire class on the common mistakes students made on two of their mini-tests. Ms. LeBlanc used the document camera and
several students’ mini tests to display these mistakes. While reviewing the mini tests, the class was interrupted by a fire
alarm. After the fire alarm, Ms. LeBlanc returned both mini-tests and modelled how to do one of the problems students had
difficulty with on the Smart Board. Then Ms. LeBlanc wrote the day’s learning goal on the Smart Board. Students copied
the learning goal onto their learning goal worksheet—I can solve problems, write linear equations to model a real world
situation, and rewrite a formula to isolate different variables. Next, Ms. LeBlanc passed out a worksheet with problems that
focused on isolating variables in different equations and a review assignment. For approximately the last 20 minutes of
class, students worked on this first worksheet. This included Ms. LeBlanc asking prompting questions and modelling how
to solve the first couple of problems. Then, students tried the next problem by themselves on their whiteboard and showed
each step to Ms. LeBlanc for feedback. Few students had the correct solution, so Ms. LeBlanc wrote some of the mistakes
she saw on the Smart Board and explained the errors to the entire class, as well as provided the correct solution. The class

236
concluded with Ms. LeBlanc assigning the remainder of the worksheet for homework, as well as the review assignment,
and students working independently on it. Ms. LeBlanc walked around and checked students’ work.
Apr. 10
In class today, Ms. LeBlanc and 13 students were present. The class started with Ms. LeBlanc recapping the previous day’s
lesson on equivalent ratios. Ms. LeBlanc wrote the learning goals on the Smart Board and discussed them. Students copied
the learning goals onto their learning goal worksheet—I can compare ratios in real life situations; I can write proportions
using two equivalent ratios; and I can problem solve using proportions. Next, Ms. LeBlanc checked homework, and
discussed a couple of the homework problems using the document camera and one student’s homework to show an
exemplary response. Then, Ms. LeBlanc passed out a new worksheet that focused on applying ratios to real-world
problems. After students read the first problem, Ms. LeBlanc explained the problem and modelled how to solve it using
three different methods: equivalent ratios, equivalent fractions, and decimals. For each method, Ms. LeBlanc asked
prompting questions to try and have students determine the next steps. After the modelling of the three methods, students
worked, independently or in pairs, for the next 20 minutes on a similar problem using all three methods to solve the
problem. Ms. LeBlanc walked around and checked students’ work. The class concluded with Ms. LeBlanc modelling how
to solve the problem using the equivalent ratios method and briefly discussing how one could apply the other two methods
to the problem. For homework, Ms. LeBlanc passed out another worksheet with ratio problems and instructed students to
solve these problems using their method of choice.
Apr. 14
In class today, Ms. LeBlanc and 15 students were present. The class started with Ms. LeBlanc returning students’
polynomial unit test and handing out a worksheet, One Star and Two Stairs, for personal goal setting. Ms. LeBlanc
instructed students to write down one thing they did well on the polynomial unit test and two things they could do better
next time to prepare for the test. Next, Ms. LeBlanc collected their homework from last class and passed out an exit card
with a ratio problem that students worked on for 20 minutes. Ms. LeBlanc walked around and provided descriptive
feedback to the entire class based on the common mistakes observed, as well as providing individual evaluative and
descriptive feedback. Then Ms. LeBlanc used the document camera and students’ work to explain how each of the three
methods—equivalent ratios, equivalent fractions, and decimals—could be applied to the problem. Ms. LeBlanc pointed out
what was done well and added steps that were missing to a student’s sheet. Then, for approximately 30 minutes, students
worked on another worksheet with the support of Ms. LeBlanc that focused on ratios and proportions. First, Ms. LeBlanc
reviewed the definitions with students that were at the top of this worksheet, and then she asked prompting questions and
modelled how to solve the first couple of problems. Next, students worked independently on the next couple of problems,
and Ms. LeBlanc walked around and provided evaluative and descriptive feedback. After students had tried the problems,
Ms. LeBlanc discussed the problems with the entire class. This pattern of teacher modelling how to solve the problems and
then guided practice continued for each new problem type on the worksheet. The class concluded with Ms. LeBlanc
assigning the last problem on the worksheet for homework, as well as another worksheet with three word problems.
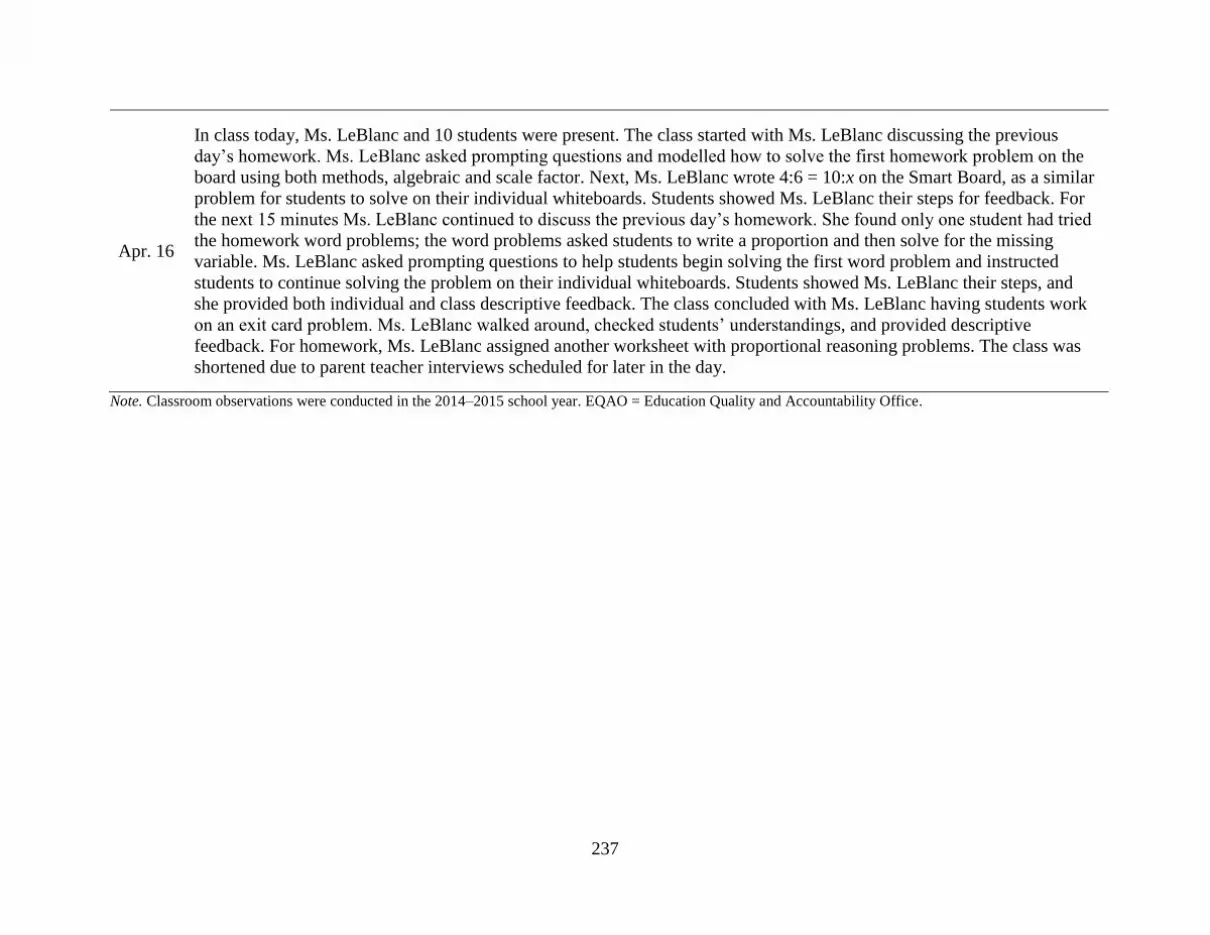
237
Apr. 16
In class today, Ms. LeBlanc and 10 students were present. The class started with Ms. LeBlanc discussing the previous
day’s homework. Ms. LeBlanc asked prompting questions and modelled how to solve the first homework problem on the
board using both methods, algebraic and scale factor. Next, Ms. LeBlanc wrote 4:6 = 10:x on the Smart Board, as a similar
problem for students to solve on their individual whiteboards. Students showed Ms. LeBlanc their steps for feedback. For
the next 15 minutes Ms. LeBlanc continued to discuss the previous day’s homework. She found only one student had tried
the homework word problems; the word problems asked students to write a proportion and then solve for the missing
variable. Ms. LeBlanc asked prompting questions to help students begin solving the first word problem and instructed
students to continue solving the problem on their individual whiteboards. Students showed Ms. LeBlanc their steps, and
she provided both individual and class descriptive feedback. The class concluded with Ms. LeBlanc having students work
on an exit card problem. Ms. LeBlanc walked around, checked students’ understandings, and provided descriptive
feedback. For homework, Ms. LeBlanc assigned another worksheet with proportional reasoning problems. The class was
shortened due to parent teacher interviews scheduled for later in the day.
Note. Classroom observations were conducted in the 2014–2015 school year. EQAO = Education Quality and Accountability Office.
238
Table E4
Classroom Observations with Mr. Lewis
Date Field Notes
Mar. 24
In class today, Mr. Lewis and 15 students were present. The class started with Mr. Lewis passing out the PowerPoint notes
for today’s lesson, which were also projected onto a screen. The first slide had the learning goals about percentages that
Mr. Lewis read—I will be able to calculate percentages when given a part of a whole, determine the percentage of an
amount when given a percentage and the total, and solve real-world problems related to percentages (e.g., discounts and
taxes, commission, grades). Next were several slides that presented a real-world example; this set of slides started with a
picture of a storefront advertising a sale. Mr. Lewis used this picture to introduce the context and asked open-ended
questions about what one needs to include when calculating a sale price. Prior to students solving this problem, Mr. Lewis
asked prompting questions and modelled how to solve several other problems that were scaffolded to support students with
the initial real-world problem. Then, Mr. Lewis returned to the real-world problem, and asked students to find the total cost
of a $49.50 shirt on sale for 40% off. Mr. Lewis walked around and helped students, one-on-one, by asking prompting
questions and providing descriptive feedback. After 10 minutes of guided practice, Mr. Lewis showed the receipt for the
shirt and explained the different amounts shown on the receipt, for example the amount labelled subtotal was the sale price
students had computed. For the last 30 minutes of class, students worked on self-paced clicker problems. Students
submitted their answers with their mobile device and received immediate evaluative feedback. Mr. Lewis walked around
and asked prompting questions to help students.
Mar. 25
In class today, Mr. Lewis and 15 students were present. The class started with Mr. Lewis asking students what items they
had recently bought. Mr. Lewis wrote these items on the chalkboard with their cost and asked students to make-up a
discount to apply to these items. One student suggested 80%. Then, Mr. Lewis created a scenario about a store closing and
students needed to calculate the total cost of the items after the discount and tax. Mr. Lewis discussed the steps to solve
this problem through asking prompting questions, and wrote the steps on the chalkboard. Students then solved the problem,
while Mr. Lewis walked around, checked students’ work, and helped students who were having difficulty. After several
minutes, Mr. Lewis projected a student’s exemplary solution on the overhead screen and the student explained their
solution. Then Mr. Lewis passed out a worksheet with a parallel task; the worksheet included two problems of similar type
but differing in difficulty level. After students had selected one of the problems to solve based on their assessed level of
understanding, students worked independently or in pairs on the problem for approximately 30 minutes. Once students
solved the problem, students wrote their solutions on chart paper to submit. All students started with the easier problem,
and several students completed both problems. While students worked, Mr. Lewis walked around, responded to questions,
239
asked prompting questions, and provided descriptive feedback.
Mar. 30
In class today, Mr. Lewis and 13 students were present. The class started with Mr. Lewis passing out the PowerPoint notes
for today’s lesson, which were also projected onto a screen. The first slide had the learning goals about proportional
reasoning that Mr. Lewis read—I will be able to use ratios, proportions, unit rates and percentages to solve, difficult, real-
world problems. The next several slides included problems for students to solve. For the first problem, Mr. Lewis
discussed what one would need to do first, that is find the unit rate. Some students were confused; Mr. Lewis referred these
students to the success criteria on chart paper posted on the chalkboard. A few minutes later, Mr. Lewis modelled how to
solve the problem on the chalkboard and discussed the value of first finding the unit rate. The next question was an EQAO
question about which student had the highest hourly rate. Mr. Lewis prompted students to first find how much each student
can make in an hour. Students tried the problem; and Mr. Lewis walked around and worked with students one-on-one. A
few minutes later, Mr. Lewis modelled how to solve the problem on the chalkboard. This guided practice continued for the
remainder of the lesson, with Mr. Lewis explaining how problems were similar and recapping steps taken to solve each
problem. The class concluded with Mr. Lewis assigning the last problem on the handout for homework.
Mar. 31
In class today, Mr. Lewis and 17 students were present. The class started with Mr. Lewis asking students about their
interactions with police and if they had heard of police carding. Then Mr. Lewis played a video clip that explained police
carding. Next, Mr. Lewis passed out a worksheet; the first question asked students to estimate the proportion of the city’s
population by skin colour. Once complete, students discussed their estimates with their table group of four, and then with
the entire class. Mr. Lewis shared the actual percentages. Next, Mr. Lewis asked, “How do you prove something?”
Students responded with various ideas, and Mr. Lewis explained the value of numbers when proving something. Mr. Lewis
passed out a bag of blocks to each pair of students (each bag contained four different colour blocks to represent the
different skin colours; and prior to the start of class, Mr. Lewis had filled the bag such that the number of colour blocks
were in the same ratio as the city’s population by skin colour). Mr. Lewis demonstrated how to simulate police carding
with the bag of blocks. After five minutes, Mr. Lewis recorded on the chalkboard the number of people from each of the
different races that students carded. Then, Mr. Lewis modelled how to calculate the percentage of people carded from each
of the different races, and students calculated the remainder of the percentages. Students shared their answers, and Mr.
Lewis wrote the percentages on the chalkboard. Students compared these percentages to the breakdown of the city’s
population. Mr. Lewis then showed the actual percentages by race of people who were carded and asked, “Based on these
numbers, can we make the argument that police officers are targeting black people?” Class discussion ensued. Mr. Lewis
explained that this is called a disproportionate relationship. The class concluded with students writing about what they
learned and a message to the city’s police. Students submitted their work to Mr. Lewis.
240
Apr. 8
In class today, Mr. Lewis and 16 students were present. The class started with Mr. Lewis passing out the PowerPoint notes
for today’s lesson, which were also projected onto a screen. The first slide had the learning goals about rate of change that
Mr. Lewis read and related to yesterday’s learning goals—To create a formula for rate of change that can be used all the
time and to learn how to use the formula to calculate rate of change using information given in various ways. The next
slide contained a problem similar to what students did yesterday; the problem required finding the rate of change using the
given graph. Mr. Lewis asked prompting questions and modelled the steps on the chalkboard. Next, Mr. Lewis scaffolded
the creation of the rate of change formula for his students; he labeled two coordinates on the graph used in the previous
question and asked how one would get a rise of 40 and run of 4 using those numbers. Students discussed this question in
their groups of four. One student suggested multiplying. Then, Mr. Lewis clarified that it needed to be the same operation
applied to both coordinates. Another student suggested subtraction and explained their reasoning. Mr. Lewis used this
student’s response to write the rate of change formula. Next, Mr. Lewis had students check the rate of change formula on a
problem they had previously found the rate of change for with the graphing method. Mr. Lewis asked prompting questions
and modelled how to do it on the chalkboard. Then Mr. Lewis asked prompting questions and modelled how to do a couple
more problems. The next slide on the handout asked students to write the success criteria for calculating rate of change
from a graph or table of values. Mr. Lewis asked prompting questions to support the development of the success criteria.
For the last 40 minutes of class, students worked independently on rate of change problems. Mr. Lewis walked around,
responded to questions, asked prompting questions, and provided evaluative and descriptive feedback.
Note. Classroom observations were conducted in the 2014–2015 school year. EQAO = Education Quality and Accountability Office.

241
Appendix F: Item Descriptives
Table F1
Means (and Standard Deviations) for AfL Strategies and Related Pedagogical Practices
School-Achievement Result Total
(N = 131) High
(n = 37)
Average
(n = 61)
Low
(n = 29)
I provide my students with learning goals. 4.05
(1.15)
4.10
(1.11)
3.59
(1.15)
3.98
(1.13)
I discuss the meaning of learning goals with my
students.
3.73
(1.26)
3.62
(1.10)
3.10
(1.40)
3.56
(1.23)
I encourage students to set personal learning goals
for themselves.
3.76
(1.30)
3.38
(1.28)
3.00
(1.20)
3.44
(1.29)
I give students success criteria. 3.76
(1.32)
3.61
(1.13)
3.48
(1.09)
3.65
(1.17)
I discuss the meaning of success criteria with my
students.
3.43
(1.43)
3.46
(1.09)
3.24
(1.15)
3.43
(1.20)
I work with my students to create success criteria. 2.59
(1.46)
2.70
(1.23)a
2.52
(1.30)
2.65
(1.31)a
I have students working independently when
learning.
3.76
(1.12)
3.56
(1.01)
3.59
(1.02)
3.63
(1.05)
I have students working in pairs when learning. 4.16
(.83)
3.82
(.93)a
3.96
(.79)a
3.96
(.88)b
I have students working in groups (3 or more)
when learning.
3.54
(1.19)
3.51
(1.09)
3.93
(1.16)
3.63
(1.14)
I use assessment information to inform my
instruction.
4.54
(.84)
4.43
(.69)
4.48
(.74)
4.48
(.74)
I use different levels of questioning to support my
students’ learning.
4.65
(.59)
4.30
(.69)
4.41
(.83)
4.44
(.70)
I provide students with descriptive feedback based
on success criteria and/or achievement levels.
4.30
(.97)
3.98
(.96)
3.83
(1.07)
4.05
(1.00)
I have my students give each other feedback on
their learning.
2.62
(1.06)a
2.82
(1.15)
2.59
(1.15)
2.75
(1.15)
I provide exemplars of student work that reflect
the success criteria and/or achievement levels.
3.42
(1.30)
3.51
(1.09)
2.86
(1.30)
3.35
(1.23)a
Note. 5-point scale (1 = never to 5 = often). AfL = assessment for learning. aMissing one response. bMissing two responses.
242
Table F2
Means (and Standard Deviations) for Classroom Assessment Practices
School-Achievement Result Total
(N = 131) High
(n = 37)
Average
(n = 61)
Low
(n = 29)
Paper-and-pencil tests 4.62
(.59)
4.41
(.88)
4.52
(.83)
4.49
(.80)
Quizzes 4.41
(.73)
4.05
(1.07)
4.36
(.95)a
4.22
(.96)a
Performance tasks 3.84
(1.19)
3.59
(1.09)
3.76
(.83)
3.70
(1.07)
Homework performance 3.36
(1.57)a
3.21
(1.29)
3.59
(1.38)
3.34
(1.38)a
Observation of students (notes/checklists) 3.73
(1.31)
3.83
(.99)a
3.48
(1.30)
3.74
(1.17)a
Projects 2.65
(1.25)
2.64
(1.10)
2.45
(.95)
2.63
(1.12)
Interviews/conferencing with students 3.16
(1.28)
3.12
(1.17)a
3.07
(1.03)
3.15
(1.17)a
Portfolios/dated work samples 2.00
(1.29)a
2.08
(1.22)
1.89
(1.23)a
2.05
(1.26)b
Student presentations to other students
(formal or informal)
2.51
(1.24)
2.72
(1.24)
2.83
(1.31)
2.68
(1.27)
Class discussions 4.03
(1.17)
3.97
(1.00)
3.90
(1.21)
3.99
(1.09)
Students' journals 1.81
(1.22)
1.89
(1.21)
2.00
(1.31)
1.90
(1.22)
Peer-assessments 2.11
(1.05)
2.25
(1.11)
1.69
(1.00)
2.12
(1.10)
Self-assessments 2.62
(1.04)
2.85
(1.08)
2.41
(1.21)
2.72
(1.11)
Computer/graphing calculator output 2.89
(1.05)
3.00
(1.33)
3.03
(1.43)
3.02
(1.27)
Math problems with multiple solutions 3.73
(1.19)
3.36
(1.18)
3.69
(1.29)
3.55
(1.22)
Note. 5-point scale (1 = never to 5 = often). aMissing one response. bMissing two responses.
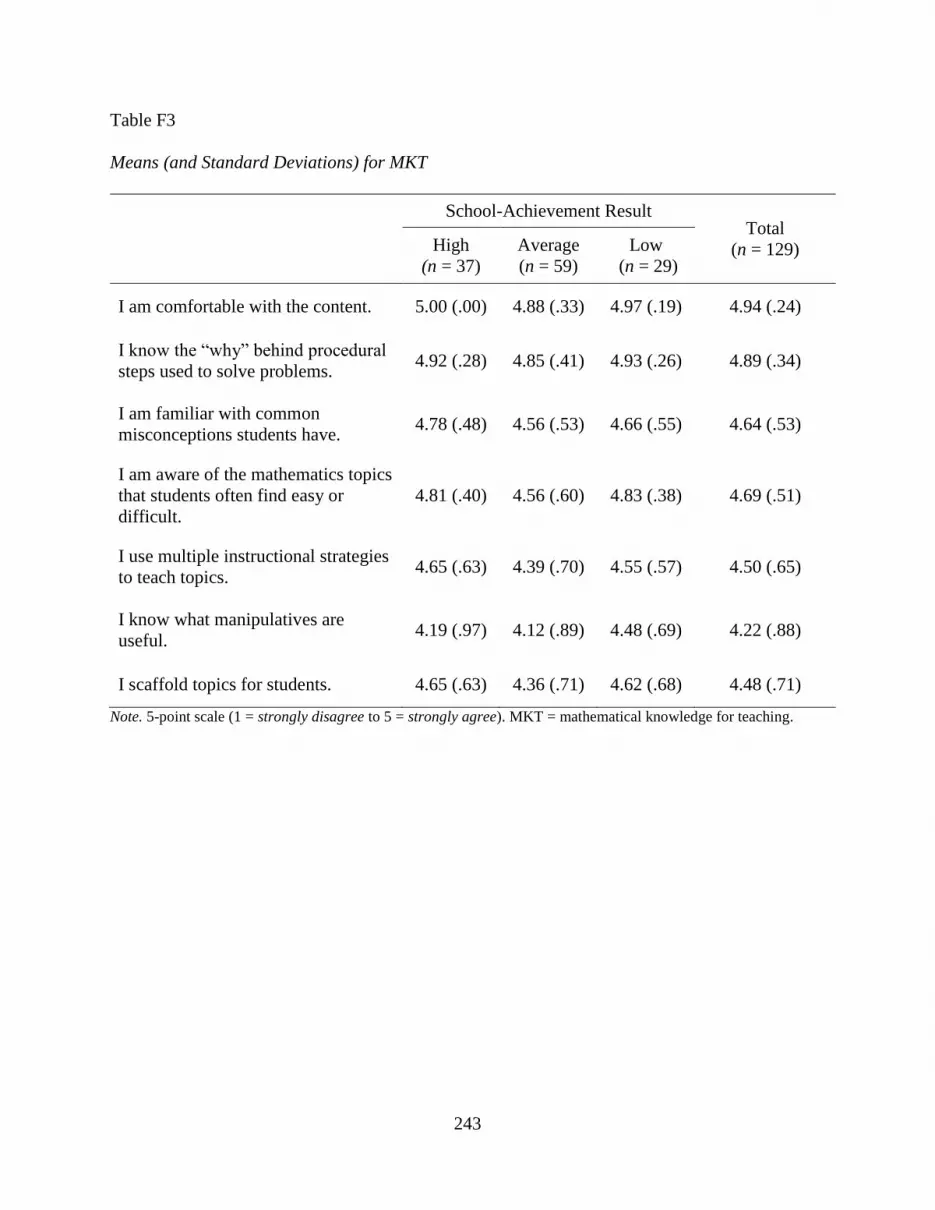
243
Table F3
Means (and Standard Deviations) for MKT
School-Achievement Result Total
(n = 129) High
(n = 37)
Average
(n = 59)
Low
(n = 29)
I am comfortable with the content. 5.00 (.00) 4.88 (.33) 4.97 (.19) 4.94 (.24)
I know the “why” behind procedural
steps used to solve problems. 4.92 (.28) 4.85 (.41) 4.93 (.26) 4.89 (.34)
I am familiar with common
misconceptions students have. 4.78 (.48) 4.56 (.53) 4.66 (.55) 4.64 (.53)
I am aware of the mathematics topics
that students often find easy or
difficult.
4.81 (.40) 4.56 (.60) 4.83 (.38) 4.69 (.51)
I use multiple instructional strategies
to teach topics. 4.65 (.63) 4.39 (.70) 4.55 (.57) 4.50 (.65)
I know what manipulatives are
useful. 4.19 (.97) 4.12 (.89) 4.48 (.69) 4.22 (.88)
I scaffold topics for students. 4.65 (.63) 4.36 (.71) 4.62 (.68) 4.48 (.71)
Note. 5-point scale (1 = strongly disagree to 5 = strongly agree). MKT = mathematical knowledge for teaching.

244
Table F4
Means (and Standard Deviations) for MKT and Beliefs
School-Achievement Result Total
(n = 129) High
(n = 37)
Average
(n = 59)
Low
(n = 29)
All students do not learn mathematics
in the same way. 4.81 (.52) 4.76 (.43) 4.86 (.44) 4.80 (.46)
Students learn mathematics most
effectively when given opportunities
to investigate ideas and concepts
through problem solving.
4.05 (.91) 3.83 (.92)a 3.90 (1.01) 3.93 (.93)a
Students learn mathematics most
effectively when teachers link new
concepts to students’ prior knowledge.
4.49 (.65) 4.53 (.57) 4.59 (.50) 4.53 (.57)
Current technologies bring many
benefits to the learning and doing of
mathematics.
3.95 (.91) 4.08 (.73) 4.03 (1.02) 4.03 (.84)
I know how the big mathematics ideas
are connected across grade levels. 4.49 (.56) 4.19 (.97) 4.52 (.69) 4.35 (.82)
Note. 5-point scale (1 = strongly disagree to 5 = strongly agree). MKT = mathematical knowledge for teaching. aMissing one response.

245
Appendix G: Factor Loadings
Table G1
Factor Loadings for AfL Strategies and Related Pedagogical Practices
Subscale
Item AfL
Strategy
Collaborative
Learning
I discuss the meaning of learning goals with my students. .84 −.11
I discuss the meaning of success criteria with my students. .82 −.07
I give students success criteria. .78 −.14
I provide my students with learning goals. .75 −.12
I work with my students to create success criteria. .70 .15
I encourage students to set personal learning goals for themselves. .63 .17
I provide students with descriptive feedback based on success criteria
and/or achievement levels. .53 −.04
I provide exemplars of student work that reflect the success criteria
and/or achievement levels. .51 .24
I use different levels of questioning to support my students’ learning. .39 .12
I use assessment information to inform my instruction. .35 −.02
I have my students give each other feedback on their learning. .31 .25
I have students working in groups (3 or more) when learning. −.06 .81
I have students working in pairs when learning. .03 .56
Cronbach’s Alpha .88 .65
Note. Factor loadings > .30 are in boldface. AfL = assessment for learning.

246
Table G2
Factor Loadings for Classroom Assessment Practices
Subscale
Item
Traditional
Classroom
Assessments
Contemporary
Classroom
Assessments
Quizzes .96 .10
Paper-and-pencil tests .61 −.10
Portfolios/dated work samples −.14 .65
Computer/graphing calculator output .13 .65
Self-assessments −.02 .64
Projects −.02 .61
Peer-assessments −.01 .61
Interviews/conferencing with students −.02 .60
Student presentations to other students (formal or informal) −.01 .56
Math problems with multiple solutions −.02 .54
Students' journals −.11 .50
Class discussions .01 .48
Performance tasks .10 .42
Observation of students (notes/checklists) .00 .37
Cronbach’s Alpha .73 .84
Note. Factor loadings > .30 are in boldface.
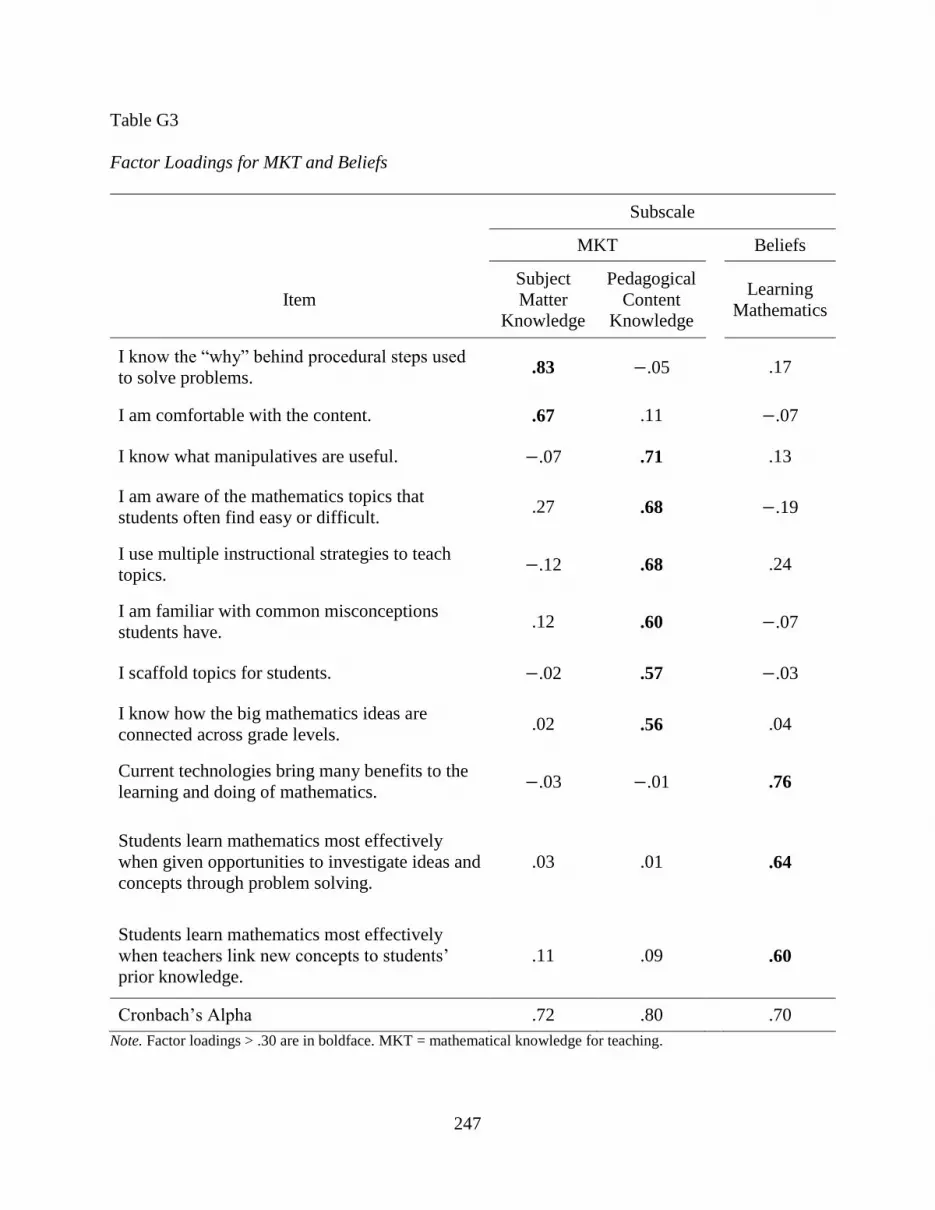
247
Table G3
Factor Loadings for MKT and Beliefs
Subscale
MKT Beliefs
Item
Subject
Matter
Knowledge
Pedagogical
Content
Knowledge
Learning
Mathematics
I know the “why” behind procedural steps used
to solve problems. .83 −.05 .17
I am comfortable with the content. .67 .11 −.07
I know what manipulatives are useful. −.07 .71 .13
I am aware of the mathematics topics that
students often find easy or difficult. .27 .68 −.19
I use multiple instructional strategies to teach
topics. −.12 .68 .24
I am familiar with common misconceptions
students have. .12 .60 −.07
I scaffold topics for students. −.02 .57 −.03
I know how the big mathematics ideas are
connected across grade levels. .02 .56 .04
Current technologies bring many benefits to the
learning and doing of mathematics. −.03 −.01 .76
Students learn mathematics most effectively
when given opportunities to investigate ideas and
concepts through problem solving.
.03 .01 .64
Students learn mathematics most effectively
when teachers link new concepts to students’
prior knowledge.
.11 .09 .60
Cronbach’s Alpha .72 .80 .70
Note. Factor loadings > .30 are in boldface. MKT = mathematical knowledge for teaching.