assessing self-care and social function using a computer adaptive testing version of the pediatric...
TRANSCRIPT

Assessing self-care and social function using a computeradaptive testing version of the Pediatric Evaluation of DisabilityInventory Accepted for Publication, Archives of Physical Medicineand Rehabilitation
Wendy J. Coster, PhD, OTR/L, Stephen M. Haley, PhD, PT, Pengsheng Ni, MD, MPH, HeleneM. Dumas, MS, PT, and Maria A. Fragala-Pinkham, MS, PTFrom the Department of Occupational Therapy and Rehabilitation Counseling, Boston UniversitySargent College, Boston, MA (Coster); Health and Disability Research Institute, Boston UniversitySchool of Public Health, Boston, MA (Haley, Ni); and Research Center for Children with SpecialHealth Care Needs, Franciscan Hospital for Children, Boston, MA (Dumas, Fragala-Pinkham).
AbstractObjective—To examine score agreement, validity, precision, and response burden of a prototypecomputer adaptive testing (CAT) version of the Self-Care and Social Function scales of the PediatricEvaluation of Disability Inventory (PEDI) compared to the full-length version of these scales.
Design—Computer simulation analysis of cross-sectional and longitudinal retrospective data;cross-sectional prospective study.
Settings—Pediatric rehabilitation hospital, including inpatient acute rehabilitation, day schoolprogram, outpatient clinics; community-based day care, preschool, and children’s homes.
Participants—Four hundred sixty-nine children with disabilities and 412 children with nodisabilities (analytic sample); 38 children with disabilities and 35 children without disabilities (cross-validation sample).
Interventions—Not applicable.
Main Outcome Measures—Summary scores from prototype CAT applications of each scaleusing 15-, 10-, and 5-item stopping rules; scores from the full-length Self-Care and Social Functionscales; time (in seconds) to complete assessments and respondent ratings of burden.
Results—Scores from both computer simulations and field administration of the prototype CATswere highly consistent with scores from full-length administration (all r’s between .94 and .99). Usingcomputer simulation of retrospective data, discriminant validity and sensitivity to change of the CATsclosely approximated that of the full-length scales, especially when the 15- and 10-item stoppingrules were applied. In the cross-validation study the time to administer both CATs was 4 minutes,compared to over 16 minutes to complete the full-length scales.
Conclusions—Self-care and Social Function score estimates from CAT administration are highlycomparable to those obtained from full-length scale administration, with small losses in validity andprecision and substantial decreases in administration time.
Corresponding Author: Wendy Coster, Department of Occupational Therapy and Rehabilitation Counseling, Boston University SargentCollege, 635 Commonwealth Avenue, Boston, MA 02215. Tel.: (617) 353-7518; Fax: (617) 353-2926; email: [email protected].
NIH Public AccessAuthor ManuscriptArch Phys Med Rehabil. Author manuscript; available in PMC 2009 April 7.
Published in final edited form as:Arch Phys Med Rehabil. 2008 April ; 89(4): 622–629. doi:10.1016/j.apmr.2007.09.053.
NIH
-PA Author Manuscript
NIH
-PA Author Manuscript
NIH
-PA Author Manuscript
Keywordsoutcome assessment (Health Care); pediatrics; rehabilitation
The past decade has seen significant effort directed to improving the measures used to examinehealth and function in children with disabilities.1,2 These efforts reflect the convergence ofmultiple forces, including increased appreciation that the child’s ability to perform importantdaily activities and to participate in important life situations is the outcome that matters mostto families3 and increased emphasis by payers on documentation that services provided haveresulted in progress toward these goals. The importance of sound measures of function hasbeen further illustrated by research findings that interventions may be associated withmeaningful functional improvement even in the absence of measurable changes inimpairments.4
Measurement development has also been advanced by the introduction of newermethodologies, in particular those using Item Response Theory (IRT).5 These methods havesupported clearer construct and item definition and the construction of scales that are sensitivethe smaller degrees of change across time often seen in children with disabilities. Nevertheless,IRT methods alone have been insufficient to address a key challenge for functional assessment:balancing comprehensiveness of coverage against practicality. In order to obtain sufficientcoverage of the full range of function across the continuum of development and across degreesof disability, traditional fixed-length instruments tend to be so long as to be impractical forroutine use in clinical settings. Alternatively, shorter instruments must sacrifice coverage,either by limiting the number of items (and therefore reducing sensitivity to change) or limitingthe age span covered by the instrument (and thereby reducing the ability to track change acrossthe full period of child development using the same instrument).
Recently, computer adaptive testing (CAT) methods have been proposed as a potential solutionto this measurement dilemma.6–8 Adaptive testing approaches tailor the assessment the currentlevel of function of the child so that only items that yield useful information (i.e. are neithertoo hard nor too easy) are administered. In CAT administration, the program uses the responseto an initial question to establish a general range of likely function. Subsequent questions areselected through application of algorithms to progressively refine the estimated score to therange of precision established a priori by the examiner. Regardless of the actual itemsadministered all scores are on the same scale, which supports comparisons across time or acrossgroups of individuals with different levels of current functional performance.
Although CAT offers a potential solution to the conflict between comprehensivenesspracticality, the reliability, validity, and acceptability of any application must still bedemonstrated through appropriate testing. The purpose of this paper is to present results froma comparison of CAT results to full-length administration of two functional scales for children,one measuring self-care activity performance and the second measuring social function.Although there is some previous work examining CAT applications in the domain of functionalmobility,9,10 to our knowledge there are no reports of investigation of the feasibility of CATfor measuring these other important domains in children.
The development of a CAT requires: (1) a large set of items (item pool) examining thefunctional area of interest; (2) items that scale consistently on a single dimension from low tohigh functional achievement; and (3) rules to guide starting, stopping, and scoring. Itemresponse theory methods are used to create hierarchically organized item pools, after whichsoftware algorithms select items that match the child’s estimated functional level. Allrespondents answer the same first question, which has been selected a priori based on its broad
Coster et al. Page 2
Arch Phys Med Rehabil. Author manuscript; available in PMC 2009 April 7.
NIH
-PA Author Manuscript
NIH
-PA Author Manuscript
NIH
-PA Author Manuscript

coverage of the range of function. The response to the first question is used to estimate an initialscore and confidence interval and guides selection of a second item within the estimated range.The response to this second question is used to re-estimate the score and confidence interval.The process continues in an iterative fashion until the computer algorithm determines that thestopping rule has been satisfied (either a pre-set number of items or a minimum confidenceinterval). The stopping rule can be altered to suit the specific purpose of measurement, e.g. alarger confidence interval may be acceptable for large population studies, whereas a narrowconfidence interval might be important for the precision required in a clinical trial.
In the present study we created prototype CATs using the Self-Care and Social FunctionFunctional Skills items from the Pediatric Evaluation of Disability Inventory (PEDI).11 Twophases of testing were conducted using the prototype CATs: computer simulation studies ofretrospective data and a prospective validation study. In addition to examining the accuracyand precision of the CATs compared to the standard fixed-form assessment, we also examinedperceived respondent burden for each method.
MethodsSamples
Analytic sample—We used an existing database of 881 children who had complete data onthe 73-item Self-Care and the 65-item Social Function Functional Skills scales of the PEDI.This retrospective analytic sample included two groups: 1) a normative sample of 412 healthychildren between the ages of 6 months and 7.5 years that was also used to create the initialstandardization and normative scoring of the PEDI, and 2) a clinical sample of 469 childrenand youth (ages 6–7 years) who had received inpatient, outpatient, or school-basedrehabilitation services at Franciscan Hospital for Children, Boston, MA. Of the 469 clinicalcases, 249 had longitudinal data appropriate for sensitivity analyses for the Self-Care scale and200 had data for the Social Function scale.
Approximately 48% of the children in the clinical sample had congenital or inherited diseases,21% had growth and maturation disorders, 16% had acquired conditions, and 15% werediagnosed with traumatic injuries. Demographic characteristics of the analytic sample arepresented in Table 1. The sample size of 881 is acceptable for initial calibration work for aprototype CAT.12.
Cross-validation sample—We recruited a convenience sample of 73 children and youthfor the prospective cross-validation study. Thirty-eight children with disabilities, ages 1 yearto 17 years, were recruited from the clinical programs (inpatient, outpatient, early intervention,and hospital-based school) at Franciscan Hospital for Children. Ethnic representationcorresponding to the current United States census was targeted for recruitment; however,respondents who did not speak English as a primary language were excluded because of theprohibitive cost of translating and interpreting. Children were further selectively recruited toassure representation each of the following four impairment groups: congenital or inheriteddisease, growth and maturation disorders, acquired conditions, and traumatic injuries. Thirty-five children without disabilities, ages 6 months to 7.5 years, were recruited through theFranciscan Family Child Care Center and the home communities of the two Field-TestCoordinators.
InstrumentThe PEDI11 is a comprehensive functional assessment instrument that measures bothcapability and performance of functional activities. The Self-Care and the Social FunctionFunctional Skills scales were used in the present investigation. Results of a CAT application
Coster et al. Page 3
Arch Phys Med Rehabil. Author manuscript; available in PMC 2009 April 7.
NIH
-PA Author Manuscript
NIH
-PA Author Manuscript
NIH
-PA Author Manuscript

for the Mobility domain of the PEDI have been reported elsewhere.10 The Self-Care domainincludes 73 activities involved in eating and drinking, grooming, dressing, and toileting tasks,which are assessed with a series of items using a dichotomous ‘capable’ or ‘unable’ scoringcriterion. The Social Function domain includes 65 items related to communication (expressionand comprehension), problem solving, interactions with peers and adults, and safety at homeand in the community. Several studies have supported the reliability and validity of the PEDIscales in a wide variety of clinical samples.13,14 Evidence of construct validity has beenobtained by demonstrating the ability of the PEDI to correctly identify children with andwithout disabilities,15 and to discriminate between different types of acquired brain injury.16,17 Studies also have reported successful outcome monitoring using the PEDI in childrenwith cerebral palsy,18,19 myelodysplasisa,20,21osteogenesis imperfecta,22 and traumaticbrain injury.23–27 The ability of the the PEDI Functional Skills scales to detect meaningfulclinical changes has also been demonstrated.28 Because the development of the PEDI scalesand construction of summary scores are based on Rasch Rating Scale methodology,29–31 thesescales provide an excellent starting point for the development of prototype CATs.
Development of the CATUnidimensionality and local independence—IRT and CAT methods assume certainmeasurement properties of item sets that purport to represent a functional construct (latentvariable). These include the assumptions of unidimensionality, local independence, andstability of item parameters across groups (e.g., clinical versus normative samples). Item setsthat violate these assumptions may be less effective in modeling the latent variable and maylimit the accuracy of a CAT instrument. A key assumption of the latent variable models thatserve as the basis for CAT is that all items in a scale measure a single, unitary concept; that is,the items are unidimensional. The latent variable alone should explain how items are relatedto one another.32,33 We tested the latent structure of the Self-Care and Social Function itemsin a series of confirmatory factor analyses34 and evaluated item loadings and residualcorrelations between items using MPlus software.35 We used weighted least squares meansand variance adjusted estimation methods, which are more precise when analyzing moderate-size samples with skewed categorical data.34,36 To determine the extent to which aunidimensional model adequately represented scale structure we considered the eigenvaluesassociated with each factor extracted; item loadings on the primary factor; and results fromoverall model fit tests. To ensure adequate sample size for estimation of model parameters wecombined the normative and clinical PEDI samples. Assuming the item parameters are similaracross groups, combining the samples enhances generalizability of results across both groupsand provides a greater number of persons at the moderate to low end of the scale to enhanceprecision of estimated scores in this region.
In the Self-Care domain, one factor explained 87.9% of the item variance and all the factorloadings were very high (range from 0.778 – 0.974). The Comparative Fit Index (CFI) valueof 0.995 indicated very good fit and can be interpreted as an indicator that 99% of covariancein the data is reproducible by the model. This conclusion was supported by the Tucker-LewisIndex (TLI) value of 0.997, also indicating good fit. The Root Mean Square Error ofApproximation (RMSEA) of 0.078 is in the acceptable range. In the Social Function domainone factor explained 87.8% of the item variance. All the factor loadings were very high, rangingfrom 0.770 to 0.987 and the fit indexes also supported the one-factor model (CFI=0.994,TLI=0.997, RMSEA=0.104).
The requirement of local independence means that scale items must be independent, orunrelated, to each other at a given score level. One indicator that items share more than thelatent trait is high residual correlations. High residual correlations (greater than +/− 0.2) wereobserved between 9 pairs of items on the Self-Care scale and 24 pairs on the Social Function
Coster et al. Page 4
Arch Phys Med Rehabil. Author manuscript; available in PMC 2009 April 7.
NIH
-PA Author Manuscript
NIH
-PA Author Manuscript
NIH
-PA Author Manuscript

scale.37 These correlations likely reflect the structure of the PEDI, which groups similar itemsinto skill sets that have an implicit hierarchical relation to each other. For example, the item“Eats all textures of table food” implies accomplishment of the previous item “Eats cut up/chunky/diced foods” and thus the response to the more challenging item is not independent ofthe response to the easier item. This violation of model assumptions may affect the estimationof test information and item discrimination parameters, but cannot be rectified in an existingdatabase.
Item calibrations—The item parameters for each scale were estimated using the Raschmodel, which estimates the item difficulty parameters.38–40 The Rasch model was selectedas the best solution for this phase of the project because of simplicity in interpretation andflexibility about the underlying form of the population or trait distributions. The itemparameters and fit statistics were calculated using ConQuest,41 which is based on marginalmaximum likelihood estimation. We evaluated fit using the fit statistics for each item basedon the comparison of expected and observed value. To maximize sample size and thedistribution of item difficulty, data for the total analytic sample were used to generate itemcalibrations. Note that the original item calibration and instrument standardization for the PEDIwas conducted using the normative sample alone (N=412).11
In the Self-Care domain there were 4 items that did not fit the model including “allows noseto be wiped” (INFIT=1.52), “removes socks and unfastened shoes” (INFIT=1.60), “managestangles and part hair” (INFIT=1.72) and “brushes or combs hair” (INFIT=1.68). Those itemswere removed from the item set to be used for the CAT prototype. In the Social Functiondomain only one item did not fit the model: “if upset because of a problem, child must behelped immediately or behavior deteriorates” (INFIT=1.81). Because of the important contentreflected in this item we chose to keep it in the item pool. We estimated the individual scoresusing weighted maximum likelihood (WML)42 estimation. WML is preferable to the Expecteda Posteriori (EAP) methods because it adjusts the first-order bias. The individual scores werestandardized to a mean 50 and standard deviation of 10.
Differential item functioning—In item response theory, the child’s score on an item shoulddepend entirely on the latent variable being measured. Significant differential item function(DIF) indicates that variables other than the latent variable, such as diagnosis, age, or gender,are likely influencing the response.43 We used logistic regression to determine the extent towhich item responses to the self-care and social function items differed by clinical diagnosisor age. The diagnosis variable was treated dichotomously (clinical; typical) while age wastreated as a continuous variable. If diagnosis or age produced significant model coefficientsand the child variable explained more than 2% of variance, considering the total score, then anitem was considered to exhibit DIF. A Bonferroni corrected p-value was applied forsignificance testing (p<0.05/73 = 0.000685 for the Self-Care domain; p<0.05/65 items =0.00077 for the Social Function domain). We also assessed the amount of model varianceexplained by the group variables.
One of the 73 Self-Care items (“remove socks and unfastened shoes”) exhibited DIF bydiagnosis. This item also showed misfit on the previous analyses thus supporting the decisionto remove this item. Sixteen of the 65 social function items exhibited DIF by diagnosis or age.There were 2 items that functioned differently for both diagnosis and age: “If upset because ofa problem, child must be helped immediately or behavior deteriorates” and “Explores andfunctions in familiar community settings without supervision.” Because the problematic itemsrepresent important content, we did not remove them. However, these items are clearlycandidates for future revision.
Coster et al. Page 5
Arch Phys Med Rehabil. Author manuscript; available in PMC 2009 April 7.
NIH
-PA Author Manuscript
NIH
-PA Author Manuscript
NIH
-PA Author Manuscript

Development of the CAT program—We based the Self-care and Social Function CATalgorithms on the HDRI™ software developed at the Health and Disability Research Institute.The CATs were designed to be completed by a child’s clinician or parent and can beadministered from a stand-alone computer. We programmed the CATs to use weightedmaximum likelihood (WML) score estimation.7 We selected the items “Puts on pants with anelastic waist” and “Provides names and descriptive information about family members” to bethe first items administered to all respondents for the Self-care and Social Function CATSrespectively. These items were chosen because their difficulty parameters were in the middleof the range, they did not exhibit DIF, and the content seemed appropriate for most respondents.The response to the first item is fed into the engine and the application calculates a probablescore as well a person-specific measure of how precise that score is. If the score is not estimatedwith sufficient precision, according to internal guidelines, additional questions are selected andadministered until either the precision standard is reached or the defined maximum number ofitems has been administered. In order to be able to compare results from the simulation andcross-validation studies we used a fixed-stopping rule of 15 items in the present project.However, we expected that only a few respondents would need to complete that many itemsto attain desirable levels of precision.
Accuracy of the CATComputer simulations—We evaluated the IRT-based algorithms for each CAT usingcomputer simulation methods for the analytic sample. The simulations compare thepsychometric merits of alternative strategies for programming assessments. In thesesimulations, responses to items selected by the CAT software were obtained for cases in theanalytic data set and "fed" to the computer to simulate the conditions of an actual CATassessment. As in an actual CAT, the simulation uses the IRT model to select the best item toadminister next, i.e., the one with the highest information function given the current score level,re-estimates the domain score and confidence interval (CI), and decides whether or not tocontinue testing. In the present study, in order to be able to compare results from the simulationand cross-validation studies, we used a fixed-stopping rule of 15 items. We developed threeCAT scores in the simulations to reflect 3 potential item-stopping rules (SC or SF-CAT-15,SC or SF-CAT-10 and SC or SF-CAT-5). These simulated scores were compared to a “goldstandard” – the actual IRT latent trait score (Self-Care or Social Function) estimated by thefull model.
Cross-validation field test—The Self-Care and Social Function CATs and full-lengthscales for each domain were completed on a sample of children with disabilities from the FCHclinical programs in the same manner typically used in that setting, that is by clinicalobservation or through parent interview conducted by the child’s physical therapist. Forchildren without disabilities, we administered both instruments via interview with the parentor the parent’s designee (in some cases the child’s teacher or day care worker). The CAT wascompleted using the pre-set 15-item stopping rule to enable comparison to scores from the fulllength scale. We provided formal training in the administration of the CAT to the physicaltherapists. The clinical staff was already familiar with the full length Self-Care and SocialFunction scales as they are used regularly in the programs at the facility. For most children,both the CAT and full length scale were completed during one session and the maximum timeinterval between test modes for an individual child was 2 days. For both groups (children withand without disabilities), the order of assessment type was counterbalanced to avoid an ordereffect. Following administration, we obtained written feedback from the physical therapist and/or parent respondent about the relative merits or limitations of both modes of administration.We collected the actual time (to the closest minute) required for administration of the full lengthscale in 73% of the cases; each CAT had an internal clock to track the amount of time and thenumber of items needed to meet pre-set levels of precision. Demographic information
Coster et al. Page 6
Arch Phys Med Rehabil. Author manuscript; available in PMC 2009 April 7.
NIH
-PA Author Manuscript
NIH
-PA Author Manuscript
NIH
-PA Author Manuscript
(ethnicity, sex, age, and diagnosis when applicable) was collected for each child. All procedureswere approved by the Institutional Review Boards at Boston University and FranciscanHospital for Children.
Data AnalysisPearson correlations were calculated between each of the CAT scores and the optimal IRT-based latent trait score (full length scale) to assess the extent to which simulated CAT scoreswere consistent with scores from the full length form. The ability of each CAT version todiscriminate between groups of children on the basis of diagnosis (normative versus clinical)as compared to the full length scale was evaluated by comparing average scores and relativevalidity coefficients (RV) based on F-ratios, as in previous studies.44 RV is the ratio of the Fstatistic for the measure in question divided by that for the best measure. The full length scalefor each domain was established as the “gold standard” and the “Relative Validity” ratio wasset to 1.0. The comparability of simulated CAT-based estimates in measuring change over timewas examined within a sub-sample of the analytic clinical sample (N=249 for Self-Care; N =200 for Social Function) who had been administered each PEDI scale more than once duringtheir rehabilitation program. Average scores and relative validity coefficients based on F-ratioswere compared. To compare the relative precision of the CAT scores to scores from the fulllength scales we plotted the confidence intervals in relation to the person ability scores. A seriesof paired t-tests was used to examine differences in the amount of time needed for each CAT(internal clock) and full length scale (timing by test administrators) in the cross-validationstudy.
ResultsScore Agreement
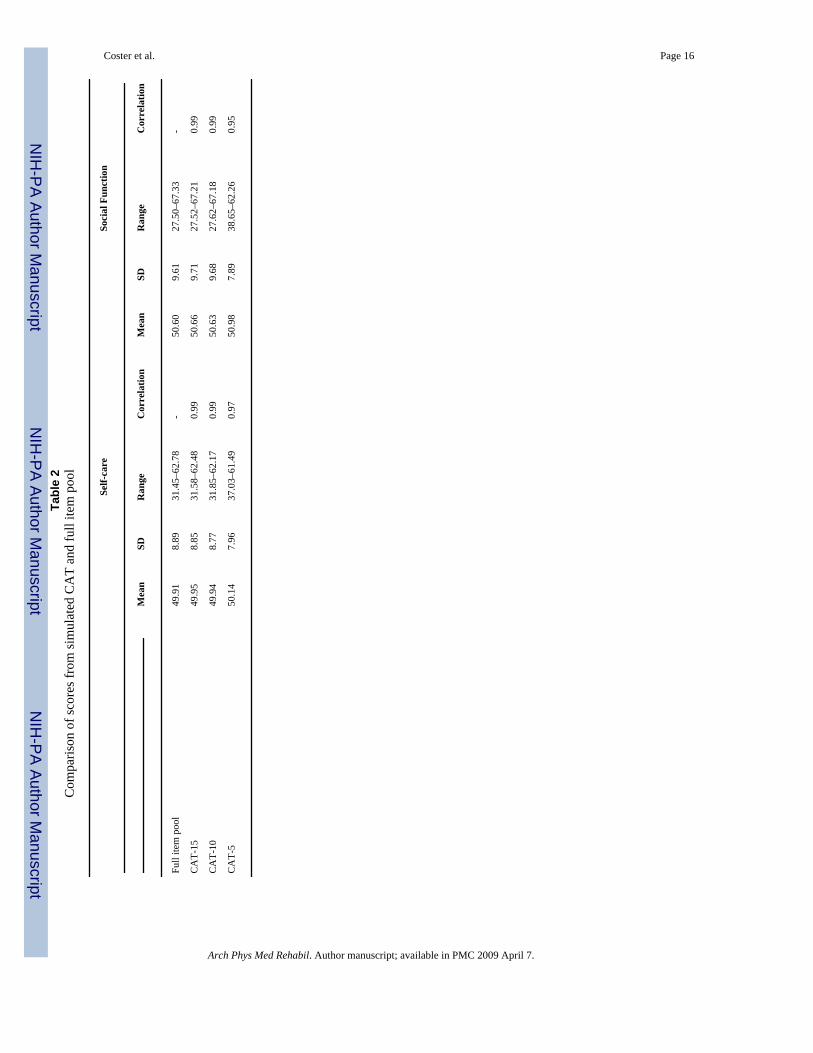
As seen in Table 2, the descriptive statistics for scores from the 10- and 15-item simulationCAT were quite similar to those for the full item pool score for both the Self-Care and SocialFunction domains. The mean score of the 5-item CAT was higher than the full item pool scorewhile the variance and range of the 5-item CAT score were smaller. The Pearson correlationsbetween CAT scores and the full item pool scores were quite strong even in the 5-itemsimulation indicating that the CAT scores accurately captured the information in the originalscales.
Score PrecisionExamination of the standard errors and corresponding confidence intervals of different scoresshowed that the CAT-15 and CAT-10 had a similar pattern however standard errors of CAT-5-item were larger across all ranges. As expected, CAT-15 and CAT-10 standard errors somewhatlarger than those from the full-length version because fewer items were used to calculate theoverall score. These patterns are illustrated in Figure 1. For all methods, the standard errorswere greater at extreme score ranges.
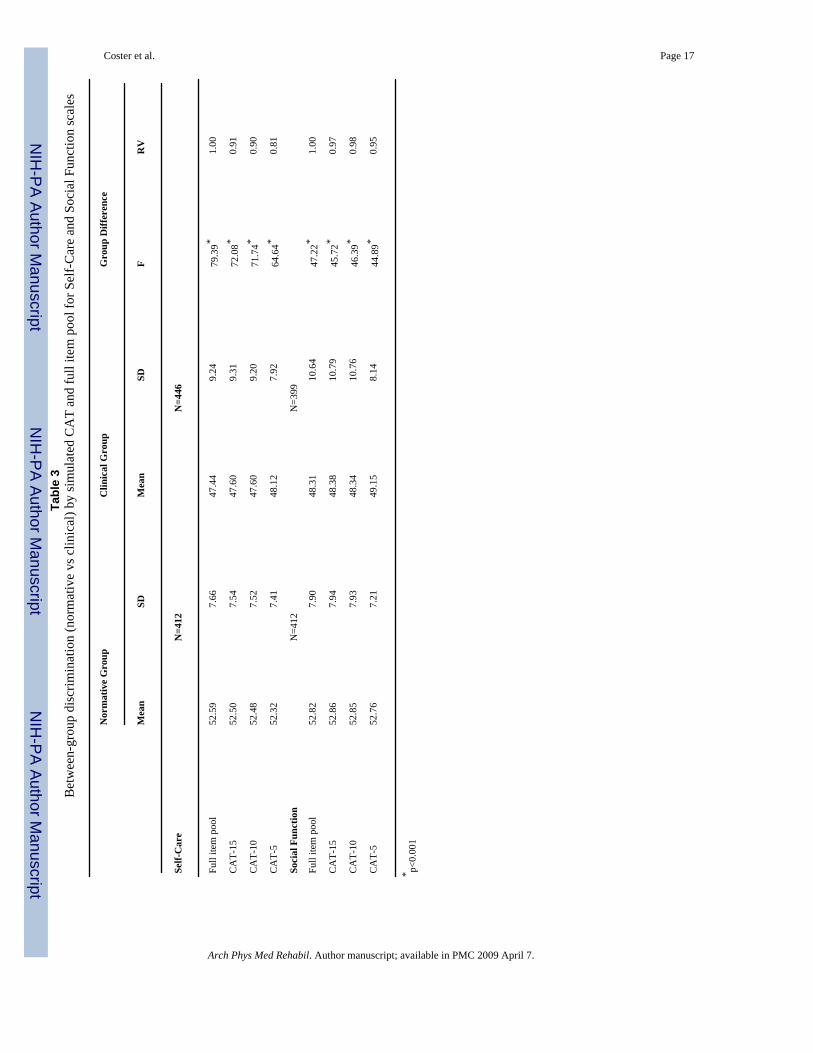
ValidityDiscriminant accuracy of the 15- and 10-item CAT was very similar for both the Self-Care andSocial Function domains, although the relative validity (RV) coefficients for the SocialFunction CATs were much closer to the RV of the full item pool. The coefficient for the 5-item Self-Care CAT simulation was considerably lower than for the 10- and 15-item CATshowever the difference was not as pronounced for the Social Function 5-item CAT. (Table 3).
Table 4 summarizes the results of the responsiveness comparisons. RCI reflects the likelihoodthat the change in score from admission to discharge is due to real change rather chance
Coster et al. Page 7
Arch Phys Med Rehabil. Author manuscript; available in PMC 2009 April 7.
NIH
-PA Author Manuscript
NIH
-PA Author Manuscript
NIH
-PA Author Manuscript

variation. An RCI value greater than 1.96 suggests it is unlikely (p<0.05) the difference fromadmission to discharge is not reflecting real change.45 For both Self-Care and Social Function,only the CAT-15 and full item pools had values that met this criterion. The relative validity(RV) ratios in both domains followed a similar pattern with the 15-item CAT having highestvalues followed relatively closely by CAT-10 and with CAT-5 values the lowest.
Cross–Validation StudyResults from administration of the prototype CATs and previous results from simulation studieswere very similar. With administration of 10 or more items, the results from the CAT werevery close to scores obtained with the full item pool in terms of precision. Correlations betweenprototype CAT scores and scores generated from the total item pool were only very slightlylower than the correlations obtained previously with the simulated CATs. (Table 5).
There were 38 children in the clinical group (mean age 8.7 years, range = 1.23~17.7) and 35typical children (mean age 4.09 years, range = 0.42~7.5) in the sample. A general linear modelthat included age, group (1: clinical group, 0: typical group), and the interaction of age andgroup was used for analysis. Results showed a positive main effect of age indicating scoresincreased with chronological age. However, in the typical group the increase slope was muchsteeper than in the clinical group. There was no main effect of group, but there was a significantby group interaction (i.e. whether age had an effect depended on which group the child wasin). These results may reflect the fact the most of the children in the clinical group were olderso the expected age effect would be much less.
Comparing the response burden of the CAT administration to the paper form (full item pool),81% of respondents said the paper version was more burdensome compared to 3% who foundthe CAT more burdensome. In fact, the average total time to administer both CATs was 3.9minutes, compared to 16.49 minutes to complete both long forms (difference significant at p<.0001). In addition, 84% of respondents answered that the paper version asked more irrelevantquestions than the CAT while only 4% gave the opposite response. An equal percent (37–38%)selected the CAT or the paper version as providing more meaningful information. Finally, 70%answered that they would be more likely to use the CAT in the future, compared to 6% whopreferred the long paper form and 23% who said they would be equally likely to use either.
DiscussionThe results of our analyses indicate that CAT models built from the PEDI self-care and socialfunction item pools can provide accurate and valid estimates of children’s functionalcapabilities while substantially reducing administrative burden compared to the full-lengthinstruments. These results are consistent with previous research with CAT models forfunctional mobility10 and confirm that effective and efficient models can be developed forother domains of function important to children and families. Results from the field study werehighly similar to those from the simulation studies in spite of the smaller number of participantsin the cross-validation sample. These findings suggest that simulations may provide very goodapproximations of actual CAT administration.
Most disabling conditions in children affect self-care skill acquisition or performance and/orsocial development. There are also a number of significant clinical disorders that may affectthese functional domains almost exclusively, such as autism spectrum disorders, emotionaldisorders, and intellectual disabilities, and others such as traumatic brain injury that may havesignificant impact across all three of the areas examined by the PEDI. Thus, it is important thatmeasures developed to document outcomes of rehabilitation services examine content in eachof these areas in order to provide an accurate and comprehensive picture of function anddisability. The results from the present study are encouraging in that they demonstrate that the
Coster et al. Page 8
Arch Phys Med Rehabil. Author manuscript; available in PMC 2009 April 7.
NIH
-PA Author Manuscript
NIH
-PA Author Manuscript
NIH
-PA Author Manuscript

goal of comprehensive coverage may be achievable without loss of precision or excessiveadministrative burden. Although further research is clearly needed, the results suggest that thePEDI-CAT offers the possibility of an outcome measure that could be usefully applied acrossdiverse populations of children with disabilities.
As was found previously for the mobility CAT, the present results suggest that very littlesensitivity to change or ability to discriminate across known groups is lost as long as the CATprogram has between 10 and 15 items. However, the 5-item CATS were notably less accurateand sensitive and therefore would not be recommended for most purposes. In a CAT modelusing a stopping rule based on a desired level of score precision, it is quite possible that thescores of some individuals might be estimated with fewer than 10 items. One of the advantagesof CAT is that it allows users to specify the level of score precision necessary for their currentpurpose. Thus, in individual assessment, where high precision is desirable, a 15-item stoppingrule or a criterion reflecting a smaller degree of measurement error could be applied. On theother hand, for large scale studies where efficiency of administration is essential and lessprecision is required, even the 5-item CAT may be acceptable.
It is noteworthy that even the 15-item CAT substantially reduced the administration timerequired to complete both scales to an average of 4 minutes (combined). In contrast, completionof the entire PEDI questionnaire through parent interview typically takes between 30 and 45minutes. The brief administration time of the CAT makes it far more feasible to conduct regularassessment of a child’s functional status and may support alternative methods foradministration such as telephone follow-up interviews that are not practical with the longersurvey format. Parent respondents may also respond more positively to the assessment in theCAT format because they are asked fewer questions that are clearly irrelevant for their child.
The present analyses also identified a number of areas where further revision of the item poolswould be appropriate. There were a substantial number of item pairs in the Social Functionpool that did not meet the criterion for local independence as well as a smaller number in theSelf-Care pool. This finding likely reflects the hierarchical organization of the 5-item setswithin each original scale and suggests that some of these items should be dropped or re-wordedto capture more distinct aspects of function in their respective areas. Further exploration shouldalso be undertaken to understand the possible reasons for differential item function (DIF) bygroup in 16 of the Social Function items so that this problem can be addressed either byrewriting or dropping the items. Although such revisions would likely improve performanceof the PEDI-CAT, our results suggest that the CAT is robust even when some items that violatescaling assumptions are retained. More direct investigation of the impact of various violationsof Rasch and IRT assumptions on the performance of CAT algorithms would be extremelyuseful to guide future measurement efforts.
In a previous study with the mobility CAT,10 clinician respondents reported that they oftenused the context of completing the full-length PEDI in a parent interview to establish rapportand initiate discussion with families around the needs of their child. In the present study, whenasked which version they found most informative, approximately equal percentages selectedthe CAT and the full-length version. These findings suggest that factors other than the timerequired for administration may be important determinants of clinicians’ acceptance and useof assessments. These factors need to be considered carefully in future CAT work so that theCAT interface, interpretative supports, and reports are optimally designed to meet the needsclinicians and families seeking information about a child’s functioning for various purposes.
Coster et al. Page 9
Arch Phys Med Rehabil. Author manuscript; available in PMC 2009 April 7.
NIH
-PA Author Manuscript
NIH
-PA Author Manuscript
NIH
-PA Author Manuscript
ConclusionsThe results of the present study confirm that computerized adaptive testing methods can beapplied successfully in two important domains of children’s functioning that have not beenexamined previously. Although the content of the self-care and social function item pools wassubstantially different from the previously examined mobility domain, the results of thesimulation and cross-validation studies were very similar. Thus, application of CATmethodology can substantially reduce the time required for administration without significantloss of precision or sensitivity to change. Although further work is recommended to refine theitem pools in these two domains, the results suggest that the CAT approach offers a valid andviable solution to the long-standing conflict between the need for accuracy in clinicalassessment and the equal need for practicality of administration.
AcknowledgementsSupported by the National Center on Medical Rehabilitation Research /NICHD/NIH (grant nos. R43 HD42388-01,K02 HD45354-01A1).
References1. Msall M. Tools for measuring daily activities in children: promoting independence and developing a
laguage for child disability. Pediatr 2002:317–319.2. Lollar D, Simeonsson R, Nanda U. Measures of outcome in children and youth. Arch Phys Med Rehabil
2000;81:S46–S51. [PubMed: 11128903]3. Butler C. Outcomes that matter [editorial]. Dev Med Child Neurol 1995;37:753–754. [PubMed:
7589857]4. Nordmark E, Jamlo GG, Hagglund G. Comparison of the Gross Motor Function Measure and Paediatric
Evaluation of Disability Inventory in assessing motor function in children undergoing selective dorsalrhizotomy. Dev Med Child Neurol 2000;42:245–252. [PubMed: 10795563]
5. Hays R, Morales L, Reise S. Item response theory and health outcomes measurement in the 21st century.Med Care 2000;38:II-28–II-42. [PubMed: 10982088]
6. Ware J, Bjorner J, Kosinski M. Practical implications of item response theory and computerizedadaptive testing. Med Care 2000;38:II 73–II 82.
7. Wainer, H.; Dorans, N.; Flaugher, R., et al. Computerized adaptive testing: A primer. Vol. 2nd ed..Mahwah, NJ: Erlbaum; 2000.
8. Revicki DA, Cella DF. Health status assessment for the twenty-first century: item response theory,item banking and computer adaptive testing. Qual Life Res 1997;6:595–600. [PubMed: 9330558]
9. Dijkers M. A computer adaptive testing simulation applied to the FIM instrument motor component.Arch Phys Med Rehabil 2003;84:384–393. [PubMed: 12638107]
10. Haley SM, Raczek AE, Coster WJ, Dumas HM, Fragala-Pinkham MA. Assessing mobility in childrenusing a computer adaptive testing version of the Pediatric Evaluation of Disability Inventory. ArchPhys Med Rehabil 2005;86:932–939. [PubMed: 15895339]
11. Haley, SM.; Coster, WJ.; Ludlow, LH., et al. Development, Standardization and AdministrationManual. Boston, MA: Trustees of Boston University; 1992. Pediatric Evaluation of DisabilityInventory.
12. Embretson, SE.; Reise, SP. Item response theory for psychologists. Mahwah, NJ: Laurence Erlbaum;2000.
13. Wright FV, Boschen KA. The Pediatric Evaluation of Disability Inventory (PEDI): validation of anew functional assessment outcome instrument. Can J Rehabil 1993;7:41–42.
14. Nichols DS, Case-Smith J. Reliability and validity of the Pediatric Evaluation of Disability Inventory.Pediatr Phys Ther 1996;8:15–24.
15. Feldman AB, Haley SM, Coryell J. Concurrent and construct validity of the Pediatric Evaluation ofDisabiliity Inventory. Phys Ther 1990;70:602–610. [PubMed: 2217539]
Coster et al. Page 10
Arch Phys Med Rehabil. Author manuscript; available in PMC 2009 April 7.
NIH
-PA Author Manuscript
NIH
-PA Author Manuscript
NIH
-PA Author Manuscript
16. Fragala MA, Haley SM, Dumas HM, Rabin JP. Classifying mobility recovery in children and youthwith brain injury during hospital-based rehabilitation. Brain Inj 2002;16:149–160. [PubMed:11839109]
17. Dumas HM, Haley SM, Ludlow LH, Rabin JP. Functional recovery in pediatric brain injury duringinpatient rehabilitation. Am J Phys Med Rehabil 2002;81:661–669. [PubMed: 12172518]
18. Ostensjo S, Strinnholm M, Carlsson M, Dahl M. Everyday functioning in young children with cerebralpalsy: functional skills, caregiver assistance, and modifications of the environment. Develop MedChild Neurol 2003;45:603–612. [PubMed: 12948327]
19. Ketelaar M, Vermeer A, Hart H, van Petegem-van Beek E, Helders PJ. Effects of a functional therapyprogram on motor abilities of children with cerebral palsy. Phys Ther 2001;81:1534–1545. [PubMed:11688590]
20. Norrlin S, Strinnholm M, Carlsson M, Dahl M. Factors of signifance for mobility in children withmyelomeningocele. Acta Paediatr 2003;92:204–210. [PubMed: 12710647]
21. Tsai P, Yang T, Chan R, et al. Functional investigation in children with spina bifida-measured by thePediatric Evaluation of Disability Inventory (PEDI). Child's Nerv Syst 2002;18:48–53. [PubMed:11935244]
22. Engelbert RHH, Custers JWH, van der Net J, et al. Functional outcome in osteogenesis imperfecta:Disability profiles using the PEDI. Pediatr Phys Ther 1997;9:18–22.
23. Haley SM, Dumas HM, Ludlow LH. Mobility outcomes of children and adolescents in an inpatientrehabilitation program: Variation by diagnostic and practice pattern groups. Phys Ther2001;81:1425–1436. [PubMed: 11509072]
24. Kothari DH, Haley SM, Gill-Body KM, Dumas HM. Measuring functional change in children withacquired brain injury: Comparison of normative and disease-specific scoring models using thePediatric Evaluation of Disability Inventory (PEDI). Phys Ther 2003;83:776–785. [PubMed:12940765]
25. Dumas H, Haley S, Rabin J. Short term durability and improvement of function in traumatic braininjury: a pilot study using the Pediatric Evaluaton of Disability Inventory (PEDI) classification levels.Brain Inj 2001;15:891–902. [PubMed: 11595085]
26. Dumas HM, Haley SM, Bedell GM, Hull EM. Social function changes in children and adolescentswith acquired brain injury during inpatient rehabilitation. Ped Rehab 2001;4:177–185.
27. Dumas HM, Haley SM, Fragala MA, Steva BJ. Self-care recovery of children with brain injury:descriptive analysis using the Pediatric Evaluation of Disability Inventory (PEDI) functionalclassification levels. Phys Occup Ther Ped 2001;21:17–27.
28. Iyer LV, Haley SM, Watkins MP, Dumas HM. Establishing minimal clinically important differencesfor scores on the Pediatric Evaluation of Disability Inventory for inpatient rehabilitation. Phys Ther2003;83:888–898. [PubMed: 14519060]
29. Ludlow L, Haley S. New directions in pediatric rehabilitation measurement: The growing challenge.J Outcome Meas 2000;4:482–490. [PubMed: 11272597]
30. Ludlow L, Haley S. Effect of context in rating of mobility activities in children with disabilities: Anassessment using the Pediatric Evaluation of Disability Inventory. Educ Psychol Meas 1996;56:122–129.
31. Haley SM, Ludlow LH, Coster WJ. Pediatric Evaluation of Disability Inventory: Clinicalinterpretation of summary scores using Rasch rating scale methodology. Phys Med Rehabil Clin NAm 1993;4:529–540.
32. Hambleton, RK.; Swaminathan, H.; Rogers, HJ. Fundamentals of item response theory. NewburyPark, California: Sage Publications; 1991.
33. Van der Linden, W.; Hambleton, R. Handbook of modern item response theory. Berlin: Springer;1997.
34. Mislevy RJ. Recent developments in the factor analysis of categorical variables. J Educ Stat1986;11:3–31.
35. Muthen, B.; Muthen, L. Mplus user's guide. Los Angeles: Muthen & Muthen; 1998.36. Beauducel A, Herzberg PY. On the performance of maximum likelihood versus means and variance
adjusted weighted least squares estimation in CFA. Struct Equat Model 2006;13(2):186–203.
Coster et al. Page 11
Arch Phys Med Rehabil. Author manuscript; available in PMC 2009 April 7.
NIH
-PA Author Manuscript
NIH
-PA Author Manuscript
NIH
-PA Author Manuscript
37. Tjur T. A connection between Rasch's item analysis model and a multiplicative Poisson model. ScandJ Stat 1982;9:23–30.
38. Fischer, G.; Molenaar, I. Rasch models: Foundations, recent developments, and applications. Berlin:Springer-Verlag; 1995.
39. Andrich, D. Rasch models for measurement. Beverly Hills, CA: Sage Publications; 1998.40. Masters GN. A Rasch model for partial credit scoring. Psychometrika 1982;47:149–174.41. Wu, ML.; Adams, RJ. ConQuest (computer software and manual). Melbourne, Australia: Australian
Council for Educational Research; 1998.42. Warm TA. Weighted likelihood estimation of ability in item response theory. Psychometrika
1989;54:427–450.43. Hariharan S, Rogers HJ. Detecting differential item functioning using logistic regression procedures.
J Educ Meas 1990;27:361–370.44. McHorney CA, Ware JE, Lu JF, Sherbourne CD. The MOS 36-item short-form health survey (SF-36):
III. Tests of data quality, scaling assumptions and reliability across diverse patient groups. Med Care1994;32:40–66. [PubMed: 8277801]
45. Jacobson NS, Truax P. Clinical significance: A statistical approach to defining meaningful changein psychotherapy research. J Consul Clin Psychol 1991;59(1):12–19.
Coster et al. Page 12
Arch Phys Med Rehabil. Author manuscript; available in PMC 2009 April 7.
NIH
-PA Author Manuscript
NIH
-PA Author Manuscript
NIH
-PA Author Manuscript
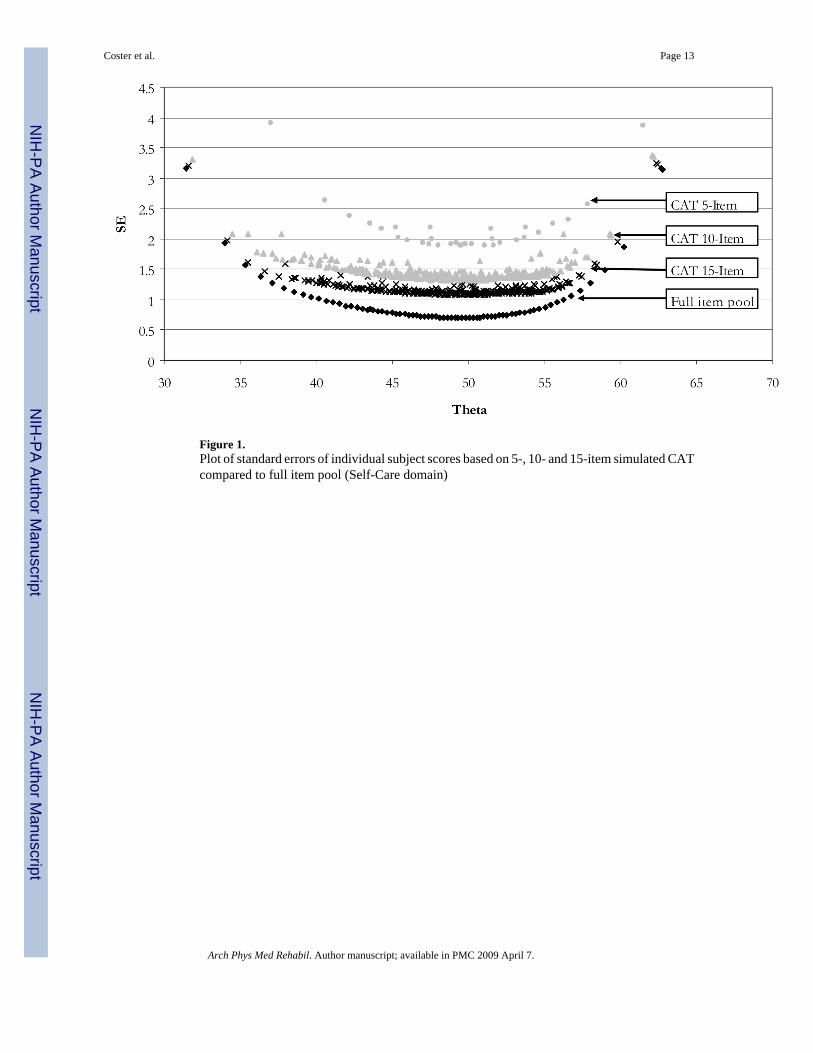
Figure 1.Plot of standard errors of individual subject scores based on 5-, 10- and 15-item simulated CATcompared to full item pool (Self-Care domain)
Coster et al. Page 13
Arch Phys Med Rehabil. Author manuscript; available in PMC 2009 April 7.
NIH
-PA Author Manuscript
NIH
-PA Author Manuscript
NIH
-PA Author Manuscript
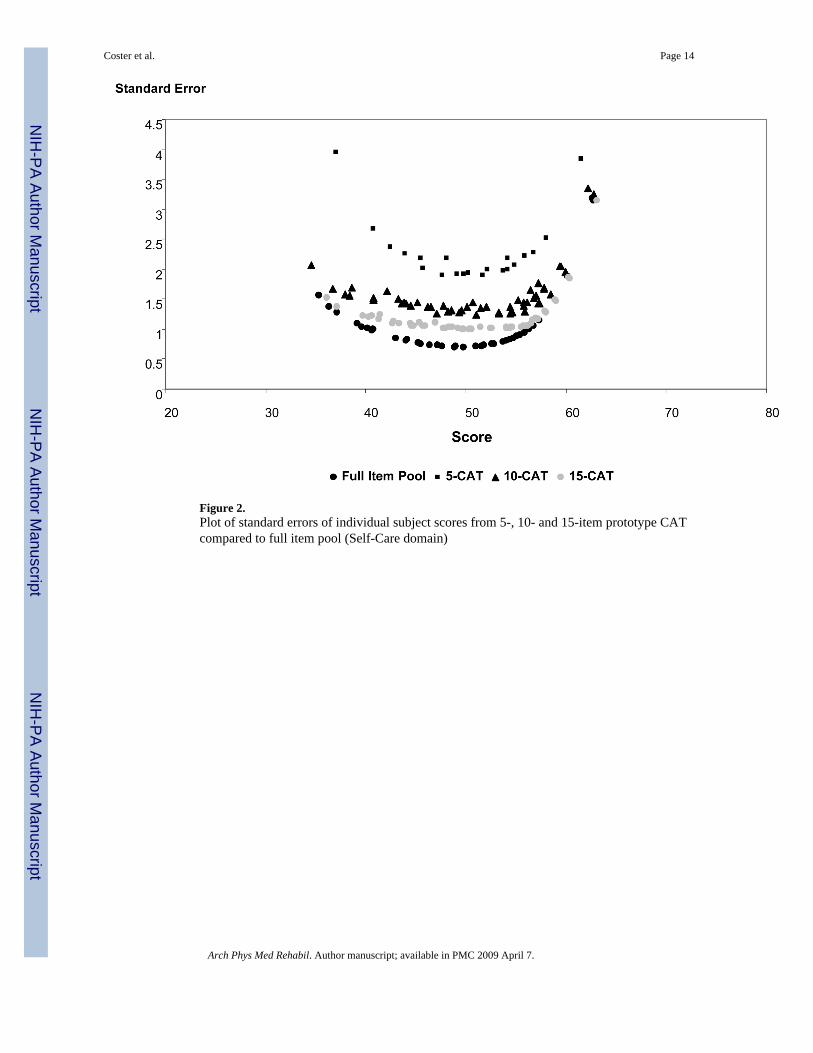
Figure 2.Plot of standard errors of individual subject scores from 5-, 10- and 15-item prototype CATcompared to full item pool (Self-Care domain)
Coster et al. Page 14
Arch Phys Med Rehabil. Author manuscript; available in PMC 2009 April 7.
NIH
-PA Author Manuscript
NIH
-PA Author Manuscript
NIH
-PA Author Manuscript

NIH
-PA Author Manuscript
NIH
-PA Author Manuscript
NIH
-PA Author Manuscript
Coster et al. Page 15
Table 1Demographic characteristics of samples
Analytic Sample Cross-validation Sample
Age Range 6 mos. – 17 yrs. 6 mos. – 18 yrs.
% Female 45.2 49.3
% Hispanic or Latino 9.3 5.5
% Asian 1.5 5.5
% Other 5.8 4.1
% Black or African American 14.6 2.7
% White 68.8 82.2
Total Sample Size 881 73
Arch Phys Med Rehabil. Author manuscript; available in PMC 2009 April 7.
NIH
-PA Author Manuscript
NIH
-PA Author Manuscript
NIH
-PA Author Manuscript
Coster et al. Page 16Ta
ble
2C
ompa
rison
of s
core
s fro
m si
mul
ated
CA
T an
d fu
ll ite
m p
ool
Sel
f-car
eSo
cial
Fun
ctio
n
Mea
nSD
Ran
geC
orre
latio
nM
ean
SDR
ange
Cor
rela
tion
Full
item
poo
l49
.91
8.89
31.4
5–62
.78
-50
.60
9.61
27.5
0–67
.33
-
CA
T-15
49.9
58.
8531
.58–
62.4
80.
9950
.66
9.71
27.5
2–67
.21
0.99
CA
T-10
49.9
48.
7731
.85–
62.1
70.
9950
.63
9.68
27.6
2–67
.18
0.99
CA
T-5
50.1
47.
9637
.03–
61.4
90.
9750
.98
7.89
38.6
5–62
.26
0.95
Arch Phys Med Rehabil. Author manuscript; available in PMC 2009 April 7.
NIH
-PA Author Manuscript
NIH
-PA Author Manuscript
NIH
-PA Author Manuscript
Coster et al. Page 17Ta
ble
3B
etw
een-
grou
p di
scrim
inat
ion
(nor
mat
ive
vs c
linic
al) b
y si
mul
ated
CA
T an
d fu
ll ite
m p
ool f
or S
elf-
Car
e an
d So
cial
Fun
ctio
n sc
ales
Nor
mat
ive
Gro
upC
linic
al G
roup
Gro
up D
iffer
ence
Mea
nSD
Mea
nSD
FR
V
Self-
Car
eN
=412
N=4
46
Full
item
poo
l52
.59
7.66
47.4
49.
2479
.39*
1.00
CA
T-15
52.5
07.
5447
.60
9.31
72.0
8*0.
91
CA
T-10
52.4
87.
5247
.60
9.20
71.7
4*0.
90
CA
T-5
52.3
27.
4148
.12
7.92
64.6
4*0.
81
Soci
al F
unct
ion
N=4
12N
=399
Full
item
poo
l52
.82
7.90
48.3
110
.64
47.2
2*1.
00
CA
T-15
52.8
67.
9448
.38
10.7
945
.72*
0.97
CA
T-10
52.8
57.
9348
.34
10.7
646
.39*
0.98
CA
T-5
52.7
67.
2149
.15
8.14
44.8
9*0.
95
* p<0.
001
Arch Phys Med Rehabil. Author manuscript; available in PMC 2009 April 7.

NIH
-PA Author Manuscript
NIH
-PA Author Manuscript
NIH
-PA Author Manuscript
Coster et al. Page 18Ta
ble
4Se
nsiti
vity
to c
hang
e of
sim
ulat
ed C
AT
and
full
item
poo
ls fo
r Sel
f-C
are
and
Soci
al F
unct
ion
dom
ains
.
Vis
it 1
Vis
it 2
Cha
nge
RC
I
Mea
nSD
Mea
nSD
Mea
nSD
Mea
nSD
FR
V
Self-
Car
e
(N=2
49)
Full
item
poo
l46
.13
10.3
651
.85
10.4
15.
737.
472.
592.
9214
6.41
*1
CA
T-15
46.3
910
.53
51.9
710
.40
5.57
7.51
2.10
2.52
137.
12*
0.94
CA
T-10
46.3
810
.34
51.9
110
.39
5.54
7.54
1.80
2.22
134.
10*
0.92
CA
T-5
47.2
78.
6652
.07
9.27
4.81
6.67
1.17
1.48
129.
28*
0.88
Soci
al F
unct
ion
(N=2
00)
Full
item
poo
l46
.81
12.5
851
.56
11.4
34.
757.
212.
473.
2786
.68*
1.00
CA
T-15
46.9
312
.83
51.8
311
.62
4.90
7.55
2.13
2.96
84.2
7*0.
97
CA
T-10
46.9
112
.80
51.6
811
.73
4.78
7.51
1.77
2.52
81.0
0*0.
93
CA
T-5
48.3
09.
0951
.62
8.67
3.32
5.58
0.85
1.33
70.9
0*0.
82
* :<0.
001
Arch Phys Med Rehabil. Author manuscript; available in PMC 2009 April 7.

NIH
-PA Author Manuscript
NIH
-PA Author Manuscript
NIH
-PA Author Manuscript
Coster et al. Page 19Ta
ble
5C
ompa
rison
of s
core
s fro
m p
roto
type
CA
T an
d fu
ll ite
m p
ool
Sel
f-car
eSo
cial
Fun
ctio
n
Mea
nSD
Ran
geC
orre
latio
nM
ean
SDR
ange
Cor
rela
tion
Full
item
poo
l52
.32
7.61
35.3
3–62
.79
-55
.55
8.86
34.9
9–67
.23
-
Act
ual C
AT-
1552
.45
7.52
35.5
6–62
.49
0.99
55.5
99.
3133
.78–
67.2
10.
98
Act
ual C
AT-
1052
.39
7.79
34.5
3–62
.19
0.98
55.5
39.
4033
.78–
67.1
80.
98
Act
ual C
AT-
551
.83
7.79
37.0
8–61
.52
0.95
54.7
38.
1837
.88–
62.1
80.
94
Arch Phys Med Rehabil. Author manuscript; available in PMC 2009 April 7.