articles of merit award on paib 2015 - mia
TRANSCRIPT

MALAYSIAN INSTITUTE OF ACCOUNTANTS
ARTICLES OF MERIT AWARD ON PAIB 2015

PUBLICATION INFORMATION
PUBLISHED BY
Malaysian Institute of Accountants
Dewan Akauntan
Unit 33-01, Level 33
Tower A, The Vertical
Avenue 3, Bangsar South City
No. 8, Jalan Kerinchi
59200 Kuala Lumpur, Malaysia
December 2016
Copyright © December 2016 by the Malaysian Institute of Accountants (MIA). All rights reserved.
The Malaysian Institute of Accountants’ logo appearing on/in this publication is a registered trademark of
MIA. No part of this publication either in whole or in part may be copied, reproduced, recorded,
distributed, republished, downloaded, displayed, posted, stored or transmitted in any form (tangible or
intangible) or by any means, including but not limited to electronic, mechanical, photocopying, scanning
or audio/video recording, information storage or retrieval system for any purpose whatsoever without prior
express written permission of MIA. Such request can be emailed to the Strategic Communication
Department at: [email protected]
Permission is however granted to any person to make copies of this publication provided that such copies
are strictly for personal use or fair use in the academic classrooms. Such copies shall not be sold or
disseminated and each copy shall bear the following credit line – “Used with the permission of the
Malaysian Institute of Accountants”.
Any unauthorised use of this publication and/or any creation of a derivative work therefrom in any form or
by any means is strictly prohibited and may violate the relevant intellectual property laws. In the event of
any violation or infringement of MIA’s copyright and/or logo, MIA will not hesitate to take legal action
for such violation and/or infringement.

DISCLAIMER
This publication contains general information only and MIA shall not, by means of this publication be
construed as rendering any professional advice in relation to any matter contained in this publication. This
document shall not be used as a basis for any decision or action that may or may not affect your business.
Before making any decision or taking any action that may or may not affect your business, you are
advised to consult an independent professional advisor.
Whilst every reasonable care has been taken in preparing/compiling this document, MIA makes no
representations or warranties of whatsoever nature (either expressly or impliedly) in respect of this
publication including but not limited to the accuracy, suitability, reliability or completeness of the
information contained in this publication.
Please take notice that under no circumstances will MIA, its Council members, directors and employees
be liable to any person or business entity for any direct or indirect losses, costs or damages howsoever
arising including due to the use of and reliance of any information contained in this publication.

FOREWORD BY CHAIRMAN OF THE
PROFESSIONAL ACCOUNTANTS IN BUSINESS
COMMITTEE
Datuk Mohd Nasir Ahmad
The Malaysian Institute of Accountants (MIA) is pleased to showcase The MIA Articles of Merit
Award on Professional Accountants in Business (PAIB) 2015 e-book.
This e-book is published in an effort to recognise authors for their articles that are judged to
make a valuable contribution to the development of the roles and domain of the professional
accountants in business (PAIB). These articles give different perspective on subjects that relate to
the PAIB and, the business environment they work in.
The Institute has been organising this Award since 2008 with the objective of recognising authors
for their exceptional articles. The winning articles provide insights on the current developments
and emerging issues that shape the accountancy profession. The articles also help to promote
global best practices for the enhancement of the accountancy profession.
A majority of the MIA members are made up of professional accountants in business. Therefore,
it is important for the Institute to continuously engage with its members and gear them towards
enhancing their knowledge and skills. The MIA Articles of Merit Award on PAIB is one such
initiative for the Institute to engage with the PAIBs.
There are ten articles in this e-book, and I trust that the diverse mix of articles presented will be a
worthwhile read for all the different segments of PAIB. I do hope that these articles would
motivate fellow PAIB and, that they would be encouraged to consider applying such strategies or
techniques in their respective organisations.
Finally I would like to congratulate the winners of the MIA Articles of Merit Award on PAIB
2015. The Institute appreciates the effort of all the authors who participated in the Award in
producing articles that contribute to the continuing professional development of the accountancy
fraternity and hope that you will continue to support the profession.
Thank you.
ACKNOWLEDGEMENTS
We wish to record our appreciation to the parties that have made this Award and the publication
of the e-book possible namely the Panel of Judges and the Review Team of the Professional
Accountants in Business Committee.
We also wish to thank the PAIB Committee members for their guidance and the MIA PAIB
Committee Secretariat of the Professional Practices and Technical (PPT) Division for their hard
work in this Award.
To the authors who participated and contributed their time and effort in submitting their articles,
we thank you.
Panel of Judges
Brian Wong Wye Pong
Professor Dr. Che Ruhana Isa@Mohamed Isa
Professor Dr. Rozainun Haji Abdul Aziz
Dr. Veerinderjeet Singh
Wong Chin Aik
Yeo Tek Ling
PAIB Committee Review Team
Associate Professor Dr. A. Thillaisundaram (Chairperson)
Dr. Ng Boon Beng
Shamini Kandasamy
NOTE: Members of the PAIB Committee or Panel of Judges are not restricted from participating
in this Award. However, if they are part of the review team they are excluded from assessing
their articles and will not be given access to the markings of their articles.

CONTENTS
Consolation Prize ARE WOMEN CHIEF FINANCIAL OFFICERS MORE RISK
AVERSE WHEN MAKING FINANCIAL DECISIONS?
Abstract 2
1. Introduction 2
2. Hypotheses Development 3
2.1 CFO Risk Taking Behaviour and Gender Difference 3
2.2 CFO Risk Taking Behaviour and Personal Shareholdings 5
2.3 CFO Risk Taking Behaviour and CEO Gender 6
3. Data and Methodology 7
3.1 Data Selection 7
3.2 Panel Regression Model 7
4. Results and Discussion 9
4.1 Descriptive Statistics 9
4.2 Firm-Country Panel Regression Estimates 10
4.3 Further Issues on Female CFO and Current Ratio: 11
The Gender of CEO
5. Summary and Conclusions 13
6. References 15
7. Authors 16
Consolation Prize AWARENESS AND KNOWLEDGE OF GOODS & SERVICES
TAX (GST) AMONG SMALL AND MEDIUM ENTERPRISES
(SMES): EVIDENCE FROM MALAYSIA
Abstract 19
1. Introduction 19
2. Literature Review 21
2.1 Some background on GST 21
2.2 Differences between SST and GST 22
2.3 Arguments For and Against GST 23
2.4 Studies on GST in Malaysia 24

3. Research Method 25
4. Findings and Discussion 26
4.1 Respondents’ Characteristics 26
4.2 Awareness and Knowledge of GST among SMEs 27
5. Conclusion 31
6. References 34
7. Authors 37
Consolation Prize CARBON DISCLOSURE AMONG ELECTRICITY GENERATING
COMPANIES IN MALAYSIA: A LONGITUDINAL ANALYSIS
Abstract 40
1. Introduction 40
2. Literature Review 43
2.1 Institutional Background 43
2.2 Prior Literature on Carbon Disclosure 44
2.3 Social Issue Life Cycle Theory 45
3. Research Methods 46
3.1 Sample Selection 46
3.2 Data Collection 47
3.2.1 Carbon Disclosure 47
4. Findings and Analysis 49
4.1 Level of Carbon Disclosure 50
4.2 Social Issue Life Cycle Theory 50
5. Conclusion 52
6. References 54
7. Authors 59

Consolation Prize CORPORATE SOCIAL RESPONSIBILITY DISCLOSURE AND
FINANCIAL PERFORMANCE: EVIDENCE FROM LISTED
MANUFACTURING FIRMS
Abstract 61
1. Introduction 61
2. Literature Review 63
2.1 Empirical Studies of CSR and Firm Performance 64
3. Data and Method 65
3.1 Data Sample 67
3.2 Dimensions of CSR 67
3.3 Short and Long Run Firm Financial Performance 68
3.4 Control Variables 68
4. Research Framework and Hypothesis 70
5. Analyses and Discussions 73
5.1 Correlation Coefficient 76
5.2 Regression Analysis 78
6. Conclusion 83
7. References 84
8. Authors 89
Consolation Prize EDUCATING TOMORROW’S ACCOUNTANTS TODAY:
STRENGTHENING THE ACCOUNTING PROFESSION WITH
AN INTEGRATED TEACHING APPROACH THROUGH A CEO
FACULTY PROGRAMME
Abstract 91
1. Introduction 92
2. Literature Review 93
2.1 Integrating Practical Application 94
2.2 ‘Who’ rather than ‘How’ 95

3. Qualitative Methodology 96
3.1 Qualitative Characteristics 96
3.2 Data Collection Method 97
4. Results and Findings 98
4.1 Theme 1: Meaning 98
4.2 Theme 2: Motivating Factors 99
4.3 Theme 3: Structure and Process 100
4.4 Theme 4: People 100
4.5 Theme 5: Applying the Triple Helix Model 101
4.6 Theme 6: Benefits 102
4.7 Theme 7: Challenges 104
4.8 Theme 8: Impact on the Accounting Profession 105
5. Discussion 106
5.1 Developing a Dynamic and Relevant 106
Accounting Curriculum
5.2 Advocating the Triple Helix in 106
Educating Accountants
5.3 Implications for the Accounting Profession 107
6. Recommendations 108
Recommendation 1: The Organisation of The 108
Programme is The Key to Success
Recommendation 2: The Government Should Play 108
A Mediating Role to Ensure the Success of
Academic-Industry Collaboration
Recommendation 3: Trial Run Before Full 109
Implementation
Recommendation 4: Readiness of Universities 109
for Collaboration
7. Conclusion 109
8. References 110
9. Authors 112

Consolation Prize EXPERTS’ PERCEPTIONS ON RELEVANT TAX INCENTIVES
FOR THE DEVELOPMENT OF MARGINAL OIL FIELDS IN
MALAYSIA
Abstract 114
1. Introduction 114
2. Literature Review 115
2.1 Definitions of Tax Incentives 115
2.2 Types of Tax Incentives 116
3. Methodology 119
3.1 Population 119
3.2 Demographic Profile 119
3.3 Instrumentation 119
3.4 Analytical Procedures 120
4. Results and Discussions 120
4.1 Descriptive Statistics 120
4.1.1 Highly Relevant Tax Incentives 121
4.1.2 Moderately Relevant Tax Incentives 122
4.2 One-Way ANOVA 122
4.2.1 One-Way ANOVA for the Three Clusters 124
of Respondents – Highly Relevant
Tax Incentives
4.2.2 One-Way ANOVA for the Three Clusters 125
of Respondents – Moderately Relevant
Tax Incentives
4.3 Summary of Findings 125
5. Conclusion and Policy Implication 126
6. References 127
7. Authors 129
Consolation Prize INFORMATION SECURITY: PLUGGING THE LEAKS
Abstract 131
1. Introduction 132
2. Views From the Experts 133
2.1 Threats of Social Engineering 133
2.2 Information is a Critical Asset 134

3. Statistical Evidences 135
4. Critical IS Behaviours 137
4.1 Data Protection 137
4.2 Password Security 138
4.3 Management of Mobile Devices 138
4.4 Influences of IS behaviours 139
5. The Outcomes 140
5.1 How Do We Increase Conformance to Good 140
Information Security Behaviours?
5.2 Practical Steps to Enhancing Information Security 141
Step 1: Identify information assets in the organization 141
Step 2: Identify who has access to that information 142
and its source
Step 3: Implement policies and procedures that can 142
protect the assets
Step 4: Create and IS culture 143
6. Conclusion 143
7. References 144
8. Authors 145
Consolation Prize JOB STRESS AND AGGRESSIVENESS IN JUDGEMENT:
SURVEY EVIDENCE FROM MALAYSIAN TAX AUDITORS
Abstract 147
A. Motivation For the Study and Research Objectives 147
B. Research Methodology 147
C. Main Findings and Conclusion 148
1. Introduction 148
2. Research Objectives 150
3. Tax Audit of SMCs: Practical Challenges as Tax Auditor 151
4. Research Methodology 153

5. Data Analysis and Findings 153
5.1 Tax Auditors’ Experiences and Challenges When 154
Conducting Tax Audit of SMCs.
5.2 Tax Auditors and Job Stress in Tax Audit of SMCs 160
5.3 Tax Auditors’ Aggressiveness in Judgement When 161
Auditing SMCs
6. Conclusion 162
7. References 164
8. Authors 168
Consolation Prize TAX COMPLIANCE BEHAVIOUR OF TAX PROFESSIONALS IN
MALAYSIA
Abstract 171
1. Introduction 171
2. Literature Review 173
2.1 Definition of Tax Compliance 173
2.2 Attitude and Tax Compliance 173
2.3 The Influence of Important Referent Others in 174
Complying with the Tax Laws
2.4 Perceived Behavioural Control and Tax Compliance 174
3. Methodology 175
4. Findings and Discussions 178
4.1 Tax Compliance Behaviour 178
4.2 Attitudes Towards Tax Compliance 179
4.3 Important Referent Others and Tax Compliance 181
4.4 Perceived Behavioural Control and Tax Compliance 182
5. Conclusions 183
6. References 186
7. Author 189
Consolation Prize TAX REGIME CHANGES AND INVESTORS’ ACCESS TO
GROSS REVENUE FOR MARGINAL OIL FIELDS IN
MALAYSIA: A SIMULATION STUDY
Abstract 191
1. Introduction 192
2. Literature Review 193
2.1 Petroleum Fiscal Regimes and Investment Climate 193
2.2 Tax Regimes Changes and Investors’ Access 195
To Gross Revenue
2.3 Petroleum Fiscal Regimes in Malaysia 195
3. Method and Assumptions 197
3.1 Model Derivation 197
3.2 Data 198
3.3 Provisions for the Two Scenarios: R/C Factor PSC and 199
RSC Fiscal Regimes
3.4 Reserve, Production and Duration Assumptions 200
3.5 Development and Operation Costs Assumption 201
3.6 Price Assumption 202
3.7 Service Fee Assumption 202
3.8 Discount Rate Assumption 202
3.9 Analytical Procedures 202
4. Analysis and Result 203
5. Conclusion and Policy Implication 205
6. Disclaimer 206
7. References 207
8. Authors 211

1
CONSOLATION PRIZE
ARE WOMEN CHIEF FINANCIAL OFFICERS MORE RISK
AVERSE WHEN MAKING FINANCIAL DECISIONS?
Mr Lok Char Lee
Associate Professor Dr. Hooy Chee Wooi

2
ARE WOMEN CHIEF FINANCIAL OFFICERS MORE RISK AVERSE WHEN MAKING
FINANCIAL DECISIONS?
ABSTRACT
This study investigates whether women Chief Financial Officers (CFOs) have a higher risk aversion
when it comes to making financial decisions. We formed our opinion based on the basic principles
of financial statement analysis - that risk-taking activities are reflected in the short-term liquidity
positions. The management of short-term liquidity positions of a firm is one of the key roles of the
CFOs. We employed panel regression on 854 public listed firms in Singapore, Malaysia, Thailand,
the Philippines and Indonesia for the financial year 2013. From the empirical analysis, we
documented statistical evidence showing that female CFOs have a higher degree of risk aversion
compared to their male counterparts in making financial decisions related to liquidity risk. This
implies that women CFOs would take lower risks when managing the liquidity position of a firm.
However, there is no statistical evidence to show that personal shareholding of CFOs in the firm
affect the financial decisions related to liquidity risk. This might be due to a small number of CFOs
holding shares in their respective firms. Further analysis found that CFOs become aggressive in
managing liquidity positions when they are reporting to female CEOs. Our results also provide
further evidence that firms with better growth opportunities will engage in more short-term debts. In
addition, our results are consistent with the pecking order hypothesis where profitable firms will use
internal financing rather than external source of finance.
1. INTRODUCTION
Generally, firms are managed by a team of professionals headed by the Chief Executive Officer
(CEO). The Chief Financial Officer (CFO) is the head of the finance team and is accountable for
financial decisions. CFOs are expected to play a central role in assisting CEOs, and provide their
expert financial opinion in helping their organisations to navigate and survive in a complex business
environment. Given that CFOs are reporting to CEOs when making financial decisions some of the
financial decisions might not be influenced by the attributes of CFOs.

3
Based on basic financial statement analysis, two financial decisions are commonly made by a firm.
The first is the capital structure decision, which is related to the long-term debts of the firm. The
second is the liquidity position, which is related to the short-term debts of the firm. Today, due to
the growing demands on and expectations of finance leaders, the responsibilities of CFOs have gone
beyond traditional stewardship functions such as implementing good financial controls and
complying business regulations and ethics. In other words, CFOs are expanding their functions from
transactional and cost efficiency focus to an increasingly value-adding strategic focus in a “business
partnering” capacity. In order to perform their duties competently, CFO candidates need highly
advanced skills.
In this paper, we aim to address one attribute of CFOs, which might influence the financial
decisions of a firm. We examine the gender profile of CFOs to explain the risk taking behaviour of
CFOs. We also address whether personal shareholding can moderate the impact of CFOs’ gender on
the risk taking behaviour. Finally we examine whether the gender effect of CFOs vary given the
gender of CEOs that they reported to. Based on a sample of 854 listed firms from five main ASEAN
countries (ASEAN5) in 2013, we documented statistical evidence that female CFOs have a higher
degree of risk aversion compared to male CFOs in making financial decisions related to liquidity
risk. This is regardless of whether they are shareholders in the firm. In addition, CFOs also become
more aggressive when they are reporting to female CEOs.
In the next section, we present our research context supported by a brief literature review. In section
3 we report the data and methodology employed for our analysis. Section 4 provides the results and
discussion, and in the final section, we conclude with some direction for future research.
2. HYPOTHESES DEVELOPMENT
2.1 CFO Risk Taking Behaviour and Gender Difference
Does gender influence the risk taking behaviour of CFOs? Prior studies found evidence that gender
difference in risk aversion behaviour does influence the financial judgment and decision-making.
Although further verification is required, the results support the view that women are generally
more cautious, risk averse and less aggressive compared to men in making business judgements and
decisions.

4
Powell & Ansic, (1997) found that men and women adopt different strategies in financial decision
environments. Women are said to be more risk adverse and tend to focus on strategies that avoid the
worst outcome. Thus, they will tend to select a loss avoiding strategy with better insurance
coverage. In contrast, men are more risk taking and tend to focus on strategies, which they think will
bring the best possible gains. Similarly, the study of Olsen & Cox, (2001) focused on professional
men and women investment managers who perceive and respond to risk differently. It was found
that women consider the possibility of loss and ambiguity, more heavily than men. In summary,
prior studies provide evidence that women emphasise risk reduction more than men do in financial
decisions. In other words, the findings suggest that females are more cautious and more likely to be
risk adverse.
However, prior studies focused on financial decisions relating to long term borrowings, debt
maturity structure, and share investments. We adopted a different approach to verify the risk
behaviour of female CFOs by examining the current ratio, which is more relevant in financial
statement analysis.
In basic financial statement analysis, a firm’s ability to survive in the short-term is measured by
evaluating its current ratio, also called liquidity ratio. Current ratio is the proportion of current assets
to current liabilities. Current assets are short-term assets such as cash, trade receivables and
inventories. Current liabilities are debts that are due to be paid within one year such as trade
payables and overdrafts, and are considered short-term debts. Short-term debts refer to debts with a
statutory term to maturity less than one year. The external sources of short-term debts include trade
payables, overdrafts, short-term loans and other payables. Short-term debts expose firms to
refinance as well as interest rate risks. Therefore, short-term debts are considered a riskier financing
choice than long-term debts. Furthermore, firms need to mitigate the risk of financial distress by
retaining more liquid assets to ensure that funds will be available to pay short-term debts, or else,
firms might be forced to access more expensive external financing to comply with short-term
obligations.

5
In general, external auditors will perceive a firm as high risk when its long-term debts approach
maturity without having sufficient funds to repay, or there is excessive reliance on short-term debts
to finance long-term assets. A low risk financial decision is where all permanent assets such as
property, plant and equipment are funded by long-term debts. Therefore, short-term debts should
only be used to finance part of the fluctuating short-term assets.
The level of the current ratio varies by industry. It is considered advisable for a business to maintain
a current ratio of at least 2:1 for the sake of sound cash flow and a healthy financial condition.
However, this rule of thumb is just a recommendation because many firms are maintaining a current
ratio below this threshold. For example, a fast food company, which adheres strictly to a credit card
and cash business, is able to maintain a lower current ratio compared to a manufacturing company.
The former’s policy will result in better financial returns because suppliers provide free financing to
the firm. In practice, some profitable hypermarkets can delay payments to local suppliers for longer
than normal credit terms owing to their volume of business. Furthermore, there are generally no
credit sales and no delayed payments at a hypermarket and its inventory turnover is greater than
other businesses. Thus, the current ratio of a firm will be higher if the CFO is more risk adverse.
This leads to our hypothesis, formally stated as:
H1: Firms that have female CFOs will have a higher current ratio than firms with male CFOs.
2.2 CFO Risk Taking Behaviour and Personal Shareholdings
Does the CFOs’ personal shareholding influence his or her risk taking behaviour? This question can
be answered by examining the current ratios of firms with CFOs holding shares in the firms.
Chava & Purnanandam, (2010) states that managers will reduce the firm’s risk following their
personal investments in the firm’s shares and options. If risk behaviour is motivated by personal
interest, then CFOs might apply lower risk strategies in managing debts. Thus, it is probable that
CFOs will reduce the current ratio of their firms if they have personal shareholdings in these firms.
This leads to our hypothesis, formally stated as:
H2: Firms where the CFO has personal shareholding will have a higher current ratio than firms
where the CFO has no personal shareholding.

6
2.3 CFO Risk Taking Behaviour and CEO Gender
In addition to operating risks, CEOs need to manage other business risks such as financial risks
resulting from financial leverage. Previous studies provide evidence that CEOs are making
decisions about capital structure. Based on the manager’s personal portfolio considerations to the
financial policies, Chava & Purnanandam, (2010) found that the CEOs’ risk-preferences are
significant determinants of broader corporate decisions such as capital structure and cash polices
because they are directly responsible for the performance of the firm.
If this is the case, what is the CFOs’ role in making financial decisions? Previous studies provide
justification that some financial decisions involve the finer aspects of corporate finance, such as
short-term debt-maturity structure and the earnings smoothing decisions. These financial decisions,
which require financial proficiency, are assigned to the finance team. Thus, CFOs are deemed to be
more influential in decisions related to short-term liquidity position. In other words, CEOs will pay
close attention to broad corporate decisions and delegate the finer aspects of financial decisions to
the CFOs. However, some may argue that CFOs are simply the CEOs’ agents and that they engage
in accounting manipulations because of pressure by the CEO. This brings us to the next question -
whether a CEO’s gender affects the risk aversion of the female CFO. However we do not impose a
prior expectation on the causal direction as both arguments on this issue are yet to be addressed by
any existing literature. The following hypothesis thus is tested.
H3: Firms that have female CFOs will have a higher current ratio than firms with male CFOs, and
this relationship can be significantly different under a CEO of a different gender.

7
3. DATA AND METHODOLOGY
3.1 Data Selection
This study focuses on public listed firms in ASEAN5 countries namely Indonesia, Malaysia, the
Philippines, Singapore and Thailand. At the initial stage we downloaded a total of 2,885 ASEAN5
firms from OSIRIS, a division of Bureau van Dijk database. Data filtering was conducted based on
CFO information disclosure. We removed the firms that do not have CFO information in the Osiris
database, yielding a sample size of 1054 firms. The Osiris database also includes other CFO
relevant information such as CFO gender and CFO share ownership. Besides that, we also
downloaded the information on CEO gender from the same database. All the other financial data
such as total assets, return on assets and market-to-book value are downloaded from DataStream, a
division of Thomson Reuters database. These are all one-year data based on the 2013 financial year.
Data were arranged in two dimensions by pooling across country and firms. For firms that do not
borrow short-term debt, we obtained missing value on current ratio and this further reduced our
sample size to 854 observations/firms.
3.2 Panel Regression Model
We conducted panel regression analyses to test our hypotheses that firms with female CFOs and the
personal shareholding of CFOs influence their risk taking behaviour. We tested whether female
CFOs are risk adverse in making financial decisions related to liquidity risk by maintaining a higher
current ratio. In addition, we tested whether the personal shareholding of CFOs motivates them to
maintain a higher current ratio to protect their personal interests.
We model CurrentRatio as a function of relevant firm characteristics and our main subject variables
are a dummy variable representing female CFO and another dummy variable representing whether
the female CFO holds any of her company’s shares. These are tested in three steps, where the
following firm-country panel regressions are set up:

8
The dependent variable is CurrentRatio, measured by the ratio of current assets to current liabilities
or short-term debts. Current assets are defined as short-term assets, which are already cash or assets
intended to be converted into cash within one year. Current liabilities are derived by deducting long-
term debts from total debts.
The other control variables in the model are basically the important determinants for current ratio.
FirmSize is measured by natural logarithm of total assets. MarketBook is measured by the ratio of
market value of equity to book value of equity. ROA is measured by the ratio of net income to total
assets.
Firm size has been used as a proxy for a variety of constructs in accounting research. Instead of
borrowing short-term debts, large firms are reported to use more long-term financing methods such
as long-term loans and loan stocks due to the relatively smaller transaction costs in accessing the
long-term market and to their lower information asymmetry resulting from higher market
monitoring. Thus, we predict a positive coefficient for FirmSize and Current Ratio.
MarketBook is a proxy for investment and growth opportunities. Prior studies provided evidence
that firms with more growth opportunities used more short-term debts to mitigate the agency costs
of debts. In other words, these firms needed to use more current liabilities to alleviate the under-
investment problem. Thus, we expect a negative relation between MarketBook and CurrentRatio.
ROA is a proxy for the firm's financial performance. The trade-off theory explains the choice of
capital structure based on the trade-off between tax savings and cost of financial distress. The
theory predicts that firms with more tangible assets and higher taxable income should have a higher
debt ratio because these firms have a larger scope for tax shields and therefore should have a higher
debt ratio. According to Cooley & Quadrini (2001), higher productivity will prompt a firm to
borrow more funds to expand its business. On the other hand, the pecking order hypothesis suggests
that firms will finance its investment through internally generated funds rather than through debt as
the firm’s profitability increases. Prior studies suggested that pecking order hypothesis is
predominant in Malaysia’s context (see Fazillah, Hui, & Azizan, 2008) Thus, when a firm’s profit
increases, it will reduce its debt financing. As such, we expect a positive relation between ROA and
CurrentRatio.

9
The two subject variables are related to two personal attributes of CFOs. DCFOFemale is a dummy
variable, which is assigned value of 1 for CFO who is a female, 0 otherwise. DCFOShareholding is a
dummy variable, which is assigned value of 1 for CFO who is also a shareholder, 0 otherwise. The
interaction term (DCFOFemale x DCFOShareholding) is the product of the two dummy variables.
As we ran firm-country panel regression, there was a need to control for country effect and industry
effect. This was done by adding country and industry dummies into the regression. We also
employed robust standard error for better statistical inferences.
4. RESULTS AND DISCUSSION
4.1 Descriptive Statistics
Table 1 presents descriptive statistics of our samples. The mean and median of CurrentRatio of our
samples are 9.5 and 4.35 respectively, which indicate that the sample firms on average are
maintaining CurrentRatio above the recommended threshold of 2:1. At the same time, the mean and
median of MarketBook are 2.92 and 1.22 respectively, which imply that the sample firms are
enjoying growth opportunities. Lastly, the mean and median of ROA are 0.04 and 0.05 respectively,
which show that the sample firms on average are profitable in the year 2013.
Table 1: Descriptive Statistics
Obs Mean Median Std Dev Min Max
Current Ratio 854 9.50 4.35 13.75 0.30 83.01
Total Assets (millions) 854 4.60 2.30 3.50 0.004 80.00
MarketBook 850 2.92 1.22 8.19 -1.01 67.79
ROA 833 0.04 0.05 0.10 -0.68 0.46
Note: Total Asset is used to proxy for firm size. Obs and Std Dev represent observation and
standard deviation, respectively.
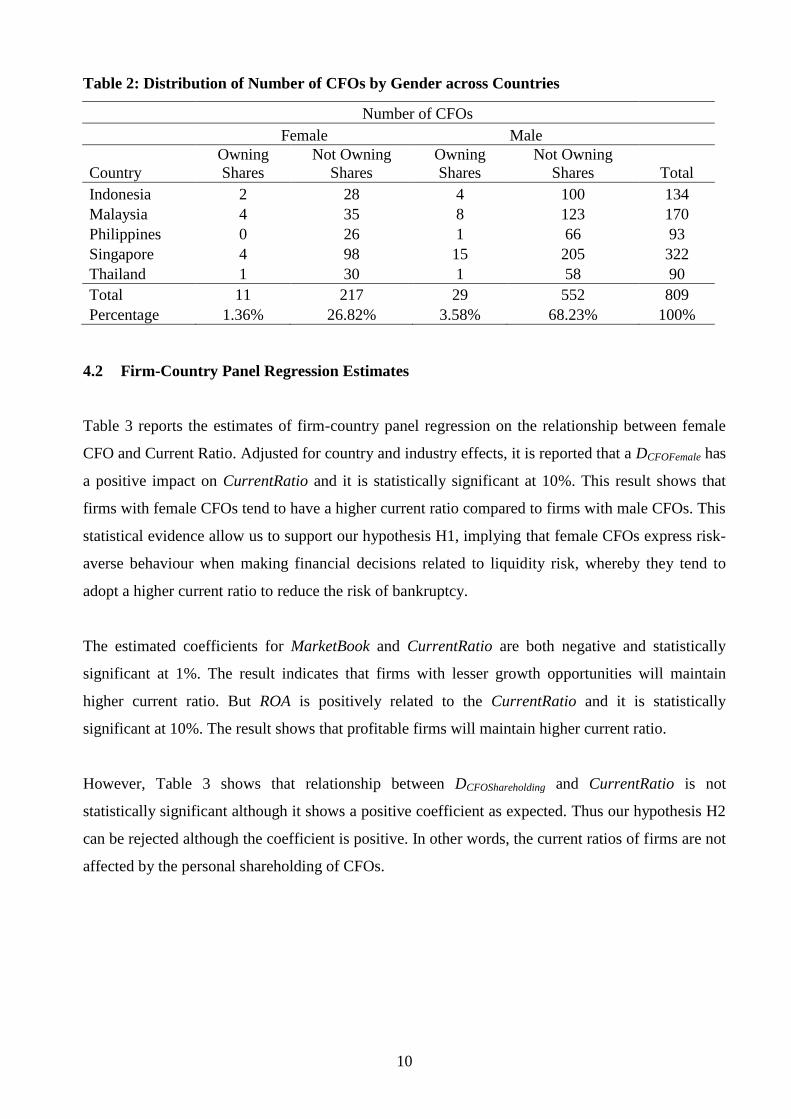
Table 2 presents the number of CFOs by gender across the ASEAN5 countries. Generally, we can
see that males are dominant as head of finance in ASEAN5. A total of 71.81% (68.23%+3.58%) of
CFOs in our sample are men. Only 28.18% (26.82%+1.36%) of CFOs are women. On top of that,
we can also tell that CFOs on average do not invest in the firms that they are working in as the data
showed that only 4.94% (1.36%+3.58%) of CFOs hold shares of their firms.
10
Table 2: Distribution of Number of CFOs by Gender across Countries
Number of CFOs
Female Male
Country
Owning
Shares
Not Owning
Shares
Owning
Shares
Not Owning
Shares Total
Indonesia 2 28 4 100 134
Malaysia 4 35 8 123 170
Philippines 0 26 1 66 93
Singapore 4 98 15 205 322
Thailand 1 30 1 58 90
Total 11 217 29 552 809
Percentage 1.36% 26.82% 3.58% 68.23% 100%
4.2 Firm-Country Panel Regression Estimates
Table 3 reports the estimates of firm-country panel regression on the relationship between female
CFO and Current Ratio. Adjusted for country and industry effects, it is reported that a DCFOFemale has
a positive impact on CurrentRatio and it is statistically significant at 10%. This result shows that
firms with female CFOs tend to have a higher current ratio compared to firms with male CFOs. This
statistical evidence allow us to support our hypothesis H1, implying that female CFOs express risk-
averse behaviour when making financial decisions related to liquidity risk, whereby they tend to
adopt a higher current ratio to reduce the risk of bankruptcy.
The estimated coefficients for MarketBook and CurrentRatio are both negative and statistically
significant at 1%. The result indicates that firms with lesser growth opportunities will maintain
higher current ratio. But ROA is positively related to the CurrentRatio and it is statistically
significant at 10%. The result shows that profitable firms will maintain higher current ratio.
However, Table 3 shows that relationship between DCFOShareholding and CurrentRatio is not
statistically significant although it shows a positive coefficient as expected. Thus our hypothesis H2
can be rejected although the coefficient is positive. In other words, the current ratios of firms are not
affected by the personal shareholding of CFOs.

11
Table 3: Regression Results on the relationship between Female CFO and Current Ratio
(1) (2) (3)
Constant -0.6323 -0.6587 -0.8769
(0.8848) (0.8774) (0.8329)
FirmSize -0.086 -0.0844 -0.0796
(0.7361) (0.7357) (0.7425)
MarketBook -0.0153*** -0.0152*** -0.0153***
(0.0014) (0.0020) (0.0024)
ROA 10.4449* 10.4858* 10.7310**
(0.0598) (0.0546) (0.0494)
DCFOFemale 1.6350* 1.6412* 1.9306*
(0.0591) (0.0596) (0.0553)
DCFOShareholding
0.3383 1.776
(0.8068) (0.3896)
DCFOFemale x DCFOShareholding
-7.2146
(0.1162)
Country Effect Yes Yes Yes
Industry Effect Yes Yes Yes
R2
0.0921 0.0922 0.0943
Note: ***, ** and * represent 1%, 5% and 10% level of significance.
4.3 Further Issues on Female CFO and Current Ratio: The Gender of CEO
In this section, we explore whether the risk aversion behaviour of female CFOs vary depending on
the gender of the key decision-making person in the firm, i.e. the CEO. Table 4 presents the gender
distribution of CEOs and CFOs in ASEAN5. Similarly, we can observe in this table that 92.10% of
CEO in ASEAN5 are male. As male CEOs are highly predominant in the market, regardless of
gender CFOs are most likely to work under a male CEO.
Table 4: Distribution of CEO Gender across Countries
No. of CEO (in %)
Female Male Total
No. of CFO
(in %)
Female 3.76 24.22 27.98
Male 4.15 67.88 72.02
Total
7.90 92.10 100.00

12
Table 5 presents subsample regression based on CEO gender. Samples of CFOs were further
classified into firms that are managed by female CEOs and male CEOs.1 As the previous table has
shown, female CFOs are risk-averse. The results of Table 5 further demonstrates that the risk-averse
behaviour of female CFOs is magnified if the female CFO is reporting to a male CEO. The positive
coefficient of DCFOFemale in male CEO subsample is higher than the estimates reported Table 4, and
it is statistically significant at 10%. The result indicates that female CFOs show higher risk adverse
behaviour when their firms are managed by male CEOs. The subsample regression provides
empirical evidence that a negative relationship exists between DCFOShareholding and CurrentRatio,
which is statistically significant at 5%. The result indicates that CFOs will maintain lower current
ratio when they hold shares in their respective firms but it only happens when the CEOs of the firms
are female.
Table 5: Subsample Regression based on CEO Gender
Panel A (CEO is Female) Panel B (CEO is Male)
Constant 8.0702 8.0702 8.0702 -0.2111 -0.2874 -0.6479
(0.7505) (0.7505) (0.7505) (0.9627) (0.9486) (0.8809)
Firm Size -0.4501 -0.4501 -0.4501 -0.0751 -0.0712 -0.0559
(0.7280) (0.7280) (0.7280) (0.7280) (0.7369) (0.7787)
Market-to-Book 0.1252 0.1252 0.1252 -0.0137** -0.0134** -0.0136*
(0.6374) (0.6374) (0.6374) (0.0348) (0.0496) (0.0500)
ROA -32.0104 -32.0104 -32.0104 11.0262* 11.1904* 11.4045*
(0.5574) (0.5574) (0.5574) (0.0910) (0.0798) (0.0740)
D_CFOFemale -4.2676 -4.2676 -4.2676 1.8376* 1.8664* 2.1631*
(0.5626) (0.5626) (0.5626) (0.0774) (0.0782) (0.0910)
D_CFOShareholder
-16.4768** -16.4768**
1.0872 2.4445
(0.0279) (0.0279)
(0.5397) (0.3460)
D_CFOFemale*DCFOShareholder
15.6798**
-7.8342
(0.0235)
(0.1440)
Country Effect Yes Yes Yes Yes Yes Yes
Industry Effect Yes Yes Yes Yes Yes Yes
R2
0.5286 0.5286 0.5286 0.1115 0.1119 0.1143
***, ** and * represent 1%, 5% and 10% level of significance.
1 We do not use dummy variable approach to test for this further issue, as it will involve complex modeling with three
dummies. Instead, subsample regression provides an equally effective solution to our research question.

13
5. SUMMARY AND CONCLUSIONS
In this paper, we examined the association between CFO gender and risk taking behaviour. Our
study is motivated by evidences from previous studies indicating that women are more cautious and
less aggressive in a variety of business and financial settings.
If women are less aggressive than men, then firms with female CFOs are likely to have higher
current ratio. We tested this hypothesis using data for the year 2013 from a total of 854 public listed
firms in ASEAN5 namely Singapore, Malaysia, Thailand, the Philippines and Indonesia. We found
that, after controlling for factors shown to be associated with the current ratio, firms that have
female CFOs report higher current ratio. The result is consistent with prior studies reporting that
women are more risk averse when making financial decisions, particularly managing liquidity risks.
Furthermore, the positive coefficient of this relationship is enlarged when the CEO of the firm is a
man. This might be due to more delegation of financial decisions from male CEOs to female CFOs.
In other words, male CEOs will pay close attention to broad corporate decisions and delegate the
finer aspects of decisions, which require more financial proficiency to CFOs.
Although the result shows that the current ratios of firms are not affected by the personal
shareholding of CFOs, we find that CFOs will maintain lower current ratio when they hold shares in
their respective firms. However this only happens when the CEOs of the firms are women. Due to
the low percentage of CFOs who are holding shares in the firms, the result might indicate that this
small number of CFOs who have personal interests in the firms will act aggressively when women
are the CEOs.
Generally, our predictions on the relationship of growth opportunities and profitability against the
current ratio have also been supported. We found that growth opportunities are negatively related to
current ratio. This is consistent with the notion that firms with more investment opportunities will
use more short-term debts to avoid under-investment problems. Short-term debts are more flexible
than long-term debts due to the shorter debt maturity period.

14
We also found that profitability is positively related to the current ratio. This finding can be
explained by the pecking order hypothesis where profitable firms will use more internal financing
than external source of finance. Thus, firms will borrow less money when the profitability increases.
Our findings also suggest possible scope for further research. Two further research questions can be
further investigated: Does the CFOs gender affect the choice of accounting policies? Do women
CFOs adopt more cautious or less aggressive accounting policies in financial reporting?

15
6. REFERENCES
Chava, S., & Purnanandam, A. (2010). CEOs versus CFOs: Incentives and Corporate Policies.
Journal of Financial Economics, 97(2), 263–278. doi:10.1016/j.jfineco.2010.03.018
Cooley, T. F., & Quadrini, V. (2001). Financial Markets and Firm Dynamics. American Economic
Review, 91(5), 1286–1310. doi:10.1257/aer.91.5.1286
Fazillah, M., Hui, T., & Azizan, N. (2008). The Relationship between Hedging Through Forwards,
Futures & Swaps and Corporate Capital Structure in Malaysia. Second Singapore International
Conference on Finance 2008, 1–18. Retrieved from http://dx.doi.org/10.2139/ssrn.1083922
Olsen, R. a., & Cox, C. M. (2001). The Influence of Gender on the Perception and Response to
Investment Risk: The Case of Professional Investors. Journal of Psychology and Financial Markets,
2(1), 29–36. doi: 10.1207/S15327760JPFM0201_3
Powell, M., & Ansic, D. (1997). Gender Differences in Risk Behaviour in Financial Decision-
Making: An Experimental Analysis. Journal of Economic Psychology, 18(6), 605–628.
doi:10.1016/S0167-4870(97)00026-3

16
7. AUTHORS
Mr Lok Char Lee (CA(M), ACMA, CGMA, FTII(M), M.Sc. (IT)(USM), B. Acc. (Hons) (UM)
holds a Bachelor of Accounting Degree (Hons) from Universiti Malaya and a Masters Degree in
Information Technology from Universiti Sains Malaysia. He is a Chartered Accountant registered
with Malaysian Institute of Accountants (MIA), a member of the Chartered Institute of Management
Accountants (CIMA), a Chartered Global Management Accountant (CGMA) and Fellow of the
Chartered Tax Institute of Malaysia (CTIM).
He has more than 20 years of working experience and obtained his accounting and finance
experience while working as a statutory auditor and tax consultant in various local and international
auditing firms. His work experience encompassed various accounting, auditing, costing and taxation
aspects for clients ranging from small medium enterprises to multinational companies which consist
of manufacturing, trading, property development, construction and financial institutions.
Mr Lok is the Chairperson of the Accounting Programme at the School of Management. He was
appointed as a speaker and head judge for training workshops on technopreneurship organised by
the International Science, Technology and Innovation Centre for South-South Cooperation (ISTIC)
under the auspices of UNESCO from 2010 to 2015. He is a facilitator for various training
programmes and an examiner for professional accountancy examinations.
Associate Professor Dr. Hooy Chee Wooi, is an Associate Professor at the School of Management,
Universiti Sains Malaysia. He obtained the Doctor of Philosophy in international finance from
University of Malaya in 2008. Dr. Hooy’s main research interest is in international and corporate
finance. He has published 4 books, and nearly 80 papers in refereed journals. Since 2009, he has
served as the co-editor of the Asian Academy of Management Journal of Accounting and Finance
and in 2015 he was appointed as the Managing Editor of Capital Market Review, the MFA official
journal sponsored by Bursa Malaysia.

17
Dr. Hooy also contributes actively to the research community locally and internationally. He has
served as an external examiner for more than 10 PhD and Master students in USM, UPM, UNIMAS
and UPSI. He has served as an invited reviewer for more than 20 refereed journals including 10 ISI
cited journals, and has reviewed book projects for Palgrave McMillan, Taylor & Francis and
Universiti Tun Hussein Onn University Press. Dr. Hooy is a life member of the Malaysian
Economic Association and Malaysian Finance Association; a member of the American Finance
Association, East Asian Economic Association and Asian Academic of Management Association.
He has experience as a visiting scholar at Columbia Business School of Columbia University in
New York, Faculty of Business and Economics of Monash University in Melbourne, Economics
Department of Chinese University of Hong Kong and recently, School of Business of Pusan
National University in South Korea.

18
CONSOLATION PRIZE
AWARENESS AND KNOWLEDGE OF GOODS & SERVICES TAX
(GST) AMONG SMALL AND MEDIUM ENTERPRISES (SMES):
EVIDENCE FROM MALAYSIA
Dr. Mazni Abdullah
Dr. Noor Sharoja Sapiei
Dr. Mohd Zulkhairi Mustapha
Dr. Anna Azriati Che Azmi

19
AWARENESS AND KNOWLEDGE OF GOODS & SERVICES TAX (GST) AMONG
SMALL AND MEDIUM ENTERPRISES (SMES): EVIDENCE FROM MALAYSIA
ABSTRACT
This study investigates the level of awareness and knowledge of the Goods and Services Tax (GST)
among Small and Medium Enterprises (SMEs) in Malaysia. A total of 500 survey questionnaires
were distributed to SMEs in the Klang Valley between October and December 2014. The findings
suggest that the level of awareness and knowledge of GST among SMEs are moderate. However,
there are three critical areas of knowledge that show relatively low scores, namely the mechanics of
GST, reasons why the government introduced the GST and potential benefits of GST to businesses.
These three critical areas, therefore require the government’s attention. This study suggests that
sufficient information and knowledge must be conveyed to SMEs so as to get their full support and
to avoid any misconceptions about GST. The quantity and quality of training sessions and seminars
should be given consideration to achieve this aim. This study also highlights the concerns of the
SMEs about the implementation of GST, and their preferred mode to improve their GST knowledge.
The findings and suggestions provided in this study might be useful to the government and the
Royal Malaysian Customs to ensure the smooth implementation of GST in Malaysia.
1. INTRODUCTION
The Goods and Services Tax (GST) is a consumption tax imposed on users of taxable goods and
services. GST has become a topical issue in Malaysia ever since the government tabled its intention
to implement the GST in the Budget 2005. However, the implementation of the GST was postponed
several times. Eventually, in the Budget 2014, the government officially declared that GST would
be implemented in Malaysia effective from 1 April 2015. The GST is known as a value-added tax
(VAT) in other countries such as the United Kingdom, Ireland, France and Canada.

20
Many parties have raised concerns about whether or not GST by and large benefits the country and
citizens. The proponents of GST argue that GST is better than the sales tax and services tax (SST)
because it will provide the government with a constant flow of income and a more effective and
transparent system of tax administration and management (Amanuddin et al., 2014; Saira et al.,
2010). Hence, GST will help the government reduce its fiscal deficit, improve economic stability
and increase the government’s ability to provide better infrastructure and services to the public
(Saira et al., 2010; McGowan and Billings, 1997). Nevertheless, many Malaysians are not
convinced about the advantages of GST (Saira et al., 2010). The majority of Malaysian citizens
believe that GST is burdensome because it leads to increased prices of goods.
Researchers argue that misconceptions about a new tax such as GST arise because of the citizens’
poor awareness and a lack of knowledge of the true value of the tax (e.g. Cullis and Jones, 1992;
Csontos et al., 1998; Mohani, 2003; Abdullah and Sapiei, 2008). Previous studies noted that while
citizens recognised tax as a government’s source of revenue, many of them were not aware of the
taxes levied on them or on the government’s true expenditure and the cost needed to sustain public
services (e.g. Csontos et al., 1998; Cullis and Jones, 1992). According to Balch (1980), people resist
or behave unexpectedly towards new products or services because they are not aware of them and
are uncertain of their consequences. He suggested that one of the strategies that can be used by the
government to change people’s behaviour or to motivate positive change is to employ information
strategies through which people will be informed about the benefits of the product or service. This
theory is also applicable to the GST situation. The implementation of a new tax system creates
uncertainty for future expenditure, and this would initiate resistance among the citizens (Saira et al.,
2010). Hence, increased awareness and knowledge of tax reform are paramount to gain public
acceptance and confidence (Saira et al., 2010; Abdullah and Sapiei, 2008). Tan and Chin-Fatt (2000,
p. 47-48) argued that “…an increase in tax knowledge should improve the attitudes of taxpayers in
relation to their perceptions of tax fairness, as it reduces taxpayers’ uncertainty and misconceptions
of the tax system.” Consequently, tax knowledge would also promote tax compliance behaviour
among citizens (Kassipilai et al., 2003; Hyun and Park, 2003; Singh, 2003). Erikesen and Fallan
(1996) also argued that citizens with tax knowledge are aware of their responsibilities towards the
growth of their country and they have better regard towards the government and the tax
administration system. This will also benefit the government because the citizens might be willing
to assist the tax authorities in their collection task.

21
Given the importance of awareness and knowledge about a new tax, this study aims to investigate
the awareness and knowledge of GST among Small and Medium Enterprises (SMEs) before its
implementation on 1 April 2015. This study focuses on SMEs because they are recognised as one of
the important sectors that contribute to the economic growth of Malaysia (Pope and Abdul-Jabbar,
2008). Due to their small size and capital structure, SMEs may face problems or difficulties with the
implementation of GST. Hence, this study will not only contribute to the growing literature on GST
and SMEs but also highlight what needs to be done by the relevant authorities and the government
to ensure the successful implementation of GST in Malaysia.
This paper is structured as follows. Section 2 provides a literature review that includes some
background of GST, arguments for and against GST and prior studies on GST. Section 3 discusses
the research method and section 4 presents the findings and discussion. Section 5 concludes the
paper.
2. LITERATURE REVIEW
2.1 Some background on GST
The origin of the GST or VAT concept can be traced back to Wilhelm von Siemens in Germany in
1910 and Thomas S. Adams in 1921 (James, 2011). However, during that time, the concept was not
put into practice. A few decades later, France became the first country to implement VAT in 1954,
with limited application. James (2011) divided the progress of VAT into two phases. The first phase
took place in Western Europe and Latin America during the 1960s and 1970s. The second phase
occurred in the late 1980s when VAT was introduced by industrialised countries outside the EU,
such as Australia, Canada and Japan, which were then followed by other developing countries in
Asia and Africa.
In Malaysia, VAT is known as GST. GST was first announced in the 2005 Budget, and it was to be
implemented in 2007. However in February 2006, the government decided to defer its
implementation. The reason given was that more time was needed to conduct studies and obtain
public feedback. In 2009, it was tabled once more for implementation in 2011 and it was to be read
again for the 2010 seating, but was again withdrawn. Finally in October 2013, the Prime Minister,
Datuk Seri Najib Tun Razak announced during his Budget 2014 speech that the GST will be
implemented on 1 April 2015. GST was introduced as a means of diversifying national revenue and
replacing the current sales tax (at 10%) and service tax (6%).

22
GST or VAT has been implemented in 160 countries globally. Among the ASEAN countries,
Malaysia is one of the last to implement GST. Table 1 shows the adoption and the rate of GST
among the ASEAN countries.
Table 1: GST in the ASEAN region
No. Country Year of
Implementation
Initial Rate
(%)
Current Rate
(%)
1 Indonesia 1984 10 10
2 Thailand 1992 7 7
3 Singapore 1993 3 7
4 Philippines 1998 10 12
5 Cambodia 1999 10 10
6 Vietnam 1999 10 10
7 Laos 2009 10 10
8 Malaysia 2015 6 6
Source: Ministry of Finance (Treasury Division)
2.2 Differences between SST and GST
In Malaysia, GST was introduced to replace the current Sales and Services Tax (SST). Both SST
and GST are consumption taxes. However, GST has a wider scope and it is more transparent to the
consumer. It also eliminates the cascading and double taxation effect of the SST. Under the sales tax
regime, taxes are imposed on all manufactured and imported goods at the manufacturers/importers
level only. Thus, the sales tax is embedded as part of the goods’ cost, and it will be cascaded
throughout the supply chain until it reaches the final consumer. As a result, final consumers pay
high prices without being aware of the amount of effective sales tax rate imposed on them.

23
The services tax, on the other hand, is levied at the consumer level on selected service providers. If
consumers consume goods provided by these service providers, there will be double taxation issues,
as particular goods will be subjected to both sales and service tax. GST eliminates the cascading and
double taxation effect by imposing tax at all stages but allows businesses to reclaim their taxes so
that GST is not part of the cost to them. In the end, consumers will be aware of the amount of GST
paid to the government and that the effective tax paid is equal to the stipulated GST tax rate required
by the government.
2.3 Arguments For and Against GST
GST is argued to be an efficient taxation system. Throughout the literature survey, GST is perceived
to be much more efficient in terms of tax turnovers because GST provided greater revenue
collection and at the same time reduced deficits (Grady 1990; Lee et. al. 2013; Schultz et.al. 2011).
Proponents of GST argued that GST provided many positive benefits to stakeholders since an
increase in government revenue would lead to greater achievements in implementing fiscal reforms,
reducing deficits, and financing social security (Poddar and Mathur, 2010; Lee et.al., 2013). Schultz
et.al (2011) suggested that the implementation of GST could provide the means for (permanently)
reducing income taxes. In the Malaysian context, income tax rates for individuals and corporations
were cut by 1% in 2015, the same year GST was introduced. The proponents also argued that GST
helps to enhance a country’s competitiveness as it would not be part of the cost to exporters (Toder
and Rosenberg, 2010).
Nevertheless, the opponents argued that GST is regressive in nature because it excessively burdens
low-income individuals while imposing a negligible burden on the wealthy (Gravelle, 2011). Others
related GST to the infringement of the fiscal autonomy of state and local government and also
expanding the size of the federal government (Lee et al., 2013; Holtz-Eakin, 2011). GST will also
affect businesses’ operating costs, both start-up costs and ongoing costs. This is especially
prominent among small and medium businesses (Gunz et al., 1995). The opponents also argued that
GST would have a profound impact on lower income groups because the ability of this group to
purchase taxable goods and services is lower compared to those of higher income groups (Hooper
and Smith, 1997).

24
2.4 Studies on GST in Malaysia
In Malaysia, only a few studies have examined the awareness and knowledge on GST. Ely Raziah et
al. (2005) and Saira et al. (2010) conducted their study following the announcement by the
government to implement GST in 2007 and 2011 respectively. The recent study on GST was by
Amanuddin et al. (2014). The findings of these earlier studies are discussed below.
Ely Raziah et al. (2005) examined the level of awareness among SMEs towards the implementation
of GST in 2007. The questionnaires were distributed to a sample of SMEs in the Klang Valley.
Their findings showed that only one-third (33.3%) of the 122 respondents could be considered
knowledgeable about GST. Due to this low level of awareness about GST, they suggested that
educating the business community about GST is needed to avoid a negative response from SMEs.
Saira et al. (2010) investigated Malaysian citizens’ awareness towards the implementation of GST
in 2011. They found that 60.53% of respondents did not agree with the implementation of GST.
Their findings also suggest that the level of awareness about GST among Malaysian citizens is
relatively low. They also found that the level of awareness among respondents is related to their
background. Generally, respondents with an accounting background were more knowledgeable and
aware of GST compared to respondents from non-accounting backgrounds.
Amanuddin et al. (2014) investigated the level of awareness and acceptance of GST among
educators in Malaysia. Their sample consisted of educators who were working in Universiti Tenaga
Nasional (UNITEN) and Politeknik Muadzam Shah (PMS). A total of 244 survey questionnaires
were distributed to these two institutions. They found that the majority of their respondents (93.8%)
showed a high-level of awareness regarding the implementation of GST. With regard to the
acceptance level, they found that the majority of respondents had a moderate to high level of
acceptance of the implementation of GST in Malaysia. Their findings also showed that the
respondents’ awareness had significant correlations with their level of education, fields of
specialisation, types of employment and monthly income. However, none of these factors had a
significant correlation with the respondents’ acceptance.
25
Overall, the findings of prior studies except for Amanuddin et al. (2014) indicated that the level of
awareness on GST in Malaysia is still low. Aminuddin et al. (2014) contrasting findings could be
due to the background of their respondents who were educators in higher learning institutions.
Educators normally keep abreast of the latest information and developments at the local and
international levels. Nevertheless, all these studies argued that lack of knowledge and awareness
about taxes might affect the acceptance of GST because citizens might have a negative perception
towards the tax levied on them.
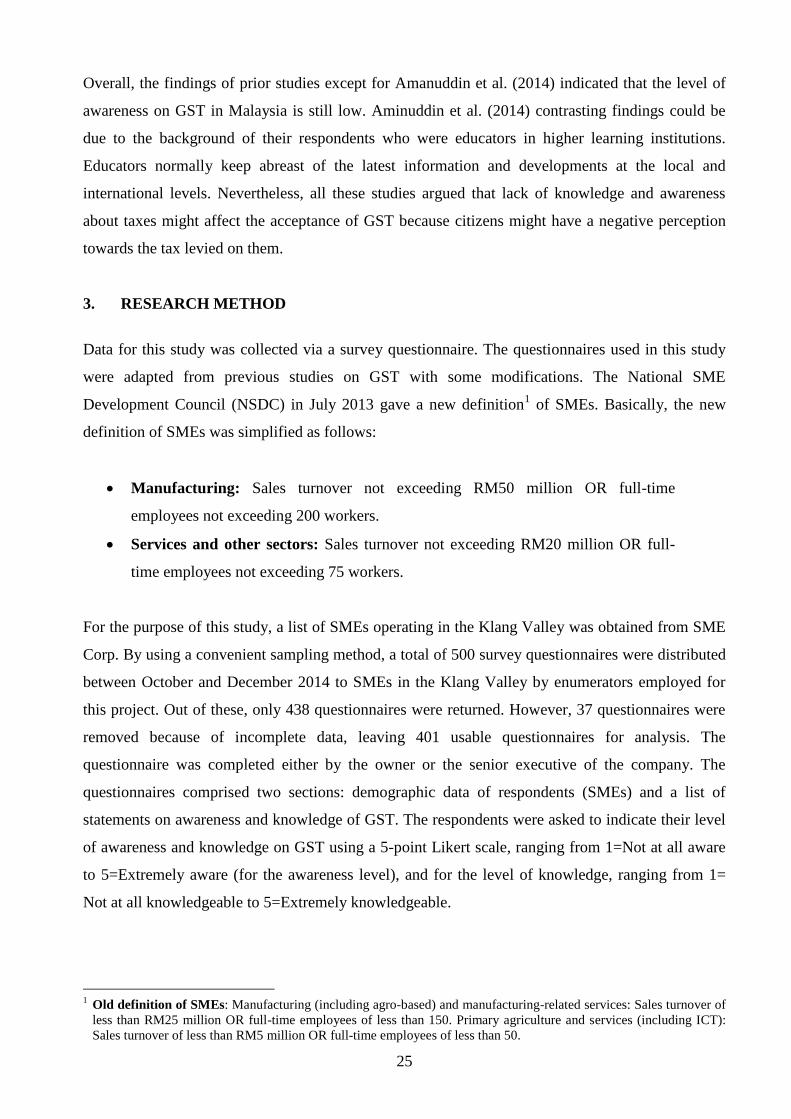
3. RESEARCH METHOD
Data for this study was collected via a survey questionnaire. The questionnaires used in this study
were adapted from previous studies on GST with some modifications. The National SME
Development Council (NSDC) in July 2013 gave a new definition1 of SMEs. Basically, the new
definition of SMEs was simplified as follows:
Manufacturing: Sales turnover not exceeding RM50 million OR full-time
employees not exceeding 200 workers.
Services and other sectors: Sales turnover not exceeding RM20 million OR full-
time employees not exceeding 75 workers.
For the purpose of this study, a list of SMEs operating in the Klang Valley was obtained from SME
Corp. By using a convenient sampling method, a total of 500 survey questionnaires were distributed
between October and December 2014 to SMEs in the Klang Valley by enumerators employed for
this project. Out of these, only 438 questionnaires were returned. However, 37 questionnaires were
removed because of incomplete data, leaving 401 usable questionnaires for analysis. The
questionnaire was completed either by the owner or the senior executive of the company. The
questionnaires comprised two sections: demographic data of respondents (SMEs) and a list of
statements on awareness and knowledge of GST. The respondents were asked to indicate their level
of awareness and knowledge on GST using a 5-point Likert scale, ranging from 1=Not at all aware
to 5=Extremely aware (for the awareness level), and for the level of knowledge, ranging from 1=
Not at all knowledgeable to 5=Extremely knowledgeable.
1 Old definition of SMEs: Manufacturing (including agro-based) and manufacturing-related services: Sales turnover of
less than RM25 million OR full-time employees of less than 150. Primary agriculture and services (including ICT):
Sales turnover of less than RM5 million OR full-time employees of less than 50.

26
Since this study was conducted before the implementation of GST, the respondents were also asked
about their willingness to use the following channels to improve their knowledge on GST:
GST helpline service provided by the government;
Special GST website provided by the government;
Attend training sessions, seminars and workshops relating to GST conducted by private
agencies;
Attend free training sessions and seminars on GST conducted by the government;
Seek advice from private consultants or accountants;
Free pamphlets on GST.
The respondents were also asked about their concerns pertaining to the following issues when the
government implements GST:
Implementation cost of GST during the transition period
Operational cost of GST
Training of employees on GST
Change or upgrade of the accounting system
Maintenance of various records to comply with GST
Impact of GST on your business cash flow
Availability of government assistance
Penalty for non-compliance
4. FINDINGS AND DISCUSSION
4.1 Respondents’ Characteristics
Table 2 presents the characteristics of all respondents (SMEs) in the study. It shows that the
majority of respondents are from other sectors (33.9%), which comprise wholesale and retail trade
and repair of motor vehicles and motorcycles. Our survey also shows that 53.4% of the respondents
have more than five years’ experience in business. We also found that the majority of the SMEs in
our sample are owned by the Bumiputera (54.6%).

27
Table 2: Characteristics of the Respondents (n=401)
Number Percentage
Type of business
Manufacturing (including agro based) 51 12.7
Manufacturing-related services 73 18.2
Services (including ICT) 116 28.9
Construction 25 6.2
Others 136 33.9
401 100
Paid up Capital
≤ RM500,000 247 61.6
RM500,001-RM2.5 million 122 30.4
>RM2.5 million 32 8
401 100
Length of business
≤ 5 years 187 46.7
>5 years 214 53.4
401 100
Ownership
Bumiputera 219 54.6
Non-Bumiputera 182 45.4
401 100
Number of full time employees
>5 129 32.2
5- 19 141 35.2
20-50 69 17.2
51-150 41 10.2
150-199 21 5.2
401 100
4.2 Awareness and Knowledge of GST among SMEs
The survey questionnaires consisted of seven statements about the awareness of GST and nine
statements on knowledge about GST. The results on awareness and knowledge of GST are
presented in Table 3 and Table 4. As shown in Table 3, the overall mean score on awareness is
almost 4.00 whereas the mean for each item is between 3.85 and 3.97. This finding indicates that the
level of awareness on GST among SMEs is moderately good. The overall mean score on knowledge
is 3.69, which means that the level of knowledge of GST is also moderate though it is a slightly
lower than the level of awareness. Our findings show that the majority of the respondents are aware
of the date of the GST implementation in Malaysia (mean = 4.03) and the meaning of GST (3.91).
Nevertheless, the mean scores for the following three questions are relatively low: the mechanics of
GST (3.26), the reasons why the government introduced GST (3.50) and the potential benefits of
GST to your business (3.24).

28
This suggests that the respondents lacked knowledge in these three areas. Table 4 clearly highlights
the findings because it presents the results in percentage (%) according to three categories i.e. aware
(know), not aware (not know) and moderately aware (moderately know).
As shown in Table 4, the majority of the respondents are aware of the issues relating to GST
implementation in Malaysia. About 25% of the respondents are moderately aware, and only a small
percentage of them are unaware of the GST issues. Regarding knowledge, less than 50% of the
respondents stated that they know about the mechanics of GST, the reasons why the government
introduced GST and the potential benefits of GST to their businesses. This implies that the majority
of SMEs only possess basic information about GST, and not many really understand the mechanics
of GST, reasons it was introduced and the potential benefits of GST. It is important to highlight that
lack of knowledge in these areas may invite negative perception towards the government and this
would also hinder them from giving full support or cooperation to the government.
Table 3: Level of Awareness and Knowledge of GST
Mean Std. Deviation
Awareness to re price goods and services due to the GST
implementation. 3.93 0.966
Awareness that business cash flow might be affected by
the GST implementation. 3.96 0.946
Awareness of the need to train employees on GST. 3.88 0.933
Awareness that the inventory for goods brought forward
from a period prior to the GST implementation might be
affected by implementation of GST.
3.87 0.944
Awareness that the existing invoicing system will be
affected by implementation of GST 3.97 0.961
Awareness of customers and competitors reaction towards
GST implementation 3.97 0.968
Awareness of the impact of the GST implementation on
the sales tax and services tax. 3.85 1.060
Overall 3.92

29
Date of the GST implementation in Malaysia 4.03 0.901
Meaning of GST 3.91 0.917
Mechanics of GST 3.26 1.186
Reasons why the government introduced GST 3.50 1.052
Impact of GST on prices of goods and services 3.79 0.929
Financial impact of GST on business 3.86 0.898
Impact of GST on day-to-day business operations 3.84 0.947
GST rate 3.76 0.998
Potential benefits of GST to your business 3.24 1.227
Overall 3.69
Table 4: Awareness and Knowledge of GST (by category)
Awareness Items AWARE NOT
AWARE
Moderately
AWARE
Awareness to re-price goods and services due to
the GST implementation. 68.1% 6% 25.9%
Awareness that business cash flow might be
affected by the GST implementation. 70.1% 4.9% 25%
Awareness of the need to train employees on
GST. 67.6% 6% 26.4%
Awareness that the inventory for goods brought
forward from a period prior to the GST
implementation might be affected by
implementation of GST.
66.9% 6% 27.1%
Awareness that the existing invoicing system will
be affected by implementation of GST 70.9% 5.7% 23.4%
Awareness of customers and competitors reaction
towards GST implementation 72.4% 7.4% 20.2%
Awareness of the impact of the GST
implementation on the sales tax and services tax. 67.4% 9.4% 23.2%
Knowledge Items KNOW NOT
KNOW
Moderately
KNOW
Date of the GST implementation in Malaysia 74.6% 5.4% 20%
Meaning of GST 70.1% 6% 23.9%
Mechanics of GST 44.2% 28.1% 27.7%
Reasons why the government introduced GST 49.1% 14.5% 36.4%
Impact of GST on prices of goods and services 67.4% 7.7% 24.9%
Financial impact of GST on business 70.6% 8.5% 20.9%
Impact of GST on day-to-day business operations 69.6% 8.9% 21.5%
GST rate 62.6% 10.7% 26.7%
Potential benefits of GST to the business 41.4% 28.9% 29.7%

30
As for the respondents’ preferred channel to improve their GST knowledge, the majority of them
chose attending free training and seminars on GST conducted by the government (59.4%) and this
was followed by the choice of using special websites on GST provided by the government (58.4%).
It shows that SMEs will opt to use channels that are convenient and available for free to them in
their efforts to improve their GST knowledge. The findings are presented in Table 5 below.
Table 5: Preferred Channel to Improve GST Knowledge
Prefer NOT
Prefer Neutral
GST help line service provided by government 51.1% 15% 33.9%
Special website on GST provided by government 58.4% 12.7% 28.9%
Attend training sessions, seminars and workshops relating
to GST conducted by private agencies 53.2% 14% 32.8%
Attend free training sessions and seminars on GST
conducted by the government 59.4% 12.7% 27.9%
Seek advice from private consultants or accountants 53.1% 13.2% 33.7%
Free pamphlet on GST 55.3% 9% 35.7%
Table 6 presents the concerns of respondents when the government implements GST in Malaysia. It
shows that the majority of respondents (78.6%) are concerned about the penalty for the non-
compliance on GST, followed by the impact of GST on their business cash flows (77.4%), the
operational cost of GST (74.5%) and availability of government assistance (73.6%). Given that the
penalty for non-compliance is the main concern of the majority of respondents, it implies that the
respondents are uncertain about the consequences of GST, which in turn also suggest that they have
little understanding of GST. The respondents perhaps do not have much knowledge of how GST
works and, therefore, are very concerned about the amount of penalty they have to pay if they fail to
comply with GST legislation. It is important to note that people might not purposely evade the tax
but might do so due to their lack of awareness pertaining to the requirements under the tax
legislation (Abdullah, 2010).

31
Table 6: Concerns on GST Implementation
Concern NOT
concern Neutral
Implementation cost during the transition period 71.6% 3.5% 24.9%
Operational cost of GST 74.5% 3.7% 21.8%
Employees’ training cost 66.3% 5% 28.7%
Change or upgrade of accounting system 69.6% 3.9% 26.5%
Maintenance of various records to comply with GST 71.3% 4.2% 24.5%
Impact of GST on your business cash flow 77.4% 3.9% 18.7%
Availability of government assistance 73.6% 6% 20.4%
Penalty for non-compliance 78.6% 3.4% 18%
Overall, the findings of this study suggest that tax knowledge is important to gain public support for
GST implementation. Just like the earlier studies, this study also argues that the level of awareness
is associated with the level of knowledge. People with knowledge are more aware of the latest
issues and development in the country and can better appreciate the fiscal policy goals, and this
indirectly helps the economic growth of the country.
5. CONCLUSION
The main objective of this study is to examine the level of awareness and knowledge of GST among
SMEs in Malaysia prior to its implementation. The findings of this study suggest that the level of
awareness and knowledge of GST are moderately good. The findings could have been influenced by
the long exposure to discussions and debates about GST in Malaysia since it was first announced in
the 2005 budget although its actual implementation was postponed several times. Nonetheless, there
are three critical areas of knowledge that show relatively low scores and thereby need attention by
the government: (1) Mechanics of GST; (2) Reasons why government introduced GST; and (3)
Potential benefits of GST to business.

32
It is important to note that SMEs play a crucial role in GST collection because they act as collection
agencies on behalf of the government. Collection agencies like SMEs need to be informed on how
GST works, whether or not GST affects their business, why GST is introduced and what are the
benefits of GST to businesses and the country. This is to avoid any negative perception towards
government so that they can give their full support or cooperation. The misconception of GST due
to a lack of knowledge not only results in resistance among citizens but also hinders the smooth
implementation of GST. Enhancing their perceptions of the fairness of GST is crucial. Hence,
government and relevant authorities like Royal Malaysian Customs Department (RMCD) need to
take proactive measures to ensure sufficient information and knowledge are conveyed to SMEs.
We suggest that the level of knowledge among SMEs can be improved if the government or RMCD
conduct more training sessions and seminars relating to GST. The quality of the training sessions
and seminars must also be improved to ensure the effectiveness of these approaches. Among the
factors that can be considered by the government or RMCD to improve the quality of training or
seminars are:
a. The target group for attending training and seminars must be clearly identified. Normally in
Malaysia, the owners send their executives or supervisors to attend the training sessions and
seminars on behalf of the organisation or company. However given a top-down approach in
the organisation, the most suitable person to attend the training sessions and seminars should
be the owner or manager because he/she manages and makes the decisions for business.
Therefore it is to these people that the messages and objectives of the training session or
seminar be properly conveyed.
b. The method of conducting the training sessions and seminars must be suitable and relevant to
the SMEs. The standard or general information that has been conveyed to the public through
the mass media might not be appropriate to a specific target group such as SMEs. Besides, the
trainers must also be knowledgeable and be properly trained. Personal qualities such as
friendliness and approachability must also be considered to attract participants.

33
c. The training sessions and seminars should be provided periodically such as every three or six
months so that the SMEs can keep abreast of the latest information and knowledge about
GST. Moreover, the SMEs can use this platform to share their problems or experiences with
relevant parties such as the government or RMCD. This approach not only ensures that any
grievances about GST can be settled in a timely fashion but it also enables the government or
RMCD to take immediate action to improve the GST system based on the feedback provided.
This study also found that the preferred channels chosen by the majority of respondents to improve
their knowledge of GST are via attending free training sessions and seminars on GST, and also
using the website on GST provided by the government. Apart from that, this study also noted that
the majority of the respondents are concerned about the possible effects of GST implementation
such as penalty for non-compliance, business cash flows and operational costs. Their elevated
concern about these issues may also indicate that they have little understanding of GST because
they are uncertain about the consequences of GST.
The limitations of this study are acknowledged. The findings reported in this study are descriptive in
nature and the sample used only covers SMEs in the Klang Valley. Therefore, the findings must be
interpreted with caution and might not be representative of all SMEs. Future research might use a
bigger sample size and cover more areas. Since this study was conducted before the implementation
of GST, future research could investigate the level of awareness and knowledge of GST after the
implementation.

34
6. REFERENCES
Abdullah, M. and Sapiei, N.S. (2008) Some Evidence of Tax Knowledge in Malaysia: The Case of
Service Tax. The International Journal of Interdisciplinary Social Sciences, vol.3, 5, pp. 73-81.
Abdullah, M. (2010). Compliance Issues in Service Tax in Qualitative Research in Accounting –
Malaysian Cases, editors: Zakiah Muhammadun Mohamed, Ainin Abdul Majid and Norsiah
Ahmad. Bangi: Penerbit UKM
Balch, G.I. (1980). The Stick, the Carrot and Other Strategies- A Theoretical Analysis of
Government Intervention in Policy Implementation Penalties or Incentives?, eds Brigham K. and
Brown D W, London: Sage Publication
Csontos, L., Kornai, J. and Toth, I.G. (1998). The Awareness and Reform of the Welfare State:
Hungarian Survey Results. Economics of Transition, 6(2), 287-312.
Cullis, J. and Jones, P. (1992). Public Finance and Public Choice. New York: McGraw Hill.
Ely Raziah Abdul Rashid, Nor Farizal Mohammed, and Norhasnah Mohd Saheh. (2005). Exploring
Level of Awareness of Small and Medium Sized Enterprises Towards Goods and Services Tax
Implementation in Malaysia. Working Paper prepared for Universiti Teknologi Mara.
Eriksen, K., and Fallan, L. (1996). Tax Knowledge and attitudes towards taxation; A report on a
quasi-experiment. Journal of Economic Psychology, 17, p 387-402.
Grady P. (1990). An Analysis of the Distributional Impact of the Goods and Services Tax.
Canadian Tax Journal. Vol. 38, No. 3, 632-643.
Gravelle J.G. (2011). The Distributive Case Against a VAT. In Sullivan, Martin (ed.). The VAT
Reader, (Tax Analyst) 102-111.
Gunz, S., A. Macnaughton & K. Wensley, (1995). Measuring the Compliance Cost of Holtz-Eakin
D. (2011). The Case against VAT. In Sullivan, Martin (ed.). The VAT Reader, (Tax Analyst), 96-
101.
Hooper, P. and Smith, K.A. (1997). A Value-Added Tax in the US: An Argument in Favor.
Business Horizon, 78-83.

35
James K. (2011). Exploring the Origins and Global Rise of VAT. The VAT Reader (Tax Analysts),
15-22.
K., Saira and M.A., Zariyawati and L., Yoke-May (2010) An Exploratory Study of Goods and
Services Tax Awareness in Malaysia. In: Proceedings Seminar on National Resilience (SNAR
2010) Political Managements and Policies in Malaysia, 13-15 July 2010, Bayview Hotel Langkawi.
Institute of Tun Dr. Mahathir Mohamad’s Thoughts, Universiti Utara Malaysia Sintok, Sintok, pp.
265-276.
Kamleitner, B., Korunka, C. and Kirchler, E. (2012). Tax Compliance of Small Business Owners: A
Review. International Journal of Entrepreneurial Behaviour & Research, Vol. 18 No. 3, pp. 330-
351
Kassipilai, J., Aripin, N. and Amran, N.A. (2003). The Influence of Tax Education on Tax
Avoidance and Tax Evasion. eJournal of Tax Research. Available via:
http://www.austlii.edu.au/au/journals/eJTR/2003/7.html
Keen M. and Lockwood B. (2010). The Value Added Tax: Its Causes and Consequences. Journal of
Development Economics, 92 (2), 138-151.
Kirchler, E., Hoelzl, E. and Wahl, I. (2008). Enforced Versus Voluntary Tax Compliance: The
‘‘Slippery Slope’’ Framework. Journal of Economic Psychology, 29, pp 210–225
Lau, Zheng Zhou, Tam, J. and Heng-Contaxis, J. The Introduction of Goods and Services Tax in
Malaysia: A Policy Analysis. Centre for Public Policy Studies Asian Strategy & Leadership
Institute, October 22, 2013.
Lee D.W., Kim D. G., Borcherding T.E. (2013). Tax Structure and Government Spending: Does
the Value-Added Tax Increase the Size of Government? National Tax Journal (September 2013),
66(3), 541-570.
Lin Mei Tan and Carrol Chin-Fatt, (2000). The Impact of Tax Knowledge on the Perceptions of Tax
Fairness and Attitudes Towards Compliance. Asian Review of Accounting, Vol. 8, 1, pp. 44 – 58.
McGowan, J.R. and Billings, B.A. (1997). An Analysis of the European community VAT:
Implications for U.S. Tax Policy. Journal of International Accounting, Auditing and Taxation,
Volume 6, Number 2, 1997, pp. 131-148(18).
36
Ministry of Finance (Treasury Division)
http://www.treasury.gov.my/index.php?option=com_content&view=article&id=4784:taklimat-cukai-
barang-dan-perkhidmatan-gst&catid=630&Itemid=2550&lang=en accessed on 19 August 2015
Mohani, A. (2003). Income Tax Non-compliance in Malaysia. Petaling Jaya: Prentice Hall.
Park, Chang G., and Hyun, Jin K. (2003). Examining the Determinants of Tax Compliance by
Experimental Data: A Case of Korea. Journal of Policy Modelling. 25. pp 673-684.
Poddar S., Mathur S. (2010). The Road Ahead for the GST. International Tax Review. Jun2010,
Vol. 21, Issue 5.
Pope, J. and Abdul-Jabbar, H. (2008) Small and Medium-Sized Enterprises and Tax Compliance
Burden in Malaysia: Issues and Challenges for Tax Administration, Small Enterprise Research,
16:1, 47-60.
Schultz T.D., Sullivan D.H. and Gould M.S. (2011). A Value-Added Tax for America?. The CPA
Journal. Pg.14-23.
Singh, V. (2003). Tax compliance and Ethical Decision Making: A Malaysian Perspective. Petaling
Jaya: Longman.
Tax Expenditures: The Case of Research and Development Incentives, Canadian Tax Journal,
43(6): 2008-2034
Toder E. and Rosenberg J. (2010). Effects of Imposing a Value-Added Tax to Replace Payroll
Taxes or Corporate Taxes. Tax Policy Center, Urban Institute and Brookings Institution,
Washington, DC.

37
7. AUTHORS
Dr. Mazni Abdullah is a Senior Lecturer at the Department of Accounting, Faculty of Business and
Accountancy, University of Malaya. She completed her Bachelor of Accountancy and MBA
(Accounting) at University of Malaya. She obtained her PhD from the University of Stirling, UK in
the area of corporate governance and International Financial Reporting Standards (IFRS). Her
research interests include corporate governance, financial reporting, zakat, taxation, business
management and accounting education. She has presented her working papers at local and
international conferences and has authored numerous book chapters and articles in academic
journals. Prior to joining the academia, she worked as an external auditor and accountant in the
private industry. She is a member of Malaysian Institute of Accountants (MIA), Malaysian Institute
of Certified Public Accountants (MICPA) and Malaysian Institute of Management (MIM).
Dr. Noor Sharoja Sapiei is a Senior Lecturer at the Department of Accounting, Faculty of Business
and Accountancy, University of Malaya since 2003 and specialises in taxation. She completed her
Bachelor of Accountancy and Finance degree at University College of Wales, UK in 1994 and
obtained the Association of Chartered Certified Accountants (ACCA) qualification in 1997. She
obtained her MBA (Accounting) from University of Malaya in 2003 and completed her PhD in
2012 at the Monash University, Sunway Campus under the supervision of Professor Jeyapalan
Kasipillai. Her research interests are on taxation compliance costs, compliance behaviour of
taxpayers and corporate governance.
Dr. Mohd Zulkhairi is currently attached to the Department of Accounting, Faculty of Business
and Accountancy, University of Malaya. He holds a PhD. in Accounting and Finance from Cardiff
University, United Kingdom and MBA (Accountancy) from University of Malaya. He is a Certified
Financial Accountant (CFiA) of the Malaysian Institute of Chartered Accountant (MICPA). He was
previously the Head of the Accounting Department and is currently the Head of Customer Feedback
and Improvement Unit at Quality Management Enhancement Centre (QMEC) in University Malaya.
He has taught various subjects in accounting and taxation at both undergraduate and postgraduate
level. His research interests among others are on corporate governance and taxation. He has
supervised a number of postgraduate students at both master and PhD level in the area of taxation
and corporate governance.

38
He is currently involved in two researches on the Goods and Services Tax (GST) sponsored by the
Ministry of Education and University Malaya. He appeared as a panel discussant for the Malaysian
pre-budget talk by local television stations such as Astro Awani and MOBTV to comment on
taxation matters.
Dr. Anna Azriati Che Azmi is a Senior Lecturer in the Department of Accounting, Faculty of
Business and Accountancy, University of Malaya. She is a member of the Malaysian Institute of
Certified Public Accountants (MICPA) and Chartered Tax Institute of Malaysia (CTIM). She has
experience teaching Malaysian taxation over 10 years. Her current research is on investigating
factors that are important for SMEs to adopt a GST-compliant accounting software.

39
CONSOLATION PRIZE
CARBON DISCLOSURE AMONG ELECTRICITY GENERATING
COMPANIES IN MALAYSIA: A LONGITUDINAL ANALYSIS
Dr. Bakhtiar Alrazi
Dr. Norhayati Mat Husin

40
CARBON DISCLOSURE AMONG ELECTRICITY GENERATING COMPANIES IN
MALAYSIA: A LONGITUDINAL ANALYSIS
ABSTRACT
This study examines the carbon disclosure of seven major electricity generating companies in
Malaysia over the 2007-2014 period. A disclosure index was developed and content analysis of the
annual reports and stand-alone sustainability reports was undertaken to assess the quality of such
disclosures. Overall, the findings suggest that (1) all companies made some form of carbon
disclosure; and (2) the quality of disclosure increased over time although not in a 'normal' path. This
study provides tentative evidence to support the arguments of social issue life cycle theory.
Although the reporting shows an increasing trend over the years, the disclosure was still considered
minimal (i.e. 13.3% in 2014). Considering the contribution of the electricity industry towards CO2
emission and climate change, there is a need to consider mandatory reporting of carbon disclosure in
Malaysia.
1. INTRODUCTION
The electricity industry is the largest contributor of carbon dioxide (CO2) emissions (IEA, 2013). In
2011, the industry was responsible for 42% of energy-related CO2 emissions, and the emission had
increased by 70% compared to the level in 1990. This is due to heavy reliance on the combustion of
coal to generate electricity. Additionally, the Intergovernmental Panel on Climate Change (IPCC)
(2007) has identified greenhouse gas (GHG) emissions build-up (of which 77% is CO2 emissions)
as the main cause of climate change. To deal with this issue, various initiatives have been
established at the international, regional, and national levels, including the ratification of the Kyoto
Protocol, the implementation of European Union Emissions Trading Scheme (EU ETS), and the
establishment of investor groups like Carbon Disclosure Project (CDP) (CDP, 2009). As a result of
all these developments, companies in this industry are expected to demonstrate carbon
accountability to their stakeholders (including shareholders, creditors, the government, and society).
This can be done through corporate carbon disclosure. Alrazi (2014) defines carbon disclosure as
"information that emphasises any concerns, initiatives, or performance of the company related to
carbon emissions" (pp. 16-17) using various communication media including annual reports, stand-
alone sustainability reports, and corporate websites.

41
Malaysia is an interesting setting for the investigation of the level of carbon disclosure for several
reasons. Firstly, Malaysia is one of the world's 20 fastest growing economies (Bloomberg, 2015).
Four of the countries from this group make the top 10 emitting countries namely China, India, South
Korea, and Saudi Arabia (IEA, 2013). The reputation of these companies as top emitters could have
a spill-over effect on Malaysia especially when the CO2 emissions per capita for Malaysia has
increased by 153% since 1990 and is well above the world's average in 2011 (World's: 5.0 metric
tons per capita; Malaysia's: 7.8) (World Bank, 2015).
Secondly, despite the constant increase in CO2 emissions over time, Malaysia has been proactive in
dealing with climate change issues. Since the 2002 Kyoto Protocol ratification, Malaysia has
introduced the National Policy on Climate Change and the National Green Technology Policy,
restructured the Ministry of Energy, Water, and Communication (currently known as the Ministry of
Energy, Green Technology, and Water), developed the National Carbon Disclosure Program
(MYCarbon), and organised the MYCarbon Award. During the United Nations Climate Change
Conference 2009 in Copenhagen, the Prime Minister expressed a commitment to reduce the
country's carbon emissions by up to 40% by the 2020 year. Emissions for the year 2005 were used
as the benchmark (Soon, 2012).
Thirdly, in Malaysia, the electricity transmission and distribution businesses are monopolised by
one company, while electricity generation is shared by a few companies. Furthermore, according to
the World Bank (2015), 93% of the electricity generated in Malaysia is derived from either oil, gas,
or coal (coal = 42%). Being associated with a high polluting industry, it is expected that companies
from the electricity industry would face a greater need to engage in carbon disclosure compared to
those from other industries.
Literature on carbon disclosure among electricity companies has been very limited. Most of the
prior literature were predominantly focusing on developed countries, cross sectional, and analysing
a single reporting medium. Additionally, most of the literature in social and environmental reporting
have used legitimacy theory to explain the trend in reporting (Abdul Hamid and Atan, 2011; Ahmed
Haji and Mohd. Ghazali, 2013; Escobar Pérez and González, 2006; Tredgiga and Milne, 2006;
Campbell, 2004, 2000; Gray et al., 1995; Tsang, 1998). However, in the absence of any specific
event/accident that could impose threats to the legitimacy of businesses, it is less likely that the
reporting practice could be explained by legitimacy theory. In fact, research by Campbell (2000)
and Guthrie and Parker (1989) provided evidence on how legitimacy theory has failed to become

42
the primary explanation for corporate social reporting. Alternative theories, including social issue
life cycle, perhaps could overcome the limitation inherent in legitimacy theory.
For these reasons, the study aims to achieve the following objectives. Firstly, it aims to examine the
level of carbon disclosure made by the electricity generating companies in Malaysia. Specifically,
we examined the quality of carbon disclosure in the annual reports and stand-alone sustainability
reports for the 2007-2014 period. Secondly, it aims to explain reporting behaviour using social issue
life cycle theory.
The research is pertinent for several reasons. It adds to the body of knowledge by filling the gap in
the extant carbon disclosure research. In essence, it focuses on the assessment of quality of
disclosure (instead of incidence or extent) in two corporate communications media (hence, is
more comprehensive) on a longitudinal basis (thus, reporting trend could be observed) using an
alternative theoretical lens (so the discussion on reasons for reporting could be enhanced). The
analysis of the disclosure also allows the identification of strengths and weaknesses in the current
reporting practice for future improvement. Finally, in the light of the introduction of MYCarbon,
this research is very timely in providing an indicator for the readiness of companies in Malaysia to
adopt the programme in the future.
The remaining sections of the paper are structured as follows. The next section provides the review
of literature, focusing on the institutional background, prior literature examining carbon disclosure,
and social issue life cycle theory. This is followed by a section on research methods. The
penultimate section presents the findings and analysis, and the final section provides the conclusion,
highlights the limitations, and offers some recommendations.

43
2. LITERATURE REVIEW
2.1 Institutional Background
The issues of climate change and global warming have received great attention by leaders around
the globe. Their commitment to mitigate these issues are attested by the number of countries signing
the United Nations Framework Convention on Climate Change (UNFCCC) in 1992, the Kyoto
Protocol in 1997, and the Copenhagen Accord in 2009, to name but a few. At the regional and
national levels, there is the EU ETS established in 2005, Canada’s Alberta Climate Change and
Emissions Management Act in 2007, California’s Global Warming Solutions Act in 2006, and the
UK’s Climate Change Act in 2008 (CDP, 2009). There have also been a growing number of
investor groups supporting climate change initiatives and relentlessly challenging companies on the
issue, including CDP, The Institutional Investors Group on Climate Change in Europe, The Investor
Network on Climate Risk in the US, and The Investor Group on Climate Change in Australia and
New Zealand (CDP, 2009). In response to climate change issues, Malaysia ratified the Kyoto
Protocol on 4 September 2002 (UNFCCC, 2013) and implemented various initiatives as described
earlier (see Section 1). As a result of its commitment, Malaysia has been ranked 51 for overall
environmental issues and 95 for climate and category, out of 178 countries assessed (Hsu et al.,
2014). Despite various initiatives, there is no specific regulation or act in Malaysia governing the
level of CO2 emissions.
The electricity industry in Malaysia is regulated by the Energy Commission of Malaysia (also
known as Suruhanjaya Tenaga Malaysia), which was established on 1 May 2001 under the Energy
Commissions Act 2001. Apart from this act, the electricity business is regulated under Electricity
Supply Act 1990, Electricity Regulations 1994, Electricity Supply (Compounding of Offences)
Regulations 2001, Licensee Supply Regulations 1990, and Efficient Management of Electrical
Energy Regulations 2008. Generally, the electricity transmission and distribution activities are
monopolised by Tenaga Nasional Berhad, which is the largest electric utility in Malaysia. However,
in terms of electricity generation, the activities are shared by a few companies, including Tenaga
Nasional Berhad itself and several other independent power producers (IPPs). According to the
Energy Commission of Malaysia’s website there were 29 utilities and major power producers and
IPPs in operation as of 2015. Furthermore, the large proportion of electricity generated in Malaysia
is derived from oil, gas, or coal (World Bank, 2015), although there is a sign of increasing use of
natural gas.

44
2.2 Prior Literature on Carbon Disclosure
In line with the increased expectation for companies to report their carbon information, various
reporting guidelines have been introduced. These include the Global Reporting Initiative (GRI)'s
Sustainability Reporting Guidelines, Greenhouse Gas Protocol's 'A Corporate Accounting and
Reporting Standard', and CDP. Furthermore, there have been an increasing number of companies
reporting carbon information voluntarily (CDP, 2011; KPMG, 2013) and the quality has increased
over the years (CDP, 2014).
In a similar vein, the number of studies investigating the extent of corporate carbon reporting has
also increased (e.g., Amran et al., 2015; Comyns and Figge, 2015; Choi et al., 2013; Luo and Tang,
2014; Rankin et al., 2011). However, most of these studies do not specifically examine the
electricity industry, which is the main focus of this study. There have been few studies investigating
carbon disclosure among electricity companies. However, these studies are predominantly based on
developed countries namely, the US (Freedman and Jaggi, 2004) and European countries (Sullivan
and Kozak, 2006). In the case of studies by CDP (2009, 2006) and Alrazi (2012), they conducted an
international comparison. However, Malaysian companies that made up the sample were either
limited in number or not represented. Alrazi (2004) conducted a study on electricity generating
companies in Malaysia, however, the study is cross sectional in nature (using 2012 data). An
examination of disclosure practices using a longitudinal approach would reveal possible variations
in disclosure practices not evident in a cross-sectional study (Murthy and Abeysekera, 2008). It may
also reveal the factors that influence changes in reporting practices over time (Nik Ahmad et al.,
2003). Additionally, most of the prior literature focused on a single reporting medium. Focusing on
one type of corporate communication medium (e.g., annual reports, CDP surveys) does not reflect
the complete picture of the company disclosure (Unerman, 2000).
Therefore, this study examines carbon disclosure among electricity generating companies in
Malaysia on a longitudinal basis using both annual reports and stand-alone sustainability
reports.

45
2.3 Social Issue Life Cycle Theory
According to social issue life cycle theory, an issue evolves through three to four predictable stages
(Mahon and Waddock, 1992; Bigelow et al., 1993; Nasi et al., 1997; Zyglidopoulos, 203). However,
an issue may not necessarily evolve according to the “normal” path (i.e., stage by stage) since issue
evolution may be affected by factors such as sudden intervention of government or other influential
stakeholders or the emergence of other issues that require immediate attention and shift attention
away from the existing issue (Bigelow et al., 1993; Nasi et al., 1997). Several studies have utilised
social issue life cycle theory to explain the corporate social responsibility initiatives and reporting.
Nasi et al. (1997) examined the annual reports of two, major Canadian and Finnish forestry
companies over a 16-year period. They found that social issues played a moderate role in the annual
report disclosures of all four companies between 1976 and early 1980s. However, there was a
significant reduction in disclosures in the mid-1980s as a result of the decline in attention paid to
societal issues. Increased disclosures in the late 1980s coincided with the general heightened
awareness on environmental issues.
Eweje (2005, 2006a, 2006b) examined the motives for corporate social responsibility initiatives
undertaken by companies from the multinational mining and oil industries operating in Nigeria and
South Africa. Several observations could be linked to social issue life cycle theory. Firstly, the
fatalities rate and injuries rate in the mining industry dropped between 1984 and 1998 by 23.2% and
38.05%, respectively (Eweje, 2005). Secondly, although it seemed that only Shell (one of the oil
companies) demonstrated its commitment towards environmental preservation since 1958, by 1997,
all other oil companies began promoting green initiatives and included environmental issues in their
strategic planning process (Eweje, 2006a). Thirdly, over time, both oil and mining companies also
appeared to be more environmentally proactive. This is evidenced by the establishment of
community relations departments to engage their stakeholders and the integration of environmental
issues in the mission statements, statements of business principles, and the Chairman’s statements
(Eweje, 2006b).

46
In a Malaysian study, Alrazi et al. (2009) examined whether there was any significant change in the
environmental reporting practice of 90 public listed companies in Malaysia for the years 1999,
2003, and 2006. They found that reporting increased significantly over the period. However, there
was a decrease in the quantity and quality of reporting in 2006 largely due to the shift of focus by
three companies involved in a merger and the possibility of companies reducing the amount of
disclosures to avoid being closely monitored by the regulators.
Therefore, based on the increased awareness towards climate change issue in Malaysia and globally,
the fact that the electricity industry is under closer scrutiny by global stakeholders due to its
contribution to CO2 emissions, and the arguments of social issue life cycle theory, it is expected that
the quality of carbon disclosure will increase over the period.
3. RESEARCH METHODS
3.1 Sample Selection
The list of electricity companies in Malaysia was obtained from the Energy Commission website
(Suruhanjaya Tenaga, 2015). As of 1 May 2015, there were 29 utilities and major power producers
and independent power producers (IPPs). However, most of these companies are private limited
companies, hence their corporate reports were not publicly accessible. We used web-based search
engines to match these companies with their parent companies. This process yielded seven unique
companies. It is worthy to note that at the beginning of the research, there were two other
companies. However, they sold their interests to other companies. Table 1 summarises the profile of
these public companies. Units generated (GWj) were estimated based on (Suruhanjaya Tenaga,
2015), while the percentage of operations was determined using the data reported in the 2014 annual
reports. Based on the table, electricity business represents a significant operation of the sample
companies.

47
Table 1: Sample Companies
Companies
Units Gen'd
(GWj)
% of Operations
Rev. Results Assets
1. Eden Inc. Bhd 231.27 26 96 58
2. Malakoff Corporation Bhd 17299.81 100 100 100
3. Mega First Corporation Bhd 103.84 72 77 37
4. MMC Corporation Bhd 8582.11 64 73 65
5. Tenaga Nasional Bhd 25800.82 100 100 100
6. YTL Corporation Bhd 7700.63 74 50 47
7. YTL Power International Bhd 7700.63 80 67 33
3.2 Data Collection
The data for both carbon disclosure and institutional governance were collected through content
analysis. Content analysis is "a research technique for making replicable and valid inferences from
texts (or other meaningful matter) to the contexts of their use" (Krippendorf, 2004, pp. 18). Annual
reports and stand-alone sustainability reports for the years 2007-2014 and the corporate websites (as
in July 2015) were examined. This period was selected based on data availability.
3.2.1 Carbon Disclosure
The disclosure index developed by Choi et al. (2013) was used as the basis to define and measure
carbon information. The index is guided by the factors identified in the Carbon Disclosure Project
(CDP) Annual Information Request sheets. CDP is a London-based not-for-profit organisation
established to help investors and cities globally to achieve sustainability. Each year, CDP has been
inviting the largest companies in the world (by size of market capitalisation) to participate in its
annual surveys on the issues of climate change, water, and forest protection. The number of
participating companies has increased over time, from 253 in 2003 to 5003 in 2014. Choi et al.
(2013) developed an 18-item disclosure index and used a dichotomous scoring system (1=disclosed,
0=not disclosed).

48
We refined the disclosure index to include two items from (CDP, 2013) (RC5 and RC6, see also
Shaiful Bahari and Alrazi, 2014); comparative figure for energy consumed (EC4, see also Clarkson
et al., 2008); policy/mission/vision (ACC4), stakeholder engagement programme (ACC3),
supporting organisations promoting climate change (ACC4), and awards received (ACC5) (see also
Van Staden and Hooks, 2007; Alrazi, 2012). Consistent with Clarkson et al. (2008), Van Staden and
Hooks (2007) and Alrazi (2012), we adopted a modified polychotomous scoring system in which
each item was assigned either 0-1 (12 items), 0-2 (10 items), or 0-4 scale (3 items) (see the
Appendix for the description of scores). This would ensure that the quality, instead of the mere
presence, of information be measured. Overall, our disclosure index contains 25 items and the
maximum possible marks for each company is 44. The scores were then converted into percentage.
Table 2 presents the disclosure index for the study.
Table 2: The Disclosure Index
No Disclosure Items Scores
A Climate change: risks and opportunities
1 CC1 – assessment/description of the risks relating to climate change 0-4
2 CC2 – assessment/description of current (and future) financial implications,
business implications, and opportunities of climate change 0-4
B GHG emissions accounting
3 GHG1 – description of the methodology used to calculate and report on GHG
emissions 0-2
4 GHG2 – existence external verification of quantity of GHG emission 0-2
5 GHG3 – total GHG emissions – metric tonnes CO2-e emitted 0-1
6 GHG4 – disclosure of Scopes 1 and 2, or Scope 3 0-1
7 GHG5 – disclosure of GHG emissions by sources 0-1
8 GHG6 – disclosure of GHG emissions by facility or segment level 0-1
9 GHG7 – comparison of GHG emissions with previous years, competitors or
industry average 0-1
C Energy consumption accounting
10 EC1 – total energy consumed 0-1
11 EC2 – quantification of energy used from renewable sources 0-1
12 EC3 – disclosure by type, facility or segment 0-1
13 EC4 - comparison of energy consumed with previous years, competitors or
industry average 0-1

49
D GHG reduction and cost
14 RC1 – detail of plans or strategies to reduce GHG emissions 0-4
15 RC2 – specification of GHG emissions reduction target level and target year 0-2
16 RC3 – emissions reductions and associated costs or savings achieved to date
as a result of the reduction plan 0-2
17 RC4 – cost of future emissions factored into capital expenditure planning 0-1
18 RC5 – the contribution of renewable electricity to the company’s EBITDA in
the current reporting year 0-1
19 RC6 – the projected contribution of renewable electricity to the company’s
EBITDA at a given point in the future 0-1
E Carbon emission accountability
20 ACC1 – indication of which board committee/other executive body has
overall responsibility for actions related to climate change 0-2
21 ACC2 – description of the mechanism by which the board/other executive
body reviews the company’s progress regarding climate change 0-2
22 ACC4 - Carbon policy/mission/vision statement 0-2
23 ACC5 - Description of stakeholder engagement programmes 0-2
24 ACC6 - Support for organisations promoting climate change 0-2
25 ACC7 - Awards received 0-2
Since this study is longitudinal, annual reports and stand-alone sustainability reports (if any) for the
years 2007-2014 were examined. Marks from both documents were totalled and subject to the
maximum mark allocated for each item. Overall, there are 56-firm year observations.
4. FINDINGS AND ANALYSIS
This study has two main objectives. First, it examines the trend in carbon reporting among
electricity generating companies in Malaysia. Second, it assesses the factors influencing the
disclosure through social issue life cycle lens. Due to the exploratory nature of the study, the
analysis is descriptive and qualitative.

50
4.1 Level of Carbon Disclosure
Figure 1 below depicts the trend in carbon disclosure among the sample companies for the period
2007-2014. All companies made some form of carbon disclosure during the period. The highest
disclosure was made by Tenaga Nasional Berhad (TNB) and YTL Corporation Berhad (YTL Corp)
both with 40.9% in 2012 and 2013, respectively. The figure also suggests that there is a general
increase in the trend of disclosure over the period - 9.1% in 2007 to 13.3% in 2014 (an increase of
46%). Although not tabulated here, most of the disclosures were related to climate change risks and
opportunities (CC1 and CC2), plans or strategies to reduce GHG emissions (RC1), and stakeholder
engagement programmes (ACC5). Only two of the companies - TNB and YTL Corp - reported
emissions data.
Figure 1: Trend in Carbon Disclosure (2007-2014)
4.2 Social Issue Life Cycle Theory
Few general patterns can be observed from Figure 1 above, and they can be divided into two sub-
periods. In the first period (2007-2010), the disclosure was at its highest in year 2009, especially for
TNB and YTL Corp (both with 31.8%). Such an increase in disclosure could be attributed to
Malaysia’s commitment to reduce its emissions as publicly declared at the United Nations Climate
Change Conference in Copenhagen. That year also saw an increase in policies at the national level
including the National Policy on Climate Change and The National Green Technology Policy.
Being among the largest companies in the highest emitting industry, these companies responded to
the public pressure through carbon disclosure. The disclosure then decreased in 2010 as public
expectation towards the company became less intense compared to when the issue was first
discussed.

51
The second period occurred between 2011 and 2014. The disclosure continued to increase in 2011
and this can be linked to the establishment of the Sustainable Energy Development Authority of
Malaysia (SEDA Malaysia), a statutory body formed under the Sustainable Energy Development
Authority Act 2011 [Act 726]. SEDA is responsible for administering and managing the
implementation of the feed-in tariff mechanism, which is mandated under the Renewable Energy
Act 2011 [Act 725]. Since renewable energy could reduce CO2 emissions and this could bring direct
impact to companies, it is rational to expect that companies would increase their disclosures by
including information related to renewable energy in their reports. In 2012, the Ministry of Natural
Resources and Environment was working with the United Nations Development Programme on the
national carbon disclosure programme for Malaysia. The framework, called 'MYCarbon - A
Corporate GHG Accounting and Reporting Programme for Malaysia', and there were two
stakeholder consultation workshops conducted in July and September 2012. In 2014, the disclosures
dropped as public pressure on the climate change issue became more stable and companies focused
on other issues important to stakeholders. For example, TNB focused on Imbalance Cost Pass-
Through (ICPT) based on Incentive Based Regulation (IBR) framework, which was effective 1
January 2014 and could impact its financial performance. Furthermore, since 2012 YTL Corp
engaged stakeholders by preparing its sustainability reports, and perhaps based on the outcome of
this engagement the company found the climate change issue less critical at that point in time.
Overall, consistent with Comyns and Figge (2015), the disclosure of carbon information increases
over time albeit not in the 'normal' path (i.e., continue to increase over time). This is perhaps
explained by social issue life cycle theory in which issue evolution may be affected by factors such
as the sudden intervention by government or other influential stakeholders or the emergence of other
issues that require immediate attention and divert attention away from the existing issue (Bigelow et
al., 1993; Zyglidopoulos, 2003).

52
5. CONCLUSION
This research investigates the trend in carbon disclosure by seven electricity generating companies
in Malaysia. Annual reports and stand-alone sustainability reports for the 2007-2014 period were
analysed for this purpose. All companies made some form of disclosure. Additionally, among the
disclosing companies, the quality of disclosure increased over time. Such an increase in disclosure
might be explained by social issue life cycle theory, in which disclosure increased when there was
heightened public awareness towards climate change issue as a result of public policies and
regulations.
The findings of this study offer several implications. Firstly, the reporting of information, despite
showing an increasing trend, is still low. This is evidenced from the highest average score in any
year, which is 15.9%. This indicates that if the companies were left alone, they will not disclose
information beyond what is required. Given that the industry is highly polluting and climate change
is the most important concern globally, mandating disclosures could help improve the quality of
information reported. Secondly, since the disclosure is minimal, it has made the decision-making
process by stakeholders more difficult. They will not be able to understand the climate change
implications on company operations and any initiatives that were undertaken by companies to
mitigate the climate change issue. For regulators, this situation could also make the tracking of
carbon emissions at the national level problematic. Carbon level tracking is important to ensure the
achievement of the 40% emission reduction target, as expressed at the Copenhagen conference, is
on-track.
There are few limitations inherent in this research. Firstly, it only focuses on the quality of reporting
and as such it is stakeholder-centric. Assessing the quantity of disclosure would enable us to
understand what is important for companies. It has been established in the literature that 'volume' of
information signifies the importance of information hence the stakeholders to companies (Unerman,
2000). Secondly, this research is based on secondary data. Additional data collected through
interviews or a survey might better reveal the motives for disclosure.

53
APPENDIX
THE SCORING SCHEME
No Scores Description
1 0-1 1 if reported, 0 if not reported
2 0-2 1 if provided minimum coverage and 2 if descriptive with clear evidence
provided
3 0-4
0 if not disclosed, no discussion of the issue
1 if minimum coverage, little detail—general terms. Anecdotal or briefly
mentioned
2 if descriptive: the impact of the company or its policies was clearly
evident
3 if quantitative: the environmental impact was clearly defined in
monetary terms or actual physical quantities
4 if truly extraordinary. Benchmarking against best practice
Source: Van Staden & Hooks (2007)

54
6. REFERENCES
Abdul Hamid, F.Z. and Atan, R., Corporate Social Responsibility by the Malaysian
Telecommunication Firms, 2011, International Journal of Business and Social Science, Vol. 2, no.
5, pp. 198-208.
Ahmed Haji, A. and Mohd. Ghazali, N.A., A Longitudinal Examination of Intellectual Capital
Disclosures and Corporate Governance Attributes in Malaysia, 2013, Asian Review of Accounting,
Vol. 21, no. 1, pp. 27-52.
Alrazi, A., The Carbon Disclosure of the Malaysian Major Power Producers: An Exploratory Study,
2004, Journal of Business Management, Vol. 3, no. 2, pp. 12-25.
Alrazi, A., The Quality and Determinants of Environmental Reporting of Electricity Generating
Companies: An International Comparison, 2012, Unpublished PhD thesis, Retrieved from:
https://researchspace.auckland.ac.nz/handle/2292/19386
Alrazi, B., Sulaiman, M., and Nik Ahmad, N.N. A Longitudinal Examination of Environmental
Reporting Practices in Malaysia, 2009, Gadjah Mada International Journal of Business, Vol. 11,
no. 1, pp. 37–72.
Amran, A., Say, K.O., Cheng, Y.W., and Hashim, F., Business Strategy for Climate Change: An
ASEAN Perspective, 2015, Corporate Social Responsibility and Environmental Management, doi:
10.1002/csr.1371.
Bigelow, B., Fahey, L., and Mahon, J.F., A Typology of Issue Evolution, 1993, Business and
Society, Vol. 32, no.1, pp. 18-29.
Bloomberg, The 20 Fastest-growing Economies This Year, 2015, Retrieved from:
http://www.bloomberg.com/news/articles/2015-02-25/the-20-fastest-growing-economies-this-year.
Campbell, D., A Longitudinal and Cross-sectional Analysis of Environmental Disclosure in UK
Companies - A Research Note, 2004, The British Accounting Review, 36, pp. 107-117.
Campbell, D., Legitimacy Theory or Managerial Reality Construction? Corporate Social Disclosure
in Marks and Spencer Plc Corporate Reports, 1969-1997, 2000, Accounting Forum, Vol. 24, no. 1,
pp. 80-100.

55
CDP, "CDP S&P 500 Climate Change Report 2014, 2014, Retrieved from:
https://www.cdp.net/CDPResults/CDP-SP500-leaders-report-2014.pdf: Carbon Disclosure Project.
CDP, Climate Change Report: Carbon Disclosure Project, 2006, Retrieved from:
https://www.cdp.net/en-US/Results/Pages/All-Investor-Reports.aspx: Carbon Disclosure Project.
CDP, Climate Change Report: Carbon Disclosure Project, 2009, Retrieved from:
https://www.cdp.net/en-US/Results/Pages/All-Investor-Reports.aspx: Carbon Disclosure Project.
CDP, Climate Change Report: Carbon Disclosure Project, 2011, Retrieved from:
https://www.cdp.net/en-US/Results/Pages/All-Investor-Reports.aspx: Carbon Disclosure Project.
CDP, Investor CDP 2013 Information Request - Electric Utilities, 2013, Retrieved from:
https://www.cdp.net/CDP%20Questionaire%20Documents/Investor-CDP-2013-Information-
Request-EUSector.pdf: Carbon Disclosure Project.
Choi, B.B., Lee, D., and Psaros, J. An Analysis of Australian Company Carbon Emission
Disclosures, 2013, Pacific Accounting Review, Vol. 25, no. 1, pp. 58-79.
Clarkson, P.M., Li, Y., Richardson, G.D., and Vasvari, F.P., Revisiting the Relation between
Environmental Performance and Environmental Disclosure: An Empirical Analysis, 2008,
Accounting, Organizations and Society, Vol. 33, pp. 303-327.
Comyns, B. and Figge, F., Greenhouse Gas Reporting Quality in the Oil and Gas Industry– A
Longitudinal Study Using the Typology of “Search”, “Experience” and “Credence”, 2015,
Information. Accounting, Auditing & Accountability Journal, Vol. 28, no. 3, pp. 403-433.
Escobar Pérez, E and González González, J.M., Corporate Social Responsibility at Multinational
Electricity Corporation: A Longitudinal Case Study, 2006, Social Responsibility Journal, Vol. 2, no.
1, pp. 69-82.
Eweje, G., Environmental Costs and Responsibilities Resulting from Oil Exploitation in Developing
Countries: The Case of the Niger Delta of Nigeria, 2006a, Journal of Business Ethics, Vol. 69, pp.
27–56.
Eweje, G., Hazardous Employment and Regulatory Regimes in the South African Mining Industry:
Arguments for Corporate Ethics at Workplace, 2005, Journal of Business Ethics, Vol. 56, pp. 163–
183.
56
Eweje, G., The role of MNEs in Community Development Initiatives in Developing Countries –
Corporate Social Responsibility at Work in Nigeria and South Africa, 2006b, Business and Society,
Vol. 45, no. 2, pp. 93–129.
Freedman, M. and Jaggi, B., Carbon Dioxide Emissions and Disclosures by Electric Utilities, 2004,
Public Interest Accounting, Vol. 10, no. 4, pp. 105-129.
Gray, R., Kouhy, R. and Levers, S., Corporate Social and Environmental Reporting - A Review of
the Literature and a Longitudinal Study of UK Disclosure, 1995, Accounting, Auditing, &
Accountability Journal, Vol. 8, no. 2, pp. 47-77.
Guthrie, J. and Parker, L., Corporate Social Reporting: A Rebuttal of Legitimacy Theory, 1989,
Accounting and Business Research, Vol. 19, no. 76, pp. 343-352.
Hsu, A., Emerson, J., Levy, M., de Sherbinin, A., Johnson, L., Malik, O., Schwartz, J., and Jaiteh,
M., The 2014 Environmental Performance Index, 2014, New Haven, CT: Yale Center for
Environmental Law & Policy. Retrieved from: www.epi.yale.edu.
IEA, CO2 Emissions from Fuel Combustion: Highlights. 2013. Retrieved from:
http://www.iea.org/publications/freepublications/publication/CO2EmissionsFromFuelCombustionH
ighlights2013.pdf: International Energy Agency.
IPCC, Climate Change 2007: Synthesis Report, 2007, Retrieved from
http://www.ipcc.ch/pdf/assessment-report/ar4/syr/ar4_syr.pdf: Intergovernmental Panel on Climate
Change
KPMG, The KPMG Survey of Corporate Responsibility Reporting, 2013, Retrieved from:
http://www.kpmg.com/AU/en/IssuesAndInsights/ArticlesPublications/Documents/corporate-
responsibility-reporting-survey-2013.pdf
Krippendorf, K., Content Analysis - An Introduction to its Methodology 2nd
ed., Thousand Oaks,
CA: Sage Publications, 2004.
Luo, L. and Tang, Q., "Does Voluntary Carbon Disclosure Reflect Underlying Carbon
Performance?, 2014, Journal of Contemporary Accounting and Economics, Vol. 10, pp. 191-205.

57
Mahon, J.F. and Waddock, S.A., Strategic Issues Management: An integration of Issue Life Cycle
Perspectives, 1992, Business and Society, Vol. 31, no. 1, pp. 19-32.
Murthy, V. and Abeysekera, I., Corporate Social Reporting Practices”, 2008, The Australasian
Accounting Business and Finance Journal, Vol. 2, no. 1, pp. 236-59.
Nasi, J., Nasi, S., Phillips, N., and Zyglidopoulos, S.C., “The Evolution of Corporate Social
Responsiveness – An Exploratory Study of Finnish and Canadian Forestry Companies,1997,
Business and Society, Vol. 36, no. 3, pp. 296-321.
Nik Ahmad, N.N., Sulaiman, M., and Siswantoro, D., “Corporate Social Responsibility Disclosure
in Malaysia: An Analysis of Annual Reports of KLSE Listed Companies”, 2003, IIUM Journal of
Economics and Management, Vol. 11, no. 1, pp. 51-86.
Rankin, M., Windsor, C., and Wahyuni, D., An Investigation of Voluntary Corporate Greenhouse
Gas Emissions Reporting in a Market Governance System: Australian Evidence, 2011, Accounting,
Auditing & Accountability Journal, Vol. 24, no. 8, pp. 1037-1070.
Shaiful Bahari, N.A. and Alrazi, B., The Level of Carbon Reporting by the Largest Electricity
Generating Companies in Malaysia: A Longitudinal Analysis, 2014, Proceedings of National
Symposium & Exhibition on Business & Accounting, March 19, Muadzam Shah, Malaysia (ISBN:
978-983-42982-6-5).
Soon, H.Y. National Carbon Disclosure Programme for Malaysia - Local emission Factor
Workshop, 2012, Retrived from:
http://ecoideal.com.my/mycarbon/download/Development%20of%20Local%20Emission%20Factor
%20Workshop-2292012shy.pdf
Sullivan, R. and Kozak, J. The Climate Change Disclosures of European Electricity Utilities, 2006,
Retrieved from:
http://www.insightinvestment.fr/global/documents/riliterature/367922/cc_disclosures_report.pdf.
Suruhanjaya Tenaga, IPPs directories, 2015, Retrieved from http://www.st.gov.my/
Tredgiga, H. and Milne, M., From Sustainable Management to Sustainable Development: A
Longitudinal Analysis of a Leading New Zealand Environmental Reporter, 2006, Business Strategy
and the Environment, Vol. 15, pp. 219-241.

58
Tsang, E.W.K., A Longitudinal Study of Corporate Social Reporting in Singapore - The case of
Banking, Food and Beverages and Hotel Industries, 1998, Accounting, Auditing, & Accountability
Journal, Vol. 11, no. 5, pp. 624-635.
Unerman, J., Methodological Issues - Reflections on Quantification in Corporate Social Reporting
Content Analysis, 2000, Accounting, Auditing & Accountability Journal, Vol. 13, no. 5, pp. 667-
680.
UNFCCC, Kyoto Protocol Status of Ratification, 2013, Retrieved from:
http://unfccc.int/files/kyoto_protocol/status_of_ratification/application/pdf/kp_ratification_2009120
3.pdf: United Nation Framework Convention on Climate Change.
Van Staden, C.J., and Hooks, J., A Comprehensive Comparison of Corporate Environmental
Reporting and Responsiveness, 2007, The British Accounting Review, Vol. 39, pp. 197-210.
World Bank, World Bank Open Data, 2015, Retrieved from: http://data.worldbank.org/
Zyglidopoulos, S.C., The Issue Life Cycle: Implications for Reputation for Social Performance and
Organisational Legitimacy, 2003, Corporate Reputation Review, Vol. 6, no. 1, pp. 70-81.

59
7. AUTHORS
Dr. Bakhtiar Alrazi is a senior lecturer at the Department of Accounting, Universiti Tenaga
Nasional. He holds a PhD (Accounting) degree from the University of Auckland, New Zealand, a
MSc. (Accounting) degree from the International Islamic University Malaysia, and a Bachelor of
Accounting (Hons.) degree from Universiti Tenaga Nasional, Malaysia. He teaches financial
accounting, integrated case study, accounting research method, and Islamic accounting courses. He
has a deep research interest in the areas of environmental reporting, corporate governance, and
accounting from the Islamic perspective. Currently, he is the Dean of College of Business
Management and Accounting and a member of the University senate.
Dr. Norhayati Mat Husin joined Universiti Tenaga Nasional (UNITEN) in 2000. She is currently
an Assistant Deputy Vice Chancellor (UNITEN Sultan Haji Ahmad Shah Campus) as well as the
Head of Research Cluster – Energy and Social Sustainability. Dr. Norhayati obtained her first
degree in the area of accounting and finance from Lincoln University, New Zealand in 2000. She
then pursued her master's degree in the area of international accounting and consultancy at the
University of Reading, United Kingdom in 2003. In 2012, she obtained her PhD from Auckland
University of Technology (AUT), New Zealand. In UNITEN, Dr. Norhayati teaches, researches,
and supervises undergraduate and postgraduate students in the area of accounting theory and
business reporting. She has presented and published several papers particularly in the area of
sustainability reporting. With her research experience, Dr. Norhayati has been appointed as reviewer
for conferences such as Asian Forum for Business Communication 2012 Conference and journals
such as Asian Academy of Management Journal of Accounting & Finance.

60
CONSOLATION PRIZE
CORPORATE SOCIAL RESPONSIBILITY DISCLOSURE AND
FINANCIAL PERFORMANCE: EVIDENCE FROM LISTED
MANUFACTURING FIRMS
Ms Sahar E-Vahdati
Professor Dr. Lai Ming Ming

61
CORPORATE SOCIAL RESPONSIBILITY DISCLOSURE AND FINANCIAL
PERFORMANCE: EVIDENCE FROM LISTED MANUFACTURING FIRMS
ABSTRACT
This paper attempts to establish the relationships between Corporate Social Responsibility (CSR)
and Return on Asset (ROA) and Tobin’s Q in Malaysia’s manufacturing industry following the
mandatory disclosure of CSR. Total CSR with both ROA and Tobin’s Q showed negative
relationships in both direction tests. The environmental and workplace dimensions of CSR reported
negative relationships with firm performance. However, marketplace and community dimensions
that had the highest disclosure showed positive associations with Tobin’s Q. Manufacturing firms
should have a paradigm shift toward CSR. The Malaysian government should also introduce tax
incentives and CSR levy to promote CSR initiatives.
1. INTRODUCTION
Corporate social responsibility (CSR) has received great attention from companies worldwide (Aras
& Crowther, 2008; Sahin et al., 2011; Bolton; 2014). Although there is no agreed upon definition of
what constitutes CSR (Ortiz & Crowther, 2005), it is described as a firm’s responsibility to carry out
social actions that benefit stakeholders. The association between CSR and firm performance has
aroused some controversies. Given the controversial arguments, many researchers have been
examining the links between financial performance and CSR in order to assess the validity of trade-
offs between investing in dimensions of CSR and firm value. Firms in the majority of developed
countries have integrated CSR in their projects - using corporate communications to highlight their
commitment to social behaviours. Furthermore, they have tried to improve marketing efforts and
legitimise good firm view from the perspective of shareholders (Birch & Moon, 2004). Nonetheless,
only limited studies on the link between CSR and profitability in developed countries have been
found.

62
In December 2014, Bursa Malaysia with the collaboration of FTSE launched a new international
benchmarking FTSE4Good Index Series to measure the performance of companies demonstrating
strong, Environment, Social and Governance (ESG) practices. “Bursa Malaysia has been valued 4th
in the world for investor protection and 4th
in Asia for corporate governance” (NST, 2014). This
index allows investors to consider the firm’s environmental and societal initiatives in their
investment decisions. Malaysia, an emerging market, was hard hit by the 1997-1998 Asian financial
crisis where the gross domestic product plummeted, threatening the country’s position as a
profitable investment destination. The government took steps to reform corporate governance and
subsequently implemented the CSR framework for all public listed companies. Beginning from
2006, Bursa Malaysia established a framework for registered public companies to follow CSR
practices (Bursa Malaysia, 2006).
Although CSR awareness had been raised among Malaysian companies, the majority were only
focused on their products and sales without considering social performance. It was unlikely that
they understood the impact of having CSR in their projects with regards to their firms’ values and
profitability. Hence, the level of CSR disclosure was still low (Bursa Malaysia, 2006). In addition,
only a few studies have examined CSR activities and their relationship with profitability Limited
studies have examined CSR in a single industry to emphasise its effects on the industry itself.
Cottrill (1990) and Waddock and Graves (1997) showed that there were great differences in CSR
from one industry to another. They suggested that more consideration should be given to the
respective industries. Simpson and Kohers (2002) also supported this finding. They urged
researchers to concentrate on one single industry as wide differences were found between industries.
On the other hand, Cooke et al. (1990) indicated that manufacturing companies may have paid more
attention to social responsibilities than the other industries despite being known as a dirty industry
(Jänicke, Binder, & Mönch, 1997). A dirty industry may have engaged in more social responsibility
than the other sectors in order to enhance its value. Dirty industries are the main polluters and cause
above-average environmental stress. These include the “producers of paper and paper board,
petroleum products, primary metals, stone, clay, glass and chemicals” (Janicke, et al. (1997, p. 468).
Hence, it is interesting to learn from the manufacturing industry of an emerging economy.

63
Prompted by all these findings, this paper is motivated to examine the relationships between CSR
with short run (return on asset) and long run (Tobin’s Q) performance measures on 202
manufacturing firms in Malaysia. This paper aims to find out if any four dimensions of CSR after
segregation affect the performance of manufacturing firms listed on Bursa Malaysia. These
manufacturing firms produce fuel, zinc, and crude steel – using more machines and services in
comparison to the other sectors. It is a highly polluting sub-sector of the economy. The findings of
this paper bridge the gap of existing literature of CSR in an emerging economy with the segregation
of total and multiple dimensions of CSR as well as capture the industry effects.
2. LITERATURE REVIEW
Underpinning the study of the relationship between CSR and firm performance is the stakeholder
theory. Within this theory, a company must be able to accommodate the different demands of
various stakeholder interests. Therefore, a company that balances both its financial performance and
its involvement in CSR activities is one that sees its trust grow, reduces the transaction cost and
certain risks (Greening and Turban, 2000).
Freeman (1984) examined the stakeholder approach on strategic management. He combined the
stakeholder theory method with statistical analysis. He found that strategic management illustrated
prominent features of stakeholders. Teoh and Thong (1984) who studied the issue from the
standpoint of a developing country examined CSR in Malaysia. They conducted a survey on Chief
Executive Officers from approximately 100 companies. They concluded that social responsibility
was lagging in corporate social activities. Corporate size and national origin of corporate ownership
were important in relation to CSR. Waddock and Graves (1997) found a positive relationship
between CSR and firm performance linking it to the slack resource theory, which supported the
good management theory.
Abdul and Ibrahim (2002) analysed views of managers and executives towards CSR in different
sectors of industry in Malaysia. The results revealed that the executives and managers had positive
attitudes towards CSR; hence, the level of awareness had risen over the years. They indicated that
the government’s attention had increased but it was likely to take more time for the government to
introduce an index for social responsibilities and tax benefit. It is worth to note that Malaysia is a
leader in the Association of South East Asian Nations (ASEAN) in terms of the number of
companies producing sustainability reports.

64
2.1 Empirical Studies of CSR and Firm Performance
Table 1 highlights some recent studies in the association between CSR and financial achievements.
The review shows that some studies reported a negative association (Van der Lann et al., 2008), but
most of the studies found mixed (McWilliams and Siegel, 2000) and positive relationships (Lin,
Yang, and Liou, 2009) between CSR and firm performance. For example, Pava and Krausz (1996)
used narrative reviews method for their meta-analysis for past studies in the US for 53 firms in the
two sample periods of 1985 to 1987, and 1989 to 1991. They examined 21 studies on the
associations between CSR and financial performance. The results show a negative relationship in
one study while eight studies showed no association and 12 studies found some positive links
between the firms’ social responsibility activities and their financial performances.
Griffin and Mahon (1997) used vote-counting method in their meta-analysis for firms in the
chemical industry in 1992 in the US. They reviewed 64 studies and found positive associations in 33
studies, negative in 22 studies while 9 studies had neutral association results.

65
Table 1: Results of Recent Studies between CSR and Financial Performance
Source: Adapted from E-vahdati, S., and Lai, M. M. (2015). Corporate Social Responsibility
and Firm Value of Malaysian Companies (1st Edition). CreateSpace Independent Publishing
Platform. Reprinted with permission.
3.0 DATA AND METHOD
Table 2 presents the associations of total and multiple dimensions of CSR with the firm’s short-
run (accounting-based) performance and firm’s long-run (market-based) performance. The
independent, dependent, control variables and hypotheses tested are described as well.
Study Variable
Sample
Results Corporate
social
responsibility
Financial
Performance
Dowell et al.
(2000)
Global
environment
Standards
Tobin’s Q 89 US
multinational
enterprises
Positive
relationship
McWilliams
& Siegel
(2000)
Kinder
Lydenberg
Domini (KLD)
index
ROA
524 US
companies
Neutral or mixed
relationship
Van der Laan
et al. (2008)
Kinder
Lydenberg
Domini (KLD)
index
ROA
Top US
companies
Negative
relationship
Lin et al.
(2009)
Annual reports
of companies
ROA,
Tobin’s Q
1000 Taiwanese
firms
Positive
relationship with
market-based
Aras et al.
(2010)
Annual reports ROA
ROE
ROS
40 Turkish
companies
Neutral or mixed
relationship
Inoue & Lee
(2011)
Kinder
Lydenberg
Domini (KLD)
index
ROA
Tobin’s Q
367 in US
tourism industry
Neutral or mixed
relationship

66
Table 2: Definition of the Variables and Hypotheses Tested
Variables Definitions Hypotheses Dependent Independent
Return On
Asset
(ROA)
Tobin’s Q
(TQ)
Corporate
Social
Responsibility
(CSR)
Net income before tax and
interests divided by total
assets.
Book value of assets minus
book value of equity plus
market value of equity
divided by book value of
assets.
Contains total of
environment, community,
workplace & marketplace,
which is calculated by the
number of sentences in an
annual report about CSR
(content analysis).
H1: Higher financial
performance leads to
higher CSR.
H2: Higher CSR leads to
higher financial
performance.
CSR
ROA
TQ
ROA
TQ
CSR
Environment
(ENV)
Dimension of CSR, which is
calculated by the number of
sentences in annual report in
the environmental section.
H3: There is a relationship
between environment
and firm performance.
ROA
TQ
ENV
Community
(COM)
Dimension of CSR, which is
calculated by the number of
sentences in annual report in
the community section.
H4: There is a relationship
between community and
firm performance.
ROA
TQ
COM
Workplace
(WP)
Dimension of CSR, which is
calculated by the number of
sentences in annual report in
the workplace section.
H5: There is a relationship
between workplace and
firm performance.
ROA
TQ
WP
Market Place
(MP)
Dimension of CSR, which is
calculated by the number of
sentences in annual report in
the marketplace section.
H6: There is a relationship
between marketplace
and firm performance.
ROA
TQ
MP
Source: Adapted from E-vahdati, S., and Lai, M. M. (2015). Corporate Social Responsibility and Firm Value
of Malaysian Companies (1st Edition). CreateSpace Independent Publishing Platform. Reprinted with
permission

67
3.1 Data Sample
The sample employed included manufacturing companies listed on Bursa Malaysia. Since there is
no special category in the Thomson Reuters DataStream database for the manufacturing industry
(DataStream International Ltd, 2006a; DataStream International Ltd, 2006b), the manufacturing
firms were selected from the emerging markets information service (EMIS, 2012); it was then
organised with companies listed in the Thomson Reuters DataStream Database (DataStream
International Ltd, 2006a; DataStream International Ltd, 2006b).
Initially, there were 397 companies but due to incomplete data the number was decreased to 202.
All CSR data were collected from the CSR section in the annual reports of these 202
manufacturing firms from 2007 to 2010. This period was chosen because of the implementation
of the CSR framework in 2006. All registered public listed firms were required to disclose their
corporate social activities in their annual reports. The CSR data were subsequently compiled
together with all financial data from the Thomson Reuters DataStream Database and financial
statements to create the complete dependent and control variables (DataStream International Ltd,
2006a; DataStream International Ltd, 2006b; Bursa Malaysia, 2012).
3.2 Dimensions of CSR
As mentioned earlier, the dimensions of CSR covered in Malaysia are: (1) environment, (2)
community, (3) workplace, and (4) marketplace. These four dimensions are in line with the
stakeholder theory (Bursa Malaysia, 2006). Given an absence of a special index for measuring
CSR activities in Malaysia, we did so through content analysis of the annual reports of the
manufacturing companies.
Gray, Kouchy and Lavers (1995) pointed out that content analysis has been widely used and the
most common method in CSR research. It simply measures the presence of certain words in the
text. The use of annual reports for content analysis is supported by Hughes et al. (2001) for easy
availability. Annual reports are proof documents for company shareholders. Applying sentences
for measuring CSR is more reliable than other units of analysis, since unreliability can occur
when words or areas like pages are used (Milne & Adler, 1999). Some studies counted words
instead of counting the number of sentences in their analyses. This method was not a precise tool,
because portion of pages may be different in different print, column and page sizes (E-vahdati
and Lai, 2015). Therefore, sentence counting can solve the problem of standardisation of words

68
(Hackston and Milne, 1996). We measured these four dimensions by counting the number of
sentences related to these variables in the annual reports (Hackston and Milne, 1996; Mustaffa
and Tamoi, 2006; Aras, Aybar and Kutlu, 2010).
3.3 Short and Long Run Firm Financial Performance
This study used two financial performance measures, namely, Return on Assets (ROA) and
Tobin’s Q. ROA represents a short-run profitability and accounting-based measurement
(McGuire, et al., 1988). It is viewed that high CSR would lead to increased profits as a result of
increased revenues and reduction in operational costs. It is a widely used instrument for firm
performance. It is the net income before interests and taxes divided by total assets (Van der
Laan, Van Ees, & Van Witteloostuijn, 2008) where the data are retrieved from the Thomson
Reuters DataStream database and the firms’ annual reports.
Meanwhile Tobin’s Q is a long-run profitability and market-based measurement of future
profitability with a reflection on long-run profitability (E-vahdati and Lai, 2015). It shows how
investors evaluate the firm’s capability in creating intangible resources and competitive
advantages, resulting in high future profits (Wu, 2006).
It is described as a ratio of firms’ value in the long run and firm’s market value to the book value
of assets (Dowell, Hart, & Yeung, 2000; Lin et al., 2009; Rossi Jr., 2009). The data were obtained
from the firms’ annual reports and the Thomson Reuters DataStream Database. The Tobin’s Q
formula is as follows:
Market value of firm = book value of assets – book value of equity + market value of the equity
Tobin’s Q = market value of firm/ book value of assets (E-vahdati and Lai, 2015).
3.4 Control Variables
This study considers four variables, namely, firm size, risk, leverage, and research &
development intensity (R&D) to control the effects between CSR and firm financial performance.
The data were obtained from the Thomson Reuters DataStream Database and the annual reports
of the firms.

69
Firstly, firm size is perceived to have a positive impact on firm performance because large firms
are more likely to engage in CSR activities. Different variables have been used to measure the
firm size. Mustaffa and Tamoi (2006) used the number of employees to obtain firm size (E-
vahdati and Lai, 2015). Waddock and Graves (1997) applied total assets, total sales and the
number of employees for measuring size. Van der Laan et al. (2008) performed natural logarithm
on the number of employees for rating the size of a firm. Some other researchers used natural
logarithm of annual sales as a measurement (Rossi Jr., 2009;Inoue & Lee, 2011). In this study,
we considered size as a control variable based on the natural logarithm of annual sales.
Secondly, risk is used to control the relationship between social behaviours and profitability.
Waddock and Graves (1997) described risk as long-term debt to total assets, and contended that
risk level was crucial since increased tolerance of risk management would lead to activities that
build or destroy an environment. These include, recycling or waste reduction to avoid air
pollution. Aras et al. (2010) mentioned risk as a ratio of debt to total assets. Some researchers
used risk as a control variable when applying on beta (McGuire et al., 1988; Seifert, Morris, &
Bartkus, 2004). We used long-term debt divided by total assets was used as a measure of risk (E-
vahdati and Lai, 2015).
Thirdly, leverage is described as the ability of companies to meet financial obligations and to
control the difference in firm capital structure. Although leverage impacts capital structure, the
relationship with firm profitability is ambiguous. Since there are tax shields in relation to
payments, the impact will be positive. If leverage causes a rise in the payment of bankruptcy cost,
the relationship will be negative. A lot of literature used leverage as a control variable for the
association between corporate social behaviours and firm profitability. Van der Laan et al. (2008)
used leverage as total debts to total equity and argued that if a firm had more debts, receiving
return of investors might not increase, and the return on equity would decrease. Rossi Jr. (2009)
defined leverage in their study as total debts divided by total equity. Inoue and Lee (2011)
measured leverage as total debts divided by total assets. We used leverage as total debts to equity
in this study (E-vahdati and Lai, 2015).

70
Lastly, research and development intensity (R&D) is used to measure the effectiveness of
innovation and reputation. Research and development is a form of capital investment. Technical
capital is the increase of knowledge about innovative products. Therefore, research and
development is related to firm performance (McWilliams & Siegel, 2000). Most researches
argued that there was a positive association between R&D and CSR. They argued that companies
with high activity in corporate social behaviours demonstrated high quality in their products and
good reputation; consequently they had high innovation (McWilliams & Siegel, 2000;Aras, et al.,
2010). Therefore, R&D intensity in this study is measured as R&D expenditure divided by net
sales or revenues.
4. RESEARCH FRAMEWORK AND HYPOTHESIS
Total CSR is described as the sum of CSR in all four dimensions: environment, community,
workplace and marketplace. Aras et al. (2010) found that there was a mixed relationship between
CSR and firm performance. As mentioned earlier, the number of sentences that were disclosed in
the annual reports during the sample period measures the quantity of CSR. Total CSR was used
as a dependent variable in hypothesis 1 (H1) which means that higher financial performance leads
to higher CSR. Model 1.1 and 1.2 used ROA and Tobin’s Q as independent variables,
respectively.
Total CSR was used again as an independent variable in model 2.1 and 2.2 in conjunction with
the stakeholder theory in hypothesis 2 (H2). It should be pointed out that model 2.1 used ROA as
a dependent variable to measure short-run profits whereas model 2.2 employed Tobin’s Q to
reflect long run profitability. These two hypotheses and their models are described as follows:
H1: Higher financial performance leads to higher CSR.
Model 1.1:
CSR = α0+ β1 ROA+ β2 SIZE+ β3 RISK+ β4 LEV+ β5 R&D + ε
Model 1.2:
CSR = α0+ β1 TQ+ β2 SIZE+ β3 RISK+ β4 LEV+ β5 R&D + ε

71
H2: Higher CSR leads to higher financial performance.
Model 2.1:
ROA = α0+ β1 CSR+ β2 SIZE+ β3 RISK+ β4 LEV+ β5 R&D + ε
Model 2.2:
TQ = α0+ β1 CSR+ β2 SIZE+ β3 RISK+ β4 LEV+ β5 R&D + ε
Where:
α = Intercept, ε = error term, ROA = return on asset (accounting-based performance)
TQ = Tobin’s Q (market-based performance), CSR = corporate social responsibility, ENV =
environment dimension, COM = community dimension, WP = workplace dimension, MP =
marketplace dimension, SIZE = size of the company, RISK = risk of company, LEV = debt level
of firm and R&D = research and development
The environment is perceived as an important dimension of CSR. Hughes et al. (2001) discussed
the extent environmental disclosure in an annual report can affect performance and concluded
that it was a negative influence.
On the other hand, Mahoney and Roberts (2007) argued that the environmental dimension had a
positive significant link with financial achievement. Scholtens (2008) indicated that each
dimension of CSR might have a different relationship with financial performance. He depicted
the environment and profitability as having a positive relationship. However, Inoue and Lee
(2011) concluded that the environment had no effect on firm performance. The environment did
not improve the outcome of profitability in the tourism industry. Therefore, we hypothesise as
follows:
H3: There is a relationship between the environment and firm performance.
Community is another dimension of CSR. Inoue and Lee (2011) stated that the community as a
dimension of CSR had different characteristics in different industries. They found that social
expenditure in community declined short-run profitability for the airline industry but raised both
short-term and long-term performances for the restaurants and hotel industries. These positive
associations in the services industry might be due to their dependency on local communities such
as suppliers and their activities. On the other hand, in the airline industry, the dependency on

72
local communities was weak and they received fewer advantages from the community. The
hypothesis is as follows:
H4: There is a relationship between community and firm performance.
Workplace that embraces employees is another important dimension of CSR. Mahoney and
Roberts (2007) stated that there was no significant relationship between employees and financial
performance. Scholtens (2008) argued that there was a unidirectional relationship between
employees and social activities. They contended that employees were concerned with profitability
in companies whereas Van der Laan et al. (2008) argued that there was a negative relationship
between employees and financial performance. They explained that employees were secondary
stakeholders. However, Inoue and Lee (2011) explained that employees had a significant positive
relationship with the long-term profitability in the airline industry but it showed no association on
short-term profitability. These mixed results might be due to the lack of awareness of employees
of CSR initiatives. Therefore, we hypothesise as follows:
H5: There is a relationship between workplace and firm performance.
The marketplace is sometimes described as products or customers, and it is another individual
dimension of CSR. Mahoney and Roberts (2007) concluded that marketplace dimension had a
significant positive association with profitability. Scholtens (2008) found a positive relationship
between products and financial achievement. Good quality products would enhance the
interaction between companies and their suppliers, which led to better firm performance. Inoue
and Lee (2011) showed that the marketplace had a positive association with firm performance for
the airline, hotel, and restaurants industries. It enhanced both short and long-term profitability.
This was supported by Galbreath and Shum (2012) who showed that customer satisfaction was
related to company profitability. On the other hand, Van der Laan et al. (2008) concluded that
consumer satisfaction was unrelated to financial performance as there was no relationship
between them. Therefore, the hypothesis as follows:
H6: There is a relationship between marketplace and firm performance.

73
Multiple regression analysis was used to test the effects of four dimensions of CSR on firm
performance. Control variables were added for better results. Two models are as follows:
Model 3.1:
ROA = α0+ β1 ENV+ β2 COM+ β3 WP+ β4 MP+ β5 SIZE+ β6 RISK+ β7 LEV+ β8 R&D + ε
Model 3.2:
TQ = α0+ β1 ENV+ β2 COM+ β3 WP+ β4 MP+ β5 SIZE+ β6 RISK+ β7 LEV+ β8 R&D + ε
Where:
α = Intercept, ε = error term, ROA = return on asset (accounting-based performance)
TQ = Tobin’s Q (market-based performance), CSR = corporate social responsibility, ENV =
environment dimension, COM = community dimension, WP = workplace dimension, MP =
marketplace dimension, SIZE = size of the company, RISK = risk of company, LEV = debt level
of firm and R&D = research and development
5. ANALYSES AND DISCUSSIONS
Table 3 reports the descriptive statistics of CSR disclosure for 202 manufacturing firms from
2007 to 2010. The amount of CSR disclosure sentences are indicated for the environment,
community, workplace, and marketplace dimensions as well as the total CSR. From 2007 to
2010, the number of disclosures in the annual reports for these four dimensions had increased. In
2010, total CSR indicated the highest disclosure sentences, whereas 2007 the lowest. It may
imply positive improvements due to the implementation of CSR framework in 2006 on these
firms. The community dimension with an average of 6.75 sentences appeared to be the highest
number of sentences disclosed in the annual reports. It implied that companies were more willing
to disclosure community activities such as building schools, education of employees or students
in their annual reports. The least number of sentences found was related to the marketplace in
relation to products and customers. Each company’s average disclosure for the marketplace
dimension of CSR stood at about 3.15 sentences.

74
Table 3: Descriptive Statistics for Social Disclosure Measures of Manufacturing Companies on Bursa Malaysia from 2007 to 2010
Sample year Environment Community Workplace Marketplace Total CSR
Disclosing
sentences
amount
(Number)
Disclosed
sentences
(Percentage)
Disclosing
sentences
amount
(Number)
Disclosed
sentences
(Percentage)
Disclosing
sentences
amount
(Number)
Disclosed
sentences
(Percentage)
Disclosing
sentences
amount
(Number)
Disclosed
sentences
(Percentage)
Disclosing
sentences
amount
(Number)
Disclosed
sentences
(Percentage)
2007 1011 29.03% 1062 30.49% 894 25.67% 515 14.8% 3482 100%
2008 1260 28.27% 1324 29.70% 1244 27.91% 629 14.11% 4457 100%
2009 1394 28.51% 1489 30.46% 1326 27.12% 679 13.89% 4888 100%
2010 1417 27.40% 1575 30.45% 1456 28.16% 723 13.98% 5171 100%
Total a 5082 113.22% 5450 121.12% 4920 108.87% 2546 56.69% 17998 400%
Average b 1270.5 28.30% 1362.5 30.28% 1230 27.21% 636.5 14.17% 4499.5 100%
Firm average c 6.28 6.75 6.09 3.15 22.35
Notes: a Total means sum up number of sentences in column one of each variable, and sum up percentage of each variable in column two.
b Average means total of each column divided by four.
c Firm average means total number of sentences of each variable divided by 808 (202 firms*4 years).
Source: Adapted from E-vahdati, S., and Lai, M. M. (2015). Corporate Social Responsibility and Firm Value of Malaysian Companies (1st Edition).
CreateSpace Independent Publishing Platform. Reprinted with permission.

75
Table 4 shows the descriptive statistics for financial performance variables, four dimensions of
CSR and control variables of 202 manufacturing firms on Bursa Malaysia from 2007 to 2010.
Specifically, ROA and Tobin’s Q showed wide differences between the profits achieved during
this four-year period in which they showed a minimum of -121.26% and 7.89% as well as a
maximum of 54.22% and 719.06%, respectively.
Table 4: Descriptive Statistics for Dependent and Independent Variables of Manufacturing
Companies on Bursa Malaysia from 2007 to 2010
Number Minimum Maximum Mean Standard
Deviation
ROA
808 -121.26 54.22 5.36 9.52
Tobin’s Q
808 7.89 719.06 95.74 61.27
Environment
808 .00 60.00 4.86 6.08
Community
808 .00 55.00 6.13 7.63
Workplace
808 .00 110.00 6.05 8.86
Marketplace
808 .00 26.00 3.15 3.80
CSR
808 2.00 227.00 20.20 22.21
RISK
808 .00 104.00 8.91 10.60
SIZE
808 7.28 16.39 12.32 1.37
Leverage
808 .00 206.54 23.74 20.57
R&D
808 .00 29.64 .18 1.60
Source: Adapted from E-vahdati, S., and Lai, M. M. (2015). Corporate Social
Responsibility and Firm Value of Malaysian Companies (1st Edition). CreateSpace
Independent Publishing Platform. Reprinted with permission.

76
5.1 Correlation Coefficient
Table 5 shows the correlation coefficients for the four dimensions of CSR with short and long-
term profitability. The coefficients indicated that there are no multi-collinearity among these
variables. The environment was not correlated to both Tobin’s Q and ROA but community and
marketplace showed significant positive correlations with ROA and Tobin’s Q. In addition, ROA
was correlated to the workplace significantly. As shown in Table 5, only R&D was not correlated
to both ROA and Tobin’s Q; the size of a company demonstrated positive significant correlation
with both short and long-run profitability.
Similarly, Table 6 reports correlation coefficient of total CSR and firm performance. The results
showed that total CSR was not correlated to ROA, but had a significant correlation with Tobin’s
Q. Last but not least, only control variables of risk and firm size were positively correlated to
Tobin’s Q significantly.

77
Table 5: Correlation Coefficient of CSR Dimensions and Financial Performance of Manufacturing Companies on Bursa Malaysia from
2007 to 2010 a
Variables
ROA TQ Environment Community Workplace Marketplace Risk Size Leverage R&D
ROA 1
TQ 1
Environment .055 .066 1
Community .081* .245** .618
** 1
Workplace .080* .051 .635
** .588
** 1
Marketplace .079* .146** .583
** .547
** .513
** 1
RISK -.091**
.116** .030 .148**
.040 .074* 1
SIZE .314**
.279** .370**
.429**
.296**
.298**
-.006 1
Leverage -.269**
.008 -.019 .087* -.007 .026 .586
** .045 1
R&D -.006 .038 .047 .239**
.043 .017 .342**
-.059 .343**
1
Notes: a Correlation is significant at the 0.01 level (2-tailed) with**. Correlation is significant at the 0.05 level (2-tailed) with*
Source: Adapted from E-vahdati, S., and Lai, M. M. (2015). Corporate Social Responsibility and Firm Value of Malaysian Companies (1st Edition).
CreateSpace Independent Publishing Platform. Reprinted with permission

78
Table 6: Correlation Coefficient of Total and Financial Performance of Manufacturing Companies
on Bursa Malaysia from 2007 to 2010 a
Variables ROA TQ CSR Risk Size Leverage R&D
ROA 1
TQ 1
CSR .065 .148** 1
Risk -.098**
.116** .089* 1
Size .296**
.279** .413**
-.003 1
Leverage -.271**
.008 .030 .586**
.050 1
R&D -.005 .038 .118**
.345**
-.059 .353**
1
Notes: a Correlation is significant at the 0.01 level (2-tailed) with** ; Correlation is significant
at the 0.05 level (2-tailed) with*
Source: Adapted from E-vahdati, S., and Lai, M. M. (2015). Corporate Social Responsibility
and Firm Value of Malaysian Companies (1st Edition). CreateSpace Independent Publishing
Platform. Reprinted with permission
5.2 Regression Analysis
Table 7 shows the regression results between CSR and firm financial performance. The variance inflation
factor (VIF) for all variables were between 1 and 3, which implied that there was no problem of multi-
collinearity. The negative association between CSR and ROA showed that these manufacturing firms
were inclined to short-term profits which were reflected by managerial opportunism hypothesis as shown
in Panel A of Table 7. This may imply that when financial performance is strong, managers may reduce
social expenditure to increase their own private gain. In contrast, when a firm has poor financial
performance, the managers may increase social expenditure and improve social performance to distract
attention (Moore, 2001).
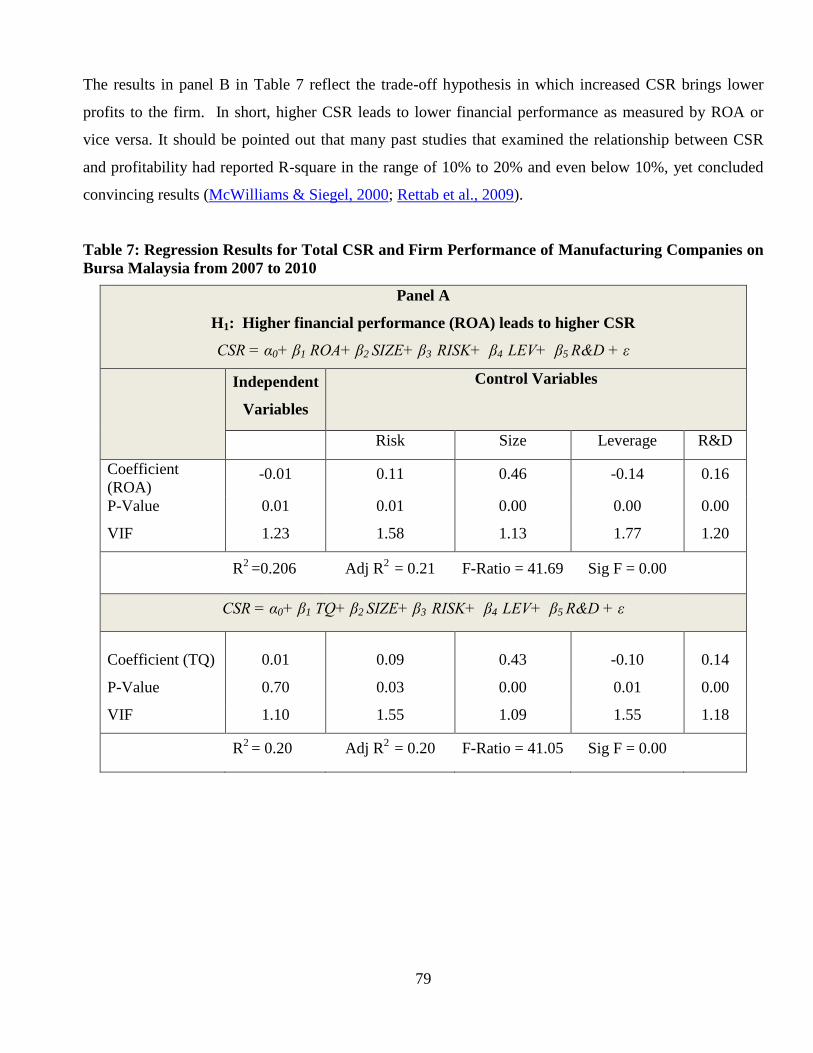
79
The results in panel B in Table 7 reflect the trade-off hypothesis in which increased CSR brings lower
profits to the firm. In short, higher CSR leads to lower financial performance as measured by ROA or
vice versa. It should be pointed out that many past studies that examined the relationship between CSR
and profitability had reported R-square in the range of 10% to 20% and even below 10%, yet concluded
convincing results (McWilliams & Siegel, 2000; Rettab et al., 2009).
Table 7: Regression Results for Total CSR and Firm Performance of Manufacturing Companies on
Bursa Malaysia from 2007 to 2010
Panel A
H1: Higher financial performance (ROA) leads to higher CSR
CSR = α0+ β1 ROA+ β2 SIZE+ β3 RISK+ β4 LEV+ β5 R&D + ε
Independent
Variables
Control Variables
Risk Size Leverage R&D
Coefficient
(ROA) -0.01 0.11 0.46 -0.14 0.16
P-Value 0.01 0.01 0.00 0.00 0.00
VIF 1.23 1.58 1.13 1.77 1.20
R2
=0.206 Adj R2
= 0.21 F-Ratio = 41.69 Sig F = 0.00
CSR = α0+ β1 TQ+ β2 SIZE+ β3 RISK+ β4 LEV+ β5 R&D + ε
Coefficient (TQ)
0.01
0.09
0.43
-0.10
0.14
P-Value 0.70 0.03 0.00 0.01 0.00
VIF 1.10 1.55 1.09 1.55 1.18
R2
= 0.20 Adj R2
= 0.20 F-Ratio = 41.05 Sig F = 0.00
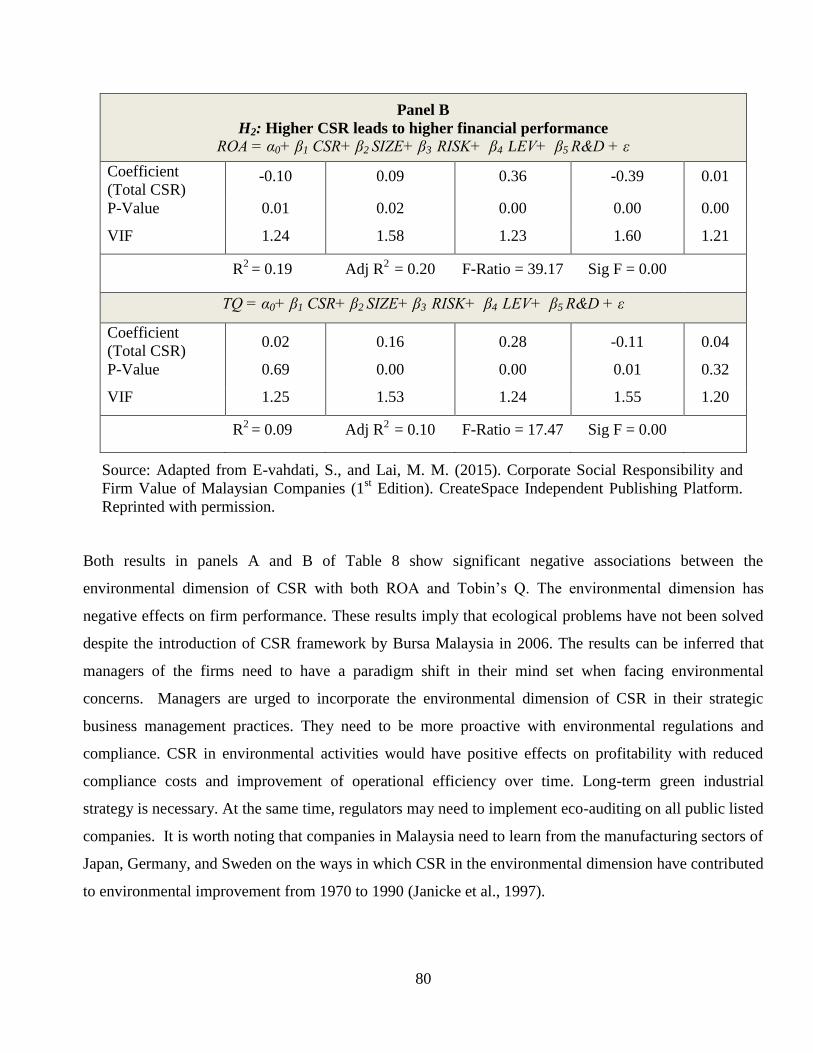
80
Panel B
H2: Higher CSR leads to higher financial performance
ROA = α0+ β1 CSR+ β2 SIZE+ β3 RISK+ β4 LEV+ β5 R&D + ε
Coefficient
(Total CSR) -0.10 0.09 0.36 -0.39 0.01
P-Value 0.01 0.02 0.00 0.00 0.00
VIF 1.24 1.58 1.23 1.60 1.21
R2
= 0.19 Adj R2
= 0.20 F-Ratio = 39.17 Sig F = 0.00
TQ = α0+ β1 CSR+ β2 SIZE+ β3 RISK+ β4 LEV+ β5 R&D + ε
Coefficient
(Total CSR) 0.02 0.16 0.28 -0.11 0.04
P-Value 0.69 0.00 0.00 0.01 0.32
VIF 1.25 1.53 1.24 1.55 1.20
R
2 = 0.09 Adj R
2 = 0.10 F-Ratio = 17.47 Sig F = 0.00
Source: Adapted from E-vahdati, S., and Lai, M. M. (2015). Corporate Social Responsibility and
Firm Value of Malaysian Companies (1st Edition). CreateSpace Independent Publishing Platform.
Reprinted with permission.
Both results in panels A and B of Table 8 show significant negative associations between the
environmental dimension of CSR with both ROA and Tobin’s Q. The environmental dimension has
negative effects on firm performance. These results imply that ecological problems have not been solved
despite the introduction of CSR framework by Bursa Malaysia in 2006. The results can be inferred that
managers of the firms need to have a paradigm shift in their mind set when facing environmental
concerns. Managers are urged to incorporate the environmental dimension of CSR in their strategic
business management practices. They need to be more proactive with environmental regulations and
compliance. CSR in environmental activities would have positive effects on profitability with reduced
compliance costs and improvement of operational efficiency over time. Long-term green industrial
strategy is necessary. At the same time, regulators may need to implement eco-auditing on all public listed
companies. It is worth noting that companies in Malaysia need to learn from the manufacturing sectors of
Japan, Germany, and Sweden on the ways in which CSR in the environmental dimension have contributed
to environmental improvement from 1970 to 1990 (Janicke et al., 1997).

81
In term of the community dimension, the mixed findings show that reducing CSR activities in the
community would lead to an increase in short-term profits as measured by ROA or vice versa.
Nonetheless, increasing community social activities results in the ability to create more future profits as
reflected by the long-term performance measure (Tobin’s Q). Higher Tobin’s Q may be an attribute of
long-term good relationship built through community involvement.
On the other hand, the workplace dimension indicated negative relationship with Tobin’s Q. It may be
explained that employees were secondary stakeholders of the manufacturing companies. At the same time,
the marketplace dimension had positive effects on firm performance only in the long run. Producing
quality products would enhance customer satisfaction that would increase a firm’s capabilities to create
higher future profits.
Overall, the results draw conclusions that the firm’s risk, size and leverage that served as control variables
have shown significant associations to both ROA and Tobin’s Q. Strong positive association between the
firm size and financial performance suggest that size represents visibility and larger firms tend to have
more CSR that would help them build a good reputation. R&D investments that were associated with
product and process innovation had shown positive associations with ROA, but not Tobin’s Q. As such
we suggest that manufacturing firms look into the reasons why the R&D dimension was not able to
increase a firm’s capability to create future profits. This is an empirical question that requires further
examination.

82
Table 8: Regression Results of the Effects of Multidimensional CSR and Financial Performance of
Manufacturing Companies on Bursa Malaysia from 2007 to 2010
Panel A: Dependent Variable (ROA)
ROA = α0+ β1 ENV+ β2 COM+ β3 WP+ β4 MP+ β5 SIZE+ β6 RISK+ β7 LEV+ β8 R&D + ε
CSR Multidimensional Control Variables
Environment Community Work-
place
Market-
place
Risk Size Leverage R&D
Beta -0.11 -0.09 0.05 0.05 0.10 0.39 -0.39 0.14
P-Value 0.02 0.06 0.26 0.20 0.10 0.00 0.00 0.00
VIF 2.20 2.28 1.92 1.71 1.59 1.30 1.61 1.30
R2 = 0.20
Adj R2
= 0.21
F-Ratio =
26.91
Sig F
= 0.00
Panel B: Dependent Variable (Tobin’s Q)
TQ = α0+ β1 ENV+ β2 COM+ β3 WP+ β4 MP+ β5 SIZE+ β6 RISK+ β7 LEV+ β8 R&D + ε
Environment Community Work
place
Marketpl
ace
Risk Size Leverage R&D
Beta -0.16 0.25 -0.12 0.09 0.14 0.24 -0.11 -0.01
P-Value 0.00 0.00 0.01 0.05 0.00 0.00 0.10 0.90
VIF 2.31 2.30 2.01 1.74 1.54 1.31 1.56 1.28
R2 = 0.13
Adj R2
= 0.14
F-Ratio =
16.06
Sig F
= 0.00
Source: Adapted from E-vahdati, S., and Lai, M. M. (2015). Corporate Social Responsibility and Firm
Value of Malaysian Companies (1st Edition). CreateSpace Independent Publishing Platform. Reprinted
with permission.

83
6. CONCLUSION
The overall results rejected hypotheses 1 and 2. Firms with higher financial performance have shown
negative relationships with its CSR. The negative relationships were found between total CSR and short-
term profits (ROA), but there was no significant relationship with long-term profits (Tobin’s Q).
The analysis of the multiple dimensions of CSR showed a negative relationship between the environment
dimension for both short and long-term performance measures. The negative effect suggests that the
manufacturing firm should pay more attention to ecological modernisation and compliance. At the same
time, the community dimension indicated mixed findings in which a negative relationship was observed
for short-term profits and positive relationship for long-term profitability. The workplace dimension
reported a negative relationship with Tobin’s Q but the marketplace dimension showed a positive
association with long-term profitability.
We concluded mixed relationships between the multiple dimensions of CSR and financial performance.
These mixed findings were not surprising given that past researchers have found mixed findings as well
(Waddock & Graves, 1997; Dowell et al., 2000; Van der laan et al., 2008). R&D intensity was the only
control variable having no link to Tobin’s Q.
Given the fact that CSR activities and disclosure by these manufacturing firms are still low, we suggest
that the Malaysian government introduce tax incentives to further encourage CSR activities. At the same
time, a CSR levy could be imposed on business activities that are detrimental to the economy or
environment. The managers of the firms should consider incorporating the findings of this paper into their
strategic plans for CSR initiatives. Future research that examines mediating factors such as customer
satisfaction, employees’ education, and environment friendly products, and tax treatment would be of
interest.

84
7. REFERENCES
Abdul, M. Z., and Ibrahim, S. (2002). Executive and Management Attitudes Towards Corporate Social
Responsibility in Malaysia. Corporate Governance, 2(4), 10-16.
Aras, G., Aybars, A., and Kutlu, O. (2010). Managing Corporate Performance: Investigating the
Relationship Between Corporate Social Responsibility and Financial Performance in Emerging Markets.
International Journal of Productivity and Performance Management, 59(3), 229-254.
Aras, G and Crowther, D. (2008). Corporate Sustainability Reporting: A Study in Disingenuity?. Journal
of Business Ethics, 87(1), 279-89.
Birch, D., and Moon, J. (2004). CSR in Asia [Special issue]. Journal of Corporate Citizenship, 13.
Bolton, B. (2014). Audit Committee Performance: Ownership vs. Independence–Did SOX Get It Wrong?.
Accounting & Finance, 54(1), 83-112.
Bursa Malaysia, B. (2006). Corporate Social Responsibility (CSR) Framework for Malaysian Public
Listed Companies. http://bursa.listedcompany.com/news.html/id/22778. [2011, November 4]
Bursa Malaysia, B. (2012). Company Announcements [Online]. Available:
http://www.bursamalaysia.com/website/bm/listed_companies/company_announcements/annual_reports/in
dex.jsp. [2011, November 4].
Cooke, T. E. (1990). The Impact of Size, Stock Market Listing and Industry Type on Disclosure in the
Annual Reports of Japanese Listed Corporations: University of Exeter, Centre for Research in Finance
and Accounting.
Cottrill, M. (1990). Corporate Social Responsibility and the Marketplace. Journal of Business Ethics 9,
723-729.
Datastream International LTD. (2006a). Datastream database [computer file]: ROA, TOBINS' Q, SIZE,
LEVERAGE, RISK, RESEARCH & DEVELOPMENT, MV. London: Datastream International Ltd.
[2006, October 31].

85
Datastream International LTD. (2006b). Datastream database [computer file]: ROA, TOBINS' Q, SIZE,
LEVERAGE, RISK, RESEARCH & DEVELOPMENT, MV. London: Datastream International Ltd.
[2006, July 27].
Dowell, G., Hart, S., and Yeung, B. (2000). Do Corporate Global Environmental Standards Create or
Destroy Market Value? Management Science, 1059-1074.
Emerging Markets Information Service (EMIS). (2012). Securities [Online]. Available:
http://www.securities.com/ci/symbol_lookup2.html?pc=MY&sv=EMIS&lng=&form_sent=1&company_
name=&listed=&prods=MY&indu_search=&indu=31&activity_type=MAIN&expanded=&city=®n=
&cids=&go=Search [2012, January 16].
E-vahdati, S., and Lai, M. M. (2015). Corporate social responsibility and firm value of Malaysian
companies (1st Edition). CreateSpace Independent Publishing Platform.
Freeman, R. E. (1984). Strategic Management: A Stakeholder Approach. Analysis, 38(1).
Galbreath, J., and Shum, P. (2012). Do Customer Satisfaction and Reputation Mediate the CSR–FP link?
Evidence from Australia. Australian Journal of Management, 37(2), 211-229.
Griffin, J. J., and Mahon, J. F. (1997). The Corporate Social Performance and Corporate Financial
Performance Debate. Business and Society, 36(1), 5-31.
Gray, R., Kouchy, R., and Lavers, S. (1995). Methodological Themes: Constructing a Research Database
of Social and Environmental Reporting by UK Companies. Accounting, Auditing and Accountability
Journal 8(2), 78-101.
Hackston, D., and Milne, M. J. (1996). Some Determinants of Social and Environmental Disclosures in
New Zealand Companies. Accounting, Auditing and Accountability Journal, 9(1), 77-108.
Hughes, S. B., Anderson, A., and Golden, S. (2001). Corporate Environmental Disclosures: Are They
Useful in Determining Environmental Performance? Journal of Accounting and Public Policy, 20(3), 217-
240.

86
Humphrey, J. E., Lee, D. D., and Shen, Y. (2012). The Independent Effects of Environmental, Social and
Governance Initiatives on the Performance of UK Firms. Australian Journal of Management, 37(2), 135-
151.
Inoue, Y., & Lee, S. (2011). Effects of Different Dimensions of Corporate Social Responsibility on
Corporate Financial Performance in Tourism-related Industries. Tourism Management, 32(4), 790-804.
Jänicke, M., Binder, M., and Mönch, H. (1997). ‘Dirty Industries’: Patterns of Change in Industrial
Countries. Environmental and Resource Economics, 9(4), 467-491.
Lichtenstein, D. R., Drumwright, M. E., and Braig, B. M. (2004). The Effect of Corporate Social
Responsibility on Customer Donations to Corporate-supported Nonprofits. Journal of Marketing, 16-32.
Lin, C. H., Yang, H. L., and Liou, D. Y. (2009). The Impact of Corporate Social Responsibility on
Financial Performance: Evidence from Business in Taiwan. Technology in Society, 31(1), 56-63.
Mahoney, L., and Roberts, R. W. (2007). Corporate Social Performance, Financial Performance and
Institutional Ownership in Canadian Firms. Accounting Forum, 31(3), 233-253.
McGuire, J. B., Sundgren, A., and Schneeweis, T. (1988). Corporate Social Responsibility and Firm
Financial Performance. Academy of Management Journal, 854-872.
McWilliams, A., and Siegel, D. (2000). Corporate Social Responsibility and Financial Performance:
Correlation or Misspecification? Strategic Management Journal, 21(5), 603-609.
Milne, M. J., and Adler, R. W. (1999). Exploring the Reliability of Social and Environmental Disclosures
Content Analysis. Accounting, Auditing & Accountability Journal, 12(2), 237-256.
Moore, G., (2001). Corporate Social and Financial Performance: An Investigation in the U.K.
Supermarket Industry, Journal of Business Ethics, 34, 299-315.
Mustaffa, M. Z., and Tamoi, J. (2006). Corporate Social Disclosure (CSD) of Construction Companies in
Malaysia. Malaysian Accounting Review, 5(1), 85-114.
87
Ortiz M. E., and Crowther, D. (2005). Corporate Social Responsibility Creates an Environment for
Business Success. Representations of Social Responsibility, (1), Hyderabad, ICFAI University Press,
Andhra Pradesh, 125-40.
Panwar, R., Rinne, T., Hansen, E., and Juslin, H. (2006). Corporate Responsibility: Balancing Economic,
Environmental, and Social Issues in the Forest Products Industry. Forest Products Journal, 56(2), p4.
Pava, M. L., and Krausz, J. (1996). The Association between Corporate Social Responsibility and
Financial Performance: The Paradox of Social Cost. Journal of Business Ethics, 15(3), 321-357.
Rettab, B., Brik, A. B., and Mellahi, K. (2009). A Study of Management Perceptions of the Impact of
Corporate Social Responsibility on Organisational Performance in Emerging Economies: The Case of
Dubai. Journal of Business Ethics, 89(3), 371-390.
Rossi Jr, J. L. (2009). What is the Value of Corporate Social Responsibility? An Answer from Brazilian
Sustainability Index. Journal of International Business and Economics, 9(3), 169-178.
Sahin, K., Basfirinci, C. S., & Ozsalih, A. (2011). The Impact of Board Composition on Corporate
Financial and Social Responsibility Performance: Evidence from Public-listed Companies in Turkey.
African Journal of Business Management, 5(7), 2959-2978.
Simpson, G. and T. Kohers (2002). The Link between Corporate Social and Financial Performance:
Evidence from the Banking Industry. Journal of Business Ethnics 35, 97-109.
Scholtens, B. (2008). A Note on the Interaction between Corporate Social Responsibility and Financial
Performance. Ecological Economics, 68(1), 46-55.
Seifert, B., Morris, S. A., and Bartkus, B. R. (2004). Having, Giving, and Getting: Slack Resources,
Corporate Philanthropy, and Firm Financial Performance. Business & Society, 43(2), 135-161.
Teoh, H. Y., and Thong, G. (1984). Another Look at Corporate Social Responsibility and Reporting: An
Empirical Study in a Developing Country. Accounting, Organizations and Society, 9(2), 189-206.
Turban, D. B., & Greening, D. W. (1997). Corporate Social Performance and Organizational
Attractiveness to Prospective Employees. Academy of Management Journal, 658-672.

88
Van der Laan, G., Van Ees, H., and Van Witteloostuijn, A. (2008). Corporate Social and Financial
Performance: An Extended Stakeholder Theory, and Empirical Test with Accounting Measures. Journal
of Business Ethics, 79(3), 299-310.
Votaw, D. (1972). Genius Becomes Rare: A Confinement on the Doctrine of Social Responsibility Pt. I.
California Management Review, 15(2), 25-32.
Waddock, S. A., and Graves, S. B. (1997). The Corporate Social Performance. Strategic Management
Journal, 8(4), 303-319.
Wood, D. J. (1991). Corporate Social Performance Revisited. Academy of Management Review, 691-718.
Wu, M. L. (2006). Corporate Social Performance, Corporate Financial Performance, and Firm Size: A
Meta-analysis. Journal of American Academy of Business Cambridge, 8(1), 163-171.

89
8. AUTHORS
Dr. Lai Ming Ming is a professor at the Faculty of Management, Multimedia University. She has a
Bachelor of Business Administration, majoring in Finance with First Class Honours from Universiti
Kebangsaan Malaysia and Master of Business Administration from Wichita State University, United
States. Dr. Lai received her PhD in Finance from Multimedia University in 2002. Her teaching interests
include investments, portfolio management, corporate finance and personal finance in both undergraduate
and graduate levels. Her research endevours have resulted in several publications in local and
international journals including The Journal of Behavioral Finance, Journal of Asian Economics,
Quarterly Journal of Business and Economics, The Journal of American Academy of Business, Academy
of Accounting and Financial Studies Journal and Banker’s Journal Malaysia. Dr. Lai won the Best Paper
Award in the Malaysian Finance Association 4th
Annual Symposium in 2002. In August 2007, she won
the third and seventh prize of the MIA-MAREF Outstanding Research Paper Award (MORPA)
2006/2007. She is listed in a variety of directories including Who’s Who in America 2008, and Who’s Who
in the World 2008. In 2009, she won the consolation prize of the MIA Articles of Merit Award on PAIB
and the silver prize in 2013. She was the director of Research Management Centre (RMC) in Multimedia
University from January 2010 to February 2013.
Ms Sahar E-Vahdati was born in Iran in 1983 and obtained a bachelor of Electrical Engineering from
AZAD Tehran University. She obtained her MBA from Multimedia University, Malaysia in 2013.
Currently, she is studying for her PhD in University of Malaya in the field of accountancy.

90
CONSOLATION PRIZE
EDUCATING TOMORROW’S ACCOUNTANTS TODAY:
STRENGTHENING THE ACCOUNTING PROFESSION WITH AN
INTEGRATED TEACHING APPROACH THROUGH A CEO
FACULTY PROGRAMME
Dr. Zaleha Othman
En Fathilatul Zakimi Abdul Hamid
En Rohami Shafie

91
EDUCATING TOMORROW’S ACCOUNTANTS TODAY: STRENGTHENING THE
ACCOUNTING PROFESSION WITH AN INTEGRATED TEACHING APPROACH
THROUGH A CEO FACULTY PROGRAMME
ABSTRACT
The World Bank released a report on the Observation of Standards and Codes in Accounting and Auditing
in 2012 - addressing an issue that may adversely impact the accounting profession, namely the need to
enhance the education and training of accountants in Malaysia. As an opportune juncture to identify a
solution, the Ministry of Education initiated a CEO Faculty Programme aimed at transforming the
education system in Malaysia in general. However, there is ambiguity regarding the concept. As such, we
conducted a feasibility study with the aim of exploring the CEO Faculty Programme concept and its
applicability in educating accounting students. We employed qualitative methodology where we
conducted an explorative case study - gathering data from purposively selected respondents from a public
university in Malaysia. The findings describe a trilateral collaboration between academia, the industry and
the government, working towards producing high-quality professional accountants for the future. The
findings show that the success of the integrated teaching approach established in the CEO Faculty
Programme should benefit the profession in the long term, as the learning gained would impact the
intrinsic and extrinsic development of accounting students.
Overall, we conclude that the CEO Faculty Programme benefits the “triple helix” (academy, industry and
government) participants in different respects. In particular, the programme has a positive impact on the
accounting profession, with the integrated educational approach aiding in producing accounting students
with informed knowledge that supports the integration of theory and practice. Our reasoning is based on
the recommendations generated by the study, which suggest directions for triple helix actors, such as
accounting educators, accounting bodies, industries and the Ministry of Education (MOE), in a manner
that is responsive to their constraints and situational conditions. Generally, the CEO Faculty Programme
is a continuous improvement initiative relevant to the mission of the International Federation of
Accountants (IFAC) in strengthening the accounting profession. These findings provide valuable
information with respect to transforming an informal teaching arrangement into a formal collaboration
between accounting educational institutions and the industry. Such collaboration would endure beyond the

92
efforts of silo initiatives conducted in accounting education for decades. In addition, the findings are
useful as they provide an understanding of the issue that was observed. The study concludes with several
recommendations aimed at improving the programme and its implementation and indirectly strengthening
accounting education in Malaysia.
1. INTRODUCTION
In 2012, the World Bank released a report on the Observation of Standards and Codes in Accounting and
Auditing (ROSC AA) containing one of the issues that may adversely impact the accounting profession if
it were to remain unaddressed, that is the need to enhance the education and training of accountants in
Malaysia. The Committee to Strengthen the Accountancy Profession’s (CSAP, 2014) report concluded
that the increasing demand for quality professional accountants “can only be met if the infrastructure
available in the education and training of accountants in Malaysia is geared towards producing the
requisite number of accountants who are competent and able to serve in various sectors across the
economy” (p.7). To facilitate this, accounting educators were called upon to provide professional
knowledge, skills, experience and values, which would serve the needs of the diverse sectors in the
Malaysian economy (CSAP, 2014).
Malaysian accounting educators have frequently commented that they are producing ill-equipped
accounting graduates - lacking in experience, who have to deal with the challenges of a dynamic and
rapidly changing business environment (Teik, Al-Mashoor, Chung, & Song, 2013). This issue is
associated with traditional accounting curricula, which were rule-based in nature (Porter & Carr, 1999).
Empirical evidence indicated that the accounting curricula have influenced the quality of accounting
graduates. According to Paino and Puteh (2006) intellectual ability had to be complemented with future
competences and these skills need to be incorporated in the accounting curriculum. This is currently
lacking in the education of accounting students, particularly in Malaysia. Accounting curricula need to
have an integrated design, combining theoretical knowledge and relevant skills in the courses offered
(Porter & Carr, 1999; Teik et al., 2013).

93
Notably, the Report on the Strengthening of the Accounting Profession in Malaysia (CSAP, 2012) issued
a recommendation (Recommendation 9: p. 46) strongly proposing cooperation between industry and
universities as a way forward in producing quality accountants. The recommendation concluded with the
pertinent remark that the “concept of having co-lecturers for certain subject such as auditing and advanced
accounting should be considered” (p. 46).
Given the crucial need for incorporating practical application in the education of accounting students to
produce quality graduates and the magnitude of the task in doing so, the Malaysian Ministry of Education
(MOE) initiated the CEO Faculty Programme. The programme involves industry–academic partnership in
educating future accountants. The MOE introduced the programme with the hope of bridging the gap
between practical application and theoretical knowledge. However, the programme is still in its infancy
and thus, there is limited information, feedback or understanding concerning its implementation. Hence,
this study examines the programme by addressing two fundamental research questions: “What are the
perceived benefits and challenges of the CEO Faculty Programme?” and “In what way(s) is the CEO
Faculty Programme strengthening the accounting profession?” The purpose of this paper is to make sense
of the CEO Faculty Programme concept through the use of a case study.
The remainder of the paper is organised as follows: a synthesis of relevant literature, the methodology
used to gather and analyse the data, a discussion of the results, recommendations and conclusions, and the
limitations and opportunities for future research.
2. LITERATURE REVIEW
Educators are frequently blamed for the lack of practical exposure given to students. Devi, Kumar & Raju
(2012), who studied the viability of the Partnering with Practice (PWP) approach to teaching accounting
in the School of Accounting and Finance (SOAF) at the University of the South Pacific (USP), stated that
although the mechanism of the teaching approach is important, who delivers taught courses matters more.
They claimed that bridging the gap between practice and theory depends on “who” rather than on “how”.

94
Geary et al. (2010), who introduced the PWP approach, also found that the individual who teaches the
course is more important than the actual process of teaching. Through the PWP approach, they revealed
the collaboration between accounting practitioners and accounting educators to be significant. They
concluded that PWP is effective, highlighting that the success of the taught course depends on the
selection of partners in addition to the implementation of a properly organised (prepared, supported and
integrated) curriculum.
2.1 Integrating Practical Application
The literature suggested that traditional approaches to teaching have limitations. Scholars were of the
opinion that there is a need to provide an integrated approach for students to prepare them for the
globalisation of the work force and take account of the fact that the job market requires a combination of
theory and practice. For example, Johnson (2014) found a perceptible gap between what is practised by
the workforce and what is taught to accounting students. Scholars recommended that accounting
educators should move away from the traditional approach in teaching accounting students. They also
stated that accounting curricula are too narrow and lack practical application.
For many years, scholars have expressed concern that due to the pluralistic nature of the accounting
profession, there was a need to change accounting education to reflect this. Pluralism in the profession
was already significant and the education of accounting students needed to keep abreast of this pluralistic
trait; hence, the relevance of an integrated approach. Such an approach to teaching has been discussed in
the literature for more than two decades. Kolb (1984, as cited in Johnson, 2014) argued the significant
influence of theoretical learning and practical application in educating students and the importance of
integrating the two. Johnson (2014) concluded that educating students through integrating theory and
practice benefits the students even more.

95
Some authors have suggested that an integrated approach should consider incorporating practical skills
into the existing theoretical curricula. For instance, ethics and forensic accounting skills, being perceived
relevant in the accounting field, should be incorporated in accounting courses (Neesham & Gu, 2014;
Heitger & Heitger, 2008). Conducting a quasi-experimental design Neesham & Gu (2014) found that
accounting curricula need to be responsive to the environment. They found that incorporating moral
identifying activities increased learning outcome as the integration of current business ethics teaching
practices benefits both theory and practices among students - validating their concern that integrating
relevant practical skills for graduates is crucial to reduce the mismatch in the focus between practice and
theory. However, as noted above, there was also the argument that the mode of teaching matters less than
the individual who teaches the students.
2.2 ‘Who’ rather than ‘How’
Previous studies have shown a solution to bridge the gap between theory and practice by considering who
does the teaching rather than how it is done. There is empirical evidence supporting a positive response to
focusing on the “who” aspect. Studies have indicated that the individual who delivers the course
influences the integration of a practical orientation and fosters practical ability among accounting
students. This implies that the person who teaches accounting students should possess practical
experience. Mounce, Mauldin & Braun (2004) stated that professors with practical experience have more
significant impact than those without practical experience, as they are able to offer students real cases as
examples. Johnson (2014) also found similar findings. Johnson (2014) studied the perceptions of
practitioners and faculty members and highlighted the importance of faculty members with practical
experience in educating accounting students. The study concluded with the recommendation that
accounting educators should link their teaching of accounting fundamentals with hands-on practice.
Professional practical skills, such as networking, marketing and career management, were some of the
important aspects needing to be integrated in accounting curricula. Furthermore, Johnson (2014)
suggested that the faculty should design a curriculum that is responsive to new developments in the field
to limit the gap between practice and theory. This supports the notion that engaging faculty members with
practical work experience rather than those with purely academic credentials would positively benefit
student learning.

96
Faculty–firm partnerships have also been suggested as a “who”-oriented mechanism that could address
the mismatch between practice and theory (Johnson, 2014). Collaboration in faculty-firm partnerships
comes in the form of appointing professionals as academics. Devi et al. (2012) also found that
collaboration is a viable means of reducing the imbalance in focus. However, there is limited empirical
evidence that such collaboration exists. This approach is relatively new and is under-researched (Devi et
al., 2012). However, there is a claim that this approach is significant in creating innovative practices
relevant to accounting students. For example, Devi et al. (2012) suggested that the Partnering with
Practice (PWP) approach provides practical implications in educating accounting students. Through in-
depth interviews with stakeholders, they found that through the PWP approach, students benefit in several
ways. For example, they are “exposed to practical case studies, learn from real life experiences of
practitioners, become familiarised with firm operations, get an opportunity to interact with practitioners,
conceptualise how theory works in practice and make informed career choices” (Devi et al., 2012, p. 70).
3. QUALITATIVE METHODOLOGY
This study employed qualitative methodology based on the study characteristics, namely exploratory
research. Specifically, case study methodology was adopted for two reasons: the suitability of the
approach in responding to the research questions and limitations in obtaining accessibility to multiple
institutions due to restricted funding, prompting an in-depth case study.
3.1 Qualitative Characteristics
Researchers such as Creswell (2007) pointed out that the characteristics of research employing qualitative
methodology includes developing research questions that focus on the “why” and “how”, as in this study.
Other qualitative characteristics include situated activity that locates the observer in the world and
conducts research that is interpretive, uses field notes and involves interviews, conversations,
photographs, recording and memos to the self as data gathering in the natural setting, where the observer
attempts to make sense of or interprets phenomena in terms of the meanings people bring (Creswell,
2007).

97
All of these characteristics were applied to this study. Firstly, situated activity locates the researcher in the
world of the respondents. Here, the activity was situated by conducting the study in a setting very closely
linked to the research phenomenon and by the relevance of the people in the setting for the research
inquiry. Secondly, the nature of inquiry in the study (reflected in the research questions) required
interpretive processes to make sense of the findings. Due to the focus on the why and how, there is no
determining of causal relationships. The findings had to be interpreted from the data. Thirdly, field notes,
interviews, conversations, recording and memos were part of the data gathering process employed in this
study. These data gathering methods assisted in collecting information related to the research questions.
Interviewing is the prominent data collection method in case study research. A semi-structured interview
protocol was developed to investigate the motivation for the inception of the CEO Faculty Programme.
Standard interview questions included “What do you think motivated the concept? What is your view of
the concept?” Constant probing was conducted throughout the interviews.
3.2 Data Collection Method
Face-to-face interviews were conducted with six respondents. Table 1 provides the profile of the
respondents.
Table 1: Profile of Respondent Experience
Respondent Number of years of work
experience
Number of years working
as academic
More than
10 years
Less than 10
years
More than
10 years
Less than 10
years
Professor 1 / /
Professor 2 / /
Professor 3 / /
Senior Lecturer 1 (Finance) / /
Senior Lecturer 2 (Accounting) / /
Senior Lecturer 3 (Finance) / /

98
For the purposes of this study, the respondents selected were defined as individuals with experience as
both practitioners and academics. Based on this criterion, six respondents were selected and consent was
obtained for them to be interviewed. Semi-structured interview questions were developed as a protocol to
guide the researcher during the interview process. Protocol questions included: “What is your view of the
CEO Faculty Programme? To what extent does the programme benefit accounting students? What
challenges do higher institutions face? How can we successfully implement the programme?” The study
employed a common data analysis process, identifying codes, reducing codes to themes and generating a
point of view. This process of coding follows the template described by Madison (2005, as cited in
Creswell, 2007).
4. RESULTS AND FINDINGS
This section provides the thematic analysis related to understanding the CEO Faculty Programme. Several
themes emerged (meaning, motivating factors, structure and process, benefits and challenges) providing a
pattern of meanings related to the concept explored.
4.1 Theme 1: Meaning
Documentary analysis implied that the CEO Faculty Programme was initiated with the objective of
formally appointing CEOs to co-teach with academics, by sharing their experiences and expertise.
Notably, the CEO Faculty Programme was designed as a continuous improvement mechanism in
educating university students. It was foreseen that through this programme, the Malaysian education
system could enhance the quality of Malaysian graduates.
To address the gap in developing practical skills, several prominent CEOs were suggested. Corporate
leaders such as Tony Fernandes were among the designated CEOs proposed to support the programme.
The selection of corporate leaders was based on several criteria developed by the MOE: (i) related to
experience and (ii) based on expertise and the CEO’s significant contribution to the industry.

99
Regarding implementation, the CEOs would be engaged as part of the teaching team at the university and
would be allocated certain contact hours with students throughout the year. The CEOs were asked to
commit two working days to the hosting universities and the CEOs were to be attached to four public
universities in Malaysia.
Their engagement involves two modes in the form of lectures and consultation. The MOE designed 30
hours of lectures in addition to the sharing of knowledge, case studies, keynote addresses and advisory
activities related to teaching, research and consultation. From the perspective of academia, this concept
was well accepted. All respondents found the concept useful and relevant. Some even proposed that if
successfully implemented, the benefits would advance the Malaysian education system.
4.2 Theme 2: Motivating Factors
Thematic analysis revealed the main motivation to be providing a platform for an integrative approach to
teaching. Integrating real life experience with the learning of theory is the ultimate goal of this
programme. Table 2 depicts the categories of codes and themes that appeared to support this pattern of
meaning (motivating factors).
Table 2: Categories of codes, themes and pattern of meaning – motivating factors
Categories of codes
Emergent themes supporting motivating
factors
Curriculum inadequate to meet business needs
Out-dated curriculum
Curriculum deficiency
Combining practice and theory
Practice is more at the forefront
Value added to current education

100
4.3 Theme 3: Structure and Process
On the process of the programme, data analysis revealed that the mode of teaching varies, the first being a
formal, traditional mode of teaching (lecture), and the second being the sharing of knowledge, for
example through case studies, keynote addresses, consultations, etc.
The data indicated the programme has a flexible structure. The university has a choice in the design of the
respective structure, including the arrangement of the programme. The first option concerns the direct
involvement of the industry, i.e. direct engagement in educating the students. This includes the formal
transfer of responsibility for a section of a taught course to the appointed CEO. The second option
involves formal interaction, although not direct involvement in the taught course. This is a form of formal
transfer of knowledge in which the engagement of industry occurs outside the classroom, unlike the first
option in which the engagement occurs in the classroom. Specifically, this differs from the first option in
that the CEO is not responsible for a section of a credit course. The third option is a flexible mechanism in
which choices are made to combine the two structures if required.
4.4 Theme 4: People
The data revealed criteria for the selection of CEOs based on their expertise in the field. The respondents
in this study perceived that the criteria for selection should be based on several extrinsic criteria: expertise
and experience in the field of CEOs’ responsibilities. These two extrinsic criteria are important for several
reasons. Firstly, the CEOs will be capable of transferring knowledge that adds value to students.
Secondly, experts relevant to the field of study will be an attraction factor gaining the attention of
students. Thirdly, an individual with real-life experience of relevant topics will create an outside-the-box
thinking environment for students. Engaging practitioners assist in providing experiential teaching and
learning. In addition, two intrinsic criteria were also revealed: interest and commitment.

101
The data indicated that the CEOs’ area of expertise and the relevance of their experience to the taught
course are important aspects. The process of transferring knowledge relates not only to the environment
but also to the individual who transfers the knowledge. A greater appreciation of knowledge is best
translated by experts who have the practical experience. The respondents perceived this as the primary
concern in attracting student interest; hence the relevance of the CEOs to the taught course.
Interestingly, the results indicated that although CEOs are preferred, other positions within top
management should also be considered. The Chief Operating Officer (COO) was mentioned as the most
important person in the industry involved in this programme. One respondent considered that COOs are
relevant because they are most knowledgeable about the operations of a company and as such have rich
experience related to managing companies. COOs, CFOs and Managing Directors are several positions
mentioned as crucial to the company. Overall, the respondents perceived that people with technical
abilities in positions of authority, and those making decisions in the company are selected for the
programme. The rationale is that these individuals have decision-making power and analytical ability in
solving situational problems.
4.5 Theme 5: Applying the Triple Helix Model
The analysis indicated that the CEO Faculty Programme represents a paradigm shift in Malaysian
education. The concepts reflect a “triple helix” structure and process within the educational system. This
triple helix includes educators, practitioners and the government. The concept promotes interactions
between academic, industrial and institutional systems as a means of fostering development and national
growth, both of which are important in educating future accountants.

102
Advancing the mode of education is crucial in the current age and application through a triple helix –
interaction between academia, industry and the government – will foster innovative and creative students,
thus producing students with technical knowledge and practical ability. The following is an excerpt taken
from an interview with a respondent:
When we went to the university in Sweden, they practise the Triple Helix Model (academia,
practitioner and government). What they do is put the practitioner together with academia.
They will come to the classroom, they will generate ideas, then they go back to their office
and develop the model and this will support the government. They have ideas and the
academics and students can use this as a project base. It is a good idea. (Professor 1)
4.6 Theme 6: Benefits
The general perception is that this programme will benefit both academia and the industry. From the
academic perspective, the learning gain emerges from two perspectives, namely intrinsic and extrinsic
development in educating accounting students. The former fills the gap in the current system of
accounting education and personality development, while the latter supports the trend in curriculum
development, teaching outcomes, the mode of teaching and concern for the profession.

103
Table 3: Themes Supporting the Development of Patterns (Academic Benefits)
Categories of codes (academic) Themes – benefits Emerging pattern of
meaning related to
benefits
Trend in curriculum development Practice-oriented
curriculum
Extrinsic outcome
Up-to-date curriculum
Filling the gap in curriculum
deficiency
Extrinsic outcome
Teaching outcomes
CEO support in terms of application
Accuracy in translating real cases Cognitive skills
Knowledge is at the fore Intrinsic outcome
Personality development
Motivation Extrinsic outcome
Confidence building Competency skills
Role models
About the profession
Provide clear understanding of the
profession
Extrinsic outcome
Change student perceptions of the
profession
Mode of teaching
Integrative mode of teaching (theory–
practice approach)
CEO brings market practice
Provide practice solution
Transfer of knowledge
- Students
Academic staff

104
Table 4: Themes Supporting the Development of Patterns (Practitioner Benefits)
Emergent themes concerning benefits Emerging pattern of meaning related to
benefits
Good way of promoting companies
Potential customers for future business
Economic impact
Monetary gain is not the driving force
Personal satisfaction in sharing experience – self
fulfilment
Personal impact
Corporate responsibility for education Social impact
Knowledge transfer exclusive to practical
application
Need to share practical application due to limited
staffing with experience
Knowledge based on experience at the fore rather
than text
Education impact
Role model for students in seeing the CEOs
present at the university; engagement in teaching
inspires students
Personal impact
4.7 Theme 7: Challenges
Although all of the respondents considered this concept as having great potential, several key concerns
were voiced regarding its implementation. The general view was that the concept has been practised
informally in the institution for years; however, this time around, the concept has formally been
established. Some respondents felt that the programme needs proper planning, monitoring and organising,
without which there was the possibility of failure. Several themes emerged that indicate the challenges in
implementing this concept. Table 5 depicts the challenges from various perspectives, including the
process and the people. The process aspect involves organising, monitoring and controlling the
programme, whereas the people aspect involves individual constraints and collective constraints.

105
Table 5: Themes Supporting the Development of Patterns (Challenges)
Emergent categories of codes Emergent themes grounded in the data
Personal obstacles
Time constraints
Commitment
Interest
Constraints
Curriculum organisation
Coverage of syllabus
Topic handling
Integrating theory and practice
Relation to theory
Teaching ability
Inadequate teaching skills
Teaching Skills
Consideration for other positions
Other position
CFO, COO, GM
Top management due to knowledge
Staffing problem
Bias in selection of choosing university
CEOs will pick established university
Reputation
Expected gain
CEOs are driven by results; they look for gain
Gain
4.8 Theme 8: Impact on the Accounting Profession
The analysis revealed several significant implications for the accounting profession, including acquiring
graduates ready for the workforce (confident, etc.) and who understand the nature of the profession. From
the long-term perspective, the profession will improve if the concept is successful, while from the short-
term perspective, the impact is more on individual development, as evidenced by several codes
(motivation, determination and knowledge). For the accounting profession, the anticipated outcome is the
generation of quality accountants and hence the improved effectiveness and efficiency of the accounting
profession.

106
5. DISCUSSION
5.1 Developing a Dynamic and Relevant Accounting Curriculum
The survey conducted by Teik et al. (2013) demonstrated that there is a mismatch between what is taught
and what is expected from Malaysian accounting students. Teik et al. (2013) found insufficient coverage
of relevant skills in the accounting syllabus. Their study proposed, for example, that fraud-related courses
are necessary to expose students to fraud-based learning and prepare them by providing fraud detection
skills. They suggested that this is both relevant and necessary because it is essential for the accounting
profession to shift its role from that of watchdog to that of bloodhound. Hence, the accounting syllabus
should be responsive to the demands of the industry.
Based on the results of this study, we make similar claims. The accounting educators were in agreement
that too great a focus on theory limits the development of practical skills. These are the critical reasons
that underpin the perception of lagging accounting graduates when they join the workforce. The findings
indicate there is a need to address this issue. It was suggested that emphasis should be placed on
implementing an integrated approach, combining both theory and practice. However, there are concerns
related to the implementation of such an approach. The findings implied that possible issues might arise
regarding both the process and the people. It was perceived that failing to obtain commitment from the
industry and incoherent implementation of the programme would result in failure, which is the main
concern of academia. However, with a proper process and commitment from practitioners, the findings
revealed the potential for a dynamic educational style.
5.2 Advocating the Triple Helix in Educating Accountants
The findings indicated that there is a reflection of the Triple Helix Model in the CEO Faculty Programme,
based on the visibility of the main components depicted in the system theory, the relationship between
components and the functions (Ranga & Etzkowitz, 2013):
(i) components (the institutional spheres of the university, industry and government) with a wide array
of actors;
107
(ii) relationships between components (collaboration and conflict moderation, collaborative leadership,
substitution and networking); and
(iii) functions, described as processes taking place in what are labelled the “knowledge, innovation and
consensus spaces”.
The programme concept has the components mentioned in the Triple Helix Model. The knowledge
management comes from the university and the innovation comes from the industry, while the lead comes
from the government. With these intersections, positive outcomes can be anticipated for the accounting
profession. Entering into a formal collaboration with the industry and gaining the CEOs’ support in terms
of practice matches the need for holistic accountants, hence potentially contributing to greater economic
development in the future.
5.3 Implications for the Accounting Profession
The start of the 21st century marked the advent of globalisation in educating future generations, and the
interactive nature of the business environment. This interactive world demands innovation and creativity.
Entering the 21st century, education faces the challenges of adapting to the interactive world. Affected by
demand, accounting educators see their responsibilities as keeping abreast of this shift. Accounting
educators need to re-examine their role in educating accounting graduates who will have an impact on the
accounting profession. The findings suggest that combining the efforts of accounting educators and the
industry will move the CEO Faculty Programme concept forward in providing dynamic accountants.
Also, the findings revealed potential short-term and long-term impacts on the profession. The short-term
impact includes preparing accounting graduates who are well informed regarding the accounting
profession. It is clear from the data that the profession requires continuous improvement, i.e. that young
accountants entering the profession are able to support the profession in terms of its dynamics.
Accounting activities are subject to events occurring in the economy. This programme concept fits in
producing future accountants with such qualities, providing a cohesive and effective approach to learning
practical skills; hence, it exerts an impact in relation to producing future accountants with knowledge to
support integrated thinking, theory and practice.

108
A keystone for the profession is to have efficient accountants of high value, with sharp reactions and the
ability for forward thinking as role models. The concept is the premise for introducing role models to the
students who possess such value.
6. RECOMMENDATIONS
There are several recommendations that could potentially contribute to the efficacy of the programme in
terms of economic, social and educational aspects.
Recommendation 1: The Organisation of The Programme is The Key to Success
Making sense of the analysis, the CEO Faculty Programme could generate positive outcomes. However, it
is important for the proper structure and process to be established. It is therefore recommended that the
programme put in place effective operationalisation mechanisms, focusing on resources, facilities and the
administration of the programme. Hosting universities are advised to provide support to the CEOs in
relation to scheduling, materials (including the course syllabus), online facilities, etc.
Recommendation 2: The Government Should Play a Mediating Role to Ensure The Success of
Academic–Industry Collaboration
It is important for both parties – host universities and the industry – to have mutual respect and
understanding. There is the view that the industry has limited respect for academia; hence, the industry,
particularly CEOs, should keep an open mind in collaborating to provide learning gains for accounting
students. Accordingly, it is recommended that the MOE should organise dialogue sessions between
universities and CEOs, deliberating on the benefits and challenges for the engaging parties.

109
Recommendation 3: Trial Run Before Full Implementation
It is recommended that there should be a clear briefing on the aims, requirements, expectations and
anticipated outcomes of collaboration. This will align the objectives for all involved parties. Furthermore,
collaboration should be piloted on a small scale to iron out issues before full-scale implementation.
Recommendation 4: Readiness of Universities For Collaboration
Hosting universities should be ready to accept practitioners in the education system and be proactive in
the collaboration. It is recommended that the host universities should be ready with adequate facilities.
7. CONCLUSION
Although the CEO Faculty Programme is in its infancy, the study had the opportunity to gain an
understanding of the concept based on the social reality. Through the experience of practitioners who are
presently engaged as academics, the findings provide a supportive rationale for adopting this concept. The
findings conclude with the proposition made in the recommendations. Overall, the concept is perceived as
significant for both academia and the accounting industry, although there are challenges that need to be
addressed. The findings support the conclusion that the appropriate selection of partners and the proper
organisation in integrating the curriculum will contribute to advancing accounting education. The positive
contributions achieved will ultimately have a positive impact on the accounting profession. To conclude,
this study contributes to the IFAC Framework in such a way that it addresses the 21st century demand for
an interactive process in educating future accountants. Thus, the CEO Faculty Programme, which reflects
the Triple Helix Model, is useful in translating the roles and domain of professional accountants in
business.

110
8. REFERENCES
Committee to Strengthen the Accountancy Profession [CASP] (2014) Report on the Strengthening of
the Accountancy Profession In Malaysia. Available at http://www.sc.com.my/wp-
content/uploads/eng/html/aob/csap_141211.pdf
Creswell, J.W. (2007). Qualitative Inquiry and Research Design: Choosing among Five Approaches (2nd
ed.). Thousand Oaks, CA: Sage.
Devi, S.S., Kumar, R.S., and Raju, K.S. (2012), Partnering with Practice for Accounting Education:
Evidence from the Pacific. Business Education & Administration 4 (2), 61-72.
Geary, W., Kutcher, E.J., and Porco, B.M. (2010). Partnering with Practice: Staffing to Achieve
Excellence in Accounting Education. Issues in Accounting Education, 25 (2), 199-213.
Gu, J. and Neesham, C. (2014). Moral Identity as Leverage Point in Teaching Business Ethics. Journal of
Business Ethics 124, 527-536.
Heitger, E.L. and Heitger, L.D. (2008). Incorporating Forensic Accounting and Litigation Advisory
Services into the Classroom. Issues in Accounting Education, 23 (4), 561-572.
Johnson, R. (2014). Accounting Practitioners Reflect on Faculty Impact: Bridging the Gap between
Theory and Practice. American Journal of Business Education, 7 (2), 109-115.
Kolb, D.A. (1984). Experiential learning: Experience as the Source of Learning and Development.
Englewood Cliffs, NJ: Prentice Hall.
Mounce, P.H., Mauldin, D.S., and Braun, R.L. (2004). The importance of Relevant Practical Experience
Among Accounting Faculty: An Empirical Analysis of Students’ Perceptions. Issues in Accounting
Education, 19 (4), 399-411.

111
Paino, H. and Puteh, M.S. (2006). A Study on Accounting Curricular and Future Accountants Graduates.
Gading Business and Management Journal, 10 (2), 13-30.
Porter, B. and Carr, S. (1999). From Strategic Plan to Practical Realities: Developing and Implementing a
Zero-based Accounting Curriculum. Issues in Accounting Education, 14 (4), 565-587.
Ranga, M. and Etzkowitz, H. (2013). Triple Helix Systems: An Analytical Framework for Innovation
Policy and Practice in the Knowledge Society. Industry and Higher Education, 27 (4), 237-262.
Teik, L.O., Al-Mashoor, A.S, Chung, W.S and Song, Q.N. (2013). A Study of Malaysian Accounting
Education in Higher-Learning Institutions: Is Malaysia Preparing Undergraduates for a Tsunami of
Fraud? World Academy of Researchers, Educators, and Scholars in Business, Social Sciences, Humanities
and Education (In Association with the Academy of World Finance, Banking, Management and IT)
Conference Proceedings, 1 (1), 68-84.

112
9. AUTHORS
Dr. Zaleha Othman is a senior lecturer at the School of Accountancy, College of Business, Universiti
Utara Malaysia, Sintok, Kedah. She graduated in accountancy at Universiti Utara Malaysia and received
her Master in Business Law from University of Leeds. She has a PhD from Universiti Teknologi MARA
for research on ethics and corporate governance. At present, she is teaching forensic accounting and
qualitative research method. She has a great passion for qualitative research. Dr. Zaleha’s research and
writing activities focuses on ethical governance, professional ethics, and corruption. She has articles
published in several journals and presented her research in international conferences. One of her recent
publication is ‘role of ethics in corporate governance’, in one of the scopus journal.
En Fathilatul Zakimi Abdul Hamid is a senior lecturer at the School of Accountancy, College of
Business, Universiti Utara Malaysia, Sintok, Kedah. Prior to working in UUM, he had worked with
Malayan Banking Berhad and BDO Binder as a junior auditor. At present, he teaches accounting theory
and analysis of financial statement. Fathilatul’s research and writing activities focuses on corporate
responsibility, sustainability and ethics. He has published articles in several journals and presented his
research in local and international conferences.
En Rohami Shafie teaches auditing, risk management, corporate governance and forensic accounting
courses at Universiti Utara Malaysia. He has a Master degree in international accounting and finance. He
is the author of several papers in auditing, corporate governance, risk management and finance which
have been published locally and internationally. He has also presented working papers at various
conferences in Malaysia and abroad. In addition, he has carried out consultation work with the industry
and conducts financial planning seminars. His works have also been published in local newspapers and
several academic books.
.

113
CONSOLATION PRIZE
EXPERTS’ PERCEPTIONS ON RELEVANT TAX INCENTIVES FOR
THE DEVELOPMENT OF MARGINAL OIL FIELDS IN MALAYSIA
Associate Professor Dr. Nor Aziah Abd Manaf
Dr. Natrah Saad
Mr Abdulsalam Mas’ud

114
EXPERTS' PERCEPTIONS ON RELEVANT TAX INCENTIVES FOR THE DEVELOPMENT
OF MARGINAL OIL FIELDS IN MALAYSIA
ABSTRACT
The extent to which foreign investors indicate interest in the development of Malaysia’s marginal oil
fields is relatively low. Tax incentives have been identified as key predictors of foreign direct investment.
An evaluation of experts’ perception on relevant tax incentives that encourage investment in marginal oil
fields in Malaysia was conducted. Three clusters of experts covering government institutions, private oil
companies, and accounting firms, directly or indirectly related to marginal oil fields, were surveyed. The
results revealed interesting findings, out of 17 tax incentives examined based on their relevance for
marginal oil field development in Malaysia, 13 were considered highly relevant, while the remaining four
were considered moderately relevant. Further analyses revealed that the three experts groups generally
agreed that eight of the 13 highly relevant tax incentives are very pertinent for marginal oil field
development in Malaysia, while they disagreed on the remaining five. Of the four moderately relevant tax
incentives, the three experts groups generally agreed that two were moderately relevant for the
development of marginal oil fields in Malaysia but they disagreed on the remaining two tax incentives.
Serving as policy insights, it is recommended that when designing marginal oil fields tax incentives,
policy preference should be given to the eight tax incentives for which the three expert groups considered
highly relevant for marginal oil field development in Malaysia, followed by the rest in sequence.
1. INTRODUCTION
The oil and gas sector is critical to the growth and development of the whole Malaysian economy. It
contributes about 20% to the gross domestic product (GDP), 76% of domestic energy needs (US-Energy
Information Administration, 2013), and about 40% of annual budgets (Lee, 2013). The sector has been
listed among the key economic areas by the Economic Transformation Programme (ETP), which was
introduced in 2010. Under the ETP, Malaysia has a vision to become the Asian energy hub by 2020
(Malaysia Petroleum Resources Corporation, 2014). However, evidence from the ETP (2010) and
Malaysia Petroleum Resources Corporation (2014) show that the country has been experiencing a decline
in reserves and production as well as a rise in the number of stranded marginal oil fields. Marginal oil
fields are classified as small oil fields containing an average of 30 million barrels of oil equivalents

115
(Manaf, Saad, Ishak, & Mas’ud, 2014; Na, Zawawi, Liew, & Razak, 2012). There are about 106 marginal
oil fields in Malaysia with cumulative reserves of 580 million barrels of oil equivalents. Many of these are
stranded, and are considered uneconomic by large foreign oil companies (Faizli, 2012; TA Securities,
2014). As a response, the government changed the fiscal arrangement of these fields and introduced some
tax incentives considered desirable to foster their development, which led to the amendment of the
Petroleum Development Act in 2011 (Mas’ud, Manaf, & Saad, 2014). Some of the tax incentives
introduced include reduced tax rate from 38% to 25%, accelerated capital allowance from 10 to 5 years,
investment allowance of 60% to 100% of qualifying capital expenditure, exemption of 10% export duty
for oil and gas produced and exported by the field operators, and transfer of capital expenditure among
contiguous sole proprietorship or partnership. However, after four years of the new policy and incentives
being rolled out, few foreign players have shown interest in developing small and marginal oil fields in
Malaysia (TA Securities, 2014).
Therefore, this study aims to evaluate the perceptions of experts on the relevant tax incentives for the
development of marginal oil fields in Malaysia. The second part of the paper is a review of the literature
relating to tax incentives applicable to the oil and gas industry. The third part covers the methodology, and
the fourth results and discussion. The last part is the conclusion and policy implication.
2. LITERATURE REVIEW
2.1 Definitions of Tax Incentives
Early scholars of tax incentives such as Surrey (1970) defined a tax incentive as a tax related expenditure
relinquished by the government to control the activities and behaviour of the benefitting investors. Tax
incentives have also been defined as subsidies given directly or indirectly by the government to businesses
but are not part of the accepted tax structure. This includes abatement for property taxes, exemptions,
firm-specific infrastructures, free real estate, specific job training and low interest loans (Hellerstein &
Coenen, 1995). It has also been described as incentives given to specific industries with the aim of
influencing their behaviour (Ricupero, 2000). It covers issues meant for reducing cost and risk as well as
boosting return from investment, but does not include infrastructure, legal and fiscal regimes, and
repatriation of profits.

116
To Buss (2001), tax incentives have been considered important measures initiated by the government to
boost business relocation and set-up, as well as to favour certain businesses over others, protecting
businesses from competition or preventing them from collapse. They are also considered by Easson and
Zolt (2003) as exclusions, exemptions and deductions given to industries such as preferential tax rate and
tax liability deferral. They are also referred to as benefits given to specific industries or sectors that is not
extended to others (Klemm, 2010). A similar definition was that of Zee, Stotsky and Ley (2002) who
defined tax incentive as the reduction of burden relating to effective tax rate given to specific industries
compared to others.
There are some features common in the above definitions, i.e. tax incentives are benefits offered to some
industries, and meant to influence or induce their behaviour or influence them to perform certain activities
for which the government has an interest. Thus, when the government has an interest in promoting a
specific industry or sector, or is interested in rescuing or encouraging investment in those industries or
sector, it offers tax incentives to improve the rate of return, reduce risk and costs. Therefore, some tax
incentives can be desirable for the development of marginal oil fields in Malaysia.
2.2 Types of Tax Incentives
There are many documented types of tax incentives. In the United Nations Conference on Trade and
Development (UNCTAD) report, Ricupero (2000) enumerated some types of tax incentives desirable for
boosting investment, such as allowable deduction for qualifying expenses, employment-based deductions,
loss carry forwards, investment allowance, investment tax credits, preferential treatments on long terms
gains, reduced corporate tax rate, reduced withholding tax rate, tax holidays, tax credit for foreign hard
currency earnings and zero or reduced tariffs, investment allowance, tax credit, accelerated depreciation,
favourable deduction rules, reinvestment incentives, sales tax exemption, reduced property taxes, reduced
personal income taxes and export licence free zones. Klemm (2010) outlined eight tax incentives covering
accelerated depreciation, financial incentives, investment tax credit, investment allowance, special zones,
tax holiday, and tax exemptions. Separately, five items of tax incentives were outlined by Morisset (2003)
which are accelerated capital allowance, duty drawback, investment allowances, import duty exemptions
and tax holiday. The most comprehensive tax incentive items were documented by Buss (2001) who
recognised that the mostly commonly applicable tax incentive items for the period of 10 years from 1986
to 1996. These cover accelerated depreciation, corporate income tax exemption, excise tax exemption,

117
equipment and machinery tax exemption, goods in transport tax exemption, manufacturers’ inventories
tax exemption, job creation tax incentive, industrial investment tax incentive, land and capital
improvements tax exemption, personal income tax exemption, raw materials for manufacturing tax
exemption, research and development tax exemption, sales and/or use tax on new equipment exemption,
specified state products tax credit, and tax stabilisation agreements.
The focus of this study is to evaluate experts’ perception of relevant tax incentives for the development of
marginal oil fields in Malaysia. In addition to the tax incentive items discussed above, other forms of tax
incentives related to the oil and gas industry have also been identified. In a report, Butcher (2012)
discussed some forms of tax incentives related to the oil and gas industry. It covers depletion/low
production allowance to encourage small field performance, tax reduction for deeper drilling, and tax
reduction when oil prices fall below the trigger price to improve production. Furthermore, other scholars
have documented more tax incentives applicable to the oil and gas industry such as bonus for reserve
addition (Onyeukwu, 2008), sliding scale royalty based on water depth to encourage deep water drilling,
(Nwete, 2005), flow through shares and loss carry back (Menezes, 2005), and transferable CAPEX within
same partnership or sole proprietorship (Okobi, 2009). Therefore, in line with the above literature, Manaf,
Saad, Ishak, and Mas'ud (2015) have tabulated a comprehensive tax incentives index for the oil and gas
industry. These are contained in Table 1 below.

118
Table 1: Summary of Tax Incentives Related to the Oil and Gas Industry
Tax Incentives Source of Items
Accelerated Capital Allowance Buss (2001)
Investment Allowance Buss (2001)
Depletion Allowance Butcher (2012)
Reinvestment Allowance Easson and Zolt (2003)
Loss Carry Forward Buss (2001)
Loss Carry Back Menezes (2005)
Tax Reduction For Deeper Drilling Butcher (2012)
Tax Reduction During Low Oil Price Butcher (2012)
General Tax Rate Reduction Okobi,(2009)
Sliding Scale Royalty Based on Water Depth to Encourage Deepwater Drilling Nwete (2005)
Bonus For Reserves Addition Onyeukwu,(2008)
Tax Credit For Investment In Scientific Research Buss (2001)
Tax Exemption On Equipment And Capital Goods Imported Buss (2001)
Transferable CAPEX Within Same Partnership Or Sole Proprietorship Okobi,(2009)
Flow Through Shares Menezes (2005)
Tax Holiday And Abatement Buss(2001)
Tax Stabilisation Agreement Buss (2001)
Note. Adopted from Manaf, N. A. A., Saad, N., Ishak, Z., & Mas'ud, A. (2015). Validation of Tax
Incentive Dimensions for Marginal Oil Field Development in Malaysia. Advanced Science Letters,
Forthcoming.
It is based on these 17 items generated from the literature that the experts’ perceptions on the relevant tax
incentives for the development of marginal oil fields in Malaysia were evaluated.

119
3. METHODOLOGY
3.1 Population
The study population consists of 361 oil and gas experts whose job specialisations relate to accounting,
finance, business development and taxation. This population was obtained from three clusters. The first
cluster consists of four government institutions, the second cluster consists of eight private oil companies,
and third and last cluster consists of four accounting firms that audit the annual accounts of marginal oil
field operators. Overall, the 16 institutions relate to marginal oil fields directly or indirectly. Due to the
small sample, questionnaires were distributed to all the 361 experts. From these, 120 valid responses were
collected, which accounted for 33.24% of the whole study population - considered adequate in line with
Sekaran (2003).
3.2 Demographic Profile
The respondents of the study comprised 64.2% males and 35.8% females. Of these, 35.8% are aged below
30 years, 37.5% from 30 to 39 years, 19.2% from 40 to 49 years, and the remaining 7.5% aged from 50 to
59 years. The qualifications of the sample comprised 81.7% with diploma/degree/professional
qualifications and 18.3% with master degrees. Of the total sample, 26.7% were employed by government
institutions/national oil company, 57.5% by private oil companies and 15.8% by accounting/consultancy
firms.
3.3 Instrumentation
Seventeen types of tax incentives identified from literature were used in soliciting the experts’ perception
on their relevance for the development of marginal oil fields in Malaysia. These 17 questions were part of
the questionnaire that consisted of 69 items for a Malaysian Fundamental Research Grant Scheme (FRGS)
with code number 12930 on marginal oil fields entitled “Is new fiscal framework required to improve
investment climate of Marginal Oil Fields in Malaysia”. A seven-point Likert measurement was used to
evaluate the relevance of each type of tax incentive item. It ranges from (1) very irrelevant, (2) irrelevant,
(3) somewhat irrelevant, (4) neutral, (5) somewhat relevant, (6) relevant to (7) very relevant.

120
3.4 Analytical Procedures
Two types of analyses were performed using SPSS. Descriptive analysis of the responses using mean
values was performed to evaluate the extent to which the experts consider the relevance of each of the 17
tax incentives for marginal oil fields development in Malaysia. Second, one-way ANOVA was also
performed to compare responses between groups i.e. three clusters comprising government institutions,
private oil company, and accounting/consultancy firms. The essence of this second analysis is to evaluate
if differences exist among the three groups of experts on their perception of each of the tax incentives for
the development of marginal oil fields in Malaysia.
4. RESULTS AND DISCUSSIONS
4.1 Descriptive Statistics
The evaluation for all the tax incentives items are based on a seven-point Likert scale anchored by 1=very
irrelevant to 7=very relevant. For easier interpretation the seven-point scale was classified into three
categories: low, moderate and high. Scores of less than 3 (6/3 + lowest value 1 is considered low), scores
of 5 and above (highest value 7- 6/3) is considered high, whereas those that fall in between the two
categories are considered moderate.

121
Table 2: Means and Level of Relevance
Items
Tax Incentives N Mean
Level of Relevance
TI1 Accelerated Capital Allowance 120 5.35 Highly Relevant
TI2 Investment Allowance 120 5.35 Highly Relevant
TI3 Depletion Allowance 120 5.24 Highly Relevant
TI4 Reinvestment Allowance 120 5.39 Highly Relevant
TI5 Loss Carry Forward 120 5.03 Highly Relevant
TI6 Loss Carry Back 120 4.59 Moderately Relevant
TI7 Tax Reduction For Deeper Drilling 120 5.13 Highly Relevant
TI8 Tax Reduction During Low Oil Price 120 5.18 Highly Relevant
TI9 General Tax Rate Reduction 120 5.26 Highly Relevant
TI10 Sliding Scale Royalty Based on Water Depth 120 5.32 Highly Relevant
TI11 Bonus For Reserves Addition 120 5.33 Highly Relevant
TI12 Tax Credit For Investment In Scientific Research 120 5.11 Highly Relevant
TI13 Tax Exemption on Equipment/Capital Goods 120 5.20 Highly Relevant
TI14 Transferable CAPEX Within Same Ownership 120 5.07 Highly Relevant
TI15 Flow Through Shares 120 4.97 Moderately Relevant
TI16 Tax Holiday And Abatement 120 4.93 Moderately Relevant
TI17 Tax Stabilisation Agreement 120 4.99 Moderately Relevant
Valid N (listwise) 120
Note. N-Number of valid responses.
4.1.1 Highly Relevant Tax Incentives
Following the criteria explained in 4.1, 13 tax incentives were considered highly relevant by the experts.
These are: accelerated capital allowance, investment allowance, depletion allowance, reinvestment
allowance, loss carry forward, tax reduction for deeper drilling, tax reduction during low oil price, general
tax rate reduction, sliding scale royalty based on water depth for deep water drilling, bonus for reserve
addition, tax credit for investment in scientific research, tax exemption for equipment and capital goods
imported, and transferable CAPEX within same partnership.

122
All the 13 tax incentives have mean values of five and above, which implied that the experts surveyed
perceived that these tax incentives are highly relevant for marginal oil field development in Malaysia.
4.1.2 Moderately Relevant Tax Incentives
The experts considered four tax incentives as moderately relevant for the development of marginal oil
fields in Malaysia. These are: loss carry back, flow through shares, tax holiday and abatement, and tax
stabilisation agreement.
These four tax incentives have mean values of greater than 3 but less than 5, implying that the experts
surveyed in this study considered these tax incentives as moderately relevant for marginal oil field
development in Malaysia.
4.2 One-Way ANOVA
To further evaluate the experts’ perception on the relevant tax incentives for marginal oil field
development in Malaysia one-way ANOVA was performed to examine whether there is a variance on the
degree of agreement among the three clusters of experts on the relevance of each tax incentive. One-way
ANOVA is performed based on the null hypothesis that the mean values of all the groups are equal. Thus,
in this case it is hypothesised that the mean values of the three experts groups are equal. Therefore, the
null hypothesis would be supported if p ≥ 0.05.

123
Table 3: One-Way ANOVA for the Three Clusters of Respondents - Highly Relevant Tax Incentives
Code Tax Incentives Mean
Variance
Mean
Square F Sig.
TI1 Accelerated Capital Allowance Between Groups 1.764 1.915 .152
Within Groups .921
TI2 Investment Allowance Between Groups 1.593 1.293 .278
Within Groups 1.232
TI3 Depletion Allowance Between Groups .992 .841 .434
Within Groups 1.180
TI4 Reinvestment Allowance Between Groups 1.483 1.023 .363
Within Groups 1.450
TI5 Loss Carry Forward Between Groups .240 .107 .899
Within Groups 2.251
TI7 Tax Reduction For Deeper Drilling Between Groups 11.110 5.351 .006*
Within Groups 2.076
TI8 Tax Reduction During Low Oil Price Between Groups 14.064 8.073 .001*
Within Groups 1.742
TI9 General Tax Rate Reduction Between Groups 5.228 3.426 .036*
Within Groups 1.526
TI10 Sliding Scale Royalty Based on Water Depth Between Groups 4.008 2.727 .070
Within Groups 1.470
TI11 Bonus For Reserves Addition Between Groups 2.892 2.103 .127
Within Groups 1.375
TI12 Tax Credit for Investment In Scientific Research Between Groups 2.393 1.422 .245
Within Groups 1.682
TI13 Tax Exemption on Equipment/Capital Goods Between Groups 9.825 5.434 .006*
Within Groups 1.808
TI14 Transferable CAPEX Within Same Ownership Between Groups 9.628 5.259 .007*
Within Groups 1.831
Note. *p< 0.05 (variance in mean values exist among three clusters of experts)

124
Table 4: One-Way ANOVA for the Three Clusters of Respondents - Moderately Relevant Tax
Incentives
Code Tax Incentives Mean Variance Mean Square F Sig.
TI6 Loss Carry Back Between Groups .219 .082 .921
Within Groups 2.671
TI15 Flow Through Shares Between Groups 8.038 4.755 .010*
Within Groups 1.691
TI16 Tax Holiday And Abatement Between Groups 9.279 4.827 .010*
Within Groups 1.922
TI17 Tax Stabilisation Agreement Between Groups .358 .170 .844
Within Groups 2.105
Note. *p< 0.05 (variance in mean values exist among three clusters of experts)
4.2.1 One-Way ANOVA for the Three Clusters of Respondents - Highly Relevant Tax Incentives
Out of the 13 highly relevant tax incentives for the development of marginal oil fields it can be seen from
Table 3 that eight have equality of mean among the three groups of respondents: accelerated capital
allowance, investment allowance, depletion allowance, reinvestment allowance, loss carry forward,
sliding scale royalty based on water depth for deep water drilling, bonus for reserve addition, and tax
credit for investment in scientific research. This means that experts in government institutions, private oil
companies and accounting firms generally agreed that these tax incentives are very relevant for the
development of marginal oil fields in Malaysia.
It can also be seen from Table 3 that there is no equality of mean values among the experts on five of the
13 tax incentives for which they agreed that these incentives highly relevant for the development of
marginal oil fields. These tax incentives are: tax reduction for deeper drilling, tax reduction during low oil
price, general tax rate reduction, tax exemption for equipment and capital goods imported, and
transferable CAPEX within same partnership. Thus, it is indicated that there is disagreement among
experts in government institutions, private oil companies and accounting firms that these tax incentives
are highly relevant for marginal oil field development in Malaysia.

125
4.2.2 One-Way ANOVA for the Three Clusters of Respondents - Moderately Relevant Tax
Incentives
Out of the four moderately relevant tax incentives for marginal oil fields development, it can be seen from
Table 4 that two have equality of mean among the three groups of experts, these are: loss carry back, and
tax stabilisation agreement. Hence, it implied that the experts generally agreed that these tax incentives
are moderately relevant for marginal oil field development in Malaysia.
It can also be seen from Table 4 that the remaining two of the four tax incentives for which experts agreed
that they are moderately relevant for marginal oil field development, there is variance in mean values
among the three groups of experts. These are: flow through shares, and tax holiday and abatement. This
implied that there is disagreement among experts in government institutions, private oil companies and
accounting firms that these tax incentives are moderately relevant for the development of marginal oil
fields in Malaysia.
4.3 Summary of Findings
Table 5 below summarises the findings made from the two analyses performed in Table 2, 3 and 4 above.
Table 5: Summary of Findings
HIGHLY RELEVANT TAX INCENTIVES
Agreed by the Three Groups of Experts Disagreed by the Three Groups of Experts
accelerated capital allowance
investment allowance
depletion allowance
reinvestment allowance
loss carry forward
sliding scale royalty based on water depth for
deeper drilling
bonus for reserve addition, and
tax credit for investment in scientific
research
tax reduction for deeper drilling
tax reduction during low oil price
general tax rate reduction
tax exemption for equipment/capital goods
imported, and
transferable CAPEX within same
partnership
MODERATELY RELEVANT TAX INCENTIVES
Agreed by the Three Groups of Experts Disagreed by the Three Groups of Experts
loss carry back, and
tax stabilisation agreement
flow through shares, and
tax holiday and abatement

126
5. CONCLUSION AND POLICY IMPLICATION
The experts’ perceptions on the relevant tax incentives for the development of marginal oil fields were
evaluated – revealing interesting findings. Out of the 17 tax incentives examined, 13 were considered
highly relevant, while the remaining four were considered moderately relevant for the development of
marginal oil fields in Malaysia. Further analyses revealed that there is a general agreement among the
three groups of experts that eight of the 13 highly relevant tax incentives are very relevant for marginal oil
field development in Malaysia, while they disagreed on the high relevance of the remaining five.
Moreover, of the four moderately relevant tax incentives, there was general agreement among the experts
that two of the four tax incentives are moderately relevant for the development of marginal oil fields in
Malaysia but they disagreed on the remaining two tax incentives.
The results could have important policy insights to authorities when considering relevant tax incentives
for the development of marginal oil fields in Malaysia. When designing marginal oil field tax incentive
policies, preference should be given to the eight tax incentives for which all the three groups of experts
have general agreement that they are highly relevant for the development of marginal oil fields in
Malaysia, followed by the five tax incentives considered highly relevant but do not have total consensus
from the experts. This is to be followed by the two tax incentives for which experts have general
agreement on its moderate relevance for the development of marginal oil fields in Malaysia, and lastly, to
the remaining two tax incentives for which there is disagreement among the experts on its moderate
relevance.

127
6. REFERENCES
Buss, T. F. (2001). The Effect of State Tax Incentives on Economic Growth and Firm Location Decisions:
An Overview of the Literature. Economic Development Quarterly, 15(1), 90-105.
Butcher, B. D. (2012). Alaska’s Oil and Gas Fiscal Regime: A Closer Look from a Global Perspective.
Alaska: Alaska Department of Revenue.
Easson, A., & Zolt, E. M. (2003). Tax Incentives. Prepared for a course on “Practical Issues of Tax
Policy in Developing Countries,” World Bank, 28.
Economic Transformation Programme. (2010). Chapter 6: Powering the Malaysian Economy with Oil,
Gas and Energy. Kuala Lumpur. : Government of Malaysia
Faizli, A. A. (2012). Is Malaysia’s Rigid Fiscal Regime the Best Recipe for Petronas’ Success?, The
Malaysian Insider. Retrieved from http://www.themalaysianinsider.com/sideviews/article/is-malaysias-
rigid-fiscal-regime-the-best-recipe-for-petronas-success-anas-alam-faizli/
Hellerstein, W., & Coenen, D. T. (1995). Commerce Clause Restraints on State Business Development
Incentives. Cornell L. Rev., 81, 789.
Klemm, A. (2010). Causes, Benefits, and Risks of Business Tax Incentives. International Tax and Public
Finance, 17(3), 315-336.
Lee, E. T. H. (2013). Scope For Improvement: Malaysia’s Oil And Gas Sector. Retrieved from
http://refsa.org/wp/wp-content/uploads/2013/07/OG-Scoping-Report-Malaysia-final-20130701.pdf
Malaysia Petroleum Resources Corporation. (2014). History of Oil and Gas Industry in Malaysia.
Retrieved on 05/05/2014, 2014, from http://www.mprc.gov.my/industry/history-of-oil-gas-in-malaysia
Manaf, N. A. A., Saad, N., Ishak, Z., & Mas'ud, A. (2015). Validation of Tax Incentive Dimensions for
Marginal Oil Field Development in Malaysia. Advanced Science Letters, Forthcoming.
Manaf, N. A. A., Saad, N., Ishak, Z., & Mas’ud, A. (2014). Effects of Fiscal Regime Changes on
Investment Climate of Malaysia's Marginal Oil Fields: Proposed Model. Procedia - Social and Behavioral
Sciences, 164(0), 55-61. doi: http://dx.doi.org/10.1016/j.sbspro.2014.11.050

128
Mas’ud, A., Manaf, N. A. A., & Saad, N. (2014). Comparison of Petroleum Fiscal Regime within
Malaysia. Petroleum Accounting and Financial Management Journal 33(2).
Menezes, R. (2005). Does India’s Tax Regime for Minerals Achieve Its Objectives. CAR CEPMLP
Annual Review, 9(2005).
Morisset, J. (2003). Using Tax Incentives to Attract Foreign Direct Investment. View Point, 25x, 1-4.
Na, K., Zawawi, N. W. A., Liew, M., & Razak, Z. A. (2012). Opportunities of Platform Reuse in
Malaysia. Energy, 60, 70.
Nwete, B. O. N. (2005). Mineral and Petroleum Taxation How Can Tax Allowances Promote Investment
in the Nigerian Petroleum Industry? CAR CEPMLP Annual Review, 8, 1-23.
Onyeukwu, H. (2008). The Incentives in the Fiscal Framework of The Nigerian MoUs with the
International Oil Companies: Have the Objectives Been Achieved?
http://works.bepress.com/humphrey_onyeukwu/3
Ricupero, R. (2000). Tax Incentives and Foreign Direct Investment: A Global Survey ASIT Advisory
Studies (Vol. 16). Geneva: United Nations Conference on Trade and Development.
Sekaran, U. (2003). Research Methods of Business-A Skill-Building Approach (4th ed.). New York: John
Wiley & Sons, Inc.
Surrey, S. S. (1970). Tax Incentives as a Device for Implementing Government Policy: A Comparison
with Direct Government Expenditures. Harvard Law Review, 83(4), 705-738. doi: 10.2307/1339837
TA Securities. (2014). Scomi Energy Services Bhd Geared for more RSCs. Kuala Lumpur.
US-Energy Information Administration. (2013). Country Report - Malaysia. Retrieved 11 November,
from US Energy Information Administration
Zee, H. H., Stotsky, J. G., & Ley, E. (2002). Tax incentives for Business Investment: A Primer for Policy
Makers in Developing Countries. World Development, 30(9), 1497-1516.

129
7. AUTHORS
Dr. Nor Aziah Abd. Manaf, CFiA is an Associate Professor at the School of Accountancy, College of
Business, Universiti Utara Malaysia, and is currently the deputy dean of the school. She holds a degree in
BAcct (Hons.) (UUM) and MBA (Acctg) (Sheffield, UK). She completed her PhD in 2004 at Nottingham
University Business School, UK. Her areas of expertise cover topics such as taxation, company secretarial
practices, corporate governance and PBL. She has published research papers in several refereed journals
and authored a few books. She is a team leader for the Fundamental Research Grant Scheme (FRGS) with
code number 12930.
Dr. Natrah Saad is a Senior Lecturer at the School of Accountancy, Universiti Utara Malaysia (UUM).
She obtained her PhD in Taxation from University of Canterbury, Christchurch, New Zealand in 2011.
Throughout her service, she has taught taxation at both undergraduate and postgraduate levels in addition
to other financial accounting courses. Her research interests focus primarily in the field of taxation.
Specific topics include compliance behaviour, compliance cost, tax administration, petroleum and
environmental tax.
Mr Abdulsalam Mas’ud, CNA is a Lecturer at the Department of Accountancy, Hussaini Adamu
Federal Polytechnic, Jigawa State - Nigeria. He obtained a B.Sc. (Accounting) from Bayero University,
Kano – Nigeria in 2005 with second class Upper. He won the prestigious Petroleum Technology
Development Fund (PTDF), Nigeria in 2009, which led to his enrolment into M.Sc. (Oil and Gas
Accounting) at Dundee Business School, University of Abertay - Dundee, UK and he graduated in 2010
with Distinction. He is currently a PhD candidate at Othman Yeop Abdulllah Graduate Business,
Universiti Utara Malaysia. His areas of specialisation cover oil and gas accounting, taxation and financial
reporting, where he has published articles in high indexed journals.

130
CONSOLATION PRIZE
INFORMATION SECURITY: PLUGGING THE LEAKS
Dr. Mariati Norhashim
Dr. Zauwiyah Ahmad

131
INFORMATION SECURITY: PLUGGING THE LEAKS
ABSTRACT
Information security (IS) ensures business continuity, minimise risks and maximise returns on
investments. A culture which encourages good IS practices is thus very important. Prior research has
studied how employees can be influenced to practice better IS practices, however, the findings are mixed.
This study was conducted with the aim to identify (i) the typology of employees based on their IS
behaviours; (ii) behaviours that are critical to organisations’ IS; and (iii) the factors underlying
employees’ behaviours in relation to IS. We examined the Malaysian scenario by conducting a focus
group discussion of experts, followed by a survey of employees in the communication and multimedia
industry, one of the Critical National Information Infrastructure providers. The focus group discussion
identified the attitude and level of knowledge that appears prevalent among Malaysian employees.
Although Malaysians are fairly familiar with high tech cyber-attacks, the level of awareness of how IS can
be compromised via low tech approach such as social engineering is poor. This may be caused by the
general attitude that information asset is not a critical asset unlike physical or financial assets.
Incorporating the discussion into the survey, we examined the level of knowledge and IS practices among
communication and multimedia industry with the assistance of Malaysian Communication and
Multimedia Commission. The results revealed that the level of information system knowledge among the
respondents were moderately high, however, the level of knowledge does not appear to have any
influence on their compliance to good IS practices. In fact, the extremes were observed where the higher
the knowledge, the respondent were likelier to either comply most assiduously, or most poorly. The
happy middle are those that possess the lowest level of knowledge. We also found that the practices that
appear to be least complied with were those related to data protection, password security and management
of mobile devices. This paper ends by recommending practical steps for organisations to improve their
IS. The study was funded by Fundamental Research Grant Scheme under the aegis of Ministry of Higher
Education.

132
1. INTRODUCTION
There has been a six fold increase from 2005 to 2011 of Cybercrimes in Malaysia (Bernama, May 2012).
Losses amounting to 2.75 billion from 2005-2012 with 3.3 million form the first three quarters of 2012
alone. Not only profitable entities are under threat, government agencies too were being threatened (The
Star, 15 June 2011). Although there are numerous legislations such as Personal Data Protection Act 2010
in place, the problem of information security (IS) breaches is growing. The increase in these security
breaches are caused not only by technical glitches but also by lack of awareness and poor IS practices.
Many organisations spend enormous amounts to ensure that their information technology systems have
the necessary controls and protection. However, the controls and protection implemented is only as good
as the employees. The biggest IS threat to organisations is the people within the organisations itself. In
these days of high dependence on data for the smooth running of operations, as well as for strategic
advantage, no organisation can take IS lightly. Unfortunately, as much as the employees desire to do their
best to protect the organisation information assets is not matched to the understanding and capabilities to
do so. This article looks at the issues and challenges facing organisations in handling the IS threats and
proposes some practical steps organisations can take to protect themselves.
IS policies and systems are vital for every organisation in order to protect its information assets and
reinforce its position against any perpetrators. The implementation of IS standards, such as Common
Criteria ISO/IEC 15408, and the Information Security Management System (ISMS) ISO/IEC 27001, help
organisations to ensure that their information system meets security standards in both the development
and implementation stages. These standards are expensive and time consuming to meet, but they’re
beneficial for identifying risk areas and as a precaution to manage IS risks. However, these policies,
systems and standards, if not complied with, will become a white elephant. One of the ways to ensure
compliance is via a workplace culture which encourages behaviours that protect information and creates
employees’ mindfulness of unacceptable behaviours pertaining to IS. Motivated by the importance of
addressing employees’ IS behaviours, we conducted a study with the aim to identify (i) the typology of
employees based on their IS behaviours; (ii) behaviours that are critical to organisations’ IS; and (iii) the
factors underlying employees’ behaviours in relation to IS.

133
2. VIEWS FROM THE EXPERTS
There has been a mixed bag of results in prior research. Some studies found that certainty of detection,
the individual’s attitudes, personal norms and self-efficacy have a significant relationship with compliance
intention (Ifinedo, 2012; Burgulcu et al., 2010; Herath & Rao, 2009), others did not (Cheng et al., 2013;
Pahnila et al, 2007). A greater understanding has been found with regards of use of sanctions whereby
Johnston et al. (2015) found that informal sanctions worked better than formal sanctions and Cheng et al.
(2013) found that employees’ attachment to organisation was a significant influence while attachment to
superiors are not. Nonetheless, the panel of experts who participated in the focus group discussion
collectively believed that the key to IS lies in the employees themselves. Two issues related to employees’
awareness that need to be addressed are (i) threats of social engineering; and (2) importance of
information as an organisation’s critical asset.
2.1 Threats of Social Engineering
In Malaysia, Dzazali et al. (2009) found that the most frequent IS breach is from spamming and malicious
codes from both internal and external sources. However what is of a bigger concern, almost half of all
breaches were of unknown origin. This implied that organisation in Malaysia are still lacking in terms of
identifying all possible IS threats.
One of the damaging preconceptions is when IS is viewed as a technology issue and not a management
issue. Such preconception leads to many security breaches being inappropriately addressed, with more
focus on the implementation of high-end technological security controls while the behavioural factor was
neglected. En. Sazali Sukardi, the Vice President of Research, Cybersecurity highlighted the significance
of the threats from the behavioural factor when he said “… awareness of information security is still
lacking. Most individuals are still unaware of the importance of data protection. There’s not necessarily
any technical sophistication in cybercrime. The criminals take time to understand and target their
victims.”

134
IS breaches can occur without technical intrusion whereby hackers use human interaction and tricks
people into breaking security procedures or revealing confidential information, which is also known as
social engineering. It is not uncommon that passwords were obtained via unsolicited emails or telephone
calls or confidential information gathered through social acquaintances. Hence, organisations should not
limit IS control mechanisms to technological threats but also address the threat of social engineering.
2.2 Information is a Critical Asset
Pn. Rafeah Omar, from TM, noted “… many (employees) don’t know or understand the kind of
information that is very useful to outsiders.” Pn. Rafeah also pointed out that one of the main reasons
employees do not take IS seriously is because “…they don’t see it as a critical asset. When you don’t
think something is of any value, then of course you won’t protect it… Even an organisation chart or staff
directory can be valuable for those who know how to use it because it gives information about access.”
Therefore, it is imperative that organisations classify their information accordingly. Staff directory,
protocols, standard operating procedures, network diagrams, and employees’ background are among
critical information that needs to be protected. It should not be assumed that employees know what is
confidential and what is not because confidentiality is dependent upon organisations and the environment
within which the organisations operate. Even though a type of information has been identified as an asset,
employers may still not know how to protect it. Hence, it is important that upon identification of critical
information, employees are guided on how to protect the information and the threats that could
compromise the information. Pn Rafeah added, “… that is when you have to enforce a system where they
cannot send confidential information without protection.”
Both En. Sazali and Pn. Rafeah agreed that employees are more influenced by their own convenience
when it comes to complying with IS protocols. It is also difficult to convince employees when they cannot
see the results or effects of IS protocols. This impacts their desire to comply or implement IS protocols
and policies because compliance can be very costly in terms of difficulty, time, energy and other
resources. Employees’ attitude towards IS will affect the inculcation of an effective IS culture in the
workplace. Thus, the importance of impressing upon the staff the impact of IS breaches.

135
3. STATISTICAL EVIDENCES
In order to examine the current state of IS behaviour among employees in Malaysia, we have conducted a
survey involving employees in the telecommunication and multimedia industry. A total of 1,099
responses were obtained from the survey – which provide a fair view of the IS practices.
Typology of employees
With the data, we first classified the respondents into four separate groups. The first group, labelled as
The Discerning, are rational respondents who will comply to IS best practices and have the relevant
knowledge. The second group, labelled as The Rebel, are those who have the knowledge but violate the
rules of behaviour. The third group, The Obedient, respondents who comply with IS best practices
without adequate knowledge about IS. The Oblivious form the last group, comprising of respondents who
compromise IS because they do not have security knowledge. The majority had high knowledge of IS.
Figure 1: Typology of employees
The largest group is the Discerning, which make up 42% of the employees surveyed. This is followed by
the Rebel (34%). The Obedient and the Oblivious make up 12% each. Although the majority are the
Discerning, the rather high percentage of the Rebel group should be a concern. These statistics implied
that knowledge does not guarantee conformance. It is possible that those in the Rebel group tend to take
things for granted and assumed that they would be able to overcome any setback due to IS breach since
they are knowledgeable in the area or perhaps, the employees feels that IS is the domain of the
information technology department and not theirs.
High conformance
Low conformance
High knowledge
Low knowledge
The Discerning 42%
The Rebel 34%
The Obedient
12%
The Oblivious
12%
The Discerning
High Knowledge + High Compliance
The Obedient
Low Knowledge + High Compliance
The Oblivious
Low Knowledge + Low Compliance
The Rebel
High Knowledge + Low Compliance

136
There doesn’t appear to be a clear profile for each of the typology. Women appear to conform more than
men. Those who are more mature also appear to be more conforming compared to the youngest group.
Education and job position doesn’t appear to have any influence on conformance levels. It could therefore
be concluded that we could not differentiate the employees as either the Discerning, the Rebel, the
Obedient, or the Oblivious based on their demographic characteristics.
Table 1: Demographic data
Characteristics
The
Discerning
(%)
The
Rebel
(%)
The
Obedient
(%)
The
Oblivious
(%)
Gender
Female 52.3 43.7 71.8 53.3
Male 47.7 56.3 28.2 46.7
Age
30 years and below 22.7 29.0 16.8 29.8
31 – 41 years 39.5 40.7 32.8 31.4
41 – 50 years 24.3 20.6 27.2 16.5
51 and above 13.4 9.7 23.2 22.3
Education
Certificate 8.4 7.3 32.3 30.8
Diploma 23.5 23.0 28.2 34.2
Bachelor 55.9 56.2 37.1 31.7
Postgraduate 12.2 13.5 2.4 3.3
Job Position
Manager 28.3 28.1 10.5 8.3
Executive 39.5 38.4 25.8 23.3
Non-executive 32.2 33.4 63.7 68.3

137
4. CRITICAL IS BEHAVIOURS
We have analysed the frequencies of the IS behaviour tested and we found eight behaviours that are of
concern, indicating the need for organisations to manage these behaviours. These behaviours were
categorised into Data Protection, Password Security and Management of Mobile Devices.
4.1 Data Protection
The most notable weakness in terms of data protection surveyed is in terms of the protection of documents
sent via email. Only 24% of users surveyed frequently implemented some form of protection. Data
backup also seemed to be less practiced by the surveyed users, with only 40% of them frequently backup
their data. Despite the risks of assessing work emails via public network, 47% of users still do on
moderate to frequent basis.

138
4.2 Password Security
Passwords provide control over access to data and information. The use of password is usually the main
access control method implemented by organisations. It was found that only 31% of users frequently use
different passwords for different access and only 46% change their passwords frequently.
4.3 Management of Mobile Devices
The use of personal mobile devices for work-related purposes has become a need in recent times –
creating the need to properly manage these devices. The survey shows 52% of users store confidential
information in personal mobile devices. Although 59% of users implemented access control for their
devices, only 25% of users frequently change the passwords to their devices.

139
4.4 Influencers of IS behaviours
In order to determine the factors influencing IS behaviours, we regressed a number of selected variables
(namely training, monitoring, security practices, norms, perceived vulnerabilities and IS awareness)
against IS behaviours. Our study reveals that compliance were more influenced by cultural factors; i.e.
norms, perceived vulnerabilities and awareness; rather than organisational factors such as training,
monitoring and practices. This suggests that management could increase compliance by developing
awareness programmes and socialising the employees to a more information sensitive culture.

140
5. THE OUTCOMES
Organisational losses due to cybercrimes not only can be attributed to fraud or extortion but also customer
compensation, damaged system replacements and lawsuits. Loss of customers and reputation could also
occur. Although numerous legislations, such as Personal Data Protection Act 2010, are in place, the
problem of IS breaches is growing. According to the panel of experts, the increase in these breaches is
caused not only by technical glitches but also by lack of awareness and poor IS practices. Research has
shown that people are more inclined to comply:
• If they can visualise the positive outcomes of compliance
• When top management is seen to be serious about IS
• When the negative outcomes of compliance are clearly understood
5.1 How Do We Increase Conformance to Good Information Security Behaviours?
There are a number of ways which has been suggested as effective in increasing compliance to good
IS practices. These include:
(i) Sanctions - Although research have shown sanctions can increase levels of compliance, it may
also increase resentment and subsequently, deliberate sabotage in certain individuals.
Effective sanction messages include elements describing the seriousness and likelihood of
threat, specific actions to prevent or defend against the threats and consequences upon failure
to comply. Informal sanctions such as social pressure has been found to be more effective
particularly among the OBLIVIOUS.
(ii) Education - effectiveness of training is grounded on two key outcomes: increased awareness
and improved self-efficacy. People need to understand why they need to comply, and more
importantly feel capable of complying. Education is more effective within an informal social
learning environment - storytelling and engaging employees in designing and implementing
security practices can create a IS mature culture particularly among the REBELS.
(iii) Systems - policies and procedures to identify potential IS threats and installing devices to
detect and prevent compliance failures are important prerequisites in ensuring that sanctions
are effective and practices can be implemented efficiently.

141
5.2 Practical Steps to Enhancing Information Security
The objective of an IS system is to protect organisation assets and reputations, ensure digital continuity,
make informed decisions, avoid or reduce risks and costs, and deliver better performance. The following
measures could be implemented towards improving IS systems.
Step 1: Identify information assets in the organisation
The National Archives in the United Kingdom published a document called ‘Identifying Information
Assets and Business Requirements’ defined information assets as “a body of information, defined and
managed as a single unit so it can be understood, shared, protected and exploited effectively. Information
assets have recognisable and manageable value, risk, content and lifecycles.” They also identified several
reasons why an organisation initiates a review of its information assets i) managing digital continuity ii)
change management iii) risk management and improving governance iv) managing retention and disposal
(of information assets) v) exploiting and sharing information and vi) streamlining technology.
The document also recommended methods for identifying an information asset. The method requires an
audit of various sources such as technical registers, databases, software lists and system configurations.
The auditor will have to ascertain the level of granularity, i.e. the minimum level the information can be
managed as a single unit. This can be done by grouping information into broad categories before
breaking it down to smaller pieces. Examples of information assets are contact lists, project
documentation, financial data, organisation charts and process flowcharts.
This exercise becomes problematic when the organisation cannot decide what information are assets and
what are simply ‘noise’. The acid test will be how could a particular piece of information be exploited; is
necessary for your operation? Could any contamination, damage or loss compromise your operations? If
yes, then, it is an asset.

142
Step 2: Identify who has access to that information and its source
Identifying the chain of data flows from entry, collection, editing, access and maintenance provides an
audit trail for review and monitoring (National Archives, 2011). This step is critical to maintaining digital
continuity. If access to the date is compromised, whether in terms of loss or accuracy, then digital
continuity is lost. Imagine if the details required to do billing is compromised, it would impact revenue
and cash flows.
Tracking access also means considering the requirements needed to access and protect the information.
Requirements could include authorisation, documentation, levels of privacy, search and editing
capabilities, duplication, and maintenance. Simple questions to discover this would be; Where is the
information located? How is it obtained or developed? Who uses the information and for what purposes?
Step 3: Implement policies and procedures that can protect the assets
There are three points at which information can be compromised; upon input, processing and output.
Ensure that these access points are secured by both digital as well as physical means. Large companies
rely on IS standards that are often expensive and cumbersome to implement. Smaller companies could
well deploy simple internal control procedures to ensure that weak points are identified and managed.
The internal control principles of establishment of responsibility, segregation of duties, documentation,
physical and mechanical controls, independent internal verification and various other controls can go a
long way towards securing and optimizing information assets.
Both finance and information technology department must work together to ensure that the business
requirements are clearly understood and prioritized. Management must also realise IS best practices may
conflict with other standard internal control procedures like asset tagging and disclosure of organisation
charts. En Azmi Md Nor of Cybersecurity cautioned that many organisations depend too much on
vendors, creating loopholes within the IS systems such as failure to update antivirus due to software
expiration.

143
Step 4: Create an IS culture
IS culture can start with awareness campaigns, followed by training. Behavioural adjustments may take
some time but with relentless efforts, it is not impossible. Assoc Prof Dr. Lau Siong Hoe, Multimedia
University, emphasises the need for not only awareness but also training and enforcement in ensuring the
success of inculcating IS culture.
6. CONCLUSION
At the end of the day, organisations need the support of its employees to ensure that its information is
secure. Costly investments in risk assessment and management systems would go to waste without the
proper IS culture to ensure its effectiveness. Organisations can customise solutions based on there IS risk
profiles. The solutions need not be costly, a cursory audit could reveal weak points that management
should be aware. Engaging staff in developing IS strategies could be fruitful without needing to overly
invest in expensive high technology solutions.

144
7. REFERENCES
Bernama. (2012, May 22). Cyberincidents have become a serious threat – Ongkili. Retrieved from
http://www.cybersecurity.my/en/knowledge_bank/news/2011/main/detail/2189/index.htm. [1 Feb 2013].
Bulgurcu, B., Cavusoglu, H., & Benbasat, I. (2010). Information security policy compliance: an empirical
study of rationality-based beliefs and information security awareness. MIS quarterly, 34(3), 523-548.
Cheng, L., Li, Y., Li, W., Holm, E., & Zhai, Q. (2013). Understanding the violation of IS security policy
in organisations: An integrated model based on social control and deterrence theory. Computers &
security, 39, 447-459.
Dzazali, S., Sulaiman, A. & Zolait, A.H. (2009). Information security landscape and maturity level: case
study of Malaysian Public Service (MPS) organisations. Government Information Quarterly, 6(4), 584-
593.
Herath, T., & Rao, H. R. (2009). Protection motivation and deterrence: a framework for security policy
compliance in organisations. European Journal of Information Systems, 18(2), 106-125.
Ifinedo, P. (2012). Understanding information systems security policy compliance: an integration of the
theory of planned behaviour and the protection motivation theory. Computers & Security, 31(1), 83-95.
Johnston, A. C., Warkentin, M., & Siponen, M. (2015). An enhanced fear appeal rhetorical framework:
Leveraging threats to the human asset through sanctioning rhetoric. Mis Quarterly, 39(1), 113-134.
National Archives (2011) Identifying Information Assets and Business Requirements retrieved from
www.nationalarchives.gov.uk/dc-guidance [30 Nov 2015]
Pahnila, S., Siponen, M., & Mahmood, A. (2007, January). Employees' behavior towards IS security
policy compliance. In System Sciences, 2007. HICSS 2007. 40th Annual Hawaii International Conference
on (pp. 156b-156b). IEEE.
The Star. (2011, June 15). Attack on government website will be prevented, says Rais. Retrieved from
http://www.cybersecurity.my/en/knowledge_bank/news/2011/main/detail/2054/
index.htm. [1 Feb 2013]

145
8. AUTHORS
Dr Mariati Norhashim has been with the Faculty of Management, Multimedia University since 1998.
She holds a Bachelor of Accounting (Hons) from Universiti Malaya, Masters of Accounting from
Universiti Kebangsaan Malaysia and a Doctorate of Philosophy from Universiti Putra Malaysia. Her
research interests include entrepreneurship, financial management, risk management and corporate
governance. She is a HRDF certified trainer and an associate member of the Malaysian Institute of
Accountants (MIA).
She has served as the Programme Coordinator of the Bachelor of Accounting programme, the Outcome
Based Education champion and various other positions and committees in the university. She also served
on national and international discussion panels pertaining to accounting and business issues.
She has published in journals and conferences and actively engages with both the academic community as
well as professional bodies. One of her key work locally was developing syllabus and materials for the
Integrated Case Studies in Accounting under the aegis of MIA. Her passion is in educating young minds
to become critical thinkers and opening their minds to global issues, and encouraging an entrepreneurial
attitude among her students.
Dr Zauwiyah Ahmad started off her academic career as a tutor at Multimedia University in 1998, after
completing the Bachelor of Accounting programme at Universiti Utara Malaysia. Since then, she has
completed her Master of Philosophy degree in 2001 and Doctor of Philosophy in 2010. Her interest
mainly lies in behavioural research, especially in areas related to accounting, ethics, personal finance, and
information security.
She has obtained a number of internal and external research grants. Outcomes of her researches have been
published in several tiered journals, including Accounting Education: an International Journal; Managerial
Auditing Journal; International Journal of Business Studies; and Asia Pacific Journal of Education. She
has also presented a number of papers in international conferences.
Dr. Zauwiyah teaches accounting courses for the bachelor degree level, specifically accounting
information systems, integrated case study, financial and managerial accounting. Apart from holding a
permanent position as a senior lecturer in accounting, Dr. Zauwiyah is also the Dean of the Faculty of
Business Administration. She previously served as the Deputy Dean (Academic), and Head of Accounting
Department at the Faculty of Business.
146
CONSOLATION PRIZE
JOB STRESS AND AGGRESSIVENESS IN JUDGEMENT: SURVEY
EVIDENCE FROM MALAYSIAN TAX AUDITORS
Ms Nor Azrina Mohd Yusof
Associate Professor Dr. Lai Ming Ling
Professor Dr. Yap Bee Wah

147
JOB STRESS AND AGGRESSIVENESS IN JUDGMENT: SURVEY EVIDENCE FROM
MALAYSIAN TAX AUDITORS
ABSTRACT
A. Motivation for the Study and Research Objectives
A review of previous studies and minutes of meetings between tax professionals and the Inland Revenue
Board of Malaysia (IRBM) provides evidence that tax auditors have been aggressive in finalising tax
cases (IRBM, 2006, 2009). However, to date, little research has been conducted to examine how tax
auditors made their judgment and decisions in imposing tax audit adjustments. In particular, little is
known about Malaysian tax auditors’ experience in conducting audits of small and medium corporations
(SMCs). We know little about the level of job stress faced by tax auditors and how aggressive they have
been in imposing tax audit adjustments when auditing SMCs. The lack of empirical studies has motivated
this study to (i) find out tax auditors’ experience and challenges when conducting tax audit of SMCs, (ii)
examine job stress level faced by tax auditors, and (iii) assess tax auditors’ aggressiveness in judgment
when auditing SMCs.
B. Research Methodology
The target subjects of this study were tax auditors who worked in the 35 IRBM’s branches throughout
Malaysia and who had conducted corporate tax audit in 2012 and/or 2013. In view of the fact that tax
research is considered personal and confidential and to preserve the anonymity of respondents, a
questionnaire was designed to collect data. The questionnaire was mailed to 357 tax auditors nationwide
from the middle of September to the middle of November 2013. Of the 357 mailed questionnaires, 318
usable questionnaires were received and analysed.

148
C. Main Findings and Conclusion
About 52.8% of the survey respondents were females and the majority of them (78%) were aged between
31-40 years old. The survey found that over claimed expenses was the most common issue found during
tax audits. About 40% of respondents indicated that they had resolved 11 to 20 corporate tax audit cases
in 2012. The majority (56.9%) of the respondents reported that they took about three to six months to
resolve tax audit cases. The survey found that tax auditors faced high task complexity, incompleteness of
documentation, larger amount of tax audit adjustment, long duration of tax non-compliance and influence
of tax agents in tax non-compliance. The findings indicated that tax auditors were not facing high job
stress although the nature of the audit environment was complex, in addition to the audit timeframe and
the high pressure to achieve the key performance index. The findings indicated that tax auditors rated
themselves as slightly aggressive when making judgment with a mean score of 4.74 on a 7-point Likert-
scale. Overall, this study has merits because it carried out a survey on tax auditors who are one of the key
players in tax audit. It is suggested that the IRBM promote a healthy working environment to balance
work and life in managing job stress. Failure to manage job stress would indirectly lead to poor quality
work in tax audit. It is also suggested that tax authorities should consider simplifying the tax laws to allow
for smoother tax audit and to promote voluntary tax compliance of SMCs.
1. INTRODUCTION
In Malaysia, the full implementation of the self-assessment system for all types of taxpayers commencing
the year of assessment (YA) 2004 has made tax audit a routine job for tax auditors. Tax auditors need to
ensure that all taxpayers’ liabilities have been reported in accordance with the Income Tax Act (ITA)
1967 and all relevant public rulings. In completing tax audit, tax auditors need to face various challenges
such as different tax issues, task complexity, ambiguity of tax laws and audit timeframe. They also need
to cope with poor commitment from taxpayers, poor record-keeping, inadequate resources, limited
manpower and higher target for tax collection. For instance, the Inland Revenue Board of Malaysia
(IRBM) collected RM129 billion taxes in 2013, RM125 billion in 2012 and RM110 billion in 2011 (“IRB
on track,” 2014). So it is reasonable to assume that a higher target for tax collection would increase the
workload of tax auditors, which in turn, could influence their judgment and decision-making. These work
challenges would cause job stress to tax auditors and might influence their judgment in tax audit. As a
result of job stress, tax auditors may act aggressively when making judgments by proposing tax audit
149
adjustments in order to close the case quickly. As a result, inaccurate amounts of tax audit adjustments
could be imposed not only on non-compliant taxpayers, but also to the compliant taxpayers.
To date, research on tax auditors has received little attention. With the exception of studies done in the US
and New Zealand by Roberts (1995) and Hite and Sawyer (2000) respectively, very few studies have
focused on tax auditors’ judgment and decision-making. A similar phenomenon was observed in
Malaysia. The evidence from auditing literature shows that the most current research in Malaysia tends to
focus on auditors in statutory audit either on audit judgment performance (Mohd-Sanusi & Mohd-
Iskandar, 2007) or dysfunctional auditor behaviour (Paino, Smith, & Ismail, 2012; Zakaria, Yahya, &
Salleh, 2013).There is limited research on inaccurate judgment by tax auditors, except for Izlawanie
(2013) who attempted to investigate Malaysian tax auditors’ dispute resolution behaviour in audit
settlement. Furthermore, the IRBM had also not published any cases involving the inaccurate judgment by
tax auditors, whilst, Hite and Sawyer (1998) were of the opinion that in New Zealand such information is
considered as privileged.
A review of past studies and minutes of meetings between tax professionals and the IRBM somewhat
indicates that tax auditors were aggressive in finalising tax cases (IRBM, 2006, 2009). On the other hand,
the annual tax survey conducted by Ernst and Young (2006) revealed that 45% of the Chief Executive
Officers surveyed were of the opinion that tax auditors were aggressive when conducting tax audits.
Notably, tax professionals also questioned the tax auditors’ professionalism during their dialogue with the
IRBM (IRBM, 2006). Tax professionals claimed that some of the IRBM tax auditors made tax audit
adjustments without being able to provide justification or rationale for such adjustments. In addition, there
was a case whereby a taxpayer had been requested to sign a form and he admitted that he did not keep
records although there were no audit findings (IRBM, 2009). Furthermore, a survey by Choong and Lai
(2009) lend support to the fact that tax auditors were not professional in conducting tax audits. A recent
study by Izlawanie (2013) revealed that inexperienced tax auditors were more aggressive and taxpayers
found it hard to tolerate them.

150
Tax auditors are the ones who carry out the tax audit policy, interact with the different behaviours of
taxpayers and determine the audit outcome (Long & Swingen, 1991; Bahl & Bird, 2008). The
aggressiveness of tax auditors’ judgment when conducting a tax audit could be seen in the case of John
Marsden vs. Canada Revenue Agency in July 2001 (“A Nightmare when the Taxman Got it Wrong”,
2010). The Canadian tax auditor had aggressively judged that Marsden was involved in tax non-
compliance because of one memo. This memo was taken as evidence for tax non-compliance. Without
further investigation, a team of Canadian tax auditors took action by quickly seizing all of Marsden’s
documents and computers which resulted in him being charged guilty of tax evasion based on one
inaccurate judgment. The inaccurate judgment caused Marsden to suffer a huge loss and wasted his time
because he did not engage in tax non-compliance. The aggressiveness of tax auditors in imposing tax
audit adjustments not only caused inconvenience to the taxpayer, but also troubled the tax auditors
themselves and had at the same time created bad impressions about tax authorities. However, at the time
of study, little was known about Malaysian tax auditors’ experience when conducting tax audit of small-
and-medium-sized corporations (SMCs) and the job stress level faced by tax auditors. How aggressive are
tax auditors in imposing tax audit adjustments when auditing SMCs? This study is conducted to bridge the
knowledge gap.
2. RESEARCH OBJECTIVES
This study aims to:
(i) Find out tax auditors’ experience and challenges when conducting tax audit of SMCs;
(ii) Examine job stress level faced by tax auditors; and
(iii) Assess tax auditors’ aggressiveness in making judgments when auditing SMCs.

151
3. TAX AUDIT OF SMCS: PRACTICAL CHALLENGES AS TAX AUDITOR
A review of the literature uncovered some practical challenges faced by tax auditors. Firstly, in principle,
the IRBM has set a target to audit 2% of corporate tax returns. Over the years, the audit rate has increased
progressively. This can be seen in Table 1, which shows that in 2014, the IRBM conducted 2% field audit
out of the total taxpayers’ returns, as compared to 0.3% in 2010. From another perspective, an increase in
the percentage of audit rate is in line with the increase in the workload or number of cases that need to be
resolved by tax auditors annually. For instance, in 2010, each tax auditor was required to resolve 11
corporate tax cases annually. However, in 2013, the key performance index or target was raised to 18
corporate tax cases annually (personal communication, March 26, 2013). It is reasonable to assume that
the heavier workload somehow creates more burden and pressure on tax auditors to meet their audit
target.
Table 1: Rates for Field Audit
Year Audit Rate
2010 0.3%
2011 0.6%
2012 1.2%
2013 1.8%
2014 2.0%
Note: IRBM (Personal Communication, April 4, 2013)
Secondly, it is about job stress. The external auditing profession such as tax audit is considered to be a
high-stress occupation - audit work is often characterised by heavy workloads with deadlines to meet.
Hence, auditors are often under pressure to produce quality work (Larson, 2004). As quoted from one of
the respondents of Izlawanie (2013):
“Audit work is a real pressure. I think about it until I am at home. The pressure is because
audit works involve other people’s income. [I am] afraid of overcharging [tax]. It is
oppression to taxpayers (p.115)”.

152
Rebele and Michaels (1990) suggested that the external auditing profession is exposed to both elements of
role stress as a consequence “…of (i) its boundary-spanning nature, (ii) the potential for conflicting
expectations from clients and firms, and (iii) the complexity of modern-day audits and the derivative
consequences of poor role performance (p.127)”. Being a boundary-spanner requires a tax auditor to have
extensive interactions with many people, inside and outside the organisation, as well as with diverse needs
and expectations (Goolsby, 1992). Furthermore, Sears (1992) argued that audit work that involves
extensive business travels and frequent changes of work locations could increase the job stress level of
auditors. Chau (1998) asserted that continuous dealing with taxpayers in stressful situations might lead to
mental and physical distress for auditors. As a result, such tasks would potentially create job stress.
Time pressure is one of the dimensions of job stress (Parker &DeCotiis, 1983). In a tax audit, the pressure
or stress could come about when the timeframe given to settle a tax audit is only four months from the
commencement of the audit (IRBM, 2015). Tax auditors need to meet their timeframe in order to fulfil the
legal requirements as well as to achieve their key performance index in consideration of the fact that they
might have several audit cases to work out during the same period. In addition, it is also crucial for tax
auditors to follow and perform the task according to the tax audit procedure outlined in the tax audit
framework. This requirement provides additional stress and pressure to tax auditors. In the US, for
instance, in order to reduce the amount of time spent by the Internal Revenue Services (IRS) in
identifying potential taxpayer issues, the IRS has introduced corporate return requirements to be phased
out over a five year period beginning in 2010 (Honaker, 2013). According to Honaker (2013), the new
form requires considerably more details on uncertain positions taken by taxpayers. In addition, the new
form is also designed to provide the IRS with more information on a firm’s interpretive tax positions.
Thirdly, tax auditors need to liaise with tax agents who represent taxpayers in a tax audit. The IRBM
(2010) noted that some tax agents are not competent and lack adequate tax knowledge; some have no idea
of what their responsibilities entail while some have difficulty in understanding the technical issues.
Worse is when some do not even understand the concept of scheduler tax deductions and the tax audit
framework (IRBM, 2010). In practice, many companies hire retired IRBM officers to act for them and as
such tax auditors are also challenged by tax agents (who previously worked with the IRBM) who have
more experience in tax audit and tax planning. Consequently, it is not easy for IRBM tax officers to solve
the audit dispute and audit settlement.

153
4. RESEARCH METHODOLOGY
The target subjects of this study were tax auditors who work in the 35 IRBM branches throughout
Malaysia and who have conducted corporate tax audit in 2012 and/or 2013. Considering the privacy and
confidential nature of tax audit, a survey is an appropriate way to study the tax matters. Sekaran and
Bougie (2009) and Zikmund et al. (2010) stated that the main advantages of a survey are (i) a wide
geographical area can be covered; (ii) data can be collected from a large number of respondents with
limited cost and time; and (iii) the anonymity of the respondents is assured because respondents’
identification is not required. Another rationale for choosing this survey method was due to the nature of
the tax auditors’ work, which is difficult to conduct as an experimental study. A questionnaire was
designed and mailed, with a self-addressed envelope enclosed, to the 357 tax auditors nationwide in the
middle of September 2013. The data collection took about two months and was completed in the middle
of November 2013. Out of the 357 of questionnaires mailed, 318 of completed questionnaires were
received, resulting in an effective response rate of 89.8%.
5. DATA ANALYSIS AND FINDINGS
Table 2 presents the respondents’ profiles. Notably, the sample comprises 318 tax auditors employed by
the IRBM throughout Malaysia. The survey found that 52.8% of the respondents were females. The
majority (78%) of the respondents were aged 31 to 40 years, followed by 11% aged 21 to 30 years. Only
5% were 51 years old and above. With regards to the level of education, the majority (90.25%) are
bachelor’s degree holders, with just 2.2% having a professional qualification. About half of the
respondents have six to 10 years working experience. Only 1.3% of the respondents have worked for
more than 15 years. This study revealed that the respondents are well versed in tax audit since the
majority of them have tertiary education and many years of working experience.

154
Table 2: The Respondents’ Profiles (n=318)
Frequency Percentage
(%)
Gender Male 150 47.20
Female 168 52.80
Age 21-30 years old 35 11.01
31-40 years old 246 77.36
41-50 years old 20 6.29
> 51 years old 17 5.35
Level of
Education
Bachelor's degree 287 90.25
Master's degree 24 7.55
Professional qualification 7 2.20
Working
Experience
Less than 5 years 134 42.14
Between 6 - 10 years 154 48.43
Between 11 - 15 years 26 6.18
More than 15 years 4 1.26
Total 318 100.00
5.1 Tax Auditors’ Experience and Challenges When Conducting Tax Audit of SMCs
The tax auditors were questioned about their experience on the most common issues found during a tax
audit. Figure 1 shows that a majority (53.1%) of the tax auditors indicated that over claimed expenses was
the most common issue found during tax audits. This finding is consistent with Choong and Lai (2008)
who found that Malaysian business taxpayers did not separate private and domestic expenses from their
business expenses. About 50% of the respondents indicated that the taxpayers’ lack of adequate tax
knowledge was the most common issue found during a tax audit. In practice, most corporate taxpayers
engaged tax agents to prepare their tax returns because the taxpayers themselves had poor tax knowledge.
About 46.5% of survey respondents indicated that underreporting of income and tax preparer’s faults
(39.9%) were the most common issues found during a tax audit. In turn, about 21% of respondents
indicated that the company auditor’s fault was one of the most common issues found in a tax audit.

155
Figure 1: Most Common Issues Found During A Tax Audit
Next, this study expects that a higher number of tax cases that needed to be audited and resolved could
create job stress and burden for tax auditors. Figure 2 shows the findings of the number of corporate tax
audited cases which had been resolved in the last year (i.e., 2012). About 40% of respondents indicated
that they had resolved 11 to 20 corporate tax audited cases in 2012. Only 7% of respondents indicated
they had resolved more than 20 corporate tax audited cases in 2012. Upon checking, it was revealed that
the highest number of cases resolved by tax auditors in 2012 was 37. Although there is no justification
provided for the high number of cases resolved, it is reasonable to assume that it was due to the backlog in
cases from the previous years and the capability of tax auditors in conducting tax audits. Notably, about
22% of the respondents indicated that they did not resolve any cases in 2012 because they had just been
transferred from the desk audit department to the field audit department.
Figure 2: Number of Corporate Tax Audited Cases Resolved in the Year Before (i.e., 2012)
Between 1 to 10 cases31%
Between 11 to 20 cases40%
More than 20 cases7%
No cases being finalized22%

156
Figure 3 shows the duration of the audit taken by the survey respondents in resolving tax audit cases.
About 27.1% of the respondents indicated that they took less than three months to resolve the cases. This
finding is in line with the Tax Audit Framework, which states that the timeframe given to settle a tax audit
is four months from the commencement of the audit (IRBM, 2015). The majority of the respondents
(56.9%) reported that they took about three to six months to resolve their cases. Only 0.3% of respondents
reported that they took more than a year to resolve their cases. The plausible explanation for taking a
longer time to resolve the cases could be the complexity of the cases, taxpayers’ co-operation in providing
documents and their record-keeping, the nature of the business and size of the firm. The findings are
consistent with Choong and Lai (2008), in which their survey respondents who are Malaysian tax
practitioners claimed that tax auditors took more than 10 weeks to resolve the cases.
Figure 3: Duration of Audit For The Year 2012
To further probe the tax auditors’ experience in tax audit, respondents were asked to recall one corporate
tax case that they had audited and resolved which resulted in tax audit adjustment and penalty. When
asked to choose “the types of industry”, 36.5% of respondents chose tax audit cases from the wholesale
and retail trade industry. About 23.6 % of the respondents chose tax audit cases from the service industry,
whereas some 16.4% of the respondents chose the construction industry. The high percentage for the
wholesale and retail trade as well as the service industry indicate that these two types of industries have
the highest proportion of corporate taxpayers in Malaysia. These findings are shown in Figure 4. Figure 5
shows that the majority of respondents (77%) chose SMCs as their recalled case.

157
Figure 4: Types of Industry
Figure 5: Types of Company
The respondents were also asked about the most recent tax case that was audited and resolved. Figure 6
shows these findings. A majority of the respondents (35.2%) chose the tax case that was audited and
resolved in less than three months. Only 7.9% of the respondents chose the tax case that took more than
one year to be audited and resolved. When asked, “what is the main issue found in the case?”, the survey
found that about 39.3% of respondents indicated over claimed expenses as the main issue found in the tax
case selected (Figure 7).

158
Figure 6: Recency of Tax Cases Audited and Resolved
Figure 7: Main Issue Found in Tax Audited Cases
Next, the respondents were asked about the challenges faced when conducting tax audit. This is because it
is reasonable to assume that significant challenges faced by tax auditors can influence tax auditors’
aggressiveness in judgment, about whether or not to impose tax audit adjustments. For example, in terms
of task complexity, past studies conducted in the US (e.g., Kaplan et al., 1988; Ayres et al., 1989 and
Spilker et al., 1999) and in Central Florida (e.g., Bobek and Hatfield, 2004) found that tax professionals’
judgment tend to be more aggressive when facing difficult tasks. With regards to the involvement of the
tax agent, Erard (1993) found that those Canadian paid-prepared returns received higher audit adjustments
compared to self-prepared returns. Meanwhile, Ho and Wong (2006) found that in Hong Kong, the long
duration involved in tax non-compliance carries substantial weight in imposing tax penalty.

159
In order to find out the challenges faced by tax auditors in completing tax audits, seven questions were
designed. Table 3 presents the findings. The first is task complexity. About 45% of respondents indicated
that the tax issue for the case selected was very complicated. Second, in terms of completeness of
documentation, about 37.1% indicated that the taxpayers’ accounting records were incomplete. Third,
about 28% of respondents claimed that the tax law for the case selected was very ambiguous. Fourth, the
majority of respondents (60.4%) indicated that they have more than average experience in tax issues in the
cases selected. Fifth, about 51% of respondents said that the size of the tax audit adjustment (in RM) for
the case selected was large in relation to the actual chargeable income. Sixth, almost half of the
respondents (45.6%) indicated that the case selected involved very a long duration in tax non-compliance.
Lastly, about 42.1% of the respondents said that tax agents had greatly influenced the taxpayers’
involvement in tax non-compliance.
The overall results indicated that tax auditors were facing great challenges in completing tax audits.
Table 3: Challenges Faced by Tax Auditors in Completing Tax Audit
No Description Frequency Percentage
(%)
1. How complicated was the tax issue for this case that
you have recalled as compared to other tax cases that
you have audited in the past?
Very Simple
Very Complicated
Average
49
143
126
15.4
45.0
39.6
2. How complete was the taxpayer accounting records
for this case that you have recalled as compared to
other tax cases that you have audited in the past?
Very Complete
Very Incomplete
Average
105
118
95
33.0
37.1
29.9
3. How clear was the tax law regarding this tax issue as
compared to other tax audit cases?
Very Clear
Very Ambiguous
Average
165
89
64
51.9
28.0
20.1

160
Table 3: Challenges Faced by Tax Auditors in Completing Tax Audit (Con’t)
No Description Frequency Percentage
(%)
4. How much experience do you have with this tax issue
as compared to other tax audit cases?
Less than Average
More than Average
Average
39
192
87
12.3
60.4
27.4
5. As compared to other tax audit cases, was the size of
tax audit adjustment (in RM) for this case large or
small in relation to the actual chargeable income?
Very Small
Very Large
Average
45
162
111
14.2
50.9
34.9
6. Was the number of years involved with tax non-
compliance for this case short (e.g. within 1 year) or
long (more than 1 year) as compared to other tax
audit cases?
Very Short
Very Long
Average
58
145
115
18.2
45.6
36.2
7. In your opinion, how much was the tax agent in this
case influenced in tax non-compliance, as compared
to other tax audit cases?
Very Minimally
Very Largely
Average
110
134
74
34.6
42.1
23.3
5.2 Tax Auditors and Job Stress in Tax Audit of SMCs
In order to examine the job stress level among tax auditors, seven questions were adapted from Parker and
DeCotiis (1983). Table 4 displays the results. This study found that “I feel guilty when i take time off
from my job” was ranked first in the list, scoring 3.14 on a 5-point Likert-scale. All other statements such
“I have too much work and too little time to do it”, “sometimes when I think about my job, I get a tight
feeling in my chest”, and “I feel fidgety or nervous as a result of my job” all recorded low scores, which is
below 3 on a 5-point Likert-scale.

161
Overall, the findings indicated that tax auditors were not facing high job stress. The findings were
somewhat surprising in view of the fact that: (i) the nature of the audit environment which is very
complex; whereby tax auditors only have very limited time for on-site examination; (ii) at the time of
study, the tight timeframe given by the IRBM which is only four months from the commencement of tax
audit; and (iii) tax auditors constantly face pressure to achieve the key performance index.
Table 4: Job Stress Level among Tax Auditors
Statement Meanª Standard
Deviation
Ranking
I feel guilty when I take time off from my job 3.14 0.868 1
I have too much work and too little time to do it 2.91 0.864 2
Sometimes when I think about my job, I get a tight
feeling in my chest.
2.72 0.970 3
I feel fidgety or nervous as a result of my job 2.53 0.903 4
Working here leaves little time for other activities 2.43 0.939 5
I feel like I never have a day off 2.28 0.914 6
Working as tax auditor makes it hard to spend
enough time with my family
2.22 0.899 7
Note: ª Measured based on a scale of 1 (strongly disagree) to 5 (strongly agree)
5.3 Tax Auditors’ Aggressiveness in Judgement When Auditing SMCs
With regard to tax auditors’ aggressiveness in judgment, they were asked “how would you rate your
judgment when finalising this case with tax audit adjustment and penalty?” Table 5 shows that the mean
score is 4.74 on a 7-point Likert-scale. The results indicated that tax auditors rated themselves as slightly
aggressive when making judgments. It is reasonable to assume that slight aggressiveness in making
judgment could be related to big challenges faced by the tax auditors. As shown in Table 3 above, tax
auditors faced higher task complexity, incompleteness of documentation, larger amount of tax audit
adjustment, longer duration involved in tax non-compliance and greater influence of tax agents in tax non-
compliance. Thus, these challenges were believed to have a greater influence for tax auditors to become
aggressive in making judgments.

162
Table 5: Tax Auditors’ Aggressiveness in Judgment
Description Meanª Standard
Deviation
How would you rate your judgment when finalising this
case with tax audit adjustment and penalty?
4.74 0.849
Note: ª Measured based on a scale of 1 (very conservative) to 7 (very aggressive)
6. CONCLUSION
This study has the merits of a tax study because the survey was on tax auditors, who are key team players
in the field of tax audit. The survey reveals the tax auditors’ experience in tax audit and challenges that
they face when conducting tax audit. The challenges faced include high task complexity, incomplete
documentation and the influence of tax agents on tax non-compliance. Surprisingly, the survey found that
tax auditors were not facing high job stress although they had to cope with a tight audit timeframe and the
need to achieve key performance indicators. However, the survey also reveals that tax auditors were
slightly aggressive when making judgments in auditing SMCs.
Overall, this study provides an important insight not only to the Malaysian tax authorities, but also to tax
authorities in other parts of the world. In order to deter tax non-compliance, it is suggested that tax
authorities should not be aggressive in conducting tax audit just to achieve a higher tax revenue collection
each year, and to overcome the shortage of manpower. Imposing pressure to achieve the key performance
index may affect the audit quality, as there is a trade-off between quality and quantity. Although the study
found that tax auditors were not facing enormous job stress when conducting tax audit, the IRBM should
consider that ‘prevention is better than cure’. The IRBM should promote a healthy working environment
for tax auditors in order for them to manage job stress. It is reasonable to assume that job stress could
influence tax auditors’ aggressiveness in judgment when conducting tax audit. Failure to manage job
stress would indirectly lead to poor quality in tax audit. With regards to task complexity faced by tax
auditors, tax authorities should consider simplifying the tax laws to ensure a smooth tax audit. Dealing
with voluminous transactions and information could cause tax auditors to be mentally overstressed.

163
It is acknowledged that there are some limitations to this study. Firstly, a survey was used in data
collection, hence according to Devos (2012) it is hard to erase the problems of dishonesty and
misinterpretation in tax surveys. Moreover, the tax auditors’ aggressiveness in judgment could be
considered as a sensitive topic and the terminology itself might have prevented some respondents from
disclosing certain information. Secondly, it is a cross-sectional survey; hence tax auditors’ experience and
opinions might change over the years. Lastly, the study only surveyed tax auditors who had experience in
auditing corporate taxpayers; hence, care must be exercised in generalising the findings. Future research
should consider surveying tax auditors who audit other types of taxpayers as well as tax auditors who
conduct desk audit because they may have different experience and different issues when conducting tax
audit.

164
7. REFERENCES
A Nightmare When the Taxman Got it Wrong. (2010). Retrieved March 16, 2012, from
http://www.ctv.ca/CTVNews/WFive/20100401/w5_taxman_100403/#ixzz1pI7tv6ix
Ayres, F. L., Jackson, B. R., & Hite, P. S. (1989). The Economic Benefits of Regulation: Evidence from
Professional Tax Preparers. The Accounting Review, 64 (2), 300-312. doi: 10.2307/248004
Bahl, R. W., & Bird, R. M. (2008). Tax Policy in Developing Countries: Looking Back and Forward.
National Tax Journal, 61(279-301).
Bobek, D. D., & Hatfield, R. C. (2004). Determinants of Tax Professionals' Advice Aggressiveness and
Fees. Advances in Accounting Behavioral Research, 7, 27-51. doi: 10.1016/S1474-7979(04)07002-4.
Bobek, D. D., Hageman, A. M., & Hatfield, R. C. (2010). The Role of Client Advocacy in the
Development of Tax Professionals' Advice. Journal of the American Taxation Association, 32 (1), 25-51.
Chau, C. T. (1998). Career Plateaux. The Internal Auditor, 55 (October), 48-52.
Choong, K. F., & Lai, M. L. (2008). Tax Practitioners' Perception on Tax Audit and Tax Evasion: Survey
Evidence in Malaysia. Paper presented at the The 8th International Business Research Conference, March
27-28, 2008, Dubai.
Choong, K. F., & Lai, M. L. (2009). Tax Audit in Malaysia: Survey Evidence from Professional
Accountants in Tax practice. MIA Articles of Merit Award on PAIB 2008 (pp.9-28). Kuala Lumpur:
Malaysian Institute of Accountants
Cuccia, A. D. (1994). The Effects of Increased Sanctions on Paid Tax Preparers: Integrating Economic
and Psychological Factors. Journal of the American Taxation Association, 16 (1), 41-66.
Devos, K. (2012). The Impact of Tax Professionals Upon the Compliance Behavior of Australian
Individual Taxpayers. Revenue Law Journal, 22 (1), 1-26.
Erard, B. (1993). Taxation with Representation: An Analysis of the Role of Tax Practitioners in Tax
Compliance. Journal of Public Economics, 52, 163-197.

165
Ernst., & Young. (2006). Annual Tax Survey. Malaysia.
Goolsby, J. R. (1992). A Theory of Role Stress in Boundary Spanning Positions of Marketing
Organizations. Journal of the Academy of Marketing Science, 20 (2), 155.
Hite, P. A., & Sawyer, A. J. (2000). The Impact of Verbal and Numerical Reporting
Ho, D., & Wong, B. (2006). An Exploratory Study of Personal Tax Ethics in Hong Kong. International
Tax Journal (Spring 2006), 31-44.
Honaker, K. H. (2013). The Influence of In-house Tax expertise on Corporate Tax Avoidance. Degree of
Doctor of Business Administration, Kennesaw State University, Kennesaw, GA.
IRB on Track to Collect Record RM140b in Taxes for 2014. (2014). Retrieved September 7, 2014, from
http://www.themalaymailonline.com/money/article/irb-on-track-to-collect-record-rm140b-in-taxes-for-
2014.
IRBM. (2006). Minutes of meeting tax audit dialogue session 1/2006 between Inland Revenue Board of
Malaysia and professional accounting bodies, date 14 November 2006.
IRBM. (2009). Minit mesyuarat working group LHDN dengan Persatuan Akauntan Desire-Bil. 3/2009.
Kuala Lumpur: Lembaga Hasil Dalam Negeri Malaysia.
IRBM. (2010). Minit mesyuarat working group LHDN dengan Persatuan Akauntan - Bil. 3/2010. Kuala
Lumpur: LHDN Malaysia.
IRBM. (2015). Tax Audit Framework (Amendment 1/2015) Inland Revenue Board of Malaysia.
Cyberjaya.
Izlawanie, M. (2013). Managing Mixed Responsibilities: A Grounded Theory of Malaysian Tax Auditors'
Dispute Resolution Behaviour in Audit Settlement. Unpublished doctoral dissertation. University of New
South Wales, Australian School of Business, Australia.
Kaplan, S. E., Reckers, P. M. J., West, S. G., & Boyd, J. C. (1988). An Examination of Tax Reporting
Recommendations of Professional Tax Preparers. Journal of Economic Psychology, 9 (4), 427-443. doi:
10.1016/0167-4870(88)90012-8

166
Larson, L. L. (2004). Internal Auditors and Job Stress. Managerial Auditing Journal, 19 (9), 1119-1130.
doi: 10.1108/02686900410562768.
Long, S. B., & Swingen, J. A. (1991). Review essay: Taxpayer Compliance: Setting a New Agenda for
Research. Law & Society Review, 25 (3), 637-683.
Lowe, D. J., Reckers, P. M. J., & Wyndelts, R. W. (1993). An Examination of Tax Professionals'
Judgments: The Role of Experience, Client Condition and Reciprocal Obligation. Journal of Business &
Psychology, 7 (3), 341-357.
Magro, A., & Nutter, S. (2012). Evaluating the Strength of Evidence: How Experience Affects the Use of
Analogical Reasoning and Configural Information Processing in Tax. The Accounting Review, 87 (1),
291.
Md Yassin, Z. A., Hasseldine, J., & Paton, D. (2010). An Analysis of Tax Non-compliance Behaviour of
Small and Medium-sized Corporations in Malaysia. In K. Datt, Tran-Nam, B., and Bain, K (Ed.),
International Tax Administration: Building Bridges (pp. 9-24). Sdney: CCH Australia Limited.
Mohd Isa, K. (2012). Corporate Taxpayers' Compliance Variables Under the Self-Assessment System in
Malaysia: A Mixed Method Approach. Unpublished doctoral dissertation. Curtin University, Curtin,
Australia.
Mohd-Sanusi, Z., &Mohd-Iskandar, T. (2007). Audit Judgment Performance: Assessing the Effect of
Performance Incentives, Effort and Task Complexity. Managerial Auditing Journal, 22 (1), 34-52. doi:
10.1108/02686900710715639
O'Donnell, E., Koch, B., & Boone, J. (2005). The Influence of Domain Knowledge and Task Complexity
on Tax Professionals' Compliance Recommendations. Accounting, Organizations and Society, 30 (2),
145-165.
Paino, H., Smith, M., & Ismail, Z. (2012). Auditor Acceptance of Dysfunctional Behaviour: An
Explanatory Model Using Individual Factors. Journal of Applied Accounting Research, 13 (1), 3-33.
Parker, D. F., & DeCotiis, T. A. (1983). Organizational Determinants of Job Stress. Organizational
Behavior and Human Performance, 32 (2), 160-177.

167
Rebele, J. E., & Michaels, R. E. (1990). Independent Auditors' Role Stress: Antecedent, Outcome, and
Moderating Variables. Behavioral Research in Accounting, 2, 124-153.
Roberts, M. L. (1995). The Influence of Contextual Factors on IRS Agents' Assessments of Taxpayer
Negligence. Journal of the American Taxation Association, 17 (2), 62-77.
Roberts, M. L. (1998). Tax Accountants Judgment/Decision-making Research: A Review and Synthesis.
The Journal of the American Taxation Association, 20 (1), 78-121.
Schisler, D. L. (1994). An Experimental Examination of Factors Affecting Tax Preparers' Aggressiveness:
A Prospect Theory Approach. Journal of the American Taxation Association, 16 (2), 124.
Sears, B. P. (1992). Travel Trauma. Internal Auditor, 49 (June), 53-58.
Sekaran, U., & Bougie. (2009). Research Methods for Business: A Skill Building Approach (Vol. Fifth
Edition): A John Wiley and Sons, Ltd, Publication
Spilker, B. C., Worsham Jr, R. G., & Prawitt, D. F. (1999). Tax Professionals' Interpretations of
Ambiguity in Compliance and Planning Decision Contexts. Journal of the American Taxation
Association, 21 (2), 75-89.
Standards on Inland Revenue Department investigators' judgments. New Zealand Journal of Taxation
Law and Policy, 6 (August), 3-23.
Trotman, K. T., Tan, H. C., &Ang, N. (2011). Fifty-year Overview of Judgment and Decision-making
Research in Accounting. Accounting & Finance, 51 (1), 278-360. doi: 10.1111/j.1467-629X.2010.00398.x
Zakaria, N. B., Yahya, N., & Salleh, K. (2013). Dysfunctional Behavior Among Auditors: The
Application of Occupational Theory. Journal of Basic and Applied Scientific Research, 3 (9), 495-503.
Zikmund, W. G., Babin, B. J., Carr, J. C., & Griffin, M. (2010). Business Research Method (Vol. Eight
Edition): South-Western Cengage Learning

168
8. AUTHORS
Dr. Nor Azrina binti Mohd Yusof obtained her PhD at Universiti Teknologi Mara (UiTM). She obtained
both Master of Accountancy and Bachelor of Accountancy (Hons) from UiTM. Her research interests are
in corporate tax non-compliance, tax judgment and decision-making and tax-related studies. She has
published in the Journal of Financial Crime and Journal of Applied Accounting Research. She can be
contacted at [email protected]
Dr. Lai Ming Ling is a fellow of the Association of Chartered Certified Accountants, UK. She is a
member of the Malaysian Institute of Accountants (MIA), Chartered Tax Institute Malaysia and
Accounting Research Institute. Currently, she is an associate professor at Faculty of Accountancy, UiTM,
Shah Alam campus. Her research interests are taxation and tax related studies. She has published in
Australian Tax Forum, Campus-wide Information system, e-Journal of Tax Research, Academy of
Accounting and Financial Studies, Journal of Financial Crime, Malaysian Accounting Review, Malaysian
Law Journal, Journal of Financial Reporting and Accounting, Tax National, Accountants Today and other
professional journals. Dr. Lai won the Gold Award (RM5,000) in MIA’s Articles of Merit Awards on
Professional Accountants in Business (PAIB) 2008, organised by MIA. In 2009, she won the First Prize
(RM3,000) in the 3rd Malaysian Outstanding Research paper Award 2009 in the tax category organised
by the Malaysian Accountancy Research and Education Foundation. Dr. Lai also won the consolation
prize and Bronze award in MIA’s Articles of Merit Awards on PAIB 2013 and 2014 respectively. She can
be contacted at [email protected] or [email protected]

169
Professor Dr. Yap Bee Wah is a faculty member of the Center of Statistical and Decision Science
Studies in Faculty of Computer and Mathematical Sciences, UiTM. She received the Bachelor of Science
(Education) (Hons) degree, majoring in Mathematics from University of Science Malaysia, Master of
Statistics from University of California Riverside and PhD (Statistics) from University of Malaya. Her
research interests are in data mining, computational statistics and multivariate data analysis. She is
currently the Head of Advanced Analytics Engineering Centre (AAEC), a Centre of Excellence in Faculty
of Computer and Mathematical Sciences. She participates actively in both local and international
conferences and also actively conduct statistical workshops (IBM SPSS STATISTICS, SPSS AMOS,
PLS-SEM, SAS EMINER). She has published papers in ISI journals such as Expert Systems with
Applications and Journal of Statistical Computation and Simulation and also in Scopus indexed journals.
She is also an active reviewer for international journals such as International Journal of Bank Marketing
and Communication in Statistics-Simulation and Computation.

170
CONSOLATION PRIZE
TAX COMPLIANCE BEHAVIOUR OF TAX PROFESSIONALS IN
MALAYSIA
Dr. Suhaila Abdul Hamid

171
TAX COMPLIANCE BEHAVIOUR OF TAX PROFESSIONALS IN MALAYSIA
ABSTRACT
Given the importance of tax professionals in a tax system, this paper examines the tax compliance
behaviour of 16 tax professionals in Malaysia. The study used semi-structured telephone interviews and
analysis of the data according to themes. The findings imply that to a certain extent tax compliance is
situational. Attitudes are important in complying with the tax laws, which can be translated as fear
towards being penalised, audited, and reputation being damaged. The study found important referent
others as a significant factor, while there were mixed findings for perceived behavioural control. None of
the interview participants are from the ‘Big Four’ public accounting firms or in-house tax professionals,
which may operate in a different environment. This study adds to the existing literature by reporting
findings in the real world and provides another perspective to understanding the tax compliance behaviour
of tax professionals using a qualitative approach. The findings are also useful to accounting bodies and
educators in shaping the ethical behaviour of tax professionals in Malaysia.
1. INTRODUCTION
A tax system in a modern world performs various functions for governments. Apart from being used as a
tool to obtain resources for the government through tax collection, it could also be a mechanism for the
government to implement their policies (Alley & James, 2006). Given the broad consequences of non-
compliance with the tax law, undertaking research on the issues that impact the levels of tax compliance
(and non-compliance) is important for any tax system.
The role of tax professionals in a tax system has been supported in previous literature especially from
Western-based tax compliance studies (Jackson & Milliron, 1986; Richardson & Sawyer, 2001). Previous
studies such as Tan and Sawyer (2003), Devos (2012) and Mohd Isa (2012) suggested that tax
professionals act as advocates to their clients and also as an intermediary to the government. Tax
professionals are appointed to assist their clients in various tax matters such as minimising the problems
of being audited, tax saving, risk management, reducing tax compliance costs, submitting accurate tax
returns or to resolve uncertainties (Tan & Sawyer, 2003; Hite et al., 2003; Tan, 2006). Depending on the
complexity of the tax law, tax professionals could become its enforcer or exploiter (Klepper & Nagin,

172
1989). If the law is ambiguous, then tax professionals will favour aggressive positions in tax, and if the
law is not complex, then tax professionals will enforce the law (Hite et al., 2003).
With the changes in the tax landscape such as the implementation of the self-assessment systems (SAS) in
many countries, the roles of tax professionals are becoming more challenging because SAS transfers more
responsibility to taxpayers to voluntarily comply with the tax laws. Those taxpayers who seek the
assistance of tax professionals may place greater reliance on them under the SAS since tax professionals
have the expertise to interpret the often complex tax laws. The various roles of tax professionals could
lead to a challenging situation for tax professionals to remain objective in their decision making while
performing their roles, due to the conflict of interests arising from performing these roles.
Given their importance in a tax system, the viewpoint of tax professionals could be considered as essential
in tax compliance. Despite their important roles in a tax system, Tan (2006) suggested that studies of tax
professionals are limited compared to research on other factors in tax compliance studies. Therefore, the
objective of this paper is to provide an insight into the perceptions of tax professionals in Malaysia with
regard to their tax compliance behaviour while performing their roles. Using semi-structured telephone
interviews, this paper specifically explores the perceptions of 16 tax professionals on their general
understanding of complying with the tax law and the influence of attitudes, important referent others and
perceived behavioural control in complying with the tax law. This study contributes to the literature on tax
professionals’ tax compliance behaviour from an Asian tax jurisdiction. It reports the findings in a real-
world setting by using a qualitative approach, in this case, through interviews.
Throughout this paper, the term tax professionals refers to tax professionals or tax practitioners practising
in public accounting firms, tax consulting firms or sole practitioners in tax practice. Following the
introduction section, the remainder of the paper is organised as follows: literature review followed by
methodology, findings and discussion and lastly, conclusion.

173
2. LITERATURE REVIEW
2.1 Definition of Tax Compliance
Tax compliance refers to the willingness of taxpayers to comply with the tax laws while non-compliance
is associated with violating the tax laws, whether or not it is intentional (Kirchler, 2007). Consequently,
tax compliance (and non-compliance) behaviour is a result of ethical and unethical decision-making
process (Singh, 2003).
Previous studies have defined tax compliance as voluntary compliance to the letter as well as the spirit of
the tax law (Alley & James, 2006), timely voluntary payment of the difference between actual tax due and
the amount reported to the tax authorities (Andreoni, Erard, & Feinstein, 1998) and the timely filing of tax
returns accurately according to the tax law and settling any tax owed without further enforcement (Singh,
2003).
Based on the various definitions, the central tenets in tax compliance are voluntary reporting and timely
payment according to the tax law. However, in reality, what is considered as the acceptable level of
compliance with the tax law is subjective and varied. In New Zealand for instance, Elliffe (2011:466)
argued that the recent Supreme Court and Court of Appeal decisions in New Zealand tax practice
suggested that “…an aggressive tax avoidance transaction may converge into criminal tax evasion”. In
this kind of situation, tax professionals play an important role in assisting their clients in determining the
boundary between tax avoidance, tax mitigation and tax evasion.
2.2 Attitude and Tax Compliance
Ajzen (1991) defined attitudes as how individuals perceive the consequences of a particular behaviour as
favourable or unfavourable. It is suggested that attitude is directly related to behaviour to the degree it is
influenced by the intention to perform behaviour (Armitage & Christian, 2003). In many tax compliance
studies, Kirchler (2007) found that despite weak relationship between attitude and tax compliance, they
are significant. However, Kirchler (2007) also argued that the definition of attitude in tax compliance is
not clear since attitude towards tax compliance is an ambiguous construct. Previous studies such as Saad
(2011) and Langham et al., (2012) found positive influence between attitudes and taxpayers’ tax
compliance behaviour. Interestingly, Buchan (2005) reported that the accountant’s attitude has strong
direct relationship with ethical intention in complying with the tax law.
174
2.3 The Influence of Important Referent Others in Complying with the Tax Laws
Important referent others or subjective norms as defined by Ajzen and Fishbein (1980), as global social
pressure from those who are close to an individual, such as family, friends and colleagues, who could
exert influence on an individual’s ethical decision-making. In the tax context, Kirchler (2007) argued that
the tax compliance behaviour of taxpayers was influenced by the group they associate with. This
argument is aligned with prior tax compliance studies. In a synthesis of past studies in tax compliance,
Jackson and Millirion (1986) and later in an updated work by Richardson and Sawyer (2001), important
referent others in the form of peer influence was found to be an important factor in complying with the tax
law. Similar findings on the positive influence of important referent others in tax compliance studies were
also recorded by more recent studies such as Saad (2011) and Langham et al., (2012).
With respect to tax professionals, Hite et al., (2003) reviewed past studies on factors that affect tax
professionals’ tax compliance behaviour and argued that tax professionals’ aggressive behaviour is
influenced by the opinions of others. A recent study by Smart (2012) with tax professionals in New
Zealand found a positive and significant influence of important referent others in the forms of
expectations, threat of losing respect and the behaviour of important referent others on tax professionals’
compliance behaviour to tax law.
2.4 Perceived Behavioural Control and Tax Compliance
A particular behaviour may not likely be displayed or engaged if that individual does not have control
over it, even with the existence of strong attitude and influence from important referent others. Thus, a
behaviour is also posited to be influenced by the ability of that person to have control in displaying or
engaging it (Ajzen, 1991). Perceived behavioural control considers personal and environmental factors,
such as the availability of information, skills and opportunities for a person to engage in a particular
behaviour (Fishbein & Ajzen, 2010). The influence of perceived behavioural control is still less explored
in tax compliance, and in general, findings from past studies (see for instance Bobek and Hatfield, 2003;
Saad, 2011 and Langham et al., 2012) on the influence of perceived behavioural control in tax compliance
are not favourable. Similar findings were recorded in a recent study by Smart (2012) who found that
perceived behavioural control had no effect on the behaviour of tax professionals in New Zealand in
complying with the tax law.

175
A review of relevant literature in this paper suggests that attitude and important referent others have
positive influence on tax compliance behaviour. The influence of perceived behavioural control in tax
compliance however, was not supported.
3. METHODOLOGY
Oats (2012) argued that taxation studies have been dominated by the use of quantitative approaches, and
suggested that future research consider other alternatives such as qualitative methodology (interview) to
understand tax issues. Hence, this study used semi-structured telephone interviews to obtain insights into
tax compliance behaviour of tax professionals in Malaysia.
The samples in this study were identified from an earlier survey conducted by the author. Sixteen
interview participants from various positions, experience and type of firms voluntarily participated in the
study. All participants interviewed for the study are members of the Malaysian Institute of Accountants
(MIA) except those with less than five years of experience. The diversity of interview participants’
professional background is expected to provide rich information, which could be helpful in understanding
the tax compliance behaviour of tax professionals in this study. The profiles of the interview participants
are summarised in Table 1 as follows:

176
Table 1: Profiles of interview participants
Position
Years of
experience in
tax practice
Type of firms
Reference in the
paper
Tax Consultant 16 Sole practitioner Participant no. 1
Principal 16 Medium size public
accounting firm
Participant no. 2
Manager 16 Medium size public
accounting firm
Participant no. 3
Senior Tax Assistant 6 Medium size public
accounting firm
Participant no. 4
Senior Tax Assistant 7 Medium size public
accounting firm
Participant no. 5
Tax Director 22 Small tax consulting
firm
Participant no. 6
Tax Consultant 21 Sole practitioner Participant no. 7
Tax Consultant 13 Small tax consulting
firm
Participant no. 8
Tax Director 16 Medium size public
accounting firm
Participant no. 9
Tax Director 12 Small size public
accounting firm
Participant no. 10
Tax Assistant 4 Small size public
accounting firm
Participant no. 11
Partner 20 Small tax consulting
firm
Participant no. 12
Tax Assistant 4 Small size public
accounting firm
Participant no. 13
Tax Assistant 4 Small size public
accounting firm
Participant no. 14
Tax Assistant 4 Small size public
accounting firm
Participant no. 15
Tax Assistant 3 Small size public
accounting firm
Participant no. 16
177
The study involved tax professionals located in different parts of Malaysia and because of the distance
constraints it was impractical to conduct face-to-face interviews. In this situation, it was also cost and time
effective to conduct telephone interviews. Furthermore, Bryman and Bell (2011) suggested that the
telephone interview is more effective in encouraging participation during the interviews involving
sensitive issues, such as those explored in this study.
To be consistent with the nature of a semi-structured interview, the researcher prepared an interview
protocol or guideline, consisting of a list of questions based on themes relevant to the study. Despite the
themes being determined a priori in the interview protocol, the nature of a semi-structured interview
allows some freedom for other themes to emerge during the interview, which is relevant to understanding
the tax compliance behaviour of tax professionals.
During the interview, several questions related to the tax professionals’ general understanding on tax
compliance, attitudes, important referent others and perceived behavioural control in complying with tax
laws were asked. On average each participant was interviewed for approximately 30 to 45 minutes using a
mix of Bahasa Malaysia and English. The interviews were recorded using an audiotape after getting the
participants’ consent.
The first step in analysing the interview data was the transcribing of the interview recordings. As the
interviews were conducted in both Bahasa Malaysia and English, the transcript was translated into a full
English text before further analysis was conducted. The transcripts were repeatedly checked to ensure that
there were no obvious errors and compared against the recording. Following the suggestion by Lincoln
and Guba (1985), the data was coded and given respective themes. Finally, a few of the interview
participants checked their interview transcripts as well as the themes identified, and provided their
feedback. This procedure, according to Creswell (2009), increased the validity of the findings.

178
4. FINDINGS AND DISCUSSIONS
4.1 Tax Compliance Behaviour
In explaining their understanding about tax compliance behaviour, generally all interview participants
associated tax compliance with complying with the Income Tax Act, standards, rules and regulations by
the tax authority. Their understanding is translated by meeting the deadlines for filing of tax returns, and
payment owed to the tax authority, having proper documentation, possessing knowledge, and declaring
the income that taxpayers earned. The following comments are some examples of how tax professionals
in this interview understand tax compliance.
“Tax compliance means…tax professional has to comply with all standards and public
rulings, rules and regulations set by the Income Tax Act…”
(Participant 2, principal, medium size public accounting firm)
“Basically if you talk about tax compliance, it can be from two areas…one is the computation
[and] the other is from the timing…for example [the] submission deadline, payment deadline,
filing deadline. At the end of the day, it is the question of effectiveness…if you do not meet the
deadlines, then you are not efficient.”
(Participant 3, manager, medium size public accounting firm)
“In my opinion, tax compliance means following the rules, it means we follow what is required
by the Income Tax Act or [any] regulations, legislations determined by the IRB.”
(Participant 4, senior tax executive, medium size public accounting firm)
There is also a suggestion that tax compliance means exercising justice, on the side of taxpayers and
tax authority. This could be achieved by ensuring that taxpayers do not overpay or underpay the
amount of tax.
“It is wrong to under declare the income…it should be a win-win situation. Taxpayers will not
pay more or less even by a cent, we just pay what we are supposed to pay.”
(Participant 8, tax consultant, small tax consulting firm)

179
Interestingly, as commented by an interview participant, complying with the tax law to a certain extent is
situation specific. In the case of a natural disaster for instance, it becomes very challenging and requires
tax professionals to be more flexible with their clients in their approach to obtain the appropriate
documents for tax filing purposes.
“…it depends on situation. Let’s say…in 2006, we had severe flooding in our town. The bills
drifted away…so how are we going to prepare the computation? I think in this case we have to
tolerate. We had to collect as much evidence as we could, find whatever documents which
were still available…and referred to previous records as well.”
(Participant 6, tax director, small tax consulting firm)
4.2 Attitudes Towards Tax Compliance
When probed further, the interview participants also explained that their attitudes to a certain extent guide
them to comply with the tax law. For instance, in addition to their awareness on the importance of
complying with the tax laws, as professionals, there is a concern that their attitude has to be aligned with
professional ethics while performing their roles.
“As a tax professional, we are given the trust, and I am afraid of the tax law. We should not go
against the law. As an accountant we have to follow the ethical conduct.”
(Participant 7, tax consultant, sole practitioner)
“As tax professionals we have to follow our [tax professional] ethics.”
(Participant 8, tax consultant, small tax consulting firm)
“It is our own self…have to follow the tax regulation. My intention also influences me but I
also want to help my client, so it’s a combination.”
(Participant 16, tax executive, small size public accounting firm)

180
There are also suggestions that their attitudes towards the possibility of being penalised for non-
compliance, the risk of losing credibility as a tax professional and the feeling of guilt for non-compliance,
influence them to comply with the tax law. Some tax professionals commented, for instance:
“Personally I think the factors that can influence…is the individual himself/herself,
mainly…the people that I meet, it all depends on that individual person. It is one’s upbringing.
I don’t want any problems, for example I prepare a client’s tax and there is something that I
did not check properly…, the client relies on me, I do the work for the sake of doing, so I feel
guilty. The other thing is, if I don’t do the work properly, later the IRB audits the client, the
blame is on me, it’s not nice being penalised, professionally it is not nice.”
(Participant 5, senior tax executive, medium size public accounting firm)
“Any decisions which are against the tax law will have an effect on the taxpayers. It will
damage our credibility as tax professionals. As a tax professional I have to understand this
and be ethical. The Code of Ethics by the Malaysian Institute of Accountants becomes my
guideline. Membership in professional accounting bodies is indeed helpful.”
(Participant 9, tax director, medium size public accounting firm)
“…depends on that particular person, whether or not to comply with the tax laws,
sometimes…we want to be ethical but others like our clients they refuse…but if [I] don’t
comply with the tax law, I’ll feel guilty.”
(Participant 15, tax executive, small size public accounting firm)

181
4.3 Important Referent Others and Tax Compliance
In addition to attitudes, the discussion during the interviews also centred on the influence of social
pressure imposed by referent or important others in the decision-making of tax professionals. The
interview participants unanimously agreed that important referent others affect their decision-making to a
degree. The influence of important referent others comes from peers, superiors and friends who are in the
same profession, in the form of exchanging different experiences and opinions especially in complicated
tax cases. This could be due to the different level of expertise in interpreting tax laws. Interestingly,
perceptions of people around them and clients can also influence their decision-making. For example:
“Yes, my colleagues. Their influence may come from their experience and knowledge.”
(Participant 1, tax consultant, sole practitioner)
“I share with my friends who are in the same profession to get their opinions. Yes, I consider
the opinions of my friends who are in the same profession. Normally, I refer to senior partners
about the final decision. If it is a simple case, I don’t refer. It’s only for complicated or big
companies.”
(Participant 9, tax director, medium size public accounting firm)
“If there are cases that require high level of technical knowledge I will ensure that I discuss
first with my colleagues, we do our own research, especially in isolated cases. Not for all
issues, only certain issues.”
(Participant 12, partner, small tax consulting firm)
“For me the perceptions of others around me are important in complying with the tax
law…influence by colleagues is an important factor for me.”
(Participant 13, tax executive, small size public accounting firm)
“Influence from peers. We will ask around among ourselves, if we still cannot find the answer,
then we will ask our supervisor.”
(Participant 14, tax executive, small size public accounting firm)

182
4.4 Perceived Behavioural Control and Tax Compliance
It is also postulated that compliance behaviour with tax laws is influenced by the perceived behavioural
control that tax professionals possessed, which is the ability of an individual to have control and the
perceived ease or difficulty in their conduct. This can be influenced by personal and environmental factors
such as having the skills and opportunities to engage in a particular behaviour (Fishbein & Ajzen, 2010).
When asked to comment on the influence of perceived behavioural control in complying with the tax
laws, the interview participants provided mixed opinions. Some interview participants agreed that they
have control in their decision-making, whether or not to comply with the tax law, but some interview
participants disagreed, stating that they only have control at the initial stage of preparing documents for
tax compliance purposes. One possible reason for the mixed opinions is because tax professionals
perceived themselves as advocates who assist their clients, and eventually it is the clients who decide for
themselves. This could possibly lessen the influence of perceived behavioural control in complying with
the tax laws. Some of the comments are presented here.
“Yes, I always have full control. Maybe because I understand how the tax laws work. My
clients typically have little knowledge. Rather than arguing the amount of tax payable, they
normally need my advice.”
(Participant 1, tax consultant, sole practitioner)
“Not necessarily, let’s say I am preparing a file for my client then finally there is something
that I am not sure, so I refer to my superior. Things that I am sure, I will make my own
decision.”
(Participant 5, senior tax executive, medium size public accounting firm)
“…I’ll ask the client. We will prepare the tax computation then we will see what the Act says,
we discuss any other transactions, so the decision of how much tax the clients have to pay is
not only based on me, it depends on the client as well.”
(Participant 9, tax director, medium size public accounting firm)

183
“Normally, it’s the client who makes the decision, we advise the client. We only advise about
their tax needs, what is compulsory for those with income reaching the tax limit.”
(Participant 10, tax director, small size public accounting firm)
“At the end of the day, the superior made the final decision. At the beginning, yes I have
control but eventually I do not have the control. Sometimes, I do not have the confidence to
support my argument. Maybe because I think, my superior has more experience than me, is
more expert.
(Participant 14, tax executive, small size public accounting)
“My boss will make the decision. Initially, yes I’ll make the decision but final decision is
always my boss.”
(Participant 16, tax executive, small size public accounting firm)
5. CONCLUSIONS
Basically, the interview participants understand tax compliance as complying with the tax law, rules,
regulations and requirements by the tax authorities, which is consistent with the definitions of tax
compliance as suggested by prior studies such as by Roth et al., (1989) and Singh (2003). Interestingly,
there is agreement by some participants that complying with the tax law to a certain extent is situation
specific. The findings are consistent with the argument by Jones (1991) that people act ethically or
unethically depending on the intensity of the moral issue. There is a possibility that if the amount of tax or
risk is minimal, then tax professionals would regard the intensity of the moral issue as low and would
respond differently to tax compliance.

184
The interview participants also concurred that their attitude could influence their tax compliance
behaviour, which support findings from prior studies such as Buchan (2005) and Langham et al., (2012).
Some interview participants agreed that as tax professionals they perceived themselves as professionals
who are obligated to abide by the professional ethical rules. In addition, some interview participants
addressed their fear that if they as tax professionals do not comply with the tax laws in assisting their
clients, the repercussions will be felt by their clients, such as becoming the subject of a tax audit or being
penalised by the tax authority. As a result, they will lose their credibility or will be perceived as being
dishonest by their clients, which could damage their reputation as tax professionals. The influence of
attitude in complying with the tax law is also translated by the feeling of guilt for non-compliance, as
commented by an interview participant.
The interview participants also unanimously agreed that to an extent, that there is influence from referent
or important others (subjective norms) in their decision-making, which is similar to the findings by Smart
(2012). Peers, superiors and friends in the same profession, could influence the decision-making of the tax
professionals in this interview study. The influence could come from exchanging opinions and
experiences especially in complicated tax situations. As commented by some interview participants, in
many cases the complexity of the tax law and the level of knowledge that they possess will determine
whether or not this influence exists. The discussion in the interviews also delved into the importance of
perceived control in the decision making of tax professionals. Some interview participants believed that
they have control, whilst some disagreed. Some interview participants suggested that they only have
control at the initial stage of decision-making. This is most likely because they may not have reached a
certain level of expertise that is required in the decision-making process. When probed further, those tax
professionals who believed that they have control, explained that they have the control in providing the
type of advice to their clients, but not necessarily in the final decision. This is because their role is to
assist their clients and the latter makes the final decision based on the tax professionals’
recommendations.

185
Since this is a qualitative study, the findings are not meant to be generalised. In addition, the interview
participants in this study were from small and medium sized public accounting firms, tax consulting firms
as well as sole practitioners. The sample may not represent tax professionals in public practice as a whole.
None of the tax professionals participated in this study came from the ‘Big Four’ public accounting firms
which may have different points of view, since as suggested by Pierce and Sweeney (2009), different firm
size may have different environment for decision-making.
Future studies could perhaps involve tax professionals from “Big Four” public accounting firms to
understand further the tax compliance behaviour of tax professionals. It is also interesting for future
studies to examine the antecedents of attitude in tax professionals’ decision making. The interview
participants for instance revealed that their attitudes are associated with economic factors such as penalty
and probability of being audited as well as behavioural factors such as reputation among peers and the
public. Combining both economic and non-economic factors could perhaps reveal more interesting
findings.
Based on the findings of the study, the researcher opines that the findings could contribute to a further
understanding of the tax compliance behaviour of accounting practitioners. In this case, tax professionals
in public accounting services while they perform their roles. For professional bodies, the findings also
provide some insights into the ethical behaviour of their members. The findings from this study and other
previous tax studies involving tax professionals, collectively, could be useful in promoting ethical
behaviour among their members. Training provided by professional bodies to their members is essentially
focused on the technical aspect of accounting issues. One way is to incorporate the non-technical
accounting elements in the training of their members, such as emphasising what is morally right, the
concept of fairness and justice, in their decision-making.

186
6. REFERENCES
Ajzen, I. (1991). The Theory of Planned Behaviour. Organizational Behaviour and Human Decision, 50,
179-221.
Ajzen, I., & Fishbein, M. (1980). Understanding Attitudes and Predicting Social Behavior. Englewood
Cliffs, NJ: Prentice-Hall.
Alley, C., & James, S. (2006). Research into Economic and Behavioural Approaches in Tax Compliance.
In A. Sawyer (Ed.), Taxation Issues in Twenty-First Century (pp. 3-14). Christchurch: The Centre for
Commercial and Corporate Law, School of Law.
Andreoni, J., Erard, B., & Feinstein, J. (1998). Tax Compliance. Journal of Economic Literature, 36(2),
818-860.
Bobek, D. D., & Hatfield, R. C. (2003). An Investigation of the Theory of Planned Behavior and The Role
of Moral Obligation in Tax Compliance. Behavioral Research In Accounting, 15, 13-38.
Bryman, A., & Bell, E. (2011). Business Research Methods. New York: Oxford University Press.
Buchan, H. F. (2005). Ethical Decision Making in the Public Accounting Profession: An Extension of
Ajzen's Theory of Planned Behavior. Journal of Business Ethics, 61, 165-181.
Crane, A., & Matten, D. (2007). Business Ethics. New York: Oxford University Press.
Creswell, J. W. (2009). Research Design: Qualitative, Quantitative and Mixed Methods Approaches.
Thousand Oaks: Sage Publications Inc.
Devos, K. (2012). The Impact of Tax Professionals Upon the Compliance Behavior of Australian
Individual Taxpayers. Revenue Law Journal, 22(1), 1-26.
Elliffe, C. (2011). The Thickness of a Prison Wall - When Does Tax Avoidance Become a Criminal
Offence? New Zealand Business Law Quarterly, 17(4), 441-446.
Fishbein, M., & Ajzen, I. (2010). Predicting and Changing Behavior. New York: Taylor and Francis
Group.

187
Hite, P., Hasseldine, J., Al-Khoury, A., James, S., Toms, S., & Toumi, M. (2003). Tax Practitioners and
Tax Compliance. In A. Lymer & D. Salter (Eds.), Contemporary Issues in Taxation Research (pp. 17-43).
England: Ashgate Publishing Limited.
Jackson, B. R., & Milliron, V. C. (1986). Tax Compliance Research: Findings, Problems and Prospects.
Journal of Accounting Literature, 5, 125-161.
Kirchler, E. (2007). The Economic Psychology of Tax Behaviour. Cambridge: Cambridge University
Press.
Klepper, S., & Nagin, D. (1989). The Role of Tax Preparers in Tax Compliance. Policy
Langham, J. A., Paulsen, N., & Hartel, E. J. (2012). Improving Tax Compliance Strategies: Can the
Theory of Planned Behaviour Predict Business Compliance? eJournal of Tax Research, 10(2), 364-402.
Lincoln, Y. S., & Guba, E. G. (1985). Naturalistic Inquiry. Beverly Hills, California: Sage Publications
Inc.
Mohd Isa, K. (2012). CorporateTax payers' Compliance Variables Under the Self-assessment System in
Malaysia: A Mixed Method Approach. Doctor of Philosophy. Curtin University, Perth.
Oats, L. (2012). Tax Research Going Forward. In L. Oats (Ed.), Taxation: A Fieldwork Research
Handbook. Oxon: Routledge.
Pierce, B., & Sweeney, B. (2009). The Relationship between Demographic Variables and Ethical
Decision Making of Trainee Accountants. International Journal of Auditing, 10, 1099-1123.
Saad, N. (2011). Fairness Perceptions and Compliance Behaviour: Taxpayers' Judgments in Self-
Assessment Environments. Doctor of Philosophy, University of Canterbury, Christchurch.
Singh, V. (2003). Tax Compliance and Ethical Decision Making: A Malaysian Perspective. Petaling Jaya:
Pearson Malaysia Sdn Bhd.

188
Smart, M. (2012). The Application of the Theory of Planned Behaviour and Structural Equation
Modelling in Tax Compliance Behaviour: A New Zealand Study. Doctor of Philosophy, University of
Canterbury, Christchurch.
Tan, L. M. (2006). Research on the Role of Tax Practitioners in Taxpayer Compliance: Identifying Some
of the Gaps In A. Sawyer (Ed.), Taxation Issues in the Twenty-First Century (pp. 15-28). Christchurch:
The Centre for Commercial and Corporate Law, School of Law, University of Canterbury.
Tan, L. M., & Sawyer, A. J. (2003). A Synopsis of Taxpayer Compliance Studies: Overseas vis-a-vis New
Zealand. New Zealand Journal of Taxation Law and Policy, 9(4), 431-454.

189
7. AUTHOR
Dr. Suhaila Abdul Hamid is a senior lecturer at the Faculty of Economics and Muamalat, Universiti
Sains Islam Malaysia. She received her Bachelor degree in Accountancy from Universiti Utara Malaysia
and later worked in the tax department of one of the Big Four public accounting firms in Kuala Lumpur.
She later joined the academic field and furthered her studies at the University of Essex, United Kingdom
and graduated with a Msc. Accounting and Finance. After teaching for a few years, she furthered her
studies at the University of Canterbury and graduated with a PhD in Taxation. Her areas of interest are
taxation, ethics, zakat and waqf. She is currently involved in three research projects under the
Fundamental Research Grant Scheme (FRGS) of which two are related to the area of taxation.

190
CONSOLATION PRIZE
TAX REGIME CHANGES AND INVESTORS’ ACCESS TO GROSS
REVENUE FOR MARGINAL OIL FIELDS IN MALAYSIA: A
SIMULATION STUDY
Associate Professor Dr. Nor Aziah Abd Manaf
Dr. Natrah Saad
Mr Abdulsalam Mas’ud

191
TAX REGIME CHANGES AND INVESTORS’ ACCESS TO GROSS REVENUE FOR
MARGINAL OIL FIELDS IN MALAYSIA: A SIMULATION STUDY
ABSTRACT
The oil and gas sector in Malaysia has been experiencing a series of fiscal regime changes including tax
policies. The motive is to improve the productivity of declining reserves and the growing number of
stranded small and marginal oil fields. Recently, a new tax regime was introduced for marginal oil fields
through increased tax incentives, and change of the fiscal arrangement from production sharing contracts
to risk service contracts. This study simulates the influence of the new tax regime in comparison to the
current one under nine different scenarios relating to oil prices and reserves levels. Results of the
simulation analysis revealed that tax regime under the risk service contract is likely to give investors more
access to gross revenue in five scenarios compared to four scenarios under the production sharing
contract. However, the scenarios in which investors may have high access to gross revenue under the risk
service contract are mainly related to low and medium oil prices. The production sharing contract is more
likely to give investors more access to gross revenue during high oil prices. Therefore, it is recommended
that attaching contractors’ remuneration fee to a hike in oil price would likely improve investors’ access
to gross revenue under the risk service contract in all the scenarios. The implication to policy is that
windfall incentives should be given to marginal oil field investors during soaring oil prices. Application of
these findings should give cognisance to assumptions employed in the analysis.

192
1. INTRODUCTION
The Malaysian oil and gas sector has been experiencing a series of fiscal regime changes including tax
policies. The motive is to improve the productivity of the declining oil and gas reserves and the growing
number of stranded marginal oil fields (Economic Transformation Program, 2010; Lacouture, 2013;
Malaysia Petroleum Resources Corporation, 2014). Recently, through the Petroleum Development Act of
2011 the government changed the fiscal arrangement of marginal fields from the production sharing
contract (PSC) to the risk service contract (RSC). New tax incentives were also introduced, i.e.: (i)
reduction of tax rate from 38% to 25%; (ii) acceleration of capital allowance from 10 to 5 years; (iii)
waive of export duty which was previously at 10% for oil produced and exported by marginal oil fields
operators; (iv) investment allowance of 60-100% on qualifying capital expenditure (QCE) and; (v)
transferable qualified capital expenditure between same partnership or sole proprietorship for oil and gas
operation.
Since the introduction of the new tax policy in November 2010, as of July 2014 only six RSCs were
signed (Mas’ud, Manaf, & Saad, 2014), whereas, 17 PSCs were signed between 2010-2012 for larger
fields (Ley, 2012). Therefore, the study intends to provide an empirical answer to the following research
question: Does the new tax regime improve investors’ access to gross revenue for marginal oil field
development projects in Malaysia? To answer this research question, analyses of investors’ access to
gross revenue (AGR) were performed for marginal oil field development projects under two tax regimes
scenarios. Under scenario one, revenue over cost (r/c factor) PSC fiscal terms were used, while in scenario
two RSC fiscal terms were utilised. The motive for this analysis is to evaluate which of the two tax
regimes increases investors’ AGR. It is important to note that scenario analysis is not a real world
analysis, rather it is a simulation of tax impositions at different oil prices and reserve levels in order to
assess its investment attractiveness (Manaf, Saad, Ishak, & Mas’ud, 2014). The method has been
commonly used in previous studies relating to petroleum fiscal regime and investment (see (Johnston,
1994,2002; Kaiser, 2007; Nakhle, 2007; Saidu & Mohammed, 2014)).

193
This study was motivated by two reasons. Firstly, each country has peculiar tax policies, which cannot be
directly copied by others due to different regulations and resource endowment (Otto & Cordes, 2002). The
second motivation is the fact that there is no study (to the researchers’ knowledge) either from the
academia or professional practice that evaluates whether or not the new marginal oil field tax regime
under the RSC arrangement improved investors’ AGR compared to the old fiscal regime under R/C factor
PSC arrangement, Hence, this study aims to bridge this gap.
The remainder of the article is structured as follows. The next section offers a review of the related
literature. This is followed by the research method and assumptions. Subsequent sections presents the
analysis and results, followed by concluding remarks, study limitations, and implication for future studies.
2. LITERATURE REVIEW
2.1 Petroleum Fiscal Regimes and Investment Climate
The effect of petroleum tax policy changes on investment viability and their sensitivities to changes in oil
price has been investigated in the extant literature. Studies also investigated the impact of tax reduction
and increased allowances on investment. Evidence from the former disclosed that changes in oil and gas
prices impact the investment climate. Specifically, an increase in oil prices renders non-commercial
viable fields economically attractive (Kemp & Stephen, 2011). On the same issue, Njeru (2010) found
that investors’ NPV and IRR decreased in low oil price periods, but AGR comparatively remained
unchanged, and vice versa. Therefore, it was concluded that the flexibility of Kenya’s petroleum fiscal
regime was not powerful enough to accommodate fluctuation in oil prices. Thus, the investment climate
was not conducive to investors under low oil price scenarios.
Review of extant literature revealed that an adjustment of the tax regime might have a positive impact on
the investment climate for an oil and gas project. Abdo (2010) discovered that petroleum tax relaxation by
UK authorities had different effects on investments in the United Kingdom Continental Shelves (UKCS).
Each relaxation led to increases in the cash flow of the affected companies. It also found that the removal
of supplementary charges in the 2011 budget by the UK government would increase the net present value
of many oil and gas development projects in UKCS (Kemp & Stephen, 2011). It was also discovered that
complementing the tax increase in 2011 with additional allowance in the following year increases the
project profitability (Kazikhanova, 2012; Kemp & Stephen, 2012).

194
Conversely, other studies record a negative influence of tax regime changes on the investment
attractiveness of an oil and gas project. By comparing 1993 and 2005 PSCs by Onaiwu (2009) it was
found that that profitability of oil and gas projects in Nigeria increased under the 1993 PSC, while the
reserve was found under the 2005 PSC. Extensive comparison was also made by Nakhle and Hawdon
(2004) of UKCS fiscal regimes and its possible effects on investment attractiveness. It was also
documented that applying a higher tax rate on oil and gas projects during oil price hikes discourages
investments in oil and gas fields, which resulted in negative influence on government revenue (Nakhle,
2007). Kemp and Stephen (2012) documented that the introduction of SC of 32 % in 2011 in UKCS
without field allowances would have had a long-term negative impact on the investment attractiveness of
oil and gas fields (Kazikhanova, 2012; Kemp & Stephen, 2012).
Nonetheless, a few studies have found insignificant influence of fiscal regime changes on the investment
attractiveness of oil and gas fields. It was concluded that regardless of tax allowances and oil price hikes,
profit after tax of oil and gas joint ventures from 1954 to 1969 were similar to that of other industries on
the basis of NPV, IRR and PI (Mead, Muraoka, & Sorensen, 1982). Likewise, Emeka, David, Yun, and
Li-Fei (2012) found that the mean and standard deviation from the scenario analyses showed insignificant
variation to the base-case values of projects’ NPV, IRR and PI.
From the foregoing review, it is evident that mixed findings were documented in the literature. A majority
of the studies found that tax reduction and increases in allowance have positive impacts on oil and gas
projects. Some documented negative impacts of tax increase and removal of allowance. In a few studies
no impact was detected. It is also important to note that these studies mainly focused on investment
appraisal tools such as NPV, IRR and PI to evaluate the impact of tax regime changes on investment
attractiveness. Although other appraisal tools such as AGR are important particularly in the oil and gas
industry (Johnston, 2007), few studies paid attention to it such as Njeru (2010). Therefore, this study
intends to simulate the influence of tax regime changes on investors’ access to gross revenue for marginal
oil fields in Malaysia under R/C factor PSC and RSC tax regimes scenarios.
195
2.2 Tax Regimes Changes and Investors’ Access to Gross Revenue
AGR refers to the maximum share of revenue a company receives from a joint venture in relation to its
share of working interest in a particular accounting period (Johnston, 2007). It has been pointed out that in
a fiscal regime with only royalty, investor AGR is only limited by the royalty paid to resource owner, i.e.
the revenue belongs entirely to the investor with the exception of royalty paid to the government or the
landlord (Johnston, 2007). The only empirical evidence that evaluates the influence of petroleum tax
regime on investors’ access to gross revenue was the work of Njeru (2010). Evidence from Njeru’s study
found that investors’ NPV and IRR decreased in low oil price periods, but AGR comparatively increased
above the base-case, and vice versa. This implies that in a fiscal arrangement such as in Njeru’s analysis
(where there is no cap on cost recovery), investors’ AGR increases even when oil price decreases. Apart
from this empirical evidence, the researchers did not come across any other study that investigated the
influence of tax regimes on investors’ AGR from any other oil and gas context including Malaysia. As
such, this article is written to fill this academic and professional gap.
2.3 Petroleum Fiscal Regimes in Malaysia
The concessionary system, otherwise known as the royalty/tax system, was the first petroleum tax regime
in Malaysia’s oil and gas industry. This type of regime was first applied to Shell in the early 1960s. In the
late 1960s other companies such as Conoco and Esso joined the race for concessionary arrangements in
Malaysia’s oil and gas industry (Mehden & Troner, 2007). The components of the regime are royalty and
tax which are levied by the governments of oil and gas producing states (Lee, 2013).
In 1974, the PSC was introduced in Malaysia’s oil and gas industry through the promulgation of the
Petroleum Development Act in 1974. In order to enhance its attractiveness to investors, the PSC has been
experiencing a series of changes, including the PSC of 1985, deep water PSCs of 1993, and Revenue over
Cost PSC of 1997. Each of these tax regime changes was attached with simplified and attractive fiscal
terms that encouraged investment in the industry. In fact the PSC was the dominant type of fiscal
arrangement in Malaysia’s oil and gas industry. Evidence showed that only five PSCs existed prior to
1998 but this increased to 83 as of 2012 (Lee, 2013). In 2013 PETRONAS celebrated 100 active deep
water PSCs (Manaf, et al., 2014).

196
The ongoing desire to enhance investment attractiveness of marginal oil fields led the Malaysian
Government to introduce the RSC in 2010, which subsequently resulted in the amendment of the
Petroleum Development Act in 2011 (Wei, 2011). The regime was accompanied by reduced tax rate and
allowances aimed at enhancing investors’ AGR under marginal oil field development projects.
In other countries like the UK, changes in the tax regime are normally followed by studies that investigate
its influence on investors NPV, IRR, PI, AGR and SI. However, in the recent adjustment of the tax regime
for marginal oil fields, from R/C factor PSC to RSC in Malaysia, there was no evidence of a study to that
effect. Therefore, this article simulates the effect of tax regime changes from R/C factor PSC to RSC on
investors’ AGR under different oil price and reserve scenarios. Consequently, the following hypotheses
are developed.
H1 New tax regime under RSC has higher investors’ AGR under High Oil Price-High Reserve
H2 New tax regime under RSC has higher investors’ AGR under High Oil Price-Medium Reserve
H3 New tax regime under RSC has higher investors’ AGR under High Oil Price-Low Reserve
H4 New tax regime under RSC has higher investors’ AGR under Medium Oil Price-High Reserve
H5 New tax regime under RSC has higher investors’ AGR under Medium Oil Price-Medium Reserve
H6 New tax regime under RSC has higher investors’ AGR under Medium Oil Price-Low Reserve
H7 New tax regime under RSC has higher investors’ AGR under Low Oil Price-High Reserve
H8 New tax regime under RSC has higher investors’ AGR under Low Oil Price-Medium Reserve
H9 New tax regime under RSC has higher investors’ AGR under Low Oil Price-Low Reserve

197
3. METHOD AND ASSUMPTIONS
3.1 Model Derivation
To achieve the objective of this article, discount cash flow (DCF) was used to compute investors’ AGR. It
was documented by Nakhle (2007) that a survey carried-out in 2001 revealed that 99% of oil companies
used DCF to evaluate the effect of tax regimes. Therefore, the DCF is then applied for computation of
various oil and gas project investment climate indicators such as Pay-Back Period, Net Present Value
(NPV), Internal Rate of Return (IRR), Profitability Index (PI), Saving Index (SI) and Access to Gross
Revenue (AGR). It was disclosed that AGR is used by oil and gas companies to evaluate its share of
project revenues under different economic conditions (Johnston, 2007). Before AGR’s computation, DCF
of the project is calculated as:
DCF under PSC Regime
DCFt= CRt + POt – CAPEXt – OPEXt - RCESSt – EDt -TAXt …………………………………...1
Where:
DCFt = Investor’s Discounted Cash Flow
CRt = Cost recovered in year t
POt = Share of investor’s profit oil in year t
CAPEXt = Capital Expenditure incurred in year t
OPEXt = Operating Expenditure in year t
RCESSt = Research CESS in year t
EDt = Export Duty in year t
TAXt = Tax paid in year t

198
DCF under RSC Regime
DCFt= CRt+ FEEOILt - CAPEXt - OPEXt –TAXt ………………………………………………………2
Where:
CRt = Cost recovery in year t
FEEOILt = Fee Oil received in year t
CAPEXt = Capital Expenditure in year t
OPEXt = Operating Expenditure incurred in year t
TAXt = Tax paid in year t
The DCF under the two tax regimes are expressed in line with the prior literature (Hao & Kaiser,
2010;Nakhle, 2010). Based on the DCFs above, investors’ AGR under the two tax regimes were
computed using the formula below:
Investors’ AGR
……………………………………………………………………………………3
Where:
agr = access to gross revenue
iagr= investors’ access to gross revenue
pagr = projects’ access to gross revenue
3.2 Data
In this paper, data for one of the Malaysian marginal oil fields located in Offshore Peninsular Malaysia
were used. The source of the data was information released by the project contractor – Coastal Energy
(Coastal Energy, 2012) and the offshore technology.com (Offshore Tecnology.com, 2014). Therefore, all
the assumptions on production, reserves, costs and duration are based on the information from the
aforementioned sources.

199
3.3 Provisions for the Two Scenarios: R/C Factor PSC and RSC Fiscal Regimes
The following tax and fiscal provisions for R/C factor PSC and RSC contained in Table 1 and 2 were used
in the analysis.
Table 1: Fiscal Provisions for R/C Factor PSC and RSC
R/C Factor
PSC
Scenario
Royalty of 10% on gross production, PIT of 38%, Research Cess of 0.5% Capital
allowance for 10 years, Export Duty 10% and Cost recovery and profit split based on R/C
ratio in Table 2 below.
RSC
Scenario
Royalty paid by PETRONAS on its share, CIT of 25% no Research CESS, Accelerated
Capital Allowance for 5years, Zero Export Duty, Remuneration fee 10%, and 100% cost
recovery.
Note. Adopted from “Simulating of the Influence of Fiscal Regime Adjustment on Marginal Oil Field
Investment Climate in Malaysia” by Mas’ud, Manaf, and Saad (2015) in International Conference on
Accounting Studies, Johor Baru, 2015 (forthcoming).
Table 2: R/C Ratio for Malaysian 1998 PSC
Contractor’ R/C
Ratio
Cost Oil Profit Oil
Cost Oil
Ceiling
Unused Cost Oil
PETRONAS: Contractor
Profit Oil
PETRONAS: Contractor
0.0< R/C < =1.0 70% N.A 20:80
1.0 < R/C <= 1.4 60% 20:80 30:70
1.4 < R/C <= 2.0 50% 30:70 40:60
2.0 < R/C <=2.5 30% 40:60 50:50
2.5 < R/C <=3.0 30% 50:50 60:40
R/C> 3.0 30% 60:40 70:30

200
3.4 Reserve, Production and Duration Assumptions
The field has recoverable reserves that range from 15 to 35 million barrels (Coastal Energy, 2012).
Therefore, the sensibilities of the three reserve levels scenarios: small, medium and large with 15, 25 and
35 million barrels of oil equivalents were tested.
For production assumptions, it was estimated that the field started production at a lower range of 4,530
barrels per day (bpd) of oil and 4 million metric cubic feet (mmcf) of gas, which is equivalent to 5,220
barrels of oil equivalent (boe). This is based on the American Petroleum Institute (API) conversion of 6:1
i.e. one barrel of oil is equivalent to six mcf of gas. Annual production of this lower range is estimated at
1,905,300 boe. The production during higher period stands at 16,495 bpd of oil and 14 mmscf of gas,
which is equivalent to 18,909 boe per day. , Thus, the annual production during high production period is
assumed at 6,901,785 boe.
The field’s contract is assumed to last for eight years (2012 to 2019), with first oil witnessed in December
2013 (Lacouture, 2013). Based on this data, it was assumed that in the low reserve scenario (15 million
boe), production started at a lower range in the second year (December, 2013), and reached its peak in the
third year (2014), and then declined at a rate of 45% annually until 2019. For the medium reserve scenario
(25 million boe), it was assumed that production started at lower range in the second year (December
2013), reached its peak in the third year (2014), and then declined at a rate of 21% annually until 2019.
For the high reserve scenario (35 million boe), it was assumed that production started at lower range in the
second year (December 2013), reached its peak in the third year (2014), and then declined at a rate of 6%
annually until 2019. Similar assumptions were made in previous studies based on other reserve levels (see
(Ghandi & Lin, 2014; Hao & Kaiser, 2010; Kaiser, 2007; Mas’ud, et al., 2015; Saidu & Mohammed,
2014)). Table 3 presents reserves, production and depletion rate assumptions used in the analyses.

201
Table 3: Reserve, Production and Depletion Assumptions
Large Size Marginal Field
(≈35m boe)
Medium Size Marginal Field
(≈25m boe)
Small Size Marginal Field
(≈15m boe)
Year Production Year Production Year Production
2012
2012
2012
2013 156600 2013 156600 2013 156600
2014 6901785 2014 6901785 2014 6901785
2015 6487678 2015 5452410 2015 3795982
2016 6098417 2016 4307404 2016 2087790
2017 5732512 2017 3402849 2017 1148284
2018 5388561 2018 2688251 2018 631556.5
2019 5065248 2019 2123718 2019 347356.1
Total 35,830,802
25,033,017
15,069,354
Decline Rate: effective from 2014
6%
21%
45%
Note. Adopted from “Simulating of the Influence of Fiscal Regime Adjustment on Marginal Oil Field
Investment Climate in Malaysia” by Mas’ud, Manaf, and Saad (2015) in International Conference on
Accounting Studies, Johor Bahru, 2015 (forthcoming).
3.5 Development and Operation Costs Assumption
It was estimated by the project contractor that the development cost (capital expenditure or CAPEX) of
marginal fields used in this study is equivalent to USD320 million to be spent within three years (Coastal
Energy, 2012), which forms the assumption of this study. There is no specific operating cost data
available for this marginal oil field; however, average operational/lifting cost (operational expenditure or
OPEX) within Asia is at USD9.5 per barrel (US Energy Information Administration, 2014b). This same
rate is assumed for the purpose of this analysis.

202
3.6 Price Assumption
Three Brent spot crude oil prices were assumed: low, medium and high. The highest average annual Brent
spot crude oil prices from 1987-2040 based on nominal dollar value of 2012 was USD141.46, while the
lowest was USD17.2 (US Energy Information Administration, 2014a). Two prices were used to arrive at
medium oil price - i.e. 141.46 plus 17.2 divided by 2, which equals to 79.33. Thus, USD79.33 was used as
medium oil price. In summary, three Brent oil prices were assumed: high, medium and low with values of
USD141.46, USD79.33 and USD17.2 respectively. It is important to note that the duration for the
development used in this study i.e. 2012 - 2019 is covered by the Brent oil price projection of 1987-2040,
providing sufficient justification for prices assumed in the analysis.
3.7 Service Fee Assumption
Service fee is otherwise called contractor-per-barrel remuneration. The rate has not been clear for
Malaysian RSCs, however, available press releases revealed that contractors are entitled to per barrel
remuneration fee attached to performance. Only Lacouture (2013) reported that contractors are entitled to
10% of per barrel revenue as a remuneration fee, therefore, this is assumed in the analyses.
3.8 Discount Rate Assumption
Most studies on the influence of petroleum tax regime changes on investment assume 15% discount rate
for computation of DCF (Kaiser & Pulsipher, 2004; Saidu & Mohammed, 2014). Upon computation of
DCF based on the aforementioned rate, AGR was computed at different oil prices and reserves scenarios.
3.9 Analytical Procedures
The assumptions set out above were used to calculate the DCF and AGR of the marginal fields used in
this study under different scenarios relating to oil prices and reserves levels. The computations were
performed using spreadsheet in Excel.

203
4. ANALYSIS AND RESULT
The output from such analysis is depicted in Figure 1 below.
Figure 1: Marginal Oil Field AGR under Different Oil Price and Reserve Levels

204
Following the analysis presented in Figure 1 above, Table 4 depicts the result of the study.
Table 4: Results
Hypotheses 1, 2, and 3 hypothesised that the new tax regime under RSC fiscal terms has higher investor AGR under high oil price-
high reserve, high oil price-medium reserve and high oil price-low reserve respectively. Results in Table 4 revealed that the three
hypotheses were not supported. Specifically, the results revealed that the investors’ AGR under high oil price-high reserve (PSC-
AGR= 33%, RSC-AGR =23%), high oil price-medium reserve (PSC-AGR= 35%, RSC-AGR =28%) and high oil price-low reserve
(PSC-AGR= 38%, RSC-AGR =32%) are higher under the R/C factor PSC tax regime compared to the RSC tax regime.
AGR
Hypotheses Statements PSC RSC Results
H1 New tax regime under RSC has higher AGR under High Oil Price-High Reserve 33% 23% Not supported
H2 New tax regime under RSC has higher AGR under High Oil Price-Medium Reserve 35% 28% Not supported
H3 New tax regime under RSC has higher AGR under High Oil Price-Low Reserve 38% 32% Not supported
H4 New tax regime under RSC has higher AGR under Medium Oil Price-High Reserve 34% 64% Supported
H5 New tax regime under RSC has higher AGR under Medium Oil Price-Medium Reserve 42% 39% Not supported
H6 New tax regime under RSC has higher AGR under Medium Oil Price-Low Reserve 37% 49% Supported
H7 New tax regime under RSC has higher AGR under Low Oil Price-High Reserve 48% 120% Supported
H8 New tax regime under RSC has higher AGR under Low Oil Price-Medium Reserve 67% 142% Supported
H9 New tax regime under RSC has higher AGR under Low Oil Price-Low Reserve 60% 191% Supported

205
Hypotheses 4, 5 and 6 proposed that the new tax regime under RSC fiscal terms has higher
investor AGR under medium oil price-high reserve, medium oil price-medium reserve and
medium oil price-low reserve respectively. The results in Table 4 revealed that hypotheses 4d and
4f were supported while hypothesis 4e was not supported. Specifically, the result showed that the
AGR under medium oil price-high reserve (PSC-AGR= 34%, RSC-AGR =64%), medium oil
price-low reserve (PSC-AGR= 37%, RSC-AGR =49%) are higher under fiscal regime for RSC
than for R/C factor PSC. However, the AGR under medium oil price-medium reserve (PSC-
AGR= 42%, RSC-AGR =39%) is higher under the tax regime for PSC than for RSC.
Hypotheses 7, 8, and 9 postulated that the new tax regime under the RSC fiscal terms has higher
investor AGR under low oil price-high reserve, low oil price-medium reserve and low oil price-
low reserve scenarios respectively. The results in Table 4 revealed all these three hypotheses
were supported. Specifically, the results highlighted that investors’ AGR under low oil price-high
reserve (PSC-AGR= 48%, RSC-AGR =120%), low oil price-medium reserve (PSC-IRR= 67%,
RSC-IRR =142%), and low oil price-low reserve (PSC-IRR= 60%, RSC-IRR =191%) are higher
under the RSC tax regime than the R/C factor PSC tax regime.
5. CONCLUSION AND POLICY IMPLICATION
The study simulated the influence of the new tax regime for marginal oil fields in comparison to
the old one under nine different scenarios relating to oil prices and reserves levels. The result
revealed that out of the nine scenarios analysed using R/C factor PSC and RSC tax terms at
different oil prices and reserve levels for the evaluation of investors’ access to gross revenue for
marginal oil fields, the RSC is favoured by five scenarios compared to four for the R/C factor
PSC.
Considering the assumptions employed in the simulation, the results should be applied with
caution. Employing assumptions relating to oil prices, reserve levels, depletion rates, costs, fiscal
terms and discount rate has been a norm in scenario based analysis, thus, this study is not an
exception.

206
Although the tax regime under the RSC arrangement was favoured by a majority of the scenarios
- with the exception of those relating to high oil prices - it is recommended that offering windfall
incentives to investors of marginal oil fields in high oil price environment would likely improve
the fields’ attractiveness. This finding implied the need for windfall incentives for investors of
marginal oil fields during soaring oil prices.
6. DISCLAIMER
The view expressed in this article is that of the authors. It does not form an opinion for any
company or organisation. The analysis is just a simulation. It should not be solely relied upon for
decision. It only gives highlights of prospects for marginal oil fields development projects in
Malaysia.

207
7. REFERENCES
Abdo, H. (2010). The Taxation of UK Oil and Gas Production: Why the Windfalls Got Away.
Energy Policy, 38(10), 5625-5635.
Coastal Energy. (2012). Malaysian Risks Service Contract Corporate Presentation 2012: Coastal
Energy.
Economic Transformation Programme. (2010). Chapter 6: Powering the Malaysian Economy
with Oil, Gas and Energy. Kuala Lumpur. : Government of Malaysia
Emeka, E. E., David, O. O., Yun, P., & Li-Fei, X. (2012). Investment Decision and Profitability
Analysis in an Upstream Petroleum Sector. Journal of Economics & Engineering, 3(1), 28-34.
Ghandi, A., & Lin, C.-Y. C. (2014). On the Rate of Return and Risk Factors to International Oil
Companies in Iran's Buy-back Service Contracts.
Hao, H., & Kaiser, M. J. (2010). Modelling China’s Offshore Production Sharing Contracts
Using Meta Analysis. Petroleum Science, 7(2), 283-288.
Johnston, D. (1994). International Petroleum Fiscal Systems and Production Sharing Contracts.
Tulsa: PennWell Books.
Johnston, D. (2002). Current Developments in Production Sharing Contracts and International
Concerns: Retrospective Government Take – Not a Perfect Statistic Petroleum Accounting and
Financial Management Journal, 21(2), 101-108.
Johnston, D. (2007). How to Evaluate the Fiscal Terms of Oil Contracts. Escaping the resource
curse, 51-88.
Kaiser, M. J. (2007). Fiscal System Analysis—Concessionary Systems. Energy, 32(11), 2135-
2147. doi: http://dx.doi.org/10.1016/j.energy.2007.04.013

208
Kaiser, M. J., & Pulsipher, A. G. (2004). Fiscal System Analysis: Concessionary and Contractual
Systems used in Offshore Petroleum Arrangements. US Department of the Interior, Minerals
Management Service, Gulf of Mexico OCS Region, New Orleans, La. OCS Study MMS, 16, 78.
Kazikhanova, A. (2012). Investment Climate in the UKCS after the Budget 2011 Changes. Msc,
University of Aberdeen, Aberdeen.
Kemp, A. G., & Stephen, L. (2012). Prospects for Activity in the UK Continental Shelf after
Recent Tax Changes: the 2012 Perspective. Aberdeen Centre for Research in Energy Economics
and Finance, North Sea Study Occasional Paper No. 125.
Lacouture, J. (2013). Tax Incentives to Boost Malaysian Oil Production, Energy Global.
Retrieved from
http://www.energyglobal.com/upstream/exploration/18112013/Tax_incentives_boost_Malaysia_
oil_production/
Lee, E. T. H. (2013). Scope For Improvement: Malaysia’s Oil And Gas Sector. Retrieved from
http://refsa.org/wp/wp-content/uploads/2013/07/OG-Scoping-Report-Malaysia-final-
20130701.pdf
Ley, L. N. (2012). Member Country Report of Malaysia 48th CCOP Annual Session (Part 1) 5-8
November 2012. Langkawi, Malaysia: Coordinating Committee for Geoscience Programmes in
East and Southeast Asia.
Malaysia Petroleum Resources Corporation. (2014). History of Oil and Gas Industry in Malaysia
Retrieved 05/05/2014, 2014, from http://www.mprc.gov.my/industry/history-of-oil-gas-in-
malaysia
Manaf, N. A. A., Saad, N., Ishak, Z., & Mas’ud, A. (2014). Effects of Fiscal Regime Changes on
Investment Climate of Malaysia's Marginal Oil Fields: Proposed Model. Procedia - Social and
Behavioral Sciences, 164(0), 55-61. doi: http://dx.doi.org/10.1016/j.sbspro.2014.11.050
Mas’ud, A., Manaf, N. A. A., & Saad, N. (2014). Comparison of Petroleum Fiscal Regime within
Malaysia. Petroleum Accounting and Financial Management Journal 33(2).

209
Mas’ud, A., Manaf, N. A. A., & Saad, N. (2015). Simulating of the Influence of Fiscal Regime
Adjustment on Marginal Oil Field’s Investment Climate in Malaysia. Paper presented at the
International Conference on Accounting Studies, Johor Bahru.
Mead, W. J., Muraoka, D. D., & Sorensen, P. E. (1982). The Effect of Taxes on the Profitability
of US Oil and Gas Production: A Case Study of the OCS Record. National Tax Journal, 21-29.
Mehden, F., & Troner, A. (2007). Petronas: A National Oil Company With An International
Vision. Rice University: James A Baker III Institute of Public Policy and Japan Petroleum
Energy Centre.
Nakhle, C. (2007). Do High Oil Prices Justify an Increase in Taxation in a Mature Oil Province?
The Case of the UK Continental Shelf. Energy Policy, 35(8), 4305-4318.
Nakhle, C. (2010). Petroleum Fiscal Regimes: Evolution and Challenges. In P. Daniel, M. Keen
& C. McPherson (Eds.), The Taxation of Petroleum and Minerals Principles, Problems and
Practice.pp. 75-86. New York: Routledge.
Nakhle, C., & Hawdon, D. (2004). Evaluating Government Fiscal Policy in Maintaining the
Attractiveness of the UK North Sea Province- A Time Line Analysis. 24th Annual IAEE North
American Conference.
Njeru, K. A. (2010). Kenya Oil & Gas Fiscal Regime: An Economic Analysis on Attainment Of
The Government Objectives. CAR CEPMLP Annual Review, 12, 1-34.
Offshore Tecnology.com. (2014). KBM Cluster Fields Development, Malaysia Retrieved
November, 20, 2014, from http://www.offshore-technology.com/projects/kbm-cluster-fields-
development/
Onaiwu, E. (2009). How Do Fluctuating Oil Prices Affect Government Take Under Nigeria's
PSCs? CEPMLP Annual Review, 13, 1-19.
Otto, J., & Cordes, J. (2002). The Regulation of Mineral Enterprises: A Global Perspective on
Economics, Law and Policy: Rocky Mountain Mineral Law Foundation Westminster, Colorado.

210
Saidu, S., & Mohammed, A. R. (2014). The Nigerian Petroleum Industry Bill: An Evaluation of
the Effect of the Proposed Fiscal Terms on Investment in the Upstream Sector. Journal of
Business and Management Sciences, 2(2), 45-57. doi: 10.12691/jbms-2-2-3
US Energy Information Administration. (2014a). Annual Energy Outlook 2014 Early Release
Overview Retrieved 18th Feb, 2015, from
http://www.eia.gov/foreercasts/aeo//pdf/0383er%282014%29.pdf
US Energy Information Administration. (2014b). How Much Does it Cost to Produce Crude Oil
and Natural Gas? Retrieved 18th January, 2015, from
http://www.eia.gov/tools/faqs/faq.cfm?id=367&t=5
Wei, Q. H. (2011). Industry Focus: Oil & Gas Companies. In W. M. Tek (Ed.), Malaysia Equity
Research PP 11272/04/2012. Kuala Lumpur HWANGDBS Vickers Research Sdn Bhd.

211
8. AUTHORS
Dr. Nor Aziah Abd. Manaf, CFiA is an Associate Professor at the School of Accountancy,
College of Business, Universiti Utara Malaysia, and is currently the deputy dean of the school.
She holds a degree in BAcct (Hons.) (UUM) and MBA (Acctg) (Sheffield, UK). She completed
her PhD in 2004 at Nottingham University Business School, UK. Her areas of expertise cover
topics such as taxation, company secretarial practices, corporate governance and PBL. She has
published research papers in several refereed journals and authored a few books. She is a team
leader for the Fundamental Research Grant Scheme (FRGS) with code number 12930.
Dr. Natrah Saad is a Senior Lecturer at the School of Accountancy, Universiti Utara Malaysia
(UUM). She obtained her PhD in Taxation from University of Canterbury, Christchurch, New
Zealand in 2011. Throughout her service, she has taught taxation at both undergraduate and
postgraduate levels in addition to other financial accounting courses. Her research interests focus
primarily in the field of taxation. Specific topics include compliance behaviour, compliance cost,
tax administration, petroleum and environmental tax.
Mr Abdulsalam Mas’ud, CNA is a Lecturer at the Department of Accountancy, Hussaini
Adamu Federal Polytechnic, Jigawa State - Nigeria. He obtained a B.Sc. (Accounting) from
Bayero University, Kano – Nigeria in 2005 with second class Upper. He won the prestigious
Petroleum Technology Development Fund (PTDF), Nigeria in 2009, which led to his enrolment
into M.Sc. (Oil and Gas Accounting) at Dundee Business School, University of Abertay -
Dundee, UK and he graduated in 2010 with Distinction. He is currently a PhD candidate at
Othman Yeop Abdulllah Graduate Business, Universiti Utara Malaysia. His areas of
specialisation cover oil and gas accounting, taxation and financial reporting, where he has
published articles in high indexed journals

Dewan AkauntanUnit 33-01, Level 33, Tower A, The VerticalAvenue 3, Bangsar South CityNo. 8, Jalan Kerinchi,59200 Kuala LumpurMalaysia[phone] +603 2722 9000 [fax] +603 2722 9100[web] www.mia.org.my [email] [email protected]