arris wp d3-1 with rf
TRANSCRIPT

VENK MUTALIK, VP TECHNOLOGY AND STRATEGY
MARCEL SCHEMMANN, PRINCIPAL ENGINEER
AYHAM AL-‐BANNA, DISTINGUISHED SYSTEMS ENGINEER
ZORAN MARICEVIC, ENGINEERING FELLOW
PARTNERSHIP FOR EXTENDED CAPACITY: DOCSIS 3.1 WITH RFOG

Copyright 2014 – ARRIS Enterprises, Inc. All rights Reserved.
2
TABLE OF CONTENTS INTRODUCTION .............................................................................................. 3 TRAFFIC GROWTH AND MODELING ............................................................... 3 DS Capacity Growth as a Function of Time ..................................................................... 4
RFOG DOWNSTREAM ..................................................................................... 7 Home Wiring ................................................................................................................... 7
SNR of Optical Link .......................................................................................................... 7
Fiber Dispersion .............................................................................................................. 9
Optical Nonlinearities ..................................................................................................... 9
MER Performance of OFDM with LDPC ........................................................................ 10
Total Throughput .......................................................................................................... 11
RFoG Receiver Performance ......................................................................................... 12
Discussion on Modulation Format and Throughput in the Access ............................... 13
A WORD ABOUT OBI .................................................................................... 14 RFoG Upstream ............................................................................................................. 14
Upstream RFoG MER and Throughput ......................................................................... 16
CONCLUSIONS .............................................................................................. 17 REFERENCES ................................................................................................. 18

Copyright 2014 – ARRIS Enterprises, Inc. All rights Reserved.
3
INTRODUCTION Anticipated growth in data capacity over the next decade may be covered in several ways. These include HFC -‐ possibly with a split change -‐ supporting greater than 10 Gbps downstream and several 100 Mbps to Gbps upstream capacity. The various PON variants, chiefly the 10G PON and point to point Ethernet with an optional video overlay could support up to 10 Gbps of data capacity. While RFoG is mentioned, it is often presented as a transitional technology that permits an easy transition to PON for the MSO. In this paper, a case will be made that technologies such as the 10G PON may not offer enough downstream capacity to justify the cost of a system change sooner than a decade from now. It will be shown that 25-‐40 Gbps is a more reasonable target for downstream traffic and around 2.5-‐4 Gbps upstream a reasonable target for upstream traffic capacity. While 40G PON technology may provide this bandwidth, such a technology requires multiple wavelength receivers or other complex technology in the optical network unit (ONU) that is inherently expensive. Here it is shown that an RFoG ONU can be designed cost effectively with current technology that can support these requirements, such that an investment made by MSOs in these ONUs is much more robust. Furthermore such an ONU is compatible with current HE and CPE equipment and further HFC plant extensions, thus extending the life of such investments. We will first discuss data traffic growth. Next, an RFoG system with an extended downstream band is introduced and SNR and data throughput analysis is performed. An RFoG system with extended upstream bandwidth is also then introduced and discussed.
TRAFFIC GROWTH AND MODELING Relentless appetite for Over the Top (OTT) content and interactivity further fueled by the imminent advent of the 4K television standard, and higher standards to come, portents a substantial growth in average and maximum advertised capacity over the next decade. Traffic is expected to grow to 10-‐100 Gbps downstream in 2030 for a reasonable service group size (128 HHP), upstream traffic is expected to grow to 2.5-‐4 Gbps upstream. A target of 40 Gbps downstream capacity and 2.5-‐4 Gbps upstream capacity is therefore proposed for FTTH deployments in this decade based on average and peak traffic modeling. 10 Gbps downstream capacity may limit service group sizes to 16 or less.

Copyright 2014 – ARRIS Enterprises, Inc. All rights Reserved.
4
DS Capacity Growth as a Function of Time The figure below [1] shows the downstream traffic growth from 1982 to the present and projected to projected to 2030 for various service group sizes and differentiated between maximum bandwidth per user and average bandwidth per user and per service group (SG). Up to 2010 the maximum tier (Tmax) per subscriber is below the average service group consumption for service groups greater than 512 subs. As service groups get smaller -‐ after 2010 -‐ this changes and the maximum tier (Tmax) starts to drive the required downstream capacity; for service group sizes of between 256 and 512 the average service group consumption and the capacity needed to support maximum tier are approximately the same. In order to ensure acceptable quality of service an aggregate service group capacity consisting of a sum of weighted (with K=1) max tier (Max_BW_sub) and average bandwidth (Avg_BW_sub) times the number of subscribers (Num_subs) is expected to be sufficient: Agg_BW_SG = K.Max_BW_sub + Num_subs.Avg_BW_sub At the end of the decade the service groups are expected to shrink and the extrapolated maximum tier drives the required forward capacity up to around 100 Gbps.
Figure 1: Illustrating the Capacity Rrowth from 1982 to the Present and Projected to 2030

Copyright 2014 – ARRIS Enterprises, Inc. All rights Reserved.
5
However, there is a possibility that the projected growth in Tmax does not come to pass (~ 100 Gbps as predicted by Nielsen’s law) for maximum downstream service tier and the maximum service tier requirement is limited to a number as low as 1 Gbps to 3 Gbps. This results in a lower aggregate service group capacity that is still dominated by the average service group capacity needs. This is illustrated in the plot below; that shows aggregate downstream throughput requirement for a max tier limited to 1 Gbps and under the assumption that a pipe with enough capacity for the average service group throughput offers sufficient quality of service. Now the average bandwidth per subscriber can dominate the total bandwidth required so that in practice some additional capacity, up to a factor M, may need to be reserved to avoid contention issues. It is therefore appropriate to rewrite the aggregate capacity requirement formula as: Agg_BW_SG = K.Max_BW_sub + M.Num_subs.Avg_BW_sub The value of M is generally around 2 for smaller service groups but becomes closer towards 1 as the service group size increases due to the statistical benefits of larger numbers of subscribers. The figure below shows average bandwidth per sub (red), max tier bandwidth and the required aggregate bandwidth (green) in a service group of 128 users as a function of time. The max tier bandwidth (blue) growth post 2013 was reduced to reach 3 Gbps in 2030 as a compromise between Nielsen’s law (~100 Gbps) and the rather conservative estimate of 1 Gbps.
Figure 2: Illustrating the Cap in Capacity Growth from Present to 2030
Copyright 2014 – ARRIS Enterprises, Inc. All rights Reserved.
6
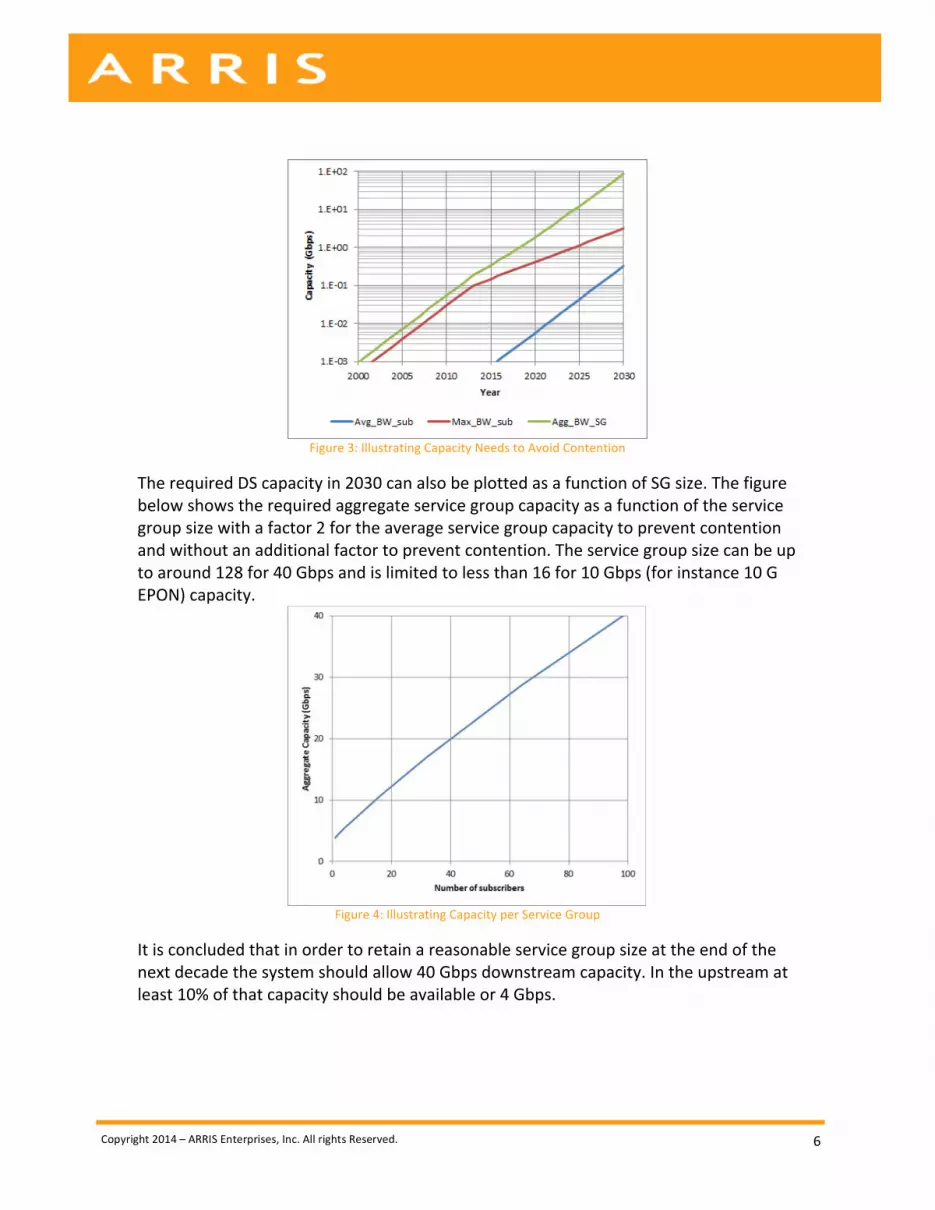
Figure 3: Illustrating Capacity Needs to Avoid Contention
The required DS capacity in 2030 can also be plotted as a function of SG size. The figure below shows the required aggregate service group capacity as a function of the service group size with a factor 2 for the average service group capacity to prevent contention and without an additional factor to prevent contention. The service group size can be up to around 128 for 40 Gbps and is limited to less than 16 for 10 Gbps (for instance 10 G EPON) capacity.
Figure 4: Illustrating Capacity per Service Group
It is concluded that in order to retain a reasonable service group size at the end of the next decade the system should allow 40 Gbps downstream capacity. In the upstream at least 10% of that capacity should be available or 4 Gbps.

Copyright 2014 – ARRIS Enterprises, Inc. All rights Reserved.
7
RFOG DOWNSTREAM
At 1550 nm RFoG is more suitable for SMF-‐28 fiber access networks than binary modulation. This surprising result is due to the twin effects of the superior capability of QAM schemes to take full advantage of available bandwidth and convert it to higher throughput relative to the binary formats and the effects of fiber dispersion on links where fundamental limits can cap NRZ binary modulation formats to around 20 Gbps throughput at 25 km and fewer at greater distances. This paper indicates that RFoG when used with the DOCSIS 3.1 standards can support greater than 40 Gbps up to 40 km.
Home Wiring In-‐home wiring exists to support satellite LNA receivers, bandwidth up to 4.5 GHz is available with RG11 cable. A typical loss curve is shown below [2].
Figure 5: Illustrating Loss of a Typical RG11 Cable
The typical return loss is better than 20 dB over the frequency range such that this cable type is suitable for distributing RF signals up to 4.5 GHz through the home.
SNR of Optical Link An optical link is characterized by a transmit power, a loss budget resulting in a receive power, receiver characteristics and modulation format and bandwidth characteristics. These will be investigated here for the example case of a 24 dB loss budget, the reference for PON and RFoG systems. The SNR (or MER) of a received signal is calculated as:
SNRµ Ipd⋅( )2
B Ipd2 10 0.1− RIN⋅⋅ 2 q⋅ Ipd⋅+ In2+( )⋅

Copyright 2014 – ARRIS Enterprises, Inc. All rights Reserved.
8
Where Ipd is the photo detector current of the receiver, the receiver, m is the effective modulation index, B is the signal bandwidth, RIN is the relative intensity noise of the optical source (can be laser and optionally includes EDFA spontaneous emission beat noise, Rayleigh backscatter noise on the fiber and optical beat interference noise for multiple optical sources), q is the electron charge in the shot noise contribution and In is the receiver equivalent thermal input noise current. Depending on the receiver design, different values of In can be achieved, for higher bandwidth In typically increases: The detector current follows from the transmit power P_tx, loss budget (24 dB) and detector sensitivity. In the forward direction the effective or composite modulation index is well controlled. For binary signals it is typically 70%, for multi-‐carrier RF signals it is around 20% and with Peak Average Power Reduction (PAPR) methods that can be improved to around 33%. With a DFB laser followed by an 18 dBm EDFA the SNR can now be calculated for a wideband TIA (transimpedance amplifier) (5 GHz+ bandwidth, suitable for 10 Gbps link). In the absence of excess phase noise from the demodulator the MER is the same as the SNR.
Figure 6: Illustrating MER for Various Effective OMI with increasing BW for a 24 dB Loss Budget
For a bandwidth of 1 GHz and a loss budget of 24 dB, the MER is just over 40 dB, as expected for an all-‐QAM loaded RFoG system with an effective modulation index of 20% (Blue line). With PAPR that could be further improved to around 45 dB or more (Red line). Also shown (Green line) is the expected SNR of a binary signal with merely 3 dBm launch power, for 7 GHz bandwidth (practical bandwidth needed for 10 Gbps) the SNR is just over 15 dB, just over the requirement for 10 Gbps binary communication. While the use of an EDFA to launch 18 dBm is a cost disadvantage for RFoG compared to a 10 Gbps PON this cost is shared over many users and results in more than quadrupling the channel throughput as will be shown later.
Copyright 2014 – ARRIS Enterprises, Inc. All rights Reserved.
9
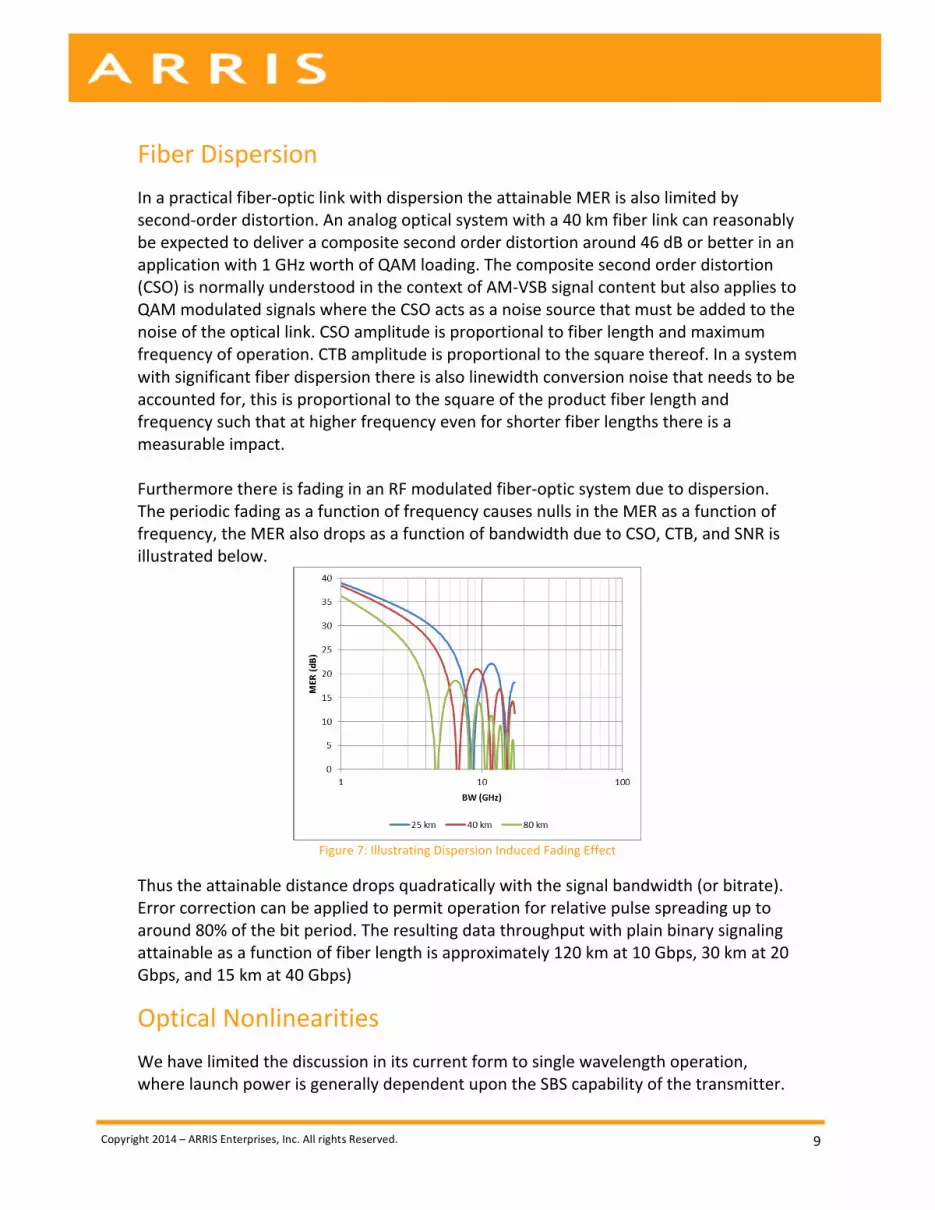
Fiber Dispersion
In a practical fiber-‐optic link with dispersion the attainable MER is also limited by second-‐order distortion. An analog optical system with a 40 km fiber link can reasonably be expected to deliver a composite second order distortion around 46 dB or better in an application with 1 GHz worth of QAM loading. The composite second order distortion (CSO) is normally understood in the context of AM-‐VSB signal content but also applies to QAM modulated signals where the CSO acts as a noise source that must be added to the noise of the optical link. CSO amplitude is proportional to fiber length and maximum frequency of operation. CTB amplitude is proportional to the square thereof. In a system with significant fiber dispersion there is also linewidth conversion noise that needs to be accounted for, this is proportional to the square of the product fiber length and frequency such that at higher frequency even for shorter fiber lengths there is a measurable impact. Furthermore there is fading in an RF modulated fiber-‐optic system due to dispersion. The periodic fading as a function of frequency causes nulls in the MER as a function of frequency, the MER also drops as a function of bandwidth due to CSO, CTB, and SNR is illustrated below.
Figure 7: Illustrating Dispersion Induced Fading Effect
Thus the attainable distance drops quadratically with the signal bandwidth (or bitrate). Error correction can be applied to permit operation for relative pulse spreading up to around 80% of the bit period. The resulting data throughput with plain binary signaling attainable as a function of fiber length is approximately 120 km at 10 Gbps, 30 km at 20 Gbps, and 15 km at 40 Gbps)
Optical Nonlinearities We have limited the discussion in its current form to single wavelength operation, where launch power is generally dependent upon the SBS capability of the transmitter.

Copyright 2014 – ARRIS Enterprises, Inc. All rights Reserved.
10
If multiwavelength operation is considered however, additional non-‐linearities such as 4WM, SRS and XPM come into play [3]. 4WM can be eliminated by a good wavelength plan, and SRS is predominantly at lower RF frequencies. The XPM however depends upon fiber dispersion and occurs at higher RF frequencies. In practical higher frequency systems, particular care must be paid to limit XPM by a combination of wavelength spacing and wavelength selection and power launch.
MER Performance of OFDM with LDPC Using OFDM modulation formats with LDPC a throughput in bps/Hz can be estimated from the figure below (from DVB-‐C2 specification). The data line is fitted through the data points and extrapolated to estimate available throughput in bits per second per Hz as a function of MER. The Shannon limit is shown for comparison [4].
Figure 8: OFDM/LDPC Capacity and the Shannon Limit
It is interesting to note that this result extends down to SNR values as low as 13 dB; almost 4 bps/Hz is still obtained as merely 13 dB of SNR (almost QAM-‐16 equivalent, realized with QAM64 and 1/3rd of FEC overhead reducing the 6 bps/Hz raw QAM64 throughput to 4 bps/Hz net throughput). Without LDPC QPSK or binary modulation is needed to allow operation at such a low SNR value (each offering only half the throughput; up to 2 bps/Hz at the Nyquist rate). The MER versus bandwidth plot can now be converted to attainable throughput in bit per second per Hz as a function of bandwidth.

Copyright 2014 – ARRIS Enterprises, Inc. All rights Reserved.
11
Figure 9: Illustrating Capacity/Hz in RFoG/OFDM/LDPC System
Total Throughput By integrating bits per second per Hz for a given bandwidth over frequency f the throughput is obtained: Using, as an example, the TIA front end (11 pA/sqrt(Hz)) but with unlimited bandwidth and the reference receiver input power P_rx (-‐6 dBm) and laser RIN and modulation index without PAPR (of 20%) the total throughput can be plotted as a function of input signal bandwidth for different fiber lengths (25, 40 and 80 km). The plots show the nulls in the transmission window as areas where bandwidth expansion of the source does not contribute to additional throughput. In practice a system would only be operated up to the first null. 40 Gbps throughput can thus be obtained with around 4 GHz of bandwidth.
Figure 10: Illustrating the Capacity of an RFoG Link with OFDM/LDPC vs. Binary Modulation

Copyright 2014 – ARRIS Enterprises, Inc. All rights Reserved.
12
For a binary system the throughput was simply given as:
This is plotted as markers for the 3 fiber lengths at their respective Nyquist bandwidths. Whereas the binary modulation permits operation at higher bandwidth (compared to a dual sideband AM modulated signal around a carrier) it does not provide more throughput at any of the distances (note it is assumed that the SNR of the RFoG signal is maintained with EDFAs to arrive at the receiver power of – 6 dBm and the EDFA(s) have sufficient input power to prevent significant contribution from the EDFAs to the noise. At 1550 nm on SMF the binary modulation format provides just over 20 Gbps at 25 km length and 12 Gbps at 80 km length, at each fiber length the binary modulation format performance falls well below the RFoG performance curves for -‐6 dBm receiver power. The RFoG performance curve can be further enhanced at higher receive power. It is thus concluded that the addition of an EDFA in the headend, as needed for RFoG, increases the available downstream bandwidth in the system from 10 Gbps (PON) to more than 40 Gbps (RFoG). As shown in the figure even more throughput can be available with wider bandwidth receivers. However this paper is limited to RFoG ONUs that can be realized with currently available low cost components and the discussion is therefore be limited to around 5 GHz receiver bandwidth. It is further concluded that due to dispersion a binary transmission format cannot reach the same throughput as an RFoG system with EDFAs, neither at 25 km reach nor at 40 km reach.
RFoG Receiver Performance Estimated capacity is shown below as a function of receiver power with 4 GHz receives bandwidth at 25, 40, and 80 km. At -‐6 dBm receive power almost 40 Gbps is achieved, the performance saturates above –3 dBm to 40 Gbps.
Figure 11: Illustrating System Throughput in Gbps as a Function of Receiver Input Power

Copyright 2014 – ARRIS Enterprises, Inc. All rights Reserved.
13
These estimates are for a multi-‐carrier RF modulated signal (OFDM with LDPC) with a modulation index set to the same value as for current QAM256 operation. With peak-‐average power reduction (PAPR) the throughput can be increased by around 10% beyond these results. Subsequent RF amplification to 4 GHz or higher is readily available with low-‐cost commercial MMICs. Thus the receive side of the ONU can be realized with a subset of the components used in a 10 Gbps PON ONU. The required components can satisfy reduced bandwidth and gain requirements. The transmit side of the ONU that will be proposed here can be based on a regular directly modulated DFB laser with 1 GHz of bandwidth. Given the availability of wideband lasers and amplifiers that is not significantly more complex than RFoG ONUs with less upstream bandwidth.
Discussion on Modulation Format and Throughput in the Access In the access part of the plant the loss budgets are relatively small compared to long haul telecommunication. In RFoG the number of forward wavelengths is also small compared to long haul communication systems. By using optical amplification in the access plant, permitted for one or a few wavelengths on a fiber, the SNR can be increased so much that analog modulation formats, in spite of their shortcomings, readily obtain 4x the throughput of binary modulation formats given practical receiver bandwidths available today using low cost components. Binary modulation formats with optical amplification could permit larger service groups, however, the size of service groups needs to be limited unless much more than 10 Gbps forward capacity can be offered, that is not available today in low cost binary data processing receiver electronics and its application is limited by fiber dispersion. Therefore the binary modulation formats do not benefit from optical amplification in the access. It can thus be concluded that, unlike in long-‐haul telecommunication, in the access plant analog modulation formats are superior to binary modulation formats. This should come as no surprise, in most short distance bandwidth limited systems analog modulation formats are used (DSL, CAT-‐6 10 GbE cables, Wi-‐Fi and of course, DOCSIS). While it may sound contradictory to classify a fiber system as a bandwidth limited system it is fiber dispersion and the OE conversion (receiver) and associated processing electronics that do pose a practical bandwidth limitation in fiber systems. In fact this bandwidth limitation is acknowledged by 40G PON manufacturers resorting to 4 wavelengths each operating at 10 Gbps rather than attempting to run one wavelength at 40 Gbps. Reality is that aggregate throughput levels are expected to increase to a level that far exceeds the baseband bandwidth of low cost receiver electronics that are used with simple on-‐off keying on standard SMF fiber. Current low-‐cost analog

Copyright 2014 – ARRIS Enterprises, Inc. All rights Reserved.
14
technology on the other hand can already provide a transparent pipe with the required throughput capability today.
A WORD ABOUT OBI Optical Beat Interference (OBI) is a profound issue in RFoG reverse path and affects the system in debilitating ways. The subject of OBI mitigation is vast and is the subject of intense study even now. While mitigating OBI could be a goal, since it is a statistical and intermittent phenomena, it is not entirely easy to establish observable performance robustness unless these tests are done at a high enough utility contention with representative systems along with the CMTS. Even then, it becomes hard to predict the performance if the SNR/MER requirement change, as would be the case of a move to D3.1 from D3.0. There are however standard ways of eliminating OBI altogether, and these might be used to get predictable and robust performance. In this paper, as OBI is not the subject under discussion, we assume that the issue of OBI is settled and the OBI occurrence is eliminated.
RFoG Upstream In the upstream SNR is evaluated accounting for laser RIN, laser power and loss budget, the upstream bandwidth and the modulation index that can be allowed per channel given a total bandwidth, an additional dynamic window to accommodate uncertainty in transmitter OMI setting and the optional use of PAPR (Peak to Average Power Reduction) in the transmission format. The effective modulation index just under clipping induced BER is 20% for regular RF modulated systems and around 32% for RF modulated systems with PAPR (Peak Average Power Reduction) methods applied. The return bandwidth can vary, up to 1 GHz should not significantly affect return laser and driver cost, this primarily affects the choice of diplex filters. However the receiver thermal noise figure is a function of bandwidth as shown below for readily available low cost receivers.

Copyright 2014 – ARRIS Enterprises, Inc. All rights Reserved.
15
Figure 12: Illustrating the Typical Receiver Noise as a Function of the Bandwidth
The blue markers show single input receivers that are practically available, 1.2 pA/sqrt(Hz) for an RFoG 55 MHz return receiver, 5 pA/sqrt(Hz) for a CATV 1 GHz forward receiver, 8 pA/sqrt(Hz) for a 2.5 GHz TIA front end and 11 pA/sqrt(Hz) for a 6..8 GHz TIA front end. The fit approximates the results very well and this is used to conservatively model the thermal noise as a function of the reverse bandwidth. In the return band multiple transmitters can be on at the same time. When these are combined before a receiver then the receiver thermal noise does not change when one or more transmitters are active. The shot noise and RIN noise for all the transmitters needs to be added appropriately. In RFoG return systems multiple receivers are also combined into a single CMTS port, when that is done the receivers usually have “low squelch”, the receiver outputs are squelched (turned off) unless there is an input signal. As a consequence the noise floor to the CMTS varies and the thermal noise contribution of multiple receivers also is a function of the number of transmitters active over a number of receivers. Here we will analyze the worst case condition with all receivers active at the same time although generally few receivers will be active and the SNR is better. An RFoG system is not limited by the fixed RF split frequency of the CATV plant. At the ONU the amount of spectrum allotted for the return band can be selected with the diplex filter and a number of different return bandwidths are evaluated

Copyright 2014 – ARRIS Enterprises, Inc. All rights Reserved.
16
Upstream RFoG MER and Throughput
Table 1: System Throughput for High Performance RFoG upstream
The table above shows the resulting upstream RFoG performance estimates. For instance a traditional RFoG return system uses a DFB laser, 3 dBm with a 24 dB loss budget resulting in -‐21 dBm at the headend receiver. Such a receiver has a low noise figure of around 1 pA/sqrt(Hz) and at the effective modulation index of 0.05, that is 12 dB (the Dynamic Window DW) less than the maximum effective modulation index of 20% an MER of 30 dB results. Best case 330 Mbit/sec could be supported with the best OFDM+LDPC scheme utilizing the full 5-‐42 MHz bandwidth (37 MHz). This assumes no that no PAPR implemented. When 4 transmitters are on at the same time the MER drops, the situation is worst when these 4 transmitters are each on a different headend receiver (“Rx ns add” column is ‘Y’ represents receiver thermal noise addition), this could result in MER values under 24 dB. In practical systems the number of channels is limited to just 24 MHz of bandwidth and often the load is less such that this worst case condition does not often occur often. However, when bandwidth is expanded to 200 MHz then the available modulation index is spread over a larger bandwidth such that the per channel modulation index drops by about 7 dB and also a typical 200 MHz receiver has a worse noise figure resulting in another 3 dB drop in performance. For a single active transmitter SNR is low but throughput up to 1 Gbps is still possible. However, when multiple transmitters are active, low SNR could result. A number of measures can be taken to overcome this

Copyright 2014 – ARRIS Enterprises, Inc. All rights Reserved.
17
limitation. Firstly the level could be set up more accurately so that the dynamic window could be reduced to 3 dB, even with multiple transmitters on a reasonable SNR is recovered. Secondly PAPR methods could be applied to permit higher modulation index without clipping. It should also be considered to use higher power return lasers (or equivalently lower noise receivers), such as a 10 dBm devices resulting in more than 30 dB SNR. Combined with PAPR a throughput up to 2 Gbps can be possible. Also shown is a relaxation of the setup accuracy in a 200 MHz return system where acceptable performance is still available. In case the return traffic grows faster than expected and 4-‐10 Gbps of return traffic is needed then the return bandwidth could be further enhanced to 1 GHz. Without any of the aforementioned measures the SNR would be too low for operation. However just changing laser power (or using improved receivers) provides enough SNR to enable data rates up to 8 Gbps. Combination with PAPR provides almost 10 Gbps and even with multiple transmitters active a high throughput up to 8 Gbps is still available.
CONCLUSIONS In this paper, we have shown a path to a much more efficient use of the RF spectrum which when used with RFoG technology and features available via the DOCSIS 3.1 standard. Innovative low cost ONU designs using current technology were presented that can address the anticipated growth rates and bandwidth expansions seamlessly over the next decade and more. Thus a well thought out partnership of DOCSIS 3.1 and RFoG can satisfy the anticipated growth in traffic demand while providing MSOs with plant and equipment investment protection well into the future.
MEET ONE OF OUR EXPERTS: Venk Mutalik Venk Mutalik is currently Vice President of Technology and Strategy at ARRIS. In this role, Venk leads the technical direction of the Access and Transport organization within ARRIS with special emphasis on optical communications. Prior to ARRIS, Venk was Chief Technologist at C-‐Cor and Technical Director at Philips Broadband. Venk has an MCA from Syracuse University, MSEE from the University of Connecticut and a BSEE from Osmania University in India. Venk has several technical papers at the SCTE, NCTA, OFC and other technical forums and over 10 patents and patents pending.

Copyright 2014 – ARRIS Enterprises, Inc. All rights Reserved.
18
REFERENCES [1]Neilsen’s Law vs. Nielsen TV Viewership for Network Capacity Planning, Mike Emmendorfer, NCTA 2014 [2]Clark CD7511P Plenum 4.5GHz HD/SDI RG11 Coaxial Cable, http://www.clarkwire.com/downloads/CD7511P_Clark_PB24202.pdf [3]When Wavelength Collide Chaos Ensues: Engineering Stable and Robust Full Spectrum Multi-‐Wavelength Networks, Venk Mutalik, Fernando Villaruel, Marcel [4]Schemmann, Kwang-‐Yi Wu, SCTE 2011 http://www.dvb.org/resources/public/factsheets/DVB-‐C2_Factsheet.pdf [5]Value of Transparency in the Evolution of the HFC Networks, Venk Mutalik, Marcel Schemmann, Brent Arnold, SCTE 2013 ©ARRIS Enterprises, Inc. 2014 All rights reserved. No part of this publication may be reproduced in any form or by any means or used to make any derivative work (such as translation, transformation, or adaptation) without written permission from ARRIS Enterprises, Inc. (“ARRIS”). ARRIS reserves the right to revise this publication and to make changes in content from time to time without obligation on the part of ARRIS to provide notification of such revision or change.