appraisal of third adbi file co - agricultural credit project
TRANSCRIPT

Report No. 398a-IRN
Appraisal of Third Adbi FILE CoAgricultural Credit Project PYIranJuly 18, 1974
Agricultural Credit and AgroindustriesProjects DepartmentEurope, Middle East and North Africa
Not for Public Use
Document of the International Bank for Reconstruction and Development
This report was prepared for official use only by the Bank Group. It may not be published,quoted or cited without Bank Group authorization. The Bank Group does not accept responsibilityfor the accuracy or completeness of the report.
Pub
lic D
iscl
osur
e A
utho
rized
Pub
lic D
iscl
osur
e A
utho
rized
Pub
lic D
iscl
osur
e A
utho
rized
Pub
lic D
iscl
osur
e A
utho
rized
Pub
lic D
iscl
osur
e A
utho
rized
Pub
lic D
iscl
osur
e A
utho
rized
Pub
lic D
iscl
osur
e A
utho
rized
Pub
lic D
iscl
osur
e A
utho
rized

CURRENCY EQUIVALENTS
us$ 1.00 Ri 67.50Rl 1.00 = us$ 0.015
WEIGHTS AND MEASURES
1 sq meter (m2 ) = 10.8 sq feet1 sq kilometer (km2) = 0.386 sq miles1 hectare (ha) = 2.47 acres1 meter (m) = 3.28 feet1 kilometer (km) = 0.62 mile1 liter (1) = 0.264 US gallons1 kilogram = 2.205 pounds1 metric ton (ton) = 2.205 pounds
ABBREVIATIONS
ACBI - Agricultural Cooperative Bank of IranADBI - Agricultural Development Bank of IranBMI - Bank Melli IranCCC - Commodity Credit CorporationMANR - Ministry of Agriculture and Natural ResourcesMCRA - Ministry of Cooperation and Rural Affairs
ADBI FISCAL YEAR
March 21 - March 20

IRAN
THIRD ADBI AGRICULTURAL CREDIT PROJECT
TABLE OF CONTENTS
MAIN TEXT
Page No.
SUMMARY AND CONCLUSIONS ......................... i - ii
I. INTRODUCTION ............ .. ........... 1
II. THE AGRICULTURAL SECTOR , ..................... 1 - 8
A. Agricultural Production ...... ................ 1Agriculture in the Economy .................... 1Crops ................................... 2Orchards ................................... 2Livestock ................................... 2
B. Land Tenure System ..................................... 3. Agricultural Development Priorities ................... 4D. Support Services .................................... 5
Extension Service .. 5.. Research.. 6
Training. . 6Agricultural Credit .. 6
III. PERFORMANCE UNDER THE FIRST ANDSECOND IBRD-ASSISTED PROJECTS ............................ 8 - 10
A. Lending Operations ................................... 8First Project. 9Second Project. 9
B. Project Performance and Impact .10
IV. THE PROJECT . . .. 10 - 19A. Brief Description ..... 10B. Detailed Features ..... 11
Mixed Farming .......................................... 12Orchards ............................................. 12Poultry .............................................. 12
This appraisal report is based on the findings of a mission which visited Iranin November 1973 and was composed of Messrs. C. E. Eugenio and R. Hanan (IBRD),and P.Skerman and L. Anderson (Consultants).

TABLE OF CONTENTS (Cont'd)
Dairy . ................................................ 12
Other On-Farm Development ............................. 13. Agri-business ......... ................................ 13
Agro-industry ......... ................................ 13
C. Cost Estimates .13D. Financing .15E. Procurement ....... ....................................... 16F. Disbursements .16G. Organization and Management .............................. 17
Organization .......... ................................ 17
Lending Policies-and Procedres .17Monitoring of Development Results ..... ................ 19
Accounts and Auditing ................................. 19
V. PRODUCTION, MARKETS AND MARKETING, ANDPRODUCER BENEFITS ....................................... 19 - 21
A. Production, Markets and Marketing ............. 9........... 1
B. Producer Benefits ....................................... 21
VI. ECONOMIC BENEFITS AND JUSTIFICATION ........ .................. 22
IvTTI. AGREEMENTS REACHED AND REC014MENDATION ....... ................. 22 - 23
ANNEXES
1. The Agricultural SectorAppendix 1 - 1 - Actual (1971) and Estimated (1977) Production
of Crops and Forest Products
Appendix 1 - 2 - Estimated Supply of and Demand for Animal
ProductsAppendix 1 - 3 - Estimated Supply of and Demand for Major Crops
and Forest Products
2. Policies and Strategies for Agricultural DevelopmentAppendix 2 - 1 - Size Classification of Agricultural Sectors and
Share of Value Added
3. The Agricultural Development Bank of IranAppendix 3 - 1 - Total ADBI Loans for Large and Commercial Projects
Appendix 3 - 2 - Comparative Statement of Income and Expenses ofADBI during the Fiscal Years Indicated
Appendix 3 - 3 - Comparative Balance Sheet of ADBI as of DatesIndicated

Appendix 3 - 4 - Projected Statements of Income and Expenses
of ADBI during Fiscal Years '75 to '79
Appendix 3 - 5 - Projected Balance Sheets of ADBI at end of
Fiscal Years '75 to '79
4. The Bank Melli IranAppendix 4 - 1 - Comparative Statement of Income and Expenses
during Fiscal Years '70 to 73
Appendix 4 - 2 - Comparative Balance Sheets at end of Fiscal
Years '70 to '73
5. Performance'under the First and Second IBRD-Assisted Projects
Appendix 5 - 1 - Predicted and Actual Investments Financed
Appendix 5 - 2 - Size Breakdown of Loans Approved
6. Projected Statement of Receipts and Disbursements -
Third Project OperationsAppendix 6 - 1 - Estimated Schedule of IBRD Disbursements
7. Considerations in Setting Up a Mechanism for Sub-Project Monitoring
8. Representative Production ModelsAppendix 8 - 1 - Small Sheep Farming Model
AAppendix 8 - 2 - Small Orchard Model
Appendix 8 - 3 - Small Poultry Layer Model
Appendix 8 - 4 - Small Dairy Farm Model
Appendix 8 - 5 - Large Mixed Farming Model
Appendix 8 - 6 - Large Orchard Model
Appendix 8 - 7 - Large Poultry Parent Stock Model
Appendix 8 - 9 - Large Poultry Layers Model
Appendix 8 - 10 - Large Dairy Farm Model
9. Summary Economic Return CalculationsAppendix 9 - 1 - Details of Economic Rate of Return Calculations

Third ADBI Agricultural Credit Project
SUMMIARY AND CONCLUSIONS
i. The growth of Iran's agricultural sector has lagged behind over-alleconomic growth and effective demand for agricultural products and the countryis faced with a rising import bill for agricultural requirements. The Govern-ment is pursuing a vigorous long-range objective of reversing this trend byencouraging investments in agriculture.
ii. The Agricultural Development Bank of Iran (ADBI), an autonomousstatutory corporation wholly owned by Government, was established in 1968 toprovide medium and long-term credit to Iran's commercial agricultural sector.IBRD helped in setting up ADBI, and since its establishment, has been involvedin helping ADBI develop into an effective agricultural credit institution.ADIBI has now become practically the only source of technically-directed in-vestment credit for the commercial agricultural sector. It has a strong tech-nical staff and management is competent.
iii. IBRD has given ADBI two loans (Loan 662-IRN for US$6.5 million inMarchl 1970 and Loan 821-IRN for USU14.0 million in May 1972) to help financeits lending operations. Loan 662-IRN has been fully disbursed and Loan 821-IRN is expected to be fully disbursed not later than December 1974. TheThird ADBI Agricultural Credit Project, for which an IBRD loan of US$40.0million equivalent is proposed, would support a two-year lending program forinvestments in commercial agriculture and processing industry, essentiallya continuation of the developmental objectives assisted by the first twoIBRD loans. In addition, the Third Project would include financing of smalleron-farm investments of no more than Rl 3.2 million for any one sub-project(about US$48,000) through a joint venture involving ADBI and Bank Melli (BMI),a Government-owned commercial bank with a wide network of branches throughoutthe country. The joint venture was set up as a pilot endeavor to increasinglydraw commercial banks into agricultural lending. As in the two previousIBRD-assisted projects, ADBI would approve all loan applications on the sub-projects' technical and financial soundness, and would supervise implementation.All sub-loans involving Ri 20 million (about US$300,000) or more would needIBRD concurrence.
iv. The total cost of the Third Project is estimated at about US$100million equivalent, of which around US$44 million, or 44%, would be the foreignexchange component. Financing of investments would come from the followingsources: sub-borrowers would, on average, contribute 14% of investment cost;the Iranian Government (through grants and "soft" loans), 17%; BMI, 6%; andADBI, 63'. The proposed IBRD loan of US$40 million would be equal to 40% ofthe total Project cost and would reimburse ADBI for around 90% of the foreignexchange cost of ADBI's financial participation in the Third Project.
v. The range of items to be financed under the Third Project is varied(irrigation wells, farm buildings, machinery and equipmient, livestock and such)and would be purclhased by individual sub-borrowers over a period of 4 years

- ii -
and, would, therefore, not be suitable for bulk procurement. A number offoreign firms are represented in Iran, assuring keen competition. Suppliesare adequate in the local market, prices competitive, and servicing good.Therefore, most procurement would be through normal commercial channels.However, contracts for civil works the equivalent of US$300,000 or more andthose the equivalent of US$100,000 or more for machinery and equipment wouldbe awarded on the basis of IBRD's Guidelines for Procurement.
vi. The Third Project is expected to provide significant increases inthe production of cereals, cotton, milk and milk products, meat, poultry andfruit crops. No significant marketing problems are foreseen for the increasedoutput.
vii. The estimated return to producers' incremental investments would besatisfactory--ranging from at least 14% to 4(%. The return to the Iranianeconomy is estimated at 21%.
viii. With the assurances that are discussed in Chapter VII of this Report,the Tlird Project would be suitable for an IBRD loan to ADBI of US$40.0 mil-lion equivalent for 14-1/2 years, including a grace period of 4-1/2 years.

IRAN
THIRD ADBI AGRICULTURAL CREDIT PROJECT
I. INTRODUCTION
1.01 In March 1970, IBRD approved a loan of US$6.5 million (Loan 662-
IRN) to the Agricultural Development Bank of Iran (ADBI) to help finance a
lending program for investments in medium- and large-scale farming and proc-
essing of agricultural products. When the Loan was fully committed, IBRDapproved a second loan of US$14 million (Loan 821-IRN) in May 1972 for thesame purpose. Loan 662-IRN has been fully disbursed, while Loan 821-IRN isexpected to be fully disbursed by December 1974. In September 1973, ADBI re-quested a third loan to continue its financing of investments in medium-
and large-scale farming, agri-business, and agro-industry projects and, inaddition, to initiate assistance to small-scale developments under the guid-ance of an IBRD-sponsored program.
1 .02 IBRD has made three other loans for agricultural development in
Iran, all in irrigation: US$4 million for the Dez Pilot Irrigation Project
(247-1URN, FY1960), US$22 million for the Ghazvin Irrigation Project (517-IRN,FY1968), and US$30 million for the Dez I Irrigation Project (594-IRN, FY1969).
Funds for these projects are either fully disbursed or committed. A fisheries
development project has been appraised (proposed loan: US$12.5 million) and
is under consideration. In addition, the IBRD Agricultural Task Force in Iran
is actively assisting the Government in preparing several agricultural and
rural development projects.
1.03 This report is based on the findings of an appraisal mission toIran in November 1973 consisting of Messrs. C.E. Eugenio and R. Hanan (IBRD),and L. Anderson and P. Skerman (Consultants).
II. THE AGRICULTURAL SECTOR
A. Agricultural Production
Agriculture in the Economy
2.01 Iran's population is about 31 million, of which approximately 18
million, or almost 60% reside in rural areas. The growth rate of population,2.9% p.a., is unevenly distributed between urban areas (5%) and rural areas(1.8%), reflecting a large urban migration, particularly to the Tehran area.Total -P grew by an impressive 11.2% per annum in real terms during the FourthFive-Y!ar Development Plan (1967/68 to 1972/73). During this period, ho.ever,
agricultural production grew at about ~.9Z annually aind agriculture's s:.areof GNP fell steadily, from 23% _n 1967/68 to 16% irn 1972/73. Thus, whi e

-2-
average per capita real income in the rural sector increased from US$100 in1967 to US$115 in 1972, it fell as a percentage of that of the urban sectorfrom 19% to 14%. If an adjustment is made for the approximately 30% of ruralpeople who are employed in non-agricultural occupations, however, these per-centages would be about 40% and 28% respectively. The more rapid growth ofthe urban sector is reflected also in a widening gap between imports and ex-ports cf agricultural products over the period. While agricultural exportsincreased by 6% per year from US$143 million to US$191 million, agriculturalimports increased by 11% per year from US$142 million to US$238 million.Principal agricultural exports are cotton, wool, hides, pistachios, almonds,and caviar. Main agricultural imports are sugar, vegetables, oil, tea, dairyproducts, and livestock. A detailed description of the agriculture sector isgiven in Annex 1.
Crops
2.02 Currently, an estimated 19 million ha are under cultivation, al-though probably no mpre than one-half is cropped in any one year due mainlyto the low and variable rainfall and the need to fallow. The area under ir-rigation is close to 3.5 million ha, but only about 1 million ha are irri-gated effectively. Irrigation from wells is increasing by an estimated30,000 ha per year.
2.03 Wheat, the staple food for much of the population, is the most im-portant crop grown in Iran. More than 5 million ha, or over 50% of culti-vated land in any one year, are devoted to it. Other important field cropsare barley (1 million tons of production in 1972/73), rice (1.2 million tons),raw cotton (600,000 tons), sugar beets (4.1 million tons), sugarcane (700,000tons), and leaf tea (90,000 tons). Sugarcane production and that of oilseed(mainly from sunflower, soybeans, and safflower) are rapidly assuming increasedimportance.
Orchards
2.04 Almost 450,000 ha are in orchards, the most important of which arethose in grapes, nuts, citrus, pears, and apples. Except for pistachio nuts,which are exported, most production is consumed domestically. Orchard-farminghas proved profitable even in small operations. In the past, Iran has notpa_d much attention to the problems of the orchard industry. For instance,citrus has been grown in the Caspian Sea area which is subject to frosts andwhere only a limited number of varieties can be successfully adapted. Follow-ing recent Government research, most new citrus orchards are being establishedin southern Iran, particularly in Kermanshah, Esfahan, and Shiraz.
Livestock
2.05 Livestock production accounted for around 40% of the value of allagricuLtural output in 1972/73. It is the Government's policy, during theFifth `?ive-Year Development Plan (1973/74 to 1977/78), to give priority tothe preduction of red meat, principally sheep meat. This requires a major

-3-
reorganization of present livestock practices, and Government has alreadybegun by constructing meat production complex,s such as that at Marv-Dashtin the Fars region. The complexes are served by livestock collection centersin strategic locations.
2.06 The greatest increase in production (and demand) has been forpoultry meat, which has grown at an average rate of almost 13% annually overthe past five years. Beef production, however, is of minor importance, andfuture production will have to depend on the utilization of surplus cattlefrom the expanding dairy industry. Pig production is unlikely to expandsignificantly--only about 14,000 pigs are slaughtered annually. Traditionally,sheep-raising in Iran has been undertaken by the subsistence sector, parti-cularly by the transhumant tribal communities and also by small farms incombination with crop production.
2.07 Much of Iran's milk production comes from small farms with one ortwo buffaloes or dairy cows producing for local consumption. The demand formilk and milk products is increasing rapidly, particularly in urban areas,and Government has encouraged the setting up of commercial dairy units of100 to 500 cows. Although a number of small commercial farmers have taken upmilk production with 15 to 30 milking cows, this has been successful only whencarried out together with the raising of grains or fodder crops.
B. Land Tenure System
2.08 The structure of land ownership in Iran is the result of a reformprogram initiated in 1962. The present status of land reform is summarizedas follows:
(a) All agricultural tenancies have been abolished; lands whichhave remained unaffected by the program are in orchards,large mechanized farms, tea plantations, small woods, pas-tures and land under public charitable endowment;
(b) About 7 million ha have been transferred from landlordsto tenants (involving some 2 million families), with mostof the remaining cultivable land (about 13 million ha) inthe hands of the commercial farming sector (para 2.10);
(c) Most of the new landowners now working their lands have notreceived title to them, pending cadastral surveys of landreceived and full payment for such lands. The majority offarms are of less than 10 ha and, for the most part, are
badly fragmented.

-4-
C. Agricultural Development Priorities
2.09 The Government has been concerned with the social and economic well-being of the new landowners who, as a sector, produce about 40% of Iran's agri-cultural value added and 10% of all marketable supplies. For instance, theGovernment, through its Ministry of Cooperation and Rural Affairs (MCRA),has, since 1968, encouraged the formation of farm corporations which are stockcompanies wherein farmers exchange their lands and any other assets for sharesin the corporation. The resulting large farm is then operated as a unit.Ownership of shares entitles farmers to share in the corporation's profits;in addition, they have first opportunity of employment in the corporation.Government aid to farm corporations has included: (a) managerial and pro-fessional manpower assistance; (b) credit for five years at 1% interest p.a.;(c) grants; and (d) investments in infrastructure. Since the financial needsof farm corporations are supplied by Government, there has been no need forinstitutional credit. There are now around 50 farm corporations; about 100more are expected to be established during the Fifth Five Year DevelopmentPlan. Production cooperatives, started in 1971, are likewise intended toraise the productivity and well-being of small farmers. Unlike farm corpora-tions, their members retain their individual land rights but undertake jointproduction, establishment of irrigation facilities, construction of accessroads, and such. Economies are also effected by the use of machinery pools,communal cropping patterns, and bulk procurement of inputs and marketing ofoutputs.
2.10 Lands below dams have been nationalized and, according to law, maybe exploited only by leasing to large-scale agricultural companies (agri-businesses) 1/; some areas, however, have been allocated to MCRA for develop-ment of farm corporations. The Government is convinced that most of theselands cannot be brought under production without massive investments in irri-gation and drainage and precision land levelling. An agri-business lease maynot exceed 30 years and must include an area of at least 1,000 ha. The Gov-ernment constructs roads to 1,000-ha plots and also constructs irrigationcanals and drainage channels to the beginning of 100-ha plots. The leasingcompany is obliged to construct and maintain all roads, irrigation facilities,and drainage networks within these plots.
2.11 Although land reform was primarily designed to give ownership totenants, at the same time it has opened the way to a modern, commercially-oriented agricultural sector consisting mainly of ex-landlords who haveretained title to their holdings following land reform. For purposes ofpolicy decisions, the commercial sector may be defined as including privatefarms of such productive capacity as to be potentially responsive to normal
1/ By definition, an agri-business includes vertically integrated produc-tion, processing, and marketing operations. On the other hand, an agro-industry is mainly concerned with processing and/or marketing agricul-tural products.

-5-
market forces and to provide their owners witn reasonable levels of income.There are some 300,000 to 400,000 farms in this sector, ranging from about 25ha to 300 ha. These farms produce nearly 50% of the value added in agricul-ture and, as such, they command extensive capital assets, borrowing power,and technical and managerial ability. Unfortunately, Government has beenslow to recognize the enormous production potential of the sector and, instead,has focused its attention on large-scale agr'.-business and farm corporations.The Project is designed mainly to help the neglected commercial sector.
2.12 Toward the end of 1973, Government announced a major revision ofpolicy 1/ involving a massive program of investment incentives and increasedguaranteed prices that should radically change the commercial farmers' reluc-tance to invest. The incentives are to be provided by Government for developingbasic infrastructure on private lands. In particular, the Government seeks tochannel a portion of increased oil revenues into productive agriculture in-vestments through the incentive program. Grants and/or low-interest loans (e.g.15 years at 6% p.a.) will be provided for such investments as land levelling,drainage, irrigation facilities, livestock, agro-industries, and machinery forcontractors providing custom services. A detailed discussion of agriculturaldevelopment priorities is in Annex 2.
D. Support Services
Extension Service
2.13 The Agriculture Extension Service employs about 1,200 technicians,operates 37 mobile units, distributes some 200 publications, sponsors nearly2,000 rural youth clubs, and conducts extensive radio and television programsthroughout the country. Particularly effective has been the Extension andDevelopment Corps which provides youth to fulfill their military obligationby an 18 month field extension assignment after a 6 months agricultural andmilitary training program. Over the years, the Extension Service becameoriented to the requirements of tenant farmers. Now, however, though thesefarmers are the responsibility of MCRA, the Extension Service itself is underthe Ministry of Agriculture and Natural Resources (MANR). Since policies,goals, and programs for small farmers are formulated and implemented by MCRA,Government should consider transfering the Extension Service to that Ministry.
1/ Note 48 of the 1973 Budget Law which is now in effect. Details on theadministration of this program and the application of incentives tospecific farm development plans have not been finalized and made av.'l-able to IBRD as yet. Nevertheless, the appraisal mission estimatesthat the portion of sub-project total investment costs to be financeaby the program will be around 17% of total commitments.

-6-
Research
2.14 MANR and the Ministry of Water and Power, as well as research de-partments of at least four universities and one agricultural college, under-take research on livestock and crop production and management. Although thefocus is on applied research, there is a lack of identification of researchpriorities in terms of Iran's current and future economic needs. Likewise,the large degree of autonomy of these research agencies results in unneces-sary duplication of effort and inefficient use of limited expertise and funds.The Government realizes this and has hired an international consulting firmto help reorganize Iran's research goals and efforts.
Training
2.15 Formal agricultural education is provided by secondary schools,post-secondary schools, and four universities and the Agricultural Collegeat Rezaiyeh. Nine secondary schools, located in different regions throughoutthe country, offer a three-year curriculum of academic and practical instruc-tion; In 1973, enrollment was almost 1,400. Professional colleges of agri-culture are attached to the universities and offer four-year degree programs.They had an enrollment of nearly 5,000 in 1973. In addition to the formalagricultural education, MANR and other agencies conduct several short-termcourses aimed at improving general agricultural skills.
Agricultural Credit -/
2.16 Credit to agriculture is provided from the following sources:
(a) Government-owned credit institutions such as the AgriculturalCooperative Bank of Iran (ACBI), ADBI, and the Bank MelliIran (BMI);
(b) Government-sponsored crop improvement programs (channelledthrough regional development authorities, or directly bythe Plan Organization, the respective ministries, or BankMarkazi Iran);
(c) Other institutions such as the Industrial Mining and Develop-ment Bank of Iran and commercial banks;
(d) Non-institutional lenders, including suppliers of agricul-tural inputs, processors of agricultural products, and pri-vate money lenders.
1/ Extracted from a report entitled "Survey of Agricultural Credit Systemin Iran" prepared by the Iran International Consultants, Ltd. undercommission by the IBRD Task Force in Iran.

- 7 -
2.17 ACBI is the largest institutional supplier of farm credit in Iran.It operates a wide network of branches and has a qualified and experiencedstaff. Around 70% of its loans have been to cooperatives and individualcooperative members, the balance to small non-member farmers. The majorityof its loans are for short-term (up to 24 months), and interest charged perannum ranges from 4% to rural cooperative societies to 6% to non-cooperativemembers. Loan collections have improved tremlendously since 1968. Lendingfunds come from Government capital contribut:ons and from savings deposits,which have been significant. ACBI has pursued a vigorous policy of encourag-ing savings by farmers.
2.18 Jointly with MANR's Extension Service, ACBI has launched a tech-nically supervised credit project involving small farmers. The project nowcovers some 720 villages and has granted loans totalling RI 3,000 millionto more than 72,000 borrowers. ACBI plans to greatly expand this program.
2.19 ADBI, established in December 1968 as a wholly Government-ownedcredit institution, was designed to provide financial (loans and equity par-ticipation) as well as technical (project planning and supervision) assist-ance to commercial farming (para 2.11) and agro-industry. In money terms,92% of financial assistance granted since start of operations to September1973 was in medium- and long-term loans, the balance in equity participationand a very small amount in short-term loans. Of total loans granted, about63% was under the first two IBRD-assisted projects. ADBIt s lending fundshave come principally from: (a) Government capital contributions (authorizedcapital, Rl 2,000 million (US$29.6 million), of which RI 1,570 million (US$23.3million) had been paid in as of November 1973); (b) borrowings from IBRD (twoloans totalling US$20.5 million equivalent) and the U.S. Commodity CreditCorporation (CCC; proceeds of sale in Iran of U.S. agricultural productsunder U.S. Public Law 480); and (c) overdrafts from the Bank Markazi Iran.Although under its Charter ADBI can issue bonds and accept deposits of notless than two years maturity, it has not been able to do so. Governmentbonds pay 9% per annum, tax free (effective yield of around 13% per annum),and it is impossible for ADBI to raise funds through bond issues under thiscondition. Deposits could be a source of lending funds as ADBI branches areexpanded and are able to adequately service its customers.
2.20 The ADBI's management is competent and technical staff are wellqualified. ADBI's financial condition as of September 1973 was good; paid-incapital was unimpaired. To protect ADBI from losses that may arise from serv-icing IBRD Loans 662-IRN and 821-IRN, Government has committed itself to re-imburse ADBI for any such loss that may arise. A detailed discussion of ADBIis in Annex 3.
2.21 Commercial banks have given loans for agricultural production buthave been reluctant to finance medium- and long-term agricultural investments.With the hope of eventually drawing commercial banks into funding medium- andlong-term agricultural requirements, a joint pilot lending program of BankMelli Iran (BMI) and ADBI for small-scale farm developments was initiated in1972. Under this scheme, BMI and ADBI contribute 40% and 60%, respectively,

-8-
of loan disbursements, with loa:1 collections and income and losses being sharedin the same proportion. BMI is responsible for approving the creditworthinessof loan applicants and disbursirng and collecting loans granted; ADBI is respon-sible for evaluating sub-project plans and for supervising their implementation.Loans are limited to no more than Rl 2.5 million (about US$37,000) for any onesub-project. As of September 1973, loans granted totalled Rl 259 million(US$3.8 million) to 180 sub-borrowers.
2.22 BIlI is a wholly Government-owned commercial bank with more than1,100 branches in Iran. Its management appears competent and its financialcondition good. A more detailed discussion of BMI is in Annex 4.
III. PERFORMANCE UNDER THE FIRST AND SECOND IBRD-ASSISTED PROJECTS
A. Lending Operations
3.01 The First and Second IBRD Loans were to assist in providing medium-and long-term loans to the private commercial sector for investments in on-farmdevelopment (mixed farming, orchards, dairy and beef, sheep, and poultry oper-ations), agri-business, and agro-industry. Both loans finance 40% of the totalestimated project costs (about 57% of total expected sub-loan amounts).
3.02 Sub-loans, which are generally limited to 70% of new investments,are based on development plans appraised by ADBI technicians as technicallyand financially feasible. Farm development plan implementation is supervised.Sub-borrowers pay 8% interest per annum (9% on agro-industry loans), whichincludes 0.5% as supervision fee, plus a 1.0% commitment fee per annum on theunused loan balance. Loan maturities can be up to 12 years depending on cashflow projections for the particular sub-project. Fifty seven percent of sub-loans, equivalent to IBRD's reimbursement, were denominated in U.S. dollars,as a measure to pass the foreign exchange risk to the sub-borrowers (para 3.08).
3.03 A summary size distribution of loans granted by ADBI shows thefollowing:
First Project Second ProjectBy No. By Amount By No. By Amount----- amount in percent----
Up to Ri 7.50 million(US$111,000) ...... .......... 45 15 55 21
Up to Rl 18.75 million(US$278,000) ...... .......... 34 25 30 32
Above I1 18.75 million ........ 21 60 15 47
Total ............... 100 100 100 100

- 9 -
It is interesting to note from the above, that ADBI is granting more smallerloans, both in number and total amount, -as its operations have expanded. Thistrend is expected to continue as more ADBI branches are established and thejoint program with BMI is expanded.
First Project
3.04 Sub-loans granted under the First Project amounted to Rl 916.6 mil-lion 1/ to finance incremental investments of Rl 1,822.9 million 1/; theseamounts were, respectively, about 10% and 53% greater than appraisal esti-mates. ADBI continued to disburse from its own resources after the closingdate, hence the greater amount of sub-lo.ms given. Over-all, sub-borrowerscontributed around 50% of sub-project costs, instead of 30% as predictedduring appraisal. This is attributable to the fact that, generally, the moreestablished farmers sought ADBI's assistance. They are more amenable toadopting new technology, have better financial resources, and appreciated theadvantages of intensifying and expanding their operations.
3.05 The number of dairy sub-projects financed was almost the same as pre-dicted during appraisal. Although only 14 crops and sheep sub-projects wereassisted, they were, on average, larger operations than anticipated. Averageinvestment per orchard was about twice the appraisal estimate because mostinvestments included those for other activities -- for instance, the growingof annual crops. The number of sub-loans for poultry production were fourtimes appraisal estimates, reflecting the large increase in demand for poultryproducts. Two sub-loans were granted for agri-business operations in theKhuzestan: one for RI 76 million to Iran California (incremental sub-projectcost - Rl 232 million), and the other to Iran America for Rl 120 million(incremental sub-project cost - Ri 273 million). While Iran California isencountering managerial and financial problems largely due to over optimisticestimates of land preparation costs and timing and levels of yields, IranAmerica's operations are reportedly doing well.
Second Project
3.06 Total sub-loans approved under the Second Project amounted to Rl1,118.3 million as of September 22, 1973. This was about 60% of the appraisalestimate in value. Second Project funds should be fully disbursed by December1974 (para 3.08). Sub-loans approved were 25% for dairying, 15% for cropsand sheep, 20% for poultry, 24% for orchards, 10% for agribusiness, and 6%for agro-industry.
1/ No US dollar equivalents are given in view of the varying exchange -atesof the US dollar to the rial during the period under review.

- 10 -
B. Project Performance and Impact
3.07 Technical evaluation and sub-project supervision are satisfactory;supervision should further improve as more ADBI branches are established(para 2.19).
3.08 When the US dollar was devalued, the inadequacy of denominating sub-loans in that currency as a measure to protect ADBI from losses that mayarise in servicing Loans 662-IRN and 821-IRN (para 3.02) became apparent.Consequently, starting in May 1973, ADBI began designating new sub-loanstotally in rials. IBRD has agreed to this efter receiving assurance thatGovernment would reimburse ADBI to the extert of such losses if they occur.
3.09 ADBI has not yet established a system for monitoring investmentresults at the farm level (in the proposed Project, an appropriate system willbe devised and implemented with IBRD assistance; see para 4.27). In any case,it is too soon to form a judgment on many sub-projects since most have devel-opment periods of 5 to 7 years. However, indications are that investmentsin early-maturing sub-projects such as poultry-raising and dairy enterpriseshave had very good results; sub-loans have generally been paid on time -- manyahead of schedule.
3.10 The two IBRD-assisted projects have helped to build ADBI into atechnical-assistance-conscious and commercially-oriented lending institution(for instance, on September 22, 1973, total loans past-due are only 1.5% ofloans outstanding under all programs -- a mere 0.9% in the case of loansunder the IBRD projects). Staff capability is being constantly improved andstrengthened by in-service training programs (including a course conducted inTeheran by the IBRD's Economic Development Institute) and the hiring of ex-perienced technicians and promising university graduates. This is importantif ADBI is to fulfill its increased lending objectives over the future years(para 4.01).
IV. THE PROJECT
A. Brief Description
4.01 ADBI foresees that during the period of Iran's Fifth DevelopmentPlan (five years ending March 1978), its lending operations will expand byabout 30% annually, and that during the next two fiscal years, ending March20, 1976, total lending will reach Rl 5,700 million (US$84.4 million). 1/
1/ ADBI estimates during appraisal. During negotiations, the Iranian dele-gation informed IBRD that lending operations could be much more in viewof the great interest generated by subsidies and grants announced byGovernment (Annex 2).

- 11 -
The Third ADBI Agricultural Credit Project would involve ADBI's entire two-year lending program, with the exception of a portion (about Rls 850 million)expected to be financed with CCC funds (para 2.19). As in the first twoIBRD-assisted Projects, finance would be given for investments in medium andlarge agricultural, agri-business, and agro-industry sub-projects. A featurewould be assistance to small farm projects under a joint lending programbetween ADBI and BMI (para 2.21), which is designed to bring institutionalcredit to small commercial farmers by taking advantage of BMI's extensivenetwork of branches and offices in the country.
4.02 The Project would involve investments of about Rl 6,740 million(US$99.8 million), of which around 19% would be in small-scale developmentprojects (involving per farm investments of no more than Ri 3.2 million(US$48,000), 63% in larger on-farm development projects (per farm invest-ments of more than Rl 3.2 million), 11% in agri-business projects (large-scaleintegrated production, processing and marketing operations), and 7% in agro-industry development.
4.03 Investments would be in the following subsectors:
Small- Med.- toscale Large-scale TotalDev. Dev. Sub- Project
Investment Category Projects Projects Sector Cost----------------------percent…--------------…
Mixed Farming ........... 46 54 100 19Orchards ................ 33 67 100 22Poultry ................. 9 91 100 21Dairy and Beef .......... 4 96 100 14Other On-Farm Development 16 84 100 6Agri-Business ........... - 100 100 11Agro-Industry ........... - 100 100 7
Total 19 81 100 100
These investment projections are considered reasonable. They are based onADBI's overall lending experience since its establishment in December 1968,its planned expansion of operations to meet credit demand, and projectedstaff capability.
B. Detailed Features
4.04 The detailed features of investment categories are based on represent-ative models (para 5.01) of production enterprises examined during appraisal.They depict typical or average costs and quantities of investment items, ope-rating inputs and outputs, and technical production coefficients. The modelsillustrate that the proposed investment categories are technically feasibleand financially sound.

- 12 -
Mixed Farming
4.05 Livestock production is generally combined with crop production,especially in the northern and eastern part of the country where most of theinvestments in mixed farming are expected to be made. Sheep are almost al-ways raised together with cereals and alfalfa, and often with cotton, sugarbeets, and several other crops. A typical small mixed farming operation wouldrequire investments of about Rl 3 million (US$45,000), with a goal of around500 breeding ewes at full development; about 200 farms are expected to beassisted. On the other hand, an average large mixed farming operation (around30 developments are expected) would require about R. 21 million (US$310,000)to raise around 1,500 breeding ewes and generate yearly crop sales of approxi-mately Rl 7 million (US$100,000) at full development. Investments would bein land preparation and crop establishment, constructions, machinery andequipment (including irrigation equipment), and breeding stock.
Orchards
4.06 Investments would be in fruit crops such as apples, pears, peaches,citrus (oranges, grapefruit, and tangerines), nuts (pistachios, almonds, andwalnuts), and grapes. Orchard-growing exhibits relatively constant economiesof scale and it is expected that a large number of small-scale farms (about190) would be involved. Required investments in a small orchard (typically,8 ha) would be approximately Rl 2.6 million (US$39,000); in a large operation(about 50 ha), in which about 65 farms are expected to be assisted, aroundRl 15 million (US$220,000). Investments would be for land levelling andpreparation; minor irrigation works; tree crop establishment; machinery andequipment; and, in addition, for large farms, roads, housing and sheds, andother constructions.
Poultry
4.07 Investments would be in three types of poultry activities: (a)parent stock (hatcheries for day-old chicks); (b) broiler production; and(c) egg production (layers). About 140 small-scale egg producing units areexpected to be financed, with investments averaging about RI 950,000(US$14,000) each. In the case of larger operations, it is expected thatabout 3 parent stock units (average investments Rl 43 million (US$640,000);24 broiler operations (average investments -- Rl 22 million (US$325,000),and 15 egg-producing enterprises (average investments -- Rl 39 million(US$580,000) would be assisted. Major investments would include buildingsand constructions, machinery and equipment (including vehicles), and poultrybirds.
Dairy
4.08 About 15 small dairy units are projected to be financed. A typicalsmall farm would require investments of about Rl 2.5 million (US$37,000),mainly in breeding stock, buildings and installations, and machinery and equip-ment. Such a farm would build up to about 20 milking cows at full development

- 13 -
after 5 years, generating annual milk sales of about Rl 1.2 million (US$18,000).Around 30 larger-scale dairy operations would loe assisted, which typicallywould require investments of about RI 31 million (US$460,000), chiefly inbreeding stock, buildings and installations, ma.chinery and equipment, electri-fication, and crop establishment (e.g. alfalfa). Each farm would begin withabout 150 milking cows and build up to 200 cows at full development in Year 6,when milk sales are expected to exceed Rl 12 million (US$180,000) annually.
Other On-Farm Development
4.09 Diverse activities such as honey production, silkworm production,and flower raising lend themselves fairly well to small-scale operations andwould be financed under the Project. Large-scale operations would likelyinclude pig production, fish production, and the raising of fur-bearinganima-A.s.
Agri-business
4.10 ADBI expects to finance three or four agri-business (para 2.10)developments under the Project. Although varying in size and investmentcomposition, they would be large operations. Investments would be in landlevelling, irrigation facilities, buildings and installations, crop establish-ment, and machinery and equipment (including that for agricultural processing).
Agro- ,ndustry
4.11 This category would include investments in milk plants, cottonginneries, cold storage and processing facilities for fruits, meat and thelike. While no investment models have been developed because of the widevariety of possible sub-projects, the major investments would be in buildingsand installations, and machinery and equipment.
C. Cost Estimates
4.12 The following cost estimates are based on ADBI's lending experience(para 4.03) and the representative production models in para 5.01. TotalProject cost is estimated at Rl 6,740 million (about US$100 million), of whichapproximately 44%, or US$44.1 million equivalent, would require foreign ex-change. Cost estimates are as follows:

-14-
R1 Million In US$ Million FEC
Local FEC Total Local FEC Total %
a. Small-ScaleDevelopment
1. Mixed Farming ...... 329 248 577 4.8 3.( 8.5 43
2. Orchards ........... 365 135 500 5.4 2.0 7.4 27
3. Poultry ........... 84 46 130 1.2 0.7 1.9 35
4. Dairy and Beef-... 13 27 40 0.2 0.4 o.6 67
5. Others ............ 37 28 65 0.6 0.4 1.0 43
Sub-Totals ...... 828 484 1312 12.2 7.2 19.4 37
b. Medium-to-Large ScaleDevelopment
1. Mixed Farming ..... 385 290 675 5.7 4.3 10.0 43
2. Orchards .......... 743 270 1013 11.0 4.0 15.0 27
3. Poultry ...... ,. 817 438 1255 12.1 6.5 18.6 35
4. Dairy and Beef 304 614 918 4.5 9.1 13.6 67
5. Others ............ 210 155 365 3.1 2.3 5.4 43
6. Agribusiness ...... 290 432 722 4.3 6.4 10.7 60
7. Agroindustry ...... 190 290 480 2.8 4.3 7.1 60
Sub-Totals ...... 2939 2489 5428 43.5 36.9 80.4 46
Grand Totals . .3767 2973 6740 55.7 44.1 99.8 44

- 15 -
4.13 The total Project cost would consist of the following investmentitems:
PercentUS$ Million Foreign Percent of
Items Local Foreign Total Exchange Total
Land Preparation ........ 1.9 1.3 3.2 40 3Crop Establishment ...... 21.7 9.3 31.0 30 21Buildings and Instal-lations ............... 19.4 14.5 3>.9 45 33
Machinery and Equipment.. 5.6 8.4 U.0 60 19Livestock and PoultryBirds ................. 7.1 10.6 17.7 60 24
Total .............. 55.7 44.1 99.8 44 100
D. Financing
4.14 Financing would be shared in the following amounts and proportions:
Sub- TotalBorrower Govt. BMI ADBI IBRD (100%)US$M % US$M % US$M % US$M % US$M % US$M
Small-scaledevelopmentprojects ....... 1.2 6 2.6 14 6.2 32 2.2 11 7.2 37 19.4
Medium- to large-scale developmentprojects ....... 9.1 15 9.7 15 - - 16.9 27 26.9 43 62.6Agri-businessprojects ....... 3.2 30 - - - - 2.9 27 4.6 43 10.7
Agro-industryprojects ....... 0.7 10 4.3 60 _ - 0.8 12 1.3 18 7.1
Total 14.2 14 16.6 17 6.2 6 22.8 23 40.0 40 99.8
As shown above, the Project would be financed as follows: (a) sub-borrowers,on average, would contribute Rl 14.2 million or about 14% of Project cost;(b) Government (through grants and "soft loans" - see para 2.12), Rl 16.6million or 17%; (c) BMI, Ri 6.2 million or 6%; (d) ADBI, Rls 62.8 million or63%. The proposed IBRD loan of US$40 million, however, would reimburse ADBI,on average, for around 64% of its disbursements; this would be equal to approx-imately 90% of the estimated foreign exchange component of the Project.

- 16 -
4.15 The IBRD loan of US$40.0 million would be made to ADBI, at the IBRDlending rate at the time of loan approval, for 14-1/2 years, including 4-1/2years of grace. The IBRD loan maturity is based on projections of ThirdProject lending operations (para 4.18). The Government will assume the foreignexchange risk and as a condition of IBRD loan effectiveness, it will formallyguarantee that it will reimburse ADBI for any foreign exchange losses that maybe incurred. Assurance was obtained on this.
E. Procurement
4.16 Items to be financed are generally small and varied and would bepurchased by individual sub-borrowers over a period of 4 years; they couldnot, therefore, be bulked for procurement through international competitivebidding. In most cases, land levelling, well drilling, and building construc-tions would be undertaken by local contractors; while planting material, andfarm machinery and equipment would be obtained through existing commercialchannels. Farm machinery and equipment such as pumps, motors, and pipes canbe imported without restriction, and are readily available through local sup-pliers. Prices are competitive and servicing is good. However, any contractfor civil works the equivalent of US$300,000 or more or those for machineryand equipment the equivalent of US$100,000 or more would be awarded on thebasis of international competitive bidding according to IBRD's Guidelines forProcurement. Assurances on these were obtained during negotiations.
4.17 Most breeding female dairy cattle would be imported by sub-borrowersthrough normal commercial channels. Inspection and quarantine procedures areadequate. An assurance was obtained during negotiations that ADBI would requiresub-borrowers to obtain quotations from at least three sources of supply.
F. Disbursements
4.18 ADBI disbursements to sub-borrowers (which would be in accordancewith the phasing of individual sub-project development) would vary from oneto three years. Since the Project commitment period is for two years (para4.01), the IBRD loan would be disbursed in about 4-1/2 years, allowing forslippage. Against documentation which it may require, IBRD would reimburse77% of ADFI's share of sub-loans to small-scale sub-projects (para 4.19),and 60% of all sub-loans disbursed to medium- and large-scale sub-projects,and agro-industry developments, and those for agri-business. Projections ofProject lending operations and IBRD loan disbursements are shown in Annex 6.

- 17 -
G. Organization and Management
Organization
4.19 Sub-loans to finance small sub-projects involving new investmentsof tno more than Rl 3.2 million (US$48,000) would be made under a joint prog-ram involving BMI and ADFI (para 2.22). Under the joint program, BMI wouldcontribute 40% of loan disbursements and ADBI, 60%. Loan collections andincome and losses would be shared in the same proportion. Also, BNI would beresponsible for approving the creditworthiness of applicants and servicingloan disbursements and collections. A major advantage of this arrangement isthe strengthening of institutional lending to small commercial farmers byexploiting BMI's extensive network of branches in rural areas. It is alsoexpected to encourage more participation in agricultural investment lendingby commercial banks in Iran. As in the first two IBRD-assisted projects,ADBI would be solely responsible for implementing sub-loans for medium- andlarge-scale developments (requiring new investments of more than RB 3.2 mil-lion) and those for agri-business and agro-industry sub-projects. An assur-ance on the foregoing was obtained during negotiations.
Lending Policies and Procedures
4.20 As under the first two IBRD-assisted projects, all sub-loans (in-cluding those where any of the required investments is provided from fundsother than the Project's) would be made on the basis of development plansevaluated by ADBI staff as technically feasible and on projections that therate of return on the new investments to be made would be satisfactory. AnAssurance was obtained on these procedures during negotiations.
4.21 Size of Sub-loans. Under existing agreement between BMI and ADBI,loans under the joint BMI/ADBI program are limited to no more than Rl 2.5million (US$37,000). In line with this, and to help encourage investments bysmall farmers under the Project (para 4.19), an assurance was obtained duringnegotiations that all sub-loans under this joint program would be limited tosub-projects costing no more than Rl 3.2 million.
1
4.22 Following the practice under the second IBRD-assisted project, allsub-loans under the Project of RB 20 million (approximately US$300,000) ormore would require IBRD approval. Supplementary or additional loans grantedby ADFI for the same sub-project, regardless of source, if the resultant totalof loans granted is Rl 20 million or more, would likewise, require IBRD ap-proval. During negotiations, an assurance was obtained on the foregoing.
4.23 Terms and Conditions of Sub-loans. During negotiations, an assur-ance was obtained that sub-loans under the Project would be charged the follow-ing interest per annum:

- 18 -
8. Sub-loans to finance small-scale on-farmdevelopment involving investments of nomore than RI 3.2 million under the jointBMI/ADFI program .................................. 8%
b. Sub-loans for medium- to large-scale on-farm development involving investments ofmore than Rl 3.2 million ....... ................... 8%
c. Sub-loans for agri-business and agro-industry ............. ........... 9%
In addition, sub-borrowers for Items b and c above, will pay a commitment feeof 1% on the unused loan balance. The foregoing interest rate and commitmentfee schedule is the one currently charged by ADBI. It is the Government'spolicy not to raise interest rates beyond 9% in order to stimulate agriculturalinvestments. This policy has recently been bolstered by a wide range of in-centives (paras 2.09 to 2.12). In view of the Government's interest to chan-nel part of increased oil revenues into agriculture and the solid financialposition projected for ADBI with the resultant interest rate spread (seeAnnex 3, Appendix 3-4), the present interest rates are acceptable. Duringnegotiations, an assurance was obtained that the above interest rates andconnitment fees would be enforced for project lending.
4.24 Since there is need to avoid competing programs within ADBI's over-all operations, an assurance was obtained during negotiations, that exceptas IBRD may otherwise agree, ADBI will charge its other operations the sameinterest rates and require the same kinds of collateral as those provided forunder the Project. Furthermore, an assurance was obtained that ADBI willcharge not less than 8% per annum on any of its loans.
4.25 Repayment periods of sub-loans, including necessary grace periods,would be in accordance with projections of the cash receipts and disburse-ments of the particular sub-project and, in addition, would take into accountthe sub-borrower's repayment capacity from other sources. During negotiations,an assurance was obtained on this.
4.26 Collateral Requirements and Loan Value. ADBI now accepts real es-tate and other immovable properties, machinery and equipment, livestock andthe signature of third parties as security for sub-loans. However, under thejoint BMI/ADBI program, only real estate and other immovable property are nowaccepted. To bring uniformity to the regulations, assurance was obtainedthat ADBI, in agreement with BMI, would accept as collateral for sub-loansunder the joint ADBI/BMI program the same kind of collateral as is now acceptedunder ADBI's other operations. Similarly, assurance was obtained that theloan value of real estate offered as collateral to secure any sub-loan grantedby ADBI including those under the joint ADBI/BMI program would be limited tono more than 75% of its market value.

_ 19 -
Monitoring of Development Results
4.27 In order to improve lending policies and decisions generally, thereis need to measure investment results at the sub-project level. Accordingly,assurance was obtained during negotiations that ADBI, in consultation withIBRD, would set up a formal mechanism for the purpose. A general frameworkfor such a monitoring system is described in Annex 7.
Accounts and Auditing
4.28 An ADBI Inspector, appointed by the General Assembly on the recom-mendation of the Minister of Finance, examines ADBI accounts and officiallycomments on operations. A firm of public accountants, also independentlyaudits ADBI operations and submits certified financial statements, besidesadvising on accounting matters. Accounting and auditing of ADBI accounts aresatisfactory. During negotiations, assurance was obtained that ADBI would:(a) keep separate accounts for the Project; (b) continue to have its accountsaudited by independent auditors acceptable to IBRD; and (c) send the auditor'sannual report to IBRD within four months of the end of ADBI's fiscal year.
V. PRODUCTION, MARKETS AND MARKETING, AND PRODUCER BENEFITS
A. Production, Markets and Marketing
5.01 With its emphasis on meat, milk and fruit production, the Projectwould contribute significantly to the production targets outlined in Iran'sFifth Five-Year Development Plan. The following Table projects the expectedvalue of incremental production ("farmgate") from Project enterprises at fullphysical development (1973 prices).

- 20-
ValueA. Commercial Farms Unit Quantity ('000 Rials)
Milk ............... '000 liters 30,200 387,000Meat (dressed wt)
Beef ...................... m tons 450 68,800Mutton & lamb ............. m tons 1,750 183,960Poultry ................... m tons 7,090 576,460
Subtotal ............. m tons 9,290 829,220Live Animals:
Heifers (pregnant) ........ No. 1,730 86,400Ewe hoggets ............... No. 18,550 24,100Bulls .............. N. 17 2,780Rams ............... Nt. 4,730 13,700Day-old female chicks ..... Nc. '000 3,380 118,400Day-old male chicks ....... No. '000 3,380 3,380
Subtotal 248,760Orchards -- Apples ........... m tons 97,400 1,168,800Crops:
Wheat . . m tons 7,440 44,640Barley .................... m tons 7,690 38,440Sugarbeets .............. m tons 74,400 111,600Alfalfa ................... m tons 9,180 32,120
Subtotal ............. m tons 98,710 226,800Others:
Eggs ...................... m tons 14,510 714,960Wool ............... m tons 290 28,170Hides and offals 33,770Poultry manure ............ m tons 22,410 13,070Miscellaneous. 310,000
Subtotal. 1,099,970
Total for Commercial Farms .3,960,550
B. Agri-Business .515,000
C. Agro-Industry ................. ....................... 340,000
Grand Total .4,815,550
5.02 The total incremental value of annual production under the Projectis expected to be about Rl 4,800 million (US$71 million). The quantities andvalues of production in Part A of the Table are derived from the represent-ative commercial farm production models in Annex 8. The Miscellaneous cate-gory comprises less prominent items typically financed by ADBI under the firsttwo loans, e.g. floriculture and honey production. Agri-businesses (PartB) are expected to share in the production of all products listed for thecommercial farming sector, excepting poultry. In addition, significantquantities of corn, oilseeds, sugarcane and cotton would be produced by agri-businesses, tne cotton being exported. The values of production for agri-businesses, agro-industries, and the miscellaneous category of Part A have

- 21 -
been estimated by prorating the expected investments in these enterprises -11%, 7%, and 6% of all Project investments, respectively (para 4.12) - withthe collective investments and outputs of the representative models.
5.03 Long-term supply and demand projections by ADBI's Economic ResearchDepartment indicate a substantial deficit in most items to be produced underthe Project. Apart from the production of about 2,000 tons of ginned cotton,much of which would likely be exported, and negligible quantities of sugarand wool that may also be exported, all incremental production under theProject would be readily absorbed by the domestic market.
B. Producer Benefits
5.04 The following Table summarizes the estimated benefits that wouldaccrue to sub-borrowers under the Project. Investment costs, gross and netincomes at full development, and financial rates of return listed below aretaken from the representative models (Annex 8).
FinancialIncremental /1 Gross Net Rate ofInvestment Income Income Return %…_-----('000 Rials)----- ---
Small-scale Development
Orchard ............ 2,639 1,920 1,417 15Poultry Layers 722 714 142 19Dairy and Beef 2,430 1,597 549 17Sheep .............. 2,860 8,885 471 14
Medium-to-Large-ScaleDevelopment
Mixed Farming .. ..... 21,503 10,316 5,084 21Orchard ............ 15,104 12,000 9,135 17PoultryParent Stock 39,530 45,132 20,728 40Broilers ......... 17,056 20,866 6,459 33Layers ........... 26,661 46,430 5,741 15Dairy and Beef ... 30,086 17,223 8,662 22
/1 Excluding incremental working capital.
All figures are based on costs and prices at the time of appraisal. Sinceprecise assumptions cannot yet be made on how new Government financial i.-.-centi"es would be applied to individual farm development plans, the finaacialrate of return calculations did not include any provision for grant financingof suh-project invest2ent and are thus conservative.

- 22 -
VI. ECONOMIC BENEFITS AND JUSTIFICATION
6.01 The economic rate of return of the Project is estimated at approxi-mately 21%, after incorporating all significant adjustments to producer ben-efits that are necessary to reflect more accurately the real costs and benefitsto the' economy. If investment costs were to become 10% greater than expected,the economic rate of return would fall to 19%. Should incremental productionbe valued at 10% less, due either to a drop in output prices or a shortfall inphysical production, the economic rate of return would drop to 15%. A 10%increase in operating expenses would reduce the rate to 18%.
6.02 At full development, and without taking into account non-exportableitems such as milk, alfalfa, and poultry manure, the Third Project would re-sult in gross savings of about US$70 million equivalent annually in foreignexchange. The annual net savings in foreign exchange are estimated to be someUS$60 million equivalent, after allowing for the foreign exchange cost of inputs.
6.03 In addition to the benefits specified above, there would be indirectbenefits that are difficult to quantify. One of the most important is that, bycontinuing to support ADBI, the means to channel increasing amounts of externaland domestic development credit, coupled with technical services to the farmsector would be further strengthened. The Project would not only train staffand strengthen the credit mechanism but would also increase the sub-projectplanning and monitoring capability of ADBI. By supporting lending to smallersub-projects, the Project would place the financing of such investments on abusiness-like and technically-oriented basis.
VII. AGREENM REACHED MD ION
7.01 Important agreements designed to make ADBI a more effective agri-cultural lending institution and ensure the objectives of the proposed Projectwere reached during negotiations:
(a) to encourage investments of no more than US$48,000 equivalent,loans to finance them would be handled through the ADBI/BMIjoint program where it is hoped the use of BNI's extensivenetwork of branches would facilitate access to institutionalcredit (para 4.19);
(b) collateral requirements for small investments under theADBI/BMI joint program would be the same as those requiredunder the current IBRD projects which are less stringent(para 4.26);
'c) the loan value of collateral would be limited to no more than75% of its appraised market value, thus giving ADBI a securitymargin of at least 1/3 over loans granted (para 4.26);

- 23 -
(d) in order to avoid competing lending programs within ADBI'soverall operations, ADBI will charge its other operationsthe same interest rates and requime the same kinds ofcollateral as those provided undei the Project (para 4.24);and
(e) in order to improve lending policies and decisions generally,ADBI would, in consultation with IBRD, set up a formalmechanism for measuring investment results at the sub-projectlevel (para 4.27).
7.02 A condition of effectiveness is a written guarantee acceptable toIBRD that Government would reimburse ADBI for any loss that may be sufferedby ADBI in its foreign exchange transactions (para 4.15).
7.03 The proposed Project constitutes a suitable base for an IBRD loanof US$40 million equivalent to ADBI for a term of 14-1/2 years, including4-1/2 years of grace.


ANNEX 1Page 1
IRANThird ADBI Agricultural Credit Project
THE AGRICULTURAL SECTOR 1/
A. General
Geography and Climate
1. Iran is located between latitudes 25° to 40e north and longitudes440 to 64' east. It is bound on the north by the Soviet Union, on the eastbv Afghanistan and Pakistan, on the south by the Persian Gulf and the Seaof Oman, and on the west by Iraq and Turkey. Much of the country consistsof a high interior plateau with an average height of over 1000 m, flankedin the north by the Elborz Mountains. North of these mountains, adjacent tothe Caspian Sea, is a narrow strip of fertile land with an annual rainfall ofmore than 1,000 mm, making for a relatively temperate climate. Average annualrainfall on the plateau ranges from about 200 mm in the north to less than120 mm in the south and southeast. With the exception of the plains borderingthe Persian Gulf and Oman Sea, climate on the plateau varies from hot and dryduring the summer months (30' to 50' C) to sub-zero temperatures duringwinter. Much of Iran's water derives from mountain ranges in the westernpart of the country. Several major rivers drain to the Persian Gulf, parti-cularly through the Khuzestan.
2. Iran covers a total area of 165 million ha. Of this, 31 million haare arable, 10 million ha are under natural (seasonal) grazing land and theremainder are either lightly forested or wasteland. Currently, 19 million haare under cultivation, though only about 8 million ha are cultivated In anyone year, due mainly to the low and variable rainfall and the need to fallow.Total irrigated land in 1973 amounted to about 3.5 million ha. Soils inmountain valleys and alluvial plains are of medium to heavy texture and,when irrigated, are suitable for a variety of agricultural uses.
1/ In addition to describing the agricultural sector generally, ±t is 'heintention of this annex to provide a background to important issues ofdevelopment of Iranian agriculture. These issues are discussed inAnnex 2, "Policies and Strategies for Agricultural Development."

ANNEX IPage 2
Agriculture in the Economy
3. In 1972/73, Iran's GNP totalled US$17,400 million, measured incurrent prices and exchange rates, having grown during the Fourth Five YearDevelopment Plan (1967/68-1972/73) at an average annual real rate of 10.8%.During this time, agriculture's contribution to GNP grew, in real terms, atless than 4Z annually and itg share of total GNP fell steadily from 232 in1967/68 to 162 in 1972/73. Total CNP per capita grew at an average annualreal rate of 7.8% and in 1972/73 was equivalent to US$562.
4. Iran's population is about 31 million of which 18 million, or 58X,reside in rural areas. The overall population growth rate of 2.9% per annumis unevenly distributed between urban areas (about 5% per annum) and ruralareas (about 1.8% per annum). These figures reflect a large urban migration,particularly to the Tehran area which is reported to be growing at some %per annum. There are no published data specifying income differentials betweenthe rural and urban sectors. However, using national aggregate value-addedstatistics and dividing by the population in each sector, it appears thatwhile real income per capita in the rural sector increased from about US$100in 1967 to *'S$115 in 1972, it fell as a percentage of that in the urban sec-tor from 19% to 14%. These percentages, respectively, would be about 40% and28Z if an adjustment were made for the approximately 30% of rural people whoare employed in non-agricultural occupations.
5. Iran's total exports (fob) were valued at US$4,650 mill:ion in1972/73, following an average annual growth rate of 23% during the FourthPlan. Expenditures on imports grew over the period by about 20% per year andwere 13S$3,580 million in 1972/73. The value of agricultural exports increasedbit 6% annually from USS143 million to US$191 million, while agriculturalimports increased by nearly 11% annually from US$142 million to US$238 millionover the period. Prior to the Fourth Agricultural Development Plan, Iran hadbeen a net agrictltural exporter. Over the course of the Plan, however, the-otuntry became a net Importer of agricultural products to the extent of nearlyT.SS200 million, or an average of US$4n million annually.
6. Principal agricultural imports in 1972/73 were sugar (US$29 million).vegetable oil (!7S$26 million), wool (US$25 million), tea (US$15 million),dairy products (US$13 million) and live animals (US$12 million). Principalagriculttural exports in the same year were cotton (US$54 million), wool and.ides (UlS$29 million), pistachio nuts (US$14 million), caviar (US$11 million)and almonds (US$10 million).
Crop Production
7. Of the 19 million ha under cultivation, some 3.5 million ha areunder permanent or seasonal irrigation. The 11 million ha in dryland produc-tion is alternately cropped and fallowed -- about 5 million ha are in produc-Lion in any one year. Around 10 million ha are in permanent fair qualitynatural pastures which are grazed during the spring, summer and fall. Also

ANNEX 1Page 3
utilized for grazing are 19 million ha under scrub or light afforestatlon and30 million ha of poor quality natural pasture on uncultivated rangeland. Theremaining 85 million ha are mostly desert wasteland.
8. Wheat, the staple food for much of the population, is the mostimportant crop grown in Iran. More than 5 million ha, or over 50% of culti-vated land, are devoted to its production, which in 1972/73 amounted to 4.5million tonnes. About 1.3 million ha are devoted to barley and 400,000 hato rice; in 1972/73 some 1.0 and 1.2 million tonnes were produced, respectively.Other important field crops (1972/73 production, tonnes) are raw cotton(600,000) sugar beets (4.1 million), sugar cane (700,000) and leaf tea(90,000). Sugar cane production, which has grown at over 10X annually overthe past five years, and oilseed production, though still relatively small,are rapidly assuming increased importance. Of the 85,000 ha in oilseeds in1972, 72,000 ha were in sunflower, 7200 ha in soybeans and 475 ha in safflower.Over a period of 10 years the Government hopes to have 145,000 ha under oilseedcrops yielding 160,000 tonnes of oil. Almost 450,000 ha are devoted to fruitproduction, the most important of which are dates (140,000 ha) and grapes(80,000 ha).
Livestock Production
9. There are an estimated 32 million sheep In Iran, 13 million goats,5 million cattle (mainly dairy cattle) and 15 million poultry birds. About7 million sheep and 2-3 million goats are slaughtered for meat each year. In1971/72, over 300,000 tonnes of red meat, 50,000 tonnes of poultry meat,80,000 tonnes of eggs, 1.9 million tonnes oSf milk and 30,000 tonnes of woolwere produced. Livestock production accounted for around 40% of the value ofall agricultural output. The greatest increase in production (and demand)has been for poultry meat, which has grown at an average rate of almost 13%annually over the past five years.
10. Traditionally, sheep raising in Iran has been undertaken by thesubsistence sector. Under the landlord-peasant tenure system, villagersrainly cropped their land, but often owned a few livestock as well. In mostinstances, however, landlords did not permit: the growing of fodder. Themajority of Iran's livestock has been owned by the transhumant tribal commu-nities. Traditionally, these people have migrated with their flocks in springto the vast rangelands to take advantage of the costless summer grazing. Inf)l1 they would return to the lowlands, grazing their stock largely on cropresidues. A scavenger type of husbandry therefore developed; migratoryherdsmen were not accustomed to purchasing fodder for their animals. Usuallythe sheep are accompanied by goats, in proportions ranging from I goat : 15sheep in Khorosan to 1 goat : 0.6 sheep in Yazd. Up to 40% of the goatsyield mohair for textile production. In recent years, increasing mechaniza-tion of drvland farming has reduced the amount of wasteland available forg.razing. Greater pressure, therefore, has been put on the natural rangelandwlhich, as a consequence, has deteriorated from overgrazing.

ANNEX 1Page 4
11. The tribal people tend to maximize their flock numbers in springand sell stock in the fall for fattening. Many of the animals put on littleor ao weight as a result of their summer on the ranges. The numbers solddeperid mainlv on predictions of winter feed supplies and immediate cash needs.Therefore, the availability of stock for fattening is highly seasonal andwill become increasingly so as the cropping of cultivable areas is inten-sified and the areas available for wintering stock become correspondinglymore restricted.
12. It is the Government's policy dur;!ng the Fifth Five-Year DevelopmentPlan (1972!73-1977/78) to increase the prodl'ction of red meat, principallysheep meat, by more than 6% per year. In older to obtain this increase, oranv increase for that matter, a major reorg&nization of present livestockpractices is required. Measures must be taken to conserve rangeland pasturesby restricting numbers of grazing stock and the length of the grazing period.To this end, it is important to provide the migratory tribesmen with permanentagricultural bases where they may winter their flocks. By providing village.and irrigation facilities, fodder and other supplementary feeds could beproduced which would enable the sheep to be kept on the lowlands for a monthlonger in spring and returned from the rangelands a month earlier in the fall.This would encourage regeneration of the rangeland pastures. It would alsoencourage the sale of stock over an extended period of the year since youngstock, particularly male weaned lambs, should be retained on the lowlands forfattening rather than migrating to the range.
13. The Government has begun construction of State Meat Complexes(fattening, slaughtering and meat-packing facilities) such as that at Marv-Dasht in the Fars region. These complexes, based largely on zero-grazing,are being complemented by several livestock collection centers located on themigratory routes of the herdsmen. It is expected that store sheep will bepurchased both on their way up and on their way down the mountains.
14. In the foreseeable future, beef production in Iran will have todepend on the utilization of surplus cattle from the expanding dairy industry.Yearling males and cull cows provide most of the beef for the larger cities.Under the modern feedlot system employed, this meat is of high quality.Beef production from local cattle is of minor importance and the developmentof a specialized beef production industry is of low priority. Because ofreligious tradition, Ei production in Iran is unlikely to expand significant-ly; only about 14,000 pigs are slaughtered annually.
15. Much of Iran's milk production derives from small farmers with oneor two buffalo or dairy cows producing milk for local or village consump-tion. With low per capita milk consumption and high income elasticity, thedemand for milk and milk products is increasing rapidly, particularly in urbanareas. To meet this demand, the Government has encouraged the setting up oflarge zero-grazing dalry units with 100-500 milking cows. Many of these cows,imported in-calf from the U.S.A. or Israel, are high quality Friesians, pro-ducing in excess of 5,000 kg of milk per lactation.

ANNEX 1Page 5
16. Much has been written about the possibilities of "low cost" dairyingon improved pastures in the Caspian area. It is true that such pastures maybe established but, with the seasonality of rainfall, it Is doubtful if theproductivity from such pastures could compete with that from Now Zealandpastures without concentrate supplementation. Given Iran's cllsate and lackof technical expertise, the larger intensive ("high cost") units appear tobe a better solution to the problem of satisfying the rapidly growing year-round demand for high quality dairy products.
17. Recently, a number of relatively small commercial farmers have takenup milk production with 15 to 30 milking cows in addition to their normalsales of grains or fodder crops. These smaller units appear to be profitable(Annex 8) but care should be taken to ensure that hygienic production methodssuch as sanitary milking parlors, cooling tanks, etc. are employed.
Irrigation
18. The shortage of water is the principal factor limiting expandedagricultural production in Iran. Though 3.5 million ha are reported to beunder irrigation, much of irrigated agriculture remains in a primitive stateof development. Some 75% of the area is supplied by run-of-the-river flowwith the timing and volumes of such flows being unrelated to crop water re-quirements. Seasonal variations in river flows are great and due to archaicdistribution systems, unleveled land, and poor seed beds, uniform waterdistribution Is impossible; the tendency has been to overirrigate during highflow periods and vice versa in times of low flows. With the traditionalcultural practices, yields of wheat and barley under irrigation have beenonly marginally greater than yields on dry lands in favorable years. Irriga-tion, therefore, has been regarded as more of an insurance against completecrop failure, which occured frequently under dryland conditions, than a meansto obtain high yields.
19. Most of the irrigated land has been tilled with a bull-noze plow toa depth of five or six inches and over the centuries a pan of compaction hasdeveloped at that depth. This pan retards root development and water pene-tration. Water-holding capacity, organic matter content and other featuresof good soils are minimal. Most crop residues have been consumed by sheepand goat flocks, or removed for fuel or construction of buildings. Eachsummer season, much of the land has been left fallow, drying out to virtuallycomplete dessication.
20. The most important requirements to improve yields on these lands arethe use of modern equipment to break up the hard pan, level and deep-tillthe soil, prepare proper seed beds, and regulate the flow of water. Comp'-rnentary inputs such as improved seeds, fertilizers, weed and pest controlsand, of course, managerial knowhow, are also required.
21. Less than 0.5 million ha are assured an adequate supply of re,ulatedflow water from modern irrigation wells, but even then the lack of lana

ANNEX 1Page 6
levelling and modern distribution systems are constraining. Some 0.7 millionha are served, but less efficiently, by ghanats and other primitive sources.
22. By the end of the 1960's, several large multipurpose dams to provideregulated flow water had been built by the Government, but little attentionhad been given to the development of water distribution systems below thesedams. The Government came to the conclusion that most of these lands couldnot be brought into production withcut investment in both distrPbution systemsand precision land leveling on a massive scale. These factors, taken in theenvironment of land reform over the previous ten years, led the Government in1969 to pass a law governing the development of irrigable lands downstreamfrom dams. Thesie lands were nationalized, the villagers and ex-landlordsbeing compensated for loss of their title rights. The law provides that theselands, totalling about 300,000 ha, will be leased to companies formed withprivate Iranian, or foreign, or Government, or mixed government-privateIranian or foreign capital. Leases do not exceed 30 years and the area ofsuch leases must be at least 1,000 ha. Thus far, four agribusinesses havetaken leases on 60,000 ha below the Dez Dam (para 29).
B. Land Use Systems
Land Reform
23. During the 1960's the Government implemented a comprehensive three-phase program of land reform whereby nearly 80% of cultivated land becamesubject to reallocation between landlords and tenants. The remaining 20Xremained in the hands of small holders who, prior to land reform, alreadyowned small properties, and ex-landlords whose lands, for various reasons,fell outside the law. The first phase, ushered in by a law passed in 1962,affectee about 30% of all cultivited land. It provided for Government ex-propriation of all cultivated lands, with two major exceptions; orchards,tea plantations, mechanized farms with paid labor and public charitableendowments were exempted, and landlords with non-exempted lands were permittedto retain the equivalent of one villape. At that time, it was not possibleto provide the new (peasant) owners with secure title to their lands sinceIt had never been the custom in Iran to define areas by cadastral measure.Traditionallv, boundaries between villages and other areas have been distinct-ive points on the rural landscape such as roads and canals. The lack ofsecure titles continues to be a major constraint to the provision of smallfarmer credit and development of the sector.
24. The second phase, introduced in 1963, dealt with the remainingvillages retained by the ex-landlords, covering an estimated additional 12to 15% of the cultivated area. Depending on the region, ex-landlords werepermitted to keep up to 500 ha of tenancy land so long as it had been undermechanized cultivation. Additional areas were shared with or disposed of totheir tenants. By 166A, almost I million tenants had received owner-occupierrights to land.

ANNEX 1Page 7
25. The third and final phase Ywas initiated by passage of the Law ofAgricultural Corporations early in 1968 (farm corporations, para 30). In1969, the Land Reform Law was again amended providing for the abolition of alltenancies and sale to the occupying tenants.
26. With completion of the third phase in 1971, more than 2 milliontenant families had been allocated between 5 and 6 million ha. In thisrespect land reform was successful. Since, however, the lands transferredwere those that tenants were actually farming at the time reform took place(landlords seldom permitted tenants to Farm the same piece of land for twoconsecutive seasons), ownership is badly fragmented. The size of these hold-inFs ranges from under 1 ha to over 10 ha, and fragmentation within eachho(1ding often varies from 2 to more than 10 non-continguous parcelles.Other major socin-economic problems such as availalility of credit, distribu-tiovi of water and the transhumant herdamen also were not dealt with.
Present Land Tenure System
27. The present structure of land ownership 'in Iran is directly relatedto the land reform program. Cultivated lands unaffected by the program arein orchards, small woods, estates held by public charitable endowments, largemechanized farms (exempted under phase one of the program), mechanized estatesup to 500 ha (exempted under phase two), and other lands exempted under phasetwo (para 24). Land reform legislation has not affected rangeland pastures,which were nationalized in 1967 under separate legislation.
28. The 11 million people (2 million families) who received land duringland reform continue to live at near subsistence levels, marketing only 10-15%of their total production. For the great majority of these people, the Gov-ernment is setting up rural cooperatives. For a minority, particularly thosein depressed areas, state farm corporations and production cooperatives arebeing established. With the exception of lands downstream from dams (para22), the remaining 13 million ha under cultivation are in the hands of thecommercial sector. According to law, lands below dams may be exploited onlybv leasing to large-scale agricultural companies. For the most part, theselands have been leased to agribusinesses, which have minority foreign partici-pation to bring in foreign capital and technology. 1/ Certain areas, however,have been allocated to the Ministry of Cooperation and Rural Affairs (para 36)for development of farm corporations.
29. An agribusiness lease may not exceed 30 years and must includean area of at least 1,000 ha. For the Government's part, the Ministry ofWater and Power undertakes to construct roads to 1,000 ha plots of land andto construct irrigation canals and drainage channels to the beginning of 100ha plots. The leasing company is obliged to construct all roads within the
11 By definitiont an agribusiness includes vertically integrated produc-tion, processing and marketing operations. An agroindustry, on theother hand, is mainly concerned with processing and/or marketing agri-cultural products.

ANNEX 1.Page 8
1,/000-ha plots and the irrigation and drainage networks within the 100-haheadgates. The cost of maintaining all these installations as well as of allland revelling, building of structures and other investments in the projectarea is the responsibility of the lessee. 1/
30. State farm cor _M tions were first established in 1968. They wereconceived as a means to increase production on areas which, following landreform, had few possibilities for improvement without collective endeavor.Thuis, thev are being selected on the basis of small size of (former) tenantholdings, high degree of fragmentation and the failure, or likely failure,of other Government programs to help the area or its inhabitants. Thecorporations are joint stockholding companies established in a contiguousareas, usually with the approval of a majority of the farmers involved. Eachfarmer exchanges his land and certain other assets for a shareholding in thecorporation, which is then operated as a single unit. Management, credit andtechnical assistance are provided centrally through the Ministry oi Coopera-tion and Rural Affairs. On average, a corporation includes 300 families and1,000 ha. By the end of 1972, 43 such units were in operation and Governmentexpects to establish a further 100 during the Fifth Plan.
31. A variation on farm corporations, initiated in 1971, is productioncooperatives. Like the former, the latter are intended to raise productivityand well-being in depressed rural areas, but are more flexible with lesscentral control. Their member' retain their individual land rights butundertake joint production, establishment of irrigation facilities, construc-tion of access roads, etc. Economies are also affected by the use of machinepools, communal cropping patterns, bulk procurement of inputs and marketingof outputs. The Government envisages the establishment of 60 productioncooperatives during the Fifth Plan.
32. The Central Organization of Rural Cooperatives (CORC) was esta-blished in 1963 to help the subsistence sector. CORC's responsibilities havebeen to promote the development of rural cooperative societies, each of whichcovers two to four villages and has an average of 200 members. By the endof 1971, some 8,500 societies had been set up, encompassing iore than 24,000villages. Membership totalled almost 1.75 million. Since there are around60,000 villages in Iran, the rural cooperative movement has become the larg-est rural institution and hence, potentially, a very important agent of ruraldevelopment and employment. The principal services performed by rural coop-eratives are marketing, distribution of consumer goods, provision of produc-tion credit, and development of non-farm activites. Institutional credit isobtained entirely from the Agricultural Credit Bank (ACB), which is represent-ed in rural areas by 170 branches, 38 agencies and 170 mobile units (Annex 4).Thus far, however, this source of credit has been quite insufficient to meet
11 TiLese requirements have not been compromised by the passing of Note 48of the 1352 Budget Law (Annex 2, pars 23).

ANNEX 1Page 9
the production requirements of i:he cooperatives and their members; nor-institutional credit sources continue to be predominant. In 1970, ACB begana supervised credit program which has proven effective in meeting smallfarmers' needs. The Government is expanding this program during the FifthPlan.
33. The commercial sector consists mainly of ex-landlords who haveretained title to their holdings following land reform. Depending on defi-nition, the sector includes up to 650,000 families, farming almost 13 millionha of cultivated lands, with the size of units ranging from 10 ha up to 5,000ha (Annex 2-1). For purposes of policy decisions, however, the commercialsector may be better defined as including medium-sized private farms of suchproductive capacity as to be potentially responsive to normal market forcesand to provide their owners with reasonable levels of income. The aboveestimate, therefore, is tailored down to inzlude 300-400,000 such farmers on6-7 million ha of land, the size of each unit ranging from about 25 to 300 ha.These farms produce nearly 50% of the value added in agriculture and, as such,conmand extensive capital assets, borrowing power and technical and managerialability.
34. Having experienced an unsettling!-decade of land reform, commercialfarmers understandably feel somewhat insectre about the future and are re-luctant to undertake long-term capital invegtments. Unfortunately, Govern-ment has been slow to recognize the enormous production potential of thecommercial sector and, as a consequence, policies have not focused on theneeds of its farmers. Instead, production policies have concentrated on theprovision of infrastructure, credit, and incentives to large-scale agribusi-nesses and farm corporations. These issues are discussed in more detail inAnnex 2.
C. Agricultural Services
35. Until .1972, the agricultural sector was served by five Ministries:Agriculture, Land Reform, Natural Resources, Agricultural Products, and Waterand Power. At that time, the Government reduced the profusion and overlappingof functions by consolidating the first four of these ministries into twoministries. At present, therefore, there are the Ministry of Agriculture andNatural Resources (MANR), the Ministry of Cooperation and Rural Affairs (MCRA)and, as before, the Ministry of Water and Power.
36. MANR has overall responsibility for agricultural policies andproduction, particularly to increase crop and livestock production from thecountry's agribusinesses, agro-industries and commercial farms. Includedamong its many bureaux, autonomous agencies apd institutes, are the NationalAgricultural Extension Service and the Research Institute. MCRA is concernedmainly with the development and welfare of subsistence village agriculture,small privately-owned farmholdings, part-time farmers and landless rural

ANNEX 1Page 10
families. In addition to the formation of rural cooperative societies (para32), MCRA has been organizing state farm corporations and,rural productioncooperatives to enable development of large economic units from small frag-riented ho dings (paras 30 and 31). The Ministry of Water and Power, mainlythrough regional Water and Power Authorities, is responsible for the planning,conc'truction and maintenance of power and public irrigation systems.
Extension Services
37. The Agricultural Extension Servi e was formed 20 years ago. It nowemplovs ahout 1,200 technical staff whose responsibilities include trainingand the dissemination of technical information. In addition, the Servicesponsors: nearly 2,000 rural youth clubs, operates 37 mobile units showingfilms oni agricultural development, distributes over 600,000 copies of some220 pubiications and conducts extensive radio and television programs in allprovinces, It also sponsors courses in s`:h areas as intensive tractordriving and machinerv maintenance in coope'ation with the Government-ownedM{achinery Bongah.
38. The Extension Service's organization and personnel were developedin the period prior to land reform to serve the traditional landlord-peasanttype of agriculture. Although the Service is now located in MANR, its acti-vities continue to be oriented primarily toward the 2.2 million families or11 million beneficiaries of land reform. These beneficiaries, in turn, arethe prime responsibility of MCRA. This dichotemy of responsibilities isnot in the best interests of the subsistence sector. Further, the ExtensionService is not equipped to disseminate effectively to agribusinesses orcommercial farmers. Given that the Service is better suited to serving thenee(ds of small farmers, and the priorities being placed on increased agricul-tur&l production, the Government may wish to consider a new competent exten-sion vehicle to help exploit the commiercial sector and agribusiness.
39. Two special programs, under the auspices of the Extension Service,have proven successful and should be mentioned briefly: the Extension andDevelopment Corps and the Impact Program. Under the Extension and DevelopmentCorps, which was set up in 1964, more than 3,000 high school and collegegraduates, both men and women, serve their two years' compulsory militaryservice assisting village agriculture. The corpsmen and women receive sixmonths of agricultural and military training at the Karoj Agricultural Exten-sion Training Center followed by 18-menth assignments in the field. Unlikecivilian extension agents, they live and workin the villages full-time.Their assignments cover all types of practical tasks, including land develop-ment, construction of buildings, other technical advice and support services.The program provides them with an excellent background in technical agri-culture, and the fact that almost all newly hired agents in the ExtensionService are ex-corpsmen is a measure of the program's success.
40. The Impact Program wax hegun five years ago by the Ministry ofAgri.-ulture to help increase the procluction of wheat, rice and forages through

ANNEX 1Page 11
the use o:' improved seeds, fertilizer and cultural practices. Now, under
direction of the Extension Service, the program is being applied also to maize
and cotton. Contracts are mace by the Extension Service with carefully
selected small farmers who are provided improved foundation seeds by the
Plant and Seed Improvement Institute (para 42). Credit is provided by ACB
and the price of the seed and fertilier is reduced by Government subsidy.
Program subsidies also include services such as seed cleaning, treating of
seed and paying the interest on ACB's production credit. The resultant crop
is purchased from the farmer at a premium price and the certified seed is
redistributed to other farmers. From the first year of the program, the use
of certified wheat seed has grown from 60,000 ha to about 400,000 ha in
1972/73. The production of certified forage seed has reached 50,000 ha and
rice seed 270,000 ha. Total subsidies paid under the prograri for these
three crops in 1972/73 amounted to Rl 440 million (US$6.5 million).
Agricultural Research
41. MANR is the principal organization responsible for agricultural
research in Iran. The Ministry of Water and Power, semi-governmental organi-
zations, development project organizations, colleges of agriculture and pri-
vate concerns also have sizeable research programs. In all, there are some
60 centers attached to these agencies and organizations, most of which have
a high degree of autonomy.
42. MANR directs five institutes: the Plant and Seed Improvement
Institue, the Sugar Beet Institute, the Soil Institute, the Pest and Disease
Institute, and the Razi Institute. In addition to conducting its research,
each institute provides extension services. The Plant and Seed Improvement
Institute has a large seed and plant material multiplication program where
foundation seed is produced and propagated both by the Institute and by
farmers via the impact program (para 40). The Soil Institute is nationwide,
conducting soil and land classification surveys, and soil and water testing
services. The present programs of the institutes are focused on applied
research, concentrating primarily on cultural practices such as fertilizer
rates and times of application, time of seeding, moisture management and so
forth. The Razi Institute develops vaccines and serums for protection of
animals and humans against diseases.
43. Within MANR the following entities also undertake research: the
Animal Husbandry Organization, the Central Office of Veterinary Medicine,
the Central Office of Agricultural Engineering and the Cotton Organization.
Several foreign countries and international organizations are participating
in various research programs, coordinated mainly by MANR. The FAO, for example,
has conducted applied research on small grains, range pastures and live3tock
production over the past 15 years.
44. The Ministry of Water and Power, through the Khuzestan Water and
Power Authority, conducts research into various crop practices at thz
Safiabad Field Trial Farm and the Haft Tapeh Sugar Plantation. The i'inistry

ALNN. 1Page ;, 2
of Education provides funds for research by four universities and one collegeof agricuiture. These institutions are: Jundi Shahpur University, Ahwaz;Pahlavi Tnlversity, Shiraz; Tabriz University, Tabriz; Tehran University,Uirai; and the College of Agriculture, Rezaiyeh. Much of this research is in
anirial and crop breeding and management, agricultural economics and humannutri tion. The Oilseed Research and Development Company, a non-profit orga-nizat.on, conducts research on variety adaption and cultural practices ofsunfiower, soybeans and safflower. Several agribusinesses also are beginningto u.v iop their own applied research programs.
45. The large degree of autonomy of agricultural research agencies inIrarn, both within and between ministries and other organizations, results inunnecessary duplication of effort, inefficient use of limited expertise andftunds and incomplete results. Other major weaknesses in the organization ofagrictltural research include the lack of identification of research prioritiesfvI ter-n,; of the country's current and future economic needs, and the inadequatecommunication between farmers and extension workers. In the case of commercialfarmers, this communication is almost non-existent (para 38). In recognitionof the need for a major reorganization of the country's research effort, theGoverniment in early 1972 contracted consultants to prepare a comprehensive.lticnal Agricultural Research Plan. The Plan has been submitted to MANR andwill likely be implemented in the near future.
Trafning and Eduration
46. Formal agricultural education in Iran is provided by secondaryschools (corresponding to senior high school level), post secondary schoolsand universities. At the secondary level, MANR is responsible for nine schools.These schools, located in different regions throughout the country, offer atlhree-vear curriculum of academic and practical instruction and in 1973 hadan enrollment of almost 1,400 students. Being eligible for two years' militaryservice upon graduation, most of these students elect to serve in the Exten-sion and Development Corps (para 39). Additionally, the Ministry of Educationruns 16 similar schools, though the curricula place more emphasis on ruralcrafts and trades. This dichotemy may be disadvantageous since, with suchservice-oriented training, instruction might better be supervised by theninistrv resnonsible for services to agriculture. Two post-secondary (sub-professional) sclhools are operated by MANR. They offer two-year programs ofacadlemic and practical training in forestry, management And fisheries to some;.,O students.
47. Professional schools of agriculture are attached to the universitiesof Tehran (Karaj), Tabriz, Shiraz, Ahwaz, and Reziyez (the latter school isofficially called an agricultural college). These schools, all of which offerfour-year degree programs in agriculture, had an enrollment of 4,600 in 1972.
48. In addition to the formal agricultural education, MhNR and otheragencies conduct several short-term courses aimed at improving general skillsin agriculture.
\'.]Ir- 0. 1 74

IRANThird ADBI Agricuiturnl Credit PrSQect
ACTUAL (1971) AND ESTIMATED (1977) PRODI0CTION OF CROPS AND FOREST PRODUCTS
1 971 197 7
Average Yield Producti-n Average Yield Produotion
Area Under Cultivation (Ha) Ng/Ha M.T. Are. Under Ceitivation (Ha) Kg/Ha .. T.
Dr Dry Dry Dry
Irrigated Farming Total Irrigated Farning Irrigated Farming Total Irrigated Fsrming
Cereals
Whbat.......... 1,533,000 3,650,000 5,183,000 1,280 500 3,700,000 1,600,000 3,000,000 4,600,000 0,100 750 5,610.o00
Barley .286,00 1,000,000 1,286,000 1,200 500 900,090 307,000 900,000 1,107,000 1,870 700 1,134,000
Rice (Paddy).392,000 -- 392,000 2,551 - 1,000,000 392,000 - 392,000 3,410 - 1,337,000
Other Grains ................ 21,217 7,300 28,517 1,220 56o 30,000 77,000 10,000 87,000 2,546 880 2051.000
TOTAL ..... 32..1 4,657,300 6,9,,9517 _2.376000 3,810.000 6,186,oo0
Indu.trial Crops
Sugar Beet. 154,000 __ 154,000 25,846 -- 3,980,000 175,000 -- 175,000 31,654 -- 5,539,000
Cotton (unginned) . 231,000 69,ooo 300,000 1,709 797 450,000 250,000 50,000 300,000 2170 1,10 6
Sugar came4,500 -- 4,500 129,920 ..- 590,000 19,500 -- 19.500 149,00o 2,90,000
Tea (leaf) -- 30,000 30,000 -- 2,166 65,000 -- 35,000 35,000 -- 2,600 91,000
Tobacco and BubblePipe Produts. 8,289 6,502 14,791 / / 18,000 9,900 ll,0OO 20,900 25,00
Oilseeds ....... .... 26,ooo 54,000 80, 0 00 750 500 46,ooo 80,000 62,000 142,000 1.367 820 160,000
TOTAL .. 423,789 159,502 . 583,291 533,400 158,000 691,400
Fruits
A~~0ee.27,000 -- ~~~~~~~27,000 9,000 -- 2i6,00o 32,000 -- 32,000 10,000 -- 320,000
Citrus Fruits .27,170 22,315 49,485 6,660 4,250 280,000 35,170 23,315 58,485 8,300 5,000 4689,00
Grapes .50,000 30,000 80,000 8,300 2,800 499,000 54,ooo 25,000 79,000 9,825 2,800 601,0O0
Dates 140,0O0 140,000 2,300 -- 322,000 140,000 -- 140,000 2,500 -- 350,000
Dried Fruits .56,472 28 56,500 890 1,500 45,000 59,700 30 59,730 1,400 1,500 84,000
Other Fruits. 73,250 7,400 80,650 6,772 3,921 525.000 84,200 17,700 101,900 6,806 4,000 643,000
TOTAL.373.892 59,743 635 45.070 66,o45
Vegetables - Su,mer Crops
Mel.na and Watermelons 60,O00 55,000 115,000 17,500 10,655 1,636,0o0 60,ooo 55,000 115,000 19,500 10,653 1,756,000
Potatoes ..... 29,500 500 30,000 9,560 4,650 234,000 41,000 500 41,500 12,097 6,0o0 499,000
Onions .10,000 2,000 12,000 18,000 10,000 200,000 11,000 2,000 13,000 20,000 10,000 240,00o
Tomatoe .9,000 1,000 10,000 22,000 10,000 2o8,000 1,000 1,000 12,000 25,550 10,000 291,000
Other Vegetables .. . 53.800 70 61 40057,300 1,000 54,800 8,350 63,150 14,330 7,390 850,000
TOTAL .162,3 .66 10 28 400 ___177,800 66,850 244,650
Pulses. 103,000 54,0oo 162,000 1,34o 1,025 200,000 126,OO0 55,000 181,0 o 2,000 1,100 312,000
Fodder Crops 233,000 130,000 363,000 4,420 l,U90 1,211,000 390,000 294,000 684,ooo 5,120 1,380 2,400,ooo
Other Farm Products 30,000 72,300 102,300 -- 50,000 32,000 100,000 132,000 -- -- 70,000
GRAhD TOTAL ......... 3,563,198 5,99,945 8,762,143 4,o40,270 4,549,895 8,590,165
Grass Greum on Pastures _ _ 100,000,000 100,000,000 186 18,600,000 1- ] 490,000 100,490,000 - 200 20,098,000
Foresf Production .-- 18,000,000 18,000,000 -- 767,000 _ _ 18,000,000 18,000,000 \_ -- 2,240,000
Not Available.
Source: Ag,ri-tur-1 Orfeool Re of Iran
April 8, 1974

Appendix 1-2IRAN P
Third 4DBI Agricultural Credit Project
ESTIMATED SUPPLY OF AND DEMAND FOR ANIMAL PRODUCTS BY 1977('000 M TONS)
Projected Projected Imports ExportsDemand Supply
1. Meat . .638 625 13
a. Red meat
Beef and Veal .110 103 -
Iamb, mutton and goat meat. 409 337 _
Camel, pork and others .5 5
Subtotal.. 524 44 1 3 -
b. White Meat/ .................
Chicken 80 120 -Fish (from the North and South
of the country) 34 60 -
Subtotal 114 180 -
2. Milk and milk products(milk equiv.) 2,753 2,830 -
3. Other animal products
Eggs 100 100 -
Silkworm Cocoons 2.2 3.2 - 1Honey 2 2 _
4. Non-edible animal products
Sheep wool 30 11 11Goat hair 6.5 '8,5 - 2
Camel wool 0.3 ff.3 -
J/ The deficit in red meat sUpply is expected to be taken up largely by increasedproduction of poultry meat and fish; the substitution will be encouraged viaGovrnment's pricing policies.
/ Carpet exports not included.
Sourcet Agricultural Development Bank of Iran
February 23, 1974

IRANThird ADBI Agricultural Credit Project
ESTIMATED SUPPLY OF AND DEMAND FOR MAJOR CROPS AND FOREST PRODUCTS('000 M TONS)
Projected Demand 1977 Projected Exports & Imports 1977Seed and Projected Imports or Re- Exports or In-
Food Demand Feed Demand Other Uses Total Demand Production duction in Stocks crease in Stocks
Wheat 5,200 120 450 5,770 5,610 160 -Barley - 1,273 200 1,473 1,134 339 /2 -Rice 1,080 - - 1,080 936 144 -Other Grains - 463 - 463 205 258 /2 -
Cotton (ginned) 110 - - 110 200 - 90Sugar and Cubed Sugar 847 - - 847 860 - 13Tea 52 - - 52 23 29 -Tobacco Products 25 - - 25 26 - 1Vegetable Oil 147 - 75 222 120 102 -
Melons and Watermelons 1,971 - - 1,971 1,756 /3 -Potatoes 455 - 40 495 500 - 5Onions 220 - - 220 240 - 20Tomatoes 280 - - 280 290 - 10Other Vegetables 900 - - 900 850 /3 -
Apples 355 - - 355 320 a -Citrus Fruit 400 - - 400 408 - 8Grapes 489 - - 489 600 - 111Dried Fruit 46 - - 46 84 - 138Other Fruit 687 - - 687 610 /3 -
Pulses 290 - 30 320 312 /3
Fodder Crops - 2,400 - 2,400 2,400 -
Grass grown on Pastures - 20,000 - 20,000 20,000 - -
Forest Products - - - 2,933 2,240 723 30
/1 Demand for 1977 is calculated on the basis of income elasticity of demand, population and per capita income increases. Constant prices are assumedfor the period under consideration.
/2 To meet the meat production target, the required amounts of barley, maize and fodder crops are 2,300, 1,150 and 8,170 thousand tons, respectively.
/3 Supply and demand are expected to be equated with assistance of Government's pricing policies.
Source: Agricultural Development Bank of Iran
February 23, 1974


ANNEX 2Page 1
IRANThird ADBI Agricultural Credit Project
POLICIES AND STRATEGIES FOR AGRICULTURAL DEVELOPMENT
Introduction
1. Water availability is the most important constraint to Iranianagriculture. Strategies for development, therefore, are geared to the useof this scarce resource. Less than 20% of the total area of the country isarable and due to the shortage of water and the need for rotational fallow,less than 5% is under cultivation at any one time. Total irrigated land atpresent is about 3.5 million ha.
2. For many centuries, Iran's better lands were exploited by a feudalsystem whereby cultivable lands were leased, on an annual basis to peasantfarring families. The extensive areas at 1igher elevations, known as therangelands, have been grazed during spring, summer and fall by sheep andgoats belonging to transhumant tribesmen. In winter the tribesmen bringtheir stock to the lowland areas to graze on crop stubble and other scarcefood residues. This centuries-old system of agricultural production wasradically changed by land reform during the 1960's (Annex 1).
Aftermath of Land Reform
3. The third and final phase of land reform was completed in 1971.In the course of 10 years, more than 2 million tenant families, or 11 millionpeople, had been allocated some 7 million ha of land formerly belongingto landlords. The land reform program did not attenipt to increase productionbut aimed at a more equitable distribution of agricultural lands. In thissense the program was successful. Many problems remain, however, the mostimportant of which are the small size of the transferred holdings, the extentof their fragmentation, and the unpreparedness of the former tenants to as-sume the necessary responsibility for managing their own independent enter-prises. The majority of these farmers continue to live at subsistence level,selling only a small part of their production, and most have not yet obtainedtitle deeds to their lands. Government Is attempting to help these people byencouraging them to form rural cooperatives or to pool their lands intoState-assisted collective production units such as agricultural cooperativesor farm corporations. Appendix 1 of this annex illustrates the present sizeclassification of agricultural units, their pattern of ownership, and theircontributions to both total and marketable agricultural output.
4. The small farm sector includes all farms with less than 10 ha. TheIBRD Agricultural Task Force estimates that this sector produces 40% of Iran's
ANNEX 2Page 2
total agricultural value added. If the migrant herdsmen with their livestocknre included, the group is responsible for about 47% of value added and 15%of all marketable production. For policy purposes, however, it is helpful todistinguish between subsistence farmers and part-time farmers. Without regu-lated flow irrigation and a contiguous area, a unit of less than 3 ha isuniikely to provide subsistence support for a family, and some or all familymembers would be employed part-time elsewhere. The subsistence sector, there-fore, is defined as including all farms with between 3 and 10 ha. Some 5million ha fall in this category, sutpporting about 1.2 million families (6million people).
5. Farms with more than 10 ha comprise the commercial sector and agri-businesses. The latter are large enterprises, usually of more than 5,000 ha,that are vertically integrated to include marketing and processing. Agri-businesses have legal priority to exploit some 300,000 ha of good qualitysilt lands downstream from dams by leasing these lands from the Governmentfor periods of up to 30 years (para 9). The commercial sector includes over600,000 madium-sized farms (10-300 ha) and about 300 large farms (300-5,000ha). The large category accounts for less than 2% of the commercially farmedarea. When combined with agribusinesses, which also accounts for less than2% of the commercially farmed area, both categories produce only 2% of allagricultural value added in Iran and about 5% of all marketable supplies.
6. Medium-sized units account for more than 95% of the commerciallyfarmed area. They are responsible for about 50% of value added in agricultureand 80% of marketable supplies. This observation is critical to the formula-tion of policies designed to increase fran's agricultural production, parti-cularly in the shorter term of five to seven years. The medium-sizedcategory, indeed the whole commercial sector, commands extensive capitalassets, borrowing power and technical and managerial ability. Having exper-ienced an unsettling decade of land reform, however, commercial farmers under-standably have been reluctant to undertake long-term financial commitmentsfor increased production. Moreover, Government policies and resources haveemphasized the development of agribusineses at one end of the scale and pro-grams for the subsistence sector at the other. The commercial sector hasbeen relatively neglected. Much greater efforts are needed to foster thesecurity and confidence of commercial farmers before they can be persuaded toundertake the investments necessary for increased production.
7. As in the first two projects, the proposed Project assists the fi-nancing of investments for commercial farms, agribusiness and agroindustry.Unlike the first two projects, however, this Project specifically includes asmall farm component: one-third of total Project costs will contribute to thedevelopment of smaller commercial farms. Financing for these small farms isto be undertaken jointly by ADBI and Bank Melli. The commercial farm com-ponent, therefore, has been appraised on the basis of two categories - small

ANNEX 2Page 3
commercial farms and medium to large commercial farms. 1/ Separate modelshave been prepared for each category (Annex 8).
Development Strateg les
8. The Government's policies for development of its agriculture havebeen influenced, to some extent, by the assumption that "bigness is better";in other words, that there are scale economies in agriculture. In particular,emphasis has been given to setting up large production enterprises such asagribusinesses, milk and meat complexes, agricultural cooperatives and statefarm corporations. In each case, some degree of vertical integration is in-volved, with processing and marketing of produce. While large-scale opera-tions may be justified for dryland farming, experience in many countries sug-gests that with irrigation the returns to scale are relatively constant. Infact, there may be better economies with smaller operations because of a moreintensive application of labor, management and water. Agribusinesses may ex-perience economies in the fields of processing and marketing, but the advant-age is often lost due to management constraints in the production of the rawmaterials. The quality of management has indeed been the principal reasonfor the relatively poor performance of agribusinesses in Iran. A majorcriticism is pre-project optimism regarding land preparation costs, yieldsand the time required to bring the land into full production.
9. As long as subproject appraisals and management are competent, therecontinues to be a case for expanding agribusiness in Iran. During the 1960's,several large multipurpose dams were built but, for various reasons, publicdistribution systems for the water were not sufficiently developed. Invest-ment in on-farm levelling, tail-end irrigation, roads and other necessaryinfrastructure were left to the owner-occupiers of the lands. The abolitionof the landlord system hardly helped. The Government realized that themajority of lands, particularly those below dams, would not come into in-creased production unless plans for their utilization were made and executedby Government. This situation led to the passage of the law governing thedevelopment of some 300,000 ha of lands downstream from dams. Governmenttook possession of these lands and the law provides that they may be developedinto State farm corporations or leased for development to large (minimum1,000 ha) agricultural companies -- agribusinesses. The cost of all on-farminfrastructure such as land levelling, drainage and irrigation distributionsystems is borne by the lessee (Annex 1, para 29). Upon termination of theleases, the lands are to be returned to the Government.
1i. Given the large investment in multipurpose dams, it was importantto bring the lands to their full potential as quickly as possible. The
1/ rhe Task Force currently is asslsting Government in preparing threeaubsistence sector projects that should be suitable for future Bankfinancing.

ANNEX 2Page 4
objective of the law, therefore, was to hasten development of these landsinto modern, high-yielding operations. Government felt that only large com-panies employing the most modern technology and management would be capableof operating on the scale and in the time required. Since no such companiesexisted in Iran, regulations were introduced, including the law for develop-ment of lands below dams, to encourage foreign interests to participate.In addition, it was realized that foreign management would attract substan-tial quantities of foreign capital for investment on these lands. Anotheriac.c'r influencing the establishment of agribusinesses has been the lack ofagriculttural infrastructure in Iran - processing, storage and other market-ing facilities - especially in the more remote areas such as the Khuzestan.In order to market their production it has been necessary for the companiesto provide their own infrastructure. In turn, to ensure sufficient volumesof raw materials to justify the additional investments, the companies haveneeded to farm large areas of lands.
11. The development of agribusiness has raised serious questions ofpolicy in Iran, both from the standpoint of the likely economies of suchlarge undertakings and from the social development point of view. The situa-tion is exemplified in the Khuzestan where four agribusinesses have received30-year leases for some 60,000 ha below the Dez Dam. 1/ Obviously, afterGovernment purchased these lands from former landlords, both tenants and land-lords have had to be relocated. Although Government has had comprehensiveplans for relocating these people, including housing and training for newemployment, implementation has been erratic. In some cases, the new facilitieshave not been completed by the time the agribusinesses wished to undertakemajor development works such as land levelling and drainage systems. Asidefrom the difficulties of implementation, however, it is important to pointout that Government's plans have provided for a major improvement in livingand working conditions for the former tenants. Nonetheless, their traditionalconservatism and lack of education almost guarantees that any change in theirway of life is a threat to their security and a hardship initially.
12. Prior to the upheaval of land reform, the peasant's lot was meagrein the Khuzestan. Hardly any kind of wheeled vehicle existed and improvedinputs were unknown. Crop intensity was low, large areas were in fallow andno alfalfa whatsoever was grown in the area. Peasants were permitted bytheir landlords to own some livestock but not to grow feed for them. Thesheep and goats existed on annual crop residues and generally were consideredscavengers. Among the stock, disease was prevalent, milk yields low andmortality high. Extreme poverty existed among the peasant people in all
1/ The Dez multipurpose dam was built in the early 1960's and has suffi-cient storage to provide year-round regulated flow irrigation to 100,000ha.

ANNEX 2Page 5
villages; living conditions were unsanitary, infant mortality was high, andserious diseases such as bilharzia, malaria and tracoma were cotmmon.
13. For the most part, these families are now living in. brick villagesnewly constructed by the Government - 300 people to a village and fourfamilies to a housing unit. They have potable water, electricity, sanitarysewers and schools for their children. The villages, each of which coversabout 100 ha, are well distributed throughout the 60,000-ha agribusinessarea. While the people live in the vicinity of their old homes, their wayof life has changed dramatically; they cannot keep livestock as in the pastand have only sufficient land for grazing one or two animals and growingvegetables for household use.
14. Although the agribusinesses are still in the process of developingtheir lands, having only a few theusand hectares in crops, all of the (new)villagers who want to work can find employment in the agribusinesses or thead`acent sugarcane plantation and factory during peak seasonal periods. Manyvillagers are working full-time, as irrigators, mechanics, drivers, construc-tion v.orkers, guards, beet thinners, cotton pickers and at many other jobs.A second 180,000 tonne sugarcane plantation and factory, adjoining the presentsugarcane operations, is about to be constructed and will absorb severalhundred more people. The agribusiness managers foresee a serious shortage ofyear-round labor -- both male and female - within two years.
15. The villagers, now free of landlord domination, have minimum wageguarantees and signu of prosperity are abundant; televisions, radios, bicy-cles, and even cars, can be seen in each village. The fact that they aremuch better off than they would have been without land reform is undisputed.The question many may wish to have answered is whether these former tenantscould have become nearly as well off, and with less dislocation, if someother method had been employed to develop their former lands than by leasingthem to large companies. The development of these lands by both agri-businesses and farm corporations, as well as the prospects for employment andimprovement of the villagers' incomes, are being closely observed. Sincethe type of development being implemented in the Khuzestan is basically thesame as that planned for other areas where multipurpose dams have been built,the successes or failures undoubtedly will affect policies for developinglands downstream from dams.
Policies under the Fifth Plan
16. Compared to the Fourth Five-Year Development Plan (1966/67-1971/72),Government has planned an almost fourfold increase of expenditure under theFifth Plan (1972/73-1977/78). This is indicated by an increase in expenditureof publ'c fuinds from RI 77 billion under the Fourth Plan to Rl 267 billionprojected under the Fifth Plan. Of the latter amount, RI 208 billion wasexpected to come from the development budget and the remainder from the normalbudget. Additionally, it was expected that around Rl 32 billion would beinvestee by private interests; Rl 22 billion from savings and Rl 10 billton

ANNEX 2Page 6
from income accrued over the Plan period. Total expenditure under the Plan,therefore, was expected to be almost Rl 300 billion (US$4.45 billion).
17. These expenditures were expected to increase the area under irriga-tion by 390,000 ha to a total of 3.9 million ha at the end of the Plan period.Of this area, about 8.5% would be farmed by agribusinesses, 8% by farm corpo-rations and production cooperatives and the remaining 83.5% by individualfarrers, most of whom are in the commercial sector. It is hoped that thearea tinder double cropping, including fodder crops, will increase to 150,000ha. The consumption of chemical fertilizers is expected to increase from305,000 tons annually at the beginning of the Plan to around 800,000 tons.Among other objectives are the spraying for pests and diseases on some 5million ha and a doubling of silo capacity from 392,000 tons to 792,000 tons.
18. The original Fifth Plan document ,rojects an average annual increasein agricultural output of 5.5%. A later es :imate given the appraisal missionbv the Ministry of Agriculture and Natural Resources (MANR) places the figureat 5.6%. This is illustrated in the following table. The value of productionin 1977, expected to be Rl 236 billion, would be 39% greater than the valuein 1971 (at constant prices).
Value of Production Annual Rate1971 1977 of Increase=---(Rl Million)- %-
Crop and OrchardProduction .............. 96,547 130,039 5.1
Livestock Production ...... 71,013 99,731 5.8Fisheries ................. 1,367 2,851 13.0Forestry .............. 831 3,401 36.6
Total ................ 169,758 236,022 5.6
19. The main thrust of development is being given to the livestock in-dustry. This branch of agriculture is receiving priority because of the ra-pidlv increasing demand for livestock products and the increasing reliance onimports. Following the recent increases in world market prices for red meat,the demand for locally produced poultry meat has developed particularlyquickly; urban demand for this product is projected to rise by about 20Z an-nually. In developing the livestock industry, the Government plans a maJorexpansion in the production of forage crops, the establishment of Government-and privately-owned meat and milk production complexes, the setting-up ofbuying centers in animal production areas, and improved stock husbandrypractices. Additionally, encouragement is being given to poultry farming,particularly by small farmer (subsistence) cooperatives; to conservation andregeneration of rangelands; to exploitation of forest resources; and to dev-elopment of an important fishing industry in the Persian Gulf and the Sea ofOman. 1/
1/ A fisheries project was apvraised by the Bank in November, 1973; a loanof US$12.5 million is currently being processed.

ANNIEX 2Page 7
20. Development policies under the Fif:h Plan have continued undcr tlcpremise that in agriculture "bigness is bett&!r". MAITR has continued to givepriority to large units in the belief that such units are better able to ab-sorb the most technically advanced (capital-intensive) production methods,leading to high yields in a relatively short period of time. By the end ofthe Plan, Government expects that agribusinesses and livestock productioncomplexes will cover some 300,000 ha. For subsistence farmers, nearly 150state farm corporations are expected to be established on more than 400,000ha; about 60 production cooperatives will also be established. The bulk ofsubsistence farmers are being encouraged to join rural cooperatives. Member-ship is expected to increase from 1.8 million at the end of the Fourth Planto around 3 million by the end of the Fifth Plan, and some 3,000 cooperativeswill be consolidated into about 2,000 larger units.
21. Although an objective of the Fifth Plan has been to encourageprivate investment in the commercial sector, Government has not establishedpolicie's -- e.g. pricing, marketing, security of tenure -- that are necessaryto induce farmers to invest. Without such investment it will be impossibleto attain the growth targets outlined in the Plan (para 18). New policiesare also required to effect the necessary private investment in agro-industry,including transportation, and certain farm services such as precision land-levelling and construction of tail-end irrigation facilities.
22. The Task Force has emphasized to Government the importance of re-vising its policies in order to encourage investment in the commercial sec-tor. Towards the end of 1973, Government announced plans for a major revi-sion of policy that should change radically the investment climate in the wholeagricultural sector. The new policies are contained in legislation underNote 48 of the 1352 (1973) Budget Law (Note 48).
Note 48 of the 1352 Budget Law
23. Note 48 provides for a massive program of investment incentives andsubstantial increases in guaranteed prices for the agricultural sector. Theincentives are to be provided by Government in the form of grants and low-interest loans for developing basic infrastructure, such as landlevelling andirrigatlon facilities, on private lands. Agribusinesses will not be eligiblefor the incentives. At the time of writing, it is unclear the extent to whichthe new law will complement, change, or even relate to expenditures foreseenin the Fifth Development Plan. It is likely, however, that Government habtaken stock of the lack of real progress being made in developing agriculture,particularly in the commercial sector, and, aided by the expected increasein oil revenues, is taking bold action to try and ensure the voluntary coo?-eration of private interests.
24. The significance of the subsidy program is not only that it isexpected to hasten large investment in agriculture; it also embodies recogni-tion of public responsibility for the development of basic infrastructure on

ANNEX 2Page 8
private lInnrl. The irvestment incentives, as summarized in a recently re-leased document from MANR, are to be provided for the following purposes:
(a) Studies, designs and other preparation for on-farm irrigationand landlevelling will be paid by Government to the extentof 85% of costs for projects to benefit commercial farmerscr cooperatives, and 100% for farm corporations. In caseswhere the developnent of on-farm canals and ditches repre-sents the completion of a public-sector irrigation network,100% of the costs of studies and designs will be met by Govern-ment.
(b) Government will pay 50% of the actual construction costs foron-farm irrigation and drainage in the case of commercialfarmers and cooperatives, and 100% in the case of farmcorporations. The balance will be met through 15-yearsupervised loans carrying 6% interest for commercial farmersor 4% interest for cooperatives.
(c) Government will assist landlevetling on commercial farms bypaying 60% of costs on areas up to 25 ha, 40% on areas 25-50ha, 20% on areas 50-100 ha, and 10% on areas above 100 ha.In each case, 50% of the balance will be met through 15-yearsupervised loans carrying 6% interest. For cooperatives,Government will finance 60% of the costs in the form ofgrants and the balance as 15-year supervised loans carry-ing 4% interest. All landlevelling costs on farm corpora-tions will be financed through grants.
(d) All agro-industries, including processing, production ofstock feed, and production of poultry parent stock, willbe eligible for Government support. In the case of privateinvestors, this will take the form of loans to cover 60%of costs over 15 years at 6% interest. For cooperativesand farm corporations, the Government will provide 20%grants and 80% loans over 15 years at 2% interest.
(e) Contractors providing inputs or custom services to theagricultural sector will be eligible for Government assist-ance, provided that the standards and prices of their serv-ices are suh1ect to Government control. Financial assist-ance will be in the form of loans over 15 years at 4% in-terest to cover 60% of capital costs in the case of privateoperators and 80% of capital costs in the case of coopera-tives.
(f) All improved livestock for milk or meat production importedeither direcrtv or through the agricultural ministries willPe eligIble ror r pmbursement of all transport costs incur-re.( in their imwror.t-;on,

ANNEX 2Page 9
(g) The construction of all offices, stores, workshops and re-lated buildings on cooperatives and farm corporationswill be financed in the form of grants.
(h) Members of farm corporations will be eligible to receiveloans up to a prescribed maximum over 15 years carryinginterest at 2% for the construction of private housing.
(i) All expenditure on machinery, livestock, and current inputson farm corporations will be financed through loans at 4%.The maturity of the loans will be 10 years for machinerypurchase, and five years for all other items.
(j) An amendment added to the 1352 Budget Law adds to these in-centives by authorizing the Government to finance also cur-rent inputs and by giving the executive ministries discre-tion to reduce further the share of costs to be borne bythe farmer, cooperative, etc.
25. The evaluation and approval of investment plans under the aboveprogram will be the responsibility of MANR, the Ministrv of Cooperativesand Rural Affairs (MCRA), and the Ministry of Water and Power. MANR will beconcerned only with investments in the commercial sector. It is intendedthat financing will be channeled through one of the three agricultural devel-opment banks: ADRI, the Agricultural Cooperative Bank and the smaller RangeDevelopment Fund. In each case the bank involved will not be concerned witheither evaluation or supervision of the investments; only a financing role isforeseen.
26. Ulnder the new law, minimum guaranteed prices have been increasedsubstantially. For example, the price of wheat will in future be guaranteedat RI 10,000 per ton compared to Rl 6,000 formerly. The prices for barleyand sugar beet have been raised by some 50%. In the face of the large invest-ment incentives under the new program, the higher guaranteed prices forcertain crops appear unnecessary to eracourage additional production.
27. The investment grants and soft loans are but a means to an end; topromote the necessarv investment for increased agricultural production.Given the large potential of the commercial sector, and the past reluctanceof colmmercial farmers to commit their on resources or to borrow for invest-nient the program is sound. And although the costs will be high, there is noreason to assume that Government's budgetary resources will be strained, cer-tainlv not in the next five years.
28. The major constraints affecting the program's implementation willlikely be the capacitv of Government agencies in terms of limited manpowerand expertise. Since these constraints already exist, they will be all themore evident with the program. The Agricultural Extension Service is expect-ed to play a major part in evaluating each loan. The Service, however, hastraditionally focused on the needs of tenant or subsistence farmers and is

ANNEX 2Page 10
ill-prepared to deal with the requirements of modern technology and large-scale development. MANR may find it advisable to transfer the present exten-sion service to MCRA, where it would be better located in any case, and toestablish a new, technically sophisticated advisory unit. This unit's res-ponsibilities would be tailored 1pecifically to the needs of commercial far-mers, and possibly agribusinesses as well.
29). Forttnately, proposals for a major reorganization of the country'sagricultural research have been prepared and are already being implementedby MANR. Although the availability of improved seeds has been no problem uptill now, the new program will likely put a strain on the present organizationwhich is largely Government controlled. Control of all improved seed produc-tion and multiplication has been the responsibility of the Plant & Seed Improve-ment Institute. Government should consider opening up the seed cleaning andtreating btusiness to private interests and adopting the regulations necessaryto encourage the required investments. In this manner, future dpmand for goodquality seeds will more likely be met.
30. Many other problems must be overcome before Note 48 can be imple-mented successfully. For example, thousands of smaller farmers whose farms,though relatively small, are potentially viable enterprises, have not yetreceived title deeds to their lands. Consequently, they cannot provide legalsecurity for loan applications and may have to join cooperative or collectivefarming operations. Concern has also been expressed in some quarters at sub-sistence farmers being compelled to join State farm corporations; the viabilityof corporations, therefore, is uncertain.
31. Although the incentives under Note 48 are mainly financial, theynontlheless represent Government's first attempt to really come to gripswith the realities of the commercial sector. The new law also providesgenerous assistance to the subsistence sector. With its broad application,it should boost agricultural production significantly, increase employmentin the rural sector and improve the level and distribution of rural incomes.
MIarch 19, 1974

IRANThird AD3I Agricultural Credit Project
SIZE CLASSIFICATION OF AGRICULTURAL SECTOBS AND SHARE OF VALUE ADDED
(ESTIMATE AS OF END OF FOURTH FIVE-YEAR DEVELOPMEDT PLAN, 1972)
Land Areas CultivatedIdle, Pasture (ha) Annual Cultivation and Orchards (ha) Value Added of
Production andPopulation Unit Size Total Land/ Dry Percenta e in 1972
Category Families Total Range Land Unit Irrigated Farming Total Billion Rls.
Agribusiness Sector 20 - >5,000 210,000 10,500 30,000 25,000 55,000
Large Commercial Sector
(a) Large Units 50 250 501-5,000 120,000 2,400 10,000 25,000 35,000
(b) Semi-Large Units 250 1,250 301 - 500 120,000 480 20,000 40,000 60,ooo
Sub-total 300 1,500 - 24o,o000 - 30,000 65,000 95,000 51/ 21/
Medium-Sized Commercial Sector
(a) Large Farmers 1,000 5,000 201 - 300 270,000 270 55,000 58,000 113,000
(b) Medium Farmers 4,000 20,000 101 - 200 630,000 158 110,000 110,000 220,000
(c) Small Farmers 40,ooo 200,000 51 - 100 2,550,000 64 310,000 335,000 645,000
(d) Very Small Farmers 600,000 3,000,000 10 - 50 9,250,000 15 1,525,000 2,180,000 3,705,000
Sub-total 645,000 3,225,000 - 12,700,000 _ 2,000,000 2,683,ooo 4,683,000 117 50
Subsistence Sector
Tenant Farmers 1,200,000 6,ooo,ooo 3 - 10 4,950,000 4.1 927,000 1,740,000 2,667,000
Part-Time Farming Sector
Tenant Farmers 1,000,000 5,000,000 0.5 - 3 2,100,000 2.1 450,000 620,000 1,070,000
Sub-total 2,200,000 11,000,000 - 7,050,000 - 1,377,000 2,360,000 3,737,000 97 41
Landless Peasants
Peasants 700,000 3,500,000 - - - -
Migrant Herdsmen 100,000 500,000 - - - - - - 16 7
Sob-total 800,000 4,000,000 - - - - - - 16 7
TOTAL 3,645,320 18,226,500 - 20,200,000 - 3,437,000 5,133,000 8,570,000 235 100
/ Including Agribusiness.
Source: IBRD Agricultural Task Force, Iran.
March 3, 1974


ANNEX 3Page 1
IRANThird ADBI Agricultural Credit Project
THE AGRICULTURAL DEVELOPMENT BANK OF IRAN
A. Organization and Management
1. The Agricultural Development Bank of Iran (ADBI) was establishedin 1968 as an autonomous and wholly Government-owned institution to fosteragricultural production by providing funds and technical assistance to farmprojects and related undertakings appraised as technically and financiallyfeasible. Its Charter provides for the following management organs and posi-tions: The General Assembly, the High Council, the President and the Inspector.
2. Government ownership of ADBI is; represented by a General Assemblycomprising the Minister of Agriculture and Natural Resources, the members ofthe Itigh Council (para 3), and ADBI's President (para 4), Executive Vice-President (para 4), and Inspector (para 5). The General Assembly approvesADBI's annual accounts and reports, determines appropriations of net income,and decides on increases in ADBI's capital.
3. The High Council is the highest policy-determining body within ADBIand is equivalent to its board of directors. Its members are the Governorof Bank Markazi Iran (as Chairman>, the Undersecretary of the Ministry ofAgriculture and Natural Resources (appointed by his Minister), the DeputyManaging Director of the Plan Organization (appointed by his Managing Di-rector), the Undersecretary of the Ministry of Finance (appointed by hisMinister), and five experienced (at least ten years) experts, one each fromthe fields of agriculture, economics, banking, finance, and law (appointed bythe Minister of Agriculture and Natural Resources upon the recommendationof the Chairman of the High Council). The High Council meets at least oncea month (ADBI's President and Executive Vice-President attend the meetingswithout the right to vote) and is responsible for setting policy (lending,interest rates, equity participation, and such), determining uncollectibledebts due ADBI to be written off, approving the annual budget, appointingthe independent firm to audit ADBI's accounts, and deciding on other matterswhich Al)BI's President may submit.
4. 1he President of ADBI is the highest executive and administrativeauthoritv aud is appointed for three years by Royal Decree on the recommenda-tion of the Ministry of Agriculture and Natural Resources (MANR) and theapproval of the Council of Ministers. He is assisted and deputized for byan i.xecutive Vice-President who is appointed similarly.

ANNEX 3Page 2
5. ADRI's Inspector, who must be a person specialized in banking,finance, and accounting, holds office for one year. He is appointed by theGeneral Assembly on the recommerdation of the Minister of Finance and hisremuneration is determined by the General Assembly. As an officer independ-ent of ADFI management, his duties include:
(a) audit and certification of ADBI's annual balance sheet andthe presentation of his comments with respect to ADBI'soperations to the General Assembly;
(b) review and certification at regular intervals of details ofADBI's assets and other accounts; and
(c) review of the report of ADBI's external auditors and the pre-sentation of his comments on the said report to ADBI'sPresident.
6. There are separate departments in charge of appraising on-farmdevelopment projects, project supervision, economic research, legal affairs,finance, and administration. A new department to appraise agro-industrial(including agribusiness) projects has just been created which will handle,in addition, special programs that may be entrusted to ADBI by Government.Besides the central office in Tehran, ADBI has five branches located in theprovinces of West Azerbaijan, Khorasan, Khozastan, Pars, and Kerman. It isplanned that by the end of March 1974, four additional branches would haveopened and that by March 1975, ADBI's branches would total 15. The plannedexpansion of ADBI's facilities is in line with its projected 30% increase inlending activities.
7. ADBI employs about 85 professionals, a tremendous jump from about35 only two years ago. By and large, the staff is highly qualified, compe-tent, and dedicated in its work. With the projected expansion of ADBI'sactivities in the provinces, ADBI intends to recruit technicians from tech-nical high schools to work in the field under experienced supervisors.
B. Objectives, Powers, and Responsibilities
8. ADBI may carry out the following operations:
(a) grant loans (short, medium- or long-term) to individuals andprivate companies and invest in share capital of private com-panies;
(b) guarantee agricultural loans to individuals and private com-panies made by third parties;

ANNEX 3Page 3
(c) issue bonds; obtain loans from international institutions aswell as foreign banks and other organizations; obtain loansfrom internal banks, institutions, and organizations with theapproval of the High Council.; utilize the rediscount, loan,and credit facilities of the Bank Markazi Iran; and accepttime deposits of not less than two years' maturity;
(d) provide technical, financial, and administrative assistanceto individuals and companies that utilize ADBI's credit fa-cilities, including assistance to them in preparing projects;
(e) accept and manage funds, for lending and equity participationin agricultural projects, as agent of ministries, Governmentorganizations, and internal or foreign institutions and banks;and
(f) undertake any other authorized banking operation which ADBIdeems necessary to accomplish its objectives.
9. Individuals and private companies who operate and/or invest in oneor more of the following agricultural enterprises or similar activities mayutilize ADBI's credit and other facilities:
(a) farming and orchard operation;
(b) breeding, raising and production of cattle, sheep, poultry,fish, bees, silk-worms, and any other animal for its milk,meat, wool, skin or other useful parts and products;
(c) production of improved seeds, saplings, and livestock andmanufacture of fertilizers, pesticides and other agricul-tural chemicals;
(d) planting trees to provide raw materials for industries;
(e) planting ornamental plants and utilizing forests;
(f) agribusiness activities;
(g) processing, refining, grading, packing, and storing of agri-cultural products and any facilities and industries whicheffectively increase and improve the production and marketingof agricultural products; and
(h) providing agricultural services such as land levelling, drain-age, irrigation networks and soil and water analysis.

ANNEX 3Page 4
C. Lending Policies and Procedures
10. ADBI is committed to technical evaluation of and assistance tofarm projects, and all medium- and lon3t-term loans granted are based on farmplans adjudged as technically feasible and financially viable. Techniciansappraise project proposals, verify borrowers' use of loan proceeds (disburse-ments are made in installments after verification of use of previous dis-bursements) and, whenevernecessary and practicable, render technical adviseand assistance. Many large farmers employ their own technical help. Projectappraisal includes examination of a borrower's past experience and operations,evaluation of the technology and management to be adopted, and an estimate ofthe rate of return on the new investments. ADBI has separate departments forproject evaluation and supervision (para 6), and these functions are performed,by and large, satisfactorily.
11. ADBI makes medium- and long-term loans under various programs, de-pending on the source of funds:
(a) Bank Melli/ADBI (BMI/ADBI) Joint Program. This involves alending program of Rl 1,500 million with funds contributed(or to be contributed as disbursements make it necessary)by Bank Melli and ADBI to the extent of 40% to 60%, respec-tively. Interest income, collections, and losses are sharedin the same proportion.
(b) IBRD-assisted Project (Loans 662-IRN and 821-IRN). IBRD pro-vides 57% of any loan granted and the balance is from ADBI'sown resources.
(c) Commodity Credit Corporation (CCC) Program. This is a lendingprogram financed from proceeds of sales in Iran of U.S. agricul-tural products under US Public Law 480. In general, fundsmay not be used to finance projects which may significantlycompete with U.S. agricultural products. Interest.paid on thesefunds has varied from 5% to 7% depending on the cost of moneyto the tT.S. Treasury at the time of withdrawal.
(d) Other Loans. Financed exclusively from ADBI's capital fundsand domestic borrowings.
12. Lending criteria vary under the different programs. Briefly, theymay be described as follows:
(a) Size of Individual Loans
(1) BMI/ADBI Loans - Rl 0.5 million (US$7,500) to Rl 2.5million (US$37,000).
(2) IBRD-assisted Loans - not exceeding 70% of new invest-ments (or 80% of new investments in the case of loansnot exceeding , RI 20 million).

ANNEX 3Page 5
(3) CCC and Other Loans - no lower and upper limits. In
accordance with ADFI regulations, no loan under anyprogram can be more than 60% of total project cost (oldplus new investments), nor can a loan to a single bor-rower be for more than 15% of ADBI's net worth.
(b) Interest Rates and Other Charges
Inter- Super- Commit-eat vision ment./aRate- Fee /a Fee /b( - percent-=-----)
(1) On-farm developtient loans:
(i) IBRD Projects - 7-1/2 1/2 1(ii) BMI/ADBI --- 8-1/2 - -
(iii) CCC------ … 8-1/2 /3 1/2 Ic -(iv) ADBI (100%) 7-1/2 1/2 1
(2) Agro-industry and agribusinessloans (regardless of source offunds) ------- 8-1/2 1/2 1
/a Percent per annum based on loan balance outstanding.T7 Based on unused balance of approved loan.7W Per agreement with CCC, the total of charges cannot exceed 9% p.a.;
however, except for three loans, the usual charges have been the sameas those for the IBRD projects.
(c) Admissible Collateral; Loan Value
(1) BMI/ADBI - 50% of the market value of immovableproperty, excluding that financed by the loan.
(2) IBRD. CCC, and Other Loans - depending on credit-worthiness, may be up to 100% of immovable property,including that financed by the loan; bank guarantees;Government bonds and securities; and bonds and sharesof private companies quoted by the Tehran Stock Exchange.
(d) Repayment Period
(1) BMI/ADBI Loans -- Based on cash flow projections, butnot exceeding 10 years.
(2) CCC Loans -- Based on cash flow projections, but notexceeding 15 years.

ANNEX 3Page 6
(3) IBRD and Other Loans - Based on cash flow projectionsbut not exceeding 12 years.
D. Lending Operations
Short-Term Loans
13. To protect medium- and long-term loans granted, ADBI ensures thatshort-term credit is available to the investing farmer or entity. ADBI pol-icy is to assist borrowers in obtaining such credit from commercial banks,and, if not available, ADBI will provide such financing. Currently, in-terest charged on short-term loans is 12% p.a. To September 22, 1973,short-term credits have been given to only 17 borrowers for a total ofabout Rl 69 million, indicating that most borrowers have been able tofinance themselves or to secure credit from sources other than ADBI.
Bank Melli/ADBI Program
14. Operations have progressed well. As of September 22, 1973, or justabout a year from the Program's start, loans totalling about Rl 260 millionhad been approved to assist investments estimated at Rl 436 million. Arelatively widespread area has already been assisted, as may be seen fromthe following distribution:
(1) (2) (3) (4) (5)Total In- Totalcremental Loans % of
No. of Costs Approved (4) toProvinces Projects (Rl M) (Rl M_ (3)
Central 18 36.7 26.3 72Khorasan ........ 40 117.9 65.5 56Kerman ..,........ 25 70.1 39.2 56West Azarbaijan . 37 64.3 40.0 62East Azarbaijan . 14 29.9 16.0 54Corgan and Dasht. 32 79.7 52.4 66Fars ............ 11 22.5 14.1 63Others 3 14.9 5.9 40
Total ...... 180 436.0 259.4 60
l3orrower contribution, which on average is 40%, is high; possibly, this isthe result of stringent collateral requirements (para 12).

ANNEX 3Page 7
15. Loan funds have been iipproved for the following subsectors(amotints in RI million):
No. of Investments LoansProjects t'otal Average Total Average
Orchards .............. 76 175.1 2.3 99.5 1.3Crons .............*.... .. 2 51.0 2.3 37.2 1.7Crops and Sheep .......... 53 108.9 2.1 76.2 1.4Potultrv ................ 13 67.9 5.2 26.0 2.0D.airy .............. .*..* 7 16.5 2.4 9.1 1.3Others .. ........ 9 16.6 NA 11.4 NA
Total ........ , 18(0 436.0 NA 259.4 NA
NA - Not available due to the lack of a common denominator.
About 58% of investments were in orchards, crops, and crops in combinationwith sheep raising. These are activities which can be handled more profitablyand efficiently (from the point of view of agricultural background and expe-rience, operating risks, capital requirements, and market accessibility) bysmall farmers and entrepreneurs. 1/ The average sizes of loans are much lowerthan those granted under the regular operations of ADBI (para 17).
Medium- and Long-Term Loans to Medium andLarge Commercial Farmers and Entities
16. From its establishment in December 1968 to September 22, 1973, totalmedium- and long-term loans approved to assist medium and large commercialfarmers and entities amounted to RI 3,248.1 million 2/. These loans wereto help finance new agricultural investments of Rl 7,399.1 million 2/ (Ap-pendix 3-1):
1/ The Program has no readv statistics showing investments in relation tosize of farm or enterprise.
2/ Tt is difficult to give the 11S dollar equivalent of the amounts involved,in view of the greatly varying exchange rates obtaining during the pe-riod under review and che time lag between individual loan commitmientsand disbursements. However, the amounts would roughly be the equivalentof US$45 million and US$103 million, respectively.

ANNEX 3Page 8
IncrementalProject Cost Loans Approved(R1 ?O No. Rl M Z
IBRn Proiects:First 1822.9 62 916.6 28Second .... 2068.6 100 1118.3 34
CCC Projects ..... 1267.1 13 375.4 12ADBI's Own .... 1492.5 23 395.6 12Undetermined Sources 748.0 45 442.2 14
Total ***,***...**oeee 7399.1 243 3248.1 100
It is important to note that operations under IBRD-assisted projects repre-sented more than 60% of the number of loans approved.
17. Financing was to the following subsectors:
AmountAve.
No. % Rl M Z Size
Dairying ............... 37 15 554.5 17 15.0Crops and Sheep ....... 58 24 407.8 12 7.0Crops . ....... 4 2 22.0 1 5.5Poultry. ........ 42 17 778.2 24 18.5Orchards 78 32 648.6 20 8.3Agribusiness .... 6....... 5 2 452.5 14 NAAgro-industry ........... 0. 6 2 147.0 5 NAOthers ......... o.*o... 13 6 237.5 7 NA
Total 243 100 3248.1 100 NA
NA - Not available due to lack of a common denominator.
On-farw investments represented around 75% of loans approved; the five agri-business loans were 12% of the total amount.
IlRP-Assisted Projects
IP. Lending operations under projects assisted by Loans 662-IRN and821-TRN are discussed fully in Annex 5.
CCC Proj ects
i9. In October 1972, ADBI entered into an agreement to use funds fromthe ('ommoi.tv Credit Corporation (CCC) of the U.S. Department of Agriculturearising outt of sales of surplus agricultural products under U.S. Public LawZRn The program is just starting and most of the assistance has been givenfor orchard establishment in the province of Kermanshah:

ANNEX 3Page 9
Incremental ApprovedProject Cost Loans
(Rl M) No Rl M x
0rchards ............ 174.7 9 124.1 33Dairving .........-... 32.1 1 24.8 7Poultrv ............. 124.7 1 80.0 21Agribusiness ........ 675.0 1 76.5 20Agro-industrv .*.. 260.6 1 70.0 19
Total ...*...... 1267.1 13 375.4 100
Other Loans
20. Since its establishment to September 22, 1973, ADBI has approvedassistance totalling Rl 1492.5 million to 23 projects in the following sub-sectors:
Incremental ApprovedProject Cost Loans
(RI M) No Rl M X
Orchards ............ 18.6 4 27.4 7Dairying ............ 73.2 4 70.8 18Crops and Sheep ..... 35.1 6 34.4 9Poultrv ........y.....* 99.3 3 74.0 19Agribusiness 10......... o.n 1 70.0 17Agro-industry ....... 74.7 1 40.n 10Others ....... 102.6 4 79.0 20
Total ..... 1492.5 23 395.6 100
The total loans approved include 16 loans amounting to Rl 62.9 million whichwere granted to supplement loans originally given under the IBRD-assistedprojects. ADBI has resorted to this practice on occasions where collateralwas sufficient to grant a bigger loan beyond the 70Z-of-new-investments limitprescribed under the IBRD-assisted projects (para 12).
Loans from Still Undetermined Sources
21. ADBI's practice is to evaluate all project proposals on the samebasis (para 10) and to decide later about which funds to use. As of Sep-tember 22, 1973, there were 45 such projects approved for financing, butas yet no disbursements on them have been made:

ANNEX 3Page 10
Incremental ApprovedProject Approved
Cost LoansRlM No. Rl M
Dairving ......... 40.9 4 29.4Crops and Sheep .. 126.6 13 94.5Poultry .......... 310.5 6 165.0Orchards ......... 171.2 19 100.6Others ... ........ ** 98.8 3 52.7
Total ....... 748.0 45 442.2
E. Financial Qperating Results and Condition
Financial Operating Results
22. The improvement in ADBIts operating results through the years maybe seen from the following (in RI millions):
Total NetExpenses Income Net& Losses or Loss ( ) Income
Total (before before orPeriod Income taxes) Taxes Taxes Loss C )
FY 1969 17.6 30.1 ( 12.5 ) - ( 12.5)FY 1970 30.3 42.8 ( 12.5 ) ( 12.5)FY 1971 58.0 65.5 ( 7.5 ) - ( 7.5)FY 1972 99.1 80.9 18.2 4.1 14.1FY 1973 /a 125.0 109.7 15.3 4.0 11.3March 23 to
September 22, 1973 120.8 108.0 12.8 - /b 12.8
/a Covering only nine months as a result of changing ADBI's fiscal year(which ended June 21 previously) to end March 22.
/b Taxes due would be computed at the end of the fiscal year.
23. As lending operations have expanded, loan interest has become themajor source of income, accounting for more than 60% of the total in recentyears. Income from Government bonds, where ADBI's funds have been investedin ADBI's early years, has fallen to around 20% of the gross but is stillsignificant.

ANNEX 3Page 11
24. Since FY'72, personnel and generil and administrative expenseshave been around 50% of the total expenses incurred. With the increase inlending volume, interest on monev borrowed has also grown and since FY'73has accounted for 40% of the total. As a result of the devaluation ofthe U.S. dollar, losses of Rl 7.3 million have been incurred during theperiod June 22, 1972 to September 22, 1973 from collections of subloansdenominated in U.S. dollars.
25. Details of ADBI's operating results since FY'69 are shown inAppendix 3-2.
Financial Condition
26. A comparative statement of ADBI's financial condition at the endof every fiscal year since 1969 and on September 22, 1973 is shown in Appen-dix 3-3. Total assets have expanded greatly - again, because of the rapidincrease in lending volume. While at end of FY'69 the loan portfolio wasRl 221.4 million, on September 22, 1973 this was Rl 2138.6 million, or al-most ten times over. These loans have been financed from capital contribu-tions from Government which on September 22, 1973 totalled Rl 1.570 million,from funds borrowed from Bank Markazi Iran (overdraft), and from IBRD andCCC (para 11).
27. ADBI is in good financial condition. Its past due loans arenegligible. Although some loans and investments may prove to be bad even-tually (notably, Iran-California), the loans, at least, are well secured.Per books, ADBI's capital is unimpaired. Although losses of some Rl 80million are expected from future collections of subloans denominated inU.S. dollars and another Rl 6 million from the servicing of amounts sofar incurred under IBRD Loans 662-IRN and 821-IRN, it is expected thatthese can be covered from future income. Appendix 3-4 is a statementshowing ADBI's operating results projected to FY'79. A projection ofADBI's financial condition is shown in Annex 3-5.


IRANThirdAisBI Agricultural Credit Project Appendix 3-1
TOTAL ADBI LOANS FOR MEDIUM AND LARGE COMMERCIAL PROJECTS
Cumulative to September 22, 1973
(All amounts in Rl M)
First Second Unde -ADFI termined
Project Project CCC ADBI Source Total
No. of Projects ............... ,. 9 1 l9 4 4 37Total Project Cost ....... ........... 505.6 609.7 80.7 181.0 54.3 1431.3
Incremental Project Cost ..... ....... 287.0 464.5 32-1 73 2 40.9 897.7Total Loans Approved..48.4 281.1 24.8 70.8 29.4 554.5
Total Loans Disbursed .... 1.......... i48.4 199.3 22.8 68.8 -.- 439.3Total Loans Undisbursed ............ - 81.8 2.0 2.0 29.4 115.2
Crops and SheepNo. of Projects ................. ... 12 27 - 6 13 58Total Project Cost ............ 391.3 474.7 -. 48.1 201..4 1115.5Incremental Project Cost .217.2 238.7 -- 35 1 12o.o 617.6Total Loans Approved .114.8 164.1 -.- 34.4 / 94.5 407.8Total Loans Disbursed .95.1 119.9 - 24.8 -. 242.8Total Loans Undisbursed . 16.7 44.2 - 9.6 94.5 165.0
CropsNo. of Projects .2 2 - - - 4Total Project Cost .51.0 15.8 -.- -. -.- 66.8Incremental Project Cost .26.7 8.3 -.- - 35.0Total Loans Approved .6.o 6.o -.- - -.- 22.0Total Loans Disbursed .14.5 5.0 - .- - - 19.5Total Loans Undisbursed . 1.5 1.0 -._ - - 2.5
PoultryNo. of Projects .13 19 1 3 6 42
Total Project Cost .746.o 739.1 124.7 214.4 407.3 2231.5Incremental Project Cost .438.8 458.6 124.7 99.3 310.5 1431.9Total Loans Approved .233.8 225.4 80.0 74.o 165.0 778.2
Total Loans Disbursed .233.8 176.2 80.0 44.0 -.- 534.oTotal Loans Undisbursed .-.- 49.2 -- 30.0 165.0 244.2
Orchard EstablishmentNo. of Projects .17 29 9 4 19 78Total Project Cost .394.1 888.9 369.o 27.9 268.4 1948.3Incremental Project Cost .224.3 464.6 174.7 18.6 171.2 1053.4
Total Loans Approved .132.3 264.2 124.1 27.4 3/ 100.6 648.6Total Loans Disbursed .113.2 164.2 62.6 24.5 - 364.5Total Loans Undisbursed .19.1 100.0 61.5 2.9 1 oo.6 284.1
Agri-BusinessNo. of Projects .2 1 1 1 5Total Project Cost .so5.8 318.7 907.3 1089.0 -- 2820.8Incremental Project Cost .505.8 318.7 675.0 1089.0 -- 2588.5Total Loans Approved .196.0 110.0 76.5 70.0 -. 452.5Total Loans Disbursed .196.o 110.0 15.0 25.0 -. 346.oTotal Loans Undisbursed ._ . _.- 61.5 45.0 - 1 o6.5
Agr.-IndustryNo. of Projects. 3 - 2 _ 6Total Project Cost .46.4 136.2 -. 123.0 -.- 305.6Incremental Project Cost .26.4 115.2 -.- 98.2 -.- 239.8Total Loans Approved. 16.o 67.5 - 63.5 - 147.0Total Loans Disbursed .7.6 64.2 -.- 58.5 - 130.3Total Loans Undisbursed .8.4 3.3 -.- 5.0 -.- 16.7
OthersNo. of Projects .6 - 1 4 3 14Total Project Cost .154.1 -.- 260.6 137.6 108.3 66o.6Incremental Project Cost .96.7 -. 260.6 79.1 95.8 535.2
Total Loans Approved .59.3 -.- 70.0 55.5 52.7 237.5
Total Loans Disbursed .59.0 _ .- 53.2 32.3 . 144.5Total Loans Undisbursed .0.3 -. 16.8 23.2 52.7 93.0
TotalsNo. of Projects .62 100 13 24 45 244
Total Project Cost .2794.3 3183.1 1742.-3 1821.0 1039.7 10580.4Incremental Project Cost .1822.9 2068.6 1267.1 1492.5 748.o 7399.1Total Loans Approved .916.6 1118.3 375.L 395.6 442.2 3248.1Total Loans Disbursed. 870.6 838.8 233.6 277.9 * 2220.9Total Loans Undisbursed .46.o 279.5 141.8 117.7 442.2 1027.2
V Includes 2 supplementary loans totalling Ris 13.3 M.
i/ Includes 2 supplementary loans totalling Rls 6.9 M.
3/ Includes 7 supplementary loans totalling Rls 16.9 M.
| Includes 1 supplementary loan totalling Rls 4.o M.
2/ Includes 2 supplemientary loans totalling Rls 9.3 M.
6 Includes 1 supplernentary loan totalling 10.0 M.
February 4, 1974

COMPARATIVE STATEMEN OF INCOEM AND EXPENSESof ate
AGRICULTUTRAL. DEVELOFS4ET BANK OF IRdN0O-oa ~the FTisa Y--r I.dicated
FY '70 FT 7 FT '72 FT '73 March 2) Sept 22, 1973C~ of Thbtnt C o Totl of Total 6or Total1 of Totai
R10 M Iac.-c Ris M bone- 0is M income Ris M inomoe Rlo N TaCome
Intere..t onLoas
a.FirsoADBO r-j-t ...o ..... 0.2 0.7 22.2 33.3 42.5 43.1 38.4 30.7 22.6 19.7b. Socond AttO r-je-t ........... - - .- 3.4 3.4 26.9 21.5 33.5 27.7
Book Nelli/AERO .....o..... IN 1.3 1.11. C. C. L00n5........................ I3.0 2.4 6.0 5.0Oth-r L-- -s..... ...... 6.3 21.9 9.2 15.9 17.7 i7 156 0-- 2.5 3.6 7.1To,ta1 1t-tret 00oL- ......... 21.5 31 54.2 -- 6:77______.1 T 72.0 %
a. Firat A101 irojet ....... N N 1.4 2.4 2.8 2.9 2.4 1.9 1.3 1.2b. Seco.d AHTC Fr-j-t ........... .- 0.2 0.2 1.3 1.4 2.2 1.8
C. C. C. L00... . ................-...... 0.2 0.2 0.A 0.3Other~- lor.0............. .6 2.3 O.6 1.0 1.1 Li1 0. 0.9 0. 0.3Total Supeoloi. to Fe.-............ 2.0 2.0 3 -~ y - : 5. - --- : 3 - 6
Loon Coaitor-t Foe:00000 Cojeoto -
o. Firot
03DB1 Pr-jet....... 0.1 0.3 0.9 1.6 0.0 2.0 0.3 0.6 0.5 0.4t. roo-d 00B1 Frojeot ........ -. -- 1.3 1.3 1.2 1.0O 1.1 0.9
Oth-er - .................. 0.2 0.7 0.3 0.5 0.2 0.2 0.3 0).2 0.6 0.50t01 1000 Co-uit-eot Foe 0.3...1.0s 1.2 2.1 3.5 3.5 2.3 1T 8 2.2
T-.,r-to 00 Co-er-to 00d000 .... 22.6 74.6 20.7 39.3 23.6 23.3 28.3 22.7 27.6 02.9
Dioido-do fer- Equity .......e... - -.- - - -. - 8.0 6.6
Otter rI,-.0................O3 0.9 0.7 1.2 4.0 4.2 5.5 4.4 6.6 5.5
Toht7 I-o n.................30. 000.0 59.0 100.0 99.1 100.0 105.0 100.0 120.3 100.0
3--ir,toos, ooo Foronoonl Renorito 27.7 91.4 34.4 59.3 00.0 40.4 42.1 33.6 35.9 29.7
3eorrnl nod Addi.iottroi- Eop-- ...... 8.8 29.0 12.3 22.1 12.2 12.3 21.2 17.0 13.0 10.
n 0001D Loan 662-I000 -.. Totere ...a I.......... - .- 7.7 13.3 22.6 02.9 21.0 16.9 16.5 13.7b. looit-et Fee......... 0-3 1.0 23 5.0 1.5 1.5 1.1 3.3 N N
oto Ch-rg- ........ 0..0 --- O 3T9 2 2'TZ 3 25.2 00.2 T9L 1.coo IBtD Loan 321-ItoN
n. Iteret ....................... -. 6.2 5.c 13.s 1.t. Coost_net fee.......-......-...- Z- 1.0, 0.3 2.0 _2.0_
Totnl Ch-r9cn.-.-.................-.7.2 5.39- 15.7 13.0Ooere-t onC. C. C. Rondo .............--- 14 E.4 13.9Tot--et on-redraft hi Rant M-kol .- -. 3.7 6.4 2.3 2.9 4.1 3.3 4.6 3.8
OiraeosFi-aninl Eope- ..... 0.1 0.3 1.2 2.0 0.3 0.3 0.3 0.2 0.4 0.3Toto1 Fin-onio1 Oopen... ..... .... 1.3 15.5 26.7 27.2 27.5 1~7t 33.3 51.6 * ~7~
E-ohang Losseo Inr..rr.d............ -. -. -. -. 1.5 1.2 5.3 4.3
Protisi- for Doubtftl Obt00.........3.7 12.2 -. -- -. 2.4 1.9 -.- -.
Drtreonstno.. ............... 2.2 7.3 2.8 4.3 1.5 1.5 0.9 1.9 1.7 1.3
Tone.................... -- -. -- 4.i 4.1 4.0 3.2 ___________
T1tl001 e~ itnc................42.3 141.2 65.5 11p'. 3 5.0 35.3 113.7 91.0 103.0 99.3
NET0800COME 12.5) 43.2) (7.5) (12.9) 14.1 14.2 11.3 9.0 123.3 10.7
LI Nine -otin ending Mor-h 20, 1973.
Tko030 02 i0 tho toots at the end of tin fiscal yea.
Petoa-r 4, 1974

Third AIBI Agsricutu . Credit Project Appendix 3-3
COMPARATIVE BALANCE SHEETo' the
AGRIOCLTURAL D RVM59E BAR OF IRANAs of Dates Indicated
JAn 21. 1970 June 21, 1971 June 21, 1972 March 20 1973 Jeopteuber 22, 1973
RI. M in M Ch nge Rla M Rls M Chu5ge hEls M Change
A C S E S S
Cash Assets . ......................................... 44.5 0.5 44.0 ) 29.1 28.6 59.0 28.9 5.0 5 3.0
1ntereot and Ceisiajno. Rcie hle .4.3 23.6 19.3 26.5 2.9 50.5 24.0 71.0 20.5
ib,:'-t-Te ..en ... ....-........ ...-.- -.- -.. 23.0 23.0 24.3 1.3 7.1 17.2
Medi-a and Lon., ['Cn:First AlRr Project .124.8 269.1 144.3 597.3 328.2 580.2 ( 17.1 ) 662.5 82.3
-econd AlktT Project .-.- . -..- 242.7 242.7 694.6 451.9 757.1 62.5
Bnk MelIiAIiBT Pr-ogra -.- _,_ _._ _,_._,_6.4 6.4 53.4 47.0
' Pro.1 ran.-- --............ . .I.............. 155.9 155.9 217.6 61.7
Others96.221.4 52135.7 20 242.6 10,3l SO.7 (2.. 91.9 ) 440"rt.I Lo , ns Ousdir 22.40.4.1105.6.604.2 161. 1 506. 136. _ 50.75
IrEs: Res_rve r., D,ubtrul Debt. _5.5 __5-.- 8.0 2.5 8.0
Net R.ok Value of -san . ... 0.0 i... IIOO...I 6 504. 0 526.6
I ..s.tje.nts 346.5 362.8 06.3 356.5 ( 6.3 ) 893.3 536.8 964.8 71.5
'iA... Ace: L .4.3 22.5 18.2 22.8 0.3 29.8 7.0 30.3 0.5
Miscellaaees Assets.9 1_3 8. 17.9 68.8 54.9
Iboal As-ets6 _6.8 923.4 306.6 159I.0 657.6 2699.6 ii8.6 3320.5 620.9
I. I A I II. I T R S A N D N E Sr W O R T E
e,l-rlel C'rodlitora and Aceroed Eppeo.ses 50.5 27.3 ( 23.2 ) 23.0 ( 4.3 ) 47.3 24.3 402.5 355.2
Lso,,-t'PIln DuAnel:IBRD L-oan 642-IRN . .. 18.3 20o.4 192.1 371.0 170.6 458.2 87.2 466.8 8.6
TBRD Loan 821-IEN .....- 293.8 293.8 376.6 82.8
CC Credit 7aeilitlee (USAID) .-.- -..- -.- -.- -.- 498.8 498.6 4988.8
fetal Long-Tern Loans.3 23. . .92.1 3 7 1 0 17 06 T7 T134 2 91.4
'te-r hiebilities- .. . . . .. 2.9 3. 1 0 2.2 __ 5.3 ____i.. 22 9.s 3.2- 8.5
Tt.l Libiliti............................ 6i.7 230.8 169.1 3993_3 - 168.5 1306.6 907.3 1744.7 438.1
Net WMeth.:Paid-It Capital. 580.0 725.0 145.0 1200.0 475.0 1400.0 200.0 1570.0 170.0
Ocoeree for fPosible Losn-c on ForeignRoohano eTeraneations... _, _. - . -_._ -_. - 6.o 6.o 6.o
Surplus.( 24.9 ) ( 32.4 ) = ( 7.'; ) J 18.3 ) _ 14.1 ( 13.0 ) 5.9.3 ( 0 2 12.8
Total Net Worth .555.1 692.6 137.5 1181.7 489.1 1393.0 211.3 1575.8 1828
Tetal Liabilitiee and Net Worth ................. 616.8 923.4 3 06.6 1581.0 657,6 _ 260 1118.6 3320.5 62o 2
/ Change feen pre-icua balanee aheet date.
2 h' COogo in fi.-en yoar to end M-rch 20.
FPbh-ary 11, 1974

DUIbrtd AS Agc I Cr dit PNct
210230! 8 8 0r Il02 MID DLERSAa=2s Beam OF n N IEN=
ToW. .4 W-.7 the
1915 116 1977 19o 19796of S otal - of .o.a % or 7t - or Total S of Total
RI 8 . R1 14 Lo RI K l U 11 I a K M4
I N C O t1 E
Interest -n Lo:IBRD Poject. -
a. Int. ADI Projc ..................... 46.0 U.6 40.7 7.3 34.3 4.5 27.7 2.9 21.9 1.9b. 2rcond ADFI Prjet .... 6 29.0 121.6 21.7 116.9 15.4 108.9 1.3 97.5 8.6c. Third ADBI Project 26.6 6.7 123.6 22.1 247.8 32.7 3U.6 32 312.67 275d. nrtene* ProJec . 10.6 2.7 31.6 5.6 45.9 6.i 46.6 43 39.2 3.4
ADBIaBnk in. pro P . . . 14.9 3.8 17.8 3.2 17.5 2.3 16.8 1.7 13.9 1.4CCC t-IT ..y.......... . . ..... 61.4 15.5 91.8 16.4 U 6.4 15.4 140.4 14.6 168. 5 14.8Oth-rl- n 5 .12.......... 58 . 10. 4 103-. 6 3 7 216.6 22S3S9.6 32 4
Totl. Int.et on las .. A.4 9.. j14 7I 1
.Pnrision le:l0RD Prajeot. _
a. trt AIt P troet .6.i 1.5 5.4 1.0 4.6 0.6 3.7 0.4 2.9 0.3b. 8ed ADIII ProJ-t .14.7 3.7 36.2 2.9 15.6 2.1 14 1.5 13.0 1.1
CCC loas .8.2 2.1 12.2 2.2 15.3 2.0 13 7 1.9 . 22.5 2.0Oth-r lan. 4.7 1.2 4.38 0.7 1.2 0. 3 2.6 0.2
Tota1 oprvtienr P. e.. 3I . .... ..... 1 ...... .
lon Codtrat FeeID Pjet. -
a. d ADDI Projot .1.2 0.3 . 0.7 0.1 -- -- _ _b. Thitd AZI PrJ. . .t 1.2 3.9 23.1 4.2 9.9 1.3 2.5 0.3 04-
Total fotite pee . 14 ; .2 ; 3 3 2 2 3...5.4 6.0
Intrert on oro.t Bnds .22.8 5.8 10.2 1.8 - _
Otber In and Cssi.a .s.2.0 ............0.5 2.4 o04 2. 9 .4 3.5 o.4 4.1 0.4
Total Reptod Inco t.. 395. 100.0 559. 100.0 757.0 100.0 A 100. 1138.7 100.0
I X P 1: b a I S
6mlarte, lBe -es and Pereonetl B e afits 92.2 23.3 129.8 21.4 155.8 20.6 202.3 21.0 263.g 23.2
eral md Ad.i.trCtiv E.pe ts. 31.2 7.9 37.4 6.7 44.9 5.9 53.9 5.6 64.7 5.7
Pinanclel n---eOn DPD an 662-IS -
a. Interst .31.6 8.o 29.2 5.2 26.6 3.5 23.9 2.5 20.9 1.8On IBPD loan 821-_INN -
a. Interst ................................ 61.3 15.5 66.9 32.0 61.9 8.2 54.8 5.7 47.2 4.2b. 0 it-nt FN. 0.8 0.2 -. _ _._ -.- _.-
on Third I20D Loana. Intareut 15.7 4 0 70.1 12.5 141.6 18.7 182.3 18.9 193.6 17.0b. Co_itnet No.18.7 4.7 13.0 2.3 .6 0.7 1.4 0.1 0.2
On 0022 Lan-Fis ere PerJeota. Interest8.09 2.3 26.7 4.8 44.5 5.9 53.3 5.5 52.4 4.6b. Cornittnet Yes .............. . 4.6 1.2 2.7 0.5 0.9 0.1
Interest an CCC Fd.n. 56.9 14.4 87.6 15.7 117.8 15.6 144.7 15.0 166.3 14.6Ieterent on O-rdrft-B.ek M-ke -T Iran 6.9 1.7 9.0 1.6 8.7 1.2 10.2 1.1 15.8 1.4Riaoollsnaas Financial Eenee 0.1 0.7 0.1 O .9 0.1 1.1 0.1 1.4 0.1
mteal in.enejal honece. 9.1.9 5U.7 W .47C17 -iZ-! 497.
Proviicne for Dvobtel Dbte. .. 50.0 12.7 75.0 13.4 125.0 16.5 200.0 20.7 220.9 i9.4
DeprecIation . --........... 2.5 o.6 3.0 0.5 3.0 0.4 3.5 0.4 3.5 0.3
Toze. .4.0 1.0 6.7 1.2 6.8 0. 3.I 1.4 46.1 4.0
Total epeated Enp.sa... 3 ................ 97.6 547.8 97. 9 744- 98. 3 945.1 98.0 1096.2 9.3
xrT IICOME 2/.3 2.4 U.9 2.1 13.0 1.7 19.4 2.0 42.5 3.7
lt lMre! 21 to lan!. 20;; b oaouidaratioo
PeFr lean gre ted -nd-r this proran prior to Third Project-lane. rented free BIRI an rtosoroes
2/ bt ian .. bee n eoeeraratielj e.ti.ated by Large previoe. f.rorpO..ible Lasso. from doobtf1l debt and by not iaclddiog p.s.ibledivldends finn AXIa equity iv-tets (see itn 'Interest an Gn-otnt Boods).
Jw lFo1 1974
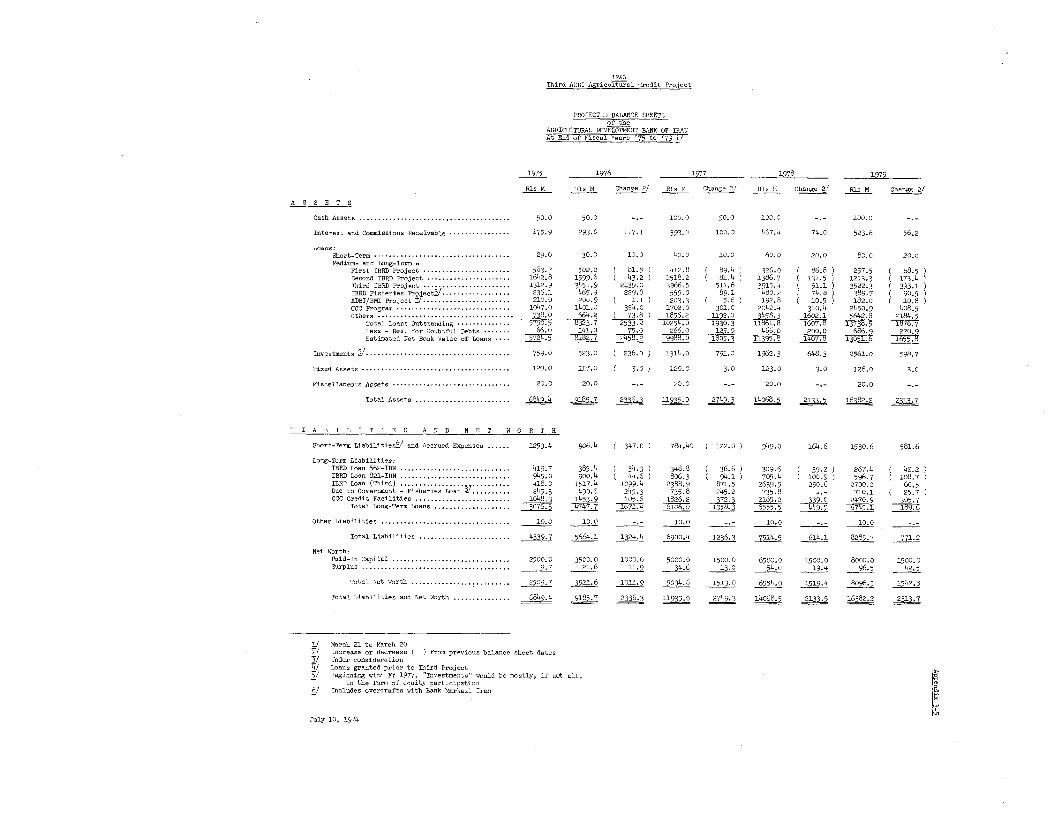
Third ADBI Agrioltlurel Credit Projeot
PRO-ECTET. BAIAICE S8EETSof the
AGRICULTURAL DEVELRPEIlT BANE OF I0A'At End of Fiscal Years '75 tO '79 17
1975 1976 1977 1978 1979
REs M _ls N CheRge i/ E1: I' ChRnge 1C M C 5 ng3. 2/ RlB M Chango 2
A S S E T S
CTSh Aets . ........................................ 50.0 50.0 - .- 100.1 50.0 19.2 -. _ 100.0
Interect. and Coanisios. Rdeceivable .175.9 293.0 117.1 393.0 100.0 467.4 74.0 523.6 56.2
Loans:Short-Teem . 29.0 30.0 10.1 42.2 17l.0 6i.o 20.0 80.0 20.0Mddium- end Sung-Torn -
First IBRD Project.. 537 502.2 ( 8
1.5 ) 412.8 89.4 326.0 66.8 ) 257.5 ( 68
.5Seoond IBP Project. 1642.8 1599.6 ( 43.2 ) 1518.2 ) 8i.4 1386.7 ( 131.5 1213.3 ( 173.4Third IBRD Project .1312.9 3451.9 2139.1 3966.5 514.6 3915.4 ( 51.1 ) 3522.3 ( 393.1IERD Fisheries - rp o.... 236.1 465.9 229.8 555.0 89.1 480.2 74.8 389.7 ( 90.5ADBI/BM Orojeot 7.010.0 o6.9 ( 1.1 ) 203.3 ( 5.6 ) 192.6 ( 10.5 ) 182.o ( 10.8CCC Frogrs .......... ,o. 1 47.o 1 4o1.o 354.o 1702.0 301.0 2042.4 340.' 2450.9 408.5Others. ....... 738.0 664.2 ( 73.8 1856.2 1192.0 3456.3 1602.1 5642.8 21.34.5
T.otal Tunis Dntstacldtg ..-.-----.-. 5790.5 8323.7 2533.2 1o25o .) 1930.3 11793.8 1607.6 37938. 18W76Les: - Ree. for Doubtful Debts 66.0 1 41.0 75.0 2 66.0 125.0 466.o 200.0 686.9 22009E.tinnted Set Book Value of Loans 5704.5 6182.7 2 518.2 9988.0 1805.3 11395.6 1407.8 13051.6 1 6 5 5 38
Investmeets 2/. ..................... 759.0 523.0 ( 236.o ) 1314.0 791.0 1962.3 648.3 2561.o 598.7
Fined Asset ............ ......... ,,.. 120.0 117.0 ( 3.0 120.0 3.0 123.0 3.0 126.o 3.0
Mi6celaneous AnneAts ..... .................... 20.0 20.0 -,- 20.0 -.- 20.0 -.- 20.0 -. -
Total Assnt .6849.4 9180.7 236 11935.2 2749.3 l4213.5 16382.2 2313.7
1 I A B I L I T I E S A N D N E T W 0 R T D
Short-Te r Liablitltte/ and Acoroed Expen.ss . 1253.4 906.4 ( 347.0 ) 784.40 ( 122.0 ) 949.o 164.6 1530.6 581.6
Long-T-rn Liabilities:IBRD Loss 662-IRN . ............... 419.7 385.4 ( 34.3) 348.8 ( 36.6) 309.6 ( 39.2) 267.4 ( 42.2IBRD Loan 821-IRN . . 945.0 900.4 ( 44.6) 806.3 ( 94.1) 705.4 ( 100.9) 596.7 ( 108.7IBRD Loss (Third) ....... 4a0.o 1517.4 1090.4 2388.9 871.5 2639.5 250.6 2700.0 60.5Foe to Novernuont - Fieheries Loan . .......... ::: 245.3 49o.6 245.3 735.8 245.2 735.8 _ ,_ 710.1 ( 25.7CCC Credit Facilities . .1048.3 1453.9 405.6 1826.2 372.3 2165.2 339. 02470.9 305.7
Total Long-Term Lnan . .3076.3 4747.7 1671.4 6106.0 135 .6555.5 449 5 6745.1 1896
Other Liabilitie .................................... 10.0 30.0 -,- 10.0 -. _ 10.0 -.- 10.0 -,_
Total Lihbiliti .. ...................... 4339.7 5664.i 1324.4 6900.4 1236.3 7514.5 614.1 8285.7 771.2
Net WorthPaid-In Capital ............................... 2500.0 3500.0 1000.0 5000.0 1500.0 6500.0 1500.0 80O.0 o 1500.0Surplos ....................................... 9 . 6 11.9 34.6 13.0 54.0 1 9.4 96.5 42.5
Total Net Worth .......................... 2509.7 3521.6 1011.9 5034.6 1513.0 6554.0 1519.4 8096.5 1542.5
Tots! iahbilities and Net Worth. 6849.4 9185.7 2336.3 11935.0 2749.3 14068.5 2133.5 16382.2 2313.7
Maro 21 to Mar.h 20- -norease or decreaso ( ) fr-o pre-oi.. balance chest dnte:
3/ Under considerstionLoans granted prior to Third Project
5/ Beginning with FY 1977, "Investments" could bo -ostLy, if not nll,is the fore of equity part-cipation
6/ In_ludes overdrafts oith B-nk Markaci Iran
July 10, 1974

ANNEX 4Page I
I RA-NThird ADBI Agricultural Credit ProJect
BANK MELLI IRAN
A. Organization and Management
1. The Bank Melli Iran (BMI) is a joint stock commercial bank whose
shares are solely owned by the Government of Iran. BMI was established some
44 years ago and for many years before the establishment of the Bank Markazi
Iran, functioned as the Iranian central bank as well. Its policies are set
by a High Council (with seven members, all appointed by Government) and its
affairs are managed by an Executive Bo;ard consisting of five BEI officers:
the President, Deputy President, and t.aree Executive Vice Presidents.
2. BMI has over 1,100 branches and offices in Iran, plus branches in
Hamburg, London, New York, Sharjah, Bahrain, Paris, Jeddah and Hong Kong.
B. Lending Policies and Procedures
3. BMI is the largest commercial bank in Iran. Its lending policies
are commercially-oriented and are based on promoting Iran's internal and ex-
ternal trade. Accordingly, it provides working capital loans to industry and
commerce as well as medium-term loans to industry. Recently, BMI, through
an arrangement with ADBI, has ventured into agricultural investment lending
as well (see Annex 3).
4. BMI's lending procedure is decentralized. Branch managers have
the authority to approve loans end credits up to prescribed amounts; beyond
that would need the approval of the Regional Head Offices, and beyond this,
the approval of the Central Head Office in Tehran.
5. Loans and credits are extended strictly against valuable assets
and securities. Loans are seldom given purely on the financial standing of
the borrower. Collaterals required by BMI, in the order of their preference,
are as follows:
(a) Bills of exchange;
(b) Bills of lading, shipping notes and other documents
of title;
(c) Goods evidenced by bonded warehouse certificates;
(d) Bank guarantees;

ANNEX 4Page 2
(e) Government securities;
(f) Joint guarantees of partiers, directors, and theborrowing company;
(g) Immovable assets, includitig plant and machinery.
6. Interest charged on loans varies from 8% to 12% per annum. InrespccL of some medium-term loans to industry, there is a small commitmentfee. For the agricultural loans shared with ADBI, interest charged in; 8-1/2%per annum.
C. Sources of Funds
7. BMI derives its lending funds from capital contributions by Govern-ment, from borrowings from the Bank Markazi Iran, and from deposits. Aidedby its widespread network of branches and offices and, reportedly, becauseof its reputation as a stable institution, deposits received have been in-creasing, as may be seen from the following:
FY'70 FY'71 FY'72 FY'73I increase - increase X increase
Ri M over FY'70 over FY'71 over FY'72
Demand Deposits .......... 21,873.3 5 10 29Savings Deposits 23,612.1 12 23 32Time Deposits ..... . 25,47.4 13 35 18
Total ........... 71,432.8 10 24 25
8. BMI currently pays 7% and 9% per annum on savings and time deposits,respectively. No interest is paid on demand deposits.
9. In FY'72, Government increased its contribution to BMI's capitalfrom RI 2,000 million (US$29.6 million) to Rl 3,000 million (US$44.5 million),which augmented BMI's lending funds. In addition, amounts owing on account ofincome tax due and dividends payable have,been allowed to accumulate; theselikewise, have been used for lending and investments.
D. Financial Operating aesults and Condition
10. Appendix 4-1 compares results of operations during FY'70 to FY'73.Briefly, total income and expenses have both increased by around 80% duringthe ;eriod. Accordingly, annuai net prorits before taxes have been maintainedat about 16% to 19% of total income. Taxes payable, which are assessed on a

ANNEX 4Page 3
graduated scale (the higher the net income the higher the tax rate), have keptyearly net profit after taxes at around 8% of total income. The major itemof income comes from BMI's banking activities (loan interest, commissions,and exchange profits), which accounts for around 95% of the annual gross.
11. The important items of expense - operating and administrativeexpenses and financial expenses - have each accounted for around 40% ofannual gross income. Htowever, comparing the trend of these items in absoluteterms, one finds that while operating and administrative expenses have risenby abcut 55% during FY'70 to FY'73, financial expenses have more than doubledduring the same period. Aside from the fact that the cost of borrowed money(including deposits) has increased, it would appear that BMI is under-capitalized.
12. Appendix 4-2 is a statement comparing BMI's financial condition(from published reports) at the end of FY'70 to FY'73. Per books, BMI is ingood financial condition. On March 20, 1973, aside from its capital of Rl3,000 million, there were surplus reserves of Rl 2,441.4 million (US$36.2million), or a total net worth of Rl 5441.4 million (US$80.6 million). Never-theless, from the viewpoint of protection of creditors, BMI's net worth wouldappear to be insufficient, it being barely 5% of "risk assets" (assets exposedto risk of loss, or, in this analysis, roughly total assets less cash assetsand Government securities). A loss of more than 5% of risk assets could wipeout net worth and infringe on the rights of creditors.
March 19, 1974


IRANThird ADBI Agricultural Credit Project
COMPARATIVE STATEMENT OF INCOME AND EXPENSESof the
BANK MELLI IRANAs of Fiscal Years / Indicated
iY70 rY 71 rY 72 Fy 73% of Total % o' Total % of Total % of Total
Ris M Xncome Rls M Income Rls M Income Rls M Income
INCOME
Interest, Commissions, and Profit onForeign Exchange Transactions 6432.9 95.2 8182.9 94.9 8967.4 95.2 11669.6 95.9
Profit on Bullion Transactions .44.8 0.7 40.2 0.5 35.0 0.4 12.2 0.1
Other Income.. 279.1 4.1 395.7 4.6 411.0 4.4 483.2 4.0
Total Incme .6756.8 100.0 8618.8 100.0 9413.4 100.0 12165.0 100.0
EXPENSES
Operating and Other Expenses 2863.8 42.4 3318.3 38.5 3896.1 41.4 4437.5 36.5
Interest and Commissions Paid .2244.3 33.2 3492.9 40.5 3535.1 37.6 4861.9 40.0
Depreciation of Assets. 343.4 5.1 383.8 4.5 406.8 4.3 481.8 3.9
TotalExpenses. 5451.5 8o.7 7195.0 83.5 7838.0 83.3 9781.2 80.4
Net Profit Before Taxes .1305.3 19.3 1423.8 16.5 1575.4 16.7 2383.8 19.6
Income Tax .734.4 10.9 807.4 9.4 875.8 9.3 1386.9 11.4
Net Profit ......... . . .. 570.9 8.4 616.4 7.1 699.6 7.4 996.9 8.2
Source: Published Statements
(D
j Twelve months ending March 20 of every year
February 11, 1974

T'hirdADBI Agricultural Credit Project
COMPARATIVE BALAUCE .iHEETof the
BANK MELLI IRANas of Dates Indicated
March 20, 1970 March 20, 1971 March 20, 1972 March 20, 1973Change from Change Change from Change from
his M Rsi M 3/20/70 Rl S Mc 3/20/71 _ ___ _Rls M __ ___ _
A S S E T S
Gold and Cash Assets ............................ 18360.8 24963.4 6602.6 24705.1 ( 2 58.3 32491.8 7786.7
Securities .4613.4 2878.3 ( 1735.1 ) 8903.6 6025.3 11824.5 2920.9
Bills Discounted .16741.5 17846.3 1104.8 20592.9 2746.6 23044.1 2451.2
Loans and Other Advances .49852.2 54921.5 5069.3 64686.4 9764.9 82767.8 18081.4
Participations and Shares .1163.3 1168.8 5.5 1187.4 18.6 1401.9 214.5
Foreclosed Mortgages ............................ 867.5 1001.3 133.8 996.6 ( 4.7 ) 1036.5 39.9
Other Assets, including Goodwill ................ . ,_2692.2 2o43.9 . 648.3 ) 2562.3 518.4 2843.4 281.1
Total Assets .9.290. 104823.5 10532.6 123634.3 18810.8 155410.0 3177o.7
L I A B I L I T I E S A 1 D NSET W O R T H
Income Tax Payable .700.6 803.5 102.9 871.8 68.3 1374.2 502.4
Dividends Payable .................. 285.0 326.0 41.0 377.5 51.5 507.0 129.5
Due to Banks ................ 1 13579.2 15273.3 1694.1 17564.6 2291.3 21652.0 4087.4
Demand Deposits .21873.3 22929.4 1056.1 25334.5 2405.1 32661.2 7326.7
Savings Deposits ............... 23612.1 26447.8 2835.7 32605.0 6157.2 43119.1 10514.1
Time Deposits .............. I , . 25947.4 29368.5 3421.1 39760.4 10391.9 46740.6 6980.2
Other Liabilities .1289.2 1197.6 ( 91.6 ) 1341.0 143.4 1472.9 131.9
Items in Transit .2665.1 _ 3847.9 1182.8 828.0 3019.9 ) 2441.6 1613.6
Total Liabilities ._ ____89951.9 _ 00194.0 10242.1 118682.8 18488.8 149968.6 31285.8
Paid-In Capital .2000.0 2000.0 -. 3000.0 1000.0 3000.0 -
Surplus and Other Reserves ...................... 2339.0 2629.5 290.5 1951.5 678. ) 2441.4 489.9
Total Net Worth ......... I .................. 4339.0 _ _4629.5 290.5 4951.5 322.0 5441.4 439.9
Total Liabilities and Net Worth .94290.9 104823.5 10532.6 123634.3 18810.8 155410.0 31775.7
Source: Published Statements
February 11, 1974 ,

ANNEX 5Page 1
IRPANThird ADBI Agricultural Credit Project
PERFOMA.NCE INIDER FIRST AND SECOND ADBI AGRICULTURAL CREDIT PROJECTS
A. Project Data and Descriptions
Project Data
1. Basic data on the two Projects are as follows:
First Project Second Project(Loan 662-IRN) (Loan 821-IRN)
Project Cost ........... US$16.0 million US$35.1 millionForeign Exchange Cost .. US$8.9 million US$15.6 millionLoan Amount ........*..** US$6.5 million US$14.0 millionLoan Terms .*.. *......... 15 years, including 12 years, including 4
4 years' grace at years' grace at.7% p.a. 7-1/4% p.a.
Date of Loan Agreement . March 25, 1970 May 22, 1972Date of Effectiveness .. April 23, 1970 September 25, 1972Closing Date (original). December 31, 1972 November 30, 1976Closing Date (actual) .. March 31, 1973Amount Disbursed ....... US$6.2 million US$7.1 million
(3/31/73) (1/31/73)Pl 1.00 to US$1.00 ..... Rl 75.35 (Feb. 1973) Rl 67.50 (Dec. 1973)
Brief Project Descriptions
2. Loans 662-IRN and 821-IRN were to assist the Agricultural Develop-ment Bank of Iran (ADBI) in financing part of its total lending program forinvestments in agriculture, agribusiness and agro-industries. ADBI grantsloans on the basis of development plans appraised as technically feasibleand financially viable and supervises subproject execution. In agreementwith IBRD, 57% of all subloans were denominated in US dollars to help protectADBI "against losses in connection with the service of the (IBRD) loans re-sulting from changes in the exchange rate between rials and the currency orcurrencies in which such service is to be met." Interest rates on subloanswere 7-1/2% per annum (8-1/2% per annum in the case of agro-industry loans)plus 11/2h as supervision fee. Although somewhat lower than the institutionalrates to commerce and industry, they were equal to rates charged at the timefor medium- and long-term loans by the Government-owned Industrial DevelopmentBank and by the Industrial Mining and Development Bank. In addition, subborrowerspaid a commitment fee of 1% on the unused loan balance. All in all, the rateswere considered reasonable if account is taken of the fact that subborrowersassumed the foreign exchange risk of servicing Loans 662-IRN and 821-IRN.

ANNEX 5Page 2
B. Lending Operations
First Prolect
3. Subloans granted under the First Project amounted to Rl 916.6million 1/ to finance incremental investments of Rl 1,822.9 million 1/; thesewere, respectively, Rl 79.6 million (or 10%) and Ri 627.9 million (or 53%)more than the total predicted during appraisal. The following shows the dif-ference between actual performance and appraisal estimates for subsectors(Appendix 5-1):
% Increase or Decrease fromTotal Estimates per AppraisalInvestments Loans
Dairying ......... 11 (18)Crops and Sheep .. (18) (37)Poultry ............ 470 333Orchards ....... (.... 35) (46)Agribusiness ....... Inf. Inf.Agro-industry ...... 23 (89)Others .............. Inf. Inf.
Totals ........ 53 10
Inf. = Infinity
4. The number of dairy subprojects financed was almost as predicted- 9 against 10. While total investments were 11% more than estimates, totalsubloans granted were short by 18%. All of the dairy operations financedrepresented expansion of ongoing operations; hence, subborrowers were generallybetter able to finance more from their own resources - 48Z on average against 3030% as predicted.
5. Although only 14 crop and sheep subprojects were financed, theywere for the most part larger operations than anticipated. Per farm invest-ments averaged RI 17,400, almost three times appraisal estimates. However,subborrowers financed 46% of project costs against the expected 30% and asa result total loans granted were 37% below predictions.
1/ 11U dollar equivalents are faot given in view of the varying exchangerates of the Rial to the US dollar during the period under review.

ANNEX 5Page 3
6. Thirteen poultry subprojects were assisted under the First Project-- five for egg hatcheries, the remainder for broilers and layers. Only cwoor three subprojects for egg hatcheries had been anticipated during appraisal;hence, total investments and subloans were, respectively, around six and fourtimes that predicted. The average investment size was almost 12% less thanestimates because of investments in broiler and layer units which are rela-tively less capital-intensive. The average loan size was about 67% of in-vestments, slightly less than the anticipated 70%.
7. Although only 17 subprojects for orchards were financed (25% oftotal expected), total investments and loans granted were, nevertheless, 64%and 54% of predictions. Average investment per farm was a little more thantwice the appraisal estimate, largely because of having financed larger farmsand/or because of the inclusion of investments in annual crops within the"Orchards" classification.
8. No funds were earmarked specifically for agrobusiness investmentsunder the First Project. It was intended that portions of subloans represent-ing financing of on-farm developments would be charged against the propersubsector (dairy, crops, and such), while that for processing would be chargedto the agro-industry allocation. Two subloans have been granted -- one to IranCalifornia Co. for Rl 76 million and the other to Iran America for Rl 120 million.Both loans have been fully disbursed. The loan to Iran California was for landlevelling and preparation, machinery and equipment, and buildings; productionhas been in wheat,.sugar beets, sorghum and alfalfa. No processing operationhas been undertaken as yet. The same inputs have been financed in the case ofIran America and production has been in cotton, sugar beets, asparagus, forage,and decidous andi citrus fruits. A cotton gin will be constructed. IranCalifornia has been experiencing managerial and financial problems and effortsare being made to remedy them; Iran America is doing fairly well.
9. A summary size distribution of loans granted (Appendix 5-2) showsthe following:
Loan Size DistributionTo Rl 7.5 million To Rl 18.75 million Above RI 18.75 millionBy By Avge. By By Avge. By By Avge.No. Amt. Size No. Amt. Size No. Amt. Size
% % RlM %.- RlM % % RLM
Dairving .2 22 9 7.0 45 30 11.1 33 61 30.0Crops and Sheep 50 24 4.5 43 44 9.6 7 32 42.0Poultry .4 46 14 5.3 15 12 13.5 39 74 35.0Orchards .5 59 36 4.7 35 45 10.0 6 19 25.0Agribusiness - - - - - - 100 100 NAAgro-industry .... - - - 100 100 NA - - -
Others .5 50 21 NA 33 45 NA 17 34 NA
Total 45 15 NA 34 25 NA 21 60 NA
NA - Not available or relevant due to lack of a common denominator.

ANNEX 5Page 4
Fortv-five percent of loans granted were for no more than Rl 7.5 million(USS110,000); these borrowers obtained about 15% of total amount granted.In this category, average size of loans was largest for the dairy and poultrysubsectors, reflecting the capital-intensive nature of the enterprises. Al-though only 21% of the number of loans granted were for RI 18.75 million(US$275,000) or more, loan amounts represented about 60% of the total granted.Under the Second Project, however, obviously with the additional lending ex-perience gained, ADBI began lending more for smaller developments.
Second Project
10. The size of loans granted under the Second Project is summarizedas follows (Appendix 5-2):
Loan Size DistributionTo RI 7.5 million To Rl 18.75 million Above Ri 18.75 millionBy By Avge. By By Avge. By By Avge.No. Amt. Amt. No. Amt. Size No. Amt. Size% % RiM % Z Ri M % Rl M
Dairying ....... 42 16 5.6 37 29 11.6 21 55 38.8Crops & Sheep .. 83 55 4.1 14 30 12.5 3 15 24.0Poultry ........ 21 7 4.1 63 64 12.0 16 29 21.7Orchards ....... 62 29 4.3 21 24 10.4 17 47 25.0Agri-business - - - - - - 100 100 NAAgro-industry 33 8 NA 33 24 NA 34 68 NAOthers ........ - _ _ _
Total ..... 55 21 NA 30 32 NA 15 47
NA - Not available or relevant due to lack of a common denominator.
It is interesting to note that under the Second Project, ADBI granted moresmaller loans both in total number and amount and that the number of loans forbigger developments has come down from 21% to 15% of the total, with the aggre-gate amount of big loans reduced from 60% to 47%.
11. As of September 22, 1973, total Second Project loans approved amountedto RI 1,118.3 million to finance new investments of RI 2,068.6 (Appendix 5-1):

ANNEX 5Page 5
(1) (2) (3) (4)No. of New Invest- Approved % orLoans ment Cost Loans to (4)
Rl M Rl M
Dairying .. 19 464.5 281.1 61Crops and Sheep .2 29 247.0 170.1 69Poultry 19 .....19 458.6 225.4 49Orchards ............ * .... 29 464.6 264.2 57Agri-business ........... .1 318.7 110.0 35Agro-industry 3 * ........ 3 115.2 67.5 59
Total ........ ....... 100 2068.6 1118.3 54
In general, ADBI subborrowers have contributed significantly to their proj-ects. Most of the subprojects financed represent expansion of on-going ones,and this accounts, in great measure, for the ability of subborrowers to con-tribute more.
12. The total loans approved of Rl 1118.3 million represent around 60%of total Second Project loans predicted during appraisal. In addition, ADBIhas approved loans amounting to a little more than Rl 440 million, for whichthe source of financing was still undetermined on September 22, 1973 (ADBI'spractice is to employ the same technical and financial tests in evaluatingall investment loan applications and to decide later on the source of financing--CCC, IBRD, or its own funds). As of the same date, there were, in addition, 22projects under consideration with loan requests amounting to about Rl 355 mil-lion. With the resolution of the problem of how best to protect ADBI frompossible losses from foreign exchange transactions (para 14), it is expectedthat Second Project funds would be fully disbursed by December 1974.
C. Project Iupact
13. ADBI has not kept records of operations that would enable evalua-tion of investment results (physical and financial) at the subproject level.Nor has AD)BI kept statistics in ready. form to permit cost analysis of par-ticular development activities (land levelling, pasture establishment, treecrop establishment, and such). Admittedly, the problem has not been madeeasy bv the fact that in Iran, crop, orchard and livestock (particularlysheep) production are often combined with one another, thus making costassignments difficult. In any case, it is clear that ADBI must monitorinvestment results in selected farms and agro-industries, and it will be sorequired under the Third Project. It must be stated, however, that past dueaccounts are less than 1% of accounts outstanding--one factor which indicatesthe general soundness of development plans and their execution.
14. Cross income from interest from June, 1970 to September, 1973 under thefirst two IBRD-assisted Projects amounted to Ri 210.2 million. This represents

ANNEX 5Page 6
about 49% of ADBI's total income during the period covered. On the otherhand, cost of IBRD funds during the same period amounted to RI 99.6 million;thus, a gross operating profit of RI 110.6 million. Future financial resultsare threatened by probable losses on collection of that part of subloansdenominated in US dollars and also from the servicing of the hard currencyportion (German marks, Kuwaiti dinars, and others) of Loans 662-IRN and821-IRN. These have been estimated at possibly Rl 86 million (US$1.3 million)and will be covered by an exchange loss reserve set up by ADBI from yearlynet income. If the reserve proves to be insufficient and the exchange lossesresult in impairing ADBI's paid-in capital, Government has agreed to reimburseADBI to the extent of the capitalAImpairment.
15. IBRD involvement in ADBI has helped in developing the institutioninto a technical-assistance-conscious and business-oriented organization.Technical staff are well trained and qualified. Lending.policies and proce-dures are good and management is satisfactory.
March 19. 1974

IRANThirdAUBI Agricultural Credit Project
PREDICTED I/ AND ACTUAL TNVESTMENTS FINANCED
UNDER FIRST AND SECOND AGRICULTURAL CREDIT PROJECTS
No. of Sub-Projects Investments (Rls '000) Loans (Rls '000)
Total Average Total Average
Predicted Actual Predicted Actual Predicted Actual r cAtual Predicte- Actual A
First ADBI Agricultural Credit Project
Dairy ......... 10 9 258,000 287,000 25,800 31.83) 181,000 148,400 18,100 16,489
Crops and Sheep g/ ................... 50 14 299,000 243,900 5,908 17,421 209,000 130,800 4,180 9,343
Poultry .............................. 2 13 77,000 438,800 38,500 33,754 54,ooo 233,800 27,000 17,985
Orchards ............................. 60 17 347,000 224,300 5,783 13,194 243,ooo 132,300 4,050 7,782
Agri-Business V/..................... - 2 505,800 -- NA -- 196,000 -- NA
Agro-Tndustry ........................ 5 1 214,000 26,400 NA 26,400 150,000 16,000 NA 16,000
Others ............................... 6 96,700 N NA -- -- NA
Totals ............ ............ 127 62 1,195,000 1,822,900 NA NA 837,000 916,600 NA NA
Second ADBI Agricultural Credit Project
Dairy ............................... 20 19 216,000 464,500 10,800 24,447 181,000 281,100 7,550 14,795
Crops and Sheep L/ ...... ............ 80 29 768,ooo 247,000 9,600 8,517 538,000 170,100 6,725 5,866
Poultry . ............................ 16 19 696,ooo 458,600 43,500 24,137 487,000 225,400 30,438 11,863
Orchards ........... 32 29 320,000 464,600 10,000 16,021 224,000 264,200 7,000 9,110
Agri-Pusiness | ....... ............. - 1 318,700 -- 318,700 -- 110,000 -- l11,ooo
Agro-Tndustry ......... .............. 12 3 660,ooo 115,200 NA NA 462,000 67,500 NA NA
Others .......-....................... - - - -- -- -- -- - -- --
Totals ........................ 160 100 2,660,0 2,068,600 Nt PA 1,862,000 1,118,300 NA NA
Per appraisal report.S Shown as separate items -- "Crops and "Sheep" in the appraisal reports.
;/ Not provided as a separate item in appraisal reports which assumed that investments for production
would be classified under the proper sub-sector (Crops, Sheep, Dairy, etc) and investments for
processing against "Agro-Industry"NA Not available because of lack of a common denominator.
February 11, 1974

SRANThird SART igricoltural Credit Poject Appendix 5-2
£13B= ,AIWN I LOANS APPROVEDUNDER FIRST .11S111~ IBRR-ASSISTES PROJECTS
April 23, 1970 to September 22, 1973
RIo o ef L oan sToRBi 7.5D M itolfl.51.2 o i 1~.O02i To RI lb.751 N Aove Ri 15.75M5 T o t s I'i-st Seconid First Secn First Second First Second First Secon.d First S.eond
DairyNlo. f Projects. .............. 2 8 2 5 1 1 1 1 3 4s 9 19Total Loans Approved 3/........... i4.c 44.6 tS.o 50.0 11.4 13.5 15.0 iS.o 90.0 155.0 p,48.4 281.1Incremental Project Co.st (sPo) 3/..... 21.2 67.2 29.5 77.3 24.6 18.3 48.2 27.4 163.5 274.3 287.0 464.5% ofLoans t.IPo.............. 66 66 6i 65 4s6 74 31 66 55 57 52 6iAverage Slo,e of Loans 2/.......... 7.0 5.6 9.0 10.0 ±i.4 13.5 15.0 18.o 30.0 36.8 16.5 14.8
Crops sod ShcesRo.of Projects. .............. 6 22 5 1 - 3 - - 1 1 12 27ITtal Icons Approved ............ s6.5 90.1 46.3 10.0 -. 40.0 -. .- 42.0 24.0 114.5 i64.iIncoreenotal Project Coot .......... 40.9 135.8 76.0 11.7 -. 57.5 -. .- 100.3 33.7 217.2 238.76 of Lowssto IPC.............. 65 66 61 85 70 --- 42 71 53 69Average Sloe of Lows............ 4.4 4.1 9.j 10.0 -- 13.3 - -- 42.0 241.0 9.6 6.1
ITo.ofProJects............... 1 2 1 - - - 2 2Toctal Loans Approvd............ 5.0 6.o n1.o . .- - -- - i6.o 6.olnorecen tal Projeot Cost .......... 8.1 8.-3 18.6 2. . . . . . 6.7 8.3
8f Lownst.IPC ............. 62 72 59 6o --- i 72Average ie of Loans ............ 5.0 3.0 11.0 -. .- - .- -. . . .0 3.0
No. of P-joct . .............. 6 4 - v 2 4 2 5 3 13 19Total loans Approved............ 31.8 i6.4 5. 4.5 27.0 54.5 -- 35.0 175.0 65.0 233.8 225.4isoc-ental Project C'st ........... o.6 38.0 - 118.4 54.6 92.8 . 85.8 333.6 123.6 438.8 458.6of Loons toIPC.............. 63 43 48 49 59 41 52 53 53 49
Aveage 9ico of loas. ............ 5.3 4.i -I 9.1 13.5 13.6 -- 17.5 35.0 21.7 18.0 11.9
Orchard EstablishmnetNo. of Projects. .............. 10 iS 5 4 -- 2 1 - 1 517Total Loans Approved ............ 47.3 76.7 42.0) 36.5 ~ 2. 6o2. 125. 23.I6.Iacr-eont1 Project CstI.......... 87.1 155.5 75.3 72.0 3. 5.8 27.0 34.9 199.3 224.3 464.63of LosantoLsPC.............. 54 48 56 52 . 73 67.0 . 72 63 59 57Average Sioe of Toans............ 4.7 4.3 8.4 9.1 -.- 13.0 i8.o 25.0 25.0 7.8 9.1
Agri-B-aniess 4JN.oof Projects............... - - - - - - - 2 1 2 1Total Loans Approved.-.-...-...-........-.-.- -.- - - i96.0 110.0 i96.o 110.0Inore-etal Project Cost ........... - -. -. -- -- .- .- -- 505.8 318.7 5os.8 318.78 f o$bsa tsITPC....-........-.......- 39 35 39 35
Agro-Ind-stry /No. of Pr.Wts.-..1..............1..1- 113Total Loans Approved.............. - 5.0 -- .- -.- -.- 6 16.056. -. 46.o i6.o 67.5Incremental Project Cost............ - 9.8 -. - -- -. .- 26.4 26.4 -. 79.0 26.4 115.23 of LoanstoIPC .............. - 51 - - - - 61 63 - s 6i 59
Otters 2/No.of Projects............... 3 - - - 2 -- - 1- 6 -Total Loans Approved ............ 12.3 -- .- .- 27.0 -- .- .- 20.0 -. 59.3 -Inoremeotal Project Cost .......... 16.3 -.- -- - 4i.1 . .- - 37. - - 96.7 -. % of loastosIPC.............. 75 - - .. 66. . 51 - 61 -
Totals 2/Ro.of Projects. .............. 26 55 13 16 5 10 3 4 13 15 62 100Total Loans Approved .i.......... 36.9 238.8 117.3 151.2 65.4 134.0 4s.o 69.5 548.0 525.0 916.6 1118.3Incremental Project Cost .......... 224.2 413.6 199.4 277.4 120.3 20)4.4 iDm.6 139.6 1177.4 1028.6 1822.9 2068.6,~of Lows t.FC .............. 61 57 59 54 54 66 48 50 47 51 50 54
2/Financed by Loan 662-tIsf
2/Financed by Loan 821-IRS
3/ is Rio million
2/Aveage Sloe of loans not relevant
February 11, 1974

3 ~~oo OHO Ha o.~~~ HO~~ 010 HO~~~ O9)OH~~H~~0 00 -tA St
H H H ~~~~~~~~~~~I HI Q K
01.0 I OH HO Ha *HHHHH1~ ~ ~ ~~~~~InI" ~
H 0 1~~~~~~~~~~~~~~~~~~~~~~~~~~~~~~~~~~~~~~~~~~~~~1
HI .333 HO~~.. ... HO . SO . 0..
I 5~~~~~~~~~~~~~~~~~~~~~~~~~~~~~~~~~~~~~~~~~~~OOHHHI S33:3,3 C ~~~~~~~~~~~~~~~~~~2
I, 000 I OHHHHHHOIOIHHH 0 nil, 1111111 H 01H I H1 I I~~~~~~~~~~~~~~~~~~~~~~~~~~I
2 Oj H2H HO~ ~~~~~~~ ~~ A033305 HO.o2
O I 00 000 HH00 ~ ii 1111 I OH
33 3~~~~~~~~~~~~~~~~~~~~~~~~~~~~~
t-101000n.eOiHOHH :i:n:iI.ln oojj .~~~~~~~~~~~~~~~~4t - -
lb~~~~~~


Appendix 6-1
IRANThird ADBI Agricultural Credit Project
ESTIMATED SCHEDULE OF IBRD DISBURSEMENTS(in US$ 000)
IBRD Fiscal Year Cumulative Disbursementand Quarter at end of Quarter
1975March 31, 1975 3,000June 30, 1975 b,200
1976September 30, 1975 10,300December 30, 1975 14,40ooMarch 31, 1976 18,4ooJune 30, 1976 22,500
1977September 30, 1976 25,600December 31, 1976 28,800March 31, 1977 32,000June 30, 1977 35, 4I00
1978September 30, 1977 36,300Decmeber 31, 1977 37,300March 31, 1978 38,200December 31, 1978 39,100
1979September 30, 1978 39,500December 31, 1978 40,000
Based on projections in Annex 6.
J uly 10, 19r741


AINEX 7Page 1
IRANThird ADBI Agricultural Credit Project
CONSIDERATIONS IN SETTING UP A MECHANISM FOR SUBPROJECT MONITORING
A. Objectives
1. The objective is to set up a lermanent mechanism for measuringinvestment results at the producer level. This would necessitate trainingADBI management and staff to design, operate, and revise, as may be necessary,the monitoring mechanism as well as training selected subborrowers in keepingrecords essential to the system. It would also be necessary to devise methodsand forms in communicating summary results and analysis to ADBI managementso that they may be used as a basis for formulating lending policies andprocedures.
B. Suggested Frame'work of Monitoring Mechanism
Organization
2. The responsibilities of ADBI personnel who will implement themonitoring mechanism must be defined, namely:
(a) the duties of staff at the Central Office in Tehran andthose at the branches; and
(b) the duties of a suitably qualified and experienced staffmember in each branch or field office who would coordinatethe monitoring of each region.
Procedures
3. A record-keeping system, simple and suitable, should be designedfor recording required data at the producer level. Such a system shouldshow:
(a) the number and/or value of assets and liabilities, as wellas details of operations (physical and financial) beforedevelopment;
(b) the number, nature, and value of investments made and theirphasing or timing;
(c) the source of investment funds for inputs made in (b) above;

ANNAX 7Page 2
(d) changes (on, at least, designated reporting datea) in thenumber of physical assets;
(e) the quantity, value, and source of income; and
(f) expenses and production costs, showing details of importantitems.
4. ADBI staff shall decide the frequency of visits to producers in orderto maintain the desired degree of accuracy in data collection. Such visitswould certainly be more frequent in the beginning.
5. A carefully stratified sample of subprojects from the totail underdevelopment should be selected for monitoring. Samples selected should re-present the more important farming, livestock producing, and agro-industriesin the different regions of Iran. It is expected that the number of samplesselected would grow in relation to the capability of ADBI staff to servicethe program.
Reports
6. Periodic reports must be required of participating producers.The reports must be easy to prepare. They should be easily comprehensible,devoid of unnecessary details, and as brief and concise as is possible con-sistent with the objectives of the progrpa. ADBI staff should impress parti-cipating producers with the mSe for accurate and timely reporting.
7. From the producers' reports, sem ry report to management mustbe made on a continuous basis. These reports should briefly discuss resultsand trends and their meaning.
March 19, 1974

ANNEX 8Page 1
IRANThird ADBI Agricultural Credit Project
REPRESENTATIVE PRODUCTION MODELS
1. The ten representative models in this Annex give details of thetechnical and financial aspects of enterprises expected to be financed underthe Project. Due to differences in the magnitude of principal resources re-quired for small farms as compared to those for large farms, separate modelshave been prepared for both sizes of enterprises -- 4 for small-scale devel-opments and 6 for large-scale developments. Because definite assumptions cannot yet be made on how the new Government financial incentives would be appliedto individual farm development plans, the financial rate of return calculationsdid not include grant financing of sub-project investment and are thus conser-vative.
2. All unit costs, yields, and o:her technical coefficients employedin the models are based on information current at the time of appraisal(November 1973). Although it is expected that input and output prices willincrease over the disbursement period of the Project, they will, in all prob-ability, increase at the same rate. Therefore, in the models, constant priceshave been used. Where yields are expected to increase significantly, thesehave been taken into account (e.g., during the growth period of orchards ormilk yields of cows in their second as compared to their first lactation).In order to help provide sufficient financing for infrastructure (e.g. stor-age barn, milking parlor, etc.), a physical contingency of 5% has been addedto all investment costs. Similarly, a 5% physical contingency has been addedto all operating expenses.
3. The representative models, including the associated tables, arelisted as follows:
8-1 Small Sheep Farming Mocel8-1-1 Flock Projection8-1-2 On-Farm Investments8-1-3 Projected Income and Operating Expenses8-1-4 Cash Flow Projections and Financial Rate of Return
Calculations
8-2 Small Orchard (Apple) Model8-2-1 On-Farm Investments8-2-2 Projected Income and Operating Expenses8-2-3 Cash Flow Projections and Financial Rate of Return
Calculations

ANNEX 8Page 2
3-3 Small Poultry Layer Model8-3-1 On-Farm Investments8-3-2 Projected Income and Operating Expenses8-3-3 Cash Flow Projections and Financial Rate of Return
Calculations
8-4 Small Dairy Farm Model8-4-1 Herd Projection8-4-2 On-Farm Investments8-4-3 Projected Income and Operating Expenses8-4-4 Cash Flow Projections and Financial Rate of Return
Calculations
8-5 Large Mixed Farming Model8-5-1 Flock Projection8-5-2 On-Farm Investments8-5-3 Projected Income and Operating Expenses8-5-4 Cash Flow Projections and Financial Rate of Return
Calculations
8-6 Large Orchard (Apple) Model8-6-1 On-Farm Investments8-6-2 Projected Income and Operating Expenses8-6-3 Cash Flow Projections and Financial Rate of Return
Calculations
3-7 Large Poultry Parent Stock Model8-7-1 Flock Projection8-7-2 On-Farm Investments8-7-3 Projected Income and Operating Expenses8-7-4 Cash Flow Projections and Financial Rate of Return
Calculations
8-8 Large Poultry Broiler Model8-8-1 Flock Projection8-8-2 On-Farm Investments8-8-3 Projected Income and Operating Expenses8-8-4 Cash Flow Projections and Financial Rate of Return
Calculations
8-9 Large Poultry Layers Model8-9-1 Flock Projection8-9-2 On-Farm Investments8-9-3 Projected Income and Operating Expenses8-9-4 Cash Flow Projections and Financial Rate of Return
Calculations
8-10 Large Dairy Farm Model8-10-1 Herd Projection8-10-2 On-Farm Investments8-10-3 Projected Income and Operating Expenses8-10-4 Cash Flow Projection and Financial Rate of Return
Calculations

IRANThirdMfll Agricultural Credit Project
SMALL SHEEP FARMING MODEL - FLOCK PROJECTIONS
Year 2 Year 3 Year 4 Year 5 Year 6 Year 7 Year 8 Year 9 Year 10
1. Flock Composition(a) Rams 22 21 20 20 19 20 19 20 19(b) Ewes 540 410 489 500 500 500 500 500 500(e) Ram lambs 230 185 220 225 225 225 225 225 225(d) Ewe lambs 229 184 220 225 225 225 225 225 225(e) Ewe weaners _ 206 169 202 207 207 207 207 207
TOTAL 1,021 1,006 1,118 1,172 1,176 1,177 1,176 1,177 1,176
2. Mortality(a) Rams 1 1 1 1 1 1 1 1 1(b) Ewes 27 20 25 25 25 25 25 25 25(c) Ram lambs 23 15 18 18 18 18 18 18 18(d) Ewe lambs 23 15 18 18 18 18 18 18 18(e) Ewe weaners - 10 8 10 10 10 10 10 10
TOTAL 74 61 70 72 72 72 72 72 72
3. Purchases
(a) Rams 22 - 20 - 20 - 20 - 20(b) Ewes 54o - - - - - - - -
TOTAL 562 - 20 - 20 - 20 - 20
4. Sales
(a)TRams - - 19 - 19 - 19 - 19(b) Culled ewes 103 97 116 125 125 125 125 125 125(c) Ram lambs 206 170 202 207 207 207 207 207 207(d) Surplus ewe weaners - - 9 42 47 47 47 47 47
TOTAL 309 267 346 374 398 379 398 379 398
5. Production Indices(a) Lambing rate q( 85 90 90 90 90 90 90 90 90(b) Mortality lambs % 10 8 8 8 8 8 8 8 8(c) Mortality ewes % 5 5 5 5 5 5 5 5 5(d) Mortality rams 5 2 2 2 2 2 2 2 2 2(e) Culling rate ewes % 20 25 25 25 25 25 25 25 25(f) Ram replacement - 2 years
Based on a unit of 500 breeding ewes at full development.
February 15, 1974 c

IRANThird ADDS Agricultural Credit Project
SMALL SHEEP FARMING MDEL 1 - ON-FARM INVESTMENTS(Rials '000) O
No. of UnitUnit Units Cost Year 1 Year 2 Year 3 Year 4 Year 5 Year 6 Year 7
1. Breeding Stock(a) Rams No. 22 4.00 - 88 -
(b) Ewes No. 540 2.70 - 1,458 -
Sub-total - 1,546 -
2. Construction(a) Open lot m
21,200 0.05 45 15 -
(b) Feeding stalls No. 600 0.70 315 105 -
(e) Store m2
250 1.00 250 - -
(d) Engine room m2 20 2.50 50 _
(e) Half deep well m 20 2.50 50 - -
Sub-total 710 120 -
3. Machinery and Equipmenta) 15 hp engine No. 1 120.00 - 120 -
(b) Pump No. 1 50.00 - 50 - - - - -
(c) Insecticide sprayer No. 2 10.00 - 20 - - - - 20
Sub-total - 190 - - - - 20
4. Crop Production(a) Land preparation 10 10.00 - 100 - - - - -
(b) Alfalfa planting 6 9.50 57 - - - - _
Sub-total _ 157 - _ _ _ _
5. Incremental Working Capital
Feed - 19 - - - - -
6. Physical contingencies (5%) 35 102 - 1
TOTAL 745 2,134 - 21
Based on a unit of 500 breeding ewes at full development. 0'
February 15, 1974
IQ

IRANThird ADBI Agricultural Credit Project
SMALL SHEEP FARMING MODEL / - PROJECTED INCOME AND OPERATING EXPENSES
(Rials 'OOO)
UnitUnit Cost Year 1 Year 2 Year 3 Year 4 Year 5 Year 6 Year 7 Year 8 Year 9 Year 10
1. Sales(a)TMeat / kg - 580 497 628 616 6i6 616 616 616 616(b) Offals hd 0.35 - 108 93 118 116 116 116 116 116 116(c) Wool / kg - 79 80 87 92 92 92 92 92 92(d) Ewe weaners hd 1.30 - - - 12 55 61 61 61 61 61(e) Rams / hd 2.50 - - - 57 - 57 - 57 - 57
TOTAL 767 670 902 879 942 885 942 885 942
2. Oerating Costbs2 a Ran purchase - - - 80 - 80 - 80 - 80(b) Feed - 37 58 70 70 70 70 70 70 70(c) Labor j - 191 183 191 191 191 191 191 191 191(d) Veterinary - 31 30 34 34 34 34 34 34 34
(e) Fuel _ 40 43 43 43 43 43 43 43 43(f) Maintenance buildings;/ - 14 17 17 17 17 17 17 17 17(g) Maintenance machinery j - - 10 10 10 10 10 10 10 10
(h) Crop production - 29 29 29 29 86 29 29 29 29
(i) Interest on seasonal credit - -6 - 2 - -_(j) Physical contingencies (5%) - 17 18 24 20 27 20 24 20 24
TOTAL 365 388 498 414 558 416 498 414 498
Based on unit of 500 breeding ewes at full development.
/ Culled ewes 22.5 kg @ Rls 70 per kg; ram lambs 22.5 kg @ Rls 90 per kg.
Ewes 1.0 kg wool @ Rls 90 per kg; rams 1.5 kg wool @ Rls 90 per kg; lambs 0.5 kg
wool @ Rls 140 per kg; ram lambs and culled ewes shorn before sale.
/ Sold as mature rams to other sheep producers. a
2/ Permanent labor 2 shepherds @ Rls 36,000 per year and engine attendant @ Rls 48,000per year.
/ 2% of capital cost.
7/ 5% of capital cost/ Assuming 30% of operating costs for 6 months @ 12% per annum.
February 15, 1974

IRANlhird ADBI Agricult-ral 'redit roj-et
SMALL SHEEP FARMING MODEL -CASH FLOW PROJECTIONS AND FINANCIAL RATE OF RETURN CALCBJLATTONS
(Rials 'OOO)
Cash Flow
1 2 3 4 5 6 7 8 9 10CASH INFLOW
1. Annual Sales - 767 670 902 879 942 885 942 885 9422. Producer's Contribution Lj 211 534 - - -_ - -3. Long-term Loans /2 559 1,600 - - - - - - - -4. Working Capital
a. Last Year's Cash Balance - - 280 368 270 160 97 126 179 136b. Seasonal Credit 3 - 108 - - - 27 -
Total Expected Cash Inflow 770 3,009 950 1,270 1,049 1,102 1,009 1,068 1,064 1,078
CASH OUTFLOW
1. Investment 745 2,134 - - - - 21 - - -2. Operating Cost - 365 388 498 414 558 416 498 414 4983. Seasonal Credit /3 - 108 - - - - 27 - - -4. Debt Service
a. Interest 25 122 194 194 167 139 ill 83 56 28b. Principal - - - 308 308 308 308 308 308 311
5. Producer's Cash Withdrawal - - - - - - - - 150 150
Total Expected Cash Outflow 770 2,729 582 1,000 889 1,005 883 889 928 987
Total Expected Cash Balance at Year's End - 280 368 270 160 97 126 179 136 91
/1 25% of investment cost and interest on long-term loan./2 75% of investment cost at 9% p.a. for 10 years including 3 years of grace./3 30% of operating cost for 6 months at 12% p.a.
Financial Rate of Return Calculation
1 2 3 4 5 6 7 8 9 10
Sales 767 670 902 879 942 885 942 885 3,098 /1Operating Cost - 365 388 498 414 558 416 498 414 498Investment Cost 745 2,134 - - - - 21 - - -
Net Benefits (745) (1,732) 282 404 465 384 448 444 471 2,600
Financial Rate of Return - 14%(over 10 years) 5
Sensitivity Analysis: +10% investment cost = 13%+10% operating cort 12% x-10% sales - 10%
/1 Includes residual value of Rials 2,156,000.
February 23 1974

IRANThird ADBI Agricultural Credit Project
SMALL ORCHARD (APPLE) MODEL - ON-FARM INVESTMENTS(Rials '000)
No. of UnitUnit Units Cost Year 1 Year 2 Year 3 Year 4 Year 5
1. Construction(a) Pump house m2 30 2,000 60,000 o o o -
(b) Deep well m 20 3,000 60,000 - - _ _
(c) Irrigation canal m 50 200 10,000 - - - -
(d) Warehouse m2
24 1,300 31,200 - -
(e) Housing for workers m2 90 2,000 180,000 - - _ _
(f) Fence m 450 220 99,000 - - - -
Sub-total 440,200 - - _ _
2. Machinery and Equipment
Deep well pump and motor 1 300,000 300,000 - - - -
3. Orchard Establishment(a) Land preparation ha 8 10,000 80,000 - - _ _
(b) Surveying (layout) ha 8 1,000 8,000 - - _ _
(c) Secondary irrigation canals ha 8 2,000 16,000 - - _ _
(d) Digging holes ha 8 4,400 35,200 - - _ _
(e) Fertilizer and manure ha 8 4,400 35,200 - - - -
(f) Mixing and filling holes ha 8 1,100 8,800 - - - _
(g) Purchase of trees ha 8 8,800 70,400 - - _ -
(h) Planting and staking ha 8 2,200 17,600 - -
(i) Windbreaks ha 8 2,000 16,000 - - _ _
(j) Planting and irrigation ha 8 500 4,000 - - _ _
Sub-total 291,200 - - - -
4. Incremental Working Capital /(a) Labor 235,000 251,000 251,000 251,000 82,000
(b) Fertilizer - 13,000 26,000 39,000 16,000
(c) Pesticides - 10,000 10,000 10,000 6,000
(d) Rent of machinery 15,000 18,000 19,000 19,000 7,000
(e) Fuel and maintenance 42,000 45,000 47,000 49,000 16,000
Sub-total 292,000 337,000 353,000 368,ooo 127,000
5. Physical Contingencies (5%) 66,170 16,850 17,650 18,400 6,350
TOTAL 1,189,570 353,850 370,650 386,400 133,350
/ Gestation period operating costs.
February 15, 1974

IRANThird ADBI Agricultural Credit Project
SMALL ORCHARD (APPLE) MODEL - PROJECTED INCOME AND OPERATING EXPENSES(Rials '000)
Year 1 Year 2 Year 3 Year 4 Year 5 Year 6 Year 7 Year 8 Year 9 Year 10 Year 11 Years 12-20
1. Sales
Apples j _ _ - 288 576 864 1,152 1,344 1,536 1,728 1,920
2. Operating Costs
(a) Labor _- - 176 258 258 258 258 258 258 258(b) Fertilizer _- - 36 65 78 91 104 117 130 130(c) Pesticides - - - - 14 20 20 20 20 20 20 20(d) Rent of machinery - - - - 14 21 21 21 21 21 21 21(e) Fuel and maintenance - - - - 34 50 50 50 50 50 50 50(f) Physical contingencies (5%) - 14 21 21 22 23 23 24 24
TOTAL Operating Costs -_ _ _ 288 435 448 462 476 489 503 503
Yield 3 tons per hectare in year 5 increasing to 20 tons per hectarein year 12; Price = Rials 12,000 per ton, sold on the tree.
February 15, 1974
ro

IRANThird ADBC Agricultural Credit Project
SMALL ORCHARD (APPLE) MODEL -CASH FLOW PJOJrCTIONR AND FINANCTAL RATE OF RETURN CALCULATIONS
(Risls 'ODn)
Cash Flow
1 2 3 4 5 6 7 8 9 10 11 12 13CASH INFLOW
1. Aanual Sales - - - - 288 576 864 1,154 1,344 1,536 1,728 1,920 1,9202. Pradaer' s Caatributioa fL 394 194 223 252 206 178 - - - - - -3. Laag-term L.. /2 1,042 266 278 290 100 - - - - - - -4. W-rking Capital
a. Last Year's Cash Balance - - - - - - 141 50 165 386 515 352 408b. S.asoaal Credit - - - - - - - - - - -
TNtal Expertsd Ca.h 1nflaw 1,436 460 501 542 594 754 1,005 1,204 1,509 1,922 2,243 2,272 2,328
CASh OUTFLOW
1. Ievestaeat 1,389 354 371 386 133 - - - - - - -2. Operatiag Cast - - - - 288 435 448 462 476 489 503 503 5033. 8e..asol Credit - - - - - - - - - - - -4. Debt Service
a. Interest 47 106 130 156 173 178 178 148 118 89 59 30b. Priacipal - - - - - - 329 379 329 329 329 331
5. Prad-rer's Cash Withdrawal - - - - - - - 10 200 580 1,000 1,000 1.500
Total Exparted Cash Outflow 1,436 460 501 542 594 613 955 1,039 1,123 1,407 1,891 1,864 2,003
Tatal Exparted Cash Balarca at Year's EDd - - - - - 141 50 165 386 515 352 408 325
/L 25% of inesetmeet rast sad interest on la-g-ter- laoa./2 75% af i-vestaent cast at 9% p.a. far 12 years includiag 6 years af grace.
Financial Rate of Retore Ceiculatioe
1 2 3 4 5 6 7 8 9 10 11 12-15
8ales - - - - 288 576 864 1,154 1,344 1,536 1,728 1,920Opesetieg Cast 1.38- - 288 435 448 462 476 489 503 503Devtster test 1,389 354 371 386 133 - - - - - - -
Nlt Benefits (1,389) (354) (371) (386) (133) 141 416 692 868 1,047 1,225 1,417
Finaneiel Rate of Retarp = 15%(ever 15 years)Sensitivity Aeslysis: + 10% inve.t-eat rest - 14%
+ 10% operatiog rest = 15%- 10% sales = 13%
February 23, 1974


IRAN Appandix 8-3-1Third ADBI Agricultural Credit Project
SMALL POULTRY LAYER MODEL - ON-FARM INVESTMENTS(Rials)
Unit No. Unit Unit Cost iaL1 Years 2_6 Year 7
1. ConstructionZa) Iaying Shed m22 240 1,700 408,000 - -
(b) Storehouse m2 30 1,500 45,000 - _
(c) Half Deep Well m 20 2,500 50,000 - -
(d) Water Tank & Stand liter 5,000 5 25.000 -Sub-total 528,000 - -
2. MachLn= and Equipment(a) Laying Cas no. 400 60 24,000 - 24,000(b) Petrol Engine &
Pmp _2 no. 1 37,400 37,400 - -(c) Coolers 6 8,000 48,ooo - -(d) Waterers no. 90 500 45,000 - 41,000(e) Hand sprayer no. 1 5,000 5.000 - 5 000
Sub-total 159,400 -
3. Incremental WorkingMCapital(a) Pullets /3 175,000 - -(b) Feed & FN;el /4 28,200 - -(c) Shavings 50 - -
Sub-total 203,250 - -
4. Physical Co1 tiAgencies (5%) 44,530 - 3.5oo
TOTAL 935,180 - 73,500
/1 Based on a unit of approximately 1,000 layers.7i 150 cc petrol engine and 1¼ inch pump.75 One Year's supply.7! One Month's supply.
February 23, 1974

APf1i5XcIT 8_3_2
IRANThirdADBI Agricultural Credit Project
SMALL POULTRY LAYER MODEL - PROJECTED INCOME AND OPERATING EXPENSES(Rials)
Unit No. Unit Unit Cost Year 1 Year 2 Years 3-101. Sale
()Eggs /2 kg 12,533 50 626,650 626,650 626,650(b) Craoked eggs 1 kg 522 35 18,270 18,270 -18,270(c) Old hens / kg 1,320 50 66,000 66,000 66,000(d) Manure . tons 5.64 600 3,380 3,380 3e380
TOTAL 7714300 714,300 714,300
2. 22:ratinx ExenseB(a) Feid /6 309,380 337,500 337,500(b) Labor 77 12,000 12,000 12,000*c) Fuel 920 1,000 1,000(d) Vaccines & medications 1,500 1,500 1,500(e) Cleaning & spraying 100 100 100f) Wood shavings 150 200 200g Maintenamne Buildings /8 - 10,560 10,560(h) Maintenance Machinerwy 7 - 7s970 7,970(i) Purchase of Pullets /10 - 175,000 175,000(k) P4ysical oontingencie-sT5%) 16 200 27 290 22
TOTAL 3 573,120
A Based on a unit of approximately 1,000 layers.2 240 eggs per bird. Mortality 12% over laying period of 12 months. Average of
940 layers per year.10 per bird.1.5 kg each.6 kg per bird per year.38 kg/bird over 12 months @ Rls 9.V/kg. Assuming some scrap feed in addition.P asrt time family labor.
/8 2% of original cost after Year 1.E 3% of original cost after Year 1./1 RlJ 175 each; included as incremental working capital in Year L1
February 23, 1974

I~~~~~~~~~~~~~~~~~~~~~~~~~~~~~~~~~~~~~~~~~~~~~~~~~~~~~~~~~~
TPANThird ADBI Agricultural Credit Project
SMALL POULTRY LAYER MODEL -CASH fLW PROJECTIONS AND FINANCIAL RATE OF RETURN CALCULATIOINS
Cash Flow
1 2 3 4 5 6 7 8 9 10CASH INFLOW
1. Annual Sales 714 714 714 714 714 714 714 714 714 7142. Producer's Contribution Li 234 - - - - - - - -
3. Long-term Loans /2 701 - - - - - - - - _4. Working Capital
a. Last Year's Cash Balance - 343 281 232 195 171 158 222 266 207
b. Seasonal Credit - - - -
Total Expected Cash Inflow 1,649 1,057 995 946 909 885 8f 939 980 921
CASE OUTFLOW
1. Investment 935 - - - - - 74 - -2. Operating Costs 340 573 573 573 573 573 573 573 573 573
3. Seasonal Credit - - - - - - - - -4. Debt Sarvice
a. Interest 31 63 50 38 25 13 - - -b. Principal - 140 140 140 140 141 - - -
5. Producer's Cash Withdrawal - - - - - - _ - 100 200 200
Total Expected Cash Outflow 1,306 776 763 751 738 727 647 673 773 773
Expected Cash Balance at Year's End 343 281 232 195 1V 158 225 266 207 13--
/1 25% of invastment cost.L2 75% of investment cost at 9% p.s. for 6 years including 1 year of grace.
Financial Rate of Return Calculation
1 2 3 4 5 6 7 8 9 10
Sales 714 714 714 714 714 714 714 714 714 742 /1Operating Cost 340 573 573 573 573 573 573 573 573 573Investment Cost 935 - - - - - 74 - -
Net Benefits (561) 141 141 141 141 141 67 141 141 169
Financial Rate of Return = 197(over 10 years)Sensitivity Analysis: + 10% investmnat cost = 15%
+ 10% operating cost = 4% 0
/1 Includes residual value of Rials 28,000.
February 23, 1974


IRAN
Third.ADBI Agricultural Credit Project
SMALL DAIRY FARM XODEL g - HERD PROJECTION
Year 2 Year 3 Year 4 Year 5 Year 6 Years 7-15
1. rCorn osition(a) Bull 1 1 1 1 1 1(b) Cows 15 14 18 20 20 20
mature _ 14 11 14 15 151st lactation 15 - 7 6 5 5
(c) Heifers - 7 5 7 8 8(d) Female calves 7 6 8 8 9 8(e) Male calves 7 6 7 9 8 9
Total 45 48 57 65 66 66
2. Mortality(a) Cows - 1 1 1 1 1(b) Heifers - - - - -(c) Calves 1 1 1 1 1 1
Total 1 2 2 2 2 2
3. Purchases /Bull - - 1 - 1 -
4. Sales(7a Cull cows 1 2 3 4 4 4(b) Surplus heifers _ - 1 2 3 3(c) Steers 1 year old 6 6 7 8 8 8(d) Bull (for breeding) : _ - 1 - 1 -
Total 7 8 12 14 16 15
5. Milk Production ('000 liters)(a) Cows - mature 60 70 83 94 95 95(b) Cows - 1st lactation - - - - - --(c) Milk for calves 0.3 0.3 0.3 0.3 0.3 0.3(d) Milk for sale 59.7 69.7 82.7 93.7 94.7 94.7
6. Production Coefficients(a) Calving rate % 95 85 85 85 85 85(b) Adult mortality % 4 4 4 4 4 4(c) Calf mortality % 8 8 5 5 5 5(d) Cow culling rate % 10 15 20 20 20 20(e) Milk production - cows lst lactation 4,ooo 4,ooo 4,ooo 4,ooo 4,ooo 4,ooo(f) Milk production - mature cows 5,000 5,000 5,000 5,000 5,000 5,000
Based on initial heidof 15 cows rising to 20 in year five.E Excluding initial stock purchases of 15 pregnant heifers and one bull beginning of Year 2./ Bull replacement every 2 years.
February 15, 1974

IRANThird ADUI Agrictural Credit Project
SMALL DAIRY FARM M)DEL - ON-FARM INVESTMENTS(Rials '000)
No. of UnitUnit Units Cost Year 1 Year 2 Year 3 Year 4 Year 5 Year 6 Year 7 Year B Year 9 Year 10 Year 11 Year 12
1. Breeding Stookac) VEegoset heifers hd 15 6o.o0 - 900
(b) Bulle hd 1 120.00 - 120
Sub-total - 1,020
2. Buildings nad Facilities(e2 550 0.25 138 -
(b) Sheds m 205 1.55 313(c) Nursery m
220 2.00 40
(d) Store house m2
20 1.90 38(e) Milking parlor j =2 50 2.50 125(f) Workersg' quarters m 30 1.20 36(g) Well 1 10 -(h) Water tank and piping 75
Sub-total 780
3 Macibiery cnd. Eq,p:,meMilking equipen - 70 - - _ _ 20 _ - - _ 70
(b) Pomping equipment - 137 - 20 _ - _ - 4o(c) Vehicle 70 - - - _ 130 - - - _ 120 -(d) Spray - 16 - - - - 16 - - 18(e) Other - 20 - - 15 - - - - 15
Sub-total 70 245 - _ 130 73 - - - 120 143
4. Crop EtablishmentAlfclfa 2/ ha 10 20.00 - 200 - - - - - -
5. Physical Contingencies (59) 42 73 - - - -6 4 - - - 6 7
TOTAl 892 1,538 - - 136 77 - _ - 126 150
1i Beginning with 15 cowe eud rieing to 20 COWe in year 4./ Local F1 generation
v Inclding cooler and engine room/ One 3 hp unit Ris 60,000 and one small cooler Rhs 10,000
W' Pickup, initial purchase used, traded for new vehicle (RSI 140,000) every 5 yearsLevell0ling Rls 10,000fha, plantig Rle 10,000/ha,
February 12, 1974

IRANThirdADBI Agricultural Credit Project
SMALL DATIY FARM M DEL - PROJECTFD INCOME AND OPERATING EXPEDSES
Year 2 Year 3 Year 4 Year 5 Year 6 Year 7 Iear 8 Year 9 Year 10 Year 11 Year 12 Year 13 Year 14 Year 15
1. SalesNT Milk 2/ 776 902 1,075 1,218 1,231 1,231 1,231 1,231 1,231 1,231 1,231 1,231 1,231 1,231
(b) Cull cows 2/ 18 36 54 72 72 72 72 72 72 72 72 72 72 72(c) Surplus heifers 2/ - - 50 100 150 150 150 150 150 150 150 150 150 150(d) Steers ore year old 2/ 106 108 126 144 144 144 144 144 144 144 144 144 144 144(e) Pull E - 100 - 100) - 100 - 100 100 l 100 100(f) Alfalfa |/ - 125 180 105 75 - - - - - - - - -
TOTAL 902 1,271 1,485 1,739 1,672 1,697 1,597 1,697 1,597 1,697 1,597 1,697 1,597 1,697
2. erating Costsa Feed 300 350 415 470 475 475 475 475 475 475 475 475 475 475
(b Wages 2/ 282 264 264 264 264 264 264 264 264 264 264 264 264 264(c) teterinary L/ 8 9 1o 10 10 10 10 10 10 10 10 10 10 10(d) Electricity and Sueel 44 45 47 47 47 47 47 47 47 47 47 47 47 47(a) Detergeats ard disinfectanta 10 10 10 10 10 10 10 10 10 10 10 10 10 10(f) Building mairtenrance / 16 16 16 16 16 16 16 16 16 16 16 16 16 16(g) Nachinery maintenance 2/ 4 16 16 16 16 16 16 16 16 16 16 16 16 16(h) Straw 12 13 15 15 15 15 15 15 15 15 15 15 15 15(i) Crop production 43/ 75 110 110 110 210 i45 145 145 145 245 185 145 145 145(j) Bull replacement - 120 - 120 - 120 - 120 - 121 - 120 - 120(k) Physical cootingencies (51) 38 48 45 54 53 56 50 56 50 61 50 56 50 56
TOTAL 789 1,001 948 1,13a 1,116 1,174 1,o48 1,174 1,048 1,270 1,048 1,'74 1.048 1,174
/ Beginning with 15 cows and rising to 20 cows in year 4.2/ Milk Eald at 13 Rials per liter.2/ Cull cows sold at 60 Rials per kg and 300 kg per heac.
r/ Surplus heifers 50,000 Rials per head.5/ Steers sold at 90 Rials per kg and 200 kg per head.6 Bull sold for breeding to another herd at 100,000 Rials per head./ Alfalfa hay at Els 4,coo per ton.2/ 1 kg concentrates to 2.5 kg milk.2/ Permanent employees Ris 180,000 per year plus seasonal labor.
rls 300 per adult head, Rls 100 per head under 12 months.
p/ 2% of capital cost./ 5% of capital cost, excluding pickup vehicle.
M/ achinery hire, seed, fertilizer, pesticides; 10 ha alfalfa (replanted every 5 years);3 ha maize for silage, increasing to 5 ha in year 7,
February 15, 1974

IRAH~Third ADBI Agricultural Credit Project
SMALL DAIRY EARM MODEL 2/ -CASH FLOW PROJECTIONS AND FINANCIAL RATE OF' RETURN; CALcIJTATIOrJI
(Rials '000)
Cash Flow
1 2 3 4 5 6 7 8 9 10 11 12 13 14 15
CASH INFLOW
1. Annual Sales - 902 1,271 1,485 1,739 1,672 1,697 1,597 1,697 1,597 1,697 1,597 1,697 1,597 1,6972. Producer's Contribution /1 253 496 - - - - - - - - - - - - -3. Long-term Loan /2 669 1,154 - - - - - - - - - - -4. Working Capital
a. Last Year's Cash Balance - - 113 219 232 338 281 273 292 308 370 262 261 284 333b. Seasonal Credit -
Total Expected Cash Inflow 922 2,552 1,384 1,704 1,971 2,010 1,978 1,870 1,989 1,905 2,067 1,859 1,958 1,881 2,030
CASH OUTFLOW
1. Investoent 892 1,538 - - - 136 77 - - - 126 150 - - -2. Operating Cost - 789 1,001 948 1,132 1,116 1,174 1,048 1,174 1,048 1,279 1,048 1,174 1,048 1,1743. Seasonal Credit - - - - - - - - - - - - - - -4. Debt Service
a. Interest 30 112 164 164 141 117 94 70 47 24b. Principal - - - 260 260 260 260 260 260 263 - - - - -5. Producer's Cash Withdrawals - - - 100 100 100 100 200 200 200 400 400 500 500 500
Total Expected Cash Outflow 922 2,439 1,165 1,472 1,633 1,729 1,705 1,578 1,681 1,535 1,805 1,598 1,674 1,548 1,674
Total Expected Cash Bealance at Year's End - 113 219 232 338 281 273 292 308 370 262 261 284 333 356
/1 25'h of investment cost and interest on long-term loan./2 75% of investment cost at 9% p.a. for 10 years including 3 years of grace.
Financial Rate of Ret.rs Calculation
1 2 3 4 5 6 7 8 9 10 11 12
Sales - 902 1,271 1,485 1,739 1,672 1,697 1,597 1,697 1,597 1,697 3,002 /1Operating Coat - 789 1,001 948 1,132 1,116 1,174 1,048 1,174 1,048 1,279 1.048Investment Coot 892 1,538 - - - 138 77 - - - 126 150
Net Benefits (892) (1,425) 270 537 607 418 446 549 523 548 292 1,804
Financial Rate of Return = 17%(over 12 years)Sensitivity Analysis: + 10% investment cost - 147,
+ 10% operating cost = 11%- 10% sales = 9%/
/1 Includes residual value of Rials 1,405,000.
February 23, 1974

IRANThird ADBI Agricultural Credit Project
LARGE MIXED FARMING MORL_ - FLOCK PROJECTIONS
Year 2 Year 3 Year 4 Year 5 Year 6 Year 7 Year 8 Year 9 Year 10
1. Flock Composition(a) Ewes 1,600 1,216 1,493 1,500 1,500 1,500 1,500 1,500 1,500(b) Rams 64 62 64 62 64 62 64 62 64(c) Ewe lambs 680 547 672 750 750 750 750 750 750(d) Ram lambs 680 547 672 750 750 750 750 750 750(e) Ewe weaners - 612 503 618 690 690 690 690 690
TOTAL 3,024 2,984 3,404 3,680 3,754 3,752 3,754 3,752 3,754
2. Mortality(a) Ewes 80 61 75 75 75 75 75 75 75(b) Rams 2 2 2 2 2 2 2 2 2(c) Ewe lambs 68 44 54 60 60 60 60 60 60(d) Ram lambs 68 44 54 60 60 60 60 60 60(e) Ewe weaners - 31 25 31 35 35 35 35 35
TOTAL 218 182 210 228 232 232 232 232 232
3. Purchases(a) Ewes 1,600 _- - - - - -(b) Rams 64 _ 64 _ 64 _ 64 _ 64
TOTAL 1,664 _ 64 - 64 - 64 - 64
4. Sales(a) Culled ewes 304 243 284 285 285 285 285 285 285(b) Ram lambs 612 503 618 690 690 690 690 690 690(c) Ewe weaners - - 112 227 295 295 295 295 295(d) Rams - - 60 - 60 - 60 - 60
TOTAL 916 746 1,07T 1,202 1,330 1,270 1,330 1,270 1,330
5. Production Coefficients
(a) Lambing percentage 85 90 90 90 90 90 90 90 90(b) Lamb mortality % 10 8 8 8 8 8 8 8 8(c) Ewe mortality % 5 5 5 5 5 5 5 5 5(d) Ram mortality % 2 2 2 2 2 2 2 2 2(e) Ewe culling rate % 20 20 20 20 20 20 20 20 20(f) Ram replacement - 2 years
-~~~~~~~~~~~~~~~~~~~~~~~~~~~~~~~~~~~~~
_1/ Based on a continuing flock of 1,500 breeding ewes.
February 15, 1974

IRANThird ADBI Agricultural Credit Project
LARGE MMDED FARMING PDDEL i/ - ON-FARM INVESTMNTS(Rials '000)
No. of UnitUnit Units Cost Year 1 Year 2 Year 3 Year 4 Year 5 Year 6 Year 7 Year 8 Year 9 Year 10
1. Breeding Stock(a) Ewes hd 1,600 2.50 - 4,000 - - _ _ _ _ _ _(b) Rams hd 64 4.00 - 256 - -
Sub-total - 4,256 - - - - - - - -
2. Construction(a) Open 1ot # m
23,600 0.02 54 18 - - -
(b) Roofed shed m2
1,500 1.20 1,350 450 - - -(c) Workers' quarters m
2350 1.80 470 160 - - -
(d) Manager's house m2
85 3.00 255 - - - -(e) Store sheds m
2245 1.95 355 123 - - -
(f) Deel wells No. 3 360.00 720 360 - -(g) Water tank No. 1 150.00 150 - - _ _ _ _ _ _ _(h) Fuel tank No. 3 60.oo 180(i) Roads a
23,000 0.06 180 - - - - -
Sub-total 3,714 1,111 - - - - - - -
3. Machinel and Equipment(a) Tr r and implements i/ - 2,104 - - - - 45 850 790 -
(b) Pumping equipment 2/ 1,042 2,084 - - - - - - - 1,190(c) Vehicle (4-wheel drive) 349 _- - 295 - -
Sub-total 1,391 4,188 - - - - 340 850 790 1,190
4. Cro Etabliohment(a) Land preparation - 5,400 - - - -(b) Alfalfa planting - 420 - - - -
Sub-total - 5,820 - - - - - - -
5. Physical Contingencies (5%) 255 769 - - - - 17 43 40 60
TOTAL 5,360 16,143 - - - - 357 893 830 1,250
V Based on 1,500 breeding ewes, 40 ha alfalfa, 80 ha wheat, 80 ha barley, 60 ha sugar beet at full development.g/ 1.5 m
2per head.
3/ Concentrates shed 85 m2
, equipment shed 100 m2
, pump and generator house 60 m2
.2 tractors 65 hp @ Rls 320,000 ea, 1 tractor 40 hp @ 220,000, plow, disc, baler, sugar beet planter, etc.
2/ 3 deep well pumps @ Rls 600,000 ea, 3 deep well engines @ Rls 442,000 ea. Do
February 15, 1974
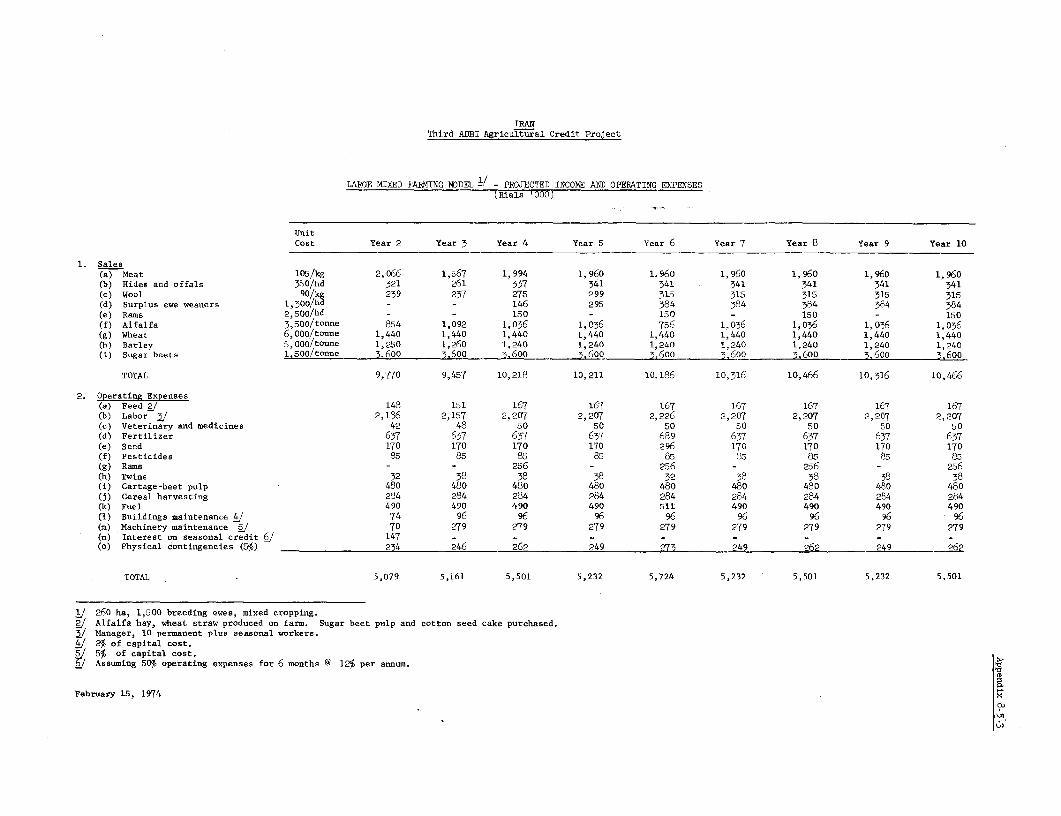
IRANThird ADBI Agricultural Credit Project
LARGE MIXED FARMING MDDEL - PROJECTED INCOME AND OPERATING EXPENSES7(Rials '000)
UnitCost Year 2 Year 3 Year 4 Year 5 Year 6 Year 7 Year 8 Year 9 Year 10
1. Sales(a) Meat 105/kg 2,066 1,567 1,994 1,960 1.960 1,960 1,960 1,960 1,960(b) Hides and offals 350/hd 321 261 337 341 341 341 341 341 341(c) Wool 90/kg 239 237 275 299 315 315 315 315 315(d) Surplus ewe weaners 1, 3 00/hd - - 146 295 384 384 384 384 384(e) Rams 2,500/hd - - 150 - 150 - 150 - 150(f) Alfalfa 3,500/tonne 854 1,092 1,036 1.036 756 1,036 1,036 1,036 1,036(g) Wheat 6,000/tonne 1,440 1,440 1,440 1,440 1,440 1,440 1,440 1,440 1,440(h) Barley 5,00 /tonne 1,250 1,260 1,240 1,240 1,240 1,240 1,240 1,240 1,240(i) Sugar beets 1.500/tonne 3.600 3'600 ~ ,60o 3.600 3,600 3.5°6 - ,600 3.600 3,600
TOTAL 9,770 9,457 10,218 10,211 10,186 10,316 10,466 10,316 10,466
2. Operating Expenses(a) Feed j 148 151 167 167 167 167 167 167 167(b) Labor 31 2,186 2,157 2,207 2,207 2,226 2,207 2,207 2,207 2,207(c) Veterinary and medicines 42 48 50 50 50 50 50 50 50(d) Fertilizer 637 637 637 637 689 637 637 637 637(e) Seed 170 170 170 170 296 170 170 170 170(f) Pesticides 85 85 85 85 85 85 85 85 85(g) Rams - - 256 - 256 - 256 - 256(h) Twine 32 38 38 38 32 38 38 38 38(i) Cartage-beet pulp 480 480 480 480 480 480 480 480 480(j) Cereal harvesting 284 284 284 284 284 284 284 284 284(k) Fuel 490 490 490 490 511 490 490 490 490(1) Buildings maintenance / 74 96 96 96 96 96 96 96 96(m) Machinery maintenance | 70 279 279 279 279 279 279 279 279(n) Interest on seasonal credit | 147 - - -
(o) Physical contingencies (5%) 234 246 262 249 273 249 262 249 262
TOTAL 5,079 5,161 5,501 5,232 5,724 5,232 5,501 5,232 5,501
I/ 260 ha, 1,500 breeding ewes, mixed cropping.
2/ Alfalfa hay, wheat straw produced on farm. Sugar beet pulp and cotton seed cake purchased./ Manager, 10 permanent plus seasonal workers./ 2% of capital cost.
J 5% of capital cost.Assuming 50% operating expenses for 6 months @ 12% per annum.
February 15, 1974 x

IRANThird AliI Agricultural Credit Project
LARGE MIXED FARMING MDDEL -CASH FLOW PROJECTIONS AND FINANCIAL RATE OF RETURN CALCULATIONS
(Rials '000)
Cash Flow
1 2 3 4 5 6 7 8 9 10CASH INFLOW
1. Annual Sales - 9,770 9,457 10,218 10,211 10,186 10,316 10,466 10,316 10,4662. Producer's Contribution L1 1,521 4,036 - - - - - - - -3. Long-term Loan /2 4,020 12,107 - - - - - - - -4. Working Capital
a. Last Year's Cash Balance - - 3,784 3,941 4,226 4,549 4,597 4,152 3,295 3,549b. Seasonal Credit /3 - 2.466 - - -
Total Expected Cash Inflow 5,541 28,379 13,241 14,159 14,437 14,735 14,913 14,618 13,611 14,015
CASN OUTFLOW
1. Investment 5,360 16,143 - - - - 357 893 830 1,2502. Operating Cost - 5,079 5,161 5,501 5,232 5,724 5,232 5,501 5,232 5,5013. Seasonal Credit /3 - 2,466 - - - - - - - -4. Debt Service
A. Interest 181 907 1,451 1,210 968 726 484 242b. Principal - - 2,688 2,688 2,688 2,688 2,688 2,687 - -
5. Producer's Cash Withdrawal - - - 534 1.000 P000 2.000 2,000 4.000 4,000
Total Expected Cash Outflow 5,541 24,595 9,300 9,933 9,888 10,138 10,761 11,323 10,062 10,751
Total Expected Cash Balance at Year's End - 3,784 3,941 4,226 4,549 4,597 4,152 3,295 3,549 3,264
1 257. of investment cost and interest on long-term loan during year 1.2 757. of investment cost at 9% p.a. for 8 years including 2 years of grace.
/3 507. of operating cost for 6 months at 12% p.a.
Financial Rate of Return Calculation
1 2 3 4 5 6 7 8 9 10
Sales - 9,770 9,457 10,218 10,211 10,186 10,316 10,466 10,316 16,606 /1Operating Cost - 5,079 5,161 5,501 5,232 5,724 5,232 5,501 5,232 5,232Investment Cost 5,360 16,143 - - - - 357 893 830 1,250
Net Benefits (5,360) (11,452) 4,296 4,717 4,979 4,462 4,727 4,072 4,254 10,124
Financial Rate of Return = 21%(over 10 years)Sensitivity Analysis: + 107. investment cost = 187,
+ 107. operating cost = 177%- 10% sales = 14%7
/L Includes residual value of Rials 6,140,000.
February 23. 1974

IRANl'Third ADBI Agrisoltaral Credit Pr-J-et
[LARGE OPCHAPJC (APPLE) MODEL - ON-FARM INVESTMENT2,(Pials '000)
Na. of CnitUnit Unaita Coat Year I Year 2 Yea, 3 Year 4 Year 5 Year 6 Year 7 Year 8 Year 9 Year 10 Year 11 Year 12 Year 13 Year 14 Year 15 Yesr 16 Year 17 Year 18
1. aad et)6Fi5TIl9ilie ha 50 10.00 500 - - - - - - - --------(b) Lod Pr-p-rtoi- ha 50 1.50 75 - - - - - - -- -------
Sub-tot.1 575 - - - - - - --- ----
2. Riahlney an 0 uiMaeta rator adimpl-e`ets 1,2000 - - 405 560 72 ---- 405 -580 -72(b) m-piog eqooprat 1,300 - - - - - - ---------
Sob-t.tel 20500 - -- - - 405 580 72 ---- 405 - 8o - 72
3. Ien aio Wonsao WrCoooOr,-tio- 100 3.00 300 - - - - - - ---------(b) Caoboilding a 600 0.20 120 -- - - - ---------
Sub-t.tal 4200
4. Other In-eu-eta(a) Feneeo~~~/ lao 222 3.0 777
(01) Whi.dbrea.ba h~ 50 2.00 10 - - - - - - ---------(a) Hoo,ing,oh.ds 3/ a.62 1,10 - - - - - - -(0) P0o0d 4,ooo0 0.05 2000
Sob-htetl 2,197 - - - - - - - - --------
5. Establialoo-t of Appie CropT., abor h 50 8.70 435 - - - - - ---------(b) PI.' ti.g haeratb 50 8.60 1404o - ----- (a) F-rtllioors be 5C [404 2200 (d) tstnblialhoot o i-rignnbo- ha 50 0.50 25 - - - - - - ----------
(a) e Oe,darsy irnigationonnal hon 50 2.00 100
Sob-total 1,2200
6. Oao -mato -rio Capita -I
(a) Labor 662 975 978 378 223 - - ----------(b) Troet-r an .ethhnery oar 508 555 581 600 136 - ----------(e) oertilioes-] - 185 265 345 92 - - - -----. (d) Cooaubhridoa 6/ 0~ ~ ~~~ ~~5 20 33 55 2
Sob-total 1,425 1,738 1,857 1,978 474 - - - ---- -----
7. PhYiseal C-ntingeni-o (5%) 417 67 93 99 24 2 0 29 4 ---- 20 -29 -4
T000AL 8,754 1,825 1,950 2,077 496 425 609 76 ---- 425 608 76
]Mod and straW at ROI. 120 per aster.6]Poplar tere 3]Mlaag-r'a h0000 Rls 500,000; per,aooeot -korera hooatng his 50,00;O aechin..ry abed Rl.l 120,000.0Gestati.n perIod operating oo-ta.e6]330 Aple trees/ba, 0.5/kg f-rttlteer/nree/y-a to msxiooe of 9 hg/tree.
6]Main pests at pr..eset are coni.sg moth and thripo. I
Febroary 12, 1974

IRANThird ADBI Agricultural Credit Project
LARGE ORCHARD (APPLE) MODEL - PROJECTED INCOME AND OPERATING EXPENSES(Rials '000)
Year 1 Year 2 Year 3 Year 4 Year 5 Year 6 Year 7 Year 8 Year 9 Year 10 Year 11 Year 12-20
1. Sales
Apples g - - - - 1,800 3,600 5,400 7,200 8,400 9,600 10,800 12,000
2. Operating Costs
(a) Labor - - - - 803 1,026 1,026 1,026 1,026 1,026 1,026 1,026(b) Tractors and machinery use - - - - 492 628 628 628 628 628 628 628(c) Fetilizers - - - - 333 505 585 665 745 825 825 825(d) Insecticides - - - - 86 150 185 220 250 250 250 250(e) Physical contingencies (5%) - - - - 86 115 121 127 132 136 136 136
TOTAL Operating Costs - - - - 1,800 2,424 2,545 2,666 2,781 2,865 2,865 2,865
Yield commencing at 3 tonnes per hectare in year 5 to 20 tonnes per hectarein year 12. Sale price 12,000 rials per tonne on the tree, being made tocontractors who harvest and sell.
g Manager, six permanent employees (Rls 127,000 each per year), seasonal labor120 rials per day, pruning 1,000 rials per hectare.
/ Apples planted 300 trees per hectare, fertilizer 0.5 kg per tree per year ofage to maximum of 5 kg tree.Main pests at present are coaling moth and thrips.
February 15, 19741
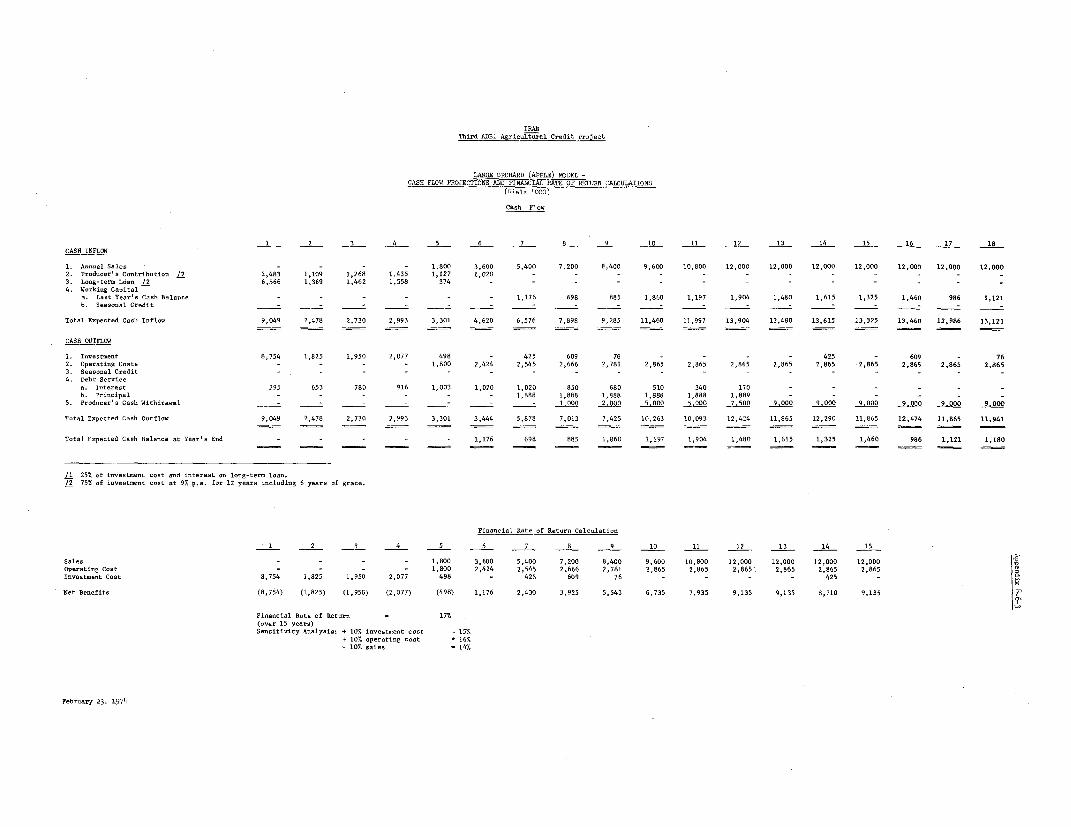
IRANThird ADBI Agricultural Credit Pro-ect
LARGE ORChIARD (APPLE) MDDEL -CASH FLOW PROJECTIONS AND FINANCIAL NATE OF RETURN CALCULATIONS
(Oialo '000)
Csash Flew
1 2 3 4 5 6 7 8 9 10 11 12 13 14 15 16 17 1a
CASH INFLOW
1. Annual Sales - - - - 1,800 3,600 5,400 7.200 8,400 9,600 10,800 12,000 12,000 12,000 12,000 12,000 12,000 12,000
2, Producer's Contribution /2 2,483 1,109 1,268 1,435 1,127 1,020 - - - - - - - - - - - _
3. Long-term Ldan /2 6,566 1,369 1,462 1,558 374 - - - - - - - - - -
4. Working Capitala. Last Year's Cash Balanre - - - - - - 1,176 698 885 1,860 1,197 1,904 1,480 1,615 1,325 1,460 986 1,121
b. Seasonal Credit - -
Total Expected Cash Inflow 9,049 2,478 2,730 2,993 3,301 4,620 6,576 7,898 9,285 11,460 11,997 13,904 13,480 13,615 23,325 13,460 12,986 13,121
CASH OUTFLOW
1. Inves-tent 8,754 1,825 1,950 2,077 498 - 425 609 76 - - - 425 - 609 - 76
2. Opacoting tests - - - - 1,800 2,424 2,545 2,666 2,781 2,865 2,865 2,865 2,865 2,865 2,865 2,865 2,865 2,865
3. Seasoa. l Credit - - - - - - - - - - - - - - - - - -
4. Debt Services. Interest 295 653 780 916 1,003 1,020 1,020 850 680 510 340 170
b. Principal - - - - - - 1,888 1,888 1,888 1,888 1,000 0,889
5. Producer's Cash Withd-awal _- - ----- 1.000 25000 ,9 9
5,000 7.500 9.00 9.000 9000 9,000 9.000 9.000
Total Expected Cash Onttlow 9,049 2,478 2,730 2,993 3.301 3,444 5,878 7,013 7,425 10,263 10,093 12,424 11,865 12,290 11,865 15,474 11,865 11,941
Total Expected Cash Balance at Year's End - - - - - 1,176 698 005 1,060 1,197 1,904 1,400 1,612 1,325 1,460 906 1,121 1.180
/1 25T, of investment cost and isteast on long-term loan./2 757 of investment cost at 9% p... for 12 yeoa- including 6 years of grace.
Financial Rate of Return Calculation
1 2 3 4 5 6 7 8 9 10 11 12 13 14 15
soles - - - - 1,800 3,600 5,400 7,200 8,400 9,600 10,800 12,000 12,000 12,000 12,000
operating Cost - - - - 1.800 2,424 2,545 2,666 2,781 2,865 2,865 2,865 2,865 2,865 2,865
Investment Cost 8,754 1,825 1,950 2,077 498 - 425 609 76 - - - - 425 -
Net Benefits (8,754) (1,825) (1,950) (2,077) (498) 1,176 2,430 3,925 5,543 6,735 7,935 9,135 9,135 8,710 9,135
Financoil Rate of Return 177,
(over 15 years)8s-itivity Analysis: + 107. investment cost 15
+ 107 operoting coat - 16%
- 107. salon = 147.
February 23. 1974


Amenai-x 8-7-1
IRAN
Third ADBI Agricultural Credit Project
LARGE POULTRY PARENT STOCK MODEL - FLOCK PROJECTIONS,i
Year 1 Years 2-8
1.Flock Comosition
(a) Imported day old pullets 24,000 24,000(b) Imported day old cockerels 9,200 9,200
2. Mortality % Pallets Cockexels
(a) 0 - 2 months 4 4
(b) 2 - 6 months 5 3
3. Culing%(a) at 2 months 2 20
(b) at 6 months 4 25
4. Culling and Mortality
6 - 16 months 10 14
Total number of eggs laid per hen (10 months) 21572 % of eggs laid are hatchable = 155
76% of hatchable eggs actually hatch = 118
98% of hatched chicks are saleable - 2 male and 2 female = 118
28% of eggs produced will be rejected for breeding but - 60
will be edible
February 15, 1974

IRANThirdASt Agricultural Credit Pro_ect
LARGE POULTRY PARENT STOCK DODEL '/ - ON-FARM INVESTMENTS(Rials '000)
No. of UnitUnit Units Cost Year 1 Year 2 Year 3 Year 4 Year 5 Year 6 Year 7 Year 8
1. Construction 2
(a) Reaxing, breeding and laying shedsm 7,200 3.0 16,200 524-o(b) Hatchery a 500 5.0 1,875 625 _ _ _ _ _(c) Office building m
2250 3.0 563 187
(d) Store & feed shed m2
250 2.0 375 125 _ _ _ _ _ _(e) Workers' quarters m2
400 2.0 600 200(f) Guard house m
250 2.5 94 31
(g) Generator and transformer houses m2
46 1.7 61 21(h) Disposal furnace buildinga M
250 2.5 94 31
(i) Well No. 1 200.0 150 50 - - - - - -(j) Water tank & reservoir 2/ 255 85(k) Fencing (wall) a 1,000 0.7 525 175(1) Road a 150 3.0 337 113
Sub-total 21,129 7,043 - - - - - -
2. Equipaent(a) Automatic feeders No. 8 200.0 1,600 - - - - - - 144(b) Semi-automatic waterers No. 8 70.0 560 - - - - - - 505(c) Feed mill, mixer, cleaner No. 1 300.0 300 -(d) Air heating & cooling equipment 3B3(e) Incubator No. 1 2,000.0 2,000(f) Brooders and tank No. 40 7.5 300 - -(g) Egg grading, storing equipment _ 200 - - - - -(h) Laying cages No. 4,000 0.1 - 400 - - - - - 4oo(i) Scale (5,000 kg) No. 1 7.5 - 8 - - - -(J) Light control clocks No. 8 2.5 - 20 - - - - -(k) Sprayer No. 1 50.0 - 50 - - - - -(1) Pumping equipment 440o - - - - - -(m) Other / 83 83 - - - - 75 75
Sub-total 5,666 761 - - - - 75 1,124
3. Electrical Equipment ,/ 2,200 - - - - - -
4. Vehicles(a) Automobile 220 - - - - - 187(b) Pickup 1,000 850
Sub-total 1,220 - - - - - 1,037
5. Incremental Working Capital(a) Purchase of chickens / 758 - - - - -(b) Feed |
2,400 - - - -
Sub-total 3,158 - - - - -
6. Physical Contingencies (5%) 1,511 548 _ - - 56 56
TOTAL 31,726 11,510 - - - - 1,168 1,180
cBased on sale of 1,125,000 Day-old female chickens per year at full development,
XConstruction 75% in Year 1, 25% in Year 2.3 Water tank (10,000 1,) and tower Rls 200,000; underground reservoir (200 m
3) Rls 140,000.
NDisposal furnace Rls 15,000; fire extinguishers, small feeders and waterers.5/ Including transformer, generator, wiring.
Equipped with cooler for chick transportation.Sufficient for one batch; 3 batchers produced per year.
February 12, 1974

IRANThird ADBI Agricultural Credit Project
LARGE POULTRY PARENT STOCK MODEL 1/ - PROJECTED INCOME AND OPERATING EXPENSES(Rials ,000)
UnitCost Year 2 Year 3 Year 4 Year 5-10
(Rials)
1. Sales(a) Day-old sexed female chicks 35/hd 19,961 39,471 39,471 39,471(b) Day-old cockerels V/hd 570 1,128 1,128 1,128(c) Reject eggs 40/kg 1,304 2,826 2,826 2,826(d) Culled chickens - 2 months 40/kg 40 40 40 40(e) Culled -6 months fowls 35/kg 90 177 177 177(f) Old fowls 40/kg - 1,690 1,690 1,690(g) Manure 600/m ton 180 432
Sub-total 21,145 45,764 45,332 45,132
2. Operating Expenses(a) Purchase of chickens / 1,518 2,276 2,276 2,276(b) Feed | 4,920 12,214 12,214 12,214(c) Labor 3,432 4,728 4,728 4,728(d) Veterinary expenses 110 127 127 127(e) Fuel,Water and Power 562 752 752 752(f) Worker insurance 446 615 615 615(g) Chick cartons 147 564 564 564(h) Advertising 250 250 250 250(i) Sanitation 23 23 23 23(j) Rent 360 360 360 360(k) Administration 50 96 96 96(1) Building maintenance 5 563 563 563 563(m) Equipment maintenance 494 494 494 494(n) Wood shavings 80 180 180 180(o) Interest on seasonal credit Z/ lCB 193 - -(p) Physical Contingencies (5%) 648 i,162 1,162 1,162
TOTAL 13,710 24r,59t 24,404 24',404
Based on the sale of 1,125,000 day-old female chickens per year at full development.I Imported at 84 rials per chick.
3 42 kg per bird during 10 months laying period, 16 kg to laying at 10 rials per kg.Managing director @ 600,000 rials per year. Financial manager @ 420,000 rials per year. Accountant@ 240,000 rials and 25 other permanent employees. X
5 2% of building cost.5% of equipment cost.
7 Assuming 20% of operating costs for 4 months @ 12% per annum.
February 12, 1974

IRANThirdi ADIBI Agricultural Credit FroJect
LARGE FOULTRY PARENT STOCK MODEL -CASH FLOW PROJECTIONS AND FINANCTAL RATE OF RETURN CALCIIIATIONS
(5ials '000)
Cash Flow
1 2 3 4 5 6 7 8 9 10
CASH INFLOW
1. Annual Sales - 21,145 45,764 45,332 45,132 45,132 45,132 45,132 45,132 45,132
2. Producer's Contribution LI 9,003 4,458 - - - - - - - -
3. Long-term Loan /2 23,794 8,632 _- - - - - -_
4. Working Capitala. Last Year's Cash Balance - - - 7,228 9,920 7,996 6,654 6,214 5,762 6,490
b. Seasonal Credit /3 - 2,742 4,881 - _ - _ - - -
Total Expected Cash Inflow 32,797 36,977 50,645 52,560 55,052 53,128 51,786 51,346 50,894 51,622
CASH OUTFLOW
1. Investment 31,726 11,510 - - - - 1,168 1,180 - -
2. Operating Cost - 13,710 24,597 24,404 24,404 24,404 24,404 24,404 24,404 24,404
3. Seasonal Credit /3 - 2,742 4,881 - - - - - - -
4. Debt Servicea. Interest 1,071 2,530 2,335 1,751 1,167 584b. Principal - 6,485 6,485 6,485 6,485 6,486 - - - -
5. Producer's Cash Withdrawals - - 5.119 10.000 15.000 15.000 20,000 20,000 20_0 200000
Total Expected Cash Outflow 32,797 36,977 43,417 42,640 47,056 46,474 45,572 45,584 44,404 44,404
Total Expected Cash Balance at Year's End - - 7,228 9,920 7,996 6,654 6,214 5,762 6,490 7,218
/1 25% of investment cost and interest on long-term loan year I and 1,530 Rials in year 2./2 757. of investment cost at 9% p.a. for 6 years including 1 year of grace.13 20% of operating cost for 4 months at 12% p.s.
Financial Rate of Return Calculation
1 2 3 4 5 6 7 8 9 10
Sales - 21,145 45,764 45,332 45,132 45,132 45,132 45,132 45,132 48,290 /1
Operating Cost - 13,710 24,597 24,404 24,404 24,404 24,404 24,404 24,404 24,404
Investment Cost 31,726 11,510 - - - - 1,168 1,180 - -
Net Benefits (31,726) (4,075) 21,167 20,928 20,728 20,728 19,560 19,548 20,728 23,886
Financial Rate of Return - 40%(over 10 years)Sensitivity Analysis. +10% investment cost - 36%
+107. operating cost - 35% --107. sales = 30. X
/1 Includes residual value of Rials 3,158,000.
February 23, 1974

IRANThird ADBI Agricultural Credit Project
LARGE POULTRY BROILER MODEL / - FLOCK PROJECTIONS
Year 1 Year 2 Year 3 Year 4 Year 5
1. Production Indices(a) Farm capacity 50,000 50,000 50,000 50,000 50,000(b) Mortality
Broilers 4 4 4 4 4Fryers 5 5 5 5 5
(c) Efficiency of Feedconversion 2.5 2.5 2.5 2.5 2.5
2. Sales(a) Broilers (birds) 31 64;,800 64,800 64,800 64,8oo 64,8oo(b) Fryers (birds) 4 192,450 192,450 192,450 192,450 192,450(c) Manure (tonnes) 353 353 353 353 353
Based on a unit of 50,000 chickens capacity at full development.1 kg feed to produce 1 kg meat.13 Broilers sold at 800 gr weight after 45 days 25%.
J Fryers sold at 1,500 gr (1.5 kg) weight after 68 days 75%.
CDFebruary 15, 1974
ozJ

IRANThirdADBI Agricultural Credit Project
LARGE POULTRY BROILER MODEL / - ON-FARM INVESTMENTS(Rials '000)
No. of UnitUnit Units Cost Year 1 Year 2 Year 3 Year 4 Year 5 Year 6 Year 7 Year 8
1. Construction and Buildings(a) Sheds 2 m2 3xlO00 2.50 5,625 1,875(b) Office m
2250 2.50 625 -- -
(c) Store sheds m2
3 x 26 2.00 117 39 - - - - - -
(d) Housing S/ m2 240 1.80 324 108(e) Equipment housing j m
23x20,lx5O 1.70 153 - _ _ _ _ _
(f) Fencing m 1000 1.00 1,000 - _ _ _ _ _ _(g) Roads m2 3000 0.15 450 - - - - -
Sub-total 8,294 2,022 - - _ _ _
2. uipment(a) Poultry equllpment 1 ,368 705 - _ _ _ - 1,345(b) Electrical and water
equipment 1,900 - - - - - - -(c) Other Q 1,955 - _ _ _ _ 1,080 -
Sub-total 5,223 705 _ _ _ _ 1,080 1,345
3. Incremental Working Capital 7/(a) Chickens 388 - - - - - - -(b) Feed 4,242 - - - - - - -
(c) Vaccines and medicine 232 - - - - - - -
Sub-total 4,862 - - - - - - -
4. Physical Contingencies (5%) 919 136 - - - - 54 67
TOTAL 19,298 2,863 - _ 1,134 1,412
7 Based on a unit of 50,000 chickens capacity at full development.' Three sheds on farm; each shed of 1,000 m
2, holding 18,000 chickens initially, then 10,000 fryers.
3/ Laborers quarters, 30 m2 per head.Generator, transformer and disposal furnace.
/ Feeders, brooders, waterers, ventillators, coolers, heaters.Feed mill, mixer, automobile, truck equipped with cooler for transporting chicks.
v One batch completed and a second batch begun in year 1, five batches per year thereafter.
0F
February 15, 1974

IRANThird ADBI Agricultural Credit Project
LARGE POULTRY BROILER MODEL ] - PROJECTED INCOME AND OPERATING EXPENSES(Rials '000)
Year 1 Year 2 Year 3 Year 4 Year 5 Year 6 Year 7 Year 8
1. SalesTa) Broilers 1 674 3,369 3,369 3,369 3,369 3,369 3,369 3,369(b) Fryers 2r 3,464 17,320 16,320 17,320 17,320(c) Manure 3,! 35 177 177 177 177 177 177 177
TOTAL 4,173 20,866 20,866 20,866 20,866 20,866 20,866 20,866
2. Operating Costs(a) Chicken purchase | 388 972 972 972 972 972 972 972(b) Feed 2/ 4,242 10,607 10,607 10,607 10,607 10,607 10,607 10o607(c) Labor 220 548 548 548 548 548 548 548(d) Vaccines and medicines 232 579 579 579 579 579 579 579(e) Maintenance of buildings 7 - 166 206 206 20o6 206 206 206(f) Maintenance of machinery ,/ - 261 296 296 296 296 296 296(g) Water and power 80 201 201 201 201 201 201 201(h) Employee insurance 28 71 71 71 71 71 71 71(i) Cleaning and spraying 12 29 29 29 29 29 29 29(j) Wood shavings 31 77 77 77 77 77 77 77(k) Fuel 54 135 135 135 135 135 135 135(1) Interest on seasonal credit 2/ - - - - - - -(m) Physical contingencies (5%) 264 682 686 686 686 686 686 686
TOTAL 446 14,330 14,407 14,407 14,407 14,407 14,407 14,407
2/ Sold 45 days old @ Rls 65 per kg.| Sold 68 days old @ Rls 60 per kg.3/ Rls 500 per tonne.25 batches per year, 10,800 birds per batch2/ 1.9 kg per bird to 45 days, 3.6 kg to 68 days.2/ Rls 2.25 per bird.7/ 2% of capital cost.2/5% of capital cost2/ Assuming 10% of operating costs for 3 months @ 12% per annum.
February 15, 1974

TIAN2hird ADBI Agricultural Credit Project
LARGE POULTRY BROILER MODEL -CASH FLOW PROJECTIONS AND FINANCIAL RATE OF RETURN CALCULATIONS
(Rials '000)
Cash Flow
1 2 3 4 5 6 7 8CASH INFLOW
1. Annual Sales 4,173 20,866 20,866 20,866 20,866 20,866 20,866 20,8662. Producer's Contribution /1 4,824 716 - - _ _ _ _3. Long-term Loan /2 14,474 2,147 - -4. Working Capital
a. Last Year's Cash Balance - 3,076 7,213 6,021 5,203 4,759 4,688 5,013b. Seasonal Credit - I _ _ _
Total Expected Cash Inflow 23,471 26,805 28,079 26,887 26,069 25,625 25,554 25,879
CASH OUTFLOWI
1. Investment 19,298 2,863 - - - - 1,134 1,4122. Operating Cost 446 14,330 14,407 14,407 14,407 14,407 14,407 14,4073. Seasonal Credit4. Debt Service
a. Interest 651 1,399 1,496 1,122 748 374 - -b. Principal - - 4,155 4,155 4,155 4,156
5. Producer's Cash Withdrawals - 1.000 200 0 20000 2000 2,000 5.000 5.000
Total Expected Cash Outflow 20,395 19,592 22,058 21,684 21,310 20,937 20,541 20,819
Total Expected Cash Balance at Year's End 3,076 7,213 6,021 5,203 4,759 4,688 5,013 5,060
/1 25% of investment cost./2 75% of investment cost at 97 p.a. for 6 years including 2 years of grace.
Financial Rate of Return Calculation
1 2 3 4 5 6 7 8 9 10
Sales 4,173 20,866 20,866 20,866 20,866 20,866 20,866 20,866 20,866 23,291 /tOperating Cost 446 14,330 14,407 14,407 14,407 14,407 14,407 14,407 14 407 14,407Investment Cost 19,298 2,863 - - - - 1,134 1,412 - -
Net Benefits (15,571) 3,673 6,459 6,459 6,459 6,459 5,325 5,047 6,459 7,477
Financial Rate of Return 33%(over 10 years)Sensitivity Analysis: + 10% investment cost - 28% '
+ 10% operating cost = 237.- 10% sales - 18% x
0.
_ c~~~~~~~~~~~~~~~~~~~~~~~~~~~~~~~~~~~~~~~~~~~~~~~~~~~~~~~~~o/1 Includes residual value of Rials 2,425,000.
February 23, 1974

IRAN Appendix 8_9-1IRAN --
ThirdADBI Agricultural Credit Project
LAR E POULTRY LAYERS MODEL - FLOCK PROJECTIO B
Year 1 Years 2-8
Production Indices
(a) Number of day old femalechicks purchased 75,000 75,000
(b) Mortality %1st two months 4%2 to 6 months 5%
(c) Culling % and soldat two months 2% i,440 1,440at six months 4% 2,682 2,682
(d) Culling plusmortality 6-18 months 12%
(e) Average number of layers 60,489 60,489(f) Average weight of eggs - 18 eggs
- l kg(g) Average number of old hens sold - 56,628
Based on a fully developed unit of approximately6o,000 layers.
February 15, 1974

!RAN
Third ADBT Agricultural Credit Project
LAPOB POLR1AYR /OE - iN-PA I4 T l7NTEYBPinls is)
No, of UnitUnit Units Cent Year 1 Year 2 Year 3 Year 4 Year 5 Year 6 Year 7 Year 8 Year 9 Year 10
1. Construction(a) Laying sheds 2/ m2 6,5oo 1.70 5,525 5,525 - - _ _ _ _ - -(b) Brooder house M/ a2 2,500 1.70 3,187 i,o63 - - - - - - - -(e) Workers' housing a
2300 2.00 450 150 - - - - - - - -
(d) Feed store a2
40 2.00 80 -(e) Office a2 200 2.50 250 250(f) Pump end transforner honoes m
240 1.70 68 -
(g) Water storage tks k./ Ne. 2 1,000(h) Well No. 1 200.00 200 - - - - - - - - -
Sub-total 10,760 6,988 - - - - - - - _
2. Equpment( c) Laying Cages No. 6o,5oo o.06 - 3,630 - - - _ - 3,270(b) Breeders NB. 8o 1.20 32 64 - -(c) Feeders and eterers 72 143 - - _ _ - 194(d) Feed mill/ N.. 1 268 - -
Seb-total 372 3,837 - - - - - 3,464
3. Electrical Inatallatiens(a) Transformer No. 1 320.00 320 - -(b) Meter generator No. 1 400.00 400(c) Wiring 360
Sub-total 1,080
4. Water Retieulation 2/ 330
5. Vehicles(a) Pickup No. 1 4oo.o0 40o - - - - - 340 - - -(b) Automebile No. 1 270.00 270 - - - - - 230
Sob-total 670 - - - -- - 570
6. Road Construction 50- -
7. Fencing a 800 1.00 80o -
8. Other Y 20 34
9. Increnental Working Capital(a) FCeed / 1,025 7,000(b) Chiekens | 925 1,850 - - - - - - - -(c) Other 2/ 1.365 - _ _ - - - - _ _
Sub-total 3,315 8,850 - -
10. Physical Contingencies (5%) 892 985 - - _ - 28 173
TOTAL 18,739 20,694 - 598 3,637 _ -
P. Bated on approximately 60,0oo layers per year at full development.2 10 layers per a
2, 15 growers per a
2.
3/ Reservoir 300 m3 and 15,000 liter tank on 12 meter tower.T Ineluding cleaner, mixer and 500 kg scale.
5/ Including sobeergable pomp end plumbing.El 12 fire extingninhers 9 RlB 4,500 ea.7 Includes all incremental feed costs in Year 1 for one batch of Iay-ld chicks for 3 aonths.
In Year 2, the incremental feed is valed at about RIo 12 million, though for cash flowreasons only Rle 7 millien is included as inveatment. a2 Includes all incremental purchase costs in Yenon 1 and 2. 1
2/ See Appendia 8-9-3.
February 15, 1974

IRANThirdADBT Agricultural Credit Project
LARGE POULTRY LAYERS YODEL - PROJECTED INCOME AND OPERATING EXPENSES(Rials '000)
UnitUnit Cost Year 1 Year 2 Year 3 Year 4 Year 5 Year 6 Year 7 Year 8
(Rials)
1. SalesT Eggs / kg 50 - 26,884 40,326 40,326 40,326 40,326 40,326 40,326
(b) Cracked eggs / kg 35 - 784 1,176 1,176 1,176 1,176 1,176 1,176
(c) Culled 2 months chicks 3/ kg 50 - 47 47 47 47 47 47 47(d) Culled 6 months pullets 2 kg 40 - 161 161 161 161 161 161 161
(e) Old hens 2/ kg 50 - 1,416 4,247 4,247 4,247 4,247 4,247 4,247
(f) Manure 2 tonne 600 - 312 473 473 473 473 473 473
Total Sales - 29,604 46,430 46,430 46,430 46,430 46,430 46,430
2. Operating Costs(a) Feed 2/ 1,025 15,600 32,416 32,416 32,416 32,416 32,416 32,416
(b) Chickens purchased 6 925 2,775 2,775 2,775 2,775 2,775 2,775 2,775
(c) Labor and labor insurance yl 1,130 1,789 2,095 2,095 2,095 2,095 2,095 2,095
(d) Vaccines and medicines 75 310 354 354 354 354 354 354
(e) Building maintenance 6 - 227 369 369 369 369 369 369(f) Equipment maintenance 9 69 263 263 263 263 263 263
(g) Water and power 48 108 144 144 144 144 144 144(h) Fuel 96 216 288 288 288 288 288 288
(i) Sanitation 10 30 30 30 30 30 30 30
(j) Wood shavings 6 15 17 17 17 17 17 17
(k) Interest on seasonal credit o - 51 - - - 138 -
(1) Physical contingencies (5%) 166 614 1,938 1,938 1,938 1,938 1,938 1,938
Total Operating Costs : - 12,954 40,689 40,689 40,689 40,689 40,689 40,689
j Based on approximately 60,000 layers per year at full development.2 240 sound eggs and 10 cracked eggs per hen per year.
At 0.65 kg per bird at 2 months, 1.5 kg at 6 months and as old hend.J 1.5 kg per chick and 6 kg per layer per year.2/ 1.8 kg up to 8 weeks, 8.5 kg from 2 to 6 months, 42 kg for layers 6
to 18 months; excluding all incremental feed costs in year 1 and about60% thereof in year 2.
| Excludes all incremental working capital in years 1 and 2.Z] One manager, one accountant, 1 foreman, 15 laborers, one driver and one
guard in year 2. 0
| 2% of original cost.2/ 5'( of original cost.S/ Assuming 20% operating costs for 4 months @ 12% per annum, from year 2.l All operating costs of year 1 included as incremental working capital.
F0u
Fehruary 15, 1974

IRANIhird ADBI Agricultural Credit ,'roject
LARGE POULTRY LAYERS MOLEL -CASH FLOW PROJECTIONS AND FINANCIAL RATE OF RETURN CALCULATIONS
(Rials '000)
Cash Flow
1 2 3 4 5 6 7 8CASH INFLOW
1. Annual Sales - 29,604 46,430 46,430 46,430 46,430 46,430 46,4302. Producer's Contribution /1 5,317 5,174 - - - - -3. Long-term Loan ]2 14,054 15,520 - - - - - -4. Working Capital
a. Last Year's Cash Balance - - 14,687 10,372 6,723 3,739 1,421 4,162b. Seasonal Credit /3 - -_9 - - - -
Total Expected Cash Inflow 19,371 51,588 61,117 56,802 53,153 50,169 47,851 50,592
CASH OUTFLOW
1. Investment 18,739 20,694 - - - - - -2. Operating Cost - 12,954 40,689 40,689 40,689 40,689 40,689 40,6893. Seasonal Credit /3 - 1,290 - - - - - -4. Debt Service
a. Interest 632 1,963 2,662 1,996 1,331 665b. Principal - - 7,394 7,394 7,394 7,394 - -
5. Producer's Cash Withdrawal - - - - - 3,00 3.000
Total Expected Cash Outflow 19,371 36,901 50,745 50,079 49,414 48,748 43,689 43,689
Total Expected Cash Balance at Year's End - 14,687 10,372 6,723 3,739 1,421 4,162 6,903
/1 25% of investment cost and interest on long-term loan./2 752, of investment cost at 97. p.a. for 6 years including 2 years of grace./3 10% of operating cost for 3 months at 12. p.a. in year 1.
Financial Rate of Return Calculation
1 2 3 4 5 6 7 8 9 10
Sales - 29,604 46,430 46,430 46,430 46,430 46,430 46,430 46,430 60,767 /1Operating Cost - 12,954 40,689 40,689 40,689 40,689 40 689 40 6S9 40 689 40,699Investment Cost 18,739 20,694 - - - - - - - -
Net Benefits (18,739) (4,044) 5,741 5,741 5,741 5,741 5,741 5,741 5,741 20,078
Financial Rate of Return = 197,(over 10 years)Sensitivity Analysis: + 10% investment cost = 15%7
.. ~~~~~~~~~~~~~~~~~~~~~~~~~~~~~~~~~~~~~~~~~~~~~~~~~~~~~~~u./1 Includes residual value of Rials 14,337,000.
February 23, 1974

ITEAThird ADBI Agricultural Credit Project
LARGE DAIRY FARM MODEL :/ - HERD PROJECTI0 ES
Year 2 Year 3 Year 4 Year 5 Year 6 Year 7 Year 8-15
1. Herd Composition
(a) Bulls 2 2 2 2 2 2 2
(b) Cows 150 132 176 196 200 200 200
mature - 132 109 146 153 156 156
let lactation 150 - 67 50 47 44 44
(0) Eleifers 69 52 71 79 80 80
(d) Female calves 75 56 75 83 85 85 85
(e) Male calves 75 56 75 84 85 85 85
2. Mortality
(a) Cows3 3 4 4 4 4 4
(b) Heifers - 2 2 2 2 2 2
(c) Calves 12 9 8 8 9 9 9
3. Purchases ?/
Bulls - - 2 - - 2 -
4. Sales
(a) Cull cows 15 20 26 39 40 40 40
(b) Surplus heifers - - - 22 33 56 56
(c) Steers (1 year old) 69 51 71 80 81 81 81
(d) Bulls - - 2 - - 2 _
5. Milk Production ('000 liters)
(a) Cows more than 1 lactation - 660 545 730 765 780 780
(b) Cows - 1st lactation 600 - 268 200 188 176 176
(c) Milk for calves 13.8 10.3 14.2 15.9 14.1 14.1 14.1
(d) Milk for sale 586.2 649.7 798.8 914.1 938.9 941.9 941.9
6. Production Coefficients
(a) Calving rate (%) 100 85 85 85 85 85 85
(b) Adult mortality (2) 2 2 2 2 2 2 2
(c) Calf mortality (2) 8 8 5 5 5 5 5
(d) Calf culling rate (2) 10 15 15 20 20 20 20
7. Milk Production (liters)
(a) Cows - 1st lactation 4,000 4,000 4,000 4,000 4,000 4,000 4,000
(b) Cows - mature 5,000 5,000 5,000 5,000 5,000 5,000 5,000
1/ Based on an initial herd of 150 cows rising to 2002 Excepting initial stock purchases in Year 1 of 150 pregnant heifers and 2 bulls.
Bull purchase every 3 years.
February 15, 1974

fIANY,0 DATRY FARM 9607711 N07-FARM INFS'TM770'T'
Unit No. ofUcit Co- UnIts Year 1 Yeor 2 Ysor 3 Ycer 4 YeOr 5 Yeor 6 Y... 7 Unor 8 Ynor 9 Year 10 Yoar 11 Yesr 12 Year 13 Year 14 Year 15
1. Breeding stock()C-ows hd 80:.00 1510 - 200 -- ---------()BoIls. 3/ hd 2.0 - 24'0 --- ---
Sub-total - 12,140 --- -------
2. C...ntrrtion
a)Open lot (octbles) 4/ 2 0.25 5,275 1,519 -- ---------(b) Shd a
71.55 1,970 3,054 --- ----------
(n) Milking Parlor 6/a2
3.050 150 450 --- ---------
(d) HB...ing 7/ on2
2.00 010 1,020 - - - --------
()stone a2
1.70 345 507- - ---------
()SIlo so3
0.20 3,000 6i0 - --- --- (eo) Wells . Iqip-et 1,000 - -- ----------(h) Fool tanks 60.00 2 120- - --------(I) Feeder -Oods 0.05 2,000 Oi - ----
Sub-tot.S 8,050 - --- ---------
3. Nehkinr, and SE-ips-t
( ilking Oq.ipsoet ~- 1,056 --- ------ ---(b iTactor aod in.p1e-t~ 2,072 - --- 2441-- --
(a) Panoisngq sqopnnt - 2.129
(d) Vehicle 9 370.00 1 370 -- 15 3 15
S.k-total 370 6,057 --- - 315 -2,441 3 15
Tl ~~~toi- 10.00 40) 400Aliolfa k. 10.50 4.0 - 420 --- 420 -- 420----
5.Eetiictn 758 - - ----- ------
6. Fe...ing a, 0.7 650 150 - --- - -- - ---
7. FkyeicaI Co.tiogo...ies (57.) F50 956 --- 21 - 15 122 21 -i
TOTAL. 10,613 70,073 441 - 330 2,563 441 3 -350
1/St-ting with 150 row and inraigto 220 cows 115 ha of icrage crPs.2/ Inported.
3/Loal bul1 to ine o e ws not holding to A.I.4 Cows 20 el, bo1ls 25 a
2, keifer 20 .
2, calves 3.5 a,
2Per hoed.
5/ ow 6.75 2,2
h. kife- 4 a,2
, bh1alls 10a2, calve 1.5 .
2, newaclve 1 a,
0per heed.
0/l locldiag c.oling rosa,7/ Manger's -eid-en and labon-r' qoarte- (30 e2/bead).8/Milking eacki.s 6 ..nts, 2 ticen refrigerted tank, nilbkoo boile.,
P/ickap, replaced after 7 years. 15% salvage vals..10/ Ge.ert-r -sd to.a
Ockb-cy 10, 1974

IRANThird ARBI Agricultural Credit Project
LARGE DAIRY FARM MOOEL 1! - PROJECTED IECOME AND OPERATING EXYPNS-N(Rials '000)
Year 2 Year 3 Year 4 Year 5 Year 6 Year 7 Year 8 Year 9 Yeer 10 Year 11 Year 12 Year 13 Year 14 Year 15
1. tale(7a)Milk 1/ 7,621 8,1146 10,384 11,883 12,2o6 12,245 12,245 12,245 12,245 I0,243 o2,245 12,o45 12,245 12,245
(b) Cull Wows i/ 270 360 468 702 720 720 720 720 720 720 720 720 720 720
(c) Surplus haifers | - - - 1,100 1,650 2,800 2,8t0 o,8o 2,800 2,180 o,80o 1,800 2,ioo 2,800
(d) Steers oae year oId i,242 918 1,278 1,44o 1,458 t,458 i,458 1,458 1l48 1,4,58 ,458 1,458 i,458 1,458
(e) Balls 9/ - - 200 - - 200 - - 200 - - 200
(f) AlSaTfa| 620 804 528 318-6 - - - - _ - _ -
DOTAL 9,753 10,528 12,858 i5,4414 16,(34 17,423 17,223 17,223 1.7,423 17,123 17,223 17,423 17,203 17,223
2. 0Oerating ClstsCa) Peed 7 2,777 2,911 3,855 4,437 5,109 5,109 5,109 5,109 5,109 5,109 5,109 5,109 5,109 5,105
(b( labor j// 1,501 1,537 1,591 1,656 1,668 1,,663 1,668 1,666 ],f68 1,668 1,668 i,668 i,668
(c) Veterinary cad scmeo 72 62 76 82 90 90 90 90 9)C 9) 90 90 90 90
(d) Flectricity anl ftor 310 282 282 290 293 293 293 293 293 293 293 293 293 293
(e) Detergents and disinfectnts 60 60 60 60 6o 6o 6o 6o 6o 60 60o 6o 61 60
(f) Buildidg mainte-ance _q/ 195 195 195 195 195 195 195 195 195 195 195 195 195 195
(g) Mtcchioery maintaensce lo/ 321 321 321 321 321 321 321 321 321 321 321 321 321 321
(h) Crap production 11/ 404 310 313 382 41i7 417 417 417 4 17 4t1 417 417
(i) Bull purchisoc - 240 - 240 - - 240 - 240 - -
(0) Intereut .n seassatl -cedit 121 71 - - - - -
(k) Physical ecotingencies (53) 282 284 34[ 371 4o8 1420 408 408 42o 408 403 4.20 4to 48
0TAL 5,991 5,962 7,280 7,794 8,561 8,813 8,56i 8,561 8,813 B,561 8,56i 8,813 8,561 8,561
i/ Milk Rls 13 per kg,
9 Cul] cows REl 60 per kg, 300 kg per head.
9/ Surplus heifers RPI 50,000 per head.Steers oee year old Rls 90 per kg, 200 kg per head.
5/ Bulls .. Id to other herds for breeding (8 Rls 100,000 each.hJ Alfalfa Rls 3,500 per toone./ 1 kg concestrrtes to 2.5 kg milk.
I/ Including manager @ Rls 300,000 per year, part-time veterinarian e Plc 120,000 per year, foreman @ RlP 96,000
par yaaro laborers and seasonal workers.
2/ Building maintenance 2%.Mac ha5nery maintenance t. 5
/ Alfalfa 45 ha, corn for silage 25 ha, barley and vetch for green feed 15 ha./ Asuming 20t operating coats for 6 mouths (8 12%.
February 15, 1974

IRANThird AflD,5 Agricultural Credit I roject
LARGE DAIRY FARM MODEL -CASH FLOW PROJECTION AND FTRANCLAJ, RATE OF RETURN CALCULATIONS
Cash Flow
1 2 3 4 5 6 7 8 9 10 11 12CASH INFLOW
1, Annual Sales - 9,753 10,528 12,858 15,441 16,034 17.423 17,223 17,223 17,423 17,223 17,2232. Producer's Contribution /1 3,011 6,412 - - - - - - - - -3. Long-term Loan /2 7,959 15,055 - - - - - - - -4. Working Capital
a, Last Year's Cash Bslance - - 3,762 4,757 3,476 4,560 3,812 4,950 4,106 3,888 1,353 3,543b, Seasonal Credit /3 - 1,184
Total Expected Cash Inflow 10,970 32,404 14,290 17,615 18,917 20,594 21,235 22,173 21,329 21,311 18,576 20,766
CASH OUTFLOW
1. Investment 10,612 20,073 - - - 441 - 330 - 2,563 441 -2. Operating Cost - 5,991 5,962 7,280 7,794 8,574 8,813 8,561 8,561 8,813 8,592 8,5613. Seasonal Credit /3 - 1,184 - - - - - - - -4. Debt Service
a. I,1terest 358 1,394 2,071 2,071 1,775 1,479 1,184 88P 592 296b. Principal - - - 3,288 3,288 3,288 3,288 3,288 3,288 3,286 -
5. Producer's Cash Withdrawal - - 1,500 150 1,500 3X000 3,000 5,000 _ ,000 98,000
Total Expected Cash Outflow 10,970 28,642 9,533 14,139 14,357 16,782 16,285 18,067 17,441 19,958 15,033 16,561
Total Expected Cash Balance at Year's End - 3,762 4,757 3,476 4,560 3,812 4,950 4,106 3,888 1,353 3,543 4,205
/1 25% of investment cost plus interest on long-term loan./2 75% of investment cost at 9%, p.a. for 10 years including 3 years of grace./3 20% of operating cost at 12% p.a. for 6 months in year 2.
Financial Rate of Return Calculation
1 2 3 4 5 6 7 8 9 10 11 12
Sales - 9,753 10,528 12,858 15,441 16,034 17,423 17,223 17,223 17,423 17,223 38,203 /1Operating Cost - 5,991 5,962 7,280 7,794 8,574 8,813 8,561 8,561 8,813 8,592 8,561Investment Cost 10,612 20,073 - - 441 - - 330 - 2,563 441 -
Net Benefits (10,612) (18,111) 4,566 5,578 7,647 7,019 8,610 8,332 8,662 6,047 8,190 29,642
Financial Rate of Return 22%(over 12 years)Sensitivity Anialysis: + 10% investment cost = 20%
+ 10% operating cost = 19%- 10% sales = 17%
/1 Includes residual value of Rials 20,980,000.
February 23, 1974

ANNEX 9Page 1
IRAN
Third ADBI Agricultural Credit Project
SUMMARY ECONOMIC RETURN CALCULATION
1. The economic return to the Project has been estimated at 21%. It
has been derived from the reprtsentative models after imaking necessary adjust-
ments to reflect more accurate.y the real costs and benefits to the economy.
With the exception of agro-indtustries, all subprojects would be ineligible
for income taxes for at least 10 years because of the statutory 10-year tax
holiday on agricultural investments. It is expected that most subloans would
be repaid within ten years. In the case of agro-industry, net operating
income would be taxable at an average anniual rate of 20%. The prices of aln
inputs and outputs used in the calculations are those that were current at
the time of appraisal (November, 1973).
2. Adjustments have been made to account for the payment of the two
principal import charges employed in Iran; customs duties and commercial
imnort taxes. Most agricultural machinery items incur 52 customs duty only
(based on fob value) and no commercial tax. Spare parts for tractors and
other agricultural machinery incur about 30% customs duty in addition to
commercial tax assessed on the basis of weight. Most irrigation equipment
incurs 5% customs duty and 5% commercial tax. Other items are charged on a
weight basis. For example, iron and steel piping faces customs duties and
commercial taxes of Rl 3.5 and Ri 4.5 per kg, respectively. The overall
combined rate of duty and tax for agricultural machinery, including irrigation
equipment, has been taken as 12%. Since it is estimated that 60% of machinery
costs, including replacements, under the Project would be in foreign exchange,
the 12% has been reduced to 7.2% of costs for the purposes of economic adjust-
ment. Much of the building and other construction material, e.g. cement, is
produced in Iran. Some quantities of sawn timber are imported, incuring 5%
duty and about RI 1,000 per ton commercial tax. For Project purposes, it
has been assumed that an average 52 duty would be payable on imported building
materials employed in subproject construction. Since the foreign exchange
component of buildings and installations is estimated to be 30%, the figureused for the economic adjustment was 1.5%.
3. No adjustments have been made for livestock investments since stock
provided for under the Project are either preferred high grade cows which are
exempt from duties or commercial import taxes, or upgraded local crossbreeds.
Adjustments have also been unnecessary for annual operating expenditures.
Most items are produced in Iran, and those that are imported incur little or
no duties or commercial taxes. For example, antibiotics, pesticides, herbicides,
barley or sugarbeet seed face no charges, while alfalfa seed incurs 5% duty
but no commercial tax.

ANNEX 9Page 2
4. A sensitivity analysis indicptes,that if investment costs or,operat-ing expenditures of subprojects were to in.rease by 10%, or if the value ofall sales were to decrease by 10Z, the economic return would fall to 19%, 18%,or 15%, respectively.

!RAN Apni -
Third ADBI Agricultur'L Credit Project Apndix 9-1
DETAILS OF ECONOMIC RATE OF RETURN CALCZJLATIOKNS3'
NetOperating Incremental
tear Investments Costs Sales Adjustments Benefits
---- -('--------------('000 Rials)---------------------------
1 1,497,560 53,930 14o0,980 29,1140 (1,381,370)
2 1,303,420 513,570 1,067,260 17,980 ( 731,750)
3 134,770 842,850 1,242,840 - 265,220
4 141,960 884,650 1,338,104 - 311,490
5 41,760 987,610 1,487,320 _ 457,950
6 8,350 1,085,000 1,620,834 376 527,860
7 44,340 1,058,520 1,745,734 3,498 646,370
8 86,380 1,079,940 2,011,652 5,390 850,720
9 17,450 493,330 1,262,770 785 752,780
10 58,380 521,500 1,895,870 2,628 1,318,620
u 8,190 330,420 952,990 369 614,750
12 2,400 326,730 1,027,470 108 698,450
13 - 332,270 1,031,870 - 699,600
14 14,025 326,730 1,027,470 631 687,350
15 4,620 328,740 1,340,670 208 1,007,520
Economic Rate of Return 21%
Sensitivity Analysis:+10% Investment Costs: 19%+10%o Operating Costs : 18%-10% Sales : 15%
j The streams show large fluctuations due to: (a) replacement of some in-vestment items in certain years, and (b) the addition of residualvalues to sales in the fiscal years of some model --e.g. poultry sub-loans should be repayable by the eighth year.