appraisal of drought prone areas project in india - world
TRANSCRIPT
Report No. 533a-IN
Appraisal ofDrought Prone Areas Projectin IndiaNovember 14, 1974
South Asia Projects DepartmentGeneral Agricultural Division
Not for Public Use
i
Document of the International Banik for Reconstruction and DevelopmentInternational Development Association
This report was prepared for official Use only, by the Banlk Group. Jt may notbe published, cquoted or Cited without Ban k Grnup authorization. The Bank Group doesnot accept responsibility, for the accuracy, or completeness of the report.
Pub
lic D
iscl
osur
e A
utho
rized
Pub
lic D
iscl
osur
e A
utho
rized
Pub
lic D
iscl
osur
e A
utho
rized
Pub
lic D
iscl
osur
e A
utho
rized
Pub
lic D
iscl
osur
e A
utho
rized
Pub
lic D
iscl
osur
e A
utho
rized
Pub
lic D
iscl
osur
e A
utho
rized
Pub
lic D
iscl
osur
e A
utho
rized
Pub
lic D
iscl
osur
e A
utho
rized
Pub
lic D
iscl
osur
e A
utho
rized
Pub
lic D
iscl
osur
e A
utho
rized
Pub
lic D
iscl
osur
e A
utho
rized
CURRENCY EQUIVALENTS
US$1 = Rs 8.00Rs1 = US$0.125Rs 1,000 = US$125.00
Metric System
ABBREVIATIONS
AI - Artifical InseminationAMUL - Anand Milk U1nion Ltd.ARC - Agricultural Refinance CorporationCAD - Command Area DevelopmentDDA - District Development AuthorityDPAP - Drought Prone Areas ProgramGOI - Government of IndiaICAR - Indian Council of Agricultural ResearchLDB - Land Development BankMFAL - Marginal Farmers and Agricultural LaborersNDDB - National Dairy Development BoardSEDA - Small Farmers Development Agency
FISCAL YEAR
April 1 - March 31
LOCAL TERMS
Bajra - Pearl milletJowar - SorghumKharif - Monsoon (June-October) seasonRabi - Low rainfall cool (October-March) seasonNalla - Small water course
INDIA
APPRAISAL OF DROUGHT PRONE AREAS PROJECT
TABLE OF CQNTENTS
Page No.
SUMMARY AND CONCLUSIONS .............................. - iv
I. INTRODUCTION ..................................... 1
II. BACKGROUND .............................................. 1
III. THE DROUGHT PRONE AREAS ............................... 2Rainfall and Soils .......................... 2Area and Population ........................ 2Agriculture and Livestock .................. ....3Agricultural Credit ........................ 3Project Area ............................... 3
IV. THE PROJECT .......................................... 4A. Brief Description ..................... 4B. Detailed Features ............................... 5
Minor Irrigation .............................. 5Watershed Management .......................... 7Improving Dryland Farming .................. 9Livestock Development ...................... 10Bagasse Treatment ......................... ... 13Diversification Schemes ........................ 13Research ................................... 15Training ................................... 16Measures to Expand Agricultural Credit 16District Core Funds ....................... 17
C. Project Costs ............................... 18D. Financing ................................... 19E. Procurement ................................. 20F. Disbursement .................. 21G. Accounts and Audit .......................... 22
This report is based on the findings of an appraisal mission consisting ofMessrs. Brown, Thornley, Kanchanalak and Loup (IDA), Groenewold (CP), Maunder(WMIO) and Jessup (Consultant), which visited India in October/November 1973and a follow-up mission (Messrs. Brown, Thornley and Groenewold) in March 1974.
-2-
Page No.
V. ORGANIZATION AND MANAGEMENT ............................. 23A. DPAP in the Central Government ................. 23B. State Level DPAP Organization............. 24C. District Level DPAP Organization ............. 24D. Project Execution ............................ 25E. Project Monitoring ......................... 25
VI. BENEFITS AND JUSTIFICATION.......................... 27
VII. AGREEMENTS REACHED AND RECOMMENDATIONS .............. 30
ANNEXES
1 Background of Drought Prone Areas Program2 Other Development Programs in Drought Prone Areas3 District Surveys4 Climate in the Drought Prone Areas5 Irrigation6 Watershed Management7 Improving Dryland Farming8 Livestock Development9 Diversification Components: A. Fisheries
B. SericultureC. Horticulture
10 Agricultural Research11 Training12 Agricultural Credit13 Project Costs14 Disbursement Schedul.e15 Organization and Management16 Yields and Prices17 Financial and Operating Results18 Economic Evaluation
MLAP
INDIA
DROUGHT PRONE AREAS PROJECT
SUMMARY AND CONCLUSIONS
The Drought Prone Areas Program
i. The erratic nature of the Indian monsoon and the drastic effectsof rain failure on traditional agriculture are a matter of record. Seventy-two districts have been identified in whole or in part as being particularlydrought prone, and in 1970-71 the Government of India (GOI) introduced theDrought Prone Areas Program (DPAP) for these districts with the objectiveof creating rural employment through government-executed construction ofproductive assets such as irrigation tanks, conservation works and roads.Unfortunately, the urgent need for relief employment during the first threeyears of the program resulted in inadequate planning of works and theconstruction of many non-productive assets.
ii. During the Fifth Plan period 1974-79 the major thrust of develop-ment effort in drought prone districts will continue to be made throughDPAP with a proposed funding of Rs 1.7 billion over 5 years from GOI anda like amount from participating states. Much more emphasis and effortare being directed toward the identification and forward planning of works.This will permit the re-orientation of the program toward the mitigationof the effects of drought through integrated agricultural development andaway from short-term famine relief operations.
The Drought Prone Areas Project
iii. This report appraises a project in support of the Drought ProneAreas Program in six districts selected from among those suffering the worsteffects of the most recent drought period (1970-1972). Total project costsover 5 years woulld be US$102.7 million, of which US$35 million would befinanced by IDA. The six districts selected for the project are: in Rajasthan,the districts of Jodhpur and Nagaur; in Maharashtra, Ahmednagar and Sholapur;in Karnataka, Bijapur; and, in Andra'Pradesh, Anantapur. The range of condi-tions in these districts is such that there would be considerable scope forreplication of successful project components elsewhere in the arid and semi-arid regions of India.
iv. The project would consist of public works and on-farm developmentin most agricultural sub-sectors of these districts, including minor irriga-tion works, command area development, watershed management, dry farming, andsheep and dairy development. In addition, the project would include afodder banking scheme, cooperative investments in calf raising and the con-version of cane bagasse to digestible fodder, and schemes to diversify therural economies into activities less dependent on rainfall. Measures wouldbe taken under the project to improve the flow of credit in the drought
prone areas of project states, especially to smallholders, and thetechnical support available to farmers in arid and semi-arid regions wouldbe strengthened by applied research and training programs under the project.
v. The total project cost would be about US$102.7 million equivalentincluding duties and taxes. The foreign exchange component would be only5% or US$5 million. The proposed IDA credit of US$35 million would cover34% of total project costs. The remaining 66% would be financed by theCentral and State Governments (36%) and commercial and cooperative banks (30%).
vi. Civil works in the public sector other than tank constructionwould be executed by government force account (US$7.0 million). Individualworks are small and spread over the project area and period, precludingbulking, and executing departments possess the necessary expertise. Civilworks contracts for tank construction, on-farm development, and cooperative-owned facilities, and contracts for eouiDment, vehicles, domestic livestockand services in excess of Rs 100,000. (US$12,500), would be let after com-petitive bidding based on local advertisitng (about US$10.8 million). Bulkingfor international competitive bidding is not practicable as individualcontracts would be small and scattered. There is adequate representationof domestic contractors and international equipment suppliers to providereasonable competition. Contracts for less than Rs 100,000 would beprocured through normal trade channels (about US$25 million). The majorityof these small contracts would consist of goods and services for on-farmdevelopment which would be financed by credit institutions. Well drillingrigs (US$ 0.3 million) would be procured through international competitivebidding in accordance with IDA guidelines. Domestic suppliers would be accordedthe usual preference of 15% or the rate of customs duty whichever is the lower.Bids for imported bulls (US$0.1 million) would be solicited from at leastthree countries free from foot and mouth disease and where animals of therequired types are available. Internationally recruited consultants wouldbe selected and employed under terms and conditions satisfactory to IDA(US$0.4 million). The balance of project costs, other than core fundsand contingencies, would consist of staff and operating expenses for govern-ment departments and agencies (US$12.9 million) and producer cooperatives(US$1.8 million), which would be subject to established cost norms.
vii. The proceeds of the IDA credit would be disbursed against 95% ofthe costs of civil works on public lands; against the full c.i.f. costs ofimported equipment, vehicles and livestock and against 80% of the costs ofsuch items locally prccured; against 60% of the costs of operating andstaff expenses of project units and against the full costs of technicalassistance and project evaluation.
viii. The bulk of the proceeds of the IDA credit would be channeledthrough GOI as budgetary grants to the participating states. Funds forresearch would be passed on by GOI to the Indian Council of AgriculturalResearch (ICAR). The Central Unit of DPAP would retain and utilize fundsrequired for training and evaluation.
Project Implementation
ix. The proposed project would be executed primarily by existingdevelopment departments and agencies of the state governments. However,the range and number of project components is such that successful imple-mentation would depend greatly on a high degree of coordination; betweenGOI and state governments, between departments within states; between officialand elected public bodies and firnally between the public sector and privateagencies supplying credit and inputs. To achieve the necessary coordinationamong the departments concerned, interdepartmental committees would beestablished at the Centre and state levels under the chairmanship of thesecretaries responsible for the program.
x. District Development Authorities (DDA), would be established tocoordinate and supervise project activity and to ensure the sound integrationof DPAP and other development programs. Typically a DDA would be chaired bythe Collector with a membership consisting of district level officers ofdevelopment departments and representatives of local government, the statelegislature, commercial banks and cooperatives. Each DDA would have a smallexecutive staff headed by a project manager of Additional Collector rank,(hence the second ranking official in the district). Powers would be vestedin the authorities and their project managers to ensure the coordinationand prompt execution of works by various departments, and to initiate develop-ment planning on a district basis.
Project Benefits
xi. It is estimated that the proposed project would improve permanentlythe income of some 225,000 rural households, most of whom would belong tothe poorest segments of the population. Average annual income gains resultingfrom direct on-farm development would range from Rs 100 (Rs 1,000 to 1,100) forthe bunding program to over Rs 4,000 (Rs 1,000 to 5,300) for tank irrigation.Dairy development, which would affect the greatest number of people would beintermediate at Rs 700 (Rs 1,050 to 1,750).
xii. Annual crop production would increase by about 58,000 tons, princi-pally foodgrains and oilseeds, and substantial increases would also berealized in saleable fodder as well as milk, wool and mutton. About 85,000man years of short-term employment would be generated over the project period,and about 20,000 man years of permanent employment would also be created.Measures to improve credit flow, research and training would have permanentbenefits as would changes in district level planning and supervisory capacitythrough the establishment of district development authorities.
xiii. The risks of this complex project must be acknowledged. Farmerresponse to technical innovation and cooperation, and the effectiveness ofinstitutional change within government, are difficult to quantify and varybetween components. Despite such risks however, the proposed project offers
- iv -
the potential for significantly improving the economic condition of very
poor rural families living in the harsh environment of the drought prone
areas.
xiv. Economic rates of return have been calculated for typical project
components and are satisfactory.
xv. The proposed project is suitable for an IDA Credit of US$35
million.
INDIA
DROUGHT PRONE AREAS PROJECT
I. INTRODUCTION
1.01 The drought prone areas of India cover about 600,000 squarekilometers and a population of about 66 million. The bulk of this populationis engaged in a perennial struggle to meet its subsistence needs in a harshenvironment. That it frequently fails in this struggle is evidenced bymassive government expenditures on famine relief, about Rs 8 billion in theperiod 1969-70 to 1972-73. In many districts, relief expenditures exceededdevelopment spending in each of the last three years.
1.02 The GOI sponsored Drought Prone Areas Program (DPAP) has evolvedfrom relief oriented programs to one which aims at the mitigation of theeffects of drought through integrated area development 1/. GOI Fifth Planexpenditure for DPAP will be about Rs 1.7 billion over five years with alike amount allocated from state funds. By providing permanent employment,on-farm development and improving public sector services, the proposed projectwould directly benefit about 225,000 rural families; in addition short termemployment of about 85,000 man years would be created as well as the equivalentof 20,000 full-time employment opportunities. This is the first Bank Groupassisted project of its kind in India. Both technically and institutionallycomplex it has tacen unusual effort and time to prepare and appraise. How-ever with continued effort through close supervision it should provideinformation and operating experience to aid in a more comprehensive attackin the future on the problems of one of the poorest segments of the ruralpopulation of India.
1.03 The project is based on proposals prepared by state governmentswhich received guidance on preparation from an IDA reconnaissance missionlwhich visited India in February 1973. This report is based on the findingsof an appraisal mission consisting of Messrs. Brown, Thornley, Kanchanalakand Loup (IDA), Groenewold (CP), Maunder (WMO) aftd Jessup (Consultant) whichvisited India in October/November 1973 and a follow-up mission in March 1974.
II. BACKGROUND
2.01 The real growth of Indian agricultural production between 1961and 1971 averaged 3% per year. Most of this increase was offset by popula-tion growth of 2.2% per year over the same period. Agriculture accountsfor over 40% of GNP in India and employs about 70% of the labor force.To bolster performance of the agricultural sector, GOI has, since 1966,adopted a policy of concentrating development efforts in priority areas:
1/ The Drought Prone Areas Program is described in Annex 1.
-2-
high-yielding crop varieties, development of irrigation resources, andincreased availability and use of inproved inputs, notably fertilizer,pesticides and certified seed. The success of this policy in recent yearslhas been vitally affected by drought and consequent crop failures. Butdespite these setbacks productivity in the agricultural sector as a wholeincreased almost twice as rapidly during the last decade as it did duringche previous ten years (2.2% a year for the decade ending in 1971/72 asagainst 1 .2% for the previous one).
2.02 While improvements in productivity brought about by the new techno-logies are beyond question, serious shortcomings remain with respect to thedistribution of benefits achieved. Increasingly sensitive to inequities inthe rural sector, GOI has taken several measures to assist the poorest segmentsof the rural population. In July 1972, it issued national guidelines fora new land ceiling program; since then most states have accordingly draftedlew ceiling legislation. It is too soon to judge whether this new round ofland reforms will be more effective than the previous attempts. During thefourth Five-year plan, the Government has also taken up special rural programswith the main objectives of creating employment and increasing opportunities;'or the poorer sections. The DPAP is the most promising of these programs 1/.
III. THE DROUGHT PRONE AREAS
,ainfall and Soils
01 Drought prone areas fall into three distinct rainfall categories:,rid, up to 375 mm; semi-arid, 376 to 750 mm; and sub-humid, 751 to 1,125 mm.5.oth major Indian soil types are present in these districts, the red latosolsand the black cotton soils. As a result of poor cultivation practices anddenuded vegetation due to overgrazing and fuelwood cutting, much of therainfall that does occur is lost in excessive runoff, frequently causingserious erosion. Excess runoff in turn results in poor groundwater rechargeand correspondingly reduced irrigation potential.
,rea and Population
3.02 The 72 districts selected for DPAP assistance are located through-out the country. Their greatest concentration is in the western and central-ones, i.e. in Rajasthan, Gujarat, Haryana, Maharashtra, Karnataka and Andhra1'radesh. The total area of drought prone districts is 590,000 square kilo-meters, representing 19% of the Indian land mass. The population of thesedistricts is about 66 million, 12% of India's total, resulting in a populationdensity of 112 persons per square kilometer compared with an all India averageof 178. The population of drought prone districts generally ranges from
I/ Other programs in the drought prone areas are described in Annex 2.
-3-
1.2 to 2.0 million, although the smallest is 167,000 (Jaisalmer, Rajasthan)and the largest is 5.5 million (Midnapor, West Bengal). A higher proportionof scheduled classes and tribes inhabit these areas, including most of thecountry's nomadic peoples. Nomadism adds further to the instability of theagricultural economy, and measures such as controlled grazing to improvepasture productivity assume very complex dimensions under these circumstances.
Agriculture and Livestock
3.03 There is considerable variation in the agricultural qystems ofdrought prone areas. Characteristically they are subsistence oriented,producing essential food and fodder for local consumption, althiough thereare some notable exceptions where cash crops such as groundnut and cottonare important to the local economy. In most districts the percentage ofcultivated to total area is substantially higher than the all India average,while forest areas are very small. In an attempt to offset low yields perhectare, farmers have expanded cultivation into areas of very poor potential.This has aggravated wind and water erosion problems with the result that theoverall ability of the land to sustain human and animal population is furtherreduced. Bajra (pearl millet) is the staple food in most of the arid zone,while jowar (sorghum) and millets other than bajra are grown most extensivelyin the semi-arid zone. In drought prone areas, as elsewhere in India, farmanimals are the main source of farm power. They are also a major source ofcash income which can be vital in bridging gaps when crop production doesnot meet subsistence needs. To meet their fodder requirements, farmers growgrain varieties with high straw yields. In spite of this, a large proportionof the feed requirements must come from public lands. In the absence ofeffective control and use of these public lands, serious overgrazing anddegradation is common.
Agricultural Credit
3.04 The dominant feature of agricultural credit in India is thepreponderance of non-institutional credit. The present share of creditprovided by various sources is approximately as follows: private moneylenders,50% (15%-professional moneylenders, 35%-farmer/moneylenders); relatives, 18%;cooperatives, 15%; traders, 13%; commercial banks, 4%. In backward areassuch as DPAP districts, credit institutions are generally weaker than else-where, and their share of agricultural lending is less than the averageestimated above. The need for credit is reflected in the high rates (25-40%per annum) generally charged on funds from private sources, far in excessof the ceilings imposed by the State Moneylenders Acts.
Project Area
3.05 The recent droughts produced their greatest havoc in a beltof Central and Western India, as did many previous droughts, and projectdistricts have been selected from among those of GOI's program in this area.
-4-
State Project District (see Map)
Rajasthan Jodhpur, NagaurMaharashtra Ahmednagar, SholapurKarnataka BijapurAndra Pradesh Anantapur
These districts represent a cross section of the climates, populations andfarming patterns found in most of the drought prone areas of India. Consequently,measures proven successful under the proposed project could be replicated inmany more of the drought prone districts. In addition to a variety of physicaland economic patterns, these districts include both principal forms of publicsector district organization. Rajasthan and Andhra Pradesh have traditionallydepended on strong district administration through the Office of the Collector,while Karnataka and Maharashtra have increasingly delegated responsibilitiesto locally-elected bodies known as Zilla Parishads. District surveys arepresented in Annex 3 while the climate of the drought prone areas is discussedin detail in Annex 4.
IV. THE PROJECT
A. Brief Description
4.01 The proposed project is designed to increase and stabilize theproduction from agriculture and related activities in six drought pronedistricts of Western and Central India. The project, to be administeredas part of GOI's DPAP, would be executed over a five year period principallyby existing development departments, and coordinated and supervised by DDAsto be established in each district.
4.02 The project would consist of:
-- Minor irrigation works including dug wells, tubewells, and tanks,with a total command area of about 20,000 hectares;
-- Command area development (CAD) of about 12,000 hectares irrigatedby the tubewells and tanks to be constructed under the project;
-- Watershed management including soil and moisture conservationworks to protect 370,000 hectares of arable land and 80,000 hectaresof non-arable public and village common pasture land; establishmentof improved grass species on the above 80,000 hectares and on10,000 hectares of privately owned fallow lands; afforestationof about 16,000 hectares of public lands, the establishment of2,000 hectares of public village woodlots and about 1,200 kilometersof roadside and boundary windbreaks, plus farm woodlots andboundary plantings;
-5-
A dry farming development program to extend improved technologyand inputs to about 37,500 farmers who cultivate some 200,000hectares;
-- Improved sheep and wool production by the introduction cf controlledgrazing on the improved pasture on village common lands, L4stribu-tion of crossbred rams and expansion of animal health services;
-- Dairy development through the establishment of producer cooperativesand milk collection systems, similar to the approach of the AnandMilk Union Ltd., Gujaral: (AIRJL). Mobile veterinary units, artificialinsemination units and calf rearing centers would also be provided;
-- Fodder banking and a pilot project for cane bagasse treatmentto increase its fodder value;
Diversification projects in sericulture, horticulture, 4nd tnlandfisheries;
An expansion of the research efforts on dryland farming, pasturedevelopment and agrometeoroloay;
Training programs for project staff;
Measures to improve the flow of agricultural credit.
Unallocated core funds to finance (i) small projects unidentifiedat the tiIne of appraisal but which fall within objectives and normsof DPAP and (ii) additional surveys, research and training duringthe project period.
B. Detailed Features
4.03 The package of investments to be undertaken reflects the particularresource endowment, degree of development and capacity to carry out produc-tive programs and works in each district.
Minor Irrigation 1/
4.04 Groundwater Development. The groundwater resources of projectdistricts have been adequately surveyed in Rajasthan, and surveys in Karnataka(previously Mysore) are now under way as part of the Mysore Agricultxral
1/ Details of the minor irrigation components of the project appear inAnnex 5.
-6-
Credit Project (Credit 278-IN). However in the case of Maharashtra and
Andhra Pradesh, additional investigation is needed for prudent groundwater
development in project districts. Assurances were given by these state
governments that they would implement and continue semi-detailed groundwater
surveys for project districts. The project would finance the following
investments, exclusively for smallholders 1/:
(a) about 170 tubewells, exclusively in Rajasthan with a total command
area of about 3,400 hectares;
(b) two air hammer drilling rigs for the Rajasthan Groundwater Board
to enable faster, more efficient drilling in sandstone;
(c) about 425 dug-cun.-bore wells; specifically, drilling into existing
dug wells and installation of pumpsets (incremental command area
1,450 hectares);
'(d) about 660 dug-cum-blast wells; specifically, the deepening of
existing wells in rock with slow percolation rates (incremental
command area about 920 hectares); 2/
(e) about 480 dug wells with pumpsets commanding about 1,700 hectares;
and
(f) pumpset installations on about 265 existing dug wells commanding
about 500 hectares.
4.05 Surface Irrigation Development. Twenty-nine minor irrigation tanks
would be constructed under the project with a total command area of about
8,900 hectares. Command areas would be planned and developed at the sane
time as the tanks. This would require the coordinated efforts of irrigation
and agriculture departments and the preparation of a master plan. Assurances
were given by participating state governments that: (a) tanks and channels
would be properly maintained, and (b) the first master plan for the integ-
rated development of tank and command area in each project district would
be submitted to IDA for comment.
1/ Groundwater development during the project period in these districts
would be considerably laraer than that included in the project. Approx-
imately 50% of original investment proposals havte been included as
project costs, These would be the works for smallholders, in which
DPAP would have a financial input, namely the smallholder assistance
similar to that now provided under Small Farmers Development Agency
(SFDA) and Marginal Farmers and Agricultural Laborers (MFAL) schemes
(para 4.50).
2/ Dug-cum-blast wells are not included in existing credit agreements.
Improvements under this project should be restricted to wells with a
reasonable certainty of yielding a discharge of 15,000 cubic meters
per year, as determined by the state irrigation department.
-. 7-
4.06 Command Area Development. At present, the full benefit of irri-gation facilities is not being derived since command areas typically haveundulating lands and poorly sited, unlined distribution channels. Underthe project, simultaneous CAD would be carried out for all tanks and tubewellsconstructed under the project. Subsidies would be provided to assistsmallholders to develop the command areas of other wells constructed orimproved under 'the project.
Watershed Management -
4.07 Land Resource and Capability Surveys,. Conservation programs todate have been carried out mainly on arable lands and their benefits havebeen literally eroded by runoff from the untreated slopes of the uppercatchment. The basic topographic unit is the watershed, and if conservationprograms are to be effective, they must address the interdependencies ofeach land class within this area. Initially, this requires land resourceand land use capability surveys to determine the conservation measures andmanagement practices most suited to the particular watershed. Staff toconduct these surveys would be provided under the project.
4.08 Forestry. At one time, substantial forests covered the upperreaches of watersheds in the project area outside Rajasthan. However, thesehave long since been destroyed, and excessive erosion is now characteristicof the area. Past attempts to extensively reafforest these areas have notbeen effective in establishing productive forests or protective cover. Theterrain is now much more suited to pasture. Rehabilitation work under theproject would be redirected towards pasture establishment, and afforestationon government lands would be restricted to about 4,000 hectares in eachdistrict outside Rajasthan, in small pockets which have escaped excessiveerosion. 2/ About 2,000 hectares of woodlots would be established under theproject on village common lands. These public lands would be fenced andplanted along contour trenches. About 1,200 km of roadside and boundarywind breaks would also be established. In addition, seedlings would beprovided to private land owners willing to establish small woodlots andboundary wind breaks. To achieve this work, additional nursery capacityof five hectares would be financed for the state forestry departments ineach project district in Maharashtra, Karnataka and Andhra Pradesh.
4.09 Pasture Development. As a result of overgrazing and neglect,pasture land in the project areas is poor, consisting of a sparse cover oflow-quality grasses. While very little research has been done on dryland
1/ Details of the Watershed Management Components of the project appear inAnnex 6.
2/ About 2,000 hectares would be included in the area developed for pastureand the balance planted only to trees elsewhere within the districts.
-8-
pasture development in India, sufficient information is available to indicatethat substantial progress can be made by fencing, to control grazing, andthe introduction of Cenchrus ciliaris (buffel grass) or Cenchrus setigerus-- indigenous species which have been grazed out of most natural pastures.The major constraint on pasture development is the extent to which controlledgrazing can be effected. For generations, pasture has been owned in commonand therefore competed for by the individual against the common good. Suchan attitude on the part of livestock owners cannot be changed quickly, andpasture development efforts at this time must be viewed as experimental.However, vast tracts of these districts are best suited to pasture, and underthe project about 80,000 hectares of government lands would be enclosed anddeveloped to demonstrate the benefits of viewing grass as a crop to becarefully managed. In some districts there are significant areas of privately-owned permanent fallow lands, of which about 10,000 hectares would be replantedunder the project. Free seed and technical assistance would be provided tolandowners willing to improve their lands under pasture. To promote andsupervise such grassland development, additional staff would be made availableto the responsible state departments. Much of the improved pasture wouldbe brought under the sheep development program (paras 4.18-4.22) and itsmanagement supervised by the state animal husbandry departments.
4.10 Technical Assistance for Pasture Development. There has beeninsufficient attention to dryland pasture research and development in Indiato generate Lhe experience required for implementation of the developmentprogram proposed under the project. GOI gave assurance that a pasture devel-opment advisor would be employed, with qualifications, experience and termsand conditions of service satisfactory to the Association, to provide techni-cal guidance to field staff undertaking pasture work. His primnary responsi-bility would be to assist pasture units and animal husbandry staff in imple-menting the pasture program in project districts, but he would also be
expected to advise on pasture development in other DPAP districts. Hiswork wculd be complemented by that of a second consultant who would assistICAR to launch a dryland pasture research program (para 4.39).
4.11 Pasture Seed Production. One seed production farm for drylandgrass speciies would be financed in each of the four states, each farm havingan area of about 400 hectares.
4.12 S-oil and Moisture Conservation. Conservation measures on uncul-tivated lands would consist of contour furrowing and seeding to improvegrass cover, a more effective measure than afforestation, and gully plugging.On arable lands, the objectives are two fold: (i) to hold as much rainfallas possible in situ to maximize moisture infiltration, and (ii) to guideexcess water slowly to safe discharge points so as to prevent soil erosion.Under the project about 230,000 hectares of cultivated land would beprotected under systems of contour or graded bunds, grassed waterways andfarm ponds. Contour bunds would be constructed only on soils of adequatenermeability (shallow and medium soils as defined for soil conservation
-9-
purposes; see also Annex 6). Bunds would be repaired over a further 135,000hectares. Bunding costs and technical specifications are given in Annex 6.
4.13 To implement these measures, one divisional soil conservationunit with four sub-divisional operating units would be financed under theproject in each district. In addition to the increased production and soilstabilization which result from bunding, this work is a very large source ofemployment during relief operations. In the past, however, planning ofthese works has been inadequate in the face of emergency employment needsand in many cases the resulting structures have not been effective inconservation. Adequate design capacity would be provided under the projectto ensure that a "shelf" of prepared works is established in each districtfor execution as employment needs arise.
Improving Dryland Farming
4.14 Under the project, dry farming development would be undertaken ona pilot scale only. There are several reasons for limiting the size of theinitial effort. Only a limited package of improved technology can be derivedfrom the preliminary findings of the recently launched All-India CoordinatedResearch Project for Dryland Agriculture. The extension mechanism needs tobe restructured and the new approach tested in the field. Institutionalcredit at present does not reach the small dryland farmer in adequate volumesto support a large program. New cooperative channels must be developed andthe confidence of financial institutions, currently wary of investing in highrisk dry farming, needs to be won. Finally, there is the acute shortage offertilizer which is expected to last for the next several years; clearly thelimited supplies should, in the main, be used to best advantage in irrigatedand assured rainfall areas. Two or three watersheds embracinlg about 7,500holdings would be selected in five of the project districts. The sixth,Jodhpur, would be excluded to further limit initial efforts in Rajasthan wherethe environment is particularly harsh. Details of the dryland farming com-ponent appear in Annex 7.
4.15 The extension service would be reorganized and expanded in projectareas. It would be essential to create a separate group of extension staffunder the supervision of one authority. 1/ These extension wo'ikers would workat all times with clearly defined programs and objectives. It would thus bepossible to monitor and evaluate program and staff performance. The use ofProgressive Farmers would be introduced as the final link in the extensionchain to widen dissemination of information and to increase program credibilitythrough close involvement of respected members of the community.
1/ The District Development Authority in Andhra Pradesh, Karnataka andMaharashtra, the Department of Agriculture in Rajasthan.
-10-
4.16 Packages of technology for the extension program 1/ would focuson each area's main crops, and the most important factors of production, toavoid dissipating efforts. The operation of the extension program would begoverned by the need to ensure the closest possible contact between thefarmer and the extension worker and between worker and supervisor. Fieldvisits would therefore be emphasized. Simple demonstration plots would bedeveloped on the farms of Progressive Farmers with more complex ones near thevillages, to be managed by extension workers. The four state governmentsgave assurances that separate groups of extension workers would be createdand that detailed extension programs would be prepared for review by IDA.
4.17 Adequate and timely supplies of credit and inputs would be vitalto the success of the program. Extension staff would work closely with thestaff of credit institutions for the provision of credit and would provideestimates of input requirements to the District Agricultural Officers. Thiswould be done as part of the work of the District Agricultural ProductionCommittee which currently prepares input requirement projections. Procurementwould be arranged by District Supply Officers. Assurances were obtainedthat state governments would ensure that the required amounts of fertilizerwould be made available to the project areas from the reduced overallsupplies.
Livestock Development -/
4.18 Sheep Development. Large areas in project districts are bestsuited to sheep husbandry. However, any sheep development is contingentupon the improvement of grazing lands. Under the project, improved grass-lands, crossbred rams, veterinary services, and improved mutton and woolmarketing conditions Vould be made available to sheep owners. Developmentswould take place through about 370 primary sheep growers' societies, eachoperating at least 100 hectares of village common grasslands, and on about400 privately-owned farms, on each of which about 10 hectares of degradedfallow lands would be converted to improved grassland.
4.19 The primary sheep growers' societies would be formed in villageswhich agreed to enclose at least 100 hectares of common lands for develop-ment. Initially, enclosed areas would not exceed 25% of common lands soas to ensure adequate grazing area to stockowners unwilling to participatein the society. At full development, these units would carry about 400mature sheep units on a year-round basis. 3/ Participation in the society
1/ Staffing patterns at the sub-district level and the design of the exten-sion program would be similar to those now being implemented in Rajas-than under the Chambal Command Area Development Project (Loan 430-IN).
2/ Detail of the livestock program appears in Annex 8.3/ 400 mature ewes, unweaned lambs, female followers and 12 rams.
would be voluntary. Shares would be purchased in cash or in kind withpreference given to the latter to best serve the interests of sheep owners,usuallv the poorer segment of village society. However, all shares wouldbe denominated in cash values; thus private ownership of sheep would ceaseupon entry into the society. The amount of private equity of the societywould be determined by the estimated carrying capacity of the units and memberswould be able to acquire a proportion of the equity up to the ratio of theirsheep numbers to the total number of sheep of intending participants. Toattract participation in this innovative venture, participants would receivea guaranteed income for each share purchased in kind for.the first four yearsof the societies' operations. Investment capital and the cost of technicalservices during the first five years would be met by government.
4.20 Assurances were given that state governments would: (i) furnish.to the Association for its comments the final draft of the model by-laws ofsheep growers primary cooperative societies; 1/ and (ii) provide funds toenable societies to make the guaranteed income payments in the event that thesocieties operating revenues were inadequate.
4.21 The implementation of sheep development, the provision of inputsand technical assistance would be the responsibility of nine service centers..It is assumed that each service center could support the development of40 to 50 primary sheep growers' societies.
4.22 The project would establish a ram multiplication farm in eachparticipating state, on an existing government sheep station, in order tosupply the participating societies and private farmers with the requiredcrossbred rams. It is assumed that the average ram multiplication farmwould have about 400 hectares and that it would produce approximately 500crossbred rams annually at full development.
4.23 Dairy Development. -/ Dairy development under the project wouldbe based mainly on indigenous animals. Upgrading through crossing withexotic breeds would be restricted to farmers with assured irrigation watersupplies who could thus produce green fodder year round. The implementationof dairy development would be the task of twelve Spearhead Team.- to betrained by the National Dairy Development Board. These mobile units wouldinitially publicize project activity and assist groups of interested farmersin the formation of producer cooperatives. The scheme would.improve farmers'income by: (i) providing .milk collection services.and thus increasing thefarm-gate price of milk, (ii) distributing concentrate feed, and (iii) improving
1/ Proposed draft by-laws are attached as Appendix 4 to Annex 8.2/ An IDA project for dairy development in Karnataka (Credit 482-IN) waspresented to the Board June 13, 1974 and others for Rajasthan and MadhyaPradesh have been appraised. The proposals in this project are consistentwith the investment criteria established in the Dairy projects. Therewould be no overlapping of project areas.
- 12 -
health care. This assistance would be extended to about 17,600 farmers
in Raj asthan, and to about 18,000 farmers in each of the four southern
districts.
4.24 In keeping with the AMUL pattern 1/, milk producers' societies
would be formed at the village level. About 480 such societies are envisaged
under the project in villages or groups of villages with a bovine population
of at least 300 mature cows. The secretary of each society would maintain
accounts for each member, recording his deliveries and charges for concentrates.
4.25 As societies become established, milk collection within the dis-
trict would be organized by the Spearhead Teams under the direction of the
District Animal Husbandry Officer. There would be at least eight societies
along a route of about 120 km. Milk would be collected twice daily by con-
tract truckers. The collection costs would be borne by the societies but
government financial assistance would be required during the first three
years.
4.26 Milk surplus over local market demands would be diverted to
existing processing plants within each state. Present capacity, including
that now under construction, would be adequate to handle projected milk
flow for at least 9 years. In order to facilitate surplus transport by hired
road tankers, chilling plants would be established in each district at the
points from where the milk collection routes originate. The chilling centers
would be managed by specially trained operators responsible to the District
Animal Husbandry' Officer. Training programs would be conducted under the
auspices of the NDDB at a suitable facility in the area concerned.
4.27 Twelve mobile veterinary units would be established to improve
the animal health services in the participating villages. These units would
work under the direction of the District Animal Husbandry Officer.
4.28 Artificial insemination (Al) is accepted by fairmers in project areas
but there is a shortage of semen. Under the project one AI center would be
constructed or expanded in each project district except Nagaur which would be
served from Jodhpur. Centers would be stocked with high quality indigenous
bulls and a small number of exotic bulls.
4.29 In keeping with government policy, milk producers unions would be
formed after an initial development period to take over the responsibilities
of Spearhead Teams and possibly also the running of artificial insemination,
veterinary and other services. However, given the difficult environment
of the drought prone districts and their present low level of dairy develop-
ment, it is impossible now to predict with confidence when viable unions could
be formed and what services they could take over from the public sector.
Assurances were given by the state governments that before unions were formed
their proposed by-laws and projected cash flows would be submitted to IDA for
comment.
1/ Anand Milk Union Limited - Gujarat. Based entirely on cooperatives, this
pattern has been adopted by GOI for dairy development throughout IrLdia.
- 13 -
4.30 Calf Rearing Centers. Although great hope is placed in crossbreedingto increase India's milk production, crossbred animals require good qualitygreen fodder year round, and are not as resistant to the climatic stressof drought prone areas as indigenous animals. To the extent that farmerswith irrigated lands are willing to produce forage and to provide shelterfor milk cows, there would be some scope for crossbred dairying in the projectarea. With the exception of city milk producers, however, there is littleevidence of this development. An experimental component in crossbred dairy-ing would be included in the project, whereby exotic semen would be madeavailable to farmers with good quality indigenous cows. Weaned calvescould then be raised by farmers who so choose, or, in the case of drylandfarmers or others, weaned calves could be sold to calf rearing centers.These (two per district except: Jodhpur, one, and Nagaur, none) would beorganized as cooperative ventures, either as part of a sugar cooperativeor milk producers' cooperative. Crossbred heifers in calf would then besold on the open market. This approach would enable officials to assessthe willingness of farmers to benefit from the sale of crossbred calves(about Rs 100 per month of age) or to undertake the greater management require-ments of maintaining crossbred cows. GOI gave an assurance that an advisorwould be employed, with qualifications, experience and terms and conditionsof employment satisfactory to the Association, to assist with the planningand start up of the calf rearing centers.
4.31 Fodder Banking. The project wqould finance the establishment of80 fodder banks in Jodhpur and 50 in Nagaur to be operated by the ForestDepartment. Each would have the capacity to store about 50 tons of fodder.In normal seasons the Department would contract for the cutting and haulingof fodder from forest reserves. In years when an area had been declareddrought stricken, an event occurring on average every third year, the fodderwould be sold by the Collector's office at a subsidized rate to the livestockowners of the vicinity.
Bagasse Treatment
4.32 Under heat and pressure, bagasse can be converted to a digestiblefodder. This process, used extensively in some countries, e.g. Cuba, wouldbe introduced on a pilot basis at one sugar mill in Ahmednagar. Localengineering capacity would be adequate for fabrication and construction.However GOI gave an assurance that a bagasse treatment specialist would beemployed, with qualifications, experience and terms and conditions ofcmployment satisfactory to the Association, to assist with the planning andstart up of the plant and the training of plant operators and feed users.
Diversification Schemes
4.33 The majority of rural families in project districts will continueto depend heavily on dryland farming in the foreseeable future. However,great importance must be placed on opportunities to diversify rural economiesaway from crop production, to the extent possible, into activities that
- 14 -
are less dependent on the vagaries of rainfall. Only a small proportionof the population would benefit from the few alternatives currently avail-able, but the inclusion of pilot schemes for fisheries, sericulture andhorticulture in the project would provide an excellent opportunity to assessthe scope for further diversification. Only in the case of Bijapur Dis-trict (Karnataka) were schemes sufficiently prepared for appraisal. Else-where, preparation would continue during the project period and approvedschemes would be financed from core funds to be allocated to the districts(para 4.49). Details of diversification schemes are given in Annex 9.
4.34 Inland Fisheries. The Karnataka Fisheries Department has beeneffectively serving an inland fisheries industry in that state for many years.The project would provide additional nursery capacity to the department inBijapur for the production of about 9 million fingerlings per year. Thiswould facilitate an expanded program of tank, reservoir and river stockingin Bijapur and provide a surplus for use in other districts. Fisheriescooperatives would be established in about 50 locations, each with about20 fishermen. 1/ Fish production from the project would be about 2,750tons per year, most of which would be consumed within the district. Two10 ton ice plants, a 20 ton cold storage unit and 10 small retail coldstorage chests would be financed to improve the quality of marketed fishand extend its marketable period.
4.35 Sericulture. Karnataka accounts for 85% of India's silk production.Bijapur District is suited to silk production based on a tall variety ofmulberry, but on-farm development has not yet begun. Under the project anegg multiplication center and demonstration farm would be established underthe Karnataka Sericulture Department. Silk production is well suited to asmallholder development program since one ha of mulberry would be sufficientto generate a net income of approximately Rs 1,700 per year, and it isexpected that about 400 such units would be established under the project.Marketing of the additional production through the established channelswithin the state would pose no difficulties.
4.36 Horticulture. The project would provide incremental nurserycapacity to the Karnataka Horticulture Department for the production of about200,000 transplants per year. Species would include ber (Zizyphus nummularia),mango, jackfruit, lime, sapota, and coconut. Ber is ideally suited to thepoorer, unirrigated soils of Bijapur, and it yields a small yellow fruit whichis very high in Vitamin C. The other species would be planted along irrigationcanals, around farm ponds or homesites and in the lower corners of irrigatedfields. One-acre mixed orchards would also be established for commercialproduction on irrigated lands. Trees would provide the added benefits offirewood and fodder from clippings, shade and windbreaks. All transplantswould be provided at a nominal charge and total numbers to each farmer limited
1/ Fishermen would be smallholders or agricultural laborers, and this sub-sidiary occupation would be an excellent source of added family income.
- 15 -
as follows: ber, not more than 50; mango and coconut, not more than 25; and,for mixed orchards, not more than 100. In no case would the total of alltransplants given to one landowner exceed 100 plus subsequent replacements.
Research
4.37 Considerable resources are already devoted to dryland agriculturalresearch; nevertheless certain gaps in the research effort have beenidentified by GOI, and an attempt would be made to fill these under theresearch component of the project. Details of the research programs aregiven in Annex 10.
4.38 The project would provide funds to the ICAR to enable it toundertake research in the fields of agricultural economics, pasture devel-opment and agrometeorology. A team of agricultural economists 1/ would beestablished within the All India Coordinated Research Project for DrylandAgriculture. GOI gave an assurance that the team would be headed by a SeniorAgricultural Economist whose qualifications and e.rperience would be acceptableto IDA. The team would:
(a) study farming systems;
(b) monitor the impact of development programs;
(c) assist in the design of technical research programs; and
(d) synthesize financially and economically viable packagesof technology for extension.
4.39 A second team, of pasture agronomists, would determine economicalmethods of dryland pasture improvement and management. In view of the lackof Indian experience in this field GOI gave an assurance that the team wouldbe led by a senior pasture agronomist who would be employed with qualifications,experience and terms and conditions of employment satisfactory to the Asso-ciation.
4.40 The aim of the agrometeorology program would be to determine thefeasibility of establishing location specific soil moisture regime pro-bilities and hence, by relating them to crop water demand profiles, theprobabilities of success of different cropping patterns. GOI gave an assur-ance that an agrometeorologist would be employed with qualifications,experience and terms and conditions of employment satisfactory to theAssociation to assist in the design of such a research program.
1/ Despite the nature of the task only agricultural economists would berequired since other specialists are already available at the researchstations.
- 16 -
4.41 GOI gave an assurance that the terms of reference for research
programs under the project would be finalized in consultation with the
Association.
Training -/
4.42 The diversity of project investments would necessitate a multi-
faceted training program. This would be the responsibility of the DPAP
central unit in New Delhi. The unit would plan, organize and conduct project
level courses for senior staff. The latter would in turn conduct district
level courses for more junior staff in line with guidelines produced by
the central unit. Two exceptions would be the training of Spearhead Teams
for the dairy programs at the NDDB's facilities at Anand, and the training
of soil conservation field assistants at established Soil Conservation
Training Centers. Project funds would cover institution operating costs
and staff and trainee subsistence and travel costs.
Measures to Expand Agricultural Credit
4.43 Correcting the institutional and resource weaknesses hindering the
effective extension of agricultural credit in India would go far beyond the
scope of a project such as DPAP, with its small scattered project area.
However, it is appropriate that the project include: improvements that can
be implemented on a district-wise basis; and, surveys and pilot efforts to
precisely identify and define credit constraints and means for their allevia-
tion. Background on agricultural credit in the project area appears in
Annex 12.
4.44 District-level Coordination. To strengthen the lirks between
district officials and credit institutions, and to improve the services and
information available to credit institutions the state governments gave
assurances that:
(a) Project M-anagers and Sub-divisional Revenue Officers would be
members of district credit coordination committees; and
(b) membership, powers and organization of DDAs would be satis-
factory to the Association, and that managers of lead banks,
district central cooperative banks and primary land development
banks would be appointed to DDAs.
4.45 Establishment of Farmers Service Societies (FSS. Farners Service
Societies have been recommended by the Reserve Bank of India as appropriate
channels for credit, especially to smallholders. Commercial banks, which
provide management and funds to FSSs, have willingly taken on this role, but
have encountered considerable difficulty in obtaining the necessary approvals
and support services of state governments. The state governments gave assur-
ances that they would render promptly such assistance as is required for the
establishment of not less than two FSSs in each project district during 1975.
1/ Details of the training program are given in Annex 11.
17 -
4.46 Updating Land Records. The most important single constraint onthe flow of credit is the absence of current land records whereby applicantscan show title or rights in support of credit applications. Under the pro-ject, land records would be updated in Anantapur, Jodhpur and Nagaur. Theprocess would be easier now than at any time in recent years because alltransfer of titles has been suspended in most states pending the ratificationof new land ceiling legislation. Assurances were obtained from the stategovernments of Andhra Pradesh and Rajasthan that the updating program wouldbe launched during calender year 1975.
4.47 Short-term Credit Surveys. Credit officers appointed to DDAs wouldconduct a detailed survey of short term agricultural credit requirements intheir respective districts, and identify constraints effecting the flow ofsuch credit particularly to smallholders. The assistance of credit institu-tions, Revenue Departments, Regional Managers, ARC, and field staff of devel-opment departments would be essential to the success of these surveys. Thestate governments gave assurances that: survey terms of reference would bedeveloped in cooperation with the Central DPAP Unit; surveys would be completednot later than December 31, 1975; and results would be made available to IDAfor comment.
4.48 District Banking Plans. GOI gave an assurance that the AgriculturalRefinance Corporation (ARC) would prepare district banking plans for eachproject district, including, inter alia, the volumes and types of agriculturalcredit required, legislative and institutional changes required to facilitatecredit expansion, and the role to be played by various credit institutionsincluding credit cooperatives, commercial banks, the Agricultural FinanceCorporation and ARC. As the responsible agency of the Reserve Bank of India(RBI) for the provision of agricultural credit through both the coolperativestructure and commercial banks, ARC is uniquely suited and qualified to under-take this work.
District Core Funds
4.49 In addition to the funds committed to each district for specifiedsub-projects, the project would include allocations to the district develop-ment authorities to finance: (i) a smallholders' and agricultural laborers'financial assistance program, and (ii) small schemes as yet unprepared whichmay be found desirable during the project period.
4.50 Smallholders and Laborers Assistance. GOI has adopted the policythat small farmers, marginal farmers and agricultural laborers in DPAPdistricts will be eligible for financial assistance similar to that nowprovided by SFDA and MFAL schemes in their respective districts. This in-volves a 25% subsidy under SFDA and a 33-1/3% subsidy under MFAL on the costof a specified range of on-farm investments and the purchase of livestock,tools and equipment. In all cases these programs under DPAP would be adminis-tered by the district development authorities, subject to guidelines issuedby the Central DPAP Unit. This assistance, which would not be financed byIDA, is reflected in project financing tables.
-18-
C. Project Costs
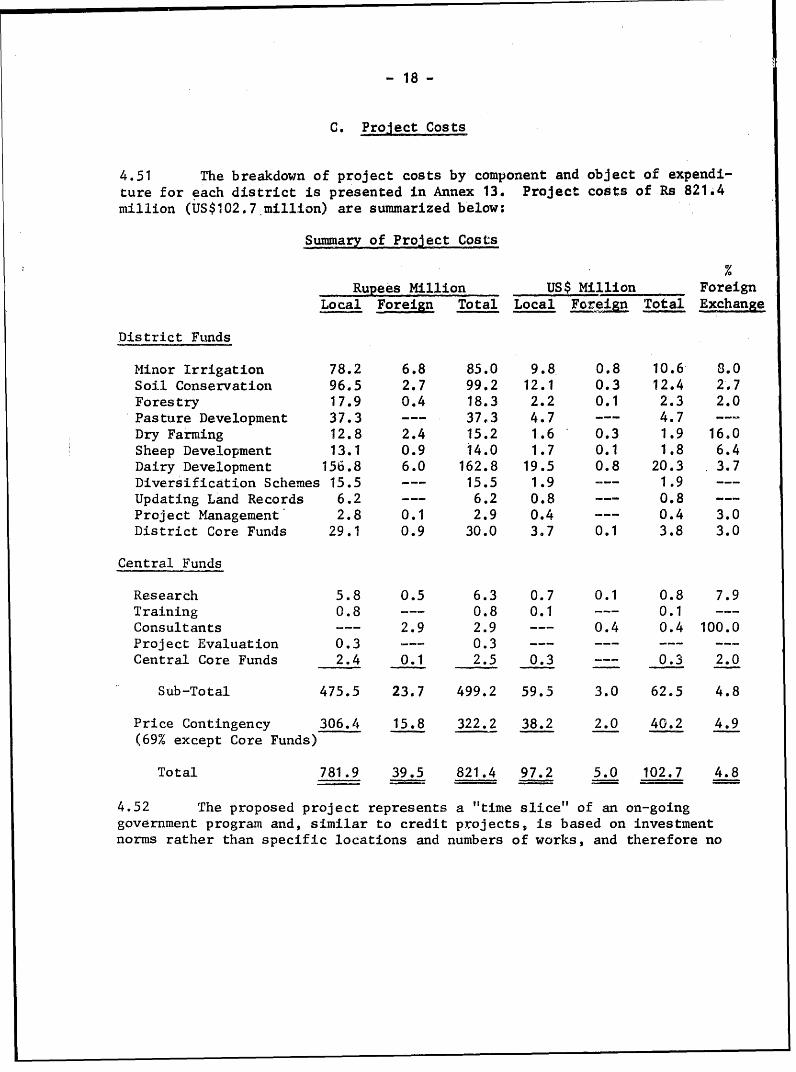
4.51 The breakdown of project costs by component and object of expendi-ture for each district is presented in Annex 13. Project costs of Rs 821.4million (US$102.7 million) are summarized below:
Summary of Project Costs
Rupees Million US$ Million ForeignLocal Foreign Total Local Foreign Total Exchange
District Funds
Minor Irrigation 78.2 6.8 85.0 9.8 0.8 10.6 3.0Soil Conservation 96.5 2.7 99.2 12.1 0.3 12.4 2..7Forestry 17.9 0.4 18.3 2.2 0.1 2.3 2.0Pasture Developmetnt 37.3 --- 37.3 4.7 --- 4.7 --Dry Farming 12.8 2.4 15.2 1.6 0.3 1.9 16.0Sheep Development 13.1 0.9 i4.0 1.7 0.1 1.8 6.4Dairy Development 156.8 6.0 162.8 19.5 0.8 20.3 3.7Diversification Schemes 15.5 --- 15.5 1.9 -- 1.9 ---Updating Land Records 6.2 --- 6.2 0.8 -- 0.8 ---Project Management 2.8 0.1 2.9 0.4 --- 0.4 3.0District Core Funds 29.1 0.9 30.0 3.7 0.1 3.8 3.0
Central Funds
Research 5.8 0.5 6.3 0.7 0.1 0.8 7.9Training 0.8 --- 0.8 0.1 --- 0.1 ---Consultants --- 2.9 2.9 --- 0.4 0.4 100.0Project Evaluation 0.3 --- 0.3 --- --- --- ---Central Core Funds 2.4 0.1 2.5 0.3 -- 0.3 2.0
Sub-Total 475.5 23.7 499.2 59.5 3.0 62.5 4.8
Price Contingency 306.4 15.8 322.2 38.2 2.0 40.2 4.9(69% except Core Funds)
Total 781.9 39.5 821.4 97.2 5.0 102.7 4.8
4.52 The proposed project represents a "time slice" of an on-goinggovernment program and, similar to credit projects, is based on investmentnorms rather than specific locations and numbers of works, and therefore no
- 19 -
physical contingency has been included in cost estimates. However a signi-ficant price contingency provision has been made since cost increases overthe project period are expected to be such as would otherwise jeopardizerealization of project objectives. 1/
D. Financing
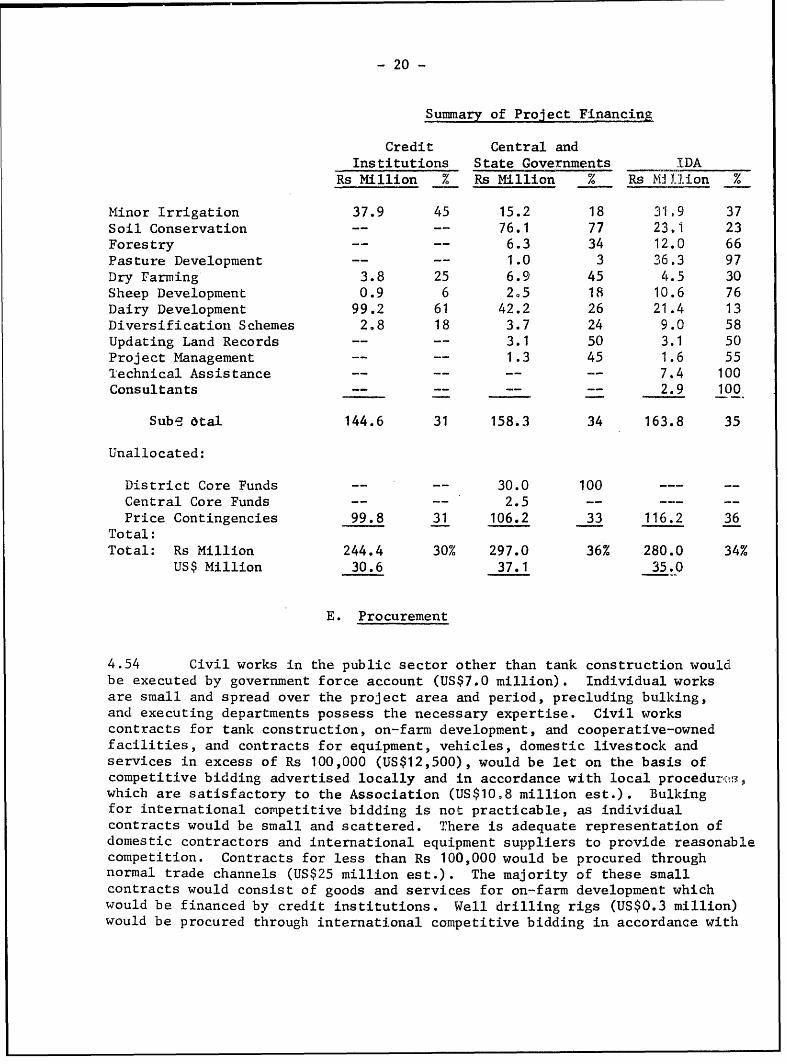
4.53 Of the total project cost, banks and cooperatives would provideRs 244.4 million (30%) to finance on-farm development and cooperative activ-ities. 2/ State and Central Government would provide Rs 297.0 million (36%)principally for government establishment and financial assistance to small-holders. IDA's contribution of Rs 280.0 million (US$35 million) amountingto 34% of total project costs would finance about 50% of public sector ex-penditures. However, activities for which institutional credit is requiredwould be eligible for ARC lending in project areas either under existingprojects 3/ or under a separate ARC credit project now under appraisal by theAssociation, provided that participating banks in these areas satisfy suchARC lending criteria as may be agreed with the Association. GOI gave anassurance that ARC would undertake the appraisal and sanctioning of proposalsreceived from the states, for institutional financing under the project insuch phasing and volume as would facilitate project implementation. Projectfinancing is summarized below:
1/ Price Contingency Provisions: Equipment Civil Works
1973 (6 months) 10% 12%1974 14% 18%1975 11% 15%1976-80 7.5% 12%
2/ About 90% of the total institutional credit requirements would probablybe financed by cooperatives and LDB's, where sources of funds includeloans from state governments, RBI and ARC.
3/ Andhra Pradesh, Credit 226-IN (1971); Karnataka Credit 278-IN (1973);and Maharashtra Credit 293-IN (1972).
- 20 -
Summary of Project Financing
Credit Central andInstitutions State Governments IDA
Rs Million % Rs Million % Rs MJIIIl.Lion %
Minor Irrigation 37.9 45 15.2 18 31,.9 37Soil Conservation -- -- 76.1 77 23.1 23Forestry -- -- 6.3 34 12.0 66Pasture Development -- -- 1.0 3 36.3 97Dry Farming 3.8 25 6.9 45 4.5 30Sheep Development 0.9 6 2.5 18 10.6 76Dairy Development 99.2 61 42.2 26 21.4 13Diversification Schemes 2.8 18 3.7 24 9.0 58Updating Land Records 3.1 50 3.1 50Project Management -- -- 1.3 45 1.6 55Technical Assistance - - 7,4 100Consultants -- = -- - 2.9 100
Subs otal 144.6 31 158.3 34 163.8 35
Unallocated:
District Core Funds -- -- 30.0 100 -- --Central Core Funds -- -- 2.5 -Price Contingencies 99.8 31 106.2 33 116.2 36
Total:Total: Rs Million 244.4 30% 297.0 36% 280.0 34%
US$ Million 30.6 37.1 35.0
E. Procurement
4.54 Civil works in the public sector other than tank construction wouldbe executed by government force account (US$7.0 million). Individual worksare small and spread over the project area and period, precluding bulking,and executing departments possess the necessary expertise. Civil workscontracts for tank construction, on-farm development, and cooperative-ownedfacilities, and contracts for equipment, vehicles, domestic livestock andservices in excess of Rs 100,000 (US$12,500), would be let on the basis ofcompetitive bidding advertised locally and in accordance with local procedurc1which are satisfactory to the Association (US$10.8 million est.). Bulkingfor international competitive bidding is not practicable, as individualcontracts would be small and scattered. There is adequate representation ofdomestic contractors and international equipment suppliers to provide reasonablecompetition. Contracts for less than Rs 100,000 would be procured throughnormal trade channels (US$25 million est.). The majority of these smallcontracts would consist of goods and services for on-farm development whichwould be financed by credit institutions. Well drilling rigs (US$0.3 million)would be procured through international competitive bidding in accordance with
- 21 -
IDA guidelines with domestic suppliers accorded the usual preference of 15%as the rate of customs duty, which ever is the lower. Bids for imported bulls(US$0.1 million) would be solicited from at least three countries free fromfoot and mouth disease and where animals of the required types are available.Consultants would be selected and employed under terms and conditions satis-factory to IDA (US$0.4 million). The balance of project costs would consistof staff.and operating expenses for government departments and agencies(US$12.9' million) and producer cooperatives (US$1.8 million), which would besubject to satisfactory state government norms.
4.55 Tender documents for drilling rigs, imported bulls and contractsin excess of Rs 800,000 (US$100,000) which would be financed by IDA would besubmitted to IDA for approval. Ternms of refqrence for studies and appliedresearch under the project would be finalized in consultation with IDA aswouild qualificat.ions and terms of employment for all consultants. Appropriateassurances were obtained to cover the foregoing.
F. Disbursement 1,
4.56 For civil works executed by force account and staff and operatingexpenses 2/ to be financed by IDA in districts, disbursement would be madequarterly against certified statements of expenditure submitted by stategovernments, the documentation for which would be retained by state financedepartments for review by supervision missions. Statements would enumerateclaims by establishment unit and category of works. Applications for dis-bursement against the cost of contracted civil works would be supported byfull documentation. Disbursement would be against CIF documents for importedequipment, and against purchase invoice for domestically-procured goods andservices. Quarterly disbursements would be made against invoice for allapproved technical assistance and project evaluation expenditures, and, inthe case of research conducted by an agency of G0I, against certified state-ment of expenditure. It would be a condition of disbursement in each statethat lDAs had been duly constituted in all project districts and that ProjectManagers with qualifications acceptable to IDA had been appointed thereto.(para 5.05). In addition, on each irrigation tank, only half of the expenditureon construction eligible for IDA disbursement would be disbursed pendingreceipt of a certificate from the Project l4anager of the district concernedthat CAD had begun in accordance with the approved master plan (para 4.05),thereafter full disbursement-would be made.
1/ A schedule of anticipated quarterly disbursements is given at Annex 14.2/ All the staff covered in project costs and against which disbursementswould be made would be incremental; the majority would be required onlyfor the development-period.
-22-
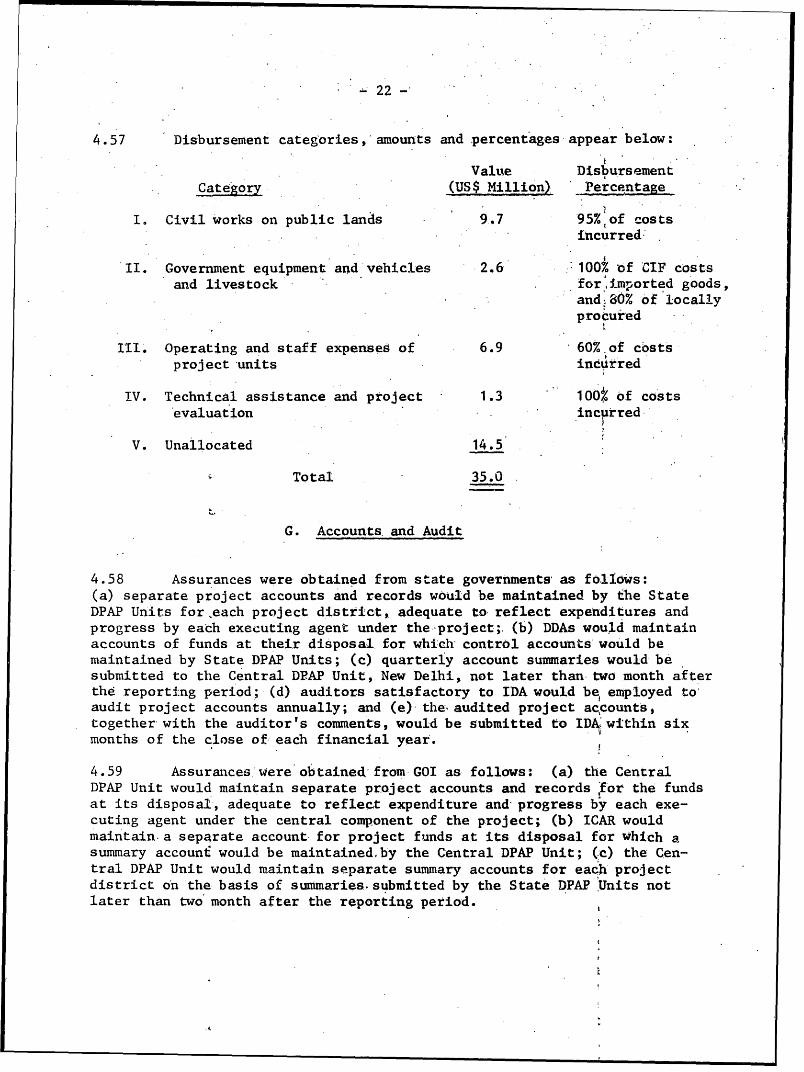
4.57 Disbursement categories, amounts and percentages appear below:
Value Disbursement
Category (US$ Million) Percentage
I. Civil works on public lands 9,7 - 95% of costsincurred'
II. Government equipment and vehicles -2.6 :100% of CIF costs
and livestock forimported goods,and 80% of locallyprocured
III. Operating and staff expenses of 6.9 60% of costs
project units incurred
IV. Technical assistance and project 1.3 100. of costs
evaluation incpirred
V. Unallocated 14.5
Total 35.0
G. Accounts. and Audit
4.58 Assurances were obtained from state governments as foliows:
(a) separate project accounts and records would b.e maintained by the State
DPAP Units for,each project district, adequate to reflect expenditures and
progress by each executing agent under the project;. (b) DDAs would maintain
accounts of funds at thei.r disposal.for which control accounts would be
maintained by State DPAP Units; (c) quarterly account summaries would be
submitted to the Central DPAP Unit, New Delhi, not later than two month after
the reporting period; (d) auditors satisfactory to IDA would be, employed to
audit project accounts annually; and (e) the audited project ac1 counts,
together with the auditor's comments, would be submitted to IDAwithin six
months of the close of each financial year.
4.59 Assurances were obtained.from GOI as follows: (a) the Central
DPAP Unit would maintain separate project accounts and records ifor the funds
at its disposal, adequate to reflect expenditure and progress by each exe-
cuting agent under the central component of the project; (b) ICAR would
maintain.a separate account for project funds at its disposal for which a
summary accounti would be maintained, by the Central DPAP Unit; (.c) the Cen-
tral DPAP Unit would maintain separate summary accounts for each project
district on the basis of summaries-submitted by the State DPAP Units not
later than two month after the reporting period.
- 23 -
V. ORGANIZATION AND MANAGEMENT V
A. DPAP in the Central Government
5.01 The DPAP Central Unit within the Department of Cooperatives andComunity Development, New Delhi, provides overall direction for the DroughtProne Areas Program. Functions of the Central Unit under the project wouldbe:
(a) Monitoring of performance, including the solicitationand review of regular performance reports;
(b) Ensuring adherence to technical, financial and economicnorms for activities to be financed under the project;
(c) Liaison with financial institutions and the identifi-cation and resolution of problems hindering the flowof credit in project areas;
(d) Planning and administration of training activities;
(e) Identification of applied research requirements andliaison with various agencies carrying out researchactivities.
5.02 To carry out these functions, the Central Unit would be strengthenedby the addition of senior specialists (Deputy Commissioner level) in the fol-lowing disciplines: livestock, dry farming and soil conservation, irrigationand economics. 2/ An assurance was obtained that these posts would atall times be filled by personnel whose qualifications and experience wereacceptable to IDA. It would be a condition of credit effectiveness thatquiRlified nominees had taken up their respective responsibilities in thesepositions. In addition, an Interdepartmental Coordination Committee would beestablished under the Chairmanship of the Secretary, Cooperatives and Commu-nity Development and an assurance to this effect was obtained. Meetingquarterly, this committee would review performance in the various sub-sectorsof the program, ensure consistency of technical norms with those of otherprograms, particularly irrigation, and advise DPAP officials of developmentsin respective departments which would have a bearing on program implementation.
1/ Details of project organization are presented in Annex 15.
2/ Present staffing of the Central Unit is discussed in Annex 1. Theprimary responsibility of the project economist would be monitoringand evaluation (see para 5.10).
- 24 -
B. State Level DPAP Organization
5.03 DPAP at the state level is typically administered by a small cellin the department that has been assigned the primary responsibility forrural development. Headed by a special secretary or deputy secretary, thisunit has some technical expertise but functions principally in a planning,budgeting and supervisory capacity. It maintains close contact with thestate planning commission and the development departments to ensure theinclusion of program activities in the annual work programs of executingdepartments. Regular reports of financial and physical performance aresubmitted to this unit by district officers and the unit is expected tomake representation to executing departments to ensure the timely executionof program works. However, this latter function has been hampered by theabsence of a regular forum in which DPAP staff can meet with departmentauthorities. Assurances were obtained that each project state wouldestablish an interdepartmental coordination committee for this purpose. Thiscommittee would be chaired by the Secretary of the department responsiblefor DPAP and would include, as members, Directors of all departments executingworks under the program, as well as representatives from the state planningcommission, finance department and the managing directors of the State LandDevelopment Bank and the Apex Cooperative Bank.
C. District Level DPAP Organization
5.04 In the past, there has been considerable overlap among the variousstate and center programs that have been applied to drought prone areas, whilesome key problems have remained untouched. Even within DPAP, investmentcomponents have not always been coordinated, nor did they always address thespecific problems and potentials of individual districts. Among the explana-tions for this can be included:
(a) insufficient planning, brought about by the need toredress immediate problems such as unemployment;
(b) application of common standards and criteria across allregions covered by a given program;
(c) lack of coordination among development departmentsdespite the integral relationship of various investmentsin the economic development of a given district.
5.05 District Development Authorities. The above problems can beresolved by strengthening district-level development administration, anddelegating to the district the resources and authority for project planningand coordination. The approach will be to establish District DevelopmentAuthorities (DDAs) to coordinate and supervise development activities indrought prone districts. Details of the organization, staffing and functions
- 25 -
of DDA's are presented in Annex 15. Assurances were obtained that stategovernments would establish DDAs with membership, powers and organizationsatisfactory to IDA. Drafts of the Cabinet Orders to create DDAs werepresented for IDA comment during negotiations. Requisite features of theconstitution of DDAs would be the provision for carry over of unused programfunds from one fiscal year to another, and the delegation of power to projectmanagers as described in Annex 15. Assurances were obtained that qualificationrsacceptable to IDA would be required throughout the project period for ProjectManagers of DDA's (para 4.56).
D. Project Execution
5.06 All public sector works under the project would be executed byexisting development departments and agencies of the state governments.Where required, additional establishment costs have been included in theproject, but in all cases line authority within departments would be main-tained. Some on-farm development such as well improvements, which wouldnot be financed by IDA, would be executed by private contractors. Thesmallholders and agricultural laborers subsldy program would be administeredby the DDA, 1/ and coordination among departments would be facilitated bya right of inspection to be vested in the manager of the authority.
E. Project Monitoring
5.07 A number of components of the proposed proj ect are experimentalin nature. While it is felt that each component would generate benefitsfor the rural population of these areas, a detailed system of monitoring andevaluation must be undertaken to assess the impact of the project on theneeds of each district as a whole. Furthermore, innovations in projectmanagement must be evaluated to determine the merit of extending the con-cept to other districts as proposed by GOI. If all. the promoters of thisproject, including the Bank Group are to benefit fully from their experiencewith it, then it must be recognized that, because of its complex nature,the IDA supervision workload will be greater than normal.
5.08 Performance Reporting. Monthly financial and physical performancereports would be prepared by the DDA of each district. These would compare
1/ Bijapur is presently included in the MFAL program, and a separateagency will continue to administer the program until it is wound upin 1976. Thereafter the Bijapur DDA would assume responsibility forsubsidy administration.
26 -
budgeted and actual performance and would include narrative explanation of
variance. Monthly reports would be submitted to the State DPAP Unit. in
addition, quarterly reports for each project district would be prepared by
the State DPAP Units for submission to the Central DPAP Unit arid to IDA.
5.09 Annual Plans. As a guide in the annual budgeting for the project
and to promote district planning, the DDA would be required to prepare annual
plans with the following major components:
(a) Summary of works and programs completed under DPAP;
(b) Detailed outline of works and programs to be taken
up under DPAP in the coming fiscal year;
(c) Outline of other development activities to be taken
up in the district in the coming fiscal year;
(d) Description of the interdependence of various programs;
and
(e) Explanation of procedures to be followed to ensurecoordination of interdependent activities.
Assurances were obtained that state governments would furnish to IDA ^or
comments: (i) at least two months prior to the beginning of the fiscai. year
the program of works to be executed under the project; and (ii) not later than
September 30 of each fiscal year statements containing information oni programs
related to DPAP and procedures to coordinate them.
5.10 Central Government Project Evaluation. An important fuxnction of
the Central DPAP Unit would be the evaluation of project activities to deter-
mine if stated objectives were being realized; for example, whether uneinploy-
ment was being reduced, if agricultural production was increasing and being
stabilized, and the numbers and types of farmers benefiting under the .. o
gram. Operating responsibility for this task would be assigned to vhe croj-
ect economist of the Unit. However, much of the actual analysis -WcouLd be
undertaken by institutions such as agricultural universities or institutes
of management. Their involvement would afford an independent pe-nip-ct.va
on evaluation and would promote an awareness of the needs anid t-bon.,uars 'Jf
district programs among individuals who might participate .n such, ;ro's
in future. Funds for this purpose would be included in the central a-.=
tion under the project. Details of the project evaluation process, c.luud-
ing the role of independent institutions, would be finalized in ccri.i-on
with IDA.
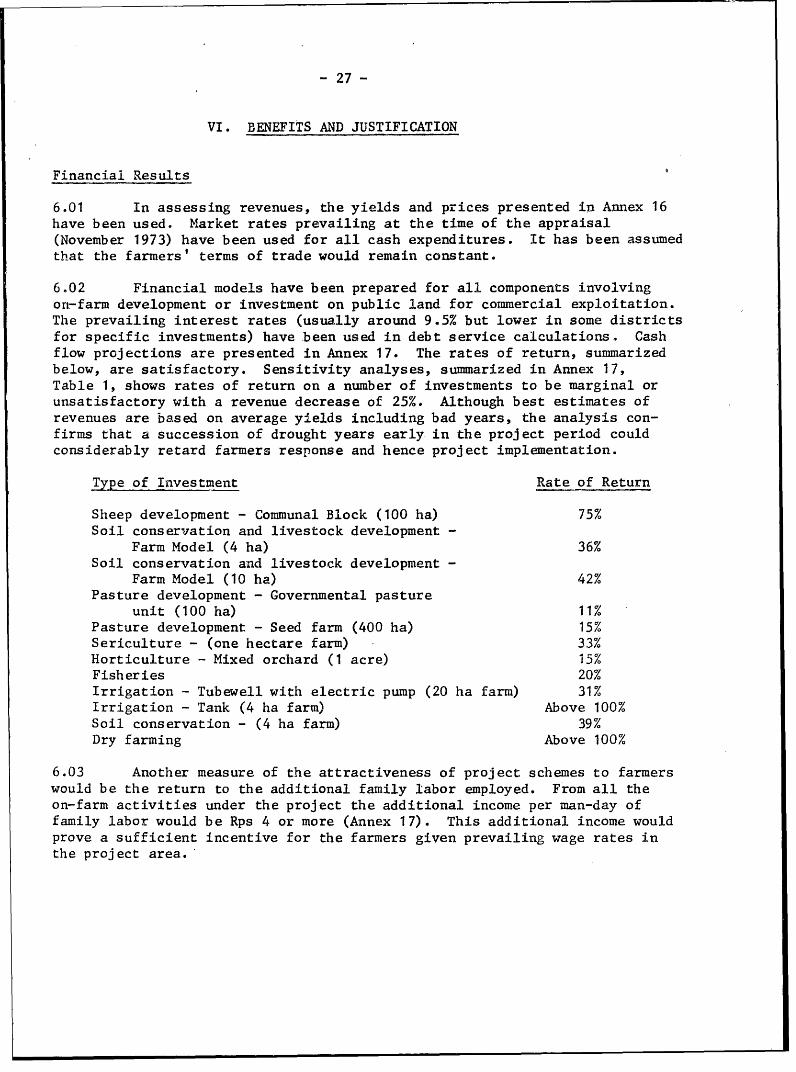
- 27 -
VI. BENEFITS AND JUSTIFICATION
Financial Results
6.01 In assessing revenues, the yields and prices presented in Annex 16have been used. Market rates prevailing at the time of the appraisal(November 1973) have been used for all cash expenditures. It has been assumedthat the farmers' terms of trade would remain constant.
6.02 Financial models have been prepared for all components involvingon-farm development or investment on public land for commercial exploitation.The prevailing interest rates (usually around 9.5% but lower in some districtsfor specific investments) have been used in debt service calculations. Cashflow projections are presented in Annex 17. The rates of return, summarizedbelow, are satisfactory. Sensitivity analyses, summarized in Annex 17,Table 1, shows rates of return on a number of investments to be marginal orunsatisfactory with a revenue decrease of 25%. Although best estimates ofrevenues are based on average yields including bad years, the analysis con-firms that a succession of drought years early in the project period couldconsiderably retard farmers response and hence project implementation.
Type of Investment Rate of Return
Sheep development - Communal Block (100 ha) 75%Soil conservation and livestock development -
Farm Model (4 ha) 36%Soil conservation and livestock development -
Farm Model (10 ha) 42%Pasture development - Governmental pasture
unit (100 ha) 11%Pasture development - Seed farm (400 ha) 15%Sericulture - (one hectare farm) 33%Horticulture - Mixed orchard (1 acre) 15%Fisheries 20%Irrigation - Tubewell with electric pump (20 ha farm) 31%Irrigation - Tank (4 ha farm) Above 100%Soil conservation - (4 ha farm) 39%Dry farming Above 100%
6.03 Another measure of the attractiveness of project schemes to farmerswould be the return to the additional family labor employed. From all theon-farm activities under the project the additional income per man-day offamily labor would be Rps 4 or more (Annex 17). This additional income wouldprove a sufficient incentive for the farmers given prevailing wage rates inthe project area.
- 28 -
Increased Agricultural Production
6.04 Irrigation development would increase the annual agricultural pro-duction in the six districts by some 30,000 tons of food crops with a valueof about Rs 30 million (Annex 18, Table 11). The introduction of improvedtecinology to dry farming should increase crop production, (mainly sorghum,millet, oilseeds and pulses) in the project area by about 22,000 tons worthabout Rs 20 million. Soil conservation works under the project should bringabout at incremental annual production of more than 6,400 tons of foodgrainsand cash crops valued at about Rs 5.7 million. Pasture development wouldresult in increased production of some 67,500 tons of saleable fodder eachyear, with a value of more than Rs 5 million; annual milk production wouldincrease by 80,000 tons, valued at Rs 97 million. Sheep development wouldresult in additional annual production of 475 tons of wool and 2,400 tonsof mutton valued at Rs 4.2 million and Rs 6 million respectively.
Employment
6.05 Employment creation for unskilled labor would result both fromconstruction works and exploitation of the newly created assets. Most ofthe investments to be made under the project are labor intensive and wouldprovide substantial employment for landless laborers and underemployedcultivators. Soil conservation works (construction and repair of bunds,check dams, farm ponds) undertaken under this project would require some15 million man-days of unskilled labor. Similarly, tank and canal irri-gation would create some 6 million man-days of employment, and pasturedevelopment another 2 million man-days. This total of 23 million man-daysof employment for the execution of major physical works above is equivalentto about 85,000 full-time employment opportunities over the five-year proj-ect period. Upon completion, these assets would require an increase in oper-ating labor. The dry farming program would require that an additional 3.3million man-days be used on farm operations. Farm exploitation on contour-bunded lands would require an incremental 800,000 man-days per year for themaintenance of the bunds. Similarly, irrigation development would createan additional 1,300,000 man-days of yearly employment as a result of increasedcrop production. This total of 5.4 million additional man-days of permanentemployment is equivalent to about 20,000 additional full-time employment op-portunities.
Impact on Government Revenues
6.06 By its nature and objectives this is not a project from which toexpect significant direct recoveries of public sector outlay. However, bymitigating the impact of the future droughts, the project would reduce theneed for government supported famine relief and thereby result in a savingof public funds. Only rough estimates of these possible savings can be madesince the incidence and effects of drought cannot be accurately predicted.Under conservative asstumptions (Annex 18), the saving in public expenditurewould be in excess of Rs 40 million during the project period.
- 29 -
6.07 Furthermore a proportion of costs would be recovered under twomajor components. Fifty percent of the cost of bund construction on privateland would be recovered from farmers (about Rs 28 million). Farmers benefitingfrom irrigation tank construction would also repay operation and maintenancecosts and part of the capital cost. Because of the diversity of systems andrates of payments (water rates, betterment levy and crop cesses) it was notpossible to estimate the precise extent of capital cost recovery. Howeverwith current practice it is unlikely to exceed 20% and even this reflecrtsa recent significant increase of rates. These are now kept under consmtantreview in recognition of the need to improve the capital recovery position.Because the project's irrigation component is but one of many and representsonly a small part of the irrigation program of participating states it wasnot considered appropriate to seek assuirances that recovery rates would befurther increased.
Number of Beneficiaries
6.08 It is estimated that the project would improve permanently theincome of some 225,000 rural households, most of which belong to the poorestsegment of the population (Annex 18). Taking the average household as fivepersons then over 1 million people, or more than 10% of the population ofthe six districts, would be permanently benefited by the project.
Indirect Benefits
6.09 Areas to be brought under forestry, pasture and bunding programswould be about 625,000 ha. These measures would arrest the process of soilerosion which now removes about 6 inches of soil from cultivated areas every10 years. Fisheries, sericulture and horticulture, as well as improved live-stock husbandry, would reduce the dependence of the rural population on dryfarming, thereby rendering beneficiaries less dependent on thle vagaries ofthe monsoon; and fish, fruit and dairy products would improve the varietyand quality of rural diets. Measures to improve the flow of credit otherthan those expressly to assist smallholders would substantially increaseoverall on-farm investments and the use of improved inputs for agriculturalproduction, and the results of applied research under the project wouldimprove the technologies of pasture development and dry farming. Finally,innovations in district level project management should greatly improve theeffectiveness of development efforts in these areas, and experience gainedunder this project would prove useful in extending similar programs to otherareas of the country.
Project Risk
6.10 Farmer response to technical innovation and cooperation, and theeffectiveness of institutional change within government, are difficult toquantify and likely to vary in relation to factors lying outside projectmanagement control, e.g. weather, political factors, etc. Despite suchrisks the proposed project is worth undertaking on economic and social
- 30 -
grounds. The project would exploit the best available potentials for sig-nificantly improving the economic condition of very poor rural familiesand it would help develop and disseminate dryland technologies adapted tothe circumstances of India's drought prone areas.
Economic Returns
6.11 An economic rate of return has been calculated for each categoryof investment under the project and sensitivity analyses have been carriedout to appraise the possible impact of the key uncertainties bearing on theseinvestments. Methodology and statements are presented in Annex 18. Resultswere all found to be satisfactory, and rates of return for major componentsare summarized below, based on a Rs 1 per day shadow price for unskilledlabor: sheep development, 17% rate of return; dairy development, 37%; pasturedevelopment, 12%; irrigation - tubewell, 17% and tank, 26%; soil conservation,22%; and dry farming, 14%.
VII. AGREEMENTS REACHED AND RECOMMENDATIOWS
7.01 During credit negotiations agreement was reached on the followingprincipal points:
(a) Consultants would be employed with qualifications and experienceand on terms and conditions satisfactory to IDA to advise on:
(i) pasture development (para 4.10);
(ii) calf rearing centers (para 4.30);
(iii) bagasse treatment (para 4.32);
(iv) pasture research (para 4.39);
(v) agrometeorological research (para 4.40).
(b) The following positions would be filled at all times bycandidates with qualifications and experience acceptable toIDA:
(i) senior agricultural economist for the agriculturaleconomics research program (para 4.38);
(ii) senior specialists in soil conservation and dry farming,irrigation and economics for the Central DPAP Unit(para 5.02);
(ili) Project Managers of DDAs (para 5.05).
31 -
(c) ARC would prepare district banking plans for each projectdistrict (para 4.48) and would appraise and sanction proposalsfor institutional financing under the project in such phasingand volume as would facilitate implementation (para 4.53).
(d) Interdepartmental committees would be established at thecentral and state levels to coordinate DPAP activity (paras5.02 and 5.03).
(e) Semidetailed ground water surveys would be undertaken inproject areas in Andhra Pradesh and Maharashtra (para 4.04).
(f) Separate groups of extension staff would be employed for thedry farming component and state governments would meet thefertllizer requirements of this component (paras 4.16 and4.17).
(g) By-laws for primary sheep growers societies would be finalizedin consultation with IDA (para 4.20).
7,02 It would be a condition of credit effectiveness that candidateswith qualifications and experience acceptable to IDA had been appointed tothe senior specialist positions in the Central DPAP Unit and had taken uptheir duties (para 5.02).
7.03 It would be a condition of disbursement against any project costin each state that duly constituted DDAs had been established in each projectdistrict of the state and that project managers of the rank of AdditionalCollectors had been appointed thereto (paras 4.56 and 5.05).
7.04 It would be a further condition of disbursement that only halfof the eligible expenditures on tank construction would be disbursed pendingreceipt by IDA of certification that CAD had commenced in accordance withthe approved plans, thereafter full disbursement would be made (paras 4.05and 4.56).
7.05 With the indicated assurance the project would be suitable foran IDA credit of US$35 million.
ANNEX 1Page 1
INDIA
DROUGHT PRONE AREAS PROJECT
Background on Drought Prone Areas Program
Historical Development
1. The Drought Prone Areas Program (DPAP), formerly known as theRural Works Program, was introduced in 1970-71 by the Central Gsvernment.Its basic objective was the creation of Rural employment through government-executed construction works. Fifty-four districts in 13 states wereselected for the program on the basis of three objective criteria:
(a) level and periodicity of rainfall;
(b) intensity and past occurrence of drought; and
(c) proportion of irrigated area to total cultivated area.
Priorities established by GOI for works under DPAP were as follows:
(a) irrigation - medium or minor;
(b) soil conservation, pasture development and affor-estation; and
(c) roads - not to exceed 25% of District allocations.
Although program works were to have been limited to the creation of permanentassets upon which further development could be programmed, the relief employ-ment needs of the selected districts during the past three years led stategovernments to ignore overall development strategies in the sanctioning ofworks, and the result has been the creation of many low priority, non-produc-tive assets. One billion rupees were budgeted for the Program for the four-year period 1970-71 to 1973-74. Approximately Rs 610 million were spent underDPAP from 1970-71 through 1972-73, and it is expected that most of the Rs 390million balance will be disbursed during 1973-74, the last year of the initialprogram and of the Fourth Plan (1969-74).
Current Objectives and Scope
2. Over the past four years, DPAP has evolved from a purely employmentoriented program to one which is intent on "drought-proofing" districts with-in the scheme. To mitigate the effects of future drought, multi-sectoraldistrict plans have been prepared with the objective of stabilizing both
ANNEX 1Page 2
production and employment under the prevailing conditions of erratic rain-fall. Plans are based on the resource potential of individual districts,and works to be taken up by various departments and agencies of governmentare to be coordinated by a district level development authority. A numberof elements of this strategy have been identified for specific attention:
(a) restoration of ecological balances;
(b) development and management of irrigation resources;
(c) soil and moisture conservation and afforestation;
(d) re-structuring of cropping pattern;
(e) changes in agronomic practices;
(f) livestock development;
(g) provision of drinking water supply;
(h) development of rural communications;
(i) development of small/marginal farmers and agricultural laborers.
All of the above, with the exception of drinking water and rural communica-tion works are within the purview of DPAP. The original 54 districts havebeen retained and individual talukas in an additional 18 districts have beenincluded under the program for the Fifth Plan.
Organization
3. At the Center, DPAP is administered within the Cooperatives andCommunity Development Department. 1/ The unit itself is staffed by a Direc-tor, Deputy Commissioner, Under Secretary and support staff. DPAP has todate relied on technical expertise from other branches and departments ofgovernment for the evaluation of scheme proposals. However, during thepreparation of district plans and the definition of DPAP projects for thenext five years, it has become increasingly apparent that the DPAP unitmust also have a core of senior experts in the major sub-sectors, such asdryland farming, if the tasks of project preparation and coordination areto be effectively accomplished.
November 49 1974
1/ Although the project appraised for IDA consideration consists primarilyof agricultural investments, DPAP finances a broader range of invest-ments including, for example, rural electrification; hences it loca-tion is the Cooperatives and Community Development Department.
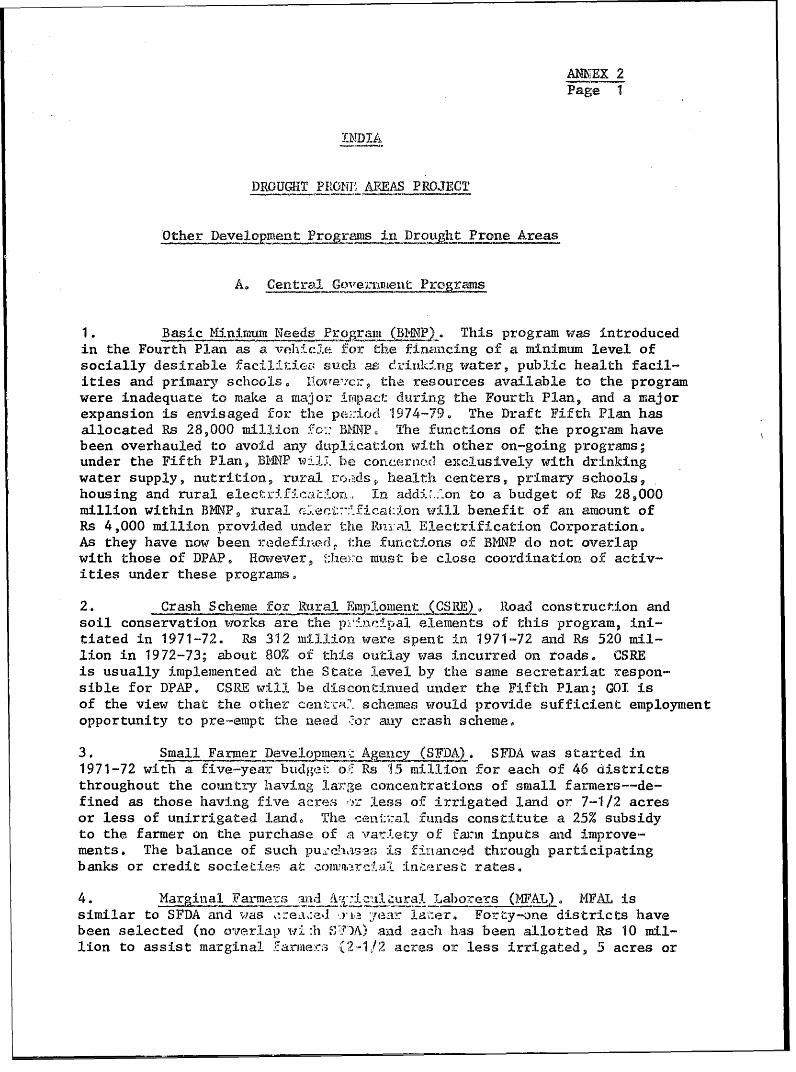
AN?EX 2Page 1
INDI
DROUGHT PRONT' AEAS PROJECT
Other Develpnent Pro;raxus injcuht Prone Areas
A. Central Gov:ernmnenit Prcgras
1. Basic Minimum Needs Program (BIPX. This program was introducedin the Fourth Plan as a ve.hicle for the financing of a m-inimum level ofsocially desirable facillties such as c½inkiing water, public health facil-ities and primary schloolsO Ic7:, the resources available to the programwere inadequate to make a mfajor i'mpac't during the Fourth Plan, and a mkajorexpansion is envisaged for the p 1:ifd 974-79. The Draft Fifth Plan hasallocated Rs 28,000 million Mf M.r I3BPO The functions of the program havebeen overhauled to avoid any duplication wi th other on-going programs;under the Fifth Plan, BI4NP 4il'. b curncernod exclusively with drinkingwater supply, nutrition, rural ro0. ds, health centers, primary schools,housing and rural elect I.i-: on. In addi_.:on to a budget of Rs 28,000million within BMP, rural e.::-:' ficas fL will benefit of an amount ofRs 4,000 million provided uiider thte b2I-:al Electrification Corporation.As they have now been redefivefd the functions of BMNP do not overlapwith those of DPAPo However, tJ.ie:ce mast be close coordination of activ-ities under these programs0
2. Crash Scheme for Rural ELojment: (CSO). Road construction andsoil conservation works are the 1-:>inciv`al elements of this program, ini-tiated in 1971-72. Rs 312 millionl were spent in 1971-72 anld Rs 520 mil-lion in 1972-73; about 80% of this outlay was incurred on roads, CSREis usually implemented at the State level by the same secretariat respon-sible for DPAP. CSRE will be discontinued under the Fifth Plan; GOI isof the view that the other centu-a'. schemes would provide sufficient employmentopportunity to pre-empt the need "or any crash scheme.
3. Small Farmer DeveLNienM. Ag DA). SFDA was started in1971-72 with a five-year budge~: o.C Rs 15 million for each of 46 &istrictsthroughout the country having la.>ge concentrations of small farmers--de-fined as those having five acrea s less of irrigated land or 7-1/2 acresor less of unirrigated land,, The cen,:al fuinds constitute a 25% subsidyto the farmer on the purchase of a vari-ei:y of farm inputs and improve-ments. The balance of such pu.'C-r!u-i:-c,S;, is flrianc-micd through participatingbanks or credit societies.a at *c, rt-Jil :Ln.-resC rates.
4. Marginial Farmars and Af -:i*zmiL: ural Laborers (1.-.AL). MFAL issimilar to SFDA and was la..ea-:ed n l ar^ aier. Forty-one districts havebeen selected (no overlai.) wJi :li'D?i) and eaah has been allotted Rs 10 mil-lion to assist marginal i`armec.3 '2-1,!2 acres or less irrigated, 5 acres or
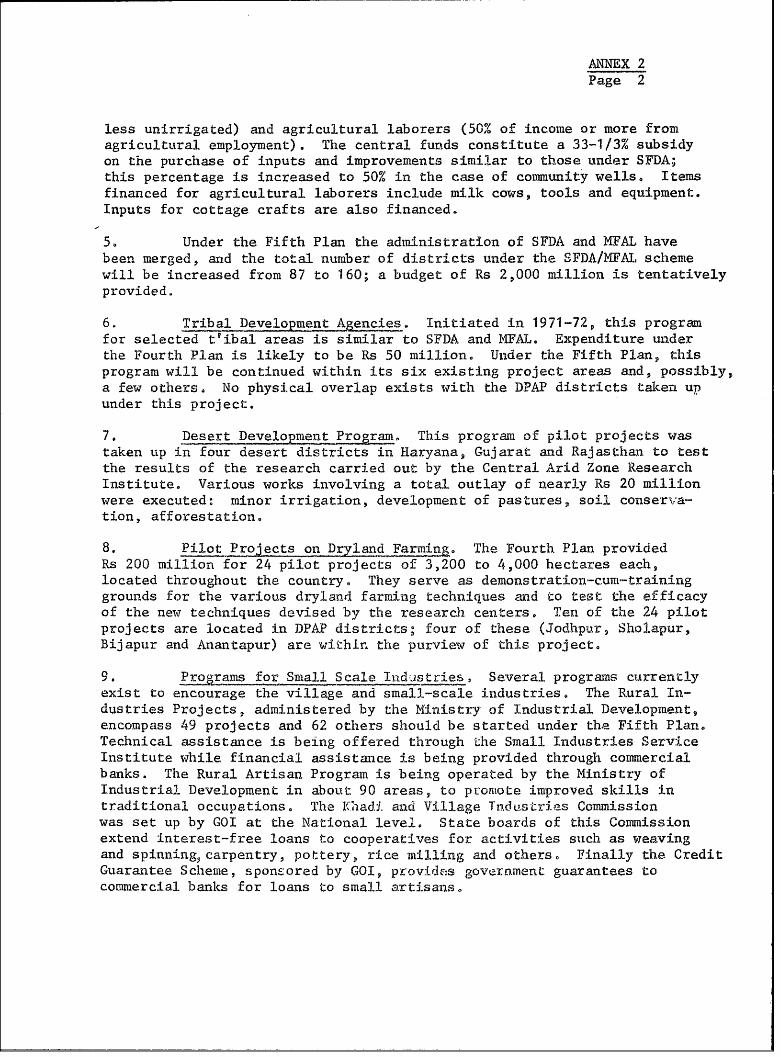
ANNEX 2Page 2
less unirrigated) and agricultural laborers (50% of income or more fromagricultural employment). The central funds constitute a 33-1 /3 7 subsidyon the purchase of inputs and improvements similar to those under SFDA;this percentage is increased to 50% in the case of community wells. Itemsfinanced for agricultural laborers include milk cows, tools and equipment.Inputs for cottage crafts are also financed.
5. Under the Fifth Plan the administration of SFDA and MFAL havebeen merged, and the total number of districts under the SlFDA/MFAIL schemewill be increased from 87 to 160; a budget of Rs 2,000 million is tentativelyprovided.
6 . Tribal Development Agencies, Initiated in 1971-72, this programfor selected t'ibal areas is similar to SFDA and MFAI. Expenditure unlderthe Fourth Plan is likely to be Rs 50 million. Under the Fifth Plan, thisprogram will be continued within its six existing project areas and, possibly,a few others. No physical overlap exists with the DPAP districts taken upunder this project.
7. Desert Development Program. This program of pilot projects wastaken up in four desert districts in Haryana, Gujarat and Rajasthan to testthe results of the research carried out by the Central Arid Zone ResearchInstitute. Various works involving a total outlay of nearly Rs 20 millionwere executed: minor irrigation, development of pastures, soil conserva-tion, afforestation.
8. Pilot Projects on Dryland Far.ing. The Fourth Plan providedRs 200 million for 24 pilot projects of 3,200 to 4,000 hectares each,located throughout the country. They serve as demonstration-cum-traininggrounds for the various dryland farming techniques and to test the efficacyof the new techniques devised by the research centers, Ten of the 24 pilotprojects are located in DPAP districts; four of these (Jodhpur, Sholapur,Bijapuir and Anantapur) are withinr the purview of this project.
9. Programs for Small Scale Indijstries,, Several programs currentlyexist to encourage the village and small-scale industries. The Rural In-dustries Projects, administered by the Ministry of Industrial Development,encompass 49 projects and 62 others should be started under the Fifth Plan.Technical assistance is being offered through the Small Industries ServiceInstitute while financial assistance is being provided through commercialbanks. The Rural Artisan Program is being operated by the Ministry ofIndustrial Development in about 90 areas, to pronmote im:proved skills intraditional occupations. The I-,"aadi and Village TnoduLs cr!es Commissionwas set up by GOI at the National level. State boards of this Commissionextend interest-free loans to cooperatives for activities such as weavingand spinning, carpentry, pottery, rice milling and others. Finally the CreditGuarantee Scheme, sponsored by GOI, provv:irs government guarantees tocommercial banks for loans to small artisa.n0s
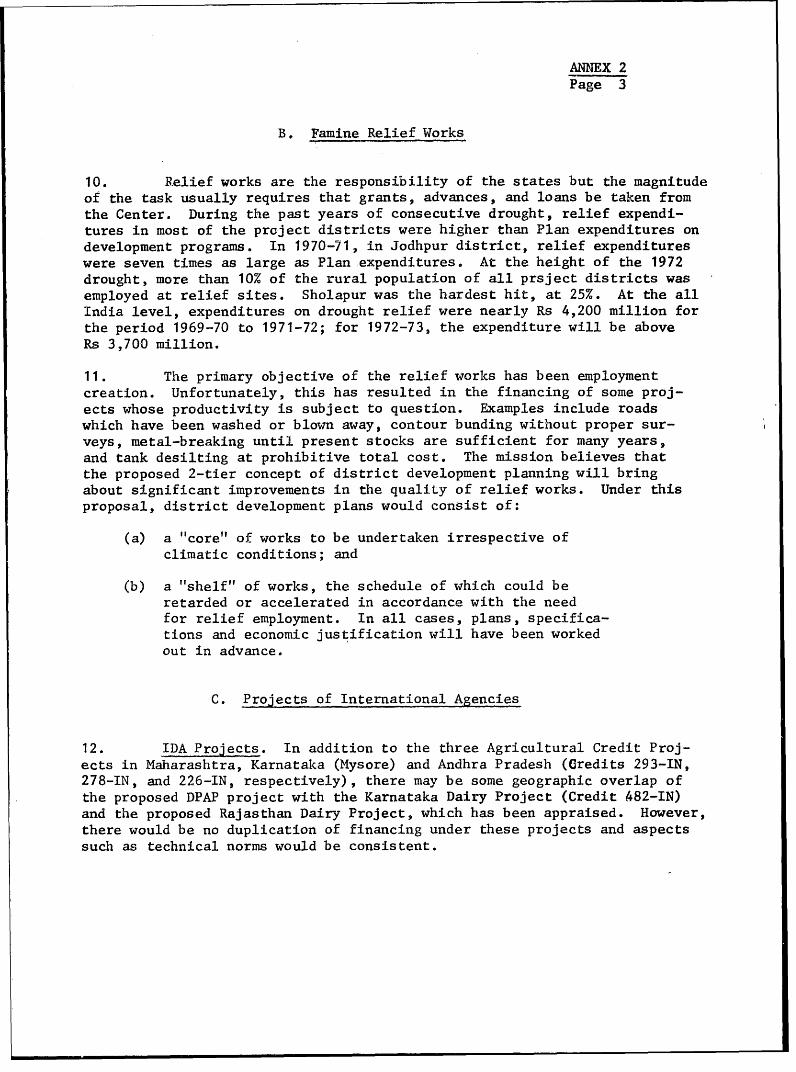
ANNEX 2Page 3
B. Famine Relief Works
10. Relief works are the responsibility of the states but the magnitudeof the task usually requires that grants, advances, and loans be taken fromthe Center. During the past years of consecutive drought, relief expendi-tures in most of the project districts were higher than Plan expenditures ondevelopment programs. In 1970-71, in Jodhpur district, relief expenditureswere seven times as large as Plan expenditures. At the height of the 1972drought, more than 10% of the rural population of all prsject districts wasemployed at relief sites. Sholapur was the hardest hit, at 25%. At the allIndia level, expenditures on drought relief were nearly Rs 4,200 million forthe period 1969-70 to 1971-72; for 1972-73, the expenditure will be aboveRs 3,700 million.
11. The primary objective of the relief works has been employmentcreation. Unfortunately, this has resulted in the financing of some proj-ects whose productivity is subject to question. Examples include roadswhich have been washed or blown away, contour bunding without proper sur-veys, metal-breaking until present stocks are sufficient for many years,and tank desilting at prohibitive total cost. The mission believes thatthe proposed 2-tier concept of district development planning will bringabout significant improvements in the quality of relief works. Under thisproposal, district development plans would consist of:
(a) a "core"l of works to be undertaken irrespective ofclimatic conditions; and
(b) a "shelf" of works, the schedule of which could beretarded or accelerated in accordance with the needfor relief employment. In all cases, plans, specifica-tions and economic justification will have been workedout in advance.
C. Projects of International Agencies
12. IDA Projects. In addition to the three Agricultural Credit Proj-ects in Maharashtra, Karnataka (Mysore) and Andhra Pradesh (Credits 293-IN,278-IN, and 226-IN, respectively), there may be some geographic overlap ofthe proposed DPAP project with the Karnataka Dairy Project (Credit 482-IN)and the proposed Rajasthan Dairy Project, which has been appraised. However,there would be no duplication of financing under these projects and aspectssuch as technical norms would be consistent.
ANNEX 2Page 4
13. World Food Program (WFP). The 12 regular WFP projects currentlyoperating in India can generally be divided into Operation Flood, 1/institutional feeding, lifestock and poultry development, and food-for-workprograms. Operation Flood is designed to increase the quantity and quality
of fluid milk entering the markets of large cities. Food-for-work projects
are the next largest WFP activities, based on the principle of providing theingredients of a balanced diet to workers and their families on selectedprojects at about half of the cost of such foodstuffs in fair price shops.In most cases this is achieved by providing give basic rations per worker
per day in lieu of 50% of the normal cash wage. The remaining 50% is paidin cash by the State or Central Government.
14. Other International Agency Projects. In drought prone areas, the
emphasis of other,international agency projects has been on the provision
of adequate drinking water. UNDP, WHO and UNICEF, for example, have provided
drilling rigs to Rajasthan. One other aid program, that of American Care,
appears to be working particularly well in Mysore. Under this project,
school children and pregnant and nursing mothers receive one prepared meal
per day on the school premises.
D. Program Coordination
15. The focal point of development efforts at present is the State
Plan, a five-year. program based on a sectoral and departmental approach to
development needs. The Planning Commission of each state is responsible
for the solicitation of sectoral proposals from State Departments, and for
modification of the Plan in accordance with the availability and priorities
of Central funds which would be extended to augment state resources. Plan-
ning Commissions are then responsible for monitoring progress during the
plan period and for vetting and integrating expenditures which lie outside
the State Plan, and which have been, to date, poorly coordinated with it:
(i) relief expenditures, and (ii) Centrally-funded programs. The mission
endorses the view of government that stronger district level coordinationis essential if the impact of these many programs is to be maximized. It
would be therefore an essential function of district development authori-
ties to be established in project districts to coordinate other programsas well as oversee the execution of DPAP.
November 4, 1974
1/ This program provides India with skim milk powder and butter fat to be
used in milk balancing by dairies in Delhi, Bombay, Calcutta and Madras.
Proceeds from the sale of these commodities are to be used by govern-
ment in dairy development.
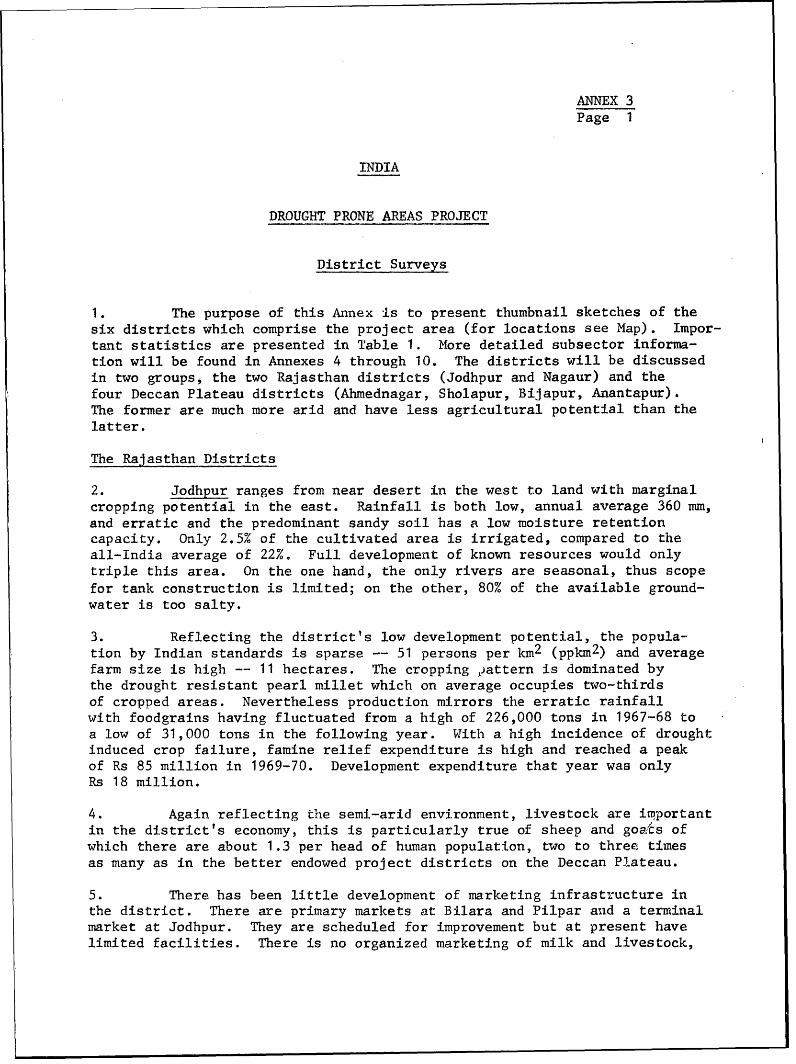
ANNEX 3Page 1
INDIA
DROUGHT PRONE AREAS PROJECT
District Surveys
1. The purpose of this Annex is to present thumbnail sketches of thesix districts which comprise the project area (for locations see Map). Impor-tant statistics are presented in Table 1. More detailed subsector informa-tion will be found in Annexes 4 through 10. The districts will be discussedin two groups, the two Rajasthan districts (Jodhpur and Nagaur) and thefour Deccan Plateau districts (Ahmednagar, Sholapur, Bijapur, Anantapur).The former are much more arid and have less agricultural potential than thelatter.
The Rajasthan Districts
2. Jodhpur ranges from near desert in the west to land with marginalcropping potential in the east. Rainfall is both low, annual average 360 mm,and erratic and the predominant sandy soil has a low moisture retentioncapacity. Only 2.5% of the cultivated area is irrigated, compared to theall-India average of 22%. Full development of known resources would onlytriple this area. On the one hand, the only rivers are seasonal, thus scopefor tank construction is limited; on the other, 80% of the available ground-water is too salty.
3. Reflecting the district's low development potential, the popula-tion by Indian standards is sparse -- 51 persons per km2 (ppkm2) and averagefarm size is high -- 11 hectares. The cropping dattern is dominated bythe drought resistant pearl millet which on average occupies two-thirdsof cropped areas. Nevertheless production mirrors the erratic rainfallwith foodgrains having fluctuated from a high of 226,000 tons in 1967-68 toa low of 31,000 tons in the following year. With a high incidence of droughtinduced crop failure, famine relief expenditure is high and reached a peakof Rs 85 million in 1969-70. Development expenditure that year was onlyRs 18 million.
4. Again reflecting the semi-arid environment, livestock are importantin the district's economy, this is particularly true of sheep and goat/Cs ofwhich there are about 1.3 per head of human population, two to three timesas many as in the better endowed project districts on the Deccan Plateau.
5. There has been little development of marketing infrastructure inthe district. There are primary markets at Bilara and Pilpar anid a terminalmarket at Jodhpur. They are scheduled for improvement but at present havelimited facilities. There is no organized marketing of milk and livestock,
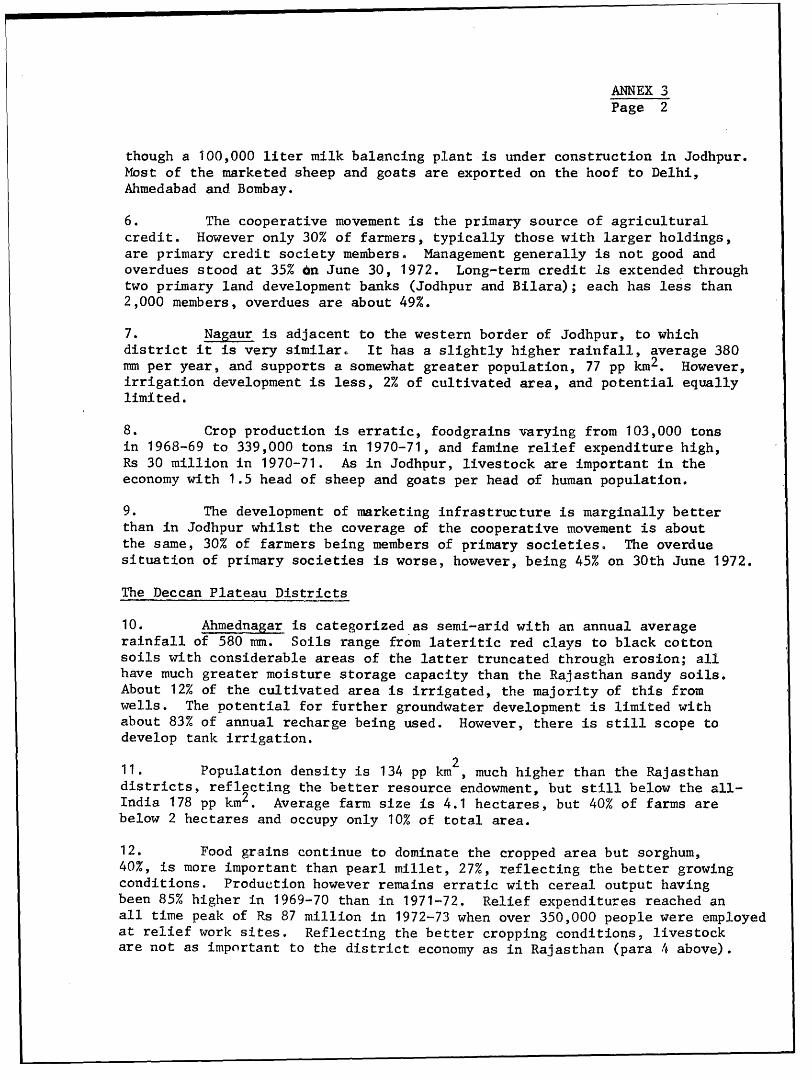
ANNEX 3Page 2
though a 100,000 liter milk balancing plant is under construction in Jodhpur.Most of the marketed sheep and goats are exported on the hoof to Delhi,Ahmedabad and Bombay.
6. The. cooperative movement is the primary source of agriculturalcredit. However only 30% of farmers, typically those with larger holdings,are primary credit society members. Management generally is not good andoverdues stood at 35% 6n June 30, 1972. Long-term credit is extended throughtwo primary land development banks (Jodhpur and Bilara); each has less than2,000 members, overdues are about 49%.
7. Nagaur is adjacent to the western border of Jodhpur, to whichdistrict it is very similar. It has a slightly higher rainfall, average 380mm per year, and supports a somewhat greater population, 77 pp km2. However,irrigation development is less, 2% of cultivated area, and potential equallylimited.
8. Crop production is erratic, foodgrains varying from 103,000 tonsin 1968-69 to 339,000 tons in 1970-71, and famine relief expenditure high,Rs 30 million in 1970-71. As in Jodhpur, livestock are important in theeconomy with 1.5 head of sheep and goats per head of human population.
9. The development of marketing infrastructure is marginally betterthan in Jodhpur whilst the coverage of the cooperative movement is aboutthe same, 30% of farmers being members of primary societies. The overduesituation of primary societies is worse, however, being 45% on 30th June 1972.
The Deccan Plateau Districts
10. Ahmednagar is categorized as semi-arid with an annual averagerainfall of 580 mm. Soils range from lateritic red clays to black cottonsoils with considerable areas of the latter truncated through erosion; allhave much greater moisture storage capacity than the Rajasthan sandy soils,About 12% of the cultivated area is irrigated, the majority of this fromwells. The potential for further groundwater development is limited withabout 83% of annual recharge being used. However, there is still scope todevelop tank irrigation.
11. Population density is 134 pp km , much higher than the Rajasthandistricts, reflecting the better resource endowment, but still below the all-India 178 pp km2 . Average farm size is 4.1 hectares, but 40% of farms arebelow 2 hectares and occupy only 10% of total area.
12. Food grains continue to dominate the cropped area but sorghum,40%, is more important than pearl millet, 27%, reflecting the better growingconditions. Production however remains erratic with cereal output havingbeen 85% higher in 1969-70 than in 1971-72. Relief expenditures reached anall time peak of Rs 87 million in 1972-73 when over 350,000 people were employedat relief work sites. Reflecting the better cropping conditions, livestockare not as important to the district economy as in Rajasthan (para 4 above).
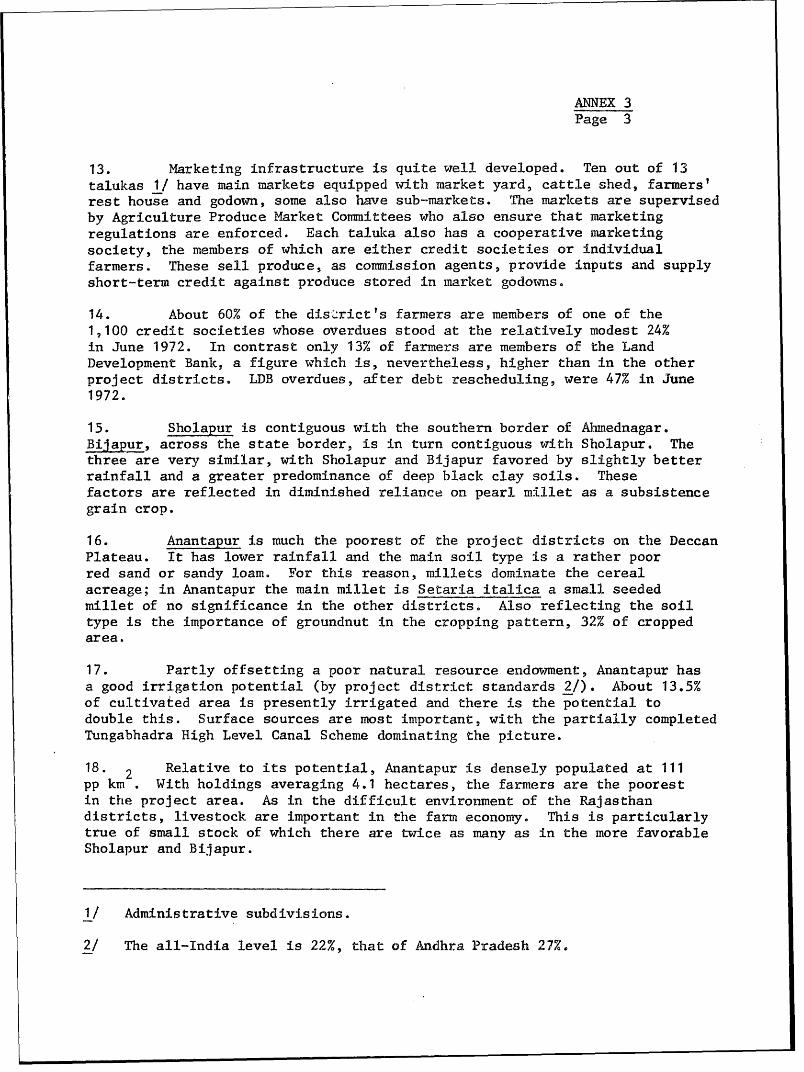
ANNEX 3Page 3
13. Marketing infrastructure is quite well developed. Ten out of 13talukas 1/ have main markets equipped with market yard, cattle shed, farmers'rest house and godown, some also have sub-markets. The markets are supervisedby Agriculture Produce Market Committees who also ensure that marketingregulations are enforced. Each talula also has a cooperative marketingsociety, the members of which are either credit socieeties or individualfarmers. These sell produce, as commission agents, provide inputs and supplyshort-term credit against produce stored in market godowns.
14. About 60% of the dis-rict's farmers are members of one of the1,100 credit societies whose overdues stood at the relatively modest 24%in June 1972. In contrast only 13% of farmers are members of the LandDevelopment Bank, a figure which is, nevertheless, higher than in the otherproject districts. LDB overdues, after debt rescheduling, were 47% in June1972.
15. Sholapur is contiguous with the southern border of Ahmednagar.Bijapur, across the state border, is in turn contiguous with Sholapur. Thethree are very similar, with Sholapur and Bijapur favored by slightly betterrainfall and a greater predominance of deep black clay soils. Thesefactors are reflected in diminished reliance on pearl millet as a subsistencegrain crop.
16. Anantapur is much the poorest of the project districts on the DeccanPlateau. It has lower rainfall and the main soil type is a rather poorred sand or sandy loam. For this reason, millets dominate the cerealacreage; in Anantapur the main millet is Setaria italica a small seededmillet of no significance in the other districts. Also reflecting the soiltype is the importance of groundnut in the cropping pattern, 32% of croppedarea.
17. Partly offsetting a poor natural resource endowment, Anantapur hasa good irrigation potential (by project district standards 2/). About 13.5%of cultivated area is presently irrigated and there is the potential todouble this. Surface sources are most important, with the partially completedTungabhadra High Level Canal Scheme dominating the picture.
18. 2 Relative to its potential, Anantapur is densely populated at 111pp km . With holdings averaging 4.1 hectares, the farmers are the poorestin the project area. As in the difficult environiment of the Rajasthandistricts, livestock are important in the farm economy. This is particularlytrue of small stock of which there are twice as many as in the more favorableSholapur and Bijapur.
1/ Administrative subdivisions.
2/ The all-India level is 22%, that of Andhra Pradesh 27%.
ANNEX 3Page 4
19. The district's marketing infrastructure is not well developed.
There are only five regulated markets, one per 50,000 farmers, and 10 sub-
centers. None has facilities such as a market yard, scales or storage.
20. Supplies of institutional credit are also only poorly developed.
Membership of primary credit societies covers only 30% of farmers; advances
are far below the levels in the other three Plateau districts, yet overdues
stood at 81% as at June 30, 1972. The picture with regard to long-term
credit and the Land Development Bank is a little better. Only 13% of
farmers are members, similar to the other districts; but overdues were only
10% as at June 30, 1972.
November 4, 1974
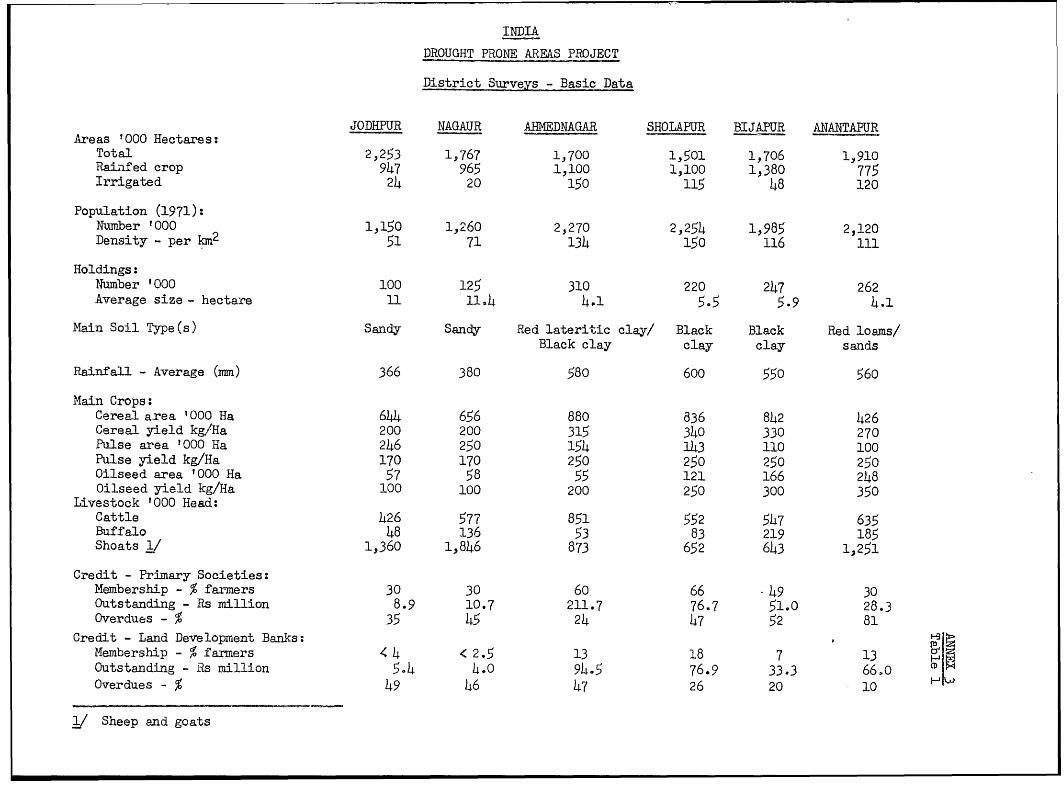
INDIA
DROUGHT PRONE AREAS PROJECT
District Surveys - Basic Data
JODHPUR NAGAUR AHMEDNAGAR SHOLAPUR BIJAPUR ANANTAPURAreas ' 000 Hectares:Total 2,253 1,767 1,,700 1,501 1,706 1,910Raiiifed crop 947 965 1,100 1,100 1,380 775Irrigated 24 20 150 115 48 120
Population (1971):Number '000 1,150 13260 2,270 2,254 1,985 2,120Density - per kIm2 51 71 134 150 116 111
Holdings:Thumber '000 100 125 310 220 247 262Average size - hectare 11 11.4 4.1 5.5 5.9 4.1
Main Soil Type(s) Sandy Sandy Red lateritic clay/ Black Black Red loams/Black clay clay clay sands
Rainfall - Average (mm) 366 380 580 600 550 560
Main Crops:Cereal area '000 Ha 644 656 880 836 842 426Cereal yield kg/Ha 200 200 315 340 330 270Pulse area '000 Ha 246 250 154 143 110 100Pulse yield kg/Ha 170 170 250 250 250 250Oilseed area '000 Ha 57 58 55 121 166 248Oilseed yield kg/Ha 100 100 200 250 300 350Livestock '000 Head:Cattle 426 577 851 552 547 635Buffalo 48 136 53 83 219 185Shoats 1/ 1,360 1,846 873 652 643 1,251
Credit - Primary Societies:Membership - % farmers 30 30 60 66 - 49 30Outstanding - Rs million 8.9 10.7 211.7 76.7 51.0 28.3Overdues - % 35 45 24 47 52 81
Credit - Land Development Banks:Membership - % farmers C 4 < 2.5 13 18 7 13Outstanding Rs million 5.4 4.0 94.5 76.9 33.3 66.0Overdues - % 49 46 47 26 20 10
j Sheep and goats
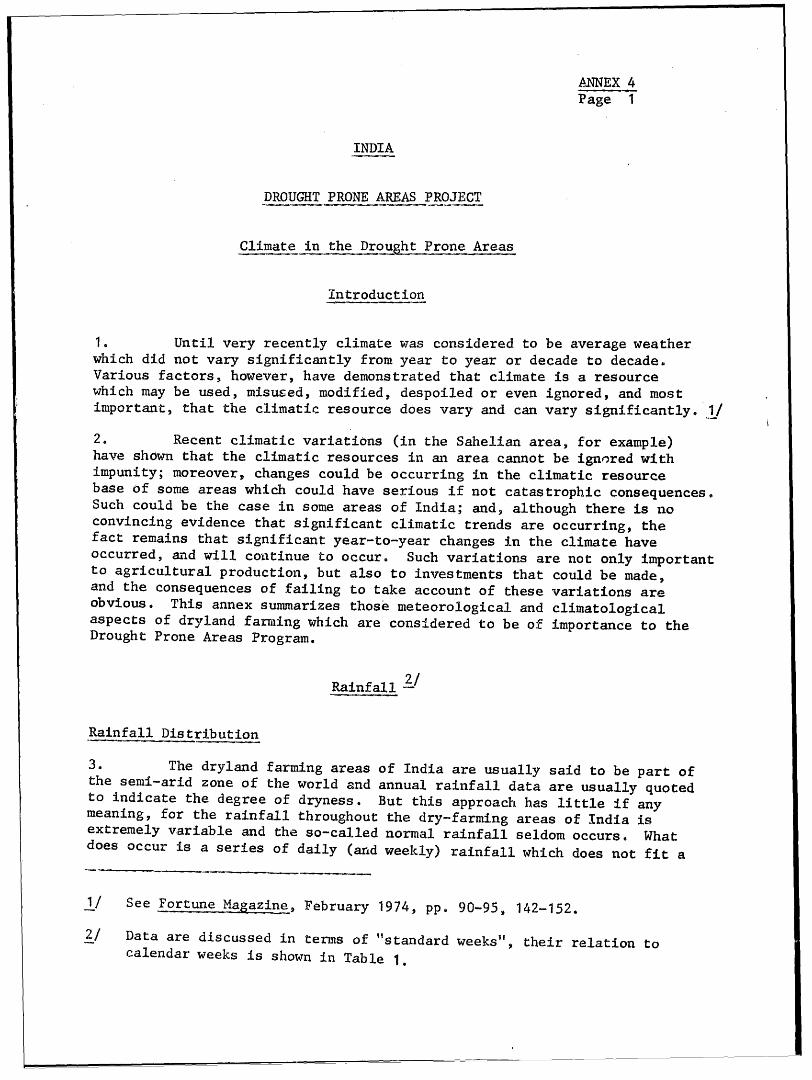
A.NNEX 4Page 1
INDIA
DROUGHT PRONE AREAS PROJECT
Climate in the Dro Prone Areas
introduction
1. Until very recently climate was considered to be average weatherwhich did not vary significantly from year to year or decade to decade.Various factors, however, have demonstrated that climate is a resourcewhich may be used, misused, modified, despoiled or even ignored, and mostimportant, that the climatic resource does vary and can vary significantly. 1/2. Recent climatic variations (in the Sahelian area, for example)have shown that the climatic resources in an area cannot be ignored withimpunity; moreover, changes could be occurring in the climatic resourcebase of some areas which could have serious if not catastrophic consequences.Such could be the case in some areas of India; and, although there is noconvincing evidence that significant climatic trends are occurring, thefact remains that significant year-to-year changes in the climate haveoccurred, and will continue to occur. Such variations are not only importantto agricultural production, but also to investments that could be made,and the consequences of failing to take account of these variations areobvious. This annex summarizes those meteorological and climatologicalaspects of dryland fanring which are considered to be of importance to theDrought Prone Areas Program.
Rainfall-/
Rainfall Distribution
3. The dryland farming areas of India are usually said to be part ofthe semi-arid zone of the world and annual rainfall data are usually quotedto indicate the degree of dryness. But this approach has little if anymeaning, for the rainfall throughout the dry-farming areas of India isextremely variable and the so-called normal rainfall seldom occurs. Whatdoes occur is a series of daily (arnd weekly) rainfall which does not fit a
1/ See Fortune Magazine, February 1974, pp. 90-95, 142-152.
2/ Data are discussed in terms of "standard weeks", their relation tocalendar weeks is shown in Table 1.
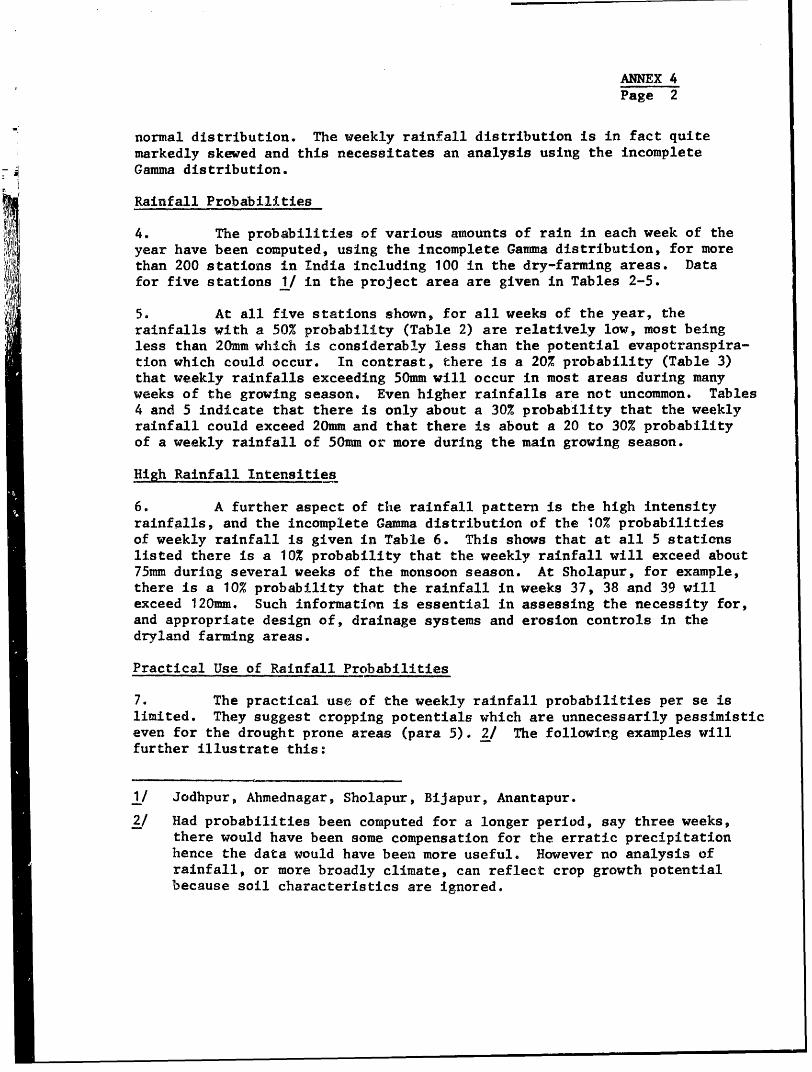
ANNEX 4Page 2
normal distribution. The weekly rainfall distribution is in fact quitemarkedly skewed and this neces8itates an analysis using the incompleteGamma distribution.
Rainfall Probabilities
4. The probabilities of various amounts of rain in each week of theyear have been computed, using the incomplete Gamma distribution, for morethan 200 stations in India including 100 in the dry-farming areas. Datafor five stations 1/ in the project area are given in Tables 2-5.
5. At all five stations shown, for all weeks of the year, therainfalls with a 50% probability (Table 2) are relatively low, most beingless than 20mm which is considerably less than the potential evapotranspira-tion which could occur. In contrast, there is a 20% probability (Table 3)that weekly rainfalls exceeding 50mm will occur in most areas during manyweeks of the growing season. Even higher rainfalls are not uncommon. Tables4 and 5 indicate that there is only about a 30% probability that the weeklyrainfall could exceed 20mm and that there is about a 20 to 30% probabilityof a weekly rainfall of 50mm or more during the main growing season.
High Rainfall Intensities
6. A further aspect of the rainfall patterna is the high intensityrainfalls, and the incomplete Gamma distribution of the 10% probabilitiesof weekly rainfall is given in Table 6. This shows that at all 5 stationslisted there is a 10% probability that the weekly rainfall will exceed about75mm during several weeks of the monsoon season. At Sholapur, for example,there is a 10% probability that the rainfall in weeks 37, 38 and 39 willexceed 120mm. Such information is essential in a£Wsessing the necessity for,and appropriate design of, drainage systems and erosion controls in thedryland farming areas.
Practical Use of Rainfall Probabilities
7. The practical use of the weekly rainfall probabilities per se islimited. They suggest cropping potentials which are unnecessarily pessimisticeven for the drought prone areas (para 5). 2/ The followirg examples willfurther illustrate this:
1/ Jodhpur, Ahmednagar, Sholapur, Bijapur, Anantapur.2/ Had probabilities been computed for a longer period, say three weeks,
there would have been some compensation for the erratic precipitationhence the data would have been more useful. However no analysis ofrainfall, or more broadly climate, can reflect crop growth potentialbecause soil characteristics are ignored.
.ANX 4Page 3
(i) At Anaitapur the probability of a weekly rainfall ofover 20mm is highest in weeks 38 and 39, but even thenis only 50%. In 47 weeks out of 52 the probability ofat least 10mm of rain is less than 50%.
(ii) At Bijapur the highest average weekly rainfall is 46mmin week 38. However there is a 50% probability of lessthan 27mm in this week and the extreme rainfalls over68 years are 0 and 235mm.
8e The problem with any analysis of rainfall data is that thestorage capacity of the soil is ignored. It is the amount of availablesoil moisture, not incident rainfall, which governs crop growth. Thestorage capacity of the soil is particularly important in areas such asthe drought prone areas of India where the rainfall pattern is extremelyerratic. The soil acts as a reservoir evening out some of the effectsof fluctuating precipitationi. This is well illustrated by Table 7 whichpresents a weekly water balance for Sholapur.
9. What the agricultural planner requires is the probabilities ofdifferent soil moisture regimes. These could then be fitted to consumptiveuse data of different crops. The outcome would be information useful bothin planning the improvement of cropping practices and in predicting produc-tion more accurately than is now possible. A proposed program to investigatethe possibility of producing soil moisture probabilities is outlined inAnnex 10.
Incidence of Droughts
10. A drought index based on the methods used by Palmer (U. S.) hasbeen computed for several sub-divisions of the dry farming areas includingInterior Mysore South for the period 1901-67. A time series of the droughtindex for Interior Mysore South is shown in Fig. 1, and although some periodsappear to be less droughty than others, the incidence of drought is generall,quite severe. It should be noted that even with a monthly Palmer index ofzero, successful agriculture in many parts of the dryland farming areas ofIndia would be difficult.
Climatic Trends Variations
Seasonal Trends and Variations
11. A considerable amount of research has been carried out in Indiain assessing the significance of clixiiatic trends, cycles, and persistence.However, except in a few cases, there is no convincing evidence that anyexist which could be used for prediction purposes. Nevertheless, in viewof the economic importance that such cycles, trends or persistence would have
ANNEX 4Page 4
if they were in fact to have some predictability, it is considered thatfurther research in these areas should be encouraged. A possible researchprogram in this extremely important area "future climate" is outlined inAnnex 10.
Drought Cycles
12. Monthly values of the Palmer index for 23 sub-divisions of Indiahave been computed from 1901 onwards. An analysis of these values shows somepersistence in drought occurrence in north India in the belt extending fromthe Bihar Plains to East Rajasthan. In the peninsula, a similar featureis seen in some areas where "cycles" corresponding in period close to thequasi-biennial oscillation of 2.3 to 2.5 years are observed. Similarly,periods closely corresponding to the sunspot cycle of 10.5 to 11 years areindicated in Rajasthan West and Madhya Pradesh West. However, it is theopinion of the Indian meteorologists that the research so far completed doesnot encourage confidence of any periodicity in droughts which could be usedfor prediction purposes.
Within Season Correlations
13. One aspect of climatic variations and climatic presistence whichhas not been studied in India to any great degree is the relationship ofthe activity of the monsoon within a season. One such study for West Bengalhas been made, but in view of the importance of "within season" rainfalland its distribution, a more intensive study of the correlations within amonsoon season should be undertaken. This research, combined with thesuggested program of research on the probability of meeting the waterrequirements of crops, as outlined in Annex 10, would be a most usefulapplication of climatological data.
Water Balance
14. The discussion thus far has focussed on rainfall, the most importantclimatic factor in the drought prone areas. However to optimize the agri-cultural development of these areas, embracing irrigated and rainfed cropproduction and livestock, an understanding of their total water balance isnecessary. This can be expressed as follows:
P = AE + SM + RO + GWwhere P precipitation
AE = actual evapotranspiration
SM = change in soil moisture status
RO = runoff
GW = addition to groundwater
ANNEX 4Page 5
15. Actual evapotranspiration is the combined loss of moisture fromthe soil, by evaporation, and from the plant, by transpiration, and isdiscussed more fully below (para 20).
16. The critical importance of soil moisture strage in mitigatingthe effects of highly erratic rainfall has been discussed (para 8).
17.. Groundwater recharg and runoff account for the balance of theincident rainfall. In India nearly one-third of the irrigated lands dependon well water. Optimizing groundwater recharge is therefore vital.(Optimizing rather than maximizing since as raixifed cropping practices improve,actual evapotranspiration will increase at the cost of ground water recharge.)The control of runoff is very important in this regard. Table 8 shows tworecharge coefficients for Sholapur, R1 where allowance is made only forevaporative losses and K12 where allowance is made for both evaporation andrunoff. This shows that in this instance elimination of runoff would virtuallydouble the water available for soil storage and groundwater recharge.
Evaporation Losses from Large Reservoirs
18. Large areas in interior India receive scanty and uncertain rainfalland are at the same time subjected to huge evaporative losses due to thehigh temperatures. For planning water storage and ensuring efficient manage-ment it is therefore essential to obtain an estimate of water losses fromlarge and closed water bodies. Some data on annual evaporation rates areshown in Fig. 2.
Crop Weather Calendars
19. It will take a considerable time to determine the relationshipbetween rainfall and soil moisture regime for a wide representation of areas.In the interim, crop planning must continue. Probably one of the best waysof so doing is to relate an area's water availability periods to the waterdemand profiles of different crops.
20. Water availait is expressed by relating precipitation to potentialevapotranspiratiot (PE). In a simple categorization, periods could bedefined thus:
H Humid, when P exceeds PEM Moist, when P is between P and 1/2 PE
MD Moderately Dry, when P is between 1/2 PE and 1/4 PED Dry, when PE is between 1/4 PE and 1/8 PE
As the ratio P:PE increases the actual evapotranspiration from a crop declines,growth is retarded and at the extreme permanent physwiLogical damage anddeath will occur. In fitting crop water demand profiles to water availability
ANNEX 4Page 6
periods, cognizance must be taken of the crops critical growth period(s).A compromise may be necessary between the fit of the critical periods(s) tothe most assured rainfall period and that of the overall water demand toavailability. Critical growth periods have been identified for several cropsin irrigation research programs; greater use should be made of these data inplanning for rainfed crop development.
Crop Research at ICRISAT
21. Water, often too little and sometimes too much, during the entirecropping season, or during short periods, is the major constraint to cropproduction in the semi-arid tropics. It is considered that some of theeffects of the variability of rainfall could be alleviated by providingoptimum conditions for monsoon cropping along with the collection, storageand efficient utilization of the excess runoff water. This involves themanagement of the precipitation that falls within a given watershed.
22. Part of ICRISAT's program therefore aims at the development of"watershed-based farming systems" which are defined as "the optimum utiliza-tion of the catchment precipitation through improved water, *oil and crGpmanagement for increasing and stabilizing production on the donor watershed".Five experimental watersheds have been so far established for intensive datacollection on various farming systems and for monitoring of their waterbalance.
23. The work at ICRISAT will orovide some of the answers to "drought-proofing" in DPAP areas of India. However it is considered that closercollaboration between the meteorologists in the India Meteorological Depart-ment and the staff at ICRISAT (which at present has no staff with expertisein meteorology) would be beneficial.
Crop Production Forecasts
Local Yield Studies
24. Crop yield predictions are now being made for a limited number oflocalities by the IMD. This information is made available to Central Govern-ment planning staff. Forecast formulae have so far been developed for 22(meteorological) sub-divisions of India for rice, 6 for wheat, 2 for millet,and 5 for sorghum. The formulae are kept under review and the errors betweenthe forecast crop and the actual yield are relatively small. The relativelyclose agreement between the reported yield figures of rabi sorghum at Bijapurand those estimated by regression techniques is shown in Fig. 3. It isplanned to expand forecasting to other areas and crops and to make theinformation available to state level planners.
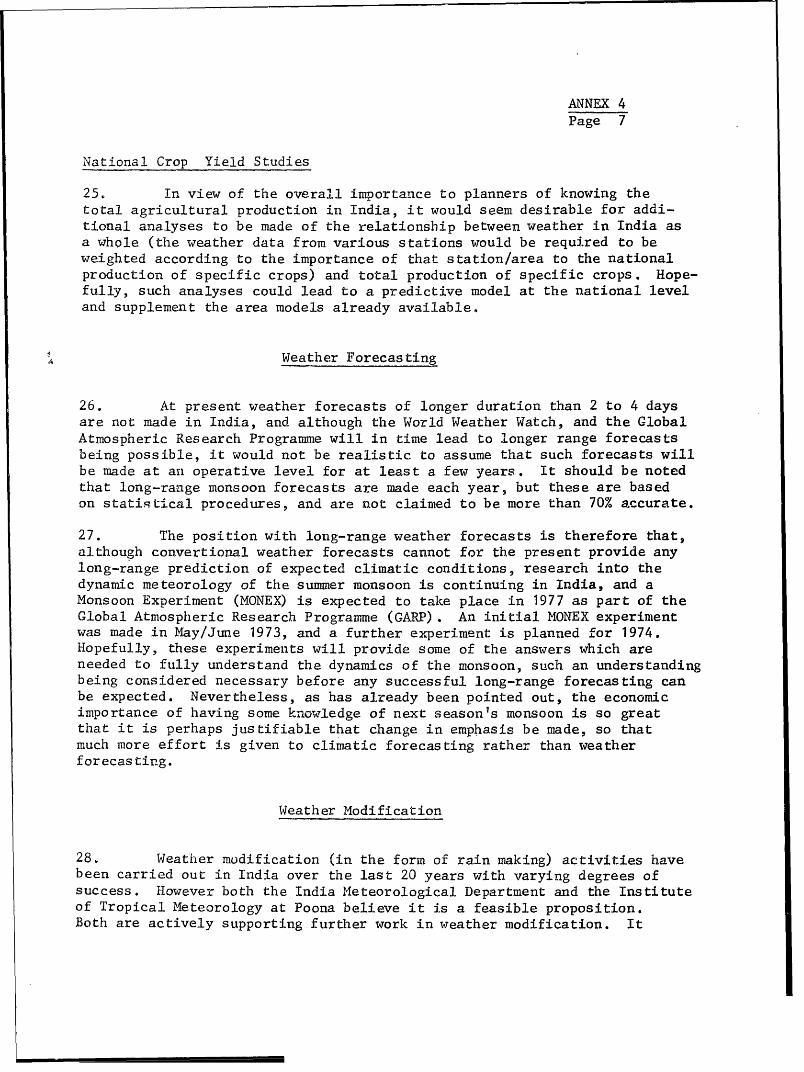
ANNEX 4Page 7
National Crop Yield Studies
25. In view of the overaLl importance to planners of knowing thetotal agricultural production in India, it would seem desirable for addi-tional analyses to be made of the relationship between weather in India asa whole (the weather data from various stations would be required to beweighted according to the importance of that station/area to the nationalproduction of specific crops) and total production of specific crops. Hope-fully, such analyses could lead to a predictive model at the national leveland supplement the area models already available,.
Weather Forecasting
26. At present weather forecasts of longer duration than 2 to 4 daysare not made in India, and although the World Weather Watch, and the GlobalAtmospheric Research Programme will in time lead to longer range forecastsbeing possible, it would not be realistic to assume that such forecasts willbe made at aIn operative level for at least a few years. It should be notedthat long-range monsoon forecasts are made each year, but these are basedon statistical procedures, and are not claimed to be more than 70% accurate.
27. The position with long-range weather forecasts is therefore that,although convertional weather forecasts cannot for the present provide anylong-range prediction of expected climatic conditions, research into thedynamic meteorology of the summer monsoon is continuing in India, and aMonsoon Experiment (MONEX) is expected to take place in 1977 as part of theGlobal Atmospheric Research Programme (GARP). An initial MONEX experimentwas made in May/June 1973, and a further experiment is planned for 1974.Hopefully, these experiments will provide some of the answers which areneeded to fully understand the dynamics of the monsoon, such an understandingbeing considered necessary before any successful long-range forecasting canbe expected. Nevertheless, as has already been pointed out, the economicimportance of having some knowledge of next season's monsoon is so greatthat it is perhaps justifiable that change in emphasis be made, so thatmuch more effort is given to climatic forecasting rather than weatherforecasting.
Weather Modification
28. Weatiher modification (in the form of rain making) activities havebeen carried out in India over the last 20 years with varying degrees ofsuccess. However both the India Meteorological Department and the Instituteof Tropical Meteorology at Poona believe it is a feasible proposition.Both are actively supporting further work in weather modification. It
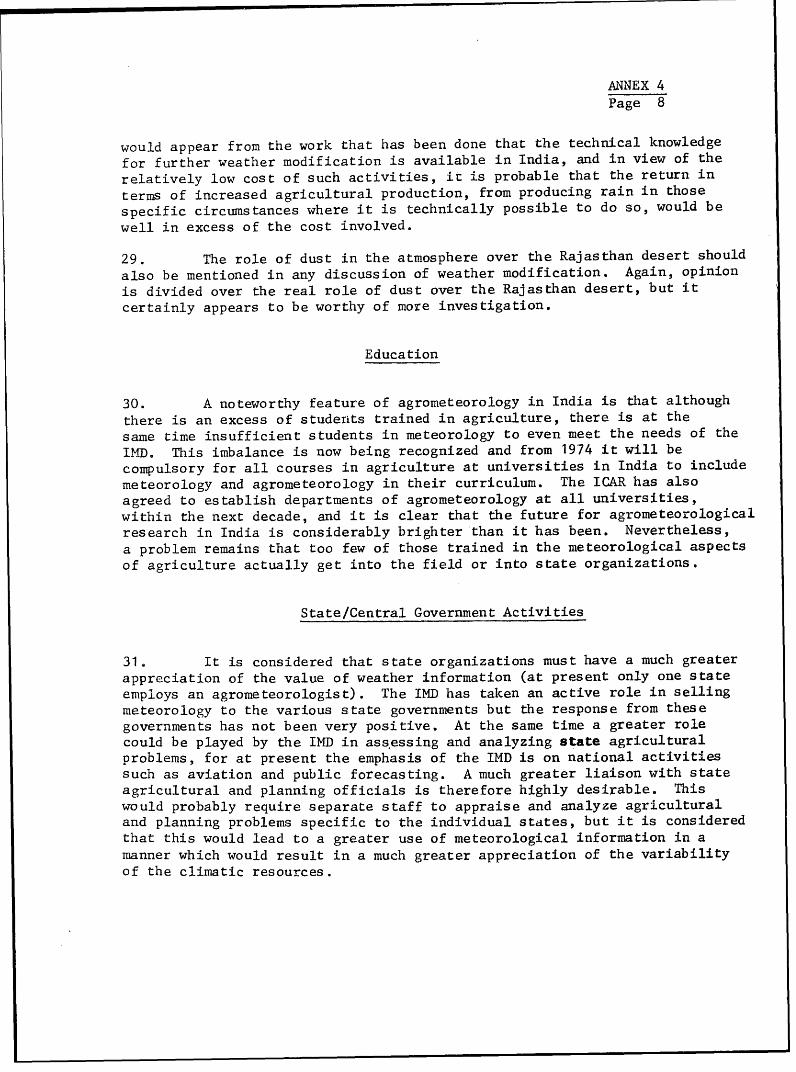
ANNEX 4Page 8
would appear from the work that has been done that the technical knowledgefor further weather modification is available in India, and in view of therelatively low cost of such activities, it is probable that the return interms of increased agricultural production, from producing rain in thosespecific circumstances where it is technically possible to do so, would bewell in excess of the cost involved.
29. The role of dust in the atmosphere over the Rajasthan desert shouldalso be mentioned in any discussion of weather modification. Again, opinionis divided over the real role of dust over the Rajasthan desert, but itcertainly appears to be worthy of more investigation.
Education
30. A noteworthy feature of agrometeorology in India is that althoughthere is an excess of studerits trained in agriculture, there is at thesame time insufficient students in meteorology to even meet the needs of theIMD. This imbalance is now being recognized and from 1974 it will becompulsory for all courses in agriculture at universities in India to includemeteorology and agrometeorology in their curriculum. The ICAR has alsoagreed to establish departments of agrometeorology at all universities,within the next decade, and it is clear that the future for agrometeorologicalresearch in India is considerably brighter than it has been. Nevertheless,a problem remains that too few of those trained in the meteorological aspectsof agriculture actually get into the field or into state organizations.
State/Central Government Activities
31. It is considered that state organizations must have a much greaterappreciation of the value of weather information (at present only one stateemploys an agrometeorologist). The IMD has taken an active role in sellingmeteorology to the various state governments but the response from thesegovernments has not been very positive. At the same time a greater rolecould be played by the IMD in assessing and analyzing state agriculturalproblems, for at present the emphasis of the IMD is on national activitiessuch as aviation and public forecasting. A much greater liaison with stateagricultural and planning officials is therefore highly desirable. Thiswould probably require separate staff to appraise and analyze agriculturaland planning problems specific to the individual states, but it is consideredthat this would lead to a greater use of meteorological information in amanner which would result in a much greater appreciation of the variabilityof the climatic resources.
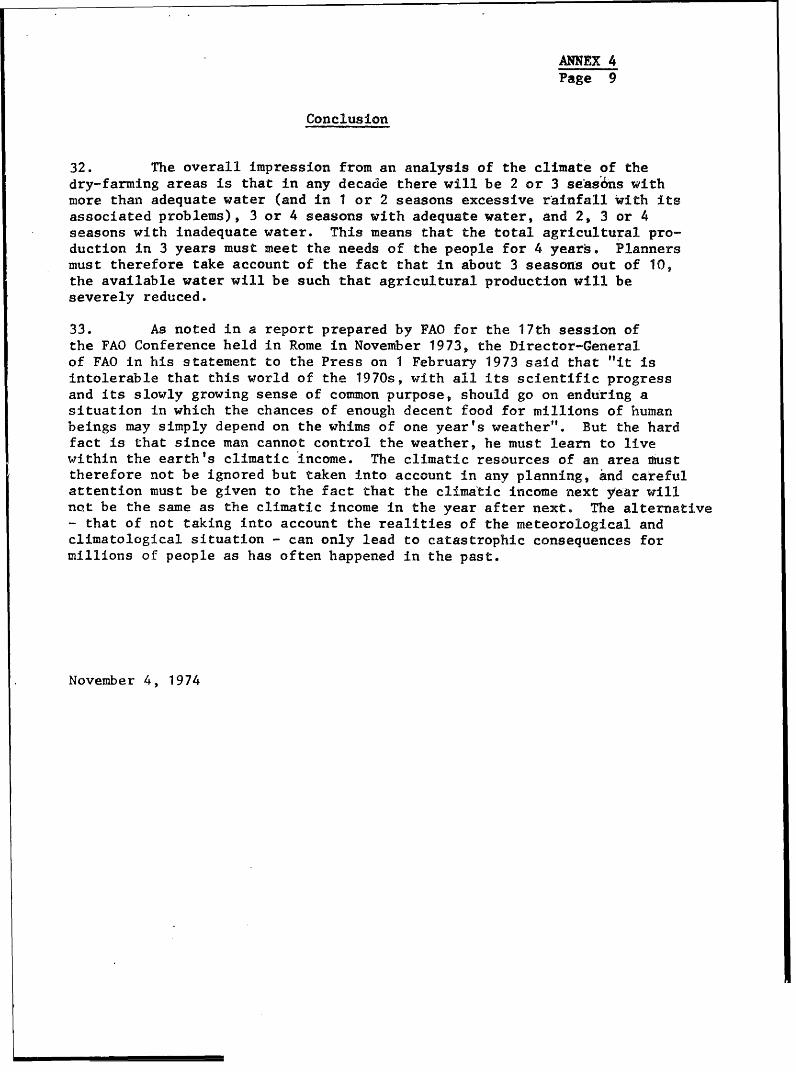
ANNEX 4Page 9
Conclusion
32. The overall impression from an analysis of the climate of thedry-farming areas is that in any decade there will be 2 or 3 seas6ns withmore than adequate water (and in 1 or 2 seasons excessive rainfall with itsassociated problems), 3 or 4 seasons with adequate water, and 2, 3 or 4seasons with inadequate water. This means that the total agricultural pro-duction in 3 years must meet the needs of the people for 4 years. Plannersmust therefore take account of the fact that in about 3 season1s out of 10,the available water will be such that agricultural production will beseverely reduced.
33. As noted in a report prepared by FAO for the 17th session ofthe FAO Conference held in Rome in November 1973, the Director-Generalof FAO in his statement to the Press on 1 February 1973 said that "it isintolerable that this world of the 1970s, with all its scientific progressand its slowly growing sense of common purpose, should go on enduring asituation in which the chances of enough decent food for millions of humanbeings may simply depend on the whims of one year's weather". But the hardfact is that since man cannot control the weather, he must learn to livewithin the earth's climatic income. The climatic resources of an area musttherefore not be ignored but taken into account in any planning, and catefulattention must be given to the fact that the climatic income next year willnot be the same as the climatic income in the year after next. The alternative- that of not taking into account the realities of the meteorological andclimatological situation - can only lead to catastrophic consequences formillions of people as has often happened in the past.
November 4, 1974
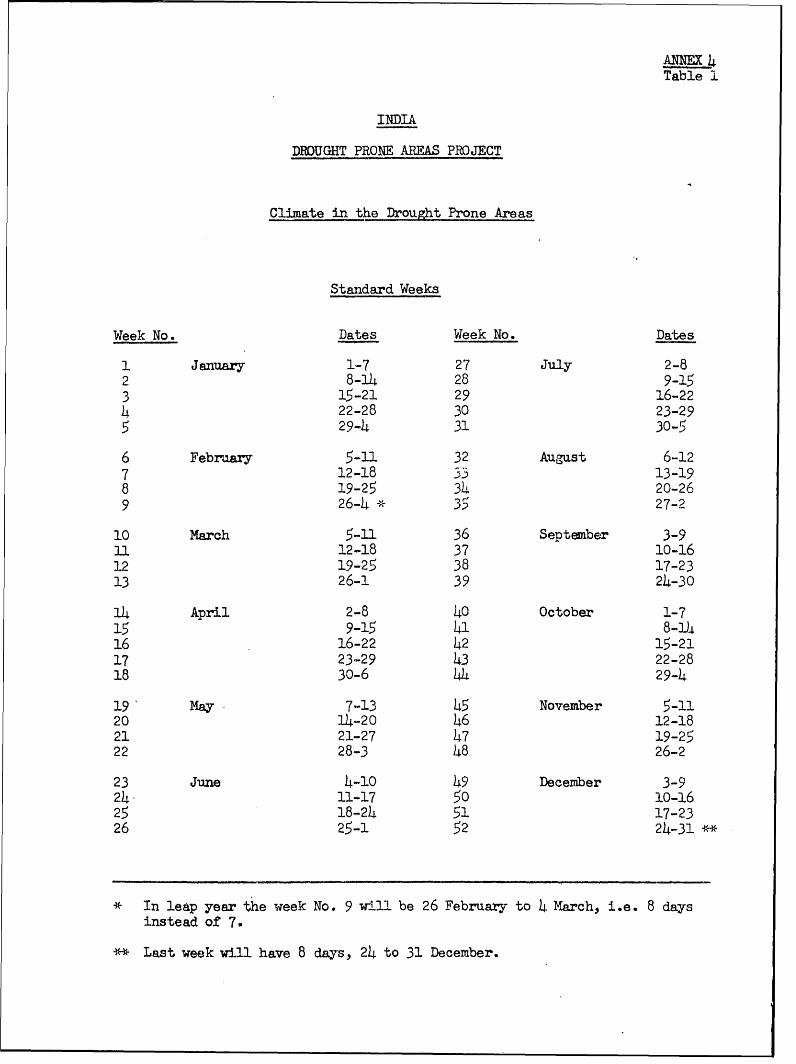
ANNEX 1iTable 1
INDIA
DRUGHIT PRONE AREAS PROJECT
Climate in the Drought Prone Areas
Standard Weeks
Week No. Dates Week No. Dates
1 January 1-7 27 July 2-82 8-14 28 9-153 15-21 29 16-22L 22-28 30 23-29
5 29-4 31 30-5
6 February 5-11 32 August 6-127 12-18 ,3 13-198 19-25 3L4 20-269 26-4 * 35 27-2
10 March 5-11 36 September 3-911 12-18 37 10-1612 19-25 38 17-2313 26-1 39 24-30
11 April 2-8 h0 October 1-7
15 9-15 41 8-1)416 16-22 42 15-2117 23-29 43 22-2818 30-6 14 29-h
19 May 7-13 45 November 5-1120 14-20 46 12-1821 21-27 47 19-2522 28-3 48 26-2
23 June 4-10 49 December 3-924 11-17 50 10-1625 18-24 51 17-2326 25-1 52 24-31
* In leap year the rweek No. 9 will be 26 February to 4 March, i.e. 8 daysinstead of 7.
*$ Last week will have 8 days, 24 to 31 December.
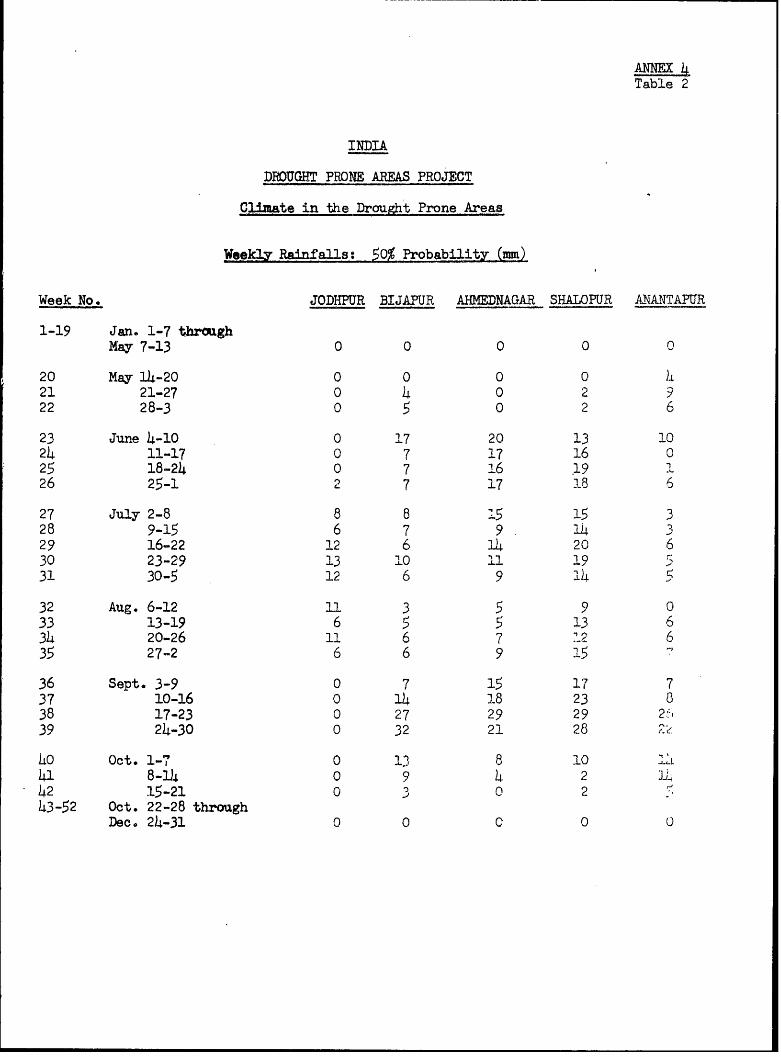
ANNFJX4Table 2
INDIA
DFtOUGHT PRONE AREAS PROJECT
Climate in the Drought Prone Areas
Weekly Rainf als: 5% _Probability (mm)
Week No. JODHPUR BIJAPUR AHMNAGAR SHAIOPUR ALNANTAPUR
1-19 Jan. 1-7 throughMaY 7-13 0 0 0 0 0
20 May 14-20 0 0 0 0 421 21-27 0 4 0 2 922 28-3 0 5 0 2 6
23 June 4-10 0 17 20 13 1024 11-17 0 7 17 16 025 18-24 0 7 16 .19 I26 25-1 2 7 17 18 6
27 July 2-8 8 8 '5 15 328 9-15 6 7 9 14 329 16-22 12 6 14 20 630 23-29 13 10 11 1931 30-5 12 6 9 14 I
32 Aug. 6-12 1. 3 5 9 033 13-19 6 5 5 13 634 20-26 11 6 7 7'2 635 27-2 6 6 9 15
36 Sept. 3-9 0 7 15 17 737 10-16 0 14 18 23 838 17-23 0 27 29 29 2!,39 24-30 0 32 21 28
1O0 Oct. 1-7 0 12 8 10 1-!41 8-14 0 9 4 2 Ji42 15-21 0 3 0 243-52 Oct. 22-28 through
Dec. 24-31 0 0 C 0 0
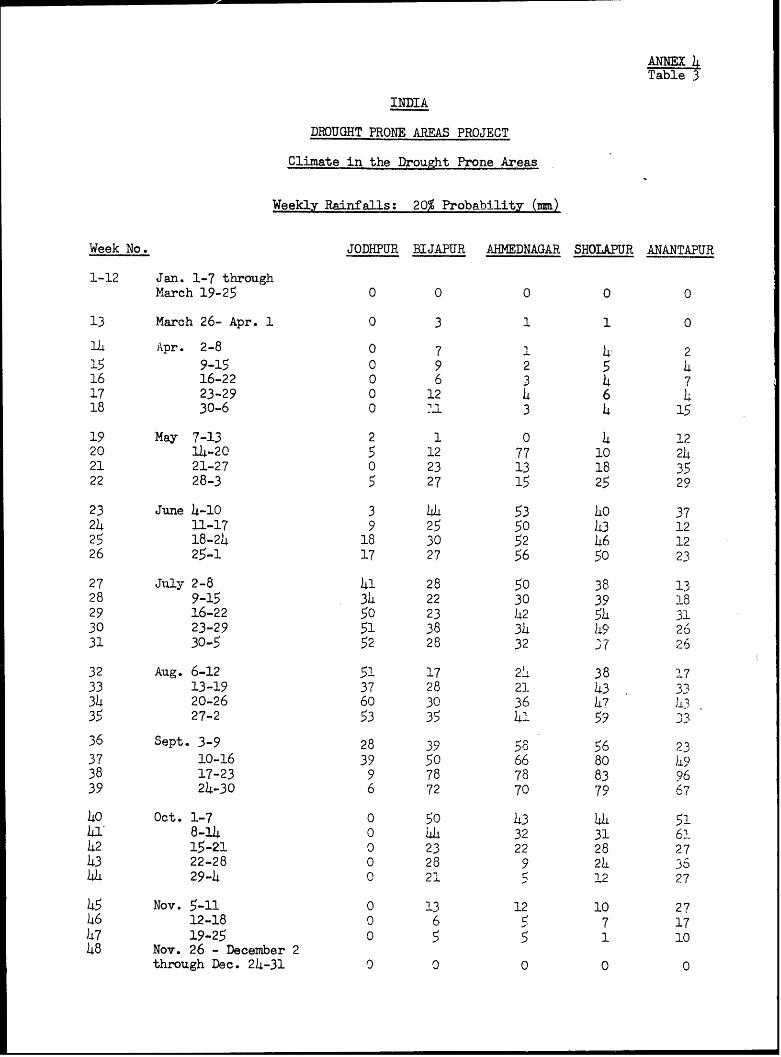
ANNEX LTable 3
INDIA
DROUGHT PRONE AREAS PROJECT
Climate in the Drought Prone Areas
Weekly Rainfalls: 20% Probability (mm)
Week No. JODHPUR BIJAPUR AHMEDNAGAR SHOLAPUR ANANTAPUR
1-12 Jan. 1-7 throughMarch 19-25 0 0 0 0 0
13 March 26- Apr. 1 0 3 1 1 0
IL Apr. 2-8 0 7 1 4, 215 9-15 0 9 2 5 h16 16-22 0 6 3 4 7'17 23-29 0 12 h 6 418 30-6 0 ' ' 3 4 15
19 May 7-13 2 1 0 4 1220 14-20 5 12 77 10 2421 21-27 0 23 13 18 3522 28-3 5 27 15 25 29
23 June 4-10 3 44 53 LO 3724 11-17 9 25 50 43 1225 18-24 18 30 52 46 1226 25-1 17 27 56 50 23
27 July 2-8 41 28 50 38 1328 9-15 3h 22 30 39 1829 16-22 50 23 42 5L 3130 23-29 51 38 34 49 2631 30-5 52 28 32 3D7 26
32 Aug. 6-12 51 17 2' 38 1733 13-19 37 28 21 43 3334 20-26 60 30 36 47 43.35 27-2 53 35 4h 59 33
36 Sept. 3-9 28 39 58 56 23
37 10-16 39 50 66 80 h938 17-23 9 78 78 83 9639 24-30 6 72 70 79 67
40 Oct. 1-7 0 50 43 4W 5141. 8-1l 0 44h 32 31 6.42 15-21 0 23 22 28 27h3 22-28 0 28 9 24 .34W 29-h 0 21 5 12 27
45 Nov . 5-11 0 13 12 10 2746 12-18 0 6 5 7 1747 19-25 0 5 5 1 10h8 Nov. 26 - December 2
through Dec. 24-31 0 0 0 0 0
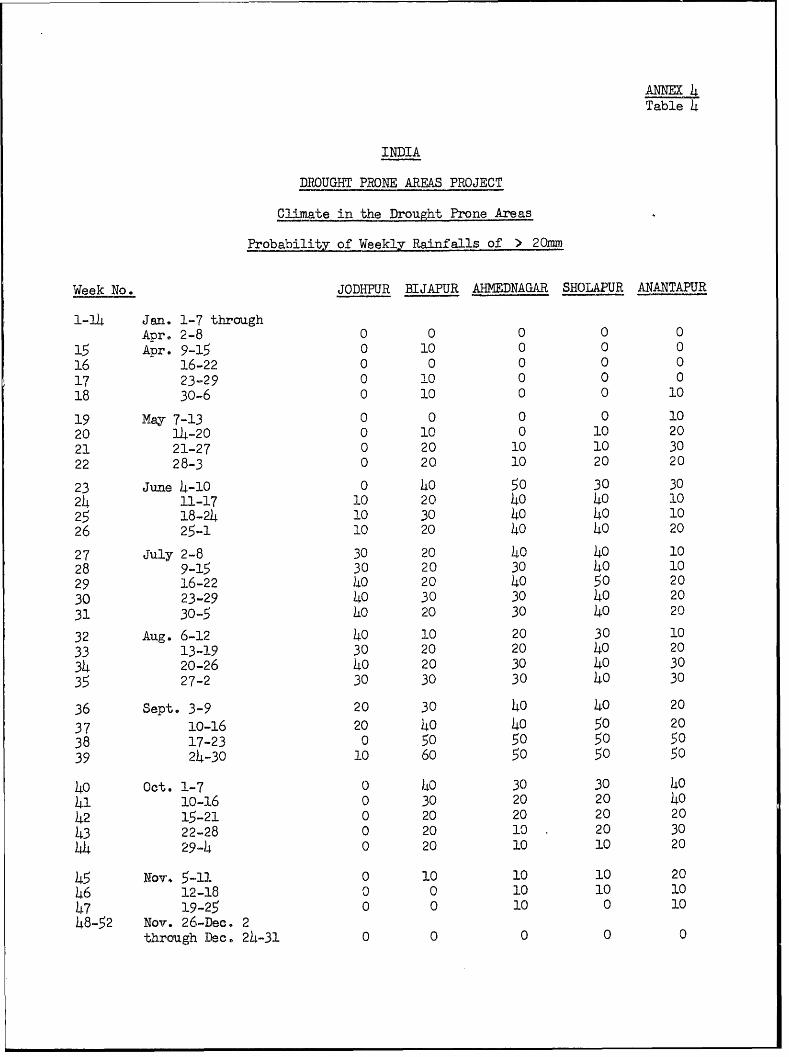
Table 4
INDIA
DROUGHT PRONE AREAS PROJECT
Climate in the Drought Prone Areas
Probability of Weekly Rainfalls of > 20mm
Week No. JODHPUR BIJAPUR AHMEDNAGAR SHOLAPUR ANANTAPUR
1-L4 Jan. 1-7 throughA-r. 2-8 0 0 0 0 0
15 Apr. 9-15 0 10 0 0 016 16-22 0 0 0 0 017 23-29 0 10 0 0 018 30-6 0 10 0 0 10
19 MaYr7-13 0 0 0 0 1020 14-20 0 10 0 10 2021 21-27 0 20 10 10 3022 28-3 0 20 10 20 20
23 June 4-10 0 40 50 30 3024 11-17 10 20 40~. 40 1025 18-24 10 30 40 40 1026 25-1 10 20 40 40 20
27 July 2-8 30 20 40 40 1028 9-15 30 20 30 40 1029 16-22 40 20 40 50 2030 23-29 40 30 30 40 2031 30-5 hO 20 30 40 20
32 Aug. 6-12 40 10 20 30 1033 13-19 30 20 20 40 2034 20-26 40 20 30 40 3035 27-2 30 30 30 40 30
36 Sept. 3-9 20 30 40 40 20
37 10-16 20 40 40 50 2038 17-23 0 50 50 50 5039 24-30 10 60 50 50 50
40 Oct. 1-7 0 40 30 30 4041 10-16 0 30 20 20 4042 15-21 0 20 20 20 2043 22-28 0 20 10 20 3044 29-4 0 20 10 10 20
45 Nowv 5-11 0 10 10 10 2046 12-18 0 0 10 10 1047 19-25 0 0 10 0 1048-52 Nov. 26-Dec. 2
through Dec. 24-31 0 0 0 0 0
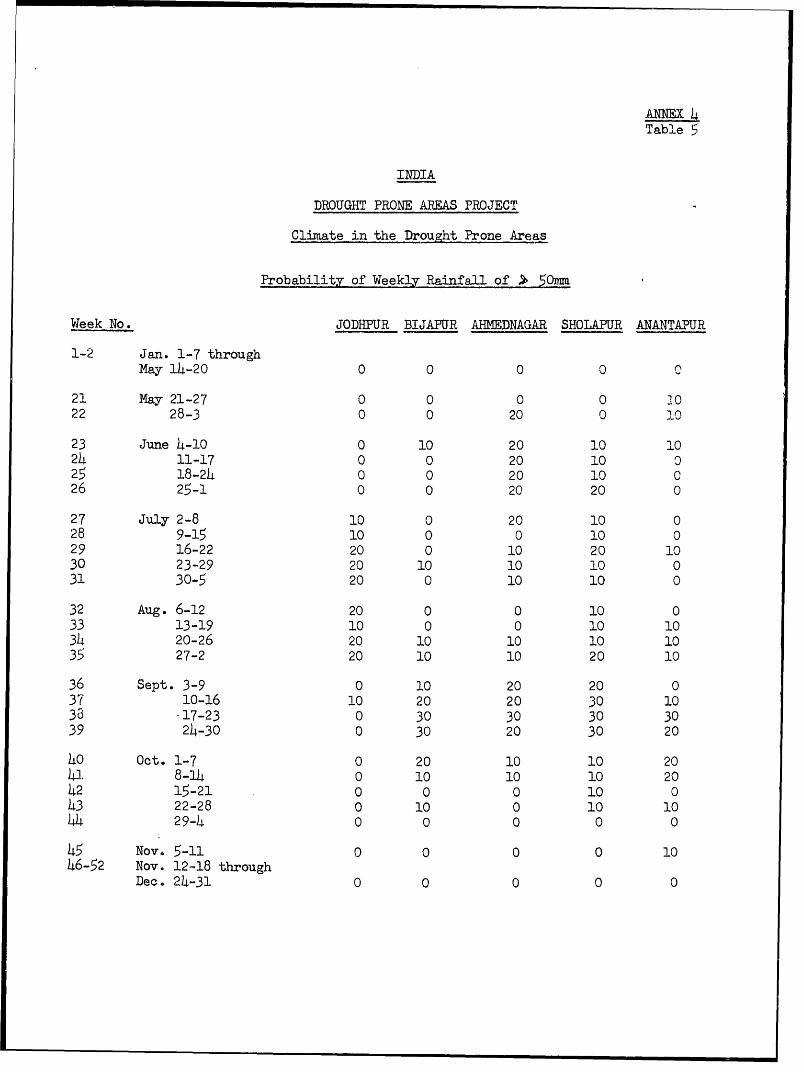
ANNEXTable 5
INDIA
DROUGHT PRONE AREAS PROJECT
Climate in the Drought Prone Areas
Probability of Weekly Rainfall of $ 50mm
Week No. JODHPUR BIJAPUR AHMEDNAGAR SHOLAPUR ANANTAPUR
1-2 Jan. 1-7 throughMayl4-20 0 0 0 0 0
21 May21-27 0 0 0 0 10
22 28-3 0 0 20 0 10)
23 June 4-10 0 10 20 10 10
24 11-17 0 0 20 10 0
25 18-24 0 0 20 10 C
26 25-1 0 0 20 20 0
27 July 2-8 10 0 20 10 0
28 9-15 10 0 0 10 0
29 16-22 20 0 10 20 10
30 23-29 20 10 10 10 0
31 30-5 20 0 10 10 0
32 Aug. 6-12 20 0 0 10 0
33 13-19 10 0 0 10 10
34 20-26 20 10 10 10 10
35 27-2 20 10 10 20 10
36 Sept. 3-9 0 10 20 20 0
37 10-16 10 20 20 30 10
38 *17-23 0 30 30 30 30
39 24-30 0 30 20 30 20
40 Oct. 1-7 0 20 10 10 20
41 8-14 0 10 10 10 20
42 15-21 0 0 0 10 0
43 22-28 0 10 0 10 10
44 29-4 0 0 0 0 0
45 Nov e5-11 0 0 0 0 10
46-52 Nov. 12-18 throughDec. 24-31 0 0 0 0 0
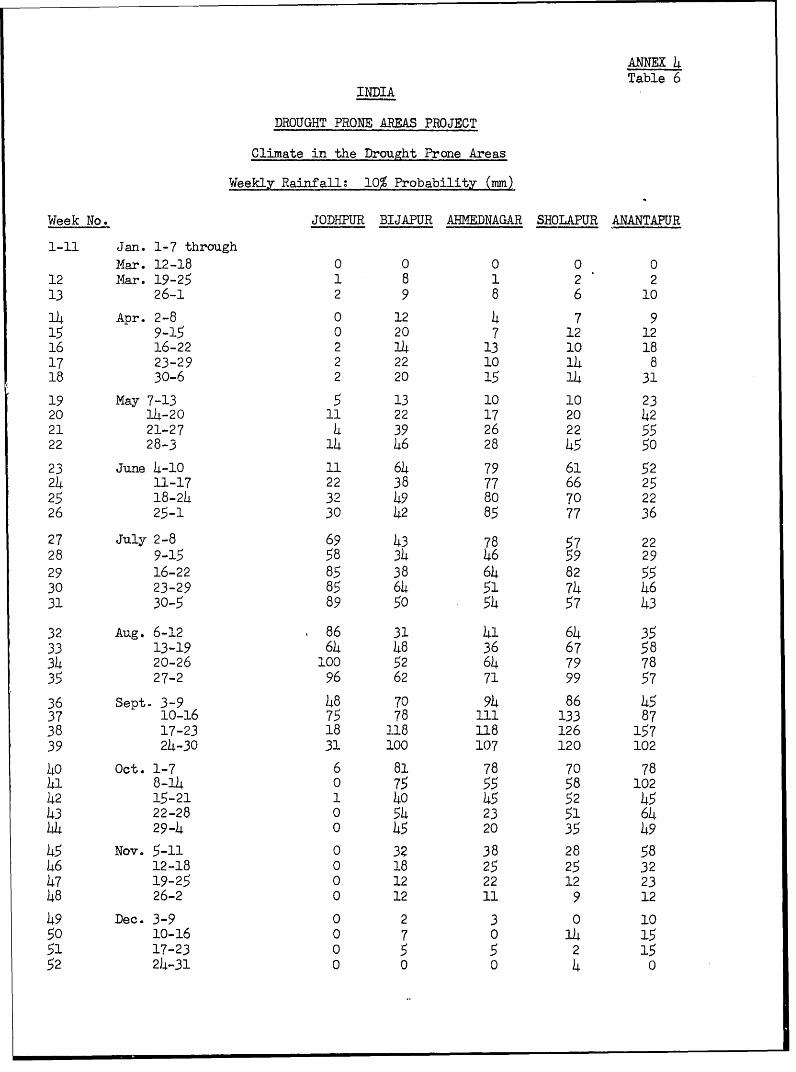
ANNEX 4Table 6
INDIA
DROUGHT PRONE AREAS PROJECT
Climate in the Drought Prone Areas
Weekly Rainfall: 10% Probability (mm)
Week No. JODHPUR BIJAPUR AHMEDNAGAR SHOLAPUR ANANTAPUR1-11 Jan. 1-7 through
Mar. 12-18 0 0 0 0 012 Mar. 19-25 1 8 1 2 213 26-1 2 9 8 6 1014 Apr. 2-8 0 12 4 7 915 9-15 0 20 7 12 1216 16-22 2 14 13 10 1817 23-29 2 22 10 1h 818 30-6 2 20 15 14 3119 May 7-13 5 13 10 10 2320 14-20 11 22 17 20 4221 21-27 4 39 26 22 5522 28-3 14 46 28 45 5023 June 4-10 11 64 79 61 5224 11-17 22 38 77 66 2525 18-24 32 49 80 70 2226 25-1 30 42 85 77 3627 July 2-8 69 43 78 57 2228 9-15 58 34 46 59 2929 16-22 85 38 64 82 5530 23-29 85 64 51 74 4631 30-5 89 50 54 57 43
32 Aug. 6-12 86 31 41 64 3533 13-19 64 48 36 67 5834 20-26 100 52 64 79 7835 27-2 96 62 71 99 5736 Sept- 3-9 48 70 94 86 4537 10-16 75 78 111 133 8738 17-23 18 118 118 126 15739 24-30 31 100 107 120 10240 Oct. 1-7 6 81 78 70 7841 8-14 0 75 55 58 10242 15-21 1 40 45 52 4543 22-28 0 54 23 51 6444 29-4 0 45 20 35 4945 Nov. 5-11 0 32 38 28 5846 12-18 0 18 25 25 3247 19-25 0 12 22 12 2348 26-2 0 12 11 9 1249 Dec. 3-9 0 2 3 0 1050 10-16 0 7 0 14 1551 17-23 0 5 5 2 1552 24-31 0 0 0 4 0
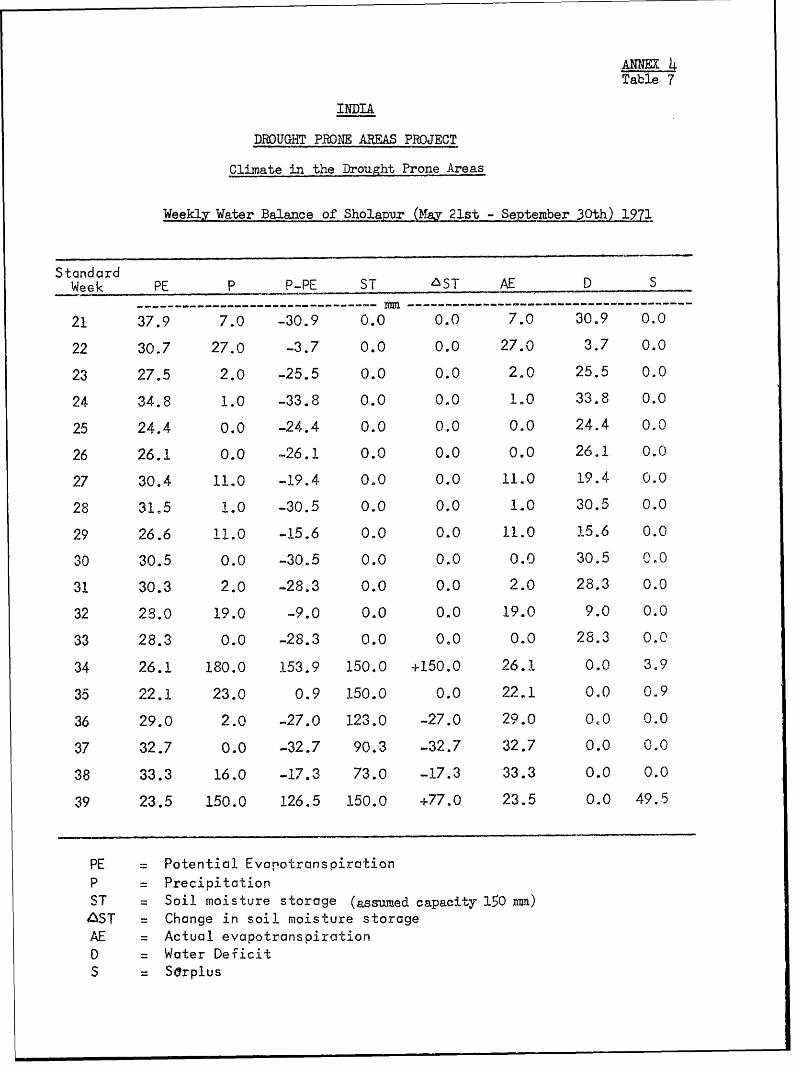
INDIA
DROUGHT PRONE ARE PROJECT
Climate in the Drought Prone Areas
Weekly Water Balance of' Sholapur (May 21st - September 30th)--1971
StandardWeek PE P P-PE ST 65T AE D S
-------------------------------- mm------------------------------------21 37.9 7.0 -30.9 0.0 0.0 7.0 30.9 0.022 30.7 27.0 -3.7 0.0 0.0 27.0 3.7 0.023 27.5 2.0 -25.5 0.0 0.0 2.0 25,5 0.024 34.8 1.0 -33.8 0.0 0.0 1.0 33.8 0.025 24.4 0.0 -24.4 0.0 0.0 0.0 24.4 0.026 26.1 0.0 -26.1 0.0 0.0 0t0 26.1 0.027 30.4 11.0 -19.4 0,0 0.0 11.0 19.4 0.028 31.5 L.O -30.5 0.0 0.0 1.0 30.5 0.029 26.6 11.0 -15.6 0,0 0,0 11.0 15.6 0.030 30.5 0.0 -30.5 0.0 0,0 0.0 30,5 0,031 30.3 2.0 -28.3 0.0 0.0 2.0 28.3 0.032 29.0 19.0 -9.0 0.0 0,0 19.0 9.0 0.033 28.3 0.0 -28.3 0.0 0,0 0.0 28,3 0.034 26.1 180.0 153.9 150.0 +150.0 26.1 0,0 3,935 22.1 23.0 0.9 150.0 0.0 22.1 0,0 0,9
36 29.0 2.0 -27.0 123.0 -27.0 29.0 O00 0.037 32.7 0.0 -32.7 90.3 -32.7 32.7 0.0 0,0
38 33.3 16.0 -17.3 73.0 -17.3 33.3 0.0 0.039 23.5 150.0 126.5 150.0 +77.0 23.5 0.0 49.5
PE = Potential EvarotranspirationP = PrecioitationST = Soil moisture storage (assumed capacity 150 nma)4ST = Change in soil moisture storageAE = Actual evapotranspirationD = Water DeficitS = Serplus
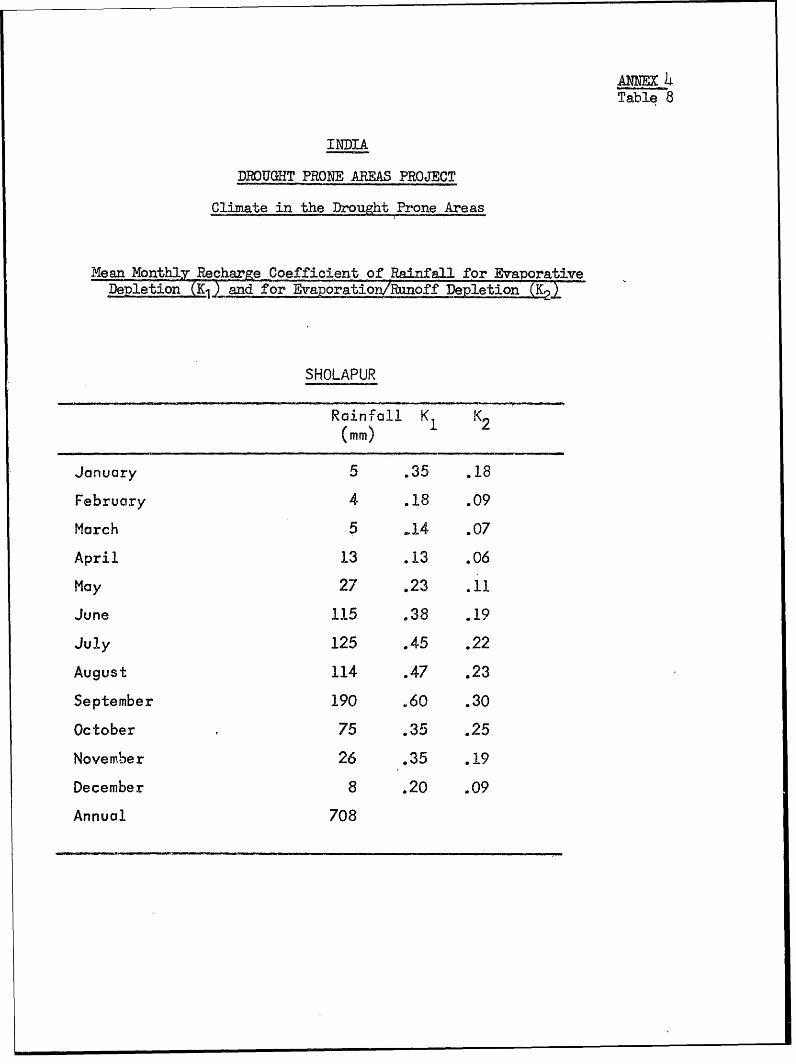
ANEX 4Table 8
INDIA
DROUGHT PRONE AREAS PROJECT
Climate in the -ought Prone Areas
Mean Monthly Recharge Coefficient of Rainfall for EvaporativeDepletion and for Evaoration/Runoff Depletion (K.)
SHOLAPUR
Rainf'all K K2(mm)
January 5 .35 .18
February 4 .18 .09
March 5 .14 o07
April 13 .13 .06
May 27 .23 .11
June 115 .38 .19
July 125 .45 .22August 114 .47 .23
September 190 .60 .30
October 75 .35 .25November 26 .35 .19
December 8 ,20 .09
Annual 708
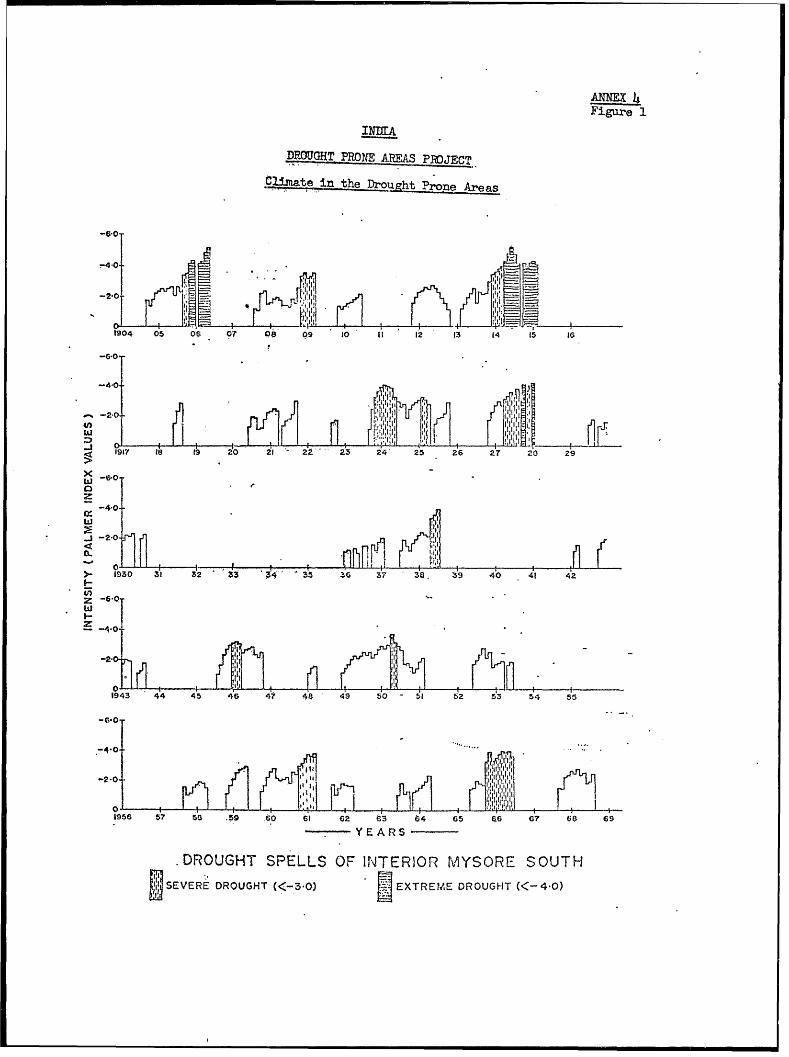
Figure 1INliA
DRO0UGHRT PRONE J?AP)JECT
jthe aog -ht Proe . Areas
-60. -
!-40--
"" ___ __ __
1904 05 06 07 08 09 10 II 12 13 14 15 I6
-40
97 l18 19 20 2- 23 24 25 26 27 20 29
z
T
Z <o3 .
-4-0
1943 44 45 46 4i 48 49 50 - 5I2 53 54 so
1956 57 50 .59 34 5 Gl 32 63 34 65 40 64 61 69
Y YE A R
.DROUGHT SPELLS OF IN4TERIOR MYSORE SOUTH
gSEVERE DROUGHT (<-3-0) EXTREMdE DROUGFIT (,<-4 0)
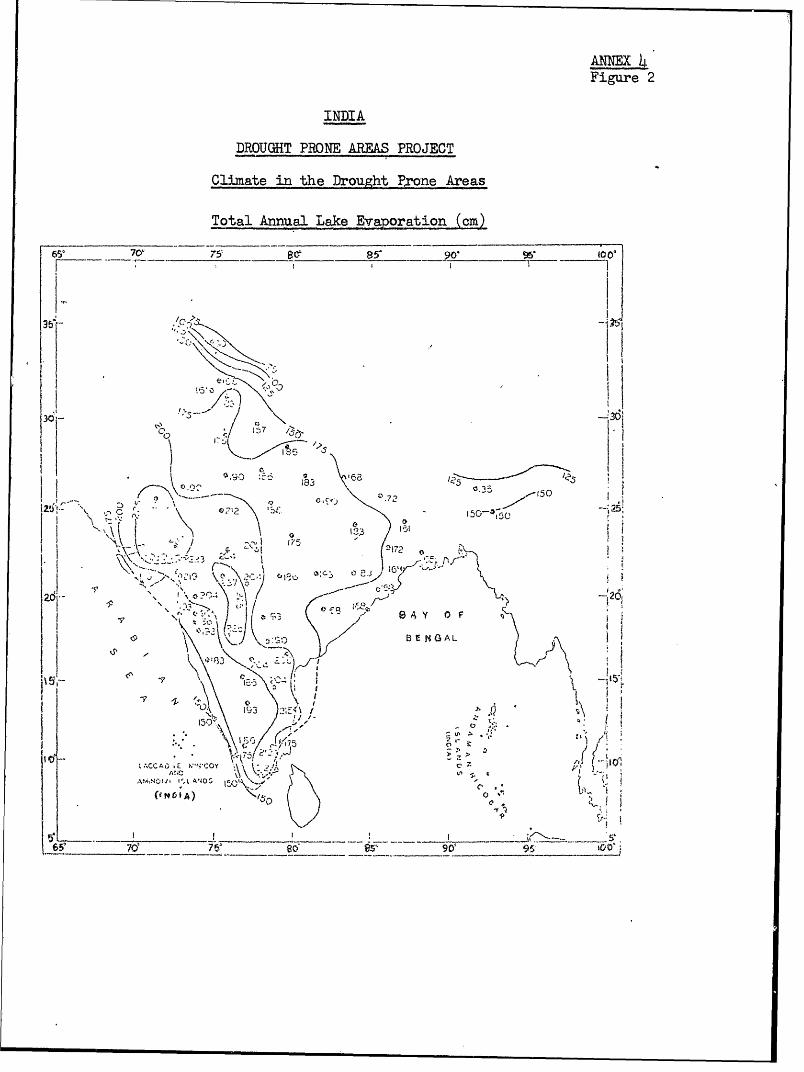
Figure 2
INDIA
DROUGHT PRONE AREAS PROJECT
Climate in the Drought P~rone Areas
Total Annual Lake Evaporation -(cm)
61-70' 75 85' ? ___ L00'
Ic, I
/ 10
~782
~~I 0
.17
T) 6=
r- tI-- .--,
3 aC~ X s
;
| i X~~~~l C ~ t c~2
t A) X O67
6 f ____ 7 __ _ _ X
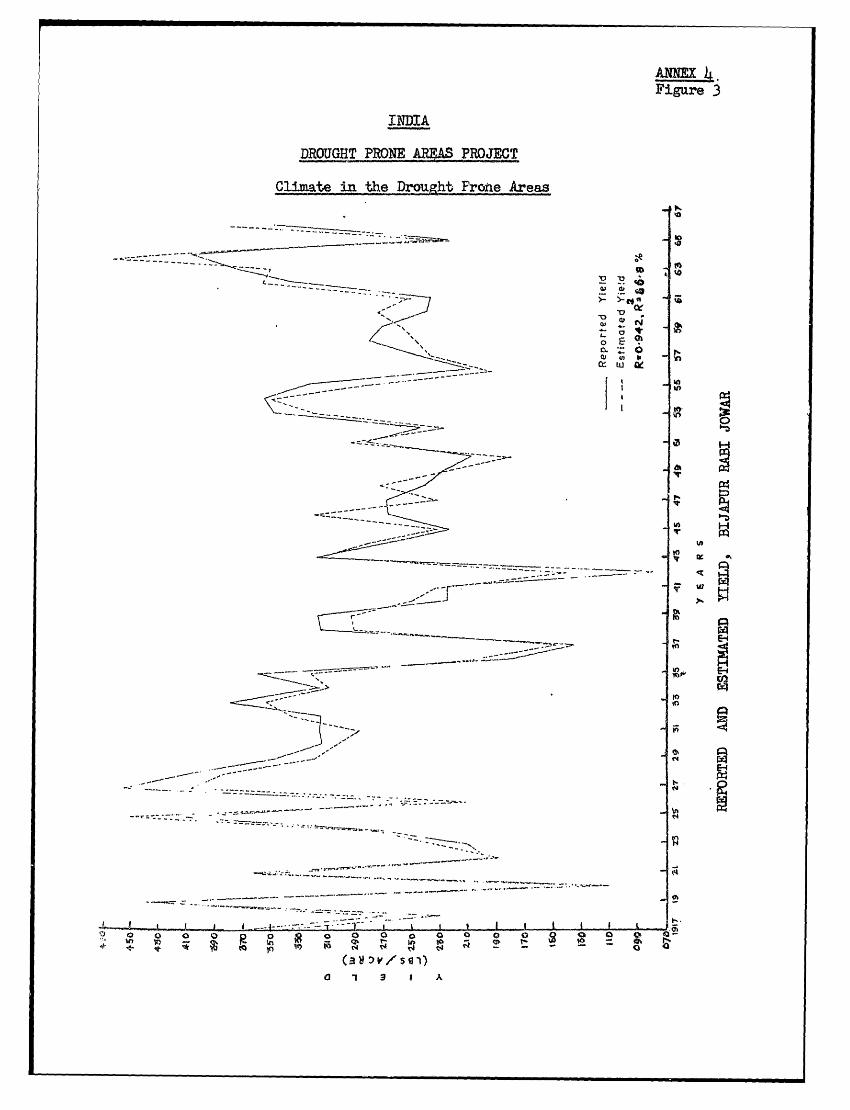
Figare 3
INDIA
DROUGHT PRONE AREA PROJECT
Climate in the Drought Frofte Areas
'0
W.
T:==:w a, ^
cc u
c-- - - - -- - -
.- t==-* X I
_< C-H£~~ ^ H
s-- H
m~- . If
71- -- -
a i ## AP
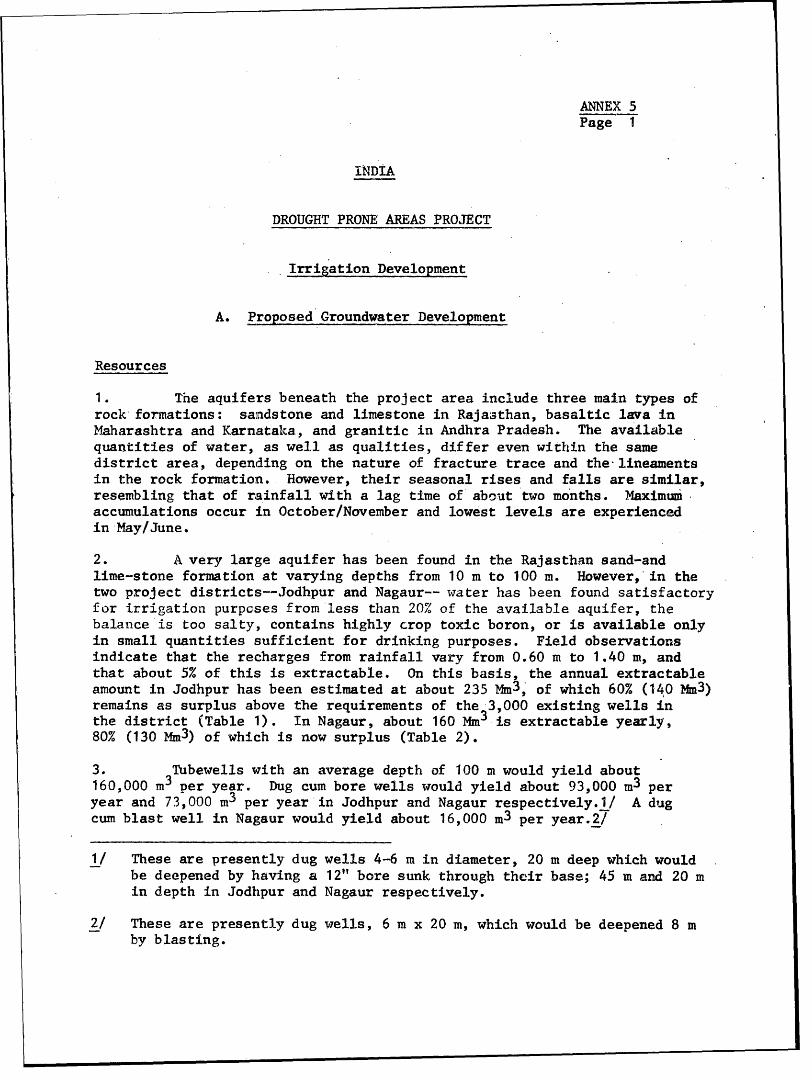
ANNEX 5Page 1
INDIA
DROUGHT PRONE AREAS PROJECT
Irrigation Development
A. Proposed Groundwater Development
Resources
1. The aquifers beneath the project area include three main types ofrock formations: sandstone and limestone in Rajasthan, basaltic lava inMaharashtra and Karnataka, and granitic in Andhra Pradesh. The availablequantities of water, as well as qualities, differ even within the samedistrict area, depending on the nature of fracture trace and the-lineamentsin the rock formation. However, their seasonal rises and falls are similar,resembling that of rainfall with a lag time of' about two months. Maximunaccumulations occur in October/November and lowest levels are experiencedin May/June.
2. A very large aquifer has been found in the Rajasthan sand-andlime-stone formation at varying depths from 10 m to 100 m. However, in thetwo project districts--Jodhpur and Nagaur-- water has been found satisfactoryfor irrigation purposes from less than 20% of the available aquifer, thebalance is too salty, contains highly crop toxic boron, or is available onlyin small quantities sufficient for drinking purposes. Field observationsindicate that the recharges from rainfall vary from 0.60 m to 1.40 m, andthat about 5% of this is extractable. On this basis, the annual extractableamount in Jodhpur has been estimated at about 235 Mm3, of which 60% (140 Mm3)remains as surplus above the requirements of the 3,000 existing wells inthe district (Table 1). In Nagaur, about 160 Mm3 is extractable yearly,80% (130 Mm3) of which is now surplus (Table 2).
3. Tubewells with an average depth of 100 m would yield about160,000 m3 per year. Dug cum bore wells would yield about 93,000 m3 peryear and 73,000 m3 per year in Jodhpur and Nagaur respectively.1/ A dugcum blast well in Nagaur would yield about 16,000 m3 per year.2/
1/ These are presently dug wells 4-6 m in diameter, 20 m deep which wouldbe deepened by having a 12" bore sunk through their base; 45 m and 20 min depth in Jodhpur and Nagaur respectively.
2/ These are presently dug wells, 6 m x 20 m, which would be deepened 8 mby blasting.
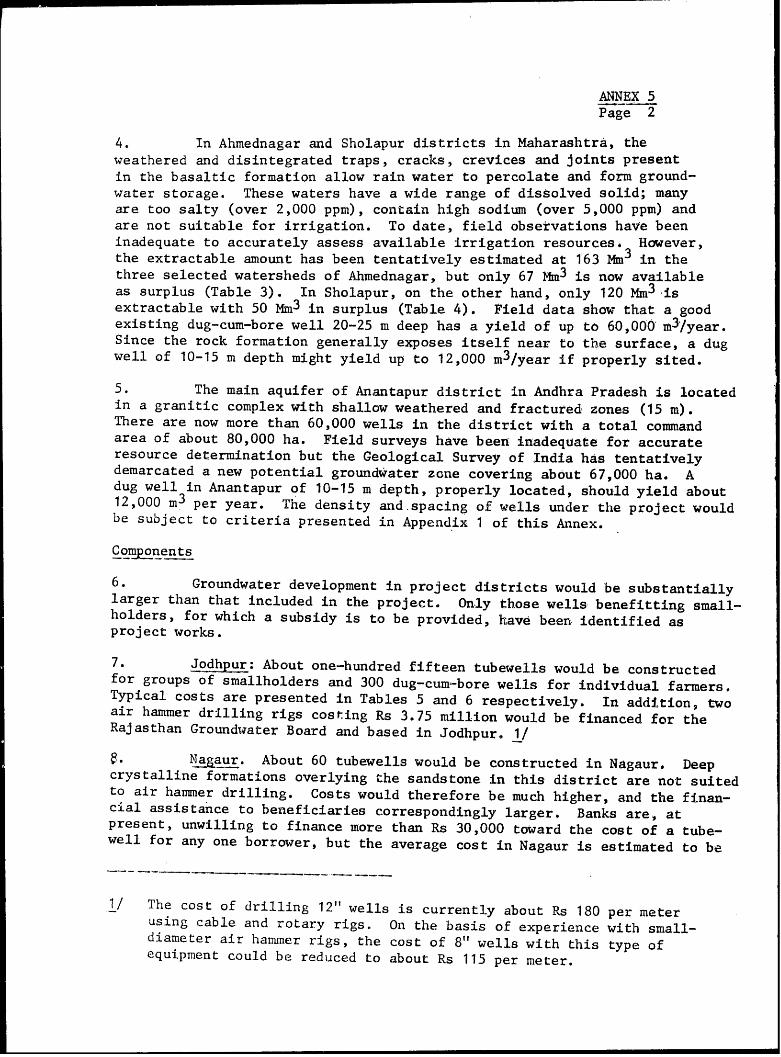
ANNEX 5Page 2
4. In Ahmednagar and Sholapur districts in Maharashtra, theweathered and disintegrated traps, cracks, crevices and joints presentin the basaltic formation allow rain water to percolate and form ground-water storage. These waters have a wide range of dissolved solid; manyare too salty (over 2,000 ppm), contain high sodium (over 5,000 ppm) andare not suitable for irrigation. To date, field observations have beeninadequate to accurately assess available irrigation resources. However,the extractable amount has been tentatively estimated at 163 Mm3 in thethree selected watersheds of Ahmednagar, but only 67 Mm3 is now availableas surplus (Table 3). In Sholapur, on the other hand, only 120 Mm3 isextractable with 50 Mm3 in surplus (Table 4). Field data show that a goodexisting dug-cum-bore well 20-25 m deep has a yield of up to 60,000 m3/year.Since the rock formation generally exposes itself near to the surface, a dugwell of 10-15 m depth might yield up to 12,000 m3 /year if properly sited.
5. The main aquifer of Anantapur district in Andhra Pradesh is locatedin a granitic complex with shallow weathered and fractured zones (15 m).There are now more than 60,000 wells in the district with a total commandarea of about 80,000 ha. Field surveys have been inadequate for accurateresource determination but the Geological Survey of India has tentativelydemarcated a new potential groundwater zone covering about 67,000 ha. Adug well in Anantapur of 10-15 m depth, properly located, should yield about12,000 m3 per year. The density and.spacing of wells under the project wouldbe subject to criteria presented in Appendix 1 of this Annex.Comyonents
6. Groundwater development in project districts would be substantiallylarger than that included in the project. Only those wells benefitting small-holders, for which a subsidy is to be provided, have been identified asproject works.
7. Jodhpur: About one-hundred fifteen tubewells would be constructedfor groups of smallholders and 300 dug-cum-bore wells for individual farmers.Typical costs are presented in Tables 5 and 6 respectively. In addition, twoair hammer drilling rigs costing Rs 3.75 million would be financed for theRajasthan Groundwater Board and based in Jodhpur. 1/
l. bLagaur. About 60 tubewells would be constructed in Nagaur. Deepcrystalline formations overlying the sandstone in this district are not suitedto air hammer drilling. Costs would therefore be much higher, and the finan-cial assistance to beneficiaries correspondingly larger. Banks are, atpresent, unwilling to finance more than Rs 30,000 toward the cost of a tube-well for any one borrower, but the average cost in Nagaur is estimated to be
1/ The cost of drilling 12" wells is currently about Rs 180 per meterusing cable and rotary rigs. On the basis of experience with small-diameter air hammer rigs, the cost of 8" wells with this type ofequipment could be reduced to about Rs 115 per meter.
ANNEX 5Page 3
Rs 45,000 per well. In other states, such installations are.generallyoperated as state tubewells, and watei charges are not sufficient tomeet investment and operating costs. The mission supports privatesector ownership facilitated by the proposed subsidy. One-hundredtwenty-five dug-cum-bore wells and 175 dug-cum-blast wells would alsobe provided under the project. All beneficiaries would be groups ofsmallholders. Typical construction costs appear in Tables 5 to 7.
9. Ahmednaqar: About 265 dug wells would be deepened and providedwith pumpsets. Blasting rather than boring would be used to provide over-night storage capacity in the well, necessary because of slow percolationrates. About 265 pump installations would also be financed. Typical con-struction costs appear in Tables 7 and 8.
10. Sholapur: About 220 dug-cum-blast wells and about 480 new dugwells would be constructed in this district. Typical construction costsappear in Tables 7 and 9.
11. Anantapur: About 375 dug wells would be constructed on small-holdings in Anantapur. Construction costs are presented in Table 9.
B. Pr ed Surface Irrigation Development
Resources
12. There is very limited scope for new medium and major surfaceirrigation schemes in the poject area. A number of works have now beencompleted or are under construction however, and there is a need forcommand area development in these schemes.. The mission recommends thatauthorities give priority to the preparation of such programs, for whichdistrict core funds under the project could be used.
Gopmpnents
13. Designs and specifications have not been finalized for all projecttanks, but locations have tentatively been selected for the following works:Ahmednagar, 4 tanks with a command area of 900 ha; Sholapur, 9 tanks, 2,5000ha; Biiapur, 12 tanks, 5,000 ha; and Anantapur, 4 tanks; 570 ha. The commandarea of A11 tanks would be developed at the same time as tank construction;specifically, land levelling, channel siting and construction, channel liningas required, and drainage would be undertaken (para 21), Development costsof a imodel tank are presented in Table 10.
ANNEX 5Page 4
C. Project Implementation
Financial Assistance
14. Groundwater development under the project would be limited tosmallholders for whom a subsidy would be paid by the District DevelopmentAuthority., In-most cases this would be 25%, although marginal farmers--those with one ha or less of irrigated land--would receive a 33-1/3% subsidy.
Executing Agencies
15. Groundwater development in Rajasthan,would be carried.out by theRajasthan Groundwater Board which would be reimbursed the financed portionof expenditures upon completion of installations. In other states, ground-water works would generally be carried out by private contractor.s, underthe supervision of the state irrigation department. Subsidies w6uld be paidby the DDA to the financing institution upon completion of works', therebyreducing,the beneficiaries debt balance. Tank construction woultd be carriedout by state public works departments under technical supervisioti of stateirrigation departments. Cosmmand area development for tanks would be doneby public worlks departments, state agro-industries corporations br privatecontractors., under the supervision of irrigation and agriculture departments.In the case of tubewells, command area development would be carried out bythe Rajasthan Groundwater Board in consultation with the Department ofAZ.;riculture.
Technical Norms
16. Groundwater development tn Maharashtra, Karnataka and Andhra Pradeshinvolves a range of investments similar to those financed under current IDAAgricultural Credit Projects in those states. Under the proposed project,governments would extend financial assistance only for works which Complywith technical norms specified under respective credit projects. In thecase of Jodhpur and Nagaur, project works would be subject to the norms andspecifications of the Rajasthan Groundwater Board. The construction of tankswould be subject to state irrigation department norms, as would land ievell-ing and channel installation.
Investment Norms
17. As a guid:e in the selection of viable irrigation development, aseries of'investment norms are presented in Table 11 (1973 prices), for therange of irrigation works to be constructed under the project. In exceptionalcases where these norms are to be exceeded, state DPAP units should undertakea cost/benefit evaluation to confirm the viability of the specific proposal.Pstii>nted operating costs, for use in financial and economic analyses, aregiven in Table 12.
ANNEX 5Page 5
Resource Surveys
18. To protect against over-exploitation, semi-detailed groundwatc'rsurveys would be undertaken and maintained in each project district for theduration of the project. Surface irrigation potential would be verified foreach watershed in which tanks are proposed by the collection of stream flowand rainfall data for not less than one year prior to construction. Thisdata would be used to "ground proof" hypothetical derivations.
19. In the absence of groundwater legislation to protect both theresource and those who use it, the mission endorses the position to be takenunder the ARC project now being appraised; that is, that the country bedivided into zones on the basis of the intensity of groundwater exploitation,and that no further investment be financed in areas where current extractionexceeds safe proportions of known recharge. Investments under DPAP wouldbe subject to these conditions.
Command Area Development
20. The small command area of a dug well is typically the leastdifficult to develop and farmers themselves, using family labor and carefulploughin practices, can develop a fairly efficient plot over a period ofyears. Large tubewells represent a substantial private capital expenditure,and the added burden of simultaneous command area development could amount toa prohibitive outlay. However, tubewells under the proposed project wouldbe sold to groups of smallholders who would receive a 25% subsidy. CADwould also be undertaken on these wells or a similar number of other small-holder wells at the subsidized rate. Tstimated costs of CAD appear inThhle 13.
21. The greatest impact of command area development is to be realizedin the case of tank schemes. Ideally, land holdings would be consolidatedand reshaped during land levelling, but the mission recognizes tlv legaland political difficulties in such an undertaking. However, substantialdevelopment can take place without the adjustment of property boundaries,and the value of ra!)id development is such that simultaneous CAD would bea condition of IDA disbursement against the cost of tank construction.Specifically, a master plan would be prepared for each tank scheme, pre-senting technical.design and phasing for both the tank and command areaworks, and a scheme would be presented to a credit institution, and approvedby it, for the financing of on-farm works. Upon approval of these, con-struction of the tank could begin, but IDA woul/d not disburse againsteligible costs without certification that land levelling had begun inaccordance with the approved design and financing plans.
Benefits
22. To ensure the broadest possible distribution of berefits under theprojc~ct, irrigation would be developed in accordance with the followingcriteria
ANNEX 5Page 6
(a) cropping patterns in tank command areas would exclude
crops with high intensity irrigation requirements.Legislation to this end exists and should be enforced;
(b) only one well, or improvements thereto, would be developed
in the properties of one land owner; and
(c) land holdings in tank command areas would be brought into
compliance with land ceiling legislation within 18 months
of construction starting.
Farm models have been developed for each of the proposed types of investment
using cropping patterns based on crops with low intensity irrigation require-
ments.(Annex 16). These showv that all are financially and economically viable.
Project Costs
23. Table 14 presents a summary of the physical works to be undertaken
and their costs, which total Rs 85 million.
November 4, 1974
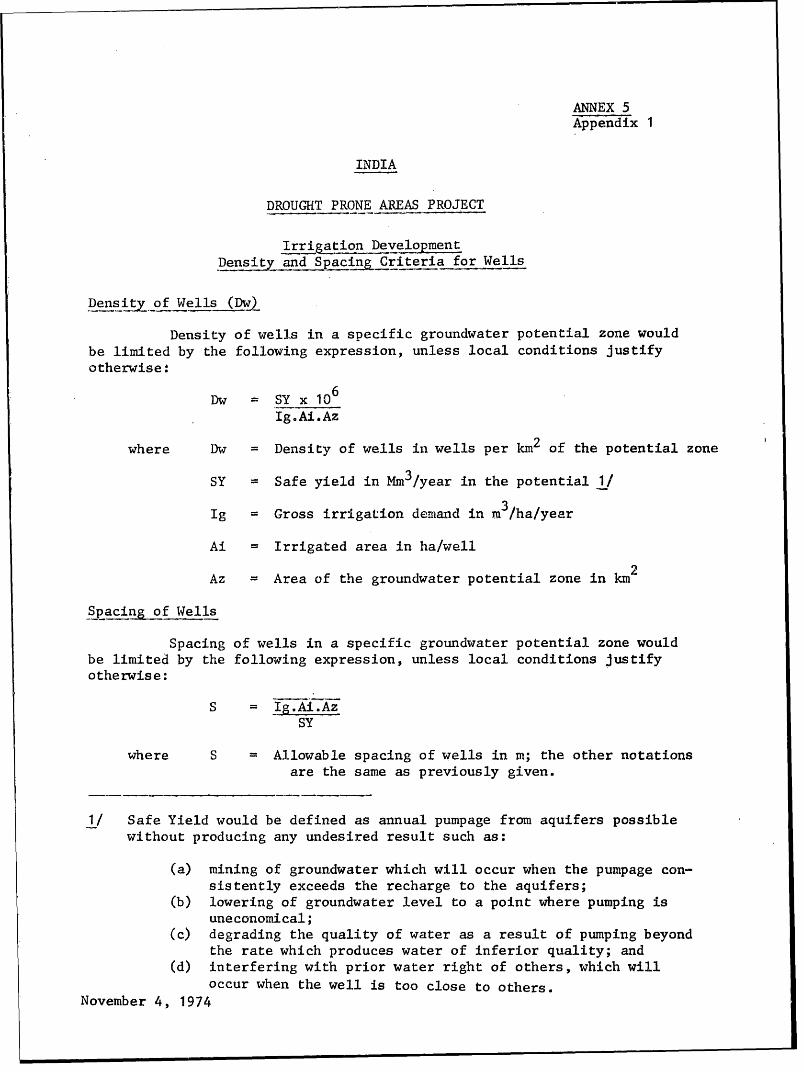
ANNEX 5Appendix 1
INDIA
DROUGHT PRONE AREAS PROJECT
Irrigation DevelopmentDensity and Spacing Criteria for Wells
Density of Wells (Dw)
Density of wells in a specific groundwater potential zone wouldbe limited by the following expression, unless local conditions justifyotherwise:
Dw = SY x 106
Ig.Ai.Az
where Dw = Density of wells in wells per km2 of the potential zone
SY = Safe yield in Mm3/year in the potential 1/
Ig = Gross irrigation demand in mr3/ha/year
Ai = Irrigated area in ha/well
Az = Area of the groundwater potential zone in km2
Syacin of Wells
Spacing of wells in a specific groundwater potential zone wouldbe limited by the following expression, unless local conditions justifyotherwise:
S = I,AizSY
where S = Allowable spacing of wells in m; the other notationsare the same as previously given.
1/ Safe Yield would be defined as annual pumpage from aquifers possiblewithout producing any undesired result such as:
(a) mining of groundwater which will occur when the pumpage con-sistently exceeds the recharge to the aquifers;
(b) lowering of groundwater level to a point where pumping isuneconomical;
(c) degrading the quality of water as a result of pumping beyondthe rate which produces water of inferior quality; and(d) interfering with prior water right of others, which willoccur when the well is too close to others.
November 4, 1974
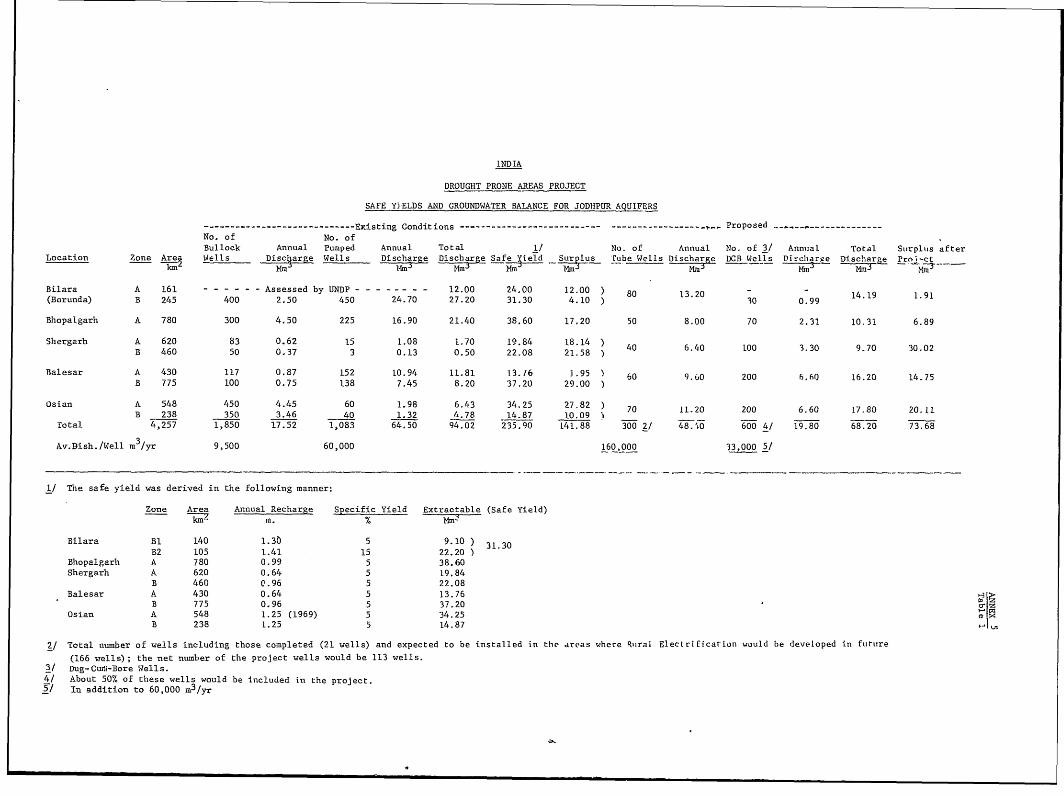
INDIA
DROUGHT PRONE AREAS PROJECT
SAFE Y)ELDS AND GROUNDWATER BALANCE FOR JODHPUR AQUIFERS
-------------------------------- Existing Conditions --------------------------------------------- -- Proposed -------------------
No. of No. ofBullock Annual Pumped Annual Total 1/ No. of Annual No. of 3/ Annual Total Surpluis after
Location Zone Are- Wells Discharge Wells Discharge Discharge Safe Yield Surplus rutbe Wells Discharge )CB Wells Disclarge Dischar e Prn-ct-3-- MmhBrem Mm
His His Hi i HsHsMi m
Bilara A 161 - - - - - - Assessed by UNDP - - --- -- - - 12.00 24.00 12.00 ) 80 13.20 - -14.19 1.91
(Borunda) B 245 400 2.50 450 24.70 27.20 31.30 4.10 ) 30 0.99
Bhopalgarh A 780 300 4.50 225 16.90 21.40 38.60 17,20 50 8.00 70 2.31 10.31 6.89
Shergarh A 620 83 0.62 15 1.08 1.70 19.84 18.14 ) 40 6.40 L00 3.30 9.70 30.02
B 460 50 0.37 3 0.13 0.50 22.08 21.58 )
Balesar A 430 117 0.87 152 10.94 11.81 13.76 ].95 60 9 .60 200 6.60 16.20 14.75
B 775 100 0.75 138 7.45 8.20 37.20 29.00
Osian A 548 450 4.45 60 1.98 6.43 34.25 27.82 70 11.20 200 6.60 17.80 20.11
B 238 350 3.46 40 1.32 4.78 14.87 10.09 _
Total 4,257 1,850 17.52 1,083 64.50 94.02 235.90 141.88 300 2/ 4 8
.'iO 600 4/ 19.80 68.20 73.68
Av.Bish./Well mi3/yr 9,500 60,000 160,000 33,000 5/
1/ The safe yield was derived in the following manner:
Zone Area Annual Recharge Specific Yield Extraotable (Safe Yield)is m. % Mi-
Bilara Bl 140 1.30 5 9.10 ) 31.30
B2 105 1.41 15 22.20
Bhopalgarh A 780 0.99 5 38.60
Shergarh A 620 0.64 5 19.84
B 460 e.96 5 22.08
Balesar A 430 0.64 5 13.76
B 775 0.96 5 37.20 '
Osian A 548 1.25 (1969) 5 34.25 is
B 238 1.25 5 14.87 FJ
2/ Total number of wells including those completed (21 wells) and expected to be installed in the areas where Rural Electrification would be developed in ftutture
(166 wells); the net number of the project wells would be 113 wells.
3/ Dug-Curu-Bore wells.
4/ About 50% of these wells would be included in the project.5/ In addition to 60,000 m
3/yr
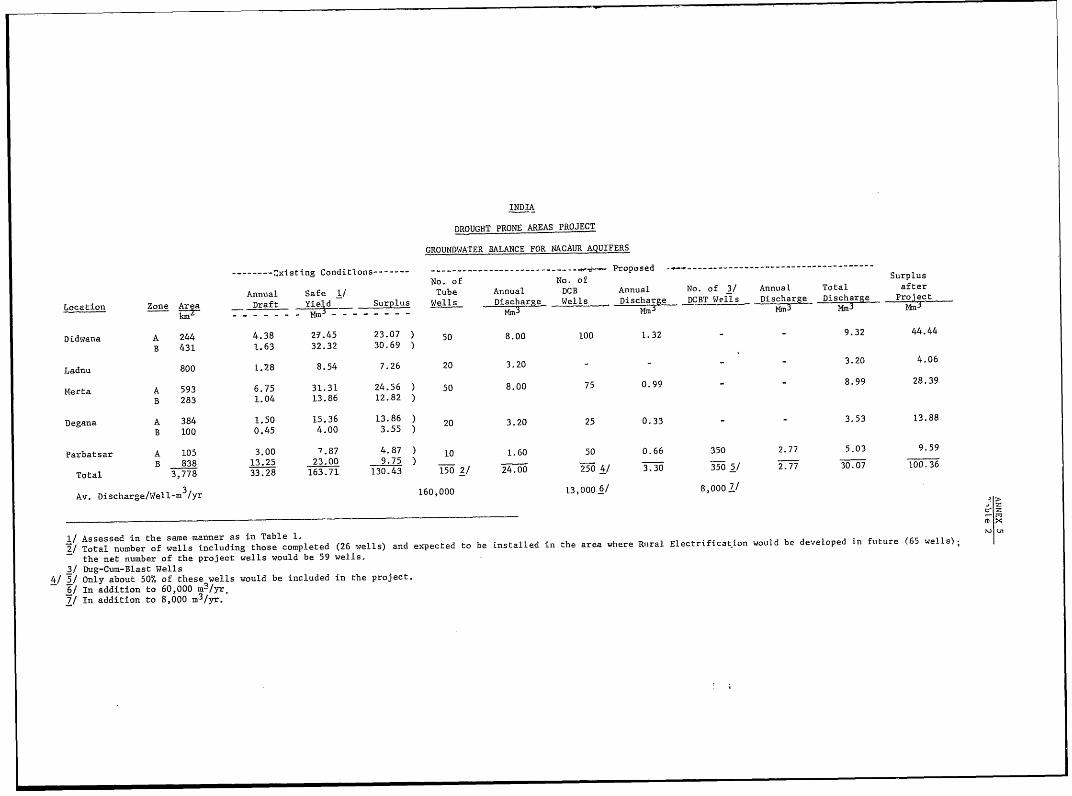
INDIA
DROUGHT PRONE AREAS PROJECT
GROUNDW4ATER BALANCE FOR NAGAUR AQUIFERS
- xisting Conditions ------- ---------------------------- N.oN. Proposed - ------------------------------- Surplus'No. o f No. of Surplus
Annual Safe l/ Tube Annual DCB Annual No. of 3/ Annual Total afterLocalion Zone Area Draft Yield - Surplus Wells Discharge Dischar DCBT Wells Dichar Di Project
Didwana A 244 4.38 23.45 23.07 ) 50 8.00 100 1.32 - - 9.32 44.44B 431 1.63 32.32 30.69 )
Ladnu 800 L.28 B.54 7.26 20 3.20 - - - - 3.20 4.06
Merta A 593 6.75 31.31 24.56 ) 50 8.00 75 0.99 - - 8.99 28.39B 283 1.04 13.86 12.82 )
Degana A 384 1.50 15.36 13.86 ) 20 3.20 25 0.33 - - 3.53 13.88B 100 0.45 4.00 3.55 )
Parbatsar A 105 3.00 7.87 4.87 ) 10 1.60 50 0.66 350 2.77 5.03 9.59B 838 13.25 23.00 9.75 )
Total 3,778 33.28 163.71 130.43 150 2/ 24.00 250 4/ 3.30 350 5/ 2.77 30.07 100.36
Av. Discharge/Vell-m3 /yr 160,O00 13,000 6/ 8,000 7/
.' z
1/ Assessed in the same manner as in Table 1.2/ Total number of wells including those completed (26 wells) and expected to be installed in the area where Rural Electrification would be developed in ftuture (65 wells);
the net number of the project wells would be 59 wells.3/ Dug-Cum-Blast Wells
4/ 5/ Only about 50% of these wells would be included in the project.6/ In addition to 60,000 m
3lyr,7/ In addition to 8,000 m
3/yr.
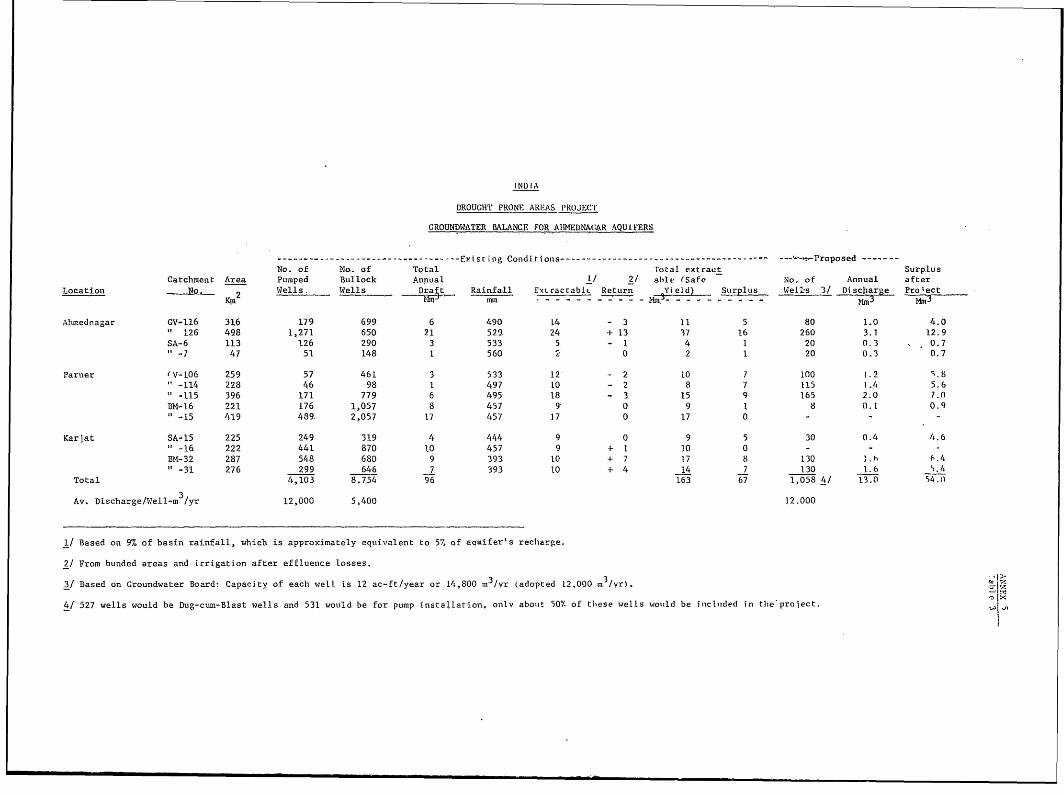
IN D I A
DROUGHT PRONE AREAS. P'ROJE(CI
GROUNDWATER BALANCE FOR AHMEDNAGAR AQUIFERS
- -- Existing Condirionls - -- -- -- t-Proposed -
No. of No. of Total Total extract Surplus
Catchment Area Pumped Bullock Annual 1/ 2/ able (Safe No. of Annual after
Location 2 tWells. Wells Draft Rainfall EXLractabli Return Yield) Surplus Wells 3/ Discharpe Pro'ectmm - - - -s- -- - - - - -Nm--------------------------- -- m3 '
Ahmednagar GV-116 316 179 699 6 490 L4 - 3 11 5 80 10 4.0
126 498 1,271 650 21 529. 24 + 13 37 16 260 3.1 12.9
SA-6 113 126 290 3 533 5. - 1 4 1 20 0.3 0.7
" -7 47 51 148 1 560 2 0 2 1 20 0.3 0,7
Partner (V-106 259 57 461 3 533 12 - 2 10 7 100 I.2 ?.8
-114 228 46 98 1 497 10 - 2 8 7 115 1.4 5.6
-115 396 171 779 6 495 18 - 3 15 9 165 2.0 7.0
BM-16 221 176 1,057 8 457 9 0 9 1 8 0.1 0.9
-15 419 489. 2,057 17 457 17 0 17 0 - - -
Karjat SA-15 225 249 319 4 444 9 0 9 5 30 0.4 4.6
" -16 222 441 870 10 457 9 + I 10 0 - - -
BMf-32 287 548 680 9 393 10 + 7 17 8 130 '.h h.4
" -31 276 299 646 7 393 10 f 4 14 7 130 1.b 't /,
Total 4,103 8.754 96 163 67 1,058 4/ 13.0 54.0)
Av. Discharge/Well-mi /yr 12,000 5,400 12.000
1/ Based on 9% of basin rainfall, which is approximately eqtuivalent to 5% of aouifer's recharge.
2/ From bunded areas and irrigation after effluence losses.
3/ Based on Groundwater Board: Capacity of each weLl is 12 ac-ft/year or 14,800 m3/vr (adopted L2,000 m /yr).
4/ 527 wells would be Dug-cum-Blast wells and 531 would be for pump installation, onlY about 507 of these wells woutld be inicluided in the-project.
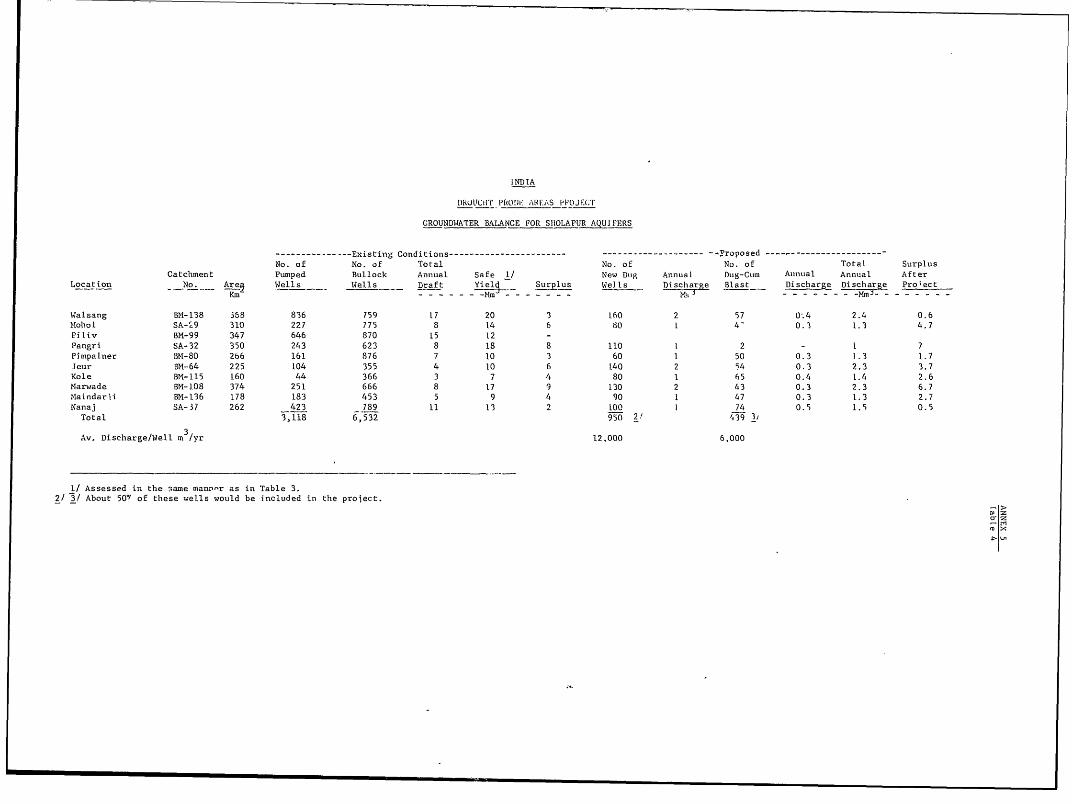
INDIA
1)RUL'CIIT P[R1MJ: PlEAS pPC'JETr
GROUINDWATER BALANCE FOR SHOLAPUR AQUJ FERS
--- Existing Conditions------------------------ -------------------- -- -lroposed ----------------------
No. of No. of Total No. of No. of Total Sturpltus
Catclcment Pumped Bullock Annual Safe 1/ New Dulg Annual Dug-Cuti Aiintnal Annual After
Location No.- Are Wells Wells- Draft Y Surplus Welts - Dicarge Blast DischargeDshareProect
Walsang B1M-138 368 836 759 17 20 3 160 2 57 0.4 2.4 0.6
MIobol SA-29 310 227 775 8 14 6 80 L 47 0.3 1.3 4.7
Piliv BM-99 347 646 870 15 12 -
Pangri SA-32 350 243 623 8 18 8 110 1 2 - 1 7
Pimpalner BM-80 266 161 876 7 10 3 60 1 50 0.3 1.3 1.7
Jeuir MI-64 225 104 355 4 10 6 140 2 54 0.3 2.3 3.7
Kole BM-115 160 44 366 3 7 4 80 1 65 0.4 1.4 2.6
Marwade BM-108 374 251 666 8 17 9 130 2 43 0.3 2.3 6.7
saindarii BM-136 178 183 453 5 9 4 90 1 47 0.3 1.3 2.7
Nanaj SA-37 262 423 789 11 13 2 100 1 74 0.5 1.5 0.5
Total 3,118 6,532 950 2 8439 3
Av. Discharge/Well m3 /yr 12,000 6,000
l/ Assessed in the ,.ame mano-r as in Table 3.
2/ 3/ About 507/ of these wells would be included in the project.
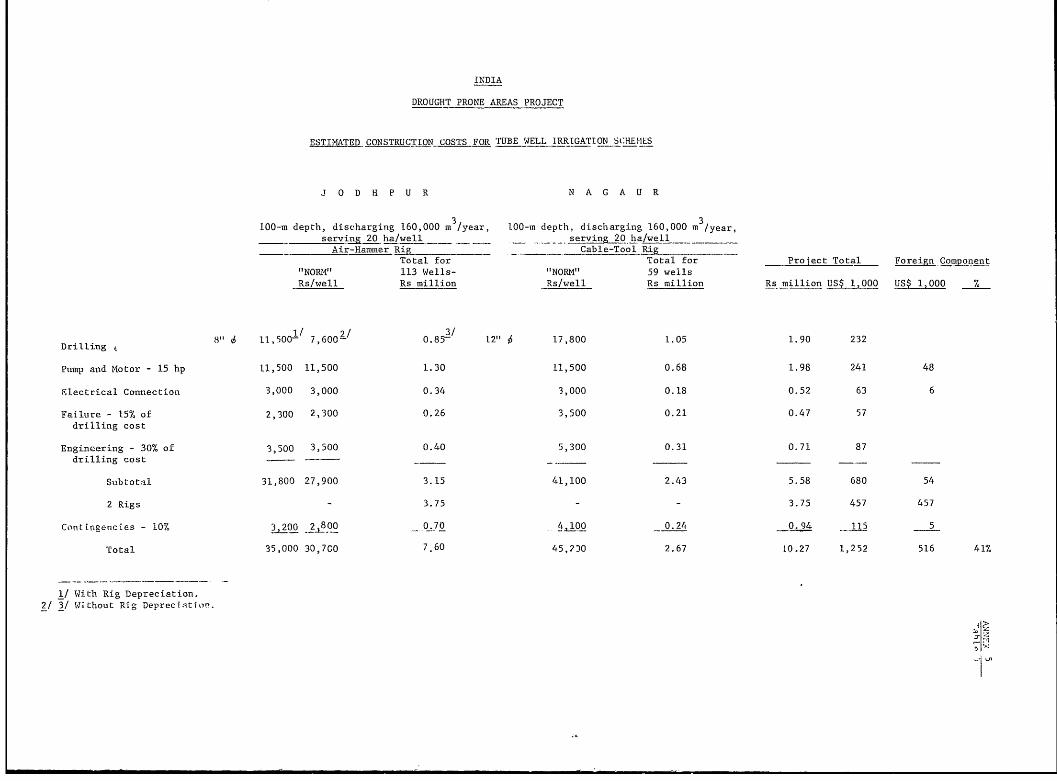
INDIA
DROUGHT PRONE AREAS PROJECT
ESTIMATED CONSTRUCTION COSTS FOR TUBE WELL IRRIGATION SCHEMES
J O D H P U R N A G A U R
100-m depth, discharging 160,000 m /year, 100-m depth, discharging 160,000 m /year,serving 20 ha/well serving 20 ha/well
Air-Hammer Ri& - - Cable-Tool RigTotal for Total for Project Total Foreign Component
"NORM" 113 Wells- "NORM" 59 wellsRs/well Rs million Rs/well Rs million Rs million US$ 1,000 US$ 1,000 %
8," 11,5001/ 7,600 21 O.85 12" 2 17,800 1.05 1.90 232Drilli-ng
Puimp and Motor - 15 hp 11,500 11,500 1.30 11,500 0,68 1.98 241 48
Electrical Connection 3,000 3,000 0.34 3,000 0.18 0.52 63 6
Failure - 15% of 2,300 2,300 0.26 3,500 0.21 0.47 57drilling cost
Engineering - 30% of 3,500 3,500 0.40 5,300 0.31 0.71 87drilling cost . - -
Subtotal 31,800 27,900 3.15 41,100 2.43 5.58 680 54
2 Rigs - 3.75 - - 3.75 457 457
Contingencies - 10% 3?OO 2.800 0.70 400 0.24 0.94 115 5
Total 35,000 30,7C0 7.60 45,2)0 2.67 10.27 1,252 516 41%
1/ With Rig Depreciation.2/ 3/ Without Ri.g Depreciition.
Ii>st
r,
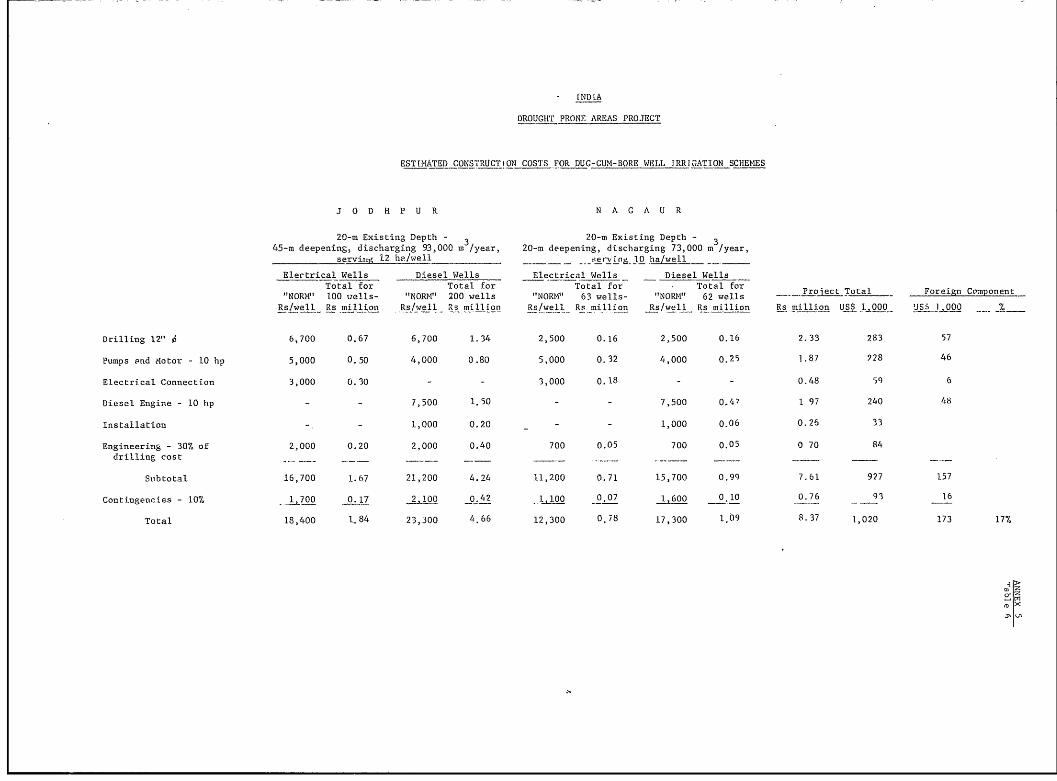
INDLA
DROUGHT PRONE AREAS PROJECT
ESTIMATED CONSTRUCTiON COSTS FOR DUG-CUM-BORE WELL IRRIGATION SCHEMES
J O D H P U R N A G A U R
20-m Existing Depth - 3 20-m Existing Depth - 345-m deepening, discharging 93,000 m /year, 20-m deepening, discharging 73,000 m /year,
servin,g 12 ha/well -ev- - - eing l0 ha/well _ -__
Electrical Wells Diesel Wells Electrical Wells Diesel WellsTotal for Total for Total for Total for roj Total Foreign Component
"NORIM' 100 wiells- "NORM" 200 wells 'NORM" 63 wells- "NORM" 62 wells _t-RsIwell Rs million Rs/well Rs million Rs/well Rs million Rs/well Rs million Rs million US$ 1,000 SSIJOOO C-LO
Drilling 12" v 6,700 0.67 6,700 1.34 2,500 0.16 2,500 0.16 2.33 283 57
Pumps and Motor - 10 hp 5,000 0.50 4,000 0.80 5,000 0.32 4,000 0.25 1.87 728 46
Electrical Connection 3,000 0.30 - - 3,000 0.18 - - 0.48 59 6
Diesel Engine - 10 hp - - 7,500 1.50 - - 7,500 O.47 1 97 240 48
Installation - - 1,000 0.20 - - 1,000 0.06 0.26 33
Engineering - 30% of 2,000 0.20 2,000 0.40 700 0.05 700 0.05 0 70 84drilling cost
Subtotal 16,700 1.67 21,200 4.24 11,200 0.71 15,700 0.99 7.61 927 157
Contingencies - 10% j,700 0.17 2,100 0.42 1,100 0.07 1,600 0.10 0.76 93 16
Total 18,400 1.84 23,300 4.66 12,300 078 17,300 1.09 8,37 1,020 173 17%
->3
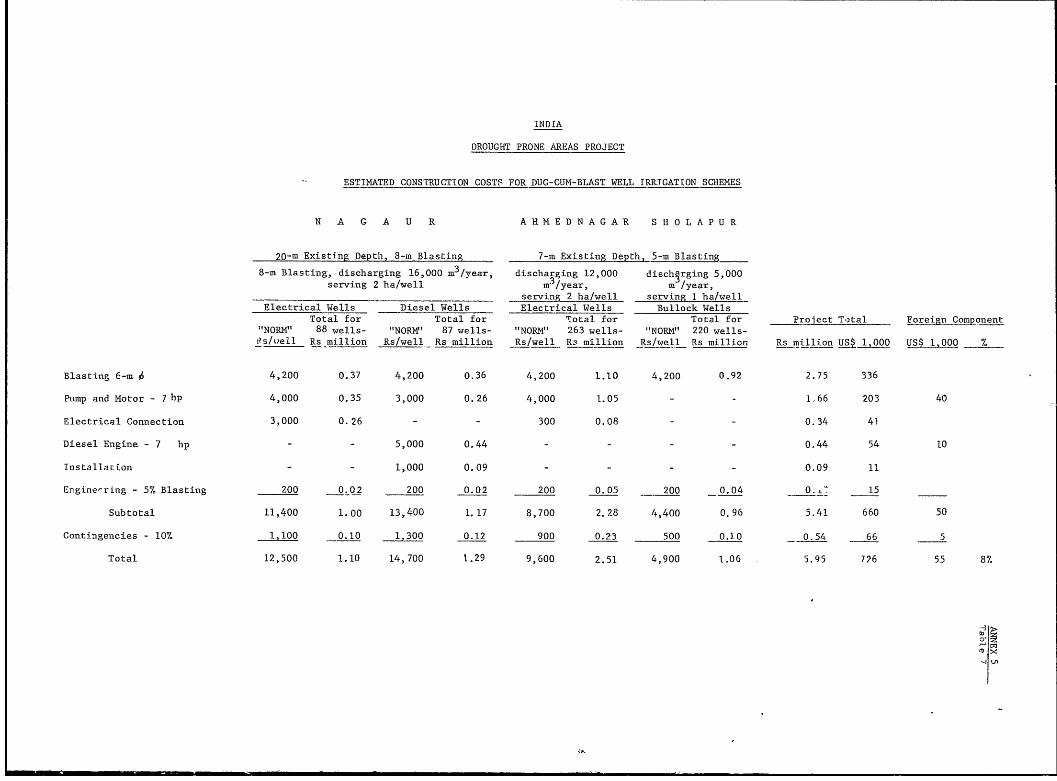
INDIA
DROUGHT PRONE AREAS PROJECT
ESTIMATED CONSTRUCTION COSTS FOR DUG-CUM-BLAST WELL IRRIGATION SCHEMES
N A G A U R A R M E D N A G A R S H O L A P U R
20-rm Existing Depth, 8-m Blasting 7-m Existing Depth_5-m Blasting_
8-m Blasting, discharging 16,000 m3/year, discharging 12,000 dischirging 5,000serving 2 ha/well m
3/year, m /year,
serving 2 ha/well serving I ha/wellElectrical Wells Diesel Wells Electrical Wells Bullock Wells
Total for Total for Total for Total for Project T-tal Foreign Component"NORIM 88 wells- "NORM" 87 wells- "NORM" 263 wells- "NORM" 220 wells-t?s/%jell Rs million Rs/well Rs million Rs/well Rz million Rs/well Rs million Rs million US 1,000 US$ 1,000 %
Blasting 6-m , 4,200 0.37 4,200 0.36 4,200 1.10 4,200 0.92 2.75 336
Pump and Motor - 7hp 4,000 0.35 3,000 0.26 4,000 1.05 - - 1.66 203 40
Electrical Connection 3,000 0.26 - - 300 0.08 - - 0.34 41
Diesel Engine - 7 hp - - 5,000 0.44 - - - - 0.44 54 10
Installation - - 1,000 0.09 - - - - 0.09 11
Engine-ring - 5% Blasting 200 0.02 200 0.02 200 0.05 200 0.04 0. J 15
Subtotal 11,400 1.00 13,400 1.17 8,700 2.28 4,400 0.96 5.41 660 50
Contingencies - 10% 1,100 0.10 1,300 0.12 900 0.23 500 0.10 0.54 66 -5
Total 12,500 1.10 14,700 1.29 9,600 2.51 4,900 i.06 5.95 726 55 8%
-tu
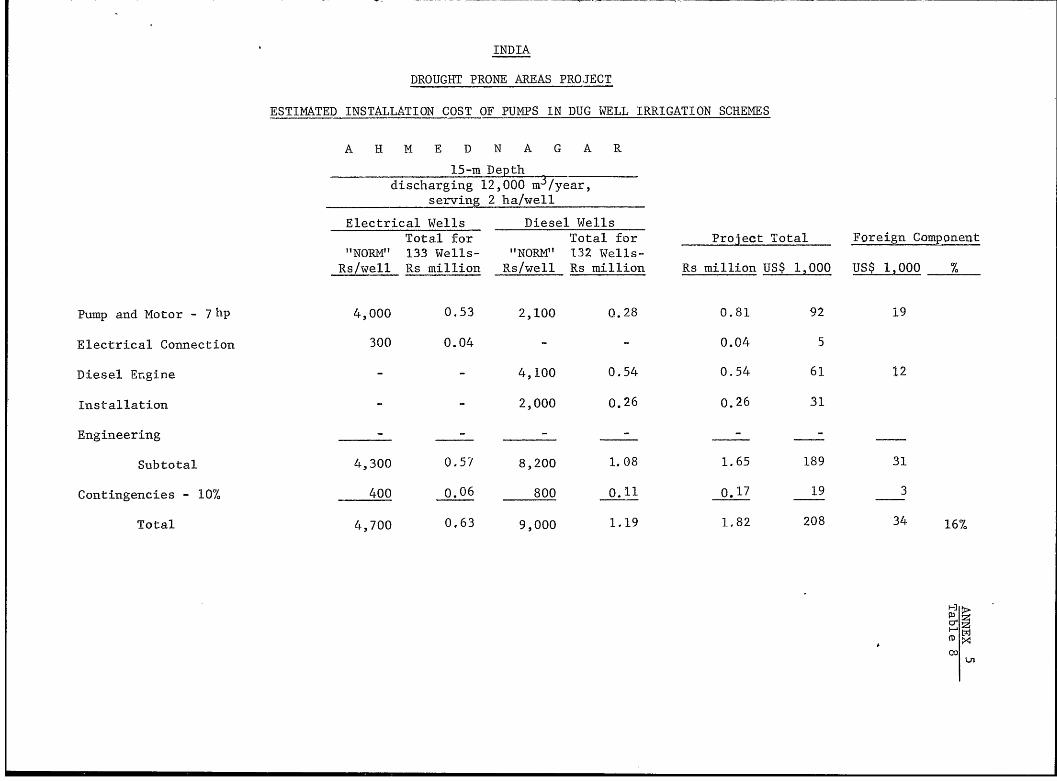
INDIA
DROUGHT PRONE AREAS PROJECT
ESTIMATED INSTALLATION COST OF PUMPS IN DUG WELL IRRIGATION SCHEMEES
A H M E D N A G A R
15-m Depthdischarging 12,000 m 5|year,
serving 2 ha/well
Electrical Wells Diesel WellsTotal for Total for Project Total Foreign Component
"NORM" 133 Wells- "NORM" 132 Wells-
Rs/well Rs million Rs/well Rs million Rs million US$ 1,000 US$ 1,000 %
Pump and Motor - 7hp 4,000 0.53 2,100 0.28 0.81 92 19
Electrical Connection 300 0.04 -- 0.04 5
Diesel Er.gine - - 4,100 0.54 0.54 61 12
Installation - 2,000 0.26 0.26 31
Engineering - - - - - -
Subtotal 4,300 0.57 8,200 1.08 1.65 189 31
Contingencies - 10% 400 0.06 800 0.11 0.17 19 3
Total 4,700 0.63 9,000 1.19 1.82 208 34 16%
Hco.
co
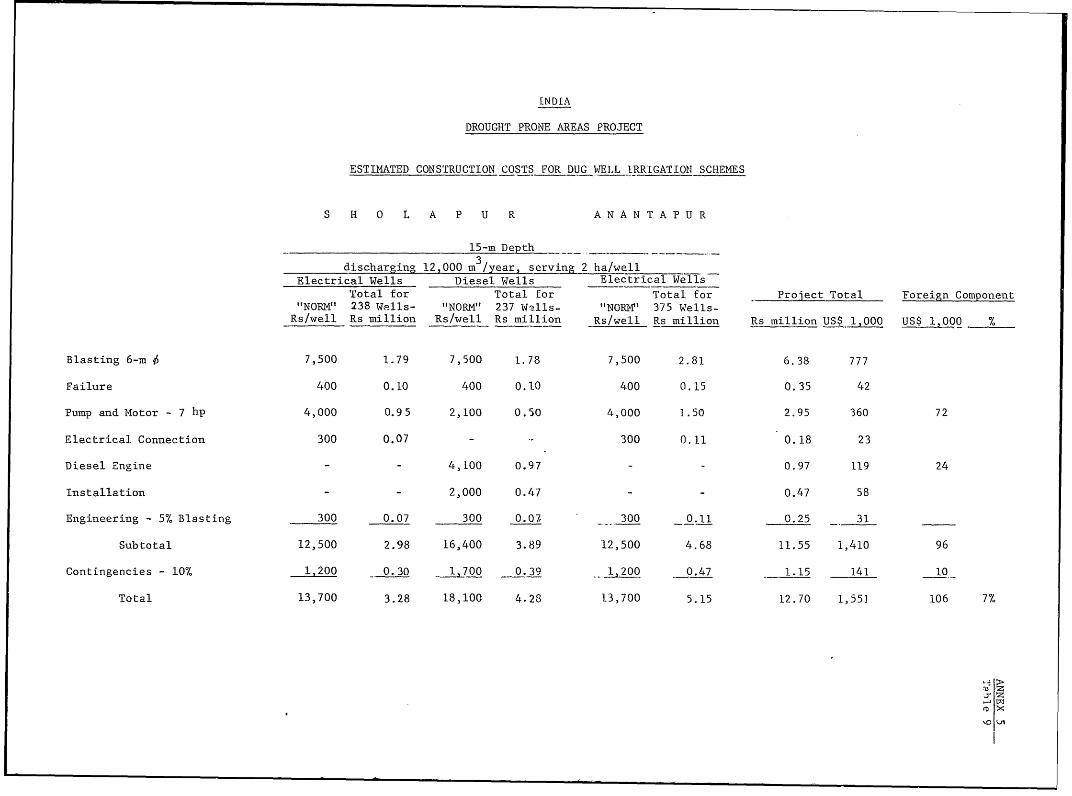
INDIA
DROUGHT PRONE AREAS PROJECT
ESTIMATED CONSTRUCTION COSTS FOR DUG WELL IRRIGATION SCHEMES
S H 0 L A P U R A N A N T A P U R
15-m Depth
discharging 12,000 m /year, serving 2 ha/well
Electrical Wells Diesel Wells Electrical Wells
Total for Total for Total for Project Total Foreign Component
"NORM" 238 Walls- "NORM" 237 Walls- "NORM" 375 Wells-
Rs/well Rs million Rs/well Rs million Rs/well Rs million Rs million US$ 1,000 US$ 1,000 7
Blasting 6-m ^ 7,500 1.79 7,500 1.78 7,500 2.81 6.38 777
Failure 400 0.10 400 0.10 400 0,15 0.35 42
Pump and Motor - 7 hp 4,000 0.95 2,100 0.50 4,000 1.50 2.95 360 72
Electrical Connection 300 0.07 - 300 0.11 0.18 23
Diesel Engine - - 4,100 0.97 - - 0.97 119 24
Installation - - 2,000 0.47 - - 0.47 58
Engineering - 5% Blasting 300 0.07 300 0.0- 300 0.11 0.25 31
Subtotal 12,500 2.98 16,400 3.89 12,500 4.68 11.55 1,410 96
Contingencies - 10% 1,200 0.30 1 700 0.39 1,200 0.47 1.15 141 10
Total 13,700 3.28 18,100 4.28 13,700 5.15 12.70 1,551 106 7%
, X'. Ul
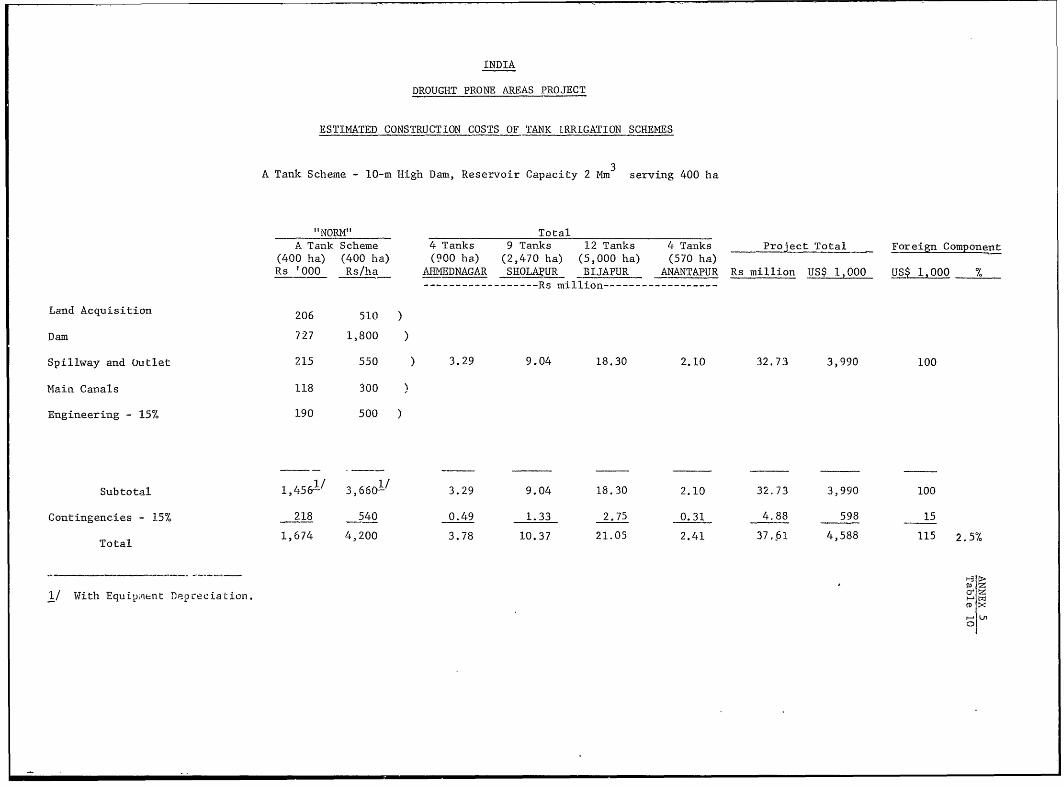
INDIA
DROUGHT PRONE AREAS PROJECT
ESTIM4ATED CONSTRUCTION COSTS OF TANK LRRIGATION SCHEMES
A Tank Scheme - 10-m High Dam, Reservoir Capacity 2 Mm serving 400 ha
" NORM" TotalA Tank Scheme 4 Tanks 9 Tanks 12 Tanks 4 Tanks Project Total Foreign Component
(400 ha) (400 ha) (900 ha) (2,470 ha) (5,000 ha) (570 ha)Rs '000 Rs/ha AHMEDNAGAR SHOLAPUR BIJAPUR ANANTAPUR Rs million US$ 1,000 US$ 1,000 °/
-- - - -- - -- ---------- Rs million------------------
Land Acquisition 206 510 )
Dam 727 1,800 )
Spillway and outlet 215 550 ) 3.29 9.04 18.30 2.10 32.73 3,990 100
Main Canals 118 300 0
Engineering - 15% 190 500 )
Subtotal 1,451/ 3,6601! 3.29 9.04 18.30 2.10 32.73 3,990 100
Contingencies - 15% 218 540 0.49 1.33 2.75 0.31 4.88 598 15
Total 1,674 4,200 3.78 10.37 21.05 2.41 37,61 4,588 115 2.5%
1/ With Equip.ient DepreciaLion.
I-. U
0,
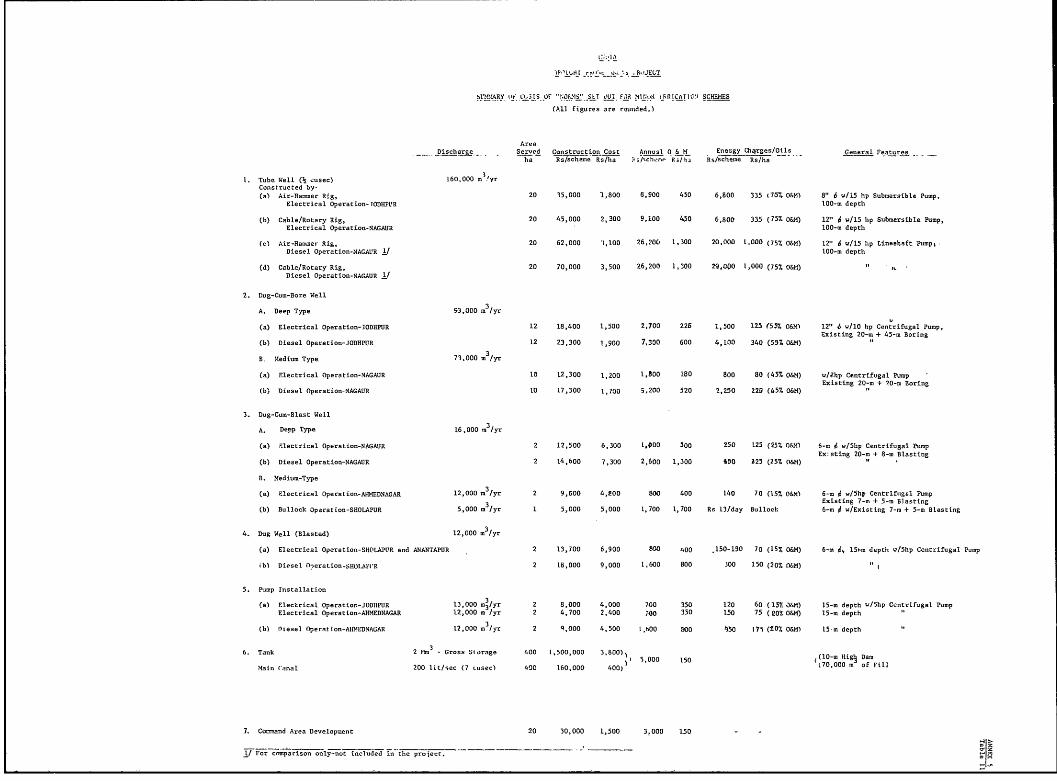
Sl'MIIARY '1 CISIS t)F '"OiŽd' -SiT 8LI1 FOR lID'SR _1i_CllAI'N SCHEMES
(All figures are rounded.)
AreaDischarge- Served Cstscton Csth Annusl o H M Enemgy the -gs/Oil- _ General Features
ha Ba/scheme R./A. R'3hŽo*0/h, Bs/schgme R.,/h.
1. Tube Well .1 cusec) 160.000 m 'yrConstructed by-(a) Air-Ha-mer Rtg, 20 35,000 1,800 6,900 450 6,800 335 (757. O&M1 8" 6 wl15 hp Submersible Pump,
Electrical Operatio-lODHPUR 100-m depth
(b) Cable/Rotary Rig, 20 45,000 2,300 9,100 450 6,800 335 (757 O&M) 12" 6 W/15 hp Submersible Pump,Electrical Operation-NAGAUR 100-m depth
tcr Air-Hammer Rig, 20 62,000 'l,100 26,206 1,300 20,000 1,OO (75Z O&M) 12" 6 ./15 hp Lineeshft Pump;Diesel Operetion-NAGAt R 1/ 100-m depth
(d) Cable/Rotary Rig, 20 70,000 3,500 26,200 1,300 20,000 1,000 (75% O&M) " .
Diesel Operatio-NAGAUR 1/
2. Dug-Cum-Bore Well
A. Deep Type 93,000 m /yr
(a) Electrical Operation-ODHBPUR 12 18,400 1,500 2,700 226 1,500 125 (557 OEM 12" 6 w/10 hp Centrifugal Pump,Existing 20-rn + 45-rn Boring
(b) Diesel Operation-JODHPUR 12 23,300 1,900 7,300 600 4,100 340 (557 O&M) "
B. Medium Type 73,000 mn /yr
(a) glectrical Operatioa-NAGAUR 10 12,300 1,200 1,800 180 800 80 (457. O&M) w/Whp Centrifugal PumpExisting 20-r + 70-m Boring
(b) Diesel Operation-NAGAUR 10 17,300 1,700 5,200 520 9,250 228 (45% O&M)
3. Dug-Cum-Blast Well
A. Deep Type 16,000 m /yr
(a) Electrical Operation-NAGAUR 2 12,500 6,300 1.000 500 250 125 (25%7 O&M) 6-r 6 w/5hp Centrifugal PumpEx sting 20-r + 8-r Blasting
(b) Diesel Operation-NAGAUR 2 14,600 7,300 2,600 1,300 t80 825 (257 o6m)
B. Medium-Type
(a) Electrical Operation-AHMEDNAGAR 12,000 m3 /yr 2 9,600 4,EOO BOO 400 140 70 (15Z O&M) 6-rn 6 Shp Centrjifgej pump(b .l. p.rt-HLPR500.3 Exis-ting 7-rnt+ 5-n_Blasting
(b) Bullock Operarion-SHOLAPOR 5,000 m /yr 1 5,000 5,000 1,700 1,700 Rs 13/day Bullock 6-r d w/Existing 7-r + 5-n Blasting
4. Dug Well (Blasted) 12,000 r 3
/yr
(a) Electrical Operation-SHOLAPUR and ANANTAPUR 2 13,700 6,900 600 400 .150-130 70 (15% O&M) 6-r n 15-m depth w/5hp Centrifugal Pomp
ib) Diesel ?leration-S-.HO;LA1VR 2 18,000 9,000 1,600 800 300 150 (20% oEM)
5. Pump Installation
(a) Elecirical Operation-JODHPUR 13,000 rn3fyr 2 8,000 4,000 700 350 120 60 (15% OEM) 15-r depth w/5hp Centrifugal Pump
Electrical Operation-AHMEDNAGAR 12,000 rn/yr 2 4,700 2,400 740 350 150 75 (807. O&M) 15-rn depth
(b) Mlesel Operat-on-AHMEDNAGAR 12,000 m /yr 2 9,000 4,500 b mOO 500 3O ?59 (f07 O&M) 15-m depth
6. Tank 2 ft.3 - Gross Storage 400 1,500,000 3,600)) (10-r Higl Dam
Main (anal 200 lit/sec (7 -user3 400 160,000 400) 570,000 m of Fill
7. CorMand Area Developuent 20 30,000 1,500 3,000 150
1/ For cpacison only-nut included in the project. saT
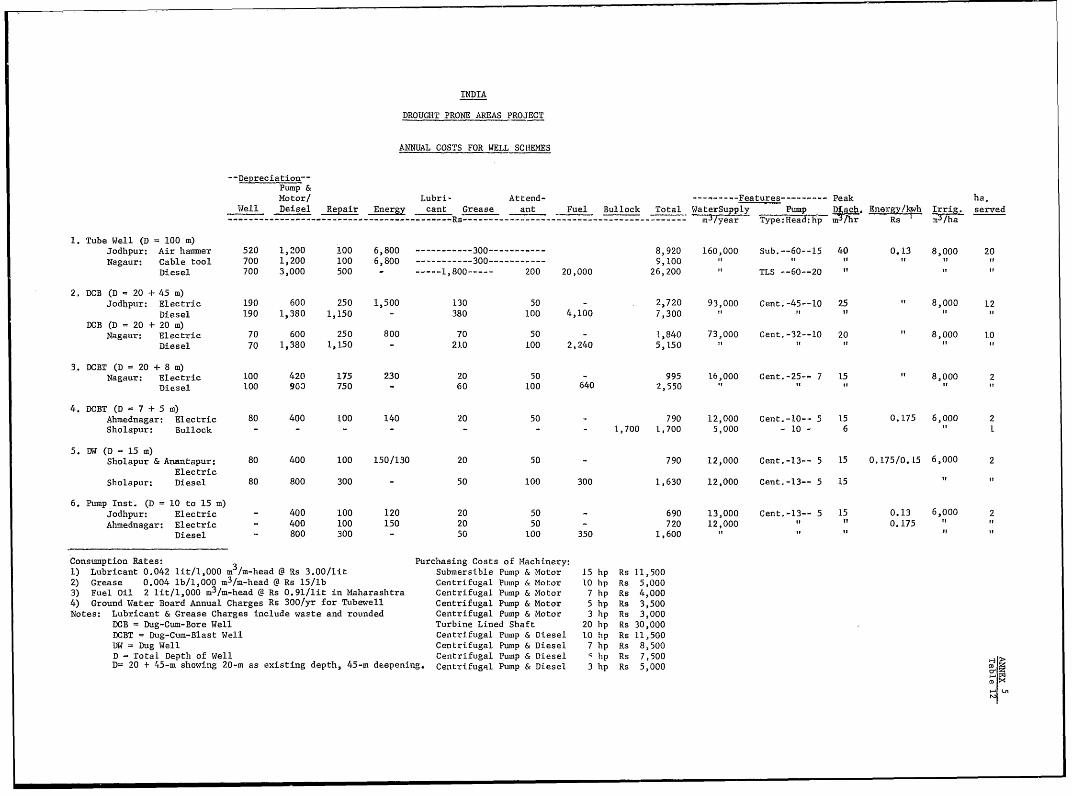
INDIA
DROUGHT PRONE AREAS PROJECT
ANNUAL COSTS FOR WELL SCUEMES
-- Depreciation-Pump &Motor/ Lubri- Attend -------- Features--------- Peak ha.Well Deisel Repair Energy cant Grease ant Fuel Bullock Total WaterSupply Pump D,. Energy/lwh Irrig. served-------------------------------------------Rs------------------------------------------- m3/year Type:Head:hp m Jhr Rs ' o/ha
1. Tube Well (D 100 m)Jodhpur: Air hammer 520 1,200 100 6,800 --------------300 8,920 160,000 Sub.--60--15 40 0.13 8,000 20Nagaur: Cable tool 700 1,200 100 6,800 ------------ 300 ----------- 9,100 " " " " "Diesel 700 3,000 500 - 1,800----- 200 20,000 26,200 " TLS --60--20 " "
2, DCB (D = 20 + 45 m)Jodhpur: Electric 190 600 250 1,500 130 50 - 2,720 93,000 Cent,-45--10 25 " 8,000 12Diesel 190 1,380 1,150 - 380 100 4,100 7,300 " I "DCB (D = 20 + 20 m)Nagaur: Electric 70 600 250 800 70 50 - 1,840 73,000 Cent,-32--10 20 " 8,000 10Diesel 70 1,380 1,150 - 21.0 100 2,240 5,150 " "
3. DCBT (D = 20 + 8 m)Nagaur: Electric 100 420 175 230 20 50 - 995 16,000 Cent.-25-- 7 15 " 8,000 2Diesel 100 9O3 750 - 60 100 640 2,550 " "
4. DCBT (D = 7 + 5 m)Ahmednagar: Electric 80 400 LOO 140 20 50 - 790 12,000 Cent.-10-- 5 15 0.175 6,000 2Sholapur: Bullock - - - - - - - t,700 1,700 5,000 - 10 - 6
5. DW (D = 15 m)Sholapur & Anantapur: 80 400 100 150/130 20 50 - 790 12,000 Cent.-13-- 5 15 0.175/0.15 6,000 2ElectricSholapur: Diesel 80 800 300 - 50 100 300 1,630 12,000 Cent.-13-- 5 15
6. Pump Inst. (D = 10 to 15 m)Jodhpur: Electric - 400 100 120 20 50 - 690 13,000 Cent.-13-- 5 15 0.13 6,000 2Ahmednagar: Electric - 400 100 150 20 50 - 720 12,000 0.175Diesel - 800 300 - 50 100 350 1,600
Consumption Rates: 3 Purchasing Costs of Machinery:1) Lubricant 0.042 lit/1,000 m /m-head @ Rs 3.00/lit Submersible Pump & Motor 15 hp Rs 11,5002) Grease 0.004 lb/1,000 m
3/m-head @ Rs 15/lb Centrifugal Pumiip & Motor 10 hp Rs 5,0003) Fuel Oil 2 lit/l,000 m
3/m-head @ Rs 0.91/lit in Maharashtra Centrifugal Ptump & Motor 7 hp Rs 4,0004) Ground Water Board Annual Charges Rs 300/yr for TLbewell Centrifugal Pump & Motor 5 hp Rs 3,500Notes: Lubricant & Grease Charges include waste and rounded Centrifugal Pump & Motor 3 hp Rs 3,000DCB = Dug-Cum-Bore Well Turbine Lined Shaft 20 hp Rs 30,000DCBT = Dug-Cum-Blast Well Centrifugal Pump & Diesel 10 hp Rs 11,500DW = Dug Well Centrifugal Pump & Diesel 7 hp Rs 8,500D = Total Depth of Well Centrifugal PumDp & Diesel 9 hp Rs 7,500 >D= 20 + 45-m showing 20-m as existing depth, 45-m deepening. Centrifugal Pump & Diesel 3 hp Rs 5,000
tD X
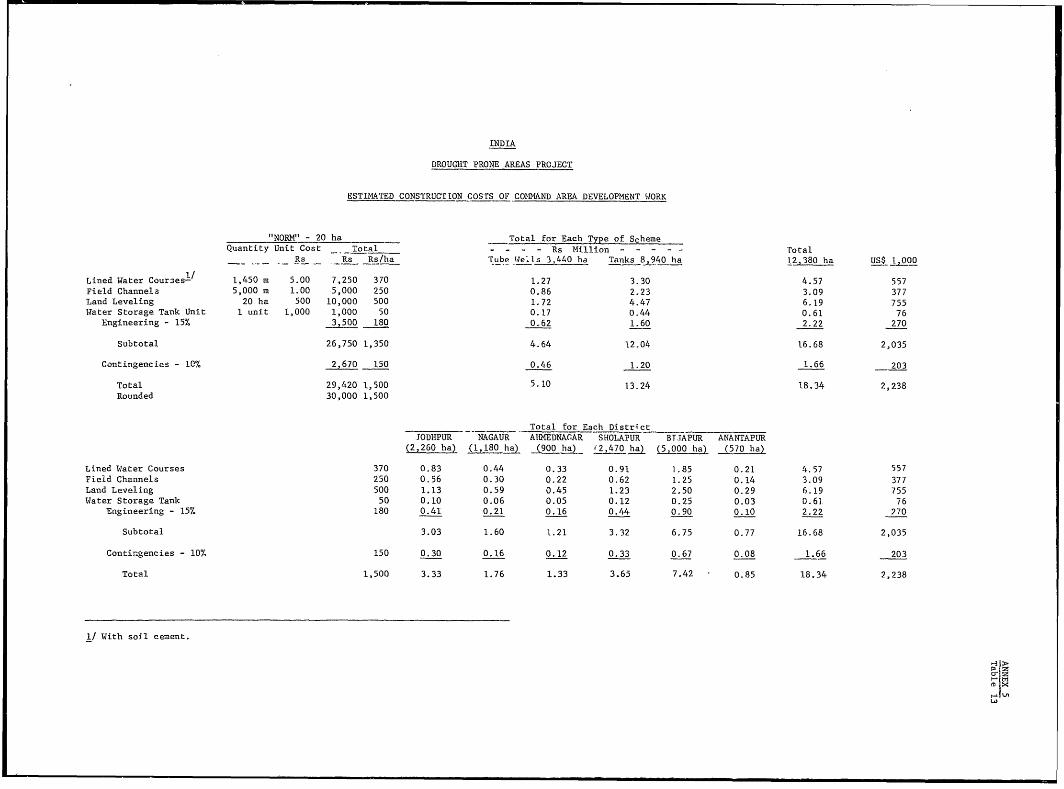
INDIA
DROUGHT PRONE AREAS PROJECT
ESTIMATED CONSTRUCTION CoSTS OF CONEAND AREA DEVELOPMENT WORK
"NORM" - 20 ha Total for Each Type of Scheme
Quantity Unit Cost Total - - - - Rs Million rotal
- - Rs Rs Rs/ha Tube e-.Is 3,440 ha Tanks 8L94O ha 12,380 ha US$ 1,000
Lined Water Cour3ea.z/ 1,450 m 5-00 7,250 370 1.27 3.30 4.57 557
Field Channels 5,000 m 1.00 5,000 250 0.86 2.23 3.09 377
Land Leveling 20 ha 500 10,000 500 1.72 4.47 6.19 755
Water Storage Tank Unit 1 unit 1,000 1,000 50 0.17 0.44 0.61 76
Engineering - 15! 3,500 180 0.62 1.60 2.22 270
Subtotal 26,750 1,350 4.64 12.04 16.68 2,035
Contingencies - 10% 2,670 150 0.46 1.20 1.66 203
Total 29,420 1,500 5.10 13.24 18.34 2,238
Rounded 30,000 1,500
H_UR-___ Total for Each DistrictJODHPUR - AGAUR AlMEDNAGAR SHOLAPUR BTJAPUR ANANTAPUR
(2,260 ha) (1,180 ha (900 ha) s2,470 jal (5,000 ha) (570 ha)
Lined Water Courses 370 0.83 0.44 0.33 0.91 1,85 0.21 4.57 557
Field Channels 250 0.56 0.30 0.22 0.62 1.25 0.14 3.09 377
Land Leveling 500 1.13 0.59 0.45 1.23 2.50 0.29 6.19 755
Water Storage Tank 50 0.10 0.06 0.05 0.12 0.25 0.03 0.61 76
Engineering - 15% 180 0.41 0.21 0.16 0.44 0.90 0.10 2.22 270
Subtotal 3.03 1.60 1.21 3.32 6.75 0.77 16.68 2,035
Contif,gencies - 10% 150 0.30 0.16 0.12 0.33 0.67 0.08 1.66 203
Total 1,500 3.33 1.76 1.33 3.65 7.42 0.85 18.34 2,238
1/ With soil cement.
>>
a xI- in
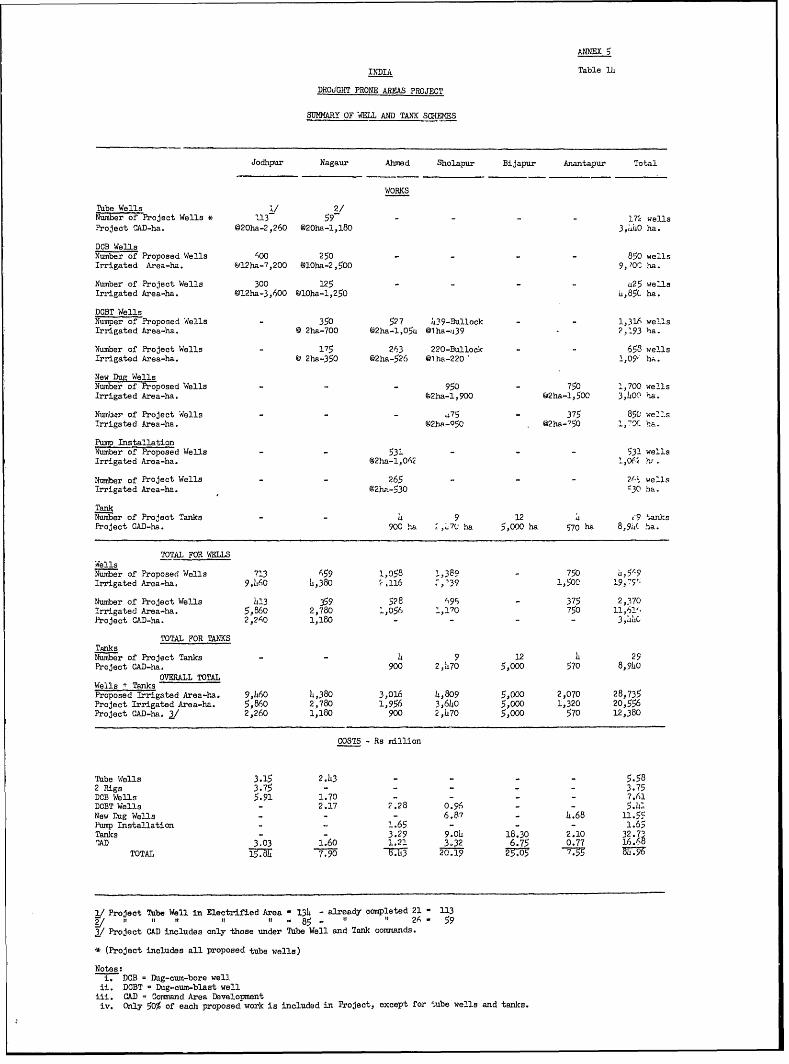
ANNEX 5
INDIA Table lb
DROUGHT PRONE AREAS PROJECT
SUMMARY OF WELL AND TANK SCHEMES
Jodhpur Nagaur Ahmed Sholapur Bijapur Anantapur Total
WORKS
Tabe Wells 1/ 2/Number of ProJect Wells * 113 59 - - - - 172 weLlsProject CAD-ha. @20ha-2,260 @20ha-1,180 3,iO ha.
DCB WdellsNuwber of Proposed Wells 0oo 250 - - - - 850 wellsirrigated Area-ha. C,l2ha-7,200 @lOha-2 ,500 9, 7O0 ha.
Number of Project Wells 300 125 - - - - 425 we'lsIrrigated Area-ha. @12ha-3,600 @lOha-1,250 4,85c ha.
DCBT WellsNumper of Proposed^ Wells - 350 527 L39-Bullock - - 1,316 wellsIrrigated Area-ha. @ 2ha-700 @2ha-1,05Lt @lha-,i39 * ?2'93 ha.
Number of Project Wells - 175 263 220-Bullock - - 658 wellsIrrigated Area-ha. @ 2ha-350 @2ha-526 @1ha-220 l,09, h.
New Dug WellsNumber of ?roposed WYells - - - 950 - 750 1,700 wellsIrrigated Area-ha. @2ha-1,900 rw2ha-1,50C 3,hOO ha.
Numb=r of Project Wells - - - "75 - 375 850 we2'.sIrrigated Area-ha. 2W2ha-950 @2ha-
750 '
Pump InstallationNumber of Proposed Wells - - 531 - - - 531 wellsIrrigated Area-ha. @2ha-1,062 1,Of% nr .
Number of Project Wells - - 265 - - - 2/- wellsIrrigated Area-ha. 92ha-530 r30 ha.
TankNumber of ProAect Tanks - - 4 9 12 4 '9 tan)ksProject CAD-ha. 900 ha _,L7C ha 5,000 ha 570 ha 8,9At. ha.
TOTAL FOR WELLS'WellsNuimber of Proposed Wells 7'3 459 1,058 1,389 - 750 u,59Irrigated Area-ha. 9,Lh6c 4 ,380 2.116 .,'39 1,500 19,5'9'
Number of Project Wells ll3 359 5?8 '9S - 375 2,370irrigated Area-ha. 5,860 2,780 1,056 ',170 750 11,6'.Project CAD-ha. 2 ,260 1,180
TOTAL FOR TANKSTanksNumber of Project Tanks - I 9 12 It 29Project CAD-ha. 900 2,L70 5,000 570 8,9hO
OVERALL TOTALWells + TanksProposed Irrigated Area-ha. 9,It60 4,380 3,016 Lt,
8 09 5,000 2,070 28,735
Project Irrigated Area-ha. 5,860 2,780 1,956 3,6
40 5,000 1,320 20,556Project CAD-ha. 2/ 2,260 1,180 900 2,It70 5,000 570 12,380
COSTS - Rs million
Tabe Wells 3.15 24.3 - - - - 5.582 Rigs 3.75 - - - - - 3.75DCB Wells 5.91 1.70 - - - - 7.61DCBT Wells - 2.17 2.28 0.96 - -5.4New Lug Wells - - - 6.87 -L.68 11.55Pmp Installation - - 1.65 - - - 1.65Tanks - - 3.29 9.0L 18.30 2.10 32.7'CAD 3.03 1.60 1.21 3.32 6.75 0.77 16.:6
TOTAL 7.90 8.43 20.19 28L.96
l/ Project Tube Well in Electrified Area - 134t - already completed 21 - 1135, it a ' 1 - a 85 - I 2(- 59
2/ Project CAD includes only those under Ttube Well and Tank comnands.
* (Project includes all proposed tube wells)
Notes:i. DCOB = Dug-cum.-bore well
ii. DCOBT = Dug-cum-blast welliii. CAD - Comnmand Area Davelopment
iv. Only 50% of each proposed work is included in Project, except for tube wells and tanks.
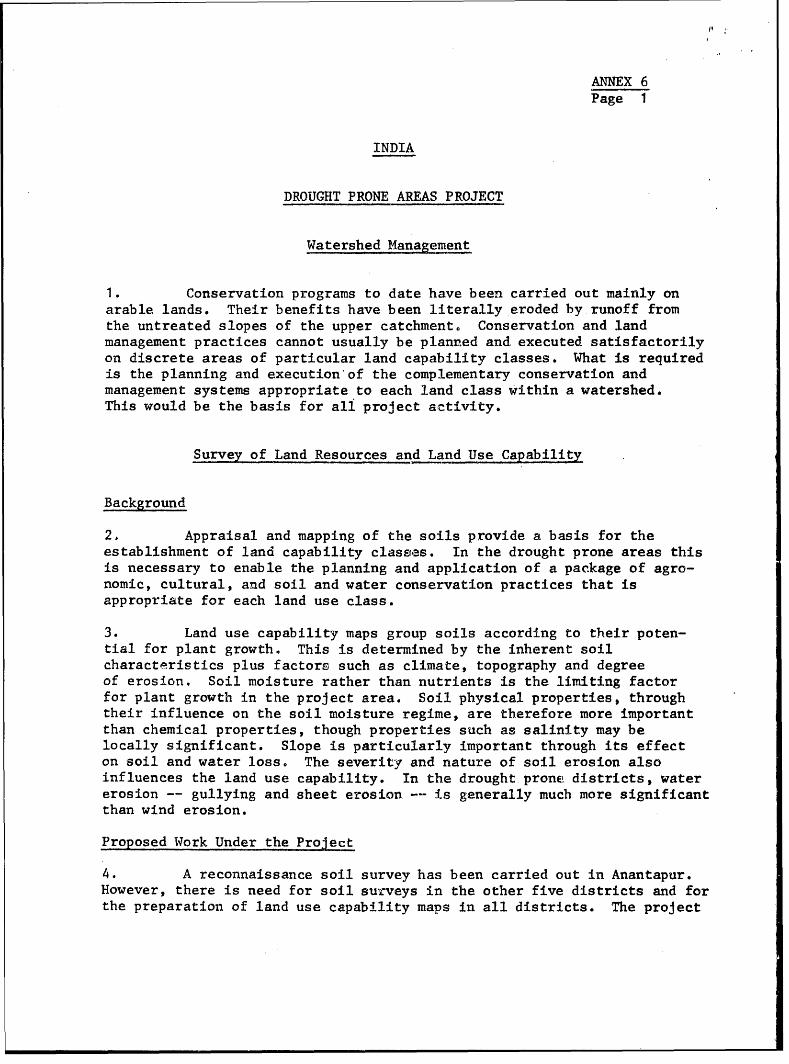
ANNEX 6Page 1
INDIA
DROUGHT PRONE AREAS PROJECT
Watershed Management
1. Conservation programs to date have been carried out mainly onarable lands. Their benefits have been literally eroded by runoff fromthe untreated slopes of the upper catchment. Conservation and landmanagement practices cannot usually be planned and.executed satisfactorilyon discrete areas of particular land capability classes. What is requiredis the planning and execution of the complementary conservation andmanagement systems appropriate to each land class within a watershed.This would be the basis for all project activity.
Survey of Land Resources and Land Use Capability
Background
2. Appraisal and mapping of the soils provide a basis for theestablishment of land capability classes. In the drought prone areas thisis necessary to enable the planning and application of a package of agro-nomic, cultural, and soil and water conservation practices that isappropriate for each land use class.
3. Land use capability maps group soils according to their poten-tial for plant growth. This is determined by the inherent soilcharacteristics plus factors such as climate, topography and degreeof erosion. Soil moisture rather than nutrients is the limiting factorfor plant growth in the project area. Soil physical properties, throughtheir influence on the soil moisture regime, are therefore more importantthan chemical properties, though properties such as salinity may belocally significant. Slope is particularly important through its effecton soil and water loss. The severity and nature of soil erosion alsoinfluences the land use capability. In the drought prone districts, watererosion -- gullying and sheet erosion -- is generally much more significantthan wind erosion.
Proposed Work Under the Project
4. A reconnaissance soil survey has been carried out in Anantapur.However, there is need for soil surveys in the other five districts and forthe preparation of land use capability maps in all districts. The project

ANNEX 6Page 2
would provide the capacity for land use capability mapping of the entirearea of each district priority being given-to project areas. This wouldenhance the quality of development planning carried out by the DistrictDevelopment Authorities.
5. The main requirement is for reconnaissance soil surveys,probably at a scale of 1:50,000, to be used as a basis for the preparationof land use capability maps. 1/ In practice this would mean the mappingof soil associations. Land use capability maps based on reconnaissancesoil surveys would be sufficient for general land use planning. In addi-tion detailed soil surveys of irrigation areas would be necessary. In thiscase, soil types would be mapped, requiring a scale of about 1:8,000. Airphotos should be used for soil mapping wherever they are available. Photointerpretation would increase the speed and accuracy of mapping and wouldbe particularly useful in the drought prone areas where soil patterns andsoil boundaries are not obscured by forests, etc.
6. The detailed staffing and equipment costs of a survey unit foreach district are set out in Table 1. The total cost would be aboutRs 307,000 during the first year and thereafter about Rs 187,000 per year.Such a '6it could be expected to cover 600,000 to 700,000 ha of recon-naissance survey per year, as well as doing any detailed survey that mightbe required.
7. The system of land classification to be used is defined in theSoil Survey Manual of the All-India Soil and Land Use Survey Organization.This distinguishes four classes of land suitable for cultivation (Classes Ito IV). Class IV is defined as marginally cultivable land suitable forcultivation only in rotation with pasture. Class V land includes mountainmeadows and is very well suited to pasture and livestock. Classes VI andVII include steep lands defined as being suitable for either pasture offorestry; but the mission recommends that most of this land be devoted onlyto pasture (para 13). Class VIII land includes barren mountain tops definedas being suitable for wildlife, recreation and watershed,
1/ Phasing of District Soil Surveys
Year 1 Year 2 Year 3 Year 4
Bijapur 600,000 600,000 560,000 °Sholapur 600,000 600,000 302,000Ahmednagar 600,000 600,000 504,000 -Jodhpur 700,000 700,000 700,000 150,000Nlagaur 700,000 700,000 367,000 -
ANNEX 6Page 3
Foreswtry
Present Situation
8. Most of the hill country, belonging to Classes V to VIII, isgovernment land under the control of the Forest and Revenue Departments.The woody vegetation originally present on the hills and uplands of droughtprone areas has largely been destroyed as a result of long-continuedexploitation. The trees and shrubs have been removed for timber andfirewood. The pastures, too, have been severely depleted by excessivelivestock grazing and burning. Depletion of the vegetative cover hasbeen accompanied by marked deterioration of the environment. Water erosionhas been so severe that the soil that remains is generally very thin andpatchy, rock outcroppings are common, and there are many erosion-gullies.These hills and uplands are now the source of much of the runoff waterthat causes erosion on the valuable arable lowlands. Thus improvementof the vegetative cover on the highlands, to reduce runoff, is an, essentialstep in the development of an integrated program of soil and water con-servation for an entire watershed.
9. To protect the environment against further deterioration, theForest Department has embarked upon a program of re-afforestation.on someof the hill country. The procedure used to aid the establishment andgrowth of trees indicates how unfavorable the environment is for treegrowth. Large contour trenches are dug at intervals of 20 to 30 feet.These are commonly 1-1/2 feet deep, with sloping sides such that they areabout 1-1/2 feet wide at the bottom and 2-1/2 feet wide at the top. Abouthalf of the excavated material, largely consisting of rock fragments butincluding a little soil, is put back into the trench--the remainder beingmounded along the downhill margin. Transplants are then placed in thetrenches and tree seed scattered on the mounds.
10. Denudation is not confined to the hills. The lowlands havealso been rendered treeless in pursuit of timber and fuel. The consequencesare threefold. Crop growth is retarded, through the unrestricted passageof hot, dehydrating winds which cause rapid depletion of soil moisture.Wind erosion adds to the ravages of the already mentioned water erosion,this is particularly severe in Rajasthan. For lack of alternate fuel,dung is burned thus precluding its use as manure.
11. An intensive program of re-afforestation in the lowlands isrequired to combat this problem. This need is recognized by GOI whoseconcern is reflected in a recent report of the National Commission onAgriculture. 1/ The social forestry component of the proposed projectwould make a start in this direction.
1/ Interim Report on Social Forestry, National Commission on Agriculture,GOI, August 1973.
ANNEX 6Page 4
Proposed Work Under the Project
12. The forestry component of the proposed project would have threemain elements: tree planting in conjunction with pasture development inthe upper catchment; small plantations on government land in more favorableenvironments; and social forestry.
13. Although the hilly lands are no longer well suited for the growthof trees even the shallow soils are capable of supporting good stands ofgrass, provided adequate protection is given from excessive grazing andburning. This also offers the additional advantage of being more effectivethan woody vegetation in protecting hillslopes against water erosion inarid lands. For these reasons, government effort on the uplands should bediverted mainly to pasture production, using contour furrows and re-seedingtechniques described in para 28-29.
14. This is not to deny that there is a place for re-afforestationon the hills. Where there is enough soil to adequately support the growthof trees (soil, other than rock fragments, more than 12 inches deep),trees or shrubs could be planted in the contour furrows along with grass.About 2,000 ha, in pockets of land suitable for trees, would thus be plantedin the upper catchments of Ahmednagar, Sholapur, Bijapur and Anantapur. Tothe cost of pasture development (para 29) would be added Rs 75 per hectarefor deeper planting trenches plus the cost of seedlings (para 20 below).
15. Small plantations covering about 2,000 ha would be planted inbetter areas of government land where the objective would be to increasebuilding material and fuel supplies per se. Costs would be about Rs 300 perhectare (Rs 125/ha for fencing; Rs 175/ha for planting trenches) plus seedlings.
16. Social forestry would involve establishment of 500 ha of woodlotson village common lands. This would be done with the agreement of panchayats.Techniques and costs would be the same as for the government plantations andcosts would be wrt by the Forest Department. The care of the woodlots wouldhowever be left to the panchayat under departmental guidance. Also in colla-boration with panchayats the Department would plant about 300 km of windbreaks along roads, railway lines and canals at a cost, for planting labor,one or two protective waterings and a thorn shield, of about Rs 1,000 per km.
17. Individuals would be encouraged to develop small private woodl1.otsand to plant trees along their boundaries to provide fuel and to serve as awind break. Seedlings, to a maximum of 500 per farmer, would be provided freeby the Department.
18. In the four southern project districts the planning andimplementation of conservation, pasture and forest development programs onpublic lands is the responsibility of the Forest Department. Despite thefact that the project proposes a marked shift on emphasis, in upper catchment
ANNEX 6Page 5
areas, from trees to pasture, the Department should continue to have this
responsibility. The discipline and motivation of departmental staff is
noteworthy and wuol.d do much to ensure the success of the proposed pasture
and forestry component of the project.
19. To enable the Department to undertake this ambitious program, it
is proposed to provide funds for the creation of a Deputy Conservator ofForests Office in the four districts with a forestry program. In Rajasthan,where the project would be concerned only with pasture development, a similaroffice would be funded to provide the incremental staff needed for the Jodhpur
and Nagaur programs. This office would be attached to the Sheep and Wool
Department. Details of staffing and costs are given in Table 2. All planning
would be undertaken in close consultation with the Soil Conservation Department
to ensure that the conservation works in the upper and lower reaches of the:
catchments were complementary.
20. In the four districts with a forestry program, five hectares of
additional nursery capacity would be developed to provide the ne':essary
seedlings. 1/ Costs are given in Table 3.
Dryland Pastures
Present Situation
21. At present, pasture is found in three distinct areas: (a) public
lands; (2) privately-owned lands on which arable farming is no longer, or
only very rarely, carried out; and (3) village common lands.
22. Pasture on Public Lands. The public lands that support pasture--
government forest lands and government revenue lands--are mainly hilly
areas with steep slopes, shallow soils and often large amounts of rock out-
crop. These characteristics have precluded cultivation. In the land
capability classification they would belong to Classes V to VIII. Because
of long periods of over-exploitation, the pastures on these public lands
now largely consist of unproductive perennial grasses of low palatability
and nutritive value. Deterioration in the condition of the pastures has
been brought about by a combination of factors, including overgrazing
and excessive cutting and burning. The dominant pasture species is usuallyspear grass (Heteropogon.contortus) which is moderately palatable in its
early stages of growth but which rapidly loses palatability on seeding.
In addition, there are places on the hills where the aromatic, unpalatableCy bopogon colaratus is dominant. Mole palatable and productive grasses
such as Schima nervosum have almost disappeared or hlave been greatly
suppressed.
1/ In order to meet the varied demands for fuel, timber and browse, a range
of species would be grown. These might include: Eucalyptus spp., Acacia
tortilis, A. nilotica, A. victorede, A. arabica (babul), Ziziphus jujuba,
A. nummularia, Azadirachta indica (neem), Albizzia lebbek, A. amara,
Tamarindus indica. Prosopis juliflora (mesquite), commonly used in the
past as a windbreak, is a pernicious weed and should not be grown.
ANNEX 6Page 6
23. Pasture on Privately Owned Lands. Privately owned pasture is onlands that have been abandoned to cropping because of repeated crop failure.Their productivity, at best marginal for crop production in the beginningbecause slopes were too steep or the soils too shallow, has been furtherreduced by severe gullying and sheet erosion. These abandoned areas, oftenreferred to as old fallow lands, carry only very poor quality pasture andare often little better than wastelands. The pasture consists mostly ofunproductive, largely unpalatable annual grasses. Aristida spp. areprominent. In terms of the land capability classification these areasprobably belong to Class IV.
24. Pasture on Village Common Lands. -ie village blocks or villagecommon lands are areas administered by local panchayats for communal grazing.They are located near the villages and may fall into a number of capabilityclasses. As a result of continued overgrazing, palatable grasses havelargely disappeared and been replaced by low quality weed communities--dominated in Rajasthan, for example, by Tephrosia.
25. Although some attention has been given to pasture developmenton government lands, it is considered that much greater emphasis should beplaced on improvement of this resource potential on all district landsunsuited to cultivation. To date most development has been based on thecontrol of grazing, burning and cutting on some government forest lands.Because the original palatable, productive grasses have largely disappeared,protection alone cannot be expected to restore a good quality pasture.
26. The few minor attempts made to establish better pasture grasseshave employed unsatisfactory and costly techniques whichl could not bereplicated on a large scale. Little attention has been given to researchinto the improvement and management of dryland pastures in the droughtprone districts.
Pasture Development Propsed in the Project
27. Improvement of the dryland pastures in most cases would have asits primary objective the provision of a better fodder supply. However,there would be an additional important benefit to be gained by improvingthe pastures; the better grass cover on the hills would reduce runoffand would be an essential component of an integrated conservation programfor an entire watershed. Under the project, pasture improvement wouldbe carried out on about 90,000 ha in the six districts. 1/ Areas wouldfirst receive appropriate conservation treatment followed by re-seedingwith productive, palatable species. Thereafter simple management wouldbe imposed to control grazing, cutting and burning.
28. The technique for pasture improvement would involve diggingfurrows on the contour wherever there was sufficient soil or loose rock.
1/ Jodhpur 16,000 ha; Nagaur 5,000 ha; Ahmednagar 20,000 ha; Sholapur15,000 ha; Bijapur 15,000 ha; Anantapur 18,000 ha.
ANNEX 6Page 7
Such furrows would generally be hand dug although alternatively a single-furrow reversible mould board plough could be used. Seed of the desiredimproved grasses would then be broadcast into the furrows. Completeclean cultivation of the land for seed bed preparation cannot be justifiedbecause of its cost; it would, furthermore, create an erosion hazardbecause of the slope on 0ost of the areas. The use of fertilizers alsocannot be justified at present because of their high cost and shortage ofsupply.
29. V-shaped furrows dug by hand about 9 inches deep, one foot wideat the top and spaced 15 feet apart would cost about Rs 75 per ha. A widerspacing might ultimately prove sufficient, especially on flatter lands, forspacing would partly be determined by runoff. However, more rapid spreadof the improved grasses to the areas between the furrows would occur withcloser spacing. Furrows provide an ideal habitat for seedling establishment.Competition with the natural grasses and weeds is removed when the furrowsare dug; the furrows catch runoff water and they also protect the seedlingsfrom drying winds and from wind-borne sand in areas with sandy soils. Formaximum efficiency the furrows must follow the contours of the land. Theyshould be turned slightly uphill at the ends and across gullies so thatwater does not spill out into these vulnerable areas. The usual practicewhen installing contour furrows is to survey and peg contour lines about60 feet apart. Furrows are first dug along these surveyed lines. Theintervening furrows, at whatever spacin,g is selected, are then dug usingthe original furrows as guidelines.
30. Little information is as yet available on grasses suitable forre-seeding, but buffel grass (Cenchrus ciliaKis) and Cenchrus setigerusshow considerable promise. 1/ These grasses are drought resistant, pala-table, productive and would be expected to compete successfully with grassessuch as Heteropogon contortus. Three kgs of seed, costing Rs 12 per kg,should be sufficient to replant one hectare. At present, no suitable legumeis available for incorporation into the pastures in the drought pronedistricts.
31. Furrows should be prepared in the dry season, and re-seedingdone after the opening rains of the monsoon. By the end of the firstmonsoon Cenchrus would be established and producing seed. Stocking couldthen commence, initially at a rate of about 2 sheep per ha. After one ortwo years the stocking rate would be raised to the maximum level, about4 sheep per ha. Grazing would be continuous, not rotational; and, atstipulated rates, improved pastures would be able to meet year-roundfodder requirements, thus obviating the need for migration. Althoughyields would vary considerably, expected averages would be 3/4 ton per ha
1/ Types 357 and 358 of Cenchrus ciliaris and type 157 of C. setigerusare recommended by the Central Arid Zone Research Institute, Jodhpur.
ANNEX 6Page 8
during the first year, 1/ 1 ton during the second, 1-1/4 ton during thethird, rising to maximum production of about 1-1/2 tons in the fourth year.
32. The furrows would gradually silt up. To sustain the pastureyields, and for soil and water conservation purposes, new furrows should'be dug between the old ones every 6 to 10 years.
33. Many of the gullies that cause damage to the arable lowlandsbegin in the hills where the pasture aievelopment would be undertaken.Wlilst improved grass cover would reduce runoff, these gullies shouldnevertheless be rehabilitated to complete the conservation program. Drystone check dams should be built in the upper parts of the gullies; onlyin exceptional circumstances should these exceed 4 feet in height and25 feet in length. They should always be provided with a central notchto discharge excess water; otherwise side-cutting would occur leadingto failure of the structure. It is estimated that check dams would costan average of Rs 37 per hectare of treated catchment.
34. The survey and planning of works for the pasture improvementprogram would be carried out by the responsible department with additionalstaff being provided for as described above (para 19). Provision has alsobeen made for four seed multiplication farms, each of 400 ha, to provideseed of dryland pasture species for the re-seed4ng work. One would bedeveloped in each state. Staffing and costs of setting up a seed multiplicationf arm are set out in Table 4.
35. Management of pastures would be an essential part of theirimprovement. To facilitate management on government lands and villagecommons, boundary fencing would be erected around areas to be developed.The cheapest and most effective type of fencing is post and wire, thespecifications of which are set out in Table 5 2/. It would not benecessary to fence improved pasture on private lands.
36. Most of the areas of public land to be developed would be underthe jurisdiction of the Forest Department which would continue to managethem. Areas of revenue lands to be developed would be adopted by theForest Department in order to provide for their long term management.In both cases the forest guard service would control the use of thepastures and collect grazing/cutting fees. These would be set by theForest Department, with the advice of the District Development Authority,
1/ The assumption is made that the present average yield of dry foragefrom the pasture lands is 3/4 ton per ha. No significant yield increaseis expected from the re-seeded land by the end of the first growingseason, although nutritive value would increase as a result of theimproved varieties.
2/ Live fencing, currently advocated in some areas, is not considered tobe adequately stock proof.
ANNEX 6Page 9
in keeping with pasture quality, demand, etc. Management of pastures oncommon lands would be provided for under the sheep program. The only chargeindividual farmers would bear for pasture improvement on their lands wouldbe the subsidized rates for soil conservation works. Extension adviceand grass seed would be provided free.
37. The mission found that there was insufficient experience amongdepartmental and research staff to carry out the proposed pasture develop-ment program. Provision would therefore be made under the project forthe engagement of two internationally recruited consultants for threeyears. One would be primarily concerned with the design and launchingof an applied research program on pasture improvement and management (Annex 10).The second consultant would provide technical guidance on the pasture andsheep development programs (Annex 8).
Soil and Moisture Conservation on Arable Lands
38. Moisture is the limiting factor for crop growth in the droughtprone areas, where the climate is characterized by low, unreliable rain-fall and a short rainy season. Successful dryland farming is, therefore,dependent upon efficient moisture conservation and utilization. UJltimatelyit is the amount of rainfall stored in the soil that determines plant growthrather than the rainfall itself. 1/ Soil conservation is also critical inthese areas, where severe erosion frequently occurs as a result of highintensity rainfall on bare cultivated land early in the monsoon.
39. The objective of soil and moisture conservation is to reducethe rate and quantity of rainfall runoff. Various physical works, culturaland cropping practices are used to maximize infiltration and to dischargeresidual water slowly at safe locations. This task is made more difficultin the project districts because of the high intensity rains which are afeature of the drought prone areas. Water losses due to runoff dependupon the slope, the physical condition of the soil surface and upper soillayers, and the nature of the plant cover. Physical structures such asbunds, contour furrows or check dams break up long slopes and retardrunoff, thus allowing more time for infiltration. Even a simple operationlike cultivating the land on the contour helps by roughening the soilsurface in lines at right angles to the direction of the slope. As muchof the soil surface as possible should be protected by plant cover duringthe rainy season.
Present Position
40. Major soil losses have already occurred in the drought prone areasof India as a result of water erosion. In Maharashtra, for example, it hasbeen estimated that only 17% of the land has slightly eroded soils, 31%
1/ See research proposal Annex 10.
ANEX 6Page 1 0
being moderately eroded and 38% severely eroded. Loss of soil by watererosion has been accelerated as a result of the cropping of unsuitableland with steep slopes or shallow soils, failure to cultivate on thecontour, depletion of natural pastures on hills and uplands, and removalof forest for timber and firewood.
41. The focus of soil and water conservation on the arable lowlandsto date has been the construction of earth bunds. Nominally, these arecontour bunds, intended to retain all rainfall in situ. However, authoritiesrecognize that it is not possible to retain all the water from rains of highintensity, so surplusing structures, generally stone slab weirs, have beeninstalled in most bunds. These add about 25% to the cost of the bundingoperation. The position of the outlet weirs in the contour bunds is dictatedby the undulations in the topography and deviations of the bund from thecontour (para 42). An attempt is made to install a weir in the bundswherever water tends 'to pond. In practice this commonly means that weirsare located in positions where the excess water is discharged from bund tobund over the soil being prepared for cropping, or on which the crop isgrowing. This is the worst possible situation, because the subjected soilsurface is bare and loose or, at best, poorly protected under the cropbecause of inter-row cultivation for weed control. Inevitably, sheeterosion and gullying take place.
42. As far as bund alignment is concerned, the state soil con-servation services, in their standards for contour bund construction,usually state that the only permitted deviations from the contour are:
(a) not more than 6 inches when crossing a narrowridge;
(b) not more than 12 inches when crossing a narrowgully or depression; and
(c) not more than 6 inches to avoid excessive sinuosityand sharp angles in bund lines.
In practice, greater deviations than those specified are frequently allowed,primarily at the insistence of the farmers who prefer that bunds delineateproperty boundaries on regular shaped plots. Unfortunately this often leadsto a situation in which the bunds actually make it impossible for the farmersto cultivate on the contour. This is unacceptable, for the bunds shouldprovide guidelines to the farmers for proper contour cultivation. In manycases the problem could have been mitigated by more careful planning.However much of the conservation work was undertaken as a famine reliefoperation in which the expedient of employment creation often precludedthorough planning. Hence the project's philosophy of providing sufficientplanning capacity to create a shelf of works against future needs (para 46).
43. In spite of the surplusing arrangements, high intensity rains onsoils of low permeability still frequently cause ponding behind the bunds.
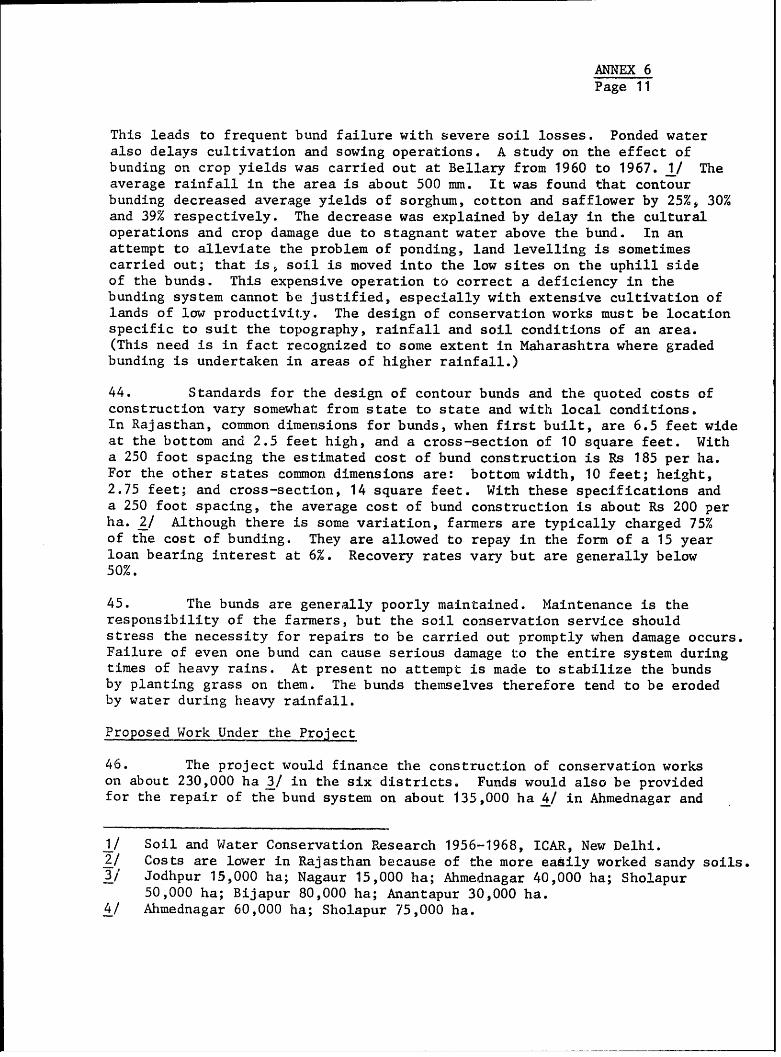
ANNEX 6Page 1 1
This leads to frequent bund failure with severe soil losses. Ponded wateralso delays cultivation and sowing operations. A study on the effect ofbunding on crop yields was carried out at Bellary from 1960 to 1967. 1/ Theaverage rainfall in the area is about 500 mm. It was found that contourbunding decreased average yields of sorghum, cotton and safflower by 25%, 30%and 39% respectively. The decrease was explained by delay in the culturaloperations and crop damage due to stagnant water above the bund. In anattempt to alleviate the problem of ponding, land levelling is sometimescarried out; that is, soil is moved into the low sites on the uphill sideof the bunds. This expensive operation to correct a deficiency in thebunding system cannot be justified, especially with extensive cultivation oflands of low productivity. The design of conservation works must be locationspecific to suit the topography, rainfall and soil conditions of an area.(This need is in fact recognized to some extent in Maharashtra where gradedbunding is undertaken in areas of higher rainfall.)
44. Standards for the design of contour bunds and the quoted costs ofconstruction vary somewhat from state to state and with local conditions.In Rajasthan, common dimensions for bunds, when first built, are 6.5 feet wideat the bottom and 2.5 feet high, and a cross-section of 10 square feet. Witha 250 foot spacing the estimated cost of bund construction is Rs 185 per ha.For the other states common dimensions are: bottom width, 10 feet; height,2.75 feet; and cross-section, 14 square feet. With these specifications anda 250 foot spacing, the average cost of bund construction is about Rs 200 perha. 2/ Although there is some variation, farmers are typically charged 75%of the cost of bunding. They are allowed to repay in the form of a 15 yearloan bearing interest at 6%. Recovery rates vary but are generally below50%.
45. The bunds are generally poorly maintained. Maintenance is theresponsibility of the farmers, but the soil conservation service shouldstress the necessity for repairs to be carried out promptly when damage occurs.Failure of even one bund can cause serious damage to the entire system duringtimes of heavy rains. At present no attempt is made to stabilize the bundsby planting grass on them. The bunds themselves therefore tend to be erodedby water during heavy rainfall.
Proposed Work Under the Project
46. The project would finance the construction of conservation workson about 230,000 ha 3/ in the six districts. Funds would also be providedfor the repair of the bund system on about 135,000 ha 4/ in Ahmednagar and
1/ Soil and Water Conservation Research 1956-1968, ICAR, New Delhi.2/ Costs are lower in Rajasthan because of the more easily worked sandy soils.3/ Jodhpur 15,000 ha; Nagaur 15,000 ha; Ahmednagar 40,000 ha; Sholapur
50,000 ha; Bijapur 80,000 ha; kiantapur 30,000 ha.4/ Ahmednagar 60,000 ha; Sholapur 75,000 ha.
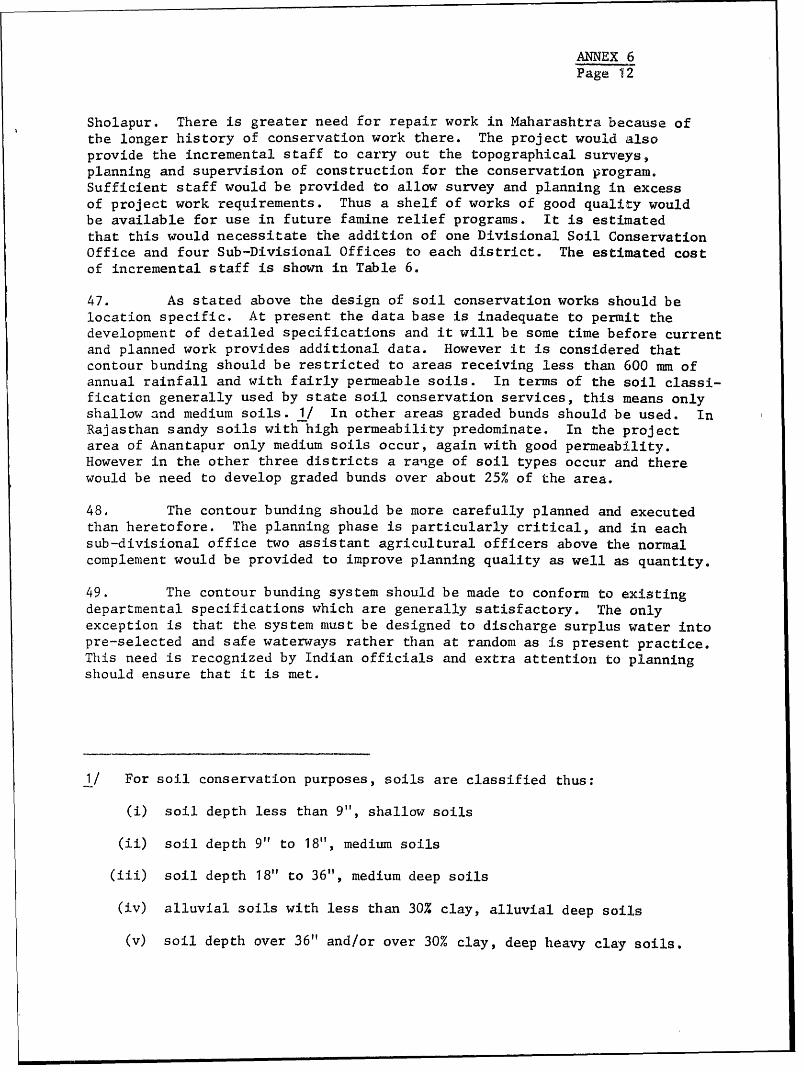
ANNEX 6Page 12
Sholapur. There is greater need for repair work in Maharashtra because ofthe longer history of conservation work there. The project would alsoprovide the incremental staff to carry out the topographical surveys,planning and supervision of construction for the conservation program.Sufficient staff would be provided to allow survey and planning in excessof project work requirements. Thus a shelf of works of good quality wouldbe available for use in future famine relief programs. It is estimatedthat this would necessitate the addition of one Divisional Soil ConservationOffice and four Sub-Divisional Offices to each district. The estimated costof incremental staff is shown in Table 6.
47. As stated above the design of soil conservation works should belocation specific. At present the data base is inadequate to permit thedevelopment of detailed specifications and it will be some time before currentand planned work provides additional data. However it is considered thatcontour bunding should be restricted to areas receiving less than 600 mm ofannual rainfall and with fairly permeable soils. In terms of the soil classi-fication generally used by state soil conservation services, this means onlyshallow and medium soils. 1/ In other areas graded bunds should be used. InRajasthan sandy soils with high permeability predominate. In the projectarea of Anantapur only medium soils occur, again with good permeability.However in the other three districts a range of soil types occur and therewould be need to develop graded bunds over about 25% of the area.
48. The contour bunding should be more carefully planned and executedthan heretofore. The planning phase is particularly critical, and in eachsub-divisional office two assistant agricultural officers above the normalcomplement would be provided to improve planning quality as well as quantity.
49. The contour bunding system should be made to conform to existingdepartmental specifications which are generally satisfactory. The onlyexception is that the system must be designed to discharge surplus water intopre-selected and safe waterways rather than at random as is present practice.This need is recognized by Indian officials and extra attention to planningshould ensure that it is met.
1/ For soil conservation purposes, soils are classified thus:
(i) soil depth less than 9", shallow soils
(ii) soil depth 9" to 18", medium soils
(iii) soil depth 18" to 36", medium deep soils
(iv) alluvial soils with less than 30% clay, alluvial deep soils
(v) soil depth over 36" and/or over 30% clay, deep heavy clay soils.
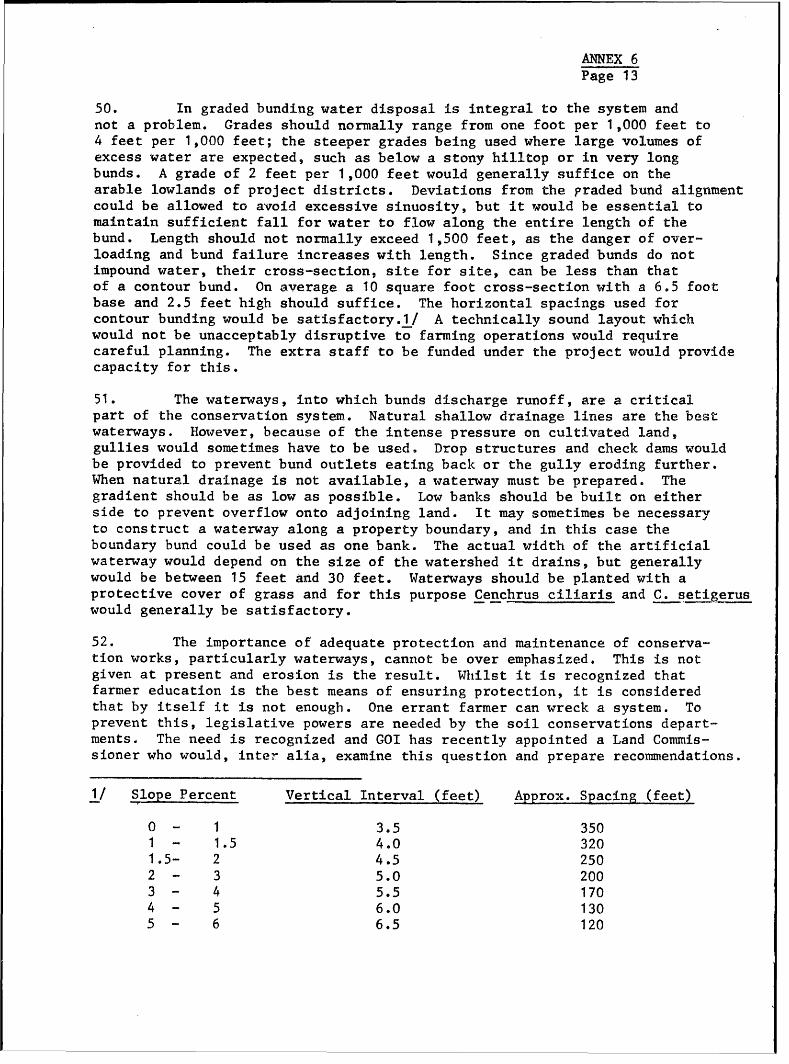
ANNEX 6Page 13
50. In graded bunding water disposal 's integral to the syrstem andnot a problem. Grades should normally range from one foot per 1,000 feet to4 feet per 1,000 feet; the steeper grades being used where large volumes ofexcess water are expected, such as below a stony hilltop or in very longbunds. A grade of 2 feet per 1,000 feet would generally suffice on thearable lowlands of project districts. Deviations from the praded bund alignmentcould be allowed to avoid excessive sinuosity, but it would be essential tomaintain sufficient fall for water to flow along the entire length of thebund. Length should not normally exceed 1,500 feet, as the danger of over-loading and bund failure increases with length. Since graded bunds do notimpound water, their cross-section, site for site, can be less than thatof a contour bund. On average a 10 square foot cross-section with a 6.5 footbase and 2.5 feet high should suffice. The horizontal spacings used forcontour bunding would be satisfactory.1/ A technically sound layout whichwould not be unacceptably disruptive to farming operations would requirecareful planning. The extra staff to be funded under the project would providecapacity for this.
51. The waterways, into which bunds discharge runoff, are a criticalpart of the conservation system. Natural shallow drainage lines are the bestwaterways. However, because of the intense pressure on cultivated land,gullies would sometimes have to be used. Drop structures and check dams wouldbe provided to prevent bund outlets eating back or the gully eroding further.When natural drainage is not available, a waterway must be prepared. Thegradient should be as low as possible. Low banks should be built on eitherside to prevent overflow onto adjoining land. It may sometimes be necessaryto construct a waterway along a property boundary, and in this case theboundary bund could be used as one bank. The actual width of the artificialwaterway would depend on the size of the watershed it drains, but generallywould be between 15 feet and 30 feet. Waterways should be planted with aprotective cover of grass and for this purpose Cenchrus ciliaris and C. setigerus
would generally be satisfactory.
52. The importance of adequate protection and maintenance of conserva-tion works, particularly waterways, cannot be over emphasized. This is notgiven at present and erosion is the result. Wlilst it is recognized thatfarmer education is the best means of ensuring protection, it is consideredthat by itself it is not enough. One errant farmer can wreck a system. Toprevent this, legislative powers are needed by the soil conservations depart-ments. The need is recognized and GOI has recently appointed a Land Conmis-sioner who would, inter alia, examine this question and prepare recommendations.
1/ Slope Percent Vertical Interval (feet) Approx. Spacing (feet)
0 - 1 3.5 3501 - 1.5 4.0 3201.5- 2 4.5 2502 - 3 5.0 2003 - 4 5.5 1704 - 5 6.0 1305 - 6 6.5 120
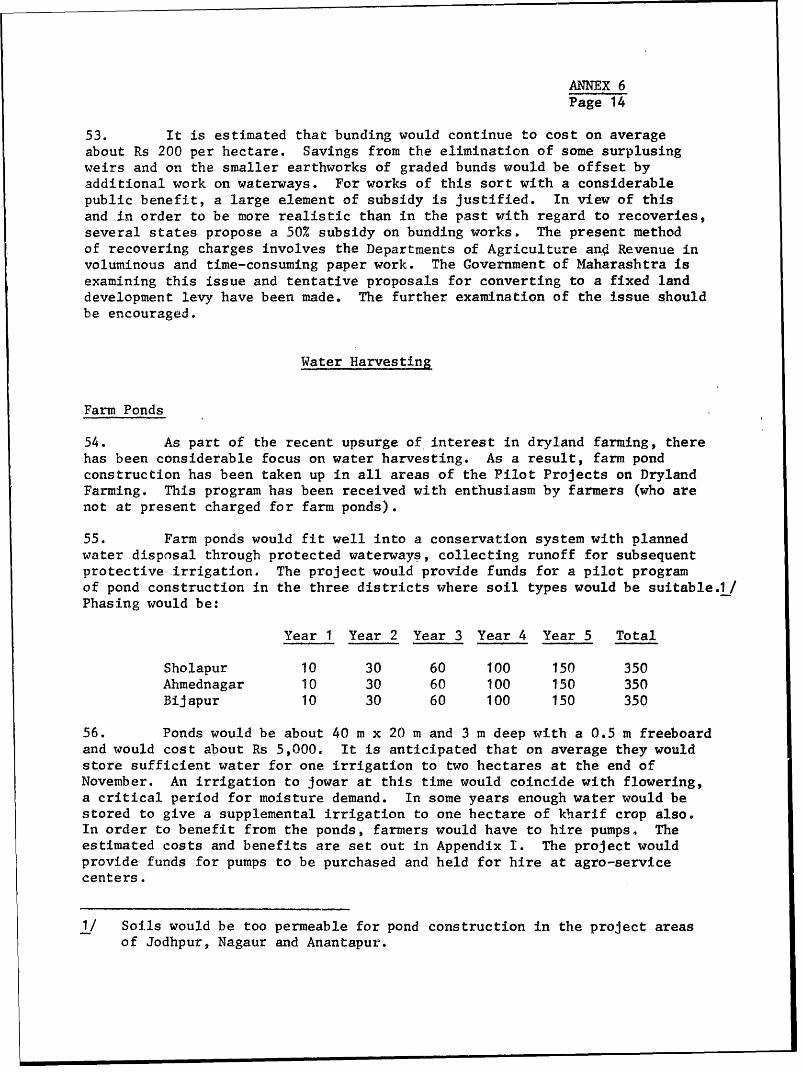
ANNEX 6Page 14
53. It is estimated that bunding would continue to cost on averageabout Rs 200 per hectare. Savings from the elimination of some surplusingweirs and on the smaller earthworks of graded bunds would be offset byadditional work on waterways. For works of this sort with a considerablepublic benefit, a large element of subsidy is justified. In view of thisand in order to be more realistic than in the past with regard to recoveries,several states propose a 50% subsidy on bunding works. The present methodof recovering charges involves the Departments of Agriculture and1 Revenue involuminous and time-consuming paper work. The Government of Maharashtra isexamining this issue and tentative proposals for converting to a fixed landdevelopment levy have been made. The further examination of the issue shouldbe encouraged.
Water Harvesting
Farm Ponds
54. As part of the recent upsurge of interest in dryland farming, therehas been considerable focus on water harvesting. As a result, farm pondconstruction has been taken up in all areas of the Pilot Projects on DrylandFarming. This program has been received with enthusiasm by farmers (who arenot at present charged for farm ponds).
55. Farm ponds would fit well into a conservation system with plannedwater disposal through protected waterways, collecting runoff for subsequentprotective irrigation. The project would provide funds for a pilot programof pond construction in the three districts where soil types would be suitable.1/Phasing would be:
Year 1 Year 2 Year 3 Year 4 Year 5 Total
Sholapur 10 30 60 100 150 350Ahmednagar 10 30 60 100 150 350Bijapur 10 30 60 100 150 350
56. Ponds would be about 40 m x 20 m and 3 m deep with a 0.5 m freeboardand would cost about Rs 5,000. It is anticipated that on average they wouldstore sufficient water for one irrigation to two hectares at the end ofNovember. An irrigation to jowar at this time would coincide with flowering,a critical period for moisture demand. In some years enough water would bestored to give a supplemental irrigation to one hectare of kharif crop also.In order to benefit from the ponds, farmers would have to hire pumps. Theestimated costs and benefits are set out in Appendix I. The project wouldprovide funds for pumps to be purchased and held for hire at agro-servicecenters.
1/ Soils would be too permeable for pond construction in the project areasof Jodhpur, Nagaur and Anantapur.
ANNEX 6Page 15
Nalla Flooding
57. It is current practice in Maharashtra to build substantial bundsacross the lower reaches of water courses (nallas) where they are wide andrelatively flat bottomed. These have a twofold objective, to impound waterand trap silt. Some of the water is expected to add to groundwater rechargevia percolation and some to be held in the silt. The latter is expected tobuild up and be cultivable, hence reclaiming a portion of the water course.Funds for the expansion of the program were requested in the original projectbut the mission recommends against the practice of nalla flooding.
58. With the integrated watershed approach to conservation proposedunder the project, large volumes of silt laden water should not accumulatein the lower reaches of water courses. Soil and water should be conservedin situ where they belong. No special provision is therefore made for nallaflooding. To the extent that no conservation system can be perfect, theremight be occasions when sufficient water would pass through a water courseto merit impounding for supplemental irrigation. There would be no objectionto small nalla bunds being built for this purpose.
Dune Stabilization
59. In Rajasthan wind erosion is a major problem. It has been suggestedthat the air over the State is the dustiest in the world. The project'sconservation programs and allied efforts under famine relief should help remedythe problem. However it will be many years before the control of wind erosioncan be effected. Meanwhile, limited areas will continue to be threatened bysand dune movement. The project would fund a small program of dune stabili-zation in Nagaur District to protect valuable arable land and small townshipsagainst dune encroachment.
60. The area to be stabilized would be perimeter fenced using post andwire fencing of the type described for pasture improvement (para 30). Alattice of brush wood barriers would then be built at a spacing of about 3 m.This would reduce wind velocities at ground level. At the onset of the monsoon,rooted slips of Lasiurus sindicus would be planted in the protected spaces ofthe lattice. Occasional seedlings of drought resistant tree species couldalso be planted (Acacia tortilis, A. senegal, Zizyphus nummularia). Thesecould be established using the clay/sand/manure brick techniques developedat the Central Arid Zone Research Institute.
61. Dune stabilization on the above basis would cost about Rs 500 perhectare. The project would provide funds to stabilize 1,000 ha of dunes.
Nove.mber 4, 1974
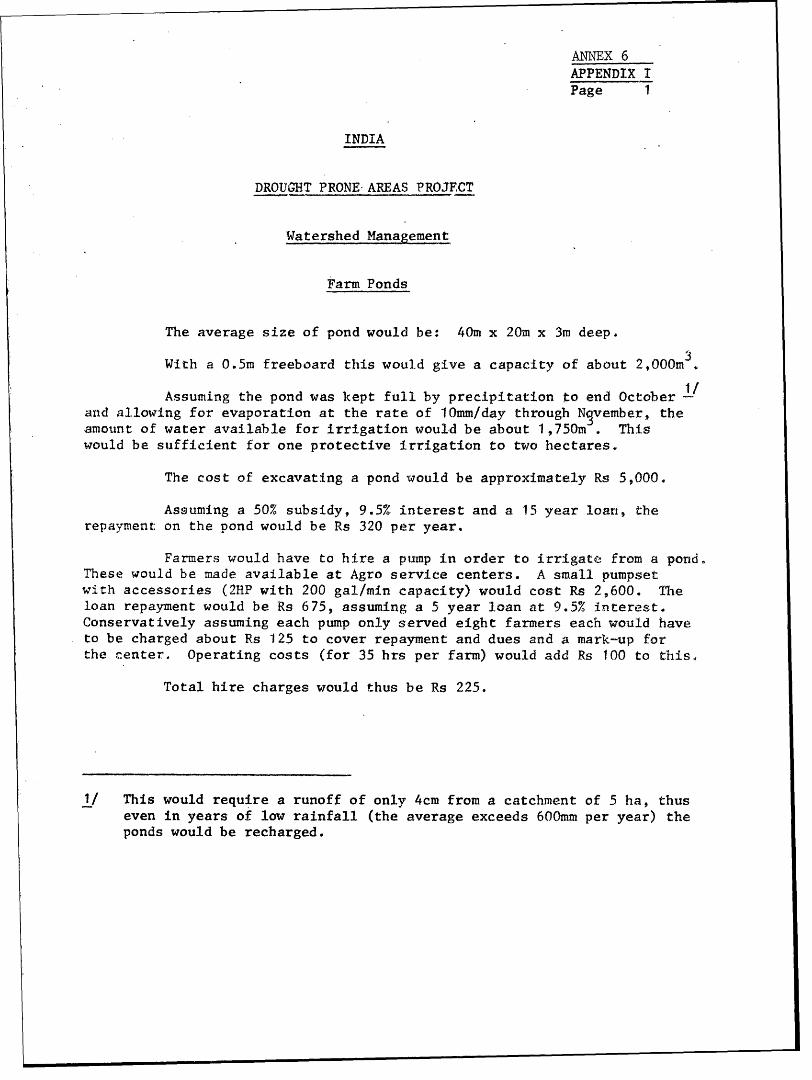
ANNEX 6APPENDIX IPage I
INDIA
DROIVGT PRONE AREAS PROJECT
Watershed Management
Farm Ponds
The average size of pond would be: 40m x 20m x 3m deep.
With a 0.5m freeboard this would give a capacity of about 2,OOOm
Assuming the pond was kept full by precipitation to end October /and allowing for evaporation at the rate of 10mm/day through Ngvember, theamount of water available for irrigation would be about 1,750m s Thiswould be sufficient for one protective irrigation to two hectares.
The cost of excavating a pond would be approximately Rs 5,000.
Assuming a 50% subsidy, 9.5% interest and a 15 year loan, therepayment on the pond would be Rs 320 per year.
Farmers would have to hire a pump in order to irrigate from a pond.These would be made available at Agro service centers. A small pumpsetwith accessories (2H1P with 200 gal/min capacity) would cost Rs 2,600. Theloan repayment would be Rs 675, assuming a 5 year loan at 9.5% interest.Conservatively assuming each pump only served eight farmers each would haveto be charged about Rs 125 to cover repayment and dues and a mark-up forthe Center. Operating costs (for 35 hrs per farm) would add Rs 100 to this,
Total hire charges would thus be Rs 225.
1/ This would require a runoff of only 4cm from a catchment of 5 ha, thuseven in years of low rainfall (the average exceeds 600mm per year) theponds would be recharged.
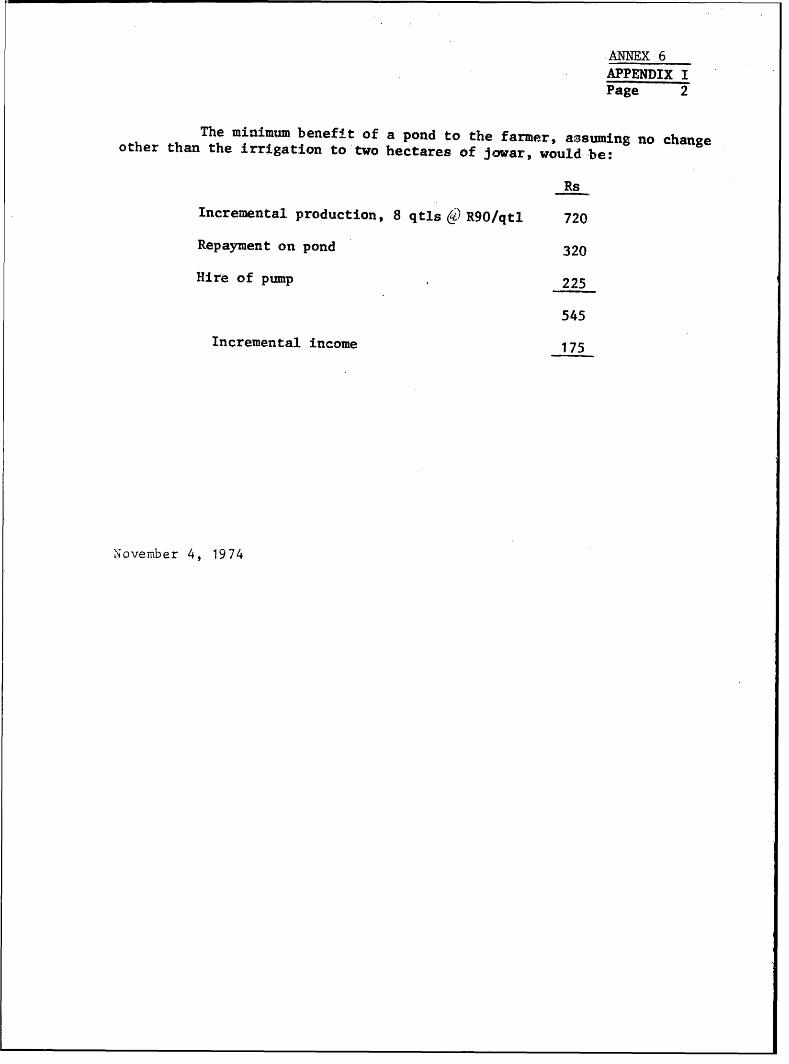
ANNEX 6APPENDIX IPage 2
The minimum benefit of a pond to the farmer, a$suming no changeother than the irrigation to two hectares of jowar, would be:
Rs
Incremental production, 8 qtls & R90/qtl 720
Repayment on pond 320
Hire of pump 225
545
Incremental income 175
November 4, 1974
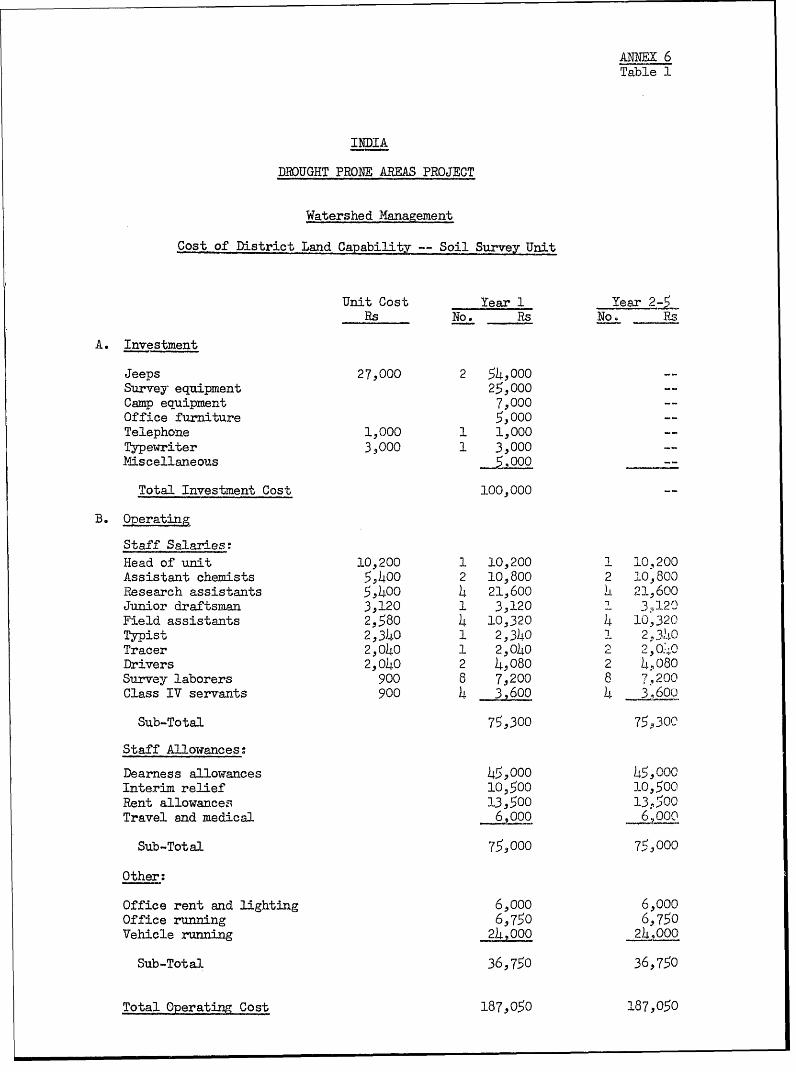
ANNEX 6Table 1
INDIA
DROUGHT PRONE AREAS PROJECT
Watershed Management
Cost of District Land Capability -- Soil Survey Unit
Unit Cost Year 1 Year 2-5Rs No. Rs No. Rs
A. Investment
Jeeps 27,000 2 54,000 --Survey equipment 25,000 --Camp eauipment 7,000Office furniture 5,000 --Telephone 1,000 1 1,000 --Typewriter 3,000 1 3,000 -Miscellaneous 5000--
Total Investment Cost 100,000 --
B. Operating
Staff Salaries:Head of unit 10,200 1 10,200 1 10,200Assistant chemists 5,400 2 10,800 2 10,800Research assistants 5,400 4 21,600 .>L 21,600Junior draftsman 3,120 1 3,120 ' 3,120Field assistants 2,580 4 10,320 4 10,320Typist 2,340 1 2,340 1 2,340Tracer 2,040 1 2,0)0 2 240.-;0Drivers 2,040 2 4,080 2 4,080Survey laborers 900 8 7,200 8 7.200Class IV servants 900 4 3 600 4 3600
Sub-Total 75,300 75,300
Staff Allowances.
Dearness allowances 45,000 45,OOCInterir relief 10,500 10,500Rent allowances 13,500 13,500Travel and medical 6L 00 -6 000
Sub-Total 75,000 75,000
Other:
Office rent and lighting 6,000 6,000Office running 6,750 6,750Vehicle running _2)4000 000
Sub-Total 36,750 36,750
Total Operating Cost 187,050 187,050
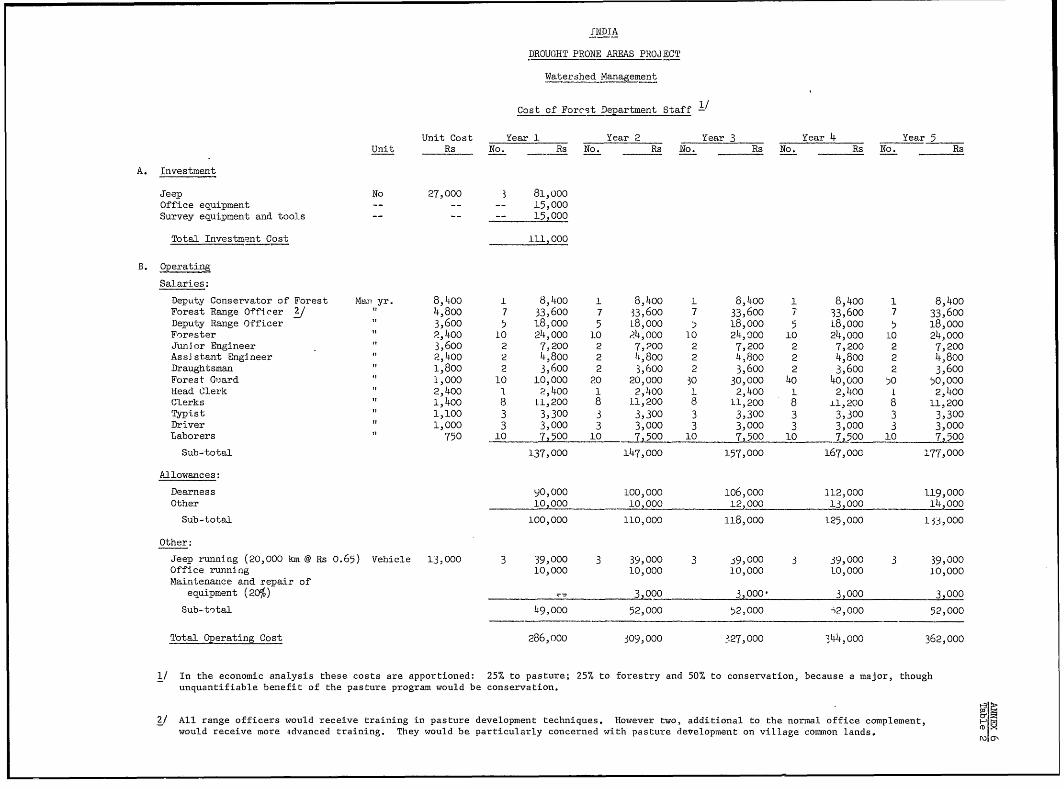
INDIA
DROUGHT PRONE AREAS PROJECT
Watershed Management
Cost of Forcst Department Staff
Unit Cost Year 1 Year 2 Year 3 Year 4 Year 5Unit Rs No. Rs No. Rs No. Rs No. Rs No. Rs
A. Investment
Jeep No 27,000 3 81,000Office equipment 15,000Survey equipment amd tools -- -- -- 15,000
Total Investment Cost 111,000
B. Operating
Salaries:
Deputty Conservator of Forest Man yr. 8,400 1 8,400 1 8,400 1 8,400 1 8,400 1 8,400Forest Range Officer i/ 4,800 7 33,600 7 33,600 7 33,600 7 33,600 7 33,600Deputy Range Officer 3,600 5 18,000 5 L8,000 5 18,000 5 18,000 5 18,000Forester 2,400 10 24,000 10 4,000 10 24,000 10 24,000 10 24,000Junior Engineer 3,600 2 7,200 2 7,200 2 7,200 2 7,200 2 7,200Assistant Engineer 2,400 2 4,800 2 4,800 2 4,800 2 4,800 2 4,800Draughtsman 1,800 2 3,600 2 3,600 2 3,600 2 3,600 2 3,600Forest Giuard " 1,000 10 10,000 20 20,000 30 30,000 40 40,0o0 50 50,000Head Clerk 2,400 I 2,400 1 2,400 1 2,400 1 2,400 1 2,400Clerks 1,400 8 11,200 8 11,200 8 11,200 8 1l,200 8 11,200Typist " 1,100 3 3,300 3 3,300 3 3,300 3 3,300 3 3,300Driver " 1,000 3 3,000 3 3,000 3 3,000 3 3,000 3 3,000Laborers " 750 10 7,500 10 7,500 10 7,500 10 7,500 10 7,500
Sub-total 137,000 147,000 157,000 167,000 177,000
Allowances:
Dearness 90,000 100,000 106,000 112,000 119,000Other 10,000 10,000 12,000 13,000 14,000
Sub-total 100,000 110,000 118,000 125,000 1$3,000
Other:
Jeep running (20,000 km @ Rs 0.65) Vehicle 13,000 3 39,000 3 39,000 3 .9,000 3 39,000 3 39,000Office running 10,000 10,000 10,000 LO,000 10,000Maintenance and repair of
equipment (20%) - 3,000 3,000' 3,000 3,000
Sub-total 49,000 52,000 52,000 i2,000 52,000
Total Oerating Cost 286,ooo 309,000 327,000 344,000 362,000
1/ In the economic analysis these costs are apportioned: 25% to pasture; 25% to forestry and 50% to conservation, because a major, thoughunquantifiable benefit of the pasture program would be conservation.
2/ All range officers would receive training in pasture development techniques. However two, additional to the normal office complement,wo-uld receive more idvanced training. They would be particularly concerned with pasture development on village common lands. (D
ro 01
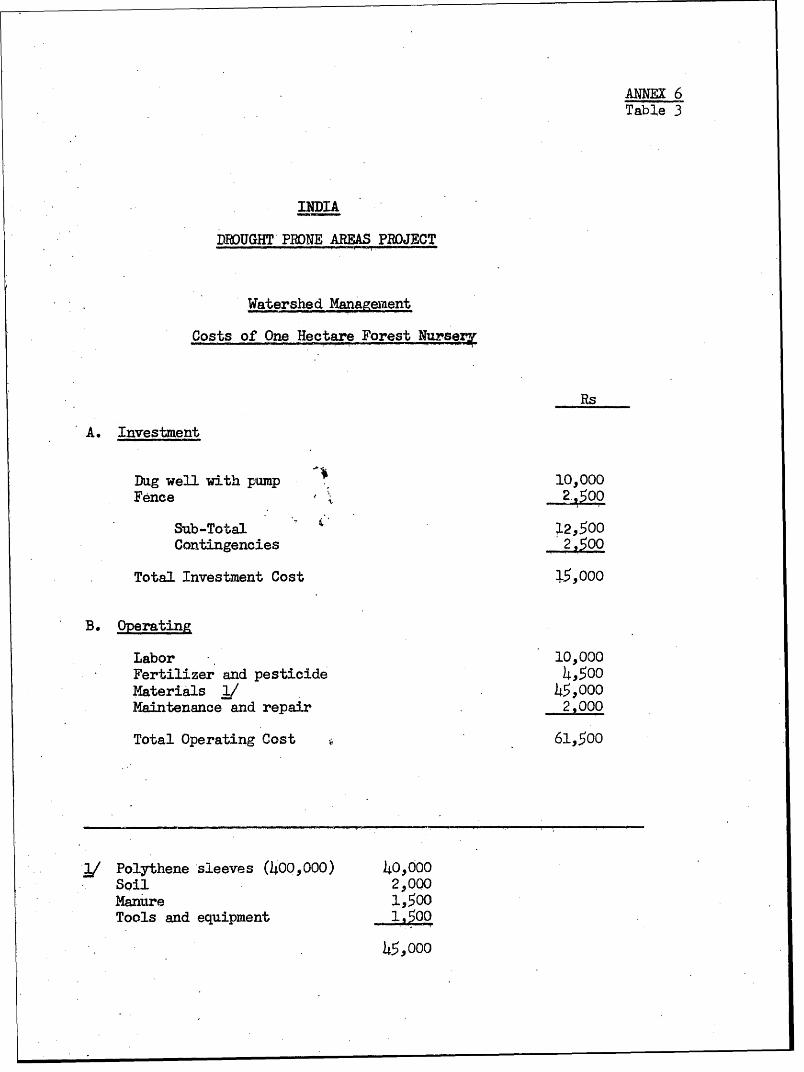
ANNEX 6Table 3
INDIA
DROUGHT PRONE AREAS PROJECT
Watershed Management
Costs of One Hectare Forest Nurgser-
Rs
A. Investment
Dug well with pump . 10,000Fence 2.2500
Sub-Total. 22,500Contingencies 2 ,50
Total Investment Cost 15J,000
B. Operating
Labor 10,000Fertilizer and pesticide 4 ,500Materials , 45,000Maintenance and repair . 2,000
Total Operating Cost s 61,500
-/ Polythene sleeves (400,000) 40,000Soil 2,v000Maniure 1.,500Tools and equipment
45,000
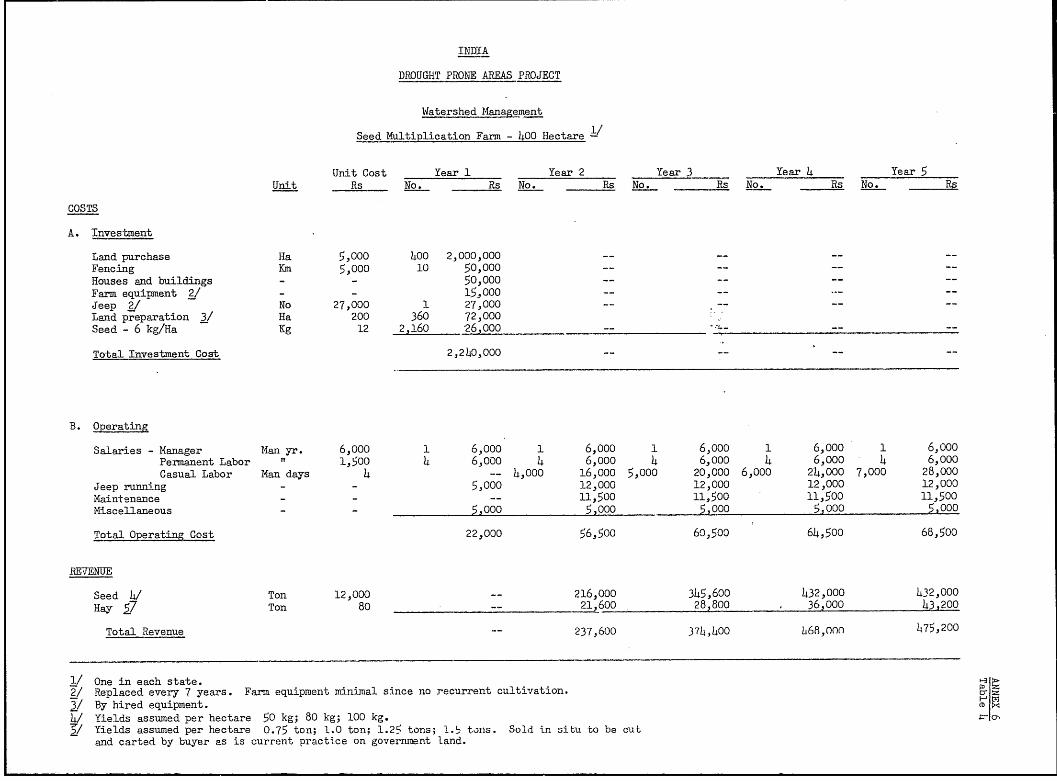
INDIA
DROUGHT PRONE AREAS PROJECT
Watershed Management
Seed Multiplication Farm - H40 Hectare -
Unit Cost Year 1 Year 2 Year 3 Year 4 Year 5Unit Rs No. Rs No. Rs No. Rs No. Rs No. Rs
COSTS
A. Investment
Land purchase Ha 5,000 400 2,000,000
Fencing Km 5,000 10 50,000 -- -- --
Houses and buildings - - 50,000 -- -- --
Farm equipment 2/ - - 15,000 -- -- --
Jeep 2/ No 27,000 1 27,000 -- -- --
Land preparation 3/ Ha 200 360 72,000Seed - 6 kg/Ha Kg 12 2,160 260 -- -
Total Investment Cost 2.2)40,000 -- -- --
B. Operating
Salaries - Manager Man yr. 6,000 1 6,000 1 6,000 1 6,000 1 6,000 1 6,000
Permanent Labor t 1,500 4 6,000 4 6,ooo 4 6,000 4 6,000 4 6,000
Casual Labor Man days 4 --. 4,000 16,000 5,000 20,000 6,000 24,000 7,000 28,000
Jeep running - - 5,000 12,000 12,000 12,000 12,000
Maintenance - - -- 11,500 11,500 11,500 11,500Miscellaneous - - 5,000 5,000 5,000 5,000 5,000
Total Operating Cost 22,000 56,500 60,500 64,500 68,500
REVENUE
Seed 4/ Ton 12,000 -- 216,000 345,600 432,000 432,000
Hay 57 Ton 80 -- 21,600 28,800 36,000 43,200
Total Revenue -- 237,600 3744,400 L68,oon 475,200
1/ One in each state.2/ Replaced every 7 years. Farm equipment mrinimal since no recurrent cultivation. C
3/ By hired equipment. CD
4/ Yields assumed per hectare 50 kg; 80 kg; 100 kg. c
:/ Yields assumed per hectare 0.75 ton; 1.0 ton; 1.25 tons; 1.b tons. Sold in situ to be cutand carted by buyer as is current practice on government land.
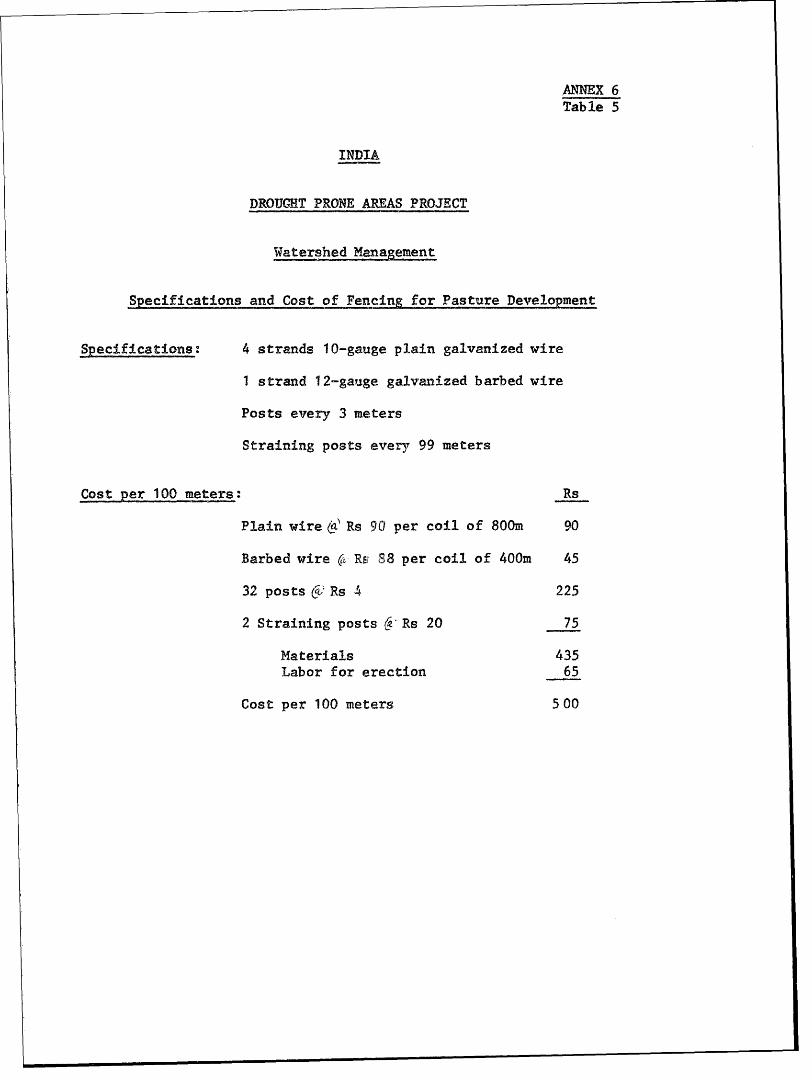
ANNEX 6Table 5
INDIA
DROUGHT PRONE AREAS PROJECT
Watershed Management,
Specifications and Cost of Fencn fr Pasture Deveqlopment
Specifications: 4 strands 10-gauge plain galvanized wire
1 strand 12-gauge galvanized barbed wire
Posts every 3 meters
Straining posts eveny 99 meters
Cost per 100 meters: Rs
Plain wire e Rs 90 per coil of 800m 90
Barbed wire (c. Rs 88 per coil of 400m 45
32 posts ,i Rs 4 225
2 Straining posts C Rs 20 75
Materials 435Labor for erection 65
Cost per 100 meters 500
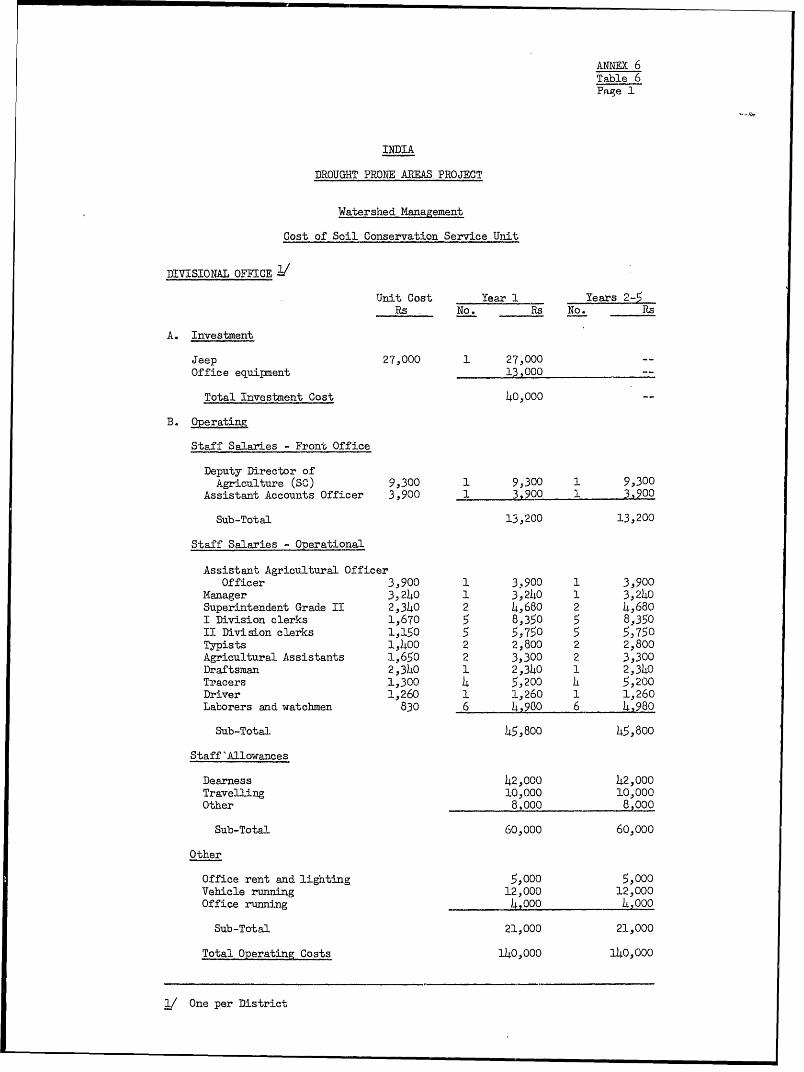
ANNEX 6Table 6Page 1
INDIA
DROUGHT PRONE AREAS PROJECT
Watershed Management
Cost of Soil Conservation Service Unit
DIVISIONAL OFFICE
Unit Cost Year 1 Years 2-5
Rs No. Rs No. Rs
A. Investment
Jeep 27,000 1 27,000 --
Office equipment 13,000 --
Total Investment Cost 40,000 --
B. Operating
Staff Salaries - Front Office
Deputy Director ofAgriculture (SC) 9,300 1 9,300 1 9,300
Assistant Accounts Officer 3,900 1 3,900 - 1 3900
Sub-Total 13,200 13,200
Staff Salaries - Operational
Assistant Agricultural OfficerOfficer 3,900 1 3,900 1 3,900
Manager 3,240 1 3,240 1 3,240
Superintendent Grade II 2,340 2 4,680 2 4,680
I Division clerks 1,670 5 8,350 5 8,350
II Division clerks 1,150 5 5,750 5 5,75oTypists 1,400 2 2,800 2 2,800
Agricultural Assistants 1,650 2 3,300 2 3,300
Draftsman 2,340 1 2,340 1 2,340
Tracers 1,300 4 5,200 L 5,200
Driver 1,260 1 1,260 1 1,260
Laborers and watchmen 830 6 4,900 6 - 4980
Sub-Total 45,800 45,800
Staff 'Allowances
Dearness 42,000 42,000
Travelling 10,000 10,000
Other 8,000 8,000
Sub-Total 60,000 60,000
Other
Office rent and lighting 5,000 5,000
Vehicle running 12,000 12,000
Office running 4,000 4,000
Sub-Total 21,000 21,000
Total Operating Costs 140,000 140,000
1/ One per District
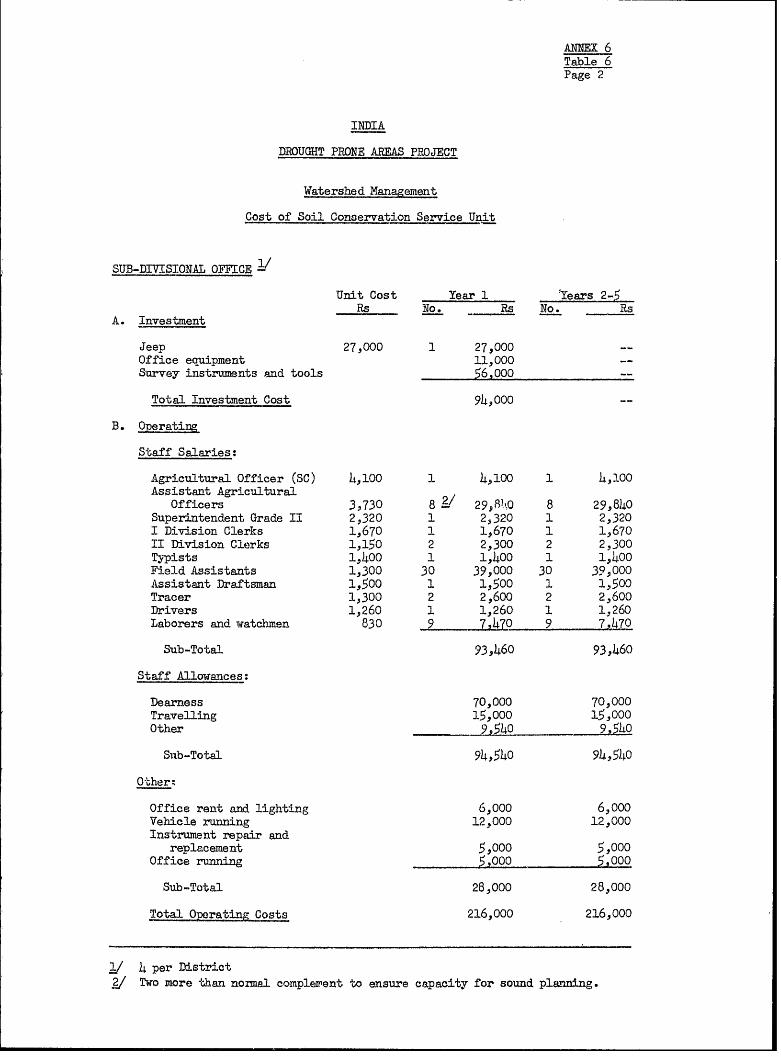
ANNEX 6Table 6Page 2
INDIA
DROUGHT PRONE AREAS PROJECT
Watershed Management
Cost of Soil Conservation Service Unit
SUB-DIVISIONAL OFFICE
Unit Cost Year 1 - ears 2-5Rs No. Rs No. Rs
A. Investment
Jeep 27,000 1 27,000 --Office equipment 11,000 --Survey instruments and tools 56,000
Total Investment Cost 94,000 --
B. Operating
Staff Salaries:
Agricultural Officer (SC) 4,100 1 4,100 1 4,100Assistant Agricultural
Officers 3,730 8 &' 29,8!Q 8 29,840Superintendent, Grade II 2,320 1 2,320 1 2,320I Division Clerks 1,670 1 1,670 1 1,670II Division Clerks 1,150 2 2,300 2 2,300Typists 1,400 1 1,400 1 1,400Field Assistants 1,300 30 39,000 30 39,000Assistant Draftsman 1,500 1 1,00 1 1,500Tracer 1,300 2 2,i600 2 2,600Drivers 1,260 1 1,260 1 1,260Laborers and watchmen 830 7.4 o 9 7_470
Sub-Total 93,460 93,460
Staff Allowances:
Dearness 70,000 70,000Travelling 15,000 15,000Other 9,54o 9,540
Sub-Total 94,540 94,540
Otherz
Office rent and lighting 6,000 6,000Vehicle running 12,000 12,000Instrument repair and
replacement 5,000 5,000Office running 5,000 5,000
Sub-Total 28,000 28,000
Total Operating Costs 216,000 216,000
/ 4 per District/ Two more than normal complewent to ensure capacity for sound planning.
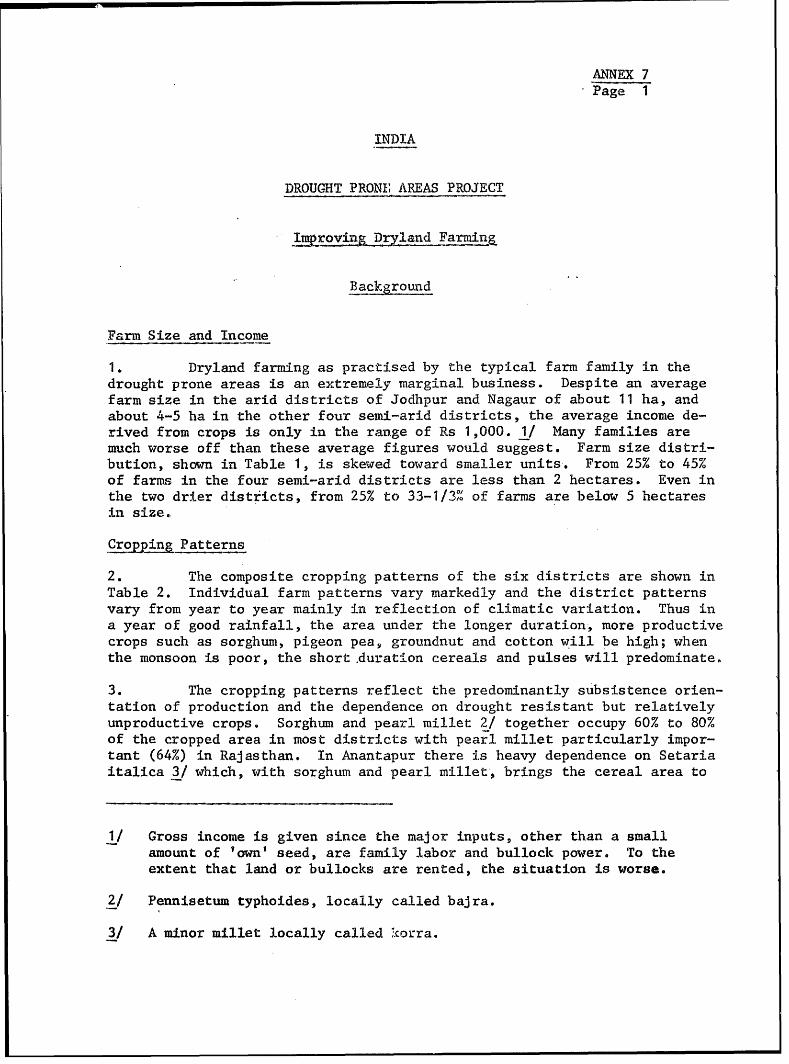
ANNEX 7Page 1
INDIA
DROUGHT PRONE AREAS PROJECT
ImpoigDryland Farmuing
Background
Farm Size and Income
1. Dryland farming as practised by the typical farm family in thedrought prone areas is an extremely marginal business. Despite an averagefarm size in the arid districts of Jodhpur and Nagaur of about 11 ha, andabout 4-5 ha in the other four semi-arid districts, the average income de-rived from crops is only in the range of Rs 1,000. 1/ Many families aremuch worse off than these average figures would suggest. Farm size distri-bution, shown in Table 1, is skewed toward smaller units. From 25% to 45%of farms in the four semi-arid districts are less than 2 hectares. Even inthe two drier districts, from 25% to 33-1/3%o of farms are below 5 hectaresin size.,
Crpping Patterns
2. The composite cropping patterns of the six districts are shown inTable 2. Individual farm patterns vary markedly and the district patternsvary from year to year mainly in reflection of climatic variation. Thus ina year of good rainfall, the area under the longer duration, more productivecrops such as sorghum, pigeon pea, groundnut and cotton will be high; whenthe monsoon is poor, the short duration cereals and pulses will predominate.
3. The cropping patterns reflect the predominantly subsistence orien-tation of production and the dependence on drought resistant but relativelyunproductive crops. Sorghum and pearl millet 2/ together occupy 60% to 80%of the cropped area in most districts with pear.l millet particularly impor-tant (64%) in Rajasthan. In Anantapur there is heavy dependence on Setariaitalica 3/ which, with sorghum and pearl millet:, brings the cereal area to
1/ Gross income is given since the major inputs, other than a smallamount of 'own' seed, are family labor and bullock power. To theextent that land or bullocks are rented, the situation is worse.
2/ Pennisetum typhoides, locally called bajra.
3/ A minor millet locally called .korra.
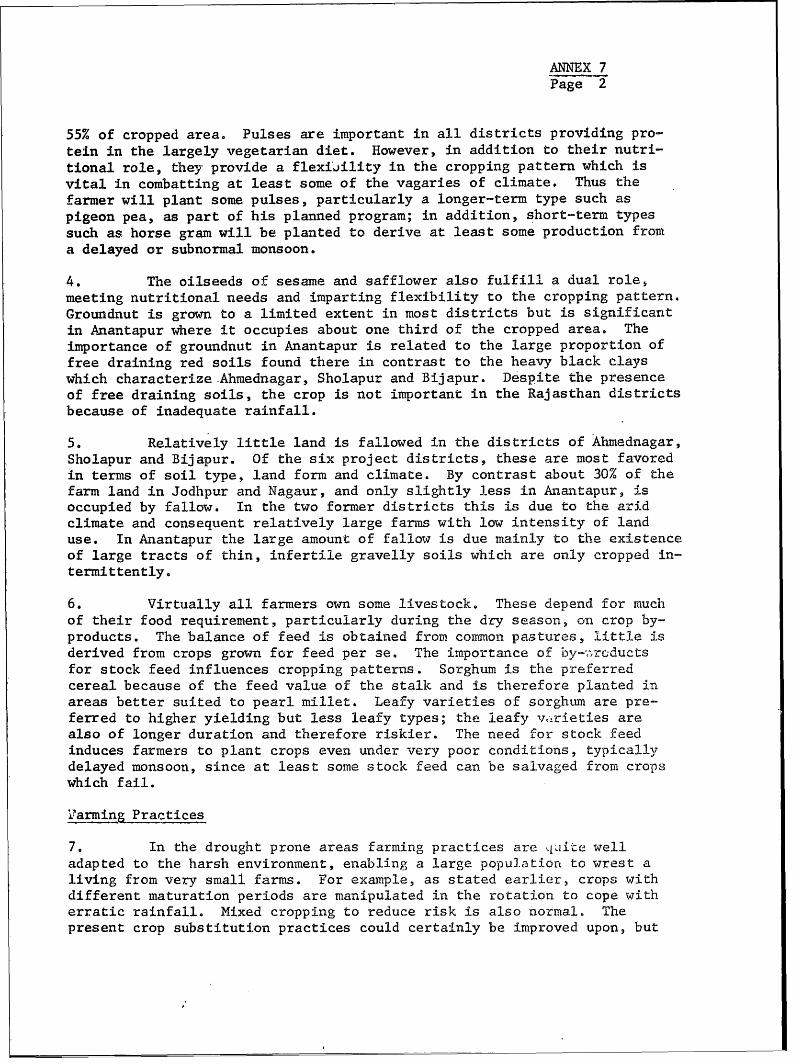
ANNEX 7Page 2
55% of cropped area. Pulses are important in all districts providing pro-tein in the largely vegetarian diet. However, in addition to their nutri-tional role, they provide a flexijility in the cropping pattern which isvital in combatting at least some of the vagaries of climate. Thus thefarmer will plant some pulses, particularly a longer-term type such aspigeon pea, as part of his planned program; in addition, short-term typessuch as horse gram will be planted to derive at least some production froma delayed or subnormal monsoon.
4. The oilseeds of sesame and safflower also fulfill a dual role,meeting nutritional needs and imparting flexibility to the cropping pattern.Groundnut is grown to a limited extent in most districts but is significantin Anantapur where it occupies about one third of the cropped area. Theimportance of groundnut in Anantapur is related to the large proportion offree draining red soils found there in contrast to the heavy black clayswhich characterize.Ahmednagar, Sholapur and Bijapur. Despite the presenceof free draining soils, the crop is not important in the Rajasthan districtsbecause of inadequate rainfall.
5. Relatively little land is f allowed in the districts of Ahmednagar,Sholapur and Bijapur. Of the six project districts, these are most favoredin terms of soil type, land form and climate. By contrast about 30% of thefarm land in Jodhpur and Nagaur, and only slightly less in Anantapur, isoccupied by fallow. In the two former districts this is due to the aridclimate and consequent relatively large farms with low intensity of landuse. In Anantapur the large amount of fallow is due mainly to the existenceof large tracts of thin, infertile gravelly soils which are only cropped in-termittently.
6. Virtually all farmers own some livestock, These depend for rnuchof their food requirement, particularly during the dry season, o n crop by-products. The balance of feed is obtained from common pastures, little isderived from crops grown for feed per se, The imiportance of by-7 ,rCductsfor stock feed influences cropping patterns. Sorghum is the preferredcereal because of the feed value of the stalk and is therefore planted inareas better suited to pearl millet. Leafy varieties of sorghum are pre-ferred to higher yielding but less leafy types; the leafy varieties arealso of longer duration and therefore riskier. The need for stock feedinduces farmers to plant crops even under very poor conditions, typicallydelayed monsoon, since at least some stock feed can be salvaged from cropswhich fail.
1arming Practices
7. In the drought prone areas farming practices are idit e welladapted to the harsh environment, enabling a large popul.atiorn to wrest aliving from very small farms. For example, as stated earlier, crops withdifferent maturation periods are manipulated in the rotation to cope witherratic rainfall. Mixed cropping to reduce risk is also normal. Thepresent crop substitution practices could certainly be improved upon, but
ANNEX 7Page 3
it is only recently that research has been focused on this field and compre-hensive recommendations have yet to emerge. Reseach is discussed in Annex 10,but it should be mentioned here that it is also only recently that the plantbreeder has begun to improve on the varieties grown in the drought proneareas. The only dramatic breakthrough has been the release of the pearlmillet hybrids.
8. Cultivation is still carried out with traditional ox-drawn im-plements; a wide blade harrow for land preparation, a simple 3 or 4 tineseeder for planting, and a narrow blade or tined harrow for intercultiva-tion. The system has advantages in that land preparation is quite rapidand the seeder gives line planting which facilitates inter-row cultivation,thus reducing weed competition. The disadvantages, as yet to be adequatelyaddressed in the research effort, are the preparation of a flat seed bed,undesirable in terms of both soil and moisture conservation, and poor plantpopulations resulting from uneven seeding and germination.
9. As the foregoing would imply, there is little use of purchased in-puts for rainfed production in the drought prone areas. A little improvedseed is purchased, particularly that of hybrid millet, but fertilizer andpesticides are seldom used.
Crop Yields
10, Crop yields in the project districts are very low, reflecting thehazards of farming there. Details of estimated average yields by districtare given in Table 3. Cereal yields are in the range 250 to 350 kg/ha;pulses, 200 to 250 kg/ha; oilseeds, excepting groundnut, around 200 kg/ha;and groundnut about 400 kg/ha, unshelled pods. Average yields are but apoor indicator of crop performance in areas with an erratic rainfall pat-tern. Unfortunately more meaningful, reliable data are not available, butweather-induced fluctuations of at least 50% around these means certainlyoccur, giving rise to the periodic famines which characterize the droughtprone areas.
11. The trend of yields over time is a good measure of an area'sagricultural performance. Again sound data are scant; such as there are,however, indicate that average yields in the project districts are staticor declining. Data from Anantapur (Table 4) show this to be true forsorghum, groundnut and cotton; in contrast pearl millet yields are increas-ing, probably due to the widespread acceptance of the hybrids.
ANNEX 7Page 4
The Extension Service
12. The structure of the extension service varies among states, par-ticularly as to the division of staff between local government authoritiesand state departments of agriculture and to the extent that agriculturaluniversities involve themselves in extension. 1/13. At the operational level, which is of most concern to DPAP, thedistrict staff is headed by a District Agricultural Officer (DAO). He mustserve a farming community usually in the range of 150,000-200,000 households.The DAO is usually supported by a group of subject matter specialists. Atthe block level there is usually an Agricultural Extension Officer (AEO)who would be an agricultural graduate with perhaps five years experience.Each block will contain from 10,000 to 20,000 farmers. Technical controlof AEO's is the responsibility of the DAO, a departmental officer; but ad-ministrative control lies with the Block Development Officer. (BDO), an em-ployee of the local government body.
14. The lowest level of extension worker is the Village Level Worker(VLW), usually a tenth grader who receives two years training at a specialVLW training center. There are about 10 VLWs per block. They, too, areunder the administrative control of the BDO but they are the field levelrepresentatives of many departments. Thus their responsibilities rangeover public health, family planning, cooperatives, collection of statistics,secretary to the panchayat, agricultural extension and more.15. Three weaknesses of the extension effort require.particular atten-tion:
(a) Inadequacy of Programmint.. Typically the extension workeris simply left to exhort farmers to "do better" over a widerange of activities. His efforts are dissipated where theyshould be focused on a few activities where the biggestgains are to be expected. In the absence of a specificprogram, the worker has no target against which to measurehis own achievement and supervisors are unable to assessperformance.
(b) Divided Control. This is most pronounced and serious at thelevel of the VLW. Since he serves several masters, the goodworker is overtaxed, while there is great scope for poorworkers to simply play off one agency against the next.Work programming is difficult and answerability limited.
1/ Within states "ordinary" districts, as all project districts are,are subject to less intensive effort than districts which are thefocus of special schemes such as the Intensive Agricultural DistrictProgram and the Intensive Agricultural Area Program.
ANNEX 7Page 5
Tacit admission of the unsatisfactory riature of the pres-ent arrangement can be, seen in many states where, forthe implementation of special schemes, a separate cadreof extension workers has been created with sole responsi-bility to the agricultural department.
(c) Staff/Farmer Ratio. There are simply too few staffrelative to the number of farmers they must serve. Thisis true at all levels but again particularly so at thevillage level. The VLW cannot possibly serve 1,000 fam-ilies or more, over his wide range of responsibilities,with any degree of effectiveness.
Other Services and IpnuSpplies
16. Credit channels and the role of the cooperative movement thereinare discussed in Annex 14. However it must be emphasized here that noagricultural development program can be effective without a smooth flowof cred.it. Where the development program is aimed at large numbers ofsmall farmers, it is almost axiomatic that this necessitates the involve-ment of cooperatives. At present both cooperatives and commercial bankssee dryland farming as a high risk outlet for their funds; their confidencemust be won. The present extension efforts are failing to bring financialinstitutions and potential borrowers together within the framework of atechnologically sound program.
17. Perhaps the most commonly heard complaint in the drought proneareas at the present time is the unavailability of inputs. Fertilizerpresents the biggest problem, but seeds and pesticides are also often notavailable. The present complainaants are farmers who can irrigate; drylandfarmers seldom use cash inputs, however, the supply problems must be overcomeif dryland farming is to be transformed. The chronic fertilizer shortage,which will continue to affect India for the next few years, is one of themain reasons for limiting the size of the dry farming project compocnent.Clearly, at a time when fertilizer is in critically short supply, it mustbe used to best advantage--namely in the irrigated and assured rainfalltracts. The provision of limited quantities to a pilot dry farming programwould however be sound. Such a program should lay firm foundations for awider effort at a time when fertilizer is expected to be readily available.
Project Proposals
The Project Area
18. Under the project, dry farming development would be undertakenon a pilot scale only, closely linked to the dry farming research projectand subject to careful monitoring and evaluation. In keeping with theland use and conservation principles outlined in Annex 6, the geographicunit for development would be the watershed. In the project districts of
ANNEX 7Page 6
the Deccan Plateau, where average holding size is betueen 4 and 5 ha, twoor three watersheds embracing about 7,500 holdings would be selected. Inthe more difficult environment of Rajasthan, the initial effort would beconfined to blocks in Nagaur District where rainfall is somewhat more reli-able. Here again watersheds containing around 7,500 holdings would be se"-lected. The area covered would be larger than in the Deccan region becausethe average holding is about 10 ha.
19. There are several reasons for limiting the size of the initialeffort. As indicated in Annex 10, only a limited package of improvedtechnology can be derived from the preliminary findings of the recentlylaunched All-India Coordinated Research Project for Dryland Agriculture.The extension mechanism needs to be restructured and the new approachtested in the field. Credit at present does not reach the small drylandfarmer. New cooperative channels must be developed and the confidence offinancial institutions, currently chary of investing in high risk dryfarming, needs to be won. Finally there is the acute shortage of fer-tilizer which is expected to last for the next several years; clearly thelimited supplies should, in the main, be used to best advantage in irrigatedand assured rainfall areas.
The Approach
20. In the pilot program, more intensive supervision could be providedthan would be possible in a large scale development effort. A high level ofsupervision should ensure that the impact of the limited available packageof technology would be sufficient to stimulate farmer interest and partici-pation. By undertaking a pilot program immediately, the years pending afull range of research results and freely available fertilizer supplieswould be used to advantage. New extension methods would be tested and fur-ther refined. Improved credit flows would be established.
21. Close links would be established between the staff of tl-.e pilotprogram and those of the research stations of the Dryland Research Projectlocated in project districts. (At present there are stations in jodhpur,Sholapur, Bijapur and Anantapur. A station is to be established shortly inAhmednagar in collaboration with the Mahatma Phule Agricultural University.)These links would ensure that extension workers were continually exposed toresearch developments and, conversely, that the researchers observed the i.r-pact of their recommendations in the field and were kept abreast of fieldlevel problems. The agricultural economists to be provided under the re-search component (Annex 10) would also be closely involved in the monitoringand evaluation so essential if a pilot program is to pave the way for devel-opment efforts on a large scale.
The Package of Technolo-
22. Extension recommendations must be location specific. Given thediverse conditions in the project area, it is impossible to detail specificrecommendations here. It is only possible to outline the nature of the re-commendations and the principles which should govern detailed specifications.
ANNEX 7Page 7
23. The overriding principle should be to concentrate effort on eacharea's main crops and on those factors of production through which the great-est yield impact can be achieved. Only through such a focusing of extensioneffort would it be possible to achieve the visible yield improvements neces-sary to stimulate widespread farmer interest in the program and, in so doing,provide the job satisfaction essential to the maintenance of staff enthusiasm.
24. A second major principle derives from the benefits of the packageapproach per se. M1ost improved practices, when applied together, interactto produce benefits greater than the sum of the parts. Thus the improvedvariety can only express its full yield potential when planted at the cor-rect time, with proper cultural practices and adequate nutrition. The ex-tension program must be planned so as to make this clear to the farmer, todissuade him from adopting isolated practices. It would also be essentialto impress on farmers that improved technology cannot eliminate weather-induced fluctuations in arnual yields; the aim can only be to reduce theseand to improve average levels of production.
25. The essential base for improved dryland farming is adequate soiland moisture conservation, The extension staff would complement the workof the soil conservatiorn E.: vice by advising farmers on the necessity fora soundly planned, well rmii.;rLtained network of conservation works. Theseare however but a second line of defense. More important, and of more im-mediate concern to extencs:lon staff, is the need to emphasize the benefitsof contour cultivation, nautely soil and moisture conservation in situ ratherthan behind intermittent bunds.
26. Research on cultural practices has been inadequate (Annex 10).Nevertheless there are a number of basic practices which can and shouldbe emphasized. Early cultivation will improve infiltration rates whenthe monsoon breaks and will reduce soil erosion. 1/ The importance of agood crop stand must be stressed with attention focused on seed rate, seed-ing method and the use of good quality seed. Where appropriate, as in thecase of sorghum in shoot fly infested areas, seed dressing must also be in-cluded in the extension package. Mulching will improve soil moisture reten-tion and should be advocated wherever suitable material, such as millet husk,would be available. (Exotic practices such as plastic and vertical mulching,seen on research stations, should not feature in extension recommendations ordemonstration plots.) Finally the importance of clean weeding, to reducecompeUition for moisture, must be stressed. This is normally a matter ofinter-row cultivation with bulloc1 -s. However some areas are infested withdeep rooted perrennial weeds, often couch grass. Farmers should be encour-aged to clear these by hand. The mission sees no justification for mecha-nized deep plowing as advocated in some areas.
1/ Immediately before the onset of the monsoon, soils are hard and bullocksweak. Earlier harvesting, when crops are physiologically mature, andstubble cultivation, may be a useful attack on this problem (see Annex 10).
ANNEX 7Page F_
27. Time of planting is an important issue. However, under theerratic rainfall conditions of the drought prone areas it is difficultand time consuming to conduct research on this subject. To date the onlyconclusive finding to emerge from the research program is that yields ofthe rabi crops in the black soil regions of the Deccan Plateau could beimproved if planting were done three to four weeks ahead of the traditionaltime. This would be part of the package for the region.
28. For a number of crops the researchers have established cutoffdates beyond which planting is likely to lead to failure. In some casesshorter duration crops which could be planted with less risk have beenidentified. The extension package must be planned with sufficient flexi-bility to permit these crop substitution, risk reducing, practices to beput across to farmers.
29. Improved hybrid or varietal material is available for most cropsnow grown by the farmer. However, as stated above, the extension programshould be restricted to each region's major crops; varietal recommendationsshould therefore be restricted to these. They should also be limited to anarrow range of varieties for each crop. This is particularly important inthe case of pulses and oilseeds where the plant breeder has made less impactthan on cereals and where, in consequence, several varieties are availablediffering little in yield potential. Restricting the range of varietalmaterial to be recommended would not only simplify extension and demonstra-tion work, it would also simplify seed supply.
30. The ongoing and past research programs have clearly establishedthat the use of fertilizer increases yields of most crops grown in thedrought prone areas. What remains to be determined is the profit maaximiz-ing dose. Pending this determination, it would be reasonable to recommendconservative doses which, though suboptimal, would be profitable. For thecereals, sorghum and pearl millet, recommended doses should be of the orderof 25 kg N per ha. Where phosphate is deficient the recommended dose shouldbe about 15 kg P 05 per ha. There appears to be no evidence to suggest adeficiency of potassium in any of the project districts.
31. Numerous trials have been conducted on different methods ofapplying nitrogenous fertilizer. Results have been erratic and no prac-tice has been shown superior, in terms of yields, to basal dressings attime of planting. Nevertheless it is recommended that farmers be advisedto split the nitrogen application to cereals. The second dressing wouldonly be applied upon the arrival of a good monsoon. The cost of cropfailure would thus be reduced. Again it must be emphasized that the ex-tension program should not be complicated by dabbling with such fancifulpractices as the foliar application of urea, a recommendation now in voguein some areas.
32. The fertilizer recommendations for pulses should be of the orderof 10 kg N and 15 kg P2 05 per ha. Those for oilseeds in the range of 15 kgN and 15 kg P205 per ha.
ANNEX 7Page 9
33. Pest outbreakls present an occasional problem. As mentioned above,
shoot fly, the most serious pest of sorghum, can be satisfactorily controlled
by seed dressing with carbofuran. Other than this, existing recommendations
and departmental pest control procedures are satisfactory and should be con-
tinuedt.
The Extension Service
34. The extension service would be reorganized and expanded in project
areas. The aim would be to create a discrete cadre of extension staff. They
would work at all times with clearly defined programs and objectives. It
would thus be possible to monitor and evaluate program and staff perform-
ance. This in turn would lead to improved programming and manpower maage-
ment; and staff able to make measurable achievements would derive greater
job satisfaction.
35. The use of Progressive Farmers (PF) would be introduced as the
final link in the extension chain. This would have a twofold objective:
to widen the disseminaction of information and to increase program credi-
bility through the close involvement of respected members of the community.
Progressive Farmers nust be chosen from groupings which reflect the range
of farm sizes and castes.
36. Staff and farmer training would be critical to the success of the
extension program and is discussed in Annex 11. Suffice it to say here
that training would be job oriented rather than academic. The aim would
be to give each worker a clear understanding of his role and his specific
program and objectives.
37. The oganization of the extension service is shown in Chart 1.
The District Agricultural Officer (DAO) would be the head of the extension
service, although he would devote onily a portion of his time to project work.
The DAO is supported by a group of subject matter specialists who would be
available as needed to support project field staff and no additional spe-
cialists would be necessary.
38. Each district is divided into development blocks and a Block
Development Officer (BDO) is at present administratively responsible for
goveniment efforts therein. Under the project, field level extension staff
would be divorced from the control of the BDO. 1/ Because of the small size
of the program, it would not be necessary, initially, to establish a block
level pzost in the extension service. If, however, the program were success-
2ul, then ex,pansion would rccquire the creation of such a post to decentral-
ize some of the workload of the DAO.
1/ Like the VLW (para 14) the BDO is a multipurpose functionary who is
unable to devote a significant share of his time and attention to
agricultural exctenfsion.
ANNEX 7Page 1 0
39. Under the project an Agricultural Extension Officer (AEO) wouldbe responsible for the extension program in each watershed, where he wouldbe assisted by five Village Extension Workers (VEWs). The present qualifi-cations for AEO posts, agricultural graduate with 5 years experience, aresatisfactory. The VEW could be a recent agricultural graduate, many ofwnom are unem-ployed, a well qualified agricultural diplomate or he couldbe drawn from the ranks of the existing VLWs. Academic qualificationsshould be a secondary consideration to obtaining sound, well motivated staffkeen to achieve the job satisfaction associated with successful developmentefforts. It would be essential, in this context, that officers for theprogram be selected on the basis of interest and experience rather thanseniority.
40. Each VEW would work with about 16 Progressive Farmers, each ofwhom would represent about 30 farmers. The selection of PFs should be leftto the villagers after the objectives of the project had been explained anddiscussed with them, re-selection would take place annually. Thle projectstaff would have to retain the right of veto over selections however. Thepresent VLWs would be able to give valuable assistance in organizing meet-ings to publicize project activity, select PFs, etc. The incremental staffrequirement and cost of the extension service are shown in Table 5.
41. Extension program guidelines and objectives would be approved bythe District Development Authority (DDA, para 5.07). The first year's pro-gram would be based on the recommendations of technical staff. However,once the project was underway, the programming exercise would start withpost-harvest evaluations of performance by AEOs and VEWs. These, the find-ings from project evaluation work, and the latest research results would beused by a small team of technicians, built around the DAO and Chief Scien-tist, to develop proposals for the next season. These would then be putbefore the DDA. After any necessary modification and clearance they wouldform the basis for the pre-season staff training sessions.
42. The detail of the extension program would be determined by theDAO in accordance with the guidelines agreed by the DDA. Because of theuncertainty of the rainfall, the annual program as outlined would have tohave ample flexibility. Programming of day-to-day operations would beundertaken in the course of field visits by the DAO and AEOs.
43. The operation of the extension pro ,ram would be governed by theneed to ensure the closest possible contact ';etween the farmer and the ex-tension worker and between worker and supervisor. At all levels, emphasiswould therefore be placed on field visits which would be made according toa fixed schedule. This would be particularly important in the case of theVEW since farmers must know of his movements in order to have frequent,ready access to him.
44. It is proposed that the DAO visit each watershed twice per month.One visit would be to the office of the AEO. VEWs would attend and progressand problems would be discussed and the following month's program agreed.
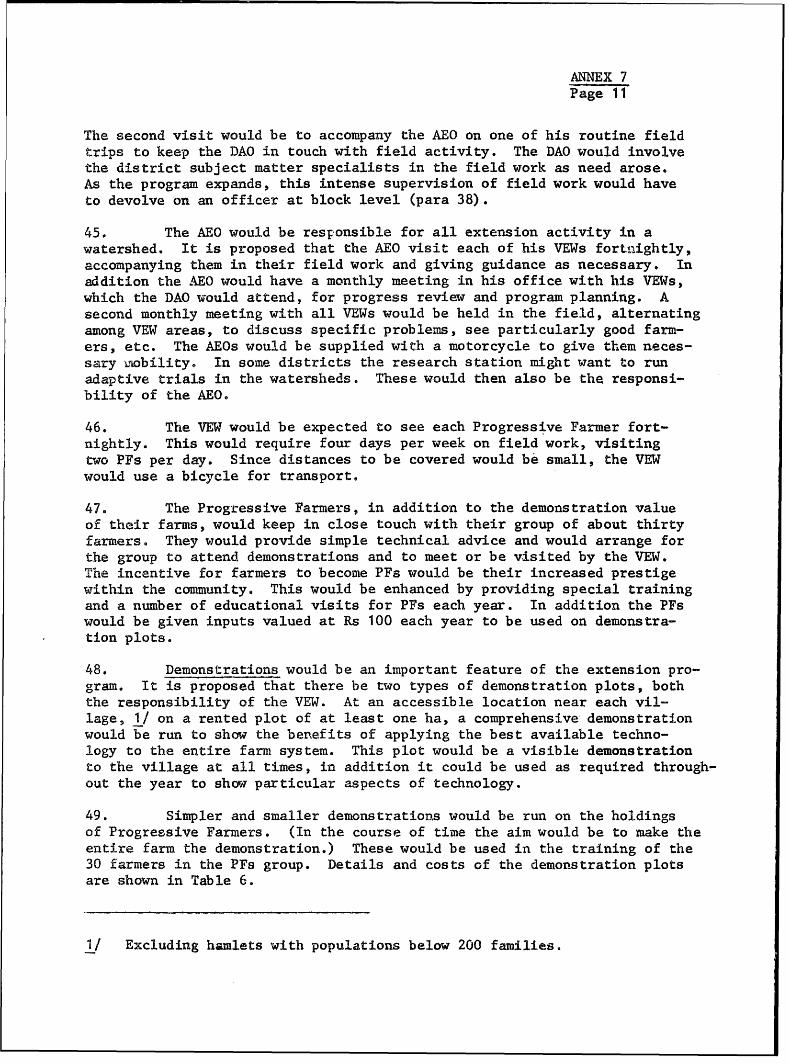
ANNEX 7Page 1 1
The second visit would be to accompany the AEO on one of his routine fieldtrips to keep the DAO in touch with field activity. The DAO would involvethe district subject matter specialists in the field work as need arose.As the program expands, this intense supervision of field work would haveto devolve on an officer at block level (para 38).
45. The AEO would be responsible for all extension activity in awatershed. It is proposed that the AEO visit each of his VEWs fortn.ightly,accompanying them in their field work and giving guidance as necessary. Inaddition the AEO would have a monthly meeting in his office with his VEWs,which the DAO would attend, for progress review and program planning. Asecond monthly meeting with all VEWs would be held in the field, alternatingamong VEW areas, to discuss specific problems, see particularly good farm-ers, etc. The AEOs would be supplied with a motorcycle to give them neces-sary Liobility. In some districts the research station might want to runadaptive trials in the watersheds. These would then also be the responsi-bility of the AEOo
46. The VEW would be expected to see each Progressive Fairmer fort-nightly. This would require four days per week on field work, visitingtwo PFs per day. Since distances to be covered would be small, the VEWwould use a bicycle for transport.
47. The Progressive Farmers, in addition to the demonstration valueof their farms, would keep in close touch with their group of about thirtyfarmers. They would provide simple technical advice and would arrange forthe group to attend demonstrations and to meet or be visited by the VEW.The incentive for farmers to become PFs would be their increased prestigewithin the community. This would be enhanced by providing special trainingand a number of educational visits for PFs each year. In addition the PFswould be given inputs valued at Rs 100 each year to be used on demonstra-tion plots.
48. Demonstrations would be an important feature of the extension pro-gram. IL is proposed that there be two types of demonstration plots, boththe responsibility of the VEW. At an accessible location near each vil-lage, 1/ on a rented plot of at least one ha, a comprehensive demonstrationwould be run to show the benefits of applying the best available techno-logy to the entire farm system. This plot would be a visible demonstrationto the village at all times, in addition it could be used as required through-out the year to show particular aspects of technology.
49. Simpler and smaller demonstrations would be run on the holdingsof Progressive Farmers. (In the course of time the aim would be to make theentire farm the demonstration.) These would be used in the training of the30 farmers in the PFs group. Details and costs of the demonstration plotsare shown in Table 6.
1/ Excluding hamlets with populations below 200 families.
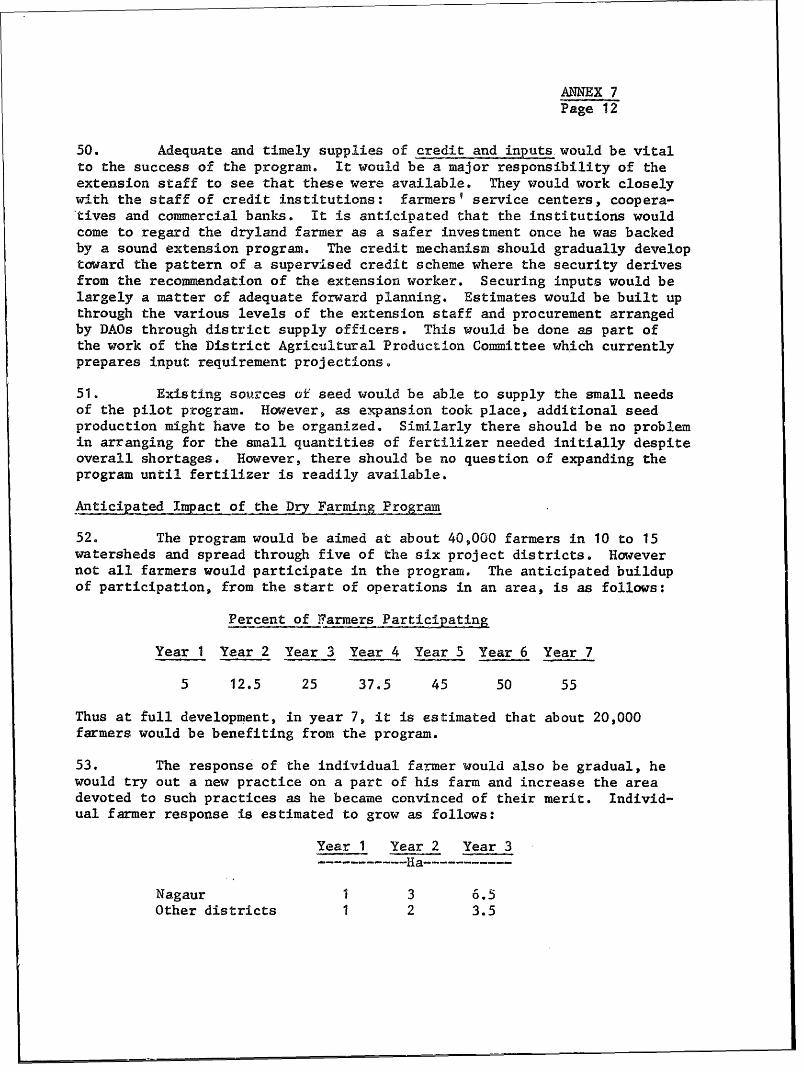
ANNEX 7Page 12
50. Adequate and timely supplies of credit and inuts.would be vitalto the success of the program. It would be a major responsibility of theextension staff to see that these were available. They would work closelywith the staff of credit institutions: farmerst service centers, coopera-tives and commercial banks. It is anticipated that the institutions wouldcome to regard the dryland farmer as a safer investment once he was backedby a sound extension program. The credit mechanism should gradually developtoward the pattern of a supervised credit scheme there the security deriv.esfrom the recommendation of the extension worker. Securing inputs would belargely a matter of adequate forward planning. Estimates would be built upthrough the various levels of the extension staff and procurement arrangedby DAOs through district supply officers. This would be done as part ofthe work of the District Agricultural Production Committee which currentlyprepares input requirement projections.
51. Existing sources of seed would be able to supply the small needsof the pilot program. However, as expansion took place, additional seedproduction might have to be organized. Similarly there should be no problemin arranging for the small quantities of fertilizer needed initially despiteoverall slhortages. However, there should be no question of expanding theprogram until fertilizer is readily available.
Anticip?ated Impact of the Dry Farming Program
52. The program would be aimed at about 40,000 farmers in 10 to 15watersheds and spread through five of the six project districts. Howevernot all farmers would participate in the program. The anticipated buildupof participation, from the start of operations in an area, is as follows:
Percent of Farmers Participating
Year 1 Year 2 Year 3 Year 4 Year 5 Year 6 Year 7
5 12.5 25 37.5 45 50 55
Thus at full development, in year 7, it is estimated that about 20,000farmers would be benefiting from the program.
53. The response of the individual farmer would also be gradual, hewould try out a new practice on a part of his farm and increase the areadevoted to such practices as he became convinced of their merit. Individ-ual farmer response is estimated to grow as follows:
Year 1 Year 2 Year 3Ha----------
Nagaur 1 3 6.5Other districts 1 2 3.5
ANNEX 7Page 13
The assumed maximum area involved is less than the total cultivated area
because of fallow and because it is assumed that farmers would continue to
grow some crops not included in the program.
54. The anticipated farm level impact of the program is shown in the
models at Tables 7 and 8.
November 4, 1974
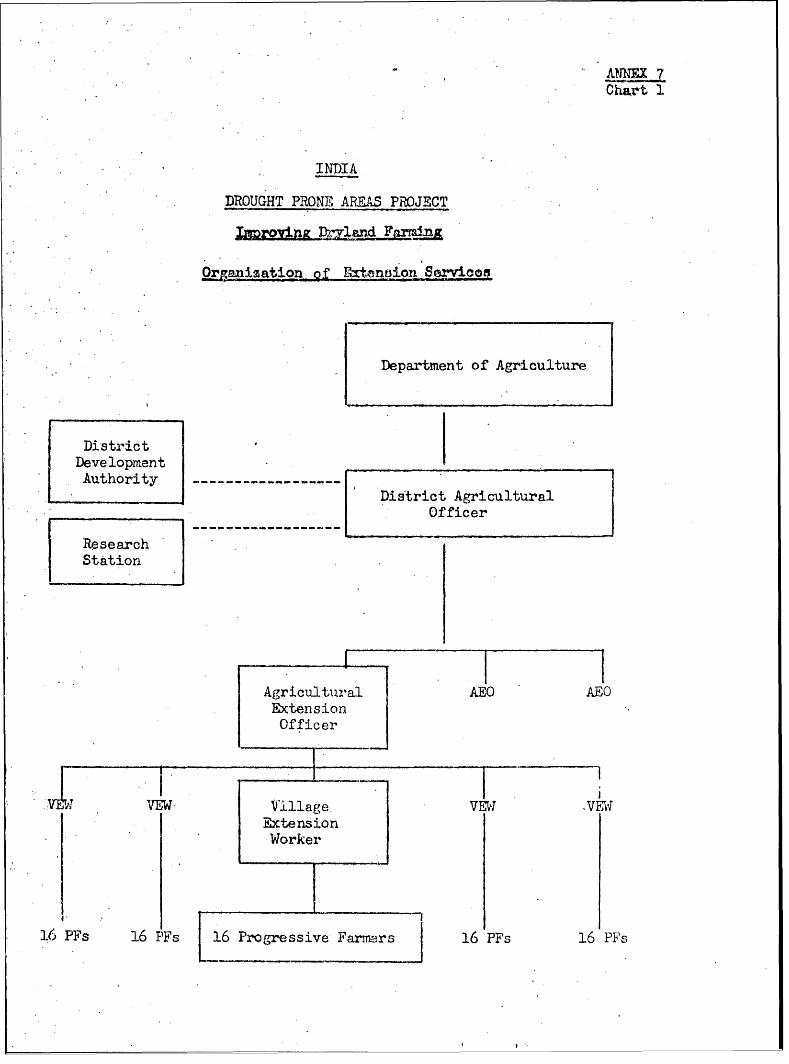
Chart 1
INDIA
DROUGHT PRONE~ AREAS PROJECT
aiation o x,nnion Servc
Department of Agriculture
Di strictDevel2opm.ent__ _ _ _ _ _ _ _ _ _ _ _ _ _ _
Authorityj------------------1 District Agricultural
Officer
ResearchStation
Agricultural A- EExtensionOfficer
"VW~ V"Illage, EW 'VEW
16 PFs 16 PFS 16 Prog~ressive Fams16 PFs 16 PFs
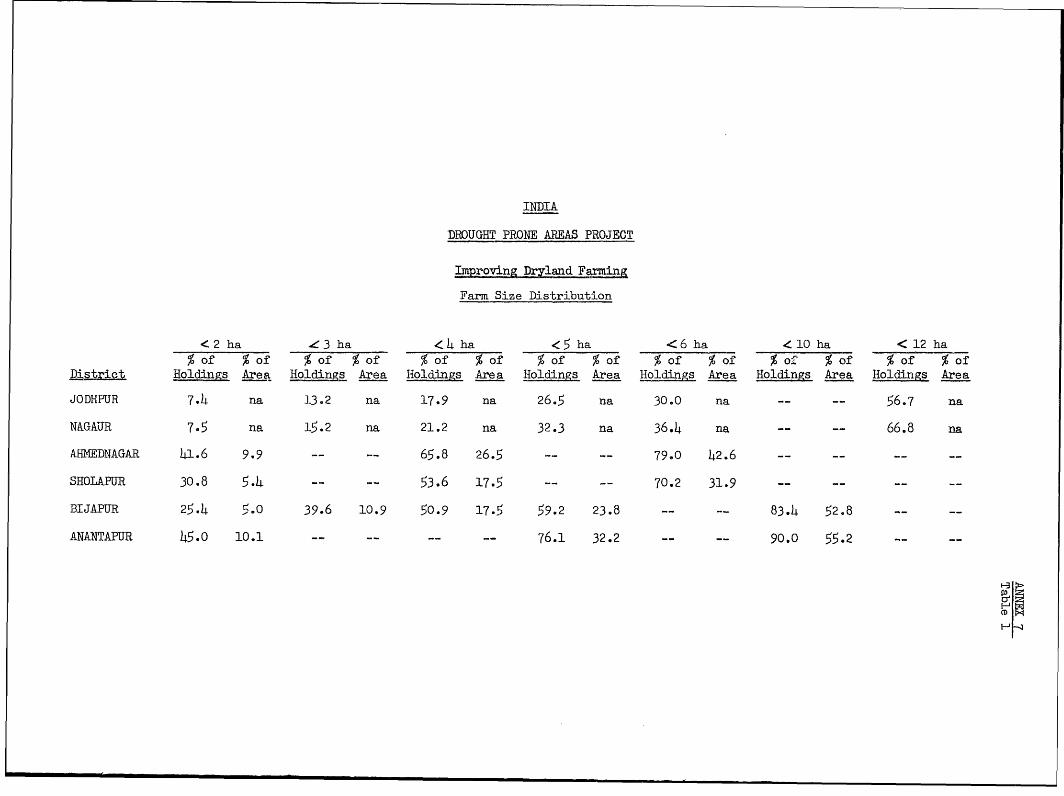
INDIA
DRiOUGHT PRONE AREAS PROJECT
IMroving Prland Farming
Farm Size Distribution
< 2 ha Z 3 ha <4 ha < 5 ha <6 ha O 10 ha < 12 ha
% of % of % of % of % of % of % of % of % of % of % of % of % of % of
District Holdings Area Holdings Area Holdings Area Holdings Area Holdings Area Holdings Area Holdings Area
JODHPUR 7.4 na 13.2 na 17.9 na 26.5 na 30.0 na -- 5- 56.7 na
NAGAUR 7.5 na 15.2 na 21.2 na 32.3 na 36.4 na -- 66.8 na
AHNEDNAGAR 41.6 9.9 -- 65.8 26.5 -- -- 79.0 42.6 -- -- -- --
SHOLAPUR 30.8 5.4 -- -- 53.6 17.5 -- -- 70.2 31.9 -- -- -- --
BIJAPUR 25.4 5.0 39.6 10.9 50.9 17.5 59.2 23.8 -- -- 83.4 52.8 -- --
ANANTAPUR 45.0 10.1 -- -- -- -- 76.1 32.2 -- -- 90.0 55.2
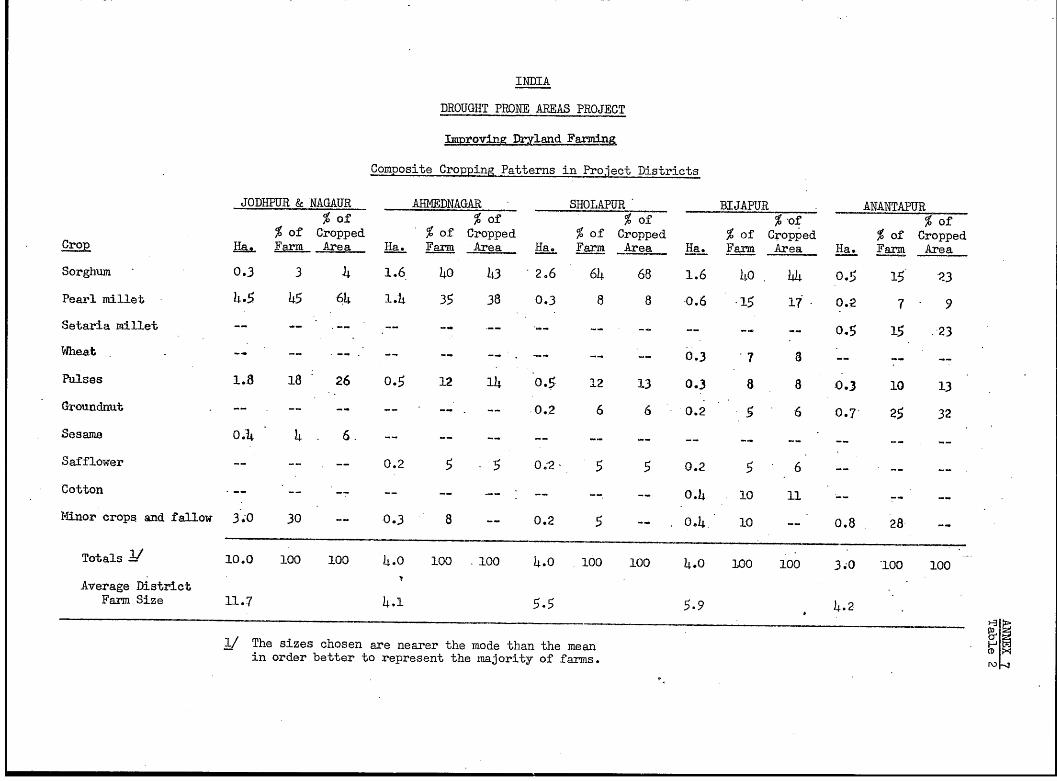
INDIA
DROUGHT PRONE AREAS PROJECT
Improving rand Fanaing
Composite Cropping Patterns in Project Districts
JODHPUR & NAGAUR AHMEDNAGAR SHOLAPUR BIJAPUR - ANANTAPUR% of %of % of % of % of
% of Cropped % of Cropped % of Cropped % of Cropped % of CroppedCrop a Farm Area Ha. Farm Area Ha. Farm Area Ha. Farm Area Ha. Farm Area
Sorghum 0.3 3 4 1.6 -40 43 2.6 64 68 1.6 40 44 0.5 15 23Pearl millet 4.5 45 654 1.i4 35 38 0.3 8 8 -0.6 15 17- 0.2 7 9
Setaria millet - -- 0.5 15 '23Wheat 0. -- -- -- -- - -- 0.3 7 8 7- -
Pulses 1.8 18 26 0.5 12 14 0.5 12 13 0.3 8 8 0.3 10 13
Groundnut -- -- -- -- -- . 0.2 6 6 -0.2 5 6 0.7 25 32
Sesame 0Xl 4 . 6. -- -- -- - -- -- -- -- -- - -- --
Safflower -- 0- . O .2 5 - 0.-2 5 5 0.2 5 6 -- -- --
Cotton -- -- -- -- -- -- -- .4 10 11 -- -- --
Minor crops. and fallow 3.0 30 -- 0.3 8 -- 0.2 5 -- 0.4 10 -- 0.8 28 --
Totals v 10.0 100 100 4.0 100 100 4.0 100 100 4.0 100 100 3.0 100 100
Average DistrictFarm Size 11.7 4.1 5.5 5.9 4.2-
1/ The sizes chosen are nearer the mode than the meanin order better to represent the majority of farms.
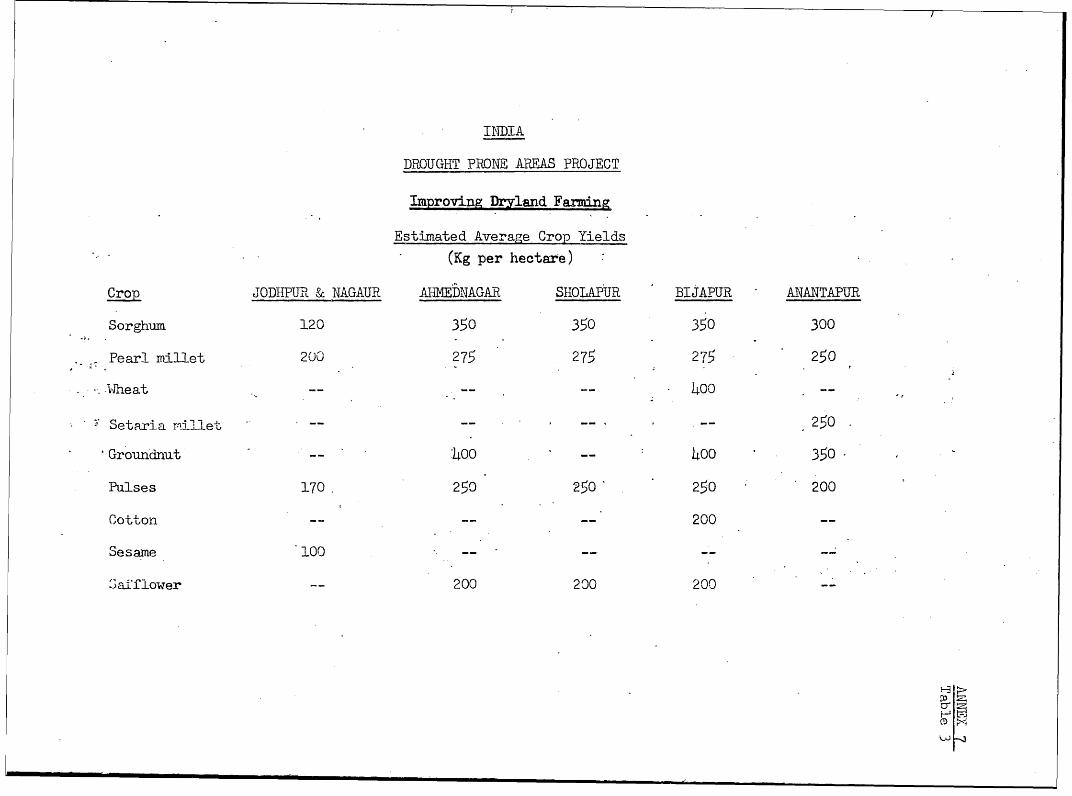
INDIA
DROUGHT PRONE AREAS PROJECT
Ixiproving Farmin
Estimated Average Crop Yields
(-Kg per heetare)
CrJp TODHPUR & NAGAUR -AIDNAGAR SHOLAPUR BIJAPU-R ANiANTAPUR
Sorghum 120 350 350 350 300
Pearl millet 200 275 275 275 250
JWheat 4-C0 --
Setaria v*iilet - -- -- -- 250
Groundnut 4 -00 40 h0O 350
Pulses 170, 250 250 250 200
C otton -- -- -- 200
Sesame 1° 00
Safflower -- 200 200 200
CD L~
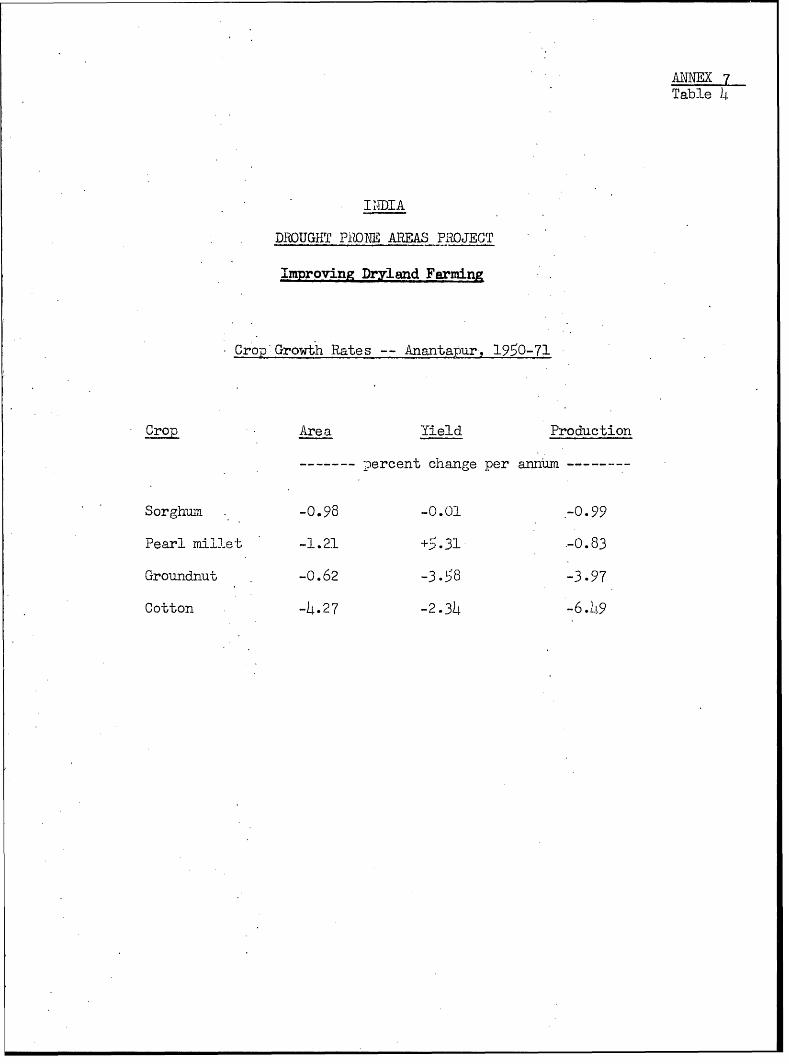
Table 4
I I4DIA
DROUGHT PONEi AREAS PiROJECT
Improving Dryland Farming
*Curop Growth Rates Anantaur,
Crop Area Yield Production
- -- ercent change per annim --------
Sorghum . -0.98 -0.01 -0 .99
Pearl millet -1.21 +) .31 -0.83
Groundnut -O.62 -3.58 -3.97
Cotton -4.27 -2.34 -6. '19
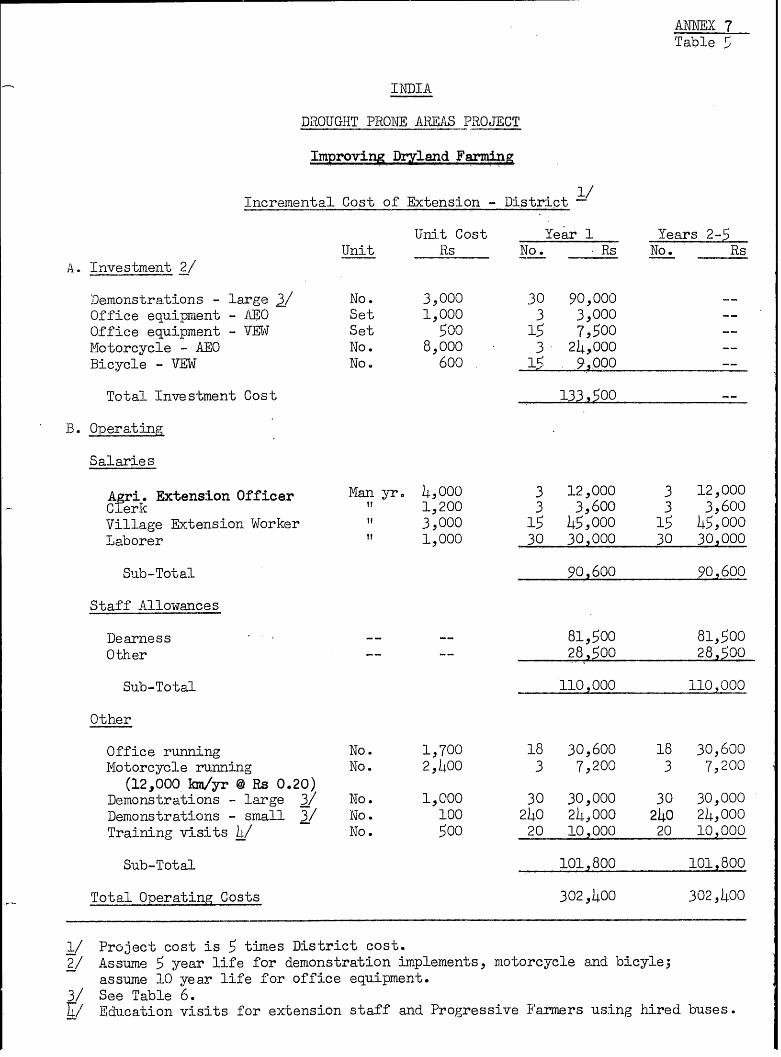
ANNJEX 7Table 5
INIIA
DROUGHT PRONE AREAS PROJECT
Improving Dryland Farmin
Incremental Cost of Extension - District. /
Unit Cost Year 1 Years 2-5Unit Hs No. Rs No. Rs
A. Investment 2/
Demonstrations - large 3/ No. 3,000 30 90,000 --
Office equipmvent - AE0 Set 1,000 3 3,000 --
Office equipment - VEW Set 500 15 7,500 --
Motorcycle - AEO No. 8,000 3 24,000 --
Bicycle - VEW No. 600 15 . 9,000 --
Total Investment Cost 133,500 --
B. Operating
Salaries
A ri. Extension Officer Man yr. 4,000 3 12,000 3 12,000Cferk " 1,200 3 3,600 3 3,600Village Extension Worker 3,000 15 45,000 15 45,000Laborer 1,000 30 30,000 30 30,000
Sub-Total 90,600 90,600
Staff Allowances
Dearness -- -- 81,500 81,500
Other 2- -- 28,500 28,500
Sub-Total 110,000 110,000
Other
Office running No. 1,700 18 30,600 18 30,600Motorcycle running No. 2,400 3 7,200 3 7,200
(12,000 km/yr @ Rs 0.20)Demonstrations - large 3/ No. 1,000 30 30,000 30 30,000
Demonstrations - small 3/ No. 100 240 24,00O 240 24,oo0Training visits 4/ No. 500 20 10,000 20 102000
Sub-Total 101,800 101,800
Total Operating Costs 302,400 302,400
1/ Project cost is 5 times District cost.2/ Assume 5 year life for demionstration implements, motorcycle and bicyle;
assume 10 year life for office equipment.3/ See Table 6.4/ Education visits for extension staff and Progressive Farmers using hired buses.
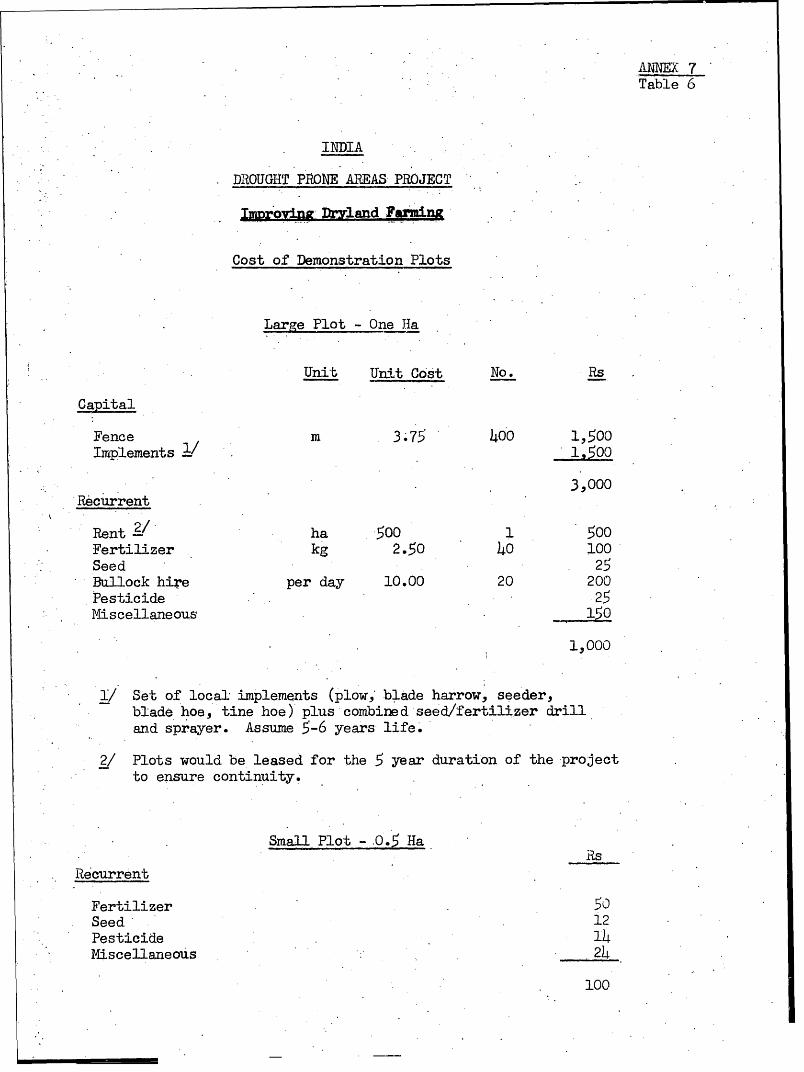
ANNEX 7Table 6
INDIA
DROUGHT PRONE AREAS PROJECT
.I IgR vin2 Drsland Farming
Cost of Demonstration Plots
Large Plot O-One Ha
Unit Unit Cost No. Rs
Capital
Fence m 3.75 400 1,500Imlplements 1.500
3,000Recurrent
Rent 2/ ha 500 1 500Fertilizer kg 2.50 40 100Seed
25Bullock hire per day 10.00 20 200Pesticide .25Miscellaneous
150
1,000
I/ Set of local implements (plow,' blade harrow, seeder,blade hoe, tine hoe) plus combined seed/fertilizer drilland sprayer. Assume 5-6 years life.
2/ Plots would be leased for the 5 year duration of the projectto ensure continuity.
Small Plot -. 0.5 Ha.
.RS
Recurrent
Fertilizer 50Seed 12Pesticide
14Miscellaneous 24
100
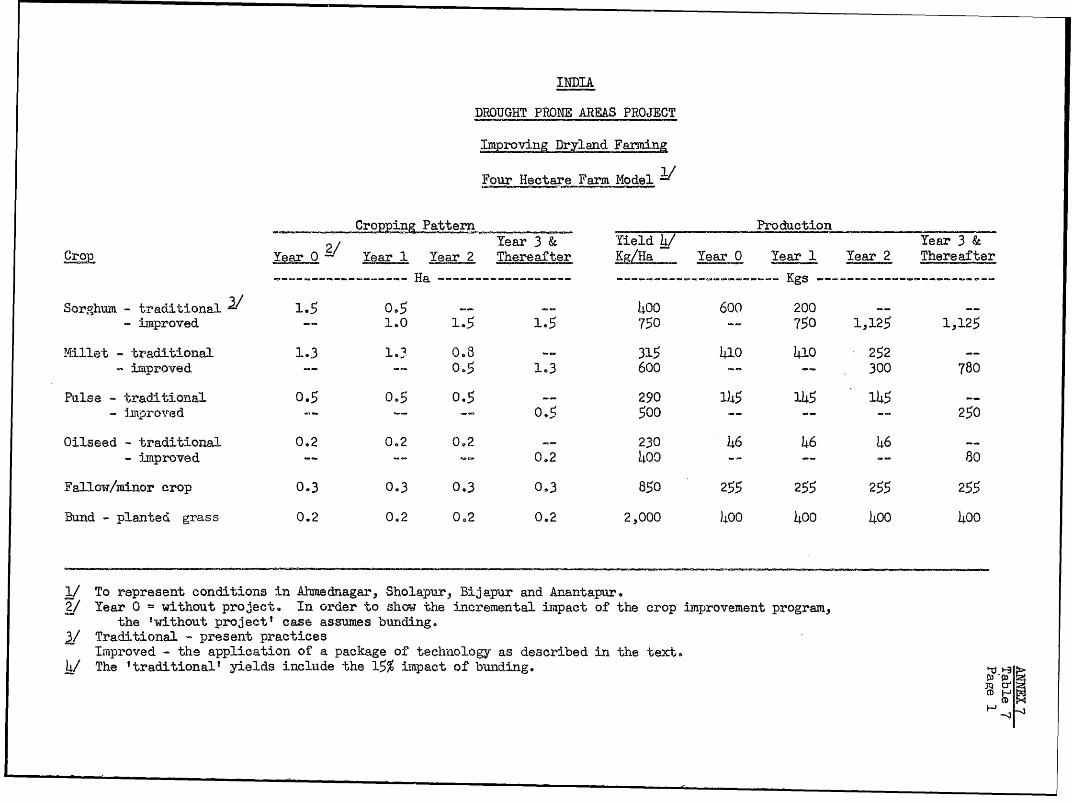
INDIA
DROUGHT PRON? AREAS PROJECT
Improving Farmin
Four Hectare Farm Model l/
Cropping Pattern Production -
2/ Year 3 & ied Year 3 &
roYe 02 Year 1 Year 2 Thereafter Kg/Ha Year 0 Year 1 Year 2 Thereafter
---------- Ha ---------------------------------- ---- Kgs ---------------------
Sorghum - traditional 1. 05 -- -- 4OO 600 200 --
- improved -- 1.0 1$5 1.5 750 -- 750 1,125 1,125
Millet - traditional 1.3 1.3 0.8 -- 315 410 410 252 --
- improved -- - c 05 1.3 600 -- -- 300 780
Pulse - traditional 0.5 0.5 0$5 -- 290 145 145 145 --
- improved -- -- - 05 500 -- -- -- 250
Oilseed - traditional 0.2 0.2 0.2 -- 230 46 46 46 --
- imprrved -- -- - 0.2 400 -- -- -- 80
Fallow/minor crop 0.3 0,3 0.3 0.3 850 255 255 255 255
Bund - plantec grass 0.2 0.2 0.2 0.2 2,000 )J00 400 400 400
f/ To represent conditions in Ahmednagar, Sholapur, Bijapur and Anantapur.
/ Year 0 = without project. In order to show the ixneremental impact of the crop improvement program,
the twithout projectt case assumes bunding.
/ Traditional present practicesImproved - the application of a package of technology as described in the text.
Ii! The 'traditional' yields include the 15% impact of bunrding.
CD
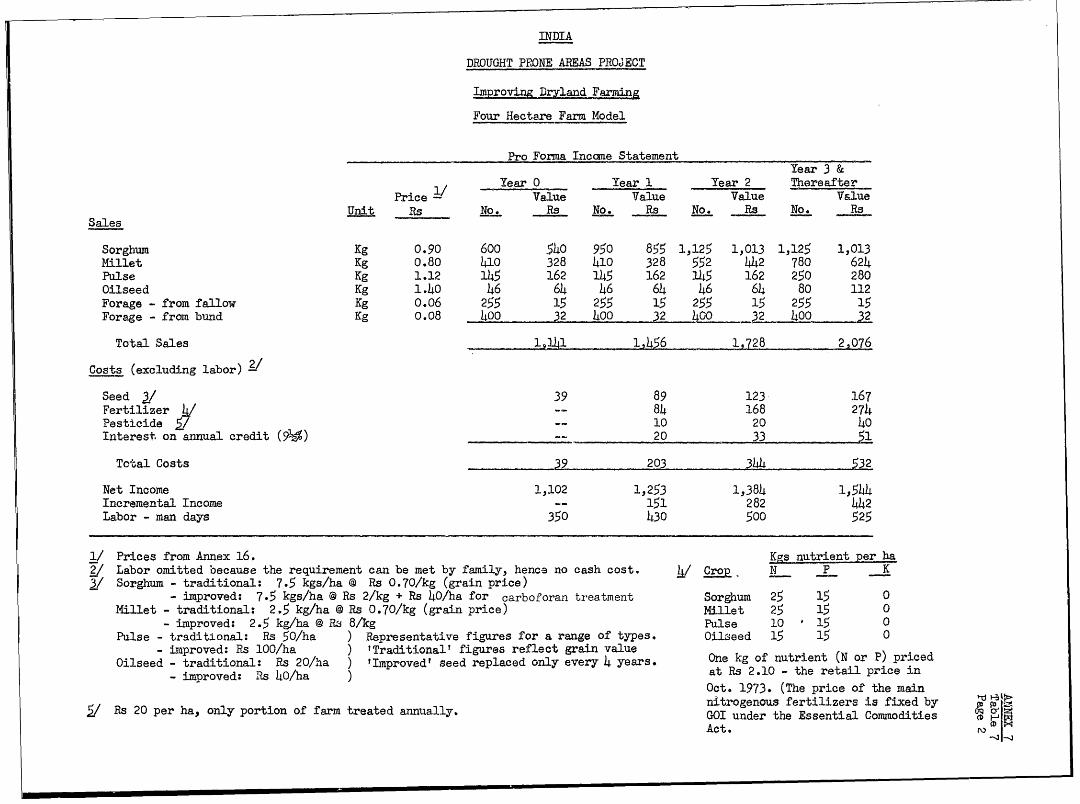
INDIA
DROUGHT PRONE AREAS PROJECT
IMproving Pr land Farming
Four Hectare Farm Model
Pro Forma Income StatementYear 3 &1/ Year 0 Year 1 Year 2 ThereafterPrice - Value Value Value ValueUnit Rs No. Rs No. Rs No. Re No. RsSales
Sorghum Kg 0.90 600 540 950 855 1,125 1,013 1,125 1,013Millet Kg 0.80 410 328 410 328 552 442 780 624Pulse Kg 1.12 145 162 145 162 145 162 250 280Oilseed Kg 1.40 46 64 46 64 46 64 80 112Forage - from fallow Kg 0.06 255 15 255 15 255 15 255 15Forage - from bund Kg 0.08 400 32 400 32 400 2 400 32Total Sales 1~141 11456 1,728 2,076
Costs (excluding labor) ./
Seed / 39 89 123 167Fertilizer / -- 84 168 274Pesticide ./ -- 10 20 40Interest. on annual credit ()20
33 51Tctal Costs
39 203 3144 532Net Income
1,102 1,253 1,384 1,544Incremental Income -- 151 282 442Labor - man days
350 430 500 525
1/ Prices from Annex 16. Kgs nutrient-per ha2/ Labor omitted because the requirement can be met by family, hence no cash cost. L Crop N P K3/ Sorghum - traditional: 7.5 kgs/ha @ Rs 0.70/kg (grain price)- improved: 7.5 kgs/ha ( Rs 2/kg + Rs 40/ha for carboforan treatment Sorghum 25 15 0Millet - traditional: 2.5 kg/ha @ Rs 0.70/kg (grain price) Millet 25 15 0- improved: 2.5 kg/ha @ Rs 8/kg
Pulse 10 ' 15 0Pulse - traditional: Rs 50/ha ) Representative figures for a range of types. Oilseed 15 15 0- improved: Rs 100/ha ) 'Traditional' figures reflect grain valueOilseed - traditional: Rs 20/ha ) 'Improved' seed replaced only every 4 years. One kg of2 nutrent (N or P) priced-ipovd Re 40/ha ' at Re 2.10 -the retail price inOct. 1973. (The price of the mainnitrogenous fertilizers is fixed by
/ Rs 20 per ha, only portion of farm treated annually. 0OI under the Essential CommoditiesAct.
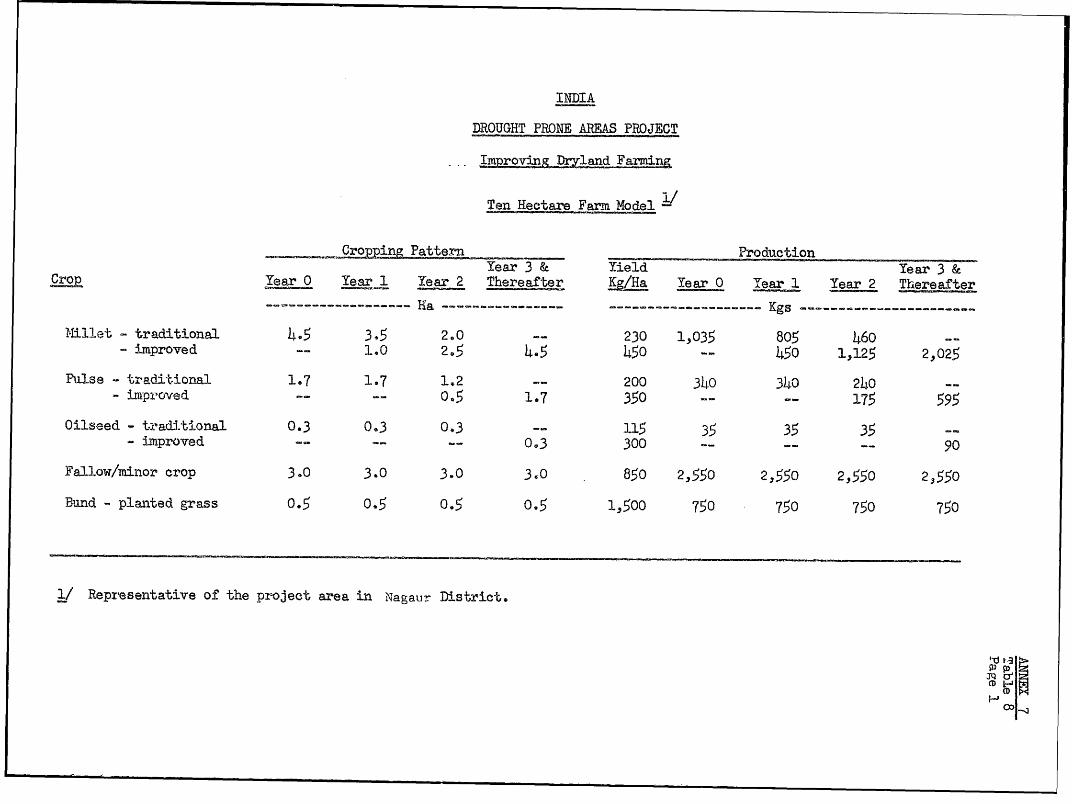
INDIA
DROUGHT PRONE ARES PROJECT
Improving Dryland FaLnin
Ten Hectare Farm Model-/
,- &/ ate ProductionYear 3 & Yield Year 3 &
Year 0 Year 1 'Year 2 Thereafter Kg/a Year 0 Year 1 Year 2 Thereafter
-------- - Kgs --------------
iI-illet - traditional 4.5 3.5 240 -- 230 1,035 805 460 --
- imaproved -- 140 2.5 4.5 450 -- 450 1,125 2,025
Pulse - traditional 1.7 1.7 1.2 -- 200 340 340 240 --
- ixproved -- -- 0.5 1.7 350 -- -- 175 595
Oilseed - tradiltional 0.3 0.3 0,3 115 35 35 35 --
- imprved -- -- -- 0.3 300 -- -- -- 90
Fallow/minor crop 3.0 3.0 3.0 3.0 850 2,550 2,550 2,550 2,550
Band - planted grass 0.5 0,5 0.5 0.5 1,500 750 750 750 750
1/ Representative of the project area in i¶agau- Disstrict.
J I
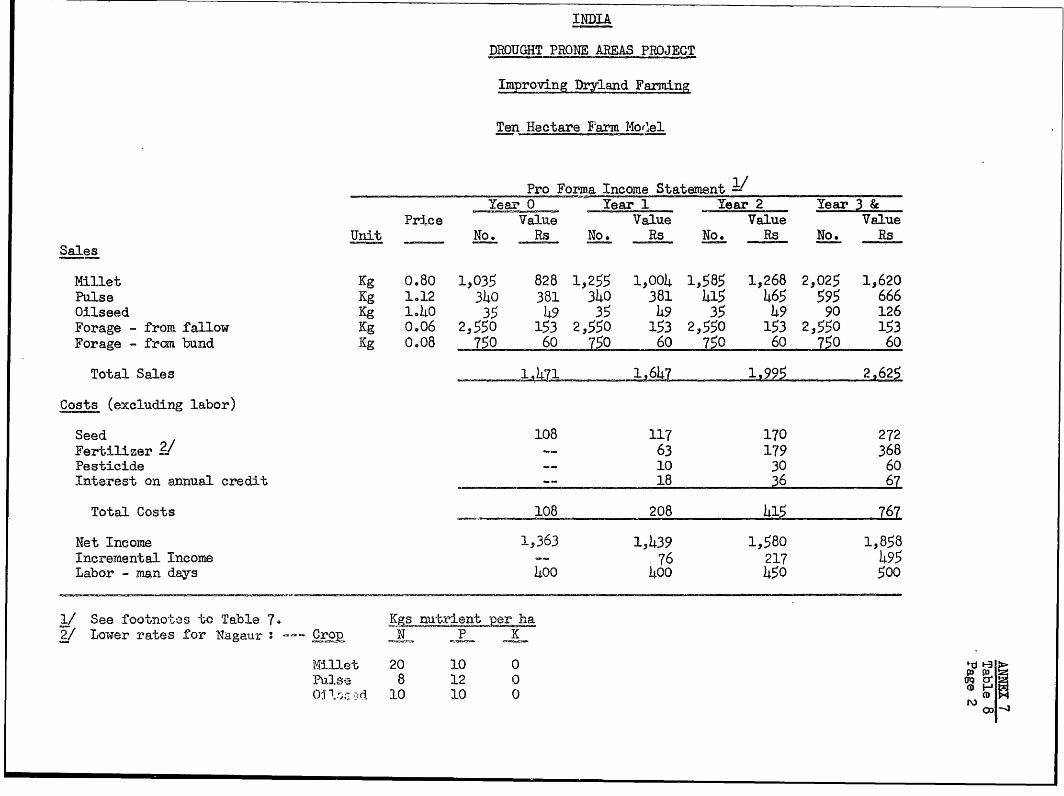
INDIA
DROUGHT PRONE AREAS PROJECT
Improving Dryland. Farming
Ten Hectare Farm Norle1
Pro Forms Income Statement -
Year 0 Year 1 Year 2Y &Price Value Value Value Value
Unit No. Rs No. Rs No. Rs No. Rs
Sales
Millet Kg 0.80 1,035 828 1,255 1,004 1,585 1,268 22025 1,620
Pulse Kg 1.12 340 381 340 381 415 465 595 666Oilseed Kg 1.40 35 49 35 49 35 49 90 126
Forage - from fallow Kg 0.06 2,550 153 2,550 153 2,550 153 2,550 153
Forage - frcm bund Kg 0.08 750 60 0 60 7=O 60 750 60
Total Sales j471 1,647 l---& 2,625
Costs (excluding labor)
Seed 108 117 170 272
Fertilizer 2/ -- 63 179 368
Pesticide -- 10 30 60
Interest on. annual credit -- 18 36 67
Total Costs 108 208 41~ 767
Net Income 1,363 1,439 1,580 1,858
Incremental Income -- 76 217 495
Labor - man days 400 400 450 500
1/ See footno tes to Table 7. cK t t2/ Lower rates for Nagaur Crop N P K
lillet 20 10 0 ii
P.se 8 12 0 oq0 d-j. 10 10 0
CX)D
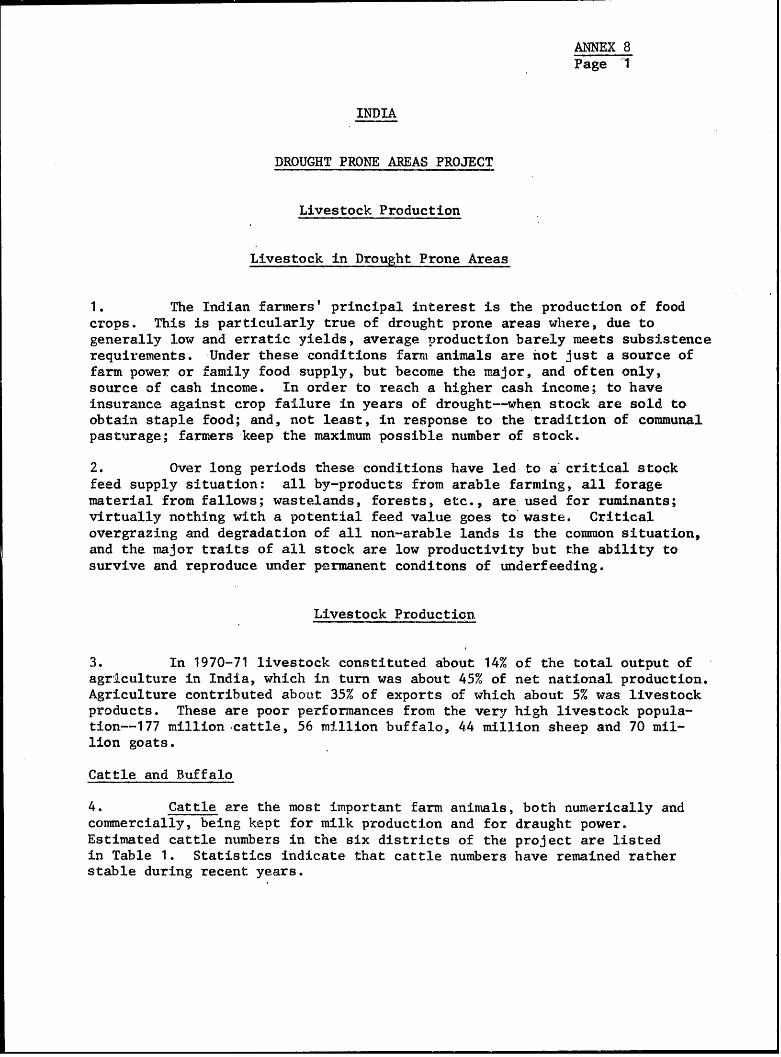
ANNEX 8Page 1
INDTA
DROUGHT PRONE AREAS PROJECT
Livestock Production
Livestock in Drought Prone Areas
1. The Indian farmers' principal interest is the production of foodcrops. This is particularly true of drought prone areas wlhere, due togenerally low and erratic yields, average production barely meets subsistencerequirements. Under these conditions farm. animals are not just a source offarm power or family food supply, but become the major, and often only,source of cash income. In order to reach a higher cash income; to haveinsurance against crop failure in years of drought--when stock are sold toobtain staple food; and, not least, in response to the tradition of communalpasturage; farmers keep the maximum possible number of stock.
2. Over long periods these conditions have led to a critical stockfeed supply situation: all by-products from arable farming, all foragematerial from fallows; wastelands, forests, etc., are used for ruminants;virtually nothing with a potential feed value goes to waste. Criticalovergrazing and degradation of all non-arable lands is the common situation,and the major traits of all stock are low productivity but the ability tosurvive and reproduce under permanent conditons of underfeeding.
Livestock Production
3. In 1970-71 livestock constituted about 14% of the total output ofagriculture in India, which in turn was about 45% of net national production.Agriculture contributed about 35% of exports of which about 5% was livestockproducts. These are poor performances from the very high livestock popula-tion--177 million cattle, 56 million buffalo, 44 million sheep and 70 mil-lion goats.
Cattle and Buffalo
4. Cattle are the most important farm animals, both numerically andcommercially, being kept for milk production and for draught power.Estimated cattle numbers in the six districts of the project are listedin Table 1. Statistics indicate that cattle numbers have remained ratherstable during recent years.
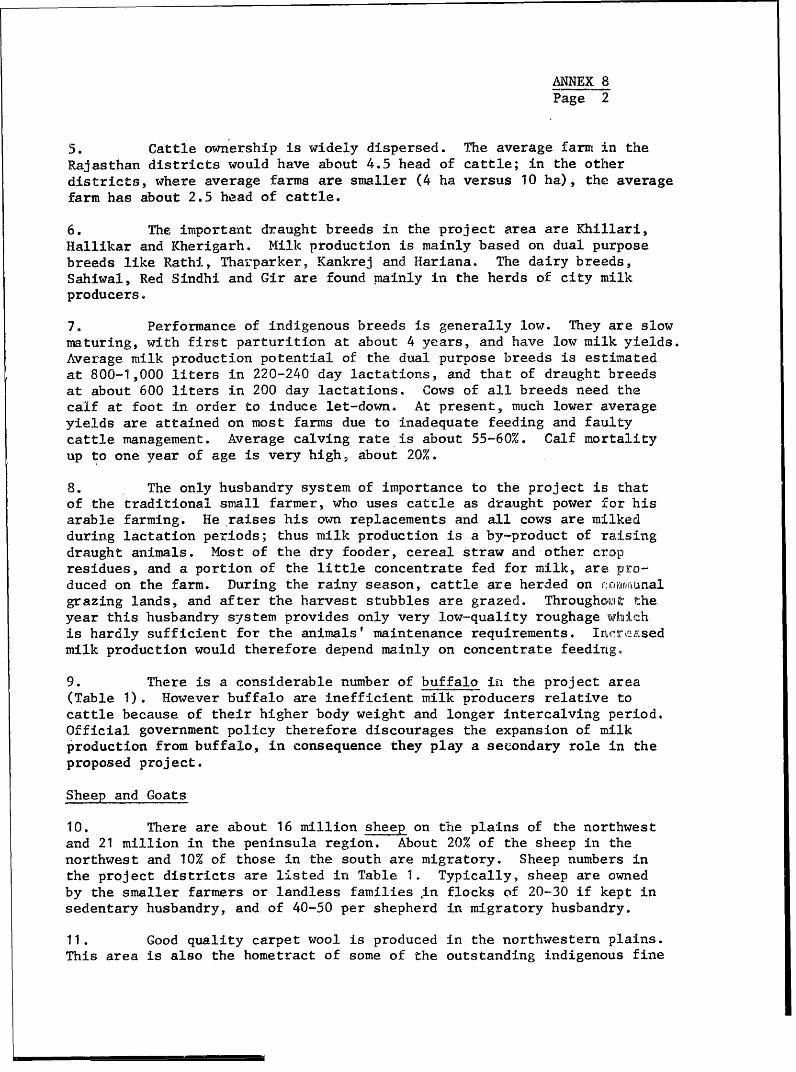
ANNEX 8Page 2
5. Cattle ownership is widely dispersed. The average farm in theRajasthan districts would have about 4.5 head of cattle; in the otherdistricts, where average farms are smaller (4 ha versus 10 ha), the averagefarm has about 2.5 head of cattle.
6. The important draught breeds in the project area are Khillari,Hallikar and Kherigarh. Milk production is mainly based on dual purposebreeds like Rathi, Tharparker, Kankrej and Hariana. The dairy breeds,Sahiwal, Red Sindhj and Gir are found mainly in the herds of city milkproducers.
7. Performance of indigenous breeds is generally low. They are slowmaturing, with first parturition at about 4 years, and have low milk yields.Average milk production potential of the dual purpose breeds is estimatedat 800-1,000 liters in 220-240 day lactations, and that of draught breedsat about 600 liters in 200 day lactations. Cows of all breeds need thecalf at foot in order to induce let-down. At present, much lower averageyields are attained on most farms due to inadequate feeding and faultycattle management. Average calving rate is about 55-60%. Calf mortalityup to one year of age is very high, about 20%.
8. The only husbandry system of importance to the project is thatof the traditional small farmer, who uses cattle as draught power for hisarable farming. He raises his own replacements and all cows are milkedduring lactation periods; thus milk production is a by-product of raisingdraught animals. Most of the dry fooder, cereal straw and other cropresidues, and a portion of the little concentrate fed for milk, are pro-duced on the farm. During the rainy season, cattle are herded on :ran,Lruianalgrazing lands, and after the harvest stubbles are grazed. Throughoo,it, theyear this husbandry system provides only very low-quality roughagewa'0d:chis hardly sufficient for the animals' maintenance requirements. Irwar-{{\Cisedmilk production would therefore depend mainly on concentrate feeding.
9. There is a considerable number of buffalo il the project area(Table 1). However buffalo are inefficient milk producers relative tocattle because of their higher body weight and longer intercalving period.Official government policy therefore discourages the expansion of milkproduction from buffalo, in consequence they play a secondary role in theproposed project.
Sheep and Goats
10. There are about 16 million sheep on the plains of the northwestand 21 million in the peninsula region. About 20% of the sheep in thenorthwest and 10% of those in the south are migratory. Sheep numbers inthe project districts are listed in Table 1. Typically, sheep are ownedby the smaller farmers or landless families in flocks of 20-30 if kept insedentary husbandry, and of 40-50 per shepherd in migratory husbandry.
11. Good quality carpet wool is produced in the northwestern plains.This area is also the hometract of some of the outstanding indigenous fine
ANNEX 8Page 3
wool breeds. Sheep in the project districts outside Rajasthan produce mostly
coarse and colored wool. Anantapur district has a large percentage of hair
sheep. Average yield of greasy wool is about 0.8 - 1.0 kg in three clips
per year. Because of the seasonality and marginality of feed supply none
of the indigenous breeds has been improved successfully for mutton production.
However some significant breed differences exist in the final weight of
mature ewes, ranging from 20 to 35 kg. Lambing takes place throughout the
year but, due to the better quality of grazing during the wet season, the
main lamb crop is born at the onset of the dry season on a declining plane
of nutrition. On average, about 50 single lambs are weaned per year from
100 mature ewes and mortality up to 2 years of age is about 25%. Yearling
rams weigh between 15 and 20 kg.
12. Sheep are kept to utilize sources of roughage which are insuffi-
cient to sustain cattle; they are, therefore, always dependent upon the
more marginal fodder source. In sedentary husbandry, sheep are grazed on
government or community owned waste lands in the vicinity of their owners'
homesteads during the crop grovwing season (August-January), and on crop
stubble from February to June. No grazing fees are paid. In migratory
husbandry, pooled flocks travel long distances between their custo3mary
sumner (wet) and winter (dry) season grazing grounds. Important migratory
routes in the project area are between wet season rangeland grazing in
Jodhpur and Nagaur districts and dry season forest grazing in the central
regions of India. Grazing fees have to be paid to the state forest depart-
ments for winter forest grazing. In both migratory and sedentary husbandry
systems the dry season feed supply is critical; mobility and ability to
survive are the most important traits of all breeds.
13. Goat numbers in the Droject districts are listed in Table 1.
During the recent years of drought, goat numbers. have increased considerably.
In Jodhpur district, for instance, the goat population increased by 80%
between 1966 and 1972. Goats can survive periods of drought because they
browse on shrubs and vegetation which is unpalatable to cattle and sheep.
But, in their ability to survive, the goats frequently destroy the final
remnants of the vegetative cover. In the project districts goats are always
kept in mixed flocks together with sheep. Their preponderance may be taken
as an indicator of range degradation, or vice versa. Goats are superior to
sheep in their reproductive performance and similar in growth rate. They
are therefore good for mutton production, particularly in poorer environments.
Feed Situa tion
14. The two project districts in Rajasthan carry an average 3.3 sheep
units per hectare of total surface area 1/. In the other districts this
f:igurce is 4.3 sheep units per ha (Table 1). These figures indicate the most
serious impediment to livestock development in all drought areas; tile present
rate of overstocking with low producing animals. The severity of feed
1/ Sheep unit: Nature ewe with lamb plus her proportion of female replace-
ments and rams. Conversion: one buffaloe equals 10, one head of cattle
8, sheep units.
ANNEX 8Page 4
shortage is most acute for sheep as they rely on rangeland, wastelandor stubble "grazing" throughout the year. The reduction of their numbersduring recent years, while other farm animal populations stagnated or in-creased (goats), indicates the critical balance of their feed supply. Anoutline of the feed balance in the project area is given in Appendix I.
Disease Situation
15. Livestock in India has been periodically decimated by outbreaks ofinfectious diseases. In the past, rinderpest was the most serious disease,and its virtual eradication has been a major achievement. Foot-and-mouthis now considered to be the most important infectious disease. It rarelycauses heavy mortality in indigenous animals but is nevertheless costly,as the repeated attacks reduce milk yields, fertility and working ability,
16. Haemorrhagic septicaemia causes many deaths among cattle andbuffaloes. An effective vaccine is available, but not in sufficientquantity. Entero-toxemia occurs in sheep during the rainy season; aneffective vaccine is now being produced. Considerable losses occur amongsheep and goats from pneumonia when flocks are crowded into yards or shedsovernight; these losses are the result of mismanagement rather than aspecific infection. Sheep pox is endemic and sometimes causes losses amongflocks on the open range. Black quarter, along with anthrax and tetanusare also endemic but locally produced vaccines are available.
17. External and internal parasites occur but are not a major problemin the dry project areas among indigenous stock. However control measureswould have to be adopted to safeguard improved stock kept under more in-tensive management.
Marketing and Prices
Milk
18. Milk and milk products are by far the most important sources ofanimal protein in India and are acceptable to practically all segments of
the population. However daily per capita consumption is low, only about114 grams compared with 730 grams for the U.S. In the rural areas cows
are traditionally milked for family milk supply. Surplus milk is converted
into ghee which can be stored. The ghee is sold to middlemen who collectit at about monthly intervals. At present they pay about Rs 15/kg of ghee;
thus the farmer realizes Rs 0.60 or Rs 1.15/kg for cows' or buffaloes' milk
respectively 1/. The ghee is sold in the towns at Rs 18-20/kg. Ruraldairying is an activity in which women have almost sole responsibility.They normally also receive the cash income from the dairy enterprise.
1/ 1 kg of ghee requires 25 liters of cows' milk or 13 liters of buffalomilk.
ANNEX 8Page 5
19. Milk producers in and around (10-15 km) urban areas sell freshmilk twice daily to middlemen who supply fixed groups of customers. Normally,only one middleman comes between the producer and the consumer, the so-called"dudhia" who is frequently an employee of the milk producer. Often milk isdiluted with water which results in price differentials even among thecustomers of the same middleman. Retail prices vary considerably withseason being highest during the hot part of the year from March/April toSeptember. Typical retail prices of slightly adulterated milk would be:
April - Sept. Nov. - March
Cows' milk per liter Rs 1.70 - 2.00 Rs 1.30 - 1.60Buffaloes' milk per liter Rs 2.20 - 2.50 Rs 1.80 - 2.00
The producers would receive the above prices minus about Rs 0.10-0.15 forthe middleman. These prices are high relative to average income levelsand indicate that the demand for fresh milk remains unsatisfied.
20. Government schemes for the collection, processing and marketingof milk have started in most project districts. One, in Jodhpur, has beenprepared with the assistance of the National Dairy Development Board (NDDB)and is being developed according to the AMUIJL pattern 1/ by a NDDB spearheadTeam. In the other project districts, however, the pattern of developmentis simpler, probably because they do not have the characteristics of poten-tial milk sheds. There governments have introduced a few modest resourceslike milk collection routes, chilling centers, etc., which create a regularoutlet of milk in rural areas at ex-farm prices exceeding the utilizationvalue of milk for ghee. These government sch'emens may be considered asprecursors to a full fledged dairy development along the AMUL pattern. Inall schemes, cows' milk is purchased from producers at Rs 0.80 - 1.210/liter,depending on season and state, and is retailed at Rs 1.30 -1.60/liter. Allgovernment schemes ration the sale of milk to consumers.
1/ AMUL means "priceless, beyond va"Xlue" in Hindi and is an abbreviationof Aniand Milk Union Ltd. It is the union that serves 783 villagecooperative societies made up of about 225,000 member-families in KairaDistrict, Gujarat State. It is also known as the Xaira District MilkProducers Cooperative Union, Ltd., with its headquarters at Anandcity. The formation and operation of AMUL is outside the influenceof Government, and its operation has been so successful that Governmentnow uses it as the model for dairy developments in other areas ofIndia. The Union serves all its village cooperative societies in theday-to-day execution of their functions. It manages the resourcesneeded to process the milk collected in the villages and to providevillagers with low-cost concentrate feed, milh: transport, veterinaryservice, artificial insemination service, and extension and managementguidance. The Union has a management board made up of nine membersrepresenting the societies, the District Cooperative Bank, the DistrictRegistrar, three individual members and a dairy expert.
ANNEX 8Page 6
21. When farmers are assuired of a better price for their milk than theycurrently get through selling ghee, they will have an incentive to use con-centrates. This is essential to increase milk production. Farmers at pre-sent pay Rs 800-900 per ton for concentrates.
Live Animals
22. All rural areas have established, regular livestock maikets wheresurplus animals are sold. Draught oxen are often sold in pairs at an averageprice of about Rs 1,500. Dairy cows are sold by milk yield at about Rs 100per liter of milk yielded in 24 hours. Prices are the same for cattle andbuffalo. For religious reasons there is a ban or severe restriction oncattle slaughter in most states (none less than 15 years of age) and verylittle beef is consumed. Most that is eaten comes from buffaloes, sincethere are fewer restrictions on their slaughter. This impedes the disposalof unproductive stock. Despite a need for changes in the slaughter policy,to reduce the large number of unproductive cattle and Duffaloe which cur-rently consume about one-half of the total livestock feed resources, it isunlikely that material changes will take place in the foreseeable future.Increasing numbers of farmers, however, have a materialistic attitude towardsthe disposal of undesirable cattle. In such transactions cull cows are soldfor about Rs 50, i.e., the value of the hide.
23. Goats and sheep can be slaughtered in all registered abattoirs;these are always managed by municipalities. The butcher-retailers purchasethe animals they need for the next day a few hours prior to the earlymorning slaughter. This transaction takes place in a market which isalways close to the slaughterhouse and where animals have been driven ortrucked by middlemen. The slaughtering is carried out by staff of theabattoir at a fee from the retailer to the municipality of about Rs 0.50per sheep or goat.
24. Farmgate prices for sheep vary beLween Rs 1.00/kg liveweiaht forculled ewes and Rs 2.00/kg liveweight for inale weaners. The price in villagemarkets goes up to about Rs 3.00/kg livel.,eig,ht. Retail prices of mutton inthe large cities vary between Rs 6.00 and 7.00/kg (bone-in).
Wool
25. Nearly all.wool is marketed through middlemen; the wool gradingand marketing centers which have been established in some states have notbeen able to obtain a significant market share due to their administrativeinflexibility. Producers obtain about Rs 5.00 per kg of coarse wool andup to Rs 15.00 per kg of fine wool. About 16-18 million kg of fine wool isimported annually by large woolen mills which manufacture for re-export.These mills are operating at only 40% of capacity because the quantity ofwool they can import under GOI imposed ceilings has declined with increasesin the world wool price. There is therefore a strong demand for domesticfine wool.
ANNEX 8Page 7
Supporting Services -
26. The state departments of animal husbandry have primary responsi-
bility for the formulation and implementation of livestock development
programs and for the organization and execution of veterinary and extension
services. Various GOI authorities issue broad development guidelines and
programs based on them are frequently given GOI financial support in sub-
sequent 5 year plans. However, program implementation remains the sole
responsibility of the states. In the project area Rajasthan has a Depart-
ment of Sheep and Wool in addition to its Department of Animal Husbandry.
Veterinary Services
27. Each district has about 10 veterinary hospitals which are sup-
plemented by mobile veterinary units and veterinary dispensaries. Veterinary
services are coordinated by the District Animal Husbandry Officer, a fully
qualified veterinarian who is technically supervised by the Department of
Animal Husbandry, but administratively answerable to the Collector. All
veterinary services are free of charge; however, the limited availability
of biologicals and of funds for field work seriously impedes the effectiveness
of the service.
28. Veterinary diagnostic facilities are limited. Some states plan the
establishment of disease investigation laboratories which assisted by mobile
veterinary units, would investigate stock losses to determine the presence
of notifiable infectious diseases.
29. The Indian Veterinary <esearch Institute (I\VRI) at Izatnagar
has overall responsibility for the production and standards of vaccines.
It is supported by 15.production centres for biologicals of which there is
one in each of the states participating in the project.
Extension
30. Animal husbandry departments have concentrated their efforts on
disease control, artificial insemination and the implementation of GOI
sponsored development schemes. The Rajasthan Department of Sheep and Wool
works mainly on wool marketing and grad-ing. An effective livestock pro-
duxction extension service does not exist in Indi.a,
31. There is a serious shortage of staff qualified to advise on
-ivestock production. Most officers entering Government service in the
livestock sector have been trained at colleges of veterinary and animal
sciences. These colleges normally have two wings at the undergraduate
level, one for veterinary science and one for animal production, but major
emphasis in teaching is on veterinary matters. There is an urgent need
for specialized training in modern techniques of livestock production,
feeding and management in semi-arid areas.
1/ Research is discussed in Annex 10.
ANNEX 8Page 8
32. At the district level, information is disseminated through theveterinary hospitals and dispensaries. Little attempt is made to reachfarmers in their villages. Livestock officers working in governmentdevelopment schemes do go into the villages, but there are too many far-mers (1,500-2,000) per officer. Similarly, Village Level Workers have toomany farmers to deal with, and livestock production is only a minor partof their wide responsibilities.
Education and Training
33. India has 21 veterinary colleges with an annual outturn ofveterinarians adequate for foreseeable needs. However few of the graduatesfrom agricultural universities and colleges major in animal husbandry. Morewill be needed to support future livestock development programs. TheNational Dairy Research Institute (NDRI) at Karnal provides under- andpost-graduate training in dairying.
Artificial Insemination
34. The development of AI facilities for cattle and sheep is con-sidered a major tool for production promotion. This is consistent with theview expressed in government policy that a rapid and massive infusion ofexotic blood is essential for increasing production. This approach may becorrect for improving the dairy qualities of cattle in well-watered areas.However the merit of upgrading cows to be milked in drought prone areasneeds further consideration. So also does the use of AI in sheep. Obviously,expensive imported rams could be used more fully with AI. However, thetechniques of semen conservation and distribution needs further investigation.Also real difficulties exist in heat detection and assembly of ewes forinsemination under the present systems of sheep husbandry.
35. The number of cattle inseminations carried out annually at presentis about 3.4 million. Most of these involve liquid semen, although somefrozen semen is used in intensive crossbreeding areas. Conception ratesvary tremendously, from abcet 20% to 70%, reflecting considerable variabilityin management and technique, and indicating great scope for improvement,especially with respect to timing of inseminations.
Government Schemes
36. India has at present 62 Intensive Cattle Development Projects(ICDP). Some states have just started with Intensive Sheep DevelopmentProjects. The approach in the Intensive Cattle (or Sheep) DevelopmentProjects is to improve infrastructure and services in a package program.This starts off, for instance, with veterinary services, artificial inaemi-nation, provision of fodder seeds, etc., and may go as far as establishingmilk collection routes, chilling centers or small milk processing units.All services are provided by Government.
ANNEX 8Page 9
37. Under the Small Farmers Development Agency (SFDA) and the MarginalFarmers and Agricultural Laborers Project (MFAL), dairy animals, mainlyshe-buffaloes, are provided to eligible families on a part grant, part loanbasis. Some states also have ram-distribution schemes under which cross-bred rams, owned by government, are loaned free of charge to sheep ownersduri-ng the breeding seasons.
Bilateral and Multilateral Support
38. Programs to upgrade local dairy stock and to improve feeding,husbanidry and to provide a better market outlet have been assisted byDenmark, Germany and Switzerland in Mysore, Himachal Pradesh and Keralarespectively. High quality dairy animals have been imported under assistancefrom Australia and the USA. Significant contributions in animal husbandryeducation and research have been made by USAID. In the sheep sector, theAustralian Government is providing capital and technical assistance for theestablishment of fodder seed and ram multiplication farms. Russian capitalaid has been used for the importation of considerable numbers of RussianMerinos,
39 'Multilateral aid to dairy development has been concerned withbreed improvement (FAO/UNDP at Haringhata), dairy plant equipment (UNICEFat Kaira), feed rhill equipment (Freedom from Hunger Campaign at Kaira), feedgrain donation (WFP at Kaira), the donation of skim milk powder and butteroil (WFP in "Operation Flood" see para 42), and technical assistance in thefield of dairy engineering to the National Dairy Development Board (NDDB)by FAOa FAO/UNDP projects continue to assist the development of the Grass-land and Fodder Research Institute at Jhansi and its sub-stations, and haveassisted the development of woul grading and marketing centers in Rajasthanand othier states with major wool-sheep populations.
Governmexnt Plans and Policies
40. During the first three Five-Year Plans (1954-1969), GOI expendedRs 22.1 mnillioin for all agricultural programs. Of this, 8% was spent foranimal husbandry and dairy development. During these years, when all programswere justly biased towards food grain production, the major achievement inthe livestock sector was the formulation of GOI and state dairy developmentpo ic:ies a
41. During the Fourth Five-Year Plan which termnAlnted March 31, 1974,expenditures for animal husbandry have been about Rs 780 million and for-i,ilk r,ocessing and distribution about Rs 820 million. The latter consistsma. y of Qperat :.on Flood, The World Food Programme (WFP) is providing overa 5 v-'.Lr ;o-iod (1969 to 1974) 126,000 tons of skim milk powder and 42,000tons of butter oil for recombination into liquid milk at processing plantsin NeA DeiTihi, Bombay, Calcutta and Madras. Profits from the sale of this
ANNEX 8Page 1 0
milk are to be used to finance developments which aim at improving milkprocessing facilities and increasing milk supplies to these four largestcities in India. Imbalances in the supply and demand would be removedthrough a National Milk Grid. Operation Flood is managed by the IndianDairy Corporation (IDC).
42. In general, the first four plans' objectives have not beenreached. Many of the dairy plants erected are operating at 60% of capacityor less. This shortfall reflects a more serious problem, namely a growthrate of only about 2% per year in milk production since 1951. This hasbeen inadequate to keep pace with population growth; per capita consumptionof milk fell from 130 grams in 1951 to 114 grams in 1970. Planners nowrecognize that there has been little incentive to produce milk. The farmerusually had to sell, via middlemen, to a government-owned dairy which wasinefficiently run and set low prices, reflecting a consumer rather thanproducer orientation. To improve matters GO and state governments are nowencouraging the setting up of producer cooperatives based on the experienceof AMUL. This is a commercial approach that provides attractive financialand social incentives for farmers to go into dairying.
43. Under the up-coming Fifth Five Year Plan, dairy development is toreceive unprecedented priority; a total expendiLture of Rs 7,000 million hasbeen proposed. The basic thrust will be on programs that will integratethe industry from the farmers' level to the consumer. Most of the fundswill come from domestic sources but significant contributions are expectedto be received from multilateral and bilateral sources. WFP will continueto support Operation Flood. Also, for the first time, the Bank Group isproviding support to this sub-sector by financing AMUL-type developmentsin a number of states and by aiding the Drought Prone Areas Project underwhich first steps towards AMUL-type developments will be taken in thesedrier areas.
44. The Fifth Five-Year Plan also gives unprecedented importance tosheep development. Rs 50 million has been earmarked for new 'developmentsin this sub-sector. The intentions are to raise the income of sheep ownerswho normally belong to the poorer section of the rural population, tosupply the type of wool which now has to be imported for the local manufac-turing industry, and to produce more and better quality mutton for urbanareas. Probably of even greater importance would be the objective todevelop systems of rangeland reclamation and utilization which can beapplied under different ecological conditions and which would bring aboutthat measure of farmers' participation without which wider developments inthis sector are impossible.
ANNEX 8Page 11
Dai Developmert Proposals
Village Societies
45. Major activity under the project would center around the work of
Spearhead Teams 1/. These would be mobile units which would publicize pro-
ject activity an_d assist groups of willing farmers in the formation of pro-
ducer cooperatives. For five years after formation the teams would help
manage societies and provide them with technical services. Each team,
working out of the office of the District Animal Husbandry Officer, would
take care of 40 societies. The composition and cost of a team are shown
in Table 2. Teams would be trained at AMUIL where existing facilities would
be adequate. The greatest increment of teams under the project would be
seven in year two (Table 3).
46. The work of the teams would be governed by the following para-
meters:
(a) promotion of societies would be restricted to groups of
farmers who reside in one village or several neighboring
villages and own at least 300 mature cows; and
(b) a potential milk collection route would have a minimum
of eight societies within a route length of approximately
120 km.
Investments, operating expenses and projected cash flows for primary
societies are showni in Tables 4a, b and c. Projected buildup of milk
volumes is presented in Table 5.
Farm Development
47. It is anticipated that farmer participation within a group would
build up as follows: year 1, 50%; year 2, 67%; year 3, 75%. Production
from indigenous cattle would be encouraged because the typical farm in the
project area has no irrigation for the perennial production of green fodder,
a prerequisite for keeping crossbred cows. 2/ In order to improve their
incoTne, and the volume of milk supplied to the collection system, participating
farmers would be encouraged to buy an addiitional cow. Cows would be purchased
at traditional village livestock markets. Within each district, purchases
would be spread over three or four years. The total number of cows to be
Utiaantferred in any year would vary between 1% of all adult females, in Nagaur,
and 5% in Sholapur and Bijapur. It is not expected that thcse transfer ra.tes
would increase cows' prices beyond the anticipated levels of Rs 600 each in
dajasthan and Rs ,,Q00 each in the other states. Spearhead Teams would assist
farmers to obtain loans for this purpose.
1/ This development technique is a feature of the AMUL pattern to be used
for dairy development throtughout India.
2/ A minor;ity of farmers would have irrigation facilities which would enable
them to keep crossbred cows or improved buffalo. HoTever such animals
will be in short supDly, hience expeasive, for several years. All project
eCt.nates are therefore conservativel- based solely on the indigenous
animal .
ANNEX 8Page 12
48. In Rajasthan, cow numbers on the typical 10 hectare farm wouldincrease from two to three. On the typical four hectare farm in the otherdistricts, cow numbers would increase from one to two. Overall this wouldrepresent an increase in animal units of about 7% in Rajasthan and 25% inthe other districts.
49. Increased feed demand would be met in two ways. It is expectedthat all farm-produced fodder would continue to be a by-product of cropfarming. However yield increases of 15% to 20% would be expected to resultfrom soil and moisture conservation measures (Annex 6). Secondly, thefarmers would be encouraged to feed concentrates.
50. The feeding of concentrates would clearly become attractive withthe development of a reasonably priced outlet for milk under the project.With concentrates fed at the rate of half a kilogram per liter of milk sold,increases in lactation yields would be expected to occur rapidly since theywould be based only on improvements to the animal environment.
51. The requirement of concentrates under the project would build uprapidly, by 30% over pre-project levels in year one and 200% in year two.It is assumed that requirements for the first two or three years could bemet by existing processing and distributing systems. Thereafter, if theproject were successful, additional investment in processing and distributionwould be required.
52. As a result of improved disease control, together with improvedmanagement and feeding, calving rate would be expected to increase from 60%to about 75%; adult mortality to decrease from 10% to 3% and mortality ofimmatures to decrease from 20% to 10%. Age at first calving would alsobe expected to fall from 48 to 36 months.
53. On-farm investment, other than the cow purchase, would beminimal -- consisting of an expansion of the cattle shelter and the pur-chase of a set of simple dairy equipment. Details of on-farm investment,operating costs and sales are given in Tables 8a and b for 10 hectare and4 hectare farm models respectively.
District Level Deveipment
54. Full scale dairy development along AMUL lines involves the or-ganization of primary producers' societies into cooperative unions whichown and operate milk and feed processing facilities and provide veterinaryand AI services, etc. This project would markedly improve the level ofdairy development. However it is not possible at this time to predictwith confidence when the level of development reached would generate therequisite cash flows for financially self supporting unions providing thecomplete range of services. For this reason it is proposed that initiallythe operations of Spearhead Teams and artificial insemination centers,mobile veterinary units, milk transport and chilling plants remain in thepublic sector. If and when adequate cash flows were generated the chillingplants should become the nuclei of cooperative unions responsible alsofor milk transport and the organisation, and possibly supply, of inputs.
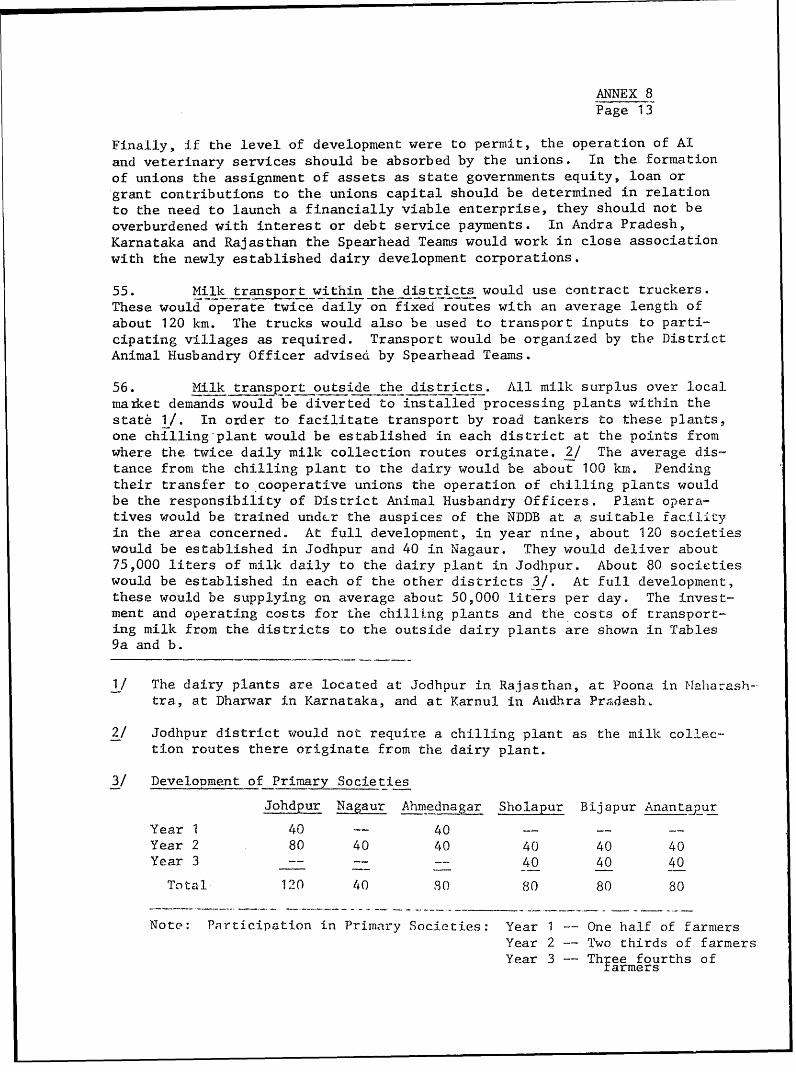
ANNEX 8Page 13
Finally, if the level of development were to permit, the operation of AIand veterinary services should be absorbed by the unions. In the formationof unions the assignment of assets as state governments equity, loan orgrant contributions to the unions capital should be determined in relationto the need to launch a financially viable enterprise, they should not beoverburdened with interest or debt service payments. In Andra Pradesh,Karnataka and Rajasthan the Spearhead Teams would work in close associationwith the newly established dairy development corporations.
55. Milk transport within the districts would use contract truckers.These would operate twice daily on fixed routes with an average length ofabout 120 km. The trucks would also be used to transport inputs to parti-cipating villages as required. Transport would be organized by the DistrictAnimal Husbandry Officer advise& by Spearhead Teams.
56. Milk transport outside the districts. All milk surplus over localma Set demands would be diverted to installed processing plants within thestate 1/. In order to facilitate transport by road tankers to these plants,one chilling plant would be established in each district at the points fromwhere the twice daily milk collection routes originate. 2/ The average dis-tance from the chilling plant to the dairy would be about 100 km. Pendingtheir transfer to cooperative unions the operation of chilling plants wouldbe the responsibility of District Animal Husbandry Officers. Plant opera-tives would be trained undLr the auspices of the NDDB at a suitable facil.icyin the area concerned. At full development, in year nine, about 120 societieswould be established in Jodhpur and 40 in Nagaur. They would deliver about75,000 liters of milk daily to the dairy plant in Jodhpur. About 80 societieswould be established in each of the other districts 3/. At full development,these would be supplying on average abou-L 50,000 liters per day. The invest-ment and operating costs for tne chillLng plants and the costs of transport-ing milk from the districts to the outside dairy plants are shown in Tables9a and b.
1/ The dairy plants are located at Jodhpur in Rajasthan, at Poona in {aharaash-tra, at Dharwar in Karnataka, and at Karnul in Autdhra Pradesh.
2/ Jodhpur district would not require a chilling plant as the milk coll ec-tion routes there originate from the dairy plant.
3/ DeveloDment of Primary Societies
Johdpur Najaur Ahmednagar Sholapur Bijapur AnantapurYear 1 40 -- 40Year 2 80 40 40 40 40 40Year 3 -- -- -- 40 40 40
Total. 120 40 so 80 80 80
Note: PMarticipation in Primary Societies: Year 1 -- One half of farmersYear 2 --- Two thirds of farmersYear 3 Thfee fourths of
ANNEX 8Page 14
57. Anrimal disease control measures would be improved by establishingone mobile veterinary unit for each group of 40 societies. In accordancewith AMUL practice, vehicles for the units would be rented. Veterinaryservices would be provided to farmers at no cost. The buildup and cost ofthe mobile units is shown at Table 10.
58. Artificial insemination (Al). Whilst the project areas are notconsidered suitable for milk production from crossbreds, indigenous cowscould be used to produce crossbred calves for sale. This would permitfarmers in the drought prone areas to participate in the profitability ofcrossbred dairying whilst helping meet the shortage of crossbred animalsneeded for dairy developments in the better watered areas. To meet thisobjective the project would expand the AI service in the project areas.Currently thisc ers only for the upgrading of indigenous stock. The projectwould finance the construction or expansion of five AI centers, one in Ra.jas-than and on in each of the other four districts. Each center would purchase10 exotic breed dairy bulls, necessary additional buildings would be constructedand an irrigation well would be dug and equipped in order to ensure an adequateyear round supply of fodder. Investment and operating costs of an AI centerare shown in Tables lla and b. Fresh semen would be distributed by themilk trucks and inseminations conducted by a trained staff member of thecooperative society.
59. Calf rearing centers. Crossbred animals are generally sold asin-calf heifers. However the crossbred calves bred in the drought proneareas should not be reared on farms without irrigation as they could not bekept oni a satisfactory plane of nutrition. To increase the supply ofcrossbred heifers the project would undertake the development of nine calfrearing centers, one in Rajasthan and two in each of the other districts.These would be cooperative undertakings by either primary milk producers'societies or by existing sugar cane producers' cooperative societies. Aninternationally recruited consultant would assist in the planning of one ortwo initial centers. Hi would also train project staff who would plan othercenters, help obtain credit for inte-res-ed coc3' ties, and subsequently assistwith management. (Proposed qualifications and job description are given inAppendix 2.)
60. Details of investment requirements are g-`van in Table 12a. Majoritemns are irrigation development to ass -ue suppics of perennial fodder andcalf houses. Total cost w6uld be about Re 2OC0,000 per center. The centerswould break even after two years of opera2tLor.A and would therefore requireloans for two years' working capital. It is assumed that some one-monthold calves would be purchased but the majority of calves would be availableonly at an age of six months, i.e. at the end of their dams' lactations. In-calf heifers would be produced at a cost of about Rs 1,500 compared to cur-rent retail prices well above Rs 2,000. The centers would be operated byspecially trained managers who would be supervised and advised by projectstaff working out of the offices of the District Animal dusbandry Officer.Operating details are shown in Table 12b.
ANNEX 8Page 15
61. Sugrcane baaasse treatment. 1/ The project would finance a pioneerphase of pressure-heat treatment for bagasse by establishing one treatmentunit at an existing cooperative sugar mill in the District of Ahmednagar.It would be operated by the mill and convert bagasse, now used for hardboard production, into higher value fodder for cattle. The pilot unit wouldhave a capacity to treat about 30 tons of bagasse per day. The treatedproduct would have an energy value similar to good quality alfalfa hay andwould be worth about Rs 40 per ton. An internationally recruited consultantwould be engaged to assist with the design and start-up of the pioneerunit. (Proposed qualifications and job description are given at Appendix 3.)A three-monthi local engineering consultanc, included in the cost ofestablishiiLig the unit which would become fin._Aally viable during the firstyear of its operation. The investment and operating costs of the pilot plantare shown in Table 13.
Sheep Development Proposals
Pasture Developmenlt
62. The project would finance the development of blocks of degradedcommunal grazing lands which are at present administered by local. panchayats.These areas, which would be not less than 100 hectares each, would be fenced,contour furrowed, seeded with improved grasses and provided with stock watersupply. 2/ The techniques of pasture/rangeland improvement are described in
1/ A typical sugar mill with a capacity of 2,000 tons of cane per daywould have 7,000 tons of excess bagasse per year. This estimate isbased on the assumption that Indian cane has, on average, about 15%fibre of which 13% is needed for generating the heat required toproduce plant-white sugar. In other words, 2% of the "cane-in" canbe considered as excess fibre. In the past, up to 10,000 tons ofbagasse has been sold by a typical mill at about Rs 10/ton for theproduction of hardboard. It is proposed to convert about 50% ofthis (about 30 t/day) into cattle fodder with an energy value of goodquality alfalfa hay, by subjecting the bagasse for about 20 minutesto temperatures of about 160%C under pressure of 90/lbs/sq. in. Thistreatment has been proven to render the cellulose of bagasse digestibleto ruminants. The equipment required for this would be a pressurecooker of about 2 ton capacity, an overhead rail with single trolly,about 5 steel bins to be placed in the pressure cooker, and equipmentfor roller-drying the bagasse-hay after treatment. The treated bagassewould then be sun-dried. It would have an estimated market value ofRs 40/ton.
2/ In some areas of Rajasthan the units may average 200 ha in size, allow-ing higher costs for the development of stock water supply.
ANNEX 8Page 16
A.nnex 6. The total development costs of a 100-hectare unit would be aboutRs 57,000 (US$80 per hectare) (details in Table 14). The areas to bedeveloped should not exceed 25% of the total area of such land availableto a village community so that: (a) stock which could not be accommodatedon the improved land could continue to be grazed along traditional lines,and (b) villagers could compare the productivity of their stock when sub-jected to different levels of feeding and management.
63. Large areas of degraded fallow land are privately-owned. Theselands have been ploughed in the past, but frequent crop failure has discouragedthe continuation of annual cropping. From a land capability point of viewsuch areas should be reconverted to grassland. Many farmers recognize thisand it is anticipated that it would be possible to persuade farmers to under-take pasture improvement to the extent that about 10% of the total degradedlands to be improved would be privately-owned. The typical property to bedeveloped would be about 10 hectares. The techniques of grassland improve-ment would be the same as for the 100-hectare units but average developmentcost per hectare would be much lower (US$16) as it is assumed that fencingand stock water supply would not be necessary (details in Table 15).
64. It is assumed that at full development, from year 3, one hectareof improved pasture land would sustain four mature sheep units, or theirequivaler. . Pasture growth will be strictly seasonal, the estinated yield of1,500 kg dry matter per hectare being produced during the monsoon. In somevillages pastures would be used seasonally, in order to make the bestpossible use of crop by-products. However, in most instances, a year-rounduse of improved pastures would be undertaken. The project would introducea lambing season at the beginning of the monsoon and sales of weaners at thebeginning of the dry season. In this way the feed requirements of the flockwould be synchronized to a considerable extent with vegetation growth.
Village Producers' Societies
65. To be of lasting benefit the improved pasture would nieed soundmanagement complemented by improved sheep husbandry, stock quality anddisease control. Producers' cooperatives would be established for each100 hectare unit to provide a management unit and a channel for technicalassistance. Proposed draft bye-laws are given at Appendi): 4. Membership,hence participation in the scheme, would be voluntary. Equity would bepurchased in cash or kind. The latter would consist of ewes of breedableage, subject to health inspection and valued on the basis of a liveweightprice for which shares of an equivalent face value would be issued. Thusshould any member wish to withdraw from the society he would receive acash value for ohares, he would not be able to withdraw his sheep whichwould have become the society's property. Preference would be given tomembers purchasing shares in kind. However any one member would only beallowed to purchase that share of the society's equity equal to the. ratioof his sheep numbers to the total number of sheep owned by all intendingmembers.
ANNEX 8Page 17
66. Guidance on the day-to-day management of village cooperative unitsand the provision of health supplies would be the responsibility of unitmanagers who would each look after about three societies. In addition, theunit managers would provide veterinary services for all non-participatingvillage livestock. In all activities, unit managers would be responsibleto, and receive backstopping from, the Service Centers (para 70).
67. As a result of improved nutrition, husbandry and disease control,it is anticipated that weaning rates would increase from 50% to 70%; adultmortality rates would fall from 10% to 5% and immature immortality from25% to 15%. With improved breeding, wool yields would go up by about 60%and considerably higher prices would be obtained for finer wool. Body growthperformance would improve by 40 to 50%. Flock projection and productionparameters for a 100-hectare unit model are given in Table 16. Yields,prices and anticipated revenue from wool and mutton are given in Tables 17aand b for the 100-hectare and 10-hectare models, respectively.
68, Despite the attractiveness of the economics of improving pastureand sheep production (Annex 18) it is considered that strong financialincentives would have to be offered to persuade farmers to participate inthis scheme. Government would therefore subsidize the cost of capitalimprovements and of the unit managers for the first five years. Furthermore,as the most telling incentive, farmers would be guaranteed for the firstfour years a minimum return for each share purchased in kind.
69. A projected cash flow for a primary society is given in Table 18.Given accee3 to the requisite working capital loans, up to Rs 2,500 forthe first two years, societies could pay farmers on a rising annual scale.The guaranteed income is within the anticipated level of operating surplus,hence little risk attaches to its being offered. The guaranteed income inyear one is calculated to be about 10% above the present gross productionvalue per ewe. 1/ The incomes would be increased thereafter at the rate ofRs 2 per ewe per year through year 4. Incomes should be held at this leveland a reserve fund built up to cove'r bad years. Any operating surplus afterpayments to the reserve would be distributed to members as a bonus payment.
Service Centers
70. The implementation of the project's sheep development componentwould be the responsibility of Service Centers to be established in eachdistrict under the Animal Husbandry Department. These would publicizeproject activity, assist groups of interested farmers in the formation of
cooperative societies, help manage societies and provide them with inputsand technical services. The centers would be staffed aad equipped to give
1/ The value of present annual production of one ewe is estimated at:1 kg wcool (Rs 5.00) from herself plus 0.3 kg of wool (Rs 1.50) fromfemale followers; plus 5 kg liveweight (Rs 8.80) from 1/4 male weanerplus 6 kg liveweight (Rs 7.50) from ewe culling; totalling Rs 22.00-23.00 per ewe, per year.
ANNEX 8Page 18
assistance in the improvement and management of grasslands, stock husbandry,veterinary services and marketing of wool and mutton for about 50 societies.They would also supply crossbred rams to the societies, and in some casesactually operate ram multiplication farms. Center managers would undergospecialized training before taking up their assignments. The investment andoperating costs of a service center are shown in Table 19. Five centerswould be established in Rajasthan and on in each project district of otherstates (details in Table 20). Three of the centers in Rajasthan would beoutside the Districts of Jodhpur and Nagaur; they would be pioneer phasesof similar developments in the southeastern and northeastern districts ofthe State.
71. Technical Assistance. Large scale rehabilitation of common pasture,and the organization of livestock owners for its utilization, has not beenattempted in India to date. It is unlikely, therefore, that there would beavailable in India anyone with the requisite training and experience toguide the planning and implementation of such an innovative and difficultprogram. It is proposed that an internationally recruited consultant beengaged for three years, to be attached to the central unit of DPAP in NewDelhi, to be responsible, under the Director of DPAP, for launching thesheep and pasture [program. Proposed qualifications and job description aregiven at Appendix 5.
Ram Multiplication
72. In order to ensure the supply of crossbred rams to participatingvillage societies, the project would develop in each state one ram multipli-cation farm on an existing government sheep station. The techniques ofpasture/rangeland improvement would be the same as described in Annex 6;however, some irrigated fodder production would be required to cater for theneeds of the purebred stud rams which would be obtained from existing govern-ment farms. These would also require special protection against ambientheat from April to July in order to keep them fertile and sexua'Lly active.The average farm size is estimated at 400 ha and the additLicnal investmentsper farm over a three-year period would total about Rs 460,000 or aboutUS$150 per hectare (details in Table 21).
73. About 500 two-year old crossbred rams could be released annuallyafter year two (details in Table 22). Rams surplus to the requirements ofthe project would be used in other DPAP districts of the State. As there i.sno proven strategy for the genetic improvement of Indian sheep, indigenousewes would be brought to replace culls. 1/ Meanwhile GOI should undertaketo establish the niost suitable level at which to stabilizye the proportionof exotic blood in the flocks of the drought prone areas (also see para 35,Annex 10, Research).
1/ For simplicity the tables show replacements from crossbred hoggetts.Since these would be more valuable than inligenous animals, this is aconservative simplification.
ANNEX 8Page 19
74. After year 2, the revenue from ram, wool and mutton sales wouldexceed the operating expenses of the ram multiplication farms. Details are
shown in Tables 23 and 24.
November 4, 1974
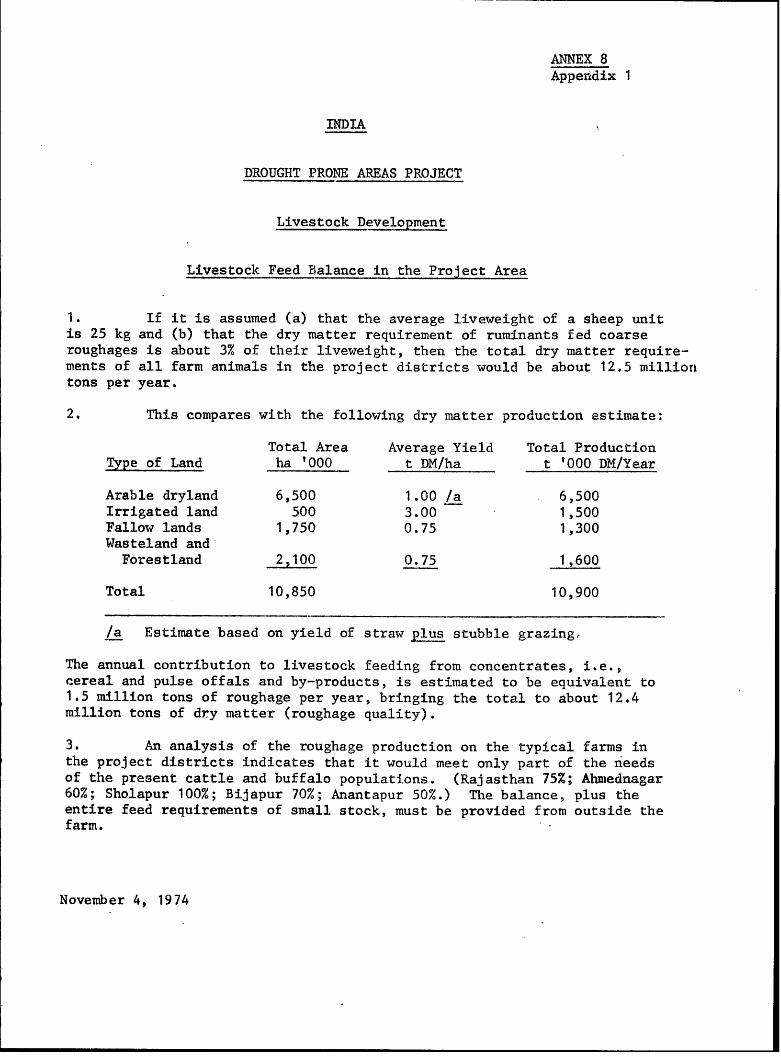
ANNEX 8Appendix 1
INDIA
DROUGHT PRONE AREAS PROJECT
Livestock Development
Livestock Feed bialance in the Project Area
1. If it is assumed (a) that the average liveweight of a sheep unitis 25 kg and (b) that the dry matter requirement of ruminants fed coarseroughages is about 3% of their liveweight, then the total dry matter require-ments of all farm animals in the project districts would be about 12.5 milliontons per year.
2. This compares with the following dry matter production estimate:
Total Area Average Yield Total ProductionType of Land ha '000 t DM/ha t '000 DM/Year
Arable dryland 6,500 1.00 /a 6,500Irrigated land 500 3.00 1,500Fallow lands 1,750 0.75 1,300Wasteland and
Forestland 2,100 0.75 1,600
Total 10,850 10,900
/a Estimate based on yield of straw plus stubble grazing,
The annual contribution to livestock feeding from concentrates, i.e.,cereal and pulse offals and by-products, is estimated to be equivalent to1.5 million tons of roughage per year, bringing the total to about 12.4million tons of dry matter (roughage quality).
3. An analysis of the roughage production on the typical farms inthe project districts indicates that it would meet only part of the needsof the present cattle and buffalo populations. (Rajasthan 75%; Ahmednagar60%; Sholapur 100%; Bijapur 70%; Anantapur 50%.) The balance, plus theentire feed requirements of small stock, must be provided from outside thefarm.
November 4, 1974
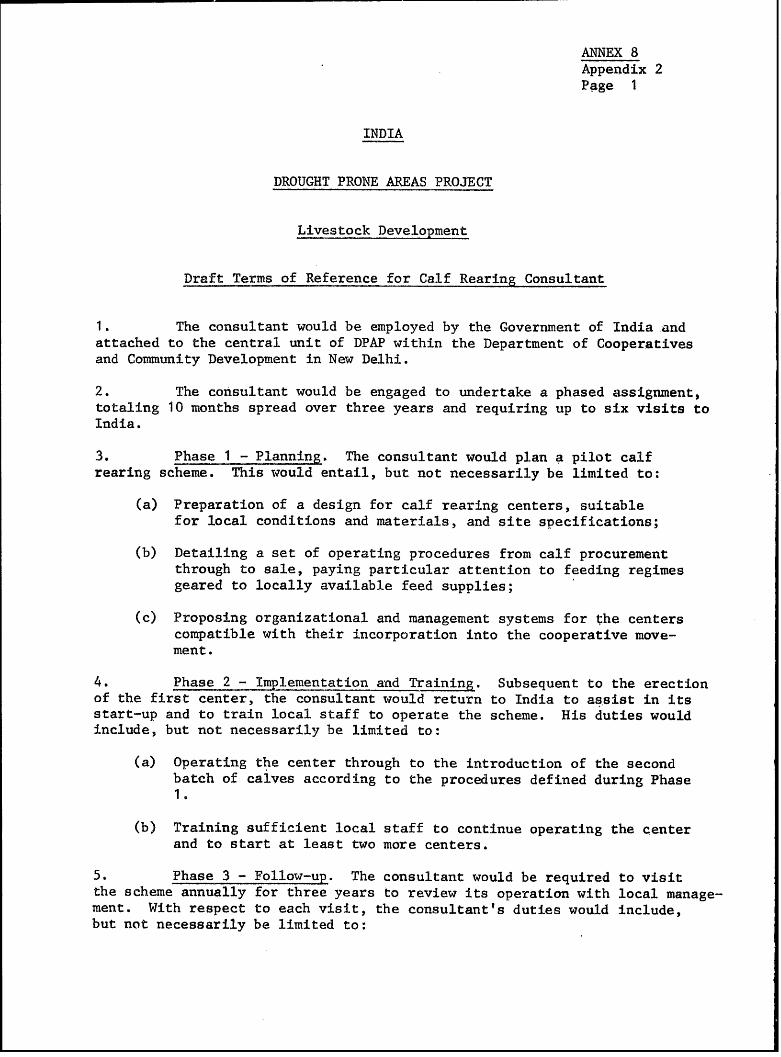
ANNEX 8Appendix 2Page 1
INDIA
DROUGHT PRONE AREAS PROJECT
Livestock Development
Draft Terms of Reference for Calf Rearing Consultant
1. The consultant would be employed by the Government of India andattached to the central unit of DPAP within the Department of Cooperativesand Community Development in New Delhi.
2. The consultant would be engaged to undertake a phased assignment,totaling 10 months spread over three years and requiring up to six visits toIndia.
3. Phase 1 - Planning. The consultant would plan a pilot calfrearing scheme. This would entail, but not necessarily be limited to:
(a) Preparation of a design for calf rearing centers, suitablefor local conditions and materials, and site specifications;
(b) Detailing a set of operating procedures from calf procurementthrough to sale, paying particular attention to feeding regimesgeared to locally available feed supplies;
(c) Proposing organizational and management systems for the centerscompatible with their incorporation into the cooperative move-ment.
4. Phase 2 - Implementation and Training. Subsequent to the erectionof the first center, the consultant would return to India to assist in itsstart-up and to train local staff to operate the scheme. His duties wouldinclude, but not necessarily be limited to:
(a) Operating the center through to the introduction of the secondbatch of calves according to the procedures defined during Phase1.
(b) Training sufficient local staff to continue operating the centerand to start at least two more centers.
5. Phase 3 - Follow-up. The consultant would be required to visitthe scheme annually for three years to review its operation with local manage-ment. With respect to each visit, the consultant's duties would include,but not necessarily be limited to;
ANNEX 8Appendix 2Page 2
(a) Visiting all operating centers to review performance,
(b) Proposing any necessary changes in center design,operating procedures or organization and management,to increase operating efficiency;
(c) Proposing any further in-service training of staff whichwould increase operating efficiency.
6. In addition to the three follow-up visits described above, theconsultant would be required to undertake one further visit, should he becalled upon to do so, in the event that a major operating problem were toarise, the resolution of which. would require the consultant's assistance.
November 4, 1974
ANNEX 8Appendix 3
INDIA
DROUGHT PRONE AREAS PROJECT
Livestock Development
Draft Terms of Reference for Bagasse Treatment Consultant
1. The consultant would be employed by the Government of India andattached to the central unit of DPAP within the Department of Cooperatives
and Community Development in New Delhi.
2. The consultant would be engaged for two months to plan the introduc-
tion of bagasse treatment at one cooperative sugat mill in the State of
Maharashtra and to assist in the implementation of the scheme. The assign-
ment would include, but not be limited to, the following specific duties and
responsibilities:
(a) Specifying to a local engineer the equipment required for thepressure/heat treatment of bagasse and assisting him in thedesign of such equipment and in the integration of this unitinto the other activities of the mill;
(b) Training staff of the mill in the operation of the bagassetreatment unit; and
(c) Advising and training various district staff on suitable waysof feeding treated bagasse to cattle.
November 4, 1974
ANNEX 8Appendix 4
INDIA
DROUGHT PRONE AREAS PROJECT
Livestock Development
MODEL BY-LAWS FOR A PRIMARY SHEEP GROWERS' SOCIETY
General
(1) The name of this society is ...................... Sheep Growers'Cooperative Society Ltd. and its registered address is at.............. .Taluka ................ District ...........Any change in address shall be communicated to the DistrictRegistrar, Cooperative Societies within 30 days. The addresscan only'be changed by amending the by-laws.
Definitions
(2) (a) Definitions and use of terms in these by-laws shallbe those specified in the (State) Cooperatives Act.
(b) Notwithstanding the provisions of 2(a), the followingterms of a specific nature appearing herein shall bedefined as:
(i) Primary Sheep Growers' Society. A joint farmingcooperative established with objectives as inSection III of these by-laws.
(ii) Livestock specified for the purpose of equitycontributions.
A female sheep of breedable age and of sound healthand frame as shall be determined by a qualifiedinspector selected by the Managing Committee orits appointed predecessor.
(iii) Unit Manager. A full-time employee of the (State)Department of (Animal Husbandry) who shall, underthe supervision of the District (Animal Husbandry)Officer, render technical and marnagerial assist-ance to primary sheep growers societies.
ANNEX 8Appendix 4Page 2
IlII. Ob jectives
,'3) The objectives of the society shall be:
(a) For the direct benefit of members,
(i) to develop and manage pasture lands sold, leased
or ceded to it,
(ii) to establish and manage a sheep flock on such
lands for which purpose the society's rightsshall include:
a. purchase and sale of sheep and sheep products
b. application of good husbandry practices to thebreeding, health care, selection and cullingof animals within such flock.
(b) For the benefit of all sheep growers in ( ) village;to provide breeding, health, and marketing services,
the type and quantity of, and charges for, such
services to be determined by the Managing Committee in
consultation with the Panchayat and District (Animal
Husbandry) Officer, due consideration being given to the
society's strength, capacity, and the interests of the
society' s membership.
(c) To engage in such other activities as shall be required
to accomplish the above objectives.
IV. Resources
(4) Resources of the society may be obtained by:
(a) Grants in cash or kind by the Government of (State)
(b) The issue of shares to:
(i) Government of (State), for which payment may be
made in cash or operating assets,
(ii) Private individuals, for which payment may be made
in cash or specified livestock (para 2(b)(ii)),in which case the value of shares given shall bedetermined on the basis of live weight at a priceper kg to be fixed by the Managing Committee or
its predecessor, such price to be approximatelythe highest seasonal level for the locality;
ANNEX 8Appendix 4Page 3
(c) Loans,
(d) Donations, and
(e) Entrance fees.
(5) (a) The amount of share capital other than that subscribedby the (State) government shall not exceed (a figureequal to the value of the mature sheep units necessaryto fully stock the society's pasture land at fulldevelopment), to be divided into equal shares -- with aface value of Rs 5.
(b) The rate at which subscriptions to said capital shallbe accepted shall not exceed the anticipated build-uprate in the carrying capacity of pasture lands managedby the society, as determined by the Managing Committeeon the advise of the Unit Manager.
(6) The funds of the society whet1 not utilized shall be depositedas per Section ( ) of the (State) Cooperative Societies Act.
V. Membership
(7) (a) No person shall be a member unless:
(i) He is a resident of the village, is 18 years ofage or more and is competent to contract,
(ii) His written application in the prescribed form formembership 'has been approved by the majority ofthe managing committee,
(iii) He has taken at least one share and paid an entrancefee of one rupee,
(iv) He is not bankrupt and is not legally disabled,
(v) He is not criminally convicted for moral terpitude.
(b) Further to the provisions of 7(a) a preference shall begiven to sheep owners wishing to purchase equity withspecified livestock, such preference to consist of a3-month advance subscription period.
(c) No individual member eligible to receive shares under7(b) shall be permitted to purchase in kind a proportionof the society's private equity (in total or anysingle offering) greater than the ratio of his sheep
ANNEX 8Appendix 4Page 4
numbers to the total number of sheep owned by allintending members. 1/
(d) Application for shares shall be made in writing andshall be disposed of by the Managing Committee.
Note: The provisions of 7 (a, b, c, and d) shallapply to the initial and all subsequent invita-tions to subscribe to share capital of thesociety.
(8) The-liability of any member shall not exceed the value ofhis subscribed shares, both paid and unpaid.
(9) Any member may withdraw from the society at any time bysubmitting his resignation to the Managing Committee uindgetting it approved, but such approval shall not be givenwhile he is in debt to the society or is a surety toanother member. In case a member has no outstanding dueswith the society or he is not a surety to another member,his resignation will be considered as accepted after onemonth from the date of his resignation even if the Managing
Committee has not approved it.
(10) (a) A member of the society may be expelled, by aresolution passed by three fourths majority of themembers entitled to vote among those who are presentat a general meeting held for the purpose, for thefollowing reasons:
(i) if he is a persistent defaulter,
(ii) if he wilfully deceives the society by falsestatements,
(iii) if lie intentionally does any act likely to injurethe credit of the society,
(iv) if he persistently dishonours the suggestions andresolutions of the Managing Committee,
(v) if he does not reside in the area of operation ofthe society regularly or ceases to possess any ofthe qualifications for becoming a member.
1 Readers of these draft by-laws should be aware that state cooperativesocieties acts generally contain an overriding provision that no membershall be allowed to purchase more than 20% of a society's equity.
ANNEX 8Appendixc 4Page 5
(b) Before expulsion a member shall be given an opportunityto present his case before the general meeting and theresolution of the general meeting shall be approved asper Section ( ) of the Cooper'ative Societies Act.
(11) (a) The membership of a person shall be treated asdiscontinued for any one of the following reasons;but the concerned member of his nominee shall beinformed of this decision within 15 days:
(i) on death,
*(ii) if his resignation is accepted by the ManagingCommittee,
tiii) if share(s) belonging to him are transferred toanother member,
(iv) if he is expelled according to Section ... of the(State) Cooperative Society Act.
(b) When a person ceases to be a member, the society shallrefund all his dues within six months.
(12) Share certificate(s) having separate serial numbers shallbe issued every shareholder. If a shareholder fails topay the share amount/installment of it as decided by theManaging Committee within 30 days, such share(s) shall beforfeited as may be decided by the Managing Committee andthe paid amount of such forfeited share(s) shall becredited to the reserve fund. However, before forfeitingsuch shares, the shareholder shall be informed in writing15 days in advance.
(13) A member, after holding share(s) for one year, with theapproval of the Managing Committee, can transfer his share(s)to another member(s); but for this he shall have to apply15 days in advance in the prescribed form showing theacceptance of the buyer of the share(s). Share transfershall not be completed unless an entry is made in the sharetransfer register and a transfer fee of 24 paise is paid tothe society.
(14) Share(s) of members expelled as per by-law No. 10 shall beforfeited by a resolution, of the general meeting.
(15) A member is entitled to receive back an amount equivalentto the face value of his share(s), less any outstandingdues, after completion of two years of his possession of
ANNEX 8Appendix 4Page 6
the share(s); provided, before making the claim, the person
shall have to give three -!oiths' prior riotice to the
society. However, the total amount of such refundable share
capital shall not exceed one tenth of the total paid-up
share capital as shown on 30th June of the previous year.
(16) When refunding the value of shares under para 15, l:he
provisions of para 44 for guaranteed bonuses shall not
apply, in lieu whereof, the dividend shall be determinedon the basis of actual performance of the society without
state government contributions during the current fiscal
period, prorated for the period during which the shares
are held.
(17) A member of the society can nominate any person except an
employee or officer of the society to receive his sKare,
interest and other dues from the society after his death.
No fee shall be charged for the first such nomination,but thereafter, for any transfer or change, a fee of
25 paise shall be charged. Such nomination paper shall be
signed by him in presence of two witnesses.
(18) On the death of a member, the amount standing to his credit
by way of share or other, subject to deductions on account
of his liabilities, shall be paid to his heir nominated by
him or in the absence of such nomination, to any other person
who according to the Managing Committee is entitled to
receive the amount as heir or legal representative of the
deceased member on his executing a deed of indemnity to the
society. The amount z,f fixed deposit shall be paid back
at the expiry of the period in such cases.
VI. General Mleeting
(19-27) As provided under State Law.
VII. Managing Committee
(28) (a) The elected 'Nanaging Committee of the society shallbe of nine members according to schedule (b) of the
by-laws of the society; of which one third of the
members shall retire every year.
(b) The membership of the Mlanagilng Committee shall include
not less than one appointee of the state governmeint who
shall be the Unit Manager whose jurisdiction shallinclude this society.
ANNEX 8Appendix 4Page 7
(c) The presence of more than one half of the members ofthe Managing Committee shall form a quorum.
(29-38) As provided under State Law.
VIII. Chairmarn/Secretary
(39-41) As provided under State Law.
IX. Distribution of Profits
(42) The gross profit of the previous year shall be declaredin the annual general meeting and the following deductionsshall be nmade from it:
(a) Debt service on loans and interest on deposits
(b) Working expenses of the society
(c) Losses
(d) Depreciation on building and other assets
(e) Bad debts sanctioned by the Managing Committee andapproved by the District Registrar
(f) Contribution, if any, to staff provident fund andstaff gratuity fund.
(43) The balance remaining after these deductions shall betreated as net profit. The net profit shall be distributedas follows:
(a) A sum not less than 25% shall be taken to the reservefund.
Note: Society shall. be exempted from this provisionfor at least four full years of operation asdetermined by the Registrar.
(b) Ci) For the first four years of operation a dividendand bonus to shareholders whose purchase of sharesshall have been made with eligible livestock(para 7(b)), the total of which shall not be lessthati an amount determined according to the follow-ing schedule:
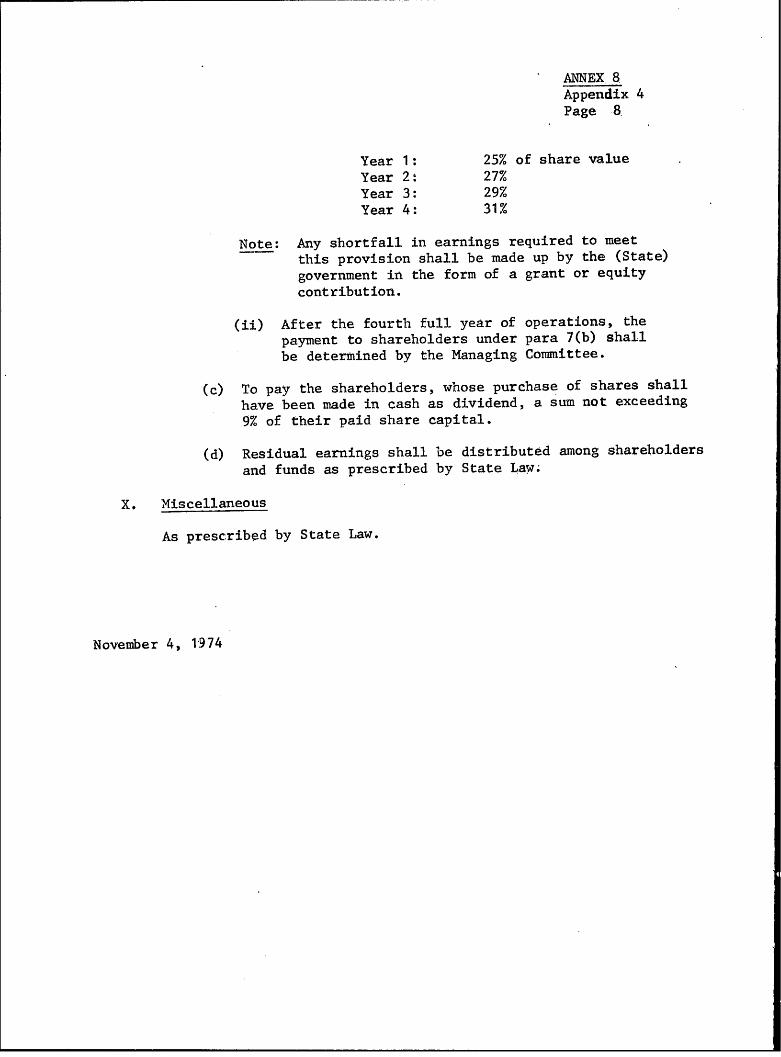
ANNEX 8Appendix 4Page 8,
Year 1: 25% of share valueYear 2: 27%Year 3: 29%Year 4: 31%
Note: Any shortfall in earnings required to meetthis provision shall be made up by the (State)government in the form of a grant or equitycontribution.
(ii) After the fourth full year of operations, the
payment to shareholders under para 7(b) shall
be determined by the Managing Committee.
(c) To pay the shareholders, whose purchase of shares shallhave been made in cash as dividend, a sum not exceeding9% of their paid share capital.
(d) Residual earnings shall be distributed among shareholders
and funds as prescribed by State Law.
X. Miscellaneous
As prescribed by State Law.
November 4, 1974
ANNEX 8Appendix 5Page 1
INDIA
DROUGHT PRONE AREAS PROJECT
Livestock Development
Senior Pasture and Sheep Development Officer
Qualifications
1. Suitable candidates would be graduates in agricultural sciencewith at least 10 years' experience in pasture and sheep-husbandry in the semi-arid/arid tropics. This experience would include exposure to the problemsof livestock and pasture improvement in a developing country, preferablyembracing societies practicing communal grazing.
2. Candidates must be willing and able to travel extensively sincethey would be required to spend at least one-third of their time in thefield.
Job Description
3. The Senior Pasture and Sheep Development Officer (SPSDO) would beattached to the central unit of DPAP within the Department of Cooperativesand Community Development in New Delhi and would be responsible to theDirector of DPAP. Whilst having Program-wide responsibilities, the mainfocus of the SPSDO would be the pasture and sheep development programs inthe six districts of the IDA assisted Drought Prone Areas Project. 1/
4. The SPSDO's responsibilities would include, but not necessarilybe limited to:
(a) Assisting state government staff to prepare pasture andsheep development proposals and subsequently assisting withthe implementation of approved programs, in particular,assistance in:
(i) selection of sites for the development of 100-hectarepasture units;
(ii) choice of pasture species, establishment techniques,fence and yard design;
(iii) design of pasture and animal management systems;
1/ Jodhpur, Nagaur,.Ahmednagar, Sholapur, Bijapur and Anantapur.
ANNEX 8Appendix 5Page 2
(b) Evaluating, and recommending to the Director, state
government annual plans for pasture and sheep development
to be financed under DPAP;
(c) Assisting state government staff to plan, develop and
operate pasture seed and ram multiplication farms;.
(d) The planning and organization of, and participation in,
training programs for the state government staff responsible
for the pasture and sheep development programs;
(e) Monitoring the performance of the pasture and sheep develop-
ment programs.
5. The SPSDO would liaise closely with people and institutions con-
cerned with pasture and sheep development in India. In particular, he
would cooperate with the team of pasture agronomists to be established in
the All-India Coordinated Research Project for Dryland Agriculture.
November 4, 1974
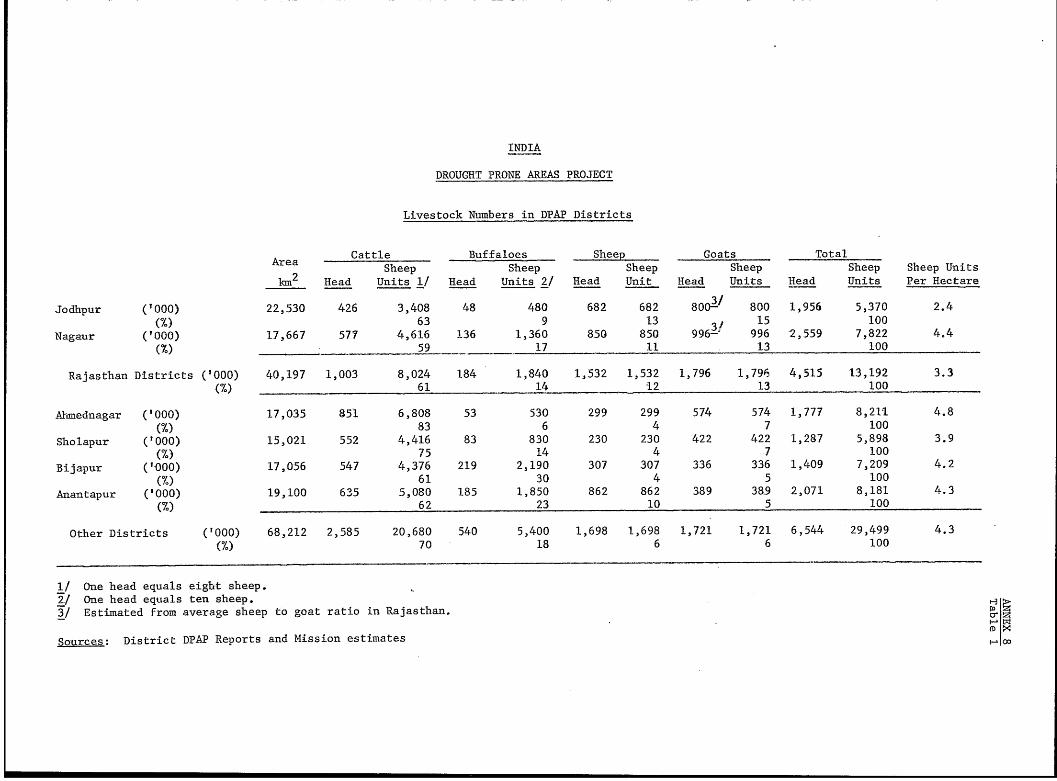
INDIA
DROUGHT PRONE AREAS PROJECT
Livestock Numbers in DPAP Districts
Area Cattle Buffaloes Sheep Goats Total2 Sheep Sheep Sheep Sheep Sheep Sheep Units
km2 Head Units 1/ Head Units 2/ Head Unit Head Units Head Units Per Hectare
Jodhpur (1Q00) 22,530 426 3,408 48 480 682 682 8003/ 800 1,956 5,370 2.4
(%) 63 9 13 31 15 100
Nagaur ('000) 17,667 577 4,616 136 1,360 850 850 996- 996 2,559 7,822 4.4
(7) 59 17 11 13 100
Rajasthan Districts ('000) 40,197 1,003 8,024 184 1,840 1,532 1,532 1,796 1,796 4,515 13,192 3.3
(7 61 14 12 13 100
Alimednagar ('000) 17,035 851 6,808 53 530 299 299 574 574 1,777 8,211 4.8
(M) 83 6 4 7 100
Sholapur ('000) 15,021 552 4,416 83 830 230 230 422 422 1,287 5,898 3.9
(X3 75 14 4 7 100
Bijapur ('000) 17,056 547 4,376 219 2,190 307 307 336 336 1,409 7,209 4.2
(Y) 61 30 4 5 100
Anantapur ('000) 19,100 635 5,080 185 1,850 862 862 389 389 2,071 8,181 4.3
%) 62 23 10 5 100
Other Districts ('000) 68,212 2,585 20,680 540 5,400 1,698 1,698 1,721 1,721 6,544 29,499 4.3
(%) 70 18 6 6 100
1/ One head equals eight sheep.2/ One head equals ten sheep.31 Estimated from average sheep to goat ratio in Rajasthan. M
Sources: District DPAP Reports and Mission estimates X
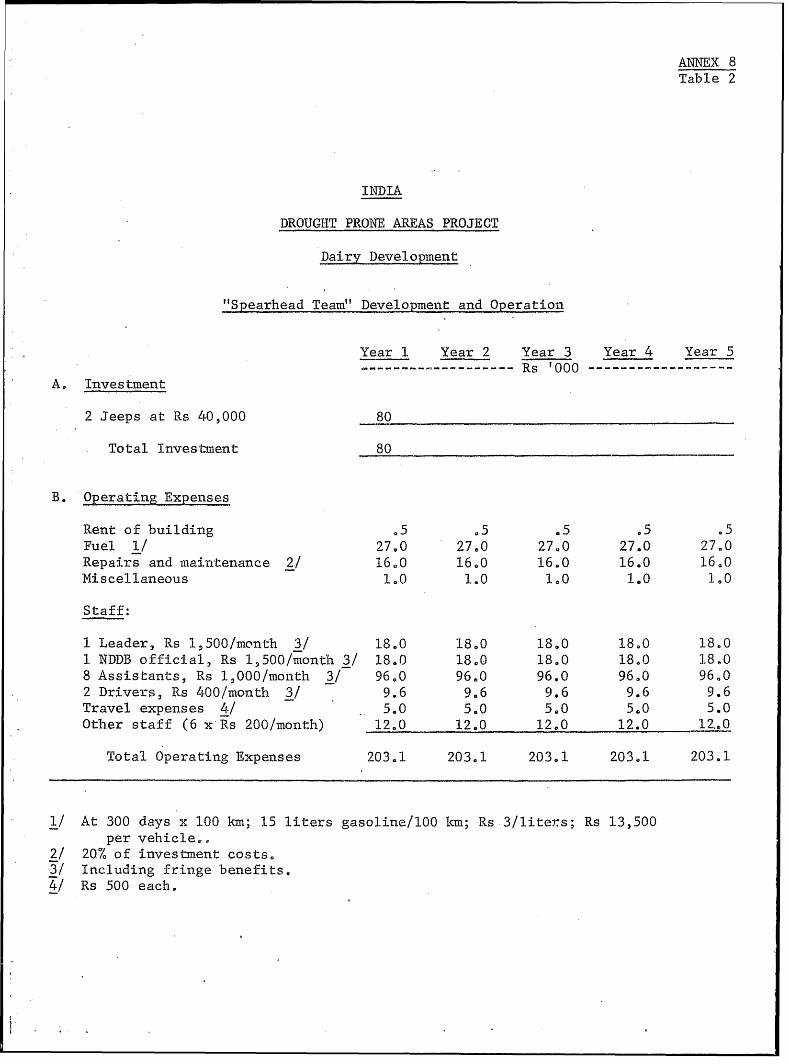
ANNEX 8Table 2
INDIA
DROUGHT PRONE AREAS PROJECT
DairV Development
"Spearhead Team" Development and Operation
Year 1 Year 2 Year 3 Year 4 Year 5- Rs '000 ------------------
A. Investment
2 Jeeps at Rs 40,000 80
Total Investment 80
B. Operating Expenses
Rent of building .5 .5 .5 .5 .5Fuel 1/ 2790 27e0 27.0 27.0 27.0Repairs and maintenance 2/ 16.0 16.0 16.0 16.0 16.0
Miscellaneous 10 1.0 1.0 1.0 1.0
Staff:
1 Leader, Rs 1,500/month 3/ 18e0 18.0 18,0 18.0 18.01 NDDB official, Rs 1,500/month 3/ 18.0 18.0 18.0 18.0 18,08 Assistants, Rs 1,000/month 3/ 96.0 96.0 96.0 96.0 96.02 Drivers, Rs 400/month 3/ 9.6 9.6 9.6 9.6 9.6Travel expenses 4/ 5.0 5e0 5,0 50 5.0Other staff (6 x Rs 200/month) 12e0 12.0 12,0 12.0 12_0
Total Operating Expenses 203e1 203,1 203o1 203.1 203,1
1/ At 300 days x 100 km; 15 liters gasoline/100 km; Rs 3/liters; Rs 13,500
per vehicle-2/ 20% of investment costs,3/ Including frin.ge benefits.4/ Rs 500 each.
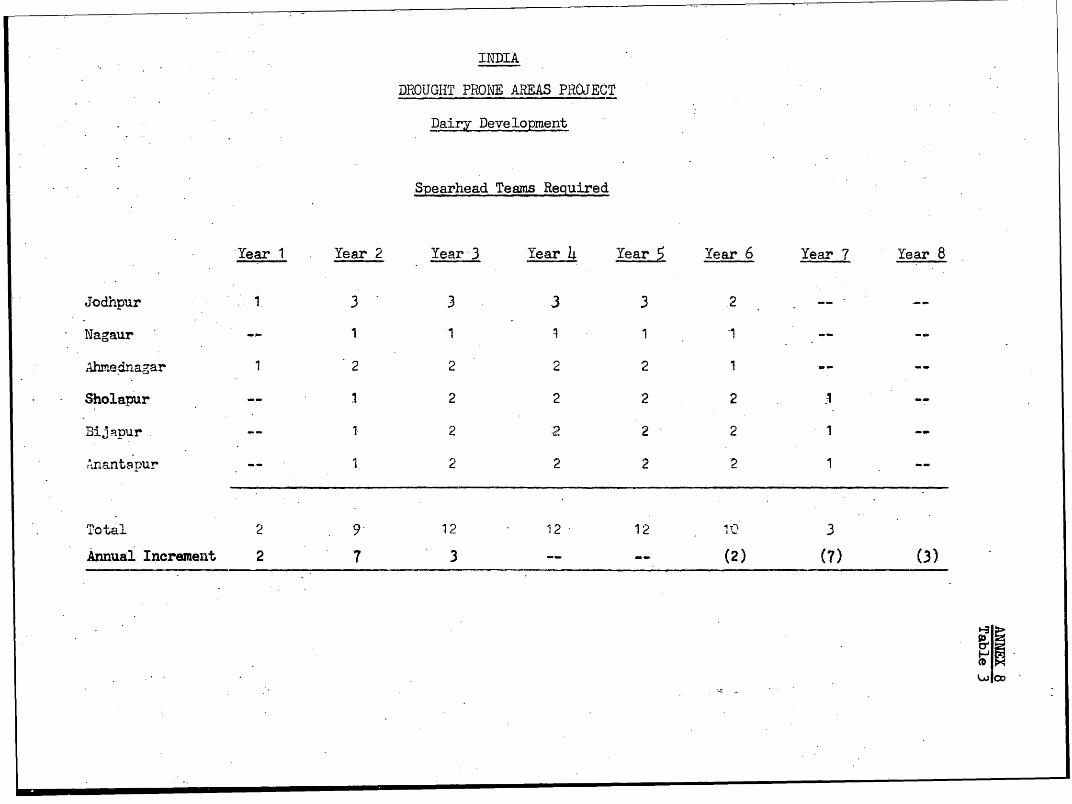
INDIA
DROUGHT PRONE AREAS PROJECT
Dairy Development
Spearhead Teamsu Required
Year 1 Year 2 Year3 Yeare 5 Year 6 Year 7 Year 8
Jodhpur -1 3 3 3 3 2 --
Nagaur - 1 1 1 1 1 --
Ahmed agar 1 2 2 2 2 1Sholapur -- 1 2 2 2 2
Bij Ppur. -- 1 2 2 2 2 1 1m,antapur -- 1 2 2 2 2 1
Total 2 9 12 12 12 IQ 3Annual Increment 2 7 3 - (2) (7) (3)
.F
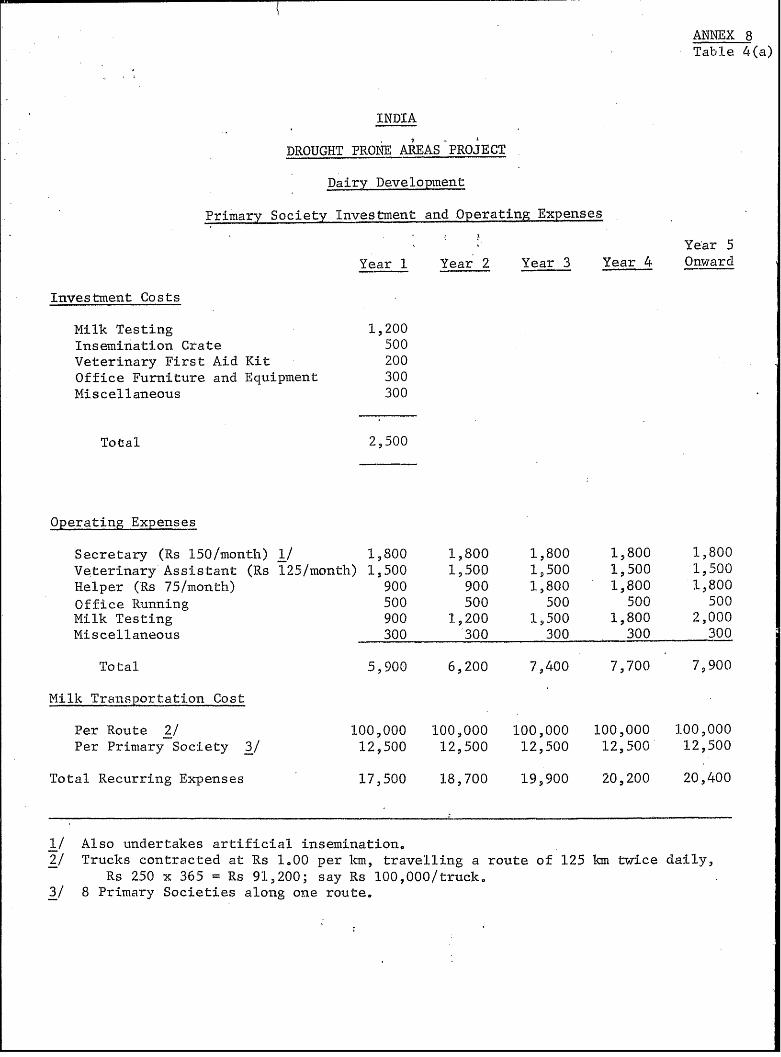
ANNEX 8Table 4(a)
INDIA
DROUGHT PRONE AREAS PROJECT
Dairy Development
Primary Society Investment and Operating Expenses
Year 5
Year 1 Year 2 Year 3 Year 4 Onward
Investment Costs
Milk Testing 1,200Insemination Crate 500Veterinary First Aid Kit 200Office Furniture and Equipment 300Miscellaneous 300
Total 2,500
Operating Expenses
Secretary (Rs 150/month) 1/ 1,800 1,800 1,800 1,800 1,800Veterinary Assistant (Rs 125/month) 1,500 1,500 1,500 1,500 1,500Helper (Rs 75/month) 900 900 1,800 1,800 1,800
Office Running 500 500 500 500 500Milk Testing 900 1,200 1,500 1,800 2,000Miscellaneous 300 300 300 300 300
Total 5,900 6,200 7,400 7,700 7,900
Milk Transportation Cost
Per Route 2/ 100,000 100,000 100,000 100,000 100,000Per Primary Society 3/ 12,500 12500 12,500 12,500 12,500
Total Recurring Expenses 17,500 18,700 19,900 20,200 20,400
1/ Also undertakes artificial insemination.2/ Trucks contracted at Rs 1.00 per Inm, travelling a route of 125 lcm twice daily,
Rs 250 x 365 = Rs 91,200; say Rs 100,000/truck.3/ 8 Primary Societies along one route.
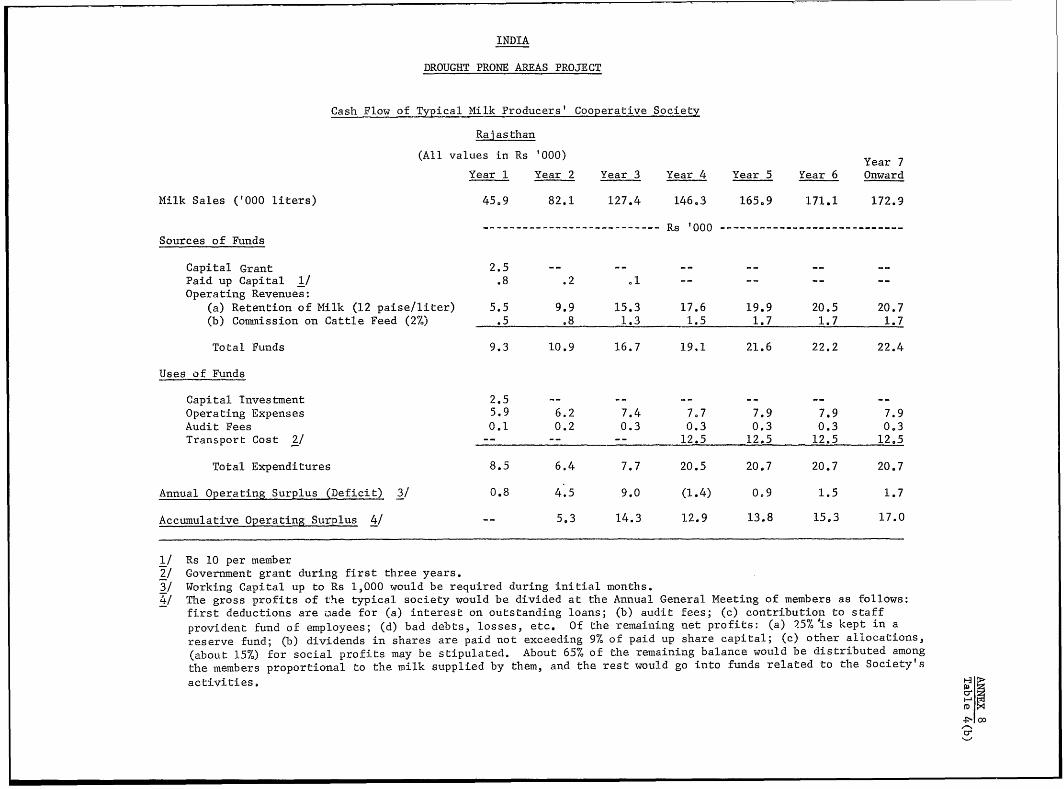
INDIA
DROUGHT PRONE AREAS PROJECT
Cash Flow of Typical Milk Producers' Cooperative Society
Rajasthan
(All values in Rs '000) Year 7
Year 1 Year 2 Year 3 Year 4 Year 5 Year 6 Onward
Milk Sales ('000 liters) 45.9 82.1 127.4 146.3 165.9 171.1 172.9
------------------------------------ Rs 'O ----------------------------Sources of Funds
Capital Grant 2.5 -- -- --Paid up Capital 1/ .8 .2 .1 -- ---- --Operating Revenues:
(a) Retention of Milk (12 paise/liter) 5.5 9.9 15.3 17.6 19.9 20.5 20.7(b) Commission on Cattle Feed (2%) .5 .8 1.3 1.5 1.7 1.7 1.7
Total Funds 9.3 10.9 16.7 19.1 21.6 22.2 22.4
Uses of Funds
Capital Investment 2.5 -- -- -- -- -- --Operating Expenses 5.9 6.2 7.4 7.7 7.9 7.9 7.9Audit Fees 0.1 0.2 0.3 0.3 0.3 0.3 0,3Transport Cost 2/ -- -- -- 12.5 12.5 12.5 12.5
Total Expenditures 8.5 6.4 7.7 20.5 20,7 20.7 20.7
Annual Operating Surplus (Deficit) 3/ 0.8 4.5 9.0 (1.4) 0.9 1.5 1.7
Accumulative Operating Surplus 4/ -- 5.3 14.3 12.9 13.8 15.3 17.0
1/ Rs 10 per member2/ Government grant during first three years.3/ Working Capital up to Rs 1,000 would be required during initial months./ The gross profits of the typical society would be divided at the Annual General Meeting of members as follows:
first deductions are uLade for (a) interest on outstanding loans; (b) audit fees; (c) contribution to staffprovident fund of employees; (d) bad debts, losses, etc. Of the remaining net profits: (a) 25% 'is kept in areserve fund; (b) dividends in shares are paid not exceeding 9% of paid up share capital; (c) other allocations,(about 15%) for social profits may be stipulated. About 65% of the remaining balance would be distributed amongthe members proportional to the milk supplied by them, and the rest would go into funds related to the Society'sactivities.
_ac
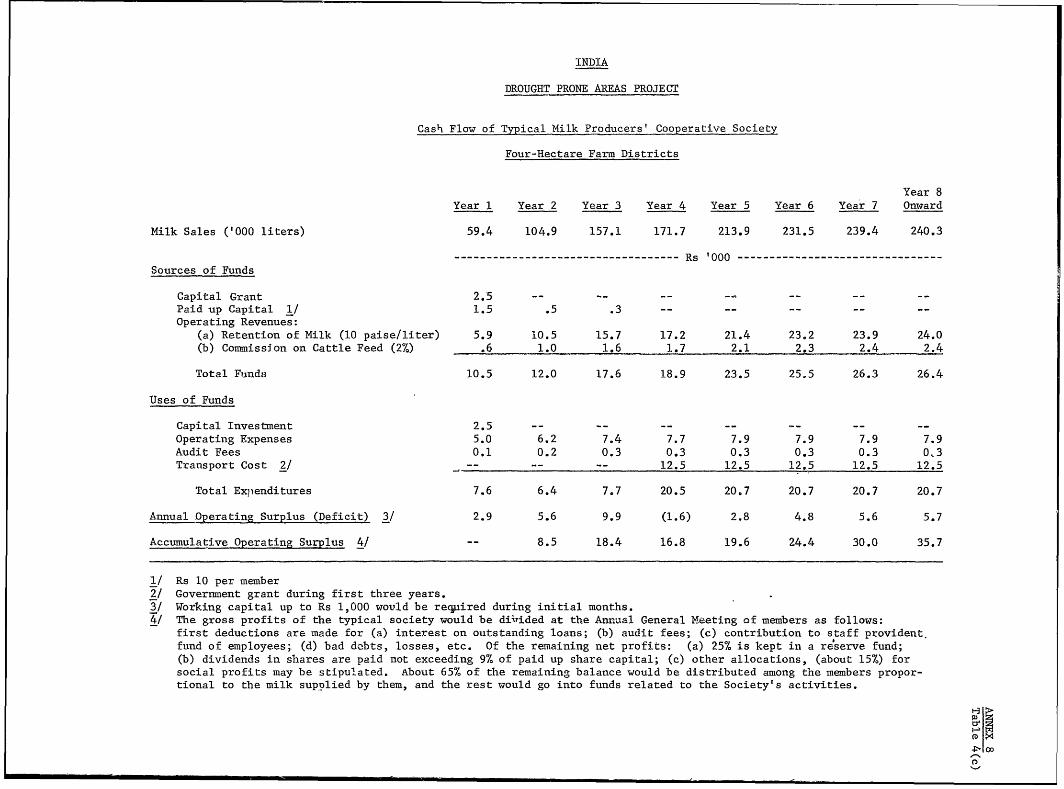
INDIA
DROUGHT PRONE AREAS PROJECT
Cash Flow of Typical Milk Producers' Cooperative Society
Four-Hectare Farm Districts
Year 8
Year 1 Year 2 Year 3 Year 4 Year 5 Year 6 Year 7 Onward
Milk Sales ('000 liters) 59.4 104.9 157.1 171.7 213.9 231.5 239.4 240.3
----------------------------------- Rs '000 --------------------------------
Sources of Funds
Capital Grant 2.5 -- -- --
Paid up Capital 1/ 1.5 .5 .3 -- -- -- -- --
Operating Revenues:(a) Retention of Milk (10 paise/liter) 5.9 10.5 15.7 17.2 21.4 23.2 23.9 24.0
(b) Commission on Cattle Feed (2%) .6 1.0 1.6 1.7 2.1 2.3 2.4 2.4
Total Funds 10.5 12.0 17.6 18.9 23.5 25.5 26.3 26.4
Uses of Funds
Capital Investment 2.5 -- -- -- -- -- --
Operating Expenses 5.0 6.2 7.4 7.7 7.9 7.9 7.9 7.9
Audit Fees 0.1 0.2 0.3 0.3 0.3 0.3 0.3 0,3
Transport Cost 2/ -- -- -- 12.5 12.5 12.5 12.5 12.5
Total Expenditures 7.6 6.4 7.7 20.5 20.7 20.7 20.7 20.7
Annual Operating Surplus (Deficit) 3/ 2.9 5.6 9.9 (1.6) 2.8 4.8 5.6 5.7
Accumulative Operating Surplus 4/ -- 8.5 18.4 16.8 19.6 24.4 30.0 35.7
1/ Rs 10 per member2/ Goverrment grant during first three years.
3/ Working capital up to Rs 1,000 would be required during initial months.
4/ The gross profits of the typical society would be dii7ided at the Annual General Meeting of members as follows:
first deductions are made for (a) interest on outstanding loans; (b) audit fees; (c) contribution to staff provident.
fund of employees; (d) bad debts, losses, etc. Of the remaining net profits: (a) 25% is kept in a reserve fund;
(b) dividends in shares are paid not exceeding 9% of paid up share capital; (c) other allocations, (about 15%) for
social profits may be stipulated. About 65% of the remaining balance would be distributed among the members propor-
tional to the milk supplied by them, and the rest would go into funds related to the Society's activities.
0 o
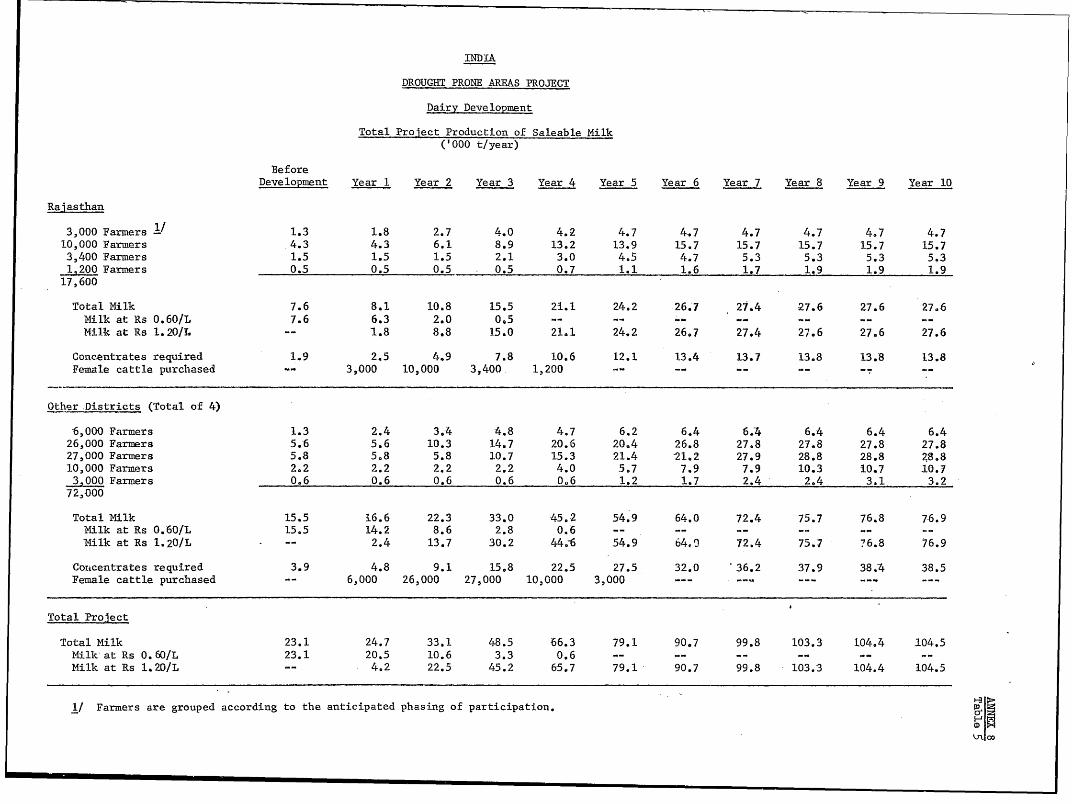
INDILA
DROUGHT PRONE AREAS PROJECT
Dairy Development
Total Project Production of Saleable Milk
('000 t/year)
BeforeDevelopment Year 1 Year 2 Year 3 Year 4 Year 5 Year 6 Year 7 Year 8 Year 9 Year 10
Ra iasthan
3,000 Farmers 11 1.3 1.8 2.7 4.0 4.2 4.7 4.7 4.7 4.7 4.7 4,7
10,000 Farmers 4.3 4.3 6.1 8.9 13.2 13.9 15.7 15.7 15.7 15.7 15.7
3,400 Farmers 1.5 1.5 1.5 2.1 3.0 4.5 4.7 5.3 5.3 5.3 5.3
1,200 Farmers 0.5 0.5 0.5 0.5 0.7 1.1 1.6 1.7 1.9 1.9 1.9
17,600
Total Milk 7.6 8.1 10.8 15.5 21.1 24.2 26.7 27.4 27.6 27.6 27.6
Milk at Rs 0.60/1L 7.6 6.3 2.0 0.5 -- - -- -- - --
Milk at Rs 1.201L -- 1.8 8.8 15.0 21.1 24.2 26.7 27.4 27.6 27.6 27.6
Concentrates required 1.9 2.5 4,9 7.8 10.6 12,1 13.4 13.7 13.8 13.8 13.8
Female cattle purchased -- 3,000 10,000 3,400 1,200 -- -- --
Other Districts (Total of 4)
6,000 Farmers 1.3 2.4 3.4 *4.8 4.7 6.2 6.4 6.4 6.4 6.4 6.4
26,000 Farmers 5.6 5.6 10.3 14.7 20.6 20.4 26.8 27.8 27.8 27.8 27.8
27,000 Farmers 5.8 5,8 5.8 10.7 15.3 21.4 21.2 27.9 28.8 28.8 28.8
10,000 Farmers 2.2 2.2 2.2 2.2 4.0 5.7 7.9 7.9 10.3 10.7 10.7
3,000 Farmers 0.6 0.6 O.6 0.6 0o6 1.2 1.7 2.4 2.4 3.1 3.2
72,000
Total Milk 15.5 16.6 22.3 33.0 45,2 54.9 64.0 72.4 75.7 76.8 7-6.9
Milk at Rs 0.60/L 15.5 14.2 8.6 2.8 0.6 -- -- -- -- -- --
Milk at Rs 1.20/L -- 2.4 13.7 30.2 44.-6 54.9 64,9 72.4 75.7 76.8 76.9
Coticentrates required 3.9 4.8 9.1 15.8 22.5 27.5 32.0 36.2 37.9 38.4 38.5
Female cattle purchased -- 6,000 26,000 27,000 10,000 3,000 - --
Total Project
Total Milk 23.1 24.7 33.1 48.5 66.3 79.1 90.7 99.8 103.3 104.4 104.5
Milk-at Rs 0.60/L 23.1 20.5 10.6 3.3 0o.6 -- -- -- -- --
Milk at Rs 1.20/L -- 4.2 22.5 45.2 65.7 79.1 90.7 99.8 103.3 104.4 104.5
1/ Farmers are grouped according to the anticipated phasing of participation.
-o
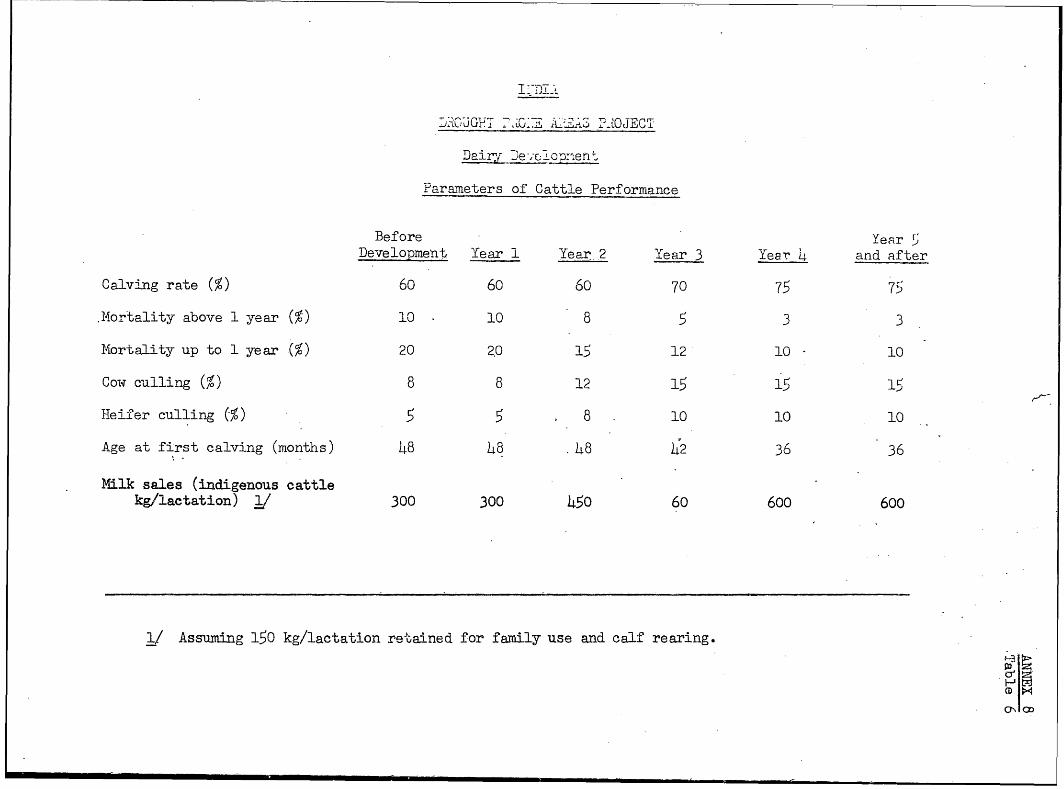
JTi,GUGF! .G7 .-X L-LEA' T.MOJECT
Daiiry Devcc api 2ent
Parameters of Cattle Performance
Before Year $Development Year 1 Year 2 Year 3 Year h4 and after
Calving rate (%) 60 60 60 70 75 75
.Mortality above 1 year (%) 10 10 8 5 3 3
TALortality up to 1 year (%) 20 2.0 15 12 10 10
Cow culling (<) 8 8 12 15 15 15
HeiLer culling (%) 5 5 8 10 10 10
Age at first calving (months) 48 48 48 42 36 36
Milk sales (indigenous cattlekg/lactation) / 300 300 450 60 600 600
1/ Assuming 150 kg/lactation retained for family use and calf rearing.
Cz.D
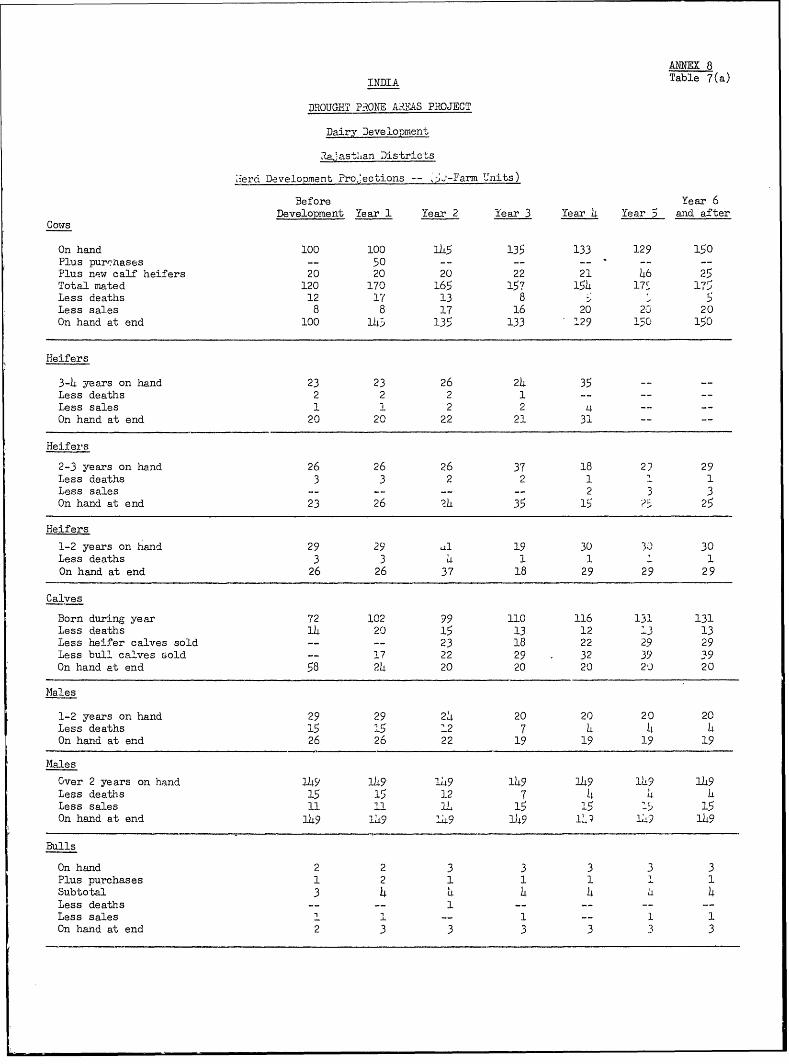
ANNEX 8
INDIA Table 7 (a)
DROUGHT PRONE AUHAS PiROJECT
Dairy Development
Raj,asthan Districts
:ercd Development Pro,ections -- ".,-Farm Units)
Before Year 6Development Year 1 Year 2 lear 3 Year 4 Year 5 and after
Cows
On hand 100 100 1L5 135 133 129 150Plus purchiases -- 50 - -- --Plus new calf heifers 20 20 20 22 21 46 25Total mated 120 170 165 15? 154 17' 17-Less deaths 12 17 13 8 5Less sales 8 8 17 16 20 20 20On hand at end 100 14-:: 135 133 129 130 150
Heifers
3-4 years on hand 23 23 26 24 35Less deaths 2 2 2 1 -- -- --Less sales 1 1 2 2 -- --On hand at end 20 20 22 21 31 -- --
Heifers
2-3 years on hand 26 26 26 37 18 22 29Less deaths 3 3 2 2 1 1 1Less sales -- -- - -- 2 3 3On hand at end 23 26 29 35 15 25
Heifers
1-2 years on hand 29 29 a1 19 30 3;. 30Less deaths 3 3 a 1 1 1On hand at end 26 26 37 18 29 29 29
Calves
Born during year 72 102 99 110 116 131 131Less deaths 14 20 15 13 12 23 13Less heifer calves sold -- -- 23 18 22 29 29Less bull calves Gold -- 17 22 29 32 39 39On hand at end 58 24 20 20 20 20 20
Males
1-2 years on hand 29 29 2. 20 20 20 20Less deaths 15 '5 ' 2 7 4 4 4On hand at end 26 26 22 19 19 19 19
Males
COver 2 years on hand 149 149 1;49 149 149 1i9 149Less deathis 15 15 12 7 4 4. 1Less sales 11 '1 1J 15 15 ' 15On hand at end 149 1LI9 149 1)49 12? 1a2 149
Bulls
On hand 2 2 3 3 3 3 3Plus purchases 1 2 1 1 1 ' 1Subto tal 3 4 4. 4 4 4Less deaths - -- -- -- --Less sales ' -- 1 -- 1 1On hand at end 2 3 3 3 3 3 3
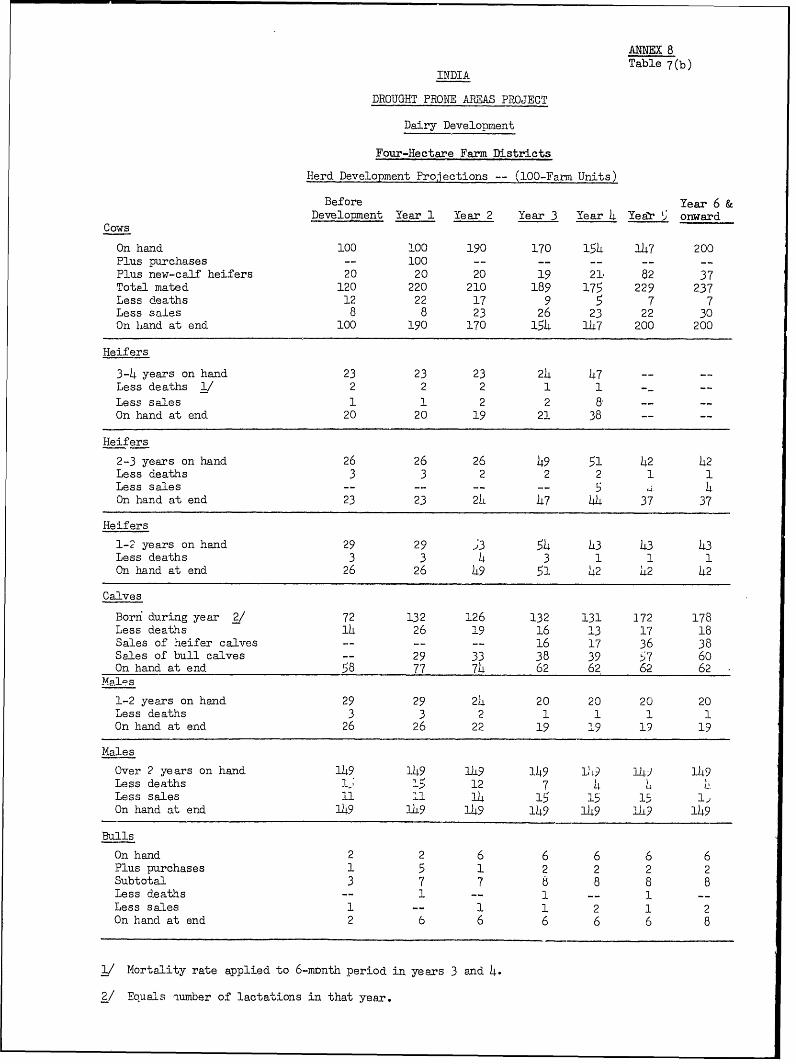
ANNEX 8Table 7(b)
INDIA
DROUGHT PRONE AREAS PROJECT
Dairy Development
Four-Hectare Farm Districts
Herd Development Projections -- (100-Farm Units)
Before Year 6 &
Development Year 1 Year 2 Year 3 Year 4 Ye&r 5 onward
Cows
On hand 100 100 190 170 154 147 200
Plus purchases -- 100 -- -- -- --
Plus new-calf heifers 20 20 20 19 21. 82 37
Total mated 120 220 210 189 175 229 237
Less deaths 12 22 17 9 5 7 7
Less sales 8 8 23 26 23 22 30
On lhand at end 100 190 170 154 147 200 200
Heifers
3-4 years on hand 23 23 23 24 47 -- --
Less deaths 1/ 2 2 2 1 1 --
Less sales 1 1 2 2 8 -- --
On hand at end 20 20 19 21 38 -- --
Heifers
2-3 years on hand 26 26 26 49 51 42 42
Less deaths 3 3 2 2 2 1 1
Less sales -- -- -- --
On hand at end 23 23 2h 47 44 37 37
Heifers
1-2 years on hand 29 29 33 54 L3 43 43
Less deaths 3 3 4 3 1 1 1
On hand at end 26 26 49 51 42 42 42
Calves
Born during year 2/ 72 132 126 132 131 272 178
Less deaths 14 26 19 16 13 17 18
Sales of heifer calves -- -- -- 16 17 36 38
Sales of bull calves -- 29 33 38 39 57 60
On hand at end 58 77 74 62 62 62 62
Males
1-2 years on hand 29 29 24 20 20 20 20
Less deaths 3 3 2 1 1 1 1
On hand at end 26 26 22 19 19 19 19
Males
Over 2 years on hand 149 149 149 149 19L9 14) 149
Less deaths 1.; 15 12 7 4 L 4
Less sales 11 11 14 15 15 15 1,
On hand at end 149 149 149 149 149 1i9 149
Bulls
On hand 2 2 6 6 6 6 6
Plus purchases 1 5 1 2 2 2 2
Subtotal 3 7 7 8 8 8 8
Less deaths -- 1 -- 1 -- 1 --
less sales 1 -- 1 1 2 1 2
On hand at end 2 6 6 6 6 6 8
1/ Mortality rate applied to 6-mnnth period in years 3 and 4.
2 Eouals aumber of lactations in that year.
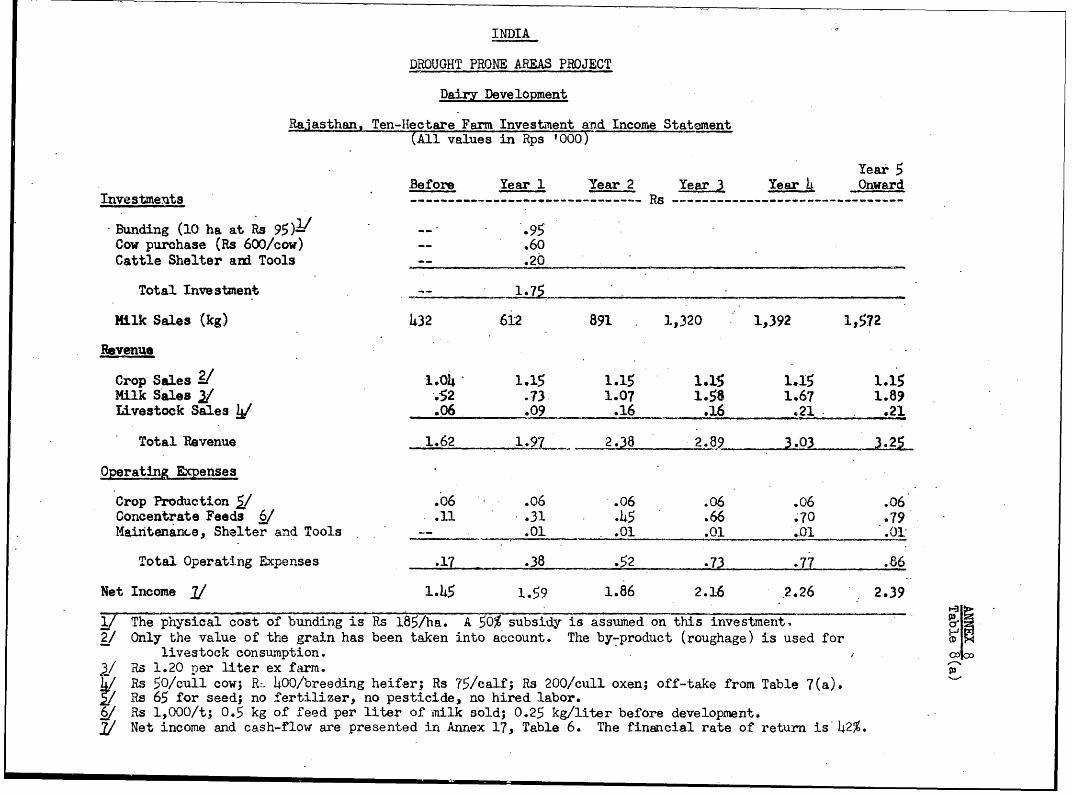
INDIA
DROUGHT PRONE AREAS PROJECT
Dairy Development
Rajasthan, Ten-Hecta.re Farm Investent an-d Income Statement(All values in Rps '000)
Year 5Before Year 1 Year 2 Year 3 Year 4 Onward
Inve-stment RS ----------------------------
Bunding (10 ha at Rs 95)1 -- .95
Cow purchase (Rs 600/cow) °- .60
Cattle Shelter and Tools .20
Total Investment -- 1.75
Milk Sales (kg) 432 612 891 1,320 1,392 1,572
Revenue
Crop Sales -1.014 1.15 1.15 1.15 1.15 1.15
Milk Sales 21 .52 .73. 1.07 1.58 1i67 1.89
Livestock Sales .06 .09 .16 .16 .21 .21
Total Revenue .62 - 2.38 2.89 3.03 . .2
Operating Expenses
Crop Production 5/ .06 .06 .06 .06 .06 .06
Concentrate Feeds 6/ .11 .31 .45 .66 .70 .79
Maintenan..e, Shelter and Tools .. 01 .0 .01 0 .01.
Total Operating Expenses -17 .38 .52 .73 .7Z .86
Net Income I./ 1.45 1.59 1.86 2.16 2.26 2.39P .
1/ The p'nysical cost of bunding is Rs 185/ha. A 50% subsidy is assumed on this investment, a'
/ Only the value of the grain has been taken into account. The by-product (roughage) is used for
livestock consumption. O ,co
i/ Rs 1.20 per liter ex farm.h/ Rs 50/cull cow; R hOO/'oreeding heifer; Rs 75/calf; Rs 200/cull oxen; off-take from Table 7(a).
Rs 65 for seed; no fertilizer, no pesticide, no hired labor.
t, Rs l,000/t; 0.5 kg of feed per liter of mnilk sold; 0.25 kg/liter before development.
_1 Net income and cash-flow are presented in Annex 17, Table 6. The financial rate of return is 42%.
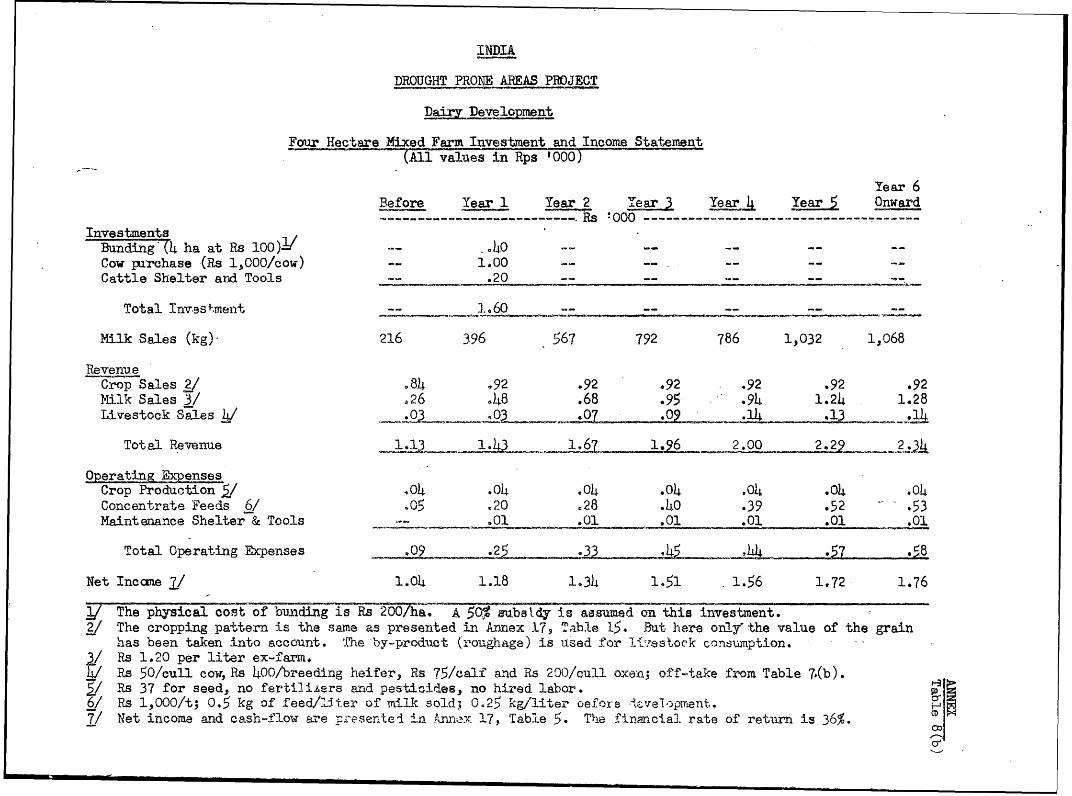
INDIA
DROUGHT PRONE AREAS PFlDJECT
DRair Develo nt
Four Hectare Mxed Farm Investment and Income Statement(All valUes in Rps '000)
Year 6
Before Year 1 Year 2 Yer 3 Year 5 Onward--------------- Rs .000-------------------------------------
InvestmentsBuding 4 ha at Rs 100)1 - ..0 -O -- --
Cow p'mchase (Rs 1,000/cow) -- 1.00 - -- .
Cattle Shelter ard Tools -. 20 ----
Total I rn r 1.60ment 1- . 60
Milk Sales (kg> 216 396 567 792 786 1,032 1,068
RevenueCrop Sales 2/ p8)4 92 .92 .92 .92 .92 .92
?Milk Sales 3/ .26 .48 .68 .95 .9)4 1.24 1.28
Livestock Sales 7 / . .1)4 .13 .1-4
Total Reveme 1. .-
Operating ExpensesCrop Production i/ -04 .04 .0)4 .0)4 .0)4 .0)4 .0)4
Concentrate Feeds 6/ .05 .20 .28 .)40 .39 .52 53
Maintenance Shelter & Tools .01 .01 .01 .01 .01 .01
Total Operating Ecpenses .09 _33_7
Net Inccvie 7f 1.0)4 1.18 1.34 1.51 1.56 1.72 1.76
, The physical cost of bunding is Rs 20fha A 50% sbsl.dy is assumed on thhis investment.
2/ The cropping pattern is the same as presented in Annex 179 Table 15. But .here on1y' the value of the grain
has been taken into account. 'The by-product (roughage) is used for li-.estook coGnsumption.
R/ R 1.20 per liter ex-far-14/ Rs 50/cull cow, Rs )400/breeding heifer, Rs 75/calf' and Rs 200/cull oxaen; of f-take from Table 7.(b).
5/ Rs 37 for seed, no fertiUiLere and pesticides, no hired labor.
/ Rs 1,000/t; 0.5 kg of feed/liter of miLk sold; 0.25 kg/liter Defore *1kTveloprent.
7/ Net incom-3 and cash-flow sare ~>resenrei La A n x 17, Table 5. The finacial rate of return is 36%. c
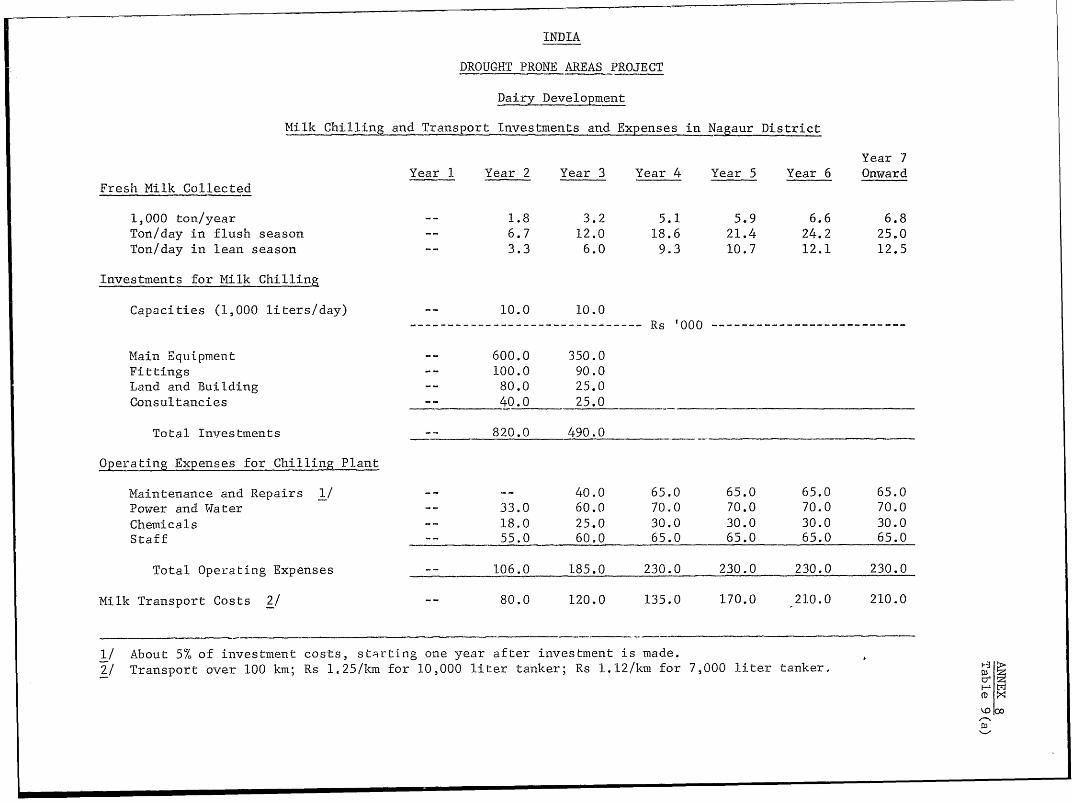
INDIA
DROUGHT PRONE AREAS PROJECT
Dairy Development
Milk Chilling and Transport Investments and Expenses in Nagaur District
Year 7Year 1 Year 2 Year 3 Year 4 Year 5 Year 6 OnwardFresh Milk Collected
1,000 ton/year 1.8 3.2 5.1 5.9 6.6 6.8Ton/day in flush season -- 6.7 12.0 18.6 21.4 24.2 25.0Ton/day in lean season -- 3.3 6.0 9.3 10.7 12.1 12.5Investments for Milk Chilling
Capacities (1,000 liters/day) -- 10.0 10.0------------------------------- Rs 000 --------------------------
Main Equiipment -- 600.0 350.0Fittings
-- 100.0 90.0Land and Building -- 80.0 25.0Consultancies -- 40.0 25.0
Total InvTestments -- 820.0 490.0 -_-_ -
Operating Expenses for Chilling Plant
Maintenance and Repairs 1/ -- -- 40.0 65.0 65.0 65.0 65.0Power and Water - 33.0 60.0 70.0 70.0 70.0 70.0Chemicals -- 18.0 25.0 30.0 30.0 30.0 30.0Staff -- 55.0 60.0 65.0 65.0 65.0 65.0
Total Operating Expenses -- 106.0 185.0 230.0 230.0 230.0 230.0Milk Transport Costs 2/ -- 80.0 120.0 135.0 170.0 210.0 210.0
1/ About 5% of investment costs, starting one year after investment is made.2/ Transport over 100 km; Rs 1.25/km for 10,000 liter tanker; Rs 1.12/km for 7,000 liter tanker.
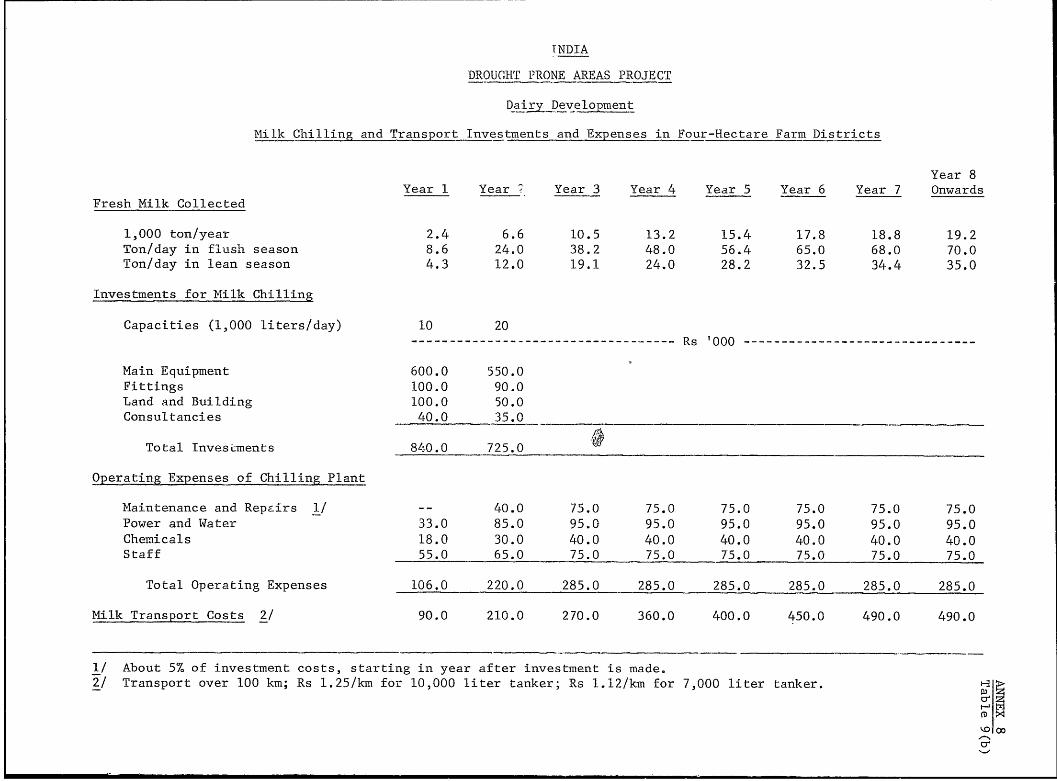
INDIA
DROUGHT PRONE AREAS PROJECT
Dairjy- DeveloLment
Milk Chilling and Transport Investments and Expenses in Four-Hectare Farm Districts
Year 8Year 1 Year Year 3 Year 4 Year 5 Year 6 Year 7 Onwards
Fresh Milk Collected
1,000 ton/year 2.4 6.6 10.5 13.2 15.4 17.8 18.8 19.2Ton/day in flush season 8.6 24.0 38.2 48.0 56.4 65.0 68.0 70.0Ton/day in lean season 4.3 12.0 19.1 24.0 28.2 32.5 34.4 35.0
Investments for Milk Chilling
Capacities (1,000 liters/day) 10 20
----------------------------------- Rs '000 ------------------------------
Main Equipment 600.0 550.0Fittings 100.0 90.0Land and Building 100.0 50.0Consultancies 40.0 35.0
Total InvesLments 840.0 - 725.0
Operating Expenses of Chilling Plant
Maintenance and Repcirs 1/ -- 40.0 75.0 75.0 75.0 75.0 75.0 75.0Power and Water 33.0 85.0 95.0 95.0 95.0 95.0 95.0 95.0Chemicals 18.0 30.0 40.0 40.0 40.0 40.0 40.0 40.0Staff 55.0 65.0 75.0 75.0 75.0 75.0 75.0 75.0
Total Operating Expenses 106.0 220.0 285.0 285.0 285.0 285.0 285.0 285.0
Milk Transport Costs 2/ 90.0 210.0 270.0 360.0 400.0 450.0 490.0 490.0
1/ About 5% of investment costs, starting in year after investment is made.2! Transport over 100 km; Rs 1.25/km for 10,000 liter tanker; Rs 1.12/km for 7,000 liter tanker.
CX c
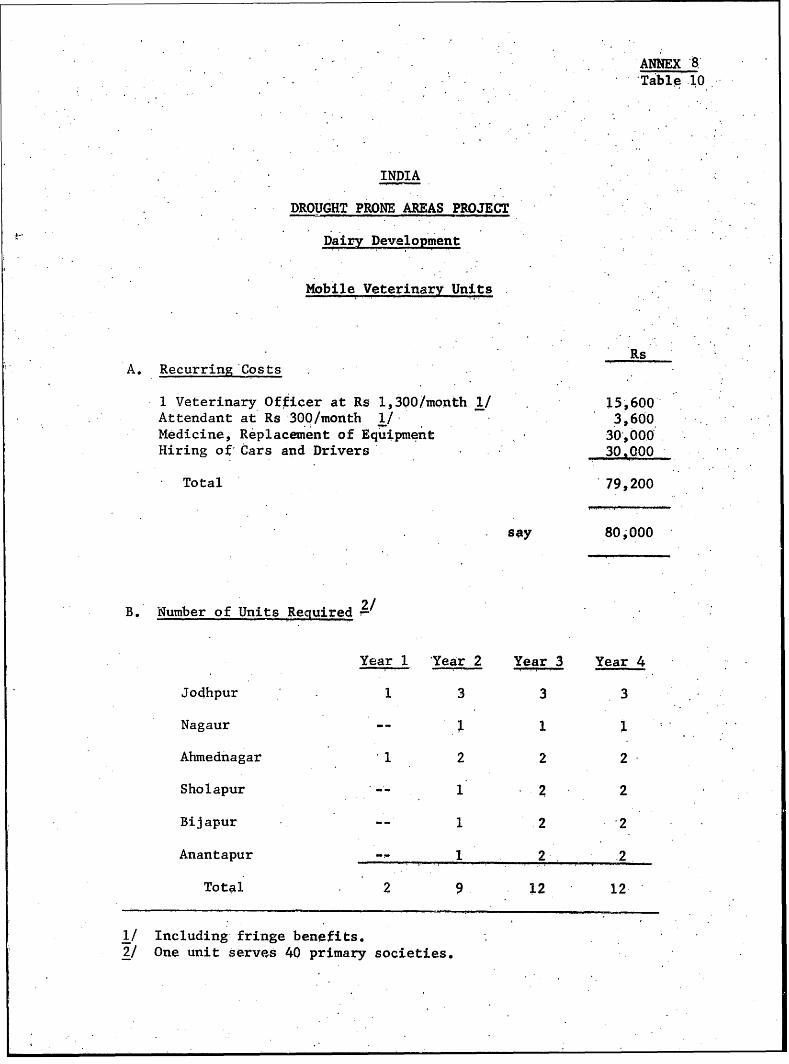
ANNEX 8*Table 10
INDIA
DROUGHT PRONE AREAS PROJECT
Dairy Development
Mobile Veterinary Units
RsA. Recurring Costs
1 Veterinary Officer at Rs 1,300/month I/ 15,600-Attendant at Rs 300/month 1/- 3,600Medicine, Replacement of Equipment 30,000Hiring of Gars and Drivers' 30.000
Total 79,200
s;y 80,000
2/B. Number of Units Required
Year 1 ear 2 Year 3 Year 4
Jodhpur 1 3 3 3
Nagaur -- 1 1
Ahmednagar 1 2 2 2
Sholapur 1 2 2
Bijapur -- .2 *2
Anantapur -- 1 2 .2
Total 2 9 12 12
1/ Including fringe benefits.2/ One unit serves 40 primary societies.
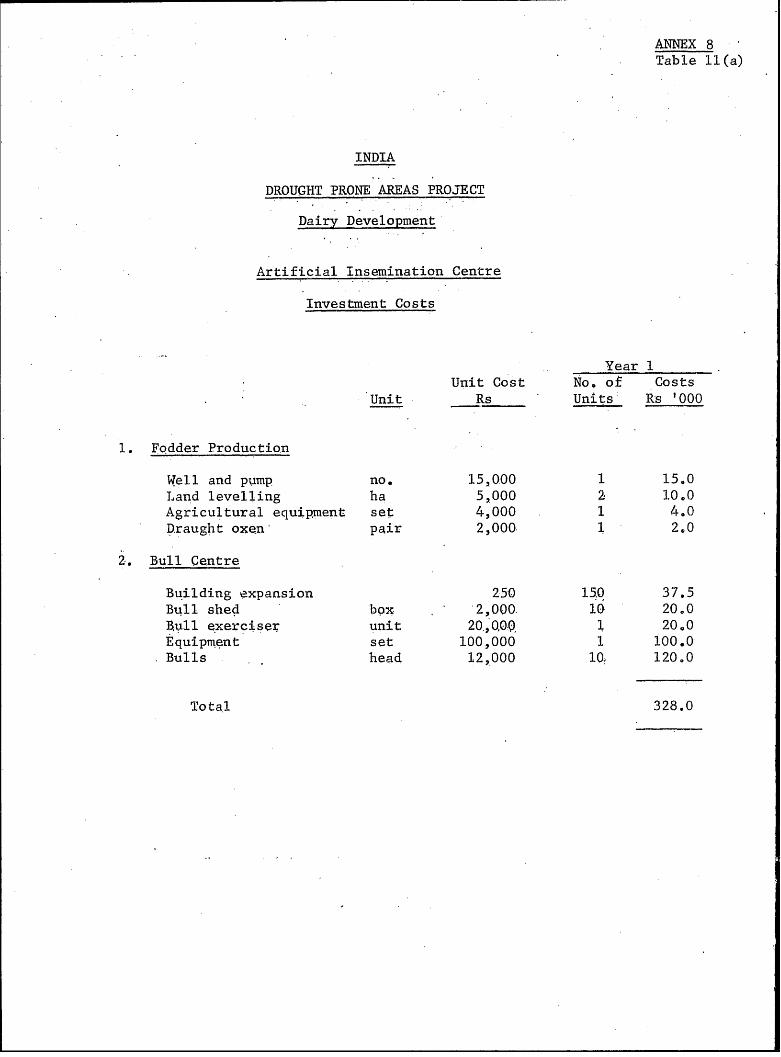
ANNEX 8Table 11(a)
INDIA
DROUGHT PRONE AREAS PROJECT
Dairy Development
Artificial Insemination Centre
Investment Costs
Year 1Unit Cost No. ot Costs
Unit Rs Units Rs 1000
Fodder Production
Well and pgimp no. 15,000 1 15.0Land levelling ha 5,000 2 10.0Agricultural equipment set 4,000 1 4.0Draught oxen' pair 2,000. 1 20
Bull Centre
Building expansion 250 150 37.5Bull shed ' box 2,000. 10- 20.0Vull exerciser unit 20.0 Q, 1 20,0Equipment set 100,000 1 100.0Bulls head 12,000 10 120.0
Total 328.0
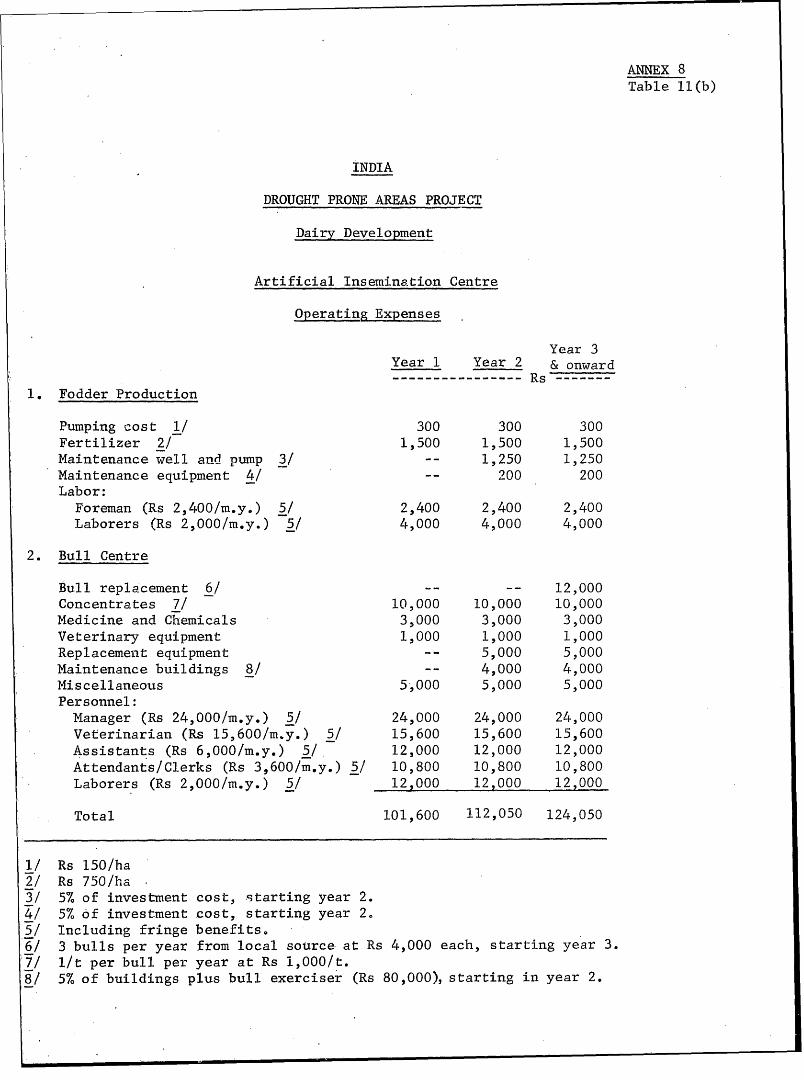
ANNEX 8Table 11(b)
INDIA
DROUGHT PRONE AREAS PROJECT
Dairy Development
Artificial Insemination Centre
Operating Expenses
Year 3Year 1 Year 2 & onward-------------------------------------RKs--------
1. Fodder Production
Pumping cost 1/ 300 300 300Fertilizer 2/ 1,500 1,500 1,500Maintenance well and pump 3/ -- 1,250 1,250Maintenance equipment 4/ -- 200 200Labor:Foreman (Rs 2,400/m.y.) 5/ 2,400 2,400 2,400Laborers (Rs 2,000/m.y.) 5/ 4,000 4,000 4,000
2. Bull Centre
Bull replacement 6/ -- -- 12,000Concentrates 7/ 10,000 10,000 10,000Medicine and Chemicals 3,000 3,000 3,000Veterinary equipment 1,000 1,000 1,000Replacement equipment -- 5,000 5,000Maintenance buildings 8/ -- 4,000 4,000Miscellaneous 5,000 5,000 5,000Personnel:Manager (Rs 24,000/m.y.) 5/ 24,000 24,000 24,000Veterinarian (Rs 15,600/m.y.) 5/ 15,600 15,600 15,600Assistants (Rs 6,000/m.y.) 5/ 12,000 12,000 12,000Attendants/Clerks (Rs 3,600/m.y.) 5/ 10,800 10,800 10,800Laborers (Rs 2,000/m.y.) 5/ 12,000 12,000 12,000
Total 101,600 112,050 124,050
1/ Rs 150/ha2/ Rs 750/ha3/ 5% of investment cost, starting year 2.4/ 5% of investment cost, starting year 205/ Including fringe benefits,6/ 3 bulls per year from local source at Rs 4,000 each, starting year 3.7/ l/t per bull per year at Rs 1,000/t.8/ 5% of buildings plus bull exerciser (Rs 80,000), starting in year 2.
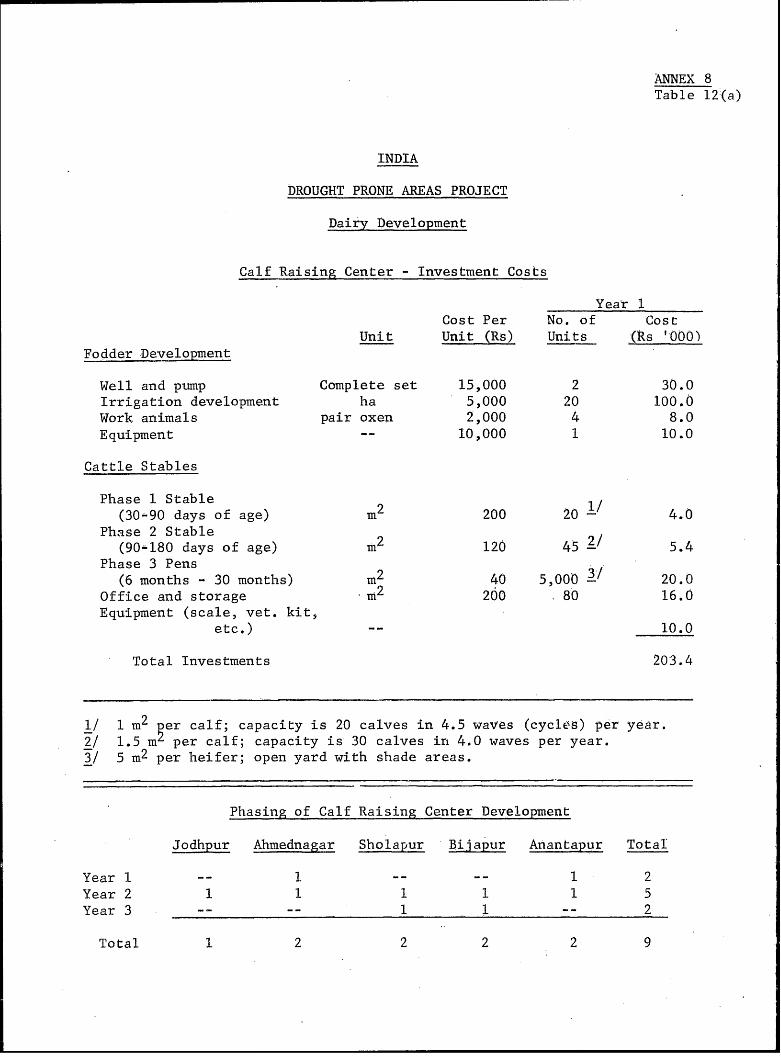
ANNEX 8Table 12(a)
INDIA
DROUGHT PRONE AREAS PROJECT
Dairy Development
Calf Raising Center - Investment Costs
Year 1Cost Per No. of Cost
Unit Unit (Rs) Units (Rs '000)Fodder Development
Well and pump Complete set 15,000 2 30.0Irrigation development ha 5,000 20 100.0Wor1k animals pair oxen 2,000 4 8.0Equipment -- 10,000 1 10.0
Cattle Stables
Phase 1 Stable 2(30-90 days of age) m 200 20 4.0
Phase 2 Stable(90-180 days of age) m2 120 45 5.4
Phase 3 Pens(6 months - 30 months) m2 40 5,000 3/ 20.0
Office and storage m2 200 80 16.0Equipment (scale, vet, kit,
etc.) -- 10.0
Total Investments 203.4
1/ 1 m2 er calf; capacity is 20 calves in 4.5 waVes (cycles) per year.2/ 1.5 m per calf; capacity is 30 calves in 4.0 waves per year.3/ 5 m2 per heifer; open yard with shade areas.
Phasing of Calf Raising Center Development
Jodhpur Ahmednagar Sholapur Bijapur Anantapur Total
Year I -- 1 1 2Year 2 1 1 1 1 1 5Year 3 -- -- 1 1 -- 2
Total 1 2 2 2 2 9
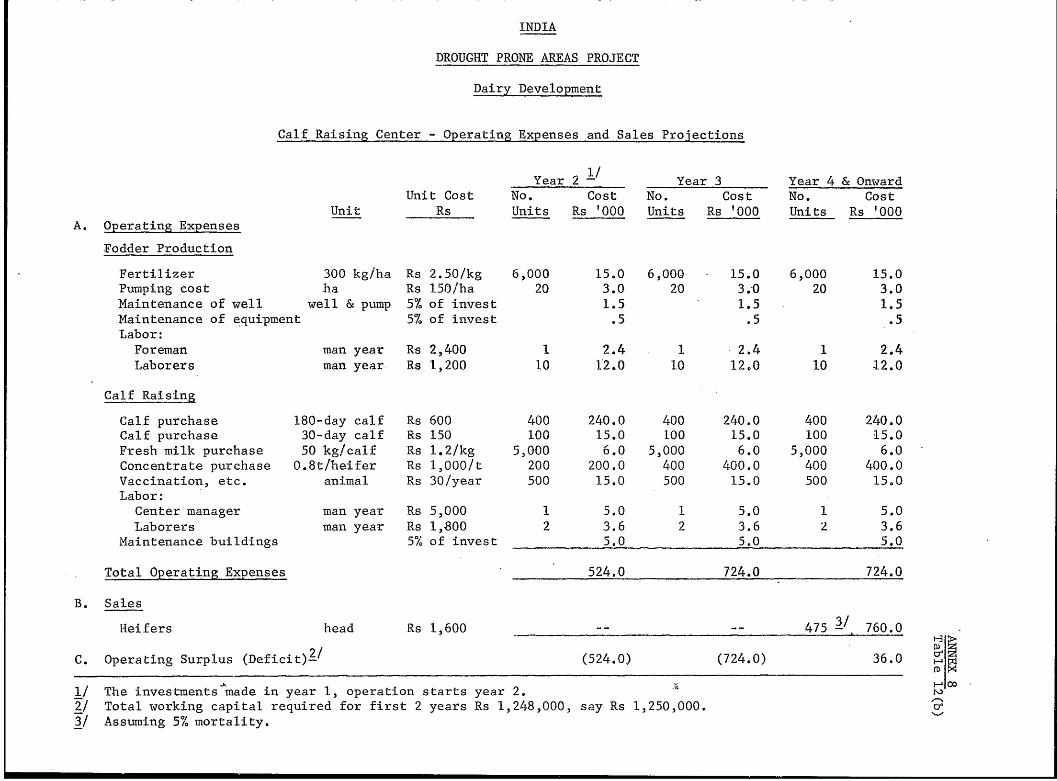
INDIA
DROUGHT PRONE AREAS PROJECT
Dairy Development
Calf Raising Center - Operating Expenses and Sales Projections
Year 2 - Year 3 Year 4 & OnwardUnit Cost No. Cost No. Cost No. Cost
Unit Rs Units Rs '000 Units Rs '000 Units Rs '000A. Operating Expenses
Fodder Production
Fertilizer 300 kg/ha Rs 2.50/kg 6,000 15.0 6,000 15.0 6,000 15.0Pumping cost ha Rs 150/ha 20 3.0 20 3.0 20 3.0Maintenance of well well & pump 5% of invest 1.5 1.5 1.5Maintenance of equipment 5% of invest .5 .5 .5Labor:Foreman man year Rs 2,400 1 2.4 1 2.4 1 2.4Laborers man year Rs 1,200 10 12.0 10 12.0 10 12.0
Calf Raising
Calf purchase 180-day calf Rs 600 400 240.0 400 240.0 400 240.0Calf purchase 30-day calf Rs 150 100 15.0 100 15.0 100 15.0Fresh milk purchase 50 kg/calf Rs 1.2/kg 5,000 6.0 5,000 6.0 5,000 6.0Concentrate purchase 0.8t/heifer Rs 1,000/t 200 200.0 400 400.0 400 400.0Vaccination, etc. animal Rs 30/year 500 15.0 500 15.0 500 15.0Labor:
Center manager man year Rs 5,000 1 5.0 1 5.0 1 5.0Laborers man year Rs 1,800 2 3.6 2 3.6 2 3.6
Maintenance buildings 5% of invest 5.0 5.0 5.0
Total Operating Expenses 524.0 724.0 724.0
B. Sales
Heifers head Rs 1,600 475 3i. 760.0
C. Operating Surplus (Deficit)./ (524.0) (724.0) 36.0
1/ The investments made in year 1, operation starts year 2.2/ Total working capital required for first 2 years Rs 1,248,000, say Rs 1,250,000.3/ Assuming 5% mortality.
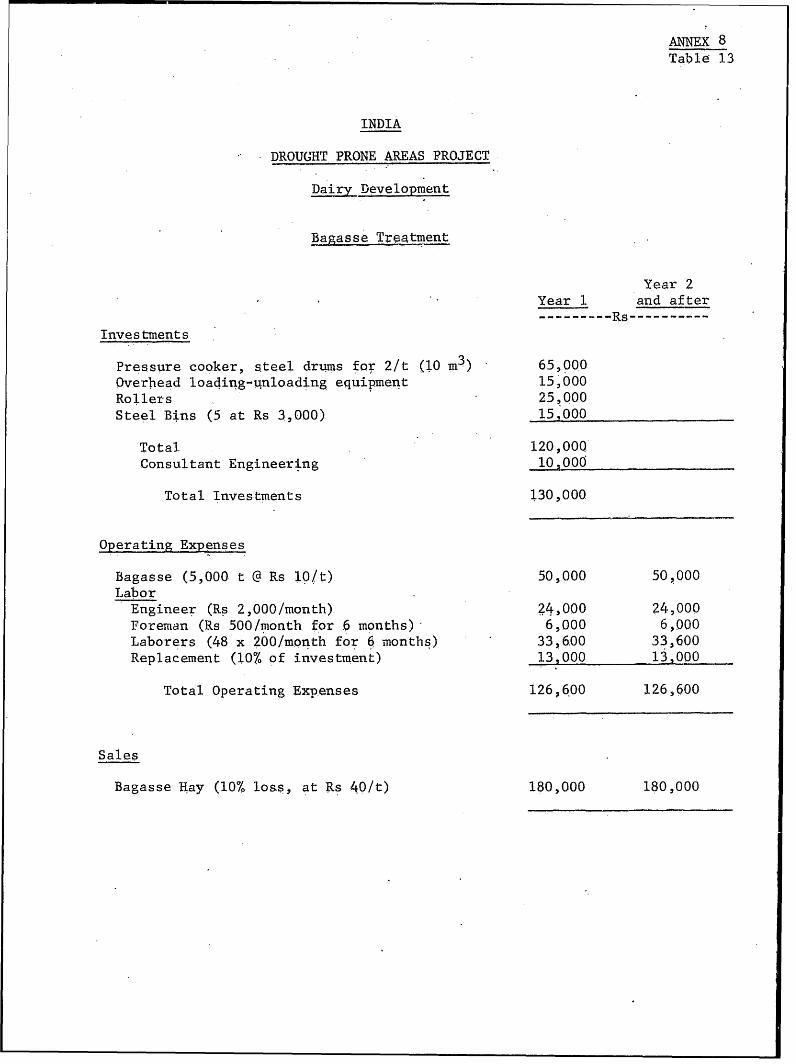
ANNEX 8Table 13
INDIA
DROUGHT PRONE AREAS PROJECT
Dairy Development
Ba asse Tratment
Year 2Year 1 and after---------- Rs---------
Investments
Pressure cooker, steel drums for 2/t (10 m3 ) 65,000
Overhead loading-u;nloading equipment 15,000
Rollers 25,000
Steel Bins (5 at Rs 3,000) 15,000
Total 120,000
Consultant Engineering 10,000
Total Investments 130,000
Operating Expenses
Bagasse (5,000 t @ Rs 10/t) 50,000 50,Q00
LaborEngineer (Rs 2,000/month) 24,000 24,000
Foreman (Rs 500/month for 6 months) 6,000 6,000
Laborers (48 x 200/month for 6 months) 33,6.00 33,600
Replacement (10% of investment) 13,000 13,000
Total Operating Expenses 126 a 600 126,600
Sales
Bagasse Hay (10% loss, at Rs 40/t) 180,000 180,000
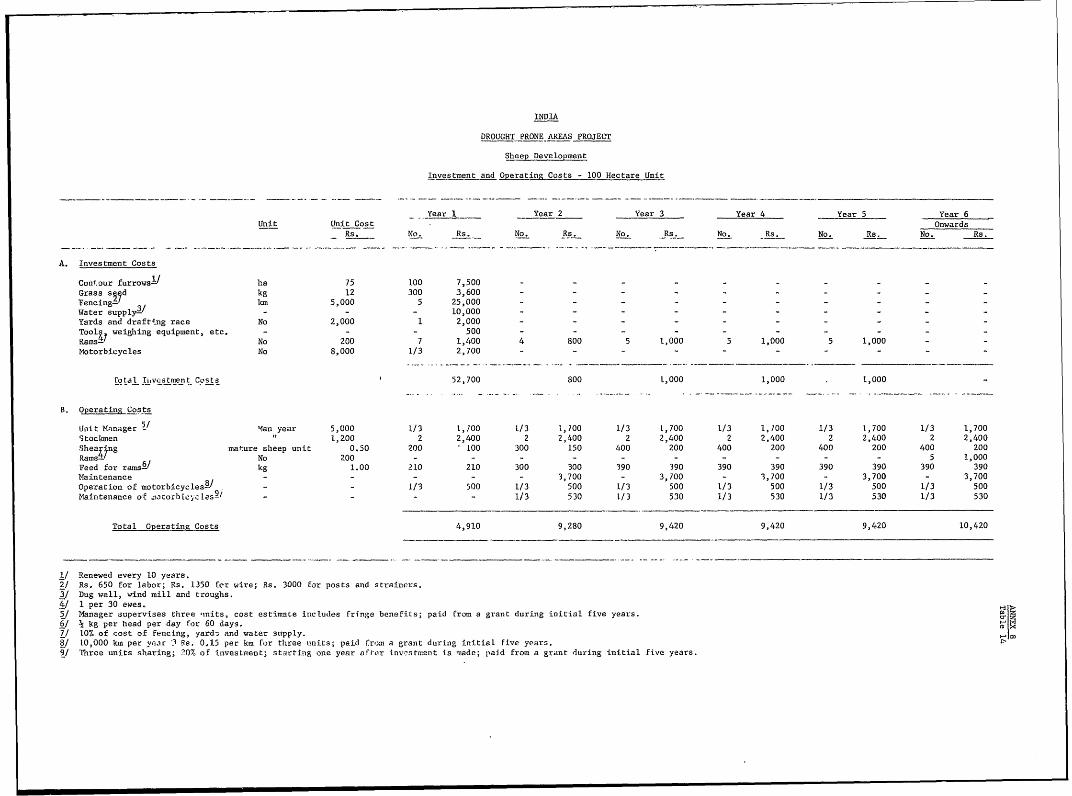
INDIA
DROUGHT PRONE AREAS PROJECT
Sheep Development
Investment and Operating Costs - 100 Hectare Unit
Year 1 - Year 2 Year 3 Year 4 Year 5 Year 6Unit Unit Cost OnwardsRs. No. Rs.- No. Rs. No. Rs. No. Rs. No. Rs. No. Rs.
A. Investment Costs
Conl.our furrowsii ha 75 100 7,500 - - - - - - - - - -Grass sed kg 12 300 3,600 - - - - - - - - -Fencing- km 5,000 5 25,000 - - - - - - - - - -Water supply3/ - - - 10,000 - - - - - - - - - -Yards and draft4ng race No 2,000 1 2,000 - - - - - - - - - -Tool weighing equipment, etc. 500 - - -5-0Rms No 200 7 1,400 4 800 5 1,000 5 1,000 5 1,000Motorbicycles No 8,000 1/3 2,700 - - - -- - - - -
rotal I ivustnient Costs 52,700 800 1,000 1,000 1,000
B. OaperatinCosts
Unit Manager - Mfan year 5,000 1/3 1,100 1/3 t,700 1/3 1,700 1/3 1,100 1/3 1,700 1/3 1,700Stockmen " 1,200 2 2,400 2 2,400 2 2,400 2 2,400 2 2,400 2 2,400Shearing mature sheep unit 0.50 200 100 300 150 400 200 400 200 400 200 400 200RamsF o No 200 - - - - - - - - - - 5 1,000Feed for rams6/ kg 1.00 210 210 300 300 390 390 390 390 390 390 390 390Maintenance - - - - - 3,700 - 3,700 - 3,700 - 3,700 - 3,700Operation of motorbicycles8/ - - 1/3 500 1/3 500 1/3 500 1/3 500 1/3 500 1/3 500Maintenance of mocorbicy -les9/ - - - - 1/3 530 1/3 530 1/3 530 1/3 530 1/3 530
Total Operating Costs 4,910 9,280 9,420 9,420 9,420 10,420
1/ Renewed every 10 years.2/ Rs. 650 for labor; Rs. 1350 fcr wire; Rs. 3000 for posts and strainers.3/ Dug well, wind mill and troughs.4/ 1 per 30 ewes..5/ Manager supervises three 'inits, cost estimate includes fringe benefits; paid from a grant during initial five years.6/
7g kg per head per day for 60 days.
7/ 10% of cost of fencinig, yard3 and water sttpply.8/ 10,000 kms per yrar '3 as. 0.15 per km for three units; paid from a grant during initial five years.9/ Three units sharing; 70% of investment; start ing one year after inv.arstment is made; paid from a grant during initial five years.
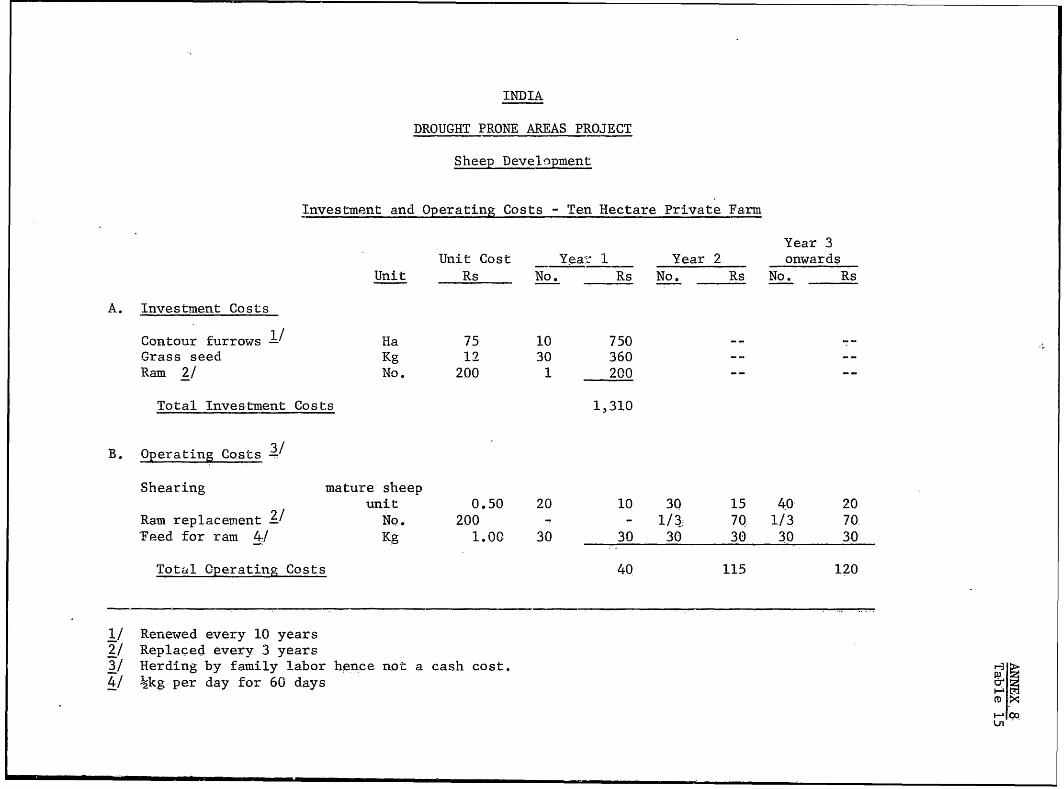
INDIA
DROUGHT PRONE AREAS PROJECT
Sheep Development
Investment and Operating Costs - Ten Hectare Private Farm
Year 3Unit Cost Yea:.-: 1 Year 2 onwards
Unit Rs No. Rs No. Rs No. Rs
A. Investment Costs
Contour furrows -Ha 75 10 750 --
Grass seed Kg 12 30 360 --
Ram 2! No. 200 1 200 --
Total Inves-tment Costs 1,310
B. Operating Costs 3
Shearing mature sheepunit 0.50 20 10 30 15 40 20
Ram replacement 2/No. 200 - - 13: 70 1/3 70
'Feed for ram 4!. Kg 1.OG 30 30 30 30 30. 30
Total1 Operating Costs 40 115 120
1/ Renewed every 10 years2/Replaced every 3 years3/Herding by fa-mily labor hence not a cash cost. -
41 kg per day for 60 days
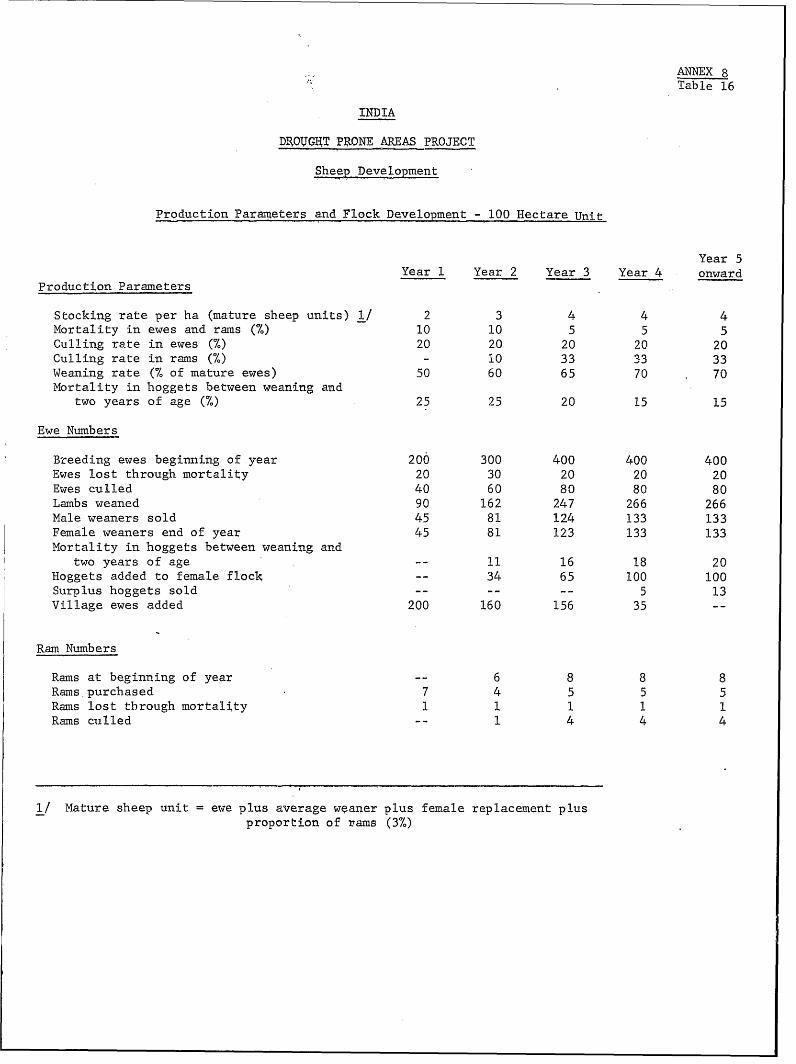
ANNEX 8Table 16
INDIA
DROUGHT PRONE AREAS PROJECT
Sheep Development
Production Parameters and Flock Development - 100 Hectare Unit
Year 5
Year 1 Year 2 Year 3 Year 4 onward
Production Parameters
Stocking rate per ha (mature sheep units) 1/ 2 3 4 4 4
Mortality in ewes and rams (%) 10 10 5 5 5
Culling rate in ewes (%) 20 20 20 20 20
Culling rate in rams (%) - 10 33 33 33
Weaning rate (7% of mature ewes) 50 60 65 70 70
Mortality in hoggets between weaning and
two years of age (%) 25 25 20 15 15
Ewe Numbers
Breeding ewes beginning of year 200 300 400 400 400
Ewes lost through mortality 20 30 20 20 20
Ewes culled 40 60 80 80 80
Lambs weaned 90 162 247 266 266
Male weaners sold 45 81 124 133 133
Female weaners end of year 45 81 123 133 133
Mortality in hoggets between weaning and
two years of age -- 11 16 18 20
Hoggets added to female flock -- 34 65 100 100
Surplus hoggets sold -- -- -- 5 13
Village ewes added 200 160 156 35 --
Ram Numbers
Rams at beginning of year -- 6 8 8 8
Ramvs, purchased 7 4 5 5 5
Rams lost tbrough mortality 1 1 1 1 1
Rams culled -- 1 4 4 4
1/ Mature sheep unit = ewe plus average weaner plus female replacement plus
proportion of rams (3%)
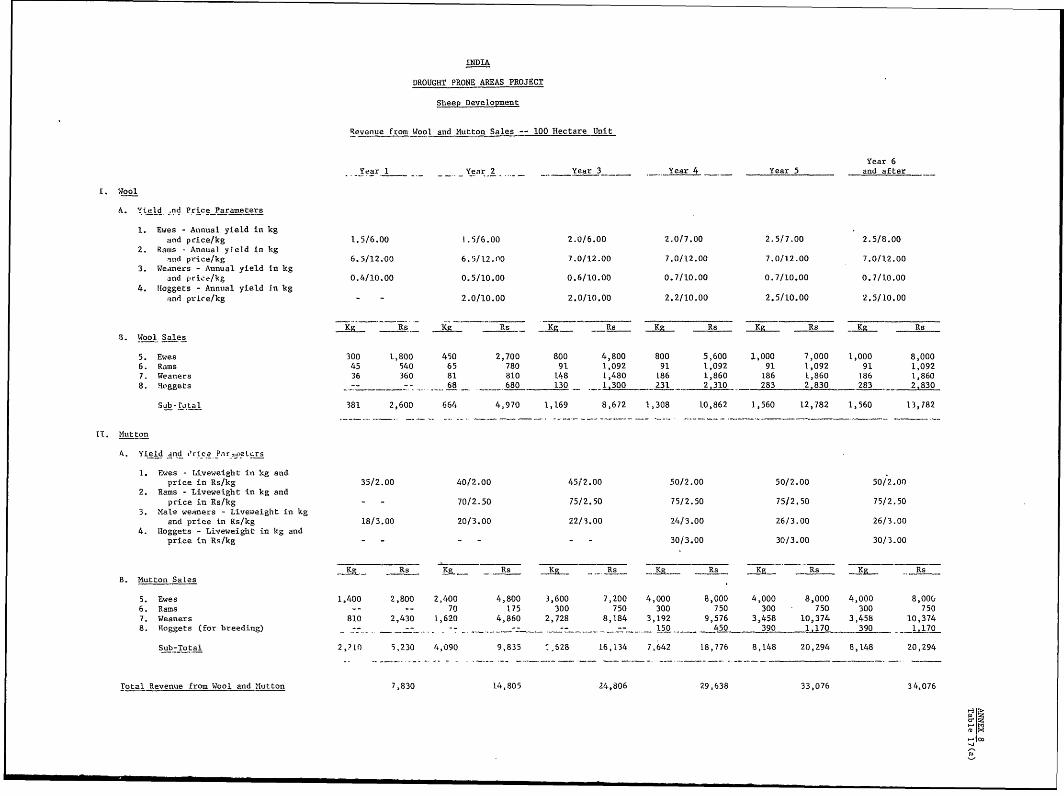
INDIA
DROUGHT PRONE AREAS PROJECT
Sheep Development
Revenue from W4ool and Mutton Sales -- 100 Hectare Unit
Year IYear 6
Yer1Year- 2 Year 3 Year 4 Year 5 and after
A. Yield .nd Price Parameters
1. Ewqes -Aninual yield in kg
and price/kg 1.5/.0V6.0o0 2.0/6.00 2.0/7.00 2.5/7.00 2.5/8.00
2. Rams Annuial yield In kgand price/kg 6.5/12.00 6.5/12.00 7.0/12.00 7.0/12.00 7.0/12.00 7.0/12.00
3. Weaners - A-nnual yield in kg
and price/kg 0.4/10.00 0.5/10.00 0.6/10.00 0.7/10.00 0.7/10.00 0.7/10.00
4. Hioggets - A-nnual yield in kg
and price/kg - 2.0/10.00 2.0/10.00 2.2/10.00 2.5/10.00 2.5/ 10.00
B. Wool Sales R gR gR
5. Ewes 300 1,800 450 2,700 800 4,800 800 5,600 1.,000 7,000 1,000 8,000
6. Rams 45 540 65 780 91 1,092 91 1,092 91 1,092 91 1,092
7. Weaners 36 360 81 810 148 1,480 1.86 1,860 186 1,860 186 1,860
8. Hoggets - -- - 68 680 130 1,300 231 283,80 280
Sub-to,tal 381 2,600 664 4,970 1,169 8,672 1,308 10,862 1,560 12,782 1,560 13,782
ET. Mutton
A. Yield and ,lrice_Par,,neLc.rs
1. Ewes - Liveweight in kcg and
2 price in Rs/kg 35/2.00 40/2.00 4512.00 50/2.00 50/2.00 50/2.00
2. Rams - Liveweight in kg and
price i-n Re/kg - - 70/2.50 75/2. 50 75/2.50 75/2.50 75/2.50
3. Male weaners - Liveweight in kg
and price in Re/kg 18/3.00 20/3.00 22/3.00 24/3.00 26/3.00 26/3.00
4. Hoggets - Liveweight in kg andprice in Re/kg - - - - - 30/3.00 30/3.00 30/3.00
K~g. Res~ Re Kg. Res Re Kg Kejg -~Re
B. Mutton Sales
5. Ewes 1,400 2,800 2,400 4,800 3,600 7,200 4,000 8,000 4,000 8,000 4,000 8,001,
6. Rams -- -- 70 175 300 750 300 750 300 750 300 750
7. Weaners 810 2,430 1,620 4,860 2,728 8,184 3,192 9,576 3,458 10,374 3,458 10,374
8. Roggets (for breedi-ng) -- ------ 150 450 390 1.170 390 17
Sub-Total 2,?If) 5,230 4,090 9,835 ,28 16,134 7,642 18,776 8,148 20,294 8,148 20,294
Total Revenue from Wool and MNutton 7,830 14,805 24,806 29,638 33,076 34,076
a.
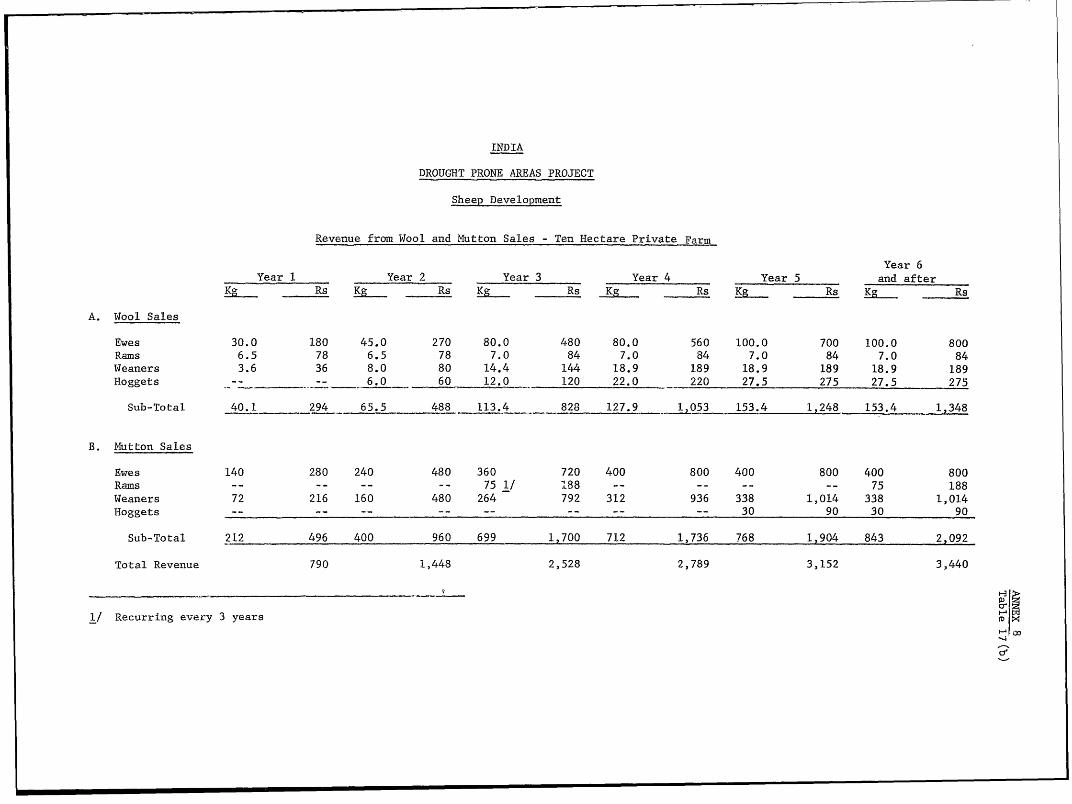
INDIA
DROUGHT PRONE AREAS PROJECT
Sheep Development
Revenue from Wool and Mutton Sales - Ten Hectare Private Farm
Year 6Year 1 Year 2 Year 3 Year 4 Year 5 and afterKg Rs Kg Rs Kg Rs Kg Rs Kg Rs Kg RsA. Wool Sales
Ewes 30.0 180 45.0 270 80.0 480 80.0 560 100.0 700 100.0 800Rams 6.5 78 6.5 78 7.0 84 7.0 84 7.0 84 7.0 84Weaners 3.6 36 8.0 80 14.4 144 18.9 189 18.9 189 18.9 189Hoggets 6.0 60 12.0 120 22.0 220 27.5 275 27.5 275Sub-Total 40.1 294 65.5 488 113.4 828 127.9 1,053 153.4 1,248 153.4 1,348
B. Mutton Sales
Ewes 140 280 240 480 360 720 400 800 400 800 400 800Rams - 75 1/ 188 -- -- -- -- 75 188Weaners 72 216 160 480 264 792 312 936 338 1,014 338 1,014Hoggets --- 30 90 30 90Sub-Total 212 496 400 960 699 1,700 712 1,736 768 1,904 843 2,092
Total Revenue 790 1,448 2,528 2,789 3,152 3,440
1/ Recurring every 3 years (
-Sc
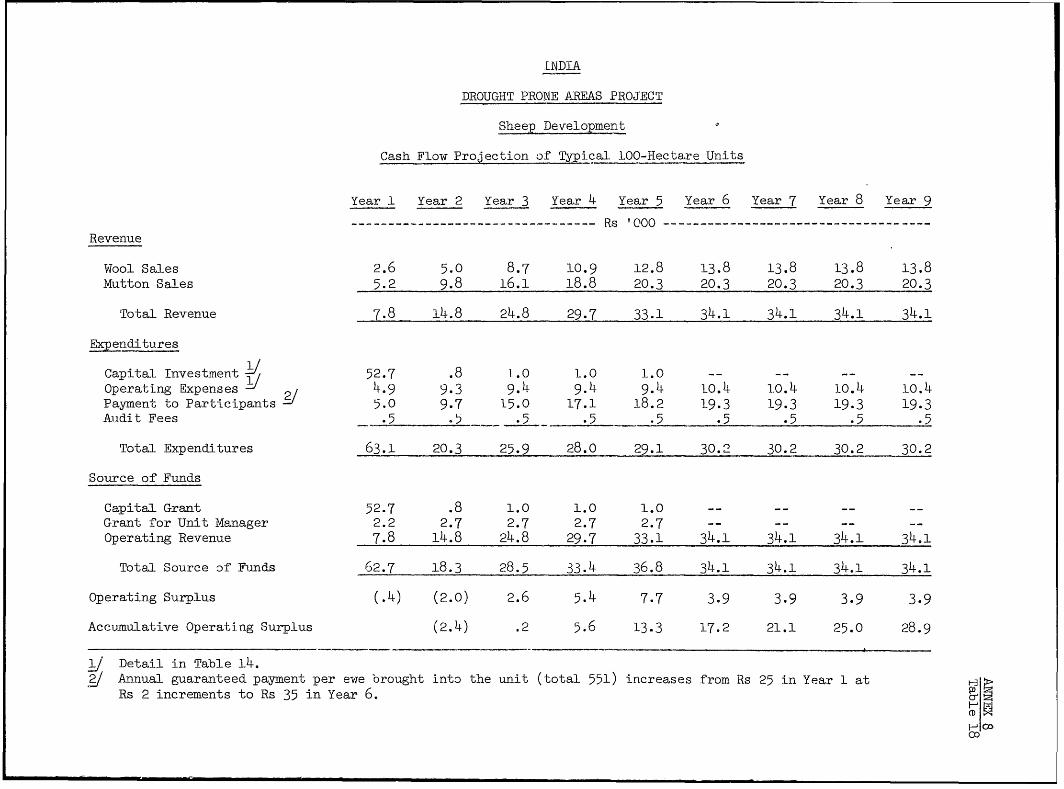
INDIA
DROUGHT PRONE AREAS PROJECT
Sheep_Development
Cash FLow Projection of Typical L0O-Heetare Units
Year 1 Year 2 Year 3 Year 4 Year 5 Year 6 Year 7 Year 8 Year 9
--------- --------------------------------- Rs '000 ------------------------------------
Revenue
Wool Sales 2.6 5.0 8.7 10.9 12.8 13.8 13.8 13.8 13.8
Mutton Sales 5.2 9.8 16.1 18.8 20.3 20.3 20.3 20.3 20.3
Total Revenue 7.8 14.8 24.8 29.7 33.1 34.1 34.1 34.1 34.1
Expenditures
Capital Investment 52.7 .8 1.0 I.0 1.0 -- -- -- --
Operating Expenses 4.9 9.3 9.4 9.4 9.4 Lo.4 1.0.4 ]0.4 10.4
Payment to Participants 5.0 9.7 15.0 17.1 18.2 19.3 19.3 19.3 19.3
Aludit Fees .5 .5 .5 .5 .5 .5 .5 .5 .5
Total Expenditures 63.1 20.3 25.9 28.0 29.1 30.2 30.2 30.2 30.2
Source of Funds
Capital Grant 52.7 .8 1.0 1.0 1.0 -- -- -- --
Grant for Unit Manager 2.2 2.7 2.7 2.7 2.7 -- -- -- --
Operating Revenue 7.8 14.8 24.8 29.7 33.1 34.1 34.1 34.1 34.1
Total Source of Funds 62.7 18.3 28.5 33.4 36.8 34.1 34.1 34.1 34.1
Operating Surplus (.4) (2.0) 2.6 5.4 7.7 3.9 3.9 3.9 3.9
Accumulative Operating Surplus (2.4) .2 5.6 13.3 17.2 21.1 25.0 28.9
/ Detail in Table 14./ Annual guaranteed payment per ewe brought into the unit (total 551) increases from Rs 25 in Year 1 at H
Rs 2 increments to Rs 35 in Year 6. C
H cIco
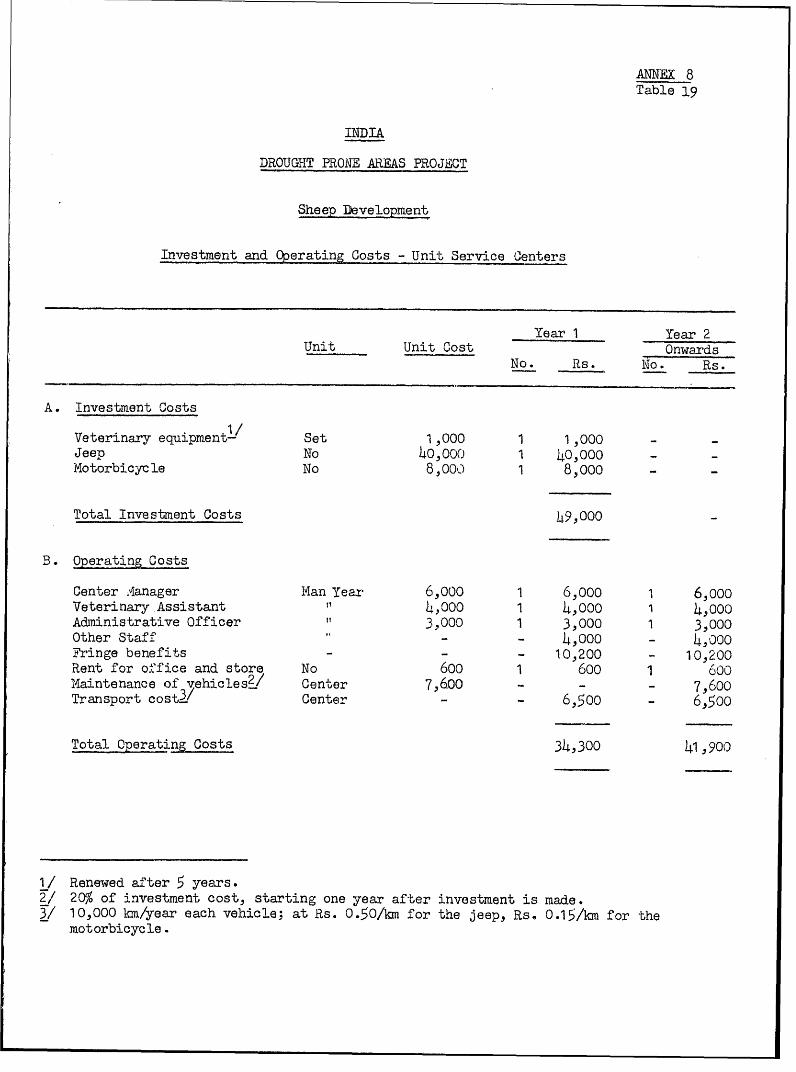
ANNEX 8Table 19
INDIA
DROUGHT PRONE AREAS PROJECT
Sheep Development
Investment and Operating Costs - Unit Service Centers
Year 1 Year 2Unit Unit Cost Onwards
No. Rs. No. Rs.
A. Investment Costs
Veterinary equipment- Set 1,000 1 1,000Jeep No 40o00,) 1 L40,000.Motorbicycle No 8,000o 1 8,000 - -
Total Investment Costs 149,000
B. Operating Costs
Center AIanager Nan Year 6,000 1 6,000 1 6,000
Veterinary Assistant 4,000 1 4,000 1 14,000Administrative Officer 3,000 1 3,000 1 3,000Other Staff - 4,000 - 4,000Fringe benefits - -- 102 - 10,200
Rent for office and store No 600 1 600 1 00Maintenance of vehiclesi/ Center 7,600 - - - 7,600Transport cost3/ Center - - 6,50o - 6,500
Total Operating Costs 34,300 41,900
1/ Renewed after 5 years.2/ 20% of investment cost, starting one year after investment is made.3/ 10,000 Im/year each vehicle; at Rs. 0.50/km for the jeep, Rs. 0.15/km for the
motorbicycle .
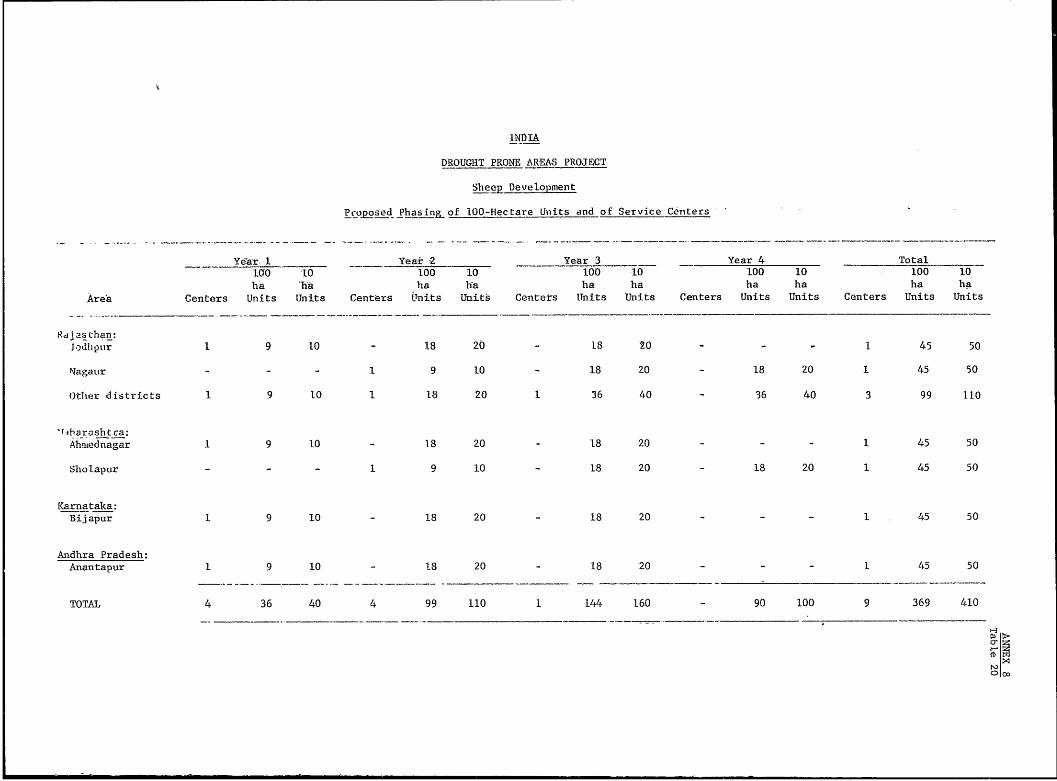
INDIA
DROUGHT PRONE AR-EAS PROJECT
Sheep Development
Pcoposed Phasing of IO-Hectare Uniits and of Service Centers
Year I Yea-i: 2 Year 3 Year 4 Total10o 1.0o loo 10 100 10 100 10 100 10ha tha ha ha ha ha ha ha ha ha
Areha Centers Units Units Centers Units Units Centets ITnits 'Units Centers Units Units Centers Units Units
Sclj.as ihan :J.)dhplur 1 9 10 - 18 20 - 18 20 - - - 1 45 50
4Tagaur - - - 1 9 10 - 18 20 - 18 20 1 45 50
Ot:ler districts 1 9 tO 1 18 20 1 36 40 36 40 3 99 110
'rbar.:sht ra:Ahqtednagar 1 9 10 - 18 20 - 18 20 - - - 1 45 50
Sholapur - - - 1 9 10 - 18 20 - 18 20 1 45 50
Karnataka:Bijapur 1 9 10 - 18 20 - 18 20 - - - 1 45 50
Andhra Pradesh:Anantapur 1 9 10 - 18 20 - 18 20 - - - 1 45 50
TOTAL 4 36 40 4 99 110 1 144 160 - 90 100 9 369 410
o co
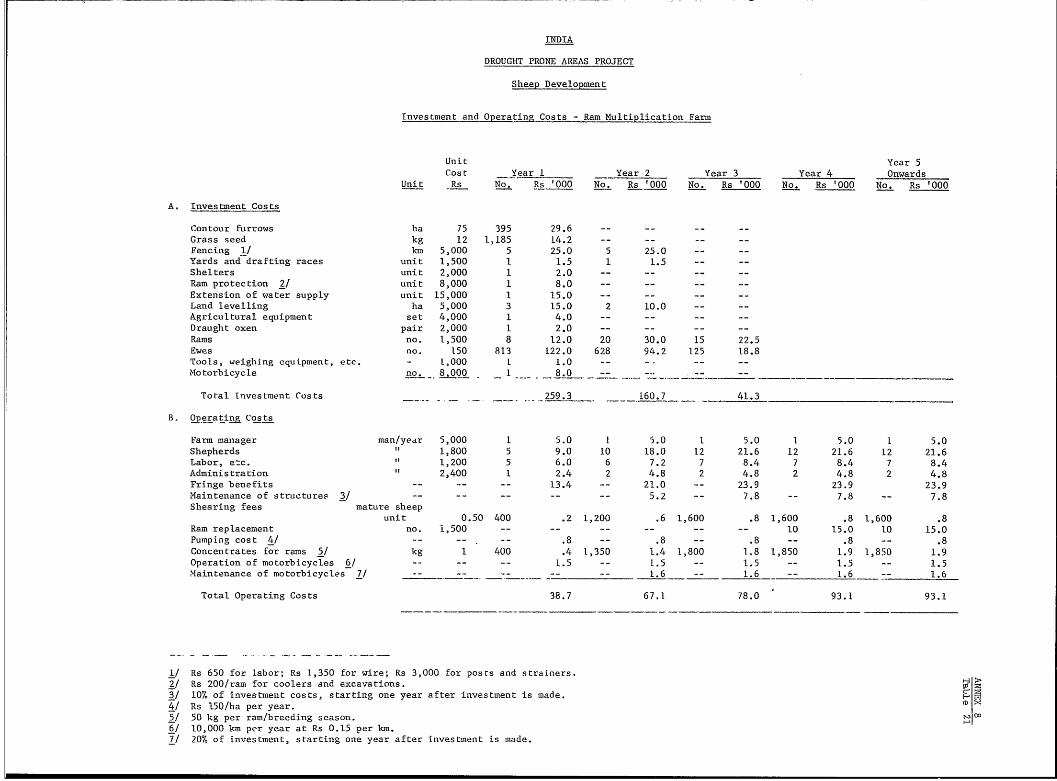
INDIA
DROUGHT PRONE AREAS PROJECT
Sheep Development
Investment and Operating Costs - Ram Multiplication Farm
Unit Year 5Cost Year 1 Year 2 Year 3 Year 4 Onwards
Unit Rs No. Rs '000 No. Rs '000 No. Rs '000 No. Rs '000 No. Rs '000
A. Investment Costs
Contour furrows ha 75 395 29.6 -- -Grass seed kg 12 1,185 14.2 -- -- -- --Fencing 1/ km 5,000 5 25.0 5 25.0 -- --Yards and drafting races unit 1,500 1 1.5 1 1.5 -- --Shelters unit 2,000 1 2.0 -- -- -- --Ram protection 2/ unit 8,000 1 8.0 -- -- -- --Extension of water supply unit 15,000 1 15.0 -- -- -- --Land levelling ha 5,000 3 15.0 2 10.0 -- --Agricultural equipment set 4,000 1 4.0 -- -- -- --Draught oxen pair 2,000 1 2.0 -- -- -- --
Rams no. 1,500 8 12.0 20 30.0 15 22.5Ewes no. 150 813 122.0 628 94.2 125 18.8Tools, weighing equipment, etc. - 1,000 1 1.0 -- -. -- --Motorbicycle no. 8 000 1 - 8.0
Total Investment Costs -- 259.3 160.7 - - 41.3
B. Qperati- Costs
Farm manager man/yedr 5,000 1 5.0 1 5.0 1 5.0 1 5.0 1 5.0Shepherds " 1,800 5 9.0 10 18.0 12 21.6 12 21.6 12 21.6Labor, etc. " 1,200 5 6.0 6 7.2 7 8.4 7 8.4 7 8.4Administration " 2,400 1 2.4 2 4.8 2 4.8 2 4.8 2 4.8Fringe benefits -- -- -- 13.4 -- 21.0 -- 23.9 23.9 23.9Maintenance of structures 3/ -- -- -- -- -- 5.2 -- 7.8 -- 7.8 -- 7.8Shearing fees mature sheep
unit 0.50 400 .2 1,200 .6 1,600 .8 1,600 .8 1,600 .8Ram replacement no. 1,500 -- -- -- -- -- -- 10 15.0 10 15.0Pumping cost 4/ -- -- -- .8 -- .8 -- .8 -- .8 -- .8Concentrates for rams 5/ kg 1 400 .4 1,350 1.4 1,800 1.8 1,850 1.9 1,850 1.9Operation of motorbicycles 6/ -- -- -- 1.5 -- 1.5 -- 1.5 -- 1.5 -- 1.5Maintenance of motorbicycles 7/ -- -- -- -- -- 1.6 -- 1.6 -- 1.6 -- 1.6
Total Operating Costs 38.7 67.1 78.0 93.1 93.1
1/ Rs 650 for labor; Rs 1,350 for wire; Rs 3,000 for posts and strainers.2/ Rs 200/ram for coolers and excavations.3/ 10% of investment costs, starting one year after investment is made.4/ Rs 150/ha per year.5 50 kg per ram/breeding season. nm
6/ 10,000 km per year at Rs 0.15 per km.7/ 20% of investment, starting one year after investment is made.
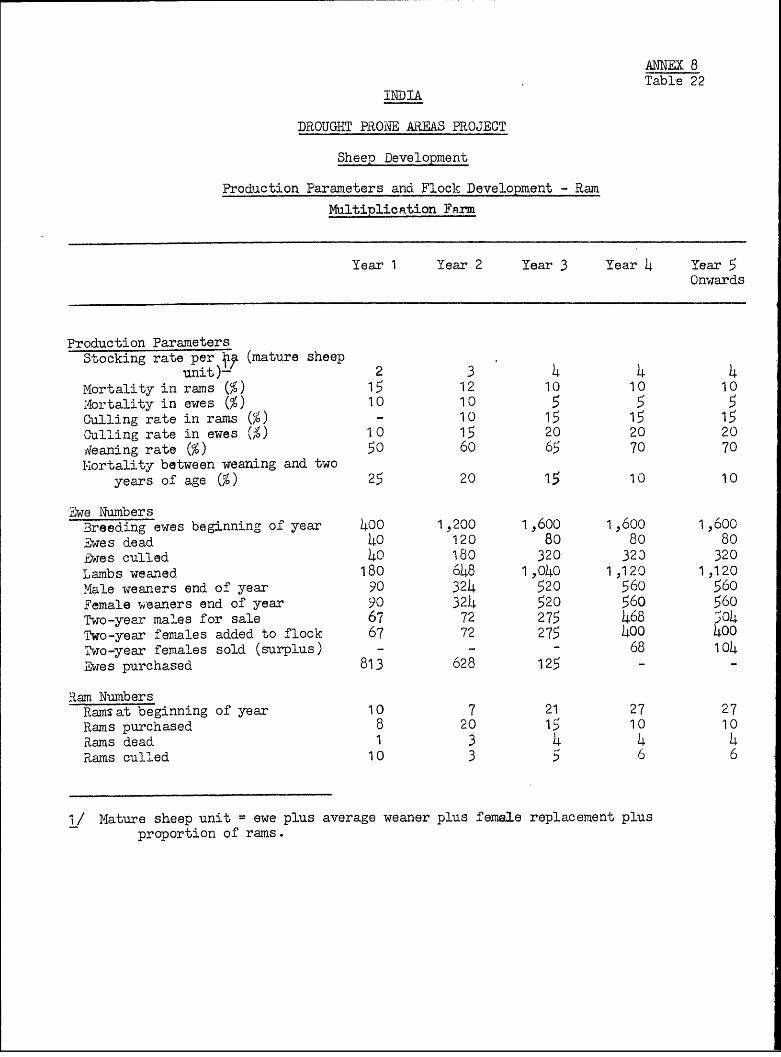
ANNEX 8Table 22
INDIA
DROUGHT PRONE AREAS PROJEGT
Sheep Development
Production Parameters and FLock Development - Ram
Multiplicntion FFnm
Year 1 Year 2 Year 3 Year4 Year 5Onwards
Production ParametersStocking rate per 4 (mature sheep
unit)- 2 3 4 4 4Mortality in rams (%) 15 12 10 10 10
M4ortality in ewes (%) 10 10 5 5 5Culling rate in rams (%) - 10 15 15 15Culling rate in ewes (,) 10 15 20 20 20
vveaning rate (%) 50 60 65 70 70Mlortality between weaning and two
years of age (%) 25 20 15 10 10
'we N\fumbers3reed.ing ewes beginning of year 400 1 ,200 1,600 1 ,o00 1,600
EVwes dead 40 120 80 80 80i'wes culled 40 180 320 323 320
Lambs weaned 180 648 1,040 1,120 1,120
Male weaners end of year 90 324 520 560 560
Female weaners end of year 90 324; 520 560 560Two-year males for sale 67 72 275 468 504
Two-year females added to flock 67 72 275 400 400
Two-year females sold (surplus) - - - 68 104
Ewes purchased 813 628 125 - -
Ram NumbersRamsat beginning of year 10 7 21 27 27
Rams purchased 8 20 15 10 10
Rams dead 1 3 4 4 4Rams cul'led 10 3 5 6 6
1/ Mature sheep unit = ewe plus average weaner plus female replacement plusproportion of rams.
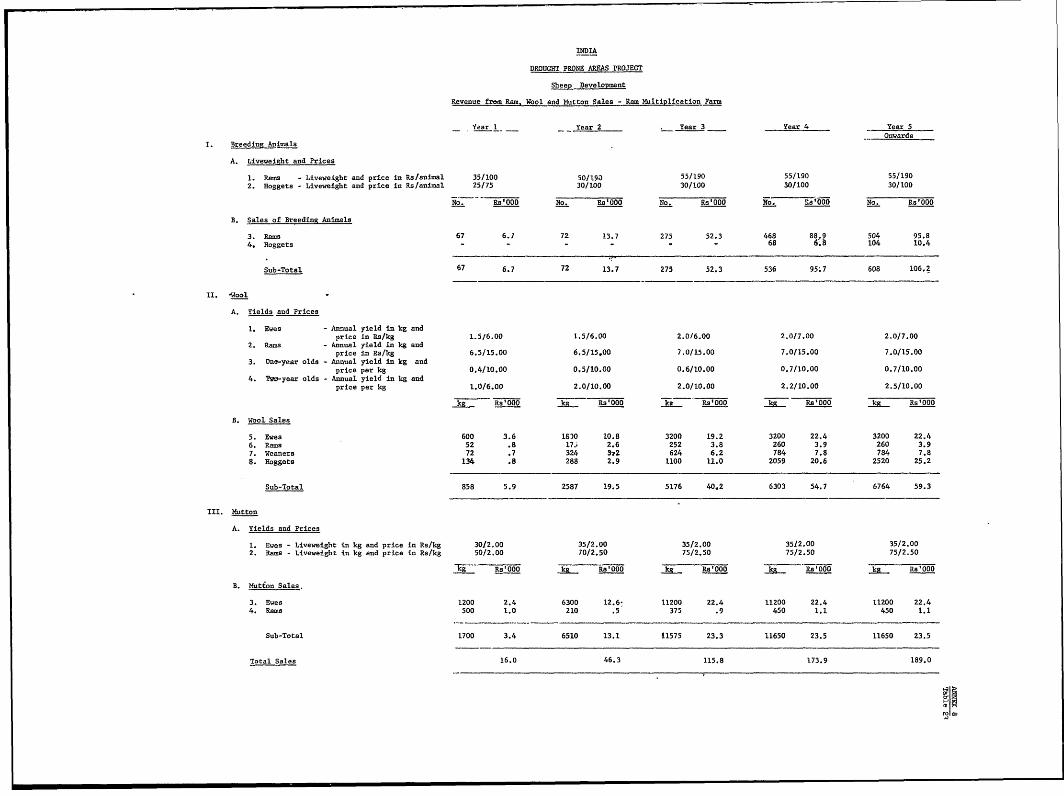
INDIA
DROUGHT PRONE AREAS PROJECT
SheepDeeo en
Revenue from Rain Wool and Hutton Sales - Rarn Multiplication Far.
Yea- Year 2 . Year 3 Year 4 - Year 5-~OnwardsI. Breeding Animals
A. Liveweight and Prices
1. Ramm - Liv,eweight and price in Rs/animal 35/100 50I19i) 55/190 55/190 55/1902. Hoggets - Liveweight and price in Rs/animal 25/75 30/100 30/100 30/100 30/ 100
Ro s'000 No. Es'O00 NO. Rs'000 No. ZCa'O00 NO. Rs'000
B. Sales of Breeding Animals
3. Rams 67 6.7 72 13.7 275 52.3 46B 88.9 504 95.84. Eoggets - - - - - 68 6.8 104 10.4
sub-Total 67 6.7 72 13.7 275 52.3 536 95.7 608 106.2
I. Woo1
A. Yields and Prices
1. Ewes - Annual yield in kg andprice in Bs/kg 1.5/6.00 1.5/6.00 2.0/6.00 2.0/7.00 2.0/7.002. Esma - Annual yield in kg andprice in Rn/kg 6.5/15.00 6.5/15.00 7.0/15.00 7.0/15.00 7.0/15.003. One-year olds - Annual yield in kg andprice per kg 0.4/10.00 0.5/10.00 0.6/10.00 0.7/10.00 0.7/10.004. Two-year olds - Annual yield in kg andprice per kg 1.0/6.00 2.0/10.00 2.0/10.00 2.2/10.00 2.5/10.00
_ISE_ 9 j~ Rs'000 kg lRs'000 kg Rs Es000 _kZ_ Rs'000kg RIO
B. Wool Sales
5. Ewes 600 3.6 1820 10.8 3200 19.2 3200 22.4 3200 22.46. Rams 52 .8 17. 2.6 252 3.8 260 3.9 260 3.97. Weaners 72 .7 324 3i2 624 6.2 784 7.8 784 7.88. Hoggats 134 .8 288 2.9 1100 11.0 2059 20.6 2520 25.2
Sub-Total 858 5.9 2587 19.5 5176 40.2 6303 54.7 6764 59.3
III. Mutton
A. Yields and Prices
1. Ewes - Liv,eweight in kg and price in Es/kg 30/2.00 35/2.00 35/2.00 3512.00 35/2.002. Rams - Liv,eeight in kg and price in Es/kg 50/2.00 70/2.50 75/2.50 75/2.50 75/2.50
RE~ s' 000 ksg Es'000 kg Ra00 A Ra'000 kg Rs'000B. Mutton Sales.
3. Ewes 1200 2.4 6300 12.6: 11200 22.4 11200 22.4 11200 22.44. Rams 500 1.0 210 .5 375 .9 450 1.1 450 1.1
Sub-Total 1700 3.4 6510 13.1 t1575 23.3 11650 23.5 11650 23.5
Total Sales 16.0 46.3 115.8 173.9 189.0
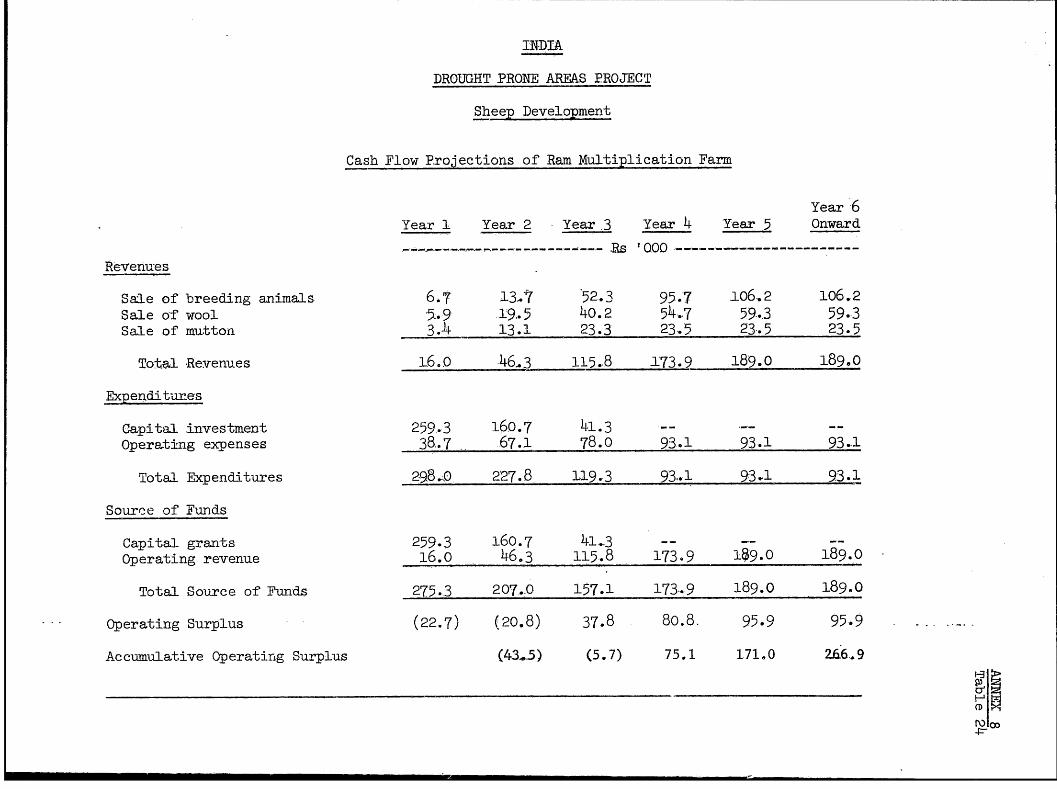
INDIA
DROUGHT PRONE AREAS PROJECT
Sheep Development
Cash Flow P.rojections of Ram Multiplication Farm
Year 6Year 1 Year 2 Year 3 Year 4 Year 5 Onward
---------- Rs 000D ----------------
Revenuies
Sale of breeding animals 6.7 13-7 52.3 95 .7 i06. 2 106. 2
Sale of wool '5.,9 19,.5 4o.2 541..7 59-.3 59.3
Sale of mutton 3.4. 13.1 23.3 23.5 23-.5 23.5
Total Revenues 16.eo -46A3 115..8 173.9 189.0 189.0
Expenditures
Capital investment 259.3 160.7 41.3 -
Operating expenses 38. 7 67.1 78.0 93.1 93.1 93.1
Total Expenditures 2-98..O 227.8 119,.3 93.,l 93.1 93.1
Source of Funds
Capital grants 259.3 160.7 41-3 -- --
Operating revenue 16.0 46.3 115.8 173.9 1$9.0 189.0
Total Source of Funds 275.3 207.0 157.1 173.-9 189.0 189.0
Operating Surplus (22.7) (20.8) 37.8 80.8. 95.9 95.9
Accumulative OperatirLg Surplus (43-5) (5.7) 75.1 171.0 26.6. 9
U 3
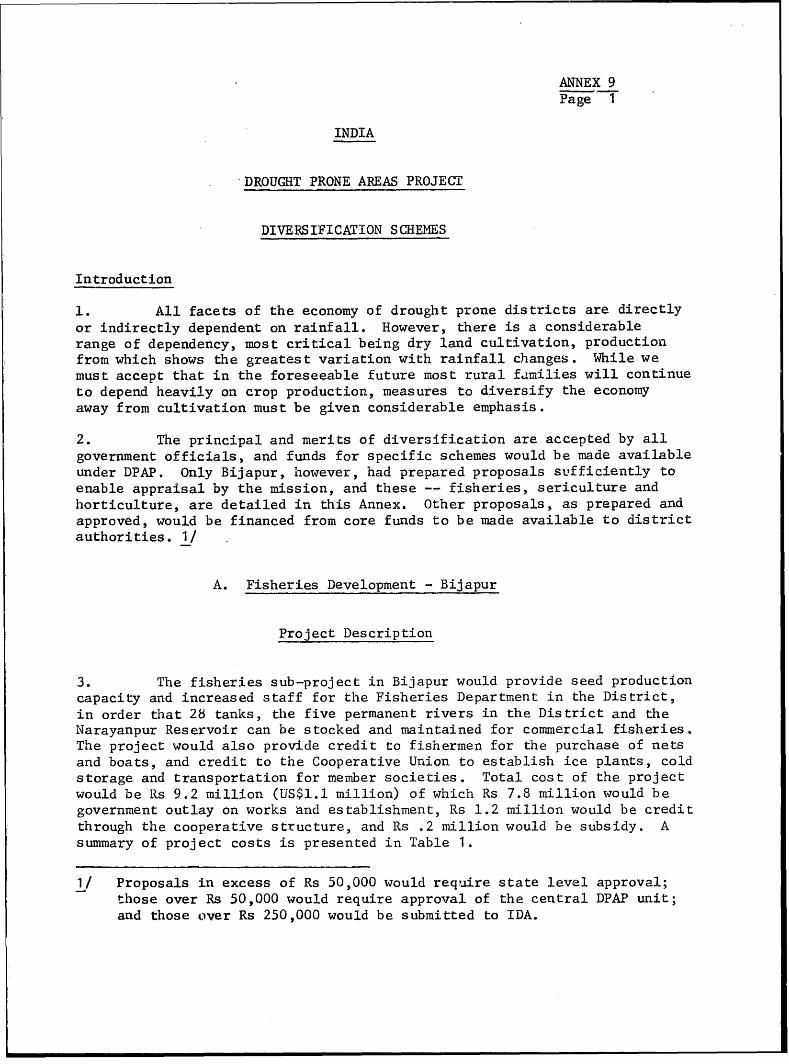
ANNEX 9Page 1
INDIA
DROUGHT PRONE AREAS PROJECT
DIVERSIFICATION SCHEMES
Introduction
1. All facets of the economy of drought prone districts are directlyor indirectly dependent on rainfall. However, there is a considerablerange of dependency, most critical being dry land cultivation, productionfrom which shows the greatest variation with rainfall changes. While wemust accept that in the foreseeable future most rural families will continueto depend heavily on crop production, measures to diversify the economyaway from cultivation must be given considerable emphasis.
2. The principal and merits of diversification are accepted by allgovernment officials, and funds for specific schemes would be made availableunder DPAP. Only Bijapur, however, had prepared proposals su'fficiently toenable appraisal by the mission, and these -- fisheries, sericulture andhorticulture, are detailed in this Annex. Other proposals, as prepared andapproved, would be financed from core funds to be made available to districtauthorities. 1/
A. Fisheries Development - Bijapur
Project Description
3. The fisheries sub-project in Bijapur would provide seed productioncapacity and increased staff for the Fisheries Department in the District,in order that 28 tanks, the five permanent rivers in the District and theNarayanpur Reservoir can be stocked and maintained for commercial fisheries.The project would also provide credit to fishermen for the purchase of netsand boats, and credit to the Cooperative Union to establish ice plants, coldstorage and transportation for member societies. Total cost of the projectwould be Rs 9.2 million (US$1.1 million) of which Rs 7.8 million would begovernment outlay on works and establishment, Rs 1.2 million would be creditthrough the cooperative structure, and Rs .2 million would be subsidy. Asummary of project costs is presented in Table 1.
1/ Proposals in excess of Rs 50,000 would require state level approval;those over Rs 50,000 would require approval of the central DPAP unit;and those over Rs 250,000 would be submitted to IDA.
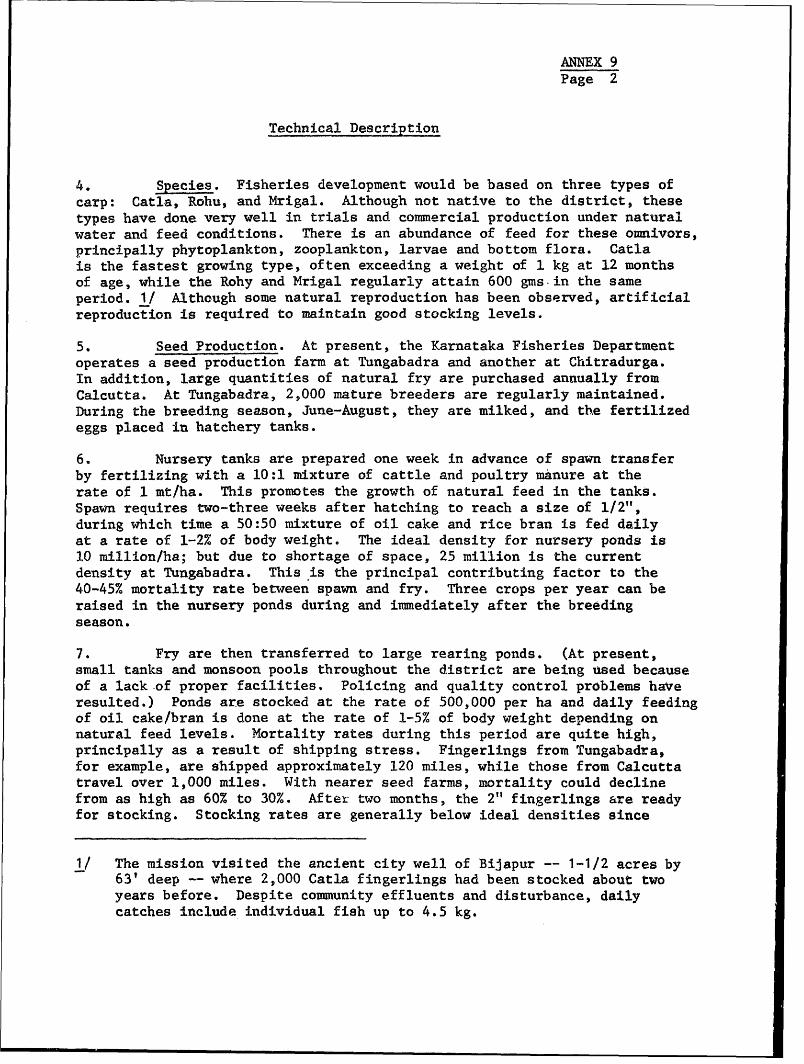
ANNEX 9Page 2
Technical Description
4. Species. Fisheries development would be based on three types of
carp: Catla, Rohu, and Mrigal. Although not native to the district, these
types have done very well in trials and commercial production under natural
water and feed conditions. There is an abundance of feed for these omnivors,
principally phytoplankton, zooplankton, larvae and bottom flora. Catla
is the fastest growing type, often exceeding a weight of 1 kg at 12 months
of age, while the Rohy and Mrigal regularly attain 600 gms.in the same
period. 1/ Although some natural reproduction has been observed, artificial
reproduction is required to maintain good stocking levels.
5. Seed Production. At present, the Karnataka Fisheries Departmentoperates a seed production farm at Tungabadra and another at Chitradurga.In addition, large quantities of natural fry are purchased annually from
Calcutta. At Tungabadra, 2,000 mature breeders are regularly maintained.During the breeding season, June-August, they are milked, and the fertilized
eggs placed in hatchery tanks.
6. Nursery tanks are prepared one week in advance of spawn transfer
by fertilizing with a 10:1 mixture of cattle and poultry manure at the
rate of 1 mt/ha. This promotes the growth of natural feed in the tanks.
Spawn requires two-three weeks after hatching to reach a size of 1/2",
during which time a 50:50 mixture of oil cake and rice bran is fed daily
at a rate of 1-2% of body weight. The ideal density for nursery ponds is
10 million/ha; but due to shortage of space, 25 million is the currentdensity at Tungabadra. This is the principal contributing factor to the
40-45% mortality rate between spawn and fry. Three crops per year can be
raised in the nursery ponds during and immediately after the breeding
season.
7. Fry are then transferred to large rearing ponds. (At present,small tanks and monsoon pools throughout the district are being used because
of a lack of proper facilities. Policing and quality control problems have
resulted.) Ponds are stocked at the rate of 500,000 per ha and daily feedingof oil cake/bran is done at the rate of 1-5% of body weight depending on
natural feed levels. Mortality rates during this period are quite high,
principally as a result of shipping stress. Fingerlings from Tungabadra,for example, are shipped approximately 120 miles, while those from Calcutta
travel over 1,000 miles. With nearer seed farms, mortality could decline
from as high as 60% to 30%. Aftex two months, the 2" fingerlings are ready
for stocking. Stocking rates are generally below ideal densities since
1/ The mission visited the ancient city well of Bijapur -- 1-1/2 acres by63' deep -- where 2,000 Catla fingerlings had been stocked about twoyears before. Despite community effluents and disturbance, dailycatches include individual fish up to 4.5 kg.
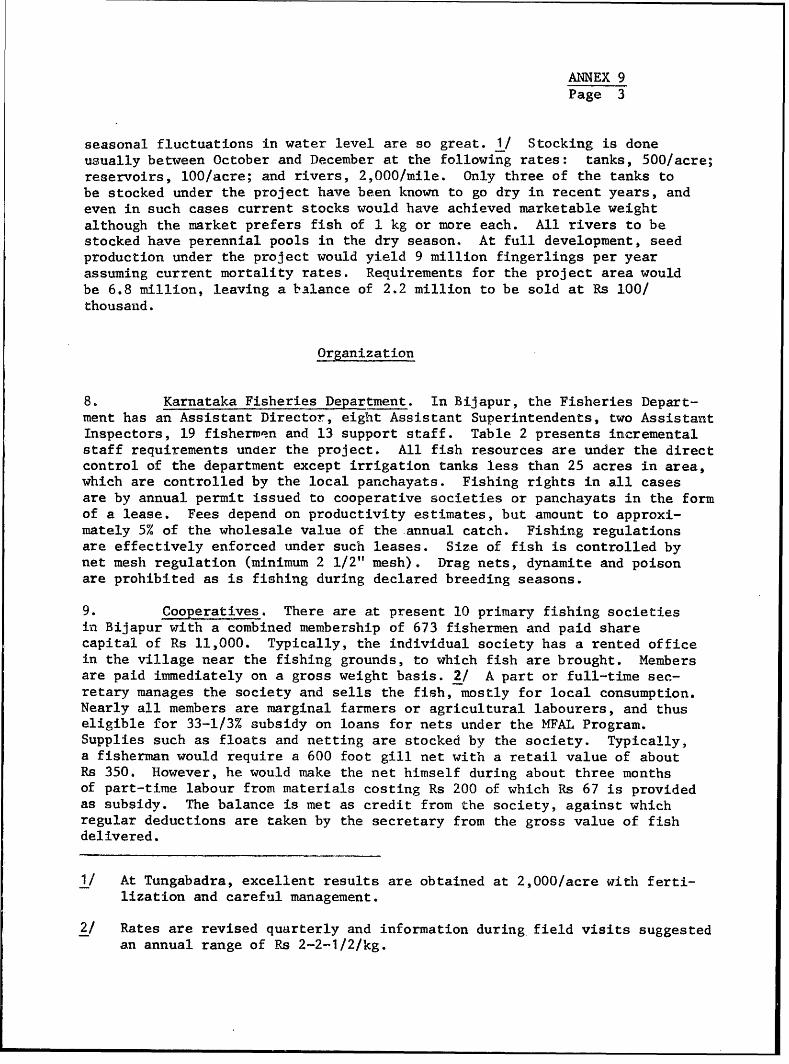
ANNEX 9Page 3
seasonal fluctuations in water level are so great. 1/ Stocking is doneusually between October and December at the following rates: tanks, 500/acre;reservoirs, 100/acre; and rivers, 2,000/mile. Only three of the tanks tobe stocked under the project have been known to go dry in recent years, andeven in such cases current stocks would have achieved marketable weightalthough the market prefers fish of 1 kg or more each. All rivers to bestocked have perennial pools in the dry season. At full development, seedproduction under the project would yield 9 million fingerlings per yearassuming current mortality rates. Requirements for the project area wouldbe 6.8 million, leaving a balance of 2.2 million to be sold at Rs 100/thousanid.
Organization
8. Karnataka Fisheries Department. In Bijapur, the Fisheries Depart-ment has an Assistant Director, eight Assistant Superintendents, two AssistantInspectors, 19 fishermen and 13 support staff. Table 2 presents incrementalstaff requirements under the project. All fish resources are under the directcontrol of the department except irrigation tanks less than 25 acres in area,which are controlled by the local panchayats. Fishing rights in all casesare by annual permit issued to cooperative societies or panchayats in the formof a lease. Fees depend on productivity estimates, but amount to approxi-mately 5% of the wholesale value of the annual catch. Fishing regulationsare effectively enforced under such leases. Size of fish is controlled bynet mesh regulation (minimum 2 1/2" mesh). Drag nets, dynamite and poisonare prohibited as is fishing during declared breeding seasons.
9. Cooperatives. There are at present 10 primary fishing societiesin Bijapur with a combined membership of 673 fishermen and paid sharecapital of Rs 11,000. Typically, the individual society has a rented officein the village near the fishing grounds, to which fish are brought. Membersare paid immediately on a gross weight basis. 2/ A part or full-time sec-retary manages the society and sells the fish, mostly for local consumption.Nearly all members are marginal farmers or agricultural labourers, and thuseligible for 33-1/3% subsidy on loans for nets under the MFAL Program.Supplies such as floats and netting are stocked by the society. Typically,a fisherman would require a 600 foot gill net with a retail value of aboutRs 350. However, he would make the net himself during about three monthsof part-time labour from materials costing Rs 200 of which Rs 67 is providedas subsidy. The balance is met as credit from the society, against whichregular deductions are taken by the secretary from the gross value of fishdelivered.
1/ At Tungabadra, excellent results are obtained at 2,000/acre with ferti-lization and careful management.
2/ Rates are revised quarterly and information during field visits suggestedan annual range of Rs 2-2-1/2/kg.
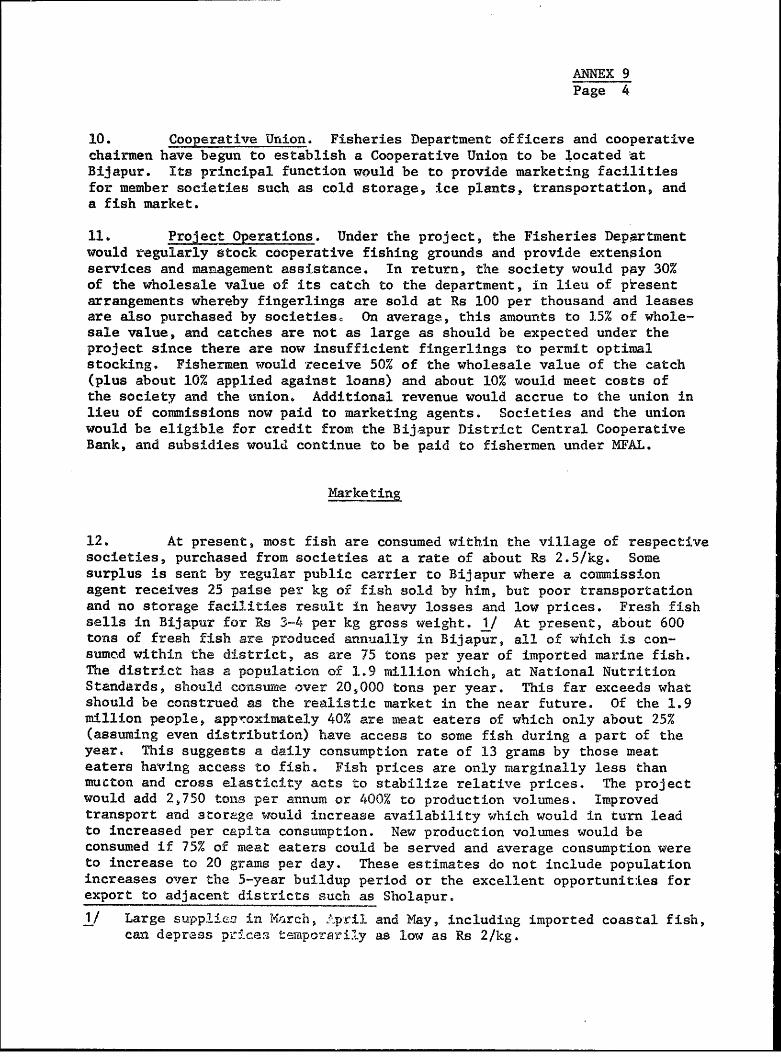
ANNEX 9Page 4
10. Cooperative Union. Fisheries Department officers and cooperativechairmen have begun to establish a Cooperative Union to be located atBijapur. Its principal function would be to provide marketing facilitiesfor member societies such as cold storage, ice plants, transportation, anda fish market.
11. Project Operations. Under the project, the Fisheries Departmentwould regularly stock cooperative fishing grounds and provide extensionservices and management assistance. In return, the society would pay 30%of the wholesale value of its catch to the department, in lieu of piresentarrangements whereby fingerlings are sold at Rs 100 per thousand and leasesare also purchased by societies. On average, this amounts to 15% of whole-sale value, and catches are not as large as should be expected under theproject since there are now instufficient fingerlings to permit optimalstocking. Fishermen would receive 50% of the wholesale value of the catch(plus about 10% applied against loans) and about 10% would meet costs ofthe society and the union. Additional revenue would accrue to the union inlieu of commissions now paid to marketing agents. Societies and the unionwould be eligible for credit from the Bijapur District Central CooperativeBank, and subsidies would continue to be paid to fishermen under MFAL.
arketing
12. At present, most fish are consumed within the village of respectivesocieties, purchased from societies at a rate of about Rs 2.5/kg. Somesurplus is sent by regular public carrier to Bijapur where a commissionagent receives 25 paise per kg of fish sold by him, but poor transportationand no storage facilities result in heavy losses and low prices. Fresh fishsells in Bijapur for Rs 3-4 per kg gross weight. 1/ At present, about 600tons of fresh fish are produced annually in Bijapur, all of which is con-sumed within the district, as are 75 tons per year of imported marine fish.The district has a population of 1.9 zillion which, at National NutritionStandards, should consme over 20,000 tons per year. This far exceeds whatshould be construed as the realistic market in the near future. Of the 1.9million people, approximately 40% are imeat eaters of which only about 25%(assuming even distribution) have access to some fish during a part of theyear, This suggests a daily consumption rate of 13 grams by those meateaters having access to fish. Fish prices are only marginally less thanmucton and cross elasticity acts to stabilize relative prices. The projectwould add 2,750 tons per annum or 400% to production volumes. Improvedtransport and storage would increase availability which would in turn leadto increased per capita consumption. New production volumes would beconsumed if 75% of meat eaters could be served and average consumption wereto increase to 20 grams per day. These estimates do not include populationincreases over the 5-year buildup period or the excellent opportunities forexport to adjacent districts such as Sholapur.
1/ Large supplic!3 in Msrch, A'-pril and May, including imported coastal fish,can depress p"ice2 'temporarily as low as Rs 2/kg.
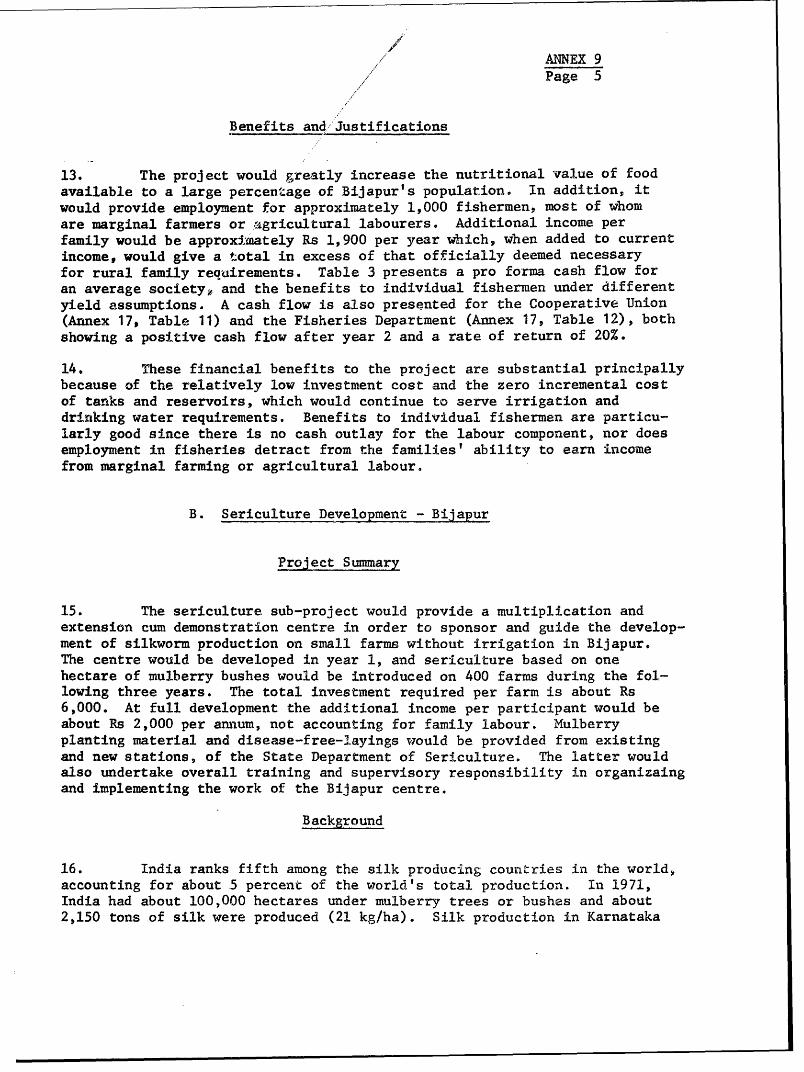
k ANNEX 9Page 5
Benefits and/Justifications
13. The project would greatly increase the nutritional value of foodavailable to a large percenZage of Bijapur's population. In addition, itwould provide employment for approximately 1,000 fishermen, most of whomare marginal farmers or ,gricultural labourers. Additional income perfamily would be approximately Rs 1,900 per year which, when added to currentincome, would give a total in excess of that officially deemed necessaryfor rural family requirements. Table 3 presents a pro forma cash flow foran average societyy, and the benefits to individual fishermen under differentyield assumptions. A cash flow is also presented for the Cooperative Union(Annex 17, Table 11) and the Fisheries Department (Annex 17, Table 12), bothshowing a positive cash flow after year 2 and a rate of return of 20%.
14. These financial benefits to the project are substantial principallybecause of the relatively low investment cost and the zero incremental costof tanks and reservoirs, which would continue to serve irrigation anddrinking water requirements. Benefits to individual fishermen are particu-larly good since there is no cash outlay for the labour component, nor doesemployment in fisheries detract from the families' ability to earn incomefrom marginal farming or agricultural labour.
B. Sericulture Development - Bijapur
Project Summary
15. The sericulture sub-project would provide a multiplication andextension cum demonstration centre in order to sponsor and guide the develop-ment of silkworm production on small farms without irrigation in Bijapur.The centre would be developed in year 1, and sericulture based on onehectare of mulberry bushes would be introduced on 400 farms during the fol-lowing three years. The total investment required per farm is about Rs6,000, At full development the additional income per participant would beabout Rs 2,000 per annum, not accounting for family labour. Mulberryplanting material and disease-free-7-ayings would be provided from existingand new stations, of the State Department of Sericulture. The latter wouldalso undertake overall training and supervisory responsibility in organizaingand implementing the work of the Bijapur centre.
Background
16. India ranks fifth among the silk producing countries in the world,accounting for about .5 percent of the world's total production. In 1971,India had about 100,000 hectares under mulberry trees or bushes and about2,150 tons of silk were produced (21 kg/ha). Silk production in Karnataka
ANNEX 9Page 6
alona accounted for 85 percent of the total. Currently, about 4.5 million
m2 of silk fabrics valued at about Rs 70 million, and about 600 t of raw
silk and silk waste, valued at about Rs 5.3 million are exported annually.
The market prospects for silk are considered to be good.
17. Being a labour intensive industry, sericulture can play a significant
role in combating under or unemployment in rural areas. The labor employed
for one hectare under mulberry is about 1,000 man hours for mulberry growing,
1,800 manhours for mulberry leaf collection and about 2,800 hour for silkworm
ra#sing, totalling 5,600 manhour, or 560 man days per hectare. 1 / Government
estimates indicate that the silk industry, including production, processing
and marketing, gave full or part-time employment to about 3.2 million Indians
in 1965/66. Most cocoon rearers are small and marginal farmers.
18. In Karnataka, mulberry is grown in bnsh form, beirg planted at
2 x 2 feet under rainfed conditions. Saplings from the locally selected
variety Mysore 5 are available free of charge from government stations; the
closest to the project area is near Belgaum, about 130 miles from Bijapur.
Mulberry saplings are planted after deep digging at the onset of the monsoon;
leaf collection can start after 6 months; full leaf production is reached
after one year. All mulberry bushes are pruned back to a level of 3-4
inches before the monsoon starts; the pruned twigs are used as saplings for
new plantings.
19. In Karnataka, sericulture has had state support for a long time.
The State Department of Sericulture has a network of certified seed producers
and provides all cocoon raisers with disease-free-layings. The average charge
is Rs 15 for 100 disease-free-layings. In a segregated area, the Mysore
oth variety has been maintained pure by banning the introduction of other
strains. At present, layings resulting from the crossing of females from
the Mysore variety with Japanese or Chinese male moths are distributed
throughout the state. Further research on crossbreeding local and exotic
strains for dryland conditions is under way, but so far bivoltine exotic
strains are recommended only for farms with irrigation.
20. Humidity, temperature, freshness of mulberry leaves, shed ventila-
tion and spacing of caterpillars are important factors for. the speed and
efficiency of silkworm development. Under good management the worms pass
from first to fifth instar in 23-25 days and 100 disease-f ree-layings - there
are between 250 and 450 eggs in one laying - yield about 22 kg of cocoons
from mulberry production without irrigation. It is estimated that without
irrigation, one hectare of mulberries will support about 1,200 disease-free-layings.
This would give about 260 kg of cocoons per hectare. At an average rendita of
1:12 this corresponds to the production of 22 kg of silk per hectare.
21. Government undertakes to distribute disease-free seed; no private
seed can be sold without inspection.' Pebrine (Nosema bombyeis) is under
control, but under low humidity and when partly wilted leaves are fed, bacte-
rial and viral diseases affect the woims' digestion. Principal diseases are
1/ This is about double the labor requirement encountered in Korea.
ANNEX 9Page 7
flacherie, grasserie and the above pebrine which cause mortality of up to
40 percent of hatched eggs. Government is considering the introduction of
centres for the rearing of chawkies (young silkworms) up to the second moult
in order to cut down mortality losses during first and second instar to 20-25
percent. The establishment of cooperatively owned and operated chawkie raising
centres could be considered at a later stage.
22. The Khadi (Rural Industry) Centre at Bengari near Hubli, 120 km to
the south of Bijapur, iS the nearest silk reeling centre. The processing
facilities there are at present not fully utilized and it is proposed that
additional cocoons being produced under the sub-project in Bijapur would
be marketed in Bengari.
Proposed Developments
23. A three-hectare sericultural farm would be established near
Bagalkot in order to serve as the centre through which Government support
would be char.nelled to the private cocoon raisers in the southern talukas of
Bijapur. This central farm would be provided with irrigation for year-round
mulberry leaf production,.I/ and have silkworm raising facilities suitable
for demonstration. The centre would be the home station for the extension
officers and would conduct in-service training courses for prospective
silkworm raisers. Administratively, the centre would be attached to the
State Department of Sericulture in Bangalore from where technical guidance
and supervision would be provided. The total investment for developing the
centre is estimated at about Rs 140,000 (Detail in Table 4). This includes
cost for land and irrigation development, silkworm management equipment and
for the extension and training functions of the station.
24. The operating expenses for the farm and its extension and training
functions and sales projections for the center indicate a maximum annual
deficit in year 3 of about Rs 45,000. Over a five-year period the cumulative
net operating deficit of the center would be about Rs 158,000 (Details in
Table 5).
25. The sub-project would finance the development of silkworm raising
on 400 farms. The development of these farms would be phased over three
years. Participating farmers would plant mulberry bushes on one hectare
of land without irrigation and would continue with their traditional dryland
farming on the other part of their properties. Total investments per farm
are estimated at Rs 5,700 of which about 20 percent for mulberry planting
occurs in the first year and the rest for silkworm management facilities in
year 2 (Table 6). Full productivity would be reached in year 3 when a farm
would produce about 260 kg of cocoons valued at about Rs 3,200. Total operat-
ing expenses, not accounting for about 450 man days of family labour, are
estimated at Rs 1,100-1,200 per annum (Table 7).
1/ A small part of the farm woul]d be under dryland mulberry for demonstration.
ANNEX 9Page 8
26. The production phase of the sub-project would provide employmentfor about 400 families, most of whom are marginal farmers. The additionallabor requirements would give part time employment (110 mandays/year) toanother 400 persons. Additional income per participating farm family would beapproximately Re 1,800 per year (Rs 2,000 from one hectare of mulberry minusRs 200 from one hectare of present traditional dryland farming). The finan-cial rate of return is estimated at 32 to 33 percent. The economic rate ofreturn of the sub-project is 20 to 21 percent.
B. Horticulture
Project Description
27. The project would provide incremental nursery capacity for theproduction of the following transplants:
Ber 750,000Mango 40,000Jackfruit 30,000Sapota 10,000Coconuts 10 000
840,000 11
/1 Some lime trees would also be planted in mixed orchards withgood 1 ziggat-aion L but the number is small, andthese would be provided fromn existing nurseries.
Nursery investment anid ope5:aitng expenses for a five year period would amountto about Rs 725,000. In $din. n assistant horticultural officersand eight . O vould be provided under the project.Total project cacts would be about Re 1,191,000. (Detailed in Table 8.)
Proj ect Operations
28. The Kar'-te-ka Horticulture Department is one of the strongest andmost active in the coLintry. Although it has been operating in Bijapur Districtfor only six yeiaco it e L stjtabl'shed six nurseries. Project fundswould provide two ; e of eiu:4aJ. nursery c pacity. All transplantswould be raised in polythese bags and given free of charge to cultivators.Transplants produced un-der the piciject would be used in four distinct programs.
29. Ber: Thli deep"-roo2reG fruit tree is well suited to poorer soilsin samiar id areas. I.ts sElmall YEllow fruit is very high in vitamin C andthe tree itself is a g;Odl of fodder and small firewood. Under theproect,tr 6'o1zl'' '{3 J t8 > ' 1+ b711's and boundaries and on private
ANNEX 9Page 9
permanent fallow lands. The number of transplants given to any one landowner would be limited to 50.
30. Mango: Mango requires more moisture than ber, although equallysuited to poorer soils, and its broad dense foliage cover renders it unsuit-able for bund planting since it would compete with field crops for light.Transplants would be placed in low corners or irrigated plots, around wells,or along water courses. Any one farmer would be limited to 25 transplantsunder the project.
31. Coconut: Coconut transplants would be placed around homesiteswhere domestic water waste would provide adequate moisture and along canalsand permanet water courses. Individual allocations would be limited to 25transplants.
32. Mixed Orchard: As a commercial venture on irrigated land, mixedorchards are very attractive. A mixture of some or all of mango, sapota,jack and limes would be planted under the project. Establishment andmaintenance costs to production are estimated at Rs 3,000 (including fencingbut excluding cost of transplants) to be met by the farmer as equity orborrowed as institutional credit. This cost could be offset by the produc-tion of vegetables in the immature orchard. An operating statement for a1-acre model appears at Annex 17, Table 10. Owing to the risk and price vola-tility involved in fresh fruit production, it is not recommended that alarge share of any land holding be converted to fruit production. Furthermore,becatuse of the no-cost provision of transplants, it would be essential tospread project benefits as widely as possible. Therefore the number of trans-plants to any one farmer for the establishment of a mixed orchard would belimited to 100 -- the number required for a 1-acre orchard.
33. Marketing: Fruit prices are extremely elastic with income andsupply. In the absence of cold storage facilities, which the mission examinedand rejected as a project component at this time, prices would be low at thetime project produce is marketed. Nevertheless the mixed orchard proposalshows a financial rate of return of 15% at the following assumed prices: mangoRs 0.20 each; c'apota Rs 0.50 each; jackfruit Rs 1.00 each; lime Rs 0.03 each.The current in-&,aqon price for ber is Rs 1/kg and project farmers areexpected to market half to two-thirds of their harvest at a farm gate priceof Rs 0.50. All produce would be sold in the villages and towns of Bijapurdistrict.
34. Benefits and Justification: Mixed orchards, as mentioned, showa financial rate of return of 15% when compared with current cropping underirrigation in Bijapur. Other project components show significant cash incomeper family, but, especially in the case of ber, it is niot possible toproject with confidence the impact of significant volume irncreases onmarket prices. In addition to cash income, the project would have othersignificant benefits for participating farmers:
';ANNEX- 9.P&ge "10
-- signif cant improvements in the v"ariety aAnd vitamin Ccontent of farmnfamily 'difes;
small firewood (in thecase 'of b"er, `estimated at Rs '4 pertree per year);
-- fodder from 'beir (,Rs 2 per tree pe-r year');
-- windbreaks; a-nd
-- .shade :for animals and cultivato'rs'.
November 4, 1974
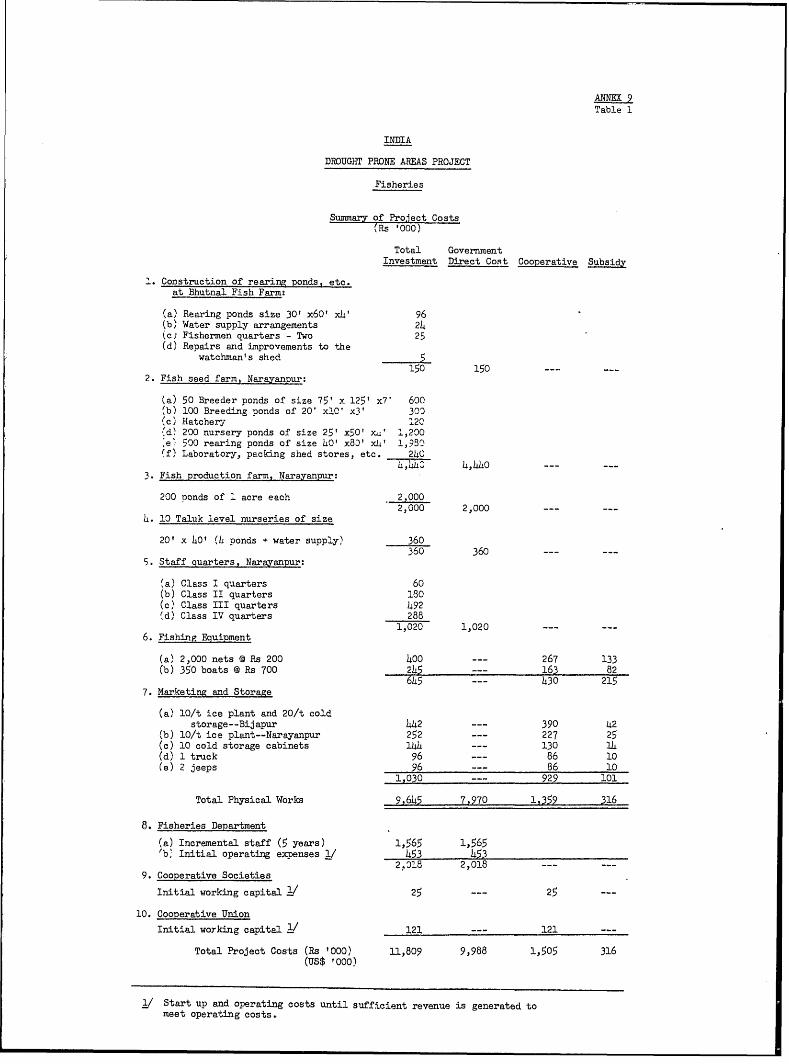
ANNEX 9Table 1
INDIA
DROUGHT PRONE AREAS PROJECT
Fisheries
Summary of Project Costs(Rs '000)
Total GovernmentInvestment Direct Cost Cooperative Subsidy
'. Construction of rearing ponds, etc.at Bhutnal Fish Farm:
(a) Rearing ponds size 30' x60' x4' 96(b) Water supply arrangements 24(c Fishermen quarters - Two 25(d) Repairs and improvements to the
watchman's shed150 150
2. Fish seed farm, Narayanpur:
(a) 50 Breeder ponds of size 75' x 125' x7' 600'b) 100 Breeding ponds of 20 xlO' x3' 300(c, Hatchery 120fd) 200 nursery ponds of size 25' x50' x< 1,200ie 500 rearing ponds of size a0' x83' xh' 1,980Cf) Laboratory, packing shed stores, etc. 2 4C
L,44C 4,WiO3. Fish production farm, Narayanpur:
200 Donds of 1 acre each 2,0002,000 2,000
L. 10 Taluk level nurseries of size
20' x 40' (h ponds + water supply) 360360 360 --- ---
5. Staff quarters, Narayanpur:
,a) Class I quarters 60(b) Class II quarters 180(c) Class III quarters 492'd) Class IV quarters 288
1,020 1,020 --- ---6. Fishing Equipment
(a) 2,000 nets @ Rs 200 400 --- 267 133(b) 350 boats @ Rs 700 245 --- 163 82
645 --- 430 215
7. Marketing and Storage
(a) 10/t ice plant and 20/t coldstorage--Bijapur 442 --- 390 42
(b) 10/t ice plant--Narayanpur 252 --- 227 25(c) 10 cold storage cabinets 14 --- 130 1L(d) 1 truck 96 --- 86 10(e) 2 jeeps 96 86 10
1,030 --- 929 101
Total Physical Works 9,645 7,970 1,359 316
8. Fisheries Department
(a) Incremental staff (5 years) 1,565 1,565'b Initial operating expenses 1/ 453 4531
2,918 2,018 -9. Cooperative Societies
Initial working capital 2/ 25 --- 25 ---
10. Cooperative Union
Initial working capital 121 --- 121 ---
Total Project Costs (Rs '000) 11,809 9,988 1,505 316(us$ '000)
1/ Start up and operating costs until sufficient revenue is generated tomeet operating costs.
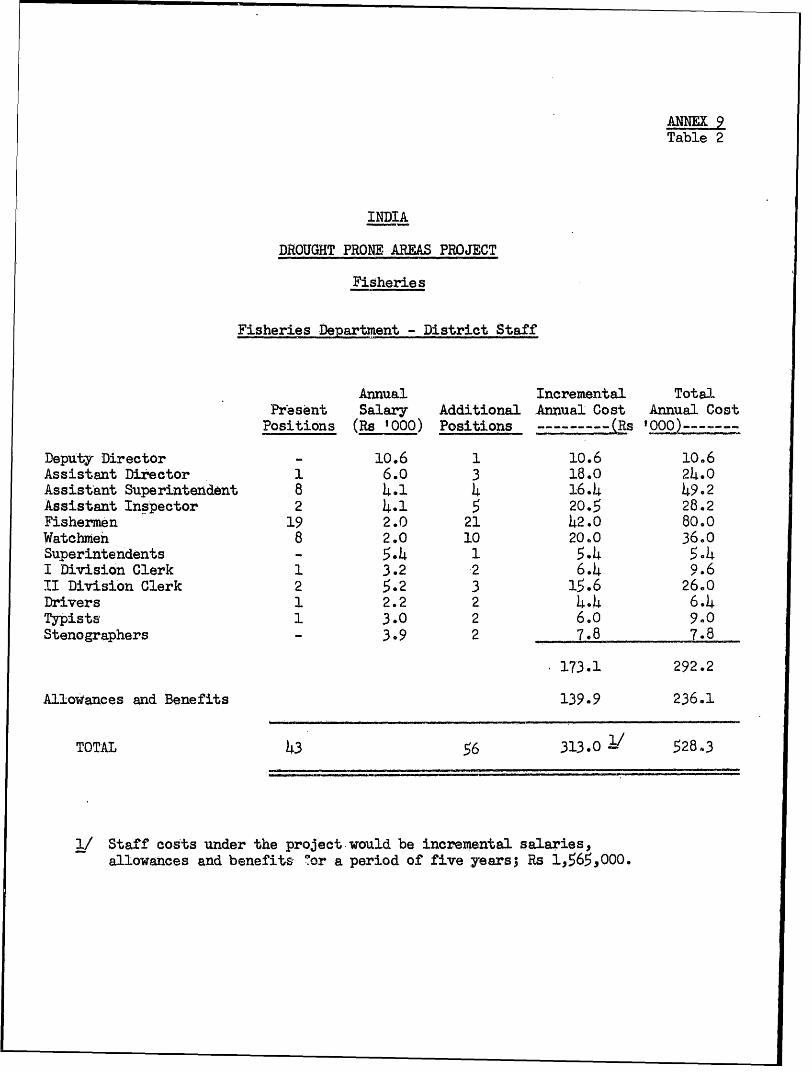
ANNEX 9Table 2
INDIA
DROUGHT PRONE AREAS PROJECT
Fisheries
Fisheries Department - District Staff
Annual Incremental Total
Present Salary Additional Anmual Cost Annual Cost
Positions (Rs '000) Positions L-Rs '000)---
Deputy Director - 10.6 1 10.6 10.6
Assistant Director 1 6.0 3 18.0 24.0
Assistant Superintendent 8 .l1 4 16.4 49.2
Assistant Inspector 2 4.1 5 20.5 28.2
Fishermen 19 2.0 21 42.0 80.0
Watchmen 8 2.0 10 20.0 36.0
Superintendents - 5c4 1 5.4 5e4I Division Clerk 1 3.2 2 6.4 9.6
II Division Clerk 2 5.2 3 15.6 26.0
D)rivers 1 2.2 2 4.4 6.4
Typists 1 3.0 2 6.0 9.0
Stenographers 3.9 2 7- 7. .8
173.1 292.2
Allowances and Benefits 139.9 236.1
TOTAL 43 56 313.0 / 528.3
1/ Staff costs under the project would be incremental salaries,
allowances and benefits 'or a period of five years; Rs 1,565,000.
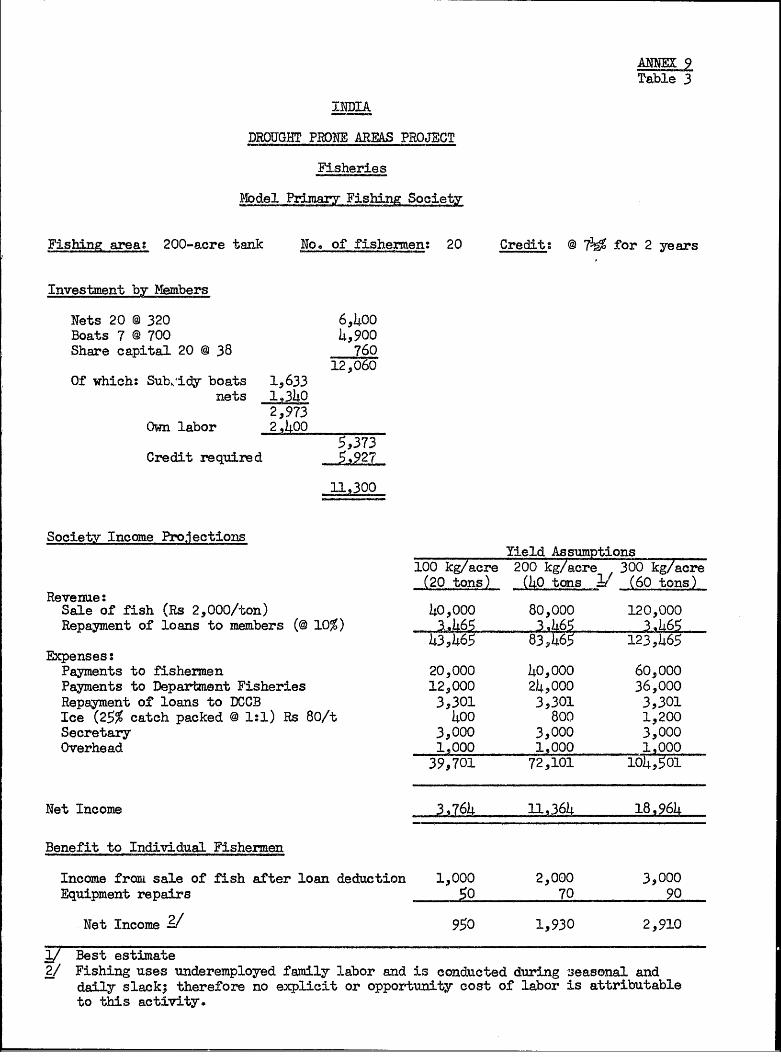
ANNEX 9T'able 3
INDIA
DROUGHT PRO)NE AREAS PROJECT
Fisheries
Model Primar,y Fishing Society
Fishing area: 200-acre tank No. of fishemen: 20 Credit: @ 73g for 2 years
Investment by Members
Nets 20 @ 320 6,400Boats 7 @ 700 4,900Share capital 20 @ 38 760
12,060Of which: Sub,'idy boats 1,633
nets 1,y3_402,973
Own labor 2 005'373
Credit required 5,927
11,300
Society Income ProjectionsYield Assumptions
100 kg/acre 200 kg/acre 300 kg/acre-(20 -. (4o tons (60 tons-)
Reveme:Sale of fish (Rs 2,000/ton) 40,000 80,000 120,000Repayment of loans to members (@ 10%) 3.L65 3,h65 3,L65
43,465 83,465 123,465Expenses:
Payments to fishermen 20,000 40,000 60,000Payments to Department Fisheries 12,000 24,000 36,000Repayment of loans to DCCB 3,301 3,301 3,301Ice (25% catch packed @ 1:1) Rs 80/t 400 800 1,200Secretary 3,000 3,000 3,000Overhead 1,000 1,000 1,000
39,701 72,101 104,50L
Net Income 3,764 11,364 18,964
Benefit to Individual Fishermen
Income from sale of fish after loan deduction 1.,000 2,000 3,000Equipment repairs 50 70 90
Net Income z/ 950 1,930 2,910
A Best estimate2/ Fishing uses underemployed family labor and is conducted during 2easonal and
daily slack; therefore no explicit or opportunity cost of labor is attributableto this activity.
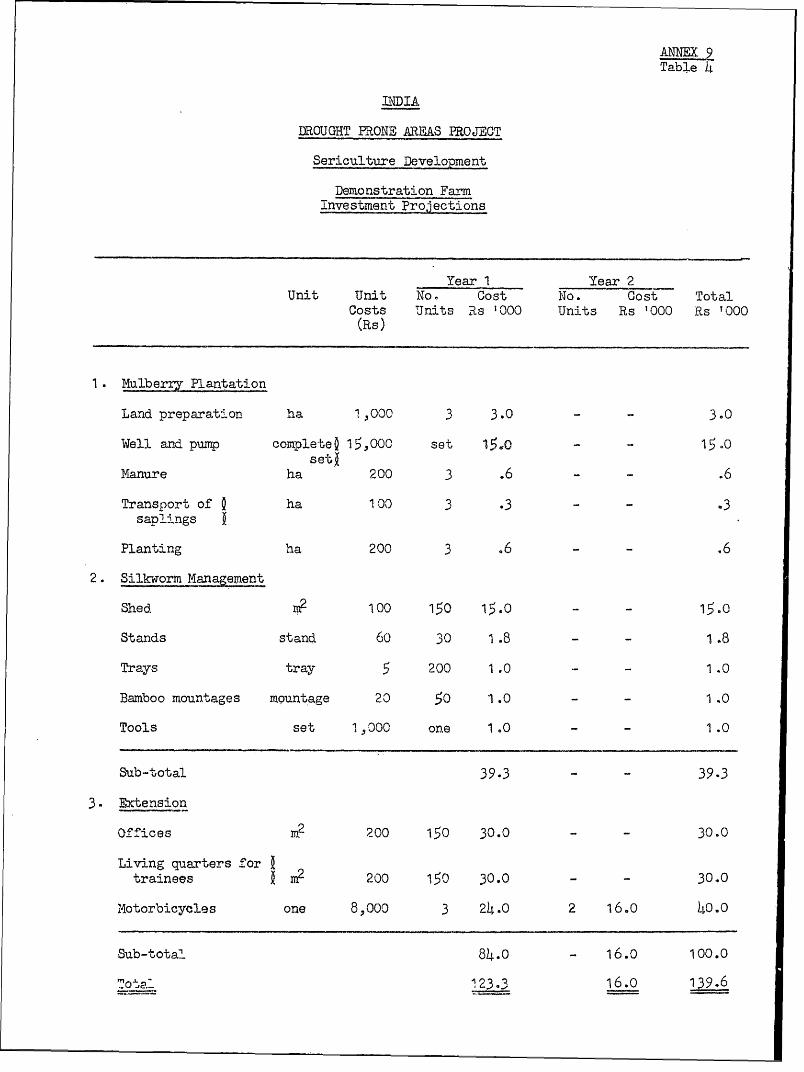
ANE 9
Table 4
INDIA
DROUGHT PRONE AREAS PEROJECT
Sericulture Development
Demonstration FarmInvestment Projections
Year 1 Year 2
Unit Unit No. Cost No. Cost Total
Costs Unnits Rs 1000 Units Rs t000 Rs 7000
(Rs)
1. ulbemj Plantation
Land preparation ha 1,000 3 3.0 - - 3.0
Well and pump completeo 15,000 set 15e0 - - 15.0
setiManure ha 200 3 .6 - - .6
Transport of Q ha 1 00 3 .3 - - .3
sapli-ngs 4
Planting ha 200 3 .6 - - .6
2. Silkworm Mangement
Shed 100 150 15.0 - - 15.0
Stands stand 60 30 1.8 - - 1.8
Trays tray 5 200 1.0 - - 1.0
Bamboo mountages mountage 20 50 1.0 - - 1.0
Tools set 1 ,000 one 1 .0 - - 1.0
Sub-total 39.3 - 39.3
3. &,tension
Offices M2 200 150 30.0 - - 30.0
Living quarters for 2trainees A 200 150 30.0 - - 30.0
Motorbicyoles one 8,000 3 24.0 2 16.o 0 .0
Sub-total 84.0 - 16.0 100.0
T_ 1 " 23 .3 16.0 139.6
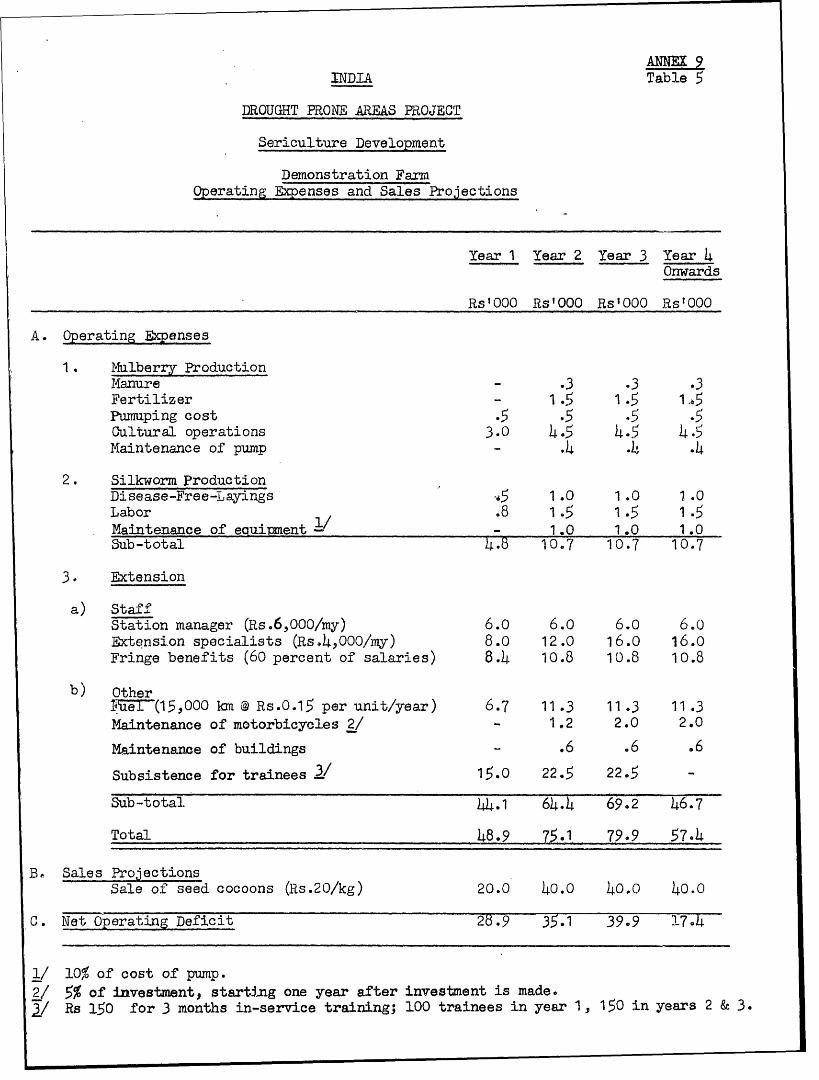
ANNE 9INDIA Table 5
DROUGHT PROIE AREAS PROJECT
Sericulture Development
Demonstration FarmOperating Expenses and Sales Projections
Year 1 Year 2 Year 3 Year 4Onwards
Rs'OOO Rs'OOO Rs'OOO Rs'000A. Operating Expenses
1. MLlberry ProductionManure
- .3 .3 .3Fertilizer - 1.5 1.5 1,5Pwuping cost .5 .5 .5 .5Cultural operations 3.0 4.5 4.5 4.5Maintenance of pump - .4 .4 .4
2. Silkworm ProductionDisease-Free-Layings a5 1.0 1.0 1.0Labor
.8 1.5 1.5 1.5Maintenance of equiMent - - 1.0 1.0 1.0Sub-total 4.8 10.7 10.7 10.7
3. Extension
a) StaffStation manager (Rs.6,000/my) 6.o 6.0 6.0 6.0Extension specialists (Rs.4,000m/my) 8.0 12.0 16.0 16.oFringe benefits (60 percent of salaries) 8.4 10.8 10.8 10.8
b) OtherIe-Ju (15,O00 mIa @ Rs.0.15 per unit/year) 6.7 11.3 11 .3 11 .3Maintenance of motorbicycles 2/ - 1.2 2.0 2.0Maintenance of buildings .6 .6 .6Subsistence for trainees 3/ 15.0 22.5 22.5 -Sub-total 44.1 64.4 69.2 46.7Total 48.9 .1 79.9 57.4
Be Sales ProjectionsSale of seed cocoons (Rs.20/kg) 20.0 40.0 40.0 40.0
C. Net Operating Deficit 23.9 35.1 39e9 17.4
1/ 10% of cost of pump.2/ 5% of investment, starting one year after investment is made.i/ Rs 150 for 3 months in-service training; 100 trainees in year 1, 150 in yea 2 & 3.
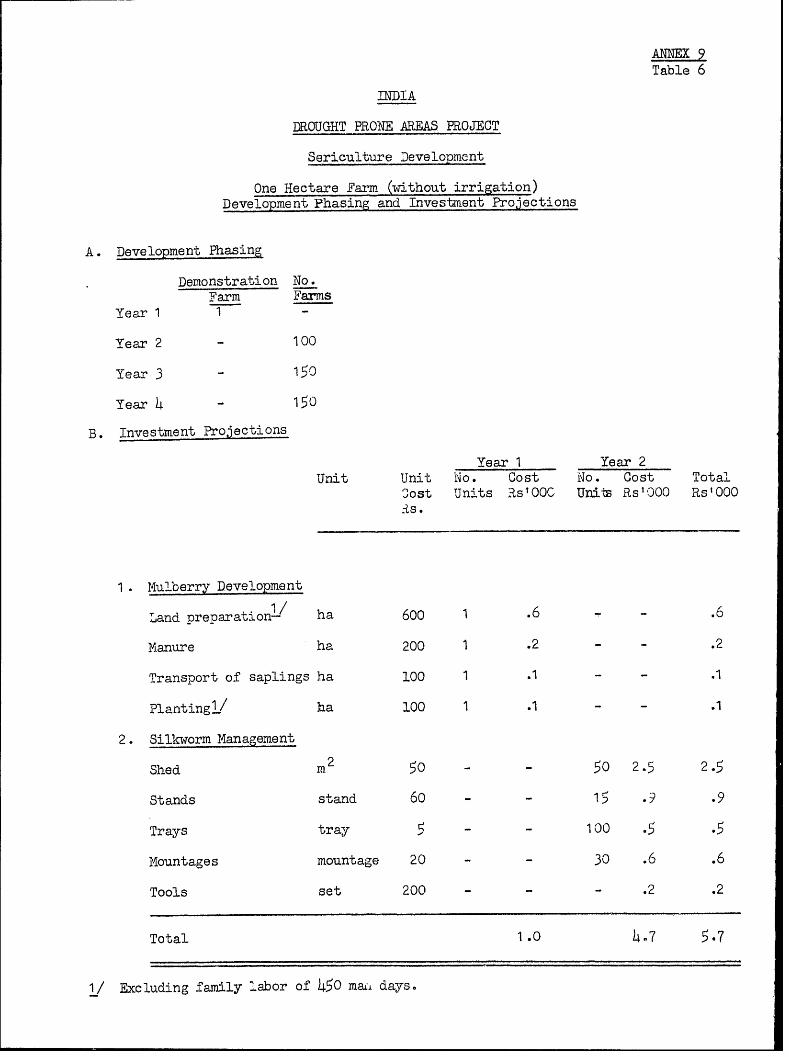
ANNEX 9Table 6
INDIA
DROUGHT PRONE AREAS PROJECT
Sericulture Developoment
One Hectare Farm (without irrigation)Development Phasing and Investment Projections
A. Development Phasing
Demonstration No.Farm Farms
Year 1 1 -
Year 2 - 100
Year 3 - 150
Year 4 - 150
B. Investment Projections
Year 1 Year 2Unit Unit No. Cost No. Cost Total
Jost Units Rs'OOC UniiU Rs0300 Rs'OOOis .
1. Mul:berry Development
Land preparation-/ ha 600 1 .6 - .6
Manure ha 200 1 .2 - - .2
Transport of saplings ha 100 1 .1 - - .1
PlantingL/ ha 100 1 .1 - - .1
2. Silkworm Management
Shed m 2 50 - - 50 2$5 2.5
Stands stand 60 - - 15 .9 .9
Trays tray - - 100 .5 5
MIountages mountage 20 - - 30 .6 .6
Tools set 200 - - - .2 .2
Total 1.0 4.7 5 7
1/ Excluding family labor of 450 mai& days.
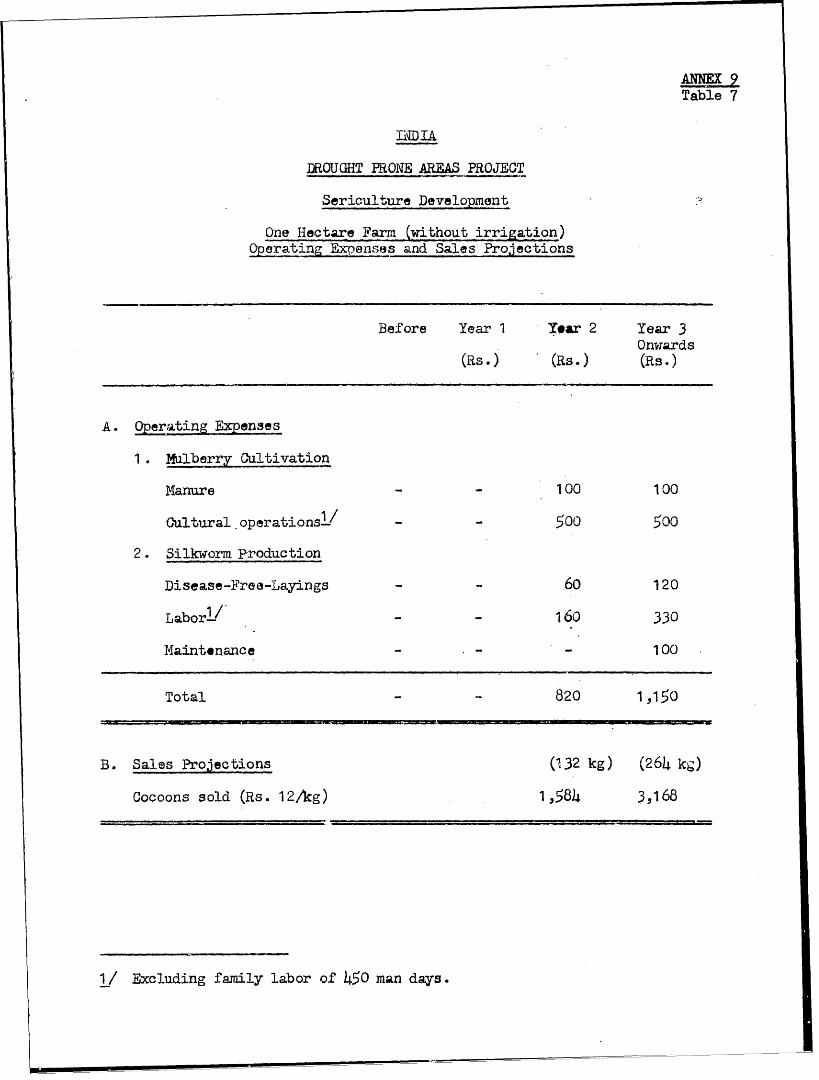
ANNEXL2Table 7
UMDIA
DROUGHT PRONE AREAS PROJECT
Sericulture Development
One Hectare Farm (without irrigation)Operating Expensas and Sales Projections
Before Year 1 Year 2 Year 3Onwards
(Rs.) (Rs.) (Rs.)
A. Oprting E.en es
1. Mulberry Cultivation
Manure - - 100 100
Cultural .operationsi/ - - 500 5002. Silkworm production
Disease-Free-I ayings - - 60 120Laborl/
- - 160 330Maintenance
- - - 100
Total - 820 1,150
B. Sales Projections (132 kg) (264 kE,)
Cocoons sold (Rs. 12/lkg) . 1,584 3,168
1/ Excluding fanily labor of 450 man days.
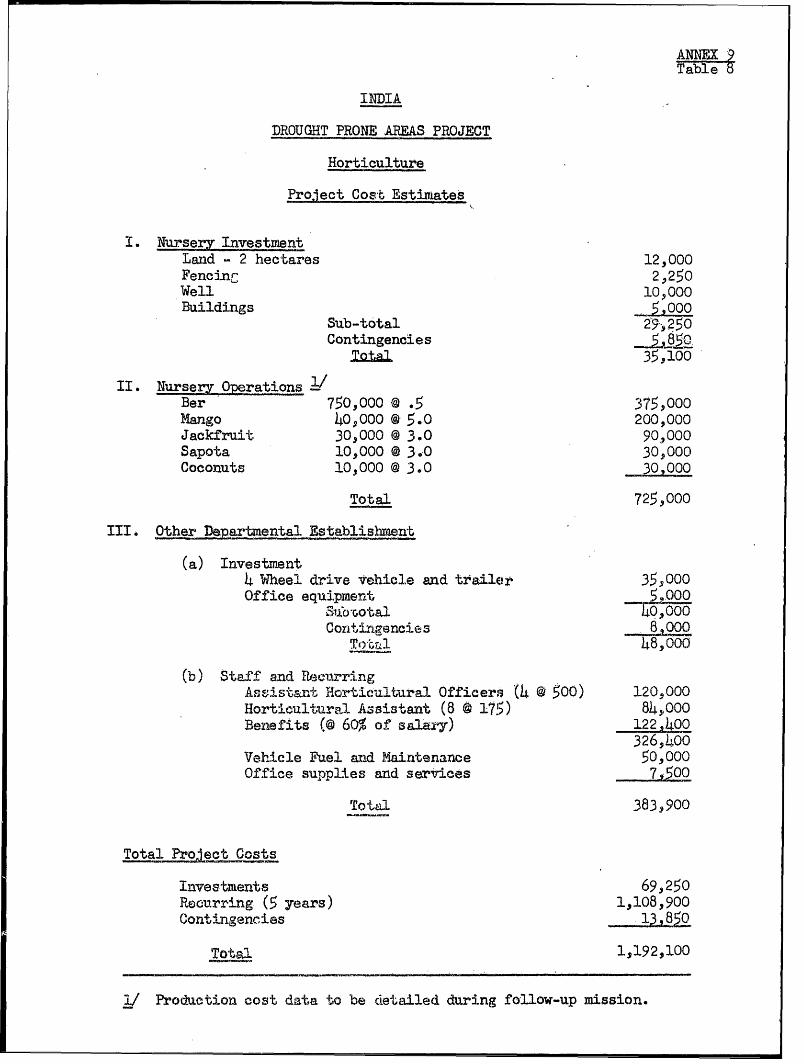
Table5
INDIA
DROUGHT PRONE AREAS PROJECT
Horticulture
Project cost EstiniLates
I. Nursery InvestmentLand - 2 hectares 12,000Fencinr 2 250Well 10,000Buildings - °5000
Sub-total 29-.250Contingencies
35,100
II. Nurser Oprations 1/Ber 750,000 @ .5 3759000Mango 40,000 @ 5.0 200,000Jackfruit 30,000 @ 3.0 90,000
Sapota 10,000 @ 3.0 30.,000Cocomnts 10,000 @ 3 .0 30 ,000
Total 725,000
III. Other Departmental Establisbment
(a) Investment4 Wheel drive vehicle and trailer 35,000Office equipment 5,000
Siiwootal 40,0ContLngencies s,
Tota,,l 148,000
(b) Staff and RecurringAssistart Horticultural Officers (4 @ 500) 120,000Horticultuara:l Assistant (8 @ 175) 84,000Benefits (@ 60% of salary) 122,400
326,,400Vehicle Fuel and Maintenance 50,000Office suppLies and serices 7,500
Total 383,900
Total Pret Costs
Investment;s 69,250Recurring (5 years) 1,108,900Contingencies 139850
Total 1,192,,100
1/ Production cost data to be ietailed during follow-up mission.
ANNEX 10Page 1
INDIA
DROUGHT PRONE AREAS PROJECT
Agricultural Research
Backgroumd
1. India's agricultural research effort is coordinated by the IndianCouncil of Agricultural Research (ICAR). Research stations are operated bystate departments of agriculture, by the agricultural universities anddirectly by ICAR. Funds are provided from state plan allocations, from GOIfor centrally sponsored schemes and from ICAR itself which has income from acess on various commodities. ICAR appoints panels of scientists in thevarious disciplines to veto and approve research proposals for funding.
Darland Agriculture Research
2. The earliest efforts on dryland research began in the 1920's.These led to a comprehensive, multi-location research project sponsoredby the Imperial Council of Agricultural Research. This project ran from1933 to 1943 at several locations in the former states of Bombay, Hyderabadand Madras and led to the development of packages of dry farming practicesnamed after the states. The Bombay Dry Farming Practices are perhaps bestknown.
3. The basic features bf these practices were: bunding to conservesoil and moisture; application of farm yard manure; deep ploughing once inthree years; shallow preparatory tillage and inter-row cultivation; lowplant populations in wide rows. The packages had marginal impact on pro-duction. The estimated yield benefit of 15% to 20% on a low base of 200 kgto 400 kg per hectare was insufficient to capture farmer interest. However,there was a major lasting benefit in that the foundations were laid for thesoil and moisture conservation programs which have subsequently had wideimpact.
4. Interest in dryland research declined for a time after the dis--appointing impact of this early effort. The next major thrust came in theearly sixties with a concerted effort in plant breeding. A number ofcentrally sponsored schemes were launched for the major crops--crop groups(sorghum, millets, pulses and oil seeds) to develop improved varietalmaterial. A breakthrough was achieved in 1965 with the release of thefirst hybrids of sorghum (CSH-1) and pearl millet (HB-1). These and laterhybrids have a yield potential well above that of local types. The hybridmillets, particularly HB-3, have been well received by farmers in the droughtprone areas but the sorghums have had a poorer reception. They are inferior
ANNEX 10Page 2
in grain quality and more susceptible to pests and disease than local types.These factors, added to the dwarf habit which farmers identified with alower yield of the all-important fodder by-product, were sufficient tocreate farmer resistance. However, recent work has produced hybrids andvarieties with better grain quality. In addition, it has been shown thatthe major pest, shoot fly, can be controlled by seed dressing with carbofuran.The way is now open therefore to improve sorghum productivity.
5. Only marginal yield grains have been made through varietal improve-ment in the oilseeds and pulses.
6. The release of the sorghum and millet hybrids gave a new dimensionto yield potentials and led to a renewal of interest in dry farming research.This culminated in the formulation, by ICAR, of the All-India CoordinatedResearch Project on Dryland Agriculture. This is a centrally sponsoredscheme which was launched with Canadian financial and technical assistancein 1970/71 1/. The proposals for the pilot dryland farming component of theDPAP are in part based on the early findings of this project. More impor-tantly, the indications from the early work, despite their inconclusive na-ture, are such as to warrant the proposed pilot program under DPAP in theconfident expectation that later results will make it possible to add tothe package of technology which can be offered to the farmer. This shouldcoincide with the time when considerable experience will have been gainedfrom the pilot program. These two factors, a more comprehensive packageof technology and development experience, should then make it possible tolaunch a full-scale development effort over a wide area.
7. As indicated above, research has established the availability ofvarietal material with superior yield potential. Work on crop nutrition hasalso established that these superior types are responsive to fertilizer appli-cation. Because of the short duration of the research effort and a failureto examine the economic impact of technical findings, it is not yet possibleto make precise profit maximizing fertilizer recommendations. Nor has therebeen time yet to conduct sufficient adaptive research to provide locationspecific recommendations. Nevertheless, it is possible to make conservativerecommendations, safe for fairly wide areas, which will profitably increaseyields. These would have to be refined as further research results emerge.
8. Sound work is underway to investigate optimum time of planting,crop sequences, crop mixtures, and crop substitution to meet the vagaries ofthe monsoon. More time is needed before this work can produce a full rangeof recommendations. However, it has already been established that yieldsof rabi crops in the black soil regions of the Deccan Plateau would beincreased significantly if planting were advanced by 3 to 4 weeks. Alsosome cut-off dates have been determined beyond which particular crops shouldnot be planted; some suitable shorter duration substitution crops have beenidentified.
1/ A brief outline of the project is given at Appendix I.
ANNEX 1 0Page 3
9. Plant population and crop geometry are being investigated as areplanting methods to improve crop stands and fertilizer placement. Theseare important fields of research. It is already clear that the new sorghumvarieties should be planted at higher densities than traditional types, butwork must continue to provide specific recommendations. However, this worksuffers from a major draback, it is geared to the present pattern of cul-tural practices. It is considered that these practices could be consider-ably improved and that failure to undertake adequate research on culturalpractices is one of the major shortcomings of the research effort.
10e The present system of flat planting is not satisfactory either interms of moisture or soil conservation. Reliance on bunding is but a secondbest answer. Water is impounded behind the bund rather than on the crop rowwhere it is required and considerable soil movement still occurs as evidencedby the rapid silting up of borrow pits from which bunds are constructed.
11. The second major shortcoming of the research effort, one alreadyidentified by Indian officials, is the failure to examine adequately farmsystems and the economic aspects of technical findings. Trials are designedand undertaken to address technical problems in the abstract without suffi-cient understanding of farm practices, the rationale for these and the con-straints within which the farmers must operate. Similarly the results oftrials are not subjected to sufficient economic analyses to determine recom-mendations which would maximize profit with a tolerable degree of risk. Infact there are many instances of recommendations being released to extensionworkers which are geared to yield rather than profit maximization and whichare risky, having been based on trials of short duration which did not spanthe full range of climatic variability.
Livestock Research
Dairying
12. Much of the basic information needed for the development of thedairy industry in India is provided by the National Dairy Research Instituteat Karnal and its regional stations at Bangalore, Bombay and Kalyani. Inaddition, a number of agricultural and veterinary institutions carry out re-search in dairying or in closely related areas. Important among these arethe Indian Veterinary Research Institute, the Indian Agricultural ResearchInstitute and the Allahabad Agricultural Institute. Research programs inthe dairy field have also been initiated at several of the recently estab-lished agricultural universities and veterinary colleges.
13. Much emphasis has been placed on research aiming at the geneticimprovement of dairy merits in cattle. To accelerate and coordinate this,the All-India Coordinated Dairy Cattle Breeding Project was initiated. Allof the major crossbreeding programs throughout the country are a part ofthis project. The results obtained to date have been dramatic. Underproper management the Fl crosses mature more quickly than their indigenousdams, produce their first calf at an earlier age, yield double or triple
ANNEX 1 0Page 4
the amount of milk, and are more efficient utilizers of feed. Breedingprograms to establish and maintain the appropriate proportions of exotic
blood in subsequent generations are currently underway.
Sheep and Wool
14. The Central Sheep and Wool Research Institute at Avikanagar has
been functioning for many years an4 is well equipped to conduct carefullycontrolled experiments. In the past, much work has been devoted to problemsof wool quality, and to research support to wool grading and selling. Stud-
ies designed to shaw how heavier yields of better quality wool can be obtained
are now in progress, making use of crossbreeding with imported rams. Datafrom this work are however still insufficient to estimate the performance of
various types of sheep under different environmental conditions.
Animal Nutrition
15. Research in animal nutrition has dealt with the composition and
nutritive value of Indian feedstuffs, including forages and by-product feeds,
and with the nutrition needs of cattle and buffaloes. Much emphasis was on
basic studies concerning energy, protein and mineral metabolism. At present,
increased attention is directed towards the efficient use of agro-industrialby-products. In all work so far, undue emphasis has been given to laboratory
and digestion/metabolism studies, too little to production-oriented research
with an economic bias.
Fodder Production
16. The Grassland and Fodder Research Institute at Jhansi is the main
center for research on fodder production. Work is concentrated on production
systems for irrigated conditions utilizing perennial grasses or multiplecropping of annxual forages. Unrder such conditions of intensity the total
annual yield of fresh material is high (100-200 tons per ha). Little work
has been done to develop systems of fodder production under rainfed condi-
tions or where supplemental water is minimal. Detailed studies to determine
the comparative economic advantage of growing forage as an alternative to
cash crops, have not been carried out. Other areas in which research is
urgently needed include the role of tropical and sub-tropical legumes in
rangeland improvement, the utilization of forages under grazing conditions,
and the preservation of surplus fodder.
17. The Central Arid Zone Research Institute at Jodhpur is well situ-
ated to undertake investigations into the techniques of rehabilitating de-
generated vegetative cover in the extensive arid areas of West Rajasthan.So far, work has been concerned mainly with the introduction of new grass
varieties. Data on the productivity of native and improved grasslands when
protected and correctly grazed has not been produced. There is inadequateinformation on the techniques and economic feasibility of improving the
productivity of dearaded rangelands.
ANNEX 9Page 5
Benefits and Justifications
13. The project would greatly increase the nutriti.onal value of foodavailable to a large percentage of Bijapur's population. In addition, itwould provide employment for approximately 1,000 fishermen, most of whomare marginal farmers or agricultural labourers. Additional income perfamily would be approximately Rs 1,900 per year which, when added to currentincome, would give a total in excess of that officially deemed necessaryfor rural family requirements. Table 3 presents a pro forma cash flow foran average society, and the benefits to individual fishermen under differentyield assumptions. A cash flow is also presented for the Cooperative Union(Annex 17, Table 11) and the Fisheries Department (Annex 17, Table 12), bothshowing a positive cash flow after year 2 and a rate of return of 20%.14. These financial benefits to the project are substantial principallybecause of the relatively low investment cost and the zero incremental costof tanks and reservoirs, which would continue to serve irrigaLtion anddrinking water requirements. Benefits to individual fishermen are particu-larly good since there is no cash outlay for the labour component, nor doesemployment in fisheries detract from the families' ability to earn incomefrom marginal farming or agricultural labour.
*B. Sericulture Development - Bijapur
Project Summary
15. The sericulture sub-project would provide a multiplication andextension cum demonstration centre in order to sponsor and guide the develop-ment of silkworm production on small farms without irrigation in Bijapur.The centre would be developed in year 1, and sericulture basedi on onehectare of mulberry buc,6hes would be introduced on 400 farms duiring the fol-lowing three years. The total investment required per farm is about Rs6,000, At full development the additional income per participant would beabout Rs 2,000 per annum, not accounting for family labour. Mulberryplanting material and disease-free-layings would be provided f.rom existingand new stations, of the State Department of Sericulture. The latter wouldalso undertake overall training and supervisory responslbility in organizaingand implementing the work of the Bijapur centre.
Background
16. India ranks fifth among the silk producing countries in the world,accounting for about 5 percent of the world's total production. In 1971,India had about 100,000 hectares under mulberry trees or busheis and about2,150 tons of silk were produced (21 kg/ha). Silk production in Karnataka
ANNEX 10Page 6
regions served by the centers. At present there is in-adequate understanding of the rationale behind farmers'actions, the resources available to them and the con-straints within which they must currently operate, topermit the design of a sound development or technicalresearch effort;
(ii) to monitor the impact of new technology introducedthrough programs such as DPAP. The aim would be toidentify constraints, at farm level or in the deliverysystem of the program, which were reducing the impactof the technology. The group would provide a feedbackmechanism enabling the research center to address suchproblems;
(iii) to assist in the design of technical research programs,drawing on knowledge gained under (i) and (ii); and
(iv) to develop, for extension programs, economically andfinancially viable packages of technology from thefindings of technical and their own economic research.At present recommendations tend to advocate what istechnically possible rathler than what would be financiallysound for the farmer.
24. The staff recruited to undertake this program would have to bebroad gauge agricultural economists. In particular they should have asound knowledge of agriculture and farm management.
25. The economiat in the DPAI? cell in Delhi should work closely withthis team of agricultural economists. Much of the information required tomonitor the DPAP would be available from their studies. To ensure themaximum complementarity of effort, the senior agricultural economist andthe economist in the DPAP cell should plan their work programs in closeconsultation.
26. It is considered that some of the ongoing research effort shouldbe redirected since it is felt that little of practical value could emergefrom current investigations of practices such as polythene and verticalmulching or the foliar application of nutrients. Conversely greater effortshould be directed to improving ci..ltural practices.
27. Wherever dryland farming has been well developed, ridge farmingis practised. Whilst it is recognized that power availability is a con-straint, it is nevertheless felt that efforts should be made to developoperations and implements to move cultural practices in this direction. Inthis connection it should be borne in mind that the bullocks used to developnew practices on research stations must bear some resemblance to the typicalfarm animal. Those currently used are atypically large, well fed and hencecapable of greater fdraught. One possible way to facilitate improved cultural
ANNEX 10Page 7
practices would be to harvest crops at the stage of physiclogical maturity.The land could then be tilled whilst there was still moisture in the soiland at a time when bullocks were strong after the rains.
28. The scientists at ICRISAT 1/ have already begun experiments embrac-ing ridge farming. Their cooperation should be sought to design an expandedprogram of trials on cultural practices. If new cultural practices emerae,they will probably necessite additional complementary work on crop geometryand populations.
29. A considerable volume of work is being done on crop nutrition andthere should soon be sufficient replication on which to base sound recom-mendations. These can however only be of a regional value. Additionallocations will have to be used for simple trials to develop location specificrecommendations. Some of these could be located in the project watershedsand placed under the agricultural extension officer.
Livestock Research
30. Under the project, funds would be made available to ICAR for theestablishment of a small cadre of pasture agronomists in the All-India Coor-dinated Research Project on Dryland Agriculture. The team would be headedby an internationally recruited Senior Pasture Agronomist who would beattached to the coordinating cell of the All-India Project at Hyderabad.(Proposed qualifications and job description are given at Appendix 3.)Research would be conducted at those centers of the All-India Project whichwould have ecological conditions typical oL those prevailing in droughtprone areas; some investigational work would also be carried out, in theform of operational research, on 100-hectare blocks being developed underthe project. Five pasture agronomists, each with a research assistant,would be provided to undertake the field work. Staff and support costs areshown at Table 2.
31. The general objectives of the investigations would be:
(a) to determine the most suitable grass, and legume species(including shrubs) for pastures in the different ecologicalconditions occurring in the drought prone areas;
(b) to develop establishment techniques;
(c) to examine fertilizer responses;
1/ The International Crops Research Institute for the Semi-Arid Tropics,supported by the Consultative Group on International AgriculturalResearch and founded in July 1972 at 'Hyderabad.
ANNEX 10Page 8
(d) to determine management techniques and stockingrates for different conditions; and
(e) to examine the possibilities of developing year-roundfodder supplies.
The investigations would aim to develop financially and economically viable
methods of pasture improvement and management. In this area, as in others,the past tendency has been to focus too much on technology rather than profit.
32. The team should cooperate closely with other research authorities,particularly with the Central Arid Zone Research Institute, in order to en-
sure a coordinated pasture research effort in India. They should also liaise
with, and support, the pasture development specialist and other staff work-
ing on the sheep component of the project.
33. In livestock research two areas have been identified where a re-
direction of effort would be beneficial. In the field of dairy husbandrymore emphasis needs to be given to problems of calf raising. The general
objective would be to reduce calf mortality and the cost of calf raising.
Investigations should take into account the different bases for calf raising
as dependent upon ecological conditions, in particular the availability of
irrigation for year-round supply of green fodder.
34. In the sheep sector, investigations should be directed to two
major problems:
(a) to determine what levels of exotic blood would be best
suited for sheep kept under different ecological and
management conditions, and to establish how theseappropriate proportions of exotic blood could best bemaintained; and
(b) to develop sheep management systems which wouldsynchronize, to the fullest extent possible, theyear-round fecd requirements of flocks with theseasonality of fodder growth.
Agro-meteorological Research
35. The project would fund a research program to determine the
feasibility of establishing location specific soil moisture regime prob-
abilities and hence, by relating these to crop water demand profiles,the probabilities of success of different cropping patterns.
36. It is recognized that several methods for doing related analyses
have been developed (Penman, Thornthwaite, Fitzpatrick, Baier and Robertson,
Shaw, Palmer) and, suitably modified, these could be used for crops and soils
in India. However they are mainly concerned with an assessment of the water
needs of various plants and little attention is given to translating this
ANNEX 10Page 9
into information regarding daily growing conditions. Furthermore littleattention has been given to the problem of how the information could beused by the agricultural planner to assess the probability of success ofspecific agricultural enterprises. It is these latter aspects of theproposed program vwhich are believed to be of paramount importance.
37. Because of the somewhat conjectural nature of the research pro-posal, and because it was impossible during the appraisal to assess thedata base 1/ adequately, it is proposed that the program consist of twophases; phase two being conditional on a successful phase one. Staff andcost details are given in Table 3.
38. Under phase one an internationally recruited consultant would behired for three months to examine the program concept and the data base todetermine the program's feasibility.
39. Phase two would commence with the further employment of theconsultant to prepare a detailed proposal for the program. (Draft termsof reference for the consultant are given at Appendix 4.) Thereafter asmall research team would be established to undertake the program. Itwould be the responsibility of the consultant to determine the size ofthe team and the minimum period for which it would have to work to testthe concept adequately. For the purpose of estimating project costs, ithas been suggested: (a) that the team might consist of an agro-meteorolo-gist Class I, as team leader, five agrometeorologists Class III and twoprogrammers; and (b) that the program would run for two and a half yearsinitially.
40. Because the research team would be required to collaborate closelywith agricultural scientists and to obtain a great deal of data from agri-cultural research stations, it is considered that they should be attachedto the ICAR rather than the IMD. This issue would be finalized at negotia-tions.
41. During appraisal one aspect of meteorological research was iden-tified which it is considered merits higher priority than heretofore. Thiscould be achieved by a reapportionment of existing resources.
1/ Location specific data required for the program would include: (a)daily rainfall, (b) evaporation/transpiration rates, (c) runoff esti-mates under different soil moisture conditions and rainfall intensi-ties, (d) infiltration rates, (e) root density, (f) soil moisturestorage capacity, and (g) crop water demand and crop production re-lated to moisture availability. Some data couid be developed duringthe study but much would have to be available from the outset.
ANNEX 10Page 10
42. As is now becoming well recognized, the climatic resources avail-able to man are both finite and subject to considerable variation 1/. More-over, it is clear that the climatic resources of any area cannot be ignored,and that a much greater attempt must be made to predict the availability ofclimatic resources on a medium to long-term basis.
43. In most areas of the world there has been little convincingevidence that climatic variations are predictable. However, the economicand social implications of a correct prediction of next season's climateis so great that there must soon emerge a much more positive attitude tothe problem of the future climate--that is, it is no longer sufficientfor the meteorologist to say that the future climate is unpredictable.What is needed in fact is an awareness by meteorologists that the futureclimate is important to man, and that a real effort must be made bymeteorologists to assess the future climate in terms which the plannercan incorporate into the prediction of how much food can be produced.
44. It is considered that there is an urgent need for a continuingassessment of climatic variations in the dryland farming areas of India.Initially such a program should focus attention on a critical assessmentof the statistical analyses of climatic variations in India that havealready been done, and this would be followed by an extension of theseanalyses to cover all dryland farming areas of India. In addition, acritical assessment of the causes of marked variations from the "normal"rainfall should be undertaken.
45. The most important and difficult part of the program would thenfollow, this would be the development of methods which could be used topredict the climatic departures from "normal" for periods of several monthsto several years. If this program was carried out there would inevitablybe errors in some of the predictions given, but it is considered that theimplications of the present alternative--that of not providing any climaticforecasts to Central Government planners--should no longer be consideredthe best contribution that a national weather service can provide.
46. To develop this program successfully would require the full-timeconsideration of a group of climatologists (and associated supporting tech-nical staff) who believe that solutions to the problem of predicting thefuture climate can be found; but given the right support from the top-level,it is believed that the return on any investment made in this field would befar in excess of the cost.
1/ See Fortune, February 1974, pp. 90-95, 142-152.
ANNEX 1 0Appendix IPage I1
INDIA
DROUGHT PRONE AREAS PROJECT
Agricultural Research
The All-India Coordinated ResearchProject for Dryland Agriculture
Organization
1. This project, sanctioned by ICAR in June 1970, operateu through 15
main centers, 8 sub-centers, one special center and a coordinating cell at
Hyderabad. The estimated project cost was Rs 26 million over 4 years, 1/ of
which the Government of Canada agreed to provide the equivalent of Rs 11
million in equipment and technical assistance.
2. The centers were chosen to represent conditions over a range of
agro-climatic zones. India has been divided into eight climatic zones on the
basis of a moisture deficit index, 2/ and these zones are subdivided on the
basis of soils; alluvial, red and lateritic and black soils. The centers are
mainly in the drier zones 2-4, with a few in zone 5. The centers and their
climatic and soil characteristics are listed at Table 1.
Staffing
3. The project coordinating cell at Hyderabad is staffed by both
Canadian and Indian scientists. The Canadian staff consists of five special-
ists in the fields of Soil Physics, Agricultural Engineering, Farm Machinery,
Agronomy and Plant Nutrition. The Indian team consists of a Project Director,
a Project Coordinator, a Statistician, a Production Economist and a Meteorolo-
gist together with support staff. In addition, five posts were created for
counterparts to the Canadians, but these have yet to be filled.
4. The staff of the coordinating cell assists centers with the design
and development of their research programs. Through regular field visits
they also assist in the conduct and analysis of the experiments, helping
overcome problems as they arise. The staff of the main centers consists of
a Chief Scientist, an Agronomist, a Soil Physicist, a Plant Breeder, an
Agricultural Engineer, plus Research Assistants and support staff. The staff
1/ The project is being continued into the Fifth Plan period. However
funding is undetermined, pending the review of the plan.
2/ Moisture Deficit Index -- P-PE 100 Where P - precipitation
PE PE - potential evapo-transpiration
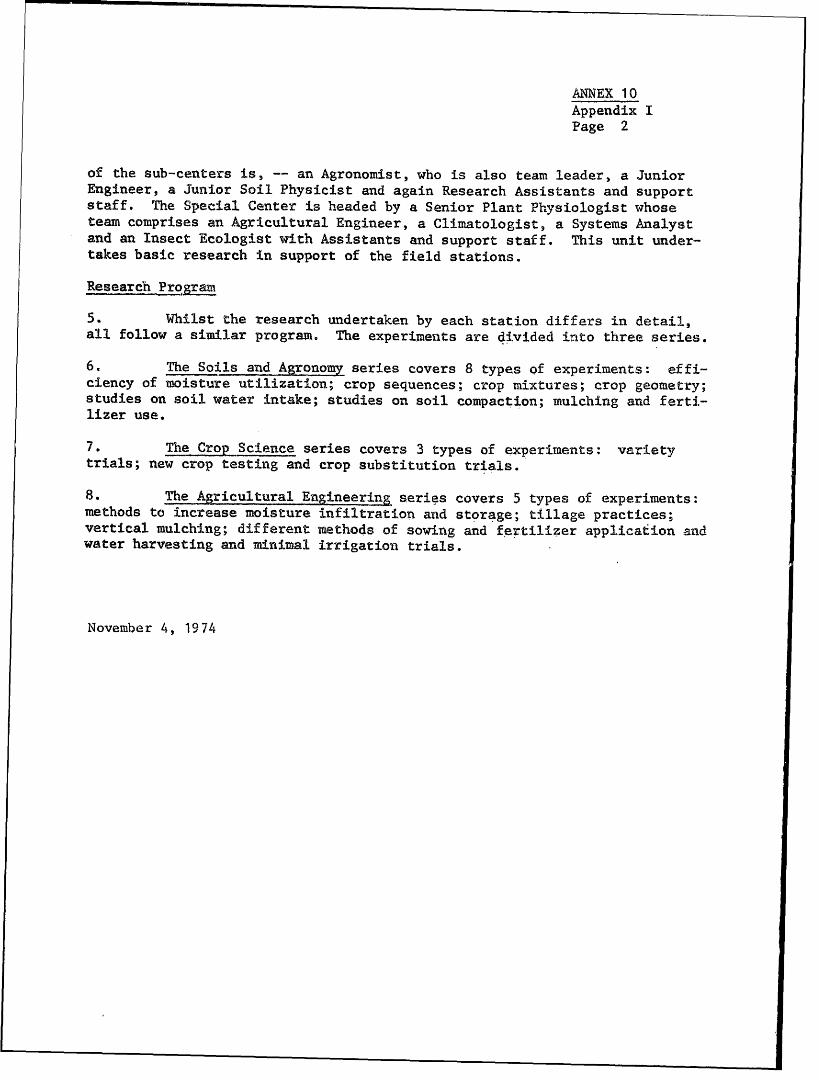
ANEX 10Appendix IPage 2
of the sub-centers is, -- an Agronomist, who is also team leader, a Junior
Engineer, a Junior Soil Physicist and again Research Assistants and support
staff. The Special Center is headed by a Senior Plant Physiologist whose
team comprises an Agricultural Engineer, a Climatologist, a Systems Analyst
and an Insect Ecologist with Assistants and support staff. This unit under-
takes basic research in support of the field stations.
Research Program
5. Whilst the research undertaken by each station differs in detail,
all follow a similar program. The experiments are divided into three series.
6. The Soils and Agronomy series covers 8 types of experiments: effi-
ciency of moisture utilization; crop sequences; crop mixtures; crop geometry;
studies on soil water intake; studies on soil compaction; mulching and ferti-
lizer use.
7. The Crop Science series covers 3 types of experiments: variety
trials; new crop testing and crop substitution trials.
8. The Agricultural Engineering series covers 5 types of experiments:
methods to increase moisture infiltration and storage; tillage practices;
vertical mulching; different methods of sowing and fertilizer application and
water harvesting and minimal irrigation trials.
November 4, 19 74
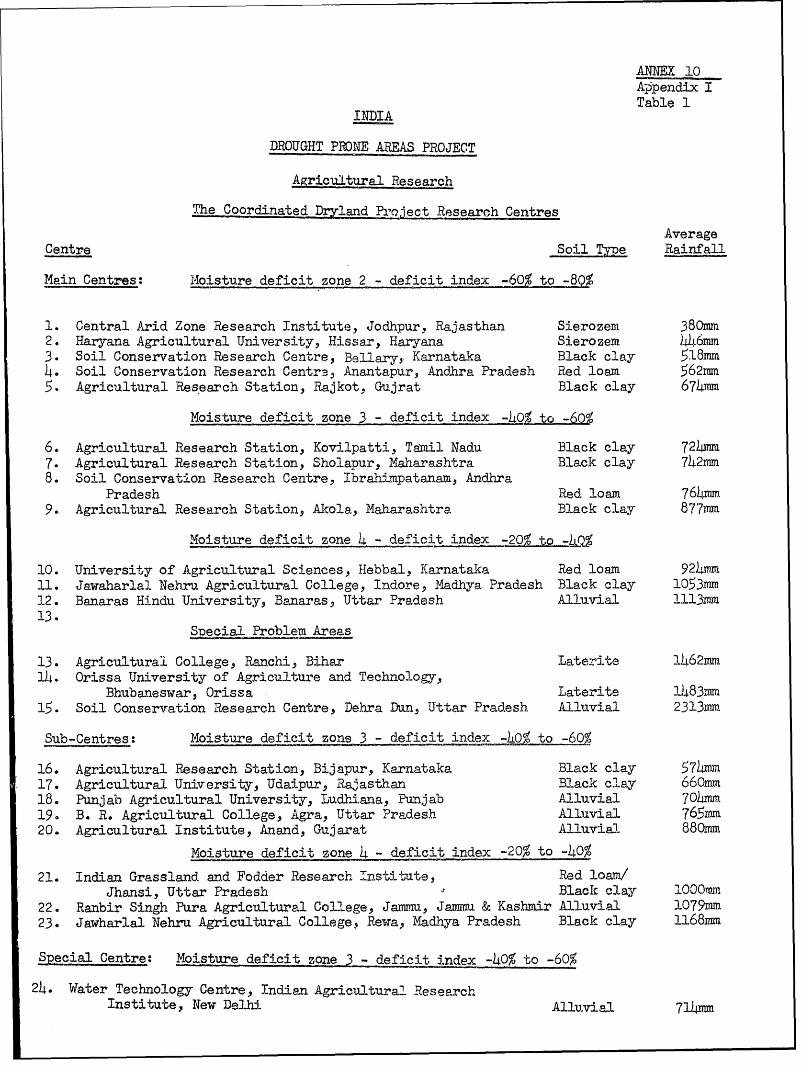
ANNEX 10Appendix ITable 1
INDIA
DROUGHT PRONIE AREAS PROJECT
Agricultural Research
'The Coordinated Dryland Project Research Centres
AverageCentre Soil TZpe Rainfall
Main Centres: A4oisture deficit zone 2 - deficit index 60% to -80%
1. Central Arid Zone Research Institute, Jodhpur, Rajasthan Sierozeml 380mm2. Haryana Agricultural University, Hissar, Haryana Sierozem. 446mm3. Soil Conservation Research Centre, Bellary, Karnataka Black clay 518mm4. Soil Conservation Research CentrB, Anantapur, Andhra Pradesh Red loam 562mm5. Agricultural Research Station, Rajkot, Gujrat Black clay 674mm
Moisture deficit zone 3 - deficit index -40% to -60%
6e Agricultural Research Station, Kovilpatti, Tamil Nadu Black clay 724mm7. Agricultural Research Station, Sholapur, Maharashtra Black clay 742mm8. Soil Conservatioon Research Centre, Ibrahimpatanam, AndhraPradesh Red loam 764mm9. Agricultural Research Station, Akola, Maharashtra Black clay- 877mm
Moisture deficit zone 4 - deficit index -20% to -@
10. University of Agricultural Sciences, Hebbal, Karnataka Red loam 924mm11. Jawaharlal Nehru Agricultural College, Indore, Madhya Pradesh Black clay 1053nm12. Banaras Hindu University, Banaras, Uttar Pradesh Alluvial 1113mm13.Special Problem Areas
13. Agricultural College, Ranchi, Bi3har Laterite 1462mm14. Orissa University of Agriculture and Technology,Bhubaneswar, Orissa Laterite 1483.-m15. Soil Conservation Research Centre, Dehra Dun, Uttar Pradesh Alluvial 2313mm
Sub-Centres: Moisture deficit zone 3 - deficit index -
16. Agricultural Research Station, Bijapur, Karnataka Black clay 574hm17. Agricultural University, Udaipur, Rajasthan Black clay 660mm18. Punjabi Agricultural University, Ludhiana, Punjab Alluvial 70amm19. B. R. Agxricultural College, Agra, Uttar Pradesh Alluvial 765m20. Agricultural Institute, Anand, Gujarat Alluvial 880mmMoisture deficit zone 4 - deficit index -20% to -40%
21. Indian Grassland and Fodder Research Tnstitute, Red loam/Jhansi, Uttar Pradesh Black clay 1000.mm22. Ranbir Singh Pura Agricultural College, Jamm,u Jammu & Kashmir Alluvial 1079mm23. Jawharlal Nehru Agricultural College, Rewa, Madhya Pradesh Black clay 1168mm
Special Centre: Moisture deficit zone 3 - deficit index -40% to -60%
24. Water Technology Centre, Indian Agricultural Research,Institute, New Delhi Allu.vial 714mm
ANNEX 10Appendix IIPage 1
INDIA
DROUGHT PRONE AREAS PROJECT
Agricultural Research
Senior Agricultural Economist
Qualifications
1. Suitable candidates would be broad gauge agricultural economistswith a sound knowledge of small scale agriculture and farm management. Theywould have a post graduate degree in agricultural economics, preferably atthe doctoral level.
2. Candidates should have had at least 10 years of operational researchor other relevanit experience, preferably with experience ih the design andmanagement of a research program. Their investigations should have involvedsome aspect of small farm systems or the related field of the small farmersoperating environment.
3. The successful candidate must be willing and able to travel exten-sively since he will be required to spend at least one third of his time inthe field.
Job Description
4. The Senior Agricultural Economist (SAE) would be a member of thecoordinating cell of the All-India Coordinated Research Project for DrylandAgriculture located at Hyderabad. He would be assisted by a team of 17agricultural economists and their assistants located at the Project's maincenters scattered throughout the country.
5. The SAE would be responsible for the design of the economicresearch program. The main objectives of this would be:
(i) to investigate the main small scale farming systems,and the total enviromnnent in which they operate, inthe regions served by the centers, in order to facili-titate the design of sound development and technicalresearch programs.
(ii) to monitor the impact of new technology introduced throughprograms such as DPAPe The aim would be to identifyconstraints, at farm level or in the delivery system ofthe program, which were reducing the impact of the programand to propose remedies.
ANNEX 1 0Appendix IIPage 2
(iii) to assist in the design of technical research programsdrawing on knowledge gained under (i) and (ii).
(iv) to synthesize economically and financially viable packagesof technology, from the findings of technical researchand the results of the economic investigations, for use indevelopment progra8s.
6. Under the leadership of the Project Director, the SAE would assistwith the recruitment of the economic staff and be responsible for theconduct of the economic investigations.
7. The SAE would be expected to liaise closely with the Senior Econo-mist of the DPAP cell in New Delhi. In addition to the routine reportsrequired of the All-India Project Staff, the SAE would prepare biannual pro-gress reports for the Director of DPAP and the IDA.
November 4, 1974
ANNEX 10Appendix IIIPage 1
INDIA
DROUGHT PRONE AREAS PROJECT
Agricultural Research
Senior Pasture Agronomist
Qualifications
1. Suitable candidates would be graduates in agricultural sciencewith extensive research experience with pastures in the semi-arid/aridtropics. This experience would include species selection and establishment,plant nutrition, seed production and pasture management.
2. Candidates must be willing and able to travel extensively sincethey would be required to spend at least one third of their time in thefield.
Job Descriptien
3. The Senior Pasture Agronomist (SPA) would be a member of the coordi-nating cell of the All-India Coordinated Research Project for Dryland Agri-culture (the Project) located at Hyderabad. He would be assisted by a teamof five pasture agronomists and their assistants located at five of the Pro-ject's centers selected to represent a range of ecological conditions.
4. The SPA would be responsible for the design of the pasture researchprogram. The main objectives of this program would be:
(a) to carry out investigational work on the Project centers andon suitable 100-hectare units being developed under theDrought Prone Areas Project, to determine the most suitablegrass and legume plants for improving the rangelands of dif-ferent ecological conditions, including:
(i) methods of establishment and cultivation techniques;
(ii) seeding and planting rates;
(iii) response to fertilizers; and
(iv) grassland management, stocking rates and possibilitiesto develop year-round fodder supplies;
ANNEX 1 0Appendix IIIPage 2
(b) to investigate methods of minimizing the cost of improvinggrassland productivity under different types of soil andclimate, with particular attention to the timing of variousoperations and the development of forage productivity afterestablishment;
(c) to participate in the technical evaluation of progress inthe development of DPAP 100-hectare units;
(d) to participate in the in-service training of DPAP staffwith responsibility in pasture and sheep development; and
(e) to cooperate with other research authorities, particularlywith the Central Arid Zone Research Institute, Jodhpur, tobring about coordinated pasture research in India.
5. Under the leadership of the Project Director, the SPA would assistwith the recruitment of staff for the pasture program and be responsible forits implementation. In addition to the routine reports required of the Projectstaff, the SPA would prepare biannual progress reports for the Director ofDPAP and the IDA.
November 4, 1974
ANNEX 10Appendix IVPage 1
INDIA
DROUGHT PRONE AREAS PROJECT
Draft Terms of Reference forAgro-Meteorological Consultant
1. The consultant would be attached to the office of the DirectorGeneral of ICAR and be responsible to him.
2. In the first instance the consultant would be employed for threemonnths to determine the feasibility of mounting a research program to attemptto develop location specific soil moisture regime probabilities and hence,by relating these to crop water demand profiles, the probabilities of successof different cropping patterns.
3. This would necessitate, but not necessarily be limited to:
(i) exploration of the program concept through a reviewof literature and discussions/correspondence withIndian and international meteorological experts, and
(ii) an examination of the data base on which the programwould depend (this would include, but not be limitedto, the range and quality of data in: daily rainfall;evaporation/transpiration rates; runoff estimates;infiltration rates; root density; soil moisture storagecapacity; crop water demand and relationships of cropproduction to moisture availability).
4. Subject to a satisfactory conduct of, and positive finding from,the first phase of his assignment the consultant would be engaged for afurther four months to assist in the design and implementation of the re-search program described in para 2 above. The program would be designedinitially for the minimum period required to test the concept.
5. Program design would include, but not be limited to, the follow-ing:
(i) a comprehensive statement of the proposed workprogram;
(ii) manpower requirements including a statement ofqualifications for, and job description of,each post;
ANNEX 10Appendix IVPage 2
(iii) equipment requirements;
(iv) cost estimates.
6. The consultant would help ICAR select the research team whichwould undertake the program and would assist the team to get the programstarted.
November 4, 1974
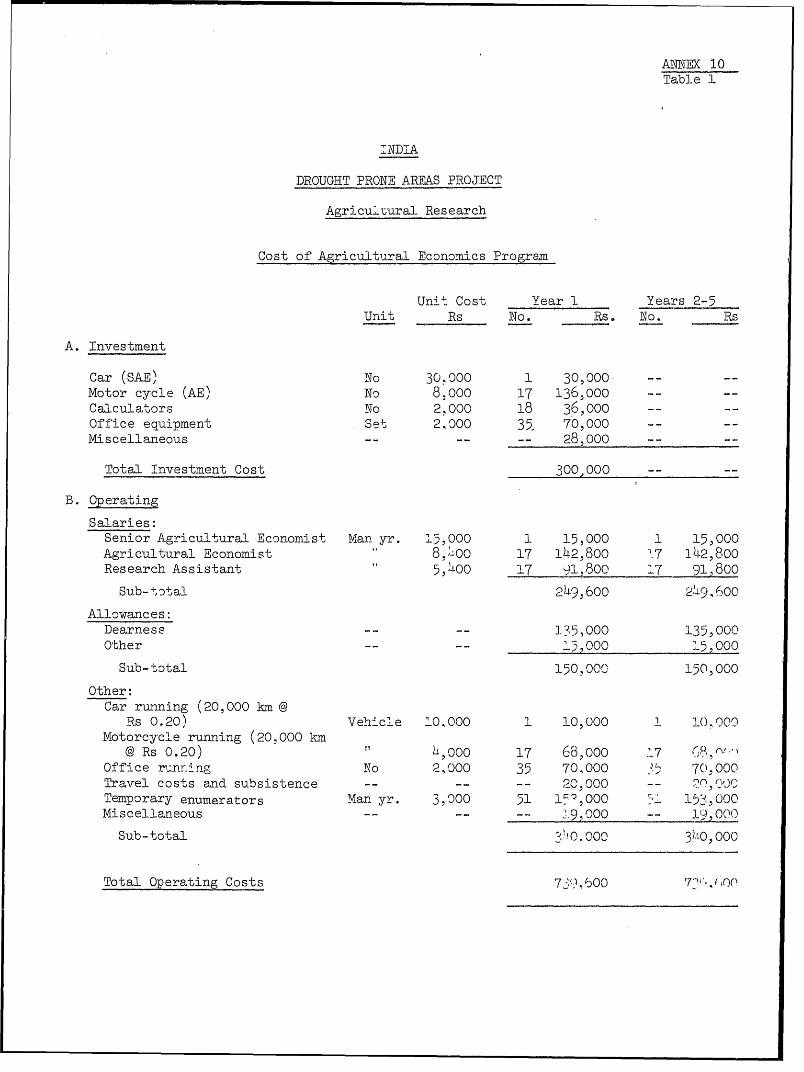
ANTE( 10Table 1
INDIA
DROUGHT PRONE AREAS PROJECT
Agricultural Research
Cost of Agricultural Economics Program
Unit. Cost Year I Years 2-5
Unit Rs No. Rs. No. Rs
A. Investment
Car (SAE) No 30.000 1 30,000 -- --
Motor cycle (AE) No 8,ooo 17 136,000
Calculators No 2,000 18 36,oooOff'ice equipment Set 2,000 35. 70,000 -- --
Miscellaneous -- 28,000
Total Investment Cost 300, 000 -- --
B. Operating
Salaries:Senior Agricultural Economist Man yr. 1,;000 1 15,000 1 15,000
Agricultural Economist 8,0oo 17 142,800 o7 142,800
Research Assistant 5,)4oo 17 91,800 17 91,800
Sub-total 2)49,600 249,6O00
Allowances:Dearness -- -- 135,000 135,000
Other -- -- 00,000 15,000
Sub-total 150,000 150,000
Other:Car running (20,000 km @
Rs 0.20) Vehicle 101000 1 1O,OO 1 s10000
Motorcycle running (20,000 km@ Rs 0.20) L 0,o0 17 68,000 17 (8,
Office runrz nc No 2,000 35 70.000 :5 70,000
Travel costs and subsistence 2\ \-- 20,000 -- ,00
Temporary enumerators Man yr. 3,000 51 l9,,00 0 1 1531000
Miscellaneous -- -- -- 19,000 -- 1, 1000
Sub-total 3 ,0n00c 31 0,000
Total Operating Costs 730, 600 7?C, ({O('
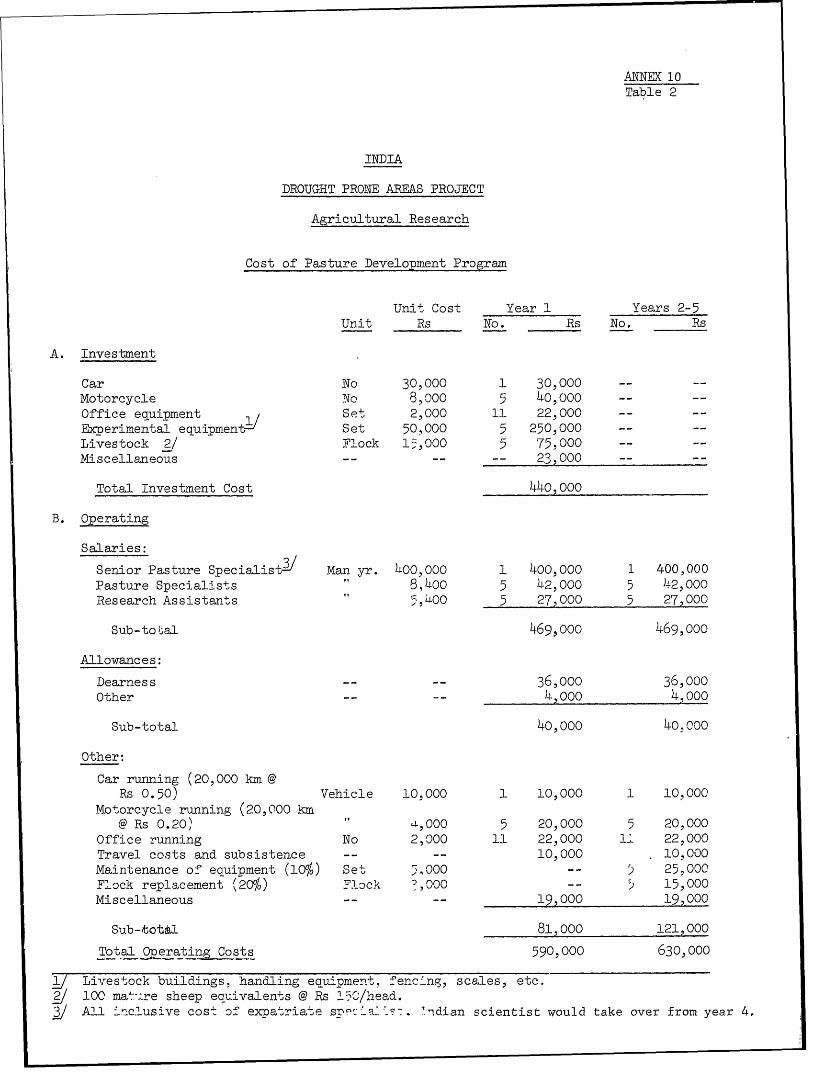
ANNEX 10Table 2
INDIA
DROUGHT PRONE AREAS PROJECT
Agricultural Research
Cost of Pasture Development Program
Unit Cost Year 1 Years 2-5Unit Rs No. Rs No. Rs
A. Investment
Car No 30,000 1 30,000 -- --Motorcycle No 8,000 5 40,,0oOffice equipment Set 2,000 11 22,000 -- --Experimental equipmentl Set 50,000 5 250,000 -- --Livestock 2/ Flock 1,-,000 5 75,000 -- --Miscellaneous - 23,000 --
Total Investment Cost 440,000
B. Operating
Salaries:
Senior Pasture Specialisti Man yr. 400,000 1 400,000 1 400,000Pasture Specialists 8,400 5 42,000 5 42,000Research Assistants 5,400 5 27,000 5 27,000Sub-tof;al
469,ooo 469,oooAllowances:
Dearness -- -- 36,ooo 36,oooOther -- -- 4OOO 4,o0OSub-total
40,000 40,000Other:
Car running (20,000 km @Rs 0.50) Vehicle 10,000 1 10,000 1 10,000Motorcycle running (20,000 km@ Rs 0.20) a,00O 5 20,000 5 20,000Office running No 2,000 11 22,000 1L 22, 000Travel costs and subsistence -- -- 10,000 10,000Maintenance of equipment (10%) Set 5,000 -- 5 25,000Flock replacement (20%) Flock >,000 -- 5 15,000Miscellaneous
-- -- 19,000 19,000Sub-bot&l
81,000 121,000Total Operating Costs
590,000 630,000j Livestock buildings, handling equipment, fencI ng, scales, etc.i/ 100 ma'-,.re sheep eauivalents @ Rs 1 50/head.j All 'cnlusive cost of expatriate s -I -. >dian scientist would take over from year 4.
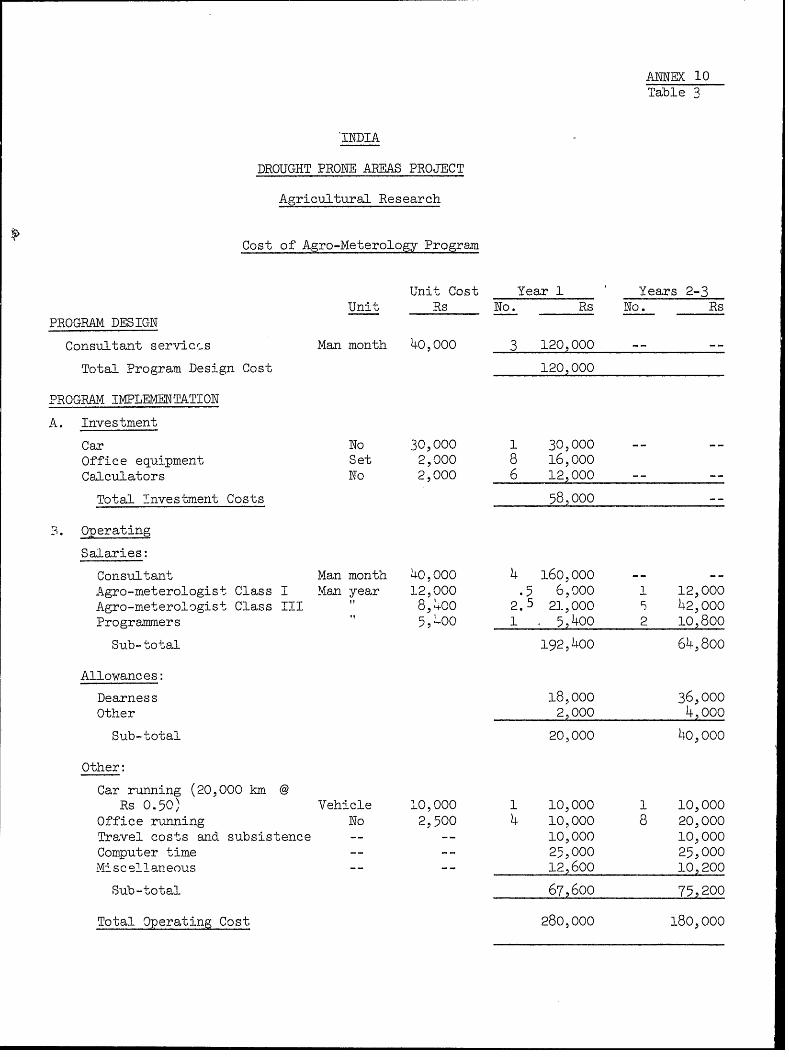
ANNEX 10Table 3
'INDIA
DROUGHT PRONE AREAS PROJECT
Agricultural Research
Cost of Agro-Meterology Program
Unit Cost Year 1 Years 2-3Unit Rs No. Rs No. Rs
PROGRAM DESIGN
Consultant services Man month 40,000 3 120,000
Total Program Design Cost 120,000
PROGRAM IMPLEMTATION
A. Investment
Car No 30,000 1 30,000 -- --
Office equipment Set 2,000 8 16,000Calculators No 2,000 6 12,000 -- --
Total investment Costs 58,ooo --
?* Operating
Salaries:
Consultant Man month 40,000 4 160,000 -- --
Agro-meterologist Class I Man year 12,000 .5 6,ooo 1 12,000Agro-meterologist Class TII 8,o00 2.5 21,000 5 42,000Programmers 5,OO 1 5,400 2 10,800
Sub- total 192,400 64,800
Allowances:
Dearness 18,000 36,000Other 2,000 4,000
Sub- total 20,000 40,000
Other:
Car running (20,000 km @Rs 0.50) Vehicle 10,000 1 10,000 1 10,000
Office running No 2,500 4 10,000 8 20,000Travel costs and subsistence 10,000 10,000Computer time -- -- 25,000 25,000Miscellaneous -- -- 12,600 10,200
Sub-total 67,600 75,200
Total Operating Cost 280,000 180,000
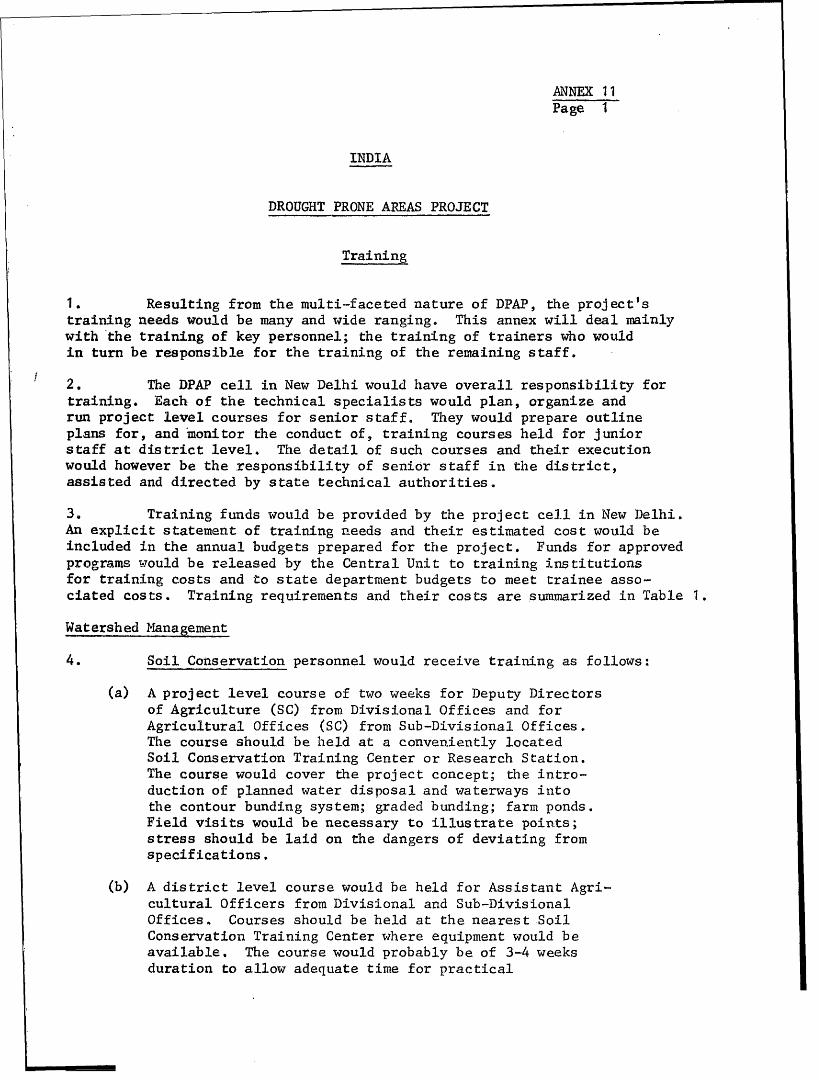
ANNEX I 1Page 1
INDIA
DROUGHT PRONE AREAS PROJECT
Training
1. Resulting from the multi-faceted nature of DPAP, the project'straining needs would be many and wide ranging. This annex will deal mainlywith'the training of key personnel; the training of trainers who wouldin turn be responsible for the training of the remaining staff.
2. The DPAP cell in New Delhi would have overall responsibility fortraining. Each of the technical specialists would plan, organize andrun project level courses for senior staff. They would prepare outlineplans for, and monitor the conduct of, training courses held for juniorstaff at district level. The detail of such courses and their executionwould however be the responsibility of senior staff in the district,assisted and directed by state technical authorities.
3. Training funds would be provided by the project cell in New Delhi.An explicit statement of training needs and their estimated cost would beincluded in the annual budgets prepared for the project. Funds for approvedprograms would be released by the Central Unit to training institutionsfor training costs and to state department budgets to meet trainee asso-ciated costs. Training requirements and their costs are summarized in Table 1.Watershed Management
4. Soil Conservation personnel would receive training as follows:
(a) A project level course of two weeks for Deputy Directorsof Agriculture (SC) from Divisional Offices and forAgricultural Offices (SC) from Sub-Divisional Offices.The course should be held at a conveniently locatedSoil Conservation Training Center or Research Station.The course would cover the project concept; the intro-duction of planned water disposal and waterways intothe contour bunding system; graded bunding; farm ponds.Field visits would be necessary to illustrate points;stress should be laid on the dangers of deviating fromspecifications.
(b) A district level course would be held for Assistant Agri-cultural Officers from Divisional and Sub-DivisionalOffices, Courses should be held at the nearest SoilConservation Training Center where equipment would beavailable. The course would probably be of 3-4 weeksduration to allow adequate time for practical
ANNEX 11Page 2
training. The course would cover project conceptand the planning of soil and moisture conservationsystems. Stress would be placed on thecritical need for high quality planning to producetechnically sound systems with minimal disruptionto farm operations.
(c) Agricultural assistants would be drawn from the normalthroughput of Soil Conservation Training Centers whichis adequate to the need. To the normal curriculum wouldbe added a few periods to cover the project concept,planned water disposal and waterways and the introductionof farm ponds to the system where feasible.
5. Forest Department staff would require little training abovethat routinely given. A project level course of one week's durationwould be held for Deputy Conservators and Forest Range Officers to explainthe project concept and the work program. The Range Officers should thencontinue for three weeks training on pasture establishment and managementtechniques. The two Range Officers who would be concerned with pasturedevelopment on village common lands for the sheep program would requirefurther specialized training which would be outlined by the PastureSpecialist (Annex 8).
Lives tock Development
6. The Dairy Development component would require a range of trainingcourses as follows,t
(a) Project level courses for Spearhead Teams wouldbe held under the auspices of the National DairyDevelopment Board (NDDB) at their facilities inAnand and at the facilities of the Kaira DistrictMilk Producers' Union. NDDB has a set program forthe training of Spearhead Teams. A number of theseare already working in the field. No difficultiesare anticipated in training the number of teams whichwould be required by the project.
(b) The training of managers fo:- Milk Producers' Coop-erative Societies would be conducted in the form ofa two-week in-service training course by the Spear-head Team at the office of the District AnimalHusbandry Officer. Further training would be doneby repeated visits of the Team members to the villagesconcerned. Training of society nmarnagers in the fieldof artificial insemination would be the responsibilityof the District Animal Hlusbandry Officer.
ANNEX 11Page 3
(c) The technicians to operate the milk chilling facilitiesat the district level would be trained under theauspices of NDDB at a suitable facility in thearea concerned. Training would be of an in-servicenature and last a month.
(d) The managers of calf rearing stations would be trainedby the calf rearing consultant. The training would beconducted at a newly established center, would bein-service iin nature and last for approximately twomonths.
7. The Sheep Development program's training needs would be:
(a) A project level course for Service Center Managers.They would require training in sheep husbandry,sheep and wool marketing, cooperative management,pasture management. A number of institutes (CentralSheep and Wool Research Institute, Central Arid ZoneResearch Institute, Grassland and Fodder ResearchInstitute) should be involved in the planning andconduct of the course. The course would probablyneed to be of about 6 weeks duration with considerabletravel and field work. The major role in the organiza-tion and conduct of this course would be placed bythe senior livestock specialist of the Central DPAPunit.
(b) District level training of sheep producers societies'managers would be conducted in the form of two-weekin-service training courses by the Service CenterManagers and pasture development staff. The DistrictAnimal Husbandry Officer would also contribute to tlletraining. Private farmers who intended to take uppasture development would be invited to participatein these courses.
Dry Farming
8. Extension staff would be trained as follows:
(a) A project level course of two weeks duration would lheheld at Hyderabad for I)istrict Agricultural Officers,Hleads of Research Stations and Agricultural ExtensionOfficers (AEOs). The aim would be to acquaint thoseresponsible for the detailed planning and implementationof the project extension program witlh project objectivesand the outline of the first year's extension program.Trainees would visit the All India Coordinated ResearchProject and ICRISAT, to see advanced dry farming techinology,and project districts, to view the task ahead. Annually,
ANNEX 11Page 4
thereafter a similar seminar/workshop would be held forthe same officers to discuss progress, problemsand to outline the program for the ensuing year.(Detailed programs would be developed at districtlevel.)
(b) The in-service training of AEOs, Village ExtensionWorkers and Progressive Farmers would follow thepattern outlined for the extension service in theCh-ibal Command Area Development Proj ect. 1/ The firstcourse would cover the project concept in additionto the extension program per se.
Project Management
9. The project managers and state deputy secretaries of the depart-ments responsible for program implementation would undergo a two-weekorientation course to be organized and conducted by the Director, DPAP,New Delhi. The curriculum would subsume demonstrated administrativecompetence and include, inter alia, the following topics:
(a) The concept of DPAP and its administrative lirnkages;
(b) The interdependence of sectoral investments andthe need for district-wise planning and development;
(c) Technical surveys of the major project components;
(d) The role of the District Development Authority andits powers (case studies to illustrate differencesamong states);
(e) Smallholder assistance administration;
(f) Agricultural credit mechanisms, constraints on credit,and their alleviation; and
(g) Accounting and reporting requirements under the project.
tO. It is expected that the expertise for this course would be drawnfrom various sources including departments of government, ICAR, and theIndian Institute of Bank Management. In addition, one-week seminars wouldbe held semi-annually by the Director, DPAP, for the following purposes:
(a) Review progress in project districts;
(b) Discuss common problems of implementation; and
/ Report to the Government of Rajasthan on Extension Service, D. Benor,January 1974.
ANTEX 11Page 5
(c) Participate in technical surveys or case studiesof subjects of common concern, for example, regionalplanning.
November 4, 1974
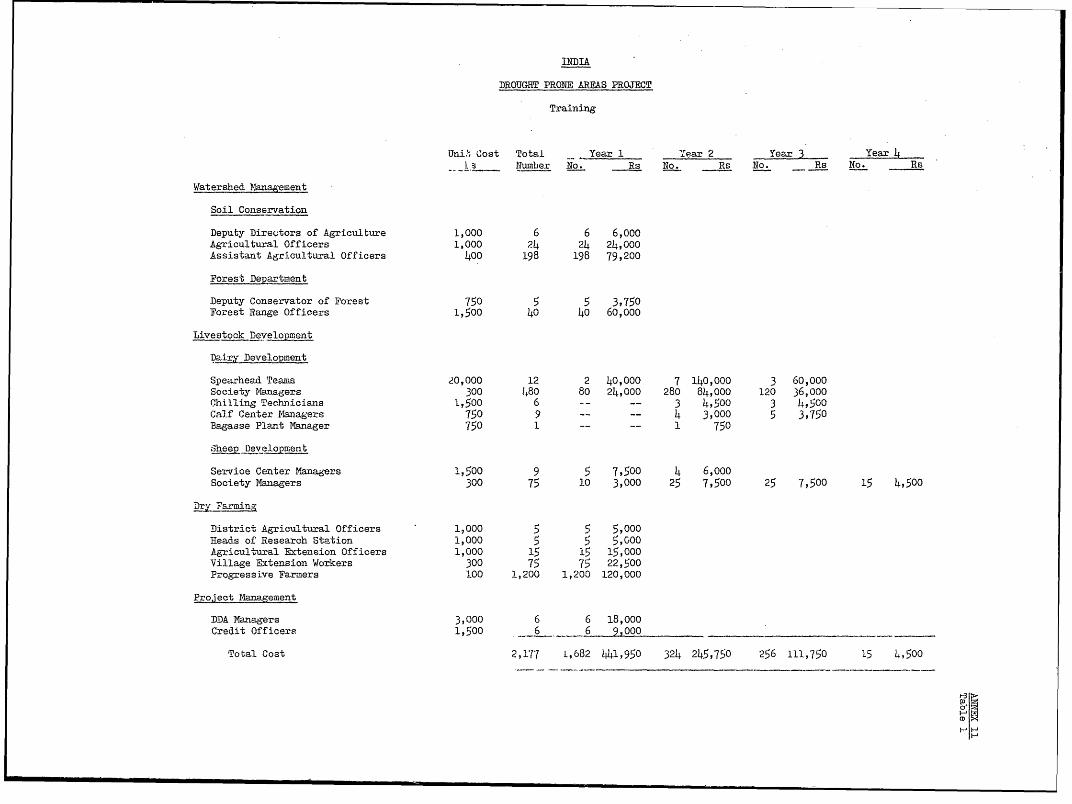
INDIA
DROUGHT PRONE AREAS PROJECT
Training
Uni.' Cost Total - Year 1 - 'ear 2 Year 3 Year 4
-La Number No. Rs No. Rs No. Rs No. Rs
Watershed Management
Soil Conservation
Deputy Direotors of Agriculture 1,000 6 6 6,000
Agricultural Officers 1,000 24 24 24,000
Assistant Agricultural Officers 400 198 198 79,200
Forest Department
Deputy Conservator of Forest 750 5 5 3,750
Forest Range Officers 1,500 40 40 60,000
Livestock Development
Dairy Development
Spearhead Teams 20,000 12 2 40,000 7 140,000 3 60,000
Society Managers 300 1480 80 24,000 280 84,000 120 36,000
Chilling Technicians 1,500 6 -- -- 3 4,500 3 4,500
Calf Center Managers 750 9 -- -- 4 3,000 5 3,750
Bagasse Plant Manager 750 1 -- -- 1 750
Sheep Development
Service Center Managers 1,500 9 5 7,500 4 6,ooo
Society Mianagers 300 75 10 3,000 25 7,500 25 7,500 15 4,500
Dry Farming
District Agricultural Officers 1,000 5 5 5,000
Heads of Research Station 1,000 5 5 5,GOO
Agricultural Extension Officers 1,000 15 15 15,000
Village Extension Workers 300 75 75 22,500
Progressive Farmers 100 1,200 1,200 120,000
Project Management
DDA Managers 3,000 6 6 18,000
Credit Officers 1,500 6 6 9,000
Total Cost 2,171 L,682 441,950 324 245,750 256 111,750 15 4,500
HCD
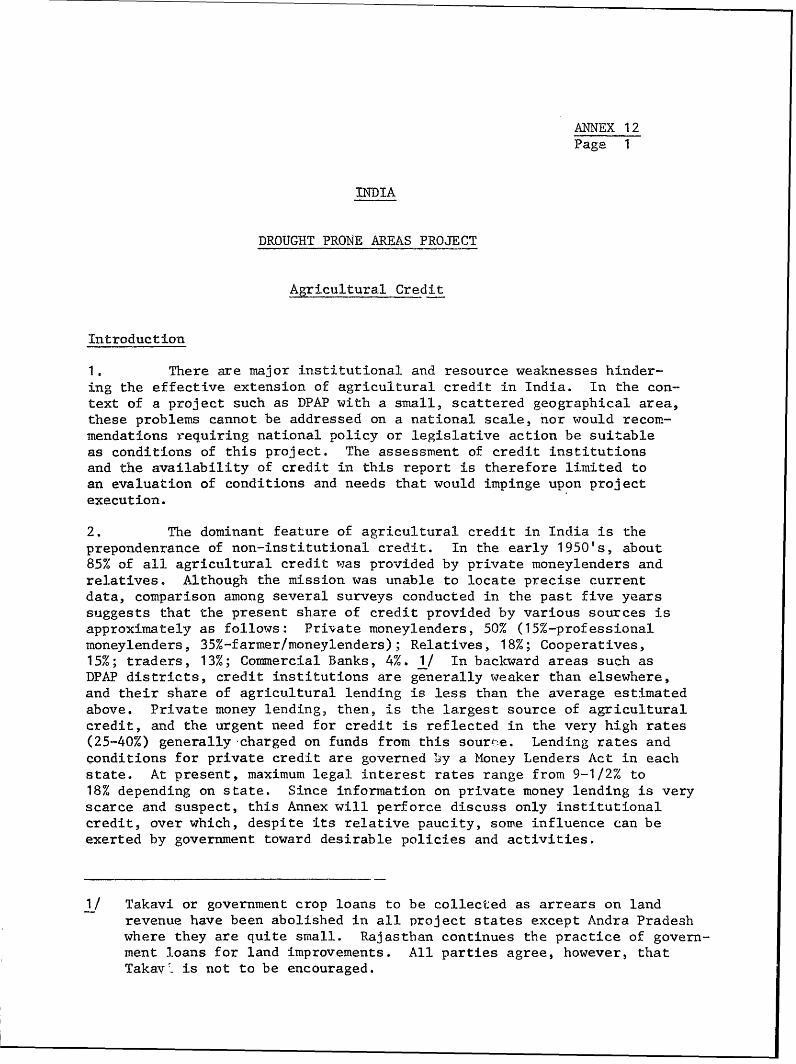
ANNEX 12Page 1
INDIA
DROUGHT PRONE AREAS PROJECT
Agricultural Credit
Introduction
1. There are major institutional and resource weaknesses hinder-
ing the effective extension of agricultural credit in India. In the con-
text of a project such as DPAP with a small, scattered geographical area,
these problems cannot be addressed on a national scale, nor would recom-
mendations requiring national policy or legislative action be suitable
as conditions of this project. The assessment of credit institutions
and the availability of credit in this report is therefore limited to
an evaluation of conditions and needs that would impinge upon project
execution.
2. The dominant feature of agricultural credit in India is the
prepondenrance of non-institutional credit. In the early 1950's, about
85% of all agricultural credit was provided by private moneylenders and
relatives. Although the mission was unable to locate precise current
data, comparison among several surveys conducted in the past five years
suggests that the present share of credit provided by various sources is
approximately as follows: Private moneylenders, 50% (15%-professional
moneylenders, 35%-farmer/moneylenders); Relatives, 18%; Cooperatives,
15%/o; traders, 13%; Commercial Banks, 4%. 1/ In backward areas such as
DPAP districts, credit institutions are generally weaker than elsewhere,
and their share of agricultural lending is less than the average estimated
above. Private money lending, then, is the largest source of agricultural
credit, and the urgent need for credit is reflected in the very high rates
(25-40%) generally charged on funds from this sourt-:e. Lending rates and
conditions for private credit are governed by a Money Lenders Act in each
state. At present, maximum legal interest rates range from 9-1/2% to
18% depending on state. Since information on private money lending is very
scarce and suspect, this Annex will perforce discuss only institutional
credit, over which, despite its relative paucity, some influence can be
exerted by government toward. desirable policies and activities.
1/ Takavi or government crop loans to be collected as arrears on land
revenue have been abolished inI all project states except Andra Pradesh
where they are quite small. Rajasthan continues the practice of govern-
ment loans for land improvements. All parties agree, however, that
Takav' is not to be encouraged.
ANNEX 12Page 2
Institutional Credit in Project Districts
3. The cooperative credit structure is the major source of shortand medium-term institutional credit for agriculture. Commercial bankshave recently entered the field but their lending volumes are very small,from 1 or 2% to 20% of that provided by cooperatives. Long-term credit,as well as some medium-term credit, is provided by Land Development Banks(LDBfs), in some states known as Land Murtgage Banks. LDB's are strL -edas cooperatives but are entirely sepu,rate entities from the cooperativer,credit structure which provides short and most medium-term credit. Sincecommercial banks are normally prohibited from lending for periods longerthan five years 1/, LDB's are the principal source of long-term institu-tional credit for agriculture. The organization and operating proceduresof the three types of credit institutions are described briefly below.
I. Cooperative Credit Structure
4. Cooperatives are constituted under state law, and within eachstate there is a three-tiered cooperative structure.
5. Primary Cooperative Societies. At the local level, usually ona village by village basis, there are Primary Cooperative Societies.Although 80-90% of all villages in the project area are covered by thesesocieties, memibershLp is much more limited, typically constituting only30-40% of rural ramilies. These are generally the literate, more pro-gressive farmers, and the average farm size among members is also muchlarger than that of the community as a whole. Furthermore, within thesociety itself, credit utilization is heavrily skewed toward a few members. 2/Borrowing members account for less than 20% of rural families in allproject states. One reason for this limited coverage of cooperativecredit is the requirement that a member deposit 12-1/2% of the amounthe intends to borrow as share capital in the society, and few farmers areable to raise significant equity contributions. Despite individualcredit ceilings, which vary among states (e.,. Maharashtra, Rs 6,000)well-to-do members have availed themselves of rescheduling privileges andparticipation in the society's management committee to build up very largecredits. Another feature of primary societies which discourages smallfarmer membership is the joint and several liability of members. Smallfarmers cannot risk the event of society bankrupcy, nor can they expectto participate in the society's management, since these positions are
1/ Special provision is made by RBI for bau-k loans longer than five yearsunder IDA credit projects.
2/ For example, in one society of Anantapur District, 90% of outs3tandingloans have been made to 10% of the members.
ANNEX 12Page 3
generally occupied by influential farmers and businessmen in the community.Management of credit societies is generally very poor. The majoritydo not have paid secretaries 1/, and abuse and ignorance on the part ofelected management committee members have led to very heavy overdues. 2/Table 1 shows cooperative society membership, recent lending activityand overdue positions.
6. District Central Cooperative Banks (DCCB). This second tiercoordinates all cooperative credit activity within the district, receivesand distributes State and Reserve Bank funds for all primary societies,and supervises their lending activities. Primary societies are membersof the DCCB, and each is allotted a credit ceiling on the basis of member-ship, share capital and overdue position. Societies must deposit anamount equivalent to 10% of their intended borrowings as share capitalin the DCCB. Individuals may also become members and may borrow on thecondition of 10% share capital contribution. To carry out its functions,the DCCB generally has a number of branch offices in the district anda cadre of credit inspectors. Unfortunately, the caliber of staff andmanagement is quite variable among DCCB's, and the supervisory functionis often jeopardized by inefficient operating procedures and a failureto override the political strengths withini member societies. Table 2presents the resource, credit and overdue position of DCCB's in projectdistricts.
7. Apex Cooperative Bank (ACB). At the state level, one institutionis responsible for all short and medium-term credit through the cooperativestructure. The ACB represents the cooperative credit structure to stateand central governments, supervises and audits the activities of DCCB's,aggregates requirements of DCCB's for credit from the state governmentand Reserve Bank, and receives such funds on its account. Members of theACB are the district banks and the state government. DCCB's must depositan amount equivalent to 8.3% of intended borrowings as share capitalin the SCB. Credit ceilings for district banks are determined on thebasis of membership, share capital and overdue position. The caliberof management at this level is generally good, although the orientationapepars much more departmental than commercial, especially in relation-ships with the state government. Although the Reserve Bank of India (RBI)is expected to be lender of last resort for the provision of cooperativecredit, in fact it is Ehe major source of borrowings by cooperatives.The trend is toward other sources, but present dependence is reflcectedin the fact that 80% of outstanding borrowing by cooperatives as
1/ For example, only 29% of societies in Nagaur have paid secretaries;only 40% in Jodhpur.
2/ The method of expressing overdues is not consistent, being either % ofoutstanding credits or % of due credits. Furthermore, a precise state-ment of overdues is usually prevented by the poor condition of societyrecords and the unwillingness of society management to disclose accountseven to authorized inspectors.
ANNEX 1 2Page 4
of June 30, 1970, were from RBI, as were 46% of borrowings in the year
ending that date. RBI currently lends sshort-term funds to Apex Banks at
5% in turn; DCCB's pay 6.2%; primary societies 8.0%; and farmers 10.0%.1/
Other sources are state and central governments (latter principally through
National Cooperative Development Corporation), money markets and commercial
banks.
Rescheduling of Cooperative Overdues
8. Natural calamities such as drought and flood jeopardize bor-
rowers t repayment capacity and, in the cooperative context, may block
additional lending activities. 2/ In an attempt to overcome the problem
of overdues as a result of natural calamity, the Reserve Bank of India
established an Agricultural Stabilization Fund in 1956, to which it
annually has contributed amounts ranging from Rs 1 crore to 8 crores.
This Fund is used to reschedule short-term agricultural loans to eligible
apex banks. Eligibility required the establishment of similar funds
at the apex and central (district) levels, and the followLng procedures
have developed.
(a) Only short-term agricultural loans may be rescheduled,
and then only those which are made to farmers in areas
where the crop produiction is less than 50% of that
in a normal year.
(b) DCCB's must meet at least 15% of the cost of rescheduling
from their own stabilization funds, reserves, and medium-
term lending resources. However, not more than 60% of
medium-term resources ray be used for this purpose.
(c) The apex bank must meet eligible DCCB demands to the
extent of its stabilizaticn fund and reserves before
approaching RBI.
(d) Apex and DCC banks must contribute 15% of annual net
incomes to their respective stabilization funds.
(e) State governments must contribute to such funds all
dividends in excess of 3% earned by them on holdings
of cooperative share capital.
1/ For medium term credit, these rates are 5.5%, 6.4%, 8% and 10%,
respectively.
2/ For example, though not strictly applied, DCCB's in Rajasthan may
not sanction funds to primary socie.ies with overdues in excess of
40% of demand; nor may the Apex Bank in Rajasthan sanction funds to
a DCCB with overdues int excess of 60%. Cut-off percentages vary
slightly among states.
ANNEX 12Page 5
(f) Most states have made lump sum allocations to sucthfunds on a part-grant, part-loan basis.(g) The national fund, adminit3tered by RBI is used only toreschedule short-term agr:'.cultural loans by RBI toeligible apex banks.
9. As a result of three consecutive years of drought, 1970/71,1971/72 and 1972/73, the normal functioning of the stabilization fundsproved inadequate. Special arrangements were made in 71/72 to Ifrephase"the previous years' "conversions". RBI financed 100% of conversionsmade from the national fund in the previous year. In 1972/73, a "reha-bilization" procedure was introduced whereby loans "rephased" in 1971/72were refinanced, 50% by RBI and 50% by state government grants to ApexBanks. While these measures have served to maintain the floiw of creditthrough the cooperative structure, inordinate debt burdens have beenimposed on final borrowers, and there is now serious concern about repay-ment capacity. For example, an RBI study of Maharashtra published inMay 1973 indicates that, on average, the debt burden or rescheduledborrowers amounts to 66% of annual gross income. State governments arenow consideving special debt relief measures, although specific termshave not been finalized.
10. There is no question that the extensive use of stabilizationfunds has enhanced the ability of the cooperative structure to extendcredit. However, rescheduling with the use of apex and central funds hasnot been done in the strict adherence to the natural calamity definitionrequired of the national fund. As a result, overdues attributable topoor management and lack of borrower disciplines have in some cases beenrescheduled and new credit limits sanctioned which have compolunded thefinancial difficulties of many primary societies, over and aboDve thatlegitimately atrrib'.:table to natural calamity.
II. Land Development Banks (LDB's)
11. The long-term cooperative credit structure is entirely in-dependent of that described above for short and medium-term credit.District and state LDB's make up the two tiers of this structure. 1/Funds for LDB's come from share capital and deposits of members, loansand grants from state governments and the sale of insecurities both tothe public and to REBI. Securities are sold in respect of specific schemessuch as the financing of tubewells in a specified area. Special debentures(those sold to ARC) bear a lower interest rate and enable LDB's; to lend1/ In some states such as Mlaharashtra, Primary (District) LDE's have beenreplaced by branches of the state bank. Operating procedures and cri-teria remain the same, but elected management boards are xeplaced bymanagers appointed by the state bank. LDB's also engage in some medium-term financing.
ANNEX 1 2Page 6
to farmers at 1/2% below the going commercial rates (e.g. , now 9-1/2%
compared to 10% on funds raised through ordinary debentures). Currently,
state LDB's pay about 6-1/2% on ordinary debentures and onlend to primaries
at 8%. Table 3 presents the resource, credit and overdue position of
primary LDB's in project districts.
12. Loans by LDB's are used to finance fixed assets, land imDrove-
ments, or durable chattels such as tractors, In all cases, hypothecation
of the land or asset is required. In appraising applicat i*-.s, considera-
tion is also given to technical and financial viability of proposals,
repayment capacity, and cropDing patterns. District level loan sanctioning
comnittees actually approve the loans, but criteria are established at
the state level for all tvpes of loans, and include certification of
unencumbered land title. This greatly restricts eligibility for LDB
credit, often for the sole reason that land rk.cords are not up to date
in the vast majority of districts and villages.
13. Three IDA projects are currently beirng executed by LDB's in
project states: M4aharashtra, Karn:itakai ('Iysorc) and,.r:- Xiadash Azad
Projects. 1/ While these are progressing satisfactorily (see Annex 1,
there is continuing concern about the quality of technical and managerial
supervision being provided to sub-borrowers. Overdues have risen sharply in
the last several years, principally as a resuslt of continuling drought
condition.s. However, with the onset of normal monsoons in most of the
country, and as an attemrpt to improve financial discipline, RBI has refused
to purchase debentures of any LDIB with overdues in excess of 25% of demands
as of December 31, 1973. Collection campaigns underway during the mission's
field visits wyere meeting with conistderable sulccess, and it is expected
that all project LDIB's will hiave mEt1. this requirementr. Several states
had also made budgetary allocainons to meet reselheduling re&quirements,
and all LDM's have esttae'd ;ta--,'Liza1tl.on funiOs fror operating
revenues similar to those used for sh,or t and me.dium-term credit.
14. Tinder the project, LDB finave:cJnFg would be required for well
const- uction and ioprcvc-ments (i-icl ding pimrnisets), and for land
improvements (soil conservatinn and command area development). RBI has
laid down technical and .l-; nnciall criteria for such loans which must be
adhered to if ref inanco or debenture assistance is to be sought, and
the missioni recommiends a. diherence to tlhese for works to be commercially
Zinanced urnder the project. 2/
1/ 293-IN, 278-IN, and 226-IN, -cespectively. IDA funds are used by
Agricultural Refiaance Corporation to refinance eligible loans by LDB.
2/ RBI letter No. AGD. LDG. 696/B. X-27/73 dated Novv. 9, 1972.
ANNEX 12Page 7
Commercial Banks
15. Direct financing of agriculture by commercial banks is a recentdevelopment in India, 1/ with serious efforts beginning primarily afternationalization of the major banks in 1969. 2/ With a few conspicuousexceptions, performance to date has been modest and banks have concentratedon medium-terra loans against securable fixed assets and chattels. Tractorsand pumpsets have been the most frequent items of finance, while croploans and other short-term credit have been generally limited to supportof individuals who have taken medium-term credit.
16. One major drawback to conmmercial bank financing of agriculturehas been the cost of administration and loan supervision. In the contextof commercial banlc activities based on individual banker-client relations,there are significant economies of scale, and most short-term creditrequirements are very small--only several hundred rupees. A creditofficer is only able to supervise 400-503 loans effectively, and themargin on that number of small loans is insufficient to meet operatingcosts. Security requirements also prevent any major expansion in short-term lending, since the great majority of would-be borrowers have in-adequate chattels, and encumbered titles or oral leases on real estate.
Recent Innovations in Agricultural Credit
17. In an effort to overcome some of these difficulties, commercialbanks have attempted a number of innovations worthy of note:
18. Villge Ado2t- -hme. In an attempt to reduce operatingcosts and increase their credit concentrations, some banks have selectedvillages at or near branch offices for which they endeavor to meet asubstantial share of credit requirements. This has served to increasefarmer awareness of the particular instituition and some success inexpanding credit volume has been experienced. However, operatingprocedures and security requirements remain unchanged and, as a result,only a small proportion of cultivators in the adopted village can availthemselves of credit. Furthermore, the mission heard aTnumber of com-
1/ Indirect financing through primary cooperative societies is describedin para 19 and onward.
2/ National pressure on coimmercial banks has been expressed in terms oftargets set by government for the opening of new branches in ruralareas. This unfortunate measure of involvement in agriculture hasled to the establishment of a large number of unprofitable branches.These both drain financial resources and detract from the real issueof defining a role for commercial banks and evolvin, operating methodscompatible with the conditions and needs of agriculture.
ANNEX 12Page 8
plaints from district authorities that the system has served to preclude
consideration of worthy applicants outside such villages. 1/
19. Bank Financing of Primary Cooperative Societies. Under this
scheme, introduced in 1970/71, primary societies are ceded to commercial
banks which provide credit in lieu of that otherwise provided by the
district central cooperative bank. The objectives are to provide a channel
for commercial bank resources into short and medium-term agricultural credit
and to introduce a greater degree of financial discipline into the workings
of PCB7s. Relationships between members and the PCB remain the same, i.e.,
share capital requirements, financing scales, interest rates, etc.,
but the PCB receives its funds at 7-1/2% from the commercial banks rather
than at 7% from the district central cooperative bank. Offsetting this
interest differential is the requirement that 50% of the cost of a paid
secretary be met by the bank (central government meets the other 50% under
a separate scheme).
20. Although more than 2,500 societies have been ceded to banks
under the scheme, including some in each proposed project district, fewer
than 60% have actually been financed. For those that have been financed,
overdues and operating costs have been very high. 2/ Several reasons
for the limited success oL this scheme have been identified:
(a) By design, weaker societies were to be ceded. Banks
thus inherited for the most part the societies with
small membership, poor management, and heavy overdues.
(b) Societies were very reluctant to accept bank financing
because:
(i) it effectively severed the supply of government
funds,
(ii) the interest margin to the PCB to the PCB is 1-1/2%
rather than 2% as for funds from DCCB s,
(iii) most societies did not have paid secretaries nor
were they desirable in the view of the management
committees,
(iv) loans were to be disbursed irn the presence of a
bank representative.
1/ Banks normally do not consider applications fro; 'arme.s located more
than 10 miles from the nearest branch. I,wev-r, A.lder village adoption,
applications within this radius are not consit',ere6 unless the applicant
is a resident of the selected vllage.
2/ A 1972 survey of 4 banks in Karnataka which had financed 266 societies
showed an aggregate operating deficit of 57% on a lending volume of
Rs 69.5 lakhs.
ANNEX 12Page 9
(c) There is a distrust of commercial banks among cooperativeleaders, and failure to establish effective communicationsat the district level has led to misconceptions andisolation from commercial banks, which have permiatedPCB's.
(d) In the case of societies which agreed to bank financing,there has been considerable difficulty in collectingoverdues, since management committee members are reluctantto assist bank staff. Despite the fact that bank rmoneyis loaned not to individuals but to the society as awhole, committee members tend to view overdues as aproblem between the bank and the sub-borrower.
(e) Overdues are much higher than in direct financing operationsbecause credit is not selectively extended to qualifiedindividuals but rather to eligible societies as a whole.
21. Among bankers interviewed during the mission, it was generallyagreed that few if any new societies would be adopted in the near future,although most were hopeful that the situation would improve with theend of drought conditions in most of the country. Preference wasexpressed for the village adoption approach to credit expansion.
22. Farmers' Service Societies (FSS's). The National Commission onAgriculture, in its report of December, 1971, recognized that bothcooperatives and commercial banks have failed to meet the credit needsof small farmers. The Commission advocated the establishment of multi-purpose Farmers' Service Societiess, and these have since been endorsedby RBI, state government and the banking community. The first 30 of thesewere only begun in 1973, so their effectiveness cannot yet be evaluated.The concept is described briefly here since it would seem to have somemerit for proposed project districts.
23. The purpose of the FSS would be to integrate the credit functionwith the provision of input and marketing services. Although membershipwould not be restricted to small and marginal farmers, membership on theManaging Board would be weighted in their favor.
24. The organization would be that of a cooperative, registeredunder the Societies Act. Each FSS would serve a Development Block orintegral geographic unit such as a watershed, and a Union of FSS's wouldbe established at the District level.
25. The management would consist of a managing director appointedby the financing commercial bank 1/ and a Managing Board of 11 members:
1/ The financing agency would be the lead bank of the district. In eachproposed project district this would be a commercial bank althoughcooperatives are lead banks in some districts in India.
ANNEX 12Page 10
5 elected small farmers, 2 nominees of government and 1 of the financing
bank and 3 other elected members of the society.
26. The operations would include the extension of credit and, where
these are found to bc required, the provision of inputs,1/ services,
and marketing facilities. These activities would be undertaken over
time, the initial focus being on credit and essential inputs. A close
link to government would be essential for the supply of Essential
Commodities (e.g., fertilizer) and extension services; hence the two
management nominees. Credit operations would be based on criteria,
scales, and procedures developed by the financing bank.
Constraints orn Flow of Credit in Project Districts
General Constraints
27. Previous Indebtedness. Virtually all cultivators in the proposed
project districts have incurred debt, often on termfs which result in perma-
nent indebtedness. The practice of hypothecating land for all loans,
save short-term cooperative credit, means that even t'hose fortunate enough
to have received institutional credit cannot obtain additional loans except
from previous creditors.
28. Credit Staff. The quality and quantity of staff available to
appraise and stupervise agricultural credit is quite inadequate. This
has bred highly selective credit policies on the part of lenders, frustra-
tion of applicants, and negligence on the part of borrowers.
29. Outdated Land Records. Discussions with officials of banks,
cooperatives and government confirmed that outdated land records consti-
tuted the most important single constraint on credit in these districts. 2/
30. Lack of Coordination Among Hinarcial_Institutions. Traditionally
there has been a much higher degree of secrecy among financial institutions
in India than elsewhere, aggravated by a mutual distrust and misunderstand-
ing between cooperatives and commercial banks. The recent establishment
of district level credit coordination committees, generally convened by the
lead bank and chaired bv the Collector, affords much scope for coordination
in the following areas:
1/ A component financing formula similar to that used by the cooperative
credit structure would provide for a mix of cash and kinid credit.
2/ One district bank manapzer interviewed during the mission had, in the
previous week, rejected 3C0 out of 43 loan applications for the sole
reason that current records were not available for the lands to be
offered as security. Andrarn ?radesh has estir-ated the cost of updating
its land records, tentatively to be undertaken in the Fifth Plan, at
Rs 5 crores (US$6.7 million).
ANNEX 12Page 11
(a) credit information on applicants and borrowers 1/
(b) branch and staff patterns
(c) financial persepective and government-proposedschemes
(d) dissemination of extension information
(e) discussion of financing scales
(f) solicitation of government assistance in expeditingland records
(g) pooling information of experience outside the district.
Constraints on Cooperatives
31. Overdues. Overdues can severely reduce the capacity of coopep-eratives to meet the credit requirements of members. For example,Nagaur DCCB had overdues of 76% of outstandings as of June 30, 1972,and only Rs 7.4 lakhs of credit wexe extended in that year to 96 of its474 member societies. In the previDus year, 245 societies had borrowerdRs 54.3 lakhs. Tnroughout the project area, cooperative credit wasdown about 40% in 1971/72 although the reduction was much greater in non-irrigated areas. To a great extent, overdues are a result of poor manage-ment and staffing patterns as well as natural calamity.
32. Membership Limitations. The prerequisite of credit throughcooperatives is membership, and the share capital requirements and riskdiscourage most cultivators from joining societies.
Constraints on Commercial Banks
33. Appraisal Procedures. Banks have not yet implemented bulkingtechniques or simplified procedures to reduce the cost of processinglarge volumes of small agricultural loans.
34. Security Evaluation. Although commercial banks interviewedduring the mission professed to use post-investment value when establish-ing security requirements, observations of specific hyvothecations indicatethat the ratio of secured land area Lo loan amount resuilted in a de factovaluation of land at pre-investment rates. A substantial number ofapplicants presently ineligible would qualify for credit if evaluationguidelines more closely reflected post-investment value and earningcapacity of proffered lands.
i/ Jodhpur appears to be the most advanced in this respect. An officerof the lead bank has been designated to receive, assemble and circulatecredits reports for all committee members.
ANNEX 12Page 12
35. Oral Tenancy. The preponderance of tenant arrangements are
neither made in writing nor registered. Such tenants are unable to
obtain bank credit since there is no £s tisfactory evidence of cultivation
rights.
36. In December, 1969, the Governor of the Reserve Bank of India
appointed an Expert Group to review legislation impinging upon commercial
bank lending in agriculture. 1/ The mission has reviewed the committee's
report and finds the following constraints identified therein to be of
particular concern to the proposed project.
37. Security Registration. Banks require the hvpothecation of real
estate against the majority of short and medium-term loans, and the costs
of mortgage preparation as well as registration fees which average about
Rs 12.5 per thousand, and charges for a certificate of encumbrance are
borne by the borrower. Where mortgages are required by cooperatives, assign-
ment may be made by Declaration, atvtomatically registered in the office of
the Sub-Registrar and placed in the Land Records.
38. Stamp Duties. A tax is assessed on all real estate assignments
in favor of commercial banks and paid by the borrower, whereas assignments
in favor of cooperatives are not so taxed. Rates vary among states from
Rs 3 to about Rs 4.5 per hundred. In several states loans of less than
Rs 5,000 are exempt from stamp duty.
39. Priority of Charges. All state acts relating to cooperatives
provide a "first charge" for cooperatives on recovery of amounts due
from members. As distinct from a mortgage, a charge need not be registered
or explicit, but may be created by the act of parties, i.e., the giving
and receipt of credit. 2/ The critical feature of this provision is that
it subordinates all other claims irrespective of whether they were
registered before or after that of the cooperative. 3/ For example,
the assignment of chattels in favor of a commercial bank does not protect
that security for the bank in the event the borrower subsequently receives,
and defaults on, credit from a cooperative. In a number of states,"first charge" also applies to real estate, but its existence elsewhere
goes far in explaining the preoccupation of commercial banks with securing
registered hypothecation of land. At the time of enactment, cooperatives
were the only institutional source of agricultural credit and this
provision was designed to discourage private lending. Now, however, it
has become a major disincentive for commercial banlks as well in the
financing of agriculture.
1/ Commonly known as the Talwar Report, its final document was issued in1971 entitled "Report of the Expert Group on State Enactments Having
a Bearing on Commercial Banks Lending to Agriculture".
2/ Transfer of Property Act, 1882; Section 100.
3/ In all project states and 5 others, "first charge" is subject to claims
of the LDB or Land Mortgage Bank. In all states, provision is subjectto claims of state government in respect of Land Revenue.
ANNEX 12Page 13
40. In summary, the drought prone areas represent the extremes oflow and uneven productivity, inicome disparity, and weak institutionalstructures, thereby rendering them among the most difficult areas of thecountry in which to extend credit. No one type of institution, wqhethercooperative or commercial, posseses the capacity or inherent flexibilityto meet credit requirements, and a multi-channel approach mulst be adopted.Within the constraints of overall national policy, there are fl number ofspecific practicable measures, described above, which should be taken tofacilitate the flow of credit and which, in the vieTAw of the mission, wouldensure the availability of sufficient credit to permit significant develop-ment under the proposed project.
November 4, 1974
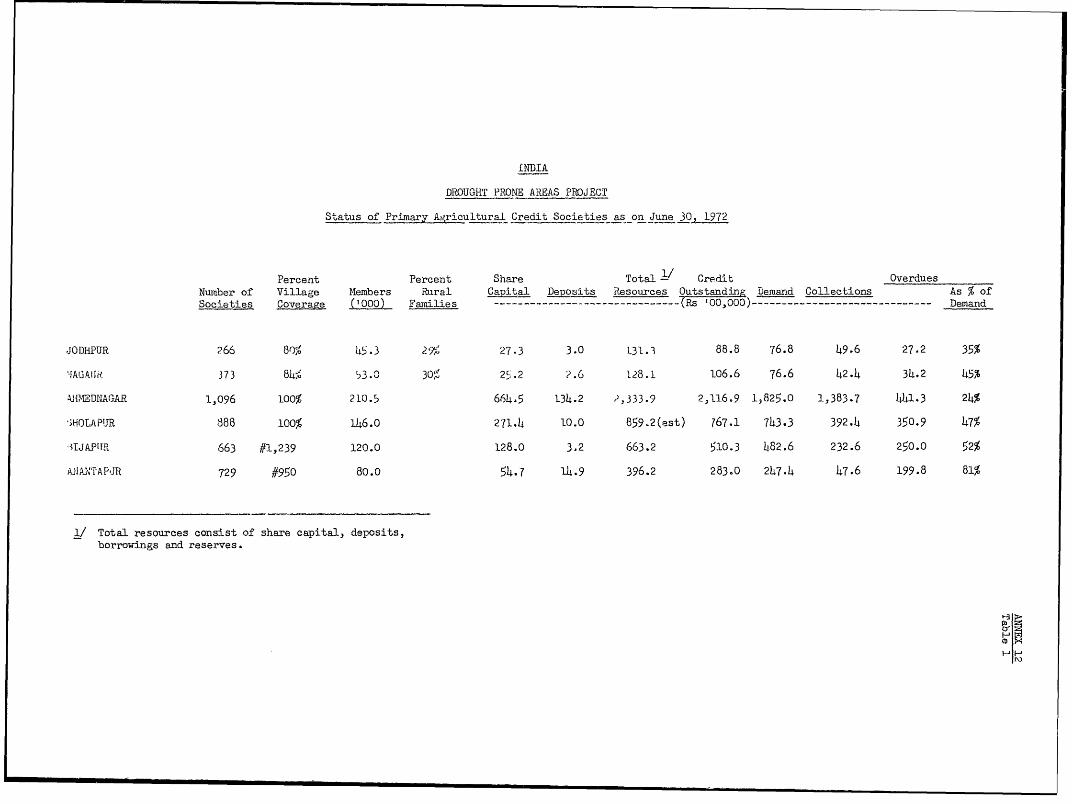
LNDIA
DROUGHT PRONE AREAS PROJECT
Status of Primary Agricultural Credit Societies-as on June 3O972
Percent Percent Share Totall/ Credit Overdues
umber of Village Members ral aital Deposits Resources Outstanding Demand Collections As % of
Societies Coverage (l000) Families --------------------------------- s '00,000)------------------------------ -Demand
JODHPUR c266 80% 45.3 29% 27.3 3.0 131.3 88.8 76.8 49.6 27.2 35%
IAIJI, 373 8h, ',3.O 30% 25.2 2.6 128.1 106.6 76.6 42.4 34.2 45X
AJT'VEDNAGIAR 1,096 100% 210.5 664.5 134.2 2,333.9 2,116.9 1,825.0 1,383.7 141.3 24%
;HOLAPIJR 888 100% 146.0 271.4 10.0 859.2(est) 767.1 743.3 392.4 350.9 47%
"4IJAPITR 663 #1,239 120.0 128.0 3.2 663.2 510.3 482.6 232.6 250.0 52%
AdlANTAPJR 729 #950 80.0 54.7 14.9 396.2 283.0 247.4 47.6 199.8 81%
1/ Total resources consist of share capital, deposits,
borrowings and reserves.
CD
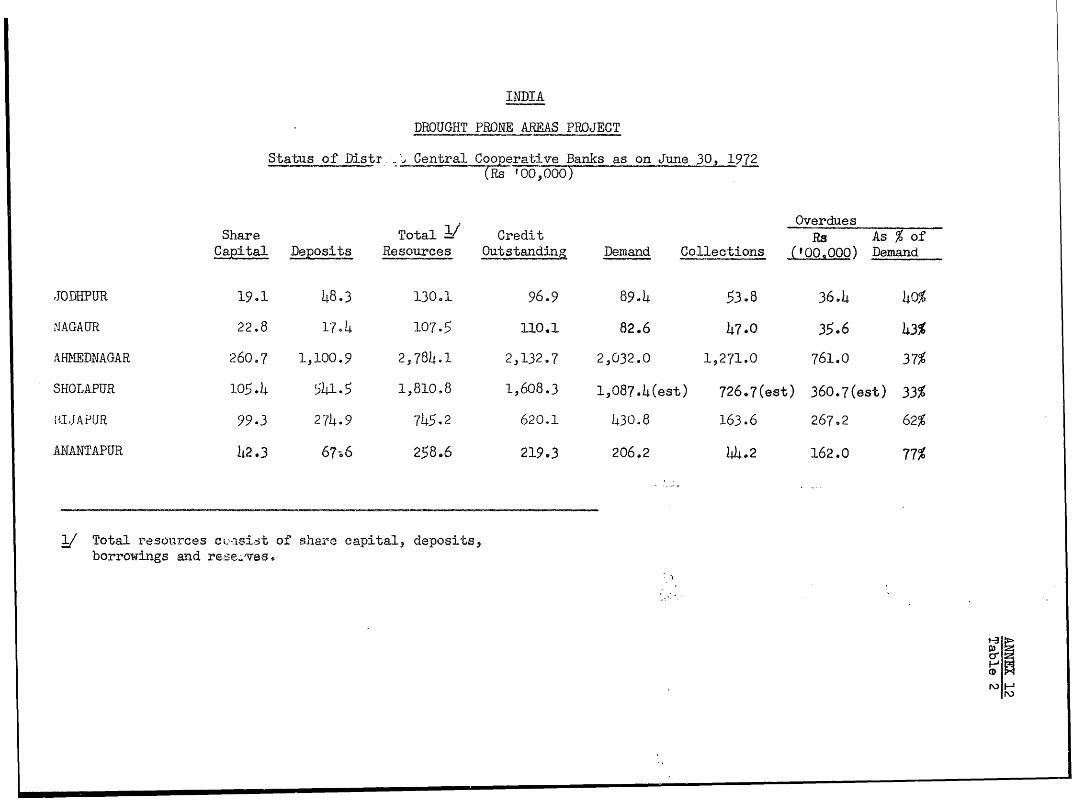
INDIA
DROUGHT PRONE AREAS PROJECT
Status of Distr- - Central Co2perative Banks as on June 30 1972(Rs '00,000
OverduesShare Total 1 Credit Rs As % ofCapital Deposits Resources Outstandi Demand Collections ('00.000) Demand
JODHPUR 19.1 48.3 130.1 96.9 89.L4 53.8 36.4 40%NAGAITR 22.8 17.4 107.5 110.1 82.6 47.0 35.6 43%AffMEDNAGAR 260.7 1,100.9 2,784,1 2,132.7 2,032.0 1,271.0 761.0 37%SH0OLAPTJR 105.4 i41.5 1,810.8 1,608.3 1,0 8 7.4(est) 726.7(est) 360.7(est) 33%UIIJAPUR 99.3 274e9 745.2 620.1 43o.8 163.6 267.2 62%ANANTAPUR 42.3 67!;6 258.6 219.3 206.2 144.2 162.0 77%
,/ Total resources c.*isst of sharc capital, deposits,borrowings and re'efves.
.-
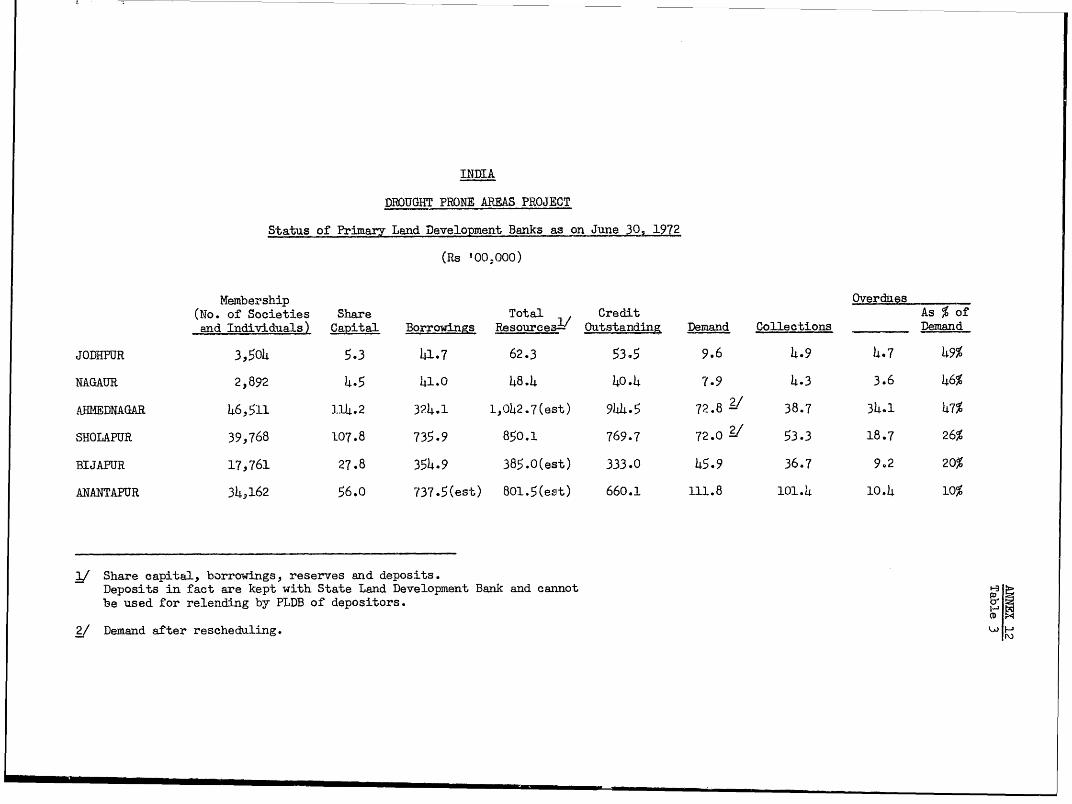
INDIA
DROUGHT PRONE AREAS PROJECT
Status of Primary Land Development Banks as on June 30, 1972
(HS '00,000)
Membership Overdues
(No. of Societies Share Total Credit As % of
and Individuals) Capital Borrowings Resources- Outstanding Demannd Collections - Demand
JODHPUR 3,504 5.3 41.7 62.3 53.5 9.6 4.9 4.7 49%
NAGAUR 2,892 4.5 41.0 48.4 40.4 7.9 4.3 3.6 46%
AFREDNAGAR 46,511 114.2 324.1 1,042.7(est) 944.5 72.8 2/ 38.7 34.1 47%
SHOLAPUR 39,768 107.8 735.9 850.1 769.7 72.0 ./ 53.3 18.7 26%
BIJAPUR 17,761 27.8 354.9 385.0(est) 333.0 45.9 36.7 9.2 20%
ANANTAPUR 34,162 56.o 737.5(est) 80o.5(est) 660.1 111.8 101.4 10.4 10%
1/ Share capital, borrowings, reserves and deposits.
Deposits in fact are kept with State Land Development Bank and cannot S
be used for relending by PLDB of depositors.
2/ Demand after rescheduling.
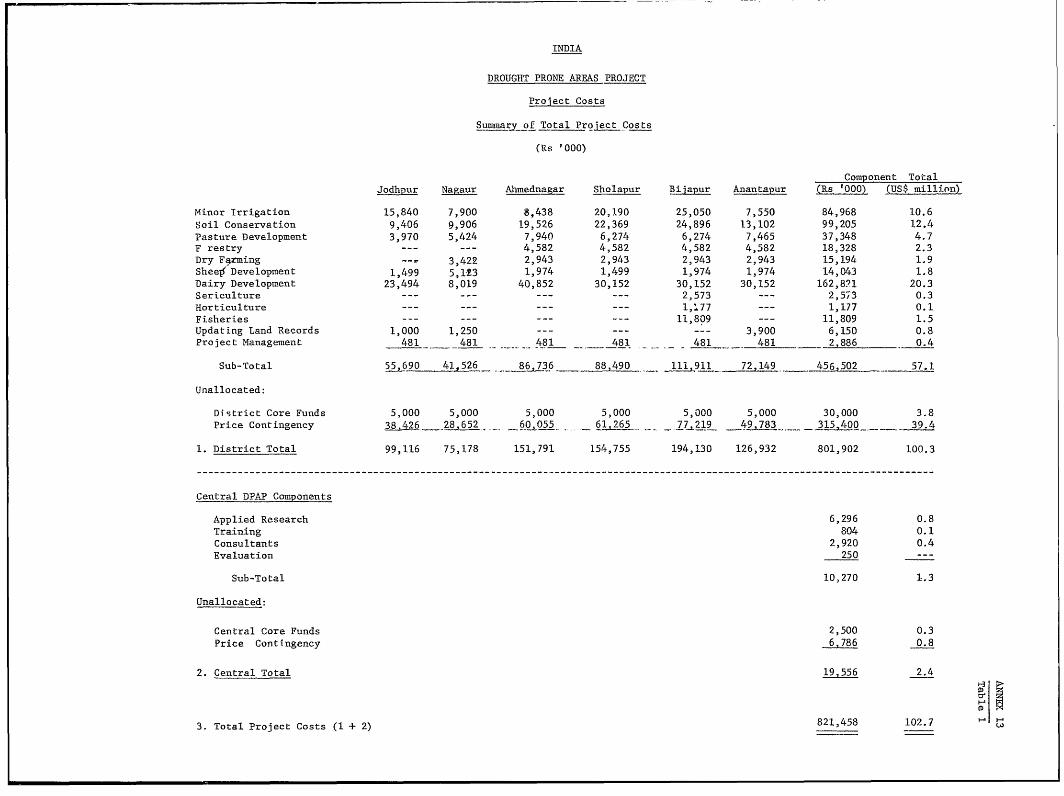
INDIA
DROUGHT PRONE AREAS PROJECT
Project Costs
Summary of Total Proqiet Costs
(Rs '000)
Component TotalJodhpur Nagaur Ahmednagar Sholapur Bijapur Anantapur (Rs '000) (USs million)
Minor Irrigation 15,840 7,900 8,438 20,190 25,050 7,550 84,968 10.6Soil Conservation 9,406 9,906 19,526 22,369 24,896 13,102 99,205 12.4Pasture Development 3,970 5,424 7,940 6,274 6,274 7,465 37,348 4.7F restry --- 4,582 4,582 4,582 4,582 18,328 2.3Dry Fgrming - 3,422 2,943 2,943 2,943 2,943 15,194 1.9Shee]' Development 1,499 5,13 1,974 1,499 1,974 1,974 14,043 1.8Dairy Development 23,494 8,019 40,852 30,152 30,152 30,152 162,8?1 20.3Sericulture --- --- --- --- 2,573 --- 2,573 0.3Horticulture --- --- --- 1,77 --- 1,177 0.1Fisheries -- ---- 11,809 --- 11,809 1.5Updating Land Records 1,000 1,250 --- --- --- 3,900 6,150 0.8Project Management 481 481 481 481 - 481 481 - 2,886 0.4
Sub-Total 55,690 41,526 86 736 88,_490 __91 _72_,149 456,502 57.1
Unallocated:
District Core Funds 5,000 5,000 5,000 5,000 5,000 5,000 30,000 3.8Price Contingency 38.426_28,652.- - 6_"O055 61,265 7 77_21 �9 4783 3154o- 39.4
1. District Total 99,116 75,178 151,791 154,755 194,130 126,932 801,902 100.3
Central DPAP Components
Applied Research 6,296 0.8Training 804 0.1Consultants 2,920 0.4Evaluation 250 ---
Sub-Total 10,270 1.3
Unallocated:
Central Core Funds 2,500 0.3Price Contingency 6,786 0.8
2. Central Total 19,556 2.4
3. Total Project Costs (1 + 2) 821,458 102.7
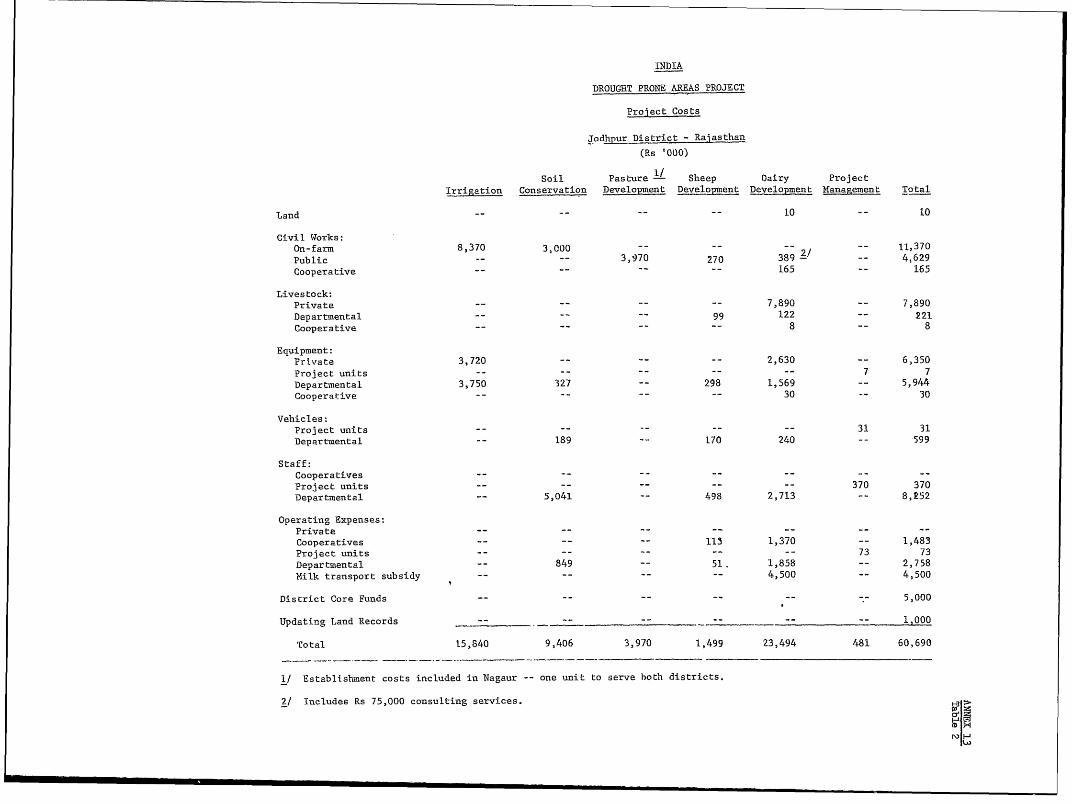
INDIA
DROUGHT PRONE AREAS PROJECT
Project Costs
Jodhpur District - Rajasthan
(Rs '000)
Soil Pasture 1L Sheep Dairy Project
Irrigation Conservation Development Development Development Management Total
Land - -- 10 -- 10
Civil tiorks:On-farm 8,370 3,000 -- -- -- 11,370
Public 3,970 270 389 2/ 4,629
Cooperative -- -- -- 165 -- 165
Livestock:Private -- -- -- -- 7,890 -- 7,890
Departmental -- -- -- 99 122 -- 221
Cooperative -- - 8 -- 8
Equipment:Private 3,720 -- -- -- 2,630 -- 6,350
Project units -- 7 7
Departmnental 3,750 327 -- 298 1,569 -- 5,944
Cooperative -- - - 30 -- 30
Vehicles:Project units - -- -- 31 31
Departmental -- 189 -- 170 240 -- 599
Staff:Cooperatives - - -- - - -- - - - - - -
Project units -- -- -- -- -- 370 370
Departmental -- 5,041 -- 498 2,713 8,252
Operating Expenses:Private -- -- -- -- -- --
Cooperatives -- -- -- 113 1,370 -- 1,483
Project units -- -- -- -- -- 73 73
Departmental -- 849 -- 51. 1,858 -- 2,758
Milk transport subsidy -- -- -- -- 4,500 -- 4,500
District Core Funds -- -- -- -- -- -- 5,000
Updating Land Records -- 1,000
Total 15,840 9,406 3,970 1,499 23,494 481 60,690
1/ Establishment costs included in Nagaur -- one unit to serve both districts.
2/ Includes Rs 75,000 consulting services. ,
rV H
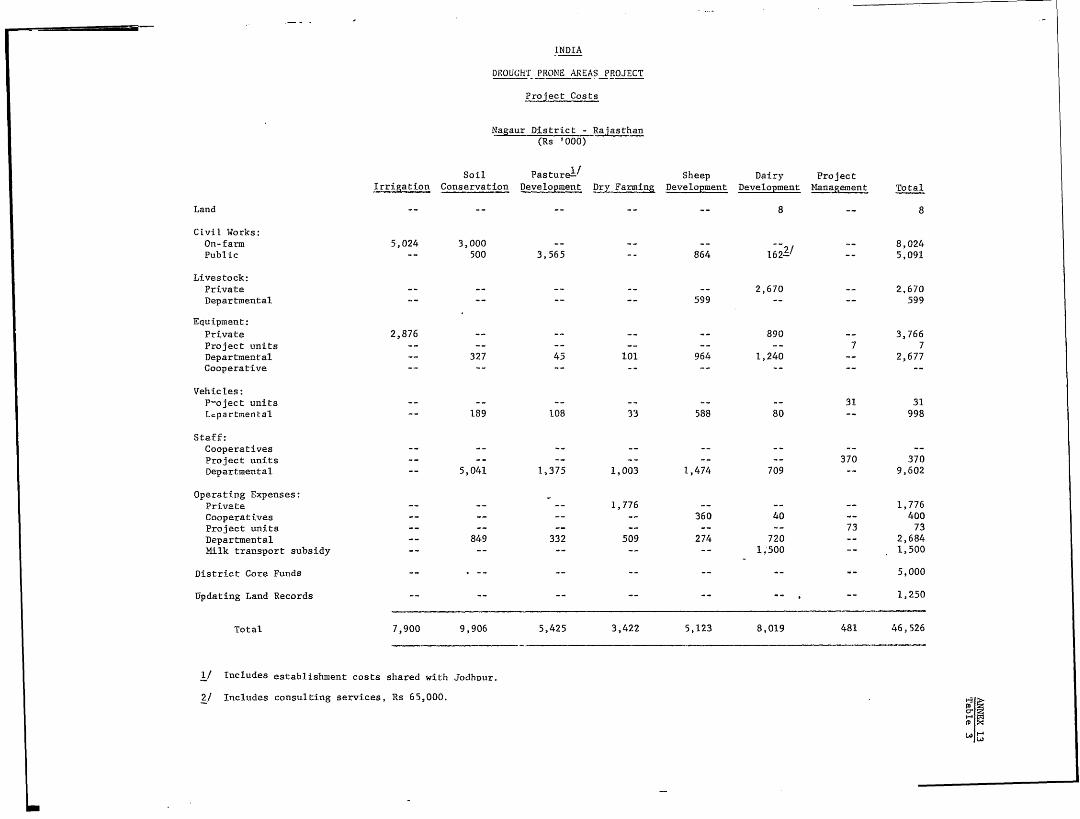
INDIA
DROUGHHT PRONE AREAS PROJECT
Project Costs
Nagaur District - Rajasthan(Rs '000)
Soil Pasture'l/ Sheep Dairy ProjectIrrigation Conservation Development Dry Farming Development Development Management TotalLand - -- --
8 -- 8Civil Works:On-farm
5,024 3,000 - -- 8,024
Public -- 500 3,565 -- 864 16221 -- 5,091Livestock:
Private -- -- -- -- -- 2,670 -- 2,670
Departmental - -- -- -- 599 -- 599Equipment:
Private 2,876 -- -- -- -- 890 -- 3,766
Project units -- -- -- -- -- -- 7 7Departmental
-- 327 45 101 964 1,240 -- 2,677Cooperative
-- -- - - - -- -- -- --Vehicles:P-oject units -- -- -- - - 31 31L.partmental
-- 189 108 33 588 80 -- 998Staff:Cooperatives
-- -- -- -- -- - - -Project units -- -- -- -- -- 370 370Departmental
-- 5,041 1,375 1,003 1,474 709 -- 9,602Operating Expenses: -Private
-1,776 -- -- -- 1,776
Cooperatives -- -- -- -- 360 40 -- 400
Project units -- -- -- -- -- -- 73 73Departmental
-- 849 332 509 274 720 -- 2,684Milk transport subsidy -- -- -- -- -- 1,500 -- 1,500District Core Funds -- -- -- -- -- -- -- 5,000Updating Land Records -- -- -- -- -- -- -- 1,250
Total 7,900 9,906 5,425 3,422 5,123 8,019 481 46,526
I/ Includes establishment costs shared with Jodhnur.
2/ Includes consulting services, Rs 65,000.
cDX
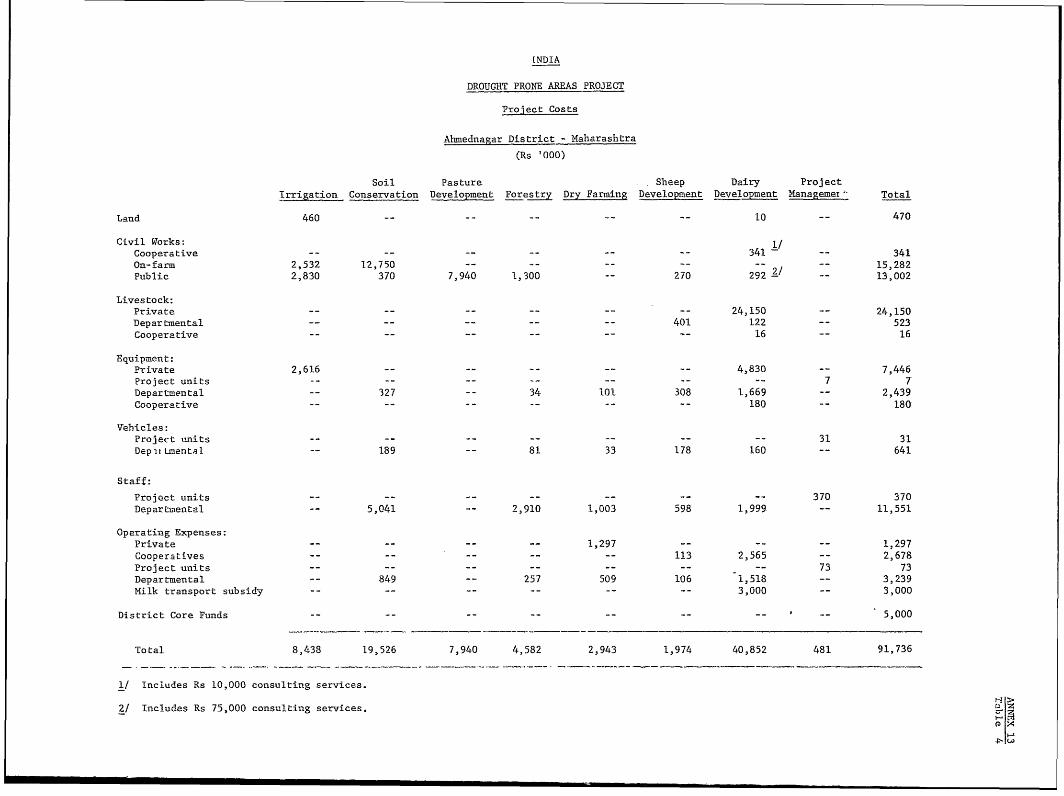
([NDIA
DROUGHT PRONE AREAS PROJECT
Project Costs
Ahmednagar District - Maharashtra
(Rs '000)
Soil Pasture Sheep Dairy Project
Irrigation Conservation Development Forestry Dry Farming Development Development Managemet'- Total
Land 460 - 10 -- 470
Civil Works: 1/
Cooperative -- -- -- - 341 -- 341
On-farm 2,532 12,750 -- 15,282
Public 2,830 370 7,940 1,300 -- 270 292 2/ 13,002
Livestock:Private -- -- -- -- -- -- 24,150 -- 24,150
Departmental -- -- -- -- -- 401 122 -- 523
Cooperative -- -- -- -- -- ^- 16 16
Equipment:Private 2,616 -- -- -- -- -- 4,830 -- 7,446
Project units -- -- -- -- -- -- -- 7 7
Departmental -- 327 -- 34 lOl 308 1,669 -- 2,439
Cooperative - -- -- 180 -- 180
Vehicles:Project units -- -- -- -- -- -- -- 31 31
Depir Lmental -- 189 -- 81 33 178 160 -- 641
Staff:
Project units -- -- -- 370 370
Departmental -- 5,041 -- 2,910 1,003 598 1,999 -- 11,551
Operating Expenses:Private -- -- -- -- 1,297 -- -- -- 1,297
Cooperatives -- -- -- -- -- 113 2,565 -- 2,678
Project units -- -- -- -- -- -- 73 73
Departmental -- 849 -- 257 509 106 1,518 -- 3,239
Milk transport subsidy -- -- -- -- -- -- 3,000 -- 3,000
District Core Funds -- -- -- -- -- -- -- -- 5,000
Total 8,438 19,526 7,940 4,582 2,943 1,974 40,852 481 91,736
1/ Includes Rs 10,000 consulting services.
2/ Includes Rs 75,000 consulting services.CDM
4-,
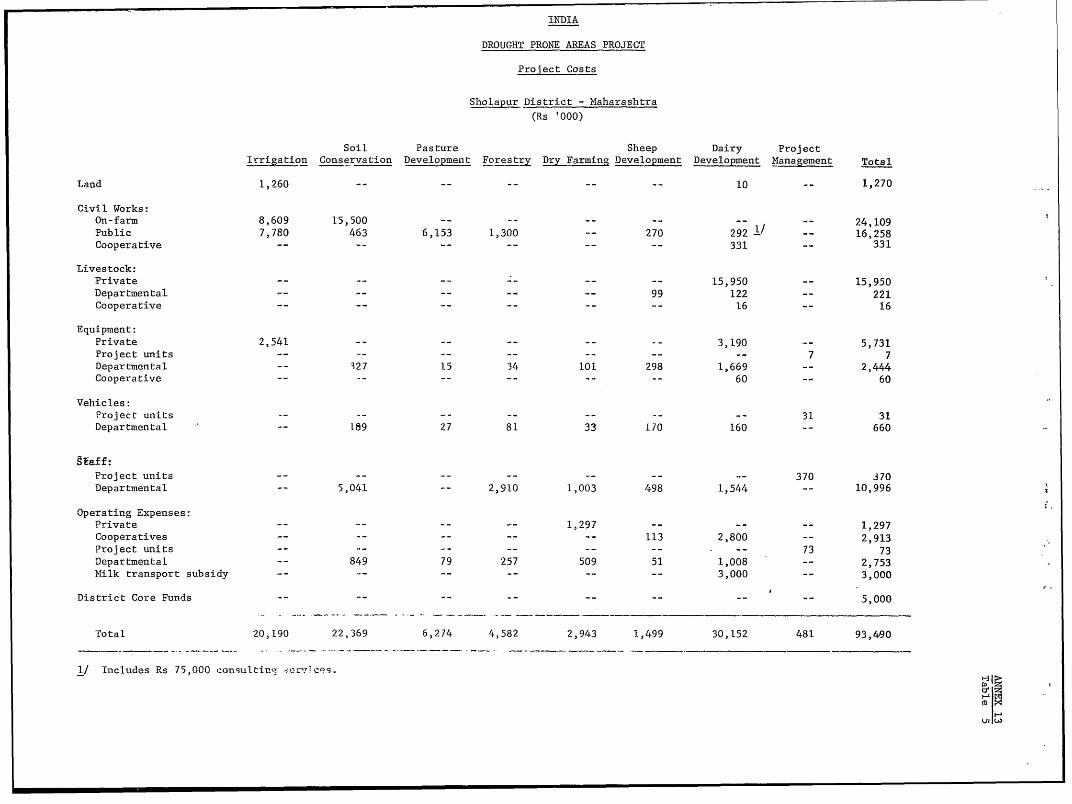
INDIA
DROUGHT PRONE AREAS PROJECT
Project Costs
Sholapur District - Maharashtra
(Rs '000)
Soil Pasture Sheep Dairy ProjectIrrigation Conservation Development Foresstry Dry Farming Development Development Management Total
Land 1,260 10 -- 1,270
Civil Works:On-farm 8,609 15,500 -- 24,109Public 7,780 463 6,153 1,300 -- 270 292 1' -- 16,258Cooperative -- -- -- 331 -- 331
Livestock:Private -- -- -- -- -- -- 15,950 -- 15,950Departmental -- -- -- -- -- 99 122 -- 221Cooperative -- -- -- -- -- -- 16 -- 16
Equipment:Private 2,541 -- -- -- -- -- 3,190 -- 5,731Project units -
7 7Departmental -- 327 15 34 101 298 1,669 -- 2,444Cooperative -- -- -- -- -- -- 60 -- 60
Vehicles:Project units - -- 31 31Departmental -- 189 27 81 33 170 160 ^- 660
gtaff:
Project units -- -- -- -- - 370 370Departmental -- 5,041 -- 2,910 1,003 498 1,544 -- 10,996
Operating Expenses:Private -- -- -- -- 1,297 - -- 1,297Cooperatives -- -- -- 113 2,800 2,913Project units -- - - .-- 73 73Departmental -- 849 79 257 509 51 1,008 -- 2,753Milk transport subsidy -- -- -- -- -- -- 3,000 -- 3,000
District Core Funds - - -- -- 5,000
Total 20,190 22,369 6,274 4,582 2,943 1,499 30,152 481 93,490
1/ Includes Rs 75,000 consultiu, -- ei-es.
fr0UlDU
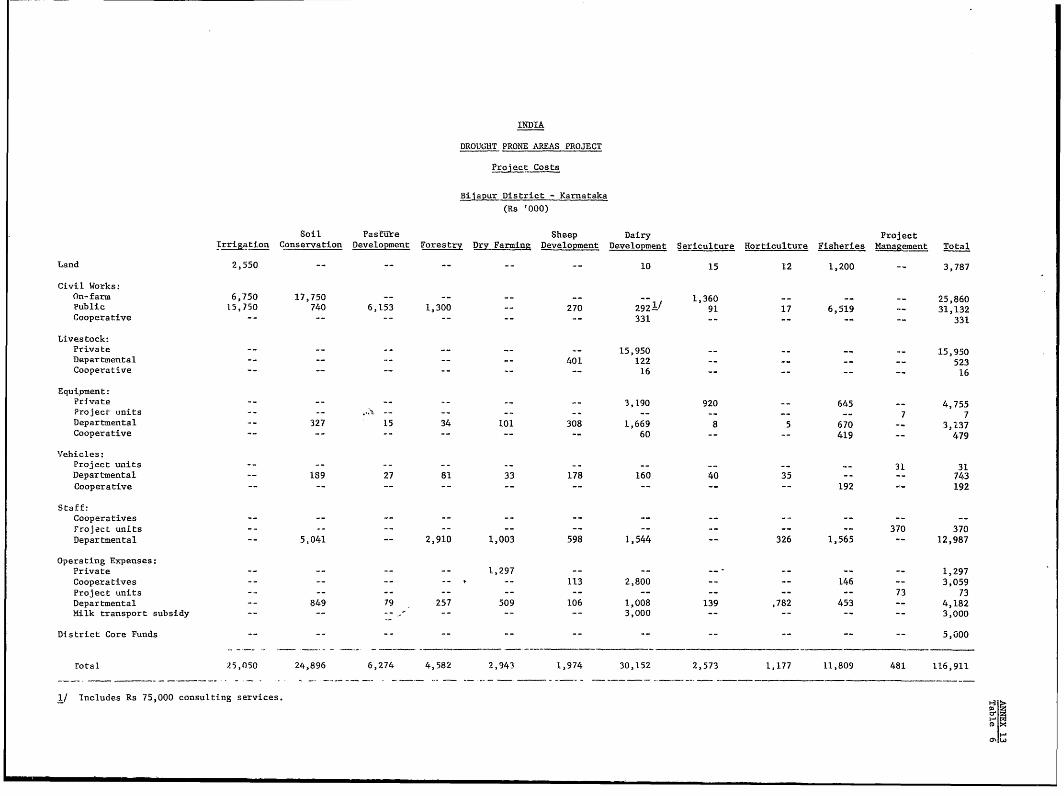
INDIA
DROUGHT PRONE AREAS PROJECT
Project Costs
Bijapur District - Karnataka
(Rs '000)
Soil PastEire Sheep Dairy Project
Irrigation Conservation Development Forestry Dry Farming Development Development Sericulture Horticulture Fisheries Management Total
Land 2,550 10 15 12 1,200 -- 3,787
Civil Works:On-farm 6,750 17,750 1-- - -^ 1360 -- -- -- 25,860
Public 15,750 740 6,153 1,300 -- 270 2921/ 91 17 6,519 -- 31,132
Cooperative -- -- -- -- -- -- 331 -- -- -- -- 331
Livestock:Private -- -- - -- 15,950 -- -- -- -- 15,950
Departmental -- -- -- -- 401 122 -- -- -- 523
Cooperative -- -- -- -- -- -- 16 -- -- -- -- 16
Equipment:Private -- -- -- -- 3,190 920 -- 645 -- 4,755
Project units -- -- -- -- -- -- -- -- -- -- 7 7
Departmental -- 327 15 34 101 308 1,669 8 5 670 -- 3,137
Cooperative -- -- -- -- -- -- 60 -- -- 419 479
Vehicles:Project units -- -- -- -- -- -- -- -- 31 31
Departmental -- 189 27 81 33 178 160 40 35 -- -- 743
Cooperative -- -- -- -- -- -- -- -- -- 192 -- 192
Staff:Cooperatives -- -- -- -- -- -- -- -- -- -- -- --
Froject units -- -- -- -- -- -- -- -- -- -- 370 370
Departmental -- 5,041 -- 2,910 1,003 598 1,544 -- 326 1,565 -- 12,987
Operating Expenses:Private -- - -- -- 1,297 -- -- -- -- -- 1,297
Cooperatives -- -- -- -- -- 113 2,800 -- -- 146 -- 3,059
Project units -- -- -- -- -- -- -- 73 73
Departmental -- 849 79 257 509 106 1,008 139 ,782 453 -- 4,182
Milk transport subsidy -- -- -- -- -- -- 3,000 -- -- -- -- 3,000
District Core Funds -- -- -- -- -- -- -- -- -- -- -- 5,000
rotal 25,050 24,896 6,274 4,582 2,943 1,974 30,152 2,573 1,177 11,809 481 116,911
1/ Includes Rs 75,000 consulting services.
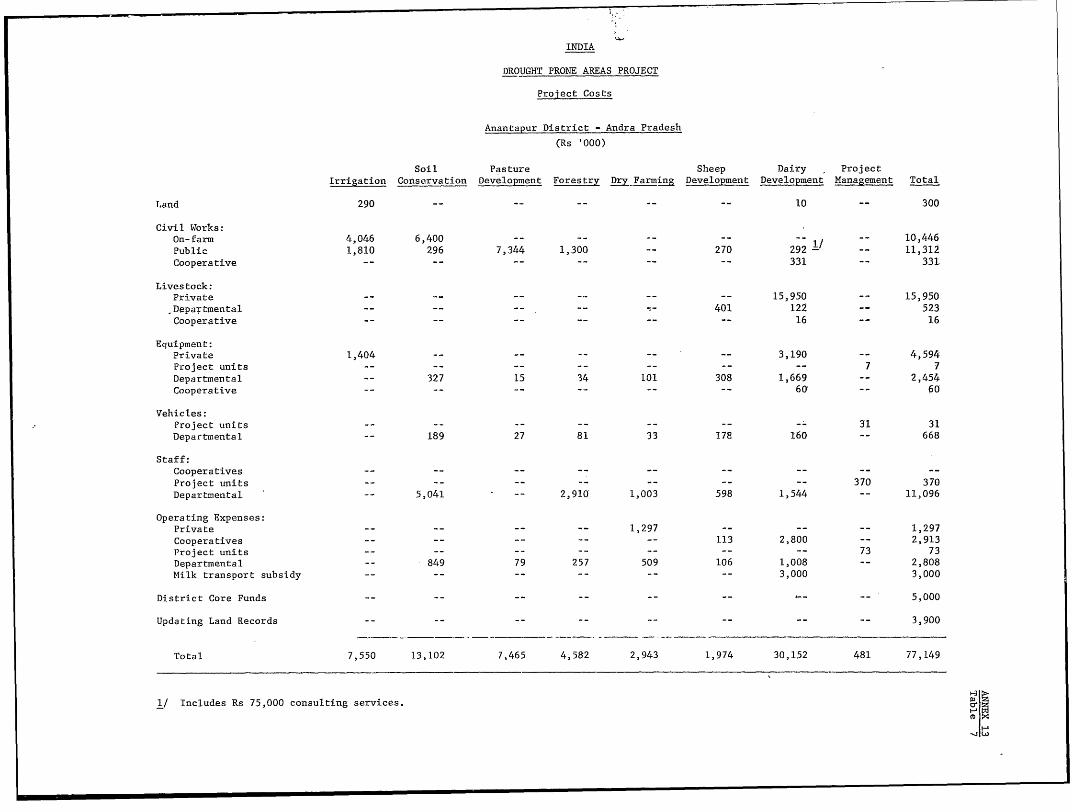
INDIA
DROUGHT PRONE AREAS PROJECT
Project Costs
Anantapur District - Andra Pradesh
(Rs '000)
Soil Pasture Sheep Dairy ProjectIrrigation Conservation Development Forestry Dry_Farming Development Development Management Total
Land 290 -- 10 -- 300
Civil Works:On-farm 4,046 6,400 -- -- -- -- -- -- 10,446Public 1,810 296 7,344 1,300 -- 270 292 -- 11,312Cooperative -- -- -- -- -- -- 331 -- 331
Livestock:Private -- - -- -- 15,950 -- 15,950Depa,tmental -- -- -- -- - 401 121 -- 523Cooperative -- -- -- -- -- -- 16 -- 16
Equipment:Private 1,404 - -- -- 3,190 -- 4,594Project units -- -- - 7 7Departmental -- 327 15 34 101 308 1,669 -- 2,454Cooperative -- -- -- -- -- -- 60 -- 60
Vehicles:Project units -- -- -- -- -- -- -- 31 31Departmental -- 189 27 81 33 178 160 -- 668
Staff:Cooperatives -- -- - -- - - - - -Project units -- -- -- -- -- - -- 370 370Departmental -- 5,041 -- 2,910 1,003 598 1,544 -- 11,096
Operating Expenses:Private -- -- -- -- 1,297 -- -- 1,297Cooperatives -- -- -- -- -- 113 2,800 -- 2,913Project units -- -- -- -- -- 73 73Departmental -- 849 79 257 509 106 1,008 -- 2,808Milk transport subsidy -- -- -- -- -- -- 3,000 3,000
District Core Funds -- -- - -- -- -- - 5,000Updating Land Records -- -- -- -- -- -- -- -- 3,900
Total 7,550 13,102 7,465 4,582 2,943 1,974 30,152 481 77,149
1/ Includes Rs 75,000 consulting services.
I,r
-I U
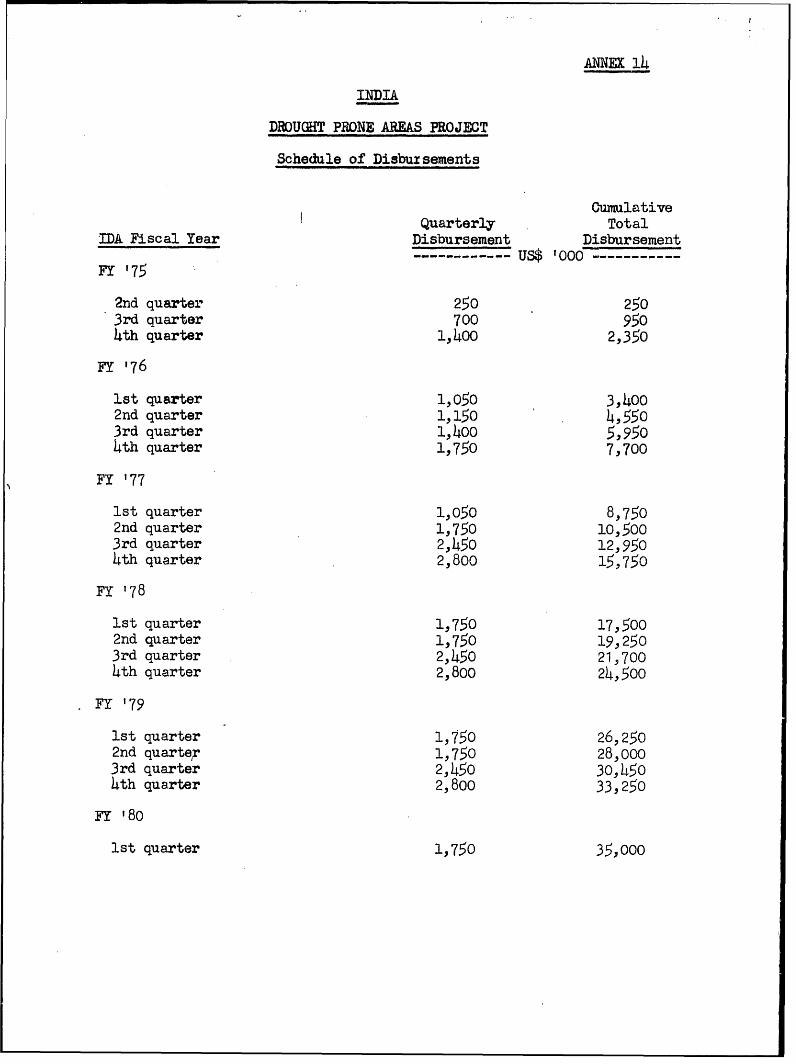
ANNEX 14
INDIA
DROUGHT PRONE AREAS P!ROJECT
Schedule of Disbursements
CumulativeQuarterly Total
IDA Fiscal Year Disbursement Disbursement------------ Us$ 000- ---------
FY '75
2nd quarter 250 2503rd quarter 700 9504th quarter 1,400 2,350
FY '76
1st qarter 1,050 3,4002nd quarter 1,150 4,5503rd quarter 1,400 5,9504th quarter 1,750 7,700
FY '77
1st quarter 1,050 8,7502nd quarter 1,750 10,5003rd quarter 2,450 12,9504th quarter 2,800 15,750
FY '78
1st quarter 1,750 17,5002nd quarter 1,750 19,2503rd quarter 2,450 21,7004th quarter 2,800 24,500
FX '79
lst quarter 1,750 26,2502nd quarter 1,750 28,0003rd quarter 2,450 30,4504th quarter 2,800 33,250
FY '80
1st quarter 1,750 35,000
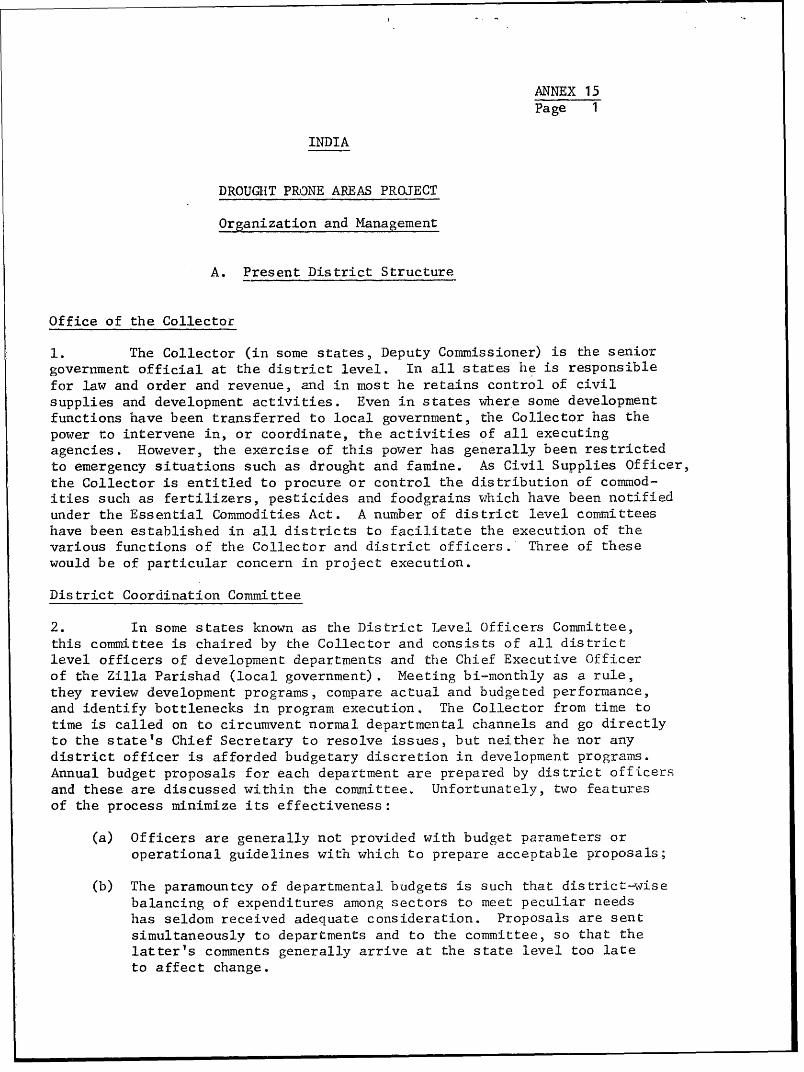
ANNEX 15Page 1
INDIA
DROUGHIT PRODNE AREAS PROJECT
Organization and Management
A. Present District Structure
Office of the Collector
1. The Collector (in some states, Deputy Commissioner) is the seniorgovernment official at the disitrict level. In all states he is responsiblefor law and order and revenue, and in most he retains control of civilsupplies and development activities. Even in states where some developmentfunctions have been transferred to local government, the Collector has thepower to intervene in, or coordinate, the activities of all executingagencies. However, the exercise of this power has generally been restrictedto emergency situations such as drought and famine. As Civil Supplies Officer,the Collector is entitled to procure or control the distribution of commod-ities such as fertilizers, pesticides and foodgrains which have been notifiedunder the Essential Commodities Act. A number of district level committeeshave been established in all districts to facilitate the execution of thevarious functions of the Collector and district officers. Three of thesewould be of particular concern in project execution.
District Coordination Committee
2. In some states known as the District Level Officers Committee,this committee is chaired by the Collector and consists of all districtlevel officers of development departments and the Chief Executive Officerof the Zilla Parishad (local government). Meeting bi-monthly as a rule,they review development programs, compare actual and budgeted performance,and identify bottlenecks in program execution. The Collector from time totime is called on to circumvent normal departmental channels and go directlyto the state's Chief Secretary to resolve issues, but neither he nor anydistrict officer is afforded budgetary discretion in development prograns.Annual budget proposals for each department are prepared by district officersand these are discussed within the committee. Unfortunately, two featuresof the process minimize its effectiveness:
(a) Officers are generally not provided with budget parameters oroperational guidelines with which to prepare acceptable proposals;
(b) The paramountcy of departmental budgets is such that district-wisebalancing of expenditures among sectors to meet peculiar needshas seldom received adequate consideration. Proposals are sentsimultaneously to departments and to the committee, so that thelatter's comments generally arrive at the state level too lateto affect change.
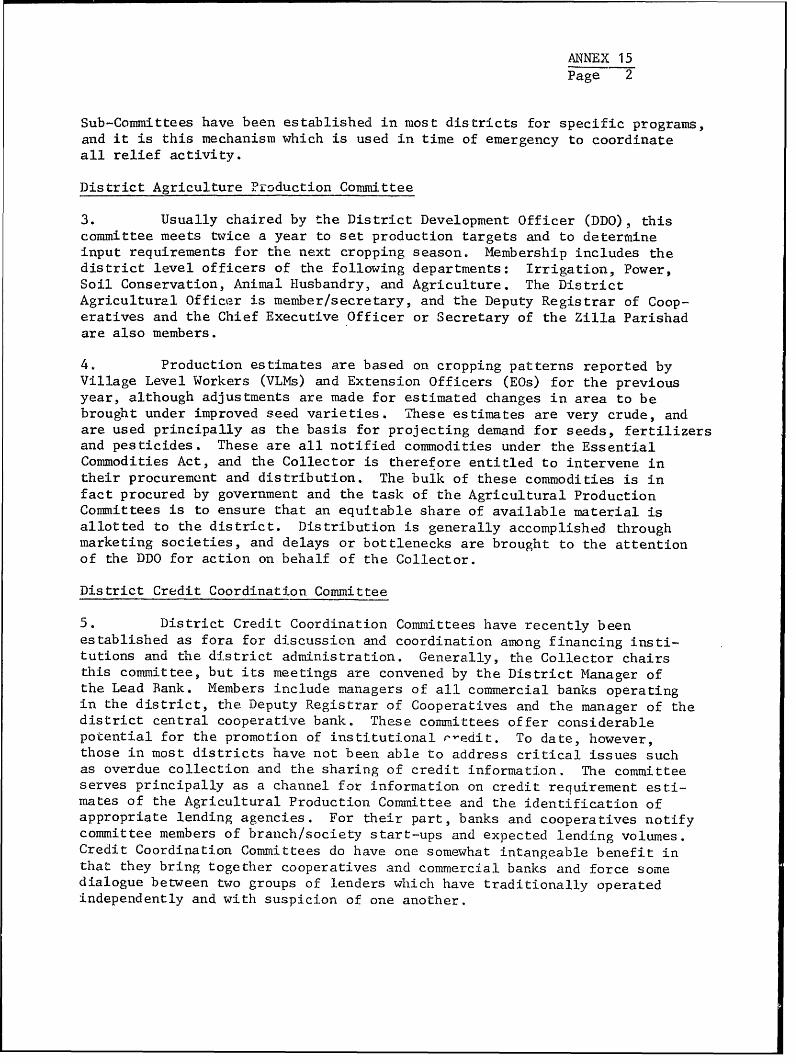
ANNEX 15Page 2
Sub-Committees have been established in most districts for specific programs,and it is this mechanism which is used in time of emergency to coordinateall relief activity.
District Agriculture lroduction Committee
3. Usually chaired by the District Development Officer (DDO), thiscommittee meets twice a year to set production targets and to deterœaineinput requirements for the next cropping season. Membership includes thedistrict level officers of the following departments: Irrigation, Power,Soil Conservation, Animal Husbandry, and Agriculture. The DistrictAgricultural Officer is member/secretary, and the Deputy Registrar of Coop-eratives and the Chief Executive Officer or Secretary of the Zilla Parishadare also members.
4. Production estimates are based on cropping patterns reported byVillage Level Workers (VLMs) and Extension Officers (EOs) for the previousyear, although adjustments are made for estimated changes in area to bebrought under improved seed varieties. These estimates are very crude, andare used principally as the basis for projecting demand for seeds, fertilizersand pesticides. These are all notified commodities under the EssentialCommodities Act, and the Collector is therefore entitled to intervene intheir procurement and distribution. The bulk of these commodities is infact procured by government and the task of the Agricultural ProductionCommittees is to ensure that an equitable share of available material isallotted to the district. Distribution is generally accomplished throughmarketing societies, and delays or bottlenecks are brought to the attentionof the DDO for action on behalf of the Collector.
District Credit Coordination Committee
5. District Credit Coordination Committees have recently beenestablished as fora for discussion and coordination among financing insti-tutions and the district administration. Generally, the Collector chairsthis committee, but its meetings are convened by the District Manager ofthe Lead Bank. Members include managers of all commercial banks operatingin the district, the Deputy Registrar of Cooperatives and the manager of thedistrict central cooperative bank, These committees offer considerablepotential for the promotion of institutional r-edit. To date7 however,those in most districts have not been able to address critical issues suchas overdue collection and the sharing of credit information. The committeeserves principally as a channel for information on credit requirement esti-mates of the Agricultural Production Committee and the identification ofappropriate lending agencies. For their part, banks and cooperatives notifycommittee members of branch/society start-ups and expected lending volumes.Credit Coordination Committees do have one somewhat intangeable benefit inthat they bring together cooperatives and commercial banks and force somedialogue between two groups of lenders wilich have traditionally operatedindependently and with suspicion of one another.
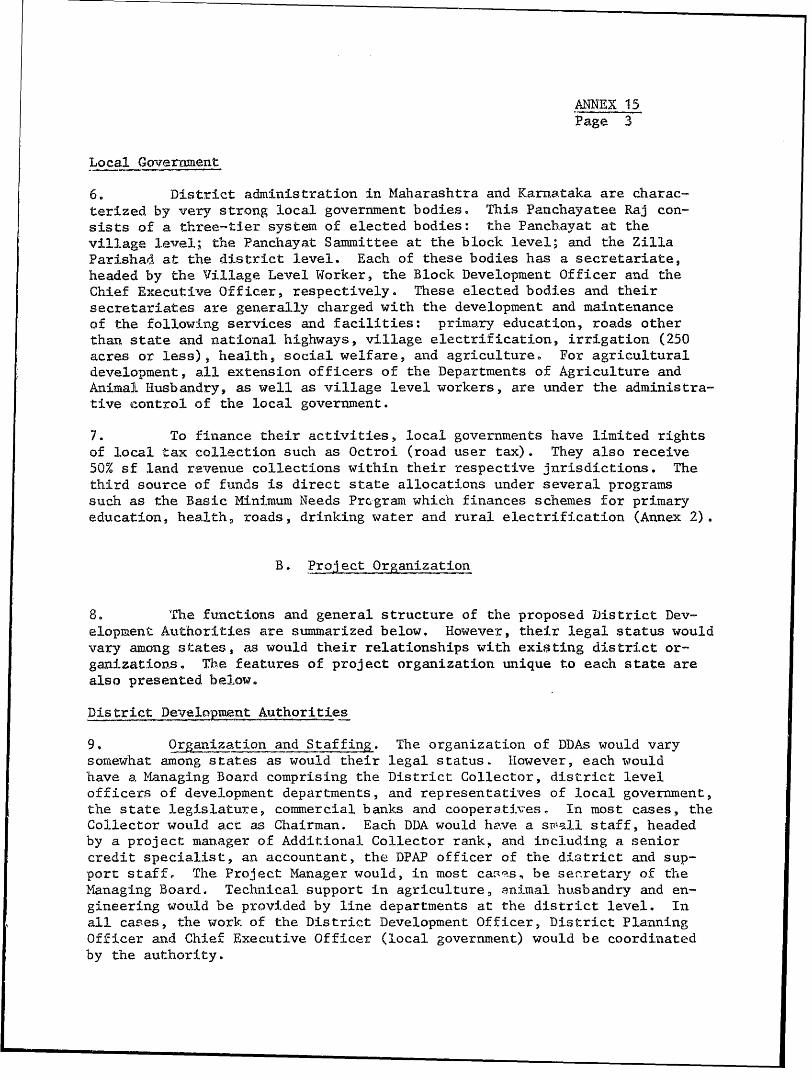
ANN{EX 15Page 3
Local Goverrnment
6. District administration in Maharashtra and Karnataka are charac-
terized by very strong local government bodies. This Panchayatee Raj con-
sists of a three-tier system of elected bodies: the Panchayat at the
village lievel; the Panchayat Saimmittee at the block level; and the Zilla
Parishad at the district level. Each of these bodies has a secretariate,
headed by the Village Level Worker, the Block Developmernt Officer and the
Chief Executive Officer, respectively. These elected bodies and their
secretariates are generally charged with the development and maintenance
of the following services and facilities: primary education, roads other
than state a-nd national highways, village electrification, irrigation (250
acres or less), health, social welfare, and agriculture. For agricultural
development, all extension officers of the Departments of Agriculture and
Animal HIusbandry, as well as village level workers, are under the administra-
tive control of the local government.
7. To finance their activities, local governments have limited rights
of local tax collection such as Octroi (road user tax). They also receive
50% sf land revenue collections within their respective inrisdictions. The
third source of funds is direct state allocations under several programs
such as the Basic Minimum Needs Prc-gram which finances schemes for primary
education, health, roads, drinking water and rural electrification (Annex 2).
B. Project Organization
8. The functions and general structure of the proposed District Dev-
elopment Authorities are summarized below. However, their legal status would
vary among states, as would their relationships with existing district or-
ganizations. The features of project organization unique to each state are
also presented below.
District Development Authorities
9. Organization and Staffing. The organization of DDAs would vary
somewhat among states as would their legal status. Hlowever, each would
have a Managing Board comprising the District Collector, district level
officers of development departments, and representatives of local government,
the state legislature, commercial banks and cooperatives, In most cases, the
Collector would act as Chairman. Each DDA would have, a sroall staff, headed
by a project manager of Additional Collector rank, and including a senior
credit specialist, an accountant, the DPAP officer of the district and sup-
port staff, The Project Manager would, in most cas.s, be senretary of th.e
Managing Board. Technical support in agriculture, animal husbandry and en-
gineering would be provided by line departments at the district level. In
all cases, the work of the District Development Officer, District Planning
Officer and Chief Executive Officer (local government) would be coordinated
by the authority.
ANNEX 15Page rs
10. Functions of the DDA with Respect to DPAP. Project responsibili-
ties of the DDAs would include:
(a) Preparation of annual project plans and budgets
for submission to state and central authorities;
(b) Coordination of project execution by development
departments and agencies;
(c) Expedition of agricultural credit application-s by
liaison with Village Level Workers, Village Accountants,
and Land Revenue Officers;
(d) Administration and financial control of the subsidy
program for smallholders and agricultural laborers;
(e) Preparation, with the assistance of development depart-
ments, of small schemes to be financed from unallocated
district funds, subject to State DPAP approval;
(f) Financial control of unallocated district funds for
(e) above; and
(g) Project monitoring, including the preparation of
monthly financial and physical performance-reports.
11. Functions of the DDA as District Planning..Agency. Although ,some
time will be required for the DDA to acquire the capacity and authority to
assume primary planning responsibility for the district, the following fuLnc-
tions would be assigned to it by the end of the project period:
(a) Conduct of resource and need surveys within the districtand tne assembly of existing surveys to maintain a current
awareness of development status;
(b) Preparation of annual district plans by coordinating the
planning efforts of individual departments'and agencies,
and presentation of plans to state planhning commissions;
(c) Coordination of DPAP with other development activities in
the district;
(d) Assurance that plans and technical designs would be pre-
pared by development departments to establish a "shelf"
of relief works and, under direction of the Collector,assistance in the conduct of relief works;
ANNEX 15Page 5
(e) Participation in the operation and mainte.nance of develop-ment programs by membership on district committees suchas the Agricultural Production Committee and the CreditCoordination Committee; and
(f) Preparation, with the assistance of depa;w .ments, of fi-nancing schemes for presentation to credit institutions.
Initially, these functions could be carried out by exist.ing and proposedstaff, but an experienced planning officer will be required toward the endof the project period. The timing and qualifications for this appointmentwill be discussed during negotiations.
12. Delegation of Powers. To ensure that the authority and its staffare able to carry out the assigned functions, it would be essential thatpowers be vested in it as follows: right to solicit reports pertaining todevelopment activities and land records from all departments and agencieswithin the district; right to solicit budget guidelines and allocationsfrom development departments and agencies at the state level to assist indt;trict planning; representation on its own behalf or through the stateDPAP unit to state departments and the planning commission; and administra-tive and financial sanction of funds vested in it.
Rajasthan Proect Organization
13. The Jodhpur Development Agency and the Nagaur Development Agencywould be formed under the Societies Act for project implementation inRajasthan. Their legal status would be similar to SFDA and MFAL agencies,and they would be entitled to contract and hold funds in their own names.Boards would include thie Manager, Central Arid Zone Research Institute andthe Divisional Manager, Rajasthan Groundwater Board. Project Officers func-tioning under the Manager would be responsible for the coordination of proj-ect components by discipline rather than by sub-district area as in otherstates. Chart I depicts state and district relationships among units con-cerned with DPAP.
Maharashtra Pro ect Organization
14. Maharashtra has been a leading state ir, the development of localgoverrnment. Project management has been designed to fit into the uniqueset of structures that exist as a result of local government, and to pro-vide staff to car-:y out functions delegated to district agencies.
15. District Planning Board. Beginning with Fiscal Year 1974 (April 1,1974) Maharashtra has introduced district budgeting, whereby all developmentresources available to the State 1/ are allocated to distri'ets using a rather
1/ Except those for power development, research, and government corporateventures.
ANNEX 15Page 6
complex formula including factors suich as: population (total, urban andscheduled castes and tribes), and agricultural, communication, and irriga-tion backwardness. Although this exercise is called District Planning,actual planning continues to be done on a sectoral basis by state depart-ments, with sub-divisional, district and divisional officers initiatingproposals for activities in individual districts. Despite the continueddominance of state departments in planning, District Planning Boards (DPB)were constituted to assume the planning function, and to coordinate planimplementation. The Chairman of the DPB is the state minister in chargeof the specific district. 1/ Members include: Divisional Commissioner asVice-Chairman, Collector, President of the Zilla Parishad as the MemberSecretary. Unfortunately, the DPBs were not provided with permanentsecretariates, nor was their role vis a vis ;tate departments and localgovernment clearly defined. As a result, they have emerged as ineffectivefora for the discussion of state and local plans which are often finalizedbefore such discussion takes place.
16. The most suitable means of providing project management at thedistrict level would be to establ3sh the office of Executive Director (ED)to the Planning Board and to provide this senior officer with a small coreof support staff. The ED would be the Member/Secretary of the ExecutiveCommittee of the Planning Board, consisting of the Mi.nister-in-Charge asChairman, the Divisional Commissioner, the President of the Zilla Parashad,the Collector, and the Chief Executive Officer of the Zilla Parashad. ThePlanning Board and its secretariate would constitute the District Develop-ment Authority, and would assume the responsibilities described above. Proj-ect relationships are depicted in Chart 2.
Karnataka Project Organization
17. To execute the proposed project the Bijapur Development Authoritywould be created with the following structure:
1/ A system of Ministers-in-Charge has been adopted in Maharashtra toprovide a direct link between the district and the state legislature.
ANNEX 15Page 7
Chairman: Divisional Commissioner 1/
Vice-Chairman: Deputy Commissioner
Managing Director: Deputy Commissioner
Board: Managers of lead bank, land development bank, anddistrict central cooperative bank, one representativeeach of GOX and state government, president of oneTaluka Development Board (nominated by state govern-ment), two or three non-officials (nominated bystate government).
18. The Managing Director (DC) would have a core staff consisting ofa Joint Director, Agriculture, and a senior officer of the Department ofAnimal Husbandry each seconded to the Agency, as well as a project econo-mist, an administrative officer, an accountant and the requisite supportstaff. As in other states, the project would be executed through existingdepartments, with additional staff as required. Chart 3 presents state anddistrict organizatior for DPAP.
Andhra Pradesh Project Organization
19. To carry out DPAP Anantapur would have a development agency similarto those of SFDA and MFAL with management as follows:
Chairman: Collector
Vice-Chairman: Chairman of Zilla Parishad
Board of Director: District level officers of agriculture,forestry, public works and animal husbandrydepartments;
- Deputy Registrar of Cooperatives
- 3 non-official members to be nominatedby government on the recommendation ofthe Collector
1/ Karnacaka, like Maharashtra, has a strong divisi.nal (multi-district)link in the administrative structure. Although all departments havedistrict-level officers, they are closely supervised by divisionalofficers and overall surveillance is maintained by the DivisionalCommission. The Commissioner also holds the position of Joint Dev-elopment Commissioner and is therefore answerable to the DevelopmentCommissioner (Bangalore) as well as to the Chief Secretary. He visitseach district regularly and has the right of inspection for all devel-opments and offices.
ANNEX 15Page 8
The agency would have a Project Manager of the rank of District RevenueOfficer (second only to Collector in rank and salary) and staff similarto that proposed for other project districts. (See Chart 4).
20. Rural Service Centers (RSC). Under the Anantapur DevelopmentAgency, it is proposed to establish rural service centers in project areasnow inadequately served by extension, input and marketing facilities. Theirlocation would be determined on the basis of accessability to large numbersof farmers, usually in one of a cluster of villages within a watershed orcommand area. Their staff, responsible to the agency, would consist of: amanager of the rank of deputy director, agriculture; and, as appropriate,an agricultural engineering supervisor; a veterinary assistant surgeon; afodder development assistant; an extension officer, cooperatives; and anadministrative officer.
November 4, 1974
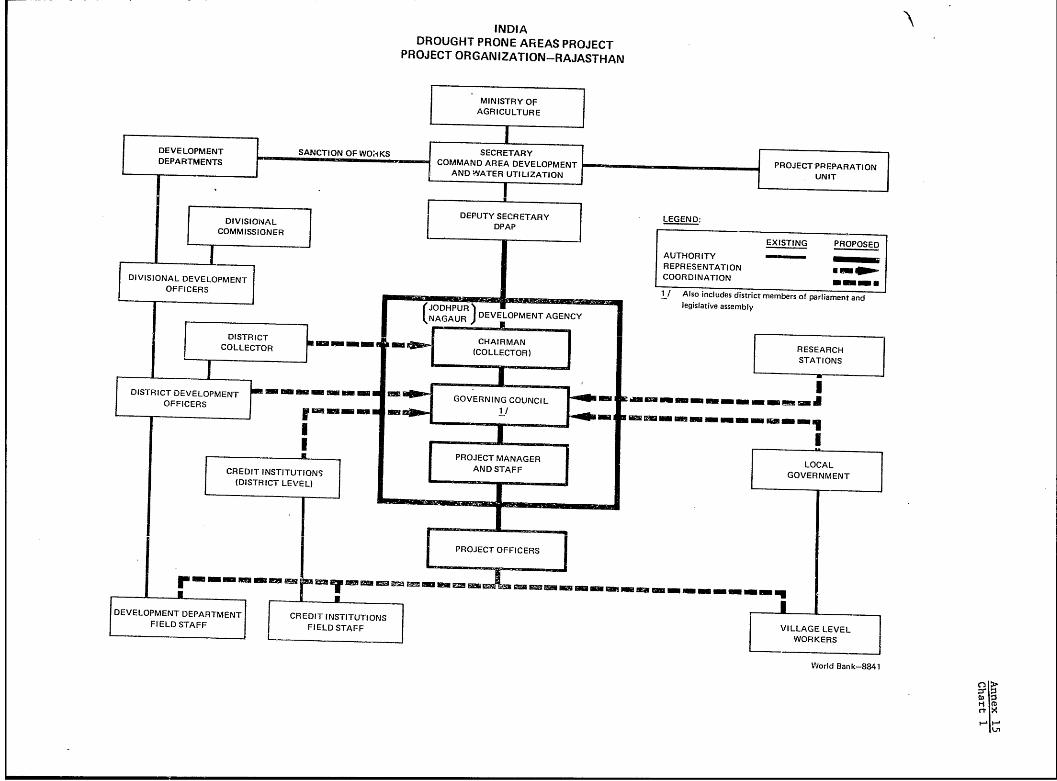
INDIADROUGHT PRONE AREAS PROJECT
PROJECT ORGAN IZATION-RAJASTHAN
DIIINLDEPUTY SECRETARY LEGEND:I IONALDPAP
EXISTING PROPOSED
AUTHORAITYREPRESENTATION urn .-COORDINATION omrmDIVIIONA DEELOPENT1
Also includes district members of parliament andOFFICERSlegislative assembly
NAGAUR DEVELOPMENT AGENCY
DISTR ICT CRESEARCH
COLLECTOYAR UTnnr H IRM ZAN iN JlUI
COLLECO ( LECETOR) -STATIONS
DISTRICT DEVELOPMENT |--- GO-ERNING -CEISTNOFFICERS J - - -
PROJECT MANAGER 1LOCALANDSTAFF
GOVERNMENT
CEI INSTINTUTIONS-
(DISTRICT LEVEL)
OFFICERS ~ ~ ~ ~ ~ ~ ~ ~ P OJC OFFICERSn ue dsrctm mer fpaAaen nr --- - - -JODPU
DEVELOPMENT DEPARTMENT CROEDIT INSTITUTIONSFILELD STAFF FIELD STAFF
LAGONELS
World Ban k-8841
-- r -- -- - -->l .DISTRICT DEVELOPMENT oss E i 1! | xsle 51~-t GOENN ONILP e; ;
OFFICERS s, . . I s":s - 1 /|-Z1 ff|ina9-a1 - . 1
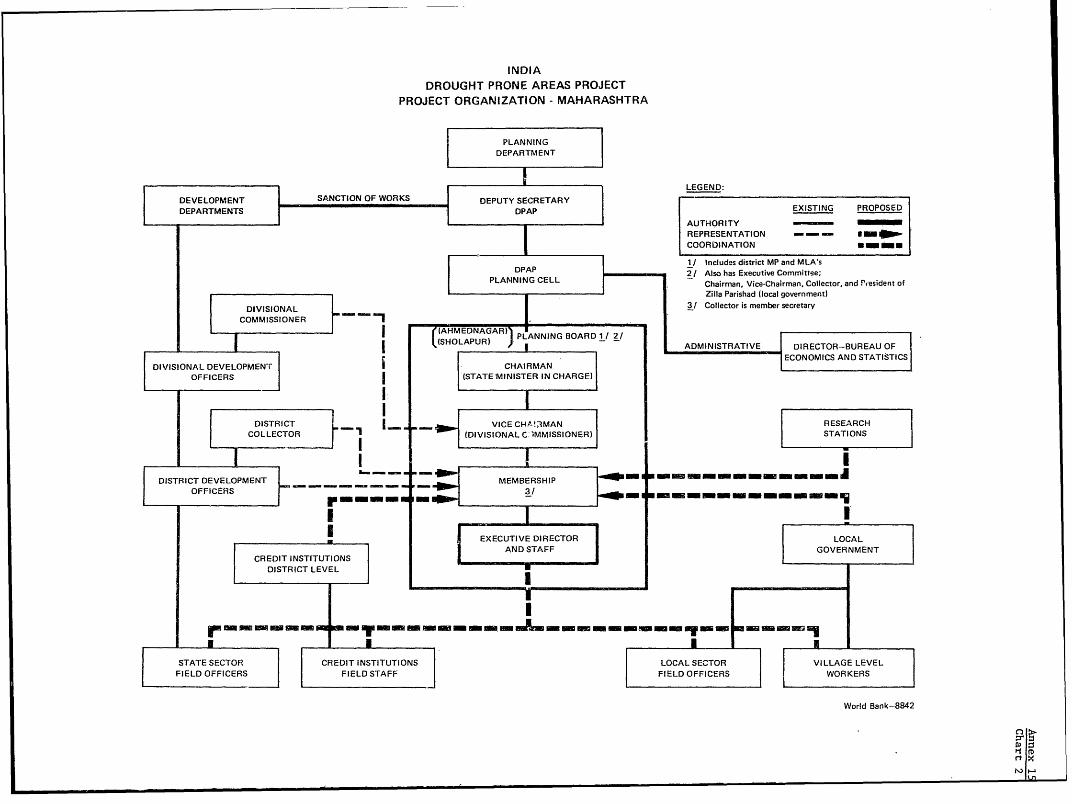
INDIADROUGHT PRONE AREAS PROJECT
PROJECT ORGANIZATION - MAHARASHTRA
-| PLANNING
I DEPARTMENT
I ,LEGEND:DEVELOPMENT SANCTION OF WORKS DEPUTY SECRETARYDEPARTM ENTS DPAP EXISTING PROPOSED
AUTHORITY - -REPRESENTATION -- |I-COORDINATION *- u
1/ Includes district MP and MLA'sDPAP 2/ Also has Executive Committee;
PLANNING CELL Chairman, Vice-Chairman, Collector, and !r'esident ofZilla Parishad (local government)
DIVISIONALEA 3/ Collector is member secretaryCOMMISSIONER l
(AHMENAA .PLANNING BOARD 11 2/I .SHOLAUR) ADMINISTRATIVE DIRECTOR-BUREAU OF1 1ECONOMICS AND STATISTICSDIVISIONAL DEVELOPMEN- ir CHAIRMANOFFICERS I (STATEMINISTER IN CHARGE)
DISTRICT -.- VICECHk!'IMAN RESEARCHCOLLECTOR J (DIVISIONAL C; lMMISSIONER) STATIONS
DISTRICT DEVELOPMENT - MEMBERSHIP in ! in--m--i.m-n miI OFFICRS - 3m -i
EXECUTIVE DIRECTOR LOCALI AND STAFF I GOVERNMENTCREDIT INSTITUTIONS ___________DISTRICT LEVEL
g I 1-- -- p in TinJfu - - -L---1---X | m x
STATE SECTOR CREDIT INSTITUTIONS LOCAL SECTOR VILLAGE LEVELFIELD OFFICERS FIELD STAFF FIELD OFFICERS WORKERS
World Bank-8842
rtX
t'3 I-
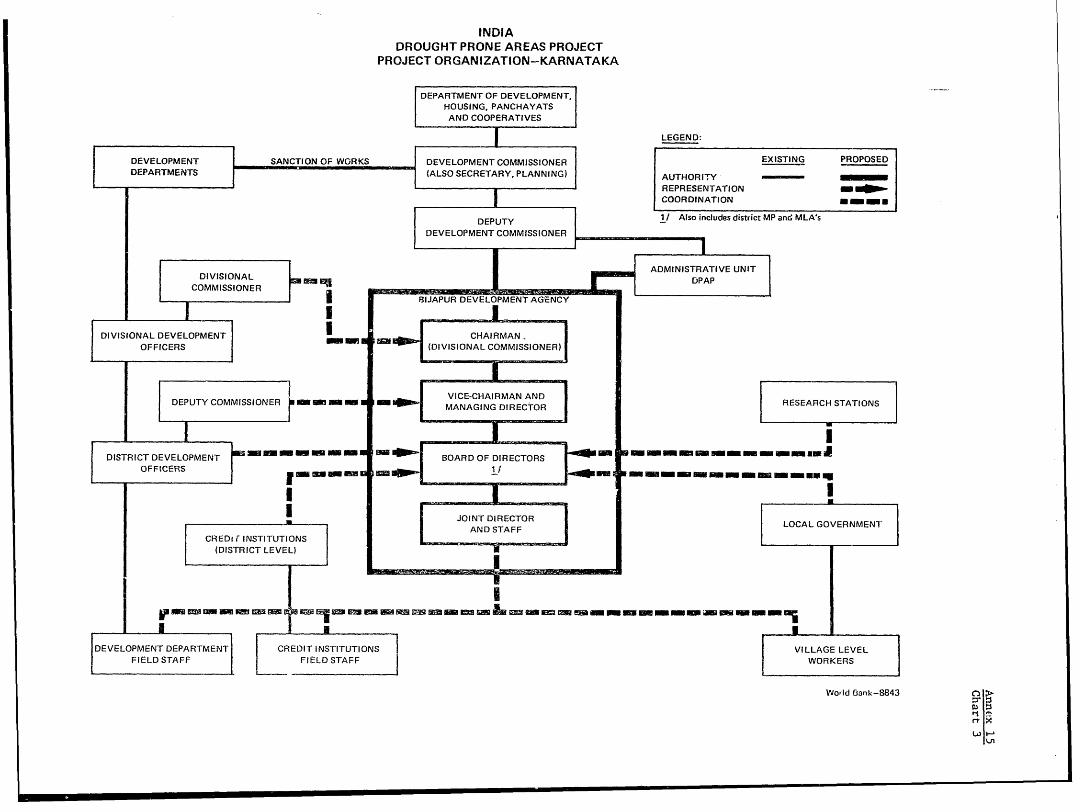
INDIADROUGHT PRONE AREAS PROJECT
PROJECT ORGANIZATION-KARNATAKA
DEPARTMENT OF DEVELOPMENT,HOUSING, PANCHAYATSAND COOPERATIVES
I LEGEND:DEVELOPMENT SANCTION OF WORKS DEVELOPMENT COMMISSIONER
EXISTING PROPOSEDDEPARTMENTS (ALSO SECRETARY, PLANNING) AUTHORITY -
REPRESENTATIONCOORDINATION u--
DEPUTY 1/ Also includes district MP and MLA'sDEVELOPMENT COMMISSIONER
ADMINISTRATIVE UNITDIVISIONAL G mm
DPAPCOMMISSIONER __11I f3IJAPUR DEVELOPMENTAGENCY
DIVISIONAL DEVELOPMENT L.. EJ CHAIRMAN.OFFICERS
(DIVISIONAL COMMISSIONER)
DEPUTY COMMISSIONER m - MAA-GN I-RECORM J RESEARCH STATIONS
DISTRICT DEVELOPMENT - -.- BOARD OF DIRECTORS -OFFICERS - - 1 f - m- - - - - -
JOIN LOCALTO GOVERNMENTj!ITDRCTRAND STAFFCREDi F INSTITUTIONS
_ __ _-(DISTRICT LEVEL) _
j- I-- un m unn
DEVELOPMENT DEPARTMENT CREDIT INSTITUTIONS VILLAGE LEVELFIELD STAFF FIELD STAFF
WORKERS
World Bank-8843 0
L-n
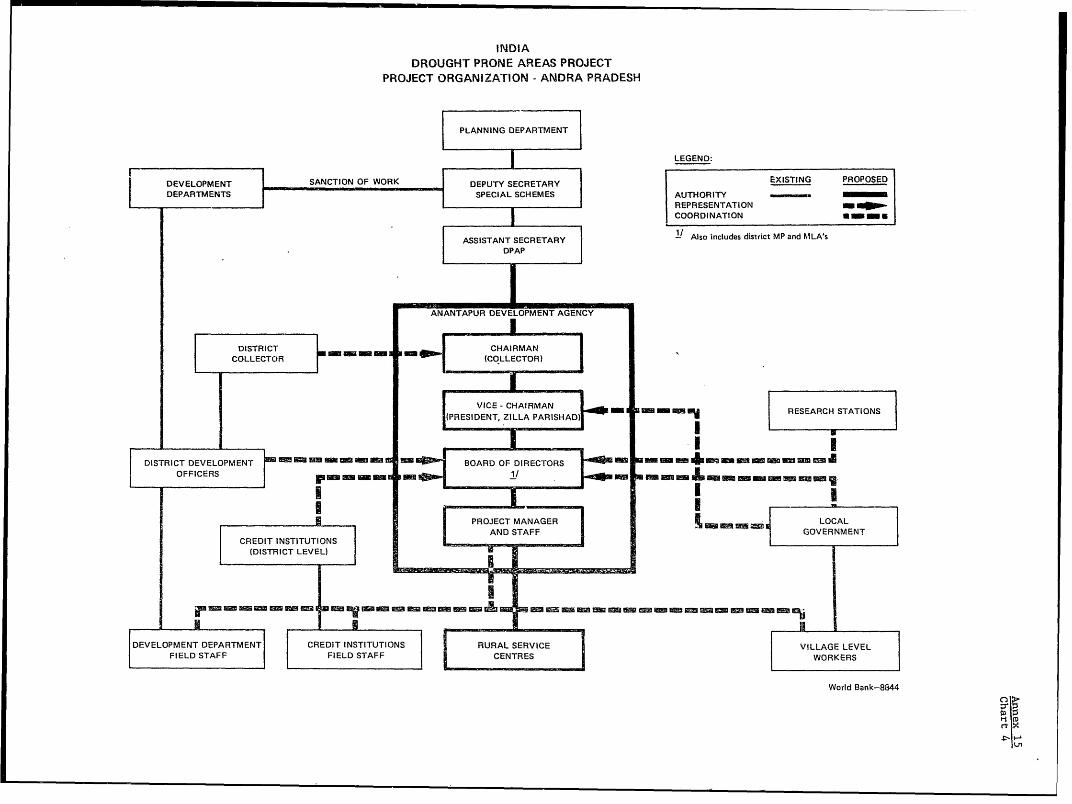
INDIADROUGHT PRONE AREAS PROJECT
PROJECT ORGANIZATION - ANDRA PRADESH
PLANNING DEPARTMENT
Z| LEGEND:
DEVELOPMENT SANCTION OF WORK DEPUTY SECRETARY EXISTING PROPOSED
DEPARTMENTS SPECIAL SCHEMES AUTHORITYREPRESENTATIONCOORDINATION *--
ASSISTANT SECRETARY I Also includes district MP and MLA's
DPAP
ANANTAPUR DEVELOPMENT AGENCY
DISTRICT CHAIRMAN
COLLECTOR (COLLECTOR)
VICE - CHAIRMAN RESEARCH STATIONS
(PRESIDENT, ZILLA PARISHAD)
- I
DISTRICT DEVELOPMENT m mm BOARD OF DIRECTO gm -a= mm am
OFFICERS -
PROJECT MANAGER LOCAL
AND STAFF GOVERNMENT
CREDIT INSTITUTIONS - _ _
(DISTRtICT LEVEL) | 1
DEVELOPMENT DEPARTMENT CREDIT INSTITUTIONS RURAL SERVICE VILLAGE LEVEL
FIELD IELD STAFF CENTRES WORKERS
World Bank-8844
ANNEX 16Page 1
INDIA
DROUGHT PRONE AREAS PROJECT
1/Yields and Prices -
A. Yields
Irrigation Component
1. The development of new wells in Rajasthan would increase rain-fed crop yields between six and eight times. Yields of bajra, the maincereal crop, would increase from 200 kg/ha to 1,700 kg/ha; pulses from170 kg/ha to 1,000 kg/ha; chillies, not grown without irrigation, wouldyield about 1,500 kg/ha. Where wells would be improved it is estimatedthat the water supply would increase yields by about 50%, to the levelsassumed for new developments. In the other four districts the relativeyield shifts resulting from new developments would be somewhat less thanin Rajasthan, ranging between four and six fold increases. This reflectsthe latter's lower rainfed crop potential. Slightly higher irrigated yieldshave been assumed for tank as against well irrigation. The consolidatedcommand area of a tank would be easier to develop and provide extensionservices to than would the proliferation of tiny areas served by wells.The yield of jowar, the major cereal crop, would increase from 350 kg/hato 2,100 kg/ha under well and 2,400 kg/ha under tank irrigation; pulsesfrom 250 kg/ha to 1,100 kg/ha and 1,200 kg/ha respectively and groundnutfrom 400 kg/ha to 1,300 kg/ha and 1,500 kg/ha respectively. As in thecase or Rajasthan it is es'timated that yields under improved wellswould increase about 50%, to the levels assumed for new developments.
2. Only modest yields have been assumed because it will take timefor new farmers to adapt to irrigated agriculture. Given the scatterednature of irrigation development under the project is not feasibleto provide the intensive extension service that would be necessary toassure a uniform attainmrent of high yields. Details of the yield impactof the irrigation component are given in Table 1.
Lives tock Component
3. A fairly rapid improvement of milk yields would be 'expected toresult from the project's impact on animal husbandry, nutrition anddisease control. Tne average lactation of the indigenous cow wouldincrease from 450 liters to 750 liters over a period of three years.
1/ The project's anticipated impact on production is summarized in Annex 17.
ANNEX 16Page 2
Reduced mortalities, age to first calving and a better calving rate wouldalso contribute to improved performance of the dairy enterprise. Theyield levels attained would gradually improve as a result of the upgradingof stock which would also begin under the project. Details of the assumedperformance of dairy stock are summarized in Table 2.
4. The impact of the project on sheep performance would be moregradual since from the outset it would depend primarily on the upgradingof stock. The wool clip from a ewe would increase from 1.5 kg/year to 2.5kg/year over five years. The average live-weight of ewes would increasemore rapidly, being more dependent on husbandry factors, from 35 kg to50 kg over three years. Also contributing to improved productivity wouldbe reduced mortalities and improved weaning rates. Details of anticipatedsheep performance are summarized in Table 2.
Watershed Management
5. It is anticipated that the impact of the soil and moistureconservation program on the arable lands would be to increase crop yieldsby an average of 15%. In the Deccan Plateau districts, 1/ the yieldsof jowar and bajra, the main cereals, would increase from 350kg/ha to400 kg/ha and 275 kg/ha to 315 kg/ha respectively. The average pulseyield would increase from 250 kg/ha to 290 kg/ha and groundnut from400 kg/ha to 460 kg/ha. Details of the expected yield increases aregiven in Table 3.
6. On the hill areas the conservation and pasture improvementprograms would be expected to double pasture yields, from 750 kg/haof dry fodder to 1,500 kg/ha. Fodder quality would also be improved.The output of the forestry program has not been quantified and would besmall. However the effort is regarded as the early phase of a plantingprogram which should ultimately increase fuelwood supplies sufficientlyto permit significant quantities of dung to be used on the land insteadof being burned.
Dry Farming Component
7. In the Deccan Plateau districts average crop yields would beexpected to rise between 70% and 90% over 'with bunding' yield levels,(climate induced fluctuations around these means would still occur). Thusthe yield of sorghum would rise from 400 kg/ha to 750 kg/ha, millet from315 kg/ha to 600 kg/ha; pulses from 290 kg/ha to 500 kg/ha and oilseedsfrom 230 kg/ha to 400 kg/ha. In Jodhpur, where conditions are much harsher,yield increases would generally be small e.g. the yield of millet, by farthe most important crop, would rise from 230 kg/ha to 450 kg/ha, pulsesfrom 200 kg/ha to 350 kg/ha. A more dramatic rise is expected on the smalloilseed area, 155 kg/ha to 300 kg/ha because of the introduction of sunflowerto replace some sesame. (Details of dry farming yields are given in thefarm models in Annex 7)e
1/ Ahmednagar, Sholapur, Bijapur, Anantapur.
ANNEX 16Page 3
B. Prices
8. At the time the mission was in the field, commodity priceswere well above long term trend levels. This was a reflection of foodshortages which had arisen as a result of two successive drought years.These had a particularly severe impact on drought prone areas. De jureprices and marketing regulations 1/ could not be enforced during thisperiod of market stress.
9. Under these conditions it was extremely difficult to predict,with any degree of confidence, what farm gate prices were likely to bein the near future. This uncertainty was aggravated subsequently by the?oil crisis'. For this reason the mission has conservatively used priceswhich reflect long term trends. Details are given in Table 4. Prices belowthese levels are considered unlikely. Higher prices, a possibility inresponse to cost inflation, have been used in sensitivity analyses (Annex 18).
November 4, 1974
1/ Prices are fixed under the Essential Commodities Act. Market regulationis carried out under the States' Agricultural Produce Marketing Acts.
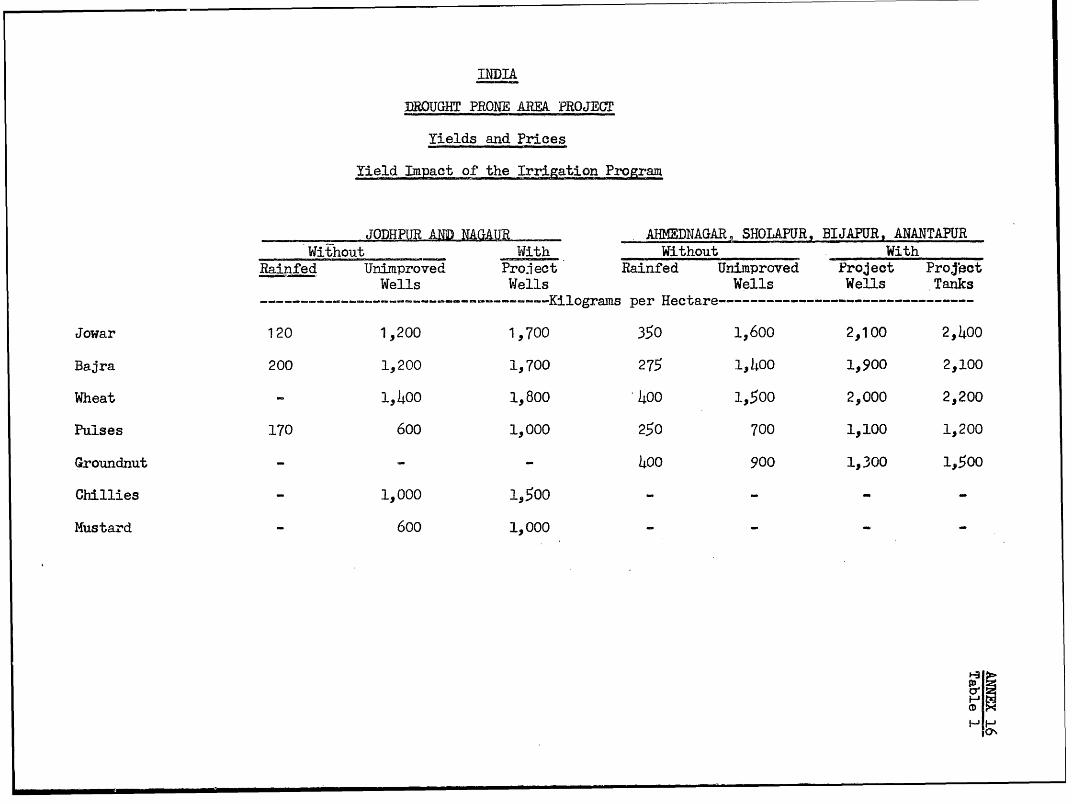
INDIA
DROUGHT PRONE AREA PROJECT
Yields and Prices
Yield Impact of the Irrigation Program
J A NA AHMEDNAGAR SHOAPUR, BIJAPUR, ANANTAPURWithout With Without With
Rainfed Unimproved Proiect Rainfed Unimproved Project ProjectWells Wells Wells Wells Tanks
------------------- Kilograms per Hectare ----------------------
Jowar 120 1,200 1,700 350 1,600 2,100 2,400
Bajra 200 1,200 1,700 275 1,h00 1900 2,100
Wheat D 1,400 1,800 400 1,500 2,000 2,200
Pulses 170 600 1,000 250 700 1,100 1,200
Groundnut - - 400 900 1,300 l.500
Chillies 1, 000 14500 - -
Mustard 600 1,000
HC
0 P
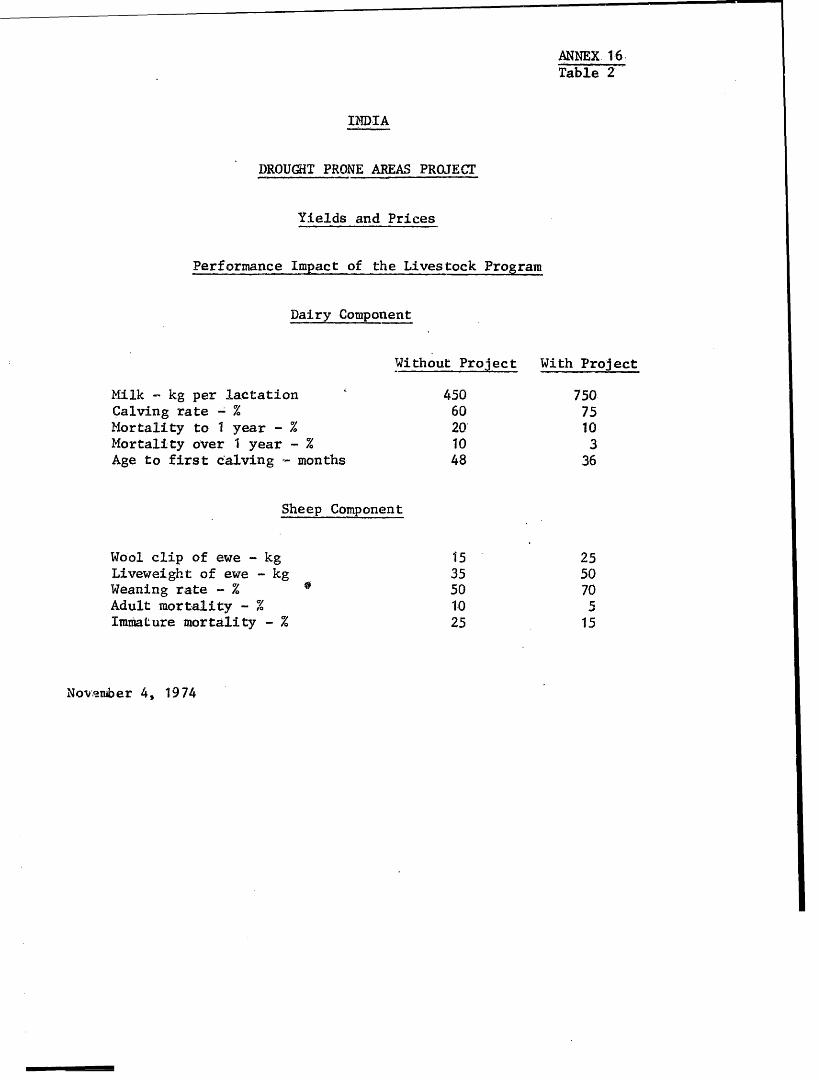
ANNEX 16Table 2
INDIA
DROUCGIT PRONE AREAS PROJECT
Yields and Prices
Performance Impact of the Livestock Program
Dairy Component
Without Project With ProjectMilk D kg per lactation 450 750Calving rate - 60 75Mortality to 1 year - % 20' 10Mortality over 1 year - % 10 3Age to first calving - months 48 36
Sheep Component
Wool clip of ewe - kg 15 25Liveweight of ewe - kg 35 50Weaning rate - % 50 70Adult mortality - %O 10 5Immature mortality - % 25 15
Nov-niber 4, 1974
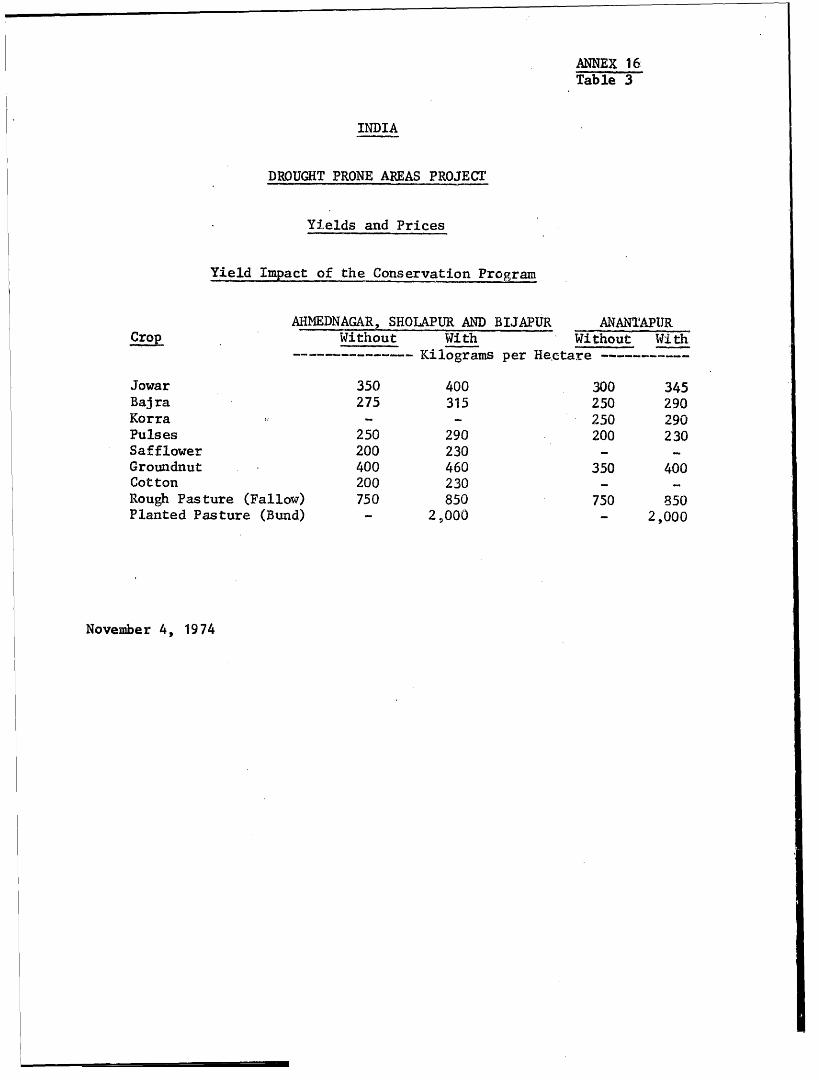
ANNEX 16Table 3
INDIA
DROUGHT PRONE AREAS PROJECT
Yields and Prices
Yield Impact of the Conservation Program
AHMEDNAGAR, SHOIAPUR AND BIJAPUR ANANTAPURCrop Without With Without Wi thKilograms per Hectare -----------
Jowar 350 400 300 345Bajra 275 315 250 290Korra - - 250 290Pulses 250 290 200 230Safflower 200 230 - -Groundnut 400 460 350 400Cotton 200 230 - -Rough Pas ture (Fallow) 750 850 750 850Planted Pasture (Bund) - 2,000 - 2,000
November 4, 1974
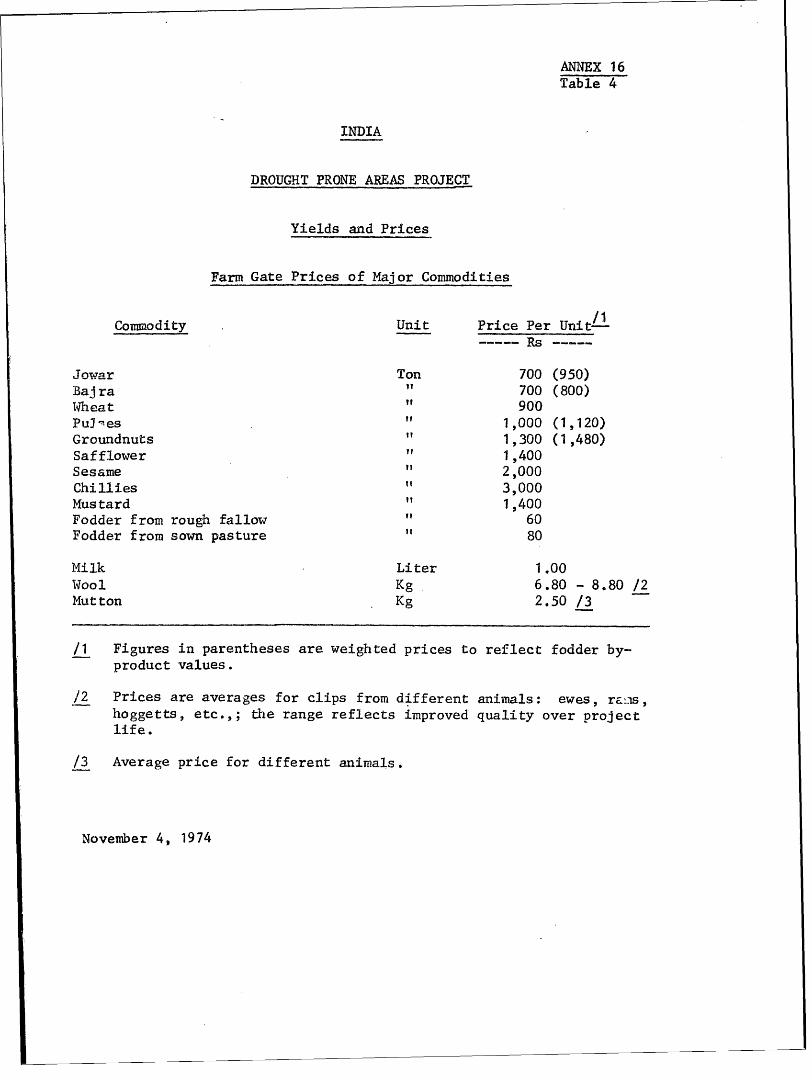
ANNEX 16Table 4
INDIA
DROUGHT PRONE AREAS PROJECT
Yields and Prices
Farm Gate Prices of Major Commodities
Commodity Unit Price Per Unit/------------------------Rs------
Jowar Ton 700 (950)Baj ra 700 (800)Wshea t I 900Pu3 les
1,000 (1,1.20)Groundnuts 1,300 (1,480)Safflower 1,400Sesame 2,000
Chil' ies " 3,000Mustard 1, 400Fodder from rough fallow 60Fodder from sown pasture " 80
Milk Liter 1.00Wool Kg 6.80 - 8.80 /2Mutton Kg 2.50 /3
/1 Figures in parentheses are weighted prices to reflect fodder by-product values.
/2 Prices are averages for clips from different animals: ewes, rAms,hoggetts, etc.,; the range reflects improved quality over projectlife.
/3 Average price for different animals.
November 4, 1974
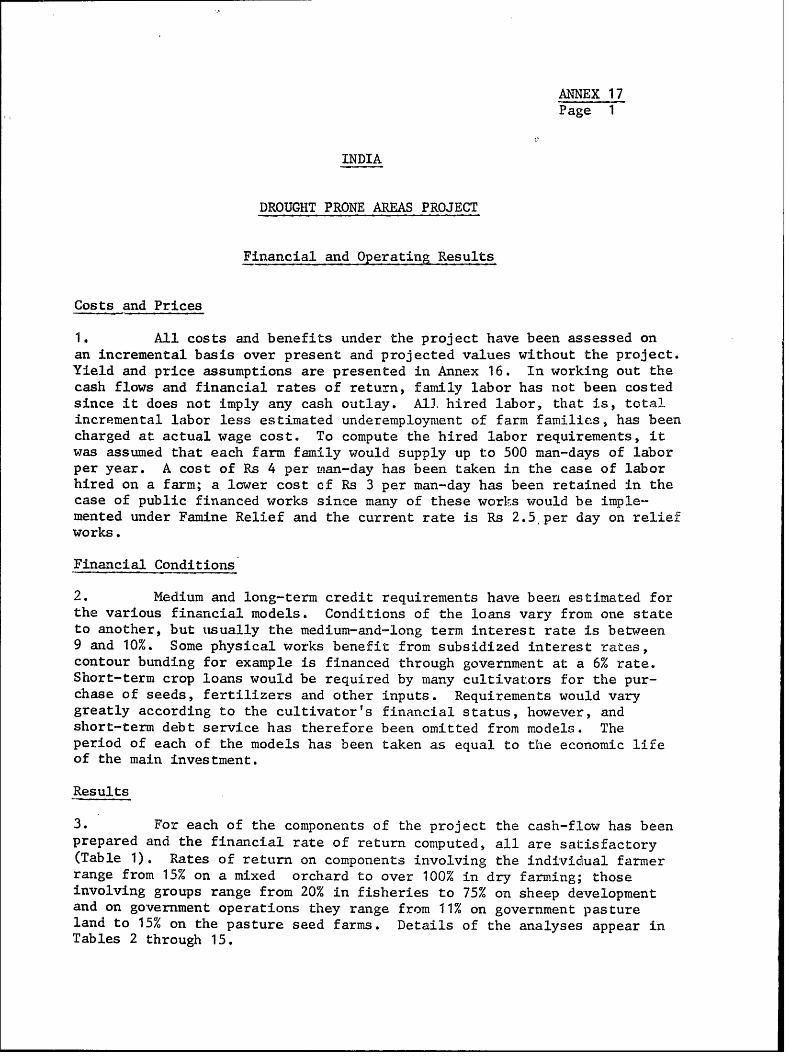
ANNEX 17Page 1
INDIA
DROUGHT PRONE AREAS PROJECT
Financial and Operating Results
Costs and Prices
1. All costs and benefits under the project have been assessed onan incremental basis over present and projected values without the project.Yield and price assumptions are presented in Annex 16. In working out thecash flows and financial rates of return, family labor has not been costedsince it does not imply any cash outlay. A13. hired labor, that is, totalincremental labor less estimated underemployment of farm families, has beencharged at actual wage cost. To compute the hired labor requirements, itwas assumed that each farm family would supply up to 500 man-days of laborper year. A cost of Rs 4 per man-day has been taken in the case of laborhired on a farm; a lower cost cf Rs 3 per man-day has been retained in thecase of public financed works since many of these works would be imple-mented under Famine Relief and the current rate is Rs 2.5 per day on reliefworks.
Financial Conditions
2. Medium and long-term credit requirements have beern estimated forthe various financial models. Conditions of the loans vary from one stateto another, but utsually the medium-and-long term interest rate is between9 and 10%. Some physical works benefit from subsidized inteirest rates,contour bunding for example is financed through government at a 6% rate.Short-term crop loans would be required by many cultivators for the pur-chase of seeds, fertilizers and other inputs. Requirements would varygreatly according to the cultivator's financial status, however, andshort-term debt service has therefore been omitted from models. Theperiod of each of the models has been taken as equal to the economic lifeof the main investment.
Results
3. For each of the components of the project the cash-flow has beenprepared and the financial rate of return computed, all are sai:isfactory(Table 1), Rates of return on components involving the individual farmerrange from 15% on a mixed orchard to over 100% in dry farming; thoseinvolving groups range from 20% in fisheries to 75% on sheep de-velopmentand on government operations they range from 11% on government pastureland to 15% on the pasture seed farms. Details of the analyses appear inTables 2 through 15.
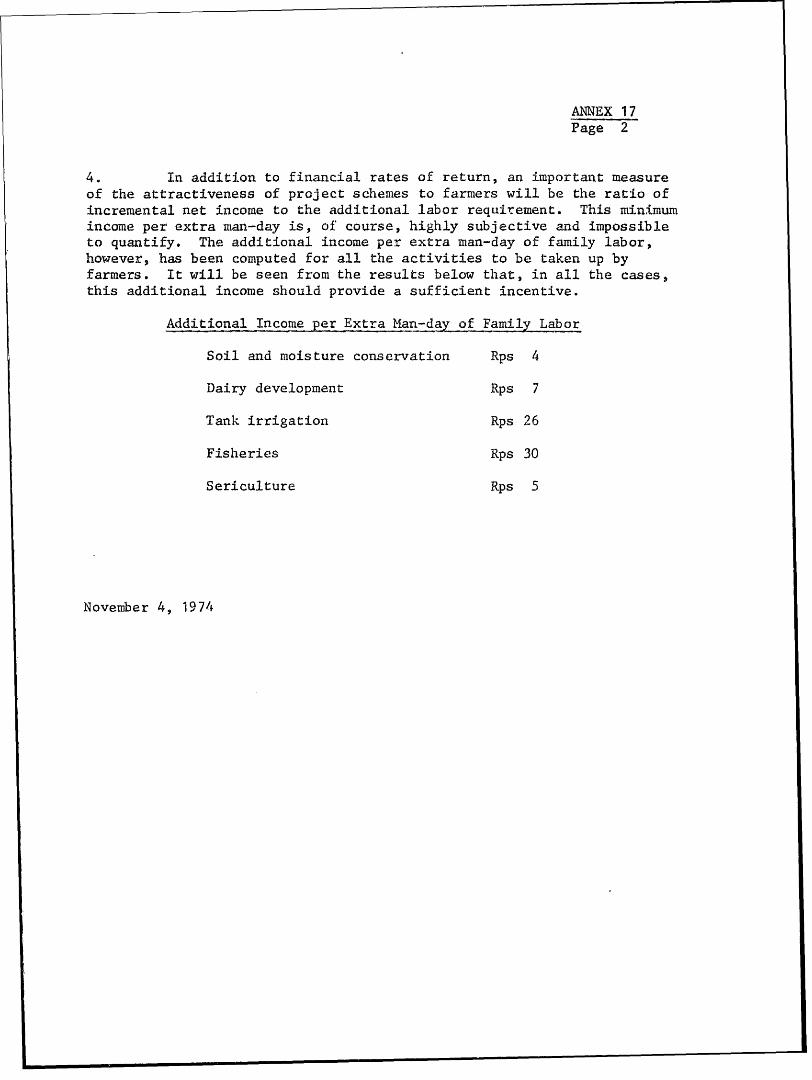
ANNEX 1 7Page 2
4. In addition to financial rates of return, an importatnt measureof the attractiveness of project schemes to farmers will be the ratio ofincremental net income to the additional labor requirement. This minimumincome per extra man-day is, of course, highly subjective and impossibleto quantify. The additional income per extra man-day of family labor,however, has been computed for all the activities to be taken up byfarmers. It will be seen from the results below that, in all the cases,this additional income should provide a sufficient incentive.
Additional Income per Extra Man-day of Family Labor
Soil and moisture conservation Rps 4
Dairy development Rps 7
Tank irrigation Rps 26
Fisheries Rps 30
Sericulture Rps 5
Noveniber 4, 19a74
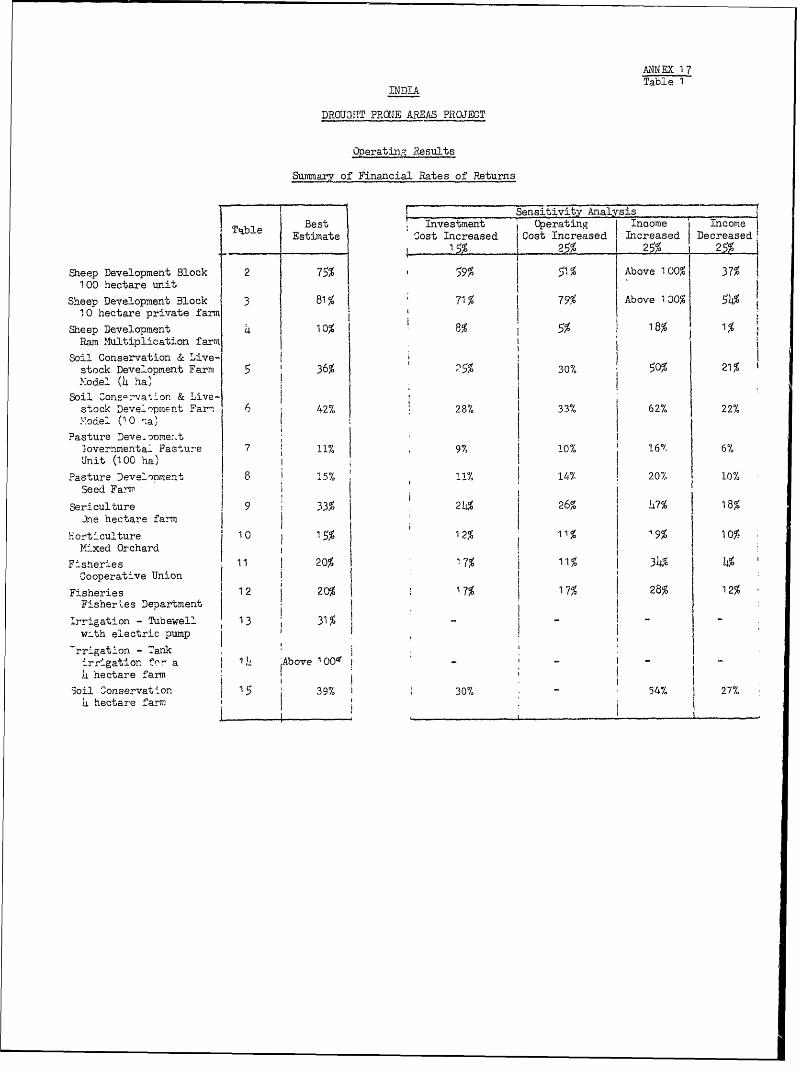
ALNN EX 1 7Tab"Le 1
INDIA
DROU31fT PRCWE AREAS PROJECT
Operating Results
Surmnma of Financial Rates of Returns
Sensitivity Analysis
Best Investment ()perating Inncome Incotae
TIble Estimate Cost Increased Cost Increased In creased Decreased!
. fi-25% 25t L% 2,5%
Sheep Development Block 2 75% 59% 51% Above 100%1 37%
100 hectare unit 1
Sheep Development Block 3 81% 71% 79% Above 130% 54%
10 hectare private farm .
Sheep Development 10% 1 8% 1 5% 18% 1%
Ram Mlultiplication farm
Soil Conservation & .,ive-
stock Development Farm 5 36% ^5% | 30% 50% 21%
>'odel (4 ha'
Soil Zonsra at''on & Live-Istock Devel^pment Far< 6 42% 28% 33% 62% 22%
Y*odel (10 ,,a)
Pasture Deve . s;s.e:t ,
3over!amenta- Pasture 7 11% 9% 10% 1 6 6%
Unit (100 ha) !
Pasture Devel'Dment 8 I 15% j11 14! 20It 10%
Seed Farri
Seri-culture 9 j 2 4h% 26% L7% 18%
nie hectare farm
Hort-culture 10 1 5% | 12% 11% 9% 10%
Mi *xed Orchard I .
Fisheries 11 20% 7% 11% 3 34
Cooperative Union 1 ! 7 I 2
F-isheries 12 | 20 , 11 17% ! 28% 1 2%
Fisheri es Department
Irrigation - Tubewell 13. 31%! - - -
w-th electric pump i
>rrgation - Tank .-rr-gation t"i a ' Above I0O I - - - I
)' hectare farm
Soil Conservati'on 39% 30% -54% 27%
LL hectare farm 4 j 27%
- I _ _ _ . ., -- -
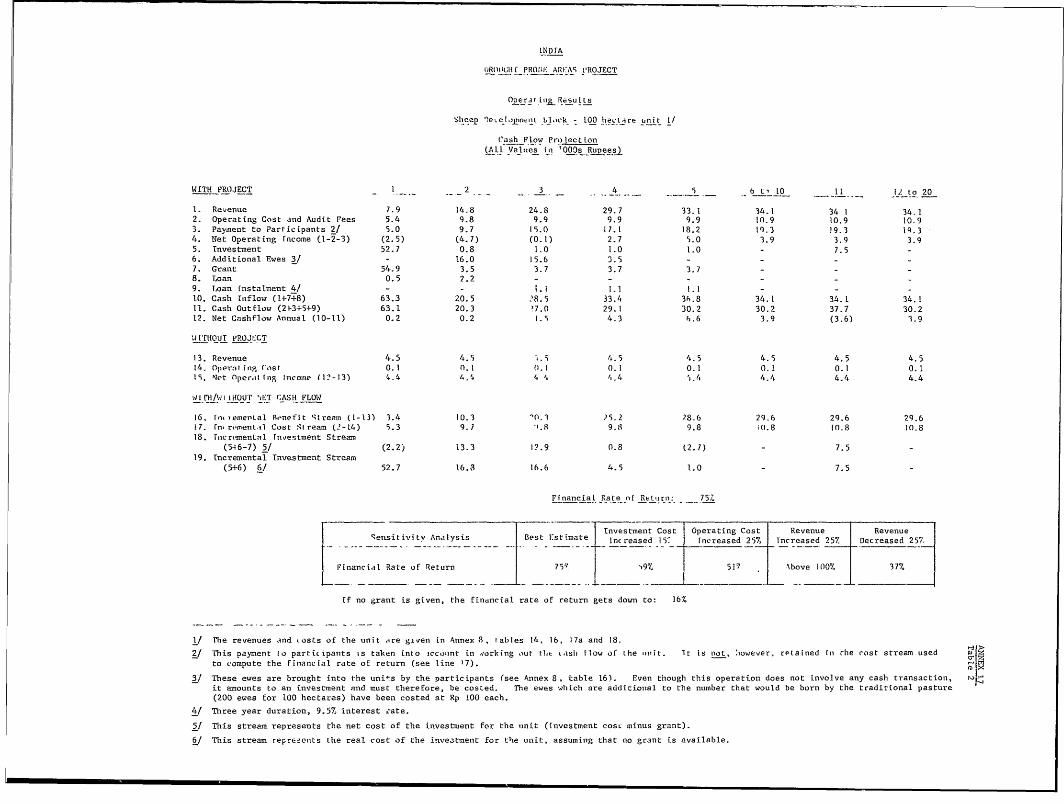
LNDIA
.iRllii c PRO1li ARE:,AS vROJECT
Oner j iny, Results
Sheep 0oe.emp Llock - l00 heuLare unit I/
(ash Flow Pro jectLion(A11 Values in '009s Rupeesj
WITH PROJECT I - 2 - 3 4 - 6 - t l 11 - 12 to 20
1. Revenue 7. 9 14.8 24.8 29.7 33-1 34.1 34 1 34.1
2. Operating Cost and Audit Fees 5.4 9.8 9.9 9.9 9.9 10.9 10.9 10.9
3. Payment to Participants 2/ 5.0 9.7 15.0 17.1 18.2 19.3 19 19.3
4. Net Operating rncome (1-2-3) (2.5) (4.7) (0.1) 2.7 5.0 3.9 3.9 3.9
5. Tnvestment 52.7 0.8 1.0 1.0 1.0 - 7.5 -
6. Additional Ewes 31 - 16.0 15.6 3*5 - -
7. Grant 54.9 3.5 3.7 3.7 3.7
8. Loan 0.5 2.2 - - -
9. Loan fnstalment 4/ - - 1.1 1.1 .1 - - -
10. Cash itnflow (1+7+8) 63.3 20.5 28.5 33.4 36.8 34.1 34.1 34.1
11. Cash Outflow (21-3+5+9) 63.1 20.3 '7.0 29.1 30.2 30.2 37.7 30.2
12. Net Cashflow Annual (10-11) 0.2 0.2 1.5 4.3 6.6 3.9 (3.6) 3.9
;i ITHOU I PROJLCT
13. Revenue 4.5 4.5 i 4.5 4.5 4.5 4.5 4.5
14. Operating Cost 0.1 0. I1.1 0.1 0.1 0.1 0.1 0.1
15. Net Oper.} ing Irncome (1'-13) 4.4 4.5 4 5 4.4 5.4 4.4 4.4 4.4
511-I /Wi l iHiIUr ',ET C ASH FLOW
16. fn-aemental B.'nefit slream (1-13) 3.4 10.3 '0.3 V5.2 28.6 29.6 29.6 29.6
17. rn remental Cost Stream (2-L4) 5.3 9.7 .8 9.8 9.8 i(.8 10.8 10.8
18. rIncnrisental niestment Streas
(546-7) 5/ (2.2) 13.3 1?.9 0.8 (2.7) - 7.5 -
19. tncremental Investment Stream(5+6) 6/ 52.7 16.3 16.6 4.5 1.0 - 7.5
Financial Rate *.f ReLLrn:: -75,,
Investment Cost Operating Cost Revenue Revenue
Sensitivity Analysis Best 1stimate Increased 15: Inereased 257k Tncreased 25% Decreased 257-
Financial Rate of Return 75Y i9% 51/ Aibove 1007, 37%
. ~~~- ....... - - - .--.-- ..-.-. -L-.- -
If no grant is given, the financial rate of return gets down to: 16'
I/ The revenues and .osts of the unit <re given in Annex 8, lables 14. 16, }7a and 18.
2/ This payment to participants is taken into icco int in .orking out t], .sh flow of the ,nit. Tr is not, N.owever, retained in the cost stream used
to compute the flnanc ial rdte of return (see line 17).
3/ These ewes are brought into the units by the participants (see Annex 8, table 16). Even though this operation does not involve any cash transaction, M e
it amounts to an investment and must therefore, be costed. The ewes which are additional to the number that would be born by the traditional pasture
(200 ewes for 100 hectares) have been costed at Rp 100 each.
-/ Three year duration, 9.5% interest iate.
5/ This streame represents the net cost of the investment for the *nit (investment cosL minuis grant).
6/ This stream represents the real cost of the invevtment for the unit, assuming that no grant is available.
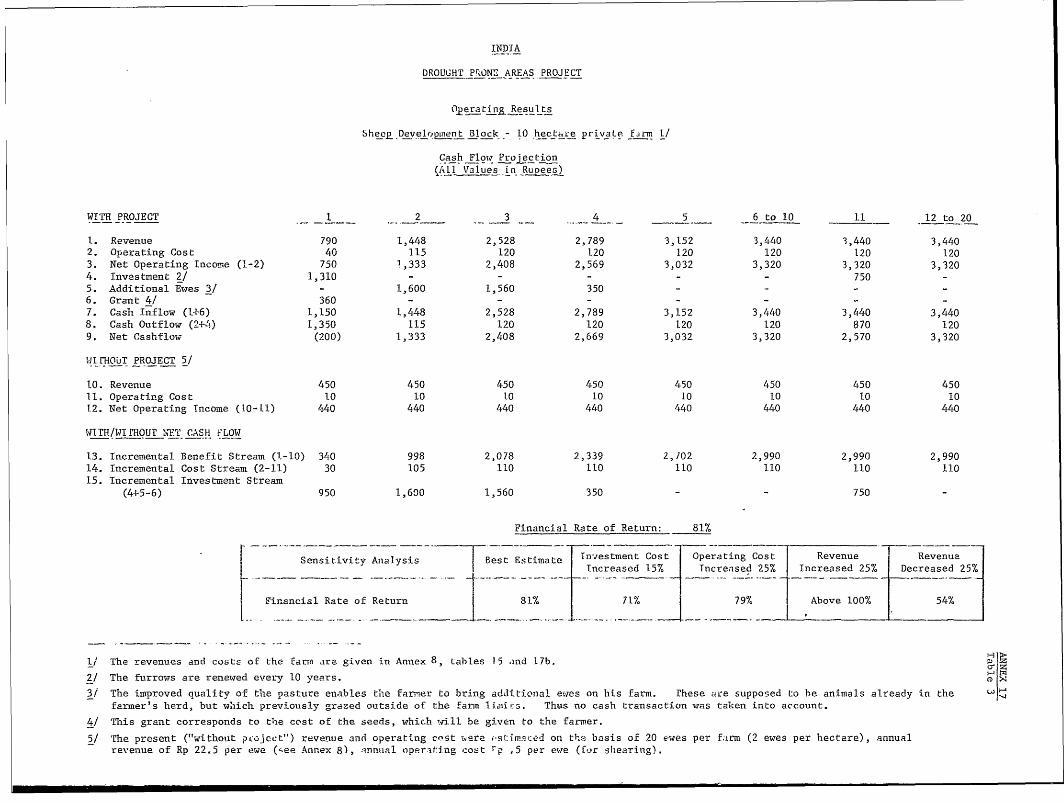
INJDIA
DROUGCHT PRO.NE AREAS PROJECT
O<erating Results
Sheep Devel.r ipent Block - 10 hectai-e private f.jrm l/
Cash Floxw ProLect: ion(All Values in RuDees)
WITEH PROJECT 1 2 3 4 5 6 to l0 11 12 to 20
1. Revenue 790 1,448 2,528 2,789 3,152 3,440 3,440 3,4402. Operating Cost 40 115 120 120 120 120 120 1203. Net Operating Income (1-2) 750 1,333 2,408 2,569 3,032 3,320 3,320 3,3204. Investment 2/ 1,310 - - - - - 750 -5. Additional Ewes 3/ - 1,600 1,560 350 - - - -6. Grant 4/ 360 - - - -7. Cash Inflow (1+6) 1,150 1,448 2,528 2,789 3,152 3,440 3,440 3,440S. Cash Outflow (2+4) 1,350 115 120 120 120 120 870 1209. Net Cashflow (200) 1,333 2,408 2,669 3,032 3,320 2,570 3,320
WIOHTuT PROJECT 5/
10. Revenue 450 450 450 450 450 450 450 45011. Operating Cost 10 10 10 10 10 10 10 1012. Net Operating Income (10-11) 440 440 440 440 440 440 440 440
WITH/1I L1HOUr ts'.T CASH FLOW
13. Incremental Benefit Stream (1-10) 340 998 2,078 2,339 2,102 2,990 2,990 2,99014. Incremental Cost Stream (2-11) 30 105 110 110 110 110 110 11015. Incremental Investment Stream(4+5-6) 950 1,600 1,560 350 - - 750 -
Financial Rate of Return: 81%
Se nsitivity Analysis Best Estimate Investment Cost Operating Cost Revenue Revenu-]Increased 15% Tnereased 25% Increased 25% Decreased 25%
| Financial Rate of Return | 81% 71% 79% Above 100% 54%
1/ The revenues and costs of the farm .are given in Annex 8, tables 15 and 17b.2/ The furrows are renewed every 10 years.
>,:31 The improved quality of the pasture enables the farmer to bring additional ewes on his farm. rhese are supposed to be animals already in the ' 'farmer's herd, but which previously grazed outside of the farm li.li':s. Thus no cash transaction was taken into account.41 This grant corresponds to thie cost of the seeds, which will be given to the farmper.5/ The present ("withouit pLajeCt") revenue and operating c0st taere istirnn:ed on tFhe basis of 20 ewes per f;irm (2 ewes per hectare), annualrevenue of Rp 22.5 per ewe (4ee Annex 8), innual operafing cost rp 5 per ewe (f.or shlearing).
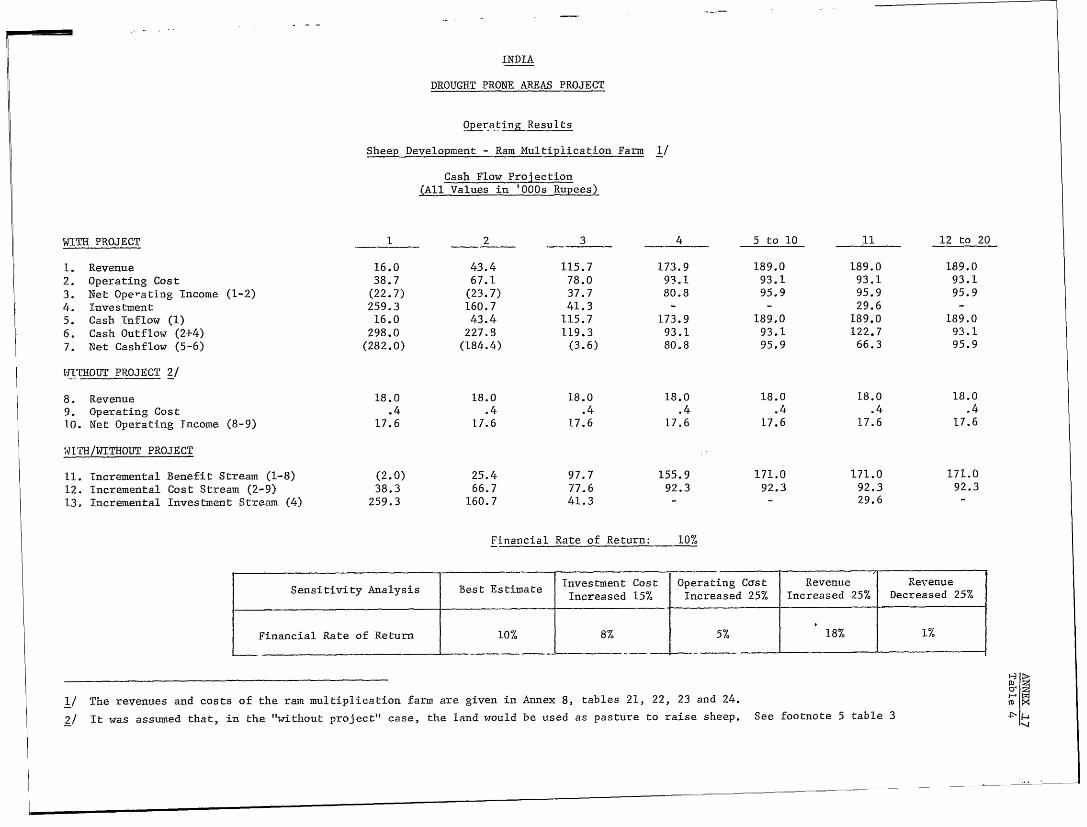
INDIA
DROUGHT PRONE AREAS PROJECT
Qperating Results
Sheep Development - Ram Multiplication Farm I/
Cash Flow Projection(All Values in '0OOs Rupees)
WITH PROJECT 1 2 3 4 5 to 10 11 12 to 201. Revenue
16.0 43.4 115.7 173.9 1.89.0 189.0 189.02. Operating Cost
38.7 67.1 78.0 93.1 93.1 93.1 93.13. Net Operating Income (1-2) (22.7) (23.7) 37.7 80.8 95.9 95.9 95.94. Investment
259.3 160.7 41.3 - - 29.6 -5. Cash Inflow (1)
16.0 43.4 115.7 173.9 189.0 189.0 189.06. Cash Outflow (2+4) 298.0 227.8 119.3 93.1 93.1 122.7 93.17. Net Cashflow (5-6) (282.0) (184.4) (3.6) 80.8 95.9 66.3 95.9WITHOUT PROJECT 2/
8. Revenue 18.0 18.0 18.0 18.0 18.0 18.0 18.0
9. Operating Cost .4 .4 .4 .4 .4 .4 .4
10. Net Operating Income (8-9) 17.6 17.6 17.6 17.6 17.6 17.6 17.6WITIH/WITHOUT PROJECT
11. Incremental Benefit Stream (1-8) (2.0) 25.4 97.7 155.9 171.0 171.0 171.012. Incremental Cost Stream (2-9) 38.3 66.7 77.6 92.3 92,3 92.3 92.313. Incremental Investment Stream (4) 259.3 160.7 41.3 - - 29.6
Financial Rate of Return: 10%
Sensitivity Analysis Best Estimate Investment Cost Operating C27st Revenue | RevenueIncreased 1.5% Increased 25% Increased 25% 4Decreased 25%
Financial Rate of Return 10% 8% 5% 18% 1%
1/ The revenues and costs of the ram multiplication farm are given in Annex 8, tables 21, 22, 23 and 24.2/ It wqas assumed that, in the "without project" case, the land would be used as pasture to raise sheep. See footnote 5 table 3 4-
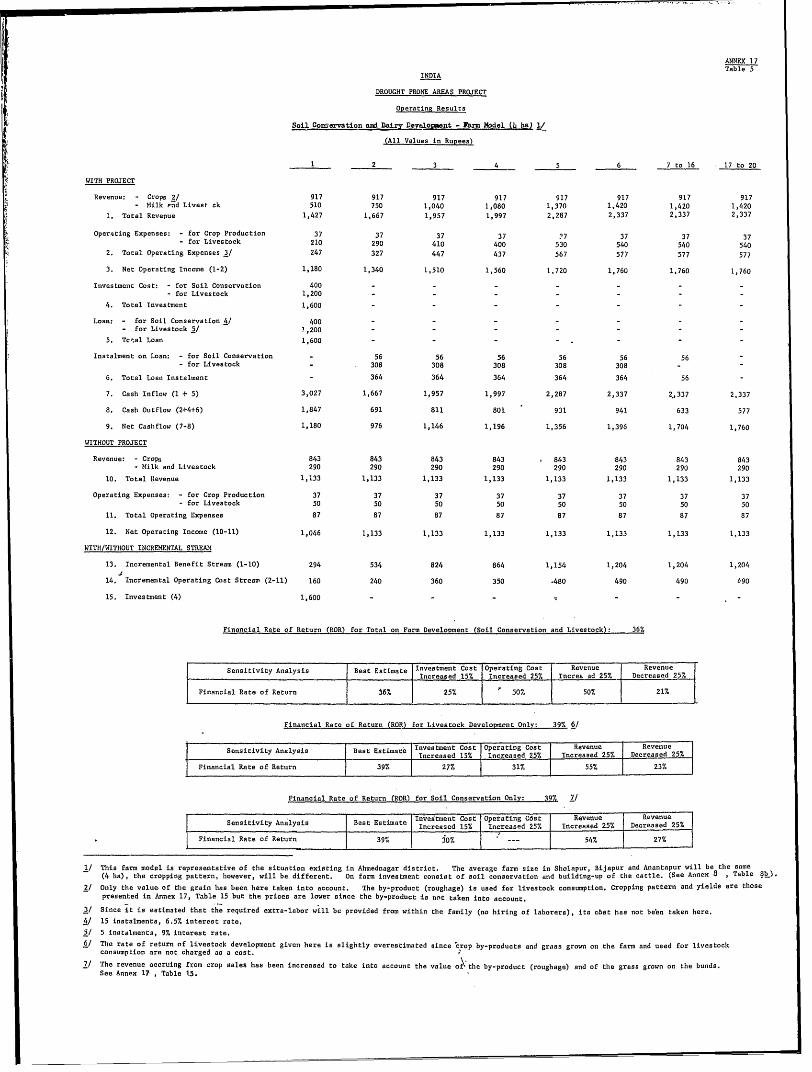
ANNEX 17Table 5INDIA
DROUGHT PRONE AREAS PROJECT
Operating Results
Soil Conservation and Dairy Dev1olmont - rm Ylkodel (h ha) 1/
(All Values in Rupees)
1 2 3 4 5 6 7 to 16 17 to 20WITH PROJECT
Revenue: - Crops 2/ 917 917 917 917 917 917 917 917- Milk end Live.t ck 510 750 1,040 1,080 1,370 1,420 1,420 1,4201. Total Revepue 1,427 1,667 1,957 1,997 2,287 2,337 2,337 2,337Operating Expenses: - for Crop Production 37 37 37 37 ?7 37 37 37- for Livestock 210 290 410 400 530 540 540 5402. Total Operating Expenses 3/ 247 327 447 437 567 577 577 577
3. Net Operating Income (1-2) 1,180 1,340 1,510 1,560 1,720 1,760 1,760 1,760Investment Cost: - for Soil Conservation 400 - - - - - - -- for Livestock 1,200 -
4. Total Investment 1,600 -
Loan; - for Soil Conservation 4/ 400 - - - - - - -- for Livestock I/ 1,200 -5. Tc-al Loan 1,600 -
Instalment on Loan: - for Soil Conservation - 56 56 56 56 56 56- for Livestock - 308 308 308 308 308 -6. Total Loan Instalment - 364 364 364 364 364 56 -7. Cash Inflow (1 + 5) 3,027 1,667 1,957 1,997 2,287 2,337 2,337 2,3378. Cash Outflow (2+4+6) 1,847 691 811 801 931 941 633 5779. Net Cashflow (7-8) 1,180 976 1,146 1,196 1,356 1,396 1,704 1,760
WITHOUT PROJECT
Revenue: - Crops 843 843 843 843 * 843 843 843 843- Milk and Livestock 290 290 290 290 290 290 290 29010. Total Revenue 1,133 1,133 1,133 1,133 1,133 1,133 1,133 1,133Operating Expenses: - for Crop Production 37 37 37 37 37 37 37 37- for Livestock 50 50 50 50 50 50 50 5011. Total Operating Expenses 87 87 87 87 87 87 87 87
12. Net Operating Income (10-11) 1,046 1,133 1,133 1,133 1,133 1,133 1,133 1,133WITH/WITHOUT INCREMENTAL STREAM
13. Incremental Benefit Stream (1-10) 294 534 824 864 1,154 1,204 1,204 1,20414. Incremental Operating Cost Stream (2-11) 160 240 360 350 .480 490 490 69015. Investment (4) 1,600 - - -
Financial Rate of Return (ROR) for Total on Farm Development (Soil Conservation and Livestock): 36%
Sensitivity Analysis B Hest Estimate Investment Cost Operating Cost Revenue RevenueI Increased 15. Increased 25% Incres ad 257. Decreased 25%Financial Rate of Return 567 25% ' 30% 50% 21%7
Financial Rate of Return _(ROR) for Livestock Development Only: 39% 6/
Sestvt nlss IBest Estimate Investment Cost Operating Cost Revenue Revenue| SIncitivity Analysis nreased 15% Increased 25% Increased 25% Decreased 25%Financial Rate of Return 39% 27% 31%7 55% 23%
Financial Rate of Return (ROR) for Soil Conservation Only: 39% 7/
Sestvt nlss Best Estimate Invrestment Cost Operating C6st Revenue RvenueSensitivity Analysis In(treased 1.5% Increased 25% Increased 25% Decreased 25%Financial Rate of Return 39% 30% --- 54% 27%
1/ This farm model is representative of the situation existing in Ahmednagar district. The average farm size in Sholapur, Bijapur and Anantapur will be the same(4 ha), the cropping pattern, however, will be different. On farm investment consist of soil conservation and building-up of the cattle. (See Annex 8, Table d)b2/ Only the value of the grain has been here taken into account. T'he by-product (roughage) is used for livestock consumption. Cropping pattern and yields are thosepresented in Annex 17, Table 15 but the prices are lower since the by-product is not taken into account.3/ Since ,t is estimated that the required extra-labor will be provided from within the family (no hiring of laborers), its cbst has not been taken here.4/ 15 instalments, 6.5% interest rate,5/ 5 instalments, 9% interest rate.6/ The rate of return nf livestock development given here is slightly overestimated since 'crop by-products and grass grown on the farm and used for livestockconsumption are not charged as a cost.7/ The revenue accruing from crop sales has been increased to take into account the value of- the by-product (roughage) and of the grass grown on the bands.See Annex 17 , Table 1.5.
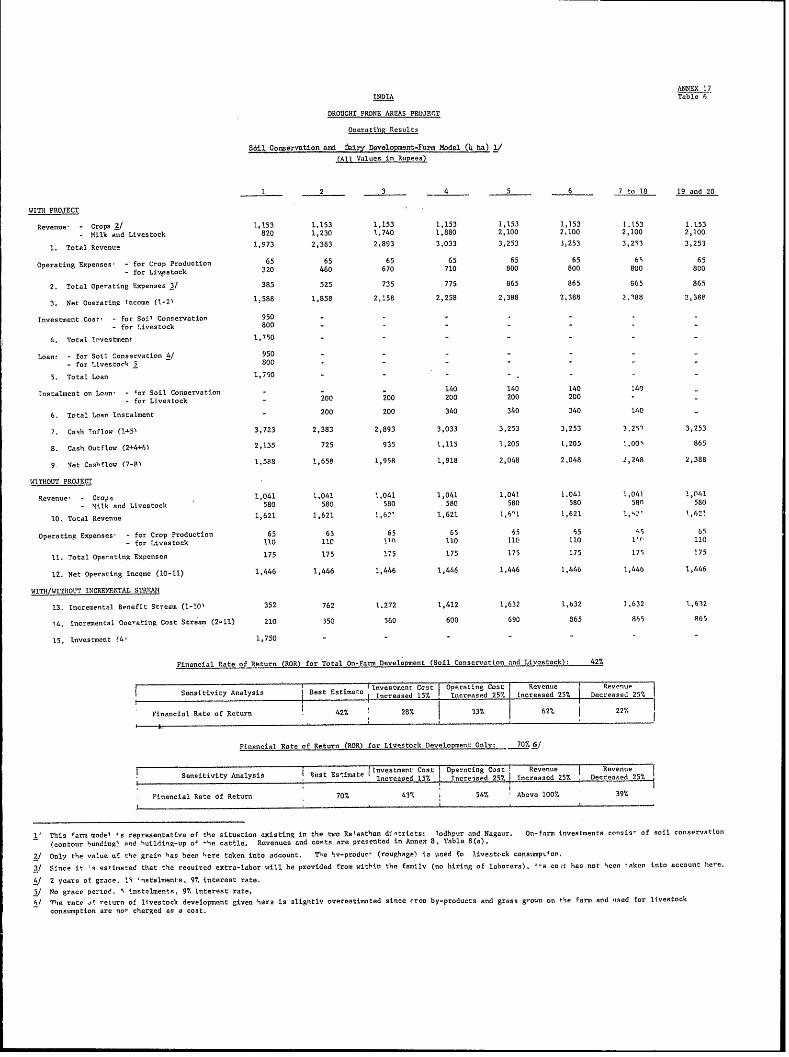
ANNEX 17
INDIA Table 6
DROUGHT PRONE ARE-AS PRII2ErT
O.eratitig Results
59632 Conservation arx1 1bary Development-Farm Model Ciha) I/(All Values in Rupe-)
1 2 3 4 5 6 7 to 18 19 and 20
WITH PROJECT
Revenue - Crops a,' 1,153 1,153 1,153 1,153 1,153 1,153 1,153 1.153
-Milk and Livestock 820 1,230 1_740 1,880 2,100 2,100 2,100 2,100
1. Total Reven-e 1,973 2,383 2,893 3,033 3,253 3,253 3,253 3,253
Operating Expenses - (or Crop Production 65 65 65 65 65 65 6as 65
-for Lilwastoc,k 320 460 670 710 800 800 800 800
2. Total Ope..ating Expenses 3/ 385 525 735 775 885 865 865 865
7. Net O.erating Income (1-2' 1,588 1,858 2,158 2,258 2,388 2,388 2.788 2,388
Investment Cost, f or Soil' Conservation- 950 - - - - --
-for Lives,tock 800-.--
4. Total Irvestnent 1,750 -----
Loan: -for Soil Conervtion 4/ 8500---. -
-for Ltvest-rh 350
5. Total Loan 1,750 - -----
Instalment on Loan'- 'or Soil Conservation - 140 140 140 :40f-
f or Lives,tock -200 200 200 200 200-
6. Total Loan Instalment - 200 200 340 340 340 140
7. Cash Tnflosa (1-'5S 3,725 2,383 2,893 3,033 3,253 3,253 3, 259 3,253
8. Cash Outflow,. (2+4+6) 2,135 725 955 1,115 1,205 1,205 1,0865
9. Iget C-,5'flow (7-8) 1,588 1,658 1,958 1,918 2,048 2,048 2,248 2,388
WIqTHOUT PROJECT
Revenue'- Cr.,O, 1,041 1,0411 1,041 1,041 1,041 1.,041 1,041 114
- 'hlk an,d Livestock 580 580 580 580 580 580 584 580
10. Total Revenue 1,621 1,621 1,62' 1,621 t, 6'l 1,621 i , 's62
Operating Expenses'- for Crop Production 65 65 65 65 .55 65 A5
-for Livestock 150I 11, 114 110 1 10 110 1 110
It. Total Operating Expenses 175 175 175 175 175 1 75 175, 175
12. Net Operating Income (10-lI) 1,446 1,446 1,446 1,446 1,446 1,446 1,446, 1,446
WITHIWITHOUT INCRENIENTAL STREAMf
13. Increm-ental Benefit Strea. (1-10' 352 762 1.272 1,412 1,632 1,632 1,632 1_632
14. Incremental Onerating Cost Stream (2-11) 210 350 560 600 690 865 865 865
15. Investment (4' 1,750 - - - - -.-
Financial Rate of Return (ROR) f6r Ttal. On-Fars, Development (Soil Conservtion and Livastock):_ 427.
Investment Cca OeangCost Revenu evenuSensitivity Analysis i Best Estimate Ic ad.52% nr. . C 5
Financial Rate of Return 427. 28% 337, 627. 227,
Financi.l Rate of Return (ROR) for Livodlotilt Development Only: 70% 6/
Sensitivity Analyi I tEtmiII etetCs prTin Cst Reene evnu IInraen3. tcreied25. nsed ed27 erased 25%.
Financial Rate of Return lo% 437. 547. Above 1007. 39".
1' This Carm made' Is representative of the situation existing in the two Raasthan di 'tricts: 7odhipur and Nagaur. On-farm investments~ -nsis' of soil conservatIon
(contour bunding1
a,d "uilding-up .C 'he cotlIe. Revenues and cortS- are presenated in Asnnex 8, Table 8(a).
.ZI Only the aleot :he grain has been h,ere taken inito adcount. Tspe h-producr (roughage) is used fo livestleck consump,5on.
3/ SInce It g es-lieted that the resuired extra-labor will be provided from within the femilv (no hiring of laborers), I's colt has not hee.n 'aken into ac ounthe.
4/ 2 years of grace. 11 'n-talments, 9% interest rate.
5/No grace period. I instal1ments,, 97. Interest rate,
'I1 The rate ,- rPeturn of livestock development given hoers is slightlY overestimated since rroo by-products and grass grown on the farm and ',sed for livestock
consumption are not charged as a cost.
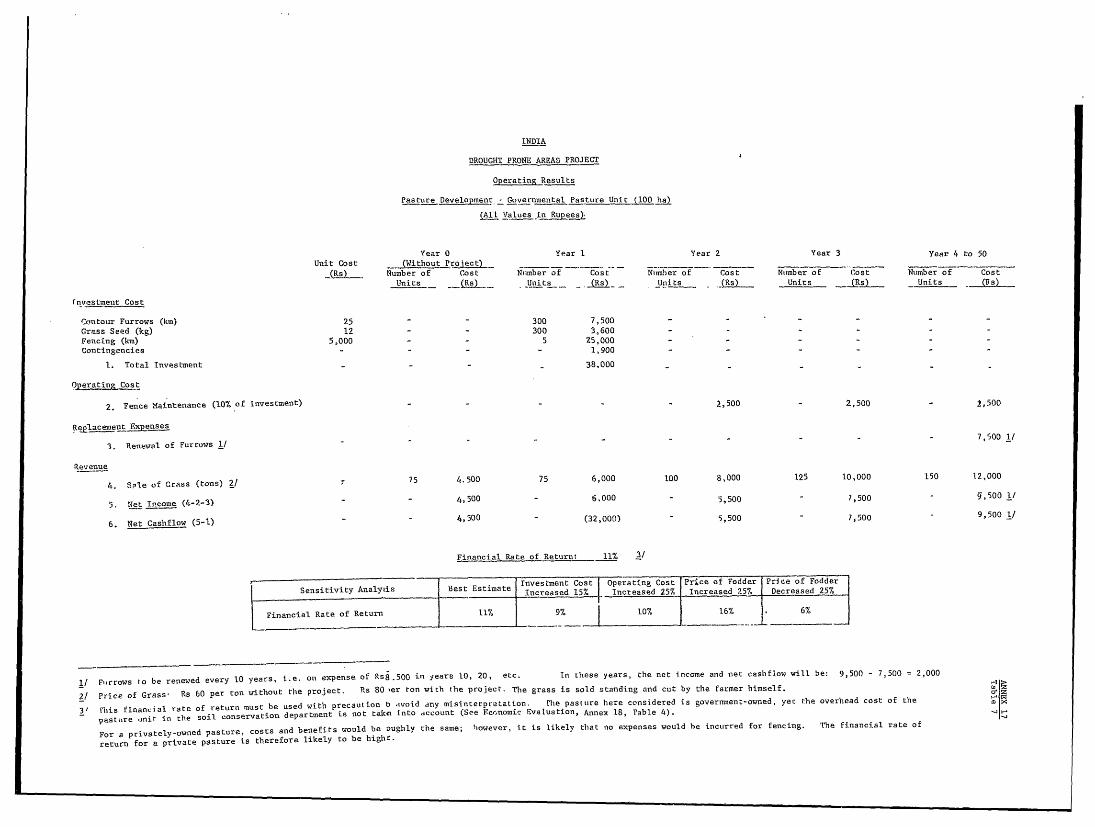
INDIA
DROUGHT PRONE AREAS PROJECT
Operating Results
Pasture Development - Governmental Pasture Unit (100 ha)
(All -alues in Ru ee
Year 0 Year l Year 2 Year 3 Year 4 to 50
Unit Cost (Without Project)
(Rs) Number of Cost Number of Cost Number of Cost Number of Cost Nuimber of Cost
Units -_(Rs) _qUnits (Rs) Units (Rs) Units R) Units (Rs)
(nvestmenit Cost
contour Furrows (kin) 25 - 300 7,500 -
- -
Grass Seed (kg) 12 - - 300 3,600
Fencing (kma) 5,000 - 5 25,000 - - - - -
Contingencies - - - - 1,900
1. Total Investment - - 38,000 - - - - -
0perating Cost
2. Fence Maintenance (10% of investment) - -,500
2,500 - 2,500
ReplacemeUit Expenses
3. Renewal of Furrows 1/ - - - - - - - - 7,500 1/
Revenue
4. Sle of Grass (tons) 2J 75 4,500 75 6,000 100 8,000 125 10,000 150 12,000
5. Net Income (4-2-3) - 4,500 - 6,000 - 5,500 - 7,500 - §,500 1/
6. Net Cashflow (5-1) - 4,500 (32,0009) - 5,500 7 7,500 9,500 1/
Financial Rate of Return: 11% 3/
Investment Cost I Operating Cost Price of Fodder Price of Fodder
Sensitivity Analytis Best Estimate Increased 15% - Increased 25% Increased 25% Decreased 25%
Fina1ncial Rate of Return 1107 9 Y 16% . ,67
1/ Fu,rrows to be renewed every 10 years, i.e. on expense of Ra8.500 in years 10, 20, etc. In these years, the net income and net cashflow will be: 9,500 - 7,500 = 2,000
2/ rie o Gass R 6 pe tn wthutthe project. Rs 80 'er ton With the project. The grass is sold standing and cut by the farmer himself.
31 rllis financial rate of return must be used with precaution b .woid any misinterpretation. rhe pastttre here considered is government-owned, vec the overhead cost of tle
pastu,re unit in the soil conservation department is not take Into account (See Fcrnomic Evaluation, Annex 18, Table 4).
For a privately-owned pasture, costs and benefits would be Dughly the same; iowever, it is likely that no expenses would he incurred for fencing. The financial rate of
returrn for a private pasture is therefore likely to be highr.
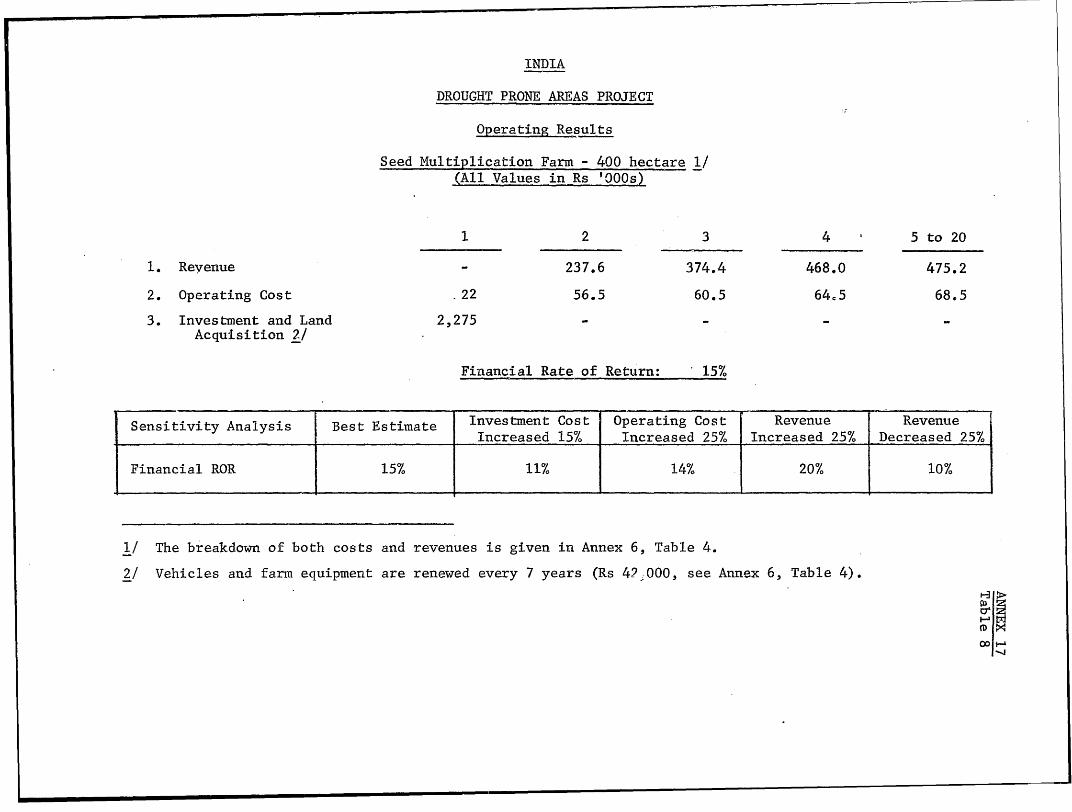
INDIA
DROUGHT PRONE AREAS PROJECT
Operating Results
Seed Multiplication Farm - 400 hectare 1/(All Values in Rs 'OQOs)
1 2 3 4 5 to 201. Revenue - 237.6 374.4 468.0 475.22. Operating Cost -22 56.5 60.5 64.5 68.53. Investment and Land 2,275 - - - -Acquisition 2/
Financial Rate of Return: 15%
r.Sensitivity Analysis Best Estimate Investment Cost Operating Cost Revenue RevenueIncreased 15% Increased 25% Increased 25% Decreased 25%Financial ROR 15% 11% 14% 20% 10%
1/ The breakdown of both costs and revenues is given in Annex 6, Table 4.2/ Vehicles and farm equipment are renewed every 7 years (Rs 4? 000, see Annex 6, Table 4).
co.E
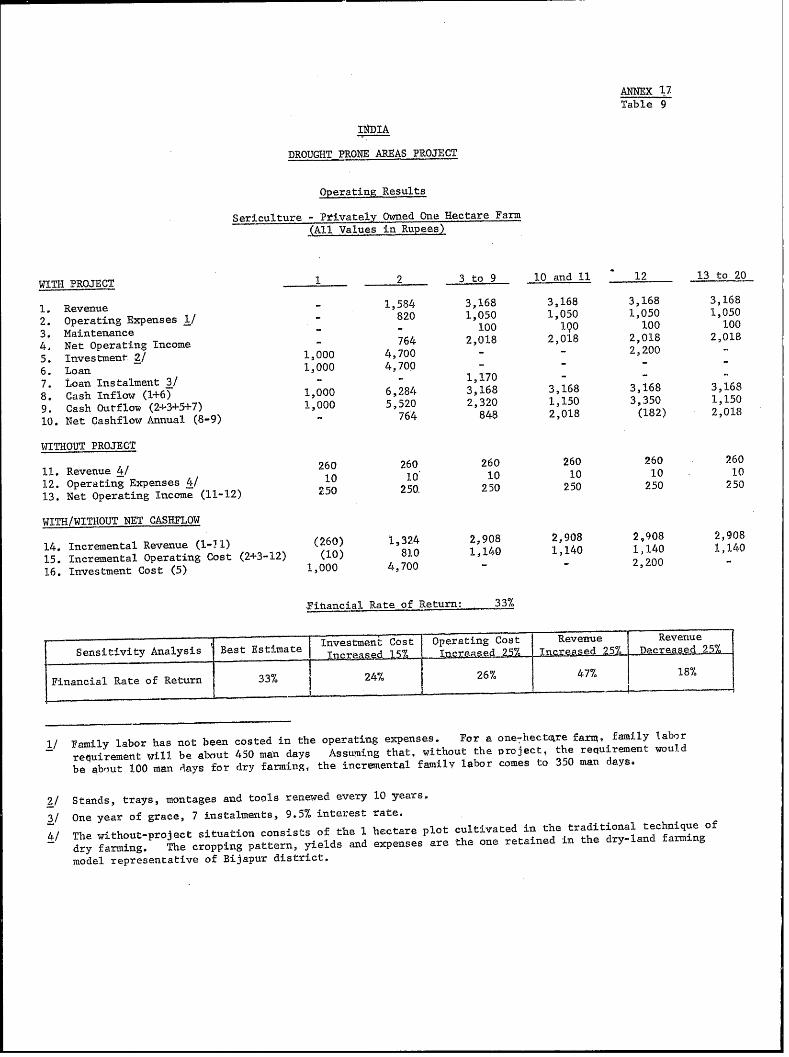
ANNEX '1.7Table 9
INDIA
DROUGHT PRONE AREAS PROJECT
Operating Results
Sericulture - Privately Owned One Hectare Farm
(All Values in Rupees)
WITH PROJECT 1 2 3 to 9 10 and 11 12 13 to 20
1. Revenue - 1,584 3,168 3,168 3,168 3,168
2. Operating Expenses 1/ - 820 1,050 1,050 1,050 1,050
3. Maintenance - - 100 190 100 100
4. Net Operating Income - 764 2,018 2,018 2,03.8 2,018
5. Investment 2/ 1,000 4,700 - - 2,200 -
6. Loan 1,000 4,700 - -
7. toan Instalment 3/ - - 1,170 - - -
8. Cash Inflaw (1+6) 1,000 6,284 3,168 3,168 3,168 3,168
9. Cash Outflow (2+3+5+7) 1,000 5,520 2,320 1,150 3,350 1,150
10. Net Cashflow Annual (8-9) - 764 848 2,018 (182) 2,018
WITHOUT PROJECT
11. Revenue 4/ 260 260 260 260 260 260
12. Operating Expenses 4/ 10 10 10 10 10 10
13. Net Operating Income (11-12) 250 250. 250 250 250 250
WITH/WITHOUT NET CASHFLOW
14. Incremental Revenue (I-11) (260) 1,324 2,908 2,908 2,908 2,908
15. Incremental Operating Cost (2+3-12) (10) 810 1,140 1,140 1,140 1,140
16. Investment Cost (5) 1,000 4,700 - - 2,200 -
Fihancial Rate of Return 33%
- i Investment Cost Operating Cost Revenue Revenue
Sensitivity Analysis Best Est-Lmate In re sd 1 ' I c.ea.EjS 2xs 25Y ' Decreased 25e/
Financial Rate of Return 33% 24% 26% 47% 18%
1/ Family labor has not been costed in the operating expenses. For a one-7hectkre far=, family labor
requirement will be about 450 man days Assuming that, without the project, the requirement would
be about 100 man days for dry farming, the incremental family labor comes to 350 man days.
2/ Stands, trays, montages and tools renewed every 10 years.
3/ One year of grace, 7 instalments, 9.5% interest rate.
4/ The without-project situation consists of the 1 hectare plot cultivated in the traditional technique of
dry farming. The cropping pattern, yields and expenses are the one retained in the dry-land farming
model representative of Bijapur district.
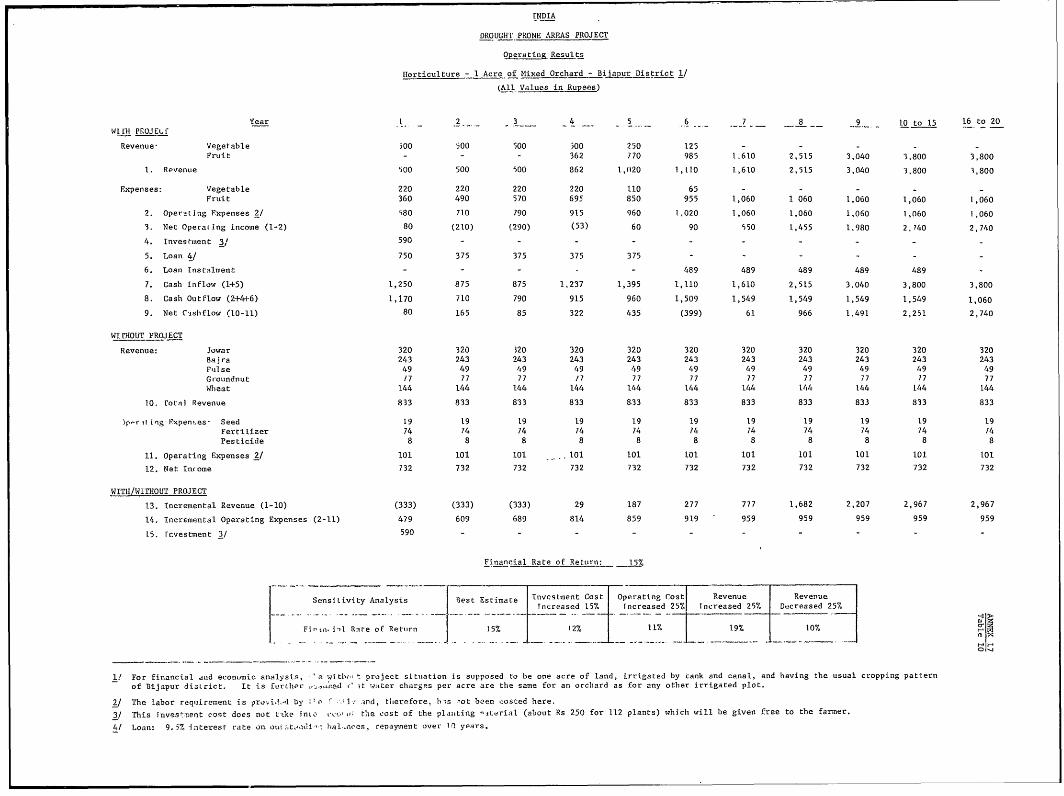
INDIA
DROUGHT PRONE AREAS PROJECT
Qpegrating Results
Ilorticulture - 1 Acre of Mixed Orchard - Biiapur District 1/
(All Values in Rupees)
Year 1 2 3 4 5 - 6 7 8 9 lOto 16 to 20WIl H PROJEL f
Revenue' Vegetable 500 500 500 300 250 125 - - -Fruit - - - 362 770 985 1,610 2,515 3,040 3,800 3,800
1. Revenue 300 500 500 862 1,020 1,110 1,610 2,515 3,040 3,800 3,800
Expenses: Vegetable 220 220 220 220 liD 65 - - - -Frujit 360 490 570 695 850 955 1,060 1 060 1,060 1,060 1,060
2. Operatitng Fxpenses 2/ s80 710 790 915 960 1,020 1,060 1,060 1,060 1,060 1,0603. Net Operating income (1-2) 80 (210) (290) (53) 60 90 '50 1,455 1,980 2.740 2,7404. Inveshtent 3/ 590 - - - - -
5. Loan 4/ 750 375 375 375 375 - - - -
6. Loan Instalment - - - - - 489 489 489 489 489 -
7. Cash InFlow (1+5) 1,250 875 875 1,237 1,395 1,110 1,610 2,515 3.040 3,800 3,8008. Cash OutFlow (2+4+6) 1,170 710 790 915 960 1,509 1,549 1,549 1,549 1,549 1,0609. Net C(A6hflow (10-11) 80 165 85 322 435 (399) 61 966 1.491 2,251 2,740
WIIrHOUXT PROJECT
Revenue: Jowar 320 320 320 320 320 320 320 320 320 320 320Bajra 243 243 243 243 243 243 243 243 243 243 243Pu,l se 49 49 49 49 49 49 49 49 49 49 49Groundnut /7 77 77 /7 77 77 77 77 77 77 77Wheat 144 144 144 144 144 144 144 144 144 144 144
10. Votal Revenue 833 833 833 833 833 833 833 833 833 833 833
I.-r1 ing Fxpen%es Seed 19 19 19 19 19 19 19 19 19 19 19Fertilizer 74 74 74 74 74 74 74 74 74 74 74Pesticide 8 8 8 8 8 8 8 8 8 8 8
11. Operating Expenses 2/ 101 101 101 101 101 101 101 101 101 101 10112. Net Intome 732 732 732 732 732 732 732 732 732 732 732
WITH/WITHOUT PROJECT
13. Incremental Revenue (1-10) (333) (333) (333) 29 187 277 777 1,682 2,207 2,967 2,96714. Incremental Operating Expenses (2-11) 479 609 689 814 859 919 959 959 959 959 95915. Trvestment 3/ 590 - - - - - - - - - -
Financial Rate of Returni: 15%
Sensitivity Analysis esit Estimate Invcstment Cost Operating Cost Revenue RevenueIncreased 157. rncreased 25% Increased 25% D,ocreased 25%
Fi 'io i'l Rat-e of Return 15%P 12%- 11% 19% 10%
11 For financial ,dOd econ,nmic analysis, '. wi tl- t project situation is supposed to be one acre of land, irrigated by cank and canal, and having the usual cropping patternof Bijapur di3trict. It is futrLheLr -.-. ,red . *t w.ater charges per acre are the same for an orchard as for any other irrigated plot.
2/ The labor requirement is proyvi..d by a ' -and, therefore, h3s 1ot been ,osted here.
3/ This inves-tent cost does not l-ke inLO cc.. o; t.he cost of the platiting -it, rial (about Rs 250 for 112 plants) which will be given free to the farmer.4/ Loan: 9.53% iaterest rate on OU4t.'aai'-- hal-wcos, reDayment over 1.1 years.
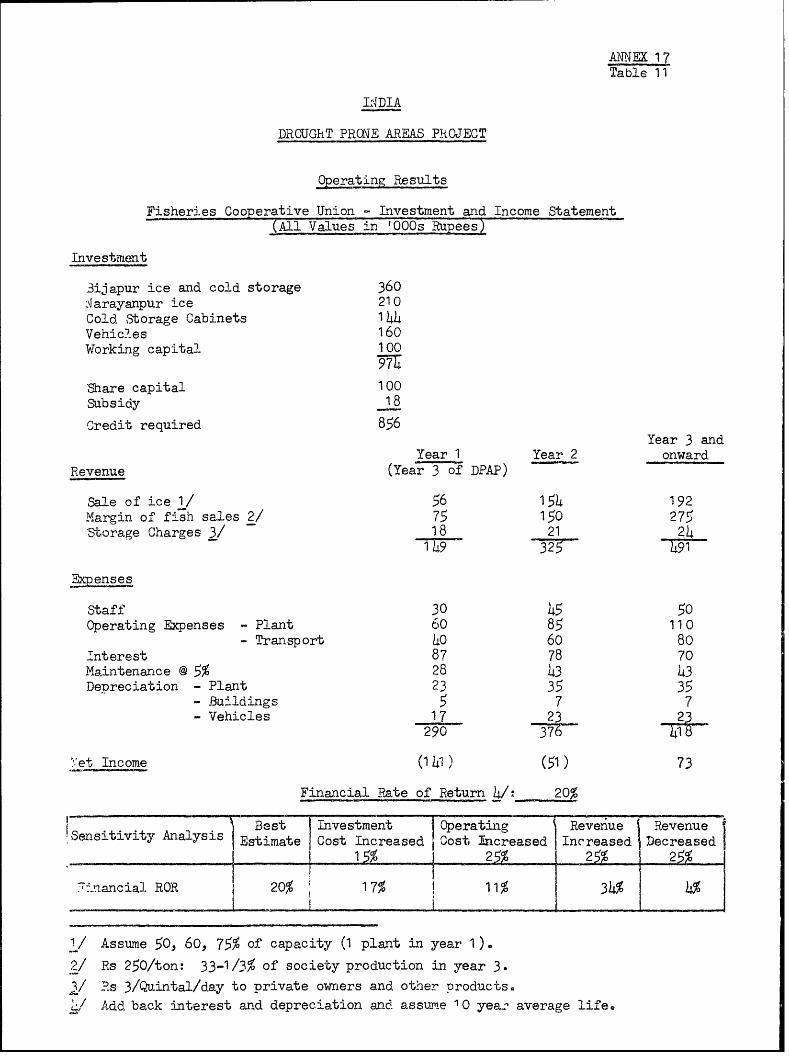
ANINEX 17Z
Table 11
LIDIA
DROUGhT PRC\i-E AREAS PROJECT
Operating Results
Fisheries Cooperative Union - Investment and Income Statement(All_ Values in I QOOs _Rupees)
Invest.ment
3ijapur ice and cold storage 3604\Jarayanpur ice 210Cold Storage Cabinets 144Vehicles 160Working capital 100
Share capital 100Subsidy 18
Credit required 856Year 3 and
Year 1 Year 2 onwardRevenue (Year 3 of DPAP)
Sale of ice 1/ 56 154 192Margin of fish sales 2/ 75 150 275Storage Charges 3/ 18 21 24
1h9 325 4~91
Expenses
Staff 30 45 50Operating Expenses - Plant 60 85 110
- Transport Lo 60 80interest 87 78 70Maintenance @ 5% 28 43 43DeDreciation - Plant 23 35 35
- Buildings 5 7 7- Vehicles 17 23 23
290 374
.'.et Income (1)41) (51) 73
Financial Rate of Return 4/: 20
S Best Investment Operatinig Revenue RevenueSensitivity AEalysis |Estimate Cost Increased ''ost Ilcreased Increased Decreased
_ 25% 2,5%
7-Mancial RO- 20% 17% 11% 34%
1/ Assume 50, 60, 75% of capacity (1 plant in year 1).
2/ Rs 250/ton: 33-1/3% of society production in year 3.
3/ Rs 3/Quintal/day to private owners and other products.</ Add back interest and deprecisation and assLme 10 yea*> average life.
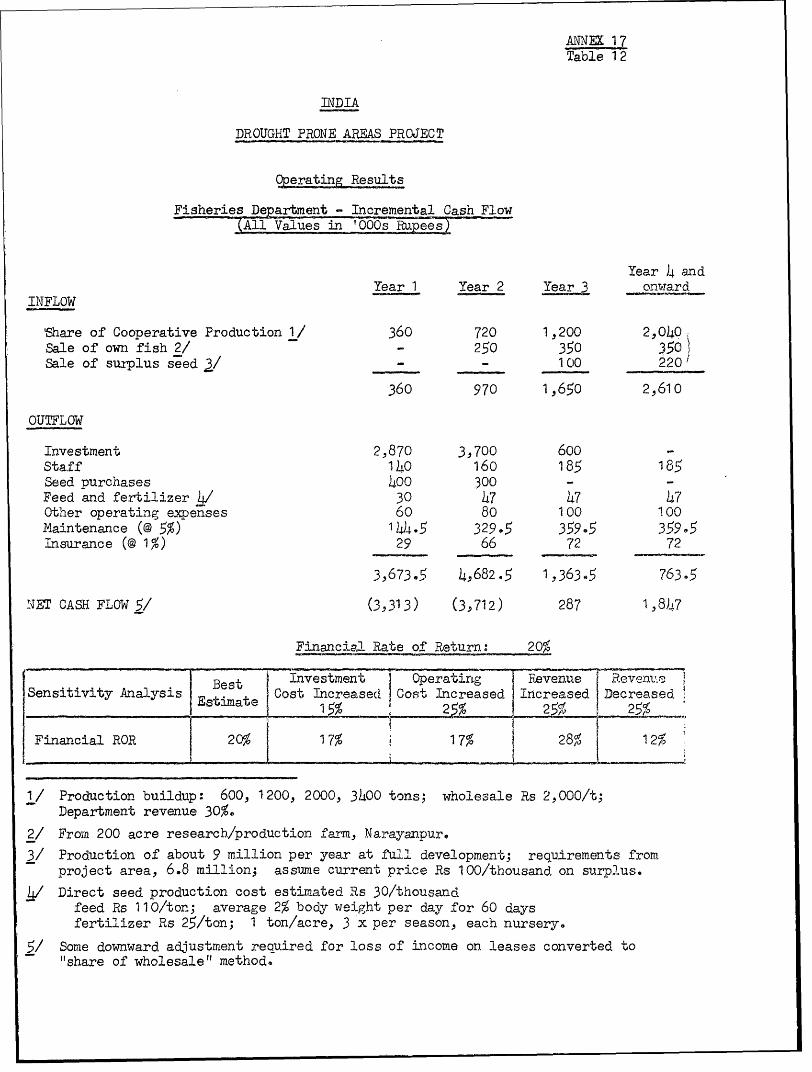
ANNEX 1 7Table 1 2
INDIA
DROUGHT PRONE AREAS PROJECT
Operating _Results
Fisheries Department - Incremental Cash Flow
Year 4 andYear 1 Year 2 Year onwardINFLOW
'Share of Cooperative Production 1/ 360 720 1,200 2,040;Sale of own fish 2/ - 250 350 350°Sale of surplus seed 3/ - - 100 220'
360 970 1,650 2,610
OUTFLOW
Investment 2,870 3,700 600Staff 140 160 185 185Seed purchases 400 300 - -Feed and fertilizer 4/ 30 47 47 47Other operating exipnses 60 80 100 100Maintenance (@ 5%) 1+445 329e5 35905 35965insurance (@ 1%) 29 66 72 72
3,67365 4,682.5 1,363.5 763.5
NET CASH FLOW 5/ (3,313) (3,712) 287 1,84J.7
Financial Rate of RetEurn: 20
Best Ivestment OperatirLg eivenue Re.venu.Sensitivity Analysis Cost Increased |Cost Increased Increased Decreased.__________15%_ _ 2_ _ 2_ _ _ 25%
Financial RORa i 20% 17% 17% 28% 12
1/ Production buildup: 600, 1200, 2000, 3400 tons; wholesale Rs 2,000/t;Department revenue 30%.
2/ From 200 acre research/production farm., Narayanpure3/ Production of about 9 million per year at full development; requirements fromproject area, 6.8 million; assume current price Rs 100/thousand on surplus._/ Direct seed production cost estimated Rs 30/thousand
feed Rs 110/ton; average 2% body weight per day for 60 daysfertilizer Rs 25/ton; 1 ton/acre, 3 x per season, each nursery.
5/ Some downward adjustment required for loss of income on leases converted to"share of wholesale" method.
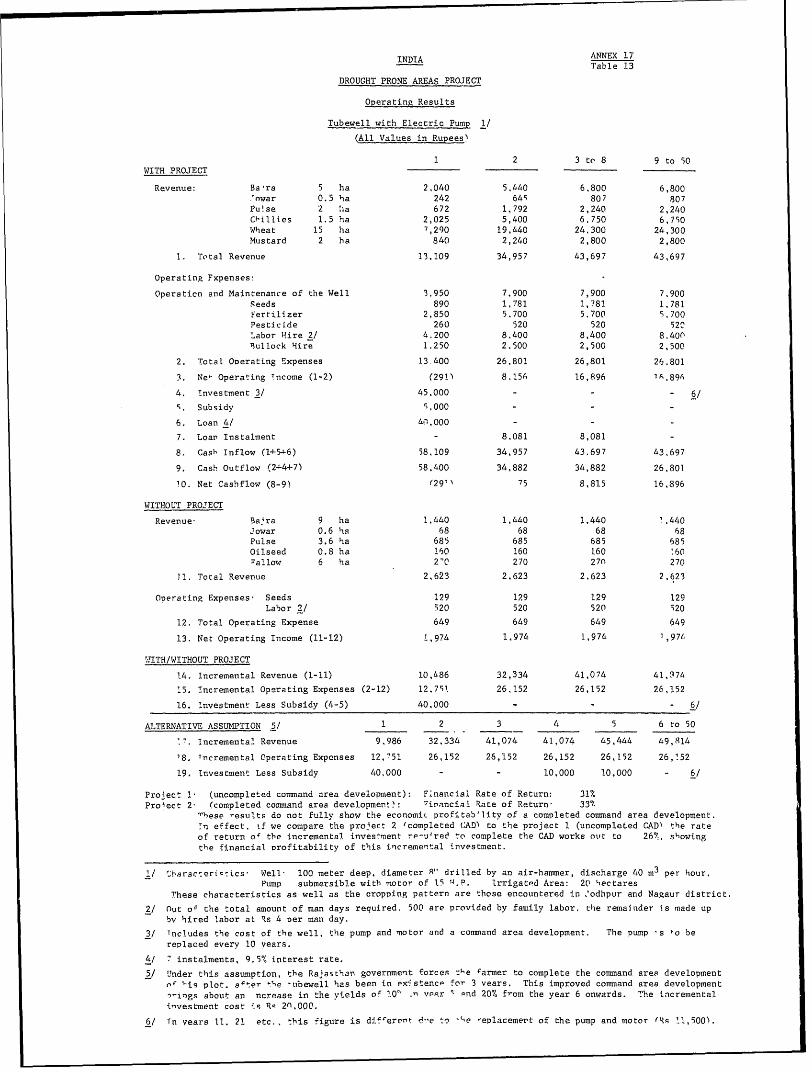
INDIA ANNEX 17Table 13DROUGHT PRONE AREAS PROJECT
Operating Results
Tubewell with Electric Pump 1/
(All Values in Rupees'
1 2 3 to 8 9 to 50WITH PROJECT
Revenue: Baira 5 ha 2,040 5,440 6,800 6,800.'nwar 0.5 ha 242 64S 807 807Pu'se 2 'ia 672 1,792 2,240 2,240Chillies 1.5 ha 2,025 5,400 6,750 6,750Wheat 15 ha 7,290 19,440 24,300 24,300Mustard 2 ha 840 2,240 2,800 2,8001. Total Revenue 13,109 34,957 43,697 43,697
Operating Fxpenses!
Operaticn and Maintenance of the Well 3,950 7,900 7,900 7,900Feeds 890 1,781 1,781 1,781Fertilizer 2,850 5.700 5.700 5,700Pesticide 260 520 520 52^Labor Hire 2/ 4.200 8.400 8,400 8.400Bullock Hire 1.250 2.500 2,500 2,5002. Total Overating Expenses 13 400 26,801 26,801 26.8013. Ne, Operating T
ncome (1-2) (291) 8,'56 16,896 1A.8964. Investment 3/ 45,000 - - 6/S. Subsidy 5,000 -6. Loan 4/ &4.1000 - - -7. Loar Instalment - 8,081 8,081 -8. Casb Inflow (1+546) 58,109 34,957 43,697 43.6979. Cash Outflow (244+7) 58.400 34.882 34,882 26,80110. Net Cashflow (8-9) (29'' 75 8,815 16,896
WITHOUT PROJECT
Revenue' Ba;ra 9 ha 1,440 1,440 1,440 '.440Jowar 0.6 ha 68 68 68 68Pulse 3.6 ha 685 685 685 685Oilseed 0.8 ha 160 160 160 '60Pallow 6 ha 2'C 270 270 27011, Total Revenue 2,623 2,623 2,623 2,623
Operating Expenses, Seeds 129 129 129 129Labor 2/ 520 520 520 52012. Total Operating Expense 649 649 649 64913. Net Operating Income (11-12) 1,974 1,974 1,974 1,97/,
'.7ITH/WITHOUT PROJECT
14. Incremental Revenue (1-11) 10,486 32,334 41,074 41,97415. incremental Operating Expenses (2-12) 12.75'. 26,152 26,152 26,15216. lnvestment Less Subsidy (4-5) 40,000 - - - 6/
ALTERNATIVE ASSUMPTION 5/ 1 2 3 4 5 6 to 50', Incremental Revenue 9,986 32,334 41,074 41,074 45,444 49,814
18, Tncremental Operating Expenses 12,751 26,152 26,152 26,152 26,152 26,15219, trivestment Less Subsidy 40,000 - - 10,000 10,000 - 6/
Project 1' (uncompleted command area development): F^nancial Rate of Return: 31%Proiect 2' (completed command area development): rinanciel Rate of Return' 3371these results do not fully show the economit profitab'lity of a completed command area development.in effect, tf we compare the pro4ect 2 'completed CAD) to the project 1 (uncompleLed CAD' the rateof return oa the incremental investment re-i4red to complete the CAD works out to 26!%, showingthe financial profitability of this incremental investment.
1/ 'haracveriC-ics' Well- 100 meter deep, diameter R" drilled by an air-hammer, discharge 40 m3
per hour.Pump submersible with motor of 15 '4.P Irrigatod Area: 201 hectaresThese characteristics as well as the cropping pattern are those encountered in .'odhpur and Nagaur district.2/ Out or the total amount of man days required. 500 are provided by family labor, the remainder is made upbv hired labor at Rs 4 per man day.3/ Tncludes the cost of the well, the pump and motor and a command area development. The pump ,s to bereplaced every 10 vears.
4/ 7 instalments, 9.5% interest rate.5/ Under this assumption, the RajasEhan government forces the farmer to complete the command area developmentof 'is plot. e4ter t"e 'ubewell has been in ex,stenc- for 3 vears. This improved command area development'1-ings about an ncrease in the yields of 10,J vear ^ and 20% from the year 6 onwards. The incrementalinvestment cost is R- 2n.000.
6/ Tn vears 11, 21 etc., this figure is difrerert d'e to "'ae -eplacemert of the pump and motor (RW " ,500.
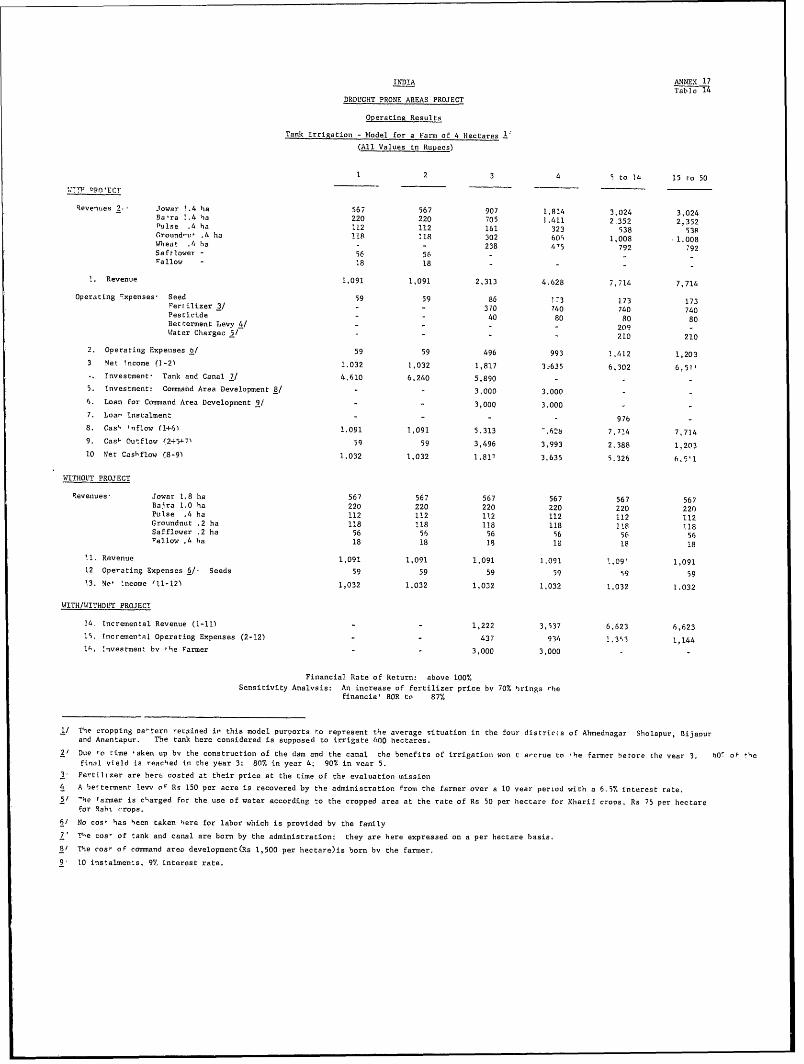
INDIA ANNEX 17
DROlUGHT PRONE AREAS PROJECT
Operating Results
Tank Irrigation - Model for a Farm of 4 Hectares I"(All Values in Rupees)
1 2 3 4 5 to 1 15 to 50-77P
5PO'ECT
Revenues 2- Jowar 1.4 ha 567 567 907 1,814 3,024 3,024Ba'ra 1.4 ha 220 220 705 1.411 2.352 2,352Pulse .4 ha 112 112 161 323 538 538(roundnu' ,h ha 118 118 302 609 1,008 1.008Wheat ,4 ha - - 238 4'5 792 '92Safflower - 56 56 - -Fallow - 18 18 - -
1. Revenue I,091 1,091 2,313 4.628 7,714 7,714Operating 1xpenses, Seed 59 59 86 173 173 173Fertilizer 3/ - - 370 740 740 740Pesticide - - 40 80 80 80Betterment Levy 4/ - - - - 209 -Water Chargec 5/ - - - - 210 210
2. Operating Expenises b/ 59 59 496 993 1,412 1,2033 Net Tncome (1-2) 1.032 1,032 1,817 3,635 6,302 6,51'tnvestment- Tank and Canal 7/ 4.610 6,240 5,890 - - -5. investment: Cosmsahd Area Development 8/ - - 3,000 3.000 -6. Loan for Command Area Development 9/ - 3,000 3.000 -7. Loar Instalment - - - - 976 -8. Gas' ,,Flow (1+61 1.091 1,091 5.313 -,618 7.714 7,7149. Cas- Outflow (2+5--7' 59 59 3,496 3,993 2.388 1,20310 Net Cashflow (8-99 1.032 1,032 1.817 3.635 9,326 6.5'1
WITHOUT PROJECT
Revenues- Jowar 1.8 ha 567 567 567 567 567 567Baira 1.0 ha 220 220 220 220 220 2201Pulse .4 ha 112 112 112 112 112 112Groundnut .2 ha 118 118 118 118 118 118Safflower .2 ha 56 56 56 56 56 56Fallow 4. ha 18 18 18 10 18 1811. Revenue 1,091 1,091 1,091 1,091 1,09' 1,09112 Operating Expenses 6/ Seeds 59 59 59 59 59 5913. Ne' Income '11-12) 1,032 1,032 1,032 1,032 1,032 1.032
WITH/WITHOUT PROJECT
14. Incremental Revenue (1-11) - - 1,222 3,537 6,623 6,62315, Increment.1 Operating Expenses (2-12) - - 437 934 1.391 1,144IA. 'nvestment by 'he Farmer - - 3,000 3,000 . -
Financial Rate of Return: above 100%Sensitivity Analvsis: An increase of fertilizer price bv 70% 'rings "he
financia' ROR to 87%
1/ The cropping Paltern retained ir this model purports to represent the average situation in the four districts of Ahmednagar Sholapur, Bijapurand Anantapur. The tank here considered is supposed to irrigate 400 hectares.2' Dtue lo time 'aken up bv the construction of the dam and the canal the benefits of irrigation won t arcrue to 'he farmer hetore the vear 3. hOV of thfinal vield is reached In the year 3; 80% in year 4; 90% in vear 5.31 Fertilizer are here costed at their price at the time of the evaluation tnission4 A betterment levy OF Rs 150 per acre is recovered by the administratior. From the farmer over a 10 vear period with a 6.5% interest rate.5/ -he Farmer is charged for the use of water according to the cropped area at the rate of Rs 50 per hectare for Kharif crops, Rs 75 per hectarefor Rabh. ,rops.
6/ No cosw has heen taken here for labor which is provided by the family7' The cost of tank and canal are born by the administration: they are here expressed on a per hectare basis.8/ The cos" of command area development(Rs 1,500 per hectare)is born bv the farmer.9 10 instalmen:s, 9% interest rate.
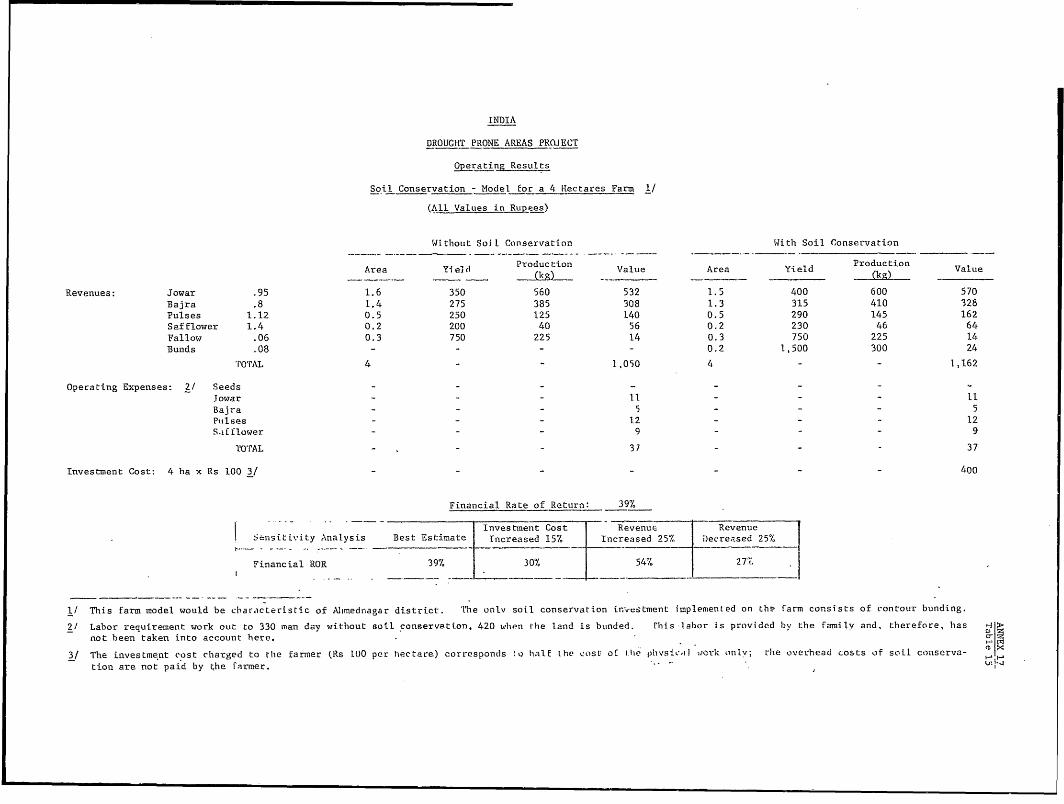
INDIA
DROUGHT PRONE AREAS PROJEC'T
Operating Results
Soil Conservation - Model for a 4 Rectares Farm l/
(All Values in Rupees)
Withouit Soil Conservation With Soil Conservation
Area Yield Production Value Area Yield Production Value
--- - -(kg ) -k g_
Revenues: Jowar .95 1.6 350 560 532 1.5 400 600 570
Bajra .8 1.4 275 385 308 1.3 315 410 328
Pulses 1.12 0.5 250 125 140 0.5 290 145 162
Safflower 1.4 0.2 200 40 56 0.2 230 46 64
Fallow .06 0.3 750 225 14 0.3 750 225 14
Bunds .08 - - - - 0.2 1,500 300 24
'rO'rAAL 4 - - 1,050 4 - - 1,162
Operating Expenses: 2/ Seeds - - -
Jowar - - - l - - - 11
Bajra - - 5 5
PitIses - - 12 - - - 12
S.ifflower - - 9 - - - 9
TOTAL 37 37
Investment Cost: 4 ha x Rs 100 3/ - - - - - - 400
Financial Rate of Return: 39%
Investmelnt Cost Revenuf Reventue
Sensitiv.ity Analysis Best Estimate Increased 15% Increased 25% Decreased 25%
Financial ROR 39% 30% 54% 27'
1/ This fa-rm model would be characteristic of Aimednagar district. The onlv soil conservation ir-,estment implemented on the farm consists of c-ontour bunding.
2/ Labor requirement work out to 330 man day without soil conservation, 420 wvhen -he land is btinded. rhis -labor is provided by the family and, therefore, has 'A >
not been taken into account here. *-
3/ The investment cost charged to thie farmer (Rs 100 per hectare) corresponts to half the costE of tlhe phyvsicl :aork *nlv; the overhead costs of soil conserva- ax
tion are not paid by the farmer. -- I
ANNEX 18
Page 1
INDIA
DROUGHT PRONE AREAS PROJECT
Economic Evaluation
A. Methodology
1. Cost's and Prices: All costs and benefits under the projecthave been assessed on an incremental basis over present and projectedvalues without thr' project. Price assutmptions are discussed in Annex 16.All costs have been based on prevailing raLes at the time of-appraisal,except unskilled labor and electricity.
2. Unskilled labor is a very important input of the project in tworespects. First, various labor-intensive investments (soil conservation,pasture development, tank irrigation) depend heavily on the use of unskilledlabor. Second, after the investment stage, all the activities implementedunder this project require some incremental labor for the yearly pzoducLioniand maino'_~m,ance, to be supplied either by on-farm family labor or by hiredlabor. The financial costs of family and hiired labor do not constitute agood approximation of the economic or opportunity cost ofL unskilled labor.The financial cost of family labor is zero, yet its opportunity cost has acertain positive value, although it is very difficult to quantify. In goodyears there are some employment opportunities for the farm popuilationi, inbad years there are nione. In drought prone areas, therefore, the o'pport-unfr'_.i-cost of family labor, if not nil, is clearly very low. The saxzui rz_su_lt ap-plies for the hired labor, due to the preponderance of relief workc. Wagelaborers under r-elief work have very few alternative possibilities of wor1k.Without this project they would be either unemployed or employed at reliefsites wqhich, too often in the past, ha\ie shown very low prodt.ctivity. Ineither case the productivity of these wage laborers in their al.ternaLlv'eoccupation is close to zero.
3. In view of the economic importance of unrskilledr laibor and theforegoing considerations of complexity in estimating its cost, two alter-native cost assumptions have been tested. The first asSuIMption retains thefinancial costs (zero for family labor, full cost for hired labor), thusestablishing a compensation between an underestimation of the cost of familylabor and an overestimation of the cost of hired labor. The second assump-tion uses a shadow price of one rupee per man day for bothi family and hiredlabor, corresponding to a weighted average of the opportunity cost in slac!!.and in peak periods.
ANNEX 18Page 2
4. The price charged to the farmers for electricity is lower thanthe cost of generation and distribution. The economic cost as estimated
by the Asia Power Division would vary from one state to another; aroundRs .30 per kwh in Rajasthan and around Rs .20 in Maharashtra, Karnataka
and Andhra Pradesh. In the economic evaluation of electrically-poweredwell irrigation schemes, the operating costs in cash flows have beenincreased to reflect this adjustment.
B. Benefits
Production Increase
5. The project would increase the production of foodgrains, cash
crops, milk, fodder, wool, fruit and fish. Irrigation development would
boost annual crop production in the six districts by some 30,000 tons
worth about Rs 30 million (the values here are based on the prices given
in Annex 16). The dry farming program would increase cereal, pulse andoilseed production by about 22,000 tons per year worth about Rs 20 million.
The soil and moisture conservation program would increase annual production
of foodgrains and cash crops (jowar, bajra, pulses, groundnuts) by more than
6,000 tons worth some Rs 6.4 million. Pasture development would increase
fodder production by some 65,000 tons each year, worth over Rs 5 million;
annual milk production would increase by 80,000 tons worth Rs 80 million
and sheep development would result in additional annual production of 300
tons of wool and 1,600 tons of mutton, worth Rs 2.6 million and Rs 4 mil-
lion, respectively.
6. Apart from any increased output, the project would result in
greater stability of agricultural production. To a great extent irrigation
would allow farmers to escape the vagaries of the weather even in drought
years. Though they are less effective than irrigation, dry farming and
soil and moisture conservation techniques would also contribute to this
stabilization. These techniques would enable farmers to get a minimal
harvest, even in most years of drought when crops would otherwise fail.
Developments in livestock and pasture, sericulture, horticulture and
fisheries would allow some diversifying of the districts' economies and
therefore render them less dependent on crop cultivation and the risks of
drought.
Employment
7. The project would increase employment in the districts concerned,
mainly for unskilled labor. Employment creation for unskilled labor would
stem both from labor-intensive construction works and exploitation of the
newly created assets. As an example, soil conservation works (construction
and repair of bunds, check dams, farm ponds) undertaken under this project
would require some 15 million man-days of unskilled wcrkers. Similarly,
ANNEX 1 8Page 3
tank and canal irrigation would create some 6 million man-days of employ-ment, and pasture development another 2 million man-days. This total of23 million man-days required for the execution of major investments aloneis equivalent to about 85,000 full time employment opportunities over theproject period. Upon completion, these assets wouLd require an increasein operating labor. For example, the contour bunds would require an in-cremental 800,000 man-days per year for maintenance, while irrigationdevelopment would create an additional 1,300,000 man-days yearly employ-ment as a result of increased crop production. The improvement of dryfarming practices and production would require the input of an additional3.3 million mandays on farm operations. The foregoing total some 5.4 mil-lion man-days, equivalent to 20,000 full time employment opportunities,Staffing of governmental departments and cooperatives would open up employ-ment opportunities for skilled workers and professional staff.
Impact on Famine Relief Expenditures
8. Under the project, a shelf of works would be established (landsurvey for soil conservation, plans and technical surveys for tanks andcanals). The execution of these works could be accelerated according tothe need for relief employment. Too often in the past, "scarcity works"implemented under famine relief have beeni takcn up quickly to create jobsin a state of emergency, with too little attention being paid to thetechnical design or economic viability of the assets thereby created.The shelf of works to be prepared under this project should ensure that,in the future, famine relief works would create sound, viable assets.
9. By mitigating the impact of the future droughts, the projectwould reduce the need for government-supported famine relief and therebyresult in a saving of public funds. Any prediction of these possiblesavings is perilous since the extent of drought mitigation cannot beeasily quantified. The following computation, however, may give a roughidea of the savings involved. The six project districts' famine reliefexpenditures amounted to some Rs 22 per rural person per year over thelast three years for which data are available. Under the project, some10,000 farm families would benefit from irrigation development; about215,000 others would be affected by various measures such as soil con-servation, dry farming, livestock and sheep development, sericulture,etc. Assuming, (a) that eight persons live on the income from an irri-gated plot and six on the income from larger unirrigated holdings; and(b) that the people who live on an irrigated plot would not need reliefwork at all and that the other project components could bring about, forthe population concerned, a 25% decrease in the famine relief requirements;then the annual decrease in public expenditures should amount to Rs 5 mil-lion per year.
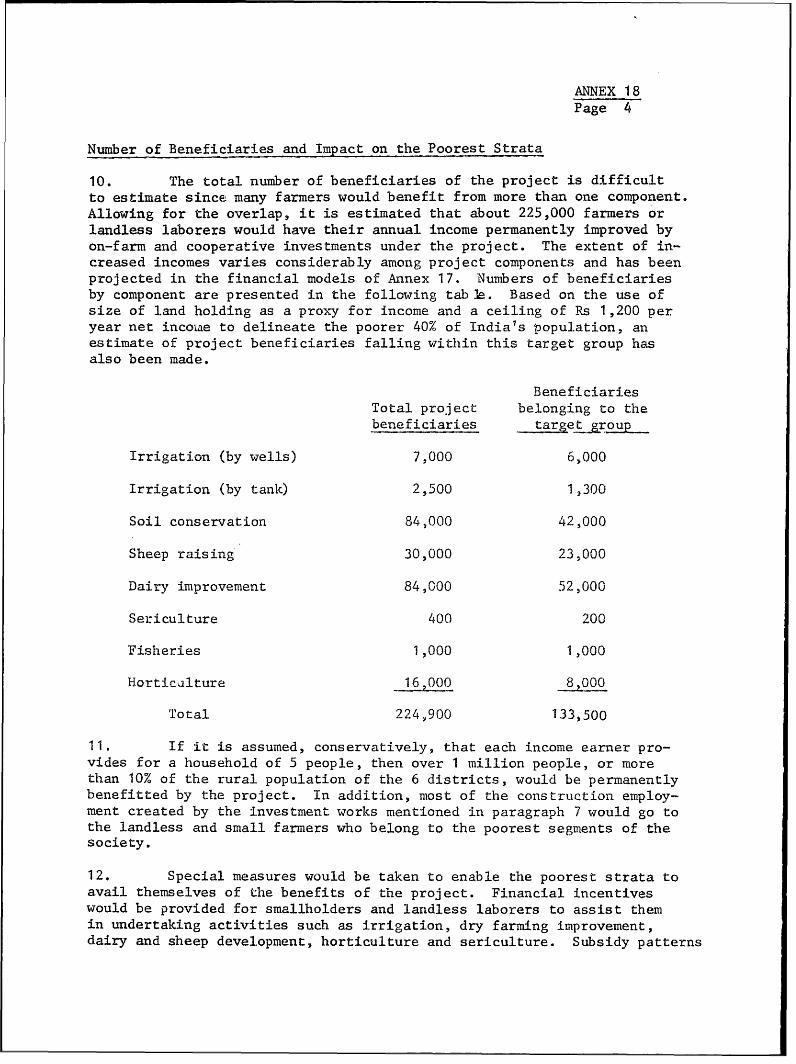
ANNEX 18Page 4
Number of Beneficiaries and Impact on the Poorest Strata
10. The total number of beneficiaries of the project is difficultto estimate since many farmers would benefit from more than one component.Allowing for the overlap, it is estimated that about 225,000 farmers orlandless laborers would have their annual income permanently improved byon-farm and cooperative investments under the project. The extent of in-creased incomes varies considerably among project components and has beenprojected in the financial models of Annex 17. Numbers of beneficiariesby component are presented in the following table. Based on the use ofsize of land holding as a proxy for income and a ceiling of Rs 1,200 peryear net inco.ae to delineate the poorer 40% of India's population, anestimate of project beneficiaries falling within this target group hasalso been made.
BeneficiariesTotal project belonging to thebeneficiaries targeigroup
Irrigation (by wells) 7,000 6,000
Irrigation (by tank) 2,500 1,300
Soil conservation 84,000 42,000
Sheep raising 30,000 23,000
Dairy improvement 84,000 52,000
Sericulture 400 200
Fisheries 1,000 1,000
Horticalture 16P8,000
Total 224,900 133,500
11. If it is assumed, conservatively, that each income earner pro-vides for a household of 5 people, then over 1 million people, or morethan 10% of the rural population of the 6 districts, would be permanentlybenefitted by the project. In addition, most of the constrtuction employ-ment created by the investment works mentioned in paragraph 7 would go tothe landless and small farmers who belong to the poorest segments of thesociety.
12. Special measures would be taken to enable the poorest strata toavail themselves of the benefits of the project. Financial incentiveswould be provided for smallholders and landless laborers to assist themin undertaking activities such as irrigation, dry farming improvement,dairy and sheep development, horticulture and sericulture. Subsidy patterns
ANNEX 1 8Page 5
would be the same in all districts, anid would be based on the pattern ofthe SFDA-MFAL schemes (Annex 2); that is, small farmers 1/ would be enti-tled to a 25% subsidy on eligible investments and marginal farmers 2/ andagricultural laborers would receive a 33-1/3% subsidy. All groundwaterdevelopment under the project would be restricted to smallholders, exceptfor a small number of tubewells and improvements in Rajasthan.
Other Benefits
13. A number of benefits of the project are not easily quantified,even though they would be significant. Conservation works, pasture devel-opment and afforestation would arrest the irreversible process of soilerosion and land degradation on about 650,000 ha. Fisheries, horticulture,cattle and sheep development would improve the variety and nutritive qualityof the diet of the population. Measures to improve the flow of credit shouldgreatly increase overall on-farm investment and the use of improved inputs,and the coordination of input supplies, credit, extension and research wouldbe strengthened. The experience gained under this project would be invalua-ble for replication in investment programs elsewhere in India. Of partic-ular interest in this respect would be project components for pasture andsheep development and horticulture, sericulture and fisheries development.District-level planning and project management, and measures to improveagricultural credit services would have general interest and application.Finally the results of the agricultural research undertaken in the project1sdistricts could also be applicable elsewhere in India.
Project Risk
14. Farmer response to technical innovation and cooperation, and theeffectiveness of institutional change within government, are difficult toquantify and likely to vary in relation to factors lying outside projectmanagement control, e.g., weather, political factors, etc. Despitc suchrisks the proposed project is worth undertaking on economic and Socialgrounds. The project would exploit the best available potentials for sig-nificantly improving the economic condition of very poor rural families andit would help develop and disseminate dryland technologies adapted to thecircumstances of India's drought prone areas.
1/ Farmers with less than 3 ha of unirrigated land or 1.5 ha of irri-gated land.
2/ Farmers with less than 1 ha of unirrigated land or 0.5 ha of irri-gated land.
ANNEX 18Page 6
C. Economic Rates of Return
15. In view of the variety of the project's components, some of whichare not revenue generating, an overall rate of return has not been calcu-lated. Rates of return have been computed instead for each production com-ponent of the project including related support services. These rates,while particularly sensitive to changes in cost assumptions for unskilledlabor, are satisfactory. Table 1 of this Annex summarizes best estimatesand sensitivity testing of rates of return based on models presented insubsequent tables.
Noveuber 4, 1974
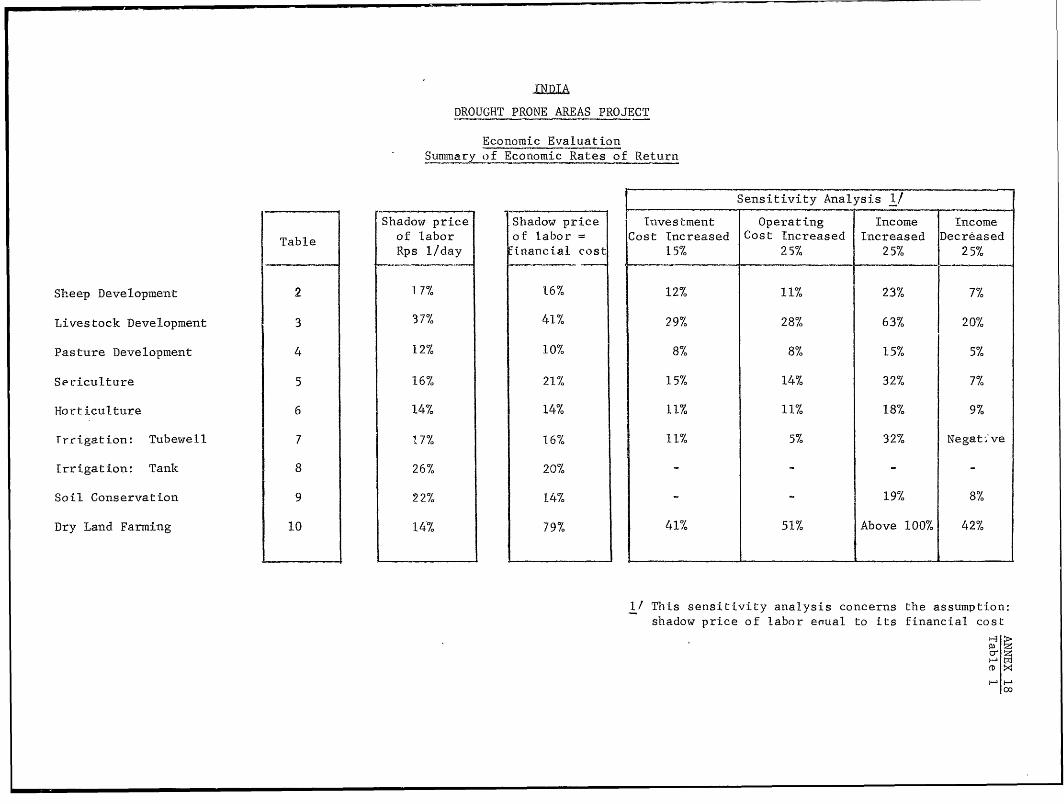
DROUGHT PRONE AREAS PROJECT
Economic EvaluationSunmmary of Economic Rates of Return
_Sensitivity Analysis 1!
Shadow price Shadow price Investment Operating Income incomeTable of labor of labor = Cost Increased Cost Increased Increased DecrVased
Rps I/day Einancial cost . 5% 257% 25%/ 25%
Sheep Development 2 17% 16% 12% 11% 23% 7%
Livestock Development 3 37% 41% 29% 28% 63% 20%
Pasture Development 4 12% 10% 8% 8% 15% 5%
Sericulture 5 16% 21% 15% 14% 32% 7%
Horticulture 6 14% 14% 11% 11% 18% 9%
Trrigation: Tubewell 7 17% 16% 11% 5% 32% Negat<ve
Errigation: Tank 8 26% 20% - - - -
Soil Conservation 9 22% 14% - 19% 8%
Dry Land Farming 10 14% 79% 41% 51% Above 100% 42%
1/ This sensitivity analysis concerns the assumption:shadow price of labor erual to its financial cost
-3 >
mrD z
00H
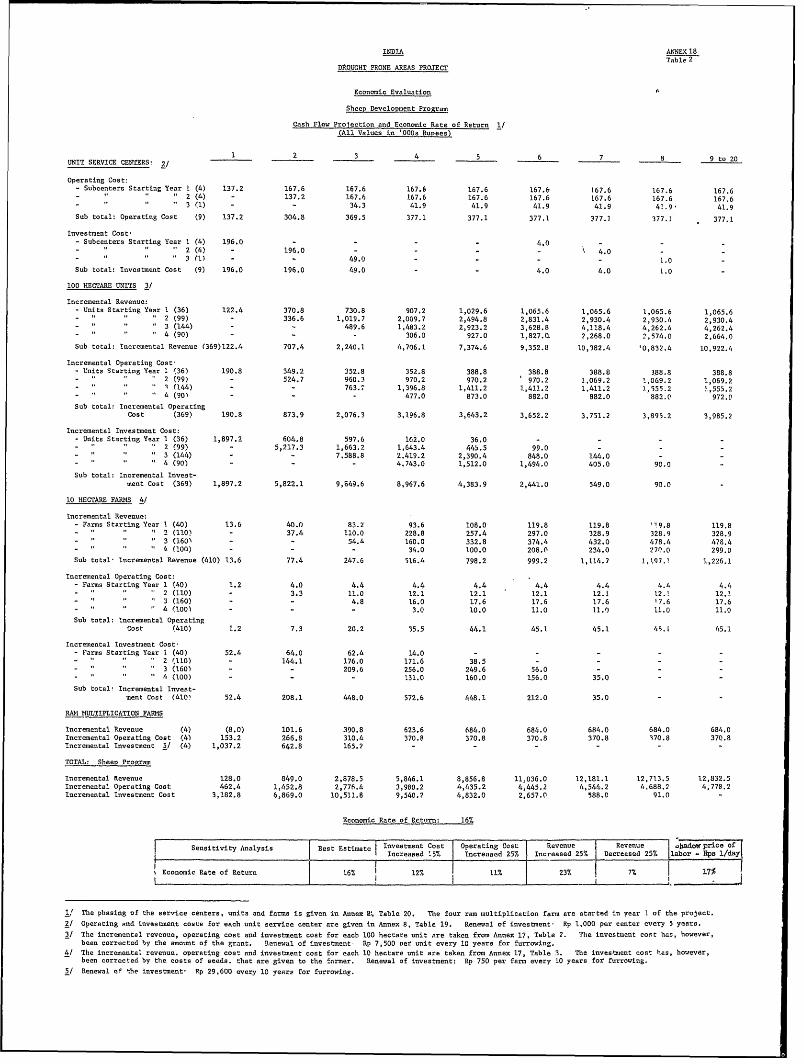
INDIA ANINEXIS8Table 2
DO4OUGHT PRONE AREAS PROJECT
Economic Evaluation
Sheep Deve.lopment Program
Cash Flow- Projection. and Economic Rate of Return I/(All Values in. '0OOs Rupees)
UNIT SERVICE CENTERS: 2/ 23456789t. 0
Operating Coat:-Sub.enters Starting Year 1 (4) 137.2 167.6 167.6 167.6 167.6 167.6 167.6 167.6 167.6
-" " " 2 (4-) - 137.2 167.6 167.6 167.6 167.6 167.6 167.6 167.6
-' 3 (1) - - 34.3 41.9 41.9 41.9 41.9 41.9' 41.9
Sub total: Operating Cost (9) 137.2 304.8 368.5 377.1 377.1 377.1 777.1 377.1' 377.1
Investment Cost--Subren.ters Starting Year 3 (4) 196.0 - - - - 4.0 - - -
-' " 2(4) - 196.0 --- \ 4.0 --
-" ' ' 3 Cl) - - 49.0o - - 1.0-
Sub total: Investment Cost (9) 196.0 196.0 49.0 - - 4.0 4.0 1.0 -
100 HECTARE TNIITS 3/
Incremental Revenue:-Units Starting Year l (36) 122.4 370.8 730.8 907.2 1,029.6 1,065.6 1,065.6 1,065.6 1,065.6
- " (99) - 336.6 1,019.7 2,009.7 2,494.8 2,831.4 2,930.4 2,930.4 2,930.4
- " " 3 (144) - 489.6 1,483.2 2,923.2 3,628.8 4,118.4 4,262.4 4,262.4
-" 4 (90) - 306.0 927.0 1,827.0. 2,268.0 2,574.0 2,664.0
Sub total: In -cretal Revenue (369)122.4 707.4 2,240.1 4,706.1 7,374.6 9,352.8 10,382.4 10,832.4 10,922.4
Incremental Operating Cost'-Units Starting Year I (363 190.8 349.2 352.8 352.8 388.8 388.8 388.8 388.8 388.8
-2 (99) - 524.7 960.3 970,2 970.2 970.2 1,069.2 O,069. 2 1,069.2
- (144) - 763.27 1,396.8 1,411.2 1,411.2 1,411.2 0,555.2 1,555.2
-" 4 (901 - - . 477.0 873.0 882.0 882.0 882.0C 972.0
Sub total: Incremental OperatingCost (369) 190.8 873.9 2,076.3 3,196.8 3,643.2 3,652.2 3.751,2 3,895.2 3,985.2
Incremental Investment Cost:-Units Starting Y.ar 3 (36) 1,897.2 604.8 597.6 162~.0 36.0 - - - -
-" 2 (99) - 5,217.3 1,663.2 1,643.4 445.5 99.0 - -
-" 3 (144) - - 7,588.8 2,419.2 2,390.4 848.0 144.0 -
-" 4 (90) - - - 4,743.0 1,512.0 1,494.0 405.0 90.0
Sub total: 'Incremental Invest-ment Cost (369) 1,897.2 5,822.1 9,649.6 8,967.6 4,383.9 2,441.0 549.0 90.0 -
10 HIECTARE FARMS 41/
Incr-emetal Reveue:tF-Fam Starting Year 1 (40) 13.6 40.0 83.2 93.6 108.0 119.8 119.8 '1-9.8 119.8
-' 2 (110) - 37.4 110.0 228.8 257.4 297.0 328.9 328.9 328.9
-" 3 (160' - 54.4 160.0 332.8 374.4 432.0 478.4 478.4
- 4(100) - - - 34.0 100.0 208.0 234.0 2770,p 299.0
Sub total' Incremental Revenue (410) 13.6 77.4 247.6 516.4 798.2 999.2 1,114.7 1,L197.3 1,226.1
Incremental Operating Cost:-Farms Starting Year 1 (40) 1.2 4.0 4.4 4.4 4.4 4.4 4.4 4.4 4.4
-' 2 (110) - 3.3 11.0 12.1 12.1 12.1 12.1 12.2 12.1
- " " " 3 (160) - 4.8 16.0 17.6 17.6 37.6 '7.6 17.6
- " " "4 (100) --- 3.0 10.0 11.0 11.0 I1.0 11.0
Sub total: Incr-emetal OperatingCost (410) 1.2 7.3 20.2 35.5 44.1 45.1 45.1 45.1 45.1
Incremental Investment Cost'F- Frs Starting Year 3 (40) 52.4 64.0 62.4 14.0 - - -
- ' " " 2 (110) - 144.1 176.0 171.6 38.5 -- -
-" 3 (160) - - 209.6 256.0 249.6 56.0--
-" 4 (TOO) - - - 131.0 160.0 156.0 35.0-
Sub total, Incremental Invest-ment Coat (410' 52.4 208.1 448.0 572.6 448.1 212.0 35.0 -
RMl MULTIPLICATIONi FARM4S
Incremental Revenue (4) (8.0) 101.6 390.8 623.6 684.0 684.0 684.0 684.0 684.0
Incremental Operating Cost (43 153.2 266.8 310.4 370.8 370.8 370.8 370.8 370.8 370.8
Incr-emetal Inveatnent 5/ (4) 1,037.2 642.8 165.7 - - - -
TOTAL: Sheep Program
Incremental Revenue 128.0 049.0 2,878.5 5,846.1 8,856.8 11,036.0 12,181.1 12,733.5 12,832.5
Incr'e,mental Operating Coat: 462.4 1,452.8 2,776.4 3,980.2 4,435.2 4,445.2 4,544.2 4,688.2 4,778.2
Incremental Investment Cost 3,182.8 6,869.0 10,511.8 9,540.7 4,832.0 2,657.0 588.0 91.0 -
Economic Rate of Return: 167.
Sensitivity Analysis Bost Estimate Investment Cost Operating Cost Revenue Revenue b4ados'5price ofI,,,I Increased 1.57 Increased 257, Increased 257. Decreased 25% la9bor - lIps 1/day
Economic Rate of Return 16%/ 127,17 237. 7%17
.' The phasing of the service centers, units and forms is given in Annex 8', Table 20. The four ram multiplication farm are started in year: 1 of the project.
2/ Operating and investment cos ts for each unit service center aer given in Annex 8, Table 19. Renewal of investment- Rp 1,000 per center every 5 years..
3/ The incremental revenue, operating cost and investment cost for each 100 hectare unit are taken from Annex 17, Table 2. Thie investment cos,t hias, however,
been qorrected by the amount of the grant. Renewal of investment- Rp 7,500 Pear unit every 10 years for furrowing.
4/ The incremen.tal revenue, operating coat and investment cost for each 10 hectare unit are taken from Annex 17, Table 3. The investment cost has, however,
been corrected by the costs of seeds, that are given to the farmer. Renewal of investment: Rp 750 per farm every to years foE furrowing.~iRenewal of the Investment' Rp 29,600 every 10 years~ for furrowing.
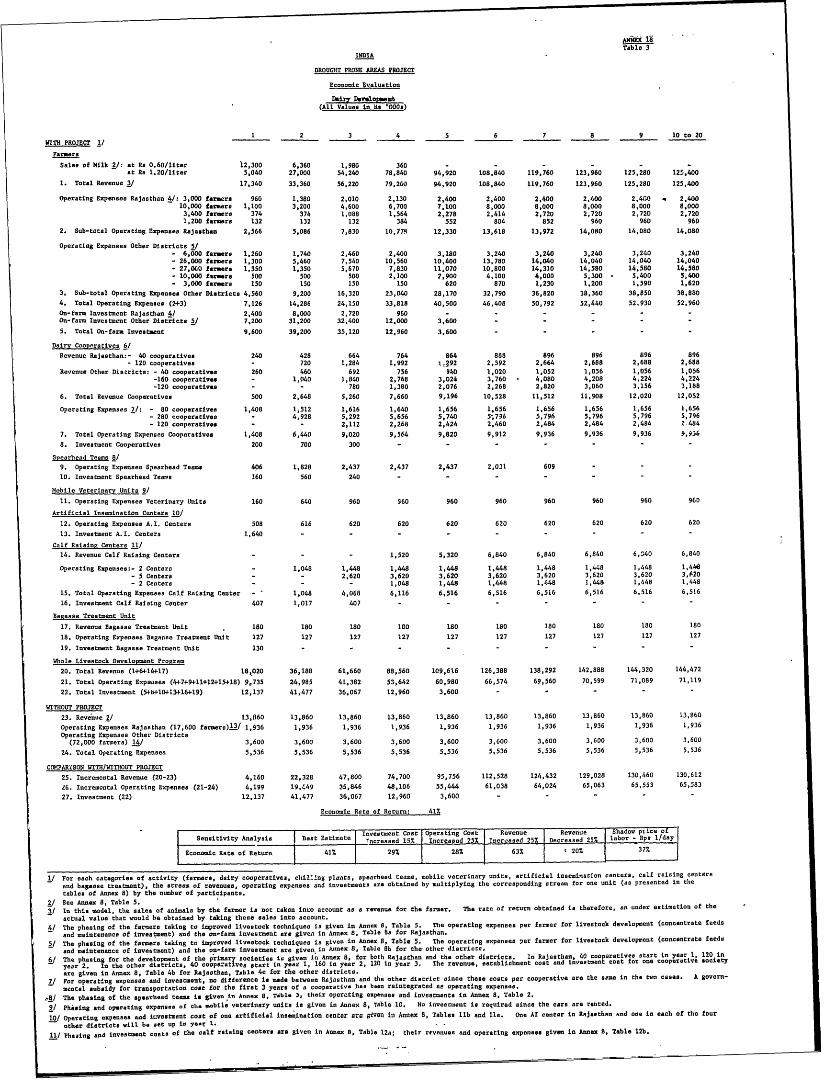
AR!iii 178Table 3INDIA
DROUGHT PRONE AREAS PRLOJECT
D.iry Dmv.lsMeet(All Val... in its OOOs.)
1 2 3 4 5 6 7 B9 l t. 20
WITH PROJECT /_
___Sale. of Milk 2/ at Re 0.60/liter 12,300 6,360 1,980 360 - - - - -
et R. 1.20/liter 5,040 27,000 54,240 78,840 94,920 108,840 119,760 123,960 125,280 125,400
1. Total R.venue I/ 17,340 33,360 56,220 79,200 94,920 108,840 119,760 123,960 125,280 125,400
Operating Expensee R.Jasthan 4/: 3,000 farmere 960 1,380 2,010 2,130 2,400 2,400 2,400 2,400 2,400 * 2,40010,000 famers 1,100 3,200 4,600 6,700 7,100 8,000 8,000 8,000 8,000 8,000
3,400 far-mre 374 374 1,088 1,564 2,278 2,414 2,720 2,720 2,720 2,7201,200 farmrs 132 132 132 384 552 804 852 960 960 960
2. Sub-total Operting Eapenaee Rajasthan 2,566 5,086 7,830 10,779I 12,330 13,618 13,972 14,080 14,080 14,080Operating Expenses Other Districts I/
-6,000 farmer 1,260 1,740 2,460 2,400 3,180 3,240 3,240 3,240 3,240 3,240
-26,000 farmers 1,300 5,460 7,540 10,560 10,400 13,780 14,040 14,040 14,040 14,040
-27,040 farmer 1,350 1,350 5,670 7,830 11,070 10,800 14,310 14,580 14,580 14,580-10,000 farmer 500 500 500 2,100 7,900 4,100 4,000 5,300 . 5,400 5,400
-3,000 farmer 150 150 150 150 620 870 1,250 1,200 1,590 1,620
3. Sub-total Operating Expeneee Other Districts 4,560 9,200 16,320 23,040 28,170 32,790 36,820 38,360 38,850 38,880
4. Total Operating Expenses (2+3) 7,126 14,286 24,150 33,818 40,500 46,408 50,792 52,440 52,930 52,960
On f-fr Inventneot RaJasthan 4/ 2,400 8,000 2,720 960 - - - ---On-fftm I-vet-et Other Districts 5j/ 7,200 31,200 32,400 12,000 3,600-S. Ttal On-farm Inveetmet
9,600 39,200 35,120 12,960 3,600-Dairy Coopsr.rti-e ~~/Revenue Ra.iaeth.n,- 40 cooperatives 240 428 664 764 864 888 896 896 896 896
-120 cooperativea . 720 1,284 1,992 1,392 2,592 2,664 2,688 2,688 2,688
Revenue Other Dii.rictn: - 40 coeaie 260 460 692 756 040 1,020 1,052 1,056 1,056 1,056
-160 coope-tiv- - 1,040 1,840 2,768 3,024 3,760 . 4,080 4,208 4,224 4,224
-120 coo peratives . . 780 1,280 2,076 2,268 2,820 3,060 3,156 3,188
6. Total Revenue Cooperatives 500 2,648 5,260 7,660 9,196 10,528 11,512 11,908 12,020 12,052
Operting Expenses 7/: -80 cooperatives 1,408 1,512 1,616 1,640 1,656 1,656 1,656 1,656 1,656 1,656
-280 coo peratives - 4,928 5,292 5,656 5,740 5;,796 5,796 5,796 5,796 5,796
-120 coopertives - - 2,112 2,268 2,424 2,460 2,484, 2,484 2,484 2.484
7. Total Operating Expenses Coopertives 1,408 6,440 9,020 9,564 9,820 9,912 9,936 9,936 9,936 9,401.6
8. Investment Cooperatives 200 700 300 - - - -Spearhead Tea-s A/
9. Operating Expenses Spearhead Teen 406 1,828 2,437 2,437 2,437 2,031 609-10. Investsent Spearhead Te-o 160 560 240 - - - --Mobile Veteri.sry Units 9/11. Operating Expenses V.terinory Units 160 640 960 960 960 960 960 960 960 961.
Artificial In-ination Centers lo/12, Operating Expenses A.l. Centers 508 616 620 620 620 620 620 620 620 620
13. Investment A.I. Centers 1,640 - - - - - - -
Calf Raii.sin Centers II1/14. RvneCalf Raising Centers - - - 1,520 5,320 6,840 6,840 6,840 6,340 6,840Opera.ting Expenses:- 2 Centeru,
1,041 1,448 1,446 1,448 1,448 1,448 1,448 1,448 1,440
-5 Centers - 2,620 3,620 3,620 3,620 3,620 3,620 3,620 3,6-20
-2 Centers -- - 1,046 1,448 1,448 1,448 1,448 1,448 1,448
15, Total Operating Expensea Calf Raising Center - 1,048 4,068 6,116 6,516 6,516 6,516 6,516 6,516 6,516
16. Inves.tment Calf Raising Center 407 1,017 407 - - - - - -Bag.... Treatment Ulnit
17. Revenue Begsse. Tretmet Unit IS18 180 180 180 180 180 180 180 180 180
18. Operting Expens.. esag...e Treatment UnIt 127 127 127 127 127 127 127 127 127 127
19. Investmet Bag...e Tretment Unit 130 - - - - - -Whole Livestock Development Progr..
20, Total Revenue (1+6+141-17) 18,020 36,188 61,660 88,560 109,616 126,388 138,292 142,888 144,320 144,472
21. Total Operating Expeses (41-7+9+11+12+15+18) 9,735 24,985 41,382 53,642 60,980 66,574 69,560 70,599 71,089 71,119
22. Total Investmnt (5+b+10+13+16+19) 12,137 41,477 36,067 12,960 3,600 - - - -WITHOUT PROJECT
23. Revenue 2/ 13,860 13,860 13,860 13,860 13,860 13,860 13,860 13,860 13,860 13,860
Operating Expenses. RaJastham (17,600 farmers)13/ 1,936 1,936 1,936 1,936 1,936 1,936 1,936 1,936 1,936 1,936
Operting Expenses. Other Districts(72,000 farmer) 14/
3,600 3,600 3,600 3,600 3,600 3,600 3,600 3,600 3,600 3,600
24. Total Operating Expenses 5,536 5,536 5,536 5,536 5,536 5,536 5,536 5,536 5,536 5,536
CIEPASIVS01 WITH/WITHOUT PROJECT25. Increnesta1 Revenu (20-23) 4,160 22,328 47,800 74,700 95,756 112,528 124,432 129,028 130,460 130,612
26. Increnota1 Operting Expenses (21-24) 4,199 19,449 35,846 46,106 55,444 61,038 64,024 65,063 65,553 65,583
27. Investment (22) 12,137 41,477 36,067 12,960 3,600 - - -
Econoic Rats of Return: 412
stmt Inetme.st Cost Operatin.g Cost ReVenue Revenue Shadow pce 0r
Sensitivity Analysis Best 'Rncreat.d 157. Incesed 252 Increase d 257. Decrease.d 255 labor - Rps 1/dayEco-qic Rtat of Return 41% 29% 28% 63% 201 71/ For eac h categories of activity (amr,dairy cooperatives, chilim.g plants, spearhead team, mobile veterinary s.ils, artificial inseninstion cetes,caf raising c-tdre
end bagasse treatment), the stream of revenues,. operating expenses. and investments are sitaind by multiplying the corresponding stream fsr oeui a presented in the
tables of Annex 8) by the number of participants.2/ See Anna,, 8, Table 5,
3/ I this model, the sales of animlal by the farmer is not taken imm account as a revenua for the fa-rmer The rate of return obtained is therefore, an under estimatisn of the
actual value that would be obtained by taking these sales into accoun..t.4/The phasing of the farmers taking to improved lives.tock techniques is given in Annam 8, Table S. The operating expenses per farmor for livestock developmen t (cocetrate feeds
andmaneac of investment) and the om-far investmet are givea in Annex 8, Ta~11s B. for R.jasthan,jjThe phasing of the farmer taking to improved livestock techniques is Riven in Annex 8, Table 5. The operating expenses per farmer for livestock development (ocnrt feeds
and maintenexce of inve8tmenl and the on-farm inetetar given in Anne 8, Table 86 for the, other districts,6/The phasing for the deve1apment of the primr soistis is given in Annex 8, for both RaJarthan and the other districts, Is Rajasthan, 40 cooperatives start in year 1, 120 in
year 2, In the other districts, 40 coope--at1vye5 star6t in ysar 1, 160 in yesr 2, 120 in year 3, The revenn, establishmet cost and inenroecoprtv
oit
ar given in Annex 8, Table 4b for Rajasthan, Table 4c for the other districts.a,
.. --
7/For operattng expen-as and investment, no difference is made baetee Rjajth-an ed the other diatrict since these. costs per cooperative are the sam in the w es. oen
mental subsidy for transportation cost for the first 3 years of a coopertive h.s hs- reintegrated ae operating expenses.4/ The phesiug of the spearhead taam in
5ivsn,in A-ne 8, Tble 3, their sper.ting expens.es nd investments in Annex 8, Table 2,/Phsinig and spa-ting expenses of the
0 abil. veterinary units is given in Annex 8, Ta,ble 10. NIs investmnt is required since the cars are tented,10/ Operating exPenses sd investment coat of one artifticil in.esination center are tdVan in Annex 8, Tables llb and lla, Qne AT centear is R.,Jasth.n and one in eac h of the four
other disttricts ill ha set up in yasr 1.-II/ Phasing and investment costs of the calf raising centers are given in Am-e 8, Table 12,,; their r-vnuss and operating expenses. given in Annex 8, Table 12b.
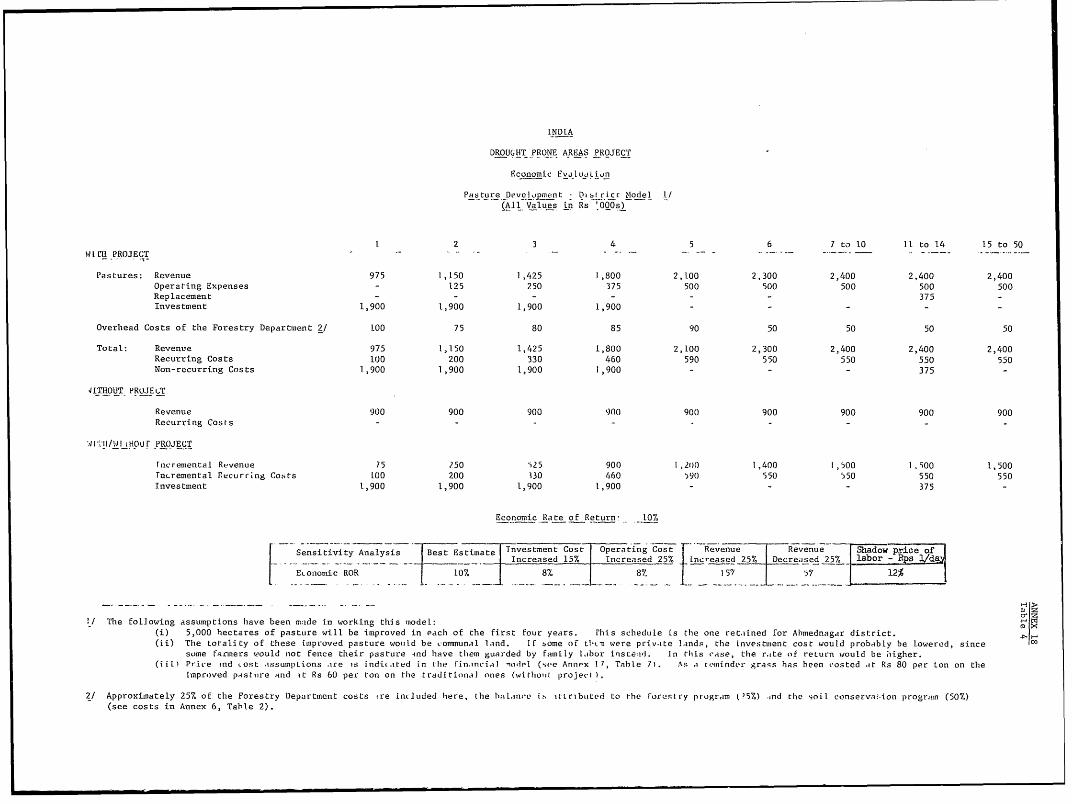
INDIA
DROUGHT PRONE AREAS PROJECT
Economic Fvdl1 tl1dLiufn
Pasture Development - Dibtric Model 1/(All Values in Rs '000s)
1 2 3 4 5 6 7 to 10 11 to 14 15 to 50WItH _PROJECT
Pastures: Revenue 975 1,150 1,425 1,800 2,100 2,300 2,400 2,400 2,400Operating Expenses - 125 250 375 500 500 500 500 500Replacement - - - - - - 375 -Investment 1,900 1,900 1,900 1,900 - - - - -
Overhead Costs of the Forestry Department 2/ l00 75 80 85 90 50 50 50 50Total: Revenue 975 1,150 1,425 1,800 2,100 2,300 2,400 2,400 2,400Recurring Costs 100 200 330 460 590 550 550 550 550Non-recurring Costs 1,900 1,900 1,900 1,900 - - - 375 -
4i.THOUT PROJ Et,T
Revenue 900 900 900 900 900 900 900 900 900Recurring Costs
Wlt:1tI1/WI LliOUr PROJECT
rticremental R,venue 75 250 i25 900 I ,2lt) 1,400 1,500 1,900 1,500TnLremental Recurring Co:ts 100 200 130 460 590 550 550 550 550Investment 1,900 1,900 1,900 1,900 - - - 375 -
Economic Rate of Return 10%
Sensitivity Analysis Best Estimate Tnvestment Cost Operating Cost Revenue RevenueIncreased 15% Increased 25% nreased 25% Decreased 25° labor - RpsE onomic ROR 10% 8% 8°/ 157 57 12%
1/ The following assumptions have been made in working this model:(i) 5,000 hectares of pasture will be improved in each of the first four years. rhis schedule is the one retained for Ahmednagar district. 4(ii) The totality of these itsproved pasture wotlld be communal Inlad. If some of tlt-s were private lands, the investment cost would probably be lowered, since c.some farmers would not fence their pasture tnd have them guarded by family libor inste:O. In this vase, the r.,te of reLurn would be hligher.(iii) Priae ,nd .ost IssumpL.ions are iS indicated In the Fin.ancial niodel (see Annex 1 7, Table 7). Asr a r'sminder graqs has been costed at Rs 80 per ton on theimpro)ved pAstuire and it Rs 60 per ton on the traditional ones (withouit project 1.
2/ Approximately 25% of the Forestry Department costs ire included here, the hataloe is tLtribttted to the Forestry ptogram ()5%) and thte soil conserv.a-ion program (50%)(see costs in Annex 6, Table 2).
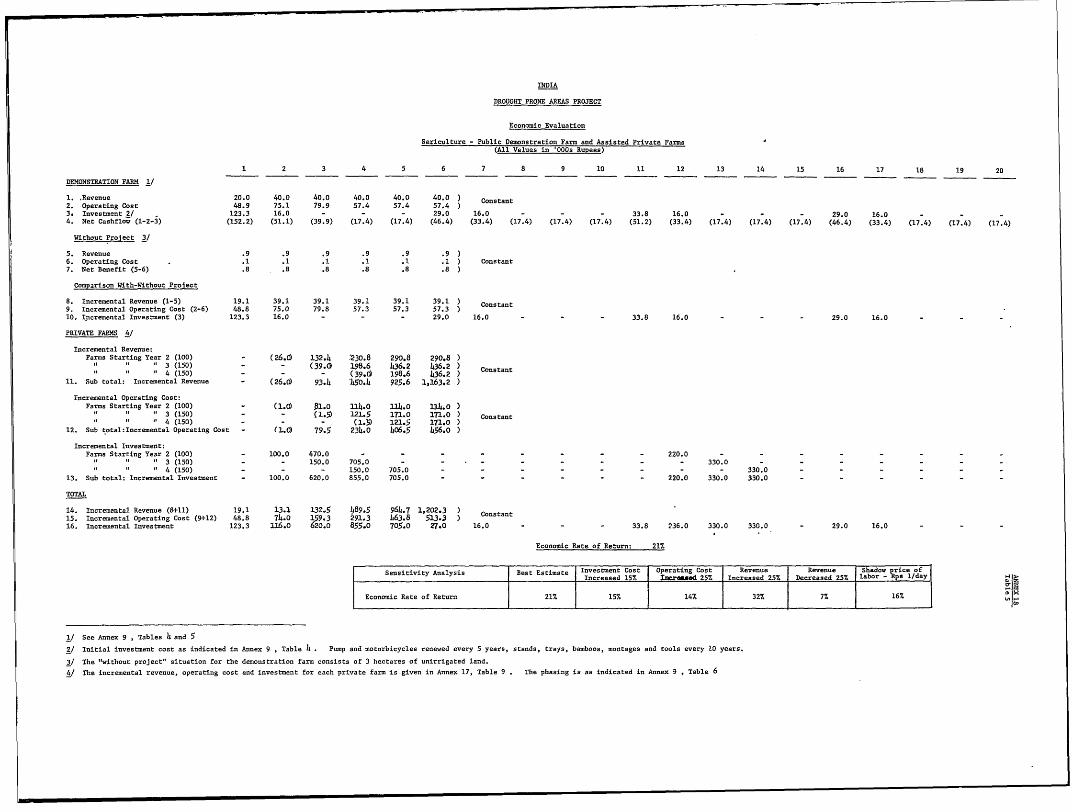
INDIA
DROUGHT PRONE AREAS PROJECT
Economic Evaluation
Sericulture - Public Demonstration Farn and Assisted Private Fams.(All Values in ODOs Rupees)
1 2 3 4 5 6 7 8 9 10 11 12 13 14 15 16 17 18 19 20DEMONSTRATION FARM I/
1. Revenue 20.0 40.0 40.0 40.0 40.0 40.0 ) Contat2. Operating Cost 48.9 75.1 79.9 57.4 57.4 57.4 Constan3. Investment 2/ 123.3 16.0 - - - 29.0 16.0 - - - 33.8 16.0 29.0 16.04. Net Cashflow (1-2-3) (152.2) (51.1) (39.9) (17.4) (17.4) (46.4) (33.4) (17.4) (17.4) (17.4) (51.2) (33.4) (17.4) (17.4) (17.4) (46.4) (33.4) (17.4) (17.4) (17.4)Without Project 3/
5. Revenue .9 .9 .9 .9 .9 .96. Operating Cost . .1 .1 .1 .1 .1 .1 ) Constant7. Net Benefit (5-6) .8 .8 .8 .8 .8 .8
Comparison With-Without ProJect
8. Incremental Revenue (1-5) 19.1 39.1 39.1 39.1 39.1 39.1 ) Constant9. Incremental Operating Cost (2-6) 48.8 75.0 79.8 57.3 57.3 57.310. Incremental Inves ment (3) 123.3 16.0 - - - 29.0 16.0 - - - 33.8 16.0 - - - 29.0 16.0PRIVATE FARKS 4/
Incremental Revenue:Parms Starting Year 2 (100) - (26.(j) 132.4 -230.8 290.8 290.8
3 (150) - - (39.0 338.6 436.2 ).2 Constant4 (150) - - (39.0) 198.6 1436.211. Sub total: Incremental Revenue - (26.0) 93.4 1450.4 925.6 1,163.2Incremental Operating Cost:
Farms Starting Year 2 (100) - (1.D) 81.0 114.0 114.0 114.0o3 (150) - - (1.5) 121.5 171.0 171.0 ) Contant4 (150) - - - (1.5 121.5 171.0 )12. Sub total:Incremental Operating Cost - (1.0) 79.5 234.0 1406.5 456.0 )
Incremental Investment:Farms Starting Year 2 (100) - 100.0 470.0 - - - - - - - - 220.03 (150) - - 150.0 705.0 - - - - - - - - 330.0 - - - - -
4 (150) - - - 150.0 705.0 - - - - - - - - 330.0 - - -13. Sub total: Incremental Investment - 100.0 620.0 855.0 705.0 - - - - - - 220.0 330.0 330.0TOTAL
14. Incremental. Revenue (8+11) 19.1 13.1 132i 5 489.5 964.7 1,202.3 ) Constant15. Incremental. Operating Cost (9+12) 48.8 74.o 159.3 291.3 h63.8 513.3 )16. Incremental. Investment 123.3 116.0 620.0 855.0 705.0 27.0 16.0 33.8 236.0 330.0 330.0 - 29.0 16.0
Economic Rate of Return: 21%
Sensitivity Analysis Best Estimte Investment Cost Operating Cost Revenue Revenue Shadow rice ofIncreased 15% Imreaod 25% Increased 25% Decreased 25% labor - Rps 1/day
Economic Rate of Return 21% 15% 147. 32% 7% 16%
1/ See Annex 9, Tables 4 and 5
2/ Initial investment cost as indicated in Annex 9, Table 4 . Pup and sotorbicycles renewed every 5 years, stands, trays, bamboos, montages and tools every 10 years.3/ The "without project" situation for the demonstration farm consists of 3 hectares of unirrigated land.4/ The incremental revenue, operating cost and investment for each private farm is given in Annex 17, Table 9 . The phasing is as indicated in Annex 9 , Table 6
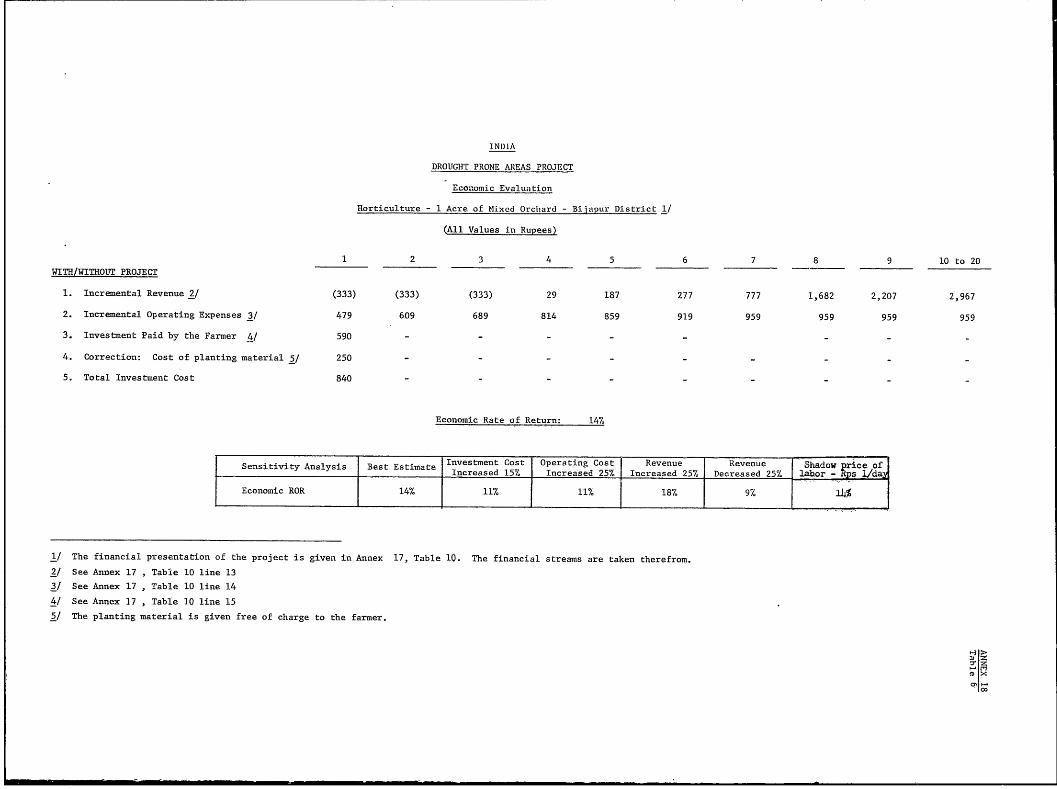
INDIA
DROUGHT PRONE AREAS PROJECT
Economic Evaltu.ation
Horticulture - 1 Acre of Mixed Orclhard - Bijapur District 1/
(All Values in Rupees)
1 2 3 4 5 6 7 8 9 10 to 20WITH/WITHOUT PROJECT
1. Incremental Revenue 2/ (333) (333) (333) 29 187 277 777 1,682 2,207 2,967
2. Incremental Operating Expenses 3/ 479 609 689 814 859 919 959 959 959 959
3. Investment Paid by the Farmer 4/ 590 - - - - - - -
4. Correction: Cost of planting material 5/ 250 - - - -
5. Total Investment Cost 840 - - - -
Economic Rate of Return: 14%
Sensitivity Analysis Best Estimate Investment Cost Operating Cost Revenue Revenue Shadow pxrLce ofIncreased 15% Increased 25% Increased 25% Decreased 25% labor - Rps l/da
Economic ROR 14% 11% 11% | 18% 9% 14%
1/ The financial presentation of the project is given in Annex 17, Table 10. The financial streams are taken therefrom.
2/ See Annex 17 , Table 10 line 13
3/ See Annex 17 , Table 10 line 14
4/ See Annex 17 , Table 10 line 15
5/ The planting material is given free of charge to the farmer.
0x
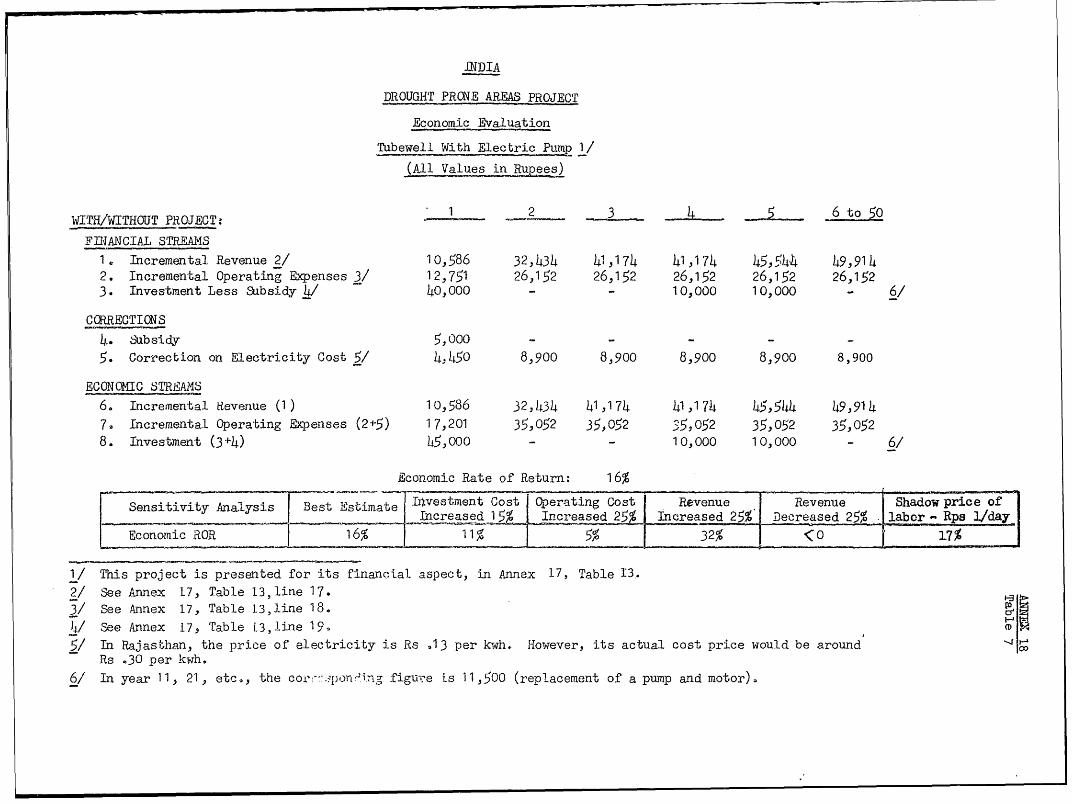
DNDIA
DROUGHT PRCNE AREAS PROJECT
Economic Evaluation
ThbeweLl With Electric Pump /
(Ml Values in Rupees)
WITH/WITHOUT PROJECT: - 2FINANCIAL STREAMS
1 Incremental Revenue 2/ 10,586 32,434 41,174 41,174 45.5,51t 49,9142. Incremental Operating Expenses 3/ 12,751 26,152 26,152 26,152 26,152 26,1523. Investment Less Sabsidy 4 40,000 - - 10,000 10,000 - 6/
CORRECTICNS
4.. Subsidy 5,000 - - - - -5. Correction on Electricity Cost 5/ 4,450 8,900 8,900 8,900 8,900 8,900
ECONCNIC STREAMS
6. Incremental Revenrue (1) 10,586 32,434 4 1,174 41,1 74 45,544 49,9147. Incremental Operating Expenses (2±5) 17,201 35,052 35,052 5, 052 35,052 35,0528. Investment (3 -h4) 45,000 - - 10,000 10,000 - 6/
Economic Rate of Return: 16%
Sensitivity Analysis Best Estimate Investment Cost Operating Cost Revenue Revenue Shadow price ofIncreased 15% Increased 25% Increased 25% Decreased 25% labor Rps 1/dayEconomic ROR 16% 11 5% 32% < 0 17%
1/ This project is presented for its finanoial aspect, in Annex 17, Table 13.2/ See Annex 17, Table 13,line 17.
3/See Annex 17, Table 13,line 18. t-3
)4/ See Annex 17, Table 13,line 19.5/ In Rajasthan, the price of electricity i.s Rs .13 per kwh. However, its actual cost price would be around coRs .30 per kwh.6/ In year 11, 21, etc., the col>pon2;ng figure is 11,500 (replacement of a pump and motor).
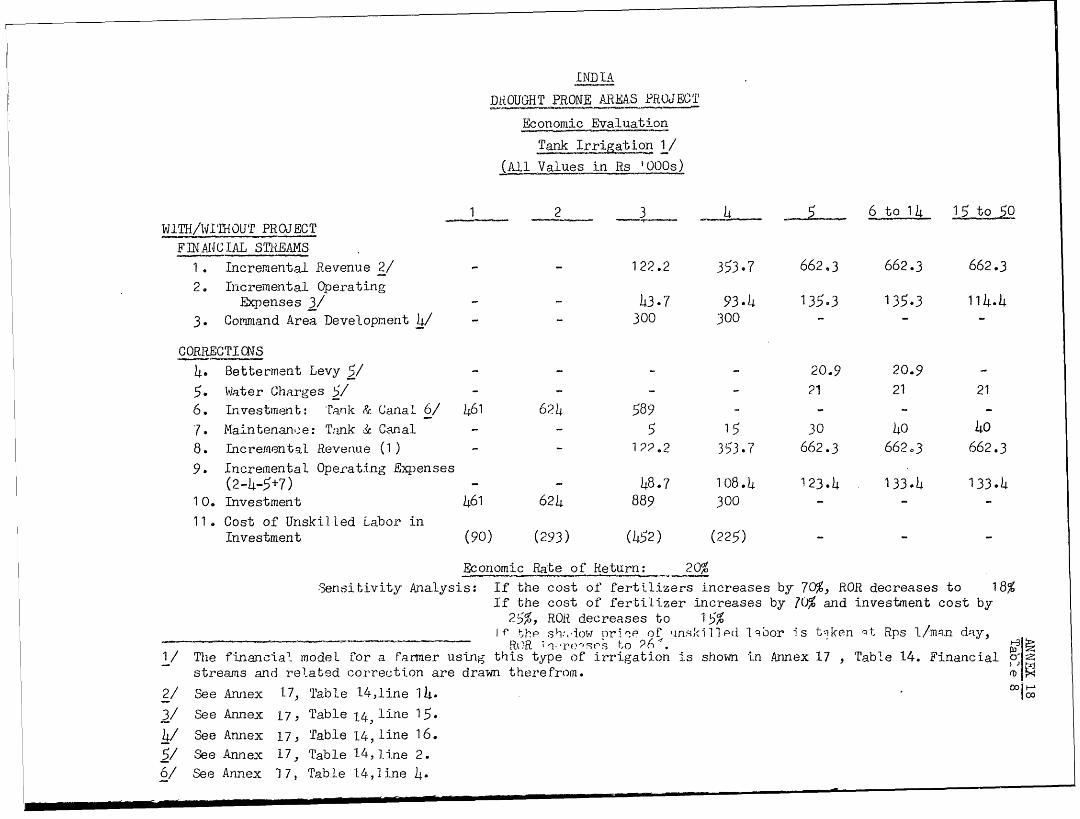
IND IA
DIROUGHT PRONE AREAS PROJECT
Economic Evaluation
T Irigat ion 1/(All Values in Rs IQOOS)
1 2 -3 4L 6o14 1t5WilTH/WIMHOUT PROJECTFINAN4CIAL STMEAMS
1. Incremental Revenue 2/ - - 122.2 353 .7 662.3 662.3 662.32. Iricremental OperatingJEcpenses 3/ - - 43.7 93.4 135 3 135.3 114.43. Corqmand Area Development 4/ - - 300 300 - - -
CORRECTI OS
4. Betterment Levy 5/ 20.9 20.9 -5. Water Charges 57 - - - - 21 21 216. Investment: Fank & Canal 6/ 461 624 589 - - - -7. Maintenan,cfe: Tank &c Canal - - 5 15 30 40 408. Encremnental Reveriue (1 ) - - 1227.2 353.7 662.3 662-3 662.39. Incremental Operating Expenses
(2-4-5+7) - - 48.7 108.4 123.4 133.4 133.410. Investment 461 624 889 300 - - -11. Cost of Ulnskil led Labor inInvestment (90) (293) (1452) (225) - - -
Economic Rate of Return: 20%Sensitivity Analysis: If the cost of fertilizers increases by 70%, ROR decreases to 18%If the cost of fertilizer increases by 70% and investment cost by25,%, ROH decreases to 15%
_1 h , she,h:.iow pri- e of .inski11edl 1.qbor is tqiken ,t Rps 1/ma.n day,R)R *re'.s t,o 26* 3-3
1/ The financial modet for a farmer using this type of irrigation is shown in Annex 17 , Table 14. Financial 6 astreams and related correction are drawn therefrom. (D2/ See Annex 17, Table l4,line 114. CT°03/ See Annex 17, Table 14, line 15.
4/ See Annex 17, Table 14, line 16.5/ See Annnex 17, Table 14, line 2.6/ See Annex l17, Tab-le l4,line 4.
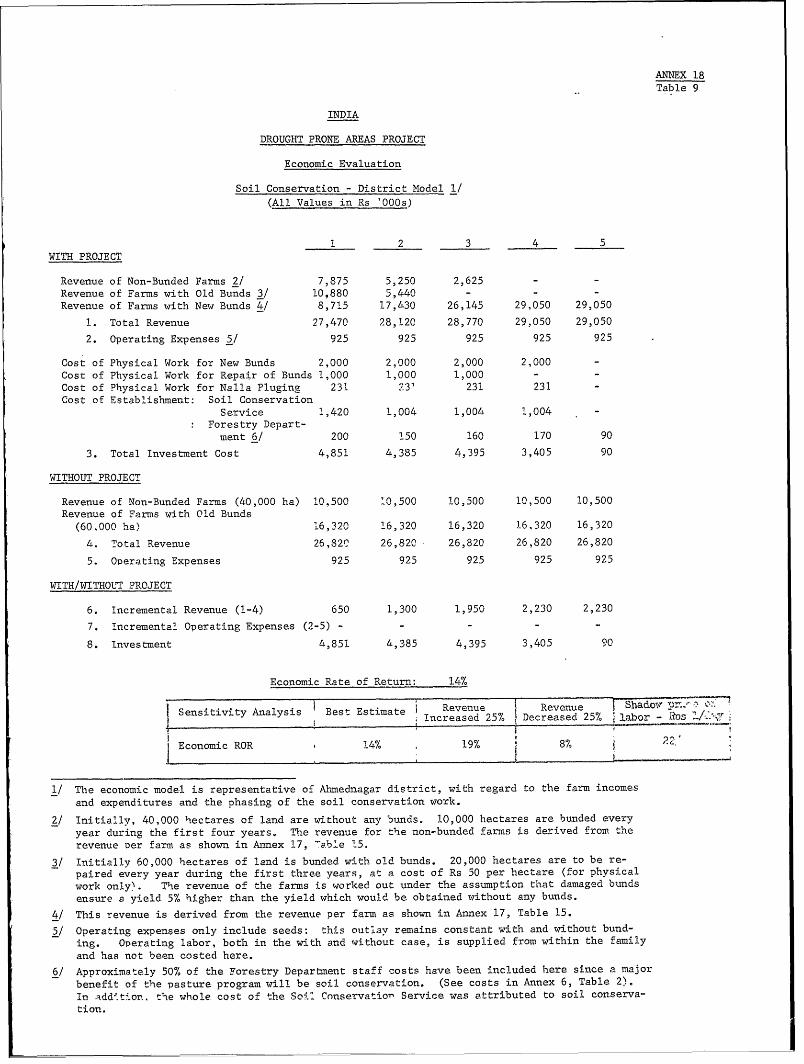
ANNEX 18Table 9
INDIA
DROUGHT PRONE AREAS PROJECT
Economic Evaluation
Soil Conservation - District Model -/(All Values in Rs 'OOOs)
1 2 3 4 5WITH PROJECT
Revenue of Non-Bunded Farms 2/ 7,875 5,250 2,625 - -Revenue of Farms with Old Bunds 3/ 10,880 5,440 - - -Revenue of Farms with New Bunds 4/ 8,715 17,430 26,145 29,050 29,050
1. Total Revenue 27,470 28,120 28,770 29,050 29,0502. Operating Expenses 5/ 925 925 925 925 925
Cost of Physical Work for New Bunds 2,000 2,000 2,000 2,000 -Cost of Physical Work for Repair of Bunds 1,000 1,000 1,000 -Cost of Physical Work for Nalla Pluging 231 ?3' 231 231 -Cost of Establishment: Soil Conservation
Service 1,420 1,004 1,004 1,004 -Forestry Depart-ment 6/ 200 150 160 170 90
3. Total Investment Cost 4,851 4,385 4,395 3,405 90
WITHOUT PROJECT
Revenue of Non-Bunded Farms (40,000 ha) 10,500 '0,500 10,500 10,500 10,500Revenue of Farms with Old Bunds
(60,000 ha) .6,320 16,320 16,320 16,320 16,320
4. Total Revenue 26,820 26,820 26,820 26,820 26,820
5. Operating Expenses 925 925 925 925 925
WITH/WITHOUT PROJECT
6. Incremental Revenue (1-4) 650 1,300 1,950 2,230 2,2307. incremental Operating Expenses (2-5) - - - - -
8. Investment 4,851 4,385 4,395 3,405 90
Economic Rate of Return: 14%
Sensitivity Analysis Best Estimate Revenue Revenue Bhadow Yz:rS tIncreased 25% 1 Decreased 25% ; labor - Nbs ./2,
Economic ROR 14% 19% 8%
1/ The economic model is representative of Ahmednagar district, with regard to the farm incomesand expenditures and the phasing of the soil conservation work.
2/ Initially, 40,000 hectares of land are without any blnds. 10,000 hectares are bunded everyyear during the first four years. The revenue for the non-bunded farms is derived from therevenue Per farm as shown in Annex 17, Table 15.
3/ Initially 60,000 hectares of land is bunded with old bunds. 20,000 hectares are to be re-paired every year during the first three years, at a cost of Rs 50 per hectare (for physicalwork only!. The revenue of the farms is worked out under the assumption that damaged bundsensure a yield 5% higher than the yield which would be obtained without any bunds.
4/ This revenue is derived from the revenue per farm as shown in Annex 17, Table 15.5/ Operating expenses only include seeds: this outlav remains constant with and without bund-
ing. Operating labor, both in the with and without case, is supplied from within the familyand has not been costed here.
6/ Approximately 50% of the Forestry Department staff costs have been included here since a majorbenefit of the pasture program will be soil conservation. (See costs in Annex 6, Table 2).In addQt-on, the whole cost of the So?- Conservatior Service was attributed to soil conserva-tion.
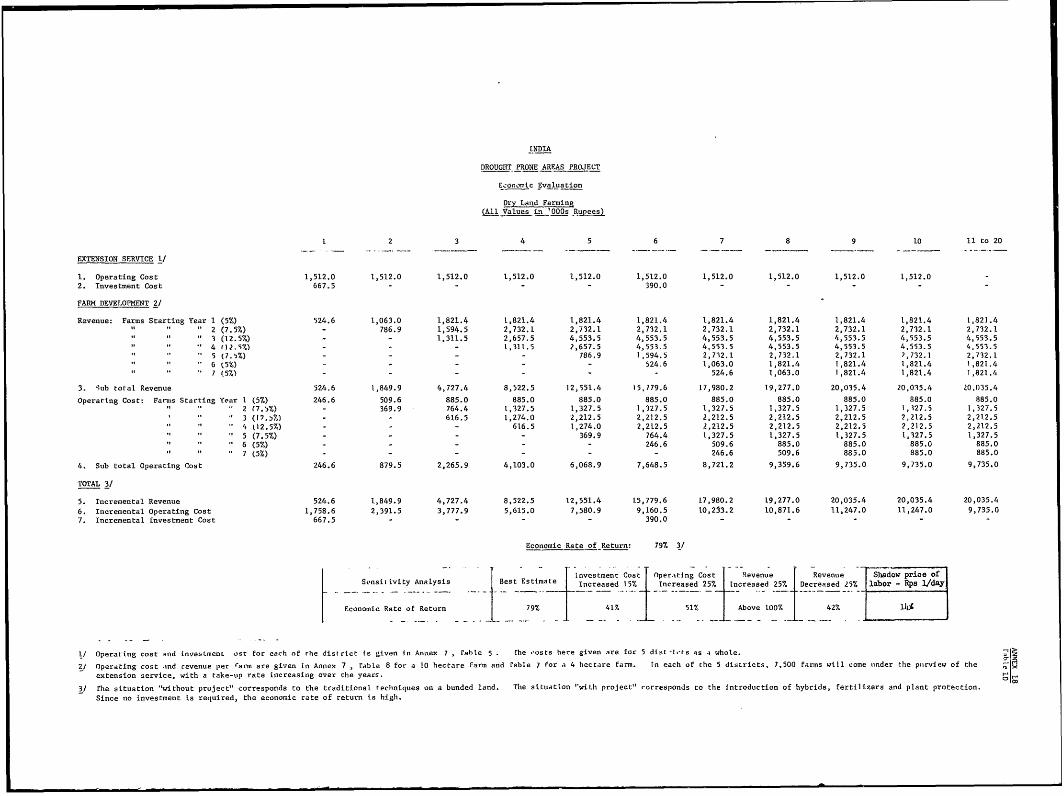
[NDIA
DROUGHT-PRONE AREAS PROJECT
t.onoic Evaluation
Dry Land Farmin(A1l Values in 'ODDs Rupees)
1 2 3 4 5 6 7 8 9 10 11 to 20
EXTENSION SERVICE 1/
1. Operating Cost 1,512.0 1,512.0 1,512.0 1,512.0 1,512.0 1,512.0 1,512.0 1,512.0 1,512.0 1,512.02. Investment Cost 667.5 - - - - 390.0 - - - -
FARM DEVELOPMENT 2/
Revenue: Farms Starting Year 1 (5%) 524.6 1,063.0 1,821.4 1,821.4 1,821.4 1,821.4 1,821.4 1,821.4 1,821.4 1,821.4 t,821.42 (7.5%) - 786.9 1,594.5 2,732.1 2,732.1 2,732.1 2,732.1 2,732.1 2,732.1 2,732.1 2,732.13 (12.57) - 1,311.5 2,657.5 4,553.5 4,553.5 4,553.5 4,553.5 4,553.5 4,553.5 4,553.54 rl2.5%) - - 1,311.5 7,657.5 4,553.5 4,553.5 4,553.5 4,553.5 4,553.5 4,553.5
(57.S%) - - - - 786.9 1,594.5 2,712.1 2,732.1 2,732.1 7,732.1 2,732.16 k5%) - - - - - 524.6 1,063.0 1,821.4 1,821.4 1,821.4 1,821.47 t5%) - - - - - - 524.6 1,063.0 1,821.4 1,821.4 1,821.4
3. Sub tolal Revenue 524.6 1,849.9 4,727.4 8,522.5 12,551.4 15,779.6 17,980.2 19,277.0 20,035.4 20,035.4 20,035.4Operating Cost- Farms Starting Year 1 (5%) 246.6 509.6 885.0 885.0 885.0 885.0 885.0 885.0 885.0 885.0 885.02 (7.5%) - 369.9 764.4 t,327.5 1,327.5 1,327.5 1,327.5 1,327.5 1,327.5 1,127.5 1,327.5
3 (19.3%) - 616.5 1,274.0 2,212,5 2,212.5 2,212.5 2,212.5 2,212.5 2,212.5 2,212.5, (12.5%) - - - 616.5 1,274.0 2,212.5 2,212.5 2,212.5 2,212.5 2,212.5 2,212.55 (7,5%) - - - - 369.9 764.4 1,327.5 1,327.5 1,327.5 1,327.5 1,327.56 (5%) -- - - - 246.6 509.6 885.0 885.0 885.0 885.07 (5%) - - - - - - 246.6 509.6 885.0 885.0 885.0
4. Sub total Operating Cost 246.6 879.5 2,265.9 4,103.0 6,068.9 7,648.5 8,721.2 9,359.6 9,735.0 9,735.0 9,735.0
TOTAL 3/
5. Incremental Revenue 524.6 1,849.9 4,727.4 8,522.5 12,551.4 15,779.6 17,980.2 19,277.0 20,035.4 20,035.4 20,035.46. Incremental Operating Cost 1,758.6 2,391.5 3,777.9 5,615.0 7,580.9 9,160.5 10,233.2 10,871.6 11,247.0 11,247.0 9,735.07. Incremental Investment Cost 667.5 - - - - 390.0 - - - - -
Economic Rate of Return: 79% 3/
'nvestment Cost fper.ting Cost Revenue Revenue Shadow price ofSensit ivity Analysis Best Estimate Increased 15% Increased 25% Increased 25% Decreased 25% labor - Rps 1/day
Economic Rate of Return 79% 41% 51% Above 100% 42% 14%
1/ Operating cost and investmenL oat for each of rhe district Is given in Annex 7, rabte 5. the *osts here given are for 5 dist-l rts aas whole.21 Operating cost and revenue per ta.ns are given In Annex 7 , rable 8 for a 10 hectare fa.n and rable 7 for a 4 hectare farmn. In each of the 5 districts, 7,500 farms will come ,inder the pulrview of the 4x
extension service, with a take-up rate increasing over che years. t'3/ rhe situation "without project" corresponds to the traditional techniques on a bunded land. The situatlon 'with project" corresponds co the introduction of hybrids, fertilizers and plant protection.
Since no investment is required, the economic rate of return is high.
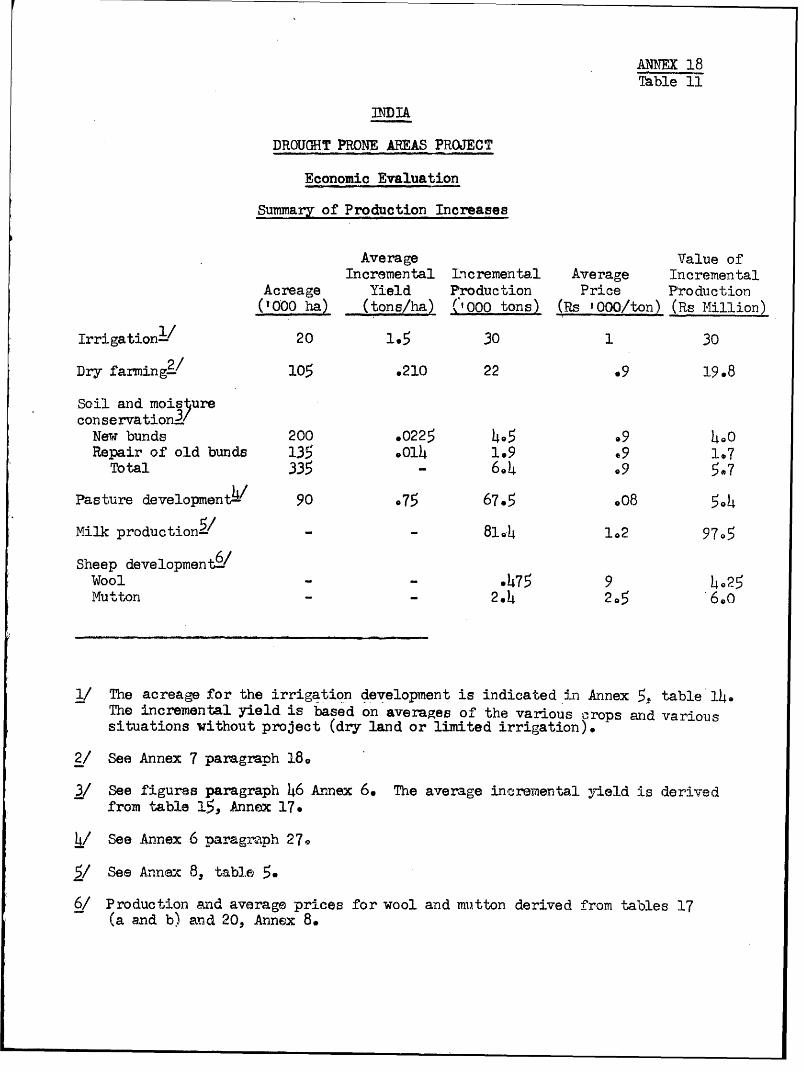
ANNEX 18Table 11
INDIA
DROUGHT PRONE AREAS PROJECT
Economic Evaluation
Summary of Production Increases
Average Value ofIncremental Lneremental Average Incremental
Acreage Yield Production Price Production('000 ha) (tons/ha) ('1000 tons) (Rs 1000/ton) (Rs Mi
Irrigation2 / 20 1.5 30 1 30
Dry farming2/ 105 .210 22 .9 19.8
Soil and mois ureconservation3/
New bunds 200 .0225 4o5 .9 4o0Repair of old bunds 135 .Ol 1.9 .9 1.7
Total 335 - 614 .9 5.7
t4/Pasture development- 90 .75 67.5 .08 5-4
Milk production- - - 81.4 102 97.5
Sheep developmentYWool -- 475 9 4.25
Mutton - 2.14 2.5 6.0
1/ The acreage for the irrigation development is indicated in Annex 5, table 14.
The incremental yield is based on averages of the various c-rops anid varioussituations without project (dry land or limited irrigation).
2/ See Annex 7 paragrph 180
3/ See figures paragraph 146 Annex 6. The average incremental yield is derived
from table 15, Annex 17.
h/ See Annex 6 paragraph 270
5/ See Annex 8, table 5.
6/ Production and average prices for wool and mutton derived from tables 17(a and b) and 20, Annex 8.
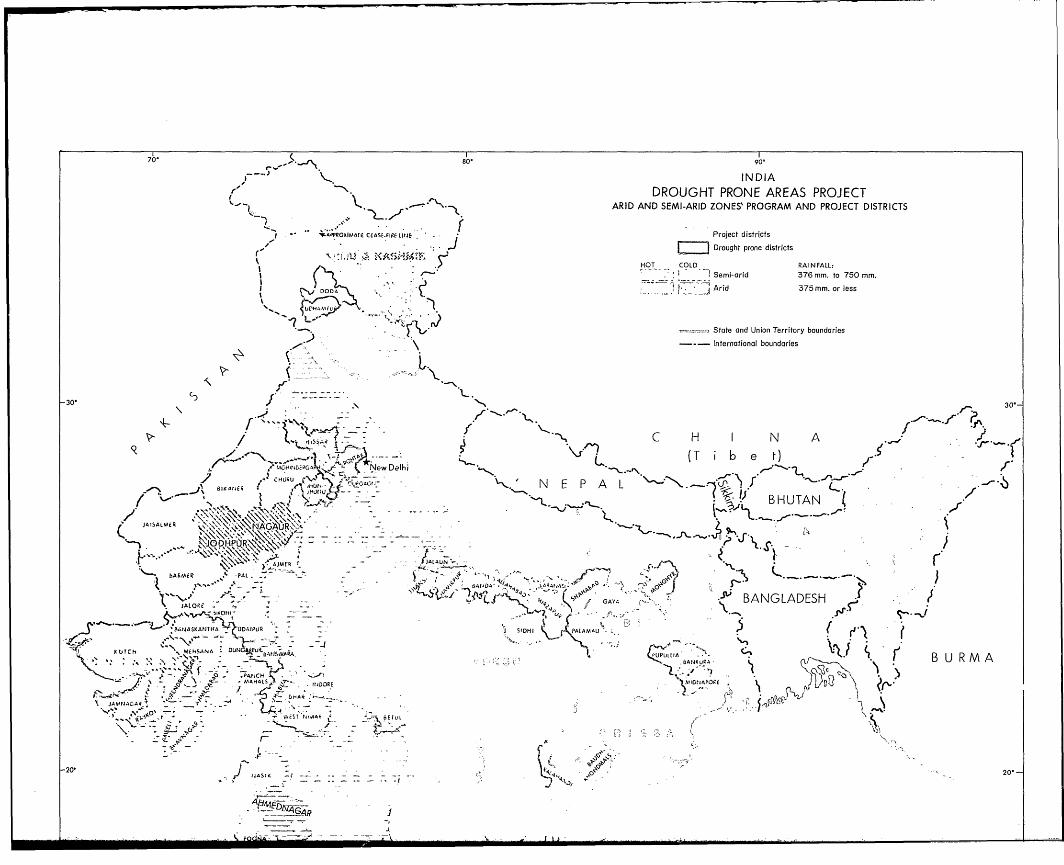
70 81 90-
INDIA> -. DROUGHT PRONE AREAS PROJECTK , , -"- ARID AND SEMI-ARID ZONES' PROGRAM AND PROJECT DISTRICTS
-- 'APROuIM11eE CASE FI9fyJp .E Project districts4 2| ,Drought prone districts
9HOT COLD RAINFALL:* - - I Semi-arid 376 mm. to 750 mm.) >ooaA sf '.j- Arid 375mm. or less
State and Union Territory boundariesKS .' \ - - International boundaries
30' 30-:
/ C H I N A ..,&
~ .(T Ib e)3| ' lx H0-t,,S N E P AL -tjfl. -|
/ '74p'R "-BHUTAN /JAISALMECR
L,CM ,~ PAL§ D 8 'i t .. ~ --f^~ . r, ,& 't"Ke r-o, -
1.N.e >510 1 'AA~~ OA. P< > BANGLADESH-sO I . L , V - f ,.
-Et^jAJMAtLDiLR- SDIt PALAMOU { , r'\ Ccur ThC SnANA, uOAAP -ASWP | ;uP- LitA ; - -f'',BU
JMF '>r.'i - 0 row ? -IWt DIo9>\-tAII tIME I 5 E AL -
L \AI J ' 11= s> )-; wh '
( BUR.M
S -
fJ JA.KJA. AC2'
~.O' ~ - ~'t' 11 M
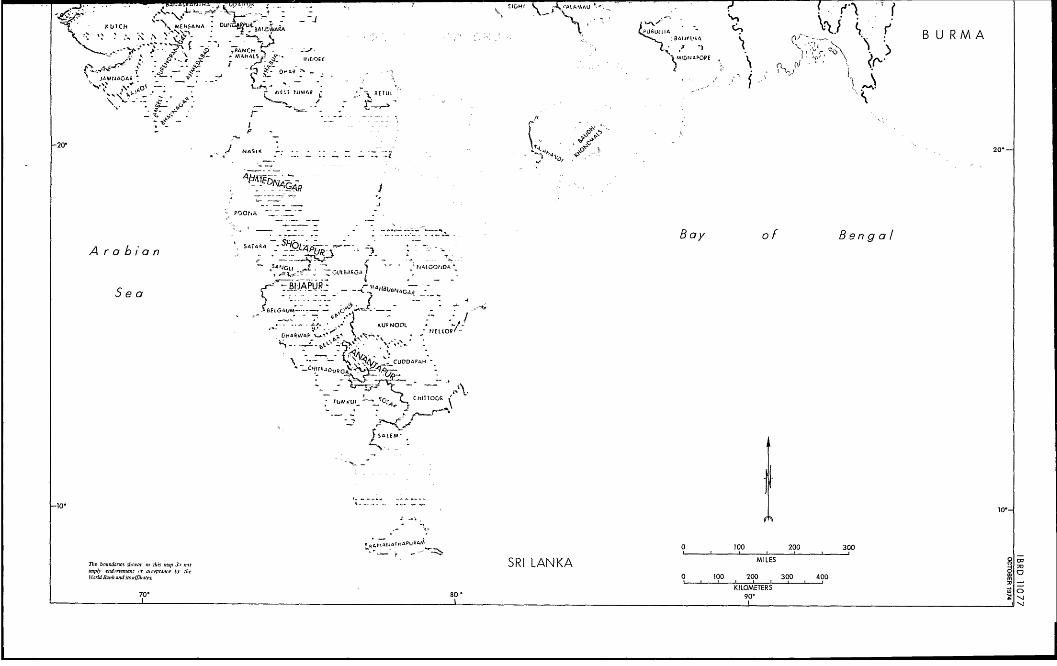
|J t 4 - r B U R M A
It BETr t W- 2>- eRh
K.0 ' A1. }@
-2 Na- e = - ?-,<, zr }.2 '- .
-C - - - J20:
POOrA -
A 14. 4 O- - Bay of B.engalA ra b i n, URt
,, -.-- -'- - UFNOOL...... . - -
- L'iJAPUR-D-A
SN- -
Th~~~~ -aA, g zi -n4 -.. SR L DANK A MILE
KIO NETRS
NN
-lo .10'-
t^raalHpRr 1~00 200 300
17,eb d-, h-s*;7 fifilt tJ,no SRI LANKA MILES 8 W
0.lralrtnrt;wlte 100 200 300 400
70- 80 * KILOMETERS e
70 .0 O' -I