application of the overlay weighted model and boolean logic to determine the best locations for...
TRANSCRIPT

Journal of Urban and Environmental Engineering (JUEE), v.5, n.2, p. 57-66, 2011
7
Journal of Urban and Environmental Engineering, v.5, n.2, p.57-66
Journal of Urban and Environmental Engineering
UEEJ ISSN 1982-3932
doi: 10.4090/juee.2011.v5n2.057066 www.journal-uee.org
APPLICATION OF THE OVERLAY WEIGHTED MODEL AND BOOLEAN LOGIC TO DETERMINE THE BEST LOCATIONS
FOR ARTIFICIAL RECHARGE OF GROUNDWATER
Peter H.S. Riad1,2∗, Max Billib2, Ahmed A. Hassan1, Maha Abdel Salam3 and Mohamed Nour El Din1
1Faculty of Engineering, Ain Shams University, Cairo/Egypt 2Institute of Water Resources Management, Hydrology and Agricultural Hydraulic Engineering, Leibniz University of
Hannover, Germany 3Research Institute for Groundwater, El Kanater-Cairo/Egypt
Received 14 February 2011; received in revised form 30 August 2011; accepted 19 September 2011
Abstract: With population increase, lack of conventional fresh water resources and uncertainties
due to climate change, there is growing interest in the arid and semi-arid areas to increase groundwater recharge with recycled water. Finding the best locations for artificial recharge of groundwater in such areas is one of the most crucial design steps to guarantee the long life and the sustainability of these projects. This study presents two ways to go about performing analysis; creating a suitability map to find out the suitability of every location on the map and another way is querying the created data sets to obtain a Boolean result of true or false map. These techniques have been applied on Sadat Industrial City which is located in a semi arid area in the western desert fringes of The Nile delta in the north west of Egypt. Thematic layers for number of parameters were prepared from some maps and satellite images and they have been classified, weighted and integrated in ArcGIS environment. By the means of the overlay weighted model in ArcGIS a suitability map which is classified into number of priority zones was obtained and it could be compared with the obtained true-false map of Boolean logic. Both methods suggested mostly the northern parts of the city for groundwater recharge; however the weighted model could give more accurate suitability map while Boolean logic suggested wider ranges of areas. This study recommends Boolean logic as a first estimator for locating the best locations as it is easier and not time consuming, while the overlay weighted model for more accurate results.
Keywords:
Semi-arid area; overlay weighted model; ArcGIS; Boolean logic; artificial recharge; groundwater
© 2011 Journal of Urban and Environmental Engineering (JUEE). All rights reserved.
∗ Correspondence to: Peter H. S. Riad. E-mail: [email protected]

Riad, Billib, Hassan, Abdel Salam and Nour El Din
Journal of Urban and Environmental Engineering (JUEE), v.5, n.2, p. 57-66, 2011
58
INTRODUCTION
Effective management of aquifer recharge is becoming an increasingly important aspect of water resource management strategies (Gale, 2005). Several studies have been carried out for the determination of areas most suitable for artificial recharge (Krishnamurthy & Srinivas, 1995; Krishnamurthy et al., 1996; Saraf & Choudhury, 1998; Han, 2003). In addition, the identification of suitable sites for flood spreading as an artificial groundwater recharge technique have been practiced in recent years (e.g. Ghayoumian et al., 2002, 2005; Zehtabian et al., 2001; Nouri, 2003, Kheirkhak Zarkesh, 2005).
Application of remote sensing (RS) and GIS in site selection for artificial recharge and flood spreading management have been the topic of several researches (Chopra & Sharma, 1993; Saraf & Choudhury, 1998; Mehrvarz & Kalantari, 2007; Alesheikh et al., 2008; Balachandar, 2010). The success of artificial groundwater recharge via surface infiltration is discussed by Fennemore et al. (2001), Haimerl (2001) and Bouwer (2002). Each artificial recharge technique has its own characteristics and the method of site determination (Ghayoumian et al., 2007). In this study the direct surface techniques by recharge ponds are suggested, as the soil of the study area has a good permeability and the area of implementation is wide enough.
The advantage of these direct-surface techniques lies in the ability to increase the groundwater potential and the added benefit from the filtering effect of soils and the transmission of water through the aquifer (Asano, 1985). The main objective here is finding out the best locations for artificial recharge of groundwater in a semi-arid area to provide it with a new source of water by making use of the huge amounts (150,000m3/d) of the misused treated waste water especially after the rapid development there. For this purpose so intensive data have been collected to carry out this study like satellite images, maps, reports, soil characteristics and hydrological data. All of these data have been stored and manipulated by using ArcGIS, hence two approaches, overlay weighted model and Boolean logic, were applied to carry out the study analysis and to hold on a comparison between the two approaches results and their efficiencies. THE STUDY AREA
The study area is Sadat City which is located between 30° 21’ E and 30° 41’ E longitude and 30° 19’ N and 30° 34’ N Latitude and it lies at the kilometer 93 on Cairo – Alexandria highway north-west of Cairo in Egypt, its total area is 523.5 km2, see Fig. 1. Sadat City is a relatively new industrial city in the western desert and
west to the Nile Delta in Egypt. This city is based upon the industrial and agricultural activities. Its unique location between Cairo (The capital) and Alexandria (one of the biggest ports on the Mediterranean Sea), along the Delta, has made it a big centre to attract the local and foreign investments to form a large urban community. The total inhabitant area is 18 km2, this area is divided into 12 parts with about 100,000 persons and it includes 5 industrial areas. The city is surrounded by a green area of 126 km2.
Fig. 1 The study area location.

Riad, Billib, Hassan, Abdel Salam and Nour El Din
Journal of Urban and Environmental Engineering (JUEE), v.5, n.2, p.57-66, 2011
59
Fig. 2 Sadat City Land use and groundwater flow directions. Figure 2 shows the Land use and the groundwater
flow directions from the north into the south. All the city activities are mainly depending on the groundwater; most of the production (supplying) wells were constructed near to the residential parts of the city to cover the city needs for water, in addition to some other private wells which are used for irrigation purposes. The city treatment plants are existed in the north of the city and it applies tertiary treatment for the industrial and municipal waste water (Al Dar, 2010).
Several studies have been done by The Research Institute of Groundwater in El Kanater-Egypt (RIGW) to find out the recharge distribution in the city, it was noticed that most of the city gets very little amount of water recharge or subsurface drainage which comes mainly from the green areas irrigation (Ghaly, 2001). The average recharge for the groundwater in the green areas is about 0.5 mm/day, (RIGW, 2006).
WEIGHTED OVERLAY SUITABILITY MODEL
To meet a specific objective, it is frequently the case that several criteria will need to be evaluated. Such a procedure is called Multi-Criteria Evaluation (Carver, 1991). A "Weighted Suitability Model" is developed using GIS techniques for proposing locations suitable for applying groundwater recharge depending on a number of thematic layers and based on the principle of Multi-Criteria Evaluation. Such models are used for applying a common measurement scale of values to diverse and dissimilar inputs in order to create an integrated analysis. Additionally, the factors of the analysis may not be equally important. Each individual
raster cell is reclassified into units of suitability and multiplied by a weight to assign relative importance to each and finally add them together for the final weight to obtain a suitability value for every location on the map; this can be interpreted by Eq. (1) (Eastman, 2001). S= Σ wi xi (1) where, wi = The weight of ith factor map xi = Criteria score of class of factor i S = Suitability index for each pixel in the map
In the present study, all the thematic layers were integrated in ArcGIS 9.3 platform in order to prepare a map depicting suitable areas for artificial groundwater recharge. The total weights of each pixel of the final integrated layer were derived from the following equation;
S= (SLf SLc +LUf LUc +LWf LWc + LTf LTc + LRf LRc + L f Lc + PRf PRc +DGf DGc
(2)
where, SL is Land slope, LU is distance to the residential (urban) areas, LW is the distance to the supply wells, LT is the distance to the treatment plants, LR is the distance to the roads, L is the land use, PR is the pollution risk and DG is depth to groundwater. The subscript letter ‘f’ represents the weight of each factor, while ‘c’ represents the weight of each class of the individual factor. Thus the artificial groundwater recharge index ‘S’, which is dimensionless quantity that helps in indexing the probable ground water recharge zones in the area, was estimated using Eq. (2) for each pixel in the final integration layer and was regrouped into different classes with equal class interval to divide the entire study area into different artificial recharge zones (Chowdhury et al., 2006). The conceptual model to create a suitability map
In this study, the main thematic layers are generated as an input for selecting suitable sites for a recharge project. A number of processes were performed to prepare these layers for being used as an input in an overlay weighted model. The following sections are going through the main steps which have been done.
The work plan
To model the spatial problem a diagram of the objectives, process models, and input datasets was created to reach the study goals was drawn, Fig. 3.

Riad, Billib, Hassan, Abdel Salam and Nour El Din
Journal of Urban and Environmental Engineering (JUEE), v.5, n.2, p.57-66, 2011
60
AR: Artificial Recharge; GW: Groundwater; RIGW: Research Institute of Groundwater Fig. 3 The work plan for the needed data and the main steps.
As shown from Fig. 3 there are 8 parameters have been selected to be thematic layers for the overlay weighted model analysis. Each parameter has some classifications and corresponding weight values which affect the model final decision, as will be shown in Table 1. Remote sensing and a DEM maps
As it is shown on the study work diagram the slope map for the study area is needed, so digital elevation maps (DEM) from Shuttle Radar Topography Mission (SRTM) database for the satellite image (path/row 177/39) were downloaded with *.tif.gz extensions for generating the topographic and slope maps in ArcGIS. Digital images of 3 arc second scene were used (USGS, 2006). These images were downloaded from the Earth Science Data Interface (ESDI) at the Global Land Cover Facility and opened on ERDAS Imagine 8.5 software and saved as one compiled imagine (*.img) file to be imported to ArcGIS platform and their data were exported to be ready for generating the topographic and accordingly the slope maps. These obtained maps were used as a reference for all the next maps. Figure 4 shows the imported image map on ArcGIS.
The obtained topographic map from ArcGIS was compared with another topographic paper map from The Egyptian Survey Authority and so much agreement was found, so the topographic map from DEM data was used in this study as a good digital map.
Thematic Layers for ArcGIS Analysis
After adding the DEM and its data to ArcGIS platform the topographic and the slope maps could be generated
by the use of the spatial analyst tools, then the study area was clipped according to its known coordinates, as shown in Figs 5–6. Three maps (land use, pollution risk and depth to groundwater) for the city were obtained from previous researches which have been done by the Research Institute of Groundwater in Egypt (RIGW, 2006) and they were added to ArcGIS and georeferenced with the first reference maps, then they have been digitized and converted into raster maps, see Figs 7–9.
Fig. 4 The imported satellite image for the study area on ArcGIS.
Best site for AR of GW
On relatively flat land
On suitable land use
Away from urban areas
Near to treatment
plants
Away from supplying
wells
Land use map from RIGW
High depths to ground water
Low or moderate
pollution risk
Away from roads
DEM map from SRTM
data and topo map
Land use map from RIGW and satellite
images
Land use map from RIGW
Land use map from RIGW
Land use map from RIGW
Pollution map from RIGW
Depth to GW map from
RIGW
Topo & Slope raster maps
and reclassified
Digitized & converted into
raster
Distance calculation
raster map & reclassified
Distance calculation
raster map & reclassified
Distance calculation
raster map & reclassified
Distance calculation
raster map & reclassified
Digitized & converted into
raster
Digitized & converted into
raster
Sadat Industrial City

Riad, Billib, Hassan, Abdel Salam and Nour El Din
Journal of Urban and Environmental Engineering (JUEE), v.5, n.2, p.57-66, 2011
61
Fig. 5 Topographic map for the study area.
Fig. 6 Slope map for the study area (in degrees).
Fig. 7 Digitized land use map on ArcGIS.
Fig. 8 Pollution risk map on ArcGIS.
Fig. 9 Depths to groundwater map on ArcGIS.
Distances maps
As the study work diagram in Fig. 3 showed that the distances to roads, urban areas, production wells and treatment plants are some of the important affecting parameters in determining the artificial recharge locations, these maps have been generated by using the Spatial Analyst Straight Line Distance function in ArcGIS which creates such maps by calculating the straight line (Euclidean) distance from the main objective site (in this case; roads, urban areas, production wells and treatment plants). The result is a raster dataset in which every cell represents the distance to the main objective site in meters. Figure 10 is an example for distances to roads.
Reclassifying the distances maps
All the distances maps have been reclassified to integer values instead of ranges to be used as inputs in the weighted model. To reclassify these maps the reclassify

Riad, Billib, Hassan, Abdel Salam and Nour El Din
Journal of Urban and Environmental Engineering (JUEE), v.5, n.2, p.57-66, 2011
62
function was applied. A value of 10 was assigned to the
Fig. 10 Distances to roads map in meters.
Fig. 11 Reclassified distance to roads.
most suitable range and 1 to the least suitable range. All the layers should have the same range of classes (1 to 10). Figure 11 shows an example for the reclassified map of distances to roads.
The reclassification for each thematic layer
(a) The land slope (S)
It was found that most of the city area is almost flat as the slopes are ranging from 0 to 11 degrees; however 0 degree was given class value 10 as the best land slope.
(b) Proximity to a waste water treatment plant (LT)
The proximity of a recharge project to a water source is considered as an advantage because such water will be used as a source for recharging the
underlying aquifer. Areas lying close to the treatment plants are considered the best and are assigned a class value of 10.
(c) Distance from urban areas (LU) On the contrary, areas lying very far from urban areas are considered the best and are assigned a class of 10. This rating is chosen because recharge projects are planned to lie at the outskirts of the urban area so as to allow for population expansion, vertical water percolation and longitudinal water flow through the soil layers. This water will later on be pumped out to be used at these urban areas.
(d) Land use class (L) As previously mentioned the study area is subdivided into five classes: bare land, green, industrial, residential areas and treatment plants. Areas lying within a bare land are rated with a high class value (10), as any area is not presently utilized it may be due to the unavailability of suitable water (in quantity and/or in quality). On the other hand, green (cultivated) areas are rated with a low value (1) because recharge is not critical in these areas. Similarly, areas of industrial and residential areas are considered as not good areas for construction of such projects.
(e) Distance to production wells (LW)
The recharged water is planned not only to be stored in the aquifer, but also to be used at distances from the recharging source and after an elapsed time to allow for the soil self purification process to take place, so the farther production wells from the recharge area got higher class.
(f) Distance to roads (LR) The distances far away from roads have been given higher class values than the closer ones to avoid the negative effects of the recharge projects on the roads.
(g) Depth to groundwater (DG) The depths to groundwater in the city was classified into four zones, as it was found that the depth to groundwater in the northern parts less than 15 meters while in the southern parts are more than 40 meters, see Fig. 9. The high depths to the groundwater were given a higher class values.
(h) Pollution Risk (PR) The pollution risk map was generated by RIGW in a previous study on the city (RIGW, 2006). The lower risk zone was given higher class values.

Riad, Billib, Hassan, Abdel Salam and Nour El Din
Journal of Urban and Environmental Engineering (JUEE), v.5, n.2, p.57-66, 2011
63
The kind of the soil and its structures were not taken into consideration because it was noticed from some borehole results which were carried out by the RIGW that all the city has the same kind of the soil and the same structure with some small differences in the depths between the northern parts and the southern parts of the city (RIGW, 2006).
Weighted Indexing table
Each raster is assigned a percentage influence according to its importance. The weight is a relative percentage, and the sum of the % influence weights must add up to 100. Each cell value is multiplied by their percentage influence then added to create the output raster. A weighted indexing table has been adopted to suggest the ideal location for artificial recharge using the eight parameters, as shown in Table 1.
The weights in the present study were given upon the experience of other specialists from previous studies and upon the economic point of view (Elbeih, 2007), so in this study all the affecting factors were given an equal weight = 10 % except only the distance to treatment plant and the land use which were given weights equal to 20 %, because it is expected that the source of the water for the artificial recharge of groundwater in this city will be provided from the treated waste water from the treatment plants, so it is preferable and costly effective if these recharge areas are close to the treatment plants, moreover it is preferable to have these projects in bare lands more than agricultural areas or others not to affect the going on investments.
Suitable recharge locations
After preparing all the thematic layers and the table of weights which were needed for the weighted model, the weighted model could be built and run on ArcGIS, this came up with the most favorable sites selected using the previously mentioned criteria, Fig. 12. The final integrated layer was classified from excellent to not suitable based on the weights assigned to each criterion. Weight “10” represents excellent sites while weight “0” represents unsuitable sites or areas out of the research study. It can be observed that the most suitable zones for artificial recharge lie in bare lands, away from the urban areas and near to the treatment plants.
BOOLEAN LOGIC METHOD
Boolean logic is an alternative way to find suitable locations for artificial recharge (rather than creating a suitability map) to query the required data. Once all the needed datasets (the thematic layers) have been created,
Table 1. Weighted indexing table
No. Input Raster Field category class
Influence (weight)
% Very steep Very Poor 1 1 Slope Flat Excellent 10 10
Very close Very Poor 1 2 Dist. to
Urban Farthest Excellent 10 10
Very close Very Poor 1 3
Dist. to pumping
wells Farthest Excellent 10 10
Farthest Very Poor 1 4
Dist. to Treatment
Plants Very close Excellent 10 20
Very close Very Poor 1 5 Dist. to
Roads Farthest Excellent 10 10
Green Area
Very Poor 1
Residents Poor 2
Industries Quite good 3
Treatment Very good 6
6 Landuse
Bare Excellent 10
20
High Very Poor 1
Medium Poor 6 7 Pollution Risk
Low Excellent 10
10
<15 m Very Poor 1
15 to 25 m Poor 8
25 to 40 m Very good
6 8 Depth to GW
> 40 m Excellent 10
10
Fig. 12 The suitability map from the weighted model by ArcGIS.

Riad, Billib, Hassan, Abdel Salam and Nour El Din
Journal of Urban and Environmental Engineering (JUEE), v.5, n.2, p.57-66, 2011
64
such a query would be to find all the suitable locations. Probably the simplest and best-known type of GIS model is based on Boolean operations. Robinov (1989) introduced the use of Boolean operations for reasoning with geological maps. In effect, Boolean modeling involves the logical combination of binary maps resulting from the application of conditional operators (Bonham-Carter, 1996). Only one or zero values are assigned to each unit area, specifying whether it is satisfactory or unsatisfactory, respectively.
The Boolean model consists of AND and OR operators. Based on set theory, the AND operator yields the logical intersection of the two data sets, and the OR operator obtains the logical union of the two data sets. The query data is analyzed based on Boolean logic and entered in the Raster Calculator (from spatial analyst) according to the existing thematic layers as following:
[Slope output] < 5 Degrees & [Distances to Urban Areas] > 2000 m & [Distance to wells] > 3000 m & [Distances to Treatment] < 10000 m & [Distances to Roads] > 500 m & [Depth to GW] > 15 m & [Landuse] == The bare land & ([Pollution_Risk] == low | [Pollution_Risk] == medium)
== means equal, | means OR, & means AND
The result is a Boolean true or false map for the locations that meet or do not meet the given criteria. The result of the Boolean query for identifying suitable locations for the artificial recharge site is shown in Fig. 13. Areas in green are not suitable and areas in violet are suitable. The difference between querying the data and creating a suitability map by the weighted model is
Fig. 13 Boolean True-false map.
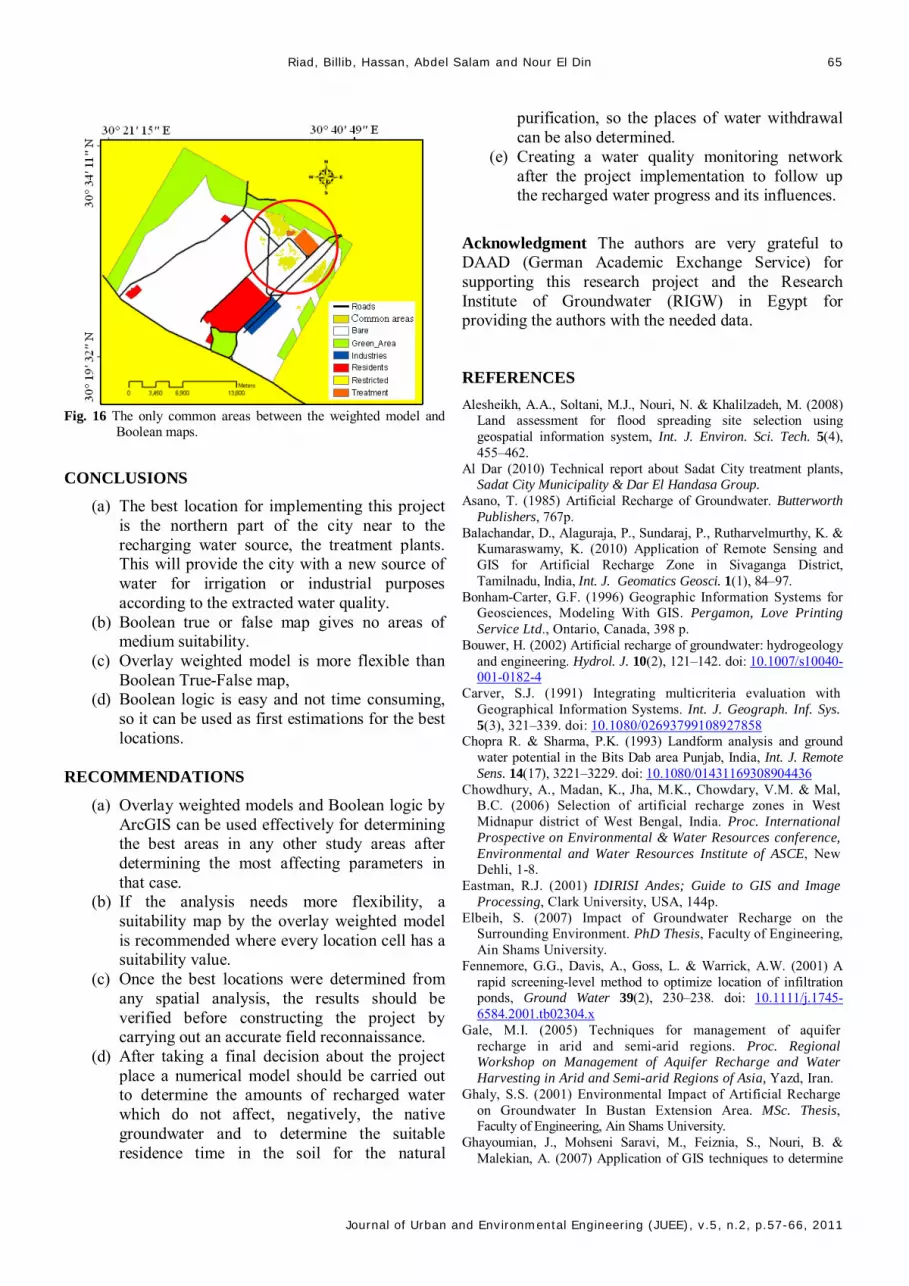
that in the Boolean true or false map, there are no areas of medium suitability. If the analysis needs more flexibility, a suitability map should be created, where every location (cell) has a suitability value. Figures 14 to 16 show the differences between Boolean map and the overlay weighted model results.
Comparing weighted models with Boolean models, it is identified that weighted models has more flexibility and ability for priority indication on spatial units of factor maps.
Fig. 14 The land use map with the only true accepted areas.
Fig. 15 True-false map and the suitability map of the weighted
model.
Riad, Billib, Hassan, Abdel Salam and Nour El Din
Journal of Urban and Environmental Engineering (JUEE), v.5, n.2, p.57-66, 2011
65
Fig. 16 The only common areas between the weighted model and
Boolean maps.
CONCLUSIONS
(a) The best location for implementing this project is the northern part of the city near to the recharging water source, the treatment plants. This will provide the city with a new source of water for irrigation or industrial purposes according to the extracted water quality.
(b) Boolean true or false map gives no areas of medium suitability.
(c) Overlay weighted model is more flexible than Boolean True-False map,
(d) Boolean logic is easy and not time consuming, so it can be used as first estimations for the best locations.
RECOMMENDATIONS
(a) Overlay weighted models and Boolean logic by ArcGIS can be used effectively for determining the best areas in any other study areas after determining the most affecting parameters in that case.
(b) If the analysis needs more flexibility, a suitability map by the overlay weighted model is recommended where every location cell has a suitability value.
(c) Once the best locations were determined from any spatial analysis, the results should be verified before constructing the project by carrying out an accurate field reconnaissance.
(d) After taking a final decision about the project place a numerical model should be carried out to determine the amounts of recharged water which do not affect, negatively, the native groundwater and to determine the suitable residence time in the soil for the natural
purification, so the places of water withdrawal can be also determined.
(e) Creating a water quality monitoring network after the project implementation to follow up the recharged water progress and its influences.
Acknowledgment The authors are very grateful to DAAD (German Academic Exchange Service) for supporting this research project and the Research Institute of Groundwater (RIGW) in Egypt for providing the authors with the needed data.
REFERENCES Alesheikh, A.A., Soltani, M.J., Nouri, N. & Khalilzadeh, M. (2008)
Land assessment for flood spreading site selection using geospatial information system, Int. J. Environ. Sci. Tech. 5(4), 455–462.
Al Dar (2010) Technical report about Sadat City treatment plants, Sadat City Municipality & Dar El Handasa Group.
Asano, T. (1985) Artificial Recharge of Groundwater. Butterworth Publishers, 767p.
Balachandar, D., Alaguraja, P., Sundaraj, P., Rutharvelmurthy, K. & Kumaraswamy, K. (2010) Application of Remote Sensing and GIS for Artificial Recharge Zone in Sivaganga District, Tamilnadu, India, Int. J. Geomatics Geosci. 1(1), 84–97.
Bonham-Carter, G.F. (1996) Geographic Information Systems for Geosciences, Modeling With GIS. Pergamon, Love Printing Service Ltd., Ontario, Canada, 398 p.
Bouwer, H. (2002) Artificial recharge of groundwater: hydrogeology and engineering. Hydrol. J. 10(2), 121–142. doi: 10.1007/s10040-001-0182-4
Carver, S.J. (1991) Integrating multicriteria evaluation with Geographical Information Systems. Int. J. Geograph. Inf. Sys. 5(3), 321–339. doi: 10.1080/02693799108927858
Chopra R. & Sharma, P.K. (1993) Landform analysis and ground water potential in the Bits Dab area Punjab, India, Int. J. Remote Sens. 14(17), 3221–3229. doi: 10.1080/01431169308904436
Chowdhury, A., Madan, K., Jha, M.K., Chowdary, V.M. & Mal, B.C. (2006) Selection of artificial recharge zones in West Midnapur district of West Bengal, India. Proc. International Prospective on Environmental & Water Resources conference, Environmental and Water Resources Institute of ASCE, New Dehli, 1-8.
Eastman, R.J. (2001) IDIRISI Andes; Guide to GIS and Image Processing, Clark University, USA, 144p.
Elbeih, S. (2007) Impact of Groundwater Recharge on the Surrounding Environment. PhD Thesis, Faculty of Engineering, Ain Shams University.
Fennemore, G.G., Davis, A., Goss, L. & Warrick, A.W. (2001) A rapid screening-level method to optimize location of infiltration ponds, Ground Water 39(2), 230–238. doi: 10.1111/j.1745-6584.2001.tb02304.x
Gale, M.I. (2005) Techniques for management of aquifer recharge in arid and semi-arid regions. Proc. Regional Workshop on Management of Aquifer Recharge and Water Harvesting in Arid and Semi-arid Regions of Asia, Yazd, Iran.
Ghaly, S.S. (2001) Environmental Impact of Artificial Recharge on Groundwater In Bustan Extension Area. MSc. Thesis, Faculty of Engineering, Ain Shams University.
Ghayoumian, J., Mohseni Saravi, M., Feiznia, S., Nouri, B. & Malekian, A. (2007) Application of GIS techniques to determine

Riad, Billib, Hassan, Abdel Salam and Nour El Din
Journal of Urban and Environmental Engineering (JUEE), v.5, n.2, p.57-66, 2011
66
areas most suitable for artificial groundwater recharge in a coastal aquifer in southern Iran, J. Asian Earth Sci. 30(2), 364–374. doi: 10.1016/j.jseaes.2006.11.002
Ghayoumian, J., Ghermezcheshmeh, B., Feiznia, S. & Noroozi, A.A. (2005) Integrating GIS and DSS for identification of suitable areas for artificial recharge, case study Meimeh Basin, Isfahan, Iran, Environ. Geology 47(4), 493–500. doi: 10.1007/s00254-004-1169-y
Ghayoumian, J., Shoaei, Z., Karimnejad, H.R., Ghermezcheshmeh, B. & Abdi, P. (2002) Some examples of artificial recharge of aquifers by flood spreading in Iran, Proc. 9th Congress of the International Association for the Engineering Geology and the Environment. Balkema, Rotterdam, p. 1529–1537.
Haimerl, G. (2001) Talsperren zur Grundwasseranreicherung in ariden Gebieten-Bewirtschaftungsstrategien und Optimierungsmo¨glichkeiten. Report of the Institute of Hydraulic and Water Resources Engineering. Technical University, Munich, Germany.
Han, Z. (2003) Groundwater resources protection and aquifer recovery in China, Environ. Geology 44(1), 106–111. doi: 10.1007/s00254-002-0705-x
Kheirkhak Zarkesh, M. (2005) Decision support system for floodwater spreading site selection in Iran, Ph.D. Thesis, International Institute for Geo-information Science & Earth Observation, Enschede, The Netherlands, 259 p.
Krishnamurthy, J. & Srinivas, G. (1995) Role of geological and geomorphological factors in groundwater exploration: a study using IRS LISS data. Int. J. Remote Sens. 16(14), 2595–2618. doi: 10.1080/01431169508954579
Krishnamurthy, J., Venkatesa Kumar, N., Jayaraman, V. & Manivel, M. (1996) An approach to demarcate groundwater potential zones through remote sensing and geographical information system. Int.
J. Remote Sens. 17(10), 1867–1884. doi: 10.1080/01431169608948744
Mehrvarz, K. & Kalantari Oskouei, A. (2007) Investigation of quaternary deposits suitable for floodwater spreading, Proc. International Congress of River Basin Management. Antalya, Turkey, 572–582.
Nouri, B. (2003) Identification of suitable sites for groundwater artificial recharge using remote sensing and GIS in Gavbandi Watershed, M.Sc. Thesis, Faculty of Natural Resources, Tehran University, Iran, p. 106.
RIGW (2006) Evaluation of different uses for the groundwater in Sadat City, Techical Report No. 3, Research Institute for Groundwater
Robinov, C.J. (1989) Principles of logic and the use of digital geographic information systems. Ripple, W.J. (Ed.), Fundamentals of Geographic Information Systems Compendium. American Society for Photogrammetry and Remote Sensing, 61–80.
Saraf, A.K. & Choudhury, P.R. (1998) Integrated remote sensing and GIS for groundwater exploration and identification of artificial recharge sites. Int. J. Remote Sens. 19(10), 2595–2616. doi: 10.1080/014311698215018
USGS (2006) Shuttle Radar Topography Mission, 3 Arc Second scene SRTM_ffB03_p177r039.tif.gz, filled finished-B WRS 2.0. Global Land Cover Facility, University of Maryland, College Park, Maryland, February 2000. http://glcf.umiacs.umd.edu/data/srtm/
Zehtabian, G.R., Alavipanah, S.K. & Hamedpanah, R. (2001) Determination of an appropriate area for flood water spreading by remote sensing data and GIS, Proc. International Conference on New Technology for a New Century, Seoul, Korea, 1–6.