application of epic model to nitrogen cycling in irrigated processing tomatoes under different...
TRANSCRIPT

ELSEVIER
Agricultural Systems, 56, No. 4, pp. 391414, 1998 0 1997 Elsevier Science Ltd
All rights reserved. Printed in Great Britain PII: SO308-521X(96)00100-X 0308-521X/98 $19.00 +O.OO
Application of Epic Model to Nitrogen Cycling in Irrigated Processing Tomatoes Under Different Management Systems
J. Cavero,a R. E. Plant,“* C. Shennaqh J. R. Williams,’ J. R. Kiniry’ & V. W. Bensonc
aDepartment of Agronomy and Range Science, University of California, Davis, CA 95616, USA bDepartment of Vegetable Crops, University of California, Davis, CA 95616, USA
‘United States Department of Agriculture, Agricultural Research Service, Grassland, Soil and Water Research Laboratory, 808 E. Blackland Road, Temple, TX 76502, USA
(Received 5 May 1996; revised version received 18 November 1996; accepted 20 November 1996)
ABSTRACT
Vegetable crops such as processing tomatoes (Lycopersicon esculentum Mill.) are usually complex in terms of nitrogen (N) dynamics because of the large amounts absorbed by the crop, the short growing season and the use of irrigation. Complexity increases when N is supplied from an organic source. A crop simulation model could be very useful to improve N man- agement in this crop. Processing tomatoes were grown on raised beds and furrow irrigated in 1994 and 1995 in the Sacramento Valley of California. Fertilizer N and/or purple vetch (Vicia sativa L.) as green manure and composted turkey manure were used as sources of N. The Erosion Pro- ductivity Impact Calculator (EPIC) model was calibrated with 1994 data and validated with 1995 data. Plant growth was accurately simulated in the conventional systems that usedfertilizer N and in the low input system that used fertilizer N plus vetch. The model accurately simulated above-ground biomass in a system that used vetch and no synthetic fertilizer N, but it over-predicted Leaf Area Index (L.41). Nitrogen deficiency was observed in the plants in this system. The model simulated nitrogen deficiency mainly as a reduction in biomass production but in the real world the reduction of leaf area was the first e#ect of nitrogen deficiency in the vegetative phase. Yields were accurately predicted except when diseases aflected plant growth. A simple reduction factor of nitrate movement in the bed
*To whom correspondence should be addressed.

392 J. Cavero et al.
adequately addressed the movement of nitrate. In general, the model accu- rately predicted the evolution of inorganic nitrogen in different soil layers during the crop season. However, simulated inorganic N in the upper 1.5 cm was underestimated in the last part of the crop season and consequently N uptake at harvest was slightly over-predicted in some cases. Nitrogen distribution and access of the roots to inorganic nitrogen are discussed as causes of this discrepancy between model simulated and observed values. 0 1997 Elsevier Science Ltd. All rights reserved
INTRODUCTION
Irrigated processing tomatoes are grown in approximately 100 000 ha in California. The crop has a short season (4-5 months), but the usual N uptake ranges between 150 and 300 kg N ha-l (Broadbent et al., 1980; Hills et al., 1983). If nitrogen application or irrigation are not correctly managed, significant amounts of nitrate can be leached below the rooting depth and plants can be deficient in nitrogen.
There has recently been a renewed interest in the use of winter legumes as green manure for summer crops LHoyt and Hargrove, 1986; Liebhardt et al., 1989; Power and Doran, 1984; Smith et al., 1987). The mild winters of Cali- fornia make it possible to obtain substantial amounts of legume biomass before planting the summer crop (Shennan, 1992). Stivers and Shennan (199 1) found similar yields of processing tomatoes using legume green man- ures or fertilizer N. However, uncertainty exists about the dynamics of nitrogen release from green manures (Magdoff, 1991; Sarrantonio and Scott, 1988; Smith et al., 1987) and from crop residues in general.
The different processes that interact simultaneously in the nitrogen cycle make it difficult to make accurate assessments of inorganic nitrogen content and distribution in the soil profile. These can be determined by soil sampling, but that is time- and labor-consuming and expensive to do repeatedly.
Crop simulation models developed in the last two decades are able to pre- dict crop growth, yield, nitrogen uptake, inorganic nitrogen in the soil and nitrate leaching below the rooting depth. Most of these models have been used with non-vegetable crops that are grown in large acreages and with conventional farming systems. However, vegetable crops are usually more complex in terms of nitrogen dynamics because of the large amounts taken up by the crop, the short growing season and the use of irrigation. When nitrogen is supplied totally or partially by legume green manures or manures, the complexity of nitrogen dynamics increases. In this situation, an accurate model could be very useful. Radke et al. (1991) used the NTRM model in corn grown under low-input and conventional management systems. They found good agreement between the observed and simulated values but they

Application of epic model to nitrogen cycling in irrigated processing tomatoes 393
indicated that there is a need for more detailed submodels of residue incor- poration and decomposition.
Most of the modeling in tomatoes has been done for greenhouse tomatoes (Acock et al., 1978; Jones et al., 1991; Kano and Van Bavel, 1988). A model that predicts the phenological development of tomato plant in field condi- tions was developed by Wolf et al. (1986). Sweeney et al. (1985) used CREAMS model to predict nitrogen losses in tomatoes and concluded that the disagreement between the observed and simulated values was due to the fact that the model did not have any means to account for raised beds and spatial application of N and water. Scholberg et al. (1995) are currently developing a tomato model for field-grown tomatoes under Florida man- agement practices. No model for plant and soil processes in processing tomatoes is yet available.
Objectives of this work were to calibrate and validate a model that can be used to predict processing tomato growth, yield, nitrogen uptake and nitro- gen dynamics in soil when fertilizer is used as a source of N and to test the model when green manures are used as a source of N.
We calibrated EPIC (Erosion Productivity Impact Calculator) (Williams et al., 1984) for use in processing tomatoes. EPIC was originally developed to simulate the effects of soil, climate, conservation practices, and crop rotation on soil erosion and the long-term effects of that erosion on crop yields and fertilizer requirements. It simulates on a daily basis many of the important weather, soil and management practices affecting yields of field crops. EPIC has been widely validated in other crops (Beckie et al., 1995; Cabel- guenne et al., 1990; Kiniry et al., 1991, 1995; Steiner et al. 1991) and has the advantage that a new crop can be simulated by obtaining appropriate parameter values. It can be used with many crops, permits simulation of rotations and gives detailed output data of the crop growth and nitrogen dynamics.
MATERIALS AND METHODS
Field experiments
The study was conducted as part of the SAFS (Sustainable Agriculture Farming Systems) Project (Temple et al., 1994). This is located on 8.1 ha of land at the Agronomy Field Facility, University of California, Davis. The soil is classified as Reiff loam (coarse-loamy, mixed, nonacid, thermic Mollic Xerofluvents).
The farming systems under study include three four-year rotational systems (conventional (conv4), low-input and organic) and a two year

394 J. Cavero et al.
conventional rotation system (conv-2). The four year rotation is: tomato (Lycopersicon esculentum L.); safflower (Curthamus tinctorius L.); corn (Zea muys L.); wheat (Triticum aestivum L.)/beans (Phaseohs vulgaris L.). The two year rotation is tomato-wheat. In the low-input and organic systems a mixture of oats (Avenu sutivu L.) and purple vetch (Viciu sutivu L.) substitute for wheat. In these two systems purple vetch is grown during the fall-winter period preceding tomatoes, safflower and corn and used as green manure. Organic plots are managed according to California Certi- fied Organic Farmers requirements (California Certified Organic Farmers, 1994).
The experimental design is a randomized complete block split plot with four replicates per system. For each farming system, all crops in the rotation are grown every year. The physical location of each farming system remains the same throughout the study. Plots are 18.3 m by 67 m.
The modeling study was conducted in the tomato crop during 1994 and 1995. Tomato cv. Brigade was direct-seeded on raised beds on 8 March 1994 and 31 March 1995 in the two conventional systems and transplanted on 14 April 1994 and 19 April 1995 in the low input and organic systems. Trans- plants are used in these systems to allow a later planting that increases the vetch biomass incorporated as green manure and because of the advantages of competition with weeds compared to direct-seeded plants. In 1994, trans- planted plants were infected with Tomato Infectious Chlorosis Virus (Duffus et al., 1996) in the greenhouse, which caused a general decrease in growth. Thus, low-input and organic systems data of 1994 were not used for testing the model. Raised beds were 1 m wide and 15-20 cm high, with centered single rows of plants 1.52 m apart.
The winter cover crop was mowed and incorporated by discing on 5 April. Previously, four 1 m2 samples of the above-ground biomass were taken from every plot, dried at 65”C, weighed, ground and analysed for total N by combustion (Sweeney, 1989). Starter fertilizer 8N-lOP-5K-5Zn at 64 kg ha-’ was placed in the plant row at planting in all systems except the organic where fish powder (12N@ 1 lPG83K) and seaweed (0.1 lP- 0.12K) at 5 kg ha-’ were used. Conventional systems were side-dressed with 341 kg ha-’ of urea (46% N) on 2 May 1994 and 112 kg ha-’ of llN-23P on 12 May and 338 kg ha-’ of urea on 18 May 1995. Low-input plots received 195 kg ha-’ of urea on 19 May 1995. Side-dress was applied in bands 23 cm to either sideof the center of the bed and 9 cm deep. In the organic system, after rnownrg the cover crop 4479 kg DM ha-’ composted turkey manure (2.8% N, 117% P, 2.1% K, 0.5% S, 0.6% Na) was spread and disced.
Plots were furrow irrigated every seven to 14 days except after seeding and transplanting when sprinkler irrigation was used. Irrigation amounts were

Application of epic model to nitrogen cycling in irrigated processing tomatoes 395
measured. Weeds were controlled in the conventional systems with napro- pamide at planting and mechanical and manual hoeing. No herbicide was used in the low-input and organic systems.
Plant analysis Above-ground biomass of tomato plants was sampled every two to four weeks during the crop season in three replicates of each system. Four 1 m by 1.52 m samples were taken from every plot except at harvest when eight samples were taken. Plants were divided into green leaves, dry leaves, stems and fruits, oven-dried at 65°C and weighed. In every sample, leaf area was measured in a sub-sample of the green leaves with a leaf area meter LICOR- 3000 (LI-COR, Inc., Lincoln, Nebraska, USA) and specific leaf area was determined. Leaf area index (LAI) was calculated using the specific leaf area and dry weight of green leaves. One sample per plot of 0.3 x 0.3 x 0.3 x m of soil was taken at every sampling date and the roots manually removed. Roots were washed with deionized water and oven dried as indicated. After grinding, total N content by combustion and total P by atomic emission spectroscopy (Franson, 1985) were analysed in the biomass (stem + leaves), fruits and roots.
In 1995, percent intercepted photosynthetically active radiation (PAR) by the crop was measured in the replicates where above-ground biomass was sampled with a Decagon Ceptometer (Decagon Devices, Pullman, Washing- ton, USA) every one or two weeks as described by Kiniry (1994) and radia- tion use efficiency was calculated (Cavero et al., 1997). Radiation use efficiency was also calculated for 1994 data using the LA1 and a light extinction coefficient of 0.45 (after our data of 1995).
Soil analysis During the crop season (every four to five weeks), after harvest and in October, soil samples were taken at depths of &15, 15-30, 30-60 and 6& 90 cm from the tomato beds in the same plots where plants were sampled. Thirty 2.5 cm in diameter cores per plot were collected and bulked for the O- 15 and 15-30 cm depth. Ten cores were taken for the other depths. Addi- tional samplings were made during the crop season at O-15 and 15-30 cm. The first sampling date was just before the mowing of cover crop on 4 April 1994 and 5 April 1995. In 1995, samples were also taken at 90-120 and 120- 150 cm at the first sampling date.
Soil samples were passed through a 4 mm sieve in the field and 5 to 10 g of soil were placed in 40 ml 2 N KC1 and transported to the laboratory in a cooler on ice. Extracts were obtained the same day as soil sampling. N03-N and NH4-N were determined by diffusion-conductivity (Carlson et al., 1990). Soil moisture was measured gravimetrically.

TAB
LE
1 So
il C
hara
cter
istic
s in
the
D
iffer
ent
Syst
ems
and
Yea
rs.
Val
ues
are
Mea
ns
of T
hree
Pl
ots
Dep
th
(cm
) PH
(2
, C
EC
C
aCO
j Sa
nd
Silt
Cla
y B
D”
FC
” W
P (m
eq
100
g-‘)
(%
) (%
) f%
) f%
) (t
mm
3)
(mlm
) (m
lml
Cow
-4,
1994
O
-15
7.1
15-3
0 7.
3 3&
60
7.6
60-9
0 7.
4 9&
120
12&
150
Cow
-2,
1994
C
l5
7.0
15-3
0 7.
4 6&
90
7.6
90-1
20
12G
lSO
Cow
-4,
199s
cl
5 6.
8 15
-30
7.0
3&60
7.
1 60
-90
7.3
90-1
20
7.2
120-
150
7.2
0.10
1 0.
90
20.6
0.
28
42
41
17
0.07
4 0.
67
21.4
0.
33
44
39
17
0.05
7 0.
48
21.4
0.
25
48
38
14
0.04
4 0.
34
20.0
0.
24
58
31
11
1 .27
b 0.
28
1.43
0.
29
1.30
0.
25
1.24
0.
21
1.23
1.
23
4
0.14
2
0.19
x
0.13
2
0.14
2 P,
.-
0.09
7 0.
86
20.8
0.
29
43
40
17
0.07
6 0.
70
21.2
0.
33
46
38
16
0.04
2 0.
34
21.0
0.
29
55
33
12
1.27
0.
26
1.43
0.
30
1.24
0.
22
1.23
1.
23
0.13
0.
19
0.13
0.11
0 0.
89
24.3
0.
07
37
46
17
0.26
0.
13
0.08
8 0.
70
24.7
0.
11
37
46
16
0.31
0.
19
0.07
6 0.
55
24.5
0.
14
44
42
14
0.27
0.
13
0.06
3 0.
42
23.5
0.
16
49
39
12
0.22
0.
14
0.05
5 0.
33
22.2
0.
13
56
32
11
0.20
0.
12
0.05
4 0.
30
22.0
0.
14
53
36
11
0.22
0.
12

Con
v-2,
19
95
Gl5
6.
6 15
-30
6.9
30-6
0 7.
0 6&
90
7.2
90-1
20
7.2
120-
150
7.1
Low
in
put,
1995
&
IS
7.0
15-3
0 7.
1 3M
O
7.1
6&90
7.
2 90
-120
7.
1 12
GlS
O
7.3
Org
anic
, 19
95
O-1
5 7.
1 15
-30
7.1
3&60
7.
3 6&
90
74.2
90
-120
7.
2 12
&15
0 7.
2
0.10
8 0.
92
24.3
0.
05
32
51
17
0.27
0.
13
0.09
3 0.
76
26.2
0.
11
33
50
17
0.32
0.
19
0.08
1
0.61
25
.3
0.12
41
44
15
0.
29
0.14
0.
068
0.48
23
.3
0.18
44
42
14
0.
26
0.16
0.
058
0.40
23
.7
0.15
48
40
12
0.
24
0.12
0.
058
0.37
23
.0
9.12
48
40
12
0.
25
0.13
0.11
6 0.
98
24.5
0.
12
36
48
16
0.26
0.
08 1
0.
63
25.7
0.
14
36
47
17
0.31
0.
07 1
0.
53
24.3
0.
12
43
43
14
0.28
0.
057
0.36
22
.3
0.14
54
35
11
0.
20
0.05
0 0.
30
20.8
0.
11
59
31
10
0.19
0.
049
0.28
21
.2
0.14
58
32
10
0.
22
0.11
5 0.
99
24.7
0.
18
35
49
16
0.27
0.
092
0.76
25
.2
0.11
38
45
17
0.
31
0.07
5 0.
60
24.7
0.
13
41
44
15
0.28
0.
060
0.40
24
.0
0.17
49
39
12
0.
24
0.05
0 0.
31
21.7
0.
19
58
31
10
0.18
0.
052
0.31
24
-3
0.15
48
42
11
0.
25
0.13
0.
19
0.13
0.
13
0.11
0.
12
0.14
0.
19
0.14
0.
14
0.11
0.
11
“BD
: bu
lk
dens
ity,
FC:
field
ca
paci
ty
(0.3
3 ba
r),
WP:
w
iltin
g po
int
(15
bar)
. “‘
Val
ues
of b
ulk
dens
ity
are
mea
ns
of t
he
12 p
lots
sa
mpl
ed
in
1994
.

398 J. Cavero et al.
Both years, samples from the first sampling date were analysed for pH, total N, total C, CEC, CaCOs, % sand, % silt, % clay and soil moisture at 0.3 and 15 bar (Table 1) by the University of California Division of Agri- culture and Natural Resources Analytical Laboratory in order to be used as input data in the model. In 1994, one intact core (8.2 cm in diameter and 6 cm in height) was taken from every depth and plot and bulk density cal- culated (Table 1). Because no difference was found between the systems, the mean value for every depth was used as input data in all the systems in 1994 and 1995. Mean soil characteristics of all the 1995 plots at 90-150 cm were used as input in the model for 1994 plots. In 1995 irrigation water samples were collected and analysed for N03-N.
Model calibration
The EPIC model contains integrated sub-models for hydrology, weather, erosion, nutrients, plant growth, soil temperature, tillage, economics and plant environment control. The hydrology sub-model uses a storage routing technique to simulate flow through soil layers. Flow from a soil layer occurs when soil water content exceeds field capacity. The N processes that are simulated include run-off of N03-N, organic N transport by sediment, upward NOs-N movement by soil water evaporation, denitrification, immo- bilization, mineralization, NOs-N leaching, crop uptake, rainfall and water irrigation contribution, fixation and ammonia volatilization. A general plant growth model is used to simulate above-ground plant growth, yield and root growth for all the crops. Specific values of the crop parameters are needed for every crop. Values for maize, grain sorghum, wheat, barley, oat, peanut, sunflower, soybean, alfalfa, cotton and grasses are currently in the model but not for processing tomatoes. The plant growth model simulates light inter- ception; energy conversion to above-ground biomass, roots and yield; and water and nutrient uptake (N and P). Plant growth is constrained by water, nutrient and temperature stresses. The plant environment control component provides options for irrigation, fetilization, liming, drainage, pesticide appli- cation, etc. The effect of tillage operations on nutrient and crop residue mixing with soil and change in bulk density are also considered. Complete details of EPIC have been described previously (Williams et al., 1984).
Calibration of the model was done using the 1994 data sets of conv-4 and conv-2 systems. Some aspects of the model were modified:
Equation for calculating potential evapo-transpiration Nitrate movement in the soil is driven by water movement. Thus, evapo- transpiration as a component of the soil water budget must be accurately simulated. EPIC has the choice of using the methods of Penman, Penman-

AppIication of epic model to nitrogen c,ycling in irrigated processing tomatoes 399
Monteith, Priestley-Taylor and Hargreaves. Benson et al. (1992) indicated that the choice of the method to calculate potential evapo-transpiration should be considered carefully to obtain meaningful simulations that reflect local conditions. Consistent differences in water percolation and N leaching occurred within a given location with different potential evapo-transpiration equations. The Penman equation used in the model is the FAO corr- ected (Doorenbos and Pruitt, 1977) but in California the original Penman equation provides results better correlated with lysimeter measurements (R. Snyder, pers. comm.). Thus, the original Penman equation was used in our simulations.
Nitrate movement in the soil Movement of water in the root zone of crops grown under furrow irrigation with widely-spaced furrows is a complex combination of horizontal and vertical components (Benjamin et al., 1994; Fonteh and Podmore, 1993) with the relative magnitude depending on depth. Under these conditions, solutes from the upper part of the bed are leached more slowly than would be the case with purely vertical water movement and may not be leached at all (Benjamin et al., 1994; Hummadi et al., 1975). The EPIC model assumes vertical water movement as would be the case in a rain-fed system and therefore tends to over-predict downward movement and leaching of nitrate in furrow irrigated tomatoes. Sweeney et al. (1985) pointed out the problem of inaccurate prediction of solute leaching associated with using models such as EPIC to simulate furrow-irrigated tomatoes.
Two-dimensional models have been developed that accurately simulate water movement in the root zone of furrow-irrigated crops, for example, SWMS_2D (Benjamin et al., 1994). We found that a detailed water and solutes movement model such as this was not necessary for our purposes. We were able to achieve a sufficiently accurate representation of nitrate move- ment by incorporating a reduction coefficient into the nitrate movement term in the upper two layers of the soil. We used a value of 0.1 for the reduction coefficient in the upper &15 cm layer, which corresponds to the soil above the depth of the furrow (i.e. the bed), and a value of 0.33 for the 15-30 cm layer, which corresponds to the soil just below the furrow depth. Nitrate movement in these layers as originally calculated by EPIC was multiplied by the indicated coefficient. Nitrate movement in deeper layers was not adjusted from the value calculated by EPIC.
Light extinction coeficient The original value of the extinction coefficient in EPIC is 0.65. In widely spaced crops values are usually lower (Muchow et al., 1982). Reported

400 J. Cavero et al.
values for tomatoes are 0.52 (Acock et al., 1978) and 0.58 (Jones et al., 1991) but indeterminate cultivars planted in narrower rows were used in these stu- dies. From our measurements of percent intercepted PAR and LA1 in 1995 we calculated a value of 0.45 and this is the value we used.
Eflect of soil water content in N mineralization EPIC calculates a soil water content factor as the actual volumetric soil water content divided by the volumetric soil water content at field capacity with a maximum value of 1. The effect of soil water content on N miner- alization is calculated as the square root of the soil water content factor. In this application the non-transformed value (i.e. without taking the square root) provided better results of mineralization of N from crop residues after harvest. This form has been used by others (Addiscott and Whitmore, 1987; Bhat et al., 1980; Smith et al., 1977).
Crop parameters Data from the two conventional systems in 1994 together with values from the literature were used to obtain values for the crop parameters. Table 2 lists the values using the original EPIC nomenclature (Kiniry et al., 1995). The value of 4.5 used for DMLA was based in our data of 1994 and Nya- bundi (1985). The values of DLAPl, DLAP2, DLAI, RLAD and RBMD were determined from our data of 1994. Base temperature was fixed to 10°C according with Geisenberg and Stewart (1986), Gould (1983) and Wolf et al. (1986). Optimum temperatures for tomato growth in the field are around 2430°C (Bolanos, 1988; Geisenberg and Stewart, 1986; Gould, 1983; Wolf et al., 1986), thus 27°C was used. Radiation use efficiency (WA) was calcu- lated after our data of 1994 and considering that lO--20% of dry wt is in the roots (Jackson and Bloom, 1990). Calculated values for HI are 0.58 (from Halbrooks and Wilcox, 1980) and 0.63 (from Hills et al., 1983), and results from the project from several years indicated a value of 0.60, therefore 0.60 was used. Values of maximum rooting depth for tomatoes varied between 1 and 2.7.m (Kamgar et al., 1980; Portas, 1973; Portas and Dordio, 1980; Rendon-Poblete, 1980; Widders and Lorenz, 1979) but most roots are in the first 60 cm (Rendon-Poblete, 1980; Widders and Lorenz, 1979). A value of l-5 m was used.
Normal concentrations of N and P in the crop and fruit were determined after our data of 1994 and several other studies (Bar-Yosef and Sagiv, 1982; Calado et al., 1980; Halbrooks and Wilcox, 1980; Hedge and Srinivas, 1990; Kafkafi and Bar-Yosef, 1980; Miller et al., 1981). Crop height was deter- mined by measurement in 1994. The fractions of root weight at emergence and maturity were obtained from Jackson and Bloom (1990). Values for WAVP, VPTH and VPD2 and GSI were obtained from Bolanos (1988).

Application of epic model to nitrogen cycling in irrigated processing tomatoes 401
Fraction of water in yield was set to 94% after our data and other references (Gould, 1983).
Simulation of the difSerent systems Values of radiation use efficiency were l&12% lower in the conv-2 than conv-4 in 1994 (Cavero et al., 1996). Results from 1995 confirmed this difference which is due to higher incidence of diseases in the two year rotation. EPIC was calibrated mainly with the conv4 system and has no way to predict those differences. However, because this is a fundamental distinction between the two systems, the value of WA was decreased for the conv-2 system in the same proportion as found in 1994 and a value of 21 kg ha-’ MJ-’ m2 was used for the simulations.
TABLE 2 Crop parameter Values of Processing Tomatoes for the EPIC Model (Williams et al., 1984)
Parameter
DMLA DLAPl
DLAP2
Potential leaf area index Defines a point on the LA1 development curve early in the season Defines a point on the LA1 development when LA1 is near maximum
DLAI
RLAD TG TB HI WA RBMD RDMX HMX BNl BN2 BN3 BP1 BP2 BP3 CNY CPY RWPCI RWPCZ WCY GSI WAVPD
Fraction of the growing season when LA1 begins to decline Rate of LA1 decline Base temperature (“C) Optimum temperature (“C) Harvest index (%) Radiation use efficiency (kg ha-’ MJ-’ m2) Rate of decline in WA after LA1 starts to decline Maximum rooting depth (m) Maximum crop height (m) Normal crop N concentration at emergence Normal crop N concentration at mid-season Normal crop N concentration at maturity Normal crop P concentration at emergence Normal crop P concentration at mid-season Normal crop P concentration at maturity Normal fraction of N in yield Normal fraction of P in yield Fraction of root weight early in the season Fraction of root at maturity Fraction of water in yield Maximum stomata1 conductance (m ss’) Rate of decline in WA per unit increase in VPD
VPTH (kg m-2 ha-’ Mg-’ kPa_‘)
Threshold value for sensitivity of leaf conductance to VPD (kPa)
VPD2 Rate of decline of leaf conductance with increasing VPD
Value
4.5 10.01
55.95
0.75
0.2 10 27
0.60 24
2.5 1.5 1.0 0.050 0.027 0.022 0.0060 0.0042 0~0030 0.030 0.0045 0.20 0.10 0.94 0.0130 7.0
1.0
3.75

402 J. Cavero et al.
Similar values of radiation use efficiency were found in 1995 in the low- input and conv-2 systems, thus the same value of WA for conv-2 was used for the low-input and organic systems. Transplanted plants used in the low- input and organic systems had a different pattern of growth than direct- seeded plants, showing a lower decrease in growth at the end of the season (Cavero et al., 1996). In consequence the value of RBMD was changed to O-5 for those systems. Potential maximum leaf area for transplanted plants was set to 4 instead of 4.5 for direct-seeded plants because the shock of trans- planting and quick fruit set soon after planting reduce the potential leaf area.
We did not measure root weight of the cover crop used as green manure but for the simulation we estimated that root weight was a third of above- ground weight and nitrogen content half of the above-ground biomass (Mitchell and Teel, 1977).
In 1995 plants from the organic system were deficient in nitrogen. Manure was applied in that system, but estimations of mineralization indicated that during the crop season a negligible amount of nitrogen was mineralized from the manure (Cavero et al., 1997). If applied manure was treated as an input in the model, the resulting simulation indicated a quick mineralization of N. In order to reflect the observation, the application of manure was not intro- duced as an input. This permitted us to test the model when a nitrogen deficit occurs in that crop.
Inorganic nitrogen content and volumetric soil water content from every soil layer at the first sampling date were used as input in the model. The measured NOs-N in irrigation water in 1995 was also used for 1994. The number of years before cultivation started was fixed at 25 years. Daily values of maximum temperature, minimum temperature, radiation, rainfall, wind speed and mean relative humidity were obtained from a weather station near to the site.
For each variable measured in the field experiment, the mean values of the three replicated plots for each system and its standard deviations (s.d.) were used for comparison with model simulations.
RESULTS AND DISCUSSION
Crop parameters are listed in Table 2. The model accurately predicted LAI, above-ground biomass and N uptake by the crop in the conventional systems in 1994 (calibration) and in general in all the systems in 1995 (validation), except the LA1 in the organic system (Figs l-3). EPIC does not distinguish between concentration of nutrients in the above-ground biomass and root. In tomatoes the N content is lower in the roots than in the above-ground biomass. Thus, simulated values of N uptake in the above-ground biomass

Application of epic model to nitrogen cycling in irrigated processing tomatoes 403
are under-estimated. Considering that root weight at harvest is around 1000 kg DM ha-’ and that N content in the root is usually half of that in the above-ground biomass, this under-estimation is around 10-15 kg N ha-‘. Thus, the ‘corrected’ simulation of N uptake by the above-ground biomass should be 1615 kg ha-’ higher. Above-ground biomass and N uptake were slightly over-estimated in 1995 in the conv-4 system at harvest (Fig. 1). In the conv-2 system, over-estimation of LA1 at the end of the season and above- ground biomass at harvest in 1995 (Fig. 2) was due to the fact that the decrease in growth caused by diseases was higher in 1995 (Cavero et al., 1997) and the model does not simulate this fact. In the organic system in 1995, the LA1 was clearly over-estimated (Fig. 3). We found that the main effect of nitrogen deficiency in the vegetative phase was a decrease in LA1 (Cavero et al., 1997) but the model simulated nitrogen deficiency mainly as a reduction in biomass production. A linear decrease in LA1 with decreasing N content and no difference in radiation use efficiency has also been found in wheat (Van Keulen and Stol, 1991). Nyabundi (1985) found in tomatoes that canopy size was more sensitive than canopy photosynthetic efficiency to
- 12 7 2 10 c 8
% 6
E 4 g 2
0
- - simulated
90 120 150 180 210 90 120 150 180 210
day of the year
Fig. 1. Observed (means of three plots and its s.d.) and simulated values by the model of LAI, above-ground biomass and N uptake in the conv-4 system in 1994 (calibration data) and 1995
(validation data).

404 J. Cavero et al.
water stress. It seems that in this crop stresses first affect leaf area develop- ment and consequently biomass production.
Simulated yields were mostly within one s.d. of the mean except in the conv-2 system in 1995 (Table 3). As indicated, the model is not able to assess disease incidence. In 1995, the low input system had a harvest index higher than 0.60 and this is the reason why yield was slightly under-estimated. It has been indicated that EPIC is best suited for long-term simulations and that it did not adequately simulate variability in yields between years (Kinky et al., 1995; Williams et al., 1989). Yield predictions are more difficult in processing tomatoes than in crops where the harvested part has a low water content because delays in harvesting will1 reduce yield due to rotting. In our case variability between years was not very important in plant growth provided that incidence of diseases was minimal.
Simulations of inorganic N concentration in the different soil layers were close to the observed values in the conventional systems in 1994 (calibration) and 1995 (validation) during the cropping season (Figs 4 and 5). In soil
6 7-
E 5- 1994 1995
%
3 :-
4- 3- i^llJ 0
-7 12- 2 lo- = 6- ??
$ 6-
E 4-
.P m
2-
0 _/I-c/
300 - - simulated
90 120 150 160 210 90 120 150 160 210
dayoftheyear
Fig. 2. Observed (means of three plots and its s.d.) and simulated values by the model of LAI, above-ground biomass and N uptake in the conv-2 system in 1994 (calibration data) and 1995
(validation data).

Application of epic model to nitrogen cycling in irrigated processing tomatoes 405
sampling just after side-dressing, samples were taken avoiding the fertilizer band and for this reason the first observed value after side-dressing is lower than that simulated by the model. EPIC accurately simulated N concentra- tion in the soil in the low input system where a legume plus a side-dressing of fertilizer N was used (Fig. 6). Considering the assumptions that we made,
&ii 5c Low input 1995 t
Organic 1995
- 12 Y r" 10 z a
2 6
- ‘;
300 r" 250 2 200 ; 150 s 100 g 50 z
0
I I I I I I I I I I
;-.,/I,+/ - simulated
_ 0 observed
I I- I 1 90 120 150 160 210 90 120 150 180 210
day of the year
Fig. 3. Observed (means of three plots and its s.d.) and simulated values by the model of LAI, above-ground biomass and N uptake in the low input and organic systems in 1995.
TABLE 3 Mean Values and s.d. of Observed Yields (t DM ha-‘) and Simulated Yields
System Observed Simulated
1994 Conv-4 4.87 + 0.49 5.15 Conv-2 4.36 + 0.25 4.66
199s Conv4 4.75 + 0.48 5.07 Conv-2 3.49 + 0.52 4.45 Low input 4.98 + 0.29 4.56 Organic 3.38 + 0.54 3.52

406 J. Cuvero et al.
simulation of soil inorganic N in the organic system adequately reflected values and trend (Fig. 6). Simulated inorganic N concentrations after the incorporation of crop residues were close to field data (Figs 4-6). Some over- estimation occurred in the last sampling date (two months after harvest). This was probably related to the over-estimation of N uptake at harvest and because the model considers the same N content for roots as for above- ground biomass.
The simulated values of inorganic N were usually lower than the observed values in the last 15-20 days of the crop season in the upper O-15 cm. Greenwood et al. (1985) found that levels of inorganic N in the first 50 cm in potato crop did not decrease below 4 ug N crne3 (x 3 pg g-i soil). This level is applicable in our conditions to the soil profile below 15 cm. However, inorganic N in the upper 15 cm did not fall below 7-10 pg g-l soil during the crop season, even when the crop was deficient in N (Figs 46). A similar finding was reported by Jackson and Bloom (1990) who concluded that this was due to a low density of roots in tomatoes in the upper 15 cm, probably related to lower soil moisture and high temperatures. In furrow-irrigated lettuce grown in beds, Hummadi et al. (1975) observed much higher N03-N levels in O-7.5 cm (and particularly in the upper 2.5 cm) than in 7.5-15 cm caused by the movement of water and solutes in the bed. In our conditions, from mid-June to the end of the season high air temperatures result in a fast drying of the upper 5 cm of the bed where root growth is probably restricted. Thus, if N03-N in the CL15 cm had a similar distribution as in Hummadi et al. (1975) , a substantial amount of the nitrogen present in this layer would not be available to the roots. Consequently, N03-N levels in this upper layer would be higher than 3 pg g-l soil, even if nitrogen uptake is limited. This could explain the discrepancy between the simulated and observed values in the upper O-15 cm and the slight over-estimation of uptake found at harvest in some simulations.
TABLE 4 Nitrate Leached Below the Rooting Zone (1.5 m) Simulated by the Model in the Different
Systems
System NOJ-N leached (kg ha-‘)
1994 Conv-4 46 Conv-2 51
1995 Conv-4 4 Conv-2 6 Low input 1 Organic 1

Application of epic model to nitrogen c.vcling in irrigated processing tomatoes 401
The model predicted nitrate leaching in the two conventional systems in 1994 (Table 4) with most.leaching occurring after the first furrow irrigation. This is in agreement with the observed lower values of inorganic N at 30-60 and 6@90 cm in the second sampling date (3 May) when N uptake by the crop had been minimal. In 1995, the model predicted small amounts of nitrate leached below the rooting depth (1.5 m) which was in agreement with slight changes in N03-N concentration in the deeper soil layers during the growing season.
The comparison of observed and simulated yield, plant growth variables and soil inorganic N in 1995 validated the calibrated model in our condi- tions. The yield and all the plant growth variables were adequately simulated
80
80
40
20
0 30
s- z 20
'; m cn 5,
10
2 L 0 5 30
+
*& 20
4 10
0 30
1 T 1 30-60 cm
[ 60-90 cm 20
1 -I-.n
10 - f,
0 """' 90 120150 180210 240270 90 120 150 180 210 240 270
day of the year
Fig. 4. Observed (means of three plots and its s.d.) and simulated values by the model of inorganic N content in different soil layers in the conv-4 system in 1994 (calibration data) and
1995 (validation data). Bold arrows indicate fertilizer N application.
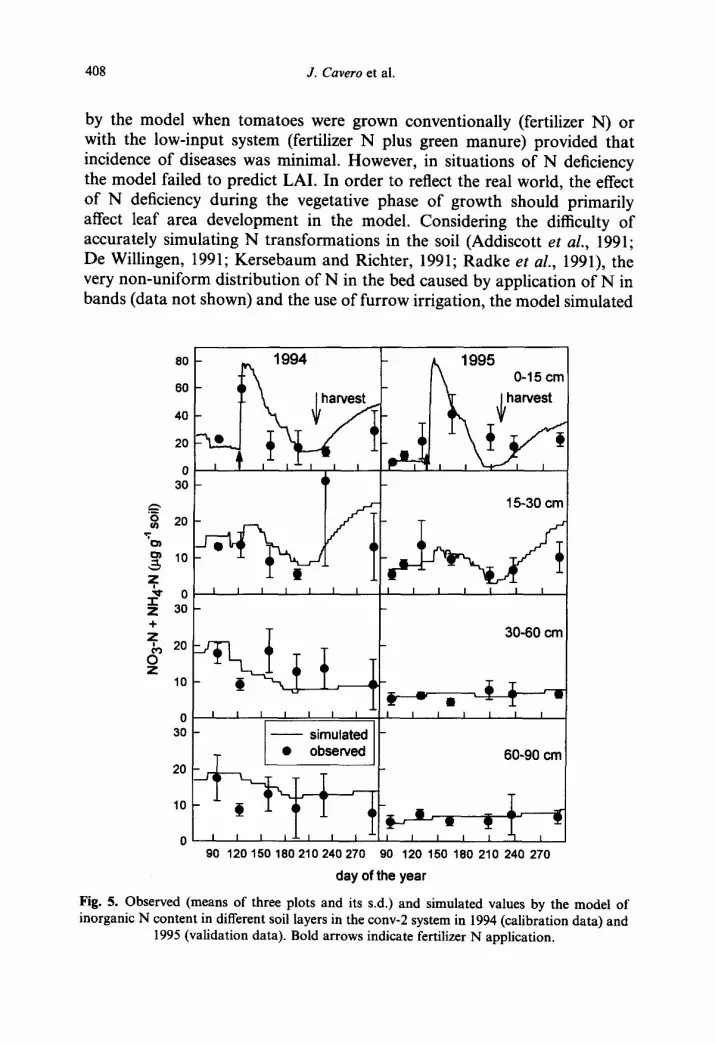
408 J. Cuvero et al.
by the model when tomatoes were grown conventionally (fertilizer N) or with the low-input system (fertilizer N plus green manure) provided that incidence of diseases was minimal. However, in situations of N deficiency the model failed to predict LAI. In order to reflect the real world, the effect of N deficiency during the vegetative phase of growth should primarily affect leaf area development in the model. Considering the difficulty of accurately simulating N transformations in the soil (Addiscott et al., 1991; De Willingen, 1991; Kersebaum and Richter, 1991; Radke et al., 1991), the very non-uniform distribution of N in the bed caused by application of N in bands (data not shown) and the use of furrow irrigation, the model simulated
60
40
20
0 30
3 5: 20
r
g 10
z Go """' I I I I I I I
$ 30- +
30-60 cm
60-90 cm
0 ’ ’ ’ ’ 90 120150190210240270 90 120 150 180 210 240 270
day of the year
Fig. 5. Observed (means of three plots and its s.d.) and simulated values by the model of inorganic N content in different soil layers in the conv-2 system in 1994 (calibration data) and
1995 (validation data). Bold arrows indicate fertilizer N application.

Application of epic model to nitrogen c,ycling in irrigated processing tomatoes 409
inorganic N evolution in the soil with very good accuracy. Despite the sim- plicity of its nitrogen sub-model, EPIC was capable not only of providing accurate simulations in conventional systems but also when legumes were used.
The conventional system used in our experiment is typical in California and other parts of the world. Moreover, the experiment was conducted in the most important production area of California and with farm scale equip- ment. Thus, the calibrated model could be used at least in this area for improving N management. Our results indicate that irrigation scheduling and N fertilization timing are the most important factors that affect soil inorganic N movement and leaching when fertilizer N is used. The model can
80
60
40
20
0 30
s 8 20
-T 0, 9 10
z' ;r 0 2 30
I h 20
4 10
0 30
20
IO
0
Organic 1995 O-15 cm
\1
harvest
15-30 cm
I 30-60 cm
60-90 cm
90 120 150 180 210 240 270 90 120 150 180 210 240 270
day of the year
Fig. 6. Observed (means of three plots and its s.d.) and simulated values by the model of inorganic N content in different soil layers in the low input and organic systems in 1995. Bold
arrows indicate fertilizer N application.

410 J. Cuvero et al.
be used to optimize these operations. The calibrated model could also be of interest when vetch (and probably other legume cover crops) are used as the source of N, given that it provided good predictions of the evolution of inorganic N in the soil which indicates that it adequately predicted the rhythm of N mineralization. Model predictions could be improved by con- sidering different nutrient contents for roots and above-ground biomass and by restricting N uptake from surface layers when soil values are around 10 pg g-l soil for processing tomatoes. The validity of the last statement could probably be extended to other summer vegetable crops grown on beds and furrow irrigated.
The use of the calibrated model is restricted to tomatoes grown in raised beds and furrow irrigated, that is the typical method in most areas. Our results indicate that a simple empirical reduction factor of nitrate leaching in the upper part of the soil can be used in models like EPIC with good results when furrow irrigation is used in wide beds. Values of this factor could be different for soils with very different textures because movement of water and solutes will vary (Benjamin et al., 1994). If tomatoes are sprinkler irrigated the original solute movement model of EPIC should not be modified. The calibrated model can be used in other locations where weather conditions are different with the precaution of using the equation of potential evapo-tran- spiration best suited for that location (Benson et al., 1992). We suggest the measurement of LAI, dry weight and N content of plants five to six times during the growing season and the indicated measurement of PAR intercepted by the crop as an easy way to obtain crop parameter values for EPIC. We also suggest soil sampling at different depths and sufficiently deep in order to calibrate this model. Good agreement between observed and simulated inorganic N concentration in all the different layers can be more reliable than the use of all the soil profile in a unique layer if we want to be confident of nitrate leaching predictions and we have not measured data of leaching.
ACKNOWLEDGEMENTS
To the Instituto National de Investigation Agraria of Spain for providing a grant for the first author. This work was partially supported by the USDA National Research Initiative Competitive Grants Program, Grant 9403946 the USDA-SARE program and the University of California SAREP. We thank the help received from Diana B. Friedman, research manager of the SAFS project, and from all the project cooperators. We also thank the advice of Dr Richard L. Snyder, biometeorologist of the University of California, Davis.

Application of epic model to nitrogen cycling in irrigated processing tomatoes 411
REFERENCES
Acock, B., Charles-Edwards, D. A., Fitter, D. J., Hand, D. W., Ludwig, L. J., Wil- son, J. W. and Withers, A. C. (1978) The contribution of leaves from different levels within a tomato crop to canopy net photosynthesis: and experimental examination of two canopy models. Journal of Experimental Botany, 29, 815- 827.
Addiscott, T. M. and Whitmore, A. P. (1987) Computer simulation of changes in soil mineral nitrogen and crop nitrogen during autumn, winter and spring. Journal of Agricultural Science, Cambridge, 109, 141-157.
Addiscott, T. M., Bailey, N. J., Bland, G. J. and Whitmore, A. P. (1991) Simulation of nitrogen in soil and winter wheat crops: a management model that makes the best use of limited information. Fertilizer Research, 27, 305-312.
Bar-Yosef, B. and Sagiv, B. (1982) Response of tomatoes to N and water applied via a trickle irrigation system. I. Nitrogen. Agronomy Journal, 74, 6333637.
Beckie, H. J., Moulin, A. P., Campbell, C. A. and Brandt, S. A. (1995) Testing effectiveness of four simulation models for estimating nitrates and water in two soils. Canadian Journal of Soil Science, 7, 135-143.
Benjamin, J. G., Havis, H. R., Ahuja, L. R. and Alonso, C. V. (1994) Leaching and water flow patterns in every-furrow and alternate-furrow irrigation. Soil Science Society of America Journal, 58, 15 1 l--l 5 17.
Benson, V. W., Potter, K. N., Bogusch, H. C., Goss, D. and Williams, J. R. (1992) Nitrogen leaching sensitivity to evapotranspiration and soil water storage esti- mates in EPIC. Journal of Soil and Water Conservation, 47, 334-337.
Bhat, K. K. S., Flowers, T. H. and O’Callaghan, J. R. (1980) A model for the simulation of the fate of nitrogen in farm wastes on land application. Journal of Agricultural Science, Cambridge, 94, 183-193.
Bolanos, J. A. (1988). Effects of water stress on photosyntethic and stomata1 beha- viour of field-grown tomato. Ph.D. Dissertation, University of California, Davis.
Broadbent F. E., Tyler K. B. and May D. M. (1980) Tomatoes make efficient use of applied nitrogen. California Agriculture, Nov-Dee, 2425.
Cabelguenne, M., Jones, C. A., Marty, J. R., Dyke, P. T. and Williams, J. R. (1990) Calibration and validation of EPIC for crop rotations in southern France. Agricultural Systems, 33, 153-l 7 1.
Calado, A. M., Portas, C. A. M. and Figueiredo, M. J. R. (1980) Growth and development of tomato ‘Cal j’. Acta Horticulturae, 100, 159-171.
California Certified Organic Farmers (1994) Handbook. Certified Organic Farmers, Inc., Santa Cruz, California.
Carlson, R. M., Cabrera, R. I., Paul, J. L., Quick, J. and Evans, R. Y. (1990) Rapid direct measurement of ammonium and nitrate in soil and plant tissue extracts. Communications in Soil Science and Plant Analysis 21, 15 19-l 529.
Cavero, J., Plant, R. E., Shennan, C. and Friedman D. B. (1997) Nitrogen dynamics in processing tomatoes under conventional, low input and organic management systems. Nutrient Cycling in Agroecosystems 47, 271-282.
De Willingen, P. (1991) Nitrogen turnover in the soilcrop system: comparison of fourteen simulation models. Fertilizer Research, 27, 141-149.
Doorenbos, J. and Pruitt, W. 0. (1977) Guidelines for predicting crop water requirements. FAO Irrigation and Drainage Paper No. 24, FAO Rome, Italy.

412 J. Cavero et al.
Duffus, J. E., Liu, H. Y. and Wisler, G. C. (in press). Tomato infectious chlorosis: a new clostero-like virus transmitted by Trialeurodes vaporariorum. European Journal of Plant Pathology.
Fonteh, M. F. and Podmore, T. (1993) A physically based infiltration model for furrow irrigation. Agricultural Water Management, 23, 271-284.
Franson, M. A. H. (1985) Standard methods for the examination of waste water. American Public Health Association, Washington, pp. 265-297.
Geisenberg, C. and Stewart, K. (1986) Field crop management. In The tomato crop. eds. J .G. Atherton and J. Rudich. Chapman and Hall Ltd., Cambridge, pp. 51 l-557.
Gould, M. A. (1983) Tomato production, processing and quality evaluation. AVI, Westport, Connecticut.
Greenwood D. J., Neeteson J. J. and Draycott, A. (1985) Response of potatoes to N fertilizer: quantitative relations for components of growth. Plant and Soil, 85, 163-183.
Halbrooks, M. C. and Wilcox, G. E. (1980) Tomato plant development and ele- mental accumulation. Journal of the American Society of Horticultureal Science, 105, 826828.
Hedge, D. M. and Srinivas, K. (1990) Effect of irrigation and nitrogen fertilization on yield, nutrient uptake, and water use of tomato. Gartenbauwissenschctft, 55, 173-177.
Hills, F. J., Broadbent, F. E. and Lorenz, 0. A. (1983) Fertilizer nitrogen utilization by corn, tomato and sugarbeet. Agronomy Journal, 75,423426.
Hoyt, G. D. and Hargrove, W. L. (1986) Legume cover crops for improving crop and soil management in the southern United States. HortScience, 21, 397- 402.
Hummadi, K. B., Fangmeier, D. D. and Tucker, T. C. (1975) Soluble salts and nitrate distribution in irrigated lettuce beds. Transactions of the ASAE l&686-689.
Jackson, L. E. and Bloom, A. J. (1990) Root distribution in relation to soil nitrogen availability in field-grown tomatoes. Plant and Soil, 128, 115-126.
Jones, J. W., Dayan, E., Allen, L. H., Van Keulen, H. and Challa, H. (1991) A dynamic tomato growth yield model (TOMGRO). Transactions of the ASAE, 34663-672.
Kafka& U. and Bar-Yosef, B. (1980) Trickle irrigation and fertilization of tomatoes in highly calcareous soils. Agronomy Journal, 72, 893-897.
Kamgar, A. A., Henderson, D. W. and Pruitt, W. 0. (1980) Evaluating leaf water potential, stomata1 resistance and canopy surface temperature of tomatoes as indices for irrigation timing. Acta Horticulturae, 100, 181-192.
Kano, A. and Van Bavel, C. H. M. (1988) Design and test of a simulation model of tomato growth and yield in a greenhouse. Journal of the Japan Society Horti- cultural Science, 56, 408-416.
Kersebaum, K. C. and Richter, J. (1991) Modelling nitrogen dynamics in a plant- soil system with a simple model for advisory purposes. Fertilizer Research, 27, 273-28 1.
Kiniry, J. R. (1994) Radiation-use efficiency and grain yield of maize competing with johnsongrass. Agronomy Journal, 86, 554557.
Kiniry, J. R., Spanel, D. A., Williams, J. R. and Jones, C. A. (1991) Demonstration and validation of crop grain yield simulation by EPIC. In EPIC-Erosion/Pro- ductivity Impact Calculator: 1. Model documentation. eds. A. N. Sharpley and

Applicution of epic model to nitrogen cycling in irrigated processing tomatoes 413
J. R. Williams., U.S. Department of Agriculture Technical Bulletin no. 1768. pp. 220-234.
Kiniry, J. R., Major, D. J., Izaurralde, R. C., Williams, J. R., Gassman, P. W., Morrison, M., Bergentine, R. and Zenther, R. P. (1995) EPIC model parameters for cereal, oilseed, and forage crops in the northern great plains region. Cuna- dian Journal of Plant Science, 75, 679-688.
Liebhardt, W. C., Andrews, R. W., Culik, M. N., Harwood, R. R., Janke, R. R., Radke, J. K. and Rieger-Schwartz, S. L. (1989) Crop production during conversion from conventional to low-input methods. Agronomy Journal 81, 15&159.
Magdoff, F. (199 1) Understanding the Magdoff pre-sidedress nitrate test for corn. J. Production Agriculture, 4, 297-305.
Miller, R. J., Rolston, D. E., Rauschkolb, R. S. and Wolfe, D. W. (1981) Labeled nitrogen uptake by drip-irrigated tomatoes. Agronomy Journal, 73, 265-270.
Mitchell, W. H. and Teel, M. R. (1977) Winter annual cover crops for no-tillage corn production. Agronomy Journal, 69, 569-573.
Muchow, R. C., Coates, D. B., Wilson, G. C. and Foale, M. A. (1982) Growth and productivity of irrigated Sorghum bicolor (L. Moench) in northern Australia. I. Plant density and arrangement effects on light interception and distribution, and grain yield, in the hybrid Texas 610 SR in low and medium latitudes. Australian Journal Agricultural Resources, 33, 773-784.
Nyabundi, J. 0. (1985). Water stress effects on biomass production and partitioning in processing tomatoes. Ph.D. Dissertation, University of California, Davis.
Power, J. F. and Doran, J. W. (1984) Nitrogen use in organic farming. In Nitrogen in crop production, ed. R. D. Hauck, ASA-CSSA-SSSA, Madison, Wisconsin, pp 585-598.
Portas, C. A. M. (1973) Development of root systems during the growth of some vegetable crops. Plant and Soil, 39, 507-518.
Portas, C. A. M. and Dordio, J. J. F. B. (1980) Tomato root systems. A short review with references on tomatoes for processing. Acta Horticulturae, 100, 113-124.
Radke, J. K., Shaffer, M. J., Kroll, K. S. and Saponara, J. (1991) Application of the Nitrogen-Tillage-Residue-Management (NTRM) model for corn grown in low- input and conventional agricultural systems. Ecological Modelling, 55, 241-255.
Rendon-Poblete, E. (1980) Effect of soil water status on yield, quality and root development of several tomato genotypes. Ph.D. Dissertation University of California, Davis.
Sarrantonio, M. and Scott, T. W. (1988) Tillage effects on availability of nitrogen to corn following a lvinter green manure crop. Soil Science Society of America Journal, 52, 1661-1668.
Scholberg, J. M. S., McNeal, B. L., Jones, J. W., Boote, K. J. and Stanley, C. D. (1995) Calibration of a generic crop-growth model (CROPGRO) for field- grown tomato. Agronomy abstracts, ASA Meeting, St Louis, MO, pp. 17.
Shennan, C. (1992) Cover crops, nitrogen cycling, and soil properties in semi-irri- gated vegetable production systems. HortScience, 27, 749-754.
Smith, M. S., Frye, W. W. and Varco, J. J. (1987) Legume winter cover crops. Advances in Soil Science, 7, 95-139.
Smith, S. J., Young, L. B. and Miller, G. E. (1977) Evaluation of soil nitrogen mineralization potentials under modified field conditions. Soil Science Society of American Journal, 41, 7476.

414 J. Cavero et al.
Steiner, J. L., Williams, J. R. and Jones, 0. R. (1991) Evaluation of EPIC using a dryland wheat-sorghum-fallow crop rotation. In EPIC-Erosion/Productivity Impact Calculator: 1. Model documentation, eds A. N. Sharpley and J. R. Willi- ams. U.S. Department of Agriculture Technical Bulletin no. 1768. pp 191-205.
Stivers, L. J. and Shennan, C. (1991) Meeting the nitrogen needs of processing tomatoes through winter cover cropping. Journal of Production Agriculture, 4, 330-335.
Sweeney, D. W., Bottcher, A. B., Campbell, K. L. and Graetz, D. A. (1985) Mea- sured and CREAMS-predicted nitrogen losses from tomato and corn manage- ment systems.. Water Resources Bulletin, 21, 867-873.
Sweeney, R. A. (1989) Generic combustion method for determination of crude pro- tein in feeds: a collaborative study. Journal of the Oficial Analytical Chemists 72, 77&774.
Temple, S. R., Friedman, D. B., Somasco, O., Ferris, H., Scow, K., and Klonsky, K., (1994) An interdisciplinary experiment station-based parcitipatory compar- ison of alternative crop management systems for California’s Sacramento Val- ley. American Journal of Alternative Agriculture, 9, 64-71.
Van Keulen, H. and Stol, W. (1991) Quantitative aspects of nitrogen nutrition in crops. Fertilizer Research, 27, 151-160.
Widders, I. E. and Lorenz, 0. A. (1979) Tomato root development as related to potassium nutrition. Journal of the American Society of Horticultural Science, 104,2 16220.
Williams, J. R., Jones, C. A. and Dyke, P. T. (1984) A modeling approach to determining the relationship between erosion and soil productivity. Transactions of the ASAE, 27, 129-144.
Williams, J. R., Jones, C. A., Kiniry, J. R. and Spanel, D. A. (1989) The EPIC crop growth model. Transactions of the ASAE, 32, 497-511.
Wolf, S., Rudich, J., Marani, A. and Rekah, Y. (1986) Predicting harvesting date of processing tomatoes by a simulation model. Journal of the American Society of Horticultural Science, 111, 11-16.