differences in consumers of fresh tomatoes at four retail venues
TRANSCRIPT
Differences in Consumers of Fresh Tomatoes atFour Retail Venues
Robin G. Brumfield
This paper presents the results of surveys of fresh tomato consumers conducted in 1990 in fourNew Jersey produce venues: a supermarket, a farmers’ market, an at-th-farm store, and tworoadside stands, The surveys were conductedthrough faceto-face interviews. Consumers’preferences, purchasingpatterns, attitudesand demographicswere examined. Results of thesurveys suggest that supermarketsshould emphasizeprice and conveniencein marketing freshtomatoes; whereas farmers’ markets, at-the-farm stores, and roadside stands should emphasizetaste and freshness.
Rutgers Cooperative Extension conducted surveys atfour different marketing outlets to determine whatmotivates consumers to purchase Jersey Fresh tomatoesat each of the outlets. A second aim of the 1990 sur-vey was to determine the differences, if any, in thedemographics of these respondents.
During two previous Rutgers surveys, whichwere conducted only at supermarkets, a few consumersmentioned that they also purchased tomatoes at otheroutlets (&utileld, et al., 1993, Brudleld 1989a,Brumfield 1989b). These specific places were roadsidestands, farmers’ markets and at-the-farm stores (thoselocated right on the farm). Data on consumers whopurchase tomatoes from supermarkets were alreadyobtained in the 1988 and 1989 Rutgers CooperativeExtension studies. Therefore, for a better representa-tion of additional tomato outlets, a third study wasconducted at a supermarket, two roadside stands, afarmers’ market, and an at-the-farm store.
Table 1 indicates that a roughly equal percentageof people purchase tomatoes yearly or seasonally at thefarmers’ market. While the majority of the respon-dents at the other sites purchase tomatoes year round,purchasers who frequented at-the-farm stores and road-side stands tended to be more likely to purchase toma-toes seasonally than the supermarket purchasers, whotended to purchase tomatoes year-round, This seemsto indicate that shoppers who visit non-supermarketlocations are looking for local tomatoes produced inseason, and tend not to buy tomatoes when vine-rip-ened local tomatoes are not available.
Robin G. Brumtield is with the Department of ExtensionSpwialists, Rutgers University, New Brunswick, New Jersey.
Although preference for Jersey Fresh tomatoesis quite high at supermarkets, this figure is nearly 20percent higher at the other three retail outlets (Table 2).This indicates that non-supermarket shoppers seek outlocal, vine-ripened tomatoes more than supermarketshoppers do.
When shoppers were asked for a reason as towhy they preferred Jersey Fresh to other tomatoes, themost common answers were taste and freshness.Another reason was that they felt Jersey Fresh was thebest tomato overall (Table 3).
When given a list of attributes and asked to rateJersey Fresh tomatoes as better, worse, or the same asother tomatoes in each category, Jersey Fresh tomatoeswere rated higher by respondents at non-supermarketvenues than by A&P supermarket respondents (Table4), An explanation may be that respondenta who fre-quent supermarkets are convenience shoppers (seeTable 20). They may not go out of their way to shopfor specialty items such as Jersey Fresh tomatoes andtherefore appear to be less knowledgeable than non-supermarket shoppers. Respondents at the other threesites go specifically to these sites for the freshness andtaste of Jersey Fresh tomatoes. Unlike A&P, whichcarried other tomato brands, the other three sites car-ried Jersey Fresh tomatoes exclusively.
Over half of the respondents felt that the priceof Jersey Fresh tomatoes was better than prices ofother tomatoes (Table 4). However, when asked whichwas a more expensive place to purchase tomatoes, alarger majority of the respondents at the non-supermar-ket sites aaid supermarkets were 10 percent to 50 per-cent more expensive than places where they wereshopping (Tables 5 & 6).
Almost threequarters of the respondents werenot aware of any of the Jersey Fresh promotional pro-
Journal of Food Distribution Research February 941page 93
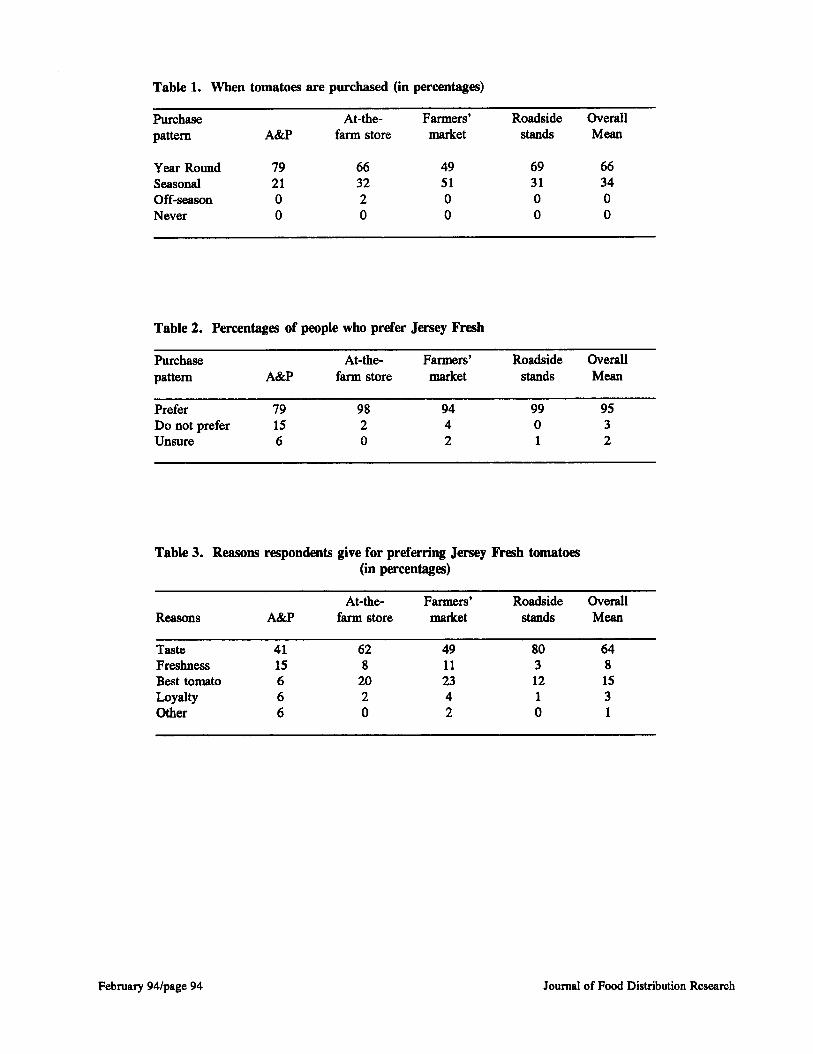
Table 1. When tomatoea are purchased (in percentages)
Purchase At-the- Farmers’ Roadside Overallpattern A&P farm store market stands Mean
Year Round 79 66 49 69 66Seasonal 21 32 51 31 34Off-season o 2 0 0 0Never o 0 0 0 0
Table 2. Percentages of people who prefer Jersey Fresh
Purchase At-the- Farmers’ Roadside Overallpattern A&P farm store market stands Mean
Prefer 79 98 94 99 95Do not prefer 15 2 4 0 3Unsure 6 0 2 1 2
Table 3. Reasons respondenta give for preferring Jersey Fresh tomatoea(in percentage)
At-the- Farmers’ Roadside OverallReasons A&P farm store market stands Mean
Taste 41 62 49 80 64Freshness 15 8 11 3 8Best tomato 6 20 23 12 15Loyalty 6 2 4 1 3Other 6 0 2 0 1
February 941page 94 Journal of Food Distribution Research
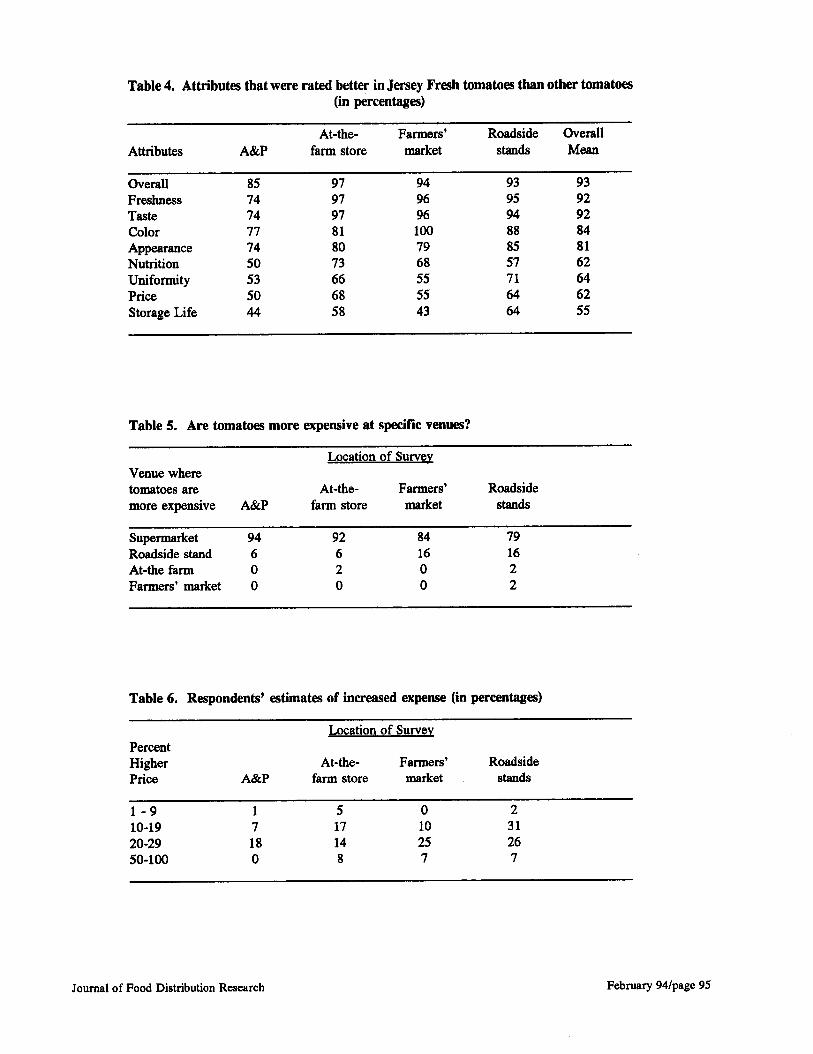
Table 4. Attributes that were rated better in Jersey Fresh tomatoes than other tomatoes(in percentages)
At-the- Farmers’ Roadside Overall
Attributes A&P farm store market stands Mean
Overall 85 97 94 93 93Freshness 74 97 96 95 92Taste 74 97 96 94 92Color 77 81 100 88 84Appearance 74 80 79 85 81Nutrition 50 73 68 57 62uniformity 53 66 55 71 64Price 50 68 55 64 62Storage Life 44 58 43 64 55
Table 5. Are tomatoes more expensive at specific venues?
Location of SurveyVenue wheretomatoes are At-the- Farmers’ Roadsidemore expensive A&P farm store market stands
Supermarket 94 92 84 79Roadside stand 6 6 16 16At-the farm o 2 0 2Farmers’ market O 0 0 2
Table 6. Respondents’ estimates of increased expeme (in percentages)
Location of SurveyPercentHigher At-the- Farmers’ RoadsidePrice A&P farm store market stands
1-9 1 5 0 210-19 7 17 10 3120-29 18 14 25 2650-100 0 8 7 7
Journal of Food Distribution Research February 94/page 95
grams (Table 7). The most frequently mentionedfactor in awareness was television.
Over a third of the respondents from non-super-market venues ate tomatoes seven days a week, whileonly 15 percent of supermarket respondents ate toms-toes every day (Table 8). The most popular meal atwhich tomatoes were eaten was dinner (Table 9),About one-fifth of the respondents also ate tomatoes atlunch.
The majority of respondents at all sites believethat all attributes are either very important or importantto their decision to purchase tomatoes (Table 10). Thetop three categories in order of importance to con-sumers’ purchasing decisions were lack of blemishes,appearance, and color.
Most consumers prefer a medium size, relativelyfirm tomato (Tables 11 and 12). Although more con-sumers at the roadside stand said medium-sized toms-toes were the preferred size, their preference for thesmall and large sized tomato are almost equally distrib-uted. However, other consumers at other locationsovenvhelmingly preferred the medium size.
Only 11 to 12 percent of shoppers at farmers’markets and at-the-farm stores earned over $70,000 peryear, while over one-third of A&P and roadside standshoppers earned over $70,000 yearly (Table 13). NoA&P shopper earned under $30,000 per year, butnearly a third of shoppers at farmers’ markets and at-the-farm stores had annual incomes of less $30,000.This means that if the shelf life and quality of JerseyFresh tomatoes is improved and consistent, this marketsegment can be increased at supermarkets and roadsidestands. Also, supermarkets would be more willing topurchase more Jersey Fresh tomatoes for their producesection.
Sixty-three percent of A&P shoppers have eithera college degree or have a degree beyond college; thisis true for less than 50 percent of the non-supermarketshoppers (Table 14). This higher percentage of edu-cated consumers either have less time to shop or areconvenience shoppers. They tend not to have hadhome gardening experience and therefore are not awareof any taste or freshness differences between vine-rip-ened tomatoes and gassed tomatoes.
Most of the respondents are over 35 years ofage (Table 15). Another study has shown that thosewho fall within this age group are conscious of nutri-tion. However, the largest group of the respondentswho bought tomatoes at A&P supermarkets were under25 years of age. None of the supermarket respondentswere over 65. The opposite was true for at-the-farmstore respondents. Nearly 30 percent of these respon-dents were over 65, but a minimal number of peopleunder 25 appeared to purchase tomatoes at this loca-tion.
The respondents in this Rutgers study were, forthe most part, caucasian and female (Tables 16& 17).A slightly higher percentage of shoppers at the A&Psupermarkets were female than at the other three loca-tions.
Although price ranges were different at the fourlocations, most consumers paid about $0.99 per poundfor their tomatoes. The exception were farmers’ mar-ket respondents who paid $0.90 per pound. Most ofthe respondents said the supermarket was a moreexpensive place to shop for tomatoes. However, inspite of this perception, supermarket prices were actu-ally lower, ranging from $0.79 to $2.00, while farm-ers’ market prices ranged from $0.90 to $2.50 (Table18).
A majority of rwpondents at all four sites saidthey were aware of that most tomatoes grown outsideNew Jersey and sold in New Jersey were gassed toma-toes (Table 19). Respondents from the farmers’ mar-kets and at-the-farm stems were more aware of thisfact than roadside stand and supermarket respondents.However, roadside stands and supermarket respondentshad about the same percentage response for this ques-tion. An explanation for this may be that respondentsat the roadside stand also shop at supermarkets, andstop at roadside stands on their way to or from work.
It appears that these respondents do not go outof their way to seek roadside stands. A majority ofthem drove an average of two miles to this site (Table20). Respondents who frequented the at-the-farm storetraveled longer distances, These shoppers probablymake a special trip to this location to purchase freshproduce.
Conclusions
Our survey of consumers who purchase tomatoes atfour market venues (supermarket, roadside stand,farmers’ market, and at-the-farm store) suggests thatconsumers who prefer Jersey Fresh tomatoes are will-ing to make a special trip to a venue that sellsin--n, vine-ripened tomatoes. These consumersbelieve that they will find fresher, tastier, less expen-sive, higher quality tomatoes when they purchase themat a direct marketing outlet. Consumers’ perceptionthat supermarket tomatoes are more expensive thanthose at the other three venues was, in fact, wrong.
The results of this survey suggest that directmarketers of fresh tomatoes should emphasize promo-tions based on taste and quality rather than convenienceor price when marketing. Supermarkets should empha-size convenience and price while pointing out that they,too, sell Jersey Fresh tomatoes in season.
February 94/page 96 Journal of Food Distribution Research
References
Brooker, J. R., D. B. Eastwood, and R. H. Orr.“Consumer’s Perceptions of Locally GrownProduce at Retail Outlets. ” Journal of FoodDiwibwion Research 18(1):99-107, 1987.
Brooker, J. R., D. B. Eashvood, C. L. Stout, and R.H. Orr. “Branding Locally Grown Produce atRetail Supermarkets. ” Journal of FoodDistribution Research 19(1):51-60, 1988.
Brumfield, R. G,, A. O. Adelaja, and K. Lininger.“Consumer Tastes, Preferences, and Behavior inPurchasing Fresh Tomatoes. ” Journal of lheAmerican Society of Honicultural Science111(3):433-438, 1993.
Bmrnfield, R. G. “Marketing Opportunities forPremium Jersey Fresh Tomatoes. ” in 1989 NewJersey Vegetable Trial Results, pp.49-56.Compiled and edited by S. Reiners and S. A.Garrison. Rutgers Cooperative ExtensionBulletin E141., 1989.
Brumfield, R. G. “The ‘Jersey Fresh’ Challenge: AnAnalysis of a Survey Taste Test for JerseyFresh Tomatoes. ” Fatm Management News &Views 1(1):3-4, 1989.
Goldman, A. “Consumer Response to PremiumQuality Branded Produce: The Case of IsraeliGhsshouse Tomatoes. “ Applia! AgriculturalResearch 3(5):264-268, 1988.
Journal of Food Distribution Research February 94/page 97
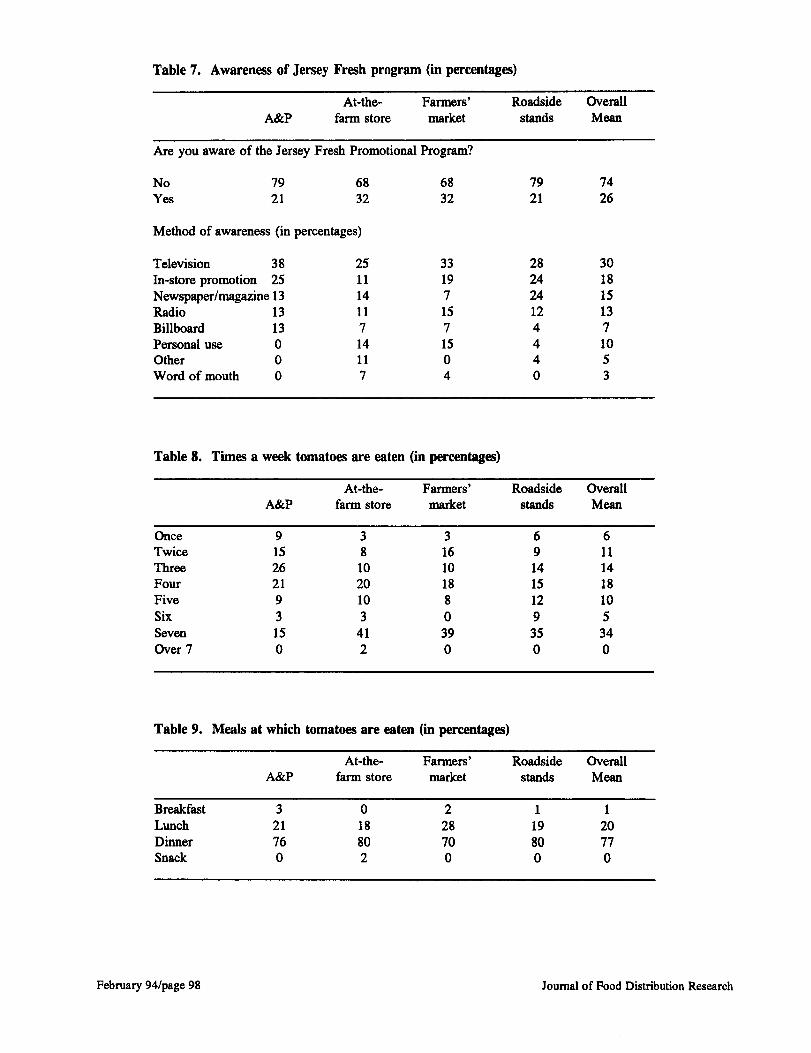
Table 7. Awareness of Jersey Fresh program (in percentages)
At-the- Farmers’ Roadside OverallA&P farm store market stands Mean
Are you aware of the Jersey Fresh Promotional Program?
No 79 68 68Yes 21 32 32
Method of awareness (in percentages)
Television 38In-store promotion 25Newspaper/magazine 13Radio 13Billboard 13Personal use oOther oWord of mouth O
25111411714117
331971571504
7921
282424124440
7426
3018151371053
Table 8. Times a week tomatoes are eaten (in percentage)
At-the- Farmers’ Roadside OverallA&P farm store market stands Mean
OnceTwiceThreeFourFiveSixSevenOver 7
915262193150
381020103
412
316101880390
691415129350
6111418105340
Table 9. Meals at which tomatoes are eaten (in percentages)
At-the- Farmers’ Roadside OverallA&P farm store market stands Mean
Breakfast 3 0 2 1 1Lunch 21 18 28 19 20Dinner 76 80 70 80 77Snack o 2 0 0 0
February 94/page 98 Journal of Food Distribution Research
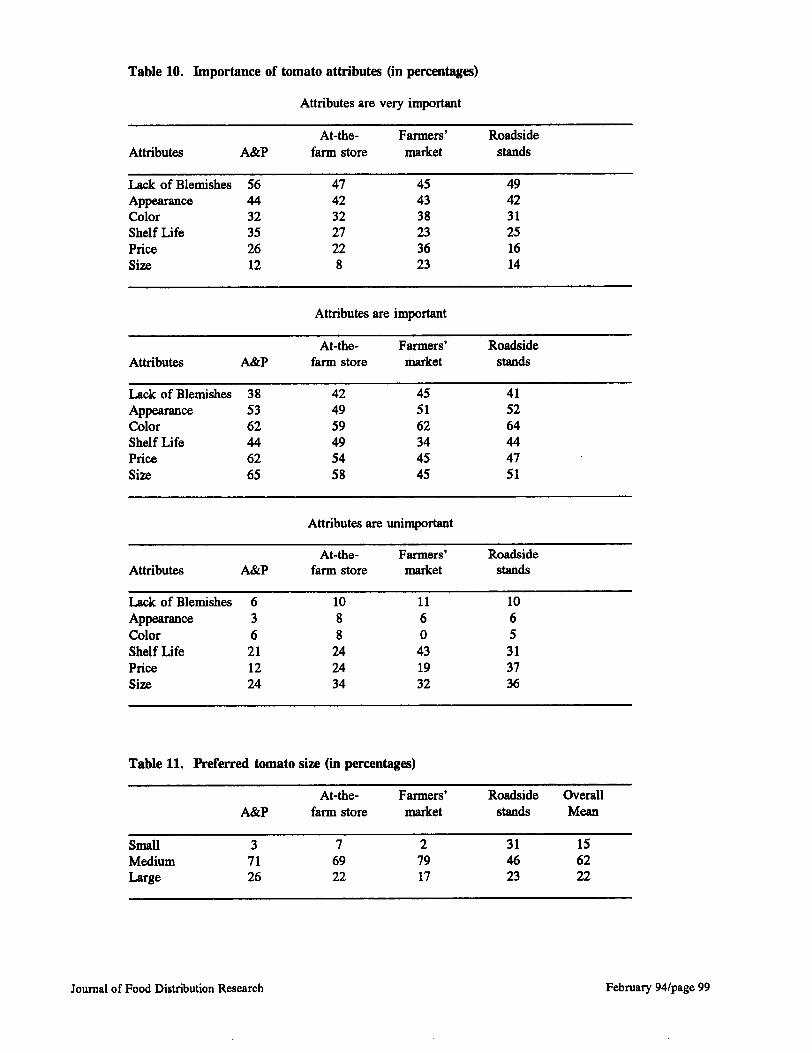
Table 10. Importance of tomato attributes (in percentages)
Attributes are very important
At-the- Farmers’ RoadsideAttributes A&P farm store market stands
Lack of Blemishes 56 47 45 49Appearance 44 42 43 42Color 32 32 38 31Shelf Life 35 27 23 25Price 26 22 36 16Size 12 8 23 14
Attributes are important
At-the- Farmers’ RoadsideAttributes A&P farm store market staods
Lack of Blemishes 38 42 45 41Appearance 53 49 51 52Color 62 59 62 64Shelf Life 44 49 34 44Price 62 54 45 47Size 65 58 45 51
Attributes are unimportant
At-the- Farmers’ RoadsideAttributes A&P farm store market stands
Lack of Blemishes 6 10 11 10Appearance 3 8 6 6Color 6 8 0 5Shelf Life 21 24 43 31Price 12 24 19 37Size 24 34 32 36
Table 11. Preferred tomato size (in percentage)
At-the- Farmers’ Roadside OverallA&P farm store market stands MearI
small 3 7 2 31 15Medium 71 69 79 46 62Large 26 22 17 23 22
Journal of Food Distribution Research February 94/page 99
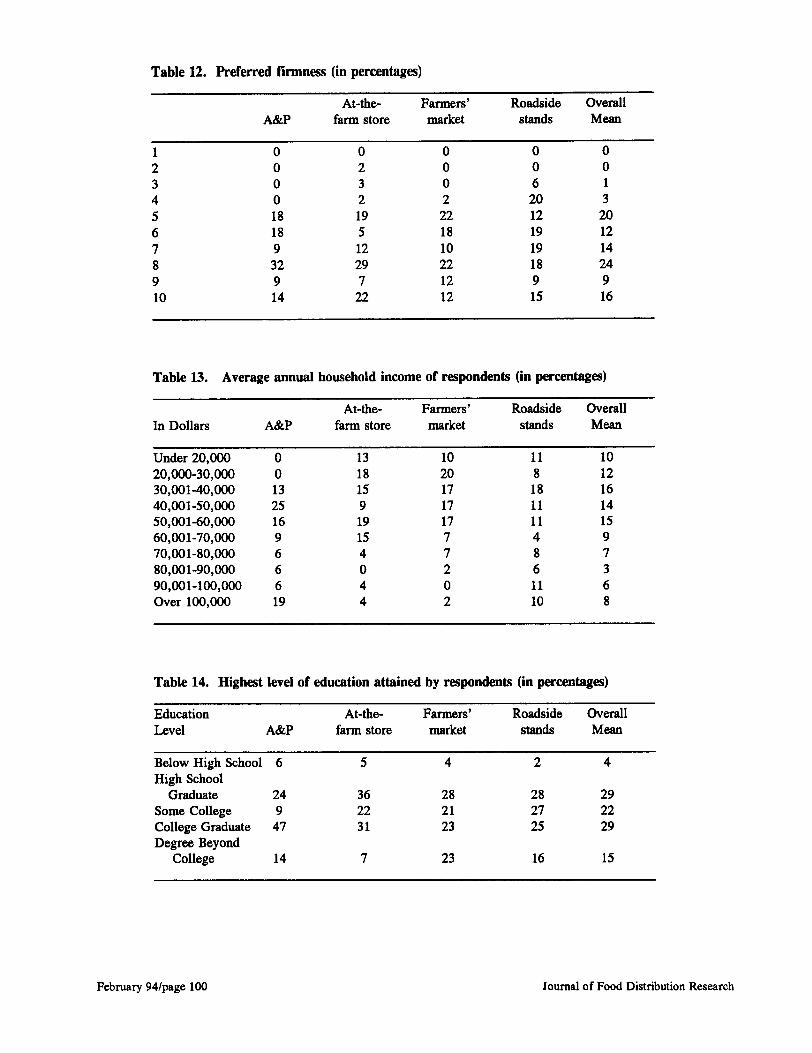
Table 12. Preferred firmness (in percentages)
At-the- Farmers’ Roadside GverallA&P farm store market stands Mean
1 0 0 0 0 02345678910
00018
18
9
32
9
14
23219512297
22
002
221810221212
06
2012191918915
013
20121424916
Table 13. Average annual household income of respondents (in percentage)
At-the- Farmers’ Roadside GverallIn Dollars A&P farm store market stands Mean
Under 20,00020,000-30,00030,001-40,00040,001-50,00050,001-60,00060,001-70,00070,001-80,00080,001-90,0009O,OO1-1OO,OOOGver 100,000
00132516966619
131815919154044
102017171777202
1181811114861110
101216141597368
Table 14. Highest level of education attained by respondents (in percentages)
Education At-the- Farmers’ Roadside GverallLevel A&P farm store market stands Mean
Below High School 6 5 4 2 4High School
Graduate 24 36 28 28 29Some College 9 22 21 27 22College Graduate 47 31 23 25 29Degree Beyond
College 14 7 23 16 15
February 941page 100 Journal of Food Distribution Research
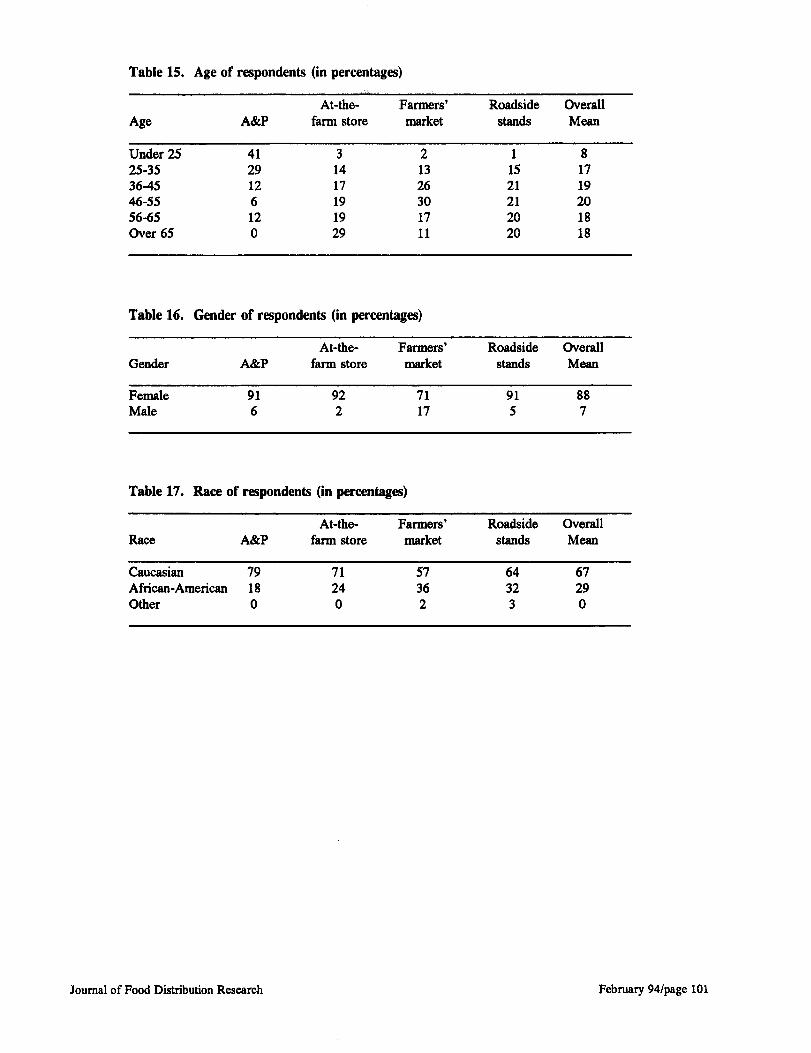
Table 15. Age of respondents (in percentages)
At-the- Farmers’ Roadside OverallAge A&P farm store market stands Mean
Under 25 41 3 2 1 825-35 29 14 13 15 1736-45 12 17 26 21 1946-55 6 19 30 21 2056-65 12 19 17 20 18Over 65 0 29 11 20 18
Table 16. Gender of respondents (in percentages)
At-the- Farmers’ Roadside OverallGender A&P farm store market stands Mean
Female 91 92 71 91 88Male 6 2 17 5 7
Table 17. Race of respondents (in percentage)
At-the- Farmers’ Roadside OverallRace A&P farm store market stands Mean
Caucasian 79 71 57 64 67Africau-American 18 24 36 32 29Other o 0 2 3 0
Journal of Food Distribution Research February 941page 101
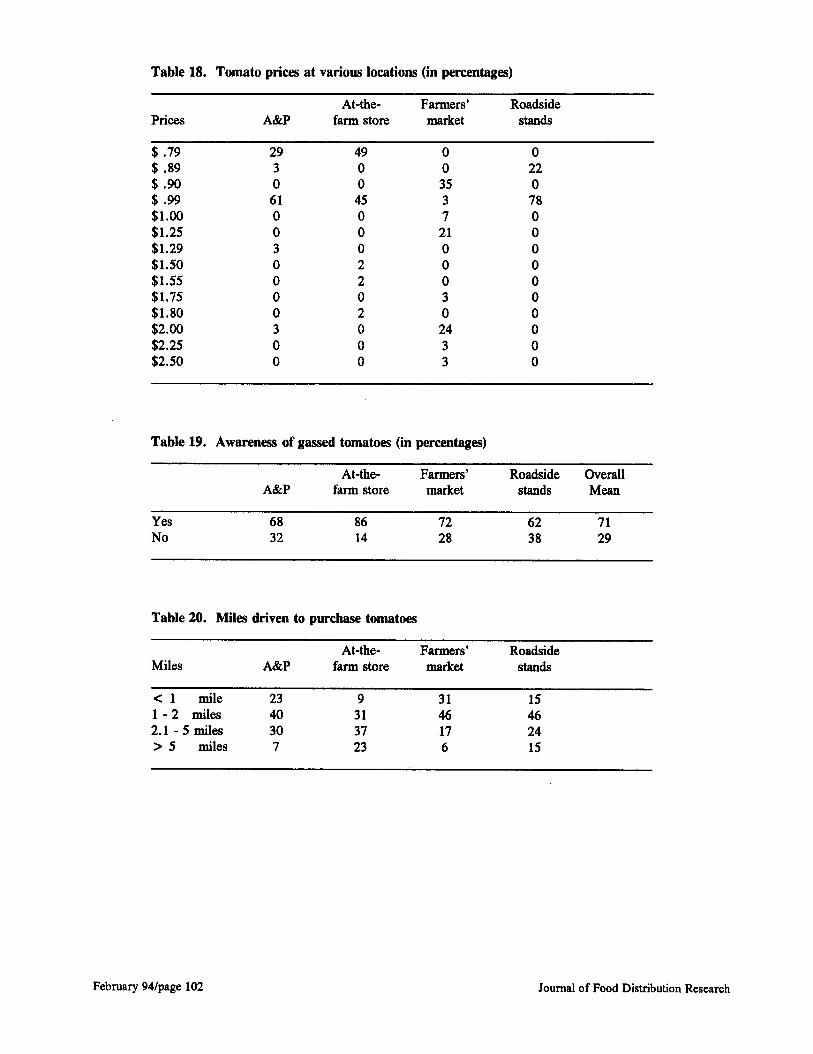
Table 18. Tomato prices at various locations (in percentages)
At-the- Farmers’ RoadsidePrices A&P farm store market stands
$.79$.89$.90$.99$1.00$1.25$1.29$1.50$1.55$1.75$1.80$2.00$2.25$2.50
2930
610030000300
4900
450002202000
003537
2100030
2433
0220780000000000
Table 19. Awareness of gassed tomatoes (in percentages)
At-the- Farmers’ Roadside overallA&P farm store market stands Mean
Yes 68 86 72 62 71No 32 14 28 38 29
Table 20. Miles driven to purchase tomatoes
At-the- Farmers’ RoadsideMiles A&P farm store market stands
<1 mile 23 9 31 151-2 miles 40 31 46 462.1-5 miles 30 37 17 24>5 miles 7 23 6 15
February 94/page 102 Journal of Food Distribution Research