applicability of nonlinear static procedures to rc moment-resisting frames
TRANSCRIPT

Application of Nonlinear Static Proceduresfor the Seismic Assessment of Regular RCMoment Frame Buildings
Michalis Fragiadakis,a) M.EERI, Dimitrios Vamvatsikos,b) M.EERI, andMark Aschheim,c) M.EERI
The applicability of nonlinear static procedures for estimating the seismicdemands of typical regular RC moment-resisting frames is evaluated. Thiswork, conducted within the framework of the ATC-76-6 project, shows thedegree to which nonlinear static methods can characterize global and localresponse demands vis-à-vis those determined by nonlinear dynamic analysisfor three RC moment-frame buildings. The response quantities (engineeringdemand parameters) considered are peak story displacements, story drifts,story shears, and floor overturning moments. The single-mode pushover methodsevaluated include the N2 and the ASCE-41 coefficient methods. Multi-modalpushover methods, such as modal pushover analysis and the consecutivemodal pushover method, were also evaluated. The results indicate that the rela-tively good performance of the single-mode methods observed for low-rise build-ings rapidly deteriorates as the number of stories increases. The multi-modaltechniques generally extend the range of applicability of pushover methods,but at the cost of additional computation and without ensuring the reliabilityof the results. [DOI: 10.1193/111511EQS281M]
INTRODUCTION
Nonlinear static procedures (NSPs) are popular for the evaluation of buildings subjected toearthquake loading, and are being considered for use in the design of new buildings inthe proposed updates toASCE31 andASCE41.However, nonlinear response history analysis(NRHA) is generally recognized as the most rigorous analysis method available. The attrac-tiveness of NSPs is attributed to the greater computing cost of NRHA, the difficulty of select-ing appropriate ground motions and scale factors, and the fact that NSP is closer to the simplerelastic-static methods traditionally used for seismic design in building codes worldwide.
For a single-story, lightly damped, single-degree-of-freedom (SDOF) structure, the dif-ference in the results of a NSP and NRHA is expected to be small. However, as the number ofstories—and thus the number of the natural modes of vibration—increase, the prominence ofthe first mode of response generally diminishes. Dispersion in response quantities results dueto the varying frequency content of ground motion excitations and the timing of interactingmodal responses. Additionally, the sensitivity of response quantities to higher-mode content
Earthquake Spectra, Volume 30, No. 2, pages 767–794, May 2014; © 2014, Earthquake Engineering Research Institute
a) School of Civil Engineering, National Technical University of Athens, Greece, [email protected]) School of Civil Engineering, National Technical University of Athens, Greece, [email protected]) Department of Civil Engineering, Santa Clara University, CA, [email protected]
767
varies with the response quantity and location within the structure. The notion of a “mode”can be applied to structures undergoing nonlinear response (e.g., Aschheim et al. 2002) andaccommodates the influence of material inelasticity on the instantaneous mode shape andfrequency.
Questions about the accuracy and utility of nonlinear static methods have been raised inrecent years. For example, limitations of nonlinear static procedures were identified in theATC-55 project (FEMA 440 2005), but the multistory building models considered were toofew in number to allow the domain of applicability of these procedures to be accuratelycharacterized. Thus, one objective of this study, conducted under the auspices of theATC 76-6 project (NIST 2010) is to evaluate error, relative to nonlinear dynamic analysisresults, in order to better identify the domain of applicability of single and multi-mode push-over procedures. The procedures include common NSPs, such as those identified in theASCE/SEI 41-06 (2007) guidelines and also more elaborate NSPs that attempt to enhancethe capability of the typical NSP in order to provide results closer to those of NRHA. Giventhe inherent inability of simple nonlinear static methods of analysis to reflect the diversity ofresponse apparent in NRHA, the accuracy of the NSP methods is evaluated relative to thecentral tendency (mean or median) of the chosen response parameters.
NONLINEAR STATIC ANALYSIS METHODS
PROBLEMS AND LIMITATIONS
Linear static methods of analysis (e.g., the equivalent lateral force procedure) have beenused successfully for design. However, where accurate analysis results are needed, such as inthe evaluation of existing and potentially deficient structures, the applicability of nonlinearstatic methods merits examination because their theoretical basis is not robust. The assump-tion that the response of a multiple-degree-of-freedom (MDOF) system is directly related tothe response of an equivalent SDOF system depends on the sensitivity of the response para-meter of interest to higher modes of vibration and the degree to which these modes areexcited. Also, peak values of different response parameters, also termed engineering demandparameters (EDPs), may occur at different times in the NRHA due to the nature of the groundmotion excitation and its effects on modal interaction in the context of potentially inelasticand possibly degrading component response. Peak values of the same EDP at different loca-tions in the structure also may occur at different times and be more or less sensitive to con-tributions from each mode.
The inherent simplicity of conventional NSPs limits their ability to represent these effectswell. In the simplest NSPs, the lateral load pattern is applied without taking into considerationmember yielding, the resulting modification of dynamic properties with changes in compo-nent stiffness, and the potential interaction of multiple modes. Improved NSPs, includingmulti-modal methods, attempt to improve the estimate obtained using nonlinear static ana-lysis methods at the expense of complicated computations (Fragiadakis et al. 2007). How-ever, these approaches tend to involve simplifying assumptions derived more on engineeringjudgment and intuition rather than being conceptually robust and numerically justified.Nevertheless, NSP is a valuable tool that is useful in conjunction with a NRHA in orderto gain a sense for the response characteristics of the structure and to check the numericalmodel.
768 FRAGIADAKIS ET AL.

Kunnath and Erduran (2008) have shown that not only are the results of NRHA affectedby modeling choices, but the evaluation of adequacy of an approximate method is a functionof these modeling choices. Divergence in the story drifts determined by different analysismethods were observed depending on whether P-Δ effects were modeled or not. Similarly,record-to-record variability was shown to affect story drift demands determined by NRHAdifferently from those determined by pushover analysis. One explanation for these observa-tions might be that these modeling and ground motion choices affected the inelastic mechan-ism that developed during response. Clearly, an evaluation of the accuracy of pushovermethods relative to results obtained by NRHA is conditioned on assumptions made inmodeling.
Nonlinear dynamic response of structures involves fairly complex interactions among theevolving modes of the structure (Aschheim et al. 2002, Haselton and Deierlein 2007). Thedevelopment of different inelastic mechanisms will increase dispersion in the values of atleast some EDPs of interest. Nonlinear static methods generally are incapable of representingthe development of alternative inelastic mechanisms and the variety of modal interactionsand timing that produce maxima in the NRHAs. There are cases where nonlinear static meth-ods may tend to exaggerate deformation demands at locations where mechanisms are deter-mined to occur, while underestimating deformation demands that occur at other locations innonlinear dynamic analysis.
SUMMARY OF EXISTING NSP METHODS AND PREVIOUSCOMPARATIVE STUDIES
Non-adaptive multimodal pushover methods such as modal pushover analysis (MPA;Chopra and Goel 2002) and its variant, modified modal pushover analysis method(MMPA; Goel and Chopra 2005), as well as adaptive single and multi-modal pushover meth-ods, have been developed as enhanced methods that promise more accurate response-quantity estimates. MMPA was conceived in order to avoid difficulties posed by reversalsin higher-mode capacity curves observed in the FEMA P-695 (FEMA 2009a) project andmakes the simplification of assuming that higher modes remain elastic, while energy-basedpushovers (e.g., Hernández-Montes et al. 2004) provide alternative means to consider non-linearity in the modal pushovers. When presented by Chopra and Goel (2002) and Goel andChopra (2005), the MPA and MMPA were suggested for estimating peak floor (or roof)displacements and story drifts; inaccuracy in the estimation of peak plastic hinge rotationswas recognized early on. A subsequent modification extended the MPA method to determinemember forces and moments by imposing computed deformations on the structural model ina second analysis phase (Goel and Chopra 2005); this was necessary for those cases in whichmodal combinations in the MPA and MMPA procedures resulted in forces in excess of mem-ber capacities (e.g., beam shears exceeding the shears that occur when plastic hinges developat the ends of a beam). Nevertheless, practitioners and researchers seem reluctant to performthis additional analysis step and usually determine all response quantities in a single applica-tion of the MPA or MMPA procedure using the square root of the sum of the squares (SRSS)combination of the response quantities obtained in each independent modal pushoveranalysis.
APPLICATIONOF NSPs FOR THE SEISMIC ASSESSMENTOF REGULAR RCMF BUILDINGS 769

Önem (2008) considered various single and multiple-mode pushover methods as appliedto moment frames and dual systems. Of note are some procedures that combine multi-modaleffects at each step in the pushover analysis, such as incremental response spectrum analysis(IRSA; Aydinoglou 2003) and displacement adaptive pushover (DAP; Antoniou and Pinho2004). Önem (2008) confirms that first mode pushover analysis produced accurate estimatesof peak floor displacements for low- and mid-rise structures, but tends to overestimate peakdisplacements for taller structures. More complex methods sometimes provided better esti-mates relative to the estimates obtained using the simpler pushover procedures, but nomethod was identified that could provide consistently reliable estimates for every EDPand building considered.
Diotallevi et al. (2008) applied various single-load vectors (first mode, triangular, andSRSS), adaptive pushover methods, and MPA to reinforced concrete (RC) frames. MPAresulted in the least average error of all methods considered for estimates of story shearsfor nearly every building (regular and irregular) examined. However, the best method touse for story drifts was less clear, as some methods were better than others for particularbuildings. Kalkan and Kunnath (2007) considered RC moment frames and report that theFEMA 356 procedure underestimates interstory drifts in the upper stories and overestimatesstory drifts in the lower stories, while the MMPA method may underestimate or overestimateinterstory drifts in the upper stories. They also report that the MMPA was inconsistent in itsability to identify yielding in potential plastic hinges.
The preceding studies leave a mixed impression as to the ability of the MPA and MMPAprocedures to provide accurate estimates of peak floor displacements, story drifts, plastichinge rotations, and story shears. Results reported in FEMA 440 (FEMA 2005) illustratethat the accuracy of the MMPA procedure varies with structural system/configurationand drift level (or intensity of inelastic response). The accuracy of the MMPA estimatesof story shears and floor overturning moments degraded significantly as the three-storysteel moment frame was driven to higher drifts and was poor at a peak roof drift of 4%.The introduction of a weak story into a nine-story steel moment frame caused the accuracyof the MMPA estimates of story shears to degrade substantially. Goel (2005) reports that theMPA procedure does not lead to a reasonable estimate of the response where a soft first storyexists.
A complete literature review on NSP methods can be found in Appendix H of NIST(2010). Of particular interest are the classic paper by Krawinkler and Seneviratna (1998)and the papers on bridges by Pinho et al. (2007, 2009). Moreover, an interesting contribu-tion comes from Kunnath (2007) who investigates the evolution of force patterns duringnonlinear response history analysis in order to identify appropriate modal lateral load pat-terns. The applicability and the accuracy of different pushover methods are also discussedand compared in Kalkan and Kunnath (2007), Isakovic and Fischinger (2011), Causevicand Mitrovic (2011), and Lagaros and Fragiadakis (2011). Finally, the topic of plan-irregular structures has been looked at by Bhatt and Bento (2012). Despite this abundanceof studies on the validity of the NSP, a consensus has not yet been reached regarding itsrange of applicability. This was the driving force behind the ATC-76-6 project (NIST2010), the most significant results of which pertaining to reinforced concrete buildingsare presented in the following.
770 FRAGIADAKIS ET AL.

APPLICABILITY OF NSP METHODS IN US GUIDELINES
Recent documents and guidelines discuss the application of alternative analysis methods,including NSP procedures. In general, according to their complexity, a hierarchy among themethods is proposed. The possible analysis methods are linear static procedure (LSP), lineardynamic procedure (LDP), nonlinear static procedure (NSP), and nonlinear dynamic proce-dure (NDP). This terminology is adopted by ASCE/SEI 31-03 (2003) and FEMA 440(FEMA 2005), while ASCE/SEI 7-10 (2010) and FEMA P750 (2009b) suggest equivalentlateral force (ELF; approximately equivalent to LSP), modal response spectrum analysis(MRSA; approximately equivalent to LDP), and seismic response history (SRH; approxi-mately equivalent to NRHA or NDP). Guidance is provided in these documents to facilitatethe choice of analysis procedure with regard to parameters including: (1) building height,(2) number of stories, (3) first-mode period, and (4) demand-to-capacity ratio (DCR).For example, ATC-40 (1996) recommends that linear analysis procedures are acceptablefor “simple” structures, while for buildings with T > 1 sec, NRHA must be adopted.ASCE-31 recommends that more elaborate methods (LDP, NSP or NDP) should be usedwhen T ≥ 3.5Ts, where Ts is the corner period (at the junction of the constant accelerationand constant velocity portions of the design spectrum). Restrictions with respect to irregula-rities (in plan and/or elevation) are also identified.
According to FEMA440 (2005), linear elastic analysis may be adoptedwhere the structureis expected to remain elastic or nearly elastic, or where the design results in nearly uniformdistribution of nonlinear response throughout the structure. Moreover, it is stated that “thedividing line between buildings for which reliable results can be obtained using NSPs andthose for which the results cannot be relied upon is nebulous” (FEMA 440 2005, p. 9-11).Thus, theNSPmethod should be appliedwhen criteria that cover a series of parameters aremet:
• EDP of interest: The method is adequate for story drifts for low-rise buildings andwall buildings. It is stated that “for virtually all cases the simplified procedures pro-duce unreliable estimates for story shears and overturning moments” (FEMA 4402005, p. 9-11).
• Degree of inelasticity: NSP is adequate for slight or moderate levels of inelasticity.• Period of vibration: The threshold on periods is set to 2Ts. The limit is smaller when
story shears are sought.• Structural system type: The NSP may not be as reliable for shear wall structures.• Post-elastic strength: The NSP may not be as reliable where significant P-Δ effects
or strength loss are present in the form of post-elastic negative tangent stiffness. Thisis measured with the Rmax quantity, that is, a conservative estimate of the availablecollapse capacity of the system expressed in terms of a maximum allowable reduc-tion factor and calculated from the properties of the NSP capacity curve.
• Inelastic mechanism: Forces associated with the second and higher modes mayaffect the inelastic mechanism. Thus, NSP may not identify the governing mechan-ism correctly. This is readily apparent where different collapse mechanisms occurunder different ground motion excitations (e.g., Haselton and Deierlein 2007).
ASCE-41 (2007) suggests that linear procedures (LSP and LDP) are not permitted forbuildings with one or more significant irregularities and one or more component demand-capacity ratios (DCRs) that exceed 2. ASCE-41 also states that modal response spectrum
APPLICATIONOF NSPs FOR THE SEISMIC ASSESSMENTOF REGULAR RCMF BUILDINGS 771
analysis must be performed using modes that achieve at least 90% modal participation, or, inother words, as many modes should be included as required so that the sum of their modalcontribution factors is equal to or greater than 90%. This criterion is intended to capture situa-tions in which higher modes are significant. However, FEMA 440 identified cases where thefirst mode achieved greater than 90% modal participation but NSP results were poor.
NSP METHODS CONSIDERED IN THE FRAMEWORK OF ATC-76-6
In current practice, enhanced multi-modal methods are being used to augment NSPs. Theenhanced methods aim to improve the accuracy of nonlinear static analysis, ultimately aim-ing to avoid NRHA. Generally, experience with these methods is quite limited, and theirrelative complexity is a barrier to implementation. Furthermore, the increased complexityand potential for inconsistent reliability has to be weighed relative to the use of NRHA.For example, as reported in FEMA 440, NRHA using even a single ground motion wasgenerally more reliable than the single and multi-modal pushover methods considered inthat project. Nevertheless, in addition to the MPA, the consecutive modal pushover(CMP; Poursha et al. 2009) was selected for further exploration. Other promising methodsreported in the literature (e.g., Aydinoglou 2003, Antoniou and Pinho 2004) were notincluded for brevity, but also, in many cases, due to their need for specialized software.The NSPs evaluated are briefly summarized below:
ASCE/SEI 41-06
This standard, aimed at the assessment of existing buildings, puts forward a basic push-over procedure. The buildings are “pushed”with a first-mode lateral load pattern until a targetdisplacement is obtained, defined as:
EQ-TARGET;temp:intralink-;e1;41;341dt ¼ C0C1C2C3SaðTeÞT2e
4π2g (1)
where C0, C1, C2, and C3 are modification factors; Te is the effective fundamental period ofthe building; and SaðTeÞ is the elastic acceleration response spectrum at Te. More specifically,C0 is considered here equal to the modal participation factor of the first mode. C1 is obtainedwith the improved ASCE/SEI 41-06 relationship: C1 ¼ 1þ ðR� 1Þ∕aT2
e , where R is thestrength reduction factor R ¼ CmSaW∕Fyg ≥ 1. In the numerical examples that follow, a ¼130 (for site class B) and Cm ¼ M�
n∕W is the first mode modal contribution factor. C3 con-siders P-Δ effects and herein is taken to equal 1. The coefficient C2 takes into considerationthe effect of hysteretic behavior and is calculated as C2 ¼ 1þ ð1∕800ÞððR� 1Þ∕TeÞ2.Eurocode/N2 Method
The N2 method was initially proposed by Fajfar and Fischinger (1988) and was laterexpressed in a displacement-acceleration format Fajfar (1999). Recently, the method wasincluded in the Eurocode 8 (CEN 2004) standards, while it has been extended to accountfor higher-mode effects recently by Kreslin and Fajfar (2011). Conceptually, in its typicalcode-format, it is a variation of the capacity spectrum method that instead of highly dampedspectra uses an R-C1-T relationship. The method, as implemented in Eurocode 8 (EC8), con-sists of the following steps: (i) Performpushover analysis and obtain the capacity curve in base-shear versus roof displacement (Vb-ur) terms, (ii) Convert the pushover curve of the MDOF
772 FRAGIADAKIS ET AL.

system to the capacity diagram of an equivalent SDOF system and approximate the capacitycurve with an idealized elastic-perfectly plastic relationship to determine the period Te of theequivalent SDOF system, (iii) estimate the displacement of the MDOF system simply asdt ¼ C0d�t , where d�t is the target displacement of the corresponding inelastic SDOF system.Only a first-mode lateral load pattern has been considered. Different expressions are suggestedfor short and for medium-to-long period ranges; for the latter case, d�t is equal to the displace-ment of the corresponding elastic SDOF system, calculated as:
EQ-TARGET;temp:intralink-;e2;62;554d�t ¼ SaðTeÞ�Te
2π
�2
(2)
Modal Pushover Analysis (MPA)
This procedure, initially proposed by Chopra and Goel (2002), makes use of two or morepushover curves obtained in separate analyses using load patterns based on the first, second,and possibly third mode. Although subsequently Chopra and Goel (2005) recommended asecond analysis phase to determine member forces, this investigation follows the processmore common among practitioners and researchers in which all response quantities are deter-mined in a single application.
The steps of the modal pushover analysis (MPA) method are summarized as follows:(1) Calculate the natural frequencies, the mode shapes and the lateral load patternssi ¼ mφi. (2) Analyze with only the gravity loads and obtain the corresponding responsequantities rg. (3) For the ith mode, develop the base shear-roof displacement curve,Vbi-urn, using the si distribution of lateral forces. (4) Idealize the pushover curve as a bilinearcurve and compute the target displacement δt for each independent modal analysis using theASCE/SEI 41-06 R-C1-T relationship. (5) From the pushover results (Step 3), extract valuesr1þg of desired response quantities due to the combined effects of gravity and lateral loads.(6) Repeat Steps 3–5 for as many modes as required (as discussed in Chopra and Goel 2002),thus two modes for the two-story RCMRF and three modes for the four- and the eight-storyRCMRF buildings. (7) Compute the dynamic response due to the ith mode as ri ¼ riþg-rg.Determine the total response (demand) by combining gravity response and the modalresponses using the SRSS rule: r ¼ rg þ ðΣr2i Þ1∕2.Consecutive Modal Pushover (CMP)
This procedure, initially proposed by Poursha et al. (2009), uses invariant load patternsfor up to three modes, applied consecutively in stages in a single pushover analysis. Themethod would appear to have an advantage over the MPA method in that nonlinear inter-actions among the modes are explicitly modeled, and capacity limits on demands (e.g., shearforces in hinging beams) are inherently represented in the analyses. Gravity loads are appliedprior to the application of the quasi–first mode load pattern. In this approach, (1) the inter-action of multiple modes is considered in a way that may cause different inelastic mechan-isms to form, and (2) the member forces resulting from the analysis are consistent withmember capacity limits (e.g., beam shears do not exceed the shears associated with devel-opment of a plastic mechanism).
The CMP considers up to three modes, applied consecutively in stages in a single push-over analysis. In this way, it may come closer to representing the higher-mode responses that
APPLICATIONOF NSPs FOR THE SEISMIC ASSESSMENTOF REGULAR RCMF BUILDINGS 773

take place when the peak displacement response is realized dynamically. The first stage of thepushover analysis uses a quasi–first mode load pattern, consisting of an inverted triangularload pattern for medium-rise buildings and a uniform load pattern for high-rise buildings. Thesecond stage consists of a sequence of quasi–first and second mode forces. The quasi–firstmode forces are applied until the roof displacement equals a1δt, where a1 is the modal con-tribution factor of the first mode, and δt is the target displacement determined for the firstmode. Upon reaching a1δt, incremental forces are applied that follow a second mode pattern.The incremental displacement used for this analysis stage is ð1-a1Þδt. The third stage,required only for buildings with fundamental periods of 2.2 seconds or higher, consistsof a sequence of quasi–first, second, and third mode forces. As before, the quasi–firstmode forces are applied until the roof displacement equals a1δt. Upon reaching a1δt, incre-mental forces are applied that follow a second-mode pattern until the roof displacementincreases by a2δt. At this point, incremental forces that follow a third-mode pattern areapplied until the roof displacement increases by ð1-a1-a2Þδt. After the last step of each sepa-rate stage is completed, the peak value of any EDP of interest is retained, and the final EDPestimate is obtained from the maximum value of the three stages.
Modal Response Spectrum Analysis (MRSA)
When applied to structures in the nonlinear range of response, modal response spectrumanalysis (MRSA) relies on simple extrapolations of linear behavior and thus approximatelyrepresents the equal displacement rule for deformation-related quantities. The demands arecalculated by linear-elastic analysis using lateral load patterns proportional to the modes ofvibration, which are similar to those of the MPA procedure. For the numerical study thatfollows, the target displacements were calculated using the C1 and C2 relationships ofASCE/SEI 41-06, while C3 was taken equal to 1.0. The EDP values obtained usingevery mode-proportional lateral load pattern are then combined using the SRSS rule to obtainthe final response estimates.
BUILDING MODELS
The structural systems considered are a two-story, a four-story, and an eight-storyreinforced concrete moment-resisting frame (RCMRF) building, originally designed as“archetype” buildings in FEMA P695 (2009a). All three buildings have three bays andare completely regular and symmetric. A generic description of the three buildings isshown in Figure 1. All buildings have bay width 9.1 m (30 ft) and story heights 4.6 m(15 ft) for the first story and 4.0 m (13 ft) for the stories above. The three buildingsform a simple basic test for the static pushover methods. For such low- and mid-rise struc-tures, NSPs are expected to perform well, especially in the near post-nominal-yield region.
The buildings were designed as special RC moment frames following the provisions ofthe 2003 IBC (IBC 2002). Beam sizes were determined by minimum size requirements. Col-umn strengths were determined to follow strong-column-weak-beam requirements, reflectedin required column-to-beam flexural strength ratios and joint shear requirements. The selec-tion of the beam stirrups was controlled by shear capacity design, while the column trans-verse reinforcement was based on confinement requirements. The design of the frames isdescribed in FEMA P695 (2009a).
774 FRAGIADAKIS ET AL.
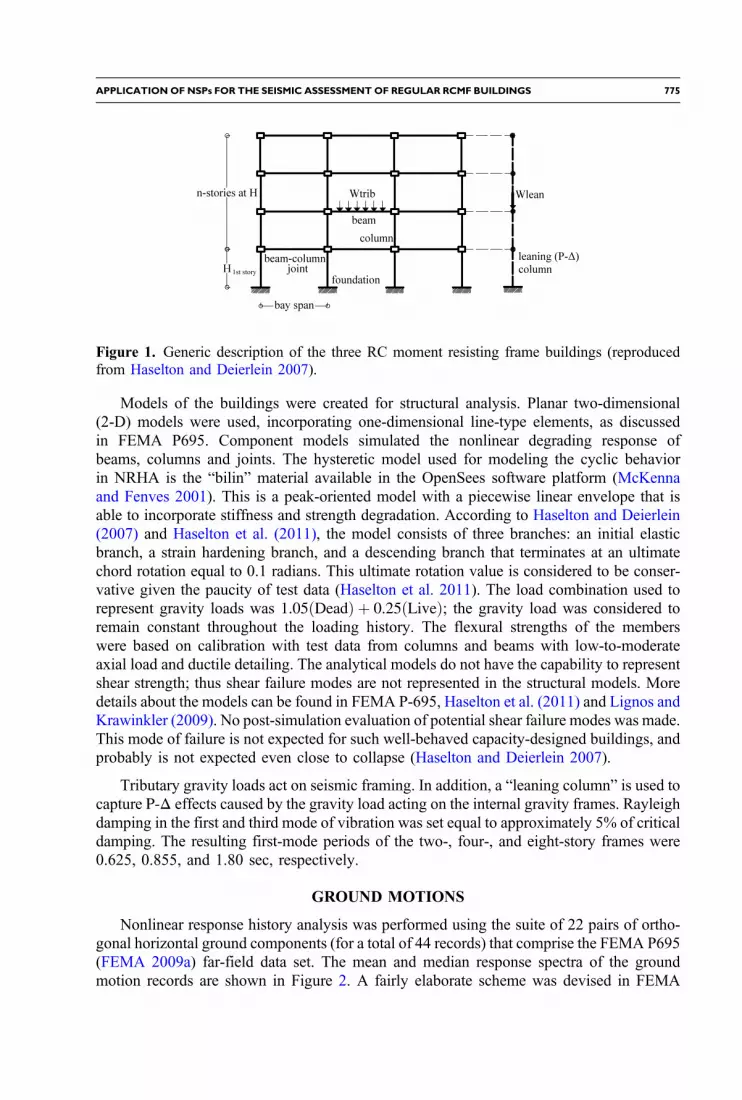
Models of the buildings were created for structural analysis. Planar two-dimensional(2-D) models were used, incorporating one-dimensional line-type elements, as discussedin FEMA P695. Component models simulated the nonlinear degrading response ofbeams, columns and joints. The hysteretic model used for modeling the cyclic behaviorin NRHA is the “bilin” material available in the OpenSees software platform (McKennaand Fenves 2001). This is a peak-oriented model with a piecewise linear envelope that isable to incorporate stiffness and strength degradation. According to Haselton and Deierlein(2007) and Haselton et al. (2011), the model consists of three branches: an initial elasticbranch, a strain hardening branch, and a descending branch that terminates at an ultimatechord rotation equal to 0.1 radians. This ultimate rotation value is considered to be conser-vative given the paucity of test data (Haselton et al. 2011). The load combination used torepresent gravity loads was 1.05ðDeadÞ þ 0.25ðLiveÞ; the gravity load was considered toremain constant throughout the loading history. The flexural strengths of the memberswere based on calibration with test data from columns and beams with low-to-moderateaxial load and ductile detailing. The analytical models do not have the capability to representshear strength; thus shear failure modes are not represented in the structural models. Moredetails about the models can be found in FEMA P-695, Haselton et al. (2011) and Lignos andKrawinkler (2009). No post-simulation evaluation of potential shear failure modes was made.This mode of failure is not expected for such well-behaved capacity-designed buildings, andprobably is not expected even close to collapse (Haselton and Deierlein 2007).
Tributary gravity loads act on seismic framing. In addition, a “leaning column” is used tocapture P-Δ effects caused by the gravity load acting on the internal gravity frames. Rayleighdamping in the first and third mode of vibration was set equal to approximately 5% of criticaldamping. The resulting first-mode periods of the two-, four-, and eight-story frames were0.625, 0.855, and 1.80 sec, respectively.
GROUND MOTIONS
Nonlinear response history analysis was performed using the suite of 22 pairs of ortho-gonal horizontal ground components (for a total of 44 records) that comprise the FEMA P695(FEMA 2009a) far-field data set. The mean and median response spectra of the groundmotion records are shown in Figure 2. A fairly elaborate scheme was devised in FEMA
Figure 1. Generic description of the three RC moment resisting frame buildings (reproducedfrom Haselton and Deierlein 2007).
APPLICATIONOF NSPs FOR THE SEISMIC ASSESSMENTOF REGULAR RCMF BUILDINGS 775

P695 (FEMA 2009a) to ensure the suite of records contains a realistic level of record-to-record dispersion. In short, the orthogonal ground motions are normalized according toPGVPEER, as discussed in FEMA P695. PGVPEER is the geometric mean (square root ofthe product) peak ground velocity (PGV) of two orthogonal components considering differ-ent record orientations. The PGVPEER values adopted were taken directly from the PEERNGA database. All ground motions are far-field recordings and they are applied in theirrecorded orientations. The 22 pairs of ground motions are first scaled so that theirPGVPEER values match the median PGVPEER value of the whole set of unscaled records.The records were further scaled using scale factors (SFs) equal to 0.5, 1, and 2. Thesescale factors result in median elastic response spectra that correspond to ground motionat a Los Angeles, California site with mean recurrence intervals of approximately 100,400, and 2,475 years, respectively. Each record of the scaled pair is applied independentlyin a planar analysis.
NUMERICAL RESULTS
A series of numerical results comparing the performance of the different NSP methodsfollows. The comparison is performed with respect to the peak values of different engineeringdemand parameters (EDPs). The term “peak” denotes the maximum absolute value of theEDP over the entire response history. The EDPs considered include both displacementand force-based quantities; intermediate-level EDPs (e.g., drifts) are emphasized overcomponent-level quantities (e.g., chord rotations). This is done because intermediate-levelEDPs correlate well to component-level quantities, but are less sensitive to the fine detailsof the component models, and thus may serve as global damage indicators. The relationshipbetween intermediate and component-level EDPs is examined further in the ATC-76-6 report(Appendix B) (NIST 2010). Therefore, the EDPs presented here are peak values of storydisplacement, story drift ratio, story shear force, and story overturning moment. The peakstory drift ratio is defined as the maximum of the absolute value of the difference of the hor-izontal displacement of adjacent stories over time, normalized by the height of the story.
Figure 2. Mean and median response spectra of the ground motion set considered.
776 FRAGIADAKIS ET AL.

NONLINEAR RESPONSE HISTORY ANALYSIS
Figures 3 and 4 present selected results from nonlinear response history analysis(NRHA). The curves shown correspond to story-wise profiles of the median response quan-tities plotted for each of the three scale factors. The results for these structures indicate:
• The maximum of the median peak floor displacements over the height of the framestypically appears at the top story (Figure 3a).
• The median of peak story drift demands is highest at the lower stories (usually at thesecond story) and lowest at the top story for these regular frames (Figure 3b, 3c).
• According to Figure 4, median peak story shears do not follow the lateral load pat-tern used to design the structure. The median peak story shears also do not followthe pattern resulting from lateral forces applied in a first-mode based pushover ana-lysis. Median peak story shears in the upper stories are significantly larger thanwould be expected from these load patterns. Median peak story shears in theupper stories increase disproportionately with an increase in scale factor.
• Median peak overturning moments tend to follow the concave pattern associatedwith the lateral load patterns used in design or first-mode pushover analysis(Figure 4c).
• Median peak story shears and overturning moments tend to “saturate” as the scalefactor increases. This reflects limits on demand associated with reaching the max-imum moment capacity in the component models (Figure 4).
The above observations suggest that a single static analysis cannot both represent medianpeak overturning moments, which tend to follow the pattern obtainable in a first mode
0 10 201
2
3
4
Peak Story Displacement (cm)
Flo
or
SF=0.50SF=1.00SF=2.00
0 0.01 0.021
2
3
4
Peak Story Drift Ratio
Flo
or
SF=0.50SF=1.00SF=2.00
0 0.01 0.021
2
3
4
5
6
7
8
Peak Story Drift Ratio
Flo
or
SF=0.50SF=1.00SF=2.00
(a) (b) (c)
Figure 3. NRHA profiles of: (a) peak story displacement (four-story), (b) peak story drift(four-story), and (c) peak story drift (eight-story).
APPLICATIONOF NSPs FOR THE SEISMIC ASSESSMENTOF REGULAR RCMF BUILDINGS 777

pushover analysis, and median peak story shears, which deviate significantly from readilyobtainable patterns. Moreover, higher modes appear to have an appreciable effect on storydrift and story shears, but not on floor displacements or overturning moments, as discussed inAschheim et al. (2007). Figures 3 and 4 display curviness in the drift and the shear profiles inthe mid-height stories, showing apparent departure from a first mode–dominated responseeven for these regular frames.
Since this is a practice-oriented study, we choose not to provide exact height-wise dis-persion values. However, average dispersion values are 0.3–0.4 for peak story displacements,0.25–0.45 for peak story drift ratio, 0.05–0.30 for peak story shears, and 0.10–0.25 for peakoverturning moments. As dispersion, we define the standard deviation of the natural loga-rithms of the height-wise EDP values.
SINGLE-MODE NONLINEAR STATIC ANALYSIS
Figure 5 shows the capacity curves obtained in first-, second-, and third-mode pushoveranalyses of the three RC moment frames. Also shown on this figure are the target displace-ments determined using the formulas of ASCE/SEI 41-06 and the N2 method of Eurocode 8(CEN 2004). Target displacements were determined using the mean elastic response spec-trum of the 44 normalized records, scaled by the relevant scale factor. Roof displacements atyield are observed to occur at target displacements about 0.5% to 0.6% of the building’sheight. Both methods produce nearly identical target displacement estimates for the threemoment frames; for this reason, only the ASCE-41 target displacements were used to esti-mate response quantities in subsequent first mode analyses. Target displacements for a scalefactor of 0.5 are in the elastic regime, those for the records scaled by 1.0 are nearly elastic, and
0 5 10
x 104
1
2
3
4
5
6
7
8
Peak OverturningMoment (kNm)
Flo
or
SF=0.50SF=1.00SF=2.00
0 500 1000 15001
2
3
4
5
6
7
8
Peak Story Shear (kN)
Flo
or
SF=0.50SF=1.00SF=2.00
0 2000 40001
2
3
4
Peak Story Shear (kN)
Flo
or
SF=0.50SF=1.00SF=2.00
(a) (b) (c)
Figure 4. NRHA profiles of: (a) peak story shear (four-story), (b) peak story shear (eight-story),and (c) peak overturning moment (eight-story).
778 FRAGIADAKIS ET AL.

those for a scale factor of 2.0 cause moderate inelastic response, developing system ductilitiesof 2–3, when viewed from a first-mode pushover perspective. Target displacement estimationmay introduce additional error on the results of NSPs. In our case, the nearly perfect bilinearshape of the first-mode capacity curves (Figure 5) resulted in insignificant mean errors(Appendix E, NIST 2010).
Figures 6 and 7 show the ratios of estimates from the pushover analyses and the mediansfrom NRHA over the height of each frame for scale factors of 0.5 and 2.0, respectively. Theestimates are reasonably accurate for all three EDPs for the two-story RCMRF, for which theerror is less than 20% (relative to the NRHA median). For the four-story frame, the accuracyof estimates of story drifts, story shears and overturning moments degraded as the scale factorincreased from 0.5 to 2.0. This is attributed to the tendency of equivalent SDOF systems tooverestimate peak displacements of MDOF systems with increasing severity of nonlinearresponse, as has been recognized previously. This tendency for ASCE-41 target
(a) (b)
(c)
Figure 5. Static pushover curves and target displacement estimates for the two-, four-, and eight-story RCMRFs, for ground motion scale factors of 0.5, 1.0, and 2.0. ASCE-41 and N2/EC8 meth-ods produce nearly coincident target displacement estimates.
APPLICATIONOF NSPs FOR THE SEISMIC ASSESSMENTOF REGULAR RCMF BUILDINGS 779

0 0.5 1 1.5 21
2
3
4
5
6
7
8
SF=0.5
OTMNSP
/OTMMedian NRHA
Flo
or
0 0.5 1 1.5 21
2
3
4
5
6
7
8
SF=0.5
SHEARNSP
/SHEARMedian NRHA
Flo
or
0 0.5 1 1.5 21
2
3
4
5
6
7
8
SF=0.5
SDRNSP
/SDRMedian NRHA
Flo
or
(a) (b) (c)
Figure 6. All buildings: ratios of ASCE-41 NSP and NRHA. (a) Peak story drifts (SF ¼ 0.5),(b) peak story shears (SF ¼ 0.5), and (c) peak overturning moments (SF ¼ 0.5).
0 0.5 1 1.5 21
2
3
4
5
6
7
8
SF=2
OTMNSP
/OTMMedian NRHA
Flo
or
0 0.5 1 1.5 21
2
3
4
5
6
7
8
SF=2
SHEARNSP
/SHEARMedian NRHA
Flo
or
0 0.5 1 1.5 21
2
3
4
5
6
7
8
SF=2
SDRNSP
/SDRMedian NRHA
Flo
or
(a) (b) (c)
Figure 7. All buildings: ratios of ASCE-41 NSP and NRHA. (a) Peak story drifts (SF ¼ 2.0),(b) peak story shears (SF ¼ 2.0), and (c) peak overturning moments (SF ¼ 2.0).
780 FRAGIADAKIS ET AL.

displacements to overestimate actual MDOF response with increasing inelasticity andincreasing numbers of stories is subtly apparent in Figure 7. The degradation in accuracywith an increase in scale factor was small for story shears and overturning moments, andgreater for the drift profiles. The accuracy of NSP estimates also degraded with an increasein scale factor for the eight-story frame, where the error in the story shears and overturningmoments of the top stories was on the order of 60%. Peak story drifts were grossly under-estimated at the top stories and overestimated at the bottom stories at higher scale factors.This is attributed to the constant shape of the lateral loading scheme.
MODAL PUSHOVER ANALYSIS
Target displacements for higher modes were determined using the coefficients providedin ASCE/SEI 41-06 and the N2 method of Eurocode 8 (CEN 2004) applied to the scaledmean elastic response spectrum. The capacity curves are shown in Figure 5. Target displace-ments for modes other than the first are not shown, since they all lie in the elastic range, whereboth methods produce identical displacement estimates. As noted earlier, SRSS combinationswere taken of the individual modal contributions for every response quantity of interest.
Selected results for the three buildings are shown in Figures 8–10. In addition to the MPAestimates, the peak responses for the individual records and their mean andmean� one stan-dard deviation values are also presented. Furthermore, ratios of NSP estimated values andNRHA medians are plotted over the height of each frame in Figure 11 and Figure 12 at scalefactors of 0.5 and 2.0, respectively. Note that when only the first mode is considered, theresults coincide with those of the ASCE/SEI 41-06 method.
400 600 800 10001
2
SF=2
Peak Story Shear (kN)
Flo
or
0 0.02 0.041
2
SF=2
Peak Story Drift Ratio
Flo
or
(a) (b) (c)
Figure 8. Two-story RCMRF: Profiles of (a) peak story drift (SF ¼ 2), (b) of peak story shears(SF ¼ 2), and (c) peak overturning moments (SF ¼ 2).
APPLICATIONOF NSPs FOR THE SEISMIC ASSESSMENTOF REGULAR RCMF BUILDINGS 781

0 750 1500 2250 30001
2
3
4
SF=0.5
Peak Story Shear (kN)
Flo
or
1000 1750 2500 3250 40001
2
3
4
SF=2
Peak Story Shear (kN)F
loor
(a) (b) (c)
Figure 9. Four-story: Profiles of (a) peak story drift (SF ¼ 2), (b) peak story drift (SF ¼ 0.5),(c) peak story shears (SF ¼ 2).
0 375 750 1125 15001
2
3
4
5
6
7
8
SF=2
Peak Story Shear (kN)
Flo
or
0 0.01 0.02 0.03 0.041
2
3
4
5
6
7
8
SF=2
Peak Story Drift Ratio
Flo
or
(a) (b) (c)
Figure 10. Eight-story, profiles of (a) peak story drift (SF ¼ 2.0), (b) peak story shears (SF ¼ 2),and (c) peak overturning moments (SF ¼ 2).
782 FRAGIADAKIS ET AL.

0 0.5 1 1.5 21
2
3
4
5
6
7
8
SF=0.5
OTMNSP
/OTMMedian NRHA
Flo
or
0 0.5 1 1.5 21
2
3
4
5
6
7
8
SF=0.5
SHEARNSP
/SHEARMedian NRHA
Flo
or
0 0.5 1 1.5 21
2
3
4
5
6
7
8
SF=0.5
SDRNSP
/SDRMedian NRHA
Flo
or
(a) (b) (c)
Figure 11. All buildings: Ratio of MPA and NRHA. (a) peak story drifts (SF ¼ 0.5), (b) peakstory shears (SF ¼ 0.5), and (c) peak overturning moments (SF ¼ 0.5).
0 0.5 1 1.5 21
2
3
4
5
6
7
8
SF=2
SHEARNSP
/SHEARMedian NRHA
Flo
or
0 0.5 1 1.5 21
2
3
4
5
6
7
8
SF=2
OTMNSP
/OTMMedian NRHA
Flo
or
0 0.5 1 1.5 21
2
3
4
5
6
7
8
SF=2
SDRNSP
/SDRMedian NRHA
Flo
or
(a) (c)(b)
Figure 12. All buildings: Ratio of MPA results and NRHA. (a) Peak story drifts (SF ¼ 2.0),(b) peak story shears (SF ¼ 2.0), and (c) peak overturning moments (SF ¼ 2.0).
APPLICATIONOF NSPs FOR THE SEISMIC ASSESSMENTOF REGULAR RCMF BUILDINGS 783

For the two-story frame, second-mode contributions to story drifts and overturningmoments were negligible, and reasonably accurate estimates of these quantities wereobtained with the first-mode estimates (Figure 8). While story shears were estimated accu-rately for a scale factor of 0.5 (Figure 6a, Figure 8a), the inclusion of second-mode contribu-tions in the MPA procedure did not sufficiently increase the story shears to result in anaccurate estimate at a scale factor of 2.0 (Figure 8b). This suggests a relatively severe con-straint on the reliable application of both single-mode and simple multimodal pushovermethods.
For the eight-story frame, second-mode contributions to story drift were not negligibleand improved the story drift estimates, but accuracy varied with location and scale factor(Figure 10). Moreover, as shown in Figure 11 and Figure 12, the accuracy of story driftestimates improved with an increase in scale factor at the upper stories, while story driftestimates became less accurate as the scale factor increased at the lower stories. The over-estimation observed at the lower stories is attributed to the constant shape of the lateral loadpattern. As for story drifts, the accuracy of story shear estimates varied with location andscale factor. Both second- and third-mode contributions to story shears were appreciable.At the lower stories, story shear estimates were most accurate at a scale factor of 0.5(Figure 11); an increase in scale factor led to significant overestimates (Figure 12). In con-trast, at the upper stories, the story shears were underestimated at a scale factor of 0.5, wereestimated with reasonable accuracy at a scale factor of 1.0 (not shown), and were signifi-cantly overestimated at a scale factor of 2.0. Second-mode contributions to overturningmoments were not negligible and improved the estimates; overturning moments tendedto be underestimated at a scale factor of 0.5, and were overestimated at a scale factor of 2.0.
CONSECUTIVE MODAL PUSHOVER
Selected results obtained by the application of consecutive modal pushover (CMP) ana-lysis to the three RCMRFs are shown in Figures 13 to 16. In addition to the single-record andNRHA curves, the figures show with dashed lines the profiles of the two CMP stages andwith a solid line their envelope. Ratios of estimated values and NRHA medians are alsoplotted.
For the two-story frame, story drifts were estimated with reasonable accuracy (Figure 15a).Story shears were significantly overestimated at a scale factor of 0.5 (Figure 15b) and signifi-cantly underestimated at a scale factor of 2.0 (Figure 13a and Figure 16b). For the four-storyframe, the accuracy of estimates of story drift, story shear, and overturning moments varied withlocation and scale factor. For example, while story drifts at the upper stories were overestimatedat a scale factor of 0.5 (Figure 15a), relatively accurate estimates of story drift were obtained overthe height of the building at higher scale factors (Figure 14b andFigure 16a).Aswell, story shearsin the upper stories were significantly overestimated at a scale factor of 0.5 (Figure 15b), andstory shears over the height of the building were significantly underestimated at a scale factor of2.0 (Figure 13b, Figure 16b).
For the eight-story frame, peak displacements were overestimated at a scale factor of2.0 (Figure 16a), just as occurred with the first-mode and multiple-mode pushover analyses.As for the four-story frame, the accuracy of estimates of story drift, story shear, and flooroverturning moments varied with location and scale factor. Although these results were not
784 FRAGIADAKIS ET AL.

0 375 750 1125 15001
2
3
4
5
6
7
8
SF=2
Peak Story Shear (kN)
Flo
or
1000 1750 2500 3250 40001
2
3
4
SF=2
Peak Story Shear (kN)
Flo
or
(a) (b) (c)
Figure 13. Peak story shears obtained with the consecutive modal pushover method: (a) Two-story (SF ¼ 2), (b) four-story (SF ¼ 2), (c) eight-story (SF ¼ 2).
0 0.01 0.02 0.03 0.041
2
SF=2
Peak Story Drift Ratio
Flo
or
0 0.01 0.02 0.03 0.041
2
3
4
SF=2
Peak Story Drift Ratio
Flo
or
(a) (b) (c)
Figure 14. Peak drift profiles obtained with the consecutive modal pushover method: (a) Two-story RCMRF (SF ¼ 2), (b) four-story RCMRF (SF ¼ 2), (c) eight-story RCMRF (SF ¼ 2).
APPLICATIONOF NSPs FOR THE SEISMIC ASSESSMENTOF REGULAR RCMF BUILDINGS 785

0 0.5 1 1.5 21
2
3
4
5
6
7
8
SF=0.5
OTMNSP
/OTMMedian NRHA
Flo
or
0 0.5 1 1.5 21
2
3
4
5
6
7
8
SF=0.5
SHEARNSP
/SHEARMedian NRHA
Flo
or
0 0.5 1 1.5 21
2
3
4
5
6
7
8
SF=0.5
SDRNSP
/SDRMedian NRHA
Flo
or
(a) (b) (c)
Figure 15. All buildings: Ratio of CMP and NRHA. (a) peak story drifts (SF ¼ 0.5), (b) peakstory shears (SF ¼ 0.5), and (c) peak overturning moments (SF ¼ 0.5).
0 0.5 1 1.5 21
2
3
4
5
6
7
8
SF=2
OTMNSP
/OTMMedian NRHA
Flo
or
0 0.5 1 1.5 21
2
3
4
5
6
7
8
SF=2
SHEARNSP
/SHEARMedian NRHA
Flo
or
0 0.5 1 1.5 21
2
3
4
5
6
7
8
SF=2
SDRNSP
/SDRMedian NRHA
Flo
or
(a) (b) (c)
Figure 16. All buildings: Ratio of CMP and NRHA. (a) Peak story drifts (SF ¼ 2.0), (b) peakstory shears (SF ¼ 2.0), and (c) peak overturning moments (SF ¼ 2.0).
786 FRAGIADAKIS ET AL.

especially promising, the authors speculate that a revised version of the CMP might be devel-oped in which loading is applied using sequential modes, considering permutations in thesigns of the modes and possibly considering adaptive load vectors.
ELASTIC MODAL RESPONSE SPECTRUM ANALYSIS
Estimates of response quantities were also made by elastic modal response spectrumanalysis using SRSS combinations of the modal values made on the basis of linear elasticresponse extrapolated to the spectral accelerations obtained using scale factors of 0.5, 1.0,and 2.0. Thus, peak floor and roof displacements represent the “equal displacement rule”,with drift profiles being proportional to the elastic distributions. Where drift patterns obtainedin modal pushover analyses resemble the elastic distributions, displacement and story driftestimates made using elastic modal response spectrum analysis will resemble those obtainedwith modal pushover analysis, given consistent target displacements (e.g., obtained using theequal displacement rule). Story shear and overturning moment distributions at low scale fac-tors will also resemble those obtained with modal pushover analysis. Of course, at high scalefactors, these force-related quantities will be significantly overestimated by the elasticmethod.
For the two-story frame, peak story drifts were estimated accurately just as occurredwith first-mode and multiple-mode pushover analysis. While story shears and overturningmoments were estimated accurately at a scale factor of 0.5 (Figures 17b, 17c and 18b, 18c),the assumption of linear elastic response in every mode led to overestimation of story shearsand overturning moments at higher scale factors (Figures 19b, 19c and 20b, 20c). For elastic
0 300 600 900 12001
2
3
4
5
6
7
8
SF=0.5
Peak Story Shear (kN)
Flo
or
0 750 1500 2250 30001
2
3
4
SF=0.5
Peak Story Shear (kN)
Flo
or
(a) (b) (c)
Figure 17. Selected results for the modal response spectrum analysis method: (a) Eight-storypeak story drift (SF ¼ 0.5), (b) four-story peak story shear (SF ¼ 0.5), and (c) eight-storypeak story shear (SF ¼ 0.5).
APPLICATIONOF NSPs FOR THE SEISMIC ASSESSMENTOF REGULAR RCMF BUILDINGS 787

0 750 1500 2250 30001
2
3
4
5
6
7
8
SF=2
Peak Story Shear (kN)
Flo
or
0 2500 5000 7500 100001
2
3
4
SF=2
Peak Story Shear (kN)
Flo
or
(a) (b) (c)
Figure 19. Selected results for the modal response spectrum analysis method: (a) Eight-storypeak story drift (SF ¼ 2.0), (b) four-story peak story shear (SF ¼ 2.0) and (c) eight-storypeak story shear (SF ¼ 2.0).
0 0.5 1 1.5 21
2
3
4
5
6
7
8
SF=0.5
OTMNSP
/OTMMedian NRHA
Flo
or
0 0.5 1 1.5 21
2
3
4
5
6
7
8
SF=0.5
SHEARNSP
/SHEARMedian NRHA
Flo
or
0 0.5 1 1.5 21
2
3
4
5
6
7
8
SF=0.5
SDRNSP
/SDRMedian NRHA
Flo
or
(a) (b) (c)
Figure 18. Ratio of elastic MRSA results and NRHA for the eight-story: (a) Peak story drifts(SF ¼ 0.5), (b) peak story shears (SF ¼ 0.5), and (c) peak overturning moments (SF ¼ 0.5).
788 FRAGIADAKIS ET AL.

response and inelastic response where the equal displacement rule applies (C1 ¼ 1.0), elasticmodal response spectrum analysis and multiple mode pushover analysis provide identicalestimates of peak displacements and drifts. For the four-story frame, accurate estimatesof floor displacements and story drifts were obtained at all scale factors. Story shearswere underestimated at the upper stories at a scale factor of 0.5 and were overestimatedat scale factors of 1.0 and 2.0. Overturning moments were slightly underestimated at thelower floors at a scale factor of 0.5 and are grossly overestimated at scale factors of 1.0and 2.0. For the eight-story frame, story drifts were underestimated at a scale factor of0.5, estimated reasonably accurately at a scale factor of 1.0, and overestimated at theupper stories at a scale factor of 2.0. Story shears and overturning moments were generallyunderestimated by modal response spectrum analysis at a scale factor of 0.5, and generallyare overestimated at scale factors of 1.0 and 2.0.
These results suggest the possibility of a more efficient application of multimodal push-over analysis for regular frames that have relatively uniform story drift demands. Therein,drift profiles are determined using elastic modal response spectrum analysis based on extra-polations to spectral amplitudes large enough to cause yielding in a nonlinear static pushoveranalysis, and these drift profiles are applied in a pushover analysis to estimate forces andmoments, as suggested in Goel and Chopra (2005).
DISCUSSION OF NSP ACCURACY
The accuracy (or inaccuracy) of the NSP predictions may be assessed relative to the fulldistribution of NRHA results. For example, a 25% error in the median estimate of a given
0 0.5 1 1.5 21
2
3
4
5
6
7
8
SF=2
OTMNSP
/OTMMedian NRHA
Flo
or
0 0.5 1 1.5 21
2
3
4
5
6
7
8
SF=2
SHEARNSP
/SHEARMedian NRHA
Flo
or
0 0.5 1 1.5 21
2
3
4
5
6
7
8
SF=2
SDRNSP
/SDRMedian NRHA
Flo
or
(a) (b) (c)
Figure 20. Ratio of elastic MRSA and NRHA for the eight-story: (a) Peak story drifts(SF ¼ 2.0), (b) peak story shears (SF ¼ 2.0), and (c) peak overturning moments (SF ¼ 2.0).
APPLICATIONOF NSPs FOR THE SEISMIC ASSESSMENTOF REGULAR RCMF BUILDINGS 789

response quantity may initially seem excessive, but becomes perfectly adequate if the cor-responding NRHA results show a 40% dispersion. To facilitate a fair comparison for allcases, we turn to the concept of confidence intervals (Benjamin and Cornell 1970). Foreach EDP, the minimum number of records (i.e., sample size) is determined that establishesa 90% confidence interval that contains the NSP result, centered on the NRHA median.Formally, each interval is estimated as:
EQ-TARGET;temp:intralink-;e3;41;566EDP50 expð∓t0.95;43 · βEDP∕ffiffiffiffiN
pÞ; where N ¼ 1; : : : ; 44 (3)
EDP50 is the median value of the 44 values of EDP response and βEDPis the correspondingstandard deviation of the log of the data. The quantity t0.95;43 ≈ 1.6811 is the 95% variate(i.e., the inverse of the cumulative distribution function) of the Student’s-t distribution with44-1 degrees of freedom. In each case, the maximum equivalent number of records N issought such that the NSP response remains within the above limits.
The results, expressed as the median number of records over all stories and SF ¼ 1, 2 areshown for each EDP type in Figure 21. Values less than or equal to 7, the minimum require-ment of modern seismic codes, are judged to be of low quality. Mediocre accuracy isachieved up to 16 records, while good predictions correspond to higher numbers. Anythingabove 30 records is considered to be near-perfect. For the two-story, the results are good, asexpected, for all NSPs. Regarding the four-story, while locally some responses may not beperfectly captured, all methods achieve good performance for displacements and story drifts.However, results are worse for story shears and overturning moments; MPA and CMA atleast provide mediocre performance. When moving to the eight-story, only displacements areconsistently estimated at a mediocre or better level; drifts, shears, and moments are estimatedrelatively poorly, with the MPA performing best for shears and overturning moments.
(a) (b)
Figure 21. The accuracy in the NSP predictions expressed in terms of the equivalent numberof records needed for NRHA to achieve the same accuracy. For each building and EDP typethe median number of records is calculated over all stories and SF ¼ 1, 2. (a) Four-story,(b) eight-story.
790 FRAGIADAKIS ET AL.

Finally, it is remarkable that MRSA achieves a near-perfect estimation of displacements anddrifts regardless of the number of stories. Still, this should not be generalized as it can beattributed to the regularity of the buildings and the absence of any significant localization ofdamage.
It should be noted that the approach described above excels at judging the results of theNSPs relative to those of NRHA. However, important limitations should be recognized:(1) For quantities with relatively little dispersion in NRHA (e.g., overturning moments), rela-tively small absolute departures from the NRHA median will be identified as a poor result(i.e., comparable to NRHA using few records); (2) the sign of the error, as well as the poten-tial consequences, are not considered. Underestimation may result in unrecognized damagewhich may or may not be significant, while overestimation may result in needless retrofitmeasures; and (3) since medians over all stories for scale factors of 1 and 2 are taken, locallysignificant errors may be missed. Nevertheless, the results of Figure 19 clearly indicate thepotential inaccuracies associated with different response quantities and the influence of thenumber of stories (or the presence of higher modes).
Considering the results from a different perspective, some important limitations on NSPscan be identified: (1) Higher modes have very little contribution to some quantities such asfloor displacements, and hence very good estimates of peak floor displacements can beobtained with single-mode pushover analyses; and (2) many other response quantitieshave appreciable higher-mode contributions, and as a result, the peak values of variousresponse quantities occur at different times and may deviate significantly from the first-mode estimates. Thus, it may not even be possible for single-mode static pushover analysesto capture the dynamics of the response. For example, NRHA peak story drifts, whensummed over the height of the structure, can greatly exceed the peak roof drift. Moreover,the patterns of peak story shears and overturning moments, if considered statically, are incon-sistent. That is, integration of the peak story shears produces a moment diagram that differssignificantly from the empirical peak moment diagram. Thus, a single-mode static pushovermethod that is tuned to give good results for some response quantities will undoubtedlygive poor estimates for other response quantities. Finally, we note that different modelingchoices—for example, lumped or distributed plasticity elements—may produce differentestimates of response. To the extent that such differences do not result in the develop-ment of different inelastic mechanisms, they are not expected to affect qualitatively ourrelative findings of NSP against NRHA, especially for the pre-collapse intensity levelsconsidered.
CONCLUSIONS
A comparison between results obtained using various NSP methods and nonlinearresponse history analysis has been presented. It is shown that the accuracy of NSP methodsdepends on the properties of the building, the EDP of interest, and the level of inelasticdemand. Standard, first mode–based, and more elaborate NSPs were included in the com-parison. The buildings considered form a simple basic test for the static pushover methods.For such low- and mid-rise structures, all NSPs were expected to perform well, especially inthe near post-nominal-yield region. However, it is concluded that no simple method existsthat is consistently reliable and generally applicable to multistory buildings; therefore,NRHA remains the most viable approach for detailed seismic performance evaluation.
APPLICATIONOF NSPs FOR THE SEISMIC ASSESSMENTOF REGULAR RCMF BUILDINGS 791

NSPs can be used to provide insight into a building’s characteristics and potential vulner-abilities, helping the engineer to understand how the system will respond from a globalperspective, and remain useful for preliminary design to limit displacement demands inperformance-based earthquake engineering. Moreover, engineers must always have inmind that any analysis results may vary from the “exact” due to the large uncertainty inherentin the problem and the limitations of their numerical models and software. All in all, whileimportant conclusions can be derived from NSP results, appropriate care is advised in allapplications of NSP methods when used for the quantitative, rather than the qualitative, esti-mation of a structure’s seismic performance. Such application is being considered for the2013 updates to ASCE 31 and 41.
ACKNOWLEDGEMENTS
This paper relies, in part, on results obtained under Task Order 6 of the NEHRP Con-sultants Joint Venture (a partnership of the Applied Technology Council and Consortium ofUniversities for Research in Earthquake Engineering), under Contract SB134107CQ0019,Earthquake Structural and Engineering Research, issued by the National Institute of Stan-dards and Technology. The views expressed do not necessarily represent those of the orga-nizations represented above. The authors also gratefully acknowledge Dr. Curt Haselton forproviding the OpenSees input files of the RC moment frames.
REFERENCES
American Society of Civil Engineers (ASCE), 2003. Seismic Evaluation of Existing Buildings,ASCE Standard ASCE/SEI 31-03, American Society of Civil Engineers/Structural Engineer-ing Institute, Reston, VA.
American Society of Civil Engineers (ASCE), 2007. Seismic Rehabilitation of Existing Buildings,ASCE Standard ASCE/SEI 41-06, Reston, VA.
American Society of Civil Engineers (ASCE), 2010. Minimum Design Loads for Buildings andOther Structures, ASCE Standard ASCE/SEI 7-10, Reston, VA.
Antoniou, S., and Pinho, R., 2004. Development and verification of a displacement-based adap-tive pushover procedure, Journal of Earthquake Engineering 8, 643–661.
Applied Technology Council (ATC), 1996. Seismic Evaluation and Retrofit of Concrete Build-ings, ATC 40 Report, Volumes 1 and 2, Redwood City, CA.
Aschheim, M., Tjhin, T., Comartin, C., Hamburger, R., and Inel, M. 2007. The scaled nonlineardynamic response, Engineering Structures 29, 1422–1441.
Aschheim, M. A., Black, E. F., and Cuesta, I., 2002. Theory of principal components analysis andapplications to multistory frame buildings responding to seismic excitation, EngineeringStructures 24, 1091–1103.
Aydınoglu, M. N., 2003. An incremental response spectrum analysis procedure based on inelasticspectral displacements for multi-mode performance evaluation, Bulletin of EarthquakeEngineering 1, 3–36.
Benjamin, J., and Cornell, C. A., 1970. Probability, Statistics, and Decisions for Civil Engineers,McGraw Hill, New York, 640 pp.
792 FRAGIADAKIS ET AL.
Bhatt, C., and Bento, R., 2012. Comparison of nonlinear static methods for the seismic assess-ment of plan irregular frame buildings with non seismic details, Journal of EarthquakeEngineering 16, 15–39.
Causevic, M., and Mitrovic, S., 2011. Comparison between non-linear dynamic and static seismicanalysis of structures according to European and U.S. provision, Bulletin of EarthquakeEngineering 9, 467–489.
Chopra, A. K., and Goel, R. K., 2002. A modal pushover analysis procedure for estimating seis-mic demands for buildings, Earthquake Engineering and Structural Dynamics 31, 561–582.
Diotallevi, P. P., Landis, L., and Pollio, B., 2008. Evaluation of conventional and advanced push-over procedures for regular and irregular RC frames, Proceeding of the 14th World Conferenceon Earthquake Engineering Innovation Practice and Safety, Beijing, China.
European Committee for Standardization (CEN), 2004. Eurocode 8: Design of structures forearthquake resistance—Part 1: General rules, seismic actions and rules for buildings,Brussels, Belgium.
Fajfar, P., 1999. Capacity spectrum method based on inelastic demand spectra, EarthquakeEngineering and Structural Dynamics 28, 979–993.
Fajfar, P., and Fischinger, M., 1988. N2—A method for non-linear seismic analysis ofregular buildings, Proceedings of the 9th World Conference on Earthquake Engineering5, 111–116.
Federal Emergency Management Agency (FEMA), 2005. Improvement of Nonlinear StaticSeismic Analysis Procedures, FEMA 440 Report, prepared by the Applied Technology Coun-cil for the Federal Emergency Management Agency, Washington, D.C.
Federal Emergency Management Agency (FEMA), 2009a. Quantification of Seismic Perfor-mance Factors, FEMA P-695 Report, prepared by the Applied Technology Council forthe Federal emergency Management Agency, Washington, D.C.
Federal Emergency Management Agency (FEMA), 2009b. NEHRP Recommended SeismicProvisions for New Buildings and Other Structures, FEMA P-750, Building Seismic SafetyCommission, Federal Emergency Management Agency, Washington, D.C.
Fragiadakis, M., Ioannidou, D., and Papadrakakis, M., 2007. Assessment of nonlinear static ana-lysis procedures in the framework of performance-based design, in 8th National Congress onMechanics (HSTAM2007), 12–17 June 2007, Patras, Greece.
Goel, R. K, and Chopra, A. K., 2005. Extension of modal pushover analysis to compute memberforces, Earthquake Spectra 21, 125–139.
Goel, R. K., 2005. Evaluation of modal and FEMA pushover procedures using strong-motionrecords of buildings, Earthquake Spectra 21, 653–684.
Haselton, C., and Deierlein, G., 2007. Assessing Seismic Collapse Safety of Modern ReinforcedConcrete Moment Frame Buildings, Report No. 156, John A. Blume Earthquake EngineeringCenter, Department of Civil and Environmental Engineering, Stanford University.
Haselton, C. B., Liel, A. B., Deierlein, G. G., Dean, B. S., and Chou, J. H., 2011. Seismic collapsesafety of reinforced concrete buildings: I. Assessment of ductile moment frames, Journal ofStructural Engineering 137, 481–492.
Hernández-Montes, E., Kwon, O-.S., and Aschheim, M., 2004. An energy-based formulation forfirst- and multiple-mode nonlinear static (pushover) analyses, Journal of Earthquake Engi-neering 8, 69–88.
International Code Council, 2002. 2003 International Building Code (IBC), International CodeCouncil, Country Club Hills, IL.
APPLICATIONOF NSPs FOR THE SEISMIC ASSESSMENTOF REGULAR RCMF BUILDINGS 793

Isakovic, T., and Fischinger, M. 2011. Applicability of pushover methods to the seismic analysesof an rc bridge, experimentally tested on three shake tables, Journal of Earthquake Engineer-ing 15, 303–320.
Kalkan, E., and Kunnath, S. K., 2007. Assessment of current nonlinear static procedures for seis-mic evaluation of buildings, Engineering Structures 29, 305–316.
Krawinkler, H., and Seneviratna, G. D. P. K., 1998. Pros and cons of a pushover analysis ofseismic performance evaluation, Engineering Structures 20, 452–464.
Kreslin, M., and Fajfar, P., 2011. The extended N2 method taking into account higher-modeeffects in elevation, Earthquake Engineering and Structural Dynamics 40, 1571–1589.
Kunnath, S. K., and Erduran, E., 2008. Pushover procedures for seismic assessment of buildings:Issues, limitations and future needs, nonlinear static methods for design/assessment of 3-Dstructures, R. Bento and R. Pinho (Eds.), 5-6 May 2008, Lisbon, Portugal.
Kunnath, S. K., 2004. Identification of modal combinations for nonlinear static analysis of build-ing structures, Computer-Aided Civil and Infrastructure Engineering 19, 246–259.
Lagaros, N. D., and Fragiadakis, M., 2011. Evaluation of static pushover methods for perfor-mance based seismic design, Soil Dynamics and Earthquake Engineering 31, 77–90.
Lignos, D. G., and Krawinkler, H., 2009. Sideways Collapse of Deteriorating Structural Systemsunder Seismic Excitations, Rept. No. TR 172, The John A. Blume Earthquake EngineeringResearch Center, Stanford University.
McKenna, F., and Fenves, G. L., 2001. The OpenSees Command Language Manual (1.2. edn).National Institute of Standards and Technology (NIST), 2010. ATC-76-6: Applicability of Non-
linear Multiple-Degree-of-Freedom Modeling for Design, Report No. NIST GCR 10-917-9,prepared for the National Institute of Standards and Technology by the NEHRP ConsultantsJoint Venture, Gaithersburg, MD.
Önem, G., 2008. Evaluation of Practice-Oriented Nonlinear Analysis Methods for SeismicPerformance Assessment, Ph.D. Thesis, Bogazici University, Instanbul, Turkey.
Pinho, R., Casarotti, C., and Antoniou, S., 2007. A comparison of single-run pushover analysistechniques for seismic assessment of bridges, Earthquake Engineering and StructuralDynamics 36, 1347–1362.
Pinho, R., Monteiro, R., Casarotti, C., and Delgado, R., 2009. Assessment of continuous spanbridges through nonlinear static procedures, Earthquake Spectra 25, 143–159.
Poursha, M., Khoshnoudian, F., and Moghadam, A. S., 2009. A consecutive modal pushoverprocedure for estimating the seismic demands of tall buildings, Engineering Structures 31,591–599.
(Received 15 November 2011; accepted 7 November 2012)
794 FRAGIADAKIS ET AL.