appendix l: related peer‐reiviewed publications
TRANSCRIPT
Page|1
APPENDIX L RELATED PEER‐REIVIEWED PUBLICATIONS AND FACT SHEETS
Burke J Sharpley AN L Berry K Brye MB Daniels E Gbur KW VanDevender S King P Hays and
BE Haggard 2018 Nutrient concentrations in Big Creek correlate to regional watershed land use
Cooperative Extension Service Division of Agriculture University of Arkansas Fact Sheet FSA9537
5 pages Available at httpswwwuaexedupublicationspdfFSA‐9537pdf
Dodd RJ AN Sharpley and LG Berry 2018 Organic phosphorus can make an important
contribution to phosphorus loss from riparian buffers Agricultural amp Environmental Letters
3180002 Available at httpsdlsciencesocietiesorgpublicationsaelarticles31180002
Jarvie HP AN Sharpley JV Brahana T Simmons A Price C Neal A Lawlor D Sleep S Thacker
and B Haggard 2014 Phosphorus retention and remobilization along hydrological pathways in
karst terrain Environ Sci Technol 484860minus4868 Available at
httppubsacsorgdoipdf101021es405585b
Jarvie HP AN Sharpley T Kresse PD Hays RJ Williams SM King and LG Berry 2018 Coupling
high‐frequency stream metabolism and nutrient monitoring to explore biogeochemical controls on
downstream nitrate delivery Environ Sci Technol 5213708‐13717 Available at
httpspubsacsorgdoiabs101021acsest8b03074
Savin M 2015 E coli in flowing waters Big Creek Research and Extension Team Information Sheet 4
pages
Sharpley AN BE Haggard L Berry K Brye J Burke MB Daniels E Gbur T Glover P Hays T
Kresse and KW VanDevender 2017 Nutrient concentrations in Big Creek correlate to regional
watershed land use Agricultural amp Environmental Letters 2017 2170027 Available at
httpsdlsciencesocietiesorgpublicationsaelarticles21170027
VanDevender KW 2014 Sampling liquid manure Division of Agriculture University of Arkansas
Systems Cooperative Extension Service 2 pages
FTN Associates 2018 Buffalo River Watershed SWAT model Project 14‐900 146 pages Available at
httpswwwadeqstatearuswaterplanningintegrated303dpdfs20182018‐05‐22‐final‐
buffalo‐river‐wmppdf
UJA--
____________________
DIVISION OF AGRICULTURE R E S E A R C H amp E X T E N S I O N
University of Arkansas System
Agriculture and Natural Resources
FSA9537
Nutrient oncentrations in Big reek orrelate to
Regional Watershed Land Use James Burke Program Associate
Andrew SharpleyProfessor
Larry BerryProgram Associate
Kris BryeProfessor
Mike Daniels Professor
Ed Gbur Professor
Karl VanDevender Professor
Stephen KingPrincipal ScientistScience and TechnologyFacilities Council Rutherford AppletonLaboratory
Phil HaysProfessor
Brian HaggardProfessor
Arkansas Is Our Ca pus
Visit our web site at httpwww uaex edu
In the Ozark Mountain karst region nutrient concentrations in streams of the BuffaloUpper Illinois and Upper White River watersheds increase as the percent of land in pas-ture and urban use increases Averaged over the last three years nutrient concentrations in Big Creek above and below the CampH Farm are similar to concentrations found in other watersheds where there is a similar amount of pasture and urban land use
Background
Land use within watersheds influences the quantity and quality of water draining from a watershed As land disturbance increases and use intensifies there is a general increase in stormwater runoff and nutrient inputs that leads to a greater poten-tial for nutrient discharge to receiving waters For instance with urban growth more impervious surfaces increase the flashiness of runoff stream flows and wastewater treat-ment discharge Also as areas of agri-cultural production grow more fer -tilizer is applied to achieve optimum production Thus as the percent of a watershed drainage area in pasture row crop or urban use increases there is a general increase in nutrient con-centrations in storm and base flows
In this fact sheet we show the effect of land use on nitrogen (N) and phosphorus (P) concentrations in streams of the Ozark Highlands and Boston Mountains northwest Arkansas by combining previously published data for the Upper Illinois River Watershed (Haggard et al 2 1 ) Upper White River Watershed (Giovannetti et al 2 13) and ongoing
monitoring in the Buffalo River Watershed The location of these watersheds is shown in Figure 1 The relationships between stream nutrient concentrations and land use for the region are used to determine if a per-mitted concentrated animal feeding operation (CAFO) in Big Creek Water-shed a sub-watershed of the Buffalo River Watershed has affected stream water quality Land use in these watersheds is given in Table 1
Nitrate-N total N dissolved P and total P concentrations have been mea-sured over varying periods during base flow at the outlet of sub-watersheds in the Big Creek (two sites 2 14 to 2 17) Buffalo (2 sites 1985 to 2 17) Upper Illinois (29 sites 2 9) and Upper White River Watersheds (2 sites 2 5 to 2 6) (Figure 1)
Data from Big Creek were paired with discharge available from a gaging station just downstream from the swine CAFO where the USGS developed the rating curve discharge information was only available from May 2 14 through December 2 17 The data were then used to look at changes in flow-adjusted nutrient concentrations[A] in Big Creek (White et al 2 4)
[A]Concentration is defined as the mass of a substance (M) such as a nutrient over the volume of water (V) in which it is contained or C = MV ldquoFlow-adjusted nutrient on entra-tionsrdquo ndash when looking at how concentrations change over time in streams we have to consider how concentrations might also change with stream flow (volume of water) and not just change in mass nutrient concentrations often have some type of relation to flow maybe increasing or even decreasing as stream flow increases We have to flow-adjust concentrations so we can remove the variability in concentrations that flow might cause to see how things are changing over time
University of Arkansas United States Department of Agriculture and County Governments Cooperating
A N
Big Creek Wat ershed
Wat ershed influen cing
dow nstr eam sit e
C- UpperWhlte R Watershed S-Upper llllnola R watershed C Buffalo Nattnoal R Watershed - lluffaloshy
BlgC-8lruma BlgC---ci
= u-wir11ec1 2 41cm
DownsnamWll8rslled
Credit UIGS ESRI and NRCS
Mottitonng Slce-t
ADEQ 0
I-IUC12 bull USGS e ~-Tribvtarios Tributar la
Tributiuies _ ~ Whlle River Buffa lo Ftlq r -shyllllnol s Rlla-1_ lit Boavor Rcs1Jrvlor 0510 20km TrlbltJry $1-1bhcidi 0
I) 10 20 km ~ KUC 12 Srit4bull 0 CJ Subs hods ~ 0 S 10 20 kffl I J I I I I II t Big CrlMlk WllhtqIMtd 6 f Uppcir llll ooh Woatltflhcd r C~middot Upper White Wiltc-hed fl Cf tlfi uses AOlQ N~it Ptrk Sttvl~
CNdit USG$ ADEQ ftd AWRC C~JW RC A Buffalo Rlver WaterslMd l ~bull
Study Watersheds in the Ozark Highlands Ecoregion Big Creek Watershed
Upper Illinois River Upper White River Buffalo River Watershed Watershed Watershed
Figure Location of the Big Creek Buffalo River Upper Illinois River and Upper White River watersheds in the BostonMountains and Ozark Highlands ecoregion Information from US eological Survey (US S) Environmental Systems Research Institute (ESRI) and National Aeronautics and Space Administration (NASA)
Table Percent of forest pasture and urban land use in the Big Creek Buffalo River UpperIllinois and Upper White River watersheds
Watershed Forest Pasture Urban - - - - - - - - - - - - - - - - - - - - - - - - - - - - - - - - - - - - - - - - - -
Big Creek Upstream 89 5 8 0 2 6 Downstream 79 5 17 0 3 5
Buffalo River 52 - 99 0 - 25 0 - 1 Upper White River 34 - 90 7 - 55 0 - 44 Upper Illinois River 2 - 70 27 - 69 3 - 61
Up and downstream of CAFO operation and fields permitted to receive manure
Wate rsheds
0 Beaver Reservoir Water shed bull Buffa lo River Wate rshed ti Illi nois River Wate rshed
020 8
Dissolved P Nitrate-N I I
016 y = OOO8e0022x t y = OO92e0043x I
--lt
6 I i R2 = 05 6
R2 = 078 I 00 012
I E I
4 I tt I
C 008 l l
0 l f--1
l
ro l 2 O 0 I
f--1 0 04 C
--Q)
u C 0 00 0 0
020 8 u C Total P Total N ro l Q) 016 y = OO13e0020x y = O21Oe0033x E
6 R2 = 06 1
R2 = 082
u I 012
f--1 Q)
E l 4
11
0 0 08 l Q) 0 l
l l9 l 2
004 l l l --
l _ - l - - zr --- ------ ----
000 - -- -- 0
0 20 40 60 80 100 0 20 40 60 80 100
Percent of land in pastur e and urba n use
____________________
utting Stream Nutrient Concentrations Into Context at Big Creek
Geometric mean concentrations[B] of stream P and N are related to the percent of watershed drainage area in pasture and urban land use for the Buffalo Upper Illinois and Upper White River watersheds (R2
of 56 to 81 where the number of observations is 71 Figure 2)[C] The dashed lines on Figure 2 represent the upper and lower thresholds concentrations where there is a 95 percent confidence that a stream draining a watershed with a specific percent pasture and urban land use will have a P and N concentration within those thresholds
The relationship between land use and stream nutrient concentrations is not a model that can be used to predict concentration Given the large vari-ability observed in these relationships they simply show trends between two variables land use and stream nutrient concentrations Continued monitor-ing of stream concentrations in Big Creek will continue to more reliably define trends
As the percent pasture and urban land (ie land use intensity) increases so does stream P and N con-centrations (see Figure 2) The general increase in nutrient concentrations is consistent with the fact that fertilizer (as mineral and manure sources) is routinely applied to pastures to maintain forage production as well as deposition of nutrients by grazing cattle
Figure 2 Relationship between land use and the geometric mean N and P concentrations (mg L- ) in the Buffalo UpperIllinois and Upper White River watersheds Dashed lines represent the 95 percent confidence intervals for the estimatedmean (solid line) Green points are geometric mean concentrations measured upstream of the CAFO on Big Creek andred points are geometric mean concentrations measured downstream of the CAFO on Big Creek
[B]ldquoGeometri meansrdquo ndash There are many ways to calculate the central or typical value of a data set like the average or median With water quality data the geometric mean is often used because it minimizes the influence of really low or high values on the average
[C]ldquoR2rdquo is the oeffi ient of determination ndash the proportion of variance in the dependent variable (ie vertical axis) that is predictable from the independent variable (ie horizontal axis) The closer to 1 the value is means less variability and the better the relationship between the two variables is
In the Big Creek watershed the percent of land influenced by human activities (ie pasture plus urban) doubles from ~1 percent to ~2 percent in the drainage area upstream and downstream of the CAFO In Big Creek itself upstream of the swine production CAFO the geometric mean concentrations of dissolved P total P nitrate-N and total N during base flow were 9 3 1 and 2 mg L-1 respectively between September 2 13 and December 2 17 Directly downstream of the CAFO the geom etric mean concentrations in Big Creek during base flow over the same period were 11 3 25 and 37 mg L-1 respectively
Geometric mean nutrient concentrations in Big Creek above and below the swine production CAFO and its current potential sphere of influence from slurry applications are similar to or lower than con-centrations measured in rivers draining other sub-watersheds in the Upper Illinois and Upper White River watersheds with similar proportions of agricultural land use (See Figure 2)
Have Nutrient Concentrations Changed in the Short Term atBig Creek
Long-term (eg decadal scale) water quality data are needed to reliably assess how stream nutrient concentrations have changed in response to water-shed management and climate variations (Hirsch et al 2 15) The literature shows that stream nutrient concentrations can change relatively quickly in response to effluent management (eg Haggard 2 1 Scott et al 2 11) but seeing a response (ie decrease or increase in concentrations) from land-scape management can take decades or more (Green et al 2 15 Sharpley et al 2 13) A myriad of fac-tors may influence observed nutrient concentrations in streams including discharge biological processes and climactic conditions (ie drought and floods) and dominant transport pathways Thus we need to use caution when interpreting trends in water quality over databases that only cover a limited time-frame Flow-adjusted concentrations showed no
2
J 0 tlO E C 0 -2
-1-- ro L
-1-- C Q) u -4 C 4 0 u
O Q)
-1-- V)
2 l middot~ O ro I
~ 0 0
LL
-2
-4
0
bull
bull
bull bull bull
a Dissolved P y = -0000lx + 00532
R2 = 0004
bull bull bull
bull
bull bull bullbull ) ~aPbull w ~ middot- bull 11fFC bull bull bull
b Total P y = -0000lx + 00671
R2 = 0005
200 400 600 800 1000 1200 1400 1600 0
c Nit rate-N y = -0000lx + 00938
R2 = 0016
bull
d Tota l N y = -00000Sx + 00226
R2 = 0002
200 400 600 800 1000 1200 1400 1600
Time sinc e May 2014 days
4
Figure 3 Change in flow-adjusted concentration of (a) dissolved P (b) total P (c) nitrate-N and (d) total N over time sinceMay 20 4 when monitoring in Big Creek started
statistically significant increasing or decreasing trends in dissolved P total P nitrate-N and total N (R2 lt 16) where number of observations is 182) over the current monitoring period (Figure 3)
Summary
Nutrient concentrations at Big Creek upstream and downstream of the swine CAFO and indeed most tributaries of the Buffalo River are low relative to other watersheds in this ecoregion (Figure 2) This provides a starting point to build a framework to evaluate changes in nutrient concentrations of streams as a function of land use and management
The evaluation of flow-adjusted concentrations over time showed that nutrients in Big Creek were not increasing over the short duration of monitoring for which concentration and discharge data were
available (May 2 14 through April 2 17) At this point in time it is evident that nutrient concentra-tions in Big Creek have not increased at the moni-tored site However flow and nutrient concentration data over a longer period are needed to reliably quan-tify water quality trends and characterize sources and monitoring needs to continue for at least a decade to evaluate how discharge season and time influence nutrient fluxes
Stream nutrient concentration-land use relationships are not a predictive tool However use of these relationships provides a method to determine if nutrient concentrations in a given watershed are similar to observed nutrient concentration-land use gradients in other watersheds of the Ozark Highlands and Boston Mountains Over time tracking these relationships provides a mechanism to note and evaluate changes in nutrient concentrations
References Giovannetti J LB Massey BE Haggard and RA Morgan 2 13 Land use effects on stream nutrients at Beaver Lake Watershed
Journal of American Water Works Association 1 5E1-E1 Available at httpwwwawwaorgpublicationsjournal-awwaabstractarticleid344 6246aspx
Green CT BA Bekins SJ Kalkhoff RM Hirsch L Liao and KK Barnes 2 14 Decadal surface water quality trends under variable climate land use and hydrogeochemical setting in Iowa USA Water esources esearch 5 (3)2425ndash2443 Available at httponlinelibrarywileycomdoi1 1 22 13WR 14829epdf
Haggard BE 2 1 Phosphorus concentrations loads and sources within the Illinois River drainage area northwest Arkansas 1997-2 8 Journal of Environmental Quality 392113ndash212
Haggard BE AN Sharpley L Massey and K Teague 2 1 Final report to the Illinois River Watershed Partnership Recommended watershed based strategy for the Upper Illinois River Watershed Northwest Arkansas Arkansas Water Resources Center University of Arkansas Technical Publication Number MSC 355 126 pages Available at httparkansas-water-centeruarkedupublicationsmscMSC355pdf
Hirsch RM SA Archfield and LA De Cicco 2 15 A bootstrap method for estimating uncertainty of water quality trends Environmental Modeling Software 73148-166
Scott JT BE Haggard AN Sharpley and JJ Romeis 2 11 Change point analysis of phosphorus trends in the Illinois River (Oklahoma) demonstrates the effects of watershed management Journal of Environmental Quality 4 1249-1256
Sharpley AN HP Jarvie A Buda L May B Spears and P Kleinman 2 13 Phosphorus legacy Overcoming the effects of past management practices to mitigate future water quality impairment Journal of Environmental Quality 4213 8-1326 Available at httpswwwsoilsorgpublicationsjeqpdfs42513 8search-result=1
White KL BE Haggard and I Chaubey 2 4 Water quality at the Buffalo National River Arkansas 1991minus2 1 Transactions of the American Society of Agricultural Engineers 47(2)4 7-417
Printed by University of Arkansas Cooperative Extension Service Printing Services
JAMES BURKE and LARRY BERRY are program associates with the Crop Soil and Environmental Sciences Department University of Arkansas System Division of Agriculture in Fayetteville KRIS BRYE ANDREW S ARPLEY EDWARD GBUR and MIKE DANIELS are professors with the Crop Soil and Environmental Sciences Department University of Arkansas System Division of Agriculture Brye Gbur and Sharpley are located in Fayetteville and Daniels is located in Little Rock STEP EN KING is a principal scientist with the Science and Technology Facilities Council at the Rutherford Appleton Laboratory in Oxfordshire United Kingdom P IL AYS is a professor with the Department of Geosciences at the University of Arkansas in Fayetteville KARL VANDEVENDER is a professor with the Bio and Ag Engineer-ing Department University of Arkansas System Division of Agriculture in Little Rock BRIAN AGGARD is a professor and director of the Arkansas Water Resources Lab Department of Biological and Agricultural Engineering University of Arkansas in Fayetteville
Issued in furtherance of Cooperative Extension work Acts of May 8 and June 3 1914 in cooperation with the US Department of Agriculture Director Cooperative Extension Service University of Arkansas The University of Arkansas System Division of Agriculture offers all its Extension and Research programs and services without regard to race color sex gender identity sexual orientation national origin religion age dis ability marital or veteran status genetic information or any other legally protected status and is an Affirmative ActionEqual Opportunity Employer
FSA9537-PD-3-2 18N
Page 1 of 6
Forested riparian zones (FRZs) or vegetated buffer strips (VBS) are composed of a zone of managed or unmanaged vegetation between the edge of the field and the receiving watercourse They are widely used
to decrease nutrient and s diment runoff leaving agricultural fields and enter-ing adjacent flowing waters The main functions of these areas are to slow the flow of surface runoff promoting sedimentation and infiltration and to act as a filter to trap sediment and reduce dissolved nutrient concentrations through soil sorption and plant uptake (Hoffmann et al 2009) Numerous studies have demonstrated the effectiveness of VBS at decreasing particulate P loss how-ever their effect on dissolved P is less clear (Dodd and Sharpley 2016) Detailed reviews of the literature have highlighted studies where such VBS have become sources rather than sinks of P where soil P concentrations are elevated (eg Hoffmann et al 2009 Roberts et al 2012 Sheppard et al 2006)
Three possible mechanisms for the release of P from VBS have been sug-gested (Roberts et al 2012) (i) decreased P sorption capacity due to saturation of P sorption sites (ii) desorption of P from soil surfaces or dissolution of pre-cipitated P and (iii) biological cycling through the plant and microbial pools Compared to much-studied geochemical processes relatively little is known about processes involved in the microbial P cycle or the impact of differing land management strategies on these Furthermore the contribution of dissolved organic P forms to P loss from VBS is often overlooked (Dodd and Sharpley 2015) and we suggest that organic forms could make up a substantial propor-tion of dissolved P in soils with active microbial P cycling This study aims to address this research gap
Organic Phosphorus Can Make an Important Contribution to Phosphorus Loss from Riparian Buffers
Rosalind J Dodd Andrew N Sharpley and Lawrence G Berry
Copyright copy American Society of Agronomy Crop Science Society of America and Soil Science Society of America 5585 Guilford Rd Madison WI 53711 USAThis is an open access article distributed under the terms of the CC BY-NC-ND license (httpcreativecom-monsorglicensesby-nc-nd40) Agric Environ Lett 3180002 (2018) doi102134ael2018010002 Received 17 Jan 2018 Accepted 19 Feb 2018 Corresponding author (sharpleyuarkedu)
Agricultural amp Environmental Letters
Research Letter
Abstract Vegetative buffer strips (VBS) and managed or unmanaged riparian zones between the edge of field and receiving watercourse are widely adopted conservation practices aimed at reducing nonpoint nutrient pollution However their effectiveness at decreasing phosphorus (P) loss has been mixed This study investigated the effectiveness of a VBS and a forested riparian zone (FRZ) in decreasing P loss from pasture soils receiving swine manure and aimed to determine the potential factors controlling P release using water extractable P (WEP) as a proxy for P loss The inorganic WEP concentrations were significantly greater in the fertilized pasture zone soils than the VBS or FRZ soils However there was no significant difference between the field and riparian soils for total WEP due to increased contribution from organic WEP in these soils Degree of P saturation which is a function of soil test P was a good predictor of inorganic WEP but not organic WEP where the variation in concentrations was better explained by variables involved in biotic P release
RJ Dodd Faculty of Agriculture and Life Sciences Lincoln Univ Lincoln Christchurch New Zealand AN Sharpley and L G Berry Dep of Crop Soil and Environmental Sciences Univ of Arkansas Fayetteville AR USA
Core Ideas
bull Forested and vegetative buffers can retain P runoff from adjacent fields
bull High concentrations of molybdate unreactive P were detected in soil water extracts
bull With time these buffer soils can be a source of soluble inorganic and organic P
bull High microbial activity in buffer soils suggests biologically mediated P release
Abbreviations DPS degree of soil phosphorus saturation FPZ fertilized pasture zone FRZ forested riparian zone M3-P Mehlich extractable P MBC microbial biomass C MBN microbial biomass N MBP microbial biomass P TC total C TN total N TP total P TWEP total water extractable phosphorus VBS vegetated buffer strips WEP water extractable phosphorus WEPi inorganic water extractable phosphorus WEPo organic water extractable phosphorus
Published online March 15 2018
Page 2 of 6 AGRICULTURAL amp ENVIRONMENTAL LETTERS
The Buffalo River is an important recreation area in northwest Arkansas In 2013 a concentrated animal feeding operation (CAFO) was permitted to operate in this water-shed (Arkansas Department of Environmental Quality 2017) raising concerns of potential impairment of area waters for recreational use In this operation swine manure is land applied to pasture land either grazed by cattle or hayed Fields adjacent to a stream have a 30-m buffer to which no manure or fertilizer can be applied providing an ideal opportunity to investigate the fate and cycling of soil P along a gradient of a fertilized pasture zone (FPZ) grass VBS and a forested riparian zone (FRZ) Three fields with differ-ent management histories soil properties and slope were selected to investigate the potential for dissolved P release as measured by water extractable P across these three zones We addressed two main objectives
1 To determine the effect of landscape position on the potential for P release as both dissolved inorganic and organic P
2 To investigate the soil chemical and biological properties that control the release of dissolved P from these soils
While it is acknowledged that vegetation can be an addi-tional source of P loss especially from forested riparian areas where there may be accumulation of litter material quantification of its contribution was beyond the scope of this study which focuses on the release of soil P to water
Materials and MethodsThe study site is located in Mount Judea AR (Fig 1) Three
fields were sampled (Fields 1 5a and 12 Fig 2) Dominant soil types along with management for these are listed in Table 1 All three fields received poultry litter once every 2 yr in March from 2004 to 2012 (45 Mg ha-1 yr-1 approximately 50 kg P and 120 kg N ha-1 yr-1) Fields 1 and 12 currently receive only swine manure In 2014 Field 1 received a total of 47 kg P ha-1 and 94 kg N ha-1 and Field 12 received 65 kg P
ha-1 and 128 kg N ha-1 In 2015 Field 1 received a total of 73 kg P ha-1 and 32 kg N ha-1 and Field 12 received 35 kg P ha-1 and 146 kg N ha-1 While no swine manure has been applied to Field 5a diammonium phosphate fertilizer was applied annually since 2012 at 11 kg P and 25 kg N ha-1
On Fields 1 and 12 receiving swine manure a required application buffer of 30 m from the field edge is in place Field 1 has a steep topography and drains into an ephem-eral stream located within the riparian zone and connected to Big Creek Fields 5a and 12 have slopes of lt2 These fields border Big Creek and are prone to flooding during large storm events Field 1 is continuously grazed by cattle whereas grass is cut for silage in Fields 5a and 12
At each field three transects were laid across the site running through the FPZ VBS and into the FRZ For each transect soil samples were taken at the 0- to 10-cm depth from three locations within the FPZ one location within the manure application VBS and one location in the FRZ which borders the stream Soil sampling at all fields was performed over the course of 1 d on four occasions October 2014 January 2015 April 2015 and July 2015 corresponding to autumn winter spring and summer to account for seasonal variability
Fig 1 Buffalo River watershed location in Arkansas USA Fig 2 Location of Big Creek watershed farm and fields studied
AGRICULTURAL amp ENVIRONMENTAL LETTERS Page 3 of 6
As much of the vegetation mat as possible was removed in the field Soil samples were separated into two subsamples for biotic and abiotic analysis Samples for biotic analysis (microbial biomass and enzyme activity) were sieved lt2 mm and stored at 4degC until analysis Samples for abiotic analysis were air-dried ground and sieved lt2 mm Additional plant material shoots and roots were removed by hand before sieving
Soil samples were analyzed for the following properties using the methods outlined in Table 2 total WEP (TWEP) inorganic WEP (WEPi) organic WEP (WEPo) Mehlich extractable P (M3-P) degree of soil P saturation (DPS) total P (TP) total C (TC) total N (TN) pH microbial biomass P C and N (MBP MBC MBN) and phosphatase enzyme activities Phosphorus concentration for all analyses except M3-P was determined using the molybdate blue method of Watanabe and Olsen (1965) M3-P concentrations were determined via inductively coupled plasma
The P content determined colorimetrically directly fol-lowing extraction with water is more accurately described as molybdate reactive P and consists mainly of orthophosphate ions and a small proportion of easily hydrolyzable inorganic and organic P The difference between this value and that determined following digestion is more accurately described as molybdate unreactive P and consists mainly of organic P forms but also a smaller fraction of condensed inorganic P
such as polyphosphates (Haygarth and Sharpley 2000) Due to the dominance of inorganic P in molybdate reactive P and organic P in molybdate unreactive P WEPi and WEPo have been used to distinguish between these two forms of P to avoid confusion and allow a clear message to be presented
Before all statistical analysis the data were examined for normality and the following parameters were log-trans-formed TWEP WEPi and WEPo To examine the differ-ences in soil properties across the three landscape positions the data from the three samples taken along each transect within the FPZ were averaged to provide one value for each zone (FPZ VBS and FRZ) for each transect Data from each of the three fields and from each of the transects within the fields were treated as replicates giving nine location rep-licates per zone These data were subjected to a one-way ANOVA by zone blocked by season providing four seasonal replicates for each location replicate and a total replication of 36 data points per zone For all parameters a Tukey test was used to determine significant differences between the zones at the p lt 005 level of significance
To determine which soil properties were contributing to the release of WEP and which soil parameters are impor-tant in regulating the release of P a stepwise regression was undertaken using the following parameters acid phospho-monoesterase alkaline phosphomonoesterase phosphodies-terase total phosphatase MBN MBP MBC M3-P DPS pH
Table 1 Field properties and management
Site Soil series Area Range in slope Managementha
Field 1 Noark very cherty silt loam 63 20ndash200 Grazed at 05 animal units ha-1
Field 5a Razort loam 108 02ndash10 Hayed and grazed at 03 animal units ha-1
Field 12 Spadra loam 96 05ndash20 Hayed and grazed at 03 animal units ha-1
Table 2 Summary of analytical methods used
Parameterdagger Analytical method ReferenceTWEP 120 soil-to-water extraction followed by centrifugation
filtration lt045 mm and acid persulfate digestionSelf-Davis et al (2009) and Rowland and Haygarth (1997)
WEPi 120 soil-to-water extraction followed by centrifugation and filtration lt045 mm
Self-Davis et al (2009)
WEPo Assumed to be the difference between TWEP and WEPi mdashM3-P 110 soil-to-Mehlich-3 extractant and centrifugation Mehlich (1984)DPS Calculated from M3-P Fe and Al according to the equation
DPS = M3-P05 times (M3-Fe + M3-Al) times 100Adapted from Schoumans (2009)
TP Alkaline oxidation Dick and Tabatabai (1977)TC Combustion on an Elementar VarioMax CN Provin (2014)TN Combustion on an Elementar VarioMax CN Provin (2014)pH 12 soil-to-water extraction mdashMBP Chloroform-fumigation extraction Adapted from Brookes et al (1985) and McLaughlin et al (1986)MBC Chloroform-fumigation extraction Vance et al (1987)MBN Chloroform-fumigation extraction Vance et al (1987)Acid Pmono Enzyme assays using 5mM para-nitrophenyl phosphate as the
substrate buffered at pH 65Tabatabai (1994)
Alk Pmono Enzyme assays using 5mM para-nitrophenyl phosphate as the substrate buffered at pH 11
Tabatabai (1994)
Pdi Enzyme assays using 1 mM bis-para-nitrophenyl phosphate as the substrate buffered at pH 8
Tabatabai (1994)
Total phosphatase Sum of acid Pmono alk Pmono and Pdi mdash
dagger acid Pmono acid phosphomonoesterase alk Pmono alkaline phosphomonoesterase DPS degree of soil phosphorus saturation M3-P Mehlich extractable P MBC microbial biomass C MBN microbial biomass N MBP microbial biomass P Pdi phosphodiesterase TC total C TN total N TP total P TWEP total water extractable phosphorus WEPi inorganic water extractable phosphorus WEPo organic water extractable phosphorus
Page 4 of 6 AGRICULTURAL amp ENVIRONMENTAL LETTERS
TP TC and TN All analyses were performed using the SPSS statistical package version 22 (IBM 2013)
Results and DiscussionWater extractable soil P concentration has been shown to
be directly related to the potential for dissolved P release from soils to surface runoff (Pote et al 1996 Sharpley 1995) The total inorganic and organic WEP (TWEP WEPi WEPo) concentrations across the three fields was significantly lower in the VBS than the FPZ reflecting the larger inputs of P to the FPZ (Fig 3) However there was no significant difference in TWEP between the pasture and FRZs despite a decrease in WEPi This is a result of the significantly higher concen-trations of WEPo present in the FRZ where WEPo made up 57 of TWEP in these soils compared with just 24 in the pasture soils This suggests that dissolved organic P can con-tribute to total P release in riparian soils
The release of soil P to water can occur through abiotic and biotic processes Desorption and dissolution reactions dominate the abiotic release mechanisms and are governed by soil chemical properties and number of available sorption sites (Arai and Sparks 2007) Microbial soil biomass can con-tain a significant pool of P in temperate pastures (Oberson and Joner 2005) This pool is in constant flux immobilizing P from or replenishing P in the soil solution during micro-bial growth or cell death Phosphorus release from this pool
occurs through three main mechanisms (i) mineralization (Oehl et al 2001) (ii) cell lysis in response to environmental stress (eg dessication) (Turner and Haygarth 2001) or (iii) predation by soil fauna (Bonkowski 2004) Biotic processes can also control the form of dissolved P in solution through the exudation of phosphatase enzymes which can catalyze the conversion of soluble organic P compounds to ortho-phosphate ions for plant uptake (Richardson et al 2011)
Table 3 shows the abiotic and biotic soil properties of the soils across the three landscape zones The FPZ soils had sig-nificantly higher concentrations of TP and M3-P but lower concentrations of TC and TN compared with the FRZ soils Additionally the DPS was significantly higher in the FPZ soils compared with the VBS and FRZ soils indicating more of the P sorption sites had become saturated Surprisingly we saw no significant difference in microbial biomass P C or N concentrations among zones despite expected increased leaf litter inputs in the FRZ However the total phosphatase activity was 17 higher in the FRZ soils than the field soils suggesting increased microbial activity
To determine which pools of P and which soil proper-ties were key in controlling the release of P to water we per-formed a stepwise regressions for TWEP WEPi and WEPo using data from all three sites and four sampling dates The results from this analysis are shown in Table 4 Both TWEP and WEPi were well predicted by the model (adjusted r2 =
Fig 3 Box plots showing the concentration of (i) total water extractable P (ii) inorganic water extractable P and (iii) organic water extractable P across the three zones (fertilized pasture zone [FPZ] vegetative buffer strip [VBS] and forested riparian zone [FRZ]) Letters denote significant differences between zones at p lt 005 as determined by Tukeyrsquos test of multiple comparisons
Table 3 Difference in mean soil properties across the different landscape zones fertilized pasture zone (FPZ) vegetative buffer strip (VBS) forested riparian zone (FRZ) pH total C (TC) total N (TN) total P (TP) Mehlich-3 P (M3-P) degree of P saturation (DPS) microbial biomass P (MBP) microbial biomass C (MBC) microbial biomass N (MBN) acid phosphomonoesterase (acid Pmono) alkaline phosphomonoesterase (alk Pmono) phosphodiester-ase (Pdi) and total phosphatase activities
ZoneSoil chemical properties Soil biological properties
pH TC TN TP M3-P DPS MBP MBC MBN Acid Pmono Alk Pmono Pdi Total phosphatase
mdashmdashmdash mdashmdashmdash mdash mg kg-1 mdash mdashmdashmdash mg kg-1 mdashmdashmdash mdashmdashmdashmdashmdash mmol pNPdagger g-1 h-1 mdashmdashmdashmdashmdashFPZ 587bDagger 206b 023b 640a 67a 748a 26 371 85 300a 133b 120b 553bVBS 571b 188b 021b 584ab 48b 489b 23 386 79 259ab 093b 096b 456bFRZ 640a 321a 026a 521b 28c 457b 28 356 101 233b 205a 205a 666ap value lt0001 lt0001 lt005 lt001 lt0005 lt0001 NS NS NS lt0005 lt0001 lt0001 lt0001
dagger pNP para-nitrophenyl phosphateDagger Means followed by the same letter are not significantly different at the p lt 005 level of significance according to Tukeyrsquos test for multiple comparisons
AGRICULTURAL amp ENVIRONMENTAL LETTERS Page 5 of 6
066 and 065 respectively) and variation in these concen-trations was mostly explained by DPS with a small con-tribution from total phosphatase activity an indicator of biologically mediated P release
In contrast to WEPi variation in WEPo was less closely related to any of the measured parameters (adjusted r2 = 037) Furthermore DPS was not included in the selected model and total phosphatase activity explained most of the variation in WEPo While total phosphatase activity was greatest in FRZ soils the activity of the different types of enzyme varied across the landscape positions (Table 3) Acid phosphomono-esterase activity was highest in the FPZ soils and of a similar magnitude to that found agricultural soils with a history of poultry manure application and high soil test PSpelled out STP correct concentrations (Tomlinson et al 2008) Acid phosphomonoesterase is thought to be mainly released by plant roots and some microbes and there is evidence that high concentrations phosphatase enzymes can be pres-ent in manures (Nannipieri et al 2011) Furthermore these enzymes have been shown to sorb strongly onto soil parti-cles (Burns 1986 Nannipieri et al 2011) hence the large acid phosphomonoesterase activates found in the FPZ may be directly due to manure application In contrast alkaline phosphomonoesterase and phosphodiesterase activities were greatest in the FRZ in keeping with the small increase in pH (Table 3) These enzymes are thought to be released by soil microorganisms rather than plant roots The differences in phosphatase activities across the zones suggest that release of P from riparian soils is likely to be controlled in part by the biologically mediated release of organic P
This study demonstrates that the significant decrease in soil test P concentrations in FRZ soils compared with regu-larly fertilized FPZ does not necessarily translate to a reduc-tion in the total amount of P which can be released to runoff due to the increase in WEPo Furthermore while DPS of which soil test P is a component was a good predictor of WEPi release additional factors relating to biological cycling need to be considered when trying to account for the poten-tial release of organic P
ReferencesArai Y and D Sparks 2007 Phosphate reaction dynamics in soils and
soil components A multiscale approach Adv Agron 94135ndash179 doi101016S0065-2113(06)94003-6
Arkansas Department of Environmental Quality 2017 Permit data system Specific NPDES water permit details Permit arg590001 httpswwwadeqstatearushomepdssqlp_permit_details_water_npdesaspxafindash=ampafin=5100164amppmtnbr=arg590001
Bonkowski M 2004 Protozoa and plant growth The microbial loop in soil revisited New Phytol 162617ndash631
Brookes PC A Landman G Pruden and DS Jenkinson 1985 Chloro-
form fumigation and the release of soil nitrogen A rapid direct extrac-tion method to measure microbial biomass nitrogen in soil Soil Biol Biochem 17837ndash842 doi1010160038-0717(85)90144-0
Burns RG 1986 Interactions of enzymes and soil mineral and organic col-loids In PM Huang and M Schnitzer editors Interactions of soil minerals with natural organics and microbes SSSA Madison WI p 429ndash453
Dick WA and MA Tabatabai 1977 An alkaline oxidation method for de-termination of total phosphorus in soils Soil Sci Soc Am J 41511ndash514 doi102136sssaj197703615995004100030015x
Dodd RJ and AN Sharpley 2015 Recognizing the role of soil organic phosphorus in soil fertility and water quality Resour Conserv Recycl 105(B) 282ndash293 doi101016jresconrec201510001
Dodd RJ and AN Sharpley 2016 Conservation practice effectiveness and adoption Unintended consequences and implications for sustain-able phosphorus management Nutr Cycling Agroecosyst 104373ndash392 doi101007s10705-015-9748-8
Haygarth PM and AN Sharpley 2000 Terminology for phos-phorus transfer J Environ Qual 2910ndash15 doi102134jeq200000472425002900010002x
Hoffmann CC C Kjaergaard J Ussi-Kaumlampauml HC Bruun Hansen and B Kronvang 2009 Phosphorus retention in riparian buffers Re-view of their efficiency J Environ Qual 381942ndash1955 doi102134jeq20080087
IBM 2013 IBM SPSS statistics for Windows version 220 IBM Corp Ar-monk NY
McLaughlin MJ AM Alston and JK Martin 1986 Measurement of phos-phorus in soil microbial biomass A modified procedure for field soils Soil Biol Biochem 18437ndash443 doi1010160038-0717(86)90050-7
Mehlich A 1984 Mehlich 3 soil test extractant A modification of the Mehlich 2 extractant Commun Soil Sci Plant Anal 151409ndash1416 doi10108000103628409367568
Nannipieri P L Giagnoni L Landi and G Renella 2011 Role of phospha-tase enzymes in soil In EK Buumlnemann A Oberson and E Frossard editors Phosphorus in action Soil Biology Ser 26 Springer Berlin p 215ndash243 doi101007978-3-642-15271-9_9
Oberson A and EJ Joner 2005 Microbial turnover of phosphorus in soil In BL Turner E Frossard and DS Baldwin editors Organic phos-phorus in the environment CAB International Wallingford UK p 133ndash164 doi10107997808519982200133
Oehl F A Oberson M Pronst A Fliessbach H Roth and E Frossard 2001 Kinetics of microbial phosphorus uptake in cultivated soils Biol Fertil Soils 3431ndash41 doi101007s003740100362
Pote DH TC Daniel AN Sharpley PA Moore Jr DR Edwards and DJ Nichols 1996 Relating extractable soil phosphorus to phospho-rus losses in runoff Soil Sci Soc Am J 60855ndash859 doi102136sssaj199603615995006000030025x
Provin T 2014 Total carbon and nitrogen and organic carbon via thermal combustion analyses In FJ Sikora and KP Moore editors Soil test methods from the southeastern United States Southern Cooperative Series Bull 419 Southern Extension and Research Activity Informa-tion Exchange Group- 6 p 149ndash154 httpaeslcesugaedusera6PUBMethodsManualFinalSERA6pdf
Richardson AE JP Lynch PR Ryan E Delhaize FA Smith PR Harvey MH Ryan EJ Veneklaas H Lambers A Oberson RA Culvenor and RJ Simpson 2011 Plant and microbial strategies to improve ef-ficiency of agriculture Plant Soil 349121ndash156
Roberts WM MI Stutter and PM Haygarth 2012 Phosphorus retention and remobilization in vegetative buffer strips A review J Environ Qual 41389ndash399 doi102134jeq20100543
Rowland AP and PM Haygarth 1997 Determination of total dis-solved phosphorus in soil solutions J Environ Qual 26410ndash415 doi102134jeq199700472425002600020011x
Table 4 Model predictions of total water extractable P (TWEP) inorganic water extractable P (WEPi) and organic water extractable P (WEPo) from stepwise regression across all data The F statistic for all three model predictions is lt0001
TWEP WEPi WEPo
r2adjusted Predictor Relative
importance r2adjusted Predictor Relative
importance r2adjusted Predictor Relative
importance066 Degree of soil P
saturation080 065 Degree of soil P
saturation093 037 Total phosphatase
activity078
Total phosphatase activity
018 Total phosphatase activity
007 Microbial biomass N 017
M3-P 002 pH 005
Page 6 of 6 AGRICULTURAL amp ENVIRONMENTAL LETTERS
Schoumans OF 2009 Determination of the degree of phosphate satura-tion in noncalcareous soils In JL Kovar and GM Pierzynski editors Methods for phosphorus analysis for soils sediments residuals and water 2nd ed SERA 17 Bull 408 Virginia Tech Blacksburg VA p 29ndash 32
Self-Davis ML PA Moore Jr and BC Joern 2009 Water- or dilute salt-extractable phosphorus in soil In JL Kovar and GM Pierzynski edi-tors Methods for phosphorus analysis for soils sediments residuals and water 2nd ed SERA 17 Bull 408 Virginia Tech Blacksburg VA p 22ndash 24
Sharpley AN 1995 Dependence of runoff phosphorus on extract-able soil phosphorus J Environ Qual 24920ndash926 doi102134jeq199500472425002400050020x
Sheppard SC MI Sheppard J Long B Sanipelli and J Tait 2006 Runoff phosphorus retention in vegetative field margins on flat landscapes Can J Soil Sci 86(5)871ndash884 doi104141S05-072
Tabatabai MA 1994 Soil enzymes In RW Weaver S Angl P Bottomley D Bezdicek S Smith and MA Tabatabai editors Methods of soil analysis Part 2 Microbiology and biological properties SSSA Madi-son WI p 775ndash833
Tomlinson PJ MC Savin and PA Moore Jr 2008 Phosphatase activities in soil after repeated untreated and alum-treated poultry litter appli-cations Biol Fertil Soils 44613ndash622 doi101007s00374-007-0245-3
Turner BL and PM Haygarth 2001 Biogeochemistry Phosphorus solu-bilization in rewetted soils Nature 411258 doi10103835077146
Vance ED PC Brookes and DS Jenkinson 1987 An extraction method for measuring soil microbial biomass C Soil Biol Biochem 19703ndash707 doi1010160038-0717(87)90052-6
Watanabe FS and SR Olsen 1965 Test of an ascorbic acid meth-od for determining phosphorus in water and NaHCO3 ex-tracts from soil Soil Sci Soc Am J 29677ndash678 doi102136sssaj196503615995002900060025x
Phosphorus Retention and Remobilization along HydrologicalPathways in Karst TerrainHelen P Jarviedagger Andrew N SharpleyDagger Van Brahanasect Tarra SimmonsDagger April PriceDagger Colin Nealdagger
Alan J Lawlor∥ Darren Sleep∥ Sarah Thacker∥ and Brian E Haggardperp
daggerCentre for Ecology amp Hydrology Wallingford OX10 8BB UKDaggerDepartment of Crop Soil amp Environmental Sciences Division of Agriculture University of Arkansas Fayetteville Arkansas 72701United StatessectDepartment of Geosciences University of Arkansas Fayetteville Arkansas 72701 United States∥Centre for Ecology amp Hydrology Lancaster LA1 4YQ UKperpArkansas Water Resources Center University of Arkansas Fayetteville Arkansas 72701 United States
S Supporting Information
ABSTRACT Karst landscapes are often perceived as highly vulnerable toagricultural phosphorus (P) loss via solution-enlarged conduits that bypass Pretention processes Although attenuation of P concentrations has been widelyreported within karst drainage the extent to which this results from hydrologicaldilution rather than P retention is poorly understood This is of strategicimportance for understanding the resilience of karst landscapes to P inputs givenincreasing pressures for intensified agricultural production Here hydrochemicaltracers were used to account for dilution of P and to quantify net P retentionalong transport pathways between agricultural fields and emergent springs for thekarst of the Ozark Plateau midcontinent USA Up to sim70 of the annual total Pflux and sim90 of the annual soluble reactive P flux was retained with preferentialretention of the most bioavailable (soluble reactive) P fractions Our resultssuggest that in some cases karst drainage may provide a greater P sink thanpreviously considered However the subsequent remobilization and release of the retained P may become a long-term source ofslowly released ldquolegacyrdquo P to surface waters
INTRODUCTION
More than 25 of the worldrsquos population either lives on orobtains its drinking water from karst aquifers Karst underlies30 of the land area of China 30 of Europe and 20 of theUnited States12 Karst aquifers exert an important control on thequality and ecology of surface waters in these areas3 Thecomplexity of subsurface drainage45 and the difficulties indeconvoluting flow pathways and groundwater contributingareas6 have been a significant barrier to detailed studies ofnutrient transport and fate in karst systems78 Nevertheless it iswidely assumed that karst drainage systems (formed bydissolution of carbonate rocks mainly limestone) are highlyvulnerable to phosphorus (P) impairment from agriculturalsourcesThis vulnerability is assumed to arise from the low nutrient
buffering capacity of the thin cherty soils which overlie karst andthe rapid transmission of surface runoff through conduitsenlarged by dissolution910 which is thought to bypass thezones where key processes of P retention occur11minus13 Nonethe-less highly intensive monitoring of Irish karst springs in areas oflivestock demonstrated major P attenuation (reduction in Pconcentrations) relative to agricultural runoff1415 with low Pconcentrations in spring discharge even during storm events
when agricultural P losses are expected to be highest Thisattenuation was attributed to a combination of both hydrologicaldilution and P retention during infiltration and transmission ofrunoff along groundwater conduit pathwaysCrucially we lack information on the extent to which P
attenuation is controlled by P retention processes during transitalong karst flow paths14 or by hydrological dilution ofagricultural runoff by cleaner groundwater sources16 This is ofstrategic importance for understanding the P buffering capacityand wider resilience of karst landscapes to nutrient inputs101718
Many karst lands have traditionally been used for low-intensitylivestock farming owing to poor soils and their unsuitability forarable production9 However there is increasing pressure forintensive livestock production as global demands for greaterefficiency in food production intensify1920 Given the movetoward more intensive livestock production systems whichaccumulate P2122 and the perceived vulnerability of karstdrainage systems to P loss there is now a pressing and strategic
Received December 14 2013Revised March 17 2014Accepted March 17 2014
Article
pubsacsorgest
copy XXXX American Chemical Society A dxdoiorg101021es405585b | Environ Sci Technol XXXX XXX XXXminusXXX
need for better understanding of the fate and transport of P inkarst landscapes Here this shortfall is addressed for karst terrainin south-central USA Hydrochemical tracers and endmembermixing analysis23minus26 were used to assess the vulnerability to Ploss by accounting for the hydrological dilution of agriculturalrunoff and directly quantifying net P retention during infiltrationthrough the soil and along karst transport pathways through tothe emergent springs
EXPERIMENTAL METHODS
Study Area The study was undertaken at the University ofArkansas long-term Savoy Experimental Watershed (SEW) NWArkansas USA27 The SEW is located in the Illinois RiverWatershed a mixed land-use watershed (sim4330 km2) whichspans the states of Arkansas and Oklahoma2829 The SEW covers1250 ha and is typical of the karst terrain of the Ozark Plateau ofmidcontinental USA (Figure SI-1a Supporting Information)The soils of the SEW are predominantly silt loams (seeSupporting Information) Around 70 of the land is nativeforest with the remaining 30 rolling pasture grazed by beefcattle (sim2 cows haminus1) The SEW also supports poultryproduction with the resulting poultry litter used to fertilizepastures There are no septic tanks or settlements in the SEWand agricultural runoff from pastures grazed by cattle providesthe overwhelmingly dominant P source in the watershed30
The stratigraphy of the SEW30minus32 (see Figure SI-1cSupporting Information) includes (a) the limestone aquifer ofthe St Joe Formation (b) the Boone Formation an impurelimestone which mantles the St Joe Formation and formsldquoepikarstrdquo and (c) a layer of regolith (vadose zone) whichoverlies the Boone Formation Karst drainage has a major controlon water quality in the Illinois River2933 67 of annual river flowcomes from karst springs rising to 80 of flow in the summerand fall34
Sample Collection and Analysis Surface runoff andspring-water chemistry and flow monitoring (Figure SI-1a andc Supporting Information) were undertaken at the following(1) two adjacent karst springs (Langle Spring LLS andCopperhead Spring CHS) which flow continually from the StJoe Formation (focused conduit flow) springs (2) two surfacerunoff field plots (Langle LL 107 ha and Copperhead CH 105ha) which are located above and within the watershed (rechargezone) of the LLS andCHS springs These runoff plots are locatedon Razort silt loams which make up most of the grazed pasturesof the SEW All pastures are treated similarly in terms of grazing
intensity and maintenance fertilizer applications (30 kg P haminus1
every two years as either poultry litter or diammoniumphosphate)Flows at the karst springs (LLS and CHS) were monitored on
15-min intervals (see Supporting Information) Karst springwater was sampled weekly with stage-triggered subdailyautomated sampling using an ISCO sampler during stormevents Figure SI-2 (Supporting Information) shows thedistribution of samples collected on the rising and falling stageof the storm hydrographs The volume of surface runoff fromboth fields was automatically measured and samples werecollected on a flow-weighted basis by an ISCO autosampler Allwater samples were filtered within 24 h of the water beingsampled and were analyzed following EPA standard protocols asdescribed below (and in the Supporting Information) Filtered(lt045 μm) samples were analyzed for soluble reactivephosphorus (SRP) by colorimetric analysis35 and for a fullsuite of major cations (including potassium K and calcium Ca)and trace elements (including lanthanum La and rubidium Rb)(see Supporting Information) Unfiltered samples were analyzedfor total phosphorus (TP) after acid-persulfate digestion bycolorimetric analysis3536 These measurements are consistentwith standard protocols for TP and SRP analysis37
Use of Conservative Tracers and Endmember MixingAnalysisConservative chemical tracers and endmember mixingmodels were used to apportion water sources and to differentiatethe effects of hydrological dilution from the biogeochemicalprocesses which retain and cycle P during transit through thekarst drainage system Chemical tracers have been widely used inwatershed hydrology for tracing water sources and flowpathways38 owing to their conservative behavior (chemicalinertness) Here we made use of chemical tracers already in thewatershed to apportion water sources Using the hydrochemicalmonitoring data tracers were chosen which had elevatedconcentrations in either base flow groundwater or in agriculturalrunoff First two-component endmember mixing models2339
were used to link the spring-water chemistry to sources withinthe watershed by (a) quantifying the relative proportions ofsurface runoff and groundwater and (b) estimating thecontribution of surface runoff from the agricultural grazed landSecond comparing the mixing patterns of P in spring water witha conservative tracer of agricultural runoff allowed us to directlyevaluate whether P was behaving nonconservatively (ie beingtaken up or released) along the hydrological pathways in the karstdrainage system
Table 1 Summary of Concentrations of Soluble Reactive Phosphorus (SRP) Total Phosphorus (TP) Potassium (K) Rubidium(Rb) and Calcium (Ca) in Field Runoff and Spring-Water Samples
field runoff (m3 ha‑1)spring flow (L s‑1)
SRP(mg Lminus1)
TP(mg Lminus1)
Rb(μg Lminus1)
K(mg Lminus1)
Ca(mg Lminus1)
Langle Field mean 380 221 257 697 104 512(LL) median 355 187 212 596 102 494
range 34minus915 059minus502 08minus553 093minus206 204minus263 211minus987Copperhead Field mean 231 068 109 294 611 345(CH) median 146 057 103 252 511 343
range 18minus799 047minus122 063minus191 058minus876 14minus147 195minus734Langle Spring mean 131 0029 0057 106 154 375(LLS) median 938 0012 0034 0878 114 367
range 124minus59 0minus0403 0002minus0608 0195minus357 0534minus492 122minus659Copperhead Spring mean 225 0019 0041 108 137 405(CHS) median 262 0017 0032 11 14 429
range 019minus253 0001minus012 0minus058 0328minus19 084minus217 145minus615
Environmental Science amp Technology Article
dxdoiorg101021es405585b | Environ Sci Technol XXXX XXX XXXminusXXXB
RESULTS AND DISCUSSION
Comparison of Agricultural Runoff and Spring-WaterChemistry Concentrations of TP SRP K and Rb wereconsistently highest in field runoff relative to the springs (Table1) and runoff from the grazed fields provides the greatestconcentrations of P K and Rb within the SEW In contrast Caconcentrations were consistently highest in the springscompared with runoff This indicates a dominant base flowgroundwater source of Ca from dissolution of limestone whichis diluted by surface runoff (Figure 1a)Concentrations of SRP TP K and Rb were all higher in field
runoff at LL compared with CH This likely reflects higher cattlegrazing density at LL (25 cows haminus1) than at CH (10 cowshaminus1) as well as higher runoff per unit area that likely led togreater solute and particulate entrainment and transport capacitycompared with CH This may also reflect a larger hydrologicallyactive area contributing runoff at LL linked to greater soilcompaction from more intensive cattle grazingFor the springs there was a greater variability in SRP TP K
and Rb concentrations at LLS than at CHS despite a much lowervariability in spring flow at LLS (Table 1) Howeverconcentrations of TP SRP K and Rb did not correlate withflow at either of the springs For most storm events at LLSconcentrations of TP SRP K and Rb increased dramatically
above base flow concentrations especially on the rising stage ofthe storm hydrograph (Figure SI-2 Supporting Information)These high concentrations on the rising stage are likely due toupstream point recharge of surface runoff from pasture land intothe underlying St Joe aquifer in locations where the confiningchert layer is breached At CHS the response of TP SRP K andRb to storm events was more mixed Small initial increases inconcentration occurred with the onset of higher flows followedby marked reductions in concentration reflecting substantialdilution by a water source with relatively low SRP TP K and Rbconcentrations most likely from the nonagricultural (ungrazedand forested) parts of the watershed Indeed karst inventorieshave verified that this part of the flow regime reflects runoff fromareas which are not grazed by livestock3031
To evaluate the attenuation (ie the reductions inconcentrations) of TP SRP K and Rb during transit throughthe karst the median concentrations in agricultural runoff werecompared with the corresponding median concentrations inCHS and LLS springs (Table 1) The average attenuation of TPand SRP concentrations ranged from 96 to 99 In contrastthe average attenuation of K and Rb concentrations was lower at56 to 89 Correspondingly under storm flow conditionscomparisons of average field runoff concentrations and the 90thpercentile concentrations in spring water (which typicallycorrespond with the rising stage of the storm hydrographs of
Figure 1 (a) Relationships between calcium (Ca) concentrations and flow at Langle and Copperhead springs (b) Relationship between rubidium (Rb)and potassium (K) concentrations in field runoff and spring-water samples
Environmental Science amp Technology Article
dxdoiorg101021es405585b | Environ Sci Technol XXXX XXX XXXminusXXXC
the springs) revealed that storm flow attenuation of TP and SRPranged from 93 to 96 compared with 46 to 74 for K andRb Across all flow conditions the higher rates of attenuation of Pconcentrations relative to K and Rb reflect the nonconservativebehavior of P during transit through the karstK and Rb show high correlation (Figure 1b) due to their
similar hydrogeochemistry (group 1a monovalent base cations ofrelatively small hydration size) Figure 1b shows a dominant two-component mixing series between a high concentrationldquoendmemberrdquo (ie surface runoff from fertilizer and grazedpastures in runoff) and a low concentration spring-waterldquoendmemberrdquo (ie runoff from nonagricultural and forestedareas which have no grazing or fertilizer inputs) Both K and Rbare highly soluble monovalent ions and once transmitted intothe karst drainage system chemical interactions will be relativelysmall Therefore the attenuation of K and Rb during transportthrough the karst will be largely controlled by hydrologicaldilution without retention mechanisms (with only possibly asmall attenuation or release within the epikarst where there is ahigh proportion of clays3140) In contrast P behaves non-conservatively reflected by the higher rates of attenuation of Prelative to K and RbSpring Hydrology and Water-Source Apportionment
Comparing the hydrology of the two springs (Figure 2) base
flows at CHS were consistently lower than at LLS the medianflow at CHS was 262 L sminus1 compared with 131 L sminus1 at LLS(Table 1) Further CHS exhibited a more flashy flow regimethan LLS and storm flows were dramatically higher at CHS Forinstance the average of the highest 10 of flows was 139 L sminus1 atCHS compared with 40 L sminus1 at LLS This discrepancy reflectsthe following (i) LLS being the ldquounderflowrdquo spring (3 cm lowerthan CHS) with a much larger groundwater drainage area underlow-flow conditions than CHS which accounts for the higherbase flows at LLS (ii) water capture (spring ldquopiracyrdquo) by CHSduring storm events which has been shown to result in adramatic expansion in the watershed drainage area for CHSrelative to LLS3233
Contributions to spring water at LLS and CHS wereapportioned by two-component endmember mixing analy-sis2341 Here Ca was used as a tracer of groundwater and K asa tracer of agricultural runoff based on the observed dominantgroundwater source of Ca and the dominant agricultural runoffsource of K For the mixing model endmembers were defined asthe following
(i) A base flow groundwater endmember with elevated Caand a storm flow endmember with low Ca concentrations
(ii) Runoff endmember from agricultural land with high Kconcentration and a spring base flow low K endmember
Figure 2 Hydrographs and water source apportionment for Langle and Copperhead springs
Environmental Science amp Technology Article
dxdoiorg101021es405585b | Environ Sci Technol XXXX XXX XXXminusXXXD
Applying a simple two-component mixing model2341 (eq 1)and the endmembers identified above Ca concentrations wereused to partition the contributions to spring flow at LLS andCHS from base flow groundwater (the high concentrationendmember) and from stormwater runoff (the low concen-tration endmember) Then a second two-component mixingmodel was used for K to quantify the contributions from grazedpasture runoff (eq 2)
= times minus minus total storm runoff
100 (Ca Ca )(Ca Ca )gw m gw ro (1)
= times minus minus
agricultural runoff
100 (K K )(K K )bf m bf ag (2)
where Cagw was the groundwater Ca concentration (highconcentration base flow endmember) defined here as theaverage Ca concentration for the lowest 10 of flows sampledCam was the measured spring-water Ca concentration Caro wasthe stormwater (agricultural runoff) endmember defined here asthe average field runoff Ca concentration Kbf was the base flowendmember (average K concentration for the lowest 10 of
spring flows sampled) Km was the measured spring-water Kconcentration and Kag was the agricultural runoff endmemberdefined here as the average field runoff K concentration Thevalues used to define the endmember concentrations at LLS andCHS are shown in Table SI-1 Supporting InformationThe water source apportionment for LLS and CHS (Figure 2)
showed similar percentage contributions from base flowgroundwater and total storm flow at LLS and CHS for most ofthe year and particularly during storm events During winter andspring storm events a much greater proportion of flow at LLSwas derived from agricultural (grazed field) runoff (up toapproximately a third of flow) This greater contribution of waterfrom pastures than from nonagricultural land at LLS accountedfor the higher storm-event concentrations of K and Rb at LLSAgricultural runoff contributed a much lower proportion ofwinter and spring storm event flow at CHS (typically less than10) These results and the much higher storm flow dischargesat CHS suggest that the water ldquopiracyrdquo at CHS during stormevents captured water sources which had a lower K and Rbconcentration from the nonagricultural (ungrazed and forested)areas
Figure 3 Relationships between total phosphorus (TP) soluble reactive phosphorus (SRP) and potassium (K) for (a) Langle Spring and (b)Copperhead Spring The dashed line denotes the conservative mixing line and the solid line denotes a line of maximum P retention (see text forexplanation)
Environmental Science amp Technology Article
dxdoiorg101021es405585b | Environ Sci Technol XXXX XXX XXXminusXXXE
Quantifying Net P Retention in Karst DrainageEndmember mixing analysis23minus26 was applied using theldquoconservativerdquo tracer K to explore the net P retention andrelease along karst hydrological pathways from infiltrationthrough the soil to spring discharge First concentrations ofTP and SRP were plotted against K as the ldquoconservativerdquo tracer(Figure 3) Two dominant and distinct sources of spring water(both with different TP SRP and K concentrations) arehypothesized (Table SI-1 Supporting Information) (i) a highconcentration agricultural endmember source (Kag TPag SRPag)defined here as the average concentrations (of K TP and SRP)in agricultural field runoff at the LL and CH field plots and (ii) alow concentration (nonagricultural) endmember (Kna TPnaSRPna) As the source of this low concentration runoff couldcome from a wide range of nonagricultural sources (ungrazedand forest land) across the watershed the most reliable means ofcapturing the integrated low-concentration endmember signalwas to use the minimum measured spring-water K TP and SRPconcentrations at LLS and CHSA theoretical linear two-component mixing series ie a
ldquoconservative mixing linerdquo between the high concentration andlow concentration endmembers (Figure 3) would be observed ifP behaved conservatively during mixing of the two endmemberwater sources during transport through the karst In contrast theobserved relationships between TP and K and SRP and K inspring water were highly scattered at LLS and CHS (Figure 3)Most of the samples plot well below the conservative mixing lineshowing predominantly net retention of TP and SRP relative toK A few isolated samples plotted above the conservative mixingline which are indicative of some sporadic net P release relativeto the K tracer The mixing patterns between TP SRP and Kconcentrations in Figure 3 had a well-defined lower boundary ofsamples with the lowest P concentrations relative to K (shown inFigure 3 as a ldquoline of maximum P retentionrdquo) This line ofmaximum P retention probably represents a secondaryendmember mixing line between the same low concentrationnonagricultural runoff endmember and a secondary agricultural
field runoff endmember with high K but lower P concentrationsas a result of P retention processes filtering out P We posit thatthe majority of this P was ldquofilteredrdquo out during diffuse recharge ofwater as through the soil and the epikarst into the karst aquiferThe spring-water samples which lie between the line ofmaximum retention and the conservative mixing series thereforelikely reflect the net effects of P retention and remobilizationprocesses for runoffwater entering the karst drainage system via amixture of diffuse and point rechargeBy comparing the observed spring-water TP and SRP versus K
relationships with the theoretical linear conservative mixingseries the net effects of P retention and release can be directlyquantified (Figure 3) By applying the theoretical conservativemixing series (TP versus K and SRP versus K) to the measuredspring-water K concentrations at LLS and CHS ldquoconservativerdquoTP and SRP concentration time series were derived (Figure SI-3ab Supporting Information) and converted to loads using thecorresponding spring flow data By taking the difference betweenmeasured and ldquoconservativerdquo TP and SRP loads we calculatednet TP and net SRP retention on an annual basis as well as forbase flows (lowest 10 of flows) and storm flows (highest 10 offlows) (Table 2)Annual net TP retention ranged from 69 at LLS to 54 at
CHS Net percentage P retention was consistently higher forSRP compared with TP not only on an annual basis but alsounder storm and base flow conditions This indicated preferentialretention of more labile SRP fractions by sorptionuptake andgreater mobility of TP organic and particulate P fractions Similarpatterns of soluble and particulate P retention have also beenobserved in other karst soils and drainage systems71113 Highestpercentage net P retention occurred during storm events at LLS(92 TP retention and 96 SRP retention) However the twosprings showed very different patterns in P retention under stormand base flow conditions At LLS net P retention was greatestduring storm flows than under base flow conditions reflecting ahigh efficiency of P retention from agricultural runoff at LLS Incontrast at CHS a greater percentage of the P load was retained
Table 2 Measured and ldquoConservativerdquo Annual Loads and Mean Daily Base Flow and Storm Flow Loads of Total Phosphorus(TP) and Soluble Reactive Phosphorus (SRP) in Langle and Copperhead Springs with Net and Percentage TP and SRP Retention
measured P load(kg yminus1 or g dminus1)
ldquoconservativerdquo P load(kg yminus1 or g dminus1)
net P retention(kg yminus1 or g dminus1) net P retention
Langle Spring(LLS)
annual TP load(kg yminus1)
701 223 153 69
annual SRP load(kg yminus1)
185 190 172 90
Copperhead Spring(CHS)
annual TP load(kg yminus1)
265 57 31 54
annual SRP load(kg yminus1)
098 33 23 70
Langle Spring(LLS)
avg base flow TP load(g dminus1)
103 233 130 56
avg base flow SRP load(g dminus1)
221 198 176 89
Copperhead Spring(CHS)
avg base flow TP load(g dminus1)
127 355 228 64
avg base flow SRP load(g dminus1)
045 214 169 79
Langle Spring(LLS)
avg storm flow TP load(g dminus1)
112 1448 1336 92
avg storm flow SRP load(g dminus1)
514 1240 1189 96
Copperhead Spring(CHS)
avg storm flow TP load(g dminus1)
445 971 527 54
avg storm flow SRP load(g dminus1)
175 567 392 69
Environmental Science amp Technology Article
dxdoiorg101021es405585b | Environ Sci Technol XXXX XXX XXXminusXXXF
under base flow than during storm flow This reflects much lowerbase flows at CHS which increase water residence time andpromote particulate sedimentation and P retention and higherstorm flows linked to stream piracy which provide greaterflushing from nonagricultural areas where flows have a low PconcentrationContaminant Residence Times in Karst DrainageWhile
monitoring P relative to a conservative tracer provides us withvaluable information on rates of annual and storm flowbase flownet retention it provides no information about the residencetimes of P within the karst or the time scales over whichretention and remobilization may occur This is of strategicconcern in relation to the ldquolegacyrdquo of P within watersheds4243
whereby time-lags in release of retained Pmaymask the effects ofconservation measures on receiving water quality By measuringa full suite of trace elements using ICP-MS a ldquoserendipitousrdquoobservation was made which may help provide clues about thewider contaminant residence times within the karst drainageConcentrations of ldquodissolvedrdquo (lt045 μm) lanthanum (La) instorm flow spring discharge at LLS were more than an order ofmagnitude higher than could be accounted for by the runoffsources measured within the SEW Figure 4 shows theconcentrations of La in the spring discharge at LLS and aldquoconservativerdquo (maximum) concentration from runoff whichaccounts for the dilution of agricultural runoff during transitthrough the karst drainage using K as a tracer The high stormflow La concentrations observed at LLS are likely a ldquolegacyrdquosignal from a past tracer experiment In 2001 lanthanum-labeledmontmorillonite clays were injected into a losing stream at SEWas part of a study to examine clay and bacterial transport44
While the La tracer was detected at LLS around 16 h after itwas injected44 our monitoring suggests the La tracer was alsoretained within the karst drainage system and continues to beremobilized and released during storm events more than 10 yearslater Unfortunately it is impossible to perform a mass balance toquantify how much of the La applied in the tracer study remainswithin the karst drainage system and how long a La ldquolegacyrdquomight persist as no La measurements were made in the
intervening 10 years between the tracer injection in 2001 and ourmonitoring which started in November 2011 Within the scopeof this study it was also not possible to determine whether the Laconcentrations measured were truly dissolved or a lt045 μmcolloidalclay fraction or whether La geochemistry is sufficientlysimilar to be used as an indicator of P transport However theseresults indicate that La a tracer expected to be flushed rapidlythrough the karst was retained and continues to be remobilizedand released during storm events more than 10 years later Thisindicates the potential for contaminant retention in thesubsurface karst drainage system where contaminant storageand gradual rerelease may occur over time scales of at least adecade
Wider Implications Hydrochemical tracers of agriculturalrunoff allowed us to directly evaluate the nonconservativebehavior of P within karst drainage and quantify net P retentionOur results challenge the widely held assumption that karstlandscapes are always highly vulnerable to P loss and suggest thatin some cases karst drainage may provide a greater sink for Pthan previously considered P from agricultural runoff wasattenuated by hydrological dilution from cleaner (nonagricul-tural) sources during transport through karst drainage Howeverthere was also a high capacity for net P retention especially forLangle Spring which was subject to the highest agricultural Ploadings Here sim70 of the annual TP flux and sim90 of theannual SRP flux was retained Moreover the buffering within thesoils and karst drainage not only retained a high proportion ofincoming fluxes of P from agricultural runoff but preferentiallyretained the most bioavailable P fractions For instance muchresearch has documented the capacity of soil to retain applied Pin various inorganic (Al Fe Ca complexes) and organic forms ofvarying stability4546 The long-term accumulation of P in soilhowever can be released slowly to soil water2847
The mechanisms of P retention were not investigated here butlikely include varying combinations of processes includingadsorption onto clays coprecipitation of P with CaCO3 andbinding with particulate humic substances11minus13 in the soil inepikarst and within the fractures and conduits These adsorption
Figure 4 Time series of measured and ldquoconservativerdquo lanthanum (La) concentrations and flow at Langle spring Measured La concentrations aredenoted by solid circles ldquoconservativerdquo La concentrations are denoted by open circles See text for explanation of how ldquoconservativerdquo La concentrationswere calculated
Environmental Science amp Technology Article
dxdoiorg101021es405585b | Environ Sci Technol XXXX XXX XXXminusXXXG
products and precipitates will be physically retained as the watervelocity slows and will be deposited as sediment along the base ofthe conduit flow paths With the recurrence of high flow thesesediments are resuspended by turbulent flow and moved alongthe flow path until redeposited or eventually resurged at thebase-level spring Given the potential importance of CaCO3minusPcoprecipitation for P retention in karst terrain and the possibilityof reductions in the efficiency of this coprecipitation mechanismunder higher P and dissolved organic carbon (DOC)concentrations124849 further work is needed to examine anyunforeseen impacts of increasing agricultural intensification onthis ldquoself-cleansingrdquo P retention mechanism However in thisstudy the site with the higher livestock intensity and with highermanure-enriched runoff actually demonstrated greater efficiencyof P retention This may indicate that critical P and DOCthresholds for inhibition of CaCO3 precipitation were notreached or that other P retention process mechanisms wereoccurringThe patterns in spring-water La concentrations suggest
continued released of La from springs more than 10 years aftera tracer injection and indicate the potential for long-termcontaminant retention storage and subsequent release Indeedthe complex nature of karst hydrological pathways can result inlarge distributions in water and contaminant residence times andlag times for discharge to surface waters may bemuch longer thanexpected50minus52 Our findings indicate that retention of P withinkarst drainage may reduce the risk of acute episodic storm-drivenlosses of agricultural P However the potential buffering of P inthe epikarst and within the fracture and conduit drainage systemcan provide a slow but long-term source of P released via springsto surface waters Further work is needed to determine theecological impacts of such patterns of P release to receivingstreams and the ability of those streams to assimilate thoseinputs compared with higher pulse inputs during storm flows
ASSOCIATED CONTENT
S Supporting InformationMap of the SEW and the karst water flow system time series ofspring-water TP SRP K and Rb concentrations table of Ca TPand SRP endmember concentrations soils and geology of theSavoy Experimental Watershed experimental methods Thismaterial is available free of charge via the Internet at httppubsacsorg
AUTHOR INFORMATION
Corresponding AuthorPhone ++44 (0)1491 838800 Fax ++44 (0)1491692424 E-mail hpjcehacuk
NotesThe authors declare no competing financial interest
ACKNOWLEDGMENTS
HPJ acknowledges funding and support from the UK NaturalEnvironment Research Council a Fulbright DistinguishedScholar Award and an OECD Co-operative Research Pro-gramme Fellowship We thank Chris Wardle (British GeologicalSurvey) for help with the artwork and Dr Tiong Ee Ting forpermission to reproduce tracer experiment results in theSupporting Information
REFERENCES(1) Panno S V Karst aquifers Can they be protected Ground Water2006 44 (4) 494minus494(2) White W B Culver D C Herman J S Kane T C Mylroie JE Karst lands Am Sci 1995 83 (5) 450minus459(3) Owen M R Pavlowsky R T Base flow hydrology and waterquality of an Ozarks spring and associated recharge area southernMissouri USA Environ Earth Sci 2011 64 (1) 169minus183(4) Baffaut C Benson VWModeling flow and pollutant transport ina karst watershed with SWAT Trans ASABE 2009 52 (2) 469minus479(5) Fournier M Motelay-Massei A Massei N Aubert MBakalowicz M Dupont J P Investigation of transport processesinside karst aquifer by means of STATIS Ground Water 2009 47 (3)391minus400(6) Brahana J V Rationale and methodology for approximatingspring-basin boundaries in the mantled karst terrane of the SpringfieldPlateau northwestern Arkansas In The engineering geology andhydrogeology of karst terranes Beck B F Stephenson B F Eds A ABalkema Rotterdam 1997 pp 77minus82(7) Kilroy G Coxon C Temporal variability of phosphorus fractionsin Irish karst springs Environ Geol 2005 47 (3) 421minus430(8) Lerch R N Contaminant transport in two central Missouri karstrecharge areas J Cave Karst Stud 2011 73 (2) 99minus113(9) Coxon C Agriculture and karst In Karst Management Beynen PE Ed Springer Dordrecht Netherlands 2011 pp 103minus138(10) Kacaroglu F Review of groundwater pollution and protection inkarst areas Wat Air Soil Pollut 1999 113 (1minus4) 337minus356(11) Allousha G A Boyer D G Belesky D P Halvorson J JPhosphorus mobility in a karst landscape under pasture grazing systemAgronomie 2003 23 (7) 593minus600(12) Neal C Jarvie H PWilliams R J Neal MWickham H HillL Phosphorus-calcium carbonate saturation relationships in a lowlandchalk river impacted by sewage inputs and phosphorus remediation Anassessment of phosphorus self-cleansing mechanisms in natural watersSci Total Environ 2002 282 295minus310(13) von Wandruszka R Phosphorus retention in calcareous soils andthe effect of organic matter on its mobility Geochem Trans 2006 7 6(14) Mellander P-E Jordan P Melland A R Murphy P N CWall D P Mechan S Meehan R Kelly C Shine O Shortle GQuantification of phosphorus transport from a karstic agriculturalwatershed to emerging spring water Environ Sci Technol 2013 47 (12)6111minus6119(15) Mellander P-E Jordan P Wall D P Melland A R MeehanR Kelly C Shortle G Delivery and impact bypass in a karst aquiferwith high phosphorus source and pathway potentialWater Res 2012 46(7) 2225minus2236(16) Stueber A M Criss R E Origin and transport of dissolvedchemicals in a karst watershed southwestern Illinois J Am Water ResAssoc 2005 41 (2) 267minus290(17) Kleinman P J A Sharpley A N McDowell R W Flaten DN Buda A R Tao L Bergstrom L Zhu Q Managing agriculturalphosphorus for water quality protection Principles for progress PlantSoil 2011 349 (1minus2) 169minus182(18) Sharpley A N Kleinman P J A Flaten D N Buda A RCritical source area management of agricultural phosphorus Experi-ences challenges and opportunities Water Sci Technol 2011 64 (4)945minus952(19) Sharpley A N Jarvie H P Agricultural management waterquality amp ecology Putting practice into policy In National AgriculturalBiotechnology Council Report 24 Eaglesham A Korth K Hardy R WF Eds Jacobs Press Auburn NY 2012 pp 73minus99(20) Sims J T Ma L Oenema O Dou Z Zhang F S Advancesand challenges for nutrient management in China in the 21st century JEnviron Qual 2013 42 (4) 947minus950(21) Kellogg R L Lander C H Moffitt D C Gollehon N Manurenutrients relative to the capacity of cropland and pastureland toassimilate nutrients Spatial and temporal trends for the United StatesResource Assessment and Strategic Planning Working Paper 98-1 USDANatural Resources Conservation Service and Economic Research
Environmental Science amp Technology Article
dxdoiorg101021es405585b | Environ Sci Technol XXXX XXX XXXminusXXXH
Service General Services Administration National Forms andPublication Center Fort Worth TX 2000 pp 1minus140 httpwwwnrcsusdagovtechnicallandpubsmanntrpdf(22) Maguire R O Rubaeligk G H Haggard B E Foy B H Criticalevaluation of the implementation of mitigation options for phosphorusfrom field to catchment scales J Environ Qual 2009 38 (5) 1989minus1997(23) Christophersen N Neal C Hooper R P Vogt R DAndersen S Modeling streamwater chemistry as a mixture of soilwaterend-members - A step towards 2nd-generation acidification models JHydrol 1990 116 (1minus4) 307minus320(24) Neal C Jarvie H P Williams R Love A Neal M WickhamH Harman S Armstrong L Declines in phosphorus concentration inthe upper River Thames (UK) Links to sewage effluent cleanup andextended end-member mixing analysis Sci Total Environ 2010 408 (6)1315minus1330(25) Jarvie H P Neal C Withers P J A Baker D B Richards RP Sharpley A N Quantifying phosphorus retention and release inrivers and watersheds using extended end-member mixing analysis (E-EMMA) J Environ Qual 2011 40 (2) 492minus504(26) Jarvie H P Sharpley A N Scott J T Haggard B E BowesM J Massey L B Within-river phosphorus retention Accounting for amissing piece in the watershed phosphorus puzzle Environ Sci Technol2012 46 (24) 13284minus13292(27) Brahana V The Savoy Experimental WatershedA long-termresearch site for karst hydrogeology In Caves and Karst of the USANational Speleological Society Guidebook for the International Congress ofSpeleology Palmer A N Palmer M V Eds National SpeleologicalSociety Huntsville AL 2009 section 5 Ozark Plateaus p 179(28) Sharpley A N Kleinman P J A Jordan P Bergstrom LAllen A L Evaluating the success of phosphorus management fromfield to watershed J Environ Qual 2009 38 1981minus1988(29) Scott J T Haggard B E Sharpley A N Romeis J J Changepoint analysis of phosphorus trends in the Illinois River (Oklahoma)demonstrates the effects of watershed management J Environ Qual2011 40 (4) 1249minus1256(30) Brahana J V Controlling influences on ground-water flow andtransport in the shallow karst aquifer of northeastern Oklahoma andnorthwestern Arkansas Proceedings volume hydrologic problemsalong the Arkansas-Oklahoma border Arkansas Water ResourcesCenter Publication No MSC-168 1995 pp 25minus3033(31) Brahana J V Ting T Al-Qinna M Murdock J Davis R KLainz J Killingbeck J J Szilvagyi E Doheny-Skubic M Chaubey IHays P D Thoma G Quantification of hydrologic budget parametersfor the vadose zone and epikarst in mantled karst US GeologicalSurvey Karst Interest Group Proceedings Rapid City SD Sept 12minus152005 Kuniansky E L Ed US Geological Survey ScientificInvestigations Report 2005-5160 pp 144minus152(32) Leh M D Chaubey I Murdoch J Brahana J V Haggard BE Delineating runoff processes and critical runoff source areas in apasture hillslope of the Ozark Highlands Hydrol Proc 2008 22 (21)4190minus4204 DOI 101002hyp7021(33) Haggard B E Phosphorus concentrations loads and sourceswithin the Illinois River drainage area Northwest Arkansas 1997minus2008J Environ Qual 2010 39 (6) 2113minus2120(34) Tortorelli R L Pickup B E Phosphorus concentrations loadsand yields in the Illinois River basin Arkansas and Oklahoma 2000minus2004 US Geological Survey Scientific Investigations Report 2006-5175 p 38(35) Murphy J Riley J P A modified single solution method for thedetermination of phosphate in natural-waters Anal Chim Acta 196227 31minus36(36) Eisenreich S J Bannerman R T Armstrong D E Simplifiedphosphorus analytical technique Environ Lett 1975 9 (1) 43minus53(37) Jarvie H P Withers P J A Neal C Review of robustmeasurement of phosphorus in river water Sampling storagefractionation and sensitivity Hydrol Earth Syst Sci 2002 6 113minus131(38) Divine C E McDonnell J J The future of applied tracers inhydrogeology J Hydrogeol 2005 13 255minus258
(39) Burns D A McDonnell J J Hooper R P Peters N E FreerJ E Kendall C Beven K Quantifying contributions to storm runoffthrough endmember mixing analysis and hydrologic measurements atthe Panola Mountain Research Watershed (Georgia USA) HydrolProc 2001 15 1903minus1924(40) Williams P W The role of the epikarst in karst and cavehydrogeology a review Int J Speleol 2008 31 1minus10(41) Jarvie H P Neal C Smart R Owen R Fraser D Forbes IWade A Use of continuous water quality records for hydrographseparation and to assess short-term variability and extremes in acidityand dissolved carbon dioxide for the River Dee Scotland Sci TotalEnviron 2001 265 (1minus3) 85minus98(42) Jarvie H P Sharpley A N Spears B Buda A R May LKleinman P J A Water quality remediation faces unprecedentedchallenges from ldquolegacy phosphorusrdquo Environ Sci Technol 2013 47(16) 8997minus8998(43) Sharpley A Jarvie H P Buda A May L Spears B KleinmanP Phosphorus legacy Overcoming the effects of past managementpractices to mitigate future water quality impairment J Environ Qual2013 42 (5) 1308minus1326(44) Ting T E E Assessing bacterial transport storage and viability inmantled karst of northwest Arkansas using clay and Escherichia colilabeled with lanthanide-series metals PhD Dissertation University ofArkansas 2005(45) Sharpley A N Smith S J Bain W R Nitrogen and phosphorusfate from long-term poultry litter applications toOklahoma soils Soil SciSoc Am J 1993 57 (4) 1131minus1137(46) Frossard E Condron L M Oberson A Sinaj S Fardeau J CProcesses governing phosphorus availability in temperate soils JEnviron Qual 2000 29 (1) 15minus23(47) Cox F R Kamprath E J McCollum R E A descriptive modelof soil test nutrient levels following fertilization Soil Sci Soc Am J 198145 (3) 529minus532(48) Inskeep W P Bloom P R kinetics of calcite precipitation in thepresence of water-soluble organic-ligands Soil Sci Soc Am J 1986 50(5) 1167minus1172(49) Dove P M Hochella M F Calcite precipitation mechanismsand inhibition by orthophosphate - insitu observations by scanning forcemicroscopy Geochim Cosmochim Acta 1993 57 (3) 705minus714(50) Kirchner J W Feng X H Neal C Fractal stream chemistry andits implications for contaminant transport in catchments Nature 2000403 (6769) 524minus527(51) Kirchner J W Neal C Universal fractal scaling in streamchemistry and its implications for solute transport and water qualitytrend detection Proc Nat Acad Sci USA 2013 110 (30) 12213minus12218(52) Neal C Catchment water quality The inconvenient butnecessary truth of fractal functioning Hydrol Proc 2013 27 (24)3516minus3520
Environmental Science amp Technology Article
dxdoiorg101021es405585b | Environ Sci Technol XXXX XXX XXXminusXXXI
Coupling High-Frequency Stream Metabolism and NutrientMonitoring to Explore Biogeochemical Controls on DownstreamNitrate DeliveryHelen P Jarviedagger Andrew N SharpleyDagger Timothy Kressesect Phillip D Hays∥ Richard J Williamsdagger
Stephen M Kingperp and Lawrence G BerryDagger
daggerNERC Centre for Ecology and Hydrology Wallingford OX10 8BB United KingdomDaggerDepartment of Crop Soil and Environmental Sciences University of Arkansas Fayetteville Arkansas 72701 United StatessectUS Geological Survey Lower Mississippi-Gulf Water Science Center 401 Hardin Road Little Rock Arkansas 72211 UnitedStates∥US Geological Survey Lower Mississippi-Gulf Water Science CenterUniversity of Arkansas Department of Geosciences 216Gearhart Hall Fayetteville Arkansas 72701 United StatesperpSTFC Rutherford Appleton Laboratory Harwell Campus Didcot Oxfordshire OX11 0QX United Kingdom
S Supporting Information
ABSTRACT Instream biogeochemical process measurementsare often short-term and localized Here we use in situ sensorsto quantify the net effects of biogeochemical processes onseasonal patterns in baseflow nitrate retention at the river-reachscale Dual-station high-frequency in situ nitrate measurementswere coupled with high-frequency measurements of streammetabolism and dissolved inorganic carbon in a tributary of theBuffalo National River Arkansas Nitrate assimilation wascalculated from net primary production and combined withmass-balance measurements to estimate net nitrification anddenitrification The combined net effects of these instreamprocesses (assimilation denitrification and nitrification)removed gt30minus90 of the baseflow nitrate load along a 65km reach Assimilation of nitrate by photoautotrophs during spring and early summer was buffered by net nitrification Netnitrification peaked during the spring After midsummer there was a pronounced switch from assimilatory nitrate uptake todenitrification There was clear synchronicity between the switch from nitrate assimilation to denitrification a reduction in riverbaseflows and a shift in stream metabolism from autotrophy to heterotrophy The results show how instream nitrate retentionand downstream delivery is driven by seasonal shifts in metabolic pathways and how continuous in situ stream sensor networksoffer new opportunities for quantifying the role of stream biota in the dynamics fate and transport of nitrogen in fluvialsystems
1 INTRODUCTION
Nutrients including nitrogen (N) phosphorus (P) and carbon(C) from agriculture and domestic wastewater are a majorsource of water-quality impairment1 Excessive nutrient inputsto rivers streams and lakes can accelerate growth of nuisanceand harmful algae Resulting increases in microbial activity anddepletion of dissolved oxygen (DO) have profound negativeconsequences for invertebrates and fish potable water supplyand recreation23 However biogeochemical processes instreams also play an important role in regulating downstreamnutrient transport with stream biota retaining and removingnutrients from the water column reducing downstreamecological impacts4minus6
Streams can provide a major sink for nitrate (NO3minus)
through uptake (assimilation) by primary production and
through denitrification78 The effectiveness of these processesvaries throughout the year and between streams butconventional methods for estimating NO3
minus uptake are basedon relatively few short-term experimental nutrient additionsand isotope measurements9minus11 making results difficult toextrapolate in space and time12 Continuous high-frequency insitu measurements offer new opportunities to explore NO3
minus
source dynamics13minus17 and instream processes have beeninferred from single-station diurnal concentration cycles121819
longitudinal profiling20minus23 and nested sensor networks24
Received June 6 2018Revised October 23 2018Accepted October 30 2018Published October 30 2018
Article
pubsacsorgestCite This Environ Sci Technol 2018 52 13708minus13717
copy 2018 American Chemical Society 13708 DOI 101021acsest8b03074Environ Sci Technol 2018 52 13708minus13717
Dow
nloa
ded
via
CT
R F
OR
EC
OL
OG
Y amp
HY
DR
OL
OG
Y o
n D
ecem
ber
4 2
018
at 0
936
54
(UT
C)
Se
e ht
tps
pub
sac
sor
gsh
arin
ggui
delin
es f
or o
ptio
ns o
n ho
w to
legi
timat
ely
shar
e pu
blis
hed
artic
les
In this study we used in situ sensors to quantify the neteffects of biogeochemical processes on seasonal patterns inbaseflow NO3
minus retention at the river-reach scale The approachemployed here is novel because it combines dual-station high-frequency NO3
minus measurements with high-frequency measure-ments of stream metabolism (analysis of diurnal DO curves tocalculate primary production and respiration) dissolvedinorganic carbon (DIC) and excess partial pressure of carbondioxide (EpCO2) to explore the capacity of instreambiogeochemical processes to retain and remove NO3
minus High-frequency in situ monitoring of water chemistry and stream-flow was undertaken along a 65 km experimental reach of BigCreek a tributary of the Buffalo National Scenic RiverArkansas USA and were used to calculate a NO3
minus massbalance along the reach Net primary production was used tocalculate NO3
minus assimilation by photoautotrophs Daily NO3minus
removal rates and rates of NO3minus assimilation by photo-
autotrophs were used to calculate net nitrification anddenitrification The biogeochemical controls on NO3
minus removalwere then evaluated in relation to wider ecosystem driversincluding streamflow DO and stream ecological function toexplore how seasonal shifts in metabolic pathways influenceinstream NO3
minus retention and downstream NO3minus delivery
2 MATERIALS AND METHODS21 Site Description and Water-Quality Monitoring
Big Creek a tributary of the Buffalo National Scenic RiverArkansas (Figure 1) is the subject of detailed water-quality
monitoring because of a permitted swine concentrated animalfeeding operation (CAFO) within the watershed in operationsince September 2013 The Big Creek watershed lies in thekarst terrain of the Ozark Plateau of the midcontinental USA(Figure 1) The watershed area is 236 km2 with 79 of theland area deciduous forest 3 evergreen forest 14grasslandpasture and 3 developed land (see SupportingInformation SI S11) Swine-manure slurry from the CAFO
has been land applied to permitted fields since January 1 2014in accordance with State regulationsThe focus of this study is an experimental reach of Big
Creek downstream of the CAFO from an upstreammonitoring station at Mt Judea (USGS site 07055790watershed area 106 km2) to a downstream monitoring stationat Carver (USGS site 07055814 watershed area 233 km2)721 and 069 km from the confluence between Big Creek andthe Buffalo River respectively (Figure 1) One tributary (LeftFork) enters Big Creek between Mt Judea and Carver Thewatershed is a mantled karst terrain characterized by intimateconnection between groundwater and surface water transportof surface-derived nutrients can be rapid25 (see S12)USGS conducted high-frequency (15 min) NO3
minus monitor-ing using submersible ultraviolet nitrate probes at Carver (06032014 to 04292017) and Mt Judea (11012014 to 11012015) there was therefore one year of overlapping data(11012014 to 11012015) during which NO3
minus monitoringwas undertaken at both Mt Judea and Carver A water-qualitysonde (YSI 6600) operating at Carver simultaneously collected15 min interval DO pH specific conductance and watertemperature data Further information about the high-frequency water-quality monitoring is provided in S13Water-quality samples collected on a weekly basis since 09
122013 with additional opportunistic high-flow sampling atMt Judea Left Fork and at a groundwater (spring) monitoringsite (Figure 1) provided NO3
minus (by ion chromatographyDionex ICS-1600) alkalinity (by fixed-end point acidimetrictitration to pH 4526) and conductivity (VWR SymphonyB10C) data All nitrate concentrations are reported as NO3minusN(mg-N Lminus1) Water-quality data are available at httpsbigcreekresearchorg
22 Stream-Flow Measurements and HydrographSeparation Stream flow was measured using establishedUSGS streamflow gauging methods27 (see S14) A two-component mixing model was used to partition thecontributions to streamflow from groundwater and surfacerunoff28 using alkalinity as a conservative groundwater tracer(see S15)
23 Analysis of Diurnal Dissolved Oxygen Curves toCalculate Primary Production and Respiration The dailyaverage gross primary production daily average ecosystemrespiration and reaeration coefficient were calculated from theseries of diurnal DO curves at Carver (see S16) using apiecewise solution of the mass balance DO model29 simplifiedfor the situation where the deficit does not vary spatially (eq1) the Delta method3031
D t k D td d ER GPP ( )a av av+ = minus (1)
where D is the DO deficit (mg-O2 Lminus1) t is the time (days) ka
is the reaeration coefficient ERav is the ecosystem respiration(mg-O2 L
minus1 dminus1) and GPPav is the gross primary production(mg-O2 Lminus1 dminus1) these are standard measures of ecosystemrespiration and gross primary production in river systems32
Odum33 suggested a classification system of flowing-watercommunities based on oxygen metabolism by using the ratio ofGPPav to ERav (GPPER) Respiration is associated with bothplant and microbial activity Photosynthesis is only associatedwith plants Autotroph-dominated communities are repre-sented by GPPER values gt1 whereas heterotroph-dominatedcommunities are represented by GPPER values lt1
24 Use of the THINCARB Model for CalculatingDissolved Inorganic Carbon Concentrations and Excess
Figure 1 Map of the Big Creek watershed and its location
Environmental Science amp Technology Article
DOI 101021acsest8b03074Environ Sci Technol 2018 52 13708minus13717
13709
Partial Pressure of Carbon Dioxide The THINCARBmodel (THermodynamic modeling of INorganic CARBon)34
uses pH Gran Alkalinity (AlkGran) and temperature measure-ments to calculate dissolved inorganic carbon (DIC)concentrations and DIC speciation from the excess partialpressures of carbon dioxide (EpCO2) in freshwatersTHINCARB is open access and is described in detail in Jarvieet al (2017)34 an outline is provided in S17 Prior to usealkalinity measurements in units of mg-CaCO3 L
minus1 were firstconverted to AlkGran (in μeq Lminus1) where 1 mg Lminus1 CaCO3 =1998 μeq Lminus134
THINCARB was applied to the high-frequency sonde datafrom Carver Specific conductance was used as a surrogate foralkalinity using the regression relationship between AlkGranand specific conductance (κ) measured across the Big Creekwatershed including the spring and Mt Judea Left Fork andCarver stream sites AlkGran = 865 (plusmn028) times κ minus 644 (plusmn66)R2 = 095 n = 270 P lt 0001 (numbers in parenthesesrepresent twice the standard error) By applying this regressionequation to the hourly κ series an hourly alkalinity record wasderived which was then used alongside the hourly pH andwater-temperature data to calculate a high-frequency DIC andEpCO2 series25 Mass-Balance Calculation of Baseflow Nitrate
Fluxes Instream Losses and Net Nitrification andDenitrification Daily mass-balance calculations were under-taken for eight quiescent low-flow periods (each typically of1minus2 weeks) USGS stream-velocity readings from Carverranged from 0457 and 122 m sminus1 and with a stream distancealong the experimental reach of 652 km the travel timesranged from 396 to 148 h Therefore daily mass balances
over a 24-h period were assumed sufficient to account fortransit of NO3
minus given (a) the relatively short travel times (b)the high degree of stationarity in flux transfers during quiescentbaseflow conditions and (c) that calculated daily massbalances were averaged over a 1minus2 week periodThe 15 min NO3
minus measurements at Mt Judea and Carverwere converted to daily means and daily nitrate loads at eachsite were calculated using the corresponding gauged dailystreamflow data To account for flow accretion along the reachthe difference between the daily flow downstream at Carverand the upstream site at Mt Judea was calculated The increasein flows was assumed to be input from Left Fork (Figure 1)Daily NO3
minus input loading to the reach (LT) was calculatedas the sum of the daily NO3
minus loads from Mt Judea (LMJ) andLeft Fork (LLF)
L L LT MJ LF= + (2)
There was no high-resolution NO3minus monitoring on Left
Fork so weekly NO3minus measurements from grab samples taken
at Left Fork were combined with the measured daily flowaccretion to derive daily loads from Left Fork (S181) Asensitivity analysis evaluated the potential effects of under- oroverestimating Left Fork NO3
minus concentrations by plusmn50(Tables SI1 and SI2)Within this karst watershed some of the flow accretion will
arise from direct groundwater input into Big Creek Dischargedata were not available from the Left Fork tributary and directapportionment of contributions from Left Fork and ground-water was not possible We therefore evaluated a secondalternative ldquoendmemberrdquo case scenario whereby all of flow
Figure 2 Time series at the downstream monitoring site (Carver) from May 2014 to May 2017 showing (a) nitrate (NO3minusN) dissolvedinorganic carbon (DIC) and streamflow and (b) daily average gross primary production (GPP) ecosystem respiration (ER) and streamflow
Environmental Science amp Technology Article
DOI 101021acsest8b03074Environ Sci Technol 2018 52 13708minus13717
13710
accretion was attributed to direct groundwater contribution(S182)The daily instream NO3
minus load removal (LR) along the reachwas calculated as the difference between the daily input NO3
minus
loading (LT) and the daily NO3minus load at Carver (LC)
L L LR T C= minus (3)
To allow direct comparison with rates of assimilatory NO3minus
uptake by photosynthesis LR (kg-N dminus1) was then convertedto a daily NO3
minus removal rate UT (mg-N Lminus1 dminus1) UTincorporates both assimilatory NO3
minus uptake by photo-autotrophs (UA) heterotrophic NO3
minus removal through directuptake and denitrification (UD) and NO3
minus enrichment due toremineralization via nitrification (R)20
U U U RT A D= + minus (4)
UA was estimated from the GPPav measurements1235 GPPavdata were converted into net primary production (NPP)assuming that autotrophic respiration consumed 50 of theGPPav
3637 NPP data were then converted from units of O2uptake (mg-O2 L
minus1 dminus1) to C uptake (mg-C Lminus1 dminus1) with aphotosynthetic quotient of 100 then converted to NO3
minus
uptake (mg-N Lminus1 dminus1) using a molar ratio of CN of 1238
Subtracting UT from UA provides a measure of either netnitrification (positive values) or net heterotrophic NO3
minus
removal through direct uptake and denitrification hereafterreferred to as ldquonet denitrificationrdquo (negative values) When theriver was influent loss of NO3
minus to groundwater was accountedfor as described in S183
3 RESULTS AND DISCUSSION31 Three-Year Time Series of Nitrate Dissolved
Inorganic Carbon and Stream Metabolism The hourlyNO3
minus and DIC concentrations variations at Carver were drivenby streamflow but in opposing directions (Figure 2a) Themean and median NO3
minus concentrations were 0128 and 0093
mg-N Lminus1 respectively Nitrate concentrations at Carver werelowest during baseflow (mean 0043 mg-N Lminus1 lowest 10 offlows) and highest during storm runoff (mean 0278 mg-N Lminus1highest 10 of flows) arising from nonpoint-sourcemobilization and delivery of NO3
minus during rainfall eventsThe mean and median DIC concentrations were 248 and
252 mg-C Lminus1 respectively DIC concentrations were highestduring baseflow (mean 317 mg-C Lminus1) with DIC concen-trations diluted by storm runoff (mean 132 mg-C Lminus1)Highest DIC and lowest NO3
minus concentrations occurred duringthe extended low-flows between August and November 2015The mean and median molar CN ratios were 356 and 305
respectively The mean CN ratio during baseflow was 882 and82 during stormflow CN ratios greater than sim66 areindicative of stoichiometric depletion of N relative to C39
Absolute NO3minus concentrations below sim01 mg-N Lminus1 are
deemed likely to be limiting to algae with algal growthresponse to NO3
minus enrichment occurring between 038 to 179mg-N Lminus140 Therefore under average and baseflow conditionsat Carver a clear potential exists for algal growth to be limitedby low NO3
minus availabilityNo longer-term trends in either NO3
minus or DIC wereobserved over the three years These high-frequencymonitoring results are consistent with results from near-weeklywater-quality monitoring of Big Creek at Mt Judea whichshowed no statistically significant increasing or decreasingtrends in dissolved or particulate forms of P and Nconcentrations since 201341
Earlier studies6 have shown that Ozark streams can be veryeffective at retaining available nutrients and buffering addi-tional nutrient inputs Therefore the absence of any increasingtrend in nutrients in the water column may result from therapid and efficient uptake of nutrient inputs by stream biotaConsequently high-resolution stream metabolism and nutrientmeasurements were used here to detect whether increasedphotosynthesis or respiration rates resulted from increased
Figure 3 Scatter plot showing the relations between mean daily nitrate concentrations upstream at Mt Judea and downstream at Carver
Environmental Science amp Technology Article
DOI 101021acsest8b03074Environ Sci Technol 2018 52 13708minus13717
13711
nutrient assimilation even where no increases in water-columnnutrient concentrations could be observed
The time series in daily rates of GPPav and ERav at Carver(Figure 2b) showed no definitive long-term trends between
Figure 4 Time series from 1 November 2014 to 1 November 2015 showing (a) Nitrate concentrations upstream at Mt Judea and downstream atCarver and the lower-flow time periods used for mass balance calculation and evaluation of biogeochemical processes (b) streamflow at Carverand the percentage groundwater contribution to streamflow (c) daily ratio of gross primary production ecosystem respiration (GPPER)downstream at Carver (horizontal dashed line shows GPPER of 1 ie balance between heterotrophy and autotrophy) and excess partial pressureof carbon dioxide (EpCO2) and (d) streamflow and the molar CN ratio (DIC dissolved inorganic carbonNO3minusN) downstream at Carver
Environmental Science amp Technology Article
DOI 101021acsest8b03074Environ Sci Technol 2018 52 13708minus13717
13712
2014 and 2017 GPPav declined rapidly in response to majorstorm runoff events but typically recovered within a couple ofweeks Highest GPPav tended to occur during quiescentbaseflow or recessional streamflow conditions during thesummer (May through August) Both GPPav and ERav declinedduring the autumn (September through December) reflectingreductions in stream biological activity and GPPav tended todecline at a faster rate than ER This was particularly apparentduring the extended low-flows between August and December2015 suggesting a decline in primary production relative tomicrobial activity and a transition from net autotrophic to netheterotrophic stream communities During winter baseflows(November through January) ERav tended to exceed GPPavDuring the 3-yr monitoring no CAFO-related impacts oneither stream nutrient concentrations or metabolism arediscernible at Carver32 Temporal and Spatial Variability in NO3
minus
Concentrations Relative to Other Key EnvironmentalVariables Mean daily NO3
minus concentrations varied betweenbaseflow and storm events at Mt Judea and Carver during theone year of overlapping data (Figure 3) There was a cleardifferentiation between a higher-flow period characterized byregular storm events from mid-December 2014 to mid-July2015 and lower-flow conditions from August to NovemberDecember 2015 (Figures 3 and 4)During the higher-flow period a positive correlation existed
between upstream (Mt Judea) and downstream (Carver)NO3
minus with a ratio approaching 1 (Figure 3) During this high-flow period NO3
minus concentrations at both upstream anddownstream sites ranged between sim01 and sim04 mg-N Lminus1Time series data show close convergence between upstreamand downstream NO3
minus concentrations during storm-eventpeak concentrations (Figure 4ab)Under lower-flow conditions NO3
minus concentrations wereconsistently higher upstream than downstream (Figure 3) Theincrease in NO3
minus concentrations at the upstream site duringthe summer and autumn 2015 corresponds with reductions inflow This is typical of the longer-term hydrologically drivencycles in NO3
minus concentrations observed at the upstream sitereflecting a strong flow dependency with highest concen-trations under the lowest flows and dilution with increasingflow (Figure SI1abc) The strong increase in NO3
minus
concentrations during July to November 2015 thereforereflects hydrological controls and is consistent with fallingflows The high NO3
minus concentrations in autumn 2015subsequently declined with the onset of higher flows (FigureSI1ab)
The gap in NO3minus concentrations between upstream and
downstream sites widened with decreasing flow particularlyduring the protracted low-flows between mid-July andNovember 2015 During this time minimal soil watercontributed to streamflow and almost all (gt95) ofstreamflow was derived from groundwater (Figure 4ab) Bythe end of October 2015 upstream NO3
minus concentrationsreached sim075 mg-N Lminus1 whereas downstream NO3
minus
concentrations were sim005 mg-N Lminus1 Between July andNovember 2015 downstream NO3
minus concentrations exhibiteda much lower range (sim005 to sim015 mg-N Lminus1) as comparedwith upstream (sim01 to sim08 mg-N Lminus1) (Figure 3) Thisreduction in both magnitude and range of downstream NO3
minus
concentrations under baseflow conditions could arise eitherfrom dilution of NO3
minus as a result of downstream accretion ofwater sources with much lower NO3
minus concentrations or byremoval of NO3
minus through biogeochemical processes neces-sitating a mass-balance evaluation (see section 33)The widening gap in NO3
minus concentrations betweenupstream and downstream sites after mid-July 2015 corre-sponded with a decline in GPPER which fell below 1indicating a change to net heterotrophy (Figure 4c) Duringthe low-flow period from mid-July to November 2015 BigCreek was heterotrophic for sim90 of days Daily streamwaterEpCO2 doubled between mid-July and November 2015 from45 to 91 times atmospheric pressure independentlyconfirming an increase in rates of respiration (CO2 release)relative to photosynthesis (CO2 uptake)During the higher-flow period from mid-January to mid-July
Big Creek was predominantly net autotrophic (GPPER gt 1for 52 of days) Net heterotrophic conditions prevailedpredominantly during lower-flow intervals between stormevents with GPPER lt 1 typically during and immediatelyafter storm eventsMolar CN ratios at Carver also increased markedly after
mid-July from sim300 to gt800 (Figure 4d) This stoichiometricdepletion of N along with persistence of low NO3
minus
concentrations below 01 mg-N Lminus1 (falling to lt004 mg-NLminus1) suggests that algal growth may have been limited by lowN availability at Carver over the late summer and autumn of2015
33 Nitrate Reach Mass Balance to Quantify SeasonalNitrate Removal during Baseflow ConditionsMean dailyNO3
minus mass balances for the eight seasonal quiescent baseflowperiods between February and October 2015 are presented inTable 1 Mean daily NO3
minus input loadings to the reach (LT)increased from 173 kg-N dminus1 in February to 617 kg-N dminus1 in
Table 1 Seasonal Patterns in Mean Daily NO3minus Input Loadings (LT) to Big Creek Mean Daily Instream NO3
minus Load Removal(LR) along the 65 km Experimental Reach Under Low-Flow Conditions and Mean Daily NO3
minus Load Removal As aPercentage of NO3
minus Inputs (UE)a
season date rangeNO3
minus input loadingto reach (LT) (kg-N dminus1)
instream NO3minus removal
along reach (LR) (kg-N dminus1)instream NO3
minus removal (LR) as of NO3minus
input loading (LT) (UE)
winter 4minus13 Feb 2015 173 (112) 768 (046) 447 (409)spring 1 5minus12 Apr 2015 441 (635) 190 (282) 439 (953)spring 2 24 Aprminus5 May 2015 379 (153) 169 (385) 476 (893)early summer 2minus10 Jun 2015 492 (236) 241 (854) 512 (534)mid summer 11minus21 Jul 2015 617 (442) 146 (282) 321(141)late summer 7minus16 Aug 2015 756 (122) 557 (059) 742 (466)autumn 1 1minus14 Sept 2015 581 (123) 449 (081) 778 (239)autumn 2 1minus11 Oct 2015 298 (029) 282 (025) 948 (120)aStandard deviations are shown in parentheses
Environmental Science amp Technology Article
DOI 101021acsest8b03074Environ Sci Technol 2018 52 13708minus13717
13713
July then declined rapidly to 756 kg-N dminus1 in August whichalso corresponded with an order of magnitude reduction inbaseflow discharge By October LT had fallen to only 298 kg-N dminus1 Instream NO3
minus removal (LR) followed a similar patternto LT with highest mean daily instream NO3
minus removal duringJune (24 kg-N dminus1) then decreasing during the late summerand autumn and falling to 282 kg-N dminus1 in October Howeverthe efficiency of instream NO3
minus removal (UE ie LR expressedas a percentage of LT) increased markedly during the latesummer and autumn from 32 in July to 74minus95 betweenAugust and OctoberThe fluvial mass balance therefore confirmed that the
observed downstream reductions in NO3minus concentrations
under baseflow were a result of net instream removal of NO3minus
by biogeochemical processes rather than a dilution effectAlthough LT and LR were greatest during the winter to early
summer period UE and the instream NO3minus removal rate (UT)
increased dramatically during the low flows of the late summerand autumn UT increased from le009 mg-N Lminus1 dminus1
(February through July) to gt02 mg-N Lminus1 dminus1 in Augustand September and 066 mg-N Lminus1 dminus1 in October (Table 2)By autumn 2015 gt75 of the NO3
minus inputs were removed bybiogeochemical processes (Table 1)We also assessed the efficiency of NO3
minus removal under thealternative scenario where the increase in flow along theexperimental reach was solely from direct groundwater input(S162) This made relatively little difference to the UE whichalso increased markedly during the late summer and autumnfrom 46 in July to 72minus94 between August and October(Table SI3) The sensitivity analysis (Tables SI1 and SI3)showed that a 50 increase or decrease in either Left Fork or
groundwater NO3minus concentrations made little difference to
these findings a consistent increase in efficiency of NO3minus
removal was observed after July with August to October UEvalues consistently sim70minus95
34 Biogeochemical Controls on Nitrate DeliveryAccounting for Assimilatory Nitrate Uptake to Calcu-late Net Nitrification and Net Denitrification FromFebruary to July assimilatory NO3
minus uptake by photosynthesiz-ing plants (UA) consistently exceeded UT (Table 2) indicatingfirst that assimilation of NO3
minus by photoautotrophs was thedominant process removing NO3
minus from the water column andsecond that assimilation was partially balanced by netnitrification NO3
minus gains In contrast from August to OctoberUT exceeded UA indicating that heterotrophic NO3
minus removalthrough direct uptake and denitrification was removing NO3
minus
along the reach in late summer and autumnTable 3 shows that net nitrification gains to the reach ranged
from 0135 mg-N Lminus1 dminus1 in February to 0273 mg-N Lminus1 dminus1
in AprilMay However after July a pronounced switch fromnet nitrification gains to net denitrification losses occurredDuring late summer and autumn denitrification losses ofNO3
minus increased from sim0100 mg-N Lminus1 dminus1 in August andSeptember to 0592 mg-N Lminus1 dminus1 in October These estimateswere based on using an average periphyton CN molar ratio of12 for USA streams3538 We also evaluated the effects ofusing an average periphyton molar CN ratio of 86 fromresearch in northern European streams17 This increased UAvalues by sim39 but did not alter our findings of a switchbetween net nitrification between February and July to netdenitrification from August to October By changing the CNstoichiometry from 12 to 86 net nitrification ranged from
Table 2 Seasonal Patterns in Mean Daily NO3minus Removal Rate (UT) along the 65 km Experimental Reach of Big Creek Under
Low-Flow Conditions And Mean Daily Assimilatory Uptake of NO3minus by Photoautotrophs (UA)
a
season date range instream NO3minus removal rate (UT) (mg-N Lminus1 dminus1) assimilatory NO3
minus uptake (UA) (mg-N Lminus1 dminus1)
winter 4minus13 Feb 2015 0077 (0006) 0212 (0035)spring 1 5minus12 Apr 2015 0072 (0017) 0256 (0050)spring 2 24 Aprminus5 May 2015 0082 (0018) 0355 (0067)early summer 2minus10 Jun 2015 0090 (0014) 0269 (0045)mid summer 11minus21 Jul 2015 0066 (0030) 0259 (0040)late summer 7minus16 Aug 2015 0284 (0026) 0180 (0016)autumn 1 1minus14 Sept 2015 0229 (0019) 0115 (0038)autumn 2 1minus11 Oct 2015 0656 (0029) 0076 (0028)
aStandard deviations are shown in parentheses
Table 3 Seasonal Patterns in Mean Daily NO3minus Concentration Gains by Net Nitrification (+) and Losses by Net
Denitrification (minus) long the Experimental Reach of Big Creek under Low-Flow Conditions Mean Daily Values of the Ratiobetween Gross Primary Production and Ecosystem Respiration (GPPER) Excess Partial Pressure of Carbon Dioxide(EpCO2) Dissolved Oxygen (DO) Streamflow and the Percentage of Groundwater Contribution to Streamflowa
season date rangenet nitrification (+) or denitrification (minus)
(mg-N Lminus1 dminus1) GPPEREpCO2
(times atm press)DO
(mg-O2 Lminus1) flow (m3 sminus1) groundwater
winter 4minus13 Feb 2015 +0135 (0032) 114 (009) 280 (020) 119 (049) 115 (007) 665 (134)spring 1 5minus12 Apr 2015 +0184 (0039) 106 (013) 364 (020) 102 (033) 310 (037) 586 (238)spring 2 24 Apr -5 May
2015+0273 (0058) 125 (016) 381 (059) 103 (050) 261 (116) 617 (579)
early summer 2minus10 Jun 2015 +0179 (0044) 134 (015) 471 (049) 939 (042) 330 (172) 580 (648)mid summer 11minus21 Jul 2015 +0193 (0024) 197 (078) 715 (046) 898 (029) 254 (128) 828 (721)late summer 7minus16 Aug 2015 minus0104 (0032) 078 (005) 106 (083) 695 (035) 023 (004) 988 (098)autumn 1 1minus14 Sept
2015minus0102 (0027) 062 (010) 985 (165) 650 (054) 024 (006) 966 (142)
autumn 2 1minus11 Oct 2015 minus0592 (0015) 057 (023) 817 (150) 785 (064) 004 (0004) 978 (064)aStandard deviations are shown in parentheses
Environmental Science amp Technology Article
DOI 101021acsest8b03074Environ Sci Technol 2018 52 13708minus13717
13714
+0218 mg-N Lminus1 dminus1 in February to +0414 mg-N Lminus1 dminus1 inAprilMay with net denitrification ranging from minus0033 mg-NLminus1 dminus1 in August to minus0562 mg-N Lminus1 dminus1 in OctoberNet nitrification and denitrification rates were compared
with mean daily GPPER EpCO2 streamflow and percentagegroundwater discharge (Table 3) The shift from netnitrification to net denitrification corresponded directly with(1) a change in stream metabolism from net autotrophic(GPPER in July was 197) to net heterotrophic (GPPER fellbelow 1 to 078 in August 062 in September and 057 inOctober) and (2) an increase in EpCO2 and a reduction inDO arising from the increases in microbial respiration relativeto photosynthesisThe alternative scenario where flow accretion between Mt
Judea and Carver was attributed to direct groundwaterdischarge to Big Creek also had no effect on the timing ofthe shift from net nitrification to denitrification (S162 TableSI4) Sensitivity analysis (Tables SI2 and SI4) also showedthat irrespective of a 50 increase or decrease in either LeftFork or groundwater NO3
minus concentrations the sameconsistent switch between net nitrification and net denitrifica-tion was observed after JulyThe consistency in this observed switch between instream
NO3minus production and instream NO3
minus removal and itssynchronicity with measured changes in stream metabolismprovides compelling evidence that the marked change ininstream NO3
minus processing and delivery after July was linked tochanges in stream metabolism from net autotrophy to netheterotrophyThe karst streams of the Ozarks are characterized by a large
hyporheic zone4243 a hotspot of nitrogen transformation44
Water residence times and redox conditions provide a keycontrol on changes between NO3
minus removal and NO3minus
production with hyporheic zone sediments45minus48 In BigCreek the winter to midsummer period was characterized byhigher baseflows (at least an order of magnitude greater thanlate summerautumn baseflows) and net autotrophy resultingin higher instream DO concentrations Rapid movement ofwell-oxygenated water throughout the water column and intothe hyporheic zone promotes aerobic metabolism of organicmatter and release of NO3
minus through nitrification4649 Fromwinter to midsummer net nitrification was observed in BigCreek and nitrification in the hyporheic zone may have beenresponsible for buffering the effects of photosyntheticassimilatory uptake of NO3
minusUnder the more sluggish flow conditions during late summer
and autumn available oxygen is depleted as a result ofincreased heterotrophic activity The reduced movement ofwater and oxygen through the hyporheic zone favors a shift torespiratory pathways with denitrification (conversion of nitrateto N2O andor N2 gas)
5051 Unlike assimilation of NO3minus into
plant biomass which retains N temporarily denitrificationresults in a permanent loss of bioavailable N The lowbaseflows of late summer and autumn 2015 resulted in higherwater residence times and a greater proportion of flow movingthrough the hyporheic zone This provides greater exposureand water contact time with microbial biofilms wheredenitrification occurs51 The death and breakdown of biomassduring the late summer and autumn contribute to theavailability of organic matter for microbial decompositionpromoting higher rates of microbial respiration relative tophotosynthesis losses of DO and greater availability of organiccarbon as a resource for denitrifying bacteria455253
Denitrification within the hyporheic zone may therefore beresponsible for losses of NO3
minus in Big Creek during the latesummer and autumn Although denitrification can also occuron suspended sediments within the water column5455 this islikely to be a second order effect under baseflow conditions ina groundwater-fed stream where suspended solids concen-trations are low (typically lt5 mg Lminus1)Under baseflow conditions instream assimilatory NO3
minus
uptake by photosynthesizing plants and hyporheic-zonedenitrification along the experimental reach removed betweensim30 and sim90 of the NO3
minus input load During the period ofmonitoring (spring 2014 to spring 2017) NO3
minus loading to theupstream section of Big Creek (at Mt Judea) was attenuated byinstream processing such that no CAFO-related impacts oneither stream nutrient concentrations or metabolism werediscernible at the downstream location (Carver) and thus tothe Buffalo River Future monitoring will be needed to detectwhether long-term changes in nutrients and organic carboninputs may occur whether this stimulates higher rates ofheterotrophic andor autotrophic activity and any longer-termeffects on the capacity of assimilation and denitrificationprocesses to remove and buffer any increase in nutrientloadingsThe novelty of this research is the combination of
continuous high-frequency in situ stream metabolism andnitrate measurements to apportion the net effects ofassimilation nitrification and denitrification on changes inbaseflow nitrate fluxes at the river-reach to watershed scale Inthis case we found that during winter to midsummer periodsNO3
minus uptake in Big Creek was dominated by assimilation byphotoautotrophs which was partially compensated by releaseof NO3
minus from nitrification In late summer the predominantmetabolic pathway switched to net heterotrophy andheterotrophic NO3
minus removal through direct uptake anddenitrification became the dominant process of nitrateremoval Removal of NO3
minus by assimilation and denitrificationprovides an important ldquoself-cleansingrdquo ecosystem serviceresulting in a pronounced shift in CN stoichiometry anddecreasing NO3
minus concentrations to low levels which would beexpected to limit algal growth56
This approach provides a means of scaling up frommicroscale and mesoscale process experiments and measure-ments which are by necessity short-term and localized toexplore how river nitrate delivery responds to shifts in streammetabolism from day-to-day and seasonal to interannualvariability This research and the methods presented here areapplicable along the river continuum from headwaters tolarge-scale fluvial systems (with large spatial and temporalvariability in nutrient fluxes) and offer a valuable way forwardin quantifying net process controls on the fate and transport ofnitrogen in fluvial systems
ASSOCIATED CONTENT
S Supporting InformationThe Supporting Information is available free of charge on theACS Publications website at DOI 101021acsest8b03074
S1 Methods Land use and cover data site hydro-geology high-frequency water-quality monitoringstreamflow measurement hydrograph separation anal-ysis of diurnal dissolved oxygen curves to calculateprimary production and respiration calculation of DICand EpCO2 nitrate mass-balance calculations and S2
Environmental Science amp Technology Article
DOI 101021acsest8b03074Environ Sci Technol 2018 52 13708minus13717
13715
Results Figure SI1 time series of nitrate and flow andnitrate plotted against stream flow for Mt Judea TablesSI1 and SI2 sensitivity analysis based on estimates ofNO3
minus load inputs from Left Fork Tables SI3 and SI4alternative scenario sensitivity analysis based onestimates of NO3
minus load inputs from groundwater andadditional references (PDF)
AUTHOR INFORMATIONCorresponding AuthorE-mail hpjcehacukORCIDHelen P Jarvie 0000-0002-4984-1607Phillip D Hays 0000-0001-5491-9272NotesThe authors declare no competing financial interest
ACKNOWLEDGMENTSHPJ and RJW were supported by NERC NationalCapability projects NEC05966 and NEC04879 Funding forthe Big Creek Research and Extension monitoring wasprovided by the Arkansas Governorrsquos Office and StateLegislature to the University of Arkansas Systemrsquos Divisionof Agriculture Hydrological and chemical monitoring by theUSGS were supported by a National Park ServiceUSGSWater Quality Partnership Grant administered by the USGSAny use of trade firm or product names is for descriptivepurposes only and does not imply endorsement by the USGovernment
REFERENCES(1) Smith V H Eutrophication of freshwater and coastal marineecosystems - A global problem Environ Sci Pollut Res 2003 10 (2)126minus139(2) Dodds W K Bouska W W Eitzmann J L Pilger T J PittsK L Riley A J Schloesser J T Thornbrugh D J Eutrophicationof US Freshwaters Analysis of Potential Economic Damages EnvironSci Technol 2009 43 (1) 12minus19(3) Dodds W K Smith V H Nitrogen phosphorus andeutrophication in streams Inland Waters 2016 6 (2) 155minus164(4) Peterson B J Wollheim W M Mulholland P J Webster JR Meyer J L Tank J L Marti E Bowden W B Valett H MHershey A E McDowell W H Dodds W K Hamilton S KGregory S Morrall D D Control of nitrogen export fromwatersheds by headwater streams Science 2001 292 (5514) 86minus90(5) Alexander R B Boyer E W Smith R A Schwarz G EMoore R B The role of headwater streams in downstream waterquality J Am Water Resour Assoc 2007 43 (1) 41minus59(6) Jarvie H P Sharpley A N Scott J T Haggard B E BowesM J Massey L B Within-River Phosphorus Retention Accountingfor a Missing Piece in the Watershed Phosphorus Puzzle Environ SciTechnol 2012 46 (24) 13284minus13292(7) Mulholland P J Helton A M Poole G C Hall R OHamilton S K Peterson B J Tank J L Ashkenas L R CooperL W Dahm C N Dodds W K Findlay S E G Gregory S VGrimm N B Johnson S L McDowell W H Meyer J L ValettH M Webster J R Arango C P Beaulieu J J Bernot M JBurgin A J Crenshaw C L Johnson L T Niederlehner B ROrsquoBrien J M Potter J D Sheibley R W Sobota D J Thomas SM Stream denitrification across biomes and its response toanthropogenic nitrate loading Nature 2008 452 (7184) 202minusU46(8) Mulholland P J Valett H M Webster J R Thomas S ACooper L W Hamilton S K Peterson B J Stream denitrificationand total nitrate uptake rates measured using a field N-15 traceraddition approach Limnol Oceanogr 2004 49 (3) 809minus820
(9) Tank J L Marti E Riis T von Schiller D Reisinger A JDodds W K Whiles M R Ashkenas L R Bowden W BCollins S M Crenshaw C L Crowl T A Griffiths N A GrimmN B Hamilton S K Johnson S L McDowell W H Norman BM Rosi E J Simon K S Thomas S A Webster J R Partitioningassimilatory nitrogen uptake in streams an analysis of stable isotopetracer additions across continents Ecol Monogr 2018 88 (1) 120minus138(10) Tank J L Meyer J L Sanzone D M Mulholland P JWebster J R Peterson B J Wollheim W M Leonard N EAnalysis of nitrogen cycling in a forest stream during autumn using aN-15-tracer addition Limnol Oceanogr 2000 45 (5) 1013minus1029(11) Ensign S H Doyle M W Nutrient spiraling in streams andriver networks Journal of Geophysical Research-Biogeosciences 2006111 (G4) G04009(12) Rode M Halbedel nee Angelstein S Anis M R BorchardtD Weitere M Continuous in-stream assimilatory nitrate uptakefrom high frequency sensor measurements Environ Sci Technol2016 50 (11) 5685minus5694(13) Bowes M J Jarvie H P Halliday S J Skeffington R AWade A J Loewenthal M Gozzard E Newman J R Palmer-Felgate E J Characterising phosphorus and nitrate inputs to a ruralriver using high-frequency concentration-flow relationships Sci TotalEnviron 2015 511 608minus620(14) Halliday S J Skeffington R A Wade A J Bowes M JGozzard E Newman J R Loewenthal M Palmer-Felgate E JJarvie H P High-frequency water quality monitoring in an urbancatchment hydrochemical dynamics primary production andimplications for the Water Framework Directive HydrologicalProcesses 2015 29 (15) 3388minus3407(15) Halliday S J Skeffington R A Wade A J Bowes M JRead D S Jarvie H P Loewenthal M Riparian shading controlsinstream spring phytoplankton and benthic algal growth Environ-mental Science-Processes amp Impacts 2016 18 (6) 677minus689(16) Wade A J Palmer-Felgate E J Halliday S J Skeffington RA Loewenthal M Jarvie H P Bowes M J Greenway G MHaswell S J Bell I M Joly E Fallatah A Neal C Williams RJ Gozzard E Newman J R Hydrochemical processes in lowlandrivers insights from in situ high-resolution monitoring Hydrol EarthSyst Sci 2012 16 (11) 4323minus4342(17) Rode M Wade A J Cohen M J Hensley R T Bowes MJ Kirchner J W Arhonditsis G B Jordan P Kronvang BHalliday S J Skeffington R A Rozemeijer J C Aubert A HRinke K Jomaa S Sensors in the stream The High-frequency waveof the present Environ Sci Technol 2016 50 (19) 10297minus10307(18) Cohen M J Kurz M J Heffernan J B Martin J BDouglass R L Foster C R Thomas R G Diel phosphorusvariation and the stoichiometry of ecosystem metabolism in a largespring-fed river Ecol Monogr 2013 83 (2) 155minus176(19) Hensley R T Cohen M J On the emergence of diel solutesignals in flowing waters Water Resour Res 2016 52 (2) 759minus772(20) Hensley R T Cohen M J Korhnak L V Inferring nitrogenremoval in large rivers from high-resolution longitudinal profilingLimnol Oceanogr 2014 59 (4) 1152minus1170(21) Kunz J V Hensley R Brase L Borchardt D Rode MHigh frequency measurements of reach scale nitrogen uptake in afourth order river with contrasting hydromorphology and variablewater chemistry (Weisse Elster Germany) Water Resour Res 201753 (1) 328minus343(22) Kraus T E C OrsquoDonnell K Downing B D Burau J RBergamaschi B A Using paired in situ high frequency nitratemeasurements to better understand controls on nitrate concentrationsand estimate nitrification rates in a wastewater-impacted river WaterResour Res 2017 53 (10) 8423minus8442(23) Jones C Kim S W Schilling K Use of continuousmonitoring to assess stream nitrate flux and transformation patternsEnviron Monit Assess 2017 189 35(24) Wollheim W M Mulukutla G K Cook C Carey R OAquatic nitrate retention at river network scales across flow conditions
Environmental Science amp Technology Article
DOI 101021acsest8b03074Environ Sci Technol 2018 52 13708minus13717
13716
determined using nested in situ sensors Water Resour Res 2017 53(11) 9740minus9756(25) Jarvie H P Sharpley A N Brahana V Simmons T PriceA Neal C Lawlor A J Sleep D Thacker S Haggard B EPhosphorus retention and remobilization along hydrological pathwaysin karst terrain Environ Sci Technol 2014 48 (9) 4860minus4868(26) American Public Health Association (APHA) AlkalinityTitration Method 2320 B In Standard Methods for the Examinationof Water and Wastewater 23rd ed 1987 ISBN 978minus0-87553minus287minus5(27) Rantz S E Measurement and computation of streamflow Vol1 Measurement of stage and discharge In US Geological SurveyWater Supply Paper 2175 1982(28) Jarvie H P Neal C Smart R Owen R Fraser D ForbesI Wade A Use of continuous water quality records for hydrographseparation and to assess short-term variability and extremes in acidityand dissolved carbon dioxide for the River Dee Scotland Sci TotalEnviron 2001 265 (1minus3) 85minus98(29) OrsquoConnor D J Ditoro D M Photosynthesis and oxygenbalance in streams Journal of the Sanitary Engineering DivisionProceedings of the American Society of Civil Engineers 1970 96 (2)547minus571(30) Williams R J White C Harrow M L Neal C Temporaland small-scale spatial variations of dissolved oxygen in the RiversThames Pang and Kennet UK Sci Total Environ 2000 251 497minus510(31) Chapra S C Ditoro D M Delta method for estimatingprimary production respiration and reaeration in streams J EnvironEng 1991 117 (5) 640minus655(32) Bernhardt E S Heffernan J B Grimm N B Stanley E HHarvey J W Arroita M Appling A P Cohen M J McDowellW H Hall R O Read J S Roberts B J Stets E G Yackulic CB The metabolic regimes of flowing waters Limnol Oceanogr 201863 S99minusS118(33) Odum H T Primary production in flowing waters LimnolOceanogr 1956 1 102minus117(34) Jarvie H P King S M Neal C Inorganic carbon dominatestotal dissolved carbon concentrations and fluxes in British riversApplication of the THINCARB model - Thermodynamic modellingof inorganic carbon in freshwaters Sci Total Environ 2017 575 496minus512(35) King S A Heffernan J B Cohen M J Nutrient flux uptakeand autotrophic limitation in streams and rivers Freshwater Science2014 33 (1) 85minus98(36) Hall R O Tank J L Ecosystem metabolism controls nitrogenuptake in streams in Grand Teton National Park Wyoming LimnolOceanogr 2003 48 (3) 1120minus1128(37) Hall R O Beaulieu J J Estimating autotrophic respiration instreams using daily metabolism data Freshwater Science 2013 32 (2)507minus516(38) Stelzer R S Lamberti G A Effects of N P ratio and totalnutrient concentration on stream periphyton community structurebiomass and elemental composition Limnol Oceanogr 2001 46 (2)356minus367(39) Redfield A C The biological control of chemical factors in theenvironment American Scientist 1958 46 (3) 205minus221(40) Evans-White M A Haggard B E Scott J T A Review ofstream nutrient criteria development in the United States Journal ofEnvironmental Quality 2013 42 (4) 1002minus1014(41) Sharpley A N Haggard B E Berry L Brye K Burke JDaniels M B Gbur E Glover T Hays P Kresse TVanDevender K W Nutrient concentrations in Big Creek correlateto regional watershed land use Agricultural amp Environmental Letters2017 2 170027(42) Miller R B Heeren D M Fox G A Halihan T Storm DE Mittelstet A R The hydraulic conductivity structure of gravel-dominated vadose zones within alluvial floodplains J Hydrol 2014513 229minus240(43) Miller R B Heeren D M Fox G A Halihan T Storm DE Heterogeneity influences on stream water-groundwater interactions
in a gravel-dominated floodplain Hydrol Sci J 2016 61 (4) 741minus750(44) Triska F J Duff J H Avanzino R J The role of waterexchange between a stream and its hyporheic zone in nitrogen cyclingat the terrestrial aquatic interface Hydrobiologia 1993 251 (1minus3)167minus184(45) Zarnetske J P Haggerty R Wondzell S M Baker M ALabile dissolved organic carbon supply limits hyporheic denitrifica-tion J Geophys Res 2011 116 G04036(46) Zarnetske J P Haggerty R Wondzell S M Bokil V AGonzalez-Pinzon R Coupled transport and reaction kinetics controlthe nitrate source-sink function of hyporheic zones Water Resour Res2012 48 W11508(47) Harvey J W Bohlke J K Voytek M A Scott D TobiasC R Hyporheic zone denitrification Controls on effective reactiondepth and contribution to whole-stream mass balance Water ResourRes 2013 49 (10) 6298minus6316(48) Moatar F Abbott B W Minaudo C Curie F Pinay GElemental properties hydrology and biology interact to shapeconcentration discharge curves for carbon nutrients sediment andmajor ions Water Resour Res 2017 53 (2) 1270minus1287(49) Zarnetske J P Haggerty R Wondzell S M Baker M ADynamics of nitrate production and removal as a function ofresidence time in the hyporheic zone J Geophys Res 2011 116G01025(50) Zarnetske J P Haggerty R Wondzell S M Couplingmultiscale observations to evaluate hyporheic nitrate removal at thereach scale Freshwater Science 2015 34 (1) 172minus186(51) Palmer-Felgate E J Mortimer R J G Krom M D JarvieH P Impact of point-source pollution on phosphorus and nitrogencycling in stream-bed sediments Environ Sci Technol 2010 44 (3)908minus914(52) Aubert A H Breuer L New seasonal shift in in-streamdiurnal nitrate cycles identified by mining high-frequency data PLoSOne 2016 11 (4) e0153138(53) Dodds W K Marti E Tank J L Pontius J Hamilton SK Grimm N B Bowden W B McDowell W H Peterson B JValett H M Webster J R Gregory S Carbon and nitrogenstoichiometry and nitrogen cycling rates in streams Oecologia 2004140 (3) 458minus467(54) Liu T Xia X H Liu S D Mou X L Qiu Y WAcceleration of Denitrification in Turbid Rivers Due to DenitrificationOccurring on Suspended Sediment in Oxic Waters Environ SciTechnol 2013 47 (9) 4053minus4061(55) Xia X H Jia Z M Liu T Zhang S B Zhang L WCoupled Nitrification-Denitrification Caused by Suspended Sediment(SPS) in Rivers Importance of SPS Size and Composition EnvironSci Technol 2017 51 (1) 212minus221(56) Jarvie H P Smith D R Norton L R Edwards F BowesM J King S M Scarlett P Davies S Dils R Bachiller-Jareno NPhosphorus and Nitrogen Limitation and Impairment of HeadwaterStreams Relative to Rivers in Great Britain A National Perspective onEutrophication Sci Total Environ 2018 621 849minus862
Environmental Science amp Technology Article
DOI 101021acsest8b03074Environ Sci Technol 2018 52 13708minus13717
13717
1
E COLI IN FLOWING WATERS
Mary Savin and BCRET members
I Why is Escherichia coli (E coli) being monitored What is the concern
Fecal pollution (from excrement of humans or animals) in the environment is of concern for many reasons not least of which is human health risks and disease control Other concerns related to fecal pollution of our natural waters include potential changes in the nutrient status of water introduction of antibiotic resistance and chemical contaminants changes in the ecological condition of waters and degradation of natural resources on which rural economies depend
People are concerned that the land application of swine effluent (pig excrement) will increase Escherichia coli in Big Creek and consequently the Buffalo River the first National Scenic River in the US This document aims to provide better understanding of
1) what is involved in E coli monitoring 2) what the numbers mean 3) some limitations in interpreting values and 4) provide a context for further research that may be needed to better interpret the E coli
numbers being measured in flowing waters such as Big Creek and Buffalo River
II What is E coli Why and how is it used as an indicator
E coli is a species of bacteria from the coliform group - bacteria that are rod-shaped gram negative non-spore forming facultative anaerobes commonly found in the feces of humans and warm blooded animals E coli occurs in human intestines - many strains with no ill effects although certain E coli cause serious human illnesses Thus while many E coli do not harm us there are important variants that do There are also other species of bacteria viruses and other small organisms that cause disease which if present in fecal sources polluting our waters can make humans sick Depending on whether E coli survive as long in the environment as these other pathogens E coli may or may not adequately warn us about a disease causing agent in our waters To date E coli is the most reliable test we have although other indicators and tests are being investigated E coli cannot be seen in streams by the human eye Thus it is important to determine if there is a problem of elevated E coli numbers by careful water sampling and using US Environmental Protection Agency (EPA) standardized methods E coli is counted in water because of the extensive studies and relationships established between the presence of E coli and the number of human illnesses occurring from contact with the water (eg swimming) containing the bacteria From these relationships there have been upper limits established for bacterial numbers that correspond to the acceptable risk of people getting sick from exposure to water containing them Water quality standards for E coli are established by the state in Arkansas Department of Environmental Quality (ADEQ) Regulation 2 (see Table 1) The E coli numbers must remain below a threshold in a specified number of total samples collected The exact upper limit that is allowed depends on the designation of the waterbody and time of year (primary or secondary contact season) Primary
2
Table 1 Upper limits for Escherichia coli counts defined in Regulation 2 of the Arkansas Department of
Environmental Quality (ADEQ) as specified by contact season and waterbody designation for both single samples and geometric mean
Contact season Water designation Limit of E coli (MPN100mL)
Single sample1
Geometric mean2
Primary (May 1-Sept 30)
Extraordinary Resource Water Ecologically Sensitive Waterbody
Natural amp Scenic Waterway Lakes
Reservoirs
298 126
All other water 410 NA3
Secondary (Oct 1-April 30)
Extraordinary Resource Water Ecologically Sensitive Waterbody
Natural amp Scenic Waterway Lakes
Reservoirs
1490 630
All other water 2050 NA 1 No more than 25 of samples from no less than 8 samples per contact season may exceed the limit 2Geometric mean is calculated from at least 5 samples collected within 30 days at evenly spaced time intervals during that 30-day period 3Not applicable
contact recreation is a designation given to a waterbody where full body contact occurs and occurs from May 1 through September 30 The ADEQ also designates any stream with a watershed (eg drainage basin in the landscape) exceeding 10 square miles and those with smaller watersheds on individual cases (ie after site verification) for primary contact recreation Secondary contact recreation designates waterbodies where activities such as boating fishing and wading take place and occurs from October 1 through April 30
E coli is measured in samples of water collected strictly following EPA guidelines The measurement of E coli starts within 8 hours of collection This method provides an estimate of E coli presence in the sampled water that is the most probable number (MPN) of E coli Using an EPA method provides numbers that are theoretically comparable to other labs using the same method The MPN depends on growing bacteria in the laboratory in ldquoculturerdquo and is an approach used routinely in microbiology This measurement is subject to high variability because of the nature of environmental bacteria thus variability in the data in E coli counts from streams is not unusual For this reason it is important to establish background levels of E coli in any water resulting from various wildlife human (eg septic tanks sewers) and agricultural (eg pig chicken cattle) sources
3
E coli thresholds are lower in late spring through summer (primary contact season) when more people are expected to be in contact with streams and lakes More stringent limits also apply to Extraordinary Resource Waters (eg Buffalo River) Ecologically Sensitive Waterbodies and Natural Scenic Waterways During the primary contact season (May 1- Sept 30) we do not want E coli to exceed 298 MPN100 mL and during secondary contact season (Oct 1 ndash Apr 30) E coli counts should not exceed 1490 MPN100 mL in single samples
III How does the E coli measurement ldquofitrdquo into the context of the landscape
While monitoring one bacterial species to assess the biological quality of water may seem simple determining the actual ecological condition of a system is complicated Measurement of E coli is an indicator for potential fecal pollution and potential pathogen problems but by itself does not identify the source(s) of the bacteria
E coli is present in intestines (and feces) and is not supposed to grow in the environment thus the presence and abundance should indicate pollution and be directly related to human and animal sources However because E coli is in many different animals (eg human wildlife agricultural) and because of the different pathways that bacteria may travel throughout the environment before ending up in water where we can measure it the presence of E coli does not identify the source of pollution
IV Why is E coli monitoring important and why is it complicated
There are many of factors that affect whether E coli survives in the environment for how long and whether it moves to other locations E coli is adapted to living in intestines After deposition from an animal cells have to survive rapidly changing environmental conditions (eg temperature and moisture) exposure to harmful UV rays in sunlight outcompete other organisms and avoid predators All these factors make it difficult to estimate how long E coli will survive in lagoon soil and river environments However there is evidence that E coli can persist in soil and sediments
V What are the numbers
E coli is measured weekly in Big Creek upstream and downstream of the CampH Farm Mt Judea Newton County Arkansas Water sample collection for E coli analysis began Sept 12 2013 prior to manure from CampH Farm application to fields either in fields adjacent to or distant from Big Creek Manure application began in 2014 to fields distant from Big Creek and then adjacent to Big Creek in March 2014 So far in the period following manure applications by CampH Farms (Jan 2 through May 19 2014) no trends in E coli with time or between sampling locations are apparent (Table 2) The Table 2 data are detailed in the Big Creek Research and Extension Team Quarterly Reports and demonstrate the week-to-week variability in E coli at upstream and downstream sites The E coli counts are expected to continue to be variable Clearly it is important to quantify the variability in E coli concentrations long-term in order to determine if changes occur as a result of CampH operation
The MPN is expected to increase with increases in flow and the recent installation of a USGS gauge to measure flow will allow for the determination of the relationship between measured flow in
4
the stream and E coli concentrations Because of the dangers during high flows most contact recreation is expected during base flow and thus sampling during base flow may provide more meaningful data
Table 2 Geometric mean of E coli (and range of sample MPN) before (Sept 12 - Dec 17 2013) and after manure applications began on the CampH Farm (Jan 2 - May 19 2014)
CampH location
Before any manure application
After manure application
Sept 12 - Dec 17 2013 Jan 2 - May 19 2014
(MPN100mL)
Upstream 82 (6 ndash 4080) 83 (NDa ndash 921)
Downstream 111 (5 ndash 3500) 39 (ND ndash 1553) aNot detected
Regulation Arkansas Pollution Control and Ecology Commission 01400-002 2014 Regulation Establishing Water Quality Standards for Surface Waters of the State of Arkansas as revised effective March 24 2014 Arkansas Department of Environmental Quality (ADEQ) Available at httpwwwadeqstatearusregsfilesreg02_final_140324pdf Last accessed 20 Aug 2014
Page 1 of 6
Nutrient impairment of surface waters continues despite widespread conservation efforts to reduce losses from urban rural and agricul-tural land uses (Scavia et al 2014) Land use within watersheds influ-
ences the quality and quantity of water in streams draining the landscape As land disturbance increases and use intensifies an increase in stormwater runoff and nutrient inputs that lead to a greater potential for transport to receiving water is generally observed (Dubrovsky et al 2010 Rebich et al 2011) This has led to efforts to identify and quantify nutrient sources within watersheds strategically target and apportion nutrient loss reduction (Reckhow et al 2011)
Many factors influence the relationship between land use in a given water-shed and nutrient transport downstream from that watershed With an increase in percentage of the drainage area in pasture row crop andor urban use a general trend of increasing nutrient concentrations in storm and base flows will manifest (Buck et al 2004 Giovannetti et al 2013 Haggard et al 2003 Migliaccio et al 2007) Thus nutrient concentrations in streams draining for-ested lands tend to be less than in watersheds with considerable anthropogenic land use
For a range of reasons great interest has been expressed in nutrient con-centrations in several streams of the Boston and Ozark Mountains region of northwest Arkansas including the Buffalo National River and its tributaries In particular Big Creek has been the center of attention within the Buffalo National River watershed (BRW) because of a permitted concentrated animal feeding operation (CAFO) The objectives of this letter are to put nutrient con-centrations of Big Creek into the context of the stream nutrient and watershed land use relationship and assess whether stream nutrient concentrations have
Nutrient Concentrations in Big Creek Correlate to Regional Watershed Land Use
A N Sharpley B E Haggard L Berry K Brye J Burke M B Daniels E Gbur T Glover P Hays T Kresse and K W VanDevender
Copyright copy American Society of Agronomy Crop Science Society of America and Soil Science Society of America 5585 Guilford Rd Madison WI 53711 USAThis is an open access article distributed under the terms of the CC BY-NC-ND license (httpcreativecom-monsorglicensesby-nc-nd40) Agric Environ Lett 2170027 (2017) doi102134ael2017080027 Received 16 Aug 2017 Accepted 25 Sep 2017 Corresponding author (sharpleyuarkedu)
Agricultural amp Environmental Letters
Research Letter
Abstract Nutrient concentrations in several streams of the Boston and Ozark Mountains region of Arkansas including the Buffalo National River and its tributaries have garnered tremendous interest In particular Big Creek has been the center of attention within the Buffalo River watershed because of a permitted concentrated animal feeding operation (CAFO) The objectives of this paper were to put nutrient concentrations of Big Creek into the context of the stream nutrient and watershed land-use relationship and develop a framework to evaluate regional land-use impacts on regional water quality Nutrient concentrations in streams draining the Boston and Ozark Mountains region were related to the intensity of watershed land use Concentrations in Big Creek were similar to other watersheds in the ecoregion with similar land use suggesting limited impact of the CAFO on Big Creek at the present time However this does not preclude future impacts and longer-term monitoring continues
AN Sharpley L Berry K Brye J Burke and T Glover Dep of Crop Soil and Environmental Sciences Univ of Arkansas 115 Plant Sciences Building Fayetteville AR 72701 BE Haggard Biological and Agricultural Engineering Univ of Arkansas BENGR201 Fayetteville AR 72701 MB Daniels and KW VanDevender Biological and Agricultural Engineering Cooperative Extension Univ of Arkansas 2301 South University Ave Little Rock AR 72203 E Gbur Agricultural Statistics Laboratory Univ of Arkansas 101 Agricultural Annex Fayetteville AR 72701 P Hays Dep of Geosciences Univ of Arkansas 216 Ozark Hall Fayetteville AR 72701 T Kresse (retired) USGS Arkansas Water Science Center 401 Hardin Rd Little Rock AR 72211
Core Ideas
bull Nutrient concentrations are low at Big Creek relative to expected biological-response thresholds
bull Nutrient concentrations at Big Creek are typical of streams draining watersheds with similar land use
bull Flow-adjusted nutrient concentrations at Big Creek have not increased over the short-term
bull Nutrient concentrations in streams increase as watershed land area in pasture and urban uses increases
Abbreviations BRW Buffalo River watershed CAFO concentrated animal feeding operation LOESS locally weighted regression SRP soluble reactive phosphorus TN total N TP total P UIRW Upper Illinois River watershed UWRW Upper White River watershed
Published online October 26 2017
Page 2 of 6 AGRICULTURAL amp ENVIRONMENTAL LETTERS
changed over the short term (3 yr of monitoring) The goal is to understand if how and why stream nutrient concentra-tions change downstream at Big Creek and whether the per-mitted swine CAFO has influenced water quality during the 3 yr since extensive monitoring began in September 2013
MethodsWater samples have been collected over varying periods
at the outlet of subwatersheds of the BRW Upper Illinois River watershed (UIRW) and Upper White River watershed (UWRW Fig 1) Land use and cover (ie forest pasture and urban) for each subwatershed was obtained from high-resolution (4-m) imagery from the USGS National Elevation Dataset (USGS 2015 Gesch et al 2002) National Land Cover Dataset (USGS 2017b) and National Hydrologic
Dataset (USGS 2017a) In the UWRW Giovannetti et al (2013) monitored 20 sites monthly for 1 yr (June 2005ndashJuly 2006) collecting water samples during base-flow condi-tions In the UIRW Haggard et al (2010) monitored 29 sites monthly during calendar year 2009 also collecting water samples during base-flow conditions
In the BRW the National Park Service in partnership with the Arkansas Department of Environmental Quality periodically collected water samples and measured nutrient concentrations at 20 stream sites from 1985 through 2015 Nitrate-nitrogen (NO3ndashN) total N (TN) soluble reactive phosphorus (SRP) and total P (TP) concentrations were obtained directly from these data Forest pasture and urban land-use areas were determined from 2006 high-resolution (4-m) land usendashland cover imagery
Fig 1 Location of the Big Creek Buffalo River Upper Illinois River and Upper White River watersheds in the Boston Mountains and Ozark Highlands ecoregion Information from USGS Environmental Systems Research Institute (ESRI) and NASA
AGRICULTURAL amp ENVIRONMENTAL LETTERS Page 3 of 6
Big Creek is monitored by the Big Creek Research and Extension Team a partnership between the University of Arkansas Systemrsquos Division of Agriculture and USGS Water samples have been collected upstream and down-stream of the swine CAFO on a near-weekly basis since September 2013 (Fig 1) The water samples were analyzed at an Arkansas Department of Environmental Quality cer-tified water quality laboratory within the Arkansas Water Resources Center (httparkansas-water-centeruarkeduwater-quality-labphp) according to methods detailed in Table 1 The data collected is made publicly available at httpsbigcreekresearchorg
The geometric mean of nutrient concentrations of base-flow samples collected between September 2013 and April 2017 were determined in order to compare with base-flow nutrient concentrations available for BRW UIRW and UWRW Base-flow conditions in Big Creek were classified from hydrograph inspection when flow had not increased or decreased within 3 d of sample collection McCarty and Haggard (2016) suggested that stream nutrient concen-trations under base flow can be used to identify nonpoint sources and target remedial measures in Boston Mountains and Ozark Highland watersheds
Using all above-listed data sources the geometric means of nutrient concentrations for streams in the BRW UIRW and UWRW were used to develop a relationship with human development within the watershed Human development is defined as the percentage of pasture plus urban land use within the watershed Exponential relationships with 95 confidence bands around the observations were developed for NO3ndashN TN SRP and TP concentrations to put nutri-ent concentration at Big Creek into the context of regional stream nutrients and watershed land use
Data from Big Creek were paired with discharge available from a gaging station just downstream from the swine CAFO where the USGS developed the rating curve discharge infor-mation was only available from May 2014 through April 2017 The data were then used in a simple three-step pro-cess (White et al 2004) to look at monotonic changes in the nutrients at Big Creek (i) log-transform concentration (mg L-1) and associated instantaneous discharge (m3 s-1) (ii) use locally weighted regression (LOESS) to smooth the data with a sampling proportion (n) of 05 and (iii) plot the resid-uals from LOESS (ie the flow-adjusted concentrations) over time and use linear regression to evaluate monotonic trends
Results and DiscussionPutting Stream Nutrient Concentrations into Context at Big Creek
In Big Creek upstream of the swine CAFO the geometric mean concentrations of base flow sampled at weekly inter-vals from September 2013 for NO3ndashN TN SRP and TP were 0098 0205 0009 and 0030 mg L-1 respectively Directly downstream of the CAFO geometric mean concentra-tions at Big Creek during base flow conditions during the same period were 0242 0356 0011 and 0031 mg L-1 for NO3ndashN TN SRP and TP respectively Arkansas has narra-tive criteria for nutrient concentrations in streams (Arkansas Pollution Control and Ecology Commission 2016) but its proposed assessment methodology has numeric screen-ing concentrations for TN (0450ndash2430 mg L-1) and TP (0040ndash0100 mg L-1) in the Boston Mountains and Ozark Highlands The geometric mean concentrations at Big Creek upstream and downstream from the CAFO were below these values for the Boston Mountains and Ozark Highlands ecoregion
Nutrient concentrations in Big Creek upstream and down-stream from the CAFO are low with respect to nutrientndashbio-logical response thresholds for algae macroinvertebrates and fish Evans-White et al (2014) reviewed the literature sum-marizing nutrientndashbiological response thresholds across the United Statesbull Algalmetricresponses TN 038ndash179 mg L-1 TP 0011ndash
028 mg L-1
bull Macroinvertebratemetric responses TN 061ndash192 mg L-1 TP 004ndash015 mg L-1
bull Fishmetricresponses TN 054ndash183 mg L-1 TP 006ndash014 mg L-1
Total N concentrations at Big Creek upstream and down-stream of the swine CAFO were well below thresholds that result in some expected biological response whereas TP con-centrations were below thresholds for expected macroinver-tebrate and fish response and on the low end of the range for expected algal response However these lower TP thresholds (0006ndash0026 mg L-1 Stevenson et al 2008) were focused on shifts in diatom species and metrics rather than nuisance algal biomass A recent study on the Illinois River Watershed showed that stream TP thresholds with Cladophora bio-volume and nuisance taxa proportion of biovolume were observed between 0032 and 0058 mg L-1 (Joint Study
Table 1 Minimum detection limits for each chemical and biological constituent
Constituent Analytical methoddagger Minimum detection limitDagger Reporting limitsectSoluble reactive P mg Lminus1 EPA 3652 0002 0010Total P mg Lminus1 APHA 4500-P J EPA 3652 0012 0020NitratendashN mg Lminus1 EPA 3000 0004 0050Total N mg Lminus1 APHA 4500-P J EPA 3532 0006 0050Total suspended solids mg Lminus1 EPA 1602 No detection limit 40
dagger EPA = Approved CWA Chemical Test Methods (USEPA 2017) APHA = American Public Health Association from the WadeableStreamsAssessmentWaterChemistryLaboratoryManual (USEPA 2004)
Dagger The minimum detection limit of an analyte is the value which can be measured and reported with 99 confidence that the analyte concentration is greater than zero Further information is available at USGS (1999)
sect The reporting limit is the least (non-zero) calibrated standard used in analysis or as defined by method for total suspended solids
Page 4 of 6 AGRICULTURAL amp ENVIRONMENTAL LETTERS
Committee 2017) Thus TP concentrations at Big Creek upstream and downstream of the CAFO were in the range in which the natural assemblage of algae is shifting but these con-centrations would likely not be indicative of problematic nuisance algae in this ecoregion
Geometric mean nutrient concentra-tions varied upstream and downstream of the swine CAFO at Big Creek and Kosič et al (2015) used the publicly available data to allude to the N increase being from human activities on the landscape such as the CAFO However the historic land use and how stream nutrient concentrations during base-flow conditions increase with human development within the Boston Mountain and Ozark Highland watersheds need to be considered (eg see Giovannetti et al 2013 Haggard et al 2003 Migliaccio et al 2007) In the Big Creek watershed the percentage of land influenced by human activities (ie pas-ture plus urban) doubles from ~10 to ~20 in the drainage area upstream and downstream of the CAFO Nutrient concentrations in Big Creek upstream and downstream of the CAFO are within the range typical of streams draining simi-lar land uses (Fig 2)
At this time nutrient concentrations in Big Creek upstream and downstream from the swine CAFO are con-sistent with the range in concentrations for other watersheds with similar pasture and urban land use characteristics (Fig 2) as well as less than most nutrient thresholds for nuisance water-quality conditions (Omernik and Griffith 2014) However this does not preclude the possibility that nutri-ent concentrations at Big Creek may increase over time especially if human development and activity in the drain-age areas increase The most important observation is that nutrient concentrations were low in Big Creek providing the ability to detect changes over time
Have Nutrient Concentrations Changed in the Short Term at Big Creek
Understanding that long-term (eg decadal-scale) water-quality data are needed to reliably assess how stream nutri-ent concentrations have changed in response to watershed management and climate variations is of critical importance (Hirsch et al 2015) The literature shows that stream nutri-ent concentrations can change relatively quickly in response to effluent management (eg Haggard 2010 Scott et al 2011) but seeing a response (ie decrease in concentrations) from landscape management can take decades or more (Green et al 2014 Sharpley et al 2013) A myriad of factors may influence observed nutrient concentrations in streams including discharge (Petersen et al 1998) biological pro-cesses and climactic conditions (ie drought and floods Jones and Stanley 2016) and dominant transport pathways (Sharpley et al 2013) Thus we need to use caution when
interpreting trends in water quality over databases that only cover a limited timeframe
Three years of flow-adjusted nutrient concentration data at Big Creek downstream from the swine CAFO (May 2014ndashApril 2017) show different relationships with flow for the various constituentsbull Nitrate-nitrogen was greatest (~05 mg L-1) during the
lowest flows sampled and concentrations decreased with increasing flow
bull Total N generally decreased with increasing flow until a minimal value occurred then TN increased with in-creasing flow
bull Soluble reactive P concentrations did not change much during base-flow conditions and the greater concentra-tions (~0100 mg L-1) sporadically occurred at larger flows indicating that enrichment from stormflow may have been influenced by availability of source or other nontransport factors and
bull Total P concentrations were also relatively stable during base-flow conditions and then increased in association with rainfall-runoff events with only a few samples hav-ing concentrations gt0100 mg L-1 indicating relatively small enrichment from the landscape
Flow-adjusted concentrations (White et al 2004) showed no monotonic (ie increasing or decreasing) trends in SRP TP or TN (P gt 016) over the current monitoring period (Fig 3) However flow-adjusted NO3ndashN concentrations decreased over time (R2 = 005 P = 001) by 7 yr-1 (Fig 3c)
Nutrient concentrations at Big Creek upstream and downstream of the swine CAFO and indeed most tributaries of the Buffalo River are low relative to other watersheds in this ecoregion (Fig 2) This provides a starting point to build a framework to evaluate changes in nutrient concentrations of streams as a function of land use and management The
Fig 2 Relationship between land use and the geometric mean N and P concentrations (mg L-1) in the Buffalo Upper Illinois and Upper White River watersheds (no total P data available for the Buffalo River watershed) Dashed lines represent the 95 confi-dence intervals for the estimated mean (solid line)
AGRICULTURAL amp ENVIRONMENTAL LETTERS Page 5 of 6
evaluation of flow-adjusted concentrations over time showed that nutrients in Big Creek were not increasing over the short duration of monitoring for which concentration and dis-charge data were available (May 2014ndashApril 2017) At this point in time (April 2014ndashApril 2017) it is evident that nutrient concentra-tions in Big Creek have not increased at the monitored site However flow and nutri-ent concentration data over a longer period are needed to reliably quantify water-quality trends and characterize sources and moni-toring needs to continue for at least a decade to evaluate how discharge season and time influence nutrient fluxes (Hirsch et al 2010)
This research details a process by which regional monitoring networks can be devel-oped to establish baseline in-stream nutri-ent concentrations and by which time andor land use and management impacts can be determined
AcknowledgmentsFunding for the Big Creek Research and Extension Team (BCRET) to undertake the on-going monitoring project was provided by the Arkansas Governorrsquos Office and State Legislature to the University of Arkansas Systemrsquos Division of Agriculture All authors are members of BCRET
ReferencesArkansas Pollution Control and Ecology Commission 2016 Regulation
no 2 Regulations establishing water quality standards for surface wa-ters of the State of Arkansas httpswwwepagovsitesproductionfiles2014-12documentsarwqspdf (accessed 21 Sept 2017)
Buck O DK Niyogi and CR Townsend 2004 Scale-dependence of land use effects on water quality of streams in agricultural catchments En-viron Pollut 130(2)287ndash299 doi101016jenvpol200310018
Dubrovsky NM KR Burow GM Clark JM Gronberg PA Hamilton KJ Hitt DK Mueller and MD Munn 2010 The quality of our na-tionrsquos waters Nutrients in the nationrsquos streams and groundwater 1992ndash2004 USGS Circ 1350 httpwaterusgsgovnawqanutrientspubscirc1350 (accessed 21 Sept 2017)
Evans-White MA BE Haggard and JT Scott 2014 A review of stream nutrient criteria development in the United States J Environ Qual 421002ndash1014 doi102134jeq20120491
Gesch D M Oimoen S Greenlee C Nelson M Steuck and D Tyler 2002 The national elevation dataset Photogramm Eng Remote Sens 68(1)5ndash11 httpsnationalmapgovPERS_Jan2002_NED_highlight_articlepdf
Giovannetti J LB Massey BE Haggard and RA Morgan 2013 Land use effects on stream nutrients at Beaver Lake watershed J Am Water Works Assoc 105E1ndashE10 doi105942jawwa20131050005
Green CT BA Bekins SJ Kalkhoff RM Hirsch L Liao and KK Barnes 2014 Decadal surface water quality trends under variable cli-mate land use and hydrogeochemical setting in Iowa USA Water Resour Res 502425ndash2443 doi1010022013WR014829
Haggard BE 2010 Phosphorus concentrations loads and sources within the Illinois River drainage area northwest Arkansas 1997ndash2008 J En-viron Qual 392113ndash2120 doi102134jeq20100049
Haggard BE PA Moore Jr I Chaubey and EH Stanley 2003 Nitrogen and phosphorus concentrations and export from an Ozark Plateau catchment in the United States Biosyst Eng 86(1)75ndash85 doi101016S1537-5110(03)00100-4
Haggard BE AN Sharpley L Massey and K Teague 2010 Final report to the Illinois River Watershed Partnership Recommended watershed based strategy for the Upper Illinois River Watershed Northwest Ar-kansas Arkansas Technical Publication Number MSC 355 Water Re-sources Center University of Arkansas httparkansas-water-centeruarkedupublicationsmscMSC355pdf (accessed 21 Sept 2017)
Hirsch RM SA Archfield and LA De Cicco 2015 A bootstrap method for estimating uncertainty of water quality trends Environ Model Softw 73148ndash166 doi101016jenvsoft201507017
Hirsch RM DL Moyer and SA Archfield 2010 Weighted regres-sion on time discharge and season (WRTOS) with an application to the Chesapeake Bay River inputs J Am Water Resour Assoc 46(5)857ndash880
Joint Study Committee 2017 Final report to governors from the Joint Study Committee and Scientific Professionals 19 Dec 2016 Arkansas-Oklahoma Joint Study Committee httpswwwokgovconservationdocumentsIR202016121920Final20Reportpdf (accessed 21 Sept 2017)
Jones JB and EH Stanley 2016 Stream ecosystems in a changing envi-ronment Academic Press Amsterdam
Kosič K CL Bitting JV Brahana and CJ Bitting 2015 Proposals for integrating karst aquifer evaluation methodologies into national en-vironmental legislations Case study of a concentrated animal feed-ing operation in Big Creek basin and Buffalo National River water-shed Arkansas USA Sustain Water Resour Manage 1363ndash374 doi101007s40899-015-0032-5
McCarty JA and BE Haggard 2016 Can we manage nonpoint-source pollution using nutrient concentrations during seasonal baseflow Ag-ric Environ Lett 1160015 doi102134ael2016030015
Migliaccio KW BE Haggard I Chaubey and MD Matlock 2007 Linking watershed subbasin characteristics to water quality param-eters in War Eagle Creek watershed Trans ASAE 50(6)2007ndash2016 doi1013031201324104
Omernik JM and GE Griffith 2014 Ecoregions of the conterminous United States Evolution of a hierarchical spatial framework Environ Manage 54(6)1249ndash1266 doi101007s00267-014-0364-1
Petersen JC JC Adamski RW Bell JV Davis SR Femmer DA Freiwald and RL Joseph 1998 Water quality in the Ozark Plateaus Arkansas Kansas Missouri and Oklahoma 1992ndash95 USGS Circ 1158 USGS Fort Collins CO httpspubsusgsgovcirccirc1158circ1158pdf (accessed 21 Sept 2017)
Rebich RA NA Houston SV Mize DK Pearson PB Ging and CE Hornig 2011 Sources and delivery of nutrients to the northwestern Gulf of Mexico from streams in the south-central United States J Am Water Resour Assoc 47(5)1061ndash1086 doi101111j1752-1688201100583x
Reckhow KH PE Norris RJ Budell DM Di Toro JN Galloway H Greening AN Sharpley A Shirmhhammadi and PE Stacey 2011 Achieving nutrient and sediment reduction goals in the Chesapeake Bay An evaluation of program strategies and implementation Na-tional Academies Press Washington DC
Fig 3 Flow-adjusted concentration of (a) soluble reactive P (b) total P (c) nitrate-N and (d) total N over time since January 2014 when monitoring in Big Creek started
Page 6 of 6 AGRICULTURAL amp ENVIRONMENTAL LETTERS
Scavia D JD Allan KK Arend S Bartell D Beletsky NS Bosch SB Brandt RD Briland I Daloglu JV DePinto DM Dolan MA Evans TM Farmer D Goto H Han TO Hoeoek R Knight SA Ludsin D Mason AM Michalak RP Richards JJ Roberts DK Rucinski E Rutherford DJ Schwab TM Sesterhenn H Zhang and Y Zhou 2014 Assessing and addressing the re-eutrophication of Lake Erie Central basin hypoxia J Great Lakes Res 40226ndash246 doi101016jjglr201402004
Scott JT BE Haggard AN Sharpley and JJ Romeis 2011 Change point analysis of phosphorus trends in the Illinois River (Oklahoma) demonstrates the effects of watershed management J Environ Qual 401249ndash1256 doi102134jeq20100476
Sharpley AN HP Jarvie A Buda L May B Spears and P Kleinman 2013 Phosphorus legacy Overcoming the effects of past management practices to mitigate future water quality impairment J Environ Qual 421308ndash1326 doi102134jeq2013030098
Stevenson RJ Y Pan KM Manoylov CA Parker DP Larsen and AT Herlihy 2008 Development of diatom indicators of ecological con-ditions for streams of the western US J North Am Benthol Soc 271000ndash1016 doi10189908-0401
USEPA 2004 Wadeable streams assessment water chemistry laboratory manual USEPA Office of Water and Office of Research and Develop-ment Washington DC
USEPA 2017 Approved CWA chemical test methods USE-PA Washington DC httpswwwepagovcwa-methodsapproved-cwa-chemical-test-methodsnumber
USGS 1999 The method detection limit procedure of the US Environmen-tal Protection Agency In New reporting procedures based on long-term method detection levels and some considerations for interpre-tations of water-quality data provided by the US Geological Survey National Water Quality Laboratory Open File Rep 99-103 USGS Reston VA httpswaterusgsgovowqOFR_99-193detectionhtml
USGS 2015 National elevation dataset httpsltacrusgsgovNEDUSGS 2017a National hydrologic dataset httpsnhdusgsgovUSGS 2017b National land cover dataset httpscatalogdatagovdataset
usgs-national-land-cover-dataset-nlcd-downloadable-data-collectionWhite KL BE Haggard and I Chaubey 2004 Water quality at the Buffalo
National River Arkansas 1991ndash2001 Trans ASAE 47(2)407ndash417 doi1013031201316042
Sampling Liquid Manure
Karl VanDevender PhD PE Professor Extension Engineer
Liquid animal manure sampling can be an important management tool Proper sampling provides the producer with nutrient analysis results that can be used in a sound farm fertilization program Nutrient analysis of manure in conjunction with soil sampling helps determine how much manure should be applied to fields to maintain adequate fertility while minimizing potential environmental problems such as ground and surface water pollution However manure applications should not exceed the maximum application rates in a manure management plan until sufficient data can be collected to justify revising the plan
When to Sample Liquid animal manure should be sampled for nutrient analysis as close to land application time as possible This helps ensure that the reported nutrient content accurately reflects what is being applied to the land If the manure is sampled as it is being land applied the results will not be available to govern present application rates It does however provide information for future land applications of animal manure if the manure management remains fairly constant over time
How to Collect a Liquid Manure Sample During Land Application The easiest way to collect liquid animal manure samples is to collect the manure as it is being land applied This approach ensures what is sample reflects what is applied Randomly place catch pans in the field to collect the liquid manure as it is land applied by an irrigation system or honey wagon Flexible rubber feed pans work well Immediately after the manure has been applied collect the manure from the catch pans combine in a bucket to make one composite sample and mix well by stirring This bucket will be the source of the manure sent for analysis From a Storage Facility If collecting liquid animal manure samples during land application is not possible collect the samples from the storage facility Liquid animal manure storage facilities have a tendency for the manure to stratify with the solids settling to the bottom and the liquids remaining on top It is also not uncommon for some solids to form a floating crust This stratification affects the manure nutrient concentrations in the storage facility The nitrogen and potassium will be more concentrated in the top liquid while the phosphorus will be more concentrated in the settled solids This stratification of nutrient concentrations increases the challenge of getting samples that represent what will be applied to a particular field If the liquids from the top and middle of the profile will be applied only this material should be sampled If the settled solids will be applied then they should be sampled However if the manure is to be agitated before pumping as has been the traditional recommendation the sample should contain representative proportions of manure from the top middle and bottom The idea is to collect a sample of an entire column of manure to represent the manure after agitation If agitating the manure prior to sampling is not possible an alternative approach is to make a sampler to collect the required sub-samples The sub-samples are then mixed to represent the manure after agitation The easiest to construct is simply a container such as a cup attached to the end of a pole Liquids from the manure surface can be simply scooped up To collect liquids from the middle depths or settled solids the container is held up side down trapping air until the desired sampling depth is reached Then the container is rotated releasing the air and collecting the sample When collecting a sample of the entire profile of the manure sub-samples are collected and mixed in a bucket
- over -
A sampler design that automatically collects a sample of the entire profile uses 10 foot 1 frac12 inch PVC pipe with a PVC ball valve at the bottom The handle of the ball valve is replaces with a lever arm about 2 feet long The free end of the lever arm is attached to the end of a 10 foot 1 inch PVC pipe The lever arm and smaller pipe allow the ball valve to be operated while holding to top of the sampler To use the sampler the valve is opened and the sampler is inserted (in a line not and arc) into the manure When the foot of the valve is at the bottom of the settled solids it is closed Then the sample of the entire manure profile can be removed from the manure and placed in a bucket
Sketch of Cup Sampler Sketch of Foot Valve Sampler
Whichever sampler is used at least 8 locations around the manure storage unit should be sampled and mixed in a bucket to serve as a final composite sample This bucket will be the source of the manure sent for analysis
Getting the Sample Analyzed After thoroughly mixing the final composite sample fill a one liter plastic bottle half full These bottles may be obtained from your county Extension office Never fill the bottle more than half full to allow for gas expansion of the sample and to prevent the bottle from exploding Keep the samples as cool as possible until you can take them to your county Extensions office for shipping to the University of Arkansas lab for analysis There you will get assistance in filling out an information sheet on your manure sample There is a fee to have the sample analyzed While the sample can be sent to a private lab the fees are often higher If you are required by the Arkansas Department of Environmental Equality (ADEQ) to sample your liquid animal manure as part of your Regulation No 5 permit make sure that you inform the individual helping you with the paperwork so the correct set of analyses can be performed In addition to the analyses to determine the fertilizer value of manure it is recommended to analyze for the amount of phosphorus in the manure that is water soluble Water soluble phosphorus is needed to evaluate the potential environmental risk associated with phosphorus application rates specified in manure management plans Having good farm based information should help planners develop plans tailored to and individual farm
Key Points to Remember The important things to remember in collecting a liquid animal manure sample are Collect a sample that best represents the nutrient content of the manure in that storage facility and what
will be applied If only the top water is to be applied it should be sampled If the storage unit will be agitated prior to application the sample should contain material from the entire depth profile
Only fill the sample bottle frac12 full Keep the sample cool prior to shipping Ship the sample to the lab as soon as possible
Handout April 27 2010
The Arkansas Cooperative Extension Service offers its programs to all eligible persons regardless of race color national origin religion
gender age disability marital or veteran status or any other legally protected status and is an Equal Opportunity Employer
- 2015_Bacteria Trends in Flowing Waterspdf
-
- E COLI IN FLOWING WATERS
-
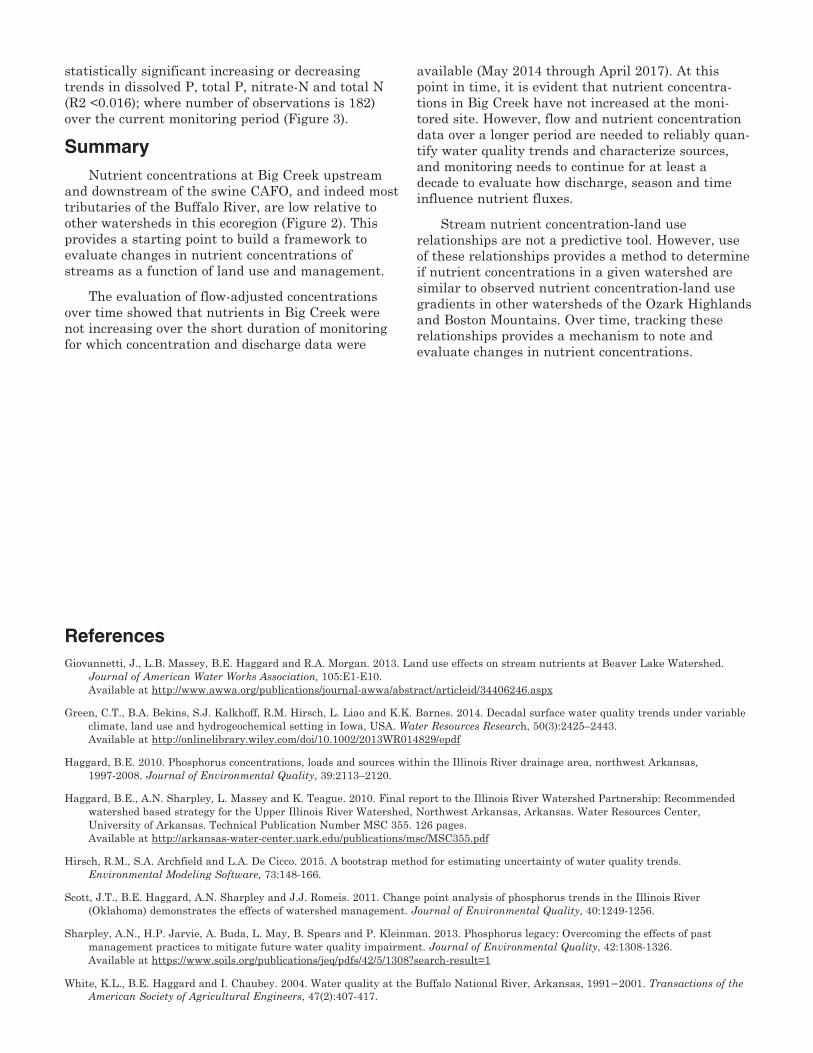

Page 1 of 6
Forested riparian zones (FRZs) or vegetated buffer strips (VBS) are composed of a zone of managed or unmanaged vegetation between the edge of the field and the receiving watercourse They are widely used
to decrease nutrient and s diment runoff leaving agricultural fields and enter-ing adjacent flowing waters The main functions of these areas are to slow the flow of surface runoff promoting sedimentation and infiltration and to act as a filter to trap sediment and reduce dissolved nutrient concentrations through soil sorption and plant uptake (Hoffmann et al 2009) Numerous studies have demonstrated the effectiveness of VBS at decreasing particulate P loss how-ever their effect on dissolved P is less clear (Dodd and Sharpley 2016) Detailed reviews of the literature have highlighted studies where such VBS have become sources rather than sinks of P where soil P concentrations are elevated (eg Hoffmann et al 2009 Roberts et al 2012 Sheppard et al 2006)
Three possible mechanisms for the release of P from VBS have been sug-gested (Roberts et al 2012) (i) decreased P sorption capacity due to saturation of P sorption sites (ii) desorption of P from soil surfaces or dissolution of pre-cipitated P and (iii) biological cycling through the plant and microbial pools Compared to much-studied geochemical processes relatively little is known about processes involved in the microbial P cycle or the impact of differing land management strategies on these Furthermore the contribution of dissolved organic P forms to P loss from VBS is often overlooked (Dodd and Sharpley 2015) and we suggest that organic forms could make up a substantial propor-tion of dissolved P in soils with active microbial P cycling This study aims to address this research gap
Organic Phosphorus Can Make an Important Contribution to Phosphorus Loss from Riparian Buffers
Rosalind J Dodd Andrew N Sharpley and Lawrence G Berry
Copyright copy American Society of Agronomy Crop Science Society of America and Soil Science Society of America 5585 Guilford Rd Madison WI 53711 USAThis is an open access article distributed under the terms of the CC BY-NC-ND license (httpcreativecom-monsorglicensesby-nc-nd40) Agric Environ Lett 3180002 (2018) doi102134ael2018010002 Received 17 Jan 2018 Accepted 19 Feb 2018 Corresponding author (sharpleyuarkedu)
Agricultural amp Environmental Letters
Research Letter
Abstract Vegetative buffer strips (VBS) and managed or unmanaged riparian zones between the edge of field and receiving watercourse are widely adopted conservation practices aimed at reducing nonpoint nutrient pollution However their effectiveness at decreasing phosphorus (P) loss has been mixed This study investigated the effectiveness of a VBS and a forested riparian zone (FRZ) in decreasing P loss from pasture soils receiving swine manure and aimed to determine the potential factors controlling P release using water extractable P (WEP) as a proxy for P loss The inorganic WEP concentrations were significantly greater in the fertilized pasture zone soils than the VBS or FRZ soils However there was no significant difference between the field and riparian soils for total WEP due to increased contribution from organic WEP in these soils Degree of P saturation which is a function of soil test P was a good predictor of inorganic WEP but not organic WEP where the variation in concentrations was better explained by variables involved in biotic P release
RJ Dodd Faculty of Agriculture and Life Sciences Lincoln Univ Lincoln Christchurch New Zealand AN Sharpley and L G Berry Dep of Crop Soil and Environmental Sciences Univ of Arkansas Fayetteville AR USA
Core Ideas
bull Forested and vegetative buffers can retain P runoff from adjacent fields
bull High concentrations of molybdate unreactive P were detected in soil water extracts
bull With time these buffer soils can be a source of soluble inorganic and organic P
bull High microbial activity in buffer soils suggests biologically mediated P release
Abbreviations DPS degree of soil phosphorus saturation FPZ fertilized pasture zone FRZ forested riparian zone M3-P Mehlich extractable P MBC microbial biomass C MBN microbial biomass N MBP microbial biomass P TC total C TN total N TP total P TWEP total water extractable phosphorus VBS vegetated buffer strips WEP water extractable phosphorus WEPi inorganic water extractable phosphorus WEPo organic water extractable phosphorus
Published online March 15 2018
Page 2 of 6 AGRICULTURAL amp ENVIRONMENTAL LETTERS
The Buffalo River is an important recreation area in northwest Arkansas In 2013 a concentrated animal feeding operation (CAFO) was permitted to operate in this water-shed (Arkansas Department of Environmental Quality 2017) raising concerns of potential impairment of area waters for recreational use In this operation swine manure is land applied to pasture land either grazed by cattle or hayed Fields adjacent to a stream have a 30-m buffer to which no manure or fertilizer can be applied providing an ideal opportunity to investigate the fate and cycling of soil P along a gradient of a fertilized pasture zone (FPZ) grass VBS and a forested riparian zone (FRZ) Three fields with differ-ent management histories soil properties and slope were selected to investigate the potential for dissolved P release as measured by water extractable P across these three zones We addressed two main objectives
1 To determine the effect of landscape position on the potential for P release as both dissolved inorganic and organic P
2 To investigate the soil chemical and biological properties that control the release of dissolved P from these soils
While it is acknowledged that vegetation can be an addi-tional source of P loss especially from forested riparian areas where there may be accumulation of litter material quantification of its contribution was beyond the scope of this study which focuses on the release of soil P to water
Materials and MethodsThe study site is located in Mount Judea AR (Fig 1) Three
fields were sampled (Fields 1 5a and 12 Fig 2) Dominant soil types along with management for these are listed in Table 1 All three fields received poultry litter once every 2 yr in March from 2004 to 2012 (45 Mg ha-1 yr-1 approximately 50 kg P and 120 kg N ha-1 yr-1) Fields 1 and 12 currently receive only swine manure In 2014 Field 1 received a total of 47 kg P ha-1 and 94 kg N ha-1 and Field 12 received 65 kg P
ha-1 and 128 kg N ha-1 In 2015 Field 1 received a total of 73 kg P ha-1 and 32 kg N ha-1 and Field 12 received 35 kg P ha-1 and 146 kg N ha-1 While no swine manure has been applied to Field 5a diammonium phosphate fertilizer was applied annually since 2012 at 11 kg P and 25 kg N ha-1
On Fields 1 and 12 receiving swine manure a required application buffer of 30 m from the field edge is in place Field 1 has a steep topography and drains into an ephem-eral stream located within the riparian zone and connected to Big Creek Fields 5a and 12 have slopes of lt2 These fields border Big Creek and are prone to flooding during large storm events Field 1 is continuously grazed by cattle whereas grass is cut for silage in Fields 5a and 12
At each field three transects were laid across the site running through the FPZ VBS and into the FRZ For each transect soil samples were taken at the 0- to 10-cm depth from three locations within the FPZ one location within the manure application VBS and one location in the FRZ which borders the stream Soil sampling at all fields was performed over the course of 1 d on four occasions October 2014 January 2015 April 2015 and July 2015 corresponding to autumn winter spring and summer to account for seasonal variability
Fig 1 Buffalo River watershed location in Arkansas USA Fig 2 Location of Big Creek watershed farm and fields studied
AGRICULTURAL amp ENVIRONMENTAL LETTERS Page 3 of 6
As much of the vegetation mat as possible was removed in the field Soil samples were separated into two subsamples for biotic and abiotic analysis Samples for biotic analysis (microbial biomass and enzyme activity) were sieved lt2 mm and stored at 4degC until analysis Samples for abiotic analysis were air-dried ground and sieved lt2 mm Additional plant material shoots and roots were removed by hand before sieving
Soil samples were analyzed for the following properties using the methods outlined in Table 2 total WEP (TWEP) inorganic WEP (WEPi) organic WEP (WEPo) Mehlich extractable P (M3-P) degree of soil P saturation (DPS) total P (TP) total C (TC) total N (TN) pH microbial biomass P C and N (MBP MBC MBN) and phosphatase enzyme activities Phosphorus concentration for all analyses except M3-P was determined using the molybdate blue method of Watanabe and Olsen (1965) M3-P concentrations were determined via inductively coupled plasma
The P content determined colorimetrically directly fol-lowing extraction with water is more accurately described as molybdate reactive P and consists mainly of orthophosphate ions and a small proportion of easily hydrolyzable inorganic and organic P The difference between this value and that determined following digestion is more accurately described as molybdate unreactive P and consists mainly of organic P forms but also a smaller fraction of condensed inorganic P
such as polyphosphates (Haygarth and Sharpley 2000) Due to the dominance of inorganic P in molybdate reactive P and organic P in molybdate unreactive P WEPi and WEPo have been used to distinguish between these two forms of P to avoid confusion and allow a clear message to be presented
Before all statistical analysis the data were examined for normality and the following parameters were log-trans-formed TWEP WEPi and WEPo To examine the differ-ences in soil properties across the three landscape positions the data from the three samples taken along each transect within the FPZ were averaged to provide one value for each zone (FPZ VBS and FRZ) for each transect Data from each of the three fields and from each of the transects within the fields were treated as replicates giving nine location rep-licates per zone These data were subjected to a one-way ANOVA by zone blocked by season providing four seasonal replicates for each location replicate and a total replication of 36 data points per zone For all parameters a Tukey test was used to determine significant differences between the zones at the p lt 005 level of significance
To determine which soil properties were contributing to the release of WEP and which soil parameters are impor-tant in regulating the release of P a stepwise regression was undertaken using the following parameters acid phospho-monoesterase alkaline phosphomonoesterase phosphodies-terase total phosphatase MBN MBP MBC M3-P DPS pH
Table 1 Field properties and management
Site Soil series Area Range in slope Managementha
Field 1 Noark very cherty silt loam 63 20ndash200 Grazed at 05 animal units ha-1
Field 5a Razort loam 108 02ndash10 Hayed and grazed at 03 animal units ha-1
Field 12 Spadra loam 96 05ndash20 Hayed and grazed at 03 animal units ha-1
Table 2 Summary of analytical methods used
Parameterdagger Analytical method ReferenceTWEP 120 soil-to-water extraction followed by centrifugation
filtration lt045 mm and acid persulfate digestionSelf-Davis et al (2009) and Rowland and Haygarth (1997)
WEPi 120 soil-to-water extraction followed by centrifugation and filtration lt045 mm
Self-Davis et al (2009)
WEPo Assumed to be the difference between TWEP and WEPi mdashM3-P 110 soil-to-Mehlich-3 extractant and centrifugation Mehlich (1984)DPS Calculated from M3-P Fe and Al according to the equation
DPS = M3-P05 times (M3-Fe + M3-Al) times 100Adapted from Schoumans (2009)
TP Alkaline oxidation Dick and Tabatabai (1977)TC Combustion on an Elementar VarioMax CN Provin (2014)TN Combustion on an Elementar VarioMax CN Provin (2014)pH 12 soil-to-water extraction mdashMBP Chloroform-fumigation extraction Adapted from Brookes et al (1985) and McLaughlin et al (1986)MBC Chloroform-fumigation extraction Vance et al (1987)MBN Chloroform-fumigation extraction Vance et al (1987)Acid Pmono Enzyme assays using 5mM para-nitrophenyl phosphate as the
substrate buffered at pH 65Tabatabai (1994)
Alk Pmono Enzyme assays using 5mM para-nitrophenyl phosphate as the substrate buffered at pH 11
Tabatabai (1994)
Pdi Enzyme assays using 1 mM bis-para-nitrophenyl phosphate as the substrate buffered at pH 8
Tabatabai (1994)
Total phosphatase Sum of acid Pmono alk Pmono and Pdi mdash
dagger acid Pmono acid phosphomonoesterase alk Pmono alkaline phosphomonoesterase DPS degree of soil phosphorus saturation M3-P Mehlich extractable P MBC microbial biomass C MBN microbial biomass N MBP microbial biomass P Pdi phosphodiesterase TC total C TN total N TP total P TWEP total water extractable phosphorus WEPi inorganic water extractable phosphorus WEPo organic water extractable phosphorus
Page 4 of 6 AGRICULTURAL amp ENVIRONMENTAL LETTERS
TP TC and TN All analyses were performed using the SPSS statistical package version 22 (IBM 2013)
Results and DiscussionWater extractable soil P concentration has been shown to
be directly related to the potential for dissolved P release from soils to surface runoff (Pote et al 1996 Sharpley 1995) The total inorganic and organic WEP (TWEP WEPi WEPo) concentrations across the three fields was significantly lower in the VBS than the FPZ reflecting the larger inputs of P to the FPZ (Fig 3) However there was no significant difference in TWEP between the pasture and FRZs despite a decrease in WEPi This is a result of the significantly higher concen-trations of WEPo present in the FRZ where WEPo made up 57 of TWEP in these soils compared with just 24 in the pasture soils This suggests that dissolved organic P can con-tribute to total P release in riparian soils
The release of soil P to water can occur through abiotic and biotic processes Desorption and dissolution reactions dominate the abiotic release mechanisms and are governed by soil chemical properties and number of available sorption sites (Arai and Sparks 2007) Microbial soil biomass can con-tain a significant pool of P in temperate pastures (Oberson and Joner 2005) This pool is in constant flux immobilizing P from or replenishing P in the soil solution during micro-bial growth or cell death Phosphorus release from this pool
occurs through three main mechanisms (i) mineralization (Oehl et al 2001) (ii) cell lysis in response to environmental stress (eg dessication) (Turner and Haygarth 2001) or (iii) predation by soil fauna (Bonkowski 2004) Biotic processes can also control the form of dissolved P in solution through the exudation of phosphatase enzymes which can catalyze the conversion of soluble organic P compounds to ortho-phosphate ions for plant uptake (Richardson et al 2011)
Table 3 shows the abiotic and biotic soil properties of the soils across the three landscape zones The FPZ soils had sig-nificantly higher concentrations of TP and M3-P but lower concentrations of TC and TN compared with the FRZ soils Additionally the DPS was significantly higher in the FPZ soils compared with the VBS and FRZ soils indicating more of the P sorption sites had become saturated Surprisingly we saw no significant difference in microbial biomass P C or N concentrations among zones despite expected increased leaf litter inputs in the FRZ However the total phosphatase activity was 17 higher in the FRZ soils than the field soils suggesting increased microbial activity
To determine which pools of P and which soil proper-ties were key in controlling the release of P to water we per-formed a stepwise regressions for TWEP WEPi and WEPo using data from all three sites and four sampling dates The results from this analysis are shown in Table 4 Both TWEP and WEPi were well predicted by the model (adjusted r2 =
Fig 3 Box plots showing the concentration of (i) total water extractable P (ii) inorganic water extractable P and (iii) organic water extractable P across the three zones (fertilized pasture zone [FPZ] vegetative buffer strip [VBS] and forested riparian zone [FRZ]) Letters denote significant differences between zones at p lt 005 as determined by Tukeyrsquos test of multiple comparisons
Table 3 Difference in mean soil properties across the different landscape zones fertilized pasture zone (FPZ) vegetative buffer strip (VBS) forested riparian zone (FRZ) pH total C (TC) total N (TN) total P (TP) Mehlich-3 P (M3-P) degree of P saturation (DPS) microbial biomass P (MBP) microbial biomass C (MBC) microbial biomass N (MBN) acid phosphomonoesterase (acid Pmono) alkaline phosphomonoesterase (alk Pmono) phosphodiester-ase (Pdi) and total phosphatase activities
ZoneSoil chemical properties Soil biological properties
pH TC TN TP M3-P DPS MBP MBC MBN Acid Pmono Alk Pmono Pdi Total phosphatase
mdashmdashmdash mdashmdashmdash mdash mg kg-1 mdash mdashmdashmdash mg kg-1 mdashmdashmdash mdashmdashmdashmdashmdash mmol pNPdagger g-1 h-1 mdashmdashmdashmdashmdashFPZ 587bDagger 206b 023b 640a 67a 748a 26 371 85 300a 133b 120b 553bVBS 571b 188b 021b 584ab 48b 489b 23 386 79 259ab 093b 096b 456bFRZ 640a 321a 026a 521b 28c 457b 28 356 101 233b 205a 205a 666ap value lt0001 lt0001 lt005 lt001 lt0005 lt0001 NS NS NS lt0005 lt0001 lt0001 lt0001
dagger pNP para-nitrophenyl phosphateDagger Means followed by the same letter are not significantly different at the p lt 005 level of significance according to Tukeyrsquos test for multiple comparisons
AGRICULTURAL amp ENVIRONMENTAL LETTERS Page 5 of 6
066 and 065 respectively) and variation in these concen-trations was mostly explained by DPS with a small con-tribution from total phosphatase activity an indicator of biologically mediated P release
In contrast to WEPi variation in WEPo was less closely related to any of the measured parameters (adjusted r2 = 037) Furthermore DPS was not included in the selected model and total phosphatase activity explained most of the variation in WEPo While total phosphatase activity was greatest in FRZ soils the activity of the different types of enzyme varied across the landscape positions (Table 3) Acid phosphomono-esterase activity was highest in the FPZ soils and of a similar magnitude to that found agricultural soils with a history of poultry manure application and high soil test PSpelled out STP correct concentrations (Tomlinson et al 2008) Acid phosphomonoesterase is thought to be mainly released by plant roots and some microbes and there is evidence that high concentrations phosphatase enzymes can be pres-ent in manures (Nannipieri et al 2011) Furthermore these enzymes have been shown to sorb strongly onto soil parti-cles (Burns 1986 Nannipieri et al 2011) hence the large acid phosphomonoesterase activates found in the FPZ may be directly due to manure application In contrast alkaline phosphomonoesterase and phosphodiesterase activities were greatest in the FRZ in keeping with the small increase in pH (Table 3) These enzymes are thought to be released by soil microorganisms rather than plant roots The differences in phosphatase activities across the zones suggest that release of P from riparian soils is likely to be controlled in part by the biologically mediated release of organic P
This study demonstrates that the significant decrease in soil test P concentrations in FRZ soils compared with regu-larly fertilized FPZ does not necessarily translate to a reduc-tion in the total amount of P which can be released to runoff due to the increase in WEPo Furthermore while DPS of which soil test P is a component was a good predictor of WEPi release additional factors relating to biological cycling need to be considered when trying to account for the poten-tial release of organic P
ReferencesArai Y and D Sparks 2007 Phosphate reaction dynamics in soils and
soil components A multiscale approach Adv Agron 94135ndash179 doi101016S0065-2113(06)94003-6
Arkansas Department of Environmental Quality 2017 Permit data system Specific NPDES water permit details Permit arg590001 httpswwwadeqstatearushomepdssqlp_permit_details_water_npdesaspxafindash=ampafin=5100164amppmtnbr=arg590001
Bonkowski M 2004 Protozoa and plant growth The microbial loop in soil revisited New Phytol 162617ndash631
Brookes PC A Landman G Pruden and DS Jenkinson 1985 Chloro-
form fumigation and the release of soil nitrogen A rapid direct extrac-tion method to measure microbial biomass nitrogen in soil Soil Biol Biochem 17837ndash842 doi1010160038-0717(85)90144-0
Burns RG 1986 Interactions of enzymes and soil mineral and organic col-loids In PM Huang and M Schnitzer editors Interactions of soil minerals with natural organics and microbes SSSA Madison WI p 429ndash453
Dick WA and MA Tabatabai 1977 An alkaline oxidation method for de-termination of total phosphorus in soils Soil Sci Soc Am J 41511ndash514 doi102136sssaj197703615995004100030015x
Dodd RJ and AN Sharpley 2015 Recognizing the role of soil organic phosphorus in soil fertility and water quality Resour Conserv Recycl 105(B) 282ndash293 doi101016jresconrec201510001
Dodd RJ and AN Sharpley 2016 Conservation practice effectiveness and adoption Unintended consequences and implications for sustain-able phosphorus management Nutr Cycling Agroecosyst 104373ndash392 doi101007s10705-015-9748-8
Haygarth PM and AN Sharpley 2000 Terminology for phos-phorus transfer J Environ Qual 2910ndash15 doi102134jeq200000472425002900010002x
Hoffmann CC C Kjaergaard J Ussi-Kaumlampauml HC Bruun Hansen and B Kronvang 2009 Phosphorus retention in riparian buffers Re-view of their efficiency J Environ Qual 381942ndash1955 doi102134jeq20080087
IBM 2013 IBM SPSS statistics for Windows version 220 IBM Corp Ar-monk NY
McLaughlin MJ AM Alston and JK Martin 1986 Measurement of phos-phorus in soil microbial biomass A modified procedure for field soils Soil Biol Biochem 18437ndash443 doi1010160038-0717(86)90050-7
Mehlich A 1984 Mehlich 3 soil test extractant A modification of the Mehlich 2 extractant Commun Soil Sci Plant Anal 151409ndash1416 doi10108000103628409367568
Nannipieri P L Giagnoni L Landi and G Renella 2011 Role of phospha-tase enzymes in soil In EK Buumlnemann A Oberson and E Frossard editors Phosphorus in action Soil Biology Ser 26 Springer Berlin p 215ndash243 doi101007978-3-642-15271-9_9
Oberson A and EJ Joner 2005 Microbial turnover of phosphorus in soil In BL Turner E Frossard and DS Baldwin editors Organic phos-phorus in the environment CAB International Wallingford UK p 133ndash164 doi10107997808519982200133
Oehl F A Oberson M Pronst A Fliessbach H Roth and E Frossard 2001 Kinetics of microbial phosphorus uptake in cultivated soils Biol Fertil Soils 3431ndash41 doi101007s003740100362
Pote DH TC Daniel AN Sharpley PA Moore Jr DR Edwards and DJ Nichols 1996 Relating extractable soil phosphorus to phospho-rus losses in runoff Soil Sci Soc Am J 60855ndash859 doi102136sssaj199603615995006000030025x
Provin T 2014 Total carbon and nitrogen and organic carbon via thermal combustion analyses In FJ Sikora and KP Moore editors Soil test methods from the southeastern United States Southern Cooperative Series Bull 419 Southern Extension and Research Activity Informa-tion Exchange Group- 6 p 149ndash154 httpaeslcesugaedusera6PUBMethodsManualFinalSERA6pdf
Richardson AE JP Lynch PR Ryan E Delhaize FA Smith PR Harvey MH Ryan EJ Veneklaas H Lambers A Oberson RA Culvenor and RJ Simpson 2011 Plant and microbial strategies to improve ef-ficiency of agriculture Plant Soil 349121ndash156
Roberts WM MI Stutter and PM Haygarth 2012 Phosphorus retention and remobilization in vegetative buffer strips A review J Environ Qual 41389ndash399 doi102134jeq20100543
Rowland AP and PM Haygarth 1997 Determination of total dis-solved phosphorus in soil solutions J Environ Qual 26410ndash415 doi102134jeq199700472425002600020011x
Table 4 Model predictions of total water extractable P (TWEP) inorganic water extractable P (WEPi) and organic water extractable P (WEPo) from stepwise regression across all data The F statistic for all three model predictions is lt0001
TWEP WEPi WEPo
r2adjusted Predictor Relative
importance r2adjusted Predictor Relative
importance r2adjusted Predictor Relative
importance066 Degree of soil P
saturation080 065 Degree of soil P
saturation093 037 Total phosphatase
activity078
Total phosphatase activity
018 Total phosphatase activity
007 Microbial biomass N 017
M3-P 002 pH 005
Page 6 of 6 AGRICULTURAL amp ENVIRONMENTAL LETTERS
Schoumans OF 2009 Determination of the degree of phosphate satura-tion in noncalcareous soils In JL Kovar and GM Pierzynski editors Methods for phosphorus analysis for soils sediments residuals and water 2nd ed SERA 17 Bull 408 Virginia Tech Blacksburg VA p 29ndash 32
Self-Davis ML PA Moore Jr and BC Joern 2009 Water- or dilute salt-extractable phosphorus in soil In JL Kovar and GM Pierzynski edi-tors Methods for phosphorus analysis for soils sediments residuals and water 2nd ed SERA 17 Bull 408 Virginia Tech Blacksburg VA p 22ndash 24
Sharpley AN 1995 Dependence of runoff phosphorus on extract-able soil phosphorus J Environ Qual 24920ndash926 doi102134jeq199500472425002400050020x
Sheppard SC MI Sheppard J Long B Sanipelli and J Tait 2006 Runoff phosphorus retention in vegetative field margins on flat landscapes Can J Soil Sci 86(5)871ndash884 doi104141S05-072
Tabatabai MA 1994 Soil enzymes In RW Weaver S Angl P Bottomley D Bezdicek S Smith and MA Tabatabai editors Methods of soil analysis Part 2 Microbiology and biological properties SSSA Madi-son WI p 775ndash833
Tomlinson PJ MC Savin and PA Moore Jr 2008 Phosphatase activities in soil after repeated untreated and alum-treated poultry litter appli-cations Biol Fertil Soils 44613ndash622 doi101007s00374-007-0245-3
Turner BL and PM Haygarth 2001 Biogeochemistry Phosphorus solu-bilization in rewetted soils Nature 411258 doi10103835077146
Vance ED PC Brookes and DS Jenkinson 1987 An extraction method for measuring soil microbial biomass C Soil Biol Biochem 19703ndash707 doi1010160038-0717(87)90052-6
Watanabe FS and SR Olsen 1965 Test of an ascorbic acid meth-od for determining phosphorus in water and NaHCO3 ex-tracts from soil Soil Sci Soc Am J 29677ndash678 doi102136sssaj196503615995002900060025x
Phosphorus Retention and Remobilization along HydrologicalPathways in Karst TerrainHelen P Jarviedagger Andrew N SharpleyDagger Van Brahanasect Tarra SimmonsDagger April PriceDagger Colin Nealdagger
Alan J Lawlor∥ Darren Sleep∥ Sarah Thacker∥ and Brian E Haggardperp
daggerCentre for Ecology amp Hydrology Wallingford OX10 8BB UKDaggerDepartment of Crop Soil amp Environmental Sciences Division of Agriculture University of Arkansas Fayetteville Arkansas 72701United StatessectDepartment of Geosciences University of Arkansas Fayetteville Arkansas 72701 United States∥Centre for Ecology amp Hydrology Lancaster LA1 4YQ UKperpArkansas Water Resources Center University of Arkansas Fayetteville Arkansas 72701 United States
S Supporting Information
ABSTRACT Karst landscapes are often perceived as highly vulnerable toagricultural phosphorus (P) loss via solution-enlarged conduits that bypass Pretention processes Although attenuation of P concentrations has been widelyreported within karst drainage the extent to which this results from hydrologicaldilution rather than P retention is poorly understood This is of strategicimportance for understanding the resilience of karst landscapes to P inputs givenincreasing pressures for intensified agricultural production Here hydrochemicaltracers were used to account for dilution of P and to quantify net P retentionalong transport pathways between agricultural fields and emergent springs for thekarst of the Ozark Plateau midcontinent USA Up to sim70 of the annual total Pflux and sim90 of the annual soluble reactive P flux was retained with preferentialretention of the most bioavailable (soluble reactive) P fractions Our resultssuggest that in some cases karst drainage may provide a greater P sink thanpreviously considered However the subsequent remobilization and release of the retained P may become a long-term source ofslowly released ldquolegacyrdquo P to surface waters
INTRODUCTION
More than 25 of the worldrsquos population either lives on orobtains its drinking water from karst aquifers Karst underlies30 of the land area of China 30 of Europe and 20 of theUnited States12 Karst aquifers exert an important control on thequality and ecology of surface waters in these areas3 Thecomplexity of subsurface drainage45 and the difficulties indeconvoluting flow pathways and groundwater contributingareas6 have been a significant barrier to detailed studies ofnutrient transport and fate in karst systems78 Nevertheless it iswidely assumed that karst drainage systems (formed bydissolution of carbonate rocks mainly limestone) are highlyvulnerable to phosphorus (P) impairment from agriculturalsourcesThis vulnerability is assumed to arise from the low nutrient
buffering capacity of the thin cherty soils which overlie karst andthe rapid transmission of surface runoff through conduitsenlarged by dissolution910 which is thought to bypass thezones where key processes of P retention occur11minus13 Nonethe-less highly intensive monitoring of Irish karst springs in areas oflivestock demonstrated major P attenuation (reduction in Pconcentrations) relative to agricultural runoff1415 with low Pconcentrations in spring discharge even during storm events
when agricultural P losses are expected to be highest Thisattenuation was attributed to a combination of both hydrologicaldilution and P retention during infiltration and transmission ofrunoff along groundwater conduit pathwaysCrucially we lack information on the extent to which P
attenuation is controlled by P retention processes during transitalong karst flow paths14 or by hydrological dilution ofagricultural runoff by cleaner groundwater sources16 This is ofstrategic importance for understanding the P buffering capacityand wider resilience of karst landscapes to nutrient inputs101718
Many karst lands have traditionally been used for low-intensitylivestock farming owing to poor soils and their unsuitability forarable production9 However there is increasing pressure forintensive livestock production as global demands for greaterefficiency in food production intensify1920 Given the movetoward more intensive livestock production systems whichaccumulate P2122 and the perceived vulnerability of karstdrainage systems to P loss there is now a pressing and strategic
Received December 14 2013Revised March 17 2014Accepted March 17 2014
Article
pubsacsorgest
copy XXXX American Chemical Society A dxdoiorg101021es405585b | Environ Sci Technol XXXX XXX XXXminusXXX
need for better understanding of the fate and transport of P inkarst landscapes Here this shortfall is addressed for karst terrainin south-central USA Hydrochemical tracers and endmembermixing analysis23minus26 were used to assess the vulnerability to Ploss by accounting for the hydrological dilution of agriculturalrunoff and directly quantifying net P retention during infiltrationthrough the soil and along karst transport pathways through tothe emergent springs
EXPERIMENTAL METHODS
Study Area The study was undertaken at the University ofArkansas long-term Savoy Experimental Watershed (SEW) NWArkansas USA27 The SEW is located in the Illinois RiverWatershed a mixed land-use watershed (sim4330 km2) whichspans the states of Arkansas and Oklahoma2829 The SEW covers1250 ha and is typical of the karst terrain of the Ozark Plateau ofmidcontinental USA (Figure SI-1a Supporting Information)The soils of the SEW are predominantly silt loams (seeSupporting Information) Around 70 of the land is nativeforest with the remaining 30 rolling pasture grazed by beefcattle (sim2 cows haminus1) The SEW also supports poultryproduction with the resulting poultry litter used to fertilizepastures There are no septic tanks or settlements in the SEWand agricultural runoff from pastures grazed by cattle providesthe overwhelmingly dominant P source in the watershed30
The stratigraphy of the SEW30minus32 (see Figure SI-1cSupporting Information) includes (a) the limestone aquifer ofthe St Joe Formation (b) the Boone Formation an impurelimestone which mantles the St Joe Formation and formsldquoepikarstrdquo and (c) a layer of regolith (vadose zone) whichoverlies the Boone Formation Karst drainage has a major controlon water quality in the Illinois River2933 67 of annual river flowcomes from karst springs rising to 80 of flow in the summerand fall34
Sample Collection and Analysis Surface runoff andspring-water chemistry and flow monitoring (Figure SI-1a andc Supporting Information) were undertaken at the following(1) two adjacent karst springs (Langle Spring LLS andCopperhead Spring CHS) which flow continually from the StJoe Formation (focused conduit flow) springs (2) two surfacerunoff field plots (Langle LL 107 ha and Copperhead CH 105ha) which are located above and within the watershed (rechargezone) of the LLS andCHS springs These runoff plots are locatedon Razort silt loams which make up most of the grazed pasturesof the SEW All pastures are treated similarly in terms of grazing
intensity and maintenance fertilizer applications (30 kg P haminus1
every two years as either poultry litter or diammoniumphosphate)Flows at the karst springs (LLS and CHS) were monitored on
15-min intervals (see Supporting Information) Karst springwater was sampled weekly with stage-triggered subdailyautomated sampling using an ISCO sampler during stormevents Figure SI-2 (Supporting Information) shows thedistribution of samples collected on the rising and falling stageof the storm hydrographs The volume of surface runoff fromboth fields was automatically measured and samples werecollected on a flow-weighted basis by an ISCO autosampler Allwater samples were filtered within 24 h of the water beingsampled and were analyzed following EPA standard protocols asdescribed below (and in the Supporting Information) Filtered(lt045 μm) samples were analyzed for soluble reactivephosphorus (SRP) by colorimetric analysis35 and for a fullsuite of major cations (including potassium K and calcium Ca)and trace elements (including lanthanum La and rubidium Rb)(see Supporting Information) Unfiltered samples were analyzedfor total phosphorus (TP) after acid-persulfate digestion bycolorimetric analysis3536 These measurements are consistentwith standard protocols for TP and SRP analysis37
Use of Conservative Tracers and Endmember MixingAnalysisConservative chemical tracers and endmember mixingmodels were used to apportion water sources and to differentiatethe effects of hydrological dilution from the biogeochemicalprocesses which retain and cycle P during transit through thekarst drainage system Chemical tracers have been widely used inwatershed hydrology for tracing water sources and flowpathways38 owing to their conservative behavior (chemicalinertness) Here we made use of chemical tracers already in thewatershed to apportion water sources Using the hydrochemicalmonitoring data tracers were chosen which had elevatedconcentrations in either base flow groundwater or in agriculturalrunoff First two-component endmember mixing models2339
were used to link the spring-water chemistry to sources withinthe watershed by (a) quantifying the relative proportions ofsurface runoff and groundwater and (b) estimating thecontribution of surface runoff from the agricultural grazed landSecond comparing the mixing patterns of P in spring water witha conservative tracer of agricultural runoff allowed us to directlyevaluate whether P was behaving nonconservatively (ie beingtaken up or released) along the hydrological pathways in the karstdrainage system
Table 1 Summary of Concentrations of Soluble Reactive Phosphorus (SRP) Total Phosphorus (TP) Potassium (K) Rubidium(Rb) and Calcium (Ca) in Field Runoff and Spring-Water Samples
field runoff (m3 ha‑1)spring flow (L s‑1)
SRP(mg Lminus1)
TP(mg Lminus1)
Rb(μg Lminus1)
K(mg Lminus1)
Ca(mg Lminus1)
Langle Field mean 380 221 257 697 104 512(LL) median 355 187 212 596 102 494
range 34minus915 059minus502 08minus553 093minus206 204minus263 211minus987Copperhead Field mean 231 068 109 294 611 345(CH) median 146 057 103 252 511 343
range 18minus799 047minus122 063minus191 058minus876 14minus147 195minus734Langle Spring mean 131 0029 0057 106 154 375(LLS) median 938 0012 0034 0878 114 367
range 124minus59 0minus0403 0002minus0608 0195minus357 0534minus492 122minus659Copperhead Spring mean 225 0019 0041 108 137 405(CHS) median 262 0017 0032 11 14 429
range 019minus253 0001minus012 0minus058 0328minus19 084minus217 145minus615
Environmental Science amp Technology Article
dxdoiorg101021es405585b | Environ Sci Technol XXXX XXX XXXminusXXXB
RESULTS AND DISCUSSION
Comparison of Agricultural Runoff and Spring-WaterChemistry Concentrations of TP SRP K and Rb wereconsistently highest in field runoff relative to the springs (Table1) and runoff from the grazed fields provides the greatestconcentrations of P K and Rb within the SEW In contrast Caconcentrations were consistently highest in the springscompared with runoff This indicates a dominant base flowgroundwater source of Ca from dissolution of limestone whichis diluted by surface runoff (Figure 1a)Concentrations of SRP TP K and Rb were all higher in field
runoff at LL compared with CH This likely reflects higher cattlegrazing density at LL (25 cows haminus1) than at CH (10 cowshaminus1) as well as higher runoff per unit area that likely led togreater solute and particulate entrainment and transport capacitycompared with CH This may also reflect a larger hydrologicallyactive area contributing runoff at LL linked to greater soilcompaction from more intensive cattle grazingFor the springs there was a greater variability in SRP TP K
and Rb concentrations at LLS than at CHS despite a much lowervariability in spring flow at LLS (Table 1) Howeverconcentrations of TP SRP K and Rb did not correlate withflow at either of the springs For most storm events at LLSconcentrations of TP SRP K and Rb increased dramatically
above base flow concentrations especially on the rising stage ofthe storm hydrograph (Figure SI-2 Supporting Information)These high concentrations on the rising stage are likely due toupstream point recharge of surface runoff from pasture land intothe underlying St Joe aquifer in locations where the confiningchert layer is breached At CHS the response of TP SRP K andRb to storm events was more mixed Small initial increases inconcentration occurred with the onset of higher flows followedby marked reductions in concentration reflecting substantialdilution by a water source with relatively low SRP TP K and Rbconcentrations most likely from the nonagricultural (ungrazedand forested) parts of the watershed Indeed karst inventorieshave verified that this part of the flow regime reflects runoff fromareas which are not grazed by livestock3031
To evaluate the attenuation (ie the reductions inconcentrations) of TP SRP K and Rb during transit throughthe karst the median concentrations in agricultural runoff werecompared with the corresponding median concentrations inCHS and LLS springs (Table 1) The average attenuation of TPand SRP concentrations ranged from 96 to 99 In contrastthe average attenuation of K and Rb concentrations was lower at56 to 89 Correspondingly under storm flow conditionscomparisons of average field runoff concentrations and the 90thpercentile concentrations in spring water (which typicallycorrespond with the rising stage of the storm hydrographs of
Figure 1 (a) Relationships between calcium (Ca) concentrations and flow at Langle and Copperhead springs (b) Relationship between rubidium (Rb)and potassium (K) concentrations in field runoff and spring-water samples
Environmental Science amp Technology Article
dxdoiorg101021es405585b | Environ Sci Technol XXXX XXX XXXminusXXXC
the springs) revealed that storm flow attenuation of TP and SRPranged from 93 to 96 compared with 46 to 74 for K andRb Across all flow conditions the higher rates of attenuation of Pconcentrations relative to K and Rb reflect the nonconservativebehavior of P during transit through the karstK and Rb show high correlation (Figure 1b) due to their
similar hydrogeochemistry (group 1a monovalent base cations ofrelatively small hydration size) Figure 1b shows a dominant two-component mixing series between a high concentrationldquoendmemberrdquo (ie surface runoff from fertilizer and grazedpastures in runoff) and a low concentration spring-waterldquoendmemberrdquo (ie runoff from nonagricultural and forestedareas which have no grazing or fertilizer inputs) Both K and Rbare highly soluble monovalent ions and once transmitted intothe karst drainage system chemical interactions will be relativelysmall Therefore the attenuation of K and Rb during transportthrough the karst will be largely controlled by hydrologicaldilution without retention mechanisms (with only possibly asmall attenuation or release within the epikarst where there is ahigh proportion of clays3140) In contrast P behaves non-conservatively reflected by the higher rates of attenuation of Prelative to K and RbSpring Hydrology and Water-Source Apportionment
Comparing the hydrology of the two springs (Figure 2) base
flows at CHS were consistently lower than at LLS the medianflow at CHS was 262 L sminus1 compared with 131 L sminus1 at LLS(Table 1) Further CHS exhibited a more flashy flow regimethan LLS and storm flows were dramatically higher at CHS Forinstance the average of the highest 10 of flows was 139 L sminus1 atCHS compared with 40 L sminus1 at LLS This discrepancy reflectsthe following (i) LLS being the ldquounderflowrdquo spring (3 cm lowerthan CHS) with a much larger groundwater drainage area underlow-flow conditions than CHS which accounts for the higherbase flows at LLS (ii) water capture (spring ldquopiracyrdquo) by CHSduring storm events which has been shown to result in adramatic expansion in the watershed drainage area for CHSrelative to LLS3233
Contributions to spring water at LLS and CHS wereapportioned by two-component endmember mixing analy-sis2341 Here Ca was used as a tracer of groundwater and K asa tracer of agricultural runoff based on the observed dominantgroundwater source of Ca and the dominant agricultural runoffsource of K For the mixing model endmembers were defined asthe following
(i) A base flow groundwater endmember with elevated Caand a storm flow endmember with low Ca concentrations
(ii) Runoff endmember from agricultural land with high Kconcentration and a spring base flow low K endmember
Figure 2 Hydrographs and water source apportionment for Langle and Copperhead springs
Environmental Science amp Technology Article
dxdoiorg101021es405585b | Environ Sci Technol XXXX XXX XXXminusXXXD
Applying a simple two-component mixing model2341 (eq 1)and the endmembers identified above Ca concentrations wereused to partition the contributions to spring flow at LLS andCHS from base flow groundwater (the high concentrationendmember) and from stormwater runoff (the low concen-tration endmember) Then a second two-component mixingmodel was used for K to quantify the contributions from grazedpasture runoff (eq 2)
= times minus minus total storm runoff
100 (Ca Ca )(Ca Ca )gw m gw ro (1)
= times minus minus
agricultural runoff
100 (K K )(K K )bf m bf ag (2)
where Cagw was the groundwater Ca concentration (highconcentration base flow endmember) defined here as theaverage Ca concentration for the lowest 10 of flows sampledCam was the measured spring-water Ca concentration Caro wasthe stormwater (agricultural runoff) endmember defined here asthe average field runoff Ca concentration Kbf was the base flowendmember (average K concentration for the lowest 10 of
spring flows sampled) Km was the measured spring-water Kconcentration and Kag was the agricultural runoff endmemberdefined here as the average field runoff K concentration Thevalues used to define the endmember concentrations at LLS andCHS are shown in Table SI-1 Supporting InformationThe water source apportionment for LLS and CHS (Figure 2)
showed similar percentage contributions from base flowgroundwater and total storm flow at LLS and CHS for most ofthe year and particularly during storm events During winter andspring storm events a much greater proportion of flow at LLSwas derived from agricultural (grazed field) runoff (up toapproximately a third of flow) This greater contribution of waterfrom pastures than from nonagricultural land at LLS accountedfor the higher storm-event concentrations of K and Rb at LLSAgricultural runoff contributed a much lower proportion ofwinter and spring storm event flow at CHS (typically less than10) These results and the much higher storm flow dischargesat CHS suggest that the water ldquopiracyrdquo at CHS during stormevents captured water sources which had a lower K and Rbconcentration from the nonagricultural (ungrazed and forested)areas
Figure 3 Relationships between total phosphorus (TP) soluble reactive phosphorus (SRP) and potassium (K) for (a) Langle Spring and (b)Copperhead Spring The dashed line denotes the conservative mixing line and the solid line denotes a line of maximum P retention (see text forexplanation)
Environmental Science amp Technology Article
dxdoiorg101021es405585b | Environ Sci Technol XXXX XXX XXXminusXXXE
Quantifying Net P Retention in Karst DrainageEndmember mixing analysis23minus26 was applied using theldquoconservativerdquo tracer K to explore the net P retention andrelease along karst hydrological pathways from infiltrationthrough the soil to spring discharge First concentrations ofTP and SRP were plotted against K as the ldquoconservativerdquo tracer(Figure 3) Two dominant and distinct sources of spring water(both with different TP SRP and K concentrations) arehypothesized (Table SI-1 Supporting Information) (i) a highconcentration agricultural endmember source (Kag TPag SRPag)defined here as the average concentrations (of K TP and SRP)in agricultural field runoff at the LL and CH field plots and (ii) alow concentration (nonagricultural) endmember (Kna TPnaSRPna) As the source of this low concentration runoff couldcome from a wide range of nonagricultural sources (ungrazedand forest land) across the watershed the most reliable means ofcapturing the integrated low-concentration endmember signalwas to use the minimum measured spring-water K TP and SRPconcentrations at LLS and CHSA theoretical linear two-component mixing series ie a
ldquoconservative mixing linerdquo between the high concentration andlow concentration endmembers (Figure 3) would be observed ifP behaved conservatively during mixing of the two endmemberwater sources during transport through the karst In contrast theobserved relationships between TP and K and SRP and K inspring water were highly scattered at LLS and CHS (Figure 3)Most of the samples plot well below the conservative mixing lineshowing predominantly net retention of TP and SRP relative toK A few isolated samples plotted above the conservative mixingline which are indicative of some sporadic net P release relativeto the K tracer The mixing patterns between TP SRP and Kconcentrations in Figure 3 had a well-defined lower boundary ofsamples with the lowest P concentrations relative to K (shown inFigure 3 as a ldquoline of maximum P retentionrdquo) This line ofmaximum P retention probably represents a secondaryendmember mixing line between the same low concentrationnonagricultural runoff endmember and a secondary agricultural
field runoff endmember with high K but lower P concentrationsas a result of P retention processes filtering out P We posit thatthe majority of this P was ldquofilteredrdquo out during diffuse recharge ofwater as through the soil and the epikarst into the karst aquiferThe spring-water samples which lie between the line ofmaximum retention and the conservative mixing series thereforelikely reflect the net effects of P retention and remobilizationprocesses for runoffwater entering the karst drainage system via amixture of diffuse and point rechargeBy comparing the observed spring-water TP and SRP versus K
relationships with the theoretical linear conservative mixingseries the net effects of P retention and release can be directlyquantified (Figure 3) By applying the theoretical conservativemixing series (TP versus K and SRP versus K) to the measuredspring-water K concentrations at LLS and CHS ldquoconservativerdquoTP and SRP concentration time series were derived (Figure SI-3ab Supporting Information) and converted to loads using thecorresponding spring flow data By taking the difference betweenmeasured and ldquoconservativerdquo TP and SRP loads we calculatednet TP and net SRP retention on an annual basis as well as forbase flows (lowest 10 of flows) and storm flows (highest 10 offlows) (Table 2)Annual net TP retention ranged from 69 at LLS to 54 at
CHS Net percentage P retention was consistently higher forSRP compared with TP not only on an annual basis but alsounder storm and base flow conditions This indicated preferentialretention of more labile SRP fractions by sorptionuptake andgreater mobility of TP organic and particulate P fractions Similarpatterns of soluble and particulate P retention have also beenobserved in other karst soils and drainage systems71113 Highestpercentage net P retention occurred during storm events at LLS(92 TP retention and 96 SRP retention) However the twosprings showed very different patterns in P retention under stormand base flow conditions At LLS net P retention was greatestduring storm flows than under base flow conditions reflecting ahigh efficiency of P retention from agricultural runoff at LLS Incontrast at CHS a greater percentage of the P load was retained
Table 2 Measured and ldquoConservativerdquo Annual Loads and Mean Daily Base Flow and Storm Flow Loads of Total Phosphorus(TP) and Soluble Reactive Phosphorus (SRP) in Langle and Copperhead Springs with Net and Percentage TP and SRP Retention
measured P load(kg yminus1 or g dminus1)
ldquoconservativerdquo P load(kg yminus1 or g dminus1)
net P retention(kg yminus1 or g dminus1) net P retention
Langle Spring(LLS)
annual TP load(kg yminus1)
701 223 153 69
annual SRP load(kg yminus1)
185 190 172 90
Copperhead Spring(CHS)
annual TP load(kg yminus1)
265 57 31 54
annual SRP load(kg yminus1)
098 33 23 70
Langle Spring(LLS)
avg base flow TP load(g dminus1)
103 233 130 56
avg base flow SRP load(g dminus1)
221 198 176 89
Copperhead Spring(CHS)
avg base flow TP load(g dminus1)
127 355 228 64
avg base flow SRP load(g dminus1)
045 214 169 79
Langle Spring(LLS)
avg storm flow TP load(g dminus1)
112 1448 1336 92
avg storm flow SRP load(g dminus1)
514 1240 1189 96
Copperhead Spring(CHS)
avg storm flow TP load(g dminus1)
445 971 527 54
avg storm flow SRP load(g dminus1)
175 567 392 69
Environmental Science amp Technology Article
dxdoiorg101021es405585b | Environ Sci Technol XXXX XXX XXXminusXXXF
under base flow than during storm flow This reflects much lowerbase flows at CHS which increase water residence time andpromote particulate sedimentation and P retention and higherstorm flows linked to stream piracy which provide greaterflushing from nonagricultural areas where flows have a low PconcentrationContaminant Residence Times in Karst DrainageWhile
monitoring P relative to a conservative tracer provides us withvaluable information on rates of annual and storm flowbase flownet retention it provides no information about the residencetimes of P within the karst or the time scales over whichretention and remobilization may occur This is of strategicconcern in relation to the ldquolegacyrdquo of P within watersheds4243
whereby time-lags in release of retained Pmaymask the effects ofconservation measures on receiving water quality By measuringa full suite of trace elements using ICP-MS a ldquoserendipitousrdquoobservation was made which may help provide clues about thewider contaminant residence times within the karst drainageConcentrations of ldquodissolvedrdquo (lt045 μm) lanthanum (La) instorm flow spring discharge at LLS were more than an order ofmagnitude higher than could be accounted for by the runoffsources measured within the SEW Figure 4 shows theconcentrations of La in the spring discharge at LLS and aldquoconservativerdquo (maximum) concentration from runoff whichaccounts for the dilution of agricultural runoff during transitthrough the karst drainage using K as a tracer The high stormflow La concentrations observed at LLS are likely a ldquolegacyrdquosignal from a past tracer experiment In 2001 lanthanum-labeledmontmorillonite clays were injected into a losing stream at SEWas part of a study to examine clay and bacterial transport44
While the La tracer was detected at LLS around 16 h after itwas injected44 our monitoring suggests the La tracer was alsoretained within the karst drainage system and continues to beremobilized and released during storm events more than 10 yearslater Unfortunately it is impossible to perform a mass balance toquantify how much of the La applied in the tracer study remainswithin the karst drainage system and how long a La ldquolegacyrdquomight persist as no La measurements were made in the
intervening 10 years between the tracer injection in 2001 and ourmonitoring which started in November 2011 Within the scopeof this study it was also not possible to determine whether the Laconcentrations measured were truly dissolved or a lt045 μmcolloidalclay fraction or whether La geochemistry is sufficientlysimilar to be used as an indicator of P transport However theseresults indicate that La a tracer expected to be flushed rapidlythrough the karst was retained and continues to be remobilizedand released during storm events more than 10 years later Thisindicates the potential for contaminant retention in thesubsurface karst drainage system where contaminant storageand gradual rerelease may occur over time scales of at least adecade
Wider Implications Hydrochemical tracers of agriculturalrunoff allowed us to directly evaluate the nonconservativebehavior of P within karst drainage and quantify net P retentionOur results challenge the widely held assumption that karstlandscapes are always highly vulnerable to P loss and suggest thatin some cases karst drainage may provide a greater sink for Pthan previously considered P from agricultural runoff wasattenuated by hydrological dilution from cleaner (nonagricul-tural) sources during transport through karst drainage Howeverthere was also a high capacity for net P retention especially forLangle Spring which was subject to the highest agricultural Ploadings Here sim70 of the annual TP flux and sim90 of theannual SRP flux was retained Moreover the buffering within thesoils and karst drainage not only retained a high proportion ofincoming fluxes of P from agricultural runoff but preferentiallyretained the most bioavailable P fractions For instance muchresearch has documented the capacity of soil to retain applied Pin various inorganic (Al Fe Ca complexes) and organic forms ofvarying stability4546 The long-term accumulation of P in soilhowever can be released slowly to soil water2847
The mechanisms of P retention were not investigated here butlikely include varying combinations of processes includingadsorption onto clays coprecipitation of P with CaCO3 andbinding with particulate humic substances11minus13 in the soil inepikarst and within the fractures and conduits These adsorption
Figure 4 Time series of measured and ldquoconservativerdquo lanthanum (La) concentrations and flow at Langle spring Measured La concentrations aredenoted by solid circles ldquoconservativerdquo La concentrations are denoted by open circles See text for explanation of how ldquoconservativerdquo La concentrationswere calculated
Environmental Science amp Technology Article
dxdoiorg101021es405585b | Environ Sci Technol XXXX XXX XXXminusXXXG
products and precipitates will be physically retained as the watervelocity slows and will be deposited as sediment along the base ofthe conduit flow paths With the recurrence of high flow thesesediments are resuspended by turbulent flow and moved alongthe flow path until redeposited or eventually resurged at thebase-level spring Given the potential importance of CaCO3minusPcoprecipitation for P retention in karst terrain and the possibilityof reductions in the efficiency of this coprecipitation mechanismunder higher P and dissolved organic carbon (DOC)concentrations124849 further work is needed to examine anyunforeseen impacts of increasing agricultural intensification onthis ldquoself-cleansingrdquo P retention mechanism However in thisstudy the site with the higher livestock intensity and with highermanure-enriched runoff actually demonstrated greater efficiencyof P retention This may indicate that critical P and DOCthresholds for inhibition of CaCO3 precipitation were notreached or that other P retention process mechanisms wereoccurringThe patterns in spring-water La concentrations suggest
continued released of La from springs more than 10 years aftera tracer injection and indicate the potential for long-termcontaminant retention storage and subsequent release Indeedthe complex nature of karst hydrological pathways can result inlarge distributions in water and contaminant residence times andlag times for discharge to surface waters may bemuch longer thanexpected50minus52 Our findings indicate that retention of P withinkarst drainage may reduce the risk of acute episodic storm-drivenlosses of agricultural P However the potential buffering of P inthe epikarst and within the fracture and conduit drainage systemcan provide a slow but long-term source of P released via springsto surface waters Further work is needed to determine theecological impacts of such patterns of P release to receivingstreams and the ability of those streams to assimilate thoseinputs compared with higher pulse inputs during storm flows
ASSOCIATED CONTENT
S Supporting InformationMap of the SEW and the karst water flow system time series ofspring-water TP SRP K and Rb concentrations table of Ca TPand SRP endmember concentrations soils and geology of theSavoy Experimental Watershed experimental methods Thismaterial is available free of charge via the Internet at httppubsacsorg
AUTHOR INFORMATION
Corresponding AuthorPhone ++44 (0)1491 838800 Fax ++44 (0)1491692424 E-mail hpjcehacuk
NotesThe authors declare no competing financial interest
ACKNOWLEDGMENTS
HPJ acknowledges funding and support from the UK NaturalEnvironment Research Council a Fulbright DistinguishedScholar Award and an OECD Co-operative Research Pro-gramme Fellowship We thank Chris Wardle (British GeologicalSurvey) for help with the artwork and Dr Tiong Ee Ting forpermission to reproduce tracer experiment results in theSupporting Information
REFERENCES(1) Panno S V Karst aquifers Can they be protected Ground Water2006 44 (4) 494minus494(2) White W B Culver D C Herman J S Kane T C Mylroie JE Karst lands Am Sci 1995 83 (5) 450minus459(3) Owen M R Pavlowsky R T Base flow hydrology and waterquality of an Ozarks spring and associated recharge area southernMissouri USA Environ Earth Sci 2011 64 (1) 169minus183(4) Baffaut C Benson VWModeling flow and pollutant transport ina karst watershed with SWAT Trans ASABE 2009 52 (2) 469minus479(5) Fournier M Motelay-Massei A Massei N Aubert MBakalowicz M Dupont J P Investigation of transport processesinside karst aquifer by means of STATIS Ground Water 2009 47 (3)391minus400(6) Brahana J V Rationale and methodology for approximatingspring-basin boundaries in the mantled karst terrane of the SpringfieldPlateau northwestern Arkansas In The engineering geology andhydrogeology of karst terranes Beck B F Stephenson B F Eds A ABalkema Rotterdam 1997 pp 77minus82(7) Kilroy G Coxon C Temporal variability of phosphorus fractionsin Irish karst springs Environ Geol 2005 47 (3) 421minus430(8) Lerch R N Contaminant transport in two central Missouri karstrecharge areas J Cave Karst Stud 2011 73 (2) 99minus113(9) Coxon C Agriculture and karst In Karst Management Beynen PE Ed Springer Dordrecht Netherlands 2011 pp 103minus138(10) Kacaroglu F Review of groundwater pollution and protection inkarst areas Wat Air Soil Pollut 1999 113 (1minus4) 337minus356(11) Allousha G A Boyer D G Belesky D P Halvorson J JPhosphorus mobility in a karst landscape under pasture grazing systemAgronomie 2003 23 (7) 593minus600(12) Neal C Jarvie H PWilliams R J Neal MWickham H HillL Phosphorus-calcium carbonate saturation relationships in a lowlandchalk river impacted by sewage inputs and phosphorus remediation Anassessment of phosphorus self-cleansing mechanisms in natural watersSci Total Environ 2002 282 295minus310(13) von Wandruszka R Phosphorus retention in calcareous soils andthe effect of organic matter on its mobility Geochem Trans 2006 7 6(14) Mellander P-E Jordan P Melland A R Murphy P N CWall D P Mechan S Meehan R Kelly C Shine O Shortle GQuantification of phosphorus transport from a karstic agriculturalwatershed to emerging spring water Environ Sci Technol 2013 47 (12)6111minus6119(15) Mellander P-E Jordan P Wall D P Melland A R MeehanR Kelly C Shortle G Delivery and impact bypass in a karst aquiferwith high phosphorus source and pathway potentialWater Res 2012 46(7) 2225minus2236(16) Stueber A M Criss R E Origin and transport of dissolvedchemicals in a karst watershed southwestern Illinois J Am Water ResAssoc 2005 41 (2) 267minus290(17) Kleinman P J A Sharpley A N McDowell R W Flaten DN Buda A R Tao L Bergstrom L Zhu Q Managing agriculturalphosphorus for water quality protection Principles for progress PlantSoil 2011 349 (1minus2) 169minus182(18) Sharpley A N Kleinman P J A Flaten D N Buda A RCritical source area management of agricultural phosphorus Experi-ences challenges and opportunities Water Sci Technol 2011 64 (4)945minus952(19) Sharpley A N Jarvie H P Agricultural management waterquality amp ecology Putting practice into policy In National AgriculturalBiotechnology Council Report 24 Eaglesham A Korth K Hardy R WF Eds Jacobs Press Auburn NY 2012 pp 73minus99(20) Sims J T Ma L Oenema O Dou Z Zhang F S Advancesand challenges for nutrient management in China in the 21st century JEnviron Qual 2013 42 (4) 947minus950(21) Kellogg R L Lander C H Moffitt D C Gollehon N Manurenutrients relative to the capacity of cropland and pastureland toassimilate nutrients Spatial and temporal trends for the United StatesResource Assessment and Strategic Planning Working Paper 98-1 USDANatural Resources Conservation Service and Economic Research
Environmental Science amp Technology Article
dxdoiorg101021es405585b | Environ Sci Technol XXXX XXX XXXminusXXXH
Service General Services Administration National Forms andPublication Center Fort Worth TX 2000 pp 1minus140 httpwwwnrcsusdagovtechnicallandpubsmanntrpdf(22) Maguire R O Rubaeligk G H Haggard B E Foy B H Criticalevaluation of the implementation of mitigation options for phosphorusfrom field to catchment scales J Environ Qual 2009 38 (5) 1989minus1997(23) Christophersen N Neal C Hooper R P Vogt R DAndersen S Modeling streamwater chemistry as a mixture of soilwaterend-members - A step towards 2nd-generation acidification models JHydrol 1990 116 (1minus4) 307minus320(24) Neal C Jarvie H P Williams R Love A Neal M WickhamH Harman S Armstrong L Declines in phosphorus concentration inthe upper River Thames (UK) Links to sewage effluent cleanup andextended end-member mixing analysis Sci Total Environ 2010 408 (6)1315minus1330(25) Jarvie H P Neal C Withers P J A Baker D B Richards RP Sharpley A N Quantifying phosphorus retention and release inrivers and watersheds using extended end-member mixing analysis (E-EMMA) J Environ Qual 2011 40 (2) 492minus504(26) Jarvie H P Sharpley A N Scott J T Haggard B E BowesM J Massey L B Within-river phosphorus retention Accounting for amissing piece in the watershed phosphorus puzzle Environ Sci Technol2012 46 (24) 13284minus13292(27) Brahana V The Savoy Experimental WatershedA long-termresearch site for karst hydrogeology In Caves and Karst of the USANational Speleological Society Guidebook for the International Congress ofSpeleology Palmer A N Palmer M V Eds National SpeleologicalSociety Huntsville AL 2009 section 5 Ozark Plateaus p 179(28) Sharpley A N Kleinman P J A Jordan P Bergstrom LAllen A L Evaluating the success of phosphorus management fromfield to watershed J Environ Qual 2009 38 1981minus1988(29) Scott J T Haggard B E Sharpley A N Romeis J J Changepoint analysis of phosphorus trends in the Illinois River (Oklahoma)demonstrates the effects of watershed management J Environ Qual2011 40 (4) 1249minus1256(30) Brahana J V Controlling influences on ground-water flow andtransport in the shallow karst aquifer of northeastern Oklahoma andnorthwestern Arkansas Proceedings volume hydrologic problemsalong the Arkansas-Oklahoma border Arkansas Water ResourcesCenter Publication No MSC-168 1995 pp 25minus3033(31) Brahana J V Ting T Al-Qinna M Murdock J Davis R KLainz J Killingbeck J J Szilvagyi E Doheny-Skubic M Chaubey IHays P D Thoma G Quantification of hydrologic budget parametersfor the vadose zone and epikarst in mantled karst US GeologicalSurvey Karst Interest Group Proceedings Rapid City SD Sept 12minus152005 Kuniansky E L Ed US Geological Survey ScientificInvestigations Report 2005-5160 pp 144minus152(32) Leh M D Chaubey I Murdoch J Brahana J V Haggard BE Delineating runoff processes and critical runoff source areas in apasture hillslope of the Ozark Highlands Hydrol Proc 2008 22 (21)4190minus4204 DOI 101002hyp7021(33) Haggard B E Phosphorus concentrations loads and sourceswithin the Illinois River drainage area Northwest Arkansas 1997minus2008J Environ Qual 2010 39 (6) 2113minus2120(34) Tortorelli R L Pickup B E Phosphorus concentrations loadsand yields in the Illinois River basin Arkansas and Oklahoma 2000minus2004 US Geological Survey Scientific Investigations Report 2006-5175 p 38(35) Murphy J Riley J P A modified single solution method for thedetermination of phosphate in natural-waters Anal Chim Acta 196227 31minus36(36) Eisenreich S J Bannerman R T Armstrong D E Simplifiedphosphorus analytical technique Environ Lett 1975 9 (1) 43minus53(37) Jarvie H P Withers P J A Neal C Review of robustmeasurement of phosphorus in river water Sampling storagefractionation and sensitivity Hydrol Earth Syst Sci 2002 6 113minus131(38) Divine C E McDonnell J J The future of applied tracers inhydrogeology J Hydrogeol 2005 13 255minus258
(39) Burns D A McDonnell J J Hooper R P Peters N E FreerJ E Kendall C Beven K Quantifying contributions to storm runoffthrough endmember mixing analysis and hydrologic measurements atthe Panola Mountain Research Watershed (Georgia USA) HydrolProc 2001 15 1903minus1924(40) Williams P W The role of the epikarst in karst and cavehydrogeology a review Int J Speleol 2008 31 1minus10(41) Jarvie H P Neal C Smart R Owen R Fraser D Forbes IWade A Use of continuous water quality records for hydrographseparation and to assess short-term variability and extremes in acidityand dissolved carbon dioxide for the River Dee Scotland Sci TotalEnviron 2001 265 (1minus3) 85minus98(42) Jarvie H P Sharpley A N Spears B Buda A R May LKleinman P J A Water quality remediation faces unprecedentedchallenges from ldquolegacy phosphorusrdquo Environ Sci Technol 2013 47(16) 8997minus8998(43) Sharpley A Jarvie H P Buda A May L Spears B KleinmanP Phosphorus legacy Overcoming the effects of past managementpractices to mitigate future water quality impairment J Environ Qual2013 42 (5) 1308minus1326(44) Ting T E E Assessing bacterial transport storage and viability inmantled karst of northwest Arkansas using clay and Escherichia colilabeled with lanthanide-series metals PhD Dissertation University ofArkansas 2005(45) Sharpley A N Smith S J Bain W R Nitrogen and phosphorusfate from long-term poultry litter applications toOklahoma soils Soil SciSoc Am J 1993 57 (4) 1131minus1137(46) Frossard E Condron L M Oberson A Sinaj S Fardeau J CProcesses governing phosphorus availability in temperate soils JEnviron Qual 2000 29 (1) 15minus23(47) Cox F R Kamprath E J McCollum R E A descriptive modelof soil test nutrient levels following fertilization Soil Sci Soc Am J 198145 (3) 529minus532(48) Inskeep W P Bloom P R kinetics of calcite precipitation in thepresence of water-soluble organic-ligands Soil Sci Soc Am J 1986 50(5) 1167minus1172(49) Dove P M Hochella M F Calcite precipitation mechanismsand inhibition by orthophosphate - insitu observations by scanning forcemicroscopy Geochim Cosmochim Acta 1993 57 (3) 705minus714(50) Kirchner J W Feng X H Neal C Fractal stream chemistry andits implications for contaminant transport in catchments Nature 2000403 (6769) 524minus527(51) Kirchner J W Neal C Universal fractal scaling in streamchemistry and its implications for solute transport and water qualitytrend detection Proc Nat Acad Sci USA 2013 110 (30) 12213minus12218(52) Neal C Catchment water quality The inconvenient butnecessary truth of fractal functioning Hydrol Proc 2013 27 (24)3516minus3520
Environmental Science amp Technology Article
dxdoiorg101021es405585b | Environ Sci Technol XXXX XXX XXXminusXXXI
Coupling High-Frequency Stream Metabolism and NutrientMonitoring to Explore Biogeochemical Controls on DownstreamNitrate DeliveryHelen P Jarviedagger Andrew N SharpleyDagger Timothy Kressesect Phillip D Hays∥ Richard J Williamsdagger
Stephen M Kingperp and Lawrence G BerryDagger
daggerNERC Centre for Ecology and Hydrology Wallingford OX10 8BB United KingdomDaggerDepartment of Crop Soil and Environmental Sciences University of Arkansas Fayetteville Arkansas 72701 United StatessectUS Geological Survey Lower Mississippi-Gulf Water Science Center 401 Hardin Road Little Rock Arkansas 72211 UnitedStates∥US Geological Survey Lower Mississippi-Gulf Water Science CenterUniversity of Arkansas Department of Geosciences 216Gearhart Hall Fayetteville Arkansas 72701 United StatesperpSTFC Rutherford Appleton Laboratory Harwell Campus Didcot Oxfordshire OX11 0QX United Kingdom
S Supporting Information
ABSTRACT Instream biogeochemical process measurementsare often short-term and localized Here we use in situ sensorsto quantify the net effects of biogeochemical processes onseasonal patterns in baseflow nitrate retention at the river-reachscale Dual-station high-frequency in situ nitrate measurementswere coupled with high-frequency measurements of streammetabolism and dissolved inorganic carbon in a tributary of theBuffalo National River Arkansas Nitrate assimilation wascalculated from net primary production and combined withmass-balance measurements to estimate net nitrification anddenitrification The combined net effects of these instreamprocesses (assimilation denitrification and nitrification)removed gt30minus90 of the baseflow nitrate load along a 65km reach Assimilation of nitrate by photoautotrophs during spring and early summer was buffered by net nitrification Netnitrification peaked during the spring After midsummer there was a pronounced switch from assimilatory nitrate uptake todenitrification There was clear synchronicity between the switch from nitrate assimilation to denitrification a reduction in riverbaseflows and a shift in stream metabolism from autotrophy to heterotrophy The results show how instream nitrate retentionand downstream delivery is driven by seasonal shifts in metabolic pathways and how continuous in situ stream sensor networksoffer new opportunities for quantifying the role of stream biota in the dynamics fate and transport of nitrogen in fluvialsystems
1 INTRODUCTION
Nutrients including nitrogen (N) phosphorus (P) and carbon(C) from agriculture and domestic wastewater are a majorsource of water-quality impairment1 Excessive nutrient inputsto rivers streams and lakes can accelerate growth of nuisanceand harmful algae Resulting increases in microbial activity anddepletion of dissolved oxygen (DO) have profound negativeconsequences for invertebrates and fish potable water supplyand recreation23 However biogeochemical processes instreams also play an important role in regulating downstreamnutrient transport with stream biota retaining and removingnutrients from the water column reducing downstreamecological impacts4minus6
Streams can provide a major sink for nitrate (NO3minus)
through uptake (assimilation) by primary production and
through denitrification78 The effectiveness of these processesvaries throughout the year and between streams butconventional methods for estimating NO3
minus uptake are basedon relatively few short-term experimental nutrient additionsand isotope measurements9minus11 making results difficult toextrapolate in space and time12 Continuous high-frequency insitu measurements offer new opportunities to explore NO3
minus
source dynamics13minus17 and instream processes have beeninferred from single-station diurnal concentration cycles121819
longitudinal profiling20minus23 and nested sensor networks24
Received June 6 2018Revised October 23 2018Accepted October 30 2018Published October 30 2018
Article
pubsacsorgestCite This Environ Sci Technol 2018 52 13708minus13717
copy 2018 American Chemical Society 13708 DOI 101021acsest8b03074Environ Sci Technol 2018 52 13708minus13717
Dow
nloa
ded
via
CT
R F
OR
EC
OL
OG
Y amp
HY
DR
OL
OG
Y o
n D
ecem
ber
4 2
018
at 0
936
54
(UT
C)
Se
e ht
tps
pub
sac
sor
gsh
arin
ggui
delin
es f
or o
ptio
ns o
n ho
w to
legi
timat
ely
shar
e pu
blis
hed
artic
les
In this study we used in situ sensors to quantify the neteffects of biogeochemical processes on seasonal patterns inbaseflow NO3
minus retention at the river-reach scale The approachemployed here is novel because it combines dual-station high-frequency NO3
minus measurements with high-frequency measure-ments of stream metabolism (analysis of diurnal DO curves tocalculate primary production and respiration) dissolvedinorganic carbon (DIC) and excess partial pressure of carbondioxide (EpCO2) to explore the capacity of instreambiogeochemical processes to retain and remove NO3
minus High-frequency in situ monitoring of water chemistry and stream-flow was undertaken along a 65 km experimental reach of BigCreek a tributary of the Buffalo National Scenic RiverArkansas USA and were used to calculate a NO3
minus massbalance along the reach Net primary production was used tocalculate NO3
minus assimilation by photoautotrophs Daily NO3minus
removal rates and rates of NO3minus assimilation by photo-
autotrophs were used to calculate net nitrification anddenitrification The biogeochemical controls on NO3
minus removalwere then evaluated in relation to wider ecosystem driversincluding streamflow DO and stream ecological function toexplore how seasonal shifts in metabolic pathways influenceinstream NO3
minus retention and downstream NO3minus delivery
2 MATERIALS AND METHODS21 Site Description and Water-Quality Monitoring
Big Creek a tributary of the Buffalo National Scenic RiverArkansas (Figure 1) is the subject of detailed water-quality
monitoring because of a permitted swine concentrated animalfeeding operation (CAFO) within the watershed in operationsince September 2013 The Big Creek watershed lies in thekarst terrain of the Ozark Plateau of the midcontinental USA(Figure 1) The watershed area is 236 km2 with 79 of theland area deciduous forest 3 evergreen forest 14grasslandpasture and 3 developed land (see SupportingInformation SI S11) Swine-manure slurry from the CAFO
has been land applied to permitted fields since January 1 2014in accordance with State regulationsThe focus of this study is an experimental reach of Big
Creek downstream of the CAFO from an upstreammonitoring station at Mt Judea (USGS site 07055790watershed area 106 km2) to a downstream monitoring stationat Carver (USGS site 07055814 watershed area 233 km2)721 and 069 km from the confluence between Big Creek andthe Buffalo River respectively (Figure 1) One tributary (LeftFork) enters Big Creek between Mt Judea and Carver Thewatershed is a mantled karst terrain characterized by intimateconnection between groundwater and surface water transportof surface-derived nutrients can be rapid25 (see S12)USGS conducted high-frequency (15 min) NO3
minus monitor-ing using submersible ultraviolet nitrate probes at Carver (06032014 to 04292017) and Mt Judea (11012014 to 11012015) there was therefore one year of overlapping data(11012014 to 11012015) during which NO3
minus monitoringwas undertaken at both Mt Judea and Carver A water-qualitysonde (YSI 6600) operating at Carver simultaneously collected15 min interval DO pH specific conductance and watertemperature data Further information about the high-frequency water-quality monitoring is provided in S13Water-quality samples collected on a weekly basis since 09
122013 with additional opportunistic high-flow sampling atMt Judea Left Fork and at a groundwater (spring) monitoringsite (Figure 1) provided NO3
minus (by ion chromatographyDionex ICS-1600) alkalinity (by fixed-end point acidimetrictitration to pH 4526) and conductivity (VWR SymphonyB10C) data All nitrate concentrations are reported as NO3minusN(mg-N Lminus1) Water-quality data are available at httpsbigcreekresearchorg
22 Stream-Flow Measurements and HydrographSeparation Stream flow was measured using establishedUSGS streamflow gauging methods27 (see S14) A two-component mixing model was used to partition thecontributions to streamflow from groundwater and surfacerunoff28 using alkalinity as a conservative groundwater tracer(see S15)
23 Analysis of Diurnal Dissolved Oxygen Curves toCalculate Primary Production and Respiration The dailyaverage gross primary production daily average ecosystemrespiration and reaeration coefficient were calculated from theseries of diurnal DO curves at Carver (see S16) using apiecewise solution of the mass balance DO model29 simplifiedfor the situation where the deficit does not vary spatially (eq1) the Delta method3031
D t k D td d ER GPP ( )a av av+ = minus (1)
where D is the DO deficit (mg-O2 Lminus1) t is the time (days) ka
is the reaeration coefficient ERav is the ecosystem respiration(mg-O2 L
minus1 dminus1) and GPPav is the gross primary production(mg-O2 Lminus1 dminus1) these are standard measures of ecosystemrespiration and gross primary production in river systems32
Odum33 suggested a classification system of flowing-watercommunities based on oxygen metabolism by using the ratio ofGPPav to ERav (GPPER) Respiration is associated with bothplant and microbial activity Photosynthesis is only associatedwith plants Autotroph-dominated communities are repre-sented by GPPER values gt1 whereas heterotroph-dominatedcommunities are represented by GPPER values lt1
24 Use of the THINCARB Model for CalculatingDissolved Inorganic Carbon Concentrations and Excess
Figure 1 Map of the Big Creek watershed and its location
Environmental Science amp Technology Article
DOI 101021acsest8b03074Environ Sci Technol 2018 52 13708minus13717
13709
Partial Pressure of Carbon Dioxide The THINCARBmodel (THermodynamic modeling of INorganic CARBon)34
uses pH Gran Alkalinity (AlkGran) and temperature measure-ments to calculate dissolved inorganic carbon (DIC)concentrations and DIC speciation from the excess partialpressures of carbon dioxide (EpCO2) in freshwatersTHINCARB is open access and is described in detail in Jarvieet al (2017)34 an outline is provided in S17 Prior to usealkalinity measurements in units of mg-CaCO3 L
minus1 were firstconverted to AlkGran (in μeq Lminus1) where 1 mg Lminus1 CaCO3 =1998 μeq Lminus134
THINCARB was applied to the high-frequency sonde datafrom Carver Specific conductance was used as a surrogate foralkalinity using the regression relationship between AlkGranand specific conductance (κ) measured across the Big Creekwatershed including the spring and Mt Judea Left Fork andCarver stream sites AlkGran = 865 (plusmn028) times κ minus 644 (plusmn66)R2 = 095 n = 270 P lt 0001 (numbers in parenthesesrepresent twice the standard error) By applying this regressionequation to the hourly κ series an hourly alkalinity record wasderived which was then used alongside the hourly pH andwater-temperature data to calculate a high-frequency DIC andEpCO2 series25 Mass-Balance Calculation of Baseflow Nitrate
Fluxes Instream Losses and Net Nitrification andDenitrification Daily mass-balance calculations were under-taken for eight quiescent low-flow periods (each typically of1minus2 weeks) USGS stream-velocity readings from Carverranged from 0457 and 122 m sminus1 and with a stream distancealong the experimental reach of 652 km the travel timesranged from 396 to 148 h Therefore daily mass balances
over a 24-h period were assumed sufficient to account fortransit of NO3
minus given (a) the relatively short travel times (b)the high degree of stationarity in flux transfers during quiescentbaseflow conditions and (c) that calculated daily massbalances were averaged over a 1minus2 week periodThe 15 min NO3
minus measurements at Mt Judea and Carverwere converted to daily means and daily nitrate loads at eachsite were calculated using the corresponding gauged dailystreamflow data To account for flow accretion along the reachthe difference between the daily flow downstream at Carverand the upstream site at Mt Judea was calculated The increasein flows was assumed to be input from Left Fork (Figure 1)Daily NO3
minus input loading to the reach (LT) was calculatedas the sum of the daily NO3
minus loads from Mt Judea (LMJ) andLeft Fork (LLF)
L L LT MJ LF= + (2)
There was no high-resolution NO3minus monitoring on Left
Fork so weekly NO3minus measurements from grab samples taken
at Left Fork were combined with the measured daily flowaccretion to derive daily loads from Left Fork (S181) Asensitivity analysis evaluated the potential effects of under- oroverestimating Left Fork NO3
minus concentrations by plusmn50(Tables SI1 and SI2)Within this karst watershed some of the flow accretion will
arise from direct groundwater input into Big Creek Dischargedata were not available from the Left Fork tributary and directapportionment of contributions from Left Fork and ground-water was not possible We therefore evaluated a secondalternative ldquoendmemberrdquo case scenario whereby all of flow
Figure 2 Time series at the downstream monitoring site (Carver) from May 2014 to May 2017 showing (a) nitrate (NO3minusN) dissolvedinorganic carbon (DIC) and streamflow and (b) daily average gross primary production (GPP) ecosystem respiration (ER) and streamflow
Environmental Science amp Technology Article
DOI 101021acsest8b03074Environ Sci Technol 2018 52 13708minus13717
13710
accretion was attributed to direct groundwater contribution(S182)The daily instream NO3
minus load removal (LR) along the reachwas calculated as the difference between the daily input NO3
minus
loading (LT) and the daily NO3minus load at Carver (LC)
L L LR T C= minus (3)
To allow direct comparison with rates of assimilatory NO3minus
uptake by photosynthesis LR (kg-N dminus1) was then convertedto a daily NO3
minus removal rate UT (mg-N Lminus1 dminus1) UTincorporates both assimilatory NO3
minus uptake by photo-autotrophs (UA) heterotrophic NO3
minus removal through directuptake and denitrification (UD) and NO3
minus enrichment due toremineralization via nitrification (R)20
U U U RT A D= + minus (4)
UA was estimated from the GPPav measurements1235 GPPavdata were converted into net primary production (NPP)assuming that autotrophic respiration consumed 50 of theGPPav
3637 NPP data were then converted from units of O2uptake (mg-O2 L
minus1 dminus1) to C uptake (mg-C Lminus1 dminus1) with aphotosynthetic quotient of 100 then converted to NO3
minus
uptake (mg-N Lminus1 dminus1) using a molar ratio of CN of 1238
Subtracting UT from UA provides a measure of either netnitrification (positive values) or net heterotrophic NO3
minus
removal through direct uptake and denitrification hereafterreferred to as ldquonet denitrificationrdquo (negative values) When theriver was influent loss of NO3
minus to groundwater was accountedfor as described in S183
3 RESULTS AND DISCUSSION31 Three-Year Time Series of Nitrate Dissolved
Inorganic Carbon and Stream Metabolism The hourlyNO3
minus and DIC concentrations variations at Carver were drivenby streamflow but in opposing directions (Figure 2a) Themean and median NO3
minus concentrations were 0128 and 0093
mg-N Lminus1 respectively Nitrate concentrations at Carver werelowest during baseflow (mean 0043 mg-N Lminus1 lowest 10 offlows) and highest during storm runoff (mean 0278 mg-N Lminus1highest 10 of flows) arising from nonpoint-sourcemobilization and delivery of NO3
minus during rainfall eventsThe mean and median DIC concentrations were 248 and
252 mg-C Lminus1 respectively DIC concentrations were highestduring baseflow (mean 317 mg-C Lminus1) with DIC concen-trations diluted by storm runoff (mean 132 mg-C Lminus1)Highest DIC and lowest NO3
minus concentrations occurred duringthe extended low-flows between August and November 2015The mean and median molar CN ratios were 356 and 305
respectively The mean CN ratio during baseflow was 882 and82 during stormflow CN ratios greater than sim66 areindicative of stoichiometric depletion of N relative to C39
Absolute NO3minus concentrations below sim01 mg-N Lminus1 are
deemed likely to be limiting to algae with algal growthresponse to NO3
minus enrichment occurring between 038 to 179mg-N Lminus140 Therefore under average and baseflow conditionsat Carver a clear potential exists for algal growth to be limitedby low NO3
minus availabilityNo longer-term trends in either NO3
minus or DIC wereobserved over the three years These high-frequencymonitoring results are consistent with results from near-weeklywater-quality monitoring of Big Creek at Mt Judea whichshowed no statistically significant increasing or decreasingtrends in dissolved or particulate forms of P and Nconcentrations since 201341
Earlier studies6 have shown that Ozark streams can be veryeffective at retaining available nutrients and buffering addi-tional nutrient inputs Therefore the absence of any increasingtrend in nutrients in the water column may result from therapid and efficient uptake of nutrient inputs by stream biotaConsequently high-resolution stream metabolism and nutrientmeasurements were used here to detect whether increasedphotosynthesis or respiration rates resulted from increased
Figure 3 Scatter plot showing the relations between mean daily nitrate concentrations upstream at Mt Judea and downstream at Carver
Environmental Science amp Technology Article
DOI 101021acsest8b03074Environ Sci Technol 2018 52 13708minus13717
13711
nutrient assimilation even where no increases in water-columnnutrient concentrations could be observed
The time series in daily rates of GPPav and ERav at Carver(Figure 2b) showed no definitive long-term trends between
Figure 4 Time series from 1 November 2014 to 1 November 2015 showing (a) Nitrate concentrations upstream at Mt Judea and downstream atCarver and the lower-flow time periods used for mass balance calculation and evaluation of biogeochemical processes (b) streamflow at Carverand the percentage groundwater contribution to streamflow (c) daily ratio of gross primary production ecosystem respiration (GPPER)downstream at Carver (horizontal dashed line shows GPPER of 1 ie balance between heterotrophy and autotrophy) and excess partial pressureof carbon dioxide (EpCO2) and (d) streamflow and the molar CN ratio (DIC dissolved inorganic carbonNO3minusN) downstream at Carver
Environmental Science amp Technology Article
DOI 101021acsest8b03074Environ Sci Technol 2018 52 13708minus13717
13712
2014 and 2017 GPPav declined rapidly in response to majorstorm runoff events but typically recovered within a couple ofweeks Highest GPPav tended to occur during quiescentbaseflow or recessional streamflow conditions during thesummer (May through August) Both GPPav and ERav declinedduring the autumn (September through December) reflectingreductions in stream biological activity and GPPav tended todecline at a faster rate than ER This was particularly apparentduring the extended low-flows between August and December2015 suggesting a decline in primary production relative tomicrobial activity and a transition from net autotrophic to netheterotrophic stream communities During winter baseflows(November through January) ERav tended to exceed GPPavDuring the 3-yr monitoring no CAFO-related impacts oneither stream nutrient concentrations or metabolism arediscernible at Carver32 Temporal and Spatial Variability in NO3
minus
Concentrations Relative to Other Key EnvironmentalVariables Mean daily NO3
minus concentrations varied betweenbaseflow and storm events at Mt Judea and Carver during theone year of overlapping data (Figure 3) There was a cleardifferentiation between a higher-flow period characterized byregular storm events from mid-December 2014 to mid-July2015 and lower-flow conditions from August to NovemberDecember 2015 (Figures 3 and 4)During the higher-flow period a positive correlation existed
between upstream (Mt Judea) and downstream (Carver)NO3
minus with a ratio approaching 1 (Figure 3) During this high-flow period NO3
minus concentrations at both upstream anddownstream sites ranged between sim01 and sim04 mg-N Lminus1Time series data show close convergence between upstreamand downstream NO3
minus concentrations during storm-eventpeak concentrations (Figure 4ab)Under lower-flow conditions NO3
minus concentrations wereconsistently higher upstream than downstream (Figure 3) Theincrease in NO3
minus concentrations at the upstream site duringthe summer and autumn 2015 corresponds with reductions inflow This is typical of the longer-term hydrologically drivencycles in NO3
minus concentrations observed at the upstream sitereflecting a strong flow dependency with highest concen-trations under the lowest flows and dilution with increasingflow (Figure SI1abc) The strong increase in NO3
minus
concentrations during July to November 2015 thereforereflects hydrological controls and is consistent with fallingflows The high NO3
minus concentrations in autumn 2015subsequently declined with the onset of higher flows (FigureSI1ab)
The gap in NO3minus concentrations between upstream and
downstream sites widened with decreasing flow particularlyduring the protracted low-flows between mid-July andNovember 2015 During this time minimal soil watercontributed to streamflow and almost all (gt95) ofstreamflow was derived from groundwater (Figure 4ab) Bythe end of October 2015 upstream NO3
minus concentrationsreached sim075 mg-N Lminus1 whereas downstream NO3
minus
concentrations were sim005 mg-N Lminus1 Between July andNovember 2015 downstream NO3
minus concentrations exhibiteda much lower range (sim005 to sim015 mg-N Lminus1) as comparedwith upstream (sim01 to sim08 mg-N Lminus1) (Figure 3) Thisreduction in both magnitude and range of downstream NO3
minus
concentrations under baseflow conditions could arise eitherfrom dilution of NO3
minus as a result of downstream accretion ofwater sources with much lower NO3
minus concentrations or byremoval of NO3
minus through biogeochemical processes neces-sitating a mass-balance evaluation (see section 33)The widening gap in NO3
minus concentrations betweenupstream and downstream sites after mid-July 2015 corre-sponded with a decline in GPPER which fell below 1indicating a change to net heterotrophy (Figure 4c) Duringthe low-flow period from mid-July to November 2015 BigCreek was heterotrophic for sim90 of days Daily streamwaterEpCO2 doubled between mid-July and November 2015 from45 to 91 times atmospheric pressure independentlyconfirming an increase in rates of respiration (CO2 release)relative to photosynthesis (CO2 uptake)During the higher-flow period from mid-January to mid-July
Big Creek was predominantly net autotrophic (GPPER gt 1for 52 of days) Net heterotrophic conditions prevailedpredominantly during lower-flow intervals between stormevents with GPPER lt 1 typically during and immediatelyafter storm eventsMolar CN ratios at Carver also increased markedly after
mid-July from sim300 to gt800 (Figure 4d) This stoichiometricdepletion of N along with persistence of low NO3
minus
concentrations below 01 mg-N Lminus1 (falling to lt004 mg-NLminus1) suggests that algal growth may have been limited by lowN availability at Carver over the late summer and autumn of2015
33 Nitrate Reach Mass Balance to Quantify SeasonalNitrate Removal during Baseflow ConditionsMean dailyNO3
minus mass balances for the eight seasonal quiescent baseflowperiods between February and October 2015 are presented inTable 1 Mean daily NO3
minus input loadings to the reach (LT)increased from 173 kg-N dminus1 in February to 617 kg-N dminus1 in
Table 1 Seasonal Patterns in Mean Daily NO3minus Input Loadings (LT) to Big Creek Mean Daily Instream NO3
minus Load Removal(LR) along the 65 km Experimental Reach Under Low-Flow Conditions and Mean Daily NO3
minus Load Removal As aPercentage of NO3
minus Inputs (UE)a
season date rangeNO3
minus input loadingto reach (LT) (kg-N dminus1)
instream NO3minus removal
along reach (LR) (kg-N dminus1)instream NO3
minus removal (LR) as of NO3minus
input loading (LT) (UE)
winter 4minus13 Feb 2015 173 (112) 768 (046) 447 (409)spring 1 5minus12 Apr 2015 441 (635) 190 (282) 439 (953)spring 2 24 Aprminus5 May 2015 379 (153) 169 (385) 476 (893)early summer 2minus10 Jun 2015 492 (236) 241 (854) 512 (534)mid summer 11minus21 Jul 2015 617 (442) 146 (282) 321(141)late summer 7minus16 Aug 2015 756 (122) 557 (059) 742 (466)autumn 1 1minus14 Sept 2015 581 (123) 449 (081) 778 (239)autumn 2 1minus11 Oct 2015 298 (029) 282 (025) 948 (120)aStandard deviations are shown in parentheses
Environmental Science amp Technology Article
DOI 101021acsest8b03074Environ Sci Technol 2018 52 13708minus13717
13713
July then declined rapidly to 756 kg-N dminus1 in August whichalso corresponded with an order of magnitude reduction inbaseflow discharge By October LT had fallen to only 298 kg-N dminus1 Instream NO3
minus removal (LR) followed a similar patternto LT with highest mean daily instream NO3
minus removal duringJune (24 kg-N dminus1) then decreasing during the late summerand autumn and falling to 282 kg-N dminus1 in October Howeverthe efficiency of instream NO3
minus removal (UE ie LR expressedas a percentage of LT) increased markedly during the latesummer and autumn from 32 in July to 74minus95 betweenAugust and OctoberThe fluvial mass balance therefore confirmed that the
observed downstream reductions in NO3minus concentrations
under baseflow were a result of net instream removal of NO3minus
by biogeochemical processes rather than a dilution effectAlthough LT and LR were greatest during the winter to early
summer period UE and the instream NO3minus removal rate (UT)
increased dramatically during the low flows of the late summerand autumn UT increased from le009 mg-N Lminus1 dminus1
(February through July) to gt02 mg-N Lminus1 dminus1 in Augustand September and 066 mg-N Lminus1 dminus1 in October (Table 2)By autumn 2015 gt75 of the NO3
minus inputs were removed bybiogeochemical processes (Table 1)We also assessed the efficiency of NO3
minus removal under thealternative scenario where the increase in flow along theexperimental reach was solely from direct groundwater input(S162) This made relatively little difference to the UE whichalso increased markedly during the late summer and autumnfrom 46 in July to 72minus94 between August and October(Table SI3) The sensitivity analysis (Tables SI1 and SI3)showed that a 50 increase or decrease in either Left Fork or
groundwater NO3minus concentrations made little difference to
these findings a consistent increase in efficiency of NO3minus
removal was observed after July with August to October UEvalues consistently sim70minus95
34 Biogeochemical Controls on Nitrate DeliveryAccounting for Assimilatory Nitrate Uptake to Calcu-late Net Nitrification and Net Denitrification FromFebruary to July assimilatory NO3
minus uptake by photosynthesiz-ing plants (UA) consistently exceeded UT (Table 2) indicatingfirst that assimilation of NO3
minus by photoautotrophs was thedominant process removing NO3
minus from the water column andsecond that assimilation was partially balanced by netnitrification NO3
minus gains In contrast from August to OctoberUT exceeded UA indicating that heterotrophic NO3
minus removalthrough direct uptake and denitrification was removing NO3
minus
along the reach in late summer and autumnTable 3 shows that net nitrification gains to the reach ranged
from 0135 mg-N Lminus1 dminus1 in February to 0273 mg-N Lminus1 dminus1
in AprilMay However after July a pronounced switch fromnet nitrification gains to net denitrification losses occurredDuring late summer and autumn denitrification losses ofNO3
minus increased from sim0100 mg-N Lminus1 dminus1 in August andSeptember to 0592 mg-N Lminus1 dminus1 in October These estimateswere based on using an average periphyton CN molar ratio of12 for USA streams3538 We also evaluated the effects ofusing an average periphyton molar CN ratio of 86 fromresearch in northern European streams17 This increased UAvalues by sim39 but did not alter our findings of a switchbetween net nitrification between February and July to netdenitrification from August to October By changing the CNstoichiometry from 12 to 86 net nitrification ranged from
Table 2 Seasonal Patterns in Mean Daily NO3minus Removal Rate (UT) along the 65 km Experimental Reach of Big Creek Under
Low-Flow Conditions And Mean Daily Assimilatory Uptake of NO3minus by Photoautotrophs (UA)
a
season date range instream NO3minus removal rate (UT) (mg-N Lminus1 dminus1) assimilatory NO3
minus uptake (UA) (mg-N Lminus1 dminus1)
winter 4minus13 Feb 2015 0077 (0006) 0212 (0035)spring 1 5minus12 Apr 2015 0072 (0017) 0256 (0050)spring 2 24 Aprminus5 May 2015 0082 (0018) 0355 (0067)early summer 2minus10 Jun 2015 0090 (0014) 0269 (0045)mid summer 11minus21 Jul 2015 0066 (0030) 0259 (0040)late summer 7minus16 Aug 2015 0284 (0026) 0180 (0016)autumn 1 1minus14 Sept 2015 0229 (0019) 0115 (0038)autumn 2 1minus11 Oct 2015 0656 (0029) 0076 (0028)
aStandard deviations are shown in parentheses
Table 3 Seasonal Patterns in Mean Daily NO3minus Concentration Gains by Net Nitrification (+) and Losses by Net
Denitrification (minus) long the Experimental Reach of Big Creek under Low-Flow Conditions Mean Daily Values of the Ratiobetween Gross Primary Production and Ecosystem Respiration (GPPER) Excess Partial Pressure of Carbon Dioxide(EpCO2) Dissolved Oxygen (DO) Streamflow and the Percentage of Groundwater Contribution to Streamflowa
season date rangenet nitrification (+) or denitrification (minus)
(mg-N Lminus1 dminus1) GPPEREpCO2
(times atm press)DO
(mg-O2 Lminus1) flow (m3 sminus1) groundwater
winter 4minus13 Feb 2015 +0135 (0032) 114 (009) 280 (020) 119 (049) 115 (007) 665 (134)spring 1 5minus12 Apr 2015 +0184 (0039) 106 (013) 364 (020) 102 (033) 310 (037) 586 (238)spring 2 24 Apr -5 May
2015+0273 (0058) 125 (016) 381 (059) 103 (050) 261 (116) 617 (579)
early summer 2minus10 Jun 2015 +0179 (0044) 134 (015) 471 (049) 939 (042) 330 (172) 580 (648)mid summer 11minus21 Jul 2015 +0193 (0024) 197 (078) 715 (046) 898 (029) 254 (128) 828 (721)late summer 7minus16 Aug 2015 minus0104 (0032) 078 (005) 106 (083) 695 (035) 023 (004) 988 (098)autumn 1 1minus14 Sept
2015minus0102 (0027) 062 (010) 985 (165) 650 (054) 024 (006) 966 (142)
autumn 2 1minus11 Oct 2015 minus0592 (0015) 057 (023) 817 (150) 785 (064) 004 (0004) 978 (064)aStandard deviations are shown in parentheses
Environmental Science amp Technology Article
DOI 101021acsest8b03074Environ Sci Technol 2018 52 13708minus13717
13714
+0218 mg-N Lminus1 dminus1 in February to +0414 mg-N Lminus1 dminus1 inAprilMay with net denitrification ranging from minus0033 mg-NLminus1 dminus1 in August to minus0562 mg-N Lminus1 dminus1 in OctoberNet nitrification and denitrification rates were compared
with mean daily GPPER EpCO2 streamflow and percentagegroundwater discharge (Table 3) The shift from netnitrification to net denitrification corresponded directly with(1) a change in stream metabolism from net autotrophic(GPPER in July was 197) to net heterotrophic (GPPER fellbelow 1 to 078 in August 062 in September and 057 inOctober) and (2) an increase in EpCO2 and a reduction inDO arising from the increases in microbial respiration relativeto photosynthesisThe alternative scenario where flow accretion between Mt
Judea and Carver was attributed to direct groundwaterdischarge to Big Creek also had no effect on the timing ofthe shift from net nitrification to denitrification (S162 TableSI4) Sensitivity analysis (Tables SI2 and SI4) also showedthat irrespective of a 50 increase or decrease in either LeftFork or groundwater NO3
minus concentrations the sameconsistent switch between net nitrification and net denitrifica-tion was observed after JulyThe consistency in this observed switch between instream
NO3minus production and instream NO3
minus removal and itssynchronicity with measured changes in stream metabolismprovides compelling evidence that the marked change ininstream NO3
minus processing and delivery after July was linked tochanges in stream metabolism from net autotrophy to netheterotrophyThe karst streams of the Ozarks are characterized by a large
hyporheic zone4243 a hotspot of nitrogen transformation44
Water residence times and redox conditions provide a keycontrol on changes between NO3
minus removal and NO3minus
production with hyporheic zone sediments45minus48 In BigCreek the winter to midsummer period was characterized byhigher baseflows (at least an order of magnitude greater thanlate summerautumn baseflows) and net autotrophy resultingin higher instream DO concentrations Rapid movement ofwell-oxygenated water throughout the water column and intothe hyporheic zone promotes aerobic metabolism of organicmatter and release of NO3
minus through nitrification4649 Fromwinter to midsummer net nitrification was observed in BigCreek and nitrification in the hyporheic zone may have beenresponsible for buffering the effects of photosyntheticassimilatory uptake of NO3
minusUnder the more sluggish flow conditions during late summer
and autumn available oxygen is depleted as a result ofincreased heterotrophic activity The reduced movement ofwater and oxygen through the hyporheic zone favors a shift torespiratory pathways with denitrification (conversion of nitrateto N2O andor N2 gas)
5051 Unlike assimilation of NO3minus into
plant biomass which retains N temporarily denitrificationresults in a permanent loss of bioavailable N The lowbaseflows of late summer and autumn 2015 resulted in higherwater residence times and a greater proportion of flow movingthrough the hyporheic zone This provides greater exposureand water contact time with microbial biofilms wheredenitrification occurs51 The death and breakdown of biomassduring the late summer and autumn contribute to theavailability of organic matter for microbial decompositionpromoting higher rates of microbial respiration relative tophotosynthesis losses of DO and greater availability of organiccarbon as a resource for denitrifying bacteria455253
Denitrification within the hyporheic zone may therefore beresponsible for losses of NO3
minus in Big Creek during the latesummer and autumn Although denitrification can also occuron suspended sediments within the water column5455 this islikely to be a second order effect under baseflow conditions ina groundwater-fed stream where suspended solids concen-trations are low (typically lt5 mg Lminus1)Under baseflow conditions instream assimilatory NO3
minus
uptake by photosynthesizing plants and hyporheic-zonedenitrification along the experimental reach removed betweensim30 and sim90 of the NO3
minus input load During the period ofmonitoring (spring 2014 to spring 2017) NO3
minus loading to theupstream section of Big Creek (at Mt Judea) was attenuated byinstream processing such that no CAFO-related impacts oneither stream nutrient concentrations or metabolism werediscernible at the downstream location (Carver) and thus tothe Buffalo River Future monitoring will be needed to detectwhether long-term changes in nutrients and organic carboninputs may occur whether this stimulates higher rates ofheterotrophic andor autotrophic activity and any longer-termeffects on the capacity of assimilation and denitrificationprocesses to remove and buffer any increase in nutrientloadingsThe novelty of this research is the combination of
continuous high-frequency in situ stream metabolism andnitrate measurements to apportion the net effects ofassimilation nitrification and denitrification on changes inbaseflow nitrate fluxes at the river-reach to watershed scale Inthis case we found that during winter to midsummer periodsNO3
minus uptake in Big Creek was dominated by assimilation byphotoautotrophs which was partially compensated by releaseof NO3
minus from nitrification In late summer the predominantmetabolic pathway switched to net heterotrophy andheterotrophic NO3
minus removal through direct uptake anddenitrification became the dominant process of nitrateremoval Removal of NO3
minus by assimilation and denitrificationprovides an important ldquoself-cleansingrdquo ecosystem serviceresulting in a pronounced shift in CN stoichiometry anddecreasing NO3
minus concentrations to low levels which would beexpected to limit algal growth56
This approach provides a means of scaling up frommicroscale and mesoscale process experiments and measure-ments which are by necessity short-term and localized toexplore how river nitrate delivery responds to shifts in streammetabolism from day-to-day and seasonal to interannualvariability This research and the methods presented here areapplicable along the river continuum from headwaters tolarge-scale fluvial systems (with large spatial and temporalvariability in nutrient fluxes) and offer a valuable way forwardin quantifying net process controls on the fate and transport ofnitrogen in fluvial systems
ASSOCIATED CONTENT
S Supporting InformationThe Supporting Information is available free of charge on theACS Publications website at DOI 101021acsest8b03074
S1 Methods Land use and cover data site hydro-geology high-frequency water-quality monitoringstreamflow measurement hydrograph separation anal-ysis of diurnal dissolved oxygen curves to calculateprimary production and respiration calculation of DICand EpCO2 nitrate mass-balance calculations and S2
Environmental Science amp Technology Article
DOI 101021acsest8b03074Environ Sci Technol 2018 52 13708minus13717
13715
Results Figure SI1 time series of nitrate and flow andnitrate plotted against stream flow for Mt Judea TablesSI1 and SI2 sensitivity analysis based on estimates ofNO3
minus load inputs from Left Fork Tables SI3 and SI4alternative scenario sensitivity analysis based onestimates of NO3
minus load inputs from groundwater andadditional references (PDF)
AUTHOR INFORMATIONCorresponding AuthorE-mail hpjcehacukORCIDHelen P Jarvie 0000-0002-4984-1607Phillip D Hays 0000-0001-5491-9272NotesThe authors declare no competing financial interest
ACKNOWLEDGMENTSHPJ and RJW were supported by NERC NationalCapability projects NEC05966 and NEC04879 Funding forthe Big Creek Research and Extension monitoring wasprovided by the Arkansas Governorrsquos Office and StateLegislature to the University of Arkansas Systemrsquos Divisionof Agriculture Hydrological and chemical monitoring by theUSGS were supported by a National Park ServiceUSGSWater Quality Partnership Grant administered by the USGSAny use of trade firm or product names is for descriptivepurposes only and does not imply endorsement by the USGovernment
REFERENCES(1) Smith V H Eutrophication of freshwater and coastal marineecosystems - A global problem Environ Sci Pollut Res 2003 10 (2)126minus139(2) Dodds W K Bouska W W Eitzmann J L Pilger T J PittsK L Riley A J Schloesser J T Thornbrugh D J Eutrophicationof US Freshwaters Analysis of Potential Economic Damages EnvironSci Technol 2009 43 (1) 12minus19(3) Dodds W K Smith V H Nitrogen phosphorus andeutrophication in streams Inland Waters 2016 6 (2) 155minus164(4) Peterson B J Wollheim W M Mulholland P J Webster JR Meyer J L Tank J L Marti E Bowden W B Valett H MHershey A E McDowell W H Dodds W K Hamilton S KGregory S Morrall D D Control of nitrogen export fromwatersheds by headwater streams Science 2001 292 (5514) 86minus90(5) Alexander R B Boyer E W Smith R A Schwarz G EMoore R B The role of headwater streams in downstream waterquality J Am Water Resour Assoc 2007 43 (1) 41minus59(6) Jarvie H P Sharpley A N Scott J T Haggard B E BowesM J Massey L B Within-River Phosphorus Retention Accountingfor a Missing Piece in the Watershed Phosphorus Puzzle Environ SciTechnol 2012 46 (24) 13284minus13292(7) Mulholland P J Helton A M Poole G C Hall R OHamilton S K Peterson B J Tank J L Ashkenas L R CooperL W Dahm C N Dodds W K Findlay S E G Gregory S VGrimm N B Johnson S L McDowell W H Meyer J L ValettH M Webster J R Arango C P Beaulieu J J Bernot M JBurgin A J Crenshaw C L Johnson L T Niederlehner B ROrsquoBrien J M Potter J D Sheibley R W Sobota D J Thomas SM Stream denitrification across biomes and its response toanthropogenic nitrate loading Nature 2008 452 (7184) 202minusU46(8) Mulholland P J Valett H M Webster J R Thomas S ACooper L W Hamilton S K Peterson B J Stream denitrificationand total nitrate uptake rates measured using a field N-15 traceraddition approach Limnol Oceanogr 2004 49 (3) 809minus820
(9) Tank J L Marti E Riis T von Schiller D Reisinger A JDodds W K Whiles M R Ashkenas L R Bowden W BCollins S M Crenshaw C L Crowl T A Griffiths N A GrimmN B Hamilton S K Johnson S L McDowell W H Norman BM Rosi E J Simon K S Thomas S A Webster J R Partitioningassimilatory nitrogen uptake in streams an analysis of stable isotopetracer additions across continents Ecol Monogr 2018 88 (1) 120minus138(10) Tank J L Meyer J L Sanzone D M Mulholland P JWebster J R Peterson B J Wollheim W M Leonard N EAnalysis of nitrogen cycling in a forest stream during autumn using aN-15-tracer addition Limnol Oceanogr 2000 45 (5) 1013minus1029(11) Ensign S H Doyle M W Nutrient spiraling in streams andriver networks Journal of Geophysical Research-Biogeosciences 2006111 (G4) G04009(12) Rode M Halbedel nee Angelstein S Anis M R BorchardtD Weitere M Continuous in-stream assimilatory nitrate uptakefrom high frequency sensor measurements Environ Sci Technol2016 50 (11) 5685minus5694(13) Bowes M J Jarvie H P Halliday S J Skeffington R AWade A J Loewenthal M Gozzard E Newman J R Palmer-Felgate E J Characterising phosphorus and nitrate inputs to a ruralriver using high-frequency concentration-flow relationships Sci TotalEnviron 2015 511 608minus620(14) Halliday S J Skeffington R A Wade A J Bowes M JGozzard E Newman J R Loewenthal M Palmer-Felgate E JJarvie H P High-frequency water quality monitoring in an urbancatchment hydrochemical dynamics primary production andimplications for the Water Framework Directive HydrologicalProcesses 2015 29 (15) 3388minus3407(15) Halliday S J Skeffington R A Wade A J Bowes M JRead D S Jarvie H P Loewenthal M Riparian shading controlsinstream spring phytoplankton and benthic algal growth Environ-mental Science-Processes amp Impacts 2016 18 (6) 677minus689(16) Wade A J Palmer-Felgate E J Halliday S J Skeffington RA Loewenthal M Jarvie H P Bowes M J Greenway G MHaswell S J Bell I M Joly E Fallatah A Neal C Williams RJ Gozzard E Newman J R Hydrochemical processes in lowlandrivers insights from in situ high-resolution monitoring Hydrol EarthSyst Sci 2012 16 (11) 4323minus4342(17) Rode M Wade A J Cohen M J Hensley R T Bowes MJ Kirchner J W Arhonditsis G B Jordan P Kronvang BHalliday S J Skeffington R A Rozemeijer J C Aubert A HRinke K Jomaa S Sensors in the stream The High-frequency waveof the present Environ Sci Technol 2016 50 (19) 10297minus10307(18) Cohen M J Kurz M J Heffernan J B Martin J BDouglass R L Foster C R Thomas R G Diel phosphorusvariation and the stoichiometry of ecosystem metabolism in a largespring-fed river Ecol Monogr 2013 83 (2) 155minus176(19) Hensley R T Cohen M J On the emergence of diel solutesignals in flowing waters Water Resour Res 2016 52 (2) 759minus772(20) Hensley R T Cohen M J Korhnak L V Inferring nitrogenremoval in large rivers from high-resolution longitudinal profilingLimnol Oceanogr 2014 59 (4) 1152minus1170(21) Kunz J V Hensley R Brase L Borchardt D Rode MHigh frequency measurements of reach scale nitrogen uptake in afourth order river with contrasting hydromorphology and variablewater chemistry (Weisse Elster Germany) Water Resour Res 201753 (1) 328minus343(22) Kraus T E C OrsquoDonnell K Downing B D Burau J RBergamaschi B A Using paired in situ high frequency nitratemeasurements to better understand controls on nitrate concentrationsand estimate nitrification rates in a wastewater-impacted river WaterResour Res 2017 53 (10) 8423minus8442(23) Jones C Kim S W Schilling K Use of continuousmonitoring to assess stream nitrate flux and transformation patternsEnviron Monit Assess 2017 189 35(24) Wollheim W M Mulukutla G K Cook C Carey R OAquatic nitrate retention at river network scales across flow conditions
Environmental Science amp Technology Article
DOI 101021acsest8b03074Environ Sci Technol 2018 52 13708minus13717
13716
determined using nested in situ sensors Water Resour Res 2017 53(11) 9740minus9756(25) Jarvie H P Sharpley A N Brahana V Simmons T PriceA Neal C Lawlor A J Sleep D Thacker S Haggard B EPhosphorus retention and remobilization along hydrological pathwaysin karst terrain Environ Sci Technol 2014 48 (9) 4860minus4868(26) American Public Health Association (APHA) AlkalinityTitration Method 2320 B In Standard Methods for the Examinationof Water and Wastewater 23rd ed 1987 ISBN 978minus0-87553minus287minus5(27) Rantz S E Measurement and computation of streamflow Vol1 Measurement of stage and discharge In US Geological SurveyWater Supply Paper 2175 1982(28) Jarvie H P Neal C Smart R Owen R Fraser D ForbesI Wade A Use of continuous water quality records for hydrographseparation and to assess short-term variability and extremes in acidityand dissolved carbon dioxide for the River Dee Scotland Sci TotalEnviron 2001 265 (1minus3) 85minus98(29) OrsquoConnor D J Ditoro D M Photosynthesis and oxygenbalance in streams Journal of the Sanitary Engineering DivisionProceedings of the American Society of Civil Engineers 1970 96 (2)547minus571(30) Williams R J White C Harrow M L Neal C Temporaland small-scale spatial variations of dissolved oxygen in the RiversThames Pang and Kennet UK Sci Total Environ 2000 251 497minus510(31) Chapra S C Ditoro D M Delta method for estimatingprimary production respiration and reaeration in streams J EnvironEng 1991 117 (5) 640minus655(32) Bernhardt E S Heffernan J B Grimm N B Stanley E HHarvey J W Arroita M Appling A P Cohen M J McDowellW H Hall R O Read J S Roberts B J Stets E G Yackulic CB The metabolic regimes of flowing waters Limnol Oceanogr 201863 S99minusS118(33) Odum H T Primary production in flowing waters LimnolOceanogr 1956 1 102minus117(34) Jarvie H P King S M Neal C Inorganic carbon dominatestotal dissolved carbon concentrations and fluxes in British riversApplication of the THINCARB model - Thermodynamic modellingof inorganic carbon in freshwaters Sci Total Environ 2017 575 496minus512(35) King S A Heffernan J B Cohen M J Nutrient flux uptakeand autotrophic limitation in streams and rivers Freshwater Science2014 33 (1) 85minus98(36) Hall R O Tank J L Ecosystem metabolism controls nitrogenuptake in streams in Grand Teton National Park Wyoming LimnolOceanogr 2003 48 (3) 1120minus1128(37) Hall R O Beaulieu J J Estimating autotrophic respiration instreams using daily metabolism data Freshwater Science 2013 32 (2)507minus516(38) Stelzer R S Lamberti G A Effects of N P ratio and totalnutrient concentration on stream periphyton community structurebiomass and elemental composition Limnol Oceanogr 2001 46 (2)356minus367(39) Redfield A C The biological control of chemical factors in theenvironment American Scientist 1958 46 (3) 205minus221(40) Evans-White M A Haggard B E Scott J T A Review ofstream nutrient criteria development in the United States Journal ofEnvironmental Quality 2013 42 (4) 1002minus1014(41) Sharpley A N Haggard B E Berry L Brye K Burke JDaniels M B Gbur E Glover T Hays P Kresse TVanDevender K W Nutrient concentrations in Big Creek correlateto regional watershed land use Agricultural amp Environmental Letters2017 2 170027(42) Miller R B Heeren D M Fox G A Halihan T Storm DE Mittelstet A R The hydraulic conductivity structure of gravel-dominated vadose zones within alluvial floodplains J Hydrol 2014513 229minus240(43) Miller R B Heeren D M Fox G A Halihan T Storm DE Heterogeneity influences on stream water-groundwater interactions
in a gravel-dominated floodplain Hydrol Sci J 2016 61 (4) 741minus750(44) Triska F J Duff J H Avanzino R J The role of waterexchange between a stream and its hyporheic zone in nitrogen cyclingat the terrestrial aquatic interface Hydrobiologia 1993 251 (1minus3)167minus184(45) Zarnetske J P Haggerty R Wondzell S M Baker M ALabile dissolved organic carbon supply limits hyporheic denitrifica-tion J Geophys Res 2011 116 G04036(46) Zarnetske J P Haggerty R Wondzell S M Bokil V AGonzalez-Pinzon R Coupled transport and reaction kinetics controlthe nitrate source-sink function of hyporheic zones Water Resour Res2012 48 W11508(47) Harvey J W Bohlke J K Voytek M A Scott D TobiasC R Hyporheic zone denitrification Controls on effective reactiondepth and contribution to whole-stream mass balance Water ResourRes 2013 49 (10) 6298minus6316(48) Moatar F Abbott B W Minaudo C Curie F Pinay GElemental properties hydrology and biology interact to shapeconcentration discharge curves for carbon nutrients sediment andmajor ions Water Resour Res 2017 53 (2) 1270minus1287(49) Zarnetske J P Haggerty R Wondzell S M Baker M ADynamics of nitrate production and removal as a function ofresidence time in the hyporheic zone J Geophys Res 2011 116G01025(50) Zarnetske J P Haggerty R Wondzell S M Couplingmultiscale observations to evaluate hyporheic nitrate removal at thereach scale Freshwater Science 2015 34 (1) 172minus186(51) Palmer-Felgate E J Mortimer R J G Krom M D JarvieH P Impact of point-source pollution on phosphorus and nitrogencycling in stream-bed sediments Environ Sci Technol 2010 44 (3)908minus914(52) Aubert A H Breuer L New seasonal shift in in-streamdiurnal nitrate cycles identified by mining high-frequency data PLoSOne 2016 11 (4) e0153138(53) Dodds W K Marti E Tank J L Pontius J Hamilton SK Grimm N B Bowden W B McDowell W H Peterson B JValett H M Webster J R Gregory S Carbon and nitrogenstoichiometry and nitrogen cycling rates in streams Oecologia 2004140 (3) 458minus467(54) Liu T Xia X H Liu S D Mou X L Qiu Y WAcceleration of Denitrification in Turbid Rivers Due to DenitrificationOccurring on Suspended Sediment in Oxic Waters Environ SciTechnol 2013 47 (9) 4053minus4061(55) Xia X H Jia Z M Liu T Zhang S B Zhang L WCoupled Nitrification-Denitrification Caused by Suspended Sediment(SPS) in Rivers Importance of SPS Size and Composition EnvironSci Technol 2017 51 (1) 212minus221(56) Jarvie H P Smith D R Norton L R Edwards F BowesM J King S M Scarlett P Davies S Dils R Bachiller-Jareno NPhosphorus and Nitrogen Limitation and Impairment of HeadwaterStreams Relative to Rivers in Great Britain A National Perspective onEutrophication Sci Total Environ 2018 621 849minus862
Environmental Science amp Technology Article
DOI 101021acsest8b03074Environ Sci Technol 2018 52 13708minus13717
13717
1
E COLI IN FLOWING WATERS
Mary Savin and BCRET members
I Why is Escherichia coli (E coli) being monitored What is the concern
Fecal pollution (from excrement of humans or animals) in the environment is of concern for many reasons not least of which is human health risks and disease control Other concerns related to fecal pollution of our natural waters include potential changes in the nutrient status of water introduction of antibiotic resistance and chemical contaminants changes in the ecological condition of waters and degradation of natural resources on which rural economies depend
People are concerned that the land application of swine effluent (pig excrement) will increase Escherichia coli in Big Creek and consequently the Buffalo River the first National Scenic River in the US This document aims to provide better understanding of
1) what is involved in E coli monitoring 2) what the numbers mean 3) some limitations in interpreting values and 4) provide a context for further research that may be needed to better interpret the E coli
numbers being measured in flowing waters such as Big Creek and Buffalo River
II What is E coli Why and how is it used as an indicator
E coli is a species of bacteria from the coliform group - bacteria that are rod-shaped gram negative non-spore forming facultative anaerobes commonly found in the feces of humans and warm blooded animals E coli occurs in human intestines - many strains with no ill effects although certain E coli cause serious human illnesses Thus while many E coli do not harm us there are important variants that do There are also other species of bacteria viruses and other small organisms that cause disease which if present in fecal sources polluting our waters can make humans sick Depending on whether E coli survive as long in the environment as these other pathogens E coli may or may not adequately warn us about a disease causing agent in our waters To date E coli is the most reliable test we have although other indicators and tests are being investigated E coli cannot be seen in streams by the human eye Thus it is important to determine if there is a problem of elevated E coli numbers by careful water sampling and using US Environmental Protection Agency (EPA) standardized methods E coli is counted in water because of the extensive studies and relationships established between the presence of E coli and the number of human illnesses occurring from contact with the water (eg swimming) containing the bacteria From these relationships there have been upper limits established for bacterial numbers that correspond to the acceptable risk of people getting sick from exposure to water containing them Water quality standards for E coli are established by the state in Arkansas Department of Environmental Quality (ADEQ) Regulation 2 (see Table 1) The E coli numbers must remain below a threshold in a specified number of total samples collected The exact upper limit that is allowed depends on the designation of the waterbody and time of year (primary or secondary contact season) Primary
2
Table 1 Upper limits for Escherichia coli counts defined in Regulation 2 of the Arkansas Department of
Environmental Quality (ADEQ) as specified by contact season and waterbody designation for both single samples and geometric mean
Contact season Water designation Limit of E coli (MPN100mL)
Single sample1
Geometric mean2
Primary (May 1-Sept 30)
Extraordinary Resource Water Ecologically Sensitive Waterbody
Natural amp Scenic Waterway Lakes
Reservoirs
298 126
All other water 410 NA3
Secondary (Oct 1-April 30)
Extraordinary Resource Water Ecologically Sensitive Waterbody
Natural amp Scenic Waterway Lakes
Reservoirs
1490 630
All other water 2050 NA 1 No more than 25 of samples from no less than 8 samples per contact season may exceed the limit 2Geometric mean is calculated from at least 5 samples collected within 30 days at evenly spaced time intervals during that 30-day period 3Not applicable
contact recreation is a designation given to a waterbody where full body contact occurs and occurs from May 1 through September 30 The ADEQ also designates any stream with a watershed (eg drainage basin in the landscape) exceeding 10 square miles and those with smaller watersheds on individual cases (ie after site verification) for primary contact recreation Secondary contact recreation designates waterbodies where activities such as boating fishing and wading take place and occurs from October 1 through April 30
E coli is measured in samples of water collected strictly following EPA guidelines The measurement of E coli starts within 8 hours of collection This method provides an estimate of E coli presence in the sampled water that is the most probable number (MPN) of E coli Using an EPA method provides numbers that are theoretically comparable to other labs using the same method The MPN depends on growing bacteria in the laboratory in ldquoculturerdquo and is an approach used routinely in microbiology This measurement is subject to high variability because of the nature of environmental bacteria thus variability in the data in E coli counts from streams is not unusual For this reason it is important to establish background levels of E coli in any water resulting from various wildlife human (eg septic tanks sewers) and agricultural (eg pig chicken cattle) sources
3
E coli thresholds are lower in late spring through summer (primary contact season) when more people are expected to be in contact with streams and lakes More stringent limits also apply to Extraordinary Resource Waters (eg Buffalo River) Ecologically Sensitive Waterbodies and Natural Scenic Waterways During the primary contact season (May 1- Sept 30) we do not want E coli to exceed 298 MPN100 mL and during secondary contact season (Oct 1 ndash Apr 30) E coli counts should not exceed 1490 MPN100 mL in single samples
III How does the E coli measurement ldquofitrdquo into the context of the landscape
While monitoring one bacterial species to assess the biological quality of water may seem simple determining the actual ecological condition of a system is complicated Measurement of E coli is an indicator for potential fecal pollution and potential pathogen problems but by itself does not identify the source(s) of the bacteria
E coli is present in intestines (and feces) and is not supposed to grow in the environment thus the presence and abundance should indicate pollution and be directly related to human and animal sources However because E coli is in many different animals (eg human wildlife agricultural) and because of the different pathways that bacteria may travel throughout the environment before ending up in water where we can measure it the presence of E coli does not identify the source of pollution
IV Why is E coli monitoring important and why is it complicated
There are many of factors that affect whether E coli survives in the environment for how long and whether it moves to other locations E coli is adapted to living in intestines After deposition from an animal cells have to survive rapidly changing environmental conditions (eg temperature and moisture) exposure to harmful UV rays in sunlight outcompete other organisms and avoid predators All these factors make it difficult to estimate how long E coli will survive in lagoon soil and river environments However there is evidence that E coli can persist in soil and sediments
V What are the numbers
E coli is measured weekly in Big Creek upstream and downstream of the CampH Farm Mt Judea Newton County Arkansas Water sample collection for E coli analysis began Sept 12 2013 prior to manure from CampH Farm application to fields either in fields adjacent to or distant from Big Creek Manure application began in 2014 to fields distant from Big Creek and then adjacent to Big Creek in March 2014 So far in the period following manure applications by CampH Farms (Jan 2 through May 19 2014) no trends in E coli with time or between sampling locations are apparent (Table 2) The Table 2 data are detailed in the Big Creek Research and Extension Team Quarterly Reports and demonstrate the week-to-week variability in E coli at upstream and downstream sites The E coli counts are expected to continue to be variable Clearly it is important to quantify the variability in E coli concentrations long-term in order to determine if changes occur as a result of CampH operation
The MPN is expected to increase with increases in flow and the recent installation of a USGS gauge to measure flow will allow for the determination of the relationship between measured flow in
4
the stream and E coli concentrations Because of the dangers during high flows most contact recreation is expected during base flow and thus sampling during base flow may provide more meaningful data
Table 2 Geometric mean of E coli (and range of sample MPN) before (Sept 12 - Dec 17 2013) and after manure applications began on the CampH Farm (Jan 2 - May 19 2014)
CampH location
Before any manure application
After manure application
Sept 12 - Dec 17 2013 Jan 2 - May 19 2014
(MPN100mL)
Upstream 82 (6 ndash 4080) 83 (NDa ndash 921)
Downstream 111 (5 ndash 3500) 39 (ND ndash 1553) aNot detected
Regulation Arkansas Pollution Control and Ecology Commission 01400-002 2014 Regulation Establishing Water Quality Standards for Surface Waters of the State of Arkansas as revised effective March 24 2014 Arkansas Department of Environmental Quality (ADEQ) Available at httpwwwadeqstatearusregsfilesreg02_final_140324pdf Last accessed 20 Aug 2014
Page 1 of 6
Nutrient impairment of surface waters continues despite widespread conservation efforts to reduce losses from urban rural and agricul-tural land uses (Scavia et al 2014) Land use within watersheds influ-
ences the quality and quantity of water in streams draining the landscape As land disturbance increases and use intensifies an increase in stormwater runoff and nutrient inputs that lead to a greater potential for transport to receiving water is generally observed (Dubrovsky et al 2010 Rebich et al 2011) This has led to efforts to identify and quantify nutrient sources within watersheds strategically target and apportion nutrient loss reduction (Reckhow et al 2011)
Many factors influence the relationship between land use in a given water-shed and nutrient transport downstream from that watershed With an increase in percentage of the drainage area in pasture row crop andor urban use a general trend of increasing nutrient concentrations in storm and base flows will manifest (Buck et al 2004 Giovannetti et al 2013 Haggard et al 2003 Migliaccio et al 2007) Thus nutrient concentrations in streams draining for-ested lands tend to be less than in watersheds with considerable anthropogenic land use
For a range of reasons great interest has been expressed in nutrient con-centrations in several streams of the Boston and Ozark Mountains region of northwest Arkansas including the Buffalo National River and its tributaries In particular Big Creek has been the center of attention within the Buffalo National River watershed (BRW) because of a permitted concentrated animal feeding operation (CAFO) The objectives of this letter are to put nutrient con-centrations of Big Creek into the context of the stream nutrient and watershed land use relationship and assess whether stream nutrient concentrations have
Nutrient Concentrations in Big Creek Correlate to Regional Watershed Land Use
A N Sharpley B E Haggard L Berry K Brye J Burke M B Daniels E Gbur T Glover P Hays T Kresse and K W VanDevender
Copyright copy American Society of Agronomy Crop Science Society of America and Soil Science Society of America 5585 Guilford Rd Madison WI 53711 USAThis is an open access article distributed under the terms of the CC BY-NC-ND license (httpcreativecom-monsorglicensesby-nc-nd40) Agric Environ Lett 2170027 (2017) doi102134ael2017080027 Received 16 Aug 2017 Accepted 25 Sep 2017 Corresponding author (sharpleyuarkedu)
Agricultural amp Environmental Letters
Research Letter
Abstract Nutrient concentrations in several streams of the Boston and Ozark Mountains region of Arkansas including the Buffalo National River and its tributaries have garnered tremendous interest In particular Big Creek has been the center of attention within the Buffalo River watershed because of a permitted concentrated animal feeding operation (CAFO) The objectives of this paper were to put nutrient concentrations of Big Creek into the context of the stream nutrient and watershed land-use relationship and develop a framework to evaluate regional land-use impacts on regional water quality Nutrient concentrations in streams draining the Boston and Ozark Mountains region were related to the intensity of watershed land use Concentrations in Big Creek were similar to other watersheds in the ecoregion with similar land use suggesting limited impact of the CAFO on Big Creek at the present time However this does not preclude future impacts and longer-term monitoring continues
AN Sharpley L Berry K Brye J Burke and T Glover Dep of Crop Soil and Environmental Sciences Univ of Arkansas 115 Plant Sciences Building Fayetteville AR 72701 BE Haggard Biological and Agricultural Engineering Univ of Arkansas BENGR201 Fayetteville AR 72701 MB Daniels and KW VanDevender Biological and Agricultural Engineering Cooperative Extension Univ of Arkansas 2301 South University Ave Little Rock AR 72203 E Gbur Agricultural Statistics Laboratory Univ of Arkansas 101 Agricultural Annex Fayetteville AR 72701 P Hays Dep of Geosciences Univ of Arkansas 216 Ozark Hall Fayetteville AR 72701 T Kresse (retired) USGS Arkansas Water Science Center 401 Hardin Rd Little Rock AR 72211
Core Ideas
bull Nutrient concentrations are low at Big Creek relative to expected biological-response thresholds
bull Nutrient concentrations at Big Creek are typical of streams draining watersheds with similar land use
bull Flow-adjusted nutrient concentrations at Big Creek have not increased over the short-term
bull Nutrient concentrations in streams increase as watershed land area in pasture and urban uses increases
Abbreviations BRW Buffalo River watershed CAFO concentrated animal feeding operation LOESS locally weighted regression SRP soluble reactive phosphorus TN total N TP total P UIRW Upper Illinois River watershed UWRW Upper White River watershed
Published online October 26 2017
Page 2 of 6 AGRICULTURAL amp ENVIRONMENTAL LETTERS
changed over the short term (3 yr of monitoring) The goal is to understand if how and why stream nutrient concentra-tions change downstream at Big Creek and whether the per-mitted swine CAFO has influenced water quality during the 3 yr since extensive monitoring began in September 2013
MethodsWater samples have been collected over varying periods
at the outlet of subwatersheds of the BRW Upper Illinois River watershed (UIRW) and Upper White River watershed (UWRW Fig 1) Land use and cover (ie forest pasture and urban) for each subwatershed was obtained from high-resolution (4-m) imagery from the USGS National Elevation Dataset (USGS 2015 Gesch et al 2002) National Land Cover Dataset (USGS 2017b) and National Hydrologic
Dataset (USGS 2017a) In the UWRW Giovannetti et al (2013) monitored 20 sites monthly for 1 yr (June 2005ndashJuly 2006) collecting water samples during base-flow condi-tions In the UIRW Haggard et al (2010) monitored 29 sites monthly during calendar year 2009 also collecting water samples during base-flow conditions
In the BRW the National Park Service in partnership with the Arkansas Department of Environmental Quality periodically collected water samples and measured nutrient concentrations at 20 stream sites from 1985 through 2015 Nitrate-nitrogen (NO3ndashN) total N (TN) soluble reactive phosphorus (SRP) and total P (TP) concentrations were obtained directly from these data Forest pasture and urban land-use areas were determined from 2006 high-resolution (4-m) land usendashland cover imagery
Fig 1 Location of the Big Creek Buffalo River Upper Illinois River and Upper White River watersheds in the Boston Mountains and Ozark Highlands ecoregion Information from USGS Environmental Systems Research Institute (ESRI) and NASA
AGRICULTURAL amp ENVIRONMENTAL LETTERS Page 3 of 6
Big Creek is monitored by the Big Creek Research and Extension Team a partnership between the University of Arkansas Systemrsquos Division of Agriculture and USGS Water samples have been collected upstream and down-stream of the swine CAFO on a near-weekly basis since September 2013 (Fig 1) The water samples were analyzed at an Arkansas Department of Environmental Quality cer-tified water quality laboratory within the Arkansas Water Resources Center (httparkansas-water-centeruarkeduwater-quality-labphp) according to methods detailed in Table 1 The data collected is made publicly available at httpsbigcreekresearchorg
The geometric mean of nutrient concentrations of base-flow samples collected between September 2013 and April 2017 were determined in order to compare with base-flow nutrient concentrations available for BRW UIRW and UWRW Base-flow conditions in Big Creek were classified from hydrograph inspection when flow had not increased or decreased within 3 d of sample collection McCarty and Haggard (2016) suggested that stream nutrient concen-trations under base flow can be used to identify nonpoint sources and target remedial measures in Boston Mountains and Ozark Highland watersheds
Using all above-listed data sources the geometric means of nutrient concentrations for streams in the BRW UIRW and UWRW were used to develop a relationship with human development within the watershed Human development is defined as the percentage of pasture plus urban land use within the watershed Exponential relationships with 95 confidence bands around the observations were developed for NO3ndashN TN SRP and TP concentrations to put nutri-ent concentration at Big Creek into the context of regional stream nutrients and watershed land use
Data from Big Creek were paired with discharge available from a gaging station just downstream from the swine CAFO where the USGS developed the rating curve discharge infor-mation was only available from May 2014 through April 2017 The data were then used in a simple three-step pro-cess (White et al 2004) to look at monotonic changes in the nutrients at Big Creek (i) log-transform concentration (mg L-1) and associated instantaneous discharge (m3 s-1) (ii) use locally weighted regression (LOESS) to smooth the data with a sampling proportion (n) of 05 and (iii) plot the resid-uals from LOESS (ie the flow-adjusted concentrations) over time and use linear regression to evaluate monotonic trends
Results and DiscussionPutting Stream Nutrient Concentrations into Context at Big Creek
In Big Creek upstream of the swine CAFO the geometric mean concentrations of base flow sampled at weekly inter-vals from September 2013 for NO3ndashN TN SRP and TP were 0098 0205 0009 and 0030 mg L-1 respectively Directly downstream of the CAFO geometric mean concentra-tions at Big Creek during base flow conditions during the same period were 0242 0356 0011 and 0031 mg L-1 for NO3ndashN TN SRP and TP respectively Arkansas has narra-tive criteria for nutrient concentrations in streams (Arkansas Pollution Control and Ecology Commission 2016) but its proposed assessment methodology has numeric screen-ing concentrations for TN (0450ndash2430 mg L-1) and TP (0040ndash0100 mg L-1) in the Boston Mountains and Ozark Highlands The geometric mean concentrations at Big Creek upstream and downstream from the CAFO were below these values for the Boston Mountains and Ozark Highlands ecoregion
Nutrient concentrations in Big Creek upstream and down-stream from the CAFO are low with respect to nutrientndashbio-logical response thresholds for algae macroinvertebrates and fish Evans-White et al (2014) reviewed the literature sum-marizing nutrientndashbiological response thresholds across the United Statesbull Algalmetricresponses TN 038ndash179 mg L-1 TP 0011ndash
028 mg L-1
bull Macroinvertebratemetric responses TN 061ndash192 mg L-1 TP 004ndash015 mg L-1
bull Fishmetricresponses TN 054ndash183 mg L-1 TP 006ndash014 mg L-1
Total N concentrations at Big Creek upstream and down-stream of the swine CAFO were well below thresholds that result in some expected biological response whereas TP con-centrations were below thresholds for expected macroinver-tebrate and fish response and on the low end of the range for expected algal response However these lower TP thresholds (0006ndash0026 mg L-1 Stevenson et al 2008) were focused on shifts in diatom species and metrics rather than nuisance algal biomass A recent study on the Illinois River Watershed showed that stream TP thresholds with Cladophora bio-volume and nuisance taxa proportion of biovolume were observed between 0032 and 0058 mg L-1 (Joint Study
Table 1 Minimum detection limits for each chemical and biological constituent
Constituent Analytical methoddagger Minimum detection limitDagger Reporting limitsectSoluble reactive P mg Lminus1 EPA 3652 0002 0010Total P mg Lminus1 APHA 4500-P J EPA 3652 0012 0020NitratendashN mg Lminus1 EPA 3000 0004 0050Total N mg Lminus1 APHA 4500-P J EPA 3532 0006 0050Total suspended solids mg Lminus1 EPA 1602 No detection limit 40
dagger EPA = Approved CWA Chemical Test Methods (USEPA 2017) APHA = American Public Health Association from the WadeableStreamsAssessmentWaterChemistryLaboratoryManual (USEPA 2004)
Dagger The minimum detection limit of an analyte is the value which can be measured and reported with 99 confidence that the analyte concentration is greater than zero Further information is available at USGS (1999)
sect The reporting limit is the least (non-zero) calibrated standard used in analysis or as defined by method for total suspended solids
Page 4 of 6 AGRICULTURAL amp ENVIRONMENTAL LETTERS
Committee 2017) Thus TP concentrations at Big Creek upstream and downstream of the CAFO were in the range in which the natural assemblage of algae is shifting but these con-centrations would likely not be indicative of problematic nuisance algae in this ecoregion
Geometric mean nutrient concentra-tions varied upstream and downstream of the swine CAFO at Big Creek and Kosič et al (2015) used the publicly available data to allude to the N increase being from human activities on the landscape such as the CAFO However the historic land use and how stream nutrient concentrations during base-flow conditions increase with human development within the Boston Mountain and Ozark Highland watersheds need to be considered (eg see Giovannetti et al 2013 Haggard et al 2003 Migliaccio et al 2007) In the Big Creek watershed the percentage of land influenced by human activities (ie pas-ture plus urban) doubles from ~10 to ~20 in the drainage area upstream and downstream of the CAFO Nutrient concentrations in Big Creek upstream and downstream of the CAFO are within the range typical of streams draining simi-lar land uses (Fig 2)
At this time nutrient concentrations in Big Creek upstream and downstream from the swine CAFO are con-sistent with the range in concentrations for other watersheds with similar pasture and urban land use characteristics (Fig 2) as well as less than most nutrient thresholds for nuisance water-quality conditions (Omernik and Griffith 2014) However this does not preclude the possibility that nutri-ent concentrations at Big Creek may increase over time especially if human development and activity in the drain-age areas increase The most important observation is that nutrient concentrations were low in Big Creek providing the ability to detect changes over time
Have Nutrient Concentrations Changed in the Short Term at Big Creek
Understanding that long-term (eg decadal-scale) water-quality data are needed to reliably assess how stream nutri-ent concentrations have changed in response to watershed management and climate variations is of critical importance (Hirsch et al 2015) The literature shows that stream nutri-ent concentrations can change relatively quickly in response to effluent management (eg Haggard 2010 Scott et al 2011) but seeing a response (ie decrease in concentrations) from landscape management can take decades or more (Green et al 2014 Sharpley et al 2013) A myriad of factors may influence observed nutrient concentrations in streams including discharge (Petersen et al 1998) biological pro-cesses and climactic conditions (ie drought and floods Jones and Stanley 2016) and dominant transport pathways (Sharpley et al 2013) Thus we need to use caution when
interpreting trends in water quality over databases that only cover a limited timeframe
Three years of flow-adjusted nutrient concentration data at Big Creek downstream from the swine CAFO (May 2014ndashApril 2017) show different relationships with flow for the various constituentsbull Nitrate-nitrogen was greatest (~05 mg L-1) during the
lowest flows sampled and concentrations decreased with increasing flow
bull Total N generally decreased with increasing flow until a minimal value occurred then TN increased with in-creasing flow
bull Soluble reactive P concentrations did not change much during base-flow conditions and the greater concentra-tions (~0100 mg L-1) sporadically occurred at larger flows indicating that enrichment from stormflow may have been influenced by availability of source or other nontransport factors and
bull Total P concentrations were also relatively stable during base-flow conditions and then increased in association with rainfall-runoff events with only a few samples hav-ing concentrations gt0100 mg L-1 indicating relatively small enrichment from the landscape
Flow-adjusted concentrations (White et al 2004) showed no monotonic (ie increasing or decreasing) trends in SRP TP or TN (P gt 016) over the current monitoring period (Fig 3) However flow-adjusted NO3ndashN concentrations decreased over time (R2 = 005 P = 001) by 7 yr-1 (Fig 3c)
Nutrient concentrations at Big Creek upstream and downstream of the swine CAFO and indeed most tributaries of the Buffalo River are low relative to other watersheds in this ecoregion (Fig 2) This provides a starting point to build a framework to evaluate changes in nutrient concentrations of streams as a function of land use and management The
Fig 2 Relationship between land use and the geometric mean N and P concentrations (mg L-1) in the Buffalo Upper Illinois and Upper White River watersheds (no total P data available for the Buffalo River watershed) Dashed lines represent the 95 confi-dence intervals for the estimated mean (solid line)
AGRICULTURAL amp ENVIRONMENTAL LETTERS Page 5 of 6
evaluation of flow-adjusted concentrations over time showed that nutrients in Big Creek were not increasing over the short duration of monitoring for which concentration and dis-charge data were available (May 2014ndashApril 2017) At this point in time (April 2014ndashApril 2017) it is evident that nutrient concentra-tions in Big Creek have not increased at the monitored site However flow and nutri-ent concentration data over a longer period are needed to reliably quantify water-quality trends and characterize sources and moni-toring needs to continue for at least a decade to evaluate how discharge season and time influence nutrient fluxes (Hirsch et al 2010)
This research details a process by which regional monitoring networks can be devel-oped to establish baseline in-stream nutri-ent concentrations and by which time andor land use and management impacts can be determined
AcknowledgmentsFunding for the Big Creek Research and Extension Team (BCRET) to undertake the on-going monitoring project was provided by the Arkansas Governorrsquos Office and State Legislature to the University of Arkansas Systemrsquos Division of Agriculture All authors are members of BCRET
ReferencesArkansas Pollution Control and Ecology Commission 2016 Regulation
no 2 Regulations establishing water quality standards for surface wa-ters of the State of Arkansas httpswwwepagovsitesproductionfiles2014-12documentsarwqspdf (accessed 21 Sept 2017)
Buck O DK Niyogi and CR Townsend 2004 Scale-dependence of land use effects on water quality of streams in agricultural catchments En-viron Pollut 130(2)287ndash299 doi101016jenvpol200310018
Dubrovsky NM KR Burow GM Clark JM Gronberg PA Hamilton KJ Hitt DK Mueller and MD Munn 2010 The quality of our na-tionrsquos waters Nutrients in the nationrsquos streams and groundwater 1992ndash2004 USGS Circ 1350 httpwaterusgsgovnawqanutrientspubscirc1350 (accessed 21 Sept 2017)
Evans-White MA BE Haggard and JT Scott 2014 A review of stream nutrient criteria development in the United States J Environ Qual 421002ndash1014 doi102134jeq20120491
Gesch D M Oimoen S Greenlee C Nelson M Steuck and D Tyler 2002 The national elevation dataset Photogramm Eng Remote Sens 68(1)5ndash11 httpsnationalmapgovPERS_Jan2002_NED_highlight_articlepdf
Giovannetti J LB Massey BE Haggard and RA Morgan 2013 Land use effects on stream nutrients at Beaver Lake watershed J Am Water Works Assoc 105E1ndashE10 doi105942jawwa20131050005
Green CT BA Bekins SJ Kalkhoff RM Hirsch L Liao and KK Barnes 2014 Decadal surface water quality trends under variable cli-mate land use and hydrogeochemical setting in Iowa USA Water Resour Res 502425ndash2443 doi1010022013WR014829
Haggard BE 2010 Phosphorus concentrations loads and sources within the Illinois River drainage area northwest Arkansas 1997ndash2008 J En-viron Qual 392113ndash2120 doi102134jeq20100049
Haggard BE PA Moore Jr I Chaubey and EH Stanley 2003 Nitrogen and phosphorus concentrations and export from an Ozark Plateau catchment in the United States Biosyst Eng 86(1)75ndash85 doi101016S1537-5110(03)00100-4
Haggard BE AN Sharpley L Massey and K Teague 2010 Final report to the Illinois River Watershed Partnership Recommended watershed based strategy for the Upper Illinois River Watershed Northwest Ar-kansas Arkansas Technical Publication Number MSC 355 Water Re-sources Center University of Arkansas httparkansas-water-centeruarkedupublicationsmscMSC355pdf (accessed 21 Sept 2017)
Hirsch RM SA Archfield and LA De Cicco 2015 A bootstrap method for estimating uncertainty of water quality trends Environ Model Softw 73148ndash166 doi101016jenvsoft201507017
Hirsch RM DL Moyer and SA Archfield 2010 Weighted regres-sion on time discharge and season (WRTOS) with an application to the Chesapeake Bay River inputs J Am Water Resour Assoc 46(5)857ndash880
Joint Study Committee 2017 Final report to governors from the Joint Study Committee and Scientific Professionals 19 Dec 2016 Arkansas-Oklahoma Joint Study Committee httpswwwokgovconservationdocumentsIR202016121920Final20Reportpdf (accessed 21 Sept 2017)
Jones JB and EH Stanley 2016 Stream ecosystems in a changing envi-ronment Academic Press Amsterdam
Kosič K CL Bitting JV Brahana and CJ Bitting 2015 Proposals for integrating karst aquifer evaluation methodologies into national en-vironmental legislations Case study of a concentrated animal feed-ing operation in Big Creek basin and Buffalo National River water-shed Arkansas USA Sustain Water Resour Manage 1363ndash374 doi101007s40899-015-0032-5
McCarty JA and BE Haggard 2016 Can we manage nonpoint-source pollution using nutrient concentrations during seasonal baseflow Ag-ric Environ Lett 1160015 doi102134ael2016030015
Migliaccio KW BE Haggard I Chaubey and MD Matlock 2007 Linking watershed subbasin characteristics to water quality param-eters in War Eagle Creek watershed Trans ASAE 50(6)2007ndash2016 doi1013031201324104
Omernik JM and GE Griffith 2014 Ecoregions of the conterminous United States Evolution of a hierarchical spatial framework Environ Manage 54(6)1249ndash1266 doi101007s00267-014-0364-1
Petersen JC JC Adamski RW Bell JV Davis SR Femmer DA Freiwald and RL Joseph 1998 Water quality in the Ozark Plateaus Arkansas Kansas Missouri and Oklahoma 1992ndash95 USGS Circ 1158 USGS Fort Collins CO httpspubsusgsgovcirccirc1158circ1158pdf (accessed 21 Sept 2017)
Rebich RA NA Houston SV Mize DK Pearson PB Ging and CE Hornig 2011 Sources and delivery of nutrients to the northwestern Gulf of Mexico from streams in the south-central United States J Am Water Resour Assoc 47(5)1061ndash1086 doi101111j1752-1688201100583x
Reckhow KH PE Norris RJ Budell DM Di Toro JN Galloway H Greening AN Sharpley A Shirmhhammadi and PE Stacey 2011 Achieving nutrient and sediment reduction goals in the Chesapeake Bay An evaluation of program strategies and implementation Na-tional Academies Press Washington DC
Fig 3 Flow-adjusted concentration of (a) soluble reactive P (b) total P (c) nitrate-N and (d) total N over time since January 2014 when monitoring in Big Creek started
Page 6 of 6 AGRICULTURAL amp ENVIRONMENTAL LETTERS
Scavia D JD Allan KK Arend S Bartell D Beletsky NS Bosch SB Brandt RD Briland I Daloglu JV DePinto DM Dolan MA Evans TM Farmer D Goto H Han TO Hoeoek R Knight SA Ludsin D Mason AM Michalak RP Richards JJ Roberts DK Rucinski E Rutherford DJ Schwab TM Sesterhenn H Zhang and Y Zhou 2014 Assessing and addressing the re-eutrophication of Lake Erie Central basin hypoxia J Great Lakes Res 40226ndash246 doi101016jjglr201402004
Scott JT BE Haggard AN Sharpley and JJ Romeis 2011 Change point analysis of phosphorus trends in the Illinois River (Oklahoma) demonstrates the effects of watershed management J Environ Qual 401249ndash1256 doi102134jeq20100476
Sharpley AN HP Jarvie A Buda L May B Spears and P Kleinman 2013 Phosphorus legacy Overcoming the effects of past management practices to mitigate future water quality impairment J Environ Qual 421308ndash1326 doi102134jeq2013030098
Stevenson RJ Y Pan KM Manoylov CA Parker DP Larsen and AT Herlihy 2008 Development of diatom indicators of ecological con-ditions for streams of the western US J North Am Benthol Soc 271000ndash1016 doi10189908-0401
USEPA 2004 Wadeable streams assessment water chemistry laboratory manual USEPA Office of Water and Office of Research and Develop-ment Washington DC
USEPA 2017 Approved CWA chemical test methods USE-PA Washington DC httpswwwepagovcwa-methodsapproved-cwa-chemical-test-methodsnumber
USGS 1999 The method detection limit procedure of the US Environmen-tal Protection Agency In New reporting procedures based on long-term method detection levels and some considerations for interpre-tations of water-quality data provided by the US Geological Survey National Water Quality Laboratory Open File Rep 99-103 USGS Reston VA httpswaterusgsgovowqOFR_99-193detectionhtml
USGS 2015 National elevation dataset httpsltacrusgsgovNEDUSGS 2017a National hydrologic dataset httpsnhdusgsgovUSGS 2017b National land cover dataset httpscatalogdatagovdataset
usgs-national-land-cover-dataset-nlcd-downloadable-data-collectionWhite KL BE Haggard and I Chaubey 2004 Water quality at the Buffalo
National River Arkansas 1991ndash2001 Trans ASAE 47(2)407ndash417 doi1013031201316042
Sampling Liquid Manure
Karl VanDevender PhD PE Professor Extension Engineer
Liquid animal manure sampling can be an important management tool Proper sampling provides the producer with nutrient analysis results that can be used in a sound farm fertilization program Nutrient analysis of manure in conjunction with soil sampling helps determine how much manure should be applied to fields to maintain adequate fertility while minimizing potential environmental problems such as ground and surface water pollution However manure applications should not exceed the maximum application rates in a manure management plan until sufficient data can be collected to justify revising the plan
When to Sample Liquid animal manure should be sampled for nutrient analysis as close to land application time as possible This helps ensure that the reported nutrient content accurately reflects what is being applied to the land If the manure is sampled as it is being land applied the results will not be available to govern present application rates It does however provide information for future land applications of animal manure if the manure management remains fairly constant over time
How to Collect a Liquid Manure Sample During Land Application The easiest way to collect liquid animal manure samples is to collect the manure as it is being land applied This approach ensures what is sample reflects what is applied Randomly place catch pans in the field to collect the liquid manure as it is land applied by an irrigation system or honey wagon Flexible rubber feed pans work well Immediately after the manure has been applied collect the manure from the catch pans combine in a bucket to make one composite sample and mix well by stirring This bucket will be the source of the manure sent for analysis From a Storage Facility If collecting liquid animal manure samples during land application is not possible collect the samples from the storage facility Liquid animal manure storage facilities have a tendency for the manure to stratify with the solids settling to the bottom and the liquids remaining on top It is also not uncommon for some solids to form a floating crust This stratification affects the manure nutrient concentrations in the storage facility The nitrogen and potassium will be more concentrated in the top liquid while the phosphorus will be more concentrated in the settled solids This stratification of nutrient concentrations increases the challenge of getting samples that represent what will be applied to a particular field If the liquids from the top and middle of the profile will be applied only this material should be sampled If the settled solids will be applied then they should be sampled However if the manure is to be agitated before pumping as has been the traditional recommendation the sample should contain representative proportions of manure from the top middle and bottom The idea is to collect a sample of an entire column of manure to represent the manure after agitation If agitating the manure prior to sampling is not possible an alternative approach is to make a sampler to collect the required sub-samples The sub-samples are then mixed to represent the manure after agitation The easiest to construct is simply a container such as a cup attached to the end of a pole Liquids from the manure surface can be simply scooped up To collect liquids from the middle depths or settled solids the container is held up side down trapping air until the desired sampling depth is reached Then the container is rotated releasing the air and collecting the sample When collecting a sample of the entire profile of the manure sub-samples are collected and mixed in a bucket
- over -
A sampler design that automatically collects a sample of the entire profile uses 10 foot 1 frac12 inch PVC pipe with a PVC ball valve at the bottom The handle of the ball valve is replaces with a lever arm about 2 feet long The free end of the lever arm is attached to the end of a 10 foot 1 inch PVC pipe The lever arm and smaller pipe allow the ball valve to be operated while holding to top of the sampler To use the sampler the valve is opened and the sampler is inserted (in a line not and arc) into the manure When the foot of the valve is at the bottom of the settled solids it is closed Then the sample of the entire manure profile can be removed from the manure and placed in a bucket
Sketch of Cup Sampler Sketch of Foot Valve Sampler
Whichever sampler is used at least 8 locations around the manure storage unit should be sampled and mixed in a bucket to serve as a final composite sample This bucket will be the source of the manure sent for analysis
Getting the Sample Analyzed After thoroughly mixing the final composite sample fill a one liter plastic bottle half full These bottles may be obtained from your county Extension office Never fill the bottle more than half full to allow for gas expansion of the sample and to prevent the bottle from exploding Keep the samples as cool as possible until you can take them to your county Extensions office for shipping to the University of Arkansas lab for analysis There you will get assistance in filling out an information sheet on your manure sample There is a fee to have the sample analyzed While the sample can be sent to a private lab the fees are often higher If you are required by the Arkansas Department of Environmental Equality (ADEQ) to sample your liquid animal manure as part of your Regulation No 5 permit make sure that you inform the individual helping you with the paperwork so the correct set of analyses can be performed In addition to the analyses to determine the fertilizer value of manure it is recommended to analyze for the amount of phosphorus in the manure that is water soluble Water soluble phosphorus is needed to evaluate the potential environmental risk associated with phosphorus application rates specified in manure management plans Having good farm based information should help planners develop plans tailored to and individual farm
Key Points to Remember The important things to remember in collecting a liquid animal manure sample are Collect a sample that best represents the nutrient content of the manure in that storage facility and what
will be applied If only the top water is to be applied it should be sampled If the storage unit will be agitated prior to application the sample should contain material from the entire depth profile
Only fill the sample bottle frac12 full Keep the sample cool prior to shipping Ship the sample to the lab as soon as possible
Handout April 27 2010
The Arkansas Cooperative Extension Service offers its programs to all eligible persons regardless of race color national origin religion
gender age disability marital or veteran status or any other legally protected status and is an Equal Opportunity Employer
- 2015_Bacteria Trends in Flowing Waterspdf
-
- E COLI IN FLOWING WATERS
-

Page 2 of 6 AGRICULTURAL amp ENVIRONMENTAL LETTERS
The Buffalo River is an important recreation area in northwest Arkansas In 2013 a concentrated animal feeding operation (CAFO) was permitted to operate in this water-shed (Arkansas Department of Environmental Quality 2017) raising concerns of potential impairment of area waters for recreational use In this operation swine manure is land applied to pasture land either grazed by cattle or hayed Fields adjacent to a stream have a 30-m buffer to which no manure or fertilizer can be applied providing an ideal opportunity to investigate the fate and cycling of soil P along a gradient of a fertilized pasture zone (FPZ) grass VBS and a forested riparian zone (FRZ) Three fields with differ-ent management histories soil properties and slope were selected to investigate the potential for dissolved P release as measured by water extractable P across these three zones We addressed two main objectives
1 To determine the effect of landscape position on the potential for P release as both dissolved inorganic and organic P
2 To investigate the soil chemical and biological properties that control the release of dissolved P from these soils
While it is acknowledged that vegetation can be an addi-tional source of P loss especially from forested riparian areas where there may be accumulation of litter material quantification of its contribution was beyond the scope of this study which focuses on the release of soil P to water
Materials and MethodsThe study site is located in Mount Judea AR (Fig 1) Three
fields were sampled (Fields 1 5a and 12 Fig 2) Dominant soil types along with management for these are listed in Table 1 All three fields received poultry litter once every 2 yr in March from 2004 to 2012 (45 Mg ha-1 yr-1 approximately 50 kg P and 120 kg N ha-1 yr-1) Fields 1 and 12 currently receive only swine manure In 2014 Field 1 received a total of 47 kg P ha-1 and 94 kg N ha-1 and Field 12 received 65 kg P
ha-1 and 128 kg N ha-1 In 2015 Field 1 received a total of 73 kg P ha-1 and 32 kg N ha-1 and Field 12 received 35 kg P ha-1 and 146 kg N ha-1 While no swine manure has been applied to Field 5a diammonium phosphate fertilizer was applied annually since 2012 at 11 kg P and 25 kg N ha-1
On Fields 1 and 12 receiving swine manure a required application buffer of 30 m from the field edge is in place Field 1 has a steep topography and drains into an ephem-eral stream located within the riparian zone and connected to Big Creek Fields 5a and 12 have slopes of lt2 These fields border Big Creek and are prone to flooding during large storm events Field 1 is continuously grazed by cattle whereas grass is cut for silage in Fields 5a and 12
At each field three transects were laid across the site running through the FPZ VBS and into the FRZ For each transect soil samples were taken at the 0- to 10-cm depth from three locations within the FPZ one location within the manure application VBS and one location in the FRZ which borders the stream Soil sampling at all fields was performed over the course of 1 d on four occasions October 2014 January 2015 April 2015 and July 2015 corresponding to autumn winter spring and summer to account for seasonal variability
Fig 1 Buffalo River watershed location in Arkansas USA Fig 2 Location of Big Creek watershed farm and fields studied
AGRICULTURAL amp ENVIRONMENTAL LETTERS Page 3 of 6
As much of the vegetation mat as possible was removed in the field Soil samples were separated into two subsamples for biotic and abiotic analysis Samples for biotic analysis (microbial biomass and enzyme activity) were sieved lt2 mm and stored at 4degC until analysis Samples for abiotic analysis were air-dried ground and sieved lt2 mm Additional plant material shoots and roots were removed by hand before sieving
Soil samples were analyzed for the following properties using the methods outlined in Table 2 total WEP (TWEP) inorganic WEP (WEPi) organic WEP (WEPo) Mehlich extractable P (M3-P) degree of soil P saturation (DPS) total P (TP) total C (TC) total N (TN) pH microbial biomass P C and N (MBP MBC MBN) and phosphatase enzyme activities Phosphorus concentration for all analyses except M3-P was determined using the molybdate blue method of Watanabe and Olsen (1965) M3-P concentrations were determined via inductively coupled plasma
The P content determined colorimetrically directly fol-lowing extraction with water is more accurately described as molybdate reactive P and consists mainly of orthophosphate ions and a small proportion of easily hydrolyzable inorganic and organic P The difference between this value and that determined following digestion is more accurately described as molybdate unreactive P and consists mainly of organic P forms but also a smaller fraction of condensed inorganic P
such as polyphosphates (Haygarth and Sharpley 2000) Due to the dominance of inorganic P in molybdate reactive P and organic P in molybdate unreactive P WEPi and WEPo have been used to distinguish between these two forms of P to avoid confusion and allow a clear message to be presented
Before all statistical analysis the data were examined for normality and the following parameters were log-trans-formed TWEP WEPi and WEPo To examine the differ-ences in soil properties across the three landscape positions the data from the three samples taken along each transect within the FPZ were averaged to provide one value for each zone (FPZ VBS and FRZ) for each transect Data from each of the three fields and from each of the transects within the fields were treated as replicates giving nine location rep-licates per zone These data were subjected to a one-way ANOVA by zone blocked by season providing four seasonal replicates for each location replicate and a total replication of 36 data points per zone For all parameters a Tukey test was used to determine significant differences between the zones at the p lt 005 level of significance
To determine which soil properties were contributing to the release of WEP and which soil parameters are impor-tant in regulating the release of P a stepwise regression was undertaken using the following parameters acid phospho-monoesterase alkaline phosphomonoesterase phosphodies-terase total phosphatase MBN MBP MBC M3-P DPS pH
Table 1 Field properties and management
Site Soil series Area Range in slope Managementha
Field 1 Noark very cherty silt loam 63 20ndash200 Grazed at 05 animal units ha-1
Field 5a Razort loam 108 02ndash10 Hayed and grazed at 03 animal units ha-1
Field 12 Spadra loam 96 05ndash20 Hayed and grazed at 03 animal units ha-1
Table 2 Summary of analytical methods used
Parameterdagger Analytical method ReferenceTWEP 120 soil-to-water extraction followed by centrifugation
filtration lt045 mm and acid persulfate digestionSelf-Davis et al (2009) and Rowland and Haygarth (1997)
WEPi 120 soil-to-water extraction followed by centrifugation and filtration lt045 mm
Self-Davis et al (2009)
WEPo Assumed to be the difference between TWEP and WEPi mdashM3-P 110 soil-to-Mehlich-3 extractant and centrifugation Mehlich (1984)DPS Calculated from M3-P Fe and Al according to the equation
DPS = M3-P05 times (M3-Fe + M3-Al) times 100Adapted from Schoumans (2009)
TP Alkaline oxidation Dick and Tabatabai (1977)TC Combustion on an Elementar VarioMax CN Provin (2014)TN Combustion on an Elementar VarioMax CN Provin (2014)pH 12 soil-to-water extraction mdashMBP Chloroform-fumigation extraction Adapted from Brookes et al (1985) and McLaughlin et al (1986)MBC Chloroform-fumigation extraction Vance et al (1987)MBN Chloroform-fumigation extraction Vance et al (1987)Acid Pmono Enzyme assays using 5mM para-nitrophenyl phosphate as the
substrate buffered at pH 65Tabatabai (1994)
Alk Pmono Enzyme assays using 5mM para-nitrophenyl phosphate as the substrate buffered at pH 11
Tabatabai (1994)
Pdi Enzyme assays using 1 mM bis-para-nitrophenyl phosphate as the substrate buffered at pH 8
Tabatabai (1994)
Total phosphatase Sum of acid Pmono alk Pmono and Pdi mdash
dagger acid Pmono acid phosphomonoesterase alk Pmono alkaline phosphomonoesterase DPS degree of soil phosphorus saturation M3-P Mehlich extractable P MBC microbial biomass C MBN microbial biomass N MBP microbial biomass P Pdi phosphodiesterase TC total C TN total N TP total P TWEP total water extractable phosphorus WEPi inorganic water extractable phosphorus WEPo organic water extractable phosphorus
Page 4 of 6 AGRICULTURAL amp ENVIRONMENTAL LETTERS
TP TC and TN All analyses were performed using the SPSS statistical package version 22 (IBM 2013)
Results and DiscussionWater extractable soil P concentration has been shown to
be directly related to the potential for dissolved P release from soils to surface runoff (Pote et al 1996 Sharpley 1995) The total inorganic and organic WEP (TWEP WEPi WEPo) concentrations across the three fields was significantly lower in the VBS than the FPZ reflecting the larger inputs of P to the FPZ (Fig 3) However there was no significant difference in TWEP between the pasture and FRZs despite a decrease in WEPi This is a result of the significantly higher concen-trations of WEPo present in the FRZ where WEPo made up 57 of TWEP in these soils compared with just 24 in the pasture soils This suggests that dissolved organic P can con-tribute to total P release in riparian soils
The release of soil P to water can occur through abiotic and biotic processes Desorption and dissolution reactions dominate the abiotic release mechanisms and are governed by soil chemical properties and number of available sorption sites (Arai and Sparks 2007) Microbial soil biomass can con-tain a significant pool of P in temperate pastures (Oberson and Joner 2005) This pool is in constant flux immobilizing P from or replenishing P in the soil solution during micro-bial growth or cell death Phosphorus release from this pool
occurs through three main mechanisms (i) mineralization (Oehl et al 2001) (ii) cell lysis in response to environmental stress (eg dessication) (Turner and Haygarth 2001) or (iii) predation by soil fauna (Bonkowski 2004) Biotic processes can also control the form of dissolved P in solution through the exudation of phosphatase enzymes which can catalyze the conversion of soluble organic P compounds to ortho-phosphate ions for plant uptake (Richardson et al 2011)
Table 3 shows the abiotic and biotic soil properties of the soils across the three landscape zones The FPZ soils had sig-nificantly higher concentrations of TP and M3-P but lower concentrations of TC and TN compared with the FRZ soils Additionally the DPS was significantly higher in the FPZ soils compared with the VBS and FRZ soils indicating more of the P sorption sites had become saturated Surprisingly we saw no significant difference in microbial biomass P C or N concentrations among zones despite expected increased leaf litter inputs in the FRZ However the total phosphatase activity was 17 higher in the FRZ soils than the field soils suggesting increased microbial activity
To determine which pools of P and which soil proper-ties were key in controlling the release of P to water we per-formed a stepwise regressions for TWEP WEPi and WEPo using data from all three sites and four sampling dates The results from this analysis are shown in Table 4 Both TWEP and WEPi were well predicted by the model (adjusted r2 =
Fig 3 Box plots showing the concentration of (i) total water extractable P (ii) inorganic water extractable P and (iii) organic water extractable P across the three zones (fertilized pasture zone [FPZ] vegetative buffer strip [VBS] and forested riparian zone [FRZ]) Letters denote significant differences between zones at p lt 005 as determined by Tukeyrsquos test of multiple comparisons
Table 3 Difference in mean soil properties across the different landscape zones fertilized pasture zone (FPZ) vegetative buffer strip (VBS) forested riparian zone (FRZ) pH total C (TC) total N (TN) total P (TP) Mehlich-3 P (M3-P) degree of P saturation (DPS) microbial biomass P (MBP) microbial biomass C (MBC) microbial biomass N (MBN) acid phosphomonoesterase (acid Pmono) alkaline phosphomonoesterase (alk Pmono) phosphodiester-ase (Pdi) and total phosphatase activities
ZoneSoil chemical properties Soil biological properties
pH TC TN TP M3-P DPS MBP MBC MBN Acid Pmono Alk Pmono Pdi Total phosphatase
mdashmdashmdash mdashmdashmdash mdash mg kg-1 mdash mdashmdashmdash mg kg-1 mdashmdashmdash mdashmdashmdashmdashmdash mmol pNPdagger g-1 h-1 mdashmdashmdashmdashmdashFPZ 587bDagger 206b 023b 640a 67a 748a 26 371 85 300a 133b 120b 553bVBS 571b 188b 021b 584ab 48b 489b 23 386 79 259ab 093b 096b 456bFRZ 640a 321a 026a 521b 28c 457b 28 356 101 233b 205a 205a 666ap value lt0001 lt0001 lt005 lt001 lt0005 lt0001 NS NS NS lt0005 lt0001 lt0001 lt0001
dagger pNP para-nitrophenyl phosphateDagger Means followed by the same letter are not significantly different at the p lt 005 level of significance according to Tukeyrsquos test for multiple comparisons
AGRICULTURAL amp ENVIRONMENTAL LETTERS Page 5 of 6
066 and 065 respectively) and variation in these concen-trations was mostly explained by DPS with a small con-tribution from total phosphatase activity an indicator of biologically mediated P release
In contrast to WEPi variation in WEPo was less closely related to any of the measured parameters (adjusted r2 = 037) Furthermore DPS was not included in the selected model and total phosphatase activity explained most of the variation in WEPo While total phosphatase activity was greatest in FRZ soils the activity of the different types of enzyme varied across the landscape positions (Table 3) Acid phosphomono-esterase activity was highest in the FPZ soils and of a similar magnitude to that found agricultural soils with a history of poultry manure application and high soil test PSpelled out STP correct concentrations (Tomlinson et al 2008) Acid phosphomonoesterase is thought to be mainly released by plant roots and some microbes and there is evidence that high concentrations phosphatase enzymes can be pres-ent in manures (Nannipieri et al 2011) Furthermore these enzymes have been shown to sorb strongly onto soil parti-cles (Burns 1986 Nannipieri et al 2011) hence the large acid phosphomonoesterase activates found in the FPZ may be directly due to manure application In contrast alkaline phosphomonoesterase and phosphodiesterase activities were greatest in the FRZ in keeping with the small increase in pH (Table 3) These enzymes are thought to be released by soil microorganisms rather than plant roots The differences in phosphatase activities across the zones suggest that release of P from riparian soils is likely to be controlled in part by the biologically mediated release of organic P
This study demonstrates that the significant decrease in soil test P concentrations in FRZ soils compared with regu-larly fertilized FPZ does not necessarily translate to a reduc-tion in the total amount of P which can be released to runoff due to the increase in WEPo Furthermore while DPS of which soil test P is a component was a good predictor of WEPi release additional factors relating to biological cycling need to be considered when trying to account for the poten-tial release of organic P
ReferencesArai Y and D Sparks 2007 Phosphate reaction dynamics in soils and
soil components A multiscale approach Adv Agron 94135ndash179 doi101016S0065-2113(06)94003-6
Arkansas Department of Environmental Quality 2017 Permit data system Specific NPDES water permit details Permit arg590001 httpswwwadeqstatearushomepdssqlp_permit_details_water_npdesaspxafindash=ampafin=5100164amppmtnbr=arg590001
Bonkowski M 2004 Protozoa and plant growth The microbial loop in soil revisited New Phytol 162617ndash631
Brookes PC A Landman G Pruden and DS Jenkinson 1985 Chloro-
form fumigation and the release of soil nitrogen A rapid direct extrac-tion method to measure microbial biomass nitrogen in soil Soil Biol Biochem 17837ndash842 doi1010160038-0717(85)90144-0
Burns RG 1986 Interactions of enzymes and soil mineral and organic col-loids In PM Huang and M Schnitzer editors Interactions of soil minerals with natural organics and microbes SSSA Madison WI p 429ndash453
Dick WA and MA Tabatabai 1977 An alkaline oxidation method for de-termination of total phosphorus in soils Soil Sci Soc Am J 41511ndash514 doi102136sssaj197703615995004100030015x
Dodd RJ and AN Sharpley 2015 Recognizing the role of soil organic phosphorus in soil fertility and water quality Resour Conserv Recycl 105(B) 282ndash293 doi101016jresconrec201510001
Dodd RJ and AN Sharpley 2016 Conservation practice effectiveness and adoption Unintended consequences and implications for sustain-able phosphorus management Nutr Cycling Agroecosyst 104373ndash392 doi101007s10705-015-9748-8
Haygarth PM and AN Sharpley 2000 Terminology for phos-phorus transfer J Environ Qual 2910ndash15 doi102134jeq200000472425002900010002x
Hoffmann CC C Kjaergaard J Ussi-Kaumlampauml HC Bruun Hansen and B Kronvang 2009 Phosphorus retention in riparian buffers Re-view of their efficiency J Environ Qual 381942ndash1955 doi102134jeq20080087
IBM 2013 IBM SPSS statistics for Windows version 220 IBM Corp Ar-monk NY
McLaughlin MJ AM Alston and JK Martin 1986 Measurement of phos-phorus in soil microbial biomass A modified procedure for field soils Soil Biol Biochem 18437ndash443 doi1010160038-0717(86)90050-7
Mehlich A 1984 Mehlich 3 soil test extractant A modification of the Mehlich 2 extractant Commun Soil Sci Plant Anal 151409ndash1416 doi10108000103628409367568
Nannipieri P L Giagnoni L Landi and G Renella 2011 Role of phospha-tase enzymes in soil In EK Buumlnemann A Oberson and E Frossard editors Phosphorus in action Soil Biology Ser 26 Springer Berlin p 215ndash243 doi101007978-3-642-15271-9_9
Oberson A and EJ Joner 2005 Microbial turnover of phosphorus in soil In BL Turner E Frossard and DS Baldwin editors Organic phos-phorus in the environment CAB International Wallingford UK p 133ndash164 doi10107997808519982200133
Oehl F A Oberson M Pronst A Fliessbach H Roth and E Frossard 2001 Kinetics of microbial phosphorus uptake in cultivated soils Biol Fertil Soils 3431ndash41 doi101007s003740100362
Pote DH TC Daniel AN Sharpley PA Moore Jr DR Edwards and DJ Nichols 1996 Relating extractable soil phosphorus to phospho-rus losses in runoff Soil Sci Soc Am J 60855ndash859 doi102136sssaj199603615995006000030025x
Provin T 2014 Total carbon and nitrogen and organic carbon via thermal combustion analyses In FJ Sikora and KP Moore editors Soil test methods from the southeastern United States Southern Cooperative Series Bull 419 Southern Extension and Research Activity Informa-tion Exchange Group- 6 p 149ndash154 httpaeslcesugaedusera6PUBMethodsManualFinalSERA6pdf
Richardson AE JP Lynch PR Ryan E Delhaize FA Smith PR Harvey MH Ryan EJ Veneklaas H Lambers A Oberson RA Culvenor and RJ Simpson 2011 Plant and microbial strategies to improve ef-ficiency of agriculture Plant Soil 349121ndash156
Roberts WM MI Stutter and PM Haygarth 2012 Phosphorus retention and remobilization in vegetative buffer strips A review J Environ Qual 41389ndash399 doi102134jeq20100543
Rowland AP and PM Haygarth 1997 Determination of total dis-solved phosphorus in soil solutions J Environ Qual 26410ndash415 doi102134jeq199700472425002600020011x
Table 4 Model predictions of total water extractable P (TWEP) inorganic water extractable P (WEPi) and organic water extractable P (WEPo) from stepwise regression across all data The F statistic for all three model predictions is lt0001
TWEP WEPi WEPo
r2adjusted Predictor Relative
importance r2adjusted Predictor Relative
importance r2adjusted Predictor Relative
importance066 Degree of soil P
saturation080 065 Degree of soil P
saturation093 037 Total phosphatase
activity078
Total phosphatase activity
018 Total phosphatase activity
007 Microbial biomass N 017
M3-P 002 pH 005
Page 6 of 6 AGRICULTURAL amp ENVIRONMENTAL LETTERS
Schoumans OF 2009 Determination of the degree of phosphate satura-tion in noncalcareous soils In JL Kovar and GM Pierzynski editors Methods for phosphorus analysis for soils sediments residuals and water 2nd ed SERA 17 Bull 408 Virginia Tech Blacksburg VA p 29ndash 32
Self-Davis ML PA Moore Jr and BC Joern 2009 Water- or dilute salt-extractable phosphorus in soil In JL Kovar and GM Pierzynski edi-tors Methods for phosphorus analysis for soils sediments residuals and water 2nd ed SERA 17 Bull 408 Virginia Tech Blacksburg VA p 22ndash 24
Sharpley AN 1995 Dependence of runoff phosphorus on extract-able soil phosphorus J Environ Qual 24920ndash926 doi102134jeq199500472425002400050020x
Sheppard SC MI Sheppard J Long B Sanipelli and J Tait 2006 Runoff phosphorus retention in vegetative field margins on flat landscapes Can J Soil Sci 86(5)871ndash884 doi104141S05-072
Tabatabai MA 1994 Soil enzymes In RW Weaver S Angl P Bottomley D Bezdicek S Smith and MA Tabatabai editors Methods of soil analysis Part 2 Microbiology and biological properties SSSA Madi-son WI p 775ndash833
Tomlinson PJ MC Savin and PA Moore Jr 2008 Phosphatase activities in soil after repeated untreated and alum-treated poultry litter appli-cations Biol Fertil Soils 44613ndash622 doi101007s00374-007-0245-3
Turner BL and PM Haygarth 2001 Biogeochemistry Phosphorus solu-bilization in rewetted soils Nature 411258 doi10103835077146
Vance ED PC Brookes and DS Jenkinson 1987 An extraction method for measuring soil microbial biomass C Soil Biol Biochem 19703ndash707 doi1010160038-0717(87)90052-6
Watanabe FS and SR Olsen 1965 Test of an ascorbic acid meth-od for determining phosphorus in water and NaHCO3 ex-tracts from soil Soil Sci Soc Am J 29677ndash678 doi102136sssaj196503615995002900060025x
Phosphorus Retention and Remobilization along HydrologicalPathways in Karst TerrainHelen P Jarviedagger Andrew N SharpleyDagger Van Brahanasect Tarra SimmonsDagger April PriceDagger Colin Nealdagger
Alan J Lawlor∥ Darren Sleep∥ Sarah Thacker∥ and Brian E Haggardperp
daggerCentre for Ecology amp Hydrology Wallingford OX10 8BB UKDaggerDepartment of Crop Soil amp Environmental Sciences Division of Agriculture University of Arkansas Fayetteville Arkansas 72701United StatessectDepartment of Geosciences University of Arkansas Fayetteville Arkansas 72701 United States∥Centre for Ecology amp Hydrology Lancaster LA1 4YQ UKperpArkansas Water Resources Center University of Arkansas Fayetteville Arkansas 72701 United States
S Supporting Information
ABSTRACT Karst landscapes are often perceived as highly vulnerable toagricultural phosphorus (P) loss via solution-enlarged conduits that bypass Pretention processes Although attenuation of P concentrations has been widelyreported within karst drainage the extent to which this results from hydrologicaldilution rather than P retention is poorly understood This is of strategicimportance for understanding the resilience of karst landscapes to P inputs givenincreasing pressures for intensified agricultural production Here hydrochemicaltracers were used to account for dilution of P and to quantify net P retentionalong transport pathways between agricultural fields and emergent springs for thekarst of the Ozark Plateau midcontinent USA Up to sim70 of the annual total Pflux and sim90 of the annual soluble reactive P flux was retained with preferentialretention of the most bioavailable (soluble reactive) P fractions Our resultssuggest that in some cases karst drainage may provide a greater P sink thanpreviously considered However the subsequent remobilization and release of the retained P may become a long-term source ofslowly released ldquolegacyrdquo P to surface waters
INTRODUCTION
More than 25 of the worldrsquos population either lives on orobtains its drinking water from karst aquifers Karst underlies30 of the land area of China 30 of Europe and 20 of theUnited States12 Karst aquifers exert an important control on thequality and ecology of surface waters in these areas3 Thecomplexity of subsurface drainage45 and the difficulties indeconvoluting flow pathways and groundwater contributingareas6 have been a significant barrier to detailed studies ofnutrient transport and fate in karst systems78 Nevertheless it iswidely assumed that karst drainage systems (formed bydissolution of carbonate rocks mainly limestone) are highlyvulnerable to phosphorus (P) impairment from agriculturalsourcesThis vulnerability is assumed to arise from the low nutrient
buffering capacity of the thin cherty soils which overlie karst andthe rapid transmission of surface runoff through conduitsenlarged by dissolution910 which is thought to bypass thezones where key processes of P retention occur11minus13 Nonethe-less highly intensive monitoring of Irish karst springs in areas oflivestock demonstrated major P attenuation (reduction in Pconcentrations) relative to agricultural runoff1415 with low Pconcentrations in spring discharge even during storm events
when agricultural P losses are expected to be highest Thisattenuation was attributed to a combination of both hydrologicaldilution and P retention during infiltration and transmission ofrunoff along groundwater conduit pathwaysCrucially we lack information on the extent to which P
attenuation is controlled by P retention processes during transitalong karst flow paths14 or by hydrological dilution ofagricultural runoff by cleaner groundwater sources16 This is ofstrategic importance for understanding the P buffering capacityand wider resilience of karst landscapes to nutrient inputs101718
Many karst lands have traditionally been used for low-intensitylivestock farming owing to poor soils and their unsuitability forarable production9 However there is increasing pressure forintensive livestock production as global demands for greaterefficiency in food production intensify1920 Given the movetoward more intensive livestock production systems whichaccumulate P2122 and the perceived vulnerability of karstdrainage systems to P loss there is now a pressing and strategic
Received December 14 2013Revised March 17 2014Accepted March 17 2014
Article
pubsacsorgest
copy XXXX American Chemical Society A dxdoiorg101021es405585b | Environ Sci Technol XXXX XXX XXXminusXXX
need for better understanding of the fate and transport of P inkarst landscapes Here this shortfall is addressed for karst terrainin south-central USA Hydrochemical tracers and endmembermixing analysis23minus26 were used to assess the vulnerability to Ploss by accounting for the hydrological dilution of agriculturalrunoff and directly quantifying net P retention during infiltrationthrough the soil and along karst transport pathways through tothe emergent springs
EXPERIMENTAL METHODS
Study Area The study was undertaken at the University ofArkansas long-term Savoy Experimental Watershed (SEW) NWArkansas USA27 The SEW is located in the Illinois RiverWatershed a mixed land-use watershed (sim4330 km2) whichspans the states of Arkansas and Oklahoma2829 The SEW covers1250 ha and is typical of the karst terrain of the Ozark Plateau ofmidcontinental USA (Figure SI-1a Supporting Information)The soils of the SEW are predominantly silt loams (seeSupporting Information) Around 70 of the land is nativeforest with the remaining 30 rolling pasture grazed by beefcattle (sim2 cows haminus1) The SEW also supports poultryproduction with the resulting poultry litter used to fertilizepastures There are no septic tanks or settlements in the SEWand agricultural runoff from pastures grazed by cattle providesthe overwhelmingly dominant P source in the watershed30
The stratigraphy of the SEW30minus32 (see Figure SI-1cSupporting Information) includes (a) the limestone aquifer ofthe St Joe Formation (b) the Boone Formation an impurelimestone which mantles the St Joe Formation and formsldquoepikarstrdquo and (c) a layer of regolith (vadose zone) whichoverlies the Boone Formation Karst drainage has a major controlon water quality in the Illinois River2933 67 of annual river flowcomes from karst springs rising to 80 of flow in the summerand fall34
Sample Collection and Analysis Surface runoff andspring-water chemistry and flow monitoring (Figure SI-1a andc Supporting Information) were undertaken at the following(1) two adjacent karst springs (Langle Spring LLS andCopperhead Spring CHS) which flow continually from the StJoe Formation (focused conduit flow) springs (2) two surfacerunoff field plots (Langle LL 107 ha and Copperhead CH 105ha) which are located above and within the watershed (rechargezone) of the LLS andCHS springs These runoff plots are locatedon Razort silt loams which make up most of the grazed pasturesof the SEW All pastures are treated similarly in terms of grazing
intensity and maintenance fertilizer applications (30 kg P haminus1
every two years as either poultry litter or diammoniumphosphate)Flows at the karst springs (LLS and CHS) were monitored on
15-min intervals (see Supporting Information) Karst springwater was sampled weekly with stage-triggered subdailyautomated sampling using an ISCO sampler during stormevents Figure SI-2 (Supporting Information) shows thedistribution of samples collected on the rising and falling stageof the storm hydrographs The volume of surface runoff fromboth fields was automatically measured and samples werecollected on a flow-weighted basis by an ISCO autosampler Allwater samples were filtered within 24 h of the water beingsampled and were analyzed following EPA standard protocols asdescribed below (and in the Supporting Information) Filtered(lt045 μm) samples were analyzed for soluble reactivephosphorus (SRP) by colorimetric analysis35 and for a fullsuite of major cations (including potassium K and calcium Ca)and trace elements (including lanthanum La and rubidium Rb)(see Supporting Information) Unfiltered samples were analyzedfor total phosphorus (TP) after acid-persulfate digestion bycolorimetric analysis3536 These measurements are consistentwith standard protocols for TP and SRP analysis37
Use of Conservative Tracers and Endmember MixingAnalysisConservative chemical tracers and endmember mixingmodels were used to apportion water sources and to differentiatethe effects of hydrological dilution from the biogeochemicalprocesses which retain and cycle P during transit through thekarst drainage system Chemical tracers have been widely used inwatershed hydrology for tracing water sources and flowpathways38 owing to their conservative behavior (chemicalinertness) Here we made use of chemical tracers already in thewatershed to apportion water sources Using the hydrochemicalmonitoring data tracers were chosen which had elevatedconcentrations in either base flow groundwater or in agriculturalrunoff First two-component endmember mixing models2339
were used to link the spring-water chemistry to sources withinthe watershed by (a) quantifying the relative proportions ofsurface runoff and groundwater and (b) estimating thecontribution of surface runoff from the agricultural grazed landSecond comparing the mixing patterns of P in spring water witha conservative tracer of agricultural runoff allowed us to directlyevaluate whether P was behaving nonconservatively (ie beingtaken up or released) along the hydrological pathways in the karstdrainage system
Table 1 Summary of Concentrations of Soluble Reactive Phosphorus (SRP) Total Phosphorus (TP) Potassium (K) Rubidium(Rb) and Calcium (Ca) in Field Runoff and Spring-Water Samples
field runoff (m3 ha‑1)spring flow (L s‑1)
SRP(mg Lminus1)
TP(mg Lminus1)
Rb(μg Lminus1)
K(mg Lminus1)
Ca(mg Lminus1)
Langle Field mean 380 221 257 697 104 512(LL) median 355 187 212 596 102 494
range 34minus915 059minus502 08minus553 093minus206 204minus263 211minus987Copperhead Field mean 231 068 109 294 611 345(CH) median 146 057 103 252 511 343
range 18minus799 047minus122 063minus191 058minus876 14minus147 195minus734Langle Spring mean 131 0029 0057 106 154 375(LLS) median 938 0012 0034 0878 114 367
range 124minus59 0minus0403 0002minus0608 0195minus357 0534minus492 122minus659Copperhead Spring mean 225 0019 0041 108 137 405(CHS) median 262 0017 0032 11 14 429
range 019minus253 0001minus012 0minus058 0328minus19 084minus217 145minus615
Environmental Science amp Technology Article
dxdoiorg101021es405585b | Environ Sci Technol XXXX XXX XXXminusXXXB
RESULTS AND DISCUSSION
Comparison of Agricultural Runoff and Spring-WaterChemistry Concentrations of TP SRP K and Rb wereconsistently highest in field runoff relative to the springs (Table1) and runoff from the grazed fields provides the greatestconcentrations of P K and Rb within the SEW In contrast Caconcentrations were consistently highest in the springscompared with runoff This indicates a dominant base flowgroundwater source of Ca from dissolution of limestone whichis diluted by surface runoff (Figure 1a)Concentrations of SRP TP K and Rb were all higher in field
runoff at LL compared with CH This likely reflects higher cattlegrazing density at LL (25 cows haminus1) than at CH (10 cowshaminus1) as well as higher runoff per unit area that likely led togreater solute and particulate entrainment and transport capacitycompared with CH This may also reflect a larger hydrologicallyactive area contributing runoff at LL linked to greater soilcompaction from more intensive cattle grazingFor the springs there was a greater variability in SRP TP K
and Rb concentrations at LLS than at CHS despite a much lowervariability in spring flow at LLS (Table 1) Howeverconcentrations of TP SRP K and Rb did not correlate withflow at either of the springs For most storm events at LLSconcentrations of TP SRP K and Rb increased dramatically
above base flow concentrations especially on the rising stage ofthe storm hydrograph (Figure SI-2 Supporting Information)These high concentrations on the rising stage are likely due toupstream point recharge of surface runoff from pasture land intothe underlying St Joe aquifer in locations where the confiningchert layer is breached At CHS the response of TP SRP K andRb to storm events was more mixed Small initial increases inconcentration occurred with the onset of higher flows followedby marked reductions in concentration reflecting substantialdilution by a water source with relatively low SRP TP K and Rbconcentrations most likely from the nonagricultural (ungrazedand forested) parts of the watershed Indeed karst inventorieshave verified that this part of the flow regime reflects runoff fromareas which are not grazed by livestock3031
To evaluate the attenuation (ie the reductions inconcentrations) of TP SRP K and Rb during transit throughthe karst the median concentrations in agricultural runoff werecompared with the corresponding median concentrations inCHS and LLS springs (Table 1) The average attenuation of TPand SRP concentrations ranged from 96 to 99 In contrastthe average attenuation of K and Rb concentrations was lower at56 to 89 Correspondingly under storm flow conditionscomparisons of average field runoff concentrations and the 90thpercentile concentrations in spring water (which typicallycorrespond with the rising stage of the storm hydrographs of
Figure 1 (a) Relationships between calcium (Ca) concentrations and flow at Langle and Copperhead springs (b) Relationship between rubidium (Rb)and potassium (K) concentrations in field runoff and spring-water samples
Environmental Science amp Technology Article
dxdoiorg101021es405585b | Environ Sci Technol XXXX XXX XXXminusXXXC
the springs) revealed that storm flow attenuation of TP and SRPranged from 93 to 96 compared with 46 to 74 for K andRb Across all flow conditions the higher rates of attenuation of Pconcentrations relative to K and Rb reflect the nonconservativebehavior of P during transit through the karstK and Rb show high correlation (Figure 1b) due to their
similar hydrogeochemistry (group 1a monovalent base cations ofrelatively small hydration size) Figure 1b shows a dominant two-component mixing series between a high concentrationldquoendmemberrdquo (ie surface runoff from fertilizer and grazedpastures in runoff) and a low concentration spring-waterldquoendmemberrdquo (ie runoff from nonagricultural and forestedareas which have no grazing or fertilizer inputs) Both K and Rbare highly soluble monovalent ions and once transmitted intothe karst drainage system chemical interactions will be relativelysmall Therefore the attenuation of K and Rb during transportthrough the karst will be largely controlled by hydrologicaldilution without retention mechanisms (with only possibly asmall attenuation or release within the epikarst where there is ahigh proportion of clays3140) In contrast P behaves non-conservatively reflected by the higher rates of attenuation of Prelative to K and RbSpring Hydrology and Water-Source Apportionment
Comparing the hydrology of the two springs (Figure 2) base
flows at CHS were consistently lower than at LLS the medianflow at CHS was 262 L sminus1 compared with 131 L sminus1 at LLS(Table 1) Further CHS exhibited a more flashy flow regimethan LLS and storm flows were dramatically higher at CHS Forinstance the average of the highest 10 of flows was 139 L sminus1 atCHS compared with 40 L sminus1 at LLS This discrepancy reflectsthe following (i) LLS being the ldquounderflowrdquo spring (3 cm lowerthan CHS) with a much larger groundwater drainage area underlow-flow conditions than CHS which accounts for the higherbase flows at LLS (ii) water capture (spring ldquopiracyrdquo) by CHSduring storm events which has been shown to result in adramatic expansion in the watershed drainage area for CHSrelative to LLS3233
Contributions to spring water at LLS and CHS wereapportioned by two-component endmember mixing analy-sis2341 Here Ca was used as a tracer of groundwater and K asa tracer of agricultural runoff based on the observed dominantgroundwater source of Ca and the dominant agricultural runoffsource of K For the mixing model endmembers were defined asthe following
(i) A base flow groundwater endmember with elevated Caand a storm flow endmember with low Ca concentrations
(ii) Runoff endmember from agricultural land with high Kconcentration and a spring base flow low K endmember
Figure 2 Hydrographs and water source apportionment for Langle and Copperhead springs
Environmental Science amp Technology Article
dxdoiorg101021es405585b | Environ Sci Technol XXXX XXX XXXminusXXXD
Applying a simple two-component mixing model2341 (eq 1)and the endmembers identified above Ca concentrations wereused to partition the contributions to spring flow at LLS andCHS from base flow groundwater (the high concentrationendmember) and from stormwater runoff (the low concen-tration endmember) Then a second two-component mixingmodel was used for K to quantify the contributions from grazedpasture runoff (eq 2)
= times minus minus total storm runoff
100 (Ca Ca )(Ca Ca )gw m gw ro (1)
= times minus minus
agricultural runoff
100 (K K )(K K )bf m bf ag (2)
where Cagw was the groundwater Ca concentration (highconcentration base flow endmember) defined here as theaverage Ca concentration for the lowest 10 of flows sampledCam was the measured spring-water Ca concentration Caro wasthe stormwater (agricultural runoff) endmember defined here asthe average field runoff Ca concentration Kbf was the base flowendmember (average K concentration for the lowest 10 of
spring flows sampled) Km was the measured spring-water Kconcentration and Kag was the agricultural runoff endmemberdefined here as the average field runoff K concentration Thevalues used to define the endmember concentrations at LLS andCHS are shown in Table SI-1 Supporting InformationThe water source apportionment for LLS and CHS (Figure 2)
showed similar percentage contributions from base flowgroundwater and total storm flow at LLS and CHS for most ofthe year and particularly during storm events During winter andspring storm events a much greater proportion of flow at LLSwas derived from agricultural (grazed field) runoff (up toapproximately a third of flow) This greater contribution of waterfrom pastures than from nonagricultural land at LLS accountedfor the higher storm-event concentrations of K and Rb at LLSAgricultural runoff contributed a much lower proportion ofwinter and spring storm event flow at CHS (typically less than10) These results and the much higher storm flow dischargesat CHS suggest that the water ldquopiracyrdquo at CHS during stormevents captured water sources which had a lower K and Rbconcentration from the nonagricultural (ungrazed and forested)areas
Figure 3 Relationships between total phosphorus (TP) soluble reactive phosphorus (SRP) and potassium (K) for (a) Langle Spring and (b)Copperhead Spring The dashed line denotes the conservative mixing line and the solid line denotes a line of maximum P retention (see text forexplanation)
Environmental Science amp Technology Article
dxdoiorg101021es405585b | Environ Sci Technol XXXX XXX XXXminusXXXE
Quantifying Net P Retention in Karst DrainageEndmember mixing analysis23minus26 was applied using theldquoconservativerdquo tracer K to explore the net P retention andrelease along karst hydrological pathways from infiltrationthrough the soil to spring discharge First concentrations ofTP and SRP were plotted against K as the ldquoconservativerdquo tracer(Figure 3) Two dominant and distinct sources of spring water(both with different TP SRP and K concentrations) arehypothesized (Table SI-1 Supporting Information) (i) a highconcentration agricultural endmember source (Kag TPag SRPag)defined here as the average concentrations (of K TP and SRP)in agricultural field runoff at the LL and CH field plots and (ii) alow concentration (nonagricultural) endmember (Kna TPnaSRPna) As the source of this low concentration runoff couldcome from a wide range of nonagricultural sources (ungrazedand forest land) across the watershed the most reliable means ofcapturing the integrated low-concentration endmember signalwas to use the minimum measured spring-water K TP and SRPconcentrations at LLS and CHSA theoretical linear two-component mixing series ie a
ldquoconservative mixing linerdquo between the high concentration andlow concentration endmembers (Figure 3) would be observed ifP behaved conservatively during mixing of the two endmemberwater sources during transport through the karst In contrast theobserved relationships between TP and K and SRP and K inspring water were highly scattered at LLS and CHS (Figure 3)Most of the samples plot well below the conservative mixing lineshowing predominantly net retention of TP and SRP relative toK A few isolated samples plotted above the conservative mixingline which are indicative of some sporadic net P release relativeto the K tracer The mixing patterns between TP SRP and Kconcentrations in Figure 3 had a well-defined lower boundary ofsamples with the lowest P concentrations relative to K (shown inFigure 3 as a ldquoline of maximum P retentionrdquo) This line ofmaximum P retention probably represents a secondaryendmember mixing line between the same low concentrationnonagricultural runoff endmember and a secondary agricultural
field runoff endmember with high K but lower P concentrationsas a result of P retention processes filtering out P We posit thatthe majority of this P was ldquofilteredrdquo out during diffuse recharge ofwater as through the soil and the epikarst into the karst aquiferThe spring-water samples which lie between the line ofmaximum retention and the conservative mixing series thereforelikely reflect the net effects of P retention and remobilizationprocesses for runoffwater entering the karst drainage system via amixture of diffuse and point rechargeBy comparing the observed spring-water TP and SRP versus K
relationships with the theoretical linear conservative mixingseries the net effects of P retention and release can be directlyquantified (Figure 3) By applying the theoretical conservativemixing series (TP versus K and SRP versus K) to the measuredspring-water K concentrations at LLS and CHS ldquoconservativerdquoTP and SRP concentration time series were derived (Figure SI-3ab Supporting Information) and converted to loads using thecorresponding spring flow data By taking the difference betweenmeasured and ldquoconservativerdquo TP and SRP loads we calculatednet TP and net SRP retention on an annual basis as well as forbase flows (lowest 10 of flows) and storm flows (highest 10 offlows) (Table 2)Annual net TP retention ranged from 69 at LLS to 54 at
CHS Net percentage P retention was consistently higher forSRP compared with TP not only on an annual basis but alsounder storm and base flow conditions This indicated preferentialretention of more labile SRP fractions by sorptionuptake andgreater mobility of TP organic and particulate P fractions Similarpatterns of soluble and particulate P retention have also beenobserved in other karst soils and drainage systems71113 Highestpercentage net P retention occurred during storm events at LLS(92 TP retention and 96 SRP retention) However the twosprings showed very different patterns in P retention under stormand base flow conditions At LLS net P retention was greatestduring storm flows than under base flow conditions reflecting ahigh efficiency of P retention from agricultural runoff at LLS Incontrast at CHS a greater percentage of the P load was retained
Table 2 Measured and ldquoConservativerdquo Annual Loads and Mean Daily Base Flow and Storm Flow Loads of Total Phosphorus(TP) and Soluble Reactive Phosphorus (SRP) in Langle and Copperhead Springs with Net and Percentage TP and SRP Retention
measured P load(kg yminus1 or g dminus1)
ldquoconservativerdquo P load(kg yminus1 or g dminus1)
net P retention(kg yminus1 or g dminus1) net P retention
Langle Spring(LLS)
annual TP load(kg yminus1)
701 223 153 69
annual SRP load(kg yminus1)
185 190 172 90
Copperhead Spring(CHS)
annual TP load(kg yminus1)
265 57 31 54
annual SRP load(kg yminus1)
098 33 23 70
Langle Spring(LLS)
avg base flow TP load(g dminus1)
103 233 130 56
avg base flow SRP load(g dminus1)
221 198 176 89
Copperhead Spring(CHS)
avg base flow TP load(g dminus1)
127 355 228 64
avg base flow SRP load(g dminus1)
045 214 169 79
Langle Spring(LLS)
avg storm flow TP load(g dminus1)
112 1448 1336 92
avg storm flow SRP load(g dminus1)
514 1240 1189 96
Copperhead Spring(CHS)
avg storm flow TP load(g dminus1)
445 971 527 54
avg storm flow SRP load(g dminus1)
175 567 392 69
Environmental Science amp Technology Article
dxdoiorg101021es405585b | Environ Sci Technol XXXX XXX XXXminusXXXF
under base flow than during storm flow This reflects much lowerbase flows at CHS which increase water residence time andpromote particulate sedimentation and P retention and higherstorm flows linked to stream piracy which provide greaterflushing from nonagricultural areas where flows have a low PconcentrationContaminant Residence Times in Karst DrainageWhile
monitoring P relative to a conservative tracer provides us withvaluable information on rates of annual and storm flowbase flownet retention it provides no information about the residencetimes of P within the karst or the time scales over whichretention and remobilization may occur This is of strategicconcern in relation to the ldquolegacyrdquo of P within watersheds4243
whereby time-lags in release of retained Pmaymask the effects ofconservation measures on receiving water quality By measuringa full suite of trace elements using ICP-MS a ldquoserendipitousrdquoobservation was made which may help provide clues about thewider contaminant residence times within the karst drainageConcentrations of ldquodissolvedrdquo (lt045 μm) lanthanum (La) instorm flow spring discharge at LLS were more than an order ofmagnitude higher than could be accounted for by the runoffsources measured within the SEW Figure 4 shows theconcentrations of La in the spring discharge at LLS and aldquoconservativerdquo (maximum) concentration from runoff whichaccounts for the dilution of agricultural runoff during transitthrough the karst drainage using K as a tracer The high stormflow La concentrations observed at LLS are likely a ldquolegacyrdquosignal from a past tracer experiment In 2001 lanthanum-labeledmontmorillonite clays were injected into a losing stream at SEWas part of a study to examine clay and bacterial transport44
While the La tracer was detected at LLS around 16 h after itwas injected44 our monitoring suggests the La tracer was alsoretained within the karst drainage system and continues to beremobilized and released during storm events more than 10 yearslater Unfortunately it is impossible to perform a mass balance toquantify how much of the La applied in the tracer study remainswithin the karst drainage system and how long a La ldquolegacyrdquomight persist as no La measurements were made in the
intervening 10 years between the tracer injection in 2001 and ourmonitoring which started in November 2011 Within the scopeof this study it was also not possible to determine whether the Laconcentrations measured were truly dissolved or a lt045 μmcolloidalclay fraction or whether La geochemistry is sufficientlysimilar to be used as an indicator of P transport However theseresults indicate that La a tracer expected to be flushed rapidlythrough the karst was retained and continues to be remobilizedand released during storm events more than 10 years later Thisindicates the potential for contaminant retention in thesubsurface karst drainage system where contaminant storageand gradual rerelease may occur over time scales of at least adecade
Wider Implications Hydrochemical tracers of agriculturalrunoff allowed us to directly evaluate the nonconservativebehavior of P within karst drainage and quantify net P retentionOur results challenge the widely held assumption that karstlandscapes are always highly vulnerable to P loss and suggest thatin some cases karst drainage may provide a greater sink for Pthan previously considered P from agricultural runoff wasattenuated by hydrological dilution from cleaner (nonagricul-tural) sources during transport through karst drainage Howeverthere was also a high capacity for net P retention especially forLangle Spring which was subject to the highest agricultural Ploadings Here sim70 of the annual TP flux and sim90 of theannual SRP flux was retained Moreover the buffering within thesoils and karst drainage not only retained a high proportion ofincoming fluxes of P from agricultural runoff but preferentiallyretained the most bioavailable P fractions For instance muchresearch has documented the capacity of soil to retain applied Pin various inorganic (Al Fe Ca complexes) and organic forms ofvarying stability4546 The long-term accumulation of P in soilhowever can be released slowly to soil water2847
The mechanisms of P retention were not investigated here butlikely include varying combinations of processes includingadsorption onto clays coprecipitation of P with CaCO3 andbinding with particulate humic substances11minus13 in the soil inepikarst and within the fractures and conduits These adsorption
Figure 4 Time series of measured and ldquoconservativerdquo lanthanum (La) concentrations and flow at Langle spring Measured La concentrations aredenoted by solid circles ldquoconservativerdquo La concentrations are denoted by open circles See text for explanation of how ldquoconservativerdquo La concentrationswere calculated
Environmental Science amp Technology Article
dxdoiorg101021es405585b | Environ Sci Technol XXXX XXX XXXminusXXXG
products and precipitates will be physically retained as the watervelocity slows and will be deposited as sediment along the base ofthe conduit flow paths With the recurrence of high flow thesesediments are resuspended by turbulent flow and moved alongthe flow path until redeposited or eventually resurged at thebase-level spring Given the potential importance of CaCO3minusPcoprecipitation for P retention in karst terrain and the possibilityof reductions in the efficiency of this coprecipitation mechanismunder higher P and dissolved organic carbon (DOC)concentrations124849 further work is needed to examine anyunforeseen impacts of increasing agricultural intensification onthis ldquoself-cleansingrdquo P retention mechanism However in thisstudy the site with the higher livestock intensity and with highermanure-enriched runoff actually demonstrated greater efficiencyof P retention This may indicate that critical P and DOCthresholds for inhibition of CaCO3 precipitation were notreached or that other P retention process mechanisms wereoccurringThe patterns in spring-water La concentrations suggest
continued released of La from springs more than 10 years aftera tracer injection and indicate the potential for long-termcontaminant retention storage and subsequent release Indeedthe complex nature of karst hydrological pathways can result inlarge distributions in water and contaminant residence times andlag times for discharge to surface waters may bemuch longer thanexpected50minus52 Our findings indicate that retention of P withinkarst drainage may reduce the risk of acute episodic storm-drivenlosses of agricultural P However the potential buffering of P inthe epikarst and within the fracture and conduit drainage systemcan provide a slow but long-term source of P released via springsto surface waters Further work is needed to determine theecological impacts of such patterns of P release to receivingstreams and the ability of those streams to assimilate thoseinputs compared with higher pulse inputs during storm flows
ASSOCIATED CONTENT
S Supporting InformationMap of the SEW and the karst water flow system time series ofspring-water TP SRP K and Rb concentrations table of Ca TPand SRP endmember concentrations soils and geology of theSavoy Experimental Watershed experimental methods Thismaterial is available free of charge via the Internet at httppubsacsorg
AUTHOR INFORMATION
Corresponding AuthorPhone ++44 (0)1491 838800 Fax ++44 (0)1491692424 E-mail hpjcehacuk
NotesThe authors declare no competing financial interest
ACKNOWLEDGMENTS
HPJ acknowledges funding and support from the UK NaturalEnvironment Research Council a Fulbright DistinguishedScholar Award and an OECD Co-operative Research Pro-gramme Fellowship We thank Chris Wardle (British GeologicalSurvey) for help with the artwork and Dr Tiong Ee Ting forpermission to reproduce tracer experiment results in theSupporting Information
REFERENCES(1) Panno S V Karst aquifers Can they be protected Ground Water2006 44 (4) 494minus494(2) White W B Culver D C Herman J S Kane T C Mylroie JE Karst lands Am Sci 1995 83 (5) 450minus459(3) Owen M R Pavlowsky R T Base flow hydrology and waterquality of an Ozarks spring and associated recharge area southernMissouri USA Environ Earth Sci 2011 64 (1) 169minus183(4) Baffaut C Benson VWModeling flow and pollutant transport ina karst watershed with SWAT Trans ASABE 2009 52 (2) 469minus479(5) Fournier M Motelay-Massei A Massei N Aubert MBakalowicz M Dupont J P Investigation of transport processesinside karst aquifer by means of STATIS Ground Water 2009 47 (3)391minus400(6) Brahana J V Rationale and methodology for approximatingspring-basin boundaries in the mantled karst terrane of the SpringfieldPlateau northwestern Arkansas In The engineering geology andhydrogeology of karst terranes Beck B F Stephenson B F Eds A ABalkema Rotterdam 1997 pp 77minus82(7) Kilroy G Coxon C Temporal variability of phosphorus fractionsin Irish karst springs Environ Geol 2005 47 (3) 421minus430(8) Lerch R N Contaminant transport in two central Missouri karstrecharge areas J Cave Karst Stud 2011 73 (2) 99minus113(9) Coxon C Agriculture and karst In Karst Management Beynen PE Ed Springer Dordrecht Netherlands 2011 pp 103minus138(10) Kacaroglu F Review of groundwater pollution and protection inkarst areas Wat Air Soil Pollut 1999 113 (1minus4) 337minus356(11) Allousha G A Boyer D G Belesky D P Halvorson J JPhosphorus mobility in a karst landscape under pasture grazing systemAgronomie 2003 23 (7) 593minus600(12) Neal C Jarvie H PWilliams R J Neal MWickham H HillL Phosphorus-calcium carbonate saturation relationships in a lowlandchalk river impacted by sewage inputs and phosphorus remediation Anassessment of phosphorus self-cleansing mechanisms in natural watersSci Total Environ 2002 282 295minus310(13) von Wandruszka R Phosphorus retention in calcareous soils andthe effect of organic matter on its mobility Geochem Trans 2006 7 6(14) Mellander P-E Jordan P Melland A R Murphy P N CWall D P Mechan S Meehan R Kelly C Shine O Shortle GQuantification of phosphorus transport from a karstic agriculturalwatershed to emerging spring water Environ Sci Technol 2013 47 (12)6111minus6119(15) Mellander P-E Jordan P Wall D P Melland A R MeehanR Kelly C Shortle G Delivery and impact bypass in a karst aquiferwith high phosphorus source and pathway potentialWater Res 2012 46(7) 2225minus2236(16) Stueber A M Criss R E Origin and transport of dissolvedchemicals in a karst watershed southwestern Illinois J Am Water ResAssoc 2005 41 (2) 267minus290(17) Kleinman P J A Sharpley A N McDowell R W Flaten DN Buda A R Tao L Bergstrom L Zhu Q Managing agriculturalphosphorus for water quality protection Principles for progress PlantSoil 2011 349 (1minus2) 169minus182(18) Sharpley A N Kleinman P J A Flaten D N Buda A RCritical source area management of agricultural phosphorus Experi-ences challenges and opportunities Water Sci Technol 2011 64 (4)945minus952(19) Sharpley A N Jarvie H P Agricultural management waterquality amp ecology Putting practice into policy In National AgriculturalBiotechnology Council Report 24 Eaglesham A Korth K Hardy R WF Eds Jacobs Press Auburn NY 2012 pp 73minus99(20) Sims J T Ma L Oenema O Dou Z Zhang F S Advancesand challenges for nutrient management in China in the 21st century JEnviron Qual 2013 42 (4) 947minus950(21) Kellogg R L Lander C H Moffitt D C Gollehon N Manurenutrients relative to the capacity of cropland and pastureland toassimilate nutrients Spatial and temporal trends for the United StatesResource Assessment and Strategic Planning Working Paper 98-1 USDANatural Resources Conservation Service and Economic Research
Environmental Science amp Technology Article
dxdoiorg101021es405585b | Environ Sci Technol XXXX XXX XXXminusXXXH
Service General Services Administration National Forms andPublication Center Fort Worth TX 2000 pp 1minus140 httpwwwnrcsusdagovtechnicallandpubsmanntrpdf(22) Maguire R O Rubaeligk G H Haggard B E Foy B H Criticalevaluation of the implementation of mitigation options for phosphorusfrom field to catchment scales J Environ Qual 2009 38 (5) 1989minus1997(23) Christophersen N Neal C Hooper R P Vogt R DAndersen S Modeling streamwater chemistry as a mixture of soilwaterend-members - A step towards 2nd-generation acidification models JHydrol 1990 116 (1minus4) 307minus320(24) Neal C Jarvie H P Williams R Love A Neal M WickhamH Harman S Armstrong L Declines in phosphorus concentration inthe upper River Thames (UK) Links to sewage effluent cleanup andextended end-member mixing analysis Sci Total Environ 2010 408 (6)1315minus1330(25) Jarvie H P Neal C Withers P J A Baker D B Richards RP Sharpley A N Quantifying phosphorus retention and release inrivers and watersheds using extended end-member mixing analysis (E-EMMA) J Environ Qual 2011 40 (2) 492minus504(26) Jarvie H P Sharpley A N Scott J T Haggard B E BowesM J Massey L B Within-river phosphorus retention Accounting for amissing piece in the watershed phosphorus puzzle Environ Sci Technol2012 46 (24) 13284minus13292(27) Brahana V The Savoy Experimental WatershedA long-termresearch site for karst hydrogeology In Caves and Karst of the USANational Speleological Society Guidebook for the International Congress ofSpeleology Palmer A N Palmer M V Eds National SpeleologicalSociety Huntsville AL 2009 section 5 Ozark Plateaus p 179(28) Sharpley A N Kleinman P J A Jordan P Bergstrom LAllen A L Evaluating the success of phosphorus management fromfield to watershed J Environ Qual 2009 38 1981minus1988(29) Scott J T Haggard B E Sharpley A N Romeis J J Changepoint analysis of phosphorus trends in the Illinois River (Oklahoma)demonstrates the effects of watershed management J Environ Qual2011 40 (4) 1249minus1256(30) Brahana J V Controlling influences on ground-water flow andtransport in the shallow karst aquifer of northeastern Oklahoma andnorthwestern Arkansas Proceedings volume hydrologic problemsalong the Arkansas-Oklahoma border Arkansas Water ResourcesCenter Publication No MSC-168 1995 pp 25minus3033(31) Brahana J V Ting T Al-Qinna M Murdock J Davis R KLainz J Killingbeck J J Szilvagyi E Doheny-Skubic M Chaubey IHays P D Thoma G Quantification of hydrologic budget parametersfor the vadose zone and epikarst in mantled karst US GeologicalSurvey Karst Interest Group Proceedings Rapid City SD Sept 12minus152005 Kuniansky E L Ed US Geological Survey ScientificInvestigations Report 2005-5160 pp 144minus152(32) Leh M D Chaubey I Murdoch J Brahana J V Haggard BE Delineating runoff processes and critical runoff source areas in apasture hillslope of the Ozark Highlands Hydrol Proc 2008 22 (21)4190minus4204 DOI 101002hyp7021(33) Haggard B E Phosphorus concentrations loads and sourceswithin the Illinois River drainage area Northwest Arkansas 1997minus2008J Environ Qual 2010 39 (6) 2113minus2120(34) Tortorelli R L Pickup B E Phosphorus concentrations loadsand yields in the Illinois River basin Arkansas and Oklahoma 2000minus2004 US Geological Survey Scientific Investigations Report 2006-5175 p 38(35) Murphy J Riley J P A modified single solution method for thedetermination of phosphate in natural-waters Anal Chim Acta 196227 31minus36(36) Eisenreich S J Bannerman R T Armstrong D E Simplifiedphosphorus analytical technique Environ Lett 1975 9 (1) 43minus53(37) Jarvie H P Withers P J A Neal C Review of robustmeasurement of phosphorus in river water Sampling storagefractionation and sensitivity Hydrol Earth Syst Sci 2002 6 113minus131(38) Divine C E McDonnell J J The future of applied tracers inhydrogeology J Hydrogeol 2005 13 255minus258
(39) Burns D A McDonnell J J Hooper R P Peters N E FreerJ E Kendall C Beven K Quantifying contributions to storm runoffthrough endmember mixing analysis and hydrologic measurements atthe Panola Mountain Research Watershed (Georgia USA) HydrolProc 2001 15 1903minus1924(40) Williams P W The role of the epikarst in karst and cavehydrogeology a review Int J Speleol 2008 31 1minus10(41) Jarvie H P Neal C Smart R Owen R Fraser D Forbes IWade A Use of continuous water quality records for hydrographseparation and to assess short-term variability and extremes in acidityand dissolved carbon dioxide for the River Dee Scotland Sci TotalEnviron 2001 265 (1minus3) 85minus98(42) Jarvie H P Sharpley A N Spears B Buda A R May LKleinman P J A Water quality remediation faces unprecedentedchallenges from ldquolegacy phosphorusrdquo Environ Sci Technol 2013 47(16) 8997minus8998(43) Sharpley A Jarvie H P Buda A May L Spears B KleinmanP Phosphorus legacy Overcoming the effects of past managementpractices to mitigate future water quality impairment J Environ Qual2013 42 (5) 1308minus1326(44) Ting T E E Assessing bacterial transport storage and viability inmantled karst of northwest Arkansas using clay and Escherichia colilabeled with lanthanide-series metals PhD Dissertation University ofArkansas 2005(45) Sharpley A N Smith S J Bain W R Nitrogen and phosphorusfate from long-term poultry litter applications toOklahoma soils Soil SciSoc Am J 1993 57 (4) 1131minus1137(46) Frossard E Condron L M Oberson A Sinaj S Fardeau J CProcesses governing phosphorus availability in temperate soils JEnviron Qual 2000 29 (1) 15minus23(47) Cox F R Kamprath E J McCollum R E A descriptive modelof soil test nutrient levels following fertilization Soil Sci Soc Am J 198145 (3) 529minus532(48) Inskeep W P Bloom P R kinetics of calcite precipitation in thepresence of water-soluble organic-ligands Soil Sci Soc Am J 1986 50(5) 1167minus1172(49) Dove P M Hochella M F Calcite precipitation mechanismsand inhibition by orthophosphate - insitu observations by scanning forcemicroscopy Geochim Cosmochim Acta 1993 57 (3) 705minus714(50) Kirchner J W Feng X H Neal C Fractal stream chemistry andits implications for contaminant transport in catchments Nature 2000403 (6769) 524minus527(51) Kirchner J W Neal C Universal fractal scaling in streamchemistry and its implications for solute transport and water qualitytrend detection Proc Nat Acad Sci USA 2013 110 (30) 12213minus12218(52) Neal C Catchment water quality The inconvenient butnecessary truth of fractal functioning Hydrol Proc 2013 27 (24)3516minus3520
Environmental Science amp Technology Article
dxdoiorg101021es405585b | Environ Sci Technol XXXX XXX XXXminusXXXI
Coupling High-Frequency Stream Metabolism and NutrientMonitoring to Explore Biogeochemical Controls on DownstreamNitrate DeliveryHelen P Jarviedagger Andrew N SharpleyDagger Timothy Kressesect Phillip D Hays∥ Richard J Williamsdagger
Stephen M Kingperp and Lawrence G BerryDagger
daggerNERC Centre for Ecology and Hydrology Wallingford OX10 8BB United KingdomDaggerDepartment of Crop Soil and Environmental Sciences University of Arkansas Fayetteville Arkansas 72701 United StatessectUS Geological Survey Lower Mississippi-Gulf Water Science Center 401 Hardin Road Little Rock Arkansas 72211 UnitedStates∥US Geological Survey Lower Mississippi-Gulf Water Science CenterUniversity of Arkansas Department of Geosciences 216Gearhart Hall Fayetteville Arkansas 72701 United StatesperpSTFC Rutherford Appleton Laboratory Harwell Campus Didcot Oxfordshire OX11 0QX United Kingdom
S Supporting Information
ABSTRACT Instream biogeochemical process measurementsare often short-term and localized Here we use in situ sensorsto quantify the net effects of biogeochemical processes onseasonal patterns in baseflow nitrate retention at the river-reachscale Dual-station high-frequency in situ nitrate measurementswere coupled with high-frequency measurements of streammetabolism and dissolved inorganic carbon in a tributary of theBuffalo National River Arkansas Nitrate assimilation wascalculated from net primary production and combined withmass-balance measurements to estimate net nitrification anddenitrification The combined net effects of these instreamprocesses (assimilation denitrification and nitrification)removed gt30minus90 of the baseflow nitrate load along a 65km reach Assimilation of nitrate by photoautotrophs during spring and early summer was buffered by net nitrification Netnitrification peaked during the spring After midsummer there was a pronounced switch from assimilatory nitrate uptake todenitrification There was clear synchronicity between the switch from nitrate assimilation to denitrification a reduction in riverbaseflows and a shift in stream metabolism from autotrophy to heterotrophy The results show how instream nitrate retentionand downstream delivery is driven by seasonal shifts in metabolic pathways and how continuous in situ stream sensor networksoffer new opportunities for quantifying the role of stream biota in the dynamics fate and transport of nitrogen in fluvialsystems
1 INTRODUCTION
Nutrients including nitrogen (N) phosphorus (P) and carbon(C) from agriculture and domestic wastewater are a majorsource of water-quality impairment1 Excessive nutrient inputsto rivers streams and lakes can accelerate growth of nuisanceand harmful algae Resulting increases in microbial activity anddepletion of dissolved oxygen (DO) have profound negativeconsequences for invertebrates and fish potable water supplyand recreation23 However biogeochemical processes instreams also play an important role in regulating downstreamnutrient transport with stream biota retaining and removingnutrients from the water column reducing downstreamecological impacts4minus6
Streams can provide a major sink for nitrate (NO3minus)
through uptake (assimilation) by primary production and
through denitrification78 The effectiveness of these processesvaries throughout the year and between streams butconventional methods for estimating NO3
minus uptake are basedon relatively few short-term experimental nutrient additionsand isotope measurements9minus11 making results difficult toextrapolate in space and time12 Continuous high-frequency insitu measurements offer new opportunities to explore NO3
minus
source dynamics13minus17 and instream processes have beeninferred from single-station diurnal concentration cycles121819
longitudinal profiling20minus23 and nested sensor networks24
Received June 6 2018Revised October 23 2018Accepted October 30 2018Published October 30 2018
Article
pubsacsorgestCite This Environ Sci Technol 2018 52 13708minus13717
copy 2018 American Chemical Society 13708 DOI 101021acsest8b03074Environ Sci Technol 2018 52 13708minus13717
Dow
nloa
ded
via
CT
R F
OR
EC
OL
OG
Y amp
HY
DR
OL
OG
Y o
n D
ecem
ber
4 2
018
at 0
936
54
(UT
C)
Se
e ht
tps
pub
sac
sor
gsh
arin
ggui
delin
es f
or o
ptio
ns o
n ho
w to
legi
timat
ely
shar
e pu
blis
hed
artic
les
In this study we used in situ sensors to quantify the neteffects of biogeochemical processes on seasonal patterns inbaseflow NO3
minus retention at the river-reach scale The approachemployed here is novel because it combines dual-station high-frequency NO3
minus measurements with high-frequency measure-ments of stream metabolism (analysis of diurnal DO curves tocalculate primary production and respiration) dissolvedinorganic carbon (DIC) and excess partial pressure of carbondioxide (EpCO2) to explore the capacity of instreambiogeochemical processes to retain and remove NO3
minus High-frequency in situ monitoring of water chemistry and stream-flow was undertaken along a 65 km experimental reach of BigCreek a tributary of the Buffalo National Scenic RiverArkansas USA and were used to calculate a NO3
minus massbalance along the reach Net primary production was used tocalculate NO3
minus assimilation by photoautotrophs Daily NO3minus
removal rates and rates of NO3minus assimilation by photo-
autotrophs were used to calculate net nitrification anddenitrification The biogeochemical controls on NO3
minus removalwere then evaluated in relation to wider ecosystem driversincluding streamflow DO and stream ecological function toexplore how seasonal shifts in metabolic pathways influenceinstream NO3
minus retention and downstream NO3minus delivery
2 MATERIALS AND METHODS21 Site Description and Water-Quality Monitoring
Big Creek a tributary of the Buffalo National Scenic RiverArkansas (Figure 1) is the subject of detailed water-quality
monitoring because of a permitted swine concentrated animalfeeding operation (CAFO) within the watershed in operationsince September 2013 The Big Creek watershed lies in thekarst terrain of the Ozark Plateau of the midcontinental USA(Figure 1) The watershed area is 236 km2 with 79 of theland area deciduous forest 3 evergreen forest 14grasslandpasture and 3 developed land (see SupportingInformation SI S11) Swine-manure slurry from the CAFO
has been land applied to permitted fields since January 1 2014in accordance with State regulationsThe focus of this study is an experimental reach of Big
Creek downstream of the CAFO from an upstreammonitoring station at Mt Judea (USGS site 07055790watershed area 106 km2) to a downstream monitoring stationat Carver (USGS site 07055814 watershed area 233 km2)721 and 069 km from the confluence between Big Creek andthe Buffalo River respectively (Figure 1) One tributary (LeftFork) enters Big Creek between Mt Judea and Carver Thewatershed is a mantled karst terrain characterized by intimateconnection between groundwater and surface water transportof surface-derived nutrients can be rapid25 (see S12)USGS conducted high-frequency (15 min) NO3
minus monitor-ing using submersible ultraviolet nitrate probes at Carver (06032014 to 04292017) and Mt Judea (11012014 to 11012015) there was therefore one year of overlapping data(11012014 to 11012015) during which NO3
minus monitoringwas undertaken at both Mt Judea and Carver A water-qualitysonde (YSI 6600) operating at Carver simultaneously collected15 min interval DO pH specific conductance and watertemperature data Further information about the high-frequency water-quality monitoring is provided in S13Water-quality samples collected on a weekly basis since 09
122013 with additional opportunistic high-flow sampling atMt Judea Left Fork and at a groundwater (spring) monitoringsite (Figure 1) provided NO3
minus (by ion chromatographyDionex ICS-1600) alkalinity (by fixed-end point acidimetrictitration to pH 4526) and conductivity (VWR SymphonyB10C) data All nitrate concentrations are reported as NO3minusN(mg-N Lminus1) Water-quality data are available at httpsbigcreekresearchorg
22 Stream-Flow Measurements and HydrographSeparation Stream flow was measured using establishedUSGS streamflow gauging methods27 (see S14) A two-component mixing model was used to partition thecontributions to streamflow from groundwater and surfacerunoff28 using alkalinity as a conservative groundwater tracer(see S15)
23 Analysis of Diurnal Dissolved Oxygen Curves toCalculate Primary Production and Respiration The dailyaverage gross primary production daily average ecosystemrespiration and reaeration coefficient were calculated from theseries of diurnal DO curves at Carver (see S16) using apiecewise solution of the mass balance DO model29 simplifiedfor the situation where the deficit does not vary spatially (eq1) the Delta method3031
D t k D td d ER GPP ( )a av av+ = minus (1)
where D is the DO deficit (mg-O2 Lminus1) t is the time (days) ka
is the reaeration coefficient ERav is the ecosystem respiration(mg-O2 L
minus1 dminus1) and GPPav is the gross primary production(mg-O2 Lminus1 dminus1) these are standard measures of ecosystemrespiration and gross primary production in river systems32
Odum33 suggested a classification system of flowing-watercommunities based on oxygen metabolism by using the ratio ofGPPav to ERav (GPPER) Respiration is associated with bothplant and microbial activity Photosynthesis is only associatedwith plants Autotroph-dominated communities are repre-sented by GPPER values gt1 whereas heterotroph-dominatedcommunities are represented by GPPER values lt1
24 Use of the THINCARB Model for CalculatingDissolved Inorganic Carbon Concentrations and Excess
Figure 1 Map of the Big Creek watershed and its location
Environmental Science amp Technology Article
DOI 101021acsest8b03074Environ Sci Technol 2018 52 13708minus13717
13709
Partial Pressure of Carbon Dioxide The THINCARBmodel (THermodynamic modeling of INorganic CARBon)34
uses pH Gran Alkalinity (AlkGran) and temperature measure-ments to calculate dissolved inorganic carbon (DIC)concentrations and DIC speciation from the excess partialpressures of carbon dioxide (EpCO2) in freshwatersTHINCARB is open access and is described in detail in Jarvieet al (2017)34 an outline is provided in S17 Prior to usealkalinity measurements in units of mg-CaCO3 L
minus1 were firstconverted to AlkGran (in μeq Lminus1) where 1 mg Lminus1 CaCO3 =1998 μeq Lminus134
THINCARB was applied to the high-frequency sonde datafrom Carver Specific conductance was used as a surrogate foralkalinity using the regression relationship between AlkGranand specific conductance (κ) measured across the Big Creekwatershed including the spring and Mt Judea Left Fork andCarver stream sites AlkGran = 865 (plusmn028) times κ minus 644 (plusmn66)R2 = 095 n = 270 P lt 0001 (numbers in parenthesesrepresent twice the standard error) By applying this regressionequation to the hourly κ series an hourly alkalinity record wasderived which was then used alongside the hourly pH andwater-temperature data to calculate a high-frequency DIC andEpCO2 series25 Mass-Balance Calculation of Baseflow Nitrate
Fluxes Instream Losses and Net Nitrification andDenitrification Daily mass-balance calculations were under-taken for eight quiescent low-flow periods (each typically of1minus2 weeks) USGS stream-velocity readings from Carverranged from 0457 and 122 m sminus1 and with a stream distancealong the experimental reach of 652 km the travel timesranged from 396 to 148 h Therefore daily mass balances
over a 24-h period were assumed sufficient to account fortransit of NO3
minus given (a) the relatively short travel times (b)the high degree of stationarity in flux transfers during quiescentbaseflow conditions and (c) that calculated daily massbalances were averaged over a 1minus2 week periodThe 15 min NO3
minus measurements at Mt Judea and Carverwere converted to daily means and daily nitrate loads at eachsite were calculated using the corresponding gauged dailystreamflow data To account for flow accretion along the reachthe difference between the daily flow downstream at Carverand the upstream site at Mt Judea was calculated The increasein flows was assumed to be input from Left Fork (Figure 1)Daily NO3
minus input loading to the reach (LT) was calculatedas the sum of the daily NO3
minus loads from Mt Judea (LMJ) andLeft Fork (LLF)
L L LT MJ LF= + (2)
There was no high-resolution NO3minus monitoring on Left
Fork so weekly NO3minus measurements from grab samples taken
at Left Fork were combined with the measured daily flowaccretion to derive daily loads from Left Fork (S181) Asensitivity analysis evaluated the potential effects of under- oroverestimating Left Fork NO3
minus concentrations by plusmn50(Tables SI1 and SI2)Within this karst watershed some of the flow accretion will
arise from direct groundwater input into Big Creek Dischargedata were not available from the Left Fork tributary and directapportionment of contributions from Left Fork and ground-water was not possible We therefore evaluated a secondalternative ldquoendmemberrdquo case scenario whereby all of flow
Figure 2 Time series at the downstream monitoring site (Carver) from May 2014 to May 2017 showing (a) nitrate (NO3minusN) dissolvedinorganic carbon (DIC) and streamflow and (b) daily average gross primary production (GPP) ecosystem respiration (ER) and streamflow
Environmental Science amp Technology Article
DOI 101021acsest8b03074Environ Sci Technol 2018 52 13708minus13717
13710
accretion was attributed to direct groundwater contribution(S182)The daily instream NO3
minus load removal (LR) along the reachwas calculated as the difference between the daily input NO3
minus
loading (LT) and the daily NO3minus load at Carver (LC)
L L LR T C= minus (3)
To allow direct comparison with rates of assimilatory NO3minus
uptake by photosynthesis LR (kg-N dminus1) was then convertedto a daily NO3
minus removal rate UT (mg-N Lminus1 dminus1) UTincorporates both assimilatory NO3
minus uptake by photo-autotrophs (UA) heterotrophic NO3
minus removal through directuptake and denitrification (UD) and NO3
minus enrichment due toremineralization via nitrification (R)20
U U U RT A D= + minus (4)
UA was estimated from the GPPav measurements1235 GPPavdata were converted into net primary production (NPP)assuming that autotrophic respiration consumed 50 of theGPPav
3637 NPP data were then converted from units of O2uptake (mg-O2 L
minus1 dminus1) to C uptake (mg-C Lminus1 dminus1) with aphotosynthetic quotient of 100 then converted to NO3
minus
uptake (mg-N Lminus1 dminus1) using a molar ratio of CN of 1238
Subtracting UT from UA provides a measure of either netnitrification (positive values) or net heterotrophic NO3
minus
removal through direct uptake and denitrification hereafterreferred to as ldquonet denitrificationrdquo (negative values) When theriver was influent loss of NO3
minus to groundwater was accountedfor as described in S183
3 RESULTS AND DISCUSSION31 Three-Year Time Series of Nitrate Dissolved
Inorganic Carbon and Stream Metabolism The hourlyNO3
minus and DIC concentrations variations at Carver were drivenby streamflow but in opposing directions (Figure 2a) Themean and median NO3
minus concentrations were 0128 and 0093
mg-N Lminus1 respectively Nitrate concentrations at Carver werelowest during baseflow (mean 0043 mg-N Lminus1 lowest 10 offlows) and highest during storm runoff (mean 0278 mg-N Lminus1highest 10 of flows) arising from nonpoint-sourcemobilization and delivery of NO3
minus during rainfall eventsThe mean and median DIC concentrations were 248 and
252 mg-C Lminus1 respectively DIC concentrations were highestduring baseflow (mean 317 mg-C Lminus1) with DIC concen-trations diluted by storm runoff (mean 132 mg-C Lminus1)Highest DIC and lowest NO3
minus concentrations occurred duringthe extended low-flows between August and November 2015The mean and median molar CN ratios were 356 and 305
respectively The mean CN ratio during baseflow was 882 and82 during stormflow CN ratios greater than sim66 areindicative of stoichiometric depletion of N relative to C39
Absolute NO3minus concentrations below sim01 mg-N Lminus1 are
deemed likely to be limiting to algae with algal growthresponse to NO3
minus enrichment occurring between 038 to 179mg-N Lminus140 Therefore under average and baseflow conditionsat Carver a clear potential exists for algal growth to be limitedby low NO3
minus availabilityNo longer-term trends in either NO3
minus or DIC wereobserved over the three years These high-frequencymonitoring results are consistent with results from near-weeklywater-quality monitoring of Big Creek at Mt Judea whichshowed no statistically significant increasing or decreasingtrends in dissolved or particulate forms of P and Nconcentrations since 201341
Earlier studies6 have shown that Ozark streams can be veryeffective at retaining available nutrients and buffering addi-tional nutrient inputs Therefore the absence of any increasingtrend in nutrients in the water column may result from therapid and efficient uptake of nutrient inputs by stream biotaConsequently high-resolution stream metabolism and nutrientmeasurements were used here to detect whether increasedphotosynthesis or respiration rates resulted from increased
Figure 3 Scatter plot showing the relations between mean daily nitrate concentrations upstream at Mt Judea and downstream at Carver
Environmental Science amp Technology Article
DOI 101021acsest8b03074Environ Sci Technol 2018 52 13708minus13717
13711
nutrient assimilation even where no increases in water-columnnutrient concentrations could be observed
The time series in daily rates of GPPav and ERav at Carver(Figure 2b) showed no definitive long-term trends between
Figure 4 Time series from 1 November 2014 to 1 November 2015 showing (a) Nitrate concentrations upstream at Mt Judea and downstream atCarver and the lower-flow time periods used for mass balance calculation and evaluation of biogeochemical processes (b) streamflow at Carverand the percentage groundwater contribution to streamflow (c) daily ratio of gross primary production ecosystem respiration (GPPER)downstream at Carver (horizontal dashed line shows GPPER of 1 ie balance between heterotrophy and autotrophy) and excess partial pressureof carbon dioxide (EpCO2) and (d) streamflow and the molar CN ratio (DIC dissolved inorganic carbonNO3minusN) downstream at Carver
Environmental Science amp Technology Article
DOI 101021acsest8b03074Environ Sci Technol 2018 52 13708minus13717
13712
2014 and 2017 GPPav declined rapidly in response to majorstorm runoff events but typically recovered within a couple ofweeks Highest GPPav tended to occur during quiescentbaseflow or recessional streamflow conditions during thesummer (May through August) Both GPPav and ERav declinedduring the autumn (September through December) reflectingreductions in stream biological activity and GPPav tended todecline at a faster rate than ER This was particularly apparentduring the extended low-flows between August and December2015 suggesting a decline in primary production relative tomicrobial activity and a transition from net autotrophic to netheterotrophic stream communities During winter baseflows(November through January) ERav tended to exceed GPPavDuring the 3-yr monitoring no CAFO-related impacts oneither stream nutrient concentrations or metabolism arediscernible at Carver32 Temporal and Spatial Variability in NO3
minus
Concentrations Relative to Other Key EnvironmentalVariables Mean daily NO3
minus concentrations varied betweenbaseflow and storm events at Mt Judea and Carver during theone year of overlapping data (Figure 3) There was a cleardifferentiation between a higher-flow period characterized byregular storm events from mid-December 2014 to mid-July2015 and lower-flow conditions from August to NovemberDecember 2015 (Figures 3 and 4)During the higher-flow period a positive correlation existed
between upstream (Mt Judea) and downstream (Carver)NO3
minus with a ratio approaching 1 (Figure 3) During this high-flow period NO3
minus concentrations at both upstream anddownstream sites ranged between sim01 and sim04 mg-N Lminus1Time series data show close convergence between upstreamand downstream NO3
minus concentrations during storm-eventpeak concentrations (Figure 4ab)Under lower-flow conditions NO3
minus concentrations wereconsistently higher upstream than downstream (Figure 3) Theincrease in NO3
minus concentrations at the upstream site duringthe summer and autumn 2015 corresponds with reductions inflow This is typical of the longer-term hydrologically drivencycles in NO3
minus concentrations observed at the upstream sitereflecting a strong flow dependency with highest concen-trations under the lowest flows and dilution with increasingflow (Figure SI1abc) The strong increase in NO3
minus
concentrations during July to November 2015 thereforereflects hydrological controls and is consistent with fallingflows The high NO3
minus concentrations in autumn 2015subsequently declined with the onset of higher flows (FigureSI1ab)
The gap in NO3minus concentrations between upstream and
downstream sites widened with decreasing flow particularlyduring the protracted low-flows between mid-July andNovember 2015 During this time minimal soil watercontributed to streamflow and almost all (gt95) ofstreamflow was derived from groundwater (Figure 4ab) Bythe end of October 2015 upstream NO3
minus concentrationsreached sim075 mg-N Lminus1 whereas downstream NO3
minus
concentrations were sim005 mg-N Lminus1 Between July andNovember 2015 downstream NO3
minus concentrations exhibiteda much lower range (sim005 to sim015 mg-N Lminus1) as comparedwith upstream (sim01 to sim08 mg-N Lminus1) (Figure 3) Thisreduction in both magnitude and range of downstream NO3
minus
concentrations under baseflow conditions could arise eitherfrom dilution of NO3
minus as a result of downstream accretion ofwater sources with much lower NO3
minus concentrations or byremoval of NO3
minus through biogeochemical processes neces-sitating a mass-balance evaluation (see section 33)The widening gap in NO3
minus concentrations betweenupstream and downstream sites after mid-July 2015 corre-sponded with a decline in GPPER which fell below 1indicating a change to net heterotrophy (Figure 4c) Duringthe low-flow period from mid-July to November 2015 BigCreek was heterotrophic for sim90 of days Daily streamwaterEpCO2 doubled between mid-July and November 2015 from45 to 91 times atmospheric pressure independentlyconfirming an increase in rates of respiration (CO2 release)relative to photosynthesis (CO2 uptake)During the higher-flow period from mid-January to mid-July
Big Creek was predominantly net autotrophic (GPPER gt 1for 52 of days) Net heterotrophic conditions prevailedpredominantly during lower-flow intervals between stormevents with GPPER lt 1 typically during and immediatelyafter storm eventsMolar CN ratios at Carver also increased markedly after
mid-July from sim300 to gt800 (Figure 4d) This stoichiometricdepletion of N along with persistence of low NO3
minus
concentrations below 01 mg-N Lminus1 (falling to lt004 mg-NLminus1) suggests that algal growth may have been limited by lowN availability at Carver over the late summer and autumn of2015
33 Nitrate Reach Mass Balance to Quantify SeasonalNitrate Removal during Baseflow ConditionsMean dailyNO3
minus mass balances for the eight seasonal quiescent baseflowperiods between February and October 2015 are presented inTable 1 Mean daily NO3
minus input loadings to the reach (LT)increased from 173 kg-N dminus1 in February to 617 kg-N dminus1 in
Table 1 Seasonal Patterns in Mean Daily NO3minus Input Loadings (LT) to Big Creek Mean Daily Instream NO3
minus Load Removal(LR) along the 65 km Experimental Reach Under Low-Flow Conditions and Mean Daily NO3
minus Load Removal As aPercentage of NO3
minus Inputs (UE)a
season date rangeNO3
minus input loadingto reach (LT) (kg-N dminus1)
instream NO3minus removal
along reach (LR) (kg-N dminus1)instream NO3
minus removal (LR) as of NO3minus
input loading (LT) (UE)
winter 4minus13 Feb 2015 173 (112) 768 (046) 447 (409)spring 1 5minus12 Apr 2015 441 (635) 190 (282) 439 (953)spring 2 24 Aprminus5 May 2015 379 (153) 169 (385) 476 (893)early summer 2minus10 Jun 2015 492 (236) 241 (854) 512 (534)mid summer 11minus21 Jul 2015 617 (442) 146 (282) 321(141)late summer 7minus16 Aug 2015 756 (122) 557 (059) 742 (466)autumn 1 1minus14 Sept 2015 581 (123) 449 (081) 778 (239)autumn 2 1minus11 Oct 2015 298 (029) 282 (025) 948 (120)aStandard deviations are shown in parentheses
Environmental Science amp Technology Article
DOI 101021acsest8b03074Environ Sci Technol 2018 52 13708minus13717
13713
July then declined rapidly to 756 kg-N dminus1 in August whichalso corresponded with an order of magnitude reduction inbaseflow discharge By October LT had fallen to only 298 kg-N dminus1 Instream NO3
minus removal (LR) followed a similar patternto LT with highest mean daily instream NO3
minus removal duringJune (24 kg-N dminus1) then decreasing during the late summerand autumn and falling to 282 kg-N dminus1 in October Howeverthe efficiency of instream NO3
minus removal (UE ie LR expressedas a percentage of LT) increased markedly during the latesummer and autumn from 32 in July to 74minus95 betweenAugust and OctoberThe fluvial mass balance therefore confirmed that the
observed downstream reductions in NO3minus concentrations
under baseflow were a result of net instream removal of NO3minus
by biogeochemical processes rather than a dilution effectAlthough LT and LR were greatest during the winter to early
summer period UE and the instream NO3minus removal rate (UT)
increased dramatically during the low flows of the late summerand autumn UT increased from le009 mg-N Lminus1 dminus1
(February through July) to gt02 mg-N Lminus1 dminus1 in Augustand September and 066 mg-N Lminus1 dminus1 in October (Table 2)By autumn 2015 gt75 of the NO3
minus inputs were removed bybiogeochemical processes (Table 1)We also assessed the efficiency of NO3
minus removal under thealternative scenario where the increase in flow along theexperimental reach was solely from direct groundwater input(S162) This made relatively little difference to the UE whichalso increased markedly during the late summer and autumnfrom 46 in July to 72minus94 between August and October(Table SI3) The sensitivity analysis (Tables SI1 and SI3)showed that a 50 increase or decrease in either Left Fork or
groundwater NO3minus concentrations made little difference to
these findings a consistent increase in efficiency of NO3minus
removal was observed after July with August to October UEvalues consistently sim70minus95
34 Biogeochemical Controls on Nitrate DeliveryAccounting for Assimilatory Nitrate Uptake to Calcu-late Net Nitrification and Net Denitrification FromFebruary to July assimilatory NO3
minus uptake by photosynthesiz-ing plants (UA) consistently exceeded UT (Table 2) indicatingfirst that assimilation of NO3
minus by photoautotrophs was thedominant process removing NO3
minus from the water column andsecond that assimilation was partially balanced by netnitrification NO3
minus gains In contrast from August to OctoberUT exceeded UA indicating that heterotrophic NO3
minus removalthrough direct uptake and denitrification was removing NO3
minus
along the reach in late summer and autumnTable 3 shows that net nitrification gains to the reach ranged
from 0135 mg-N Lminus1 dminus1 in February to 0273 mg-N Lminus1 dminus1
in AprilMay However after July a pronounced switch fromnet nitrification gains to net denitrification losses occurredDuring late summer and autumn denitrification losses ofNO3
minus increased from sim0100 mg-N Lminus1 dminus1 in August andSeptember to 0592 mg-N Lminus1 dminus1 in October These estimateswere based on using an average periphyton CN molar ratio of12 for USA streams3538 We also evaluated the effects ofusing an average periphyton molar CN ratio of 86 fromresearch in northern European streams17 This increased UAvalues by sim39 but did not alter our findings of a switchbetween net nitrification between February and July to netdenitrification from August to October By changing the CNstoichiometry from 12 to 86 net nitrification ranged from
Table 2 Seasonal Patterns in Mean Daily NO3minus Removal Rate (UT) along the 65 km Experimental Reach of Big Creek Under
Low-Flow Conditions And Mean Daily Assimilatory Uptake of NO3minus by Photoautotrophs (UA)
a
season date range instream NO3minus removal rate (UT) (mg-N Lminus1 dminus1) assimilatory NO3
minus uptake (UA) (mg-N Lminus1 dminus1)
winter 4minus13 Feb 2015 0077 (0006) 0212 (0035)spring 1 5minus12 Apr 2015 0072 (0017) 0256 (0050)spring 2 24 Aprminus5 May 2015 0082 (0018) 0355 (0067)early summer 2minus10 Jun 2015 0090 (0014) 0269 (0045)mid summer 11minus21 Jul 2015 0066 (0030) 0259 (0040)late summer 7minus16 Aug 2015 0284 (0026) 0180 (0016)autumn 1 1minus14 Sept 2015 0229 (0019) 0115 (0038)autumn 2 1minus11 Oct 2015 0656 (0029) 0076 (0028)
aStandard deviations are shown in parentheses
Table 3 Seasonal Patterns in Mean Daily NO3minus Concentration Gains by Net Nitrification (+) and Losses by Net
Denitrification (minus) long the Experimental Reach of Big Creek under Low-Flow Conditions Mean Daily Values of the Ratiobetween Gross Primary Production and Ecosystem Respiration (GPPER) Excess Partial Pressure of Carbon Dioxide(EpCO2) Dissolved Oxygen (DO) Streamflow and the Percentage of Groundwater Contribution to Streamflowa
season date rangenet nitrification (+) or denitrification (minus)
(mg-N Lminus1 dminus1) GPPEREpCO2
(times atm press)DO
(mg-O2 Lminus1) flow (m3 sminus1) groundwater
winter 4minus13 Feb 2015 +0135 (0032) 114 (009) 280 (020) 119 (049) 115 (007) 665 (134)spring 1 5minus12 Apr 2015 +0184 (0039) 106 (013) 364 (020) 102 (033) 310 (037) 586 (238)spring 2 24 Apr -5 May
2015+0273 (0058) 125 (016) 381 (059) 103 (050) 261 (116) 617 (579)
early summer 2minus10 Jun 2015 +0179 (0044) 134 (015) 471 (049) 939 (042) 330 (172) 580 (648)mid summer 11minus21 Jul 2015 +0193 (0024) 197 (078) 715 (046) 898 (029) 254 (128) 828 (721)late summer 7minus16 Aug 2015 minus0104 (0032) 078 (005) 106 (083) 695 (035) 023 (004) 988 (098)autumn 1 1minus14 Sept
2015minus0102 (0027) 062 (010) 985 (165) 650 (054) 024 (006) 966 (142)
autumn 2 1minus11 Oct 2015 minus0592 (0015) 057 (023) 817 (150) 785 (064) 004 (0004) 978 (064)aStandard deviations are shown in parentheses
Environmental Science amp Technology Article
DOI 101021acsest8b03074Environ Sci Technol 2018 52 13708minus13717
13714
+0218 mg-N Lminus1 dminus1 in February to +0414 mg-N Lminus1 dminus1 inAprilMay with net denitrification ranging from minus0033 mg-NLminus1 dminus1 in August to minus0562 mg-N Lminus1 dminus1 in OctoberNet nitrification and denitrification rates were compared
with mean daily GPPER EpCO2 streamflow and percentagegroundwater discharge (Table 3) The shift from netnitrification to net denitrification corresponded directly with(1) a change in stream metabolism from net autotrophic(GPPER in July was 197) to net heterotrophic (GPPER fellbelow 1 to 078 in August 062 in September and 057 inOctober) and (2) an increase in EpCO2 and a reduction inDO arising from the increases in microbial respiration relativeto photosynthesisThe alternative scenario where flow accretion between Mt
Judea and Carver was attributed to direct groundwaterdischarge to Big Creek also had no effect on the timing ofthe shift from net nitrification to denitrification (S162 TableSI4) Sensitivity analysis (Tables SI2 and SI4) also showedthat irrespective of a 50 increase or decrease in either LeftFork or groundwater NO3
minus concentrations the sameconsistent switch between net nitrification and net denitrifica-tion was observed after JulyThe consistency in this observed switch between instream
NO3minus production and instream NO3
minus removal and itssynchronicity with measured changes in stream metabolismprovides compelling evidence that the marked change ininstream NO3
minus processing and delivery after July was linked tochanges in stream metabolism from net autotrophy to netheterotrophyThe karst streams of the Ozarks are characterized by a large
hyporheic zone4243 a hotspot of nitrogen transformation44
Water residence times and redox conditions provide a keycontrol on changes between NO3
minus removal and NO3minus
production with hyporheic zone sediments45minus48 In BigCreek the winter to midsummer period was characterized byhigher baseflows (at least an order of magnitude greater thanlate summerautumn baseflows) and net autotrophy resultingin higher instream DO concentrations Rapid movement ofwell-oxygenated water throughout the water column and intothe hyporheic zone promotes aerobic metabolism of organicmatter and release of NO3
minus through nitrification4649 Fromwinter to midsummer net nitrification was observed in BigCreek and nitrification in the hyporheic zone may have beenresponsible for buffering the effects of photosyntheticassimilatory uptake of NO3
minusUnder the more sluggish flow conditions during late summer
and autumn available oxygen is depleted as a result ofincreased heterotrophic activity The reduced movement ofwater and oxygen through the hyporheic zone favors a shift torespiratory pathways with denitrification (conversion of nitrateto N2O andor N2 gas)
5051 Unlike assimilation of NO3minus into
plant biomass which retains N temporarily denitrificationresults in a permanent loss of bioavailable N The lowbaseflows of late summer and autumn 2015 resulted in higherwater residence times and a greater proportion of flow movingthrough the hyporheic zone This provides greater exposureand water contact time with microbial biofilms wheredenitrification occurs51 The death and breakdown of biomassduring the late summer and autumn contribute to theavailability of organic matter for microbial decompositionpromoting higher rates of microbial respiration relative tophotosynthesis losses of DO and greater availability of organiccarbon as a resource for denitrifying bacteria455253
Denitrification within the hyporheic zone may therefore beresponsible for losses of NO3
minus in Big Creek during the latesummer and autumn Although denitrification can also occuron suspended sediments within the water column5455 this islikely to be a second order effect under baseflow conditions ina groundwater-fed stream where suspended solids concen-trations are low (typically lt5 mg Lminus1)Under baseflow conditions instream assimilatory NO3
minus
uptake by photosynthesizing plants and hyporheic-zonedenitrification along the experimental reach removed betweensim30 and sim90 of the NO3
minus input load During the period ofmonitoring (spring 2014 to spring 2017) NO3
minus loading to theupstream section of Big Creek (at Mt Judea) was attenuated byinstream processing such that no CAFO-related impacts oneither stream nutrient concentrations or metabolism werediscernible at the downstream location (Carver) and thus tothe Buffalo River Future monitoring will be needed to detectwhether long-term changes in nutrients and organic carboninputs may occur whether this stimulates higher rates ofheterotrophic andor autotrophic activity and any longer-termeffects on the capacity of assimilation and denitrificationprocesses to remove and buffer any increase in nutrientloadingsThe novelty of this research is the combination of
continuous high-frequency in situ stream metabolism andnitrate measurements to apportion the net effects ofassimilation nitrification and denitrification on changes inbaseflow nitrate fluxes at the river-reach to watershed scale Inthis case we found that during winter to midsummer periodsNO3
minus uptake in Big Creek was dominated by assimilation byphotoautotrophs which was partially compensated by releaseof NO3
minus from nitrification In late summer the predominantmetabolic pathway switched to net heterotrophy andheterotrophic NO3
minus removal through direct uptake anddenitrification became the dominant process of nitrateremoval Removal of NO3
minus by assimilation and denitrificationprovides an important ldquoself-cleansingrdquo ecosystem serviceresulting in a pronounced shift in CN stoichiometry anddecreasing NO3
minus concentrations to low levels which would beexpected to limit algal growth56
This approach provides a means of scaling up frommicroscale and mesoscale process experiments and measure-ments which are by necessity short-term and localized toexplore how river nitrate delivery responds to shifts in streammetabolism from day-to-day and seasonal to interannualvariability This research and the methods presented here areapplicable along the river continuum from headwaters tolarge-scale fluvial systems (with large spatial and temporalvariability in nutrient fluxes) and offer a valuable way forwardin quantifying net process controls on the fate and transport ofnitrogen in fluvial systems
ASSOCIATED CONTENT
S Supporting InformationThe Supporting Information is available free of charge on theACS Publications website at DOI 101021acsest8b03074
S1 Methods Land use and cover data site hydro-geology high-frequency water-quality monitoringstreamflow measurement hydrograph separation anal-ysis of diurnal dissolved oxygen curves to calculateprimary production and respiration calculation of DICand EpCO2 nitrate mass-balance calculations and S2
Environmental Science amp Technology Article
DOI 101021acsest8b03074Environ Sci Technol 2018 52 13708minus13717
13715
Results Figure SI1 time series of nitrate and flow andnitrate plotted against stream flow for Mt Judea TablesSI1 and SI2 sensitivity analysis based on estimates ofNO3
minus load inputs from Left Fork Tables SI3 and SI4alternative scenario sensitivity analysis based onestimates of NO3
minus load inputs from groundwater andadditional references (PDF)
AUTHOR INFORMATIONCorresponding AuthorE-mail hpjcehacukORCIDHelen P Jarvie 0000-0002-4984-1607Phillip D Hays 0000-0001-5491-9272NotesThe authors declare no competing financial interest
ACKNOWLEDGMENTSHPJ and RJW were supported by NERC NationalCapability projects NEC05966 and NEC04879 Funding forthe Big Creek Research and Extension monitoring wasprovided by the Arkansas Governorrsquos Office and StateLegislature to the University of Arkansas Systemrsquos Divisionof Agriculture Hydrological and chemical monitoring by theUSGS were supported by a National Park ServiceUSGSWater Quality Partnership Grant administered by the USGSAny use of trade firm or product names is for descriptivepurposes only and does not imply endorsement by the USGovernment
REFERENCES(1) Smith V H Eutrophication of freshwater and coastal marineecosystems - A global problem Environ Sci Pollut Res 2003 10 (2)126minus139(2) Dodds W K Bouska W W Eitzmann J L Pilger T J PittsK L Riley A J Schloesser J T Thornbrugh D J Eutrophicationof US Freshwaters Analysis of Potential Economic Damages EnvironSci Technol 2009 43 (1) 12minus19(3) Dodds W K Smith V H Nitrogen phosphorus andeutrophication in streams Inland Waters 2016 6 (2) 155minus164(4) Peterson B J Wollheim W M Mulholland P J Webster JR Meyer J L Tank J L Marti E Bowden W B Valett H MHershey A E McDowell W H Dodds W K Hamilton S KGregory S Morrall D D Control of nitrogen export fromwatersheds by headwater streams Science 2001 292 (5514) 86minus90(5) Alexander R B Boyer E W Smith R A Schwarz G EMoore R B The role of headwater streams in downstream waterquality J Am Water Resour Assoc 2007 43 (1) 41minus59(6) Jarvie H P Sharpley A N Scott J T Haggard B E BowesM J Massey L B Within-River Phosphorus Retention Accountingfor a Missing Piece in the Watershed Phosphorus Puzzle Environ SciTechnol 2012 46 (24) 13284minus13292(7) Mulholland P J Helton A M Poole G C Hall R OHamilton S K Peterson B J Tank J L Ashkenas L R CooperL W Dahm C N Dodds W K Findlay S E G Gregory S VGrimm N B Johnson S L McDowell W H Meyer J L ValettH M Webster J R Arango C P Beaulieu J J Bernot M JBurgin A J Crenshaw C L Johnson L T Niederlehner B ROrsquoBrien J M Potter J D Sheibley R W Sobota D J Thomas SM Stream denitrification across biomes and its response toanthropogenic nitrate loading Nature 2008 452 (7184) 202minusU46(8) Mulholland P J Valett H M Webster J R Thomas S ACooper L W Hamilton S K Peterson B J Stream denitrificationand total nitrate uptake rates measured using a field N-15 traceraddition approach Limnol Oceanogr 2004 49 (3) 809minus820
(9) Tank J L Marti E Riis T von Schiller D Reisinger A JDodds W K Whiles M R Ashkenas L R Bowden W BCollins S M Crenshaw C L Crowl T A Griffiths N A GrimmN B Hamilton S K Johnson S L McDowell W H Norman BM Rosi E J Simon K S Thomas S A Webster J R Partitioningassimilatory nitrogen uptake in streams an analysis of stable isotopetracer additions across continents Ecol Monogr 2018 88 (1) 120minus138(10) Tank J L Meyer J L Sanzone D M Mulholland P JWebster J R Peterson B J Wollheim W M Leonard N EAnalysis of nitrogen cycling in a forest stream during autumn using aN-15-tracer addition Limnol Oceanogr 2000 45 (5) 1013minus1029(11) Ensign S H Doyle M W Nutrient spiraling in streams andriver networks Journal of Geophysical Research-Biogeosciences 2006111 (G4) G04009(12) Rode M Halbedel nee Angelstein S Anis M R BorchardtD Weitere M Continuous in-stream assimilatory nitrate uptakefrom high frequency sensor measurements Environ Sci Technol2016 50 (11) 5685minus5694(13) Bowes M J Jarvie H P Halliday S J Skeffington R AWade A J Loewenthal M Gozzard E Newman J R Palmer-Felgate E J Characterising phosphorus and nitrate inputs to a ruralriver using high-frequency concentration-flow relationships Sci TotalEnviron 2015 511 608minus620(14) Halliday S J Skeffington R A Wade A J Bowes M JGozzard E Newman J R Loewenthal M Palmer-Felgate E JJarvie H P High-frequency water quality monitoring in an urbancatchment hydrochemical dynamics primary production andimplications for the Water Framework Directive HydrologicalProcesses 2015 29 (15) 3388minus3407(15) Halliday S J Skeffington R A Wade A J Bowes M JRead D S Jarvie H P Loewenthal M Riparian shading controlsinstream spring phytoplankton and benthic algal growth Environ-mental Science-Processes amp Impacts 2016 18 (6) 677minus689(16) Wade A J Palmer-Felgate E J Halliday S J Skeffington RA Loewenthal M Jarvie H P Bowes M J Greenway G MHaswell S J Bell I M Joly E Fallatah A Neal C Williams RJ Gozzard E Newman J R Hydrochemical processes in lowlandrivers insights from in situ high-resolution monitoring Hydrol EarthSyst Sci 2012 16 (11) 4323minus4342(17) Rode M Wade A J Cohen M J Hensley R T Bowes MJ Kirchner J W Arhonditsis G B Jordan P Kronvang BHalliday S J Skeffington R A Rozemeijer J C Aubert A HRinke K Jomaa S Sensors in the stream The High-frequency waveof the present Environ Sci Technol 2016 50 (19) 10297minus10307(18) Cohen M J Kurz M J Heffernan J B Martin J BDouglass R L Foster C R Thomas R G Diel phosphorusvariation and the stoichiometry of ecosystem metabolism in a largespring-fed river Ecol Monogr 2013 83 (2) 155minus176(19) Hensley R T Cohen M J On the emergence of diel solutesignals in flowing waters Water Resour Res 2016 52 (2) 759minus772(20) Hensley R T Cohen M J Korhnak L V Inferring nitrogenremoval in large rivers from high-resolution longitudinal profilingLimnol Oceanogr 2014 59 (4) 1152minus1170(21) Kunz J V Hensley R Brase L Borchardt D Rode MHigh frequency measurements of reach scale nitrogen uptake in afourth order river with contrasting hydromorphology and variablewater chemistry (Weisse Elster Germany) Water Resour Res 201753 (1) 328minus343(22) Kraus T E C OrsquoDonnell K Downing B D Burau J RBergamaschi B A Using paired in situ high frequency nitratemeasurements to better understand controls on nitrate concentrationsand estimate nitrification rates in a wastewater-impacted river WaterResour Res 2017 53 (10) 8423minus8442(23) Jones C Kim S W Schilling K Use of continuousmonitoring to assess stream nitrate flux and transformation patternsEnviron Monit Assess 2017 189 35(24) Wollheim W M Mulukutla G K Cook C Carey R OAquatic nitrate retention at river network scales across flow conditions
Environmental Science amp Technology Article
DOI 101021acsest8b03074Environ Sci Technol 2018 52 13708minus13717
13716
determined using nested in situ sensors Water Resour Res 2017 53(11) 9740minus9756(25) Jarvie H P Sharpley A N Brahana V Simmons T PriceA Neal C Lawlor A J Sleep D Thacker S Haggard B EPhosphorus retention and remobilization along hydrological pathwaysin karst terrain Environ Sci Technol 2014 48 (9) 4860minus4868(26) American Public Health Association (APHA) AlkalinityTitration Method 2320 B In Standard Methods for the Examinationof Water and Wastewater 23rd ed 1987 ISBN 978minus0-87553minus287minus5(27) Rantz S E Measurement and computation of streamflow Vol1 Measurement of stage and discharge In US Geological SurveyWater Supply Paper 2175 1982(28) Jarvie H P Neal C Smart R Owen R Fraser D ForbesI Wade A Use of continuous water quality records for hydrographseparation and to assess short-term variability and extremes in acidityand dissolved carbon dioxide for the River Dee Scotland Sci TotalEnviron 2001 265 (1minus3) 85minus98(29) OrsquoConnor D J Ditoro D M Photosynthesis and oxygenbalance in streams Journal of the Sanitary Engineering DivisionProceedings of the American Society of Civil Engineers 1970 96 (2)547minus571(30) Williams R J White C Harrow M L Neal C Temporaland small-scale spatial variations of dissolved oxygen in the RiversThames Pang and Kennet UK Sci Total Environ 2000 251 497minus510(31) Chapra S C Ditoro D M Delta method for estimatingprimary production respiration and reaeration in streams J EnvironEng 1991 117 (5) 640minus655(32) Bernhardt E S Heffernan J B Grimm N B Stanley E HHarvey J W Arroita M Appling A P Cohen M J McDowellW H Hall R O Read J S Roberts B J Stets E G Yackulic CB The metabolic regimes of flowing waters Limnol Oceanogr 201863 S99minusS118(33) Odum H T Primary production in flowing waters LimnolOceanogr 1956 1 102minus117(34) Jarvie H P King S M Neal C Inorganic carbon dominatestotal dissolved carbon concentrations and fluxes in British riversApplication of the THINCARB model - Thermodynamic modellingof inorganic carbon in freshwaters Sci Total Environ 2017 575 496minus512(35) King S A Heffernan J B Cohen M J Nutrient flux uptakeand autotrophic limitation in streams and rivers Freshwater Science2014 33 (1) 85minus98(36) Hall R O Tank J L Ecosystem metabolism controls nitrogenuptake in streams in Grand Teton National Park Wyoming LimnolOceanogr 2003 48 (3) 1120minus1128(37) Hall R O Beaulieu J J Estimating autotrophic respiration instreams using daily metabolism data Freshwater Science 2013 32 (2)507minus516(38) Stelzer R S Lamberti G A Effects of N P ratio and totalnutrient concentration on stream periphyton community structurebiomass and elemental composition Limnol Oceanogr 2001 46 (2)356minus367(39) Redfield A C The biological control of chemical factors in theenvironment American Scientist 1958 46 (3) 205minus221(40) Evans-White M A Haggard B E Scott J T A Review ofstream nutrient criteria development in the United States Journal ofEnvironmental Quality 2013 42 (4) 1002minus1014(41) Sharpley A N Haggard B E Berry L Brye K Burke JDaniels M B Gbur E Glover T Hays P Kresse TVanDevender K W Nutrient concentrations in Big Creek correlateto regional watershed land use Agricultural amp Environmental Letters2017 2 170027(42) Miller R B Heeren D M Fox G A Halihan T Storm DE Mittelstet A R The hydraulic conductivity structure of gravel-dominated vadose zones within alluvial floodplains J Hydrol 2014513 229minus240(43) Miller R B Heeren D M Fox G A Halihan T Storm DE Heterogeneity influences on stream water-groundwater interactions
in a gravel-dominated floodplain Hydrol Sci J 2016 61 (4) 741minus750(44) Triska F J Duff J H Avanzino R J The role of waterexchange between a stream and its hyporheic zone in nitrogen cyclingat the terrestrial aquatic interface Hydrobiologia 1993 251 (1minus3)167minus184(45) Zarnetske J P Haggerty R Wondzell S M Baker M ALabile dissolved organic carbon supply limits hyporheic denitrifica-tion J Geophys Res 2011 116 G04036(46) Zarnetske J P Haggerty R Wondzell S M Bokil V AGonzalez-Pinzon R Coupled transport and reaction kinetics controlthe nitrate source-sink function of hyporheic zones Water Resour Res2012 48 W11508(47) Harvey J W Bohlke J K Voytek M A Scott D TobiasC R Hyporheic zone denitrification Controls on effective reactiondepth and contribution to whole-stream mass balance Water ResourRes 2013 49 (10) 6298minus6316(48) Moatar F Abbott B W Minaudo C Curie F Pinay GElemental properties hydrology and biology interact to shapeconcentration discharge curves for carbon nutrients sediment andmajor ions Water Resour Res 2017 53 (2) 1270minus1287(49) Zarnetske J P Haggerty R Wondzell S M Baker M ADynamics of nitrate production and removal as a function ofresidence time in the hyporheic zone J Geophys Res 2011 116G01025(50) Zarnetske J P Haggerty R Wondzell S M Couplingmultiscale observations to evaluate hyporheic nitrate removal at thereach scale Freshwater Science 2015 34 (1) 172minus186(51) Palmer-Felgate E J Mortimer R J G Krom M D JarvieH P Impact of point-source pollution on phosphorus and nitrogencycling in stream-bed sediments Environ Sci Technol 2010 44 (3)908minus914(52) Aubert A H Breuer L New seasonal shift in in-streamdiurnal nitrate cycles identified by mining high-frequency data PLoSOne 2016 11 (4) e0153138(53) Dodds W K Marti E Tank J L Pontius J Hamilton SK Grimm N B Bowden W B McDowell W H Peterson B JValett H M Webster J R Gregory S Carbon and nitrogenstoichiometry and nitrogen cycling rates in streams Oecologia 2004140 (3) 458minus467(54) Liu T Xia X H Liu S D Mou X L Qiu Y WAcceleration of Denitrification in Turbid Rivers Due to DenitrificationOccurring on Suspended Sediment in Oxic Waters Environ SciTechnol 2013 47 (9) 4053minus4061(55) Xia X H Jia Z M Liu T Zhang S B Zhang L WCoupled Nitrification-Denitrification Caused by Suspended Sediment(SPS) in Rivers Importance of SPS Size and Composition EnvironSci Technol 2017 51 (1) 212minus221(56) Jarvie H P Smith D R Norton L R Edwards F BowesM J King S M Scarlett P Davies S Dils R Bachiller-Jareno NPhosphorus and Nitrogen Limitation and Impairment of HeadwaterStreams Relative to Rivers in Great Britain A National Perspective onEutrophication Sci Total Environ 2018 621 849minus862
Environmental Science amp Technology Article
DOI 101021acsest8b03074Environ Sci Technol 2018 52 13708minus13717
13717
1
E COLI IN FLOWING WATERS
Mary Savin and BCRET members
I Why is Escherichia coli (E coli) being monitored What is the concern
Fecal pollution (from excrement of humans or animals) in the environment is of concern for many reasons not least of which is human health risks and disease control Other concerns related to fecal pollution of our natural waters include potential changes in the nutrient status of water introduction of antibiotic resistance and chemical contaminants changes in the ecological condition of waters and degradation of natural resources on which rural economies depend
People are concerned that the land application of swine effluent (pig excrement) will increase Escherichia coli in Big Creek and consequently the Buffalo River the first National Scenic River in the US This document aims to provide better understanding of
1) what is involved in E coli monitoring 2) what the numbers mean 3) some limitations in interpreting values and 4) provide a context for further research that may be needed to better interpret the E coli
numbers being measured in flowing waters such as Big Creek and Buffalo River
II What is E coli Why and how is it used as an indicator
E coli is a species of bacteria from the coliform group - bacteria that are rod-shaped gram negative non-spore forming facultative anaerobes commonly found in the feces of humans and warm blooded animals E coli occurs in human intestines - many strains with no ill effects although certain E coli cause serious human illnesses Thus while many E coli do not harm us there are important variants that do There are also other species of bacteria viruses and other small organisms that cause disease which if present in fecal sources polluting our waters can make humans sick Depending on whether E coli survive as long in the environment as these other pathogens E coli may or may not adequately warn us about a disease causing agent in our waters To date E coli is the most reliable test we have although other indicators and tests are being investigated E coli cannot be seen in streams by the human eye Thus it is important to determine if there is a problem of elevated E coli numbers by careful water sampling and using US Environmental Protection Agency (EPA) standardized methods E coli is counted in water because of the extensive studies and relationships established between the presence of E coli and the number of human illnesses occurring from contact with the water (eg swimming) containing the bacteria From these relationships there have been upper limits established for bacterial numbers that correspond to the acceptable risk of people getting sick from exposure to water containing them Water quality standards for E coli are established by the state in Arkansas Department of Environmental Quality (ADEQ) Regulation 2 (see Table 1) The E coli numbers must remain below a threshold in a specified number of total samples collected The exact upper limit that is allowed depends on the designation of the waterbody and time of year (primary or secondary contact season) Primary
2
Table 1 Upper limits for Escherichia coli counts defined in Regulation 2 of the Arkansas Department of
Environmental Quality (ADEQ) as specified by contact season and waterbody designation for both single samples and geometric mean
Contact season Water designation Limit of E coli (MPN100mL)
Single sample1
Geometric mean2
Primary (May 1-Sept 30)
Extraordinary Resource Water Ecologically Sensitive Waterbody
Natural amp Scenic Waterway Lakes
Reservoirs
298 126
All other water 410 NA3
Secondary (Oct 1-April 30)
Extraordinary Resource Water Ecologically Sensitive Waterbody
Natural amp Scenic Waterway Lakes
Reservoirs
1490 630
All other water 2050 NA 1 No more than 25 of samples from no less than 8 samples per contact season may exceed the limit 2Geometric mean is calculated from at least 5 samples collected within 30 days at evenly spaced time intervals during that 30-day period 3Not applicable
contact recreation is a designation given to a waterbody where full body contact occurs and occurs from May 1 through September 30 The ADEQ also designates any stream with a watershed (eg drainage basin in the landscape) exceeding 10 square miles and those with smaller watersheds on individual cases (ie after site verification) for primary contact recreation Secondary contact recreation designates waterbodies where activities such as boating fishing and wading take place and occurs from October 1 through April 30
E coli is measured in samples of water collected strictly following EPA guidelines The measurement of E coli starts within 8 hours of collection This method provides an estimate of E coli presence in the sampled water that is the most probable number (MPN) of E coli Using an EPA method provides numbers that are theoretically comparable to other labs using the same method The MPN depends on growing bacteria in the laboratory in ldquoculturerdquo and is an approach used routinely in microbiology This measurement is subject to high variability because of the nature of environmental bacteria thus variability in the data in E coli counts from streams is not unusual For this reason it is important to establish background levels of E coli in any water resulting from various wildlife human (eg septic tanks sewers) and agricultural (eg pig chicken cattle) sources
3
E coli thresholds are lower in late spring through summer (primary contact season) when more people are expected to be in contact with streams and lakes More stringent limits also apply to Extraordinary Resource Waters (eg Buffalo River) Ecologically Sensitive Waterbodies and Natural Scenic Waterways During the primary contact season (May 1- Sept 30) we do not want E coli to exceed 298 MPN100 mL and during secondary contact season (Oct 1 ndash Apr 30) E coli counts should not exceed 1490 MPN100 mL in single samples
III How does the E coli measurement ldquofitrdquo into the context of the landscape
While monitoring one bacterial species to assess the biological quality of water may seem simple determining the actual ecological condition of a system is complicated Measurement of E coli is an indicator for potential fecal pollution and potential pathogen problems but by itself does not identify the source(s) of the bacteria
E coli is present in intestines (and feces) and is not supposed to grow in the environment thus the presence and abundance should indicate pollution and be directly related to human and animal sources However because E coli is in many different animals (eg human wildlife agricultural) and because of the different pathways that bacteria may travel throughout the environment before ending up in water where we can measure it the presence of E coli does not identify the source of pollution
IV Why is E coli monitoring important and why is it complicated
There are many of factors that affect whether E coli survives in the environment for how long and whether it moves to other locations E coli is adapted to living in intestines After deposition from an animal cells have to survive rapidly changing environmental conditions (eg temperature and moisture) exposure to harmful UV rays in sunlight outcompete other organisms and avoid predators All these factors make it difficult to estimate how long E coli will survive in lagoon soil and river environments However there is evidence that E coli can persist in soil and sediments
V What are the numbers
E coli is measured weekly in Big Creek upstream and downstream of the CampH Farm Mt Judea Newton County Arkansas Water sample collection for E coli analysis began Sept 12 2013 prior to manure from CampH Farm application to fields either in fields adjacent to or distant from Big Creek Manure application began in 2014 to fields distant from Big Creek and then adjacent to Big Creek in March 2014 So far in the period following manure applications by CampH Farms (Jan 2 through May 19 2014) no trends in E coli with time or between sampling locations are apparent (Table 2) The Table 2 data are detailed in the Big Creek Research and Extension Team Quarterly Reports and demonstrate the week-to-week variability in E coli at upstream and downstream sites The E coli counts are expected to continue to be variable Clearly it is important to quantify the variability in E coli concentrations long-term in order to determine if changes occur as a result of CampH operation
The MPN is expected to increase with increases in flow and the recent installation of a USGS gauge to measure flow will allow for the determination of the relationship between measured flow in
4
the stream and E coli concentrations Because of the dangers during high flows most contact recreation is expected during base flow and thus sampling during base flow may provide more meaningful data
Table 2 Geometric mean of E coli (and range of sample MPN) before (Sept 12 - Dec 17 2013) and after manure applications began on the CampH Farm (Jan 2 - May 19 2014)
CampH location
Before any manure application
After manure application
Sept 12 - Dec 17 2013 Jan 2 - May 19 2014
(MPN100mL)
Upstream 82 (6 ndash 4080) 83 (NDa ndash 921)
Downstream 111 (5 ndash 3500) 39 (ND ndash 1553) aNot detected
Regulation Arkansas Pollution Control and Ecology Commission 01400-002 2014 Regulation Establishing Water Quality Standards for Surface Waters of the State of Arkansas as revised effective March 24 2014 Arkansas Department of Environmental Quality (ADEQ) Available at httpwwwadeqstatearusregsfilesreg02_final_140324pdf Last accessed 20 Aug 2014
Page 1 of 6
Nutrient impairment of surface waters continues despite widespread conservation efforts to reduce losses from urban rural and agricul-tural land uses (Scavia et al 2014) Land use within watersheds influ-
ences the quality and quantity of water in streams draining the landscape As land disturbance increases and use intensifies an increase in stormwater runoff and nutrient inputs that lead to a greater potential for transport to receiving water is generally observed (Dubrovsky et al 2010 Rebich et al 2011) This has led to efforts to identify and quantify nutrient sources within watersheds strategically target and apportion nutrient loss reduction (Reckhow et al 2011)
Many factors influence the relationship between land use in a given water-shed and nutrient transport downstream from that watershed With an increase in percentage of the drainage area in pasture row crop andor urban use a general trend of increasing nutrient concentrations in storm and base flows will manifest (Buck et al 2004 Giovannetti et al 2013 Haggard et al 2003 Migliaccio et al 2007) Thus nutrient concentrations in streams draining for-ested lands tend to be less than in watersheds with considerable anthropogenic land use
For a range of reasons great interest has been expressed in nutrient con-centrations in several streams of the Boston and Ozark Mountains region of northwest Arkansas including the Buffalo National River and its tributaries In particular Big Creek has been the center of attention within the Buffalo National River watershed (BRW) because of a permitted concentrated animal feeding operation (CAFO) The objectives of this letter are to put nutrient con-centrations of Big Creek into the context of the stream nutrient and watershed land use relationship and assess whether stream nutrient concentrations have
Nutrient Concentrations in Big Creek Correlate to Regional Watershed Land Use
A N Sharpley B E Haggard L Berry K Brye J Burke M B Daniels E Gbur T Glover P Hays T Kresse and K W VanDevender
Copyright copy American Society of Agronomy Crop Science Society of America and Soil Science Society of America 5585 Guilford Rd Madison WI 53711 USAThis is an open access article distributed under the terms of the CC BY-NC-ND license (httpcreativecom-monsorglicensesby-nc-nd40) Agric Environ Lett 2170027 (2017) doi102134ael2017080027 Received 16 Aug 2017 Accepted 25 Sep 2017 Corresponding author (sharpleyuarkedu)
Agricultural amp Environmental Letters
Research Letter
Abstract Nutrient concentrations in several streams of the Boston and Ozark Mountains region of Arkansas including the Buffalo National River and its tributaries have garnered tremendous interest In particular Big Creek has been the center of attention within the Buffalo River watershed because of a permitted concentrated animal feeding operation (CAFO) The objectives of this paper were to put nutrient concentrations of Big Creek into the context of the stream nutrient and watershed land-use relationship and develop a framework to evaluate regional land-use impacts on regional water quality Nutrient concentrations in streams draining the Boston and Ozark Mountains region were related to the intensity of watershed land use Concentrations in Big Creek were similar to other watersheds in the ecoregion with similar land use suggesting limited impact of the CAFO on Big Creek at the present time However this does not preclude future impacts and longer-term monitoring continues
AN Sharpley L Berry K Brye J Burke and T Glover Dep of Crop Soil and Environmental Sciences Univ of Arkansas 115 Plant Sciences Building Fayetteville AR 72701 BE Haggard Biological and Agricultural Engineering Univ of Arkansas BENGR201 Fayetteville AR 72701 MB Daniels and KW VanDevender Biological and Agricultural Engineering Cooperative Extension Univ of Arkansas 2301 South University Ave Little Rock AR 72203 E Gbur Agricultural Statistics Laboratory Univ of Arkansas 101 Agricultural Annex Fayetteville AR 72701 P Hays Dep of Geosciences Univ of Arkansas 216 Ozark Hall Fayetteville AR 72701 T Kresse (retired) USGS Arkansas Water Science Center 401 Hardin Rd Little Rock AR 72211
Core Ideas
bull Nutrient concentrations are low at Big Creek relative to expected biological-response thresholds
bull Nutrient concentrations at Big Creek are typical of streams draining watersheds with similar land use
bull Flow-adjusted nutrient concentrations at Big Creek have not increased over the short-term
bull Nutrient concentrations in streams increase as watershed land area in pasture and urban uses increases
Abbreviations BRW Buffalo River watershed CAFO concentrated animal feeding operation LOESS locally weighted regression SRP soluble reactive phosphorus TN total N TP total P UIRW Upper Illinois River watershed UWRW Upper White River watershed
Published online October 26 2017
Page 2 of 6 AGRICULTURAL amp ENVIRONMENTAL LETTERS
changed over the short term (3 yr of monitoring) The goal is to understand if how and why stream nutrient concentra-tions change downstream at Big Creek and whether the per-mitted swine CAFO has influenced water quality during the 3 yr since extensive monitoring began in September 2013
MethodsWater samples have been collected over varying periods
at the outlet of subwatersheds of the BRW Upper Illinois River watershed (UIRW) and Upper White River watershed (UWRW Fig 1) Land use and cover (ie forest pasture and urban) for each subwatershed was obtained from high-resolution (4-m) imagery from the USGS National Elevation Dataset (USGS 2015 Gesch et al 2002) National Land Cover Dataset (USGS 2017b) and National Hydrologic
Dataset (USGS 2017a) In the UWRW Giovannetti et al (2013) monitored 20 sites monthly for 1 yr (June 2005ndashJuly 2006) collecting water samples during base-flow condi-tions In the UIRW Haggard et al (2010) monitored 29 sites monthly during calendar year 2009 also collecting water samples during base-flow conditions
In the BRW the National Park Service in partnership with the Arkansas Department of Environmental Quality periodically collected water samples and measured nutrient concentrations at 20 stream sites from 1985 through 2015 Nitrate-nitrogen (NO3ndashN) total N (TN) soluble reactive phosphorus (SRP) and total P (TP) concentrations were obtained directly from these data Forest pasture and urban land-use areas were determined from 2006 high-resolution (4-m) land usendashland cover imagery
Fig 1 Location of the Big Creek Buffalo River Upper Illinois River and Upper White River watersheds in the Boston Mountains and Ozark Highlands ecoregion Information from USGS Environmental Systems Research Institute (ESRI) and NASA
AGRICULTURAL amp ENVIRONMENTAL LETTERS Page 3 of 6
Big Creek is monitored by the Big Creek Research and Extension Team a partnership between the University of Arkansas Systemrsquos Division of Agriculture and USGS Water samples have been collected upstream and down-stream of the swine CAFO on a near-weekly basis since September 2013 (Fig 1) The water samples were analyzed at an Arkansas Department of Environmental Quality cer-tified water quality laboratory within the Arkansas Water Resources Center (httparkansas-water-centeruarkeduwater-quality-labphp) according to methods detailed in Table 1 The data collected is made publicly available at httpsbigcreekresearchorg
The geometric mean of nutrient concentrations of base-flow samples collected between September 2013 and April 2017 were determined in order to compare with base-flow nutrient concentrations available for BRW UIRW and UWRW Base-flow conditions in Big Creek were classified from hydrograph inspection when flow had not increased or decreased within 3 d of sample collection McCarty and Haggard (2016) suggested that stream nutrient concen-trations under base flow can be used to identify nonpoint sources and target remedial measures in Boston Mountains and Ozark Highland watersheds
Using all above-listed data sources the geometric means of nutrient concentrations for streams in the BRW UIRW and UWRW were used to develop a relationship with human development within the watershed Human development is defined as the percentage of pasture plus urban land use within the watershed Exponential relationships with 95 confidence bands around the observations were developed for NO3ndashN TN SRP and TP concentrations to put nutri-ent concentration at Big Creek into the context of regional stream nutrients and watershed land use
Data from Big Creek were paired with discharge available from a gaging station just downstream from the swine CAFO where the USGS developed the rating curve discharge infor-mation was only available from May 2014 through April 2017 The data were then used in a simple three-step pro-cess (White et al 2004) to look at monotonic changes in the nutrients at Big Creek (i) log-transform concentration (mg L-1) and associated instantaneous discharge (m3 s-1) (ii) use locally weighted regression (LOESS) to smooth the data with a sampling proportion (n) of 05 and (iii) plot the resid-uals from LOESS (ie the flow-adjusted concentrations) over time and use linear regression to evaluate monotonic trends
Results and DiscussionPutting Stream Nutrient Concentrations into Context at Big Creek
In Big Creek upstream of the swine CAFO the geometric mean concentrations of base flow sampled at weekly inter-vals from September 2013 for NO3ndashN TN SRP and TP were 0098 0205 0009 and 0030 mg L-1 respectively Directly downstream of the CAFO geometric mean concentra-tions at Big Creek during base flow conditions during the same period were 0242 0356 0011 and 0031 mg L-1 for NO3ndashN TN SRP and TP respectively Arkansas has narra-tive criteria for nutrient concentrations in streams (Arkansas Pollution Control and Ecology Commission 2016) but its proposed assessment methodology has numeric screen-ing concentrations for TN (0450ndash2430 mg L-1) and TP (0040ndash0100 mg L-1) in the Boston Mountains and Ozark Highlands The geometric mean concentrations at Big Creek upstream and downstream from the CAFO were below these values for the Boston Mountains and Ozark Highlands ecoregion
Nutrient concentrations in Big Creek upstream and down-stream from the CAFO are low with respect to nutrientndashbio-logical response thresholds for algae macroinvertebrates and fish Evans-White et al (2014) reviewed the literature sum-marizing nutrientndashbiological response thresholds across the United Statesbull Algalmetricresponses TN 038ndash179 mg L-1 TP 0011ndash
028 mg L-1
bull Macroinvertebratemetric responses TN 061ndash192 mg L-1 TP 004ndash015 mg L-1
bull Fishmetricresponses TN 054ndash183 mg L-1 TP 006ndash014 mg L-1
Total N concentrations at Big Creek upstream and down-stream of the swine CAFO were well below thresholds that result in some expected biological response whereas TP con-centrations were below thresholds for expected macroinver-tebrate and fish response and on the low end of the range for expected algal response However these lower TP thresholds (0006ndash0026 mg L-1 Stevenson et al 2008) were focused on shifts in diatom species and metrics rather than nuisance algal biomass A recent study on the Illinois River Watershed showed that stream TP thresholds with Cladophora bio-volume and nuisance taxa proportion of biovolume were observed between 0032 and 0058 mg L-1 (Joint Study
Table 1 Minimum detection limits for each chemical and biological constituent
Constituent Analytical methoddagger Minimum detection limitDagger Reporting limitsectSoluble reactive P mg Lminus1 EPA 3652 0002 0010Total P mg Lminus1 APHA 4500-P J EPA 3652 0012 0020NitratendashN mg Lminus1 EPA 3000 0004 0050Total N mg Lminus1 APHA 4500-P J EPA 3532 0006 0050Total suspended solids mg Lminus1 EPA 1602 No detection limit 40
dagger EPA = Approved CWA Chemical Test Methods (USEPA 2017) APHA = American Public Health Association from the WadeableStreamsAssessmentWaterChemistryLaboratoryManual (USEPA 2004)
Dagger The minimum detection limit of an analyte is the value which can be measured and reported with 99 confidence that the analyte concentration is greater than zero Further information is available at USGS (1999)
sect The reporting limit is the least (non-zero) calibrated standard used in analysis or as defined by method for total suspended solids
Page 4 of 6 AGRICULTURAL amp ENVIRONMENTAL LETTERS
Committee 2017) Thus TP concentrations at Big Creek upstream and downstream of the CAFO were in the range in which the natural assemblage of algae is shifting but these con-centrations would likely not be indicative of problematic nuisance algae in this ecoregion
Geometric mean nutrient concentra-tions varied upstream and downstream of the swine CAFO at Big Creek and Kosič et al (2015) used the publicly available data to allude to the N increase being from human activities on the landscape such as the CAFO However the historic land use and how stream nutrient concentrations during base-flow conditions increase with human development within the Boston Mountain and Ozark Highland watersheds need to be considered (eg see Giovannetti et al 2013 Haggard et al 2003 Migliaccio et al 2007) In the Big Creek watershed the percentage of land influenced by human activities (ie pas-ture plus urban) doubles from ~10 to ~20 in the drainage area upstream and downstream of the CAFO Nutrient concentrations in Big Creek upstream and downstream of the CAFO are within the range typical of streams draining simi-lar land uses (Fig 2)
At this time nutrient concentrations in Big Creek upstream and downstream from the swine CAFO are con-sistent with the range in concentrations for other watersheds with similar pasture and urban land use characteristics (Fig 2) as well as less than most nutrient thresholds for nuisance water-quality conditions (Omernik and Griffith 2014) However this does not preclude the possibility that nutri-ent concentrations at Big Creek may increase over time especially if human development and activity in the drain-age areas increase The most important observation is that nutrient concentrations were low in Big Creek providing the ability to detect changes over time
Have Nutrient Concentrations Changed in the Short Term at Big Creek
Understanding that long-term (eg decadal-scale) water-quality data are needed to reliably assess how stream nutri-ent concentrations have changed in response to watershed management and climate variations is of critical importance (Hirsch et al 2015) The literature shows that stream nutri-ent concentrations can change relatively quickly in response to effluent management (eg Haggard 2010 Scott et al 2011) but seeing a response (ie decrease in concentrations) from landscape management can take decades or more (Green et al 2014 Sharpley et al 2013) A myriad of factors may influence observed nutrient concentrations in streams including discharge (Petersen et al 1998) biological pro-cesses and climactic conditions (ie drought and floods Jones and Stanley 2016) and dominant transport pathways (Sharpley et al 2013) Thus we need to use caution when
interpreting trends in water quality over databases that only cover a limited timeframe
Three years of flow-adjusted nutrient concentration data at Big Creek downstream from the swine CAFO (May 2014ndashApril 2017) show different relationships with flow for the various constituentsbull Nitrate-nitrogen was greatest (~05 mg L-1) during the
lowest flows sampled and concentrations decreased with increasing flow
bull Total N generally decreased with increasing flow until a minimal value occurred then TN increased with in-creasing flow
bull Soluble reactive P concentrations did not change much during base-flow conditions and the greater concentra-tions (~0100 mg L-1) sporadically occurred at larger flows indicating that enrichment from stormflow may have been influenced by availability of source or other nontransport factors and
bull Total P concentrations were also relatively stable during base-flow conditions and then increased in association with rainfall-runoff events with only a few samples hav-ing concentrations gt0100 mg L-1 indicating relatively small enrichment from the landscape
Flow-adjusted concentrations (White et al 2004) showed no monotonic (ie increasing or decreasing) trends in SRP TP or TN (P gt 016) over the current monitoring period (Fig 3) However flow-adjusted NO3ndashN concentrations decreased over time (R2 = 005 P = 001) by 7 yr-1 (Fig 3c)
Nutrient concentrations at Big Creek upstream and downstream of the swine CAFO and indeed most tributaries of the Buffalo River are low relative to other watersheds in this ecoregion (Fig 2) This provides a starting point to build a framework to evaluate changes in nutrient concentrations of streams as a function of land use and management The
Fig 2 Relationship between land use and the geometric mean N and P concentrations (mg L-1) in the Buffalo Upper Illinois and Upper White River watersheds (no total P data available for the Buffalo River watershed) Dashed lines represent the 95 confi-dence intervals for the estimated mean (solid line)
AGRICULTURAL amp ENVIRONMENTAL LETTERS Page 5 of 6
evaluation of flow-adjusted concentrations over time showed that nutrients in Big Creek were not increasing over the short duration of monitoring for which concentration and dis-charge data were available (May 2014ndashApril 2017) At this point in time (April 2014ndashApril 2017) it is evident that nutrient concentra-tions in Big Creek have not increased at the monitored site However flow and nutri-ent concentration data over a longer period are needed to reliably quantify water-quality trends and characterize sources and moni-toring needs to continue for at least a decade to evaluate how discharge season and time influence nutrient fluxes (Hirsch et al 2010)
This research details a process by which regional monitoring networks can be devel-oped to establish baseline in-stream nutri-ent concentrations and by which time andor land use and management impacts can be determined
AcknowledgmentsFunding for the Big Creek Research and Extension Team (BCRET) to undertake the on-going monitoring project was provided by the Arkansas Governorrsquos Office and State Legislature to the University of Arkansas Systemrsquos Division of Agriculture All authors are members of BCRET
ReferencesArkansas Pollution Control and Ecology Commission 2016 Regulation
no 2 Regulations establishing water quality standards for surface wa-ters of the State of Arkansas httpswwwepagovsitesproductionfiles2014-12documentsarwqspdf (accessed 21 Sept 2017)
Buck O DK Niyogi and CR Townsend 2004 Scale-dependence of land use effects on water quality of streams in agricultural catchments En-viron Pollut 130(2)287ndash299 doi101016jenvpol200310018
Dubrovsky NM KR Burow GM Clark JM Gronberg PA Hamilton KJ Hitt DK Mueller and MD Munn 2010 The quality of our na-tionrsquos waters Nutrients in the nationrsquos streams and groundwater 1992ndash2004 USGS Circ 1350 httpwaterusgsgovnawqanutrientspubscirc1350 (accessed 21 Sept 2017)
Evans-White MA BE Haggard and JT Scott 2014 A review of stream nutrient criteria development in the United States J Environ Qual 421002ndash1014 doi102134jeq20120491
Gesch D M Oimoen S Greenlee C Nelson M Steuck and D Tyler 2002 The national elevation dataset Photogramm Eng Remote Sens 68(1)5ndash11 httpsnationalmapgovPERS_Jan2002_NED_highlight_articlepdf
Giovannetti J LB Massey BE Haggard and RA Morgan 2013 Land use effects on stream nutrients at Beaver Lake watershed J Am Water Works Assoc 105E1ndashE10 doi105942jawwa20131050005
Green CT BA Bekins SJ Kalkhoff RM Hirsch L Liao and KK Barnes 2014 Decadal surface water quality trends under variable cli-mate land use and hydrogeochemical setting in Iowa USA Water Resour Res 502425ndash2443 doi1010022013WR014829
Haggard BE 2010 Phosphorus concentrations loads and sources within the Illinois River drainage area northwest Arkansas 1997ndash2008 J En-viron Qual 392113ndash2120 doi102134jeq20100049
Haggard BE PA Moore Jr I Chaubey and EH Stanley 2003 Nitrogen and phosphorus concentrations and export from an Ozark Plateau catchment in the United States Biosyst Eng 86(1)75ndash85 doi101016S1537-5110(03)00100-4
Haggard BE AN Sharpley L Massey and K Teague 2010 Final report to the Illinois River Watershed Partnership Recommended watershed based strategy for the Upper Illinois River Watershed Northwest Ar-kansas Arkansas Technical Publication Number MSC 355 Water Re-sources Center University of Arkansas httparkansas-water-centeruarkedupublicationsmscMSC355pdf (accessed 21 Sept 2017)
Hirsch RM SA Archfield and LA De Cicco 2015 A bootstrap method for estimating uncertainty of water quality trends Environ Model Softw 73148ndash166 doi101016jenvsoft201507017
Hirsch RM DL Moyer and SA Archfield 2010 Weighted regres-sion on time discharge and season (WRTOS) with an application to the Chesapeake Bay River inputs J Am Water Resour Assoc 46(5)857ndash880
Joint Study Committee 2017 Final report to governors from the Joint Study Committee and Scientific Professionals 19 Dec 2016 Arkansas-Oklahoma Joint Study Committee httpswwwokgovconservationdocumentsIR202016121920Final20Reportpdf (accessed 21 Sept 2017)
Jones JB and EH Stanley 2016 Stream ecosystems in a changing envi-ronment Academic Press Amsterdam
Kosič K CL Bitting JV Brahana and CJ Bitting 2015 Proposals for integrating karst aquifer evaluation methodologies into national en-vironmental legislations Case study of a concentrated animal feed-ing operation in Big Creek basin and Buffalo National River water-shed Arkansas USA Sustain Water Resour Manage 1363ndash374 doi101007s40899-015-0032-5
McCarty JA and BE Haggard 2016 Can we manage nonpoint-source pollution using nutrient concentrations during seasonal baseflow Ag-ric Environ Lett 1160015 doi102134ael2016030015
Migliaccio KW BE Haggard I Chaubey and MD Matlock 2007 Linking watershed subbasin characteristics to water quality param-eters in War Eagle Creek watershed Trans ASAE 50(6)2007ndash2016 doi1013031201324104
Omernik JM and GE Griffith 2014 Ecoregions of the conterminous United States Evolution of a hierarchical spatial framework Environ Manage 54(6)1249ndash1266 doi101007s00267-014-0364-1
Petersen JC JC Adamski RW Bell JV Davis SR Femmer DA Freiwald and RL Joseph 1998 Water quality in the Ozark Plateaus Arkansas Kansas Missouri and Oklahoma 1992ndash95 USGS Circ 1158 USGS Fort Collins CO httpspubsusgsgovcirccirc1158circ1158pdf (accessed 21 Sept 2017)
Rebich RA NA Houston SV Mize DK Pearson PB Ging and CE Hornig 2011 Sources and delivery of nutrients to the northwestern Gulf of Mexico from streams in the south-central United States J Am Water Resour Assoc 47(5)1061ndash1086 doi101111j1752-1688201100583x
Reckhow KH PE Norris RJ Budell DM Di Toro JN Galloway H Greening AN Sharpley A Shirmhhammadi and PE Stacey 2011 Achieving nutrient and sediment reduction goals in the Chesapeake Bay An evaluation of program strategies and implementation Na-tional Academies Press Washington DC
Fig 3 Flow-adjusted concentration of (a) soluble reactive P (b) total P (c) nitrate-N and (d) total N over time since January 2014 when monitoring in Big Creek started
Page 6 of 6 AGRICULTURAL amp ENVIRONMENTAL LETTERS
Scavia D JD Allan KK Arend S Bartell D Beletsky NS Bosch SB Brandt RD Briland I Daloglu JV DePinto DM Dolan MA Evans TM Farmer D Goto H Han TO Hoeoek R Knight SA Ludsin D Mason AM Michalak RP Richards JJ Roberts DK Rucinski E Rutherford DJ Schwab TM Sesterhenn H Zhang and Y Zhou 2014 Assessing and addressing the re-eutrophication of Lake Erie Central basin hypoxia J Great Lakes Res 40226ndash246 doi101016jjglr201402004
Scott JT BE Haggard AN Sharpley and JJ Romeis 2011 Change point analysis of phosphorus trends in the Illinois River (Oklahoma) demonstrates the effects of watershed management J Environ Qual 401249ndash1256 doi102134jeq20100476
Sharpley AN HP Jarvie A Buda L May B Spears and P Kleinman 2013 Phosphorus legacy Overcoming the effects of past management practices to mitigate future water quality impairment J Environ Qual 421308ndash1326 doi102134jeq2013030098
Stevenson RJ Y Pan KM Manoylov CA Parker DP Larsen and AT Herlihy 2008 Development of diatom indicators of ecological con-ditions for streams of the western US J North Am Benthol Soc 271000ndash1016 doi10189908-0401
USEPA 2004 Wadeable streams assessment water chemistry laboratory manual USEPA Office of Water and Office of Research and Develop-ment Washington DC
USEPA 2017 Approved CWA chemical test methods USE-PA Washington DC httpswwwepagovcwa-methodsapproved-cwa-chemical-test-methodsnumber
USGS 1999 The method detection limit procedure of the US Environmen-tal Protection Agency In New reporting procedures based on long-term method detection levels and some considerations for interpre-tations of water-quality data provided by the US Geological Survey National Water Quality Laboratory Open File Rep 99-103 USGS Reston VA httpswaterusgsgovowqOFR_99-193detectionhtml
USGS 2015 National elevation dataset httpsltacrusgsgovNEDUSGS 2017a National hydrologic dataset httpsnhdusgsgovUSGS 2017b National land cover dataset httpscatalogdatagovdataset
usgs-national-land-cover-dataset-nlcd-downloadable-data-collectionWhite KL BE Haggard and I Chaubey 2004 Water quality at the Buffalo
National River Arkansas 1991ndash2001 Trans ASAE 47(2)407ndash417 doi1013031201316042
Sampling Liquid Manure
Karl VanDevender PhD PE Professor Extension Engineer
Liquid animal manure sampling can be an important management tool Proper sampling provides the producer with nutrient analysis results that can be used in a sound farm fertilization program Nutrient analysis of manure in conjunction with soil sampling helps determine how much manure should be applied to fields to maintain adequate fertility while minimizing potential environmental problems such as ground and surface water pollution However manure applications should not exceed the maximum application rates in a manure management plan until sufficient data can be collected to justify revising the plan
When to Sample Liquid animal manure should be sampled for nutrient analysis as close to land application time as possible This helps ensure that the reported nutrient content accurately reflects what is being applied to the land If the manure is sampled as it is being land applied the results will not be available to govern present application rates It does however provide information for future land applications of animal manure if the manure management remains fairly constant over time
How to Collect a Liquid Manure Sample During Land Application The easiest way to collect liquid animal manure samples is to collect the manure as it is being land applied This approach ensures what is sample reflects what is applied Randomly place catch pans in the field to collect the liquid manure as it is land applied by an irrigation system or honey wagon Flexible rubber feed pans work well Immediately after the manure has been applied collect the manure from the catch pans combine in a bucket to make one composite sample and mix well by stirring This bucket will be the source of the manure sent for analysis From a Storage Facility If collecting liquid animal manure samples during land application is not possible collect the samples from the storage facility Liquid animal manure storage facilities have a tendency for the manure to stratify with the solids settling to the bottom and the liquids remaining on top It is also not uncommon for some solids to form a floating crust This stratification affects the manure nutrient concentrations in the storage facility The nitrogen and potassium will be more concentrated in the top liquid while the phosphorus will be more concentrated in the settled solids This stratification of nutrient concentrations increases the challenge of getting samples that represent what will be applied to a particular field If the liquids from the top and middle of the profile will be applied only this material should be sampled If the settled solids will be applied then they should be sampled However if the manure is to be agitated before pumping as has been the traditional recommendation the sample should contain representative proportions of manure from the top middle and bottom The idea is to collect a sample of an entire column of manure to represent the manure after agitation If agitating the manure prior to sampling is not possible an alternative approach is to make a sampler to collect the required sub-samples The sub-samples are then mixed to represent the manure after agitation The easiest to construct is simply a container such as a cup attached to the end of a pole Liquids from the manure surface can be simply scooped up To collect liquids from the middle depths or settled solids the container is held up side down trapping air until the desired sampling depth is reached Then the container is rotated releasing the air and collecting the sample When collecting a sample of the entire profile of the manure sub-samples are collected and mixed in a bucket
- over -
A sampler design that automatically collects a sample of the entire profile uses 10 foot 1 frac12 inch PVC pipe with a PVC ball valve at the bottom The handle of the ball valve is replaces with a lever arm about 2 feet long The free end of the lever arm is attached to the end of a 10 foot 1 inch PVC pipe The lever arm and smaller pipe allow the ball valve to be operated while holding to top of the sampler To use the sampler the valve is opened and the sampler is inserted (in a line not and arc) into the manure When the foot of the valve is at the bottom of the settled solids it is closed Then the sample of the entire manure profile can be removed from the manure and placed in a bucket
Sketch of Cup Sampler Sketch of Foot Valve Sampler
Whichever sampler is used at least 8 locations around the manure storage unit should be sampled and mixed in a bucket to serve as a final composite sample This bucket will be the source of the manure sent for analysis
Getting the Sample Analyzed After thoroughly mixing the final composite sample fill a one liter plastic bottle half full These bottles may be obtained from your county Extension office Never fill the bottle more than half full to allow for gas expansion of the sample and to prevent the bottle from exploding Keep the samples as cool as possible until you can take them to your county Extensions office for shipping to the University of Arkansas lab for analysis There you will get assistance in filling out an information sheet on your manure sample There is a fee to have the sample analyzed While the sample can be sent to a private lab the fees are often higher If you are required by the Arkansas Department of Environmental Equality (ADEQ) to sample your liquid animal manure as part of your Regulation No 5 permit make sure that you inform the individual helping you with the paperwork so the correct set of analyses can be performed In addition to the analyses to determine the fertilizer value of manure it is recommended to analyze for the amount of phosphorus in the manure that is water soluble Water soluble phosphorus is needed to evaluate the potential environmental risk associated with phosphorus application rates specified in manure management plans Having good farm based information should help planners develop plans tailored to and individual farm
Key Points to Remember The important things to remember in collecting a liquid animal manure sample are Collect a sample that best represents the nutrient content of the manure in that storage facility and what
will be applied If only the top water is to be applied it should be sampled If the storage unit will be agitated prior to application the sample should contain material from the entire depth profile
Only fill the sample bottle frac12 full Keep the sample cool prior to shipping Ship the sample to the lab as soon as possible
Handout April 27 2010
The Arkansas Cooperative Extension Service offers its programs to all eligible persons regardless of race color national origin religion
gender age disability marital or veteran status or any other legally protected status and is an Equal Opportunity Employer
- 2015_Bacteria Trends in Flowing Waterspdf
-
- E COLI IN FLOWING WATERS
-

AGRICULTURAL amp ENVIRONMENTAL LETTERS Page 3 of 6
As much of the vegetation mat as possible was removed in the field Soil samples were separated into two subsamples for biotic and abiotic analysis Samples for biotic analysis (microbial biomass and enzyme activity) were sieved lt2 mm and stored at 4degC until analysis Samples for abiotic analysis were air-dried ground and sieved lt2 mm Additional plant material shoots and roots were removed by hand before sieving
Soil samples were analyzed for the following properties using the methods outlined in Table 2 total WEP (TWEP) inorganic WEP (WEPi) organic WEP (WEPo) Mehlich extractable P (M3-P) degree of soil P saturation (DPS) total P (TP) total C (TC) total N (TN) pH microbial biomass P C and N (MBP MBC MBN) and phosphatase enzyme activities Phosphorus concentration for all analyses except M3-P was determined using the molybdate blue method of Watanabe and Olsen (1965) M3-P concentrations were determined via inductively coupled plasma
The P content determined colorimetrically directly fol-lowing extraction with water is more accurately described as molybdate reactive P and consists mainly of orthophosphate ions and a small proportion of easily hydrolyzable inorganic and organic P The difference between this value and that determined following digestion is more accurately described as molybdate unreactive P and consists mainly of organic P forms but also a smaller fraction of condensed inorganic P
such as polyphosphates (Haygarth and Sharpley 2000) Due to the dominance of inorganic P in molybdate reactive P and organic P in molybdate unreactive P WEPi and WEPo have been used to distinguish between these two forms of P to avoid confusion and allow a clear message to be presented
Before all statistical analysis the data were examined for normality and the following parameters were log-trans-formed TWEP WEPi and WEPo To examine the differ-ences in soil properties across the three landscape positions the data from the three samples taken along each transect within the FPZ were averaged to provide one value for each zone (FPZ VBS and FRZ) for each transect Data from each of the three fields and from each of the transects within the fields were treated as replicates giving nine location rep-licates per zone These data were subjected to a one-way ANOVA by zone blocked by season providing four seasonal replicates for each location replicate and a total replication of 36 data points per zone For all parameters a Tukey test was used to determine significant differences between the zones at the p lt 005 level of significance
To determine which soil properties were contributing to the release of WEP and which soil parameters are impor-tant in regulating the release of P a stepwise regression was undertaken using the following parameters acid phospho-monoesterase alkaline phosphomonoesterase phosphodies-terase total phosphatase MBN MBP MBC M3-P DPS pH
Table 1 Field properties and management
Site Soil series Area Range in slope Managementha
Field 1 Noark very cherty silt loam 63 20ndash200 Grazed at 05 animal units ha-1
Field 5a Razort loam 108 02ndash10 Hayed and grazed at 03 animal units ha-1
Field 12 Spadra loam 96 05ndash20 Hayed and grazed at 03 animal units ha-1
Table 2 Summary of analytical methods used
Parameterdagger Analytical method ReferenceTWEP 120 soil-to-water extraction followed by centrifugation
filtration lt045 mm and acid persulfate digestionSelf-Davis et al (2009) and Rowland and Haygarth (1997)
WEPi 120 soil-to-water extraction followed by centrifugation and filtration lt045 mm
Self-Davis et al (2009)
WEPo Assumed to be the difference between TWEP and WEPi mdashM3-P 110 soil-to-Mehlich-3 extractant and centrifugation Mehlich (1984)DPS Calculated from M3-P Fe and Al according to the equation
DPS = M3-P05 times (M3-Fe + M3-Al) times 100Adapted from Schoumans (2009)
TP Alkaline oxidation Dick and Tabatabai (1977)TC Combustion on an Elementar VarioMax CN Provin (2014)TN Combustion on an Elementar VarioMax CN Provin (2014)pH 12 soil-to-water extraction mdashMBP Chloroform-fumigation extraction Adapted from Brookes et al (1985) and McLaughlin et al (1986)MBC Chloroform-fumigation extraction Vance et al (1987)MBN Chloroform-fumigation extraction Vance et al (1987)Acid Pmono Enzyme assays using 5mM para-nitrophenyl phosphate as the
substrate buffered at pH 65Tabatabai (1994)
Alk Pmono Enzyme assays using 5mM para-nitrophenyl phosphate as the substrate buffered at pH 11
Tabatabai (1994)
Pdi Enzyme assays using 1 mM bis-para-nitrophenyl phosphate as the substrate buffered at pH 8
Tabatabai (1994)
Total phosphatase Sum of acid Pmono alk Pmono and Pdi mdash
dagger acid Pmono acid phosphomonoesterase alk Pmono alkaline phosphomonoesterase DPS degree of soil phosphorus saturation M3-P Mehlich extractable P MBC microbial biomass C MBN microbial biomass N MBP microbial biomass P Pdi phosphodiesterase TC total C TN total N TP total P TWEP total water extractable phosphorus WEPi inorganic water extractable phosphorus WEPo organic water extractable phosphorus
Page 4 of 6 AGRICULTURAL amp ENVIRONMENTAL LETTERS
TP TC and TN All analyses were performed using the SPSS statistical package version 22 (IBM 2013)
Results and DiscussionWater extractable soil P concentration has been shown to
be directly related to the potential for dissolved P release from soils to surface runoff (Pote et al 1996 Sharpley 1995) The total inorganic and organic WEP (TWEP WEPi WEPo) concentrations across the three fields was significantly lower in the VBS than the FPZ reflecting the larger inputs of P to the FPZ (Fig 3) However there was no significant difference in TWEP between the pasture and FRZs despite a decrease in WEPi This is a result of the significantly higher concen-trations of WEPo present in the FRZ where WEPo made up 57 of TWEP in these soils compared with just 24 in the pasture soils This suggests that dissolved organic P can con-tribute to total P release in riparian soils
The release of soil P to water can occur through abiotic and biotic processes Desorption and dissolution reactions dominate the abiotic release mechanisms and are governed by soil chemical properties and number of available sorption sites (Arai and Sparks 2007) Microbial soil biomass can con-tain a significant pool of P in temperate pastures (Oberson and Joner 2005) This pool is in constant flux immobilizing P from or replenishing P in the soil solution during micro-bial growth or cell death Phosphorus release from this pool
occurs through three main mechanisms (i) mineralization (Oehl et al 2001) (ii) cell lysis in response to environmental stress (eg dessication) (Turner and Haygarth 2001) or (iii) predation by soil fauna (Bonkowski 2004) Biotic processes can also control the form of dissolved P in solution through the exudation of phosphatase enzymes which can catalyze the conversion of soluble organic P compounds to ortho-phosphate ions for plant uptake (Richardson et al 2011)
Table 3 shows the abiotic and biotic soil properties of the soils across the three landscape zones The FPZ soils had sig-nificantly higher concentrations of TP and M3-P but lower concentrations of TC and TN compared with the FRZ soils Additionally the DPS was significantly higher in the FPZ soils compared with the VBS and FRZ soils indicating more of the P sorption sites had become saturated Surprisingly we saw no significant difference in microbial biomass P C or N concentrations among zones despite expected increased leaf litter inputs in the FRZ However the total phosphatase activity was 17 higher in the FRZ soils than the field soils suggesting increased microbial activity
To determine which pools of P and which soil proper-ties were key in controlling the release of P to water we per-formed a stepwise regressions for TWEP WEPi and WEPo using data from all three sites and four sampling dates The results from this analysis are shown in Table 4 Both TWEP and WEPi were well predicted by the model (adjusted r2 =
Fig 3 Box plots showing the concentration of (i) total water extractable P (ii) inorganic water extractable P and (iii) organic water extractable P across the three zones (fertilized pasture zone [FPZ] vegetative buffer strip [VBS] and forested riparian zone [FRZ]) Letters denote significant differences between zones at p lt 005 as determined by Tukeyrsquos test of multiple comparisons
Table 3 Difference in mean soil properties across the different landscape zones fertilized pasture zone (FPZ) vegetative buffer strip (VBS) forested riparian zone (FRZ) pH total C (TC) total N (TN) total P (TP) Mehlich-3 P (M3-P) degree of P saturation (DPS) microbial biomass P (MBP) microbial biomass C (MBC) microbial biomass N (MBN) acid phosphomonoesterase (acid Pmono) alkaline phosphomonoesterase (alk Pmono) phosphodiester-ase (Pdi) and total phosphatase activities
ZoneSoil chemical properties Soil biological properties
pH TC TN TP M3-P DPS MBP MBC MBN Acid Pmono Alk Pmono Pdi Total phosphatase
mdashmdashmdash mdashmdashmdash mdash mg kg-1 mdash mdashmdashmdash mg kg-1 mdashmdashmdash mdashmdashmdashmdashmdash mmol pNPdagger g-1 h-1 mdashmdashmdashmdashmdashFPZ 587bDagger 206b 023b 640a 67a 748a 26 371 85 300a 133b 120b 553bVBS 571b 188b 021b 584ab 48b 489b 23 386 79 259ab 093b 096b 456bFRZ 640a 321a 026a 521b 28c 457b 28 356 101 233b 205a 205a 666ap value lt0001 lt0001 lt005 lt001 lt0005 lt0001 NS NS NS lt0005 lt0001 lt0001 lt0001
dagger pNP para-nitrophenyl phosphateDagger Means followed by the same letter are not significantly different at the p lt 005 level of significance according to Tukeyrsquos test for multiple comparisons
AGRICULTURAL amp ENVIRONMENTAL LETTERS Page 5 of 6
066 and 065 respectively) and variation in these concen-trations was mostly explained by DPS with a small con-tribution from total phosphatase activity an indicator of biologically mediated P release
In contrast to WEPi variation in WEPo was less closely related to any of the measured parameters (adjusted r2 = 037) Furthermore DPS was not included in the selected model and total phosphatase activity explained most of the variation in WEPo While total phosphatase activity was greatest in FRZ soils the activity of the different types of enzyme varied across the landscape positions (Table 3) Acid phosphomono-esterase activity was highest in the FPZ soils and of a similar magnitude to that found agricultural soils with a history of poultry manure application and high soil test PSpelled out STP correct concentrations (Tomlinson et al 2008) Acid phosphomonoesterase is thought to be mainly released by plant roots and some microbes and there is evidence that high concentrations phosphatase enzymes can be pres-ent in manures (Nannipieri et al 2011) Furthermore these enzymes have been shown to sorb strongly onto soil parti-cles (Burns 1986 Nannipieri et al 2011) hence the large acid phosphomonoesterase activates found in the FPZ may be directly due to manure application In contrast alkaline phosphomonoesterase and phosphodiesterase activities were greatest in the FRZ in keeping with the small increase in pH (Table 3) These enzymes are thought to be released by soil microorganisms rather than plant roots The differences in phosphatase activities across the zones suggest that release of P from riparian soils is likely to be controlled in part by the biologically mediated release of organic P
This study demonstrates that the significant decrease in soil test P concentrations in FRZ soils compared with regu-larly fertilized FPZ does not necessarily translate to a reduc-tion in the total amount of P which can be released to runoff due to the increase in WEPo Furthermore while DPS of which soil test P is a component was a good predictor of WEPi release additional factors relating to biological cycling need to be considered when trying to account for the poten-tial release of organic P
ReferencesArai Y and D Sparks 2007 Phosphate reaction dynamics in soils and
soil components A multiscale approach Adv Agron 94135ndash179 doi101016S0065-2113(06)94003-6
Arkansas Department of Environmental Quality 2017 Permit data system Specific NPDES water permit details Permit arg590001 httpswwwadeqstatearushomepdssqlp_permit_details_water_npdesaspxafindash=ampafin=5100164amppmtnbr=arg590001
Bonkowski M 2004 Protozoa and plant growth The microbial loop in soil revisited New Phytol 162617ndash631
Brookes PC A Landman G Pruden and DS Jenkinson 1985 Chloro-
form fumigation and the release of soil nitrogen A rapid direct extrac-tion method to measure microbial biomass nitrogen in soil Soil Biol Biochem 17837ndash842 doi1010160038-0717(85)90144-0
Burns RG 1986 Interactions of enzymes and soil mineral and organic col-loids In PM Huang and M Schnitzer editors Interactions of soil minerals with natural organics and microbes SSSA Madison WI p 429ndash453
Dick WA and MA Tabatabai 1977 An alkaline oxidation method for de-termination of total phosphorus in soils Soil Sci Soc Am J 41511ndash514 doi102136sssaj197703615995004100030015x
Dodd RJ and AN Sharpley 2015 Recognizing the role of soil organic phosphorus in soil fertility and water quality Resour Conserv Recycl 105(B) 282ndash293 doi101016jresconrec201510001
Dodd RJ and AN Sharpley 2016 Conservation practice effectiveness and adoption Unintended consequences and implications for sustain-able phosphorus management Nutr Cycling Agroecosyst 104373ndash392 doi101007s10705-015-9748-8
Haygarth PM and AN Sharpley 2000 Terminology for phos-phorus transfer J Environ Qual 2910ndash15 doi102134jeq200000472425002900010002x
Hoffmann CC C Kjaergaard J Ussi-Kaumlampauml HC Bruun Hansen and B Kronvang 2009 Phosphorus retention in riparian buffers Re-view of their efficiency J Environ Qual 381942ndash1955 doi102134jeq20080087
IBM 2013 IBM SPSS statistics for Windows version 220 IBM Corp Ar-monk NY
McLaughlin MJ AM Alston and JK Martin 1986 Measurement of phos-phorus in soil microbial biomass A modified procedure for field soils Soil Biol Biochem 18437ndash443 doi1010160038-0717(86)90050-7
Mehlich A 1984 Mehlich 3 soil test extractant A modification of the Mehlich 2 extractant Commun Soil Sci Plant Anal 151409ndash1416 doi10108000103628409367568
Nannipieri P L Giagnoni L Landi and G Renella 2011 Role of phospha-tase enzymes in soil In EK Buumlnemann A Oberson and E Frossard editors Phosphorus in action Soil Biology Ser 26 Springer Berlin p 215ndash243 doi101007978-3-642-15271-9_9
Oberson A and EJ Joner 2005 Microbial turnover of phosphorus in soil In BL Turner E Frossard and DS Baldwin editors Organic phos-phorus in the environment CAB International Wallingford UK p 133ndash164 doi10107997808519982200133
Oehl F A Oberson M Pronst A Fliessbach H Roth and E Frossard 2001 Kinetics of microbial phosphorus uptake in cultivated soils Biol Fertil Soils 3431ndash41 doi101007s003740100362
Pote DH TC Daniel AN Sharpley PA Moore Jr DR Edwards and DJ Nichols 1996 Relating extractable soil phosphorus to phospho-rus losses in runoff Soil Sci Soc Am J 60855ndash859 doi102136sssaj199603615995006000030025x
Provin T 2014 Total carbon and nitrogen and organic carbon via thermal combustion analyses In FJ Sikora and KP Moore editors Soil test methods from the southeastern United States Southern Cooperative Series Bull 419 Southern Extension and Research Activity Informa-tion Exchange Group- 6 p 149ndash154 httpaeslcesugaedusera6PUBMethodsManualFinalSERA6pdf
Richardson AE JP Lynch PR Ryan E Delhaize FA Smith PR Harvey MH Ryan EJ Veneklaas H Lambers A Oberson RA Culvenor and RJ Simpson 2011 Plant and microbial strategies to improve ef-ficiency of agriculture Plant Soil 349121ndash156
Roberts WM MI Stutter and PM Haygarth 2012 Phosphorus retention and remobilization in vegetative buffer strips A review J Environ Qual 41389ndash399 doi102134jeq20100543
Rowland AP and PM Haygarth 1997 Determination of total dis-solved phosphorus in soil solutions J Environ Qual 26410ndash415 doi102134jeq199700472425002600020011x
Table 4 Model predictions of total water extractable P (TWEP) inorganic water extractable P (WEPi) and organic water extractable P (WEPo) from stepwise regression across all data The F statistic for all three model predictions is lt0001
TWEP WEPi WEPo
r2adjusted Predictor Relative
importance r2adjusted Predictor Relative
importance r2adjusted Predictor Relative
importance066 Degree of soil P
saturation080 065 Degree of soil P
saturation093 037 Total phosphatase
activity078
Total phosphatase activity
018 Total phosphatase activity
007 Microbial biomass N 017
M3-P 002 pH 005
Page 6 of 6 AGRICULTURAL amp ENVIRONMENTAL LETTERS
Schoumans OF 2009 Determination of the degree of phosphate satura-tion in noncalcareous soils In JL Kovar and GM Pierzynski editors Methods for phosphorus analysis for soils sediments residuals and water 2nd ed SERA 17 Bull 408 Virginia Tech Blacksburg VA p 29ndash 32
Self-Davis ML PA Moore Jr and BC Joern 2009 Water- or dilute salt-extractable phosphorus in soil In JL Kovar and GM Pierzynski edi-tors Methods for phosphorus analysis for soils sediments residuals and water 2nd ed SERA 17 Bull 408 Virginia Tech Blacksburg VA p 22ndash 24
Sharpley AN 1995 Dependence of runoff phosphorus on extract-able soil phosphorus J Environ Qual 24920ndash926 doi102134jeq199500472425002400050020x
Sheppard SC MI Sheppard J Long B Sanipelli and J Tait 2006 Runoff phosphorus retention in vegetative field margins on flat landscapes Can J Soil Sci 86(5)871ndash884 doi104141S05-072
Tabatabai MA 1994 Soil enzymes In RW Weaver S Angl P Bottomley D Bezdicek S Smith and MA Tabatabai editors Methods of soil analysis Part 2 Microbiology and biological properties SSSA Madi-son WI p 775ndash833
Tomlinson PJ MC Savin and PA Moore Jr 2008 Phosphatase activities in soil after repeated untreated and alum-treated poultry litter appli-cations Biol Fertil Soils 44613ndash622 doi101007s00374-007-0245-3
Turner BL and PM Haygarth 2001 Biogeochemistry Phosphorus solu-bilization in rewetted soils Nature 411258 doi10103835077146
Vance ED PC Brookes and DS Jenkinson 1987 An extraction method for measuring soil microbial biomass C Soil Biol Biochem 19703ndash707 doi1010160038-0717(87)90052-6
Watanabe FS and SR Olsen 1965 Test of an ascorbic acid meth-od for determining phosphorus in water and NaHCO3 ex-tracts from soil Soil Sci Soc Am J 29677ndash678 doi102136sssaj196503615995002900060025x
Phosphorus Retention and Remobilization along HydrologicalPathways in Karst TerrainHelen P Jarviedagger Andrew N SharpleyDagger Van Brahanasect Tarra SimmonsDagger April PriceDagger Colin Nealdagger
Alan J Lawlor∥ Darren Sleep∥ Sarah Thacker∥ and Brian E Haggardperp
daggerCentre for Ecology amp Hydrology Wallingford OX10 8BB UKDaggerDepartment of Crop Soil amp Environmental Sciences Division of Agriculture University of Arkansas Fayetteville Arkansas 72701United StatessectDepartment of Geosciences University of Arkansas Fayetteville Arkansas 72701 United States∥Centre for Ecology amp Hydrology Lancaster LA1 4YQ UKperpArkansas Water Resources Center University of Arkansas Fayetteville Arkansas 72701 United States
S Supporting Information
ABSTRACT Karst landscapes are often perceived as highly vulnerable toagricultural phosphorus (P) loss via solution-enlarged conduits that bypass Pretention processes Although attenuation of P concentrations has been widelyreported within karst drainage the extent to which this results from hydrologicaldilution rather than P retention is poorly understood This is of strategicimportance for understanding the resilience of karst landscapes to P inputs givenincreasing pressures for intensified agricultural production Here hydrochemicaltracers were used to account for dilution of P and to quantify net P retentionalong transport pathways between agricultural fields and emergent springs for thekarst of the Ozark Plateau midcontinent USA Up to sim70 of the annual total Pflux and sim90 of the annual soluble reactive P flux was retained with preferentialretention of the most bioavailable (soluble reactive) P fractions Our resultssuggest that in some cases karst drainage may provide a greater P sink thanpreviously considered However the subsequent remobilization and release of the retained P may become a long-term source ofslowly released ldquolegacyrdquo P to surface waters
INTRODUCTION
More than 25 of the worldrsquos population either lives on orobtains its drinking water from karst aquifers Karst underlies30 of the land area of China 30 of Europe and 20 of theUnited States12 Karst aquifers exert an important control on thequality and ecology of surface waters in these areas3 Thecomplexity of subsurface drainage45 and the difficulties indeconvoluting flow pathways and groundwater contributingareas6 have been a significant barrier to detailed studies ofnutrient transport and fate in karst systems78 Nevertheless it iswidely assumed that karst drainage systems (formed bydissolution of carbonate rocks mainly limestone) are highlyvulnerable to phosphorus (P) impairment from agriculturalsourcesThis vulnerability is assumed to arise from the low nutrient
buffering capacity of the thin cherty soils which overlie karst andthe rapid transmission of surface runoff through conduitsenlarged by dissolution910 which is thought to bypass thezones where key processes of P retention occur11minus13 Nonethe-less highly intensive monitoring of Irish karst springs in areas oflivestock demonstrated major P attenuation (reduction in Pconcentrations) relative to agricultural runoff1415 with low Pconcentrations in spring discharge even during storm events
when agricultural P losses are expected to be highest Thisattenuation was attributed to a combination of both hydrologicaldilution and P retention during infiltration and transmission ofrunoff along groundwater conduit pathwaysCrucially we lack information on the extent to which P
attenuation is controlled by P retention processes during transitalong karst flow paths14 or by hydrological dilution ofagricultural runoff by cleaner groundwater sources16 This is ofstrategic importance for understanding the P buffering capacityand wider resilience of karst landscapes to nutrient inputs101718
Many karst lands have traditionally been used for low-intensitylivestock farming owing to poor soils and their unsuitability forarable production9 However there is increasing pressure forintensive livestock production as global demands for greaterefficiency in food production intensify1920 Given the movetoward more intensive livestock production systems whichaccumulate P2122 and the perceived vulnerability of karstdrainage systems to P loss there is now a pressing and strategic
Received December 14 2013Revised March 17 2014Accepted March 17 2014
Article
pubsacsorgest
copy XXXX American Chemical Society A dxdoiorg101021es405585b | Environ Sci Technol XXXX XXX XXXminusXXX
need for better understanding of the fate and transport of P inkarst landscapes Here this shortfall is addressed for karst terrainin south-central USA Hydrochemical tracers and endmembermixing analysis23minus26 were used to assess the vulnerability to Ploss by accounting for the hydrological dilution of agriculturalrunoff and directly quantifying net P retention during infiltrationthrough the soil and along karst transport pathways through tothe emergent springs
EXPERIMENTAL METHODS
Study Area The study was undertaken at the University ofArkansas long-term Savoy Experimental Watershed (SEW) NWArkansas USA27 The SEW is located in the Illinois RiverWatershed a mixed land-use watershed (sim4330 km2) whichspans the states of Arkansas and Oklahoma2829 The SEW covers1250 ha and is typical of the karst terrain of the Ozark Plateau ofmidcontinental USA (Figure SI-1a Supporting Information)The soils of the SEW are predominantly silt loams (seeSupporting Information) Around 70 of the land is nativeforest with the remaining 30 rolling pasture grazed by beefcattle (sim2 cows haminus1) The SEW also supports poultryproduction with the resulting poultry litter used to fertilizepastures There are no septic tanks or settlements in the SEWand agricultural runoff from pastures grazed by cattle providesthe overwhelmingly dominant P source in the watershed30
The stratigraphy of the SEW30minus32 (see Figure SI-1cSupporting Information) includes (a) the limestone aquifer ofthe St Joe Formation (b) the Boone Formation an impurelimestone which mantles the St Joe Formation and formsldquoepikarstrdquo and (c) a layer of regolith (vadose zone) whichoverlies the Boone Formation Karst drainage has a major controlon water quality in the Illinois River2933 67 of annual river flowcomes from karst springs rising to 80 of flow in the summerand fall34
Sample Collection and Analysis Surface runoff andspring-water chemistry and flow monitoring (Figure SI-1a andc Supporting Information) were undertaken at the following(1) two adjacent karst springs (Langle Spring LLS andCopperhead Spring CHS) which flow continually from the StJoe Formation (focused conduit flow) springs (2) two surfacerunoff field plots (Langle LL 107 ha and Copperhead CH 105ha) which are located above and within the watershed (rechargezone) of the LLS andCHS springs These runoff plots are locatedon Razort silt loams which make up most of the grazed pasturesof the SEW All pastures are treated similarly in terms of grazing
intensity and maintenance fertilizer applications (30 kg P haminus1
every two years as either poultry litter or diammoniumphosphate)Flows at the karst springs (LLS and CHS) were monitored on
15-min intervals (see Supporting Information) Karst springwater was sampled weekly with stage-triggered subdailyautomated sampling using an ISCO sampler during stormevents Figure SI-2 (Supporting Information) shows thedistribution of samples collected on the rising and falling stageof the storm hydrographs The volume of surface runoff fromboth fields was automatically measured and samples werecollected on a flow-weighted basis by an ISCO autosampler Allwater samples were filtered within 24 h of the water beingsampled and were analyzed following EPA standard protocols asdescribed below (and in the Supporting Information) Filtered(lt045 μm) samples were analyzed for soluble reactivephosphorus (SRP) by colorimetric analysis35 and for a fullsuite of major cations (including potassium K and calcium Ca)and trace elements (including lanthanum La and rubidium Rb)(see Supporting Information) Unfiltered samples were analyzedfor total phosphorus (TP) after acid-persulfate digestion bycolorimetric analysis3536 These measurements are consistentwith standard protocols for TP and SRP analysis37
Use of Conservative Tracers and Endmember MixingAnalysisConservative chemical tracers and endmember mixingmodels were used to apportion water sources and to differentiatethe effects of hydrological dilution from the biogeochemicalprocesses which retain and cycle P during transit through thekarst drainage system Chemical tracers have been widely used inwatershed hydrology for tracing water sources and flowpathways38 owing to their conservative behavior (chemicalinertness) Here we made use of chemical tracers already in thewatershed to apportion water sources Using the hydrochemicalmonitoring data tracers were chosen which had elevatedconcentrations in either base flow groundwater or in agriculturalrunoff First two-component endmember mixing models2339
were used to link the spring-water chemistry to sources withinthe watershed by (a) quantifying the relative proportions ofsurface runoff and groundwater and (b) estimating thecontribution of surface runoff from the agricultural grazed landSecond comparing the mixing patterns of P in spring water witha conservative tracer of agricultural runoff allowed us to directlyevaluate whether P was behaving nonconservatively (ie beingtaken up or released) along the hydrological pathways in the karstdrainage system
Table 1 Summary of Concentrations of Soluble Reactive Phosphorus (SRP) Total Phosphorus (TP) Potassium (K) Rubidium(Rb) and Calcium (Ca) in Field Runoff and Spring-Water Samples
field runoff (m3 ha‑1)spring flow (L s‑1)
SRP(mg Lminus1)
TP(mg Lminus1)
Rb(μg Lminus1)
K(mg Lminus1)
Ca(mg Lminus1)
Langle Field mean 380 221 257 697 104 512(LL) median 355 187 212 596 102 494
range 34minus915 059minus502 08minus553 093minus206 204minus263 211minus987Copperhead Field mean 231 068 109 294 611 345(CH) median 146 057 103 252 511 343
range 18minus799 047minus122 063minus191 058minus876 14minus147 195minus734Langle Spring mean 131 0029 0057 106 154 375(LLS) median 938 0012 0034 0878 114 367
range 124minus59 0minus0403 0002minus0608 0195minus357 0534minus492 122minus659Copperhead Spring mean 225 0019 0041 108 137 405(CHS) median 262 0017 0032 11 14 429
range 019minus253 0001minus012 0minus058 0328minus19 084minus217 145minus615
Environmental Science amp Technology Article
dxdoiorg101021es405585b | Environ Sci Technol XXXX XXX XXXminusXXXB
RESULTS AND DISCUSSION
Comparison of Agricultural Runoff and Spring-WaterChemistry Concentrations of TP SRP K and Rb wereconsistently highest in field runoff relative to the springs (Table1) and runoff from the grazed fields provides the greatestconcentrations of P K and Rb within the SEW In contrast Caconcentrations were consistently highest in the springscompared with runoff This indicates a dominant base flowgroundwater source of Ca from dissolution of limestone whichis diluted by surface runoff (Figure 1a)Concentrations of SRP TP K and Rb were all higher in field
runoff at LL compared with CH This likely reflects higher cattlegrazing density at LL (25 cows haminus1) than at CH (10 cowshaminus1) as well as higher runoff per unit area that likely led togreater solute and particulate entrainment and transport capacitycompared with CH This may also reflect a larger hydrologicallyactive area contributing runoff at LL linked to greater soilcompaction from more intensive cattle grazingFor the springs there was a greater variability in SRP TP K
and Rb concentrations at LLS than at CHS despite a much lowervariability in spring flow at LLS (Table 1) Howeverconcentrations of TP SRP K and Rb did not correlate withflow at either of the springs For most storm events at LLSconcentrations of TP SRP K and Rb increased dramatically
above base flow concentrations especially on the rising stage ofthe storm hydrograph (Figure SI-2 Supporting Information)These high concentrations on the rising stage are likely due toupstream point recharge of surface runoff from pasture land intothe underlying St Joe aquifer in locations where the confiningchert layer is breached At CHS the response of TP SRP K andRb to storm events was more mixed Small initial increases inconcentration occurred with the onset of higher flows followedby marked reductions in concentration reflecting substantialdilution by a water source with relatively low SRP TP K and Rbconcentrations most likely from the nonagricultural (ungrazedand forested) parts of the watershed Indeed karst inventorieshave verified that this part of the flow regime reflects runoff fromareas which are not grazed by livestock3031
To evaluate the attenuation (ie the reductions inconcentrations) of TP SRP K and Rb during transit throughthe karst the median concentrations in agricultural runoff werecompared with the corresponding median concentrations inCHS and LLS springs (Table 1) The average attenuation of TPand SRP concentrations ranged from 96 to 99 In contrastthe average attenuation of K and Rb concentrations was lower at56 to 89 Correspondingly under storm flow conditionscomparisons of average field runoff concentrations and the 90thpercentile concentrations in spring water (which typicallycorrespond with the rising stage of the storm hydrographs of
Figure 1 (a) Relationships between calcium (Ca) concentrations and flow at Langle and Copperhead springs (b) Relationship between rubidium (Rb)and potassium (K) concentrations in field runoff and spring-water samples
Environmental Science amp Technology Article
dxdoiorg101021es405585b | Environ Sci Technol XXXX XXX XXXminusXXXC
the springs) revealed that storm flow attenuation of TP and SRPranged from 93 to 96 compared with 46 to 74 for K andRb Across all flow conditions the higher rates of attenuation of Pconcentrations relative to K and Rb reflect the nonconservativebehavior of P during transit through the karstK and Rb show high correlation (Figure 1b) due to their
similar hydrogeochemistry (group 1a monovalent base cations ofrelatively small hydration size) Figure 1b shows a dominant two-component mixing series between a high concentrationldquoendmemberrdquo (ie surface runoff from fertilizer and grazedpastures in runoff) and a low concentration spring-waterldquoendmemberrdquo (ie runoff from nonagricultural and forestedareas which have no grazing or fertilizer inputs) Both K and Rbare highly soluble monovalent ions and once transmitted intothe karst drainage system chemical interactions will be relativelysmall Therefore the attenuation of K and Rb during transportthrough the karst will be largely controlled by hydrologicaldilution without retention mechanisms (with only possibly asmall attenuation or release within the epikarst where there is ahigh proportion of clays3140) In contrast P behaves non-conservatively reflected by the higher rates of attenuation of Prelative to K and RbSpring Hydrology and Water-Source Apportionment
Comparing the hydrology of the two springs (Figure 2) base
flows at CHS were consistently lower than at LLS the medianflow at CHS was 262 L sminus1 compared with 131 L sminus1 at LLS(Table 1) Further CHS exhibited a more flashy flow regimethan LLS and storm flows were dramatically higher at CHS Forinstance the average of the highest 10 of flows was 139 L sminus1 atCHS compared with 40 L sminus1 at LLS This discrepancy reflectsthe following (i) LLS being the ldquounderflowrdquo spring (3 cm lowerthan CHS) with a much larger groundwater drainage area underlow-flow conditions than CHS which accounts for the higherbase flows at LLS (ii) water capture (spring ldquopiracyrdquo) by CHSduring storm events which has been shown to result in adramatic expansion in the watershed drainage area for CHSrelative to LLS3233
Contributions to spring water at LLS and CHS wereapportioned by two-component endmember mixing analy-sis2341 Here Ca was used as a tracer of groundwater and K asa tracer of agricultural runoff based on the observed dominantgroundwater source of Ca and the dominant agricultural runoffsource of K For the mixing model endmembers were defined asthe following
(i) A base flow groundwater endmember with elevated Caand a storm flow endmember with low Ca concentrations
(ii) Runoff endmember from agricultural land with high Kconcentration and a spring base flow low K endmember
Figure 2 Hydrographs and water source apportionment for Langle and Copperhead springs
Environmental Science amp Technology Article
dxdoiorg101021es405585b | Environ Sci Technol XXXX XXX XXXminusXXXD
Applying a simple two-component mixing model2341 (eq 1)and the endmembers identified above Ca concentrations wereused to partition the contributions to spring flow at LLS andCHS from base flow groundwater (the high concentrationendmember) and from stormwater runoff (the low concen-tration endmember) Then a second two-component mixingmodel was used for K to quantify the contributions from grazedpasture runoff (eq 2)
= times minus minus total storm runoff
100 (Ca Ca )(Ca Ca )gw m gw ro (1)
= times minus minus
agricultural runoff
100 (K K )(K K )bf m bf ag (2)
where Cagw was the groundwater Ca concentration (highconcentration base flow endmember) defined here as theaverage Ca concentration for the lowest 10 of flows sampledCam was the measured spring-water Ca concentration Caro wasthe stormwater (agricultural runoff) endmember defined here asthe average field runoff Ca concentration Kbf was the base flowendmember (average K concentration for the lowest 10 of
spring flows sampled) Km was the measured spring-water Kconcentration and Kag was the agricultural runoff endmemberdefined here as the average field runoff K concentration Thevalues used to define the endmember concentrations at LLS andCHS are shown in Table SI-1 Supporting InformationThe water source apportionment for LLS and CHS (Figure 2)
showed similar percentage contributions from base flowgroundwater and total storm flow at LLS and CHS for most ofthe year and particularly during storm events During winter andspring storm events a much greater proportion of flow at LLSwas derived from agricultural (grazed field) runoff (up toapproximately a third of flow) This greater contribution of waterfrom pastures than from nonagricultural land at LLS accountedfor the higher storm-event concentrations of K and Rb at LLSAgricultural runoff contributed a much lower proportion ofwinter and spring storm event flow at CHS (typically less than10) These results and the much higher storm flow dischargesat CHS suggest that the water ldquopiracyrdquo at CHS during stormevents captured water sources which had a lower K and Rbconcentration from the nonagricultural (ungrazed and forested)areas
Figure 3 Relationships between total phosphorus (TP) soluble reactive phosphorus (SRP) and potassium (K) for (a) Langle Spring and (b)Copperhead Spring The dashed line denotes the conservative mixing line and the solid line denotes a line of maximum P retention (see text forexplanation)
Environmental Science amp Technology Article
dxdoiorg101021es405585b | Environ Sci Technol XXXX XXX XXXminusXXXE
Quantifying Net P Retention in Karst DrainageEndmember mixing analysis23minus26 was applied using theldquoconservativerdquo tracer K to explore the net P retention andrelease along karst hydrological pathways from infiltrationthrough the soil to spring discharge First concentrations ofTP and SRP were plotted against K as the ldquoconservativerdquo tracer(Figure 3) Two dominant and distinct sources of spring water(both with different TP SRP and K concentrations) arehypothesized (Table SI-1 Supporting Information) (i) a highconcentration agricultural endmember source (Kag TPag SRPag)defined here as the average concentrations (of K TP and SRP)in agricultural field runoff at the LL and CH field plots and (ii) alow concentration (nonagricultural) endmember (Kna TPnaSRPna) As the source of this low concentration runoff couldcome from a wide range of nonagricultural sources (ungrazedand forest land) across the watershed the most reliable means ofcapturing the integrated low-concentration endmember signalwas to use the minimum measured spring-water K TP and SRPconcentrations at LLS and CHSA theoretical linear two-component mixing series ie a
ldquoconservative mixing linerdquo between the high concentration andlow concentration endmembers (Figure 3) would be observed ifP behaved conservatively during mixing of the two endmemberwater sources during transport through the karst In contrast theobserved relationships between TP and K and SRP and K inspring water were highly scattered at LLS and CHS (Figure 3)Most of the samples plot well below the conservative mixing lineshowing predominantly net retention of TP and SRP relative toK A few isolated samples plotted above the conservative mixingline which are indicative of some sporadic net P release relativeto the K tracer The mixing patterns between TP SRP and Kconcentrations in Figure 3 had a well-defined lower boundary ofsamples with the lowest P concentrations relative to K (shown inFigure 3 as a ldquoline of maximum P retentionrdquo) This line ofmaximum P retention probably represents a secondaryendmember mixing line between the same low concentrationnonagricultural runoff endmember and a secondary agricultural
field runoff endmember with high K but lower P concentrationsas a result of P retention processes filtering out P We posit thatthe majority of this P was ldquofilteredrdquo out during diffuse recharge ofwater as through the soil and the epikarst into the karst aquiferThe spring-water samples which lie between the line ofmaximum retention and the conservative mixing series thereforelikely reflect the net effects of P retention and remobilizationprocesses for runoffwater entering the karst drainage system via amixture of diffuse and point rechargeBy comparing the observed spring-water TP and SRP versus K
relationships with the theoretical linear conservative mixingseries the net effects of P retention and release can be directlyquantified (Figure 3) By applying the theoretical conservativemixing series (TP versus K and SRP versus K) to the measuredspring-water K concentrations at LLS and CHS ldquoconservativerdquoTP and SRP concentration time series were derived (Figure SI-3ab Supporting Information) and converted to loads using thecorresponding spring flow data By taking the difference betweenmeasured and ldquoconservativerdquo TP and SRP loads we calculatednet TP and net SRP retention on an annual basis as well as forbase flows (lowest 10 of flows) and storm flows (highest 10 offlows) (Table 2)Annual net TP retention ranged from 69 at LLS to 54 at
CHS Net percentage P retention was consistently higher forSRP compared with TP not only on an annual basis but alsounder storm and base flow conditions This indicated preferentialretention of more labile SRP fractions by sorptionuptake andgreater mobility of TP organic and particulate P fractions Similarpatterns of soluble and particulate P retention have also beenobserved in other karst soils and drainage systems71113 Highestpercentage net P retention occurred during storm events at LLS(92 TP retention and 96 SRP retention) However the twosprings showed very different patterns in P retention under stormand base flow conditions At LLS net P retention was greatestduring storm flows than under base flow conditions reflecting ahigh efficiency of P retention from agricultural runoff at LLS Incontrast at CHS a greater percentage of the P load was retained
Table 2 Measured and ldquoConservativerdquo Annual Loads and Mean Daily Base Flow and Storm Flow Loads of Total Phosphorus(TP) and Soluble Reactive Phosphorus (SRP) in Langle and Copperhead Springs with Net and Percentage TP and SRP Retention
measured P load(kg yminus1 or g dminus1)
ldquoconservativerdquo P load(kg yminus1 or g dminus1)
net P retention(kg yminus1 or g dminus1) net P retention
Langle Spring(LLS)
annual TP load(kg yminus1)
701 223 153 69
annual SRP load(kg yminus1)
185 190 172 90
Copperhead Spring(CHS)
annual TP load(kg yminus1)
265 57 31 54
annual SRP load(kg yminus1)
098 33 23 70
Langle Spring(LLS)
avg base flow TP load(g dminus1)
103 233 130 56
avg base flow SRP load(g dminus1)
221 198 176 89
Copperhead Spring(CHS)
avg base flow TP load(g dminus1)
127 355 228 64
avg base flow SRP load(g dminus1)
045 214 169 79
Langle Spring(LLS)
avg storm flow TP load(g dminus1)
112 1448 1336 92
avg storm flow SRP load(g dminus1)
514 1240 1189 96
Copperhead Spring(CHS)
avg storm flow TP load(g dminus1)
445 971 527 54
avg storm flow SRP load(g dminus1)
175 567 392 69
Environmental Science amp Technology Article
dxdoiorg101021es405585b | Environ Sci Technol XXXX XXX XXXminusXXXF
under base flow than during storm flow This reflects much lowerbase flows at CHS which increase water residence time andpromote particulate sedimentation and P retention and higherstorm flows linked to stream piracy which provide greaterflushing from nonagricultural areas where flows have a low PconcentrationContaminant Residence Times in Karst DrainageWhile
monitoring P relative to a conservative tracer provides us withvaluable information on rates of annual and storm flowbase flownet retention it provides no information about the residencetimes of P within the karst or the time scales over whichretention and remobilization may occur This is of strategicconcern in relation to the ldquolegacyrdquo of P within watersheds4243
whereby time-lags in release of retained Pmaymask the effects ofconservation measures on receiving water quality By measuringa full suite of trace elements using ICP-MS a ldquoserendipitousrdquoobservation was made which may help provide clues about thewider contaminant residence times within the karst drainageConcentrations of ldquodissolvedrdquo (lt045 μm) lanthanum (La) instorm flow spring discharge at LLS were more than an order ofmagnitude higher than could be accounted for by the runoffsources measured within the SEW Figure 4 shows theconcentrations of La in the spring discharge at LLS and aldquoconservativerdquo (maximum) concentration from runoff whichaccounts for the dilution of agricultural runoff during transitthrough the karst drainage using K as a tracer The high stormflow La concentrations observed at LLS are likely a ldquolegacyrdquosignal from a past tracer experiment In 2001 lanthanum-labeledmontmorillonite clays were injected into a losing stream at SEWas part of a study to examine clay and bacterial transport44
While the La tracer was detected at LLS around 16 h after itwas injected44 our monitoring suggests the La tracer was alsoretained within the karst drainage system and continues to beremobilized and released during storm events more than 10 yearslater Unfortunately it is impossible to perform a mass balance toquantify how much of the La applied in the tracer study remainswithin the karst drainage system and how long a La ldquolegacyrdquomight persist as no La measurements were made in the
intervening 10 years between the tracer injection in 2001 and ourmonitoring which started in November 2011 Within the scopeof this study it was also not possible to determine whether the Laconcentrations measured were truly dissolved or a lt045 μmcolloidalclay fraction or whether La geochemistry is sufficientlysimilar to be used as an indicator of P transport However theseresults indicate that La a tracer expected to be flushed rapidlythrough the karst was retained and continues to be remobilizedand released during storm events more than 10 years later Thisindicates the potential for contaminant retention in thesubsurface karst drainage system where contaminant storageand gradual rerelease may occur over time scales of at least adecade
Wider Implications Hydrochemical tracers of agriculturalrunoff allowed us to directly evaluate the nonconservativebehavior of P within karst drainage and quantify net P retentionOur results challenge the widely held assumption that karstlandscapes are always highly vulnerable to P loss and suggest thatin some cases karst drainage may provide a greater sink for Pthan previously considered P from agricultural runoff wasattenuated by hydrological dilution from cleaner (nonagricul-tural) sources during transport through karst drainage Howeverthere was also a high capacity for net P retention especially forLangle Spring which was subject to the highest agricultural Ploadings Here sim70 of the annual TP flux and sim90 of theannual SRP flux was retained Moreover the buffering within thesoils and karst drainage not only retained a high proportion ofincoming fluxes of P from agricultural runoff but preferentiallyretained the most bioavailable P fractions For instance muchresearch has documented the capacity of soil to retain applied Pin various inorganic (Al Fe Ca complexes) and organic forms ofvarying stability4546 The long-term accumulation of P in soilhowever can be released slowly to soil water2847
The mechanisms of P retention were not investigated here butlikely include varying combinations of processes includingadsorption onto clays coprecipitation of P with CaCO3 andbinding with particulate humic substances11minus13 in the soil inepikarst and within the fractures and conduits These adsorption
Figure 4 Time series of measured and ldquoconservativerdquo lanthanum (La) concentrations and flow at Langle spring Measured La concentrations aredenoted by solid circles ldquoconservativerdquo La concentrations are denoted by open circles See text for explanation of how ldquoconservativerdquo La concentrationswere calculated
Environmental Science amp Technology Article
dxdoiorg101021es405585b | Environ Sci Technol XXXX XXX XXXminusXXXG
products and precipitates will be physically retained as the watervelocity slows and will be deposited as sediment along the base ofthe conduit flow paths With the recurrence of high flow thesesediments are resuspended by turbulent flow and moved alongthe flow path until redeposited or eventually resurged at thebase-level spring Given the potential importance of CaCO3minusPcoprecipitation for P retention in karst terrain and the possibilityof reductions in the efficiency of this coprecipitation mechanismunder higher P and dissolved organic carbon (DOC)concentrations124849 further work is needed to examine anyunforeseen impacts of increasing agricultural intensification onthis ldquoself-cleansingrdquo P retention mechanism However in thisstudy the site with the higher livestock intensity and with highermanure-enriched runoff actually demonstrated greater efficiencyof P retention This may indicate that critical P and DOCthresholds for inhibition of CaCO3 precipitation were notreached or that other P retention process mechanisms wereoccurringThe patterns in spring-water La concentrations suggest
continued released of La from springs more than 10 years aftera tracer injection and indicate the potential for long-termcontaminant retention storage and subsequent release Indeedthe complex nature of karst hydrological pathways can result inlarge distributions in water and contaminant residence times andlag times for discharge to surface waters may bemuch longer thanexpected50minus52 Our findings indicate that retention of P withinkarst drainage may reduce the risk of acute episodic storm-drivenlosses of agricultural P However the potential buffering of P inthe epikarst and within the fracture and conduit drainage systemcan provide a slow but long-term source of P released via springsto surface waters Further work is needed to determine theecological impacts of such patterns of P release to receivingstreams and the ability of those streams to assimilate thoseinputs compared with higher pulse inputs during storm flows
ASSOCIATED CONTENT
S Supporting InformationMap of the SEW and the karst water flow system time series ofspring-water TP SRP K and Rb concentrations table of Ca TPand SRP endmember concentrations soils and geology of theSavoy Experimental Watershed experimental methods Thismaterial is available free of charge via the Internet at httppubsacsorg
AUTHOR INFORMATION
Corresponding AuthorPhone ++44 (0)1491 838800 Fax ++44 (0)1491692424 E-mail hpjcehacuk
NotesThe authors declare no competing financial interest
ACKNOWLEDGMENTS
HPJ acknowledges funding and support from the UK NaturalEnvironment Research Council a Fulbright DistinguishedScholar Award and an OECD Co-operative Research Pro-gramme Fellowship We thank Chris Wardle (British GeologicalSurvey) for help with the artwork and Dr Tiong Ee Ting forpermission to reproduce tracer experiment results in theSupporting Information
REFERENCES(1) Panno S V Karst aquifers Can they be protected Ground Water2006 44 (4) 494minus494(2) White W B Culver D C Herman J S Kane T C Mylroie JE Karst lands Am Sci 1995 83 (5) 450minus459(3) Owen M R Pavlowsky R T Base flow hydrology and waterquality of an Ozarks spring and associated recharge area southernMissouri USA Environ Earth Sci 2011 64 (1) 169minus183(4) Baffaut C Benson VWModeling flow and pollutant transport ina karst watershed with SWAT Trans ASABE 2009 52 (2) 469minus479(5) Fournier M Motelay-Massei A Massei N Aubert MBakalowicz M Dupont J P Investigation of transport processesinside karst aquifer by means of STATIS Ground Water 2009 47 (3)391minus400(6) Brahana J V Rationale and methodology for approximatingspring-basin boundaries in the mantled karst terrane of the SpringfieldPlateau northwestern Arkansas In The engineering geology andhydrogeology of karst terranes Beck B F Stephenson B F Eds A ABalkema Rotterdam 1997 pp 77minus82(7) Kilroy G Coxon C Temporal variability of phosphorus fractionsin Irish karst springs Environ Geol 2005 47 (3) 421minus430(8) Lerch R N Contaminant transport in two central Missouri karstrecharge areas J Cave Karst Stud 2011 73 (2) 99minus113(9) Coxon C Agriculture and karst In Karst Management Beynen PE Ed Springer Dordrecht Netherlands 2011 pp 103minus138(10) Kacaroglu F Review of groundwater pollution and protection inkarst areas Wat Air Soil Pollut 1999 113 (1minus4) 337minus356(11) Allousha G A Boyer D G Belesky D P Halvorson J JPhosphorus mobility in a karst landscape under pasture grazing systemAgronomie 2003 23 (7) 593minus600(12) Neal C Jarvie H PWilliams R J Neal MWickham H HillL Phosphorus-calcium carbonate saturation relationships in a lowlandchalk river impacted by sewage inputs and phosphorus remediation Anassessment of phosphorus self-cleansing mechanisms in natural watersSci Total Environ 2002 282 295minus310(13) von Wandruszka R Phosphorus retention in calcareous soils andthe effect of organic matter on its mobility Geochem Trans 2006 7 6(14) Mellander P-E Jordan P Melland A R Murphy P N CWall D P Mechan S Meehan R Kelly C Shine O Shortle GQuantification of phosphorus transport from a karstic agriculturalwatershed to emerging spring water Environ Sci Technol 2013 47 (12)6111minus6119(15) Mellander P-E Jordan P Wall D P Melland A R MeehanR Kelly C Shortle G Delivery and impact bypass in a karst aquiferwith high phosphorus source and pathway potentialWater Res 2012 46(7) 2225minus2236(16) Stueber A M Criss R E Origin and transport of dissolvedchemicals in a karst watershed southwestern Illinois J Am Water ResAssoc 2005 41 (2) 267minus290(17) Kleinman P J A Sharpley A N McDowell R W Flaten DN Buda A R Tao L Bergstrom L Zhu Q Managing agriculturalphosphorus for water quality protection Principles for progress PlantSoil 2011 349 (1minus2) 169minus182(18) Sharpley A N Kleinman P J A Flaten D N Buda A RCritical source area management of agricultural phosphorus Experi-ences challenges and opportunities Water Sci Technol 2011 64 (4)945minus952(19) Sharpley A N Jarvie H P Agricultural management waterquality amp ecology Putting practice into policy In National AgriculturalBiotechnology Council Report 24 Eaglesham A Korth K Hardy R WF Eds Jacobs Press Auburn NY 2012 pp 73minus99(20) Sims J T Ma L Oenema O Dou Z Zhang F S Advancesand challenges for nutrient management in China in the 21st century JEnviron Qual 2013 42 (4) 947minus950(21) Kellogg R L Lander C H Moffitt D C Gollehon N Manurenutrients relative to the capacity of cropland and pastureland toassimilate nutrients Spatial and temporal trends for the United StatesResource Assessment and Strategic Planning Working Paper 98-1 USDANatural Resources Conservation Service and Economic Research
Environmental Science amp Technology Article
dxdoiorg101021es405585b | Environ Sci Technol XXXX XXX XXXminusXXXH
Service General Services Administration National Forms andPublication Center Fort Worth TX 2000 pp 1minus140 httpwwwnrcsusdagovtechnicallandpubsmanntrpdf(22) Maguire R O Rubaeligk G H Haggard B E Foy B H Criticalevaluation of the implementation of mitigation options for phosphorusfrom field to catchment scales J Environ Qual 2009 38 (5) 1989minus1997(23) Christophersen N Neal C Hooper R P Vogt R DAndersen S Modeling streamwater chemistry as a mixture of soilwaterend-members - A step towards 2nd-generation acidification models JHydrol 1990 116 (1minus4) 307minus320(24) Neal C Jarvie H P Williams R Love A Neal M WickhamH Harman S Armstrong L Declines in phosphorus concentration inthe upper River Thames (UK) Links to sewage effluent cleanup andextended end-member mixing analysis Sci Total Environ 2010 408 (6)1315minus1330(25) Jarvie H P Neal C Withers P J A Baker D B Richards RP Sharpley A N Quantifying phosphorus retention and release inrivers and watersheds using extended end-member mixing analysis (E-EMMA) J Environ Qual 2011 40 (2) 492minus504(26) Jarvie H P Sharpley A N Scott J T Haggard B E BowesM J Massey L B Within-river phosphorus retention Accounting for amissing piece in the watershed phosphorus puzzle Environ Sci Technol2012 46 (24) 13284minus13292(27) Brahana V The Savoy Experimental WatershedA long-termresearch site for karst hydrogeology In Caves and Karst of the USANational Speleological Society Guidebook for the International Congress ofSpeleology Palmer A N Palmer M V Eds National SpeleologicalSociety Huntsville AL 2009 section 5 Ozark Plateaus p 179(28) Sharpley A N Kleinman P J A Jordan P Bergstrom LAllen A L Evaluating the success of phosphorus management fromfield to watershed J Environ Qual 2009 38 1981minus1988(29) Scott J T Haggard B E Sharpley A N Romeis J J Changepoint analysis of phosphorus trends in the Illinois River (Oklahoma)demonstrates the effects of watershed management J Environ Qual2011 40 (4) 1249minus1256(30) Brahana J V Controlling influences on ground-water flow andtransport in the shallow karst aquifer of northeastern Oklahoma andnorthwestern Arkansas Proceedings volume hydrologic problemsalong the Arkansas-Oklahoma border Arkansas Water ResourcesCenter Publication No MSC-168 1995 pp 25minus3033(31) Brahana J V Ting T Al-Qinna M Murdock J Davis R KLainz J Killingbeck J J Szilvagyi E Doheny-Skubic M Chaubey IHays P D Thoma G Quantification of hydrologic budget parametersfor the vadose zone and epikarst in mantled karst US GeologicalSurvey Karst Interest Group Proceedings Rapid City SD Sept 12minus152005 Kuniansky E L Ed US Geological Survey ScientificInvestigations Report 2005-5160 pp 144minus152(32) Leh M D Chaubey I Murdoch J Brahana J V Haggard BE Delineating runoff processes and critical runoff source areas in apasture hillslope of the Ozark Highlands Hydrol Proc 2008 22 (21)4190minus4204 DOI 101002hyp7021(33) Haggard B E Phosphorus concentrations loads and sourceswithin the Illinois River drainage area Northwest Arkansas 1997minus2008J Environ Qual 2010 39 (6) 2113minus2120(34) Tortorelli R L Pickup B E Phosphorus concentrations loadsand yields in the Illinois River basin Arkansas and Oklahoma 2000minus2004 US Geological Survey Scientific Investigations Report 2006-5175 p 38(35) Murphy J Riley J P A modified single solution method for thedetermination of phosphate in natural-waters Anal Chim Acta 196227 31minus36(36) Eisenreich S J Bannerman R T Armstrong D E Simplifiedphosphorus analytical technique Environ Lett 1975 9 (1) 43minus53(37) Jarvie H P Withers P J A Neal C Review of robustmeasurement of phosphorus in river water Sampling storagefractionation and sensitivity Hydrol Earth Syst Sci 2002 6 113minus131(38) Divine C E McDonnell J J The future of applied tracers inhydrogeology J Hydrogeol 2005 13 255minus258
(39) Burns D A McDonnell J J Hooper R P Peters N E FreerJ E Kendall C Beven K Quantifying contributions to storm runoffthrough endmember mixing analysis and hydrologic measurements atthe Panola Mountain Research Watershed (Georgia USA) HydrolProc 2001 15 1903minus1924(40) Williams P W The role of the epikarst in karst and cavehydrogeology a review Int J Speleol 2008 31 1minus10(41) Jarvie H P Neal C Smart R Owen R Fraser D Forbes IWade A Use of continuous water quality records for hydrographseparation and to assess short-term variability and extremes in acidityand dissolved carbon dioxide for the River Dee Scotland Sci TotalEnviron 2001 265 (1minus3) 85minus98(42) Jarvie H P Sharpley A N Spears B Buda A R May LKleinman P J A Water quality remediation faces unprecedentedchallenges from ldquolegacy phosphorusrdquo Environ Sci Technol 2013 47(16) 8997minus8998(43) Sharpley A Jarvie H P Buda A May L Spears B KleinmanP Phosphorus legacy Overcoming the effects of past managementpractices to mitigate future water quality impairment J Environ Qual2013 42 (5) 1308minus1326(44) Ting T E E Assessing bacterial transport storage and viability inmantled karst of northwest Arkansas using clay and Escherichia colilabeled with lanthanide-series metals PhD Dissertation University ofArkansas 2005(45) Sharpley A N Smith S J Bain W R Nitrogen and phosphorusfate from long-term poultry litter applications toOklahoma soils Soil SciSoc Am J 1993 57 (4) 1131minus1137(46) Frossard E Condron L M Oberson A Sinaj S Fardeau J CProcesses governing phosphorus availability in temperate soils JEnviron Qual 2000 29 (1) 15minus23(47) Cox F R Kamprath E J McCollum R E A descriptive modelof soil test nutrient levels following fertilization Soil Sci Soc Am J 198145 (3) 529minus532(48) Inskeep W P Bloom P R kinetics of calcite precipitation in thepresence of water-soluble organic-ligands Soil Sci Soc Am J 1986 50(5) 1167minus1172(49) Dove P M Hochella M F Calcite precipitation mechanismsand inhibition by orthophosphate - insitu observations by scanning forcemicroscopy Geochim Cosmochim Acta 1993 57 (3) 705minus714(50) Kirchner J W Feng X H Neal C Fractal stream chemistry andits implications for contaminant transport in catchments Nature 2000403 (6769) 524minus527(51) Kirchner J W Neal C Universal fractal scaling in streamchemistry and its implications for solute transport and water qualitytrend detection Proc Nat Acad Sci USA 2013 110 (30) 12213minus12218(52) Neal C Catchment water quality The inconvenient butnecessary truth of fractal functioning Hydrol Proc 2013 27 (24)3516minus3520
Environmental Science amp Technology Article
dxdoiorg101021es405585b | Environ Sci Technol XXXX XXX XXXminusXXXI
Coupling High-Frequency Stream Metabolism and NutrientMonitoring to Explore Biogeochemical Controls on DownstreamNitrate DeliveryHelen P Jarviedagger Andrew N SharpleyDagger Timothy Kressesect Phillip D Hays∥ Richard J Williamsdagger
Stephen M Kingperp and Lawrence G BerryDagger
daggerNERC Centre for Ecology and Hydrology Wallingford OX10 8BB United KingdomDaggerDepartment of Crop Soil and Environmental Sciences University of Arkansas Fayetteville Arkansas 72701 United StatessectUS Geological Survey Lower Mississippi-Gulf Water Science Center 401 Hardin Road Little Rock Arkansas 72211 UnitedStates∥US Geological Survey Lower Mississippi-Gulf Water Science CenterUniversity of Arkansas Department of Geosciences 216Gearhart Hall Fayetteville Arkansas 72701 United StatesperpSTFC Rutherford Appleton Laboratory Harwell Campus Didcot Oxfordshire OX11 0QX United Kingdom
S Supporting Information
ABSTRACT Instream biogeochemical process measurementsare often short-term and localized Here we use in situ sensorsto quantify the net effects of biogeochemical processes onseasonal patterns in baseflow nitrate retention at the river-reachscale Dual-station high-frequency in situ nitrate measurementswere coupled with high-frequency measurements of streammetabolism and dissolved inorganic carbon in a tributary of theBuffalo National River Arkansas Nitrate assimilation wascalculated from net primary production and combined withmass-balance measurements to estimate net nitrification anddenitrification The combined net effects of these instreamprocesses (assimilation denitrification and nitrification)removed gt30minus90 of the baseflow nitrate load along a 65km reach Assimilation of nitrate by photoautotrophs during spring and early summer was buffered by net nitrification Netnitrification peaked during the spring After midsummer there was a pronounced switch from assimilatory nitrate uptake todenitrification There was clear synchronicity between the switch from nitrate assimilation to denitrification a reduction in riverbaseflows and a shift in stream metabolism from autotrophy to heterotrophy The results show how instream nitrate retentionand downstream delivery is driven by seasonal shifts in metabolic pathways and how continuous in situ stream sensor networksoffer new opportunities for quantifying the role of stream biota in the dynamics fate and transport of nitrogen in fluvialsystems
1 INTRODUCTION
Nutrients including nitrogen (N) phosphorus (P) and carbon(C) from agriculture and domestic wastewater are a majorsource of water-quality impairment1 Excessive nutrient inputsto rivers streams and lakes can accelerate growth of nuisanceand harmful algae Resulting increases in microbial activity anddepletion of dissolved oxygen (DO) have profound negativeconsequences for invertebrates and fish potable water supplyand recreation23 However biogeochemical processes instreams also play an important role in regulating downstreamnutrient transport with stream biota retaining and removingnutrients from the water column reducing downstreamecological impacts4minus6
Streams can provide a major sink for nitrate (NO3minus)
through uptake (assimilation) by primary production and
through denitrification78 The effectiveness of these processesvaries throughout the year and between streams butconventional methods for estimating NO3
minus uptake are basedon relatively few short-term experimental nutrient additionsand isotope measurements9minus11 making results difficult toextrapolate in space and time12 Continuous high-frequency insitu measurements offer new opportunities to explore NO3
minus
source dynamics13minus17 and instream processes have beeninferred from single-station diurnal concentration cycles121819
longitudinal profiling20minus23 and nested sensor networks24
Received June 6 2018Revised October 23 2018Accepted October 30 2018Published October 30 2018
Article
pubsacsorgestCite This Environ Sci Technol 2018 52 13708minus13717
copy 2018 American Chemical Society 13708 DOI 101021acsest8b03074Environ Sci Technol 2018 52 13708minus13717
Dow
nloa
ded
via
CT
R F
OR
EC
OL
OG
Y amp
HY
DR
OL
OG
Y o
n D
ecem
ber
4 2
018
at 0
936
54
(UT
C)
Se
e ht
tps
pub
sac
sor
gsh
arin
ggui
delin
es f
or o
ptio
ns o
n ho
w to
legi
timat
ely
shar
e pu
blis
hed
artic
les
In this study we used in situ sensors to quantify the neteffects of biogeochemical processes on seasonal patterns inbaseflow NO3
minus retention at the river-reach scale The approachemployed here is novel because it combines dual-station high-frequency NO3
minus measurements with high-frequency measure-ments of stream metabolism (analysis of diurnal DO curves tocalculate primary production and respiration) dissolvedinorganic carbon (DIC) and excess partial pressure of carbondioxide (EpCO2) to explore the capacity of instreambiogeochemical processes to retain and remove NO3
minus High-frequency in situ monitoring of water chemistry and stream-flow was undertaken along a 65 km experimental reach of BigCreek a tributary of the Buffalo National Scenic RiverArkansas USA and were used to calculate a NO3
minus massbalance along the reach Net primary production was used tocalculate NO3
minus assimilation by photoautotrophs Daily NO3minus
removal rates and rates of NO3minus assimilation by photo-
autotrophs were used to calculate net nitrification anddenitrification The biogeochemical controls on NO3
minus removalwere then evaluated in relation to wider ecosystem driversincluding streamflow DO and stream ecological function toexplore how seasonal shifts in metabolic pathways influenceinstream NO3
minus retention and downstream NO3minus delivery
2 MATERIALS AND METHODS21 Site Description and Water-Quality Monitoring
Big Creek a tributary of the Buffalo National Scenic RiverArkansas (Figure 1) is the subject of detailed water-quality
monitoring because of a permitted swine concentrated animalfeeding operation (CAFO) within the watershed in operationsince September 2013 The Big Creek watershed lies in thekarst terrain of the Ozark Plateau of the midcontinental USA(Figure 1) The watershed area is 236 km2 with 79 of theland area deciduous forest 3 evergreen forest 14grasslandpasture and 3 developed land (see SupportingInformation SI S11) Swine-manure slurry from the CAFO
has been land applied to permitted fields since January 1 2014in accordance with State regulationsThe focus of this study is an experimental reach of Big
Creek downstream of the CAFO from an upstreammonitoring station at Mt Judea (USGS site 07055790watershed area 106 km2) to a downstream monitoring stationat Carver (USGS site 07055814 watershed area 233 km2)721 and 069 km from the confluence between Big Creek andthe Buffalo River respectively (Figure 1) One tributary (LeftFork) enters Big Creek between Mt Judea and Carver Thewatershed is a mantled karst terrain characterized by intimateconnection between groundwater and surface water transportof surface-derived nutrients can be rapid25 (see S12)USGS conducted high-frequency (15 min) NO3
minus monitor-ing using submersible ultraviolet nitrate probes at Carver (06032014 to 04292017) and Mt Judea (11012014 to 11012015) there was therefore one year of overlapping data(11012014 to 11012015) during which NO3
minus monitoringwas undertaken at both Mt Judea and Carver A water-qualitysonde (YSI 6600) operating at Carver simultaneously collected15 min interval DO pH specific conductance and watertemperature data Further information about the high-frequency water-quality monitoring is provided in S13Water-quality samples collected on a weekly basis since 09
122013 with additional opportunistic high-flow sampling atMt Judea Left Fork and at a groundwater (spring) monitoringsite (Figure 1) provided NO3
minus (by ion chromatographyDionex ICS-1600) alkalinity (by fixed-end point acidimetrictitration to pH 4526) and conductivity (VWR SymphonyB10C) data All nitrate concentrations are reported as NO3minusN(mg-N Lminus1) Water-quality data are available at httpsbigcreekresearchorg
22 Stream-Flow Measurements and HydrographSeparation Stream flow was measured using establishedUSGS streamflow gauging methods27 (see S14) A two-component mixing model was used to partition thecontributions to streamflow from groundwater and surfacerunoff28 using alkalinity as a conservative groundwater tracer(see S15)
23 Analysis of Diurnal Dissolved Oxygen Curves toCalculate Primary Production and Respiration The dailyaverage gross primary production daily average ecosystemrespiration and reaeration coefficient were calculated from theseries of diurnal DO curves at Carver (see S16) using apiecewise solution of the mass balance DO model29 simplifiedfor the situation where the deficit does not vary spatially (eq1) the Delta method3031
D t k D td d ER GPP ( )a av av+ = minus (1)
where D is the DO deficit (mg-O2 Lminus1) t is the time (days) ka
is the reaeration coefficient ERav is the ecosystem respiration(mg-O2 L
minus1 dminus1) and GPPav is the gross primary production(mg-O2 Lminus1 dminus1) these are standard measures of ecosystemrespiration and gross primary production in river systems32
Odum33 suggested a classification system of flowing-watercommunities based on oxygen metabolism by using the ratio ofGPPav to ERav (GPPER) Respiration is associated with bothplant and microbial activity Photosynthesis is only associatedwith plants Autotroph-dominated communities are repre-sented by GPPER values gt1 whereas heterotroph-dominatedcommunities are represented by GPPER values lt1
24 Use of the THINCARB Model for CalculatingDissolved Inorganic Carbon Concentrations and Excess
Figure 1 Map of the Big Creek watershed and its location
Environmental Science amp Technology Article
DOI 101021acsest8b03074Environ Sci Technol 2018 52 13708minus13717
13709
Partial Pressure of Carbon Dioxide The THINCARBmodel (THermodynamic modeling of INorganic CARBon)34
uses pH Gran Alkalinity (AlkGran) and temperature measure-ments to calculate dissolved inorganic carbon (DIC)concentrations and DIC speciation from the excess partialpressures of carbon dioxide (EpCO2) in freshwatersTHINCARB is open access and is described in detail in Jarvieet al (2017)34 an outline is provided in S17 Prior to usealkalinity measurements in units of mg-CaCO3 L
minus1 were firstconverted to AlkGran (in μeq Lminus1) where 1 mg Lminus1 CaCO3 =1998 μeq Lminus134
THINCARB was applied to the high-frequency sonde datafrom Carver Specific conductance was used as a surrogate foralkalinity using the regression relationship between AlkGranand specific conductance (κ) measured across the Big Creekwatershed including the spring and Mt Judea Left Fork andCarver stream sites AlkGran = 865 (plusmn028) times κ minus 644 (plusmn66)R2 = 095 n = 270 P lt 0001 (numbers in parenthesesrepresent twice the standard error) By applying this regressionequation to the hourly κ series an hourly alkalinity record wasderived which was then used alongside the hourly pH andwater-temperature data to calculate a high-frequency DIC andEpCO2 series25 Mass-Balance Calculation of Baseflow Nitrate
Fluxes Instream Losses and Net Nitrification andDenitrification Daily mass-balance calculations were under-taken for eight quiescent low-flow periods (each typically of1minus2 weeks) USGS stream-velocity readings from Carverranged from 0457 and 122 m sminus1 and with a stream distancealong the experimental reach of 652 km the travel timesranged from 396 to 148 h Therefore daily mass balances
over a 24-h period were assumed sufficient to account fortransit of NO3
minus given (a) the relatively short travel times (b)the high degree of stationarity in flux transfers during quiescentbaseflow conditions and (c) that calculated daily massbalances were averaged over a 1minus2 week periodThe 15 min NO3
minus measurements at Mt Judea and Carverwere converted to daily means and daily nitrate loads at eachsite were calculated using the corresponding gauged dailystreamflow data To account for flow accretion along the reachthe difference between the daily flow downstream at Carverand the upstream site at Mt Judea was calculated The increasein flows was assumed to be input from Left Fork (Figure 1)Daily NO3
minus input loading to the reach (LT) was calculatedas the sum of the daily NO3
minus loads from Mt Judea (LMJ) andLeft Fork (LLF)
L L LT MJ LF= + (2)
There was no high-resolution NO3minus monitoring on Left
Fork so weekly NO3minus measurements from grab samples taken
at Left Fork were combined with the measured daily flowaccretion to derive daily loads from Left Fork (S181) Asensitivity analysis evaluated the potential effects of under- oroverestimating Left Fork NO3
minus concentrations by plusmn50(Tables SI1 and SI2)Within this karst watershed some of the flow accretion will
arise from direct groundwater input into Big Creek Dischargedata were not available from the Left Fork tributary and directapportionment of contributions from Left Fork and ground-water was not possible We therefore evaluated a secondalternative ldquoendmemberrdquo case scenario whereby all of flow
Figure 2 Time series at the downstream monitoring site (Carver) from May 2014 to May 2017 showing (a) nitrate (NO3minusN) dissolvedinorganic carbon (DIC) and streamflow and (b) daily average gross primary production (GPP) ecosystem respiration (ER) and streamflow
Environmental Science amp Technology Article
DOI 101021acsest8b03074Environ Sci Technol 2018 52 13708minus13717
13710
accretion was attributed to direct groundwater contribution(S182)The daily instream NO3
minus load removal (LR) along the reachwas calculated as the difference between the daily input NO3
minus
loading (LT) and the daily NO3minus load at Carver (LC)
L L LR T C= minus (3)
To allow direct comparison with rates of assimilatory NO3minus
uptake by photosynthesis LR (kg-N dminus1) was then convertedto a daily NO3
minus removal rate UT (mg-N Lminus1 dminus1) UTincorporates both assimilatory NO3
minus uptake by photo-autotrophs (UA) heterotrophic NO3
minus removal through directuptake and denitrification (UD) and NO3
minus enrichment due toremineralization via nitrification (R)20
U U U RT A D= + minus (4)
UA was estimated from the GPPav measurements1235 GPPavdata were converted into net primary production (NPP)assuming that autotrophic respiration consumed 50 of theGPPav
3637 NPP data were then converted from units of O2uptake (mg-O2 L
minus1 dminus1) to C uptake (mg-C Lminus1 dminus1) with aphotosynthetic quotient of 100 then converted to NO3
minus
uptake (mg-N Lminus1 dminus1) using a molar ratio of CN of 1238
Subtracting UT from UA provides a measure of either netnitrification (positive values) or net heterotrophic NO3
minus
removal through direct uptake and denitrification hereafterreferred to as ldquonet denitrificationrdquo (negative values) When theriver was influent loss of NO3
minus to groundwater was accountedfor as described in S183
3 RESULTS AND DISCUSSION31 Three-Year Time Series of Nitrate Dissolved
Inorganic Carbon and Stream Metabolism The hourlyNO3
minus and DIC concentrations variations at Carver were drivenby streamflow but in opposing directions (Figure 2a) Themean and median NO3
minus concentrations were 0128 and 0093
mg-N Lminus1 respectively Nitrate concentrations at Carver werelowest during baseflow (mean 0043 mg-N Lminus1 lowest 10 offlows) and highest during storm runoff (mean 0278 mg-N Lminus1highest 10 of flows) arising from nonpoint-sourcemobilization and delivery of NO3
minus during rainfall eventsThe mean and median DIC concentrations were 248 and
252 mg-C Lminus1 respectively DIC concentrations were highestduring baseflow (mean 317 mg-C Lminus1) with DIC concen-trations diluted by storm runoff (mean 132 mg-C Lminus1)Highest DIC and lowest NO3
minus concentrations occurred duringthe extended low-flows between August and November 2015The mean and median molar CN ratios were 356 and 305
respectively The mean CN ratio during baseflow was 882 and82 during stormflow CN ratios greater than sim66 areindicative of stoichiometric depletion of N relative to C39
Absolute NO3minus concentrations below sim01 mg-N Lminus1 are
deemed likely to be limiting to algae with algal growthresponse to NO3
minus enrichment occurring between 038 to 179mg-N Lminus140 Therefore under average and baseflow conditionsat Carver a clear potential exists for algal growth to be limitedby low NO3
minus availabilityNo longer-term trends in either NO3
minus or DIC wereobserved over the three years These high-frequencymonitoring results are consistent with results from near-weeklywater-quality monitoring of Big Creek at Mt Judea whichshowed no statistically significant increasing or decreasingtrends in dissolved or particulate forms of P and Nconcentrations since 201341
Earlier studies6 have shown that Ozark streams can be veryeffective at retaining available nutrients and buffering addi-tional nutrient inputs Therefore the absence of any increasingtrend in nutrients in the water column may result from therapid and efficient uptake of nutrient inputs by stream biotaConsequently high-resolution stream metabolism and nutrientmeasurements were used here to detect whether increasedphotosynthesis or respiration rates resulted from increased
Figure 3 Scatter plot showing the relations between mean daily nitrate concentrations upstream at Mt Judea and downstream at Carver
Environmental Science amp Technology Article
DOI 101021acsest8b03074Environ Sci Technol 2018 52 13708minus13717
13711
nutrient assimilation even where no increases in water-columnnutrient concentrations could be observed
The time series in daily rates of GPPav and ERav at Carver(Figure 2b) showed no definitive long-term trends between
Figure 4 Time series from 1 November 2014 to 1 November 2015 showing (a) Nitrate concentrations upstream at Mt Judea and downstream atCarver and the lower-flow time periods used for mass balance calculation and evaluation of biogeochemical processes (b) streamflow at Carverand the percentage groundwater contribution to streamflow (c) daily ratio of gross primary production ecosystem respiration (GPPER)downstream at Carver (horizontal dashed line shows GPPER of 1 ie balance between heterotrophy and autotrophy) and excess partial pressureof carbon dioxide (EpCO2) and (d) streamflow and the molar CN ratio (DIC dissolved inorganic carbonNO3minusN) downstream at Carver
Environmental Science amp Technology Article
DOI 101021acsest8b03074Environ Sci Technol 2018 52 13708minus13717
13712
2014 and 2017 GPPav declined rapidly in response to majorstorm runoff events but typically recovered within a couple ofweeks Highest GPPav tended to occur during quiescentbaseflow or recessional streamflow conditions during thesummer (May through August) Both GPPav and ERav declinedduring the autumn (September through December) reflectingreductions in stream biological activity and GPPav tended todecline at a faster rate than ER This was particularly apparentduring the extended low-flows between August and December2015 suggesting a decline in primary production relative tomicrobial activity and a transition from net autotrophic to netheterotrophic stream communities During winter baseflows(November through January) ERav tended to exceed GPPavDuring the 3-yr monitoring no CAFO-related impacts oneither stream nutrient concentrations or metabolism arediscernible at Carver32 Temporal and Spatial Variability in NO3
minus
Concentrations Relative to Other Key EnvironmentalVariables Mean daily NO3
minus concentrations varied betweenbaseflow and storm events at Mt Judea and Carver during theone year of overlapping data (Figure 3) There was a cleardifferentiation between a higher-flow period characterized byregular storm events from mid-December 2014 to mid-July2015 and lower-flow conditions from August to NovemberDecember 2015 (Figures 3 and 4)During the higher-flow period a positive correlation existed
between upstream (Mt Judea) and downstream (Carver)NO3
minus with a ratio approaching 1 (Figure 3) During this high-flow period NO3
minus concentrations at both upstream anddownstream sites ranged between sim01 and sim04 mg-N Lminus1Time series data show close convergence between upstreamand downstream NO3
minus concentrations during storm-eventpeak concentrations (Figure 4ab)Under lower-flow conditions NO3
minus concentrations wereconsistently higher upstream than downstream (Figure 3) Theincrease in NO3
minus concentrations at the upstream site duringthe summer and autumn 2015 corresponds with reductions inflow This is typical of the longer-term hydrologically drivencycles in NO3
minus concentrations observed at the upstream sitereflecting a strong flow dependency with highest concen-trations under the lowest flows and dilution with increasingflow (Figure SI1abc) The strong increase in NO3
minus
concentrations during July to November 2015 thereforereflects hydrological controls and is consistent with fallingflows The high NO3
minus concentrations in autumn 2015subsequently declined with the onset of higher flows (FigureSI1ab)
The gap in NO3minus concentrations between upstream and
downstream sites widened with decreasing flow particularlyduring the protracted low-flows between mid-July andNovember 2015 During this time minimal soil watercontributed to streamflow and almost all (gt95) ofstreamflow was derived from groundwater (Figure 4ab) Bythe end of October 2015 upstream NO3
minus concentrationsreached sim075 mg-N Lminus1 whereas downstream NO3
minus
concentrations were sim005 mg-N Lminus1 Between July andNovember 2015 downstream NO3
minus concentrations exhibiteda much lower range (sim005 to sim015 mg-N Lminus1) as comparedwith upstream (sim01 to sim08 mg-N Lminus1) (Figure 3) Thisreduction in both magnitude and range of downstream NO3
minus
concentrations under baseflow conditions could arise eitherfrom dilution of NO3
minus as a result of downstream accretion ofwater sources with much lower NO3
minus concentrations or byremoval of NO3
minus through biogeochemical processes neces-sitating a mass-balance evaluation (see section 33)The widening gap in NO3
minus concentrations betweenupstream and downstream sites after mid-July 2015 corre-sponded with a decline in GPPER which fell below 1indicating a change to net heterotrophy (Figure 4c) Duringthe low-flow period from mid-July to November 2015 BigCreek was heterotrophic for sim90 of days Daily streamwaterEpCO2 doubled between mid-July and November 2015 from45 to 91 times atmospheric pressure independentlyconfirming an increase in rates of respiration (CO2 release)relative to photosynthesis (CO2 uptake)During the higher-flow period from mid-January to mid-July
Big Creek was predominantly net autotrophic (GPPER gt 1for 52 of days) Net heterotrophic conditions prevailedpredominantly during lower-flow intervals between stormevents with GPPER lt 1 typically during and immediatelyafter storm eventsMolar CN ratios at Carver also increased markedly after
mid-July from sim300 to gt800 (Figure 4d) This stoichiometricdepletion of N along with persistence of low NO3
minus
concentrations below 01 mg-N Lminus1 (falling to lt004 mg-NLminus1) suggests that algal growth may have been limited by lowN availability at Carver over the late summer and autumn of2015
33 Nitrate Reach Mass Balance to Quantify SeasonalNitrate Removal during Baseflow ConditionsMean dailyNO3
minus mass balances for the eight seasonal quiescent baseflowperiods between February and October 2015 are presented inTable 1 Mean daily NO3
minus input loadings to the reach (LT)increased from 173 kg-N dminus1 in February to 617 kg-N dminus1 in
Table 1 Seasonal Patterns in Mean Daily NO3minus Input Loadings (LT) to Big Creek Mean Daily Instream NO3
minus Load Removal(LR) along the 65 km Experimental Reach Under Low-Flow Conditions and Mean Daily NO3
minus Load Removal As aPercentage of NO3
minus Inputs (UE)a
season date rangeNO3
minus input loadingto reach (LT) (kg-N dminus1)
instream NO3minus removal
along reach (LR) (kg-N dminus1)instream NO3
minus removal (LR) as of NO3minus
input loading (LT) (UE)
winter 4minus13 Feb 2015 173 (112) 768 (046) 447 (409)spring 1 5minus12 Apr 2015 441 (635) 190 (282) 439 (953)spring 2 24 Aprminus5 May 2015 379 (153) 169 (385) 476 (893)early summer 2minus10 Jun 2015 492 (236) 241 (854) 512 (534)mid summer 11minus21 Jul 2015 617 (442) 146 (282) 321(141)late summer 7minus16 Aug 2015 756 (122) 557 (059) 742 (466)autumn 1 1minus14 Sept 2015 581 (123) 449 (081) 778 (239)autumn 2 1minus11 Oct 2015 298 (029) 282 (025) 948 (120)aStandard deviations are shown in parentheses
Environmental Science amp Technology Article
DOI 101021acsest8b03074Environ Sci Technol 2018 52 13708minus13717
13713
July then declined rapidly to 756 kg-N dminus1 in August whichalso corresponded with an order of magnitude reduction inbaseflow discharge By October LT had fallen to only 298 kg-N dminus1 Instream NO3
minus removal (LR) followed a similar patternto LT with highest mean daily instream NO3
minus removal duringJune (24 kg-N dminus1) then decreasing during the late summerand autumn and falling to 282 kg-N dminus1 in October Howeverthe efficiency of instream NO3
minus removal (UE ie LR expressedas a percentage of LT) increased markedly during the latesummer and autumn from 32 in July to 74minus95 betweenAugust and OctoberThe fluvial mass balance therefore confirmed that the
observed downstream reductions in NO3minus concentrations
under baseflow were a result of net instream removal of NO3minus
by biogeochemical processes rather than a dilution effectAlthough LT and LR were greatest during the winter to early
summer period UE and the instream NO3minus removal rate (UT)
increased dramatically during the low flows of the late summerand autumn UT increased from le009 mg-N Lminus1 dminus1
(February through July) to gt02 mg-N Lminus1 dminus1 in Augustand September and 066 mg-N Lminus1 dminus1 in October (Table 2)By autumn 2015 gt75 of the NO3
minus inputs were removed bybiogeochemical processes (Table 1)We also assessed the efficiency of NO3
minus removal under thealternative scenario where the increase in flow along theexperimental reach was solely from direct groundwater input(S162) This made relatively little difference to the UE whichalso increased markedly during the late summer and autumnfrom 46 in July to 72minus94 between August and October(Table SI3) The sensitivity analysis (Tables SI1 and SI3)showed that a 50 increase or decrease in either Left Fork or
groundwater NO3minus concentrations made little difference to
these findings a consistent increase in efficiency of NO3minus
removal was observed after July with August to October UEvalues consistently sim70minus95
34 Biogeochemical Controls on Nitrate DeliveryAccounting for Assimilatory Nitrate Uptake to Calcu-late Net Nitrification and Net Denitrification FromFebruary to July assimilatory NO3
minus uptake by photosynthesiz-ing plants (UA) consistently exceeded UT (Table 2) indicatingfirst that assimilation of NO3
minus by photoautotrophs was thedominant process removing NO3
minus from the water column andsecond that assimilation was partially balanced by netnitrification NO3
minus gains In contrast from August to OctoberUT exceeded UA indicating that heterotrophic NO3
minus removalthrough direct uptake and denitrification was removing NO3
minus
along the reach in late summer and autumnTable 3 shows that net nitrification gains to the reach ranged
from 0135 mg-N Lminus1 dminus1 in February to 0273 mg-N Lminus1 dminus1
in AprilMay However after July a pronounced switch fromnet nitrification gains to net denitrification losses occurredDuring late summer and autumn denitrification losses ofNO3
minus increased from sim0100 mg-N Lminus1 dminus1 in August andSeptember to 0592 mg-N Lminus1 dminus1 in October These estimateswere based on using an average periphyton CN molar ratio of12 for USA streams3538 We also evaluated the effects ofusing an average periphyton molar CN ratio of 86 fromresearch in northern European streams17 This increased UAvalues by sim39 but did not alter our findings of a switchbetween net nitrification between February and July to netdenitrification from August to October By changing the CNstoichiometry from 12 to 86 net nitrification ranged from
Table 2 Seasonal Patterns in Mean Daily NO3minus Removal Rate (UT) along the 65 km Experimental Reach of Big Creek Under
Low-Flow Conditions And Mean Daily Assimilatory Uptake of NO3minus by Photoautotrophs (UA)
a
season date range instream NO3minus removal rate (UT) (mg-N Lminus1 dminus1) assimilatory NO3
minus uptake (UA) (mg-N Lminus1 dminus1)
winter 4minus13 Feb 2015 0077 (0006) 0212 (0035)spring 1 5minus12 Apr 2015 0072 (0017) 0256 (0050)spring 2 24 Aprminus5 May 2015 0082 (0018) 0355 (0067)early summer 2minus10 Jun 2015 0090 (0014) 0269 (0045)mid summer 11minus21 Jul 2015 0066 (0030) 0259 (0040)late summer 7minus16 Aug 2015 0284 (0026) 0180 (0016)autumn 1 1minus14 Sept 2015 0229 (0019) 0115 (0038)autumn 2 1minus11 Oct 2015 0656 (0029) 0076 (0028)
aStandard deviations are shown in parentheses
Table 3 Seasonal Patterns in Mean Daily NO3minus Concentration Gains by Net Nitrification (+) and Losses by Net
Denitrification (minus) long the Experimental Reach of Big Creek under Low-Flow Conditions Mean Daily Values of the Ratiobetween Gross Primary Production and Ecosystem Respiration (GPPER) Excess Partial Pressure of Carbon Dioxide(EpCO2) Dissolved Oxygen (DO) Streamflow and the Percentage of Groundwater Contribution to Streamflowa
season date rangenet nitrification (+) or denitrification (minus)
(mg-N Lminus1 dminus1) GPPEREpCO2
(times atm press)DO
(mg-O2 Lminus1) flow (m3 sminus1) groundwater
winter 4minus13 Feb 2015 +0135 (0032) 114 (009) 280 (020) 119 (049) 115 (007) 665 (134)spring 1 5minus12 Apr 2015 +0184 (0039) 106 (013) 364 (020) 102 (033) 310 (037) 586 (238)spring 2 24 Apr -5 May
2015+0273 (0058) 125 (016) 381 (059) 103 (050) 261 (116) 617 (579)
early summer 2minus10 Jun 2015 +0179 (0044) 134 (015) 471 (049) 939 (042) 330 (172) 580 (648)mid summer 11minus21 Jul 2015 +0193 (0024) 197 (078) 715 (046) 898 (029) 254 (128) 828 (721)late summer 7minus16 Aug 2015 minus0104 (0032) 078 (005) 106 (083) 695 (035) 023 (004) 988 (098)autumn 1 1minus14 Sept
2015minus0102 (0027) 062 (010) 985 (165) 650 (054) 024 (006) 966 (142)
autumn 2 1minus11 Oct 2015 minus0592 (0015) 057 (023) 817 (150) 785 (064) 004 (0004) 978 (064)aStandard deviations are shown in parentheses
Environmental Science amp Technology Article
DOI 101021acsest8b03074Environ Sci Technol 2018 52 13708minus13717
13714
+0218 mg-N Lminus1 dminus1 in February to +0414 mg-N Lminus1 dminus1 inAprilMay with net denitrification ranging from minus0033 mg-NLminus1 dminus1 in August to minus0562 mg-N Lminus1 dminus1 in OctoberNet nitrification and denitrification rates were compared
with mean daily GPPER EpCO2 streamflow and percentagegroundwater discharge (Table 3) The shift from netnitrification to net denitrification corresponded directly with(1) a change in stream metabolism from net autotrophic(GPPER in July was 197) to net heterotrophic (GPPER fellbelow 1 to 078 in August 062 in September and 057 inOctober) and (2) an increase in EpCO2 and a reduction inDO arising from the increases in microbial respiration relativeto photosynthesisThe alternative scenario where flow accretion between Mt
Judea and Carver was attributed to direct groundwaterdischarge to Big Creek also had no effect on the timing ofthe shift from net nitrification to denitrification (S162 TableSI4) Sensitivity analysis (Tables SI2 and SI4) also showedthat irrespective of a 50 increase or decrease in either LeftFork or groundwater NO3
minus concentrations the sameconsistent switch between net nitrification and net denitrifica-tion was observed after JulyThe consistency in this observed switch between instream
NO3minus production and instream NO3
minus removal and itssynchronicity with measured changes in stream metabolismprovides compelling evidence that the marked change ininstream NO3
minus processing and delivery after July was linked tochanges in stream metabolism from net autotrophy to netheterotrophyThe karst streams of the Ozarks are characterized by a large
hyporheic zone4243 a hotspot of nitrogen transformation44
Water residence times and redox conditions provide a keycontrol on changes between NO3
minus removal and NO3minus
production with hyporheic zone sediments45minus48 In BigCreek the winter to midsummer period was characterized byhigher baseflows (at least an order of magnitude greater thanlate summerautumn baseflows) and net autotrophy resultingin higher instream DO concentrations Rapid movement ofwell-oxygenated water throughout the water column and intothe hyporheic zone promotes aerobic metabolism of organicmatter and release of NO3
minus through nitrification4649 Fromwinter to midsummer net nitrification was observed in BigCreek and nitrification in the hyporheic zone may have beenresponsible for buffering the effects of photosyntheticassimilatory uptake of NO3
minusUnder the more sluggish flow conditions during late summer
and autumn available oxygen is depleted as a result ofincreased heterotrophic activity The reduced movement ofwater and oxygen through the hyporheic zone favors a shift torespiratory pathways with denitrification (conversion of nitrateto N2O andor N2 gas)
5051 Unlike assimilation of NO3minus into
plant biomass which retains N temporarily denitrificationresults in a permanent loss of bioavailable N The lowbaseflows of late summer and autumn 2015 resulted in higherwater residence times and a greater proportion of flow movingthrough the hyporheic zone This provides greater exposureand water contact time with microbial biofilms wheredenitrification occurs51 The death and breakdown of biomassduring the late summer and autumn contribute to theavailability of organic matter for microbial decompositionpromoting higher rates of microbial respiration relative tophotosynthesis losses of DO and greater availability of organiccarbon as a resource for denitrifying bacteria455253
Denitrification within the hyporheic zone may therefore beresponsible for losses of NO3
minus in Big Creek during the latesummer and autumn Although denitrification can also occuron suspended sediments within the water column5455 this islikely to be a second order effect under baseflow conditions ina groundwater-fed stream where suspended solids concen-trations are low (typically lt5 mg Lminus1)Under baseflow conditions instream assimilatory NO3
minus
uptake by photosynthesizing plants and hyporheic-zonedenitrification along the experimental reach removed betweensim30 and sim90 of the NO3
minus input load During the period ofmonitoring (spring 2014 to spring 2017) NO3
minus loading to theupstream section of Big Creek (at Mt Judea) was attenuated byinstream processing such that no CAFO-related impacts oneither stream nutrient concentrations or metabolism werediscernible at the downstream location (Carver) and thus tothe Buffalo River Future monitoring will be needed to detectwhether long-term changes in nutrients and organic carboninputs may occur whether this stimulates higher rates ofheterotrophic andor autotrophic activity and any longer-termeffects on the capacity of assimilation and denitrificationprocesses to remove and buffer any increase in nutrientloadingsThe novelty of this research is the combination of
continuous high-frequency in situ stream metabolism andnitrate measurements to apportion the net effects ofassimilation nitrification and denitrification on changes inbaseflow nitrate fluxes at the river-reach to watershed scale Inthis case we found that during winter to midsummer periodsNO3
minus uptake in Big Creek was dominated by assimilation byphotoautotrophs which was partially compensated by releaseof NO3
minus from nitrification In late summer the predominantmetabolic pathway switched to net heterotrophy andheterotrophic NO3
minus removal through direct uptake anddenitrification became the dominant process of nitrateremoval Removal of NO3
minus by assimilation and denitrificationprovides an important ldquoself-cleansingrdquo ecosystem serviceresulting in a pronounced shift in CN stoichiometry anddecreasing NO3
minus concentrations to low levels which would beexpected to limit algal growth56
This approach provides a means of scaling up frommicroscale and mesoscale process experiments and measure-ments which are by necessity short-term and localized toexplore how river nitrate delivery responds to shifts in streammetabolism from day-to-day and seasonal to interannualvariability This research and the methods presented here areapplicable along the river continuum from headwaters tolarge-scale fluvial systems (with large spatial and temporalvariability in nutrient fluxes) and offer a valuable way forwardin quantifying net process controls on the fate and transport ofnitrogen in fluvial systems
ASSOCIATED CONTENT
S Supporting InformationThe Supporting Information is available free of charge on theACS Publications website at DOI 101021acsest8b03074
S1 Methods Land use and cover data site hydro-geology high-frequency water-quality monitoringstreamflow measurement hydrograph separation anal-ysis of diurnal dissolved oxygen curves to calculateprimary production and respiration calculation of DICand EpCO2 nitrate mass-balance calculations and S2
Environmental Science amp Technology Article
DOI 101021acsest8b03074Environ Sci Technol 2018 52 13708minus13717
13715
Results Figure SI1 time series of nitrate and flow andnitrate plotted against stream flow for Mt Judea TablesSI1 and SI2 sensitivity analysis based on estimates ofNO3
minus load inputs from Left Fork Tables SI3 and SI4alternative scenario sensitivity analysis based onestimates of NO3
minus load inputs from groundwater andadditional references (PDF)
AUTHOR INFORMATIONCorresponding AuthorE-mail hpjcehacukORCIDHelen P Jarvie 0000-0002-4984-1607Phillip D Hays 0000-0001-5491-9272NotesThe authors declare no competing financial interest
ACKNOWLEDGMENTSHPJ and RJW were supported by NERC NationalCapability projects NEC05966 and NEC04879 Funding forthe Big Creek Research and Extension monitoring wasprovided by the Arkansas Governorrsquos Office and StateLegislature to the University of Arkansas Systemrsquos Divisionof Agriculture Hydrological and chemical monitoring by theUSGS were supported by a National Park ServiceUSGSWater Quality Partnership Grant administered by the USGSAny use of trade firm or product names is for descriptivepurposes only and does not imply endorsement by the USGovernment
REFERENCES(1) Smith V H Eutrophication of freshwater and coastal marineecosystems - A global problem Environ Sci Pollut Res 2003 10 (2)126minus139(2) Dodds W K Bouska W W Eitzmann J L Pilger T J PittsK L Riley A J Schloesser J T Thornbrugh D J Eutrophicationof US Freshwaters Analysis of Potential Economic Damages EnvironSci Technol 2009 43 (1) 12minus19(3) Dodds W K Smith V H Nitrogen phosphorus andeutrophication in streams Inland Waters 2016 6 (2) 155minus164(4) Peterson B J Wollheim W M Mulholland P J Webster JR Meyer J L Tank J L Marti E Bowden W B Valett H MHershey A E McDowell W H Dodds W K Hamilton S KGregory S Morrall D D Control of nitrogen export fromwatersheds by headwater streams Science 2001 292 (5514) 86minus90(5) Alexander R B Boyer E W Smith R A Schwarz G EMoore R B The role of headwater streams in downstream waterquality J Am Water Resour Assoc 2007 43 (1) 41minus59(6) Jarvie H P Sharpley A N Scott J T Haggard B E BowesM J Massey L B Within-River Phosphorus Retention Accountingfor a Missing Piece in the Watershed Phosphorus Puzzle Environ SciTechnol 2012 46 (24) 13284minus13292(7) Mulholland P J Helton A M Poole G C Hall R OHamilton S K Peterson B J Tank J L Ashkenas L R CooperL W Dahm C N Dodds W K Findlay S E G Gregory S VGrimm N B Johnson S L McDowell W H Meyer J L ValettH M Webster J R Arango C P Beaulieu J J Bernot M JBurgin A J Crenshaw C L Johnson L T Niederlehner B ROrsquoBrien J M Potter J D Sheibley R W Sobota D J Thomas SM Stream denitrification across biomes and its response toanthropogenic nitrate loading Nature 2008 452 (7184) 202minusU46(8) Mulholland P J Valett H M Webster J R Thomas S ACooper L W Hamilton S K Peterson B J Stream denitrificationand total nitrate uptake rates measured using a field N-15 traceraddition approach Limnol Oceanogr 2004 49 (3) 809minus820
(9) Tank J L Marti E Riis T von Schiller D Reisinger A JDodds W K Whiles M R Ashkenas L R Bowden W BCollins S M Crenshaw C L Crowl T A Griffiths N A GrimmN B Hamilton S K Johnson S L McDowell W H Norman BM Rosi E J Simon K S Thomas S A Webster J R Partitioningassimilatory nitrogen uptake in streams an analysis of stable isotopetracer additions across continents Ecol Monogr 2018 88 (1) 120minus138(10) Tank J L Meyer J L Sanzone D M Mulholland P JWebster J R Peterson B J Wollheim W M Leonard N EAnalysis of nitrogen cycling in a forest stream during autumn using aN-15-tracer addition Limnol Oceanogr 2000 45 (5) 1013minus1029(11) Ensign S H Doyle M W Nutrient spiraling in streams andriver networks Journal of Geophysical Research-Biogeosciences 2006111 (G4) G04009(12) Rode M Halbedel nee Angelstein S Anis M R BorchardtD Weitere M Continuous in-stream assimilatory nitrate uptakefrom high frequency sensor measurements Environ Sci Technol2016 50 (11) 5685minus5694(13) Bowes M J Jarvie H P Halliday S J Skeffington R AWade A J Loewenthal M Gozzard E Newman J R Palmer-Felgate E J Characterising phosphorus and nitrate inputs to a ruralriver using high-frequency concentration-flow relationships Sci TotalEnviron 2015 511 608minus620(14) Halliday S J Skeffington R A Wade A J Bowes M JGozzard E Newman J R Loewenthal M Palmer-Felgate E JJarvie H P High-frequency water quality monitoring in an urbancatchment hydrochemical dynamics primary production andimplications for the Water Framework Directive HydrologicalProcesses 2015 29 (15) 3388minus3407(15) Halliday S J Skeffington R A Wade A J Bowes M JRead D S Jarvie H P Loewenthal M Riparian shading controlsinstream spring phytoplankton and benthic algal growth Environ-mental Science-Processes amp Impacts 2016 18 (6) 677minus689(16) Wade A J Palmer-Felgate E J Halliday S J Skeffington RA Loewenthal M Jarvie H P Bowes M J Greenway G MHaswell S J Bell I M Joly E Fallatah A Neal C Williams RJ Gozzard E Newman J R Hydrochemical processes in lowlandrivers insights from in situ high-resolution monitoring Hydrol EarthSyst Sci 2012 16 (11) 4323minus4342(17) Rode M Wade A J Cohen M J Hensley R T Bowes MJ Kirchner J W Arhonditsis G B Jordan P Kronvang BHalliday S J Skeffington R A Rozemeijer J C Aubert A HRinke K Jomaa S Sensors in the stream The High-frequency waveof the present Environ Sci Technol 2016 50 (19) 10297minus10307(18) Cohen M J Kurz M J Heffernan J B Martin J BDouglass R L Foster C R Thomas R G Diel phosphorusvariation and the stoichiometry of ecosystem metabolism in a largespring-fed river Ecol Monogr 2013 83 (2) 155minus176(19) Hensley R T Cohen M J On the emergence of diel solutesignals in flowing waters Water Resour Res 2016 52 (2) 759minus772(20) Hensley R T Cohen M J Korhnak L V Inferring nitrogenremoval in large rivers from high-resolution longitudinal profilingLimnol Oceanogr 2014 59 (4) 1152minus1170(21) Kunz J V Hensley R Brase L Borchardt D Rode MHigh frequency measurements of reach scale nitrogen uptake in afourth order river with contrasting hydromorphology and variablewater chemistry (Weisse Elster Germany) Water Resour Res 201753 (1) 328minus343(22) Kraus T E C OrsquoDonnell K Downing B D Burau J RBergamaschi B A Using paired in situ high frequency nitratemeasurements to better understand controls on nitrate concentrationsand estimate nitrification rates in a wastewater-impacted river WaterResour Res 2017 53 (10) 8423minus8442(23) Jones C Kim S W Schilling K Use of continuousmonitoring to assess stream nitrate flux and transformation patternsEnviron Monit Assess 2017 189 35(24) Wollheim W M Mulukutla G K Cook C Carey R OAquatic nitrate retention at river network scales across flow conditions
Environmental Science amp Technology Article
DOI 101021acsest8b03074Environ Sci Technol 2018 52 13708minus13717
13716
determined using nested in situ sensors Water Resour Res 2017 53(11) 9740minus9756(25) Jarvie H P Sharpley A N Brahana V Simmons T PriceA Neal C Lawlor A J Sleep D Thacker S Haggard B EPhosphorus retention and remobilization along hydrological pathwaysin karst terrain Environ Sci Technol 2014 48 (9) 4860minus4868(26) American Public Health Association (APHA) AlkalinityTitration Method 2320 B In Standard Methods for the Examinationof Water and Wastewater 23rd ed 1987 ISBN 978minus0-87553minus287minus5(27) Rantz S E Measurement and computation of streamflow Vol1 Measurement of stage and discharge In US Geological SurveyWater Supply Paper 2175 1982(28) Jarvie H P Neal C Smart R Owen R Fraser D ForbesI Wade A Use of continuous water quality records for hydrographseparation and to assess short-term variability and extremes in acidityand dissolved carbon dioxide for the River Dee Scotland Sci TotalEnviron 2001 265 (1minus3) 85minus98(29) OrsquoConnor D J Ditoro D M Photosynthesis and oxygenbalance in streams Journal of the Sanitary Engineering DivisionProceedings of the American Society of Civil Engineers 1970 96 (2)547minus571(30) Williams R J White C Harrow M L Neal C Temporaland small-scale spatial variations of dissolved oxygen in the RiversThames Pang and Kennet UK Sci Total Environ 2000 251 497minus510(31) Chapra S C Ditoro D M Delta method for estimatingprimary production respiration and reaeration in streams J EnvironEng 1991 117 (5) 640minus655(32) Bernhardt E S Heffernan J B Grimm N B Stanley E HHarvey J W Arroita M Appling A P Cohen M J McDowellW H Hall R O Read J S Roberts B J Stets E G Yackulic CB The metabolic regimes of flowing waters Limnol Oceanogr 201863 S99minusS118(33) Odum H T Primary production in flowing waters LimnolOceanogr 1956 1 102minus117(34) Jarvie H P King S M Neal C Inorganic carbon dominatestotal dissolved carbon concentrations and fluxes in British riversApplication of the THINCARB model - Thermodynamic modellingof inorganic carbon in freshwaters Sci Total Environ 2017 575 496minus512(35) King S A Heffernan J B Cohen M J Nutrient flux uptakeand autotrophic limitation in streams and rivers Freshwater Science2014 33 (1) 85minus98(36) Hall R O Tank J L Ecosystem metabolism controls nitrogenuptake in streams in Grand Teton National Park Wyoming LimnolOceanogr 2003 48 (3) 1120minus1128(37) Hall R O Beaulieu J J Estimating autotrophic respiration instreams using daily metabolism data Freshwater Science 2013 32 (2)507minus516(38) Stelzer R S Lamberti G A Effects of N P ratio and totalnutrient concentration on stream periphyton community structurebiomass and elemental composition Limnol Oceanogr 2001 46 (2)356minus367(39) Redfield A C The biological control of chemical factors in theenvironment American Scientist 1958 46 (3) 205minus221(40) Evans-White M A Haggard B E Scott J T A Review ofstream nutrient criteria development in the United States Journal ofEnvironmental Quality 2013 42 (4) 1002minus1014(41) Sharpley A N Haggard B E Berry L Brye K Burke JDaniels M B Gbur E Glover T Hays P Kresse TVanDevender K W Nutrient concentrations in Big Creek correlateto regional watershed land use Agricultural amp Environmental Letters2017 2 170027(42) Miller R B Heeren D M Fox G A Halihan T Storm DE Mittelstet A R The hydraulic conductivity structure of gravel-dominated vadose zones within alluvial floodplains J Hydrol 2014513 229minus240(43) Miller R B Heeren D M Fox G A Halihan T Storm DE Heterogeneity influences on stream water-groundwater interactions
in a gravel-dominated floodplain Hydrol Sci J 2016 61 (4) 741minus750(44) Triska F J Duff J H Avanzino R J The role of waterexchange between a stream and its hyporheic zone in nitrogen cyclingat the terrestrial aquatic interface Hydrobiologia 1993 251 (1minus3)167minus184(45) Zarnetske J P Haggerty R Wondzell S M Baker M ALabile dissolved organic carbon supply limits hyporheic denitrifica-tion J Geophys Res 2011 116 G04036(46) Zarnetske J P Haggerty R Wondzell S M Bokil V AGonzalez-Pinzon R Coupled transport and reaction kinetics controlthe nitrate source-sink function of hyporheic zones Water Resour Res2012 48 W11508(47) Harvey J W Bohlke J K Voytek M A Scott D TobiasC R Hyporheic zone denitrification Controls on effective reactiondepth and contribution to whole-stream mass balance Water ResourRes 2013 49 (10) 6298minus6316(48) Moatar F Abbott B W Minaudo C Curie F Pinay GElemental properties hydrology and biology interact to shapeconcentration discharge curves for carbon nutrients sediment andmajor ions Water Resour Res 2017 53 (2) 1270minus1287(49) Zarnetske J P Haggerty R Wondzell S M Baker M ADynamics of nitrate production and removal as a function ofresidence time in the hyporheic zone J Geophys Res 2011 116G01025(50) Zarnetske J P Haggerty R Wondzell S M Couplingmultiscale observations to evaluate hyporheic nitrate removal at thereach scale Freshwater Science 2015 34 (1) 172minus186(51) Palmer-Felgate E J Mortimer R J G Krom M D JarvieH P Impact of point-source pollution on phosphorus and nitrogencycling in stream-bed sediments Environ Sci Technol 2010 44 (3)908minus914(52) Aubert A H Breuer L New seasonal shift in in-streamdiurnal nitrate cycles identified by mining high-frequency data PLoSOne 2016 11 (4) e0153138(53) Dodds W K Marti E Tank J L Pontius J Hamilton SK Grimm N B Bowden W B McDowell W H Peterson B JValett H M Webster J R Gregory S Carbon and nitrogenstoichiometry and nitrogen cycling rates in streams Oecologia 2004140 (3) 458minus467(54) Liu T Xia X H Liu S D Mou X L Qiu Y WAcceleration of Denitrification in Turbid Rivers Due to DenitrificationOccurring on Suspended Sediment in Oxic Waters Environ SciTechnol 2013 47 (9) 4053minus4061(55) Xia X H Jia Z M Liu T Zhang S B Zhang L WCoupled Nitrification-Denitrification Caused by Suspended Sediment(SPS) in Rivers Importance of SPS Size and Composition EnvironSci Technol 2017 51 (1) 212minus221(56) Jarvie H P Smith D R Norton L R Edwards F BowesM J King S M Scarlett P Davies S Dils R Bachiller-Jareno NPhosphorus and Nitrogen Limitation and Impairment of HeadwaterStreams Relative to Rivers in Great Britain A National Perspective onEutrophication Sci Total Environ 2018 621 849minus862
Environmental Science amp Technology Article
DOI 101021acsest8b03074Environ Sci Technol 2018 52 13708minus13717
13717
1
E COLI IN FLOWING WATERS
Mary Savin and BCRET members
I Why is Escherichia coli (E coli) being monitored What is the concern
Fecal pollution (from excrement of humans or animals) in the environment is of concern for many reasons not least of which is human health risks and disease control Other concerns related to fecal pollution of our natural waters include potential changes in the nutrient status of water introduction of antibiotic resistance and chemical contaminants changes in the ecological condition of waters and degradation of natural resources on which rural economies depend
People are concerned that the land application of swine effluent (pig excrement) will increase Escherichia coli in Big Creek and consequently the Buffalo River the first National Scenic River in the US This document aims to provide better understanding of
1) what is involved in E coli monitoring 2) what the numbers mean 3) some limitations in interpreting values and 4) provide a context for further research that may be needed to better interpret the E coli
numbers being measured in flowing waters such as Big Creek and Buffalo River
II What is E coli Why and how is it used as an indicator
E coli is a species of bacteria from the coliform group - bacteria that are rod-shaped gram negative non-spore forming facultative anaerobes commonly found in the feces of humans and warm blooded animals E coli occurs in human intestines - many strains with no ill effects although certain E coli cause serious human illnesses Thus while many E coli do not harm us there are important variants that do There are also other species of bacteria viruses and other small organisms that cause disease which if present in fecal sources polluting our waters can make humans sick Depending on whether E coli survive as long in the environment as these other pathogens E coli may or may not adequately warn us about a disease causing agent in our waters To date E coli is the most reliable test we have although other indicators and tests are being investigated E coli cannot be seen in streams by the human eye Thus it is important to determine if there is a problem of elevated E coli numbers by careful water sampling and using US Environmental Protection Agency (EPA) standardized methods E coli is counted in water because of the extensive studies and relationships established between the presence of E coli and the number of human illnesses occurring from contact with the water (eg swimming) containing the bacteria From these relationships there have been upper limits established for bacterial numbers that correspond to the acceptable risk of people getting sick from exposure to water containing them Water quality standards for E coli are established by the state in Arkansas Department of Environmental Quality (ADEQ) Regulation 2 (see Table 1) The E coli numbers must remain below a threshold in a specified number of total samples collected The exact upper limit that is allowed depends on the designation of the waterbody and time of year (primary or secondary contact season) Primary
2
Table 1 Upper limits for Escherichia coli counts defined in Regulation 2 of the Arkansas Department of
Environmental Quality (ADEQ) as specified by contact season and waterbody designation for both single samples and geometric mean
Contact season Water designation Limit of E coli (MPN100mL)
Single sample1
Geometric mean2
Primary (May 1-Sept 30)
Extraordinary Resource Water Ecologically Sensitive Waterbody
Natural amp Scenic Waterway Lakes
Reservoirs
298 126
All other water 410 NA3
Secondary (Oct 1-April 30)
Extraordinary Resource Water Ecologically Sensitive Waterbody
Natural amp Scenic Waterway Lakes
Reservoirs
1490 630
All other water 2050 NA 1 No more than 25 of samples from no less than 8 samples per contact season may exceed the limit 2Geometric mean is calculated from at least 5 samples collected within 30 days at evenly spaced time intervals during that 30-day period 3Not applicable
contact recreation is a designation given to a waterbody where full body contact occurs and occurs from May 1 through September 30 The ADEQ also designates any stream with a watershed (eg drainage basin in the landscape) exceeding 10 square miles and those with smaller watersheds on individual cases (ie after site verification) for primary contact recreation Secondary contact recreation designates waterbodies where activities such as boating fishing and wading take place and occurs from October 1 through April 30
E coli is measured in samples of water collected strictly following EPA guidelines The measurement of E coli starts within 8 hours of collection This method provides an estimate of E coli presence in the sampled water that is the most probable number (MPN) of E coli Using an EPA method provides numbers that are theoretically comparable to other labs using the same method The MPN depends on growing bacteria in the laboratory in ldquoculturerdquo and is an approach used routinely in microbiology This measurement is subject to high variability because of the nature of environmental bacteria thus variability in the data in E coli counts from streams is not unusual For this reason it is important to establish background levels of E coli in any water resulting from various wildlife human (eg septic tanks sewers) and agricultural (eg pig chicken cattle) sources
3
E coli thresholds are lower in late spring through summer (primary contact season) when more people are expected to be in contact with streams and lakes More stringent limits also apply to Extraordinary Resource Waters (eg Buffalo River) Ecologically Sensitive Waterbodies and Natural Scenic Waterways During the primary contact season (May 1- Sept 30) we do not want E coli to exceed 298 MPN100 mL and during secondary contact season (Oct 1 ndash Apr 30) E coli counts should not exceed 1490 MPN100 mL in single samples
III How does the E coli measurement ldquofitrdquo into the context of the landscape
While monitoring one bacterial species to assess the biological quality of water may seem simple determining the actual ecological condition of a system is complicated Measurement of E coli is an indicator for potential fecal pollution and potential pathogen problems but by itself does not identify the source(s) of the bacteria
E coli is present in intestines (and feces) and is not supposed to grow in the environment thus the presence and abundance should indicate pollution and be directly related to human and animal sources However because E coli is in many different animals (eg human wildlife agricultural) and because of the different pathways that bacteria may travel throughout the environment before ending up in water where we can measure it the presence of E coli does not identify the source of pollution
IV Why is E coli monitoring important and why is it complicated
There are many of factors that affect whether E coli survives in the environment for how long and whether it moves to other locations E coli is adapted to living in intestines After deposition from an animal cells have to survive rapidly changing environmental conditions (eg temperature and moisture) exposure to harmful UV rays in sunlight outcompete other organisms and avoid predators All these factors make it difficult to estimate how long E coli will survive in lagoon soil and river environments However there is evidence that E coli can persist in soil and sediments
V What are the numbers
E coli is measured weekly in Big Creek upstream and downstream of the CampH Farm Mt Judea Newton County Arkansas Water sample collection for E coli analysis began Sept 12 2013 prior to manure from CampH Farm application to fields either in fields adjacent to or distant from Big Creek Manure application began in 2014 to fields distant from Big Creek and then adjacent to Big Creek in March 2014 So far in the period following manure applications by CampH Farms (Jan 2 through May 19 2014) no trends in E coli with time or between sampling locations are apparent (Table 2) The Table 2 data are detailed in the Big Creek Research and Extension Team Quarterly Reports and demonstrate the week-to-week variability in E coli at upstream and downstream sites The E coli counts are expected to continue to be variable Clearly it is important to quantify the variability in E coli concentrations long-term in order to determine if changes occur as a result of CampH operation
The MPN is expected to increase with increases in flow and the recent installation of a USGS gauge to measure flow will allow for the determination of the relationship between measured flow in
4
the stream and E coli concentrations Because of the dangers during high flows most contact recreation is expected during base flow and thus sampling during base flow may provide more meaningful data
Table 2 Geometric mean of E coli (and range of sample MPN) before (Sept 12 - Dec 17 2013) and after manure applications began on the CampH Farm (Jan 2 - May 19 2014)
CampH location
Before any manure application
After manure application
Sept 12 - Dec 17 2013 Jan 2 - May 19 2014
(MPN100mL)
Upstream 82 (6 ndash 4080) 83 (NDa ndash 921)
Downstream 111 (5 ndash 3500) 39 (ND ndash 1553) aNot detected
Regulation Arkansas Pollution Control and Ecology Commission 01400-002 2014 Regulation Establishing Water Quality Standards for Surface Waters of the State of Arkansas as revised effective March 24 2014 Arkansas Department of Environmental Quality (ADEQ) Available at httpwwwadeqstatearusregsfilesreg02_final_140324pdf Last accessed 20 Aug 2014
Page 1 of 6
Nutrient impairment of surface waters continues despite widespread conservation efforts to reduce losses from urban rural and agricul-tural land uses (Scavia et al 2014) Land use within watersheds influ-
ences the quality and quantity of water in streams draining the landscape As land disturbance increases and use intensifies an increase in stormwater runoff and nutrient inputs that lead to a greater potential for transport to receiving water is generally observed (Dubrovsky et al 2010 Rebich et al 2011) This has led to efforts to identify and quantify nutrient sources within watersheds strategically target and apportion nutrient loss reduction (Reckhow et al 2011)
Many factors influence the relationship between land use in a given water-shed and nutrient transport downstream from that watershed With an increase in percentage of the drainage area in pasture row crop andor urban use a general trend of increasing nutrient concentrations in storm and base flows will manifest (Buck et al 2004 Giovannetti et al 2013 Haggard et al 2003 Migliaccio et al 2007) Thus nutrient concentrations in streams draining for-ested lands tend to be less than in watersheds with considerable anthropogenic land use
For a range of reasons great interest has been expressed in nutrient con-centrations in several streams of the Boston and Ozark Mountains region of northwest Arkansas including the Buffalo National River and its tributaries In particular Big Creek has been the center of attention within the Buffalo National River watershed (BRW) because of a permitted concentrated animal feeding operation (CAFO) The objectives of this letter are to put nutrient con-centrations of Big Creek into the context of the stream nutrient and watershed land use relationship and assess whether stream nutrient concentrations have
Nutrient Concentrations in Big Creek Correlate to Regional Watershed Land Use
A N Sharpley B E Haggard L Berry K Brye J Burke M B Daniels E Gbur T Glover P Hays T Kresse and K W VanDevender
Copyright copy American Society of Agronomy Crop Science Society of America and Soil Science Society of America 5585 Guilford Rd Madison WI 53711 USAThis is an open access article distributed under the terms of the CC BY-NC-ND license (httpcreativecom-monsorglicensesby-nc-nd40) Agric Environ Lett 2170027 (2017) doi102134ael2017080027 Received 16 Aug 2017 Accepted 25 Sep 2017 Corresponding author (sharpleyuarkedu)
Agricultural amp Environmental Letters
Research Letter
Abstract Nutrient concentrations in several streams of the Boston and Ozark Mountains region of Arkansas including the Buffalo National River and its tributaries have garnered tremendous interest In particular Big Creek has been the center of attention within the Buffalo River watershed because of a permitted concentrated animal feeding operation (CAFO) The objectives of this paper were to put nutrient concentrations of Big Creek into the context of the stream nutrient and watershed land-use relationship and develop a framework to evaluate regional land-use impacts on regional water quality Nutrient concentrations in streams draining the Boston and Ozark Mountains region were related to the intensity of watershed land use Concentrations in Big Creek were similar to other watersheds in the ecoregion with similar land use suggesting limited impact of the CAFO on Big Creek at the present time However this does not preclude future impacts and longer-term monitoring continues
AN Sharpley L Berry K Brye J Burke and T Glover Dep of Crop Soil and Environmental Sciences Univ of Arkansas 115 Plant Sciences Building Fayetteville AR 72701 BE Haggard Biological and Agricultural Engineering Univ of Arkansas BENGR201 Fayetteville AR 72701 MB Daniels and KW VanDevender Biological and Agricultural Engineering Cooperative Extension Univ of Arkansas 2301 South University Ave Little Rock AR 72203 E Gbur Agricultural Statistics Laboratory Univ of Arkansas 101 Agricultural Annex Fayetteville AR 72701 P Hays Dep of Geosciences Univ of Arkansas 216 Ozark Hall Fayetteville AR 72701 T Kresse (retired) USGS Arkansas Water Science Center 401 Hardin Rd Little Rock AR 72211
Core Ideas
bull Nutrient concentrations are low at Big Creek relative to expected biological-response thresholds
bull Nutrient concentrations at Big Creek are typical of streams draining watersheds with similar land use
bull Flow-adjusted nutrient concentrations at Big Creek have not increased over the short-term
bull Nutrient concentrations in streams increase as watershed land area in pasture and urban uses increases
Abbreviations BRW Buffalo River watershed CAFO concentrated animal feeding operation LOESS locally weighted regression SRP soluble reactive phosphorus TN total N TP total P UIRW Upper Illinois River watershed UWRW Upper White River watershed
Published online October 26 2017
Page 2 of 6 AGRICULTURAL amp ENVIRONMENTAL LETTERS
changed over the short term (3 yr of monitoring) The goal is to understand if how and why stream nutrient concentra-tions change downstream at Big Creek and whether the per-mitted swine CAFO has influenced water quality during the 3 yr since extensive monitoring began in September 2013
MethodsWater samples have been collected over varying periods
at the outlet of subwatersheds of the BRW Upper Illinois River watershed (UIRW) and Upper White River watershed (UWRW Fig 1) Land use and cover (ie forest pasture and urban) for each subwatershed was obtained from high-resolution (4-m) imagery from the USGS National Elevation Dataset (USGS 2015 Gesch et al 2002) National Land Cover Dataset (USGS 2017b) and National Hydrologic
Dataset (USGS 2017a) In the UWRW Giovannetti et al (2013) monitored 20 sites monthly for 1 yr (June 2005ndashJuly 2006) collecting water samples during base-flow condi-tions In the UIRW Haggard et al (2010) monitored 29 sites monthly during calendar year 2009 also collecting water samples during base-flow conditions
In the BRW the National Park Service in partnership with the Arkansas Department of Environmental Quality periodically collected water samples and measured nutrient concentrations at 20 stream sites from 1985 through 2015 Nitrate-nitrogen (NO3ndashN) total N (TN) soluble reactive phosphorus (SRP) and total P (TP) concentrations were obtained directly from these data Forest pasture and urban land-use areas were determined from 2006 high-resolution (4-m) land usendashland cover imagery
Fig 1 Location of the Big Creek Buffalo River Upper Illinois River and Upper White River watersheds in the Boston Mountains and Ozark Highlands ecoregion Information from USGS Environmental Systems Research Institute (ESRI) and NASA
AGRICULTURAL amp ENVIRONMENTAL LETTERS Page 3 of 6
Big Creek is monitored by the Big Creek Research and Extension Team a partnership between the University of Arkansas Systemrsquos Division of Agriculture and USGS Water samples have been collected upstream and down-stream of the swine CAFO on a near-weekly basis since September 2013 (Fig 1) The water samples were analyzed at an Arkansas Department of Environmental Quality cer-tified water quality laboratory within the Arkansas Water Resources Center (httparkansas-water-centeruarkeduwater-quality-labphp) according to methods detailed in Table 1 The data collected is made publicly available at httpsbigcreekresearchorg
The geometric mean of nutrient concentrations of base-flow samples collected between September 2013 and April 2017 were determined in order to compare with base-flow nutrient concentrations available for BRW UIRW and UWRW Base-flow conditions in Big Creek were classified from hydrograph inspection when flow had not increased or decreased within 3 d of sample collection McCarty and Haggard (2016) suggested that stream nutrient concen-trations under base flow can be used to identify nonpoint sources and target remedial measures in Boston Mountains and Ozark Highland watersheds
Using all above-listed data sources the geometric means of nutrient concentrations for streams in the BRW UIRW and UWRW were used to develop a relationship with human development within the watershed Human development is defined as the percentage of pasture plus urban land use within the watershed Exponential relationships with 95 confidence bands around the observations were developed for NO3ndashN TN SRP and TP concentrations to put nutri-ent concentration at Big Creek into the context of regional stream nutrients and watershed land use
Data from Big Creek were paired with discharge available from a gaging station just downstream from the swine CAFO where the USGS developed the rating curve discharge infor-mation was only available from May 2014 through April 2017 The data were then used in a simple three-step pro-cess (White et al 2004) to look at monotonic changes in the nutrients at Big Creek (i) log-transform concentration (mg L-1) and associated instantaneous discharge (m3 s-1) (ii) use locally weighted regression (LOESS) to smooth the data with a sampling proportion (n) of 05 and (iii) plot the resid-uals from LOESS (ie the flow-adjusted concentrations) over time and use linear regression to evaluate monotonic trends
Results and DiscussionPutting Stream Nutrient Concentrations into Context at Big Creek
In Big Creek upstream of the swine CAFO the geometric mean concentrations of base flow sampled at weekly inter-vals from September 2013 for NO3ndashN TN SRP and TP were 0098 0205 0009 and 0030 mg L-1 respectively Directly downstream of the CAFO geometric mean concentra-tions at Big Creek during base flow conditions during the same period were 0242 0356 0011 and 0031 mg L-1 for NO3ndashN TN SRP and TP respectively Arkansas has narra-tive criteria for nutrient concentrations in streams (Arkansas Pollution Control and Ecology Commission 2016) but its proposed assessment methodology has numeric screen-ing concentrations for TN (0450ndash2430 mg L-1) and TP (0040ndash0100 mg L-1) in the Boston Mountains and Ozark Highlands The geometric mean concentrations at Big Creek upstream and downstream from the CAFO were below these values for the Boston Mountains and Ozark Highlands ecoregion
Nutrient concentrations in Big Creek upstream and down-stream from the CAFO are low with respect to nutrientndashbio-logical response thresholds for algae macroinvertebrates and fish Evans-White et al (2014) reviewed the literature sum-marizing nutrientndashbiological response thresholds across the United Statesbull Algalmetricresponses TN 038ndash179 mg L-1 TP 0011ndash
028 mg L-1
bull Macroinvertebratemetric responses TN 061ndash192 mg L-1 TP 004ndash015 mg L-1
bull Fishmetricresponses TN 054ndash183 mg L-1 TP 006ndash014 mg L-1
Total N concentrations at Big Creek upstream and down-stream of the swine CAFO were well below thresholds that result in some expected biological response whereas TP con-centrations were below thresholds for expected macroinver-tebrate and fish response and on the low end of the range for expected algal response However these lower TP thresholds (0006ndash0026 mg L-1 Stevenson et al 2008) were focused on shifts in diatom species and metrics rather than nuisance algal biomass A recent study on the Illinois River Watershed showed that stream TP thresholds with Cladophora bio-volume and nuisance taxa proportion of biovolume were observed between 0032 and 0058 mg L-1 (Joint Study
Table 1 Minimum detection limits for each chemical and biological constituent
Constituent Analytical methoddagger Minimum detection limitDagger Reporting limitsectSoluble reactive P mg Lminus1 EPA 3652 0002 0010Total P mg Lminus1 APHA 4500-P J EPA 3652 0012 0020NitratendashN mg Lminus1 EPA 3000 0004 0050Total N mg Lminus1 APHA 4500-P J EPA 3532 0006 0050Total suspended solids mg Lminus1 EPA 1602 No detection limit 40
dagger EPA = Approved CWA Chemical Test Methods (USEPA 2017) APHA = American Public Health Association from the WadeableStreamsAssessmentWaterChemistryLaboratoryManual (USEPA 2004)
Dagger The minimum detection limit of an analyte is the value which can be measured and reported with 99 confidence that the analyte concentration is greater than zero Further information is available at USGS (1999)
sect The reporting limit is the least (non-zero) calibrated standard used in analysis or as defined by method for total suspended solids
Page 4 of 6 AGRICULTURAL amp ENVIRONMENTAL LETTERS
Committee 2017) Thus TP concentrations at Big Creek upstream and downstream of the CAFO were in the range in which the natural assemblage of algae is shifting but these con-centrations would likely not be indicative of problematic nuisance algae in this ecoregion
Geometric mean nutrient concentra-tions varied upstream and downstream of the swine CAFO at Big Creek and Kosič et al (2015) used the publicly available data to allude to the N increase being from human activities on the landscape such as the CAFO However the historic land use and how stream nutrient concentrations during base-flow conditions increase with human development within the Boston Mountain and Ozark Highland watersheds need to be considered (eg see Giovannetti et al 2013 Haggard et al 2003 Migliaccio et al 2007) In the Big Creek watershed the percentage of land influenced by human activities (ie pas-ture plus urban) doubles from ~10 to ~20 in the drainage area upstream and downstream of the CAFO Nutrient concentrations in Big Creek upstream and downstream of the CAFO are within the range typical of streams draining simi-lar land uses (Fig 2)
At this time nutrient concentrations in Big Creek upstream and downstream from the swine CAFO are con-sistent with the range in concentrations for other watersheds with similar pasture and urban land use characteristics (Fig 2) as well as less than most nutrient thresholds for nuisance water-quality conditions (Omernik and Griffith 2014) However this does not preclude the possibility that nutri-ent concentrations at Big Creek may increase over time especially if human development and activity in the drain-age areas increase The most important observation is that nutrient concentrations were low in Big Creek providing the ability to detect changes over time
Have Nutrient Concentrations Changed in the Short Term at Big Creek
Understanding that long-term (eg decadal-scale) water-quality data are needed to reliably assess how stream nutri-ent concentrations have changed in response to watershed management and climate variations is of critical importance (Hirsch et al 2015) The literature shows that stream nutri-ent concentrations can change relatively quickly in response to effluent management (eg Haggard 2010 Scott et al 2011) but seeing a response (ie decrease in concentrations) from landscape management can take decades or more (Green et al 2014 Sharpley et al 2013) A myriad of factors may influence observed nutrient concentrations in streams including discharge (Petersen et al 1998) biological pro-cesses and climactic conditions (ie drought and floods Jones and Stanley 2016) and dominant transport pathways (Sharpley et al 2013) Thus we need to use caution when
interpreting trends in water quality over databases that only cover a limited timeframe
Three years of flow-adjusted nutrient concentration data at Big Creek downstream from the swine CAFO (May 2014ndashApril 2017) show different relationships with flow for the various constituentsbull Nitrate-nitrogen was greatest (~05 mg L-1) during the
lowest flows sampled and concentrations decreased with increasing flow
bull Total N generally decreased with increasing flow until a minimal value occurred then TN increased with in-creasing flow
bull Soluble reactive P concentrations did not change much during base-flow conditions and the greater concentra-tions (~0100 mg L-1) sporadically occurred at larger flows indicating that enrichment from stormflow may have been influenced by availability of source or other nontransport factors and
bull Total P concentrations were also relatively stable during base-flow conditions and then increased in association with rainfall-runoff events with only a few samples hav-ing concentrations gt0100 mg L-1 indicating relatively small enrichment from the landscape
Flow-adjusted concentrations (White et al 2004) showed no monotonic (ie increasing or decreasing) trends in SRP TP or TN (P gt 016) over the current monitoring period (Fig 3) However flow-adjusted NO3ndashN concentrations decreased over time (R2 = 005 P = 001) by 7 yr-1 (Fig 3c)
Nutrient concentrations at Big Creek upstream and downstream of the swine CAFO and indeed most tributaries of the Buffalo River are low relative to other watersheds in this ecoregion (Fig 2) This provides a starting point to build a framework to evaluate changes in nutrient concentrations of streams as a function of land use and management The
Fig 2 Relationship between land use and the geometric mean N and P concentrations (mg L-1) in the Buffalo Upper Illinois and Upper White River watersheds (no total P data available for the Buffalo River watershed) Dashed lines represent the 95 confi-dence intervals for the estimated mean (solid line)
AGRICULTURAL amp ENVIRONMENTAL LETTERS Page 5 of 6
evaluation of flow-adjusted concentrations over time showed that nutrients in Big Creek were not increasing over the short duration of monitoring for which concentration and dis-charge data were available (May 2014ndashApril 2017) At this point in time (April 2014ndashApril 2017) it is evident that nutrient concentra-tions in Big Creek have not increased at the monitored site However flow and nutri-ent concentration data over a longer period are needed to reliably quantify water-quality trends and characterize sources and moni-toring needs to continue for at least a decade to evaluate how discharge season and time influence nutrient fluxes (Hirsch et al 2010)
This research details a process by which regional monitoring networks can be devel-oped to establish baseline in-stream nutri-ent concentrations and by which time andor land use and management impacts can be determined
AcknowledgmentsFunding for the Big Creek Research and Extension Team (BCRET) to undertake the on-going monitoring project was provided by the Arkansas Governorrsquos Office and State Legislature to the University of Arkansas Systemrsquos Division of Agriculture All authors are members of BCRET
ReferencesArkansas Pollution Control and Ecology Commission 2016 Regulation
no 2 Regulations establishing water quality standards for surface wa-ters of the State of Arkansas httpswwwepagovsitesproductionfiles2014-12documentsarwqspdf (accessed 21 Sept 2017)
Buck O DK Niyogi and CR Townsend 2004 Scale-dependence of land use effects on water quality of streams in agricultural catchments En-viron Pollut 130(2)287ndash299 doi101016jenvpol200310018
Dubrovsky NM KR Burow GM Clark JM Gronberg PA Hamilton KJ Hitt DK Mueller and MD Munn 2010 The quality of our na-tionrsquos waters Nutrients in the nationrsquos streams and groundwater 1992ndash2004 USGS Circ 1350 httpwaterusgsgovnawqanutrientspubscirc1350 (accessed 21 Sept 2017)
Evans-White MA BE Haggard and JT Scott 2014 A review of stream nutrient criteria development in the United States J Environ Qual 421002ndash1014 doi102134jeq20120491
Gesch D M Oimoen S Greenlee C Nelson M Steuck and D Tyler 2002 The national elevation dataset Photogramm Eng Remote Sens 68(1)5ndash11 httpsnationalmapgovPERS_Jan2002_NED_highlight_articlepdf
Giovannetti J LB Massey BE Haggard and RA Morgan 2013 Land use effects on stream nutrients at Beaver Lake watershed J Am Water Works Assoc 105E1ndashE10 doi105942jawwa20131050005
Green CT BA Bekins SJ Kalkhoff RM Hirsch L Liao and KK Barnes 2014 Decadal surface water quality trends under variable cli-mate land use and hydrogeochemical setting in Iowa USA Water Resour Res 502425ndash2443 doi1010022013WR014829
Haggard BE 2010 Phosphorus concentrations loads and sources within the Illinois River drainage area northwest Arkansas 1997ndash2008 J En-viron Qual 392113ndash2120 doi102134jeq20100049
Haggard BE PA Moore Jr I Chaubey and EH Stanley 2003 Nitrogen and phosphorus concentrations and export from an Ozark Plateau catchment in the United States Biosyst Eng 86(1)75ndash85 doi101016S1537-5110(03)00100-4
Haggard BE AN Sharpley L Massey and K Teague 2010 Final report to the Illinois River Watershed Partnership Recommended watershed based strategy for the Upper Illinois River Watershed Northwest Ar-kansas Arkansas Technical Publication Number MSC 355 Water Re-sources Center University of Arkansas httparkansas-water-centeruarkedupublicationsmscMSC355pdf (accessed 21 Sept 2017)
Hirsch RM SA Archfield and LA De Cicco 2015 A bootstrap method for estimating uncertainty of water quality trends Environ Model Softw 73148ndash166 doi101016jenvsoft201507017
Hirsch RM DL Moyer and SA Archfield 2010 Weighted regres-sion on time discharge and season (WRTOS) with an application to the Chesapeake Bay River inputs J Am Water Resour Assoc 46(5)857ndash880
Joint Study Committee 2017 Final report to governors from the Joint Study Committee and Scientific Professionals 19 Dec 2016 Arkansas-Oklahoma Joint Study Committee httpswwwokgovconservationdocumentsIR202016121920Final20Reportpdf (accessed 21 Sept 2017)
Jones JB and EH Stanley 2016 Stream ecosystems in a changing envi-ronment Academic Press Amsterdam
Kosič K CL Bitting JV Brahana and CJ Bitting 2015 Proposals for integrating karst aquifer evaluation methodologies into national en-vironmental legislations Case study of a concentrated animal feed-ing operation in Big Creek basin and Buffalo National River water-shed Arkansas USA Sustain Water Resour Manage 1363ndash374 doi101007s40899-015-0032-5
McCarty JA and BE Haggard 2016 Can we manage nonpoint-source pollution using nutrient concentrations during seasonal baseflow Ag-ric Environ Lett 1160015 doi102134ael2016030015
Migliaccio KW BE Haggard I Chaubey and MD Matlock 2007 Linking watershed subbasin characteristics to water quality param-eters in War Eagle Creek watershed Trans ASAE 50(6)2007ndash2016 doi1013031201324104
Omernik JM and GE Griffith 2014 Ecoregions of the conterminous United States Evolution of a hierarchical spatial framework Environ Manage 54(6)1249ndash1266 doi101007s00267-014-0364-1
Petersen JC JC Adamski RW Bell JV Davis SR Femmer DA Freiwald and RL Joseph 1998 Water quality in the Ozark Plateaus Arkansas Kansas Missouri and Oklahoma 1992ndash95 USGS Circ 1158 USGS Fort Collins CO httpspubsusgsgovcirccirc1158circ1158pdf (accessed 21 Sept 2017)
Rebich RA NA Houston SV Mize DK Pearson PB Ging and CE Hornig 2011 Sources and delivery of nutrients to the northwestern Gulf of Mexico from streams in the south-central United States J Am Water Resour Assoc 47(5)1061ndash1086 doi101111j1752-1688201100583x
Reckhow KH PE Norris RJ Budell DM Di Toro JN Galloway H Greening AN Sharpley A Shirmhhammadi and PE Stacey 2011 Achieving nutrient and sediment reduction goals in the Chesapeake Bay An evaluation of program strategies and implementation Na-tional Academies Press Washington DC
Fig 3 Flow-adjusted concentration of (a) soluble reactive P (b) total P (c) nitrate-N and (d) total N over time since January 2014 when monitoring in Big Creek started
Page 6 of 6 AGRICULTURAL amp ENVIRONMENTAL LETTERS
Scavia D JD Allan KK Arend S Bartell D Beletsky NS Bosch SB Brandt RD Briland I Daloglu JV DePinto DM Dolan MA Evans TM Farmer D Goto H Han TO Hoeoek R Knight SA Ludsin D Mason AM Michalak RP Richards JJ Roberts DK Rucinski E Rutherford DJ Schwab TM Sesterhenn H Zhang and Y Zhou 2014 Assessing and addressing the re-eutrophication of Lake Erie Central basin hypoxia J Great Lakes Res 40226ndash246 doi101016jjglr201402004
Scott JT BE Haggard AN Sharpley and JJ Romeis 2011 Change point analysis of phosphorus trends in the Illinois River (Oklahoma) demonstrates the effects of watershed management J Environ Qual 401249ndash1256 doi102134jeq20100476
Sharpley AN HP Jarvie A Buda L May B Spears and P Kleinman 2013 Phosphorus legacy Overcoming the effects of past management practices to mitigate future water quality impairment J Environ Qual 421308ndash1326 doi102134jeq2013030098
Stevenson RJ Y Pan KM Manoylov CA Parker DP Larsen and AT Herlihy 2008 Development of diatom indicators of ecological con-ditions for streams of the western US J North Am Benthol Soc 271000ndash1016 doi10189908-0401
USEPA 2004 Wadeable streams assessment water chemistry laboratory manual USEPA Office of Water and Office of Research and Develop-ment Washington DC
USEPA 2017 Approved CWA chemical test methods USE-PA Washington DC httpswwwepagovcwa-methodsapproved-cwa-chemical-test-methodsnumber
USGS 1999 The method detection limit procedure of the US Environmen-tal Protection Agency In New reporting procedures based on long-term method detection levels and some considerations for interpre-tations of water-quality data provided by the US Geological Survey National Water Quality Laboratory Open File Rep 99-103 USGS Reston VA httpswaterusgsgovowqOFR_99-193detectionhtml
USGS 2015 National elevation dataset httpsltacrusgsgovNEDUSGS 2017a National hydrologic dataset httpsnhdusgsgovUSGS 2017b National land cover dataset httpscatalogdatagovdataset
usgs-national-land-cover-dataset-nlcd-downloadable-data-collectionWhite KL BE Haggard and I Chaubey 2004 Water quality at the Buffalo
National River Arkansas 1991ndash2001 Trans ASAE 47(2)407ndash417 doi1013031201316042
Sampling Liquid Manure
Karl VanDevender PhD PE Professor Extension Engineer
Liquid animal manure sampling can be an important management tool Proper sampling provides the producer with nutrient analysis results that can be used in a sound farm fertilization program Nutrient analysis of manure in conjunction with soil sampling helps determine how much manure should be applied to fields to maintain adequate fertility while minimizing potential environmental problems such as ground and surface water pollution However manure applications should not exceed the maximum application rates in a manure management plan until sufficient data can be collected to justify revising the plan
When to Sample Liquid animal manure should be sampled for nutrient analysis as close to land application time as possible This helps ensure that the reported nutrient content accurately reflects what is being applied to the land If the manure is sampled as it is being land applied the results will not be available to govern present application rates It does however provide information for future land applications of animal manure if the manure management remains fairly constant over time
How to Collect a Liquid Manure Sample During Land Application The easiest way to collect liquid animal manure samples is to collect the manure as it is being land applied This approach ensures what is sample reflects what is applied Randomly place catch pans in the field to collect the liquid manure as it is land applied by an irrigation system or honey wagon Flexible rubber feed pans work well Immediately after the manure has been applied collect the manure from the catch pans combine in a bucket to make one composite sample and mix well by stirring This bucket will be the source of the manure sent for analysis From a Storage Facility If collecting liquid animal manure samples during land application is not possible collect the samples from the storage facility Liquid animal manure storage facilities have a tendency for the manure to stratify with the solids settling to the bottom and the liquids remaining on top It is also not uncommon for some solids to form a floating crust This stratification affects the manure nutrient concentrations in the storage facility The nitrogen and potassium will be more concentrated in the top liquid while the phosphorus will be more concentrated in the settled solids This stratification of nutrient concentrations increases the challenge of getting samples that represent what will be applied to a particular field If the liquids from the top and middle of the profile will be applied only this material should be sampled If the settled solids will be applied then they should be sampled However if the manure is to be agitated before pumping as has been the traditional recommendation the sample should contain representative proportions of manure from the top middle and bottom The idea is to collect a sample of an entire column of manure to represent the manure after agitation If agitating the manure prior to sampling is not possible an alternative approach is to make a sampler to collect the required sub-samples The sub-samples are then mixed to represent the manure after agitation The easiest to construct is simply a container such as a cup attached to the end of a pole Liquids from the manure surface can be simply scooped up To collect liquids from the middle depths or settled solids the container is held up side down trapping air until the desired sampling depth is reached Then the container is rotated releasing the air and collecting the sample When collecting a sample of the entire profile of the manure sub-samples are collected and mixed in a bucket
- over -
A sampler design that automatically collects a sample of the entire profile uses 10 foot 1 frac12 inch PVC pipe with a PVC ball valve at the bottom The handle of the ball valve is replaces with a lever arm about 2 feet long The free end of the lever arm is attached to the end of a 10 foot 1 inch PVC pipe The lever arm and smaller pipe allow the ball valve to be operated while holding to top of the sampler To use the sampler the valve is opened and the sampler is inserted (in a line not and arc) into the manure When the foot of the valve is at the bottom of the settled solids it is closed Then the sample of the entire manure profile can be removed from the manure and placed in a bucket
Sketch of Cup Sampler Sketch of Foot Valve Sampler
Whichever sampler is used at least 8 locations around the manure storage unit should be sampled and mixed in a bucket to serve as a final composite sample This bucket will be the source of the manure sent for analysis
Getting the Sample Analyzed After thoroughly mixing the final composite sample fill a one liter plastic bottle half full These bottles may be obtained from your county Extension office Never fill the bottle more than half full to allow for gas expansion of the sample and to prevent the bottle from exploding Keep the samples as cool as possible until you can take them to your county Extensions office for shipping to the University of Arkansas lab for analysis There you will get assistance in filling out an information sheet on your manure sample There is a fee to have the sample analyzed While the sample can be sent to a private lab the fees are often higher If you are required by the Arkansas Department of Environmental Equality (ADEQ) to sample your liquid animal manure as part of your Regulation No 5 permit make sure that you inform the individual helping you with the paperwork so the correct set of analyses can be performed In addition to the analyses to determine the fertilizer value of manure it is recommended to analyze for the amount of phosphorus in the manure that is water soluble Water soluble phosphorus is needed to evaluate the potential environmental risk associated with phosphorus application rates specified in manure management plans Having good farm based information should help planners develop plans tailored to and individual farm
Key Points to Remember The important things to remember in collecting a liquid animal manure sample are Collect a sample that best represents the nutrient content of the manure in that storage facility and what
will be applied If only the top water is to be applied it should be sampled If the storage unit will be agitated prior to application the sample should contain material from the entire depth profile
Only fill the sample bottle frac12 full Keep the sample cool prior to shipping Ship the sample to the lab as soon as possible
Handout April 27 2010
The Arkansas Cooperative Extension Service offers its programs to all eligible persons regardless of race color national origin religion
gender age disability marital or veteran status or any other legally protected status and is an Equal Opportunity Employer
- 2015_Bacteria Trends in Flowing Waterspdf
-
- E COLI IN FLOWING WATERS
-

Page 4 of 6 AGRICULTURAL amp ENVIRONMENTAL LETTERS
TP TC and TN All analyses were performed using the SPSS statistical package version 22 (IBM 2013)
Results and DiscussionWater extractable soil P concentration has been shown to
be directly related to the potential for dissolved P release from soils to surface runoff (Pote et al 1996 Sharpley 1995) The total inorganic and organic WEP (TWEP WEPi WEPo) concentrations across the three fields was significantly lower in the VBS than the FPZ reflecting the larger inputs of P to the FPZ (Fig 3) However there was no significant difference in TWEP between the pasture and FRZs despite a decrease in WEPi This is a result of the significantly higher concen-trations of WEPo present in the FRZ where WEPo made up 57 of TWEP in these soils compared with just 24 in the pasture soils This suggests that dissolved organic P can con-tribute to total P release in riparian soils
The release of soil P to water can occur through abiotic and biotic processes Desorption and dissolution reactions dominate the abiotic release mechanisms and are governed by soil chemical properties and number of available sorption sites (Arai and Sparks 2007) Microbial soil biomass can con-tain a significant pool of P in temperate pastures (Oberson and Joner 2005) This pool is in constant flux immobilizing P from or replenishing P in the soil solution during micro-bial growth or cell death Phosphorus release from this pool
occurs through three main mechanisms (i) mineralization (Oehl et al 2001) (ii) cell lysis in response to environmental stress (eg dessication) (Turner and Haygarth 2001) or (iii) predation by soil fauna (Bonkowski 2004) Biotic processes can also control the form of dissolved P in solution through the exudation of phosphatase enzymes which can catalyze the conversion of soluble organic P compounds to ortho-phosphate ions for plant uptake (Richardson et al 2011)
Table 3 shows the abiotic and biotic soil properties of the soils across the three landscape zones The FPZ soils had sig-nificantly higher concentrations of TP and M3-P but lower concentrations of TC and TN compared with the FRZ soils Additionally the DPS was significantly higher in the FPZ soils compared with the VBS and FRZ soils indicating more of the P sorption sites had become saturated Surprisingly we saw no significant difference in microbial biomass P C or N concentrations among zones despite expected increased leaf litter inputs in the FRZ However the total phosphatase activity was 17 higher in the FRZ soils than the field soils suggesting increased microbial activity
To determine which pools of P and which soil proper-ties were key in controlling the release of P to water we per-formed a stepwise regressions for TWEP WEPi and WEPo using data from all three sites and four sampling dates The results from this analysis are shown in Table 4 Both TWEP and WEPi were well predicted by the model (adjusted r2 =
Fig 3 Box plots showing the concentration of (i) total water extractable P (ii) inorganic water extractable P and (iii) organic water extractable P across the three zones (fertilized pasture zone [FPZ] vegetative buffer strip [VBS] and forested riparian zone [FRZ]) Letters denote significant differences between zones at p lt 005 as determined by Tukeyrsquos test of multiple comparisons
Table 3 Difference in mean soil properties across the different landscape zones fertilized pasture zone (FPZ) vegetative buffer strip (VBS) forested riparian zone (FRZ) pH total C (TC) total N (TN) total P (TP) Mehlich-3 P (M3-P) degree of P saturation (DPS) microbial biomass P (MBP) microbial biomass C (MBC) microbial biomass N (MBN) acid phosphomonoesterase (acid Pmono) alkaline phosphomonoesterase (alk Pmono) phosphodiester-ase (Pdi) and total phosphatase activities
ZoneSoil chemical properties Soil biological properties
pH TC TN TP M3-P DPS MBP MBC MBN Acid Pmono Alk Pmono Pdi Total phosphatase
mdashmdashmdash mdashmdashmdash mdash mg kg-1 mdash mdashmdashmdash mg kg-1 mdashmdashmdash mdashmdashmdashmdashmdash mmol pNPdagger g-1 h-1 mdashmdashmdashmdashmdashFPZ 587bDagger 206b 023b 640a 67a 748a 26 371 85 300a 133b 120b 553bVBS 571b 188b 021b 584ab 48b 489b 23 386 79 259ab 093b 096b 456bFRZ 640a 321a 026a 521b 28c 457b 28 356 101 233b 205a 205a 666ap value lt0001 lt0001 lt005 lt001 lt0005 lt0001 NS NS NS lt0005 lt0001 lt0001 lt0001
dagger pNP para-nitrophenyl phosphateDagger Means followed by the same letter are not significantly different at the p lt 005 level of significance according to Tukeyrsquos test for multiple comparisons
AGRICULTURAL amp ENVIRONMENTAL LETTERS Page 5 of 6
066 and 065 respectively) and variation in these concen-trations was mostly explained by DPS with a small con-tribution from total phosphatase activity an indicator of biologically mediated P release
In contrast to WEPi variation in WEPo was less closely related to any of the measured parameters (adjusted r2 = 037) Furthermore DPS was not included in the selected model and total phosphatase activity explained most of the variation in WEPo While total phosphatase activity was greatest in FRZ soils the activity of the different types of enzyme varied across the landscape positions (Table 3) Acid phosphomono-esterase activity was highest in the FPZ soils and of a similar magnitude to that found agricultural soils with a history of poultry manure application and high soil test PSpelled out STP correct concentrations (Tomlinson et al 2008) Acid phosphomonoesterase is thought to be mainly released by plant roots and some microbes and there is evidence that high concentrations phosphatase enzymes can be pres-ent in manures (Nannipieri et al 2011) Furthermore these enzymes have been shown to sorb strongly onto soil parti-cles (Burns 1986 Nannipieri et al 2011) hence the large acid phosphomonoesterase activates found in the FPZ may be directly due to manure application In contrast alkaline phosphomonoesterase and phosphodiesterase activities were greatest in the FRZ in keeping with the small increase in pH (Table 3) These enzymes are thought to be released by soil microorganisms rather than plant roots The differences in phosphatase activities across the zones suggest that release of P from riparian soils is likely to be controlled in part by the biologically mediated release of organic P
This study demonstrates that the significant decrease in soil test P concentrations in FRZ soils compared with regu-larly fertilized FPZ does not necessarily translate to a reduc-tion in the total amount of P which can be released to runoff due to the increase in WEPo Furthermore while DPS of which soil test P is a component was a good predictor of WEPi release additional factors relating to biological cycling need to be considered when trying to account for the poten-tial release of organic P
ReferencesArai Y and D Sparks 2007 Phosphate reaction dynamics in soils and
soil components A multiscale approach Adv Agron 94135ndash179 doi101016S0065-2113(06)94003-6
Arkansas Department of Environmental Quality 2017 Permit data system Specific NPDES water permit details Permit arg590001 httpswwwadeqstatearushomepdssqlp_permit_details_water_npdesaspxafindash=ampafin=5100164amppmtnbr=arg590001
Bonkowski M 2004 Protozoa and plant growth The microbial loop in soil revisited New Phytol 162617ndash631
Brookes PC A Landman G Pruden and DS Jenkinson 1985 Chloro-
form fumigation and the release of soil nitrogen A rapid direct extrac-tion method to measure microbial biomass nitrogen in soil Soil Biol Biochem 17837ndash842 doi1010160038-0717(85)90144-0
Burns RG 1986 Interactions of enzymes and soil mineral and organic col-loids In PM Huang and M Schnitzer editors Interactions of soil minerals with natural organics and microbes SSSA Madison WI p 429ndash453
Dick WA and MA Tabatabai 1977 An alkaline oxidation method for de-termination of total phosphorus in soils Soil Sci Soc Am J 41511ndash514 doi102136sssaj197703615995004100030015x
Dodd RJ and AN Sharpley 2015 Recognizing the role of soil organic phosphorus in soil fertility and water quality Resour Conserv Recycl 105(B) 282ndash293 doi101016jresconrec201510001
Dodd RJ and AN Sharpley 2016 Conservation practice effectiveness and adoption Unintended consequences and implications for sustain-able phosphorus management Nutr Cycling Agroecosyst 104373ndash392 doi101007s10705-015-9748-8
Haygarth PM and AN Sharpley 2000 Terminology for phos-phorus transfer J Environ Qual 2910ndash15 doi102134jeq200000472425002900010002x
Hoffmann CC C Kjaergaard J Ussi-Kaumlampauml HC Bruun Hansen and B Kronvang 2009 Phosphorus retention in riparian buffers Re-view of their efficiency J Environ Qual 381942ndash1955 doi102134jeq20080087
IBM 2013 IBM SPSS statistics for Windows version 220 IBM Corp Ar-monk NY
McLaughlin MJ AM Alston and JK Martin 1986 Measurement of phos-phorus in soil microbial biomass A modified procedure for field soils Soil Biol Biochem 18437ndash443 doi1010160038-0717(86)90050-7
Mehlich A 1984 Mehlich 3 soil test extractant A modification of the Mehlich 2 extractant Commun Soil Sci Plant Anal 151409ndash1416 doi10108000103628409367568
Nannipieri P L Giagnoni L Landi and G Renella 2011 Role of phospha-tase enzymes in soil In EK Buumlnemann A Oberson and E Frossard editors Phosphorus in action Soil Biology Ser 26 Springer Berlin p 215ndash243 doi101007978-3-642-15271-9_9
Oberson A and EJ Joner 2005 Microbial turnover of phosphorus in soil In BL Turner E Frossard and DS Baldwin editors Organic phos-phorus in the environment CAB International Wallingford UK p 133ndash164 doi10107997808519982200133
Oehl F A Oberson M Pronst A Fliessbach H Roth and E Frossard 2001 Kinetics of microbial phosphorus uptake in cultivated soils Biol Fertil Soils 3431ndash41 doi101007s003740100362
Pote DH TC Daniel AN Sharpley PA Moore Jr DR Edwards and DJ Nichols 1996 Relating extractable soil phosphorus to phospho-rus losses in runoff Soil Sci Soc Am J 60855ndash859 doi102136sssaj199603615995006000030025x
Provin T 2014 Total carbon and nitrogen and organic carbon via thermal combustion analyses In FJ Sikora and KP Moore editors Soil test methods from the southeastern United States Southern Cooperative Series Bull 419 Southern Extension and Research Activity Informa-tion Exchange Group- 6 p 149ndash154 httpaeslcesugaedusera6PUBMethodsManualFinalSERA6pdf
Richardson AE JP Lynch PR Ryan E Delhaize FA Smith PR Harvey MH Ryan EJ Veneklaas H Lambers A Oberson RA Culvenor and RJ Simpson 2011 Plant and microbial strategies to improve ef-ficiency of agriculture Plant Soil 349121ndash156
Roberts WM MI Stutter and PM Haygarth 2012 Phosphorus retention and remobilization in vegetative buffer strips A review J Environ Qual 41389ndash399 doi102134jeq20100543
Rowland AP and PM Haygarth 1997 Determination of total dis-solved phosphorus in soil solutions J Environ Qual 26410ndash415 doi102134jeq199700472425002600020011x
Table 4 Model predictions of total water extractable P (TWEP) inorganic water extractable P (WEPi) and organic water extractable P (WEPo) from stepwise regression across all data The F statistic for all three model predictions is lt0001
TWEP WEPi WEPo
r2adjusted Predictor Relative
importance r2adjusted Predictor Relative
importance r2adjusted Predictor Relative
importance066 Degree of soil P
saturation080 065 Degree of soil P
saturation093 037 Total phosphatase
activity078
Total phosphatase activity
018 Total phosphatase activity
007 Microbial biomass N 017
M3-P 002 pH 005
Page 6 of 6 AGRICULTURAL amp ENVIRONMENTAL LETTERS
Schoumans OF 2009 Determination of the degree of phosphate satura-tion in noncalcareous soils In JL Kovar and GM Pierzynski editors Methods for phosphorus analysis for soils sediments residuals and water 2nd ed SERA 17 Bull 408 Virginia Tech Blacksburg VA p 29ndash 32
Self-Davis ML PA Moore Jr and BC Joern 2009 Water- or dilute salt-extractable phosphorus in soil In JL Kovar and GM Pierzynski edi-tors Methods for phosphorus analysis for soils sediments residuals and water 2nd ed SERA 17 Bull 408 Virginia Tech Blacksburg VA p 22ndash 24
Sharpley AN 1995 Dependence of runoff phosphorus on extract-able soil phosphorus J Environ Qual 24920ndash926 doi102134jeq199500472425002400050020x
Sheppard SC MI Sheppard J Long B Sanipelli and J Tait 2006 Runoff phosphorus retention in vegetative field margins on flat landscapes Can J Soil Sci 86(5)871ndash884 doi104141S05-072
Tabatabai MA 1994 Soil enzymes In RW Weaver S Angl P Bottomley D Bezdicek S Smith and MA Tabatabai editors Methods of soil analysis Part 2 Microbiology and biological properties SSSA Madi-son WI p 775ndash833
Tomlinson PJ MC Savin and PA Moore Jr 2008 Phosphatase activities in soil after repeated untreated and alum-treated poultry litter appli-cations Biol Fertil Soils 44613ndash622 doi101007s00374-007-0245-3
Turner BL and PM Haygarth 2001 Biogeochemistry Phosphorus solu-bilization in rewetted soils Nature 411258 doi10103835077146
Vance ED PC Brookes and DS Jenkinson 1987 An extraction method for measuring soil microbial biomass C Soil Biol Biochem 19703ndash707 doi1010160038-0717(87)90052-6
Watanabe FS and SR Olsen 1965 Test of an ascorbic acid meth-od for determining phosphorus in water and NaHCO3 ex-tracts from soil Soil Sci Soc Am J 29677ndash678 doi102136sssaj196503615995002900060025x
Phosphorus Retention and Remobilization along HydrologicalPathways in Karst TerrainHelen P Jarviedagger Andrew N SharpleyDagger Van Brahanasect Tarra SimmonsDagger April PriceDagger Colin Nealdagger
Alan J Lawlor∥ Darren Sleep∥ Sarah Thacker∥ and Brian E Haggardperp
daggerCentre for Ecology amp Hydrology Wallingford OX10 8BB UKDaggerDepartment of Crop Soil amp Environmental Sciences Division of Agriculture University of Arkansas Fayetteville Arkansas 72701United StatessectDepartment of Geosciences University of Arkansas Fayetteville Arkansas 72701 United States∥Centre for Ecology amp Hydrology Lancaster LA1 4YQ UKperpArkansas Water Resources Center University of Arkansas Fayetteville Arkansas 72701 United States
S Supporting Information
ABSTRACT Karst landscapes are often perceived as highly vulnerable toagricultural phosphorus (P) loss via solution-enlarged conduits that bypass Pretention processes Although attenuation of P concentrations has been widelyreported within karst drainage the extent to which this results from hydrologicaldilution rather than P retention is poorly understood This is of strategicimportance for understanding the resilience of karst landscapes to P inputs givenincreasing pressures for intensified agricultural production Here hydrochemicaltracers were used to account for dilution of P and to quantify net P retentionalong transport pathways between agricultural fields and emergent springs for thekarst of the Ozark Plateau midcontinent USA Up to sim70 of the annual total Pflux and sim90 of the annual soluble reactive P flux was retained with preferentialretention of the most bioavailable (soluble reactive) P fractions Our resultssuggest that in some cases karst drainage may provide a greater P sink thanpreviously considered However the subsequent remobilization and release of the retained P may become a long-term source ofslowly released ldquolegacyrdquo P to surface waters
INTRODUCTION
More than 25 of the worldrsquos population either lives on orobtains its drinking water from karst aquifers Karst underlies30 of the land area of China 30 of Europe and 20 of theUnited States12 Karst aquifers exert an important control on thequality and ecology of surface waters in these areas3 Thecomplexity of subsurface drainage45 and the difficulties indeconvoluting flow pathways and groundwater contributingareas6 have been a significant barrier to detailed studies ofnutrient transport and fate in karst systems78 Nevertheless it iswidely assumed that karst drainage systems (formed bydissolution of carbonate rocks mainly limestone) are highlyvulnerable to phosphorus (P) impairment from agriculturalsourcesThis vulnerability is assumed to arise from the low nutrient
buffering capacity of the thin cherty soils which overlie karst andthe rapid transmission of surface runoff through conduitsenlarged by dissolution910 which is thought to bypass thezones where key processes of P retention occur11minus13 Nonethe-less highly intensive monitoring of Irish karst springs in areas oflivestock demonstrated major P attenuation (reduction in Pconcentrations) relative to agricultural runoff1415 with low Pconcentrations in spring discharge even during storm events
when agricultural P losses are expected to be highest Thisattenuation was attributed to a combination of both hydrologicaldilution and P retention during infiltration and transmission ofrunoff along groundwater conduit pathwaysCrucially we lack information on the extent to which P
attenuation is controlled by P retention processes during transitalong karst flow paths14 or by hydrological dilution ofagricultural runoff by cleaner groundwater sources16 This is ofstrategic importance for understanding the P buffering capacityand wider resilience of karst landscapes to nutrient inputs101718
Many karst lands have traditionally been used for low-intensitylivestock farming owing to poor soils and their unsuitability forarable production9 However there is increasing pressure forintensive livestock production as global demands for greaterefficiency in food production intensify1920 Given the movetoward more intensive livestock production systems whichaccumulate P2122 and the perceived vulnerability of karstdrainage systems to P loss there is now a pressing and strategic
Received December 14 2013Revised March 17 2014Accepted March 17 2014
Article
pubsacsorgest
copy XXXX American Chemical Society A dxdoiorg101021es405585b | Environ Sci Technol XXXX XXX XXXminusXXX
need for better understanding of the fate and transport of P inkarst landscapes Here this shortfall is addressed for karst terrainin south-central USA Hydrochemical tracers and endmembermixing analysis23minus26 were used to assess the vulnerability to Ploss by accounting for the hydrological dilution of agriculturalrunoff and directly quantifying net P retention during infiltrationthrough the soil and along karst transport pathways through tothe emergent springs
EXPERIMENTAL METHODS
Study Area The study was undertaken at the University ofArkansas long-term Savoy Experimental Watershed (SEW) NWArkansas USA27 The SEW is located in the Illinois RiverWatershed a mixed land-use watershed (sim4330 km2) whichspans the states of Arkansas and Oklahoma2829 The SEW covers1250 ha and is typical of the karst terrain of the Ozark Plateau ofmidcontinental USA (Figure SI-1a Supporting Information)The soils of the SEW are predominantly silt loams (seeSupporting Information) Around 70 of the land is nativeforest with the remaining 30 rolling pasture grazed by beefcattle (sim2 cows haminus1) The SEW also supports poultryproduction with the resulting poultry litter used to fertilizepastures There are no septic tanks or settlements in the SEWand agricultural runoff from pastures grazed by cattle providesthe overwhelmingly dominant P source in the watershed30
The stratigraphy of the SEW30minus32 (see Figure SI-1cSupporting Information) includes (a) the limestone aquifer ofthe St Joe Formation (b) the Boone Formation an impurelimestone which mantles the St Joe Formation and formsldquoepikarstrdquo and (c) a layer of regolith (vadose zone) whichoverlies the Boone Formation Karst drainage has a major controlon water quality in the Illinois River2933 67 of annual river flowcomes from karst springs rising to 80 of flow in the summerand fall34
Sample Collection and Analysis Surface runoff andspring-water chemistry and flow monitoring (Figure SI-1a andc Supporting Information) were undertaken at the following(1) two adjacent karst springs (Langle Spring LLS andCopperhead Spring CHS) which flow continually from the StJoe Formation (focused conduit flow) springs (2) two surfacerunoff field plots (Langle LL 107 ha and Copperhead CH 105ha) which are located above and within the watershed (rechargezone) of the LLS andCHS springs These runoff plots are locatedon Razort silt loams which make up most of the grazed pasturesof the SEW All pastures are treated similarly in terms of grazing
intensity and maintenance fertilizer applications (30 kg P haminus1
every two years as either poultry litter or diammoniumphosphate)Flows at the karst springs (LLS and CHS) were monitored on
15-min intervals (see Supporting Information) Karst springwater was sampled weekly with stage-triggered subdailyautomated sampling using an ISCO sampler during stormevents Figure SI-2 (Supporting Information) shows thedistribution of samples collected on the rising and falling stageof the storm hydrographs The volume of surface runoff fromboth fields was automatically measured and samples werecollected on a flow-weighted basis by an ISCO autosampler Allwater samples were filtered within 24 h of the water beingsampled and were analyzed following EPA standard protocols asdescribed below (and in the Supporting Information) Filtered(lt045 μm) samples were analyzed for soluble reactivephosphorus (SRP) by colorimetric analysis35 and for a fullsuite of major cations (including potassium K and calcium Ca)and trace elements (including lanthanum La and rubidium Rb)(see Supporting Information) Unfiltered samples were analyzedfor total phosphorus (TP) after acid-persulfate digestion bycolorimetric analysis3536 These measurements are consistentwith standard protocols for TP and SRP analysis37
Use of Conservative Tracers and Endmember MixingAnalysisConservative chemical tracers and endmember mixingmodels were used to apportion water sources and to differentiatethe effects of hydrological dilution from the biogeochemicalprocesses which retain and cycle P during transit through thekarst drainage system Chemical tracers have been widely used inwatershed hydrology for tracing water sources and flowpathways38 owing to their conservative behavior (chemicalinertness) Here we made use of chemical tracers already in thewatershed to apportion water sources Using the hydrochemicalmonitoring data tracers were chosen which had elevatedconcentrations in either base flow groundwater or in agriculturalrunoff First two-component endmember mixing models2339
were used to link the spring-water chemistry to sources withinthe watershed by (a) quantifying the relative proportions ofsurface runoff and groundwater and (b) estimating thecontribution of surface runoff from the agricultural grazed landSecond comparing the mixing patterns of P in spring water witha conservative tracer of agricultural runoff allowed us to directlyevaluate whether P was behaving nonconservatively (ie beingtaken up or released) along the hydrological pathways in the karstdrainage system
Table 1 Summary of Concentrations of Soluble Reactive Phosphorus (SRP) Total Phosphorus (TP) Potassium (K) Rubidium(Rb) and Calcium (Ca) in Field Runoff and Spring-Water Samples
field runoff (m3 ha‑1)spring flow (L s‑1)
SRP(mg Lminus1)
TP(mg Lminus1)
Rb(μg Lminus1)
K(mg Lminus1)
Ca(mg Lminus1)
Langle Field mean 380 221 257 697 104 512(LL) median 355 187 212 596 102 494
range 34minus915 059minus502 08minus553 093minus206 204minus263 211minus987Copperhead Field mean 231 068 109 294 611 345(CH) median 146 057 103 252 511 343
range 18minus799 047minus122 063minus191 058minus876 14minus147 195minus734Langle Spring mean 131 0029 0057 106 154 375(LLS) median 938 0012 0034 0878 114 367
range 124minus59 0minus0403 0002minus0608 0195minus357 0534minus492 122minus659Copperhead Spring mean 225 0019 0041 108 137 405(CHS) median 262 0017 0032 11 14 429
range 019minus253 0001minus012 0minus058 0328minus19 084minus217 145minus615
Environmental Science amp Technology Article
dxdoiorg101021es405585b | Environ Sci Technol XXXX XXX XXXminusXXXB
RESULTS AND DISCUSSION
Comparison of Agricultural Runoff and Spring-WaterChemistry Concentrations of TP SRP K and Rb wereconsistently highest in field runoff relative to the springs (Table1) and runoff from the grazed fields provides the greatestconcentrations of P K and Rb within the SEW In contrast Caconcentrations were consistently highest in the springscompared with runoff This indicates a dominant base flowgroundwater source of Ca from dissolution of limestone whichis diluted by surface runoff (Figure 1a)Concentrations of SRP TP K and Rb were all higher in field
runoff at LL compared with CH This likely reflects higher cattlegrazing density at LL (25 cows haminus1) than at CH (10 cowshaminus1) as well as higher runoff per unit area that likely led togreater solute and particulate entrainment and transport capacitycompared with CH This may also reflect a larger hydrologicallyactive area contributing runoff at LL linked to greater soilcompaction from more intensive cattle grazingFor the springs there was a greater variability in SRP TP K
and Rb concentrations at LLS than at CHS despite a much lowervariability in spring flow at LLS (Table 1) Howeverconcentrations of TP SRP K and Rb did not correlate withflow at either of the springs For most storm events at LLSconcentrations of TP SRP K and Rb increased dramatically
above base flow concentrations especially on the rising stage ofthe storm hydrograph (Figure SI-2 Supporting Information)These high concentrations on the rising stage are likely due toupstream point recharge of surface runoff from pasture land intothe underlying St Joe aquifer in locations where the confiningchert layer is breached At CHS the response of TP SRP K andRb to storm events was more mixed Small initial increases inconcentration occurred with the onset of higher flows followedby marked reductions in concentration reflecting substantialdilution by a water source with relatively low SRP TP K and Rbconcentrations most likely from the nonagricultural (ungrazedand forested) parts of the watershed Indeed karst inventorieshave verified that this part of the flow regime reflects runoff fromareas which are not grazed by livestock3031
To evaluate the attenuation (ie the reductions inconcentrations) of TP SRP K and Rb during transit throughthe karst the median concentrations in agricultural runoff werecompared with the corresponding median concentrations inCHS and LLS springs (Table 1) The average attenuation of TPand SRP concentrations ranged from 96 to 99 In contrastthe average attenuation of K and Rb concentrations was lower at56 to 89 Correspondingly under storm flow conditionscomparisons of average field runoff concentrations and the 90thpercentile concentrations in spring water (which typicallycorrespond with the rising stage of the storm hydrographs of
Figure 1 (a) Relationships between calcium (Ca) concentrations and flow at Langle and Copperhead springs (b) Relationship between rubidium (Rb)and potassium (K) concentrations in field runoff and spring-water samples
Environmental Science amp Technology Article
dxdoiorg101021es405585b | Environ Sci Technol XXXX XXX XXXminusXXXC
the springs) revealed that storm flow attenuation of TP and SRPranged from 93 to 96 compared with 46 to 74 for K andRb Across all flow conditions the higher rates of attenuation of Pconcentrations relative to K and Rb reflect the nonconservativebehavior of P during transit through the karstK and Rb show high correlation (Figure 1b) due to their
similar hydrogeochemistry (group 1a monovalent base cations ofrelatively small hydration size) Figure 1b shows a dominant two-component mixing series between a high concentrationldquoendmemberrdquo (ie surface runoff from fertilizer and grazedpastures in runoff) and a low concentration spring-waterldquoendmemberrdquo (ie runoff from nonagricultural and forestedareas which have no grazing or fertilizer inputs) Both K and Rbare highly soluble monovalent ions and once transmitted intothe karst drainage system chemical interactions will be relativelysmall Therefore the attenuation of K and Rb during transportthrough the karst will be largely controlled by hydrologicaldilution without retention mechanisms (with only possibly asmall attenuation or release within the epikarst where there is ahigh proportion of clays3140) In contrast P behaves non-conservatively reflected by the higher rates of attenuation of Prelative to K and RbSpring Hydrology and Water-Source Apportionment
Comparing the hydrology of the two springs (Figure 2) base
flows at CHS were consistently lower than at LLS the medianflow at CHS was 262 L sminus1 compared with 131 L sminus1 at LLS(Table 1) Further CHS exhibited a more flashy flow regimethan LLS and storm flows were dramatically higher at CHS Forinstance the average of the highest 10 of flows was 139 L sminus1 atCHS compared with 40 L sminus1 at LLS This discrepancy reflectsthe following (i) LLS being the ldquounderflowrdquo spring (3 cm lowerthan CHS) with a much larger groundwater drainage area underlow-flow conditions than CHS which accounts for the higherbase flows at LLS (ii) water capture (spring ldquopiracyrdquo) by CHSduring storm events which has been shown to result in adramatic expansion in the watershed drainage area for CHSrelative to LLS3233
Contributions to spring water at LLS and CHS wereapportioned by two-component endmember mixing analy-sis2341 Here Ca was used as a tracer of groundwater and K asa tracer of agricultural runoff based on the observed dominantgroundwater source of Ca and the dominant agricultural runoffsource of K For the mixing model endmembers were defined asthe following
(i) A base flow groundwater endmember with elevated Caand a storm flow endmember with low Ca concentrations
(ii) Runoff endmember from agricultural land with high Kconcentration and a spring base flow low K endmember
Figure 2 Hydrographs and water source apportionment for Langle and Copperhead springs
Environmental Science amp Technology Article
dxdoiorg101021es405585b | Environ Sci Technol XXXX XXX XXXminusXXXD
Applying a simple two-component mixing model2341 (eq 1)and the endmembers identified above Ca concentrations wereused to partition the contributions to spring flow at LLS andCHS from base flow groundwater (the high concentrationendmember) and from stormwater runoff (the low concen-tration endmember) Then a second two-component mixingmodel was used for K to quantify the contributions from grazedpasture runoff (eq 2)
= times minus minus total storm runoff
100 (Ca Ca )(Ca Ca )gw m gw ro (1)
= times minus minus
agricultural runoff
100 (K K )(K K )bf m bf ag (2)
where Cagw was the groundwater Ca concentration (highconcentration base flow endmember) defined here as theaverage Ca concentration for the lowest 10 of flows sampledCam was the measured spring-water Ca concentration Caro wasthe stormwater (agricultural runoff) endmember defined here asthe average field runoff Ca concentration Kbf was the base flowendmember (average K concentration for the lowest 10 of
spring flows sampled) Km was the measured spring-water Kconcentration and Kag was the agricultural runoff endmemberdefined here as the average field runoff K concentration Thevalues used to define the endmember concentrations at LLS andCHS are shown in Table SI-1 Supporting InformationThe water source apportionment for LLS and CHS (Figure 2)
showed similar percentage contributions from base flowgroundwater and total storm flow at LLS and CHS for most ofthe year and particularly during storm events During winter andspring storm events a much greater proportion of flow at LLSwas derived from agricultural (grazed field) runoff (up toapproximately a third of flow) This greater contribution of waterfrom pastures than from nonagricultural land at LLS accountedfor the higher storm-event concentrations of K and Rb at LLSAgricultural runoff contributed a much lower proportion ofwinter and spring storm event flow at CHS (typically less than10) These results and the much higher storm flow dischargesat CHS suggest that the water ldquopiracyrdquo at CHS during stormevents captured water sources which had a lower K and Rbconcentration from the nonagricultural (ungrazed and forested)areas
Figure 3 Relationships between total phosphorus (TP) soluble reactive phosphorus (SRP) and potassium (K) for (a) Langle Spring and (b)Copperhead Spring The dashed line denotes the conservative mixing line and the solid line denotes a line of maximum P retention (see text forexplanation)
Environmental Science amp Technology Article
dxdoiorg101021es405585b | Environ Sci Technol XXXX XXX XXXminusXXXE
Quantifying Net P Retention in Karst DrainageEndmember mixing analysis23minus26 was applied using theldquoconservativerdquo tracer K to explore the net P retention andrelease along karst hydrological pathways from infiltrationthrough the soil to spring discharge First concentrations ofTP and SRP were plotted against K as the ldquoconservativerdquo tracer(Figure 3) Two dominant and distinct sources of spring water(both with different TP SRP and K concentrations) arehypothesized (Table SI-1 Supporting Information) (i) a highconcentration agricultural endmember source (Kag TPag SRPag)defined here as the average concentrations (of K TP and SRP)in agricultural field runoff at the LL and CH field plots and (ii) alow concentration (nonagricultural) endmember (Kna TPnaSRPna) As the source of this low concentration runoff couldcome from a wide range of nonagricultural sources (ungrazedand forest land) across the watershed the most reliable means ofcapturing the integrated low-concentration endmember signalwas to use the minimum measured spring-water K TP and SRPconcentrations at LLS and CHSA theoretical linear two-component mixing series ie a
ldquoconservative mixing linerdquo between the high concentration andlow concentration endmembers (Figure 3) would be observed ifP behaved conservatively during mixing of the two endmemberwater sources during transport through the karst In contrast theobserved relationships between TP and K and SRP and K inspring water were highly scattered at LLS and CHS (Figure 3)Most of the samples plot well below the conservative mixing lineshowing predominantly net retention of TP and SRP relative toK A few isolated samples plotted above the conservative mixingline which are indicative of some sporadic net P release relativeto the K tracer The mixing patterns between TP SRP and Kconcentrations in Figure 3 had a well-defined lower boundary ofsamples with the lowest P concentrations relative to K (shown inFigure 3 as a ldquoline of maximum P retentionrdquo) This line ofmaximum P retention probably represents a secondaryendmember mixing line between the same low concentrationnonagricultural runoff endmember and a secondary agricultural
field runoff endmember with high K but lower P concentrationsas a result of P retention processes filtering out P We posit thatthe majority of this P was ldquofilteredrdquo out during diffuse recharge ofwater as through the soil and the epikarst into the karst aquiferThe spring-water samples which lie between the line ofmaximum retention and the conservative mixing series thereforelikely reflect the net effects of P retention and remobilizationprocesses for runoffwater entering the karst drainage system via amixture of diffuse and point rechargeBy comparing the observed spring-water TP and SRP versus K
relationships with the theoretical linear conservative mixingseries the net effects of P retention and release can be directlyquantified (Figure 3) By applying the theoretical conservativemixing series (TP versus K and SRP versus K) to the measuredspring-water K concentrations at LLS and CHS ldquoconservativerdquoTP and SRP concentration time series were derived (Figure SI-3ab Supporting Information) and converted to loads using thecorresponding spring flow data By taking the difference betweenmeasured and ldquoconservativerdquo TP and SRP loads we calculatednet TP and net SRP retention on an annual basis as well as forbase flows (lowest 10 of flows) and storm flows (highest 10 offlows) (Table 2)Annual net TP retention ranged from 69 at LLS to 54 at
CHS Net percentage P retention was consistently higher forSRP compared with TP not only on an annual basis but alsounder storm and base flow conditions This indicated preferentialretention of more labile SRP fractions by sorptionuptake andgreater mobility of TP organic and particulate P fractions Similarpatterns of soluble and particulate P retention have also beenobserved in other karst soils and drainage systems71113 Highestpercentage net P retention occurred during storm events at LLS(92 TP retention and 96 SRP retention) However the twosprings showed very different patterns in P retention under stormand base flow conditions At LLS net P retention was greatestduring storm flows than under base flow conditions reflecting ahigh efficiency of P retention from agricultural runoff at LLS Incontrast at CHS a greater percentage of the P load was retained
Table 2 Measured and ldquoConservativerdquo Annual Loads and Mean Daily Base Flow and Storm Flow Loads of Total Phosphorus(TP) and Soluble Reactive Phosphorus (SRP) in Langle and Copperhead Springs with Net and Percentage TP and SRP Retention
measured P load(kg yminus1 or g dminus1)
ldquoconservativerdquo P load(kg yminus1 or g dminus1)
net P retention(kg yminus1 or g dminus1) net P retention
Langle Spring(LLS)
annual TP load(kg yminus1)
701 223 153 69
annual SRP load(kg yminus1)
185 190 172 90
Copperhead Spring(CHS)
annual TP load(kg yminus1)
265 57 31 54
annual SRP load(kg yminus1)
098 33 23 70
Langle Spring(LLS)
avg base flow TP load(g dminus1)
103 233 130 56
avg base flow SRP load(g dminus1)
221 198 176 89
Copperhead Spring(CHS)
avg base flow TP load(g dminus1)
127 355 228 64
avg base flow SRP load(g dminus1)
045 214 169 79
Langle Spring(LLS)
avg storm flow TP load(g dminus1)
112 1448 1336 92
avg storm flow SRP load(g dminus1)
514 1240 1189 96
Copperhead Spring(CHS)
avg storm flow TP load(g dminus1)
445 971 527 54
avg storm flow SRP load(g dminus1)
175 567 392 69
Environmental Science amp Technology Article
dxdoiorg101021es405585b | Environ Sci Technol XXXX XXX XXXminusXXXF
under base flow than during storm flow This reflects much lowerbase flows at CHS which increase water residence time andpromote particulate sedimentation and P retention and higherstorm flows linked to stream piracy which provide greaterflushing from nonagricultural areas where flows have a low PconcentrationContaminant Residence Times in Karst DrainageWhile
monitoring P relative to a conservative tracer provides us withvaluable information on rates of annual and storm flowbase flownet retention it provides no information about the residencetimes of P within the karst or the time scales over whichretention and remobilization may occur This is of strategicconcern in relation to the ldquolegacyrdquo of P within watersheds4243
whereby time-lags in release of retained Pmaymask the effects ofconservation measures on receiving water quality By measuringa full suite of trace elements using ICP-MS a ldquoserendipitousrdquoobservation was made which may help provide clues about thewider contaminant residence times within the karst drainageConcentrations of ldquodissolvedrdquo (lt045 μm) lanthanum (La) instorm flow spring discharge at LLS were more than an order ofmagnitude higher than could be accounted for by the runoffsources measured within the SEW Figure 4 shows theconcentrations of La in the spring discharge at LLS and aldquoconservativerdquo (maximum) concentration from runoff whichaccounts for the dilution of agricultural runoff during transitthrough the karst drainage using K as a tracer The high stormflow La concentrations observed at LLS are likely a ldquolegacyrdquosignal from a past tracer experiment In 2001 lanthanum-labeledmontmorillonite clays were injected into a losing stream at SEWas part of a study to examine clay and bacterial transport44
While the La tracer was detected at LLS around 16 h after itwas injected44 our monitoring suggests the La tracer was alsoretained within the karst drainage system and continues to beremobilized and released during storm events more than 10 yearslater Unfortunately it is impossible to perform a mass balance toquantify how much of the La applied in the tracer study remainswithin the karst drainage system and how long a La ldquolegacyrdquomight persist as no La measurements were made in the
intervening 10 years between the tracer injection in 2001 and ourmonitoring which started in November 2011 Within the scopeof this study it was also not possible to determine whether the Laconcentrations measured were truly dissolved or a lt045 μmcolloidalclay fraction or whether La geochemistry is sufficientlysimilar to be used as an indicator of P transport However theseresults indicate that La a tracer expected to be flushed rapidlythrough the karst was retained and continues to be remobilizedand released during storm events more than 10 years later Thisindicates the potential for contaminant retention in thesubsurface karst drainage system where contaminant storageand gradual rerelease may occur over time scales of at least adecade
Wider Implications Hydrochemical tracers of agriculturalrunoff allowed us to directly evaluate the nonconservativebehavior of P within karst drainage and quantify net P retentionOur results challenge the widely held assumption that karstlandscapes are always highly vulnerable to P loss and suggest thatin some cases karst drainage may provide a greater sink for Pthan previously considered P from agricultural runoff wasattenuated by hydrological dilution from cleaner (nonagricul-tural) sources during transport through karst drainage Howeverthere was also a high capacity for net P retention especially forLangle Spring which was subject to the highest agricultural Ploadings Here sim70 of the annual TP flux and sim90 of theannual SRP flux was retained Moreover the buffering within thesoils and karst drainage not only retained a high proportion ofincoming fluxes of P from agricultural runoff but preferentiallyretained the most bioavailable P fractions For instance muchresearch has documented the capacity of soil to retain applied Pin various inorganic (Al Fe Ca complexes) and organic forms ofvarying stability4546 The long-term accumulation of P in soilhowever can be released slowly to soil water2847
The mechanisms of P retention were not investigated here butlikely include varying combinations of processes includingadsorption onto clays coprecipitation of P with CaCO3 andbinding with particulate humic substances11minus13 in the soil inepikarst and within the fractures and conduits These adsorption
Figure 4 Time series of measured and ldquoconservativerdquo lanthanum (La) concentrations and flow at Langle spring Measured La concentrations aredenoted by solid circles ldquoconservativerdquo La concentrations are denoted by open circles See text for explanation of how ldquoconservativerdquo La concentrationswere calculated
Environmental Science amp Technology Article
dxdoiorg101021es405585b | Environ Sci Technol XXXX XXX XXXminusXXXG
products and precipitates will be physically retained as the watervelocity slows and will be deposited as sediment along the base ofthe conduit flow paths With the recurrence of high flow thesesediments are resuspended by turbulent flow and moved alongthe flow path until redeposited or eventually resurged at thebase-level spring Given the potential importance of CaCO3minusPcoprecipitation for P retention in karst terrain and the possibilityof reductions in the efficiency of this coprecipitation mechanismunder higher P and dissolved organic carbon (DOC)concentrations124849 further work is needed to examine anyunforeseen impacts of increasing agricultural intensification onthis ldquoself-cleansingrdquo P retention mechanism However in thisstudy the site with the higher livestock intensity and with highermanure-enriched runoff actually demonstrated greater efficiencyof P retention This may indicate that critical P and DOCthresholds for inhibition of CaCO3 precipitation were notreached or that other P retention process mechanisms wereoccurringThe patterns in spring-water La concentrations suggest
continued released of La from springs more than 10 years aftera tracer injection and indicate the potential for long-termcontaminant retention storage and subsequent release Indeedthe complex nature of karst hydrological pathways can result inlarge distributions in water and contaminant residence times andlag times for discharge to surface waters may bemuch longer thanexpected50minus52 Our findings indicate that retention of P withinkarst drainage may reduce the risk of acute episodic storm-drivenlosses of agricultural P However the potential buffering of P inthe epikarst and within the fracture and conduit drainage systemcan provide a slow but long-term source of P released via springsto surface waters Further work is needed to determine theecological impacts of such patterns of P release to receivingstreams and the ability of those streams to assimilate thoseinputs compared with higher pulse inputs during storm flows
ASSOCIATED CONTENT
S Supporting InformationMap of the SEW and the karst water flow system time series ofspring-water TP SRP K and Rb concentrations table of Ca TPand SRP endmember concentrations soils and geology of theSavoy Experimental Watershed experimental methods Thismaterial is available free of charge via the Internet at httppubsacsorg
AUTHOR INFORMATION
Corresponding AuthorPhone ++44 (0)1491 838800 Fax ++44 (0)1491692424 E-mail hpjcehacuk
NotesThe authors declare no competing financial interest
ACKNOWLEDGMENTS
HPJ acknowledges funding and support from the UK NaturalEnvironment Research Council a Fulbright DistinguishedScholar Award and an OECD Co-operative Research Pro-gramme Fellowship We thank Chris Wardle (British GeologicalSurvey) for help with the artwork and Dr Tiong Ee Ting forpermission to reproduce tracer experiment results in theSupporting Information
REFERENCES(1) Panno S V Karst aquifers Can they be protected Ground Water2006 44 (4) 494minus494(2) White W B Culver D C Herman J S Kane T C Mylroie JE Karst lands Am Sci 1995 83 (5) 450minus459(3) Owen M R Pavlowsky R T Base flow hydrology and waterquality of an Ozarks spring and associated recharge area southernMissouri USA Environ Earth Sci 2011 64 (1) 169minus183(4) Baffaut C Benson VWModeling flow and pollutant transport ina karst watershed with SWAT Trans ASABE 2009 52 (2) 469minus479(5) Fournier M Motelay-Massei A Massei N Aubert MBakalowicz M Dupont J P Investigation of transport processesinside karst aquifer by means of STATIS Ground Water 2009 47 (3)391minus400(6) Brahana J V Rationale and methodology for approximatingspring-basin boundaries in the mantled karst terrane of the SpringfieldPlateau northwestern Arkansas In The engineering geology andhydrogeology of karst terranes Beck B F Stephenson B F Eds A ABalkema Rotterdam 1997 pp 77minus82(7) Kilroy G Coxon C Temporal variability of phosphorus fractionsin Irish karst springs Environ Geol 2005 47 (3) 421minus430(8) Lerch R N Contaminant transport in two central Missouri karstrecharge areas J Cave Karst Stud 2011 73 (2) 99minus113(9) Coxon C Agriculture and karst In Karst Management Beynen PE Ed Springer Dordrecht Netherlands 2011 pp 103minus138(10) Kacaroglu F Review of groundwater pollution and protection inkarst areas Wat Air Soil Pollut 1999 113 (1minus4) 337minus356(11) Allousha G A Boyer D G Belesky D P Halvorson J JPhosphorus mobility in a karst landscape under pasture grazing systemAgronomie 2003 23 (7) 593minus600(12) Neal C Jarvie H PWilliams R J Neal MWickham H HillL Phosphorus-calcium carbonate saturation relationships in a lowlandchalk river impacted by sewage inputs and phosphorus remediation Anassessment of phosphorus self-cleansing mechanisms in natural watersSci Total Environ 2002 282 295minus310(13) von Wandruszka R Phosphorus retention in calcareous soils andthe effect of organic matter on its mobility Geochem Trans 2006 7 6(14) Mellander P-E Jordan P Melland A R Murphy P N CWall D P Mechan S Meehan R Kelly C Shine O Shortle GQuantification of phosphorus transport from a karstic agriculturalwatershed to emerging spring water Environ Sci Technol 2013 47 (12)6111minus6119(15) Mellander P-E Jordan P Wall D P Melland A R MeehanR Kelly C Shortle G Delivery and impact bypass in a karst aquiferwith high phosphorus source and pathway potentialWater Res 2012 46(7) 2225minus2236(16) Stueber A M Criss R E Origin and transport of dissolvedchemicals in a karst watershed southwestern Illinois J Am Water ResAssoc 2005 41 (2) 267minus290(17) Kleinman P J A Sharpley A N McDowell R W Flaten DN Buda A R Tao L Bergstrom L Zhu Q Managing agriculturalphosphorus for water quality protection Principles for progress PlantSoil 2011 349 (1minus2) 169minus182(18) Sharpley A N Kleinman P J A Flaten D N Buda A RCritical source area management of agricultural phosphorus Experi-ences challenges and opportunities Water Sci Technol 2011 64 (4)945minus952(19) Sharpley A N Jarvie H P Agricultural management waterquality amp ecology Putting practice into policy In National AgriculturalBiotechnology Council Report 24 Eaglesham A Korth K Hardy R WF Eds Jacobs Press Auburn NY 2012 pp 73minus99(20) Sims J T Ma L Oenema O Dou Z Zhang F S Advancesand challenges for nutrient management in China in the 21st century JEnviron Qual 2013 42 (4) 947minus950(21) Kellogg R L Lander C H Moffitt D C Gollehon N Manurenutrients relative to the capacity of cropland and pastureland toassimilate nutrients Spatial and temporal trends for the United StatesResource Assessment and Strategic Planning Working Paper 98-1 USDANatural Resources Conservation Service and Economic Research
Environmental Science amp Technology Article
dxdoiorg101021es405585b | Environ Sci Technol XXXX XXX XXXminusXXXH
Service General Services Administration National Forms andPublication Center Fort Worth TX 2000 pp 1minus140 httpwwwnrcsusdagovtechnicallandpubsmanntrpdf(22) Maguire R O Rubaeligk G H Haggard B E Foy B H Criticalevaluation of the implementation of mitigation options for phosphorusfrom field to catchment scales J Environ Qual 2009 38 (5) 1989minus1997(23) Christophersen N Neal C Hooper R P Vogt R DAndersen S Modeling streamwater chemistry as a mixture of soilwaterend-members - A step towards 2nd-generation acidification models JHydrol 1990 116 (1minus4) 307minus320(24) Neal C Jarvie H P Williams R Love A Neal M WickhamH Harman S Armstrong L Declines in phosphorus concentration inthe upper River Thames (UK) Links to sewage effluent cleanup andextended end-member mixing analysis Sci Total Environ 2010 408 (6)1315minus1330(25) Jarvie H P Neal C Withers P J A Baker D B Richards RP Sharpley A N Quantifying phosphorus retention and release inrivers and watersheds using extended end-member mixing analysis (E-EMMA) J Environ Qual 2011 40 (2) 492minus504(26) Jarvie H P Sharpley A N Scott J T Haggard B E BowesM J Massey L B Within-river phosphorus retention Accounting for amissing piece in the watershed phosphorus puzzle Environ Sci Technol2012 46 (24) 13284minus13292(27) Brahana V The Savoy Experimental WatershedA long-termresearch site for karst hydrogeology In Caves and Karst of the USANational Speleological Society Guidebook for the International Congress ofSpeleology Palmer A N Palmer M V Eds National SpeleologicalSociety Huntsville AL 2009 section 5 Ozark Plateaus p 179(28) Sharpley A N Kleinman P J A Jordan P Bergstrom LAllen A L Evaluating the success of phosphorus management fromfield to watershed J Environ Qual 2009 38 1981minus1988(29) Scott J T Haggard B E Sharpley A N Romeis J J Changepoint analysis of phosphorus trends in the Illinois River (Oklahoma)demonstrates the effects of watershed management J Environ Qual2011 40 (4) 1249minus1256(30) Brahana J V Controlling influences on ground-water flow andtransport in the shallow karst aquifer of northeastern Oklahoma andnorthwestern Arkansas Proceedings volume hydrologic problemsalong the Arkansas-Oklahoma border Arkansas Water ResourcesCenter Publication No MSC-168 1995 pp 25minus3033(31) Brahana J V Ting T Al-Qinna M Murdock J Davis R KLainz J Killingbeck J J Szilvagyi E Doheny-Skubic M Chaubey IHays P D Thoma G Quantification of hydrologic budget parametersfor the vadose zone and epikarst in mantled karst US GeologicalSurvey Karst Interest Group Proceedings Rapid City SD Sept 12minus152005 Kuniansky E L Ed US Geological Survey ScientificInvestigations Report 2005-5160 pp 144minus152(32) Leh M D Chaubey I Murdoch J Brahana J V Haggard BE Delineating runoff processes and critical runoff source areas in apasture hillslope of the Ozark Highlands Hydrol Proc 2008 22 (21)4190minus4204 DOI 101002hyp7021(33) Haggard B E Phosphorus concentrations loads and sourceswithin the Illinois River drainage area Northwest Arkansas 1997minus2008J Environ Qual 2010 39 (6) 2113minus2120(34) Tortorelli R L Pickup B E Phosphorus concentrations loadsand yields in the Illinois River basin Arkansas and Oklahoma 2000minus2004 US Geological Survey Scientific Investigations Report 2006-5175 p 38(35) Murphy J Riley J P A modified single solution method for thedetermination of phosphate in natural-waters Anal Chim Acta 196227 31minus36(36) Eisenreich S J Bannerman R T Armstrong D E Simplifiedphosphorus analytical technique Environ Lett 1975 9 (1) 43minus53(37) Jarvie H P Withers P J A Neal C Review of robustmeasurement of phosphorus in river water Sampling storagefractionation and sensitivity Hydrol Earth Syst Sci 2002 6 113minus131(38) Divine C E McDonnell J J The future of applied tracers inhydrogeology J Hydrogeol 2005 13 255minus258
(39) Burns D A McDonnell J J Hooper R P Peters N E FreerJ E Kendall C Beven K Quantifying contributions to storm runoffthrough endmember mixing analysis and hydrologic measurements atthe Panola Mountain Research Watershed (Georgia USA) HydrolProc 2001 15 1903minus1924(40) Williams P W The role of the epikarst in karst and cavehydrogeology a review Int J Speleol 2008 31 1minus10(41) Jarvie H P Neal C Smart R Owen R Fraser D Forbes IWade A Use of continuous water quality records for hydrographseparation and to assess short-term variability and extremes in acidityand dissolved carbon dioxide for the River Dee Scotland Sci TotalEnviron 2001 265 (1minus3) 85minus98(42) Jarvie H P Sharpley A N Spears B Buda A R May LKleinman P J A Water quality remediation faces unprecedentedchallenges from ldquolegacy phosphorusrdquo Environ Sci Technol 2013 47(16) 8997minus8998(43) Sharpley A Jarvie H P Buda A May L Spears B KleinmanP Phosphorus legacy Overcoming the effects of past managementpractices to mitigate future water quality impairment J Environ Qual2013 42 (5) 1308minus1326(44) Ting T E E Assessing bacterial transport storage and viability inmantled karst of northwest Arkansas using clay and Escherichia colilabeled with lanthanide-series metals PhD Dissertation University ofArkansas 2005(45) Sharpley A N Smith S J Bain W R Nitrogen and phosphorusfate from long-term poultry litter applications toOklahoma soils Soil SciSoc Am J 1993 57 (4) 1131minus1137(46) Frossard E Condron L M Oberson A Sinaj S Fardeau J CProcesses governing phosphorus availability in temperate soils JEnviron Qual 2000 29 (1) 15minus23(47) Cox F R Kamprath E J McCollum R E A descriptive modelof soil test nutrient levels following fertilization Soil Sci Soc Am J 198145 (3) 529minus532(48) Inskeep W P Bloom P R kinetics of calcite precipitation in thepresence of water-soluble organic-ligands Soil Sci Soc Am J 1986 50(5) 1167minus1172(49) Dove P M Hochella M F Calcite precipitation mechanismsand inhibition by orthophosphate - insitu observations by scanning forcemicroscopy Geochim Cosmochim Acta 1993 57 (3) 705minus714(50) Kirchner J W Feng X H Neal C Fractal stream chemistry andits implications for contaminant transport in catchments Nature 2000403 (6769) 524minus527(51) Kirchner J W Neal C Universal fractal scaling in streamchemistry and its implications for solute transport and water qualitytrend detection Proc Nat Acad Sci USA 2013 110 (30) 12213minus12218(52) Neal C Catchment water quality The inconvenient butnecessary truth of fractal functioning Hydrol Proc 2013 27 (24)3516minus3520
Environmental Science amp Technology Article
dxdoiorg101021es405585b | Environ Sci Technol XXXX XXX XXXminusXXXI
Coupling High-Frequency Stream Metabolism and NutrientMonitoring to Explore Biogeochemical Controls on DownstreamNitrate DeliveryHelen P Jarviedagger Andrew N SharpleyDagger Timothy Kressesect Phillip D Hays∥ Richard J Williamsdagger
Stephen M Kingperp and Lawrence G BerryDagger
daggerNERC Centre for Ecology and Hydrology Wallingford OX10 8BB United KingdomDaggerDepartment of Crop Soil and Environmental Sciences University of Arkansas Fayetteville Arkansas 72701 United StatessectUS Geological Survey Lower Mississippi-Gulf Water Science Center 401 Hardin Road Little Rock Arkansas 72211 UnitedStates∥US Geological Survey Lower Mississippi-Gulf Water Science CenterUniversity of Arkansas Department of Geosciences 216Gearhart Hall Fayetteville Arkansas 72701 United StatesperpSTFC Rutherford Appleton Laboratory Harwell Campus Didcot Oxfordshire OX11 0QX United Kingdom
S Supporting Information
ABSTRACT Instream biogeochemical process measurementsare often short-term and localized Here we use in situ sensorsto quantify the net effects of biogeochemical processes onseasonal patterns in baseflow nitrate retention at the river-reachscale Dual-station high-frequency in situ nitrate measurementswere coupled with high-frequency measurements of streammetabolism and dissolved inorganic carbon in a tributary of theBuffalo National River Arkansas Nitrate assimilation wascalculated from net primary production and combined withmass-balance measurements to estimate net nitrification anddenitrification The combined net effects of these instreamprocesses (assimilation denitrification and nitrification)removed gt30minus90 of the baseflow nitrate load along a 65km reach Assimilation of nitrate by photoautotrophs during spring and early summer was buffered by net nitrification Netnitrification peaked during the spring After midsummer there was a pronounced switch from assimilatory nitrate uptake todenitrification There was clear synchronicity between the switch from nitrate assimilation to denitrification a reduction in riverbaseflows and a shift in stream metabolism from autotrophy to heterotrophy The results show how instream nitrate retentionand downstream delivery is driven by seasonal shifts in metabolic pathways and how continuous in situ stream sensor networksoffer new opportunities for quantifying the role of stream biota in the dynamics fate and transport of nitrogen in fluvialsystems
1 INTRODUCTION
Nutrients including nitrogen (N) phosphorus (P) and carbon(C) from agriculture and domestic wastewater are a majorsource of water-quality impairment1 Excessive nutrient inputsto rivers streams and lakes can accelerate growth of nuisanceand harmful algae Resulting increases in microbial activity anddepletion of dissolved oxygen (DO) have profound negativeconsequences for invertebrates and fish potable water supplyand recreation23 However biogeochemical processes instreams also play an important role in regulating downstreamnutrient transport with stream biota retaining and removingnutrients from the water column reducing downstreamecological impacts4minus6
Streams can provide a major sink for nitrate (NO3minus)
through uptake (assimilation) by primary production and
through denitrification78 The effectiveness of these processesvaries throughout the year and between streams butconventional methods for estimating NO3
minus uptake are basedon relatively few short-term experimental nutrient additionsand isotope measurements9minus11 making results difficult toextrapolate in space and time12 Continuous high-frequency insitu measurements offer new opportunities to explore NO3
minus
source dynamics13minus17 and instream processes have beeninferred from single-station diurnal concentration cycles121819
longitudinal profiling20minus23 and nested sensor networks24
Received June 6 2018Revised October 23 2018Accepted October 30 2018Published October 30 2018
Article
pubsacsorgestCite This Environ Sci Technol 2018 52 13708minus13717
copy 2018 American Chemical Society 13708 DOI 101021acsest8b03074Environ Sci Technol 2018 52 13708minus13717
Dow
nloa
ded
via
CT
R F
OR
EC
OL
OG
Y amp
HY
DR
OL
OG
Y o
n D
ecem
ber
4 2
018
at 0
936
54
(UT
C)
Se
e ht
tps
pub
sac
sor
gsh
arin
ggui
delin
es f
or o
ptio
ns o
n ho
w to
legi
timat
ely
shar
e pu
blis
hed
artic
les
In this study we used in situ sensors to quantify the neteffects of biogeochemical processes on seasonal patterns inbaseflow NO3
minus retention at the river-reach scale The approachemployed here is novel because it combines dual-station high-frequency NO3
minus measurements with high-frequency measure-ments of stream metabolism (analysis of diurnal DO curves tocalculate primary production and respiration) dissolvedinorganic carbon (DIC) and excess partial pressure of carbondioxide (EpCO2) to explore the capacity of instreambiogeochemical processes to retain and remove NO3
minus High-frequency in situ monitoring of water chemistry and stream-flow was undertaken along a 65 km experimental reach of BigCreek a tributary of the Buffalo National Scenic RiverArkansas USA and were used to calculate a NO3
minus massbalance along the reach Net primary production was used tocalculate NO3
minus assimilation by photoautotrophs Daily NO3minus
removal rates and rates of NO3minus assimilation by photo-
autotrophs were used to calculate net nitrification anddenitrification The biogeochemical controls on NO3
minus removalwere then evaluated in relation to wider ecosystem driversincluding streamflow DO and stream ecological function toexplore how seasonal shifts in metabolic pathways influenceinstream NO3
minus retention and downstream NO3minus delivery
2 MATERIALS AND METHODS21 Site Description and Water-Quality Monitoring
Big Creek a tributary of the Buffalo National Scenic RiverArkansas (Figure 1) is the subject of detailed water-quality
monitoring because of a permitted swine concentrated animalfeeding operation (CAFO) within the watershed in operationsince September 2013 The Big Creek watershed lies in thekarst terrain of the Ozark Plateau of the midcontinental USA(Figure 1) The watershed area is 236 km2 with 79 of theland area deciduous forest 3 evergreen forest 14grasslandpasture and 3 developed land (see SupportingInformation SI S11) Swine-manure slurry from the CAFO
has been land applied to permitted fields since January 1 2014in accordance with State regulationsThe focus of this study is an experimental reach of Big
Creek downstream of the CAFO from an upstreammonitoring station at Mt Judea (USGS site 07055790watershed area 106 km2) to a downstream monitoring stationat Carver (USGS site 07055814 watershed area 233 km2)721 and 069 km from the confluence between Big Creek andthe Buffalo River respectively (Figure 1) One tributary (LeftFork) enters Big Creek between Mt Judea and Carver Thewatershed is a mantled karst terrain characterized by intimateconnection between groundwater and surface water transportof surface-derived nutrients can be rapid25 (see S12)USGS conducted high-frequency (15 min) NO3
minus monitor-ing using submersible ultraviolet nitrate probes at Carver (06032014 to 04292017) and Mt Judea (11012014 to 11012015) there was therefore one year of overlapping data(11012014 to 11012015) during which NO3
minus monitoringwas undertaken at both Mt Judea and Carver A water-qualitysonde (YSI 6600) operating at Carver simultaneously collected15 min interval DO pH specific conductance and watertemperature data Further information about the high-frequency water-quality monitoring is provided in S13Water-quality samples collected on a weekly basis since 09
122013 with additional opportunistic high-flow sampling atMt Judea Left Fork and at a groundwater (spring) monitoringsite (Figure 1) provided NO3
minus (by ion chromatographyDionex ICS-1600) alkalinity (by fixed-end point acidimetrictitration to pH 4526) and conductivity (VWR SymphonyB10C) data All nitrate concentrations are reported as NO3minusN(mg-N Lminus1) Water-quality data are available at httpsbigcreekresearchorg
22 Stream-Flow Measurements and HydrographSeparation Stream flow was measured using establishedUSGS streamflow gauging methods27 (see S14) A two-component mixing model was used to partition thecontributions to streamflow from groundwater and surfacerunoff28 using alkalinity as a conservative groundwater tracer(see S15)
23 Analysis of Diurnal Dissolved Oxygen Curves toCalculate Primary Production and Respiration The dailyaverage gross primary production daily average ecosystemrespiration and reaeration coefficient were calculated from theseries of diurnal DO curves at Carver (see S16) using apiecewise solution of the mass balance DO model29 simplifiedfor the situation where the deficit does not vary spatially (eq1) the Delta method3031
D t k D td d ER GPP ( )a av av+ = minus (1)
where D is the DO deficit (mg-O2 Lminus1) t is the time (days) ka
is the reaeration coefficient ERav is the ecosystem respiration(mg-O2 L
minus1 dminus1) and GPPav is the gross primary production(mg-O2 Lminus1 dminus1) these are standard measures of ecosystemrespiration and gross primary production in river systems32
Odum33 suggested a classification system of flowing-watercommunities based on oxygen metabolism by using the ratio ofGPPav to ERav (GPPER) Respiration is associated with bothplant and microbial activity Photosynthesis is only associatedwith plants Autotroph-dominated communities are repre-sented by GPPER values gt1 whereas heterotroph-dominatedcommunities are represented by GPPER values lt1
24 Use of the THINCARB Model for CalculatingDissolved Inorganic Carbon Concentrations and Excess
Figure 1 Map of the Big Creek watershed and its location
Environmental Science amp Technology Article
DOI 101021acsest8b03074Environ Sci Technol 2018 52 13708minus13717
13709
Partial Pressure of Carbon Dioxide The THINCARBmodel (THermodynamic modeling of INorganic CARBon)34
uses pH Gran Alkalinity (AlkGran) and temperature measure-ments to calculate dissolved inorganic carbon (DIC)concentrations and DIC speciation from the excess partialpressures of carbon dioxide (EpCO2) in freshwatersTHINCARB is open access and is described in detail in Jarvieet al (2017)34 an outline is provided in S17 Prior to usealkalinity measurements in units of mg-CaCO3 L
minus1 were firstconverted to AlkGran (in μeq Lminus1) where 1 mg Lminus1 CaCO3 =1998 μeq Lminus134
THINCARB was applied to the high-frequency sonde datafrom Carver Specific conductance was used as a surrogate foralkalinity using the regression relationship between AlkGranand specific conductance (κ) measured across the Big Creekwatershed including the spring and Mt Judea Left Fork andCarver stream sites AlkGran = 865 (plusmn028) times κ minus 644 (plusmn66)R2 = 095 n = 270 P lt 0001 (numbers in parenthesesrepresent twice the standard error) By applying this regressionequation to the hourly κ series an hourly alkalinity record wasderived which was then used alongside the hourly pH andwater-temperature data to calculate a high-frequency DIC andEpCO2 series25 Mass-Balance Calculation of Baseflow Nitrate
Fluxes Instream Losses and Net Nitrification andDenitrification Daily mass-balance calculations were under-taken for eight quiescent low-flow periods (each typically of1minus2 weeks) USGS stream-velocity readings from Carverranged from 0457 and 122 m sminus1 and with a stream distancealong the experimental reach of 652 km the travel timesranged from 396 to 148 h Therefore daily mass balances
over a 24-h period were assumed sufficient to account fortransit of NO3
minus given (a) the relatively short travel times (b)the high degree of stationarity in flux transfers during quiescentbaseflow conditions and (c) that calculated daily massbalances were averaged over a 1minus2 week periodThe 15 min NO3
minus measurements at Mt Judea and Carverwere converted to daily means and daily nitrate loads at eachsite were calculated using the corresponding gauged dailystreamflow data To account for flow accretion along the reachthe difference between the daily flow downstream at Carverand the upstream site at Mt Judea was calculated The increasein flows was assumed to be input from Left Fork (Figure 1)Daily NO3
minus input loading to the reach (LT) was calculatedas the sum of the daily NO3
minus loads from Mt Judea (LMJ) andLeft Fork (LLF)
L L LT MJ LF= + (2)
There was no high-resolution NO3minus monitoring on Left
Fork so weekly NO3minus measurements from grab samples taken
at Left Fork were combined with the measured daily flowaccretion to derive daily loads from Left Fork (S181) Asensitivity analysis evaluated the potential effects of under- oroverestimating Left Fork NO3
minus concentrations by plusmn50(Tables SI1 and SI2)Within this karst watershed some of the flow accretion will
arise from direct groundwater input into Big Creek Dischargedata were not available from the Left Fork tributary and directapportionment of contributions from Left Fork and ground-water was not possible We therefore evaluated a secondalternative ldquoendmemberrdquo case scenario whereby all of flow
Figure 2 Time series at the downstream monitoring site (Carver) from May 2014 to May 2017 showing (a) nitrate (NO3minusN) dissolvedinorganic carbon (DIC) and streamflow and (b) daily average gross primary production (GPP) ecosystem respiration (ER) and streamflow
Environmental Science amp Technology Article
DOI 101021acsest8b03074Environ Sci Technol 2018 52 13708minus13717
13710
accretion was attributed to direct groundwater contribution(S182)The daily instream NO3
minus load removal (LR) along the reachwas calculated as the difference between the daily input NO3
minus
loading (LT) and the daily NO3minus load at Carver (LC)
L L LR T C= minus (3)
To allow direct comparison with rates of assimilatory NO3minus
uptake by photosynthesis LR (kg-N dminus1) was then convertedto a daily NO3
minus removal rate UT (mg-N Lminus1 dminus1) UTincorporates both assimilatory NO3
minus uptake by photo-autotrophs (UA) heterotrophic NO3
minus removal through directuptake and denitrification (UD) and NO3
minus enrichment due toremineralization via nitrification (R)20
U U U RT A D= + minus (4)
UA was estimated from the GPPav measurements1235 GPPavdata were converted into net primary production (NPP)assuming that autotrophic respiration consumed 50 of theGPPav
3637 NPP data were then converted from units of O2uptake (mg-O2 L
minus1 dminus1) to C uptake (mg-C Lminus1 dminus1) with aphotosynthetic quotient of 100 then converted to NO3
minus
uptake (mg-N Lminus1 dminus1) using a molar ratio of CN of 1238
Subtracting UT from UA provides a measure of either netnitrification (positive values) or net heterotrophic NO3
minus
removal through direct uptake and denitrification hereafterreferred to as ldquonet denitrificationrdquo (negative values) When theriver was influent loss of NO3
minus to groundwater was accountedfor as described in S183
3 RESULTS AND DISCUSSION31 Three-Year Time Series of Nitrate Dissolved
Inorganic Carbon and Stream Metabolism The hourlyNO3
minus and DIC concentrations variations at Carver were drivenby streamflow but in opposing directions (Figure 2a) Themean and median NO3
minus concentrations were 0128 and 0093
mg-N Lminus1 respectively Nitrate concentrations at Carver werelowest during baseflow (mean 0043 mg-N Lminus1 lowest 10 offlows) and highest during storm runoff (mean 0278 mg-N Lminus1highest 10 of flows) arising from nonpoint-sourcemobilization and delivery of NO3
minus during rainfall eventsThe mean and median DIC concentrations were 248 and
252 mg-C Lminus1 respectively DIC concentrations were highestduring baseflow (mean 317 mg-C Lminus1) with DIC concen-trations diluted by storm runoff (mean 132 mg-C Lminus1)Highest DIC and lowest NO3
minus concentrations occurred duringthe extended low-flows between August and November 2015The mean and median molar CN ratios were 356 and 305
respectively The mean CN ratio during baseflow was 882 and82 during stormflow CN ratios greater than sim66 areindicative of stoichiometric depletion of N relative to C39
Absolute NO3minus concentrations below sim01 mg-N Lminus1 are
deemed likely to be limiting to algae with algal growthresponse to NO3
minus enrichment occurring between 038 to 179mg-N Lminus140 Therefore under average and baseflow conditionsat Carver a clear potential exists for algal growth to be limitedby low NO3
minus availabilityNo longer-term trends in either NO3
minus or DIC wereobserved over the three years These high-frequencymonitoring results are consistent with results from near-weeklywater-quality monitoring of Big Creek at Mt Judea whichshowed no statistically significant increasing or decreasingtrends in dissolved or particulate forms of P and Nconcentrations since 201341
Earlier studies6 have shown that Ozark streams can be veryeffective at retaining available nutrients and buffering addi-tional nutrient inputs Therefore the absence of any increasingtrend in nutrients in the water column may result from therapid and efficient uptake of nutrient inputs by stream biotaConsequently high-resolution stream metabolism and nutrientmeasurements were used here to detect whether increasedphotosynthesis or respiration rates resulted from increased
Figure 3 Scatter plot showing the relations between mean daily nitrate concentrations upstream at Mt Judea and downstream at Carver
Environmental Science amp Technology Article
DOI 101021acsest8b03074Environ Sci Technol 2018 52 13708minus13717
13711
nutrient assimilation even where no increases in water-columnnutrient concentrations could be observed
The time series in daily rates of GPPav and ERav at Carver(Figure 2b) showed no definitive long-term trends between
Figure 4 Time series from 1 November 2014 to 1 November 2015 showing (a) Nitrate concentrations upstream at Mt Judea and downstream atCarver and the lower-flow time periods used for mass balance calculation and evaluation of biogeochemical processes (b) streamflow at Carverand the percentage groundwater contribution to streamflow (c) daily ratio of gross primary production ecosystem respiration (GPPER)downstream at Carver (horizontal dashed line shows GPPER of 1 ie balance between heterotrophy and autotrophy) and excess partial pressureof carbon dioxide (EpCO2) and (d) streamflow and the molar CN ratio (DIC dissolved inorganic carbonNO3minusN) downstream at Carver
Environmental Science amp Technology Article
DOI 101021acsest8b03074Environ Sci Technol 2018 52 13708minus13717
13712
2014 and 2017 GPPav declined rapidly in response to majorstorm runoff events but typically recovered within a couple ofweeks Highest GPPav tended to occur during quiescentbaseflow or recessional streamflow conditions during thesummer (May through August) Both GPPav and ERav declinedduring the autumn (September through December) reflectingreductions in stream biological activity and GPPav tended todecline at a faster rate than ER This was particularly apparentduring the extended low-flows between August and December2015 suggesting a decline in primary production relative tomicrobial activity and a transition from net autotrophic to netheterotrophic stream communities During winter baseflows(November through January) ERav tended to exceed GPPavDuring the 3-yr monitoring no CAFO-related impacts oneither stream nutrient concentrations or metabolism arediscernible at Carver32 Temporal and Spatial Variability in NO3
minus
Concentrations Relative to Other Key EnvironmentalVariables Mean daily NO3
minus concentrations varied betweenbaseflow and storm events at Mt Judea and Carver during theone year of overlapping data (Figure 3) There was a cleardifferentiation between a higher-flow period characterized byregular storm events from mid-December 2014 to mid-July2015 and lower-flow conditions from August to NovemberDecember 2015 (Figures 3 and 4)During the higher-flow period a positive correlation existed
between upstream (Mt Judea) and downstream (Carver)NO3
minus with a ratio approaching 1 (Figure 3) During this high-flow period NO3
minus concentrations at both upstream anddownstream sites ranged between sim01 and sim04 mg-N Lminus1Time series data show close convergence between upstreamand downstream NO3
minus concentrations during storm-eventpeak concentrations (Figure 4ab)Under lower-flow conditions NO3
minus concentrations wereconsistently higher upstream than downstream (Figure 3) Theincrease in NO3
minus concentrations at the upstream site duringthe summer and autumn 2015 corresponds with reductions inflow This is typical of the longer-term hydrologically drivencycles in NO3
minus concentrations observed at the upstream sitereflecting a strong flow dependency with highest concen-trations under the lowest flows and dilution with increasingflow (Figure SI1abc) The strong increase in NO3
minus
concentrations during July to November 2015 thereforereflects hydrological controls and is consistent with fallingflows The high NO3
minus concentrations in autumn 2015subsequently declined with the onset of higher flows (FigureSI1ab)
The gap in NO3minus concentrations between upstream and
downstream sites widened with decreasing flow particularlyduring the protracted low-flows between mid-July andNovember 2015 During this time minimal soil watercontributed to streamflow and almost all (gt95) ofstreamflow was derived from groundwater (Figure 4ab) Bythe end of October 2015 upstream NO3
minus concentrationsreached sim075 mg-N Lminus1 whereas downstream NO3
minus
concentrations were sim005 mg-N Lminus1 Between July andNovember 2015 downstream NO3
minus concentrations exhibiteda much lower range (sim005 to sim015 mg-N Lminus1) as comparedwith upstream (sim01 to sim08 mg-N Lminus1) (Figure 3) Thisreduction in both magnitude and range of downstream NO3
minus
concentrations under baseflow conditions could arise eitherfrom dilution of NO3
minus as a result of downstream accretion ofwater sources with much lower NO3
minus concentrations or byremoval of NO3
minus through biogeochemical processes neces-sitating a mass-balance evaluation (see section 33)The widening gap in NO3
minus concentrations betweenupstream and downstream sites after mid-July 2015 corre-sponded with a decline in GPPER which fell below 1indicating a change to net heterotrophy (Figure 4c) Duringthe low-flow period from mid-July to November 2015 BigCreek was heterotrophic for sim90 of days Daily streamwaterEpCO2 doubled between mid-July and November 2015 from45 to 91 times atmospheric pressure independentlyconfirming an increase in rates of respiration (CO2 release)relative to photosynthesis (CO2 uptake)During the higher-flow period from mid-January to mid-July
Big Creek was predominantly net autotrophic (GPPER gt 1for 52 of days) Net heterotrophic conditions prevailedpredominantly during lower-flow intervals between stormevents with GPPER lt 1 typically during and immediatelyafter storm eventsMolar CN ratios at Carver also increased markedly after
mid-July from sim300 to gt800 (Figure 4d) This stoichiometricdepletion of N along with persistence of low NO3
minus
concentrations below 01 mg-N Lminus1 (falling to lt004 mg-NLminus1) suggests that algal growth may have been limited by lowN availability at Carver over the late summer and autumn of2015
33 Nitrate Reach Mass Balance to Quantify SeasonalNitrate Removal during Baseflow ConditionsMean dailyNO3
minus mass balances for the eight seasonal quiescent baseflowperiods between February and October 2015 are presented inTable 1 Mean daily NO3
minus input loadings to the reach (LT)increased from 173 kg-N dminus1 in February to 617 kg-N dminus1 in
Table 1 Seasonal Patterns in Mean Daily NO3minus Input Loadings (LT) to Big Creek Mean Daily Instream NO3
minus Load Removal(LR) along the 65 km Experimental Reach Under Low-Flow Conditions and Mean Daily NO3
minus Load Removal As aPercentage of NO3
minus Inputs (UE)a
season date rangeNO3
minus input loadingto reach (LT) (kg-N dminus1)
instream NO3minus removal
along reach (LR) (kg-N dminus1)instream NO3
minus removal (LR) as of NO3minus
input loading (LT) (UE)
winter 4minus13 Feb 2015 173 (112) 768 (046) 447 (409)spring 1 5minus12 Apr 2015 441 (635) 190 (282) 439 (953)spring 2 24 Aprminus5 May 2015 379 (153) 169 (385) 476 (893)early summer 2minus10 Jun 2015 492 (236) 241 (854) 512 (534)mid summer 11minus21 Jul 2015 617 (442) 146 (282) 321(141)late summer 7minus16 Aug 2015 756 (122) 557 (059) 742 (466)autumn 1 1minus14 Sept 2015 581 (123) 449 (081) 778 (239)autumn 2 1minus11 Oct 2015 298 (029) 282 (025) 948 (120)aStandard deviations are shown in parentheses
Environmental Science amp Technology Article
DOI 101021acsest8b03074Environ Sci Technol 2018 52 13708minus13717
13713
July then declined rapidly to 756 kg-N dminus1 in August whichalso corresponded with an order of magnitude reduction inbaseflow discharge By October LT had fallen to only 298 kg-N dminus1 Instream NO3
minus removal (LR) followed a similar patternto LT with highest mean daily instream NO3
minus removal duringJune (24 kg-N dminus1) then decreasing during the late summerand autumn and falling to 282 kg-N dminus1 in October Howeverthe efficiency of instream NO3
minus removal (UE ie LR expressedas a percentage of LT) increased markedly during the latesummer and autumn from 32 in July to 74minus95 betweenAugust and OctoberThe fluvial mass balance therefore confirmed that the
observed downstream reductions in NO3minus concentrations
under baseflow were a result of net instream removal of NO3minus
by biogeochemical processes rather than a dilution effectAlthough LT and LR were greatest during the winter to early
summer period UE and the instream NO3minus removal rate (UT)
increased dramatically during the low flows of the late summerand autumn UT increased from le009 mg-N Lminus1 dminus1
(February through July) to gt02 mg-N Lminus1 dminus1 in Augustand September and 066 mg-N Lminus1 dminus1 in October (Table 2)By autumn 2015 gt75 of the NO3
minus inputs were removed bybiogeochemical processes (Table 1)We also assessed the efficiency of NO3
minus removal under thealternative scenario where the increase in flow along theexperimental reach was solely from direct groundwater input(S162) This made relatively little difference to the UE whichalso increased markedly during the late summer and autumnfrom 46 in July to 72minus94 between August and October(Table SI3) The sensitivity analysis (Tables SI1 and SI3)showed that a 50 increase or decrease in either Left Fork or
groundwater NO3minus concentrations made little difference to
these findings a consistent increase in efficiency of NO3minus
removal was observed after July with August to October UEvalues consistently sim70minus95
34 Biogeochemical Controls on Nitrate DeliveryAccounting for Assimilatory Nitrate Uptake to Calcu-late Net Nitrification and Net Denitrification FromFebruary to July assimilatory NO3
minus uptake by photosynthesiz-ing plants (UA) consistently exceeded UT (Table 2) indicatingfirst that assimilation of NO3
minus by photoautotrophs was thedominant process removing NO3
minus from the water column andsecond that assimilation was partially balanced by netnitrification NO3
minus gains In contrast from August to OctoberUT exceeded UA indicating that heterotrophic NO3
minus removalthrough direct uptake and denitrification was removing NO3
minus
along the reach in late summer and autumnTable 3 shows that net nitrification gains to the reach ranged
from 0135 mg-N Lminus1 dminus1 in February to 0273 mg-N Lminus1 dminus1
in AprilMay However after July a pronounced switch fromnet nitrification gains to net denitrification losses occurredDuring late summer and autumn denitrification losses ofNO3
minus increased from sim0100 mg-N Lminus1 dminus1 in August andSeptember to 0592 mg-N Lminus1 dminus1 in October These estimateswere based on using an average periphyton CN molar ratio of12 for USA streams3538 We also evaluated the effects ofusing an average periphyton molar CN ratio of 86 fromresearch in northern European streams17 This increased UAvalues by sim39 but did not alter our findings of a switchbetween net nitrification between February and July to netdenitrification from August to October By changing the CNstoichiometry from 12 to 86 net nitrification ranged from
Table 2 Seasonal Patterns in Mean Daily NO3minus Removal Rate (UT) along the 65 km Experimental Reach of Big Creek Under
Low-Flow Conditions And Mean Daily Assimilatory Uptake of NO3minus by Photoautotrophs (UA)
a
season date range instream NO3minus removal rate (UT) (mg-N Lminus1 dminus1) assimilatory NO3
minus uptake (UA) (mg-N Lminus1 dminus1)
winter 4minus13 Feb 2015 0077 (0006) 0212 (0035)spring 1 5minus12 Apr 2015 0072 (0017) 0256 (0050)spring 2 24 Aprminus5 May 2015 0082 (0018) 0355 (0067)early summer 2minus10 Jun 2015 0090 (0014) 0269 (0045)mid summer 11minus21 Jul 2015 0066 (0030) 0259 (0040)late summer 7minus16 Aug 2015 0284 (0026) 0180 (0016)autumn 1 1minus14 Sept 2015 0229 (0019) 0115 (0038)autumn 2 1minus11 Oct 2015 0656 (0029) 0076 (0028)
aStandard deviations are shown in parentheses
Table 3 Seasonal Patterns in Mean Daily NO3minus Concentration Gains by Net Nitrification (+) and Losses by Net
Denitrification (minus) long the Experimental Reach of Big Creek under Low-Flow Conditions Mean Daily Values of the Ratiobetween Gross Primary Production and Ecosystem Respiration (GPPER) Excess Partial Pressure of Carbon Dioxide(EpCO2) Dissolved Oxygen (DO) Streamflow and the Percentage of Groundwater Contribution to Streamflowa
season date rangenet nitrification (+) or denitrification (minus)
(mg-N Lminus1 dminus1) GPPEREpCO2
(times atm press)DO
(mg-O2 Lminus1) flow (m3 sminus1) groundwater
winter 4minus13 Feb 2015 +0135 (0032) 114 (009) 280 (020) 119 (049) 115 (007) 665 (134)spring 1 5minus12 Apr 2015 +0184 (0039) 106 (013) 364 (020) 102 (033) 310 (037) 586 (238)spring 2 24 Apr -5 May
2015+0273 (0058) 125 (016) 381 (059) 103 (050) 261 (116) 617 (579)
early summer 2minus10 Jun 2015 +0179 (0044) 134 (015) 471 (049) 939 (042) 330 (172) 580 (648)mid summer 11minus21 Jul 2015 +0193 (0024) 197 (078) 715 (046) 898 (029) 254 (128) 828 (721)late summer 7minus16 Aug 2015 minus0104 (0032) 078 (005) 106 (083) 695 (035) 023 (004) 988 (098)autumn 1 1minus14 Sept
2015minus0102 (0027) 062 (010) 985 (165) 650 (054) 024 (006) 966 (142)
autumn 2 1minus11 Oct 2015 minus0592 (0015) 057 (023) 817 (150) 785 (064) 004 (0004) 978 (064)aStandard deviations are shown in parentheses
Environmental Science amp Technology Article
DOI 101021acsest8b03074Environ Sci Technol 2018 52 13708minus13717
13714
+0218 mg-N Lminus1 dminus1 in February to +0414 mg-N Lminus1 dminus1 inAprilMay with net denitrification ranging from minus0033 mg-NLminus1 dminus1 in August to minus0562 mg-N Lminus1 dminus1 in OctoberNet nitrification and denitrification rates were compared
with mean daily GPPER EpCO2 streamflow and percentagegroundwater discharge (Table 3) The shift from netnitrification to net denitrification corresponded directly with(1) a change in stream metabolism from net autotrophic(GPPER in July was 197) to net heterotrophic (GPPER fellbelow 1 to 078 in August 062 in September and 057 inOctober) and (2) an increase in EpCO2 and a reduction inDO arising from the increases in microbial respiration relativeto photosynthesisThe alternative scenario where flow accretion between Mt
Judea and Carver was attributed to direct groundwaterdischarge to Big Creek also had no effect on the timing ofthe shift from net nitrification to denitrification (S162 TableSI4) Sensitivity analysis (Tables SI2 and SI4) also showedthat irrespective of a 50 increase or decrease in either LeftFork or groundwater NO3
minus concentrations the sameconsistent switch between net nitrification and net denitrifica-tion was observed after JulyThe consistency in this observed switch between instream
NO3minus production and instream NO3
minus removal and itssynchronicity with measured changes in stream metabolismprovides compelling evidence that the marked change ininstream NO3
minus processing and delivery after July was linked tochanges in stream metabolism from net autotrophy to netheterotrophyThe karst streams of the Ozarks are characterized by a large
hyporheic zone4243 a hotspot of nitrogen transformation44
Water residence times and redox conditions provide a keycontrol on changes between NO3
minus removal and NO3minus
production with hyporheic zone sediments45minus48 In BigCreek the winter to midsummer period was characterized byhigher baseflows (at least an order of magnitude greater thanlate summerautumn baseflows) and net autotrophy resultingin higher instream DO concentrations Rapid movement ofwell-oxygenated water throughout the water column and intothe hyporheic zone promotes aerobic metabolism of organicmatter and release of NO3
minus through nitrification4649 Fromwinter to midsummer net nitrification was observed in BigCreek and nitrification in the hyporheic zone may have beenresponsible for buffering the effects of photosyntheticassimilatory uptake of NO3
minusUnder the more sluggish flow conditions during late summer
and autumn available oxygen is depleted as a result ofincreased heterotrophic activity The reduced movement ofwater and oxygen through the hyporheic zone favors a shift torespiratory pathways with denitrification (conversion of nitrateto N2O andor N2 gas)
5051 Unlike assimilation of NO3minus into
plant biomass which retains N temporarily denitrificationresults in a permanent loss of bioavailable N The lowbaseflows of late summer and autumn 2015 resulted in higherwater residence times and a greater proportion of flow movingthrough the hyporheic zone This provides greater exposureand water contact time with microbial biofilms wheredenitrification occurs51 The death and breakdown of biomassduring the late summer and autumn contribute to theavailability of organic matter for microbial decompositionpromoting higher rates of microbial respiration relative tophotosynthesis losses of DO and greater availability of organiccarbon as a resource for denitrifying bacteria455253
Denitrification within the hyporheic zone may therefore beresponsible for losses of NO3
minus in Big Creek during the latesummer and autumn Although denitrification can also occuron suspended sediments within the water column5455 this islikely to be a second order effect under baseflow conditions ina groundwater-fed stream where suspended solids concen-trations are low (typically lt5 mg Lminus1)Under baseflow conditions instream assimilatory NO3
minus
uptake by photosynthesizing plants and hyporheic-zonedenitrification along the experimental reach removed betweensim30 and sim90 of the NO3
minus input load During the period ofmonitoring (spring 2014 to spring 2017) NO3
minus loading to theupstream section of Big Creek (at Mt Judea) was attenuated byinstream processing such that no CAFO-related impacts oneither stream nutrient concentrations or metabolism werediscernible at the downstream location (Carver) and thus tothe Buffalo River Future monitoring will be needed to detectwhether long-term changes in nutrients and organic carboninputs may occur whether this stimulates higher rates ofheterotrophic andor autotrophic activity and any longer-termeffects on the capacity of assimilation and denitrificationprocesses to remove and buffer any increase in nutrientloadingsThe novelty of this research is the combination of
continuous high-frequency in situ stream metabolism andnitrate measurements to apportion the net effects ofassimilation nitrification and denitrification on changes inbaseflow nitrate fluxes at the river-reach to watershed scale Inthis case we found that during winter to midsummer periodsNO3
minus uptake in Big Creek was dominated by assimilation byphotoautotrophs which was partially compensated by releaseof NO3
minus from nitrification In late summer the predominantmetabolic pathway switched to net heterotrophy andheterotrophic NO3
minus removal through direct uptake anddenitrification became the dominant process of nitrateremoval Removal of NO3
minus by assimilation and denitrificationprovides an important ldquoself-cleansingrdquo ecosystem serviceresulting in a pronounced shift in CN stoichiometry anddecreasing NO3
minus concentrations to low levels which would beexpected to limit algal growth56
This approach provides a means of scaling up frommicroscale and mesoscale process experiments and measure-ments which are by necessity short-term and localized toexplore how river nitrate delivery responds to shifts in streammetabolism from day-to-day and seasonal to interannualvariability This research and the methods presented here areapplicable along the river continuum from headwaters tolarge-scale fluvial systems (with large spatial and temporalvariability in nutrient fluxes) and offer a valuable way forwardin quantifying net process controls on the fate and transport ofnitrogen in fluvial systems
ASSOCIATED CONTENT
S Supporting InformationThe Supporting Information is available free of charge on theACS Publications website at DOI 101021acsest8b03074
S1 Methods Land use and cover data site hydro-geology high-frequency water-quality monitoringstreamflow measurement hydrograph separation anal-ysis of diurnal dissolved oxygen curves to calculateprimary production and respiration calculation of DICand EpCO2 nitrate mass-balance calculations and S2
Environmental Science amp Technology Article
DOI 101021acsest8b03074Environ Sci Technol 2018 52 13708minus13717
13715
Results Figure SI1 time series of nitrate and flow andnitrate plotted against stream flow for Mt Judea TablesSI1 and SI2 sensitivity analysis based on estimates ofNO3
minus load inputs from Left Fork Tables SI3 and SI4alternative scenario sensitivity analysis based onestimates of NO3
minus load inputs from groundwater andadditional references (PDF)
AUTHOR INFORMATIONCorresponding AuthorE-mail hpjcehacukORCIDHelen P Jarvie 0000-0002-4984-1607Phillip D Hays 0000-0001-5491-9272NotesThe authors declare no competing financial interest
ACKNOWLEDGMENTSHPJ and RJW were supported by NERC NationalCapability projects NEC05966 and NEC04879 Funding forthe Big Creek Research and Extension monitoring wasprovided by the Arkansas Governorrsquos Office and StateLegislature to the University of Arkansas Systemrsquos Divisionof Agriculture Hydrological and chemical monitoring by theUSGS were supported by a National Park ServiceUSGSWater Quality Partnership Grant administered by the USGSAny use of trade firm or product names is for descriptivepurposes only and does not imply endorsement by the USGovernment
REFERENCES(1) Smith V H Eutrophication of freshwater and coastal marineecosystems - A global problem Environ Sci Pollut Res 2003 10 (2)126minus139(2) Dodds W K Bouska W W Eitzmann J L Pilger T J PittsK L Riley A J Schloesser J T Thornbrugh D J Eutrophicationof US Freshwaters Analysis of Potential Economic Damages EnvironSci Technol 2009 43 (1) 12minus19(3) Dodds W K Smith V H Nitrogen phosphorus andeutrophication in streams Inland Waters 2016 6 (2) 155minus164(4) Peterson B J Wollheim W M Mulholland P J Webster JR Meyer J L Tank J L Marti E Bowden W B Valett H MHershey A E McDowell W H Dodds W K Hamilton S KGregory S Morrall D D Control of nitrogen export fromwatersheds by headwater streams Science 2001 292 (5514) 86minus90(5) Alexander R B Boyer E W Smith R A Schwarz G EMoore R B The role of headwater streams in downstream waterquality J Am Water Resour Assoc 2007 43 (1) 41minus59(6) Jarvie H P Sharpley A N Scott J T Haggard B E BowesM J Massey L B Within-River Phosphorus Retention Accountingfor a Missing Piece in the Watershed Phosphorus Puzzle Environ SciTechnol 2012 46 (24) 13284minus13292(7) Mulholland P J Helton A M Poole G C Hall R OHamilton S K Peterson B J Tank J L Ashkenas L R CooperL W Dahm C N Dodds W K Findlay S E G Gregory S VGrimm N B Johnson S L McDowell W H Meyer J L ValettH M Webster J R Arango C P Beaulieu J J Bernot M JBurgin A J Crenshaw C L Johnson L T Niederlehner B ROrsquoBrien J M Potter J D Sheibley R W Sobota D J Thomas SM Stream denitrification across biomes and its response toanthropogenic nitrate loading Nature 2008 452 (7184) 202minusU46(8) Mulholland P J Valett H M Webster J R Thomas S ACooper L W Hamilton S K Peterson B J Stream denitrificationand total nitrate uptake rates measured using a field N-15 traceraddition approach Limnol Oceanogr 2004 49 (3) 809minus820
(9) Tank J L Marti E Riis T von Schiller D Reisinger A JDodds W K Whiles M R Ashkenas L R Bowden W BCollins S M Crenshaw C L Crowl T A Griffiths N A GrimmN B Hamilton S K Johnson S L McDowell W H Norman BM Rosi E J Simon K S Thomas S A Webster J R Partitioningassimilatory nitrogen uptake in streams an analysis of stable isotopetracer additions across continents Ecol Monogr 2018 88 (1) 120minus138(10) Tank J L Meyer J L Sanzone D M Mulholland P JWebster J R Peterson B J Wollheim W M Leonard N EAnalysis of nitrogen cycling in a forest stream during autumn using aN-15-tracer addition Limnol Oceanogr 2000 45 (5) 1013minus1029(11) Ensign S H Doyle M W Nutrient spiraling in streams andriver networks Journal of Geophysical Research-Biogeosciences 2006111 (G4) G04009(12) Rode M Halbedel nee Angelstein S Anis M R BorchardtD Weitere M Continuous in-stream assimilatory nitrate uptakefrom high frequency sensor measurements Environ Sci Technol2016 50 (11) 5685minus5694(13) Bowes M J Jarvie H P Halliday S J Skeffington R AWade A J Loewenthal M Gozzard E Newman J R Palmer-Felgate E J Characterising phosphorus and nitrate inputs to a ruralriver using high-frequency concentration-flow relationships Sci TotalEnviron 2015 511 608minus620(14) Halliday S J Skeffington R A Wade A J Bowes M JGozzard E Newman J R Loewenthal M Palmer-Felgate E JJarvie H P High-frequency water quality monitoring in an urbancatchment hydrochemical dynamics primary production andimplications for the Water Framework Directive HydrologicalProcesses 2015 29 (15) 3388minus3407(15) Halliday S J Skeffington R A Wade A J Bowes M JRead D S Jarvie H P Loewenthal M Riparian shading controlsinstream spring phytoplankton and benthic algal growth Environ-mental Science-Processes amp Impacts 2016 18 (6) 677minus689(16) Wade A J Palmer-Felgate E J Halliday S J Skeffington RA Loewenthal M Jarvie H P Bowes M J Greenway G MHaswell S J Bell I M Joly E Fallatah A Neal C Williams RJ Gozzard E Newman J R Hydrochemical processes in lowlandrivers insights from in situ high-resolution monitoring Hydrol EarthSyst Sci 2012 16 (11) 4323minus4342(17) Rode M Wade A J Cohen M J Hensley R T Bowes MJ Kirchner J W Arhonditsis G B Jordan P Kronvang BHalliday S J Skeffington R A Rozemeijer J C Aubert A HRinke K Jomaa S Sensors in the stream The High-frequency waveof the present Environ Sci Technol 2016 50 (19) 10297minus10307(18) Cohen M J Kurz M J Heffernan J B Martin J BDouglass R L Foster C R Thomas R G Diel phosphorusvariation and the stoichiometry of ecosystem metabolism in a largespring-fed river Ecol Monogr 2013 83 (2) 155minus176(19) Hensley R T Cohen M J On the emergence of diel solutesignals in flowing waters Water Resour Res 2016 52 (2) 759minus772(20) Hensley R T Cohen M J Korhnak L V Inferring nitrogenremoval in large rivers from high-resolution longitudinal profilingLimnol Oceanogr 2014 59 (4) 1152minus1170(21) Kunz J V Hensley R Brase L Borchardt D Rode MHigh frequency measurements of reach scale nitrogen uptake in afourth order river with contrasting hydromorphology and variablewater chemistry (Weisse Elster Germany) Water Resour Res 201753 (1) 328minus343(22) Kraus T E C OrsquoDonnell K Downing B D Burau J RBergamaschi B A Using paired in situ high frequency nitratemeasurements to better understand controls on nitrate concentrationsand estimate nitrification rates in a wastewater-impacted river WaterResour Res 2017 53 (10) 8423minus8442(23) Jones C Kim S W Schilling K Use of continuousmonitoring to assess stream nitrate flux and transformation patternsEnviron Monit Assess 2017 189 35(24) Wollheim W M Mulukutla G K Cook C Carey R OAquatic nitrate retention at river network scales across flow conditions
Environmental Science amp Technology Article
DOI 101021acsest8b03074Environ Sci Technol 2018 52 13708minus13717
13716
determined using nested in situ sensors Water Resour Res 2017 53(11) 9740minus9756(25) Jarvie H P Sharpley A N Brahana V Simmons T PriceA Neal C Lawlor A J Sleep D Thacker S Haggard B EPhosphorus retention and remobilization along hydrological pathwaysin karst terrain Environ Sci Technol 2014 48 (9) 4860minus4868(26) American Public Health Association (APHA) AlkalinityTitration Method 2320 B In Standard Methods for the Examinationof Water and Wastewater 23rd ed 1987 ISBN 978minus0-87553minus287minus5(27) Rantz S E Measurement and computation of streamflow Vol1 Measurement of stage and discharge In US Geological SurveyWater Supply Paper 2175 1982(28) Jarvie H P Neal C Smart R Owen R Fraser D ForbesI Wade A Use of continuous water quality records for hydrographseparation and to assess short-term variability and extremes in acidityand dissolved carbon dioxide for the River Dee Scotland Sci TotalEnviron 2001 265 (1minus3) 85minus98(29) OrsquoConnor D J Ditoro D M Photosynthesis and oxygenbalance in streams Journal of the Sanitary Engineering DivisionProceedings of the American Society of Civil Engineers 1970 96 (2)547minus571(30) Williams R J White C Harrow M L Neal C Temporaland small-scale spatial variations of dissolved oxygen in the RiversThames Pang and Kennet UK Sci Total Environ 2000 251 497minus510(31) Chapra S C Ditoro D M Delta method for estimatingprimary production respiration and reaeration in streams J EnvironEng 1991 117 (5) 640minus655(32) Bernhardt E S Heffernan J B Grimm N B Stanley E HHarvey J W Arroita M Appling A P Cohen M J McDowellW H Hall R O Read J S Roberts B J Stets E G Yackulic CB The metabolic regimes of flowing waters Limnol Oceanogr 201863 S99minusS118(33) Odum H T Primary production in flowing waters LimnolOceanogr 1956 1 102minus117(34) Jarvie H P King S M Neal C Inorganic carbon dominatestotal dissolved carbon concentrations and fluxes in British riversApplication of the THINCARB model - Thermodynamic modellingof inorganic carbon in freshwaters Sci Total Environ 2017 575 496minus512(35) King S A Heffernan J B Cohen M J Nutrient flux uptakeand autotrophic limitation in streams and rivers Freshwater Science2014 33 (1) 85minus98(36) Hall R O Tank J L Ecosystem metabolism controls nitrogenuptake in streams in Grand Teton National Park Wyoming LimnolOceanogr 2003 48 (3) 1120minus1128(37) Hall R O Beaulieu J J Estimating autotrophic respiration instreams using daily metabolism data Freshwater Science 2013 32 (2)507minus516(38) Stelzer R S Lamberti G A Effects of N P ratio and totalnutrient concentration on stream periphyton community structurebiomass and elemental composition Limnol Oceanogr 2001 46 (2)356minus367(39) Redfield A C The biological control of chemical factors in theenvironment American Scientist 1958 46 (3) 205minus221(40) Evans-White M A Haggard B E Scott J T A Review ofstream nutrient criteria development in the United States Journal ofEnvironmental Quality 2013 42 (4) 1002minus1014(41) Sharpley A N Haggard B E Berry L Brye K Burke JDaniels M B Gbur E Glover T Hays P Kresse TVanDevender K W Nutrient concentrations in Big Creek correlateto regional watershed land use Agricultural amp Environmental Letters2017 2 170027(42) Miller R B Heeren D M Fox G A Halihan T Storm DE Mittelstet A R The hydraulic conductivity structure of gravel-dominated vadose zones within alluvial floodplains J Hydrol 2014513 229minus240(43) Miller R B Heeren D M Fox G A Halihan T Storm DE Heterogeneity influences on stream water-groundwater interactions
in a gravel-dominated floodplain Hydrol Sci J 2016 61 (4) 741minus750(44) Triska F J Duff J H Avanzino R J The role of waterexchange between a stream and its hyporheic zone in nitrogen cyclingat the terrestrial aquatic interface Hydrobiologia 1993 251 (1minus3)167minus184(45) Zarnetske J P Haggerty R Wondzell S M Baker M ALabile dissolved organic carbon supply limits hyporheic denitrifica-tion J Geophys Res 2011 116 G04036(46) Zarnetske J P Haggerty R Wondzell S M Bokil V AGonzalez-Pinzon R Coupled transport and reaction kinetics controlthe nitrate source-sink function of hyporheic zones Water Resour Res2012 48 W11508(47) Harvey J W Bohlke J K Voytek M A Scott D TobiasC R Hyporheic zone denitrification Controls on effective reactiondepth and contribution to whole-stream mass balance Water ResourRes 2013 49 (10) 6298minus6316(48) Moatar F Abbott B W Minaudo C Curie F Pinay GElemental properties hydrology and biology interact to shapeconcentration discharge curves for carbon nutrients sediment andmajor ions Water Resour Res 2017 53 (2) 1270minus1287(49) Zarnetske J P Haggerty R Wondzell S M Baker M ADynamics of nitrate production and removal as a function ofresidence time in the hyporheic zone J Geophys Res 2011 116G01025(50) Zarnetske J P Haggerty R Wondzell S M Couplingmultiscale observations to evaluate hyporheic nitrate removal at thereach scale Freshwater Science 2015 34 (1) 172minus186(51) Palmer-Felgate E J Mortimer R J G Krom M D JarvieH P Impact of point-source pollution on phosphorus and nitrogencycling in stream-bed sediments Environ Sci Technol 2010 44 (3)908minus914(52) Aubert A H Breuer L New seasonal shift in in-streamdiurnal nitrate cycles identified by mining high-frequency data PLoSOne 2016 11 (4) e0153138(53) Dodds W K Marti E Tank J L Pontius J Hamilton SK Grimm N B Bowden W B McDowell W H Peterson B JValett H M Webster J R Gregory S Carbon and nitrogenstoichiometry and nitrogen cycling rates in streams Oecologia 2004140 (3) 458minus467(54) Liu T Xia X H Liu S D Mou X L Qiu Y WAcceleration of Denitrification in Turbid Rivers Due to DenitrificationOccurring on Suspended Sediment in Oxic Waters Environ SciTechnol 2013 47 (9) 4053minus4061(55) Xia X H Jia Z M Liu T Zhang S B Zhang L WCoupled Nitrification-Denitrification Caused by Suspended Sediment(SPS) in Rivers Importance of SPS Size and Composition EnvironSci Technol 2017 51 (1) 212minus221(56) Jarvie H P Smith D R Norton L R Edwards F BowesM J King S M Scarlett P Davies S Dils R Bachiller-Jareno NPhosphorus and Nitrogen Limitation and Impairment of HeadwaterStreams Relative to Rivers in Great Britain A National Perspective onEutrophication Sci Total Environ 2018 621 849minus862
Environmental Science amp Technology Article
DOI 101021acsest8b03074Environ Sci Technol 2018 52 13708minus13717
13717
1
E COLI IN FLOWING WATERS
Mary Savin and BCRET members
I Why is Escherichia coli (E coli) being monitored What is the concern
Fecal pollution (from excrement of humans or animals) in the environment is of concern for many reasons not least of which is human health risks and disease control Other concerns related to fecal pollution of our natural waters include potential changes in the nutrient status of water introduction of antibiotic resistance and chemical contaminants changes in the ecological condition of waters and degradation of natural resources on which rural economies depend
People are concerned that the land application of swine effluent (pig excrement) will increase Escherichia coli in Big Creek and consequently the Buffalo River the first National Scenic River in the US This document aims to provide better understanding of
1) what is involved in E coli monitoring 2) what the numbers mean 3) some limitations in interpreting values and 4) provide a context for further research that may be needed to better interpret the E coli
numbers being measured in flowing waters such as Big Creek and Buffalo River
II What is E coli Why and how is it used as an indicator
E coli is a species of bacteria from the coliform group - bacteria that are rod-shaped gram negative non-spore forming facultative anaerobes commonly found in the feces of humans and warm blooded animals E coli occurs in human intestines - many strains with no ill effects although certain E coli cause serious human illnesses Thus while many E coli do not harm us there are important variants that do There are also other species of bacteria viruses and other small organisms that cause disease which if present in fecal sources polluting our waters can make humans sick Depending on whether E coli survive as long in the environment as these other pathogens E coli may or may not adequately warn us about a disease causing agent in our waters To date E coli is the most reliable test we have although other indicators and tests are being investigated E coli cannot be seen in streams by the human eye Thus it is important to determine if there is a problem of elevated E coli numbers by careful water sampling and using US Environmental Protection Agency (EPA) standardized methods E coli is counted in water because of the extensive studies and relationships established between the presence of E coli and the number of human illnesses occurring from contact with the water (eg swimming) containing the bacteria From these relationships there have been upper limits established for bacterial numbers that correspond to the acceptable risk of people getting sick from exposure to water containing them Water quality standards for E coli are established by the state in Arkansas Department of Environmental Quality (ADEQ) Regulation 2 (see Table 1) The E coli numbers must remain below a threshold in a specified number of total samples collected The exact upper limit that is allowed depends on the designation of the waterbody and time of year (primary or secondary contact season) Primary
2
Table 1 Upper limits for Escherichia coli counts defined in Regulation 2 of the Arkansas Department of
Environmental Quality (ADEQ) as specified by contact season and waterbody designation for both single samples and geometric mean
Contact season Water designation Limit of E coli (MPN100mL)
Single sample1
Geometric mean2
Primary (May 1-Sept 30)
Extraordinary Resource Water Ecologically Sensitive Waterbody
Natural amp Scenic Waterway Lakes
Reservoirs
298 126
All other water 410 NA3
Secondary (Oct 1-April 30)
Extraordinary Resource Water Ecologically Sensitive Waterbody
Natural amp Scenic Waterway Lakes
Reservoirs
1490 630
All other water 2050 NA 1 No more than 25 of samples from no less than 8 samples per contact season may exceed the limit 2Geometric mean is calculated from at least 5 samples collected within 30 days at evenly spaced time intervals during that 30-day period 3Not applicable
contact recreation is a designation given to a waterbody where full body contact occurs and occurs from May 1 through September 30 The ADEQ also designates any stream with a watershed (eg drainage basin in the landscape) exceeding 10 square miles and those with smaller watersheds on individual cases (ie after site verification) for primary contact recreation Secondary contact recreation designates waterbodies where activities such as boating fishing and wading take place and occurs from October 1 through April 30
E coli is measured in samples of water collected strictly following EPA guidelines The measurement of E coli starts within 8 hours of collection This method provides an estimate of E coli presence in the sampled water that is the most probable number (MPN) of E coli Using an EPA method provides numbers that are theoretically comparable to other labs using the same method The MPN depends on growing bacteria in the laboratory in ldquoculturerdquo and is an approach used routinely in microbiology This measurement is subject to high variability because of the nature of environmental bacteria thus variability in the data in E coli counts from streams is not unusual For this reason it is important to establish background levels of E coli in any water resulting from various wildlife human (eg septic tanks sewers) and agricultural (eg pig chicken cattle) sources
3
E coli thresholds are lower in late spring through summer (primary contact season) when more people are expected to be in contact with streams and lakes More stringent limits also apply to Extraordinary Resource Waters (eg Buffalo River) Ecologically Sensitive Waterbodies and Natural Scenic Waterways During the primary contact season (May 1- Sept 30) we do not want E coli to exceed 298 MPN100 mL and during secondary contact season (Oct 1 ndash Apr 30) E coli counts should not exceed 1490 MPN100 mL in single samples
III How does the E coli measurement ldquofitrdquo into the context of the landscape
While monitoring one bacterial species to assess the biological quality of water may seem simple determining the actual ecological condition of a system is complicated Measurement of E coli is an indicator for potential fecal pollution and potential pathogen problems but by itself does not identify the source(s) of the bacteria
E coli is present in intestines (and feces) and is not supposed to grow in the environment thus the presence and abundance should indicate pollution and be directly related to human and animal sources However because E coli is in many different animals (eg human wildlife agricultural) and because of the different pathways that bacteria may travel throughout the environment before ending up in water where we can measure it the presence of E coli does not identify the source of pollution
IV Why is E coli monitoring important and why is it complicated
There are many of factors that affect whether E coli survives in the environment for how long and whether it moves to other locations E coli is adapted to living in intestines After deposition from an animal cells have to survive rapidly changing environmental conditions (eg temperature and moisture) exposure to harmful UV rays in sunlight outcompete other organisms and avoid predators All these factors make it difficult to estimate how long E coli will survive in lagoon soil and river environments However there is evidence that E coli can persist in soil and sediments
V What are the numbers
E coli is measured weekly in Big Creek upstream and downstream of the CampH Farm Mt Judea Newton County Arkansas Water sample collection for E coli analysis began Sept 12 2013 prior to manure from CampH Farm application to fields either in fields adjacent to or distant from Big Creek Manure application began in 2014 to fields distant from Big Creek and then adjacent to Big Creek in March 2014 So far in the period following manure applications by CampH Farms (Jan 2 through May 19 2014) no trends in E coli with time or between sampling locations are apparent (Table 2) The Table 2 data are detailed in the Big Creek Research and Extension Team Quarterly Reports and demonstrate the week-to-week variability in E coli at upstream and downstream sites The E coli counts are expected to continue to be variable Clearly it is important to quantify the variability in E coli concentrations long-term in order to determine if changes occur as a result of CampH operation
The MPN is expected to increase with increases in flow and the recent installation of a USGS gauge to measure flow will allow for the determination of the relationship between measured flow in
4
the stream and E coli concentrations Because of the dangers during high flows most contact recreation is expected during base flow and thus sampling during base flow may provide more meaningful data
Table 2 Geometric mean of E coli (and range of sample MPN) before (Sept 12 - Dec 17 2013) and after manure applications began on the CampH Farm (Jan 2 - May 19 2014)
CampH location
Before any manure application
After manure application
Sept 12 - Dec 17 2013 Jan 2 - May 19 2014
(MPN100mL)
Upstream 82 (6 ndash 4080) 83 (NDa ndash 921)
Downstream 111 (5 ndash 3500) 39 (ND ndash 1553) aNot detected
Regulation Arkansas Pollution Control and Ecology Commission 01400-002 2014 Regulation Establishing Water Quality Standards for Surface Waters of the State of Arkansas as revised effective March 24 2014 Arkansas Department of Environmental Quality (ADEQ) Available at httpwwwadeqstatearusregsfilesreg02_final_140324pdf Last accessed 20 Aug 2014
Page 1 of 6
Nutrient impairment of surface waters continues despite widespread conservation efforts to reduce losses from urban rural and agricul-tural land uses (Scavia et al 2014) Land use within watersheds influ-
ences the quality and quantity of water in streams draining the landscape As land disturbance increases and use intensifies an increase in stormwater runoff and nutrient inputs that lead to a greater potential for transport to receiving water is generally observed (Dubrovsky et al 2010 Rebich et al 2011) This has led to efforts to identify and quantify nutrient sources within watersheds strategically target and apportion nutrient loss reduction (Reckhow et al 2011)
Many factors influence the relationship between land use in a given water-shed and nutrient transport downstream from that watershed With an increase in percentage of the drainage area in pasture row crop andor urban use a general trend of increasing nutrient concentrations in storm and base flows will manifest (Buck et al 2004 Giovannetti et al 2013 Haggard et al 2003 Migliaccio et al 2007) Thus nutrient concentrations in streams draining for-ested lands tend to be less than in watersheds with considerable anthropogenic land use
For a range of reasons great interest has been expressed in nutrient con-centrations in several streams of the Boston and Ozark Mountains region of northwest Arkansas including the Buffalo National River and its tributaries In particular Big Creek has been the center of attention within the Buffalo National River watershed (BRW) because of a permitted concentrated animal feeding operation (CAFO) The objectives of this letter are to put nutrient con-centrations of Big Creek into the context of the stream nutrient and watershed land use relationship and assess whether stream nutrient concentrations have
Nutrient Concentrations in Big Creek Correlate to Regional Watershed Land Use
A N Sharpley B E Haggard L Berry K Brye J Burke M B Daniels E Gbur T Glover P Hays T Kresse and K W VanDevender
Copyright copy American Society of Agronomy Crop Science Society of America and Soil Science Society of America 5585 Guilford Rd Madison WI 53711 USAThis is an open access article distributed under the terms of the CC BY-NC-ND license (httpcreativecom-monsorglicensesby-nc-nd40) Agric Environ Lett 2170027 (2017) doi102134ael2017080027 Received 16 Aug 2017 Accepted 25 Sep 2017 Corresponding author (sharpleyuarkedu)
Agricultural amp Environmental Letters
Research Letter
Abstract Nutrient concentrations in several streams of the Boston and Ozark Mountains region of Arkansas including the Buffalo National River and its tributaries have garnered tremendous interest In particular Big Creek has been the center of attention within the Buffalo River watershed because of a permitted concentrated animal feeding operation (CAFO) The objectives of this paper were to put nutrient concentrations of Big Creek into the context of the stream nutrient and watershed land-use relationship and develop a framework to evaluate regional land-use impacts on regional water quality Nutrient concentrations in streams draining the Boston and Ozark Mountains region were related to the intensity of watershed land use Concentrations in Big Creek were similar to other watersheds in the ecoregion with similar land use suggesting limited impact of the CAFO on Big Creek at the present time However this does not preclude future impacts and longer-term monitoring continues
AN Sharpley L Berry K Brye J Burke and T Glover Dep of Crop Soil and Environmental Sciences Univ of Arkansas 115 Plant Sciences Building Fayetteville AR 72701 BE Haggard Biological and Agricultural Engineering Univ of Arkansas BENGR201 Fayetteville AR 72701 MB Daniels and KW VanDevender Biological and Agricultural Engineering Cooperative Extension Univ of Arkansas 2301 South University Ave Little Rock AR 72203 E Gbur Agricultural Statistics Laboratory Univ of Arkansas 101 Agricultural Annex Fayetteville AR 72701 P Hays Dep of Geosciences Univ of Arkansas 216 Ozark Hall Fayetteville AR 72701 T Kresse (retired) USGS Arkansas Water Science Center 401 Hardin Rd Little Rock AR 72211
Core Ideas
bull Nutrient concentrations are low at Big Creek relative to expected biological-response thresholds
bull Nutrient concentrations at Big Creek are typical of streams draining watersheds with similar land use
bull Flow-adjusted nutrient concentrations at Big Creek have not increased over the short-term
bull Nutrient concentrations in streams increase as watershed land area in pasture and urban uses increases
Abbreviations BRW Buffalo River watershed CAFO concentrated animal feeding operation LOESS locally weighted regression SRP soluble reactive phosphorus TN total N TP total P UIRW Upper Illinois River watershed UWRW Upper White River watershed
Published online October 26 2017
Page 2 of 6 AGRICULTURAL amp ENVIRONMENTAL LETTERS
changed over the short term (3 yr of monitoring) The goal is to understand if how and why stream nutrient concentra-tions change downstream at Big Creek and whether the per-mitted swine CAFO has influenced water quality during the 3 yr since extensive monitoring began in September 2013
MethodsWater samples have been collected over varying periods
at the outlet of subwatersheds of the BRW Upper Illinois River watershed (UIRW) and Upper White River watershed (UWRW Fig 1) Land use and cover (ie forest pasture and urban) for each subwatershed was obtained from high-resolution (4-m) imagery from the USGS National Elevation Dataset (USGS 2015 Gesch et al 2002) National Land Cover Dataset (USGS 2017b) and National Hydrologic
Dataset (USGS 2017a) In the UWRW Giovannetti et al (2013) monitored 20 sites monthly for 1 yr (June 2005ndashJuly 2006) collecting water samples during base-flow condi-tions In the UIRW Haggard et al (2010) monitored 29 sites monthly during calendar year 2009 also collecting water samples during base-flow conditions
In the BRW the National Park Service in partnership with the Arkansas Department of Environmental Quality periodically collected water samples and measured nutrient concentrations at 20 stream sites from 1985 through 2015 Nitrate-nitrogen (NO3ndashN) total N (TN) soluble reactive phosphorus (SRP) and total P (TP) concentrations were obtained directly from these data Forest pasture and urban land-use areas were determined from 2006 high-resolution (4-m) land usendashland cover imagery
Fig 1 Location of the Big Creek Buffalo River Upper Illinois River and Upper White River watersheds in the Boston Mountains and Ozark Highlands ecoregion Information from USGS Environmental Systems Research Institute (ESRI) and NASA
AGRICULTURAL amp ENVIRONMENTAL LETTERS Page 3 of 6
Big Creek is monitored by the Big Creek Research and Extension Team a partnership between the University of Arkansas Systemrsquos Division of Agriculture and USGS Water samples have been collected upstream and down-stream of the swine CAFO on a near-weekly basis since September 2013 (Fig 1) The water samples were analyzed at an Arkansas Department of Environmental Quality cer-tified water quality laboratory within the Arkansas Water Resources Center (httparkansas-water-centeruarkeduwater-quality-labphp) according to methods detailed in Table 1 The data collected is made publicly available at httpsbigcreekresearchorg
The geometric mean of nutrient concentrations of base-flow samples collected between September 2013 and April 2017 were determined in order to compare with base-flow nutrient concentrations available for BRW UIRW and UWRW Base-flow conditions in Big Creek were classified from hydrograph inspection when flow had not increased or decreased within 3 d of sample collection McCarty and Haggard (2016) suggested that stream nutrient concen-trations under base flow can be used to identify nonpoint sources and target remedial measures in Boston Mountains and Ozark Highland watersheds
Using all above-listed data sources the geometric means of nutrient concentrations for streams in the BRW UIRW and UWRW were used to develop a relationship with human development within the watershed Human development is defined as the percentage of pasture plus urban land use within the watershed Exponential relationships with 95 confidence bands around the observations were developed for NO3ndashN TN SRP and TP concentrations to put nutri-ent concentration at Big Creek into the context of regional stream nutrients and watershed land use
Data from Big Creek were paired with discharge available from a gaging station just downstream from the swine CAFO where the USGS developed the rating curve discharge infor-mation was only available from May 2014 through April 2017 The data were then used in a simple three-step pro-cess (White et al 2004) to look at monotonic changes in the nutrients at Big Creek (i) log-transform concentration (mg L-1) and associated instantaneous discharge (m3 s-1) (ii) use locally weighted regression (LOESS) to smooth the data with a sampling proportion (n) of 05 and (iii) plot the resid-uals from LOESS (ie the flow-adjusted concentrations) over time and use linear regression to evaluate monotonic trends
Results and DiscussionPutting Stream Nutrient Concentrations into Context at Big Creek
In Big Creek upstream of the swine CAFO the geometric mean concentrations of base flow sampled at weekly inter-vals from September 2013 for NO3ndashN TN SRP and TP were 0098 0205 0009 and 0030 mg L-1 respectively Directly downstream of the CAFO geometric mean concentra-tions at Big Creek during base flow conditions during the same period were 0242 0356 0011 and 0031 mg L-1 for NO3ndashN TN SRP and TP respectively Arkansas has narra-tive criteria for nutrient concentrations in streams (Arkansas Pollution Control and Ecology Commission 2016) but its proposed assessment methodology has numeric screen-ing concentrations for TN (0450ndash2430 mg L-1) and TP (0040ndash0100 mg L-1) in the Boston Mountains and Ozark Highlands The geometric mean concentrations at Big Creek upstream and downstream from the CAFO were below these values for the Boston Mountains and Ozark Highlands ecoregion
Nutrient concentrations in Big Creek upstream and down-stream from the CAFO are low with respect to nutrientndashbio-logical response thresholds for algae macroinvertebrates and fish Evans-White et al (2014) reviewed the literature sum-marizing nutrientndashbiological response thresholds across the United Statesbull Algalmetricresponses TN 038ndash179 mg L-1 TP 0011ndash
028 mg L-1
bull Macroinvertebratemetric responses TN 061ndash192 mg L-1 TP 004ndash015 mg L-1
bull Fishmetricresponses TN 054ndash183 mg L-1 TP 006ndash014 mg L-1
Total N concentrations at Big Creek upstream and down-stream of the swine CAFO were well below thresholds that result in some expected biological response whereas TP con-centrations were below thresholds for expected macroinver-tebrate and fish response and on the low end of the range for expected algal response However these lower TP thresholds (0006ndash0026 mg L-1 Stevenson et al 2008) were focused on shifts in diatom species and metrics rather than nuisance algal biomass A recent study on the Illinois River Watershed showed that stream TP thresholds with Cladophora bio-volume and nuisance taxa proportion of biovolume were observed between 0032 and 0058 mg L-1 (Joint Study
Table 1 Minimum detection limits for each chemical and biological constituent
Constituent Analytical methoddagger Minimum detection limitDagger Reporting limitsectSoluble reactive P mg Lminus1 EPA 3652 0002 0010Total P mg Lminus1 APHA 4500-P J EPA 3652 0012 0020NitratendashN mg Lminus1 EPA 3000 0004 0050Total N mg Lminus1 APHA 4500-P J EPA 3532 0006 0050Total suspended solids mg Lminus1 EPA 1602 No detection limit 40
dagger EPA = Approved CWA Chemical Test Methods (USEPA 2017) APHA = American Public Health Association from the WadeableStreamsAssessmentWaterChemistryLaboratoryManual (USEPA 2004)
Dagger The minimum detection limit of an analyte is the value which can be measured and reported with 99 confidence that the analyte concentration is greater than zero Further information is available at USGS (1999)
sect The reporting limit is the least (non-zero) calibrated standard used in analysis or as defined by method for total suspended solids
Page 4 of 6 AGRICULTURAL amp ENVIRONMENTAL LETTERS
Committee 2017) Thus TP concentrations at Big Creek upstream and downstream of the CAFO were in the range in which the natural assemblage of algae is shifting but these con-centrations would likely not be indicative of problematic nuisance algae in this ecoregion
Geometric mean nutrient concentra-tions varied upstream and downstream of the swine CAFO at Big Creek and Kosič et al (2015) used the publicly available data to allude to the N increase being from human activities on the landscape such as the CAFO However the historic land use and how stream nutrient concentrations during base-flow conditions increase with human development within the Boston Mountain and Ozark Highland watersheds need to be considered (eg see Giovannetti et al 2013 Haggard et al 2003 Migliaccio et al 2007) In the Big Creek watershed the percentage of land influenced by human activities (ie pas-ture plus urban) doubles from ~10 to ~20 in the drainage area upstream and downstream of the CAFO Nutrient concentrations in Big Creek upstream and downstream of the CAFO are within the range typical of streams draining simi-lar land uses (Fig 2)
At this time nutrient concentrations in Big Creek upstream and downstream from the swine CAFO are con-sistent with the range in concentrations for other watersheds with similar pasture and urban land use characteristics (Fig 2) as well as less than most nutrient thresholds for nuisance water-quality conditions (Omernik and Griffith 2014) However this does not preclude the possibility that nutri-ent concentrations at Big Creek may increase over time especially if human development and activity in the drain-age areas increase The most important observation is that nutrient concentrations were low in Big Creek providing the ability to detect changes over time
Have Nutrient Concentrations Changed in the Short Term at Big Creek
Understanding that long-term (eg decadal-scale) water-quality data are needed to reliably assess how stream nutri-ent concentrations have changed in response to watershed management and climate variations is of critical importance (Hirsch et al 2015) The literature shows that stream nutri-ent concentrations can change relatively quickly in response to effluent management (eg Haggard 2010 Scott et al 2011) but seeing a response (ie decrease in concentrations) from landscape management can take decades or more (Green et al 2014 Sharpley et al 2013) A myriad of factors may influence observed nutrient concentrations in streams including discharge (Petersen et al 1998) biological pro-cesses and climactic conditions (ie drought and floods Jones and Stanley 2016) and dominant transport pathways (Sharpley et al 2013) Thus we need to use caution when
interpreting trends in water quality over databases that only cover a limited timeframe
Three years of flow-adjusted nutrient concentration data at Big Creek downstream from the swine CAFO (May 2014ndashApril 2017) show different relationships with flow for the various constituentsbull Nitrate-nitrogen was greatest (~05 mg L-1) during the
lowest flows sampled and concentrations decreased with increasing flow
bull Total N generally decreased with increasing flow until a minimal value occurred then TN increased with in-creasing flow
bull Soluble reactive P concentrations did not change much during base-flow conditions and the greater concentra-tions (~0100 mg L-1) sporadically occurred at larger flows indicating that enrichment from stormflow may have been influenced by availability of source or other nontransport factors and
bull Total P concentrations were also relatively stable during base-flow conditions and then increased in association with rainfall-runoff events with only a few samples hav-ing concentrations gt0100 mg L-1 indicating relatively small enrichment from the landscape
Flow-adjusted concentrations (White et al 2004) showed no monotonic (ie increasing or decreasing) trends in SRP TP or TN (P gt 016) over the current monitoring period (Fig 3) However flow-adjusted NO3ndashN concentrations decreased over time (R2 = 005 P = 001) by 7 yr-1 (Fig 3c)
Nutrient concentrations at Big Creek upstream and downstream of the swine CAFO and indeed most tributaries of the Buffalo River are low relative to other watersheds in this ecoregion (Fig 2) This provides a starting point to build a framework to evaluate changes in nutrient concentrations of streams as a function of land use and management The
Fig 2 Relationship between land use and the geometric mean N and P concentrations (mg L-1) in the Buffalo Upper Illinois and Upper White River watersheds (no total P data available for the Buffalo River watershed) Dashed lines represent the 95 confi-dence intervals for the estimated mean (solid line)
AGRICULTURAL amp ENVIRONMENTAL LETTERS Page 5 of 6
evaluation of flow-adjusted concentrations over time showed that nutrients in Big Creek were not increasing over the short duration of monitoring for which concentration and dis-charge data were available (May 2014ndashApril 2017) At this point in time (April 2014ndashApril 2017) it is evident that nutrient concentra-tions in Big Creek have not increased at the monitored site However flow and nutri-ent concentration data over a longer period are needed to reliably quantify water-quality trends and characterize sources and moni-toring needs to continue for at least a decade to evaluate how discharge season and time influence nutrient fluxes (Hirsch et al 2010)
This research details a process by which regional monitoring networks can be devel-oped to establish baseline in-stream nutri-ent concentrations and by which time andor land use and management impacts can be determined
AcknowledgmentsFunding for the Big Creek Research and Extension Team (BCRET) to undertake the on-going monitoring project was provided by the Arkansas Governorrsquos Office and State Legislature to the University of Arkansas Systemrsquos Division of Agriculture All authors are members of BCRET
ReferencesArkansas Pollution Control and Ecology Commission 2016 Regulation
no 2 Regulations establishing water quality standards for surface wa-ters of the State of Arkansas httpswwwepagovsitesproductionfiles2014-12documentsarwqspdf (accessed 21 Sept 2017)
Buck O DK Niyogi and CR Townsend 2004 Scale-dependence of land use effects on water quality of streams in agricultural catchments En-viron Pollut 130(2)287ndash299 doi101016jenvpol200310018
Dubrovsky NM KR Burow GM Clark JM Gronberg PA Hamilton KJ Hitt DK Mueller and MD Munn 2010 The quality of our na-tionrsquos waters Nutrients in the nationrsquos streams and groundwater 1992ndash2004 USGS Circ 1350 httpwaterusgsgovnawqanutrientspubscirc1350 (accessed 21 Sept 2017)
Evans-White MA BE Haggard and JT Scott 2014 A review of stream nutrient criteria development in the United States J Environ Qual 421002ndash1014 doi102134jeq20120491
Gesch D M Oimoen S Greenlee C Nelson M Steuck and D Tyler 2002 The national elevation dataset Photogramm Eng Remote Sens 68(1)5ndash11 httpsnationalmapgovPERS_Jan2002_NED_highlight_articlepdf
Giovannetti J LB Massey BE Haggard and RA Morgan 2013 Land use effects on stream nutrients at Beaver Lake watershed J Am Water Works Assoc 105E1ndashE10 doi105942jawwa20131050005
Green CT BA Bekins SJ Kalkhoff RM Hirsch L Liao and KK Barnes 2014 Decadal surface water quality trends under variable cli-mate land use and hydrogeochemical setting in Iowa USA Water Resour Res 502425ndash2443 doi1010022013WR014829
Haggard BE 2010 Phosphorus concentrations loads and sources within the Illinois River drainage area northwest Arkansas 1997ndash2008 J En-viron Qual 392113ndash2120 doi102134jeq20100049
Haggard BE PA Moore Jr I Chaubey and EH Stanley 2003 Nitrogen and phosphorus concentrations and export from an Ozark Plateau catchment in the United States Biosyst Eng 86(1)75ndash85 doi101016S1537-5110(03)00100-4
Haggard BE AN Sharpley L Massey and K Teague 2010 Final report to the Illinois River Watershed Partnership Recommended watershed based strategy for the Upper Illinois River Watershed Northwest Ar-kansas Arkansas Technical Publication Number MSC 355 Water Re-sources Center University of Arkansas httparkansas-water-centeruarkedupublicationsmscMSC355pdf (accessed 21 Sept 2017)
Hirsch RM SA Archfield and LA De Cicco 2015 A bootstrap method for estimating uncertainty of water quality trends Environ Model Softw 73148ndash166 doi101016jenvsoft201507017
Hirsch RM DL Moyer and SA Archfield 2010 Weighted regres-sion on time discharge and season (WRTOS) with an application to the Chesapeake Bay River inputs J Am Water Resour Assoc 46(5)857ndash880
Joint Study Committee 2017 Final report to governors from the Joint Study Committee and Scientific Professionals 19 Dec 2016 Arkansas-Oklahoma Joint Study Committee httpswwwokgovconservationdocumentsIR202016121920Final20Reportpdf (accessed 21 Sept 2017)
Jones JB and EH Stanley 2016 Stream ecosystems in a changing envi-ronment Academic Press Amsterdam
Kosič K CL Bitting JV Brahana and CJ Bitting 2015 Proposals for integrating karst aquifer evaluation methodologies into national en-vironmental legislations Case study of a concentrated animal feed-ing operation in Big Creek basin and Buffalo National River water-shed Arkansas USA Sustain Water Resour Manage 1363ndash374 doi101007s40899-015-0032-5
McCarty JA and BE Haggard 2016 Can we manage nonpoint-source pollution using nutrient concentrations during seasonal baseflow Ag-ric Environ Lett 1160015 doi102134ael2016030015
Migliaccio KW BE Haggard I Chaubey and MD Matlock 2007 Linking watershed subbasin characteristics to water quality param-eters in War Eagle Creek watershed Trans ASAE 50(6)2007ndash2016 doi1013031201324104
Omernik JM and GE Griffith 2014 Ecoregions of the conterminous United States Evolution of a hierarchical spatial framework Environ Manage 54(6)1249ndash1266 doi101007s00267-014-0364-1
Petersen JC JC Adamski RW Bell JV Davis SR Femmer DA Freiwald and RL Joseph 1998 Water quality in the Ozark Plateaus Arkansas Kansas Missouri and Oklahoma 1992ndash95 USGS Circ 1158 USGS Fort Collins CO httpspubsusgsgovcirccirc1158circ1158pdf (accessed 21 Sept 2017)
Rebich RA NA Houston SV Mize DK Pearson PB Ging and CE Hornig 2011 Sources and delivery of nutrients to the northwestern Gulf of Mexico from streams in the south-central United States J Am Water Resour Assoc 47(5)1061ndash1086 doi101111j1752-1688201100583x
Reckhow KH PE Norris RJ Budell DM Di Toro JN Galloway H Greening AN Sharpley A Shirmhhammadi and PE Stacey 2011 Achieving nutrient and sediment reduction goals in the Chesapeake Bay An evaluation of program strategies and implementation Na-tional Academies Press Washington DC
Fig 3 Flow-adjusted concentration of (a) soluble reactive P (b) total P (c) nitrate-N and (d) total N over time since January 2014 when monitoring in Big Creek started
Page 6 of 6 AGRICULTURAL amp ENVIRONMENTAL LETTERS
Scavia D JD Allan KK Arend S Bartell D Beletsky NS Bosch SB Brandt RD Briland I Daloglu JV DePinto DM Dolan MA Evans TM Farmer D Goto H Han TO Hoeoek R Knight SA Ludsin D Mason AM Michalak RP Richards JJ Roberts DK Rucinski E Rutherford DJ Schwab TM Sesterhenn H Zhang and Y Zhou 2014 Assessing and addressing the re-eutrophication of Lake Erie Central basin hypoxia J Great Lakes Res 40226ndash246 doi101016jjglr201402004
Scott JT BE Haggard AN Sharpley and JJ Romeis 2011 Change point analysis of phosphorus trends in the Illinois River (Oklahoma) demonstrates the effects of watershed management J Environ Qual 401249ndash1256 doi102134jeq20100476
Sharpley AN HP Jarvie A Buda L May B Spears and P Kleinman 2013 Phosphorus legacy Overcoming the effects of past management practices to mitigate future water quality impairment J Environ Qual 421308ndash1326 doi102134jeq2013030098
Stevenson RJ Y Pan KM Manoylov CA Parker DP Larsen and AT Herlihy 2008 Development of diatom indicators of ecological con-ditions for streams of the western US J North Am Benthol Soc 271000ndash1016 doi10189908-0401
USEPA 2004 Wadeable streams assessment water chemistry laboratory manual USEPA Office of Water and Office of Research and Develop-ment Washington DC
USEPA 2017 Approved CWA chemical test methods USE-PA Washington DC httpswwwepagovcwa-methodsapproved-cwa-chemical-test-methodsnumber
USGS 1999 The method detection limit procedure of the US Environmen-tal Protection Agency In New reporting procedures based on long-term method detection levels and some considerations for interpre-tations of water-quality data provided by the US Geological Survey National Water Quality Laboratory Open File Rep 99-103 USGS Reston VA httpswaterusgsgovowqOFR_99-193detectionhtml
USGS 2015 National elevation dataset httpsltacrusgsgovNEDUSGS 2017a National hydrologic dataset httpsnhdusgsgovUSGS 2017b National land cover dataset httpscatalogdatagovdataset
usgs-national-land-cover-dataset-nlcd-downloadable-data-collectionWhite KL BE Haggard and I Chaubey 2004 Water quality at the Buffalo
National River Arkansas 1991ndash2001 Trans ASAE 47(2)407ndash417 doi1013031201316042
Sampling Liquid Manure
Karl VanDevender PhD PE Professor Extension Engineer
Liquid animal manure sampling can be an important management tool Proper sampling provides the producer with nutrient analysis results that can be used in a sound farm fertilization program Nutrient analysis of manure in conjunction with soil sampling helps determine how much manure should be applied to fields to maintain adequate fertility while minimizing potential environmental problems such as ground and surface water pollution However manure applications should not exceed the maximum application rates in a manure management plan until sufficient data can be collected to justify revising the plan
When to Sample Liquid animal manure should be sampled for nutrient analysis as close to land application time as possible This helps ensure that the reported nutrient content accurately reflects what is being applied to the land If the manure is sampled as it is being land applied the results will not be available to govern present application rates It does however provide information for future land applications of animal manure if the manure management remains fairly constant over time
How to Collect a Liquid Manure Sample During Land Application The easiest way to collect liquid animal manure samples is to collect the manure as it is being land applied This approach ensures what is sample reflects what is applied Randomly place catch pans in the field to collect the liquid manure as it is land applied by an irrigation system or honey wagon Flexible rubber feed pans work well Immediately after the manure has been applied collect the manure from the catch pans combine in a bucket to make one composite sample and mix well by stirring This bucket will be the source of the manure sent for analysis From a Storage Facility If collecting liquid animal manure samples during land application is not possible collect the samples from the storage facility Liquid animal manure storage facilities have a tendency for the manure to stratify with the solids settling to the bottom and the liquids remaining on top It is also not uncommon for some solids to form a floating crust This stratification affects the manure nutrient concentrations in the storage facility The nitrogen and potassium will be more concentrated in the top liquid while the phosphorus will be more concentrated in the settled solids This stratification of nutrient concentrations increases the challenge of getting samples that represent what will be applied to a particular field If the liquids from the top and middle of the profile will be applied only this material should be sampled If the settled solids will be applied then they should be sampled However if the manure is to be agitated before pumping as has been the traditional recommendation the sample should contain representative proportions of manure from the top middle and bottom The idea is to collect a sample of an entire column of manure to represent the manure after agitation If agitating the manure prior to sampling is not possible an alternative approach is to make a sampler to collect the required sub-samples The sub-samples are then mixed to represent the manure after agitation The easiest to construct is simply a container such as a cup attached to the end of a pole Liquids from the manure surface can be simply scooped up To collect liquids from the middle depths or settled solids the container is held up side down trapping air until the desired sampling depth is reached Then the container is rotated releasing the air and collecting the sample When collecting a sample of the entire profile of the manure sub-samples are collected and mixed in a bucket
- over -
A sampler design that automatically collects a sample of the entire profile uses 10 foot 1 frac12 inch PVC pipe with a PVC ball valve at the bottom The handle of the ball valve is replaces with a lever arm about 2 feet long The free end of the lever arm is attached to the end of a 10 foot 1 inch PVC pipe The lever arm and smaller pipe allow the ball valve to be operated while holding to top of the sampler To use the sampler the valve is opened and the sampler is inserted (in a line not and arc) into the manure When the foot of the valve is at the bottom of the settled solids it is closed Then the sample of the entire manure profile can be removed from the manure and placed in a bucket
Sketch of Cup Sampler Sketch of Foot Valve Sampler
Whichever sampler is used at least 8 locations around the manure storage unit should be sampled and mixed in a bucket to serve as a final composite sample This bucket will be the source of the manure sent for analysis
Getting the Sample Analyzed After thoroughly mixing the final composite sample fill a one liter plastic bottle half full These bottles may be obtained from your county Extension office Never fill the bottle more than half full to allow for gas expansion of the sample and to prevent the bottle from exploding Keep the samples as cool as possible until you can take them to your county Extensions office for shipping to the University of Arkansas lab for analysis There you will get assistance in filling out an information sheet on your manure sample There is a fee to have the sample analyzed While the sample can be sent to a private lab the fees are often higher If you are required by the Arkansas Department of Environmental Equality (ADEQ) to sample your liquid animal manure as part of your Regulation No 5 permit make sure that you inform the individual helping you with the paperwork so the correct set of analyses can be performed In addition to the analyses to determine the fertilizer value of manure it is recommended to analyze for the amount of phosphorus in the manure that is water soluble Water soluble phosphorus is needed to evaluate the potential environmental risk associated with phosphorus application rates specified in manure management plans Having good farm based information should help planners develop plans tailored to and individual farm
Key Points to Remember The important things to remember in collecting a liquid animal manure sample are Collect a sample that best represents the nutrient content of the manure in that storage facility and what
will be applied If only the top water is to be applied it should be sampled If the storage unit will be agitated prior to application the sample should contain material from the entire depth profile
Only fill the sample bottle frac12 full Keep the sample cool prior to shipping Ship the sample to the lab as soon as possible
Handout April 27 2010
The Arkansas Cooperative Extension Service offers its programs to all eligible persons regardless of race color national origin religion
gender age disability marital or veteran status or any other legally protected status and is an Equal Opportunity Employer
- 2015_Bacteria Trends in Flowing Waterspdf
-
- E COLI IN FLOWING WATERS
-
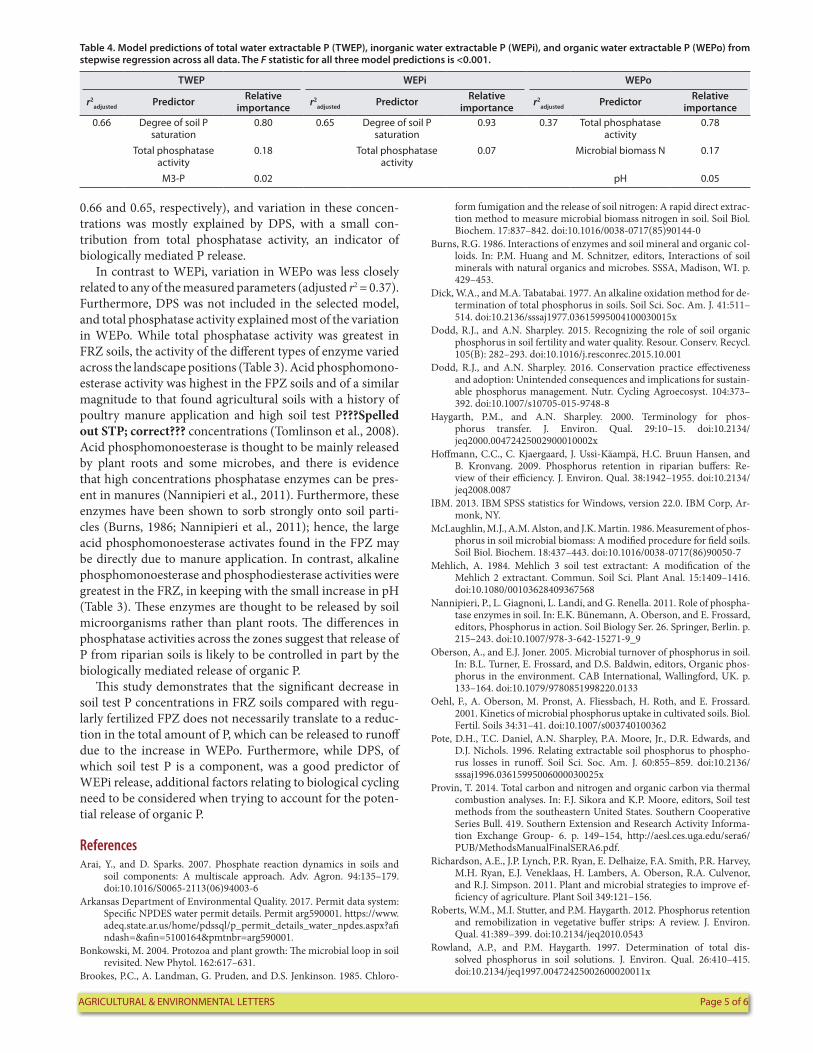
AGRICULTURAL amp ENVIRONMENTAL LETTERS Page 5 of 6
066 and 065 respectively) and variation in these concen-trations was mostly explained by DPS with a small con-tribution from total phosphatase activity an indicator of biologically mediated P release
In contrast to WEPi variation in WEPo was less closely related to any of the measured parameters (adjusted r2 = 037) Furthermore DPS was not included in the selected model and total phosphatase activity explained most of the variation in WEPo While total phosphatase activity was greatest in FRZ soils the activity of the different types of enzyme varied across the landscape positions (Table 3) Acid phosphomono-esterase activity was highest in the FPZ soils and of a similar magnitude to that found agricultural soils with a history of poultry manure application and high soil test PSpelled out STP correct concentrations (Tomlinson et al 2008) Acid phosphomonoesterase is thought to be mainly released by plant roots and some microbes and there is evidence that high concentrations phosphatase enzymes can be pres-ent in manures (Nannipieri et al 2011) Furthermore these enzymes have been shown to sorb strongly onto soil parti-cles (Burns 1986 Nannipieri et al 2011) hence the large acid phosphomonoesterase activates found in the FPZ may be directly due to manure application In contrast alkaline phosphomonoesterase and phosphodiesterase activities were greatest in the FRZ in keeping with the small increase in pH (Table 3) These enzymes are thought to be released by soil microorganisms rather than plant roots The differences in phosphatase activities across the zones suggest that release of P from riparian soils is likely to be controlled in part by the biologically mediated release of organic P
This study demonstrates that the significant decrease in soil test P concentrations in FRZ soils compared with regu-larly fertilized FPZ does not necessarily translate to a reduc-tion in the total amount of P which can be released to runoff due to the increase in WEPo Furthermore while DPS of which soil test P is a component was a good predictor of WEPi release additional factors relating to biological cycling need to be considered when trying to account for the poten-tial release of organic P
ReferencesArai Y and D Sparks 2007 Phosphate reaction dynamics in soils and
soil components A multiscale approach Adv Agron 94135ndash179 doi101016S0065-2113(06)94003-6
Arkansas Department of Environmental Quality 2017 Permit data system Specific NPDES water permit details Permit arg590001 httpswwwadeqstatearushomepdssqlp_permit_details_water_npdesaspxafindash=ampafin=5100164amppmtnbr=arg590001
Bonkowski M 2004 Protozoa and plant growth The microbial loop in soil revisited New Phytol 162617ndash631
Brookes PC A Landman G Pruden and DS Jenkinson 1985 Chloro-
form fumigation and the release of soil nitrogen A rapid direct extrac-tion method to measure microbial biomass nitrogen in soil Soil Biol Biochem 17837ndash842 doi1010160038-0717(85)90144-0
Burns RG 1986 Interactions of enzymes and soil mineral and organic col-loids In PM Huang and M Schnitzer editors Interactions of soil minerals with natural organics and microbes SSSA Madison WI p 429ndash453
Dick WA and MA Tabatabai 1977 An alkaline oxidation method for de-termination of total phosphorus in soils Soil Sci Soc Am J 41511ndash514 doi102136sssaj197703615995004100030015x
Dodd RJ and AN Sharpley 2015 Recognizing the role of soil organic phosphorus in soil fertility and water quality Resour Conserv Recycl 105(B) 282ndash293 doi101016jresconrec201510001
Dodd RJ and AN Sharpley 2016 Conservation practice effectiveness and adoption Unintended consequences and implications for sustain-able phosphorus management Nutr Cycling Agroecosyst 104373ndash392 doi101007s10705-015-9748-8
Haygarth PM and AN Sharpley 2000 Terminology for phos-phorus transfer J Environ Qual 2910ndash15 doi102134jeq200000472425002900010002x
Hoffmann CC C Kjaergaard J Ussi-Kaumlampauml HC Bruun Hansen and B Kronvang 2009 Phosphorus retention in riparian buffers Re-view of their efficiency J Environ Qual 381942ndash1955 doi102134jeq20080087
IBM 2013 IBM SPSS statistics for Windows version 220 IBM Corp Ar-monk NY
McLaughlin MJ AM Alston and JK Martin 1986 Measurement of phos-phorus in soil microbial biomass A modified procedure for field soils Soil Biol Biochem 18437ndash443 doi1010160038-0717(86)90050-7
Mehlich A 1984 Mehlich 3 soil test extractant A modification of the Mehlich 2 extractant Commun Soil Sci Plant Anal 151409ndash1416 doi10108000103628409367568
Nannipieri P L Giagnoni L Landi and G Renella 2011 Role of phospha-tase enzymes in soil In EK Buumlnemann A Oberson and E Frossard editors Phosphorus in action Soil Biology Ser 26 Springer Berlin p 215ndash243 doi101007978-3-642-15271-9_9
Oberson A and EJ Joner 2005 Microbial turnover of phosphorus in soil In BL Turner E Frossard and DS Baldwin editors Organic phos-phorus in the environment CAB International Wallingford UK p 133ndash164 doi10107997808519982200133
Oehl F A Oberson M Pronst A Fliessbach H Roth and E Frossard 2001 Kinetics of microbial phosphorus uptake in cultivated soils Biol Fertil Soils 3431ndash41 doi101007s003740100362
Pote DH TC Daniel AN Sharpley PA Moore Jr DR Edwards and DJ Nichols 1996 Relating extractable soil phosphorus to phospho-rus losses in runoff Soil Sci Soc Am J 60855ndash859 doi102136sssaj199603615995006000030025x
Provin T 2014 Total carbon and nitrogen and organic carbon via thermal combustion analyses In FJ Sikora and KP Moore editors Soil test methods from the southeastern United States Southern Cooperative Series Bull 419 Southern Extension and Research Activity Informa-tion Exchange Group- 6 p 149ndash154 httpaeslcesugaedusera6PUBMethodsManualFinalSERA6pdf
Richardson AE JP Lynch PR Ryan E Delhaize FA Smith PR Harvey MH Ryan EJ Veneklaas H Lambers A Oberson RA Culvenor and RJ Simpson 2011 Plant and microbial strategies to improve ef-ficiency of agriculture Plant Soil 349121ndash156
Roberts WM MI Stutter and PM Haygarth 2012 Phosphorus retention and remobilization in vegetative buffer strips A review J Environ Qual 41389ndash399 doi102134jeq20100543
Rowland AP and PM Haygarth 1997 Determination of total dis-solved phosphorus in soil solutions J Environ Qual 26410ndash415 doi102134jeq199700472425002600020011x
Table 4 Model predictions of total water extractable P (TWEP) inorganic water extractable P (WEPi) and organic water extractable P (WEPo) from stepwise regression across all data The F statistic for all three model predictions is lt0001
TWEP WEPi WEPo
r2adjusted Predictor Relative
importance r2adjusted Predictor Relative
importance r2adjusted Predictor Relative
importance066 Degree of soil P
saturation080 065 Degree of soil P
saturation093 037 Total phosphatase
activity078
Total phosphatase activity
018 Total phosphatase activity
007 Microbial biomass N 017
M3-P 002 pH 005
Page 6 of 6 AGRICULTURAL amp ENVIRONMENTAL LETTERS
Schoumans OF 2009 Determination of the degree of phosphate satura-tion in noncalcareous soils In JL Kovar and GM Pierzynski editors Methods for phosphorus analysis for soils sediments residuals and water 2nd ed SERA 17 Bull 408 Virginia Tech Blacksburg VA p 29ndash 32
Self-Davis ML PA Moore Jr and BC Joern 2009 Water- or dilute salt-extractable phosphorus in soil In JL Kovar and GM Pierzynski edi-tors Methods for phosphorus analysis for soils sediments residuals and water 2nd ed SERA 17 Bull 408 Virginia Tech Blacksburg VA p 22ndash 24
Sharpley AN 1995 Dependence of runoff phosphorus on extract-able soil phosphorus J Environ Qual 24920ndash926 doi102134jeq199500472425002400050020x
Sheppard SC MI Sheppard J Long B Sanipelli and J Tait 2006 Runoff phosphorus retention in vegetative field margins on flat landscapes Can J Soil Sci 86(5)871ndash884 doi104141S05-072
Tabatabai MA 1994 Soil enzymes In RW Weaver S Angl P Bottomley D Bezdicek S Smith and MA Tabatabai editors Methods of soil analysis Part 2 Microbiology and biological properties SSSA Madi-son WI p 775ndash833
Tomlinson PJ MC Savin and PA Moore Jr 2008 Phosphatase activities in soil after repeated untreated and alum-treated poultry litter appli-cations Biol Fertil Soils 44613ndash622 doi101007s00374-007-0245-3
Turner BL and PM Haygarth 2001 Biogeochemistry Phosphorus solu-bilization in rewetted soils Nature 411258 doi10103835077146
Vance ED PC Brookes and DS Jenkinson 1987 An extraction method for measuring soil microbial biomass C Soil Biol Biochem 19703ndash707 doi1010160038-0717(87)90052-6
Watanabe FS and SR Olsen 1965 Test of an ascorbic acid meth-od for determining phosphorus in water and NaHCO3 ex-tracts from soil Soil Sci Soc Am J 29677ndash678 doi102136sssaj196503615995002900060025x
Phosphorus Retention and Remobilization along HydrologicalPathways in Karst TerrainHelen P Jarviedagger Andrew N SharpleyDagger Van Brahanasect Tarra SimmonsDagger April PriceDagger Colin Nealdagger
Alan J Lawlor∥ Darren Sleep∥ Sarah Thacker∥ and Brian E Haggardperp
daggerCentre for Ecology amp Hydrology Wallingford OX10 8BB UKDaggerDepartment of Crop Soil amp Environmental Sciences Division of Agriculture University of Arkansas Fayetteville Arkansas 72701United StatessectDepartment of Geosciences University of Arkansas Fayetteville Arkansas 72701 United States∥Centre for Ecology amp Hydrology Lancaster LA1 4YQ UKperpArkansas Water Resources Center University of Arkansas Fayetteville Arkansas 72701 United States
S Supporting Information
ABSTRACT Karst landscapes are often perceived as highly vulnerable toagricultural phosphorus (P) loss via solution-enlarged conduits that bypass Pretention processes Although attenuation of P concentrations has been widelyreported within karst drainage the extent to which this results from hydrologicaldilution rather than P retention is poorly understood This is of strategicimportance for understanding the resilience of karst landscapes to P inputs givenincreasing pressures for intensified agricultural production Here hydrochemicaltracers were used to account for dilution of P and to quantify net P retentionalong transport pathways between agricultural fields and emergent springs for thekarst of the Ozark Plateau midcontinent USA Up to sim70 of the annual total Pflux and sim90 of the annual soluble reactive P flux was retained with preferentialretention of the most bioavailable (soluble reactive) P fractions Our resultssuggest that in some cases karst drainage may provide a greater P sink thanpreviously considered However the subsequent remobilization and release of the retained P may become a long-term source ofslowly released ldquolegacyrdquo P to surface waters
INTRODUCTION
More than 25 of the worldrsquos population either lives on orobtains its drinking water from karst aquifers Karst underlies30 of the land area of China 30 of Europe and 20 of theUnited States12 Karst aquifers exert an important control on thequality and ecology of surface waters in these areas3 Thecomplexity of subsurface drainage45 and the difficulties indeconvoluting flow pathways and groundwater contributingareas6 have been a significant barrier to detailed studies ofnutrient transport and fate in karst systems78 Nevertheless it iswidely assumed that karst drainage systems (formed bydissolution of carbonate rocks mainly limestone) are highlyvulnerable to phosphorus (P) impairment from agriculturalsourcesThis vulnerability is assumed to arise from the low nutrient
buffering capacity of the thin cherty soils which overlie karst andthe rapid transmission of surface runoff through conduitsenlarged by dissolution910 which is thought to bypass thezones where key processes of P retention occur11minus13 Nonethe-less highly intensive monitoring of Irish karst springs in areas oflivestock demonstrated major P attenuation (reduction in Pconcentrations) relative to agricultural runoff1415 with low Pconcentrations in spring discharge even during storm events
when agricultural P losses are expected to be highest Thisattenuation was attributed to a combination of both hydrologicaldilution and P retention during infiltration and transmission ofrunoff along groundwater conduit pathwaysCrucially we lack information on the extent to which P
attenuation is controlled by P retention processes during transitalong karst flow paths14 or by hydrological dilution ofagricultural runoff by cleaner groundwater sources16 This is ofstrategic importance for understanding the P buffering capacityand wider resilience of karst landscapes to nutrient inputs101718
Many karst lands have traditionally been used for low-intensitylivestock farming owing to poor soils and their unsuitability forarable production9 However there is increasing pressure forintensive livestock production as global demands for greaterefficiency in food production intensify1920 Given the movetoward more intensive livestock production systems whichaccumulate P2122 and the perceived vulnerability of karstdrainage systems to P loss there is now a pressing and strategic
Received December 14 2013Revised March 17 2014Accepted March 17 2014
Article
pubsacsorgest
copy XXXX American Chemical Society A dxdoiorg101021es405585b | Environ Sci Technol XXXX XXX XXXminusXXX
need for better understanding of the fate and transport of P inkarst landscapes Here this shortfall is addressed for karst terrainin south-central USA Hydrochemical tracers and endmembermixing analysis23minus26 were used to assess the vulnerability to Ploss by accounting for the hydrological dilution of agriculturalrunoff and directly quantifying net P retention during infiltrationthrough the soil and along karst transport pathways through tothe emergent springs
EXPERIMENTAL METHODS
Study Area The study was undertaken at the University ofArkansas long-term Savoy Experimental Watershed (SEW) NWArkansas USA27 The SEW is located in the Illinois RiverWatershed a mixed land-use watershed (sim4330 km2) whichspans the states of Arkansas and Oklahoma2829 The SEW covers1250 ha and is typical of the karst terrain of the Ozark Plateau ofmidcontinental USA (Figure SI-1a Supporting Information)The soils of the SEW are predominantly silt loams (seeSupporting Information) Around 70 of the land is nativeforest with the remaining 30 rolling pasture grazed by beefcattle (sim2 cows haminus1) The SEW also supports poultryproduction with the resulting poultry litter used to fertilizepastures There are no septic tanks or settlements in the SEWand agricultural runoff from pastures grazed by cattle providesthe overwhelmingly dominant P source in the watershed30
The stratigraphy of the SEW30minus32 (see Figure SI-1cSupporting Information) includes (a) the limestone aquifer ofthe St Joe Formation (b) the Boone Formation an impurelimestone which mantles the St Joe Formation and formsldquoepikarstrdquo and (c) a layer of regolith (vadose zone) whichoverlies the Boone Formation Karst drainage has a major controlon water quality in the Illinois River2933 67 of annual river flowcomes from karst springs rising to 80 of flow in the summerand fall34
Sample Collection and Analysis Surface runoff andspring-water chemistry and flow monitoring (Figure SI-1a andc Supporting Information) were undertaken at the following(1) two adjacent karst springs (Langle Spring LLS andCopperhead Spring CHS) which flow continually from the StJoe Formation (focused conduit flow) springs (2) two surfacerunoff field plots (Langle LL 107 ha and Copperhead CH 105ha) which are located above and within the watershed (rechargezone) of the LLS andCHS springs These runoff plots are locatedon Razort silt loams which make up most of the grazed pasturesof the SEW All pastures are treated similarly in terms of grazing
intensity and maintenance fertilizer applications (30 kg P haminus1
every two years as either poultry litter or diammoniumphosphate)Flows at the karst springs (LLS and CHS) were monitored on
15-min intervals (see Supporting Information) Karst springwater was sampled weekly with stage-triggered subdailyautomated sampling using an ISCO sampler during stormevents Figure SI-2 (Supporting Information) shows thedistribution of samples collected on the rising and falling stageof the storm hydrographs The volume of surface runoff fromboth fields was automatically measured and samples werecollected on a flow-weighted basis by an ISCO autosampler Allwater samples were filtered within 24 h of the water beingsampled and were analyzed following EPA standard protocols asdescribed below (and in the Supporting Information) Filtered(lt045 μm) samples were analyzed for soluble reactivephosphorus (SRP) by colorimetric analysis35 and for a fullsuite of major cations (including potassium K and calcium Ca)and trace elements (including lanthanum La and rubidium Rb)(see Supporting Information) Unfiltered samples were analyzedfor total phosphorus (TP) after acid-persulfate digestion bycolorimetric analysis3536 These measurements are consistentwith standard protocols for TP and SRP analysis37
Use of Conservative Tracers and Endmember MixingAnalysisConservative chemical tracers and endmember mixingmodels were used to apportion water sources and to differentiatethe effects of hydrological dilution from the biogeochemicalprocesses which retain and cycle P during transit through thekarst drainage system Chemical tracers have been widely used inwatershed hydrology for tracing water sources and flowpathways38 owing to their conservative behavior (chemicalinertness) Here we made use of chemical tracers already in thewatershed to apportion water sources Using the hydrochemicalmonitoring data tracers were chosen which had elevatedconcentrations in either base flow groundwater or in agriculturalrunoff First two-component endmember mixing models2339
were used to link the spring-water chemistry to sources withinthe watershed by (a) quantifying the relative proportions ofsurface runoff and groundwater and (b) estimating thecontribution of surface runoff from the agricultural grazed landSecond comparing the mixing patterns of P in spring water witha conservative tracer of agricultural runoff allowed us to directlyevaluate whether P was behaving nonconservatively (ie beingtaken up or released) along the hydrological pathways in the karstdrainage system
Table 1 Summary of Concentrations of Soluble Reactive Phosphorus (SRP) Total Phosphorus (TP) Potassium (K) Rubidium(Rb) and Calcium (Ca) in Field Runoff and Spring-Water Samples
field runoff (m3 ha‑1)spring flow (L s‑1)
SRP(mg Lminus1)
TP(mg Lminus1)
Rb(μg Lminus1)
K(mg Lminus1)
Ca(mg Lminus1)
Langle Field mean 380 221 257 697 104 512(LL) median 355 187 212 596 102 494
range 34minus915 059minus502 08minus553 093minus206 204minus263 211minus987Copperhead Field mean 231 068 109 294 611 345(CH) median 146 057 103 252 511 343
range 18minus799 047minus122 063minus191 058minus876 14minus147 195minus734Langle Spring mean 131 0029 0057 106 154 375(LLS) median 938 0012 0034 0878 114 367
range 124minus59 0minus0403 0002minus0608 0195minus357 0534minus492 122minus659Copperhead Spring mean 225 0019 0041 108 137 405(CHS) median 262 0017 0032 11 14 429
range 019minus253 0001minus012 0minus058 0328minus19 084minus217 145minus615
Environmental Science amp Technology Article
dxdoiorg101021es405585b | Environ Sci Technol XXXX XXX XXXminusXXXB
RESULTS AND DISCUSSION
Comparison of Agricultural Runoff and Spring-WaterChemistry Concentrations of TP SRP K and Rb wereconsistently highest in field runoff relative to the springs (Table1) and runoff from the grazed fields provides the greatestconcentrations of P K and Rb within the SEW In contrast Caconcentrations were consistently highest in the springscompared with runoff This indicates a dominant base flowgroundwater source of Ca from dissolution of limestone whichis diluted by surface runoff (Figure 1a)Concentrations of SRP TP K and Rb were all higher in field
runoff at LL compared with CH This likely reflects higher cattlegrazing density at LL (25 cows haminus1) than at CH (10 cowshaminus1) as well as higher runoff per unit area that likely led togreater solute and particulate entrainment and transport capacitycompared with CH This may also reflect a larger hydrologicallyactive area contributing runoff at LL linked to greater soilcompaction from more intensive cattle grazingFor the springs there was a greater variability in SRP TP K
and Rb concentrations at LLS than at CHS despite a much lowervariability in spring flow at LLS (Table 1) Howeverconcentrations of TP SRP K and Rb did not correlate withflow at either of the springs For most storm events at LLSconcentrations of TP SRP K and Rb increased dramatically
above base flow concentrations especially on the rising stage ofthe storm hydrograph (Figure SI-2 Supporting Information)These high concentrations on the rising stage are likely due toupstream point recharge of surface runoff from pasture land intothe underlying St Joe aquifer in locations where the confiningchert layer is breached At CHS the response of TP SRP K andRb to storm events was more mixed Small initial increases inconcentration occurred with the onset of higher flows followedby marked reductions in concentration reflecting substantialdilution by a water source with relatively low SRP TP K and Rbconcentrations most likely from the nonagricultural (ungrazedand forested) parts of the watershed Indeed karst inventorieshave verified that this part of the flow regime reflects runoff fromareas which are not grazed by livestock3031
To evaluate the attenuation (ie the reductions inconcentrations) of TP SRP K and Rb during transit throughthe karst the median concentrations in agricultural runoff werecompared with the corresponding median concentrations inCHS and LLS springs (Table 1) The average attenuation of TPand SRP concentrations ranged from 96 to 99 In contrastthe average attenuation of K and Rb concentrations was lower at56 to 89 Correspondingly under storm flow conditionscomparisons of average field runoff concentrations and the 90thpercentile concentrations in spring water (which typicallycorrespond with the rising stage of the storm hydrographs of
Figure 1 (a) Relationships between calcium (Ca) concentrations and flow at Langle and Copperhead springs (b) Relationship between rubidium (Rb)and potassium (K) concentrations in field runoff and spring-water samples
Environmental Science amp Technology Article
dxdoiorg101021es405585b | Environ Sci Technol XXXX XXX XXXminusXXXC
the springs) revealed that storm flow attenuation of TP and SRPranged from 93 to 96 compared with 46 to 74 for K andRb Across all flow conditions the higher rates of attenuation of Pconcentrations relative to K and Rb reflect the nonconservativebehavior of P during transit through the karstK and Rb show high correlation (Figure 1b) due to their
similar hydrogeochemistry (group 1a monovalent base cations ofrelatively small hydration size) Figure 1b shows a dominant two-component mixing series between a high concentrationldquoendmemberrdquo (ie surface runoff from fertilizer and grazedpastures in runoff) and a low concentration spring-waterldquoendmemberrdquo (ie runoff from nonagricultural and forestedareas which have no grazing or fertilizer inputs) Both K and Rbare highly soluble monovalent ions and once transmitted intothe karst drainage system chemical interactions will be relativelysmall Therefore the attenuation of K and Rb during transportthrough the karst will be largely controlled by hydrologicaldilution without retention mechanisms (with only possibly asmall attenuation or release within the epikarst where there is ahigh proportion of clays3140) In contrast P behaves non-conservatively reflected by the higher rates of attenuation of Prelative to K and RbSpring Hydrology and Water-Source Apportionment
Comparing the hydrology of the two springs (Figure 2) base
flows at CHS were consistently lower than at LLS the medianflow at CHS was 262 L sminus1 compared with 131 L sminus1 at LLS(Table 1) Further CHS exhibited a more flashy flow regimethan LLS and storm flows were dramatically higher at CHS Forinstance the average of the highest 10 of flows was 139 L sminus1 atCHS compared with 40 L sminus1 at LLS This discrepancy reflectsthe following (i) LLS being the ldquounderflowrdquo spring (3 cm lowerthan CHS) with a much larger groundwater drainage area underlow-flow conditions than CHS which accounts for the higherbase flows at LLS (ii) water capture (spring ldquopiracyrdquo) by CHSduring storm events which has been shown to result in adramatic expansion in the watershed drainage area for CHSrelative to LLS3233
Contributions to spring water at LLS and CHS wereapportioned by two-component endmember mixing analy-sis2341 Here Ca was used as a tracer of groundwater and K asa tracer of agricultural runoff based on the observed dominantgroundwater source of Ca and the dominant agricultural runoffsource of K For the mixing model endmembers were defined asthe following
(i) A base flow groundwater endmember with elevated Caand a storm flow endmember with low Ca concentrations
(ii) Runoff endmember from agricultural land with high Kconcentration and a spring base flow low K endmember
Figure 2 Hydrographs and water source apportionment for Langle and Copperhead springs
Environmental Science amp Technology Article
dxdoiorg101021es405585b | Environ Sci Technol XXXX XXX XXXminusXXXD
Applying a simple two-component mixing model2341 (eq 1)and the endmembers identified above Ca concentrations wereused to partition the contributions to spring flow at LLS andCHS from base flow groundwater (the high concentrationendmember) and from stormwater runoff (the low concen-tration endmember) Then a second two-component mixingmodel was used for K to quantify the contributions from grazedpasture runoff (eq 2)
= times minus minus total storm runoff
100 (Ca Ca )(Ca Ca )gw m gw ro (1)
= times minus minus
agricultural runoff
100 (K K )(K K )bf m bf ag (2)
where Cagw was the groundwater Ca concentration (highconcentration base flow endmember) defined here as theaverage Ca concentration for the lowest 10 of flows sampledCam was the measured spring-water Ca concentration Caro wasthe stormwater (agricultural runoff) endmember defined here asthe average field runoff Ca concentration Kbf was the base flowendmember (average K concentration for the lowest 10 of
spring flows sampled) Km was the measured spring-water Kconcentration and Kag was the agricultural runoff endmemberdefined here as the average field runoff K concentration Thevalues used to define the endmember concentrations at LLS andCHS are shown in Table SI-1 Supporting InformationThe water source apportionment for LLS and CHS (Figure 2)
showed similar percentage contributions from base flowgroundwater and total storm flow at LLS and CHS for most ofthe year and particularly during storm events During winter andspring storm events a much greater proportion of flow at LLSwas derived from agricultural (grazed field) runoff (up toapproximately a third of flow) This greater contribution of waterfrom pastures than from nonagricultural land at LLS accountedfor the higher storm-event concentrations of K and Rb at LLSAgricultural runoff contributed a much lower proportion ofwinter and spring storm event flow at CHS (typically less than10) These results and the much higher storm flow dischargesat CHS suggest that the water ldquopiracyrdquo at CHS during stormevents captured water sources which had a lower K and Rbconcentration from the nonagricultural (ungrazed and forested)areas
Figure 3 Relationships between total phosphorus (TP) soluble reactive phosphorus (SRP) and potassium (K) for (a) Langle Spring and (b)Copperhead Spring The dashed line denotes the conservative mixing line and the solid line denotes a line of maximum P retention (see text forexplanation)
Environmental Science amp Technology Article
dxdoiorg101021es405585b | Environ Sci Technol XXXX XXX XXXminusXXXE
Quantifying Net P Retention in Karst DrainageEndmember mixing analysis23minus26 was applied using theldquoconservativerdquo tracer K to explore the net P retention andrelease along karst hydrological pathways from infiltrationthrough the soil to spring discharge First concentrations ofTP and SRP were plotted against K as the ldquoconservativerdquo tracer(Figure 3) Two dominant and distinct sources of spring water(both with different TP SRP and K concentrations) arehypothesized (Table SI-1 Supporting Information) (i) a highconcentration agricultural endmember source (Kag TPag SRPag)defined here as the average concentrations (of K TP and SRP)in agricultural field runoff at the LL and CH field plots and (ii) alow concentration (nonagricultural) endmember (Kna TPnaSRPna) As the source of this low concentration runoff couldcome from a wide range of nonagricultural sources (ungrazedand forest land) across the watershed the most reliable means ofcapturing the integrated low-concentration endmember signalwas to use the minimum measured spring-water K TP and SRPconcentrations at LLS and CHSA theoretical linear two-component mixing series ie a
ldquoconservative mixing linerdquo between the high concentration andlow concentration endmembers (Figure 3) would be observed ifP behaved conservatively during mixing of the two endmemberwater sources during transport through the karst In contrast theobserved relationships between TP and K and SRP and K inspring water were highly scattered at LLS and CHS (Figure 3)Most of the samples plot well below the conservative mixing lineshowing predominantly net retention of TP and SRP relative toK A few isolated samples plotted above the conservative mixingline which are indicative of some sporadic net P release relativeto the K tracer The mixing patterns between TP SRP and Kconcentrations in Figure 3 had a well-defined lower boundary ofsamples with the lowest P concentrations relative to K (shown inFigure 3 as a ldquoline of maximum P retentionrdquo) This line ofmaximum P retention probably represents a secondaryendmember mixing line between the same low concentrationnonagricultural runoff endmember and a secondary agricultural
field runoff endmember with high K but lower P concentrationsas a result of P retention processes filtering out P We posit thatthe majority of this P was ldquofilteredrdquo out during diffuse recharge ofwater as through the soil and the epikarst into the karst aquiferThe spring-water samples which lie between the line ofmaximum retention and the conservative mixing series thereforelikely reflect the net effects of P retention and remobilizationprocesses for runoffwater entering the karst drainage system via amixture of diffuse and point rechargeBy comparing the observed spring-water TP and SRP versus K
relationships with the theoretical linear conservative mixingseries the net effects of P retention and release can be directlyquantified (Figure 3) By applying the theoretical conservativemixing series (TP versus K and SRP versus K) to the measuredspring-water K concentrations at LLS and CHS ldquoconservativerdquoTP and SRP concentration time series were derived (Figure SI-3ab Supporting Information) and converted to loads using thecorresponding spring flow data By taking the difference betweenmeasured and ldquoconservativerdquo TP and SRP loads we calculatednet TP and net SRP retention on an annual basis as well as forbase flows (lowest 10 of flows) and storm flows (highest 10 offlows) (Table 2)Annual net TP retention ranged from 69 at LLS to 54 at
CHS Net percentage P retention was consistently higher forSRP compared with TP not only on an annual basis but alsounder storm and base flow conditions This indicated preferentialretention of more labile SRP fractions by sorptionuptake andgreater mobility of TP organic and particulate P fractions Similarpatterns of soluble and particulate P retention have also beenobserved in other karst soils and drainage systems71113 Highestpercentage net P retention occurred during storm events at LLS(92 TP retention and 96 SRP retention) However the twosprings showed very different patterns in P retention under stormand base flow conditions At LLS net P retention was greatestduring storm flows than under base flow conditions reflecting ahigh efficiency of P retention from agricultural runoff at LLS Incontrast at CHS a greater percentage of the P load was retained
Table 2 Measured and ldquoConservativerdquo Annual Loads and Mean Daily Base Flow and Storm Flow Loads of Total Phosphorus(TP) and Soluble Reactive Phosphorus (SRP) in Langle and Copperhead Springs with Net and Percentage TP and SRP Retention
measured P load(kg yminus1 or g dminus1)
ldquoconservativerdquo P load(kg yminus1 or g dminus1)
net P retention(kg yminus1 or g dminus1) net P retention
Langle Spring(LLS)
annual TP load(kg yminus1)
701 223 153 69
annual SRP load(kg yminus1)
185 190 172 90
Copperhead Spring(CHS)
annual TP load(kg yminus1)
265 57 31 54
annual SRP load(kg yminus1)
098 33 23 70
Langle Spring(LLS)
avg base flow TP load(g dminus1)
103 233 130 56
avg base flow SRP load(g dminus1)
221 198 176 89
Copperhead Spring(CHS)
avg base flow TP load(g dminus1)
127 355 228 64
avg base flow SRP load(g dminus1)
045 214 169 79
Langle Spring(LLS)
avg storm flow TP load(g dminus1)
112 1448 1336 92
avg storm flow SRP load(g dminus1)
514 1240 1189 96
Copperhead Spring(CHS)
avg storm flow TP load(g dminus1)
445 971 527 54
avg storm flow SRP load(g dminus1)
175 567 392 69
Environmental Science amp Technology Article
dxdoiorg101021es405585b | Environ Sci Technol XXXX XXX XXXminusXXXF
under base flow than during storm flow This reflects much lowerbase flows at CHS which increase water residence time andpromote particulate sedimentation and P retention and higherstorm flows linked to stream piracy which provide greaterflushing from nonagricultural areas where flows have a low PconcentrationContaminant Residence Times in Karst DrainageWhile
monitoring P relative to a conservative tracer provides us withvaluable information on rates of annual and storm flowbase flownet retention it provides no information about the residencetimes of P within the karst or the time scales over whichretention and remobilization may occur This is of strategicconcern in relation to the ldquolegacyrdquo of P within watersheds4243
whereby time-lags in release of retained Pmaymask the effects ofconservation measures on receiving water quality By measuringa full suite of trace elements using ICP-MS a ldquoserendipitousrdquoobservation was made which may help provide clues about thewider contaminant residence times within the karst drainageConcentrations of ldquodissolvedrdquo (lt045 μm) lanthanum (La) instorm flow spring discharge at LLS were more than an order ofmagnitude higher than could be accounted for by the runoffsources measured within the SEW Figure 4 shows theconcentrations of La in the spring discharge at LLS and aldquoconservativerdquo (maximum) concentration from runoff whichaccounts for the dilution of agricultural runoff during transitthrough the karst drainage using K as a tracer The high stormflow La concentrations observed at LLS are likely a ldquolegacyrdquosignal from a past tracer experiment In 2001 lanthanum-labeledmontmorillonite clays were injected into a losing stream at SEWas part of a study to examine clay and bacterial transport44
While the La tracer was detected at LLS around 16 h after itwas injected44 our monitoring suggests the La tracer was alsoretained within the karst drainage system and continues to beremobilized and released during storm events more than 10 yearslater Unfortunately it is impossible to perform a mass balance toquantify how much of the La applied in the tracer study remainswithin the karst drainage system and how long a La ldquolegacyrdquomight persist as no La measurements were made in the
intervening 10 years between the tracer injection in 2001 and ourmonitoring which started in November 2011 Within the scopeof this study it was also not possible to determine whether the Laconcentrations measured were truly dissolved or a lt045 μmcolloidalclay fraction or whether La geochemistry is sufficientlysimilar to be used as an indicator of P transport However theseresults indicate that La a tracer expected to be flushed rapidlythrough the karst was retained and continues to be remobilizedand released during storm events more than 10 years later Thisindicates the potential for contaminant retention in thesubsurface karst drainage system where contaminant storageand gradual rerelease may occur over time scales of at least adecade
Wider Implications Hydrochemical tracers of agriculturalrunoff allowed us to directly evaluate the nonconservativebehavior of P within karst drainage and quantify net P retentionOur results challenge the widely held assumption that karstlandscapes are always highly vulnerable to P loss and suggest thatin some cases karst drainage may provide a greater sink for Pthan previously considered P from agricultural runoff wasattenuated by hydrological dilution from cleaner (nonagricul-tural) sources during transport through karst drainage Howeverthere was also a high capacity for net P retention especially forLangle Spring which was subject to the highest agricultural Ploadings Here sim70 of the annual TP flux and sim90 of theannual SRP flux was retained Moreover the buffering within thesoils and karst drainage not only retained a high proportion ofincoming fluxes of P from agricultural runoff but preferentiallyretained the most bioavailable P fractions For instance muchresearch has documented the capacity of soil to retain applied Pin various inorganic (Al Fe Ca complexes) and organic forms ofvarying stability4546 The long-term accumulation of P in soilhowever can be released slowly to soil water2847
The mechanisms of P retention were not investigated here butlikely include varying combinations of processes includingadsorption onto clays coprecipitation of P with CaCO3 andbinding with particulate humic substances11minus13 in the soil inepikarst and within the fractures and conduits These adsorption
Figure 4 Time series of measured and ldquoconservativerdquo lanthanum (La) concentrations and flow at Langle spring Measured La concentrations aredenoted by solid circles ldquoconservativerdquo La concentrations are denoted by open circles See text for explanation of how ldquoconservativerdquo La concentrationswere calculated
Environmental Science amp Technology Article
dxdoiorg101021es405585b | Environ Sci Technol XXXX XXX XXXminusXXXG
products and precipitates will be physically retained as the watervelocity slows and will be deposited as sediment along the base ofthe conduit flow paths With the recurrence of high flow thesesediments are resuspended by turbulent flow and moved alongthe flow path until redeposited or eventually resurged at thebase-level spring Given the potential importance of CaCO3minusPcoprecipitation for P retention in karst terrain and the possibilityof reductions in the efficiency of this coprecipitation mechanismunder higher P and dissolved organic carbon (DOC)concentrations124849 further work is needed to examine anyunforeseen impacts of increasing agricultural intensification onthis ldquoself-cleansingrdquo P retention mechanism However in thisstudy the site with the higher livestock intensity and with highermanure-enriched runoff actually demonstrated greater efficiencyof P retention This may indicate that critical P and DOCthresholds for inhibition of CaCO3 precipitation were notreached or that other P retention process mechanisms wereoccurringThe patterns in spring-water La concentrations suggest
continued released of La from springs more than 10 years aftera tracer injection and indicate the potential for long-termcontaminant retention storage and subsequent release Indeedthe complex nature of karst hydrological pathways can result inlarge distributions in water and contaminant residence times andlag times for discharge to surface waters may bemuch longer thanexpected50minus52 Our findings indicate that retention of P withinkarst drainage may reduce the risk of acute episodic storm-drivenlosses of agricultural P However the potential buffering of P inthe epikarst and within the fracture and conduit drainage systemcan provide a slow but long-term source of P released via springsto surface waters Further work is needed to determine theecological impacts of such patterns of P release to receivingstreams and the ability of those streams to assimilate thoseinputs compared with higher pulse inputs during storm flows
ASSOCIATED CONTENT
S Supporting InformationMap of the SEW and the karst water flow system time series ofspring-water TP SRP K and Rb concentrations table of Ca TPand SRP endmember concentrations soils and geology of theSavoy Experimental Watershed experimental methods Thismaterial is available free of charge via the Internet at httppubsacsorg
AUTHOR INFORMATION
Corresponding AuthorPhone ++44 (0)1491 838800 Fax ++44 (0)1491692424 E-mail hpjcehacuk
NotesThe authors declare no competing financial interest
ACKNOWLEDGMENTS
HPJ acknowledges funding and support from the UK NaturalEnvironment Research Council a Fulbright DistinguishedScholar Award and an OECD Co-operative Research Pro-gramme Fellowship We thank Chris Wardle (British GeologicalSurvey) for help with the artwork and Dr Tiong Ee Ting forpermission to reproduce tracer experiment results in theSupporting Information
REFERENCES(1) Panno S V Karst aquifers Can they be protected Ground Water2006 44 (4) 494minus494(2) White W B Culver D C Herman J S Kane T C Mylroie JE Karst lands Am Sci 1995 83 (5) 450minus459(3) Owen M R Pavlowsky R T Base flow hydrology and waterquality of an Ozarks spring and associated recharge area southernMissouri USA Environ Earth Sci 2011 64 (1) 169minus183(4) Baffaut C Benson VWModeling flow and pollutant transport ina karst watershed with SWAT Trans ASABE 2009 52 (2) 469minus479(5) Fournier M Motelay-Massei A Massei N Aubert MBakalowicz M Dupont J P Investigation of transport processesinside karst aquifer by means of STATIS Ground Water 2009 47 (3)391minus400(6) Brahana J V Rationale and methodology for approximatingspring-basin boundaries in the mantled karst terrane of the SpringfieldPlateau northwestern Arkansas In The engineering geology andhydrogeology of karst terranes Beck B F Stephenson B F Eds A ABalkema Rotterdam 1997 pp 77minus82(7) Kilroy G Coxon C Temporal variability of phosphorus fractionsin Irish karst springs Environ Geol 2005 47 (3) 421minus430(8) Lerch R N Contaminant transport in two central Missouri karstrecharge areas J Cave Karst Stud 2011 73 (2) 99minus113(9) Coxon C Agriculture and karst In Karst Management Beynen PE Ed Springer Dordrecht Netherlands 2011 pp 103minus138(10) Kacaroglu F Review of groundwater pollution and protection inkarst areas Wat Air Soil Pollut 1999 113 (1minus4) 337minus356(11) Allousha G A Boyer D G Belesky D P Halvorson J JPhosphorus mobility in a karst landscape under pasture grazing systemAgronomie 2003 23 (7) 593minus600(12) Neal C Jarvie H PWilliams R J Neal MWickham H HillL Phosphorus-calcium carbonate saturation relationships in a lowlandchalk river impacted by sewage inputs and phosphorus remediation Anassessment of phosphorus self-cleansing mechanisms in natural watersSci Total Environ 2002 282 295minus310(13) von Wandruszka R Phosphorus retention in calcareous soils andthe effect of organic matter on its mobility Geochem Trans 2006 7 6(14) Mellander P-E Jordan P Melland A R Murphy P N CWall D P Mechan S Meehan R Kelly C Shine O Shortle GQuantification of phosphorus transport from a karstic agriculturalwatershed to emerging spring water Environ Sci Technol 2013 47 (12)6111minus6119(15) Mellander P-E Jordan P Wall D P Melland A R MeehanR Kelly C Shortle G Delivery and impact bypass in a karst aquiferwith high phosphorus source and pathway potentialWater Res 2012 46(7) 2225minus2236(16) Stueber A M Criss R E Origin and transport of dissolvedchemicals in a karst watershed southwestern Illinois J Am Water ResAssoc 2005 41 (2) 267minus290(17) Kleinman P J A Sharpley A N McDowell R W Flaten DN Buda A R Tao L Bergstrom L Zhu Q Managing agriculturalphosphorus for water quality protection Principles for progress PlantSoil 2011 349 (1minus2) 169minus182(18) Sharpley A N Kleinman P J A Flaten D N Buda A RCritical source area management of agricultural phosphorus Experi-ences challenges and opportunities Water Sci Technol 2011 64 (4)945minus952(19) Sharpley A N Jarvie H P Agricultural management waterquality amp ecology Putting practice into policy In National AgriculturalBiotechnology Council Report 24 Eaglesham A Korth K Hardy R WF Eds Jacobs Press Auburn NY 2012 pp 73minus99(20) Sims J T Ma L Oenema O Dou Z Zhang F S Advancesand challenges for nutrient management in China in the 21st century JEnviron Qual 2013 42 (4) 947minus950(21) Kellogg R L Lander C H Moffitt D C Gollehon N Manurenutrients relative to the capacity of cropland and pastureland toassimilate nutrients Spatial and temporal trends for the United StatesResource Assessment and Strategic Planning Working Paper 98-1 USDANatural Resources Conservation Service and Economic Research
Environmental Science amp Technology Article
dxdoiorg101021es405585b | Environ Sci Technol XXXX XXX XXXminusXXXH
Service General Services Administration National Forms andPublication Center Fort Worth TX 2000 pp 1minus140 httpwwwnrcsusdagovtechnicallandpubsmanntrpdf(22) Maguire R O Rubaeligk G H Haggard B E Foy B H Criticalevaluation of the implementation of mitigation options for phosphorusfrom field to catchment scales J Environ Qual 2009 38 (5) 1989minus1997(23) Christophersen N Neal C Hooper R P Vogt R DAndersen S Modeling streamwater chemistry as a mixture of soilwaterend-members - A step towards 2nd-generation acidification models JHydrol 1990 116 (1minus4) 307minus320(24) Neal C Jarvie H P Williams R Love A Neal M WickhamH Harman S Armstrong L Declines in phosphorus concentration inthe upper River Thames (UK) Links to sewage effluent cleanup andextended end-member mixing analysis Sci Total Environ 2010 408 (6)1315minus1330(25) Jarvie H P Neal C Withers P J A Baker D B Richards RP Sharpley A N Quantifying phosphorus retention and release inrivers and watersheds using extended end-member mixing analysis (E-EMMA) J Environ Qual 2011 40 (2) 492minus504(26) Jarvie H P Sharpley A N Scott J T Haggard B E BowesM J Massey L B Within-river phosphorus retention Accounting for amissing piece in the watershed phosphorus puzzle Environ Sci Technol2012 46 (24) 13284minus13292(27) Brahana V The Savoy Experimental WatershedA long-termresearch site for karst hydrogeology In Caves and Karst of the USANational Speleological Society Guidebook for the International Congress ofSpeleology Palmer A N Palmer M V Eds National SpeleologicalSociety Huntsville AL 2009 section 5 Ozark Plateaus p 179(28) Sharpley A N Kleinman P J A Jordan P Bergstrom LAllen A L Evaluating the success of phosphorus management fromfield to watershed J Environ Qual 2009 38 1981minus1988(29) Scott J T Haggard B E Sharpley A N Romeis J J Changepoint analysis of phosphorus trends in the Illinois River (Oklahoma)demonstrates the effects of watershed management J Environ Qual2011 40 (4) 1249minus1256(30) Brahana J V Controlling influences on ground-water flow andtransport in the shallow karst aquifer of northeastern Oklahoma andnorthwestern Arkansas Proceedings volume hydrologic problemsalong the Arkansas-Oklahoma border Arkansas Water ResourcesCenter Publication No MSC-168 1995 pp 25minus3033(31) Brahana J V Ting T Al-Qinna M Murdock J Davis R KLainz J Killingbeck J J Szilvagyi E Doheny-Skubic M Chaubey IHays P D Thoma G Quantification of hydrologic budget parametersfor the vadose zone and epikarst in mantled karst US GeologicalSurvey Karst Interest Group Proceedings Rapid City SD Sept 12minus152005 Kuniansky E L Ed US Geological Survey ScientificInvestigations Report 2005-5160 pp 144minus152(32) Leh M D Chaubey I Murdoch J Brahana J V Haggard BE Delineating runoff processes and critical runoff source areas in apasture hillslope of the Ozark Highlands Hydrol Proc 2008 22 (21)4190minus4204 DOI 101002hyp7021(33) Haggard B E Phosphorus concentrations loads and sourceswithin the Illinois River drainage area Northwest Arkansas 1997minus2008J Environ Qual 2010 39 (6) 2113minus2120(34) Tortorelli R L Pickup B E Phosphorus concentrations loadsand yields in the Illinois River basin Arkansas and Oklahoma 2000minus2004 US Geological Survey Scientific Investigations Report 2006-5175 p 38(35) Murphy J Riley J P A modified single solution method for thedetermination of phosphate in natural-waters Anal Chim Acta 196227 31minus36(36) Eisenreich S J Bannerman R T Armstrong D E Simplifiedphosphorus analytical technique Environ Lett 1975 9 (1) 43minus53(37) Jarvie H P Withers P J A Neal C Review of robustmeasurement of phosphorus in river water Sampling storagefractionation and sensitivity Hydrol Earth Syst Sci 2002 6 113minus131(38) Divine C E McDonnell J J The future of applied tracers inhydrogeology J Hydrogeol 2005 13 255minus258
(39) Burns D A McDonnell J J Hooper R P Peters N E FreerJ E Kendall C Beven K Quantifying contributions to storm runoffthrough endmember mixing analysis and hydrologic measurements atthe Panola Mountain Research Watershed (Georgia USA) HydrolProc 2001 15 1903minus1924(40) Williams P W The role of the epikarst in karst and cavehydrogeology a review Int J Speleol 2008 31 1minus10(41) Jarvie H P Neal C Smart R Owen R Fraser D Forbes IWade A Use of continuous water quality records for hydrographseparation and to assess short-term variability and extremes in acidityand dissolved carbon dioxide for the River Dee Scotland Sci TotalEnviron 2001 265 (1minus3) 85minus98(42) Jarvie H P Sharpley A N Spears B Buda A R May LKleinman P J A Water quality remediation faces unprecedentedchallenges from ldquolegacy phosphorusrdquo Environ Sci Technol 2013 47(16) 8997minus8998(43) Sharpley A Jarvie H P Buda A May L Spears B KleinmanP Phosphorus legacy Overcoming the effects of past managementpractices to mitigate future water quality impairment J Environ Qual2013 42 (5) 1308minus1326(44) Ting T E E Assessing bacterial transport storage and viability inmantled karst of northwest Arkansas using clay and Escherichia colilabeled with lanthanide-series metals PhD Dissertation University ofArkansas 2005(45) Sharpley A N Smith S J Bain W R Nitrogen and phosphorusfate from long-term poultry litter applications toOklahoma soils Soil SciSoc Am J 1993 57 (4) 1131minus1137(46) Frossard E Condron L M Oberson A Sinaj S Fardeau J CProcesses governing phosphorus availability in temperate soils JEnviron Qual 2000 29 (1) 15minus23(47) Cox F R Kamprath E J McCollum R E A descriptive modelof soil test nutrient levels following fertilization Soil Sci Soc Am J 198145 (3) 529minus532(48) Inskeep W P Bloom P R kinetics of calcite precipitation in thepresence of water-soluble organic-ligands Soil Sci Soc Am J 1986 50(5) 1167minus1172(49) Dove P M Hochella M F Calcite precipitation mechanismsand inhibition by orthophosphate - insitu observations by scanning forcemicroscopy Geochim Cosmochim Acta 1993 57 (3) 705minus714(50) Kirchner J W Feng X H Neal C Fractal stream chemistry andits implications for contaminant transport in catchments Nature 2000403 (6769) 524minus527(51) Kirchner J W Neal C Universal fractal scaling in streamchemistry and its implications for solute transport and water qualitytrend detection Proc Nat Acad Sci USA 2013 110 (30) 12213minus12218(52) Neal C Catchment water quality The inconvenient butnecessary truth of fractal functioning Hydrol Proc 2013 27 (24)3516minus3520
Environmental Science amp Technology Article
dxdoiorg101021es405585b | Environ Sci Technol XXXX XXX XXXminusXXXI
Coupling High-Frequency Stream Metabolism and NutrientMonitoring to Explore Biogeochemical Controls on DownstreamNitrate DeliveryHelen P Jarviedagger Andrew N SharpleyDagger Timothy Kressesect Phillip D Hays∥ Richard J Williamsdagger
Stephen M Kingperp and Lawrence G BerryDagger
daggerNERC Centre for Ecology and Hydrology Wallingford OX10 8BB United KingdomDaggerDepartment of Crop Soil and Environmental Sciences University of Arkansas Fayetteville Arkansas 72701 United StatessectUS Geological Survey Lower Mississippi-Gulf Water Science Center 401 Hardin Road Little Rock Arkansas 72211 UnitedStates∥US Geological Survey Lower Mississippi-Gulf Water Science CenterUniversity of Arkansas Department of Geosciences 216Gearhart Hall Fayetteville Arkansas 72701 United StatesperpSTFC Rutherford Appleton Laboratory Harwell Campus Didcot Oxfordshire OX11 0QX United Kingdom
S Supporting Information
ABSTRACT Instream biogeochemical process measurementsare often short-term and localized Here we use in situ sensorsto quantify the net effects of biogeochemical processes onseasonal patterns in baseflow nitrate retention at the river-reachscale Dual-station high-frequency in situ nitrate measurementswere coupled with high-frequency measurements of streammetabolism and dissolved inorganic carbon in a tributary of theBuffalo National River Arkansas Nitrate assimilation wascalculated from net primary production and combined withmass-balance measurements to estimate net nitrification anddenitrification The combined net effects of these instreamprocesses (assimilation denitrification and nitrification)removed gt30minus90 of the baseflow nitrate load along a 65km reach Assimilation of nitrate by photoautotrophs during spring and early summer was buffered by net nitrification Netnitrification peaked during the spring After midsummer there was a pronounced switch from assimilatory nitrate uptake todenitrification There was clear synchronicity between the switch from nitrate assimilation to denitrification a reduction in riverbaseflows and a shift in stream metabolism from autotrophy to heterotrophy The results show how instream nitrate retentionand downstream delivery is driven by seasonal shifts in metabolic pathways and how continuous in situ stream sensor networksoffer new opportunities for quantifying the role of stream biota in the dynamics fate and transport of nitrogen in fluvialsystems
1 INTRODUCTION
Nutrients including nitrogen (N) phosphorus (P) and carbon(C) from agriculture and domestic wastewater are a majorsource of water-quality impairment1 Excessive nutrient inputsto rivers streams and lakes can accelerate growth of nuisanceand harmful algae Resulting increases in microbial activity anddepletion of dissolved oxygen (DO) have profound negativeconsequences for invertebrates and fish potable water supplyand recreation23 However biogeochemical processes instreams also play an important role in regulating downstreamnutrient transport with stream biota retaining and removingnutrients from the water column reducing downstreamecological impacts4minus6
Streams can provide a major sink for nitrate (NO3minus)
through uptake (assimilation) by primary production and
through denitrification78 The effectiveness of these processesvaries throughout the year and between streams butconventional methods for estimating NO3
minus uptake are basedon relatively few short-term experimental nutrient additionsand isotope measurements9minus11 making results difficult toextrapolate in space and time12 Continuous high-frequency insitu measurements offer new opportunities to explore NO3
minus
source dynamics13minus17 and instream processes have beeninferred from single-station diurnal concentration cycles121819
longitudinal profiling20minus23 and nested sensor networks24
Received June 6 2018Revised October 23 2018Accepted October 30 2018Published October 30 2018
Article
pubsacsorgestCite This Environ Sci Technol 2018 52 13708minus13717
copy 2018 American Chemical Society 13708 DOI 101021acsest8b03074Environ Sci Technol 2018 52 13708minus13717
Dow
nloa
ded
via
CT
R F
OR
EC
OL
OG
Y amp
HY
DR
OL
OG
Y o
n D
ecem
ber
4 2
018
at 0
936
54
(UT
C)
Se
e ht
tps
pub
sac
sor
gsh
arin
ggui
delin
es f
or o
ptio
ns o
n ho
w to
legi
timat
ely
shar
e pu
blis
hed
artic
les
In this study we used in situ sensors to quantify the neteffects of biogeochemical processes on seasonal patterns inbaseflow NO3
minus retention at the river-reach scale The approachemployed here is novel because it combines dual-station high-frequency NO3
minus measurements with high-frequency measure-ments of stream metabolism (analysis of diurnal DO curves tocalculate primary production and respiration) dissolvedinorganic carbon (DIC) and excess partial pressure of carbondioxide (EpCO2) to explore the capacity of instreambiogeochemical processes to retain and remove NO3
minus High-frequency in situ monitoring of water chemistry and stream-flow was undertaken along a 65 km experimental reach of BigCreek a tributary of the Buffalo National Scenic RiverArkansas USA and were used to calculate a NO3
minus massbalance along the reach Net primary production was used tocalculate NO3
minus assimilation by photoautotrophs Daily NO3minus
removal rates and rates of NO3minus assimilation by photo-
autotrophs were used to calculate net nitrification anddenitrification The biogeochemical controls on NO3
minus removalwere then evaluated in relation to wider ecosystem driversincluding streamflow DO and stream ecological function toexplore how seasonal shifts in metabolic pathways influenceinstream NO3
minus retention and downstream NO3minus delivery
2 MATERIALS AND METHODS21 Site Description and Water-Quality Monitoring
Big Creek a tributary of the Buffalo National Scenic RiverArkansas (Figure 1) is the subject of detailed water-quality
monitoring because of a permitted swine concentrated animalfeeding operation (CAFO) within the watershed in operationsince September 2013 The Big Creek watershed lies in thekarst terrain of the Ozark Plateau of the midcontinental USA(Figure 1) The watershed area is 236 km2 with 79 of theland area deciduous forest 3 evergreen forest 14grasslandpasture and 3 developed land (see SupportingInformation SI S11) Swine-manure slurry from the CAFO
has been land applied to permitted fields since January 1 2014in accordance with State regulationsThe focus of this study is an experimental reach of Big
Creek downstream of the CAFO from an upstreammonitoring station at Mt Judea (USGS site 07055790watershed area 106 km2) to a downstream monitoring stationat Carver (USGS site 07055814 watershed area 233 km2)721 and 069 km from the confluence between Big Creek andthe Buffalo River respectively (Figure 1) One tributary (LeftFork) enters Big Creek between Mt Judea and Carver Thewatershed is a mantled karst terrain characterized by intimateconnection between groundwater and surface water transportof surface-derived nutrients can be rapid25 (see S12)USGS conducted high-frequency (15 min) NO3
minus monitor-ing using submersible ultraviolet nitrate probes at Carver (06032014 to 04292017) and Mt Judea (11012014 to 11012015) there was therefore one year of overlapping data(11012014 to 11012015) during which NO3
minus monitoringwas undertaken at both Mt Judea and Carver A water-qualitysonde (YSI 6600) operating at Carver simultaneously collected15 min interval DO pH specific conductance and watertemperature data Further information about the high-frequency water-quality monitoring is provided in S13Water-quality samples collected on a weekly basis since 09
122013 with additional opportunistic high-flow sampling atMt Judea Left Fork and at a groundwater (spring) monitoringsite (Figure 1) provided NO3
minus (by ion chromatographyDionex ICS-1600) alkalinity (by fixed-end point acidimetrictitration to pH 4526) and conductivity (VWR SymphonyB10C) data All nitrate concentrations are reported as NO3minusN(mg-N Lminus1) Water-quality data are available at httpsbigcreekresearchorg
22 Stream-Flow Measurements and HydrographSeparation Stream flow was measured using establishedUSGS streamflow gauging methods27 (see S14) A two-component mixing model was used to partition thecontributions to streamflow from groundwater and surfacerunoff28 using alkalinity as a conservative groundwater tracer(see S15)
23 Analysis of Diurnal Dissolved Oxygen Curves toCalculate Primary Production and Respiration The dailyaverage gross primary production daily average ecosystemrespiration and reaeration coefficient were calculated from theseries of diurnal DO curves at Carver (see S16) using apiecewise solution of the mass balance DO model29 simplifiedfor the situation where the deficit does not vary spatially (eq1) the Delta method3031
D t k D td d ER GPP ( )a av av+ = minus (1)
where D is the DO deficit (mg-O2 Lminus1) t is the time (days) ka
is the reaeration coefficient ERav is the ecosystem respiration(mg-O2 L
minus1 dminus1) and GPPav is the gross primary production(mg-O2 Lminus1 dminus1) these are standard measures of ecosystemrespiration and gross primary production in river systems32
Odum33 suggested a classification system of flowing-watercommunities based on oxygen metabolism by using the ratio ofGPPav to ERav (GPPER) Respiration is associated with bothplant and microbial activity Photosynthesis is only associatedwith plants Autotroph-dominated communities are repre-sented by GPPER values gt1 whereas heterotroph-dominatedcommunities are represented by GPPER values lt1
24 Use of the THINCARB Model for CalculatingDissolved Inorganic Carbon Concentrations and Excess
Figure 1 Map of the Big Creek watershed and its location
Environmental Science amp Technology Article
DOI 101021acsest8b03074Environ Sci Technol 2018 52 13708minus13717
13709
Partial Pressure of Carbon Dioxide The THINCARBmodel (THermodynamic modeling of INorganic CARBon)34
uses pH Gran Alkalinity (AlkGran) and temperature measure-ments to calculate dissolved inorganic carbon (DIC)concentrations and DIC speciation from the excess partialpressures of carbon dioxide (EpCO2) in freshwatersTHINCARB is open access and is described in detail in Jarvieet al (2017)34 an outline is provided in S17 Prior to usealkalinity measurements in units of mg-CaCO3 L
minus1 were firstconverted to AlkGran (in μeq Lminus1) where 1 mg Lminus1 CaCO3 =1998 μeq Lminus134
THINCARB was applied to the high-frequency sonde datafrom Carver Specific conductance was used as a surrogate foralkalinity using the regression relationship between AlkGranand specific conductance (κ) measured across the Big Creekwatershed including the spring and Mt Judea Left Fork andCarver stream sites AlkGran = 865 (plusmn028) times κ minus 644 (plusmn66)R2 = 095 n = 270 P lt 0001 (numbers in parenthesesrepresent twice the standard error) By applying this regressionequation to the hourly κ series an hourly alkalinity record wasderived which was then used alongside the hourly pH andwater-temperature data to calculate a high-frequency DIC andEpCO2 series25 Mass-Balance Calculation of Baseflow Nitrate
Fluxes Instream Losses and Net Nitrification andDenitrification Daily mass-balance calculations were under-taken for eight quiescent low-flow periods (each typically of1minus2 weeks) USGS stream-velocity readings from Carverranged from 0457 and 122 m sminus1 and with a stream distancealong the experimental reach of 652 km the travel timesranged from 396 to 148 h Therefore daily mass balances
over a 24-h period were assumed sufficient to account fortransit of NO3
minus given (a) the relatively short travel times (b)the high degree of stationarity in flux transfers during quiescentbaseflow conditions and (c) that calculated daily massbalances were averaged over a 1minus2 week periodThe 15 min NO3
minus measurements at Mt Judea and Carverwere converted to daily means and daily nitrate loads at eachsite were calculated using the corresponding gauged dailystreamflow data To account for flow accretion along the reachthe difference between the daily flow downstream at Carverand the upstream site at Mt Judea was calculated The increasein flows was assumed to be input from Left Fork (Figure 1)Daily NO3
minus input loading to the reach (LT) was calculatedas the sum of the daily NO3
minus loads from Mt Judea (LMJ) andLeft Fork (LLF)
L L LT MJ LF= + (2)
There was no high-resolution NO3minus monitoring on Left
Fork so weekly NO3minus measurements from grab samples taken
at Left Fork were combined with the measured daily flowaccretion to derive daily loads from Left Fork (S181) Asensitivity analysis evaluated the potential effects of under- oroverestimating Left Fork NO3
minus concentrations by plusmn50(Tables SI1 and SI2)Within this karst watershed some of the flow accretion will
arise from direct groundwater input into Big Creek Dischargedata were not available from the Left Fork tributary and directapportionment of contributions from Left Fork and ground-water was not possible We therefore evaluated a secondalternative ldquoendmemberrdquo case scenario whereby all of flow
Figure 2 Time series at the downstream monitoring site (Carver) from May 2014 to May 2017 showing (a) nitrate (NO3minusN) dissolvedinorganic carbon (DIC) and streamflow and (b) daily average gross primary production (GPP) ecosystem respiration (ER) and streamflow
Environmental Science amp Technology Article
DOI 101021acsest8b03074Environ Sci Technol 2018 52 13708minus13717
13710
accretion was attributed to direct groundwater contribution(S182)The daily instream NO3
minus load removal (LR) along the reachwas calculated as the difference between the daily input NO3
minus
loading (LT) and the daily NO3minus load at Carver (LC)
L L LR T C= minus (3)
To allow direct comparison with rates of assimilatory NO3minus
uptake by photosynthesis LR (kg-N dminus1) was then convertedto a daily NO3
minus removal rate UT (mg-N Lminus1 dminus1) UTincorporates both assimilatory NO3
minus uptake by photo-autotrophs (UA) heterotrophic NO3
minus removal through directuptake and denitrification (UD) and NO3
minus enrichment due toremineralization via nitrification (R)20
U U U RT A D= + minus (4)
UA was estimated from the GPPav measurements1235 GPPavdata were converted into net primary production (NPP)assuming that autotrophic respiration consumed 50 of theGPPav
3637 NPP data were then converted from units of O2uptake (mg-O2 L
minus1 dminus1) to C uptake (mg-C Lminus1 dminus1) with aphotosynthetic quotient of 100 then converted to NO3
minus
uptake (mg-N Lminus1 dminus1) using a molar ratio of CN of 1238
Subtracting UT from UA provides a measure of either netnitrification (positive values) or net heterotrophic NO3
minus
removal through direct uptake and denitrification hereafterreferred to as ldquonet denitrificationrdquo (negative values) When theriver was influent loss of NO3
minus to groundwater was accountedfor as described in S183
3 RESULTS AND DISCUSSION31 Three-Year Time Series of Nitrate Dissolved
Inorganic Carbon and Stream Metabolism The hourlyNO3
minus and DIC concentrations variations at Carver were drivenby streamflow but in opposing directions (Figure 2a) Themean and median NO3
minus concentrations were 0128 and 0093
mg-N Lminus1 respectively Nitrate concentrations at Carver werelowest during baseflow (mean 0043 mg-N Lminus1 lowest 10 offlows) and highest during storm runoff (mean 0278 mg-N Lminus1highest 10 of flows) arising from nonpoint-sourcemobilization and delivery of NO3
minus during rainfall eventsThe mean and median DIC concentrations were 248 and
252 mg-C Lminus1 respectively DIC concentrations were highestduring baseflow (mean 317 mg-C Lminus1) with DIC concen-trations diluted by storm runoff (mean 132 mg-C Lminus1)Highest DIC and lowest NO3
minus concentrations occurred duringthe extended low-flows between August and November 2015The mean and median molar CN ratios were 356 and 305
respectively The mean CN ratio during baseflow was 882 and82 during stormflow CN ratios greater than sim66 areindicative of stoichiometric depletion of N relative to C39
Absolute NO3minus concentrations below sim01 mg-N Lminus1 are
deemed likely to be limiting to algae with algal growthresponse to NO3
minus enrichment occurring between 038 to 179mg-N Lminus140 Therefore under average and baseflow conditionsat Carver a clear potential exists for algal growth to be limitedby low NO3
minus availabilityNo longer-term trends in either NO3
minus or DIC wereobserved over the three years These high-frequencymonitoring results are consistent with results from near-weeklywater-quality monitoring of Big Creek at Mt Judea whichshowed no statistically significant increasing or decreasingtrends in dissolved or particulate forms of P and Nconcentrations since 201341
Earlier studies6 have shown that Ozark streams can be veryeffective at retaining available nutrients and buffering addi-tional nutrient inputs Therefore the absence of any increasingtrend in nutrients in the water column may result from therapid and efficient uptake of nutrient inputs by stream biotaConsequently high-resolution stream metabolism and nutrientmeasurements were used here to detect whether increasedphotosynthesis or respiration rates resulted from increased
Figure 3 Scatter plot showing the relations between mean daily nitrate concentrations upstream at Mt Judea and downstream at Carver
Environmental Science amp Technology Article
DOI 101021acsest8b03074Environ Sci Technol 2018 52 13708minus13717
13711
nutrient assimilation even where no increases in water-columnnutrient concentrations could be observed
The time series in daily rates of GPPav and ERav at Carver(Figure 2b) showed no definitive long-term trends between
Figure 4 Time series from 1 November 2014 to 1 November 2015 showing (a) Nitrate concentrations upstream at Mt Judea and downstream atCarver and the lower-flow time periods used for mass balance calculation and evaluation of biogeochemical processes (b) streamflow at Carverand the percentage groundwater contribution to streamflow (c) daily ratio of gross primary production ecosystem respiration (GPPER)downstream at Carver (horizontal dashed line shows GPPER of 1 ie balance between heterotrophy and autotrophy) and excess partial pressureof carbon dioxide (EpCO2) and (d) streamflow and the molar CN ratio (DIC dissolved inorganic carbonNO3minusN) downstream at Carver
Environmental Science amp Technology Article
DOI 101021acsest8b03074Environ Sci Technol 2018 52 13708minus13717
13712
2014 and 2017 GPPav declined rapidly in response to majorstorm runoff events but typically recovered within a couple ofweeks Highest GPPav tended to occur during quiescentbaseflow or recessional streamflow conditions during thesummer (May through August) Both GPPav and ERav declinedduring the autumn (September through December) reflectingreductions in stream biological activity and GPPav tended todecline at a faster rate than ER This was particularly apparentduring the extended low-flows between August and December2015 suggesting a decline in primary production relative tomicrobial activity and a transition from net autotrophic to netheterotrophic stream communities During winter baseflows(November through January) ERav tended to exceed GPPavDuring the 3-yr monitoring no CAFO-related impacts oneither stream nutrient concentrations or metabolism arediscernible at Carver32 Temporal and Spatial Variability in NO3
minus
Concentrations Relative to Other Key EnvironmentalVariables Mean daily NO3
minus concentrations varied betweenbaseflow and storm events at Mt Judea and Carver during theone year of overlapping data (Figure 3) There was a cleardifferentiation between a higher-flow period characterized byregular storm events from mid-December 2014 to mid-July2015 and lower-flow conditions from August to NovemberDecember 2015 (Figures 3 and 4)During the higher-flow period a positive correlation existed
between upstream (Mt Judea) and downstream (Carver)NO3
minus with a ratio approaching 1 (Figure 3) During this high-flow period NO3
minus concentrations at both upstream anddownstream sites ranged between sim01 and sim04 mg-N Lminus1Time series data show close convergence between upstreamand downstream NO3
minus concentrations during storm-eventpeak concentrations (Figure 4ab)Under lower-flow conditions NO3
minus concentrations wereconsistently higher upstream than downstream (Figure 3) Theincrease in NO3
minus concentrations at the upstream site duringthe summer and autumn 2015 corresponds with reductions inflow This is typical of the longer-term hydrologically drivencycles in NO3
minus concentrations observed at the upstream sitereflecting a strong flow dependency with highest concen-trations under the lowest flows and dilution with increasingflow (Figure SI1abc) The strong increase in NO3
minus
concentrations during July to November 2015 thereforereflects hydrological controls and is consistent with fallingflows The high NO3
minus concentrations in autumn 2015subsequently declined with the onset of higher flows (FigureSI1ab)
The gap in NO3minus concentrations between upstream and
downstream sites widened with decreasing flow particularlyduring the protracted low-flows between mid-July andNovember 2015 During this time minimal soil watercontributed to streamflow and almost all (gt95) ofstreamflow was derived from groundwater (Figure 4ab) Bythe end of October 2015 upstream NO3
minus concentrationsreached sim075 mg-N Lminus1 whereas downstream NO3
minus
concentrations were sim005 mg-N Lminus1 Between July andNovember 2015 downstream NO3
minus concentrations exhibiteda much lower range (sim005 to sim015 mg-N Lminus1) as comparedwith upstream (sim01 to sim08 mg-N Lminus1) (Figure 3) Thisreduction in both magnitude and range of downstream NO3
minus
concentrations under baseflow conditions could arise eitherfrom dilution of NO3
minus as a result of downstream accretion ofwater sources with much lower NO3
minus concentrations or byremoval of NO3
minus through biogeochemical processes neces-sitating a mass-balance evaluation (see section 33)The widening gap in NO3
minus concentrations betweenupstream and downstream sites after mid-July 2015 corre-sponded with a decline in GPPER which fell below 1indicating a change to net heterotrophy (Figure 4c) Duringthe low-flow period from mid-July to November 2015 BigCreek was heterotrophic for sim90 of days Daily streamwaterEpCO2 doubled between mid-July and November 2015 from45 to 91 times atmospheric pressure independentlyconfirming an increase in rates of respiration (CO2 release)relative to photosynthesis (CO2 uptake)During the higher-flow period from mid-January to mid-July
Big Creek was predominantly net autotrophic (GPPER gt 1for 52 of days) Net heterotrophic conditions prevailedpredominantly during lower-flow intervals between stormevents with GPPER lt 1 typically during and immediatelyafter storm eventsMolar CN ratios at Carver also increased markedly after
mid-July from sim300 to gt800 (Figure 4d) This stoichiometricdepletion of N along with persistence of low NO3
minus
concentrations below 01 mg-N Lminus1 (falling to lt004 mg-NLminus1) suggests that algal growth may have been limited by lowN availability at Carver over the late summer and autumn of2015
33 Nitrate Reach Mass Balance to Quantify SeasonalNitrate Removal during Baseflow ConditionsMean dailyNO3
minus mass balances for the eight seasonal quiescent baseflowperiods between February and October 2015 are presented inTable 1 Mean daily NO3
minus input loadings to the reach (LT)increased from 173 kg-N dminus1 in February to 617 kg-N dminus1 in
Table 1 Seasonal Patterns in Mean Daily NO3minus Input Loadings (LT) to Big Creek Mean Daily Instream NO3
minus Load Removal(LR) along the 65 km Experimental Reach Under Low-Flow Conditions and Mean Daily NO3
minus Load Removal As aPercentage of NO3
minus Inputs (UE)a
season date rangeNO3
minus input loadingto reach (LT) (kg-N dminus1)
instream NO3minus removal
along reach (LR) (kg-N dminus1)instream NO3
minus removal (LR) as of NO3minus
input loading (LT) (UE)
winter 4minus13 Feb 2015 173 (112) 768 (046) 447 (409)spring 1 5minus12 Apr 2015 441 (635) 190 (282) 439 (953)spring 2 24 Aprminus5 May 2015 379 (153) 169 (385) 476 (893)early summer 2minus10 Jun 2015 492 (236) 241 (854) 512 (534)mid summer 11minus21 Jul 2015 617 (442) 146 (282) 321(141)late summer 7minus16 Aug 2015 756 (122) 557 (059) 742 (466)autumn 1 1minus14 Sept 2015 581 (123) 449 (081) 778 (239)autumn 2 1minus11 Oct 2015 298 (029) 282 (025) 948 (120)aStandard deviations are shown in parentheses
Environmental Science amp Technology Article
DOI 101021acsest8b03074Environ Sci Technol 2018 52 13708minus13717
13713
July then declined rapidly to 756 kg-N dminus1 in August whichalso corresponded with an order of magnitude reduction inbaseflow discharge By October LT had fallen to only 298 kg-N dminus1 Instream NO3
minus removal (LR) followed a similar patternto LT with highest mean daily instream NO3
minus removal duringJune (24 kg-N dminus1) then decreasing during the late summerand autumn and falling to 282 kg-N dminus1 in October Howeverthe efficiency of instream NO3
minus removal (UE ie LR expressedas a percentage of LT) increased markedly during the latesummer and autumn from 32 in July to 74minus95 betweenAugust and OctoberThe fluvial mass balance therefore confirmed that the
observed downstream reductions in NO3minus concentrations
under baseflow were a result of net instream removal of NO3minus
by biogeochemical processes rather than a dilution effectAlthough LT and LR were greatest during the winter to early
summer period UE and the instream NO3minus removal rate (UT)
increased dramatically during the low flows of the late summerand autumn UT increased from le009 mg-N Lminus1 dminus1
(February through July) to gt02 mg-N Lminus1 dminus1 in Augustand September and 066 mg-N Lminus1 dminus1 in October (Table 2)By autumn 2015 gt75 of the NO3
minus inputs were removed bybiogeochemical processes (Table 1)We also assessed the efficiency of NO3
minus removal under thealternative scenario where the increase in flow along theexperimental reach was solely from direct groundwater input(S162) This made relatively little difference to the UE whichalso increased markedly during the late summer and autumnfrom 46 in July to 72minus94 between August and October(Table SI3) The sensitivity analysis (Tables SI1 and SI3)showed that a 50 increase or decrease in either Left Fork or
groundwater NO3minus concentrations made little difference to
these findings a consistent increase in efficiency of NO3minus
removal was observed after July with August to October UEvalues consistently sim70minus95
34 Biogeochemical Controls on Nitrate DeliveryAccounting for Assimilatory Nitrate Uptake to Calcu-late Net Nitrification and Net Denitrification FromFebruary to July assimilatory NO3
minus uptake by photosynthesiz-ing plants (UA) consistently exceeded UT (Table 2) indicatingfirst that assimilation of NO3
minus by photoautotrophs was thedominant process removing NO3
minus from the water column andsecond that assimilation was partially balanced by netnitrification NO3
minus gains In contrast from August to OctoberUT exceeded UA indicating that heterotrophic NO3
minus removalthrough direct uptake and denitrification was removing NO3
minus
along the reach in late summer and autumnTable 3 shows that net nitrification gains to the reach ranged
from 0135 mg-N Lminus1 dminus1 in February to 0273 mg-N Lminus1 dminus1
in AprilMay However after July a pronounced switch fromnet nitrification gains to net denitrification losses occurredDuring late summer and autumn denitrification losses ofNO3
minus increased from sim0100 mg-N Lminus1 dminus1 in August andSeptember to 0592 mg-N Lminus1 dminus1 in October These estimateswere based on using an average periphyton CN molar ratio of12 for USA streams3538 We also evaluated the effects ofusing an average periphyton molar CN ratio of 86 fromresearch in northern European streams17 This increased UAvalues by sim39 but did not alter our findings of a switchbetween net nitrification between February and July to netdenitrification from August to October By changing the CNstoichiometry from 12 to 86 net nitrification ranged from
Table 2 Seasonal Patterns in Mean Daily NO3minus Removal Rate (UT) along the 65 km Experimental Reach of Big Creek Under
Low-Flow Conditions And Mean Daily Assimilatory Uptake of NO3minus by Photoautotrophs (UA)
a
season date range instream NO3minus removal rate (UT) (mg-N Lminus1 dminus1) assimilatory NO3
minus uptake (UA) (mg-N Lminus1 dminus1)
winter 4minus13 Feb 2015 0077 (0006) 0212 (0035)spring 1 5minus12 Apr 2015 0072 (0017) 0256 (0050)spring 2 24 Aprminus5 May 2015 0082 (0018) 0355 (0067)early summer 2minus10 Jun 2015 0090 (0014) 0269 (0045)mid summer 11minus21 Jul 2015 0066 (0030) 0259 (0040)late summer 7minus16 Aug 2015 0284 (0026) 0180 (0016)autumn 1 1minus14 Sept 2015 0229 (0019) 0115 (0038)autumn 2 1minus11 Oct 2015 0656 (0029) 0076 (0028)
aStandard deviations are shown in parentheses
Table 3 Seasonal Patterns in Mean Daily NO3minus Concentration Gains by Net Nitrification (+) and Losses by Net
Denitrification (minus) long the Experimental Reach of Big Creek under Low-Flow Conditions Mean Daily Values of the Ratiobetween Gross Primary Production and Ecosystem Respiration (GPPER) Excess Partial Pressure of Carbon Dioxide(EpCO2) Dissolved Oxygen (DO) Streamflow and the Percentage of Groundwater Contribution to Streamflowa
season date rangenet nitrification (+) or denitrification (minus)
(mg-N Lminus1 dminus1) GPPEREpCO2
(times atm press)DO
(mg-O2 Lminus1) flow (m3 sminus1) groundwater
winter 4minus13 Feb 2015 +0135 (0032) 114 (009) 280 (020) 119 (049) 115 (007) 665 (134)spring 1 5minus12 Apr 2015 +0184 (0039) 106 (013) 364 (020) 102 (033) 310 (037) 586 (238)spring 2 24 Apr -5 May
2015+0273 (0058) 125 (016) 381 (059) 103 (050) 261 (116) 617 (579)
early summer 2minus10 Jun 2015 +0179 (0044) 134 (015) 471 (049) 939 (042) 330 (172) 580 (648)mid summer 11minus21 Jul 2015 +0193 (0024) 197 (078) 715 (046) 898 (029) 254 (128) 828 (721)late summer 7minus16 Aug 2015 minus0104 (0032) 078 (005) 106 (083) 695 (035) 023 (004) 988 (098)autumn 1 1minus14 Sept
2015minus0102 (0027) 062 (010) 985 (165) 650 (054) 024 (006) 966 (142)
autumn 2 1minus11 Oct 2015 minus0592 (0015) 057 (023) 817 (150) 785 (064) 004 (0004) 978 (064)aStandard deviations are shown in parentheses
Environmental Science amp Technology Article
DOI 101021acsest8b03074Environ Sci Technol 2018 52 13708minus13717
13714
+0218 mg-N Lminus1 dminus1 in February to +0414 mg-N Lminus1 dminus1 inAprilMay with net denitrification ranging from minus0033 mg-NLminus1 dminus1 in August to minus0562 mg-N Lminus1 dminus1 in OctoberNet nitrification and denitrification rates were compared
with mean daily GPPER EpCO2 streamflow and percentagegroundwater discharge (Table 3) The shift from netnitrification to net denitrification corresponded directly with(1) a change in stream metabolism from net autotrophic(GPPER in July was 197) to net heterotrophic (GPPER fellbelow 1 to 078 in August 062 in September and 057 inOctober) and (2) an increase in EpCO2 and a reduction inDO arising from the increases in microbial respiration relativeto photosynthesisThe alternative scenario where flow accretion between Mt
Judea and Carver was attributed to direct groundwaterdischarge to Big Creek also had no effect on the timing ofthe shift from net nitrification to denitrification (S162 TableSI4) Sensitivity analysis (Tables SI2 and SI4) also showedthat irrespective of a 50 increase or decrease in either LeftFork or groundwater NO3
minus concentrations the sameconsistent switch between net nitrification and net denitrifica-tion was observed after JulyThe consistency in this observed switch between instream
NO3minus production and instream NO3
minus removal and itssynchronicity with measured changes in stream metabolismprovides compelling evidence that the marked change ininstream NO3
minus processing and delivery after July was linked tochanges in stream metabolism from net autotrophy to netheterotrophyThe karst streams of the Ozarks are characterized by a large
hyporheic zone4243 a hotspot of nitrogen transformation44
Water residence times and redox conditions provide a keycontrol on changes between NO3
minus removal and NO3minus
production with hyporheic zone sediments45minus48 In BigCreek the winter to midsummer period was characterized byhigher baseflows (at least an order of magnitude greater thanlate summerautumn baseflows) and net autotrophy resultingin higher instream DO concentrations Rapid movement ofwell-oxygenated water throughout the water column and intothe hyporheic zone promotes aerobic metabolism of organicmatter and release of NO3
minus through nitrification4649 Fromwinter to midsummer net nitrification was observed in BigCreek and nitrification in the hyporheic zone may have beenresponsible for buffering the effects of photosyntheticassimilatory uptake of NO3
minusUnder the more sluggish flow conditions during late summer
and autumn available oxygen is depleted as a result ofincreased heterotrophic activity The reduced movement ofwater and oxygen through the hyporheic zone favors a shift torespiratory pathways with denitrification (conversion of nitrateto N2O andor N2 gas)
5051 Unlike assimilation of NO3minus into
plant biomass which retains N temporarily denitrificationresults in a permanent loss of bioavailable N The lowbaseflows of late summer and autumn 2015 resulted in higherwater residence times and a greater proportion of flow movingthrough the hyporheic zone This provides greater exposureand water contact time with microbial biofilms wheredenitrification occurs51 The death and breakdown of biomassduring the late summer and autumn contribute to theavailability of organic matter for microbial decompositionpromoting higher rates of microbial respiration relative tophotosynthesis losses of DO and greater availability of organiccarbon as a resource for denitrifying bacteria455253
Denitrification within the hyporheic zone may therefore beresponsible for losses of NO3
minus in Big Creek during the latesummer and autumn Although denitrification can also occuron suspended sediments within the water column5455 this islikely to be a second order effect under baseflow conditions ina groundwater-fed stream where suspended solids concen-trations are low (typically lt5 mg Lminus1)Under baseflow conditions instream assimilatory NO3
minus
uptake by photosynthesizing plants and hyporheic-zonedenitrification along the experimental reach removed betweensim30 and sim90 of the NO3
minus input load During the period ofmonitoring (spring 2014 to spring 2017) NO3
minus loading to theupstream section of Big Creek (at Mt Judea) was attenuated byinstream processing such that no CAFO-related impacts oneither stream nutrient concentrations or metabolism werediscernible at the downstream location (Carver) and thus tothe Buffalo River Future monitoring will be needed to detectwhether long-term changes in nutrients and organic carboninputs may occur whether this stimulates higher rates ofheterotrophic andor autotrophic activity and any longer-termeffects on the capacity of assimilation and denitrificationprocesses to remove and buffer any increase in nutrientloadingsThe novelty of this research is the combination of
continuous high-frequency in situ stream metabolism andnitrate measurements to apportion the net effects ofassimilation nitrification and denitrification on changes inbaseflow nitrate fluxes at the river-reach to watershed scale Inthis case we found that during winter to midsummer periodsNO3
minus uptake in Big Creek was dominated by assimilation byphotoautotrophs which was partially compensated by releaseof NO3
minus from nitrification In late summer the predominantmetabolic pathway switched to net heterotrophy andheterotrophic NO3
minus removal through direct uptake anddenitrification became the dominant process of nitrateremoval Removal of NO3
minus by assimilation and denitrificationprovides an important ldquoself-cleansingrdquo ecosystem serviceresulting in a pronounced shift in CN stoichiometry anddecreasing NO3
minus concentrations to low levels which would beexpected to limit algal growth56
This approach provides a means of scaling up frommicroscale and mesoscale process experiments and measure-ments which are by necessity short-term and localized toexplore how river nitrate delivery responds to shifts in streammetabolism from day-to-day and seasonal to interannualvariability This research and the methods presented here areapplicable along the river continuum from headwaters tolarge-scale fluvial systems (with large spatial and temporalvariability in nutrient fluxes) and offer a valuable way forwardin quantifying net process controls on the fate and transport ofnitrogen in fluvial systems
ASSOCIATED CONTENT
S Supporting InformationThe Supporting Information is available free of charge on theACS Publications website at DOI 101021acsest8b03074
S1 Methods Land use and cover data site hydro-geology high-frequency water-quality monitoringstreamflow measurement hydrograph separation anal-ysis of diurnal dissolved oxygen curves to calculateprimary production and respiration calculation of DICand EpCO2 nitrate mass-balance calculations and S2
Environmental Science amp Technology Article
DOI 101021acsest8b03074Environ Sci Technol 2018 52 13708minus13717
13715
Results Figure SI1 time series of nitrate and flow andnitrate plotted against stream flow for Mt Judea TablesSI1 and SI2 sensitivity analysis based on estimates ofNO3
minus load inputs from Left Fork Tables SI3 and SI4alternative scenario sensitivity analysis based onestimates of NO3
minus load inputs from groundwater andadditional references (PDF)
AUTHOR INFORMATIONCorresponding AuthorE-mail hpjcehacukORCIDHelen P Jarvie 0000-0002-4984-1607Phillip D Hays 0000-0001-5491-9272NotesThe authors declare no competing financial interest
ACKNOWLEDGMENTSHPJ and RJW were supported by NERC NationalCapability projects NEC05966 and NEC04879 Funding forthe Big Creek Research and Extension monitoring wasprovided by the Arkansas Governorrsquos Office and StateLegislature to the University of Arkansas Systemrsquos Divisionof Agriculture Hydrological and chemical monitoring by theUSGS were supported by a National Park ServiceUSGSWater Quality Partnership Grant administered by the USGSAny use of trade firm or product names is for descriptivepurposes only and does not imply endorsement by the USGovernment
REFERENCES(1) Smith V H Eutrophication of freshwater and coastal marineecosystems - A global problem Environ Sci Pollut Res 2003 10 (2)126minus139(2) Dodds W K Bouska W W Eitzmann J L Pilger T J PittsK L Riley A J Schloesser J T Thornbrugh D J Eutrophicationof US Freshwaters Analysis of Potential Economic Damages EnvironSci Technol 2009 43 (1) 12minus19(3) Dodds W K Smith V H Nitrogen phosphorus andeutrophication in streams Inland Waters 2016 6 (2) 155minus164(4) Peterson B J Wollheim W M Mulholland P J Webster JR Meyer J L Tank J L Marti E Bowden W B Valett H MHershey A E McDowell W H Dodds W K Hamilton S KGregory S Morrall D D Control of nitrogen export fromwatersheds by headwater streams Science 2001 292 (5514) 86minus90(5) Alexander R B Boyer E W Smith R A Schwarz G EMoore R B The role of headwater streams in downstream waterquality J Am Water Resour Assoc 2007 43 (1) 41minus59(6) Jarvie H P Sharpley A N Scott J T Haggard B E BowesM J Massey L B Within-River Phosphorus Retention Accountingfor a Missing Piece in the Watershed Phosphorus Puzzle Environ SciTechnol 2012 46 (24) 13284minus13292(7) Mulholland P J Helton A M Poole G C Hall R OHamilton S K Peterson B J Tank J L Ashkenas L R CooperL W Dahm C N Dodds W K Findlay S E G Gregory S VGrimm N B Johnson S L McDowell W H Meyer J L ValettH M Webster J R Arango C P Beaulieu J J Bernot M JBurgin A J Crenshaw C L Johnson L T Niederlehner B ROrsquoBrien J M Potter J D Sheibley R W Sobota D J Thomas SM Stream denitrification across biomes and its response toanthropogenic nitrate loading Nature 2008 452 (7184) 202minusU46(8) Mulholland P J Valett H M Webster J R Thomas S ACooper L W Hamilton S K Peterson B J Stream denitrificationand total nitrate uptake rates measured using a field N-15 traceraddition approach Limnol Oceanogr 2004 49 (3) 809minus820
(9) Tank J L Marti E Riis T von Schiller D Reisinger A JDodds W K Whiles M R Ashkenas L R Bowden W BCollins S M Crenshaw C L Crowl T A Griffiths N A GrimmN B Hamilton S K Johnson S L McDowell W H Norman BM Rosi E J Simon K S Thomas S A Webster J R Partitioningassimilatory nitrogen uptake in streams an analysis of stable isotopetracer additions across continents Ecol Monogr 2018 88 (1) 120minus138(10) Tank J L Meyer J L Sanzone D M Mulholland P JWebster J R Peterson B J Wollheim W M Leonard N EAnalysis of nitrogen cycling in a forest stream during autumn using aN-15-tracer addition Limnol Oceanogr 2000 45 (5) 1013minus1029(11) Ensign S H Doyle M W Nutrient spiraling in streams andriver networks Journal of Geophysical Research-Biogeosciences 2006111 (G4) G04009(12) Rode M Halbedel nee Angelstein S Anis M R BorchardtD Weitere M Continuous in-stream assimilatory nitrate uptakefrom high frequency sensor measurements Environ Sci Technol2016 50 (11) 5685minus5694(13) Bowes M J Jarvie H P Halliday S J Skeffington R AWade A J Loewenthal M Gozzard E Newman J R Palmer-Felgate E J Characterising phosphorus and nitrate inputs to a ruralriver using high-frequency concentration-flow relationships Sci TotalEnviron 2015 511 608minus620(14) Halliday S J Skeffington R A Wade A J Bowes M JGozzard E Newman J R Loewenthal M Palmer-Felgate E JJarvie H P High-frequency water quality monitoring in an urbancatchment hydrochemical dynamics primary production andimplications for the Water Framework Directive HydrologicalProcesses 2015 29 (15) 3388minus3407(15) Halliday S J Skeffington R A Wade A J Bowes M JRead D S Jarvie H P Loewenthal M Riparian shading controlsinstream spring phytoplankton and benthic algal growth Environ-mental Science-Processes amp Impacts 2016 18 (6) 677minus689(16) Wade A J Palmer-Felgate E J Halliday S J Skeffington RA Loewenthal M Jarvie H P Bowes M J Greenway G MHaswell S J Bell I M Joly E Fallatah A Neal C Williams RJ Gozzard E Newman J R Hydrochemical processes in lowlandrivers insights from in situ high-resolution monitoring Hydrol EarthSyst Sci 2012 16 (11) 4323minus4342(17) Rode M Wade A J Cohen M J Hensley R T Bowes MJ Kirchner J W Arhonditsis G B Jordan P Kronvang BHalliday S J Skeffington R A Rozemeijer J C Aubert A HRinke K Jomaa S Sensors in the stream The High-frequency waveof the present Environ Sci Technol 2016 50 (19) 10297minus10307(18) Cohen M J Kurz M J Heffernan J B Martin J BDouglass R L Foster C R Thomas R G Diel phosphorusvariation and the stoichiometry of ecosystem metabolism in a largespring-fed river Ecol Monogr 2013 83 (2) 155minus176(19) Hensley R T Cohen M J On the emergence of diel solutesignals in flowing waters Water Resour Res 2016 52 (2) 759minus772(20) Hensley R T Cohen M J Korhnak L V Inferring nitrogenremoval in large rivers from high-resolution longitudinal profilingLimnol Oceanogr 2014 59 (4) 1152minus1170(21) Kunz J V Hensley R Brase L Borchardt D Rode MHigh frequency measurements of reach scale nitrogen uptake in afourth order river with contrasting hydromorphology and variablewater chemistry (Weisse Elster Germany) Water Resour Res 201753 (1) 328minus343(22) Kraus T E C OrsquoDonnell K Downing B D Burau J RBergamaschi B A Using paired in situ high frequency nitratemeasurements to better understand controls on nitrate concentrationsand estimate nitrification rates in a wastewater-impacted river WaterResour Res 2017 53 (10) 8423minus8442(23) Jones C Kim S W Schilling K Use of continuousmonitoring to assess stream nitrate flux and transformation patternsEnviron Monit Assess 2017 189 35(24) Wollheim W M Mulukutla G K Cook C Carey R OAquatic nitrate retention at river network scales across flow conditions
Environmental Science amp Technology Article
DOI 101021acsest8b03074Environ Sci Technol 2018 52 13708minus13717
13716
determined using nested in situ sensors Water Resour Res 2017 53(11) 9740minus9756(25) Jarvie H P Sharpley A N Brahana V Simmons T PriceA Neal C Lawlor A J Sleep D Thacker S Haggard B EPhosphorus retention and remobilization along hydrological pathwaysin karst terrain Environ Sci Technol 2014 48 (9) 4860minus4868(26) American Public Health Association (APHA) AlkalinityTitration Method 2320 B In Standard Methods for the Examinationof Water and Wastewater 23rd ed 1987 ISBN 978minus0-87553minus287minus5(27) Rantz S E Measurement and computation of streamflow Vol1 Measurement of stage and discharge In US Geological SurveyWater Supply Paper 2175 1982(28) Jarvie H P Neal C Smart R Owen R Fraser D ForbesI Wade A Use of continuous water quality records for hydrographseparation and to assess short-term variability and extremes in acidityand dissolved carbon dioxide for the River Dee Scotland Sci TotalEnviron 2001 265 (1minus3) 85minus98(29) OrsquoConnor D J Ditoro D M Photosynthesis and oxygenbalance in streams Journal of the Sanitary Engineering DivisionProceedings of the American Society of Civil Engineers 1970 96 (2)547minus571(30) Williams R J White C Harrow M L Neal C Temporaland small-scale spatial variations of dissolved oxygen in the RiversThames Pang and Kennet UK Sci Total Environ 2000 251 497minus510(31) Chapra S C Ditoro D M Delta method for estimatingprimary production respiration and reaeration in streams J EnvironEng 1991 117 (5) 640minus655(32) Bernhardt E S Heffernan J B Grimm N B Stanley E HHarvey J W Arroita M Appling A P Cohen M J McDowellW H Hall R O Read J S Roberts B J Stets E G Yackulic CB The metabolic regimes of flowing waters Limnol Oceanogr 201863 S99minusS118(33) Odum H T Primary production in flowing waters LimnolOceanogr 1956 1 102minus117(34) Jarvie H P King S M Neal C Inorganic carbon dominatestotal dissolved carbon concentrations and fluxes in British riversApplication of the THINCARB model - Thermodynamic modellingof inorganic carbon in freshwaters Sci Total Environ 2017 575 496minus512(35) King S A Heffernan J B Cohen M J Nutrient flux uptakeand autotrophic limitation in streams and rivers Freshwater Science2014 33 (1) 85minus98(36) Hall R O Tank J L Ecosystem metabolism controls nitrogenuptake in streams in Grand Teton National Park Wyoming LimnolOceanogr 2003 48 (3) 1120minus1128(37) Hall R O Beaulieu J J Estimating autotrophic respiration instreams using daily metabolism data Freshwater Science 2013 32 (2)507minus516(38) Stelzer R S Lamberti G A Effects of N P ratio and totalnutrient concentration on stream periphyton community structurebiomass and elemental composition Limnol Oceanogr 2001 46 (2)356minus367(39) Redfield A C The biological control of chemical factors in theenvironment American Scientist 1958 46 (3) 205minus221(40) Evans-White M A Haggard B E Scott J T A Review ofstream nutrient criteria development in the United States Journal ofEnvironmental Quality 2013 42 (4) 1002minus1014(41) Sharpley A N Haggard B E Berry L Brye K Burke JDaniels M B Gbur E Glover T Hays P Kresse TVanDevender K W Nutrient concentrations in Big Creek correlateto regional watershed land use Agricultural amp Environmental Letters2017 2 170027(42) Miller R B Heeren D M Fox G A Halihan T Storm DE Mittelstet A R The hydraulic conductivity structure of gravel-dominated vadose zones within alluvial floodplains J Hydrol 2014513 229minus240(43) Miller R B Heeren D M Fox G A Halihan T Storm DE Heterogeneity influences on stream water-groundwater interactions
in a gravel-dominated floodplain Hydrol Sci J 2016 61 (4) 741minus750(44) Triska F J Duff J H Avanzino R J The role of waterexchange between a stream and its hyporheic zone in nitrogen cyclingat the terrestrial aquatic interface Hydrobiologia 1993 251 (1minus3)167minus184(45) Zarnetske J P Haggerty R Wondzell S M Baker M ALabile dissolved organic carbon supply limits hyporheic denitrifica-tion J Geophys Res 2011 116 G04036(46) Zarnetske J P Haggerty R Wondzell S M Bokil V AGonzalez-Pinzon R Coupled transport and reaction kinetics controlthe nitrate source-sink function of hyporheic zones Water Resour Res2012 48 W11508(47) Harvey J W Bohlke J K Voytek M A Scott D TobiasC R Hyporheic zone denitrification Controls on effective reactiondepth and contribution to whole-stream mass balance Water ResourRes 2013 49 (10) 6298minus6316(48) Moatar F Abbott B W Minaudo C Curie F Pinay GElemental properties hydrology and biology interact to shapeconcentration discharge curves for carbon nutrients sediment andmajor ions Water Resour Res 2017 53 (2) 1270minus1287(49) Zarnetske J P Haggerty R Wondzell S M Baker M ADynamics of nitrate production and removal as a function ofresidence time in the hyporheic zone J Geophys Res 2011 116G01025(50) Zarnetske J P Haggerty R Wondzell S M Couplingmultiscale observations to evaluate hyporheic nitrate removal at thereach scale Freshwater Science 2015 34 (1) 172minus186(51) Palmer-Felgate E J Mortimer R J G Krom M D JarvieH P Impact of point-source pollution on phosphorus and nitrogencycling in stream-bed sediments Environ Sci Technol 2010 44 (3)908minus914(52) Aubert A H Breuer L New seasonal shift in in-streamdiurnal nitrate cycles identified by mining high-frequency data PLoSOne 2016 11 (4) e0153138(53) Dodds W K Marti E Tank J L Pontius J Hamilton SK Grimm N B Bowden W B McDowell W H Peterson B JValett H M Webster J R Gregory S Carbon and nitrogenstoichiometry and nitrogen cycling rates in streams Oecologia 2004140 (3) 458minus467(54) Liu T Xia X H Liu S D Mou X L Qiu Y WAcceleration of Denitrification in Turbid Rivers Due to DenitrificationOccurring on Suspended Sediment in Oxic Waters Environ SciTechnol 2013 47 (9) 4053minus4061(55) Xia X H Jia Z M Liu T Zhang S B Zhang L WCoupled Nitrification-Denitrification Caused by Suspended Sediment(SPS) in Rivers Importance of SPS Size and Composition EnvironSci Technol 2017 51 (1) 212minus221(56) Jarvie H P Smith D R Norton L R Edwards F BowesM J King S M Scarlett P Davies S Dils R Bachiller-Jareno NPhosphorus and Nitrogen Limitation and Impairment of HeadwaterStreams Relative to Rivers in Great Britain A National Perspective onEutrophication Sci Total Environ 2018 621 849minus862
Environmental Science amp Technology Article
DOI 101021acsest8b03074Environ Sci Technol 2018 52 13708minus13717
13717
1
E COLI IN FLOWING WATERS
Mary Savin and BCRET members
I Why is Escherichia coli (E coli) being monitored What is the concern
Fecal pollution (from excrement of humans or animals) in the environment is of concern for many reasons not least of which is human health risks and disease control Other concerns related to fecal pollution of our natural waters include potential changes in the nutrient status of water introduction of antibiotic resistance and chemical contaminants changes in the ecological condition of waters and degradation of natural resources on which rural economies depend
People are concerned that the land application of swine effluent (pig excrement) will increase Escherichia coli in Big Creek and consequently the Buffalo River the first National Scenic River in the US This document aims to provide better understanding of
1) what is involved in E coli monitoring 2) what the numbers mean 3) some limitations in interpreting values and 4) provide a context for further research that may be needed to better interpret the E coli
numbers being measured in flowing waters such as Big Creek and Buffalo River
II What is E coli Why and how is it used as an indicator
E coli is a species of bacteria from the coliform group - bacteria that are rod-shaped gram negative non-spore forming facultative anaerobes commonly found in the feces of humans and warm blooded animals E coli occurs in human intestines - many strains with no ill effects although certain E coli cause serious human illnesses Thus while many E coli do not harm us there are important variants that do There are also other species of bacteria viruses and other small organisms that cause disease which if present in fecal sources polluting our waters can make humans sick Depending on whether E coli survive as long in the environment as these other pathogens E coli may or may not adequately warn us about a disease causing agent in our waters To date E coli is the most reliable test we have although other indicators and tests are being investigated E coli cannot be seen in streams by the human eye Thus it is important to determine if there is a problem of elevated E coli numbers by careful water sampling and using US Environmental Protection Agency (EPA) standardized methods E coli is counted in water because of the extensive studies and relationships established between the presence of E coli and the number of human illnesses occurring from contact with the water (eg swimming) containing the bacteria From these relationships there have been upper limits established for bacterial numbers that correspond to the acceptable risk of people getting sick from exposure to water containing them Water quality standards for E coli are established by the state in Arkansas Department of Environmental Quality (ADEQ) Regulation 2 (see Table 1) The E coli numbers must remain below a threshold in a specified number of total samples collected The exact upper limit that is allowed depends on the designation of the waterbody and time of year (primary or secondary contact season) Primary
2
Table 1 Upper limits for Escherichia coli counts defined in Regulation 2 of the Arkansas Department of
Environmental Quality (ADEQ) as specified by contact season and waterbody designation for both single samples and geometric mean
Contact season Water designation Limit of E coli (MPN100mL)
Single sample1
Geometric mean2
Primary (May 1-Sept 30)
Extraordinary Resource Water Ecologically Sensitive Waterbody
Natural amp Scenic Waterway Lakes
Reservoirs
298 126
All other water 410 NA3
Secondary (Oct 1-April 30)
Extraordinary Resource Water Ecologically Sensitive Waterbody
Natural amp Scenic Waterway Lakes
Reservoirs
1490 630
All other water 2050 NA 1 No more than 25 of samples from no less than 8 samples per contact season may exceed the limit 2Geometric mean is calculated from at least 5 samples collected within 30 days at evenly spaced time intervals during that 30-day period 3Not applicable
contact recreation is a designation given to a waterbody where full body contact occurs and occurs from May 1 through September 30 The ADEQ also designates any stream with a watershed (eg drainage basin in the landscape) exceeding 10 square miles and those with smaller watersheds on individual cases (ie after site verification) for primary contact recreation Secondary contact recreation designates waterbodies where activities such as boating fishing and wading take place and occurs from October 1 through April 30
E coli is measured in samples of water collected strictly following EPA guidelines The measurement of E coli starts within 8 hours of collection This method provides an estimate of E coli presence in the sampled water that is the most probable number (MPN) of E coli Using an EPA method provides numbers that are theoretically comparable to other labs using the same method The MPN depends on growing bacteria in the laboratory in ldquoculturerdquo and is an approach used routinely in microbiology This measurement is subject to high variability because of the nature of environmental bacteria thus variability in the data in E coli counts from streams is not unusual For this reason it is important to establish background levels of E coli in any water resulting from various wildlife human (eg septic tanks sewers) and agricultural (eg pig chicken cattle) sources
3
E coli thresholds are lower in late spring through summer (primary contact season) when more people are expected to be in contact with streams and lakes More stringent limits also apply to Extraordinary Resource Waters (eg Buffalo River) Ecologically Sensitive Waterbodies and Natural Scenic Waterways During the primary contact season (May 1- Sept 30) we do not want E coli to exceed 298 MPN100 mL and during secondary contact season (Oct 1 ndash Apr 30) E coli counts should not exceed 1490 MPN100 mL in single samples
III How does the E coli measurement ldquofitrdquo into the context of the landscape
While monitoring one bacterial species to assess the biological quality of water may seem simple determining the actual ecological condition of a system is complicated Measurement of E coli is an indicator for potential fecal pollution and potential pathogen problems but by itself does not identify the source(s) of the bacteria
E coli is present in intestines (and feces) and is not supposed to grow in the environment thus the presence and abundance should indicate pollution and be directly related to human and animal sources However because E coli is in many different animals (eg human wildlife agricultural) and because of the different pathways that bacteria may travel throughout the environment before ending up in water where we can measure it the presence of E coli does not identify the source of pollution
IV Why is E coli monitoring important and why is it complicated
There are many of factors that affect whether E coli survives in the environment for how long and whether it moves to other locations E coli is adapted to living in intestines After deposition from an animal cells have to survive rapidly changing environmental conditions (eg temperature and moisture) exposure to harmful UV rays in sunlight outcompete other organisms and avoid predators All these factors make it difficult to estimate how long E coli will survive in lagoon soil and river environments However there is evidence that E coli can persist in soil and sediments
V What are the numbers
E coli is measured weekly in Big Creek upstream and downstream of the CampH Farm Mt Judea Newton County Arkansas Water sample collection for E coli analysis began Sept 12 2013 prior to manure from CampH Farm application to fields either in fields adjacent to or distant from Big Creek Manure application began in 2014 to fields distant from Big Creek and then adjacent to Big Creek in March 2014 So far in the period following manure applications by CampH Farms (Jan 2 through May 19 2014) no trends in E coli with time or between sampling locations are apparent (Table 2) The Table 2 data are detailed in the Big Creek Research and Extension Team Quarterly Reports and demonstrate the week-to-week variability in E coli at upstream and downstream sites The E coli counts are expected to continue to be variable Clearly it is important to quantify the variability in E coli concentrations long-term in order to determine if changes occur as a result of CampH operation
The MPN is expected to increase with increases in flow and the recent installation of a USGS gauge to measure flow will allow for the determination of the relationship between measured flow in
4
the stream and E coli concentrations Because of the dangers during high flows most contact recreation is expected during base flow and thus sampling during base flow may provide more meaningful data
Table 2 Geometric mean of E coli (and range of sample MPN) before (Sept 12 - Dec 17 2013) and after manure applications began on the CampH Farm (Jan 2 - May 19 2014)
CampH location
Before any manure application
After manure application
Sept 12 - Dec 17 2013 Jan 2 - May 19 2014
(MPN100mL)
Upstream 82 (6 ndash 4080) 83 (NDa ndash 921)
Downstream 111 (5 ndash 3500) 39 (ND ndash 1553) aNot detected
Regulation Arkansas Pollution Control and Ecology Commission 01400-002 2014 Regulation Establishing Water Quality Standards for Surface Waters of the State of Arkansas as revised effective March 24 2014 Arkansas Department of Environmental Quality (ADEQ) Available at httpwwwadeqstatearusregsfilesreg02_final_140324pdf Last accessed 20 Aug 2014
Page 1 of 6
Nutrient impairment of surface waters continues despite widespread conservation efforts to reduce losses from urban rural and agricul-tural land uses (Scavia et al 2014) Land use within watersheds influ-
ences the quality and quantity of water in streams draining the landscape As land disturbance increases and use intensifies an increase in stormwater runoff and nutrient inputs that lead to a greater potential for transport to receiving water is generally observed (Dubrovsky et al 2010 Rebich et al 2011) This has led to efforts to identify and quantify nutrient sources within watersheds strategically target and apportion nutrient loss reduction (Reckhow et al 2011)
Many factors influence the relationship between land use in a given water-shed and nutrient transport downstream from that watershed With an increase in percentage of the drainage area in pasture row crop andor urban use a general trend of increasing nutrient concentrations in storm and base flows will manifest (Buck et al 2004 Giovannetti et al 2013 Haggard et al 2003 Migliaccio et al 2007) Thus nutrient concentrations in streams draining for-ested lands tend to be less than in watersheds with considerable anthropogenic land use
For a range of reasons great interest has been expressed in nutrient con-centrations in several streams of the Boston and Ozark Mountains region of northwest Arkansas including the Buffalo National River and its tributaries In particular Big Creek has been the center of attention within the Buffalo National River watershed (BRW) because of a permitted concentrated animal feeding operation (CAFO) The objectives of this letter are to put nutrient con-centrations of Big Creek into the context of the stream nutrient and watershed land use relationship and assess whether stream nutrient concentrations have
Nutrient Concentrations in Big Creek Correlate to Regional Watershed Land Use
A N Sharpley B E Haggard L Berry K Brye J Burke M B Daniels E Gbur T Glover P Hays T Kresse and K W VanDevender
Copyright copy American Society of Agronomy Crop Science Society of America and Soil Science Society of America 5585 Guilford Rd Madison WI 53711 USAThis is an open access article distributed under the terms of the CC BY-NC-ND license (httpcreativecom-monsorglicensesby-nc-nd40) Agric Environ Lett 2170027 (2017) doi102134ael2017080027 Received 16 Aug 2017 Accepted 25 Sep 2017 Corresponding author (sharpleyuarkedu)
Agricultural amp Environmental Letters
Research Letter
Abstract Nutrient concentrations in several streams of the Boston and Ozark Mountains region of Arkansas including the Buffalo National River and its tributaries have garnered tremendous interest In particular Big Creek has been the center of attention within the Buffalo River watershed because of a permitted concentrated animal feeding operation (CAFO) The objectives of this paper were to put nutrient concentrations of Big Creek into the context of the stream nutrient and watershed land-use relationship and develop a framework to evaluate regional land-use impacts on regional water quality Nutrient concentrations in streams draining the Boston and Ozark Mountains region were related to the intensity of watershed land use Concentrations in Big Creek were similar to other watersheds in the ecoregion with similar land use suggesting limited impact of the CAFO on Big Creek at the present time However this does not preclude future impacts and longer-term monitoring continues
AN Sharpley L Berry K Brye J Burke and T Glover Dep of Crop Soil and Environmental Sciences Univ of Arkansas 115 Plant Sciences Building Fayetteville AR 72701 BE Haggard Biological and Agricultural Engineering Univ of Arkansas BENGR201 Fayetteville AR 72701 MB Daniels and KW VanDevender Biological and Agricultural Engineering Cooperative Extension Univ of Arkansas 2301 South University Ave Little Rock AR 72203 E Gbur Agricultural Statistics Laboratory Univ of Arkansas 101 Agricultural Annex Fayetteville AR 72701 P Hays Dep of Geosciences Univ of Arkansas 216 Ozark Hall Fayetteville AR 72701 T Kresse (retired) USGS Arkansas Water Science Center 401 Hardin Rd Little Rock AR 72211
Core Ideas
bull Nutrient concentrations are low at Big Creek relative to expected biological-response thresholds
bull Nutrient concentrations at Big Creek are typical of streams draining watersheds with similar land use
bull Flow-adjusted nutrient concentrations at Big Creek have not increased over the short-term
bull Nutrient concentrations in streams increase as watershed land area in pasture and urban uses increases
Abbreviations BRW Buffalo River watershed CAFO concentrated animal feeding operation LOESS locally weighted regression SRP soluble reactive phosphorus TN total N TP total P UIRW Upper Illinois River watershed UWRW Upper White River watershed
Published online October 26 2017
Page 2 of 6 AGRICULTURAL amp ENVIRONMENTAL LETTERS
changed over the short term (3 yr of monitoring) The goal is to understand if how and why stream nutrient concentra-tions change downstream at Big Creek and whether the per-mitted swine CAFO has influenced water quality during the 3 yr since extensive monitoring began in September 2013
MethodsWater samples have been collected over varying periods
at the outlet of subwatersheds of the BRW Upper Illinois River watershed (UIRW) and Upper White River watershed (UWRW Fig 1) Land use and cover (ie forest pasture and urban) for each subwatershed was obtained from high-resolution (4-m) imagery from the USGS National Elevation Dataset (USGS 2015 Gesch et al 2002) National Land Cover Dataset (USGS 2017b) and National Hydrologic
Dataset (USGS 2017a) In the UWRW Giovannetti et al (2013) monitored 20 sites monthly for 1 yr (June 2005ndashJuly 2006) collecting water samples during base-flow condi-tions In the UIRW Haggard et al (2010) monitored 29 sites monthly during calendar year 2009 also collecting water samples during base-flow conditions
In the BRW the National Park Service in partnership with the Arkansas Department of Environmental Quality periodically collected water samples and measured nutrient concentrations at 20 stream sites from 1985 through 2015 Nitrate-nitrogen (NO3ndashN) total N (TN) soluble reactive phosphorus (SRP) and total P (TP) concentrations were obtained directly from these data Forest pasture and urban land-use areas were determined from 2006 high-resolution (4-m) land usendashland cover imagery
Fig 1 Location of the Big Creek Buffalo River Upper Illinois River and Upper White River watersheds in the Boston Mountains and Ozark Highlands ecoregion Information from USGS Environmental Systems Research Institute (ESRI) and NASA
AGRICULTURAL amp ENVIRONMENTAL LETTERS Page 3 of 6
Big Creek is monitored by the Big Creek Research and Extension Team a partnership between the University of Arkansas Systemrsquos Division of Agriculture and USGS Water samples have been collected upstream and down-stream of the swine CAFO on a near-weekly basis since September 2013 (Fig 1) The water samples were analyzed at an Arkansas Department of Environmental Quality cer-tified water quality laboratory within the Arkansas Water Resources Center (httparkansas-water-centeruarkeduwater-quality-labphp) according to methods detailed in Table 1 The data collected is made publicly available at httpsbigcreekresearchorg
The geometric mean of nutrient concentrations of base-flow samples collected between September 2013 and April 2017 were determined in order to compare with base-flow nutrient concentrations available for BRW UIRW and UWRW Base-flow conditions in Big Creek were classified from hydrograph inspection when flow had not increased or decreased within 3 d of sample collection McCarty and Haggard (2016) suggested that stream nutrient concen-trations under base flow can be used to identify nonpoint sources and target remedial measures in Boston Mountains and Ozark Highland watersheds
Using all above-listed data sources the geometric means of nutrient concentrations for streams in the BRW UIRW and UWRW were used to develop a relationship with human development within the watershed Human development is defined as the percentage of pasture plus urban land use within the watershed Exponential relationships with 95 confidence bands around the observations were developed for NO3ndashN TN SRP and TP concentrations to put nutri-ent concentration at Big Creek into the context of regional stream nutrients and watershed land use
Data from Big Creek were paired with discharge available from a gaging station just downstream from the swine CAFO where the USGS developed the rating curve discharge infor-mation was only available from May 2014 through April 2017 The data were then used in a simple three-step pro-cess (White et al 2004) to look at monotonic changes in the nutrients at Big Creek (i) log-transform concentration (mg L-1) and associated instantaneous discharge (m3 s-1) (ii) use locally weighted regression (LOESS) to smooth the data with a sampling proportion (n) of 05 and (iii) plot the resid-uals from LOESS (ie the flow-adjusted concentrations) over time and use linear regression to evaluate monotonic trends
Results and DiscussionPutting Stream Nutrient Concentrations into Context at Big Creek
In Big Creek upstream of the swine CAFO the geometric mean concentrations of base flow sampled at weekly inter-vals from September 2013 for NO3ndashN TN SRP and TP were 0098 0205 0009 and 0030 mg L-1 respectively Directly downstream of the CAFO geometric mean concentra-tions at Big Creek during base flow conditions during the same period were 0242 0356 0011 and 0031 mg L-1 for NO3ndashN TN SRP and TP respectively Arkansas has narra-tive criteria for nutrient concentrations in streams (Arkansas Pollution Control and Ecology Commission 2016) but its proposed assessment methodology has numeric screen-ing concentrations for TN (0450ndash2430 mg L-1) and TP (0040ndash0100 mg L-1) in the Boston Mountains and Ozark Highlands The geometric mean concentrations at Big Creek upstream and downstream from the CAFO were below these values for the Boston Mountains and Ozark Highlands ecoregion
Nutrient concentrations in Big Creek upstream and down-stream from the CAFO are low with respect to nutrientndashbio-logical response thresholds for algae macroinvertebrates and fish Evans-White et al (2014) reviewed the literature sum-marizing nutrientndashbiological response thresholds across the United Statesbull Algalmetricresponses TN 038ndash179 mg L-1 TP 0011ndash
028 mg L-1
bull Macroinvertebratemetric responses TN 061ndash192 mg L-1 TP 004ndash015 mg L-1
bull Fishmetricresponses TN 054ndash183 mg L-1 TP 006ndash014 mg L-1
Total N concentrations at Big Creek upstream and down-stream of the swine CAFO were well below thresholds that result in some expected biological response whereas TP con-centrations were below thresholds for expected macroinver-tebrate and fish response and on the low end of the range for expected algal response However these lower TP thresholds (0006ndash0026 mg L-1 Stevenson et al 2008) were focused on shifts in diatom species and metrics rather than nuisance algal biomass A recent study on the Illinois River Watershed showed that stream TP thresholds with Cladophora bio-volume and nuisance taxa proportion of biovolume were observed between 0032 and 0058 mg L-1 (Joint Study
Table 1 Minimum detection limits for each chemical and biological constituent
Constituent Analytical methoddagger Minimum detection limitDagger Reporting limitsectSoluble reactive P mg Lminus1 EPA 3652 0002 0010Total P mg Lminus1 APHA 4500-P J EPA 3652 0012 0020NitratendashN mg Lminus1 EPA 3000 0004 0050Total N mg Lminus1 APHA 4500-P J EPA 3532 0006 0050Total suspended solids mg Lminus1 EPA 1602 No detection limit 40
dagger EPA = Approved CWA Chemical Test Methods (USEPA 2017) APHA = American Public Health Association from the WadeableStreamsAssessmentWaterChemistryLaboratoryManual (USEPA 2004)
Dagger The minimum detection limit of an analyte is the value which can be measured and reported with 99 confidence that the analyte concentration is greater than zero Further information is available at USGS (1999)
sect The reporting limit is the least (non-zero) calibrated standard used in analysis or as defined by method for total suspended solids
Page 4 of 6 AGRICULTURAL amp ENVIRONMENTAL LETTERS
Committee 2017) Thus TP concentrations at Big Creek upstream and downstream of the CAFO were in the range in which the natural assemblage of algae is shifting but these con-centrations would likely not be indicative of problematic nuisance algae in this ecoregion
Geometric mean nutrient concentra-tions varied upstream and downstream of the swine CAFO at Big Creek and Kosič et al (2015) used the publicly available data to allude to the N increase being from human activities on the landscape such as the CAFO However the historic land use and how stream nutrient concentrations during base-flow conditions increase with human development within the Boston Mountain and Ozark Highland watersheds need to be considered (eg see Giovannetti et al 2013 Haggard et al 2003 Migliaccio et al 2007) In the Big Creek watershed the percentage of land influenced by human activities (ie pas-ture plus urban) doubles from ~10 to ~20 in the drainage area upstream and downstream of the CAFO Nutrient concentrations in Big Creek upstream and downstream of the CAFO are within the range typical of streams draining simi-lar land uses (Fig 2)
At this time nutrient concentrations in Big Creek upstream and downstream from the swine CAFO are con-sistent with the range in concentrations for other watersheds with similar pasture and urban land use characteristics (Fig 2) as well as less than most nutrient thresholds for nuisance water-quality conditions (Omernik and Griffith 2014) However this does not preclude the possibility that nutri-ent concentrations at Big Creek may increase over time especially if human development and activity in the drain-age areas increase The most important observation is that nutrient concentrations were low in Big Creek providing the ability to detect changes over time
Have Nutrient Concentrations Changed in the Short Term at Big Creek
Understanding that long-term (eg decadal-scale) water-quality data are needed to reliably assess how stream nutri-ent concentrations have changed in response to watershed management and climate variations is of critical importance (Hirsch et al 2015) The literature shows that stream nutri-ent concentrations can change relatively quickly in response to effluent management (eg Haggard 2010 Scott et al 2011) but seeing a response (ie decrease in concentrations) from landscape management can take decades or more (Green et al 2014 Sharpley et al 2013) A myriad of factors may influence observed nutrient concentrations in streams including discharge (Petersen et al 1998) biological pro-cesses and climactic conditions (ie drought and floods Jones and Stanley 2016) and dominant transport pathways (Sharpley et al 2013) Thus we need to use caution when
interpreting trends in water quality over databases that only cover a limited timeframe
Three years of flow-adjusted nutrient concentration data at Big Creek downstream from the swine CAFO (May 2014ndashApril 2017) show different relationships with flow for the various constituentsbull Nitrate-nitrogen was greatest (~05 mg L-1) during the
lowest flows sampled and concentrations decreased with increasing flow
bull Total N generally decreased with increasing flow until a minimal value occurred then TN increased with in-creasing flow
bull Soluble reactive P concentrations did not change much during base-flow conditions and the greater concentra-tions (~0100 mg L-1) sporadically occurred at larger flows indicating that enrichment from stormflow may have been influenced by availability of source or other nontransport factors and
bull Total P concentrations were also relatively stable during base-flow conditions and then increased in association with rainfall-runoff events with only a few samples hav-ing concentrations gt0100 mg L-1 indicating relatively small enrichment from the landscape
Flow-adjusted concentrations (White et al 2004) showed no monotonic (ie increasing or decreasing) trends in SRP TP or TN (P gt 016) over the current monitoring period (Fig 3) However flow-adjusted NO3ndashN concentrations decreased over time (R2 = 005 P = 001) by 7 yr-1 (Fig 3c)
Nutrient concentrations at Big Creek upstream and downstream of the swine CAFO and indeed most tributaries of the Buffalo River are low relative to other watersheds in this ecoregion (Fig 2) This provides a starting point to build a framework to evaluate changes in nutrient concentrations of streams as a function of land use and management The
Fig 2 Relationship between land use and the geometric mean N and P concentrations (mg L-1) in the Buffalo Upper Illinois and Upper White River watersheds (no total P data available for the Buffalo River watershed) Dashed lines represent the 95 confi-dence intervals for the estimated mean (solid line)
AGRICULTURAL amp ENVIRONMENTAL LETTERS Page 5 of 6
evaluation of flow-adjusted concentrations over time showed that nutrients in Big Creek were not increasing over the short duration of monitoring for which concentration and dis-charge data were available (May 2014ndashApril 2017) At this point in time (April 2014ndashApril 2017) it is evident that nutrient concentra-tions in Big Creek have not increased at the monitored site However flow and nutri-ent concentration data over a longer period are needed to reliably quantify water-quality trends and characterize sources and moni-toring needs to continue for at least a decade to evaluate how discharge season and time influence nutrient fluxes (Hirsch et al 2010)
This research details a process by which regional monitoring networks can be devel-oped to establish baseline in-stream nutri-ent concentrations and by which time andor land use and management impacts can be determined
AcknowledgmentsFunding for the Big Creek Research and Extension Team (BCRET) to undertake the on-going monitoring project was provided by the Arkansas Governorrsquos Office and State Legislature to the University of Arkansas Systemrsquos Division of Agriculture All authors are members of BCRET
ReferencesArkansas Pollution Control and Ecology Commission 2016 Regulation
no 2 Regulations establishing water quality standards for surface wa-ters of the State of Arkansas httpswwwepagovsitesproductionfiles2014-12documentsarwqspdf (accessed 21 Sept 2017)
Buck O DK Niyogi and CR Townsend 2004 Scale-dependence of land use effects on water quality of streams in agricultural catchments En-viron Pollut 130(2)287ndash299 doi101016jenvpol200310018
Dubrovsky NM KR Burow GM Clark JM Gronberg PA Hamilton KJ Hitt DK Mueller and MD Munn 2010 The quality of our na-tionrsquos waters Nutrients in the nationrsquos streams and groundwater 1992ndash2004 USGS Circ 1350 httpwaterusgsgovnawqanutrientspubscirc1350 (accessed 21 Sept 2017)
Evans-White MA BE Haggard and JT Scott 2014 A review of stream nutrient criteria development in the United States J Environ Qual 421002ndash1014 doi102134jeq20120491
Gesch D M Oimoen S Greenlee C Nelson M Steuck and D Tyler 2002 The national elevation dataset Photogramm Eng Remote Sens 68(1)5ndash11 httpsnationalmapgovPERS_Jan2002_NED_highlight_articlepdf
Giovannetti J LB Massey BE Haggard and RA Morgan 2013 Land use effects on stream nutrients at Beaver Lake watershed J Am Water Works Assoc 105E1ndashE10 doi105942jawwa20131050005
Green CT BA Bekins SJ Kalkhoff RM Hirsch L Liao and KK Barnes 2014 Decadal surface water quality trends under variable cli-mate land use and hydrogeochemical setting in Iowa USA Water Resour Res 502425ndash2443 doi1010022013WR014829
Haggard BE 2010 Phosphorus concentrations loads and sources within the Illinois River drainage area northwest Arkansas 1997ndash2008 J En-viron Qual 392113ndash2120 doi102134jeq20100049
Haggard BE PA Moore Jr I Chaubey and EH Stanley 2003 Nitrogen and phosphorus concentrations and export from an Ozark Plateau catchment in the United States Biosyst Eng 86(1)75ndash85 doi101016S1537-5110(03)00100-4
Haggard BE AN Sharpley L Massey and K Teague 2010 Final report to the Illinois River Watershed Partnership Recommended watershed based strategy for the Upper Illinois River Watershed Northwest Ar-kansas Arkansas Technical Publication Number MSC 355 Water Re-sources Center University of Arkansas httparkansas-water-centeruarkedupublicationsmscMSC355pdf (accessed 21 Sept 2017)
Hirsch RM SA Archfield and LA De Cicco 2015 A bootstrap method for estimating uncertainty of water quality trends Environ Model Softw 73148ndash166 doi101016jenvsoft201507017
Hirsch RM DL Moyer and SA Archfield 2010 Weighted regres-sion on time discharge and season (WRTOS) with an application to the Chesapeake Bay River inputs J Am Water Resour Assoc 46(5)857ndash880
Joint Study Committee 2017 Final report to governors from the Joint Study Committee and Scientific Professionals 19 Dec 2016 Arkansas-Oklahoma Joint Study Committee httpswwwokgovconservationdocumentsIR202016121920Final20Reportpdf (accessed 21 Sept 2017)
Jones JB and EH Stanley 2016 Stream ecosystems in a changing envi-ronment Academic Press Amsterdam
Kosič K CL Bitting JV Brahana and CJ Bitting 2015 Proposals for integrating karst aquifer evaluation methodologies into national en-vironmental legislations Case study of a concentrated animal feed-ing operation in Big Creek basin and Buffalo National River water-shed Arkansas USA Sustain Water Resour Manage 1363ndash374 doi101007s40899-015-0032-5
McCarty JA and BE Haggard 2016 Can we manage nonpoint-source pollution using nutrient concentrations during seasonal baseflow Ag-ric Environ Lett 1160015 doi102134ael2016030015
Migliaccio KW BE Haggard I Chaubey and MD Matlock 2007 Linking watershed subbasin characteristics to water quality param-eters in War Eagle Creek watershed Trans ASAE 50(6)2007ndash2016 doi1013031201324104
Omernik JM and GE Griffith 2014 Ecoregions of the conterminous United States Evolution of a hierarchical spatial framework Environ Manage 54(6)1249ndash1266 doi101007s00267-014-0364-1
Petersen JC JC Adamski RW Bell JV Davis SR Femmer DA Freiwald and RL Joseph 1998 Water quality in the Ozark Plateaus Arkansas Kansas Missouri and Oklahoma 1992ndash95 USGS Circ 1158 USGS Fort Collins CO httpspubsusgsgovcirccirc1158circ1158pdf (accessed 21 Sept 2017)
Rebich RA NA Houston SV Mize DK Pearson PB Ging and CE Hornig 2011 Sources and delivery of nutrients to the northwestern Gulf of Mexico from streams in the south-central United States J Am Water Resour Assoc 47(5)1061ndash1086 doi101111j1752-1688201100583x
Reckhow KH PE Norris RJ Budell DM Di Toro JN Galloway H Greening AN Sharpley A Shirmhhammadi and PE Stacey 2011 Achieving nutrient and sediment reduction goals in the Chesapeake Bay An evaluation of program strategies and implementation Na-tional Academies Press Washington DC
Fig 3 Flow-adjusted concentration of (a) soluble reactive P (b) total P (c) nitrate-N and (d) total N over time since January 2014 when monitoring in Big Creek started
Page 6 of 6 AGRICULTURAL amp ENVIRONMENTAL LETTERS
Scavia D JD Allan KK Arend S Bartell D Beletsky NS Bosch SB Brandt RD Briland I Daloglu JV DePinto DM Dolan MA Evans TM Farmer D Goto H Han TO Hoeoek R Knight SA Ludsin D Mason AM Michalak RP Richards JJ Roberts DK Rucinski E Rutherford DJ Schwab TM Sesterhenn H Zhang and Y Zhou 2014 Assessing and addressing the re-eutrophication of Lake Erie Central basin hypoxia J Great Lakes Res 40226ndash246 doi101016jjglr201402004
Scott JT BE Haggard AN Sharpley and JJ Romeis 2011 Change point analysis of phosphorus trends in the Illinois River (Oklahoma) demonstrates the effects of watershed management J Environ Qual 401249ndash1256 doi102134jeq20100476
Sharpley AN HP Jarvie A Buda L May B Spears and P Kleinman 2013 Phosphorus legacy Overcoming the effects of past management practices to mitigate future water quality impairment J Environ Qual 421308ndash1326 doi102134jeq2013030098
Stevenson RJ Y Pan KM Manoylov CA Parker DP Larsen and AT Herlihy 2008 Development of diatom indicators of ecological con-ditions for streams of the western US J North Am Benthol Soc 271000ndash1016 doi10189908-0401
USEPA 2004 Wadeable streams assessment water chemistry laboratory manual USEPA Office of Water and Office of Research and Develop-ment Washington DC
USEPA 2017 Approved CWA chemical test methods USE-PA Washington DC httpswwwepagovcwa-methodsapproved-cwa-chemical-test-methodsnumber
USGS 1999 The method detection limit procedure of the US Environmen-tal Protection Agency In New reporting procedures based on long-term method detection levels and some considerations for interpre-tations of water-quality data provided by the US Geological Survey National Water Quality Laboratory Open File Rep 99-103 USGS Reston VA httpswaterusgsgovowqOFR_99-193detectionhtml
USGS 2015 National elevation dataset httpsltacrusgsgovNEDUSGS 2017a National hydrologic dataset httpsnhdusgsgovUSGS 2017b National land cover dataset httpscatalogdatagovdataset
usgs-national-land-cover-dataset-nlcd-downloadable-data-collectionWhite KL BE Haggard and I Chaubey 2004 Water quality at the Buffalo
National River Arkansas 1991ndash2001 Trans ASAE 47(2)407ndash417 doi1013031201316042
Sampling Liquid Manure
Karl VanDevender PhD PE Professor Extension Engineer
Liquid animal manure sampling can be an important management tool Proper sampling provides the producer with nutrient analysis results that can be used in a sound farm fertilization program Nutrient analysis of manure in conjunction with soil sampling helps determine how much manure should be applied to fields to maintain adequate fertility while minimizing potential environmental problems such as ground and surface water pollution However manure applications should not exceed the maximum application rates in a manure management plan until sufficient data can be collected to justify revising the plan
When to Sample Liquid animal manure should be sampled for nutrient analysis as close to land application time as possible This helps ensure that the reported nutrient content accurately reflects what is being applied to the land If the manure is sampled as it is being land applied the results will not be available to govern present application rates It does however provide information for future land applications of animal manure if the manure management remains fairly constant over time
How to Collect a Liquid Manure Sample During Land Application The easiest way to collect liquid animal manure samples is to collect the manure as it is being land applied This approach ensures what is sample reflects what is applied Randomly place catch pans in the field to collect the liquid manure as it is land applied by an irrigation system or honey wagon Flexible rubber feed pans work well Immediately after the manure has been applied collect the manure from the catch pans combine in a bucket to make one composite sample and mix well by stirring This bucket will be the source of the manure sent for analysis From a Storage Facility If collecting liquid animal manure samples during land application is not possible collect the samples from the storage facility Liquid animal manure storage facilities have a tendency for the manure to stratify with the solids settling to the bottom and the liquids remaining on top It is also not uncommon for some solids to form a floating crust This stratification affects the manure nutrient concentrations in the storage facility The nitrogen and potassium will be more concentrated in the top liquid while the phosphorus will be more concentrated in the settled solids This stratification of nutrient concentrations increases the challenge of getting samples that represent what will be applied to a particular field If the liquids from the top and middle of the profile will be applied only this material should be sampled If the settled solids will be applied then they should be sampled However if the manure is to be agitated before pumping as has been the traditional recommendation the sample should contain representative proportions of manure from the top middle and bottom The idea is to collect a sample of an entire column of manure to represent the manure after agitation If agitating the manure prior to sampling is not possible an alternative approach is to make a sampler to collect the required sub-samples The sub-samples are then mixed to represent the manure after agitation The easiest to construct is simply a container such as a cup attached to the end of a pole Liquids from the manure surface can be simply scooped up To collect liquids from the middle depths or settled solids the container is held up side down trapping air until the desired sampling depth is reached Then the container is rotated releasing the air and collecting the sample When collecting a sample of the entire profile of the manure sub-samples are collected and mixed in a bucket
- over -
A sampler design that automatically collects a sample of the entire profile uses 10 foot 1 frac12 inch PVC pipe with a PVC ball valve at the bottom The handle of the ball valve is replaces with a lever arm about 2 feet long The free end of the lever arm is attached to the end of a 10 foot 1 inch PVC pipe The lever arm and smaller pipe allow the ball valve to be operated while holding to top of the sampler To use the sampler the valve is opened and the sampler is inserted (in a line not and arc) into the manure When the foot of the valve is at the bottom of the settled solids it is closed Then the sample of the entire manure profile can be removed from the manure and placed in a bucket
Sketch of Cup Sampler Sketch of Foot Valve Sampler
Whichever sampler is used at least 8 locations around the manure storage unit should be sampled and mixed in a bucket to serve as a final composite sample This bucket will be the source of the manure sent for analysis
Getting the Sample Analyzed After thoroughly mixing the final composite sample fill a one liter plastic bottle half full These bottles may be obtained from your county Extension office Never fill the bottle more than half full to allow for gas expansion of the sample and to prevent the bottle from exploding Keep the samples as cool as possible until you can take them to your county Extensions office for shipping to the University of Arkansas lab for analysis There you will get assistance in filling out an information sheet on your manure sample There is a fee to have the sample analyzed While the sample can be sent to a private lab the fees are often higher If you are required by the Arkansas Department of Environmental Equality (ADEQ) to sample your liquid animal manure as part of your Regulation No 5 permit make sure that you inform the individual helping you with the paperwork so the correct set of analyses can be performed In addition to the analyses to determine the fertilizer value of manure it is recommended to analyze for the amount of phosphorus in the manure that is water soluble Water soluble phosphorus is needed to evaluate the potential environmental risk associated with phosphorus application rates specified in manure management plans Having good farm based information should help planners develop plans tailored to and individual farm
Key Points to Remember The important things to remember in collecting a liquid animal manure sample are Collect a sample that best represents the nutrient content of the manure in that storage facility and what
will be applied If only the top water is to be applied it should be sampled If the storage unit will be agitated prior to application the sample should contain material from the entire depth profile
Only fill the sample bottle frac12 full Keep the sample cool prior to shipping Ship the sample to the lab as soon as possible
Handout April 27 2010
The Arkansas Cooperative Extension Service offers its programs to all eligible persons regardless of race color national origin religion
gender age disability marital or veteran status or any other legally protected status and is an Equal Opportunity Employer
- 2015_Bacteria Trends in Flowing Waterspdf
-
- E COLI IN FLOWING WATERS
-

Page 6 of 6 AGRICULTURAL amp ENVIRONMENTAL LETTERS
Schoumans OF 2009 Determination of the degree of phosphate satura-tion in noncalcareous soils In JL Kovar and GM Pierzynski editors Methods for phosphorus analysis for soils sediments residuals and water 2nd ed SERA 17 Bull 408 Virginia Tech Blacksburg VA p 29ndash 32
Self-Davis ML PA Moore Jr and BC Joern 2009 Water- or dilute salt-extractable phosphorus in soil In JL Kovar and GM Pierzynski edi-tors Methods for phosphorus analysis for soils sediments residuals and water 2nd ed SERA 17 Bull 408 Virginia Tech Blacksburg VA p 22ndash 24
Sharpley AN 1995 Dependence of runoff phosphorus on extract-able soil phosphorus J Environ Qual 24920ndash926 doi102134jeq199500472425002400050020x
Sheppard SC MI Sheppard J Long B Sanipelli and J Tait 2006 Runoff phosphorus retention in vegetative field margins on flat landscapes Can J Soil Sci 86(5)871ndash884 doi104141S05-072
Tabatabai MA 1994 Soil enzymes In RW Weaver S Angl P Bottomley D Bezdicek S Smith and MA Tabatabai editors Methods of soil analysis Part 2 Microbiology and biological properties SSSA Madi-son WI p 775ndash833
Tomlinson PJ MC Savin and PA Moore Jr 2008 Phosphatase activities in soil after repeated untreated and alum-treated poultry litter appli-cations Biol Fertil Soils 44613ndash622 doi101007s00374-007-0245-3
Turner BL and PM Haygarth 2001 Biogeochemistry Phosphorus solu-bilization in rewetted soils Nature 411258 doi10103835077146
Vance ED PC Brookes and DS Jenkinson 1987 An extraction method for measuring soil microbial biomass C Soil Biol Biochem 19703ndash707 doi1010160038-0717(87)90052-6
Watanabe FS and SR Olsen 1965 Test of an ascorbic acid meth-od for determining phosphorus in water and NaHCO3 ex-tracts from soil Soil Sci Soc Am J 29677ndash678 doi102136sssaj196503615995002900060025x
Phosphorus Retention and Remobilization along HydrologicalPathways in Karst TerrainHelen P Jarviedagger Andrew N SharpleyDagger Van Brahanasect Tarra SimmonsDagger April PriceDagger Colin Nealdagger
Alan J Lawlor∥ Darren Sleep∥ Sarah Thacker∥ and Brian E Haggardperp
daggerCentre for Ecology amp Hydrology Wallingford OX10 8BB UKDaggerDepartment of Crop Soil amp Environmental Sciences Division of Agriculture University of Arkansas Fayetteville Arkansas 72701United StatessectDepartment of Geosciences University of Arkansas Fayetteville Arkansas 72701 United States∥Centre for Ecology amp Hydrology Lancaster LA1 4YQ UKperpArkansas Water Resources Center University of Arkansas Fayetteville Arkansas 72701 United States
S Supporting Information
ABSTRACT Karst landscapes are often perceived as highly vulnerable toagricultural phosphorus (P) loss via solution-enlarged conduits that bypass Pretention processes Although attenuation of P concentrations has been widelyreported within karst drainage the extent to which this results from hydrologicaldilution rather than P retention is poorly understood This is of strategicimportance for understanding the resilience of karst landscapes to P inputs givenincreasing pressures for intensified agricultural production Here hydrochemicaltracers were used to account for dilution of P and to quantify net P retentionalong transport pathways between agricultural fields and emergent springs for thekarst of the Ozark Plateau midcontinent USA Up to sim70 of the annual total Pflux and sim90 of the annual soluble reactive P flux was retained with preferentialretention of the most bioavailable (soluble reactive) P fractions Our resultssuggest that in some cases karst drainage may provide a greater P sink thanpreviously considered However the subsequent remobilization and release of the retained P may become a long-term source ofslowly released ldquolegacyrdquo P to surface waters
INTRODUCTION
More than 25 of the worldrsquos population either lives on orobtains its drinking water from karst aquifers Karst underlies30 of the land area of China 30 of Europe and 20 of theUnited States12 Karst aquifers exert an important control on thequality and ecology of surface waters in these areas3 Thecomplexity of subsurface drainage45 and the difficulties indeconvoluting flow pathways and groundwater contributingareas6 have been a significant barrier to detailed studies ofnutrient transport and fate in karst systems78 Nevertheless it iswidely assumed that karst drainage systems (formed bydissolution of carbonate rocks mainly limestone) are highlyvulnerable to phosphorus (P) impairment from agriculturalsourcesThis vulnerability is assumed to arise from the low nutrient
buffering capacity of the thin cherty soils which overlie karst andthe rapid transmission of surface runoff through conduitsenlarged by dissolution910 which is thought to bypass thezones where key processes of P retention occur11minus13 Nonethe-less highly intensive monitoring of Irish karst springs in areas oflivestock demonstrated major P attenuation (reduction in Pconcentrations) relative to agricultural runoff1415 with low Pconcentrations in spring discharge even during storm events
when agricultural P losses are expected to be highest Thisattenuation was attributed to a combination of both hydrologicaldilution and P retention during infiltration and transmission ofrunoff along groundwater conduit pathwaysCrucially we lack information on the extent to which P
attenuation is controlled by P retention processes during transitalong karst flow paths14 or by hydrological dilution ofagricultural runoff by cleaner groundwater sources16 This is ofstrategic importance for understanding the P buffering capacityand wider resilience of karst landscapes to nutrient inputs101718
Many karst lands have traditionally been used for low-intensitylivestock farming owing to poor soils and their unsuitability forarable production9 However there is increasing pressure forintensive livestock production as global demands for greaterefficiency in food production intensify1920 Given the movetoward more intensive livestock production systems whichaccumulate P2122 and the perceived vulnerability of karstdrainage systems to P loss there is now a pressing and strategic
Received December 14 2013Revised March 17 2014Accepted March 17 2014
Article
pubsacsorgest
copy XXXX American Chemical Society A dxdoiorg101021es405585b | Environ Sci Technol XXXX XXX XXXminusXXX
need for better understanding of the fate and transport of P inkarst landscapes Here this shortfall is addressed for karst terrainin south-central USA Hydrochemical tracers and endmembermixing analysis23minus26 were used to assess the vulnerability to Ploss by accounting for the hydrological dilution of agriculturalrunoff and directly quantifying net P retention during infiltrationthrough the soil and along karst transport pathways through tothe emergent springs
EXPERIMENTAL METHODS
Study Area The study was undertaken at the University ofArkansas long-term Savoy Experimental Watershed (SEW) NWArkansas USA27 The SEW is located in the Illinois RiverWatershed a mixed land-use watershed (sim4330 km2) whichspans the states of Arkansas and Oklahoma2829 The SEW covers1250 ha and is typical of the karst terrain of the Ozark Plateau ofmidcontinental USA (Figure SI-1a Supporting Information)The soils of the SEW are predominantly silt loams (seeSupporting Information) Around 70 of the land is nativeforest with the remaining 30 rolling pasture grazed by beefcattle (sim2 cows haminus1) The SEW also supports poultryproduction with the resulting poultry litter used to fertilizepastures There are no septic tanks or settlements in the SEWand agricultural runoff from pastures grazed by cattle providesthe overwhelmingly dominant P source in the watershed30
The stratigraphy of the SEW30minus32 (see Figure SI-1cSupporting Information) includes (a) the limestone aquifer ofthe St Joe Formation (b) the Boone Formation an impurelimestone which mantles the St Joe Formation and formsldquoepikarstrdquo and (c) a layer of regolith (vadose zone) whichoverlies the Boone Formation Karst drainage has a major controlon water quality in the Illinois River2933 67 of annual river flowcomes from karst springs rising to 80 of flow in the summerand fall34
Sample Collection and Analysis Surface runoff andspring-water chemistry and flow monitoring (Figure SI-1a andc Supporting Information) were undertaken at the following(1) two adjacent karst springs (Langle Spring LLS andCopperhead Spring CHS) which flow continually from the StJoe Formation (focused conduit flow) springs (2) two surfacerunoff field plots (Langle LL 107 ha and Copperhead CH 105ha) which are located above and within the watershed (rechargezone) of the LLS andCHS springs These runoff plots are locatedon Razort silt loams which make up most of the grazed pasturesof the SEW All pastures are treated similarly in terms of grazing
intensity and maintenance fertilizer applications (30 kg P haminus1
every two years as either poultry litter or diammoniumphosphate)Flows at the karst springs (LLS and CHS) were monitored on
15-min intervals (see Supporting Information) Karst springwater was sampled weekly with stage-triggered subdailyautomated sampling using an ISCO sampler during stormevents Figure SI-2 (Supporting Information) shows thedistribution of samples collected on the rising and falling stageof the storm hydrographs The volume of surface runoff fromboth fields was automatically measured and samples werecollected on a flow-weighted basis by an ISCO autosampler Allwater samples were filtered within 24 h of the water beingsampled and were analyzed following EPA standard protocols asdescribed below (and in the Supporting Information) Filtered(lt045 μm) samples were analyzed for soluble reactivephosphorus (SRP) by colorimetric analysis35 and for a fullsuite of major cations (including potassium K and calcium Ca)and trace elements (including lanthanum La and rubidium Rb)(see Supporting Information) Unfiltered samples were analyzedfor total phosphorus (TP) after acid-persulfate digestion bycolorimetric analysis3536 These measurements are consistentwith standard protocols for TP and SRP analysis37
Use of Conservative Tracers and Endmember MixingAnalysisConservative chemical tracers and endmember mixingmodels were used to apportion water sources and to differentiatethe effects of hydrological dilution from the biogeochemicalprocesses which retain and cycle P during transit through thekarst drainage system Chemical tracers have been widely used inwatershed hydrology for tracing water sources and flowpathways38 owing to their conservative behavior (chemicalinertness) Here we made use of chemical tracers already in thewatershed to apportion water sources Using the hydrochemicalmonitoring data tracers were chosen which had elevatedconcentrations in either base flow groundwater or in agriculturalrunoff First two-component endmember mixing models2339
were used to link the spring-water chemistry to sources withinthe watershed by (a) quantifying the relative proportions ofsurface runoff and groundwater and (b) estimating thecontribution of surface runoff from the agricultural grazed landSecond comparing the mixing patterns of P in spring water witha conservative tracer of agricultural runoff allowed us to directlyevaluate whether P was behaving nonconservatively (ie beingtaken up or released) along the hydrological pathways in the karstdrainage system
Table 1 Summary of Concentrations of Soluble Reactive Phosphorus (SRP) Total Phosphorus (TP) Potassium (K) Rubidium(Rb) and Calcium (Ca) in Field Runoff and Spring-Water Samples
field runoff (m3 ha‑1)spring flow (L s‑1)
SRP(mg Lminus1)
TP(mg Lminus1)
Rb(μg Lminus1)
K(mg Lminus1)
Ca(mg Lminus1)
Langle Field mean 380 221 257 697 104 512(LL) median 355 187 212 596 102 494
range 34minus915 059minus502 08minus553 093minus206 204minus263 211minus987Copperhead Field mean 231 068 109 294 611 345(CH) median 146 057 103 252 511 343
range 18minus799 047minus122 063minus191 058minus876 14minus147 195minus734Langle Spring mean 131 0029 0057 106 154 375(LLS) median 938 0012 0034 0878 114 367
range 124minus59 0minus0403 0002minus0608 0195minus357 0534minus492 122minus659Copperhead Spring mean 225 0019 0041 108 137 405(CHS) median 262 0017 0032 11 14 429
range 019minus253 0001minus012 0minus058 0328minus19 084minus217 145minus615
Environmental Science amp Technology Article
dxdoiorg101021es405585b | Environ Sci Technol XXXX XXX XXXminusXXXB
RESULTS AND DISCUSSION
Comparison of Agricultural Runoff and Spring-WaterChemistry Concentrations of TP SRP K and Rb wereconsistently highest in field runoff relative to the springs (Table1) and runoff from the grazed fields provides the greatestconcentrations of P K and Rb within the SEW In contrast Caconcentrations were consistently highest in the springscompared with runoff This indicates a dominant base flowgroundwater source of Ca from dissolution of limestone whichis diluted by surface runoff (Figure 1a)Concentrations of SRP TP K and Rb were all higher in field
runoff at LL compared with CH This likely reflects higher cattlegrazing density at LL (25 cows haminus1) than at CH (10 cowshaminus1) as well as higher runoff per unit area that likely led togreater solute and particulate entrainment and transport capacitycompared with CH This may also reflect a larger hydrologicallyactive area contributing runoff at LL linked to greater soilcompaction from more intensive cattle grazingFor the springs there was a greater variability in SRP TP K
and Rb concentrations at LLS than at CHS despite a much lowervariability in spring flow at LLS (Table 1) Howeverconcentrations of TP SRP K and Rb did not correlate withflow at either of the springs For most storm events at LLSconcentrations of TP SRP K and Rb increased dramatically
above base flow concentrations especially on the rising stage ofthe storm hydrograph (Figure SI-2 Supporting Information)These high concentrations on the rising stage are likely due toupstream point recharge of surface runoff from pasture land intothe underlying St Joe aquifer in locations where the confiningchert layer is breached At CHS the response of TP SRP K andRb to storm events was more mixed Small initial increases inconcentration occurred with the onset of higher flows followedby marked reductions in concentration reflecting substantialdilution by a water source with relatively low SRP TP K and Rbconcentrations most likely from the nonagricultural (ungrazedand forested) parts of the watershed Indeed karst inventorieshave verified that this part of the flow regime reflects runoff fromareas which are not grazed by livestock3031
To evaluate the attenuation (ie the reductions inconcentrations) of TP SRP K and Rb during transit throughthe karst the median concentrations in agricultural runoff werecompared with the corresponding median concentrations inCHS and LLS springs (Table 1) The average attenuation of TPand SRP concentrations ranged from 96 to 99 In contrastthe average attenuation of K and Rb concentrations was lower at56 to 89 Correspondingly under storm flow conditionscomparisons of average field runoff concentrations and the 90thpercentile concentrations in spring water (which typicallycorrespond with the rising stage of the storm hydrographs of
Figure 1 (a) Relationships between calcium (Ca) concentrations and flow at Langle and Copperhead springs (b) Relationship between rubidium (Rb)and potassium (K) concentrations in field runoff and spring-water samples
Environmental Science amp Technology Article
dxdoiorg101021es405585b | Environ Sci Technol XXXX XXX XXXminusXXXC
the springs) revealed that storm flow attenuation of TP and SRPranged from 93 to 96 compared with 46 to 74 for K andRb Across all flow conditions the higher rates of attenuation of Pconcentrations relative to K and Rb reflect the nonconservativebehavior of P during transit through the karstK and Rb show high correlation (Figure 1b) due to their
similar hydrogeochemistry (group 1a monovalent base cations ofrelatively small hydration size) Figure 1b shows a dominant two-component mixing series between a high concentrationldquoendmemberrdquo (ie surface runoff from fertilizer and grazedpastures in runoff) and a low concentration spring-waterldquoendmemberrdquo (ie runoff from nonagricultural and forestedareas which have no grazing or fertilizer inputs) Both K and Rbare highly soluble monovalent ions and once transmitted intothe karst drainage system chemical interactions will be relativelysmall Therefore the attenuation of K and Rb during transportthrough the karst will be largely controlled by hydrologicaldilution without retention mechanisms (with only possibly asmall attenuation or release within the epikarst where there is ahigh proportion of clays3140) In contrast P behaves non-conservatively reflected by the higher rates of attenuation of Prelative to K and RbSpring Hydrology and Water-Source Apportionment
Comparing the hydrology of the two springs (Figure 2) base
flows at CHS were consistently lower than at LLS the medianflow at CHS was 262 L sminus1 compared with 131 L sminus1 at LLS(Table 1) Further CHS exhibited a more flashy flow regimethan LLS and storm flows were dramatically higher at CHS Forinstance the average of the highest 10 of flows was 139 L sminus1 atCHS compared with 40 L sminus1 at LLS This discrepancy reflectsthe following (i) LLS being the ldquounderflowrdquo spring (3 cm lowerthan CHS) with a much larger groundwater drainage area underlow-flow conditions than CHS which accounts for the higherbase flows at LLS (ii) water capture (spring ldquopiracyrdquo) by CHSduring storm events which has been shown to result in adramatic expansion in the watershed drainage area for CHSrelative to LLS3233
Contributions to spring water at LLS and CHS wereapportioned by two-component endmember mixing analy-sis2341 Here Ca was used as a tracer of groundwater and K asa tracer of agricultural runoff based on the observed dominantgroundwater source of Ca and the dominant agricultural runoffsource of K For the mixing model endmembers were defined asthe following
(i) A base flow groundwater endmember with elevated Caand a storm flow endmember with low Ca concentrations
(ii) Runoff endmember from agricultural land with high Kconcentration and a spring base flow low K endmember
Figure 2 Hydrographs and water source apportionment for Langle and Copperhead springs
Environmental Science amp Technology Article
dxdoiorg101021es405585b | Environ Sci Technol XXXX XXX XXXminusXXXD
Applying a simple two-component mixing model2341 (eq 1)and the endmembers identified above Ca concentrations wereused to partition the contributions to spring flow at LLS andCHS from base flow groundwater (the high concentrationendmember) and from stormwater runoff (the low concen-tration endmember) Then a second two-component mixingmodel was used for K to quantify the contributions from grazedpasture runoff (eq 2)
= times minus minus total storm runoff
100 (Ca Ca )(Ca Ca )gw m gw ro (1)
= times minus minus
agricultural runoff
100 (K K )(K K )bf m bf ag (2)
where Cagw was the groundwater Ca concentration (highconcentration base flow endmember) defined here as theaverage Ca concentration for the lowest 10 of flows sampledCam was the measured spring-water Ca concentration Caro wasthe stormwater (agricultural runoff) endmember defined here asthe average field runoff Ca concentration Kbf was the base flowendmember (average K concentration for the lowest 10 of
spring flows sampled) Km was the measured spring-water Kconcentration and Kag was the agricultural runoff endmemberdefined here as the average field runoff K concentration Thevalues used to define the endmember concentrations at LLS andCHS are shown in Table SI-1 Supporting InformationThe water source apportionment for LLS and CHS (Figure 2)
showed similar percentage contributions from base flowgroundwater and total storm flow at LLS and CHS for most ofthe year and particularly during storm events During winter andspring storm events a much greater proportion of flow at LLSwas derived from agricultural (grazed field) runoff (up toapproximately a third of flow) This greater contribution of waterfrom pastures than from nonagricultural land at LLS accountedfor the higher storm-event concentrations of K and Rb at LLSAgricultural runoff contributed a much lower proportion ofwinter and spring storm event flow at CHS (typically less than10) These results and the much higher storm flow dischargesat CHS suggest that the water ldquopiracyrdquo at CHS during stormevents captured water sources which had a lower K and Rbconcentration from the nonagricultural (ungrazed and forested)areas
Figure 3 Relationships between total phosphorus (TP) soluble reactive phosphorus (SRP) and potassium (K) for (a) Langle Spring and (b)Copperhead Spring The dashed line denotes the conservative mixing line and the solid line denotes a line of maximum P retention (see text forexplanation)
Environmental Science amp Technology Article
dxdoiorg101021es405585b | Environ Sci Technol XXXX XXX XXXminusXXXE
Quantifying Net P Retention in Karst DrainageEndmember mixing analysis23minus26 was applied using theldquoconservativerdquo tracer K to explore the net P retention andrelease along karst hydrological pathways from infiltrationthrough the soil to spring discharge First concentrations ofTP and SRP were plotted against K as the ldquoconservativerdquo tracer(Figure 3) Two dominant and distinct sources of spring water(both with different TP SRP and K concentrations) arehypothesized (Table SI-1 Supporting Information) (i) a highconcentration agricultural endmember source (Kag TPag SRPag)defined here as the average concentrations (of K TP and SRP)in agricultural field runoff at the LL and CH field plots and (ii) alow concentration (nonagricultural) endmember (Kna TPnaSRPna) As the source of this low concentration runoff couldcome from a wide range of nonagricultural sources (ungrazedand forest land) across the watershed the most reliable means ofcapturing the integrated low-concentration endmember signalwas to use the minimum measured spring-water K TP and SRPconcentrations at LLS and CHSA theoretical linear two-component mixing series ie a
ldquoconservative mixing linerdquo between the high concentration andlow concentration endmembers (Figure 3) would be observed ifP behaved conservatively during mixing of the two endmemberwater sources during transport through the karst In contrast theobserved relationships between TP and K and SRP and K inspring water were highly scattered at LLS and CHS (Figure 3)Most of the samples plot well below the conservative mixing lineshowing predominantly net retention of TP and SRP relative toK A few isolated samples plotted above the conservative mixingline which are indicative of some sporadic net P release relativeto the K tracer The mixing patterns between TP SRP and Kconcentrations in Figure 3 had a well-defined lower boundary ofsamples with the lowest P concentrations relative to K (shown inFigure 3 as a ldquoline of maximum P retentionrdquo) This line ofmaximum P retention probably represents a secondaryendmember mixing line between the same low concentrationnonagricultural runoff endmember and a secondary agricultural
field runoff endmember with high K but lower P concentrationsas a result of P retention processes filtering out P We posit thatthe majority of this P was ldquofilteredrdquo out during diffuse recharge ofwater as through the soil and the epikarst into the karst aquiferThe spring-water samples which lie between the line ofmaximum retention and the conservative mixing series thereforelikely reflect the net effects of P retention and remobilizationprocesses for runoffwater entering the karst drainage system via amixture of diffuse and point rechargeBy comparing the observed spring-water TP and SRP versus K
relationships with the theoretical linear conservative mixingseries the net effects of P retention and release can be directlyquantified (Figure 3) By applying the theoretical conservativemixing series (TP versus K and SRP versus K) to the measuredspring-water K concentrations at LLS and CHS ldquoconservativerdquoTP and SRP concentration time series were derived (Figure SI-3ab Supporting Information) and converted to loads using thecorresponding spring flow data By taking the difference betweenmeasured and ldquoconservativerdquo TP and SRP loads we calculatednet TP and net SRP retention on an annual basis as well as forbase flows (lowest 10 of flows) and storm flows (highest 10 offlows) (Table 2)Annual net TP retention ranged from 69 at LLS to 54 at
CHS Net percentage P retention was consistently higher forSRP compared with TP not only on an annual basis but alsounder storm and base flow conditions This indicated preferentialretention of more labile SRP fractions by sorptionuptake andgreater mobility of TP organic and particulate P fractions Similarpatterns of soluble and particulate P retention have also beenobserved in other karst soils and drainage systems71113 Highestpercentage net P retention occurred during storm events at LLS(92 TP retention and 96 SRP retention) However the twosprings showed very different patterns in P retention under stormand base flow conditions At LLS net P retention was greatestduring storm flows than under base flow conditions reflecting ahigh efficiency of P retention from agricultural runoff at LLS Incontrast at CHS a greater percentage of the P load was retained
Table 2 Measured and ldquoConservativerdquo Annual Loads and Mean Daily Base Flow and Storm Flow Loads of Total Phosphorus(TP) and Soluble Reactive Phosphorus (SRP) in Langle and Copperhead Springs with Net and Percentage TP and SRP Retention
measured P load(kg yminus1 or g dminus1)
ldquoconservativerdquo P load(kg yminus1 or g dminus1)
net P retention(kg yminus1 or g dminus1) net P retention
Langle Spring(LLS)
annual TP load(kg yminus1)
701 223 153 69
annual SRP load(kg yminus1)
185 190 172 90
Copperhead Spring(CHS)
annual TP load(kg yminus1)
265 57 31 54
annual SRP load(kg yminus1)
098 33 23 70
Langle Spring(LLS)
avg base flow TP load(g dminus1)
103 233 130 56
avg base flow SRP load(g dminus1)
221 198 176 89
Copperhead Spring(CHS)
avg base flow TP load(g dminus1)
127 355 228 64
avg base flow SRP load(g dminus1)
045 214 169 79
Langle Spring(LLS)
avg storm flow TP load(g dminus1)
112 1448 1336 92
avg storm flow SRP load(g dminus1)
514 1240 1189 96
Copperhead Spring(CHS)
avg storm flow TP load(g dminus1)
445 971 527 54
avg storm flow SRP load(g dminus1)
175 567 392 69
Environmental Science amp Technology Article
dxdoiorg101021es405585b | Environ Sci Technol XXXX XXX XXXminusXXXF
under base flow than during storm flow This reflects much lowerbase flows at CHS which increase water residence time andpromote particulate sedimentation and P retention and higherstorm flows linked to stream piracy which provide greaterflushing from nonagricultural areas where flows have a low PconcentrationContaminant Residence Times in Karst DrainageWhile
monitoring P relative to a conservative tracer provides us withvaluable information on rates of annual and storm flowbase flownet retention it provides no information about the residencetimes of P within the karst or the time scales over whichretention and remobilization may occur This is of strategicconcern in relation to the ldquolegacyrdquo of P within watersheds4243
whereby time-lags in release of retained Pmaymask the effects ofconservation measures on receiving water quality By measuringa full suite of trace elements using ICP-MS a ldquoserendipitousrdquoobservation was made which may help provide clues about thewider contaminant residence times within the karst drainageConcentrations of ldquodissolvedrdquo (lt045 μm) lanthanum (La) instorm flow spring discharge at LLS were more than an order ofmagnitude higher than could be accounted for by the runoffsources measured within the SEW Figure 4 shows theconcentrations of La in the spring discharge at LLS and aldquoconservativerdquo (maximum) concentration from runoff whichaccounts for the dilution of agricultural runoff during transitthrough the karst drainage using K as a tracer The high stormflow La concentrations observed at LLS are likely a ldquolegacyrdquosignal from a past tracer experiment In 2001 lanthanum-labeledmontmorillonite clays were injected into a losing stream at SEWas part of a study to examine clay and bacterial transport44
While the La tracer was detected at LLS around 16 h after itwas injected44 our monitoring suggests the La tracer was alsoretained within the karst drainage system and continues to beremobilized and released during storm events more than 10 yearslater Unfortunately it is impossible to perform a mass balance toquantify how much of the La applied in the tracer study remainswithin the karst drainage system and how long a La ldquolegacyrdquomight persist as no La measurements were made in the
intervening 10 years between the tracer injection in 2001 and ourmonitoring which started in November 2011 Within the scopeof this study it was also not possible to determine whether the Laconcentrations measured were truly dissolved or a lt045 μmcolloidalclay fraction or whether La geochemistry is sufficientlysimilar to be used as an indicator of P transport However theseresults indicate that La a tracer expected to be flushed rapidlythrough the karst was retained and continues to be remobilizedand released during storm events more than 10 years later Thisindicates the potential for contaminant retention in thesubsurface karst drainage system where contaminant storageand gradual rerelease may occur over time scales of at least adecade
Wider Implications Hydrochemical tracers of agriculturalrunoff allowed us to directly evaluate the nonconservativebehavior of P within karst drainage and quantify net P retentionOur results challenge the widely held assumption that karstlandscapes are always highly vulnerable to P loss and suggest thatin some cases karst drainage may provide a greater sink for Pthan previously considered P from agricultural runoff wasattenuated by hydrological dilution from cleaner (nonagricul-tural) sources during transport through karst drainage Howeverthere was also a high capacity for net P retention especially forLangle Spring which was subject to the highest agricultural Ploadings Here sim70 of the annual TP flux and sim90 of theannual SRP flux was retained Moreover the buffering within thesoils and karst drainage not only retained a high proportion ofincoming fluxes of P from agricultural runoff but preferentiallyretained the most bioavailable P fractions For instance muchresearch has documented the capacity of soil to retain applied Pin various inorganic (Al Fe Ca complexes) and organic forms ofvarying stability4546 The long-term accumulation of P in soilhowever can be released slowly to soil water2847
The mechanisms of P retention were not investigated here butlikely include varying combinations of processes includingadsorption onto clays coprecipitation of P with CaCO3 andbinding with particulate humic substances11minus13 in the soil inepikarst and within the fractures and conduits These adsorption
Figure 4 Time series of measured and ldquoconservativerdquo lanthanum (La) concentrations and flow at Langle spring Measured La concentrations aredenoted by solid circles ldquoconservativerdquo La concentrations are denoted by open circles See text for explanation of how ldquoconservativerdquo La concentrationswere calculated
Environmental Science amp Technology Article
dxdoiorg101021es405585b | Environ Sci Technol XXXX XXX XXXminusXXXG
products and precipitates will be physically retained as the watervelocity slows and will be deposited as sediment along the base ofthe conduit flow paths With the recurrence of high flow thesesediments are resuspended by turbulent flow and moved alongthe flow path until redeposited or eventually resurged at thebase-level spring Given the potential importance of CaCO3minusPcoprecipitation for P retention in karst terrain and the possibilityof reductions in the efficiency of this coprecipitation mechanismunder higher P and dissolved organic carbon (DOC)concentrations124849 further work is needed to examine anyunforeseen impacts of increasing agricultural intensification onthis ldquoself-cleansingrdquo P retention mechanism However in thisstudy the site with the higher livestock intensity and with highermanure-enriched runoff actually demonstrated greater efficiencyof P retention This may indicate that critical P and DOCthresholds for inhibition of CaCO3 precipitation were notreached or that other P retention process mechanisms wereoccurringThe patterns in spring-water La concentrations suggest
continued released of La from springs more than 10 years aftera tracer injection and indicate the potential for long-termcontaminant retention storage and subsequent release Indeedthe complex nature of karst hydrological pathways can result inlarge distributions in water and contaminant residence times andlag times for discharge to surface waters may bemuch longer thanexpected50minus52 Our findings indicate that retention of P withinkarst drainage may reduce the risk of acute episodic storm-drivenlosses of agricultural P However the potential buffering of P inthe epikarst and within the fracture and conduit drainage systemcan provide a slow but long-term source of P released via springsto surface waters Further work is needed to determine theecological impacts of such patterns of P release to receivingstreams and the ability of those streams to assimilate thoseinputs compared with higher pulse inputs during storm flows
ASSOCIATED CONTENT
S Supporting InformationMap of the SEW and the karst water flow system time series ofspring-water TP SRP K and Rb concentrations table of Ca TPand SRP endmember concentrations soils and geology of theSavoy Experimental Watershed experimental methods Thismaterial is available free of charge via the Internet at httppubsacsorg
AUTHOR INFORMATION
Corresponding AuthorPhone ++44 (0)1491 838800 Fax ++44 (0)1491692424 E-mail hpjcehacuk
NotesThe authors declare no competing financial interest
ACKNOWLEDGMENTS
HPJ acknowledges funding and support from the UK NaturalEnvironment Research Council a Fulbright DistinguishedScholar Award and an OECD Co-operative Research Pro-gramme Fellowship We thank Chris Wardle (British GeologicalSurvey) for help with the artwork and Dr Tiong Ee Ting forpermission to reproduce tracer experiment results in theSupporting Information
REFERENCES(1) Panno S V Karst aquifers Can they be protected Ground Water2006 44 (4) 494minus494(2) White W B Culver D C Herman J S Kane T C Mylroie JE Karst lands Am Sci 1995 83 (5) 450minus459(3) Owen M R Pavlowsky R T Base flow hydrology and waterquality of an Ozarks spring and associated recharge area southernMissouri USA Environ Earth Sci 2011 64 (1) 169minus183(4) Baffaut C Benson VWModeling flow and pollutant transport ina karst watershed with SWAT Trans ASABE 2009 52 (2) 469minus479(5) Fournier M Motelay-Massei A Massei N Aubert MBakalowicz M Dupont J P Investigation of transport processesinside karst aquifer by means of STATIS Ground Water 2009 47 (3)391minus400(6) Brahana J V Rationale and methodology for approximatingspring-basin boundaries in the mantled karst terrane of the SpringfieldPlateau northwestern Arkansas In The engineering geology andhydrogeology of karst terranes Beck B F Stephenson B F Eds A ABalkema Rotterdam 1997 pp 77minus82(7) Kilroy G Coxon C Temporal variability of phosphorus fractionsin Irish karst springs Environ Geol 2005 47 (3) 421minus430(8) Lerch R N Contaminant transport in two central Missouri karstrecharge areas J Cave Karst Stud 2011 73 (2) 99minus113(9) Coxon C Agriculture and karst In Karst Management Beynen PE Ed Springer Dordrecht Netherlands 2011 pp 103minus138(10) Kacaroglu F Review of groundwater pollution and protection inkarst areas Wat Air Soil Pollut 1999 113 (1minus4) 337minus356(11) Allousha G A Boyer D G Belesky D P Halvorson J JPhosphorus mobility in a karst landscape under pasture grazing systemAgronomie 2003 23 (7) 593minus600(12) Neal C Jarvie H PWilliams R J Neal MWickham H HillL Phosphorus-calcium carbonate saturation relationships in a lowlandchalk river impacted by sewage inputs and phosphorus remediation Anassessment of phosphorus self-cleansing mechanisms in natural watersSci Total Environ 2002 282 295minus310(13) von Wandruszka R Phosphorus retention in calcareous soils andthe effect of organic matter on its mobility Geochem Trans 2006 7 6(14) Mellander P-E Jordan P Melland A R Murphy P N CWall D P Mechan S Meehan R Kelly C Shine O Shortle GQuantification of phosphorus transport from a karstic agriculturalwatershed to emerging spring water Environ Sci Technol 2013 47 (12)6111minus6119(15) Mellander P-E Jordan P Wall D P Melland A R MeehanR Kelly C Shortle G Delivery and impact bypass in a karst aquiferwith high phosphorus source and pathway potentialWater Res 2012 46(7) 2225minus2236(16) Stueber A M Criss R E Origin and transport of dissolvedchemicals in a karst watershed southwestern Illinois J Am Water ResAssoc 2005 41 (2) 267minus290(17) Kleinman P J A Sharpley A N McDowell R W Flaten DN Buda A R Tao L Bergstrom L Zhu Q Managing agriculturalphosphorus for water quality protection Principles for progress PlantSoil 2011 349 (1minus2) 169minus182(18) Sharpley A N Kleinman P J A Flaten D N Buda A RCritical source area management of agricultural phosphorus Experi-ences challenges and opportunities Water Sci Technol 2011 64 (4)945minus952(19) Sharpley A N Jarvie H P Agricultural management waterquality amp ecology Putting practice into policy In National AgriculturalBiotechnology Council Report 24 Eaglesham A Korth K Hardy R WF Eds Jacobs Press Auburn NY 2012 pp 73minus99(20) Sims J T Ma L Oenema O Dou Z Zhang F S Advancesand challenges for nutrient management in China in the 21st century JEnviron Qual 2013 42 (4) 947minus950(21) Kellogg R L Lander C H Moffitt D C Gollehon N Manurenutrients relative to the capacity of cropland and pastureland toassimilate nutrients Spatial and temporal trends for the United StatesResource Assessment and Strategic Planning Working Paper 98-1 USDANatural Resources Conservation Service and Economic Research
Environmental Science amp Technology Article
dxdoiorg101021es405585b | Environ Sci Technol XXXX XXX XXXminusXXXH
Service General Services Administration National Forms andPublication Center Fort Worth TX 2000 pp 1minus140 httpwwwnrcsusdagovtechnicallandpubsmanntrpdf(22) Maguire R O Rubaeligk G H Haggard B E Foy B H Criticalevaluation of the implementation of mitigation options for phosphorusfrom field to catchment scales J Environ Qual 2009 38 (5) 1989minus1997(23) Christophersen N Neal C Hooper R P Vogt R DAndersen S Modeling streamwater chemistry as a mixture of soilwaterend-members - A step towards 2nd-generation acidification models JHydrol 1990 116 (1minus4) 307minus320(24) Neal C Jarvie H P Williams R Love A Neal M WickhamH Harman S Armstrong L Declines in phosphorus concentration inthe upper River Thames (UK) Links to sewage effluent cleanup andextended end-member mixing analysis Sci Total Environ 2010 408 (6)1315minus1330(25) Jarvie H P Neal C Withers P J A Baker D B Richards RP Sharpley A N Quantifying phosphorus retention and release inrivers and watersheds using extended end-member mixing analysis (E-EMMA) J Environ Qual 2011 40 (2) 492minus504(26) Jarvie H P Sharpley A N Scott J T Haggard B E BowesM J Massey L B Within-river phosphorus retention Accounting for amissing piece in the watershed phosphorus puzzle Environ Sci Technol2012 46 (24) 13284minus13292(27) Brahana V The Savoy Experimental WatershedA long-termresearch site for karst hydrogeology In Caves and Karst of the USANational Speleological Society Guidebook for the International Congress ofSpeleology Palmer A N Palmer M V Eds National SpeleologicalSociety Huntsville AL 2009 section 5 Ozark Plateaus p 179(28) Sharpley A N Kleinman P J A Jordan P Bergstrom LAllen A L Evaluating the success of phosphorus management fromfield to watershed J Environ Qual 2009 38 1981minus1988(29) Scott J T Haggard B E Sharpley A N Romeis J J Changepoint analysis of phosphorus trends in the Illinois River (Oklahoma)demonstrates the effects of watershed management J Environ Qual2011 40 (4) 1249minus1256(30) Brahana J V Controlling influences on ground-water flow andtransport in the shallow karst aquifer of northeastern Oklahoma andnorthwestern Arkansas Proceedings volume hydrologic problemsalong the Arkansas-Oklahoma border Arkansas Water ResourcesCenter Publication No MSC-168 1995 pp 25minus3033(31) Brahana J V Ting T Al-Qinna M Murdock J Davis R KLainz J Killingbeck J J Szilvagyi E Doheny-Skubic M Chaubey IHays P D Thoma G Quantification of hydrologic budget parametersfor the vadose zone and epikarst in mantled karst US GeologicalSurvey Karst Interest Group Proceedings Rapid City SD Sept 12minus152005 Kuniansky E L Ed US Geological Survey ScientificInvestigations Report 2005-5160 pp 144minus152(32) Leh M D Chaubey I Murdoch J Brahana J V Haggard BE Delineating runoff processes and critical runoff source areas in apasture hillslope of the Ozark Highlands Hydrol Proc 2008 22 (21)4190minus4204 DOI 101002hyp7021(33) Haggard B E Phosphorus concentrations loads and sourceswithin the Illinois River drainage area Northwest Arkansas 1997minus2008J Environ Qual 2010 39 (6) 2113minus2120(34) Tortorelli R L Pickup B E Phosphorus concentrations loadsand yields in the Illinois River basin Arkansas and Oklahoma 2000minus2004 US Geological Survey Scientific Investigations Report 2006-5175 p 38(35) Murphy J Riley J P A modified single solution method for thedetermination of phosphate in natural-waters Anal Chim Acta 196227 31minus36(36) Eisenreich S J Bannerman R T Armstrong D E Simplifiedphosphorus analytical technique Environ Lett 1975 9 (1) 43minus53(37) Jarvie H P Withers P J A Neal C Review of robustmeasurement of phosphorus in river water Sampling storagefractionation and sensitivity Hydrol Earth Syst Sci 2002 6 113minus131(38) Divine C E McDonnell J J The future of applied tracers inhydrogeology J Hydrogeol 2005 13 255minus258
(39) Burns D A McDonnell J J Hooper R P Peters N E FreerJ E Kendall C Beven K Quantifying contributions to storm runoffthrough endmember mixing analysis and hydrologic measurements atthe Panola Mountain Research Watershed (Georgia USA) HydrolProc 2001 15 1903minus1924(40) Williams P W The role of the epikarst in karst and cavehydrogeology a review Int J Speleol 2008 31 1minus10(41) Jarvie H P Neal C Smart R Owen R Fraser D Forbes IWade A Use of continuous water quality records for hydrographseparation and to assess short-term variability and extremes in acidityand dissolved carbon dioxide for the River Dee Scotland Sci TotalEnviron 2001 265 (1minus3) 85minus98(42) Jarvie H P Sharpley A N Spears B Buda A R May LKleinman P J A Water quality remediation faces unprecedentedchallenges from ldquolegacy phosphorusrdquo Environ Sci Technol 2013 47(16) 8997minus8998(43) Sharpley A Jarvie H P Buda A May L Spears B KleinmanP Phosphorus legacy Overcoming the effects of past managementpractices to mitigate future water quality impairment J Environ Qual2013 42 (5) 1308minus1326(44) Ting T E E Assessing bacterial transport storage and viability inmantled karst of northwest Arkansas using clay and Escherichia colilabeled with lanthanide-series metals PhD Dissertation University ofArkansas 2005(45) Sharpley A N Smith S J Bain W R Nitrogen and phosphorusfate from long-term poultry litter applications toOklahoma soils Soil SciSoc Am J 1993 57 (4) 1131minus1137(46) Frossard E Condron L M Oberson A Sinaj S Fardeau J CProcesses governing phosphorus availability in temperate soils JEnviron Qual 2000 29 (1) 15minus23(47) Cox F R Kamprath E J McCollum R E A descriptive modelof soil test nutrient levels following fertilization Soil Sci Soc Am J 198145 (3) 529minus532(48) Inskeep W P Bloom P R kinetics of calcite precipitation in thepresence of water-soluble organic-ligands Soil Sci Soc Am J 1986 50(5) 1167minus1172(49) Dove P M Hochella M F Calcite precipitation mechanismsand inhibition by orthophosphate - insitu observations by scanning forcemicroscopy Geochim Cosmochim Acta 1993 57 (3) 705minus714(50) Kirchner J W Feng X H Neal C Fractal stream chemistry andits implications for contaminant transport in catchments Nature 2000403 (6769) 524minus527(51) Kirchner J W Neal C Universal fractal scaling in streamchemistry and its implications for solute transport and water qualitytrend detection Proc Nat Acad Sci USA 2013 110 (30) 12213minus12218(52) Neal C Catchment water quality The inconvenient butnecessary truth of fractal functioning Hydrol Proc 2013 27 (24)3516minus3520
Environmental Science amp Technology Article
dxdoiorg101021es405585b | Environ Sci Technol XXXX XXX XXXminusXXXI
Coupling High-Frequency Stream Metabolism and NutrientMonitoring to Explore Biogeochemical Controls on DownstreamNitrate DeliveryHelen P Jarviedagger Andrew N SharpleyDagger Timothy Kressesect Phillip D Hays∥ Richard J Williamsdagger
Stephen M Kingperp and Lawrence G BerryDagger
daggerNERC Centre for Ecology and Hydrology Wallingford OX10 8BB United KingdomDaggerDepartment of Crop Soil and Environmental Sciences University of Arkansas Fayetteville Arkansas 72701 United StatessectUS Geological Survey Lower Mississippi-Gulf Water Science Center 401 Hardin Road Little Rock Arkansas 72211 UnitedStates∥US Geological Survey Lower Mississippi-Gulf Water Science CenterUniversity of Arkansas Department of Geosciences 216Gearhart Hall Fayetteville Arkansas 72701 United StatesperpSTFC Rutherford Appleton Laboratory Harwell Campus Didcot Oxfordshire OX11 0QX United Kingdom
S Supporting Information
ABSTRACT Instream biogeochemical process measurementsare often short-term and localized Here we use in situ sensorsto quantify the net effects of biogeochemical processes onseasonal patterns in baseflow nitrate retention at the river-reachscale Dual-station high-frequency in situ nitrate measurementswere coupled with high-frequency measurements of streammetabolism and dissolved inorganic carbon in a tributary of theBuffalo National River Arkansas Nitrate assimilation wascalculated from net primary production and combined withmass-balance measurements to estimate net nitrification anddenitrification The combined net effects of these instreamprocesses (assimilation denitrification and nitrification)removed gt30minus90 of the baseflow nitrate load along a 65km reach Assimilation of nitrate by photoautotrophs during spring and early summer was buffered by net nitrification Netnitrification peaked during the spring After midsummer there was a pronounced switch from assimilatory nitrate uptake todenitrification There was clear synchronicity between the switch from nitrate assimilation to denitrification a reduction in riverbaseflows and a shift in stream metabolism from autotrophy to heterotrophy The results show how instream nitrate retentionand downstream delivery is driven by seasonal shifts in metabolic pathways and how continuous in situ stream sensor networksoffer new opportunities for quantifying the role of stream biota in the dynamics fate and transport of nitrogen in fluvialsystems
1 INTRODUCTION
Nutrients including nitrogen (N) phosphorus (P) and carbon(C) from agriculture and domestic wastewater are a majorsource of water-quality impairment1 Excessive nutrient inputsto rivers streams and lakes can accelerate growth of nuisanceand harmful algae Resulting increases in microbial activity anddepletion of dissolved oxygen (DO) have profound negativeconsequences for invertebrates and fish potable water supplyand recreation23 However biogeochemical processes instreams also play an important role in regulating downstreamnutrient transport with stream biota retaining and removingnutrients from the water column reducing downstreamecological impacts4minus6
Streams can provide a major sink for nitrate (NO3minus)
through uptake (assimilation) by primary production and
through denitrification78 The effectiveness of these processesvaries throughout the year and between streams butconventional methods for estimating NO3
minus uptake are basedon relatively few short-term experimental nutrient additionsand isotope measurements9minus11 making results difficult toextrapolate in space and time12 Continuous high-frequency insitu measurements offer new opportunities to explore NO3
minus
source dynamics13minus17 and instream processes have beeninferred from single-station diurnal concentration cycles121819
longitudinal profiling20minus23 and nested sensor networks24
Received June 6 2018Revised October 23 2018Accepted October 30 2018Published October 30 2018
Article
pubsacsorgestCite This Environ Sci Technol 2018 52 13708minus13717
copy 2018 American Chemical Society 13708 DOI 101021acsest8b03074Environ Sci Technol 2018 52 13708minus13717
Dow
nloa
ded
via
CT
R F
OR
EC
OL
OG
Y amp
HY
DR
OL
OG
Y o
n D
ecem
ber
4 2
018
at 0
936
54
(UT
C)
Se
e ht
tps
pub
sac
sor
gsh
arin
ggui
delin
es f
or o
ptio
ns o
n ho
w to
legi
timat
ely
shar
e pu
blis
hed
artic
les
In this study we used in situ sensors to quantify the neteffects of biogeochemical processes on seasonal patterns inbaseflow NO3
minus retention at the river-reach scale The approachemployed here is novel because it combines dual-station high-frequency NO3
minus measurements with high-frequency measure-ments of stream metabolism (analysis of diurnal DO curves tocalculate primary production and respiration) dissolvedinorganic carbon (DIC) and excess partial pressure of carbondioxide (EpCO2) to explore the capacity of instreambiogeochemical processes to retain and remove NO3
minus High-frequency in situ monitoring of water chemistry and stream-flow was undertaken along a 65 km experimental reach of BigCreek a tributary of the Buffalo National Scenic RiverArkansas USA and were used to calculate a NO3
minus massbalance along the reach Net primary production was used tocalculate NO3
minus assimilation by photoautotrophs Daily NO3minus
removal rates and rates of NO3minus assimilation by photo-
autotrophs were used to calculate net nitrification anddenitrification The biogeochemical controls on NO3
minus removalwere then evaluated in relation to wider ecosystem driversincluding streamflow DO and stream ecological function toexplore how seasonal shifts in metabolic pathways influenceinstream NO3
minus retention and downstream NO3minus delivery
2 MATERIALS AND METHODS21 Site Description and Water-Quality Monitoring
Big Creek a tributary of the Buffalo National Scenic RiverArkansas (Figure 1) is the subject of detailed water-quality
monitoring because of a permitted swine concentrated animalfeeding operation (CAFO) within the watershed in operationsince September 2013 The Big Creek watershed lies in thekarst terrain of the Ozark Plateau of the midcontinental USA(Figure 1) The watershed area is 236 km2 with 79 of theland area deciduous forest 3 evergreen forest 14grasslandpasture and 3 developed land (see SupportingInformation SI S11) Swine-manure slurry from the CAFO
has been land applied to permitted fields since January 1 2014in accordance with State regulationsThe focus of this study is an experimental reach of Big
Creek downstream of the CAFO from an upstreammonitoring station at Mt Judea (USGS site 07055790watershed area 106 km2) to a downstream monitoring stationat Carver (USGS site 07055814 watershed area 233 km2)721 and 069 km from the confluence between Big Creek andthe Buffalo River respectively (Figure 1) One tributary (LeftFork) enters Big Creek between Mt Judea and Carver Thewatershed is a mantled karst terrain characterized by intimateconnection between groundwater and surface water transportof surface-derived nutrients can be rapid25 (see S12)USGS conducted high-frequency (15 min) NO3
minus monitor-ing using submersible ultraviolet nitrate probes at Carver (06032014 to 04292017) and Mt Judea (11012014 to 11012015) there was therefore one year of overlapping data(11012014 to 11012015) during which NO3
minus monitoringwas undertaken at both Mt Judea and Carver A water-qualitysonde (YSI 6600) operating at Carver simultaneously collected15 min interval DO pH specific conductance and watertemperature data Further information about the high-frequency water-quality monitoring is provided in S13Water-quality samples collected on a weekly basis since 09
122013 with additional opportunistic high-flow sampling atMt Judea Left Fork and at a groundwater (spring) monitoringsite (Figure 1) provided NO3
minus (by ion chromatographyDionex ICS-1600) alkalinity (by fixed-end point acidimetrictitration to pH 4526) and conductivity (VWR SymphonyB10C) data All nitrate concentrations are reported as NO3minusN(mg-N Lminus1) Water-quality data are available at httpsbigcreekresearchorg
22 Stream-Flow Measurements and HydrographSeparation Stream flow was measured using establishedUSGS streamflow gauging methods27 (see S14) A two-component mixing model was used to partition thecontributions to streamflow from groundwater and surfacerunoff28 using alkalinity as a conservative groundwater tracer(see S15)
23 Analysis of Diurnal Dissolved Oxygen Curves toCalculate Primary Production and Respiration The dailyaverage gross primary production daily average ecosystemrespiration and reaeration coefficient were calculated from theseries of diurnal DO curves at Carver (see S16) using apiecewise solution of the mass balance DO model29 simplifiedfor the situation where the deficit does not vary spatially (eq1) the Delta method3031
D t k D td d ER GPP ( )a av av+ = minus (1)
where D is the DO deficit (mg-O2 Lminus1) t is the time (days) ka
is the reaeration coefficient ERav is the ecosystem respiration(mg-O2 L
minus1 dminus1) and GPPav is the gross primary production(mg-O2 Lminus1 dminus1) these are standard measures of ecosystemrespiration and gross primary production in river systems32
Odum33 suggested a classification system of flowing-watercommunities based on oxygen metabolism by using the ratio ofGPPav to ERav (GPPER) Respiration is associated with bothplant and microbial activity Photosynthesis is only associatedwith plants Autotroph-dominated communities are repre-sented by GPPER values gt1 whereas heterotroph-dominatedcommunities are represented by GPPER values lt1
24 Use of the THINCARB Model for CalculatingDissolved Inorganic Carbon Concentrations and Excess
Figure 1 Map of the Big Creek watershed and its location
Environmental Science amp Technology Article
DOI 101021acsest8b03074Environ Sci Technol 2018 52 13708minus13717
13709
Partial Pressure of Carbon Dioxide The THINCARBmodel (THermodynamic modeling of INorganic CARBon)34
uses pH Gran Alkalinity (AlkGran) and temperature measure-ments to calculate dissolved inorganic carbon (DIC)concentrations and DIC speciation from the excess partialpressures of carbon dioxide (EpCO2) in freshwatersTHINCARB is open access and is described in detail in Jarvieet al (2017)34 an outline is provided in S17 Prior to usealkalinity measurements in units of mg-CaCO3 L
minus1 were firstconverted to AlkGran (in μeq Lminus1) where 1 mg Lminus1 CaCO3 =1998 μeq Lminus134
THINCARB was applied to the high-frequency sonde datafrom Carver Specific conductance was used as a surrogate foralkalinity using the regression relationship between AlkGranand specific conductance (κ) measured across the Big Creekwatershed including the spring and Mt Judea Left Fork andCarver stream sites AlkGran = 865 (plusmn028) times κ minus 644 (plusmn66)R2 = 095 n = 270 P lt 0001 (numbers in parenthesesrepresent twice the standard error) By applying this regressionequation to the hourly κ series an hourly alkalinity record wasderived which was then used alongside the hourly pH andwater-temperature data to calculate a high-frequency DIC andEpCO2 series25 Mass-Balance Calculation of Baseflow Nitrate
Fluxes Instream Losses and Net Nitrification andDenitrification Daily mass-balance calculations were under-taken for eight quiescent low-flow periods (each typically of1minus2 weeks) USGS stream-velocity readings from Carverranged from 0457 and 122 m sminus1 and with a stream distancealong the experimental reach of 652 km the travel timesranged from 396 to 148 h Therefore daily mass balances
over a 24-h period were assumed sufficient to account fortransit of NO3
minus given (a) the relatively short travel times (b)the high degree of stationarity in flux transfers during quiescentbaseflow conditions and (c) that calculated daily massbalances were averaged over a 1minus2 week periodThe 15 min NO3
minus measurements at Mt Judea and Carverwere converted to daily means and daily nitrate loads at eachsite were calculated using the corresponding gauged dailystreamflow data To account for flow accretion along the reachthe difference between the daily flow downstream at Carverand the upstream site at Mt Judea was calculated The increasein flows was assumed to be input from Left Fork (Figure 1)Daily NO3
minus input loading to the reach (LT) was calculatedas the sum of the daily NO3
minus loads from Mt Judea (LMJ) andLeft Fork (LLF)
L L LT MJ LF= + (2)
There was no high-resolution NO3minus monitoring on Left
Fork so weekly NO3minus measurements from grab samples taken
at Left Fork were combined with the measured daily flowaccretion to derive daily loads from Left Fork (S181) Asensitivity analysis evaluated the potential effects of under- oroverestimating Left Fork NO3
minus concentrations by plusmn50(Tables SI1 and SI2)Within this karst watershed some of the flow accretion will
arise from direct groundwater input into Big Creek Dischargedata were not available from the Left Fork tributary and directapportionment of contributions from Left Fork and ground-water was not possible We therefore evaluated a secondalternative ldquoendmemberrdquo case scenario whereby all of flow
Figure 2 Time series at the downstream monitoring site (Carver) from May 2014 to May 2017 showing (a) nitrate (NO3minusN) dissolvedinorganic carbon (DIC) and streamflow and (b) daily average gross primary production (GPP) ecosystem respiration (ER) and streamflow
Environmental Science amp Technology Article
DOI 101021acsest8b03074Environ Sci Technol 2018 52 13708minus13717
13710
accretion was attributed to direct groundwater contribution(S182)The daily instream NO3
minus load removal (LR) along the reachwas calculated as the difference between the daily input NO3
minus
loading (LT) and the daily NO3minus load at Carver (LC)
L L LR T C= minus (3)
To allow direct comparison with rates of assimilatory NO3minus
uptake by photosynthesis LR (kg-N dminus1) was then convertedto a daily NO3
minus removal rate UT (mg-N Lminus1 dminus1) UTincorporates both assimilatory NO3
minus uptake by photo-autotrophs (UA) heterotrophic NO3
minus removal through directuptake and denitrification (UD) and NO3
minus enrichment due toremineralization via nitrification (R)20
U U U RT A D= + minus (4)
UA was estimated from the GPPav measurements1235 GPPavdata were converted into net primary production (NPP)assuming that autotrophic respiration consumed 50 of theGPPav
3637 NPP data were then converted from units of O2uptake (mg-O2 L
minus1 dminus1) to C uptake (mg-C Lminus1 dminus1) with aphotosynthetic quotient of 100 then converted to NO3
minus
uptake (mg-N Lminus1 dminus1) using a molar ratio of CN of 1238
Subtracting UT from UA provides a measure of either netnitrification (positive values) or net heterotrophic NO3
minus
removal through direct uptake and denitrification hereafterreferred to as ldquonet denitrificationrdquo (negative values) When theriver was influent loss of NO3
minus to groundwater was accountedfor as described in S183
3 RESULTS AND DISCUSSION31 Three-Year Time Series of Nitrate Dissolved
Inorganic Carbon and Stream Metabolism The hourlyNO3
minus and DIC concentrations variations at Carver were drivenby streamflow but in opposing directions (Figure 2a) Themean and median NO3
minus concentrations were 0128 and 0093
mg-N Lminus1 respectively Nitrate concentrations at Carver werelowest during baseflow (mean 0043 mg-N Lminus1 lowest 10 offlows) and highest during storm runoff (mean 0278 mg-N Lminus1highest 10 of flows) arising from nonpoint-sourcemobilization and delivery of NO3
minus during rainfall eventsThe mean and median DIC concentrations were 248 and
252 mg-C Lminus1 respectively DIC concentrations were highestduring baseflow (mean 317 mg-C Lminus1) with DIC concen-trations diluted by storm runoff (mean 132 mg-C Lminus1)Highest DIC and lowest NO3
minus concentrations occurred duringthe extended low-flows between August and November 2015The mean and median molar CN ratios were 356 and 305
respectively The mean CN ratio during baseflow was 882 and82 during stormflow CN ratios greater than sim66 areindicative of stoichiometric depletion of N relative to C39
Absolute NO3minus concentrations below sim01 mg-N Lminus1 are
deemed likely to be limiting to algae with algal growthresponse to NO3
minus enrichment occurring between 038 to 179mg-N Lminus140 Therefore under average and baseflow conditionsat Carver a clear potential exists for algal growth to be limitedby low NO3
minus availabilityNo longer-term trends in either NO3
minus or DIC wereobserved over the three years These high-frequencymonitoring results are consistent with results from near-weeklywater-quality monitoring of Big Creek at Mt Judea whichshowed no statistically significant increasing or decreasingtrends in dissolved or particulate forms of P and Nconcentrations since 201341
Earlier studies6 have shown that Ozark streams can be veryeffective at retaining available nutrients and buffering addi-tional nutrient inputs Therefore the absence of any increasingtrend in nutrients in the water column may result from therapid and efficient uptake of nutrient inputs by stream biotaConsequently high-resolution stream metabolism and nutrientmeasurements were used here to detect whether increasedphotosynthesis or respiration rates resulted from increased
Figure 3 Scatter plot showing the relations between mean daily nitrate concentrations upstream at Mt Judea and downstream at Carver
Environmental Science amp Technology Article
DOI 101021acsest8b03074Environ Sci Technol 2018 52 13708minus13717
13711
nutrient assimilation even where no increases in water-columnnutrient concentrations could be observed
The time series in daily rates of GPPav and ERav at Carver(Figure 2b) showed no definitive long-term trends between
Figure 4 Time series from 1 November 2014 to 1 November 2015 showing (a) Nitrate concentrations upstream at Mt Judea and downstream atCarver and the lower-flow time periods used for mass balance calculation and evaluation of biogeochemical processes (b) streamflow at Carverand the percentage groundwater contribution to streamflow (c) daily ratio of gross primary production ecosystem respiration (GPPER)downstream at Carver (horizontal dashed line shows GPPER of 1 ie balance between heterotrophy and autotrophy) and excess partial pressureof carbon dioxide (EpCO2) and (d) streamflow and the molar CN ratio (DIC dissolved inorganic carbonNO3minusN) downstream at Carver
Environmental Science amp Technology Article
DOI 101021acsest8b03074Environ Sci Technol 2018 52 13708minus13717
13712
2014 and 2017 GPPav declined rapidly in response to majorstorm runoff events but typically recovered within a couple ofweeks Highest GPPav tended to occur during quiescentbaseflow or recessional streamflow conditions during thesummer (May through August) Both GPPav and ERav declinedduring the autumn (September through December) reflectingreductions in stream biological activity and GPPav tended todecline at a faster rate than ER This was particularly apparentduring the extended low-flows between August and December2015 suggesting a decline in primary production relative tomicrobial activity and a transition from net autotrophic to netheterotrophic stream communities During winter baseflows(November through January) ERav tended to exceed GPPavDuring the 3-yr monitoring no CAFO-related impacts oneither stream nutrient concentrations or metabolism arediscernible at Carver32 Temporal and Spatial Variability in NO3
minus
Concentrations Relative to Other Key EnvironmentalVariables Mean daily NO3
minus concentrations varied betweenbaseflow and storm events at Mt Judea and Carver during theone year of overlapping data (Figure 3) There was a cleardifferentiation between a higher-flow period characterized byregular storm events from mid-December 2014 to mid-July2015 and lower-flow conditions from August to NovemberDecember 2015 (Figures 3 and 4)During the higher-flow period a positive correlation existed
between upstream (Mt Judea) and downstream (Carver)NO3
minus with a ratio approaching 1 (Figure 3) During this high-flow period NO3
minus concentrations at both upstream anddownstream sites ranged between sim01 and sim04 mg-N Lminus1Time series data show close convergence between upstreamand downstream NO3
minus concentrations during storm-eventpeak concentrations (Figure 4ab)Under lower-flow conditions NO3
minus concentrations wereconsistently higher upstream than downstream (Figure 3) Theincrease in NO3
minus concentrations at the upstream site duringthe summer and autumn 2015 corresponds with reductions inflow This is typical of the longer-term hydrologically drivencycles in NO3
minus concentrations observed at the upstream sitereflecting a strong flow dependency with highest concen-trations under the lowest flows and dilution with increasingflow (Figure SI1abc) The strong increase in NO3
minus
concentrations during July to November 2015 thereforereflects hydrological controls and is consistent with fallingflows The high NO3
minus concentrations in autumn 2015subsequently declined with the onset of higher flows (FigureSI1ab)
The gap in NO3minus concentrations between upstream and
downstream sites widened with decreasing flow particularlyduring the protracted low-flows between mid-July andNovember 2015 During this time minimal soil watercontributed to streamflow and almost all (gt95) ofstreamflow was derived from groundwater (Figure 4ab) Bythe end of October 2015 upstream NO3
minus concentrationsreached sim075 mg-N Lminus1 whereas downstream NO3
minus
concentrations were sim005 mg-N Lminus1 Between July andNovember 2015 downstream NO3
minus concentrations exhibiteda much lower range (sim005 to sim015 mg-N Lminus1) as comparedwith upstream (sim01 to sim08 mg-N Lminus1) (Figure 3) Thisreduction in both magnitude and range of downstream NO3
minus
concentrations under baseflow conditions could arise eitherfrom dilution of NO3
minus as a result of downstream accretion ofwater sources with much lower NO3
minus concentrations or byremoval of NO3
minus through biogeochemical processes neces-sitating a mass-balance evaluation (see section 33)The widening gap in NO3
minus concentrations betweenupstream and downstream sites after mid-July 2015 corre-sponded with a decline in GPPER which fell below 1indicating a change to net heterotrophy (Figure 4c) Duringthe low-flow period from mid-July to November 2015 BigCreek was heterotrophic for sim90 of days Daily streamwaterEpCO2 doubled between mid-July and November 2015 from45 to 91 times atmospheric pressure independentlyconfirming an increase in rates of respiration (CO2 release)relative to photosynthesis (CO2 uptake)During the higher-flow period from mid-January to mid-July
Big Creek was predominantly net autotrophic (GPPER gt 1for 52 of days) Net heterotrophic conditions prevailedpredominantly during lower-flow intervals between stormevents with GPPER lt 1 typically during and immediatelyafter storm eventsMolar CN ratios at Carver also increased markedly after
mid-July from sim300 to gt800 (Figure 4d) This stoichiometricdepletion of N along with persistence of low NO3
minus
concentrations below 01 mg-N Lminus1 (falling to lt004 mg-NLminus1) suggests that algal growth may have been limited by lowN availability at Carver over the late summer and autumn of2015
33 Nitrate Reach Mass Balance to Quantify SeasonalNitrate Removal during Baseflow ConditionsMean dailyNO3
minus mass balances for the eight seasonal quiescent baseflowperiods between February and October 2015 are presented inTable 1 Mean daily NO3
minus input loadings to the reach (LT)increased from 173 kg-N dminus1 in February to 617 kg-N dminus1 in
Table 1 Seasonal Patterns in Mean Daily NO3minus Input Loadings (LT) to Big Creek Mean Daily Instream NO3
minus Load Removal(LR) along the 65 km Experimental Reach Under Low-Flow Conditions and Mean Daily NO3
minus Load Removal As aPercentage of NO3
minus Inputs (UE)a
season date rangeNO3
minus input loadingto reach (LT) (kg-N dminus1)
instream NO3minus removal
along reach (LR) (kg-N dminus1)instream NO3
minus removal (LR) as of NO3minus
input loading (LT) (UE)
winter 4minus13 Feb 2015 173 (112) 768 (046) 447 (409)spring 1 5minus12 Apr 2015 441 (635) 190 (282) 439 (953)spring 2 24 Aprminus5 May 2015 379 (153) 169 (385) 476 (893)early summer 2minus10 Jun 2015 492 (236) 241 (854) 512 (534)mid summer 11minus21 Jul 2015 617 (442) 146 (282) 321(141)late summer 7minus16 Aug 2015 756 (122) 557 (059) 742 (466)autumn 1 1minus14 Sept 2015 581 (123) 449 (081) 778 (239)autumn 2 1minus11 Oct 2015 298 (029) 282 (025) 948 (120)aStandard deviations are shown in parentheses
Environmental Science amp Technology Article
DOI 101021acsest8b03074Environ Sci Technol 2018 52 13708minus13717
13713
July then declined rapidly to 756 kg-N dminus1 in August whichalso corresponded with an order of magnitude reduction inbaseflow discharge By October LT had fallen to only 298 kg-N dminus1 Instream NO3
minus removal (LR) followed a similar patternto LT with highest mean daily instream NO3
minus removal duringJune (24 kg-N dminus1) then decreasing during the late summerand autumn and falling to 282 kg-N dminus1 in October Howeverthe efficiency of instream NO3
minus removal (UE ie LR expressedas a percentage of LT) increased markedly during the latesummer and autumn from 32 in July to 74minus95 betweenAugust and OctoberThe fluvial mass balance therefore confirmed that the
observed downstream reductions in NO3minus concentrations
under baseflow were a result of net instream removal of NO3minus
by biogeochemical processes rather than a dilution effectAlthough LT and LR were greatest during the winter to early
summer period UE and the instream NO3minus removal rate (UT)
increased dramatically during the low flows of the late summerand autumn UT increased from le009 mg-N Lminus1 dminus1
(February through July) to gt02 mg-N Lminus1 dminus1 in Augustand September and 066 mg-N Lminus1 dminus1 in October (Table 2)By autumn 2015 gt75 of the NO3
minus inputs were removed bybiogeochemical processes (Table 1)We also assessed the efficiency of NO3
minus removal under thealternative scenario where the increase in flow along theexperimental reach was solely from direct groundwater input(S162) This made relatively little difference to the UE whichalso increased markedly during the late summer and autumnfrom 46 in July to 72minus94 between August and October(Table SI3) The sensitivity analysis (Tables SI1 and SI3)showed that a 50 increase or decrease in either Left Fork or
groundwater NO3minus concentrations made little difference to
these findings a consistent increase in efficiency of NO3minus
removal was observed after July with August to October UEvalues consistently sim70minus95
34 Biogeochemical Controls on Nitrate DeliveryAccounting for Assimilatory Nitrate Uptake to Calcu-late Net Nitrification and Net Denitrification FromFebruary to July assimilatory NO3
minus uptake by photosynthesiz-ing plants (UA) consistently exceeded UT (Table 2) indicatingfirst that assimilation of NO3
minus by photoautotrophs was thedominant process removing NO3
minus from the water column andsecond that assimilation was partially balanced by netnitrification NO3
minus gains In contrast from August to OctoberUT exceeded UA indicating that heterotrophic NO3
minus removalthrough direct uptake and denitrification was removing NO3
minus
along the reach in late summer and autumnTable 3 shows that net nitrification gains to the reach ranged
from 0135 mg-N Lminus1 dminus1 in February to 0273 mg-N Lminus1 dminus1
in AprilMay However after July a pronounced switch fromnet nitrification gains to net denitrification losses occurredDuring late summer and autumn denitrification losses ofNO3
minus increased from sim0100 mg-N Lminus1 dminus1 in August andSeptember to 0592 mg-N Lminus1 dminus1 in October These estimateswere based on using an average periphyton CN molar ratio of12 for USA streams3538 We also evaluated the effects ofusing an average periphyton molar CN ratio of 86 fromresearch in northern European streams17 This increased UAvalues by sim39 but did not alter our findings of a switchbetween net nitrification between February and July to netdenitrification from August to October By changing the CNstoichiometry from 12 to 86 net nitrification ranged from
Table 2 Seasonal Patterns in Mean Daily NO3minus Removal Rate (UT) along the 65 km Experimental Reach of Big Creek Under
Low-Flow Conditions And Mean Daily Assimilatory Uptake of NO3minus by Photoautotrophs (UA)
a
season date range instream NO3minus removal rate (UT) (mg-N Lminus1 dminus1) assimilatory NO3
minus uptake (UA) (mg-N Lminus1 dminus1)
winter 4minus13 Feb 2015 0077 (0006) 0212 (0035)spring 1 5minus12 Apr 2015 0072 (0017) 0256 (0050)spring 2 24 Aprminus5 May 2015 0082 (0018) 0355 (0067)early summer 2minus10 Jun 2015 0090 (0014) 0269 (0045)mid summer 11minus21 Jul 2015 0066 (0030) 0259 (0040)late summer 7minus16 Aug 2015 0284 (0026) 0180 (0016)autumn 1 1minus14 Sept 2015 0229 (0019) 0115 (0038)autumn 2 1minus11 Oct 2015 0656 (0029) 0076 (0028)
aStandard deviations are shown in parentheses
Table 3 Seasonal Patterns in Mean Daily NO3minus Concentration Gains by Net Nitrification (+) and Losses by Net
Denitrification (minus) long the Experimental Reach of Big Creek under Low-Flow Conditions Mean Daily Values of the Ratiobetween Gross Primary Production and Ecosystem Respiration (GPPER) Excess Partial Pressure of Carbon Dioxide(EpCO2) Dissolved Oxygen (DO) Streamflow and the Percentage of Groundwater Contribution to Streamflowa
season date rangenet nitrification (+) or denitrification (minus)
(mg-N Lminus1 dminus1) GPPEREpCO2
(times atm press)DO
(mg-O2 Lminus1) flow (m3 sminus1) groundwater
winter 4minus13 Feb 2015 +0135 (0032) 114 (009) 280 (020) 119 (049) 115 (007) 665 (134)spring 1 5minus12 Apr 2015 +0184 (0039) 106 (013) 364 (020) 102 (033) 310 (037) 586 (238)spring 2 24 Apr -5 May
2015+0273 (0058) 125 (016) 381 (059) 103 (050) 261 (116) 617 (579)
early summer 2minus10 Jun 2015 +0179 (0044) 134 (015) 471 (049) 939 (042) 330 (172) 580 (648)mid summer 11minus21 Jul 2015 +0193 (0024) 197 (078) 715 (046) 898 (029) 254 (128) 828 (721)late summer 7minus16 Aug 2015 minus0104 (0032) 078 (005) 106 (083) 695 (035) 023 (004) 988 (098)autumn 1 1minus14 Sept
2015minus0102 (0027) 062 (010) 985 (165) 650 (054) 024 (006) 966 (142)
autumn 2 1minus11 Oct 2015 minus0592 (0015) 057 (023) 817 (150) 785 (064) 004 (0004) 978 (064)aStandard deviations are shown in parentheses
Environmental Science amp Technology Article
DOI 101021acsest8b03074Environ Sci Technol 2018 52 13708minus13717
13714
+0218 mg-N Lminus1 dminus1 in February to +0414 mg-N Lminus1 dminus1 inAprilMay with net denitrification ranging from minus0033 mg-NLminus1 dminus1 in August to minus0562 mg-N Lminus1 dminus1 in OctoberNet nitrification and denitrification rates were compared
with mean daily GPPER EpCO2 streamflow and percentagegroundwater discharge (Table 3) The shift from netnitrification to net denitrification corresponded directly with(1) a change in stream metabolism from net autotrophic(GPPER in July was 197) to net heterotrophic (GPPER fellbelow 1 to 078 in August 062 in September and 057 inOctober) and (2) an increase in EpCO2 and a reduction inDO arising from the increases in microbial respiration relativeto photosynthesisThe alternative scenario where flow accretion between Mt
Judea and Carver was attributed to direct groundwaterdischarge to Big Creek also had no effect on the timing ofthe shift from net nitrification to denitrification (S162 TableSI4) Sensitivity analysis (Tables SI2 and SI4) also showedthat irrespective of a 50 increase or decrease in either LeftFork or groundwater NO3
minus concentrations the sameconsistent switch between net nitrification and net denitrifica-tion was observed after JulyThe consistency in this observed switch between instream
NO3minus production and instream NO3
minus removal and itssynchronicity with measured changes in stream metabolismprovides compelling evidence that the marked change ininstream NO3
minus processing and delivery after July was linked tochanges in stream metabolism from net autotrophy to netheterotrophyThe karst streams of the Ozarks are characterized by a large
hyporheic zone4243 a hotspot of nitrogen transformation44
Water residence times and redox conditions provide a keycontrol on changes between NO3
minus removal and NO3minus
production with hyporheic zone sediments45minus48 In BigCreek the winter to midsummer period was characterized byhigher baseflows (at least an order of magnitude greater thanlate summerautumn baseflows) and net autotrophy resultingin higher instream DO concentrations Rapid movement ofwell-oxygenated water throughout the water column and intothe hyporheic zone promotes aerobic metabolism of organicmatter and release of NO3
minus through nitrification4649 Fromwinter to midsummer net nitrification was observed in BigCreek and nitrification in the hyporheic zone may have beenresponsible for buffering the effects of photosyntheticassimilatory uptake of NO3
minusUnder the more sluggish flow conditions during late summer
and autumn available oxygen is depleted as a result ofincreased heterotrophic activity The reduced movement ofwater and oxygen through the hyporheic zone favors a shift torespiratory pathways with denitrification (conversion of nitrateto N2O andor N2 gas)
5051 Unlike assimilation of NO3minus into
plant biomass which retains N temporarily denitrificationresults in a permanent loss of bioavailable N The lowbaseflows of late summer and autumn 2015 resulted in higherwater residence times and a greater proportion of flow movingthrough the hyporheic zone This provides greater exposureand water contact time with microbial biofilms wheredenitrification occurs51 The death and breakdown of biomassduring the late summer and autumn contribute to theavailability of organic matter for microbial decompositionpromoting higher rates of microbial respiration relative tophotosynthesis losses of DO and greater availability of organiccarbon as a resource for denitrifying bacteria455253
Denitrification within the hyporheic zone may therefore beresponsible for losses of NO3
minus in Big Creek during the latesummer and autumn Although denitrification can also occuron suspended sediments within the water column5455 this islikely to be a second order effect under baseflow conditions ina groundwater-fed stream where suspended solids concen-trations are low (typically lt5 mg Lminus1)Under baseflow conditions instream assimilatory NO3
minus
uptake by photosynthesizing plants and hyporheic-zonedenitrification along the experimental reach removed betweensim30 and sim90 of the NO3
minus input load During the period ofmonitoring (spring 2014 to spring 2017) NO3
minus loading to theupstream section of Big Creek (at Mt Judea) was attenuated byinstream processing such that no CAFO-related impacts oneither stream nutrient concentrations or metabolism werediscernible at the downstream location (Carver) and thus tothe Buffalo River Future monitoring will be needed to detectwhether long-term changes in nutrients and organic carboninputs may occur whether this stimulates higher rates ofheterotrophic andor autotrophic activity and any longer-termeffects on the capacity of assimilation and denitrificationprocesses to remove and buffer any increase in nutrientloadingsThe novelty of this research is the combination of
continuous high-frequency in situ stream metabolism andnitrate measurements to apportion the net effects ofassimilation nitrification and denitrification on changes inbaseflow nitrate fluxes at the river-reach to watershed scale Inthis case we found that during winter to midsummer periodsNO3
minus uptake in Big Creek was dominated by assimilation byphotoautotrophs which was partially compensated by releaseof NO3
minus from nitrification In late summer the predominantmetabolic pathway switched to net heterotrophy andheterotrophic NO3
minus removal through direct uptake anddenitrification became the dominant process of nitrateremoval Removal of NO3
minus by assimilation and denitrificationprovides an important ldquoself-cleansingrdquo ecosystem serviceresulting in a pronounced shift in CN stoichiometry anddecreasing NO3
minus concentrations to low levels which would beexpected to limit algal growth56
This approach provides a means of scaling up frommicroscale and mesoscale process experiments and measure-ments which are by necessity short-term and localized toexplore how river nitrate delivery responds to shifts in streammetabolism from day-to-day and seasonal to interannualvariability This research and the methods presented here areapplicable along the river continuum from headwaters tolarge-scale fluvial systems (with large spatial and temporalvariability in nutrient fluxes) and offer a valuable way forwardin quantifying net process controls on the fate and transport ofnitrogen in fluvial systems
ASSOCIATED CONTENT
S Supporting InformationThe Supporting Information is available free of charge on theACS Publications website at DOI 101021acsest8b03074
S1 Methods Land use and cover data site hydro-geology high-frequency water-quality monitoringstreamflow measurement hydrograph separation anal-ysis of diurnal dissolved oxygen curves to calculateprimary production and respiration calculation of DICand EpCO2 nitrate mass-balance calculations and S2
Environmental Science amp Technology Article
DOI 101021acsest8b03074Environ Sci Technol 2018 52 13708minus13717
13715
Results Figure SI1 time series of nitrate and flow andnitrate plotted against stream flow for Mt Judea TablesSI1 and SI2 sensitivity analysis based on estimates ofNO3
minus load inputs from Left Fork Tables SI3 and SI4alternative scenario sensitivity analysis based onestimates of NO3
minus load inputs from groundwater andadditional references (PDF)
AUTHOR INFORMATIONCorresponding AuthorE-mail hpjcehacukORCIDHelen P Jarvie 0000-0002-4984-1607Phillip D Hays 0000-0001-5491-9272NotesThe authors declare no competing financial interest
ACKNOWLEDGMENTSHPJ and RJW were supported by NERC NationalCapability projects NEC05966 and NEC04879 Funding forthe Big Creek Research and Extension monitoring wasprovided by the Arkansas Governorrsquos Office and StateLegislature to the University of Arkansas Systemrsquos Divisionof Agriculture Hydrological and chemical monitoring by theUSGS were supported by a National Park ServiceUSGSWater Quality Partnership Grant administered by the USGSAny use of trade firm or product names is for descriptivepurposes only and does not imply endorsement by the USGovernment
REFERENCES(1) Smith V H Eutrophication of freshwater and coastal marineecosystems - A global problem Environ Sci Pollut Res 2003 10 (2)126minus139(2) Dodds W K Bouska W W Eitzmann J L Pilger T J PittsK L Riley A J Schloesser J T Thornbrugh D J Eutrophicationof US Freshwaters Analysis of Potential Economic Damages EnvironSci Technol 2009 43 (1) 12minus19(3) Dodds W K Smith V H Nitrogen phosphorus andeutrophication in streams Inland Waters 2016 6 (2) 155minus164(4) Peterson B J Wollheim W M Mulholland P J Webster JR Meyer J L Tank J L Marti E Bowden W B Valett H MHershey A E McDowell W H Dodds W K Hamilton S KGregory S Morrall D D Control of nitrogen export fromwatersheds by headwater streams Science 2001 292 (5514) 86minus90(5) Alexander R B Boyer E W Smith R A Schwarz G EMoore R B The role of headwater streams in downstream waterquality J Am Water Resour Assoc 2007 43 (1) 41minus59(6) Jarvie H P Sharpley A N Scott J T Haggard B E BowesM J Massey L B Within-River Phosphorus Retention Accountingfor a Missing Piece in the Watershed Phosphorus Puzzle Environ SciTechnol 2012 46 (24) 13284minus13292(7) Mulholland P J Helton A M Poole G C Hall R OHamilton S K Peterson B J Tank J L Ashkenas L R CooperL W Dahm C N Dodds W K Findlay S E G Gregory S VGrimm N B Johnson S L McDowell W H Meyer J L ValettH M Webster J R Arango C P Beaulieu J J Bernot M JBurgin A J Crenshaw C L Johnson L T Niederlehner B ROrsquoBrien J M Potter J D Sheibley R W Sobota D J Thomas SM Stream denitrification across biomes and its response toanthropogenic nitrate loading Nature 2008 452 (7184) 202minusU46(8) Mulholland P J Valett H M Webster J R Thomas S ACooper L W Hamilton S K Peterson B J Stream denitrificationand total nitrate uptake rates measured using a field N-15 traceraddition approach Limnol Oceanogr 2004 49 (3) 809minus820
(9) Tank J L Marti E Riis T von Schiller D Reisinger A JDodds W K Whiles M R Ashkenas L R Bowden W BCollins S M Crenshaw C L Crowl T A Griffiths N A GrimmN B Hamilton S K Johnson S L McDowell W H Norman BM Rosi E J Simon K S Thomas S A Webster J R Partitioningassimilatory nitrogen uptake in streams an analysis of stable isotopetracer additions across continents Ecol Monogr 2018 88 (1) 120minus138(10) Tank J L Meyer J L Sanzone D M Mulholland P JWebster J R Peterson B J Wollheim W M Leonard N EAnalysis of nitrogen cycling in a forest stream during autumn using aN-15-tracer addition Limnol Oceanogr 2000 45 (5) 1013minus1029(11) Ensign S H Doyle M W Nutrient spiraling in streams andriver networks Journal of Geophysical Research-Biogeosciences 2006111 (G4) G04009(12) Rode M Halbedel nee Angelstein S Anis M R BorchardtD Weitere M Continuous in-stream assimilatory nitrate uptakefrom high frequency sensor measurements Environ Sci Technol2016 50 (11) 5685minus5694(13) Bowes M J Jarvie H P Halliday S J Skeffington R AWade A J Loewenthal M Gozzard E Newman J R Palmer-Felgate E J Characterising phosphorus and nitrate inputs to a ruralriver using high-frequency concentration-flow relationships Sci TotalEnviron 2015 511 608minus620(14) Halliday S J Skeffington R A Wade A J Bowes M JGozzard E Newman J R Loewenthal M Palmer-Felgate E JJarvie H P High-frequency water quality monitoring in an urbancatchment hydrochemical dynamics primary production andimplications for the Water Framework Directive HydrologicalProcesses 2015 29 (15) 3388minus3407(15) Halliday S J Skeffington R A Wade A J Bowes M JRead D S Jarvie H P Loewenthal M Riparian shading controlsinstream spring phytoplankton and benthic algal growth Environ-mental Science-Processes amp Impacts 2016 18 (6) 677minus689(16) Wade A J Palmer-Felgate E J Halliday S J Skeffington RA Loewenthal M Jarvie H P Bowes M J Greenway G MHaswell S J Bell I M Joly E Fallatah A Neal C Williams RJ Gozzard E Newman J R Hydrochemical processes in lowlandrivers insights from in situ high-resolution monitoring Hydrol EarthSyst Sci 2012 16 (11) 4323minus4342(17) Rode M Wade A J Cohen M J Hensley R T Bowes MJ Kirchner J W Arhonditsis G B Jordan P Kronvang BHalliday S J Skeffington R A Rozemeijer J C Aubert A HRinke K Jomaa S Sensors in the stream The High-frequency waveof the present Environ Sci Technol 2016 50 (19) 10297minus10307(18) Cohen M J Kurz M J Heffernan J B Martin J BDouglass R L Foster C R Thomas R G Diel phosphorusvariation and the stoichiometry of ecosystem metabolism in a largespring-fed river Ecol Monogr 2013 83 (2) 155minus176(19) Hensley R T Cohen M J On the emergence of diel solutesignals in flowing waters Water Resour Res 2016 52 (2) 759minus772(20) Hensley R T Cohen M J Korhnak L V Inferring nitrogenremoval in large rivers from high-resolution longitudinal profilingLimnol Oceanogr 2014 59 (4) 1152minus1170(21) Kunz J V Hensley R Brase L Borchardt D Rode MHigh frequency measurements of reach scale nitrogen uptake in afourth order river with contrasting hydromorphology and variablewater chemistry (Weisse Elster Germany) Water Resour Res 201753 (1) 328minus343(22) Kraus T E C OrsquoDonnell K Downing B D Burau J RBergamaschi B A Using paired in situ high frequency nitratemeasurements to better understand controls on nitrate concentrationsand estimate nitrification rates in a wastewater-impacted river WaterResour Res 2017 53 (10) 8423minus8442(23) Jones C Kim S W Schilling K Use of continuousmonitoring to assess stream nitrate flux and transformation patternsEnviron Monit Assess 2017 189 35(24) Wollheim W M Mulukutla G K Cook C Carey R OAquatic nitrate retention at river network scales across flow conditions
Environmental Science amp Technology Article
DOI 101021acsest8b03074Environ Sci Technol 2018 52 13708minus13717
13716
determined using nested in situ sensors Water Resour Res 2017 53(11) 9740minus9756(25) Jarvie H P Sharpley A N Brahana V Simmons T PriceA Neal C Lawlor A J Sleep D Thacker S Haggard B EPhosphorus retention and remobilization along hydrological pathwaysin karst terrain Environ Sci Technol 2014 48 (9) 4860minus4868(26) American Public Health Association (APHA) AlkalinityTitration Method 2320 B In Standard Methods for the Examinationof Water and Wastewater 23rd ed 1987 ISBN 978minus0-87553minus287minus5(27) Rantz S E Measurement and computation of streamflow Vol1 Measurement of stage and discharge In US Geological SurveyWater Supply Paper 2175 1982(28) Jarvie H P Neal C Smart R Owen R Fraser D ForbesI Wade A Use of continuous water quality records for hydrographseparation and to assess short-term variability and extremes in acidityand dissolved carbon dioxide for the River Dee Scotland Sci TotalEnviron 2001 265 (1minus3) 85minus98(29) OrsquoConnor D J Ditoro D M Photosynthesis and oxygenbalance in streams Journal of the Sanitary Engineering DivisionProceedings of the American Society of Civil Engineers 1970 96 (2)547minus571(30) Williams R J White C Harrow M L Neal C Temporaland small-scale spatial variations of dissolved oxygen in the RiversThames Pang and Kennet UK Sci Total Environ 2000 251 497minus510(31) Chapra S C Ditoro D M Delta method for estimatingprimary production respiration and reaeration in streams J EnvironEng 1991 117 (5) 640minus655(32) Bernhardt E S Heffernan J B Grimm N B Stanley E HHarvey J W Arroita M Appling A P Cohen M J McDowellW H Hall R O Read J S Roberts B J Stets E G Yackulic CB The metabolic regimes of flowing waters Limnol Oceanogr 201863 S99minusS118(33) Odum H T Primary production in flowing waters LimnolOceanogr 1956 1 102minus117(34) Jarvie H P King S M Neal C Inorganic carbon dominatestotal dissolved carbon concentrations and fluxes in British riversApplication of the THINCARB model - Thermodynamic modellingof inorganic carbon in freshwaters Sci Total Environ 2017 575 496minus512(35) King S A Heffernan J B Cohen M J Nutrient flux uptakeand autotrophic limitation in streams and rivers Freshwater Science2014 33 (1) 85minus98(36) Hall R O Tank J L Ecosystem metabolism controls nitrogenuptake in streams in Grand Teton National Park Wyoming LimnolOceanogr 2003 48 (3) 1120minus1128(37) Hall R O Beaulieu J J Estimating autotrophic respiration instreams using daily metabolism data Freshwater Science 2013 32 (2)507minus516(38) Stelzer R S Lamberti G A Effects of N P ratio and totalnutrient concentration on stream periphyton community structurebiomass and elemental composition Limnol Oceanogr 2001 46 (2)356minus367(39) Redfield A C The biological control of chemical factors in theenvironment American Scientist 1958 46 (3) 205minus221(40) Evans-White M A Haggard B E Scott J T A Review ofstream nutrient criteria development in the United States Journal ofEnvironmental Quality 2013 42 (4) 1002minus1014(41) Sharpley A N Haggard B E Berry L Brye K Burke JDaniels M B Gbur E Glover T Hays P Kresse TVanDevender K W Nutrient concentrations in Big Creek correlateto regional watershed land use Agricultural amp Environmental Letters2017 2 170027(42) Miller R B Heeren D M Fox G A Halihan T Storm DE Mittelstet A R The hydraulic conductivity structure of gravel-dominated vadose zones within alluvial floodplains J Hydrol 2014513 229minus240(43) Miller R B Heeren D M Fox G A Halihan T Storm DE Heterogeneity influences on stream water-groundwater interactions
in a gravel-dominated floodplain Hydrol Sci J 2016 61 (4) 741minus750(44) Triska F J Duff J H Avanzino R J The role of waterexchange between a stream and its hyporheic zone in nitrogen cyclingat the terrestrial aquatic interface Hydrobiologia 1993 251 (1minus3)167minus184(45) Zarnetske J P Haggerty R Wondzell S M Baker M ALabile dissolved organic carbon supply limits hyporheic denitrifica-tion J Geophys Res 2011 116 G04036(46) Zarnetske J P Haggerty R Wondzell S M Bokil V AGonzalez-Pinzon R Coupled transport and reaction kinetics controlthe nitrate source-sink function of hyporheic zones Water Resour Res2012 48 W11508(47) Harvey J W Bohlke J K Voytek M A Scott D TobiasC R Hyporheic zone denitrification Controls on effective reactiondepth and contribution to whole-stream mass balance Water ResourRes 2013 49 (10) 6298minus6316(48) Moatar F Abbott B W Minaudo C Curie F Pinay GElemental properties hydrology and biology interact to shapeconcentration discharge curves for carbon nutrients sediment andmajor ions Water Resour Res 2017 53 (2) 1270minus1287(49) Zarnetske J P Haggerty R Wondzell S M Baker M ADynamics of nitrate production and removal as a function ofresidence time in the hyporheic zone J Geophys Res 2011 116G01025(50) Zarnetske J P Haggerty R Wondzell S M Couplingmultiscale observations to evaluate hyporheic nitrate removal at thereach scale Freshwater Science 2015 34 (1) 172minus186(51) Palmer-Felgate E J Mortimer R J G Krom M D JarvieH P Impact of point-source pollution on phosphorus and nitrogencycling in stream-bed sediments Environ Sci Technol 2010 44 (3)908minus914(52) Aubert A H Breuer L New seasonal shift in in-streamdiurnal nitrate cycles identified by mining high-frequency data PLoSOne 2016 11 (4) e0153138(53) Dodds W K Marti E Tank J L Pontius J Hamilton SK Grimm N B Bowden W B McDowell W H Peterson B JValett H M Webster J R Gregory S Carbon and nitrogenstoichiometry and nitrogen cycling rates in streams Oecologia 2004140 (3) 458minus467(54) Liu T Xia X H Liu S D Mou X L Qiu Y WAcceleration of Denitrification in Turbid Rivers Due to DenitrificationOccurring on Suspended Sediment in Oxic Waters Environ SciTechnol 2013 47 (9) 4053minus4061(55) Xia X H Jia Z M Liu T Zhang S B Zhang L WCoupled Nitrification-Denitrification Caused by Suspended Sediment(SPS) in Rivers Importance of SPS Size and Composition EnvironSci Technol 2017 51 (1) 212minus221(56) Jarvie H P Smith D R Norton L R Edwards F BowesM J King S M Scarlett P Davies S Dils R Bachiller-Jareno NPhosphorus and Nitrogen Limitation and Impairment of HeadwaterStreams Relative to Rivers in Great Britain A National Perspective onEutrophication Sci Total Environ 2018 621 849minus862
Environmental Science amp Technology Article
DOI 101021acsest8b03074Environ Sci Technol 2018 52 13708minus13717
13717
1
E COLI IN FLOWING WATERS
Mary Savin and BCRET members
I Why is Escherichia coli (E coli) being monitored What is the concern
Fecal pollution (from excrement of humans or animals) in the environment is of concern for many reasons not least of which is human health risks and disease control Other concerns related to fecal pollution of our natural waters include potential changes in the nutrient status of water introduction of antibiotic resistance and chemical contaminants changes in the ecological condition of waters and degradation of natural resources on which rural economies depend
People are concerned that the land application of swine effluent (pig excrement) will increase Escherichia coli in Big Creek and consequently the Buffalo River the first National Scenic River in the US This document aims to provide better understanding of
1) what is involved in E coli monitoring 2) what the numbers mean 3) some limitations in interpreting values and 4) provide a context for further research that may be needed to better interpret the E coli
numbers being measured in flowing waters such as Big Creek and Buffalo River
II What is E coli Why and how is it used as an indicator
E coli is a species of bacteria from the coliform group - bacteria that are rod-shaped gram negative non-spore forming facultative anaerobes commonly found in the feces of humans and warm blooded animals E coli occurs in human intestines - many strains with no ill effects although certain E coli cause serious human illnesses Thus while many E coli do not harm us there are important variants that do There are also other species of bacteria viruses and other small organisms that cause disease which if present in fecal sources polluting our waters can make humans sick Depending on whether E coli survive as long in the environment as these other pathogens E coli may or may not adequately warn us about a disease causing agent in our waters To date E coli is the most reliable test we have although other indicators and tests are being investigated E coli cannot be seen in streams by the human eye Thus it is important to determine if there is a problem of elevated E coli numbers by careful water sampling and using US Environmental Protection Agency (EPA) standardized methods E coli is counted in water because of the extensive studies and relationships established between the presence of E coli and the number of human illnesses occurring from contact with the water (eg swimming) containing the bacteria From these relationships there have been upper limits established for bacterial numbers that correspond to the acceptable risk of people getting sick from exposure to water containing them Water quality standards for E coli are established by the state in Arkansas Department of Environmental Quality (ADEQ) Regulation 2 (see Table 1) The E coli numbers must remain below a threshold in a specified number of total samples collected The exact upper limit that is allowed depends on the designation of the waterbody and time of year (primary or secondary contact season) Primary
2
Table 1 Upper limits for Escherichia coli counts defined in Regulation 2 of the Arkansas Department of
Environmental Quality (ADEQ) as specified by contact season and waterbody designation for both single samples and geometric mean
Contact season Water designation Limit of E coli (MPN100mL)
Single sample1
Geometric mean2
Primary (May 1-Sept 30)
Extraordinary Resource Water Ecologically Sensitive Waterbody
Natural amp Scenic Waterway Lakes
Reservoirs
298 126
All other water 410 NA3
Secondary (Oct 1-April 30)
Extraordinary Resource Water Ecologically Sensitive Waterbody
Natural amp Scenic Waterway Lakes
Reservoirs
1490 630
All other water 2050 NA 1 No more than 25 of samples from no less than 8 samples per contact season may exceed the limit 2Geometric mean is calculated from at least 5 samples collected within 30 days at evenly spaced time intervals during that 30-day period 3Not applicable
contact recreation is a designation given to a waterbody where full body contact occurs and occurs from May 1 through September 30 The ADEQ also designates any stream with a watershed (eg drainage basin in the landscape) exceeding 10 square miles and those with smaller watersheds on individual cases (ie after site verification) for primary contact recreation Secondary contact recreation designates waterbodies where activities such as boating fishing and wading take place and occurs from October 1 through April 30
E coli is measured in samples of water collected strictly following EPA guidelines The measurement of E coli starts within 8 hours of collection This method provides an estimate of E coli presence in the sampled water that is the most probable number (MPN) of E coli Using an EPA method provides numbers that are theoretically comparable to other labs using the same method The MPN depends on growing bacteria in the laboratory in ldquoculturerdquo and is an approach used routinely in microbiology This measurement is subject to high variability because of the nature of environmental bacteria thus variability in the data in E coli counts from streams is not unusual For this reason it is important to establish background levels of E coli in any water resulting from various wildlife human (eg septic tanks sewers) and agricultural (eg pig chicken cattle) sources
3
E coli thresholds are lower in late spring through summer (primary contact season) when more people are expected to be in contact with streams and lakes More stringent limits also apply to Extraordinary Resource Waters (eg Buffalo River) Ecologically Sensitive Waterbodies and Natural Scenic Waterways During the primary contact season (May 1- Sept 30) we do not want E coli to exceed 298 MPN100 mL and during secondary contact season (Oct 1 ndash Apr 30) E coli counts should not exceed 1490 MPN100 mL in single samples
III How does the E coli measurement ldquofitrdquo into the context of the landscape
While monitoring one bacterial species to assess the biological quality of water may seem simple determining the actual ecological condition of a system is complicated Measurement of E coli is an indicator for potential fecal pollution and potential pathogen problems but by itself does not identify the source(s) of the bacteria
E coli is present in intestines (and feces) and is not supposed to grow in the environment thus the presence and abundance should indicate pollution and be directly related to human and animal sources However because E coli is in many different animals (eg human wildlife agricultural) and because of the different pathways that bacteria may travel throughout the environment before ending up in water where we can measure it the presence of E coli does not identify the source of pollution
IV Why is E coli monitoring important and why is it complicated
There are many of factors that affect whether E coli survives in the environment for how long and whether it moves to other locations E coli is adapted to living in intestines After deposition from an animal cells have to survive rapidly changing environmental conditions (eg temperature and moisture) exposure to harmful UV rays in sunlight outcompete other organisms and avoid predators All these factors make it difficult to estimate how long E coli will survive in lagoon soil and river environments However there is evidence that E coli can persist in soil and sediments
V What are the numbers
E coli is measured weekly in Big Creek upstream and downstream of the CampH Farm Mt Judea Newton County Arkansas Water sample collection for E coli analysis began Sept 12 2013 prior to manure from CampH Farm application to fields either in fields adjacent to or distant from Big Creek Manure application began in 2014 to fields distant from Big Creek and then adjacent to Big Creek in March 2014 So far in the period following manure applications by CampH Farms (Jan 2 through May 19 2014) no trends in E coli with time or between sampling locations are apparent (Table 2) The Table 2 data are detailed in the Big Creek Research and Extension Team Quarterly Reports and demonstrate the week-to-week variability in E coli at upstream and downstream sites The E coli counts are expected to continue to be variable Clearly it is important to quantify the variability in E coli concentrations long-term in order to determine if changes occur as a result of CampH operation
The MPN is expected to increase with increases in flow and the recent installation of a USGS gauge to measure flow will allow for the determination of the relationship between measured flow in
4
the stream and E coli concentrations Because of the dangers during high flows most contact recreation is expected during base flow and thus sampling during base flow may provide more meaningful data
Table 2 Geometric mean of E coli (and range of sample MPN) before (Sept 12 - Dec 17 2013) and after manure applications began on the CampH Farm (Jan 2 - May 19 2014)
CampH location
Before any manure application
After manure application
Sept 12 - Dec 17 2013 Jan 2 - May 19 2014
(MPN100mL)
Upstream 82 (6 ndash 4080) 83 (NDa ndash 921)
Downstream 111 (5 ndash 3500) 39 (ND ndash 1553) aNot detected
Regulation Arkansas Pollution Control and Ecology Commission 01400-002 2014 Regulation Establishing Water Quality Standards for Surface Waters of the State of Arkansas as revised effective March 24 2014 Arkansas Department of Environmental Quality (ADEQ) Available at httpwwwadeqstatearusregsfilesreg02_final_140324pdf Last accessed 20 Aug 2014
Page 1 of 6
Nutrient impairment of surface waters continues despite widespread conservation efforts to reduce losses from urban rural and agricul-tural land uses (Scavia et al 2014) Land use within watersheds influ-
ences the quality and quantity of water in streams draining the landscape As land disturbance increases and use intensifies an increase in stormwater runoff and nutrient inputs that lead to a greater potential for transport to receiving water is generally observed (Dubrovsky et al 2010 Rebich et al 2011) This has led to efforts to identify and quantify nutrient sources within watersheds strategically target and apportion nutrient loss reduction (Reckhow et al 2011)
Many factors influence the relationship between land use in a given water-shed and nutrient transport downstream from that watershed With an increase in percentage of the drainage area in pasture row crop andor urban use a general trend of increasing nutrient concentrations in storm and base flows will manifest (Buck et al 2004 Giovannetti et al 2013 Haggard et al 2003 Migliaccio et al 2007) Thus nutrient concentrations in streams draining for-ested lands tend to be less than in watersheds with considerable anthropogenic land use
For a range of reasons great interest has been expressed in nutrient con-centrations in several streams of the Boston and Ozark Mountains region of northwest Arkansas including the Buffalo National River and its tributaries In particular Big Creek has been the center of attention within the Buffalo National River watershed (BRW) because of a permitted concentrated animal feeding operation (CAFO) The objectives of this letter are to put nutrient con-centrations of Big Creek into the context of the stream nutrient and watershed land use relationship and assess whether stream nutrient concentrations have
Nutrient Concentrations in Big Creek Correlate to Regional Watershed Land Use
A N Sharpley B E Haggard L Berry K Brye J Burke M B Daniels E Gbur T Glover P Hays T Kresse and K W VanDevender
Copyright copy American Society of Agronomy Crop Science Society of America and Soil Science Society of America 5585 Guilford Rd Madison WI 53711 USAThis is an open access article distributed under the terms of the CC BY-NC-ND license (httpcreativecom-monsorglicensesby-nc-nd40) Agric Environ Lett 2170027 (2017) doi102134ael2017080027 Received 16 Aug 2017 Accepted 25 Sep 2017 Corresponding author (sharpleyuarkedu)
Agricultural amp Environmental Letters
Research Letter
Abstract Nutrient concentrations in several streams of the Boston and Ozark Mountains region of Arkansas including the Buffalo National River and its tributaries have garnered tremendous interest In particular Big Creek has been the center of attention within the Buffalo River watershed because of a permitted concentrated animal feeding operation (CAFO) The objectives of this paper were to put nutrient concentrations of Big Creek into the context of the stream nutrient and watershed land-use relationship and develop a framework to evaluate regional land-use impacts on regional water quality Nutrient concentrations in streams draining the Boston and Ozark Mountains region were related to the intensity of watershed land use Concentrations in Big Creek were similar to other watersheds in the ecoregion with similar land use suggesting limited impact of the CAFO on Big Creek at the present time However this does not preclude future impacts and longer-term monitoring continues
AN Sharpley L Berry K Brye J Burke and T Glover Dep of Crop Soil and Environmental Sciences Univ of Arkansas 115 Plant Sciences Building Fayetteville AR 72701 BE Haggard Biological and Agricultural Engineering Univ of Arkansas BENGR201 Fayetteville AR 72701 MB Daniels and KW VanDevender Biological and Agricultural Engineering Cooperative Extension Univ of Arkansas 2301 South University Ave Little Rock AR 72203 E Gbur Agricultural Statistics Laboratory Univ of Arkansas 101 Agricultural Annex Fayetteville AR 72701 P Hays Dep of Geosciences Univ of Arkansas 216 Ozark Hall Fayetteville AR 72701 T Kresse (retired) USGS Arkansas Water Science Center 401 Hardin Rd Little Rock AR 72211
Core Ideas
bull Nutrient concentrations are low at Big Creek relative to expected biological-response thresholds
bull Nutrient concentrations at Big Creek are typical of streams draining watersheds with similar land use
bull Flow-adjusted nutrient concentrations at Big Creek have not increased over the short-term
bull Nutrient concentrations in streams increase as watershed land area in pasture and urban uses increases
Abbreviations BRW Buffalo River watershed CAFO concentrated animal feeding operation LOESS locally weighted regression SRP soluble reactive phosphorus TN total N TP total P UIRW Upper Illinois River watershed UWRW Upper White River watershed
Published online October 26 2017
Page 2 of 6 AGRICULTURAL amp ENVIRONMENTAL LETTERS
changed over the short term (3 yr of monitoring) The goal is to understand if how and why stream nutrient concentra-tions change downstream at Big Creek and whether the per-mitted swine CAFO has influenced water quality during the 3 yr since extensive monitoring began in September 2013
MethodsWater samples have been collected over varying periods
at the outlet of subwatersheds of the BRW Upper Illinois River watershed (UIRW) and Upper White River watershed (UWRW Fig 1) Land use and cover (ie forest pasture and urban) for each subwatershed was obtained from high-resolution (4-m) imagery from the USGS National Elevation Dataset (USGS 2015 Gesch et al 2002) National Land Cover Dataset (USGS 2017b) and National Hydrologic
Dataset (USGS 2017a) In the UWRW Giovannetti et al (2013) monitored 20 sites monthly for 1 yr (June 2005ndashJuly 2006) collecting water samples during base-flow condi-tions In the UIRW Haggard et al (2010) monitored 29 sites monthly during calendar year 2009 also collecting water samples during base-flow conditions
In the BRW the National Park Service in partnership with the Arkansas Department of Environmental Quality periodically collected water samples and measured nutrient concentrations at 20 stream sites from 1985 through 2015 Nitrate-nitrogen (NO3ndashN) total N (TN) soluble reactive phosphorus (SRP) and total P (TP) concentrations were obtained directly from these data Forest pasture and urban land-use areas were determined from 2006 high-resolution (4-m) land usendashland cover imagery
Fig 1 Location of the Big Creek Buffalo River Upper Illinois River and Upper White River watersheds in the Boston Mountains and Ozark Highlands ecoregion Information from USGS Environmental Systems Research Institute (ESRI) and NASA
AGRICULTURAL amp ENVIRONMENTAL LETTERS Page 3 of 6
Big Creek is monitored by the Big Creek Research and Extension Team a partnership between the University of Arkansas Systemrsquos Division of Agriculture and USGS Water samples have been collected upstream and down-stream of the swine CAFO on a near-weekly basis since September 2013 (Fig 1) The water samples were analyzed at an Arkansas Department of Environmental Quality cer-tified water quality laboratory within the Arkansas Water Resources Center (httparkansas-water-centeruarkeduwater-quality-labphp) according to methods detailed in Table 1 The data collected is made publicly available at httpsbigcreekresearchorg
The geometric mean of nutrient concentrations of base-flow samples collected between September 2013 and April 2017 were determined in order to compare with base-flow nutrient concentrations available for BRW UIRW and UWRW Base-flow conditions in Big Creek were classified from hydrograph inspection when flow had not increased or decreased within 3 d of sample collection McCarty and Haggard (2016) suggested that stream nutrient concen-trations under base flow can be used to identify nonpoint sources and target remedial measures in Boston Mountains and Ozark Highland watersheds
Using all above-listed data sources the geometric means of nutrient concentrations for streams in the BRW UIRW and UWRW were used to develop a relationship with human development within the watershed Human development is defined as the percentage of pasture plus urban land use within the watershed Exponential relationships with 95 confidence bands around the observations were developed for NO3ndashN TN SRP and TP concentrations to put nutri-ent concentration at Big Creek into the context of regional stream nutrients and watershed land use
Data from Big Creek were paired with discharge available from a gaging station just downstream from the swine CAFO where the USGS developed the rating curve discharge infor-mation was only available from May 2014 through April 2017 The data were then used in a simple three-step pro-cess (White et al 2004) to look at monotonic changes in the nutrients at Big Creek (i) log-transform concentration (mg L-1) and associated instantaneous discharge (m3 s-1) (ii) use locally weighted regression (LOESS) to smooth the data with a sampling proportion (n) of 05 and (iii) plot the resid-uals from LOESS (ie the flow-adjusted concentrations) over time and use linear regression to evaluate monotonic trends
Results and DiscussionPutting Stream Nutrient Concentrations into Context at Big Creek
In Big Creek upstream of the swine CAFO the geometric mean concentrations of base flow sampled at weekly inter-vals from September 2013 for NO3ndashN TN SRP and TP were 0098 0205 0009 and 0030 mg L-1 respectively Directly downstream of the CAFO geometric mean concentra-tions at Big Creek during base flow conditions during the same period were 0242 0356 0011 and 0031 mg L-1 for NO3ndashN TN SRP and TP respectively Arkansas has narra-tive criteria for nutrient concentrations in streams (Arkansas Pollution Control and Ecology Commission 2016) but its proposed assessment methodology has numeric screen-ing concentrations for TN (0450ndash2430 mg L-1) and TP (0040ndash0100 mg L-1) in the Boston Mountains and Ozark Highlands The geometric mean concentrations at Big Creek upstream and downstream from the CAFO were below these values for the Boston Mountains and Ozark Highlands ecoregion
Nutrient concentrations in Big Creek upstream and down-stream from the CAFO are low with respect to nutrientndashbio-logical response thresholds for algae macroinvertebrates and fish Evans-White et al (2014) reviewed the literature sum-marizing nutrientndashbiological response thresholds across the United Statesbull Algalmetricresponses TN 038ndash179 mg L-1 TP 0011ndash
028 mg L-1
bull Macroinvertebratemetric responses TN 061ndash192 mg L-1 TP 004ndash015 mg L-1
bull Fishmetricresponses TN 054ndash183 mg L-1 TP 006ndash014 mg L-1
Total N concentrations at Big Creek upstream and down-stream of the swine CAFO were well below thresholds that result in some expected biological response whereas TP con-centrations were below thresholds for expected macroinver-tebrate and fish response and on the low end of the range for expected algal response However these lower TP thresholds (0006ndash0026 mg L-1 Stevenson et al 2008) were focused on shifts in diatom species and metrics rather than nuisance algal biomass A recent study on the Illinois River Watershed showed that stream TP thresholds with Cladophora bio-volume and nuisance taxa proportion of biovolume were observed between 0032 and 0058 mg L-1 (Joint Study
Table 1 Minimum detection limits for each chemical and biological constituent
Constituent Analytical methoddagger Minimum detection limitDagger Reporting limitsectSoluble reactive P mg Lminus1 EPA 3652 0002 0010Total P mg Lminus1 APHA 4500-P J EPA 3652 0012 0020NitratendashN mg Lminus1 EPA 3000 0004 0050Total N mg Lminus1 APHA 4500-P J EPA 3532 0006 0050Total suspended solids mg Lminus1 EPA 1602 No detection limit 40
dagger EPA = Approved CWA Chemical Test Methods (USEPA 2017) APHA = American Public Health Association from the WadeableStreamsAssessmentWaterChemistryLaboratoryManual (USEPA 2004)
Dagger The minimum detection limit of an analyte is the value which can be measured and reported with 99 confidence that the analyte concentration is greater than zero Further information is available at USGS (1999)
sect The reporting limit is the least (non-zero) calibrated standard used in analysis or as defined by method for total suspended solids
Page 4 of 6 AGRICULTURAL amp ENVIRONMENTAL LETTERS
Committee 2017) Thus TP concentrations at Big Creek upstream and downstream of the CAFO were in the range in which the natural assemblage of algae is shifting but these con-centrations would likely not be indicative of problematic nuisance algae in this ecoregion
Geometric mean nutrient concentra-tions varied upstream and downstream of the swine CAFO at Big Creek and Kosič et al (2015) used the publicly available data to allude to the N increase being from human activities on the landscape such as the CAFO However the historic land use and how stream nutrient concentrations during base-flow conditions increase with human development within the Boston Mountain and Ozark Highland watersheds need to be considered (eg see Giovannetti et al 2013 Haggard et al 2003 Migliaccio et al 2007) In the Big Creek watershed the percentage of land influenced by human activities (ie pas-ture plus urban) doubles from ~10 to ~20 in the drainage area upstream and downstream of the CAFO Nutrient concentrations in Big Creek upstream and downstream of the CAFO are within the range typical of streams draining simi-lar land uses (Fig 2)
At this time nutrient concentrations in Big Creek upstream and downstream from the swine CAFO are con-sistent with the range in concentrations for other watersheds with similar pasture and urban land use characteristics (Fig 2) as well as less than most nutrient thresholds for nuisance water-quality conditions (Omernik and Griffith 2014) However this does not preclude the possibility that nutri-ent concentrations at Big Creek may increase over time especially if human development and activity in the drain-age areas increase The most important observation is that nutrient concentrations were low in Big Creek providing the ability to detect changes over time
Have Nutrient Concentrations Changed in the Short Term at Big Creek
Understanding that long-term (eg decadal-scale) water-quality data are needed to reliably assess how stream nutri-ent concentrations have changed in response to watershed management and climate variations is of critical importance (Hirsch et al 2015) The literature shows that stream nutri-ent concentrations can change relatively quickly in response to effluent management (eg Haggard 2010 Scott et al 2011) but seeing a response (ie decrease in concentrations) from landscape management can take decades or more (Green et al 2014 Sharpley et al 2013) A myriad of factors may influence observed nutrient concentrations in streams including discharge (Petersen et al 1998) biological pro-cesses and climactic conditions (ie drought and floods Jones and Stanley 2016) and dominant transport pathways (Sharpley et al 2013) Thus we need to use caution when
interpreting trends in water quality over databases that only cover a limited timeframe
Three years of flow-adjusted nutrient concentration data at Big Creek downstream from the swine CAFO (May 2014ndashApril 2017) show different relationships with flow for the various constituentsbull Nitrate-nitrogen was greatest (~05 mg L-1) during the
lowest flows sampled and concentrations decreased with increasing flow
bull Total N generally decreased with increasing flow until a minimal value occurred then TN increased with in-creasing flow
bull Soluble reactive P concentrations did not change much during base-flow conditions and the greater concentra-tions (~0100 mg L-1) sporadically occurred at larger flows indicating that enrichment from stormflow may have been influenced by availability of source or other nontransport factors and
bull Total P concentrations were also relatively stable during base-flow conditions and then increased in association with rainfall-runoff events with only a few samples hav-ing concentrations gt0100 mg L-1 indicating relatively small enrichment from the landscape
Flow-adjusted concentrations (White et al 2004) showed no monotonic (ie increasing or decreasing) trends in SRP TP or TN (P gt 016) over the current monitoring period (Fig 3) However flow-adjusted NO3ndashN concentrations decreased over time (R2 = 005 P = 001) by 7 yr-1 (Fig 3c)
Nutrient concentrations at Big Creek upstream and downstream of the swine CAFO and indeed most tributaries of the Buffalo River are low relative to other watersheds in this ecoregion (Fig 2) This provides a starting point to build a framework to evaluate changes in nutrient concentrations of streams as a function of land use and management The
Fig 2 Relationship between land use and the geometric mean N and P concentrations (mg L-1) in the Buffalo Upper Illinois and Upper White River watersheds (no total P data available for the Buffalo River watershed) Dashed lines represent the 95 confi-dence intervals for the estimated mean (solid line)
AGRICULTURAL amp ENVIRONMENTAL LETTERS Page 5 of 6
evaluation of flow-adjusted concentrations over time showed that nutrients in Big Creek were not increasing over the short duration of monitoring for which concentration and dis-charge data were available (May 2014ndashApril 2017) At this point in time (April 2014ndashApril 2017) it is evident that nutrient concentra-tions in Big Creek have not increased at the monitored site However flow and nutri-ent concentration data over a longer period are needed to reliably quantify water-quality trends and characterize sources and moni-toring needs to continue for at least a decade to evaluate how discharge season and time influence nutrient fluxes (Hirsch et al 2010)
This research details a process by which regional monitoring networks can be devel-oped to establish baseline in-stream nutri-ent concentrations and by which time andor land use and management impacts can be determined
AcknowledgmentsFunding for the Big Creek Research and Extension Team (BCRET) to undertake the on-going monitoring project was provided by the Arkansas Governorrsquos Office and State Legislature to the University of Arkansas Systemrsquos Division of Agriculture All authors are members of BCRET
ReferencesArkansas Pollution Control and Ecology Commission 2016 Regulation
no 2 Regulations establishing water quality standards for surface wa-ters of the State of Arkansas httpswwwepagovsitesproductionfiles2014-12documentsarwqspdf (accessed 21 Sept 2017)
Buck O DK Niyogi and CR Townsend 2004 Scale-dependence of land use effects on water quality of streams in agricultural catchments En-viron Pollut 130(2)287ndash299 doi101016jenvpol200310018
Dubrovsky NM KR Burow GM Clark JM Gronberg PA Hamilton KJ Hitt DK Mueller and MD Munn 2010 The quality of our na-tionrsquos waters Nutrients in the nationrsquos streams and groundwater 1992ndash2004 USGS Circ 1350 httpwaterusgsgovnawqanutrientspubscirc1350 (accessed 21 Sept 2017)
Evans-White MA BE Haggard and JT Scott 2014 A review of stream nutrient criteria development in the United States J Environ Qual 421002ndash1014 doi102134jeq20120491
Gesch D M Oimoen S Greenlee C Nelson M Steuck and D Tyler 2002 The national elevation dataset Photogramm Eng Remote Sens 68(1)5ndash11 httpsnationalmapgovPERS_Jan2002_NED_highlight_articlepdf
Giovannetti J LB Massey BE Haggard and RA Morgan 2013 Land use effects on stream nutrients at Beaver Lake watershed J Am Water Works Assoc 105E1ndashE10 doi105942jawwa20131050005
Green CT BA Bekins SJ Kalkhoff RM Hirsch L Liao and KK Barnes 2014 Decadal surface water quality trends under variable cli-mate land use and hydrogeochemical setting in Iowa USA Water Resour Res 502425ndash2443 doi1010022013WR014829
Haggard BE 2010 Phosphorus concentrations loads and sources within the Illinois River drainage area northwest Arkansas 1997ndash2008 J En-viron Qual 392113ndash2120 doi102134jeq20100049
Haggard BE PA Moore Jr I Chaubey and EH Stanley 2003 Nitrogen and phosphorus concentrations and export from an Ozark Plateau catchment in the United States Biosyst Eng 86(1)75ndash85 doi101016S1537-5110(03)00100-4
Haggard BE AN Sharpley L Massey and K Teague 2010 Final report to the Illinois River Watershed Partnership Recommended watershed based strategy for the Upper Illinois River Watershed Northwest Ar-kansas Arkansas Technical Publication Number MSC 355 Water Re-sources Center University of Arkansas httparkansas-water-centeruarkedupublicationsmscMSC355pdf (accessed 21 Sept 2017)
Hirsch RM SA Archfield and LA De Cicco 2015 A bootstrap method for estimating uncertainty of water quality trends Environ Model Softw 73148ndash166 doi101016jenvsoft201507017
Hirsch RM DL Moyer and SA Archfield 2010 Weighted regres-sion on time discharge and season (WRTOS) with an application to the Chesapeake Bay River inputs J Am Water Resour Assoc 46(5)857ndash880
Joint Study Committee 2017 Final report to governors from the Joint Study Committee and Scientific Professionals 19 Dec 2016 Arkansas-Oklahoma Joint Study Committee httpswwwokgovconservationdocumentsIR202016121920Final20Reportpdf (accessed 21 Sept 2017)
Jones JB and EH Stanley 2016 Stream ecosystems in a changing envi-ronment Academic Press Amsterdam
Kosič K CL Bitting JV Brahana and CJ Bitting 2015 Proposals for integrating karst aquifer evaluation methodologies into national en-vironmental legislations Case study of a concentrated animal feed-ing operation in Big Creek basin and Buffalo National River water-shed Arkansas USA Sustain Water Resour Manage 1363ndash374 doi101007s40899-015-0032-5
McCarty JA and BE Haggard 2016 Can we manage nonpoint-source pollution using nutrient concentrations during seasonal baseflow Ag-ric Environ Lett 1160015 doi102134ael2016030015
Migliaccio KW BE Haggard I Chaubey and MD Matlock 2007 Linking watershed subbasin characteristics to water quality param-eters in War Eagle Creek watershed Trans ASAE 50(6)2007ndash2016 doi1013031201324104
Omernik JM and GE Griffith 2014 Ecoregions of the conterminous United States Evolution of a hierarchical spatial framework Environ Manage 54(6)1249ndash1266 doi101007s00267-014-0364-1
Petersen JC JC Adamski RW Bell JV Davis SR Femmer DA Freiwald and RL Joseph 1998 Water quality in the Ozark Plateaus Arkansas Kansas Missouri and Oklahoma 1992ndash95 USGS Circ 1158 USGS Fort Collins CO httpspubsusgsgovcirccirc1158circ1158pdf (accessed 21 Sept 2017)
Rebich RA NA Houston SV Mize DK Pearson PB Ging and CE Hornig 2011 Sources and delivery of nutrients to the northwestern Gulf of Mexico from streams in the south-central United States J Am Water Resour Assoc 47(5)1061ndash1086 doi101111j1752-1688201100583x
Reckhow KH PE Norris RJ Budell DM Di Toro JN Galloway H Greening AN Sharpley A Shirmhhammadi and PE Stacey 2011 Achieving nutrient and sediment reduction goals in the Chesapeake Bay An evaluation of program strategies and implementation Na-tional Academies Press Washington DC
Fig 3 Flow-adjusted concentration of (a) soluble reactive P (b) total P (c) nitrate-N and (d) total N over time since January 2014 when monitoring in Big Creek started
Page 6 of 6 AGRICULTURAL amp ENVIRONMENTAL LETTERS
Scavia D JD Allan KK Arend S Bartell D Beletsky NS Bosch SB Brandt RD Briland I Daloglu JV DePinto DM Dolan MA Evans TM Farmer D Goto H Han TO Hoeoek R Knight SA Ludsin D Mason AM Michalak RP Richards JJ Roberts DK Rucinski E Rutherford DJ Schwab TM Sesterhenn H Zhang and Y Zhou 2014 Assessing and addressing the re-eutrophication of Lake Erie Central basin hypoxia J Great Lakes Res 40226ndash246 doi101016jjglr201402004
Scott JT BE Haggard AN Sharpley and JJ Romeis 2011 Change point analysis of phosphorus trends in the Illinois River (Oklahoma) demonstrates the effects of watershed management J Environ Qual 401249ndash1256 doi102134jeq20100476
Sharpley AN HP Jarvie A Buda L May B Spears and P Kleinman 2013 Phosphorus legacy Overcoming the effects of past management practices to mitigate future water quality impairment J Environ Qual 421308ndash1326 doi102134jeq2013030098
Stevenson RJ Y Pan KM Manoylov CA Parker DP Larsen and AT Herlihy 2008 Development of diatom indicators of ecological con-ditions for streams of the western US J North Am Benthol Soc 271000ndash1016 doi10189908-0401
USEPA 2004 Wadeable streams assessment water chemistry laboratory manual USEPA Office of Water and Office of Research and Develop-ment Washington DC
USEPA 2017 Approved CWA chemical test methods USE-PA Washington DC httpswwwepagovcwa-methodsapproved-cwa-chemical-test-methodsnumber
USGS 1999 The method detection limit procedure of the US Environmen-tal Protection Agency In New reporting procedures based on long-term method detection levels and some considerations for interpre-tations of water-quality data provided by the US Geological Survey National Water Quality Laboratory Open File Rep 99-103 USGS Reston VA httpswaterusgsgovowqOFR_99-193detectionhtml
USGS 2015 National elevation dataset httpsltacrusgsgovNEDUSGS 2017a National hydrologic dataset httpsnhdusgsgovUSGS 2017b National land cover dataset httpscatalogdatagovdataset
usgs-national-land-cover-dataset-nlcd-downloadable-data-collectionWhite KL BE Haggard and I Chaubey 2004 Water quality at the Buffalo
National River Arkansas 1991ndash2001 Trans ASAE 47(2)407ndash417 doi1013031201316042
Sampling Liquid Manure
Karl VanDevender PhD PE Professor Extension Engineer
Liquid animal manure sampling can be an important management tool Proper sampling provides the producer with nutrient analysis results that can be used in a sound farm fertilization program Nutrient analysis of manure in conjunction with soil sampling helps determine how much manure should be applied to fields to maintain adequate fertility while minimizing potential environmental problems such as ground and surface water pollution However manure applications should not exceed the maximum application rates in a manure management plan until sufficient data can be collected to justify revising the plan
When to Sample Liquid animal manure should be sampled for nutrient analysis as close to land application time as possible This helps ensure that the reported nutrient content accurately reflects what is being applied to the land If the manure is sampled as it is being land applied the results will not be available to govern present application rates It does however provide information for future land applications of animal manure if the manure management remains fairly constant over time
How to Collect a Liquid Manure Sample During Land Application The easiest way to collect liquid animal manure samples is to collect the manure as it is being land applied This approach ensures what is sample reflects what is applied Randomly place catch pans in the field to collect the liquid manure as it is land applied by an irrigation system or honey wagon Flexible rubber feed pans work well Immediately after the manure has been applied collect the manure from the catch pans combine in a bucket to make one composite sample and mix well by stirring This bucket will be the source of the manure sent for analysis From a Storage Facility If collecting liquid animal manure samples during land application is not possible collect the samples from the storage facility Liquid animal manure storage facilities have a tendency for the manure to stratify with the solids settling to the bottom and the liquids remaining on top It is also not uncommon for some solids to form a floating crust This stratification affects the manure nutrient concentrations in the storage facility The nitrogen and potassium will be more concentrated in the top liquid while the phosphorus will be more concentrated in the settled solids This stratification of nutrient concentrations increases the challenge of getting samples that represent what will be applied to a particular field If the liquids from the top and middle of the profile will be applied only this material should be sampled If the settled solids will be applied then they should be sampled However if the manure is to be agitated before pumping as has been the traditional recommendation the sample should contain representative proportions of manure from the top middle and bottom The idea is to collect a sample of an entire column of manure to represent the manure after agitation If agitating the manure prior to sampling is not possible an alternative approach is to make a sampler to collect the required sub-samples The sub-samples are then mixed to represent the manure after agitation The easiest to construct is simply a container such as a cup attached to the end of a pole Liquids from the manure surface can be simply scooped up To collect liquids from the middle depths or settled solids the container is held up side down trapping air until the desired sampling depth is reached Then the container is rotated releasing the air and collecting the sample When collecting a sample of the entire profile of the manure sub-samples are collected and mixed in a bucket
- over -
A sampler design that automatically collects a sample of the entire profile uses 10 foot 1 frac12 inch PVC pipe with a PVC ball valve at the bottom The handle of the ball valve is replaces with a lever arm about 2 feet long The free end of the lever arm is attached to the end of a 10 foot 1 inch PVC pipe The lever arm and smaller pipe allow the ball valve to be operated while holding to top of the sampler To use the sampler the valve is opened and the sampler is inserted (in a line not and arc) into the manure When the foot of the valve is at the bottom of the settled solids it is closed Then the sample of the entire manure profile can be removed from the manure and placed in a bucket
Sketch of Cup Sampler Sketch of Foot Valve Sampler
Whichever sampler is used at least 8 locations around the manure storage unit should be sampled and mixed in a bucket to serve as a final composite sample This bucket will be the source of the manure sent for analysis
Getting the Sample Analyzed After thoroughly mixing the final composite sample fill a one liter plastic bottle half full These bottles may be obtained from your county Extension office Never fill the bottle more than half full to allow for gas expansion of the sample and to prevent the bottle from exploding Keep the samples as cool as possible until you can take them to your county Extensions office for shipping to the University of Arkansas lab for analysis There you will get assistance in filling out an information sheet on your manure sample There is a fee to have the sample analyzed While the sample can be sent to a private lab the fees are often higher If you are required by the Arkansas Department of Environmental Equality (ADEQ) to sample your liquid animal manure as part of your Regulation No 5 permit make sure that you inform the individual helping you with the paperwork so the correct set of analyses can be performed In addition to the analyses to determine the fertilizer value of manure it is recommended to analyze for the amount of phosphorus in the manure that is water soluble Water soluble phosphorus is needed to evaluate the potential environmental risk associated with phosphorus application rates specified in manure management plans Having good farm based information should help planners develop plans tailored to and individual farm
Key Points to Remember The important things to remember in collecting a liquid animal manure sample are Collect a sample that best represents the nutrient content of the manure in that storage facility and what
will be applied If only the top water is to be applied it should be sampled If the storage unit will be agitated prior to application the sample should contain material from the entire depth profile
Only fill the sample bottle frac12 full Keep the sample cool prior to shipping Ship the sample to the lab as soon as possible
Handout April 27 2010
The Arkansas Cooperative Extension Service offers its programs to all eligible persons regardless of race color national origin religion
gender age disability marital or veteran status or any other legally protected status and is an Equal Opportunity Employer
- 2015_Bacteria Trends in Flowing Waterspdf
-
- E COLI IN FLOWING WATERS
-
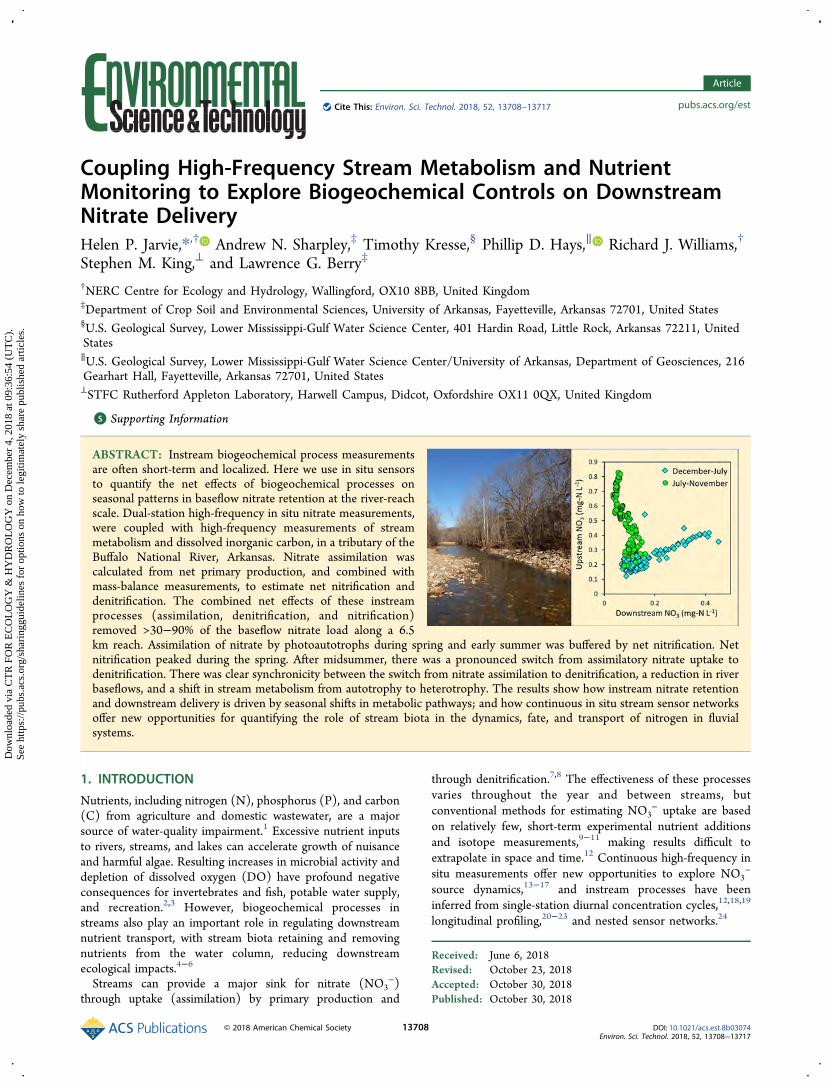
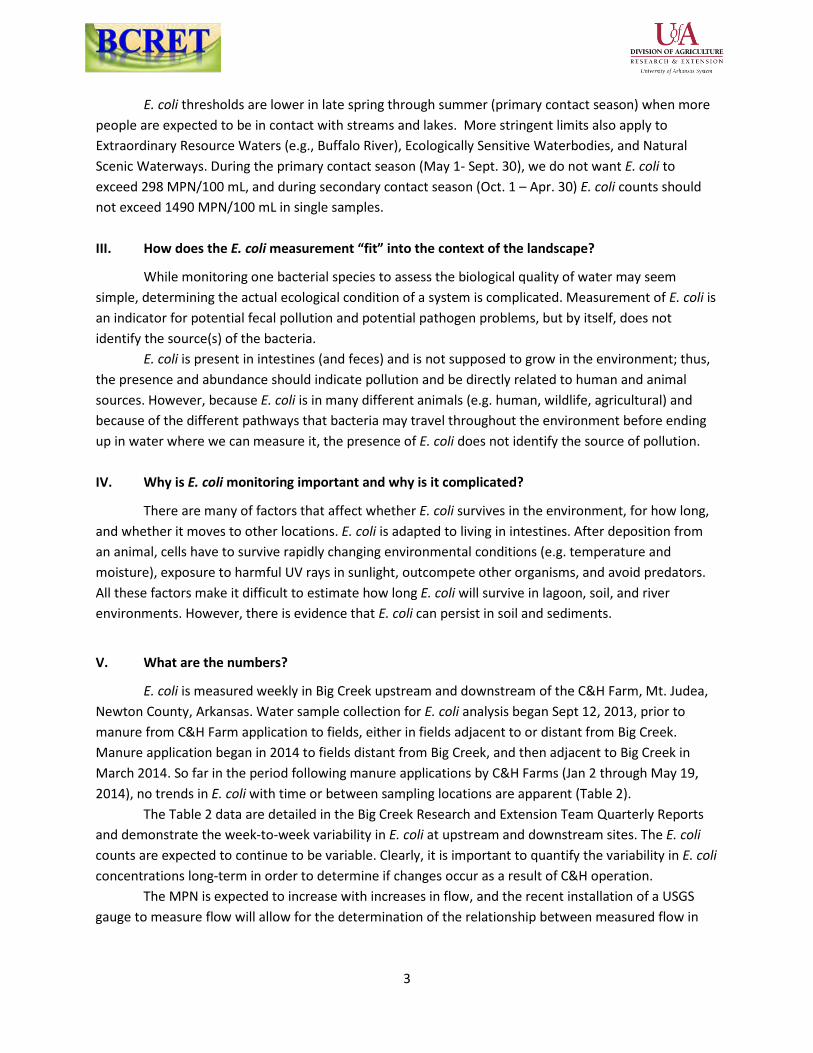
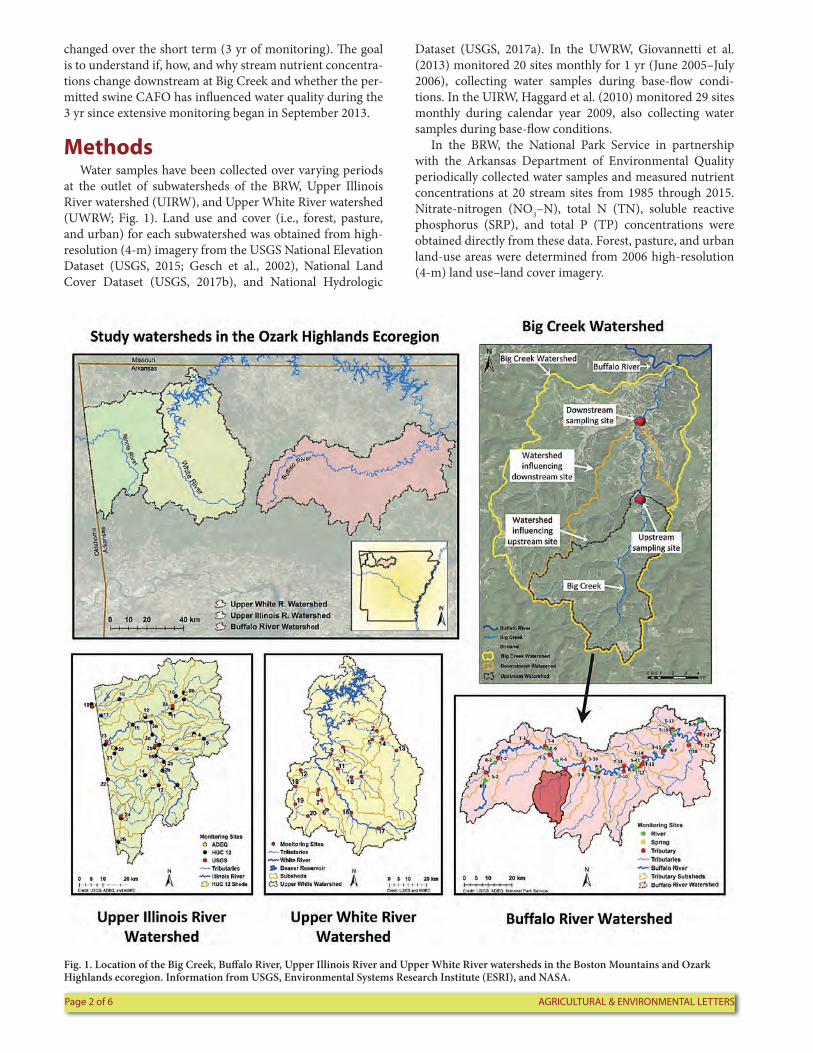
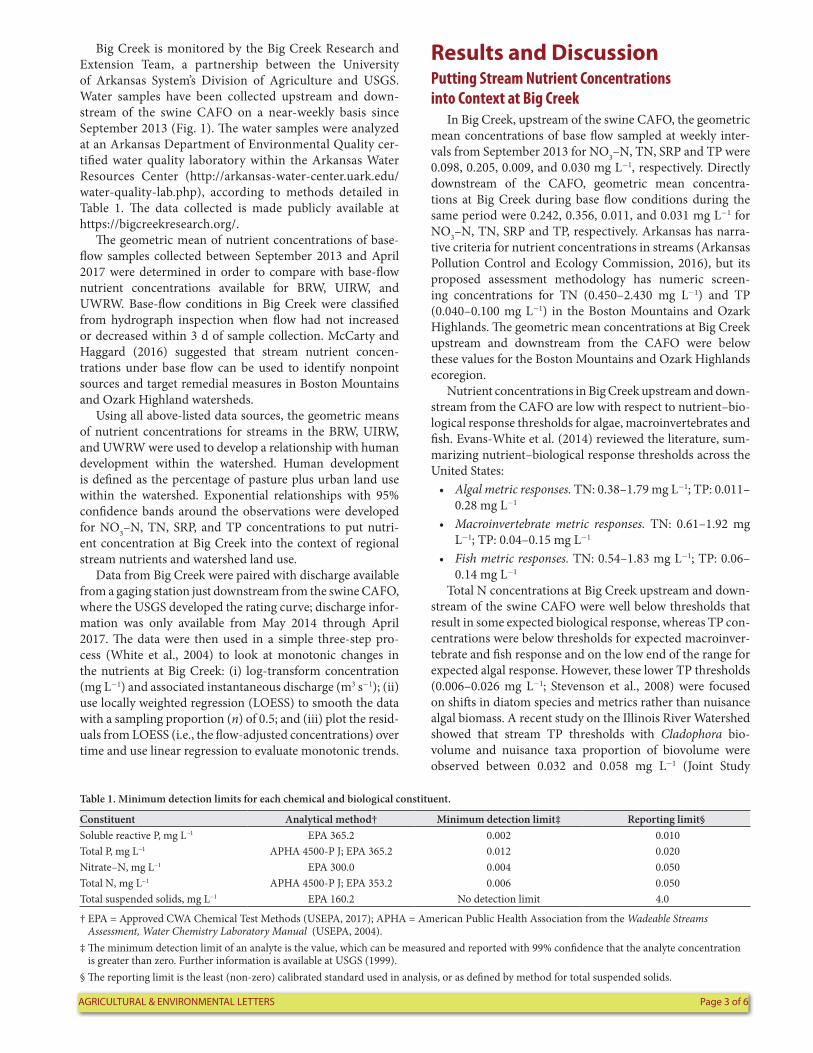
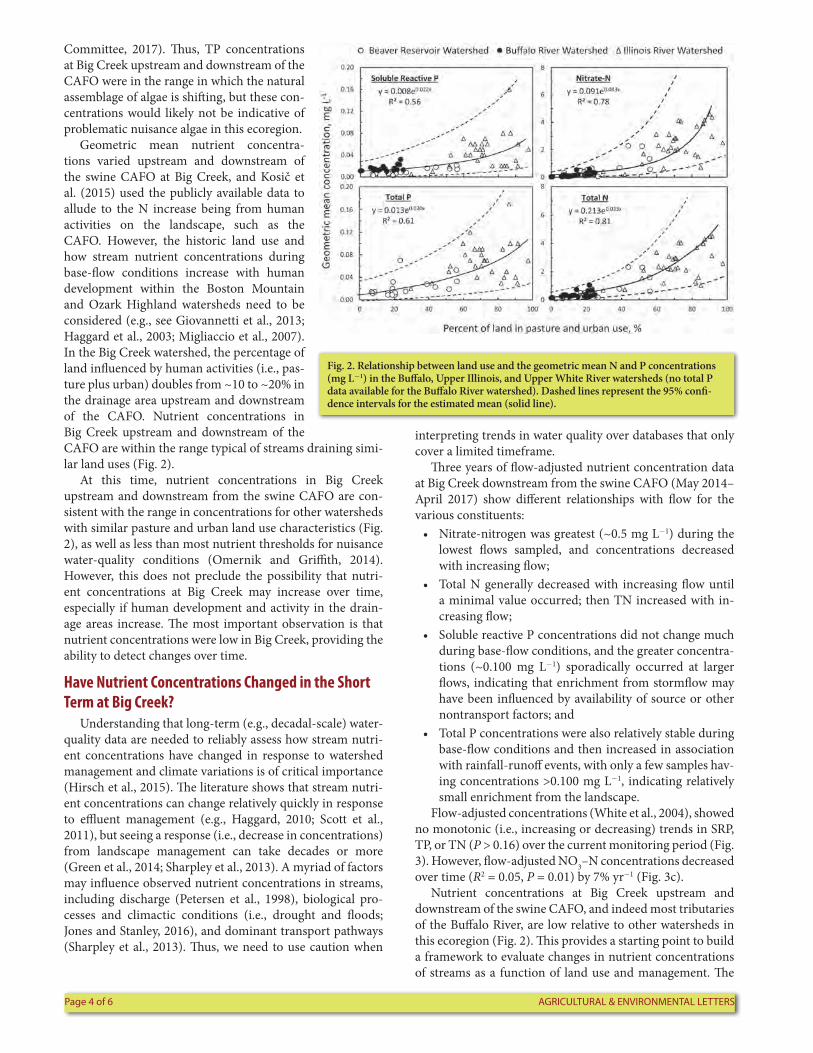