appendix-g - agriculture and agroforestry
TRANSCRIPT
Appendix-GAGRICULTURE
ANDAGROFORESTRY
G-i
THE STUDYON
CRITICAL LANDAND
PROTECTION FOREST REHABILITATIONAT TONDANO WATERSHEHD
INTHE REPUBLIC OF INDONESIA
Volume III
APPENDIX-G
AGRICULTURE AND AGROFORESTRY
Table of Contents
Page
Chapter 1 INTRODUCTION..........................................................................................G-1
Chapter 2 GENERAL BACKGROUND ........................................................................G-32.1 Economic Background .........................................................................................G-32.2 Agricultural Background .......................................................................................G-32.3 Scientific Basis of Agroforestry ............................................................................G-4
Chapter 3 MASTER PLAN FOR THE STUIDY AREA..............................................G-133.1 Present Condition of Agriculture and Agroforestry.............................................G-13
3.1.1 Land Holding Size and Land Tenure.....................................................G-133.1.2 Agricultural Land Use ...........................................................................G-133.1.3 Crop Cultivation ....................................................................................G-143.1.4 Agroforestry System .............................................................................G-173.1.5 Evaluation of Existing Agroforestry System.........................................G-213.1.6 Animal Husbandry.................................................................................G-213.1.7 Inland Fishery........................................................................................G-233.1.8 Farm Economy and Crop Budget ..........................................................G-243.1.9 Marketing .............................................................................................G-253.1.10 Agricultural Extension Service and Farmers Organization...................G-263.1.11 Current Problems in Agricultural Activities ..........................................G-28
3.2 Development Plan of Agriculture and Agroforestry............................................G-323.2.1 Basic Concept .......................................................................................G-323.2.2 Selection of Suitable Agroforestry System ...........................................G-32
G-ii
Page
3.2.3 Conservation Plan of Each Zone ...........................................................G-333.2.4 Imprvement of Cultural Practices..........................................................G-373.2.5 Improvement of Agricultural Extension Service...................................G-373.2.6 Improvement of Farmers� Group...........................................................G-38
Chapter 4 FEASIBILITY STUDY FOR THE INTENSIVE AREA4.1 Present Condition of the Intensive Area..............................................................G-39
4.1.1 Land Holding Size and Land Tenure.....................................................G-394.1.2 Agricultural Land Use by Farming Category........................................G-394.1.3 Major Trees and Crops .........................................................................G-414.1.4 Agroforestry System in the Intensive Area ..........................................G-454.1.5 Crop Production.....................................................................................G-484.1.6 Present Farming Practices .....................................................................G-514.1.7 Crop Budget of Major Crops.................................................................G-524.1.8 Farm Economy ......................................................................................G-534.1.9 Animal Husbandry.................................................................................G-544.1.10 Inland Fishery........................................................................................G-544.1.11 Agricultural Extension Service..............................................................G-594.1.12 Current Problems on Agriculture and Agroforestry System
in the Intensive Area..............................................................................G-604.2 Improvement Plan of Agriculture and Agroforestry............................................G-61
4.2.1 Need of Watershed Conservation from the Viewpoint of Agricultureand Agroforestry....................................................................................G-61
4.2.2 Strategy for Agricultural and Agroforestry Development .....................G-614.2.3 Improvement of Agroforestry System and Cultural Practices ..............G-624.2.4 Application of Suitable Agroforestry System by Area ..........................G-664.2.5 Improvement Plan of Each Zone...........................................................G-664.2.6 Anticipated Crop Production.................................................................G-694.2.7 Crop Budget, Farm Budget and Farm Economy ...................................G-704.2.8 Strengthen of Agricultural and Forestry Extension Service ..................G-724.2.9 Implementation Schedule ......................................................................G-754.2.10 Project Cost ...........................................................................................G-764.2.11 Project Running Cost.............................................................................G-774.2.11 Recommendation...................................................................................G-77

G-iii
List of Tables
Page
Table G.2.1 GRDP of North Sulawesi Province at 1993 Constant Market Price...........GT-1Table G.2.2 GRDP of Minahasa District at 1993 Constant Market Price ......................GT-2Table G.3.1 Average Farm Size by Related Sub-district ................................................GT-3Table G.3.2 The Results of Farm Survey in Five (5) Villages in the Study Area...........GT-4Table G.3.3 Agricultural Land Use in the Study Area....................................................GT-5Table G.3.4 Production of Food Crops...........................................................................GT-6Table G.3.5 Production of Estate Crops .........................................................................GT-7Table G.3.6 Major Crops Used for Agroforestry Systems in Indonesia.........................GT-8Table G.3.7 Types of Agroforestry System in the Study area ........................................GT-9Table G.3.8 Agroforestry Systems in the Study Area..................................................GT-10Table G.3.9 Animal Population ....................................................................................GT-11Table G.3.10 The Number of Fisherman, Fishery Area and Fish Production ................GT-12Table G.3.11 Local Market in the Study Area................................................................GT-13Table G.3.12 Price of Farm Commodities and Farm Input ............................................GT-14Table G.3.13 Activity of BIPP .......................................................................................GT-15Table G.3.14 Farmers� Group in the Study Area............................................................GT-16Table G.3.15 Farmers� Constraints from Farmers� Interview Survey............................GT-17Table G.3.16 Farmers� Request to Credit System and Agricultural Extension ..............GT-18Table G.3.17 The Components for Determination of Recommendable
Agroforestry System.................................................................................GT-19Table G.3.18 Recommendable Type of Agroforstry System in the Study Area .............GT-20Table G.3.19 Characteristics of Each Type of Agroforestry System..............................GT-21Table G.4.1 Agricultural Land Use by Slope and Farming Type .................................GT-22Table G.4.2 Tree Species for Agroforestry...................................................................GT-23Table G.4.3 Planted Area, Production and Value of Clove in North Sulawesi.............GT-24Table G.4.4 The Area of Improper Agricultural Land Use...........................................GT-25Table G.4.5 Planted Area of Major Crops (1/2~2/2) ..................................................GT-26Table G.4.6 The Area of Tree Species in Agricultural Area .........................................GT-28Table G.4.7 Species of Hedgerow Plant and Their Occupied Area..............................GT-29Table G 4.8 Present Crop Production in Intensive Area...............................................GT-30Table G.4.9 Fram Economy of Average Farm Household ...........................................GT-31Table G.4.10 Number of Fishermen in Related Sub-district ..........................................GT-32Table G.4.11 Condition of Fish Culture in Lake Tondano -1 (1/3~3/3) .......................GT-33Table G.4.12 Condition of Fish Culture in Lake Tondano -2 (1/2~2/2) .......................GT-36Table G.4.13 Fish Growth in Unit Cage.........................................................................GT-38Table G.4.14 Tilapia Culture in Lake Tondano ..............................................................GT-38
G-iv
Page
Table G.4.15 Composition of Pellet Fish Feed...............................................................GT-39Table G.4.16 Production Cost of Small Scale Tilapia Culture in Lake Tondano ...........GT-40Table G.4.17 Extension Workers in Intensive Area........................................................GT-41Table G.4.18 Application of Different Farming Category to Each Zone .......................GT-42Table G.4.19 Proposed Planted Area of Major Crops (1/3~3/3) ..................................GT-43Table. G.4.20 Anticipated Crop Production ....................................................................GT-46Table G.4.21 Financial Crop Budget (1/9~9/9) ............................................................GT-47Table G.4.22 Farm Budget .............................................................................................GT-56Table G.4.23 Farm Economy of Average Farm Household under
with Project Condition..............................................................................GT-57Table G.4.24 Cost for Strengthening Extension Service ................................................GT-58Table G.4.25 Annual Disbursement Schedule................................................................GT-58
List of Figures
Page
Figure G.3.1 Distribution of Each Agroforestry System in the Study Area.....................GF-1Figure G.3.2 Poor Managed Agroforestry System...........................................................GF-2Figure G.3.3 Well Managed Agroforestry System with Coconuts...................................GF-3Figure G.3.4 Well Managed Agroforestry System with Cloves.......................................GF-4Figure G.4.1 AGF -I (Type I-2)/IM .................................................................................GF-5Figure G.4.2 AGF -I (Type I-5)/IM .................................................................................GF-6Figure G.4.3 AGF -II (Type II-2)/IM...............................................................................GF-7Figure G.4.4 AGF -III (Type III-2)/IM ............................................................................GF-8Figure G.4.5 UF/IM .........................................................................................................GF-9
Attachment
Attachment-G.1 Summary of Farmers� Interview SurveyAttachment-G.2 Questionnaire to the Local Government and Fisherman
G-1
THE STUDYON
CRITICAL LANDAND
PROTECTION FOREST REHABILITATIONAT TONDANO WATERSHED
INTHE REPUBLIC OF INDONESIA
FINAL REPORTVolume-III
APPENDIX-G
AGRICULTURE AND AGROFORESTRY
CHAPTER 1 INTRODUCTION
This appendix presents firstly the agricultural background, present condition ofagricultural and agfroforestry, current problems of agricultural activities. Based on theanalysis of present condition of agriculture and agroforestry, and current problems ofagriculture, and referring newly issued five years national development plan called as�PROPENAS (National Development Programme 2000-2004�, improvement plan foragriculture and agroforestry improvement is presented.
Economic and agricultural background, especially in GRDP and labour force, andnational policy of agriculture are generally stated in Chapter 2. The importance ofagriculture sector in the Study Area is stressed in this Chapter. Since agroforestrysystem is recently recognized as an important area for crop production, soilconservation, education and training in agroforestry lags far behind other agriculturaldisciplines, leaving a definite shortage of experienced and qualified specialist.Scientific basis of agroforestry is also presented in Chapter 2.
In Chapter 3, the results of master plan study are presented. Present condition ofagriculture, including crop production, animal husbandry and fishery, and agroforestrysystem in the Study Area, is stated. Agroforestry system in the Study Area iscategorized into three, and is classified into 10 types of agroforestry system. At thesame time, each type of agroforestry system is also evaluated with view point of soilconservation and productivity. Based on the analysis of above-mentioned facts,improvement plan of agriculture and agroforestry is proposed in Chapter 3.
G-2
In Chapter 4, the results of feasibility study of Intensive Area are presented. Presentcondition of agriculture in the Intensive Area, including crop production, animalhusbandry and fishery, and forestry, is stated in this Chapter. Based on the analysis ofpresent condition of agriculture and agroforestry, agriculture and agroforestryimprovement plan is proposed. Improvement plan stressed the proper land use,improvement of agroforestry system, cultural practices, including cropping pattern, bystrengthening agricultural extension activity. It is also stated that the farm incomecould be increased by improving agroforestry system and cultural practices of crops.
G-3
CHAPTER 2 GENERAL BACKGROUND
2.1 Economic Background
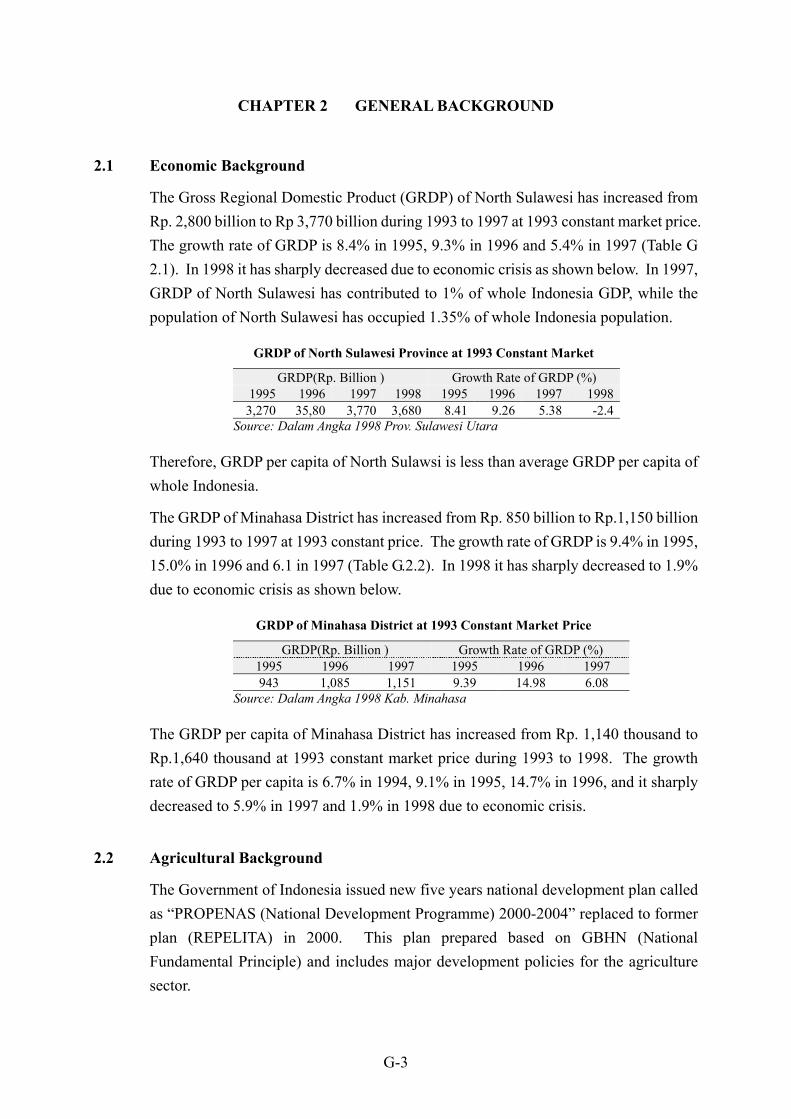
The Gross Regional Domestic Product (GRDP) of North Sulawesi has increased fromRp. 2,800 billion to Rp 3,770 billion during 1993 to 1997 at 1993 constant market price.The growth rate of GRDP is 8.4% in 1995, 9.3% in 1996 and 5.4% in 1997 (Table G2.1). In 1998 it has sharply decreased due to economic crisis as shown below. In 1997,GRDP of North Sulawesi has contributed to 1% of whole Indonesia GDP, while thepopulation of North Sulawesi has occupied 1.35% of whole Indonesia population.
GRDP of North Sulawesi Province at 1993 Constant Market
GRDP(Rp. Billion ) Growth Rate of GRDP (%)1995 1996 1997 1998 1995 1996 1997 1998
3,270 35,80 3,770 3,680 8.41 9.26 5.38 -2.4Source: Dalam Angka 1998 Prov. Sulawesi Utara
Therefore, GRDP per capita of North Sulawsi is less than average GRDP per capita ofwhole Indonesia.
The GRDP of Minahasa District has increased from Rp. 850 billion to Rp.1,150 billionduring 1993 to 1997 at 1993 constant price. The growth rate of GRDP is 9.4% in 1995,15.0% in 1996 and 6.1 in 1997 (Table G.2.2). In 1998 it has sharply decreased to 1.9%due to economic crisis as shown below.
GRDP of Minahasa District at 1993 Constant Market Price
GRDP(Rp. Billion ) Growth Rate of GRDP (%)1995 1996 1997 1995 1996 1997943 1,085 1,151 9.39 14.98 6.08
Source: Dalam Angka 1998 Kab. Minahasa
The GRDP per capita of Minahasa District has increased from Rp. 1,140 thousand toRp.1,640 thousand at 1993 constant market price during 1993 to 1998. The growthrate of GRDP per capita is 6.7% in 1994, 9.1% in 1995, 14.7% in 1996, and it sharplydecreased to 5.9% in 1997 and 1.9% in 1998 due to economic crisis.
2.2 Agricultural Background
The Government of Indonesia issued new five years national development plan calledas �PROPENAS (National Development Programme) 2000-2004� replaced to formerplan (REPELITA) in 2000. This plan prepared based on GBHN (NationalFundamental Principle) and includes major development policies for the agriculturesector.
G-4
In this programme, it is declared that, in future, the development for agriculture andfoods aims the leveling up productivity of small households, overcoming of povertyand putting high additional value on agricultural commodities through the connectionwith other sectors. The programme includes sub-sector programmes of agri-businessdevelopment, stable food supply and water resource development and utilization.
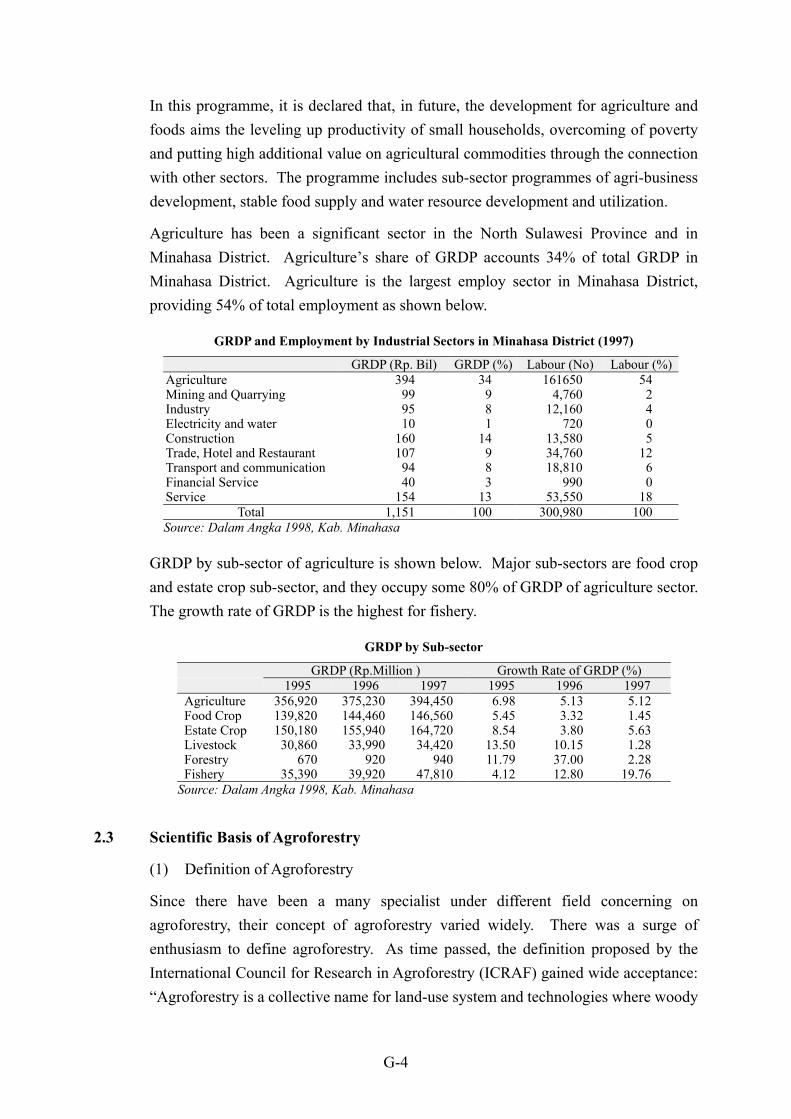
Agriculture has been a significant sector in the North Sulawesi Province and inMinahasa District. Agriculture�s share of GRDP accounts 34% of total GRDP inMinahasa District. Agriculture is the largest employ sector in Minahasa District,providing 54% of total employment as shown below.
GRDP and Employment by Industrial Sectors in Minahasa District (1997)
GRDP (Rp. Bil) GRDP (%) Labour (No) Labour (%)Agriculture 394 34 161650 54Mining and Quarrying 99 9 4,760 2Industry 95 8 12,160 4Electricity and water 10 1 720 0Construction 160 14 13,580 5Trade, Hotel and Restaurant 107 9 34,760 12Transport and communication 94 8 18,810 6Financial Service 40 3 990 0Service 154 13 53,550 18
Total 1,151 100 300,980 100Source: Dalam Angka 1998, Kab. Minahasa
GRDP by sub-sector of agriculture is shown below. Major sub-sectors are food cropand estate crop sub-sector, and they occupy some 80% of GRDP of agriculture sector.The growth rate of GRDP is the highest for fishery.
GRDP by Sub-sector
GRDP (Rp.Million ) Growth Rate of GRDP (%)1995 1996 1997 1995 1996 1997
Agriculture 356,920 375,230 394,450 6.98 5.13 5.12Food Crop 139,820 144,460 146,560 5.45 3.32 1.45Estate Crop 150,180 155,940 164,720 8.54 3.80 5.63Livestock 30,860 33,990 34,420 13.50 10.15 1.28Forestry 670 920 940 11.79 37.00 2.28Fishery 35,390 39,920 47,810 4.12 12.80 19.76
Source: Dalam Angka 1998, Kab. Minahasa
2.3 Scientific Basis of Agroforestry
(1) Definition of Agroforestry
Since there have been a many specialist under different field concerning onagroforestry, their concept of agroforestry varied widely. There was a surge ofenthusiasm to define agroforestry. As time passed, the definition proposed by theInternational Council for Research in Agroforestry (ICRAF) gained wide acceptance:�Agroforestry is a collective name for land-use system and technologies where woody
G-5
perennials are deliberately used on the same land management unts as agriculturalcrops and/or animals, in some form of spatial arrangement or temporal sequence. Inagroforestry systems there are both ecological and economical interactions betweenthe different components�. The definition of agroforestry proposed by ICRAF is alsoaccepted in Indonesia.
(2) Effect of Agroforestry system on soil and biomass production
It is now widely believed that agroforestry holds considerable potential as a majorland-management alternative for conserving the soil and maintaining soil productivityin the tropics. Farmers have known that they can get a good return by cultivating cropsin forest clearance area and the return is decreasing year by year by continuous cropcultivation. One of the reasons of decline of the crop yield could be due to degradationof soil fertility by improper farming practices.
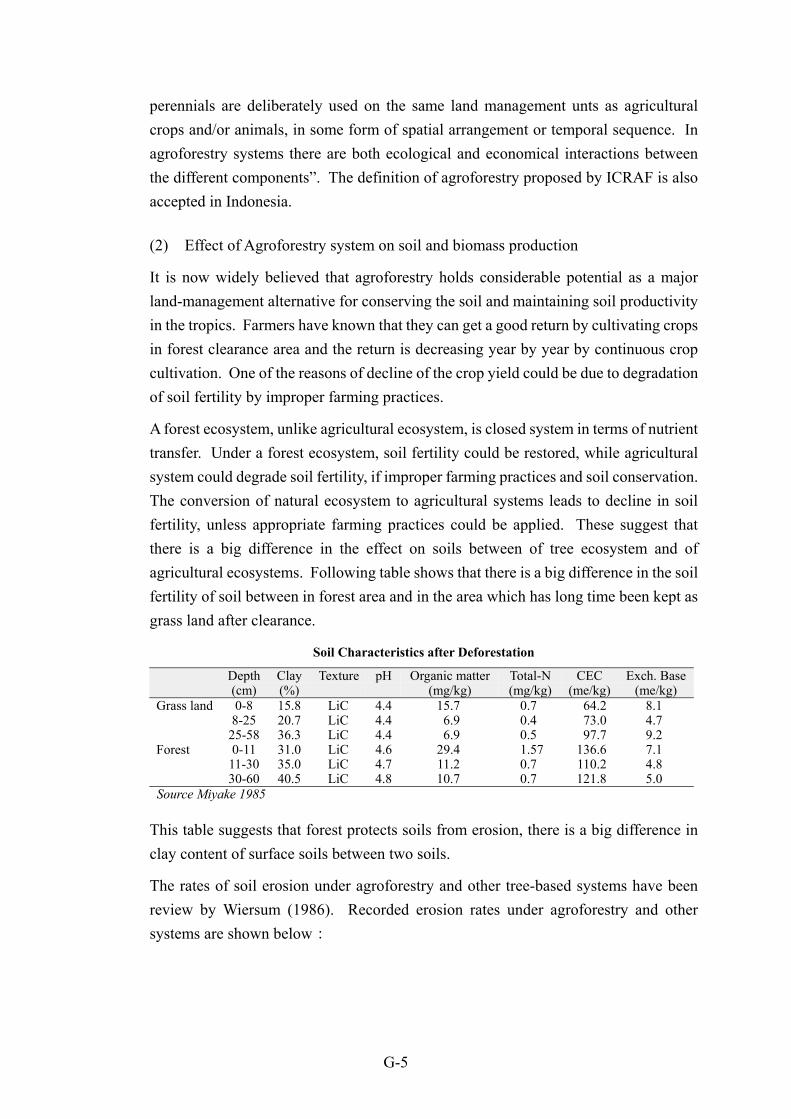
A forest ecosystem, unlike agricultural ecosystem, is closed system in terms of nutrienttransfer. Under a forest ecosystem, soil fertility could be restored, while agriculturalsystem could degrade soil fertility, if improper farming practices and soil conservation.The conversion of natural ecosystem to agricultural systems leads to decline in soilfertility, unless appropriate farming practices could be applied. These suggest thatthere is a big difference in the effect on soils between of tree ecosystem and ofagricultural ecosystems. Following table shows that there is a big difference in the soilfertility of soil between in forest area and in the area which has long time been kept asgrass land after clearance.
Soil Characteristics after Deforestation
Depth(cm)
Clay(%)
Texture pH Organic matter(mg/kg)
Total-N(mg/kg)
CEC(me/kg)
Exch. Base(me/kg)
Grass land 0-8 15.8 LiC 4.4 15.7 0.7 64.2 8.18-25 20.7 LiC 4.4 6.9 0.4 73.0 4.7
25-58 36.3 LiC 4.4 6.9 0.5 97.7 9.2Forest 0-11 31.0 LiC 4.6 29.4 1.57 136.6 7.1
11-30 35.0 LiC 4.7 11.2 0.7 110.2 4.830-60 40.5 LiC 4.8 10.7 0.7 121.8 5.0
Source Miyake 1985
This table suggests that forest protects soils from erosion, there is a big difference inclay content of surface soils between two soils.
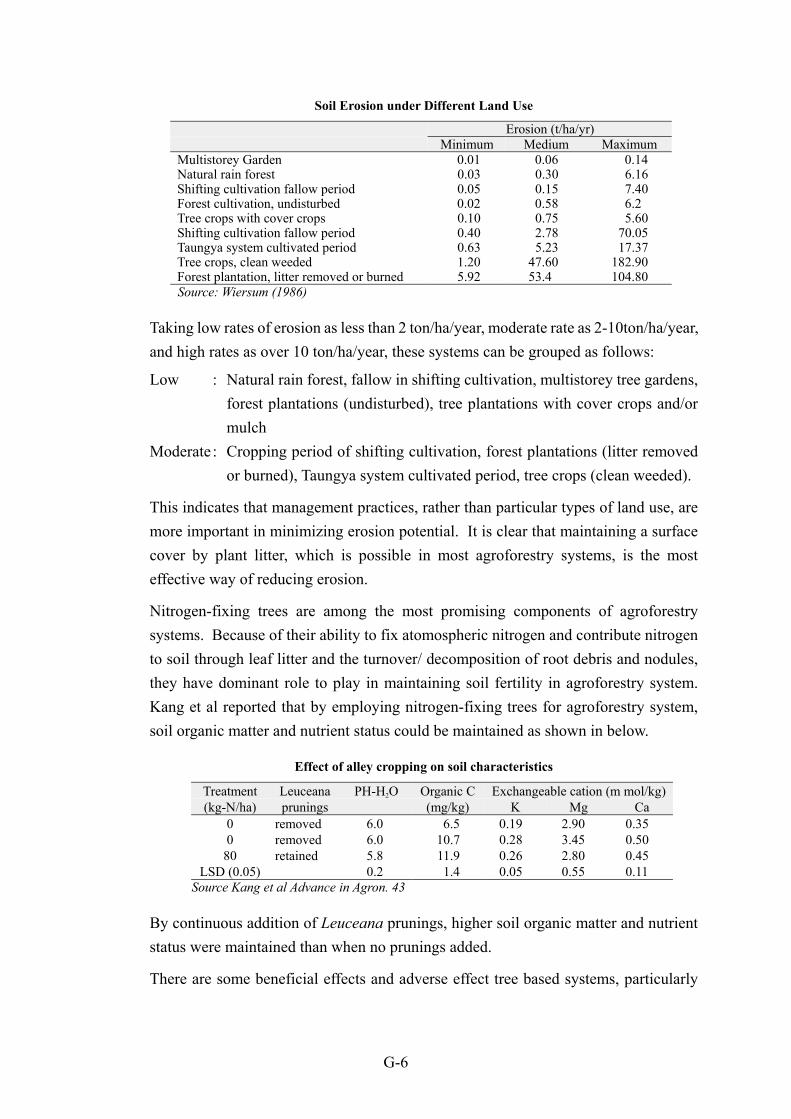
The rates of soil erosion under agroforestry and other tree-based systems have beenreview by Wiersum (1986). Recorded erosion rates under agroforestry and othersystems are shown below:
G-6
Soil Erosion under Different Land Use
Erosion (t/ha/yr)Minimum Medium Maximum
Multistorey Garden 0.01 0.06 0.14Natural rain forest 0.03 0.30 6.16Shifting cultivation fallow period 0.05 0.15 7.40Forest cultivation, undisturbed 0.02 0.58 6.2Tree crops with cover crops 0.10 0.75 5.60Shifting cultivation fallow period 0.40 2.78 70.05Taungya system cultivated period 0.63 5.23 17.37Tree crops, clean weeded 1.20 47.60 182.90Forest plantation, litter removed or burned 5.92 53.4 104.80Source: Wiersum (1986)
Taking low rates of erosion as less than 2 ton/ha/year, moderate rate as 2-10ton/ha/year,and high rates as over 10 ton/ha/year, these systems can be grouped as follows:
Low : Natural rain forest, fallow in shifting cultivation, multistorey tree gardens,forest plantations (undisturbed), tree plantations with cover crops and/ormulch
Moderate : Cropping period of shifting cultivation, forest plantations (litter removedor burned), Taungya system cultivated period, tree crops (clean weeded).
This indicates that management practices, rather than particular types of land use, aremore important in minimizing erosion potential. It is clear that maintaining a surfacecover by plant litter, which is possible in most agroforestry systems, is the mosteffective way of reducing erosion.
Nitrogen-fixing trees are among the most promising components of agroforestrysystems. Because of their ability to fix atomospheric nitrogen and contribute nitrogento soil through leaf litter and the turnover/ decomposition of root debris and nodules,they have dominant role to play in maintaining soil fertility in agroforestry system.Kang et al reported that by employing nitrogen-fixing trees for agroforestry system,soil organic matter and nutrient status could be maintained as shown in below.
Effect of alley cropping on soil characteristics
Treatment Leuceana PH-H2O Organic C Exchangeable cation (m mol/kg)(kg-N/ha) prunings (mg/kg) K Mg Ca
0 removed 6.0 6.5 0.19 2.90 0.350 removed 6.0 10.7 0.28 3.45 0.50
80 retained 5.8 11.9 0.26 2.80 0.45LSD (0.05) 0.2 1.4 0.05 0.55 0.11
Source Kang et al Advance in Agron. 43
By continuous addition of Leuceana prunings, higher soil organic matter and nutrientstatus were maintained than when no prunings added.
There are some beneficial effects and adverse effect tree based systems, particularly
G-7
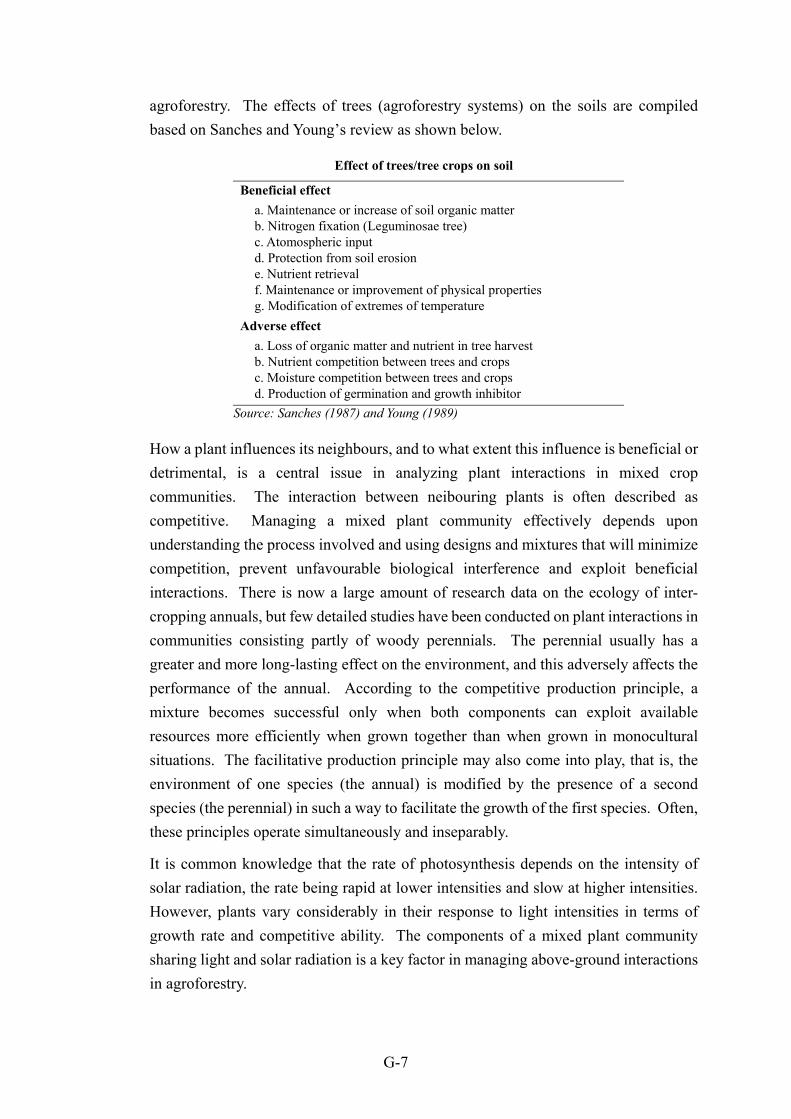
agroforestry. The effects of trees (agroforestry systems) on the soils are compiledbased on Sanches and Young�s review as shown below.
Effect of trees/tree crops on soil
Beneficial effecta. Maintenance or increase of soil organic matterb. Nitrogen fixation (Leguminosae tree)c. Atomospheric inputd. Protection from soil erosione. Nutrient retrievalf. Maintenance or improvement of physical propertiesg. Modification of extremes of temperature
Adverse effecta. Loss of organic matter and nutrient in tree harvestb. Nutrient competition between trees and cropsc. Moisture competition between trees and cropsd. Production of germination and growth inhibitor
Source: Sanches (1987) and Young (1989)
How a plant influences its neighbours, and to what extent this influence is beneficial ordetrimental, is a central issue in analyzing plant interactions in mixed cropcommunities. The interaction between neibouring plants is often described ascompetitive. Managing a mixed plant community effectively depends uponunderstanding the process involved and using designs and mixtures that will minimizecompetition, prevent unfavourable biological interference and exploit beneficialinteractions. There is now a large amount of research data on the ecology of inter-cropping annuals, but few detailed studies have been conducted on plant interactions incommunities consisting partly of woody perennials. The perennial usually has agreater and more long-lasting effect on the environment, and this adversely affects theperformance of the annual. According to the competitive production principle, amixture becomes successful only when both components can exploit availableresources more efficiently when grown together than when grown in monoculturalsituations. The facilitative production principle may also come into play, that is, theenvironment of one species (the annual) is modified by the presence of a secondspecies (the perennial) in such a way to facilitate the growth of the first species. Often,these principles operate simultaneously and inseparably.
It is common knowledge that the rate of photosynthesis depends on the intensity ofsolar radiation, the rate being rapid at lower intensities and slow at higher intensities.However, plants vary considerably in their response to light intensities in terms ofgrowth rate and competitive ability. The components of a mixed plant communitysharing light and solar radiation is a key factor in managing above-ground interactionsin agroforestry.
G-8
Some of the available light and solar radiation is intercepted by the top layer of leavesof the overstorey species, while the rest of it is available to the understorey species.The curve of net photosynthesis saturates at 20 to 40 percent of full sunlight, andtherefore a larger part of leaves of understorey species receiving more than thisintensity should operate at full capacity. Therefore, theoretically mixed plantcommunities should have a better photosynthetic efficiency (biomass production) thanmonocultural stand.
In the mixed plant communities, key factor in below-ground interaction is the structureand efficiency of the root systems of individual components, which determine theuptake of and competition for nutrient and moisture. The root biomass of trees isusually 20-30% of total plant biomass, although it may vary from 15% to 50% of thetotal by influence of environmental conditions. In general, rooting densities of treesare lower than those of cereals and herbaceous legumes. The rooting density anddistribution of particular plant depends on various site-related factors. Combiningtrees and crops increases rooting densities and reduces inter-root distances, whichincreases the likelihood inter-plant competition. One of the most important aspects ofrhyzosphere interaction in agroforestry is competition for water and nutrient uptake.To avoid or minimize the effects of competition, rooting pattern of trees and cropsshould differ in terms of structure and depth.
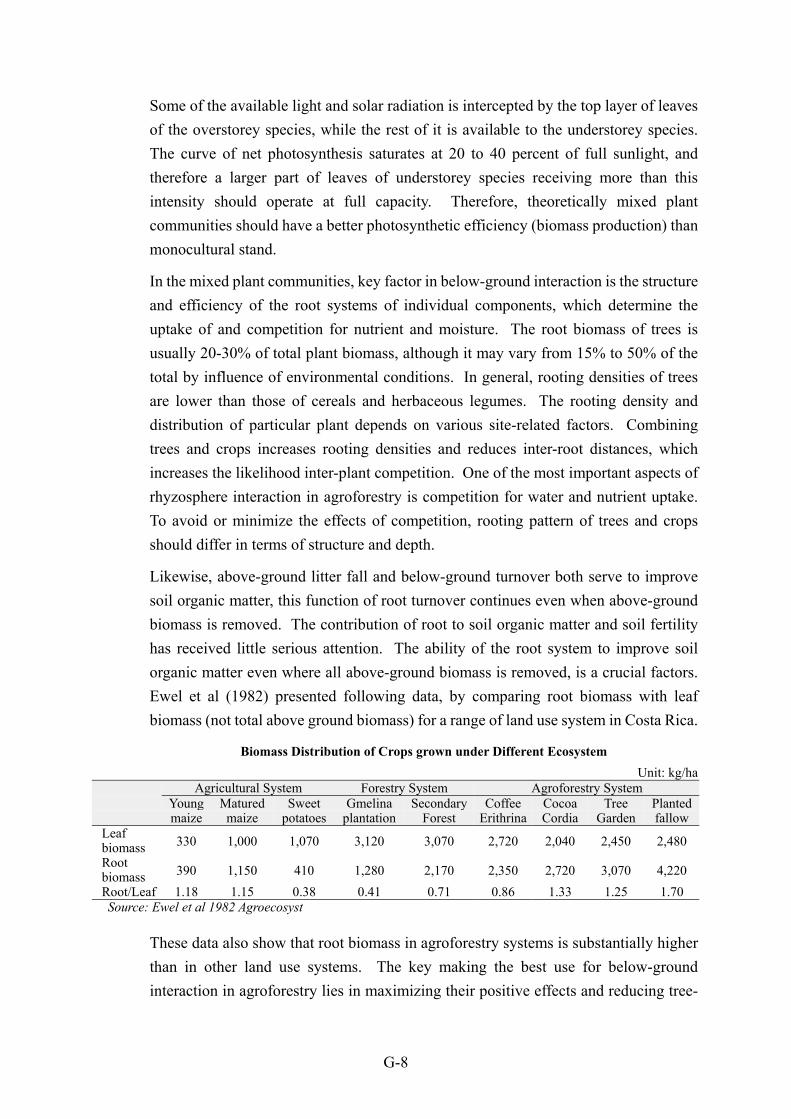
Likewise, above-ground litter fall and below-ground turnover both serve to improvesoil organic matter, this function of root turnover continues even when above-groundbiomass is removed. The contribution of root to soil organic matter and soil fertilityhas received little serious attention. The ability of the root system to improve soilorganic matter even where all above-ground biomass is removed, is a crucial factors.Ewel et al (1982) presented following data, by comparing root biomass with leafbiomass (not total above ground biomass) for a range of land use system in Costa Rica.
Biomass Distribution of Crops grown under Different EcosystemUnit: kg/ha
Agricultural System Forestry System Agroforestry SystemYoung Matured Sweet Gmelina Secondary Coffee Cocoa Tree Plantedmaize maize potatoes plantation Forest Erithrina Cordia Garden fallow
Leafbiomass 330 1,000 1,070 3,120 3,070 2,720 2,040 2,450 2,480Rootbiomass 390 1,150 410 1,280 2,170 2,350 2,720 3,070 4,220Root/Leaf 1.18 1.15 0.38 0.41 0.71 0.86 1.33 1.25 1.70Source: Ewel et al 1982 Agroecosyst
These data also show that root biomass in agroforestry systems is substantially higherthan in other land use systems. The key making the best use for below-groundinteraction in agroforestry lies in maximizing their positive effects and reducing tree-
G-9
crop competition.
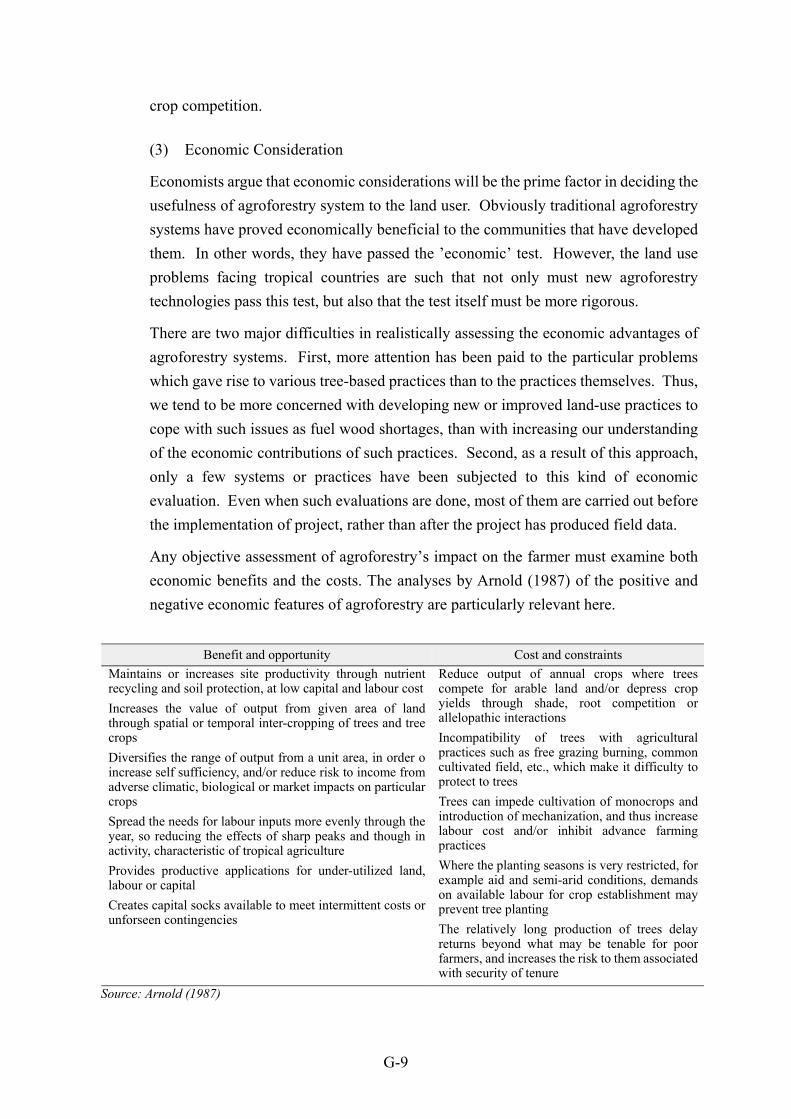
(3) Economic Consideration
Economists argue that economic considerations will be the prime factor in deciding theusefulness of agroforestry system to the land user. Obviously traditional agroforestrysystems have proved economically beneficial to the communities that have developedthem. In other words, they have passed the �economic� test. However, the land useproblems facing tropical countries are such that not only must new agroforestrytechnologies pass this test, but also that the test itself must be more rigorous.
There are two major difficulties in realistically assessing the economic advantages ofagroforestry systems. First, more attention has been paid to the particular problemswhich gave rise to various tree-based practices than to the practices themselves. Thus,we tend to be more concerned with developing new or improved land-use practices tocope with such issues as fuel wood shortages, than with increasing our understandingof the economic contributions of such practices. Second, as a result of this approach,only a few systems or practices have been subjected to this kind of economicevaluation. Even when such evaluations are done, most of them are carried out beforethe implementation of project, rather than after the project has produced field data.
Any objective assessment of agroforestry�s impact on the farmer must examine botheconomic benefits and the costs. The analyses by Arnold (1987) of the positive andnegative economic features of agroforestry are particularly relevant here.
Benefit and opportunity Cost and constraintsMaintains or increases site productivity through nutrientrecycling and soil protection, at low capital and labour costIncreases the value of output from given area of landthrough spatial or temporal inter-cropping of trees and treecropsDiversifies the range of output from a unit area, in order oincrease self sufficiency, and/or reduce risk to income fromadverse climatic, biological or market impacts on particularcropsSpread the needs for labour inputs more evenly through theyear, so reducing the effects of sharp peaks and though inactivity, characteristic of tropical agricultureProvides productive applications for under-utilized land,labour or capitalCreates capital socks available to meet intermittent costs orunforseen contingencies
Reduce output of annual crops where treescompete for arable land and/or depress cropyields through shade, root competition orallelopathic interactionsIncompatibility of trees with agriculturalpractices such as free grazing burning, commoncultivated field, etc., which make it difficulty toprotect to treesTrees can impede cultivation of monocrops andintroduction of mechanization, and thus increaselabour cost and/or inhibit advance farmingpracticesWhere the planting seasons is very restricted, forexample aid and semi-arid conditions, demandson available labour for crop establishment mayprevent tree plantingThe relatively long production of trees delayreturns beyond what may be tenable for poorfarmers, and increases the risk to them associatedwith security of tenure
Source: Arnold (1987)
G-10
The methods of carrying out such analysis have been reviewed by a number of experts.Hockstra (1985, 1990) provides a detailed examination of the issues or obstacles thateconomists encounter, as well as the options that are available to them, in the appraisalof agroforestry project.
(4) Socio-cultural considerations
The social acceptability of agroforestry is influenced by biophysical, socio-economicand cultural factors. In recent analysis of this issue, Hoskins (1987) highlightedseveral factors, which must be considered, if new agroforestrty practices are to beadopted by farmers. Foremost among these are land tenure, labour availability and themarketability of tree products. In addition, the way in which agroforestry technologiesare transferred to farmers must be adapted to suit the particular social contexts withinwhich these farmers live.
1) Land tenure
There is less likelihood that long term agricultural strategies will be adopted inthe areas where land tenure systems do not guarantee continued ownership andcontrol of land. The incentives for investing in soil fertility improvement forfuture use of the land is low unless the benefit accrue to the tree planter.
Rights over land are often distinct from rights over trees. Tree tenure issuesinclude the right to own or inherit trees, the right to plant trees, the right to usetrees and tree products and the right to dispose of tree products. These variousrights differ widely across cultural zones and have a major influence on the socialacceptability of agroforestry initiatives.
Social acceptability is also closely linked with the economic feasibility of thesystem. Although prospects were high for the integration of tree planting intotraditional farming system, social acceptability relied heavily on cost-sharingdevices between government and rural farmers, the availability of an activeextension service and the potential of some direct economic output from the treesin the system.
2) Labour requirement
Almost all agroforestry innovations demand changes in labour patterns, andlabour requirement is always a factor which rural people take into considerationwhen deciding whether or not to adopt a new practice. Farm families havedeveloped labour strategies based on using the inputs of most members of thefamily at various times of the year for different tasks. Obviously, additional
G-11
labour for persons already fully occupied at peak labour seasons is consideredmore costly than additional demands during a slack season. For example, alleycropping is a labour intensive practice and the costs of production increaseconsiderably if additional labour has to be hired. Although these additional costswill be offset by increased benefits, the immediate need for additional labourcould be a disincentive to the adoption of the practice.
In densely populated areas where labour is assumed to be in abundant supply,there area distinct labour peaks that coincide with the sowing and harvestingseasons of principal crops. Agroforestry systems could have the advantage ofhelping to spread the use of labour supplied by member a farming family moreevenly through out the year. Labour intensity is one of main deciding factors inmoving from traditional shifting cultivation practices to intensive agroforestrysystems.
3) Marketability
Direct and immediate income from a land use system is a central issue indetermining the social acceptability of that system. The processing and/or sale ofagricultural commodities, and the rural industries based on these commodities,are essential sources of off-farm income for many farming societies. The majorconstraints affecting the viability of such enterprises are poor access to marketsand raw materials and inadequate organizational management skills. Aneffective rural development through agroforestry is possible if policiessupporting the establishment of appropriate market infrastructures and thedevelopment of the necessary skills are implemented.
4) Social Context
The best measure of the social success of new or improved technologies is thereadiness with which farmers accept them. If innovation do not take account ofthe social context in which small holders operate, then the potential of suchinnovations will not be realized. If the extension effort used to transfer thetechnology in the first project had been modified to take account not only of thedifferent agro-ecological conditions but also of the different social patterns, ahigher rate of adoption might have been achieved. With minimum but suitablymodified extension efforts, farmers willingly accepted new system.
There is now a considerable amount of information on the design of agroforestrypractices to suit particular farming conditions and particular social and politicalcontexts. The next crucial step is to collate this information and incorporate it
G-12
into the training of those responsible for transferring new or improvedagroforestry practices. This involves developing technology-testing methodswhich can be easily understood and used by farmers in their own environments,and emphasizing the need for strong links between the technology transfer agentand the farmers so as to ensure effective feedback from the farmers to theresearchers.
As new agroforestry techniques move into farmers� fields, overall developmentissues will also become increasingly important, and the need for in-depthanalyses of these issues will become more apparent. Policies need to be designedwhich support agroforestry as an integral part of better land use planning andwhich strengthen small holders� access to new techniques. This applies not onlythe wastelands and denuded hillsides created by defective land use practices, butalso to the prime lands that are soon likely to become wastelands if farmerscontinue to use poorly designed monocultural production systems.
G-13
CHAPTER 3 MASTER PLAN STUDY FOR THE STUDY AREA
3.1 Present Condition of Agriculture and Agroforestry
3.1.1 Land Holding Size and Land Tenure
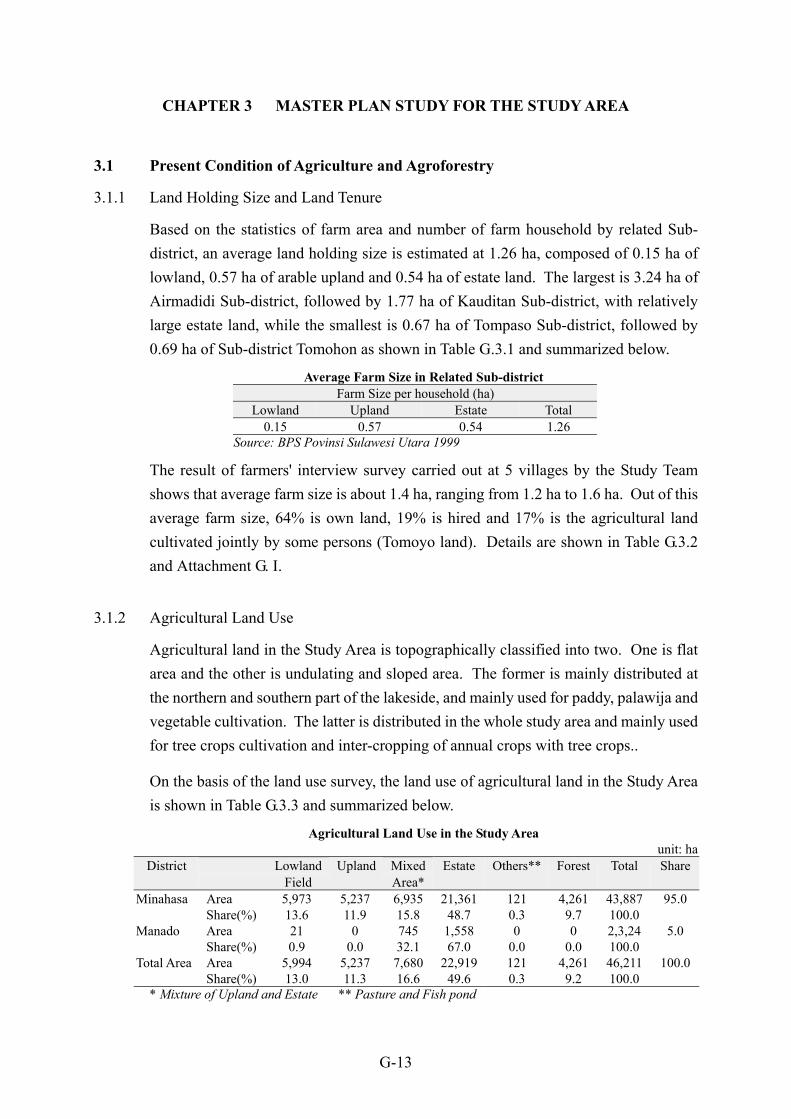
Based on the statistics of farm area and number of farm household by related Sub-district, an average land holding size is estimated at 1.26 ha, composed of 0.15 ha oflowland, 0.57 ha of arable upland and 0.54 ha of estate land. The largest is 3.24 ha ofAirmadidi Sub-district, followed by 1.77 ha of Kauditan Sub-district, with relativelylarge estate land, while the smallest is 0.67 ha of Tompaso Sub-district, followed by0.69 ha of Sub-district Tomohon as shown in Table G.3.1 and summarized below.
Average Farm Size in Related Sub-districtFarm Size per household (ha)
Lowland Upland Estate Total0.15 0.57 0.54 1.26
Source: BPS Povinsi Sulawesi Utara 1999
The result of farmers' interview survey carried out at 5 villages by the Study Teamshows that average farm size is about 1.4 ha, ranging from 1.2 ha to 1.6 ha. Out of thisaverage farm size, 64% is own land, 19% is hired and 17% is the agricultural landcultivated jointly by some persons (Tomoyo land). Details are shown in Table G.3.2and Attachment G. I.
3.1.2 Agricultural Land Use
Agricultural land in the Study Area is topographically classified into two. One is flatarea and the other is undulating and sloped area. The former is mainly distributed atthe northern and southern part of the lakeside, and mainly used for paddy, palawija andvegetable cultivation. The latter is distributed in the whole study area and mainly usedfor tree crops cultivation and inter-cropping of annual crops with tree crops..
On the basis of the land use survey, the land use of agricultural land in the Study Areais shown in Table G.3.3 and summarized below.
Agricultural Land Use in the Study Areaunit: ha
Lowland MixedDistrictField
UplandArea*
Estate Others** Forest Total Share
Minahasa Area 5,973 5,237 6,935 21,361 121 4,261 43,887 95.0Share(%) 13.6 11.9 15.8 48.7 0.3 9.7 100.0
Manado Area 21 0 745 1,558 0 0 2,3,24 5.0Share(%) 0.9 0.0 32.1 67.0 0.0 0.0 100.0
Total Area Area 5,994 5,237 7,680 22,919 121 4,261 46,211 100.0Share(%) 13.0 11.3 16.6 49.6 0.3 9.2 100.0
* Mixture of Upland and Estate ** Pasture and Fish pond
G-14
Some 95% of the Study Area belongs to Minahasa District. About 50% of the totalagricultural land is used for estate crop. Larger part of estate crop area is distributed onundulated or hilly area and mountain foot, especially dominant in northern Sub-districtAirmadidi and Pineleng. Upland and mixture area (mixture of upland and estate land)accounts for 28% of total. In the estate crop area and mixture area, several types ofagroforestry systems have been practiced as mentioned later. Larger part of uplandarea is located around the Lake Tondano. The other upland area is scattered among theestate area. Both types of the land use system are much mixed or overlapped eachother. Paddy field occupies 13% of total agricultural land and mainly located aroundLake Tondano, especially Sub-district Langowan, Kakas, Tondano and Tooulimambot.Forest area remains only 9.2%, most of which is observed in Sub-district Airmadidi,Langowan and Tondano.
3.1.3 Crop Cultivation
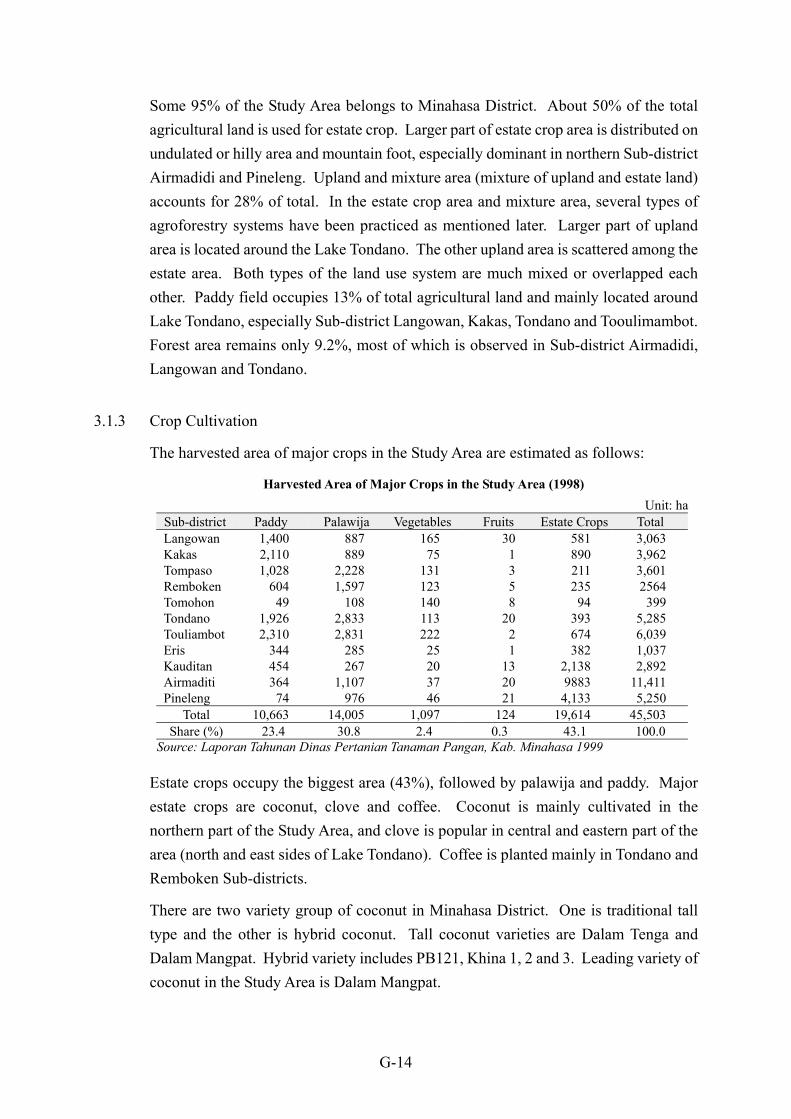
The harvested area of major crops in the Study Area are estimated as follows:
Harvested Area of Major Crops in the Study Area (1998)Unit: ha
Sub-district Paddy Palawija Vegetables Fruits Estate Crops TotalLangowan 1,400 887 165 30 581 3,063Kakas 2,110 889 75 1 890 3,962Tompaso 1,028 2,228 131 3 211 3,601Remboken 604 1,597 123 5 235 2564Tomohon 49 108 140 8 94 399Tondano 1,926 2,833 113 20 393 5,285Touliambot 2,310 2,831 222 2 674 6,039Eris 344 285 25 1 382 1,037Kauditan 454 267 20 13 2,138 2,892Airmaditi 364 1,107 37 20 9883 11,411Pineleng 74 976 46 21 4,133 5,250
Total 10,663 14,005 1,097 124 19,614 45,503Share (%) 23.4 30.8 2.4 0.3 43.1 100.0
Source: Laporan Tahunan Dinas Pertanian Tanaman Pangan, Kab. Minahasa 1999
Estate crops occupy the biggest area (43%), followed by palawija and paddy. Majorestate crops are coconut, clove and coffee. Coconut is mainly cultivated in thenorthern part of the Study Area, and clove is popular in central and eastern part of thearea (north and east sides of Lake Tondano). Coffee is planted mainly in Tondano andRemboken Sub-districts.
There are two variety group of coconut in Minahasa District. One is traditional talltype and the other is hybrid coconut. Tall coconut varieties are Dalam Tenga andDalam Mangpat. Hybrid variety includes PB121, Khina 1, 2 and 3. Leading variety ofcoconut in the Study Area is Dalam Mangpat.
G-15
Dominant variety of clove in the Study Area is Zanzibar which is originated in Malukuislands and re-imported from Zanzibar in East Africa. During the period from 1993 to1998, Clove Management Agency (BPPC, Badan Penyangga Pengelolaan TanamanCengkeh) controlled price at low level ($ 0.6-1.5 /kg), while the price of clove was at$ 6-12 /kg during the period from 1977 to 1983. And farmers were forced to sell theircommodities only to Cooperative (KUD). Most of clove farmers disappointed andidled maintenance of clove gardens. Considerable clove gardens had converted toother crops because of serious price declining. After late 1998, price of clove has beenreleased from government control and has been governed by market. Since 1999farmers start to renew old clove garden and maintain carefully.
Out of palawija, maize is predominant and the rests are ground nuts, cassava, sweetpotatoes, etc. Palawija are mainly planted at the flat to gentle sloped area or mountainfoot, and sometimes maize is also inter-cropped with coconut or clove underagroforestry system. Generally it is said that about 15% out of estate crop garden isinter-cropped with annual crops in Indonesia, however this rate is estimated at 30-40%in Minahasa District.
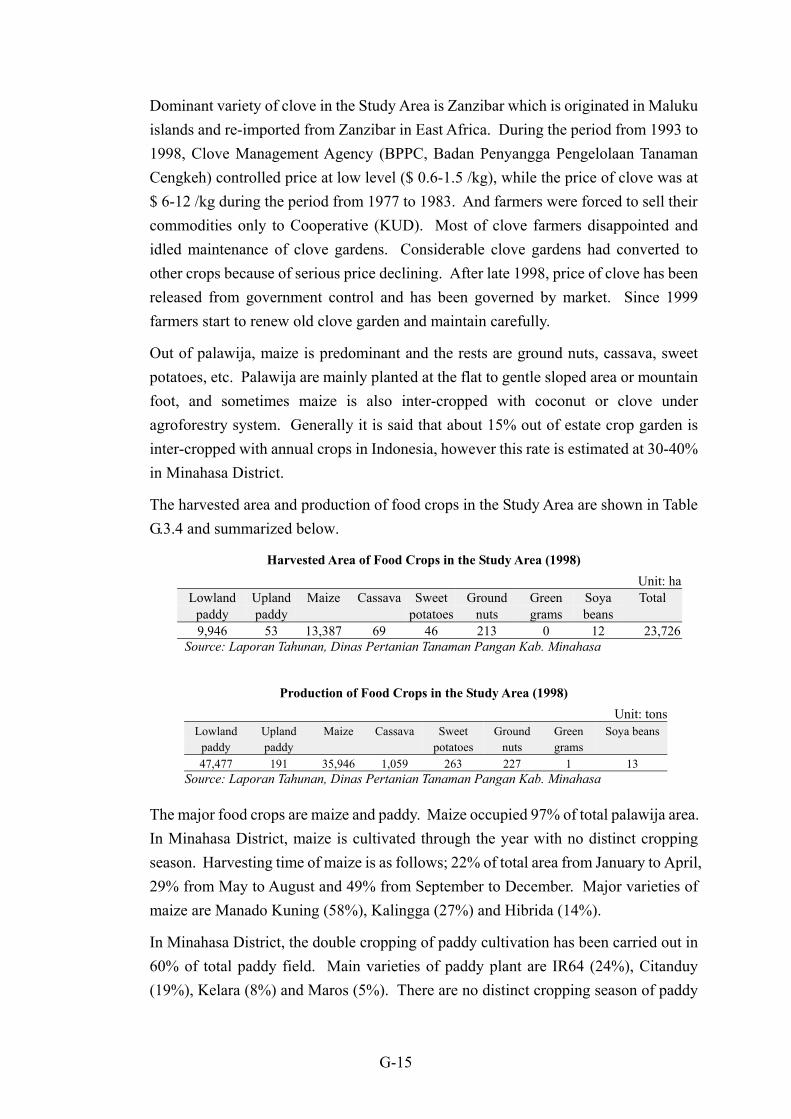
The harvested area and production of food crops in the Study Area are shown in TableG.3.4 and summarized below.
Harvested Area of Food Crops in the Study Area (1998)Unit: ha
Lowland Upland Sweet Ground Green Soyapaddy paddy
Maize Cassavapotatoes nuts grams beans
Total
9,946 53 13,387 69 46 213 0 12 23,726Source: Laporan Tahunan, Dinas Pertanian Tanaman Pangan Kab. Minahasa
Production of Food Crops in the Study Area (1998)Unit: tons
Lowlandpaddy
Uplandpaddy
Maize Cassava Sweetpotatoes
Groundnuts
Greengrams
Soya beans
47,477 191 35,946 1,059 263 227 1 13Source: Laporan Tahunan, Dinas Pertanian Tanaman Pangan Kab. Minahasa
The major food crops are maize and paddy. Maize occupied 97% of total palawija area.In Minahasa District, maize is cultivated through the year with no distinct croppingseason. Harvesting time of maize is as follows; 22% of total area from January to April,29% from May to August and 49% from September to December. Major varieties ofmaize are Manado Kuning (58%), Kalingga (27%) and Hibrida (14%).
In Minahasa District, the double cropping of paddy cultivation has been carried out in60% of total paddy field. Main varieties of paddy plant are IR64 (24%), Citanduy(19%), Kelara (8%) and Maros (5%). There are no distinct cropping season of paddy
G-16
cultivation,and harvesting time of paddy is as follows; 21% of total during the periodfrom January to April, 42% from May to August and 37% from September toDecember.
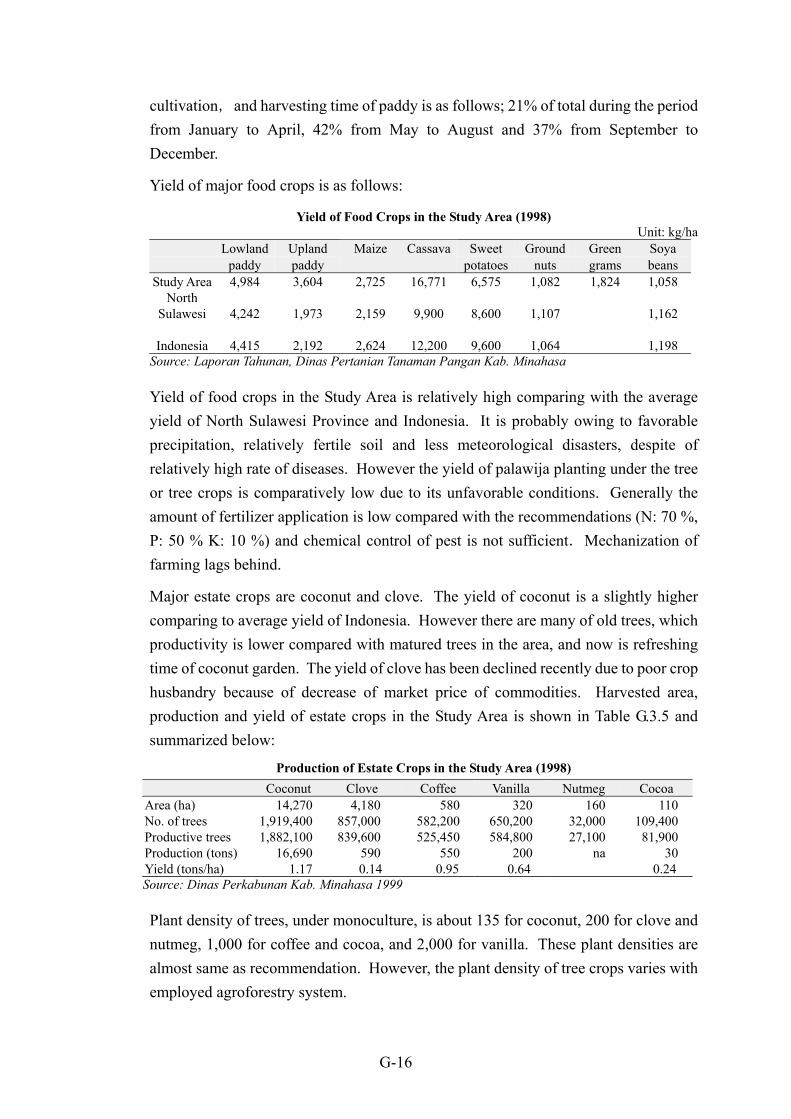
Yield of major food crops is as follows:
Yield of Food Crops in the Study Area (1998)Unit: kg/ha
Lowland Upland Sweet Ground Green Soyapaddy paddy
Maize Cassavapotatoes nuts grams beans
Study Area 4,984 3,604 2,725 16,771 6,575 1,082 1,824 1,058North
Sulawesi 4,242 1,973 2,159 9,900 8,600 1,107 1,162
Indonesia 4,415 2,192 2,624 12,200 9,600 1,064 1,198Source: Laporan Tahunan, Dinas Pertanian Tanaman Pangan Kab. Minahasa
Yield of food crops in the Study Area is relatively high comparing with the averageyield of North Sulawesi Province and Indonesia. It is probably owing to favorableprecipitation, relatively fertile soil and less meteorological disasters, despite ofrelatively high rate of diseases. However the yield of palawija planting under the treeor tree crops is comparatively low due to its unfavorable conditions. Generally theamount of fertilizer application is low compared with the recommendations (N: 70 %,P: 50 % K: 10 %) and chemical control of pest is not sufficient.Mechanization offarming lags behind.
Major estate crops are coconut and clove. The yield of coconut is a slightly highercomparing to average yield of Indonesia. However there are many of old trees, whichproductivity is lower compared with matured trees in the area, and now is refreshingtime of coconut garden. The yield of clove has been declined recently due to poor crophusbandry because of decrease of market price of commodities. Harvested area,production and yield of estate crops in the Study Area is shown in Table G.3.5 andsummarized below:
Production of Estate Crops in the Study Area (1998)Coconut Clove Coffee Vanilla Nutmeg Cocoa
Area (ha) 14,270 4,180 580 320 160 110No. of trees 1,919,400 857,000 582,200 650,200 32,000 109,400Productive trees 1,882,100 839,600 525,450 584,800 27,100 81,900Production (tons) 16,690 590 550 200 na 30Yield (tons/ha) 1.17 0.14 0.95 0.64 0.24Source: Dinas Perkabunan Kab. Minahasa 1999
Plant density of trees, under monoculture, is about 135 for coconut, 200 for clove andnutmeg, 1,000 for coffee and cocoa, and 2,000 for vanilla. These plant densities arealmost same as recommendation. However, the plant density of tree crops varies withemployed agroforestry system.
G-17
To improve the present condition of estate crops, the District Office of Estate CropService has promoted the replantation, rehabilitation and diversification of existingestate gardens, and supported farmers to make post harvest and marketing systemeffective and efficient.
Although total vegetable area amounts only 2.4% of total agricultural land in the StudyArea, relatively large vegetable areas are observed especially near the town. Mainvegetables are red shallot, leaf onion, chili, tomato, cabbage, Chinese cabbage andcarrot.
In spite of fruits area being only 0.3% of total, there are various species of fruits, suchas pineapple, banana,mango, papaya, langsat, rambutan, avocado, durian, mangostinetc. Fruit trees are planted mainly in home garden around the residential area exceptbanana which is scattered all over the hilly and mountainous area. Main fruit area isobserved in Airmadidi District along the Manado � Bitung road. No sericulture isobserved in this area.
3.1.4 Agroforestry System
(1) Agroforestry system in Indonesia
There are developed three major types of agroforestry system in Indonesia,�Tumpansgari, �Pekarangan� and shifting cultivation. Tumpansgari is as same asTaungya system which combines stand of woody and agricultural species (herbaceous)during the early stage of establishment of plantations. This system had beenintroduced to Indonesia in 1850�s from Burma and improved for a long time. Thepresent system had been established in 1920�s. Tumpansgari system is employed forestablishing Teak (Tetona grandis Linn. F.) and fast grow trees such as Merkusii pine(Pinus merkusii Jungh et De Vr) plantation. During the early stage of establishment ofplantation, upland paddy and maize are mainly inter-cropped, sometimes, cassava,Irish potato and vegetables are also inter-cropped.
The Pekarangan system originates in a homegarden. This system is a multi-storiedcropping system associated with settlements. The varieties of species applied areplenty. The higher canopy is composed of coconuts and fruit trees, and the middle andlower canopies of coffee, cocoa, vanilla and herbaceous crops. Its original form isfound in Central Java. In the home garden, lots of species of fruit trees, estate crops,multi-purpose trees and herbaceous crops are planted at a high plant density. ThePekarangan system has many types depending on different combination of species.
Now, there are many types of agroforestry system originated from the Pekaranganapplied in Indonesia. These are multi-layer tree garden, plantation crop combinations
G-18
with shade trees and/or hedge trees, inter-cropping system of herbaceous crop withwoody trees and tree crops, and hedgerow cultivation. Table G.3.6 shows the majortrees and crops introduced for agoroforestry in Indonesia.
(2) Type of Existing Agroforestry System
As mentioned in Sub-section 3.1.3, Total agricultural land accounts for the Study Areaconsisting of estate garden, arable upland, mixture of estate and arable upland, lowlandand the other category.
The harvested area of major crops in the Study Area is some 45,500 ha as described inSub-section 3.1.3. The estate crops area accounts for 43% of total harvested area, butthese are mostly mixed with herbaceous crops or other tree crops, and mono-culture ofestate crop area is very limited. Many trees, tree crops and fruit trees are observed inupland field. It means that agroforestry system has been already introduced in thelarger parts of the Study Area. It could be supposed that there had been serious soilerosion problem at few decades before and this problems might put spurs toincorporation of agroforestry system into the Study Area.
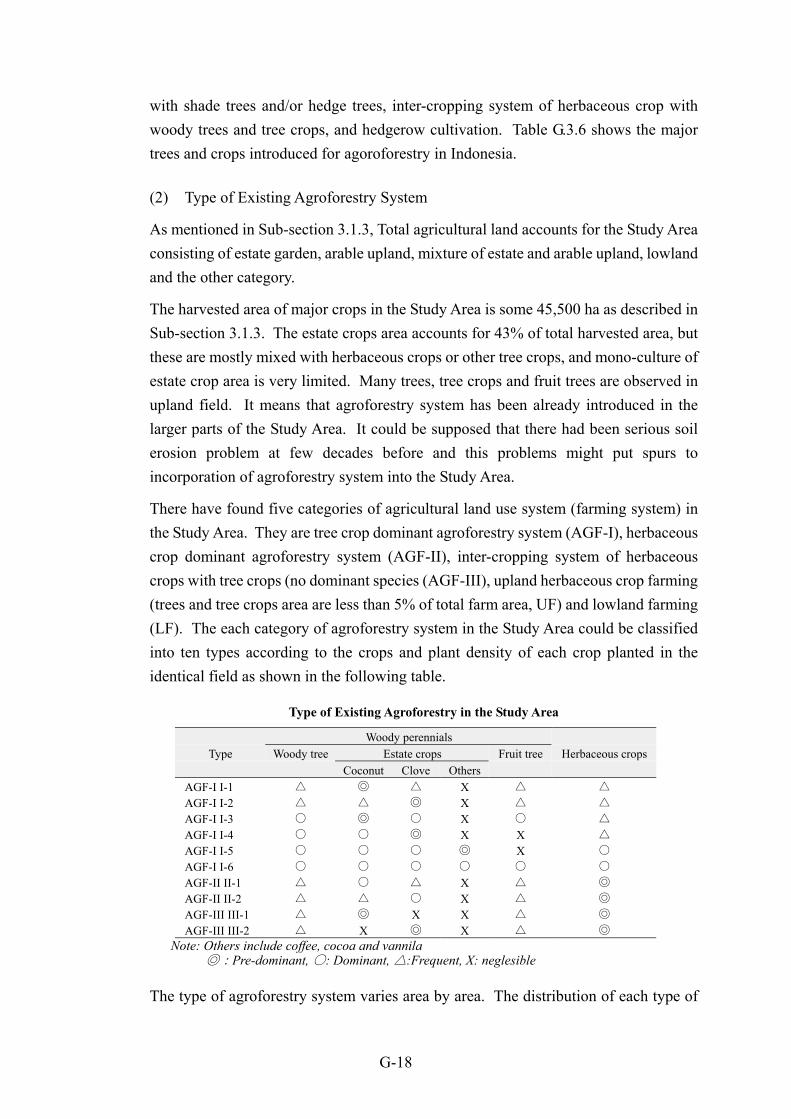
There have found five categories of agricultural land use system (farming system) inthe Study Area. They are tree crop dominant agroforestry system (AGF-I), herbaceouscrop dominant agroforestry system (AGF-II), inter-cropping system of herbaceouscrops with tree crops (no dominant species (AGF-III), upland herbaceous crop farming(trees and tree crops area are less than 5% of total farm area, UF) and lowland farming(LF). The each category of agroforestry system in the Study Area could be classifiedinto ten types according to the crops and plant density of each crop planted in theidentical field as shown in the following table.
Type of Existing Agroforestry in the Study Area
Woody perennialsType Woody tree Estate crops Fruit tree Herbaceous crops
Coconut Clove OthersAGF-I I-1 △ ◎ △ X △ △
AGF-I I-2 △ △ ◎ X △ △
AGF-I I-3 ○ ◎ ○ X ○ △
AGF-I I-4 ○ ○ ◎ X X △
AGF-I I-5 ○ ○ ○ ◎ X ○
AGF-I I-6 ○ ○ ○ ○ ○ ○
AGF-II II-1 △ ○ △ X △ ◎
AGF-II II-2 △ △ ○ X △ ◎
AGF-III III-1 △ ◎ X X △ ◎
AGF-III III-2 △ X ◎ X △ ◎
Note: Others include coffee, cocoa and vannila◎:Pre-dominant, ○: Dominant, △:Frequent, X: neglesible
The type of agroforestry system varies area by area. The distribution of each type of
G-19
agroforestry system in the Study Area is shown in Figure G.3.1 and Tables G.3.7 andG.3.8.
1) Tree Crop Dominant Agroforestry System
One Estate Crop Dominant Agroforestry System (AGF-I Type I-1, -2)
Estate crops dominant agroforestry system is mainly distributed in the northernpart of the Study Area and the eastern side of Lake Tondano. In the estate cropdominant area, coconut is dominant in the northern area, northern part ofAirmadidi Sub-district and Pineleng Sub-district, and clove vegetation increaseswith down to south, and it becomes dominant at the southern part of AirmadidiSub-district.
2) Tree (woody trees and Tree Crops) Dominant Agroforestry System (AGF-ITypes I-3, -4, -5, -6)
The tree crop dominant agroforestry system is divided into multi-storeies treecomplex and upland annual crops being cultivated in the small area under treecrops and fruit trees. The multistorey tree complex is combination of tall treesmedium height and short trees. There are two types of multistorey tree complex;one is well managed one (AGF-I Types I-5, -6) which area is now still small anddistributed on gentle slope area of Airmadidi, Tompaso, Remboken, Tondano andLangowan. The other is poorly managed one (AGF-I Types I-3, -4), which ismainly distributed in steep slope area.
Under the second type of trees dominant agroforestry system, herbaceous cropsare planted under the trees. In the old coconut garden, coconuts are plantedrandomly in 1950�s to 1960�s. An introduction of agroforestry system for thesearea, there are some difficulties for herbaceous cultivation, because of too smalland irregular shaped area for herbaceous crops. The irregular shape of croppingarea, irregular planting of coconuts and small space for herbaceous crops wouldinterfere crop husbandry and lead to increase labour requirement for farmingactivities and also decreases the plant density. These causes uneven distributionof solar radiation. As a result, crop yield of herbaceous crop becomes low. Samephenomenon is observed in some clove garden.
Figure G.3.2. shows the prevailing agroforestry system in the Study Area,although it is low productive due to irregular planting and low crop husbandry.Under this system trees are planted randomly and the herbaceous crops are alsoplanted irregularly. On the other hand, in the area where trees are regularlyplanted herbaceous crops is also planted regularly and the area is effectivelyutilized for herbaceous crops cultivation. It could be recommended that seedling
G-20
of coconut and clove should be transplanted regularly at the refreshing time.
(2) Herbaceous Crop Dominant Agroforestry (AGF-II Type II-1, -2)
Herbaceous crop dominant agroforestry system is mainly distributed in the south-eastern part of the Study Area. Under herbaceous crops dominant agroforestry system,many types of agroforestry system is observed. They are:
- planting of coconut or clove in farms of maize, pulses or vegetables;- planting of trees, such as cempaka, fruit trees, such as mango banana and papaya,
in maize or ground nuts field, with multipurpose tree such as Gliricidia as ahedgerow crops and
- hedgerow cropping using banana, cassava and Gliricidia as hedgerow crops.
In these case, plant density of trees is very low, and mainly these trees are planted at theborder of the field or as hedgerow plants. Sometimes, they are observed old and non-productive trees in the field under extensive cultural practices. The herbaceous cropdominant agroforestry systems are mainly employed in the flat to gentle slope area.
(3) Non Dominant Crop Agroforestry System (AGF-III Type III-1, -2)
The third category of agroforestry systems is mixed cropping of herbaceous crop withcoconut or clove. Under this system, coconut or clove is regularly planted at wide rowconsidering the herbaceous crop cultivation (Figure G.3.3 and G.3.4). Under thissystem, herbaceous crops are intensively cultivated and the production of tree crops iscomparable with monoculture. The plant density of these tree crops is similar to that ofmono-cropping, only spacing is different. For example, under coconut mono-cropping,spacing is some 9 x 9 m (plant density at 125 nos. per ha) but under this system plantspacing becomes some 15 x 5 m (plant density at 130 per ha). Maize is cultivatedbetween coconut row by row planting at the row-width at some 70 cm. According toCoconut Research Centre (BALITKA), a coconut yield of mixed cropping system isalmost same as mono-culture, and planted area of maize occupies some 80% of field.Its production is estimated at 70% of that of mono-cropping. From these findings, itcould be recommended that this system should be applied for flat and gentle slopedarea .in the flat area and gentle slope area.
(4) Shifting Cultivation and Other Systems
According to the District Agriculture Service Office, shifting cultivation area ispresently less than 50 ha in total. In the Study Area, it accounts for further small area.
There has been observed silvopastoral systems and agrosilvopastoral systems in verylimited area.
G-21
3.1.5 Evaluation of Existing Agroforestry System
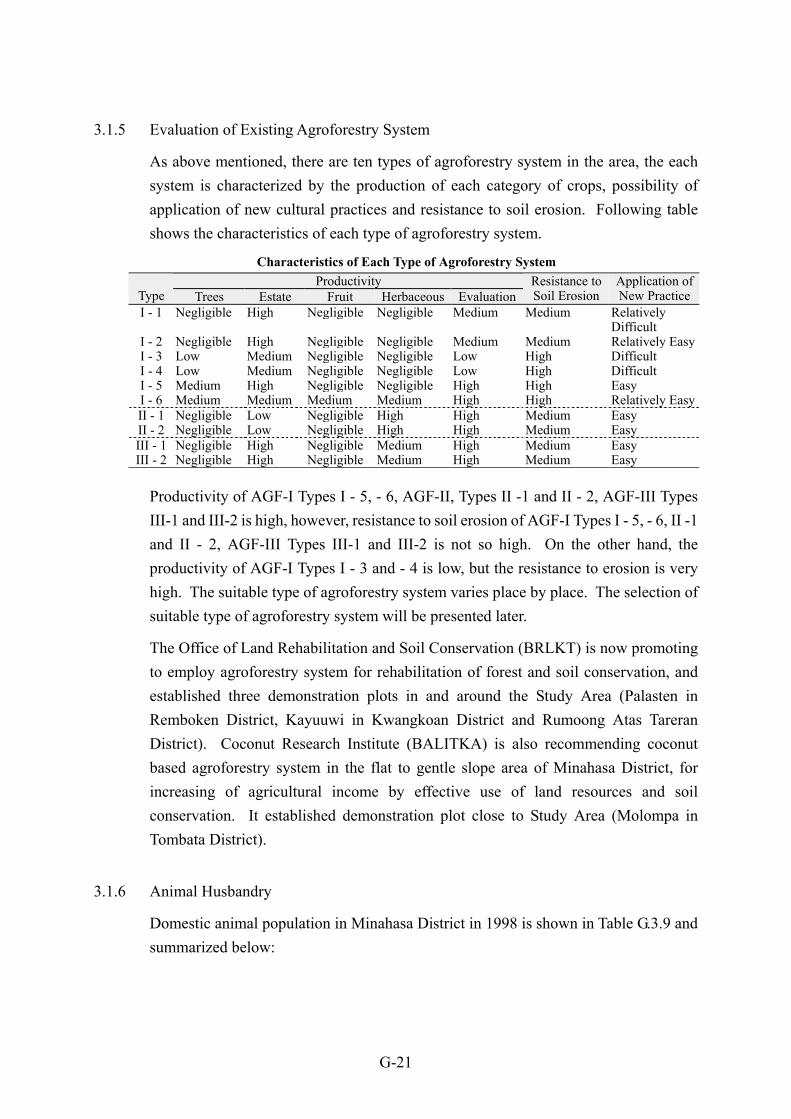
As above mentioned, there are ten types of agroforestry system in the area, the eachsystem is characterized by the production of each category of crops, possibility ofapplication of new cultural practices and resistance to soil erosion. Following tableshows the characteristics of each type of agroforestry system.
Characteristics of Each Type of Agroforestry SystemProductivity
Type Trees Estate Fruit Herbaceous EvaluationResistance toSoil Erosion
Application ofNew Practice
I - 1 Negligible High Negligible Negligible Medium Medium RelativelyDifficult
I - 2 Negligible High Negligible Negligible Medium Medium Relatively EasyI - 3 Low Medium Negligible Negligible Low High DifficultI - 4 Low Medium Negligible Negligible Low High DifficultI - 5 Medium High Negligible Negligible High High EasyI - 6 Medium Medium Medium Medium High High Relatively EasyII - 1 Negligible Low Negligible High High Medium EasyII - 2 Negligible Low Negligible High High Medium EasyIII - 1 Negligible High Negligible Medium High Medium EasyIII - 2 Negligible High Negligible Medium High Medium Easy
Productivity of AGF-I Types I - 5, - 6, AGF-II, Types II -1 and II - 2, AGF-III TypesIII-1 and III-2 is high, however, resistance to soil erosion of AGF-I Types I - 5, - 6, II -1and II - 2, AGF-III Types III-1 and III-2 is not so high. On the other hand, theproductivity of AGF-I Types I - 3 and - 4 is low, but the resistance to erosion is veryhigh. The suitable type of agroforestry system varies place by place. The selection ofsuitable type of agroforestry system will be presented later.
The Office of Land Rehabilitation and Soil Conservation (BRLKT) is now promotingto employ agroforestry system for rehabilitation of forest and soil conservation, andestablished three demonstration plots in and around the Study Area (Palasten inRemboken District, Kayuuwi in Kwangkoan District and Rumoong Atas TareranDistrict). Coconut Research Institute (BALITKA) is also recommending coconutbased agroforestry system in the flat to gentle slope area of Minahasa District, forincreasing of agricultural income by effective use of land resources and soilconservation. It established demonstration plot close to Study Area (Molompa inTombata District).
3.1.6 Animal Husbandry
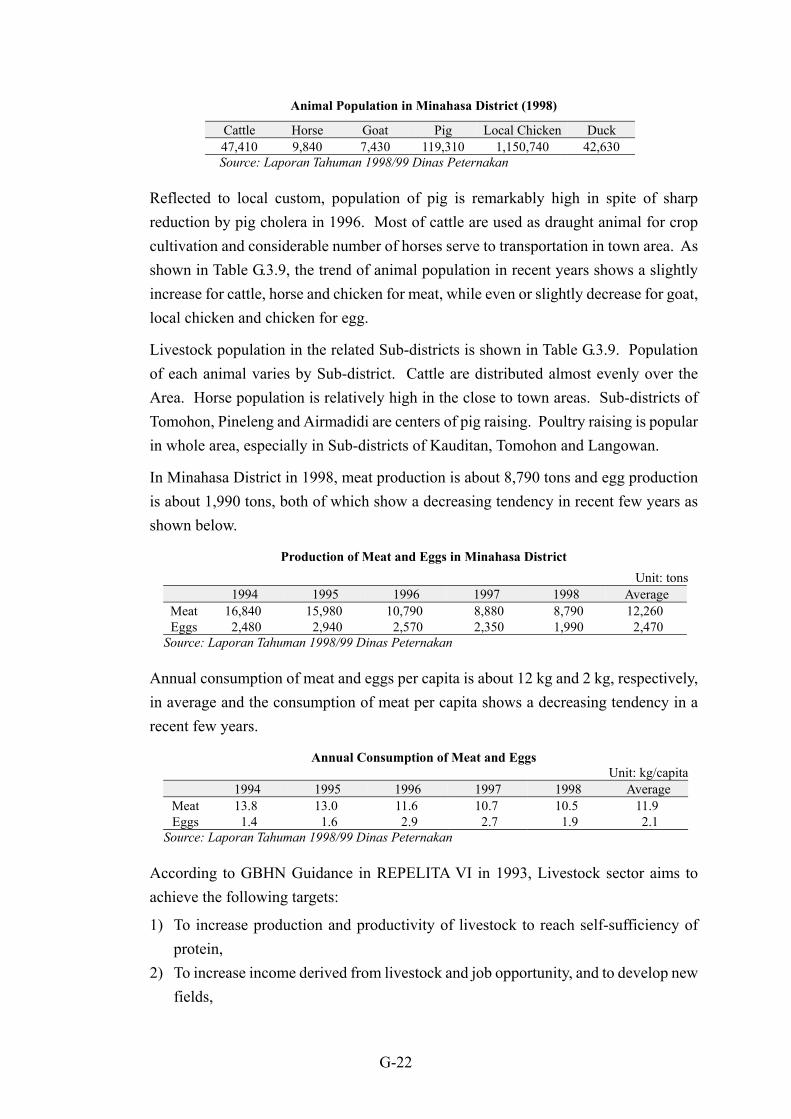
Domestic animal population in Minahasa District in 1998 is shown in Table G.3.9 andsummarized below:
G-22
Animal Population in Minahasa District (1998)
Cattle Horse Goat Pig Local Chicken Duck47,410 9,840 7,430 119,310 1,150,740 42,630Source: Laporan Tahuman 1998/99 Dinas Peternakan
Reflected to local custom, population of pig is remarkably high in spite of sharpreduction by pig cholera in 1996. Most of cattle are used as draught animal for cropcultivation and considerable number of horses serve to transportation in town area. Asshown in Table G.3.9, the trend of animal population in recent years shows a slightlyincrease for cattle, horse and chicken for meat, while even or slightly decrease for goat,local chicken and chicken for egg.
Livestock population in the related Sub-districts is shown in Table G.3.9. Populationof each animal varies by Sub-district. Cattle are distributed almost evenly over theArea. Horse population is relatively high in the close to town areas. Sub-districts ofTomohon, Pineleng and Airmadidi are centers of pig raising. Poultry raising is popularin whole area, especially in Sub-districts of Kauditan, Tomohon and Langowan.
In Minahasa District in 1998, meat production is about 8,790 tons and egg productionis about 1,990 tons, both of which show a decreasing tendency in recent few years asshown below.
Production of Meat and Eggs in Minahasa DistrictUnit: tons
1994 1995 1996 1997 1998 AverageMeat 16,840 15,980 10,790 8,880 8,790 12,260Eggs 2,480 2,940 2,570 2,350 1,990 2,470
Source: Laporan Tahuman 1998/99 Dinas Peternakan
Annual consumption of meat and eggs per capita is about 12 kg and 2 kg, respectively,in average and the consumption of meat per capita shows a decreasing tendency in arecent few years.
Annual Consumption of Meat and EggsUnit: kg/capita
1994 1995 1996 1997 1998 AverageMeat 13.8 13.0 11.6 10.7 10.5 11.9Eggs 1.4 1.6 2.9 2.7 1.9 2.1
Source: Laporan Tahuman 1998/99 Dinas Peternakan
According to GBHN Guidance in REPELITA VI in 1993, Livestock sector aims toachieve the following targets:
1) To increase production and productivity of livestock to reach self-sufficiency ofprotein,
2) To increase income derived from livestock and job opportunity, and to develop newfields,
G-23
3) To improve the food quality and nutrition of habitant with the diversification offood using animal products,
4) To develop the agri-business, and5) To make the best exploit of natural resources for the intensification of livestock
production with the consideration of environment conservation.
3.1.7 Inland Fishery
Fishery in the Study Area is carried out mainly in Lake Tondano. In addition, smallscale fishery is also observed out at some reservoirs and rivers. Besides these, sometypes of fish cultivation are observed in small fishponds scattering at lowlands orvalleys, parts of paddy fields, etc. In the related Sub-districts, the number of inlandfishermen is about 1,000, and some 2,000 farmers run fishing as a side job. Recentlythe fish production by traditional method has decreased year by year because of over-fishing, over-catching of fry, overgrowing of aquatic-weeds (water hyacinth and otherweeds), and water pollution caused by domestic waste. In addition, because of seriousdrought attacked the area, fish production by traditional fishing sharply decreased in1998. Cage cultivation at lake-coast is gradually developping in stead of traditionalmethod. Main fish species in Lake Tondano are carp, payangka, tilapia, gabus, gurame,mujair, etc.
Fish cultivation at small fishpond and paddy field has also declined in recent few yearsdue to the increasing of production cost, reducing fish stock and serious drought in1997 and 1998.
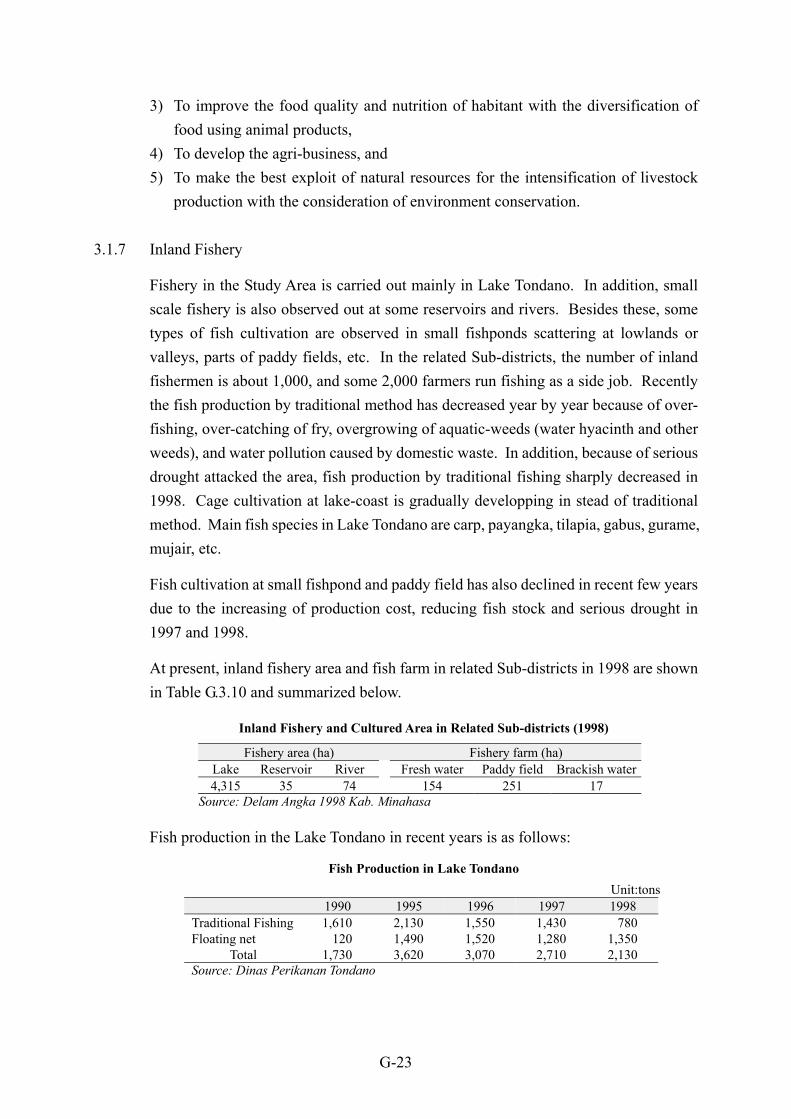
At present, inland fishery area and fish farm in related Sub-districts in 1998 are shownin Table G.3.10 and summarized below.
Inland Fishery and Cultured Area in Related Sub-districts (1998)
Fishery area (ha) Fishery farm (ha)Lake Reservoir River Fresh water Paddy field Brackish water4,315 35 74 154 251 17
Source: Delam Angka 1998 Kab. Minahasa
Fish production in the Lake Tondano in recent years is as follows:
Fish Production in Lake TondanoUnit:tons
1990 1995 1996 1997 1998Traditional Fishing 1,610 2,130 1,550 1,430 780Floating net 120 1,490 1,520 1,280 1,350
Total 1,730 3,620 3,070 2,710 2,130Source: Dinas Perikanan Tondano
G-24
Fishery office reported that Lake Tondano has a high potential for fish cultivation,however, the fish production in the lake is generally stagnant because of low qualityand quantity of seeds, low level of fishing skill, insufficient infrastructure for fishcultivation, lack of funds, deteriorating lake water condition, etc. Generally fishermancould not continue their exertion, because of deficiency of fund to prepare large nets,the economic crisis caused by recent big droughts, the slow fish growing due to the lowquality of seeds, etc.
There are 4 PPS and 68 PPL in BIPP for fishery extension in Minahasa District in 1998.Extension and training are carried out by visiting system through 206 fishery group,and followings are main target of extension for fish cultivation.:
1) Improvement of infrastructure2) Preparation and arrangement of good water condition3) Distribution of high quality food4) Spreading of prime seed5) Efficient pest control6) Expansion of marketing of the products7) Upgrading of fishery skill
Fish markets are generally opened at Tondano, Remboken and some villages of lakeside, and a part of fish is brought to Manado and Bitung.
3.1.8 Farm Economy and Crop Budget
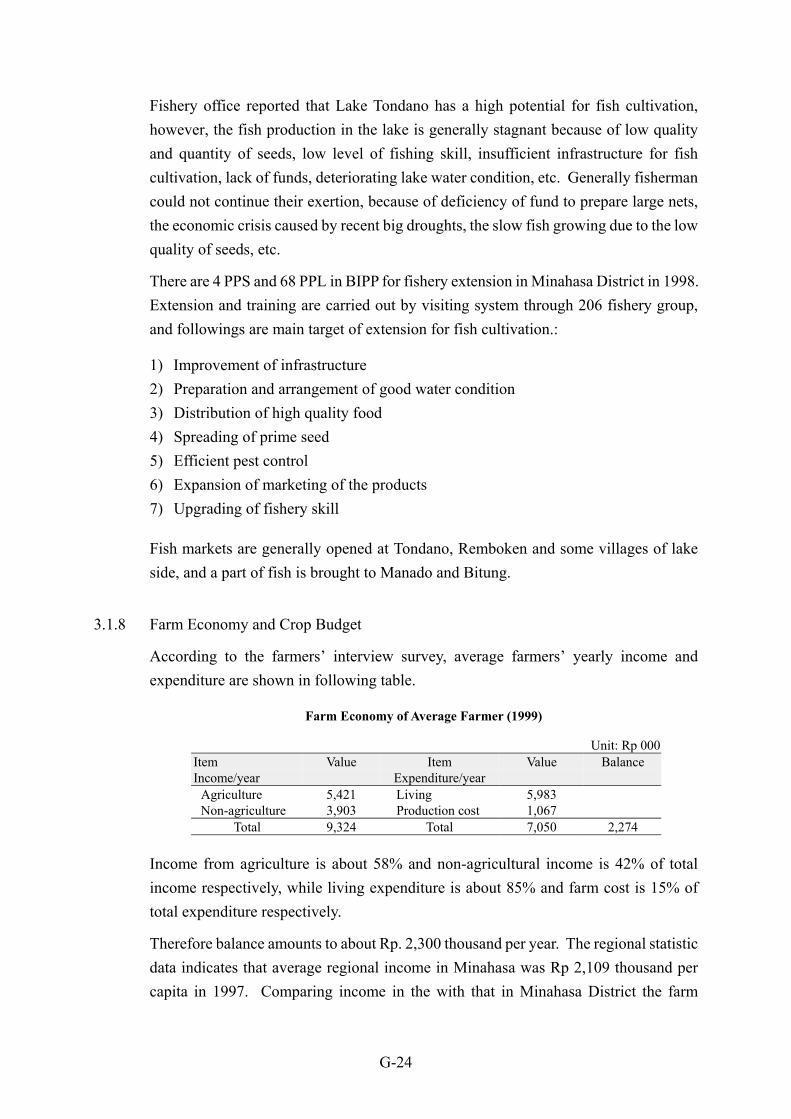
According to the farmers� interview survey, average farmers� yearly income andexpenditure are shown in following table.
Farm Economy of Average Farmer (1999)
Unit: Rp 000ItemIncome/year
Value ItemExpenditure/year
Value Balance
Agriculture 5,421 Living 5,983Non-agriculture 3,903 Production cost 1,067
Total 9,324 Total 7,050 2,274
Income from agriculture is about 58% and non-agricultural income is 42% of totalincome respectively, while living expenditure is about 85% and farm cost is 15% oftotal expenditure respectively.
Therefore balance amounts to about Rp. 2,300 thousand per year. The regional statisticdata indicates that average regional income in Minahasa was Rp 2,109 thousand percapita in 1997. Comparing income in the with that in Minahasa District the farm
G-25
household income of the Study Area would be approximately even.
Besides, the farmers' interview survey indicates the interviewed farmers consumesome 40 kg of fuel wood per week in average.
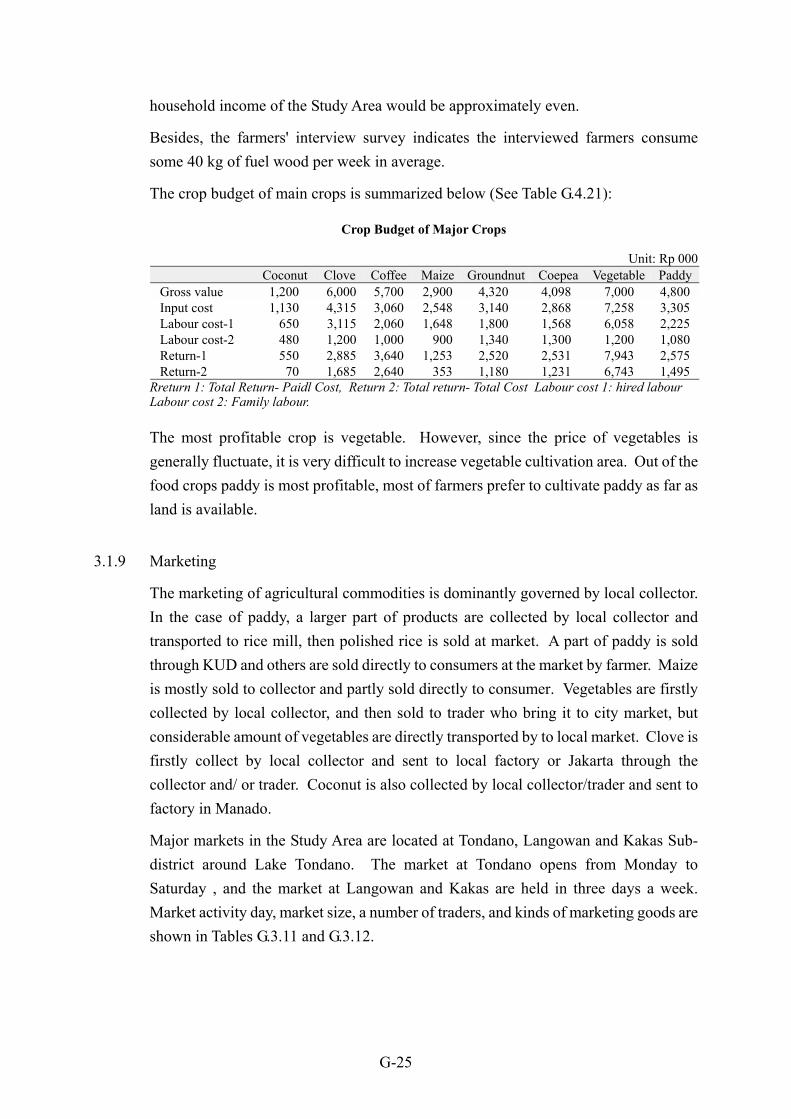
The crop budget of main crops is summarized below (See Table G.4.21):
Crop Budget of Major Crops
Unit: Rp 000Coconut Clove Coffee Maize Groundnut Coepea Vegetable Paddy
Gross value 1,200 6,000 5,700 2,900 4,320 4,098 7,000 4,800Input cost 1,130 4,315 3,060 2,548 3,140 2,868 7,258 3,305Labour cost-1 650 3,115 2,060 1,648 1,800 1,568 6,058 2,225Labour cost-2 480 1,200 1,000 900 1,340 1,300 1,200 1,080Return-1 550 2,885 3,640 1,253 2,520 2,531 7,943 2,575Return-2 70 1,685 2,640 353 1,180 1,231 6,743 1,495
Rreturn 1: Total Return- Paidl Cost, Return 2: Total return- Total Cost Labour cost 1: hired labourLabour cost 2: Family labour.
The most profitable crop is vegetable. However, since the price of vegetables isgenerally fluctuate, it is very difficult to increase vegetable cultivation area. Out of thefood crops paddy is most profitable, most of farmers prefer to cultivate paddy as far asland is available.
3.1.9 Marketing
The marketing of agricultural commodities is dominantly governed by local collector.In the case of paddy, a larger part of products are collected by local collector andtransported to rice mill, then polished rice is sold at market. A part of paddy is soldthrough KUD and others are sold directly to consumers at the market by farmer. Maizeis mostly sold to collector and partly sold directly to consumer. Vegetables are firstlycollected by local collector, and then sold to trader who bring it to city market, butconsiderable amount of vegetables are directly transported by to local market. Clove isfirstly collect by local collector and sent to local factory or Jakarta through thecollector and/ or trader. Coconut is also collected by local collector/trader and sent tofactory in Manado.
Major markets in the Study Area are located at Tondano, Langowan and Kakas Sub-district around Lake Tondano. The market at Tondano opens from Monday toSaturday , and the market at Langowan and Kakas are held in three days a week.Market activity day, market size, a number of traders, and kinds of marketing goods areshown in Tables G.3.11 and G.3.12.
G-26
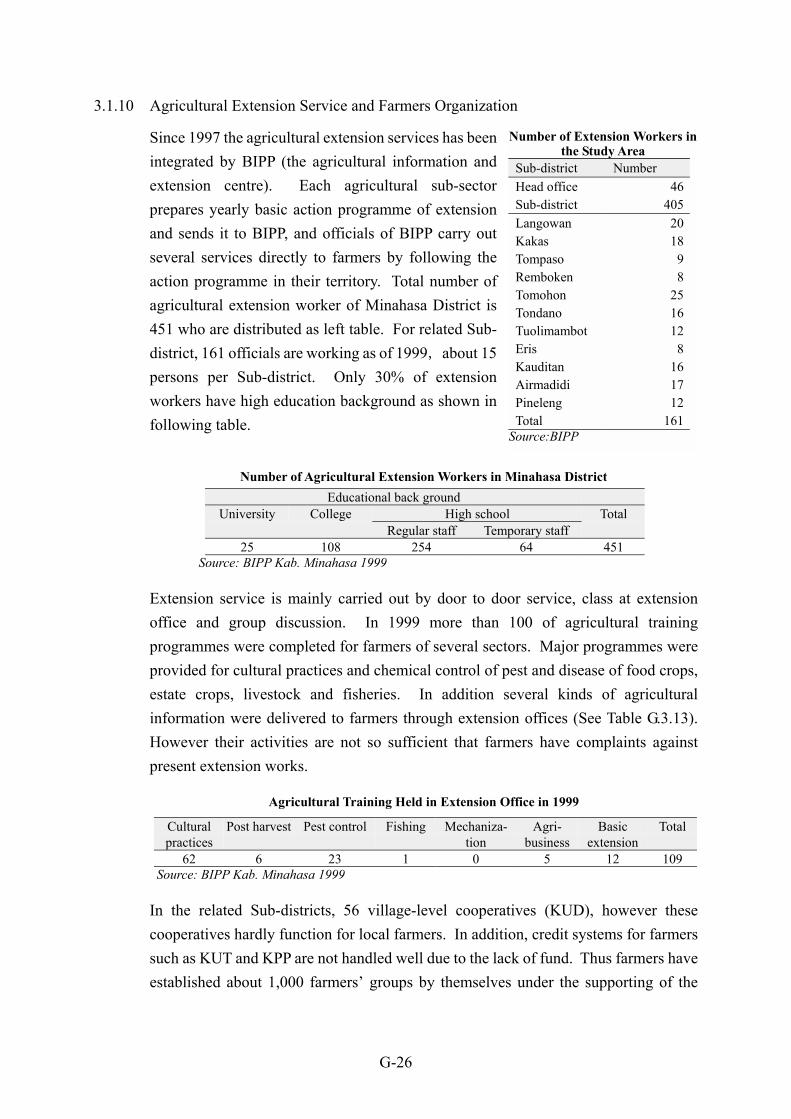
3.1.10 Agricultural Extension Service and Farmers Organization
Since 1997 the agricultural extension services has beenintegrated by BIPP (the agricultural information andextension centre). Each agricultural sub-sectorprepares yearly basic action programme of extensionand sends it to BIPP, and officials of BIPP carry outseveral services directly to farmers by following theaction programme in their territory. Total number ofagricultural extension worker of Minahasa District is451 who are distributed as left table. For related Sub-district, 161 officials are working as of 1999,about 15persons per Sub-district. Only 30% of extensionworkers have high education background as shown infollowing table.
Number of Agricultural Extension Workers in Minahasa DistrictEducational back ground
University College High school TotalRegular staff Temporary staff
25 108 254 64 451Source: BIPP Kab. Minahasa 1999
Extension service is mainly carried out by door to door service, class at extensionoffice and group discussion. In 1999 more than 100 of agricultural trainingprogrammes were completed for farmers of several sectors. Major programmes wereprovided for cultural practices and chemical control of pest and disease of food crops,estate crops, livestock and fisheries. In addition several kinds of agriculturalinformation were delivered to farmers through extension offices (See Table G.3.13).However their activities are not so sufficient that farmers have complaints againstpresent extension works.
Agricultural Training Held in Extension Office in 1999
Culturalpractices
Post harvest Pest control Fishing Mechaniza-tion
Agri-business
Basicextension
Total
62 6 23 1 0 5 12 109Source: BIPP Kab. Minahasa 1999
In the related Sub-districts, 56 village-level cooperatives (KUD), however thesecooperatives hardly function for local farmers. In addition, credit systems for farmerssuch as KUT and KPP are not handled well due to the lack of fund. Thus farmers haveestablished about 1,000 farmers� groups by themselves under the supporting of the
Number of Extension Workers inthe Study Area
Sub-district NumberHead office 46Sub-district 405Langowan 20Kakas 18Tompaso 9Remboken 8Tomohon 25Tondano 16Tuolimambot 12Eris 8Kauditan 16Airmadidi 17Pineleng 12Total 161
Source:BIPP
G-27
government. These farmers' groups have been formed to increase income andupgrading farmers' ability. However, there is no big progress in the farmer�s income.Farmer�s groups are divided into 4 groups, which are beginner, advanced, medium andskilled, based on the grading system of BIPP.
Criterion for grading areas follows: (1) the ability to develop technology, (2) the abilityto multiply basic assets, (3) the ability to corporate between farmers, (4) the ability tobe aware of agreement and (5) the ability to formulate a planning. Each criterion isgrading 0-1000. Total values divided by 5 is used to rank of farmers group. Gradingvalue of each group is as follows:
- Beginner group (Pemula): 0-250,- Advanced group (Lanjut): 251-500,- Middle group (Madya): 501-750,- Skilled group (Utama): 751-1000.
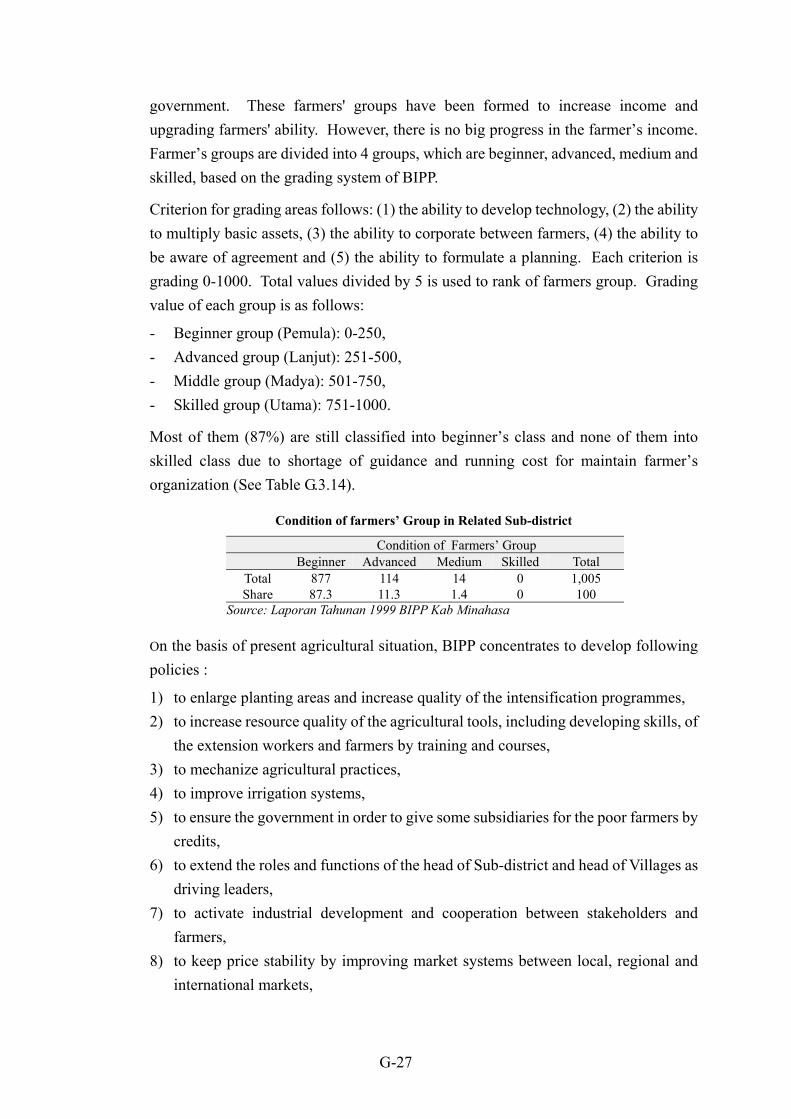
Most of them (87%) are still classified into beginner�s class and none of them intoskilled class due to shortage of guidance and running cost for maintain farmer�sorganization (See Table G.3.14).
Condition of farmers� Group in Related Sub-district
Condition of Farmers� GroupBeginner Advanced Medium Skilled Total
Total 877 114 14 0 1,005Share 87.3 11.3 1.4 0 100
Source: Laporan Tahunan 1999 BIPP Kab Minahasa
On the basis of present agricultural situation, BIPP concentrates to develop followingpolicies :
1) to enlarge planting areas and increase quality of the intensification programmes,2) to increase resource quality of the agricultural tools, including developing skills, of
the extension workers and farmers by training and courses,3) to mechanize agricultural practices,4) to improve irrigation systems,5) to ensure the government in order to give some subsidiaries for the poor farmers by
credits,6) to extend the roles and functions of the head of Sub-district and head of Villages as
driving leaders,7) to activate industrial development and cooperation between stakeholders and
farmers,8) to keep price stability by improving market systems between local, regional and
international markets,
G-28
9) to support and assist trading development through agricultural seed/seedlingquarantines, and
10) demonstrate agricultural technology on the farmer levels.
3.1.11 Current Problems in Agricultural Activities
(1) General
The District Office of Food Crops Service Minahasa (Dinas Pertanian TanamanPangan) points out the current problem in agriculture of the District as below:
1) Twenty three (23) percent of the paddy field in the District is still not wellfunctioned, and the productivity of paddy is still stagnant. Average production ofpaddy can increase at least 15% through the optimization and intensification offield management.
2) The irrigation system is not appropriate, because only 35% of paddy field isirrigated at present.
3) The quality of human resources in agriculture sector (both of farmers and officials)are low. Farmers have still adopted the traditional farming, due to the lack ofinformation for modern agricultural technologies.
4) Mass guidance action for agricultural intensification (BIMAS) programme is notsufficiently functioned at the field level, because of lack of understanding of localleaders.
The farm household survey conducted by JICA Study Team elucidated that about 100farmers interviewed have several constraints under the present agricultural, marketingand living condition, and desire the several countermeasures shown in Table G.3.15and 3.16 (See Attachment - G.1).
Many farmers complain on biological disaster, high production cost, low soilproductivity and labour shortage from the view point of production. For marketingcondition, most of farmers complain to low price and price fluctuation of agriculturalcommodities. For living condition, high constraints are found on labour shortage, lackof domestic water and poor road condition.
Based on the these constraints, major countermeasures farmers desire are shown inTable G.3.16. In spite of less priority in the present constraints, farmers put the highpriority on protection of soil erosion as they recognize strongly its importance.Besides this improvement of domestic water supply, improvement of road conditionand improvement of extension system are expected as the desirable countermeasure.

G-29
(2) Soil Erosion Caused by Clove Cultivation
It is often said that clove cultivation had been introduced and extended rapidly to thesloped area around Lake Tondano during the period from 1950-1980s. And it becamea cause of serious soil erosion throughout the area in those days. To make sure it, JICAStudy Team contacted with some farmers, who have cultivated clove since a fewdecades before, and interviewed how they experienced about soil erosion in thosedays.
1) Sub-district Toulimambot, Village Papakelan
Some farmers told that there had been serious soil erosion from 1970s to1980s.They began clove cultivation in 1950s to 1980s. Their clove planting area wasaround 2 ha. They employed clean cultivation method for clove. They weededfrequently to clear the soil surface for growth and harvest of clove. Such farmmanagement invited serious soil erosion. The water color of the stream had beenchanged to brown with the eroded soil, when heavy rain came. They recognizedsoil erosion came out in their farm land and also saw some dark streams flew intoLake Tondano.
From the end of 1980 to 1990s, soil erosion settled down, because the price ofclove decreased so much that farmers disappointed to carry out intensivemanagement for clove cultivation. Although their clove garden still have keptthe area as it was, tree population has decreased and a part of the area is graduallychanging to shrubs due to poor management. One of the farmers told that theyield of clove products has reduced from former 600 kg/ha to only 200 kg/ha atpresent.
Now they pick the clove buds by hand using stepladder instead of dropping downthem on the cleared land under the tree. They intend to cultivate clove again, ifthe price of clove would rise in future, but they told that they will take care of soilconservation under such a situation.
2) Sub-district Kakas, Village Kaweng
Some farmers remembered that in 1970s �1980s, when heavy rain came, therehappened not only serious soil erosion but also two times of land collapse in theirfarm lands caused by clove cultivation. Their clove garden was 0.6 � 3 ha. Inthose days they used to clear soil surface of farmland for tree management andharvesting of clove buds. Therefore soil of the clove garden was very erosive.Farmers had recognized that the eroded soil used to flow into Lake Tondanowhen heavy rain came. Such serious soil erosion has settled down from the end
G-30
of 1980s. However they insist that soil erosion is still observed because of theerosive soil in this area though it is not so serious.
They said production of clove decreased from 100 litre/tree to only 20 litre/tree.So they have been discouraged to carry out intensive management for their clovegarden. One of the farmers lost all of the clove trees in his 1 ha clove garden dueto the serious plant pest and another farmer also lost most of his clove trees withsame way.
To recover their income, some farmer began fishery, some migrated to town towork, and some is working for mining. They desire to cultivate clove intensivelyagain, if the price of the clove rise up, and actually some farmers have started torehabilitate their clove garden as the price of clove seems to be a little improved.They intend to protect soil erosion in their farm, if they would start again clovecultivation, but they wondered it may require high labour cost.
3) Sub-district Eris, Village Eris
Some farmers interviewed at the Village office answered that there were 7 timesof big flooding in 1970s to 1980s, and every time serious soil erosion wasobserved in this area. In their own clove gardens, soil erosion were observed, andthey remember small river close to their farm land changed color to dark brownwith eroded soil. In those days they used to clean cultivation method for clovegarden. Since 1987 when drought weather lasted, serious soil erosion has settleddown. They improved clove cultivation method taking account of soilconservation, and in addition they have introduced Calliandra to make hedgerows for protection of soil erosion. However such farming practices requireshigh labour cost.
One of farmers told clove production has decreased from 1.5 tons/year to0.3 tons/year because of extensive farming. However if the price of clove rise up,farmers will strengthen clove cultivation again. The head of Village told that heexpected three countermeasures, they are, the improvement of credit system,extension of clove rehabilitation technology, and guarantee fund.
4) Sub-district Toulimambot, Village Paleloan
The farmers told that clove cultivation was introduced around 1970 - 1980, andtheir farm sizes of clove garden were about 1-2 ha for each, most of which werekept the size even now as it was. Main variety of clove is Zanzibar. They saidthat soil erosion from the clove gardens always occurred during 1970s �1980s
G-31
when heavy rain came. And they observed gully erosion developed on the slopedfarm. Furthermore they insisted the soil erosion still happen even now, not onlyin clove garden but also in annual crop area, though their viewpoint sometimesconfused. Perhaps, it will be a fact that soil erosion still continues in some extentat a part of steep sloped and improper farming area.
They recognize their soil conservation technology is insufficient, and extensionservices should be strengthened for improvement of soil conservation method.The head of village wants to construct a check dam at the upper stream of thevillage.
(3) Problems of Agroforestry System in the Study Area
According to the result of farm household survey, no farmer in the Study Area has aconstraint on agroforestry system. The reason, why there is no constraint of farmers onagroforestry system in spite of the productivity being not so high, can be assumed thatagroforestry system in the area has short history and farmers do not understand what isconstraints on agroforestry system. By field reconnaissance, some problems werefound. In the northern part of the Study Area, since trees are randomly planted in oldcoconuts garden, an area for annual crops are irregular shape and crop husbandry forannual crops are ineffective. In addition, irregular spacing of coconuts also prevents toincrease coconut production and efficient farming practice. Trees can impedecultivation of herbaceous crops and introduction of mechanization, and thus increaselabour cost and inhibit advanced farming practices. And inadequate planting systemwas observed in some places such as some kind of trees being planted withoutconsidering crop husbandry, herbaceous crop being planted under high density treegardens. Sometimes, unsuitable agroforestry system is employed. For example in thearea with high land resources, only low productive agroforestry system is employed.Selection of suitable agroforestry system is very important for not only cropproduction but also conservation of environmental condition. For this purpose, it isnecessary to strengthen farmers knowledge by extension workers.
There is few extension worker for agroforestry system and their capability is quite low.This is one of the reason why modern agroforestry cannot extend the area. Therefore,it is necessary to increase the number of agroforestry extension workers and upgradingof extension worker by training.
G-32
3.2 Development Plan of Agriculture and Agroforestry
3.2.1 Basic Concept
It has been said that the ecological condition of Tondano watershed is degrading bysedimentation and environmental pollution. One of the main factors of sedimentationis soil erosion due to improper agricultural practices, improper land use anddeforestation. As a result, there has been observed a small area of critical land whichhas some problems such as low agricultural productivity and adverse effect on theenvironment. Soil erosion is now decreasing by employing soil conservationtechnology and improved cultural practices, however, there are still some space toimprove land conservation technique. It could be supposed that there would be highpossibility of soil erosion, unless proper farming practice and adequate land use planwould be employed in future. Therefore, it is necessary to establish proper land useplan for each category land classified by zoning under consideration on vegetation,physical and social condition, present land use, and appropriate cultural practices forsustainable agriculture. As a larger part of the Study Area is sloped area, anagroforestry system is one of the most effective systems for soil conservation andincrease of soil fertility and productivity. For this purpose, it could be discussed basedon the land use plan, cultural practices, agricultural extension service, organization offarmers group, agricultural credit and farmers participation. Fortunately, since onlyless than 20% of total farm is tenant land in the study area, there is very little landtenure problem, which becomes sometimes a big barrier or agroforestry system inmany countries
3.2.2 Selection of Suitable Agroforestry System
An agroforestry system is one of the most effective systems for soil conservation andincrease of soil fertility and productivity. The agroforestry system in the Study Areahas a short history and farmers could not adequately understand which is moreeffective agroforestry system. The system in the larger part of the area is stillrudimentary, and there is a big space to improve this system for decreasing soil erosionand for getting high return. One of the reason of this is due to the shortage of expert ofagroforestry and the shortage of number and capability of extension workers. Thereare two ways to decrease soil erosion and to increase land productivity by employingagroforestry system, one is to select the suitable agroforestry system and the other is toimprove farming practices of each component. The suitable type of agroforestrysystem varies area by area. It could be determined by the combination of physical andsocial condition of the area. The suitable agroforestry systems could be determinedbased on the physical condition, required agricultural practices and soil conservation
G-33
technology, social condition and the characteristics of each type of agroforestry system.Following factors are considered for determination of the suitable agroforestry system:
i) physical condition such as topography, soil characteristics and potential of soilerosion,
ii) required agricultural practices and soil conservation technology, such as requiredvegetation, necessity of hedge crops and ridge row cultivation, and possibility ofapplication of new technology,
iii) social condition such as access to the field and commodities, andiv) characteristics of each type of agroforestry system such as productivity of each
category of crops, possibility of soil erosion and application of new culturalpractices for herbaceous crops.
The evaluation of each component and the suitable agroforestry system by differentarea are shown in Tables G.3.17, 3.18 and 3.19. These tables show that all theagroforestry systems are applicable for flat to gentle slope area, and the moreproductive system are suitable for flat to gentle sloped area. While agroforestry system,which has a strong resistance to soil erosion but less productivity are suitable forsloped area. The recommendable agroforestry system by area is also presented inTable G.3.18. This are only guide line or recommendation, applicable agroforestrysystem should be determined by considering on farmers requirement and communitiesrequirement.
Fortunately, since only less than 20% of total farm is tenant land in the study area, thereis very little land tenure problem, which becomes sometimes big barrier oragroforestry system in many countries.
3.2.3 Conservation Plan of Each Zone
(1) Protection Zone
Only Protection forest among State Forest is distributed within the Study Area. Thefirst priority is to maintain well stocked forest stand. In the area main activities arerehabilitation and reforestation. According to the New Forest Law, protection forestcan be used for environmental service and collection of non-timber products andcannot be used for other purpose. However, in some part of protection forest,inhabitants illegally encroach to the protection forest and carried out productionactivity and the capacity, for soil erosion and water and moisture keeping, of theencroached forest decreased. Since it is very difficult to recover or to rehabilitateprotection forest, which is encroached by inhabitants, it could be recommended toemploy social forestry system by participation of inhabitants in the area. As
G-34
inhabitants expect some returns from social forestry, it could be recommended toemploy agroforestry system which has a same capacity of forestry for prevention ofsoil erosion and moisture keeping. As the area is situated in the steep slope area,tree/tree crop dominant agroforestry system which is highly resistance to soil erosionbut not so high productivity (AGF-I Type I -3. -4) would be recommended.
(2) Buffer Zone
Buffer Zone is classified into two Sub-Zones: Mountain Buffer Sub-Zone andWaterfront Buffer Sub-Zone.
1) Mountain Buffer Sub-zone
Forest ecosystems play an important role as a regulator of ecological andhydrologic functions. In the Study Area, state forest and right forest havedecreased by legal or illegal deforestation. In order to keep good environmentalcondition, it is important to maintain the forest areas by establishing buffer zone.
In the Mountain Buffer Sub-Zone, the area surrounding the Protection Zone isprimary buffer zone in which vegetation type should be similar to the ProtectionZone. Primary buffer zone is surrounded by secondary buffer zone and/ortransitional zone where possibilities exist for production activity. MountainBuffer Sub-Zone includes right forest area and arable upland area, and a largerpart of the area distributes in sloped area. Generally a slope becomes gentle withan increase of distance from the Protection Zone. In the arable upland farm, therewill be a high potential of soil erosion unless adequate land use and properfarming system, while potential soil erosion would be relatively low in the forest.For the soil conservation, proper land use and proper farming practices are, ofcourse, important, and the civil engineering approach such as construction ofcheck dam and formation of terrace is also necessary.
i) Right forest area
Some of the right forest area under good management and keep good forestcapacity and productivity, however, some of them are under a poor managementor no management and have poor forest capacity and poor productivity. As theforest area is very small in the Study Area, only 9 % of total, it is important tokeep forest area and to keep forest capacity. The forest under good managementcould be recommended to keep as forest. The forest area, under poor or nomanagement, which has a lower forest capacity for soil erosion, water andmoisture keeping, should be improved or change land-use. For the poor managedright forest, it could be recommended to apply agroforestry system, which has a
G-35
same capacity of forest for soil erosion and water and moisture reservation. Thesuitable type of agroforestry system for sloped area is mulistorey tree garden(AGF-I Type I -3, -4, and -5) and for gentle sloped area, multistorey tree gardenand/or non dominant crop agroforestry system (AGF-III Type III-1, -2).
ii) Sloped area and the area around the Protection Zone
Sloped area has a high potential soil erosion, therefore, the land-use systemwhich is resistance to soil erosion should be employed. The suitable agroforestrysystem is tree/tree crop dominant type (AGF-I Type I-3, -4 and -5), especiallymultistorey tree garden. The vegetation of area surrounding the Protection Zoneshould be tree (tree crop) vegetation. Since the Protection Zone is distributed inthe steep sloped area, the buffer zone surrounding the Protection Zone is also inthe steep sloped area. Therefore multistorey tree garden type of agroforestrysystem could be recommended for the area. Generally, the slope becomes gentlewith an increase of distance from the Protection Zone and limitation for cropcultivation also decreases and possibilities of employing higher productiveagroforestry system.
In the some part of the Study Area, vegetable cultivation in a steep sloped area isobserved. In the area, combination of contour ridge cultivation, ridge rowcultivation, mulching and no tillage planting are employed for controlling soilerosion. This area is situated near the town and has a good access. When annualcrops or vegetables are cultivated in a sloped area, it is required a specialtechnique for controlling soil erosion such as contour ridge cultivation, no tillagecultivation, mulching and hedgerow cropping.
At present, the agricultural production in the slope area is stagnant at low levelcompared with flat area, because of land condition, poor management for cropand land due to poor access to the field and long distance from the settlement area.It is important to arrange good access by improving road condition andconstruction of new road for farmers in the area to improve soil conservation andcrop production. Though it is important to employ proper land use and properfarming system, it is also important to prevent soil erosion by physical andtechnical approach such as construction of check dam and terrace.
iii) Gently sloped area and flat area
Generally, the slope becomes gentle with an increase of distance from theProtection Zone and limitation for crop cultivation also decreases by departingfrom the Protection Zone. As potential of soil erosion in the flat or gentle sloped
G-36
area is low, the highly productive agroforestry system, which are not highlyresistance to soil erosion, could be employed in flat or gentle sloped area. In thearea, all the types of agroforestry system are applicable and high productiveagroforestry system, could be recommended in the area.
The fuel wood consumption in the Study Area is estimated by farmers interviewsurvey at some 40 kg per farm household per week and a larger part of farmersare mainly collecting from their fields, estates and bushes. Therefore, it could berecommended to employ multipurpose trees for their agroforestry system notonly to supply fuel wood but also to supply organic carbon to soil and to protectsoil erosion. Especially, it could be strongly recommended hedgerow croppingby using leguminous trees which increase soil fertility by fixing atmosphericnitrogen and supply of organic carbon.
2) Waterfront Buffer Sub-Zone
Waterfront Buffer Sub-Zone can be classified into two, alongside of river andlakeshore. For the area of alongside of rivers, it could be recommended toestablish a green belt or to employ agroforestry system depending on topographyand width of basin. For narrow basin, green belt is suitable while for wide basingreen belt and AGF-I can be recommended. For the area of lakeshore, it could berecommended firstly to establish green belt along the edge of the lake exceptswamp area and secondly to employ agroforestry system considering on the landcondition. AGF-I Type I-6 for the area, close to settlement area, and AGF-I TypeI-3, -4 for the other area.
Changing a view into the waterbody of the Lake Tondano, the water quality of theLake has recently been degrading, due to the several human activities in andaround the Lake. As one of these activities, the development of fish cultivationby cage at the lakeshore could be involved, because a considerable amount ofresidual feed and dung of fish would contaminate the lake water. Therefore thecontrol of increasing cage cultivation in future is an important countermeasurefor the protection of water quality of the Lake.
(3) Farming Zone
In this area, an intensive agriculture is acceptable, especially in the flat area. Thefarming pattern varies area by area depending upon the natural and social condition. Inflat area, mono-cropping or mixed-cropping of annual crops under multiple croppingsystem are recommended and agroforestry systems are also recommended. Suitableagroforestry system in the flat area would be AGF-II (Type II-1 and -2) and AGF-III
G-37
(Type III-1 and -2). Considering the fuel wood consumption and maintaining soilfertility, hedgerow cropping of leguminous trees would be recommendable.
In the sloped area, AGF-III (Type III-1, -2) and tree/tree crop dominant agroforestrysystem AGF-I (Type I-5 and -6) could be recommended.
3.2.4 Improvement of Cultural Practices
Cultural practices of paddy and vegetables in the area are now advanced, however,those of other annual upland crops, especially maize, is extensive in some parts and theyields are still low. The cultural practices of some upland crops in a larger part of thearea employ soil conservation technique which have still some space to improve. Asan extensive maize cultivation sometimes accelerates soil erosion and decreases soilfertility, this cultural practice should be improved to keep sustainable agriculture. Forimproving cultural practices, it is necessary not only to increase yield but also toconsider sustainability of agriculture. It is very effective for soil conservation andincreasing soil fertility to employ contour ridge, mulching and hedgerow cultivation byusing multipurpose Leguminosae trees. At present, maize occupies more than 90% ofpalawija area, and the return from the maize cultivation is not so high compared withother crops. It should be considered crop diversification by employing leguminouscrops which increase the soil fertility.
In the larger part of the Study Area, coconuts and clove trees are now at replanting time.It was believed that serious soil erosion occurred at few decades before was due to landclearance for planting clove and clean cultivation of clove. Therefore, it could berecommended that planting clove should be carried out without land clearance andafter growing of cover crops, cereals or pulses. Clove seedlings should be cultivated inthe clean circle at early growth stage and never under clean cultivation. In addition,employment of hedgerow cultivation could be effective.
In old coconut garden, coconuts were randomly planted in 1950 to 60�s. Introductionof agroforestry system for this area, there would be some difficulties for herbaceouscrop cultivation, because of small and irregular shape of area for herbaceous crops. Itcould be recommended that coconut should be regularly planted at refreshing time,considering on employment of agroforestry.
3.2.5 Improvement of Agricultural Extension Service
Farmers request more intensive door to door service and supply of information on newcultural practices. Since there are not enough extension workers for intensiveagricultural extension service required by farmers, it is necessary to employ more
G-38
effective extension method. Followings are examples of effective agriculturalextension service, extension service should
i) collaborate with other related institutions,ii) adopt group guidance method by organizing farmers group and establishing
demonstration plot,iii) provide the chance of farmers training programme.
As already stated, a larger part of farmers in the Study Area have no constraints foragroforestry, although there could be observed many problems in their agroforestrysystem. Agroforestry system has only recently recognized as an important area ofscientific inquiry. Since it incorporates the management of trees, tree crops andherbaceous crops on the same pieces of land, the knowledge and skills to manageagroforestry are broad and varied. Research and extension of each category of treesand crops have been carried out by different institution and there is little corporation onagroforestry among them. As a result, education and training in agroforestry lags farbehind other agricultural disciplines leaving a definite shortage of experienced,qualified trainers in agroforestry. Therefore, it is urgently need to increase the numberof agroforestry extension workers and also upgrade them by training.
3.2.6 Improvement of Farmers� Group
On village level, there are many farmers� organizations or farmers� group, but largerpart of them is not so active, because of shortage of running fund and managementknow-how. These farmers� organizations have been formed to increase income andupgrading farmers� ability, however, there is no big progress in the farmers� income.To activate these organizations, it is necessary capacity building of organization andlocal leaders through technology transfer. Technology transfer can be expectedthrough agricultural extension service, public service from university and otherinstitutions. For receiving the technology transfer, group guidance is the mosteffective.
In order to increase concern of farmers in the Study Area on suitable agriculturalmanagement and keeping good environmental condition, it needs to establishcommunity base development. For this purpose, it should be discussed on the farmers�requirement, upgrading technologies, and capital arrangement for the requirement todevelop the programme at community level.
Programme for community base development can be established through several ways.They are adoption new cultural techniques of group discussion.
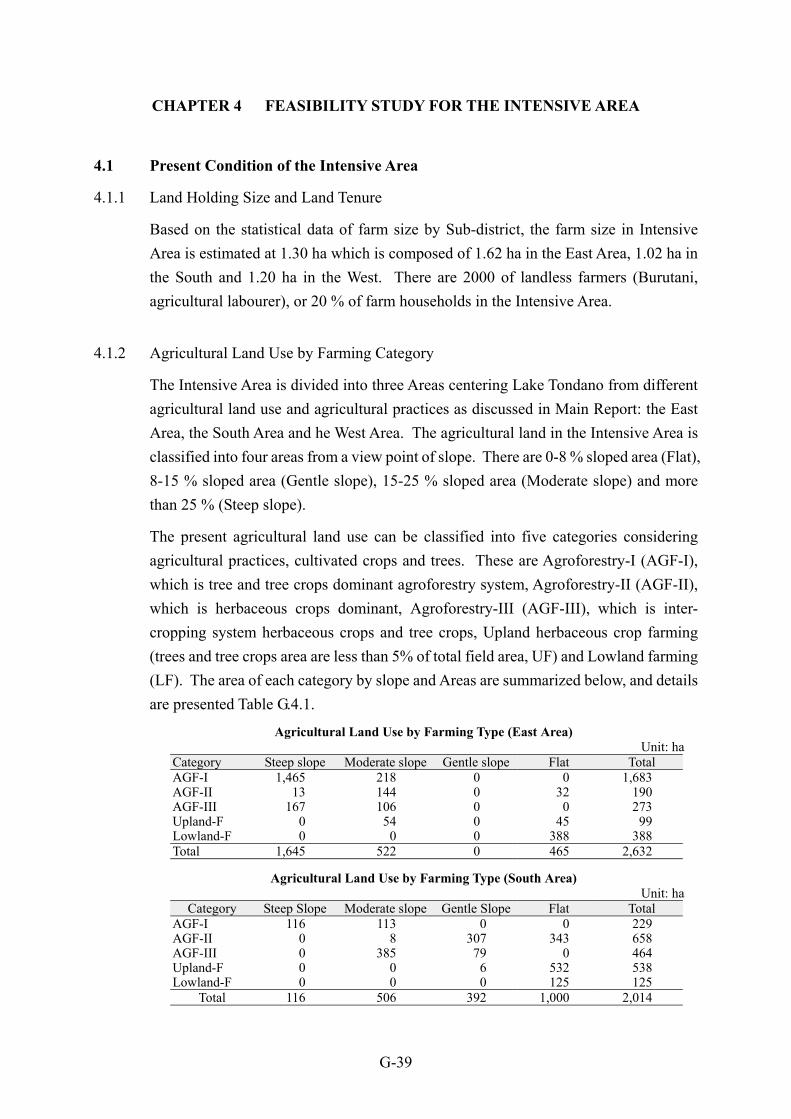
G-39
CHAPTER 4 FEASIBILITY STUDY FOR THE INTENSIVE AREA
4.1 Present Condition of the Intensive Area
4.1.1 Land Holding Size and Land Tenure
Based on the statistical data of farm size by Sub-district, the farm size in IntensiveArea is estimated at 1.30 ha which is composed of 1.62 ha in the East Area, 1.02 ha inthe South and 1.20 ha in the West. There are 2000 of landless farmers (Burutani,agricultural labourer), or 20 % of farm households in the Intensive Area.
4.1.2 Agricultural Land Use by Farming Category
The Intensive Area is divided into three Areas centering Lake Tondano from differentagricultural land use and agricultural practices as discussed in Main Report: the EastArea, the South Area and he West Area. The agricultural land in the Intensive Area isclassified into four areas from a view point of slope. There are 0-8 % sloped area (Flat),8-15 % sloped area (Gentle slope), 15-25 % sloped area (Moderate slope) and morethan 25 % (Steep slope).
The present agricultural land use can be classified into five categories consideringagricultural practices, cultivated crops and trees. These are Agroforestry-I (AGF-I),which is tree and tree crops dominant agroforestry system, Agroforestry-II (AGF-II),which is herbaceous crops dominant, Agroforestry-III (AGF-III), which is inter-cropping system herbaceous crops and tree crops, Upland herbaceous crop farming(trees and tree crops area are less than 5% of total field area, UF) and Lowland farming(LF). The area of each category by slope and Areas are summarized below, and detailsare presented Table G.4.1.
Agricultural Land Use by Farming Type (East Area)Unit: ha
Category Steep slope Moderate slope Gentle slope Flat TotalAGF-I 1,465 218 0 0 1,683AGF-II 13 144 0 32 190AGF-III 167 106 0 0 273Upland-F 0 54 0 45 99Lowland-F 0 0 0 388 388Total 1,645 522 0 465 2,632
Agricultural Land Use by Farming Type (South Area)Unit: ha
Category Steep Slope Moderate slope Gentle Slope Flat TotalAGF-I 116 113 0 0 229AGF-II 0 8 307 343 658AGF-III 0 385 79 0 464Upland-F 0 0 6 532 538Lowland-F 0 0 0 125 125
Total 116 506 392 1,000 2,014

G-40
Agricultural Land Use by Farming Type (West Area)Unit: ha
Category Steep Slope Moderate slope Gentle Slope Flat TotalAGF-I 140 837 0 0 977AGF-II 0 539 335 35 909AGF-III 0 1210 20 0 1,231Upland-F 0 20 760 344 1,124Lowland-F 0 0 0 125 125
Total 140 2,606 1,115 504 4,365
Agricultural Land Use by Farming Type (Intensive Area)Unit: ha
Category Steep slope Moderate slope Gentle slope Flat TotalAGF-I 1,722 1167 0 0 2,889AGF-II 13 692 642 409 1,756AGF-III 167 1,701 100 0 1,968Upland-F 0 74 767 919 1,760Lowland-F 0 0 0 638 638
Total 1,902 3,634 1,509 1,966 9,011Note: Steep slope; slope more than 25%, Slope; slope 15-25%, Gentle slope; Slope; slope 8-15%,
Flat; slope 0-8%.
AGF-I is mainly distributed in steep slope and moderate slope area, and negligiblydistributed in gentle slope and flat area. AGF-II is mainly distributed in moderatesloped, gentle slope and flat area, and slightly in steep slope area. AGF III is mainlydistributed in slope and slightly in steep slope and gentle slope area. Agroforestrysystem covers some 80% of total agricultural upland in the Intensive Area. UF ismainly distributed in gentle slope and flat area, and slightly in moderate slope area andnegligibly in steep slope area. LF is distributed only in flat area.
Farmers apply AGF-I mainly for steep slope area, which has a high erosive potential,and UF for gentle slope and flat area, which have a low erosive potential. Thisselection of farming type for each slope area is reasonable, however, there is foundimproper land use such as UF being carried out in steep slope, although its area is verylimited. UF in steep slope has a possibility of increasing soil erosion.
In the East Area, agroforestry system covers 96% of total agricultural upland area.AGF-I is predominant and occupies 75% of agricultural upland area, because a largerpart of agricultural area belongs to steep slope area. AGF-II and AGF III cover 8% and12% of total upland agricultural area, respectively. UF area is very limited anddistributed in moderate slope and flat area. The soil fertility in this area is not so high.
The South Area is stretched to down area of the Protection Forest, and the slope andundulation are relatively gentle. In this area, agroforestry system covers 82% of totalagricultural upland area and there is a little difference in covering area among eachagroforestry system. Some 40% of flat are under agroforestry system. AGF Idistributes in steep slope and slope area, AGF II mainly in gentle slope and flat area,
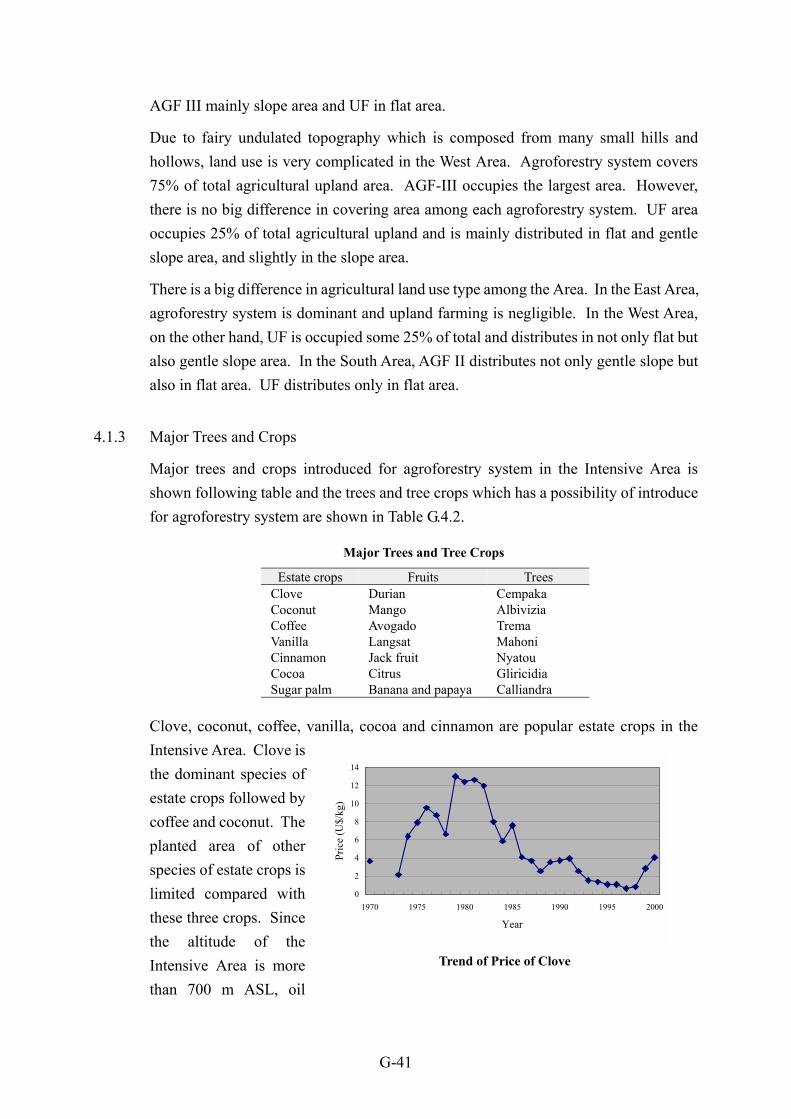
AGF III mainly slope area and UF in flat area.
Due to fairy undulated topography which is composed from many small hills andhollows, land use is very complicated in the West Area. Agroforestry system covers75% of total agricultural upland area. AGF-III occupies the largest area. However,there is no big difference in covering area among each agroforestry system. UF areaoccupies 25% of total agricultural upland and is mainly distributed in flat and gentleslope area, and slightly in the slope area.
There is a big difference in agricultural land use type among the Area. In the East Area,agroforestry system is dominant and upland farming is negligible. In the West Area,on the other hand, UF is occupied some 25% of total and distributes in not only flat butalso gentle slope area. In the South Area, AGF II distributes not only gentle slope butalso in flat area. UF distributes only in flat area.
4.1.3 Major Trees and Crops
Major trees and crops introduced for agroforestry system in the Intensive Area isshown following table and the trees and tree crops which has a possibility of introducefor agroforestry system are shown in Table G.4.2.
Major Trees and Tree Crops
Estate crops Fruits TreesClove Durian CempakaCoconut Mango AlbiviziaCoffee Avogado TremaVanilla Langsat MahoniCinnamon Jack fruit NyatouCocoa Citrus GliricidiaSugar palm Banana and papaya Calliandra
Clove, coconut, coffee, va theIntensive Area. Clove isthe dominant species ofestate crops followed bycoffee and coconut. Theplanted area of otherspecies of estate crops islimited compared withthese three crops. Sincethe altitude of theIntensive Area is morethan 700 m ASL, oil
nilla, cocoa and cinnamon are popular estate crops in
0
2
4
6
8
10
12
14
1970 1975 1980 1985 1990 1995 2000
Year
Pric
e (U
$/kg
)
Trend of Price of Clove
G-41
G-42
content of copra is low, therefore, coconut is mainly cultivated for fresh coconuts. Theplanted area of coconut is very small compared with that of clove, although the plantedarea of coconut in Minahasa District is comparable with that of clove. Clove is themain estate crop in the Intensive Area. Its planted area is increasing gradually from1970�s to 1986. After 1986, its area had been kept at constant as shown in Table G.4.3.Because the price of clove showed a decreasing tendency from 1983 and it had beenkept at very low price from 1992 to 1997 under government control as shown in rightfigure.
The low price of clove make farmers lazy for maintenance of clove and to discountingrenewal of clove garden where the trees become too old to produce. Then a largenumber of trees are infected by disease and suffered by nutritional problems. After late1998, the price of clove is put at the out of government control and has been governedby the market. The price of clove is increasing from 1998 and becomes the same levelof early 1980�s in 2000. From 1999, farmers start to renew old clove garden and tomaintain carefully clove garden. At present, the production of clove is 60,000 tons peryear and the demand is 100,000 tons per year. Considering present situation of clovemarket, it could be said that clove based agroforestry system is hopeful in the area.Sugar palm, which is extensively cultivated, is also found in all over the IntensiveArea.
In Indonesia, the most widespread agroforestry system is rubber agroforestry whichoccupies over 2.5 million ha. The biodiversity levels of this system often approach tothose of natural and secondary forest and its soil conservation capacity is very high.However, since this system required large area, it is very difficult to introduce to theIntensive Area.
Major fruit trees are banana, durian, mango, langsat, avogado, jackfruit, rambutan,citrus and papaya. These trees are planted in home garden and upland field close todwelling area. Banana and papaya are sometimes planted as hedgerow crops. It isvery difficult to find the orchard in the area.
Popular trees used for agroforestry system in the area are Cempaka, Albizia, Trema,Mahoni, Nyatou, Caliandra and Gliricidia. Kordia and Erythrina are only found in theSouth Area. Although Piper and Ficus are autogenesis plant, they have been found inagroforestry system in whole area. These trees contribute to soil conservation and areused for building material and fuel. Recently, Cempaka and Mahoni are planted in thewhole Intensive Area by recommendation of forestry department. Calliandra andGliricidia are also used as hedgerow trees. Bamboo is the most popular species in thearea used for agroforestry system and distributed all the Intensive Area. Sugar palm
G-43
are also extensively cultivated in whole the Intensive Area.
Teak (Tectona spp.) is the most popular species for agroforestry in Indonesia and highvalue. Golden teak (Tectona spp.) has been proposed to employ for agroforestrysystem in the Intensive Area at the interim report meeting. However, the climaticcondition of the Intensive Area is not adequate for growth of golden teak whichrequires relatively long duration (4 to 6 month) of dry period. And it requires a longperiod from planting to harvesting (some 50 to 80 years). Therefore, golden teak couldnot be employed for agroforestry system in the area as new tree species.
Major food crops in the area is maize, followed by pulses such as ground nuts and cowpeas, vegetables such as tomatoes, chili, leaks, carrot and cucumber, and root cropssuch as cassava and sweet potatoes. Cassava and sweet potatoes are also used as hedgecrops.
The characteristics of major crops are as follows.
(1) Maize
Maize is a predominant crop in this area. It is cultivated not only mono-culture but alsointer-cropping with estate crops. As maize can cultivate through the year, generally itis cultivated 2 times a year, and rotated with pulses or vegetables. Most of varieties arecomposite type, while hybrid type with high productivity is still low.
(2) Pulses
Groundnuts and cowpeas are usually cultivated as a rotation crop in arable upland andinter-cropped with estate crops. Groundnuts are mainly cultivated at west part ofIntensive Area, Sub-district Tondano, Remboken and Kawangkowan. Cowpeas arecultivated in same situation as groundnut. But its dominant area is southern part of theIntensive Area, Sub-district Tompaso, Langowan and Kakas, where groundnut area isvery limited.
(3) Vegetables
Major vegetables in Intensive Area are tomato and leaf onion. Tomato is commonlyplanted in small parcels in home gardens. Commercially it is planted mainly atsouthern mountain foot. Generally the fruits of tomato are very small because ofcharacteristics of variety, no fruits thinning depending on the market demand. It isdirectly sown without raising seedling in nursery. The farmers in southern area areeager to cultivate tomato because of relatively high profitability. Leaf onion is also oneof the main vegetables. Vegetable area is scattered all over the Intensive Area, thoughits planting scale is so small that total cropped area is not much.
G-44
(4) Paddy
Most of paddy fields in the Study Area is located at out of the Intensive Area. From theviewpoint of watershed conservation, paddy fields do not have any problem, but itprotects soil sedimentation in Lake Tondano. Almost all of farmers are eager to paddycultivation. In a flat area and the terraced area, farmers would like to cultivate paddyplant if irrigation water is available. Problem seems to be high water level in most ofpaddy field where natural drainage is difficult due to the high lake water level. Paddycan be cultivated through a year. Most of farmers cultivate paddy two times a year.Mechanization of farm practices is under progress, while mechanization of uplandcrop cultivation is far behind.
(5) Clove
Clove gardens in the Intensive Area are mainly stretched in eastern sloped land andmany small gardens are scattered all over the area. Dominant variety is Zanzibar, andsome traditional varieties, such as Siputih and Sikotok are observed. Decades before,clove cultivation was rapidly spread in the Lake Tondano watershed. After CloveManagement Agency (BPPC, Badan Penyangga Pengelolaan Tanaman Cengkeh)began to control the price and marketing of clove, farmers were forced to sell theirproducts only to cooperatives (KUDs). There are no processing factories in NorthSulawesi Province. Almost all products are sent to Surabaya in West Java wheretobacco companies are concentrated.
(6) Coconut
Coconut is predominant estate crop in North Sulawesi Province. Coconut plantationarea is more than 300,000 ha and distributed at relatively low elevation area. However,coconut is not suitable to the area higher than ASL. 500 m due to the low content of oilcaused by low temperature. As almost all of the Intensive Area is located at higherthan ASL 500 m, coconut trees are mainly observed in the tree complex at hillsides andthe border of upland or estate land. Most of coconut trees are not planted for copraproduction, but for fruit production.
(7) Coffee, Cocaoa and Vanilla
Long before, coffee had been introduced at the western part of Tondano watershed area,after 1970s coffee plantation was changed to clove garden, and now it is anticipatedagain as an estate crop with relatively high return. Cocoa is also anticipated as anestate crop as same as coffee. It began to introduce mainly in hilly area of west ofSub-district Remboken and Tondano and some small plots of cocoa are observed in the
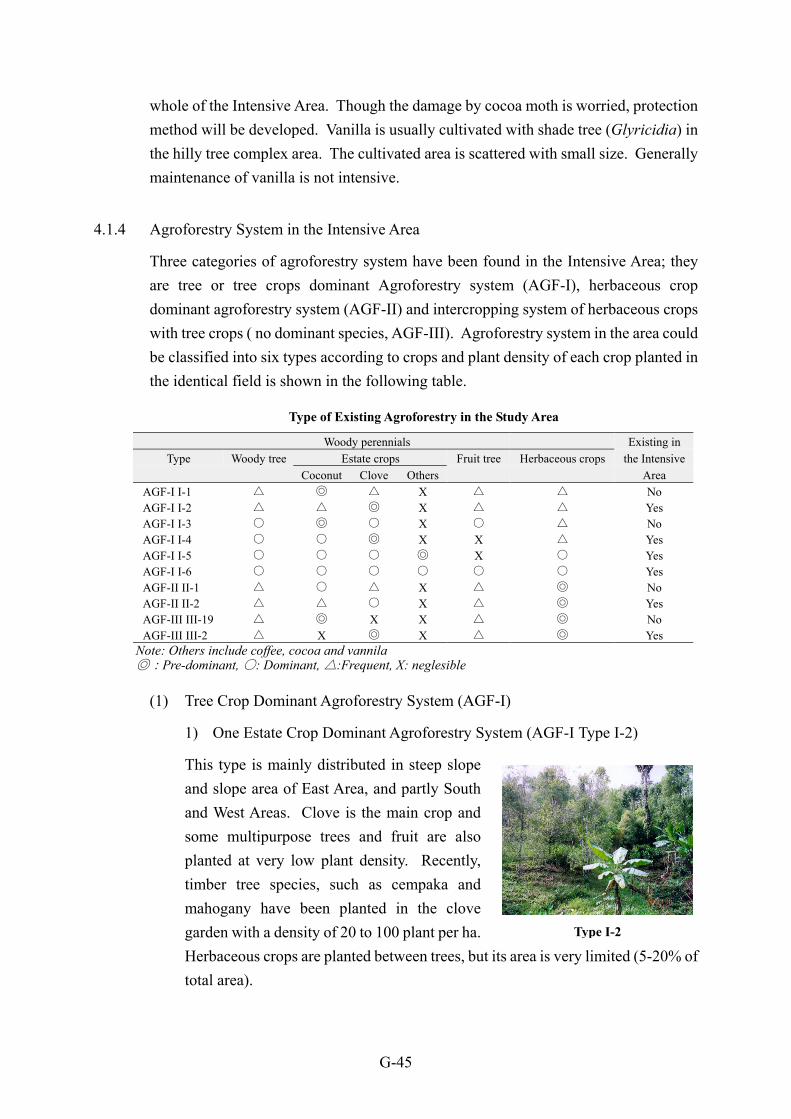
G-45
whole of the Intensive Area. Though the damage by cocoa moth is worried, protectionmethod will be developed. Vanilla is usually cultivated with shade tree (Glyricidia) inthe hilly tree complex area. The cultivated area is scattered with small size. Generallymaintenance of vanilla is not intensive.
4.1.4 Agroforestry System in the Intensive Area
Three categories of agroforestry system have been found in the Intensive Area; theyare tree or tree crops dominant Agroforestry system (AGF-I), herbaceous cropdominant agroforestry system (AGF-II) and intercropping system of herbaceous cropswith tree crops ( no dominant species, AGF-III). Agroforestry system in the area couldbe classified into six types according to crops and plant density of each crop planted inthe identical field is shown in the following table.
Type of Existing Agroforestry in the Study Area
Woody perennials Existing inType Woody tree Estate crops Fruit tree Herbaceous crops the Intensive
Coconut Clove Others AreaAGF-I I-1 △ ◎ △ X △ △ NoAGF-I I-2 △ △ ◎ X △ △ YesAGF-I I-3 ○ ◎ ○ X ○ △ NoAGF-I I-4 ○ ○ ◎ X X △ YesAGF-I I-5 ○ ○ ○ ◎ X ○ YesAGF-I I-6 ○ ○ ○ ○ ○ ○ YesAGF-II II-1 △ ○ △ X △ ◎ NoAGF-II II-2 △ △ ○ X △ ◎ YesAGF-III III-19 △ ◎ X X △ ◎ NoAGF-III III-2 △ X ◎ X △ ◎ Yes
Note: Others include coffee, cocoa and vannila◎:Pre-dominant, ○: Dominant, △:Frequent, X: neglesible
(1) Tree Crop Dominant Agroforestry System (AGF-I)
1) One Estate Crop Dominant Agroforestry System (AGF-I Type I-2)
This type is mainly distributed in steep slopeand slope area of East Area, and partly Southand West Areas. Clove is the main crop andsome multipurpose trees and fruit are alsoplanted at very low plant density. Recently,timber tree species, such as cempaka andmahogany have been planted in the clovegarden with a density of 20 to 100 plant per ha.Herbaceous crops are planted between trees, but itotal area).
Type I-2
ts area is very limited (5-20% of
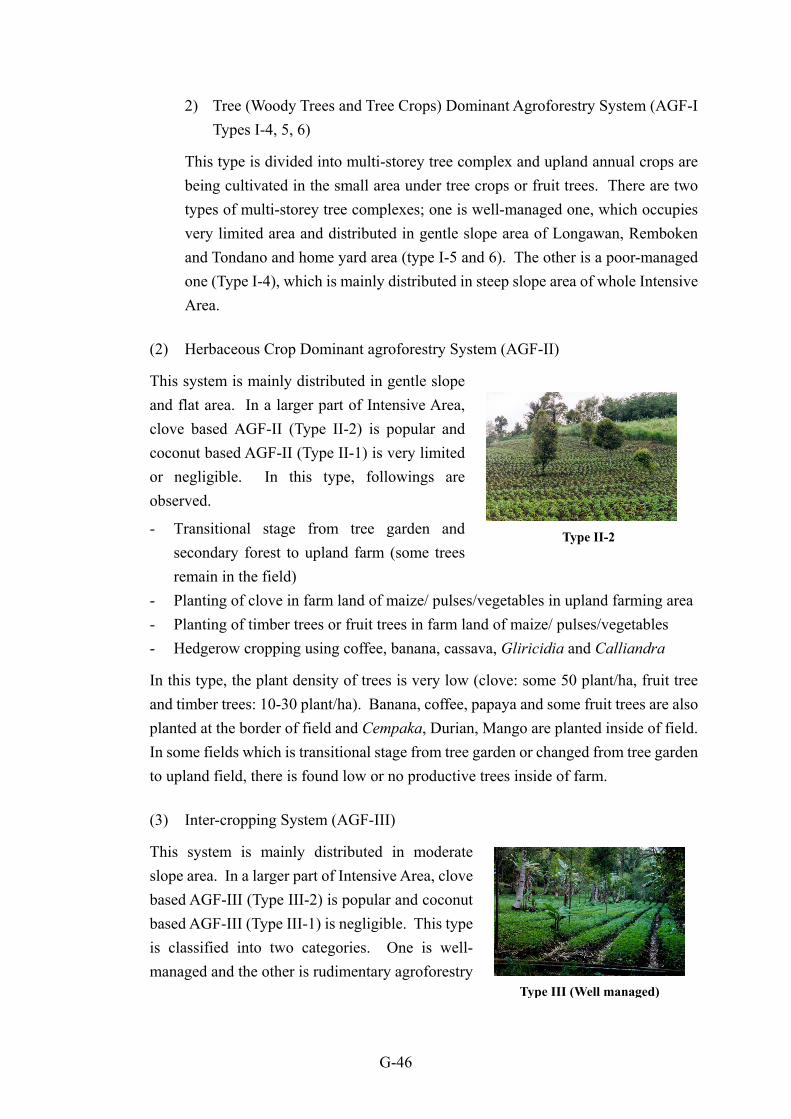
G-46
2) Tree (Woody Trees and Tree Crops) Dominant Agroforestry System (AGF-ITypes I-4, 5, 6)
This type is divided into multi-storey tree complex and upland annual crops arebeing cultivated in the small area under tree crops or fruit trees. There are twotypes of multi-storey tree complexes; one is well-managed one, which occupiesvery limited area and distributed in gentle slope area of Longawan, Rembokenand Tondano and home yard area (type I-5 and 6). The other is a poor-managedone (Type I-4), which is mainly distributed in steep slope area of whole IntensiveArea.
(2) Herbaceous Crop Dominant agroforestry System (AGF-II)
This system is mainly distributed in gentle slopeand flat area. In a larger part of Intensive Area,clove based AGF-II (Type II-2) is popular andcoconut based AGF-II (Type II-1) is very limitedor negligible. In this type, followings areobserved.
- Transitional stage from tree garden andsecondary forest to upland farm (some treesremain in the field)
- Planting of clove in farm land of maize/ pulses/vegetables in upland farming area- Planting of timber trees or fruit trees in farm land of maize/ pulses/vegetables- Hedgerow cropping using coffee, banana, cassava, Gliricidia and Calliandra
In this type, the plant density of trees is very low (clove: some 50 plant/ha, fruit treeand timber trees: 10-30 plant/ha). Banana, coffee, papaya and some fruit trees are alsoplanted at the border of field and Cempaka, Durian, Mango are planted inside of field.In some fields which is transitional stage from tree garden or changed from tree gardento upland field, there is found low or no productive trees inside of farm.
(3) Inter-cropping System (AGF-III)
This system is mainly distributed in moderateslope area. In a larger part of Intensive Area, clovebased AGF-III (Type III-2) is popular and coconutbased AGF-III (Type III-1) is negligible. This typeis classified into two categories. One is well-managed and the other is rudimentary agroforestry
Type II-2
Type III (Well managed)
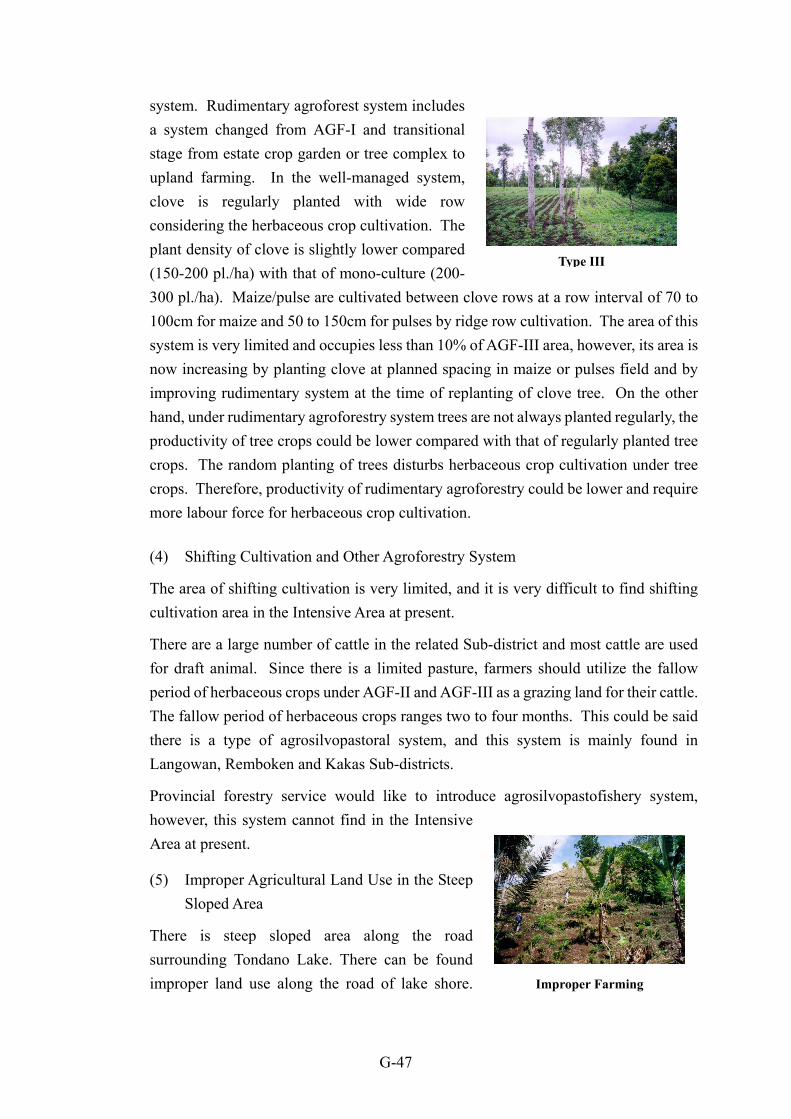
G-47
system. Rudimentary agroforest system includesa system changed from AGF-I and transitionalstage from estate crop garden or tree complex toupland farming. In the well-managed system,clove is regularly planted with wide rowconsidering the herbaceous crop cultivation. Theplant density of clove is slightly lower compared(150-200 pl./ha) with that of mono-culture (200-300 pl./ha). Maize/pulse are cultivated between clo100cm for maize and 50 to 150cm for pulses by ridgsystem is very limited and occupies less than 10% onow increasing by planting clove at planned spacinimproving rudimentary system at the time of replahand, under rudimentary agroforestry system trees aproductivity of tree crops could be lower comparedcrops. The random planting of trees disturbs herbacrops. Therefore, productivity of rudimentary agrofmore labour force for herbaceous crop cultivation.
(4) Shifting Cultivation and Other Agroforestry S
The area of shifting cultivation is very limited, andcultivation area in the Intensive Area at present.
There are a large number of cattle in the related Sufor draft animal. Since there is a limited pasture,period of herbaceous crops under AGF-II and AGF-IThe fallow period of herbaceous crops ranges two tthere is a type of agrosilvopastoral system, andLangowan, Remboken and Kakas Sub-districts.
Provincial forestry service would like to introduhowever, this system cannot find in the IntensiveArea at present.
(5) Improper Agricultural Land Use in the SteepSloped Area
There is steep sloped area along the roadsurrounding Tondano Lake. There can be foundimproper land use along the road of lake shore.
Type III
ve rows at a row interval of 70 toe row cultivation. The area of thisf AGF-III area, however, its area isg in maize or pulses field and bynting of clove tree. On the otherre not always planted regularly, the with that of regularly planted treeceous crop cultivation under tree
orestry could be lower and require
ystem
it is very difficult to find shifting
b-district and most cattle are used farmers should utilize the fallowII as a grazing land for their cattle.o four months. This could be said this system is mainly found in
ce agrosilvopastofishery system,
Improper Farming
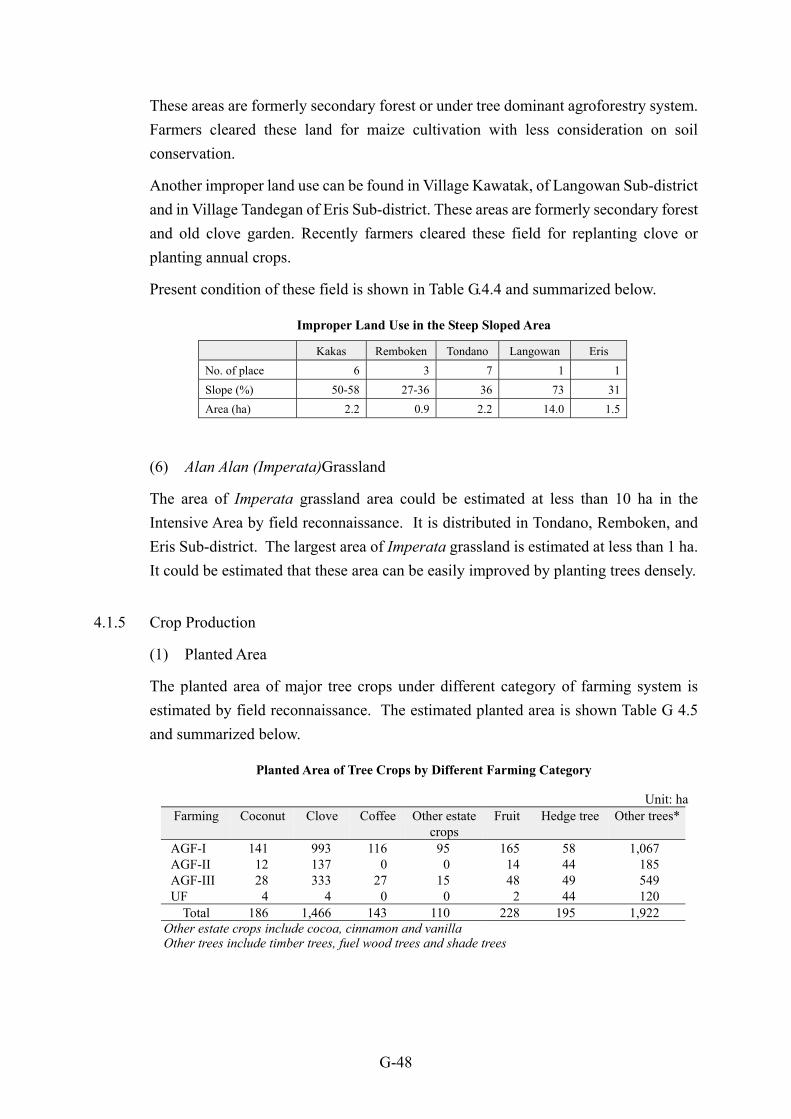
G-48
These areas are formerly secondary forest or under tree dominant agroforestry system.Farmers cleared these land for maize cultivation with less consideration on soilconservation.
Another improper land use can be found in Village Kawatak, of Langowan Sub-districtand in Village Tandegan of Eris Sub-district. These areas are formerly secondary forestand old clove garden. Recently farmers cleared these field for replanting clove orplanting annual crops.
Present condition of these field is shown in Table G.4.4 and summarized below.
Improper Land Use in the Steep Sloped Area
Kakas Remboken Tondano Langowan ErisNo. of place 6 3 7 1 1Slope (%) 50-58 27-36 36 73 31Area (ha) 2.2 0.9 2.2 14.0 1.5
(6) Alan Alan (Imperata)Grassland
The area of Imperata grassland area could be estimated at less than 10 ha in theIntensive Area by field reconnaissance. It is distributed in Tondano, Remboken, andEris Sub-district. The largest area of Imperata grassland is estimated at less than 1 ha.It could be estimated that these area can be easily improved by planting trees densely.
4.1.5 Crop Production
(1) Planted Area
The planted area of major tree crops under different category of farming system isestimated by field reconnaissance. The estimated planted area is shown Table G 4.5and summarized below.
Planted Area of Tree Crops by Different Farming Category
Unit: haFarming Coconut Clove Coffee Other estate
cropsFruit Hedge tree Other trees*
AGF-I 141 993 116 95 165 58 1,067AGF-II 12 137 0 0 14 44 185AGF-III 28 333 27 15 48 49 549UF 4 4 0 0 2 44 120
Total 186 1,466 143 110 228 195 1,922Other estate crops include cocoa, cinnamon and vanillaOther trees include timber trees, fuel wood trees and shade trees
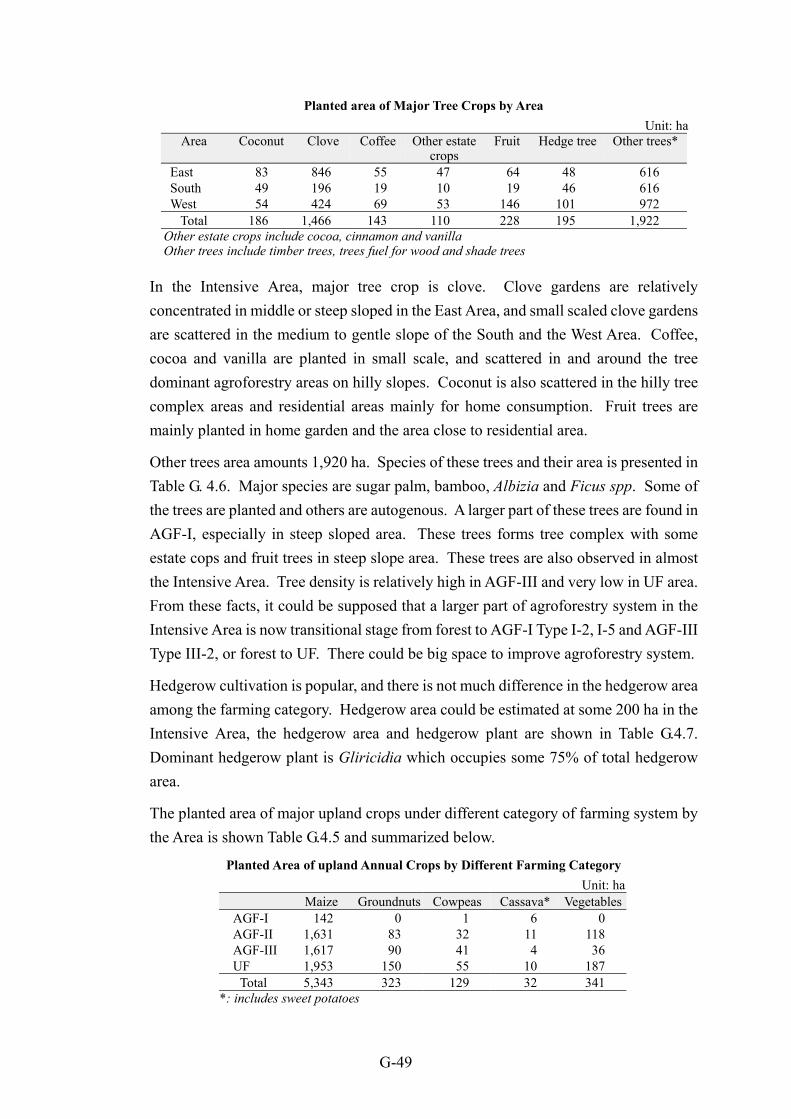
G-49
Planted area of Major Tree Crops by AreaUnit: ha
Area Coconut Clove Coffee Other estatecrops
Fruit Hedge tree Other trees*
East 83 846 55 47 64 48 616South 49 196 19 10 19 46 616West 54 424 69 53 146 101 972
Total 186 1,466 143 110 228 195 1,922Other estate crops include cocoa, cinnamon and vanillaOther trees include timber trees, trees fuel for wood and shade trees
In the Intensive Area, major tree crop is clove. Clove gardens are relativelyconcentrated in middle or steep sloped in the East Area, and small scaled clove gardensare scattered in the medium to gentle slope of the South and the West Area. Coffee,cocoa and vanilla are planted in small scale, and scattered in and around the treedominant agroforestry areas on hilly slopes. Coconut is also scattered in the hilly treecomplex areas and residential areas mainly for home consumption. Fruit trees aremainly planted in home garden and the area close to residential area.
Other trees area amounts 1,920 ha. Species of these trees and their area is presented inTable G. 4.6. Major species are sugar palm, bamboo, Albizia and Ficus spp. Some ofthe trees are planted and others are autogenous. A larger part of these trees are found inAGF-I, especially in steep sloped area. These trees forms tree complex with someestate cops and fruit trees in steep slope area. These trees are also observed in almostthe Intensive Area. Tree density is relatively high in AGF-III and very low in UF area.From these facts, it could be supposed that a larger part of agroforestry system in theIntensive Area is now transitional stage from forest to AGF-I Type I-2, I-5 and AGF-IIIType III-2, or forest to UF. There could be big space to improve agroforestry system.
Hedgerow cultivation is popular, and there is not much difference in the hedgerow areaamong the farming category. Hedgerow area could be estimated at some 200 ha in theIntensive Area, the hedgerow area and hedgerow plant are shown in Table G.4.7.Dominant hedgerow plant is Gliricidia which occupies some 75% of total hedgerowarea.
The planted area of major upland crops under different category of farming system bythe Area is shown Table G.4.5 and summarized below.
Planted Area of upland Annual Crops by Different Farming CategoryUnit: ha
Maize Groundnuts Cowpeas Cassava* VegetablesAGF-I 142 0 1 6 0AGF-II 1,631 83 32 11 118AGF-III 1,617 90 41 4 36UF 1,953 150 55 10 187
Total 5,343 323 129 32 341*: includes sweet potatoes
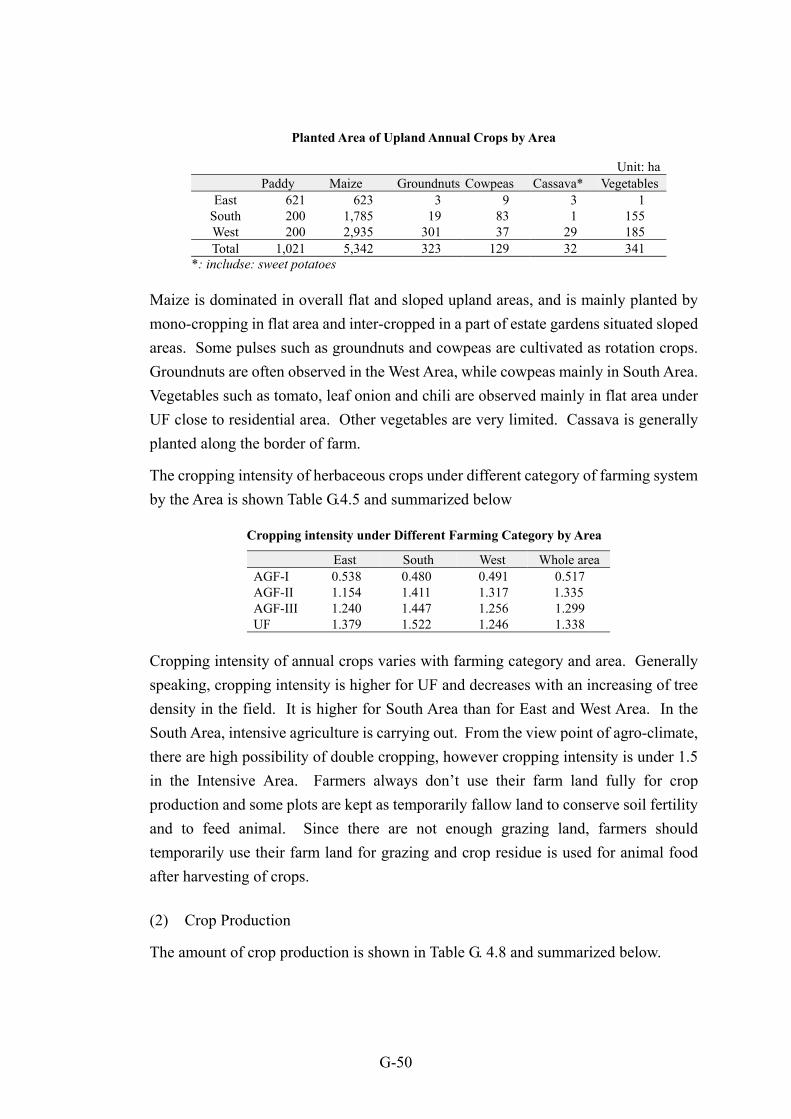
G-50
Planted Area of Upland Annual Crops by Area
Unit: haPaddy Maize Groundnuts Cowpeas Cassava* Vegetables
East 621 623 3 9 3 1South 200 1,785 19 83 1 155West 200 2,935 301 37 29 185Total 1,021 5,342 323 129 32 341
*: includse: sweet potatoes
Maize is dominated in overall flat and sloped upland areas, and is mainly planted bymono-cropping in flat area and inter-cropped in a part of estate gardens situated slopedareas. Some pulses such as groundnuts and cowpeas are cultivated as rotation crops.Groundnuts are often observed in the West Area, while cowpeas mainly in South Area.Vegetables such as tomato, leaf onion and chili are observed mainly in flat area underUF close to residential area. Other vegetables are very limited. Cassava is generallyplanted along the border of farm.
The cropping intensity of herbaceous crops under different category of farming systemby the Area is shown Table G.4.5 and summarized below
Cropping intensity under Different Farming Category by Area
East South West Whole areaAGF-I 0.538 0.480 0.491 0.517AGF-II 1.154 1.411 1.317 1.335AGF-III 1.240 1.447 1.256 1.299UF 1.379 1.522 1.246 1.338
Cropping intensity of annual crops varies with farming category and area. Generallyspeaking, cropping intensity is higher for UF and decreases with an increasing of treedensity in the field. It is higher for South Area than for East and West Area. In theSouth Area, intensive agriculture is carrying out. From the view point of agro-climate,there are high possibility of double cropping, however cropping intensity is under 1.5in the Intensive Area. Farmers always don�t use their farm land fully for cropproduction and some plots are kept as temporarily fallow land to conserve soil fertilityand to feed animal. Since there are not enough grazing land, farmers shouldtemporarily use their farm land for grazing and crop residue is used for animal foodafter harvesting of crops.
(2) Crop Production
The amount of crop production is shown in Table G. 4.8 and summarized below.
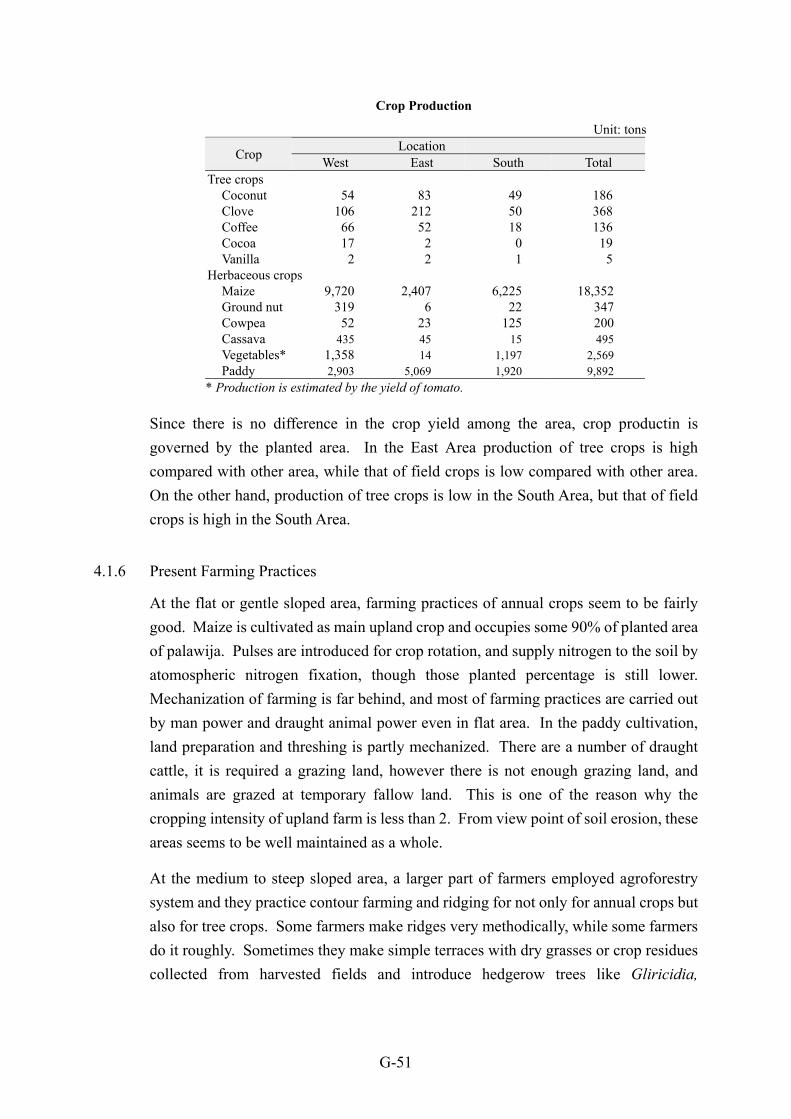
G-51
Crop Production
Unit: tonsLocationCrop West East South Total
Tree cropsCoconut 54 83 49 186Clove 106 212 50 368Coffee 66 52 18 136Cocoa 17 2 0 19Vanilla 2 2 1 5
Herbaceous cropsMaize 9,720 2,407 6,225 18,352Ground nut 319 6 22 347Cowpea 52 23 125 200Cassava 435 45 15 495Vegetables* 1,358 14 1,197 2,569Paddy 2,903 5,069 1,920 9,892
* Production is estimated by the yield of tomato.
Since there is no difference in the crop yield among the area, crop productin isgoverned by the planted area. In the East Area production of tree crops is highcompared with other area, while that of field crops is low compared with other area.On the other hand, production of tree crops is low in the South Area, but that of fieldcrops is high in the South Area.
4.1.6 Present Farming Practices
At the flat or gentle sloped area, farming practices of annual crops seem to be fairlygood. Maize is cultivated as main upland crop and occupies some 90% of planted areaof palawija. Pulses are introduced for crop rotation, and supply nitrogen to the soil byatomospheric nitrogen fixation, though those planted percentage is still lower.Mechanization of farming is far behind, and most of farming practices are carried outby man power and draught animal power even in flat area. In the paddy cultivation,land preparation and threshing is partly mechanized. There are a number of draughtcattle, it is required a grazing land, however there is not enough grazing land, andanimals are grazed at temporary fallow land. This is one of the reason why thecropping intensity of upland farm is less than 2. From view point of soil erosion, theseareas seems to be well maintained as a whole.
At the medium to steep sloped area, a larger part of farmers employed agroforestrysystem and they practice contour farming and ridging for not only for annual crops butalso for tree crops. Some farmers make ridges very methodically, while some farmersdo it roughly. Sometimes they make simple terraces with dry grasses or crop residuescollected from harvested fields and introduce hedgerow trees like Gliricidia,
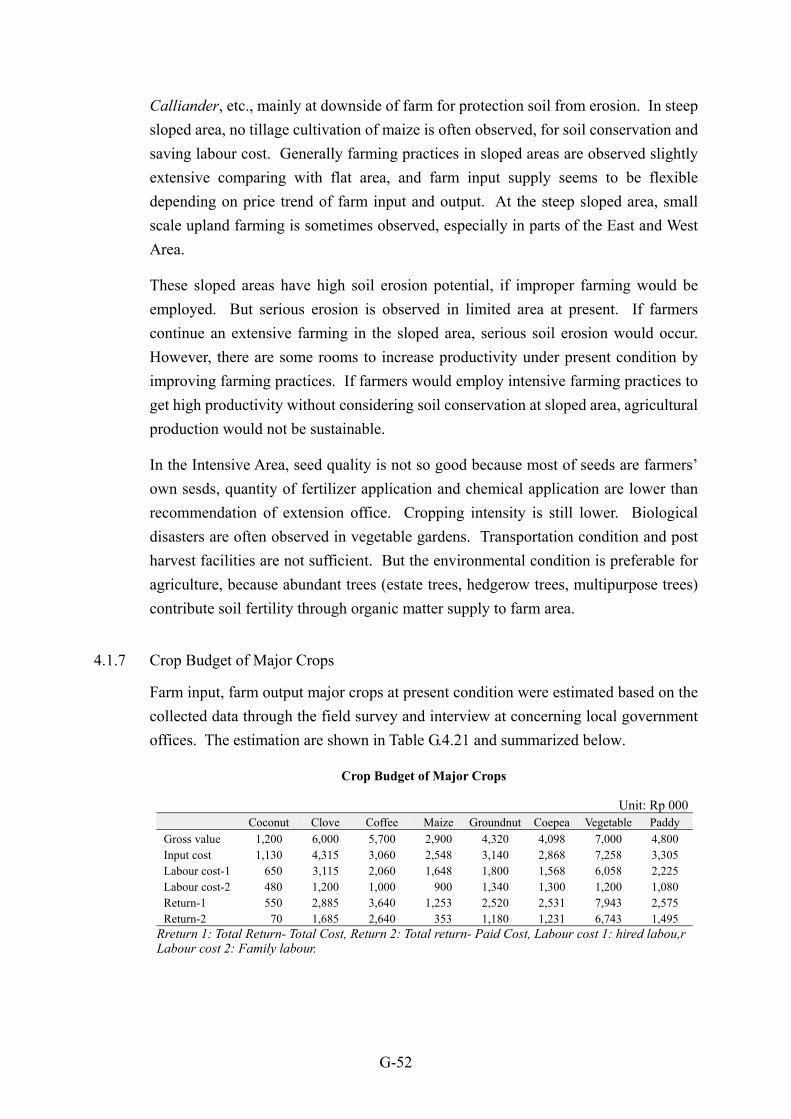
G-52
Calliander, etc., mainly at downside of farm for protection soil from erosion. In steepsloped area, no tillage cultivation of maize is often observed, for soil conservation andsaving labour cost. Generally farming practices in sloped areas are observed slightlyextensive comparing with flat area, and farm input supply seems to be flexibledepending on price trend of farm input and output. At the steep sloped area, smallscale upland farming is sometimes observed, especially in parts of the East and WestArea.
These sloped areas have high soil erosion potential, if improper farming would beemployed. But serious erosion is observed in limited area at present. If farmerscontinue an extensive farming in the sloped area, serious soil erosion would occur.However, there are some rooms to increase productivity under present condition byimproving farming practices. If farmers would employ intensive farming practices toget high productivity without considering soil conservation at sloped area, agriculturalproduction would not be sustainable.
In the Intensive Area, seed quality is not so good because most of seeds are farmers�own sesds, quantity of fertilizer application and chemical application are lower thanrecommendation of extension office. Cropping intensity is still lower. Biologicaldisasters are often observed in vegetable gardens. Transportation condition and postharvest facilities are not sufficient. But the environmental condition is preferable foragriculture, because abundant trees (estate trees, hedgerow trees, multipurpose trees)contribute soil fertility through organic matter supply to farm area.
4.1.7 Crop Budget of Major Crops
Farm input, farm output major crops at present condition were estimated based on thecollected data through the field survey and interview at concerning local governmentoffices. The estimation are shown in Table G.4.21 and summarized below.
Crop Budget of Major Crops
Unit: Rp 000Coconut Clove Coffee Maize Groundnut Coepea Vegetable Paddy
Gross value 1,200 6,000 5,700 2,900 4,320 4,098 7,000 4,800Input cost 1,130 4,315 3,060 2,548 3,140 2,868 7,258 3,305Labour cost-1 650 3,115 2,060 1,648 1,800 1,568 6,058 2,225Labour cost-2 480 1,200 1,000 900 1,340 1,300 1,200 1,080Return-1 550 2,885 3,640 1,253 2,520 2,531 7,943 2,575Return-2 70 1,685 2,640 353 1,180 1,231 6,743 1,495
Rreturn 1: Total Return- Total Cost, Return 2: Total return- Paid Cost, Labour cost 1: hired labou,rLabour cost 2: Family labour.
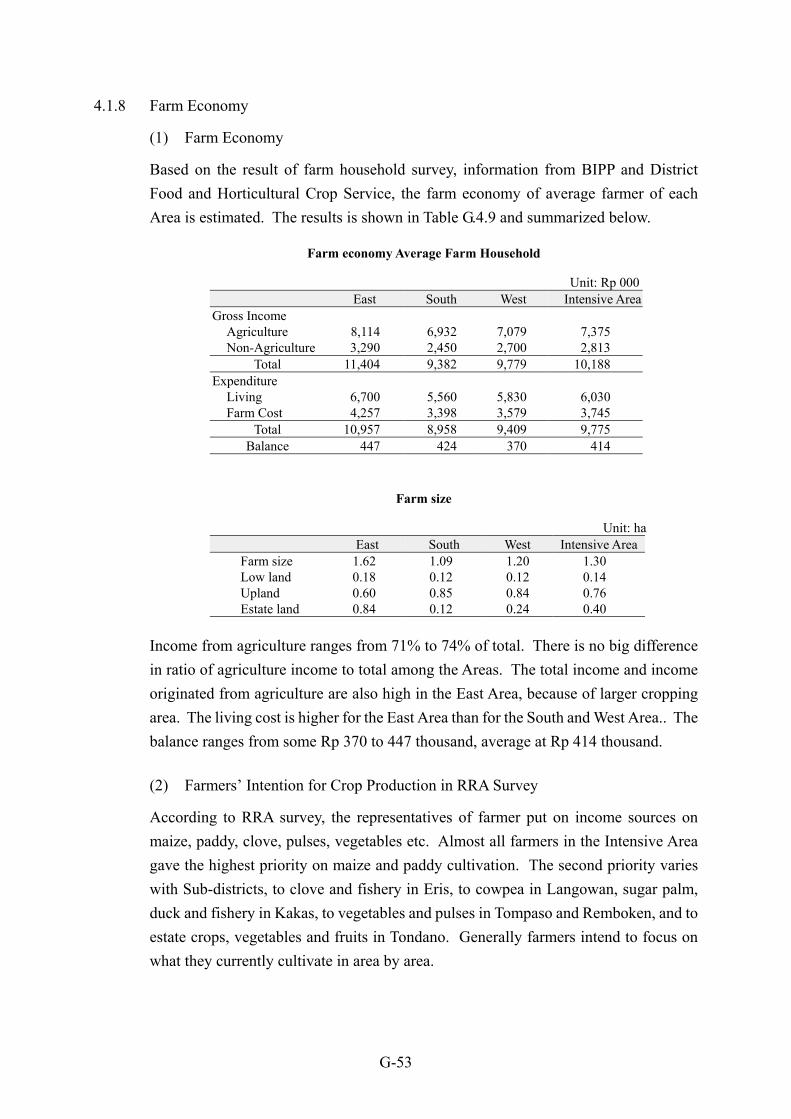
G-53
4.1.8 Farm Economy
(1) Farm Economy
Based on the result of farm household survey, information from BIPP and DistrictFood and Horticultural Crop Service, the farm economy of average farmer of eachArea is estimated. The results is shown in Table G.4.9 and summarized below.
Farm economy Average Farm Household
Unit: Rp 000East South West Intensive Area
Gross IncomeAgriculture 8,114 6,932 7,079 7,375Non-Agriculture 3,290 2,450 2,700 2,813
Total 11,404 9,382 9,779 10,188Expenditure
Living 6,700 5,560 5,830 6,030Farm Cost 4,257 3,398 3,579 3,745
Total 10,957 8,958 9,409 9,775Balance 447 424 370 414
Farm size
Unit: haEast South West Intensive Area
Farm size 1.62 1.09 1.20 1.30Low land 0.18 0.12 0.12 0.14Upland 0.60 0.85 0.84 0.76Estate land 0.84 0.12 0.24 0.40
Income from agriculture ranges from 71% to 74% of total. There is no big differencein ratio of agriculture income to total among the Areas. The total income and incomeoriginated from agriculture are also high in the East Area, because of larger croppingarea. The living cost is higher for the East Area than for the South and West Area.. Thebalance ranges from some Rp 370 to 447 thousand, average at Rp 414 thousand.
(2) Farmers� Intention for Crop Production in RRA Survey
According to RRA survey, the representatives of farmer put on income sources onmaize, paddy, clove, pulses, vegetables etc. Almost all farmers in the Intensive Areagave the highest priority on maize and paddy cultivation. The second priority varieswith Sub-districts, to clove and fishery in Eris, to cowpea in Langowan, sugar palm,duck and fishery in Kakas, to vegetables and pulses in Tompaso and Remboken, and toestate crops, vegetables and fruits in Tondano. Generally farmers intend to focus onwhat they currently cultivate in area by area.
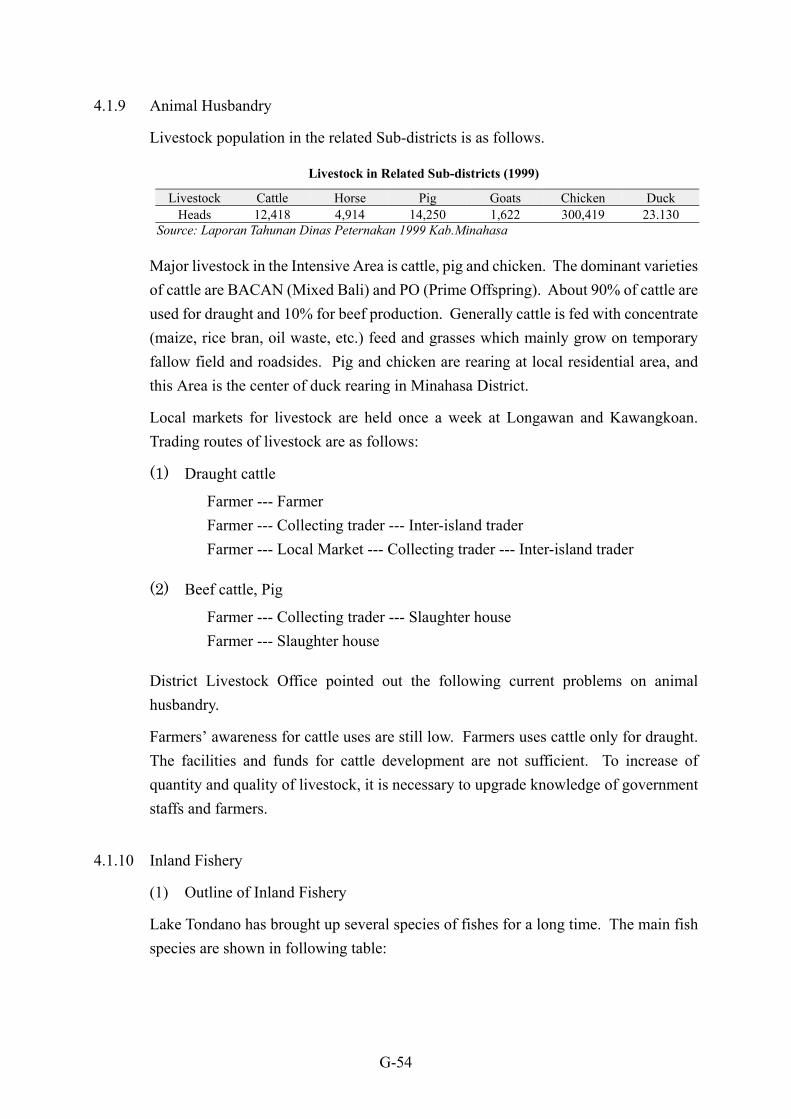
G-54
4.1.9 Animal Husbandry
Livestock population in the related Sub-districts is as follows.
Livestock in Related Sub-districts (1999)
Livestock Cattle Horse Pig Goats Chicken DuckHeads 12,418 4,914 14,250 1,622 300,419 23.130
Source: Laporan Tahunan Dinas Peternakan 1999 Kab.Minahasa
Major livestock in the Intensive Area is cattle, pig and chicken. The dominant varietiesof cattle are BACAN (Mixed Bali) and PO (Prime Offspring). About 90% of cattle areused for draught and 10% for beef production. Generally cattle is fed with concentrate(maize, rice bran, oil waste, etc.) feed and grasses which mainly grow on temporaryfallow field and roadsides. Pig and chicken are rearing at local residential area, andthis Area is the center of duck rearing in Minahasa District.
Local markets for livestock are held once a week at Longawan and Kawangkoan.Trading routes of livestock are as follows:
(1) Draught cattle
Farmer --- FarmerFarmer --- Collecting trader --- Inter-island traderFarmer --- Local Market --- Collecting trader --- Inter-island trader
(2) Beef cattle, Pig
Farmer --- Collecting trader --- Slaughter houseFarmer --- Slaughter house
District Livestock Office pointed out the following current problems on animalhusbandry.
Farmers� awareness for cattle uses are still low. Farmers uses cattle only for draught.The facilities and funds for cattle development are not sufficient. To increase ofquantity and quality of livestock, it is necessary to upgrade knowledge of governmentstaffs and farmers.
4.1.10 Inland Fishery
(1) Outline of Inland Fishery
Lake Tondano has brought up several species of fishes for a long time. The main fishspecies are shown in following table:
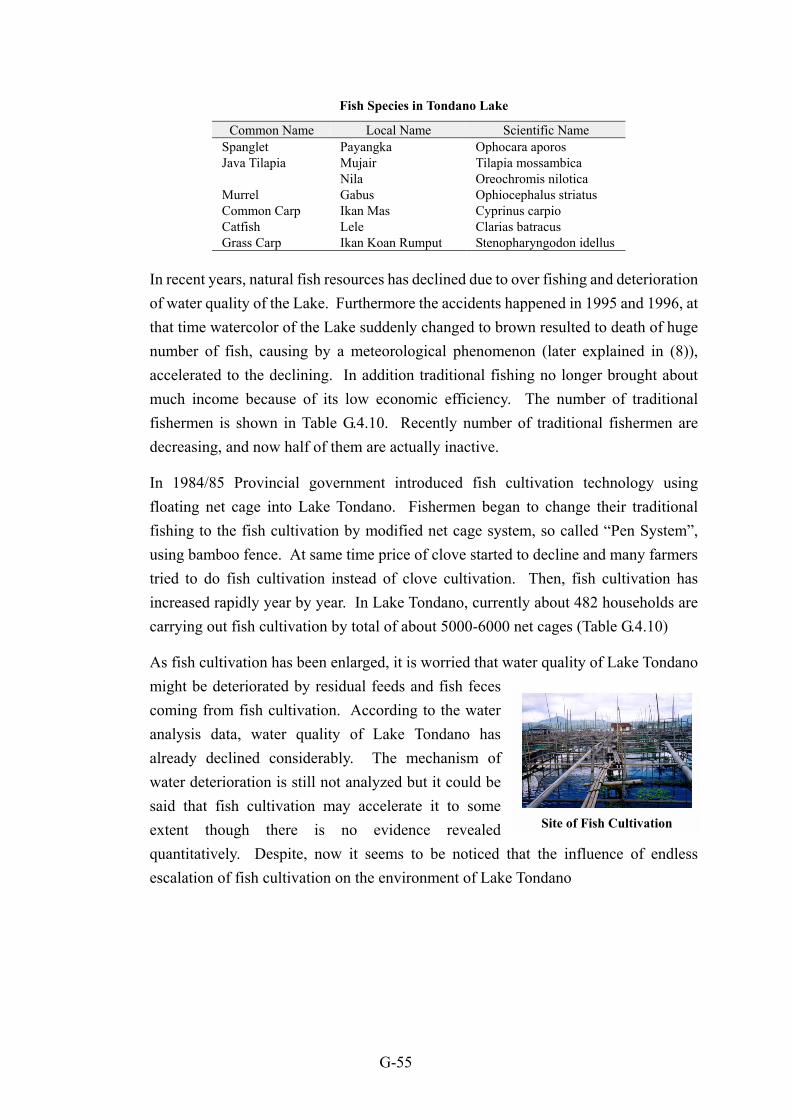
G-55
Fish Species in Tondano Lake
Common Name Local Name Scientific NameSpanglet Payangka Ophocara aporosJava Tilapia Mujair Tilapia mossambica
Nila Oreochromis niloticaMurrel Gabus Ophiocephalus striatusCommon Carp Ikan Mas Cyprinus carpioCatfish Lele Clarias batracusGrass Carp Ikan Koan Rumput Stenopharyngodon idellus
In recent years, natural fish resources has declined due to over fishing and deteriorationof water quality of the Lake. Furthermore the accidents happened in 1995 and 1996, atthat time watercolor of the Lake suddenly changed to brown resulted to death of hugenumber of fish, causing by a meteorological phenomenon (later explained in (8)),accelerated to the declining. In addition traditional fishing no longer brought aboutmuch income because of its low economic efficiency. The number of traditionalfishermen is shown in Table G.4.10. Recently number of traditional fishermen aredecreasing, and now half of them are actually inactive.
In 1984/85 Provincial government introduced fish cultivation technology usingfloating net cage into Lake Tondano. Fishermen began to change their traditionalfishing to the fish cultivation by modified net cage system, so called �Pen System�,using bamboo fence. At same time price of clove started to decline and many farmerstried to do fish cultivation instead of clove cultivation. Then, fish cultivation hasincreased rapidly year by year. In Lake Tondano, currently about 482 households arecarrying out fish cultivation by total of about 5000-6000 net cages (Table G.4.10)
As fish cultivation has been enlarged, it is worried that water quality of Lake Tondanomight be deteriorated by residual feeds and fish fecescoming from fish cultivation. According to the wateranalysis data, water quality of Lake Tondano hasalready declined considerably. The mechanism ofwater deterioration is still not analyzed but it could besaid that fish cultivation may accelerate it to someextent though there is no evidence revealedquantitatively. Despite, now it seems to be noticed thaescalation of fish cultivation on the environment of Lake T
Site of Fish Cultivation
t the influence of endlessondano
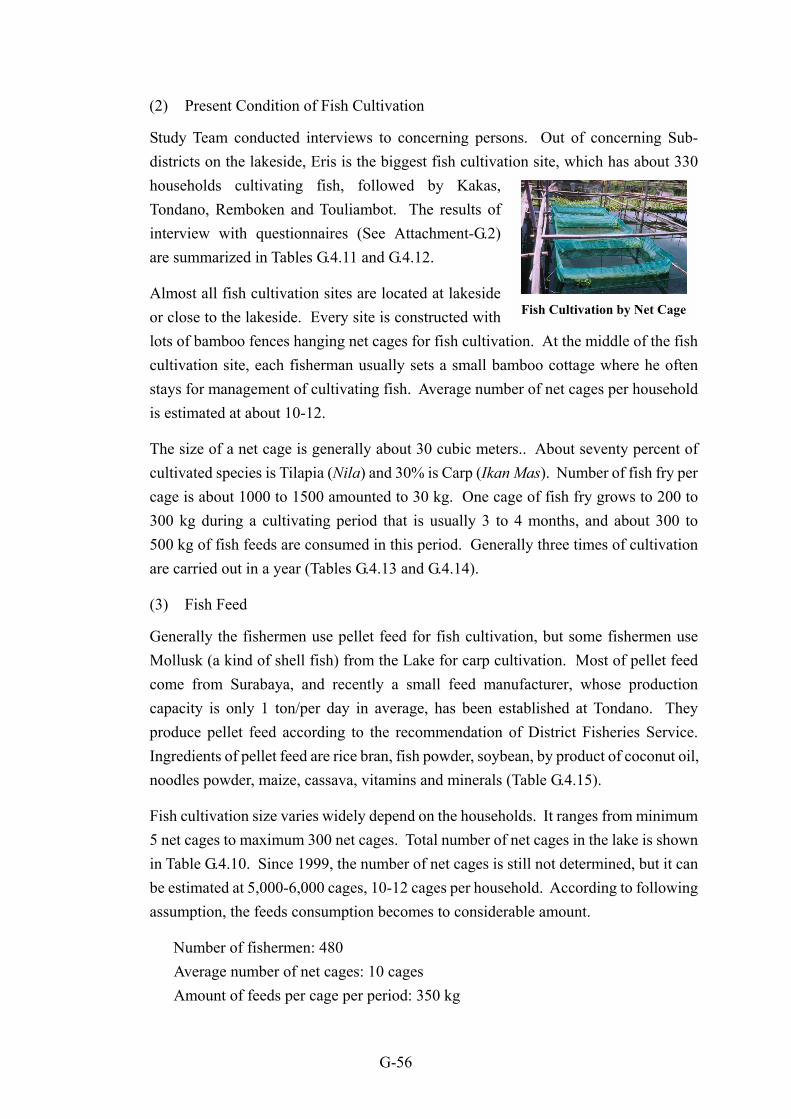
G-56
(2) Present Condition of Fish Cultivation
Study Team conducted interviews to concerning persons. Out of concerning Sub-districts on the lakeside, Eris is the biggest fish cultivation site, which has about 330households cultivating fish, followed by Kakas,Tondano, Remboken and Touliambot. The results ofinterview with questionnaires (See Attachment-G.2)are summarized in Tables G.4.11 and G.4.12.
Almost all fish cultivation sites are located at lakesideor close to the lakeside. Every site is constructed withlots of bamboo fences hanging net cages for fish cultivatiocultivation site, each fisherman usually sets a small bambstays for management of cultivating fish. Average numberis estimated at about 10-12.
The size of a net cage is generally about 30 cubic meters.cultivated species is Tilapia (Nila) and 30% is Carp (Ikan Mcage is about 1000 to 1500 amounted to 30 kg. One cage300 kg during a cultivating period that is usually 3 to 4500 kg of fish feeds are consumed in this period. Generallare carried out in a year (Tables G.4.13 and G.4.14).
(3) Fish Feed
Generally the fishermen use pellet feed for fish cultivatioMollusk (a kind of shell fish) from the Lake for carp culticome from Surabaya, and recently a small feed manufcapacity is only 1 ton/per day in average, has been estaproduce pellet feed according to the recommendation ofIngredients of pellet feed are rice bran, fish powder, soybeanoodles powder, maize, cassava, vitamins and minerals (Ta
Fish cultivation size varies widely depend on the household5 net cages to maximum 300 net cages. Total number of nein Table G.4.10. Since 1999, the number of net cages is stibe estimated at 5,000-6,000 cages, 10-12 cages per househoassumption, the feeds consumption becomes to considerab
Number of fishermen: 480Average number of net cages: 10 cagesAmount of feeds per cage per period: 350 kg
F
ish Cultivation by Net Cagen. At the middle of the fishoo cottage where he often of net cages per household
. About seventy percent ofas). Number of fish fry per of fish fry grows to 200 to months, and about 300 toy three times of cultivation
n, but some fishermen usevation. Most of pellet feedacturer, whose productionblished at Tondano. They District Fisheries Service.n, by product of coconut oil,ble G.4.15).
s. It ranges from minimumt cages in the lake is shownll not determined, but it canld. According to followingle amount.
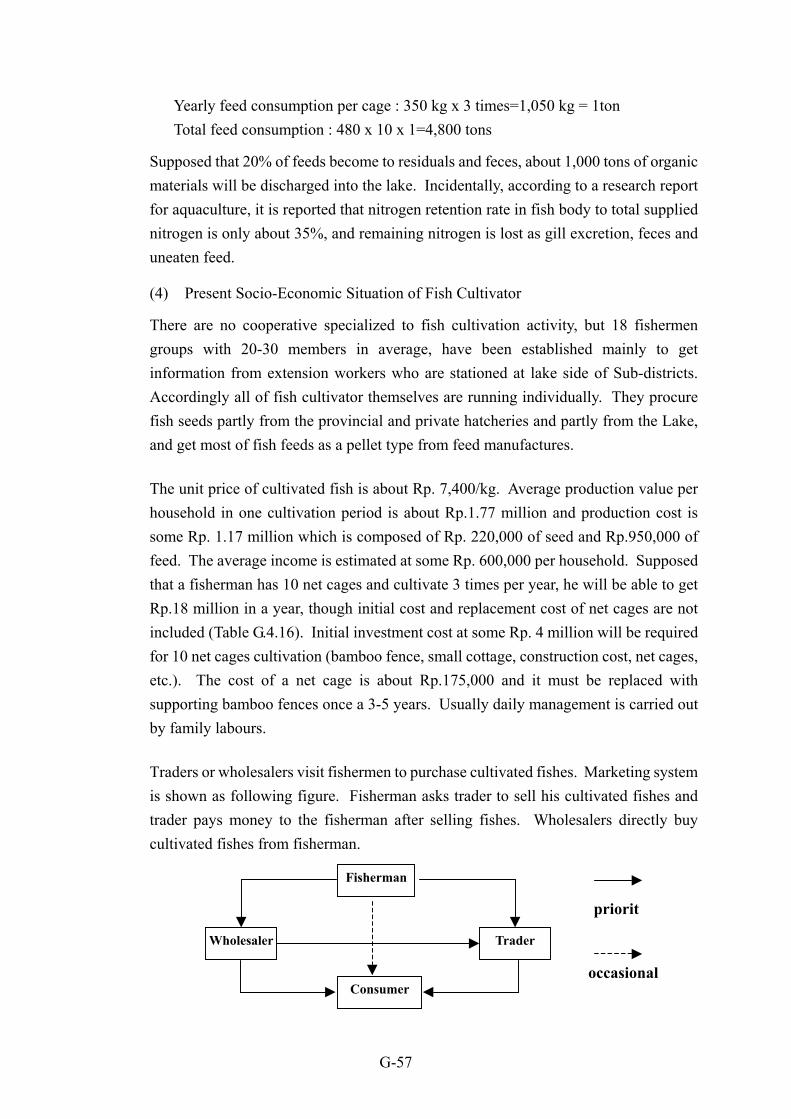
G-57
Yearly feed consumption per cage : 350 kg x 3 times=1,050 kg = 1tonTotal feed consumption : 480 x 10 x 1=4,800 tons
Supposed that 20% of feeds become to residuals and feces, about 1,000 tons of organicmaterials will be discharged into the lake. Incidentally, according to a research reportfor aquaculture, it is reported that nitrogen retention rate in fish body to total suppliednitrogen is only about 35%, and remaining nitrogen is lost as gill excretion, feces anduneaten feed.
(4) Present Socio-Economic Situation of Fish Cultivator
There are no cooperative specialized to fish cultivation activity, but 18 fishermengroups with 20-30 members in average, have been established mainly to getinformation from extension workers who are stationed at lake side of Sub-districts.Accordingly all of fish cultivator themselves are running individually. They procurefish seeds partly from the provincial and private hatcheries and partly from the Lake,and get most of fish feeds as a pellet type from feed manufactures.
The unit price of cultivated fish is about Rp. 7,400/kg. Average production value perhousehold in one cultivation period is about Rp.1.77 million and production cost issome Rp. 1.17 million which is composed of Rp. 220,000 of seed and Rp.950,000 offeed. The average income is estimated at some Rp. 600,000 per household. Supposedthat a fisherman has 10 net cages and cultivate 3 times per year, he will be able to getRp.18 million in a year, though initial cost and replacement cost of net cages are notincluded (Table G.4.16). Initial investment cost at some Rp. 4 million will be requiredfor 10 net cages cultivation (bamboo fence, small cottage, construction cost, net cages,etc.). The cost of a net cage is about Rp.175,000 and it must be replaced withsupporting bamboo fences once a 3-5 years. Usually daily management is carried outby family labours.
Traders or wholesalers visit fishermen to purchase cultivated fishes. Marketing systemis shown as following figure. Fisherman asks trader to sell his cultivated fishes andtrader pays money to the fisherman after selling fishes. Wholesalers directly buycultivated fishes from fisherman.
Fisherman
Wholesaler Trader
Consumer
priorit
occasional
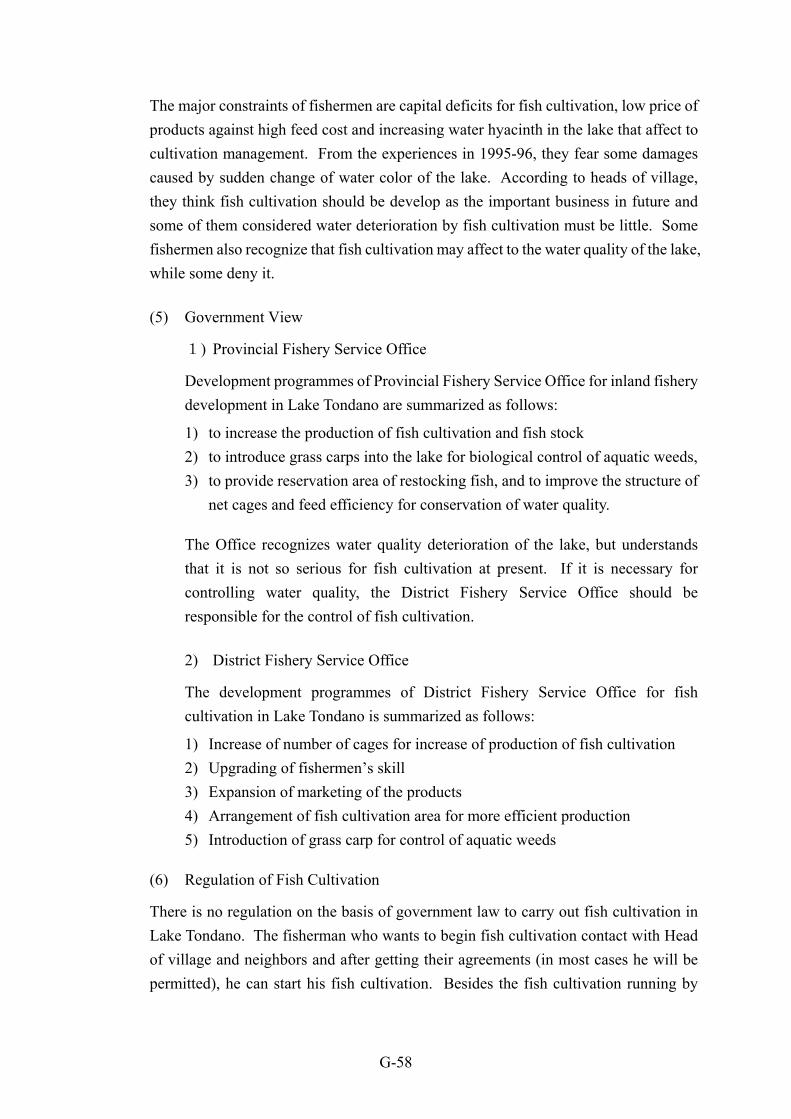
G-58
The major constraints of fishermen are capital deficits for fish cultivation, low price ofproducts against high feed cost and increasing water hyacinth in the lake that affect tocultivation management. From the experiences in 1995-96, they fear some damagescaused by sudden change of water color of the lake. According to heads of village,they think fish cultivation should be develop as the important business in future andsome of them considered water deterioration by fish cultivation must be little. Somefishermen also recognize that fish cultivation may affect to the water quality of the lake,while some deny it.
(5) Government View
1) Provincial Fishery Service Office
Development programmes of Provincial Fishery Service Office for inland fisherydevelopment in Lake Tondano are summarized as follows:
1) to increase the production of fish cultivation and fish stock2) to introduce grass carps into the lake for biological control of aquatic weeds,3) to provide reservation area of restocking fish, and to improve the structure of
net cages and feed efficiency for conservation of water quality.
The Office recognizes water quality deterioration of the lake, but understandsthat it is not so serious for fish cultivation at present. If it is necessary forcontrolling water quality, the District Fishery Service Office should beresponsible for the control of fish cultivation.
2) District Fishery Service Office
The development programmes of District Fishery Service Office for fishcultivation in Lake Tondano is summarized as follows:
1) Increase of number of cages for increase of production of fish cultivation2) Upgrading of fishermen�s skill3) Expansion of marketing of the products4) Arrangement of fish cultivation area for more efficient production5) Introduction of grass carp for control of aquatic weeds
(6) Regulation of Fish Cultivation
There is no regulation on the basis of government law to carry out fish cultivation inLake Tondano. The fisherman who wants to begin fish cultivation contact with Headof village and neighbors and after getting their agreements (in most cases he will bepermitted), he can start his fish cultivation. Besides the fish cultivation running by
G-59
local fishermen, there are some fish-restaurants located at lakeside, serving cultivatedfishes from their net cages. These restaurants are also not regulated. Heads of villageconsider government if necessary should do the control of fish cultivation, but theyalso think lakeshore conservation and control of domestic wastes are rather importantfor the lake.
(7) Fish Cultivation as a Water Pollutant
It is difficult to judge whether the present situation of fish cultivation in Lake Tondanois critical or not for water conservation of the lake. Because there are still few data ofload of pollutants come from other sources such as domestic wastes, agriculturaldrainage (including fertilizers and animal wastes) and natural flows from the wholewatershed area, so as to know the contribution rate of fish cultivation in total pollutantload pouring to the Lake.
Therefore, before control of the fish cultivation, accumulation of these data is essentialand in addition, hydrological analysis of replacement of the lake water (inflows,outflows, convection mechanism, etc.) should be more studied. Furthermore, fromviewpoints of environment and socio-economy it is important to discuss what kind ofwater quality standard should be applied for the lake water. However it is consideredthat the load of organic pollutants causing by fish cultivation should not be neglectedtaking into consideration about its huge feed consumption, as the water quality of theLake has already deteriorated in recent years.
(8) �Air Lewo� Phenomenon
Air Lewo means bad water. This phenomenon occurs usually in the beginning of rainyseason when strong south wind lasts and large mass of water flows into the lake, and itis believed that this raises up-welling of organic deposits from the lake bottom. Thesedeposits consume much amount of oxygen and produce hydro-sulfide, methane andammonia, and make water color brownish. Fishermen are afraid of it very much. Thisphenomenon had occurred during the period from 1995 to 1998, especially in 1995 and1996. In the studying of water quality in Lake Tondano, analysis of this mechanism isimportant because it must be affect water quality of the lake.
4.1.11 Agricultural Extension Service
Agricultural extension service is carried out by Agricultural Information andExtension Service (BIPP) and forestry extension service by District Forestry Service.BIPP has 17 specialists and 234 extension workers (PPL) for food crop and
G-60
horticultural crop sub-sector, 2 specialists and 114 PPLs for estate crop sub-sector, 5specialist and 63 extension workers for animal husbandry sub-sector, 4 specialists and68 extension workers for fishery sub-sector, but there is no specialist and limitednumber of PPL for agroforestry (See Table G.4.17). District Forestry Service has 2specialist (soil conservation and forest) and 64 extension workers but only fewextension workers for agroforestry development. These officials covers wholeMinahasa District. However, farmers always complain that they have some difficultiesto contact to PPL. PPL visit farmers only once a month or sometimes once a year dueto shortage of budget for activities of PPL. Since agroforestry has been recognized inearly 1980�s as an important area of scientific inquiry, education and training inagroforestry lags far behind other agricultural and forestry disciplines, leaving adefinite shortage of experienced, qualified trainers in agroforestry. Only limitednumber of officials in District Forestry Service guide farmers technically as a side job.Only BRLKT has established demonstration farm of agroforestry at Remboken Sub-district.
4.1.12 Current Problems on Agriculture and Agroforestry System in the Intensive Area
There is two categories of problems on agriculture production, one is production sideand the other is marketing. The biggest problem for production is relatively low levelof cultural practices, biological disasters, high production cost and poor extensionservice, while constraints for marketing is quality control of commodities, low price ofcommodities and fluctuation of price. Biological disasters and quality control ofcommodities could be controlled by strengthening extension activity.
No farmers in the Intensive Area have raised complain against the existingagroforestry system in spite of the productivity being not so high. It could beexplained that the agroforestry system in the area has short history, and farmers can notadequately understand agroforestry system. When the farmers can get knowledge onagroforestry system, problems would come to the surface. By field observation,following problems can be pointed out.
1) Improper agricultural land use due to lack of information on soil conservation2) Still using rudimentary agroforestry system3) Poor maintenance for tree crops and herbaceous crops4) The activities of agricultural and forestry extension service have declined5) There is no extension activity for agroforestry system.
G-61
4.2 Improvement Plan of Agriculture and Agrofrestry
4.2.1 Needs of Watershed Conservation from the Viewpoint of Agriculture and Agroforestry
Some 80% of the Intensive Area are presently used for agricultural activities. Out ofthem, about 80% are located at undulated and sloped area gradient more than 8%.Such topographic conditions require the more careful land use to keep sound soilconservation and soil fertility. In fact, the interviews with farmers concerned revealedthat improper farming practice on clove cultivation would cause tremendous surfacesoil erosion in 1980s.
A well-designed agroforestry system is one of the most effective system for soilconservation and increase of soil fertility, which farmers could participate in. In theIntensive Area, some 80% of agricultural upland are already covered with agroforestrysystem. But it is mostly at rudimentary level judging from its random plant spacing oftrees, and thus it is essential to improve the present agricultural system, to realize thewatershed conservation functions mentioned above.
On the other hand, the fuel wood consumption is significant in the Intensive Area.About 40 kg/household of fuel woods would be consumed in a week on average.Farmers get it from their fields and bush and/or purchase it from other farmers atpresent. Agroforestry including hedgerow cropping also highly contributes to supplyof fuel woods without disturbing environment.
Dissemination of well-designed agroforestry system needs intensive extensionservices. However, there is poor extension system for agroforestry development in theIntensive Area. It is urgently necessary to establish the extension system foragroforestry development. Since agroforestry has been only recently recognized as animportant field for soil fertility increase in the tropics, education and training inagroforestry lag far behind other agricultural disciplines leaving a definite shortage ofexperienced and qualified trainers. Therefore, training for specialist, extensionworkers and farmers are urgently required.
4.2.2 Strategy for Agiculture and Agroforestry Development
Based on the principles and objective of WACSLU, Strategy 3, Reduction ofpotential critical land, could be proposed for agricultural development. As a largerpart of the Intensive Area is undulated and sloped area, soil conservation practices isone of the key factors for agricultural development. Agroforestry system is one of themost effective farming systems for soil conservation and increase of soil fertility andproductivity. However there is poor extension system for agroforestry development.Under this condition, key components of agriculture and agroforestry development as
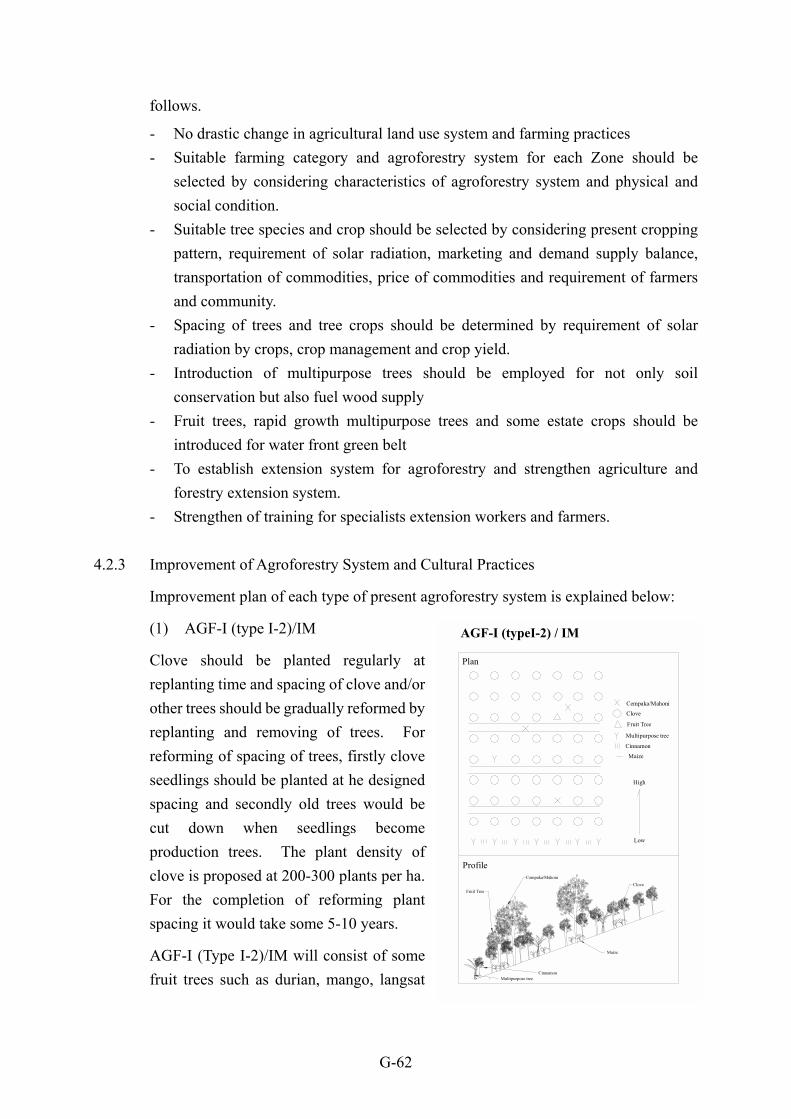
G-62
follows.
- No drastic change in agricultural land use system and farming practices- Suitable farming category and agroforestry system for each Zone should be
selected by considering characteristics of agroforestry system and physical andsocial condition.
- Suitable tree species and crop should be selected by considering present croppingpattern, requirement of solar radiation, marketing and demand supply balance,transportation of commodities, price of commodities and requirement of farmersand community.
- Spacing of trees and tree crops should be determined by requirement of solarradiation by crops, crop management and crop yield.
- Introduction of multipurpose trees should be employed for not only soilconservation but also fuel wood supply
- Fruit trees, rapid growth multipurpose trees and some estate crops should beintroduced for water front green belt
- To establish extension system for agroforestry and strengthen agriculture andforestry extension system.
- Strengthen of training for specialists extension workers and farmers.
4.2.3 Improvement of Agroforestry System and Cultural Practices
Improvement plan of each type of present agroforestry system is explained below:
(1) AGF-I (type I-2)/IM
Clove should be planted regularly atreplanting time and spacing of clove and/orother trees should be gradually reformed byreplanting and removing of trees. Forreforming of spacing of trees, firstly cloveseedlings should be planted at he designedspacing and secondly old trees would becut down when seedlings becomeproduction trees. The plant density ofclove is proposed at 200-300 plants per ha.For the completion of reforming plantspacing it would take some 5-10 years.
AGF-I (Type I-2)/IM will consist of somefruit trees such as durian, mango, langsat
AGF-I (typeI-2) / IM
Plan
Fruit Tree
Cempaka/Mahoni
Clove
Fruit Tree
Multipurpose tree
Cinnamon
Profile
Multipurpose tree
CloveCempaka/Mahoni
Low
High
Cinnamon
Maize
Maize
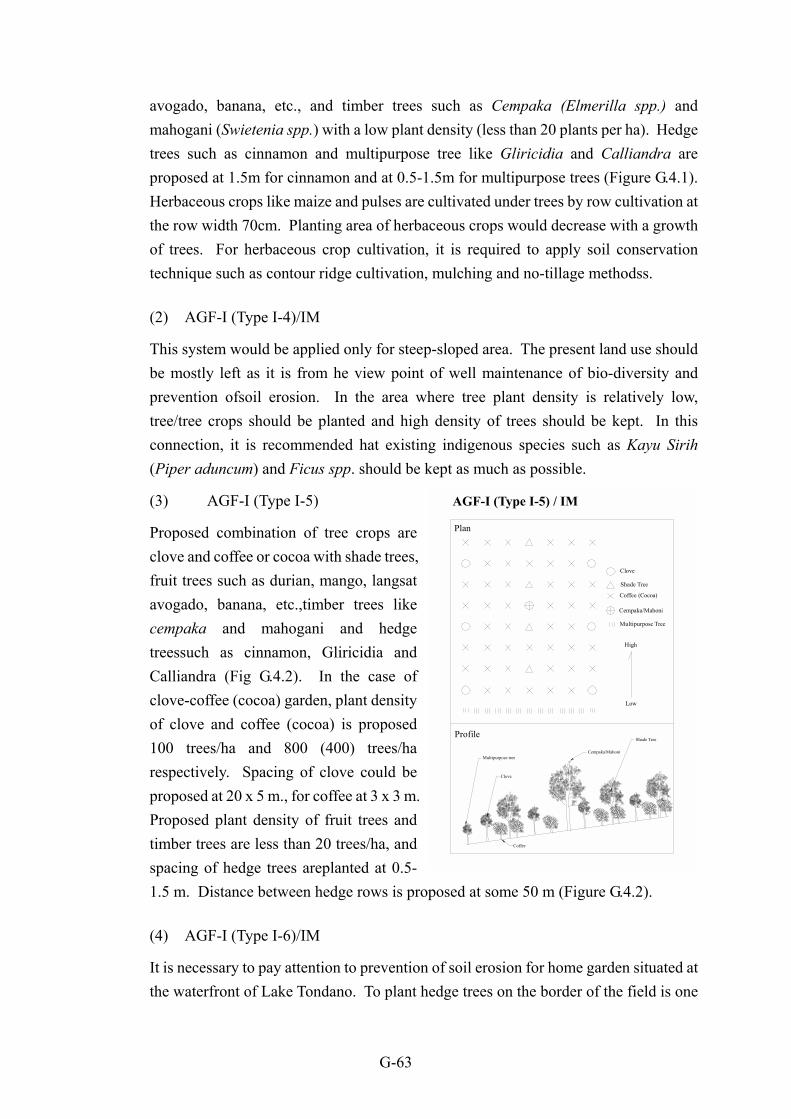
G-63
avogado, banana, etc., and timber trees such as Cempaka (Elmerilla spp.) andmahogani (Swietenia spp.) with a low plant density (less than 20 plants per ha). Hedgetrees such as cinnamon and multipurpose tree like Gliricidia and Calliandra areproposed at 1.5m for cinnamon and at 0.5-1.5m for multipurpose trees (Figure G.4.1).Herbaceous crops like maize and pulses are cultivated under trees by row cultivation atthe row width 70cm. Planting area of herbaceous crops would decrease with a growthof trees. For herbaceous crop cultivation, it is required to apply soil conservationtechnique such as contour ridge cultivation, mulching and no-tillage methodss.
(2) AGF-I (Type I-4)/IM
This system would be applied only for steep-sloped area. The present land use shouldbe mostly left as it is from he view point of well maintenance of bio-diversity andprevention ofsoil erosion. In the area where tree plant density is relatively low,tree/tree crops should be planted and high density of trees should be kept. In thisconnection, it is recommended hat existing indigenous species such as Kayu Sirih(Piper aduncum) and Ficus spp. should be kept as much as possible.
(3) AGF-I (Type I-5)
Proposed combination of tree crops areclove and coffee or cocoa with shade trees,fruit trees such as durian, mango, langsatavogado, banana, etc.,timber trees likecempaka and mahogani and hedgetreessuch as cinnamon, Gliricidia andCalliandra (Fig G.4.2). In the case ofclove-coffee (cocoa) garden, plant densityof clove and coffee (cocoa) is proposed100 trees/ha and 800 (400) trees/harespectively. Spacing of clove could beproposed at 20 x 5 m., for coffee at 3 x 3 m.Proposed plant density of fruit trees andtimber trees are less than 20 trees/ha, andspacing of hedge trees areplanted at 0.5-1.5 m. Distance between hedge rows is propos
(4) AGF-I (Type I-6)/IM
It is necessary to pay attention to prevention ofthe waterfront of Lake Tondano. To plant hedg
AGF-I (Type I-5) / IM
Plan
ed at some 50 m (Figure G.4.2).
soil erosion for home garden situated ate trees on the border of the field is one
Profile
Shade Tree
Coffee (Cocoa)
Clove
Cempaka/Mahoni
Cempaka/Mahoni
Shade Tree
Clove
Coffee
High
Low
Multipurpose Tree
Multipurpose tree
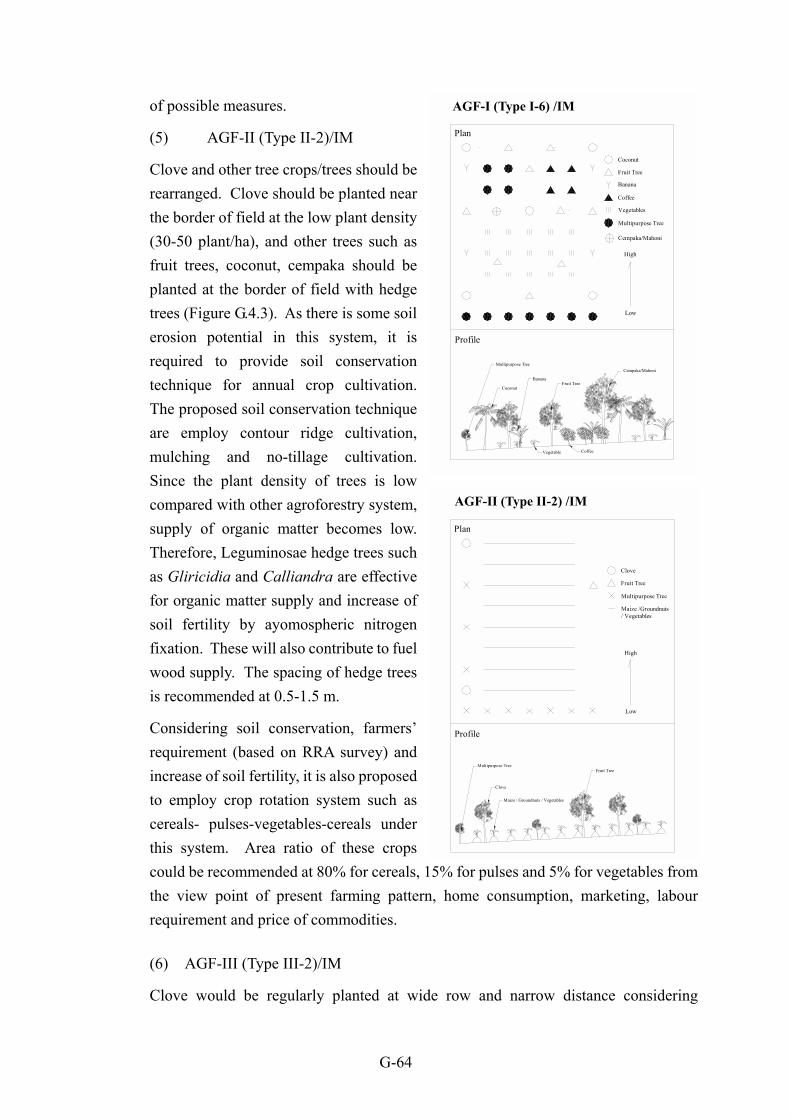
G-64
of possible measures.
(5) AGF-II (Type II-2)/IM
Clove and other tree crops/trees should berearranged. Clove should be planted nearthe border of field at the low plant density(30-50 plant/ha), and other trees such asfruit trees, coconut, cempaka should beplanted at the border of field with hedgetrees (Figure G.4.3). As there is some soilerosion potential in this system, it isrequired to provide soil conservationtechnique for annual crop cultivation.The proposed soil conservation techniqueare employ contour ridge cultivation,mulching and no-tillage cultivation.Since the plant density of trees is lowcompared with other agroforestry system,supply of organic matter becomes low.Therefore, Leguminosae hedge trees suchas Gliricidia and Calliandra are effectivefor organic matter supply and increase ofsoil fertility by ayomospheric nitrogenfixation. These will also contribute to fuelwood supply. The spacing of hedge treesis recommended at 0.5-1.5 m.
Considering soil conservation, farmers�requirement (based on RRA survey) andincrease of soil fertility, it is also proposedto employ crop rotation system such ascereals- pulses-vegetables-cereals underthis system. Area ratio of these cropscould be recommended at 80% for cereals, 15%the view point of present farming pattern, hrequirement and price of commodities.
(6) AGF-III (Type III-2)/IM
Clove would be regularly planted at wide
Profile
Plan
Vegetables
Fruit Tree
Coconut
Banana
Multipurpose Tree
Coffee
Multipurpose Tree
Coconut
BananaFruit Tree
Vegetable Coffee
Low
High
Cempaka/Mahoni
Cempaka/Mahoni
AGF-II (Type II-2) /IM
Plan
AGF-I (Type I-6) /IM
for pulses and 5% for vegetables fromome consumption, marketing, labour
row and narrow distance considering
Multipurpose Tree
Fruit Tree
Clove
Profile
Maize /Groundnuts / Vegetables
Multipurpose Tree
Clove
Maize / Groundnuts / Vegetables
Fruit Tree
Low
High
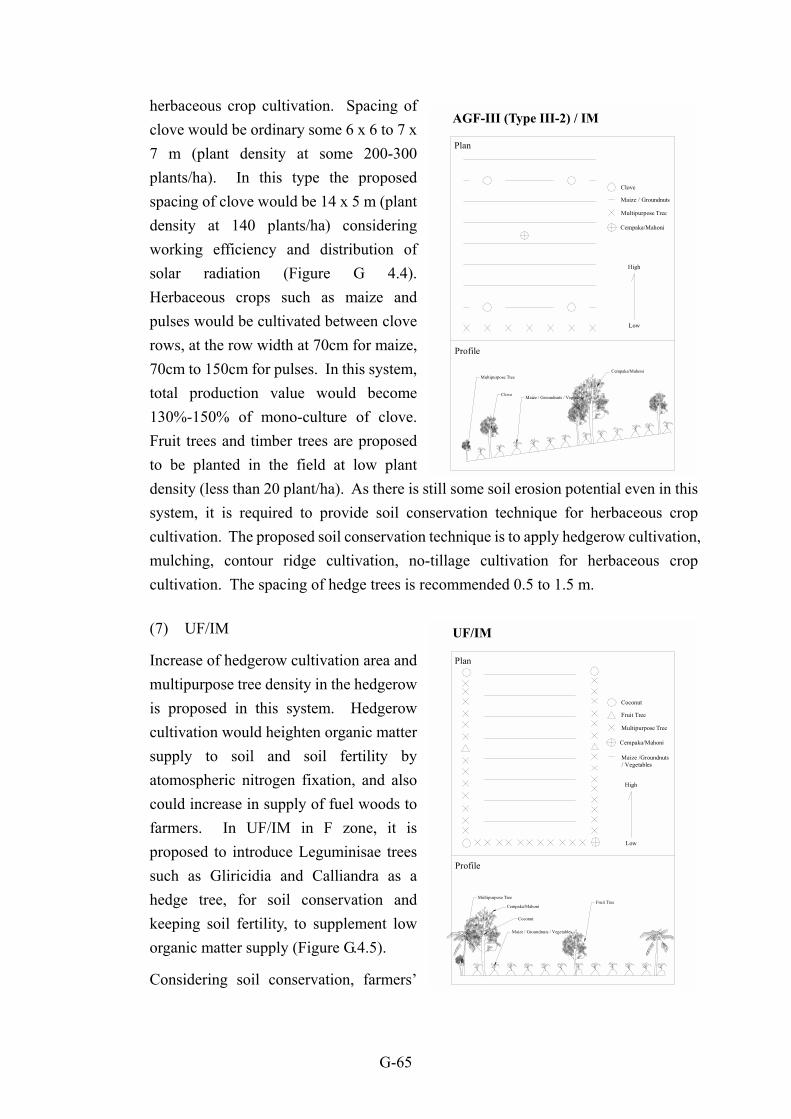
G-65
herbaceous crop cultivation. Spacing ofclove would be ordinary some 6 x 6 to 7 x7 m (plant density at some 200-300plants/ha). In this type the proposedspacing of clove would be 14 x 5 m (plantdensity at 140 plants/ha) consideringworking efficiency and distribution ofsolar radiation (Figure G 4.4).Herbaceous crops such as maize andpulses would be cultivated between cloverows, at the row width at 70cm for maize,70cm to 150cm for pulses. In this system,total production value would become130%-150% of mono-culture of clove.Fruit trees and timber trees are proposedto be planted in the field at low plantdensity (less than 20 plant/ha). As there is stillsystem, it is required to provide soil consercultivation. The proposed soil conservation tecmulching, contour ridge cultivation, no-tillcultivation. The spacing of hedge trees is reco
(7) UF/IM
Increase of hedgerow cultivation area andmultipurpose tree density in the hedgerowis proposed in this system. Hedgerowcultivation would heighten organic mattersupply to soil and soil fertility byatomospheric nitrogen fixation, and alsocould increase in supply of fuel woods tofarmers. In UF/IM in F zone, it isproposed to introduce Leguminisae treessuch as Gliricidia and Calliandra as ahedge tree, for soil conservation andkeeping soil fertility, to supplement loworganic matter supply (Figure G.4.5).
Considering soil conservation, farmers�
AGF-III (Type III-2) / IM
Plan
some soil erosion potential even in thisvation technique for herbaceous crophnique is to apply hedgerow cultivation,age cultivation for herbaceous cropmmended 0.5 to 1.5 m.
Maize / Groundnuts / Vegetable
Profile
Multipurpose Tree
Clove
Multipurpose Tree
Low
High
Maize / Groundnuts
Clove
Cempaka/Mahoni
Cempaka/Mahoni
UF/IM
Plan
Multipurpose Tree
Fruit Tree
Coconut
Profile
Maize /Groundnuts / Vegetables
Multipurpose Tree
Coconut
Maize / Groundnuts / Vegetables
Fruit Tree
Low
High
Cempaka/Mahoni
Cempaka/Mahoni

G-66
requirement (based on RRA survey) and increase of soil fertility, it is also proposed toemploy crop rotation system such as cereals- pulses-vegetables-cereals under UF/IM.Area ratio of these crops could be recommended at 70% for cereals, 20% for pulsesand 10% for vegetables from the view point of present farming pattern, homeconsumption, marketing, labour requirement and price of commodities. Majorvegetables would be tomato, leaf onion, ginger, chili, long beans Pumpkins andcucumber. Cropping intensity of these crops could be recommended at 1.5 to 1.6,considering 1.3 to 1.5 of present cropping intensity and grazing cattle at fallow field.
4.2.4 Application of Suitable Agroforestry System by Area
In accordance with Section 4.2.1 the suitable agroforestry system for each zone hasbeen selected through evaluation of each component as shown in Tables G.3.17, G.3.18and G.3.1.9. The summary of application of suitable type of agroforestry system foreach zone is shown below (Details are shown in Table G.4.18).
Application of Suitable Type of Agroforestry
Proposed Type Area (ha) Recommended ZoneAGF-I (Type I-2)/IM 1,900 Bm1 and Bm3 ZoneAGF-I (Type I-4)/IM 860 Bm1 and Bw ZoneAGF-I (Type I-5)/IM 100 Bm1, Bm2 and Bm3 ZoneAGF-I (Type I-6) 10 Bm1, Bm2 Bm3 and Bw ZoneAGF-II (Type II-2)/IM 1,760 Bm2, Bm3 and F ZoneAGF-III(Type III-2)/IM 1,970 Bm2 and Bm3 ZoneUF/IM 1,680 Bm3 and F Zone
4.2.5 Improvement Plan of Each Zone
(1) P Zone
Among the East Area, South Area and West Area, the encroached area of South Area isonly discussed here, because there is no application of agroforestry system for theremaining two areas.
Proposed agroforestry system for the encroached area of some 30 ha, which will betreated as community forestry, are discussed at every three parts of upper part, middlepart and lower part.
Upper part
In the upper part, more than 70% of the area is remained as rotational fallow land. It istherefore recommended tat upper part should become tree plantation with pine andmultipurpose trees including fruit trees such as Albizia, Gliricidia, Calliandra, durianmangostin, mango, etc. Since the land utilisation of the area is very extensive, there isnot much problem if farmers discontinue cultivation of annual crops. Therefore, it
G-67
could be proposed to start planting trees immediately after agreement between head ofdistrict (Bupati) and community.
Middle part
In the middle part, land is presently utilized more effectively than upper part. It isrecommended that the middle part should be fruit tree dominant agroforestry system.The proposed species are durian, mangostin, mango, avogado, langsat, jackfruit,Albizia, Gliricidia and Calliandra. A larger part of the area is now under cultivatedland. Planting of these trees would be completed during 20 years.
Lower part
In the lower part, an intensive agriculture is concentrated at present. Thus, there wouldbe big problem for encroachers, if they would be forced to discontinue annual cropcultivation. It is recommended that the land use of lower part should be graduallychanged by application of �Tumpansary� system within twenty years consideringencroachers livings. The application rate of �Tumpansary� system could be proposedat 0.5 ha per year. Fruit trees such as durian, mangostin, mango, avogado, langsat,jackfruit and cempaka and mahogani are proposed in this system. Tree density atproduction stage would be 150-200 plants/ha. During the younger stage of trees somefood crops and vegetables could be cultivated under trees. Maize, pulses, tomato chiliand cucumber are recommended as annual crops, and taro/talas (Colocasia esculenta)and ginger are recommendable as annual crops during later stage.
Details for these proposed agroforestry system are mentioned in Sub-section 4.2.3.
(2) Bm1 Zone
Agricultural area of Bm1 Zone is estimated at 1,850 ha, out of which 1,620 ha aredistributed in the East Area. Bm1 Zone is largely divided into steep sloped area andsloped area in terms of steep gradient.
Steep sloped area (more than or equal 40% in slope gradient: about 720 ha)
In this area, AGF-I (type I-4)/IM is proposed. For the limited area of some 20 ha,where improper farming practice are presently conducted, it is proposed to correctivemeasures such as ridge cultivation, no-tillage cultivation, mulching, terracing andhedgerow, to avoid further deterioration.
Sloped area (less than 40% in slope gradient: about 1,130 ha)
AGF-I (Type I-2)/IM and AGF-I (Type I-5)/IM are proposed in this area from a viewpoint of soil conservation and production. AGF-I (Type I-2)/IM would be applied forlarger part of this area (Some 1,100 ha in total; 810 ha for the East Area and 290 ha for
G-68
West and South Areas). AGF-I (TypeI-5) could be proposed for about 100 ha in thiszone.
Details for these proposed agroforestry system are mentioned in Sub-section 4.2.3.
(3) Bm2 Zone
Agricultural area of Bm2 Zone is 3,630 ha. Some 2,600 ha of total are distributed inthe West Area followed by the East Area (520 ha) and there is a small area of Bm2Zone in the South Area (510 ha). The proposed agroforestry systems are as follows:
- AGF-III (Type III-2)/IM is basically proposed for 1,700 ha of the relatively lowpotential of soil erosion area
- AGF-I (Type I-2)/IM and AGF-I (TypeI-4)/IM are proposed for 1,080 ha and 90 haof relatively high potential of soil erosion area, respectively.
- AGF-II (Type II-2)/IM is proposed for 690 ha of the low potential of soil erosionarea.
- UF/IM is proposed for 70 ha of the low potential of soil erosion area.Details for these proposed agroforestry system are mentioned in Sub-section 4.2.3.
(4) Bm3 Zone
Agricultural area of Bm3 Zone is about 1,500 ha consist of 1,110 ha in the West Areaand 390 ha in the South Area. UF/IM, AGF-II (Type II-2)/IM and AGF-III (Type III-2)/IM are proposed in this zone, and occupy 770 ha, 640 ha and 90 ha, respectively.
Details for these proposed agroforestry system are mentioned in Sub-section 4.2.3.
(5) Bw Zone
Agricultural area of Bw Zone is 94 ha. It distributes in the east and west sides of LakeTondano. Fifty percent of the area are dwelling area, which are surrounded by homegarden, and 40% are lowland where paddy plant is cultivate throughout the year.Remaining 10% are upland covered with tree dominant agroforestry system and grassfallow.
For keeping the waterfront in good condition, it is proposed to make green belt alongthe lakeshore. In Bw Zone of the Intensive Area, followings are proposed forenvironment conservation.
1) AGF-I (Type I-4)/IM is proposed for steep-sloped area along the road. High treedensity should be kept to mitigate soil erosion.
2) AGF-III (Type III-2)/IM for foot of steep-sloped area. In the area, herbaceous cropcultivation should be applied as soil conservation technique such as ridge row
G-69
cultivation, mulching and hedgerow etc.3) Upland of grass fallow could be proposed to be changed into lowland field (flat and
lower area) or into fruit tree dominant tree complex (undulated area).4) In AGF-I (Type I-6)/IM (home garden), it is necessary to pay attention for soil
erosion. To plant hedge trees on the border is one of possible measures.5) Since the area is close to the lake, ground water level would be high, therefore,
proposed trees should be resistant to high ground water level. Bamboo, Ficus spp.,Albizia Gliricidia durian, avogado langsat, coconut sugar palm and sago palm,which are observed, are proposed to plant in water front.
Details for these proposed agroforestry system are mentioned in Sub-section 4.2.3.
(6) F Zone
Agricultural area of F Zone is 1,940 ha consisting of 620 ha of lowland and 1,320 ha ofupland. Some 1,080 ha or 75% of upland distributes in the South Area.
UF/IM and AGF-II (Type II-2)/IM are proposed for this zone and occupy 910 ha and410 ha, respectivly. Average weekly consumption of fuel wood per household is some40 kg. Framers collect fuel woods from their field or bush. As F Zone is close todwelling area, farmers can save labour force to collect fuel woods, if they can get fuelwoods from the neighbouring area. Considering the fuel wood consumption andmaintaining soil fertility, application of Leguminisae hedgerow is useful.
Details for these proposed agroforestry system are mentioned in Sub-section 4.2.3.
4.2.6 Anticipated Crop Production
The proposed planting area of each crops is shown in Table G.4.19, and summarizedbelow. Since there is no big change in land utilization, the planted area of each cropswould be slightly changed by improvement of agroforestry system and crop rotation.The planted area of tree crops would be increased, while that of field crops wouldslightly increased for pulses and vegetables, but decreased for maize.
Although present yield of food crops in the Intensive Area is relatively high comparingwith the average yield of North Sulawesi Province and Indonesia, there is some spacefor yield increase by improving farming practices. The yield of these crops could beincreased by application of improved cultural practices and by more intensiveagricultural extension service. The yield of estate crops could be also increased byemploying improved agroforestry system and by more intensive extension service.
By application of the project, crop production would increase. The production would

G-70
increase year by year and attain the anticipated production ten years for tree crops andfive years for herbaceous crops after start of project.
Trend of yield of Tree Crops
Year 1 2 3 4 5 6 7 8 9 10Increment (%)* 0 0 0 0 0 10 30 70 90 100
Trend of yield of Herbaceous Crops
Year 1 2 3 4 5 6 7 8 9 10Increment (%) 0 30 60 80 100 100 100 100 100 100*: shows the percentage of increased production to anticipated increased production
The yields of major crops under �with project condition� could be estimated on thebasis of present technology level, research outcomes on the yield potential,strengthening of agricultural extension service. The yields of the major crops under�without project condition� are estimated at the present yield level by considering onthe yield level by considering on the yield trends of recent few years and thetechnology level of farmers. The anticipated crop yields thus estimated for the�without project� and �with project� conditions are shown below.
Anticipated yield and production
Crop Area (ha) Yield (kg/ha) Production (t)without with without with without with
Paddy 1,020 1,020 4,800 5040 4,900 5,140Maize 5,343 4,955 2,900 3,050 15,500 15,110Ground nut 320 600 1,080 1,130 350 680Cowpea 130 360 900 950 120 340Vegetables 340 485 7,000 7,350 2,390 3,570Clove 1,470 2,570 200 215 295 550Coffee 190 270 950 1,000 180 270Coconut 190 80 1,200 1,250 240 100Other estate crops 110 160Other trees 2,203 981
Future crop production after completion of the project could be estimated on the basisof the proposed land use, cropping pattern and anticipated yield of crops. Theanticipated production in the Intensive Area is given in above table (Details arepresented in Table G.4.20).
4.2.7 Crop Budget, Farm Budget and Farm Economy
Crop budget have been prepared based on estimated �without project� and �withproject� conditions. The results of financial crop budget for each crop under future�without project� and �with project� conditions are summarized in following table(Details are shown in Table G 4.21). Under with project condition, net return of whole
G-71
crops would be increased for all the crops.
Crop Budget of Major CropsUnit Rp. 000/ha
Without project With projectGrossValue
Productioncost
Net Return Gross Value Productioncost
Net Return Increasefrom w/o
Paddy 4,800 3,304 1496 5,040 3,372 1,668 172Maize 2,900 2,547 353 3,050 2578 472 119Groundnut 4,320 3,140 1,180 4,520 3,272 1,248 68Cowpea 4,098 2,868 1,230 4,323 2,969 1,355 125Vegetables 12,000 8,084 3,916 12,600 8,295 4,305 389Clove 6,000 4,315 1,685 6,450 4,675 1,775 90Coffee 5,700 3,060 2,640 6,120 3,398 2722 82Coconut 1,200 1,130 70 1,250 1,130 120 50
Farm budget have been prepared based on estimated crop budget and the planted areaof each crops under �without project� and �with project� conditions. The results offinancial farm budget for each crop under future �without project� and �with project�conditions are summarized in following table (Details are shown in Table G 4.22).
Farm budgetUnit: Rp million
East South West Whole AreaWithout With Without With Without With Without With2,931 3,679 2,105 3,145 3,585 6,188 8,622 13,012
Under future �with project condition�, incremental benefit would increase year by yearand reached at Rp 4.4 billion in ten years after start of project.
Under the �with project condition, farm economy could be improved. The farmeconomy of average farmer under �with project� and �without project� condition ofeach Area could be estimated. The results is shown in Tables G.4.9 and G.4.23 andsummarized below. Net benefit of average farm household under �with project�condition would be increased at some Rp five hundred thousand compared with that of�without project� condition.
Farm Economy of Average Farm Household
Unit: Rp 000East Area South Area West Area Intensive Area
Without With Without With Without With Without WithIncome 11,404 12,221 9,382 10,205 9,779 10,534 10,188 10,986Expenditure 10,957 11,254 8,958 9,245 9,409 9,617 9,775 10,039Balance 447 967 424 960 370 917 414 948
G-72
4.2.8 Strengthen of Agricultural and Forestry Extension Service
(1) Extension system
Agricultural extension service has a long history and the extension system has beencompleted. According to RRA survey, farmers complain poor agricultural extensionservice (visiting service is very poor, once per month or two month) due to shortage offund, especially in transportation cost. Therefore, project would provide transportationfacility by supplying motor cycles and bicycle for strengthen agricultural extensionservice.
At present, extension system for agroforestry development under both DistrictForestry Service office and under Agriculural Information and Extension Service(BIPP) is very poor. These offices cover whole Minahasa District. There is noagroforestry specialist and few extention worker (PPL) in both District ForestryService office and BIPP. It is urgently required to establish the extension servicesystem for agroforestry under the District Forestry Service office. For intensiveextension of agroforestry, three agroforestry specialist (soil conservation and soilfertility, crop management and forestry) and 60 extension workers (one extensionworker for one village) would be required as a special programme. This specialprogramme would be employed at least five years. Although some organizations havetrained staff whose jobs are to train farmers, it may make sense for institutions to workwith farmers as trainer in order to increase the efficiency of their staff and help morerelevant to farmer needs. Under this condition, District Forestry Service, whichhandles agroforestry extension work, should closely cooperate with BIPP.
Since there are not enough extension services for intensive agricultural extensionservice required by farmers, it is necessary to employ more effective extension method.Followings are examples of effective agricultural extension service;
1) to collaborate with other related institutions such as universities and NGOs,2) to adopt group guidance method by organizing farmers group and establishing
demonstration plot,3) to provide the chance of farmers training programme.
(2) Training programme
While agroforestry, as a land use practice, has existed for a long time, it has onlyrecently recognized as an important area for crop production, soil conservation andincreasing soil fertility, especially in the tropics. As a result, education and training inagroforestry lags far behind other agricultural disciplines, leaving a definite shortageof experienced, qualified trainers in agroforestry. Therefore, the training for planners,
G-73
specialist, extension workers and farmers is urgently required for agroforestrydevelopment. The training programme varies with each category of group. It could beproposed training programme on agroforestry under special programme whichcontinue for five years. Following plan could be proposed.
1) Training for policy planners and specialist
The success of agroforestry development will depends in part on the firmsconviction of policy makers, specialists and farmers who plan and implement it.Existing land-tenure policies, forest produce transit rules, forest laws andregulation which limit the practice of agroforestry should be reviewed andmodified to enable to choose the species of their own choice and to market themas they see fit. Policy makers and specialist often need to be adequate trained tosee the promise of agroforestry and constraints to successful implementation ofthe agroforestry development.
The training of planners and specialists aims:
- to strengthen their capabilities to develop policies and plans to increaseproduction of commodities from agroforestry,
- to enable them to better support research and extension programmes forimproving agroforestry systems to produce more commodities,
- to better understanding the market needs of farmers, processors and end users,and
- to organize training programmes in agroforestry within their ownorganizations.
To realize above mentioned, following curriculum would be proposed.
- agroforestry production and market study.- soil and water conservation, seed and nursery management.- information service and data base.- technology verification (Field visit).
One week training course for planner and specialist would open three times perfive years. Proposed trainer would be teaching staff of universities, researchersof research institute, government officers and NGO staff.
2) Extension worker training
Training topics for extension worker are mainly designed using a top-downapproach and many prove appropriate to meet farmer�s needs and problems.Thus extension workers need training in assessing farmers� needs. This may
G-74
include methods such as diagnosis and design, sketch mapping, rapid ruralappraisal, problem census analysis.
Since a thorough understanding of agroforestry requires exposure to variousdisciplines, the extension worker needs to have some background in the subjectsother than his own area of training.
Training courses, which add specific area of technical agroforestry knowledge,can be extremely valuable to extentionist who are generalist.
For extension worker who have either substantial field experience or technicaltraining before entering agroforestry extension, participatory training approachesare most appropriate. In participatory training, both trainees and trainers becomelearners.
In stead of relying on traditional methods (lecture), greater emphasis could beplaced is focused on the following method:
- working groups discussion,- workshops,- role playing,- field visits and exercises, and- case studies and study tours.
The training course for extension workers could be proposed to open once a yearwith one week duration. The combination of participatory training andtraditional method are proposed as training measure for extension workers.Teaching staff of universities, researchers of research institutes, specialists ofProvincial and District Forestry Service, government officers and NGO staffwould be proposed as trainers.
(3) Training farmers
The training of farmers requires both sensitivity to farmers interests and solidknowledge based on experience. Framers are often interested in more money orincreasing their productivity and efficiency. Successful training providesinformation and skills that help them to realize these gains. Proposedagroforestry training topics that may be of interest to farmers include:
- home nursery development,- benefit of multipurpose tree and shrubs- cultural practices of inter-cropping and no tillage- soil and water conservation techniques- simple record keeping and information management, and
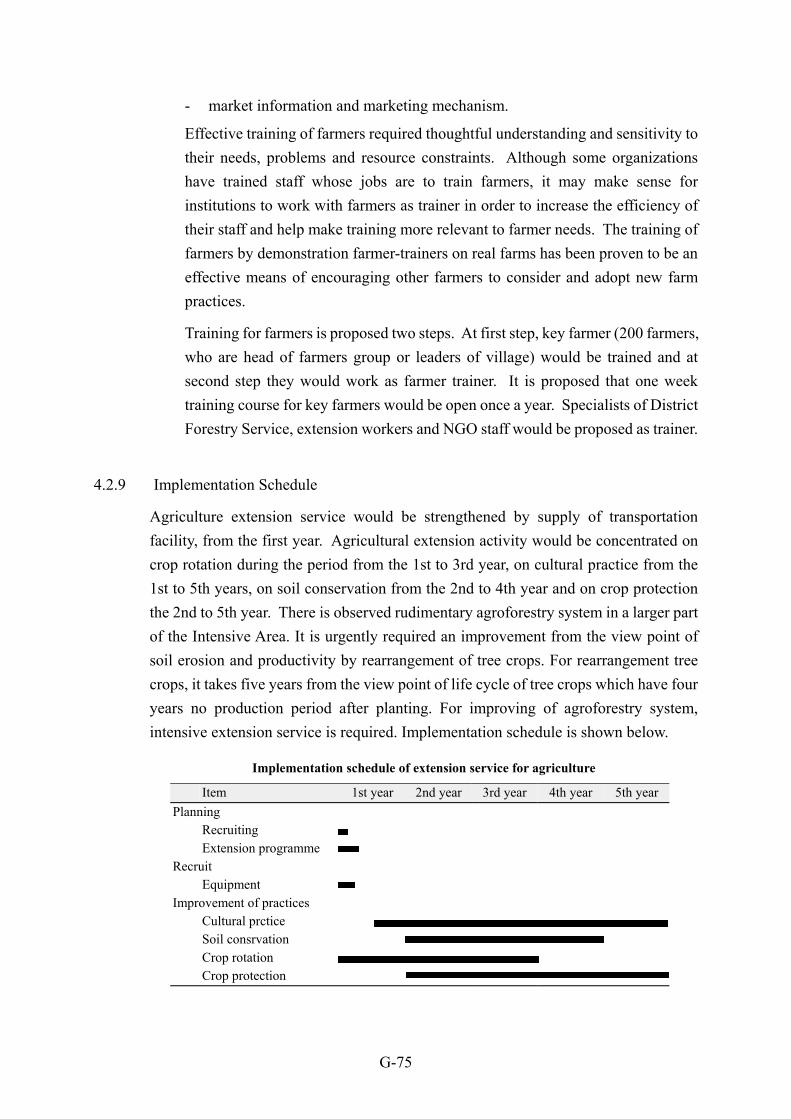
G-75
- market information and marketing mechanism.
Effective training of farmers required thoughtful understanding and sensitivity totheir needs, problems and resource constraints. Although some organizationshave trained staff whose jobs are to train farmers, it may make sense forinstitutions to work with farmers as trainer in order to increase the efficiency oftheir staff and help make training more relevant to farmer needs. The training offarmers by demonstration farmer-trainers on real farms has been proven to be aneffective means of encouraging other farmers to consider and adopt new farmpractices.
Training for farmers is proposed two steps. At first step, key farmer (200 farmers,who are head of farmers group or leaders of village) would be trained and atsecond step they would work as farmer trainer. It is proposed that one weektraining course for key farmers would be open once a year. Specialists of DistrictForestry Service, extension workers and NGO staff would be proposed as trainer.
4.2.9 Implementation Schedule
Agriculture extension service would be strengthened by supply of transportationfacility, from the first year. Agricultural extension activity would be concentrated oncrop rotation during the period from the 1st to 3rd year, on cultural practice from the1st to 5th years, on soil conservation from the 2nd to 4th year and on crop protectionthe 2nd to 5th year. There is observed rudimentary agroforestry system in a larger partof the Intensive Area. It is urgently required an improvement from the view point ofsoil erosion and productivity by rearrangement of tree crops. For rearrangement treecrops, it takes five years from the view point of life cycle of tree crops which have fouryears no production period after planting. For improving of agroforestry system,intensive extension service is required. Implementation schedule is shown below.
Implementation schedule of extension service for agriculture
Item 1st year 2nd year 3rd year 4th year 5th yearPlanning
RecruitingExtension programme
RecruitEquipment
Improvement of practicesCultural prcticeSoil consrvationCrop rotationCrop protection
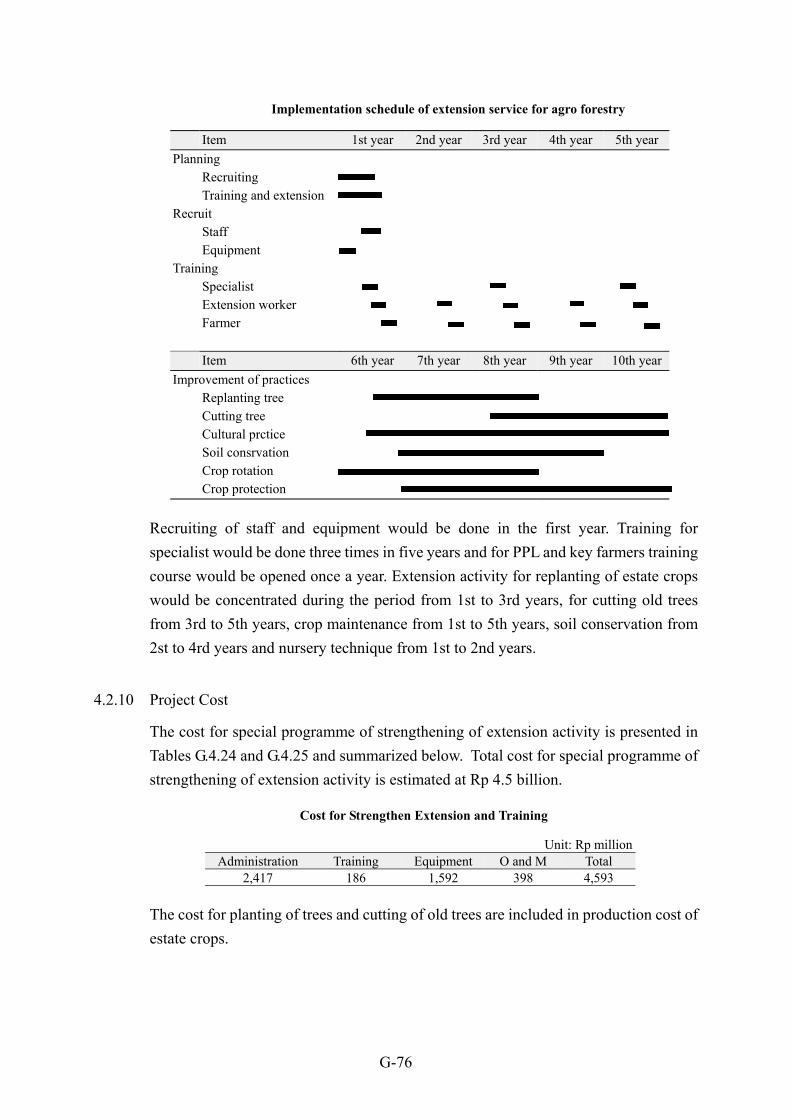
G-76
Implementation schedule of extension service for agro forestry
Item 1st year 2nd year 3rd year 4th year 5th yearPlanning
RecruitingTraining and extension
RecruitStaffEquipment
TrainingSpecialistExtension workerFarmer
Item 6th year 7th year 8th year 9th year 10th yearImprovement of practices
Replanting treeCutting treeCultural prcticeSoil consrvationCrop rotationCrop protection
Recruiting of staff and equipment would be done in the first year. Training forspecialist would be done three times in five years and for PPL and key farmers trainingcourse would be opened once a year. Extension activity for replanting of estate cropswould be concentrated during the period from 1st to 3rd years, for cutting old treesfrom 3rd to 5th years, crop maintenance from 1st to 5th years, soil conservation from2st to 4rd years and nursery technique from 1st to 2nd years.
4.2.10 Project Cost
The cost for special programme of strengthening of extension activity is presented inTables G.4.24 and G.4.25 and summarized below. Total cost for special programme ofstrengthening of extension activity is estimated at Rp 4.5 billion.
Cost for Strengthen Extension and Training
Unit: Rp millionAdministration Training Equipment O and M Total
2,417 186 1,592 398 4,593
The cost for planting of trees and cutting of old trees are included in production cost ofestate crops.
G-77
4.2.11 Project Running Cost
Replacement of equipment would be done every ten years. Annual operation andmaintenance cost is Rp 74 million during the period from sixth year to sixtieth yearafter starting of the project. The equipment would be replaced once in ten years andthe cost for replacement of equipment is estimated at Rp 1.59 billion (See TableG.4.25).
4.2.12 Recommendation
(1) As a larger part of the Intensive Area is sloped area, there would be high possibilityof soil erosion unless proper farming practice and adequate land use plan would beemployed in future. Therefore, it is necessary to establish proper land use systemfor each category of land classified by zoning.
(2) Agroforestry system is the one of the most effective system for soil conservationand increase of soil fertility and productivity. It is necessary to select suitableagroforestry system to increase production and for more effective soilconservation.
(3) Suitable agroforestry system varies area by area. The suitable agroforestry systemcould be determined based on the physical condition, required vegetation, soilconservation technology, social condition and the characteristics of each type ofagroforestry system. Since a larger part of agroforestry system is still rudimentary,it is necessary to improve agroforestry system and cultural practices. Forimproving agroforestry system and cultural practices, it is necessary not only toincrease production but also to consider soil conservation for sustainableagriculture.
(4) Agroforestry is recently recognized as a important area crop production and soilconservation. As a result, education and training in agroforestry lags far behindother agricultural disciplines, leaving a definite shortage of experienced, qualifiedtrainers in agroforestry. Therefore, the training for planners, specialist, extensionworkers and farmers is urgently required for agroforestry development.
(5) For inland fishery, it is necessary to be leveled up of fish cultivation technologyand conservation of water quality of the Lake by strengthen extension service.Since there is no regulation for inland fishery, it is urgently expected to establishrules and by-law for sustaining inland fishery. For prevention of deterioration ofwater quality in Lake Tondano, it is recommended to monitouring of water qualityof the Lake.