appendix a compliance calculations and design examples
TRANSCRIPT
A-1
Appendix A Compliance Calculations and Design
Examples
A.1 General Retention Compliance CalculatorCompliance Calculations
The General Retention Compliance Calculator is an Excel file located on the DDOE website at
http://ddoe.dc.gov/swregs.
Each regulated project must use the General Retention Compliance Calculator to demonstrate
proper BMP selection and sizing to achieve the required amount of stormwater retention and/or
water quality treatment. The completed worksheets from this calculator must be submitted with
the Stormwater Management Plan (SWMP). All major regulated projects are required to address
the Stormwater Retention Volume (SWRv), and major regulated projects in the Anacostia
Waterfront Development Zone (AWDZ) are required to address the Water Quality Treatment
Volume (WQTv), as described in Chapter 2.
Section A.2 provides guidance on using the General Retention Compliance Calculator. The
resulting worksheets from this Excel program must be submitted with the Stormwater
Management Plan (SWMP) for retention approval. The General Retention Compliance
Calculator can also be used, in addition to other hydrologic methods and models, to demonstrate
compliance with Achieving detention obligations (see may be demonstrated with these
worksheets or other hydrologic methods and models as detailed in Chapter Section 2.6 and
Appendix H).
A.2 Instructions for Compliance CalculationsDistrict of Columbia
Stormwater Compliance Spreadsheet
The following guidance goes through the explains how to use of each of the worksheet tabs in
the General Retention Compliance Calculator.
Note: All cells highlighted in blue are user input cells. Cells highlighted in gray are calculation
cells, and cells highlighted in yellow are constant values that generally should not be changed.
Site Data Sheet
1. Input the name of the proposed project on line 9.
2. Determine if the site is located in the AWDZ and note in cell E13.
3. Determine if the site is located in the MS4 and note in cell E14.
4. The regulatory rain event for calculation of the SWRv varies depending upon the type of
development. For major land-disturbing activities, the SWRv is based upon the 90th
percentile depth (1.2 inches). For major substantial improvements, the SWRv is based upon
the 80th percentile depth (0.8 inches). If the site is in the AWDZ and undergoing major
Appendix A Compliance Calculations and Design ExamplesCompliance Calculations and Design
Examples
A-2
Formatted: Font: 11 pt
substantial improvement, the SWRv is based upon the 85th percentile depth (1.0 inches).
Choose the type of development on line 15. The regulatory rain event for SWRv will be
shown on line 16, and the regulatory rain event for the WQTv (if applicable) will be shown
on line 17.
5. For the site, indicate the area (in square feet) of post-development Natural Cover, Compacted
Cover, and bBest mManagement pPractice (BMP) surface area in cells D22–D25. Guidance
for various land covers is provided in Table A.1. Efforts to reduce iImpervious cCover on the
site and maximize Natural Cover will reduce the required Stormwater Retention Volume
(SWRv). Portions of a project located in the pPublic rRight-of-wWay should be considered
separately from the rest of the site and surface area by cover type should be indicated in cells
E22–E25.
Note: This step will be iterative as BMP sizing is performed, and the area of both BMPs and
other land cover types are adjusted.
6. From the land cover input, weighted site-runoff coefficients (Rv) will be calculated (line 33)
for both the site and the public right-of-way based upon the land cover Rv values of 0.00 for
Natural Cover, 0.25 for Compacted Cover, and 0.95 for Impervious Cover.
%N = AN/SA × 100
%C = AC/SA × 100
%I = AI/SA × 100
Rv = (%N× RvN + (%C) × RvC + (%I) × RVI
where:
%N = percent of site in natural cover
AN = area of post-development natural cover (ft2)
%C = percent of site in compacted cover
AC = area of post-development compacted cover (ft2)
%I = percent of site in impervious cover
AI = area of post-development impervious cover (ft2)
SA = total site area (ft2)
Rv = weighted site runoff coefficient
RvN = runoff coefficient for natural cover (0.00)
RvC = runoff coefficient for compacted cover (0.25)
RvI = runoff coefficient for impervious cover (0.95)
7. The SWRv that must be retained on the site and in the PROW will be calculated on line 37.
SWRv = P/12 × Rv × SA
where:
Appendix A Compliance Calculations and Design ExamplesCompliance Calculations and Design
Examples
A-3
Formatted: Font: 11 pt
SWRv = Sstormwater Rretention Vvolume (ft3)
P = regulatory rain event (in.)
12 = conversion from inches to feet
Rv = weighted site runoff coefficient
SA = total site area (ac)
8. If the site is in the AWDZ, the WQTv that must be treated on site and in the PROW will be
calculated on line 39. The regulatory rain event for calculation of the WQTv is based upon
the 95th percentile depth (1.7 inches).
WQTv = P/12 × Rv × SA
where:
WQTv = stormwater treatment volume (ft3)
P = regulatory rain event (1.7 in.)
12 = conversion from inches to feet
Rv = weighted site runoff coefficient
SA = total site area (ac)
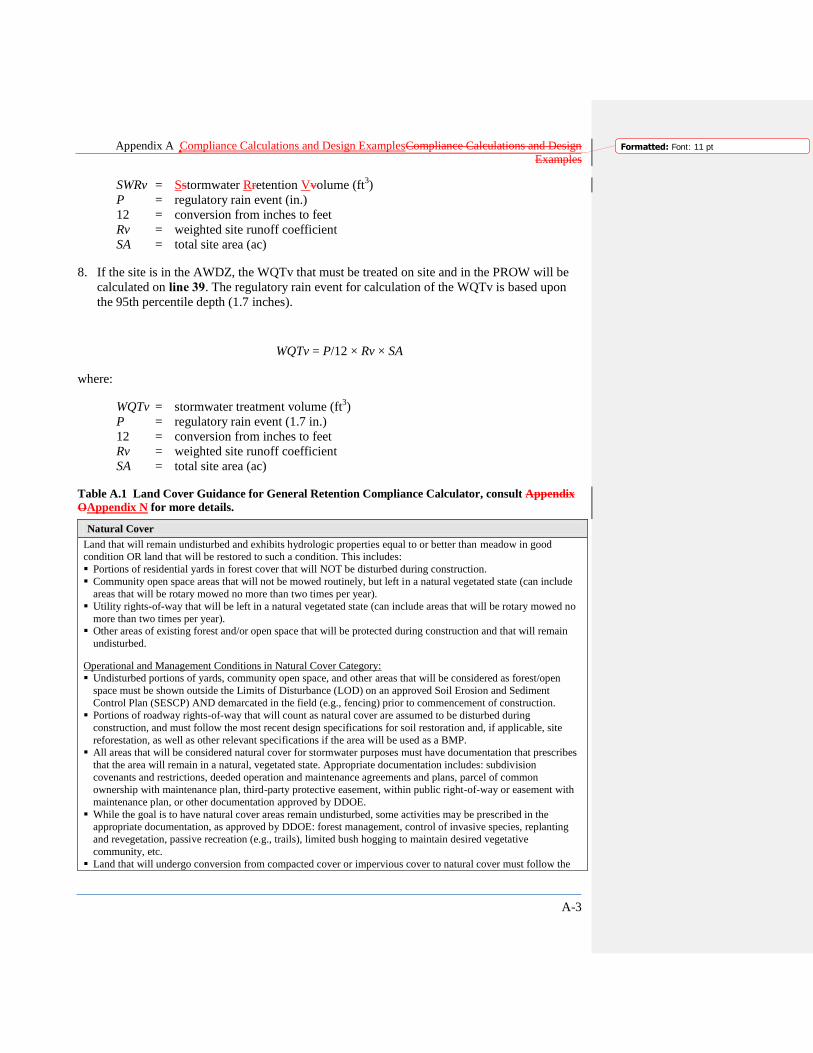
Table A.1 Land Cover Guidance for General Retention Compliance Calculator, consult Appendix
OAppendix N for more details.
Natural Cover
Land that will remain undisturbed and exhibits hydrologic properties equal to or better than meadow in good
condition OR land that will be restored to such a condition. This includes:
Portions of residential yards in forest cover that will NOT be disturbed during construction.
Community open space areas that will not be mowed routinely, but left in a natural vegetated state (can include
areas that will be rotary mowed no more than two times per year).
Utility rights-of-way that will be left in a natural vegetated state (can include areas that will be rotary mowed no
more than two times per year).
Other areas of existing forest and/or open space that will be protected during construction and that will remain
undisturbed.
Operational and Management Conditions in Natural Cover Category:
Undisturbed portions of yards, community open space, and other areas that will be considered as forest/open
space must be shown outside the Limits of Disturbance (LOD) on an approved Soil Erosion and Sediment
Control Plan (SESCP) AND demarcated in the field (e.g., fencing) prior to commencement of construction.
Portions of roadway rights-of-way that will count as natural cover are assumed to be disturbed during
construction, and must follow the most recent design specifications for soil restoration and, if applicable, site
reforestation, as well as other relevant specifications if the area will be used as a BMP.
All areas that will be considered natural cover for stormwater purposes must have documentation that prescribes
that the area will remain in a natural, vegetated state. Appropriate documentation includes: subdivision
covenants and restrictions, deeded operation and maintenance agreements and plans, parcel of common
ownership with maintenance plan, third-party protective easement, within public right-of-way or easement with
maintenance plan, or other documentation approved by DDOE.
While the goal is to have natural cover areas remain undisturbed, some activities may be prescribed in the
appropriate documentation, as approved by DDOE: forest management, control of invasive species, replanting
and revegetation, passive recreation (e.g., trails), limited bush hogging to maintain desired vegetative
community, etc.
Land that will undergo conversion from compacted cover or impervious cover to natural cover must follow the

Appendix A Compliance Calculations and Design ExamplesCompliance Calculations and Design
Examples
A-4
Formatted: Font: 11 pt
guidelines for compost amended soils in Appendix KAppendix J.
Compacted Cover
Land disturbed and/or graded for eventual use as managed turf or landscaping. Managed turf comprises of areas
that are graded or disturbed, and maintained as turf, including yard areas, septic fields, residential utility
connections, and roadway rights of way. Landscaping includes areas that are intended to be maintained in
vegetation other than turf within residential, commercial, industrial, and institutional settings.
Impervious Cover
Roadways, driveways, rooftops, parking lots, sidewalks, and other areas of impervious cover. While they are noted
separately in the spreadsheet, the surface area of all BMPs, except disconnection areas are included with
impervious cover in the spreadsheet‘s calculations.
Drainage Area Sheets 1–510
If the site has multiple discharge points, or complex treatment sequences, it must be divided into
individual drainage areas (DAs). For each DA, a minimum of 50 percent of the SWRv must be
retained. In the MS4, if 50 percent of the SWRv cannot be retained, that volume (or equivalent
24-hour storm) must be captured and treated with an accepted TSS treatment practice.
For each DA sheet:
1. Indicate the specific area of post-development Natural Cover, Compacted Cover, Impervious
Cover, Vehicular Access, and BMP surface area in lines 6–10. The SWRv for the DA will be
calculated in cell G11G12, and the WQTv (if in the AWDZ) will be calculated in cell
G15G17.
Note: This step will be iterative as BMP sizing is performed, and the area of both BMPs and
other land cover types is adjusted. Vehicular Access Areas are a sub-category of Impervious
Cover. Therefore, the Vehicular Access Areas must be included as a part of the total
Impervious Cover area.
2. Apply BMPs to the drainage area to address the required SWRv and WQTv by indicating the
area in square feet of compacted cover, impervious cover, and vehicular access areas (see not
above) to be treated by a given BMP in columns B, D, and F (or the number of trees in the
case of tree preservation or planting). This will likely be an iterative process. The available
BMPs include the following:
Green Roofs
Rainwater Harvesting
Simple Disconnection to a Pervious Area (Compacted Cover)
Simple Disconnection to a Conservation Area (Natural Cover)

Appendix A Compliance Calculations and Design ExamplesCompliance Calculations and Design
Examples
A-5
Formatted: Font: 11 pt
Simple Disconnection to Amended Soils
Permeable Pavement Systems - Enhanced
Permeable Pavement Systems - Standard
Bioretention - Enhanced
Bioretention - Standard
Stormwater Filtering Systems
Stormwater Infiltration
Grass Channels
Grass Channel with Amended Soils
Dry Swales
Wet Swales Storage
Stormwater Ponds
Stormwater Wetlands
Grass Channel
Grass Channel with Amended Soils
Dry Swale
Wet Swale Storage Practices
Proprietary Practices
Tree Planting
Tree Preservation
3. Based upon the area input for a given BMP, the spreadsheet will calculate the Maximum
Retention Volume Received by BMP in column H. Regardless of the Regulatory Rainfall
Event that applies to the site, the volume calculated in column F is based on a rainfall depth
of 1.7 inches. Therefore, the value in column H represents the greatest retention volume for
which a BMP can be valued, rather than the volume that must be retained to achieve
compliance. In other words, it is possible to ―oversize‖ BMPs in one drainage area and
―undersize‖ others to achieve compliance. However, as noted above, in the MS4, a minimum
of 50 percent of the SWRv must be retained in each drainage area. Otherwise, treatment of
the remaining runoff to reach 50 percent of the SWRv must be provided by an accepted TSS
treatment practice.
Vmax = 1.7/12 × (RvN × ANC + RvC × AC + RvI × (AI +ABMP))
where:
Vmax = volume received by the BMP from 1.7-inch rain event (ft3)
Appendix A Compliance Calculations and Design ExamplesCompliance Calculations and Design
Examples
A-6
Formatted: Font: 11 pt
RvN = runoff coefficient for natural cover (0.00)
AN = area of post-development natural cover (ft2)
RvC = runoff coefficient for compacted cover (0.25)
AC = area of post-development compacted cover (ft2)
RvI = runoff coefficient for impervious cover (0.95)
AI = area of post-development impervious cover (ft2)
ABMP = area of BMP (ft2)
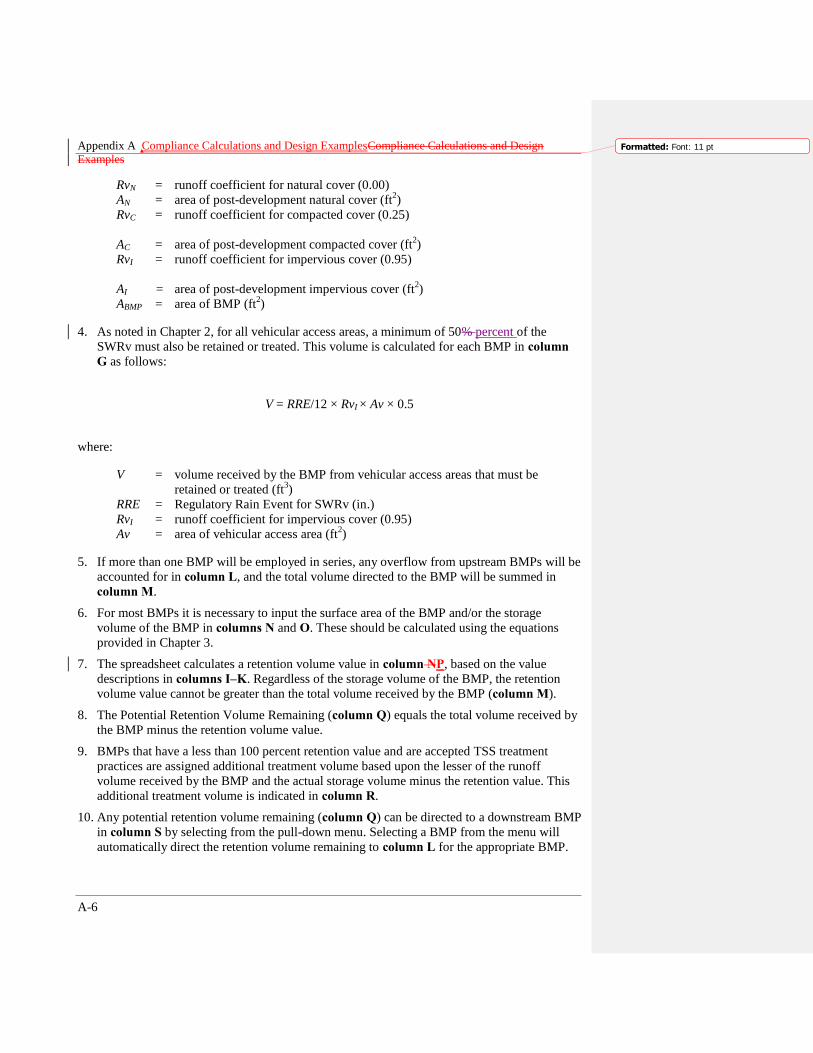
4. As noted in Chapter 2, for all vehicular access areas, a minimum of 50% percent of the
SWRv must also be retained or treated. This volume is calculated for each BMP in column
G as follows:
V = RRE/12 × RvI × Av × 0.5
where:
V = volume received by the BMP from vehicular access areas that must be
retained or treated (ft3)
RRE = Regulatory Rain Event for SWRv (in.)
RvI = runoff coefficient for impervious cover (0.95)
Av = area of vehicular access area (ft2)
5. If more than one BMP will be employed in series, any overflow from upstream BMPs will be
accounted for in column L, and the total volume directed to the BMP will be summed in
column M.
6. For most BMPs it is necessary to input the surface area of the BMP and/or the storage
volume of the BMP in columns N and O. These should be calculated using the equations
provided in Chapter 3.
7. The spreadsheet calculates a retention volume value in column NP, based on the value
descriptions in columns I–K. Regardless of the storage volume of the BMP, the retention
volume value cannot be greater than the total volume received by the BMP (column M).
8. The Potential Retention Volume Remaining (column Q) equals the total volume received by
the BMP minus the retention volume value.
9. BMPs that have a less than 100 percent retention value and are accepted TSS treatment
practices are assigned additional treatment volume based upon the lesser of the runoff
volume received by the BMP and the actual storage volume minus the retention value. This
additional treatment volume is indicated in column R.
10. Any potential retention volume remaining (column Q) can be directed to a downstream BMP
in column S by selecting from the pull-down menu. Selecting a BMP from the menu will
automatically direct the retention volume remaining to column L for the appropriate BMP.
Appendix A Compliance Calculations and Design ExamplesCompliance Calculations and Design
Examples
A-7
Formatted: Font: 11 pt
11. Column T calculates whether or not the vehicular access area directed to each BMP is
adequately addressed, via retention or treatment. To do this, the required runoff volume from
the vehicular access area is compared to the retention and treatment volumes provided by the
BMP, as well as from a downstream BMP, if selected. For each BMP that receives vehicular
access runoff, ―Yes‖ or ―No‖ will be displayed. It should be noted that while this column
does take downstream BMPs into account, it is not a precise enough check to ensure that all
possible design variations are accounted for. Sufficient retention or treatment from vehicular
access areas must be clearly shown on the design plans.
12. From the selected BMPs, the total volume retained will be summed in cell P66. The retention
volume remaining will then be calculated as the difference between the SWRv and the total
volume retained in cell P68 (in cubic feet) and cell P69 (in gallons). Cell P71 indicates if at
least 50 percent of the SWRv has been retained for the DA.
13. Cell P72 indicates whether or not all of the vehicular access areas have been adequately
addressed. This is accomplished with two checks. First, the cell checks that the entire
vehicular access area for the drainage area indicated in cell B9 has been included in column
F, by comparing cell F66 to cell B9. Second, the cell checks that sufficient retention or
treatment volume has been provided in each BMP by searching for ―No‘s‖ in column T. As
noted above, this check is not precise enough to ensure that all possible design variations are
accounted for. Sufficient retention or treatment from vehicular access areas must be clearly
shown on the design plans.
14. If in the MS4, if 50 percent of the SWRv has not been retained, cell P73 indicates that
treatment is required.
15. From the selected BMPs, cell T66 is the sum of the total volume treated. If treatment is
required due to a shortage of retention, cells T68 (cubic feet) and T69 (gallons) indicate how
much more runoff must be treated. If treatment is required because the site is located in the
AWDZ, cells T71 (cubic feet) and T72 (gallons) indicate how much runoff must be treated to
meet WQTv requirements.
16. Cell P75 will indicate compliance for the DA with a ―Yes‖ or ―No,‖ depending on retention
and treatment volume provided in the drainage area.
Note: Since only 50 percent of the SWRv must be retained in any individual DA,
compliance in each drainage area does not automatically mean that compliance for the entire
site has been achieved.
Public Right-of-Way Sheet
The Public Right-of-Way sheet is functionally identical to the Drainage Area sheet; therefore,
Steps 1–16 should be followed as stated above. If SWRv or WQTv is not met, the site may still
comply if it follows the Maximum Extent Practicable (MEP) process as described in Appendix
B.
Compliance Worksheet Tab
The Compliance worksheet summarizes the stormwater retention and treatment results for each
DA as well as the whole site. For all sites, in order to comply with the stormwater management
requirements, each DA must indicate that the vehicular access areas volume has been addressed.
Appendix A Compliance Calculations and Design ExamplesCompliance Calculations and Design
Examples
A-8
Formatted: Font: 11 pt
In the MS4, each DA must either indicate that 50 percent of the SWRv has been retained, or that
there are ―0 inches of remaining volume to treat 50% percent of the SWRv. Key values for each
drainage area are described on this worksheet, with sSite cCompliance and the pPublic rRight-of-
wWay summarized at the bottom.
Cell B106 B206 indicates the tTotal vVolume rRetained on site. Cell B108 B208 (cubic feet)
and cell B109 B209 (gallons) indicate the remaining retention volume (if any) to meet the
SWRv. If the SWRv has not been fully met, cell B115 B215 indicates the required Off-site
Retention Volume (Offv). The Offv may be addressed through the use of Stormwater Retention
Credits (SRCs) and/or payment of an in-lieu fee. If the SWRv has been exceeded, cell B114
B214 indicates the volume that may be available for to generate SRCs
This sheet also summarizes the stormwater retention results from the Public Rright-of-Wway
(PROW) sheet. Cell B124 B224 indicates the Total Volume Retained on site. Cells B125 B225
and B126 B226 show the remaining retention volume (if any) in cubic feet and gallons,
respectively. Cells B131B232–B134 B235 show the remaining treatment volume (if any) to meet
SWRv and WQTv requirements.
Channel and Flood Protection
This sheet assists with calculation of Adjusted Curve Numbers that can be used to calculate peak
flows associated with the 2-year storm, 15-year storm, or other storm events.
1. Indicate the appropriate depths for the 1-year, 2-year, and 100-year 24-hour storms (or other
storms as needed) on line 5.
2. Each cover type is associated with a Natural Resource Conservation Service (NRCS) curve
number. Cells D34–D38D54, D56, and D58 show the curve number for D.A. 1. Using these
curve numbers (or other curve numbers if appropriate), a weighted curve number and the
total runoff volume for D.A. 1 is calculated (cell E38E58).
3. Line 41 61 calculates the runoff volume without regard to the BMPs employed in D.A. 1.
Line 42 62 subtracts the storage volume provided by the BMPs in D.A. 1 from these totals.
4. The spreadsheet then determines the curve number that results in the calculated runoff
volume with the BMPs. This Adjusted Curve Number is reported on line 4363.
5. These steps are repeated for Drainage Areas B2–E10.
Weighted Curve Number
CN = [(AN × 70) + (AC × 74) + (AI × 98)]/SA
where:
CN = weighted curve number
AN = area of post-development natural cover (ft2)
AC = area of post-development compacted cover (ft2)
AI = area of post-development impervious cover (ft2)
SA = total site area (ft2)
Appendix A Compliance Calculations and Design ExamplesCompliance Calculations and Design
Examples
A-9
Formatted: Font: 11 pt
Potential Abstraction
S = 1000/(CN-10)
where:
S = potential abstraction (in.)
CN = weighted curve number
Runoff Volume with no Retention
Q = (P – 0.2 × S)2/( P + 0.8 × S)
where:
Q = runoff volume with no BMPs (in.)
P = precipitation depth for a given 24-hour storm (in.)
S = potential abstraction (in.)
Runoff Volume with BMPs
QBMP = Q – CvDA(da) × 12/SDA
where:
QBMP = runoff volume with BMPs (in.)
Q = runoff volume with no BMPs (in.)
CvDA(da) = total storage volume provided by BMPs for the drainage area (ft3)
363012 = unit adjustment factor, cubic feet to acre-feet to inches
DA = site drainage area (acft2)
Adjusted Curve Number
The adjusted curve number is calculated using a lookup table of curve number and runoff
volumes so that:
CNadjusted, so (P – 0.2 × Sadjusted) ×2/(P + 0.8 × Sadjusted) = QBMP
Sadjusted = 1000/(CNadjusted – 10)
where:
CNadjusted = adjusted curve number that will create a runoff volume equal to the
drainage area runoff volume including BMPs
P = precipitation depth for a given 24-hour storm (in.)
Sadjusted = adjusted potential abstraction based upon adjusted curve number
(in.)
QBMP = runoff volume with BMPs (in.)
Appendix A Compliance Calculations and Design ExamplesCompliance Calculations and Design
Examples
A-10
Formatted: Font: 11 pt
A.3 Design Examples
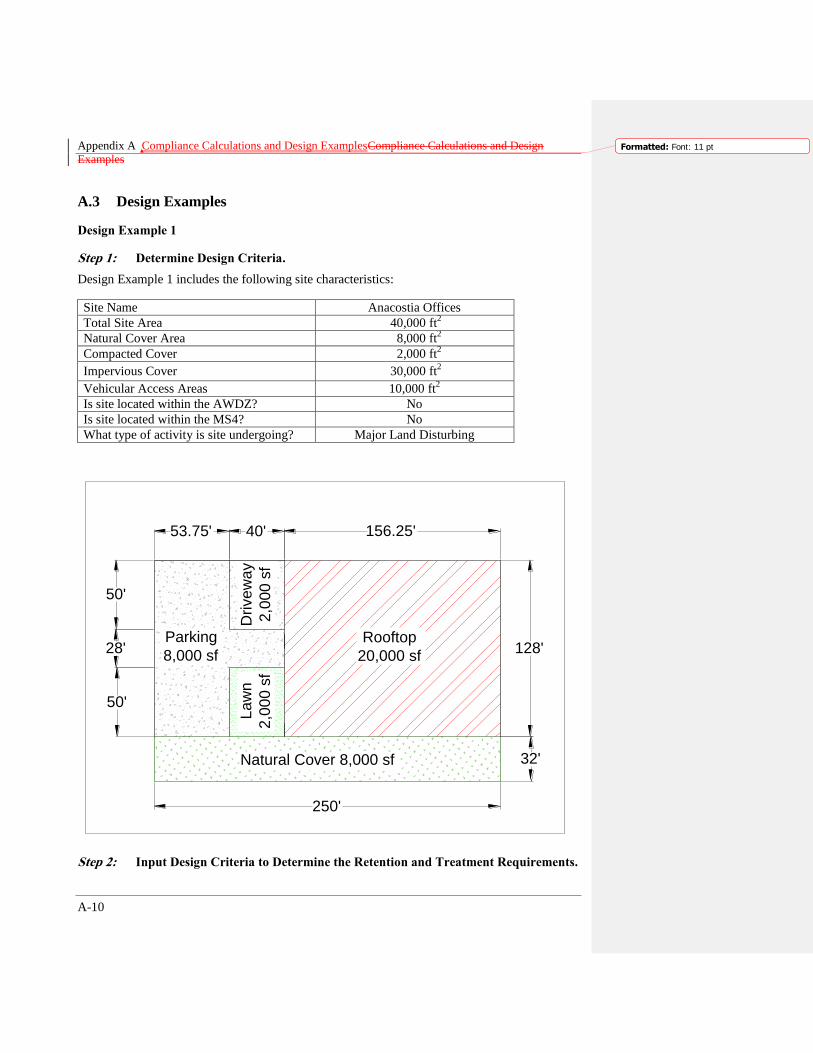
Design Example 1
Step 1: Determine Design Criteria.
Design Example 1 includes the following site characteristics:
Site Name Anacostia Offices
Total Site Area 40,000 ft2
Natural Cover Area 8,000 ft2
Compacted Cover 2,000 ft2
Impervious Cover 30,000 ft2
Vehicular Access Areas 10,000 ft2
Is site located within the AWDZ? No
Is site located within the MS4? No
What type of activity is site undergoing? Major Land Disturbing
Step 2: Input Design Criteria to Determine the Retention and Treatment Requirements.
Rooftop
20,000 sf
Natural Cover 8,000 sf
128'
32'
156.25'
250'
Drive
wa
y
2,0
00
sf
Parking
8,000 sf
40'53.75'
50'
50'
28'
La
wn
2,0
00
sf
Appendix A Compliance Calculations and Design ExamplesCompliance Calculations and Design
Examples
A-11
Formatted: Font: 11 pt
The General Retention Compliance Calculator will calculate a Stormwater Retention Volume
(SWRv), once the natural cover, compacted cover, and impervious cover areas are put into cells
D22–D25 on the Site Data sheet.
Based on the design criteria above, Anacostia Offices has the following requirements:
SWRv =× cell D37 = 2,900 ft3
Step 3: Identify Site Constraints and BMP Restrictions.
Key considerations for Anacostia Offices include the following:
Site soils are contaminated, so infiltration is not allowed, and impermeable liners will be
required for most BMPs.
The commercial land use means that most BMPs are otherwise acceptable.
Step 4: Select BMPs to Meet the Retention and Treatment Requirements.
While there are numerous options for treatment of this site, two BMPs were selected: rainwater
harvesting (R1) for the rooftop and bioretention (B1) for any remaining rooftop runoff and the
rest of the site. Since the site is contaminated, a liner is required and the enhanced bioretention
option is not available.
The site will ultimately have one outlet point, and the selected treatment train is relatively
simple, so the calculations can be performed on one Drainage Area tab – D.A. 1. Therefore, all
of the same values from the Site Data tab for the various cover types (plus the vehicle access
area) should be put into cells B6-B10 on the D.A.1tab.
The first BMP selected is rainwater harvesting for runoff from the rooftop. The Cistern Design
spreadsheetRainwater Harvesting Retention Calculator should be used to determine the cistern
size and the associated retention value. In the Cistern Design SpreadsheetRainwater Harvesting
Retention Calculator 20,000 square feet should be put in as the Contributing Drainage Area
(CDA) (cell L7). For utilization of the rainwater, flushing toilets/urinals is selected as the use,
and the appropriate values are entered. In this case, 500 people will use the building per day (cell
L21), Monday through Friday (cells L30 and L32), 8 hours per day (cell L34). On the Results –
Retention Value sheet, the retention values are given for various tank sizes. The tables and
graphs show that a 30,000 gallon underground tank (or series of tanks) would meet much of the
demand and have a very high retention value—94 percent.
The next step is to return to the D.A. 1 tab and input the 20,000-square foot CDA into cell D25
for rainwater harvesting and input the efficiency (94%) into cell K25. The result is that 2,530
cubic feet of runoff are retained and 162 cubic feet remain. Since Standard Bioretention will be
the next BMP in the series, it should be selected from the pull-down menu in cell S25. The
remaining runoff volume will then be directed to this BMP.
In addition to the overflow from the rainwater harvesting BMP, the bioretention area will receive
runoff from the rest of the site. Initially, these land uses can be input into cells B39–D40.
However, the surface area of the bioretention area must be accounted for as well. Through trial
Appendix A Compliance Calculations and Design ExamplesCompliance Calculations and Design
Examples
A-12
Formatted: Font: 11 pt
and error, it was determined that a 1,000-square-foot bioretention area would be sufficient to
meet the retention requirement. This area will be taken from the compacted cover area and will
need to be changed on the Site Data Tab as well as at the top of DA. 1. Compacted cover will
now be 1,000 square feet, and BMP will be 1,000 square feet. The 8,000 square feet of natural
cover will remain. Impervious cover directed to the bioretention area (cell D39) will be 10,000
square feet (the remaining impervious area after 20,000 square feet was removed for rainwater
harvesting). 1,000 square feet of compacted cover and 1,000 square feet of BMP surface area
will also be directed to the bioretention area (cells B40 and D40). Since thise 10,000 square feet
of impervious cover is made up of driveway and parking area, it is all classified as vehicular
access area, so 10,000 should be put into cell F39 as well.
The vehicular access retention/treatment requirement is 475 cubic feet (cell G39), and the total
volume directed to the bioretention area, including the ―overflow‖ from the rainwater harvesting
BMP, will be 1,677 cubic feet (cell M39) is more than sufficient to address the vehicular access
volume and. Inputting 800 cubic feet for the storage volume in the spreadsheet (cell O39) is
more than sufficient to address the vehicular access volume and leads to an exceedaence of 300
gallons for the SWRv (cell Q69). This information is also summarized on the Compliance
worksheet tab.
Step 5: Size the BMPs According to the Design Equations.
The size of the rainwater-harvesting cistern was already determined to be 30,000 gallons,
although additional volume may be necessary for dead storage for a pump, and/or freeboard.
To meet the bioretention criteria, the bioretention area is sized with 1.5 feet of filter media, 0.75
feet of gravel, and a 0.5-foot ponding depth. The bioretention cell sizing goal is 800 cubic feet.
Step 5.1: Check the Filter Media Depth.
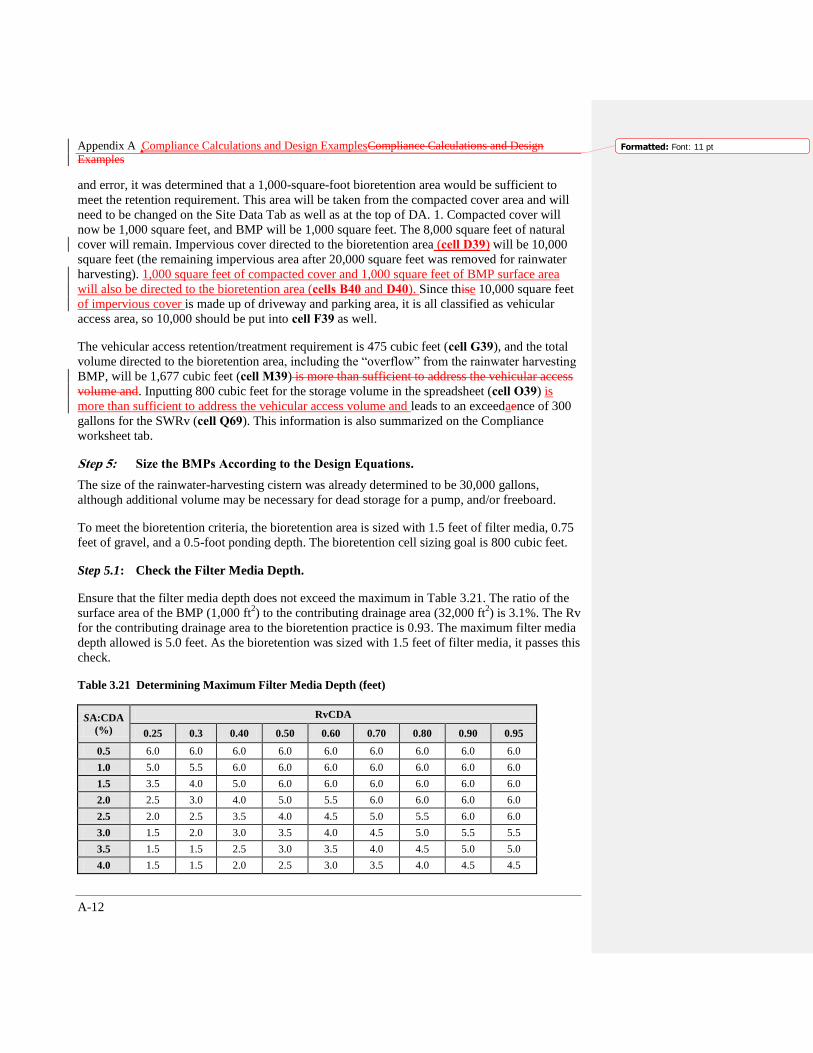
Ensure that the filter media depth does not exceed the maximum in Table 3.21. The ratio of the
surface area of the BMP (1,000 ft2) to the contributing drainage area (32,000 ft
2) is 3.1%. The Rv
for the contributing drainage area to the bioretention practice is 0.93. The maximum filter media
depth allowed is 5.0 feet. As the bioretention was sized with 1.5 feet of filter media, it passes this
check.
Table 3.21 Determining Maximum Filter Media Depth (feet)
SA:CDA
(%)
RvCDA
0.25 0.3 0.40 0.50 0.60 0.70 0.80 0.90 0.95
0.5 6.0 6.0 6.0 6.0 6.0 6.0 6.0 6.0 6.0
1.0 5.0 5.5 6.0 6.0 6.0 6.0 6.0 6.0 6.0
1.5 3.5 4.0 5.0 6.0 6.0 6.0 6.0 6.0 6.0
2.0 2.5 3.0 4.0 5.0 5.5 6.0 6.0 6.0 6.0
2.5 2.0 2.5 3.5 4.0 4.5 5.0 5.5 6.0 6.0
3.0 1.5 2.0 3.0 3.5 4.0 4.5 5.0 5.5 5.5
3.5 1.5 1.5 2.5 3.0 3.5 4.0 4.5 5.0 5.0
4.0 1.5 1.5 2.0 2.5 3.0 3.5 4.0 4.5 4.5
Appendix A Compliance Calculations and Design ExamplesCompliance Calculations and Design
Examples
A-13
Formatted: Font: 11 pt
4.5 1.5 1.5 2.0 2.5 3.0 3.5 3.5 4.0 4.5
5.0 1.5 1.5 1.5 2.0 2.5 3.0 3.5 4.0 4.0
5.5 1.5 1.5 1.5 2.0 2.5 2.5 3.0 3.5 3.5
6.0 1.5 1.5 1.5 1.5 2.0 2.5 3.0 3.0 3.5
6.5 1.5 1.5 1.5 1.5 2.0 2.5 2.5 3.0 3.0
7.0 1.5 1.5 1.5 1.5 1.5 2.0 2.5 3.0 3.0
7.5 1.5 1.5 1.5 1.5 1.5 2.0 2.5 2.5 2.5
8.0 1.5 1.5 1.5 1.5 1.5 2.0 2.0 2.5 2.5
8.5 1.5 1.5 1.5 1.5 1.5 1.5 2.0 2.0 2.5
9.0 1.5 1.5 1.5 1.5 1.5 1.5 2.0 2.0 2.0
9.5 1.5 1.5 1.5 1.5 1.5 1.5 1.5 2.0 2.0
10.0 1.5 1.5 1.5 1.5 1.5 1.5 1.5 2.0 2.0
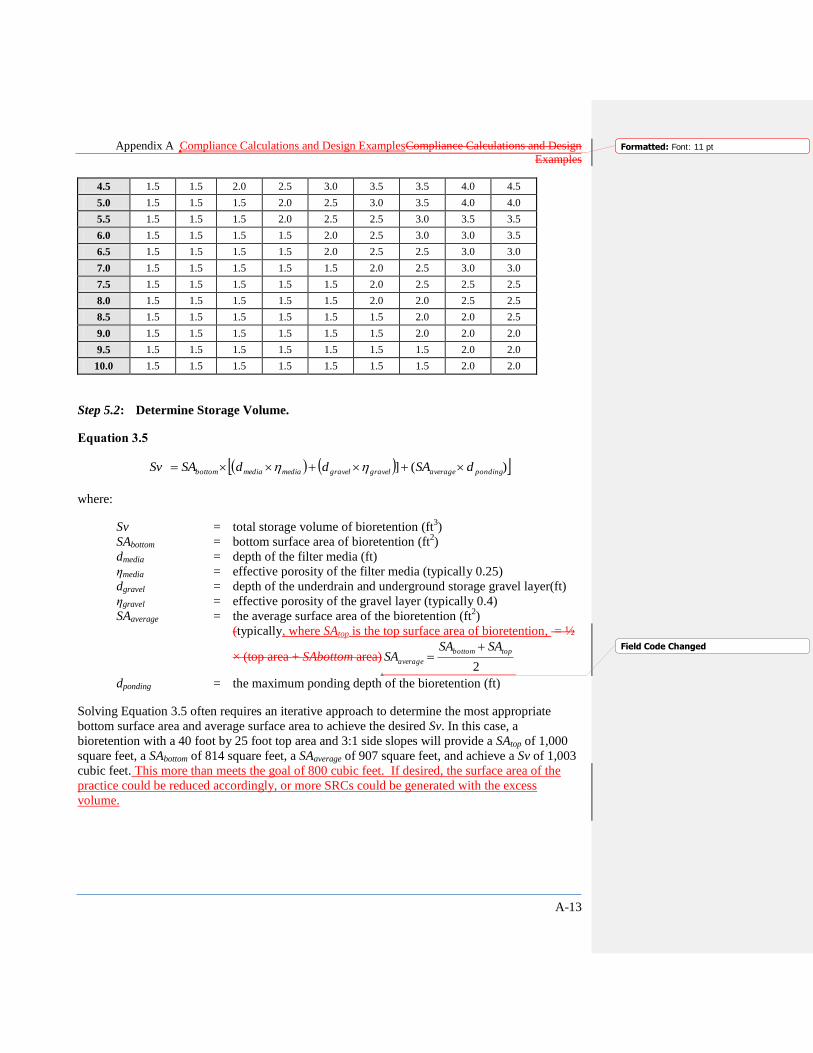
Step 5.2: Determine Storage Volume.
Equation 3.5
)(] pondingaveragegravelgravelmediamediabottom dSAddSASv
where:
Sv = total storage volume of bioretention (ft3)
SAbottom = bottom surface area of bioretention (ft2)
dmedia = depth of the filter media (ft)
ηmedia = effective porosity of the filter media (typically 0.25)
dgravel = depth of the underdrain and underground storage gravel layer(ft)
ηgravel = effective porosity of the gravel layer (typically 0.4)
SAaverage = the average surface area of the bioretention (ft2)
(typically, where SAtop is the top surface area of bioretention, = ½
× (top area + SAbottom area)2
topbottom
average
SASASA
dponding = the maximum ponding depth of the bioretention (ft)
Solving Equation 3.5 often requires an iterative approach to determine the most appropriate
bottom surface area and average surface area to achieve the desired Sv. In this case, a
bioretention with a 40 foot by 25 foot top area and 3:1 side slopes will provide a SAtop of 1,000
square feet, a SAbottom of 814 square feet, a SAaverage of 907 square feet, and achieve a Sv of 1,003
cubic feet. This more than meets the goal of 800 cubic feet. If desired, the surface area of the
practice could be reduced accordingly, or more SRCs could be generated with the excess
volume.
Field Code Changed
Appendix A Compliance Calculations and Design ExamplesCompliance Calculations and Design
Examples
A-14
Formatted: Font: 11 pt
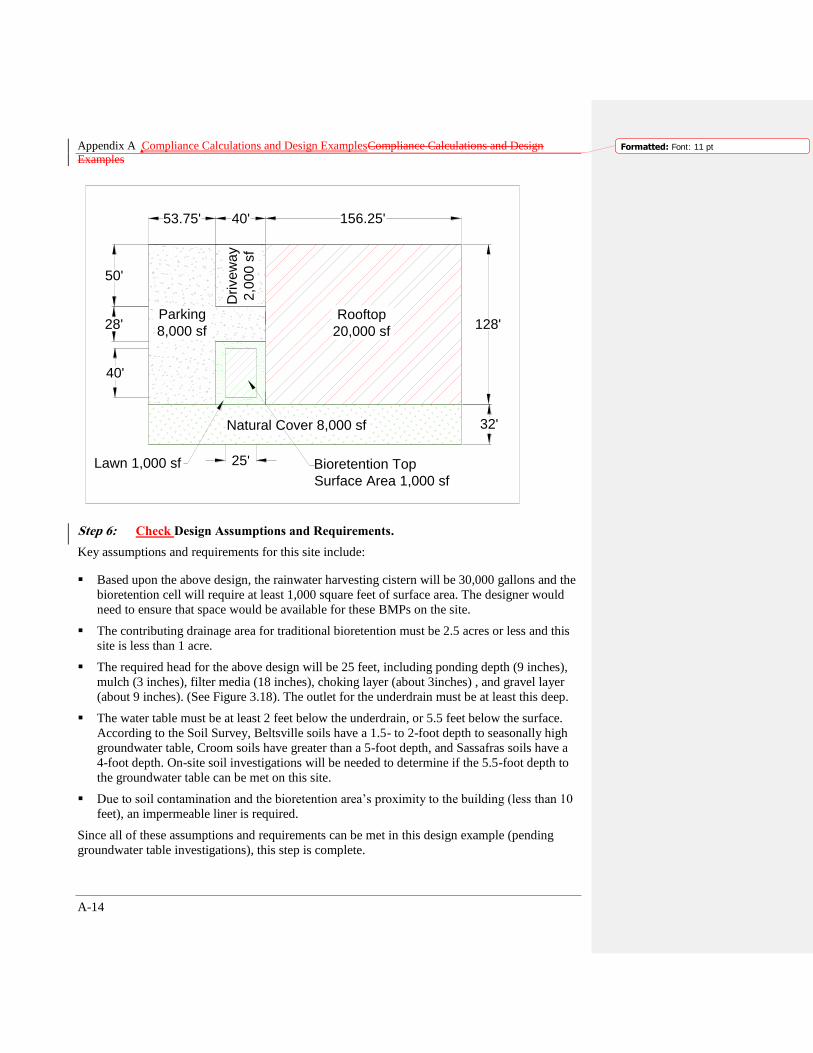
Step 6: Check Design Assumptions and Requirements.
Key assumptions and requirements for this site include:
Based upon the above design, the rainwater harvesting cistern will be 30,000 gallons and the
bioretention cell will require at least 1,000 square feet of surface area. The designer would
need to ensure that space would be available for these BMPs on the site.
The contributing drainage area for traditional bioretention must be 2.5 acres or less and this
site is less than 1 acre.
The required head for the above design will be 25 feet, including ponding depth (9 inches),
mulch (3 inches), filter media (18 inches), choking layer (about 3inches) , and gravel layer
(about 9 inches). (See Figure 3.18). The outlet for the underdrain must be at least this deep.
The water table must be at least 2 feet below the underdrain, or 5.5 feet below the surface.
According to the Soil Survey, Beltsville soils have a 1.5- to 2-foot depth to seasonally high
groundwater table, Croom soils have greater than a 5-foot depth, and Sassafras soils have a
4-foot depth. On-site soil investigations will be needed to determine if the 5.5-foot depth to
the groundwater table can be met on this site.
Due to soil contamination and the bioretention area‘s proximity to the building (less than 10
feet), an impermeable liner is required.
Since all of these assumptions and requirements can be met in this design example (pending
groundwater table investigations), this step is complete.
Bioretention Top
Surface Area 1,000 sf
Lawn 1,000 sf 25'
Rooftop
20,000 sf
Natural Cover 8,000 sf
128'
32'
156.25'D
rive
wa
y
2,0
00
sf
Parking
8,000 sf
40'53.75'
50'
40'
28'

Appendix A Compliance Calculations and Design ExamplesCompliance Calculations and Design
Examples
A-15
Formatted: Font: 11 pt
Step 7: Use the Adjusted Curve Number to Address Peak Flow Requirements.
On the Channel and Flood Protection tab, enter values for C soils in cells D34D54, D36D56, and
D38 D58 (70 for natural areas, 74 for turf, and 98 for impervious cover, respectively). The
original site curve number of 92 is reduced for the 2-year, 15-year, and 100-year storms to 79,
82, and 83, respectively, by the retention provided by the cistern and bioretention cell. These
values can be used to help determine detention requirements for this site.
Step 8: Determine Detention Requirements.
Detention is required to reduce the peak discharge rate from the 2-year storm event to the
predevelopment (meadow conditions or better) peak discharge rate and to reduce the peak
discharge rate from the 15-year storm event to the preproject peak discharge rate. Appendix H
includes details on the procedure for calculating the detention volume. In this example, the
proposed impervious cover and the proposed runoff curve number is less than the preproject
conditions, so detention for the 15-year storm is not required. Detention for the 2-year storm will
be required.
The peak inflow (qi2) and the peak outflow (qo2) can be calculated using the WinTR-55 Small
Watershed Hydrology program, the area of the site, the time of concentration (Tc), assumed to be
10 minutes), and the curve numbers. The reduced curve of 79, determined above, generates a qi2
of 1.61 cubic feet per second (cfs). The curve number for meadow in good condition, 71,
generates a qo2 of 1.07 cfs.
The ratio of 1.07 cfs to 1.61 cfs equals 0.63. Using Figure H.1, the ratio of storage volume (Vs2)
to runoff volume (Vr2) is 0.22.
The runoff volume (Vr2) determined from the General Retention Compliance Calculator
spreadsheet is 1.33 inches, which equates to 4,333 cubic feet. Using the calculated ratio of
Vs2/Vr2, the storage volume required for the site (Vs2) is 1,020 cubic feet.
With appropriate orifice design to ensure that outflows are properly restricted, this detention
volume can be incorporated below the proposed bioretention area or located elsewhere on the
site as a standalone detention practice.
Design Example 2
Step 1: Determine Design Criteria.
Design Example 2 includes the following proposed design criteria:
Site Name Downtown Multi-Story Renovation
Total Site Area 15,000 ft2
Natural Cover Area 0 ft2
Compacted Cover 0 ft2
Impervious Cover (Rooftop) 15,000 ft2
Vehicular Access Areas 0 ft2
Formatted: Subscript
Formatted: Subscript
Formatted: Subscript
Formatted: Subscript
Formatted: Subscript
Formatted: Subscript

Appendix A Compliance Calculations and Design ExamplesCompliance Calculations and Design
Examples
A-16
Formatted: Font: 11 pt
Is site located within the AWDZ? No
Is site located within the MS4? Yes
What type of activity is the site
undergoing? Major Substantial Improvement
Step 2: Input Design Criteria to Determine the Retention and Treatment Requirements.
The Compliance Calculator Spreadsheet will calculate a Stormwater Retention Volume (SWRv),
once the above values are put into the Site Data sheet.
Based on the design criteria above, the Multi-Story Renovation project is required to treat 0.8
inches of rainfall for the SWRv:
SWRv =× cell D37 = 950 ft3
Step 3: Identify Site Constraints and BMP Restrictions.
Key considerations for the Multi-Story Renovation project include the following:
Since this is a rooftop-only site, very few treatment options are available.
As a renovation, the structure of the existing roof will be a factor for any rooftop practice.
Step 4: Select BMPs to Meet the Retention and Treatment Requirements.
As an initial estimate 75 percent of the rooftop is proposed to be converted to a green roof, with
the remaining 25 percent draining to it. Therefore, the land use values need to be changed to
account for the green roof: 3,750 square feet should be entered as rooftop impervious cover in
cell D24 on the Site Data sheet, and 11,250 square feet should be entered in cell D25 as ―BMP.‖
As there will be only one drainage area for the site, these same values should be entered into
cells B8 and B10 on sheet D.A. 1. and as the Green Roof drainage area (cells D23 and D24).
The goal of this design is to capture the entire retention volume (950 ft3) in the Green Roof. This
can be shown on the spreadsheet by entering 950 cubic feet in cell O23 on sheet D.A. A. Cell
Q69 shows that the SWRv has been met for the site. This information is also summarized on the
Compliance worksheet tab.
Step 5: Size the BMPs According to the Design Equations.
The green roof needs to be sized according to Equation 3.1. Note: Since green roofs are typically
manufactured systems, several of the parameters, such as the drainage layer depth and porosity
maximum water retention of all layers, need to be provided by the manufacturer. The values for
the roof used in this design are provided in the variable descriptions below Equation 3.1 (with
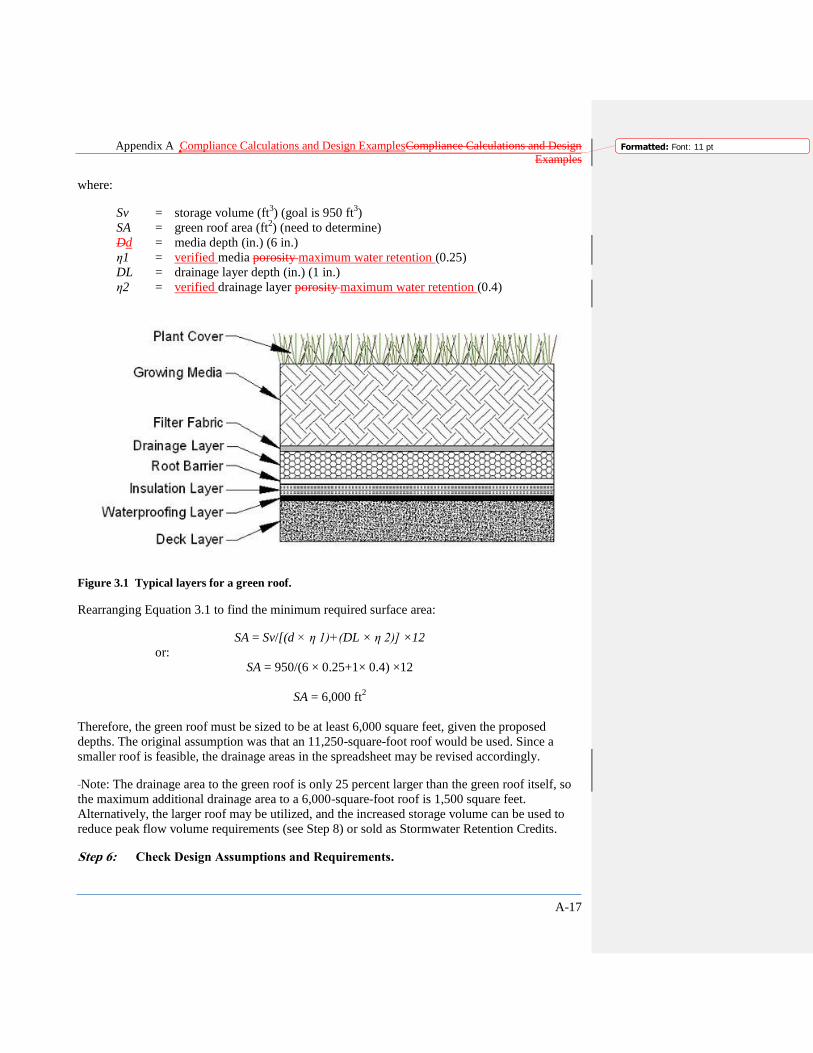
each layer illustrated in Figure 3.1).
Equation 3.1 Storage Volume for Green Roofs
12
+ 21
DLdSASv
Appendix A Compliance Calculations and Design ExamplesCompliance Calculations and Design
Examples
A-17
Formatted: Font: 11 pt
where:
Sv = storage volume (ft3) (goal is 950 ft
3)
SA = green roof area (ft2) (need to determine)
Dd = media depth (in.) (6 in.)
η1 = verified media porosity maximum water retention (0.25)
DL = drainage layer depth (in.) (1 in.)
η2 = verified drainage layer porosity maximum water retention (0.4)
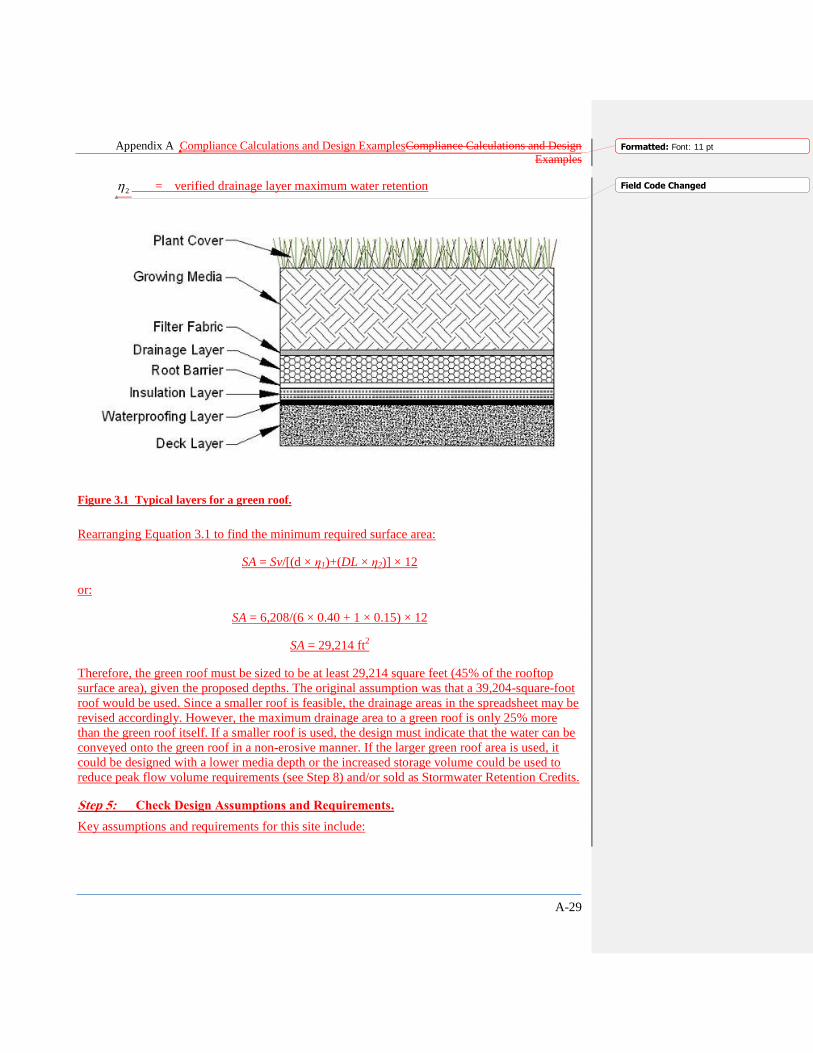
Figure 3.1 Typical layers for a green roof.
Rearranging Equation 3.1 to find the minimum required surface area:
SA = Sv/[(d × η 1)+(DL × η 2)] ×12
or:
SA = 950/(6 × 0.25+1× 0.4) ×12
SA = 6,000 ft2
Therefore, the green roof must be sized to be at least 6,000 square feet, given the proposed
depths. The original assumption was that an 11,250-square-foot roof would be used. Since a
smaller roof is feasible, the drainage areas in the spreadsheet may be revised accordingly.
Note: The drainage area to the green roof is only 25 percent larger than the green roof itself, so
the maximum additional drainage area to a 6,000-square-foot roof is 1,500 square feet.
Alternatively, the larger roof may be utilized, and the increased storage volume can be used to
reduce peak flow volume requirements (see Step 8) or sold as Stormwater Retention Credits.
Step 6: Check Design Assumptions and Requirements.

Appendix A Compliance Calculations and Design ExamplesCompliance Calculations and Design
Examples
A-18
Formatted: Font: 11 pt
Key assumptions and requirements for this site include:
A structural analysis of the building is needed to determine that the green roof can be
supported by the existing structure.
Ensure that there is sufficient space on the rooftop (allowing for structures such as vents,
steep areas of the roof, and other panels). In this case, the minimum roof area of 6,000 square
feet is less than half of the entire roof area and most roofs can accommodate this area.
At least 1,500 square feet of the rooftop not covered by green roof needs to be designed so
that it drains to the green roof without damaging it.
Since all of these assumptions and requirements can be met in this design example, this step is
complete.
Step 7: Use the Adjusted Curve Number to Address Peak Flow Requirements.
The initial curve number for this site is 98, but retention provided by the green roof changes this
number. The Channel and Flood Protection tab notes the reduced curve numbers for the 2-year,
15-year, and 100-year storms: 90, 91, and 92, respectively. These curve numbers can be used to
help determine detention requirements for this site.
Step 8: Determine Detention Requirements.
Detention is required to reduce the peak discharge rate from the 2-year-storm event to the
predevelopment (meadow conditions or better) peak discharge rate and to reduce the peak
discharge rate from the 15-year storm event to the preproject peak discharge rate. Appendix H
includes details on the procedure for calculating the detention volume. In this example, since the
proposed land cover is the same as the preproject conditions, detention is not required for the 15-
year storm. However, detention is required for the 2-year storm.
The peak inflow, qi2and the peak outflow, qo2 can be calculated using the WinTR-55 Small
Watershed Hydrology program, the area of the site, the time of concentration (Tc, assumed to be
10 minutes), and the curve numbers. The reduced curve of 90, determined above, generates a qi2
of 1.00 cubic foot per second (cfs). The curve number for meadow in good condition, 71,
generates a qo2 of 0.39 cfs.
The ratio of 0.39 cfs to 1.00 cfs equals 0.39. Using Figure H.1, this equates to a ratio of storage
volume (Vs2) to runoff volume (Vr2) of 0.33.
The runoff volume (Vr2) determined in the Compliance Calculator spreadsheet is 2.21 inches,
which equates to 2,763 cubic feet. Using the calculated ratio of Vs2/Vr2, the storage volume
required for the site (Vs2) is912 cubic feet.
Rooftop Storage (see Appendix I) may be the most cost effective method for achieving this
detention volume in this example.
Design Example 3
Step 1: Determine Design Criteria.
Formatted: Subscript
Formatted: Subscript
Formatted: Subscript
Formatted: Subscript
Formatted: Subscript
Formatted: Subscript
Appendix A Compliance Calculations and Design ExamplesCompliance Calculations and Design
Examples
A-19
Formatted: Font: 11 pt
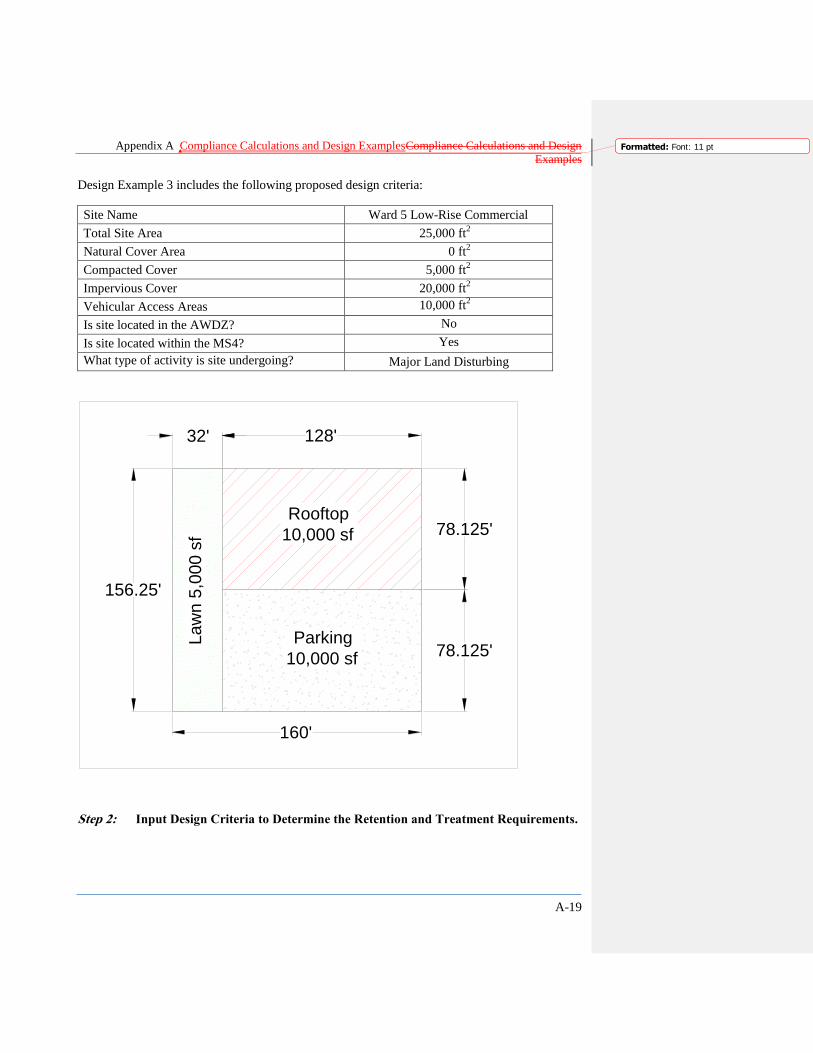
Design Example 3 includes the following proposed design criteria:
Site Name Ward 5 Low-Rise Commercial
Total Site Area 25,000 ft2
Natural Cover Area 0 ft2
Compacted Cover 5,000 ft2
Impervious Cover 20,000 ft2
Vehicular Access Areas 10,000 ft2
Is site located in the AWDZ? No
Is site located within the MS4? Yes
What type of activity is site undergoing? Major Land Disturbing
Step 2: Input Design Criteria to Determine the Retention and Treatment Requirements.
Rooftop
10,000 sf
Parking
10,000 sf
La
wn
5,0
00
sf 78.125'
78.125'
128'32'
156.25'
160'

Appendix A Compliance Calculations and Design ExamplesCompliance Calculations and Design
Examples
A-20
Formatted: Font: 11 pt
The Compliance Calculator Spreadsheet will calculate a Stormwater Retention Volume (SWRv),
once the natural cover, compacted cover, and impervious cover areas are put into cells D22–D25
on the Site Data sheet.
Based on the design criteria above, the project has the following requirement:
SWRv =× cell D37 = 2,025 ft3
Step 3: Identify Site Constraints and BMP Restrictions.
Key considerations for the project include the following:
Only a small portion of the compacted cover is available for potential BMPs.
The Multi-Family Residential site is not restrictive of BMP options.
The relatively permeable Sunnyside-Sassafras-Muirkirk-Christiana soils on this site allow for
infiltration into site soils. However, it is not likely that infiltration rates will be greater than 2
inches per hour.
Step 4: Select BMPs to Meet the Retention and Treatment Requirements.
An enhanced bioretention with no underdrain is chosen for this site, primarily to minimize cost.
Several other options, such as permeable pavers, would have been acceptable at this site.
The site will ultimately have one outlet point, with only one BMP, so the calculations can be
performed on one Drainage Area tab—D.A. 1. Therefore, all of the same values from the Site
Data tab for the various cover types (plus the vehicle access area) should be put into cells B6–
B10 on the D.A. 1 sheet.
It is assumed that the entire site will be directed to the bioretention area, so the same values from
the top of the DAA DA1 sheet may be input into cells B37–F38 (including the 10,000 square
feet of vehicle access area in cell F387. However, the surface area of the bioretention area must
be accounted for as well. It was determined that only 1,000 square feet of compacted cover
would be available for a bioretention area. This area will be taken from the compacted cover
area, and will need to be changed on the Site Data Tab as well as the top of D.A. 1. Compacted
cover will now be 4,000 square feet, and ―BMP‖ will be 1,000 square feet. The rooftop and
parking areas will not change. This approach will lead to a total volume of 2,968 cubic feet
directed to the BMP.
Since enhanced bioretention receives100 percent retention value, the required storage volume to
meet the SWRv is 2,095 cubic feet (this is the required SWRv after changes in land use were
made to account for the bioretention surface area). However, the 1,000 square feet available will
not be sufficient to provide the entire required storage volume. Through trial and error (see Step
5 below) it was determined that the maximum storage volume is 1,077301 cubic feet. This value
can be input into cell O37. Cell P68 indicates that there is still 1,018 794 cubic feet, or 7,615
5,939 gallons (cell P69), remaining. This volume will have to be met through the purchase or
generation of Stormwater Retention Credits (SRCs) (see Chapter 7 and Step 9 below).
Step 5: Size the BMPs According to the Design Equations.
Appendix A Compliance Calculations and Design ExamplesCompliance Calculations and Design
Examples
A-21
Formatted: Font: 11 pt
Assume a filter media depth of 2 feet, a gravel depth of 0.75 feet, and a ponding depth of 1 foot.
Step 5.1: Check the Filter Media Depth.
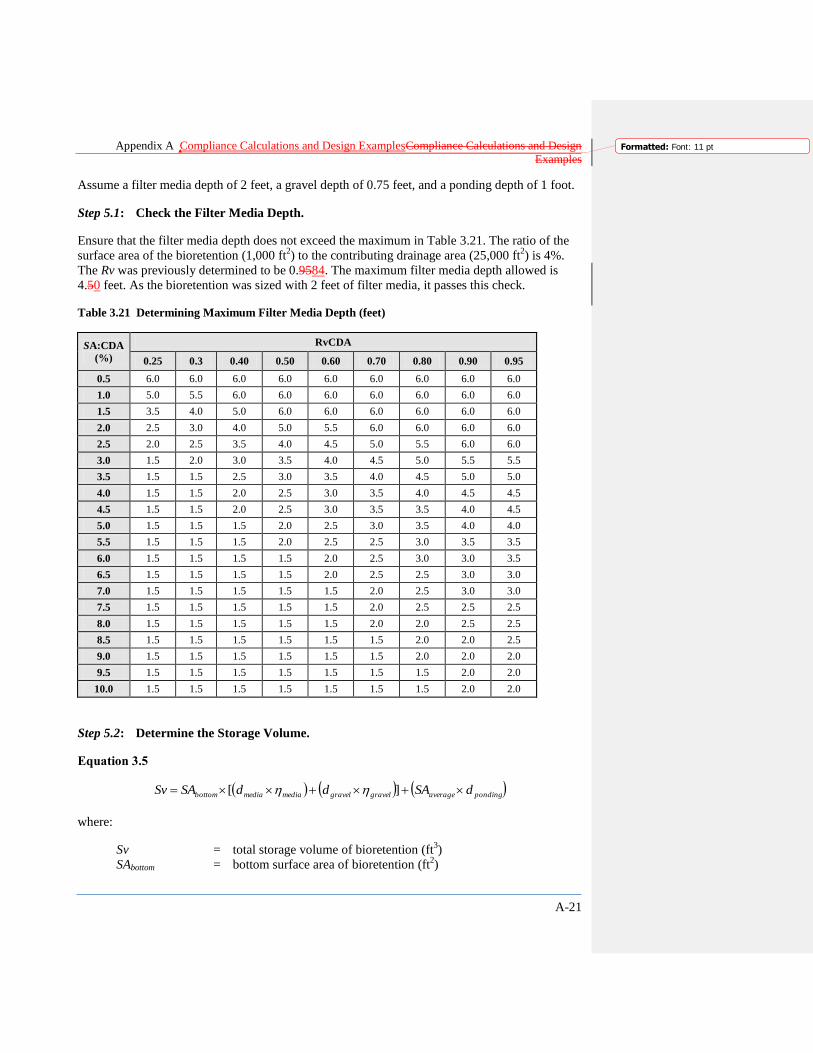
Ensure that the filter media depth does not exceed the maximum in Table 3.21. The ratio of the
surface area of the bioretention (1,000 ft2) to the contributing drainage area (25,000 ft
2) is 4%.
The Rv was previously determined to be 0.9584. The maximum filter media depth allowed is
4.50 feet. As the bioretention was sized with 2 feet of filter media, it passes this check.
Table 3.21 Determining Maximum Filter Media Depth (feet)
SA:CDA
(%)
RvCDA
0.25 0.3 0.40 0.50 0.60 0.70 0.80 0.90 0.95
0.5 6.0 6.0 6.0 6.0 6.0 6.0 6.0 6.0 6.0
1.0 5.0 5.5 6.0 6.0 6.0 6.0 6.0 6.0 6.0
1.5 3.5 4.0 5.0 6.0 6.0 6.0 6.0 6.0 6.0
2.0 2.5 3.0 4.0 5.0 5.5 6.0 6.0 6.0 6.0
2.5 2.0 2.5 3.5 4.0 4.5 5.0 5.5 6.0 6.0
3.0 1.5 2.0 3.0 3.5 4.0 4.5 5.0 5.5 5.5
3.5 1.5 1.5 2.5 3.0 3.5 4.0 4.5 5.0 5.0
4.0 1.5 1.5 2.0 2.5 3.0 3.5 4.0 4.5 4.5
4.5 1.5 1.5 2.0 2.5 3.0 3.5 3.5 4.0 4.5
5.0 1.5 1.5 1.5 2.0 2.5 3.0 3.5 4.0 4.0
5.5 1.5 1.5 1.5 2.0 2.5 2.5 3.0 3.5 3.5
6.0 1.5 1.5 1.5 1.5 2.0 2.5 3.0 3.0 3.5
6.5 1.5 1.5 1.5 1.5 2.0 2.5 2.5 3.0 3.0
7.0 1.5 1.5 1.5 1.5 1.5 2.0 2.5 3.0 3.0
7.5 1.5 1.5 1.5 1.5 1.5 2.0 2.5 2.5 2.5
8.0 1.5 1.5 1.5 1.5 1.5 2.0 2.0 2.5 2.5
8.5 1.5 1.5 1.5 1.5 1.5 1.5 2.0 2.0 2.5
9.0 1.5 1.5 1.5 1.5 1.5 1.5 2.0 2.0 2.0
9.5 1.5 1.5 1.5 1.5 1.5 1.5 1.5 2.0 2.0
10.0 1.5 1.5 1.5 1.5 1.5 1.5 1.5 2.0 2.0
Step 5.2: Determine the Storage Volume.
Equation 3.5
pondingaveragegravelgravelmediamediabottom dSAddSASv ][
where:
Sv = total storage volume of bioretention (ft3)
SAbottom = bottom surface area of bioretention (ft2)
Appendix A Compliance Calculations and Design ExamplesCompliance Calculations and Design
Examples
A-22
Formatted: Font: 11 pt
dmedia = depth of the filter media (ft)
ηmedia = effective porosity of the filter media (typically 0.25)
dgravel = depth of the underdrain and underground storage gravel layer(ft)
ηgravel = effective porosity of the gravel layer (typically 0.4)
SAaverage = the average surface area of the bioretention (ft2)
(typically, where SAtop is the top surface area of bioretention, = 1/2
× (top area + SAbottom area)) 2
topbottom
average
SASASA
dponding = the maximum ponding depth of the bioretention (ft)
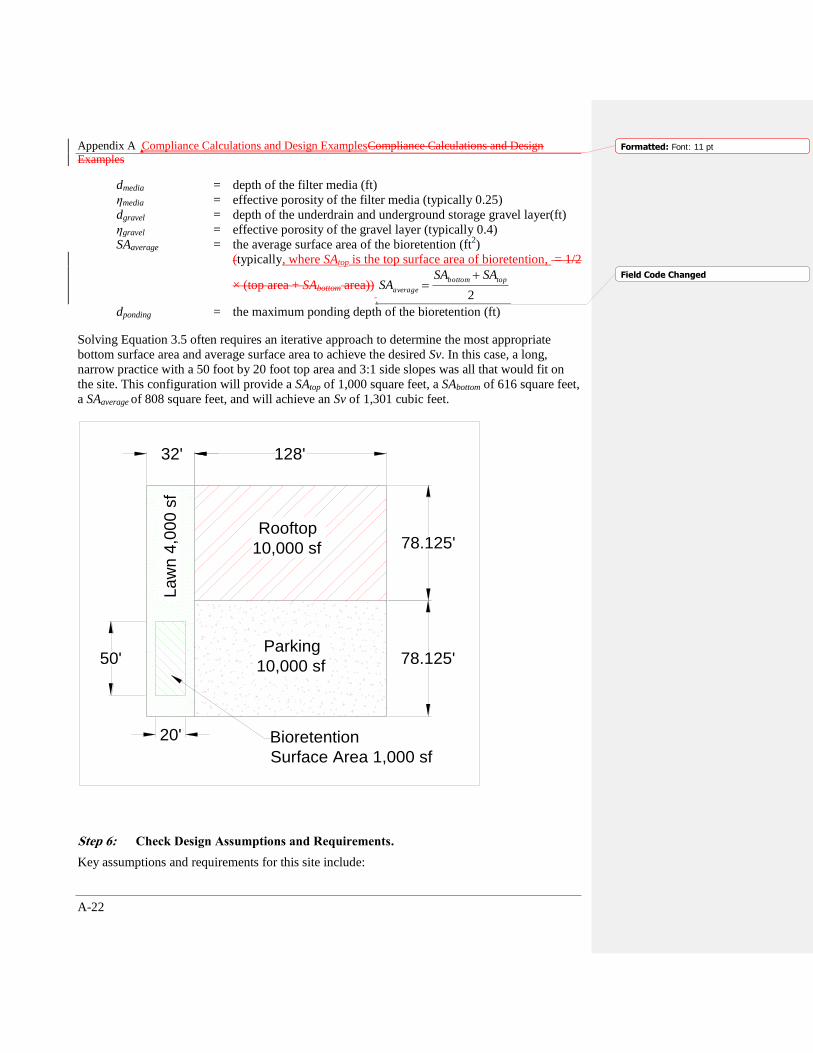
Solving Equation 3.5 often requires an iterative approach to determine the most appropriate
bottom surface area and average surface area to achieve the desired Sv. In this case, a long,
narrow practice with a 50 foot by 20 foot top area and 3:1 side slopes was all that would fit on
the site. This configuration will provide a SAtop of 1,000 square feet, a SAbottom of 616 square feet,
a SAaverage of 808 square feet, and will achieve an Sv of 1,301 cubic feet.
Step 6: Check Design Assumptions and Requirements.
Key assumptions and requirements for this site include:
Rooftop
10,000 sf
Parking
10,000 sf
78.125'
78.125'
128'32'
La
wn
4,0
00
sf
50'
20' Bioretention
Surface Area 1,000 sf
Field Code Changed

Appendix A Compliance Calculations and Design ExamplesCompliance Calculations and Design
Examples
A-23
Formatted: Font: 11 pt
The design will need at least 1,000 square feet of surface area. The designer would need to
ensure that this area is available.
Contributing drainage area for traditional bioretention must be 2.5 acres are less, and this site
has a total drainage area of less than 0.5 acres.
Vehicle access areas must be addressed. The vehicle access retention/treatment requirement
of 475 cubic feet is met by this design.
Head requirements are not likely to be an issue, since this is an infiltration design.
The water table must be at least 2 feet below the bottom of the bioretention, or 4.25 feet
below the surface.
The measured permeability of the underlying soils must be at least 0.5 inches/hour.
Additional SRCs will need to be generated or purchased off-site.
Since all of these assumptions and requirements can be met (pending groundwater table and
infiltration rate investigations) in this design example, this step is complete.
Step 7: Use the Adjusted Curve Number to Address Peak Flow Requirements.
On the Channel and Flood Protection tab, enter values for B soils in cells D34D54, D36D56, and
D38 D58 (55 for natural areas, 61 for turf, and 98 for impervious cover, respectively). The
original site curve number of 92 is reduced for the 2-year, 15-year, and 100-year storms to 86,
87, 88, and 889, respectively by the retention provided by the bioretention cell. These curve
numbers can be used to help determine detention requirements for this site.
Step 8: Determine the Detention Requirements.
Detention is required to reduce the peak discharge rate from the 2-year storm event to the
predevelopment (meadow conditions or better) peak discharge rate and to reduce the peak
discharge rate from the 15-year storm event to the preproject peak discharge rate. Appendix H
includes details on the procedure for calculating the detention volume. In this example, the
proposed impervious cover and the proposed runoff curve number is less than the preproject
conditions, so detention for the 15-year storm is not required. Detention for the 2-year storm will
be required.
The peak inflow (qi2) and the peak outflow (qo2) can be calculated using the WinTR-55 Small
Watershed Hydrology program, the area of the site, the time of concentration (Tc, assumed to be
10 minutes), and the curve numbers. The reduced curve of 87, determined above, generates a qi2
of 1.4550 cubic feet per second (cfs). The curve number for meadow in good condition, 58,
generates a qo2 of 0.18 cfs.
The ratio of 0.18 cfs to 1.4550 cfs equals 0.12. Using Figure H.1, the ratio of storage volume
(Vs2) to runoff volume (Vr2) is 0.53.
The runoff volume (Vr2) determined in the Compliance Calculator spreadsheet is 1.84 inches,
which equates to 3,833 cubic feet. Using the calculated ratio of Vs2/Vr2, the storage volume
required for the site (Vs2) is 2,032 cubic feet.
Formatted: Subscript
Formatted: Subscript
Formatted: Subscript
Formatted: Subscript
Formatted: Subscript
Formatted: Subscript
Appendix A Compliance Calculations and Design ExamplesCompliance Calculations and Design
Examples
A-24
Formatted: Font: 11 pt
This detention volume, with appropriate orifice design to ensure that outflows are properly
restricted, can be incorporated below the proposed bioretention area or located elsewhere on the
site, such as underneath the parking lot as a standalone detention practice.
Step 9: Identify Stormwater Retention Credits.
Since the SWRv was short of the requirement by 7,615 gallons, 7,615 SRCs will need to be
purchased or generated annually for this site to achieve compliance (see Chapter 7 for more
details and example calculations).
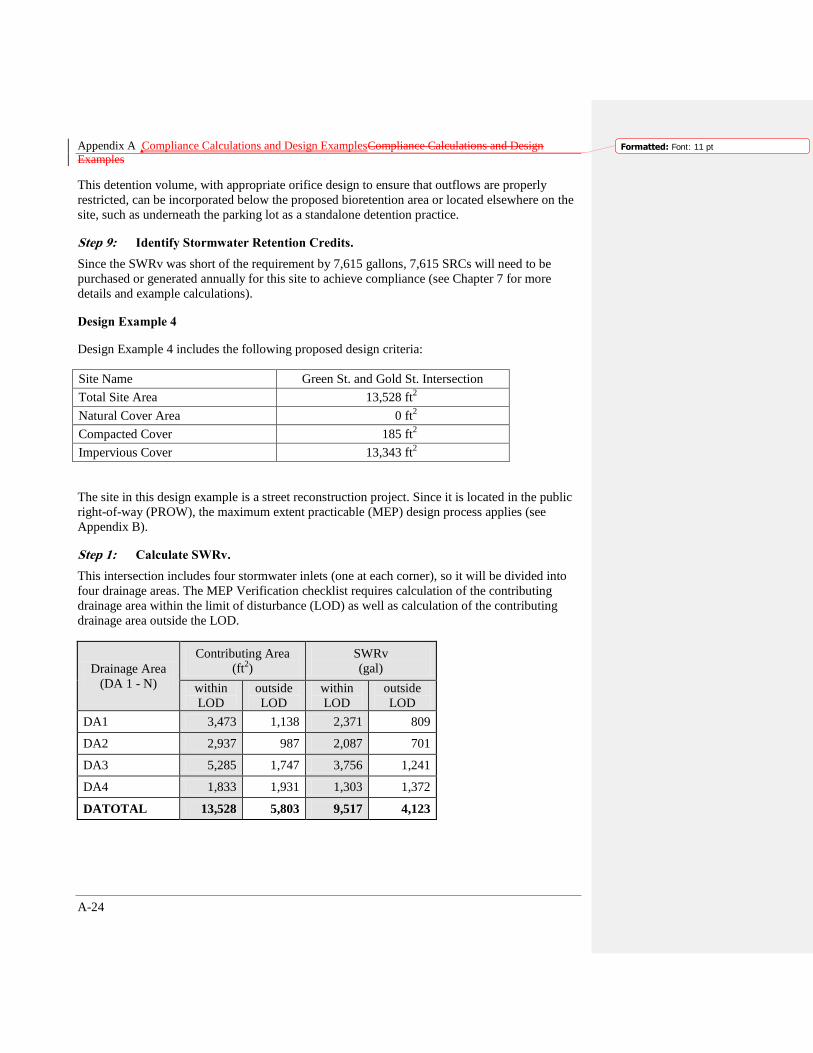
Design Example 4
Design Example 4 includes the following proposed design criteria:
Site Name Green St. and Gold St. Intersection
Total Site Area 13,528 ft2
Natural Cover Area 0 ft2
Compacted Cover 185 ft2
Impervious Cover 13,343 ft2
The site in this design example is a street reconstruction project. Since it is located in the public
right-of-way (PROW), the maximum extent practicable (MEP) design process applies (see
Appendix B).
Step 1: Calculate SWRv.
This intersection includes four stormwater inlets (one at each corner), so it will be divided into
four drainage areas. The MEP Verification checklist requires calculation of the contributing
drainage area within the limit of disturbance (LOD) as well as calculation of the contributing
drainage area outside the LOD.
Drainage Area
(DA 1 - N)
Contributing Area
(ft2)
SWRv
(gal)
within
LOD
outside
LOD
within
LOD
outside
LOD
DA1 3,473 1,138 2,371 809
DA2 2,937 987 2,087 701
DA3 5,285 1,747 3,756 1,241
DA4 1,833 1,931 1,303 1,372
DATOTAL 13,528 5,803 9,517 4,123
Appendix A Compliance Calculations and Design ExamplesCompliance Calculations and Design
Examples
A-25
Formatted: Font: 11 pt
SWRv can be calculated using the Compliance Calculator spreadsheet. In this case, all of the
drainage areas were 100 percent impervious, except for DA1, which included 185 square feet of
landscaped area within the LOD.
Step 2: Consider Infiltration.
This step requires looking at infiltration options by identifying constraints to infiltration, such as
a high water table, soil contamination, or poor infiltration rates and locating areas that are well
suited for infiltration.
In this example, a high water table and soil contamination were not a concern, The soil had only
a moderate to low infiltration rate, making an infiltration sump a possibility as part of another
BMP (such as enhanced bioretention) but not feasible as a standalone BMP.
Step 3: Demonstrate Full Consideration of Land-Cover Conversions and Optimum
BMP Placement.
Opportunities for BMP placement within and adjacent to the PROW include traffic islands,
triangle parks, median islands, cul-de-sacs, paper streets, and traffic calming measures, such as
median islands, pedestrian curb extensions, bump outs, chicanes, and turning radius reductions.
As this example is a small intersection project, pedestrian curb extensions are the only feasible
location for BMP placement. BMP locations in the pedestrian curb extensions will be possible at
three of the four corners of the intersection.
Step 4: Demonstrate Full Consideration of Opportunities Within Existing
Infrastructure.
This step requires the assessment and documentation of utility locations, storm sewer depths,
right-of-way widths, and exiting trees to determine potential conflicts.
In this example, the difference in elevation between the storm sewer inlets and the invert of the
pipes is approximately 5 feet. Other utilities will constrain the space available for the proposed
BMPs but will not eliminate the pedestrian curb extension spaces entirely.
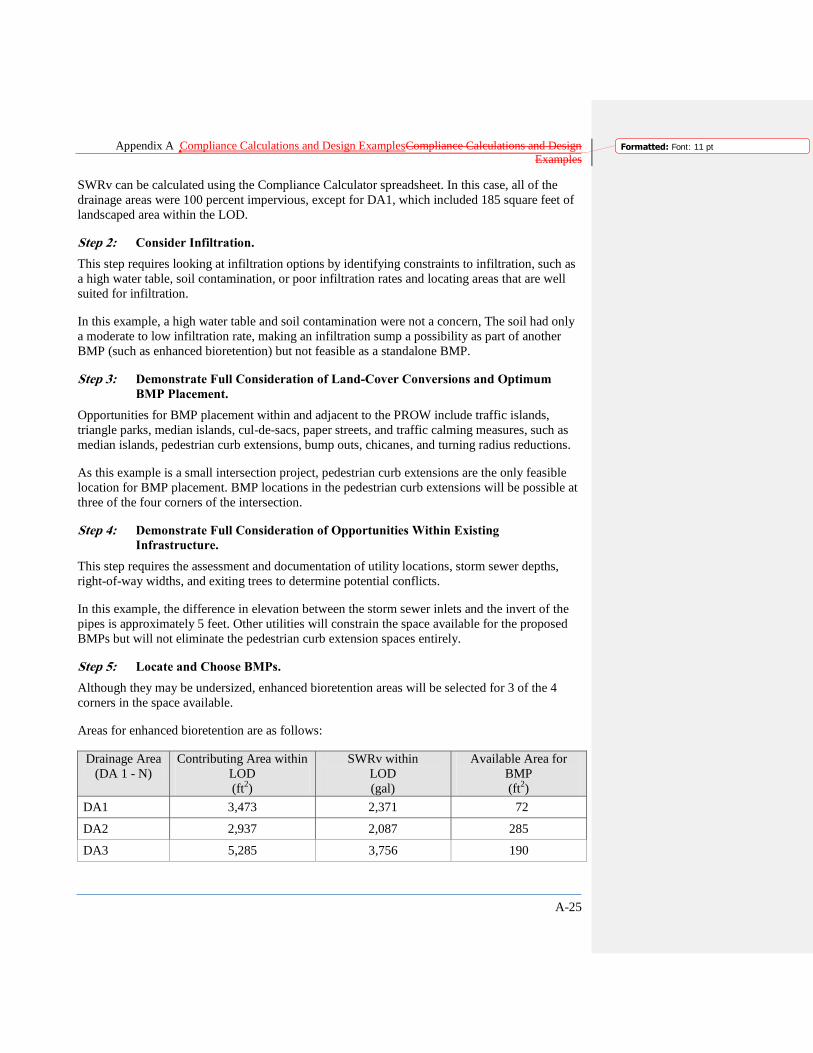
Step 5: Locate and Choose BMPs.
Although they may be undersized, enhanced bioretention areas will be selected for 3 of the 4
corners in the space available.
Areas for enhanced bioretention are as follows:
Drainage Area
(DA 1 - N)
Contributing Area within
LOD
(ft2)
SWRv within
LOD
(gal)
Available Area for
BMP
(ft2)
DA1 3,473 2,371 72
DA2 2,937 2,087 285
DA3 5,285 3,756 190
Appendix A Compliance Calculations and Design ExamplesCompliance Calculations and Design
Examples
A-26
Formatted: Font: 11 pt
DA4 1,833 1,303 0
DATOTAL 13,528 9,517 N/A
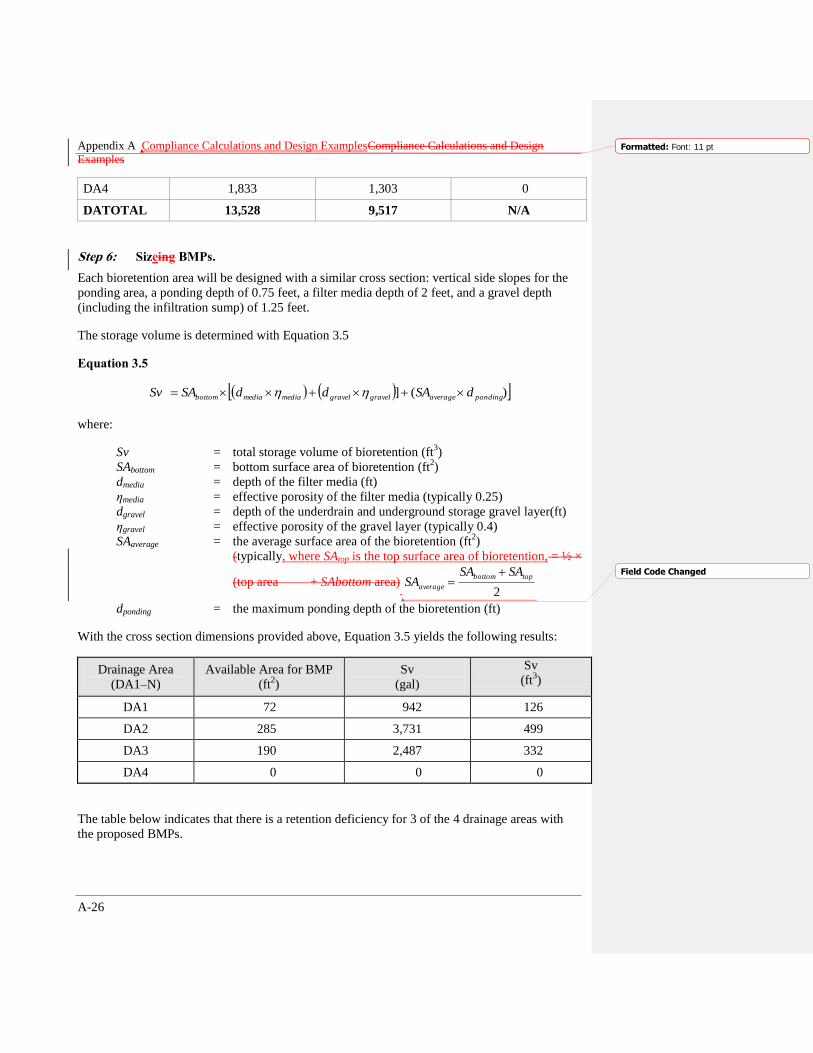
Step 6: Sizeing BMPs.
Each bioretention area will be designed with a similar cross section: vertical side slopes for the
ponding area, a ponding depth of 0.75 feet, a filter media depth of 2 feet, and a gravel depth
(including the infiltration sump) of 1.25 feet.
The storage volume is determined with Equation 3.5
Equation 3.5
)(] pondingaveragegravelgravelmediamediabottom dSAddSASv
where:
Sv = total storage volume of bioretention (ft3)
SAbottom = bottom surface area of bioretention (ft2)
dmedia = depth of the filter media (ft)
ηmedia = effective porosity of the filter media (typically 0.25)
dgravel = depth of the underdrain and underground storage gravel layer(ft)
ηgravel = effective porosity of the gravel layer (typically 0.4)
SAaverage = the average surface area of the bioretention (ft2)
(typically, where SAtop is the top surface area of bioretention, = ½ ×
(top area + SAbottom area) 2
topbottom
average
SASASA
dponding = the maximum ponding depth of the bioretention (ft)
With the cross section dimensions provided above, Equation 3.5 yields the following results:
Drainage Area
(DA1–N)
Available Area for BMP
(ft2)
Sv
(gal)
Sv
(ft3)
DA1 72 942 126
DA2 285 3,731 499
DA3 190 2,487 332
DA4 0 0 0
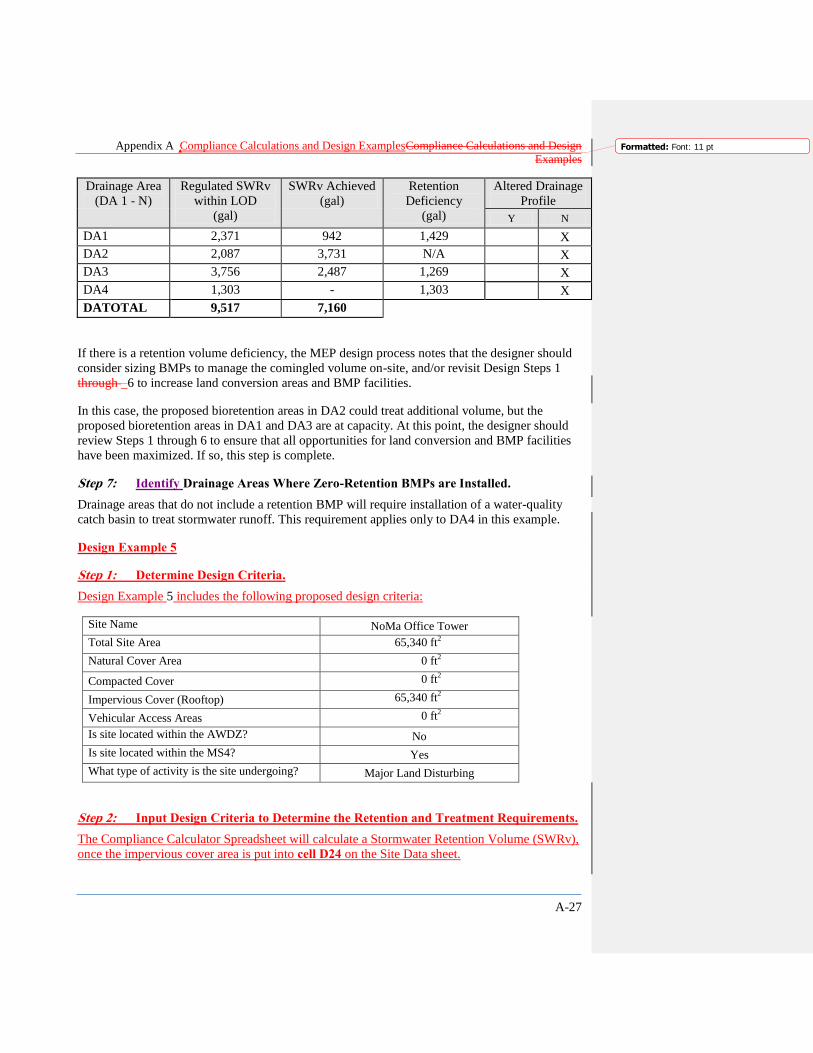
The table below indicates that there is a retention deficiency for 3 of the 4 drainage areas with
the proposed BMPs.
Field Code Changed
Appendix A Compliance Calculations and Design ExamplesCompliance Calculations and Design
Examples
A-27
Formatted: Font: 11 pt
Drainage Area
(DA 1 - N)
Regulated SWRv
within LOD
(gal)
SWRv Achieved
(gal)
Retention
Deficiency
(gal)
Altered Drainage
Profile
Y N
DA1 2,371 942 1,429 X
DA2 2,087 3,731 N/A X
DA3 3,756 2,487 1,269 X
DA4 1,303 - 1,303 X
DATOTAL 9,517 7,160
If there is a retention volume deficiency, the MEP design process notes that the designer should
consider sizing BMPs to manage the comingled volume on-site, and/or revisit Design Steps 1
through –6 to increase land conversion areas and BMP facilities.
In this case, the proposed bioretention areas in DA2 could treat additional volume, but the
proposed bioretention areas in DA1 and DA3 are at capacity. At this point, the designer should
review Steps 1 through 6 to ensure that all opportunities for land conversion and BMP facilities
have been maximized. If so, this step is complete.
Step 7: Identify Drainage Areas Where Zero-Retention BMPs are Installed.
Drainage areas that do not include a retention BMP will require installation of a water-quality
catch basin to treat stormwater runoff. This requirement applies only to DA4 in this example.
Design Example 5
Step 1: Determine Design Criteria.
Design Example 5 includes the following proposed design criteria:
Site Name NoMa Office Tower
Total Site Area 65,340 ft2
Natural Cover Area 0 ft2
Compacted Cover 0 ft2
Impervious Cover (Rooftop) 65,340 ft2
Vehicular Access Areas 0 ft2
Is site located within the AWDZ? No
Is site located within the MS4? Yes
What type of activity is the site undergoing? Major Land Disturbing
Step 2: Input Design Criteria to Determine the Retention and Treatment Requirements.
The Compliance Calculator Spreadsheet will calculate a Stormwater Retention Volume (SWRv),
once the impervious cover area is put into cell D24 on the Site Data sheet.

Appendix A Compliance Calculations and Design ExamplesCompliance Calculations and Design
Examples
A-28
Formatted: Font: 11 pt
Based on the design criteria above, the NoMa Office Tower project is required to treat 1.2 inches
of rainfall for the SWRv:
SWRv (cell D37) = 6,207 ft3
Identify Site Constraints and BMP Restrictions.
Limitation of space is the key considerations for the NoMa Office tower project. The lot line to
lot line construction means there are limited retention and treatment options. A rooftop approach
is selected.
Step 3: Select BMPs to Meet the Retention and Treatment Requirements.
As an initial estimate 60 percent of the rooftop is proposed to be converted to a green roof, with
an additional 15 percent of the remaining rooftop draining to it. Therefore, the land use values
need to be changed to account for the green roof: 26,136 square feet should be entered as rooftop
in cell D24 on the Site Data sheet, and 39,204 square feet should be entered in cell D25 as
―BMP.‖ As there will be only one drainage area for the site, these same values should be entered
into cells B8 and B10 on sheet DA A. For the Green Roof drainage area (cells D23 and D24),
9801 square feet should be entered as impervious cover, and 39,204 should be entered as BMP
surface area.
The goal of this design is to capture the entire retention volume (6,207 ft3) in the Green Roof.
This can be shown on the spreadsheet by entering 6,208 cubic feet (1 extra cubic foot to ensure
that any rounding losses are covered) in cell O23 on sheet DA A. Cell P68 shows that the SWRv
has been met for the site. This information is also summarized on the Compliance worksheet tab.
Step 4: Size the BMPs According to the Design Equations.
The green roof needs to be sized according to Equation 3.1. Note that, since green roofs are
typically manufactured systems, several of the parameters, such as the drainage layer depth and
maximum water retention of all layers, need to be provided by the manufacturer. In this example,
a media depth of 6 inches with a maximum water retention of 0.40 was chosen. The drainage
layer has a depth of 1 inch and a maximum water retention of 0.15. These values are indicated in
the variable descriptions below Equation 3.1 (with each layer illustrated in Figure 3.1).
Equation 3.1 Storage Volume for Green Roofs
12
+ 21
DLdSASv
where:
Sv = storage volume (ft3)
SA = green roof area (ft2)
d = media depth (in.) (minimum 3 in.)
1 = verified media maximum water retention
DL = drainage layer depth (in.)
Field Code Changed
Field Code Changed
Appendix A Compliance Calculations and Design ExamplesCompliance Calculations and Design
Examples
A-29
Formatted: Font: 11 pt
2 = verified drainage layer maximum water retention
Figure 3.1 Typical layers for a green roof.
Rearranging Equation 3.1 to find the minimum required surface area:
SA = Sv/[(d × η1)+(DL × η2)] × 12
or:
SA = 6,208/(6 × 0.40 + 1 × 0.15) × 12
SA = 29,214 ft2
Therefore, the green roof must be sized to be at least 29,214 square feet (45% of the rooftop
surface area), given the proposed depths. The original assumption was that a 39,204-square-foot
roof would be used. Since a smaller roof is feasible, the drainage areas in the spreadsheet may be
revised accordingly. However, the maximum drainage area to a green roof is only 25% more
than the green roof itself. If a smaller roof is used, the design must indicate that the water can be
conveyed onto the green roof in a non-erosive manner. If the larger green roof area is used, it
could be designed with a lower media depth or the increased storage volume could be used to
reduce peak flow volume requirements (see Step 8) and/or sold as Stormwater Retention Credits.
Step 5: Check Design Assumptions and Requirements.
Key assumptions and requirements for this site include:
Field Code Changed

Appendix A Compliance Calculations and Design ExamplesCompliance Calculations and Design
Examples
A-30
Formatted: Font: 11 pt
Ensure that there is sufficient space on the rooftop (allowing for structures such as vents,
steep areas of the roof, and other panels). In this case, the green roof area of 29,214 square
feet is less than half of the entire roof area.
At least 19,791 square feet of the rooftop not covered by green roof needs to be designed so
that it drains to the green roof without damaging it. This may require level spreaders or other
devices.
Since all of these assumptions and requirements can be met in this design example, this step is
complete.
Step 6: Use the Adjusted Curve Number to Address Peak Flow Requirements.
The initial curve number for this site is 98, but retention provided by the green roof change this
number. The Channel and Flood Protection tab notes the reduced curve numbers for the 2-year,
15-year, and 100-year storms: 86, 88, and 88, respectively. These curve numbers can be used to
help determine detention requirements for this site.
Step 7: Determine Detention Requirements.
Detention is required to reduce the peak discharge rate from the 2-year-storm event to the
predevelopment (meadow conditions or better) peak discharge rate and to reduce the peak
discharge rate from the 15-year storm event to the preproject peak discharge rate. Appendix H
includes details on the procedure for calculating the detention volume. In this example, the
proposed land cover is the same as the preproject conditions, so detention is not required for the
15-year storm. However, detention is required for the 2-year storm.
The peak inflow, qi2 and the peak outflow, qo2 can be calculated using the WinTR-55 Small
Watershed Hydrology program, the area of the site, the time of concentration (Tc, assumed to be
10 minutes), and the curve numbers. The reduced curve of 90, determined above, generates a
qi2of 3.80 cubic foot per second (cfs). The curve number for meadow in good condition, 71,
generates a qo2 of 1.74 cfs.
The ratio of 0.39 cfs to 1.00 cfs equals 0.46. Using Figure H.1, this equates to a ratio of storage
volume (Vs2) to runoff volume (Vr2) of approximately 0.29.
The runoff volume (Vr2) determined in the Compliance Calculator spreadsheet is 1.83 inches,
which equates to 9,964 cubic feet. Using the calculated ratio of Vs2/Vr2, the storage volume
required for the site (Vs2) is 2,890 cubic feet.
Rooftop Storage (see Appendix I) may be the most cost effective method for achieving this
detention volume in this example, if space is available, and the design configuration can be
created that routes the green roof to the rooftop storage. Alternatively, the required storage could
be achieved via a tank located somewhere in the building
Design Example 6
Step 1: Determine Design Criteria
Design Example 6 includes the following proposed design criteria:
Appendix A Compliance Calculations and Design ExamplesCompliance Calculations and Design
Examples
A-31
Formatted: Font: 11 pt
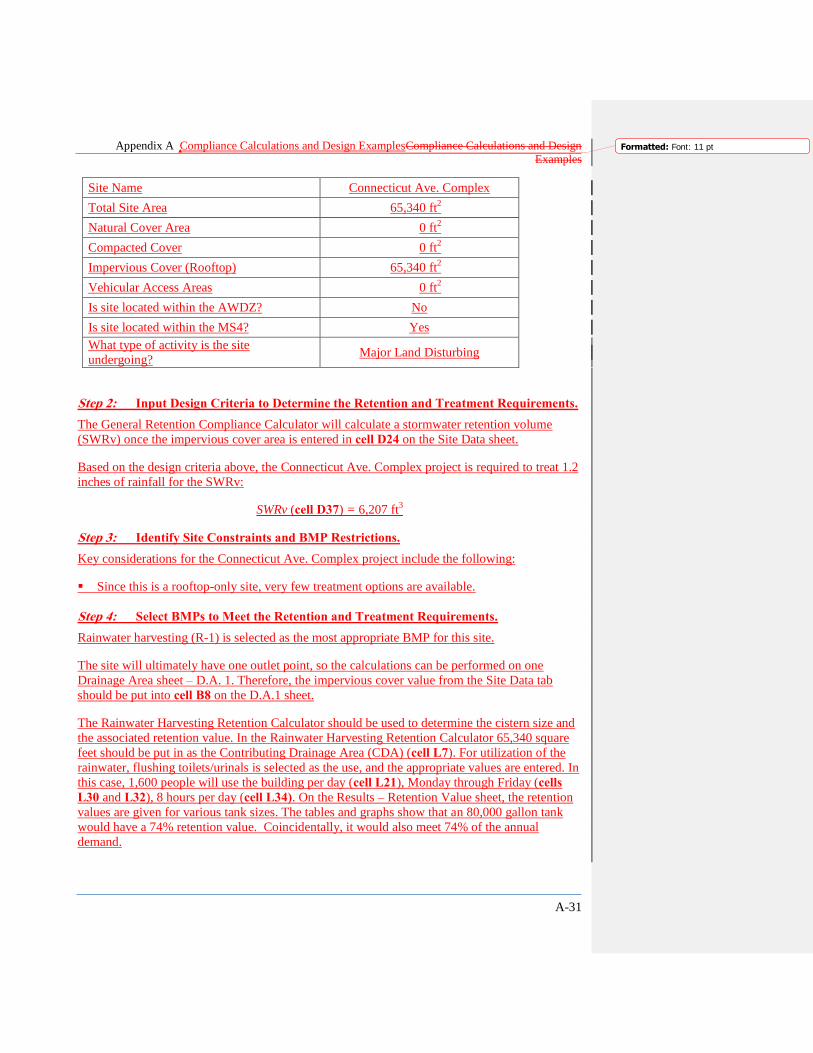
Site Name Connecticut Ave. Complex
Total Site Area 65,340 ft2
Natural Cover Area 0 ft2
Compacted Cover 0 ft2
Impervious Cover (Rooftop) 65,340 ft2
Vehicular Access Areas 0 ft2
Is site located within the AWDZ? No
Is site located within the MS4? Yes
What type of activity is the site
undergoing? Major Land Disturbing
Step 2: Input Design Criteria to Determine the Retention and Treatment Requirements.
The General Retention Compliance Calculator will calculate a stormwater retention volume
(SWRv) once the impervious cover area is entered in cell D24 on the Site Data sheet.
Based on the design criteria above, the Connecticut Ave. Complex project is required to treat 1.2
inches of rainfall for the SWRv:
SWRv (cell D37) = 6,207 ft3
Step 3: Identify Site Constraints and BMP Restrictions.
Key considerations for the Connecticut Ave. Complex project include the following:
Since this is a rooftop-only site, very few treatment options are available.
Step 4: Select BMPs to Meet the Retention and Treatment Requirements.
Rainwater harvesting (R-1) is selected as the most appropriate BMP for this site.
The site will ultimately have one outlet point, so the calculations can be performed on one
Drainage Area sheet – D.A. 1. Therefore, the impervious cover value from the Site Data tab
should be put into cell B8 on the D.A.1 sheet.
The Rainwater Harvesting Retention Calculator should be used to determine the cistern size and
the associated retention value. In the Rainwater Harvesting Retention Calculator 65,340 square
feet should be put in as the Contributing Drainage Area (CDA) (cell L7). For utilization of the
rainwater, flushing toilets/urinals is selected as the use, and the appropriate values are entered. In
this case, 1,600 people will use the building per day (cell L21), Monday through Friday (cells
L30 and L32), 8 hours per day (cell L34). On the Results – Retention Value sheet, the retention
values are given for various tank sizes. The tables and graphs show that an 80,000 gallon tank
would have a 74% retention value. Coincidentally, it would also meet 74% of the annual
demand.

Appendix A Compliance Calculations and Design ExamplesCompliance Calculations and Design
Examples
A-32
Formatted: Font: 11 pt
The next step is to return to the D.A. 1 tab and input the 65,340-square foot CDA into cell D25
for rainwater harvesting and input the efficiency (74%) into cell K25. The result is that 6,507
cubic feet of runoff are retained and 2,286 cubic feet remain. Cell P68 shows that the SWRv has
been met for the site, and cell Q69 shows that the SWRv exceedance of 2,244 gallons may be
available to generate SRCs.
Step 5: Size the BMPs According to the Design Equations.
The size of the rainwater-harvesting cistern was already determined to be 80,000 gallons,
although additional volume may be necessary for detention, as described in Step 8 below, as well
as for dead storage for a pump, and/or freeboard.
Step 6: Check Design Assumptions and Requirements.
Key assumptions and requirements for this site include:
The rainwater harvesting cistern will be at least 80,000 gallons. The designer would need to
ensure that space would be available for these BMPs on the site.
Demand for the water from toilet flushing should be verified.
Since all of these assumptions and requirements can be met in this design example, this step is
complete.
Step 7: Use the Adjusted Curve Number to Address Peak Flow Requirements.
The initial curve number for this site is 98, but retention provided by rainwater harvesting
changes this number. The Channel and Flood Protection tab notes the reduced curve numbers for
the 2-year, 15-year, and 100-year storms: 85, 87, and 88, respectively. These curve numbers can
be used to help determine detention requirements for this site.
Step 8: Determine Detention Requirements.
Detention is required to reduce the peak discharge rate from the 2-year-storm event to the pre-
development (meadow conditions or better) peak discharge rate and to reduce the peak discharge
rate from the 15-year storm event to the pre-project peak discharge rate. Appendix H includes
details on the procedure for calculating the detention volume. In this example, the proposed land
cover is the same as the pre-project conditions, so detention is not required for the 15-year storm.
However, detention is required for the 2-year storm.
The peak inflow, qi2 and the peak outflow, qo2 can be calculated using the WinTR-55 Small
Watershed Hydrology program, the area of the site, the time of concentration (Tc, assumed to be
10 minutes), and the curve numbers. The reduced curve of 85, determined above, generates a qi2
of 3.64 cubic foot per second (cfs). The curve number for meadow in good condition, 71,
generates a qo2 of 1.74 cfs.
The ratio of 1.74 cfs to 3.64 cfs equals 0.48. Using Appendix H this equates to a ratio of storage
volume (Vs2) to runoff volume (Vr2) of approximately 0.29.

Appendix A Compliance Calculations and Design ExamplesCompliance Calculations and Design
Examples
A-33
Formatted: Font: 11 pt
The runoff volume (Vr2) determined in the Compliance Calculator spreadsheet is 1.77 inches,
which equates to 9,938 cubic feet. Using the calculated ratio of Vs2/Vr2, the storage volume
required for the site (Vs2) is 2,795 cubic feet.
Since rainwater harvesting is the selected BMP on this project, the most appropriate means for
detaining the 2,795 cubic feet (20,907 gallons) may be to increase the size of the cistern to
13,500 cubic feet (101,000 gallons). Alternatively, if stage-storage routing is performed on the
tank for a 2-year storm event, beginning with the average daily volume in the tank, the detention
volume may be decreased significantly.


B-1
Appendix B Maximum Extent Practicable Process
for Existing Public Right-of-Way
B.1 Maximum Extent Practicable: Overview
Maximum extent practicable, or "MEP,", is the language of the Clean Water Act that sets the
standards to evaluate efforts pursued to achieve pollution reduction to US United States water
bodies. The MEP refers to management practices, ; control techniques, ; and system, design, and
engineering methods for the control of pollutants. It allows for considerations of public health
risks, societal concerns, and social benefits, along with the gravity of the problem, and the
technical feasibility of solutions.
The MEP is achieved, in part, by through a process of selecting and implementing different
design options with various effective structural and non-structural stormwater best management
practices (BMPs) and, rejecting where ineffective BMPsBMP options may be rejected, and
replacing them with and replaced when more effective management practices (BMPs) options
are found. MEP is an iterative standard, which that evolves over time as urban runoff
management knowledge increases. As such, it must continually be assessed continually and
modified to incorporate improved programs, control measures, and BMPs, etc., to attain
compliance with water quality standards. Because As a result of this evolution, some end-of-pipe
strategies, which that were considered to meet the MEP standard ten years ago, are no longer
accepted as such. Similarly, in cases where just one BMP may have gained project approval in
the past, today there are many cases where multiple BMPs will be required in order to achieve
treatment to the MEP.
Many jurisdictions have said of the MEP standard that there ―must be a serious attempt to
comply, and practical solutions may not be lightly rejected.‖ If project applicants implement only
a few of the least expensive BMPs, and the regulated volume has not been retained, it is likely
that the MEP standard has not been met. If, on the other hand, a project applicant implements all
applicable and effective BMPs except those shown to be technically infeasible, then the project
applicant would have achieved retention to the MEP.
B.2 Public Right-of-Way Projects
Public right-of-way (PROW) projects within the District of Columbia are owned and operated by
the District Government. They are linear in orientation and are distinct from parcel or lot
development within the District of Columbia. These projects are linear in orientation. They. may
consist of bridges, highways, commercial and residential streets, alleyways, pedestrian
walkways, bicycle trails, tunnels and railway tracks. They are owned and operated by the
Government.
The PROW is defined as the surface, and the air space above the surface (including air space
immediately adjacent to a private structure located on public space or in a PROW), and the area
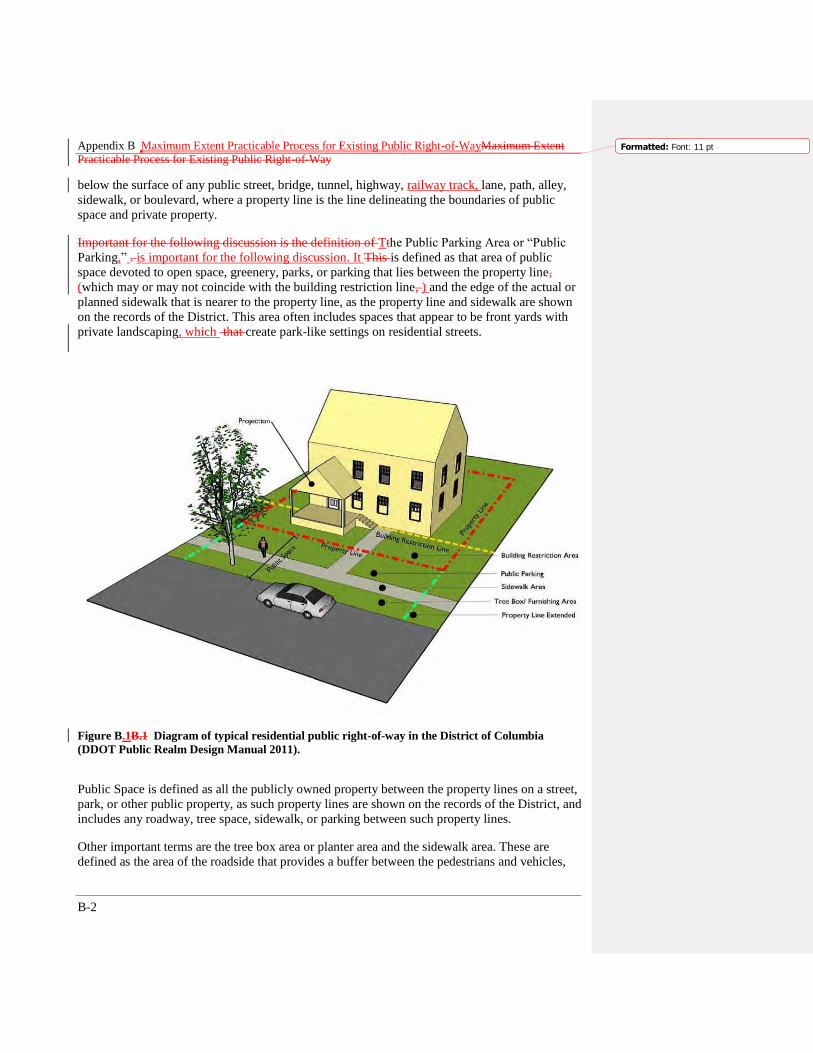
Appendix B Maximum Extent Practicable Process for Existing Public Right-of-WayMaximum Extent
Practicable Process for Existing Public Right-of-Way
B-2
Formatted: Font: 11 pt
below the surface of any public street, bridge, tunnel, highway, railway track, lane, path, alley,
sidewalk, or boulevard, where a property line is the line delineating the boundaries of public
space and private property.
Important for the following discussion is the definition of Tthe Public Parking Area or ―Public
Parking,‖ . is important for the following discussion. It This is defined as that area of public
space devoted to open space, greenery, parks, or parking that lies between the property line,
(which may or may not coincide with the building restriction line, ) and the edge of the actual or
planned sidewalk that is nearer to the property line, as the property line and sidewalk are shown
on the records of the District. This area often includes spaces that appear to be front yards with
private landscaping, which that create park-like settings on residential streets.
Figure B.1B.1 Diagram of typical residential public right-of-way in the District of Columbia
(DDOT Public Realm Design Manual 2011).
Public Space is defined as all the publicly owned property between the property lines on a street,
park, or other public property, as such property lines are shown on the records of the District, and
includes any roadway, tree space, sidewalk, or parking between such property lines.
Other important terms are the tree box area or planter area and the sidewalk area. These are
defined as the area of the roadside that provides a buffer between the pedestrians and vehicles,

Appendix B Maximum Extent Practicable Process for Existing Public Right-of-WayMaximum Extent
Practicable Process for Existing Public Right-of-Way
B-3
Formatted: Font: 11 pt
which primarily contains landscaping such as a continuous planting strip in residential areas. The
sidewalk area is sometimes known as the ―pedestrian clear zone‖, this is the walking zone
adjacent to the tree box that must remain clear, both horizontally and vertically.
In the MEP discussion that follows, a PROW project means a land-disturbing activity conducted
in the existing PROW and the existing public space associated with the project. The MEP
discussion applies only to those PROW projects required for the operation and maintenance of
existing commercial and residential streets, existing alleyways, and other existing transportation
infrastructure designed and maintained for the safe conveyance of people and commerce. Private
subdivision roads or streets shall not be considered PROW projects.
Construction projects to maintain and upgrade the District‘s PROW are faced with a multitude of
unique site constraints that vary widely. Limited space outside of the roadway restricts
opportunities for infiltration and evapotranspiration, and in many cases the width of the roadway
cannot be reduced to create additional space. In the roadway itself, the structural integrity of the
pavement is the prime concern. The weight and volume of traffic loads may limit the use of
permeable pavements.
The PROW occupy approximately 25 percent of the impervious area of the District of Columbia,
making the PROW one of the most significant sources of stormwater runoff impacting District
water bodies. Stormwater runoff from roadways can present high pollutant loading. Despite the
challenges to stormwater management faced by PROW projects, it is essential for the protection
of District water bodies to strive to achieve full retention of the regulated stormwater volume
through the use of BMPs to the MEP on all PROW projects. This means the design process of all
PROW projects shall evaluate and implement all applicable and effective BMPs except those
shown to be technically infeasible.
The aim for full retention on-site of a PROW project‘s regulated stormwater volume is consistent
with the District of Columbia‘s Department of Transportation‘s (DDOT‘s) ―Complete Streets‖
policy which states, ―improvements to the right-of-way shall consider… environmental
enhancements including, reducing right-of-way stormwater run-off, improving water quality,
prioritizing and allocating sustainable tree space and planting areas (both surface and
subsurface), … wherever possible‖. It is also an effort consistent with the District‘s 2012
Municipal Separated Storm Sewer System (MS4) permit which requires the retrofit for on-site
stormwater retention of 1,500,000 sft2 of PROW by 2016, which might translate to 35.5 miles of
8 foot wide pervious parking lanes or 4.7 miles of 60 foot wide full PROW cross section where
the runoff is captured and managed from sidewalks, tree boxes, parking lanes, and the roadway.
The sections that follow, Design Considerations and Decision Process, are intended to provide
structure for planners, designers and reviewers to evaluate whether or not a PROW project has
exhausted every opportunity to achieve the full retention of the regulated stormwater volume.
Achieving the regulated Sstormwater Rretention Vvolume (SWRv) in the PROW projects will be
technically infeasible on many occasions, even after going through the MEP process. Given this
and the compelling interest of the ongoing reconstruction of the PROW for the maintenance of
public safety and well-being, PROW projects can be excluded from the requirement to use
Stormwater Retention Credits (SRCs) or pay an in-lieu fee to satisfy any shortfall in attaining the

Appendix B Maximum Extent Practicable Process for Existing Public Right-of-WayMaximum Extent
Practicable Process for Existing Public Right-of-Way
B-4
Formatted: Font: 11 pt
SWRv if the MEP is demonstrated. These PROW projects are the only type of projects that are
excluded from this requirement.
DDOE‘s MEP process applies to two types of projects. One project type, MEP Ttype 1, is
projects where solely involve the reconstruction of the existing PROW constitutes the entirety of
a project, such as when the District of Columbia Department of Transportation reconstructs
multiple blocks of a roadway. The second project type, MEP Ttype 2 designates , is a parcel-
based development projects that the reconstructs the adjacent, existing PROW as portion of the
projectpart of the development process. Under this project type the PROW reconstruction
constitutes a portion of the project. Under the MEP process for Type 2 scenarioprojects, the
parcel portion of the application will be reviewed under the full stormwater management
performance standards defined in Chapter 2, while the PROW portion of the application will be
reviewed under the MEP Type 2 approach defined in this appendix.
The General Retention Compliance Calculator has a separate PROW worksheet that allows
MEP Type 2 applicants to keep separate parcel drainage area obligations from PROW
obligations. The final compliance worksheet tab also presents these drainage areas separately to
simplify tkeep the review process and make it transparent and simple. To request aAn MEP Type
2 review, an applicant wishing to use MEP Type 2 review will follow the format used to the
request ―relief for extraordinarily difficult site conditions‖ described in Appendix E, which
includes requires a request memo with supporting evidence in addition to the completed
worksheets from the General Retention Compliance Calculator worksheets.
The memo must address the six designs steps spelled outdescribed in this appendixSection B.5.
Type 2 applicants can choice choose to follow the same table, plan view, and narrative approach
identified for Type 1 applicants without the multiple- stage review process for the (30 percent
/65 percent, and /90 percent design phases). Type 1 projects will use a stormwater report that
contains information in spreadsheet, plan view, and narrative formats for the submission and
review of the 30 percent, 65 percent, and 90 percent design stages, typically of District of
Columbia Department of Transportation (DDOT) projects. A sample chart is provided at the end
of this appendix toTable B.3 indicates the information and submission format expected at each
review stage and in which format.
B.3 Codes
DDOT uses a ―functional street classification‖ system that is defined in Chapter 30 of the
Transportation Design and Engineering Manual. There are five functional categories including
Freeways, Principal arterials, Minor arterials, Collector streets and Local streets. Table B.1
shows relative distribution of roadway classifications in the District. Each type has design
criteria that are governed by traffic volumes, land use, and expected growth. These design
criteria set the acceptable ranges for geometric design elements that will govern roadway
geometry. The MEP process assumes transportation design criteria govern when conflicting
demands exist.
Table B.1 Roadway Classification and Extent Relative to Total Roadway System
Type Approximate Miles % of District Roadway System
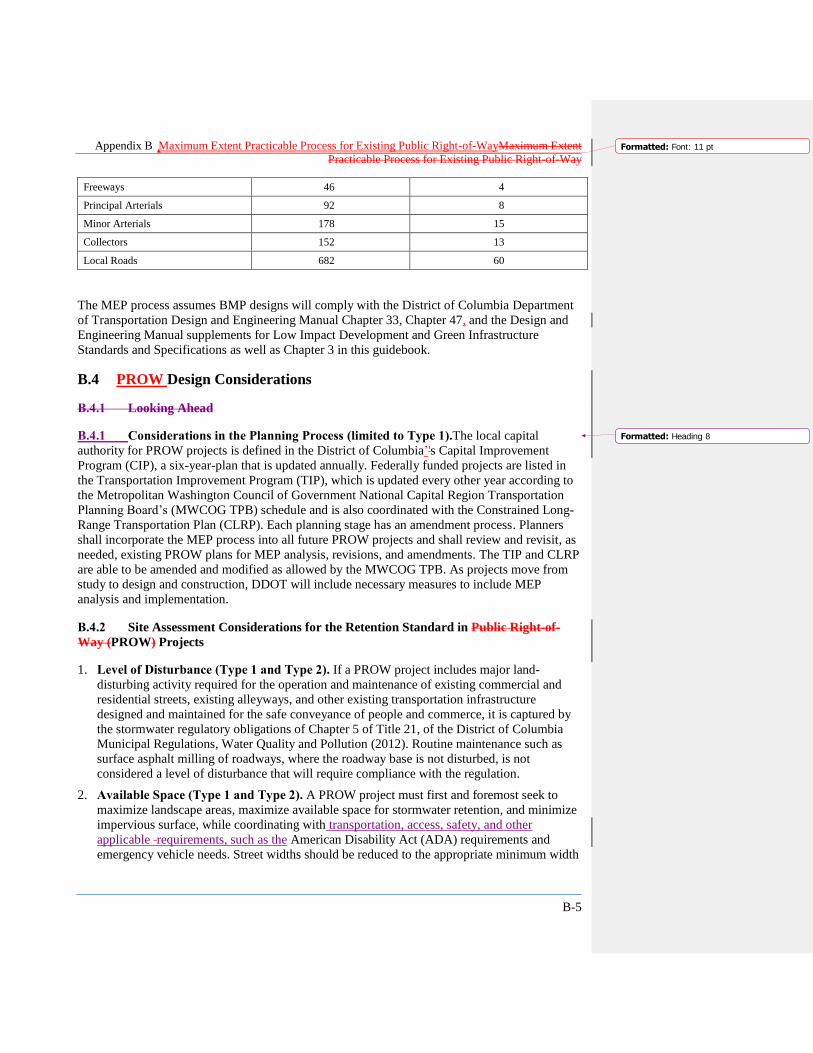
Appendix B Maximum Extent Practicable Process for Existing Public Right-of-WayMaximum Extent
Practicable Process for Existing Public Right-of-Way
B-5
Formatted: Font: 11 pt
Freeways 46 4
Principal Arterials 92 8
Minor Arterials 178 15
Collectors 152 13
Local Roads 682 60
The MEP process assumes BMP designs will comply with the District of Columbia Department
of Transportation Design and Engineering Manual Chapter 33, Chapter 47, and the Design and
Engineering Manual supplements for Low Impact Development and Green Infrastructure
Standards and Specifications as well as Chapter 3 in this guidebook.
B.4 PROW Design Considerations
B.4.1 Looking Ahead
B.4.1 Considerations in the Planning Process (limited to Type 1).The local capital
authority for PROW projects is defined in the District of Columbia‘'s Capital Improvement
Program (CIP), a six-year-plan that is updated annually. Federally funded projects are listed in
the Transportation Improvement Program (TIP), which is updated every other year according to
the Metropolitan Washington Council of Government National Capital Region Transportation
Planning Board‘s (MWCOG TPB) schedule and is also coordinated with the Constrained Long-
Range Transportation Plan (CLRP). Each planning stage has an amendment process. Planners
shall incorporate the MEP process into all future PROW projects and shall review and revisit, as
needed, existing PROW plans for MEP analysis, revisions, and amendments. The TIP and CLRP
are able to be amended and modified as allowed by the MWCOG TPB. As projects move from
study to design and construction, DDOT will include necessary measures to include MEP
analysis and implementation.
B.4.2 Site Assessment Considerations for the Retention Standard in Public Right-of-
Way (PROW) Projects
1. Level of Disturbance (Type 1 and Type 2). If a PROW project includes major land-
disturbing activity required for the operation and maintenance of existing commercial and
residential streets, existing alleyways, and other existing transportation infrastructure
designed and maintained for the safe conveyance of people and commerce, it is captured by
the stormwater regulatory obligations of Chapter 5 of Title 21, of the District of Columbia
Municipal Regulations, Water Quality and Pollution (2012). Routine maintenance such as
surface asphalt milling of roadways, where the roadway base is not disturbed, is not
considered a level of disturbance that will require compliance with the regulation.
2. Available Space (Type 1 and Type 2). A PROW project must first and foremost seek to
maximize landscape areas, maximize available space for stormwater retention, and minimize
impervious surface, while coordinating with transportation, access, safety, and other
applicable requirements, such as the American Disability Act (ADA) requirements and
emergency vehicle needs. Street widths should be reduced to the appropriate minimum width
Formatted: Heading 8

Appendix B Maximum Extent Practicable Process for Existing Public Right-of-WayMaximum Extent
Practicable Process for Existing Public Right-of-Way
B-6
Formatted: Font: 11 pt
while maintaining multi-modal transportation needs, parking, traffic flow and public safety.
A common rule of thumb used in some cities (e.g. Los Angeles, Portland, Seattle, and
Philadelphia) is to equates the expected landscape space to be a minimum of ten percentage
of the imperviousness within each drainage area within the PROW project limits of
disturbance. This percentage ranges from 4 percent to 10 percent.
In the District of Columbia several hundred triangular islands, less than one acre in area, are
created by diagonal street intersections. A PROW project must consider the opportunity for
stormwater retention within traffic islands, or triangle parks, that fall within, or adjacent to,
the project limits of disturbance. Streets that end as cul-de-sacs, are less prevalent in the
District, however, when present cul-de-sacs within, or adjacent to, the limits of disturbance
of a PROW project must be evaluated for stormwater retention opportunities. In the District
―paper streets‖ exist throughout, as areas of the City dedicated as streets but not useable as
transportation passageways. These areas, under the control of the DDOT, may be created by
the intersection of streets with parks and streams, and are often mowed grass areas. ―Paper
streets‖ within, or adjacent to, the limits of disturbance of a PROW project must be evaluated
for stormwater retention opportunities.
3. Impervious Cover Removal (Type 1 and& Type 2). The elimination of impervious surface
may be accomplished by closing diagonal roadways adjacent to triangle parks to create larger
parks. Diagonal roadways that are adjacent to triangle parks and fall within, or are adjacent
to, a PROW project must be evaluated for stormwater retention opportunities. PROW
projects must evaluate the opportunity to integrate traffic calming measures including but not
limited to, median islands, pedestrian curb extensions, bump outs and chicanes, and turning
radius reductions that may double as areas for impervious surface removal and BMPs.
Replacing impervious cover with landscape area in the contributing drainage area converts
the runoff coefficient from 95 percent to 25 percent in essence decreasing that area‘s
contribution to stormwater runoff by 70 percent without the use of an active stormwater
facility. If an area can be converted to ―natural cover‖ through conservation and reforestation
strategies that area‘s contribution to stormwater runoff is reduced to zero. Consult Appendix
OAppendix N for minimum thresholds and other required for each land cover designation.
Further opportunities to reduce stormwater runoff in these drainage areas should be explored
with adjacent property both public and private as source control may be the most cost
effective approach to managing stormwater runoff, see Section 3.4 Impervious Surface
Disconnection.
4. Drainage Areas (Type 1 and Type 2). Overall conceptual drainage plans for PROW
projects should identify drainage areas outside of the project‘s limits of disturbance that
generate runoff that may comingle with on-site runoff. The project is not required to consider
off-site runoff in the calculation for the regulated Sstormwater Rretention Vvolume (SWRv);
however BMPs sized for retention of comingled off-site runoff can be used to off-set the
inability to capture and retain the SWRv in areas within the project for which significant
constraints prevent retention.
For example, a typical city block will have at least two distinct drainage areas created by the
crown in the center of the road. While one side of the road may have significant obstacles to
the implementation of retention practices the other may not. If the limits of disturbance are
defined by the boundaries of the sidewalks on either side of the roadway this is the area that

Appendix B Maximum Extent Practicable Process for Existing Public Right-of-WayMaximum Extent
Practicable Process for Existing Public Right-of-Way
B-7
Formatted: Font: 11 pt
is used to calculate the SWRv. However, in many circumstances stormwater runoff is
entering the sidewalk and roadway from adjacent properties, both public and private, creating
a comingled stormwater runoff. Under these conditions the side of the street that has the
greater opportunity to implement retention strategies shall be designed to manage that
comingled volume up to the full SWRv.
Type 1 and Type 2 projects must prioritize capturing roadway runoff. For Type 2 projects,
where limits of disturbance do not extend into the roadway, the capture of roadway runoff
from adjacent roadway drainage areas may be accomplished with curb cuts or sidewalk
trenches used to direct roadway runoff from the curb line into sidewalk BMPs within the
project‘s limits of disturbance. This must be the first consideration to satisfy the SWRv
calculated for the project‘s PROW portion.
5. Ownership of Land Adjacent to Right-of-Ways (limited to Type 1). The opportunity to
incorporate stormwater retention may depend on the ownership of land adjacent to the right-
of-way. Acquisition of additional right-of-way and/or access easements may only be feasible
if land bordering the project is publicly owned. PROW project must identify public lands and
public rights of way adjacent to the project‘s limit of disturbance. PROW project planners
and managers may need to consult with adjacent public property owners and managers to
evaluate opportunities to direct stormwater runoff from the project drainage area to adjacent
public lands.
6. Location of Existing Utilities (Type 1 and Type 2). The location of existing storm drainage
utilities (grey infrastructure) can influence the opportunities for stormwater retention in
PROW projects. Utilizing the existing grey infrastructure for the conveyance of large events
with under drain connections and curb line overflows can reduce costs. Using existing grey
infrastructure where possible frees funds for drainage areas within the project limits of
disturbance where grey infrastructure does not exist or is more challenging to utilize.
Standard peak-flow curb inlets, such as catch basins, should be located downstream of areas
with potential for stormwater retention practices so that water can first flow into the BMP,
and then overflow to the downstream inlet if capacity of the BMP is exceeded. It is more
difficult to apply retention practices after water has entered the storm drain. The location of
other utilities will influence the ability connect BMPs to storm drains, and may limit the
allowable placement of BMPs to only those areas where a clear pathway to the storm drain
exists.
The fFollowing outlines an approach to take these steps when considering the design and
location of BMPs in the existing PROW relative to existing utilities: 1) avoidance; 2)
mitigation; 3) relocation; and 4) acceptance.
The first step is aAvoidance. Whenever possible, locate BMPs to avoid a conflict that either
jeopardizes the functionality and longevity of the utility or complicates future utility
maintenance. Consult with each utility company on their recommended offsets which will
allow utility maintenance work with minimal disturbance to the BMP. A consolidated
presentation of the various utility offset recommendations can be found in Chapter 33.14.5 of
the District of Columbia Department of Transportation Design and Engineering Manual,
latest edition. Consult the District of Columbia Water and Sewer Authority (DC Water)
Green Infrastructure Utility Protection Guidelines, latest edition, for water and sewer line

Appendix B Maximum Extent Practicable Process for Existing Public Right-of-WayMaximum Extent
Practicable Process for Existing Public Right-of-Way
B-8
Formatted: Font: 11 pt
recommendations. Avoidance of utility conflicts may mean one BMP type is selected over
another. It may mean the sizing of a BMP is altered.
The second step is mMitigation. Under the mitigation approach the BMP design is adjusted
to mitigate utility concerns. A BMP design may need to be resized or otherwise altered to
satisfy utility offsets. This may include moving, adding, or deleting a key design feature of
the BMP such as check dams, inlets, outlets and trees.
The third step is Rrelocation. Under the relocation approach an attempt is made to
coordinate with utility companies to allow them to replace or relocate their aging
infrastructure while BMPs are being implemented. Where the capital budget and priorities of
the utility can be aligned with the larger construction in the PROW, there are potential
benefits, including cost savings, for both the utility and the entity undertaking the
reconstruction of the PROW. The age of the utility line is a factor in selecting this solution.
While a utility relocation during a street re-construction project may be advantageous to the
utility provider, it is understood that the utility may not be able to align its capital budget or
may be otherwise unable or unwilling to take advantage of the relocation opportunity.
The fourth step is aAcceptance. When the first three steps approaches are inadequate to
achieve the required stormwater retention, consider a the fourth step is approach, acceptance
of conflicts that do not jeopardize the functionality, longevity and vehicular access to
manholes and other key points of utility maintenance. This does not preclude the typical
public right-of-way PROW BMP such as street trees, bioretention, or permeable pavement
which the utility would be expected to replace if maintenance in those areas was required. In
this scenario, a BMP location and design that complicates utility maintenance should be
considered acceptable if it does not compromise the utility function, longevity, and major
access points. When accepting utility conflict into the BMP location and design, it is
understood the BMP will be temporarily impacted during utility work but the utility will
replace the BMP or, alternatively, install a functionally comparable BMP according to the
specifications in the current version of this Stormwater Management Guidebook and the
District of Columbia Department of Transportation Design and Engineering Manual with
special attention to Chapter 33, Chapter 47, and the Design and Engineering Manual
supplements for Low Impact Development and Green Infrastructure Standards and
Specifications. To clarify whether a conflict jeopardizes the functionality, longevity and
access to a utility consider the latest editions of the District of Columbia Department of
Transportation Design and Engineering Manual and the District of Columbia Water and
Sewer Authority (DC Water) Green Infrastructure Utility Protection Guidelines.
7. Grade Differential Between Road Surface and Storm Drain System (Type 1 and Type
2). Some BMPs require more head from inlet to outlet than others; therefore, allowable head
drop may be an important consideration in BMP selection. Storm drain elevations may be
constrained by a variety of factors in a roadway project (utility crossings, outfall elevations,
etc.) that cannot be overcome and may override Sstormwater Rretention Vvolume
considerations.
8. Longitudinal Slope (limited to Type 1). The suite of BMPs which may be installed on
steeper road sections is more limited. Specifically, permeable pavement and swales are more
suitable for gentle grades. Other BMPs may be more readily terraced to be used on steeper
slopes. Check dams and weirs should be incorporated into BMP designs on steeper slopes.

Appendix B Maximum Extent Practicable Process for Existing Public Right-of-WayMaximum Extent
Practicable Process for Existing Public Right-of-Way
B-9
Formatted: Font: 11 pt
9. Potential Access Opportunities (limited to Type 1). A significant concern with the
installation of BMPs in high speed, high volume PROW is the ability to safely access the
BMPs for maintenance considering traffic hazards. A PROW project involving high speed,
high volume PROW should include a site assessment to identify vehicle travel lanes and
areas of specific safety hazards for maintenance crews. Subsequent steps in the preparation of
the stormwater management plan (SWMP) for the PROW project should attempt to avoid
placing BMPs in these areas.
10. Tree Canopy and Vegetation (Type 1 and Type 2). Concern for the preservation of
existing mature trees is a reasonable consideration when determining where and how to
direct stormwater runoff from the curb line for retention goals in a PROW project. In general,
stormwater retention practices should be installed outside the drip line of existing trees (more
specific guidance is provided in Section 3.14). A guiding principal for PROW projects
should be the improvement and maintenance of the most robust tree canopy possible along
the PROW. The planting of trees and the preservation of trees should look to the latest
science on the soil volume requirements, spacing needs and methods to connect stormwater
runoff to tree roots to support healthy vigorous tree growth. PROW projects should clearly
identify existing healthy trees and detail how to prevent tree losses during construction.
Additionally, diseased and dead trees should be removed. Soils in tree planting areas should
be amended and volumes expanded whenever trees are replaced or new trees are planted.
11. Infiltration (Type 1 and Type 2). Infiltration practices have very high storage and retention
capabilities when sited and designed appropriately. Designers should evaluate the range of
soil properties during initial site layout and seek to configure the site to conserve and protect
the soils with the greatest recharge and infiltration rates. In particular, areas of Hydrologic
Soil Group A or B soils shown on NRCS soil surveys should be considered as primary
locations for infiltration practices. When designing a PROW project consult Appendix
PAppendix O, Geotechnical, and Chapter 3.7, Infiltration, as well as chapters on specific
BMPs under consideration in this Stormwater Management Guidebook (SWMG) for specific
design details and constraints.
In areas where a qualified professional engineer, soils scientist or geologist determines
during an initial feasibility test the presence of soil characteristics which support the
categorization as D soils, no further investigation is required. A designer of a PROW project
should first consider reducing the impervious surface area draining to these poor soil areas.
Other soil types may require further analysis to determine infiltration feasibility. Note: AIt is
important to understand that areas with poor soils may still be sites for BMPs that are
designed with underdrains.
If the seasonally high water table is determined to be less than two feet from the bottom of
the proposed BMP, infiltration may not be appropriate. This may be determined through a
comparison of historic and actual elevations. If the site is one of known soil contamination or
receiving uncontrolled stormwater runoff from a land use hotspot, as determined by guidance
in Appendix QAppendix P. Stormwater Hotspots, infiltration must not be used.
12. Street Profile (limited to Type 1). The profile of an impervious surface such as a street or
an alleyway determines how stormwater runoff flows off the surface. District streets follow a
crowned design with the high point in the center draining to both sides, alleyways are
typically reverse crowned, draining to the center and sidewalks side shed, draining to one

Appendix B Maximum Extent Practicable Process for Existing Public Right-of-WayMaximum Extent
Practicable Process for Existing Public Right-of-Way
B-10
Formatted: Font: 11 pt
side. Flat drainage is a term used to denote vertical drainage through a permeable paving
profile. A PROW project should consider all variations of drainage patterns when the
standard drainage design does not provide retention for the full regulated Sstormwater
Rretention Vvolume (SWRv). The drainage patterns of the project should be developed so
that drainage can be routed to areas with BMP opportunities before entering storm drains.
For example, if a median strip is present, a reverse crown should be considered, so that
stormwater can drain to a median swale.
13. Pedestrian Circulation (Type 1 and Type 2). The design of stormwater retention facilities
should harmonize with effective pedestrian circulation in PROW projects. PROW project
BMPs commonly integrate the goals of stormwater retention and pedestrian safety by
reducing pedestrian crossing distances, providing more space against vehicular traffic, and
improving site angles at intersections. While pedestrian circulation and stormwater retention
should not be at odds, conflicts can arise with on street parking. Considerations should be
given to provide adequate egress for parking adjacent to a BMP (typically 23 feet). In
addition, frequent walkways across BMPs can give pedestrians sufficient access to parking
zones.
Retention facilities with vertical drops of greater than six inches in a PROW projects should
provide pedestrians with visual or physical signals that denote a significant drop in grade,
such as a raised curb edge, a detectable warning strip or a raised railing. Railings maybe
designed to perform additional functions such as seating or bicycle racks. In areas with the
potential for high pedestrian volume railings may be needed to prevent pedestrians from
cutting through landscaped areas, trampling vegetation and compacting soils.
B.4.3 Fundamental Tenets of MEP for PROW
A PROW project shall demonstrate a design approach that indicates stormwater retention
opportunities were evaluated to the MEP, which includes the following:
a. Selecting BMPs based on site opportunities to reduce stormwater runoff volumes.
b. Sizing BMPs opportunistically to provide the maximum stormwater retention while
accounting for the many competing considerations in PROW projects.
c. Prioritizing capturing roadway runoff. By managing comingled stormwater runoff within
some project drainage areas to offset minimum retention achieved in other project drainage
areas.
d. Developing innovative stormwater management configurations integrating ―green‖ with
―grey‖ infrastructure,
e. Minimizing street width to the appropriate minimum width for maintaining traffic flow and
public safety.
f. Maximizing tree canopy by planting or preserving trees/shrubs, amending soils, increasing
soil volumes and connecting tree roots with stormwater runoff.
g. Using porous pavement or pavers for low traffic roadways, on-street parking, shoulders or
sidewalks.

Appendix B Maximum Extent Practicable Process for Existing Public Right-of-WayMaximum Extent
Practicable Process for Existing Public Right-of-Way
B-11
Formatted: Font: 11 pt
h. Integrating traffic calming measures that serve as stormwater retention BMPs.
i. Reducing stormwater runoff volume by converting impervious surfaces to land cover types
that generate little or zero stormwater runoff.
j. Reducing stormwater runoff volume by employing impervious surface disconnection
strategies within and adjacent to the project‘s limits of disturbance.
B.5 Design Process for PROW
Step 1: Identify Drainage Areas and Calculate SWRv.
a. Define the limits of disturbance for the PROW project.
b. Delineate all drainage areas both within, and contributing to, the limits of disturbance for the
PROW project. Prioritize drainage areas conveying roadway runoff.
c. Identify proposed land covers within the limits of disturbance for the PROW project,
including impervious cover, compacted cover, and natural cover. Area under proposed BMPs
counts as impervious cover. A continuous planter strip may be consider compacted cover, or
natural cover; consult Appendix OAppendix N for the minimum thresholds an area needs to
qualify for each designation. Individual street trees may count as compacted cover or as a
BMP. Use the General Retention Compliance Calculator PROW worksheet to determine
which approach provides the greatest SWRv reduction.
d. Calculate the regulated Sstormwater Rretention Vvolume (SWRv) based on land cover and
area within the limits of disturbance for the entire PROW project. Calculate the portion of the
SWRv for each drainage area within the limits of disturbance of the PROW project.
Calculate any ―unregulated‖ off-site stormwater retention volume contributing to the project
limits of disturbance.
d. Note: When off-site stormwater runoff volumes are managed their reduction will count
toward a reduction in the SWRv. Off-site stormwater runoff volumes may be managed at the
source or within the project‘s limits of disturbance. Prioritize drainage areas conveying
roadway runoff.
e. Consider land conversion and BMP designations in adjacent public lands. While these
volumes are not counted in the calculation of the site‘s SWRv, if controlled they will count
towards the reduction of the site‘s SWRv. Identify opportunities for land cover conversions
or other source control measures that would reduce these off-site volumes.
f. Consider altering the drainage profile if that alteration would increase runoff capture
opportunities. This consideration will typically be set aside until all other considerations have
been exhausted (limited to Type 1).
Step 2: Consider Evaluate Infiltration.
a. Determine historical and actual water table elevations to evaluate opportunities and
restrictions for locating infiltration practices.
b. Consult a qualified professional engineer, soil scientist or geologist using initial infiltration
feasibility tests, to identify the areas within the limits of disturbance with Hydrologic Soil
Formatted: Indent: Left: 0.25", No bullets ornumbering

Appendix B Maximum Extent Practicable Process for Existing Public Right-of-WayMaximum Extent
Practicable Process for Existing Public Right-of-Way
B-12
Formatted: Font: 11 pt
groups that should be preserved and targeted for infiltration BMPs, and areas where
infiltration BMPs will require amended soils and under drains.
c. Identify any areas within the limits of disturbance where there is a known issue of soil
contamination. Infiltration BMPs in these areas are not allowed. Use the guidance in
Appendix QAppendix P. Stormwater Hotspots to evaluate adjacent land use hotspots that
may be a source of uncontrolled contaminates in stormwater runoff.
Step 3: Demonstrate Full Consideration of Opportunities with Existing Infrastructure.
a. Review substructure maps and utility plans; delineate areas of potential conflict as well as
areas without conflict.
b. Identify the location and elevation of the existing the storm drainage system (grey
infrastructure), including catch basins, drain inlets, and manholes in both the drainage areas
within, and those drainage areas contributing stormwater runoff to, the limits of disturbance
for the PROW project.
c. Identify all existing trees to be preserved. Identify and record tree species, size and
preservation status.
Step 4: Demonstrate Full Consideration of Land Cover Conversions and Optimum
BMP Placement.
a. Identify traffic islands, triangle parks, median islands, cul-de-sacs, and paper streets within
and adjacent to the PROW project‘s limits of disturbance. These areas can be the focus of
land cover conversions and BMP locations (unless within LOD of Type 2 this is limited Type
1).
b. Evaluate the opportunity to integrate traffic calming measures including but not limited to,
median islands, pedestrian curb extensions, bump outs and chicanes, and turning radius
reductions. Delineate these areas out for consideration for impervious surface removal and
BMP facilities. Delineate areas available for additional tree planting. Note whether soil
volume increases and amended soils are required (unless within LOD of Type 2 this is
limited Type 1).
c. Evaluate right-of-way widths; identify minimum requirements for trails, alleys, roadways and
sidewalks. Delineate sections where existing conditions exceed minimum requirements.
These areas can be the focus of land cover conversions and BMP locations (limited to Type
1).
d. Select areas delineated as optimum opportunities for land conversion or BMP location.
d. Note: Land conversions can significantly reduce the project‘s SWRv without the use of
an active stormwater facility. Designate land conversions and recalculate SWRv at the full
project scale and the scale of the individual drainage areas within the project area.
e. Select most appropriate BMP types for each area delineated as optimum opportunities for
BMP locations. Consult Table B.2 for potential BMPs recommended by US EPA for ―Green
Streets‖, DDOT‘s AWI Chapter 5 LID, DDOT‘s LID Action Plan, DDOT‘s LID Standards
and Specifications, and Chapters 3.1 through 3.12 in this Guidance Manual.
Formatted: Indent: Left: 0.25", No bullets ornumbering

Appendix B Maximum Extent Practicable Process for Existing Public Right-of-WayMaximum Extent
Practicable Process for Existing Public Right-of-Way
B-13
Formatted: Font: 11 pt
Step 5: Size BMPs.
a. The following steps process are used to size BMPs for PROW projects:
1. Delineate drainage areas to BMP locations including any area outside the limits of
disturbance contributing off-site stormwater runoff volume; prioritize roadway runoff;
consider the land covers to compute optimum Sstormwater Rretention Vvolume. Consider
designing to the over control retention volume, above the regulated requirement of 1.2
inches, up to the regulated ceiling of 1.7 inches.
2. Look up the recommended sizing methodology for the BMP selected in each drainage area
and using the appropriate BMP chapter of this guidance manual to calculate target sizing
criteria.
3. Design BMPs per the appropriate chapter of this guidance manual and the District of
Columbia Department of Transportation Design and Engineering Manual.
4. Attempt to provide the calculated sizing criteria for the selected BMPs.
5. If sizing criteria cannot be achieved, document the constraints that override the application
of BMPs, and provide the largest portion of the sizing criteria that can be reasonably
provided given constraints.
Note: If BMPs cannot be sized to provide the calculated volume for the drainage area, it is
still essential to design the BMP inlet, energy dissipation, and overflow capacity for the full
drainage area, including any area contributing off-site stormwater runoff volume, to ensure
that flooding and scour is avoided. It is strongly recommended that BMPs which are
designed to less than their target design volume be designed to bypass peak flows.
b. Aggregate the retention values achieved with the BMPs designed in Step 5 and compare with
the regulated Stormwater Retention Volume (SWRv) for PROW project. If the aggregate
retention value meets or exceeds the SWRv the project has meet its regulatory obligation.
c. If there is a retention volume deficiency, consider sizing BMPs to manage the comingled
volume on-site.
d. If there is a retention volume deficiency, revisit Design Steps 1 through– 4. Increase land
conversion areas and BMP facilities. Depending on the extent and complexity of the PROW
project this may require several iterations.
Step 6: Address Drainage Areas where Zero-Retention Practices are Installed.
It is possible, despite following the design considerations, fundamental tenants, and the iterative
Steps 1through –5 of the design process, that drainage areas within the proposed limits of
disturbance may emerge without any retention practices. If these cases occur in the Municipal
Separate Storm Sewer System (MS4)In these cases, those drainage areas will must incorporate
water quality catch basins, or other emergent technologytechnologies, that provides water quality
treatment for the SWRv of those drainage areas, if the project is in the Municipal Separate Storm
Sewer System (MS4).

Appendix B Maximum Extent Practicable Process for Existing Public Right-of-WayMaximum Extent
Practicable Process for Existing Public Right-of-Way
B-14
Formatted: Font: 11 pt
Table B.2 Potential BMPs for Green Streets Projects (modified US EPA)
BMP Type Opportunity Criteria for PROW Projects
Street Trees, Canopy
Interception
Access roads, residential streets, local roads and minor arterials
Drainage infrastructure, sea walls/break water
Effective for projects with any slope
Trees may be prohibited along high speed roads for safety reasons or must be
setback behind the clear zone or protected with guard rails and barriers;
planting setbacks may also be required for traffic and pedestrian lines of sight.
Stormwater Curb Extensions /
Stormwater Planters
Access roads, residential streets, and local roads with parallel or angle parking
and sidewalks
Can be designed to overflow back to curb line and to standard inlet
Shape is not important and can be integrated wherever unused space exists
Can be installed on relatively steep grades with terracing
Bioretention Areas Low density residential streets without sidewalks; along roadways adjacent to
park space; well suited for the DCistrict‘'s triangle parks; ramp, slipways and
road closings can make good conversion-sites
May require more space than curb extensions/ planters, consider combing with
minimized road widths to maximize bioretention area.
Permeable Pavement Parking and sidewalk areas of residential streets, and local roads
If significant run-on from major roads is a possibility ensure deign and
maintenance protocols to accommodate potential TSS loads
Should not be subject to heavy truck/ equipment traffic
Light vehicle access roads and alleyways
Permeable Friction Course
Overlays
High speed roadways unsuitable for full depth permeable pavement
Suitable for parking lots and all roadway types
Vegetated Swales (compost
amended were possible)
Roadways with low to moderate slope or terraced systems
Residential streets with minimal driveway access
Minor to major arterials with medians or mandatory sidewalk set-backs
Access roads
Swales running parallel to storm drain can have intermittent discharge points to
reduce required flow capacity
Filter strips (amended road
shoulder)
Access roads
Major roadways with excess PROW
Not practicable in most PROWs because of width requirements
Proprietary Biotreatment Constrained PROWs
Typically have small footprint to drainage area ratio
Simple install and maintenance
Can be installed on roadways of any slope
Can be designed to overflow back to curb line and to standard inlet
Infiltration Trench Constrained PROWs
Can require small footprint where soils are suitable
Low to moderate traffic roadways
Infiltration trenches are not suitable for high traffic roadways
Requires robust pretreatment
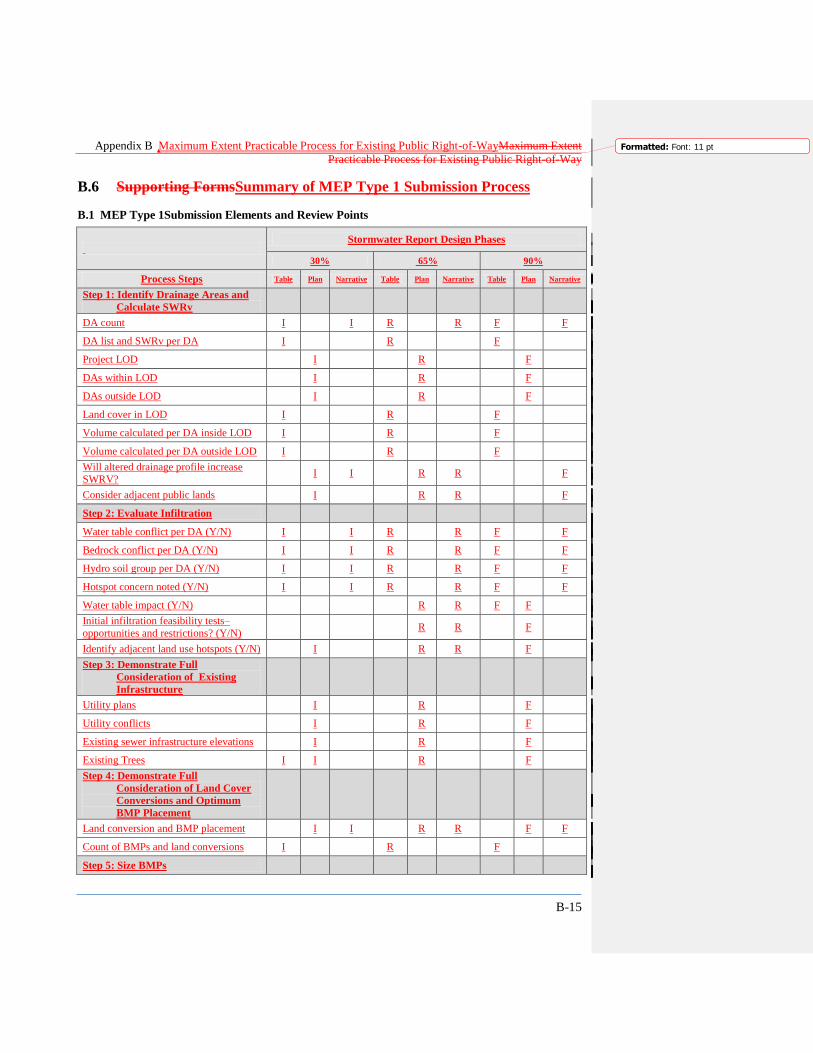
Appendix B Maximum Extent Practicable Process for Existing Public Right-of-WayMaximum Extent
Practicable Process for Existing Public Right-of-Way
B-15
Formatted: Font: 11 pt
B.6 Supporting FormsSummary of MEP Type 1 Submission Process
B.1 MEP Type 1Submission Elements and Review Points
Stormwater Report Design Phases
30% 65% 90%
Process Steps Table Plan Narrative Table Plan Narrative Table Plan Narrative
Step 1: Identify Drainage Areas and
Calculate SWRv
DA count I
I R
R F
F
DA list and SWRv per DA I
R
F
Project LOD
I
R
F
DAs within LOD
I
R
F
DAs outside LOD
I
R
F
Land cover in LOD I
R
F
Volume calculated per DA inside LOD I
R
F
Volume calculated per DA outside LOD I
R
F
Will altered drainage profile increase
SWRV? I I
R R
F
Consider adjacent public lands
I
R R
F
Step 2: Evaluate Infiltration
Water table conflict per DA (Y/N) I
I R
R F
F
Bedrock conflict per DA (Y/N) I
I R
R F
F
Hydro soil group per DA (Y/N) I
I R
R F
F
Hotspot concern noted (Y/N) I
I R
R F
F
Water table impact (Y/N)
R R F F
Initial infiltration feasibility tests–
opportunities and restrictions? (Y/N) R R
F
Identify adjacent land use hotspots (Y/N)
I
R R
F
Step 3: Demonstrate Full
Consideration of Existing
Infrastructure
Utility plans
I
R
F
Utility conflicts
I
R
F
Existing sewer infrastructure elevations
I
R
F
Existing Trees I I
R
F
Step 4: Demonstrate Full
Consideration of Land Cover
Conversions and Optimum
BMP Placement
Land conversion and BMP placement
I I
R R
F F
Count of BMPs and land conversions I
R
F
Step 5: Size BMPs
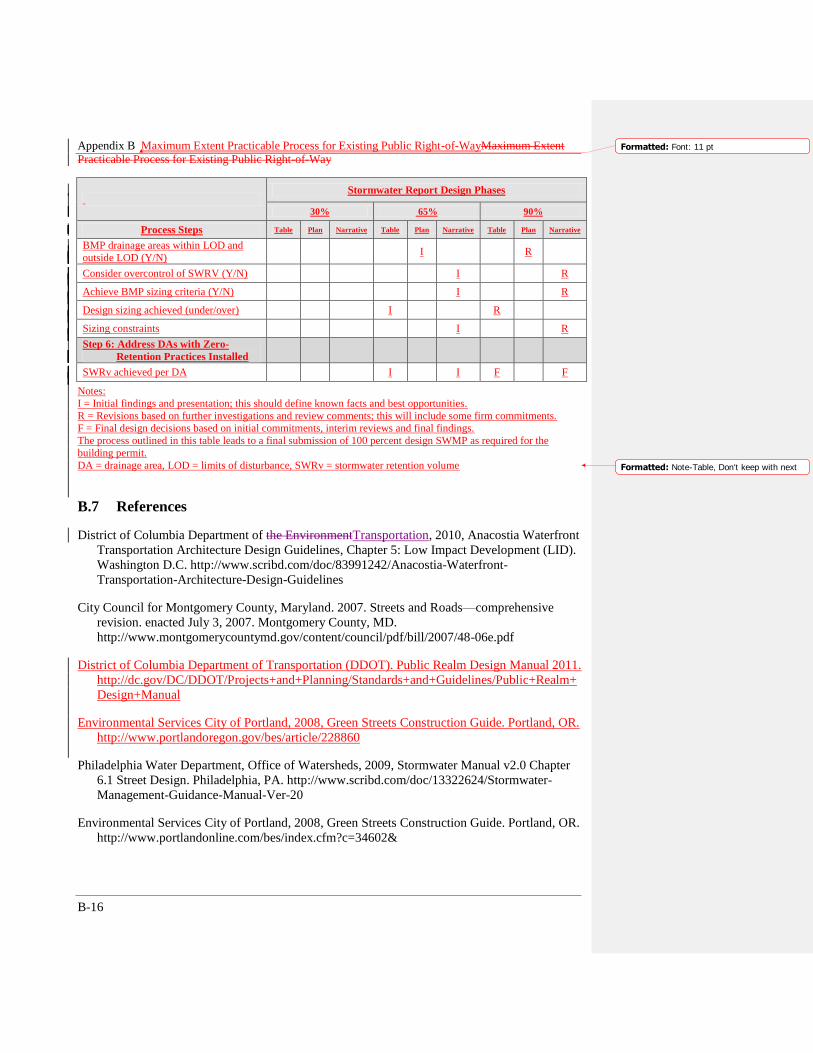
Appendix B Maximum Extent Practicable Process for Existing Public Right-of-WayMaximum Extent
Practicable Process for Existing Public Right-of-Way
B-16
Formatted: Font: 11 pt
Stormwater Report Design Phases
30% 65% 90%
Process Steps Table Plan Narrative Table Plan Narrative Table Plan Narrative
BMP drainage areas within LOD and
outside LOD (Y/N) I
R
Consider overcontrol of SWRV (Y/N)
I
R
Achieve BMP sizing criteria (Y/N)
I
R
Design sizing achieved (under/over)
I
R
Sizing constraints
I
R
Step 6: Address DAs with Zero-
Retention Practices Installed
SWRv achieved per DA
I
I F
F
Notes:
I = Initial findings and presentation; this should define known facts and best opportunities.
R = Revisions based on further investigations and review comments; this will include some firm commitments.
F = Final design decisions based on initial commitments, interim reviews and final findings.
The process outlined in this table leads to a final submission of 100 percent design SWMP as required for the
building permit.
DA = drainage area, LOD = limits of disturbance, SWRv = stormwater retention volume
B.7 References
District of Columbia Department of the EnvironmentTransportation, 2010, Anacostia Waterfront
Transportation Architecture Design Guidelines, Chapter 5: Low Impact Development (LID).
Washington D.C. http://www.scribd.com/doc/83991242/Anacostia-Waterfront-
Transportation-Architecture-Design-Guidelines
City Council for Montgomery County, Maryland. 2007. Streets and Roads—comprehensive
revision. enacted July 3, 2007. Montgomery County, MD.
http://www.montgomerycountymd.gov/content/council/pdf/bill/2007/48-06e.pdf
District of Columbia Department of Transportation (DDOT). Public Realm Design Manual 2011.
http://dc.gov/DC/DDOT/Projects+and+Planning/Standards+and+Guidelines/Public+Realm+
Design+Manual
Environmental Services City of Portland, 2008, Green Streets Construction Guide. Portland, OR.
http://www.portlandoregon.gov/bes/article/228860
Philadelphia Water Department, Office of Watersheds, 2009, Stormwater Manual v2.0 Chapter
6.1 Street Design. Philadelphia, PA. http://www.scribd.com/doc/13322624/Stormwater-
Management-Guidance-Manual-Ver-20
Environmental Services City of Portland, 2008, Green Streets Construction Guide. Portland, OR.
http://www.portlandonline.com/bes/index.cfm?c=34602&
Formatted: Note-Table, Don't keep with next

Appendix B Maximum Extent Practicable Process for Existing Public Right-of-WayMaximum Extent
Practicable Process for Existing Public Right-of-Way
B-17
Formatted: Font: 11 pt
City of Los Angeles, 2009, Green Streets & Green Alleys: design guidelines standards. Los
Angeles, CA. http://www.lastormwater.org/wp-content/files_mf/greenstreetguidelines.pdf
Santa Ana Regional Water Quality Control Board, May 19, 2011. Exhibit 7.III Technical
guidance document for the preparation of conceptual/preliminary and/or project water quality
management plans (WQMPs); Santa Ana County, CA.
http://www.cityoforange.org/civicax/filebank/blobdload.aspx?blobid=9653
San Francisco Planning Department, 2010, San Francisco Better Streets Plan, Final Draft, 2010,
http://www.sf-planning.org/ftp/BetterStreets/proposals.htm#Final_Plan
San Mateo Countywide Water Pollution Prevention Program, San Mateo County Sustainable
Green Streets and Parking Lots Guide, 2009; San Mateo, CA.
http://www.flowstobay.org/ms_sustainable_guidebook.php
U.S. Environmental Protection Agency, Managing Wet Weather with Green Infrastructure
Municipal Handbook, Green Streets, EPA Publication 833-F-08-009, 2008;
http://water.epa.gov/infrastructure/greeninfrastructure/upload/gi_munichandbook_green_stre
ets.pdf


C-1
Appendix C Off-Site Retention Forms for
Regulated Sites
This appendix includes the following off-site retention forms for regulated sites:
Application to Use Stormwater Retention Credits for Off-Site Retention Volume
Notification of In-Lieu Fee Payment to Meet Off-Site Retention Volume

Appendix C Off-Site Retention Forms for Regulated SitesOff-Site Retention Forms for Regulated Sites
C-2
Formatted: Font: 11 pt
Figure C.1C.1 Application to Use Stormwater Retention Credits for Off-Site Retention Volume.
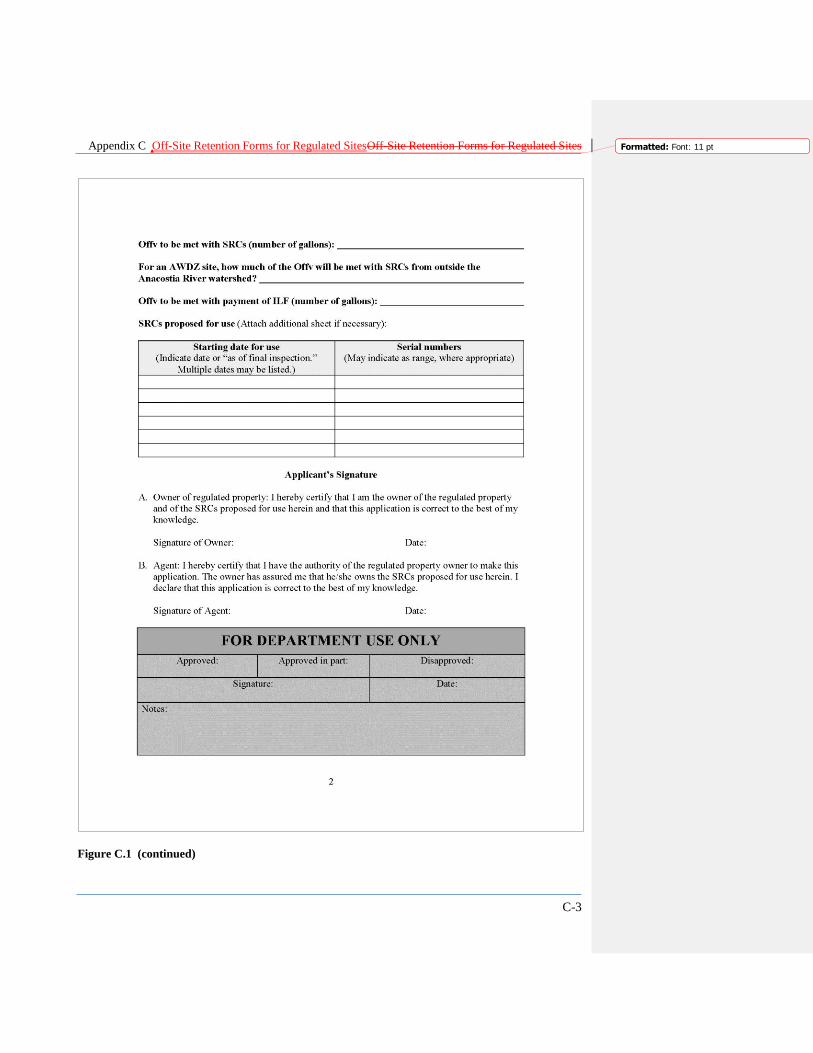
Appendix C Off-Site Retention Forms for Regulated SitesOff-Site Retention Forms for Regulated Sites
C-3
Formatted: Font: 11 pt
Figure C.1 (continued)

Appendix C Off-Site Retention Forms for Regulated SitesOff-Site Retention Forms for Regulated Sites
C-4
Formatted: Font: 11 pt
Figure C.1 (continued)

Appendix C Off-Site Retention Forms for Regulated SitesOff-Site Retention Forms for Regulated Sites
C-5
Formatted: Font: 11 pt
Figure C.2C.2 Notification of In-Lieu Fee Payment to Meet Off-Site Retention Volume.
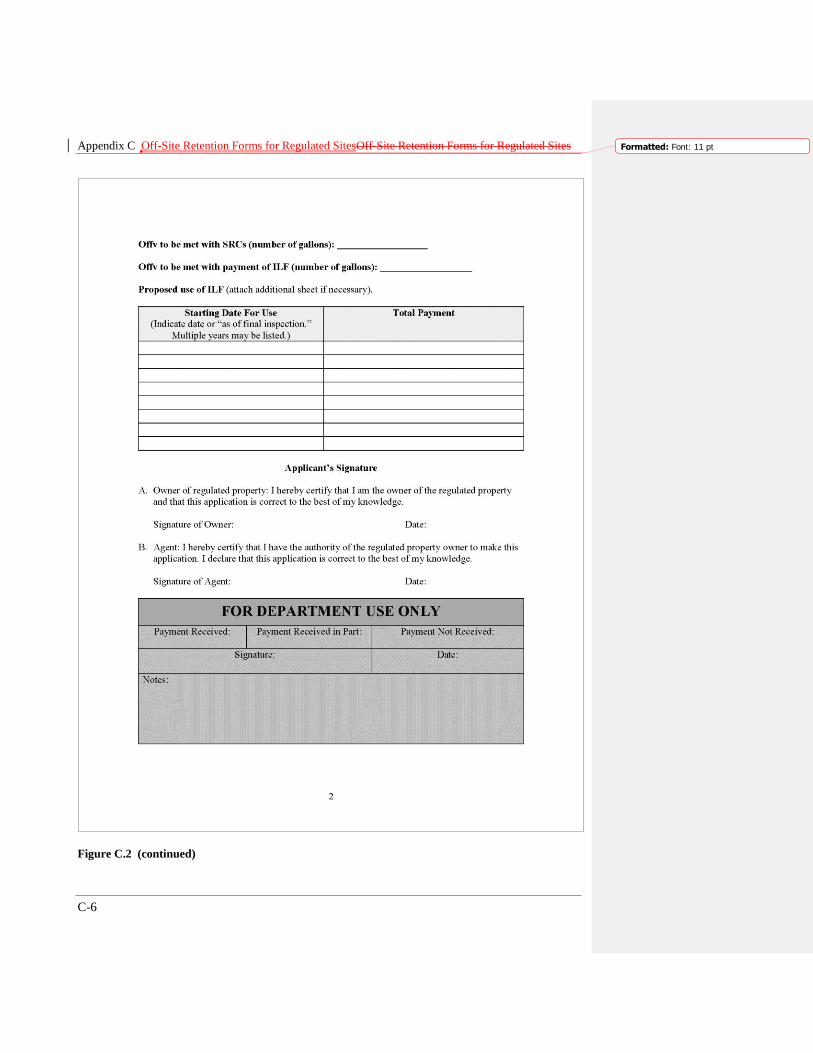
Appendix C Off-Site Retention Forms for Regulated SitesOff-Site Retention Forms for Regulated Sites
C-6
Formatted: Font: 11 pt
Figure C.2 (continued)

Appendix C Off-Site Retention Forms for Regulated SitesOff-Site Retention Forms for Regulated Sites
C-7
Formatted: Font: 11 pt
Figure C.2 (continued)


D-1
Appendix D Stormwater Retention Credit Forms
(Certification, Trading, and
Retirement)
This appendix includes the following Stormwater Retention Credit forms:
Application for Certification of Stormwater Retention Credits
Application for Transfer of Stormwater Retention Credit Ownership
Application to Retire Stormwater Retention Credits

Appendix D Stormwater Retention Credit Forms (Certification, Trading, and Retirement)Stormwater
Retention Credit Forms (Certification, Trading, and Retirement)
D-2
Formatted: Font: 11 pt
Figure D.1D.1 Application for Certification of Stormwater Retention Credits.

Appendix D Stormwater Retention Credit Forms (Certification, Trading, and Retirement)Stormwater
Retention Credit Forms (Certification, Trading, and Retirement)
D-3
Formatted: Font: 11 pt
Figure D.1 (continued)
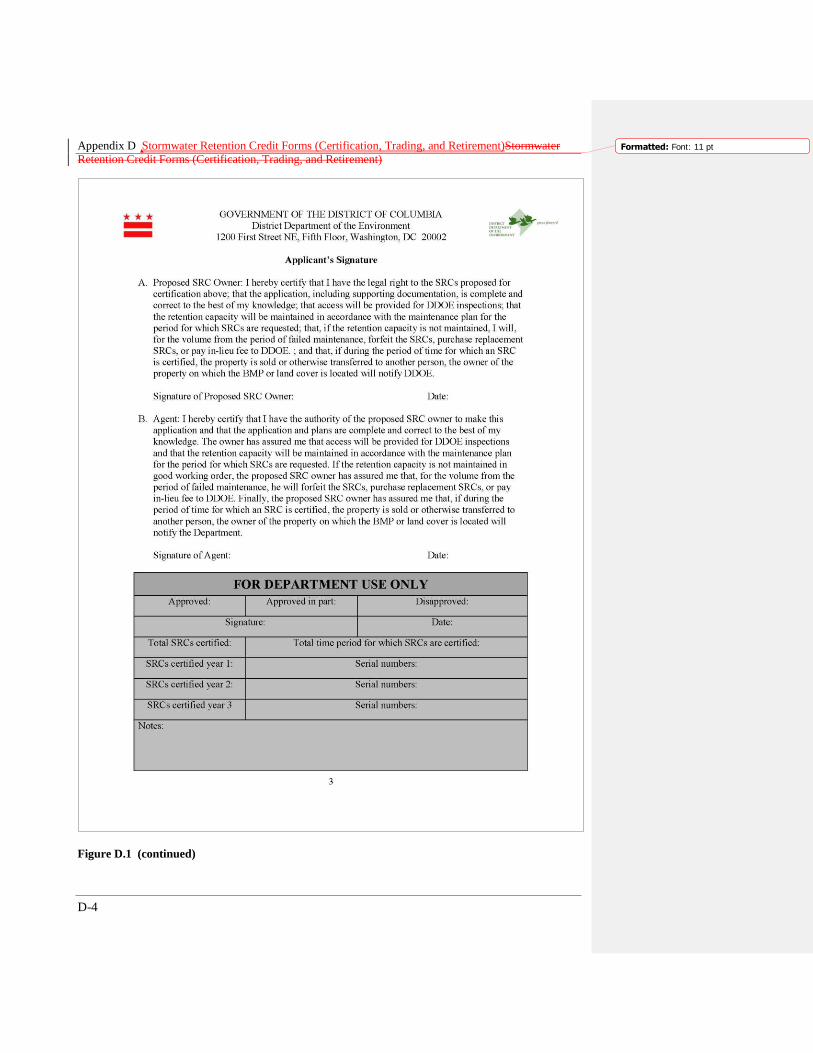
Appendix D Stormwater Retention Credit Forms (Certification, Trading, and Retirement)Stormwater
Retention Credit Forms (Certification, Trading, and Retirement)
D-4
Formatted: Font: 11 pt
Figure D.1 (continued)

Appendix D Stormwater Retention Credit Forms (Certification, Trading, and Retirement)Stormwater
Retention Credit Forms (Certification, Trading, and Retirement)
D-5
Formatted: Font: 11 pt
Figure D.1 (continued)
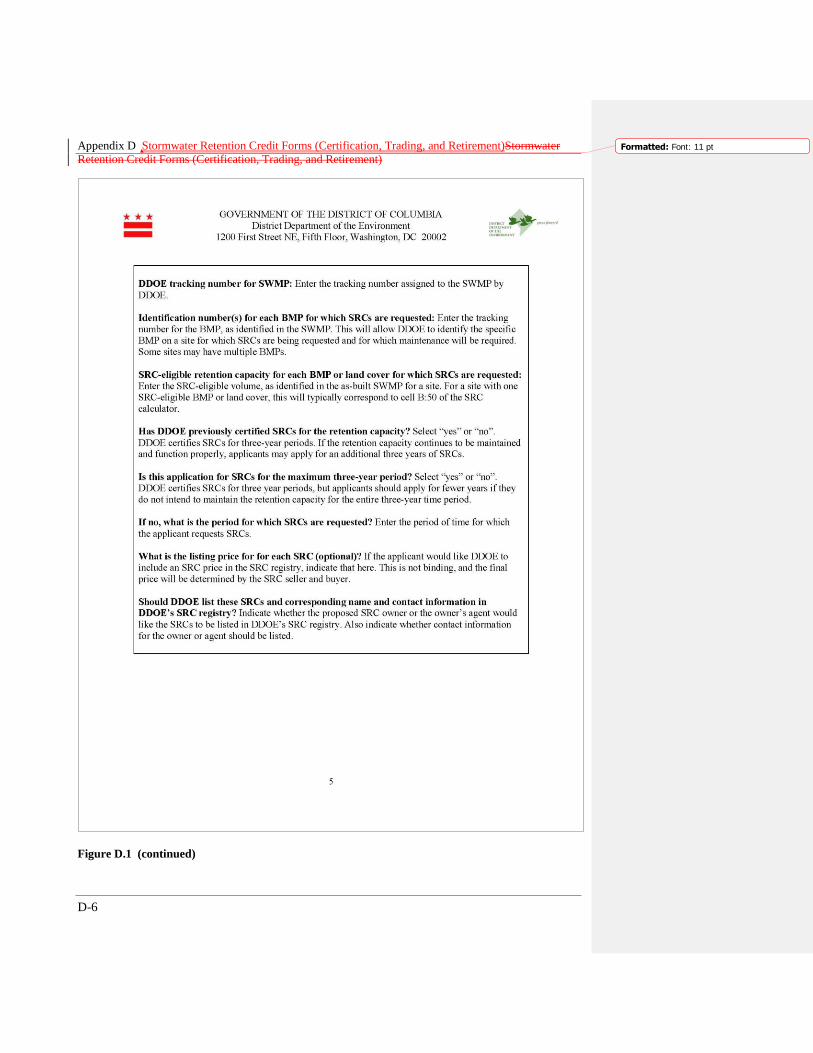
Appendix D Stormwater Retention Credit Forms (Certification, Trading, and Retirement)Stormwater
Retention Credit Forms (Certification, Trading, and Retirement)
D-6
Formatted: Font: 11 pt
Figure D.1 (continued)

Appendix D Stormwater Retention Credit Forms (Certification, Trading, and Retirement)Stormwater
Retention Credit Forms (Certification, Trading, and Retirement)
D-7
Formatted: Font: 11 pt
Figure D.2D.2 Application for Transfer of Stormwater Retention Credit Ownership.
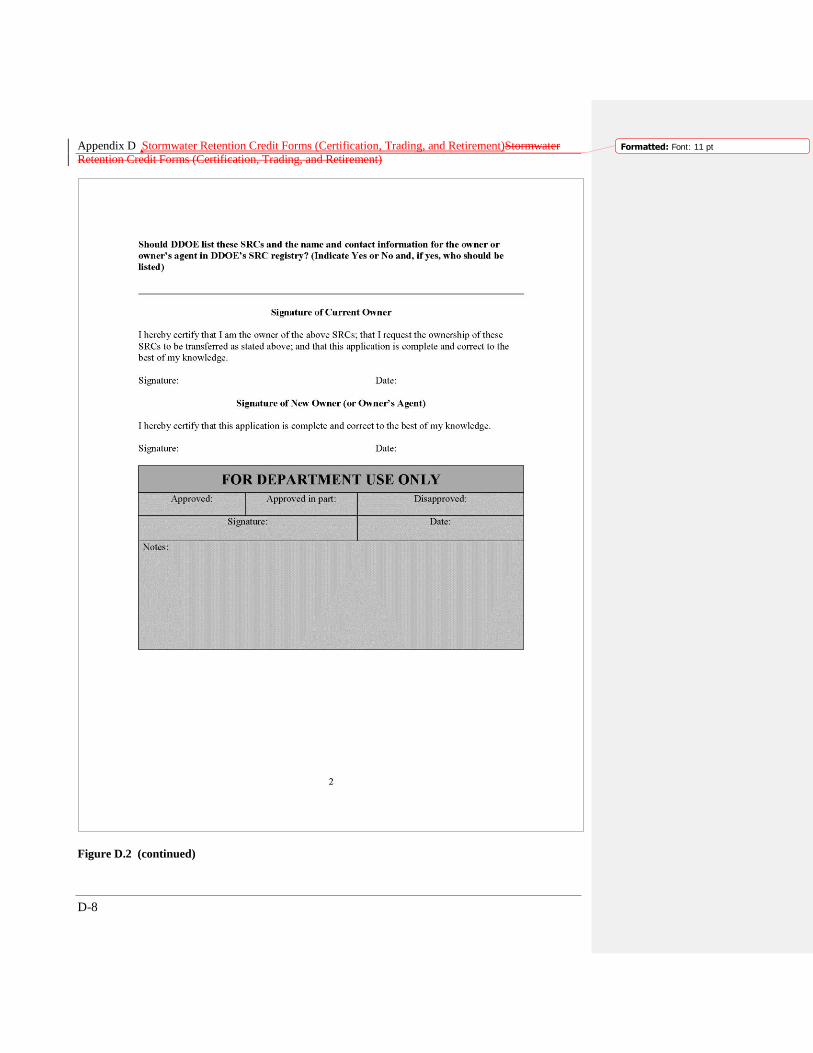
Appendix D Stormwater Retention Credit Forms (Certification, Trading, and Retirement)Stormwater
Retention Credit Forms (Certification, Trading, and Retirement)
D-8
Formatted: Font: 11 pt
Figure D.2 (continued)

Appendix D Stormwater Retention Credit Forms (Certification, Trading, and Retirement)Stormwater
Retention Credit Forms (Certification, Trading, and Retirement)
D-9
Formatted: Font: 11 pt
Figure D.2 (continued)

Appendix D Stormwater Retention Credit Forms (Certification, Trading, and Retirement)Stormwater
Retention Credit Forms (Certification, Trading, and Retirement)
D-10
Formatted: Font: 11 pt
Figure D.3D.3 Application to Retire Stormwater Retention Credits.

Appendix D Stormwater Retention Credit Forms (Certification, Trading, and Retirement)Stormwater
Retention Credit Forms (Certification, Trading, and Retirement)
D-11
Formatted: Font: 11 pt
Figure D.3 (continued)

E-1
Appendix E Relief for Extraordinarily Difficult
Site Conditions
E.1 Relief from Extraordinarily Difficult Site Conditions
Note that major land-disturbing activity in the existing public right-of-way (PROW) uses the
maximum extent practicable process detailed in Appendix B to determine sizing criteria used to
achieve the stormwater management performance requirements for regulated activity. These
projects are not required to apply for relief from extraordinarily difficult site conditions.
Regulated activity located in the Anacostia Waterfront Development Zone (AWDZ) that are
governed by the Anacostia Waterfront Environmental Standards Amendment Act of 2012 (see
D.C. Official Code §§ 2-1226.36(c)(1)) must have all off-site retention and all off-site water
quality treatment volume approved by DDOE through the process defined in this appendix, even
if the District-wide minimum 50 percent on-site retention requirement is met. All development
sites are required to address the Stormwater Retention Volume (SWRv), as described in Chapter
2. All development sites in the Anacostia Waterfront Development Zone (AWDZ), governed by
the Anacostia Waterfront Environmental Standards Amendment Act of 2012, are required to
address the Water Quality Treatment Volume (WQTv), as described in Chapter 2. If compliance
with the minimum on-site retention requirement or on-site water quality treatment requirement is
technically infeasible or environmentally harmful, the applicant may apply for relief from
extraordinarily difficult site conditions. Additionally, if the regulated activity is in the Anacostia
Waterfront Development Zone (AWDZ), governed by the Anacostia Waterfront Environmental
Standards Amendment Act of 2012, consideration for a request for relief will include the limited
appropriateness of on-site compliance in terms of impact on surrounding landowners or overall
benefit to District waterbodies. In cases where an applicant claims extraordinarily difficult site
conditions, it is the responsibility of the applicant to provide sufficient evidence to support the
claim.
Once granted relief from extraordinarily difficult site conditions, an applicant is allowed to
provide less than the minimum compliance requirements on site by managing a greater retention
volume or water quality treatment volume through off-site mitigation. This process does not
relieve the applicant from the obligation to manage the full SWRv or the WQTv determined
through compliance calculations. Additionally, stormwater runoff not receiving the minimum on-
site retention must receive treatment to remove 80 percent of total suspended solids based on the
treatment practices, as defined in Chapter 3 of this guidance manual. When DDOE finds the
evidence presented is sufficient and compelling to grant relief, the Stormwater Management Plan
(SWMP) for the project must the two conditions for relief have been satisfied: (1) removing 80
percent of total suspended solids from 50% percent of the SWRv and (2) identifying the
requirement for the use of off-site retention to offset the entire on-site retention deficit.

Appendix E Relief for Extraordinarily Difficult Site ConditionsRelief for Extraordinarily Difficult Site
Conditions
E-2
Formatted: Font: 11 pt
E.2 Submission requirements for Relief from Extraordinarily Difficult Site
Conditions
A request for relief is made through a ―relief request memo.‖ The memo is submitted in advance
of a final SWMP, but not before the 65 percent design stage of the SWMP, as part of the SWMP
with supporting evidence to demonstrate the claim of technical infeasibility or environmental
harm. The memo shall provide a detailed explanation of each opportunity for on-site installation
of retention BMPs that was considered and rejected, and the reasons for each rejection. The
applicant shall address each retention practice specified in this guidance manual in BMP groups
1 through 13, specifically,
BMP Group 1 Green Roofs
BMP Group 2 Rainwater Harvesting
BMP Group 3 Impermeable Surface Disconnection
BMP Group 4 Permeable Pavement Systems
BMP Group 5 Bioretention
BMP Group 7 Infiltration
BMP Group 8 Open Channel Systems
BMP Group 13 Tree Planting
Evidence of site conditions limiting each opportunity for a retention BMP include the following:
1. Data on soil and groundwater contamination;
2. Data from soils testing consistent with the geotechnical requirements in Appendix
PAppendix O;
3. Documentation of the presence of utilities requiring impermeable protection or a setback;
4. Evidence of the applicability of a statute, regulation, court order, preexisting covenant, or
other restriction having the force of law;
5. Evidence that the installation of a retention BMP would conflict with the terms of a non-
expired approval, applied for prior to the end of Transition Period Two A for a major land-
disturbing activity or before the end of Transition Period Two B for a major substantial
improvement activity, of a:
(a) Concept review by the Historic Preservation Review Board;
(b) Concept review by the Commission on Fine Arts;
(c) Preliminary or final design submission by the National Capital Planning Commission;
(d) Variance or special exception from the Board of Zoning Adjustment; or
(e) Large Tract Review by the District Office of Planning; and
6. For a utility, evidence that a property owner on or under whose land the utility is conducting
work objects to the installation of a BMP; and

Appendix E Relief for Extraordinarily Difficult Site ConditionsRelief for Extraordinarily Difficult Site
Conditions
E-3
Formatted: Font: 11 pt
7. For a major substantial improvement activity, evidence that the structure cannot
accommodate a BMP without significant alteration, because of a lack of available interior or
exterior space or limited load-bearing capacity.
Projects in the AWDZ, governed by the Anacostia Waterfront Environmental Standards
Amendment Act of 2012, may also discuss the limited appropriateness of on-site compliance
verses a combination of off-site and on-site retention and or water quality treatment in terms of
the impact on surrounding landowners or the overall benefit to District waterbodies.
E.3 Review of Requests for Relief from Extraordinarily Difficult Site
Conditions
In an application for Relief from Extraordinarily Difficult Site Conditions, a completed
application and proof of payment of the applicable fee are required to begin the review of the
request. DDOE cannot render a final decision until an application for relief is considered
complete. However, if an application is substantially complete, DDOE may begin consideration
of the request for relief. Upon accepting an application, DDOE will review and determine
whether the application meets the requirements of this section, including the following:
a. Require additional information;
b. Grant relief;
c. Grant relief, with conditions;
d. Deny relief; or
e. Deny relief in part.
In determining whether to grant relief, DDOE may consider the following:
a. The applicant‘s submittal;
b. Other site-related information;
c. An alternative design;
d. DDOE‘s Stormwater Management Guidebook (SWMG);
e. Another BMP that meets the SWMG‘s approval requirements; and
f. Relevant scientific and technical literature, reports, guidance, and standards.

F-1
Appendix F Stormwater Conveyance System
Design
F.1 Introduction
The focus of this SWMG is to define standards and specifications for design, construction and
maintenance of BMPs required to meet stormwater performance objectives. The components and
considerations of the accompanying stormwater conveyance system are outlined in this
appendix.
F.2 Clearance with Other Utilities
All proposed and existing utilities crossing or parallel to designed storm sewer systems must
be shown on the plan and profile.
Storm drain and utility crossings must not have be less than a 45-degree angle between them.
A minimum Minimum vertical and horizontal clearances of one foot and a minimum
horizontal clearance of five feet, wall to wall, must be provided between storm drainage lines
and other utilities as defined by the District of Columbia Water and Sewer Authority (DC
Water). Consult DC Water‘s Project Design Manual and Green Infrastructure Utility
Protection Guidelines, latest additions, for details. Exceptions may be granted by the District
of Columbia Water and Sewer Authority (DC Water) on a case-by-case basis when justified.
Consult DC Water‘s Project Design Manual, latest addition, for details.
F.1F.3 Design of Stormwater Conveyance Systems
The Chezy-Manning formula is to be used to compute the system‘'s transport capacities:
2/13/2486.1SRA
nQ
where:
Q = channel flow (cfs)
n = Manning‘s roughness coefficient (Table F.1)
A = cross-sectional area of flow (ft2)
R = hydraulic radius (ft)
S = channel slope (ft/ft)
Wp = wetland perimeter
R = A/WP
Table F.1 Manning’s Roughness Coefficient (n) Values for Various Channel Materials
Channel Materials Roughness Coefficient
Formatted: Font: 12 pt, Not Bold
Formatted: Font: 12 pt, Not Bold, Font color:Auto
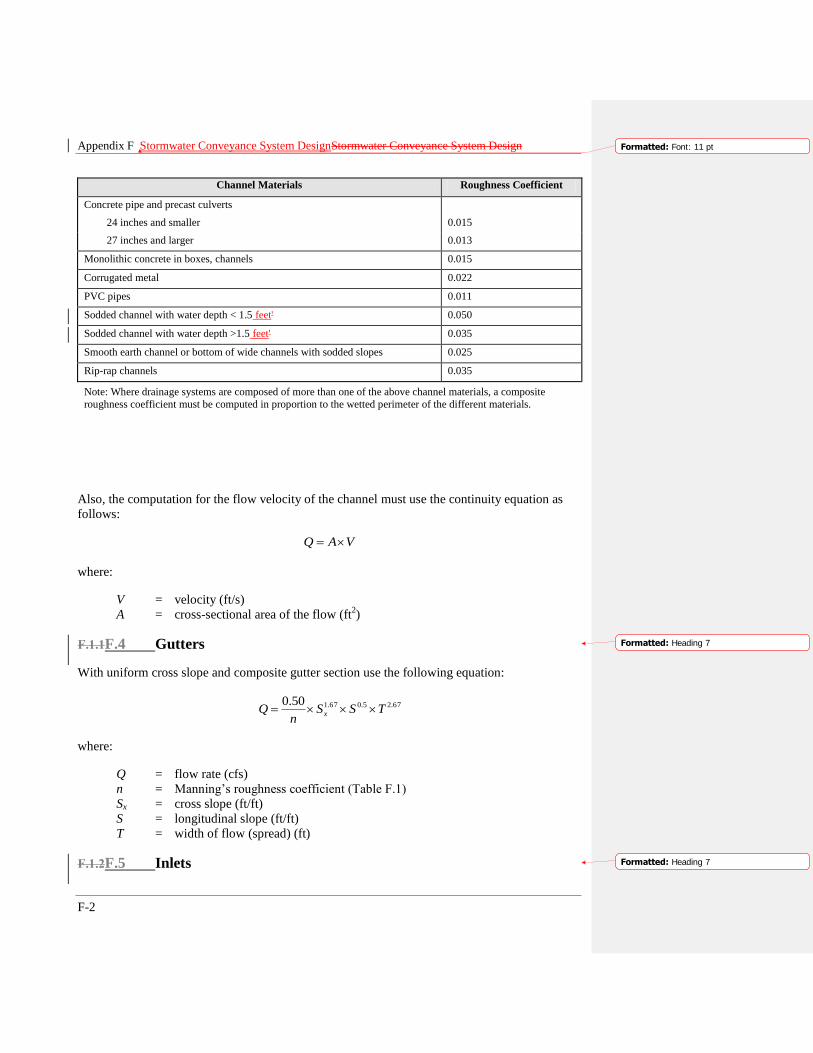
Appendix F Stormwater Conveyance System DesignStormwater Conveyance System Design
F-2
Formatted: Font: 11 pt
Channel Materials Roughness Coefficient
Concrete pipe and precast culverts
24 inches and smaller 0.015
27 inches and larger 0.013
Monolithic concrete in boxes, channels 0.015
Corrugated metal 0.022
PVC pipes 0.011
Sodded channel with water depth < 1.5 feet' 0.050
Sodded channel with water depth >1.5 feet' 0.035
Smooth earth channel or bottom of wide channels with sodded slopes 0.025
Rip-rap channels 0.035
Note: Where drainage systems are composed of more than one of the above channel materials, a composite
roughness coefficient must be computed in proportion to the wetted perimeter of the different materials.
Also, the computation for the flow velocity of the channel must use the continuity equation as
follows:
VAQ
where:
V = velocity (ft/s)
A = cross-sectional area of the flow (ft2)
F.1.1F.4 Gutters
With uniform cross slope and composite gutter section use the following equation:
67.25.067.150.0TSS
nQ x
where:
Q = flow rate (cfs)
n = Manning‘s roughness coefficient (Table F.1)
Sx = cross slope (ft/ft)
S = longitudinal slope (ft/ft)
T = width of flow (spread) (ft)
F.1.2F.5 Inlets
Formatted: Heading 7
Formatted: Heading 7
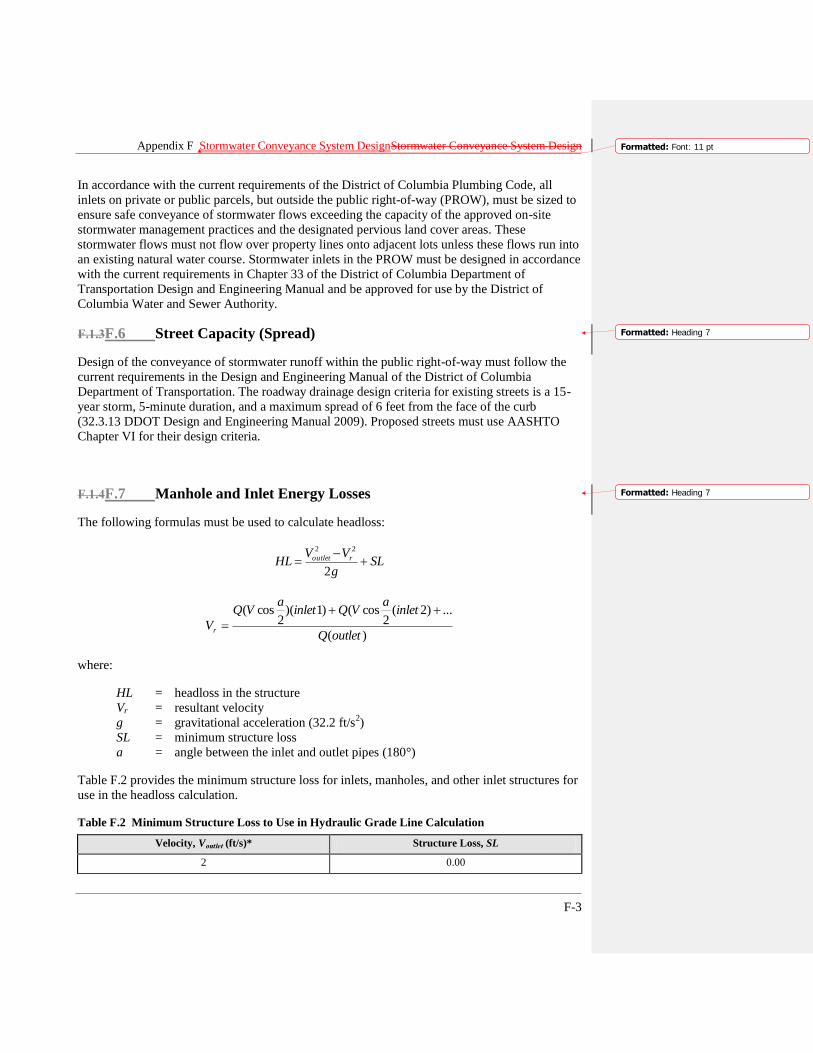
Appendix F Stormwater Conveyance System DesignStormwater Conveyance System Design
F-3
Formatted: Font: 11 pt
In accordance with the current requirements of the District of Columbia Plumbing Code, all
inlets on private or public parcels, but outside the public right-of-way (PROW), must be sized to
ensure safe conveyance of stormwater flows exceeding the capacity of the approved on-site
stormwater management practices and the designated pervious land cover areas. These
stormwater flows must not flow over property lines onto adjacent lots unless these flows run into
an existing natural water course. Stormwater inlets in the PROW must be designed in accordance
with the current requirements in Chapter 33 of the District of Columbia Department of
Transportation Design and Engineering Manual and be approved for use by the District of
Columbia Water and Sewer Authority.
F.1.3F.6 Street Capacity (Spread)
Design of the conveyance of stormwater runoff within the public right-of-way must follow the
current requirements in the Design and Engineering Manual of the District of Columbia
Department of Transportation. The roadway drainage design criteria for existing streets is a 15-
year storm, 5-minute duration, and a maximum spread of 6 feet from the face of the curb
(32.3.13 DDOT Design and Engineering Manual 2009). Proposed streets must use AASHTO
Chapter VI for their design criteria.
F.1.4F.7 Manhole and Inlet Energy Losses
The following formulas must be used to calculate headloss:
SLg
VVHL routlet
2
22
)(
...)2(2
cos()1)(2
cos(
outletQ
inleta
VQinleta
VQ
Vr
where:
HL = headloss in the structure
Vr = resultant velocity
g = gravitational acceleration (32.2 ft/s2)
SL = minimum structure loss
a = angle between the inlet and outlet pipes (180°)
Table F.2 provides the minimum structure loss for inlets, manholes, and other inlet structures for
use in the headloss calculation.
Table F.2 Minimum Structure Loss to Use in Hydraulic Grade Line Calculation
Velocity, Voutlet (ft/s)* Structure Loss, SL
2 0.00
Formatted: Heading 7
Formatted: Heading 7
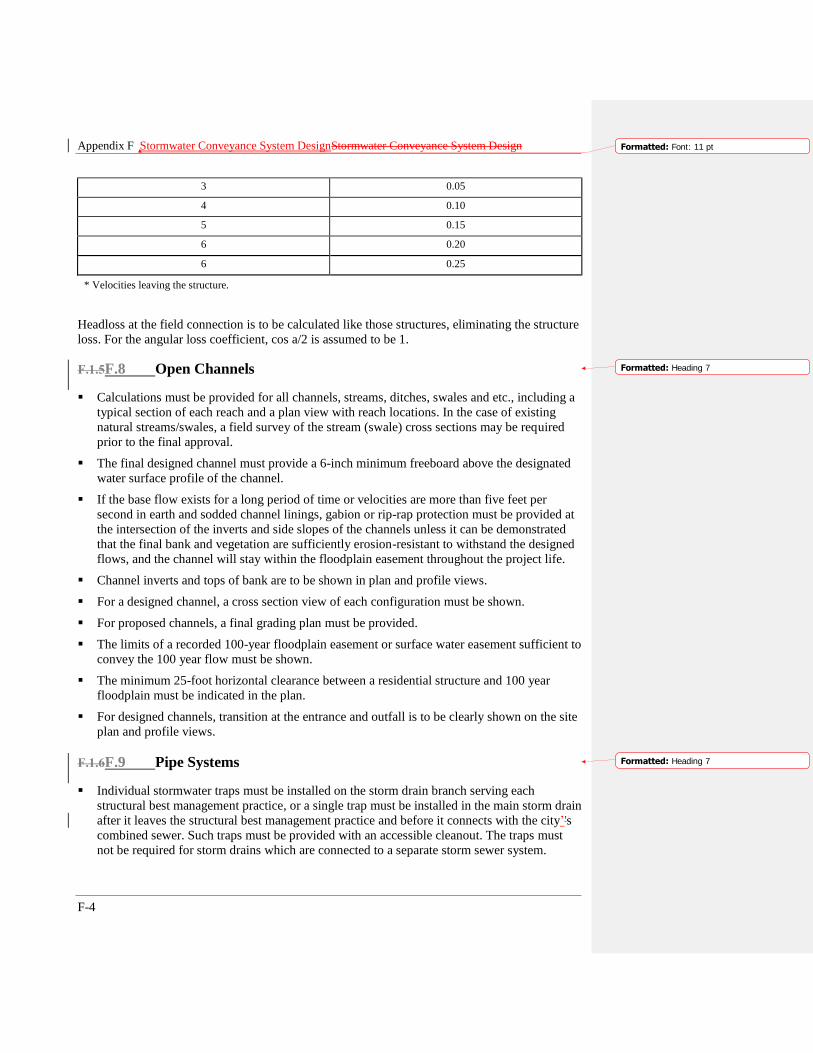
Appendix F Stormwater Conveyance System DesignStormwater Conveyance System Design
F-4
Formatted: Font: 11 pt
3 0.05
4 0.10
5 0.15
6 0.20
6 0.25
* Velocities leaving the structure.
Headloss at the field connection is to be calculated like those structures, eliminating the structure
loss. For the angular loss coefficient, cos a/2 is assumed to be 1.
F.1.5F.8 Open Channels
Calculations must be provided for all channels, streams, ditches, swales and etc., including a
typical section of each reach and a plan view with reach locations. In the case of existing
natural streams/swales, a field survey of the stream (swale) cross sections may be required
prior to the final approval.
The final designed channel must provide a 6-inch minimum freeboard above the designated
water surface profile of the channel.
If the base flow exists for a long period of time or velocities are more than five feet per
second in earth and sodded channel linings, gabion or rip-rap protection must be provided at
the intersection of the inverts and side slopes of the channels unless it can be demonstrated
that the final bank and vegetation are sufficiently erosion-resistant to withstand the designed
flows, and the channel will stay within the floodplain easement throughout the project life.
Channel inverts and tops of bank are to be shown in plan and profile views.
For a designed channel, a cross section view of each configuration must be shown.
For proposed channels, a final grading plan must be provided.
The limits of a recorded 100-year floodplain easement or surface water easement sufficient to
convey the 100 year flow must be shown.
The minimum 25-foot horizontal clearance between a residential structure and 100 year
floodplain must be indicated in the plan.
For designed channels, transition at the entrance and outfall is to be clearly shown on the site
plan and profile views.
F.1.6F.9 Pipe Systems
Individual stormwater traps must be installed on the storm drain branch serving each
structural best management practice, or a single trap must be installed in the main storm drain
after it leaves the structural best management practice and before it connects with the city‘'s
combined sewer. Such traps must be provided with an accessible cleanout. The traps must
not be required for storm drains which are connected to a separate storm sewer system.
Formatted: Heading 7
Formatted: Heading 7
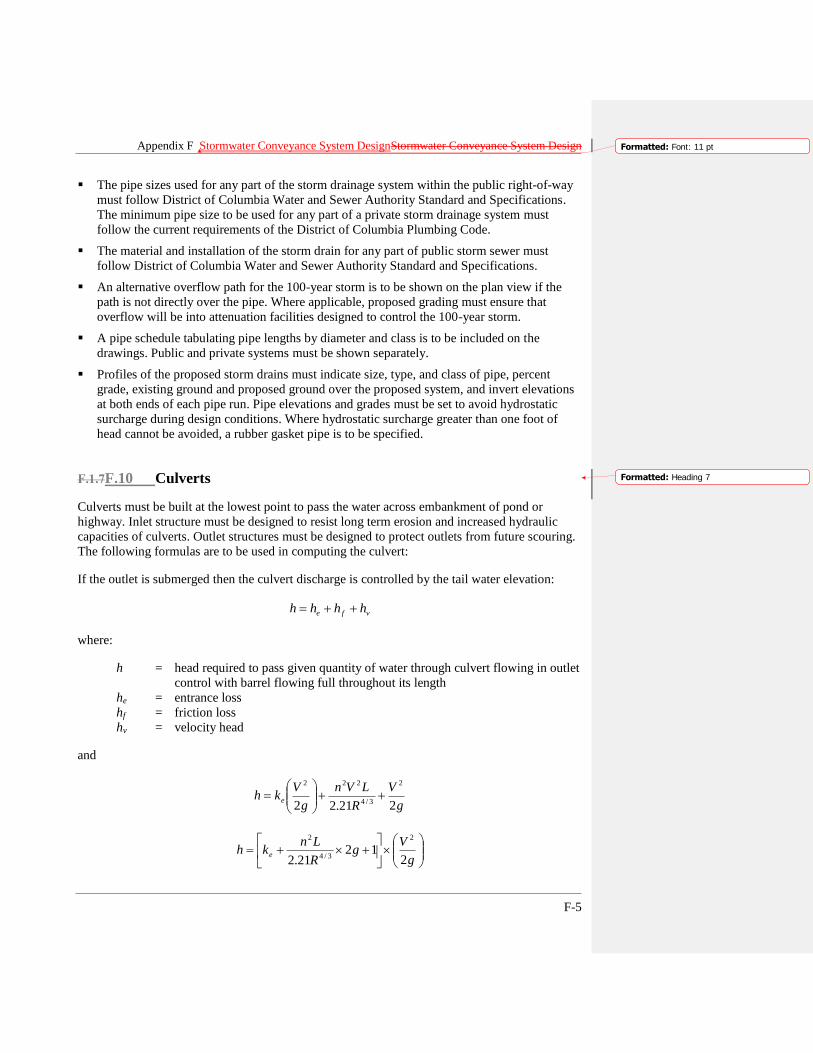
Appendix F Stormwater Conveyance System DesignStormwater Conveyance System Design
F-5
Formatted: Font: 11 pt
The pipe sizes used for any part of the storm drainage system within the public right-of-way
must follow District of Columbia Water and Sewer Authority Standard and Specifications.
The minimum pipe size to be used for any part of a private storm drainage system must
follow the current requirements of the District of Columbia Plumbing Code.
The material and installation of the storm drain for any part of public storm sewer must
follow District of Columbia Water and Sewer Authority Standard and Specifications.
An alternative overflow path for the 100-year storm is to be shown on the plan view if the
path is not directly over the pipe. Where applicable, proposed grading must ensure that
overflow will be into attenuation facilities designed to control the 100-year storm.
A pipe schedule tabulating pipe lengths by diameter and class is to be included on the
drawings. Public and private systems must be shown separately.
Profiles of the proposed storm drains must indicate size, type, and class of pipe, percent
grade, existing ground and proposed ground over the proposed system, and invert elevations
at both ends of each pipe run. Pipe elevations and grades must be set to avoid hydrostatic
surcharge during design conditions. Where hydrostatic surcharge greater than one foot of
head cannot be avoided, a rubber gasket pipe is to be specified.
F.1.7F.10 Culverts
Culverts must be built at the lowest point to pass the water across embankment of pond or
highway. Inlet structure must be designed to resist long term erosion and increased hydraulic
capacities of culverts. Outlet structures must be designed to protect outlets from future scouring.
The following formulas are to be used in computing the culvert:
If the outlet is submerged then the culvert discharge is controlled by the tail water elevation:
vfe hhhh
where:
h = head required to pass given quantity of water through culvert flowing in outlet
control with barrel flowing full throughout its length
he = entrance loss
hf = friction loss
hv = velocity head
and
g
V
R
LVn
g
Vkh e
221.22
2
3/4
222
g
Vg
R
Lnkh e
212
21.2
2
3/4
2
Formatted: Heading 7
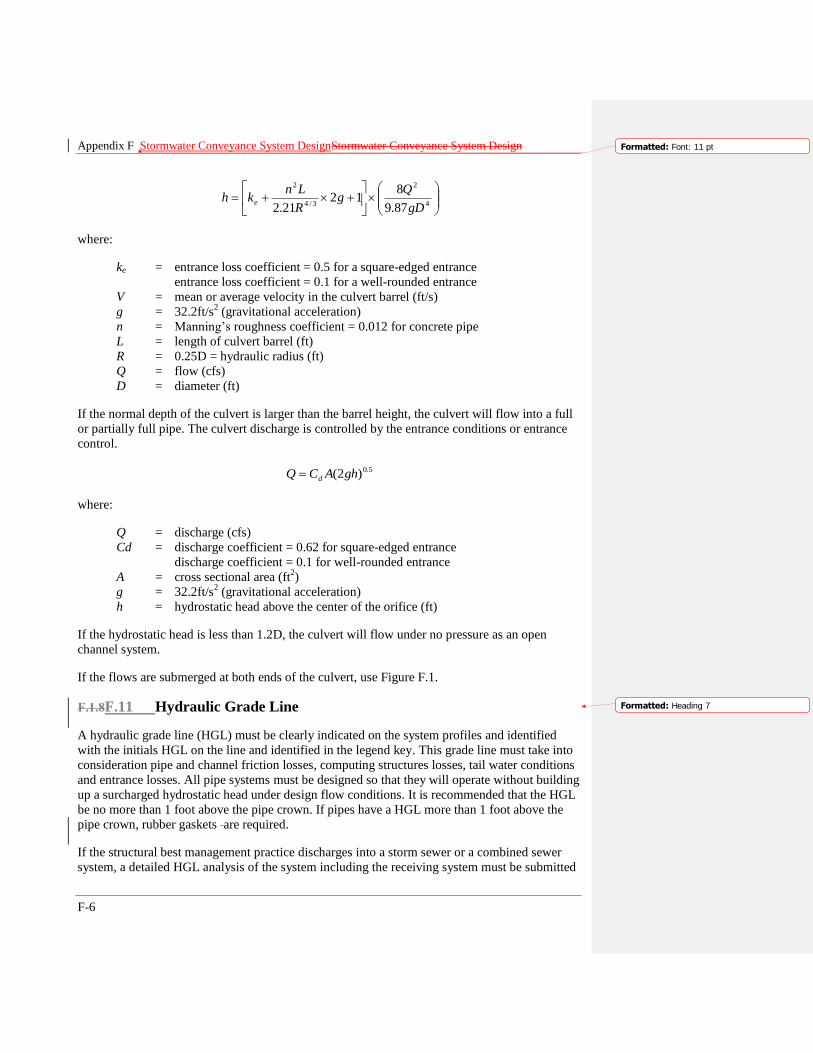
Appendix F Stormwater Conveyance System DesignStormwater Conveyance System Design
F-6
Formatted: Font: 11 pt
4
2
3/4
2
87.9
812
21.2 gD
Qg
R
Lnkh e
where:
ke = entrance loss coefficient = 0.5 for a square-edged entrance
entrance loss coefficient = 0.1 for a well-rounded entrance
V = mean or average velocity in the culvert barrel (ft/s)
g = 32.2ft/s2 (gravitational acceleration)
n = Manning‘s roughness coefficient = 0.012 for concrete pipe
L = length of culvert barrel (ft)
R = 0.25D = hydraulic radius (ft)
Q = flow (cfs)
D = diameter (ft)
If the normal depth of the culvert is larger than the barrel height, the culvert will flow into a full
or partially full pipe. The culvert discharge is controlled by the entrance conditions or entrance
control.
5.0)2( ghACQ d
where:
Q = discharge (cfs)
Cd = discharge coefficient = 0.62 for square-edged entrance
discharge coefficient = 0.1 for well-rounded entrance
A = cross sectional area (ft2)
g = 32.2ft/s2 (gravitational acceleration)
h = hydrostatic head above the center of the orifice (ft)
If the hydrostatic head is less than 1.2D, the culvert will flow under no pressure as an open
channel system.
If the flows are submerged at both ends of the culvert, use Figure F.1.
F.1.8F.11 Hydraulic Grade Line
A hydraulic grade line (HGL) must be clearly indicated on the system profiles and identified
with the initials HGL on the line and identified in the legend key. This grade line must take into
consideration pipe and channel friction losses, computing structures losses, tail water conditions
and entrance losses. All pipe systems must be designed so that they will operate without building
up a surcharged hydrostatic head under design flow conditions. It is recommended that the HGL
be no more than 1 foot above the pipe crown. If pipes have a HGL more than 1 foot above the
pipe crown, rubber gaskets are required.
If the structural best management practice discharges into a storm sewer or a combined sewer
system, a detailed HGL analysis of the system including the receiving system must be submitted
Formatted: Heading 7

Appendix F Stormwater Conveyance System DesignStormwater Conveyance System Design
F-7
Formatted: Font: 11 pt
with the final stormwater management plans for the 15- and 100-year flow frequencies. If the
time characteristics of the HGL are unknown, the designed structural best management practice
must be functional under expected minimum and maximum grade lines.
F.1.9F.12 Manholes and Inlets
District of Columbia Water and Sewer Authority Standards and Specifications must be used.
All structures are to be numbered and listed in the structure schedule and must include type,
standard detail number, size, top elevation, slot elevation and locations, and modification
notes.
Access structures must be spaced according to the District of Columbia Water and Sewer
Authority Standards and Specifications and the Design and Engineering Manual of the
District of Columbia Department of Transportation.
Where two or more pipes enter a structure maintain a minimum of 9 inches of undisturbed
concrete between holes in precast concrete is required to ensure sufficient steel. Consult the
District of Columbia Water and Sewer Authority (DC Water) for more specifics.
A minimum drop of 0.1 foot must be provided through the structure invert.
Drainage boundary and contours must be shown around each inlet to ensure that positive
drainage to the proposed inlet is provided.
Invert elevations of the pipes entering and leaving the structures must be shown in the profile
view.
Yard or grate inlets must show the 15-year and 100-year ponding limits (if applicable). A
depth of not more than two feet is allowed from the throat or grate to the 100-year storm
elevation.
Public street inlets must follow District of Columbia Water and Sewer Authority and District
of Columbia Department of Transportation criteria.
Additional structures are recommended and may be required on steep slopes to reduce
excessive pipe depths and/or to provide deliberate drops in the main line to facilitate safe
conveyance to a proper outfall discharge point. In order to provide an outfall at a suitable
slope (i.e., less than 5 percent slope), drop structures may need to be used to reduce the
velocity before discharging on a rip-rap area.
Curb inlets located on private cul-de-sacs must have a maximum 10 linear feet opening.
For commercial/industrial areas, inlets must be kept at least five feet away from the driveway
aprons.Where two or more pipes enter a structure, a minimum of two feet horizontal
clearance must be maintained between the pipes connected to the structure at the same
elevation.
Formatted: Heading 7
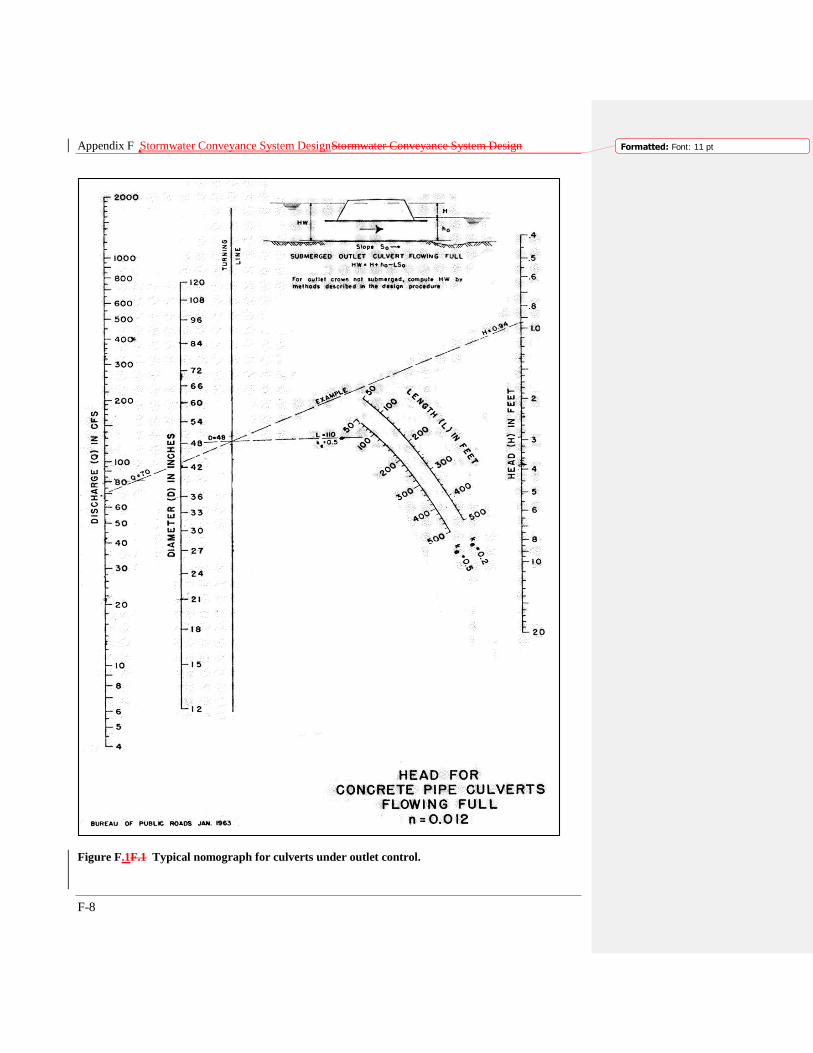
Appendix F Stormwater Conveyance System DesignStormwater Conveyance System Design
F-8
Formatted: Font: 11 pt
Figure F.1F.1 Typical nomograph for culverts under outlet control.
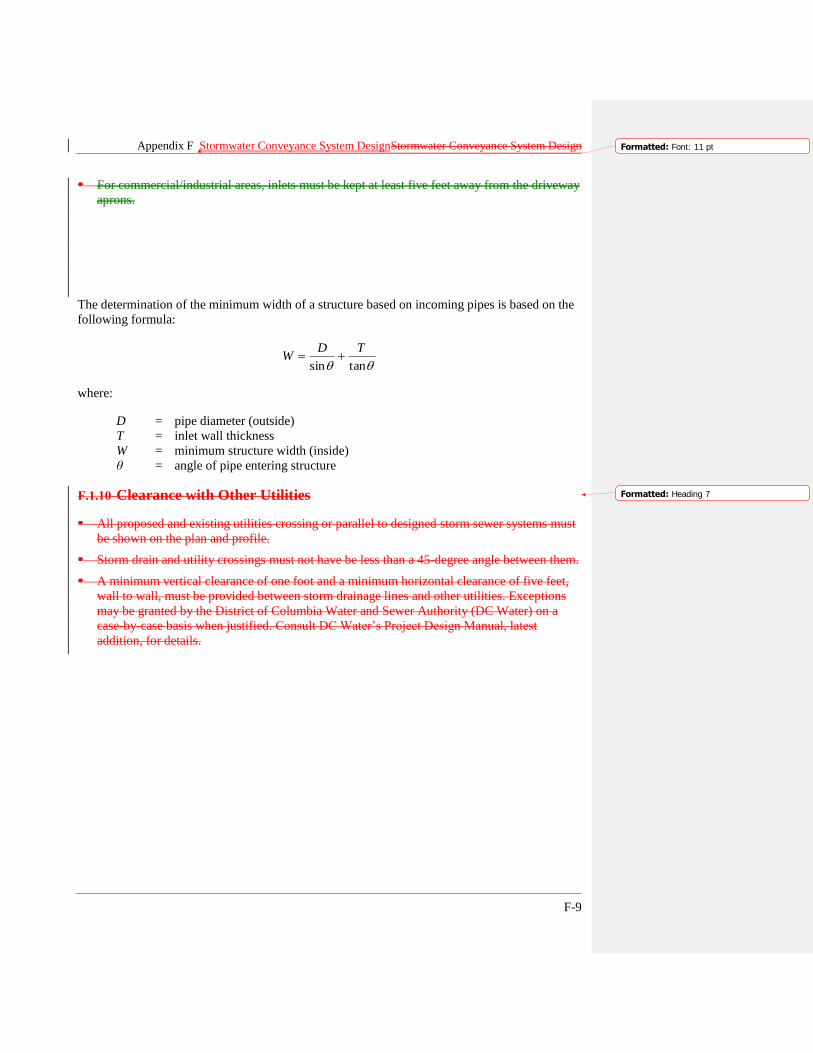
Appendix F Stormwater Conveyance System DesignStormwater Conveyance System Design
F-9
Formatted: Font: 11 pt
For commercial/industrial areas, inlets must be kept at least five feet away from the driveway
aprons.
The determination of the minimum width of a structure based on incoming pipes is based on the
following formula:
tansin
TDW
where:
D = pipe diameter (outside)
T = inlet wall thickness
W = minimum structure width (inside)
θ = angle of pipe entering structure
F.1.10 Clearance with Other Utilities
All proposed and existing utilities crossing or parallel to designed storm sewer systems must
be shown on the plan and profile.
Storm drain and utility crossings must not have be less than a 45-degree angle between them.
A minimum vertical clearance of one foot and a minimum horizontal clearance of five feet,
wall to wall, must be provided between storm drainage lines and other utilities. Exceptions
may be granted by the District of Columbia Water and Sewer Authority (DC Water) on a
case-by-case basis when justified. Consult DC Water‘s Project Design Manual, latest
addition, for details.
Formatted: Heading 7


G-1
Appendix G Design of Flow Control Structures
G.1 Design of Flow Control Structures
Flow control devices are orifices and weirs. The following formulas shall be used in computing
maximum release rates from the designed stormwater management facilitystructural BMP.
G.1.1 Circular Orifices
5.0)2( ghCAQ
where:
Q = orifice discharge (cfs)
C = discharge coefficient = 0.6
A = orifice cross-sectional area (ft2) = 3.1416(D2/4)
g = gravitational acceleration (ft/s2) = 32.2
h = hydraulic head above the center of the orifice (ft)
When h < D, the orifice shall be treated as a weir:
2/3CLHQ
where:
Q = flow through the weir (cfs)
C = 3
L = diameter of orifice (ft)
H = hydraulic head above bottom of weir opening (ft)
G.1.2 Flow Under Gates
Flow under a vertical gate can be treated as a square orifice. For submerged conditions:
When outflow is not influenced by downstream water level:
5.0
0
0 )(2
iHH
HgCabQ
where:
Q = flow through the gate (cfs)
b = width of gate (ft)
a = gate opening height (ft)
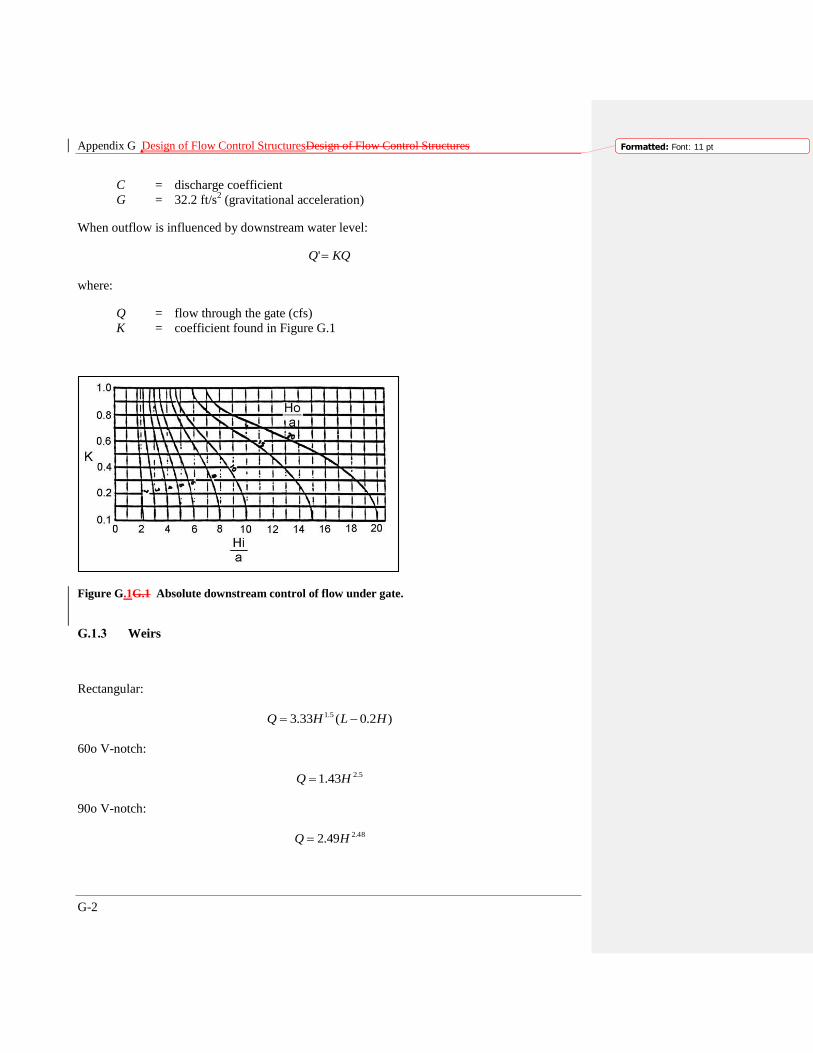
Appendix G Design of Flow Control StructuresDesign of Flow Control Structures
G-2
Formatted: Font: 11 pt
C = discharge coefficient
G = 32.2 ft/s2 (gravitational acceleration)
When outflow is influenced by downstream water level:
KQQ '
where:
Q = flow through the gate (cfs)
K = coefficient found in Figure G.1
Figure G.1G.1 Absolute downstream control of flow under gate.
G.1.3 Weirs
Rectangular:
)2.0(33.3 5.1 HLHQ
60o V-notch:
5.243.1 HQ
90o V-notch:
48.249.2 HQ

Appendix G Design of Flow Control StructuresDesign of Flow Control Structures
G-3
Formatted: Font: 11 pt
where:
Q = low through the weir (cfs)
H = hydraulic head above the bottom of the weir (ft)
L = length of the weir crest (ft)


H-1
Appendix H Acceptable Hydrological Methods
and Models
H.1 Acceptable Hydrologic Methods and Models
The following are the acceptable methodologies and computer models for estimating runoff
hydrographs before and after development. These methods are used to predict the runoff
response from given rainfall information and site surface characteristic conditions. The design
storm frequencies used in all of the hydrologic engineering calculations will be based on design
storms required in this guidebook unless circumstances make consideration of another storm
intensity criterion appropriate:
Urban Hydrology for Small Watersheds TR-55 (TR-55)
Storage-Indication Routing
HEC-1, WinTR-55, TR-20, and SWMM Computer Models
Rational Method (limited to sites under five acres)
These methods are given as valid in principle, and are applicable to most stormwater
management design situations in the District. Other methods may be used when the District
reviewing authority approves their application.
Note: Of the above methods, TR-55 and SWMM allow for the easiest correlation of the benefits
of retention BMPs used to meet the SWRv with peak flow detention requirements, and are
therefore strongly recommended. Appendix A includes more information on using the General
Retention Compliance CalculatorStormwater Compliance Spreadsheet to account for retention
BMPs in calculating peak flow detention requirements.
The following conditions should be assumed when developing predevelopment, preproject, and
post-development hydrology, as applicable:
Predevelopment runoff conditions (used for the 2-year storm) shall be computed independent
of existing developed land uses and conditions and shall be based on ―Meadow in good
condition‖ or better, assuming good hydrologic conditions and land with grass cover.
Preproject runoff conditions (used for the 15-year storm) shall be based on the existing
condition of the site
Post-development shall be computed for future land use assuming good hydrologic and
appropriate land use conditions. If a NRCS CN Method-based approach, such as TR-55, is
used, this curve number may be reduced based upon the application of retention BMPs, as
indicated in the General Retention Compliance CalculatorStormwater Compliance
Spreadsheet (see Appendix A). This curve number reduction will reduce the required

Appendix H Acceptable Hydrological Methods and ModelsAcceptable Hydrological Methods and
Models
H-2
Formatted: Font: 11 pt
detention volume for a site, but it should not be used to reduce the size of conveyance
infrastructure.
The rainfall intensity - duration - frequency curve should be determined from the most recent
version of the Hydrometeorological Design Studies Center‘s Precipitation Frequency Data
Server (NOAA Atlas 14, Volume 2). http://hdsc.nws.noaa.gov/hdsc/pfds/index.html
Predevelopment time of concentration shall be based on the sum total of computed or
estimated overland flow time and travel in natural swales, streams, creeks and rivers, but
never less than six minutes.
Post-development time of concentration shall be based on the sum total of the inlet time and
travel time in improved channels or storm drains, but shall not be less than six minutes.
Drainage areas exceeding 25 acres that are heterogeneous with respect to land use, soils,
RCN or Time of Concentration (Tc) shall require a separate hydrological analysis for each
sub-area including Tc, RCN, soils and land use.
Hydrologic Soil Groups approved for use in the District are contained in the Soil Survey of
the District of Columbia Handbook. Where the Hydrologic Soil Group is not available
through the Soil Survey due to the listed soil type being ―Urban Soils‖ or similar, a
Hydrologic Soil Group of C shall be used.
H.2 Urban Hydrology for Small Watersheds TR-55
Chapter 6 of Urban Hydrology for Small Watersheds TR-55, Storage Volume for Detention
Basins, or TR-55 shortcut procedure, is based on average storage and routing effects for many
structures, and can be used for multistage outflow devices. Refer to TR-55 for more detailed
discussions and limitations.
Information Needed
To calculate the required storage volume using TR-55, the predevelopment hydrology for the 2-
year storm, and the preproject hydrology for the 15-year storm are needed, along with post-
development hydrology for both the 2-year and 15-year storms. The predevelopment hydrology
for the 2-year storm is based on natural conditions (meadow), and will determine the site‘s
predevelopment peak rate of discharge, or allowable release rate, qo2, for the 2-year storm,
where as the preproject hydrology for the 15-year storm is based on existing conditions, and will
determine the site‘s preproject peak rate of discharge, or allowable release rate, qo15, for the 15-
year storm.
The post-development hydrology may be determined using the reduced curve numbers
calculated in the General Retention Compliance CalculatorStormwater Compliance Spreadsheet
(See Appendix A) or more detailed routing calculations. This will determine the site‘s post-
development peak rate of discharge, or inflow for both the 2-year and 15-year storms, qi2 and
qi15, respectively, and the site‘s post-developed runoff, Q2 and Q15, in inches. (Note that this
method does not require a hydrograph.) Once the above parameters are known, the TR-55
Manual can be used to approximate the storage volume required for each design storm. The
following procedure summarizes the TR-55 shortcut method.
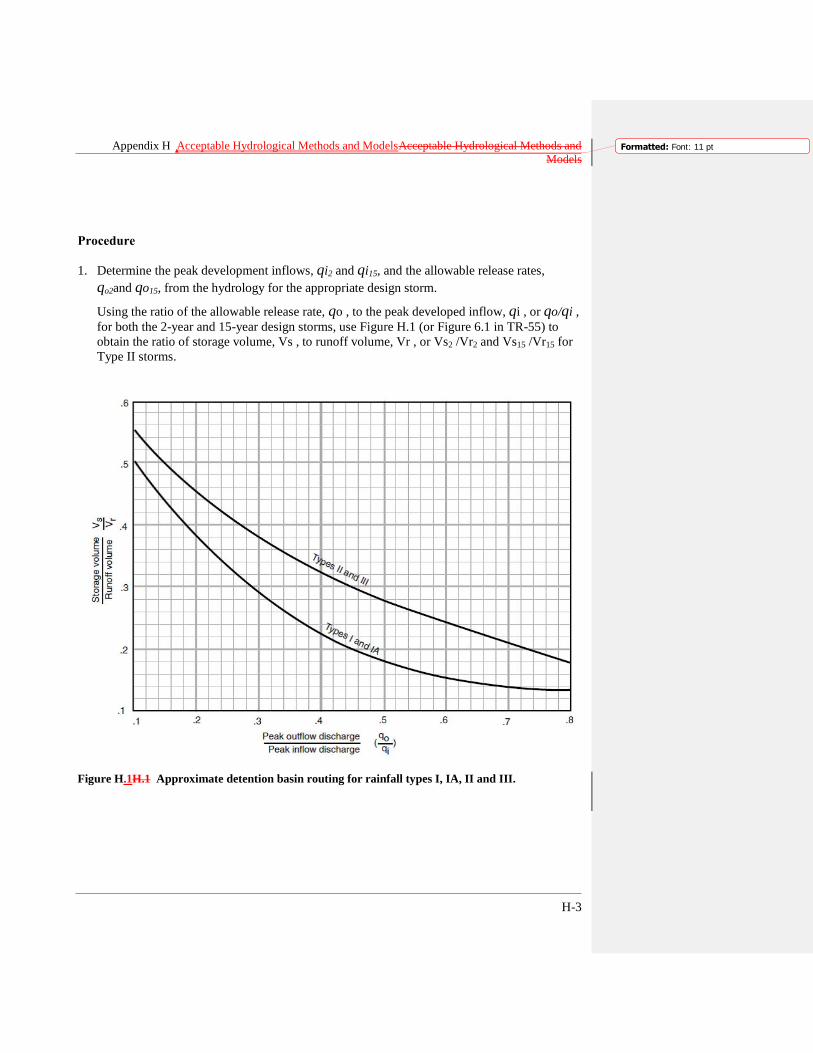
Appendix H Acceptable Hydrological Methods and ModelsAcceptable Hydrological Methods and
Models
H-3
Formatted: Font: 11 pt
Procedure
1. Determine the peak development inflows, qi2 and qi15, and the allowable release rates,
qo2and qo15, from the hydrology for the appropriate design storm.
Using the ratio of the allowable release rate, qo , to the peak developed inflow, qi , or qo/qi ,
for both the 2-year and 15-year design storms, use Figure H.1 (or Figure 6.1 in TR-55) to
obtain the ratio of storage volume, Vs , to runoff volume, Vr , or Vs2 /Vr2 and Vs15 /Vr15 for
Type II storms.
Figure H.1H.1 Approximate detention basin routing for rainfall types I, IA, II and III.
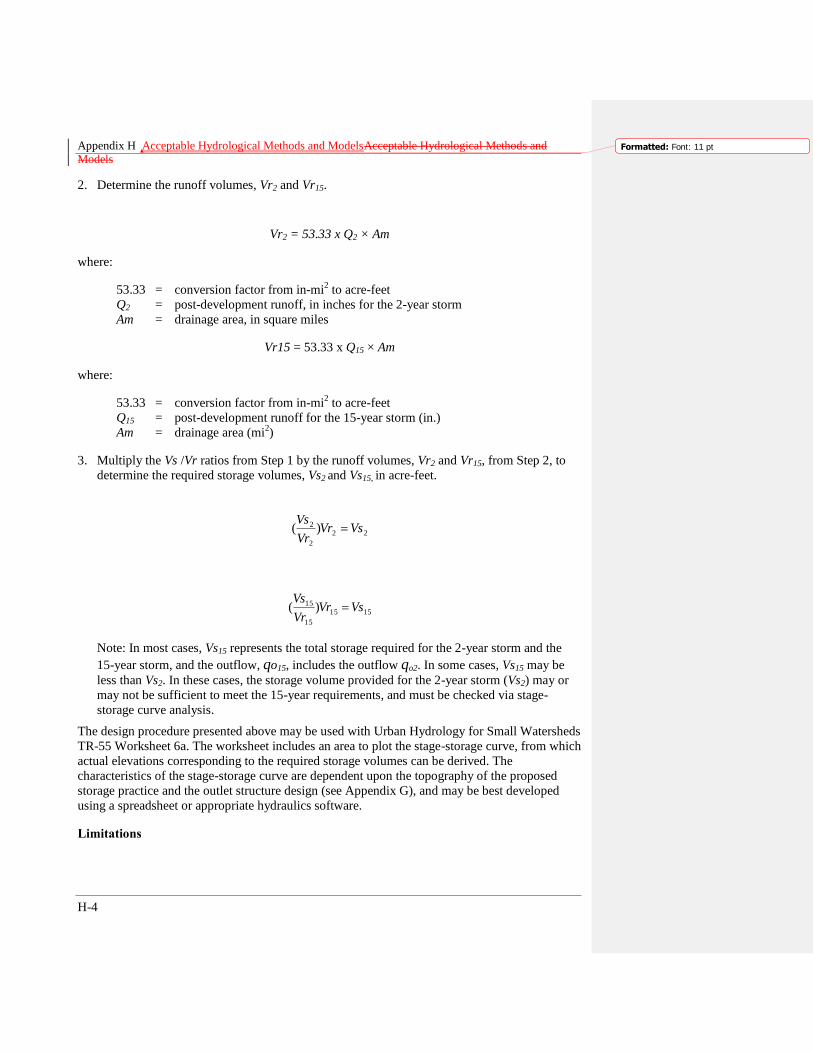
Appendix H Acceptable Hydrological Methods and ModelsAcceptable Hydrological Methods and
Models
H-4
Formatted: Font: 11 pt
2. Determine the runoff volumes, Vr2 and Vr15.
Vr2 = 53.33 x Q2 × Am
where:
53.33 = conversion factor from in-mi2 to acre-feet
Q2 = post-development runoff, in inches for the 2-year storm
Am = drainage area, in square miles
Vr15 = 53.33 x Q15 × Am
where:
53.33 = conversion factor from in-mi2 to acre-feet
Q15 = post-development runoff for the 15-year storm (in.)
Am = drainage area (mi2)
3. Multiply the Vs /Vr ratios from Step 1 by the runoff volumes, Vr2 and Vr15, from Step 2, to
determine the required storage volumes, Vs2 and Vs15, in acre-feet.
22
2
2 )( VsVrVr
Vs
1515
15
15 )( VsVrVr
Vs
Note: In most cases, Vs15 represents the total storage required for the 2-year storm and the
15-year storm, and the outflow, qo15, includes the outflow qo2. In some cases, Vs15 may be
less than Vs2. In these cases, the storage volume provided for the 2-year storm (Vs2) may or
may not be sufficient to meet the 15-year requirements, and must be checked via stage-
storage curve analysis.
The design procedure presented above may be used with Urban Hydrology for Small Watersheds
TR-55 Worksheet 6a. The worksheet includes an area to plot the stage-storage curve, from which
actual elevations corresponding to the required storage volumes can be derived. The
characteristics of the stage-storage curve are dependent upon the topography of the proposed
storage practice and the outlet structure design (see Appendix G), and may be best developed
using a spreadsheet or appropriate hydraulics software.
Limitations

Appendix H Acceptable Hydrological Methods and ModelsAcceptable Hydrological Methods and
Models
H-5
Formatted: Font: 11 pt
This routing method is less accurate as the qo/qi ratio approaches the limits shown in Figure H.1.
The curves in Figure H.1 depend on the relationship between available storage, outflow device,
inflow volume, and shape of the inflow hydrograph. When storage volume (Vs) required is small,
the shape of the outflow hydrograph is sensitive to the rate of the inflow hydrograph.
Conversely, when Vs is large, the inflow hydrograph shape has little effect on the outflow
hydrograph. In such instances, the outflow hydrograph is controlled by the hydraulics of the
outflow device and the procedure therefore yields consistent results. When the peak outflow
discharge (qo) approaches the peak inflow discharge (qi) parameters that affect the rate of rise of
a hydrograph, such as rainfall volume, curve number, and time of concentration, become
especially significant.
The procedure should not be used to perform final design if an error in storage of 25 percent
cannot be tolerated. Figure H.1 is biased to prevent undersizing of outflow devices, but it may
significantly overestimate the required storage capacity. More detailed hydrograph development
and storage indication routing will often pay for itself through reduced construction costs.
H.3 Storage-Indication Routing
Storage-Indication Routing may be used to analyze storage detention practices. This approach
requires that the inflow hydrograph be developed through one of the methods listed in this
appendix (TR-55, WinTR-55, SWMM, etc.), as well as the required maximum outflows, qo2 and
qo15. Using the stage-discharge relationship for a given combination outlet devices, the detention
volume necessary to achieve the maximum outflows can be determined.
H.4 HEC-1, WinTR-55, TR-20, and SWMM Computer Models
If the application of the above computer models is needed, the complete input data file and
printout will be submitted with the stormwater management plans at the 85 percent submittal
stage. Submission of stormwater management plans shall include the following computer model
documentation:
For all computer models, supporting computations prepared for the data input file shall be
submitted with the stormwater management plans.
Inflow-outflow hydrographs shall be computed for each design storm presented graphically,
and submitted for all plans.
Schematic (node) diagrams must be provided for all routings.
H.5 Rational Method
While this method is not recommended, as it cannot account for the retention/detention benefits
of the BMPs applied on a site, this method will be permitted for use in a development of five
acres or less. When applying this method, the following steps must be taken in the design
consideration:
In the case of more than one sub-drainage area, the longest time of concentration shall be
selected.
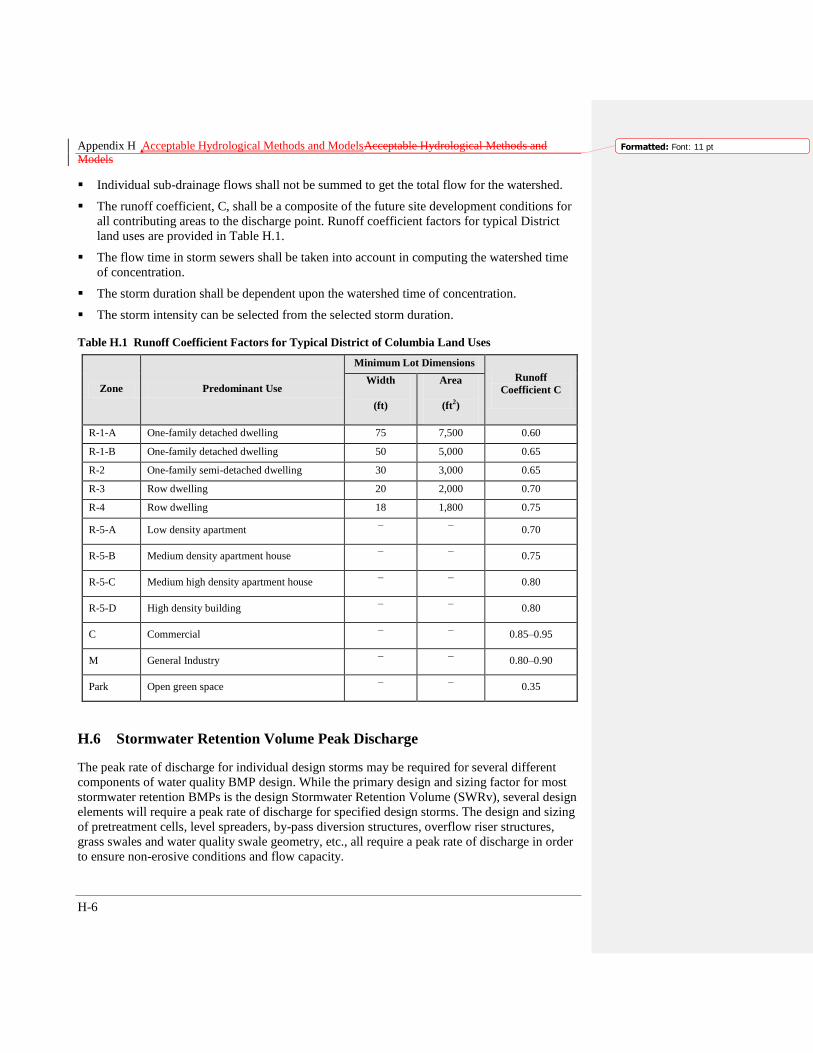
Appendix H Acceptable Hydrological Methods and ModelsAcceptable Hydrological Methods and
Models
H-6
Formatted: Font: 11 pt
Individual sub-drainage flows shall not be summed to get the total flow for the watershed.
The runoff coefficient, C, shall be a composite of the future site development conditions for
all contributing areas to the discharge point. Runoff coefficient factors for typical District
land uses are provided in Table H.1.
The flow time in storm sewers shall be taken into account in computing the watershed time
of concentration.
The storm duration shall be dependent upon the watershed time of concentration.
The storm intensity can be selected from the selected storm duration.
Table H.1 Runoff Coefficient Factors for Typical District of Columbia Land Uses
Zone Predominant Use
Minimum Lot Dimensions
Runoff
Coefficient C Width
(ft)
Area
(ft2)
R-1-A One-family detached dwelling 75 7,500 0.60
R-1-B One-family detached dwelling 50 5,000 0.65
R-2 One-family semi-detached dwelling 30 3,000 0.65
R-3 Row dwelling 20 2,000 0.70
R-4 Row dwelling 18 1,800 0.75
R-5-A Low density apartment – –
0.70
R-5-B Medium density apartment house – –
0.75
R-5-C Medium high density apartment house – –
0.80
R-5-D High density building – –
0.80
C Commercial – – 0.85–0.95
M General Industry – –
0.80–0.90
Park Open green space – –
0.35
H.6 Stormwater Retention Volume Peak Discharge
The peak rate of discharge for individual design storms may be required for several different
components of water quality BMP design. While the primary design and sizing factor for most
stormwater retention BMPs is the design Stormwater Retention Volume (SWRv), several design
elements will require a peak rate of discharge for specified design storms. The design and sizing
of pretreatment cells, level spreaders, by-pass diversion structures, overflow riser structures,
grass swales and water quality swale geometry, etc., all require a peak rate of discharge in order
to ensure non-erosive conditions and flow capacity.
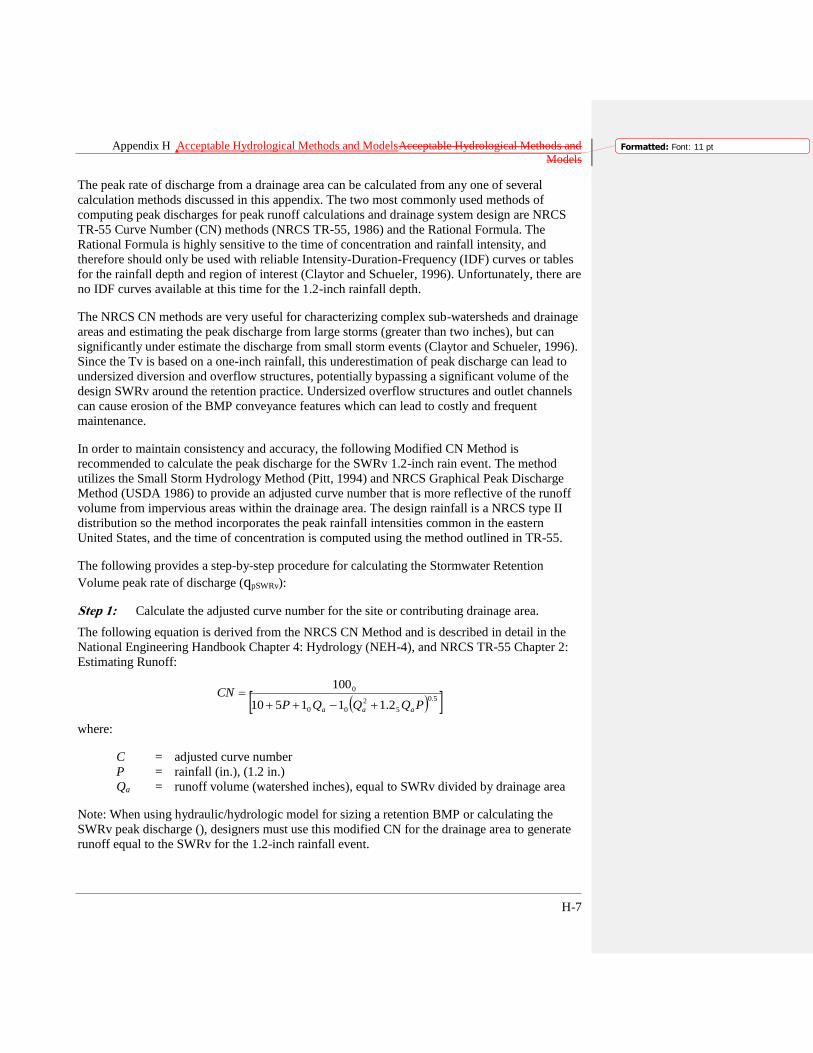
Appendix H Acceptable Hydrological Methods and ModelsAcceptable Hydrological Methods and
Models
H-7
Formatted: Font: 11 pt
The peak rate of discharge from a drainage area can be calculated from any one of several
calculation methods discussed in this appendix. The two most commonly used methods of
computing peak discharges for peak runoff calculations and drainage system design are NRCS
TR-55 Curve Number (CN) methods (NRCS TR-55, 1986) and the Rational Formula. The
Rational Formula is highly sensitive to the time of concentration and rainfall intensity, and
therefore should only be used with reliable Intensity-Duration-Frequency (IDF) curves or tables
for the rainfall depth and region of interest (Claytor and Schueler, 1996). Unfortunately, there are
no IDF curves available at this time for the 1.2-inch rainfall depth.
The NRCS CN methods are very useful for characterizing complex sub-watersheds and drainage
areas and estimating the peak discharge from large storms (greater than two inches), but can
significantly under estimate the discharge from small storm events (Claytor and Schueler, 1996).
Since the Tv is based on a one-inch rainfall, this underestimation of peak discharge can lead to
undersized diversion and overflow structures, potentially bypassing a significant volume of the
design SWRv around the retention practice. Undersized overflow structures and outlet channels
can cause erosion of the BMP conveyance features which can lead to costly and frequent
maintenance.
In order to maintain consistency and accuracy, the following Modified CN Method is
recommended to calculate the peak discharge for the SWRv 1.2-inch rain event. The method
utilizes the Small Storm Hydrology Method (Pitt, 1994) and NRCS Graphical Peak Discharge
Method (USDA 1986) to provide an adjusted curve number that is more reflective of the runoff
volume from impervious areas within the drainage area. The design rainfall is a NRCS type II
distribution so the method incorporates the peak rainfall intensities common in the eastern
United States, and the time of concentration is computed using the method outlined in TR-55.
The following provides a step-by-step procedure for calculating the Stormwater Retention
Volume peak rate of discharge (qpSWRv):
Step 1: Calculate the adjusted curve number for the site or contributing drainage area.
The following equation is derived from the NRCS CN Method and is described in detail in the
National Engineering Handbook Chapter 4: Hydrology (NEH-4), and NRCS TR-55 Chapter 2:
Estimating Runoff:
5.0
5
2
00
0
2.111510
100
PQQQPCN
aaa
where:
C = adjusted curve number
P = rainfall (in.), (1.2 in.)
Qa = runoff volume (watershed inches), equal to SWRv divided by drainage area
Note: When using hydraulic/hydrologic model for sizing a retention BMP or calculating the
SWRv peak discharge (), designers must use this modified CN for the drainage area to generate
runoff equal to the SWRv for the 1.2-inch rainfall event.
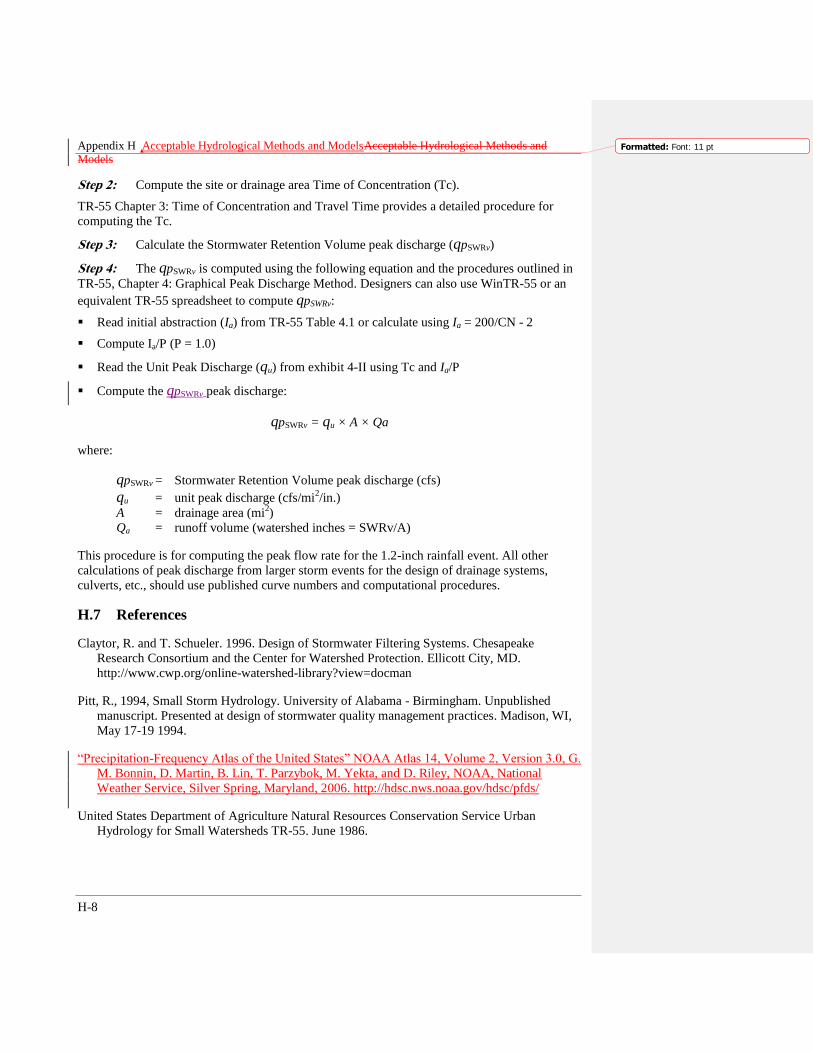
Appendix H Acceptable Hydrological Methods and ModelsAcceptable Hydrological Methods and
Models
H-8
Formatted: Font: 11 pt
Step 2: Compute the site or drainage area Time of Concentration (Tc).
TR-55 Chapter 3: Time of Concentration and Travel Time provides a detailed procedure for
computing the Tc.
Step 3: Calculate the Stormwater Retention Volume peak discharge (qpSWRv)
Step 4: The qpSWRv is computed using the following equation and the procedures outlined in
TR-55, Chapter 4: Graphical Peak Discharge Method. Designers can also use WinTR-55 or an
equivalent TR-55 spreadsheet to compute qpSWRv:
Read initial abstraction (Ia) from TR-55 Table 4.1 or calculate using Ia = 200/CN - 2
Compute Ia/P (P = 1.0)
Read the Unit Peak Discharge (qu) from exhibit 4-II using Tc and Ia/P
Compute the qpSWRv peak discharge:
qpSWRv = qu × A × Qa
where:
qpSWRv = Stormwater Retention Volume peak discharge (cfs)
qu = unit peak discharge (cfs/mi2/in.)
A = drainage area (mi2)
Qa = runoff volume (watershed inches = SWRv/A)
This procedure is for computing the peak flow rate for the 1.2-inch rainfall event. All other
calculations of peak discharge from larger storm events for the design of drainage systems,
culverts, etc., should use published curve numbers and computational procedures.
H.7 References
Claytor, R. and T. Schueler. 1996. Design of Stormwater Filtering Systems. Chesapeake
Research Consortium and the Center for Watershed Protection. Ellicott City, MD.
http://www.cwp.org/online-watershed-library?view=docman
Pitt, R., 1994, Small Storm Hydrology. University of Alabama - Birmingham. Unpublished
manuscript. Presented at design of stormwater quality management practices. Madison, WI,
May 17-19 1994.
―Precipitation-Frequency Atlas of the United States‖ NOAA Atlas 14, Volume 2, Version 3.0, G.
M. Bonnin, D. Martin, B. Lin, T. Parzybok, M. Yekta, and D. Riley, NOAA, National
Weather Service, Silver Spring, Maryland, 2006. http://hdsc.nws.noaa.gov/hdsc/pfds/
United States Department of Agriculture Natural Resources Conservation Service Urban
Hydrology for Small Watersheds TR-55. June 1986.

Appendix H Acceptable Hydrological Methods and ModelsAcceptable Hydrological Methods and
Models
H-9
Formatted: Font: 11 pt
Virginia Department of Conservation and Recreation DRAFT 2009 Virginia Stormwater
Management Handbook. September 2009.


I-1
Appendix I Rooftop Storage Design Guidance
and Criteria
I.1 Rooftop Storage Design Guidance and Criteria
Note: Rooftop storage, as described in this Appendix, is intended as a detention practice only.
The rules and guidelines presented in this Appendix do not apply to green roofs (Section 3.2).
1. Rooftop storage may be used to provide detention for the 2-year and 15-year storms, as
applicable. Detention calculations must follow the procedures identified in Chapter 2 and
Appendix H.
2. Rainfall from the 2-year, 24-hour storm results in an accumulated rainfall of approximately
3.2 inches, and rainfall from the 15-year, 24-hour storm results in an accumulated rainfall of
approximately 5.2 inches. Peak flow detention calculations for either of these storms will
require less than these depths (assuming there is no run-on from other rooftop areas.
(a) Based on a snow load of 30 pounds per square foot or 5.8 inches of water, properly
designed roofs must be structurally capable of holding the required detention volume
with a reasonable factor of safety.
(b) Roofs calculated to store depths greater than three inches shall be required to show
structural adequacy of the roof design.
3. No less than two roof drains shall be installed in roof areas of 10,000 square feet or less, and
at least four drains shall be installed in roof areas over 10,000 square feet in area. Roof areas
exceeding 40,000 square feet shall have one drain for each 10,000 square foot area.
4. Emergency overflow measures adequate to discharge the 100-year, 45-minute storm must be
provided.
(a) If parapet walls exceed 5 inches in height, the designer shall provide openings (scuppers)
in the parapet wall sufficient to discharge the design storm flow at a water level not
exceeding 5 inches.
(b) One scupper shall be provided for every 20,000 square feet of roof area, and the invert of
the scupper shall not be more than 5 inches above the roof level. (If such openings are not
practical, then detention rings shall be sized accordingly).
5. Detention rings shall be placed around all roof drains that do not have controlled flow.
(a) The number of holes or size of openings in the rings shall be computed based on the area
of roof drained and run-off criteria.
(b) The minimum spacing of sets of holes is 2 inches center-to-center.
(c) The height of the ring is determined by the roof slope and detention requirements, and
shall be 5 inches maximum.

Appendix I Rooftop Storage Design Guidance and CriteriaRooftop Storage Design Guidance and Criteria
I-2
Formatted: Font: 11 pt
(d) The diameter of the rings shall be sized to accommodate the required openings and, if
scuppers are not provided, to allow the 100-year design storm to overtop the ring
(overflow design is based on weir computations with the weir length equal to the
circumference of the detention ring).
(e) Conductors and leaders shall also be sized to pass the expected flow from the 100-year
design storm.
6. The maximum time of drawdown on the roof shall not exceed 17 hours.
7. Josam Manufacturing Company and Zurn Industries, Inc. market ―controlled-flow‖ roof
drains. These products, or their equivalent, are acceptable.
8. Computations required on plans:
(a) Roof area in square feet.
(b) Storage provided at design depth.
(c) Maximum allowable discharge rate.
(d) Inflow-outflow hydrograph analysis or acceptable charts (for Josam Manufacturing
Company and Zurn Industries, Inc. standard drains, the peak discharge rates as given in
their charts are acceptable for drainage calculation purposes without requiring full
inflow-outflow hydrograph analysis).
(e) Number of drains required.
(f) Sizing of openings required in detention rings.
(g) Sizing of ring to accept openings and to pass 100-year design storm.
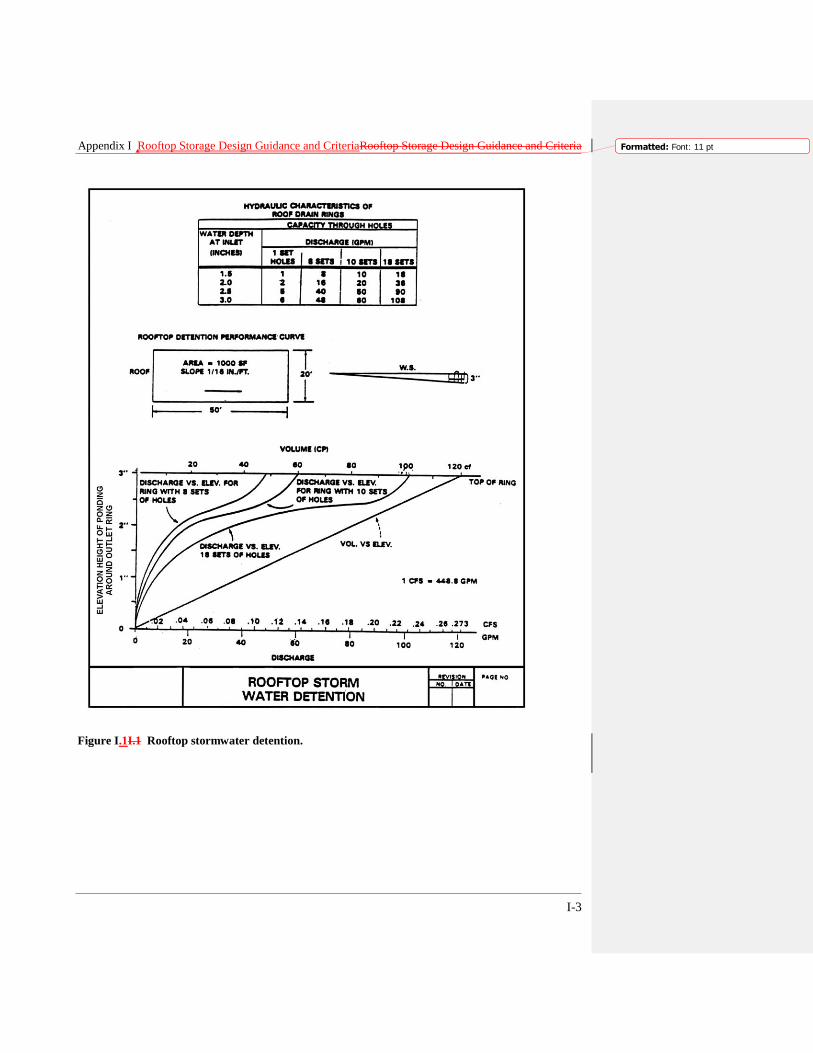
Appendix I Rooftop Storage Design Guidance and CriteriaRooftop Storage Design Guidance and Criteria
I-3
Formatted: Font: 11 pt
Figure I.1I.1 Rooftop stormwater detention.
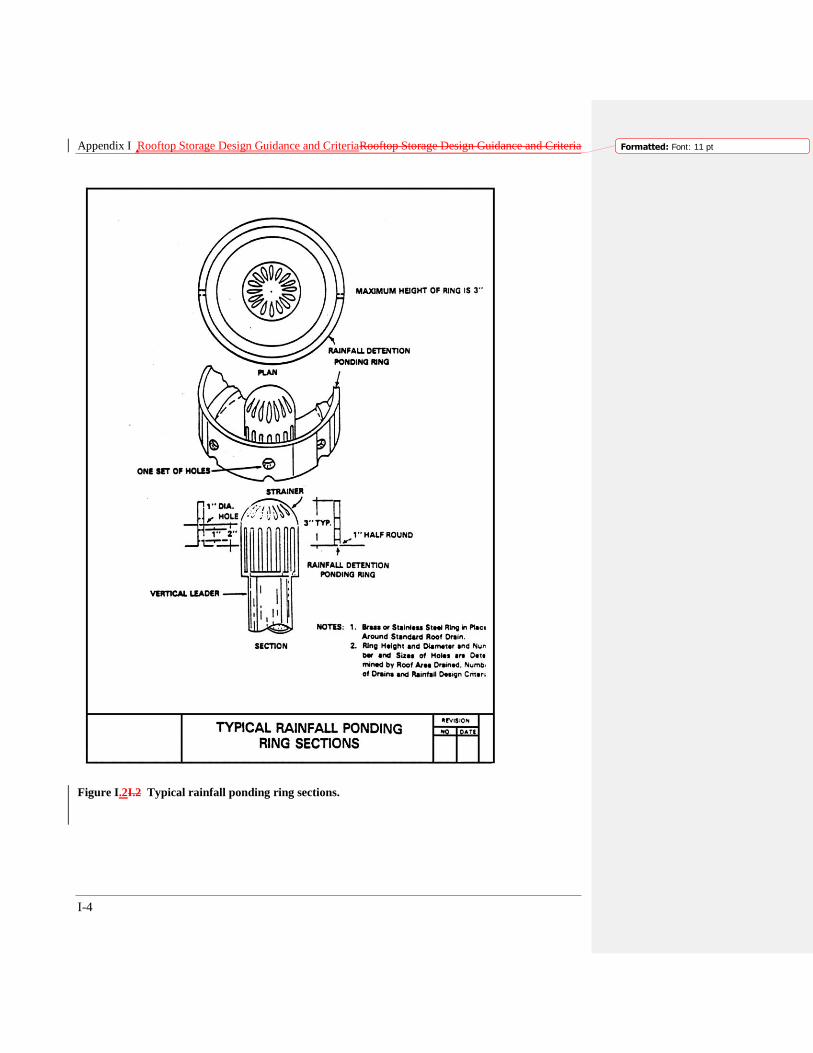
Appendix I Rooftop Storage Design Guidance and CriteriaRooftop Storage Design Guidance and Criteria
I-4
Formatted: Font: 11 pt
Figure I.2I.2 Typical rainfall ponding ring sections.

I-1
Appendix J Reserved
The appendix on the Green Area Ratio (GAR) was removed. Guidance on the GAR will be
through separate guidance documents available on DDOE‘s website when the GAR Rule is
finalized.


J-1
Appendix KAppendix J Soil Compost Amendment
Requirements
J.1 Introduction
Soil amendment (also called soil restoration) is a technique applied after construction to deeply
till compacted soils and restore their porosity by amending them with compost. These soil
amendments can be used to enhance the performance of impervious cover disconnections and
grass channels.
K.1J.2 Physical Feasibility and Design Applications
Amended soils are suitable for any pervious area where soils have been or will be compacted by
the grading and construction process. They are particularly well suited when existing soils have
low infiltration rates (HSG C and D) and when the pervious area will be used to filter runoff
(downspout disconnections and grass channels). The area or strip of amended soils should be
hydraulically connected to the stormwater conveyance system. Soil restoration is recommended
for sites that will experience mass grading of more than a foot of cut and fill across the site.
Compost amendments are not recommended where:
Existing soils have high infiltration rates (e.g., HSG A and B), although compost
amendments may be needed at mass-graded B soils in order to maintain infiltration rates.
The water table or bedrock is located within 1.5 feet of the soil surface.
Slopes exceed 10 percent (compost can be used on slopes exceeding 10 percent as long as
proper soil erosion and sediment control measures are included in the plan).
Existing soils are saturated or seasonally wet.
They would harm roots of existing trees (keep amendments outside the tree drip line).
The downhill slope runs toward an existing or proposed building foundation.
Areas that will be used for snow storage.
K.2J.3 Design Criteria
Performance. When Used in Conjunction with Other Practices. As referenced in several of the
Chapter 3 specifications, soil compost amendments can be used to enhance the performance of
allied practices by improving runoff infiltration. The specifications for each of these practices
contain design criteria for how compost amendments can be incorporated into those designs:
Impermeable Surface Disconnection – See Section 3.4 Impervious Surface Disconnection.
Grass Channels –See Section 3.9 Open Channel Systems.
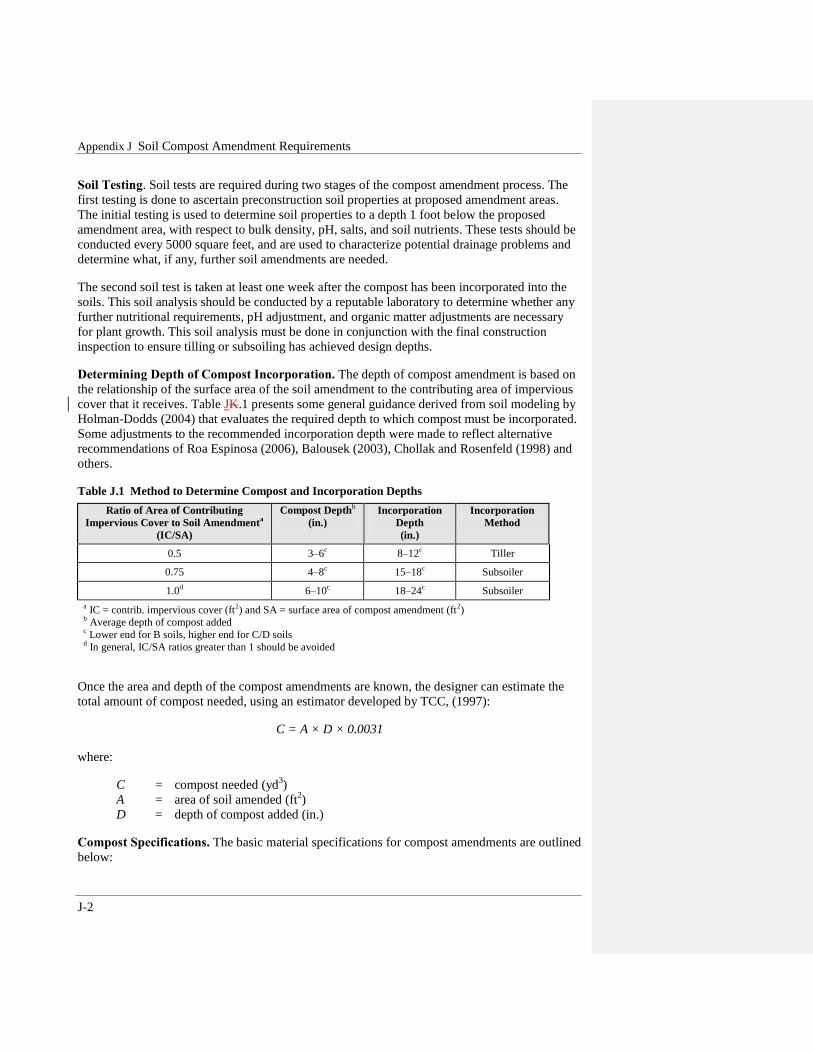
Appendix J Soil Compost Amendment Requirements
J-2
Soil Testing. Soil tests are required during two stages of the compost amendment process. The
first testing is done to ascertain preconstruction soil properties at proposed amendment areas.
The initial testing is used to determine soil properties to a depth 1 foot below the proposed
amendment area, with respect to bulk density, pH, salts, and soil nutrients. These tests should be
conducted every 5000 square feet, and are used to characterize potential drainage problems and
determine what, if any, further soil amendments are needed.
The second soil test is taken at least one week after the compost has been incorporated into the
soils. This soil analysis should be conducted by a reputable laboratory to determine whether any
further nutritional requirements, pH adjustment, and organic matter adjustments are necessary
for plant growth. This soil analysis must be done in conjunction with the final construction
inspection to ensure tilling or subsoiling has achieved design depths.
Determining Depth of Compost Incorporation. The depth of compost amendment is based on
the relationship of the surface area of the soil amendment to the contributing area of impervious
cover that it receives. Table JK.1 presents some general guidance derived from soil modeling by
Holman-Dodds (2004) that evaluates the required depth to which compost must be incorporated.
Some adjustments to the recommended incorporation depth were made to reflect alternative
recommendations of Roa Espinosa (2006), Balousek (2003), Chollak and Rosenfeld (1998) and
others.
Table J.1 Method to Determine Compost and Incorporation Depths
Ratio of Area of Contributing
Impervious Cover to Soil Amendmenta
(IC/SA)
Compost Depthb
(in.)
Incorporation
Depth
(in.)
Incorporation
Method
0.5 3–6c 8–12
c Tiller
0.75 4–8c 15–18
c Subsoiler
1.0d 6–10
c 18–24
c Subsoiler
a IC = contrib. impervious cover (ft
2) and SA = surface area of compost amendment (ft
2)
b Average depth of compost added
c Lower end for B soils, higher end for C/D soils
d In general, IC/SA ratios greater than 1 should be avoided
Once the area and depth of the compost amendments are known, the designer can estimate the
total amount of compost needed, using an estimator developed by TCC, (1997):
C = A × D × 0.0031
where:
C = compost needed (yd3)
A = area of soil amended (ft2)
D = depth of compost added (in.)
Compost Specifications. The basic material specifications for compost amendments are outlined
below:

Appendix J Soil Compost Amendment Requirements
J-3
Compost shall be derived from plant material and provided by a member of the U.S.
Composting Seal of Testing Assurance (STA) program. See www.compostingcouncil.org for
a list of local providers.
Alternative specifications and/or certifications, such as those administered by the Maryland
Department of Agriculture or other agencies, may be substituted, as authorized by DDOE. In
all cases, compost material must meet standards for chemical contamination and pathogen
limits pertaining to source materials, as well as reasonable limits on phosphorus and nitrogen
content to avoid excessive leaching of nutrients.
The compost shall be the result of the biological degradation and transformation of plant-
derived materials under conditions that promote anaerobic decomposition. The material shall
be well composted, free of viable weed seeds, and stable with regard to oxygen consumption
and carbon dioxide generation. The compost shall have a moisture content that has no visible
free water or dust produced when handling the material. It shall meet the following criteria,
as reported by the U.S. Composting Council STA Compost Technical Data Sheet provided
by the vendor:
(a) 100 percent of the material must pass through a half-inch screen
(b) The pH of the material shall be between 6 and 8
(c) Manufactured inert material (plastic, concrete, ceramics, metal, etc.) shall be less than 1.0
percent by weight
(d) The organic matter content shall be between 35 and 65 percent
(e) Soluble salt content shall be less than 6.0 mmhos/cm
(f) Maturity must be greater than 80 percent
(g) Stability shall be 7 or less
(h) Carbon/nitrogen ratio shall be less than 25:1
(i) Trace metal test result = ―pass‖
(j) The compost must have a dry bulk density ranging from 40 to 50 lb/ft3
K.3J.4 Construction Sequence
The construction sequence for compost amendments differs depending whether the practice will
be applied to a large area or a narrow filter strip, such as in a rooftop disconnection or grass
channel. For larger areas, a typical construction sequence is as follows:
Step 1: Soil Erosion and Sediment Control. When areas of compost amendments exceed
2500 square feet install soil erosion and sediment control measures, such as silt fences, are
required to secure the area until the surface is stabilized by vegetation.
Step 1:Step 2: Deep Till. DA deep tilling to a depth of 12 to 18 inches after the final building
lots have been graded is recommended prior to the addition of compost.
Step 2:Step 3: Dry Conditions. It is important to haveWait for dry conditions at the site prior to
incorporating compost.

Appendix J Soil Compost Amendment Requirements
J-4
Step 3:Step 4: Compost. The Incorporate the required depth of compost depth (as indicated in
Table JK.1) is then incorporated into the tilled soil to the required depth using the appropriate
equipment.
Level tThe site should be leveled. and sSeeds or sod used are required to establish a vigorous
grass cover. To help the grass grow quickly lLime or irrigation may initially be neededis
recommended. to help the grass grow quickly.
Step 4: Areas of compost amendments exceeding 2500 square feet should employ simple
erosion control measures, such as silt fence, to reduce the potential for erosion and trap sediment.
Step 5: Vegetation. Ensure surface area is stabilized with vegetation.
Construction Inspection. Construction inspection by a qualified professional involves digging a
test pit to verify the depth of amended soil and scarification. A rod penetrometer should be used
to establish the depth of uncompacted soil at a minimum of one location per 10,000 square feet.
K.4J.5 Maintenance
First-Year Maintenance Operations. In order to ensure the success of soil compost
amendments, the following tasks must be undertaken in the first year following soil restoration:
Initial inspections. For the first six months following the incorporation of soil amendments,
the site should be inspected by a qualified professional at least once after each storm event
that exceeds 1/2-inch of rainfall.
Spot Reseeding. Inspectors should look for bare or eroding areas in the contributing drainage
area or around the soil restoration area and make sure they are immediately stabilized with
grass cover.
Fertilization. Depending on the amended soils test, a one-time, spot fertilization may be
needed in the fall after the first growing season to increase plant vigor.
Watering. Water once every three days for the first month, and then weekly during the first
year (April-October), depending on rainfall.
Ongoing Maintenance. There are no major ongoing maintenance needs associated with soil
compost amendments, although the owners may want to de-thatch the turf every few years to
increase permeability. The owner should also be aware that there are maintenance tasks needed
for filter strips, grass channels, and reforestation areas. DDOE‘s maintenance inspection
checklist for an area of Soil Compost Amendments can be accessed in Appendix MAppendix L.
Declaration of Covenants. A maintenance covenant is required for all stormwater management
practices. The covenant specifies the property owner‘s primary maintenance responsibilities, and
authorizes DDOE staff to access the property for inspection or corrective action in the event the
proper maintenance is not performed. The covenant is attached to the deed of the property (see
standard form, variations exist for scenarios where stormwater crosses property lines). The
covenant is between the property and the District Government of the District of Columbia. It is
submitted through the Office of the Attorney General. All SWMPs have a maintenance
agreement stamp that must be signed for a building permit to proceed. There may be a

Appendix J Soil Compost Amendment Requirements
J-5
maintenance schedule on the drawings themselves or the plans may refer to the maintenance
schedule (schedule cExhibit C in the covenant).
Covenants are not required on government properties, but maintenance responsibilities must be
defined through a partnership agreement or a memorandum of understanding.
K.5J.6 References
Balusek. 2003. Quantifying decreases in stormwater runoff from deep-tilling, chisel-planting and
compost amendments. Dane County Land Conservation Department. Madison, Wisconsin.
Chollak, T. and P. Rosenfeld. 1998. Guidelines for Landscaping with Compost-Amended Soils.
City of Redmond Public Works. Redmond, WA. Available online at:
www.redmond.gov/common/pages/UserFile.aspx?fileId=14766
The Composting Council (TCC). 1997. Development of a Landscape Architect Specification for
Compost Utilization. Alexandria, VA. http://www.cwc.org/organics/org972rpt.pdf
Holman-Dodds, L. 2004. Chapter 6. Assessing Infiltration-Based Stormwater Practices. PhD
Dissertation. Department of Hydroscience and Engineering. University of Iowa. Iowa City,
IA.
Low Impact Development Center. 2003. Guideline for Soil Amendments. Available online at:
http://www.lowimpactdevelopment.org/epa03/soilamend.htm
Roa-Espinosa. 2006. An Introduction to Soil Compaction and the Subsoiling Practice. Technical
Note. Dane County Land Conservation Department. Madison, Wisconsin