appendix a – amended environmental compliance approval
TRANSCRIPT
Township of Mapleton Mapleton Wastewater Servicing Class EA - Environmental Study Report
BRM-605325-A0 November 2017
Appendix A – Amended Environmental Compliance Approval
Number 0963-A4ZMVA


Township of Mapleton Mapleton Wastewater Servicing Class EA - Environmental Study Report
BRM-605325-A0 November 2017
Appendix B – Receiving Water Impact Assessment Update

EXP Services Inc.
1595 Clark Blvd.Brampton, Ontario, L6T 4V1
T: 905.793.9800 • www.exp.com
Memorandum
To: Brad McRoberts, P.Eng. From: EXP Services Inc.
Date: October 13, 2017
Project Name Mapleton WPCP Class EA Project No.: BRM-00605325-A0
Subject Receiving Water Impact Assessment (Final)
Prepared By: Hui Wang, P.Eng; Arun Jain, P.Eng., Jesse Newton, EIT, Jean-Louis Gaudet
Distribution:
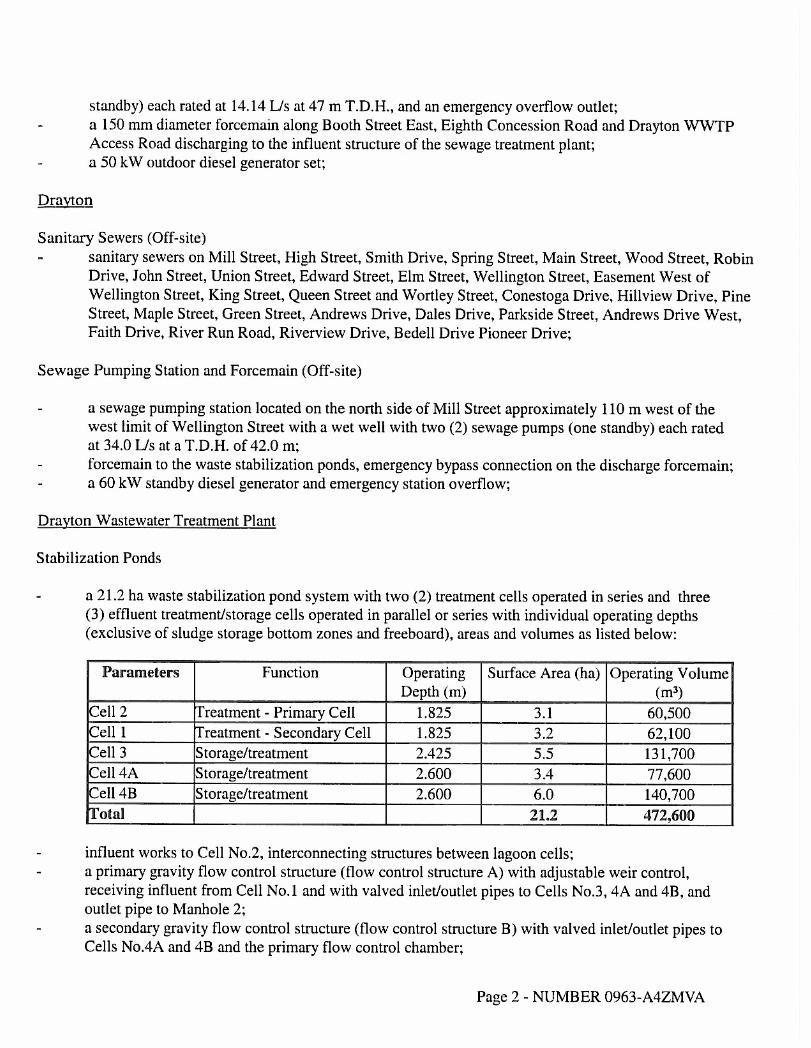
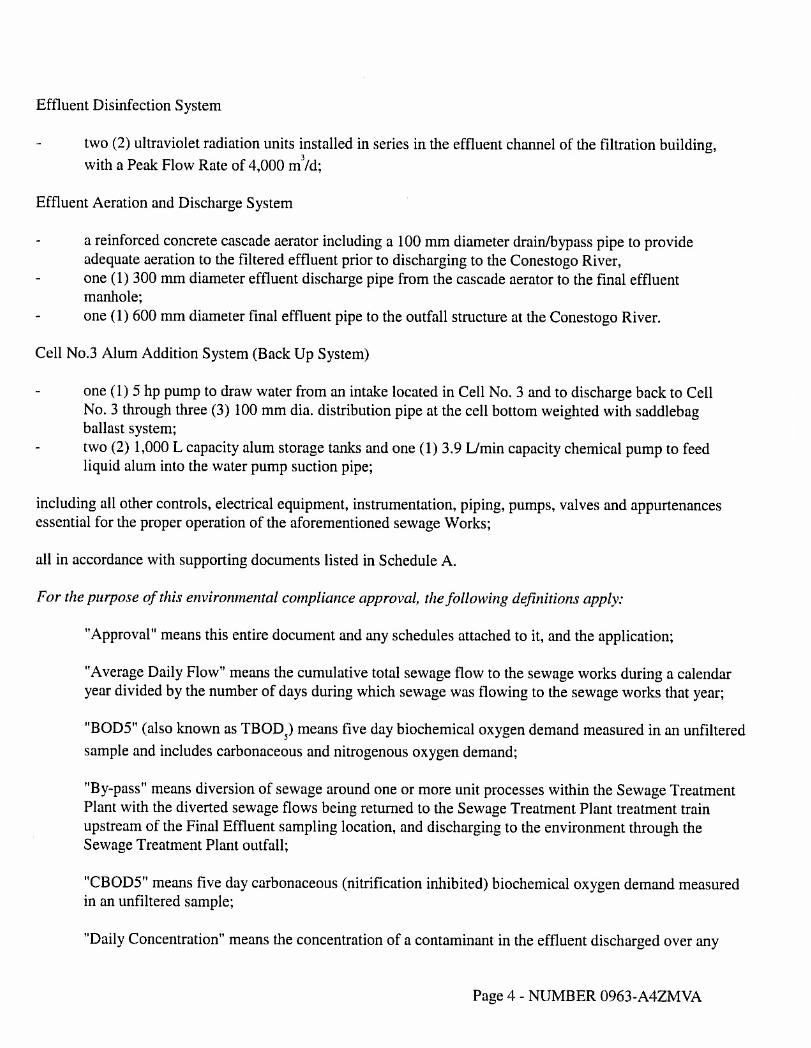
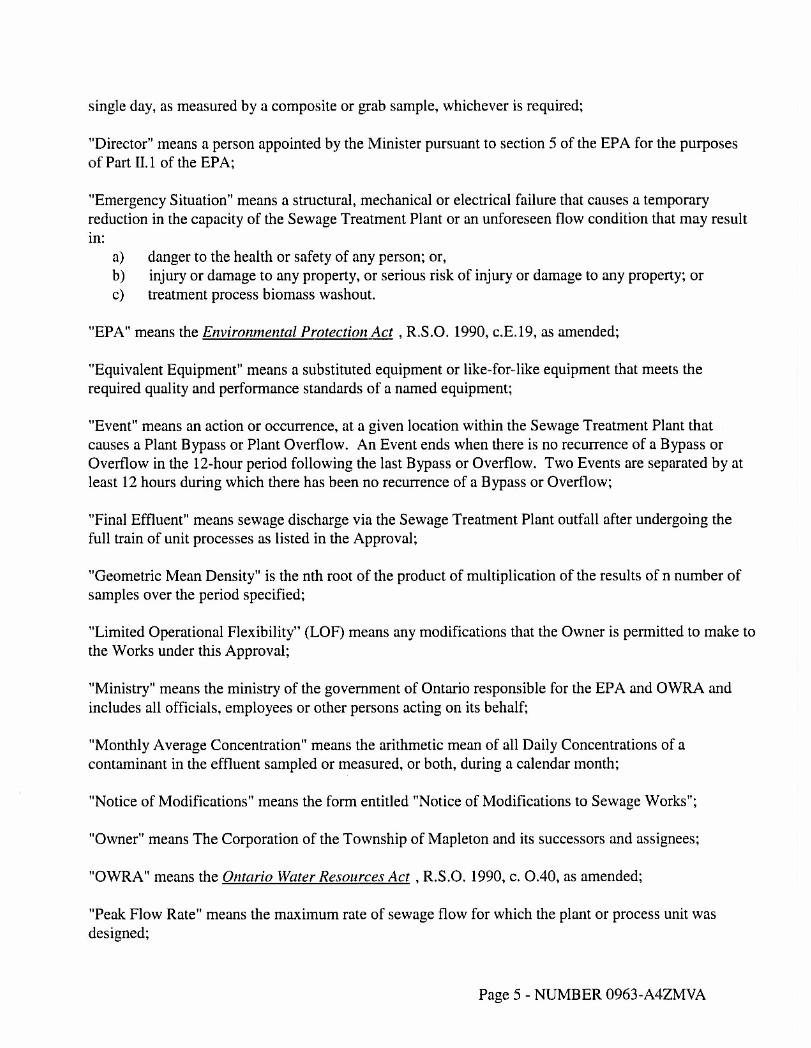
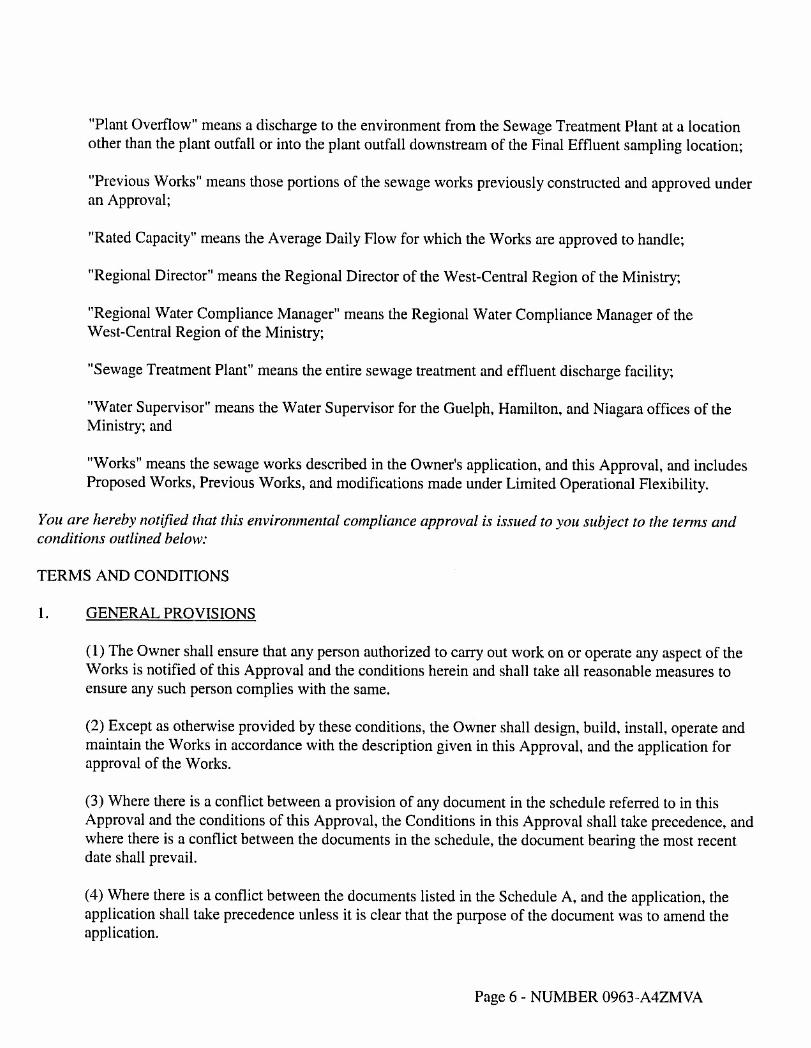
1 Summary
The Township of Mapleton is undertaking a Schedule C Class Environmental Assessment (EA) to expand the Mapleton Wastewater Pollution Control Plant (WPCP) to cater to 2031 demands. It is expected that plant will need to be expanded from the current 750 m3/day capacity to a future capacity of 1,300 m3 /day.
In this context, the previous Receiving Water Impact Assessment – Mapleton WPCP, Conestogo River at Drayton (2008) was reviewed. The previous work recommended a discharge of 4000 m3/day through months of January – April and from October – December. This approach was not deemed to be entirely correct due to lack of correlation between proposed discharge and monthly 7Q20 flows in the river.
The approach taken in this Receiving Water Impact Assessment (RWIA) update relies on new calculation of 7Q20 flows based on 38 year of data from 1973-2013. The maximum potential discharge flow was established by maintaining the river water concentration of un-ionized ammonia in line with the Ontario Provincial Water Quality Objectives (PWQO). This should serve as the theoretical maximum allowable discharge flow for current and future expansions of the plant.
The proposed discharge flow, however, has been developed based on the following:
• Adjusting dilution in way as to not go below current minimum dilution achieved in December discharges;
• Allowing for discharge of accumulated rainfall volume of 158 m3.
Since the river waters are deemed to be Policy 2 with respect to total phosphorus (TP), the new TP limit is based on no increased loading to the river in future, compared to the WPCP’s existing (2016) amended Environmental Compliance Approval (included in Appendix A).
Township of Mapleton Receiving Water Impact Assessment for Mapleton WPCP Upgrade
BRM-00605325-A0 October 13, 2017
Page 2
2 Introduction
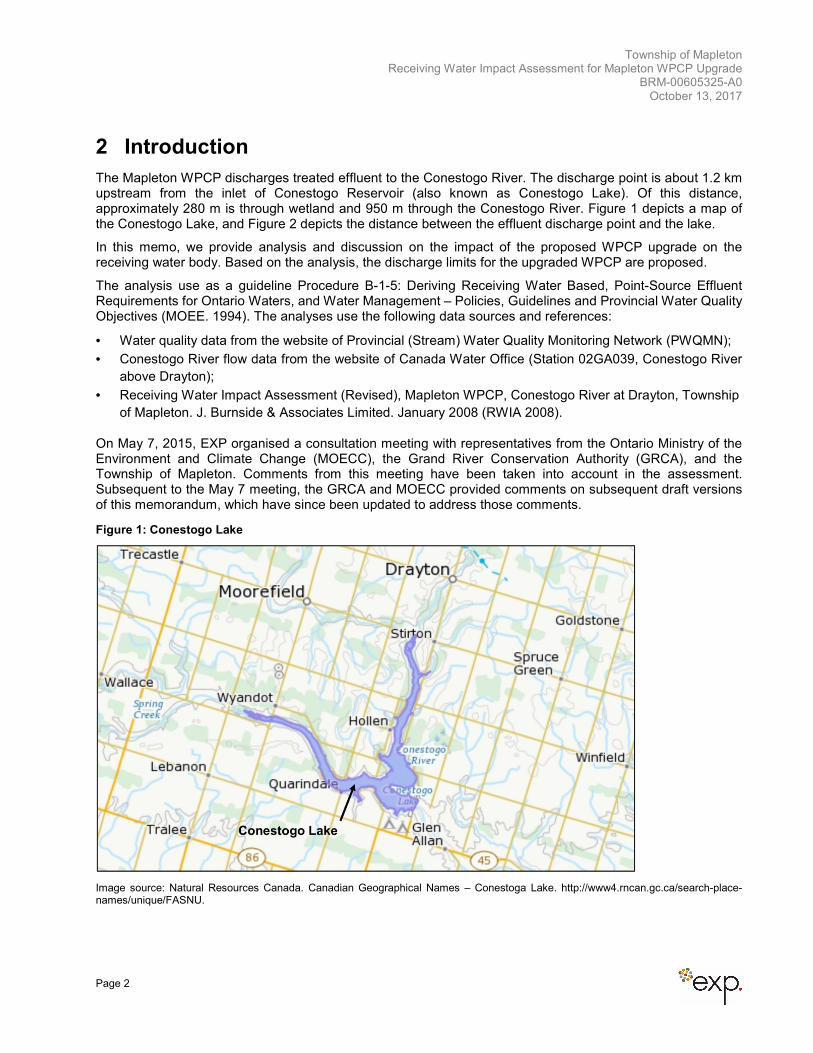
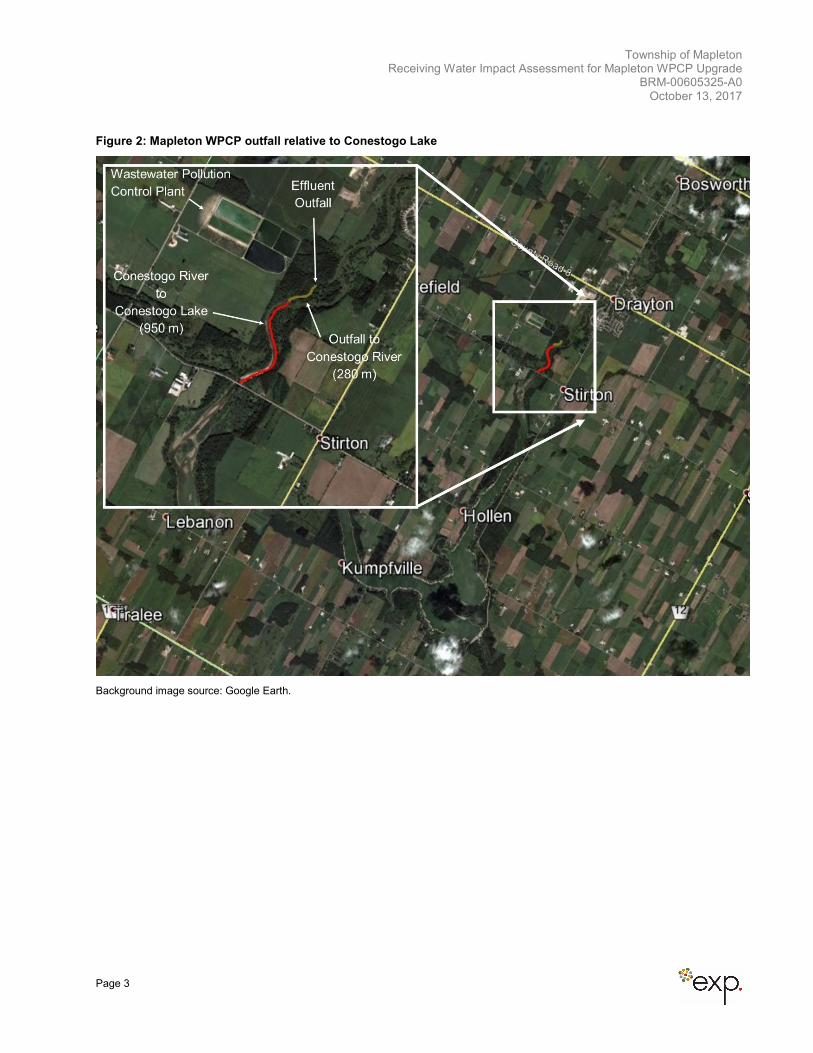
The Mapleton WPCP discharges treated effluent to the Conestogo River. The discharge point is about 1.2 km upstream from the inlet of Conestogo Reservoir (also known as Conestogo Lake). Of this distance, approximately 280 m is through wetland and 950 m through the Conestogo River. Figure 1 depicts a map of the Conestogo Lake, and Figure 2 depicts the distance between the effluent discharge point and the lake.
In this memo, we provide analysis and discussion on the impact of the proposed WPCP upgrade on the receiving water body. Based on the analysis, the discharge limits for the upgraded WPCP are proposed.
The analysis use as a guideline Procedure B-1-5: Deriving Receiving Water Based, Point-Source Effluent Requirements for Ontario Waters, and Water Management – Policies, Guidelines and Provincial Water Quality Objectives (MOEE. 1994). The analyses use the following data sources and references:
• Water quality data from the website of Provincial (Stream) Water Quality Monitoring Network (PWQMN);
• Conestogo River flow data from the website of Canada Water Office (Station 02GA039, Conestogo River
above Drayton);
• Receiving Water Impact Assessment (Revised), Mapleton WPCP, Conestogo River at Drayton, Township
of Mapleton. J. Burnside & Associates Limited. January 2008 (RWIA 2008).
On May 7, 2015, EXP organised a consultation meeting with representatives from the Ontario Ministry of the Environment and Climate Change (MOECC), the Grand River Conservation Authority (GRCA), and the Township of Mapleton. Comments from this meeting have been taken into account in the assessment. Subsequent to the May 7 meeting, the GRCA and MOECC provided comments on subsequent draft versions of this memorandum, which have since been updated to address those comments.
Figure 1: Conestogo Lake
Image source: Natural Resources Canada. Canadian Geographical Names – Conestoga Lake. http://www4.rncan.gc.ca/search-place-names/unique/FASNU.
Township of Mapleton Receiving Water Impact Assessment for Mapleton WPCP Upgrade
BRM-00605325-A0 October 13, 2017
Page 3
Figure 2: Mapleton WPCP outfall relative to Conestogo Lake
Background image source: Google Earth.
Township of Mapleton Receiving Water Impact Assessment for Mapleton WPCP Upgrade
BRM-00605325-A0 October 13, 2017
Page 4
3 Receiving Water Impact Assessment Approach
With reference of background water quality, the MOECC applies two policies to the receiving water:
• Policy 1: In areas which have water quality better than the Provincial Water Quality Objectives, water
quality shall be maintained at or above the objective; and
• Policy 2: Water quality which presently does not meet the Provincial Water Quality Objectives shall not be
degraded further and all practical measures shall be taken to upgrade the water quality to the Objectives.
With respect to Policy 2, the MOECC recognizes that, under certain circumstances, it may not be technically feasible, physically possible or socially desirable to improve water quality toward the PWQOs. The Policy notes that:
where it is clearly demonstrated that all reasonable and practical measures to attain the Provincial Water Quality
Objectives have been undertaken but where:
1) The Provincial Water Quality Objectives are not attainable because of natural background water quality; or
2) The Provincial Water Quality Objectives are not attainable because of irreversible human-induced conditions;
or
3) To attain or maintain the Provincial Water Quality Objectives would result in substantial and widespread
adverse economic or social impact; or
4) Suitable treatment techniques are not available;
then deviations from this policy may be allowed, subject to the approval of the Ministry of Environment and Energy.1
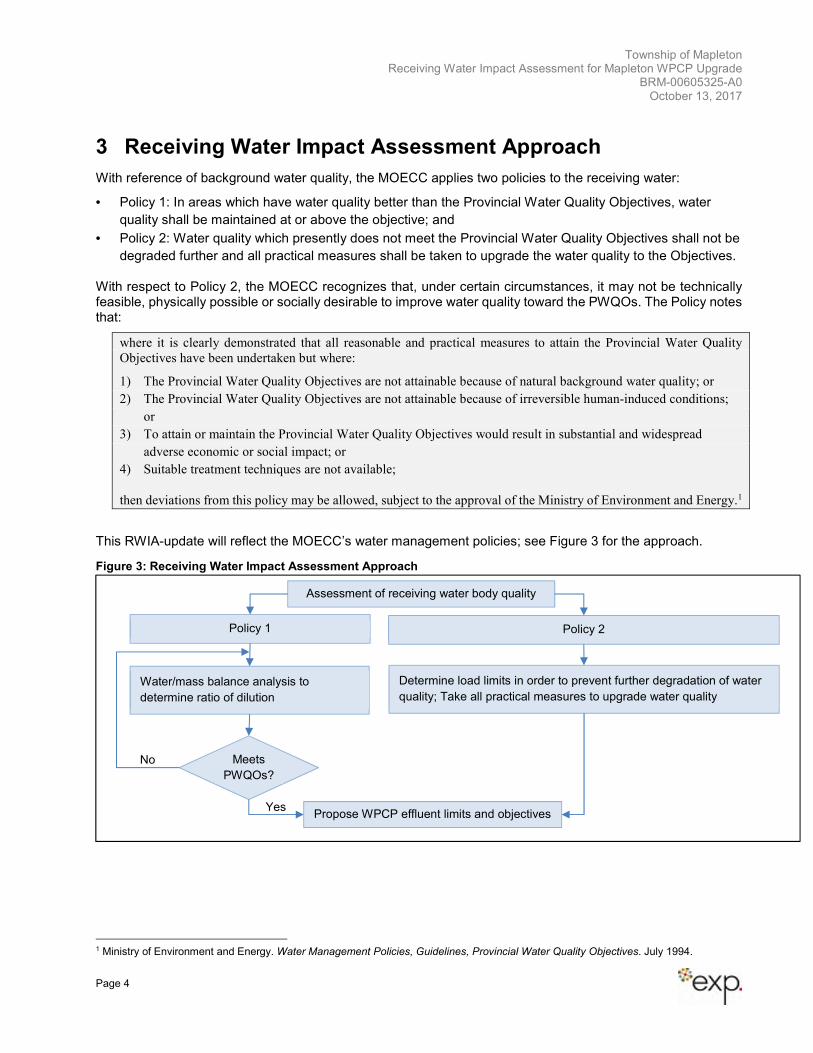
This RWIA-update will reflect the MOECC’s water management policies; see Figure 3 for the approach.
Figure 3: Receiving Water Impact Assessment Approach
1 Ministry of Environment and Energy. Water Management Policies, Guidelines, Provincial Water Quality Objectives. July 1994.
Assessment of receiving water body quality
Policy 1 Policy 2
Water/mass balance analysis to
determine ratio of dilution
Determine load limits in order to prevent further degradation of water
quality; Take all practical measures to upgrade water quality
Meets
PWQOs?
Yes
No
Propose WPCP effluent limits and objectives
Township of Mapleton Receiving Water Impact Assessment for Mapleton WPCP Upgrade
BRM-00605325-A0 October 13, 2017
Page 5
4 Conestogo River 7Q20 Flows
The MOECC’s Procedure B-1-5 (Deriving Receiving-water Based, Point-Source Effluent Requirements for Ontario Waters, July 1994) notes that the low flow statistic 7Q20 is to be used as the basic design flow for the receiving stream for continuous point source discharges (where 7Q20 is the minimum 7-day flow equalled or exceeded on average 95% of the time, over a 20-year period). The 7Q20 provides a conservative approach to ensuring there is sufficient streamflow for the assimilation or dilution of point source discharges. This section presents the approach taken to calculate the 7Q20, the resulting 7Q20 values, and a comparison to 7Q20 calculated in the previous studies.
4.1 Estimation of 7Q20 Flows
Flow frequency analysis was used to estimate monthly 7Q20 low flows of the Conestogo River at Drayton. The technique applied uses observed flow discharge data to calculate statistical information such as mean values, standard deviations, skewness, and recurrence intervals. The statistical data were then fitted to a Log-Pearson Type III distribution. The technique used is discussed below.
Historical flow discharge data from hydrometric Station 02GA039 on the Conestogo River above Drayton was obtained from the Government of Canada’s Wateroffice website (https://wateroffice.ec.gc.ca/). For this station a database of 38 years of daily flow data from 1973 to 2013 (missing April 1998 to March 2001) was available and used.
Calculation of the 7Q20 involved the following steps:
1. Calculating the 7-day moving window average of daily flows;
2. Determining the monthly minimum of the 7-day moving window average of daily flows of each year;
and
3. Fitting the monthly data series to a Log-Pearson Type III distribution.
The Log-Pearson Type III distribution is fitted to the monthly 7-day low flow data series by the method of moments:
µ = γ + αβ
σ = αβ²
γ₁ = 2α-0.5
where µ, σ, and γ₁ are the mean, standard deviation, and skewness of the log data series, respectively, and α,
β and γ are the parameters of the Log-Pearson Type III distribution. The Cunnane plotting position equation
was used to calculate the exceedance probability of the ranked data.
Table 1 presents the calculated 7Q20 flows, as well as the estimation error (coefficient of determination). The graphs of the curve fitting are provided in Appendix E. Appendices B to E include the raw and processed data tables related to these steps. These include:
• Appendix B: Daily discharge as reported by Station 02GA039 and the 7-day moving window average.
• Appendix C: Monthly minimums of the 7-day moving window average for each month;
• Appendix D: Summary of 7Q20 values; and
• Appendix E: 7Q20 calculation tables and graphs.
Township of Mapleton Receiving Water Impact Assessment for Mapleton WPCP Upgrade
BRM-00605325-A0 October 13, 2017
Page 6
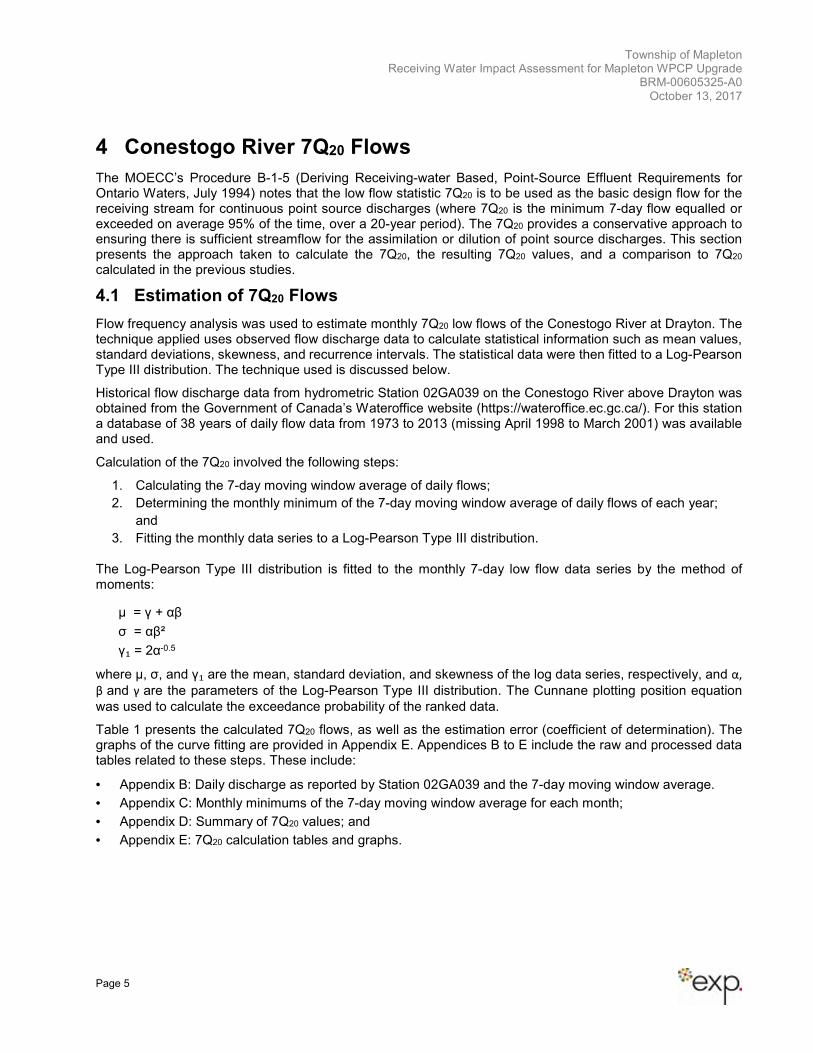
Table 1: Summary of estimation of 7Q20 by Log Pearson-III distribution (based on daily flow data observed at station 02GA039, 1973-2013)
Month 7Q20 (m³/s) 7Q20 (m³/d) # of samples Coefficient of determination, R2
Jan 0.265 22,918 38 0.92
Feb 0.205 17,740 38 0.94
Mar 0.245 21,129 38 0.97
April 0.526 45,407 38 0.99
May 0.171 14,738 38 0.98
Jun 0.019 1,643 38 0.97
Jul 0.007 639 38 0.90
Aug 0.015 1,312 38 0.86
Sept* 0.008 712 38 0.74*
Oct 0.035 3,057 38 0.93
Nov 0.175 15,085 38 0.94
Dec 0.282 24,402 38 0.99
*While the curve fit for September is a little poor, it is irrelevant for the purpose of this memo since no discharge is proposed for this month.
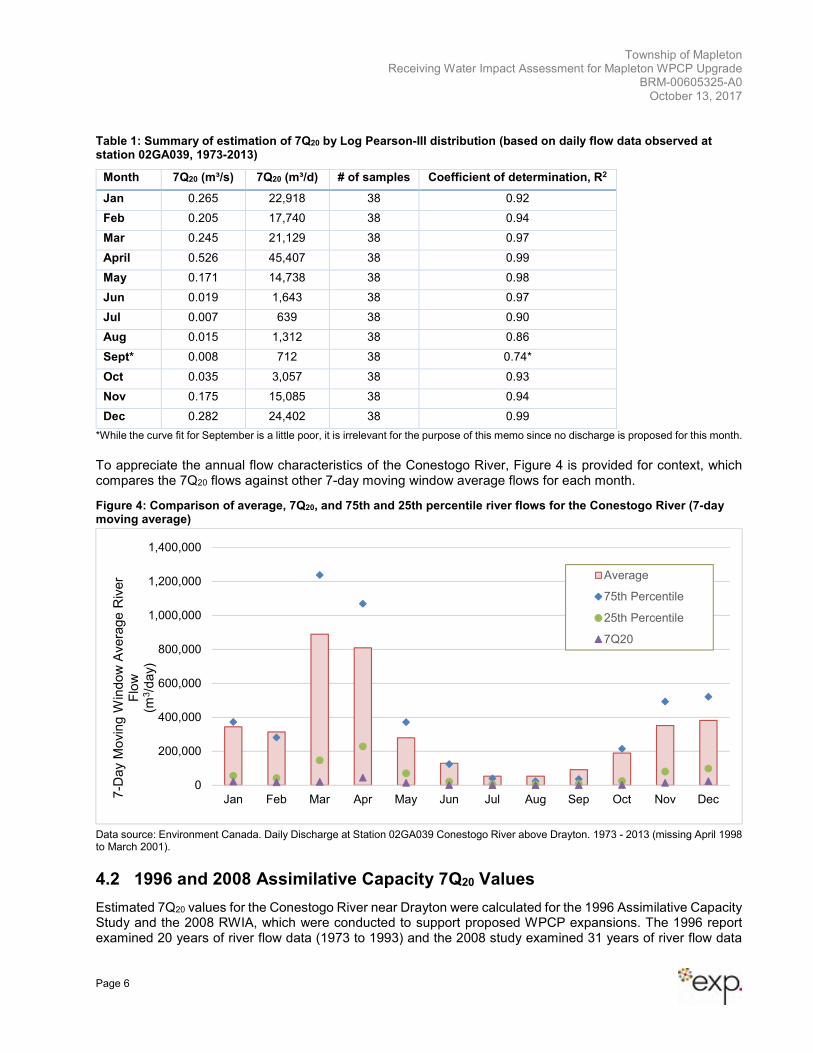
To appreciate the annual flow characteristics of the Conestogo River, Figure 4 is provided for context, which compares the 7Q20 flows against other 7-day moving window average flows for each month.
Figure 4: Comparison of average, 7Q20, and 75th and 25th percentile river flows for the Conestogo River (7-day moving average)
Data source: Environment Canada. Daily Discharge at Station 02GA039 Conestogo River above Drayton. 1973 - 2013 (missing April 1998 to March 2001).
4.2 1996 and 2008 Assimilative Capacity 7Q20 Values
Estimated 7Q20 values for the Conestogo River near Drayton were calculated for the 1996 Assimilative Capacity Study and the 2008 RWIA, which were conducted to support proposed WPCP expansions. The 1996 report examined 20 years of river flow data (1973 to 1993) and the 2008 study examined 31 years of river flow data
0
200,000
400,000
600,000
800,000
1,000,000
1,200,000
1,400,000
Jan Feb Mar Apr May Jun Jul Aug Sep Oct Nov Dec7-D
ay M
ovin
g W
indow
Avera
ge R
iver
Flo
w
(m3/d
ay)
Average
75th Percentile
25th Percentile
7Q20
Township of Mapleton Receiving Water Impact Assessment for Mapleton WPCP Upgrade
BRM-00605325-A0 October 13, 2017
Page 7
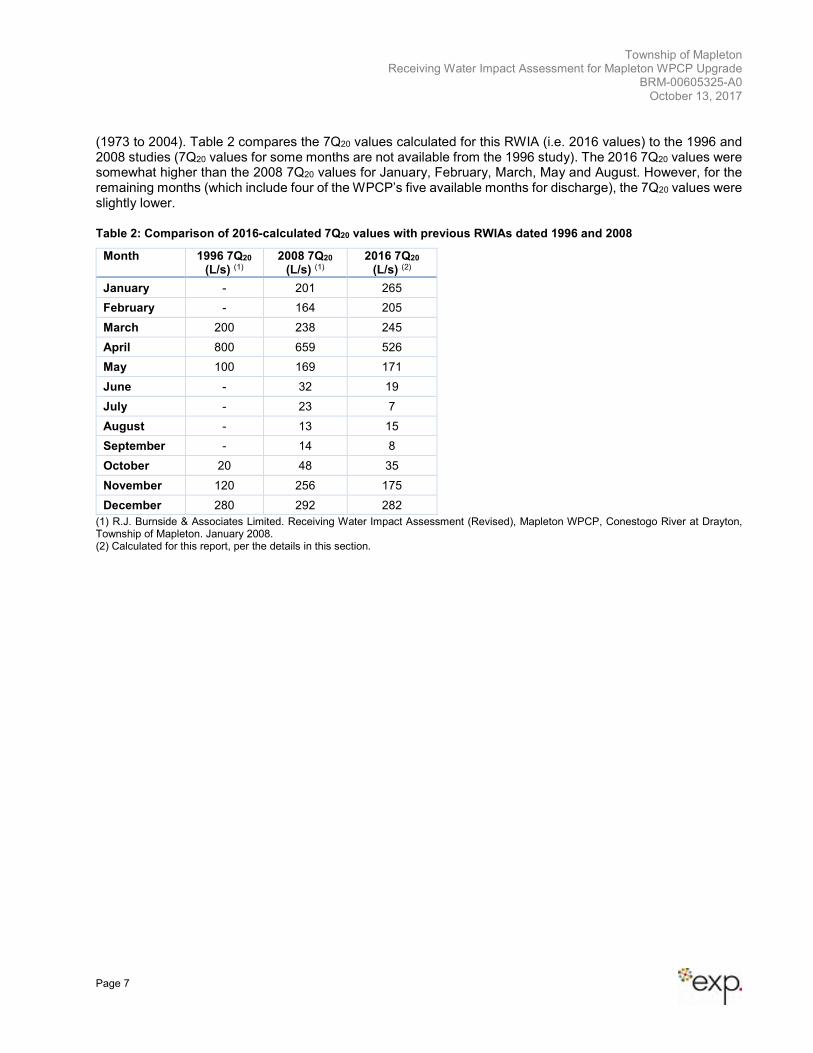
(1973 to 2004). Table 2 compares the 7Q20 values calculated for this RWIA (i.e. 2016 values) to the 1996 and 2008 studies (7Q20 values for some months are not available from the 1996 study). The 2016 7Q20 values were somewhat higher than the 2008 7Q20 values for January, February, March, May and August. However, for the remaining months (which include four of the WPCP’s five available months for discharge), the 7Q20 values were slightly lower.
Table 2: Comparison of 2016-calculated 7Q20 values with previous RWIAs dated 1996 and 2008
Month 1996 7Q20 (L/s) (1)
2008 7Q20 (L/s) (1)
2016 7Q20 (L/s) (2)
January - 201 265
February - 164 205
March 200 238 245
April 800 659 526
May 100 169 171
June - 32 19
July - 23 7
August - 13 15
September - 14 8
October 20 48 35
November 120 256 175
December 280 292 282
(1) R.J. Burnside & Associates Limited. Receiving Water Impact Assessment (Revised), Mapleton WPCP, Conestogo River at Drayton, Township of Mapleton. January 2008. (2) Calculated for this report, per the details in this section.
Township of Mapleton Receiving Water Impact Assessment for Mapleton WPCP Upgrade
BRM-00605325-A0 October 13, 2017
Page 8
5 Conestogo River Water Quality at Drayton
For this RWIA, data from two stations in Ontario‘s Provincial (Stream) Water Quality Monitoring Network (PWQMN) were used to assess the water quality in the Conestogo River near Drayton:
• Station ID: 16018407502 (data from 2007 to 2014), located at Wellington Street North in Drayton, approximately 2.4 km upstream from the Mapleton WPCP discharge point.
• Station ID: 16018410002 (data from 1990 to 2006), located near Wellington County Road 7 and about 5.3 km further upstream from Station 16018407502 .
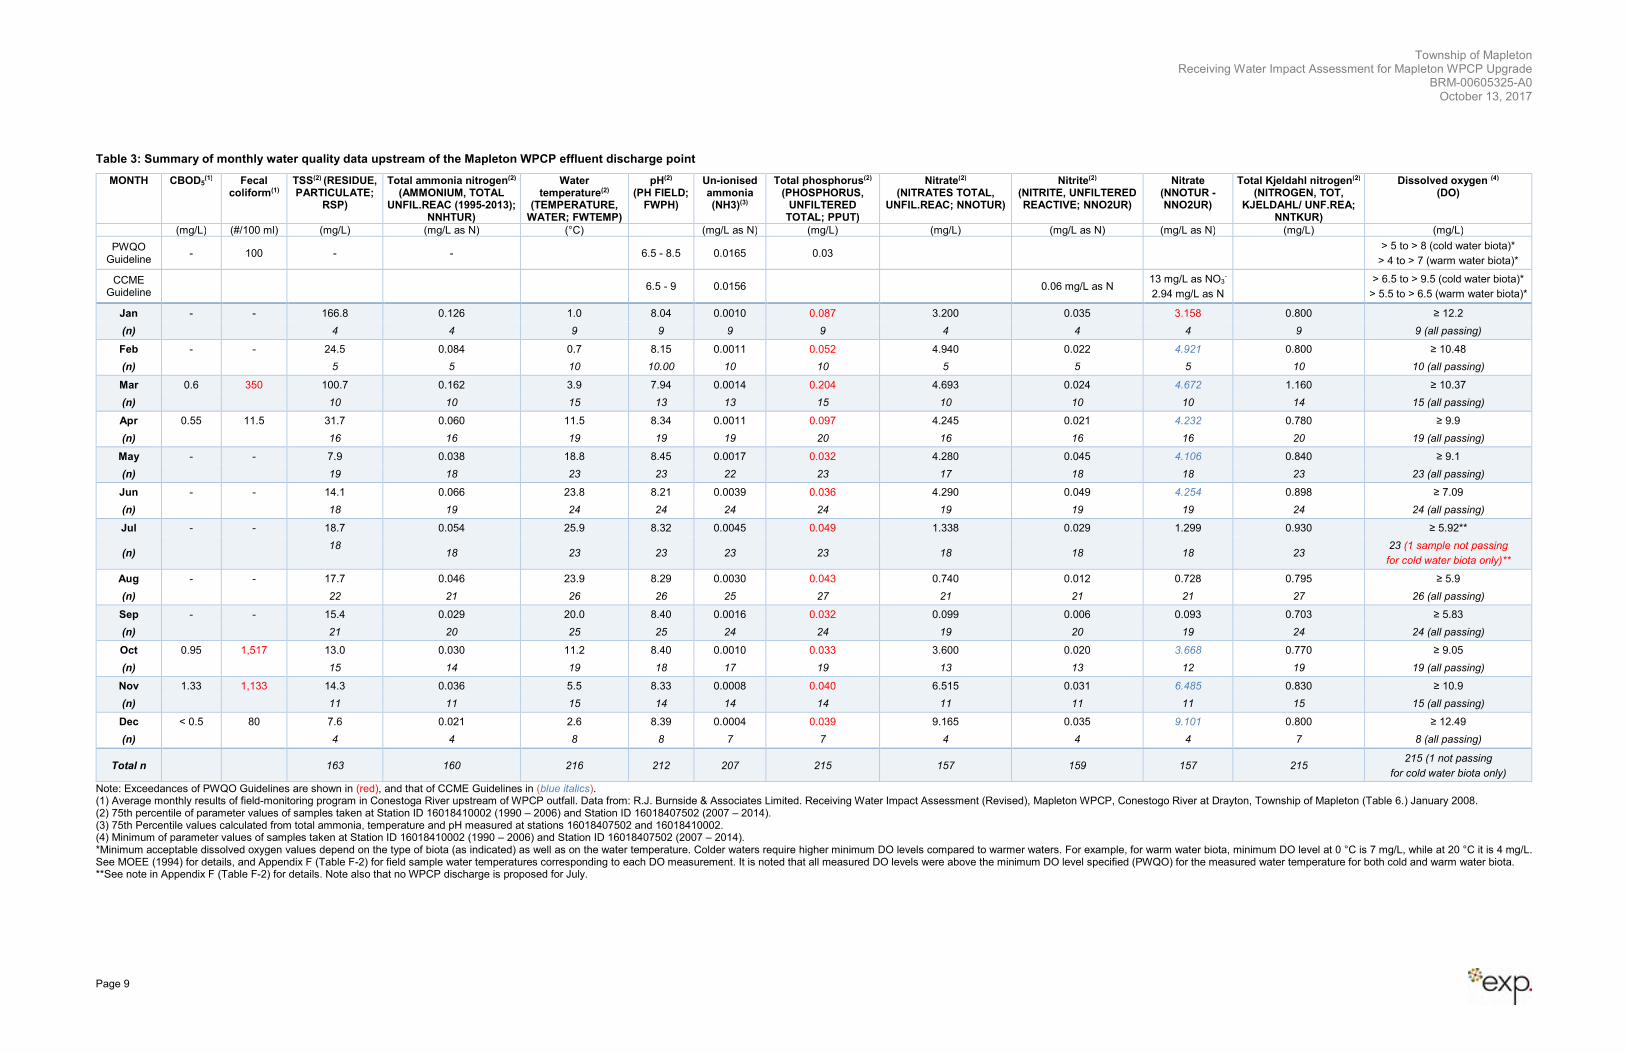
These stations were used to provide data for total phosphorus (TP), total ammonia nitrogen (TAN), pH and water temperature. The un-ionized ammonia (NH3) concentrations were calculated using Emerson equation and based on water, pH and temperature. Other water quality parameters were obtained from the Station data. Data for CBOD5 and Escherichia coli (E. coli) was obtained from R.J. Burnside’s 2008 RWIA. The water quality data from these sources is summarized in Table 3, with provincial water quality objective exceedances shown in red. The raw data used in this analysis is provided in Appendix F, with some datasets presented graphically. The calculation table for NH3 are provided in Appendix G.
From the data presented in Table 3, it was determined that, with reference to the parameters concerning the WPCP’s effluent, the applicable water management policies are as follow:
• Policy 2: Total phosphorus (TP), and fecal coliform;
• Policy 1: Un-ionized ammonia (NH3), and dissolved oxygen (DO).
Township of Mapleton Receiving Water Impact Assessment for Mapleton WPCP Upgrade
BRM-00605325-A0 October 13, 2017
Page 9
Table 3: Summary of monthly water quality data upstream of the Mapleton WPCP effluent discharge point
MONTH CBOD5(1) Fecal
coliform(1) TSS(2) (RESIDUE, PARTICULATE;
RSP)
Total ammonia nitrogen(2) (AMMONIUM, TOTAL
UNFIL.REAC (1995-2013); NNHTUR)
Water temperature(2)
(TEMPERATURE, WATER; FWTEMP)
pH(2) (PH FIELD;
FWPH)
Un-ionised ammonia (NH3)(3)
Total phosphorus(2)
(PHOSPHORUS, UNFILTERED
TOTAL; PPUT)
Nitrate(2) (NITRATES TOTAL,
UNFIL.REAC; NNOTUR)
Nitrite(2) (NITRITE, UNFILTERED REACTIVE; NNO2UR)
Nitrate (NNOTUR - NNO2UR)
Total Kjeldahl nitrogen(2) (NITROGEN, TOT,
KJELDAHL/ UNF.REA; NNTKUR)
Dissolved oxygen (4) (DO)
(mg/L) (#/100 ml) (mg/L) (mg/L as N) (°C) (mg/L as N) (mg/L) (mg/L) (mg/L as N) (mg/L as N) (mg/L) (mg/L)
PWQO Guideline
- 100 - - 6.5 - 8.5 0.0165 0.03 > 5 to > 8 (cold water biota)*
> 4 to > 7 (warm water biota)*
CCME Guideline
6.5 - 9 0.0156 0.06 mg/L as N 13 mg/L as NO3
-
2.94 mg/L as N > 6.5 to > 9.5 (cold water biota)*
> 5.5 to > 6.5 (warm water biota)*
Jan - - 166.8 0.126 1.0 8.04 0.0010 0.087 3.200 0.035 3.158 0.800 ≥ 12.2
(n) 4 4 9 9 9 9 4 4 4 9 9 (all passing)
Feb - - 24.5 0.084 0.7 8.15 0.0011 0.052 4.940 0.022 4.921 0.800 ≥ 10.48
(n) 5 5 10 10.00 10 10 5 5 5 10 10 (all passing)
Mar 0.6 350 100.7 0.162 3.9 7.94 0.0014 0.204 4.693 0.024 4.672 1.160 ≥ 10.37
(n) 10 10 15 13 13 15 10 10 10 14 15 (all passing)
Apr 0.55 11.5 31.7 0.060 11.5 8.34 0.0011 0.097 4.245 0.021 4.232 0.780 ≥ 9.9
(n) 16 16 19 19 19 20 16 16 16 20 19 (all passing)
May - - 7.9 0.038 18.8 8.45 0.0017 0.032 4.280 0.045 4.106 0.840 ≥ 9.1
(n) 19 18 23 23 22 23 17 18 18 23 23 (all passing)
Jun - - 14.1 0.066 23.8 8.21 0.0039 0.036 4.290 0.049 4.254 0.898 ≥ 7.09
(n) 18 19 24 24 24 24 19 19 19 24 24 (all passing)
Jul - - 18.7 0.054 25.9 8.32 0.0045 0.049 1.338 0.029 1.299 0.930 ≥ 5.92**
(n) 18 18 23 23 23 23 18 18 18 23
23 (1 sample not passing
for cold water biota only)**
Aug - - 17.7 0.046 23.9 8.29 0.0030 0.043 0.740 0.012 0.728 0.795 ≥ 5.9
(n) 22 21 26 26 25 27 21 21 21 27 26 (all passing)
Sep - - 15.4 0.029 20.0 8.40 0.0016 0.032 0.099 0.006 0.093 0.703 ≥ 5.83
(n) 21 20 25 25 24 24 19 20 19 24 24 (all passing)
Oct 0.95 1,517 13.0 0.030 11.2 8.40 0.0010 0.033 3.600 0.020 3.668 0.770 ≥ 9.05
(n) 15 14 19 18 17 19 13 13 12 19 19 (all passing)
Nov 1.33 1,133 14.3 0.036 5.5 8.33 0.0008 0.040 6.515 0.031 6.485 0.830 ≥ 10.9
(n) 11 11 15 14 14 14 11 11 11 15 15 (all passing)
Dec < 0.5 80 7.6 0.021 2.6 8.39 0.0004 0.039 9.165 0.035 9.101 0.800 ≥ 12.49
(n) 4 4 8 8 7 7 4 4 4 7 8 (all passing)
Total n 163 160 216 212 207 215 157 159 157 215 215 (1 not passing
for cold water biota only)
Note: Exceedances of PWQO Guidelines are shown in (red), and that of CCME Guidelines in (blue italics). (1) Average monthly results of field-monitoring program in Conestoga River upstream of WPCP outfall. Data from: R.J. Burnside & Associates Limited. Receiving Water Impact Assessment (Revised), Mapleton WPCP, Conestogo River at Drayton, Township of Mapleton (Table 6.) January 2008. (2) 75th percentile of parameter values of samples taken at Station ID 16018410002 (1990 – 2006) and Station ID 16018407502 (2007 – 2014). (3) 75th Percentile values calculated from total ammonia, temperature and pH measured at stations 16018407502 and 16018410002. (4) Minimum of parameter values of samples taken at Station ID 16018410002 (1990 – 2006) and Station ID 16018407502 (2007 – 2014). *Minimum acceptable dissolved oxygen values depend on the type of biota (as indicated) as well as on the water temperature. Colder waters require higher minimum DO levels compared to warmer waters. For example, for warm water biota, minimum DO level at 0 °C is 7 mg/L, while at 20 °C it is 4 mg/L. See MOEE (1994) for details, and Appendix F (Table F-2) for field sample water temperatures corresponding to each DO measurement. It is noted that all measured DO levels were above the minimum DO level specified (PWQO) for the measured water temperature for both cold and warm water biota. **See note in Appendix F (Table F-2) for details. Note also that no WPCP discharge is proposed for July.
Township of Mapleton Receiving Water Impact Assessment for Mapleton WPCP Upgrade
BRM-00605325-A0 October 13, 2017
Page 10
6 Existing Effluent Discharge Regime
6.1 Effluent Criteria and Current Discharge Window
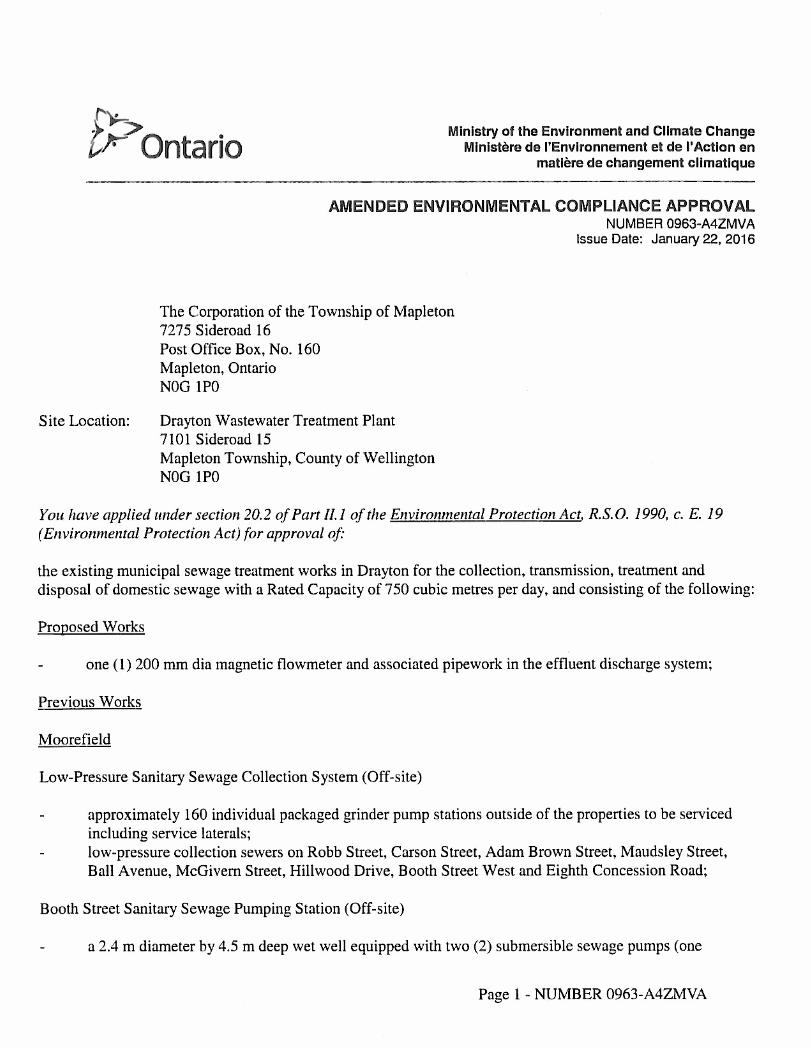
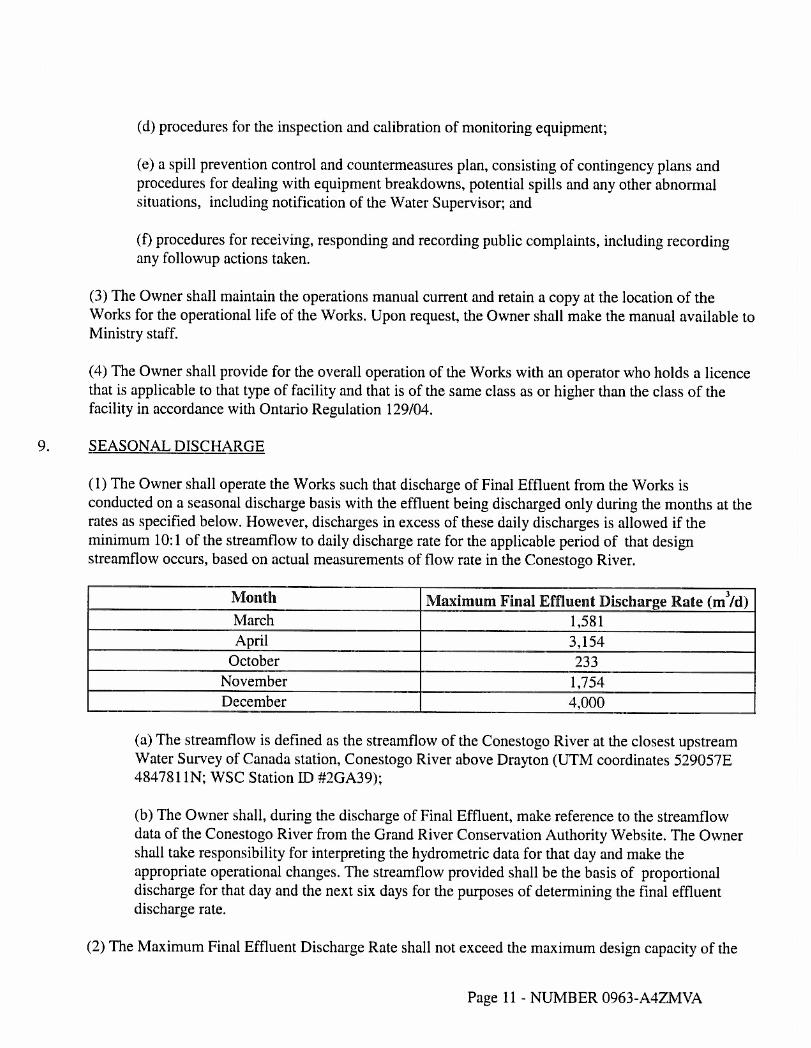
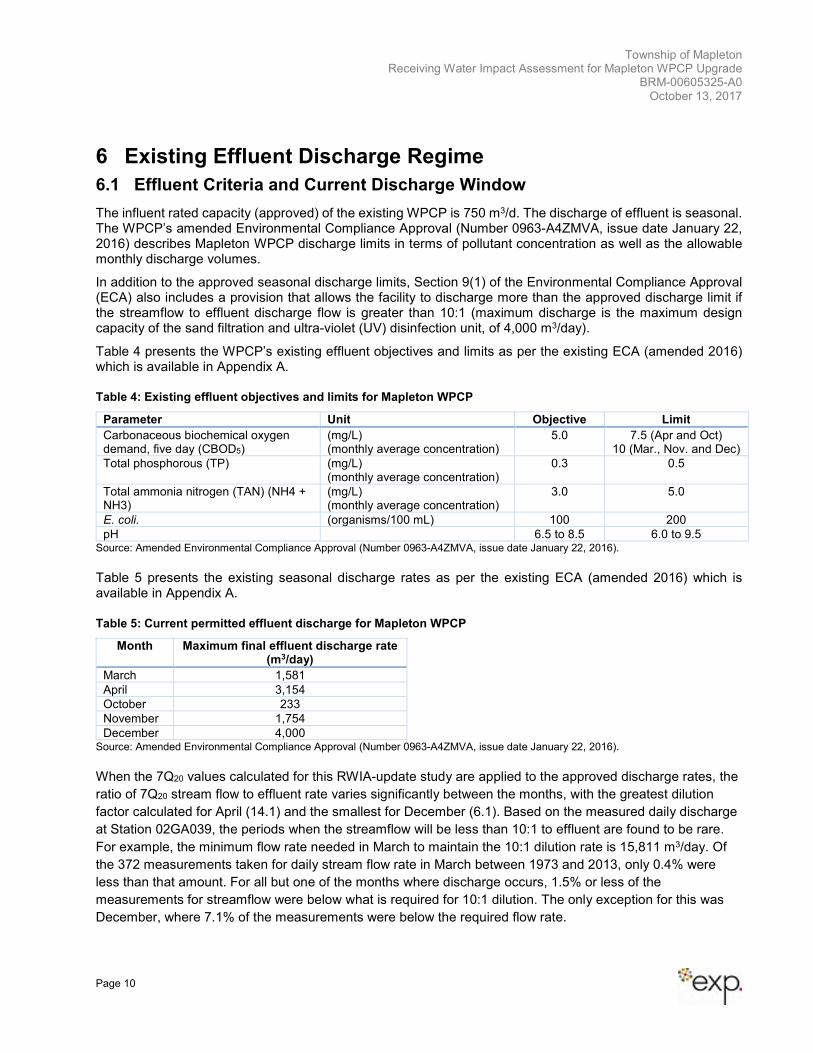
The influent rated capacity (approved) of the existing WPCP is 750 m3/d. The discharge of effluent is seasonal. The WPCP’s amended Environmental Compliance Approval (Number 0963-A4ZMVA, issue date January 22, 2016) describes Mapleton WPCP discharge limits in terms of pollutant concentration as well as the allowable monthly discharge volumes.
In addition to the approved seasonal discharge limits, Section 9(1) of the Environmental Compliance Approval (ECA) also includes a provision that allows the facility to discharge more than the approved discharge limit if the streamflow to effluent discharge flow is greater than 10:1 (maximum discharge is the maximum design capacity of the sand filtration and ultra-violet (UV) disinfection unit, of 4,000 m3/day).
Table 4 presents the WPCP’s existing effluent objectives and limits as per the existing ECA (amended 2016) which is available in Appendix A.
Table 4: Existing effluent objectives and limits for Mapleton WPCP
Parameter Unit Objective Limit
Carbonaceous biochemical oxygen demand, five day (CBOD5)
(mg/L) (monthly average concentration)
5.0 7.5 (Apr and Oct) 10 (Mar., Nov. and Dec)
Total phosphorous (TP) (mg/L) (monthly average concentration)
0.3 0.5
Total ammonia nitrogen (TAN) (NH4 + NH3)
(mg/L) (monthly average concentration)
3.0 5.0
E. coli. (organisms/100 mL) 100 200
pH 6.5 to 8.5 6.0 to 9.5 Source: Amended Environmental Compliance Approval (Number 0963-A4ZMVA, issue date January 22, 2016).
Table 5 presents the existing seasonal discharge rates as per the existing ECA (amended 2016) which is available in Appendix A.
Table 5: Current permitted effluent discharge for Mapleton WPCP
Month Maximum final effluent discharge rate (m3/day)
March 1,581
April 3,154
October 233
November 1,754
December 4,000 Source: Amended Environmental Compliance Approval (Number 0963-A4ZMVA, issue date January 22, 2016).
When the 7Q20 values calculated for this RWIA-update study are applied to the approved discharge rates, the
ratio of 7Q20 stream flow to effluent rate varies significantly between the months, with the greatest dilution
factor calculated for April (14.1) and the smallest for December (6.1). Based on the measured daily discharge
at Station 02GA039, the periods when the streamflow will be less than 10:1 to effluent are found to be rare.
For example, the minimum flow rate needed in March to maintain the 10:1 dilution rate is 15,811 m3/day. Of
the 372 measurements taken for daily stream flow rate in March between 1973 and 2013, only 0.4% were
less than that amount. For all but one of the months where discharge occurs, 1.5% or less of the
measurements for streamflow were below what is required for 10:1 dilution. The only exception for this was
December, where 7.1% of the measurements were below the required flow rate.
Township of Mapleton Receiving Water Impact Assessment for Mapleton WPCP Upgrade
BRM-00605325-A0 October 13, 2017
Page 11
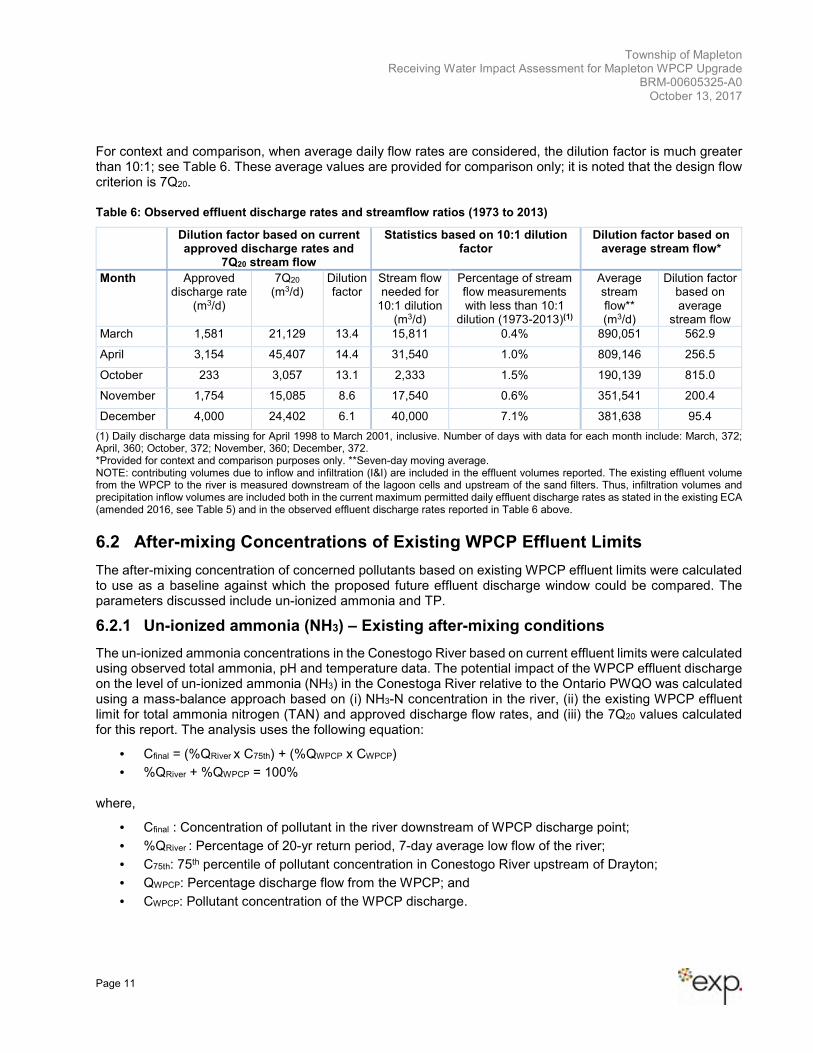
For context and comparison, when average daily flow rates are considered, the dilution factor is much greater than 10:1; see Table 6. These average values are provided for comparison only; it is noted that the design flow criterion is 7Q20.
Table 6: Observed effluent discharge rates and streamflow ratios (1973 to 2013)
Dilution factor based on current approved discharge rates and
7Q20 stream flow
Statistics based on 10:1 dilution factor
Dilution factor based on average stream flow*
Month Approved discharge rate
(m3/d)
7Q20 (m3/d)
Dilution factor
Stream flow needed for
10:1 dilution (m3/d)
Percentage of stream flow measurements with less than 10:1
dilution (1973-2013)(1)
Average stream flow** (m3/d)
Dilution factor based on average
stream flow
March 1,581 21,129 13.4 15,811 0.4% 890,051 562.9
April 3,154 45,407 14.4 31,540 1.0% 809,146 256.5
October 233 3,057 13.1 2,333 1.5% 190,139 815.0
November 1,754 15,085 8.6 17,540 0.6% 351,541 200.4
December 4,000 24,402 6.1 40,000 7.1% 381,638 95.4
(1) Daily discharge data missing for April 1998 to March 2001, inclusive. Number of days with data for each month include: March, 372; April, 360; October, 372; November, 360; December, 372. *Provided for context and comparison purposes only. **Seven-day moving average. NOTE: contributing volumes due to inflow and infiltration (I&I) are included in the effluent volumes reported. The existing effluent volume from the WPCP to the river is measured downstream of the lagoon cells and upstream of the sand filters. Thus, infiltration volumes and precipitation inflow volumes are included both in the current maximum permitted daily effluent discharge rates as stated in the existing ECA (amended 2016, see Table 5) and in the observed effluent discharge rates reported in Table 6 above.
6.2 After-mixing Concentrations of Existing WPCP Effluent Limits
The after-mixing concentration of concerned pollutants based on existing WPCP effluent limits were calculated to use as a baseline against which the proposed future effluent discharge window could be compared. The parameters discussed include un-ionized ammonia and TP.
6.2.1 Un-ionized ammonia (NH3) – Existing after-mixing conditions
The un-ionized ammonia concentrations in the Conestogo River based on current effluent limits were calculated using observed total ammonia, pH and temperature data. The potential impact of the WPCP effluent discharge on the level of un-ionized ammonia (NH3) in the Conestoga River relative to the Ontario PWQO was calculated using a mass-balance approach based on (i) NH3-N concentration in the river, (ii) the existing WPCP effluent limit for total ammonia nitrogen (TAN) and approved discharge flow rates, and (iii) the 7Q20 values calculated for this report. The analysis uses the following equation:
• Cfinal = (%QRiver x C75th) + (%QWPCP x CWPCP)
• %QRiver + %QWPCP = 100%
where,
• Cfinal : Concentration of pollutant in the river downstream of WPCP discharge point;
• %QRiver : Percentage of 20-yr return period, 7-day average low flow of the river;
• C75th: 75th percentile of pollutant concentration in Conestogo River upstream of Drayton;
• QWPCP: Percentage discharge flow from the WPCP; and
• CWPCP: Pollutant concentration of the WPCP discharge.
Township of Mapleton Receiving Water Impact Assessment for Mapleton WPCP Upgrade
BRM-00605325-A0 October 13, 2017
Page 12
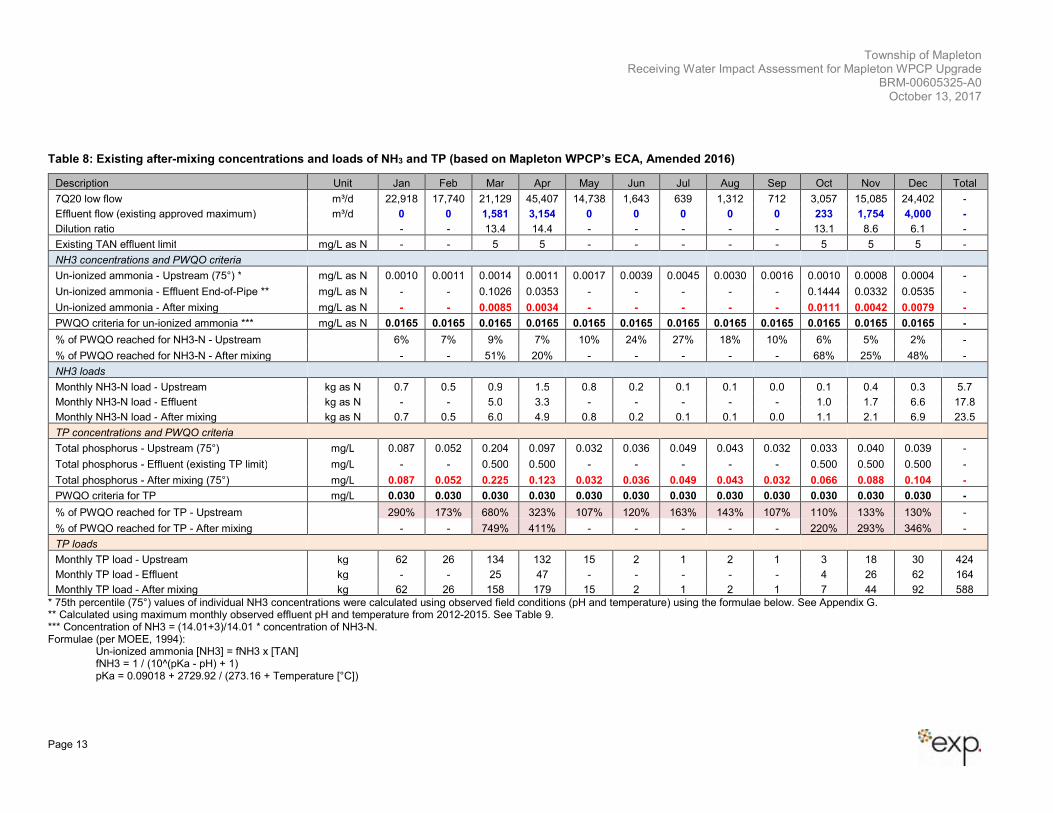
Table 8 (following page) presents the estimated after-mixing un-ionized ammonia (NH3) concentrations in the Conestogo River during 7Q20 conditions under the existing TAN limit (5 mg/L) and flow regime (per the plant’s ECA, amended 2016). The resulting concentrations for NH3 are within the PWQO with the exception of December, where the PWQO is marginally exceeded at ~101% of the PWQO limit (October approaches the PWQO limit at 99%). Note that actual TAN concentration of the WPCP’s effluent is generally lower than the 5mg/L discharge limit permitted under the plant’s ECA. Note also that the 7Q20 values calculated for this study are slightly lower than in the 2008 RWIA study, which increases the after-mixing concentration of NH3 compared to the 2008 7Q20 values.
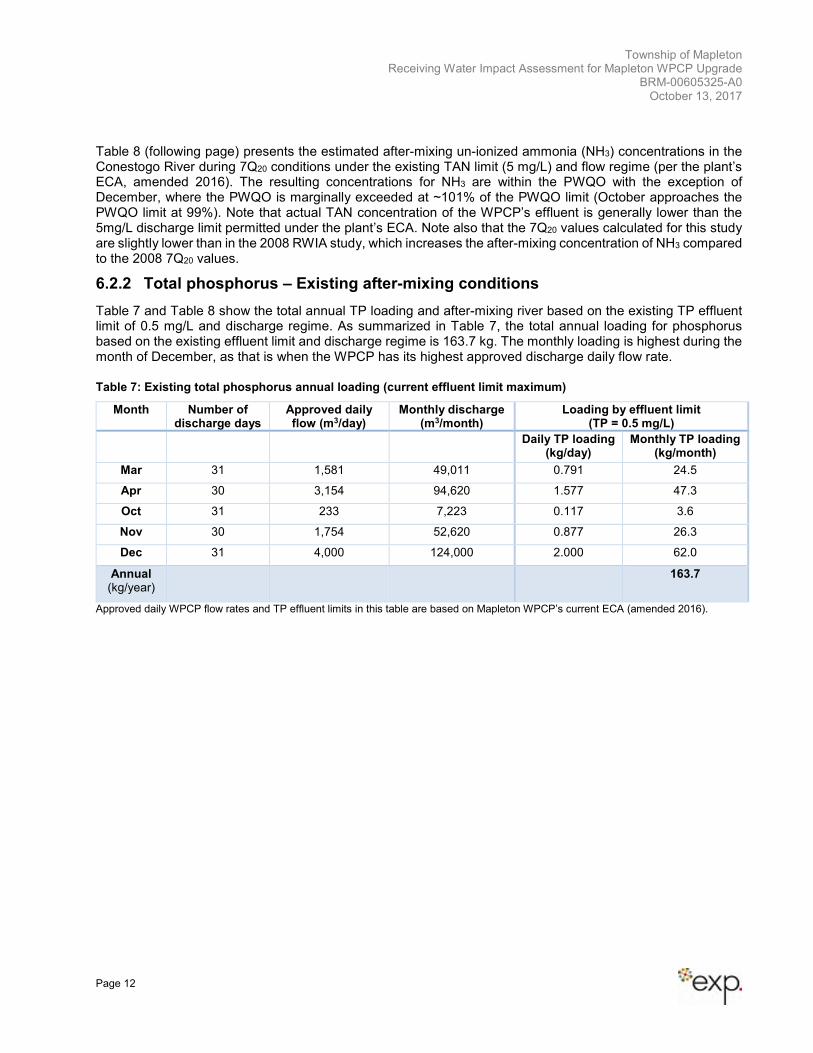
6.2.2 Total phosphorus – Existing after-mixing conditions
Table 7 and Table 8 show the total annual TP loading and after-mixing river based on the existing TP effluent limit of 0.5 mg/L and discharge regime. As summarized in Table 7, the total annual loading for phosphorus based on the existing effluent limit and discharge regime is 163.7 kg. The monthly loading is highest during the month of December, as that is when the WPCP has its highest approved discharge daily flow rate.
Table 7: Existing total phosphorus annual loading (current effluent limit maximum)
Month Number of discharge days
Approved daily flow (m3/day)
Monthly discharge (m3/month)
Loading by effluent limit (TP = 0.5 mg/L)
Daily TP loading (kg/day)
Monthly TP loading (kg/month)
Mar 31 1,581 49,011 0.791 24.5
Apr 30 3,154 94,620 1.577 47.3
Oct 31 233 7,223 0.117 3.6
Nov 30 1,754 52,620 0.877 26.3
Dec 31 4,000 124,000 2.000 62.0
Annual (kg/year)
163.7
Approved daily WPCP flow rates and TP effluent limits in this table are based on Mapleton WPCP’s current ECA (amended 2016).
Township of Mapleton Receiving Water Impact Assessment for Mapleton WPCP Upgrade
BRM-00605325-A0 October 13, 2017
Page 13
Table 8: Existing after-mixing concentrations and loads of NH3 and TP (based on Mapleton WPCP’s ECA, Amended 2016)
Description Unit Jan Feb Mar Apr May Jun Jul Aug Sep Oct Nov Dec Total
7Q20 low flow m³/d 22,918 17,740 21,129 45,407 14,738 1,643 639 1,312 712 3,057 15,085 24,402 -
Effluent flow (existing approved maximum) m³/d 0 0 1,581 3,154 0 0 0 0 0 233 1,754 4,000 -
Dilution ratio - - 13.4 14.4 - - - - - 13.1 8.6 6.1 -
Existing TAN effluent limit mg/L as N - - 5 5 - - - - - 5 5 5 -
NH3 concentrations and PWQO criteria
Un-ionized ammonia - Upstream (75°) * mg/L as N 0.0010 0.0011 0.0014 0.0011 0.0017 0.0039 0.0045 0.0030 0.0016 0.0010 0.0008 0.0004 -
Un-ionized ammonia - Effluent End-of-Pipe ** mg/L as N - - 0.1026 0.0353 - - - - - 0.1444 0.0332 0.0535 -
Un-ionized ammonia - After mixing mg/L as N - - 0.0085 0.0034 - - - - - 0.0111 0.0042 0.0079 -
PWQO criteria for un-ionized ammonia *** mg/L as N 0.0165 0.0165 0.0165 0.0165 0.0165 0.0165 0.0165 0.0165 0.0165 0.0165 0.0165 0.0165 -
% of PWQO reached for NH3-N - Upstream 6% 7% 9% 7% 10% 24% 27% 18% 10% 6% 5% 2% -
% of PWQO reached for NH3-N - After mixing - - 51% 20% - - - - - 68% 25% 48% -
NH3 loads
Monthly NH3-N load - Upstream kg as N 0.7 0.5 0.9 1.5 0.8 0.2 0.1 0.1 0.0 0.1 0.4 0.3 5.7
Monthly NH3-N load - Effluent kg as N - - 5.0 3.3 - - - - - 1.0 1.7 6.6 17.8
Monthly NH3-N load - After mixing kg as N 0.7 0.5 6.0 4.9 0.8 0.2 0.1 0.1 0.0 1.1 2.1 6.9 23.5
TP concentrations and PWQO criteria
Total phosphorus - Upstream (75°) mg/L 0.087 0.052 0.204 0.097 0.032 0.036 0.049 0.043 0.032 0.033 0.040 0.039 -
Total phosphorus - Effluent (existing TP limit) mg/L - - 0.500 0.500 - - - - - 0.500 0.500 0.500 -
Total phosphorus - After mixing (75°) mg/L 0.087 0.052 0.225 0.123 0.032 0.036 0.049 0.043 0.032 0.066 0.088 0.104 -
PWQO criteria for TP mg/L 0.030 0.030 0.030 0.030 0.030 0.030 0.030 0.030 0.030 0.030 0.030 0.030 -
% of PWQO reached for TP - Upstream 290% 173% 680% 323% 107% 120% 163% 143% 107% 110% 133% 130% -
% of PWQO reached for TP - After mixing - - 749% 411% - - - - - 220% 293% 346% -
TP loads
Monthly TP load - Upstream kg 62 26 134 132 15 2 1 2 1 3 18 30 424
Monthly TP load - Effluent kg - - 25 47 - - - - - 4 26 62 164
Monthly TP load - After mixing kg 62 26 158 179 15 2 1 2 1 7 44 92 588
* 75th percentile (75°) values of individual NH3 concentrations were calculated using observed field conditions (pH and temperature) using the formulae below. See Appendix G. ** Calculated using maximum monthly observed effluent pH and temperature from 2012-2015. See Table 9. *** Concentration of NH3 = (14.01+3)/14.01 * concentration of NH3-N. Formulae (per MOEE, 1994):
Un-ionized ammonia [NH3] = fNH3 x [TAN] fNH3 = 1 / (10^(pKa - pH) + 1) pKa = 0.09018 + 2729.92 / (273.16 + Temperature [°C])
Township of Mapleton Receiving Water Impact Assessment for Mapleton WPCP Upgrade
BRM-00605325-A0 October 13, 2017
Page 14
6.3 WPCP Effluent Quality (Sept 2012 to Apr 2016)
This section describes the quality of the WPCP’s effluent from September 2012 to April 2016, as the data available was limited to this period. The parameters discussed include:
• Carbonaceous biochemical oxygen demand, five-day (CBOD5);
• Total phosphorus (TP);
• Total ammonia nitrogen (TAN);
• E. coli;
• Total suspended solids (TSS);
• pH; and
• Temperature.
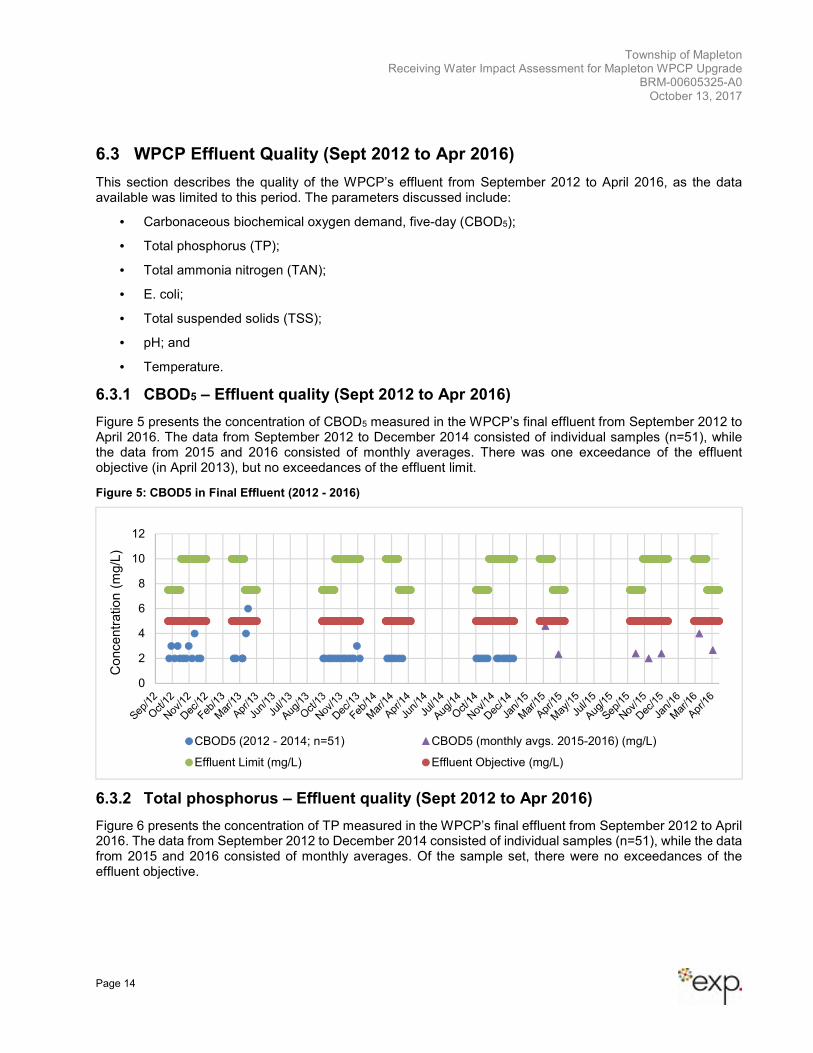
6.3.1 CBOD5 – Effluent quality (Sept 2012 to Apr 2016)
Figure 5 presents the concentration of CBOD5 measured in the WPCP’s final effluent from September 2012 to April 2016. The data from September 2012 to December 2014 consisted of individual samples (n=51), while the data from 2015 and 2016 consisted of monthly averages. There was one exceedance of the effluent objective (in April 2013), but no exceedances of the effluent limit.
Figure 5: CBOD5 in Final Effluent (2012 - 2016)
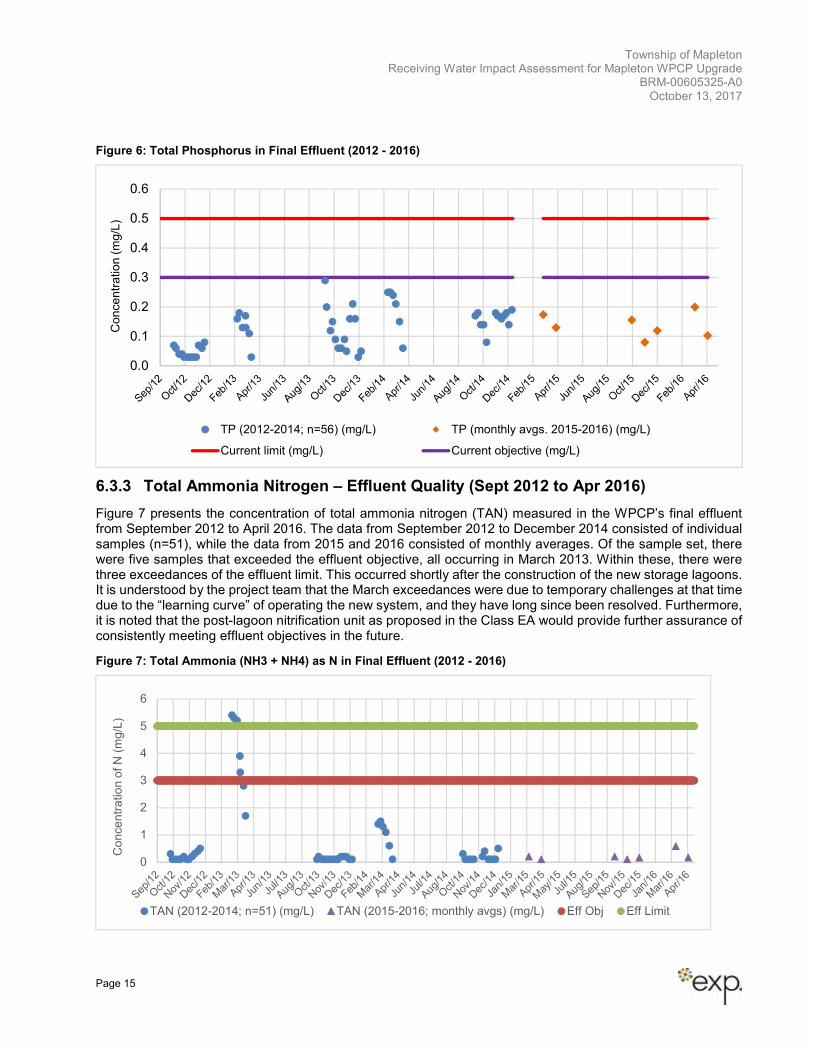
6.3.2 Total phosphorus – Effluent quality (Sept 2012 to Apr 2016)
Figure 6 presents the concentration of TP measured in the WPCP’s final effluent from September 2012 to April 2016. The data from September 2012 to December 2014 consisted of individual samples (n=51), while the data from 2015 and 2016 consisted of monthly averages. Of the sample set, there were no exceedances of the effluent objective.
0
2
4
6
8
10
12
Concentr
ation (
mg/L
)
CBOD5 (2012 - 2014; n=51) CBOD5 (monthly avgs. 2015-2016) (mg/L)
Effluent Limit (mg/L) Effluent Objective (mg/L)
Township of Mapleton Receiving Water Impact Assessment for Mapleton WPCP Upgrade
BRM-00605325-A0 October 13, 2017
Page 15
Figure 6: Total Phosphorus in Final Effluent (2012 - 2016)
6.3.3 Total Ammonia Nitrogen – Effluent Quality (Sept 2012 to Apr 2016)
Figure 7 presents the concentration of total ammonia nitrogen (TAN) measured in the WPCP’s final effluent from September 2012 to April 2016. The data from September 2012 to December 2014 consisted of individual samples (n=51), while the data from 2015 and 2016 consisted of monthly averages. Of the sample set, there were five samples that exceeded the effluent objective, all occurring in March 2013. Within these, there were three exceedances of the effluent limit. This occurred shortly after the construction of the new storage lagoons. It is understood by the project team that the March exceedances were due to temporary challenges at that time due to the “learning curve” of operating the new system, and they have long since been resolved. Furthermore, it is noted that the post-lagoon nitrification unit as proposed in the Class EA would provide further assurance of consistently meeting effluent objectives in the future.
Figure 7: Total Ammonia (NH3 + NH4) as N in Final Effluent (2012 - 2016)
0.0
0.1
0.2
0.3
0.4
0.5
0.6
Co
nce
ntr
atio
n (
mg
/L)
TP (2012-2014; n=56) (mg/L) TP (monthly avgs. 2015-2016) (mg/L)
Current limit (mg/L) Current objective (mg/L)
0
1
2
3
4
5
6
Co
nce
ntr
atio
n o
f N
(m
g/L
)
TAN (2012-2014; n=51) (mg/L) TAN (2015-2016; monthly avgs) (mg/L) Eff Obj Eff Limit
Township of Mapleton Receiving Water Impact Assessment for Mapleton WPCP Upgrade
BRM-00605325-A0 October 13, 2017
Page 16
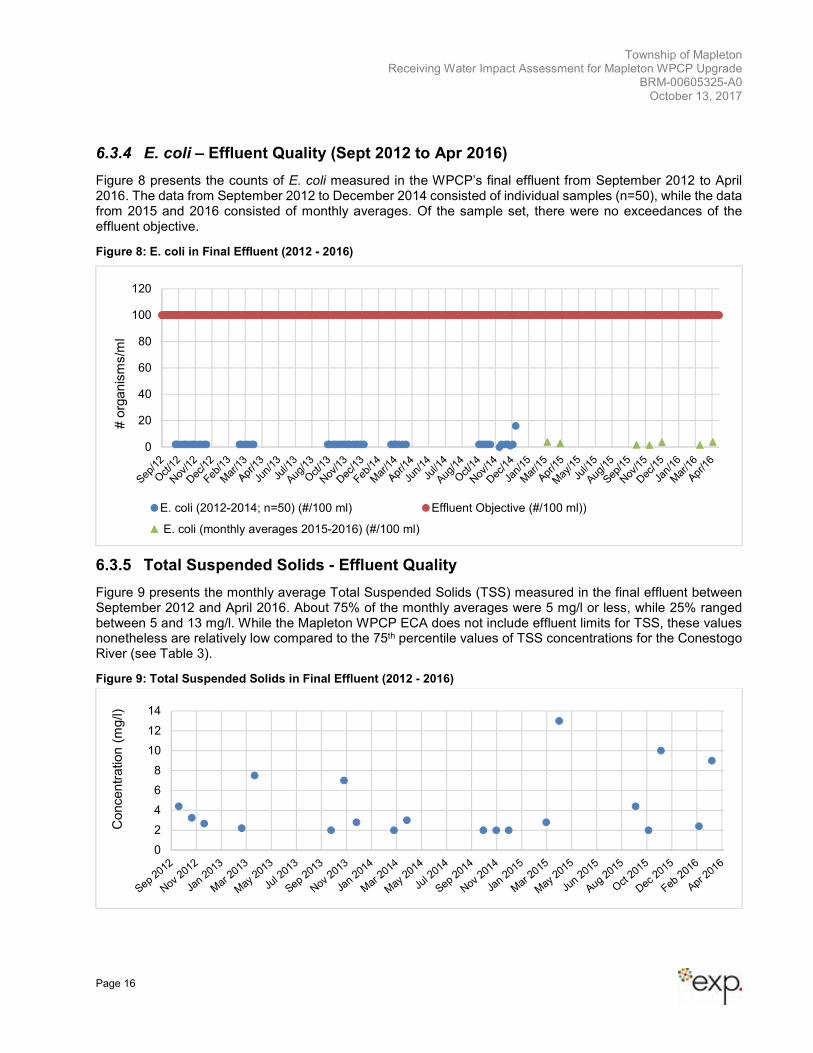
6.3.4 E. coli – Effluent Quality (Sept 2012 to Apr 2016)
Figure 8 presents the counts of E. coli measured in the WPCP’s final effluent from September 2012 to April 2016. The data from September 2012 to December 2014 consisted of individual samples (n=50), while the data from 2015 and 2016 consisted of monthly averages. Of the sample set, there were no exceedances of the effluent objective.
Figure 8: E. coli in Final Effluent (2012 - 2016)
6.3.5 Total Suspended Solids - Effluent Quality
Figure 9 presents the monthly average Total Suspended Solids (TSS) measured in the final effluent between September 2012 and April 2016. About 75% of the monthly averages were 5 mg/l or less, while 25% ranged between 5 and 13 mg/l. While the Mapleton WPCP ECA does not include effluent limits for TSS, these values nonetheless are relatively low compared to the 75th percentile values of TSS concentrations for the Conestogo River (see Table 3).
Figure 9: Total Suspended Solids in Final Effluent (2012 - 2016)
0
20
40
60
80
100
120
# o
rganis
ms/m
l
E. coli (2012-2014; n=50) (#/100 ml) Effluent Objective (#/100 ml))
E. coli (monthly averages 2015-2016) (#/100 ml)
0
2
4
6
8
10
12
14
Concentr
ation (
mg/l)
Township of Mapleton Receiving Water Impact Assessment for Mapleton WPCP Upgrade
BRM-00605325-A0 October 13, 2017
Page 17
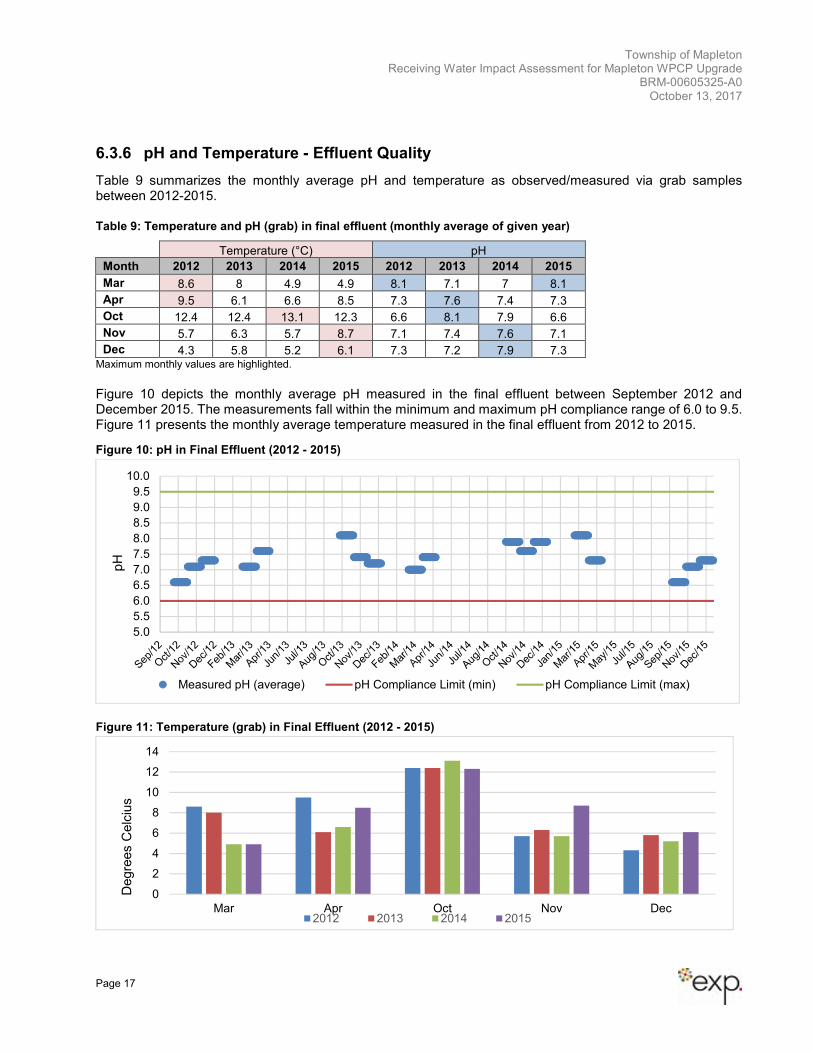
6.3.6 pH and Temperature - Effluent Quality
Table 9 summarizes the monthly average pH and temperature as observed/measured via grab samples between 2012-2015.
Table 9: Temperature and pH (grab) in final effluent (monthly average of given year)
Temperature (°C) pH
Month 2012 2013 2014 2015 2012 2013 2014 2015
Mar 8.6 8 4.9 4.9 8.1 7.1 7 8.1
Apr 9.5 6.1 6.6 8.5 7.3 7.6 7.4 7.3
Oct 12.4 12.4 13.1 12.3 6.6 8.1 7.9 6.6
Nov 5.7 6.3 5.7 8.7 7.1 7.4 7.6 7.1
Dec 4.3 5.8 5.2 6.1 7.3 7.2 7.9 7.3 Maximum monthly values are highlighted.
Figure 10 depicts the monthly average pH measured in the final effluent between September 2012 and December 2015. The measurements fall within the minimum and maximum pH compliance range of 6.0 to 9.5. Figure 11 presents the monthly average temperature measured in the final effluent from 2012 to 2015.
Figure 10: pH in Final Effluent (2012 - 2015)
Figure 11: Temperature (grab) in Final Effluent (2012 - 2015)
5.0
5.5
6.0
6.5
7.0
7.5
8.0
8.5
9.0
9.5
10.0
pH
Measured pH (average) pH Compliance Limit (min) pH Compliance Limit (max)
0
2
4
6
8
10
12
14
Mar Apr Oct Nov Dec
Degre
es C
elc
ius
2012 2013 2014 2015
Township of Mapleton Receiving Water Impact Assessment for Mapleton WPCP Upgrade
BRM-00605325-A0 October 13, 2017
Page 18
6.3.7 Hydrogen Sulphide
The 2008 RWIA notes that hydrogen sulphide (H2S) had in the past been an issue due to anaerobic conditions in the lagoons caused by ice coverage. However, the report also notes that then-recent upgrades to the WPCP and operational changes had significantly reduced those concerns. More specifically, there is a reinforced concrete cascade aerator (installed 2010 as per Town staff) that provides adequate aeration to the filtered effluent prior to discharge to Conestogo River.
A review of monthly process and compliance reports from 2012 to 2014, the WPCP’s comprehensive performance evaluation report, the facility’s annual reports from 2012-2015, and the MOECC’s WPCP inspection report for February 26, 2015 (Inspection Number 1-BH00D) did not indicate any concerns with hydrogen sulphide. Therefore, the project team concludes that hydrogen sulphide is no longer an issue with this facility.
It should be noted that the effluent quality will be greatly improved after the proposed upgrades to install a
Submerged Attached Growth Reactor (SAGR®) which provides a high level of aeration, further reducing the
likelihood H2S generation.
Township of Mapleton Receiving Water Impact Assessment for Mapleton WPCP Upgrade
BRM-00605325-A0 October 13, 2017
Page 19
7 Identification of a Proposed Discharge Regime
The RWIA process was used to help identify a proposed discharge regime that would allow adequate discharge for the expanded WPCP with an acceptable impact on the receiving waters. The process included:
• Consultation with MOECC and GRCA on the WPCP and on river water quality concerns to be considered;
• Calculation of theoretical maximum allowable effluent discharge rates, based on PWQO for NH3;
• Adjust maximum allowable discharge to improve upon or maintain the minimum dilution ratio, to ensure existing effluent mixing zones are not negatively impacted upon;
• Propose a discharge regime that is adequate to discharge the proposed future treated influent plus the accumulated precipitation; and
• Comparison of after-mixing concentrations and annual loadings for NH3 and TP for the existing and proposed discharge regime.
These steps are discussed below.
NOTE: contributing volumes due to inflow and infiltration (I&I) are included in the proposed effluent volumes. Precipitation inflow volumes are included in the storage capacity and proposed discharge limits (158 m3/day, see Section 7.3 below).
7.1 Consultations with MOECC and GRCA
Consultation with the MOECC and GRCA included in-person meetings, telephone conversations, and reviews of drafts of the RWIA. While the full documentation of this consultation will be included in the Mapleton Wastewater Class EA Environmental Study Report, key take-aways for EXP in preparing a proposed effluent discharge regime included:
• Un-ionized ammonia (NH3) and TP are the key parameters of concern; Conestoga River is a Policy 2 receiver with respect to TP.
• Given the Conestogo River’s traditionally low flows in the summer months and the concern over feeding phosphorus to Conestogo Lake in the summer (due to the potential for algal blooms), both the MOECC and the GRCA agreed that there should not be any effluent discharge during the summer months.
• Given the improvements in recent years to the WPCP, and the proposed reduction to the total ammonia effluent limit, the MOECC and GRCA agreed that they would be open to effluent discharge from the WPCP in the winter months.
Based on these key considerations, the proposed expanded discharge window was designed to include January and February, with no discharge proposed from May to September.
7.2 Calculation of Theoretical Maximum Potential Discharge Flows
Theoretical maximum potential discharge flows were determined based on the Conestogo River’s ability to assimilate un-ionized ammonia up to the PWQO. This exercise was done only to determine what the maximum WPCP effluent rate would be if the un-ionized ammonia PWQO limit was maximized. The theoretical maximum discharge flows were estimated using the following parameters:
• The updated 7Q20 values prepared for this study;
• The previously discussed river water quality data for ammonia, water temperature and pH (Section 6);
• The proposed future effluent limit for total ammonia of 3 mg/L;
• An expanded discharge regime that includes January and February; and
Township of Mapleton Receiving Water Impact Assessment for Mapleton WPCP Upgrade
BRM-00605325-A0 October 13, 2017
Page 20
• The upset limit of 4,000 m3/day for the WPCP’s effluent filtration/disinfection unit.
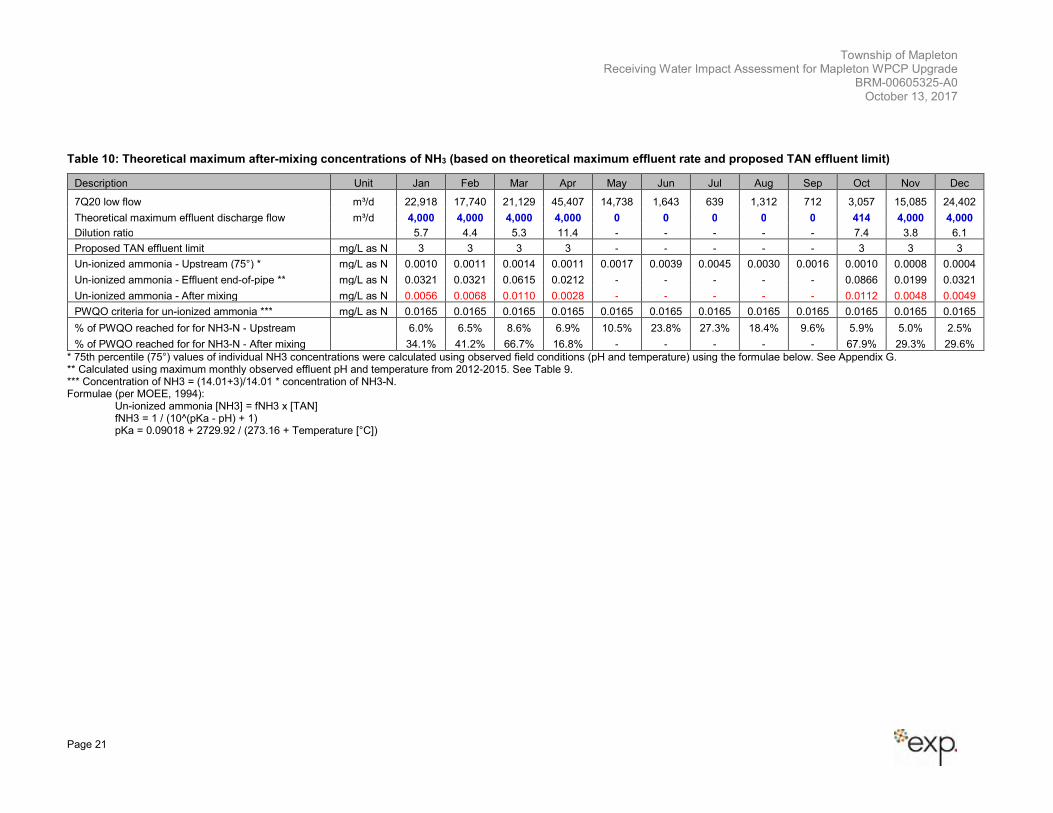
The analysis showed that the maximum possible flow rate of 4,000 m3/day could potentially be achieved without increasing after-mixing un-ionized ammonia levels above the PWQO for the months of January, February, March, April, November and December. The maximum flow rate for October was lower, at 414 m3/day. These maximum values, presented in Table 10, form the upper limits to discharge flow rates to be used when considering the proposed future discharge regime.
Township of Mapleton Receiving Water Impact Assessment for Mapleton WPCP Upgrade
BRM-00605325-A0 October 13, 2017
Page 21
Table 10: Theoretical maximum after-mixing concentrations of NH3 (based on theoretical maximum effluent rate and proposed TAN effluent limit)
Description Unit Jan Feb Mar Apr May Jun Jul Aug Sep Oct Nov Dec
7Q20 low flow m³/d 22,918 17,740 21,129 45,407 14,738 1,643 639 1,312 712 3,057 15,085 24,402
Theoretical maximum effluent discharge flow m³/d 4,000 4,000 4,000 4,000 0 0 0 0 0 414 4,000 4,000
Dilution ratio 5.7 4.4 5.3 11.4 - - - - - 7.4 3.8 6.1
Proposed TAN effluent limit mg/L as N 3 3 3 3 - - - - - 3 3 3
Un-ionized ammonia - Upstream (75°) * mg/L as N 0.0010 0.0011 0.0014 0.0011 0.0017 0.0039 0.0045 0.0030 0.0016 0.0010 0.0008 0.0004
Un-ionized ammonia - Effluent end-of-pipe ** mg/L as N 0.0321 0.0321 0.0615 0.0212 - - - - - 0.0866 0.0199 0.0321
Un-ionized ammonia - After mixing mg/L as N 0.0056 0.0068 0.0110 0.0028 - - - - - 0.0112 0.0048 0.0049
PWQO criteria for un-ionized ammonia *** mg/L as N 0.0165 0.0165 0.0165 0.0165 0.0165 0.0165 0.0165 0.0165 0.0165 0.0165 0.0165 0.0165
% of PWQO reached for for NH3-N - Upstream 6.0% 6.5% 8.6% 6.9% 10.5% 23.8% 27.3% 18.4% 9.6% 5.9% 5.0% 2.5%
% of PWQO reached for for NH3-N - After mixing 34.1% 41.2% 66.7% 16.8% - - - - - 67.9% 29.3% 29.6%
* 75th percentile (75°) values of individual NH3 concentrations were calculated using observed field conditions (pH and temperature) using the formulae below. See Appendix G. ** Calculated using maximum monthly observed effluent pH and temperature from 2012-2015. See Table 9. *** Concentration of NH3 = (14.01+3)/14.01 * concentration of NH3-N. Formulae (per MOEE, 1994):
Un-ionized ammonia [NH3] = fNH3 x [TAN] fNH3 = 1 / (10^(pKa - pH) + 1) pKa = 0.09018 + 2729.92 / (273.16 + Temperature [°C])
Township of Mapleton Receiving Water Impact Assessment for Mapleton WPCP Upgrade
BRM-00605325-A0 October 13, 2017
Page 22
7.3 Water Balance Accountability
A key issue facing the WPCP is how to manage water entering the lagoon system through precipitation. Prior to the WPCP’s 2016 amended ECA, the facility’s approved discharge volume was ultimately equal to that of its inflow rating. For example, the facility is currently rated to receive 750 m3/day of influent, which amounts to 273,750 m3 of influent per year. The previous (2013) ECA provided monthly upper limits, which added up to an annual total of 273,872 m3. The consequence of this was twofold:
1. First, since the facility was required to discharge any accumulated rainfall within its approved volume, this in effect reduced the upper limit of influent the Township was able to receive, as it need to create a buffer to allow for incoming precipitation. As the level of precipitation varies year to year and month to month, this provided additional challenges for facility operations and growth planning.
2. Second, the facility on occasion would reach or exceed the safe storage limits of its storage lagoons. This most recently occurred in the spring of 2015. Given volume of treated effluent and rainwater/melted snow stored in its lagoons, it was determined that the allowed spring discharge volumes would not be sufficient to prevent the lagoons from exceeding their storage capacity prior to the fall discharge. To address this, a Provincial Order (I-BXVN3) was signed on March 11, 2015 allowing the facility to extend its discharge until April 30 and increase its discharge flowrate to the minimum 10:1 of the streamflow (up to the sand filtration and UV disinfection limits of 4,000 m3/day). This Provincial Order allowed the facility to safely discharge its excess stored water and avoid a potential overflow of the lagoons.
For the purpose of this assessment, the value of 158 m3/day (annual daily average) was used for the precipitation allowance added to the daily WPCP influent flow. When compared to precipitation data for the Glen Allan weather station (Climate Identifier # 6142803) for 1999 to 2013 and an assumed pan evaporation rate of 700 mm/year,2 the value of 158 m3/day corresponded to an amount of rainfall that fell within a 2-year to 5-year return period, which should be sufficient when setting discharge flow rates in 7Q20 conditions.
7.4 Developing the Proposed Effluent Discharge Regime
The next stage in identifying a proposed effluent discharge regime involved maintaining (or improving) existing dilution rates while balancing the need to ensure adequate flow to discharge the WPCP’s annual influent plus precipitation.
In setting a proposed discharge flow rate, several factors were considered in finding the most suitable balance of flow rates and dilution rates throughout the discharge period. Key among these included:
• Constraint to maintain the minimum dilution rate of 6.1, which is experienced in December; and
• Requirement to be conservative with respect to discharge rates in January and February, as per MOECC.
Based on these considerations, and assuming a daily influent rate of 1,300 m3/day and an average daily accumulation of 158 m3/day of precipitation, the proposed future effluent discharge flow rate is presented in Table 11, followed by a comparison of the proposed discharge regime and dilution ratios to the existing in Table 12. A comparison of after-mixing concentrations of the existing and proposed discharge regime in the Conestoga River for un-ionized ammonia and TP is discussed in the following section (Section 8).
The nominal capacity of the storage lagoons should be designed based on average influent flow and average precipitation. Since the precipitation value of 158 m3/day is the daily average of the total annual accumulation, it is recognized that actual monthly accumulation may be higher or lower depending on the time of year. Therefore, during detailed design any potential adjustments to the storage lagoon capacity should be confirmed to ensure adequate storage capacity based the minimum effluent holdover volumes after future facility
2 Pan evaporation rate based on low range of the Class A Pan Evaporation Rate as per the Hydrological Atlas of Canada Plate 17. Mean Annual Lake Evaporation, prepared by G. den Hartog and H.L. Ferguson (1978). The Township of Mapleton falls within band of 700 to 900 mm per year for Class A Pan Evaporation.
Township of Mapleton Receiving Water Impact Assessment for Mapleton WPCP Upgrade
BRM-00605325-A0 October 13, 2017
Page 23
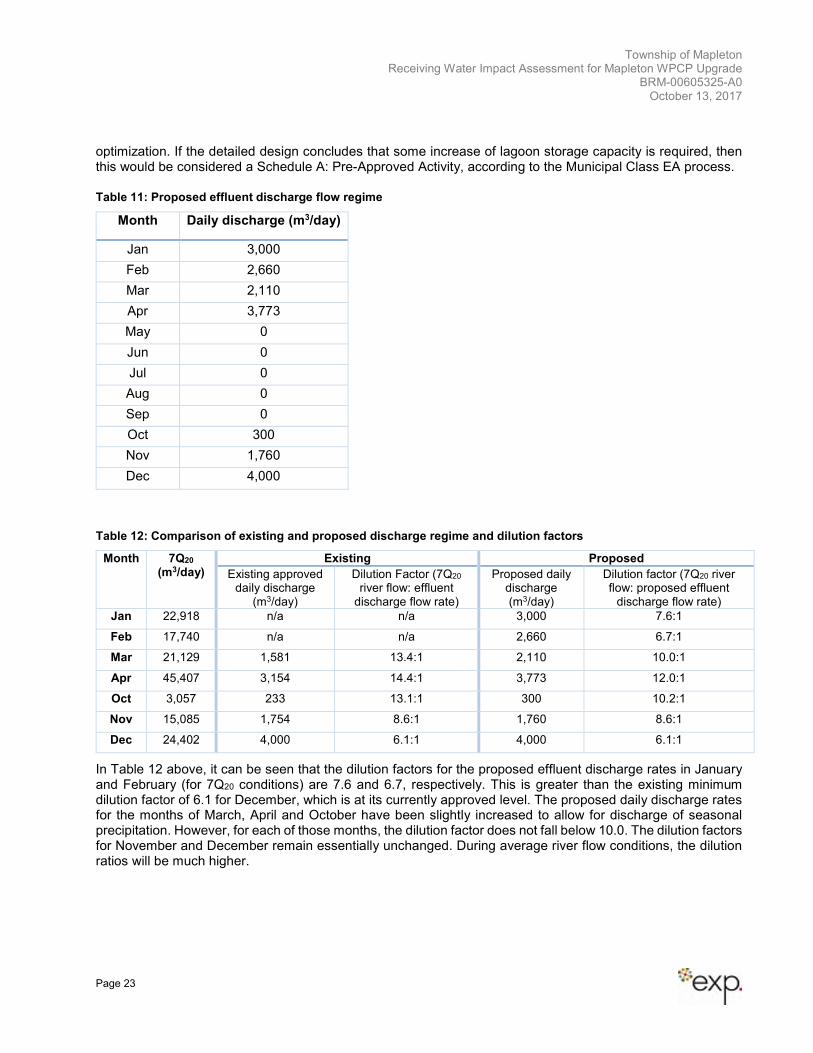
optimization. If the detailed design concludes that some increase of lagoon storage capacity is required, then this would be considered a Schedule A: Pre-Approved Activity, according to the Municipal Class EA process.
Table 11: Proposed effluent discharge flow regime
Month Daily discharge (m3/day)
Jan 3,000
Feb 2,660
Mar 2,110
Apr 3,773
May 0
Jun 0
Jul 0
Aug 0
Sep 0
Oct 300
Nov 1,760
Dec 4,000
Table 12: Comparison of existing and proposed discharge regime and dilution factors
Month 7Q20 (m3/day)
Existing Proposed
Existing approved daily discharge
(m3/day)
Dilution Factor (7Q20 river flow: effluent
discharge flow rate)
Proposed daily discharge (m3/day)
Dilution factor (7Q20 river flow: proposed effluent
discharge flow rate)
Jan 22,918 n/a n/a 3,000 7.6:1
Feb 17,740 n/a n/a 2,660 6.7:1
Mar 21,129 1,581 13.4:1 2,110 10.0:1
Apr 45,407 3,154 14.4:1 3,773 12.0:1
Oct 3,057 233 13.1:1 300 10.2:1
Nov 15,085 1,754 8.6:1 1,760 8.6:1
Dec 24,402 4,000 6.1:1 4,000 6.1:1
In Table 12 above, it can be seen that the dilution factors for the proposed effluent discharge rates in January and February (for 7Q20 conditions) are 7.6 and 6.7, respectively. This is greater than the existing minimum dilution factor of 6.1 for December, which is at its currently approved level. The proposed daily discharge rates for the months of March, April and October have been slightly increased to allow for discharge of seasonal precipitation. However, for each of those months, the dilution factor does not fall below 10.0. The dilution factors for November and December remain essentially unchanged. During average river flow conditions, the dilution ratios will be much higher.
Township of Mapleton Receiving Water Impact Assessment for Mapleton WPCP Upgrade
BRM-00605325-A0 October 13, 2017
Page 24
8 Effluent Water Quality Objectives under the Proposed
Discharge Regime
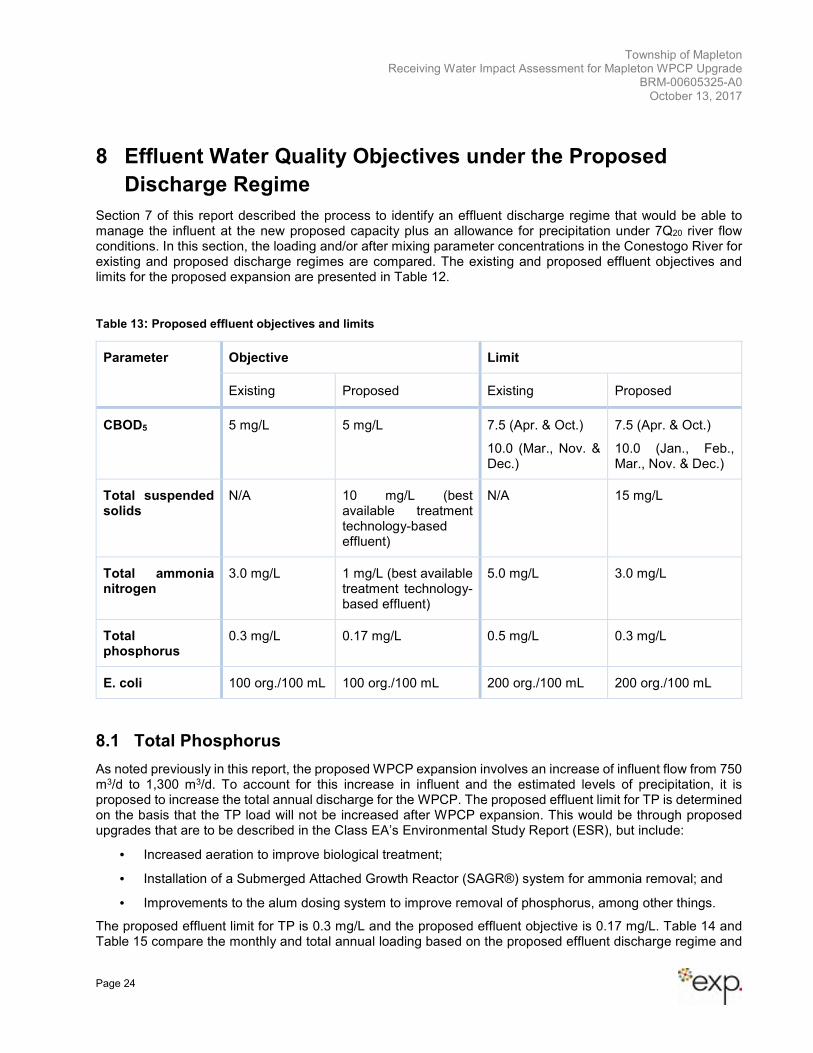
Section 7 of this report described the process to identify an effluent discharge regime that would be able to manage the influent at the new proposed capacity plus an allowance for precipitation under 7Q20 river flow conditions. In this section, the loading and/or after mixing parameter concentrations in the Conestogo River for existing and proposed discharge regimes are compared. The existing and proposed effluent objectives and limits for the proposed expansion are presented in Table 12.
Table 13: Proposed effluent objectives and limits
Parameter Objective Limit
Existing Proposed Existing Proposed
CBOD5 5 mg/L 5 mg/L 7.5 (Apr. & Oct.)
10.0 (Mar., Nov. & Dec.)
7.5 (Apr. & Oct.)
10.0 (Jan., Feb., Mar., Nov. & Dec.)
Total suspended solids
N/A 10 mg/L (best available treatment technology-based effluent)
N/A 15 mg/L
Total ammonia nitrogen
3.0 mg/L 1 mg/L (best available treatment technology-based effluent)
5.0 mg/L 3.0 mg/L
Total phosphorus
0.3 mg/L 0.17 mg/L 0.5 mg/L 0.3 mg/L
E. coli 100 org./100 mL 100 org./100 mL 200 org./100 mL 200 org./100 mL
8.1 Total Phosphorus
As noted previously in this report, the proposed WPCP expansion involves an increase of influent flow from 750 m3/d to 1,300 m3/d. To account for this increase in influent and the estimated levels of precipitation, it is proposed to increase the total annual discharge for the WPCP. The proposed effluent limit for TP is determined on the basis that the TP load will not be increased after WPCP expansion. This would be through proposed upgrades that are to be described in the Class EA’s Environmental Study Report (ESR), but include:
• Increased aeration to improve biological treatment;
• Installation of a Submerged Attached Growth Reactor (SAGR®) system for ammonia removal; and
• Improvements to the alum dosing system to improve removal of phosphorus, among other things.
The proposed effluent limit for TP is 0.3 mg/L and the proposed effluent objective is 0.17 mg/L. Table 14 and Table 15 compare the monthly and total annual loading based on the proposed effluent discharge regime and
Township of Mapleton Receiving Water Impact Assessment for Mapleton WPCP Upgrade
BRM-00605325-A0 October 13, 2017
Page 25
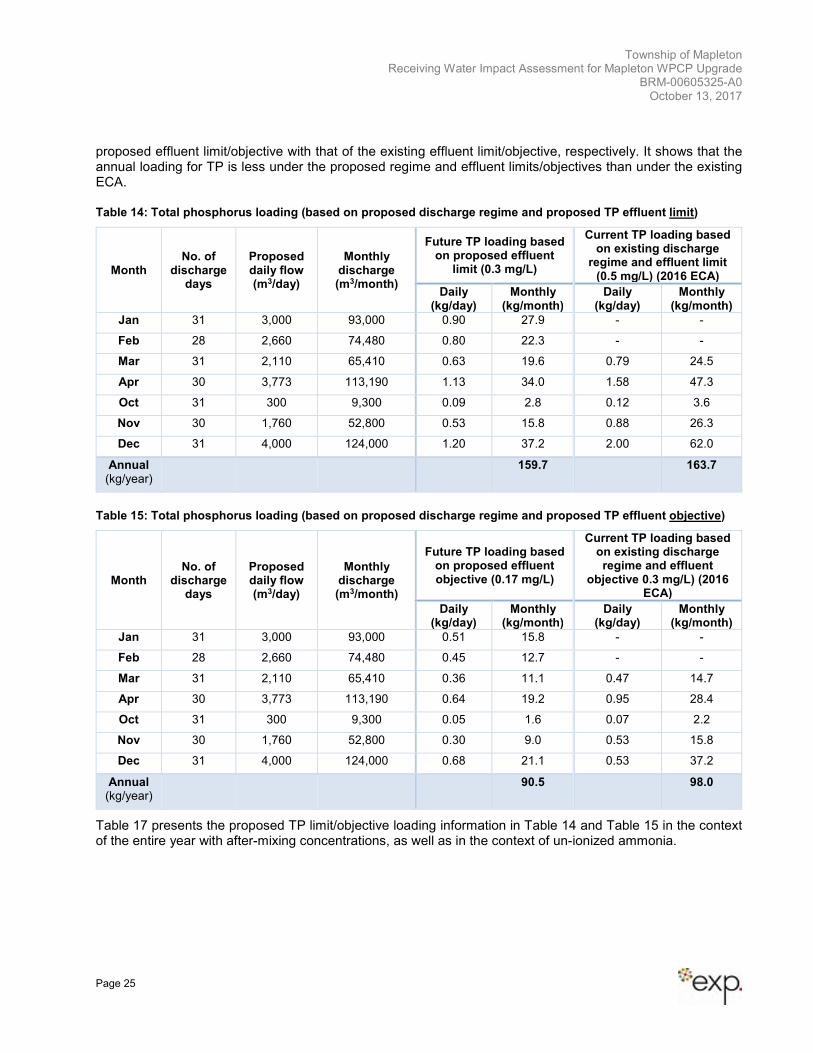
proposed effluent limit/objective with that of the existing effluent limit/objective, respectively. It shows that the annual loading for TP is less under the proposed regime and effluent limits/objectives than under the existing ECA.
Table 14: Total phosphorus loading (based on proposed discharge regime and proposed TP effluent limit)
Month No. of
discharge days
Proposed daily flow (m3/day)
Monthly discharge (m3/month)
Future TP loading based on proposed effluent
limit (0.3 mg/L)
Current TP loading based on existing discharge
regime and effluent limit (0.5 mg/L) (2016 ECA)
Daily (kg/day)
Monthly (kg/month)
Daily (kg/day)
Monthly (kg/month)
Jan 31 3,000 93,000 0.90 27.9 - -
Feb 28 2,660 74,480 0.80 22.3 - -
Mar 31 2,110 65,410 0.63 19.6 0.79 24.5
Apr 30 3,773 113,190 1.13 34.0 1.58 47.3
Oct 31 300 9,300 0.09 2.8 0.12 3.6
Nov 30 1,760 52,800 0.53 15.8 0.88 26.3
Dec 31 4,000 124,000 1.20 37.2 2.00 62.0
Annual (kg/year)
159.7
163.7
Table 15: Total phosphorus loading (based on proposed discharge regime and proposed TP effluent objective)
Month No. of
discharge days
Proposed daily flow (m3/day)
Monthly discharge (m3/month)
Future TP loading based on proposed effluent objective (0.17 mg/L)
Current TP loading based on existing discharge regime and effluent
objective 0.3 mg/L) (2016 ECA)
Daily (kg/day)
Monthly (kg/month)
Daily (kg/day)
Monthly (kg/month)
Jan 31 3,000 93,000 0.51 15.8 - -
Feb 28 2,660 74,480 0.45 12.7 - -
Mar 31 2,110 65,410 0.36 11.1 0.47 14.7
Apr 30 3,773 113,190 0.64 19.2 0.95 28.4
Oct 31 300 9,300 0.05 1.6 0.07 2.2
Nov 30 1,760 52,800 0.30 9.0 0.53 15.8
Dec 31 4,000 124,000 0.68 21.1 0.53 37.2
Annual (kg/year)
90.5 98.0
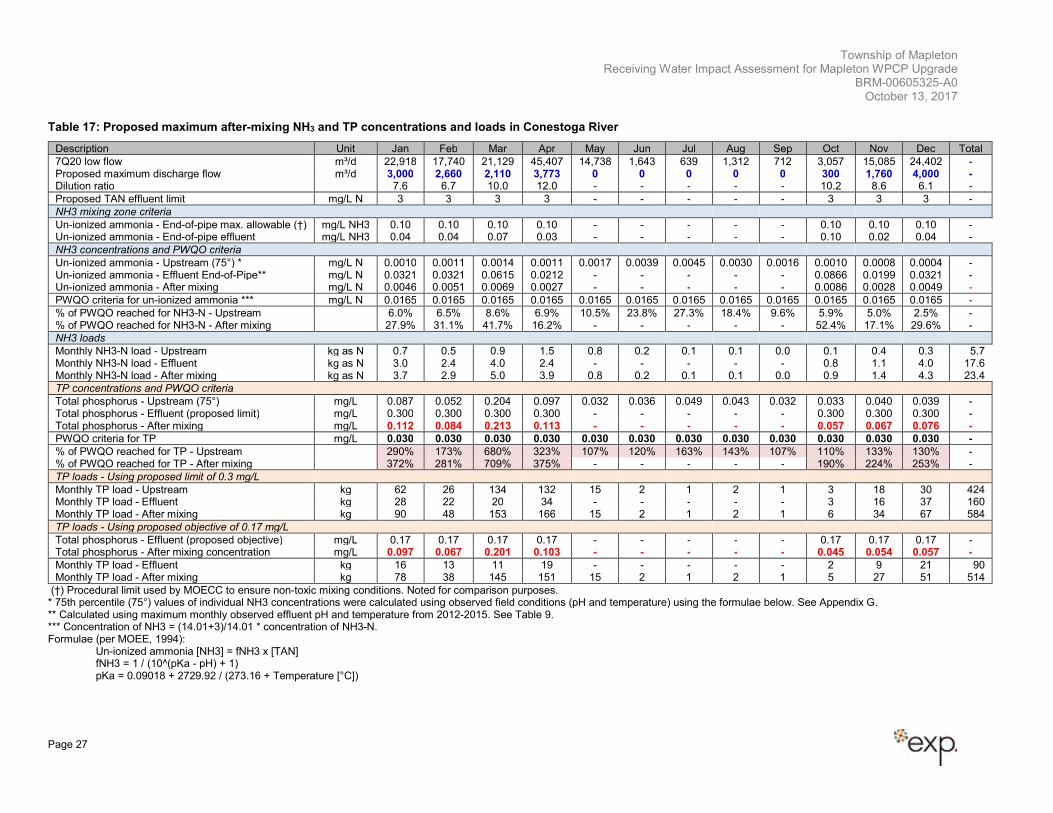
Table 17 presents the proposed TP limit/objective loading information in Table 14 and Table 15 in the context of the entire year with after-mixing concentrations, as well as in the context of un-ionized ammonia.
Township of Mapleton Receiving Water Impact Assessment for Mapleton WPCP Upgrade
BRM-00605325-A0 October 13, 2017
Page 26
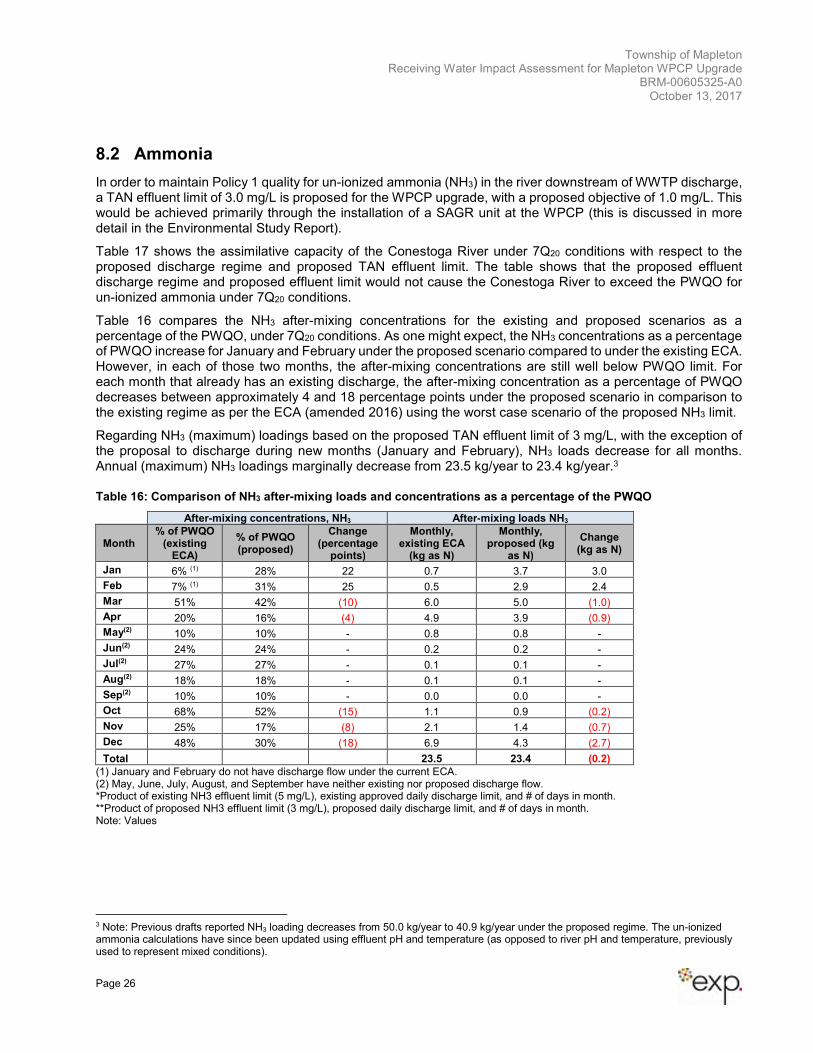
8.2 Ammonia
In order to maintain Policy 1 quality for un-ionized ammonia (NH3) in the river downstream of WWTP discharge, a TAN effluent limit of 3.0 mg/L is proposed for the WPCP upgrade, with a proposed objective of 1.0 mg/L. This would be achieved primarily through the installation of a SAGR unit at the WPCP (this is discussed in more detail in the Environmental Study Report).
Table 17 shows the assimilative capacity of the Conestoga River under 7Q20 conditions with respect to the proposed discharge regime and proposed TAN effluent limit. The table shows that the proposed effluent discharge regime and proposed effluent limit would not cause the Conestoga River to exceed the PWQO for un-ionized ammonia under 7Q20 conditions.
Table 16 compares the NH3 after-mixing concentrations for the existing and proposed scenarios as a percentage of the PWQO, under 7Q20 conditions. As one might expect, the NH3 concentrations as a percentage of PWQO increase for January and February under the proposed scenario compared to under the existing ECA. However, in each of those two months, the after-mixing concentrations are still well below PWQO limit. For each month that already has an existing discharge, the after-mixing concentration as a percentage of PWQO decreases between approximately 4 and 18 percentage points under the proposed scenario in comparison to the existing regime as per the ECA (amended 2016) using the worst case scenario of the proposed NH3 limit.
Regarding NH3 (maximum) loadings based on the proposed TAN effluent limit of 3 mg/L, with the exception of the proposal to discharge during new months (January and February), NH3 loads decrease for all months. Annual (maximum) NH3 loadings marginally decrease from 23.5 kg/year to 23.4 kg/year.3
Table 16: Comparison of NH3 after-mixing loads and concentrations as a percentage of the PWQO
After-mixing concentrations, NH3 After-mixing loads NH3
Month % of PWQO
(existing ECA)
% of PWQO (proposed)
Change (percentage
points)
Monthly, existing ECA
(kg as N)
Monthly, proposed (kg
as N)
Change (kg as N)
Jan 6% (1) 28% 22 0.7 3.7 3.0
Feb 7% (1) 31% 25 0.5 2.9 2.4
Mar 51% 42% (10) 6.0 5.0 (1.0)
Apr 20% 16% (4) 4.9 3.9 (0.9)
May(2) 10% 10% - 0.8 0.8 -
Jun(2) 24% 24% - 0.2 0.2 -
Jul(2) 27% 27% - 0.1 0.1 -
Aug(2) 18% 18% - 0.1 0.1 -
Sep(2) 10% 10% - 0.0 0.0 -
Oct 68% 52% (15) 1.1 0.9 (0.2)
Nov 25% 17% (8) 2.1 1.4 (0.7)
Dec 48% 30% (18) 6.9 4.3 (2.7)
Total 23.5 23.4 (0.2)
(1) January and February do not have discharge flow under the current ECA. (2) May, June, July, August, and September have neither existing nor proposed discharge flow. *Product of existing NH3 effluent limit (5 mg/L), existing approved daily discharge limit, and # of days in month. **Product of proposed NH3 effluent limit (3 mg/L), proposed daily discharge limit, and # of days in month. Note: Values
3 Note: Previous drafts reported NH3 loading decreases from 50.0 kg/year to 40.9 kg/year under the proposed regime. The un-ionized ammonia calculations have since been updated using effluent pH and temperature (as opposed to river pH and temperature, previously used to represent mixed conditions).
Township of Mapleton Receiving Water Impact Assessment for Mapleton WPCP Upgrade
BRM-00605325-A0 October 13, 2017
Page 27
Table 17: Proposed maximum after-mixing NH3 and TP concentrations and loads in Conestoga River
Description Unit Jan Feb Mar Apr May Jun Jul Aug Sep Oct Nov Dec Total
7Q20 low flow m³/d 22,918 17,740 21,129 45,407 14,738 1,643 639 1,312 712 3,057 15,085 24,402 - Proposed maximum discharge flow m³/d 3,000 2,660 2,110 3,773 0 0 0 0 0 300 1,760 4,000 - Dilution ratio 7.6 6.7 10.0 12.0 - - - - - 10.2 8.6 6.1 -
Proposed TAN effluent limit mg/L N 3 3 3 3 - - - - - 3 3 3 -
NH3 mixing zone criteria
Un-ionized ammonia - End-of-pipe max. allowable (†) mg/L NH3 0.10 0.10 0.10 0.10 - - - - - 0.10 0.10 0.10 - Un-ionized ammonia - End-of-pipe effluent mg/L NH3 0.04 0.04 0.07 0.03 - - - - - 0.10 0.02 0.04 -
NH3 concentrations and PWQO criteria
Un-ionized ammonia - Upstream (75°) * mg/L N 0.0010 0.0011 0.0014 0.0011 0.0017 0.0039 0.0045 0.0030 0.0016 0.0010 0.0008 0.0004 - Un-ionized ammonia - Effluent End-of-Pipe** mg/L N 0.0321 0.0321 0.0615 0.0212 - - - - - 0.0866 0.0199 0.0321 - Un-ionized ammonia - After mixing mg/L N 0.0046 0.0051 0.0069 0.0027 - - - - - 0.0086 0.0028 0.0049 -
PWQO criteria for un-ionized ammonia *** mg/L N 0.0165 0.0165 0.0165 0.0165 0.0165 0.0165 0.0165 0.0165 0.0165 0.0165 0.0165 0.0165 -
% of PWQO reached for NH3-N - Upstream 6.0% 6.5% 8.6% 6.9% 10.5% 23.8% 27.3% 18.4% 9.6% 5.9% 5.0% 2.5% - % of PWQO reached for NH3-N - After mixing 27.9% 31.1% 41.7% 16.2% - - - - - 52.4% 17.1% 29.6% -
NH3 loads
Monthly NH3-N load - Upstream kg as N 0.7 0.5 0.9 1.5 0.8 0.2 0.1 0.1 0.0 0.1 0.4 0.3 5.7 Monthly NH3-N load - Effluent kg as N 3.0 2.4 4.0 2.4 - - - - - 0.8 1.1 4.0 17.6 Monthly NH3-N load - After mixing kg as N 3.7 2.9 5.0 3.9 0.8 0.2 0.1 0.1 0.0 0.9 1.4 4.3 23.4
TP concentrations and PWQO criteria
Total phosphorus - Upstream (75°) mg/L 0.087 0.052 0.204 0.097 0.032 0.036 0.049 0.043 0.032 0.033 0.040 0.039 - Total phosphorus - Effluent (proposed limit) mg/L 0.300 0.300 0.300 0.300 - - - - - 0.300 0.300 0.300 - Total phosphorus - After mixing mg/L 0.112 0.084 0.213 0.113 - - - - - 0.057 0.067 0.076 -
PWQO criteria for TP mg/L 0.030 0.030 0.030 0.030 0.030 0.030 0.030 0.030 0.030 0.030 0.030 0.030 -
% of PWQO reached for TP - Upstream 290% 173% 680% 323% 107% 120% 163% 143% 107% 110% 133% 130% - % of PWQO reached for TP - After mixing 372% 281% 709% 375% - - - - - 190% 224% 253% -
TP loads - Using proposed limit of 0.3 mg/L
Monthly TP load - Upstream kg 62 26 134 132 15 2 1 2 1 3 18 30 424 Monthly TP load - Effluent kg 28 22 20 34 - - - - - 3 16 37 160 Monthly TP load - After mixing kg 90 48 153 166 15 2 1 2 1 6 34 67 584
TP loads - Using proposed objective of 0.17 mg/L
Total phosphorus - Effluent (proposed objective) mg/L 0.17 0.17 0.17 0.17 - - - - - 0.17 0.17 0.17 - Total phosphorus - After mixing concentration mg/L 0.097 0.067 0.201 0.103 - - - - - 0.045 0.054 0.057 -
Monthly TP load - Effluent kg 16 13 11 19 - - - - - 2 9 21 90 Monthly TP load - After mixing kg 78 38 145 151 15 2 1 2 1 5 27 51 514
(†) Procedural limit used by MOECC to ensure non-toxic mixing conditions. Noted for comparison purposes. * 75th percentile (75°) values of individual NH3 concentrations were calculated using observed field conditions (pH and temperature) using the formulae below. See Appendix G. ** Calculated using maximum monthly observed effluent pH and temperature from 2012-2015. See Table 9. *** Concentration of NH3 = (14.01+3)/14.01 * concentration of NH3-N. Formulae (per MOEE, 1994):
Un-ionized ammonia [NH3] = fNH3 x [TAN] fNH3 = 1 / (10^(pKa - pH) + 1) pKa = 0.09018 + 2729.92 / (273.16 + Temperature [°C])
Township of Mapleton Receiving Water Impact Assessment for Mapleton WPCP Upgrade
BRM-00605325-A0 October 13, 2017
Page 28
8.3 Hydrogen Sulphide
Further to the discussion regarding hydrogen sulphide (H2S) in Section 6.3.6; it may be noted that, with the proposed upgrades, two additional steps would mitigate any (H2S) related concerns, namely:
1. The influent treatment would involve a high degree of aeration in the proposed SAGR system prior to
the effluent’s flow into the storage cells, as opposed to the facultative lagoon in the current system.
2. Secondly, it may be noted that there would be ongoing discharge through the winter months from the
storage, and as such, the potential for H2S generation would be further diminished.
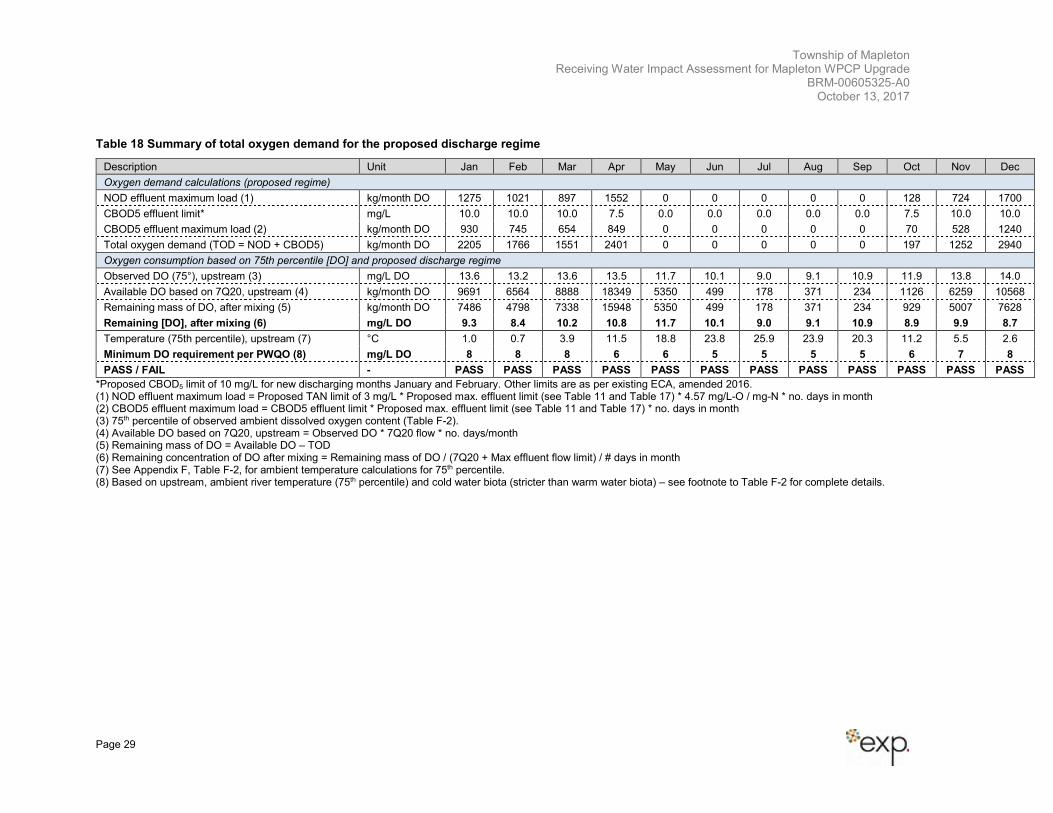
8.4 Dissolved Oxygen, CBOD5, and NOD
In order to maintain Policy 1 for dissolved oxygen (DO), the receiving water has to have sufficient DO in order to manage the total oxygen demand (TOD) of the effluent while remaining above the specified PWQO temperature- and biota- based DO minimum. For this plant, the TOD will be comprised of carbonaceous biochemical oxygen demand (CBOD) and nitrogenous oxygen demand (NOD). Evaluating the impact of TOD on DO in flowing river systems often requires the use of computer models such as the Grand River Simulation Model (GRSM). However, the use of a complicated modeling approach for DO is not necessary in this case for several reasons including:
• The proposed discharge regime occurs during cold weather months (e.g. October to April) when
photosynthetic activity in the river is low which means diurnal variations in DO are expected to be
small;
• DO levels are elevated during this period of the year as summarized in Table 3 and lower
temperatures allow more oxygen dissolve in the water, i.e. oxygen saturation is higher during this
period; and,
• The oxygen demand exerted by BOD decay and nitrification is low due to cold water conditions and
slower biochemical reaction rates.
For ambient conditions, the Greenbook4 indicates that the 75th percentile (75°) is normally used to determine background water quality, including DO. Accordingly, the after-mixing conditions were evaluated under the proposed effluent discharge regime to determine the remaining, after-mixing dissolved oxygen content (see Table 16). The values in Table 16 were calculated using the 75th percentile of ambient DO, CBOD5 limits, proposed TAN effluent limit of 3 mg/L (to estimate the nitrogenous oxygen demand), and 7Q20 flows. Based on these conditions, the DO content passes the minimum DO temperature- and biota- based PWQO requirements for all months
This simple mass balance type of approach demonstrates that DO impacts will be minimal even with highly
conservative assumptions, e.g. assuming all BOD is biodegradable, complete nitrification, no loss of TAN to
the atmosphere, and no reaeration of DO.
4 See Section 4.5 in Ontario Ministry of Environment and Energy. July 1994. Deriving receiving-water based, point-source effluent requirements for Ontario waters (Procedure B-1-5). PIBS# 3302.
Township of Mapleton Receiving Water Impact Assessment for Mapleton WPCP Upgrade
BRM-00605325-A0 October 13, 2017
Page 29
Table 18 Summary of total oxygen demand for the proposed discharge regime
Description Unit Jan Feb Mar Apr May Jun Jul Aug Sep Oct Nov Dec
Oxygen demand calculations (proposed regime)
NOD effluent maximum load (1) kg/month DO 1275 1021 897 1552 0 0 0 0 0 128 724 1700
CBOD5 effluent limit* mg/L 10.0 10.0 10.0 7.5 0.0 0.0 0.0 0.0 0.0 7.5 10.0 10.0
CBOD5 effluent maximum load (2) kg/month DO 930 745 654 849 0 0 0 0 0 70 528 1240
Total oxygen demand (TOD = NOD + CBOD5) kg/month DO 2205 1766 1551 2401 0 0 0 0 0 197 1252 2940
Oxygen consumption based on 75th percentile [DO] and proposed discharge regime
Observed DO (75°), upstream (3) mg/L DO 13.6 13.2 13.6 13.5 11.7 10.1 9.0 9.1 10.9 11.9 13.8 14.0
Available DO based on 7Q20, upstream (4) kg/month DO 9691 6564 8888 18349 5350 499 178 371 234 1126 6259 10568
Remaining mass of DO, after mixing (5) kg/month DO 7486 4798 7338 15948 5350 499 178 371 234 929 5007 7628
Remaining [DO], after mixing (6) mg/L DO 9.3 8.4 10.2 10.8 11.7 10.1 9.0 9.1 10.9 8.9 9.9 8.7
Temperature (75th percentile), upstream (7) °C 1.0 0.7 3.9 11.5 18.8 23.8 25.9 23.9 20.3 11.2 5.5 2.6
Minimum DO requirement per PWQO (8) mg/L DO 8 8 8 6 6 5 5 5 5 6 7 8
PASS / FAIL - PASS PASS PASS PASS PASS PASS PASS PASS PASS PASS PASS PASS
*Proposed CBOD5 limit of 10 mg/L for new discharging months January and February. Other limits are as per existing ECA, amended 2016. (1) NOD effluent maximum load = Proposed TAN limit of 3 mg/L * Proposed max. effluent limit (see Table 11 and Table 17) * 4.57 mg/L-O / mg-N * no. days in month (2) CBOD5 effluent maximum load = CBOD5 effluent limit * Proposed max. effluent limit (see Table 11 and Table 17) * no. days in month (3) 75th percentile of observed ambient dissolved oxygen content (Table F-2). (4) Available DO based on 7Q20, upstream = Observed DO * 7Q20 flow * no. days/month (5) Remaining mass of DO = Available DO – TOD (6) Remaining concentration of DO after mixing = Remaining mass of DO / (7Q20 + Max effluent flow limit) / # days in month (7) See Appendix F, Table F-2, for ambient temperature calculations for 75th percentile. (8) Based on upstream, ambient river temperature (75th percentile) and cold water biota (stricter than warm water biota) – see footnote to Table F-2 for complete details.
Township of Mapleton Receiving Water Impact Assessment for Mapleton WPCP Upgrade
BRM-00605325-A0 October 13, 2017
Page 30
8.5 Total Suspended Solids
Effluent total suspended solids (TSS) are not expected to have an impact on the quality of the Conestogo River. The current and proposed effluent limits for cBOD and TP necessitate a high degree of TSS removal which is achieved using tertiary filtration. It is expected that effluent TSS will be less than 15 mg/L on a monthly average basis. When compared to background conditions in the Conestogo River (see Table 3), the 75th percentile of TSS concentrations in most months is approximately equal to or greater than 15 mg/L and therefore the effluent is likely to have lower TSS than the Conestogo River. The maximum impact of the effluent on TSS may occur in December, which has the lowest background concentration of TSS. A simple mass balance calculation suggests that the effluent may cause an increase in TSS during December of approximately 1 mg/L under 7Q20 conditions.
8.6 Impacts on Conestogo Reservoir
8.6.1 Background and Operation The Conestogo Reservoir was built in 1958 as part of a network of dams that provide flood control and low
flow augmentation on the Conestogo River5. It provides low flow augmentation by releasing water stored in
the reservoir during times when the river flow is low (i.e., summer periods). From a wastewater management
perspective, this provides WPCP downstream of the reservoir with a river flow in which to release their
discharge. This dam has additional purposes for electricity production and recreation; however, these are
auxiliary uses that result from its primary functions of flood control and low flow augmentation6.
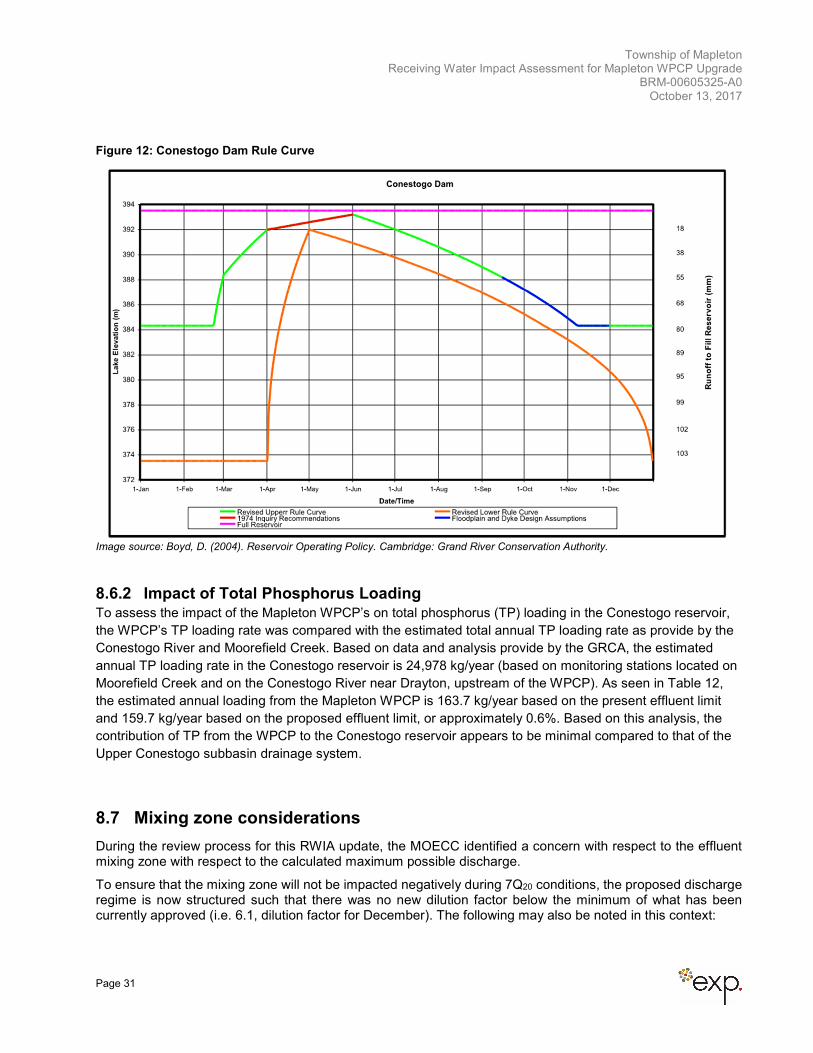
The Conestogo dam operates within upper and lower rule curves, or water level limits. Water levels are maintained between these limits, which shift over the course of the year. The Conestogo Dam rule curves are presented in Figure 12. The reservoir’s fill and drawdown phases include:
• Early January to Mid-February - winter drawdown phase;
• Mid-February to Late May - spring reservoir filling phase;
• Early June to Late October - summer drawdown phase; and
• Late October to Late December - fall drawdown phase.
5 Grand River Conservation Authority. (2014). Background Briefing Reservoir operations. Cambridge: Grand River Conservation Authority. 6 Shifflett, S. (2011). Conestogo Dam Operations. Cambridge: Grand River Conservation Authority.
Township of Mapleton Receiving Water Impact Assessment for Mapleton WPCP Upgrade
BRM-00605325-A0 October 13, 2017
Page 31
Figure 12: Conestogo Dam Rule Curve
Image source: Boyd, D. (2004). Reservoir Operating Policy. Cambridge: Grand River Conservation Authority.
8.6.2 Impact of Total Phosphorus Loading To assess the impact of the Mapleton WPCP’s on total phosphorus (TP) loading in the Conestogo reservoir,
the WPCP’s TP loading rate was compared with the estimated total annual TP loading rate as provide by the
Conestogo River and Moorefield Creek. Based on data and analysis provide by the GRCA, the estimated
annual TP loading rate in the Conestogo reservoir is 24,978 kg/year (based on monitoring stations located on
Moorefield Creek and on the Conestogo River near Drayton, upstream of the WPCP). As seen in Table 12,
the estimated annual loading from the Mapleton WPCP is 163.7 kg/year based on the present effluent limit
and 159.7 kg/year based on the proposed effluent limit, or approximately 0.6%. Based on this analysis, the
contribution of TP from the WPCP to the Conestogo reservoir appears to be minimal compared to that of the
Upper Conestogo subbasin drainage system.
8.7 Mixing zone considerations
During the review process for this RWIA update, the MOECC identified a concern with respect to the effluent mixing zone with respect to the calculated maximum possible discharge.
To ensure that the mixing zone will not be impacted negatively during 7Q20 conditions, the proposed discharge regime is now structured such that there was no new dilution factor below the minimum of what has been currently approved (i.e. 6.1, dilution factor for December). The following may also be noted in this context:
Township of Mapleton Receiving Water Impact Assessment for Mapleton WPCP Upgrade
BRM-00605325-A0 October 13, 2017
Page 32
1. While it is proposed to extend the allowable discharge window, the maximum discharge flowrate (4,000 m3/day) and minimum dilution factor (6.1) remain the same.
2. As noted above, the discharge flow has been structured such that it does not fall below the minimum permitted dilution factor of 6.1 during 7Q20 conditions (while it is further noted that dilution under average conditions will be much greater, see Table 6).
3. The dilution factors for additional discharge months (i.e. January and February) are greater than 6.1; therefore, it is reasonable to assume that the mixing zone boundary during these two months should be smaller than that of December.
4. The effluent concentration and total loading of un-ionized ammonia (NH3) in the proposed discharge regime is less than that of the existing discharge regime. Our ecologist has noted that with the proposed stricter effluent discharge limits, conditions within the mixing zone are likely to improve.
5. Impacts from the potential aquatic toxicity of the effluent discharge plume in the proposed January and February discharge period are likely to be small, due to the following reasons:
o Ammonia is less toxic to aquatic life at lower temperature and pH values7. During the months of January and February, the water temperature will be very low, thereby reducing its potential aquatic toxicity.
o The concentrations of ammonia that cause toxicity to fish depend on the length of exposure8. In January and February, the level of biological activity in the river would be lower compared to other parts of the year; therefore, exposure of aquatic life to ammonia in the river water likely would be minimal.
We also that with the installation of the proposed SAGR® system, while a significant reduction to the TAN effluent limit (from 5 to 3 mg/L) is proposed, note that the SAGR® system is expected to produce levels below 1 mg/L.
Therefore, in consideration of these factors, conditions within the mixing zone will improve under the proposed discharge regime in comparison to the same of the existing discharge regime.
In November 2016, Hutchinson Environmental Sciences Limited (HESL), on behalf of the Township, completed a dye tracer study to verify the mixing zone of the WPCP discharge (available in Appendix H). The purpose of the dye tracer study was to delineate the extent of the mixing zone in the Conestoga River and to measure the dilution of the effluent in the mixing zone. The study report noted the following conclusions:
• By about 480 m downstream, Rhodamine WT dye concentrations were approximately equal across the
width of the river indicating that the effluent was homogenously mixed with Conestoga River at this point
(at a river flow of 153 L/s and effluent discharge of 26 L/s).
• At the confluence between the effluent-receiving channel and the Conestoga River, the WPCP effluent
from the receiving channel was contained to the northern side (left bank) due to the presence of an island
in the Conestoga River located at the receiving channel discharge location, which splits the river flows at
this point.
• The island in the Conestoga River located at the confluence between the effluent-receiving channel and
the river was effective in isolating the effluent to the north side of the island while providing an area for
safe fish passage along the south side of the island.
• Downstream of this island (approximately 75 m downstream of the confluence with the effluent receiving
channel) the effluent plume mixed across the entire width of the river, such that at cross-section 4 (114 m
downstream), the Rhodamine WT dye tracer was detected at all points across the width of the river. At
7 Levit, Stuart M. Center for Science in Public Participation. A Literature Review of Effects of Ammonia on Fish. Prepared for The Nature Conservancy. November 2010. 8 Ibid.
Township of Mapleton Receiving Water Impact Assessment for Mapleton WPCP Upgrade
BRM-00605325-A0 October 13, 2017
Page 33
this location, there was approximately 40% of the river width available for fish passage where the effluent
made up less than 10% of the river volume (at effluent flows of 26 L/s and river flows of 153 L/s).
• The highest dye concentrations were measured near the left bank between 28 and 287 m downstream of
the confluence with the effluent-receiving channel.
• Based on the Rhodamine WT dye tracer and water quality results, there was safe fish passage alongside
the Mapleton WPCP effluent plume on the day of the dye tracer study. At higher river flows, there would
be even greater river width available, as increased Conestoga River flows would tend to keep the WPCP
plume toward the left bank for a greater downstream distance9.
8.8 Water Quality Summary
The Class EA process for the Mapleton WPCP upgrade includes the identification of a preferred effluent discharge regime that is able to discharge 1,300 m3/day of treated influent plus an allowance for precipitation while at the same time protecting the sensitive environmental conditions within the Conestogo River. To do this, stricter effluent limits for TAN and TP were proposed, which would be achieved through improvements to the WPCP’s treatment process.
An effluent discharge regime was identified that would allow the WPCP to achieve its discharge volume requirements while producing an effluent that would reduce the overall impact of on the Conestogo River under 7Q20 conditions. The proposed discharge allowance had been established by maintaining the Conestogo River’s water quality in its actual Policy designation (i.e., Policy 1 for NH3, and Policy 2 for TP) and by considering the storage capacity limit at the WPCP.
Further, the proposed discharge should not cause negative impacts to the wetland, since the new effluent quality will be much improved as compared to the existing effluent discharge.
While the available background river data for the new proposed discharge period of January and February is limited, the GRCA is continuing with its river quality monitoring program, which will provide additional data for verification of the analysis in this report. To allow adequate time for the collection of this data, an interim phasing of the proposed WPCP capacity is proposed and introduced in Section 9.
9 Tara Roumeliotis and Deborah Sinclair. Mapleton WWTF – Dye Tracer Study in Conestoga River. Draft Memorandum to Brad McRoberts (Township of Mapleton). January 20, 2017.
Township of Mapleton Receiving Water Impact Assessment for Mapleton WPCP Upgrade
BRM-00605325-A0 October 13, 2017
Page 34
9 Interim Phasing
One of the primary concerns raised by the MOECC regarding adding discharge in January and February is the lack of available river water quality data during cold winter months. While the assimilative capacity assessment calculations discussed in Sections 8 show that river water quality for ammonia will remain below the PWQO, the limited dataset for background river water quality and its age insert uncertainty into the accuracy of the results.
To resolve this uncertainty, it is proposed that the Township phase in the implementation of the expansion in two phases:
• Phase 1 - Interim Rating: The first phase of the expansion would have the influent capacity of the WPCP raised to an interim-capacity of about 900 m3/day (exact rating to be confirmed during approvals process). It be achieved by rerating the existing WPCP through optimization, which will allow the Township to increase the WPCP’s capacity without a large capital investment, thereby relieving the Township’s immediate growth pressures while providing time for additional winter river water quality monitoring. As discussed previously, the GRCA has implemented a monitoring program for the Conestogo River, which would act as a source for the additional data.
• Phase 2 - Full Rating: The second phase of the phasing process would increase the facility’s influent rating to 1,300 m3/day, to be achieved through implementation of the EA’s preferred design. It would occur once sufficient data has been generated adequately calculate the potential impact of adding a January and February discharge period to the WPCP’s existing discharge regime.
10 Conclusion
Based on the analysis discussed in the previous sections, the proposed discharge regime and proposed effluent objectives / limits are expected to result in a net improvement to the after-mixing river water quality, while providing the Township with additional influent capacity that considers an allocation for net precipitation. Uncertainties related to the limited available river water quality background data for January and February can be addressed through:
• A two-phase approach to implementation; and
• Incorporation of additional river water quality monitoring data from the GRCA’s monitoring program.
The phased approach will allow the Township to increase the WPCP’s capacity to an interim rating through facility rerating under the current effluent objectives/limits and provide the time required for the additional data from GRCA’s monitoring program to help verify this document’s analysis.

Township of Mapleton Receiving Water Impact Assessment for Mapleton WPCP Upgrade
BRM-00605325-A0 October 13, 2017
Appendix A: Amended Environmental Compliance Approval
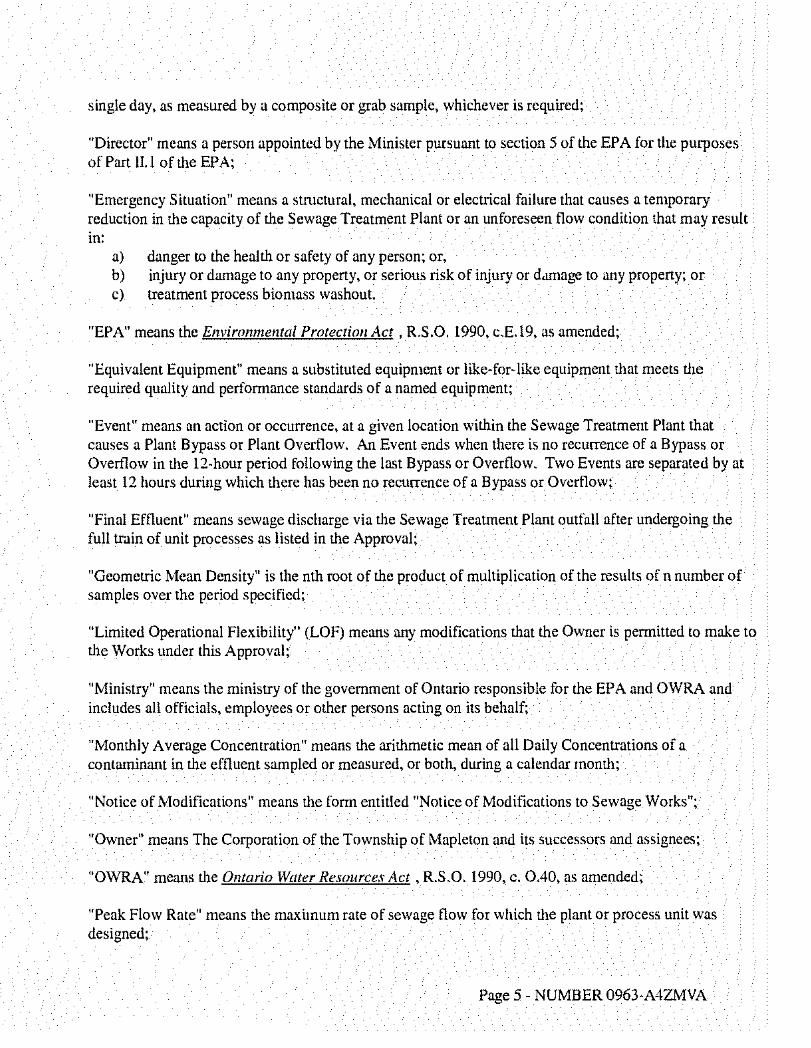
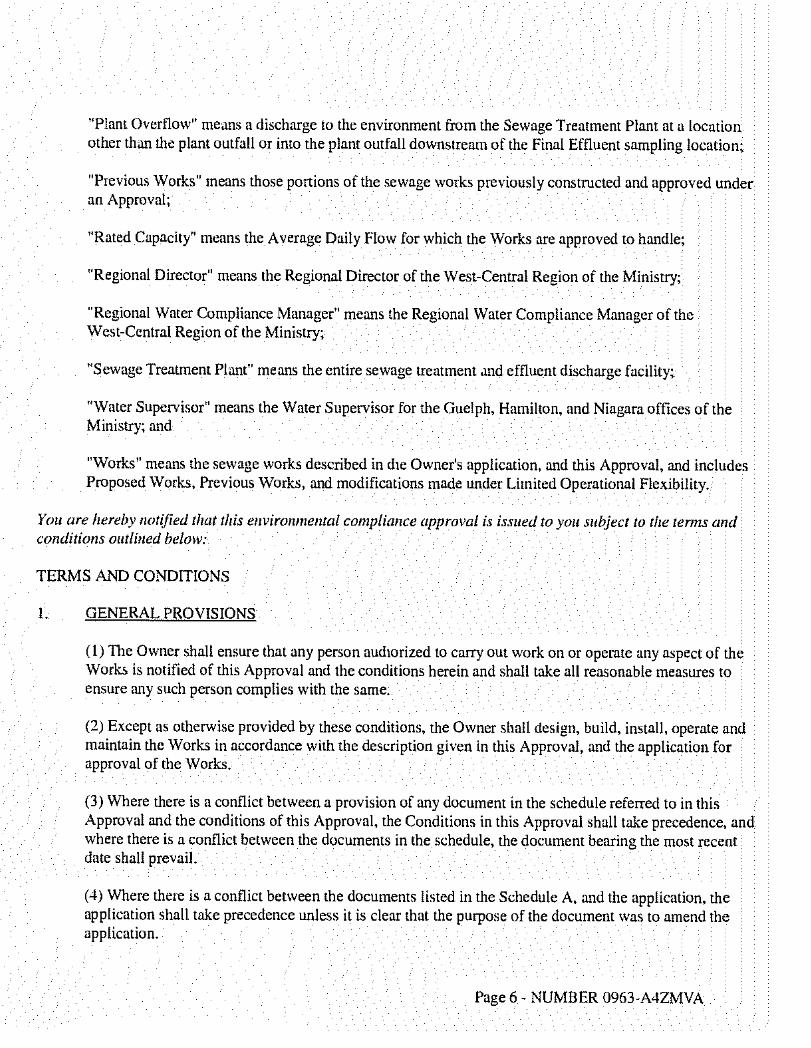

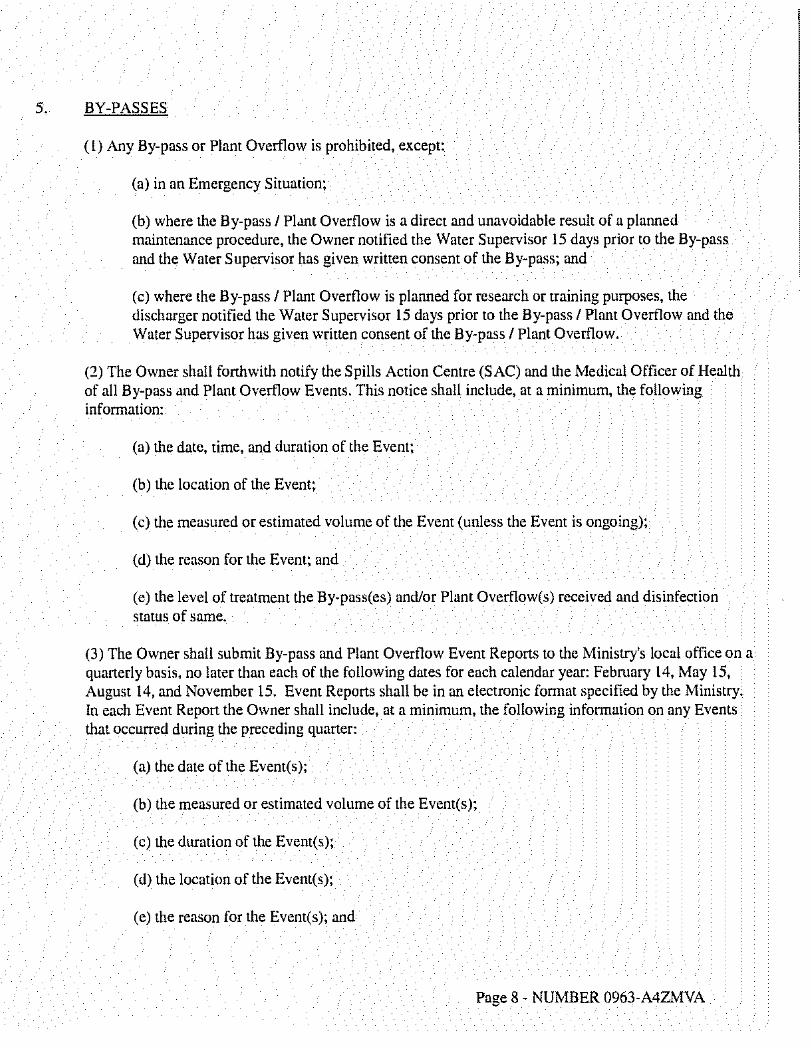
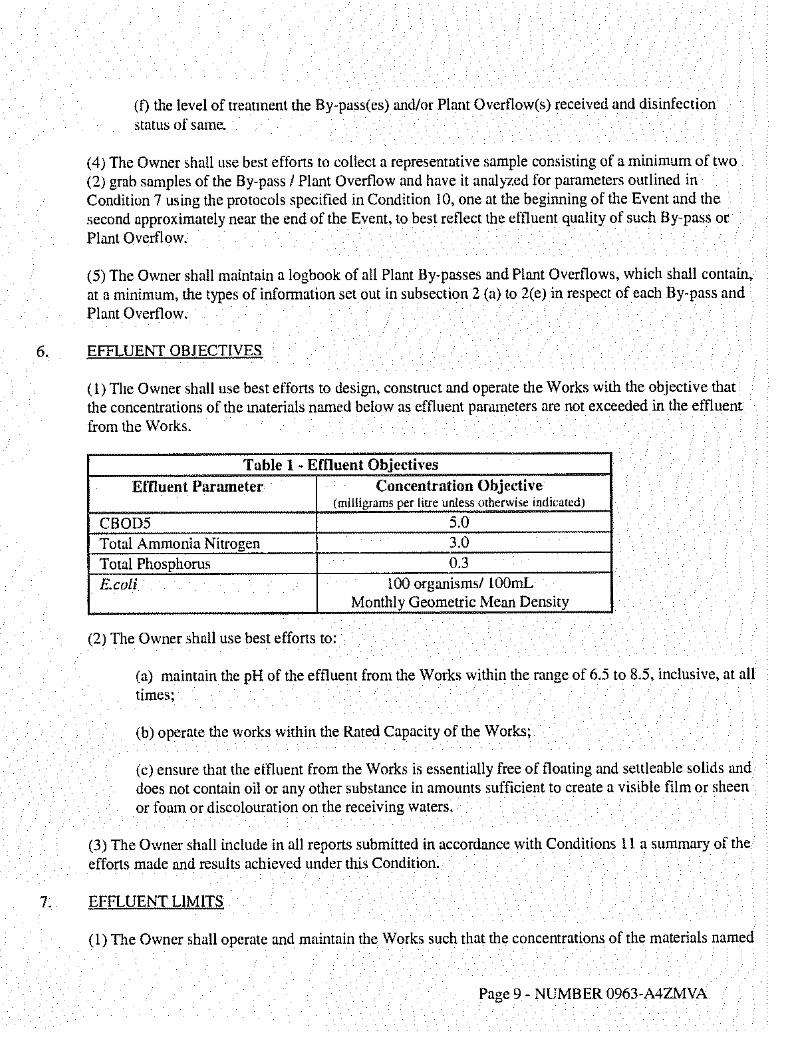
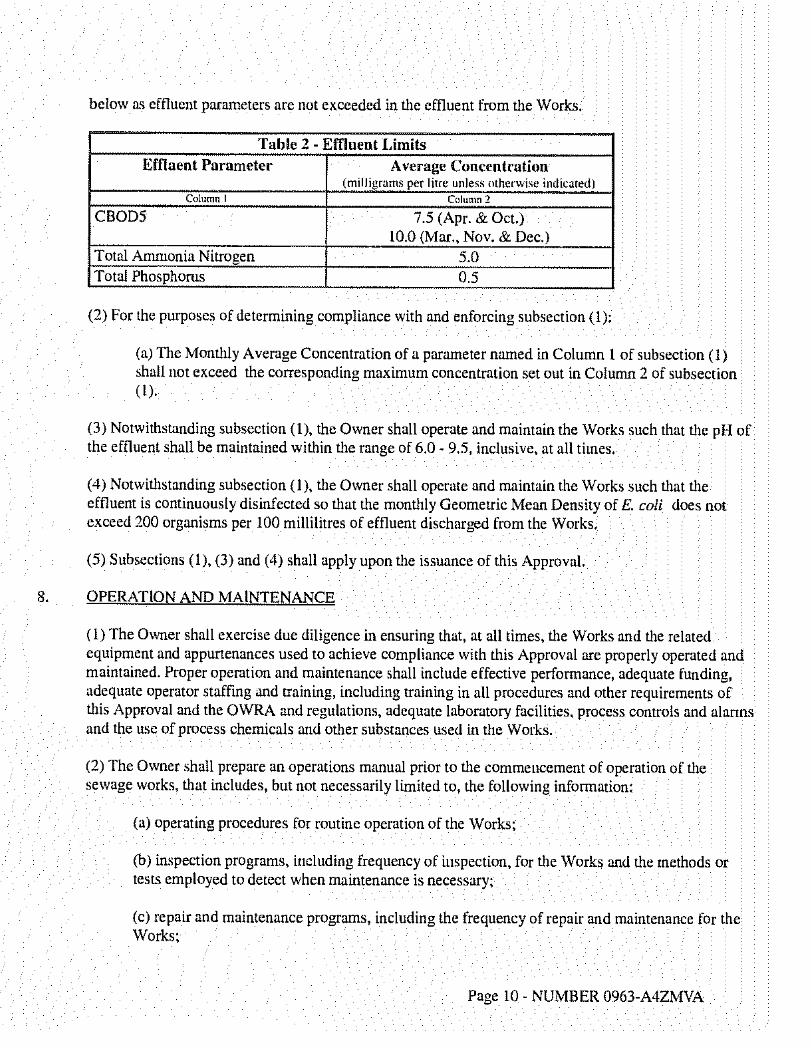
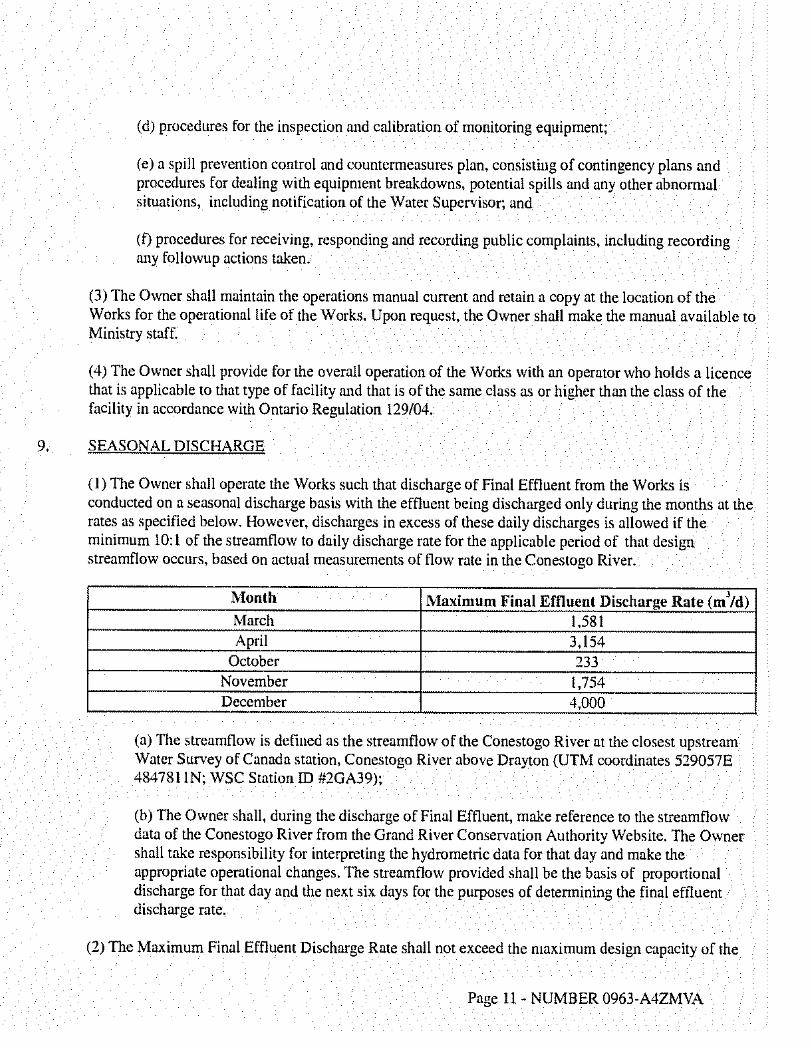

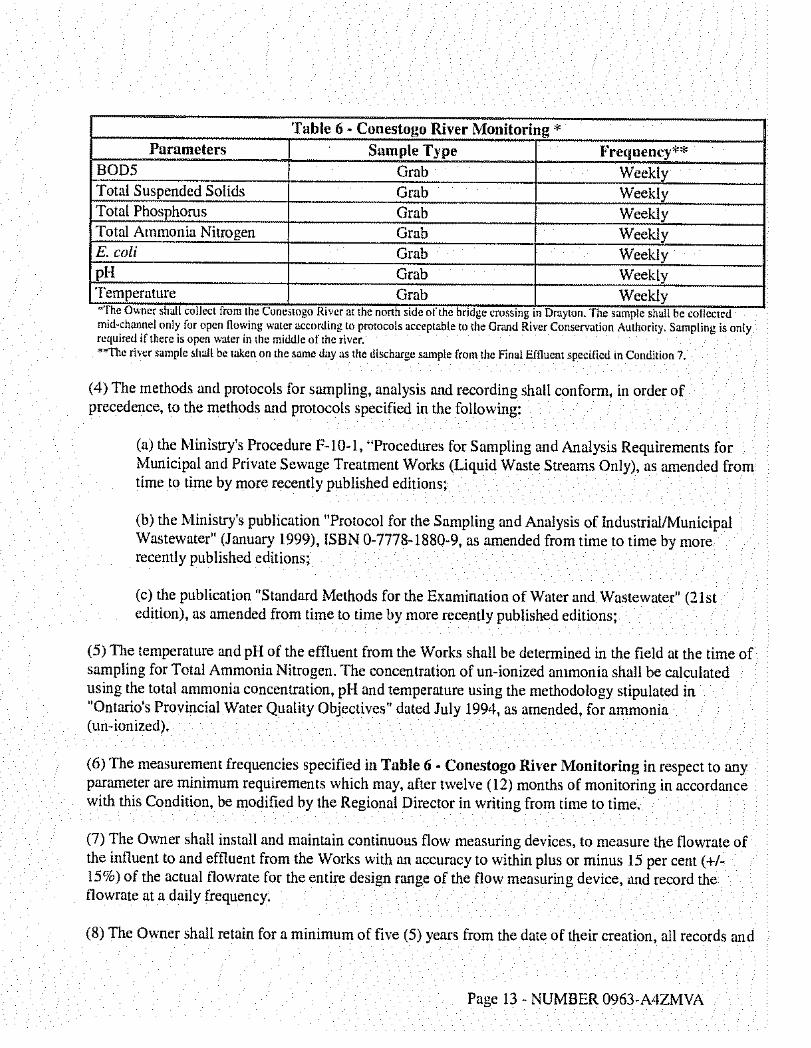

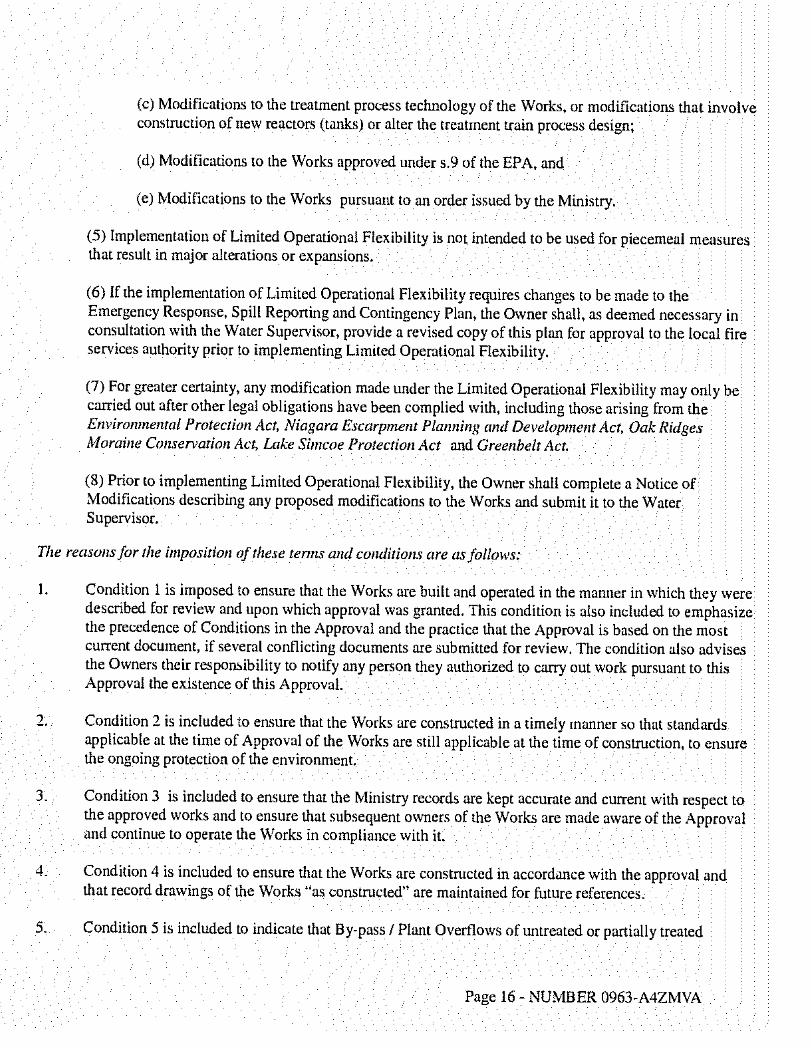


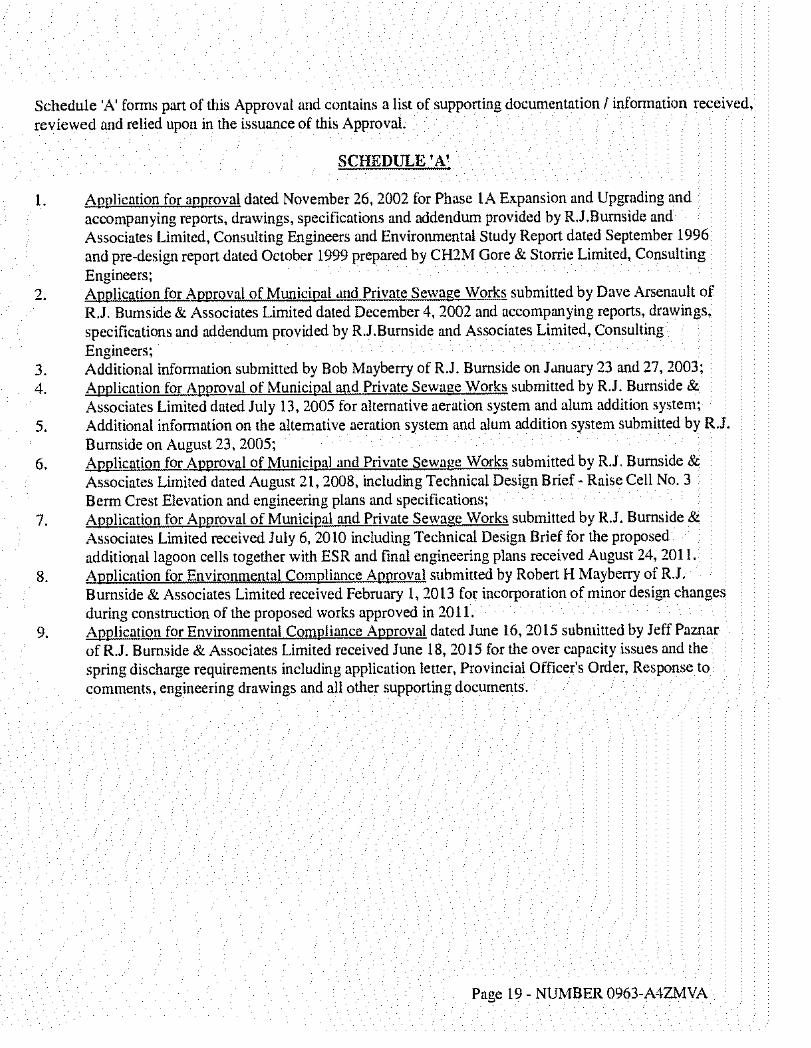
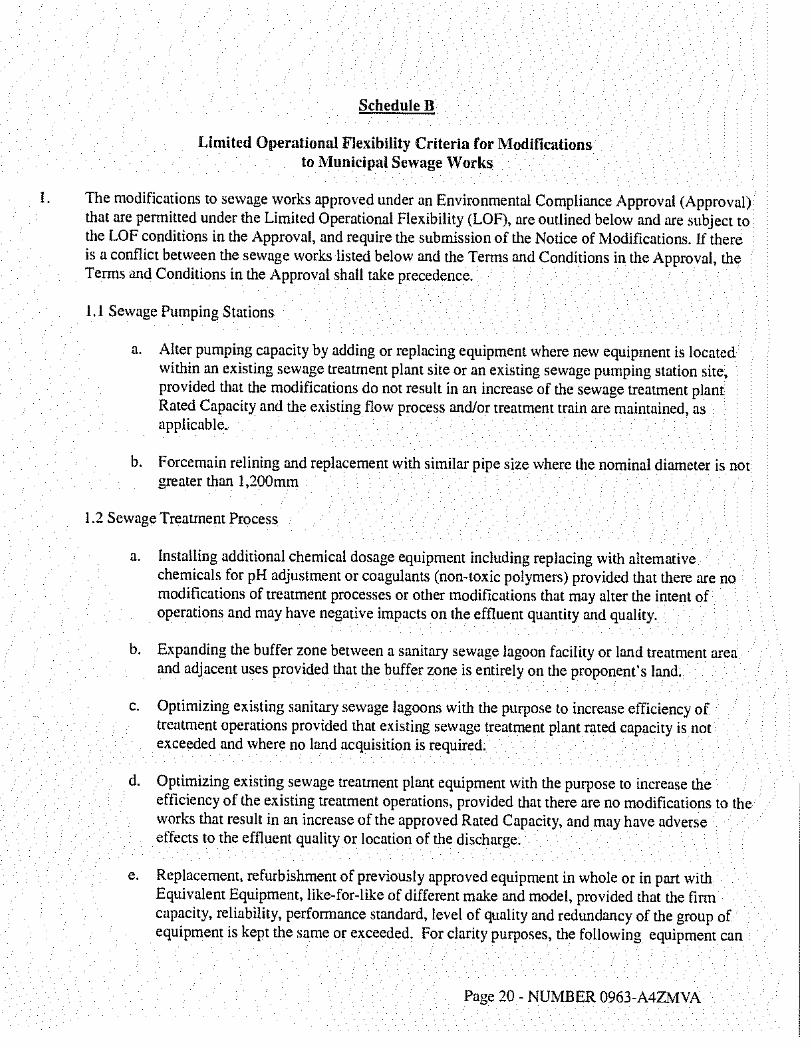
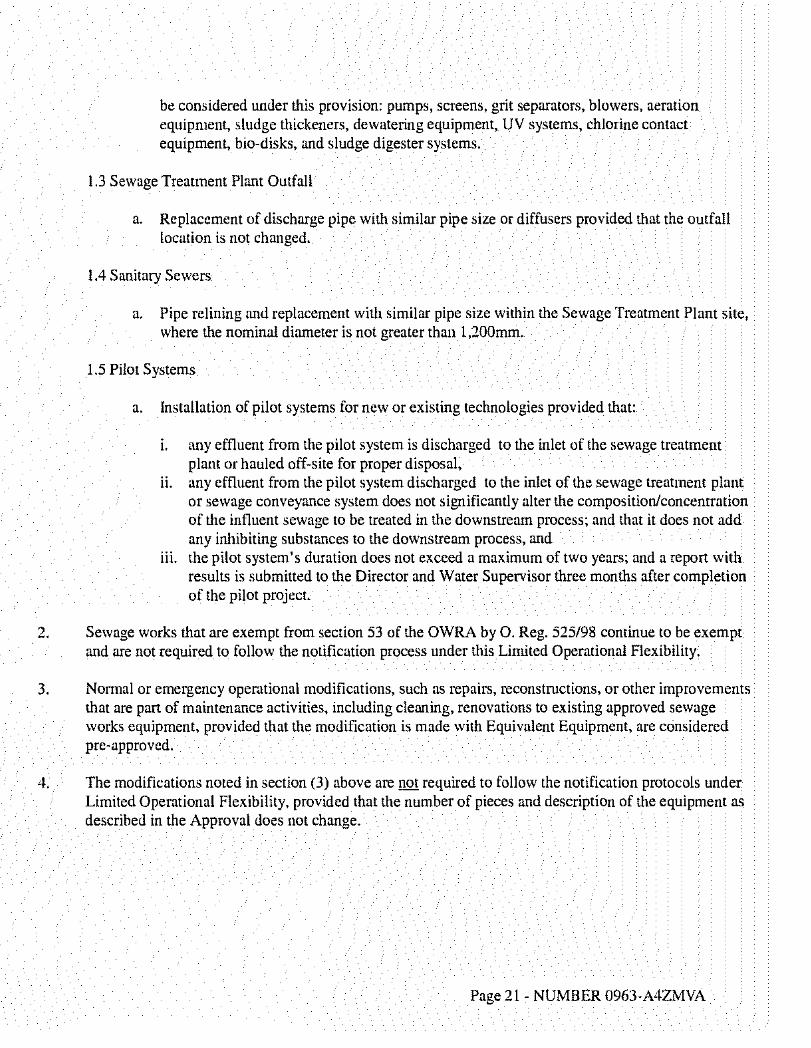


Township of Mapleton Receiving Water Impact Assessment for Mapleton WPCP Upgrade
BRM-00605325-A0 October 13, 2017
Appendix B: Station 02GA039 data and 7-day Moving Window Average
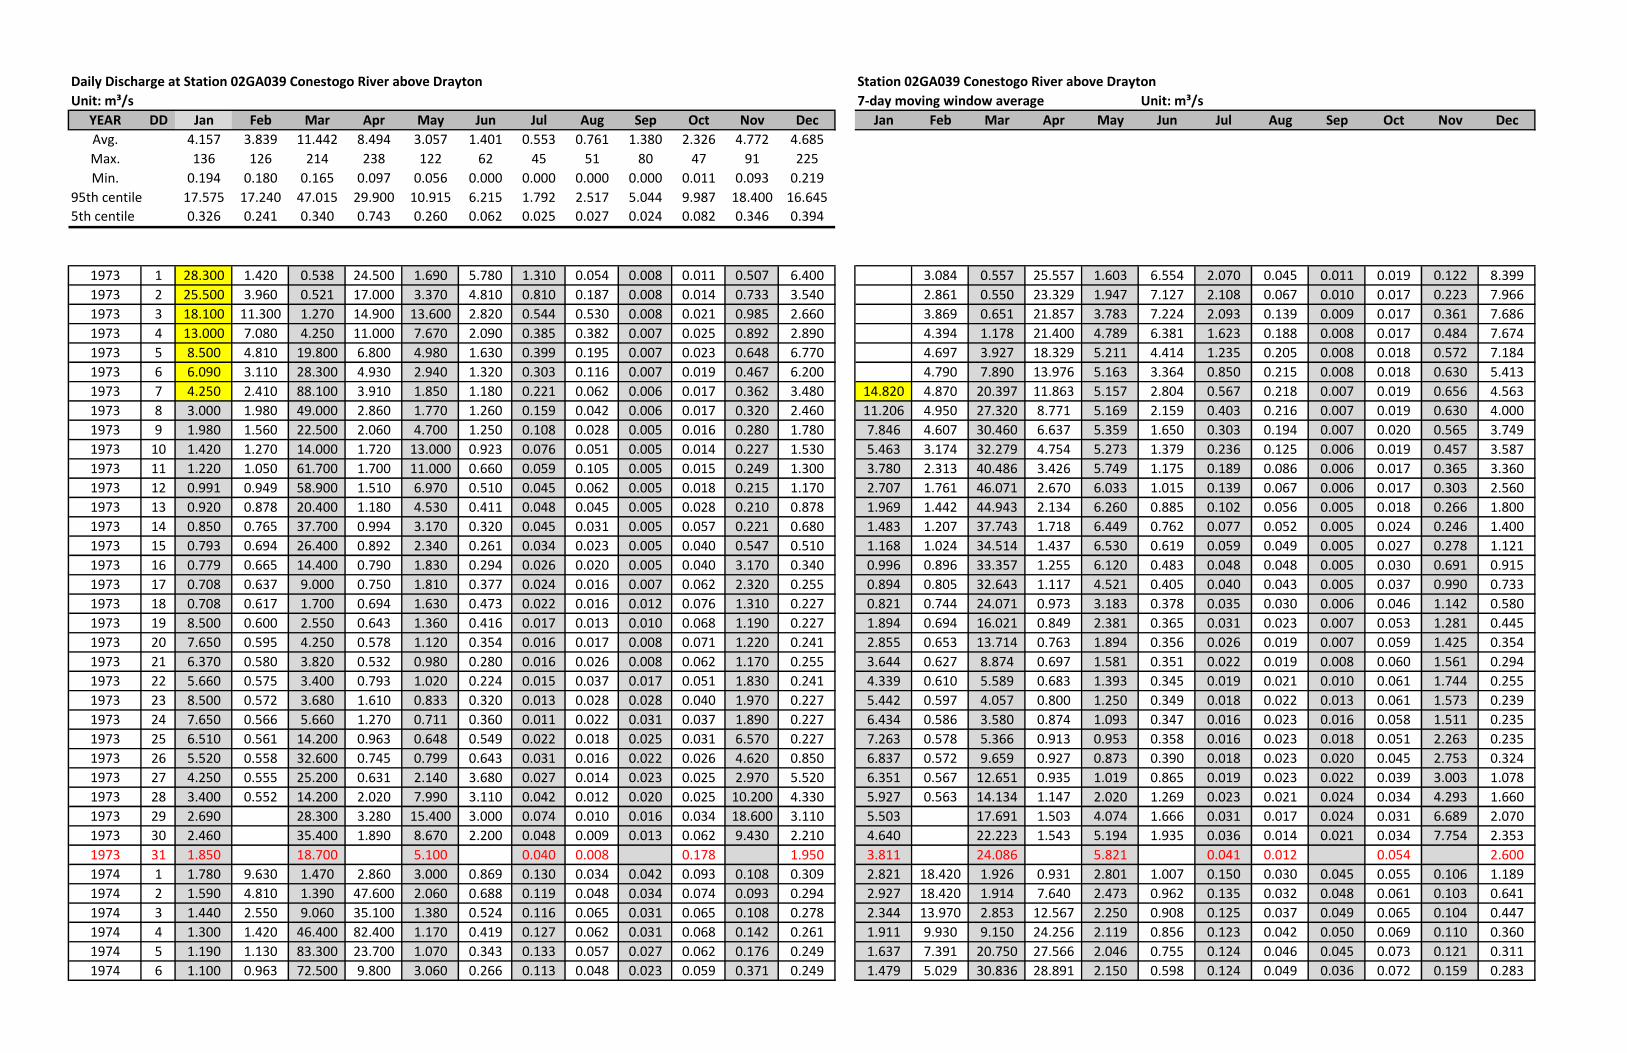
Daily Discharge at Station 02GA039 Conestogo River above Drayton Station 02GA039 Conestogo River above Drayton
Unit: m³/s 7-day moving window average Unit: m³/s
YEAR DD Jan Feb Mar Apr May Jun Jul Aug Sep Oct Nov Dec Jan Feb Mar Apr May Jun Jul Aug Sep Oct Nov Dec
Avg. 4.157 3.839 11.442 8.494 3.057 1.401 0.553 0.761 1.380 2.326 4.772 4.685
Max. 136 126 214 238 122 62 45 51 80 47 91 225
Min. 0.194 0.180 0.165 0.097 0.056 0.000 0.000 0.000 0.000 0.011 0.093 0.219
95th centile 17.575 17.240 47.015 29.900 10.915 6.215 1.792 2.517 5.044 9.987 18.400 16.645
5th centile 0.326 0.241 0.340 0.743 0.260 0.062 0.025 0.027 0.024 0.082 0.346 0.394
1973 1 28.300 1.420 0.538 24.500 1.690 5.780 1.310 0.054 0.008 0.011 0.507 6.400 3.084 0.557 25.557 1.603 6.554 2.070 0.045 0.011 0.019 0.122 8.399
1973 2 25.500 3.960 0.521 17.000 3.370 4.810 0.810 0.187 0.008 0.014 0.733 3.540 2.861 0.550 23.329 1.947 7.127 2.108 0.067 0.010 0.017 0.223 7.966
1973 3 18.100 11.300 1.270 14.900 13.600 2.820 0.544 0.530 0.008 0.021 0.985 2.660 3.869 0.651 21.857 3.783 7.224 2.093 0.139 0.009 0.017 0.361 7.686
1973 4 13.000 7.080 4.250 11.000 7.670 2.090 0.385 0.382 0.007 0.025 0.892 2.890 4.394 1.178 21.400 4.789 6.381 1.623 0.188 0.008 0.017 0.484 7.674
1973 5 8.500 4.810 19.800 6.800 4.980 1.630 0.399 0.195 0.007 0.023 0.648 6.770 4.697 3.927 18.329 5.211 4.414 1.235 0.205 0.008 0.018 0.572 7.184
1973 6 6.090 3.110 28.300 4.930 2.940 1.320 0.303 0.116 0.007 0.019 0.467 6.200 4.790 7.890 13.976 5.163 3.364 0.850 0.215 0.008 0.018 0.630 5.413
1973 7 4.250 2.410 88.100 3.910 1.850 1.180 0.221 0.062 0.006 0.017 0.362 3.480 14.820 4.870 20.397 11.863 5.157 2.804 0.567 0.218 0.007 0.019 0.656 4.563
1973 8 3.000 1.980 49.000 2.860 1.770 1.260 0.159 0.042 0.006 0.017 0.320 2.460 11.206 4.950 27.320 8.771 5.169 2.159 0.403 0.216 0.007 0.019 0.630 4.000
1973 9 1.980 1.560 22.500 2.060 4.700 1.250 0.108 0.028 0.005 0.016 0.280 1.780 7.846 4.607 30.460 6.637 5.359 1.650 0.303 0.194 0.007 0.020 0.565 3.749
1973 10 1.420 1.270 14.000 1.720 13.000 0.923 0.076 0.051 0.005 0.014 0.227 1.530 5.463 3.174 32.279 4.754 5.273 1.379 0.236 0.125 0.006 0.019 0.457 3.587
1973 11 1.220 1.050 61.700 1.700 11.000 0.660 0.059 0.105 0.005 0.015 0.249 1.300 3.780 2.313 40.486 3.426 5.749 1.175 0.189 0.086 0.006 0.017 0.365 3.360
1973 12 0.991 0.949 58.900 1.510 6.970 0.510 0.045 0.062 0.005 0.018 0.215 1.170 2.707 1.761 46.071 2.670 6.033 1.015 0.139 0.067 0.006 0.017 0.303 2.560
1973 13 0.920 0.878 20.400 1.180 4.530 0.411 0.048 0.045 0.005 0.028 0.210 0.878 1.969 1.442 44.943 2.134 6.260 0.885 0.102 0.056 0.005 0.018 0.266 1.800
1973 14 0.850 0.765 37.700 0.994 3.170 0.320 0.045 0.031 0.005 0.057 0.221 0.680 1.483 1.207 37.743 1.718 6.449 0.762 0.077 0.052 0.005 0.024 0.246 1.400
1973 15 0.793 0.694 26.400 0.892 2.340 0.261 0.034 0.023 0.005 0.040 0.547 0.510 1.168 1.024 34.514 1.437 6.530 0.619 0.059 0.049 0.005 0.027 0.278 1.121
1973 16 0.779 0.665 14.400 0.790 1.830 0.294 0.026 0.020 0.005 0.040 3.170 0.340 0.996 0.896 33.357 1.255 6.120 0.483 0.048 0.048 0.005 0.030 0.691 0.915
1973 17 0.708 0.637 9.000 0.750 1.810 0.377 0.024 0.016 0.007 0.062 2.320 0.255 0.894 0.805 32.643 1.117 4.521 0.405 0.040 0.043 0.005 0.037 0.990 0.733
1973 18 0.708 0.617 1.700 0.694 1.630 0.473 0.022 0.016 0.012 0.076 1.310 0.227 0.821 0.744 24.071 0.973 3.183 0.378 0.035 0.030 0.006 0.046 1.142 0.580
1973 19 8.500 0.600 2.550 0.643 1.360 0.416 0.017 0.013 0.010 0.068 1.190 0.227 1.894 0.694 16.021 0.849 2.381 0.365 0.031 0.023 0.007 0.053 1.281 0.445
1973 20 7.650 0.595 4.250 0.578 1.120 0.354 0.016 0.017 0.008 0.071 1.220 0.241 2.855 0.653 13.714 0.763 1.894 0.356 0.026 0.019 0.007 0.059 1.425 0.354
1973 21 6.370 0.580 3.820 0.532 0.980 0.280 0.016 0.026 0.008 0.062 1.170 0.255 3.644 0.627 8.874 0.697 1.581 0.351 0.022 0.019 0.008 0.060 1.561 0.294
1973 22 5.660 0.575 3.400 0.793 1.020 0.224 0.015 0.037 0.017 0.051 1.830 0.241 4.339 0.610 5.589 0.683 1.393 0.345 0.019 0.021 0.010 0.061 1.744 0.255
1973 23 8.500 0.572 3.680 1.610 0.833 0.320 0.013 0.028 0.028 0.040 1.970 0.227 5.442 0.597 4.057 0.800 1.250 0.349 0.018 0.022 0.013 0.061 1.573 0.239
1973 24 7.650 0.566 5.660 1.270 0.711 0.360 0.011 0.022 0.031 0.037 1.890 0.227 6.434 0.586 3.580 0.874 1.093 0.347 0.016 0.023 0.016 0.058 1.511 0.235
1973 25 6.510 0.561 14.200 0.963 0.648 0.549 0.022 0.018 0.025 0.031 6.570 0.227 7.263 0.578 5.366 0.913 0.953 0.358 0.016 0.023 0.018 0.051 2.263 0.235
1973 26 5.520 0.558 32.600 0.745 0.799 0.643 0.031 0.016 0.022 0.026 4.620 0.850 6.837 0.572 9.659 0.927 0.873 0.390 0.018 0.023 0.020 0.045 2.753 0.324
1973 27 4.250 0.555 25.200 0.631 2.140 3.680 0.027 0.014 0.023 0.025 2.970 5.520 6.351 0.567 12.651 0.935 1.019 0.865 0.019 0.023 0.022 0.039 3.003 1.078
1973 28 3.400 0.552 14.200 2.020 7.990 3.110 0.042 0.012 0.020 0.025 10.200 4.330 5.927 0.563 14.134 1.147 2.020 1.269 0.023 0.021 0.024 0.034 4.293 1.660
1973 29 2.690 28.300 3.280 15.400 3.000 0.074 0.010 0.016 0.034 18.600 3.110 5.503 17.691 1.503 4.074 1.666 0.031 0.017 0.024 0.031 6.689 2.070
1973 30 2.460 35.400 1.890 8.670 2.200 0.048 0.009 0.013 0.062 9.430 2.210 4.640 22.223 1.543 5.194 1.935 0.036 0.014 0.021 0.034 7.754 2.353
1973 31 1.850 18.700 5.100 0.040 0.008 0.178 1.950 3.811 24.086 5.821 0.041 0.012 0.054 2.600
1974 1 1.780 9.630 1.470 2.860 3.000 0.869 0.130 0.034 0.042 0.093 0.108 0.309 2.821 18.420 1.926 0.931 2.801 1.007 0.150 0.030 0.045 0.055 0.106 1.189
1974 2 1.590 4.810 1.390 47.600 2.060 0.688 0.119 0.048 0.034 0.074 0.093 0.294 2.927 18.420 1.914 7.640 2.473 0.962 0.135 0.032 0.048 0.061 0.103 0.641
1974 3 1.440 2.550 9.060 35.100 1.380 0.524 0.116 0.065 0.031 0.065 0.108 0.278 2.344 13.970 2.853 12.567 2.250 0.908 0.125 0.037 0.049 0.065 0.104 0.447
1974 4 1.300 1.420 46.400 82.400 1.170 0.419 0.127 0.062 0.031 0.068 0.142 0.261 1.911 9.930 9.150 24.256 2.119 0.856 0.123 0.042 0.050 0.069 0.110 0.360
1974 5 1.190 1.130 83.300 23.700 1.070 0.343 0.133 0.057 0.027 0.062 0.176 0.249 1.637 7.391 20.750 27.566 2.046 0.755 0.124 0.046 0.045 0.073 0.121 0.311
1974 6 1.100 0.963 72.500 9.800 3.060 0.266 0.113 0.048 0.023 0.059 0.371 0.249 1.479 5.029 30.836 28.891 2.150 0.598 0.124 0.049 0.036 0.072 0.159 0.283
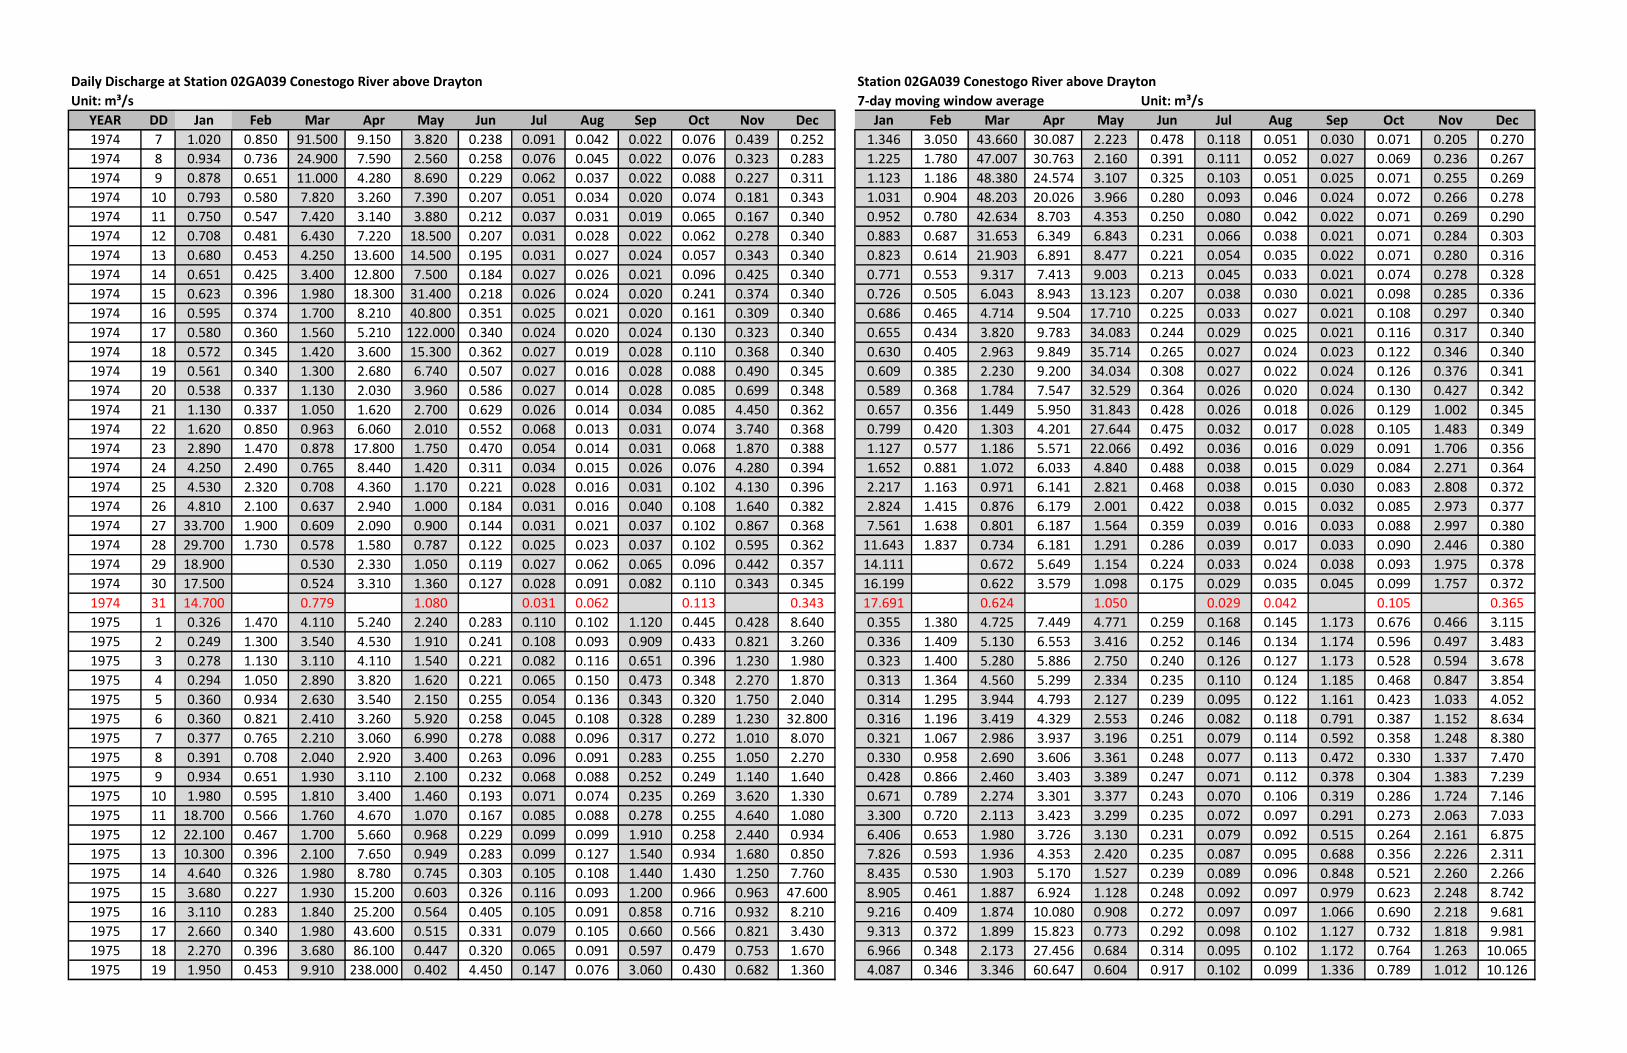
Daily Discharge at Station 02GA039 Conestogo River above Drayton Station 02GA039 Conestogo River above Drayton
Unit: m³/s 7-day moving window average Unit: m³/s
YEAR DD Jan Feb Mar Apr May Jun Jul Aug Sep Oct Nov Dec Jan Feb Mar Apr May Jun Jul Aug Sep Oct Nov Dec
1974 7 1.020 0.850 91.500 9.150 3.820 0.238 0.091 0.042 0.022 0.076 0.439 0.252 1.346 3.050 43.660 30.087 2.223 0.478 0.118 0.051 0.030 0.071 0.205 0.270
1974 8 0.934 0.736 24.900 7.590 2.560 0.258 0.076 0.045 0.022 0.076 0.323 0.283 1.225 1.780 47.007 30.763 2.160 0.391 0.111 0.052 0.027 0.069 0.236 0.267
1974 9 0.878 0.651 11.000 4.280 8.690 0.229 0.062 0.037 0.022 0.088 0.227 0.311 1.123 1.186 48.380 24.574 3.107 0.325 0.103 0.051 0.025 0.071 0.255 0.269
1974 10 0.793 0.580 7.820 3.260 7.390 0.207 0.051 0.034 0.020 0.074 0.181 0.343 1.031 0.904 48.203 20.026 3.966 0.280 0.093 0.046 0.024 0.072 0.266 0.278
1974 11 0.750 0.547 7.420 3.140 3.880 0.212 0.037 0.031 0.019 0.065 0.167 0.340 0.952 0.780 42.634 8.703 4.353 0.250 0.080 0.042 0.022 0.071 0.269 0.290
1974 12 0.708 0.481 6.430 7.220 18.500 0.207 0.031 0.028 0.022 0.062 0.278 0.340 0.883 0.687 31.653 6.349 6.843 0.231 0.066 0.038 0.021 0.071 0.284 0.303
1974 13 0.680 0.453 4.250 13.600 14.500 0.195 0.031 0.027 0.024 0.057 0.343 0.340 0.823 0.614 21.903 6.891 8.477 0.221 0.054 0.035 0.022 0.071 0.280 0.316
1974 14 0.651 0.425 3.400 12.800 7.500 0.184 0.027 0.026 0.021 0.096 0.425 0.340 0.771 0.553 9.317 7.413 9.003 0.213 0.045 0.033 0.021 0.074 0.278 0.328
1974 15 0.623 0.396 1.980 18.300 31.400 0.218 0.026 0.024 0.020 0.241 0.374 0.340 0.726 0.505 6.043 8.943 13.123 0.207 0.038 0.030 0.021 0.098 0.285 0.336
1974 16 0.595 0.374 1.700 8.210 40.800 0.351 0.025 0.021 0.020 0.161 0.309 0.340 0.686 0.465 4.714 9.504 17.710 0.225 0.033 0.027 0.021 0.108 0.297 0.340
1974 17 0.580 0.360 1.560 5.210 122.000 0.340 0.024 0.020 0.024 0.130 0.323 0.340 0.655 0.434 3.820 9.783 34.083 0.244 0.029 0.025 0.021 0.116 0.317 0.340
1974 18 0.572 0.345 1.420 3.600 15.300 0.362 0.027 0.019 0.028 0.110 0.368 0.340 0.630 0.405 2.963 9.849 35.714 0.265 0.027 0.024 0.023 0.122 0.346 0.340
1974 19 0.561 0.340 1.300 2.680 6.740 0.507 0.027 0.016 0.028 0.088 0.490 0.345 0.609 0.385 2.230 9.200 34.034 0.308 0.027 0.022 0.024 0.126 0.376 0.341
1974 20 0.538 0.337 1.130 2.030 3.960 0.586 0.027 0.014 0.028 0.085 0.699 0.348 0.589 0.368 1.784 7.547 32.529 0.364 0.026 0.020 0.024 0.130 0.427 0.342
1974 21 1.130 0.337 1.050 1.620 2.700 0.629 0.026 0.014 0.034 0.085 4.450 0.362 0.657 0.356 1.449 5.950 31.843 0.428 0.026 0.018 0.026 0.129 1.002 0.345
1974 22 1.620 0.850 0.963 6.060 2.010 0.552 0.068 0.013 0.031 0.074 3.740 0.368 0.799 0.420 1.303 4.201 27.644 0.475 0.032 0.017 0.028 0.105 1.483 0.349
1974 23 2.890 1.470 0.878 17.800 1.750 0.470 0.054 0.014 0.031 0.068 1.870 0.388 1.127 0.577 1.186 5.571 22.066 0.492 0.036 0.016 0.029 0.091 1.706 0.356
1974 24 4.250 2.490 0.765 8.440 1.420 0.311 0.034 0.015 0.026 0.076 4.280 0.394 1.652 0.881 1.072 6.033 4.840 0.488 0.038 0.015 0.029 0.084 2.271 0.364
1974 25 4.530 2.320 0.708 4.360 1.170 0.221 0.028 0.016 0.031 0.102 4.130 0.396 2.217 1.163 0.971 6.141 2.821 0.468 0.038 0.015 0.030 0.083 2.808 0.372
1974 26 4.810 2.100 0.637 2.940 1.000 0.184 0.031 0.016 0.040 0.108 1.640 0.382 2.824 1.415 0.876 6.179 2.001 0.422 0.038 0.015 0.032 0.085 2.973 0.377
1974 27 33.700 1.900 0.609 2.090 0.900 0.144 0.031 0.021 0.037 0.102 0.867 0.368 7.561 1.638 0.801 6.187 1.564 0.359 0.039 0.016 0.033 0.088 2.997 0.380
1974 28 29.700 1.730 0.578 1.580 0.787 0.122 0.025 0.023 0.037 0.102 0.595 0.362 11.643 1.837 0.734 6.181 1.291 0.286 0.039 0.017 0.033 0.090 2.446 0.380
1974 29 18.900 0.530 2.330 1.050 0.119 0.027 0.062 0.065 0.096 0.442 0.357 14.111 0.672 5.649 1.154 0.224 0.033 0.024 0.038 0.093 1.975 0.378
1974 30 17.500 0.524 3.310 1.360 0.127 0.028 0.091 0.082 0.110 0.343 0.345 16.199 0.622 3.579 1.098 0.175 0.029 0.035 0.045 0.099 1.757 0.372
1974 31 14.700 0.779 1.080 0.031 0.062 0.113 0.343 17.691 0.624 1.050 0.029 0.042 0.105 0.365
1975 1 0.326 1.470 4.110 5.240 2.240 0.283 0.110 0.102 1.120 0.445 0.428 8.640 0.355 1.380 4.725 7.449 4.771 0.259 0.168 0.145 1.173 0.676 0.466 3.115
1975 2 0.249 1.300 3.540 4.530 1.910 0.241 0.108 0.093 0.909 0.433 0.821 3.260 0.336 1.409 5.130 6.553 3.416 0.252 0.146 0.134 1.174 0.596 0.497 3.483
1975 3 0.278 1.130 3.110 4.110 1.540 0.221 0.082 0.116 0.651 0.396 1.230 1.980 0.323 1.400 5.280 5.886 2.750 0.240 0.126 0.127 1.173 0.528 0.594 3.678
1975 4 0.294 1.050 2.890 3.820 1.620 0.221 0.065 0.150 0.473 0.348 2.270 1.870 0.313 1.364 4.560 5.299 2.334 0.235 0.110 0.124 1.185 0.468 0.847 3.854
1975 5 0.360 0.934 2.630 3.540 2.150 0.255 0.054 0.136 0.343 0.320 1.750 2.040 0.314 1.295 3.944 4.793 2.127 0.239 0.095 0.122 1.161 0.423 1.033 4.052
1975 6 0.360 0.821 2.410 3.260 5.920 0.258 0.045 0.108 0.328 0.289 1.230 32.800 0.316 1.196 3.419 4.329 2.553 0.246 0.082 0.118 0.791 0.387 1.152 8.634
1975 7 0.377 0.765 2.210 3.060 6.990 0.278 0.088 0.096 0.317 0.272 1.010 8.070 0.321 1.067 2.986 3.937 3.196 0.251 0.079 0.114 0.592 0.358 1.248 8.380
1975 8 0.391 0.708 2.040 2.920 3.400 0.263 0.096 0.091 0.283 0.255 1.050 2.270 0.330 0.958 2.690 3.606 3.361 0.248 0.077 0.113 0.472 0.330 1.337 7.470
1975 9 0.934 0.651 1.930 3.110 2.100 0.232 0.068 0.088 0.252 0.249 1.140 1.640 0.428 0.866 2.460 3.403 3.389 0.247 0.071 0.112 0.378 0.304 1.383 7.239
1975 10 1.980 0.595 1.810 3.400 1.460 0.193 0.071 0.074 0.235 0.269 3.620 1.330 0.671 0.789 2.274 3.301 3.377 0.243 0.070 0.106 0.319 0.286 1.724 7.146
1975 11 18.700 0.566 1.760 4.670 1.070 0.167 0.085 0.088 0.278 0.255 4.640 1.080 3.300 0.720 2.113 3.423 3.299 0.235 0.072 0.097 0.291 0.273 2.063 7.033
1975 12 22.100 0.467 1.700 5.660 0.968 0.229 0.099 0.099 1.910 0.258 2.440 0.934 6.406 0.653 1.980 3.726 3.130 0.231 0.079 0.092 0.515 0.264 2.161 6.875
1975 13 10.300 0.396 2.100 7.650 0.949 0.283 0.099 0.127 1.540 0.934 1.680 0.850 7.826 0.593 1.936 4.353 2.420 0.235 0.087 0.095 0.688 0.356 2.226 2.311
1975 14 4.640 0.326 1.980 8.780 0.745 0.303 0.105 0.108 1.440 1.430 1.250 7.760 8.435 0.530 1.903 5.170 1.527 0.239 0.089 0.096 0.848 0.521 2.260 2.266
1975 15 3.680 0.227 1.930 15.200 0.603 0.326 0.116 0.093 1.200 0.966 0.963 47.600 8.905 0.461 1.887 6.924 1.128 0.248 0.092 0.097 0.979 0.623 2.248 8.742
1975 16 3.110 0.283 1.840 25.200 0.564 0.405 0.105 0.091 0.858 0.716 0.932 8.210 9.216 0.409 1.874 10.080 0.908 0.272 0.097 0.097 1.066 0.690 2.218 9.681
1975 17 2.660 0.340 1.980 43.600 0.515 0.331 0.079 0.105 0.660 0.566 0.821 3.430 9.313 0.372 1.899 15.823 0.773 0.292 0.098 0.102 1.127 0.732 1.818 9.981
1975 18 2.270 0.396 3.680 86.100 0.447 0.320 0.065 0.091 0.597 0.479 0.753 1.670 6.966 0.348 2.173 27.456 0.684 0.314 0.095 0.102 1.172 0.764 1.263 10.065
1975 19 1.950 0.453 9.910 238.000 0.402 4.450 0.147 0.076 3.060 0.430 0.682 1.360 4.087 0.346 3.346 60.647 0.604 0.917 0.102 0.099 1.336 0.789 1.012 10.126
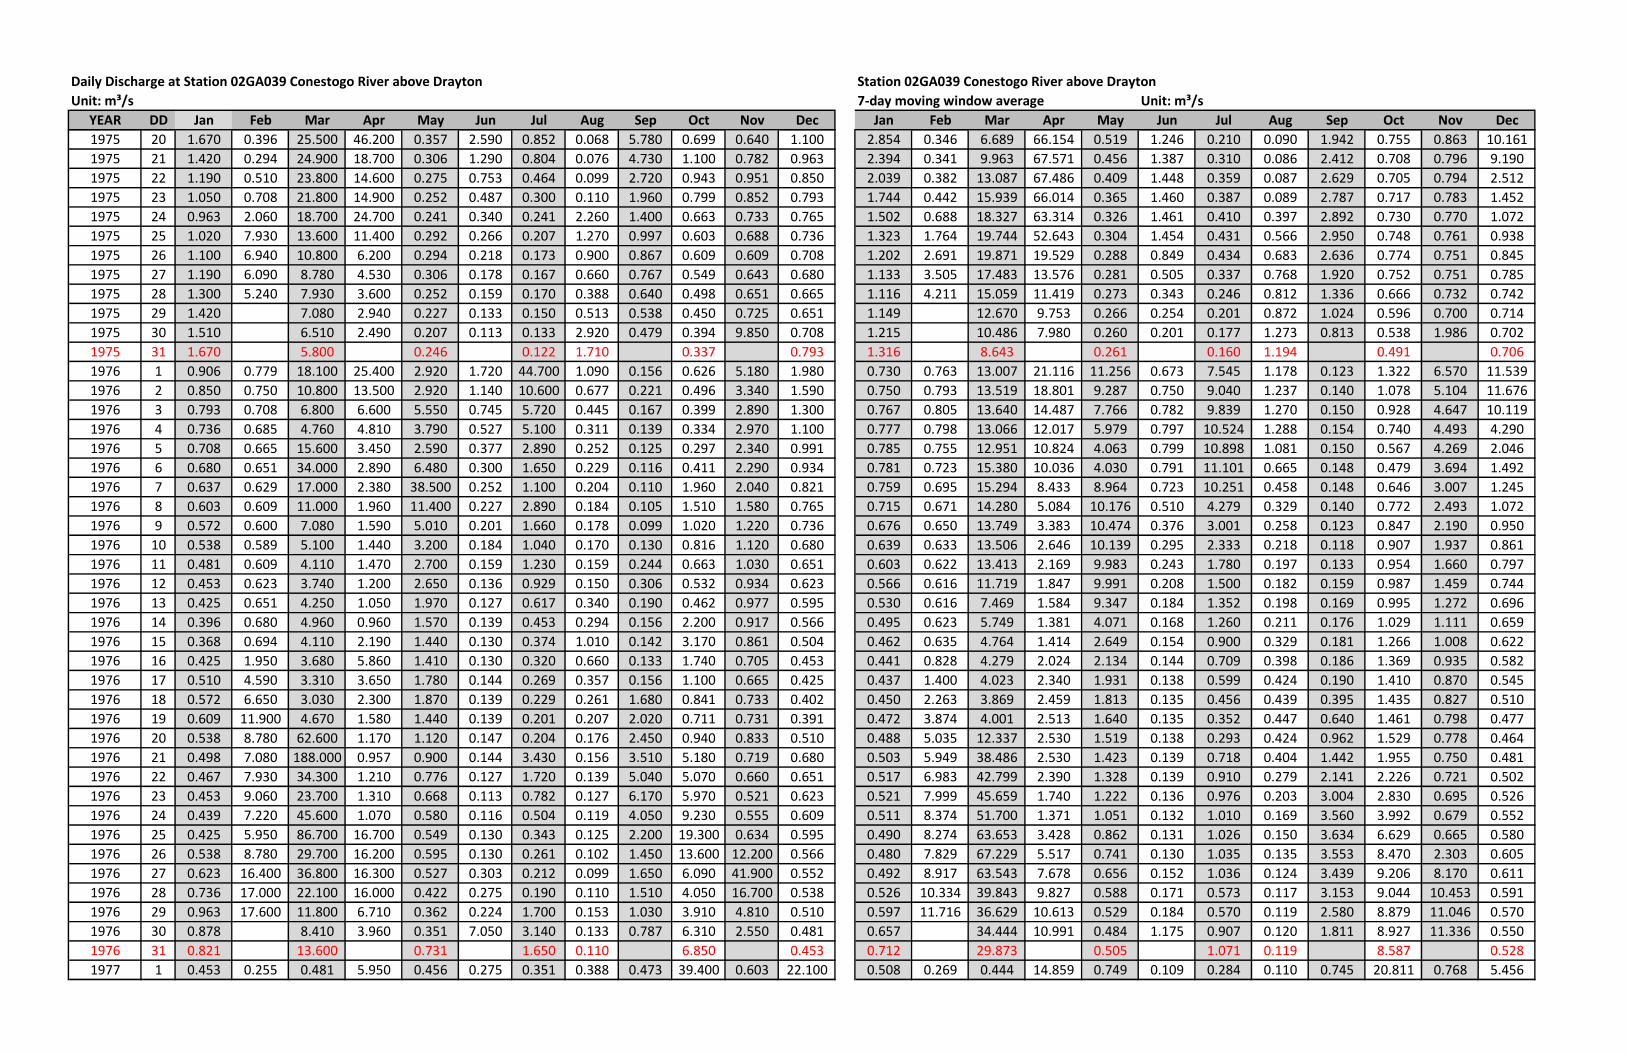
Daily Discharge at Station 02GA039 Conestogo River above Drayton Station 02GA039 Conestogo River above Drayton
Unit: m³/s 7-day moving window average Unit: m³/s
YEAR DD Jan Feb Mar Apr May Jun Jul Aug Sep Oct Nov Dec Jan Feb Mar Apr May Jun Jul Aug Sep Oct Nov Dec
1975 20 1.670 0.396 25.500 46.200 0.357 2.590 0.852 0.068 5.780 0.699 0.640 1.100 2.854 0.346 6.689 66.154 0.519 1.246 0.210 0.090 1.942 0.755 0.863 10.161
1975 21 1.420 0.294 24.900 18.700 0.306 1.290 0.804 0.076 4.730 1.100 0.782 0.963 2.394 0.341 9.963 67.571 0.456 1.387 0.310 0.086 2.412 0.708 0.796 9.190
1975 22 1.190 0.510 23.800 14.600 0.275 0.753 0.464 0.099 2.720 0.943 0.951 0.850 2.039 0.382 13.087 67.486 0.409 1.448 0.359 0.087 2.629 0.705 0.794 2.512
1975 23 1.050 0.708 21.800 14.900 0.252 0.487 0.300 0.110 1.960 0.799 0.852 0.793 1.744 0.442 15.939 66.014 0.365 1.460 0.387 0.089 2.787 0.717 0.783 1.452
1975 24 0.963 2.060 18.700 24.700 0.241 0.340 0.241 2.260 1.400 0.663 0.733 0.765 1.502 0.688 18.327 63.314 0.326 1.461 0.410 0.397 2.892 0.730 0.770 1.072
1975 25 1.020 7.930 13.600 11.400 0.292 0.266 0.207 1.270 0.997 0.603 0.688 0.736 1.323 1.764 19.744 52.643 0.304 1.454 0.431 0.566 2.950 0.748 0.761 0.938
1975 26 1.100 6.940 10.800 6.200 0.294 0.218 0.173 0.900 0.867 0.609 0.609 0.708 1.202 2.691 19.871 19.529 0.288 0.849 0.434 0.683 2.636 0.774 0.751 0.845
1975 27 1.190 6.090 8.780 4.530 0.306 0.178 0.167 0.660 0.767 0.549 0.643 0.680 1.133 3.505 17.483 13.576 0.281 0.505 0.337 0.768 1.920 0.752 0.751 0.785
1975 28 1.300 5.240 7.930 3.600 0.252 0.159 0.170 0.388 0.640 0.498 0.651 0.665 1.116 4.211 15.059 11.419 0.273 0.343 0.246 0.812 1.336 0.666 0.732 0.742
1975 29 1.420 7.080 2.940 0.227 0.133 0.150 0.513 0.538 0.450 0.725 0.651 1.149 12.670 9.753 0.266 0.254 0.201 0.872 1.024 0.596 0.700 0.714
1975 30 1.510 6.510 2.490 0.207 0.113 0.133 2.920 0.479 0.394 9.850 0.708 1.215 10.486 7.980 0.260 0.201 0.177 1.273 0.813 0.538 1.986 0.702
1975 31 1.670 5.800 0.246 0.122 1.710 0.337 0.793 1.316 8.643 0.261 0.160 1.194 0.491 0.706
1976 1 0.906 0.779 18.100 25.400 2.920 1.720 44.700 1.090 0.156 0.626 5.180 1.980 0.730 0.763 13.007 21.116 11.256 0.673 7.545 1.178 0.123 1.322 6.570 11.539
1976 2 0.850 0.750 10.800 13.500 2.920 1.140 10.600 0.677 0.221 0.496 3.340 1.590 0.750 0.793 13.519 18.801 9.287 0.750 9.040 1.237 0.140 1.078 5.104 11.676
1976 3 0.793 0.708 6.800 6.600 5.550 0.745 5.720 0.445 0.167 0.399 2.890 1.300 0.767 0.805 13.640 14.487 7.766 0.782 9.839 1.270 0.150 0.928 4.647 10.119
1976 4 0.736 0.685 4.760 4.810 3.790 0.527 5.100 0.311 0.139 0.334 2.970 1.100 0.777 0.798 13.066 12.017 5.979 0.797 10.524 1.288 0.154 0.740 4.493 4.290
1976 5 0.708 0.665 15.600 3.450 2.590 0.377 2.890 0.252 0.125 0.297 2.340 0.991 0.785 0.755 12.951 10.824 4.063 0.799 10.898 1.081 0.150 0.567 4.269 2.046
1976 6 0.680 0.651 34.000 2.890 6.480 0.300 1.650 0.229 0.116 0.411 2.290 0.934 0.781 0.723 15.380 10.036 4.030 0.791 11.101 0.665 0.148 0.479 3.694 1.492
1976 7 0.637 0.629 17.000 2.380 38.500 0.252 1.100 0.204 0.110 1.960 2.040 0.821 0.759 0.695 15.294 8.433 8.964 0.723 10.251 0.458 0.148 0.646 3.007 1.245
1976 8 0.603 0.609 11.000 1.960 11.400 0.227 2.890 0.184 0.105 1.510 1.580 0.765 0.715 0.671 14.280 5.084 10.176 0.510 4.279 0.329 0.140 0.772 2.493 1.072
1976 9 0.572 0.600 7.080 1.590 5.010 0.201 1.660 0.178 0.099 1.020 1.220 0.736 0.676 0.650 13.749 3.383 10.474 0.376 3.001 0.258 0.123 0.847 2.190 0.950
1976 10 0.538 0.589 5.100 1.440 3.200 0.184 1.040 0.170 0.130 0.816 1.120 0.680 0.639 0.633 13.506 2.646 10.139 0.295 2.333 0.218 0.118 0.907 1.937 0.861
1976 11 0.481 0.609 4.110 1.470 2.700 0.159 1.230 0.159 0.244 0.663 1.030 0.651 0.603 0.622 13.413 2.169 9.983 0.243 1.780 0.197 0.133 0.954 1.660 0.797
1976 12 0.453 0.623 3.740 1.200 2.650 0.136 0.929 0.150 0.306 0.532 0.934 0.623 0.566 0.616 11.719 1.847 9.991 0.208 1.500 0.182 0.159 0.987 1.459 0.744
1976 13 0.425 0.651 4.250 1.050 1.970 0.127 0.617 0.340 0.190 0.462 0.977 0.595 0.530 0.616 7.469 1.584 9.347 0.184 1.352 0.198 0.169 0.995 1.272 0.696
1976 14 0.396 0.680 4.960 0.960 1.570 0.139 0.453 0.294 0.156 2.200 0.917 0.566 0.495 0.623 5.749 1.381 4.071 0.168 1.260 0.211 0.176 1.029 1.111 0.659
1976 15 0.368 0.694 4.110 2.190 1.440 0.130 0.374 1.010 0.142 3.170 0.861 0.504 0.462 0.635 4.764 1.414 2.649 0.154 0.900 0.329 0.181 1.266 1.008 0.622
1976 16 0.425 1.950 3.680 5.860 1.410 0.130 0.320 0.660 0.133 1.740 0.705 0.453 0.441 0.828 4.279 2.024 2.134 0.144 0.709 0.398 0.186 1.369 0.935 0.582
1976 17 0.510 4.590 3.310 3.650 1.780 0.144 0.269 0.357 0.156 1.100 0.665 0.425 0.437 1.400 4.023 2.340 1.931 0.138 0.599 0.424 0.190 1.410 0.870 0.545
1976 18 0.572 6.650 3.030 2.300 1.870 0.139 0.229 0.261 1.680 0.841 0.733 0.402 0.450 2.263 3.869 2.459 1.813 0.135 0.456 0.439 0.395 1.435 0.827 0.510
1976 19 0.609 11.900 4.670 1.580 1.440 0.139 0.201 0.207 2.020 0.711 0.731 0.391 0.472 3.874 4.001 2.513 1.640 0.135 0.352 0.447 0.640 1.461 0.798 0.477
1976 20 0.538 8.780 62.600 1.170 1.120 0.147 0.204 0.176 2.450 0.940 0.833 0.510 0.488 5.035 12.337 2.530 1.519 0.138 0.293 0.424 0.962 1.529 0.778 0.464
1976 21 0.498 7.080 188.000 0.957 0.900 0.144 3.430 0.156 3.510 5.180 0.719 0.680 0.503 5.949 38.486 2.530 1.423 0.139 0.718 0.404 1.442 1.955 0.750 0.481
1976 22 0.467 7.930 34.300 1.210 0.776 0.127 1.720 0.139 5.040 5.070 0.660 0.651 0.517 6.983 42.799 2.390 1.328 0.139 0.910 0.279 2.141 2.226 0.721 0.502
1976 23 0.453 9.060 23.700 1.310 0.668 0.113 0.782 0.127 6.170 5.970 0.521 0.623 0.521 7.999 45.659 1.740 1.222 0.136 0.976 0.203 3.004 2.830 0.695 0.526
1976 24 0.439 7.220 45.600 1.070 0.580 0.116 0.504 0.119 4.050 9.230 0.555 0.609 0.511 8.374 51.700 1.371 1.051 0.132 1.010 0.169 3.560 3.992 0.679 0.552
1976 25 0.425 5.950 86.700 16.700 0.549 0.130 0.343 0.125 2.200 19.300 0.634 0.595 0.490 8.274 63.653 3.428 0.862 0.131 1.026 0.150 3.634 6.629 0.665 0.580
1976 26 0.538 8.780 29.700 16.200 0.595 0.130 0.261 0.102 1.450 13.600 12.200 0.566 0.480 7.829 67.229 5.517 0.741 0.130 1.035 0.135 3.553 8.470 2.303 0.605
1976 27 0.623 16.400 36.800 16.300 0.527 0.303 0.212 0.099 1.650 6.090 41.900 0.552 0.492 8.917 63.543 7.678 0.656 0.152 1.036 0.124 3.439 9.206 8.170 0.611
1976 28 0.736 17.000 22.100 16.000 0.422 0.275 0.190 0.110 1.510 4.050 16.700 0.538 0.526 10.334 39.843 9.827 0.588 0.171 0.573 0.117 3.153 9.044 10.453 0.591
1976 29 0.963 17.600 11.800 6.710 0.362 0.224 1.700 0.153 1.030 3.910 4.810 0.510 0.597 11.716 36.629 10.613 0.529 0.184 0.570 0.119 2.580 8.879 11.046 0.570
1976 30 0.878 8.410 3.960 0.351 7.050 3.140 0.133 0.787 6.310 2.550 0.481 0.657 34.444 10.991 0.484 1.175 0.907 0.120 1.811 8.927 11.336 0.550
1976 31 0.821 13.600 0.731 1.650 0.110 6.850 0.453 0.712 29.873 0.505 1.071 0.119 8.587 0.528
1977 1 0.453 0.255 0.481 5.950 0.456 0.275 0.351 0.388 0.473 39.400 0.603 22.100 0.508 0.269 0.444 14.859 0.749 0.109 0.284 0.110 0.745 20.811 0.768 5.456
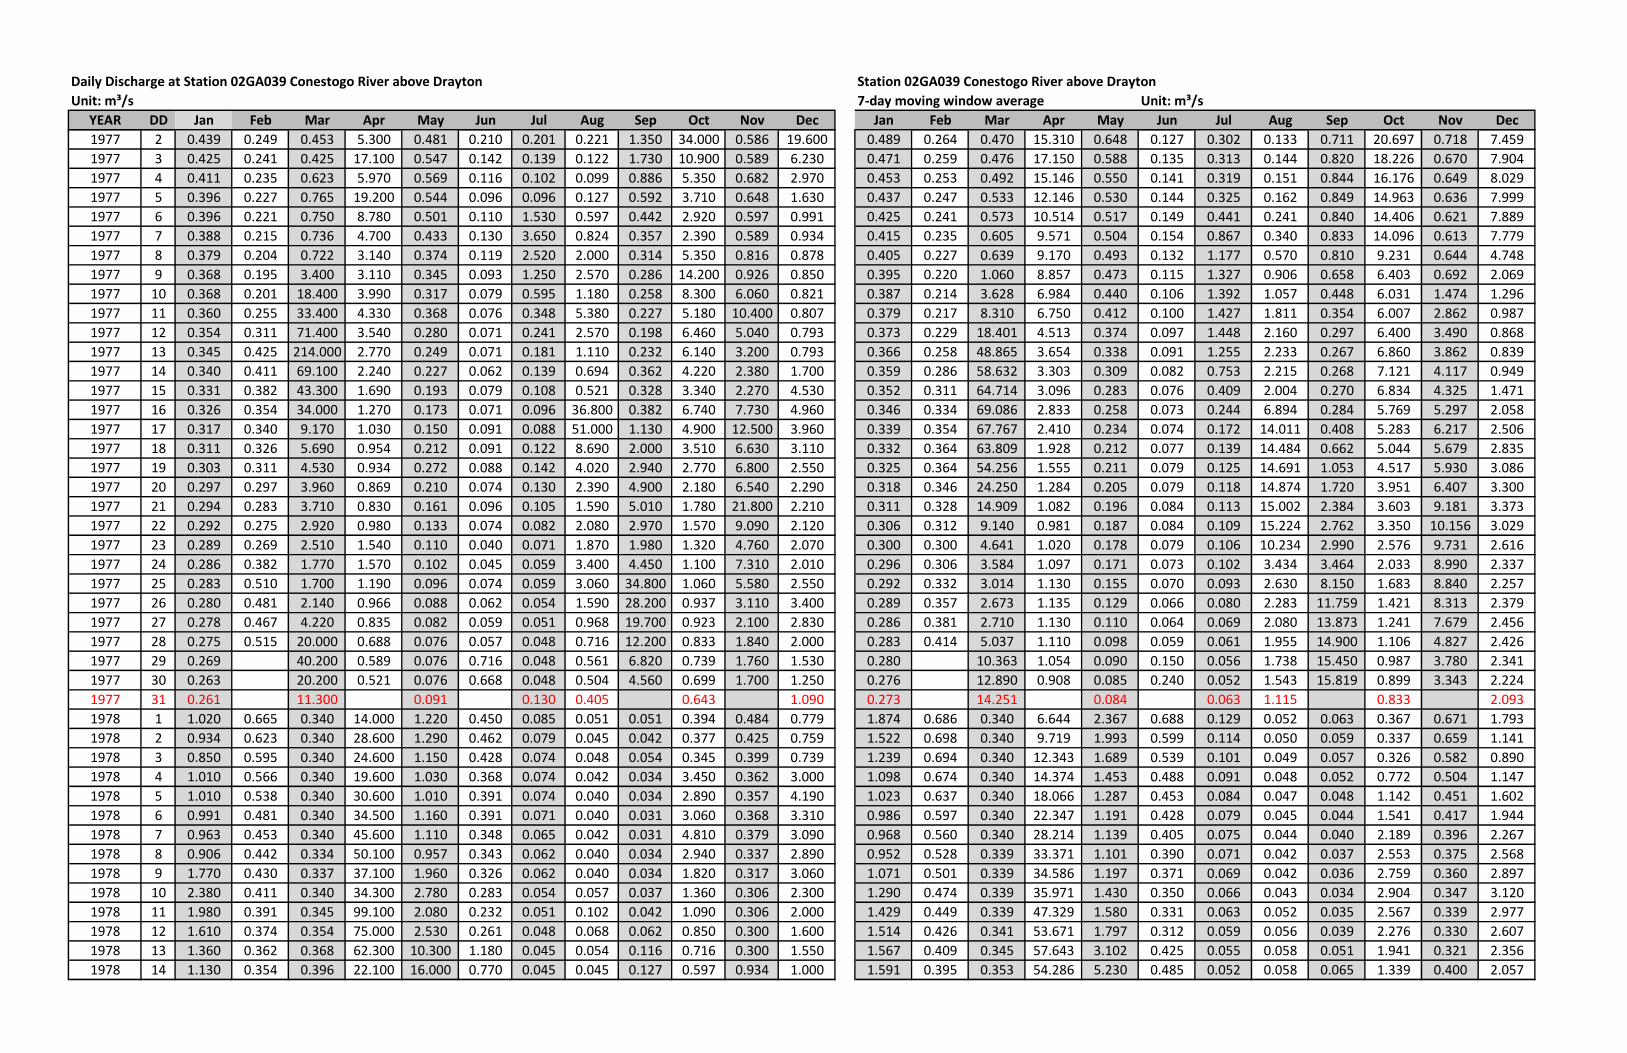
Daily Discharge at Station 02GA039 Conestogo River above Drayton Station 02GA039 Conestogo River above Drayton
Unit: m³/s 7-day moving window average Unit: m³/s
YEAR DD Jan Feb Mar Apr May Jun Jul Aug Sep Oct Nov Dec Jan Feb Mar Apr May Jun Jul Aug Sep Oct Nov Dec
1977 2 0.439 0.249 0.453 5.300 0.481 0.210 0.201 0.221 1.350 34.000 0.586 19.600 0.489 0.264 0.470 15.310 0.648 0.127 0.302 0.133 0.711 20.697 0.718 7.459
1977 3 0.425 0.241 0.425 17.100 0.547 0.142 0.139 0.122 1.730 10.900 0.589 6.230 0.471 0.259 0.476 17.150 0.588 0.135 0.313 0.144 0.820 18.226 0.670 7.904
1977 4 0.411 0.235 0.623 5.970 0.569 0.116 0.102 0.099 0.886 5.350 0.682 2.970 0.453 0.253 0.492 15.146 0.550 0.141 0.319 0.151 0.844 16.176 0.649 8.029
1977 5 0.396 0.227 0.765 19.200 0.544 0.096 0.096 0.127 0.592 3.710 0.648 1.630 0.437 0.247 0.533 12.146 0.530 0.144 0.325 0.162 0.849 14.963 0.636 7.999
1977 6 0.396 0.221 0.750 8.780 0.501 0.110 1.530 0.597 0.442 2.920 0.597 0.991 0.425 0.241 0.573 10.514 0.517 0.149 0.441 0.241 0.840 14.406 0.621 7.889
1977 7 0.388 0.215 0.736 4.700 0.433 0.130 3.650 0.824 0.357 2.390 0.589 0.934 0.415 0.235 0.605 9.571 0.504 0.154 0.867 0.340 0.833 14.096 0.613 7.779
1977 8 0.379 0.204 0.722 3.140 0.374 0.119 2.520 2.000 0.314 5.350 0.816 0.878 0.405 0.227 0.639 9.170 0.493 0.132 1.177 0.570 0.810 9.231 0.644 4.748
1977 9 0.368 0.195 3.400 3.110 0.345 0.093 1.250 2.570 0.286 14.200 0.926 0.850 0.395 0.220 1.060 8.857 0.473 0.115 1.327 0.906 0.658 6.403 0.692 2.069
1977 10 0.368 0.201 18.400 3.990 0.317 0.079 0.595 1.180 0.258 8.300 6.060 0.821 0.387 0.214 3.628 6.984 0.440 0.106 1.392 1.057 0.448 6.031 1.474 1.296
1977 11 0.360 0.255 33.400 4.330 0.368 0.076 0.348 5.380 0.227 5.180 10.400 0.807 0.379 0.217 8.310 6.750 0.412 0.100 1.427 1.811 0.354 6.007 2.862 0.987
1977 12 0.354 0.311 71.400 3.540 0.280 0.071 0.241 2.570 0.198 6.460 5.040 0.793 0.373 0.229 18.401 4.513 0.374 0.097 1.448 2.160 0.297 6.400 3.490 0.868
1977 13 0.345 0.425 214.000 2.770 0.249 0.071 0.181 1.110 0.232 6.140 3.200 0.793 0.366 0.258 48.865 3.654 0.338 0.091 1.255 2.233 0.267 6.860 3.862 0.839
1977 14 0.340 0.411 69.100 2.240 0.227 0.062 0.139 0.694 0.362 4.220 2.380 1.700 0.359 0.286 58.632 3.303 0.309 0.082 0.753 2.215 0.268 7.121 4.117 0.949
1977 15 0.331 0.382 43.300 1.690 0.193 0.079 0.108 0.521 0.328 3.340 2.270 4.530 0.352 0.311 64.714 3.096 0.283 0.076 0.409 2.004 0.270 6.834 4.325 1.471
1977 16 0.326 0.354 34.000 1.270 0.173 0.071 0.096 36.800 0.382 6.740 7.730 4.960 0.346 0.334 69.086 2.833 0.258 0.073 0.244 6.894 0.284 5.769 5.297 2.058
1977 17 0.317 0.340 9.170 1.030 0.150 0.091 0.088 51.000 1.130 4.900 12.500 3.960 0.339 0.354 67.767 2.410 0.234 0.074 0.172 14.011 0.408 5.283 6.217 2.506
1977 18 0.311 0.326 5.690 0.954 0.212 0.091 0.122 8.690 2.000 3.510 6.630 3.110 0.332 0.364 63.809 1.928 0.212 0.077 0.139 14.484 0.662 5.044 5.679 2.835
1977 19 0.303 0.311 4.530 0.934 0.272 0.088 0.142 4.020 2.940 2.770 6.800 2.550 0.325 0.364 54.256 1.555 0.211 0.079 0.125 14.691 1.053 4.517 5.930 3.086
1977 20 0.297 0.297 3.960 0.869 0.210 0.074 0.130 2.390 4.900 2.180 6.540 2.290 0.318 0.346 24.250 1.284 0.205 0.079 0.118 14.874 1.720 3.951 6.407 3.300
1977 21 0.294 0.283 3.710 0.830 0.161 0.096 0.105 1.590 5.010 1.780 21.800 2.210 0.311 0.328 14.909 1.082 0.196 0.084 0.113 15.002 2.384 3.603 9.181 3.373
1977 22 0.292 0.275 2.920 0.980 0.133 0.074 0.082 2.080 2.970 1.570 9.090 2.120 0.306 0.312 9.140 0.981 0.187 0.084 0.109 15.224 2.762 3.350 10.156 3.029
1977 23 0.289 0.269 2.510 1.540 0.110 0.040 0.071 1.870 1.980 1.320 4.760 2.070 0.300 0.300 4.641 1.020 0.178 0.079 0.106 10.234 2.990 2.576 9.731 2.616
1977 24 0.286 0.382 1.770 1.570 0.102 0.045 0.059 3.400 4.450 1.100 7.310 2.010 0.296 0.306 3.584 1.097 0.171 0.073 0.102 3.434 3.464 2.033 8.990 2.337
1977 25 0.283 0.510 1.700 1.190 0.096 0.074 0.059 3.060 34.800 1.060 5.580 2.550 0.292 0.332 3.014 1.130 0.155 0.070 0.093 2.630 8.150 1.683 8.840 2.257
1977 26 0.280 0.481 2.140 0.966 0.088 0.062 0.054 1.590 28.200 0.937 3.110 3.400 0.289 0.357 2.673 1.135 0.129 0.066 0.080 2.283 11.759 1.421 8.313 2.379
1977 27 0.278 0.467 4.220 0.835 0.082 0.059 0.051 0.968 19.700 0.923 2.100 2.830 0.286 0.381 2.710 1.130 0.110 0.064 0.069 2.080 13.873 1.241 7.679 2.456
1977 28 0.275 0.515 20.000 0.688 0.076 0.057 0.048 0.716 12.200 0.833 1.840 2.000 0.283 0.414 5.037 1.110 0.098 0.059 0.061 1.955 14.900 1.106 4.827 2.426
1977 29 0.269 40.200 0.589 0.076 0.716 0.048 0.561 6.820 0.739 1.760 1.530 0.280 10.363 1.054 0.090 0.150 0.056 1.738 15.450 0.987 3.780 2.341
1977 30 0.263 20.200 0.521 0.076 0.668 0.048 0.504 4.560 0.699 1.700 1.250 0.276 12.890 0.908 0.085 0.240 0.052 1.543 15.819 0.899 3.343 2.224
1977 31 0.261 11.300 0.091 0.130 0.405 0.643 1.090 0.273 14.251 0.084 0.063 1.115 0.833 2.093
1978 1 1.020 0.665 0.340 14.000 1.220 0.450 0.085 0.051 0.051 0.394 0.484 0.779 1.874 0.686 0.340 6.644 2.367 0.688 0.129 0.052 0.063 0.367 0.671 1.793
1978 2 0.934 0.623 0.340 28.600 1.290 0.462 0.079 0.045 0.042 0.377 0.425 0.759 1.522 0.698 0.340 9.719 1.993 0.599 0.114 0.050 0.059 0.337 0.659 1.141
1978 3 0.850 0.595 0.340 24.600 1.150 0.428 0.074 0.048 0.054 0.345 0.399 0.739 1.239 0.694 0.340 12.343 1.689 0.539 0.101 0.049 0.057 0.326 0.582 0.890
1978 4 1.010 0.566 0.340 19.600 1.030 0.368 0.074 0.042 0.034 3.450 0.362 3.000 1.098 0.674 0.340 14.374 1.453 0.488 0.091 0.048 0.052 0.772 0.504 1.147
1978 5 1.010 0.538 0.340 30.600 1.010 0.391 0.074 0.040 0.034 2.890 0.357 4.190 1.023 0.637 0.340 18.066 1.287 0.453 0.084 0.047 0.048 1.142 0.451 1.602
1978 6 0.991 0.481 0.340 34.500 1.160 0.391 0.071 0.040 0.031 3.060 0.368 3.310 0.986 0.597 0.340 22.347 1.191 0.428 0.079 0.045 0.044 1.541 0.417 1.944
1978 7 0.963 0.453 0.340 45.600 1.110 0.348 0.065 0.042 0.031 4.810 0.379 3.090 0.968 0.560 0.340 28.214 1.139 0.405 0.075 0.044 0.040 2.189 0.396 2.267
1978 8 0.906 0.442 0.334 50.100 0.957 0.343 0.062 0.040 0.034 2.940 0.337 2.890 0.952 0.528 0.339 33.371 1.101 0.390 0.071 0.042 0.037 2.553 0.375 2.568
1978 9 1.770 0.430 0.337 37.100 1.960 0.326 0.062 0.040 0.034 1.820 0.317 3.060 1.071 0.501 0.339 34.586 1.197 0.371 0.069 0.042 0.036 2.759 0.360 2.897
1978 10 2.380 0.411 0.340 34.300 2.780 0.283 0.054 0.057 0.037 1.360 0.306 2.300 1.290 0.474 0.339 35.971 1.430 0.350 0.066 0.043 0.034 2.904 0.347 3.120
1978 11 1.980 0.391 0.345 99.100 2.080 0.232 0.051 0.102 0.042 1.090 0.306 2.000 1.429 0.449 0.339 47.329 1.580 0.331 0.063 0.052 0.035 2.567 0.339 2.977
1978 12 1.610 0.374 0.354 75.000 2.530 0.261 0.048 0.068 0.062 0.850 0.300 1.600 1.514 0.426 0.341 53.671 1.797 0.312 0.059 0.056 0.039 2.276 0.330 2.607
1978 13 1.360 0.362 0.368 62.300 10.300 1.180 0.045 0.054 0.116 0.716 0.300 1.550 1.567 0.409 0.345 57.643 3.102 0.425 0.055 0.058 0.051 1.941 0.321 2.356
1978 14 1.130 0.354 0.396 22.100 16.000 0.770 0.045 0.045 0.127 0.597 0.934 1.000 1.591 0.395 0.353 54.286 5.230 0.485 0.052 0.058 0.065 1.339 0.400 2.057
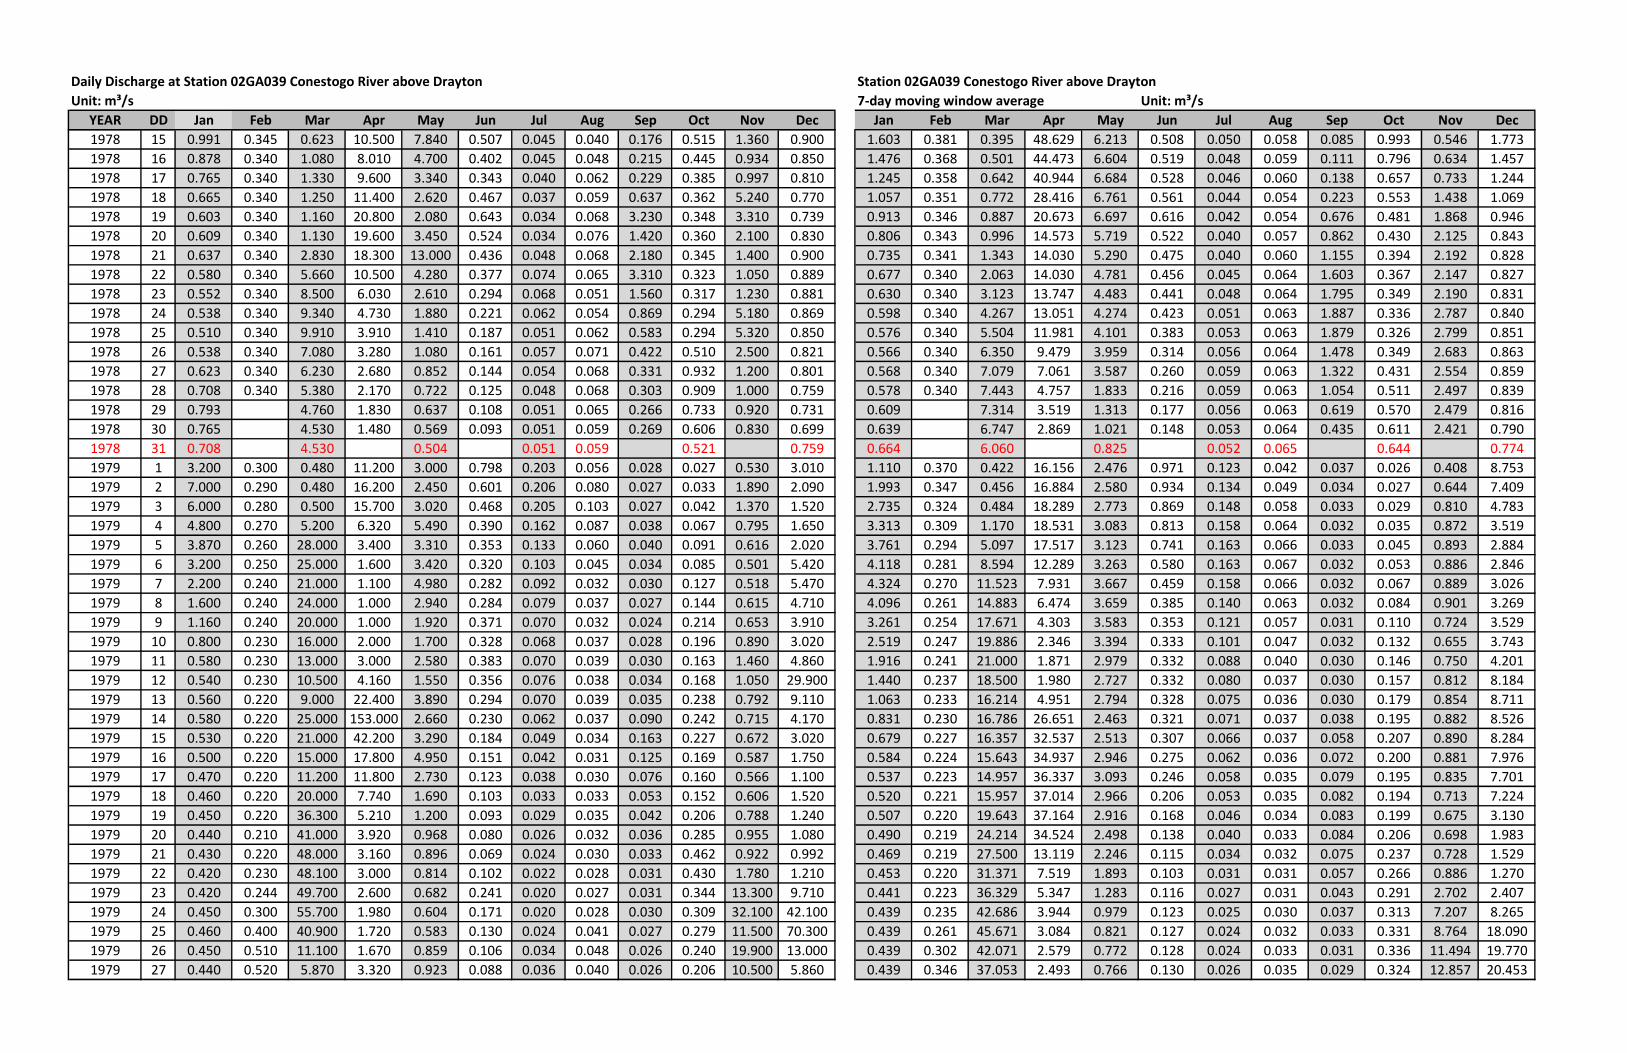
Daily Discharge at Station 02GA039 Conestogo River above Drayton Station 02GA039 Conestogo River above Drayton
Unit: m³/s 7-day moving window average Unit: m³/s
YEAR DD Jan Feb Mar Apr May Jun Jul Aug Sep Oct Nov Dec Jan Feb Mar Apr May Jun Jul Aug Sep Oct Nov Dec
1978 15 0.991 0.345 0.623 10.500 7.840 0.507 0.045 0.040 0.176 0.515 1.360 0.900 1.603 0.381 0.395 48.629 6.213 0.508 0.050 0.058 0.085 0.993 0.546 1.773
1978 16 0.878 0.340 1.080 8.010 4.700 0.402 0.045 0.048 0.215 0.445 0.934 0.850 1.476 0.368 0.501 44.473 6.604 0.519 0.048 0.059 0.111 0.796 0.634 1.457
1978 17 0.765 0.340 1.330 9.600 3.340 0.343 0.040 0.062 0.229 0.385 0.997 0.810 1.245 0.358 0.642 40.944 6.684 0.528 0.046 0.060 0.138 0.657 0.733 1.244
1978 18 0.665 0.340 1.250 11.400 2.620 0.467 0.037 0.059 0.637 0.362 5.240 0.770 1.057 0.351 0.772 28.416 6.761 0.561 0.044 0.054 0.223 0.553 1.438 1.069
1978 19 0.603 0.340 1.160 20.800 2.080 0.643 0.034 0.068 3.230 0.348 3.310 0.739 0.913 0.346 0.887 20.673 6.697 0.616 0.042 0.054 0.676 0.481 1.868 0.946
1978 20 0.609 0.340 1.130 19.600 3.450 0.524 0.034 0.076 1.420 0.360 2.100 0.830 0.806 0.343 0.996 14.573 5.719 0.522 0.040 0.057 0.862 0.430 2.125 0.843
1978 21 0.637 0.340 2.830 18.300 13.000 0.436 0.048 0.068 2.180 0.345 1.400 0.900 0.735 0.341 1.343 14.030 5.290 0.475 0.040 0.060 1.155 0.394 2.192 0.828
1978 22 0.580 0.340 5.660 10.500 4.280 0.377 0.074 0.065 3.310 0.323 1.050 0.889 0.677 0.340 2.063 14.030 4.781 0.456 0.045 0.064 1.603 0.367 2.147 0.827
1978 23 0.552 0.340 8.500 6.030 2.610 0.294 0.068 0.051 1.560 0.317 1.230 0.881 0.630 0.340 3.123 13.747 4.483 0.441 0.048 0.064 1.795 0.349 2.190 0.831
1978 24 0.538 0.340 9.340 4.730 1.880 0.221 0.062 0.054 0.869 0.294 5.180 0.869 0.598 0.340 4.267 13.051 4.274 0.423 0.051 0.063 1.887 0.336 2.787 0.840
1978 25 0.510 0.340 9.910 3.910 1.410 0.187 0.051 0.062 0.583 0.294 5.320 0.850 0.576 0.340 5.504 11.981 4.101 0.383 0.053 0.063 1.879 0.326 2.799 0.851
1978 26 0.538 0.340 7.080 3.280 1.080 0.161 0.057 0.071 0.422 0.510 2.500 0.821 0.566 0.340 6.350 9.479 3.959 0.314 0.056 0.064 1.478 0.349 2.683 0.863
1978 27 0.623 0.340 6.230 2.680 0.852 0.144 0.054 0.068 0.331 0.932 1.200 0.801 0.568 0.340 7.079 7.061 3.587 0.260 0.059 0.063 1.322 0.431 2.554 0.859
1978 28 0.708 0.340 5.380 2.170 0.722 0.125 0.048 0.068 0.303 0.909 1.000 0.759 0.578 0.340 7.443 4.757 1.833 0.216 0.059 0.063 1.054 0.511 2.497 0.839
1978 29 0.793 4.760 1.830 0.637 0.108 0.051 0.065 0.266 0.733 0.920 0.731 0.609 7.314 3.519 1.313 0.177 0.056 0.063 0.619 0.570 2.479 0.816
1978 30 0.765 4.530 1.480 0.569 0.093 0.051 0.059 0.269 0.606 0.830 0.699 0.639 6.747 2.869 1.021 0.148 0.053 0.064 0.435 0.611 2.421 0.790
1978 31 0.708 4.530 0.504 0.051 0.059 0.521 0.759 0.664 6.060 0.825 0.052 0.065 0.644 0.774
1979 1 3.200 0.300 0.480 11.200 3.000 0.798 0.203 0.056 0.028 0.027 0.530 3.010 1.110 0.370 0.422 16.156 2.476 0.971 0.123 0.042 0.037 0.026 0.408 8.753
1979 2 7.000 0.290 0.480 16.200 2.450 0.601 0.206 0.080 0.027 0.033 1.890 2.090 1.993 0.347 0.456 16.884 2.580 0.934 0.134 0.049 0.034 0.027 0.644 7.409
1979 3 6.000 0.280 0.500 15.700 3.020 0.468 0.205 0.103 0.027 0.042 1.370 1.520 2.735 0.324 0.484 18.289 2.773 0.869 0.148 0.058 0.033 0.029 0.810 4.783
1979 4 4.800 0.270 5.200 6.320 5.490 0.390 0.162 0.087 0.038 0.067 0.795 1.650 3.313 0.309 1.170 18.531 3.083 0.813 0.158 0.064 0.032 0.035 0.872 3.519
1979 5 3.870 0.260 28.000 3.400 3.310 0.353 0.133 0.060 0.040 0.091 0.616 2.020 3.761 0.294 5.097 17.517 3.123 0.741 0.163 0.066 0.033 0.045 0.893 2.884
1979 6 3.200 0.250 25.000 1.600 3.420 0.320 0.103 0.045 0.034 0.085 0.501 5.420 4.118 0.281 8.594 12.289 3.263 0.580 0.163 0.067 0.032 0.053 0.886 2.846
1979 7 2.200 0.240 21.000 1.100 4.980 0.282 0.092 0.032 0.030 0.127 0.518 5.470 4.324 0.270 11.523 7.931 3.667 0.459 0.158 0.066 0.032 0.067 0.889 3.026
1979 8 1.600 0.240 24.000 1.000 2.940 0.284 0.079 0.037 0.027 0.144 0.615 4.710 4.096 0.261 14.883 6.474 3.659 0.385 0.140 0.063 0.032 0.084 0.901 3.269
1979 9 1.160 0.240 20.000 1.000 1.920 0.371 0.070 0.032 0.024 0.214 0.653 3.910 3.261 0.254 17.671 4.303 3.583 0.353 0.121 0.057 0.031 0.110 0.724 3.529
1979 10 0.800 0.230 16.000 2.000 1.700 0.328 0.068 0.037 0.028 0.196 0.890 3.020 2.519 0.247 19.886 2.346 3.394 0.333 0.101 0.047 0.032 0.132 0.655 3.743
1979 11 0.580 0.230 13.000 3.000 2.580 0.383 0.070 0.039 0.030 0.163 1.460 4.860 1.916 0.241 21.000 1.871 2.979 0.332 0.088 0.040 0.030 0.146 0.750 4.201
1979 12 0.540 0.230 10.500 4.160 1.550 0.356 0.076 0.038 0.034 0.168 1.050 29.900 1.440 0.237 18.500 1.980 2.727 0.332 0.080 0.037 0.030 0.157 0.812 8.184
1979 13 0.560 0.220 9.000 22.400 3.890 0.294 0.070 0.039 0.035 0.238 0.792 9.110 1.063 0.233 16.214 4.951 2.794 0.328 0.075 0.036 0.030 0.179 0.854 8.711
1979 14 0.580 0.220 25.000 153.000 2.660 0.230 0.062 0.037 0.090 0.242 0.715 4.170 0.831 0.230 16.786 26.651 2.463 0.321 0.071 0.037 0.038 0.195 0.882 8.526
1979 15 0.530 0.220 21.000 42.200 3.290 0.184 0.049 0.034 0.163 0.227 0.672 3.020 0.679 0.227 16.357 32.537 2.513 0.307 0.066 0.037 0.058 0.207 0.890 8.284
1979 16 0.500 0.220 15.000 17.800 4.950 0.151 0.042 0.031 0.125 0.169 0.587 1.750 0.584 0.224 15.643 34.937 2.946 0.275 0.062 0.036 0.072 0.200 0.881 7.976
1979 17 0.470 0.220 11.200 11.800 2.730 0.123 0.038 0.030 0.076 0.160 0.566 1.100 0.537 0.223 14.957 36.337 3.093 0.246 0.058 0.035 0.079 0.195 0.835 7.701
1979 18 0.460 0.220 20.000 7.740 1.690 0.103 0.033 0.033 0.053 0.152 0.606 1.520 0.520 0.221 15.957 37.014 2.966 0.206 0.053 0.035 0.082 0.194 0.713 7.224
1979 19 0.450 0.220 36.300 5.210 1.200 0.093 0.029 0.035 0.042 0.206 0.788 1.240 0.507 0.220 19.643 37.164 2.916 0.168 0.046 0.034 0.083 0.199 0.675 3.130
1979 20 0.440 0.210 41.000 3.920 0.968 0.080 0.026 0.032 0.036 0.285 0.955 1.080 0.490 0.219 24.214 34.524 2.498 0.138 0.040 0.033 0.084 0.206 0.698 1.983
1979 21 0.430 0.220 48.000 3.160 0.896 0.069 0.024 0.030 0.033 0.462 0.922 0.992 0.469 0.219 27.500 13.119 2.246 0.115 0.034 0.032 0.075 0.237 0.728 1.529
1979 22 0.420 0.230 48.100 3.000 0.814 0.102 0.022 0.028 0.031 0.430 1.780 1.210 0.453 0.220 31.371 7.519 1.893 0.103 0.031 0.031 0.057 0.266 0.886 1.270
1979 23 0.420 0.244 49.700 2.600 0.682 0.241 0.020 0.027 0.031 0.344 13.300 9.710 0.441 0.223 36.329 5.347 1.283 0.116 0.027 0.031 0.043 0.291 2.702 2.407
1979 24 0.450 0.300 55.700 1.980 0.604 0.171 0.020 0.028 0.030 0.309 32.100 42.100 0.439 0.235 42.686 3.944 0.979 0.123 0.025 0.030 0.037 0.313 7.207 8.265
1979 25 0.460 0.400 40.900 1.720 0.583 0.130 0.024 0.041 0.027 0.279 11.500 70.300 0.439 0.261 45.671 3.084 0.821 0.127 0.024 0.032 0.033 0.331 8.764 18.090
1979 26 0.450 0.510 11.100 1.670 0.859 0.106 0.034 0.048 0.026 0.240 19.900 13.000 0.439 0.302 42.071 2.579 0.772 0.128 0.024 0.033 0.031 0.336 11.494 19.770
1979 27 0.440 0.520 5.870 3.320 0.923 0.088 0.036 0.040 0.026 0.206 10.500 5.860 0.439 0.346 37.053 2.493 0.766 0.130 0.026 0.035 0.029 0.324 12.857 20.453
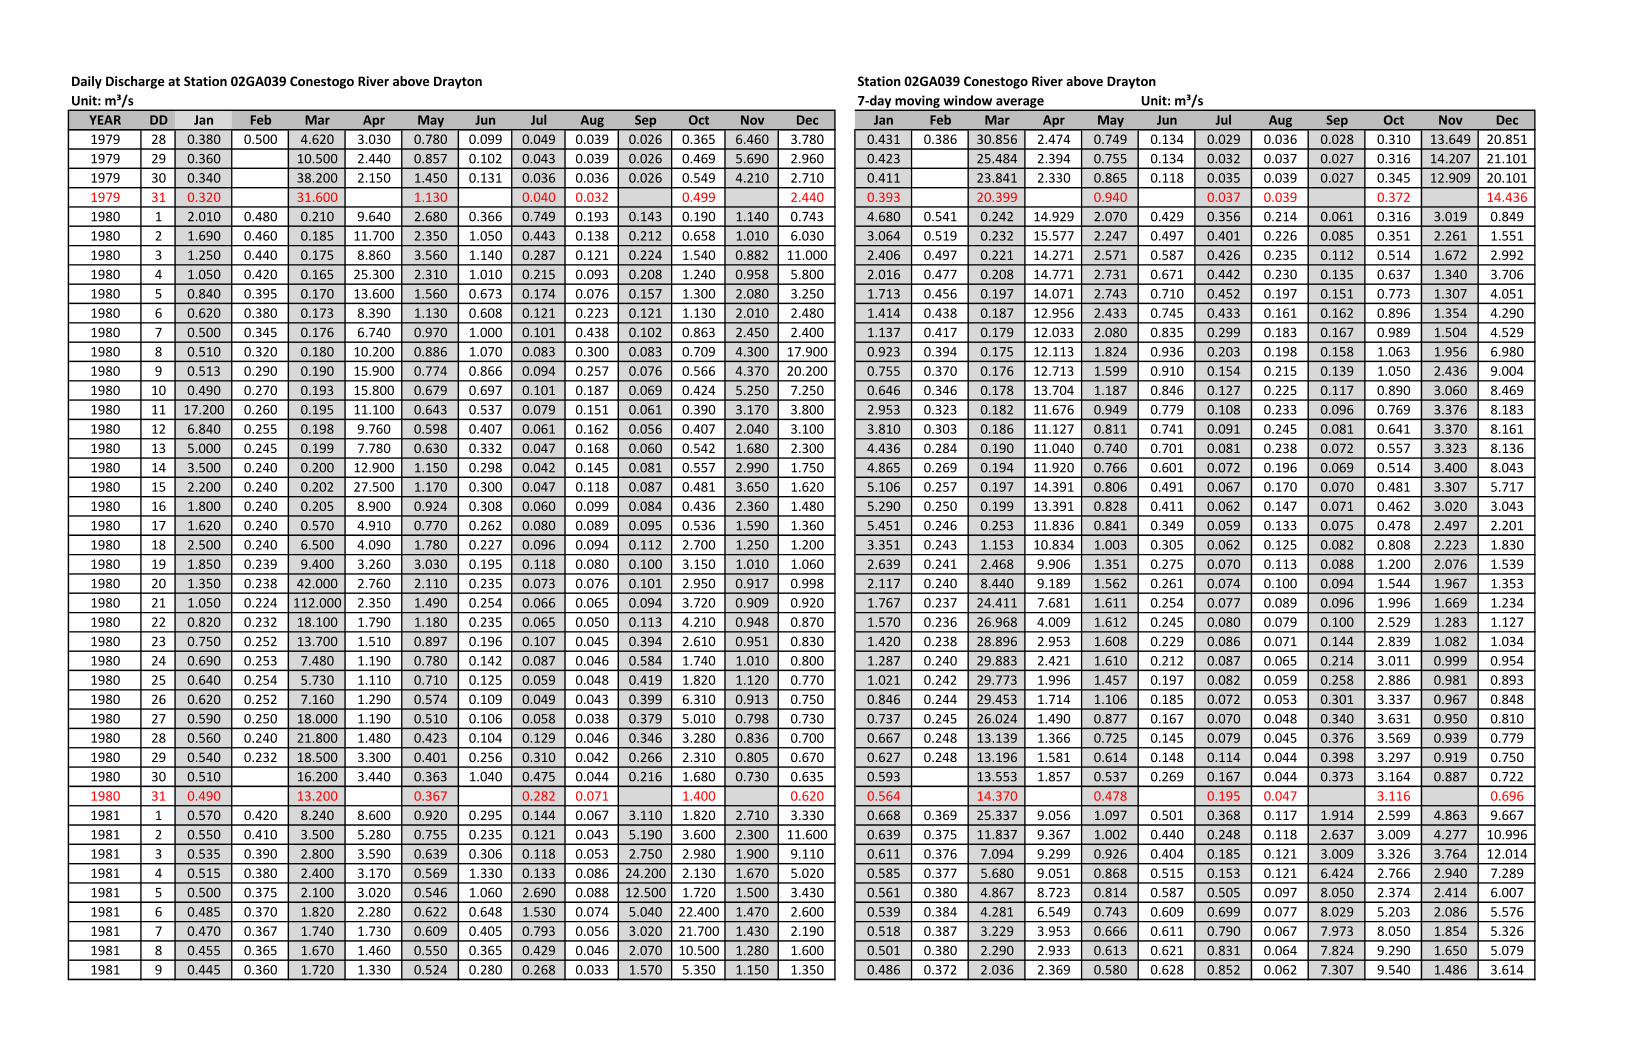
Daily Discharge at Station 02GA039 Conestogo River above Drayton Station 02GA039 Conestogo River above Drayton
Unit: m³/s 7-day moving window average Unit: m³/s
YEAR DD Jan Feb Mar Apr May Jun Jul Aug Sep Oct Nov Dec Jan Feb Mar Apr May Jun Jul Aug Sep Oct Nov Dec
1979 28 0.380 0.500 4.620 3.030 0.780 0.099 0.049 0.039 0.026 0.365 6.460 3.780 0.431 0.386 30.856 2.474 0.749 0.134 0.029 0.036 0.028 0.310 13.649 20.851
1979 29 0.360 10.500 2.440 0.857 0.102 0.043 0.039 0.026 0.469 5.690 2.960 0.423 25.484 2.394 0.755 0.134 0.032 0.037 0.027 0.316 14.207 21.101
1979 30 0.340 38.200 2.150 1.450 0.131 0.036 0.036 0.026 0.549 4.210 2.710 0.411 23.841 2.330 0.865 0.118 0.035 0.039 0.027 0.345 12.909 20.101
1979 31 0.320 31.600 1.130 0.040 0.032 0.499 2.440 0.393 20.399 0.940 0.037 0.039 0.372 14.436
1980 1 2.010 0.480 0.210 9.640 2.680 0.366 0.749 0.193 0.143 0.190 1.140 0.743 4.680 0.541 0.242 14.929 2.070 0.429 0.356 0.214 0.061 0.316 3.019 0.849
1980 2 1.690 0.460 0.185 11.700 2.350 1.050 0.443 0.138 0.212 0.658 1.010 6.030 3.064 0.519 0.232 15.577 2.247 0.497 0.401 0.226 0.085 0.351 2.261 1.551
1980 3 1.250 0.440 0.175 8.860 3.560 1.140 0.287 0.121 0.224 1.540 0.882 11.000 2.406 0.497 0.221 14.271 2.571 0.587 0.426 0.235 0.112 0.514 1.672 2.992
1980 4 1.050 0.420 0.165 25.300 2.310 1.010 0.215 0.093 0.208 1.240 0.958 5.800 2.016 0.477 0.208 14.771 2.731 0.671 0.442 0.230 0.135 0.637 1.340 3.706
1980 5 0.840 0.395 0.170 13.600 1.560 0.673 0.174 0.076 0.157 1.300 2.080 3.250 1.713 0.456 0.197 14.071 2.743 0.710 0.452 0.197 0.151 0.773 1.307 4.051
1980 6 0.620 0.380 0.173 8.390 1.130 0.608 0.121 0.223 0.121 1.130 2.010 2.480 1.414 0.438 0.187 12.956 2.433 0.745 0.433 0.161 0.162 0.896 1.354 4.290
1980 7 0.500 0.345 0.176 6.740 0.970 1.000 0.101 0.438 0.102 0.863 2.450 2.400 1.137 0.417 0.179 12.033 2.080 0.835 0.299 0.183 0.167 0.989 1.504 4.529
1980 8 0.510 0.320 0.180 10.200 0.886 1.070 0.083 0.300 0.083 0.709 4.300 17.900 0.923 0.394 0.175 12.113 1.824 0.936 0.203 0.198 0.158 1.063 1.956 6.980
1980 9 0.513 0.290 0.190 15.900 0.774 0.866 0.094 0.257 0.076 0.566 4.370 20.200 0.755 0.370 0.176 12.713 1.599 0.910 0.154 0.215 0.139 1.050 2.436 9.004
1980 10 0.490 0.270 0.193 15.800 0.679 0.697 0.101 0.187 0.069 0.424 5.250 7.250 0.646 0.346 0.178 13.704 1.187 0.846 0.127 0.225 0.117 0.890 3.060 8.469
1980 11 17.200 0.260 0.195 11.100 0.643 0.537 0.079 0.151 0.061 0.390 3.170 3.800 2.953 0.323 0.182 11.676 0.949 0.779 0.108 0.233 0.096 0.769 3.376 8.183
1980 12 6.840 0.255 0.198 9.760 0.598 0.407 0.061 0.162 0.056 0.407 2.040 3.100 3.810 0.303 0.186 11.127 0.811 0.741 0.091 0.245 0.081 0.641 3.370 8.161
1980 13 5.000 0.245 0.199 7.780 0.630 0.332 0.047 0.168 0.060 0.542 1.680 2.300 4.436 0.284 0.190 11.040 0.740 0.701 0.081 0.238 0.072 0.557 3.323 8.136
1980 14 3.500 0.240 0.200 12.900 1.150 0.298 0.042 0.145 0.081 0.557 2.990 1.750 4.865 0.269 0.194 11.920 0.766 0.601 0.072 0.196 0.069 0.514 3.400 8.043
1980 15 2.200 0.240 0.202 27.500 1.170 0.300 0.047 0.118 0.087 0.481 3.650 1.620 5.106 0.257 0.197 14.391 0.806 0.491 0.067 0.170 0.070 0.481 3.307 5.717
1980 16 1.800 0.240 0.205 8.900 0.924 0.308 0.060 0.099 0.084 0.436 2.360 1.480 5.290 0.250 0.199 13.391 0.828 0.411 0.062 0.147 0.071 0.462 3.020 3.043
1980 17 1.620 0.240 0.570 4.910 0.770 0.262 0.080 0.089 0.095 0.536 1.590 1.360 5.451 0.246 0.253 11.836 0.841 0.349 0.059 0.133 0.075 0.478 2.497 2.201
1980 18 2.500 0.240 6.500 4.090 1.780 0.227 0.096 0.094 0.112 2.700 1.250 1.200 3.351 0.243 1.153 10.834 1.003 0.305 0.062 0.125 0.082 0.808 2.223 1.830
1980 19 1.850 0.239 9.400 3.260 3.030 0.195 0.118 0.080 0.100 3.150 1.010 1.060 2.639 0.241 2.468 9.906 1.351 0.275 0.070 0.113 0.088 1.200 2.076 1.539
1980 20 1.350 0.238 42.000 2.760 2.110 0.235 0.073 0.076 0.101 2.950 0.917 0.998 2.117 0.240 8.440 9.189 1.562 0.261 0.074 0.100 0.094 1.544 1.967 1.353
1980 21 1.050 0.224 112.000 2.350 1.490 0.254 0.066 0.065 0.094 3.720 0.909 0.920 1.767 0.237 24.411 7.681 1.611 0.254 0.077 0.089 0.096 1.996 1.669 1.234
1980 22 0.820 0.232 18.100 1.790 1.180 0.235 0.065 0.050 0.113 4.210 0.948 0.870 1.570 0.236 26.968 4.009 1.612 0.245 0.080 0.079 0.100 2.529 1.283 1.127
1980 23 0.750 0.252 13.700 1.510 0.897 0.196 0.107 0.045 0.394 2.610 0.951 0.830 1.420 0.238 28.896 2.953 1.608 0.229 0.086 0.071 0.144 2.839 1.082 1.034
1980 24 0.690 0.253 7.480 1.190 0.780 0.142 0.087 0.046 0.584 1.740 1.010 0.800 1.287 0.240 29.883 2.421 1.610 0.212 0.087 0.065 0.214 3.011 0.999 0.954
1980 25 0.640 0.254 5.730 1.110 0.710 0.125 0.059 0.048 0.419 1.820 1.120 0.770 1.021 0.242 29.773 1.996 1.457 0.197 0.082 0.059 0.258 2.886 0.981 0.893
1980 26 0.620 0.252 7.160 1.290 0.574 0.109 0.049 0.043 0.399 6.310 0.913 0.750 0.846 0.244 29.453 1.714 1.106 0.185 0.072 0.053 0.301 3.337 0.967 0.848
1980 27 0.590 0.250 18.000 1.190 0.510 0.106 0.058 0.038 0.379 5.010 0.798 0.730 0.737 0.245 26.024 1.490 0.877 0.167 0.070 0.048 0.340 3.631 0.950 0.810
1980 28 0.560 0.240 21.800 1.480 0.423 0.104 0.129 0.046 0.346 3.280 0.836 0.700 0.667 0.248 13.139 1.366 0.725 0.145 0.079 0.045 0.376 3.569 0.939 0.779
1980 29 0.540 0.232 18.500 3.300 0.401 0.256 0.310 0.042 0.266 2.310 0.805 0.670 0.627 0.248 13.196 1.581 0.614 0.148 0.114 0.044 0.398 3.297 0.919 0.750
1980 30 0.510 16.200 3.440 0.363 1.040 0.475 0.044 0.216 1.680 0.730 0.635 0.593 13.553 1.857 0.537 0.269 0.167 0.044 0.373 3.164 0.887 0.722
1980 31 0.490 13.200 0.367 0.282 0.071 1.400 0.620 0.564 14.370 0.478 0.195 0.047 3.116 0.696
1981 1 0.570 0.420 8.240 8.600 0.920 0.295 0.144 0.067 3.110 1.820 2.710 3.330 0.668 0.369 25.337 9.056 1.097 0.501 0.368 0.117 1.914 2.599 4.863 9.667
1981 2 0.550 0.410 3.500 5.280 0.755 0.235 0.121 0.043 5.190 3.600 2.300 11.600 0.639 0.375 11.837 9.367 1.002 0.440 0.248 0.118 2.637 3.009 4.277 10.996
1981 3 0.535 0.390 2.800 3.590 0.639 0.306 0.118 0.053 2.750 2.980 1.900 9.110 0.611 0.376 7.094 9.299 0.926 0.404 0.185 0.121 3.009 3.326 3.764 12.014
1981 4 0.515 0.380 2.400 3.170 0.569 1.330 0.133 0.086 24.200 2.130 1.670 5.020 0.585 0.377 5.680 9.051 0.868 0.515 0.153 0.121 6.424 2.766 2.940 7.289
1981 5 0.500 0.375 2.100 3.020 0.546 1.060 2.690 0.088 12.500 1.720 1.500 3.430 0.561 0.380 4.867 8.723 0.814 0.587 0.505 0.097 8.050 2.374 2.414 6.007
1981 6 0.485 0.370 1.820 2.280 0.622 0.648 1.530 0.074 5.040 22.400 1.470 2.600 0.539 0.384 4.281 6.549 0.743 0.609 0.699 0.077 8.029 5.203 2.086 5.576
1981 7 0.470 0.367 1.740 1.730 0.609 0.405 0.793 0.056 3.020 21.700 1.430 2.190 0.518 0.387 3.229 3.953 0.666 0.611 0.790 0.067 7.973 8.050 1.854 5.326
1981 8 0.455 0.365 1.670 1.460 0.550 0.365 0.429 0.046 2.070 10.500 1.280 1.600 0.501 0.380 2.290 2.933 0.613 0.621 0.831 0.064 7.824 9.290 1.650 5.079
1981 9 0.445 0.360 1.720 1.330 0.524 0.280 0.268 0.033 1.570 5.350 1.150 1.350 0.486 0.372 2.036 2.369 0.580 0.628 0.852 0.062 7.307 9.540 1.486 3.614
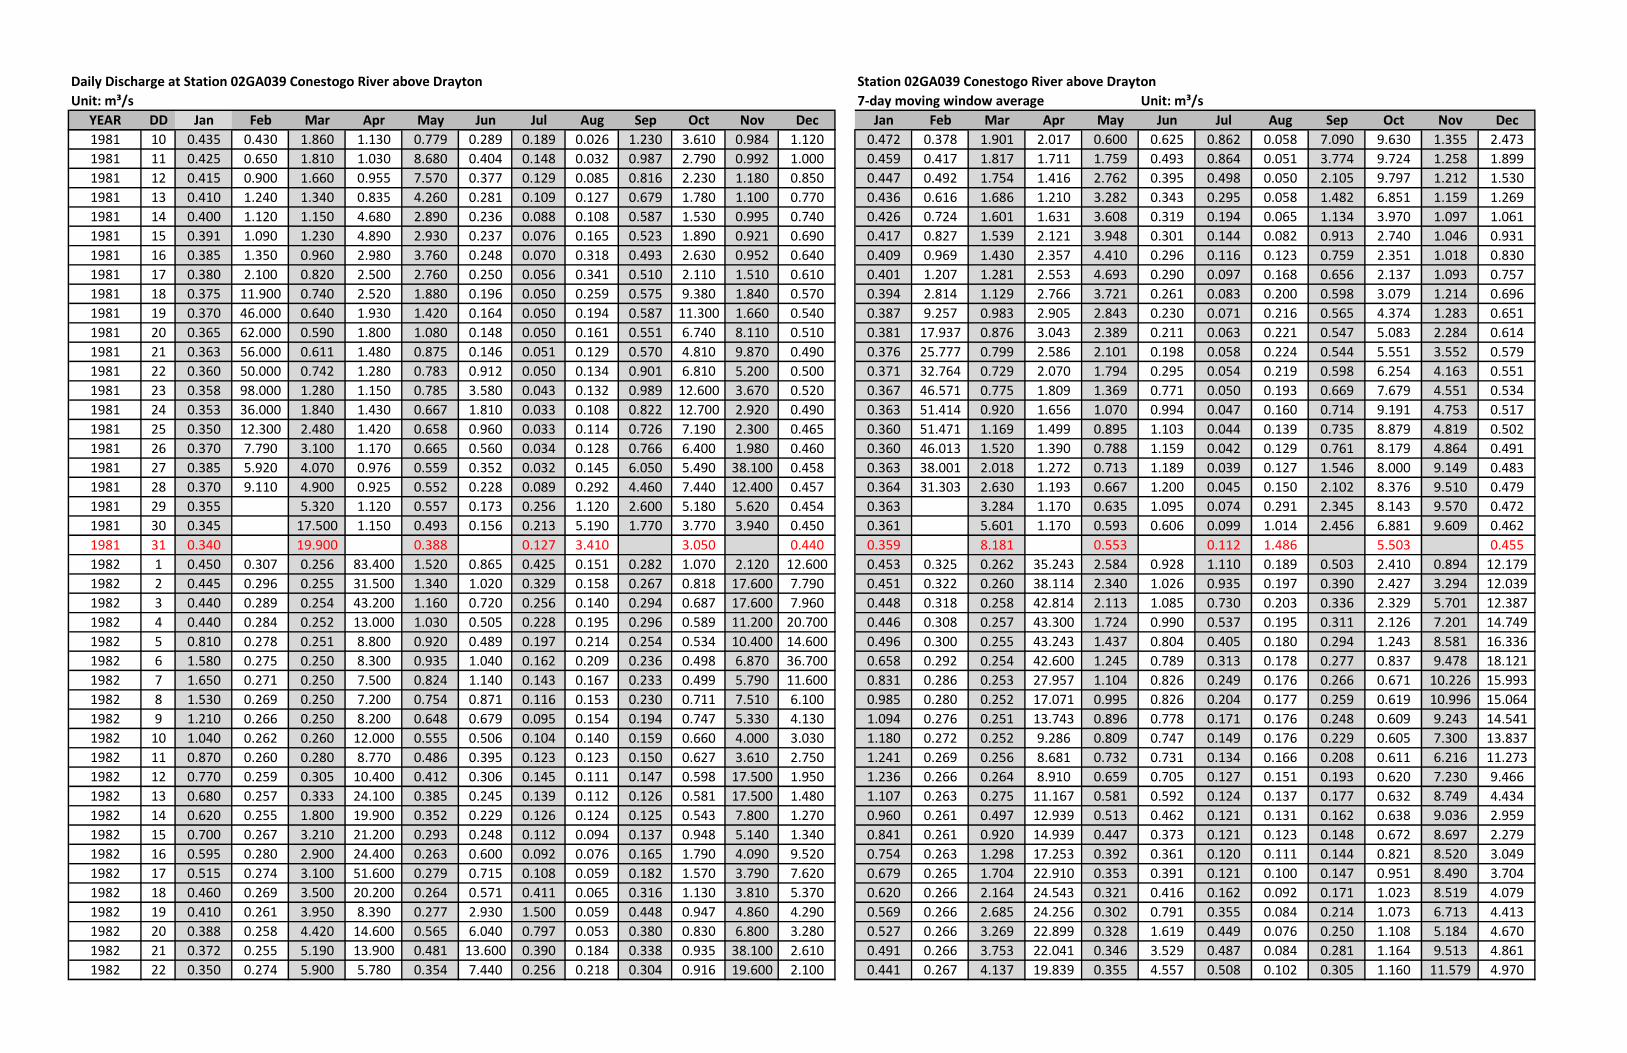
Daily Discharge at Station 02GA039 Conestogo River above Drayton Station 02GA039 Conestogo River above Drayton
Unit: m³/s 7-day moving window average Unit: m³/s
YEAR DD Jan Feb Mar Apr May Jun Jul Aug Sep Oct Nov Dec Jan Feb Mar Apr May Jun Jul Aug Sep Oct Nov Dec
1981 10 0.435 0.430 1.860 1.130 0.779 0.289 0.189 0.026 1.230 3.610 0.984 1.120 0.472 0.378 1.901 2.017 0.600 0.625 0.862 0.058 7.090 9.630 1.355 2.473
1981 11 0.425 0.650 1.810 1.030 8.680 0.404 0.148 0.032 0.987 2.790 0.992 1.000 0.459 0.417 1.817 1.711 1.759 0.493 0.864 0.051 3.774 9.724 1.258 1.899
1981 12 0.415 0.900 1.660 0.955 7.570 0.377 0.129 0.085 0.816 2.230 1.180 0.850 0.447 0.492 1.754 1.416 2.762 0.395 0.498 0.050 2.105 9.797 1.212 1.530
1981 13 0.410 1.240 1.340 0.835 4.260 0.281 0.109 0.127 0.679 1.780 1.100 0.770 0.436 0.616 1.686 1.210 3.282 0.343 0.295 0.058 1.482 6.851 1.159 1.269
1981 14 0.400 1.120 1.150 4.680 2.890 0.236 0.088 0.108 0.587 1.530 0.995 0.740 0.426 0.724 1.601 1.631 3.608 0.319 0.194 0.065 1.134 3.970 1.097 1.061
1981 15 0.391 1.090 1.230 4.890 2.930 0.237 0.076 0.165 0.523 1.890 0.921 0.690 0.417 0.827 1.539 2.121 3.948 0.301 0.144 0.082 0.913 2.740 1.046 0.931
1981 16 0.385 1.350 0.960 2.980 3.760 0.248 0.070 0.318 0.493 2.630 0.952 0.640 0.409 0.969 1.430 2.357 4.410 0.296 0.116 0.123 0.759 2.351 1.018 0.830
1981 17 0.380 2.100 0.820 2.500 2.760 0.250 0.056 0.341 0.510 2.110 1.510 0.610 0.401 1.207 1.281 2.553 4.693 0.290 0.097 0.168 0.656 2.137 1.093 0.757
1981 18 0.375 11.900 0.740 2.520 1.880 0.196 0.050 0.259 0.575 9.380 1.840 0.570 0.394 2.814 1.129 2.766 3.721 0.261 0.083 0.200 0.598 3.079 1.214 0.696
1981 19 0.370 46.000 0.640 1.930 1.420 0.164 0.050 0.194 0.587 11.300 1.660 0.540 0.387 9.257 0.983 2.905 2.843 0.230 0.071 0.216 0.565 4.374 1.283 0.651
1981 20 0.365 62.000 0.590 1.800 1.080 0.148 0.050 0.161 0.551 6.740 8.110 0.510 0.381 17.937 0.876 3.043 2.389 0.211 0.063 0.221 0.547 5.083 2.284 0.614
1981 21 0.363 56.000 0.611 1.480 0.875 0.146 0.051 0.129 0.570 4.810 9.870 0.490 0.376 25.777 0.799 2.586 2.101 0.198 0.058 0.224 0.544 5.551 3.552 0.579
1981 22 0.360 50.000 0.742 1.280 0.783 0.912 0.050 0.134 0.901 6.810 5.200 0.500 0.371 32.764 0.729 2.070 1.794 0.295 0.054 0.219 0.598 6.254 4.163 0.551
1981 23 0.358 98.000 1.280 1.150 0.785 3.580 0.043 0.132 0.989 12.600 3.670 0.520 0.367 46.571 0.775 1.809 1.369 0.771 0.050 0.193 0.669 7.679 4.551 0.534
1981 24 0.353 36.000 1.840 1.430 0.667 1.810 0.033 0.108 0.822 12.700 2.920 0.490 0.363 51.414 0.920 1.656 1.070 0.994 0.047 0.160 0.714 9.191 4.753 0.517
1981 25 0.350 12.300 2.480 1.420 0.658 0.960 0.033 0.114 0.726 7.190 2.300 0.465 0.360 51.471 1.169 1.499 0.895 1.103 0.044 0.139 0.735 8.879 4.819 0.502
1981 26 0.370 7.790 3.100 1.170 0.665 0.560 0.034 0.128 0.766 6.400 1.980 0.460 0.360 46.013 1.520 1.390 0.788 1.159 0.042 0.129 0.761 8.179 4.864 0.491
1981 27 0.385 5.920 4.070 0.976 0.559 0.352 0.032 0.145 6.050 5.490 38.100 0.458 0.363 38.001 2.018 1.272 0.713 1.189 0.039 0.127 1.546 8.000 9.149 0.483
1981 28 0.370 9.110 4.900 0.925 0.552 0.228 0.089 0.292 4.460 7.440 12.400 0.457 0.364 31.303 2.630 1.193 0.667 1.200 0.045 0.150 2.102 8.376 9.510 0.479
1981 29 0.355 5.320 1.120 0.557 0.173 0.256 1.120 2.600 5.180 5.620 0.454 0.363 3.284 1.170 0.635 1.095 0.074 0.291 2.345 8.143 9.570 0.472
1981 30 0.345 17.500 1.150 0.493 0.156 0.213 5.190 1.770 3.770 3.940 0.450 0.361 5.601 1.170 0.593 0.606 0.099 1.014 2.456 6.881 9.609 0.462
1981 31 0.340 19.900 0.388 0.127 3.410 3.050 0.440 0.359 8.181 0.553 0.112 1.486 5.503 0.455
1982 1 0.450 0.307 0.256 83.400 1.520 0.865 0.425 0.151 0.282 1.070 2.120 12.600 0.453 0.325 0.262 35.243 2.584 0.928 1.110 0.189 0.503 2.410 0.894 12.179
1982 2 0.445 0.296 0.255 31.500 1.340 1.020 0.329 0.158 0.267 0.818 17.600 7.790 0.451 0.322 0.260 38.114 2.340 1.026 0.935 0.197 0.390 2.427 3.294 12.039
1982 3 0.440 0.289 0.254 43.200 1.160 0.720 0.256 0.140 0.294 0.687 17.600 7.960 0.448 0.318 0.258 42.814 2.113 1.085 0.730 0.203 0.336 2.329 5.701 12.387
1982 4 0.440 0.284 0.252 13.000 1.030 0.505 0.228 0.195 0.296 0.589 11.200 20.700 0.446 0.308 0.257 43.300 1.724 0.990 0.537 0.195 0.311 2.126 7.201 14.749
1982 5 0.810 0.278 0.251 8.800 0.920 0.489 0.197 0.214 0.254 0.534 10.400 14.600 0.496 0.300 0.255 43.243 1.437 0.804 0.405 0.180 0.294 1.243 8.581 16.336
1982 6 1.580 0.275 0.250 8.300 0.935 1.040 0.162 0.209 0.236 0.498 6.870 36.700 0.658 0.292 0.254 42.600 1.245 0.789 0.313 0.178 0.277 0.837 9.478 18.121
1982 7 1.650 0.271 0.250 7.500 0.824 1.140 0.143 0.167 0.233 0.499 5.790 11.600 0.831 0.286 0.253 27.957 1.104 0.826 0.249 0.176 0.266 0.671 10.226 15.993
1982 8 1.530 0.269 0.250 7.200 0.754 0.871 0.116 0.153 0.230 0.711 7.510 6.100 0.985 0.280 0.252 17.071 0.995 0.826 0.204 0.177 0.259 0.619 10.996 15.064
1982 9 1.210 0.266 0.250 8.200 0.648 0.679 0.095 0.154 0.194 0.747 5.330 4.130 1.094 0.276 0.251 13.743 0.896 0.778 0.171 0.176 0.248 0.609 9.243 14.541
1982 10 1.040 0.262 0.260 12.000 0.555 0.506 0.104 0.140 0.159 0.660 4.000 3.030 1.180 0.272 0.252 9.286 0.809 0.747 0.149 0.176 0.229 0.605 7.300 13.837
1982 11 0.870 0.260 0.280 8.770 0.486 0.395 0.123 0.123 0.150 0.627 3.610 2.750 1.241 0.269 0.256 8.681 0.732 0.731 0.134 0.166 0.208 0.611 6.216 11.273
1982 12 0.770 0.259 0.305 10.400 0.412 0.306 0.145 0.111 0.147 0.598 17.500 1.950 1.236 0.266 0.264 8.910 0.659 0.705 0.127 0.151 0.193 0.620 7.230 9.466
1982 13 0.680 0.257 0.333 24.100 0.385 0.245 0.139 0.112 0.126 0.581 17.500 1.480 1.107 0.263 0.275 11.167 0.581 0.592 0.124 0.137 0.177 0.632 8.749 4.434
1982 14 0.620 0.255 1.800 19.900 0.352 0.229 0.126 0.124 0.125 0.543 7.800 1.270 0.960 0.261 0.497 12.939 0.513 0.462 0.121 0.131 0.162 0.638 9.036 2.959
1982 15 0.700 0.267 3.210 21.200 0.293 0.248 0.112 0.094 0.137 0.948 5.140 1.340 0.841 0.261 0.920 14.939 0.447 0.373 0.121 0.123 0.148 0.672 8.697 2.279
1982 16 0.595 0.280 2.900 24.400 0.263 0.600 0.092 0.076 0.165 1.790 4.090 9.520 0.754 0.263 1.298 17.253 0.392 0.361 0.120 0.111 0.144 0.821 8.520 3.049
1982 17 0.515 0.274 3.100 51.600 0.279 0.715 0.108 0.059 0.182 1.570 3.790 7.620 0.679 0.265 1.704 22.910 0.353 0.391 0.121 0.100 0.147 0.951 8.490 3.704
1982 18 0.460 0.269 3.500 20.200 0.264 0.571 0.411 0.065 0.316 1.130 3.810 5.370 0.620 0.266 2.164 24.543 0.321 0.416 0.162 0.092 0.171 1.023 8.519 4.079
1982 19 0.410 0.261 3.950 8.390 0.277 2.930 1.500 0.059 0.448 0.947 4.860 4.290 0.569 0.266 2.685 24.256 0.302 0.791 0.355 0.084 0.214 1.073 6.713 4.413
1982 20 0.388 0.258 4.420 14.600 0.565 6.040 0.797 0.053 0.380 0.830 6.800 3.280 0.527 0.266 3.269 22.899 0.328 1.619 0.449 0.076 0.250 1.108 5.184 4.670
1982 21 0.372 0.255 5.190 13.900 0.481 13.600 0.390 0.184 0.338 0.935 38.100 2.610 0.491 0.266 3.753 22.041 0.346 3.529 0.487 0.084 0.281 1.164 9.513 4.861
1982 22 0.350 0.274 5.900 5.780 0.354 7.440 0.256 0.218 0.304 0.916 19.600 2.100 0.441 0.267 4.137 19.839 0.355 4.557 0.508 0.102 0.305 1.160 11.579 4.970
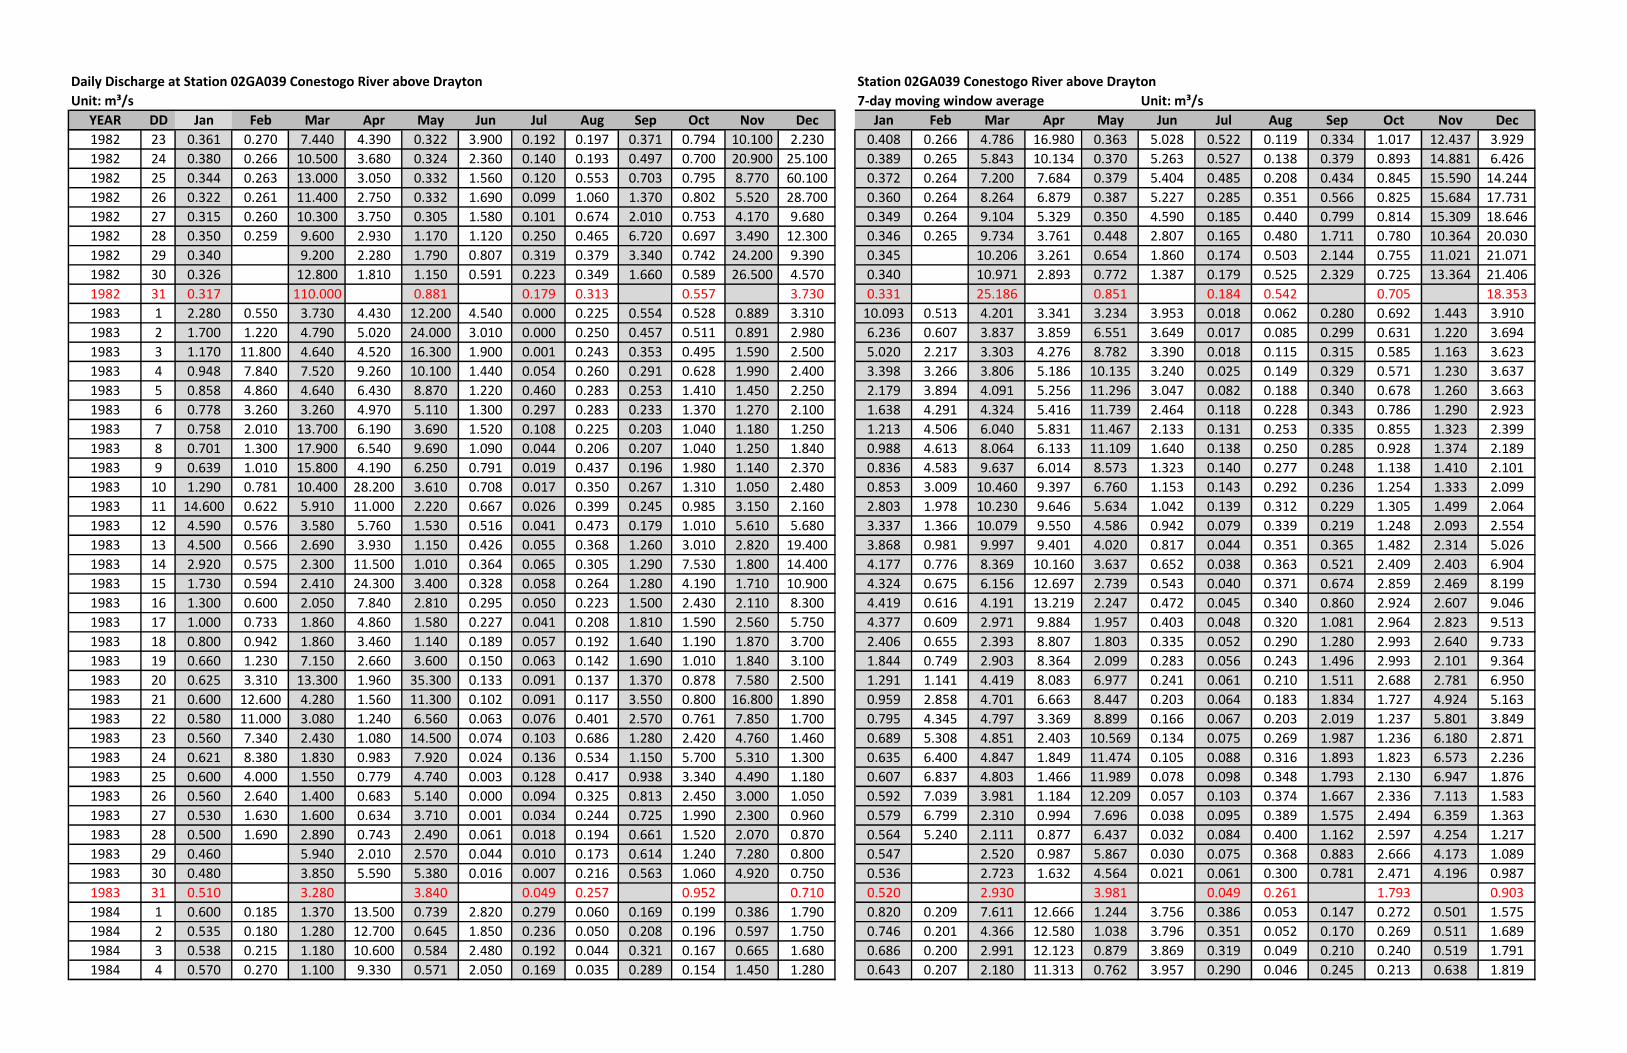
Daily Discharge at Station 02GA039 Conestogo River above Drayton Station 02GA039 Conestogo River above Drayton
Unit: m³/s 7-day moving window average Unit: m³/s
YEAR DD Jan Feb Mar Apr May Jun Jul Aug Sep Oct Nov Dec Jan Feb Mar Apr May Jun Jul Aug Sep Oct Nov Dec
1982 23 0.361 0.270 7.440 4.390 0.322 3.900 0.192 0.197 0.371 0.794 10.100 2.230 0.408 0.266 4.786 16.980 0.363 5.028 0.522 0.119 0.334 1.017 12.437 3.929
1982 24 0.380 0.266 10.500 3.680 0.324 2.360 0.140 0.193 0.497 0.700 20.900 25.100 0.389 0.265 5.843 10.134 0.370 5.263 0.527 0.138 0.379 0.893 14.881 6.426
1982 25 0.344 0.263 13.000 3.050 0.332 1.560 0.120 0.553 0.703 0.795 8.770 60.100 0.372 0.264 7.200 7.684 0.379 5.404 0.485 0.208 0.434 0.845 15.590 14.244
1982 26 0.322 0.261 11.400 2.750 0.332 1.690 0.099 1.060 1.370 0.802 5.520 28.700 0.360 0.264 8.264 6.879 0.387 5.227 0.285 0.351 0.566 0.825 15.684 17.731
1982 27 0.315 0.260 10.300 3.750 0.305 1.580 0.101 0.674 2.010 0.753 4.170 9.680 0.349 0.264 9.104 5.329 0.350 4.590 0.185 0.440 0.799 0.814 15.309 18.646
1982 28 0.350 0.259 9.600 2.930 1.170 1.120 0.250 0.465 6.720 0.697 3.490 12.300 0.346 0.265 9.734 3.761 0.448 2.807 0.165 0.480 1.711 0.780 10.364 20.030
1982 29 0.340 9.200 2.280 1.790 0.807 0.319 0.379 3.340 0.742 24.200 9.390 0.345 10.206 3.261 0.654 1.860 0.174 0.503 2.144 0.755 11.021 21.071
1982 30 0.326 12.800 1.810 1.150 0.591 0.223 0.349 1.660 0.589 26.500 4.570 0.340 10.971 2.893 0.772 1.387 0.179 0.525 2.329 0.725 13.364 21.406
1982 31 0.317 110.000 0.881 0.179 0.313 0.557 3.730 0.331 25.186 0.851 0.184 0.542 0.705 18.353
1983 1 2.280 0.550 3.730 4.430 12.200 4.540 0.000 0.225 0.554 0.528 0.889 3.310 10.093 0.513 4.201 3.341 3.234 3.953 0.018 0.062 0.280 0.692 1.443 3.910
1983 2 1.700 1.220 4.790 5.020 24.000 3.010 0.000 0.250 0.457 0.511 0.891 2.980 6.236 0.607 3.837 3.859 6.551 3.649 0.017 0.085 0.299 0.631 1.220 3.694
1983 3 1.170 11.800 4.640 4.520 16.300 1.900 0.001 0.243 0.353 0.495 1.590 2.500 5.020 2.217 3.303 4.276 8.782 3.390 0.018 0.115 0.315 0.585 1.163 3.623
1983 4 0.948 7.840 7.520 9.260 10.100 1.440 0.054 0.260 0.291 0.628 1.990 2.400 3.398 3.266 3.806 5.186 10.135 3.240 0.025 0.149 0.329 0.571 1.230 3.637
1983 5 0.858 4.860 4.640 6.430 8.870 1.220 0.460 0.283 0.253 1.410 1.450 2.250 2.179 3.894 4.091 5.256 11.296 3.047 0.082 0.188 0.340 0.678 1.260 3.663
1983 6 0.778 3.260 3.260 4.970 5.110 1.300 0.297 0.283 0.233 1.370 1.270 2.100 1.638 4.291 4.324 5.416 11.739 2.464 0.118 0.228 0.343 0.786 1.290 2.923
1983 7 0.758 2.010 13.700 6.190 3.690 1.520 0.108 0.225 0.203 1.040 1.180 1.250 1.213 4.506 6.040 5.831 11.467 2.133 0.131 0.253 0.335 0.855 1.323 2.399
1983 8 0.701 1.300 17.900 6.540 9.690 1.090 0.044 0.206 0.207 1.040 1.250 1.840 0.988 4.613 8.064 6.133 11.109 1.640 0.138 0.250 0.285 0.928 1.374 2.189
1983 9 0.639 1.010 15.800 4.190 6.250 0.791 0.019 0.437 0.196 1.980 1.140 2.370 0.836 4.583 9.637 6.014 8.573 1.323 0.140 0.277 0.248 1.138 1.410 2.101
1983 10 1.290 0.781 10.400 28.200 3.610 0.708 0.017 0.350 0.267 1.310 1.050 2.480 0.853 3.009 10.460 9.397 6.760 1.153 0.143 0.292 0.236 1.254 1.333 2.099
1983 11 14.600 0.622 5.910 11.000 2.220 0.667 0.026 0.399 0.245 0.985 3.150 2.160 2.803 1.978 10.230 9.646 5.634 1.042 0.139 0.312 0.229 1.305 1.499 2.064
1983 12 4.590 0.576 3.580 5.760 1.530 0.516 0.041 0.473 0.179 1.010 5.610 5.680 3.337 1.366 10.079 9.550 4.586 0.942 0.079 0.339 0.219 1.248 2.093 2.554
1983 13 4.500 0.566 2.690 3.930 1.150 0.426 0.055 0.368 1.260 3.010 2.820 19.400 3.868 0.981 9.997 9.401 4.020 0.817 0.044 0.351 0.365 1.482 2.314 5.026
1983 14 2.920 0.575 2.300 11.500 1.010 0.364 0.065 0.305 1.290 7.530 1.800 14.400 4.177 0.776 8.369 10.160 3.637 0.652 0.038 0.363 0.521 2.409 2.403 6.904
1983 15 1.730 0.594 2.410 24.300 3.400 0.328 0.058 0.264 1.280 4.190 1.710 10.900 4.324 0.675 6.156 12.697 2.739 0.543 0.040 0.371 0.674 2.859 2.469 8.199
1983 16 1.300 0.600 2.050 7.840 2.810 0.295 0.050 0.223 1.500 2.430 2.110 8.300 4.419 0.616 4.191 13.219 2.247 0.472 0.045 0.340 0.860 2.924 2.607 9.046
1983 17 1.000 0.733 1.860 4.860 1.580 0.227 0.041 0.208 1.810 1.590 2.560 5.750 4.377 0.609 2.971 9.884 1.957 0.403 0.048 0.320 1.081 2.964 2.823 9.513
1983 18 0.800 0.942 1.860 3.460 1.140 0.189 0.057 0.192 1.640 1.190 1.870 3.700 2.406 0.655 2.393 8.807 1.803 0.335 0.052 0.290 1.280 2.993 2.640 9.733
1983 19 0.660 1.230 7.150 2.660 3.600 0.150 0.063 0.142 1.690 1.010 1.840 3.100 1.844 0.749 2.903 8.364 2.099 0.283 0.056 0.243 1.496 2.993 2.101 9.364
1983 20 0.625 3.310 13.300 1.960 35.300 0.133 0.091 0.137 1.370 0.878 7.580 2.500 1.291 1.141 4.419 8.083 6.977 0.241 0.061 0.210 1.511 2.688 2.781 6.950
1983 21 0.600 12.600 4.280 1.560 11.300 0.102 0.091 0.117 3.550 0.800 16.800 1.890 0.959 2.858 4.701 6.663 8.447 0.203 0.064 0.183 1.834 1.727 4.924 5.163
1983 22 0.580 11.000 3.080 1.240 6.560 0.063 0.076 0.401 2.570 0.761 7.850 1.700 0.795 4.345 4.797 3.369 8.899 0.166 0.067 0.203 2.019 1.237 5.801 3.849
1983 23 0.560 7.340 2.430 1.080 14.500 0.074 0.103 0.686 1.280 2.420 4.760 1.460 0.689 5.308 4.851 2.403 10.569 0.134 0.075 0.269 1.987 1.236 6.180 2.871
1983 24 0.621 8.380 1.830 0.983 7.920 0.024 0.136 0.534 1.150 5.700 5.310 1.300 0.635 6.400 4.847 1.849 11.474 0.105 0.088 0.316 1.893 1.823 6.573 2.236
1983 25 0.600 4.000 1.550 0.779 4.740 0.003 0.128 0.417 0.938 3.340 4.490 1.180 0.607 6.837 4.803 1.466 11.989 0.078 0.098 0.348 1.793 2.130 6.947 1.876
1983 26 0.560 2.640 1.400 0.683 5.140 0.000 0.094 0.325 0.813 2.450 3.000 1.050 0.592 7.039 3.981 1.184 12.209 0.057 0.103 0.374 1.667 2.336 7.113 1.583
1983 27 0.530 1.630 1.600 0.634 3.710 0.001 0.034 0.244 0.725 1.990 2.300 0.960 0.579 6.799 2.310 0.994 7.696 0.038 0.095 0.389 1.575 2.494 6.359 1.363
1983 28 0.500 1.690 2.890 0.743 2.490 0.061 0.018 0.194 0.661 1.520 2.070 0.870 0.564 5.240 2.111 0.877 6.437 0.032 0.084 0.400 1.162 2.597 4.254 1.217
1983 29 0.460 5.940 2.010 2.570 0.044 0.010 0.173 0.614 1.240 7.280 0.800 0.547 2.520 0.987 5.867 0.030 0.075 0.368 0.883 2.666 4.173 1.089
1983 30 0.480 3.850 5.590 5.380 0.016 0.007 0.216 0.563 1.060 4.920 0.750 0.536 2.723 1.632 4.564 0.021 0.061 0.300 0.781 2.471 4.196 0.987
1983 31 0.510 3.280 3.840 0.049 0.257 0.952 0.710 0.520 2.930 3.981 0.049 0.261 1.793 0.903
1984 1 0.600 0.185 1.370 13.500 0.739 2.820 0.279 0.060 0.169 0.199 0.386 1.790 0.820 0.209 7.611 12.666 1.244 3.756 0.386 0.053 0.147 0.272 0.501 1.575
1984 2 0.535 0.180 1.280 12.700 0.645 1.850 0.236 0.050 0.208 0.196 0.597 1.750 0.746 0.201 4.366 12.580 1.038 3.796 0.351 0.052 0.170 0.269 0.511 1.689
1984 3 0.538 0.215 1.180 10.600 0.584 2.480 0.192 0.044 0.321 0.167 0.665 1.680 0.686 0.200 2.991 12.123 0.879 3.869 0.319 0.049 0.210 0.240 0.519 1.791
1984 4 0.570 0.270 1.100 9.330 0.571 2.050 0.169 0.035 0.289 0.154 1.450 1.280 0.643 0.207 2.180 11.313 0.762 3.957 0.290 0.046 0.245 0.213 0.638 1.819

Daily Discharge at Station 02GA039 Conestogo River above Drayton Station 02GA039 Conestogo River above Drayton
Unit: m³/s 7-day moving window average Unit: m³/s
YEAR DD Jan Feb Mar Apr May Jun Jul Aug Sep Oct Nov Dec Jan Feb Mar Apr May Jun Jul Aug Sep Oct Nov Dec
1984 5 0.609 0.289 1.030 23.000 0.535 1.260 0.165 0.038 0.219 0.151 4.850 1.190 0.616 0.219 1.484 12.784 0.678 3.084 0.252 0.046 0.247 0.192 1.252 1.767
1984 6 0.580 0.264 0.980 15.600 0.498 0.885 0.319 0.037 0.166 0.133 2.890 1.040 0.592 0.228 1.206 13.719 0.624 2.249 0.241 0.045 0.231 0.174 1.601 1.544
1984 7 0.540 0.247 0.930 9.370 0.460 0.698 0.479 0.042 0.132 0.143 1.770 0.784 0.567 0.236 1.124 13.443 0.576 1.720 0.263 0.044 0.215 0.163 1.801 1.359
1984 8 0.505 0.235 0.890 6.160 0.630 0.549 0.384 0.046 0.113 0.147 1.230 0.777 0.554 0.243 1.056 12.394 0.560 1.396 0.278 0.042 0.207 0.156 1.922 1.214
1984 9 0.470 0.229 0.860 5.080 0.972 0.463 0.296 0.055 0.128 0.192 1.170 0.722 0.545 0.250 0.996 11.306 0.607 1.198 0.286 0.042 0.195 0.155 2.004 1.068
1984 10 0.445 0.241 0.820 4.260 0.876 0.422 0.267 0.058 0.206 0.254 4.430 0.742 0.531 0.254 0.944 10.400 0.649 0.904 0.297 0.044 0.179 0.168 2.541 0.934
1984 11 0.420 0.264 0.790 3.610 0.778 0.427 0.402 0.050 0.340 0.241 23.200 0.828 0.510 0.253 0.900 9.583 0.678 0.672 0.330 0.047 0.186 0.180 5.649 0.869
1984 12 0.398 0.620 0.760 3.210 0.840 0.352 0.406 0.042 0.290 0.233 12.100 2.060 0.480 0.300 0.861 6.756 0.722 0.542 0.365 0.047 0.196 0.192 6.684 0.993
1984 13 0.379 2.500 0.750 3.170 0.798 0.310 0.312 0.041 0.323 0.229 5.520 30.200 0.451 0.619 0.829 4.980 0.765 0.460 0.364 0.048 0.219 0.206 7.060 5.159
1984 14 0.360 63.200 0.740 3.240 0.810 0.273 0.261 0.031 0.804 0.203 3.670 9.890 0.425 9.613 0.801 4.104 0.815 0.399 0.333 0.046 0.315 0.214 7.331 6.460
1984 15 0.340 59.800 0.725 5.200 0.728 0.246 0.227 0.022 1.470 0.162 3.640 5.490 0.402 18.122 0.778 3.967 0.829 0.356 0.310 0.043 0.509 0.216 7.676 7.133
1984 16 0.323 43.200 12.200 5.820 0.637 0.220 0.212 0.048 1.350 0.134 6.810 4.990 0.381 24.261 2.398 4.073 0.781 0.321 0.298 0.042 0.683 0.208 8.481 7.743
1984 17 0.305 34.800 41.500 6.520 0.574 0.335 0.210 0.040 1.250 0.136 4.290 9.650 0.361 29.198 8.209 4.396 0.738 0.309 0.290 0.039 0.832 0.191 8.461 9.015
1984 18 0.291 34.400 41.000 6.180 0.566 17.900 0.239 0.037 1.190 0.219 3.080 5.870 0.342 34.074 13.954 4.763 0.708 2.805 0.267 0.037 0.954 0.188 5.587 9.736
1984 19 0.288 40.400 23.100 5.900 0.569 8.970 0.187 0.031 0.726 0.467 2.420 4.040 0.327 39.757 17.145 5.147 0.669 4.036 0.235 0.036 1.016 0.221 4.204 10.019
1984 20 0.265 38.700 12.400 4.480 0.511 3.480 0.148 0.026 0.274 0.428 1.750 2.840 0.310 44.929 18.809 5.334 0.628 4.489 0.212 0.034 1.009 0.250 3.666 6.110
1984 21 0.254 16.800 33.300 3.280 0.469 1.700 0.118 0.021 0.185 0.533 1.310 2.400 0.295 38.300 23.461 5.340 0.579 4.693 0.192 0.032 0.921 0.297 3.329 5.040
1984 22 0.246 11.700 25.000 2.410 0.474 0.938 0.108 0.025 0.141 0.591 1.060 10.800 0.282 31.429 26.929 4.941 0.543 4.792 0.175 0.033 0.731 0.358 2.960 5.799
1984 23 0.237 20.600 11.500 2.130 0.926 0.632 0.098 0.036 0.135 0.539 0.970 8.200 0.269 28.200 26.829 4.414 0.584 4.851 0.158 0.031 0.557 0.416 2.126 6.257
1984 24 0.260 24.000 8.100 2.100 1.190 0.526 0.075 0.053 0.135 0.472 1.020 4.650 0.263 26.657 22.057 3.783 0.672 4.878 0.139 0.033 0.398 0.464 1.659 5.543
1984 25 0.248 10.800 9.640 2.090 0.881 0.486 0.055 0.045 0.219 0.416 0.953 2.520 0.257 23.286 17.577 3.199 0.717 2.390 0.113 0.034 0.259 0.492 1.355 5.064
1984 26 0.235 6.780 13.300 1.700 1.570 0.414 0.052 0.049 0.365 0.529 0.964 2.350 0.249 18.483 16.177 2.599 0.860 1.168 0.093 0.036 0.208 0.501 1.147 4.823
1984 27 0.226 5.900 13.800 1.390 1.970 0.371 0.067 0.045 0.348 0.613 1.090 2.090 0.244 13.797 16.377 2.157 1.069 0.724 0.082 0.039 0.218 0.528 1.052 4.716
1984 28 0.217 2.930 15.000 1.120 1.430 0.431 0.054 0.039 0.297 0.613 1.550 17.600 0.238 11.816 13.763 1.849 1.206 0.543 0.073 0.042 0.234 0.539 1.087 6.887
1984 29 0.208 1.500 12.700 0.878 7.370 0.398 0.044 0.206 0.254 0.555 2.600 107.000 0.233 10.359 12.006 1.630 2.191 0.465 0.064 0.068 0.250 0.534 1.307 20.630
1984 30 0.200 9.060 0.794 6.730 0.325 0.044 0.281 0.221 0.447 2.080 27.500 0.228 11.657 1.439 3.020 0.422 0.056 0.103 0.263 0.521 1.465 23.387
1984 31 0.194 11.300 4.400 0.048 0.243 0.367 8.950 0.218 12.114 3.479 0.052 0.130 0.506 24.001
1985 1 5.850 0.460 12.000 21.400 1.110 14.400 0.000 0.537 0.778 0.106 0.804 4.670 24.477 0.504 29.657 43.900 1.416 6.212 0.050 0.077 0.931 0.231 1.248 2.264
1985 2 5.000 0.450 10.000 11.400 0.999 5.040 0.000 1.050 0.568 0.102 0.760 28.900 24.856 0.491 29.557 44.471 1.283 6.911 0.014 0.227 0.794 0.181 0.986 6.051
1985 3 3.600 0.440 8.800 8.170 0.930 2.220 0.000 1.030 0.447 0.059 0.975 8.500 25.071 0.479 22.557 41.981 1.154 5.814 0.001 0.374 0.692 0.140 0.913 6.979
1985 4 2.700 0.430 7.400 8.790 0.763 1.240 0.000 1.010 0.320 0.047 6.340 5.410 22.943 0.466 16.386 26.809 1.055 4.813 0.000 0.518 0.639 0.107 1.660 7.477
1985 5 2.100 0.420 6.600 110.000 0.896 0.943 0.000 1.000 0.319 0.110 16.200 3.910 7.957 0.453 12.057 31.694 1.004 4.429 0.000 0.661 0.623 0.092 3.844 7.784
1985 6 1.700 0.410 5.600 73.600 1.180 0.776 0.000 0.538 1.970 0.261 8.150 2.840 4.271 0.441 9.486 36.609 1.010 4.308 0.000 0.738 0.793 0.110 4.877 7.967
1985 7 1.400 0.400 5.000 24.500 1.270 0.622 0.062 0.130 2.400 0.271 5.760 2.300 3.193 0.430 7.914 36.837 1.021 3.606 0.009 0.756 0.972 0.137 5.570 8.076
1985 8 1.200 0.390 4.600 18.600 1.030 0.539 0.259 0.852 1.300 0.216 5.300 2.010 2.529 0.420 6.857 36.437 1.010 1.626 0.046 0.801 1.046 0.152 6.212 7.696
1985 9 1.100 0.385 4.800 9.620 0.862 0.430 0.074 0.851 1.170 0.317 4.880 1.690 1.971 0.411 6.114 36.183 0.990 0.967 0.056 0.773 1.132 0.183 6.801 3.809
1985 10 1.040 0.380 5.200 6.610 0.725 0.318 0.011 0.745 8.890 0.469 23.700 1.570 1.606 0.402 5.600 35.960 0.961 0.695 0.058 0.732 2.338 0.242 10.047 2.819
1985 11 0.980 0.370 6.000 13.100 0.619 0.237 0.000 0.172 6.070 0.617 10.400 1.790 1.360 0.394 5.400 36.576 0.940 0.552 0.058 0.613 3.160 0.323 10.627 2.301
1985 12 0.930 0.460 9.000 16.800 0.541 0.233 0.000 0.000 2.610 0.861 5.610 1.980 1.193 0.399 5.743 23.261 0.890 0.451 0.058 0.470 3.487 0.430 9.114 2.026
1985 13 0.890 0.540 15.000 16.000 0.465 0.201 0.000 0.000 1.270 4.820 19.700 1.700 1.077 0.418 7.086 15.033 0.787 0.369 0.058 0.393 3.387 1.082 10.764 1.863
1985 14 0.850 0.487 13.500 14.800 0.365 0.143 0.444 0.000 0.892 3.030 25.500 1.230 0.999 0.430 8.300 13.647 0.658 0.300 0.113 0.374 3.172 1.476 13.584 1.710
1985 15 0.810 0.450 11.800 15.900 0.306 0.083 0.925 0.072 0.689 1.920 21.100 1.150 0.943 0.439 9.329 13.261 0.555 0.235 0.208 0.263 3.084 1.719 15.841 1.587
1985 16 0.780 0.440 9.600 10.300 0.302 0.177 0.505 0.251 0.555 2.370 9.090 1.080 0.897 0.447 10.014 13.359 0.475 0.199 0.269 0.177 2.997 2.012 16.443 1.500
1985 17 0.750 0.430 8.200 6.240 0.278 0.381 0.202 0.019 0.423 1.790 10.100 1.090 0.856 0.454 10.443 13.306 0.411 0.208 0.297 0.073 1.787 2.201 14.500 1.431
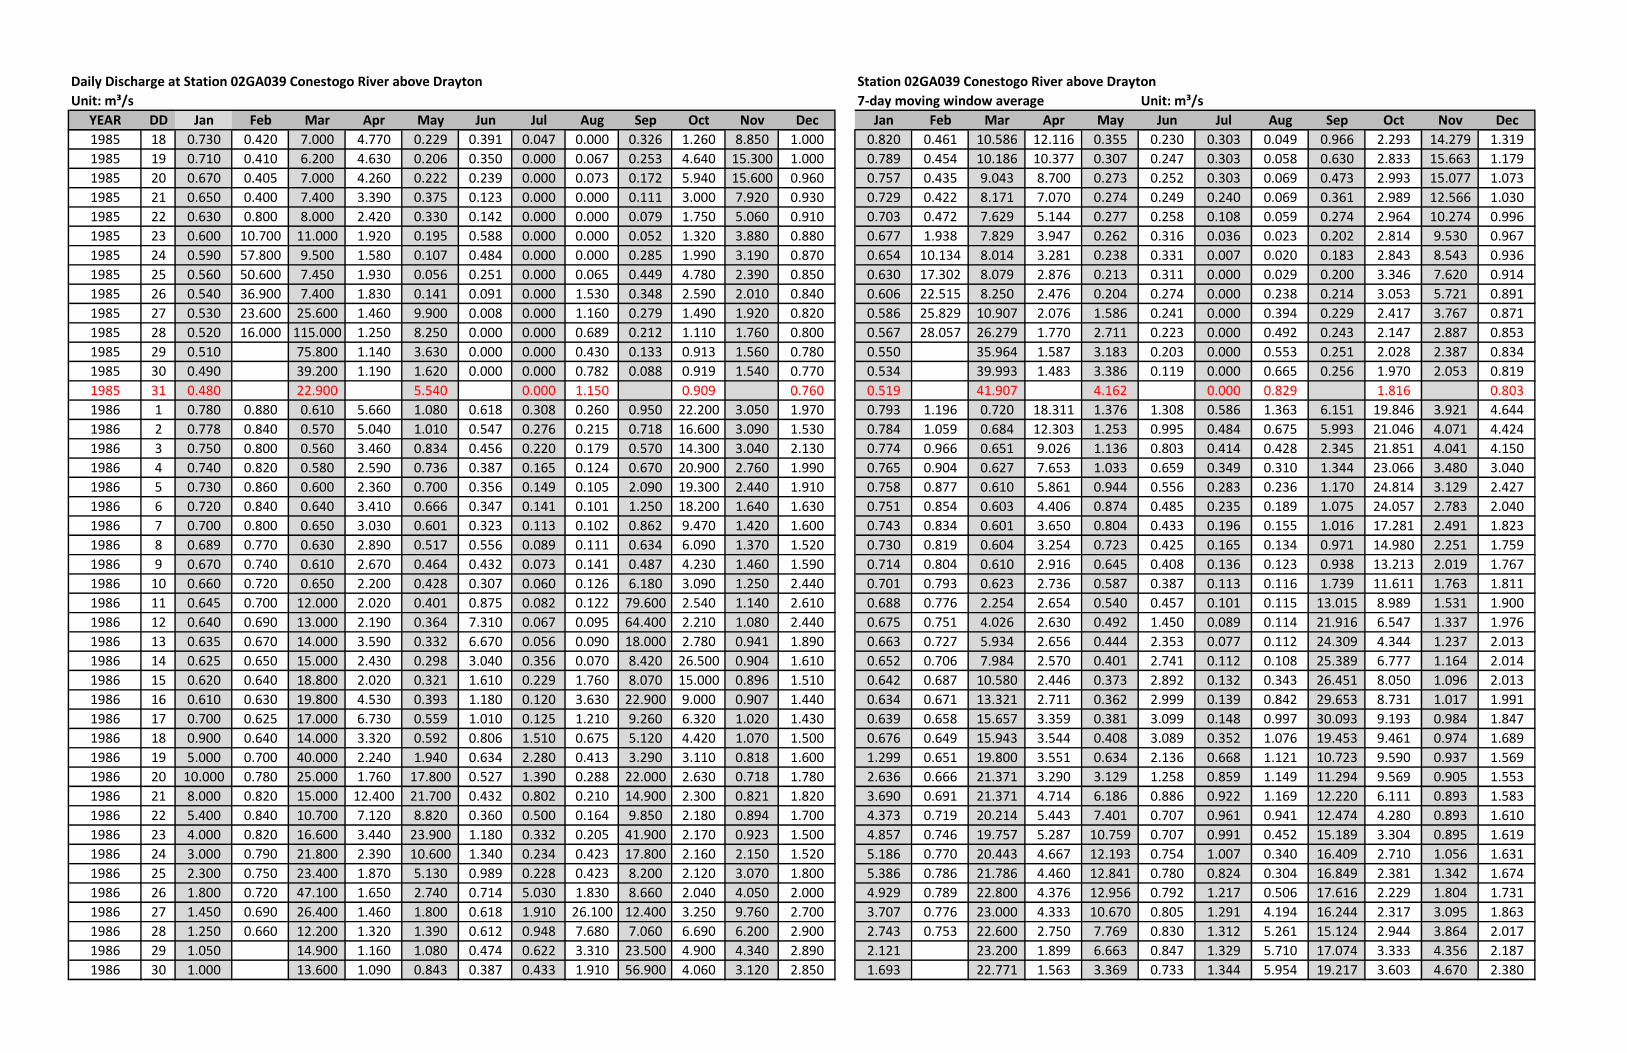
Daily Discharge at Station 02GA039 Conestogo River above Drayton Station 02GA039 Conestogo River above Drayton
Unit: m³/s 7-day moving window average Unit: m³/s
YEAR DD Jan Feb Mar Apr May Jun Jul Aug Sep Oct Nov Dec Jan Feb Mar Apr May Jun Jul Aug Sep Oct Nov Dec
1985 18 0.730 0.420 7.000 4.770 0.229 0.391 0.047 0.000 0.326 1.260 8.850 1.000 0.820 0.461 10.586 12.116 0.355 0.230 0.303 0.049 0.966 2.293 14.279 1.319
1985 19 0.710 0.410 6.200 4.630 0.206 0.350 0.000 0.067 0.253 4.640 15.300 1.000 0.789 0.454 10.186 10.377 0.307 0.247 0.303 0.058 0.630 2.833 15.663 1.179
1985 20 0.670 0.405 7.000 4.260 0.222 0.239 0.000 0.073 0.172 5.940 15.600 0.960 0.757 0.435 9.043 8.700 0.273 0.252 0.303 0.069 0.473 2.993 15.077 1.073
1985 21 0.650 0.400 7.400 3.390 0.375 0.123 0.000 0.000 0.111 3.000 7.920 0.930 0.729 0.422 8.171 7.070 0.274 0.249 0.240 0.069 0.361 2.989 12.566 1.030
1985 22 0.630 0.800 8.000 2.420 0.330 0.142 0.000 0.000 0.079 1.750 5.060 0.910 0.703 0.472 7.629 5.144 0.277 0.258 0.108 0.059 0.274 2.964 10.274 0.996
1985 23 0.600 10.700 11.000 1.920 0.195 0.588 0.000 0.000 0.052 1.320 3.880 0.880 0.677 1.938 7.829 3.947 0.262 0.316 0.036 0.023 0.202 2.814 9.530 0.967
1985 24 0.590 57.800 9.500 1.580 0.107 0.484 0.000 0.000 0.285 1.990 3.190 0.870 0.654 10.134 8.014 3.281 0.238 0.331 0.007 0.020 0.183 2.843 8.543 0.936
1985 25 0.560 50.600 7.450 1.930 0.056 0.251 0.000 0.065 0.449 4.780 2.390 0.850 0.630 17.302 8.079 2.876 0.213 0.311 0.000 0.029 0.200 3.346 7.620 0.914
1985 26 0.540 36.900 7.400 1.830 0.141 0.091 0.000 1.530 0.348 2.590 2.010 0.840 0.606 22.515 8.250 2.476 0.204 0.274 0.000 0.238 0.214 3.053 5.721 0.891
1985 27 0.530 23.600 25.600 1.460 9.900 0.008 0.000 1.160 0.279 1.490 1.920 0.820 0.586 25.829 10.907 2.076 1.586 0.241 0.000 0.394 0.229 2.417 3.767 0.871
1985 28 0.520 16.000 115.000 1.250 8.250 0.000 0.000 0.689 0.212 1.110 1.760 0.800 0.567 28.057 26.279 1.770 2.711 0.223 0.000 0.492 0.243 2.147 2.887 0.853
1985 29 0.510 75.800 1.140 3.630 0.000 0.000 0.430 0.133 0.913 1.560 0.780 0.550 35.964 1.587 3.183 0.203 0.000 0.553 0.251 2.028 2.387 0.834
1985 30 0.490 39.200 1.190 1.620 0.000 0.000 0.782 0.088 0.919 1.540 0.770 0.534 39.993 1.483 3.386 0.119 0.000 0.665 0.256 1.970 2.053 0.819
1985 31 0.480 22.900 5.540 0.000 1.150 0.909 0.760 0.519 41.907 4.162 0.000 0.829 1.816 0.803
1986 1 0.780 0.880 0.610 5.660 1.080 0.618 0.308 0.260 0.950 22.200 3.050 1.970 0.793 1.196 0.720 18.311 1.376 1.308 0.586 1.363 6.151 19.846 3.921 4.644
1986 2 0.778 0.840 0.570 5.040 1.010 0.547 0.276 0.215 0.718 16.600 3.090 1.530 0.784 1.059 0.684 12.303 1.253 0.995 0.484 0.675 5.993 21.046 4.071 4.424
1986 3 0.750 0.800 0.560 3.460 0.834 0.456 0.220 0.179 0.570 14.300 3.040 2.130 0.774 0.966 0.651 9.026 1.136 0.803 0.414 0.428 2.345 21.851 4.041 4.150
1986 4 0.740 0.820 0.580 2.590 0.736 0.387 0.165 0.124 0.670 20.900 2.760 1.990 0.765 0.904 0.627 7.653 1.033 0.659 0.349 0.310 1.344 23.066 3.480 3.040
1986 5 0.730 0.860 0.600 2.360 0.700 0.356 0.149 0.105 2.090 19.300 2.440 1.910 0.758 0.877 0.610 5.861 0.944 0.556 0.283 0.236 1.170 24.814 3.129 2.427
1986 6 0.720 0.840 0.640 3.410 0.666 0.347 0.141 0.101 1.250 18.200 1.640 1.630 0.751 0.854 0.603 4.406 0.874 0.485 0.235 0.189 1.075 24.057 2.783 2.040
1986 7 0.700 0.800 0.650 3.030 0.601 0.323 0.113 0.102 0.862 9.470 1.420 1.600 0.743 0.834 0.601 3.650 0.804 0.433 0.196 0.155 1.016 17.281 2.491 1.823
1986 8 0.689 0.770 0.630 2.890 0.517 0.556 0.089 0.111 0.634 6.090 1.370 1.520 0.730 0.819 0.604 3.254 0.723 0.425 0.165 0.134 0.971 14.980 2.251 1.759
1986 9 0.670 0.740 0.610 2.670 0.464 0.432 0.073 0.141 0.487 4.230 1.460 1.590 0.714 0.804 0.610 2.916 0.645 0.408 0.136 0.123 0.938 13.213 2.019 1.767
1986 10 0.660 0.720 0.650 2.200 0.428 0.307 0.060 0.126 6.180 3.090 1.250 2.440 0.701 0.793 0.623 2.736 0.587 0.387 0.113 0.116 1.739 11.611 1.763 1.811
1986 11 0.645 0.700 12.000 2.020 0.401 0.875 0.082 0.122 79.600 2.540 1.140 2.610 0.688 0.776 2.254 2.654 0.540 0.457 0.101 0.115 13.015 8.989 1.531 1.900
1986 12 0.640 0.690 13.000 2.190 0.364 7.310 0.067 0.095 64.400 2.210 1.080 2.440 0.675 0.751 4.026 2.630 0.492 1.450 0.089 0.114 21.916 6.547 1.337 1.976
1986 13 0.635 0.670 14.000 3.590 0.332 6.670 0.056 0.090 18.000 2.780 0.941 1.890 0.663 0.727 5.934 2.656 0.444 2.353 0.077 0.112 24.309 4.344 1.237 2.013
1986 14 0.625 0.650 15.000 2.430 0.298 3.040 0.356 0.070 8.420 26.500 0.904 1.610 0.652 0.706 7.984 2.570 0.401 2.741 0.112 0.108 25.389 6.777 1.164 2.014
1986 15 0.620 0.640 18.800 2.020 0.321 1.610 0.229 1.760 8.070 15.000 0.896 1.510 0.642 0.687 10.580 2.446 0.373 2.892 0.132 0.343 26.451 8.050 1.096 2.013
1986 16 0.610 0.630 19.800 4.530 0.393 1.180 0.120 3.630 22.900 9.000 0.907 1.440 0.634 0.671 13.321 2.711 0.362 2.999 0.139 0.842 29.653 8.731 1.017 1.991
1986 17 0.700 0.625 17.000 6.730 0.559 1.010 0.125 1.210 9.260 6.320 1.020 1.430 0.639 0.658 15.657 3.359 0.381 3.099 0.148 0.997 30.093 9.193 0.984 1.847
1986 18 0.900 0.640 14.000 3.320 0.592 0.806 1.510 0.675 5.120 4.420 1.070 1.500 0.676 0.649 15.943 3.544 0.408 3.089 0.352 1.076 19.453 9.461 0.974 1.689
1986 19 5.000 0.700 40.000 2.240 1.940 0.634 2.280 0.413 3.290 3.110 0.818 1.600 1.299 0.651 19.800 3.551 0.634 2.136 0.668 1.121 10.723 9.590 0.937 1.569
1986 20 10.000 0.780 25.000 1.760 17.800 0.527 1.390 0.288 22.000 2.630 0.718 1.780 2.636 0.666 21.371 3.290 3.129 1.258 0.859 1.149 11.294 9.569 0.905 1.553
1986 21 8.000 0.820 15.000 12.400 21.700 0.432 0.802 0.210 14.900 2.300 0.821 1.820 3.690 0.691 21.371 4.714 6.186 0.886 0.922 1.169 12.220 6.111 0.893 1.583
1986 22 5.400 0.840 10.700 7.120 8.820 0.360 0.500 0.164 9.850 2.180 0.894 1.700 4.373 0.719 20.214 5.443 7.401 0.707 0.961 0.941 12.474 4.280 0.893 1.610
1986 23 4.000 0.820 16.600 3.440 23.900 1.180 0.332 0.205 41.900 2.170 0.923 1.500 4.857 0.746 19.757 5.287 10.759 0.707 0.991 0.452 15.189 3.304 0.895 1.619
1986 24 3.000 0.790 21.800 2.390 10.600 1.340 0.234 0.423 17.800 2.160 2.150 1.520 5.186 0.770 20.443 4.667 12.193 0.754 1.007 0.340 16.409 2.710 1.056 1.631
1986 25 2.300 0.750 23.400 1.870 5.130 0.989 0.228 0.423 8.200 2.120 3.070 1.800 5.386 0.786 21.786 4.460 12.841 0.780 0.824 0.304 16.849 2.381 1.342 1.674
1986 26 1.800 0.720 47.100 1.650 2.740 0.714 5.030 1.830 8.660 2.040 4.050 2.000 4.929 0.789 22.800 4.376 12.956 0.792 1.217 0.506 17.616 2.229 1.804 1.731
1986 27 1.450 0.690 26.400 1.460 1.800 0.618 1.910 26.100 12.400 3.250 9.760 2.700 3.707 0.776 23.000 4.333 10.670 0.805 1.291 4.194 16.244 2.317 3.095 1.863
1986 28 1.250 0.660 12.200 1.320 1.390 0.612 0.948 7.680 7.060 6.690 6.200 2.900 2.743 0.753 22.600 2.750 7.769 0.830 1.312 5.261 15.124 2.944 3.864 2.017
1986 29 1.050 14.900 1.160 1.080 0.474 0.622 3.310 23.500 4.900 4.340 2.890 2.121 23.200 1.899 6.663 0.847 1.329 5.710 17.074 3.333 4.356 2.187
1986 30 1.000 13.600 1.090 0.843 0.387 0.433 1.910 56.900 4.060 3.120 2.850 1.693 22.771 1.563 3.369 0.733 1.344 5.954 19.217 3.603 4.670 2.380
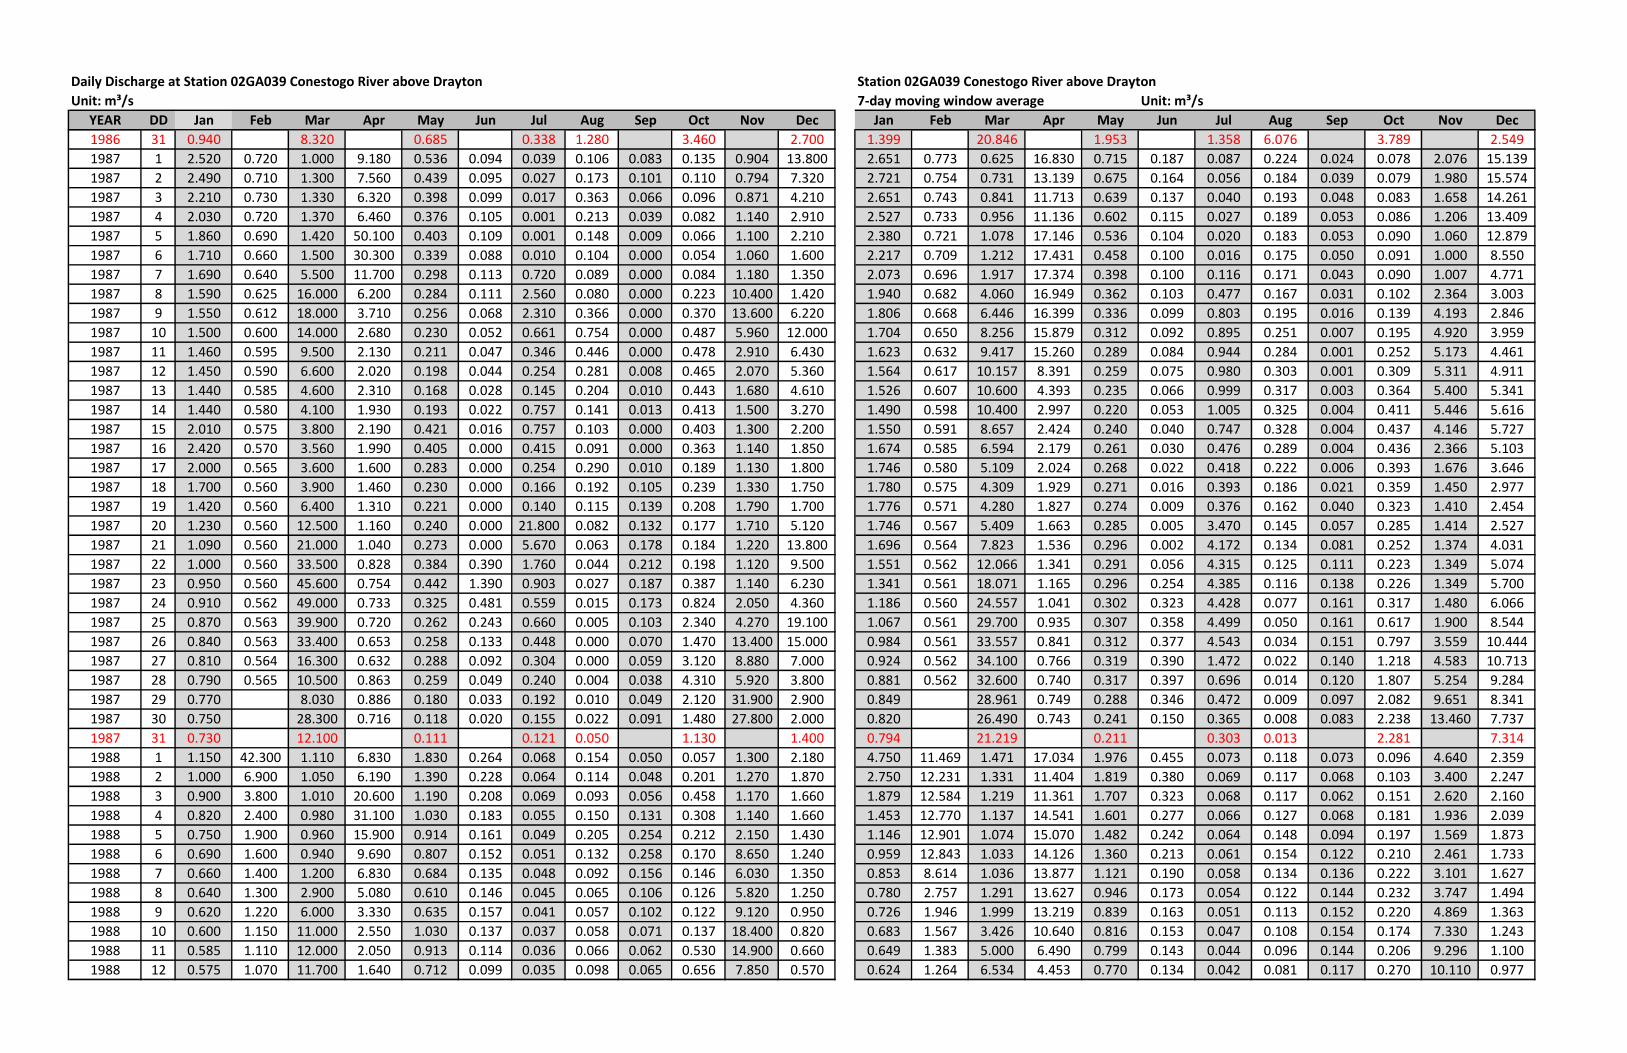
Daily Discharge at Station 02GA039 Conestogo River above Drayton Station 02GA039 Conestogo River above Drayton
Unit: m³/s 7-day moving window average Unit: m³/s
YEAR DD Jan Feb Mar Apr May Jun Jul Aug Sep Oct Nov Dec Jan Feb Mar Apr May Jun Jul Aug Sep Oct Nov Dec
1986 31 0.940 8.320 0.685 0.338 1.280 3.460 2.700 1.399 20.846 1.953 1.358 6.076 3.789 2.549
1987 1 2.520 0.720 1.000 9.180 0.536 0.094 0.039 0.106 0.083 0.135 0.904 13.800 2.651 0.773 0.625 16.830 0.715 0.187 0.087 0.224 0.024 0.078 2.076 15.139
1987 2 2.490 0.710 1.300 7.560 0.439 0.095 0.027 0.173 0.101 0.110 0.794 7.320 2.721 0.754 0.731 13.139 0.675 0.164 0.056 0.184 0.039 0.079 1.980 15.574
1987 3 2.210 0.730 1.330 6.320 0.398 0.099 0.017 0.363 0.066 0.096 0.871 4.210 2.651 0.743 0.841 11.713 0.639 0.137 0.040 0.193 0.048 0.083 1.658 14.261
1987 4 2.030 0.720 1.370 6.460 0.376 0.105 0.001 0.213 0.039 0.082 1.140 2.910 2.527 0.733 0.956 11.136 0.602 0.115 0.027 0.189 0.053 0.086 1.206 13.409
1987 5 1.860 0.690 1.420 50.100 0.403 0.109 0.001 0.148 0.009 0.066 1.100 2.210 2.380 0.721 1.078 17.146 0.536 0.104 0.020 0.183 0.053 0.090 1.060 12.879
1987 6 1.710 0.660 1.500 30.300 0.339 0.088 0.010 0.104 0.000 0.054 1.060 1.600 2.217 0.709 1.212 17.431 0.458 0.100 0.016 0.175 0.050 0.091 1.000 8.550
1987 7 1.690 0.640 5.500 11.700 0.298 0.113 0.720 0.089 0.000 0.084 1.180 1.350 2.073 0.696 1.917 17.374 0.398 0.100 0.116 0.171 0.043 0.090 1.007 4.771
1987 8 1.590 0.625 16.000 6.200 0.284 0.111 2.560 0.080 0.000 0.223 10.400 1.420 1.940 0.682 4.060 16.949 0.362 0.103 0.477 0.167 0.031 0.102 2.364 3.003
1987 9 1.550 0.612 18.000 3.710 0.256 0.068 2.310 0.366 0.000 0.370 13.600 6.220 1.806 0.668 6.446 16.399 0.336 0.099 0.803 0.195 0.016 0.139 4.193 2.846
1987 10 1.500 0.600 14.000 2.680 0.230 0.052 0.661 0.754 0.000 0.487 5.960 12.000 1.704 0.650 8.256 15.879 0.312 0.092 0.895 0.251 0.007 0.195 4.920 3.959
1987 11 1.460 0.595 9.500 2.130 0.211 0.047 0.346 0.446 0.000 0.478 2.910 6.430 1.623 0.632 9.417 15.260 0.289 0.084 0.944 0.284 0.001 0.252 5.173 4.461
1987 12 1.450 0.590 6.600 2.020 0.198 0.044 0.254 0.281 0.008 0.465 2.070 5.360 1.564 0.617 10.157 8.391 0.259 0.075 0.980 0.303 0.001 0.309 5.311 4.911
1987 13 1.440 0.585 4.600 2.310 0.168 0.028 0.145 0.204 0.010 0.443 1.680 4.610 1.526 0.607 10.600 4.393 0.235 0.066 0.999 0.317 0.003 0.364 5.400 5.341
1987 14 1.440 0.580 4.100 1.930 0.193 0.022 0.757 0.141 0.013 0.413 1.500 3.270 1.490 0.598 10.400 2.997 0.220 0.053 1.005 0.325 0.004 0.411 5.446 5.616
1987 15 2.010 0.575 3.800 2.190 0.421 0.016 0.757 0.103 0.000 0.403 1.300 2.200 1.550 0.591 8.657 2.424 0.240 0.040 0.747 0.328 0.004 0.437 4.146 5.727
1987 16 2.420 0.570 3.560 1.990 0.405 0.000 0.415 0.091 0.000 0.363 1.140 1.850 1.674 0.585 6.594 2.179 0.261 0.030 0.476 0.289 0.004 0.436 2.366 5.103
1987 17 2.000 0.565 3.600 1.600 0.283 0.000 0.254 0.290 0.010 0.189 1.130 1.800 1.746 0.580 5.109 2.024 0.268 0.022 0.418 0.222 0.006 0.393 1.676 3.646
1987 18 1.700 0.560 3.900 1.460 0.230 0.000 0.166 0.192 0.105 0.239 1.330 1.750 1.780 0.575 4.309 1.929 0.271 0.016 0.393 0.186 0.021 0.359 1.450 2.977
1987 19 1.420 0.560 6.400 1.310 0.221 0.000 0.140 0.115 0.139 0.208 1.790 1.700 1.776 0.571 4.280 1.827 0.274 0.009 0.376 0.162 0.040 0.323 1.410 2.454
1987 20 1.230 0.560 12.500 1.160 0.240 0.000 21.800 0.082 0.132 0.177 1.710 5.120 1.746 0.567 5.409 1.663 0.285 0.005 3.470 0.145 0.057 0.285 1.414 2.527
1987 21 1.090 0.560 21.000 1.040 0.273 0.000 5.670 0.063 0.178 0.184 1.220 13.800 1.696 0.564 7.823 1.536 0.296 0.002 4.172 0.134 0.081 0.252 1.374 4.031
1987 22 1.000 0.560 33.500 0.828 0.384 0.390 1.760 0.044 0.212 0.198 1.120 9.500 1.551 0.562 12.066 1.341 0.291 0.056 4.315 0.125 0.111 0.223 1.349 5.074
1987 23 0.950 0.560 45.600 0.754 0.442 1.390 0.903 0.027 0.187 0.387 1.140 6.230 1.341 0.561 18.071 1.165 0.296 0.254 4.385 0.116 0.138 0.226 1.349 5.700
1987 24 0.910 0.562 49.000 0.733 0.325 0.481 0.559 0.015 0.173 0.824 2.050 4.360 1.186 0.560 24.557 1.041 0.302 0.323 4.428 0.077 0.161 0.317 1.480 6.066
1987 25 0.870 0.563 39.900 0.720 0.262 0.243 0.660 0.005 0.103 2.340 4.270 19.100 1.067 0.561 29.700 0.935 0.307 0.358 4.499 0.050 0.161 0.617 1.900 8.544
1987 26 0.840 0.563 33.400 0.653 0.258 0.133 0.448 0.000 0.070 1.470 13.400 15.000 0.984 0.561 33.557 0.841 0.312 0.377 4.543 0.034 0.151 0.797 3.559 10.444
1987 27 0.810 0.564 16.300 0.632 0.288 0.092 0.304 0.000 0.059 3.120 8.880 7.000 0.924 0.562 34.100 0.766 0.319 0.390 1.472 0.022 0.140 1.218 4.583 10.713
1987 28 0.790 0.565 10.500 0.863 0.259 0.049 0.240 0.004 0.038 4.310 5.920 3.800 0.881 0.562 32.600 0.740 0.317 0.397 0.696 0.014 0.120 1.807 5.254 9.284
1987 29 0.770 8.030 0.886 0.180 0.033 0.192 0.010 0.049 2.120 31.900 2.900 0.849 28.961 0.749 0.288 0.346 0.472 0.009 0.097 2.082 9.651 8.341
1987 30 0.750 28.300 0.716 0.118 0.020 0.155 0.022 0.091 1.480 27.800 2.000 0.820 26.490 0.743 0.241 0.150 0.365 0.008 0.083 2.238 13.460 7.737
1987 31 0.730 12.100 0.111 0.121 0.050 1.130 1.400 0.794 21.219 0.211 0.303 0.013 2.281 7.314
1988 1 1.150 42.300 1.110 6.830 1.830 0.264 0.068 0.154 0.050 0.057 1.300 2.180 4.750 11.469 1.471 17.034 1.976 0.455 0.073 0.118 0.073 0.096 4.640 2.359
1988 2 1.000 6.900 1.050 6.190 1.390 0.228 0.064 0.114 0.048 0.201 1.270 1.870 2.750 12.231 1.331 11.404 1.819 0.380 0.069 0.117 0.068 0.103 3.400 2.247
1988 3 0.900 3.800 1.010 20.600 1.190 0.208 0.069 0.093 0.056 0.458 1.170 1.660 1.879 12.584 1.219 11.361 1.707 0.323 0.068 0.117 0.062 0.151 2.620 2.160
1988 4 0.820 2.400 0.980 31.100 1.030 0.183 0.055 0.150 0.131 0.308 1.140 1.660 1.453 12.770 1.137 14.541 1.601 0.277 0.066 0.127 0.068 0.181 1.936 2.039
1988 5 0.750 1.900 0.960 15.900 0.914 0.161 0.049 0.205 0.254 0.212 2.150 1.430 1.146 12.901 1.074 15.070 1.482 0.242 0.064 0.148 0.094 0.197 1.569 1.873
1988 6 0.690 1.600 0.940 9.690 0.807 0.152 0.051 0.132 0.258 0.170 8.650 1.240 0.959 12.843 1.033 14.126 1.360 0.213 0.061 0.154 0.122 0.210 2.461 1.733
1988 7 0.660 1.400 1.200 6.830 0.684 0.135 0.048 0.092 0.156 0.146 6.030 1.350 0.853 8.614 1.036 13.877 1.121 0.190 0.058 0.134 0.136 0.222 3.101 1.627
1988 8 0.640 1.300 2.900 5.080 0.610 0.146 0.045 0.065 0.106 0.126 5.820 1.250 0.780 2.757 1.291 13.627 0.946 0.173 0.054 0.122 0.144 0.232 3.747 1.494
1988 9 0.620 1.220 6.000 3.330 0.635 0.157 0.041 0.057 0.102 0.122 9.120 0.950 0.726 1.946 1.999 13.219 0.839 0.163 0.051 0.113 0.152 0.220 4.869 1.363
1988 10 0.600 1.150 11.000 2.550 1.030 0.137 0.037 0.058 0.071 0.137 18.400 0.820 0.683 1.567 3.426 10.640 0.816 0.153 0.047 0.108 0.154 0.174 7.330 1.243
1988 11 0.585 1.110 12.000 2.050 0.913 0.114 0.036 0.066 0.062 0.530 14.900 0.660 0.649 1.383 5.000 6.490 0.799 0.143 0.044 0.096 0.144 0.206 9.296 1.100
1988 12 0.575 1.070 11.700 1.640 0.712 0.099 0.035 0.098 0.065 0.656 7.850 0.570 0.624 1.264 6.534 4.453 0.770 0.134 0.042 0.081 0.117 0.270 10.110 0.977
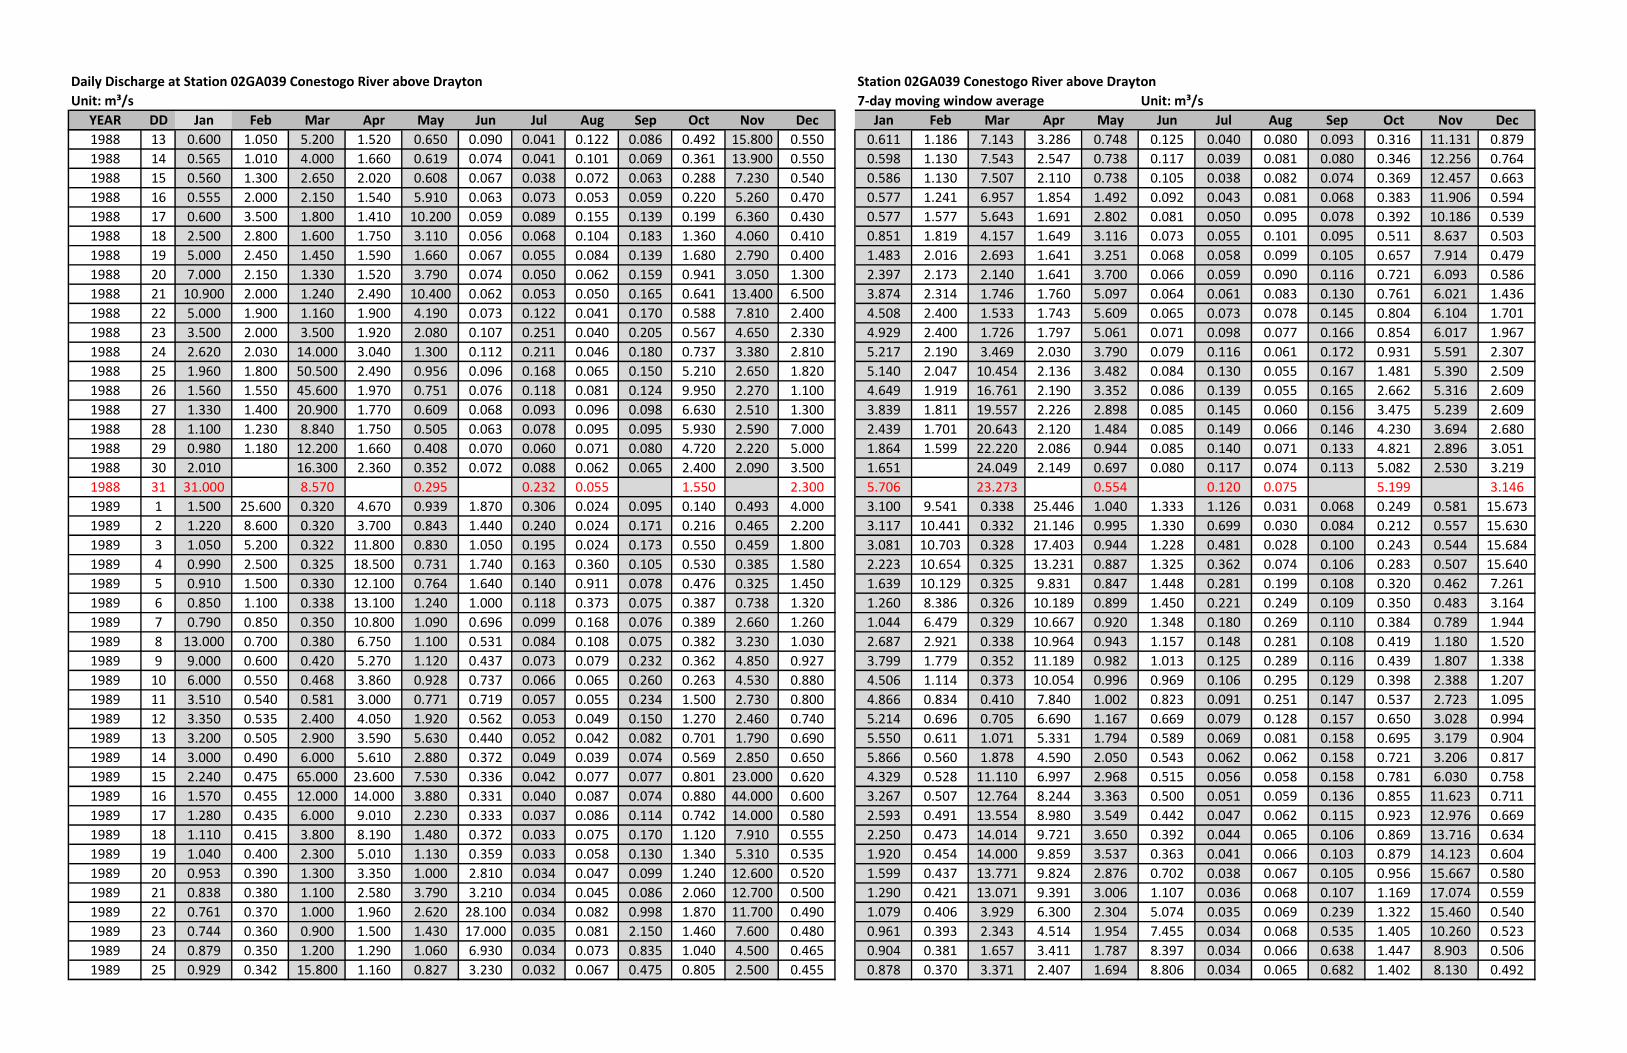
Daily Discharge at Station 02GA039 Conestogo River above Drayton Station 02GA039 Conestogo River above Drayton
Unit: m³/s 7-day moving window average Unit: m³/s
YEAR DD Jan Feb Mar Apr May Jun Jul Aug Sep Oct Nov Dec Jan Feb Mar Apr May Jun Jul Aug Sep Oct Nov Dec
1988 13 0.600 1.050 5.200 1.520 0.650 0.090 0.041 0.122 0.086 0.492 15.800 0.550 0.611 1.186 7.143 3.286 0.748 0.125 0.040 0.080 0.093 0.316 11.131 0.879
1988 14 0.565 1.010 4.000 1.660 0.619 0.074 0.041 0.101 0.069 0.361 13.900 0.550 0.598 1.130 7.543 2.547 0.738 0.117 0.039 0.081 0.080 0.346 12.256 0.764
1988 15 0.560 1.300 2.650 2.020 0.608 0.067 0.038 0.072 0.063 0.288 7.230 0.540 0.586 1.130 7.507 2.110 0.738 0.105 0.038 0.082 0.074 0.369 12.457 0.663
1988 16 0.555 2.000 2.150 1.540 5.910 0.063 0.073 0.053 0.059 0.220 5.260 0.470 0.577 1.241 6.957 1.854 1.492 0.092 0.043 0.081 0.068 0.383 11.906 0.594
1988 17 0.600 3.500 1.800 1.410 10.200 0.059 0.089 0.155 0.139 0.199 6.360 0.430 0.577 1.577 5.643 1.691 2.802 0.081 0.050 0.095 0.078 0.392 10.186 0.539
1988 18 2.500 2.800 1.600 1.750 3.110 0.056 0.068 0.104 0.183 1.360 4.060 0.410 0.851 1.819 4.157 1.649 3.116 0.073 0.055 0.101 0.095 0.511 8.637 0.503
1988 19 5.000 2.450 1.450 1.590 1.660 0.067 0.055 0.084 0.139 1.680 2.790 0.400 1.483 2.016 2.693 1.641 3.251 0.068 0.058 0.099 0.105 0.657 7.914 0.479
1988 20 7.000 2.150 1.330 1.520 3.790 0.074 0.050 0.062 0.159 0.941 3.050 1.300 2.397 2.173 2.140 1.641 3.700 0.066 0.059 0.090 0.116 0.721 6.093 0.586
1988 21 10.900 2.000 1.240 2.490 10.400 0.062 0.053 0.050 0.165 0.641 13.400 6.500 3.874 2.314 1.746 1.760 5.097 0.064 0.061 0.083 0.130 0.761 6.021 1.436
1988 22 5.000 1.900 1.160 1.900 4.190 0.073 0.122 0.041 0.170 0.588 7.810 2.400 4.508 2.400 1.533 1.743 5.609 0.065 0.073 0.078 0.145 0.804 6.104 1.701
1988 23 3.500 2.000 3.500 1.920 2.080 0.107 0.251 0.040 0.205 0.567 4.650 2.330 4.929 2.400 1.726 1.797 5.061 0.071 0.098 0.077 0.166 0.854 6.017 1.967
1988 24 2.620 2.030 14.000 3.040 1.300 0.112 0.211 0.046 0.180 0.737 3.380 2.810 5.217 2.190 3.469 2.030 3.790 0.079 0.116 0.061 0.172 0.931 5.591 2.307
1988 25 1.960 1.800 50.500 2.490 0.956 0.096 0.168 0.065 0.150 5.210 2.650 1.820 5.140 2.047 10.454 2.136 3.482 0.084 0.130 0.055 0.167 1.481 5.390 2.509
1988 26 1.560 1.550 45.600 1.970 0.751 0.076 0.118 0.081 0.124 9.950 2.270 1.100 4.649 1.919 16.761 2.190 3.352 0.086 0.139 0.055 0.165 2.662 5.316 2.609
1988 27 1.330 1.400 20.900 1.770 0.609 0.068 0.093 0.096 0.098 6.630 2.510 1.300 3.839 1.811 19.557 2.226 2.898 0.085 0.145 0.060 0.156 3.475 5.239 2.609
1988 28 1.100 1.230 8.840 1.750 0.505 0.063 0.078 0.095 0.095 5.930 2.590 7.000 2.439 1.701 20.643 2.120 1.484 0.085 0.149 0.066 0.146 4.230 3.694 2.680
1988 29 0.980 1.180 12.200 1.660 0.408 0.070 0.060 0.071 0.080 4.720 2.220 5.000 1.864 1.599 22.220 2.086 0.944 0.085 0.140 0.071 0.133 4.821 2.896 3.051
1988 30 2.010 16.300 2.360 0.352 0.072 0.088 0.062 0.065 2.400 2.090 3.500 1.651 24.049 2.149 0.697 0.080 0.117 0.074 0.113 5.082 2.530 3.219
1988 31 31.000 8.570 0.295 0.232 0.055 1.550 2.300 5.706 23.273 0.554 0.120 0.075 5.199 3.146
1989 1 1.500 25.600 0.320 4.670 0.939 1.870 0.306 0.024 0.095 0.140 0.493 4.000 3.100 9.541 0.338 25.446 1.040 1.333 1.126 0.031 0.068 0.249 0.581 15.673
1989 2 1.220 8.600 0.320 3.700 0.843 1.440 0.240 0.024 0.171 0.216 0.465 2.200 3.117 10.441 0.332 21.146 0.995 1.330 0.699 0.030 0.084 0.212 0.557 15.630
1989 3 1.050 5.200 0.322 11.800 0.830 1.050 0.195 0.024 0.173 0.550 0.459 1.800 3.081 10.703 0.328 17.403 0.944 1.228 0.481 0.028 0.100 0.243 0.544 15.684
1989 4 0.990 2.500 0.325 18.500 0.731 1.740 0.163 0.360 0.105 0.530 0.385 1.580 2.223 10.654 0.325 13.231 0.887 1.325 0.362 0.074 0.106 0.283 0.507 15.640
1989 5 0.910 1.500 0.330 12.100 0.764 1.640 0.140 0.911 0.078 0.476 0.325 1.450 1.639 10.129 0.325 9.831 0.847 1.448 0.281 0.199 0.108 0.320 0.462 7.261
1989 6 0.850 1.100 0.338 13.100 1.240 1.000 0.118 0.373 0.075 0.387 0.738 1.320 1.260 8.386 0.326 10.189 0.899 1.450 0.221 0.249 0.109 0.350 0.483 3.164
1989 7 0.790 0.850 0.350 10.800 1.090 0.696 0.099 0.168 0.076 0.389 2.660 1.260 1.044 6.479 0.329 10.667 0.920 1.348 0.180 0.269 0.110 0.384 0.789 1.944
1989 8 13.000 0.700 0.380 6.750 1.100 0.531 0.084 0.108 0.075 0.382 3.230 1.030 2.687 2.921 0.338 10.964 0.943 1.157 0.148 0.281 0.108 0.419 1.180 1.520
1989 9 9.000 0.600 0.420 5.270 1.120 0.437 0.073 0.079 0.232 0.362 4.850 0.927 3.799 1.779 0.352 11.189 0.982 1.013 0.125 0.289 0.116 0.439 1.807 1.338
1989 10 6.000 0.550 0.468 3.860 0.928 0.737 0.066 0.065 0.260 0.263 4.530 0.880 4.506 1.114 0.373 10.054 0.996 0.969 0.106 0.295 0.129 0.398 2.388 1.207
1989 11 3.510 0.540 0.581 3.000 0.771 0.719 0.057 0.055 0.234 1.500 2.730 0.800 4.866 0.834 0.410 7.840 1.002 0.823 0.091 0.251 0.147 0.537 2.723 1.095
1989 12 3.350 0.535 2.400 4.050 1.920 0.562 0.053 0.049 0.150 1.270 2.460 0.740 5.214 0.696 0.705 6.690 1.167 0.669 0.079 0.128 0.157 0.650 3.028 0.994
1989 13 3.200 0.505 2.900 3.590 5.630 0.440 0.052 0.042 0.082 0.701 1.790 0.690 5.550 0.611 1.071 5.331 1.794 0.589 0.069 0.081 0.158 0.695 3.179 0.904
1989 14 3.000 0.490 6.000 5.610 2.880 0.372 0.049 0.039 0.074 0.569 2.850 0.650 5.866 0.560 1.878 4.590 2.050 0.543 0.062 0.062 0.158 0.721 3.206 0.817
1989 15 2.240 0.475 65.000 23.600 7.530 0.336 0.042 0.077 0.077 0.801 23.000 0.620 4.329 0.528 11.110 6.997 2.968 0.515 0.056 0.058 0.158 0.781 6.030 0.758
1989 16 1.570 0.455 12.000 14.000 3.880 0.331 0.040 0.087 0.074 0.880 44.000 0.600 3.267 0.507 12.764 8.244 3.363 0.500 0.051 0.059 0.136 0.855 11.623 0.711
1989 17 1.280 0.435 6.000 9.010 2.230 0.333 0.037 0.086 0.114 0.742 14.000 0.580 2.593 0.491 13.554 8.980 3.549 0.442 0.047 0.062 0.115 0.923 12.976 0.669
1989 18 1.110 0.415 3.800 8.190 1.480 0.372 0.033 0.075 0.170 1.120 7.910 0.555 2.250 0.473 14.014 9.721 3.650 0.392 0.044 0.065 0.106 0.869 13.716 0.634
1989 19 1.040 0.400 2.300 5.010 1.130 0.359 0.033 0.058 0.130 1.340 5.310 0.535 1.920 0.454 14.000 9.859 3.537 0.363 0.041 0.066 0.103 0.879 14.123 0.604
1989 20 0.953 0.390 1.300 3.350 1.000 2.810 0.034 0.047 0.099 1.240 12.600 0.520 1.599 0.437 13.771 9.824 2.876 0.702 0.038 0.067 0.105 0.956 15.667 0.580
1989 21 0.838 0.380 1.100 2.580 3.790 3.210 0.034 0.045 0.086 2.060 12.700 0.500 1.290 0.421 13.071 9.391 3.006 1.107 0.036 0.068 0.107 1.169 17.074 0.559
1989 22 0.761 0.370 1.000 1.960 2.620 28.100 0.034 0.082 0.998 1.870 11.700 0.490 1.079 0.406 3.929 6.300 2.304 5.074 0.035 0.069 0.239 1.322 15.460 0.540
1989 23 0.744 0.360 0.900 1.500 1.430 17.000 0.035 0.081 2.150 1.460 7.600 0.480 0.961 0.393 2.343 4.514 1.954 7.455 0.034 0.068 0.535 1.405 10.260 0.523
1989 24 0.879 0.350 1.200 1.290 1.060 6.930 0.034 0.073 0.835 1.040 4.500 0.465 0.904 0.381 1.657 3.411 1.787 8.397 0.034 0.066 0.638 1.447 8.903 0.506
1989 25 0.929 0.342 15.800 1.160 0.827 3.230 0.032 0.067 0.475 0.805 2.500 0.455 0.878 0.370 3.371 2.407 1.694 8.806 0.034 0.065 0.682 1.402 8.130 0.492
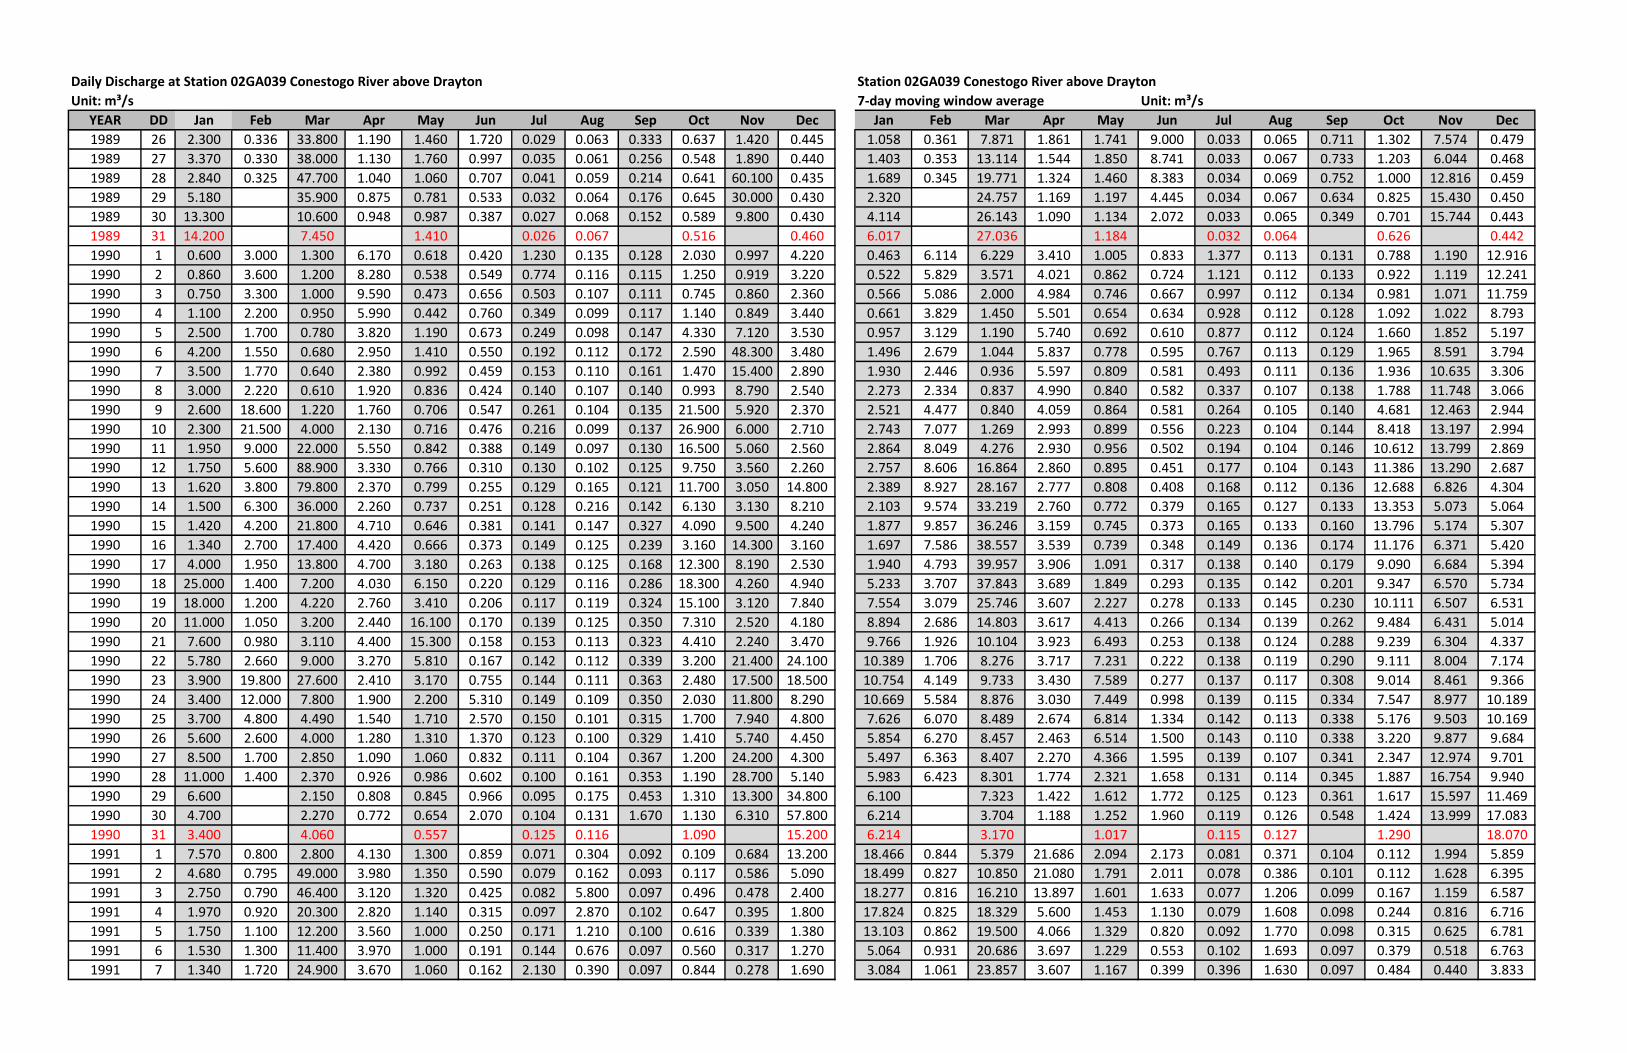
Daily Discharge at Station 02GA039 Conestogo River above Drayton Station 02GA039 Conestogo River above Drayton
Unit: m³/s 7-day moving window average Unit: m³/s
YEAR DD Jan Feb Mar Apr May Jun Jul Aug Sep Oct Nov Dec Jan Feb Mar Apr May Jun Jul Aug Sep Oct Nov Dec
1989 26 2.300 0.336 33.800 1.190 1.460 1.720 0.029 0.063 0.333 0.637 1.420 0.445 1.058 0.361 7.871 1.861 1.741 9.000 0.033 0.065 0.711 1.302 7.574 0.479
1989 27 3.370 0.330 38.000 1.130 1.760 0.997 0.035 0.061 0.256 0.548 1.890 0.440 1.403 0.353 13.114 1.544 1.850 8.741 0.033 0.067 0.733 1.203 6.044 0.468
1989 28 2.840 0.325 47.700 1.040 1.060 0.707 0.041 0.059 0.214 0.641 60.100 0.435 1.689 0.345 19.771 1.324 1.460 8.383 0.034 0.069 0.752 1.000 12.816 0.459
1989 29 5.180 35.900 0.875 0.781 0.533 0.032 0.064 0.176 0.645 30.000 0.430 2.320 24.757 1.169 1.197 4.445 0.034 0.067 0.634 0.825 15.430 0.450
1989 30 13.300 10.600 0.948 0.987 0.387 0.027 0.068 0.152 0.589 9.800 0.430 4.114 26.143 1.090 1.134 2.072 0.033 0.065 0.349 0.701 15.744 0.443
1989 31 14.200 7.450 1.410 0.026 0.067 0.516 0.460 6.017 27.036 1.184 0.032 0.064 0.626 0.442
1990 1 0.600 3.000 1.300 6.170 0.618 0.420 1.230 0.135 0.128 2.030 0.997 4.220 0.463 6.114 6.229 3.410 1.005 0.833 1.377 0.113 0.131 0.788 1.190 12.916
1990 2 0.860 3.600 1.200 8.280 0.538 0.549 0.774 0.116 0.115 1.250 0.919 3.220 0.522 5.829 3.571 4.021 0.862 0.724 1.121 0.112 0.133 0.922 1.119 12.241
1990 3 0.750 3.300 1.000 9.590 0.473 0.656 0.503 0.107 0.111 0.745 0.860 2.360 0.566 5.086 2.000 4.984 0.746 0.667 0.997 0.112 0.134 0.981 1.071 11.759
1990 4 1.100 2.200 0.950 5.990 0.442 0.760 0.349 0.099 0.117 1.140 0.849 3.440 0.661 3.829 1.450 5.501 0.654 0.634 0.928 0.112 0.128 1.092 1.022 8.793
1990 5 2.500 1.700 0.780 3.820 1.190 0.673 0.249 0.098 0.147 4.330 7.120 3.530 0.957 3.129 1.190 5.740 0.692 0.610 0.877 0.112 0.124 1.660 1.852 5.197
1990 6 4.200 1.550 0.680 2.950 1.410 0.550 0.192 0.112 0.172 2.590 48.300 3.480 1.496 2.679 1.044 5.837 0.778 0.595 0.767 0.113 0.129 1.965 8.591 3.794
1990 7 3.500 1.770 0.640 2.380 0.992 0.459 0.153 0.110 0.161 1.470 15.400 2.890 1.930 2.446 0.936 5.597 0.809 0.581 0.493 0.111 0.136 1.936 10.635 3.306
1990 8 3.000 2.220 0.610 1.920 0.836 0.424 0.140 0.107 0.140 0.993 8.790 2.540 2.273 2.334 0.837 4.990 0.840 0.582 0.337 0.107 0.138 1.788 11.748 3.066
1990 9 2.600 18.600 1.220 1.760 0.706 0.547 0.261 0.104 0.135 21.500 5.920 2.370 2.521 4.477 0.840 4.059 0.864 0.581 0.264 0.105 0.140 4.681 12.463 2.944
1990 10 2.300 21.500 4.000 2.130 0.716 0.476 0.216 0.099 0.137 26.900 6.000 2.710 2.743 7.077 1.269 2.993 0.899 0.556 0.223 0.104 0.144 8.418 13.197 2.994
1990 11 1.950 9.000 22.000 5.550 0.842 0.388 0.149 0.097 0.130 16.500 5.060 2.560 2.864 8.049 4.276 2.930 0.956 0.502 0.194 0.104 0.146 10.612 13.799 2.869
1990 12 1.750 5.600 88.900 3.330 0.766 0.310 0.130 0.102 0.125 9.750 3.560 2.260 2.757 8.606 16.864 2.860 0.895 0.451 0.177 0.104 0.143 11.386 13.290 2.687
1990 13 1.620 3.800 79.800 2.370 0.799 0.255 0.129 0.165 0.121 11.700 3.050 14.800 2.389 8.927 28.167 2.777 0.808 0.408 0.168 0.112 0.136 12.688 6.826 4.304
1990 14 1.500 6.300 36.000 2.260 0.737 0.251 0.128 0.216 0.142 6.130 3.130 8.210 2.103 9.574 33.219 2.760 0.772 0.379 0.165 0.127 0.133 13.353 5.073 5.064
1990 15 1.420 4.200 21.800 4.710 0.646 0.381 0.141 0.147 0.327 4.090 9.500 4.240 1.877 9.857 36.246 3.159 0.745 0.373 0.165 0.133 0.160 13.796 5.174 5.307
1990 16 1.340 2.700 17.400 4.420 0.666 0.373 0.149 0.125 0.239 3.160 14.300 3.160 1.697 7.586 38.557 3.539 0.739 0.348 0.149 0.136 0.174 11.176 6.371 5.420
1990 17 4.000 1.950 13.800 4.700 3.180 0.263 0.138 0.125 0.168 12.300 8.190 2.530 1.940 4.793 39.957 3.906 1.091 0.317 0.138 0.140 0.179 9.090 6.684 5.394
1990 18 25.000 1.400 7.200 4.030 6.150 0.220 0.129 0.116 0.286 18.300 4.260 4.940 5.233 3.707 37.843 3.689 1.849 0.293 0.135 0.142 0.201 9.347 6.570 5.734
1990 19 18.000 1.200 4.220 2.760 3.410 0.206 0.117 0.119 0.324 15.100 3.120 7.840 7.554 3.079 25.746 3.607 2.227 0.278 0.133 0.145 0.230 10.111 6.507 6.531
1990 20 11.000 1.050 3.200 2.440 16.100 0.170 0.139 0.125 0.350 7.310 2.520 4.180 8.894 2.686 14.803 3.617 4.413 0.266 0.134 0.139 0.262 9.484 6.431 5.014
1990 21 7.600 0.980 3.110 4.400 15.300 0.158 0.153 0.113 0.323 4.410 2.240 3.470 9.766 1.926 10.104 3.923 6.493 0.253 0.138 0.124 0.288 9.239 6.304 4.337
1990 22 5.780 2.660 9.000 3.270 5.810 0.167 0.142 0.112 0.339 3.200 21.400 24.100 10.389 1.706 8.276 3.717 7.231 0.222 0.138 0.119 0.290 9.111 8.004 7.174
1990 23 3.900 19.800 27.600 2.410 3.170 0.755 0.144 0.111 0.363 2.480 17.500 18.500 10.754 4.149 9.733 3.430 7.589 0.277 0.137 0.117 0.308 9.014 8.461 9.366
1990 24 3.400 12.000 7.800 1.900 2.200 5.310 0.149 0.109 0.350 2.030 11.800 8.290 10.669 5.584 8.876 3.030 7.449 0.998 0.139 0.115 0.334 7.547 8.977 10.189
1990 25 3.700 4.800 4.490 1.540 1.710 2.570 0.150 0.101 0.315 1.700 7.940 4.800 7.626 6.070 8.489 2.674 6.814 1.334 0.142 0.113 0.338 5.176 9.503 10.169
1990 26 5.600 2.600 4.000 1.280 1.310 1.370 0.123 0.100 0.329 1.410 5.740 4.450 5.854 6.270 8.457 2.463 6.514 1.500 0.143 0.110 0.338 3.220 9.877 9.684
1990 27 8.500 1.700 2.850 1.090 1.060 0.832 0.111 0.104 0.367 1.200 24.200 4.300 5.497 6.363 8.407 2.270 4.366 1.595 0.139 0.107 0.341 2.347 12.974 9.701
1990 28 11.000 1.400 2.370 0.926 0.986 0.602 0.100 0.161 0.353 1.190 28.700 5.140 5.983 6.423 8.301 1.774 2.321 1.658 0.131 0.114 0.345 1.887 16.754 9.940
1990 29 6.600 2.150 0.808 0.845 0.966 0.095 0.175 0.453 1.310 13.300 34.800 6.100 7.323 1.422 1.612 1.772 0.125 0.123 0.361 1.617 15.597 11.469
1990 30 4.700 2.270 0.772 0.654 2.070 0.104 0.131 1.670 1.130 6.310 57.800 6.214 3.704 1.188 1.252 1.960 0.119 0.126 0.548 1.424 13.999 17.083
1990 31 3.400 4.060 0.557 0.125 0.116 1.090 15.200 6.214 3.170 1.017 0.115 0.127 1.290 18.070
1991 1 7.570 0.800 2.800 4.130 1.300 0.859 0.071 0.304 0.092 0.109 0.684 13.200 18.466 0.844 5.379 21.686 2.094 2.173 0.081 0.371 0.104 0.112 1.994 5.859
1991 2 4.680 0.795 49.000 3.980 1.350 0.590 0.079 0.162 0.093 0.117 0.586 5.090 18.499 0.827 10.850 21.080 1.791 2.011 0.078 0.386 0.101 0.112 1.628 6.395
1991 3 2.750 0.790 46.400 3.120 1.320 0.425 0.082 5.800 0.097 0.496 0.478 2.400 18.277 0.816 16.210 13.897 1.601 1.633 0.077 1.206 0.099 0.167 1.159 6.587
1991 4 1.970 0.920 20.300 2.820 1.140 0.315 0.097 2.870 0.102 0.647 0.395 1.800 17.824 0.825 18.329 5.600 1.453 1.130 0.079 1.608 0.098 0.244 0.816 6.716
1991 5 1.750 1.100 12.200 3.560 1.000 0.250 0.171 1.210 0.100 0.616 0.339 1.380 13.103 0.862 19.500 4.066 1.329 0.820 0.092 1.770 0.098 0.315 0.625 6.781
1991 6 1.530 1.300 11.400 3.970 1.000 0.191 0.144 0.676 0.097 0.560 0.317 1.270 5.064 0.931 20.686 3.697 1.229 0.553 0.102 1.693 0.097 0.379 0.518 6.763
1991 7 1.340 1.720 24.900 3.670 1.060 0.162 2.130 0.390 0.097 0.844 0.278 1.690 3.084 1.061 23.857 3.607 1.167 0.399 0.396 1.630 0.097 0.484 0.440 3.833
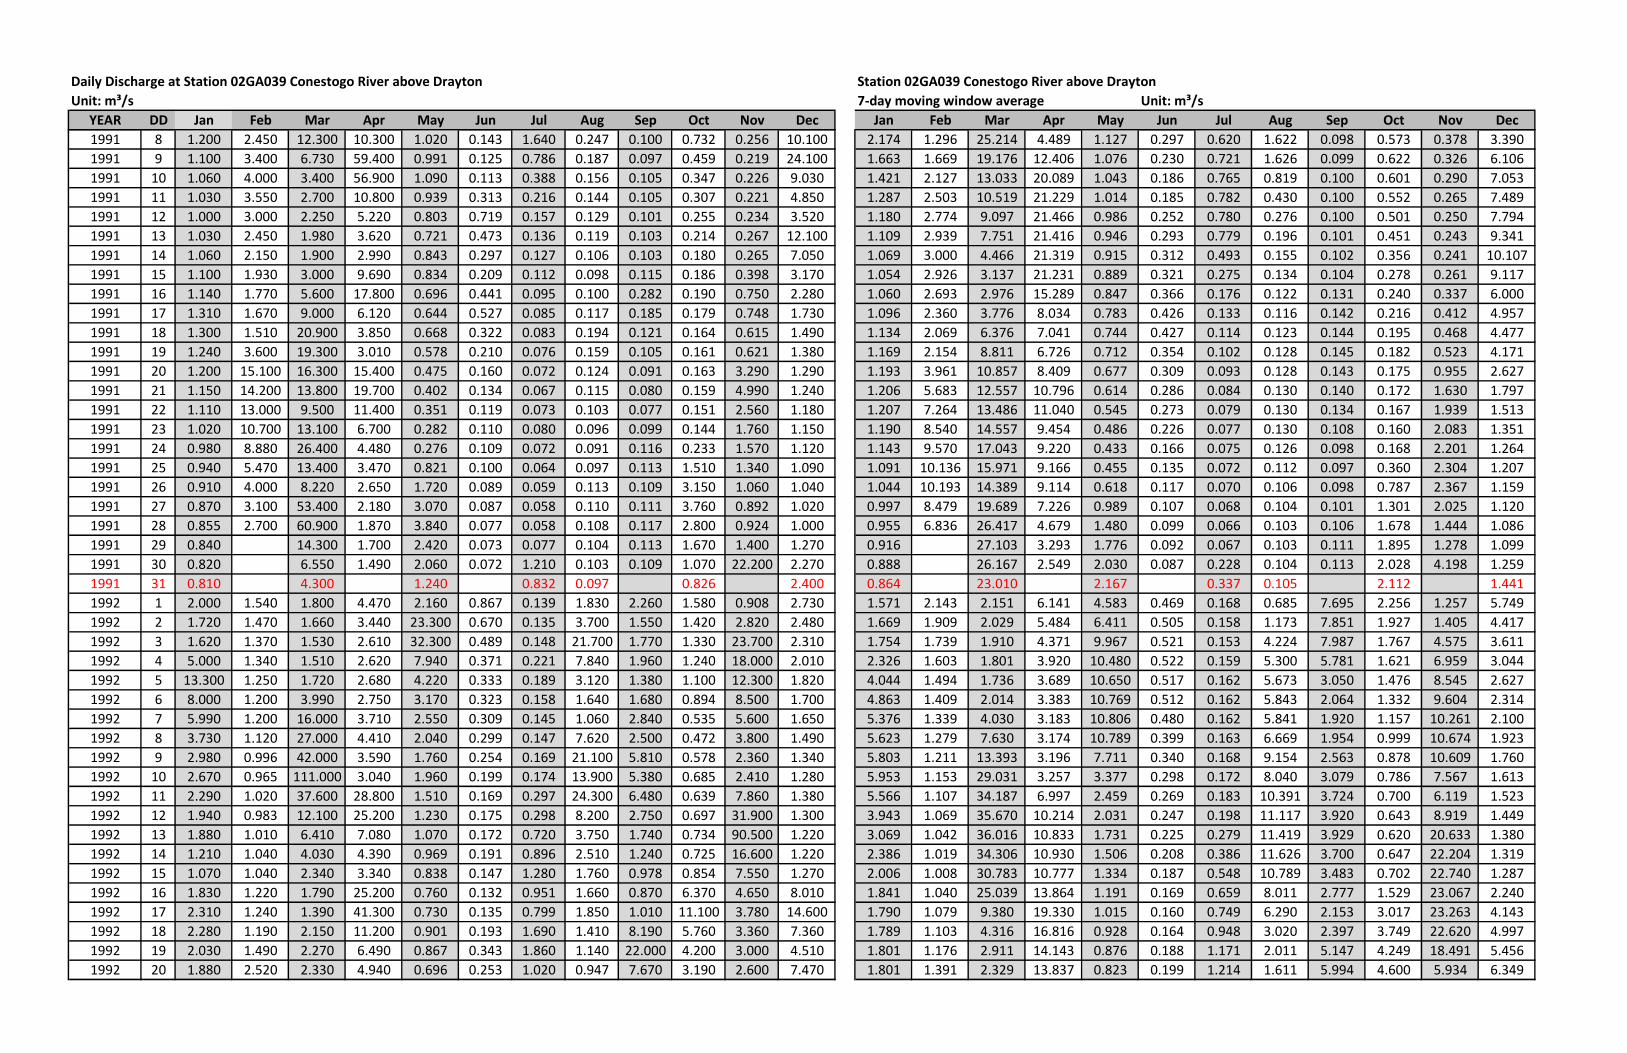
Daily Discharge at Station 02GA039 Conestogo River above Drayton Station 02GA039 Conestogo River above Drayton
Unit: m³/s 7-day moving window average Unit: m³/s
YEAR DD Jan Feb Mar Apr May Jun Jul Aug Sep Oct Nov Dec Jan Feb Mar Apr May Jun Jul Aug Sep Oct Nov Dec
1991 8 1.200 2.450 12.300 10.300 1.020 0.143 1.640 0.247 0.100 0.732 0.256 10.100 2.174 1.296 25.214 4.489 1.127 0.297 0.620 1.622 0.098 0.573 0.378 3.390
1991 9 1.100 3.400 6.730 59.400 0.991 0.125 0.786 0.187 0.097 0.459 0.219 24.100 1.663 1.669 19.176 12.406 1.076 0.230 0.721 1.626 0.099 0.622 0.326 6.106
1991 10 1.060 4.000 3.400 56.900 1.090 0.113 0.388 0.156 0.105 0.347 0.226 9.030 1.421 2.127 13.033 20.089 1.043 0.186 0.765 0.819 0.100 0.601 0.290 7.053
1991 11 1.030 3.550 2.700 10.800 0.939 0.313 0.216 0.144 0.105 0.307 0.221 4.850 1.287 2.503 10.519 21.229 1.014 0.185 0.782 0.430 0.100 0.552 0.265 7.489
1991 12 1.000 3.000 2.250 5.220 0.803 0.719 0.157 0.129 0.101 0.255 0.234 3.520 1.180 2.774 9.097 21.466 0.986 0.252 0.780 0.276 0.100 0.501 0.250 7.794
1991 13 1.030 2.450 1.980 3.620 0.721 0.473 0.136 0.119 0.103 0.214 0.267 12.100 1.109 2.939 7.751 21.416 0.946 0.293 0.779 0.196 0.101 0.451 0.243 9.341
1991 14 1.060 2.150 1.900 2.990 0.843 0.297 0.127 0.106 0.103 0.180 0.265 7.050 1.069 3.000 4.466 21.319 0.915 0.312 0.493 0.155 0.102 0.356 0.241 10.107
1991 15 1.100 1.930 3.000 9.690 0.834 0.209 0.112 0.098 0.115 0.186 0.398 3.170 1.054 2.926 3.137 21.231 0.889 0.321 0.275 0.134 0.104 0.278 0.261 9.117
1991 16 1.140 1.770 5.600 17.800 0.696 0.441 0.095 0.100 0.282 0.190 0.750 2.280 1.060 2.693 2.976 15.289 0.847 0.366 0.176 0.122 0.131 0.240 0.337 6.000
1991 17 1.310 1.670 9.000 6.120 0.644 0.527 0.085 0.117 0.185 0.179 0.748 1.730 1.096 2.360 3.776 8.034 0.783 0.426 0.133 0.116 0.142 0.216 0.412 4.957
1991 18 1.300 1.510 20.900 3.850 0.668 0.322 0.083 0.194 0.121 0.164 0.615 1.490 1.134 2.069 6.376 7.041 0.744 0.427 0.114 0.123 0.144 0.195 0.468 4.477
1991 19 1.240 3.600 19.300 3.010 0.578 0.210 0.076 0.159 0.105 0.161 0.621 1.380 1.169 2.154 8.811 6.726 0.712 0.354 0.102 0.128 0.145 0.182 0.523 4.171
1991 20 1.200 15.100 16.300 15.400 0.475 0.160 0.072 0.124 0.091 0.163 3.290 1.290 1.193 3.961 10.857 8.409 0.677 0.309 0.093 0.128 0.143 0.175 0.955 2.627
1991 21 1.150 14.200 13.800 19.700 0.402 0.134 0.067 0.115 0.080 0.159 4.990 1.240 1.206 5.683 12.557 10.796 0.614 0.286 0.084 0.130 0.140 0.172 1.630 1.797
1991 22 1.110 13.000 9.500 11.400 0.351 0.119 0.073 0.103 0.077 0.151 2.560 1.180 1.207 7.264 13.486 11.040 0.545 0.273 0.079 0.130 0.134 0.167 1.939 1.513
1991 23 1.020 10.700 13.100 6.700 0.282 0.110 0.080 0.096 0.099 0.144 1.760 1.150 1.190 8.540 14.557 9.454 0.486 0.226 0.077 0.130 0.108 0.160 2.083 1.351
1991 24 0.980 8.880 26.400 4.480 0.276 0.109 0.072 0.091 0.116 0.233 1.570 1.120 1.143 9.570 17.043 9.220 0.433 0.166 0.075 0.126 0.098 0.168 2.201 1.264
1991 25 0.940 5.470 13.400 3.470 0.821 0.100 0.064 0.097 0.113 1.510 1.340 1.090 1.091 10.136 15.971 9.166 0.455 0.135 0.072 0.112 0.097 0.360 2.304 1.207
1991 26 0.910 4.000 8.220 2.650 1.720 0.089 0.059 0.113 0.109 3.150 1.060 1.040 1.044 10.193 14.389 9.114 0.618 0.117 0.070 0.106 0.098 0.787 2.367 1.159
1991 27 0.870 3.100 53.400 2.180 3.070 0.087 0.058 0.110 0.111 3.760 0.892 1.020 0.997 8.479 19.689 7.226 0.989 0.107 0.068 0.104 0.101 1.301 2.025 1.120
1991 28 0.855 2.700 60.900 1.870 3.840 0.077 0.058 0.108 0.117 2.800 0.924 1.000 0.955 6.836 26.417 4.679 1.480 0.099 0.066 0.103 0.106 1.678 1.444 1.086
1991 29 0.840 14.300 1.700 2.420 0.073 0.077 0.104 0.113 1.670 1.400 1.270 0.916 27.103 3.293 1.776 0.092 0.067 0.103 0.111 1.895 1.278 1.099
1991 30 0.820 6.550 1.490 2.060 0.072 1.210 0.103 0.109 1.070 22.200 2.270 0.888 26.167 2.549 2.030 0.087 0.228 0.104 0.113 2.028 4.198 1.259
1991 31 0.810 4.300 1.240 0.832 0.097 0.826 2.400 0.864 23.010 2.167 0.337 0.105 2.112 1.441
1992 1 2.000 1.540 1.800 4.470 2.160 0.867 0.139 1.830 2.260 1.580 0.908 2.730 1.571 2.143 2.151 6.141 4.583 0.469 0.168 0.685 7.695 2.256 1.257 5.749
1992 2 1.720 1.470 1.660 3.440 23.300 0.670 0.135 3.700 1.550 1.420 2.820 2.480 1.669 1.909 2.029 5.484 6.411 0.505 0.158 1.173 7.851 1.927 1.405 4.417
1992 3 1.620 1.370 1.530 2.610 32.300 0.489 0.148 21.700 1.770 1.330 23.700 2.310 1.754 1.739 1.910 4.371 9.967 0.521 0.153 4.224 7.987 1.767 4.575 3.611
1992 4 5.000 1.340 1.510 2.620 7.940 0.371 0.221 7.840 1.960 1.240 18.000 2.010 2.326 1.603 1.801 3.920 10.480 0.522 0.159 5.300 5.781 1.621 6.959 3.044
1992 5 13.300 1.250 1.720 2.680 4.220 0.333 0.189 3.120 1.380 1.100 12.300 1.820 4.044 1.494 1.736 3.689 10.650 0.517 0.162 5.673 3.050 1.476 8.545 2.627
1992 6 8.000 1.200 3.990 2.750 3.170 0.323 0.158 1.640 1.680 0.894 8.500 1.700 4.863 1.409 2.014 3.383 10.769 0.512 0.162 5.843 2.064 1.332 9.604 2.314
1992 7 5.990 1.200 16.000 3.710 2.550 0.309 0.145 1.060 2.840 0.535 5.600 1.650 5.376 1.339 4.030 3.183 10.806 0.480 0.162 5.841 1.920 1.157 10.261 2.100
1992 8 3.730 1.120 27.000 4.410 2.040 0.299 0.147 7.620 2.500 0.472 3.800 1.490 5.623 1.279 7.630 3.174 10.789 0.399 0.163 6.669 1.954 0.999 10.674 1.923
1992 9 2.980 0.996 42.000 3.590 1.760 0.254 0.169 21.100 5.810 0.578 2.360 1.340 5.803 1.211 13.393 3.196 7.711 0.340 0.168 9.154 2.563 0.878 10.609 1.760
1992 10 2.670 0.965 111.000 3.040 1.960 0.199 0.174 13.900 5.380 0.685 2.410 1.280 5.953 1.153 29.031 3.257 3.377 0.298 0.172 8.040 3.079 0.786 7.567 1.613
1992 11 2.290 1.020 37.600 28.800 1.510 0.169 0.297 24.300 6.480 0.639 7.860 1.380 5.566 1.107 34.187 6.997 2.459 0.269 0.183 10.391 3.724 0.700 6.119 1.523
1992 12 1.940 0.983 12.100 25.200 1.230 0.175 0.298 8.200 2.750 0.697 31.900 1.300 3.943 1.069 35.670 10.214 2.031 0.247 0.198 11.117 3.920 0.643 8.919 1.449
1992 13 1.880 1.010 6.410 7.080 1.070 0.172 0.720 3.750 1.740 0.734 90.500 1.220 3.069 1.042 36.016 10.833 1.731 0.225 0.279 11.419 3.929 0.620 20.633 1.380
1992 14 1.210 1.040 4.030 4.390 0.969 0.191 0.896 2.510 1.240 0.725 16.600 1.220 2.386 1.019 34.306 10.930 1.506 0.208 0.386 11.626 3.700 0.647 22.204 1.319
1992 15 1.070 1.040 2.340 3.340 0.838 0.147 1.280 1.760 0.978 0.854 7.550 1.270 2.006 1.008 30.783 10.777 1.334 0.187 0.548 10.789 3.483 0.702 22.740 1.287
1992 16 1.830 1.220 1.790 25.200 0.760 0.132 0.951 1.660 0.870 6.370 4.650 8.010 1.841 1.040 25.039 13.864 1.191 0.169 0.659 8.011 2.777 1.529 23.067 2.240
1992 17 2.310 1.240 1.390 41.300 0.730 0.135 0.799 1.850 1.010 11.100 3.780 14.600 1.790 1.079 9.380 19.330 1.015 0.160 0.749 6.290 2.153 3.017 23.263 4.143
1992 18 2.280 1.190 2.150 11.200 0.901 0.193 1.690 1.410 8.190 5.760 3.360 7.360 1.789 1.103 4.316 16.816 0.928 0.164 0.948 3.020 2.397 3.749 22.620 4.997
1992 19 2.030 1.490 2.270 6.490 0.867 0.343 1.860 1.140 22.000 4.200 3.000 4.510 1.801 1.176 2.911 14.143 0.876 0.188 1.171 2.011 5.147 4.249 18.491 5.456
1992 20 1.880 2.520 2.330 4.940 0.696 0.253 1.020 0.947 7.670 3.190 2.600 7.470 1.801 1.391 2.329 13.837 0.823 0.199 1.214 1.611 5.994 4.600 5.934 6.349
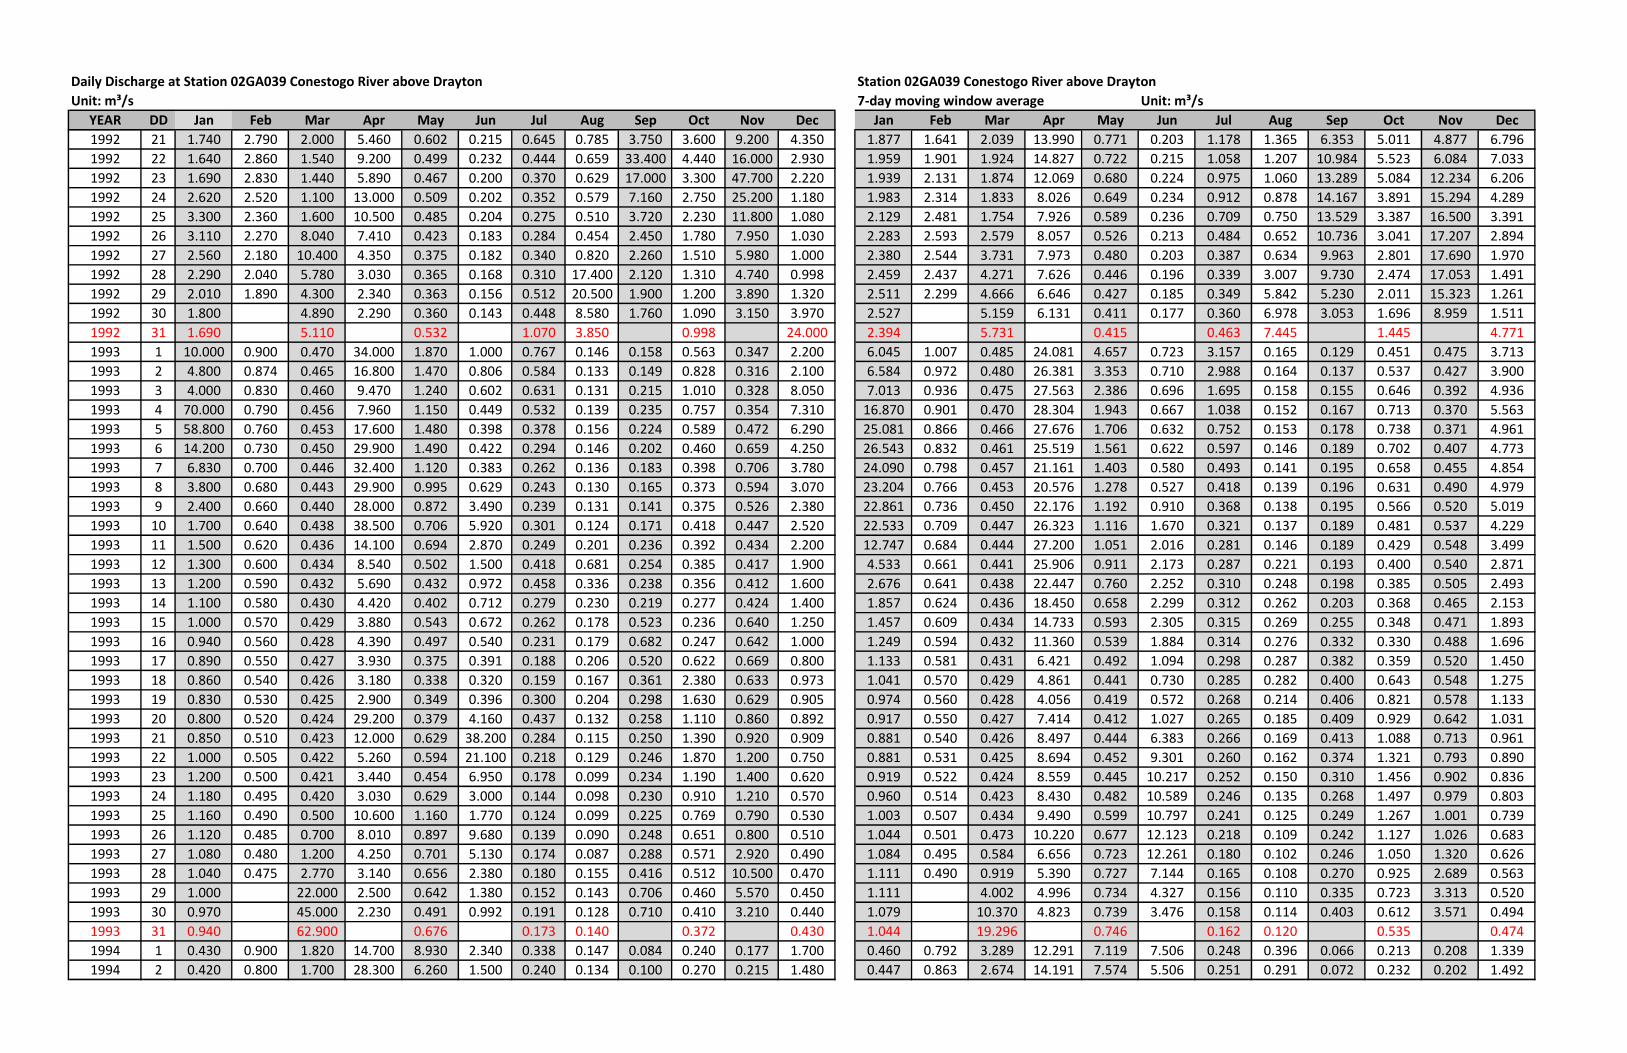
Daily Discharge at Station 02GA039 Conestogo River above Drayton Station 02GA039 Conestogo River above Drayton
Unit: m³/s 7-day moving window average Unit: m³/s
YEAR DD Jan Feb Mar Apr May Jun Jul Aug Sep Oct Nov Dec Jan Feb Mar Apr May Jun Jul Aug Sep Oct Nov Dec
1992 21 1.740 2.790 2.000 5.460 0.602 0.215 0.645 0.785 3.750 3.600 9.200 4.350 1.877 1.641 2.039 13.990 0.771 0.203 1.178 1.365 6.353 5.011 4.877 6.796
1992 22 1.640 2.860 1.540 9.200 0.499 0.232 0.444 0.659 33.400 4.440 16.000 2.930 1.959 1.901 1.924 14.827 0.722 0.215 1.058 1.207 10.984 5.523 6.084 7.033
1992 23 1.690 2.830 1.440 5.890 0.467 0.200 0.370 0.629 17.000 3.300 47.700 2.220 1.939 2.131 1.874 12.069 0.680 0.224 0.975 1.060 13.289 5.084 12.234 6.206
1992 24 2.620 2.520 1.100 13.000 0.509 0.202 0.352 0.579 7.160 2.750 25.200 1.180 1.983 2.314 1.833 8.026 0.649 0.234 0.912 0.878 14.167 3.891 15.294 4.289
1992 25 3.300 2.360 1.600 10.500 0.485 0.204 0.275 0.510 3.720 2.230 11.800 1.080 2.129 2.481 1.754 7.926 0.589 0.236 0.709 0.750 13.529 3.387 16.500 3.391
1992 26 3.110 2.270 8.040 7.410 0.423 0.183 0.284 0.454 2.450 1.780 7.950 1.030 2.283 2.593 2.579 8.057 0.526 0.213 0.484 0.652 10.736 3.041 17.207 2.894
1992 27 2.560 2.180 10.400 4.350 0.375 0.182 0.340 0.820 2.260 1.510 5.980 1.000 2.380 2.544 3.731 7.973 0.480 0.203 0.387 0.634 9.963 2.801 17.690 1.970
1992 28 2.290 2.040 5.780 3.030 0.365 0.168 0.310 17.400 2.120 1.310 4.740 0.998 2.459 2.437 4.271 7.626 0.446 0.196 0.339 3.007 9.730 2.474 17.053 1.491
1992 29 2.010 1.890 4.300 2.340 0.363 0.156 0.512 20.500 1.900 1.200 3.890 1.320 2.511 2.299 4.666 6.646 0.427 0.185 0.349 5.842 5.230 2.011 15.323 1.261
1992 30 1.800 4.890 2.290 0.360 0.143 0.448 8.580 1.760 1.090 3.150 3.970 2.527 5.159 6.131 0.411 0.177 0.360 6.978 3.053 1.696 8.959 1.511
1992 31 1.690 5.110 0.532 1.070 3.850 0.998 24.000 2.394 5.731 0.415 0.463 7.445 1.445 4.771
1993 1 10.000 0.900 0.470 34.000 1.870 1.000 0.767 0.146 0.158 0.563 0.347 2.200 6.045 1.007 0.485 24.081 4.657 0.723 3.157 0.165 0.129 0.451 0.475 3.713
1993 2 4.800 0.874 0.465 16.800 1.470 0.806 0.584 0.133 0.149 0.828 0.316 2.100 6.584 0.972 0.480 26.381 3.353 0.710 2.988 0.164 0.137 0.537 0.427 3.900
1993 3 4.000 0.830 0.460 9.470 1.240 0.602 0.631 0.131 0.215 1.010 0.328 8.050 7.013 0.936 0.475 27.563 2.386 0.696 1.695 0.158 0.155 0.646 0.392 4.936
1993 4 70.000 0.790 0.456 7.960 1.150 0.449 0.532 0.139 0.235 0.757 0.354 7.310 16.870 0.901 0.470 28.304 1.943 0.667 1.038 0.152 0.167 0.713 0.370 5.563
1993 5 58.800 0.760 0.453 17.600 1.480 0.398 0.378 0.156 0.224 0.589 0.472 6.290 25.081 0.866 0.466 27.676 1.706 0.632 0.752 0.153 0.178 0.738 0.371 4.961
1993 6 14.200 0.730 0.450 29.900 1.490 0.422 0.294 0.146 0.202 0.460 0.659 4.250 26.543 0.832 0.461 25.519 1.561 0.622 0.597 0.146 0.189 0.702 0.407 4.773
1993 7 6.830 0.700 0.446 32.400 1.120 0.383 0.262 0.136 0.183 0.398 0.706 3.780 24.090 0.798 0.457 21.161 1.403 0.580 0.493 0.141 0.195 0.658 0.455 4.854
1993 8 3.800 0.680 0.443 29.900 0.995 0.629 0.243 0.130 0.165 0.373 0.594 3.070 23.204 0.766 0.453 20.576 1.278 0.527 0.418 0.139 0.196 0.631 0.490 4.979
1993 9 2.400 0.660 0.440 28.000 0.872 3.490 0.239 0.131 0.141 0.375 0.526 2.380 22.861 0.736 0.450 22.176 1.192 0.910 0.368 0.138 0.195 0.566 0.520 5.019
1993 10 1.700 0.640 0.438 38.500 0.706 5.920 0.301 0.124 0.171 0.418 0.447 2.520 22.533 0.709 0.447 26.323 1.116 1.670 0.321 0.137 0.189 0.481 0.537 4.229
1993 11 1.500 0.620 0.436 14.100 0.694 2.870 0.249 0.201 0.236 0.392 0.434 2.200 12.747 0.684 0.444 27.200 1.051 2.016 0.281 0.146 0.189 0.429 0.548 3.499
1993 12 1.300 0.600 0.434 8.540 0.502 1.500 0.418 0.681 0.254 0.385 0.417 1.900 4.533 0.661 0.441 25.906 0.911 2.173 0.287 0.221 0.193 0.400 0.540 2.871
1993 13 1.200 0.590 0.432 5.690 0.432 0.972 0.458 0.336 0.238 0.356 0.412 1.600 2.676 0.641 0.438 22.447 0.760 2.252 0.310 0.248 0.198 0.385 0.505 2.493
1993 14 1.100 0.580 0.430 4.420 0.402 0.712 0.279 0.230 0.219 0.277 0.424 1.400 1.857 0.624 0.436 18.450 0.658 2.299 0.312 0.262 0.203 0.368 0.465 2.153
1993 15 1.000 0.570 0.429 3.880 0.543 0.672 0.262 0.178 0.523 0.236 0.640 1.250 1.457 0.609 0.434 14.733 0.593 2.305 0.315 0.269 0.255 0.348 0.471 1.893
1993 16 0.940 0.560 0.428 4.390 0.497 0.540 0.231 0.179 0.682 0.247 0.642 1.000 1.249 0.594 0.432 11.360 0.539 1.884 0.314 0.276 0.332 0.330 0.488 1.696
1993 17 0.890 0.550 0.427 3.930 0.375 0.391 0.188 0.206 0.520 0.622 0.669 0.800 1.133 0.581 0.431 6.421 0.492 1.094 0.298 0.287 0.382 0.359 0.520 1.450
1993 18 0.860 0.540 0.426 3.180 0.338 0.320 0.159 0.167 0.361 2.380 0.633 0.973 1.041 0.570 0.429 4.861 0.441 0.730 0.285 0.282 0.400 0.643 0.548 1.275
1993 19 0.830 0.530 0.425 2.900 0.349 0.396 0.300 0.204 0.298 1.630 0.629 0.905 0.974 0.560 0.428 4.056 0.419 0.572 0.268 0.214 0.406 0.821 0.578 1.133
1993 20 0.800 0.520 0.424 29.200 0.379 4.160 0.437 0.132 0.258 1.110 0.860 0.892 0.917 0.550 0.427 7.414 0.412 1.027 0.265 0.185 0.409 0.929 0.642 1.031
1993 21 0.850 0.510 0.423 12.000 0.629 38.200 0.284 0.115 0.250 1.390 0.920 0.909 0.881 0.540 0.426 8.497 0.444 6.383 0.266 0.169 0.413 1.088 0.713 0.961
1993 22 1.000 0.505 0.422 5.260 0.594 21.100 0.218 0.129 0.246 1.870 1.200 0.750 0.881 0.531 0.425 8.694 0.452 9.301 0.260 0.162 0.374 1.321 0.793 0.890
1993 23 1.200 0.500 0.421 3.440 0.454 6.950 0.178 0.099 0.234 1.190 1.400 0.620 0.919 0.522 0.424 8.559 0.445 10.217 0.252 0.150 0.310 1.456 0.902 0.836
1993 24 1.180 0.495 0.420 3.030 0.629 3.000 0.144 0.098 0.230 0.910 1.210 0.570 0.960 0.514 0.423 8.430 0.482 10.589 0.246 0.135 0.268 1.497 0.979 0.803
1993 25 1.160 0.490 0.500 10.600 1.160 1.770 0.124 0.099 0.225 0.769 0.790 0.530 1.003 0.507 0.434 9.490 0.599 10.797 0.241 0.125 0.249 1.267 1.001 0.739
1993 26 1.120 0.485 0.700 8.010 0.897 9.680 0.139 0.090 0.248 0.651 0.800 0.510 1.044 0.501 0.473 10.220 0.677 12.123 0.218 0.109 0.242 1.127 1.026 0.683
1993 27 1.080 0.480 1.200 4.250 0.701 5.130 0.174 0.087 0.288 0.571 2.920 0.490 1.084 0.495 0.584 6.656 0.723 12.261 0.180 0.102 0.246 1.050 1.320 0.626
1993 28 1.040 0.475 2.770 3.140 0.656 2.380 0.180 0.155 0.416 0.512 10.500 0.470 1.111 0.490 0.919 5.390 0.727 7.144 0.165 0.108 0.270 0.925 2.689 0.563
1993 29 1.000 22.000 2.500 0.642 1.380 0.152 0.143 0.706 0.460 5.570 0.450 1.111 4.002 4.996 0.734 4.327 0.156 0.110 0.335 0.723 3.313 0.520
1993 30 0.970 45.000 2.230 0.491 0.992 0.191 0.128 0.710 0.410 3.210 0.440 1.079 10.370 4.823 0.739 3.476 0.158 0.114 0.403 0.612 3.571 0.494
1993 31 0.940 62.900 0.676 0.173 0.140 0.372 0.430 1.044 19.296 0.746 0.162 0.120 0.535 0.474
1994 1 0.430 0.900 1.820 14.700 8.930 2.340 0.338 0.147 0.084 0.240 0.177 1.700 0.460 0.792 3.289 12.291 7.119 7.506 0.248 0.396 0.066 0.213 0.208 1.339
1994 2 0.420 0.800 1.700 28.300 6.260 1.500 0.240 0.134 0.100 0.270 0.215 1.480 0.447 0.863 2.674 14.191 7.574 5.506 0.251 0.291 0.072 0.232 0.202 1.492
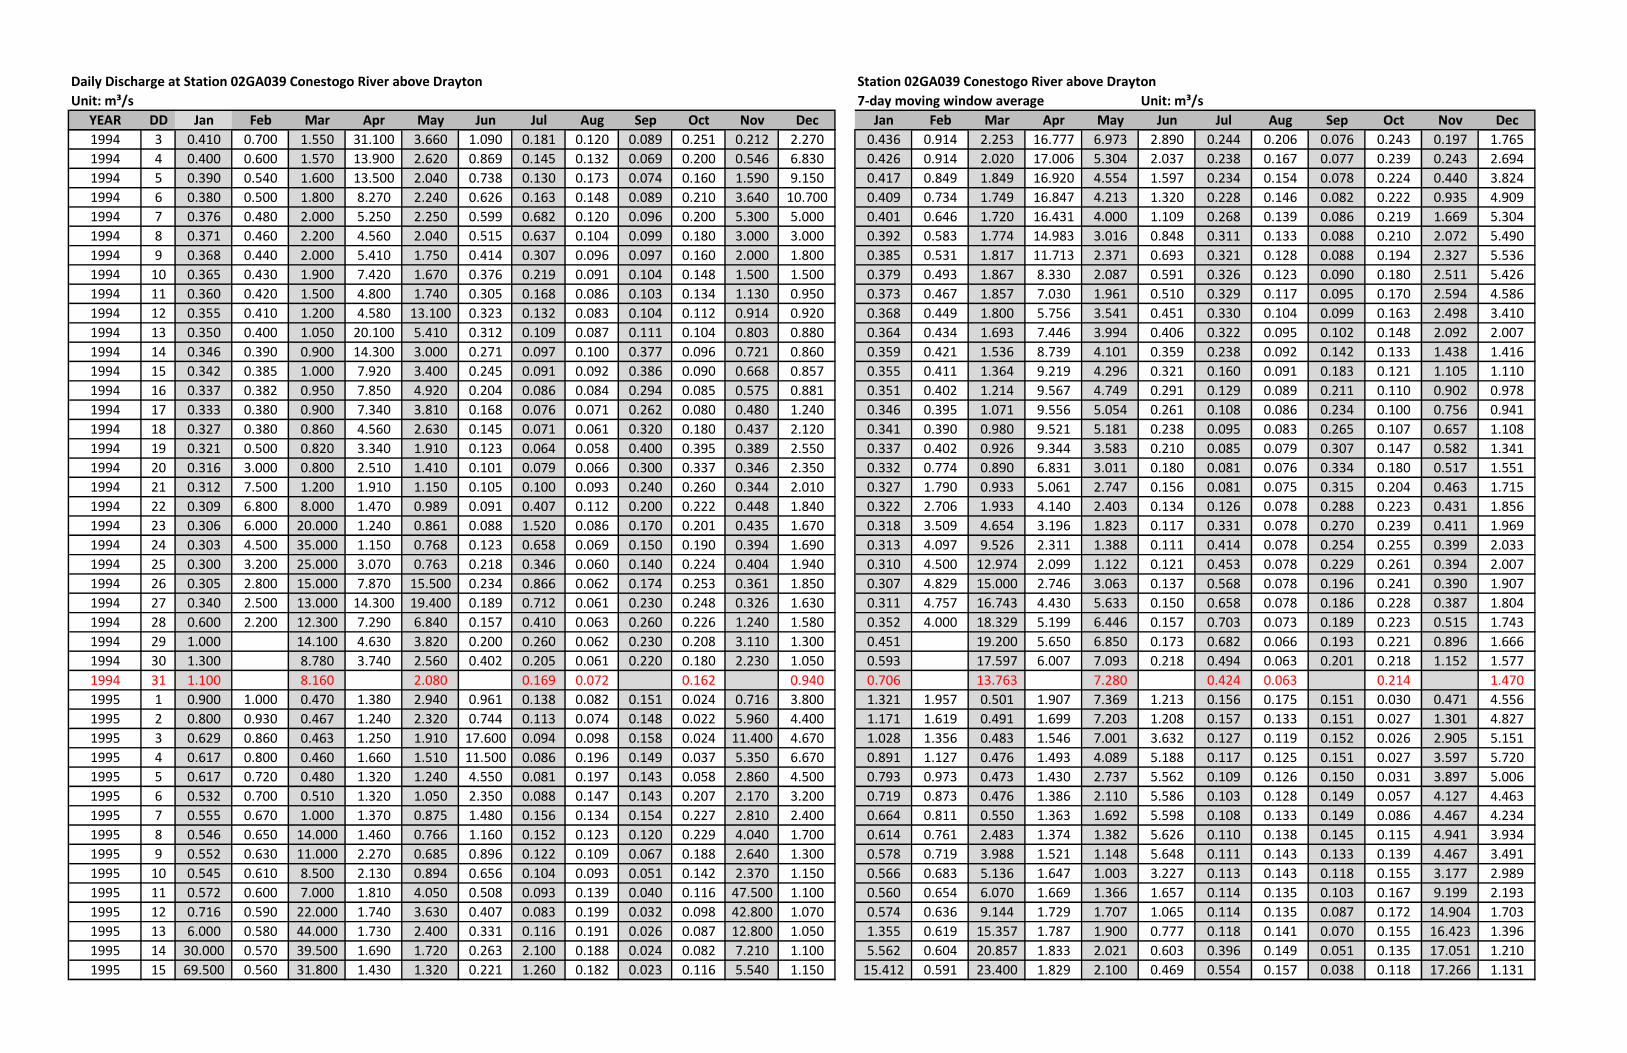
Daily Discharge at Station 02GA039 Conestogo River above Drayton Station 02GA039 Conestogo River above Drayton
Unit: m³/s 7-day moving window average Unit: m³/s
YEAR DD Jan Feb Mar Apr May Jun Jul Aug Sep Oct Nov Dec Jan Feb Mar Apr May Jun Jul Aug Sep Oct Nov Dec
1994 3 0.410 0.700 1.550 31.100 3.660 1.090 0.181 0.120 0.089 0.251 0.212 2.270 0.436 0.914 2.253 16.777 6.973 2.890 0.244 0.206 0.076 0.243 0.197 1.765
1994 4 0.400 0.600 1.570 13.900 2.620 0.869 0.145 0.132 0.069 0.200 0.546 6.830 0.426 0.914 2.020 17.006 5.304 2.037 0.238 0.167 0.077 0.239 0.243 2.694
1994 5 0.390 0.540 1.600 13.500 2.040 0.738 0.130 0.173 0.074 0.160 1.590 9.150 0.417 0.849 1.849 16.920 4.554 1.597 0.234 0.154 0.078 0.224 0.440 3.824
1994 6 0.380 0.500 1.800 8.270 2.240 0.626 0.163 0.148 0.089 0.210 3.640 10.700 0.409 0.734 1.749 16.847 4.213 1.320 0.228 0.146 0.082 0.222 0.935 4.909
1994 7 0.376 0.480 2.000 5.250 2.250 0.599 0.682 0.120 0.096 0.200 5.300 5.000 0.401 0.646 1.720 16.431 4.000 1.109 0.268 0.139 0.086 0.219 1.669 5.304
1994 8 0.371 0.460 2.200 4.560 2.040 0.515 0.637 0.104 0.099 0.180 3.000 3.000 0.392 0.583 1.774 14.983 3.016 0.848 0.311 0.133 0.088 0.210 2.072 5.490
1994 9 0.368 0.440 2.000 5.410 1.750 0.414 0.307 0.096 0.097 0.160 2.000 1.800 0.385 0.531 1.817 11.713 2.371 0.693 0.321 0.128 0.088 0.194 2.327 5.536
1994 10 0.365 0.430 1.900 7.420 1.670 0.376 0.219 0.091 0.104 0.148 1.500 1.500 0.379 0.493 1.867 8.330 2.087 0.591 0.326 0.123 0.090 0.180 2.511 5.426
1994 11 0.360 0.420 1.500 4.800 1.740 0.305 0.168 0.086 0.103 0.134 1.130 0.950 0.373 0.467 1.857 7.030 1.961 0.510 0.329 0.117 0.095 0.170 2.594 4.586
1994 12 0.355 0.410 1.200 4.580 13.100 0.323 0.132 0.083 0.104 0.112 0.914 0.920 0.368 0.449 1.800 5.756 3.541 0.451 0.330 0.104 0.099 0.163 2.498 3.410
1994 13 0.350 0.400 1.050 20.100 5.410 0.312 0.109 0.087 0.111 0.104 0.803 0.880 0.364 0.434 1.693 7.446 3.994 0.406 0.322 0.095 0.102 0.148 2.092 2.007
1994 14 0.346 0.390 0.900 14.300 3.000 0.271 0.097 0.100 0.377 0.096 0.721 0.860 0.359 0.421 1.536 8.739 4.101 0.359 0.238 0.092 0.142 0.133 1.438 1.416
1994 15 0.342 0.385 1.000 7.920 3.400 0.245 0.091 0.092 0.386 0.090 0.668 0.857 0.355 0.411 1.364 9.219 4.296 0.321 0.160 0.091 0.183 0.121 1.105 1.110
1994 16 0.337 0.382 0.950 7.850 4.920 0.204 0.086 0.084 0.294 0.085 0.575 0.881 0.351 0.402 1.214 9.567 4.749 0.291 0.129 0.089 0.211 0.110 0.902 0.978
1994 17 0.333 0.380 0.900 7.340 3.810 0.168 0.076 0.071 0.262 0.080 0.480 1.240 0.346 0.395 1.071 9.556 5.054 0.261 0.108 0.086 0.234 0.100 0.756 0.941
1994 18 0.327 0.380 0.860 4.560 2.630 0.145 0.071 0.061 0.320 0.180 0.437 2.120 0.341 0.390 0.980 9.521 5.181 0.238 0.095 0.083 0.265 0.107 0.657 1.108
1994 19 0.321 0.500 0.820 3.340 1.910 0.123 0.064 0.058 0.400 0.395 0.389 2.550 0.337 0.402 0.926 9.344 3.583 0.210 0.085 0.079 0.307 0.147 0.582 1.341
1994 20 0.316 3.000 0.800 2.510 1.410 0.101 0.079 0.066 0.300 0.337 0.346 2.350 0.332 0.774 0.890 6.831 3.011 0.180 0.081 0.076 0.334 0.180 0.517 1.551
1994 21 0.312 7.500 1.200 1.910 1.150 0.105 0.100 0.093 0.240 0.260 0.344 2.010 0.327 1.790 0.933 5.061 2.747 0.156 0.081 0.075 0.315 0.204 0.463 1.715
1994 22 0.309 6.800 8.000 1.470 0.989 0.091 0.407 0.112 0.200 0.222 0.448 1.840 0.322 2.706 1.933 4.140 2.403 0.134 0.126 0.078 0.288 0.223 0.431 1.856
1994 23 0.306 6.000 20.000 1.240 0.861 0.088 1.520 0.086 0.170 0.201 0.435 1.670 0.318 3.509 4.654 3.196 1.823 0.117 0.331 0.078 0.270 0.239 0.411 1.969
1994 24 0.303 4.500 35.000 1.150 0.768 0.123 0.658 0.069 0.150 0.190 0.394 1.690 0.313 4.097 9.526 2.311 1.388 0.111 0.414 0.078 0.254 0.255 0.399 2.033
1994 25 0.300 3.200 25.000 3.070 0.763 0.218 0.346 0.060 0.140 0.224 0.404 1.940 0.310 4.500 12.974 2.099 1.122 0.121 0.453 0.078 0.229 0.261 0.394 2.007
1994 26 0.305 2.800 15.000 7.870 15.500 0.234 0.866 0.062 0.174 0.253 0.361 1.850 0.307 4.829 15.000 2.746 3.063 0.137 0.568 0.078 0.196 0.241 0.390 1.907
1994 27 0.340 2.500 13.000 14.300 19.400 0.189 0.712 0.061 0.230 0.248 0.326 1.630 0.311 4.757 16.743 4.430 5.633 0.150 0.658 0.078 0.186 0.228 0.387 1.804
1994 28 0.600 2.200 12.300 7.290 6.840 0.157 0.410 0.063 0.260 0.226 1.240 1.580 0.352 4.000 18.329 5.199 6.446 0.157 0.703 0.073 0.189 0.223 0.515 1.743
1994 29 1.000 14.100 4.630 3.820 0.200 0.260 0.062 0.230 0.208 3.110 1.300 0.451 19.200 5.650 6.850 0.173 0.682 0.066 0.193 0.221 0.896 1.666
1994 30 1.300 8.780 3.740 2.560 0.402 0.205 0.061 0.220 0.180 2.230 1.050 0.593 17.597 6.007 7.093 0.218 0.494 0.063 0.201 0.218 1.152 1.577
1994 31 1.100 8.160 2.080 0.169 0.072 0.162 0.940 0.706 13.763 7.280 0.424 0.063 0.214 1.470
1995 1 0.900 1.000 0.470 1.380 2.940 0.961 0.138 0.082 0.151 0.024 0.716 3.800 1.321 1.957 0.501 1.907 7.369 1.213 0.156 0.175 0.151 0.030 0.471 4.556
1995 2 0.800 0.930 0.467 1.240 2.320 0.744 0.113 0.074 0.148 0.022 5.960 4.400 1.171 1.619 0.491 1.699 7.203 1.208 0.157 0.133 0.151 0.027 1.301 4.827
1995 3 0.629 0.860 0.463 1.250 1.910 17.600 0.094 0.098 0.158 0.024 11.400 4.670 1.028 1.356 0.483 1.546 7.001 3.632 0.127 0.119 0.152 0.026 2.905 5.151
1995 4 0.617 0.800 0.460 1.660 1.510 11.500 0.086 0.196 0.149 0.037 5.350 6.670 0.891 1.127 0.476 1.493 4.089 5.188 0.117 0.125 0.151 0.027 3.597 5.720
1995 5 0.617 0.720 0.480 1.320 1.240 4.550 0.081 0.197 0.143 0.058 2.860 4.500 0.793 0.973 0.473 1.430 2.737 5.562 0.109 0.126 0.150 0.031 3.897 5.006
1995 6 0.532 0.700 0.510 1.320 1.050 2.350 0.088 0.147 0.143 0.207 2.170 3.200 0.719 0.873 0.476 1.386 2.110 5.586 0.103 0.128 0.149 0.057 4.127 4.463
1995 7 0.555 0.670 1.000 1.370 0.875 1.480 0.156 0.134 0.154 0.227 2.810 2.400 0.664 0.811 0.550 1.363 1.692 5.598 0.108 0.133 0.149 0.086 4.467 4.234
1995 8 0.546 0.650 14.000 1.460 0.766 1.160 0.152 0.123 0.120 0.229 4.040 1.700 0.614 0.761 2.483 1.374 1.382 5.626 0.110 0.138 0.145 0.115 4.941 3.934
1995 9 0.552 0.630 11.000 2.270 0.685 0.896 0.122 0.109 0.067 0.188 2.640 1.300 0.578 0.719 3.988 1.521 1.148 5.648 0.111 0.143 0.133 0.139 4.467 3.491
1995 10 0.545 0.610 8.500 2.130 0.894 0.656 0.104 0.093 0.051 0.142 2.370 1.150 0.566 0.683 5.136 1.647 1.003 3.227 0.113 0.143 0.118 0.155 3.177 2.989
1995 11 0.572 0.600 7.000 1.810 4.050 0.508 0.093 0.139 0.040 0.116 47.500 1.100 0.560 0.654 6.070 1.669 1.366 1.657 0.114 0.135 0.103 0.167 9.199 2.193
1995 12 0.716 0.590 22.000 1.740 3.630 0.407 0.083 0.199 0.032 0.098 42.800 1.070 0.574 0.636 9.144 1.729 1.707 1.065 0.114 0.135 0.087 0.172 14.904 1.703
1995 13 6.000 0.580 44.000 1.730 2.400 0.331 0.116 0.191 0.026 0.087 12.800 1.050 1.355 0.619 15.357 1.787 1.900 0.777 0.118 0.141 0.070 0.155 16.423 1.396
1995 14 30.000 0.570 39.500 1.690 1.720 0.263 2.100 0.188 0.024 0.082 7.210 1.100 5.562 0.604 20.857 1.833 2.021 0.603 0.396 0.149 0.051 0.135 17.051 1.210
1995 15 69.500 0.560 31.800 1.430 1.320 0.221 1.260 0.182 0.023 0.116 5.540 1.150 15.412 0.591 23.400 1.829 2.100 0.469 0.554 0.157 0.038 0.118 17.266 1.131
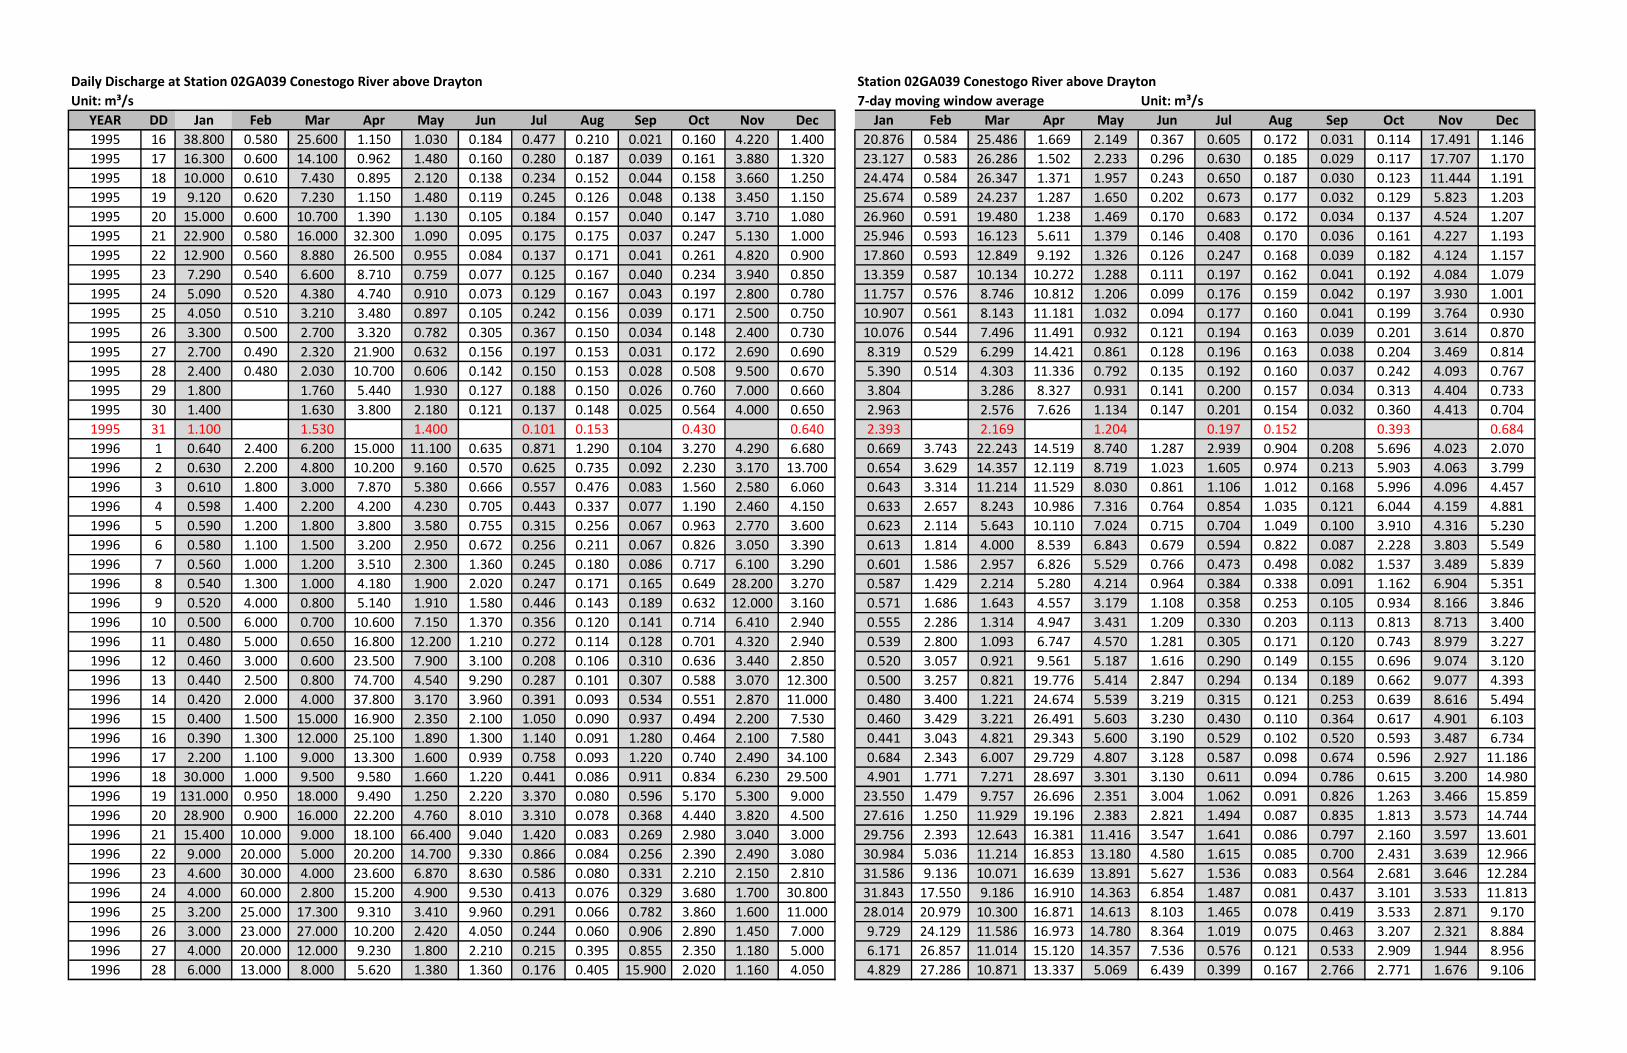
Daily Discharge at Station 02GA039 Conestogo River above Drayton Station 02GA039 Conestogo River above Drayton
Unit: m³/s 7-day moving window average Unit: m³/s
YEAR DD Jan Feb Mar Apr May Jun Jul Aug Sep Oct Nov Dec Jan Feb Mar Apr May Jun Jul Aug Sep Oct Nov Dec
1995 16 38.800 0.580 25.600 1.150 1.030 0.184 0.477 0.210 0.021 0.160 4.220 1.400 20.876 0.584 25.486 1.669 2.149 0.367 0.605 0.172 0.031 0.114 17.491 1.146
1995 17 16.300 0.600 14.100 0.962 1.480 0.160 0.280 0.187 0.039 0.161 3.880 1.320 23.127 0.583 26.286 1.502 2.233 0.296 0.630 0.185 0.029 0.117 17.707 1.170
1995 18 10.000 0.610 7.430 0.895 2.120 0.138 0.234 0.152 0.044 0.158 3.660 1.250 24.474 0.584 26.347 1.371 1.957 0.243 0.650 0.187 0.030 0.123 11.444 1.191
1995 19 9.120 0.620 7.230 1.150 1.480 0.119 0.245 0.126 0.048 0.138 3.450 1.150 25.674 0.589 24.237 1.287 1.650 0.202 0.673 0.177 0.032 0.129 5.823 1.203
1995 20 15.000 0.600 10.700 1.390 1.130 0.105 0.184 0.157 0.040 0.147 3.710 1.080 26.960 0.591 19.480 1.238 1.469 0.170 0.683 0.172 0.034 0.137 4.524 1.207
1995 21 22.900 0.580 16.000 32.300 1.090 0.095 0.175 0.175 0.037 0.247 5.130 1.000 25.946 0.593 16.123 5.611 1.379 0.146 0.408 0.170 0.036 0.161 4.227 1.193
1995 22 12.900 0.560 8.880 26.500 0.955 0.084 0.137 0.171 0.041 0.261 4.820 0.900 17.860 0.593 12.849 9.192 1.326 0.126 0.247 0.168 0.039 0.182 4.124 1.157
1995 23 7.290 0.540 6.600 8.710 0.759 0.077 0.125 0.167 0.040 0.234 3.940 0.850 13.359 0.587 10.134 10.272 1.288 0.111 0.197 0.162 0.041 0.192 4.084 1.079
1995 24 5.090 0.520 4.380 4.740 0.910 0.073 0.129 0.167 0.043 0.197 2.800 0.780 11.757 0.576 8.746 10.812 1.206 0.099 0.176 0.159 0.042 0.197 3.930 1.001
1995 25 4.050 0.510 3.210 3.480 0.897 0.105 0.242 0.156 0.039 0.171 2.500 0.750 10.907 0.561 8.143 11.181 1.032 0.094 0.177 0.160 0.041 0.199 3.764 0.930
1995 26 3.300 0.500 2.700 3.320 0.782 0.305 0.367 0.150 0.034 0.148 2.400 0.730 10.076 0.544 7.496 11.491 0.932 0.121 0.194 0.163 0.039 0.201 3.614 0.870
1995 27 2.700 0.490 2.320 21.900 0.632 0.156 0.197 0.153 0.031 0.172 2.690 0.690 8.319 0.529 6.299 14.421 0.861 0.128 0.196 0.163 0.038 0.204 3.469 0.814
1995 28 2.400 0.480 2.030 10.700 0.606 0.142 0.150 0.153 0.028 0.508 9.500 0.670 5.390 0.514 4.303 11.336 0.792 0.135 0.192 0.160 0.037 0.242 4.093 0.767
1995 29 1.800 1.760 5.440 1.930 0.127 0.188 0.150 0.026 0.760 7.000 0.660 3.804 3.286 8.327 0.931 0.141 0.200 0.157 0.034 0.313 4.404 0.733
1995 30 1.400 1.630 3.800 2.180 0.121 0.137 0.148 0.025 0.564 4.000 0.650 2.963 2.576 7.626 1.134 0.147 0.201 0.154 0.032 0.360 4.413 0.704
1995 31 1.100 1.530 1.400 0.101 0.153 0.430 0.640 2.393 2.169 1.204 0.197 0.152 0.393 0.684
1996 1 0.640 2.400 6.200 15.000 11.100 0.635 0.871 1.290 0.104 3.270 4.290 6.680 0.669 3.743 22.243 14.519 8.740 1.287 2.939 0.904 0.208 5.696 4.023 2.070
1996 2 0.630 2.200 4.800 10.200 9.160 0.570 0.625 0.735 0.092 2.230 3.170 13.700 0.654 3.629 14.357 12.119 8.719 1.023 1.605 0.974 0.213 5.903 4.063 3.799
1996 3 0.610 1.800 3.000 7.870 5.380 0.666 0.557 0.476 0.083 1.560 2.580 6.060 0.643 3.314 11.214 11.529 8.030 0.861 1.106 1.012 0.168 5.996 4.096 4.457
1996 4 0.598 1.400 2.200 4.200 4.230 0.705 0.443 0.337 0.077 1.190 2.460 4.150 0.633 2.657 8.243 10.986 7.316 0.764 0.854 1.035 0.121 6.044 4.159 4.881
1996 5 0.590 1.200 1.800 3.800 3.580 0.755 0.315 0.256 0.067 0.963 2.770 3.600 0.623 2.114 5.643 10.110 7.024 0.715 0.704 1.049 0.100 3.910 4.316 5.230
1996 6 0.580 1.100 1.500 3.200 2.950 0.672 0.256 0.211 0.067 0.826 3.050 3.390 0.613 1.814 4.000 8.539 6.843 0.679 0.594 0.822 0.087 2.228 3.803 5.549
1996 7 0.560 1.000 1.200 3.510 2.300 1.360 0.245 0.180 0.086 0.717 6.100 3.290 0.601 1.586 2.957 6.826 5.529 0.766 0.473 0.498 0.082 1.537 3.489 5.839
1996 8 0.540 1.300 1.000 4.180 1.900 2.020 0.247 0.171 0.165 0.649 28.200 3.270 0.587 1.429 2.214 5.280 4.214 0.964 0.384 0.338 0.091 1.162 6.904 5.351
1996 9 0.520 4.000 0.800 5.140 1.910 1.580 0.446 0.143 0.189 0.632 12.000 3.160 0.571 1.686 1.643 4.557 3.179 1.108 0.358 0.253 0.105 0.934 8.166 3.846
1996 10 0.500 6.000 0.700 10.600 7.150 1.370 0.356 0.120 0.141 0.714 6.410 2.940 0.555 2.286 1.314 4.947 3.431 1.209 0.330 0.203 0.113 0.813 8.713 3.400
1996 11 0.480 5.000 0.650 16.800 12.200 1.210 0.272 0.114 0.128 0.701 4.320 2.940 0.539 2.800 1.093 6.747 4.570 1.281 0.305 0.171 0.120 0.743 8.979 3.227
1996 12 0.460 3.000 0.600 23.500 7.900 3.100 0.208 0.106 0.310 0.636 3.440 2.850 0.520 3.057 0.921 9.561 5.187 1.616 0.290 0.149 0.155 0.696 9.074 3.120
1996 13 0.440 2.500 0.800 74.700 4.540 9.290 0.287 0.101 0.307 0.588 3.070 12.300 0.500 3.257 0.821 19.776 5.414 2.847 0.294 0.134 0.189 0.662 9.077 4.393
1996 14 0.420 2.000 4.000 37.800 3.170 3.960 0.391 0.093 0.534 0.551 2.870 11.000 0.480 3.400 1.221 24.674 5.539 3.219 0.315 0.121 0.253 0.639 8.616 5.494
1996 15 0.400 1.500 15.000 16.900 2.350 2.100 1.050 0.090 0.937 0.494 2.200 7.530 0.460 3.429 3.221 26.491 5.603 3.230 0.430 0.110 0.364 0.617 4.901 6.103
1996 16 0.390 1.300 12.000 25.100 1.890 1.300 1.140 0.091 1.280 0.464 2.100 7.580 0.441 3.043 4.821 29.343 5.600 3.190 0.529 0.102 0.520 0.593 3.487 6.734
1996 17 2.200 1.100 9.000 13.300 1.600 0.939 0.758 0.093 1.220 0.740 2.490 34.100 0.684 2.343 6.007 29.729 4.807 3.128 0.587 0.098 0.674 0.596 2.927 11.186
1996 18 30.000 1.000 9.500 9.580 1.660 1.220 0.441 0.086 0.911 0.834 6.230 29.500 4.901 1.771 7.271 28.697 3.301 3.130 0.611 0.094 0.786 0.615 3.200 14.980
1996 19 131.000 0.950 18.000 9.490 1.250 2.220 3.370 0.080 0.596 5.170 5.300 9.000 23.550 1.479 9.757 26.696 2.351 3.004 1.062 0.091 0.826 1.263 3.466 15.859
1996 20 28.900 0.900 16.000 22.200 4.760 8.010 3.310 0.078 0.368 4.440 3.820 4.500 27.616 1.250 11.929 19.196 2.383 2.821 1.494 0.087 0.835 1.813 3.573 14.744
1996 21 15.400 10.000 9.000 18.100 66.400 9.040 1.420 0.083 0.269 2.980 3.040 3.000 29.756 2.393 12.643 16.381 11.416 3.547 1.641 0.086 0.797 2.160 3.597 13.601
1996 22 9.000 20.000 5.000 20.200 14.700 9.330 0.866 0.084 0.256 2.390 2.490 3.080 30.984 5.036 11.214 16.853 13.180 4.580 1.615 0.085 0.700 2.431 3.639 12.966
1996 23 4.600 30.000 4.000 23.600 6.870 8.630 0.586 0.080 0.331 2.210 2.150 2.810 31.586 9.136 10.071 16.639 13.891 5.627 1.536 0.083 0.564 2.681 3.646 12.284
1996 24 4.000 60.000 2.800 15.200 4.900 9.530 0.413 0.076 0.329 3.680 1.700 30.800 31.843 17.550 9.186 16.910 14.363 6.854 1.487 0.081 0.437 3.101 3.533 11.813
1996 25 3.200 25.000 17.300 9.310 3.410 9.960 0.291 0.066 0.782 3.860 1.600 11.000 28.014 20.979 10.300 16.871 14.613 8.103 1.465 0.078 0.419 3.533 2.871 9.170
1996 26 3.000 23.000 27.000 10.200 2.420 4.050 0.244 0.060 0.906 2.890 1.450 7.000 9.729 24.129 11.586 16.973 14.780 8.364 1.019 0.075 0.463 3.207 2.321 8.884
1996 27 4.000 20.000 12.000 9.230 1.800 2.210 0.215 0.395 0.855 2.350 1.180 5.000 6.171 26.857 11.014 15.120 14.357 7.536 0.576 0.121 0.533 2.909 1.944 8.956
1996 28 6.000 13.000 8.000 5.620 1.380 1.360 0.176 0.405 15.900 2.020 1.160 4.050 4.829 27.286 10.871 13.337 5.069 6.439 0.399 0.167 2.766 2.771 1.676 9.106
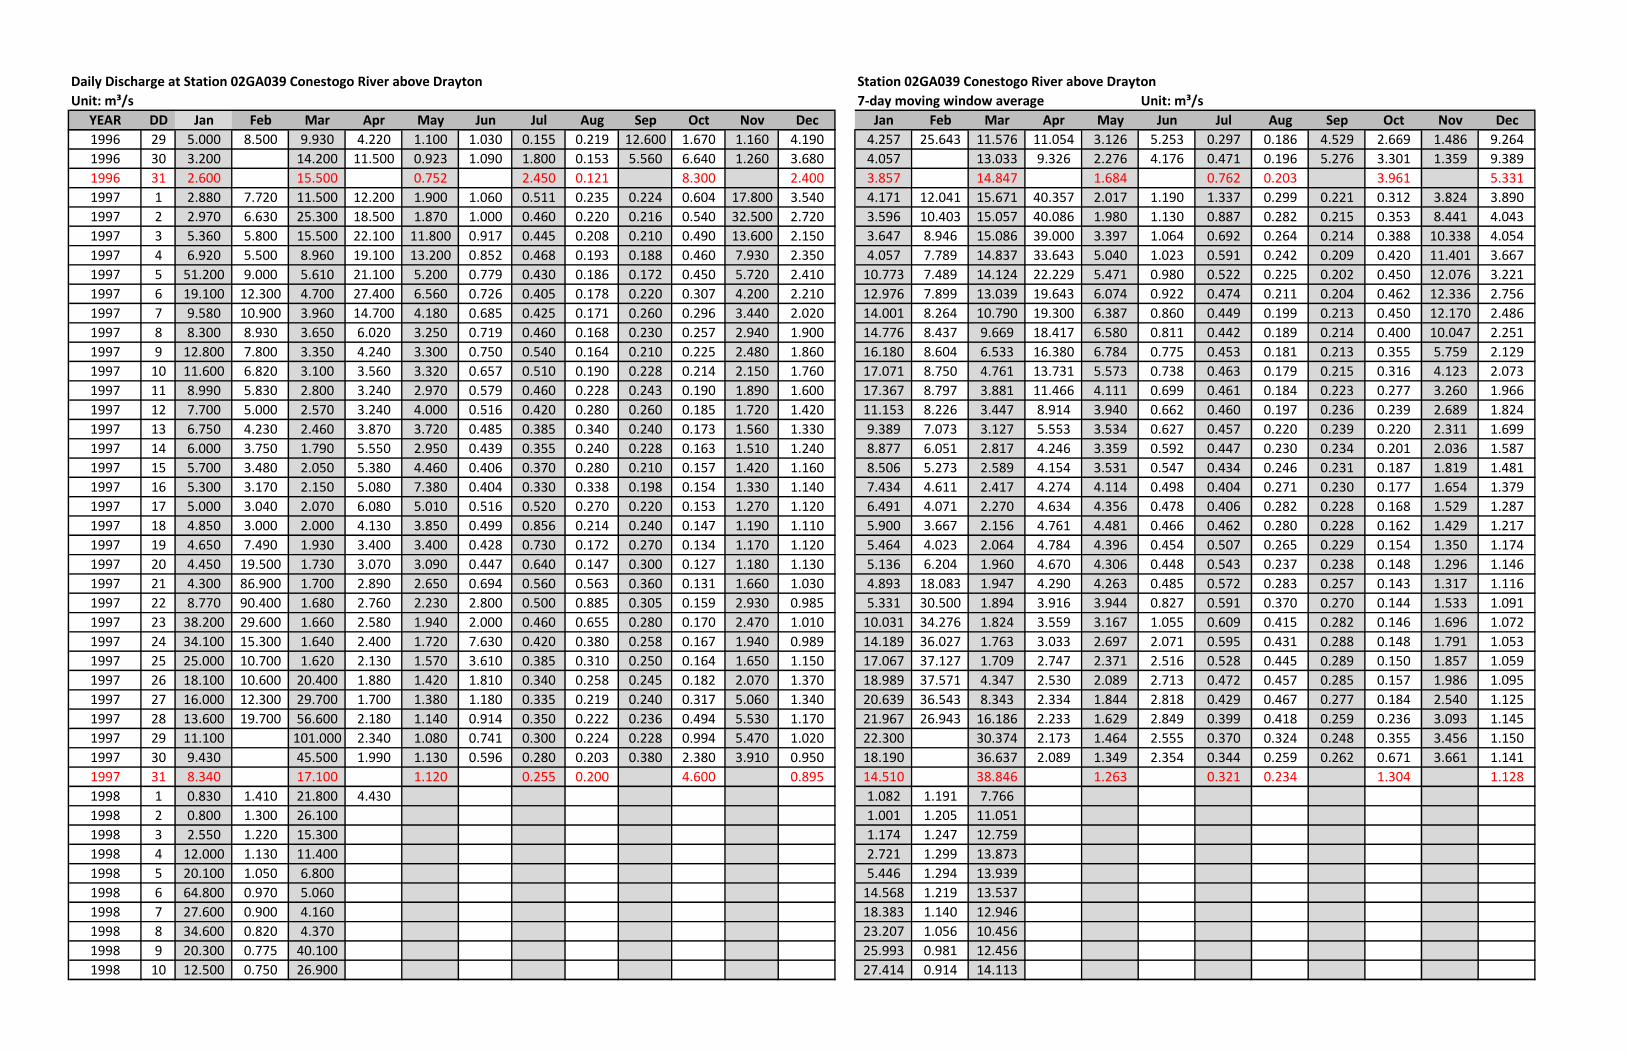
Daily Discharge at Station 02GA039 Conestogo River above Drayton Station 02GA039 Conestogo River above Drayton
Unit: m³/s 7-day moving window average Unit: m³/s
YEAR DD Jan Feb Mar Apr May Jun Jul Aug Sep Oct Nov Dec Jan Feb Mar Apr May Jun Jul Aug Sep Oct Nov Dec
1996 29 5.000 8.500 9.930 4.220 1.100 1.030 0.155 0.219 12.600 1.670 1.160 4.190 4.257 25.643 11.576 11.054 3.126 5.253 0.297 0.186 4.529 2.669 1.486 9.264
1996 30 3.200 14.200 11.500 0.923 1.090 1.800 0.153 5.560 6.640 1.260 3.680 4.057 13.033 9.326 2.276 4.176 0.471 0.196 5.276 3.301 1.359 9.389
1996 31 2.600 15.500 0.752 2.450 0.121 8.300 2.400 3.857 14.847 1.684 0.762 0.203 3.961 5.331
1997 1 2.880 7.720 11.500 12.200 1.900 1.060 0.511 0.235 0.224 0.604 17.800 3.540 4.171 12.041 15.671 40.357 2.017 1.190 1.337 0.299 0.221 0.312 3.824 3.890
1997 2 2.970 6.630 25.300 18.500 1.870 1.000 0.460 0.220 0.216 0.540 32.500 2.720 3.596 10.403 15.057 40.086 1.980 1.130 0.887 0.282 0.215 0.353 8.441 4.043
1997 3 5.360 5.800 15.500 22.100 11.800 0.917 0.445 0.208 0.210 0.490 13.600 2.150 3.647 8.946 15.086 39.000 3.397 1.064 0.692 0.264 0.214 0.388 10.338 4.054
1997 4 6.920 5.500 8.960 19.100 13.200 0.852 0.468 0.193 0.188 0.460 7.930 2.350 4.057 7.789 14.837 33.643 5.040 1.023 0.591 0.242 0.209 0.420 11.401 3.667
1997 5 51.200 9.000 5.610 21.100 5.200 0.779 0.430 0.186 0.172 0.450 5.720 2.410 10.773 7.489 14.124 22.229 5.471 0.980 0.522 0.225 0.202 0.450 12.076 3.221
1997 6 19.100 12.300 4.700 27.400 6.560 0.726 0.405 0.178 0.220 0.307 4.200 2.210 12.976 7.899 13.039 19.643 6.074 0.922 0.474 0.211 0.204 0.462 12.336 2.756
1997 7 9.580 10.900 3.960 14.700 4.180 0.685 0.425 0.171 0.260 0.296 3.440 2.020 14.001 8.264 10.790 19.300 6.387 0.860 0.449 0.199 0.213 0.450 12.170 2.486
1997 8 8.300 8.930 3.650 6.020 3.250 0.719 0.460 0.168 0.230 0.257 2.940 1.900 14.776 8.437 9.669 18.417 6.580 0.811 0.442 0.189 0.214 0.400 10.047 2.251
1997 9 12.800 7.800 3.350 4.240 3.300 0.750 0.540 0.164 0.210 0.225 2.480 1.860 16.180 8.604 6.533 16.380 6.784 0.775 0.453 0.181 0.213 0.355 5.759 2.129
1997 10 11.600 6.820 3.100 3.560 3.320 0.657 0.510 0.190 0.228 0.214 2.150 1.760 17.071 8.750 4.761 13.731 5.573 0.738 0.463 0.179 0.215 0.316 4.123 2.073
1997 11 8.990 5.830 2.800 3.240 2.970 0.579 0.460 0.228 0.243 0.190 1.890 1.600 17.367 8.797 3.881 11.466 4.111 0.699 0.461 0.184 0.223 0.277 3.260 1.966
1997 12 7.700 5.000 2.570 3.240 4.000 0.516 0.420 0.280 0.260 0.185 1.720 1.420 11.153 8.226 3.447 8.914 3.940 0.662 0.460 0.197 0.236 0.239 2.689 1.824
1997 13 6.750 4.230 2.460 3.870 3.720 0.485 0.385 0.340 0.240 0.173 1.560 1.330 9.389 7.073 3.127 5.553 3.534 0.627 0.457 0.220 0.239 0.220 2.311 1.699
1997 14 6.000 3.750 1.790 5.550 2.950 0.439 0.355 0.240 0.228 0.163 1.510 1.240 8.877 6.051 2.817 4.246 3.359 0.592 0.447 0.230 0.234 0.201 2.036 1.587
1997 15 5.700 3.480 2.050 5.380 4.460 0.406 0.370 0.280 0.210 0.157 1.420 1.160 8.506 5.273 2.589 4.154 3.531 0.547 0.434 0.246 0.231 0.187 1.819 1.481
1997 16 5.300 3.170 2.150 5.080 7.380 0.404 0.330 0.338 0.198 0.154 1.330 1.140 7.434 4.611 2.417 4.274 4.114 0.498 0.404 0.271 0.230 0.177 1.654 1.379
1997 17 5.000 3.040 2.070 6.080 5.010 0.516 0.520 0.270 0.220 0.153 1.270 1.120 6.491 4.071 2.270 4.634 4.356 0.478 0.406 0.282 0.228 0.168 1.529 1.287
1997 18 4.850 3.000 2.000 4.130 3.850 0.499 0.856 0.214 0.240 0.147 1.190 1.110 5.900 3.667 2.156 4.761 4.481 0.466 0.462 0.280 0.228 0.162 1.429 1.217
1997 19 4.650 7.490 1.930 3.400 3.400 0.428 0.730 0.172 0.270 0.134 1.170 1.120 5.464 4.023 2.064 4.784 4.396 0.454 0.507 0.265 0.229 0.154 1.350 1.174
1997 20 4.450 19.500 1.730 3.070 3.090 0.447 0.640 0.147 0.300 0.127 1.180 1.130 5.136 6.204 1.960 4.670 4.306 0.448 0.543 0.237 0.238 0.148 1.296 1.146
1997 21 4.300 86.900 1.700 2.890 2.650 0.694 0.560 0.563 0.360 0.131 1.660 1.030 4.893 18.083 1.947 4.290 4.263 0.485 0.572 0.283 0.257 0.143 1.317 1.116
1997 22 8.770 90.400 1.680 2.760 2.230 2.800 0.500 0.885 0.305 0.159 2.930 0.985 5.331 30.500 1.894 3.916 3.944 0.827 0.591 0.370 0.270 0.144 1.533 1.091
1997 23 38.200 29.600 1.660 2.580 1.940 2.000 0.460 0.655 0.280 0.170 2.470 1.010 10.031 34.276 1.824 3.559 3.167 1.055 0.609 0.415 0.282 0.146 1.696 1.072
1997 24 34.100 15.300 1.640 2.400 1.720 7.630 0.420 0.380 0.258 0.167 1.940 0.989 14.189 36.027 1.763 3.033 2.697 2.071 0.595 0.431 0.288 0.148 1.791 1.053
1997 25 25.000 10.700 1.620 2.130 1.570 3.610 0.385 0.310 0.250 0.164 1.650 1.150 17.067 37.127 1.709 2.747 2.371 2.516 0.528 0.445 0.289 0.150 1.857 1.059
1997 26 18.100 10.600 20.400 1.880 1.420 1.810 0.340 0.258 0.245 0.182 2.070 1.370 18.989 37.571 4.347 2.530 2.089 2.713 0.472 0.457 0.285 0.157 1.986 1.095
1997 27 16.000 12.300 29.700 1.700 1.380 1.180 0.335 0.219 0.240 0.317 5.060 1.340 20.639 36.543 8.343 2.334 1.844 2.818 0.429 0.467 0.277 0.184 2.540 1.125
1997 28 13.600 19.700 56.600 2.180 1.140 0.914 0.350 0.222 0.236 0.494 5.530 1.170 21.967 26.943 16.186 2.233 1.629 2.849 0.399 0.418 0.259 0.236 3.093 1.145
1997 29 11.100 101.000 2.340 1.080 0.741 0.300 0.224 0.228 0.994 5.470 1.020 22.300 30.374 2.173 1.464 2.555 0.370 0.324 0.248 0.355 3.456 1.150
1997 30 9.430 45.500 1.990 1.130 0.596 0.280 0.203 0.380 2.380 3.910 0.950 18.190 36.637 2.089 1.349 2.354 0.344 0.259 0.262 0.671 3.661 1.141
1997 31 8.340 17.100 1.120 0.255 0.200 4.600 0.895 14.510 38.846 1.263 0.321 0.234 1.304 1.128
1998 1 0.830 1.410 21.800 4.430 1.082 1.191 7.766
1998 2 0.800 1.300 26.100 1.001 1.205 11.051
1998 3 2.550 1.220 15.300 1.174 1.247 12.759
1998 4 12.000 1.130 11.400 2.721 1.299 13.873
1998 5 20.100 1.050 6.800 5.446 1.294 13.939
1998 6 64.800 0.970 5.060 14.568 1.219 13.537
1998 7 27.600 0.900 4.160 18.383 1.140 12.946
1998 8 34.600 0.820 4.370 23.207 1.056 10.456
1998 9 20.300 0.775 40.100 25.993 0.981 12.456
1998 10 12.500 0.750 26.900 27.414 0.914 14.113
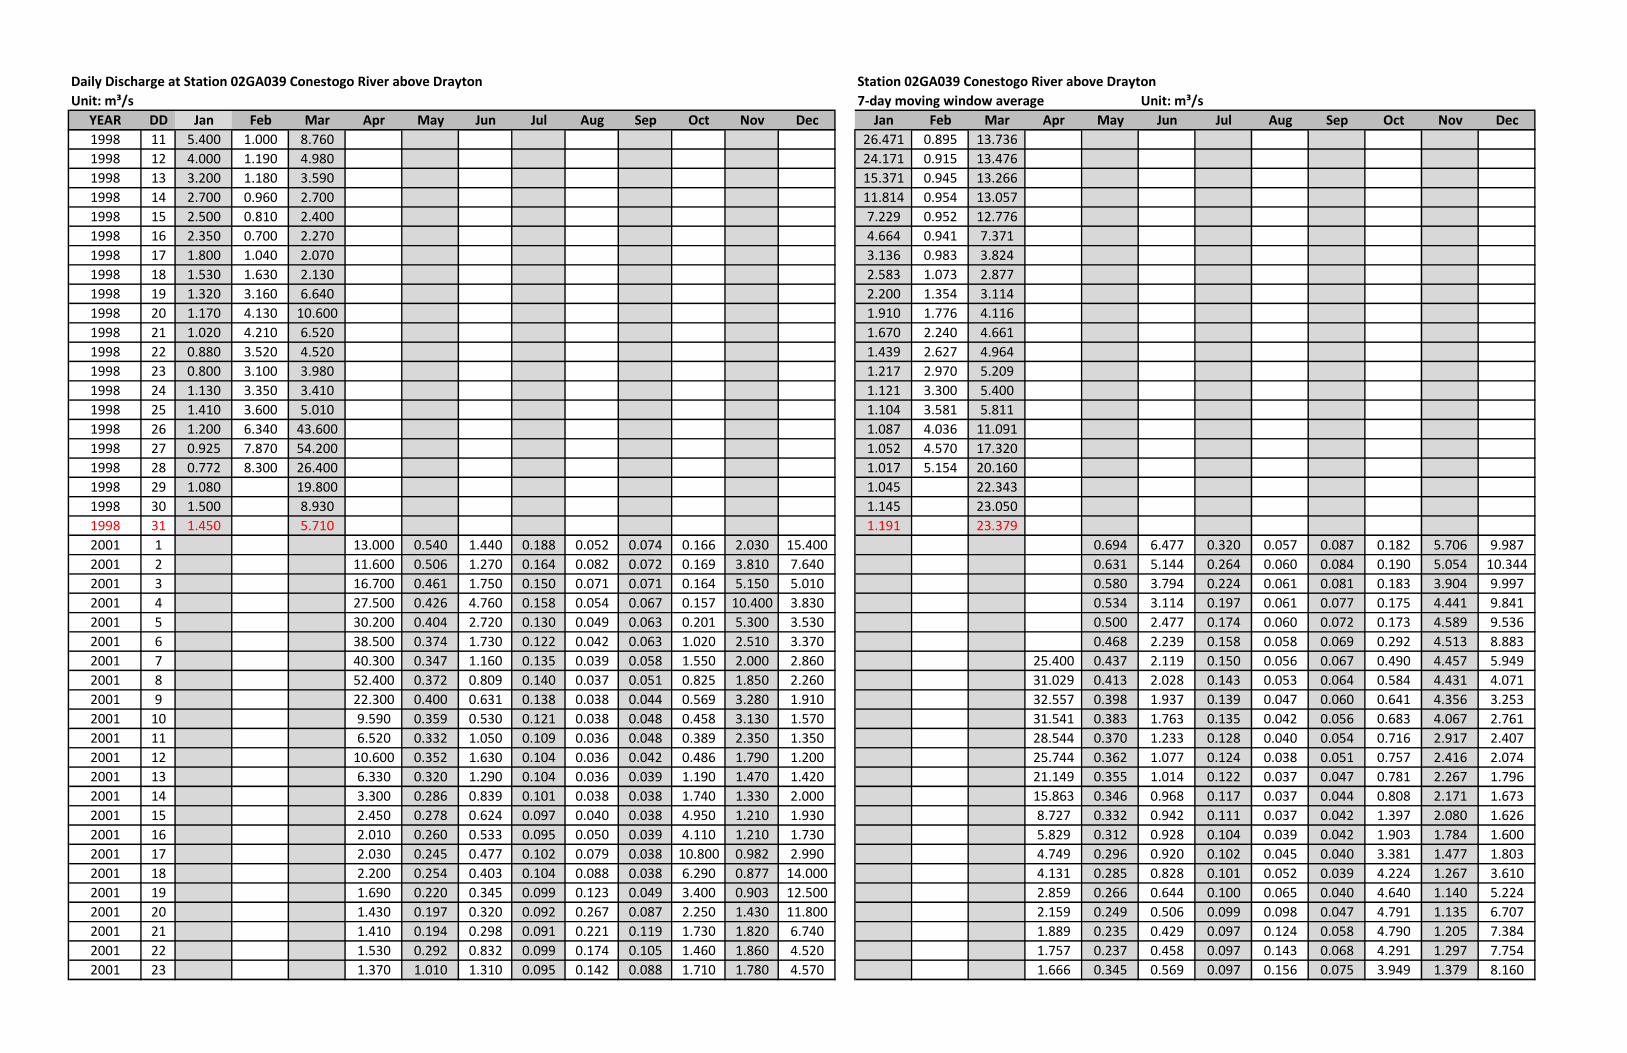
Daily Discharge at Station 02GA039 Conestogo River above Drayton Station 02GA039 Conestogo River above Drayton
Unit: m³/s 7-day moving window average Unit: m³/s
YEAR DD Jan Feb Mar Apr May Jun Jul Aug Sep Oct Nov Dec Jan Feb Mar Apr May Jun Jul Aug Sep Oct Nov Dec
1998 11 5.400 1.000 8.760 26.471 0.895 13.736
1998 12 4.000 1.190 4.980 24.171 0.915 13.476
1998 13 3.200 1.180 3.590 15.371 0.945 13.266
1998 14 2.700 0.960 2.700 11.814 0.954 13.057
1998 15 2.500 0.810 2.400 7.229 0.952 12.776
1998 16 2.350 0.700 2.270 4.664 0.941 7.371
1998 17 1.800 1.040 2.070 3.136 0.983 3.824
1998 18 1.530 1.630 2.130 2.583 1.073 2.877
1998 19 1.320 3.160 6.640 2.200 1.354 3.114
1998 20 1.170 4.130 10.600 1.910 1.776 4.116
1998 21 1.020 4.210 6.520 1.670 2.240 4.661
1998 22 0.880 3.520 4.520 1.439 2.627 4.964
1998 23 0.800 3.100 3.980 1.217 2.970 5.209
1998 24 1.130 3.350 3.410 1.121 3.300 5.400
1998 25 1.410 3.600 5.010 1.104 3.581 5.811
1998 26 1.200 6.340 43.600 1.087 4.036 11.091
1998 27 0.925 7.870 54.200 1.052 4.570 17.320
1998 28 0.772 8.300 26.400 1.017 5.154 20.160
1998 29 1.080 19.800 1.045 22.343
1998 30 1.500 8.930 1.145 23.050
1998 31 1.450 5.710 1.191 23.379
2001 1 13.000 0.540 1.440 0.188 0.052 0.074 0.166 2.030 15.400 0.694 6.477 0.320 0.057 0.087 0.182 5.706 9.987
2001 2 11.600 0.506 1.270 0.164 0.082 0.072 0.169 3.810 7.640 0.631 5.144 0.264 0.060 0.084 0.190 5.054 10.344
2001 3 16.700 0.461 1.750 0.150 0.071 0.071 0.164 5.150 5.010 0.580 3.794 0.224 0.061 0.081 0.183 3.904 9.997
2001 4 27.500 0.426 4.760 0.158 0.054 0.067 0.157 10.400 3.830 0.534 3.114 0.197 0.061 0.077 0.175 4.441 9.841
2001 5 30.200 0.404 2.720 0.130 0.049 0.063 0.201 5.300 3.530 0.500 2.477 0.174 0.060 0.072 0.173 4.589 9.536
2001 6 38.500 0.374 1.730 0.122 0.042 0.063 1.020 2.510 3.370 0.468 2.239 0.158 0.058 0.069 0.292 4.513 8.883
2001 7 40.300 0.347 1.160 0.135 0.039 0.058 1.550 2.000 2.860 25.400 0.437 2.119 0.150 0.056 0.067 0.490 4.457 5.949
2001 8 52.400 0.372 0.809 0.140 0.037 0.051 0.825 1.850 2.260 31.029 0.413 2.028 0.143 0.053 0.064 0.584 4.431 4.071
2001 9 22.300 0.400 0.631 0.138 0.038 0.044 0.569 3.280 1.910 32.557 0.398 1.937 0.139 0.047 0.060 0.641 4.356 3.253
2001 10 9.590 0.359 0.530 0.121 0.038 0.048 0.458 3.130 1.570 31.541 0.383 1.763 0.135 0.042 0.056 0.683 4.067 2.761
2001 11 6.520 0.332 1.050 0.109 0.036 0.048 0.389 2.350 1.350 28.544 0.370 1.233 0.128 0.040 0.054 0.716 2.917 2.407
2001 12 10.600 0.352 1.630 0.104 0.036 0.042 0.486 1.790 1.200 25.744 0.362 1.077 0.124 0.038 0.051 0.757 2.416 2.074
2001 13 6.330 0.320 1.290 0.104 0.036 0.039 1.190 1.470 1.420 21.149 0.355 1.014 0.122 0.037 0.047 0.781 2.267 1.796
2001 14 3.300 0.286 0.839 0.101 0.038 0.038 1.740 1.330 2.000 15.863 0.346 0.968 0.117 0.037 0.044 0.808 2.171 1.673
2001 15 2.450 0.278 0.624 0.097 0.040 0.038 4.950 1.210 1.930 8.727 0.332 0.942 0.111 0.037 0.042 1.397 2.080 1.626
2001 16 2.010 0.260 0.533 0.095 0.050 0.039 4.110 1.210 1.730 5.829 0.312 0.928 0.104 0.039 0.042 1.903 1.784 1.600
2001 17 2.030 0.245 0.477 0.102 0.079 0.038 10.800 0.982 2.990 4.749 0.296 0.920 0.102 0.045 0.040 3.381 1.477 1.803
2001 18 2.200 0.254 0.403 0.104 0.088 0.038 6.290 0.877 14.000 4.131 0.285 0.828 0.101 0.052 0.039 4.224 1.267 3.610
2001 19 1.690 0.220 0.345 0.099 0.123 0.049 3.400 0.903 12.500 2.859 0.266 0.644 0.100 0.065 0.040 4.640 1.140 5.224
2001 20 1.430 0.197 0.320 0.092 0.267 0.087 2.250 1.430 11.800 2.159 0.249 0.506 0.099 0.098 0.047 4.791 1.135 6.707
2001 21 1.410 0.194 0.298 0.091 0.221 0.119 1.730 1.820 6.740 1.889 0.235 0.429 0.097 0.124 0.058 4.790 1.205 7.384
2001 22 1.530 0.292 0.832 0.099 0.174 0.105 1.460 1.860 4.520 1.757 0.237 0.458 0.097 0.143 0.068 4.291 1.297 7.754
2001 23 1.370 1.010 1.310 0.095 0.142 0.088 1.710 1.780 4.570 1.666 0.345 0.569 0.097 0.156 0.075 3.949 1.379 8.160
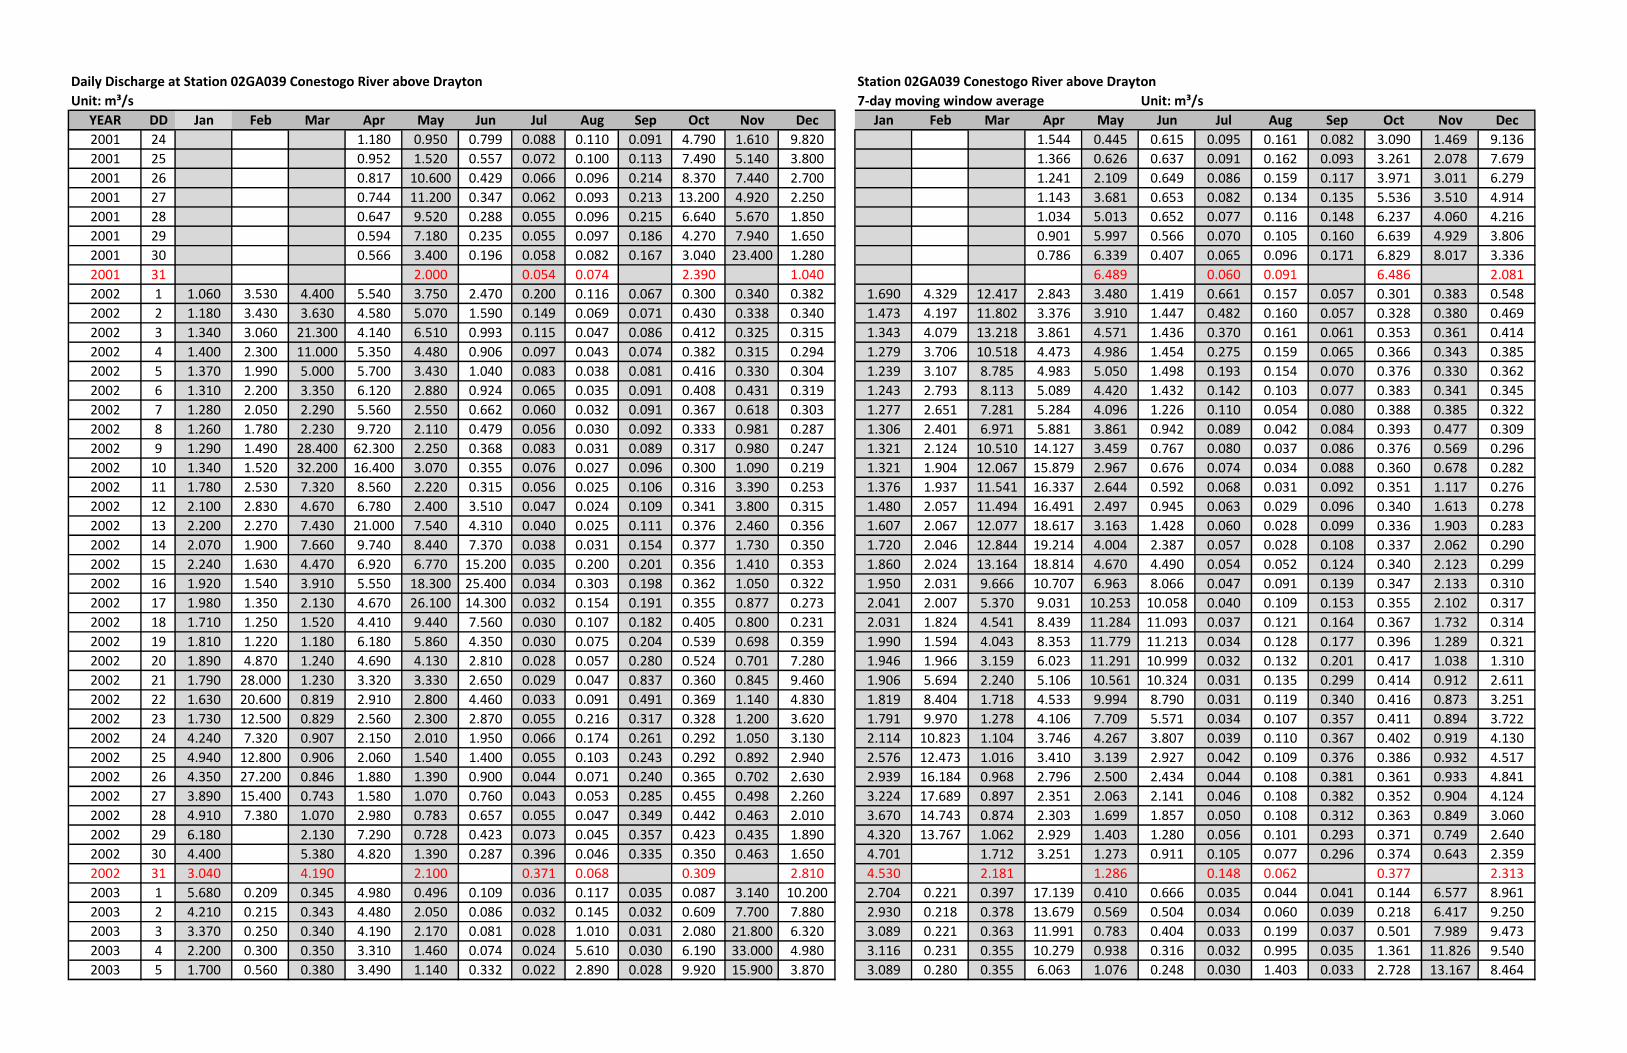
Daily Discharge at Station 02GA039 Conestogo River above Drayton Station 02GA039 Conestogo River above Drayton
Unit: m³/s 7-day moving window average Unit: m³/s
YEAR DD Jan Feb Mar Apr May Jun Jul Aug Sep Oct Nov Dec Jan Feb Mar Apr May Jun Jul Aug Sep Oct Nov Dec
2001 24 1.180 0.950 0.799 0.088 0.110 0.091 4.790 1.610 9.820 1.544 0.445 0.615 0.095 0.161 0.082 3.090 1.469 9.136
2001 25 0.952 1.520 0.557 0.072 0.100 0.113 7.490 5.140 3.800 1.366 0.626 0.637 0.091 0.162 0.093 3.261 2.078 7.679
2001 26 0.817 10.600 0.429 0.066 0.096 0.214 8.370 7.440 2.700 1.241 2.109 0.649 0.086 0.159 0.117 3.971 3.011 6.279
2001 27 0.744 11.200 0.347 0.062 0.093 0.213 13.200 4.920 2.250 1.143 3.681 0.653 0.082 0.134 0.135 5.536 3.510 4.914
2001 28 0.647 9.520 0.288 0.055 0.096 0.215 6.640 5.670 1.850 1.034 5.013 0.652 0.077 0.116 0.148 6.237 4.060 4.216
2001 29 0.594 7.180 0.235 0.055 0.097 0.186 4.270 7.940 1.650 0.901 5.997 0.566 0.070 0.105 0.160 6.639 4.929 3.806
2001 30 0.566 3.400 0.196 0.058 0.082 0.167 3.040 23.400 1.280 0.786 6.339 0.407 0.065 0.096 0.171 6.829 8.017 3.336
2001 31 2.000 0.054 0.074 2.390 1.040 6.489 0.060 0.091 6.486 2.081
2002 1 1.060 3.530 4.400 5.540 3.750 2.470 0.200 0.116 0.067 0.300 0.340 0.382 1.690 4.329 12.417 2.843 3.480 1.419 0.661 0.157 0.057 0.301 0.383 0.548
2002 2 1.180 3.430 3.630 4.580 5.070 1.590 0.149 0.069 0.071 0.430 0.338 0.340 1.473 4.197 11.802 3.376 3.910 1.447 0.482 0.160 0.057 0.328 0.380 0.469
2002 3 1.340 3.060 21.300 4.140 6.510 0.993 0.115 0.047 0.086 0.412 0.325 0.315 1.343 4.079 13.218 3.861 4.571 1.436 0.370 0.161 0.061 0.353 0.361 0.414
2002 4 1.400 2.300 11.000 5.350 4.480 0.906 0.097 0.043 0.074 0.382 0.315 0.294 1.279 3.706 10.518 4.473 4.986 1.454 0.275 0.159 0.065 0.366 0.343 0.385
2002 5 1.370 1.990 5.000 5.700 3.430 1.040 0.083 0.038 0.081 0.416 0.330 0.304 1.239 3.107 8.785 4.983 5.050 1.498 0.193 0.154 0.070 0.376 0.330 0.362
2002 6 1.310 2.200 3.350 6.120 2.880 0.924 0.065 0.035 0.091 0.408 0.431 0.319 1.243 2.793 8.113 5.089 4.420 1.432 0.142 0.103 0.077 0.383 0.341 0.345
2002 7 1.280 2.050 2.290 5.560 2.550 0.662 0.060 0.032 0.091 0.367 0.618 0.303 1.277 2.651 7.281 5.284 4.096 1.226 0.110 0.054 0.080 0.388 0.385 0.322
2002 8 1.260 1.780 2.230 9.720 2.110 0.479 0.056 0.030 0.092 0.333 0.981 0.287 1.306 2.401 6.971 5.881 3.861 0.942 0.089 0.042 0.084 0.393 0.477 0.309
2002 9 1.290 1.490 28.400 62.300 2.250 0.368 0.083 0.031 0.089 0.317 0.980 0.247 1.321 2.124 10.510 14.127 3.459 0.767 0.080 0.037 0.086 0.376 0.569 0.296
2002 10 1.340 1.520 32.200 16.400 3.070 0.355 0.076 0.027 0.096 0.300 1.090 0.219 1.321 1.904 12.067 15.879 2.967 0.676 0.074 0.034 0.088 0.360 0.678 0.282
2002 11 1.780 2.530 7.320 8.560 2.220 0.315 0.056 0.025 0.106 0.316 3.390 0.253 1.376 1.937 11.541 16.337 2.644 0.592 0.068 0.031 0.092 0.351 1.117 0.276
2002 12 2.100 2.830 4.670 6.780 2.400 3.510 0.047 0.024 0.109 0.341 3.800 0.315 1.480 2.057 11.494 16.491 2.497 0.945 0.063 0.029 0.096 0.340 1.613 0.278
2002 13 2.200 2.270 7.430 21.000 7.540 4.310 0.040 0.025 0.111 0.376 2.460 0.356 1.607 2.067 12.077 18.617 3.163 1.428 0.060 0.028 0.099 0.336 1.903 0.283
2002 14 2.070 1.900 7.660 9.740 8.440 7.370 0.038 0.031 0.154 0.377 1.730 0.350 1.720 2.046 12.844 19.214 4.004 2.387 0.057 0.028 0.108 0.337 2.062 0.290
2002 15 2.240 1.630 4.470 6.920 6.770 15.200 0.035 0.200 0.201 0.356 1.410 0.353 1.860 2.024 13.164 18.814 4.670 4.490 0.054 0.052 0.124 0.340 2.123 0.299
2002 16 1.920 1.540 3.910 5.550 18.300 25.400 0.034 0.303 0.198 0.362 1.050 0.322 1.950 2.031 9.666 10.707 6.963 8.066 0.047 0.091 0.139 0.347 2.133 0.310
2002 17 1.980 1.350 2.130 4.670 26.100 14.300 0.032 0.154 0.191 0.355 0.877 0.273 2.041 2.007 5.370 9.031 10.253 10.058 0.040 0.109 0.153 0.355 2.102 0.317
2002 18 1.710 1.250 1.520 4.410 9.440 7.560 0.030 0.107 0.182 0.405 0.800 0.231 2.031 1.824 4.541 8.439 11.284 11.093 0.037 0.121 0.164 0.367 1.732 0.314
2002 19 1.810 1.220 1.180 6.180 5.860 4.350 0.030 0.075 0.204 0.539 0.698 0.359 1.990 1.594 4.043 8.353 11.779 11.213 0.034 0.128 0.177 0.396 1.289 0.321
2002 20 1.890 4.870 1.240 4.690 4.130 2.810 0.028 0.057 0.280 0.524 0.701 7.280 1.946 1.966 3.159 6.023 11.291 10.999 0.032 0.132 0.201 0.417 1.038 1.310
2002 21 1.790 28.000 1.230 3.320 3.330 2.650 0.029 0.047 0.837 0.360 0.845 9.460 1.906 5.694 2.240 5.106 10.561 10.324 0.031 0.135 0.299 0.414 0.912 2.611
2002 22 1.630 20.600 0.819 2.910 2.800 4.460 0.033 0.091 0.491 0.369 1.140 4.830 1.819 8.404 1.718 4.533 9.994 8.790 0.031 0.119 0.340 0.416 0.873 3.251
2002 23 1.730 12.500 0.829 2.560 2.300 2.870 0.055 0.216 0.317 0.328 1.200 3.620 1.791 9.970 1.278 4.106 7.709 5.571 0.034 0.107 0.357 0.411 0.894 3.722
2002 24 4.240 7.320 0.907 2.150 2.010 1.950 0.066 0.174 0.261 0.292 1.050 3.130 2.114 10.823 1.104 3.746 4.267 3.807 0.039 0.110 0.367 0.402 0.919 4.130
2002 25 4.940 12.800 0.906 2.060 1.540 1.400 0.055 0.103 0.243 0.292 0.892 2.940 2.576 12.473 1.016 3.410 3.139 2.927 0.042 0.109 0.376 0.386 0.932 4.517
2002 26 4.350 27.200 0.846 1.880 1.390 0.900 0.044 0.071 0.240 0.365 0.702 2.630 2.939 16.184 0.968 2.796 2.500 2.434 0.044 0.108 0.381 0.361 0.933 4.841
2002 27 3.890 15.400 0.743 1.580 1.070 0.760 0.043 0.053 0.285 0.455 0.498 2.260 3.224 17.689 0.897 2.351 2.063 2.141 0.046 0.108 0.382 0.352 0.904 4.124
2002 28 4.910 7.380 1.070 2.980 0.783 0.657 0.055 0.047 0.349 0.442 0.463 2.010 3.670 14.743 0.874 2.303 1.699 1.857 0.050 0.108 0.312 0.363 0.849 3.060
2002 29 6.180 2.130 7.290 0.728 0.423 0.073 0.045 0.357 0.423 0.435 1.890 4.320 13.767 1.062 2.929 1.403 1.280 0.056 0.101 0.293 0.371 0.749 2.640
2002 30 4.400 5.380 4.820 1.390 0.287 0.396 0.046 0.335 0.350 0.463 1.650 4.701 1.712 3.251 1.273 0.911 0.105 0.077 0.296 0.374 0.643 2.359
2002 31 3.040 4.190 2.100 0.371 0.068 0.309 2.810 4.530 2.181 1.286 0.148 0.062 0.377 2.313
2003 1 5.680 0.209 0.345 4.980 0.496 0.109 0.036 0.117 0.035 0.087 3.140 10.200 2.704 0.221 0.397 17.139 0.410 0.666 0.035 0.044 0.041 0.144 6.577 8.961
2003 2 4.210 0.215 0.343 4.480 2.050 0.086 0.032 0.145 0.032 0.609 7.700 7.880 2.930 0.218 0.378 13.679 0.569 0.504 0.034 0.060 0.039 0.218 6.417 9.250
2003 3 3.370 0.250 0.340 4.190 2.170 0.081 0.028 1.010 0.031 2.080 21.800 6.320 3.089 0.221 0.363 11.991 0.783 0.404 0.033 0.199 0.037 0.501 7.989 9.473
2003 4 2.200 0.300 0.350 3.310 1.460 0.074 0.024 5.610 0.030 6.190 33.000 4.980 3.116 0.231 0.355 10.279 0.938 0.316 0.032 0.995 0.035 1.361 11.826 9.540
2003 5 1.700 0.560 0.380 3.490 1.140 0.332 0.022 2.890 0.028 9.920 15.900 3.870 3.089 0.280 0.355 6.063 1.076 0.248 0.030 1.403 0.033 2.728 13.167 8.464
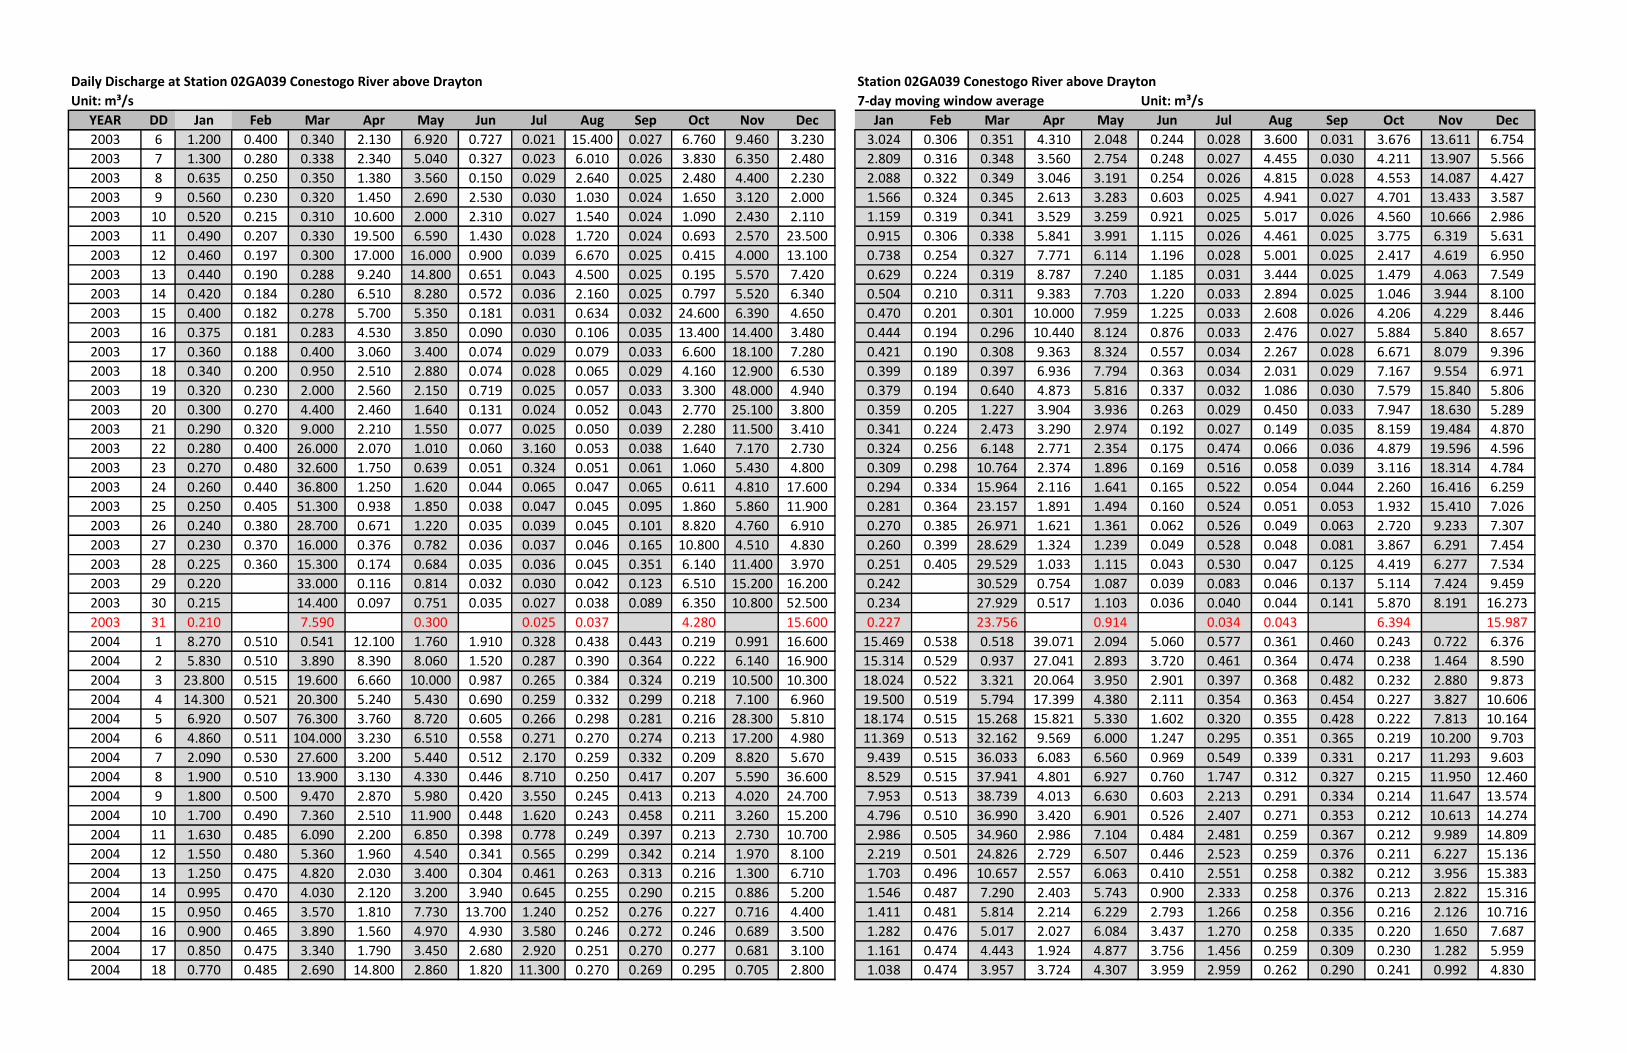
Daily Discharge at Station 02GA039 Conestogo River above Drayton Station 02GA039 Conestogo River above Drayton
Unit: m³/s 7-day moving window average Unit: m³/s
YEAR DD Jan Feb Mar Apr May Jun Jul Aug Sep Oct Nov Dec Jan Feb Mar Apr May Jun Jul Aug Sep Oct Nov Dec
2003 6 1.200 0.400 0.340 2.130 6.920 0.727 0.021 15.400 0.027 6.760 9.460 3.230 3.024 0.306 0.351 4.310 2.048 0.244 0.028 3.600 0.031 3.676 13.611 6.754
2003 7 1.300 0.280 0.338 2.340 5.040 0.327 0.023 6.010 0.026 3.830 6.350 2.480 2.809 0.316 0.348 3.560 2.754 0.248 0.027 4.455 0.030 4.211 13.907 5.566
2003 8 0.635 0.250 0.350 1.380 3.560 0.150 0.029 2.640 0.025 2.480 4.400 2.230 2.088 0.322 0.349 3.046 3.191 0.254 0.026 4.815 0.028 4.553 14.087 4.427
2003 9 0.560 0.230 0.320 1.450 2.690 2.530 0.030 1.030 0.024 1.650 3.120 2.000 1.566 0.324 0.345 2.613 3.283 0.603 0.025 4.941 0.027 4.701 13.433 3.587
2003 10 0.520 0.215 0.310 10.600 2.000 2.310 0.027 1.540 0.024 1.090 2.430 2.110 1.159 0.319 0.341 3.529 3.259 0.921 0.025 5.017 0.026 4.560 10.666 2.986
2003 11 0.490 0.207 0.330 19.500 6.590 1.430 0.028 1.720 0.024 0.693 2.570 23.500 0.915 0.306 0.338 5.841 3.991 1.115 0.026 4.461 0.025 3.775 6.319 5.631
2003 12 0.460 0.197 0.300 17.000 16.000 0.900 0.039 6.670 0.025 0.415 4.000 13.100 0.738 0.254 0.327 7.771 6.114 1.196 0.028 5.001 0.025 2.417 4.619 6.950
2003 13 0.440 0.190 0.288 9.240 14.800 0.651 0.043 4.500 0.025 0.195 5.570 7.420 0.629 0.224 0.319 8.787 7.240 1.185 0.031 3.444 0.025 1.479 4.063 7.549
2003 14 0.420 0.184 0.280 6.510 8.280 0.572 0.036 2.160 0.025 0.797 5.520 6.340 0.504 0.210 0.311 9.383 7.703 1.220 0.033 2.894 0.025 1.046 3.944 8.100
2003 15 0.400 0.182 0.278 5.700 5.350 0.181 0.031 0.634 0.032 24.600 6.390 4.650 0.470 0.201 0.301 10.000 7.959 1.225 0.033 2.608 0.026 4.206 4.229 8.446
2003 16 0.375 0.181 0.283 4.530 3.850 0.090 0.030 0.106 0.035 13.400 14.400 3.480 0.444 0.194 0.296 10.440 8.124 0.876 0.033 2.476 0.027 5.884 5.840 8.657
2003 17 0.360 0.188 0.400 3.060 3.400 0.074 0.029 0.079 0.033 6.600 18.100 7.280 0.421 0.190 0.308 9.363 8.324 0.557 0.034 2.267 0.028 6.671 8.079 9.396
2003 18 0.340 0.200 0.950 2.510 2.880 0.074 0.028 0.065 0.029 4.160 12.900 6.530 0.399 0.189 0.397 6.936 7.794 0.363 0.034 2.031 0.029 7.167 9.554 6.971
2003 19 0.320 0.230 2.000 2.560 2.150 0.719 0.025 0.057 0.033 3.300 48.000 4.940 0.379 0.194 0.640 4.873 5.816 0.337 0.032 1.086 0.030 7.579 15.840 5.806
2003 20 0.300 0.270 4.400 2.460 1.640 0.131 0.024 0.052 0.043 2.770 25.100 3.800 0.359 0.205 1.227 3.904 3.936 0.263 0.029 0.450 0.033 7.947 18.630 5.289
2003 21 0.290 0.320 9.000 2.210 1.550 0.077 0.025 0.050 0.039 2.280 11.500 3.410 0.341 0.224 2.473 3.290 2.974 0.192 0.027 0.149 0.035 8.159 19.484 4.870
2003 22 0.280 0.400 26.000 2.070 1.010 0.060 3.160 0.053 0.038 1.640 7.170 2.730 0.324 0.256 6.148 2.771 2.354 0.175 0.474 0.066 0.036 4.879 19.596 4.596
2003 23 0.270 0.480 32.600 1.750 0.639 0.051 0.324 0.051 0.061 1.060 5.430 4.800 0.309 0.298 10.764 2.374 1.896 0.169 0.516 0.058 0.039 3.116 18.314 4.784
2003 24 0.260 0.440 36.800 1.250 1.620 0.044 0.065 0.047 0.065 0.611 4.810 17.600 0.294 0.334 15.964 2.116 1.641 0.165 0.522 0.054 0.044 2.260 16.416 6.259
2003 25 0.250 0.405 51.300 0.938 1.850 0.038 0.047 0.045 0.095 1.860 5.860 11.900 0.281 0.364 23.157 1.891 1.494 0.160 0.524 0.051 0.053 1.932 15.410 7.026
2003 26 0.240 0.380 28.700 0.671 1.220 0.035 0.039 0.045 0.101 8.820 4.760 6.910 0.270 0.385 26.971 1.621 1.361 0.062 0.526 0.049 0.063 2.720 9.233 7.307
2003 27 0.230 0.370 16.000 0.376 0.782 0.036 0.037 0.046 0.165 10.800 4.510 4.830 0.260 0.399 28.629 1.324 1.239 0.049 0.528 0.048 0.081 3.867 6.291 7.454
2003 28 0.225 0.360 15.300 0.174 0.684 0.035 0.036 0.045 0.351 6.140 11.400 3.970 0.251 0.405 29.529 1.033 1.115 0.043 0.530 0.047 0.125 4.419 6.277 7.534
2003 29 0.220 33.000 0.116 0.814 0.032 0.030 0.042 0.123 6.510 15.200 16.200 0.242 30.529 0.754 1.087 0.039 0.083 0.046 0.137 5.114 7.424 9.459
2003 30 0.215 14.400 0.097 0.751 0.035 0.027 0.038 0.089 6.350 10.800 52.500 0.234 27.929 0.517 1.103 0.036 0.040 0.044 0.141 5.870 8.191 16.273
2003 31 0.210 7.590 0.300 0.025 0.037 4.280 15.600 0.227 23.756 0.914 0.034 0.043 6.394 15.987
2004 1 8.270 0.510 0.541 12.100 1.760 1.910 0.328 0.438 0.443 0.219 0.991 16.600 15.469 0.538 0.518 39.071 2.094 5.060 0.577 0.361 0.460 0.243 0.722 6.376
2004 2 5.830 0.510 3.890 8.390 8.060 1.520 0.287 0.390 0.364 0.222 6.140 16.900 15.314 0.529 0.937 27.041 2.893 3.720 0.461 0.364 0.474 0.238 1.464 8.590
2004 3 23.800 0.515 19.600 6.660 10.000 0.987 0.265 0.384 0.324 0.219 10.500 10.300 18.024 0.522 3.321 20.064 3.950 2.901 0.397 0.368 0.482 0.232 2.880 9.873
2004 4 14.300 0.521 20.300 5.240 5.430 0.690 0.259 0.332 0.299 0.218 7.100 6.960 19.500 0.519 5.794 17.399 4.380 2.111 0.354 0.363 0.454 0.227 3.827 10.606
2004 5 6.920 0.507 76.300 3.760 8.720 0.605 0.266 0.298 0.281 0.216 28.300 5.810 18.174 0.515 15.268 15.821 5.330 1.602 0.320 0.355 0.428 0.222 7.813 10.164
2004 6 4.860 0.511 104.000 3.230 6.510 0.558 0.271 0.270 0.274 0.213 17.200 4.980 11.369 0.513 32.162 9.569 6.000 1.247 0.295 0.351 0.365 0.219 10.200 9.703
2004 7 2.090 0.530 27.600 3.200 5.440 0.512 2.170 0.259 0.332 0.209 8.820 5.670 9.439 0.515 36.033 6.083 6.560 0.969 0.549 0.339 0.331 0.217 11.293 9.603
2004 8 1.900 0.510 13.900 3.130 4.330 0.446 8.710 0.250 0.417 0.207 5.590 36.600 8.529 0.515 37.941 4.801 6.927 0.760 1.747 0.312 0.327 0.215 11.950 12.460
2004 9 1.800 0.500 9.470 2.870 5.980 0.420 3.550 0.245 0.413 0.213 4.020 24.700 7.953 0.513 38.739 4.013 6.630 0.603 2.213 0.291 0.334 0.214 11.647 13.574
2004 10 1.700 0.490 7.360 2.510 11.900 0.448 1.620 0.243 0.458 0.211 3.260 15.200 4.796 0.510 36.990 3.420 6.901 0.526 2.407 0.271 0.353 0.212 10.613 14.274
2004 11 1.630 0.485 6.090 2.200 6.850 0.398 0.778 0.249 0.397 0.213 2.730 10.700 2.986 0.505 34.960 2.986 7.104 0.484 2.481 0.259 0.367 0.212 9.989 14.809
2004 12 1.550 0.480 5.360 1.960 4.540 0.341 0.565 0.299 0.342 0.214 1.970 8.100 2.219 0.501 24.826 2.729 6.507 0.446 2.523 0.259 0.376 0.211 6.227 15.136
2004 13 1.250 0.475 4.820 2.030 3.400 0.304 0.461 0.263 0.313 0.216 1.300 6.710 1.703 0.496 10.657 2.557 6.063 0.410 2.551 0.258 0.382 0.212 3.956 15.383
2004 14 0.995 0.470 4.030 2.120 3.200 3.940 0.645 0.255 0.290 0.215 0.886 5.200 1.546 0.487 7.290 2.403 5.743 0.900 2.333 0.258 0.376 0.213 2.822 15.316
2004 15 0.950 0.465 3.570 1.810 7.730 13.700 1.240 0.252 0.276 0.227 0.716 4.400 1.411 0.481 5.814 2.214 6.229 2.793 1.266 0.258 0.356 0.216 2.126 10.716
2004 16 0.900 0.465 3.890 1.560 4.970 4.930 3.580 0.246 0.272 0.246 0.689 3.500 1.282 0.476 5.017 2.027 6.084 3.437 1.270 0.258 0.335 0.220 1.650 7.687
2004 17 0.850 0.475 3.340 1.790 3.450 2.680 2.920 0.251 0.270 0.277 0.681 3.100 1.161 0.474 4.443 1.924 4.877 3.756 1.456 0.259 0.309 0.230 1.282 5.959
2004 18 0.770 0.485 2.690 14.800 2.860 1.820 11.300 0.270 0.269 0.295 0.705 2.800 1.038 0.474 3.957 3.724 4.307 3.959 2.959 0.262 0.290 0.241 0.992 4.830
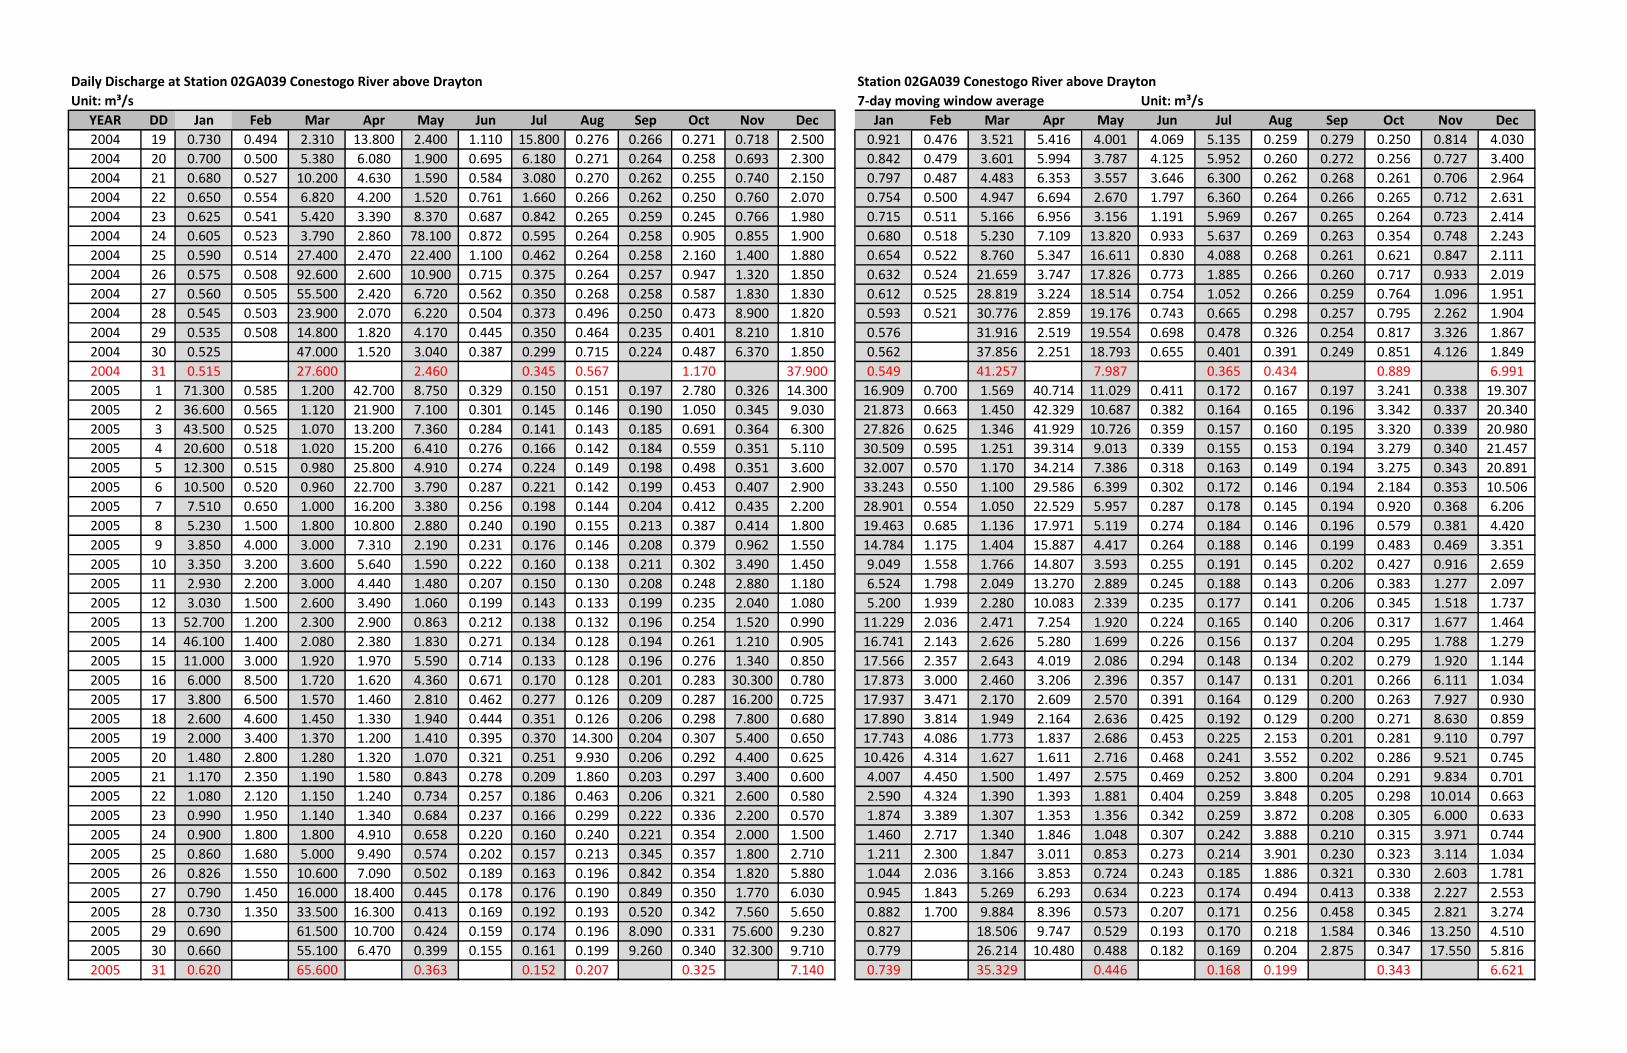
Daily Discharge at Station 02GA039 Conestogo River above Drayton Station 02GA039 Conestogo River above Drayton
Unit: m³/s 7-day moving window average Unit: m³/s
YEAR DD Jan Feb Mar Apr May Jun Jul Aug Sep Oct Nov Dec Jan Feb Mar Apr May Jun Jul Aug Sep Oct Nov Dec
2004 19 0.730 0.494 2.310 13.800 2.400 1.110 15.800 0.276 0.266 0.271 0.718 2.500 0.921 0.476 3.521 5.416 4.001 4.069 5.135 0.259 0.279 0.250 0.814 4.030
2004 20 0.700 0.500 5.380 6.080 1.900 0.695 6.180 0.271 0.264 0.258 0.693 2.300 0.842 0.479 3.601 5.994 3.787 4.125 5.952 0.260 0.272 0.256 0.727 3.400
2004 21 0.680 0.527 10.200 4.630 1.590 0.584 3.080 0.270 0.262 0.255 0.740 2.150 0.797 0.487 4.483 6.353 3.557 3.646 6.300 0.262 0.268 0.261 0.706 2.964
2004 22 0.650 0.554 6.820 4.200 1.520 0.761 1.660 0.266 0.262 0.250 0.760 2.070 0.754 0.500 4.947 6.694 2.670 1.797 6.360 0.264 0.266 0.265 0.712 2.631
2004 23 0.625 0.541 5.420 3.390 8.370 0.687 0.842 0.265 0.259 0.245 0.766 1.980 0.715 0.511 5.166 6.956 3.156 1.191 5.969 0.267 0.265 0.264 0.723 2.414
2004 24 0.605 0.523 3.790 2.860 78.100 0.872 0.595 0.264 0.258 0.905 0.855 1.900 0.680 0.518 5.230 7.109 13.820 0.933 5.637 0.269 0.263 0.354 0.748 2.243
2004 25 0.590 0.514 27.400 2.470 22.400 1.100 0.462 0.264 0.258 2.160 1.400 1.880 0.654 0.522 8.760 5.347 16.611 0.830 4.088 0.268 0.261 0.621 0.847 2.111
2004 26 0.575 0.508 92.600 2.600 10.900 0.715 0.375 0.264 0.257 0.947 1.320 1.850 0.632 0.524 21.659 3.747 17.826 0.773 1.885 0.266 0.260 0.717 0.933 2.019
2004 27 0.560 0.505 55.500 2.420 6.720 0.562 0.350 0.268 0.258 0.587 1.830 1.830 0.612 0.525 28.819 3.224 18.514 0.754 1.052 0.266 0.259 0.764 1.096 1.951
2004 28 0.545 0.503 23.900 2.070 6.220 0.504 0.373 0.496 0.250 0.473 8.900 1.820 0.593 0.521 30.776 2.859 19.176 0.743 0.665 0.298 0.257 0.795 2.262 1.904
2004 29 0.535 0.508 14.800 1.820 4.170 0.445 0.350 0.464 0.235 0.401 8.210 1.810 0.576 31.916 2.519 19.554 0.698 0.478 0.326 0.254 0.817 3.326 1.867
2004 30 0.525 47.000 1.520 3.040 0.387 0.299 0.715 0.224 0.487 6.370 1.850 0.562 37.856 2.251 18.793 0.655 0.401 0.391 0.249 0.851 4.126 1.849
2004 31 0.515 27.600 2.460 0.345 0.567 1.170 37.900 0.549 41.257 7.987 0.365 0.434 0.889 6.991
2005 1 71.300 0.585 1.200 42.700 8.750 0.329 0.150 0.151 0.197 2.780 0.326 14.300 16.909 0.700 1.569 40.714 11.029 0.411 0.172 0.167 0.197 3.241 0.338 19.307
2005 2 36.600 0.565 1.120 21.900 7.100 0.301 0.145 0.146 0.190 1.050 0.345 9.030 21.873 0.663 1.450 42.329 10.687 0.382 0.164 0.165 0.196 3.342 0.337 20.340
2005 3 43.500 0.525 1.070 13.200 7.360 0.284 0.141 0.143 0.185 0.691 0.364 6.300 27.826 0.625 1.346 41.929 10.726 0.359 0.157 0.160 0.195 3.320 0.339 20.980
2005 4 20.600 0.518 1.020 15.200 6.410 0.276 0.166 0.142 0.184 0.559 0.351 5.110 30.509 0.595 1.251 39.314 9.013 0.339 0.155 0.153 0.194 3.279 0.340 21.457
2005 5 12.300 0.515 0.980 25.800 4.910 0.274 0.224 0.149 0.198 0.498 0.351 3.600 32.007 0.570 1.170 34.214 7.386 0.318 0.163 0.149 0.194 3.275 0.343 20.891
2005 6 10.500 0.520 0.960 22.700 3.790 0.287 0.221 0.142 0.199 0.453 0.407 2.900 33.243 0.550 1.100 29.586 6.399 0.302 0.172 0.146 0.194 2.184 0.353 10.506
2005 7 7.510 0.650 1.000 16.200 3.380 0.256 0.198 0.144 0.204 0.412 0.435 2.200 28.901 0.554 1.050 22.529 5.957 0.287 0.178 0.145 0.194 0.920 0.368 6.206
2005 8 5.230 1.500 1.800 10.800 2.880 0.240 0.190 0.155 0.213 0.387 0.414 1.800 19.463 0.685 1.136 17.971 5.119 0.274 0.184 0.146 0.196 0.579 0.381 4.420
2005 9 3.850 4.000 3.000 7.310 2.190 0.231 0.176 0.146 0.208 0.379 0.962 1.550 14.784 1.175 1.404 15.887 4.417 0.264 0.188 0.146 0.199 0.483 0.469 3.351
2005 10 3.350 3.200 3.600 5.640 1.590 0.222 0.160 0.138 0.211 0.302 3.490 1.450 9.049 1.558 1.766 14.807 3.593 0.255 0.191 0.145 0.202 0.427 0.916 2.659
2005 11 2.930 2.200 3.000 4.440 1.480 0.207 0.150 0.130 0.208 0.248 2.880 1.180 6.524 1.798 2.049 13.270 2.889 0.245 0.188 0.143 0.206 0.383 1.277 2.097
2005 12 3.030 1.500 2.600 3.490 1.060 0.199 0.143 0.133 0.199 0.235 2.040 1.080 5.200 1.939 2.280 10.083 2.339 0.235 0.177 0.141 0.206 0.345 1.518 1.737
2005 13 52.700 1.200 2.300 2.900 0.863 0.212 0.138 0.132 0.196 0.254 1.520 0.990 11.229 2.036 2.471 7.254 1.920 0.224 0.165 0.140 0.206 0.317 1.677 1.464
2005 14 46.100 1.400 2.080 2.380 1.830 0.271 0.134 0.128 0.194 0.261 1.210 0.905 16.741 2.143 2.626 5.280 1.699 0.226 0.156 0.137 0.204 0.295 1.788 1.279
2005 15 11.000 3.000 1.920 1.970 5.590 0.714 0.133 0.128 0.196 0.276 1.340 0.850 17.566 2.357 2.643 4.019 2.086 0.294 0.148 0.134 0.202 0.279 1.920 1.144
2005 16 6.000 8.500 1.720 1.620 4.360 0.671 0.170 0.128 0.201 0.283 30.300 0.780 17.873 3.000 2.460 3.206 2.396 0.357 0.147 0.131 0.201 0.266 6.111 1.034
2005 17 3.800 6.500 1.570 1.460 2.810 0.462 0.277 0.126 0.209 0.287 16.200 0.725 17.937 3.471 2.170 2.609 2.570 0.391 0.164 0.129 0.200 0.263 7.927 0.930
2005 18 2.600 4.600 1.450 1.330 1.940 0.444 0.351 0.126 0.206 0.298 7.800 0.680 17.890 3.814 1.949 2.164 2.636 0.425 0.192 0.129 0.200 0.271 8.630 0.859
2005 19 2.000 3.400 1.370 1.200 1.410 0.395 0.370 14.300 0.204 0.307 5.400 0.650 17.743 4.086 1.773 1.837 2.686 0.453 0.225 2.153 0.201 0.281 9.110 0.797
2005 20 1.480 2.800 1.280 1.320 1.070 0.321 0.251 9.930 0.206 0.292 4.400 0.625 10.426 4.314 1.627 1.611 2.716 0.468 0.241 3.552 0.202 0.286 9.521 0.745
2005 21 1.170 2.350 1.190 1.580 0.843 0.278 0.209 1.860 0.203 0.297 3.400 0.600 4.007 4.450 1.500 1.497 2.575 0.469 0.252 3.800 0.204 0.291 9.834 0.701
2005 22 1.080 2.120 1.150 1.240 0.734 0.257 0.186 0.463 0.206 0.321 2.600 0.580 2.590 4.324 1.390 1.393 1.881 0.404 0.259 3.848 0.205 0.298 10.014 0.663
2005 23 0.990 1.950 1.140 1.340 0.684 0.237 0.166 0.299 0.222 0.336 2.200 0.570 1.874 3.389 1.307 1.353 1.356 0.342 0.259 3.872 0.208 0.305 6.000 0.633
2005 24 0.900 1.800 1.800 4.910 0.658 0.220 0.160 0.240 0.221 0.354 2.000 1.500 1.460 2.717 1.340 1.846 1.048 0.307 0.242 3.888 0.210 0.315 3.971 0.744
2005 25 0.860 1.680 5.000 9.490 0.574 0.202 0.157 0.213 0.345 0.357 1.800 2.710 1.211 2.300 1.847 3.011 0.853 0.273 0.214 3.901 0.230 0.323 3.114 1.034
2005 26 0.826 1.550 10.600 7.090 0.502 0.189 0.163 0.196 0.842 0.354 1.820 5.880 1.044 2.036 3.166 3.853 0.724 0.243 0.185 1.886 0.321 0.330 2.603 1.781
2005 27 0.790 1.450 16.000 18.400 0.445 0.178 0.176 0.190 0.849 0.350 1.770 6.030 0.945 1.843 5.269 6.293 0.634 0.223 0.174 0.494 0.413 0.338 2.227 2.553
2005 28 0.730 1.350 33.500 16.300 0.413 0.169 0.192 0.193 0.520 0.342 7.560 5.650 0.882 1.700 9.884 8.396 0.573 0.207 0.171 0.256 0.458 0.345 2.821 3.274
2005 29 0.690 61.500 10.700 0.424 0.159 0.174 0.196 8.090 0.331 75.600 9.230 0.827 18.506 9.747 0.529 0.193 0.170 0.218 1.584 0.346 13.250 4.510
2005 30 0.660 55.100 6.470 0.399 0.155 0.161 0.199 9.260 0.340 32.300 9.710 0.779 26.214 10.480 0.488 0.182 0.169 0.204 2.875 0.347 17.550 5.816
2005 31 0.620 65.600 0.363 0.152 0.207 0.325 7.140 0.739 35.329 0.446 0.168 0.199 0.343 6.621
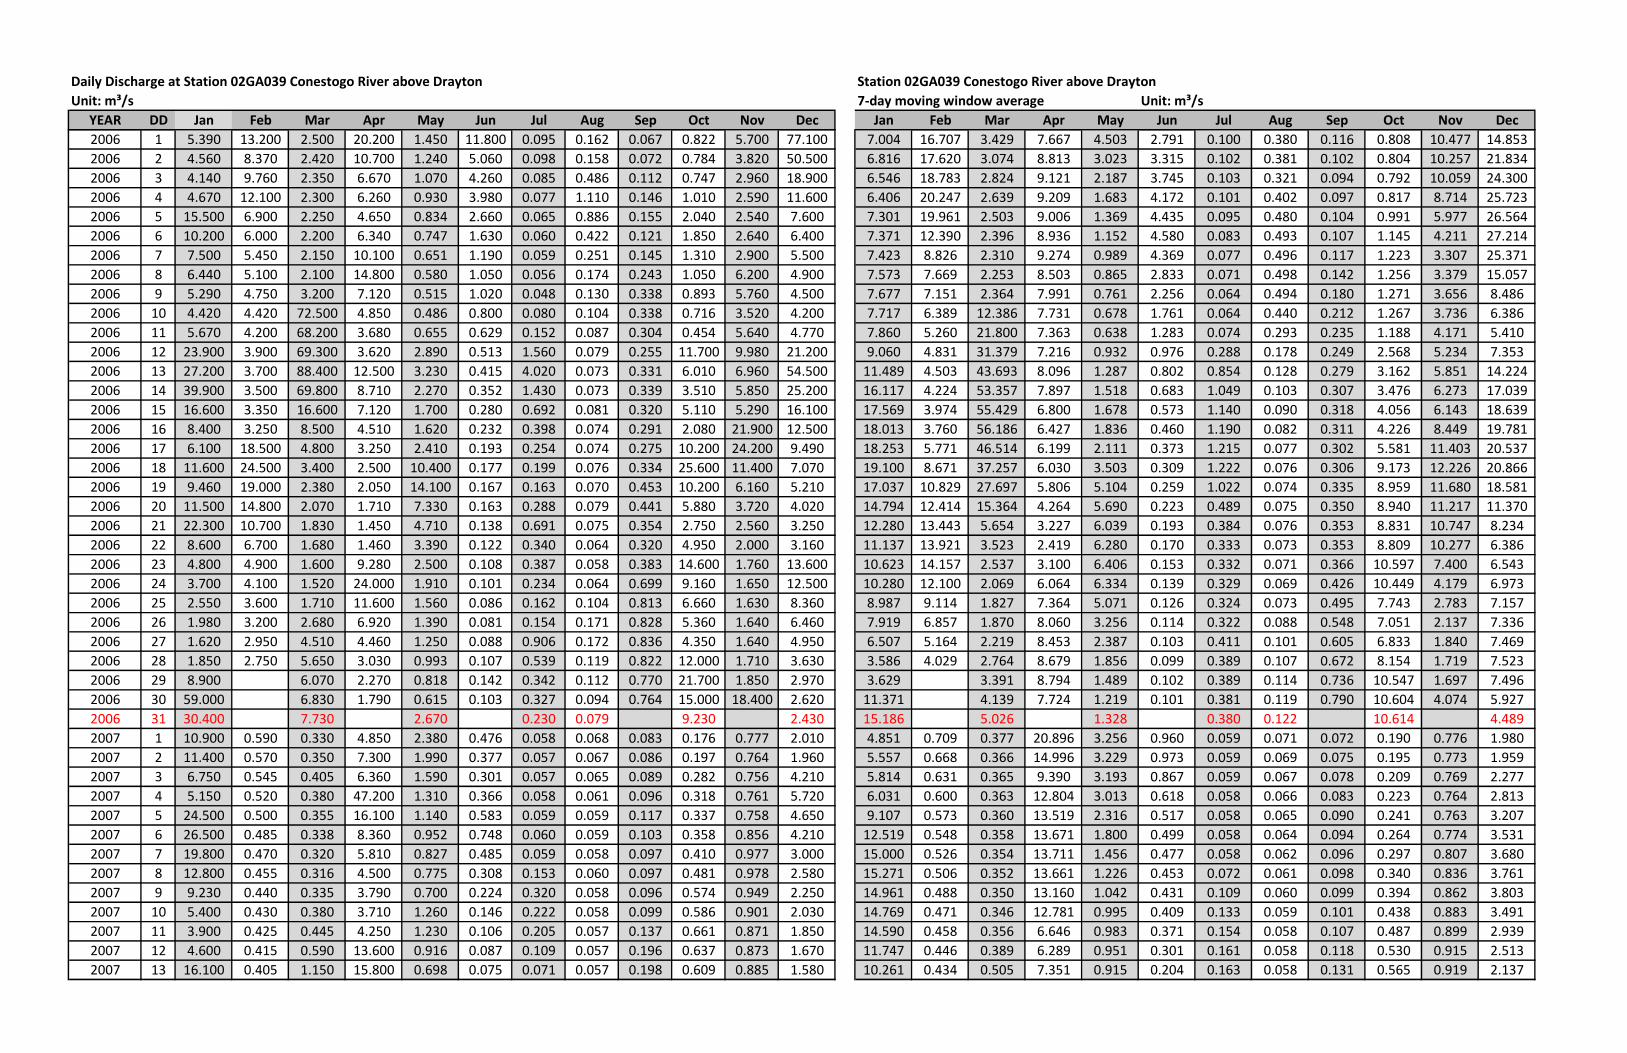
Daily Discharge at Station 02GA039 Conestogo River above Drayton Station 02GA039 Conestogo River above Drayton
Unit: m³/s 7-day moving window average Unit: m³/s
YEAR DD Jan Feb Mar Apr May Jun Jul Aug Sep Oct Nov Dec Jan Feb Mar Apr May Jun Jul Aug Sep Oct Nov Dec
2006 1 5.390 13.200 2.500 20.200 1.450 11.800 0.095 0.162 0.067 0.822 5.700 77.100 7.004 16.707 3.429 7.667 4.503 2.791 0.100 0.380 0.116 0.808 10.477 14.853
2006 2 4.560 8.370 2.420 10.700 1.240 5.060 0.098 0.158 0.072 0.784 3.820 50.500 6.816 17.620 3.074 8.813 3.023 3.315 0.102 0.381 0.102 0.804 10.257 21.834
2006 3 4.140 9.760 2.350 6.670 1.070 4.260 0.085 0.486 0.112 0.747 2.960 18.900 6.546 18.783 2.824 9.121 2.187 3.745 0.103 0.321 0.094 0.792 10.059 24.300
2006 4 4.670 12.100 2.300 6.260 0.930 3.980 0.077 1.110 0.146 1.010 2.590 11.600 6.406 20.247 2.639 9.209 1.683 4.172 0.101 0.402 0.097 0.817 8.714 25.723
2006 5 15.500 6.900 2.250 4.650 0.834 2.660 0.065 0.886 0.155 2.040 2.540 7.600 7.301 19.961 2.503 9.006 1.369 4.435 0.095 0.480 0.104 0.991 5.977 26.564
2006 6 10.200 6.000 2.200 6.340 0.747 1.630 0.060 0.422 0.121 1.850 2.640 6.400 7.371 12.390 2.396 8.936 1.152 4.580 0.083 0.493 0.107 1.145 4.211 27.214
2006 7 7.500 5.450 2.150 10.100 0.651 1.190 0.059 0.251 0.145 1.310 2.900 5.500 7.423 8.826 2.310 9.274 0.989 4.369 0.077 0.496 0.117 1.223 3.307 25.371
2006 8 6.440 5.100 2.100 14.800 0.580 1.050 0.056 0.174 0.243 1.050 6.200 4.900 7.573 7.669 2.253 8.503 0.865 2.833 0.071 0.498 0.142 1.256 3.379 15.057
2006 9 5.290 4.750 3.200 7.120 0.515 1.020 0.048 0.130 0.338 0.893 5.760 4.500 7.677 7.151 2.364 7.991 0.761 2.256 0.064 0.494 0.180 1.271 3.656 8.486
2006 10 4.420 4.420 72.500 4.850 0.486 0.800 0.080 0.104 0.338 0.716 3.520 4.200 7.717 6.389 12.386 7.731 0.678 1.761 0.064 0.440 0.212 1.267 3.736 6.386
2006 11 5.670 4.200 68.200 3.680 0.655 0.629 0.152 0.087 0.304 0.454 5.640 4.770 7.860 5.260 21.800 7.363 0.638 1.283 0.074 0.293 0.235 1.188 4.171 5.410
2006 12 23.900 3.900 69.300 3.620 2.890 0.513 1.560 0.079 0.255 11.700 9.980 21.200 9.060 4.831 31.379 7.216 0.932 0.976 0.288 0.178 0.249 2.568 5.234 7.353
2006 13 27.200 3.700 88.400 12.500 3.230 0.415 4.020 0.073 0.331 6.010 6.960 54.500 11.489 4.503 43.693 8.096 1.287 0.802 0.854 0.128 0.279 3.162 5.851 14.224
2006 14 39.900 3.500 69.800 8.710 2.270 0.352 1.430 0.073 0.339 3.510 5.850 25.200 16.117 4.224 53.357 7.897 1.518 0.683 1.049 0.103 0.307 3.476 6.273 17.039
2006 15 16.600 3.350 16.600 7.120 1.700 0.280 0.692 0.081 0.320 5.110 5.290 16.100 17.569 3.974 55.429 6.800 1.678 0.573 1.140 0.090 0.318 4.056 6.143 18.639
2006 16 8.400 3.250 8.500 4.510 1.620 0.232 0.398 0.074 0.291 2.080 21.900 12.500 18.013 3.760 56.186 6.427 1.836 0.460 1.190 0.082 0.311 4.226 8.449 19.781
2006 17 6.100 18.500 4.800 3.250 2.410 0.193 0.254 0.074 0.275 10.200 24.200 9.490 18.253 5.771 46.514 6.199 2.111 0.373 1.215 0.077 0.302 5.581 11.403 20.537
2006 18 11.600 24.500 3.400 2.500 10.400 0.177 0.199 0.076 0.334 25.600 11.400 7.070 19.100 8.671 37.257 6.030 3.503 0.309 1.222 0.076 0.306 9.173 12.226 20.866
2006 19 9.460 19.000 2.380 2.050 14.100 0.167 0.163 0.070 0.453 10.200 6.160 5.210 17.037 10.829 27.697 5.806 5.104 0.259 1.022 0.074 0.335 8.959 11.680 18.581
2006 20 11.500 14.800 2.070 1.710 7.330 0.163 0.288 0.079 0.441 5.880 3.720 4.020 14.794 12.414 15.364 4.264 5.690 0.223 0.489 0.075 0.350 8.940 11.217 11.370
2006 21 22.300 10.700 1.830 1.450 4.710 0.138 0.691 0.075 0.354 2.750 2.560 3.250 12.280 13.443 5.654 3.227 6.039 0.193 0.384 0.076 0.353 8.831 10.747 8.234
2006 22 8.600 6.700 1.680 1.460 3.390 0.122 0.340 0.064 0.320 4.950 2.000 3.160 11.137 13.921 3.523 2.419 6.280 0.170 0.333 0.073 0.353 8.809 10.277 6.386
2006 23 4.800 4.900 1.600 9.280 2.500 0.108 0.387 0.058 0.383 14.600 1.760 13.600 10.623 14.157 2.537 3.100 6.406 0.153 0.332 0.071 0.366 10.597 7.400 6.543
2006 24 3.700 4.100 1.520 24.000 1.910 0.101 0.234 0.064 0.699 9.160 1.650 12.500 10.280 12.100 2.069 6.064 6.334 0.139 0.329 0.069 0.426 10.449 4.179 6.973
2006 25 2.550 3.600 1.710 11.600 1.560 0.086 0.162 0.104 0.813 6.660 1.630 8.360 8.987 9.114 1.827 7.364 5.071 0.126 0.324 0.073 0.495 7.743 2.783 7.157
2006 26 1.980 3.200 2.680 6.920 1.390 0.081 0.154 0.171 0.828 5.360 1.640 6.460 7.919 6.857 1.870 8.060 3.256 0.114 0.322 0.088 0.548 7.051 2.137 7.336
2006 27 1.620 2.950 4.510 4.460 1.250 0.088 0.906 0.172 0.836 4.350 1.640 4.950 6.507 5.164 2.219 8.453 2.387 0.103 0.411 0.101 0.605 6.833 1.840 7.469
2006 28 1.850 2.750 5.650 3.030 0.993 0.107 0.539 0.119 0.822 12.000 1.710 3.630 3.586 4.029 2.764 8.679 1.856 0.099 0.389 0.107 0.672 8.154 1.719 7.523
2006 29 8.900 6.070 2.270 0.818 0.142 0.342 0.112 0.770 21.700 1.850 2.970 3.629 3.391 8.794 1.489 0.102 0.389 0.114 0.736 10.547 1.697 7.496
2006 30 59.000 6.830 1.790 0.615 0.103 0.327 0.094 0.764 15.000 18.400 2.620 11.371 4.139 7.724 1.219 0.101 0.381 0.119 0.790 10.604 4.074 5.927
2006 31 30.400 7.730 2.670 0.230 0.079 9.230 2.430 15.186 5.026 1.328 0.380 0.122 10.614 4.489
2007 1 10.900 0.590 0.330 4.850 2.380 0.476 0.058 0.068 0.083 0.176 0.777 2.010 4.851 0.709 0.377 20.896 3.256 0.960 0.059 0.071 0.072 0.190 0.776 1.980
2007 2 11.400 0.570 0.350 7.300 1.990 0.377 0.057 0.067 0.086 0.197 0.764 1.960 5.557 0.668 0.366 14.996 3.229 0.973 0.059 0.069 0.075 0.195 0.773 1.959
2007 3 6.750 0.545 0.405 6.360 1.590 0.301 0.057 0.065 0.089 0.282 0.756 4.210 5.814 0.631 0.365 9.390 3.193 0.867 0.059 0.067 0.078 0.209 0.769 2.277
2007 4 5.150 0.520 0.380 47.200 1.310 0.366 0.058 0.061 0.096 0.318 0.761 5.720 6.031 0.600 0.363 12.804 3.013 0.618 0.058 0.066 0.083 0.223 0.764 2.813
2007 5 24.500 0.500 0.355 16.100 1.140 0.583 0.059 0.059 0.117 0.337 0.758 4.650 9.107 0.573 0.360 13.519 2.316 0.517 0.058 0.065 0.090 0.241 0.763 3.207
2007 6 26.500 0.485 0.338 8.360 0.952 0.748 0.060 0.059 0.103 0.358 0.856 4.210 12.519 0.548 0.358 13.671 1.800 0.499 0.058 0.064 0.094 0.264 0.774 3.531
2007 7 19.800 0.470 0.320 5.810 0.827 0.485 0.059 0.058 0.097 0.410 0.977 3.000 15.000 0.526 0.354 13.711 1.456 0.477 0.058 0.062 0.096 0.297 0.807 3.680
2007 8 12.800 0.455 0.316 4.500 0.775 0.308 0.153 0.060 0.097 0.481 0.978 2.580 15.271 0.506 0.352 13.661 1.226 0.453 0.072 0.061 0.098 0.340 0.836 3.761
2007 9 9.230 0.440 0.335 3.790 0.700 0.224 0.320 0.058 0.096 0.574 0.949 2.250 14.961 0.488 0.350 13.160 1.042 0.431 0.109 0.060 0.099 0.394 0.862 3.803
2007 10 5.400 0.430 0.380 3.710 1.260 0.146 0.222 0.058 0.099 0.586 0.901 2.030 14.769 0.471 0.346 12.781 0.995 0.409 0.133 0.059 0.101 0.438 0.883 3.491
2007 11 3.900 0.425 0.445 4.250 1.230 0.106 0.205 0.057 0.137 0.661 0.871 1.850 14.590 0.458 0.356 6.646 0.983 0.371 0.154 0.058 0.107 0.487 0.899 2.939
2007 12 4.600 0.415 0.590 13.600 0.916 0.087 0.109 0.057 0.196 0.637 0.873 1.670 11.747 0.446 0.389 6.289 0.951 0.301 0.161 0.058 0.118 0.530 0.915 2.513
2007 13 16.100 0.405 1.150 15.800 0.698 0.075 0.071 0.057 0.198 0.609 0.885 1.580 10.261 0.434 0.505 7.351 0.915 0.204 0.163 0.058 0.131 0.565 0.919 2.137
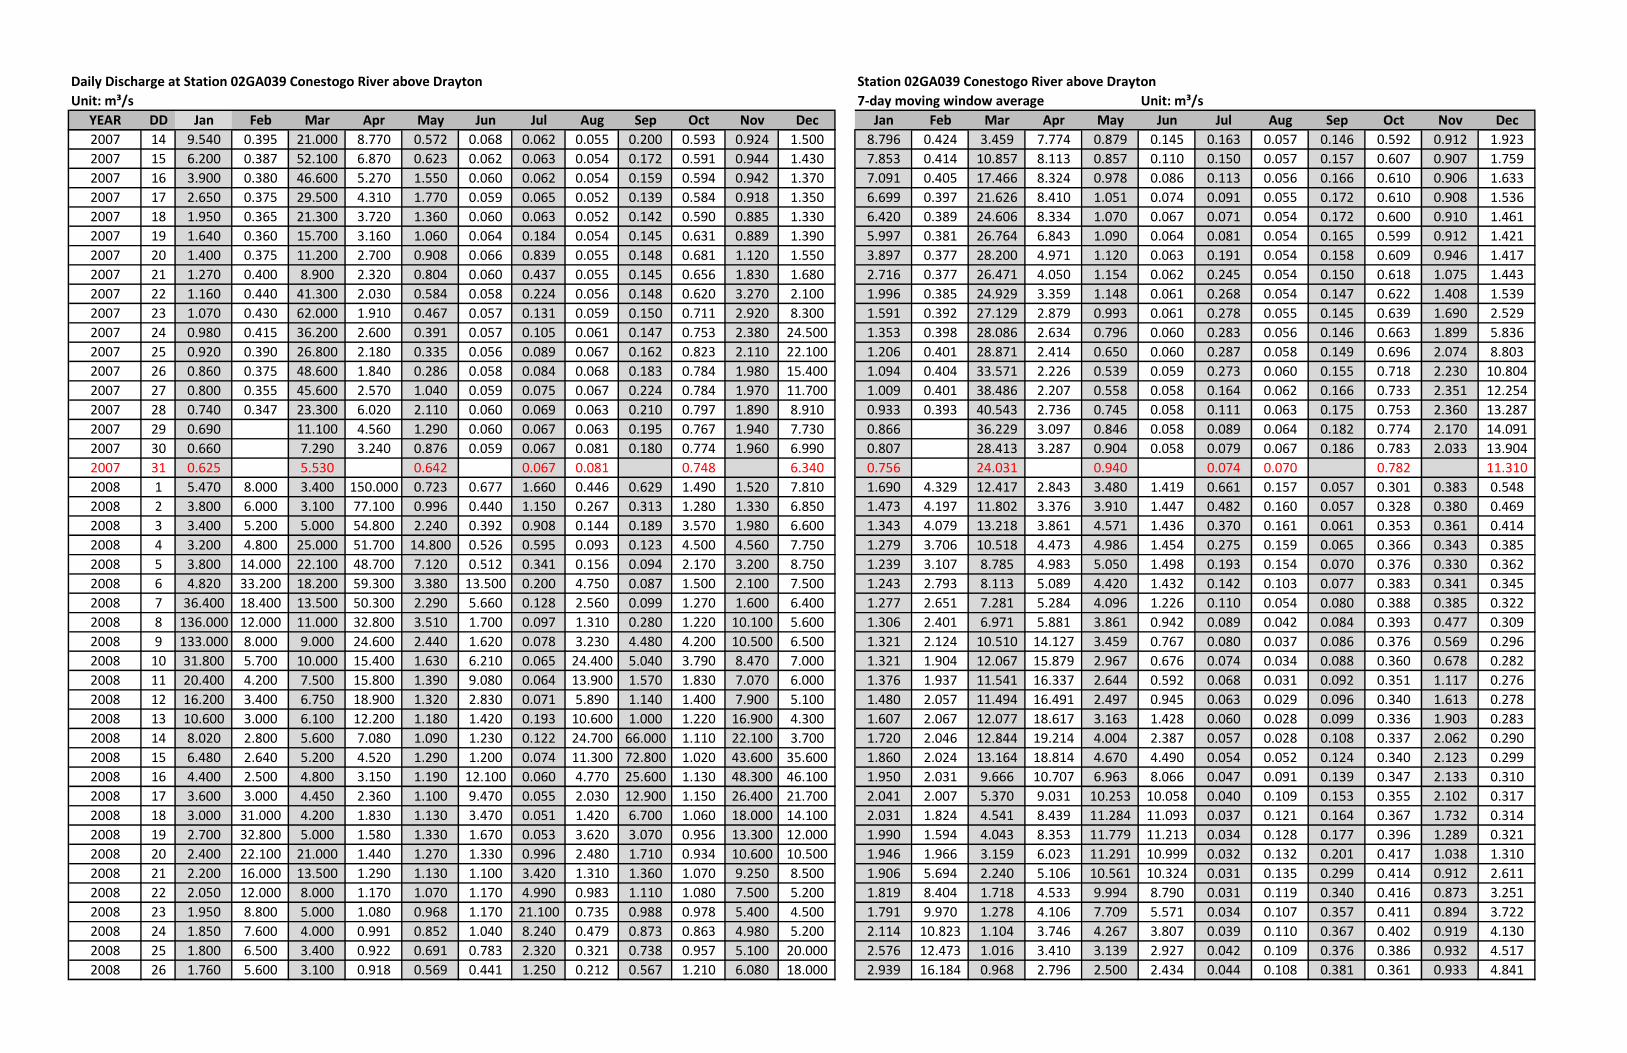
Daily Discharge at Station 02GA039 Conestogo River above Drayton Station 02GA039 Conestogo River above Drayton
Unit: m³/s 7-day moving window average Unit: m³/s
YEAR DD Jan Feb Mar Apr May Jun Jul Aug Sep Oct Nov Dec Jan Feb Mar Apr May Jun Jul Aug Sep Oct Nov Dec
2007 14 9.540 0.395 21.000 8.770 0.572 0.068 0.062 0.055 0.200 0.593 0.924 1.500 8.796 0.424 3.459 7.774 0.879 0.145 0.163 0.057 0.146 0.592 0.912 1.923
2007 15 6.200 0.387 52.100 6.870 0.623 0.062 0.063 0.054 0.172 0.591 0.944 1.430 7.853 0.414 10.857 8.113 0.857 0.110 0.150 0.057 0.157 0.607 0.907 1.759
2007 16 3.900 0.380 46.600 5.270 1.550 0.060 0.062 0.054 0.159 0.594 0.942 1.370 7.091 0.405 17.466 8.324 0.978 0.086 0.113 0.056 0.166 0.610 0.906 1.633
2007 17 2.650 0.375 29.500 4.310 1.770 0.059 0.065 0.052 0.139 0.584 0.918 1.350 6.699 0.397 21.626 8.410 1.051 0.074 0.091 0.055 0.172 0.610 0.908 1.536
2007 18 1.950 0.365 21.300 3.720 1.360 0.060 0.063 0.052 0.142 0.590 0.885 1.330 6.420 0.389 24.606 8.334 1.070 0.067 0.071 0.054 0.172 0.600 0.910 1.461
2007 19 1.640 0.360 15.700 3.160 1.060 0.064 0.184 0.054 0.145 0.631 0.889 1.390 5.997 0.381 26.764 6.843 1.090 0.064 0.081 0.054 0.165 0.599 0.912 1.421
2007 20 1.400 0.375 11.200 2.700 0.908 0.066 0.839 0.055 0.148 0.681 1.120 1.550 3.897 0.377 28.200 4.971 1.120 0.063 0.191 0.054 0.158 0.609 0.946 1.417
2007 21 1.270 0.400 8.900 2.320 0.804 0.060 0.437 0.055 0.145 0.656 1.830 1.680 2.716 0.377 26.471 4.050 1.154 0.062 0.245 0.054 0.150 0.618 1.075 1.443
2007 22 1.160 0.440 41.300 2.030 0.584 0.058 0.224 0.056 0.148 0.620 3.270 2.100 1.996 0.385 24.929 3.359 1.148 0.061 0.268 0.054 0.147 0.622 1.408 1.539
2007 23 1.070 0.430 62.000 1.910 0.467 0.057 0.131 0.059 0.150 0.711 2.920 8.300 1.591 0.392 27.129 2.879 0.993 0.061 0.278 0.055 0.145 0.639 1.690 2.529
2007 24 0.980 0.415 36.200 2.600 0.391 0.057 0.105 0.061 0.147 0.753 2.380 24.500 1.353 0.398 28.086 2.634 0.796 0.060 0.283 0.056 0.146 0.663 1.899 5.836
2007 25 0.920 0.390 26.800 2.180 0.335 0.056 0.089 0.067 0.162 0.823 2.110 22.100 1.206 0.401 28.871 2.414 0.650 0.060 0.287 0.058 0.149 0.696 2.074 8.803
2007 26 0.860 0.375 48.600 1.840 0.286 0.058 0.084 0.068 0.183 0.784 1.980 15.400 1.094 0.404 33.571 2.226 0.539 0.059 0.273 0.060 0.155 0.718 2.230 10.804
2007 27 0.800 0.355 45.600 2.570 1.040 0.059 0.075 0.067 0.224 0.784 1.970 11.700 1.009 0.401 38.486 2.207 0.558 0.058 0.164 0.062 0.166 0.733 2.351 12.254
2007 28 0.740 0.347 23.300 6.020 2.110 0.060 0.069 0.063 0.210 0.797 1.890 8.910 0.933 0.393 40.543 2.736 0.745 0.058 0.111 0.063 0.175 0.753 2.360 13.287
2007 29 0.690 11.100 4.560 1.290 0.060 0.067 0.063 0.195 0.767 1.940 7.730 0.866 36.229 3.097 0.846 0.058 0.089 0.064 0.182 0.774 2.170 14.091
2007 30 0.660 7.290 3.240 0.876 0.059 0.067 0.081 0.180 0.774 1.960 6.990 0.807 28.413 3.287 0.904 0.058 0.079 0.067 0.186 0.783 2.033 13.904
2007 31 0.625 5.530 0.642 0.067 0.081 0.748 6.340 0.756 24.031 0.940 0.074 0.070 0.782 11.310
2008 1 5.470 8.000 3.400 150.000 0.723 0.677 1.660 0.446 0.629 1.490 1.520 7.810 1.690 4.329 12.417 2.843 3.480 1.419 0.661 0.157 0.057 0.301 0.383 0.548
2008 2 3.800 6.000 3.100 77.100 0.996 0.440 1.150 0.267 0.313 1.280 1.330 6.850 1.473 4.197 11.802 3.376 3.910 1.447 0.482 0.160 0.057 0.328 0.380 0.469
2008 3 3.400 5.200 5.000 54.800 2.240 0.392 0.908 0.144 0.189 3.570 1.980 6.600 1.343 4.079 13.218 3.861 4.571 1.436 0.370 0.161 0.061 0.353 0.361 0.414
2008 4 3.200 4.800 25.000 51.700 14.800 0.526 0.595 0.093 0.123 4.500 4.560 7.750 1.279 3.706 10.518 4.473 4.986 1.454 0.275 0.159 0.065 0.366 0.343 0.385
2008 5 3.800 14.000 22.100 48.700 7.120 0.512 0.341 0.156 0.094 2.170 3.200 8.750 1.239 3.107 8.785 4.983 5.050 1.498 0.193 0.154 0.070 0.376 0.330 0.362
2008 6 4.820 33.200 18.200 59.300 3.380 13.500 0.200 4.750 0.087 1.500 2.100 7.500 1.243 2.793 8.113 5.089 4.420 1.432 0.142 0.103 0.077 0.383 0.341 0.345
2008 7 36.400 18.400 13.500 50.300 2.290 5.660 0.128 2.560 0.099 1.270 1.600 6.400 1.277 2.651 7.281 5.284 4.096 1.226 0.110 0.054 0.080 0.388 0.385 0.322
2008 8 136.000 12.000 11.000 32.800 3.510 1.700 0.097 1.310 0.280 1.220 10.100 5.600 1.306 2.401 6.971 5.881 3.861 0.942 0.089 0.042 0.084 0.393 0.477 0.309
2008 9 133.000 8.000 9.000 24.600 2.440 1.620 0.078 3.230 4.480 4.200 10.500 6.500 1.321 2.124 10.510 14.127 3.459 0.767 0.080 0.037 0.086 0.376 0.569 0.296
2008 10 31.800 5.700 10.000 15.400 1.630 6.210 0.065 24.400 5.040 3.790 8.470 7.000 1.321 1.904 12.067 15.879 2.967 0.676 0.074 0.034 0.088 0.360 0.678 0.282
2008 11 20.400 4.200 7.500 15.800 1.390 9.080 0.064 13.900 1.570 1.830 7.070 6.000 1.376 1.937 11.541 16.337 2.644 0.592 0.068 0.031 0.092 0.351 1.117 0.276
2008 12 16.200 3.400 6.750 18.900 1.320 2.830 0.071 5.890 1.140 1.400 7.900 5.100 1.480 2.057 11.494 16.491 2.497 0.945 0.063 0.029 0.096 0.340 1.613 0.278
2008 13 10.600 3.000 6.100 12.200 1.180 1.420 0.193 10.600 1.000 1.220 16.900 4.300 1.607 2.067 12.077 18.617 3.163 1.428 0.060 0.028 0.099 0.336 1.903 0.283
2008 14 8.020 2.800 5.600 7.080 1.090 1.230 0.122 24.700 66.000 1.110 22.100 3.700 1.720 2.046 12.844 19.214 4.004 2.387 0.057 0.028 0.108 0.337 2.062 0.290
2008 15 6.480 2.640 5.200 4.520 1.290 1.200 0.074 11.300 72.800 1.020 43.600 35.600 1.860 2.024 13.164 18.814 4.670 4.490 0.054 0.052 0.124 0.340 2.123 0.299
2008 16 4.400 2.500 4.800 3.150 1.190 12.100 0.060 4.770 25.600 1.130 48.300 46.100 1.950 2.031 9.666 10.707 6.963 8.066 0.047 0.091 0.139 0.347 2.133 0.310
2008 17 3.600 3.000 4.450 2.360 1.100 9.470 0.055 2.030 12.900 1.150 26.400 21.700 2.041 2.007 5.370 9.031 10.253 10.058 0.040 0.109 0.153 0.355 2.102 0.317
2008 18 3.000 31.000 4.200 1.830 1.130 3.470 0.051 1.420 6.700 1.060 18.000 14.100 2.031 1.824 4.541 8.439 11.284 11.093 0.037 0.121 0.164 0.367 1.732 0.314
2008 19 2.700 32.800 5.000 1.580 1.330 1.670 0.053 3.620 3.070 0.956 13.300 12.000 1.990 1.594 4.043 8.353 11.779 11.213 0.034 0.128 0.177 0.396 1.289 0.321
2008 20 2.400 22.100 21.000 1.440 1.270 1.330 0.996 2.480 1.710 0.934 10.600 10.500 1.946 1.966 3.159 6.023 11.291 10.999 0.032 0.132 0.201 0.417 1.038 1.310
2008 21 2.200 16.000 13.500 1.290 1.130 1.100 3.420 1.310 1.360 1.070 9.250 8.500 1.906 5.694 2.240 5.106 10.561 10.324 0.031 0.135 0.299 0.414 0.912 2.611
2008 22 2.050 12.000 8.000 1.170 1.070 1.170 4.990 0.983 1.110 1.080 7.500 5.200 1.819 8.404 1.718 4.533 9.994 8.790 0.031 0.119 0.340 0.416 0.873 3.251
2008 23 1.950 8.800 5.000 1.080 0.968 1.170 21.100 0.735 0.988 0.978 5.400 4.500 1.791 9.970 1.278 4.106 7.709 5.571 0.034 0.107 0.357 0.411 0.894 3.722
2008 24 1.850 7.600 4.000 0.991 0.852 1.040 8.240 0.479 0.873 0.863 4.980 5.200 2.114 10.823 1.104 3.746 4.267 3.807 0.039 0.110 0.367 0.402 0.919 4.130
2008 25 1.800 6.500 3.400 0.922 0.691 0.783 2.320 0.321 0.738 0.957 5.100 20.000 2.576 12.473 1.016 3.410 3.139 2.927 0.042 0.109 0.376 0.386 0.932 4.517
2008 26 1.760 5.600 3.100 0.918 0.569 0.441 1.250 0.212 0.567 1.210 6.080 18.000 2.939 16.184 0.968 2.796 2.500 2.434 0.044 0.108 0.381 0.361 0.933 4.841
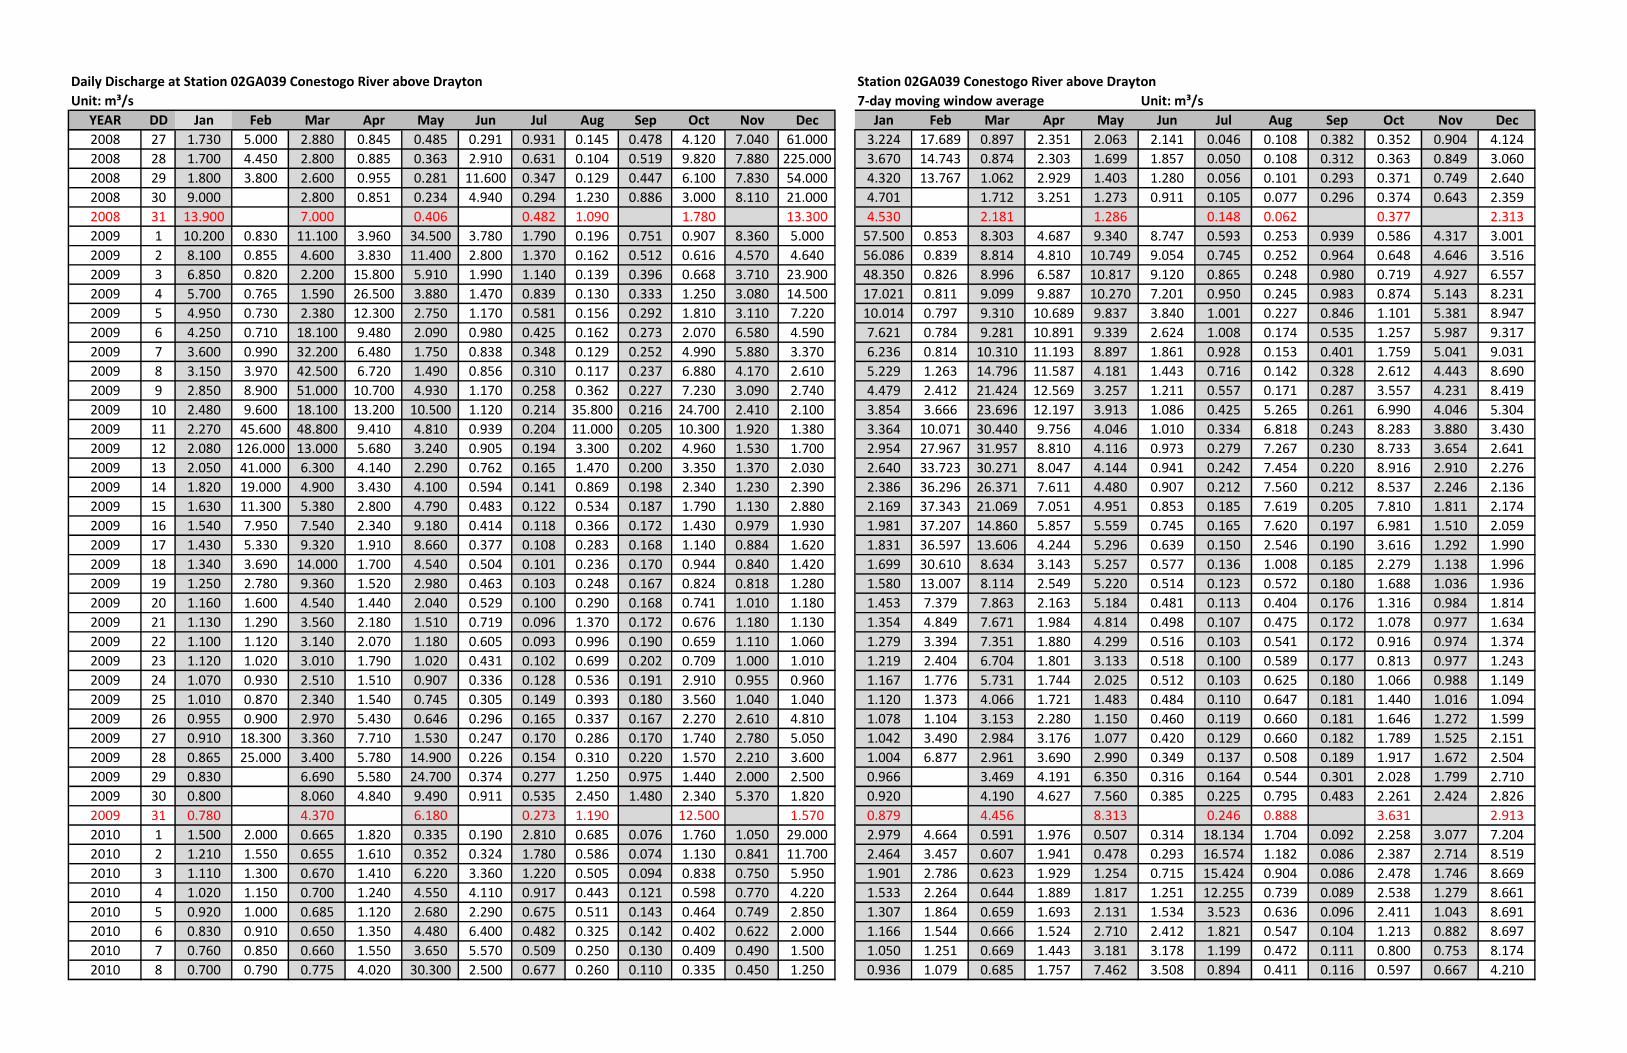
Daily Discharge at Station 02GA039 Conestogo River above Drayton Station 02GA039 Conestogo River above Drayton
Unit: m³/s 7-day moving window average Unit: m³/s
YEAR DD Jan Feb Mar Apr May Jun Jul Aug Sep Oct Nov Dec Jan Feb Mar Apr May Jun Jul Aug Sep Oct Nov Dec
2008 27 1.730 5.000 2.880 0.845 0.485 0.291 0.931 0.145 0.478 4.120 7.040 61.000 3.224 17.689 0.897 2.351 2.063 2.141 0.046 0.108 0.382 0.352 0.904 4.124
2008 28 1.700 4.450 2.800 0.885 0.363 2.910 0.631 0.104 0.519 9.820 7.880 225.000 3.670 14.743 0.874 2.303 1.699 1.857 0.050 0.108 0.312 0.363 0.849 3.060
2008 29 1.800 3.800 2.600 0.955 0.281 11.600 0.347 0.129 0.447 6.100 7.830 54.000 4.320 13.767 1.062 2.929 1.403 1.280 0.056 0.101 0.293 0.371 0.749 2.640
2008 30 9.000 2.800 0.851 0.234 4.940 0.294 1.230 0.886 3.000 8.110 21.000 4.701 1.712 3.251 1.273 0.911 0.105 0.077 0.296 0.374 0.643 2.359
2008 31 13.900 7.000 0.406 0.482 1.090 1.780 13.300 4.530 2.181 1.286 0.148 0.062 0.377 2.313
2009 1 10.200 0.830 11.100 3.960 34.500 3.780 1.790 0.196 0.751 0.907 8.360 5.000 57.500 0.853 8.303 4.687 9.340 8.747 0.593 0.253 0.939 0.586 4.317 3.001
2009 2 8.100 0.855 4.600 3.830 11.400 2.800 1.370 0.162 0.512 0.616 4.570 4.640 56.086 0.839 8.814 4.810 10.749 9.054 0.745 0.252 0.964 0.648 4.646 3.516
2009 3 6.850 0.820 2.200 15.800 5.910 1.990 1.140 0.139 0.396 0.668 3.710 23.900 48.350 0.826 8.996 6.587 10.817 9.120 0.865 0.248 0.980 0.719 4.927 6.557
2009 4 5.700 0.765 1.590 26.500 3.880 1.470 0.839 0.130 0.333 1.250 3.080 14.500 17.021 0.811 9.099 9.887 10.270 7.201 0.950 0.245 0.983 0.874 5.143 8.231
2009 5 4.950 0.730 2.380 12.300 2.750 1.170 0.581 0.156 0.292 1.810 3.110 7.220 10.014 0.797 9.310 10.689 9.837 3.840 1.001 0.227 0.846 1.101 5.381 8.947
2009 6 4.250 0.710 18.100 9.480 2.090 0.980 0.425 0.162 0.273 2.070 6.580 4.590 7.621 0.784 9.281 10.891 9.339 2.624 1.008 0.174 0.535 1.257 5.987 9.317
2009 7 3.600 0.990 32.200 6.480 1.750 0.838 0.348 0.129 0.252 4.990 5.880 3.370 6.236 0.814 10.310 11.193 8.897 1.861 0.928 0.153 0.401 1.759 5.041 9.031
2009 8 3.150 3.970 42.500 6.720 1.490 0.856 0.310 0.117 0.237 6.880 4.170 2.610 5.229 1.263 14.796 11.587 4.181 1.443 0.716 0.142 0.328 2.612 4.443 8.690
2009 9 2.850 8.900 51.000 10.700 4.930 1.170 0.258 0.362 0.227 7.230 3.090 2.740 4.479 2.412 21.424 12.569 3.257 1.211 0.557 0.171 0.287 3.557 4.231 8.419
2009 10 2.480 9.600 18.100 13.200 10.500 1.120 0.214 35.800 0.216 24.700 2.410 2.100 3.854 3.666 23.696 12.197 3.913 1.086 0.425 5.265 0.261 6.990 4.046 5.304
2009 11 2.270 45.600 48.800 9.410 4.810 0.939 0.204 11.000 0.205 10.300 1.920 1.380 3.364 10.071 30.440 9.756 4.046 1.010 0.334 6.818 0.243 8.283 3.880 3.430
2009 12 2.080 126.000 13.000 5.680 3.240 0.905 0.194 3.300 0.202 4.960 1.530 1.700 2.954 27.967 31.957 8.810 4.116 0.973 0.279 7.267 0.230 8.733 3.654 2.641
2009 13 2.050 41.000 6.300 4.140 2.290 0.762 0.165 1.470 0.200 3.350 1.370 2.030 2.640 33.723 30.271 8.047 4.144 0.941 0.242 7.454 0.220 8.916 2.910 2.276
2009 14 1.820 19.000 4.900 3.430 4.100 0.594 0.141 0.869 0.198 2.340 1.230 2.390 2.386 36.296 26.371 7.611 4.480 0.907 0.212 7.560 0.212 8.537 2.246 2.136
2009 15 1.630 11.300 5.380 2.800 4.790 0.483 0.122 0.534 0.187 1.790 1.130 2.880 2.169 37.343 21.069 7.051 4.951 0.853 0.185 7.619 0.205 7.810 1.811 2.174
2009 16 1.540 7.950 7.540 2.340 9.180 0.414 0.118 0.366 0.172 1.430 0.979 1.930 1.981 37.207 14.860 5.857 5.559 0.745 0.165 7.620 0.197 6.981 1.510 2.059
2009 17 1.430 5.330 9.320 1.910 8.660 0.377 0.108 0.283 0.168 1.140 0.884 1.620 1.831 36.597 13.606 4.244 5.296 0.639 0.150 2.546 0.190 3.616 1.292 1.990
2009 18 1.340 3.690 14.000 1.700 4.540 0.504 0.101 0.236 0.170 0.944 0.840 1.420 1.699 30.610 8.634 3.143 5.257 0.577 0.136 1.008 0.185 2.279 1.138 1.996
2009 19 1.250 2.780 9.360 1.520 2.980 0.463 0.103 0.248 0.167 0.824 0.818 1.280 1.580 13.007 8.114 2.549 5.220 0.514 0.123 0.572 0.180 1.688 1.036 1.936
2009 20 1.160 1.600 4.540 1.440 2.040 0.529 0.100 0.290 0.168 0.741 1.010 1.180 1.453 7.379 7.863 2.163 5.184 0.481 0.113 0.404 0.176 1.316 0.984 1.814
2009 21 1.130 1.290 3.560 2.180 1.510 0.719 0.096 1.370 0.172 0.676 1.180 1.130 1.354 4.849 7.671 1.984 4.814 0.498 0.107 0.475 0.172 1.078 0.977 1.634
2009 22 1.100 1.120 3.140 2.070 1.180 0.605 0.093 0.996 0.190 0.659 1.110 1.060 1.279 3.394 7.351 1.880 4.299 0.516 0.103 0.541 0.172 0.916 0.974 1.374
2009 23 1.120 1.020 3.010 1.790 1.020 0.431 0.102 0.699 0.202 0.709 1.000 1.010 1.219 2.404 6.704 1.801 3.133 0.518 0.100 0.589 0.177 0.813 0.977 1.243
2009 24 1.070 0.930 2.510 1.510 0.907 0.336 0.128 0.536 0.191 2.910 0.955 0.960 1.167 1.776 5.731 1.744 2.025 0.512 0.103 0.625 0.180 1.066 0.988 1.149
2009 25 1.010 0.870 2.340 1.540 0.745 0.305 0.149 0.393 0.180 3.560 1.040 1.040 1.120 1.373 4.066 1.721 1.483 0.484 0.110 0.647 0.181 1.440 1.016 1.094
2009 26 0.955 0.900 2.970 5.430 0.646 0.296 0.165 0.337 0.167 2.270 2.610 4.810 1.078 1.104 3.153 2.280 1.150 0.460 0.119 0.660 0.181 1.646 1.272 1.599
2009 27 0.910 18.300 3.360 7.710 1.530 0.247 0.170 0.286 0.170 1.740 2.780 5.050 1.042 3.490 2.984 3.176 1.077 0.420 0.129 0.660 0.182 1.789 1.525 2.151
2009 28 0.865 25.000 3.400 5.780 14.900 0.226 0.154 0.310 0.220 1.570 2.210 3.600 1.004 6.877 2.961 3.690 2.990 0.349 0.137 0.508 0.189 1.917 1.672 2.504
2009 29 0.830 6.690 5.580 24.700 0.374 0.277 1.250 0.975 1.440 2.000 2.500 0.966 3.469 4.191 6.350 0.316 0.164 0.544 0.301 2.028 1.799 2.710
2009 30 0.800 8.060 4.840 9.490 0.911 0.535 2.450 1.480 2.340 5.370 1.820 0.920 4.190 4.627 7.560 0.385 0.225 0.795 0.483 2.261 2.424 2.826
2009 31 0.780 4.370 6.180 0.273 1.190 12.500 1.570 0.879 4.456 8.313 0.246 0.888 3.631 2.913
2010 1 1.500 2.000 0.665 1.820 0.335 0.190 2.810 0.685 0.076 1.760 1.050 29.000 2.979 4.664 0.591 1.976 0.507 0.314 18.134 1.704 0.092 2.258 3.077 7.204
2010 2 1.210 1.550 0.655 1.610 0.352 0.324 1.780 0.586 0.074 1.130 0.841 11.700 2.464 3.457 0.607 1.941 0.478 0.293 16.574 1.182 0.086 2.387 2.714 8.519
2010 3 1.110 1.300 0.670 1.410 6.220 3.360 1.220 0.505 0.094 0.838 0.750 5.950 1.901 2.786 0.623 1.929 1.254 0.715 15.424 0.904 0.086 2.478 1.746 8.669
2010 4 1.020 1.150 0.700 1.240 4.550 4.110 0.917 0.443 0.121 0.598 0.770 4.220 1.533 2.264 0.644 1.889 1.817 1.251 12.255 0.739 0.089 2.538 1.279 8.661
2010 5 0.920 1.000 0.685 1.120 2.680 2.290 0.675 0.511 0.143 0.464 0.749 2.850 1.307 1.864 0.659 1.693 2.131 1.534 3.523 0.636 0.096 2.411 1.043 8.691
2010 6 0.830 0.910 0.650 1.350 4.480 6.400 0.482 0.325 0.142 0.402 0.622 2.000 1.166 1.544 0.666 1.524 2.710 2.412 1.821 0.547 0.104 1.213 0.882 8.697
2010 7 0.760 0.850 0.660 1.550 3.650 5.570 0.509 0.250 0.130 0.409 0.490 1.500 1.050 1.251 0.669 1.443 3.181 3.178 1.199 0.472 0.111 0.800 0.753 8.174
2010 8 0.700 0.790 0.775 4.020 30.300 2.500 0.677 0.260 0.110 0.335 0.450 1.250 0.936 1.079 0.685 1.757 7.462 3.508 0.894 0.411 0.116 0.597 0.667 4.210
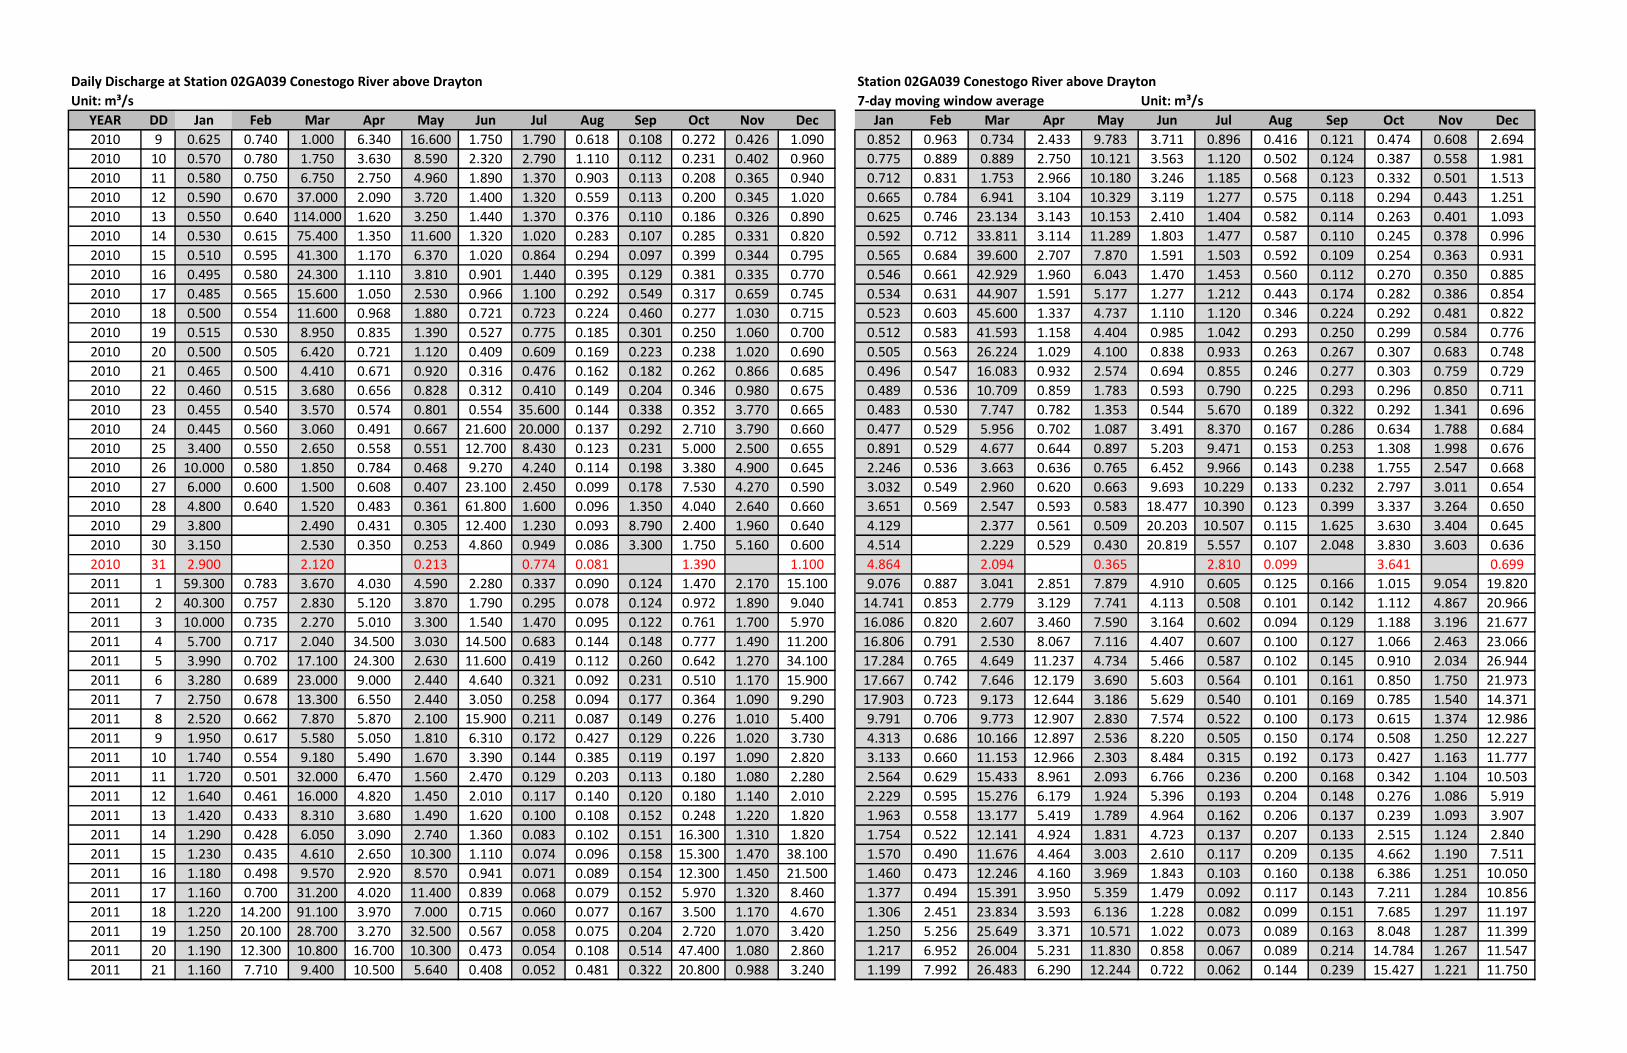
Daily Discharge at Station 02GA039 Conestogo River above Drayton Station 02GA039 Conestogo River above Drayton
Unit: m³/s 7-day moving window average Unit: m³/s
YEAR DD Jan Feb Mar Apr May Jun Jul Aug Sep Oct Nov Dec Jan Feb Mar Apr May Jun Jul Aug Sep Oct Nov Dec
2010 9 0.625 0.740 1.000 6.340 16.600 1.750 1.790 0.618 0.108 0.272 0.426 1.090 0.852 0.963 0.734 2.433 9.783 3.711 0.896 0.416 0.121 0.474 0.608 2.694
2010 10 0.570 0.780 1.750 3.630 8.590 2.320 2.790 1.110 0.112 0.231 0.402 0.960 0.775 0.889 0.889 2.750 10.121 3.563 1.120 0.502 0.124 0.387 0.558 1.981
2010 11 0.580 0.750 6.750 2.750 4.960 1.890 1.370 0.903 0.113 0.208 0.365 0.940 0.712 0.831 1.753 2.966 10.180 3.246 1.185 0.568 0.123 0.332 0.501 1.513
2010 12 0.590 0.670 37.000 2.090 3.720 1.400 1.320 0.559 0.113 0.200 0.345 1.020 0.665 0.784 6.941 3.104 10.329 3.119 1.277 0.575 0.118 0.294 0.443 1.251
2010 13 0.550 0.640 114.000 1.620 3.250 1.440 1.370 0.376 0.110 0.186 0.326 0.890 0.625 0.746 23.134 3.143 10.153 2.410 1.404 0.582 0.114 0.263 0.401 1.093
2010 14 0.530 0.615 75.400 1.350 11.600 1.320 1.020 0.283 0.107 0.285 0.331 0.820 0.592 0.712 33.811 3.114 11.289 1.803 1.477 0.587 0.110 0.245 0.378 0.996
2010 15 0.510 0.595 41.300 1.170 6.370 1.020 0.864 0.294 0.097 0.399 0.344 0.795 0.565 0.684 39.600 2.707 7.870 1.591 1.503 0.592 0.109 0.254 0.363 0.931
2010 16 0.495 0.580 24.300 1.110 3.810 0.901 1.440 0.395 0.129 0.381 0.335 0.770 0.546 0.661 42.929 1.960 6.043 1.470 1.453 0.560 0.112 0.270 0.350 0.885
2010 17 0.485 0.565 15.600 1.050 2.530 0.966 1.100 0.292 0.549 0.317 0.659 0.745 0.534 0.631 44.907 1.591 5.177 1.277 1.212 0.443 0.174 0.282 0.386 0.854
2010 18 0.500 0.554 11.600 0.968 1.880 0.721 0.723 0.224 0.460 0.277 1.030 0.715 0.523 0.603 45.600 1.337 4.737 1.110 1.120 0.346 0.224 0.292 0.481 0.822
2010 19 0.515 0.530 8.950 0.835 1.390 0.527 0.775 0.185 0.301 0.250 1.060 0.700 0.512 0.583 41.593 1.158 4.404 0.985 1.042 0.293 0.250 0.299 0.584 0.776
2010 20 0.500 0.505 6.420 0.721 1.120 0.409 0.609 0.169 0.223 0.238 1.020 0.690 0.505 0.563 26.224 1.029 4.100 0.838 0.933 0.263 0.267 0.307 0.683 0.748
2010 21 0.465 0.500 4.410 0.671 0.920 0.316 0.476 0.162 0.182 0.262 0.866 0.685 0.496 0.547 16.083 0.932 2.574 0.694 0.855 0.246 0.277 0.303 0.759 0.729
2010 22 0.460 0.515 3.680 0.656 0.828 0.312 0.410 0.149 0.204 0.346 0.980 0.675 0.489 0.536 10.709 0.859 1.783 0.593 0.790 0.225 0.293 0.296 0.850 0.711
2010 23 0.455 0.540 3.570 0.574 0.801 0.554 35.600 0.144 0.338 0.352 3.770 0.665 0.483 0.530 7.747 0.782 1.353 0.544 5.670 0.189 0.322 0.292 1.341 0.696
2010 24 0.445 0.560 3.060 0.491 0.667 21.600 20.000 0.137 0.292 2.710 3.790 0.660 0.477 0.529 5.956 0.702 1.087 3.491 8.370 0.167 0.286 0.634 1.788 0.684
2010 25 3.400 0.550 2.650 0.558 0.551 12.700 8.430 0.123 0.231 5.000 2.500 0.655 0.891 0.529 4.677 0.644 0.897 5.203 9.471 0.153 0.253 1.308 1.998 0.676
2010 26 10.000 0.580 1.850 0.784 0.468 9.270 4.240 0.114 0.198 3.380 4.900 0.645 2.246 0.536 3.663 0.636 0.765 6.452 9.966 0.143 0.238 1.755 2.547 0.668
2010 27 6.000 0.600 1.500 0.608 0.407 23.100 2.450 0.099 0.178 7.530 4.270 0.590 3.032 0.549 2.960 0.620 0.663 9.693 10.229 0.133 0.232 2.797 3.011 0.654
2010 28 4.800 0.640 1.520 0.483 0.361 61.800 1.600 0.096 1.350 4.040 2.640 0.660 3.651 0.569 2.547 0.593 0.583 18.477 10.390 0.123 0.399 3.337 3.264 0.650
2010 29 3.800 2.490 0.431 0.305 12.400 1.230 0.093 8.790 2.400 1.960 0.640 4.129 2.377 0.561 0.509 20.203 10.507 0.115 1.625 3.630 3.404 0.645
2010 30 3.150 2.530 0.350 0.253 4.860 0.949 0.086 3.300 1.750 5.160 0.600 4.514 2.229 0.529 0.430 20.819 5.557 0.107 2.048 3.830 3.603 0.636
2010 31 2.900 2.120 0.213 0.774 0.081 1.390 1.100 4.864 2.094 0.365 2.810 0.099 3.641 0.699
2011 1 59.300 0.783 3.670 4.030 4.590 2.280 0.337 0.090 0.124 1.470 2.170 15.100 9.076 0.887 3.041 2.851 7.879 4.910 0.605 0.125 0.166 1.015 9.054 19.820
2011 2 40.300 0.757 2.830 5.120 3.870 1.790 0.295 0.078 0.124 0.972 1.890 9.040 14.741 0.853 2.779 3.129 7.741 4.113 0.508 0.101 0.142 1.112 4.867 20.966
2011 3 10.000 0.735 2.270 5.010 3.300 1.540 1.470 0.095 0.122 0.761 1.700 5.970 16.086 0.820 2.607 3.460 7.590 3.164 0.602 0.094 0.129 1.188 3.196 21.677
2011 4 5.700 0.717 2.040 34.500 3.030 14.500 0.683 0.144 0.148 0.777 1.490 11.200 16.806 0.791 2.530 8.067 7.116 4.407 0.607 0.100 0.127 1.066 2.463 23.066
2011 5 3.990 0.702 17.100 24.300 2.630 11.600 0.419 0.112 0.260 0.642 1.270 34.100 17.284 0.765 4.649 11.237 4.734 5.466 0.587 0.102 0.145 0.910 2.034 26.944
2011 6 3.280 0.689 23.000 9.000 2.440 4.640 0.321 0.092 0.231 0.510 1.170 15.900 17.667 0.742 7.646 12.179 3.690 5.603 0.564 0.101 0.161 0.850 1.750 21.973
2011 7 2.750 0.678 13.300 6.550 2.440 3.050 0.258 0.094 0.177 0.364 1.090 9.290 17.903 0.723 9.173 12.644 3.186 5.629 0.540 0.101 0.169 0.785 1.540 14.371
2011 8 2.520 0.662 7.870 5.870 2.100 15.900 0.211 0.087 0.149 0.276 1.010 5.400 9.791 0.706 9.773 12.907 2.830 7.574 0.522 0.100 0.173 0.615 1.374 12.986
2011 9 1.950 0.617 5.580 5.050 1.810 6.310 0.172 0.427 0.129 0.226 1.020 3.730 4.313 0.686 10.166 12.897 2.536 8.220 0.505 0.150 0.174 0.508 1.250 12.227
2011 10 1.740 0.554 9.180 5.490 1.670 3.390 0.144 0.385 0.119 0.197 1.090 2.820 3.133 0.660 11.153 12.966 2.303 8.484 0.315 0.192 0.173 0.427 1.163 11.777
2011 11 1.720 0.501 32.000 6.470 1.560 2.470 0.129 0.203 0.113 0.180 1.080 2.280 2.564 0.629 15.433 8.961 2.093 6.766 0.236 0.200 0.168 0.342 1.104 10.503
2011 12 1.640 0.461 16.000 4.820 1.450 2.010 0.117 0.140 0.120 0.180 1.140 2.010 2.229 0.595 15.276 6.179 1.924 5.396 0.193 0.204 0.148 0.276 1.086 5.919
2011 13 1.420 0.433 8.310 3.680 1.490 1.620 0.100 0.108 0.152 0.248 1.220 1.820 1.963 0.558 13.177 5.419 1.789 4.964 0.162 0.206 0.137 0.239 1.093 3.907
2011 14 1.290 0.428 6.050 3.090 2.740 1.360 0.083 0.102 0.151 16.300 1.310 1.820 1.754 0.522 12.141 4.924 1.831 4.723 0.137 0.207 0.133 2.515 1.124 2.840
2011 15 1.230 0.435 4.610 2.650 10.300 1.110 0.074 0.096 0.158 15.300 1.470 38.100 1.570 0.490 11.676 4.464 3.003 2.610 0.117 0.209 0.135 4.662 1.190 7.511
2011 16 1.180 0.498 9.570 2.920 8.570 0.941 0.071 0.089 0.154 12.300 1.450 21.500 1.460 0.473 12.246 4.160 3.969 1.843 0.103 0.160 0.138 6.386 1.251 10.050
2011 17 1.160 0.700 31.200 4.020 11.400 0.839 0.068 0.079 0.152 5.970 1.320 8.460 1.377 0.494 15.391 3.950 5.359 1.479 0.092 0.117 0.143 7.211 1.284 10.856
2011 18 1.220 14.200 91.100 3.970 7.000 0.715 0.060 0.077 0.167 3.500 1.170 4.670 1.306 2.451 23.834 3.593 6.136 1.228 0.082 0.099 0.151 7.685 1.297 11.197
2011 19 1.250 20.100 28.700 3.270 32.500 0.567 0.058 0.075 0.204 2.720 1.070 3.420 1.250 5.256 25.649 3.371 10.571 1.022 0.073 0.089 0.163 8.048 1.287 11.399
2011 20 1.190 12.300 10.800 16.700 10.300 0.473 0.054 0.108 0.514 47.400 1.080 2.860 1.217 6.952 26.004 5.231 11.830 0.858 0.067 0.089 0.214 14.784 1.267 11.547
2011 21 1.160 7.710 9.400 10.500 5.640 0.408 0.052 0.481 0.322 20.800 0.988 3.240 1.199 7.992 26.483 6.290 12.244 0.722 0.062 0.144 0.239 15.427 1.221 11.750
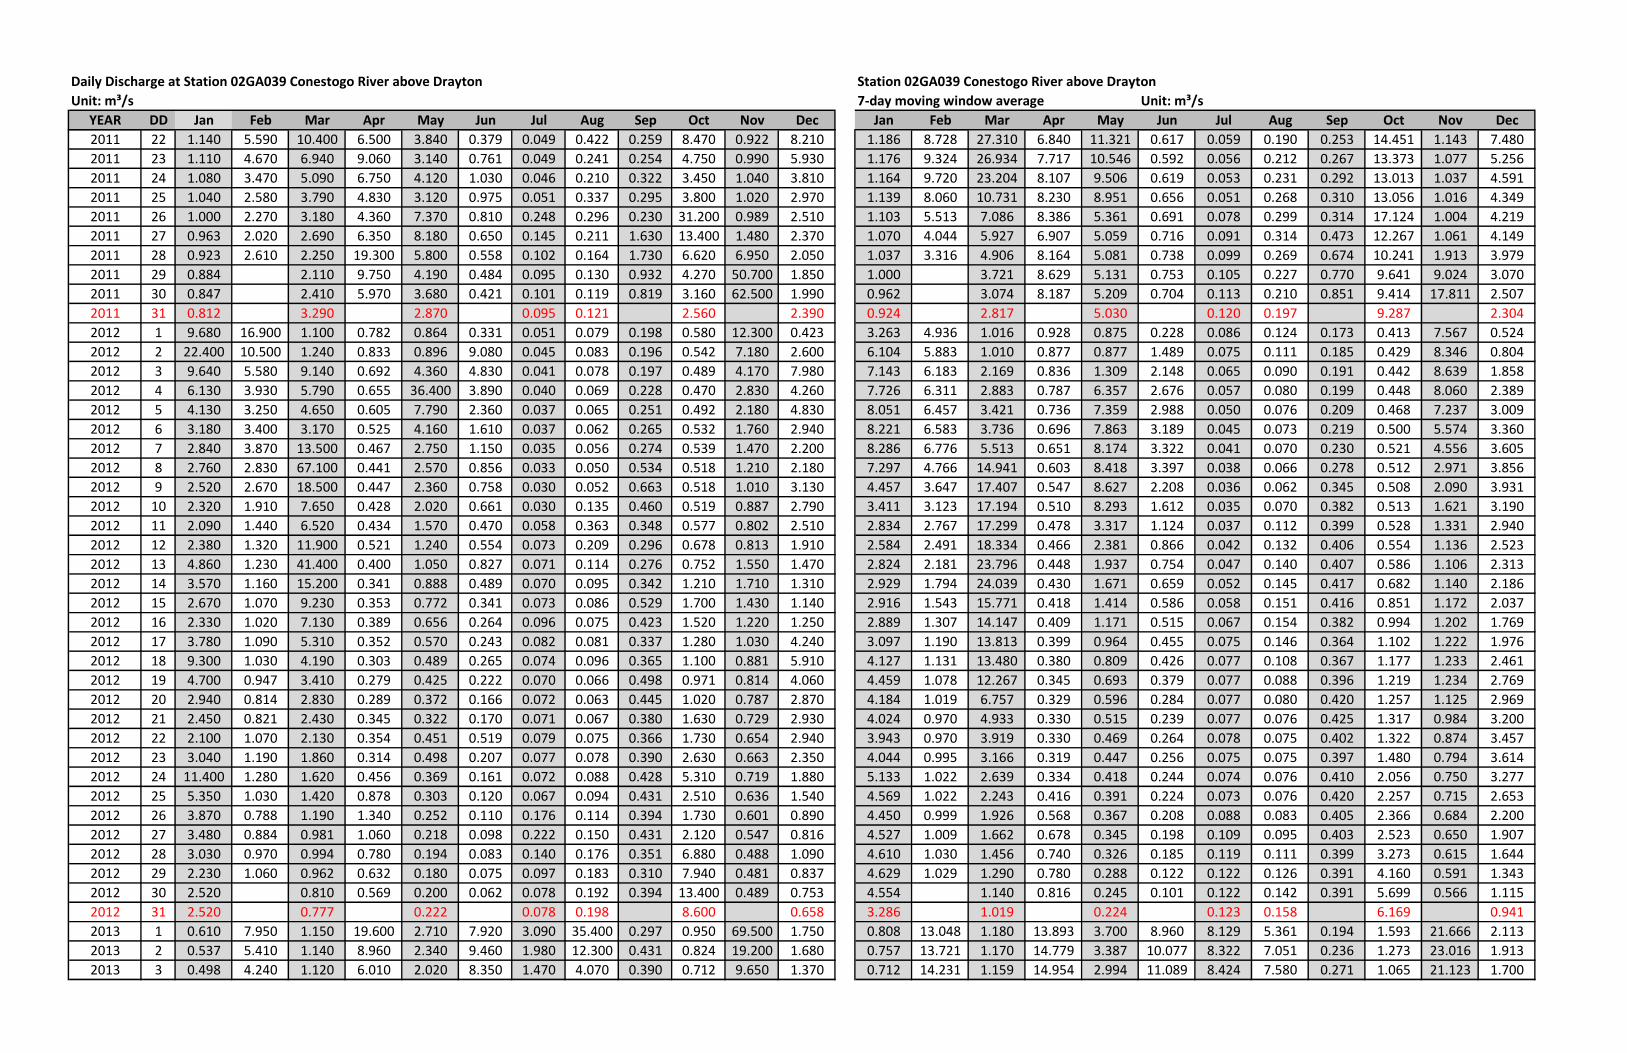
Daily Discharge at Station 02GA039 Conestogo River above Drayton Station 02GA039 Conestogo River above Drayton
Unit: m³/s 7-day moving window average Unit: m³/s
YEAR DD Jan Feb Mar Apr May Jun Jul Aug Sep Oct Nov Dec Jan Feb Mar Apr May Jun Jul Aug Sep Oct Nov Dec
2011 22 1.140 5.590 10.400 6.500 3.840 0.379 0.049 0.422 0.259 8.470 0.922 8.210 1.186 8.728 27.310 6.840 11.321 0.617 0.059 0.190 0.253 14.451 1.143 7.480
2011 23 1.110 4.670 6.940 9.060 3.140 0.761 0.049 0.241 0.254 4.750 0.990 5.930 1.176 9.324 26.934 7.717 10.546 0.592 0.056 0.212 0.267 13.373 1.077 5.256
2011 24 1.080 3.470 5.090 6.750 4.120 1.030 0.046 0.210 0.322 3.450 1.040 3.810 1.164 9.720 23.204 8.107 9.506 0.619 0.053 0.231 0.292 13.013 1.037 4.591
2011 25 1.040 2.580 3.790 4.830 3.120 0.975 0.051 0.337 0.295 3.800 1.020 2.970 1.139 8.060 10.731 8.230 8.951 0.656 0.051 0.268 0.310 13.056 1.016 4.349
2011 26 1.000 2.270 3.180 4.360 7.370 0.810 0.248 0.296 0.230 31.200 0.989 2.510 1.103 5.513 7.086 8.386 5.361 0.691 0.078 0.299 0.314 17.124 1.004 4.219
2011 27 0.963 2.020 2.690 6.350 8.180 0.650 0.145 0.211 1.630 13.400 1.480 2.370 1.070 4.044 5.927 6.907 5.059 0.716 0.091 0.314 0.473 12.267 1.061 4.149
2011 28 0.923 2.610 2.250 19.300 5.800 0.558 0.102 0.164 1.730 6.620 6.950 2.050 1.037 3.316 4.906 8.164 5.081 0.738 0.099 0.269 0.674 10.241 1.913 3.979
2011 29 0.884 2.110 9.750 4.190 0.484 0.095 0.130 0.932 4.270 50.700 1.850 1.000 3.721 8.629 5.131 0.753 0.105 0.227 0.770 9.641 9.024 3.070
2011 30 0.847 2.410 5.970 3.680 0.421 0.101 0.119 0.819 3.160 62.500 1.990 0.962 3.074 8.187 5.209 0.704 0.113 0.210 0.851 9.414 17.811 2.507
2011 31 0.812 3.290 2.870 0.095 0.121 2.560 2.390 0.924 2.817 5.030 0.120 0.197 9.287 2.304
2012 1 9.680 16.900 1.100 0.782 0.864 0.331 0.051 0.079 0.198 0.580 12.300 0.423 3.263 4.936 1.016 0.928 0.875 0.228 0.086 0.124 0.173 0.413 7.567 0.524
2012 2 22.400 10.500 1.240 0.833 0.896 9.080 0.045 0.083 0.196 0.542 7.180 2.600 6.104 5.883 1.010 0.877 0.877 1.489 0.075 0.111 0.185 0.429 8.346 0.804
2012 3 9.640 5.580 9.140 0.692 4.360 4.830 0.041 0.078 0.197 0.489 4.170 7.980 7.143 6.183 2.169 0.836 1.309 2.148 0.065 0.090 0.191 0.442 8.639 1.858
2012 4 6.130 3.930 5.790 0.655 36.400 3.890 0.040 0.069 0.228 0.470 2.830 4.260 7.726 6.311 2.883 0.787 6.357 2.676 0.057 0.080 0.199 0.448 8.060 2.389
2012 5 4.130 3.250 4.650 0.605 7.790 2.360 0.037 0.065 0.251 0.492 2.180 4.830 8.051 6.457 3.421 0.736 7.359 2.988 0.050 0.076 0.209 0.468 7.237 3.009
2012 6 3.180 3.400 3.170 0.525 4.160 1.610 0.037 0.062 0.265 0.532 1.760 2.940 8.221 6.583 3.736 0.696 7.863 3.189 0.045 0.073 0.219 0.500 5.574 3.360
2012 7 2.840 3.870 13.500 0.467 2.750 1.150 0.035 0.056 0.274 0.539 1.470 2.200 8.286 6.776 5.513 0.651 8.174 3.322 0.041 0.070 0.230 0.521 4.556 3.605
2012 8 2.760 2.830 67.100 0.441 2.570 0.856 0.033 0.050 0.534 0.518 1.210 2.180 7.297 4.766 14.941 0.603 8.418 3.397 0.038 0.066 0.278 0.512 2.971 3.856
2012 9 2.520 2.670 18.500 0.447 2.360 0.758 0.030 0.052 0.663 0.518 1.010 3.130 4.457 3.647 17.407 0.547 8.627 2.208 0.036 0.062 0.345 0.508 2.090 3.931
2012 10 2.320 1.910 7.650 0.428 2.020 0.661 0.030 0.135 0.460 0.519 0.887 2.790 3.411 3.123 17.194 0.510 8.293 1.612 0.035 0.070 0.382 0.513 1.621 3.190
2012 11 2.090 1.440 6.520 0.434 1.570 0.470 0.058 0.363 0.348 0.577 0.802 2.510 2.834 2.767 17.299 0.478 3.317 1.124 0.037 0.112 0.399 0.528 1.331 2.940
2012 12 2.380 1.320 11.900 0.521 1.240 0.554 0.073 0.209 0.296 0.678 0.813 1.910 2.584 2.491 18.334 0.466 2.381 0.866 0.042 0.132 0.406 0.554 1.136 2.523
2012 13 4.860 1.230 41.400 0.400 1.050 0.827 0.071 0.114 0.276 0.752 1.550 1.470 2.824 2.181 23.796 0.448 1.937 0.754 0.047 0.140 0.407 0.586 1.106 2.313
2012 14 3.570 1.160 15.200 0.341 0.888 0.489 0.070 0.095 0.342 1.210 1.710 1.310 2.929 1.794 24.039 0.430 1.671 0.659 0.052 0.145 0.417 0.682 1.140 2.186
2012 15 2.670 1.070 9.230 0.353 0.772 0.341 0.073 0.086 0.529 1.700 1.430 1.140 2.916 1.543 15.771 0.418 1.414 0.586 0.058 0.151 0.416 0.851 1.172 2.037
2012 16 2.330 1.020 7.130 0.389 0.656 0.264 0.096 0.075 0.423 1.520 1.220 1.250 2.889 1.307 14.147 0.409 1.171 0.515 0.067 0.154 0.382 0.994 1.202 1.769
2012 17 3.780 1.090 5.310 0.352 0.570 0.243 0.082 0.081 0.337 1.280 1.030 4.240 3.097 1.190 13.813 0.399 0.964 0.455 0.075 0.146 0.364 1.102 1.222 1.976
2012 18 9.300 1.030 4.190 0.303 0.489 0.265 0.074 0.096 0.365 1.100 0.881 5.910 4.127 1.131 13.480 0.380 0.809 0.426 0.077 0.108 0.367 1.177 1.233 2.461
2012 19 4.700 0.947 3.410 0.279 0.425 0.222 0.070 0.066 0.498 0.971 0.814 4.060 4.459 1.078 12.267 0.345 0.693 0.379 0.077 0.088 0.396 1.219 1.234 2.769
2012 20 2.940 0.814 2.830 0.289 0.372 0.166 0.072 0.063 0.445 1.020 0.787 2.870 4.184 1.019 6.757 0.329 0.596 0.284 0.077 0.080 0.420 1.257 1.125 2.969
2012 21 2.450 0.821 2.430 0.345 0.322 0.170 0.071 0.067 0.380 1.630 0.729 2.930 4.024 0.970 4.933 0.330 0.515 0.239 0.077 0.076 0.425 1.317 0.984 3.200
2012 22 2.100 1.070 2.130 0.354 0.451 0.519 0.079 0.075 0.366 1.730 0.654 2.940 3.943 0.970 3.919 0.330 0.469 0.264 0.078 0.075 0.402 1.322 0.874 3.457
2012 23 3.040 1.190 1.860 0.314 0.498 0.207 0.077 0.078 0.390 2.630 0.663 2.350 4.044 0.995 3.166 0.319 0.447 0.256 0.075 0.075 0.397 1.480 0.794 3.614
2012 24 11.400 1.280 1.620 0.456 0.369 0.161 0.072 0.088 0.428 5.310 0.719 1.880 5.133 1.022 2.639 0.334 0.418 0.244 0.074 0.076 0.410 2.056 0.750 3.277
2012 25 5.350 1.030 1.420 0.878 0.303 0.120 0.067 0.094 0.431 2.510 0.636 1.540 4.569 1.022 2.243 0.416 0.391 0.224 0.073 0.076 0.420 2.257 0.715 2.653
2012 26 3.870 0.788 1.190 1.340 0.252 0.110 0.176 0.114 0.394 1.730 0.601 0.890 4.450 0.999 1.926 0.568 0.367 0.208 0.088 0.083 0.405 2.366 0.684 2.200
2012 27 3.480 0.884 0.981 1.060 0.218 0.098 0.222 0.150 0.431 2.120 0.547 0.816 4.527 1.009 1.662 0.678 0.345 0.198 0.109 0.095 0.403 2.523 0.650 1.907
2012 28 3.030 0.970 0.994 0.780 0.194 0.083 0.140 0.176 0.351 6.880 0.488 1.090 4.610 1.030 1.456 0.740 0.326 0.185 0.119 0.111 0.399 3.273 0.615 1.644
2012 29 2.230 1.060 0.962 0.632 0.180 0.075 0.097 0.183 0.310 7.940 0.481 0.837 4.629 1.029 1.290 0.780 0.288 0.122 0.122 0.126 0.391 4.160 0.591 1.343
2012 30 2.520 0.810 0.569 0.200 0.062 0.078 0.192 0.394 13.400 0.489 0.753 4.554 1.140 0.816 0.245 0.101 0.122 0.142 0.391 5.699 0.566 1.115
2012 31 2.520 0.777 0.222 0.078 0.198 8.600 0.658 3.286 1.019 0.224 0.123 0.158 6.169 0.941
2013 1 0.610 7.950 1.150 19.600 2.710 7.920 3.090 35.400 0.297 0.950 69.500 1.750 0.808 13.048 1.180 13.893 3.700 8.960 8.129 5.361 0.194 1.593 21.666 2.113
2013 2 0.537 5.410 1.140 8.960 2.340 9.460 1.980 12.300 0.431 0.824 19.200 1.680 0.757 13.721 1.170 14.779 3.387 10.077 8.322 7.051 0.236 1.273 23.016 1.913
2013 3 0.498 4.240 1.120 6.010 2.020 8.350 1.470 4.070 0.390 0.712 9.650 1.370 0.712 14.231 1.159 14.954 2.994 11.089 8.424 7.580 0.271 1.065 21.123 1.700
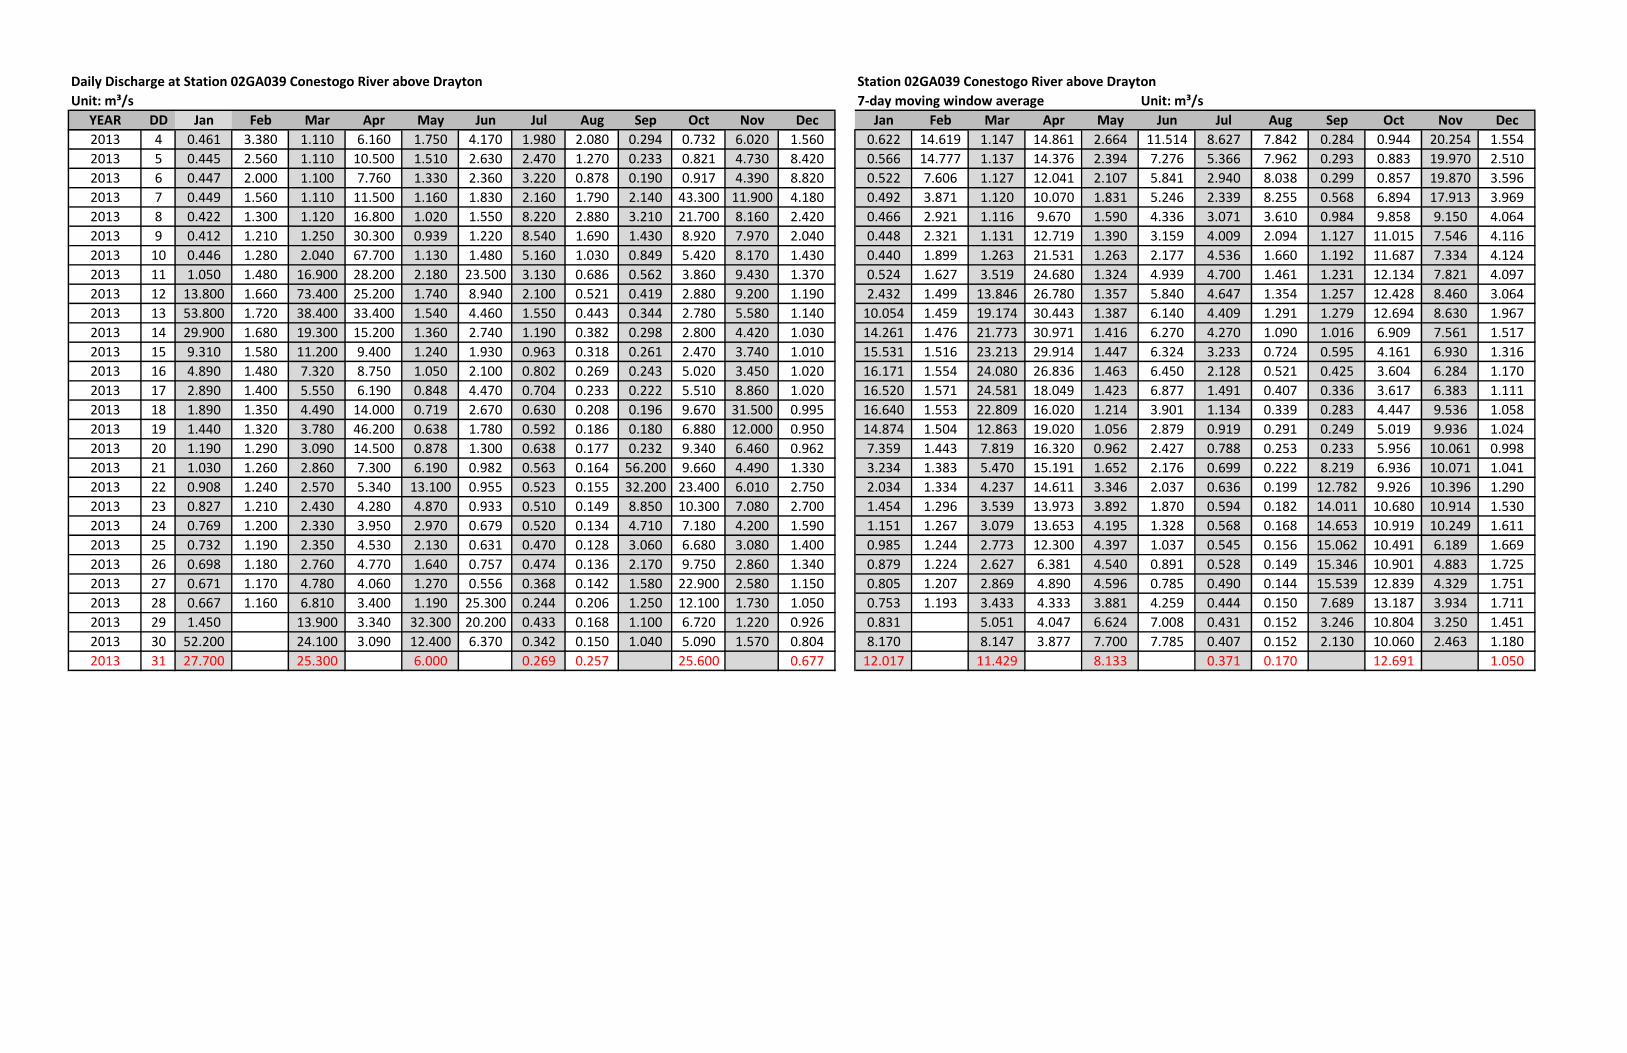
Daily Discharge at Station 02GA039 Conestogo River above Drayton Station 02GA039 Conestogo River above Drayton
Unit: m³/s 7-day moving window average Unit: m³/s
YEAR DD Jan Feb Mar Apr May Jun Jul Aug Sep Oct Nov Dec Jan Feb Mar Apr May Jun Jul Aug Sep Oct Nov Dec
2013 4 0.461 3.380 1.110 6.160 1.750 4.170 1.980 2.080 0.294 0.732 6.020 1.560 0.622 14.619 1.147 14.861 2.664 11.514 8.627 7.842 0.284 0.944 20.254 1.554
2013 5 0.445 2.560 1.110 10.500 1.510 2.630 2.470 1.270 0.233 0.821 4.730 8.420 0.566 14.777 1.137 14.376 2.394 7.276 5.366 7.962 0.293 0.883 19.970 2.510
2013 6 0.447 2.000 1.100 7.760 1.330 2.360 3.220 0.878 0.190 0.917 4.390 8.820 0.522 7.606 1.127 12.041 2.107 5.841 2.940 8.038 0.299 0.857 19.870 3.596
2013 7 0.449 1.560 1.110 11.500 1.160 1.830 2.160 1.790 2.140 43.300 11.900 4.180 0.492 3.871 1.120 10.070 1.831 5.246 2.339 8.255 0.568 6.894 17.913 3.969
2013 8 0.422 1.300 1.120 16.800 1.020 1.550 8.220 2.880 3.210 21.700 8.160 2.420 0.466 2.921 1.116 9.670 1.590 4.336 3.071 3.610 0.984 9.858 9.150 4.064
2013 9 0.412 1.210 1.250 30.300 0.939 1.220 8.540 1.690 1.430 8.920 7.970 2.040 0.448 2.321 1.131 12.719 1.390 3.159 4.009 2.094 1.127 11.015 7.546 4.116
2013 10 0.446 1.280 2.040 67.700 1.130 1.480 5.160 1.030 0.849 5.420 8.170 1.430 0.440 1.899 1.263 21.531 1.263 2.177 4.536 1.660 1.192 11.687 7.334 4.124
2013 11 1.050 1.480 16.900 28.200 2.180 23.500 3.130 0.686 0.562 3.860 9.430 1.370 0.524 1.627 3.519 24.680 1.324 4.939 4.700 1.461 1.231 12.134 7.821 4.097
2013 12 13.800 1.660 73.400 25.200 1.740 8.940 2.100 0.521 0.419 2.880 9.200 1.190 2.432 1.499 13.846 26.780 1.357 5.840 4.647 1.354 1.257 12.428 8.460 3.064
2013 13 53.800 1.720 38.400 33.400 1.540 4.460 1.550 0.443 0.344 2.780 5.580 1.140 10.054 1.459 19.174 30.443 1.387 6.140 4.409 1.291 1.279 12.694 8.630 1.967
2013 14 29.900 1.680 19.300 15.200 1.360 2.740 1.190 0.382 0.298 2.800 4.420 1.030 14.261 1.476 21.773 30.971 1.416 6.270 4.270 1.090 1.016 6.909 7.561 1.517
2013 15 9.310 1.580 11.200 9.400 1.240 1.930 0.963 0.318 0.261 2.470 3.740 1.010 15.531 1.516 23.213 29.914 1.447 6.324 3.233 0.724 0.595 4.161 6.930 1.316
2013 16 4.890 1.480 7.320 8.750 1.050 2.100 0.802 0.269 0.243 5.020 3.450 1.020 16.171 1.554 24.080 26.836 1.463 6.450 2.128 0.521 0.425 3.604 6.284 1.170
2013 17 2.890 1.400 5.550 6.190 0.848 4.470 0.704 0.233 0.222 5.510 8.860 1.020 16.520 1.571 24.581 18.049 1.423 6.877 1.491 0.407 0.336 3.617 6.383 1.111
2013 18 1.890 1.350 4.490 14.000 0.719 2.670 0.630 0.208 0.196 9.670 31.500 0.995 16.640 1.553 22.809 16.020 1.214 3.901 1.134 0.339 0.283 4.447 9.536 1.058
2013 19 1.440 1.320 3.780 46.200 0.638 1.780 0.592 0.186 0.180 6.880 12.000 0.950 14.874 1.504 12.863 19.020 1.056 2.879 0.919 0.291 0.249 5.019 9.936 1.024
2013 20 1.190 1.290 3.090 14.500 0.878 1.300 0.638 0.177 0.232 9.340 6.460 0.962 7.359 1.443 7.819 16.320 0.962 2.427 0.788 0.253 0.233 5.956 10.061 0.998
2013 21 1.030 1.260 2.860 7.300 6.190 0.982 0.563 0.164 56.200 9.660 4.490 1.330 3.234 1.383 5.470 15.191 1.652 2.176 0.699 0.222 8.219 6.936 10.071 1.041
2013 22 0.908 1.240 2.570 5.340 13.100 0.955 0.523 0.155 32.200 23.400 6.010 2.750 2.034 1.334 4.237 14.611 3.346 2.037 0.636 0.199 12.782 9.926 10.396 1.290
2013 23 0.827 1.210 2.430 4.280 4.870 0.933 0.510 0.149 8.850 10.300 7.080 2.700 1.454 1.296 3.539 13.973 3.892 1.870 0.594 0.182 14.011 10.680 10.914 1.530
2013 24 0.769 1.200 2.330 3.950 2.970 0.679 0.520 0.134 4.710 7.180 4.200 1.590 1.151 1.267 3.079 13.653 4.195 1.328 0.568 0.168 14.653 10.919 10.249 1.611
2013 25 0.732 1.190 2.350 4.530 2.130 0.631 0.470 0.128 3.060 6.680 3.080 1.400 0.985 1.244 2.773 12.300 4.397 1.037 0.545 0.156 15.062 10.491 6.189 1.669
2013 26 0.698 1.180 2.760 4.770 1.640 0.757 0.474 0.136 2.170 9.750 2.860 1.340 0.879 1.224 2.627 6.381 4.540 0.891 0.528 0.149 15.346 10.901 4.883 1.725
2013 27 0.671 1.170 4.780 4.060 1.270 0.556 0.368 0.142 1.580 22.900 2.580 1.150 0.805 1.207 2.869 4.890 4.596 0.785 0.490 0.144 15.539 12.839 4.329 1.751
2013 28 0.667 1.160 6.810 3.400 1.190 25.300 0.244 0.206 1.250 12.100 1.730 1.050 0.753 1.193 3.433 4.333 3.881 4.259 0.444 0.150 7.689 13.187 3.934 1.711
2013 29 1.450 13.900 3.340 32.300 20.200 0.433 0.168 1.100 6.720 1.220 0.926 0.831 5.051 4.047 6.624 7.008 0.431 0.152 3.246 10.804 3.250 1.451
2013 30 52.200 24.100 3.090 12.400 6.370 0.342 0.150 1.040 5.090 1.570 0.804 8.170 8.147 3.877 7.700 7.785 0.407 0.152 2.130 10.060 2.463 1.180
2013 31 27.700 25.300 6.000 0.269 0.257 25.600 0.677 12.017 11.429 8.133 0.371 0.170 12.691 1.050

Township of Mapleton Receiving Water Impact Assessment for Mapleton WPCP Upgrade
BRM-00605325-A0 October 13, 2017
Appendix C: Monthly Minimums of 7-day Moving Window Average
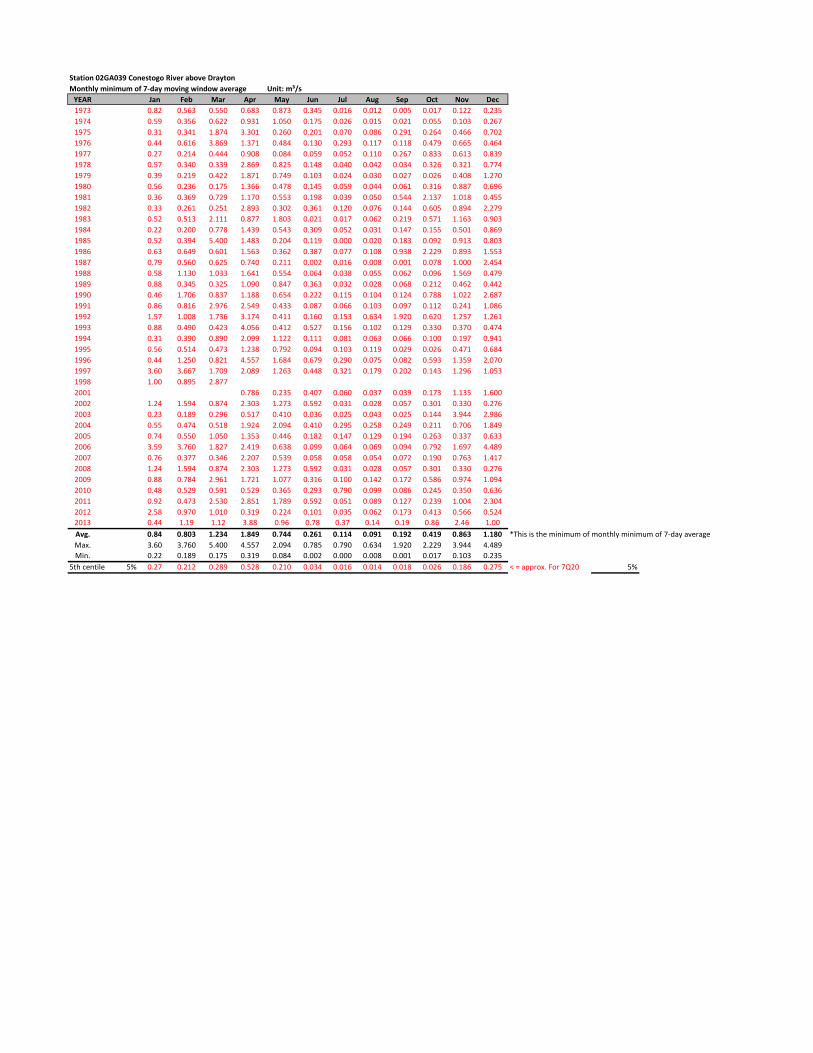
Station 02GA039 Conestogo River above Drayton
Monthly minimum of 7-day moving window average Unit: m³/s
YEAR Jan Feb Mar Apr May Jun Jul Aug Sep Oct Nov Dec
1973 0.82 0.563 0.550 0.683 0.873 0.345 0.016 0.012 0.005 0.017 0.122 0.235
1974 0.59 0.356 0.622 0.931 1.050 0.175 0.026 0.015 0.021 0.055 0.103 0.267
1975 0.31 0.341 1.874 3.301 0.260 0.201 0.070 0.086 0.291 0.264 0.466 0.702
1976 0.44 0.616 3.869 1.371 0.484 0.130 0.293 0.117 0.118 0.479 0.665 0.464
1977 0.27 0.214 0.444 0.908 0.084 0.059 0.052 0.110 0.267 0.833 0.613 0.839
1978 0.57 0.340 0.339 2.869 0.825 0.148 0.040 0.042 0.034 0.326 0.321 0.774
1979 0.39 0.219 0.422 1.871 0.749 0.103 0.024 0.030 0.027 0.026 0.408 1.270
1980 0.56 0.236 0.175 1.366 0.478 0.145 0.059 0.044 0.061 0.316 0.887 0.696
1981 0.36 0.369 0.729 1.170 0.553 0.198 0.039 0.050 0.544 2.137 1.018 0.455
1982 0.33 0.261 0.251 2.893 0.302 0.361 0.120 0.076 0.144 0.605 0.894 2.279
1983 0.52 0.513 2.111 0.877 1.803 0.021 0.017 0.062 0.219 0.571 1.163 0.903
1984 0.22 0.200 0.778 1.439 0.543 0.309 0.052 0.031 0.147 0.155 0.501 0.869
1985 0.52 0.394 5.400 1.483 0.204 0.119 0.000 0.020 0.183 0.092 0.913 0.803
1986 0.63 0.649 0.601 1.563 0.362 0.387 0.077 0.108 0.938 2.229 0.893 1.553
1987 0.79 0.560 0.625 0.740 0.211 0.002 0.016 0.008 0.001 0.078 1.000 2.454
1988 0.58 1.130 1.033 1.641 0.554 0.064 0.038 0.055 0.062 0.096 1.569 0.479
1989 0.88 0.345 0.325 1.090 0.847 0.363 0.032 0.028 0.068 0.212 0.462 0.442
1990 0.46 1.706 0.837 1.188 0.654 0.222 0.115 0.104 0.124 0.788 1.022 2.687
1991 0.86 0.816 2.976 2.549 0.433 0.087 0.066 0.103 0.097 0.112 0.241 1.086
1992 1.57 1.008 1.736 3.174 0.411 0.160 0.153 0.634 1.920 0.620 1.257 1.261
1993 0.88 0.490 0.423 4.056 0.412 0.527 0.156 0.102 0.129 0.330 0.370 0.474
1994 0.31 0.390 0.890 2.099 1.122 0.111 0.081 0.063 0.066 0.100 0.197 0.941
1995 0.56 0.514 0.473 1.238 0.792 0.094 0.103 0.119 0.029 0.026 0.471 0.684
1996 0.44 1.250 0.821 4.557 1.684 0.679 0.290 0.075 0.082 0.593 1.359 2.070
1997 3.60 3.667 1.709 2.089 1.263 0.448 0.321 0.179 0.202 0.143 1.296 1.053
1998 1.00 0.895 2.877
2001 0.786 0.235 0.407 0.060 0.037 0.039 0.173 1.135 1.600
2002 1.24 1.594 0.874 2.303 1.273 0.592 0.031 0.028 0.057 0.301 0.330 0.276
2003 0.23 0.189 0.296 0.517 0.410 0.036 0.025 0.043 0.025 0.144 3.944 2.986
2004 0.55 0.474 0.518 1.924 2.094 0.410 0.295 0.258 0.249 0.211 0.706 1.849
2005 0.74 0.550 1.050 1.353 0.446 0.182 0.147 0.129 0.194 0.263 0.337 0.633
2006 3.59 3.760 1.827 2.419 0.638 0.099 0.064 0.069 0.094 0.792 1.697 4.489
2007 0.76 0.377 0.346 2.207 0.539 0.058 0.058 0.054 0.072 0.190 0.763 1.417
2008 1.24 1.594 0.874 2.303 1.273 0.592 0.031 0.028 0.057 0.301 0.330 0.276
2009 0.88 0.784 2.961 1.721 1.077 0.316 0.100 0.142 0.172 0.586 0.974 1.094
2010 0.48 0.529 0.591 0.529 0.365 0.293 0.790 0.099 0.086 0.245 0.350 0.636
2011 0.92 0.473 2.530 2.851 1.789 0.592 0.051 0.089 0.127 0.239 1.004 2.304
2012 2.58 0.970 1.010 0.319 0.224 0.101 0.035 0.062 0.173 0.413 0.566 0.524
2013 0.44 1.19 1.12 3.88 0.96 0.78 0.37 0.14 0.19 0.86 2.46 1.00
Avg. 0.84 0.803 1.234 1.849 0.744 0.261 0.114 0.091 0.192 0.419 0.863 1.180 *This is the minimum of monthly minimum of 7-day average
Max. 3.60 3.760 5.400 4.557 2.094 0.785 0.790 0.634 1.920 2.229 3.944 4.489
Min. 0.22 0.189 0.175 0.319 0.084 0.002 0.000 0.008 0.001 0.017 0.103 0.235
5th centile 5% 0.27 0.212 0.289 0.528 0.210 0.034 0.016 0.014 0.018 0.026 0.186 0.275 < = approx. For 7Q20 5%

Township of Mapleton Receiving Water Impact Assessment for Mapleton WPCP Upgrade
BRM-00605325-A0 October 13, 2017
Appendix D: Summary of 7Q20 Values

Estimate of monthly 7Q20 of Conestogo River at Drayton
(Fitted to Log-Pearson III distribution)
Month 7Q20 (m³/s) No. of date Coef. of determination , R2
Jan 0.265 38 0.92
Feb 0.205 38 0.94
Mar 0.245 38 0.97
April 0.526 38 0.99
May 0.171 38 0.98
Jun 0.019 38 0.97
Jul 0.007 38 0.90
Aug 0.015 38 0.86
Sept 0.008 38 0.74
Oct 0.035 38 0.93
Nov 0.175 38 0.94
Dec 0.282 38 0.99
Township of Mapleton Receiving Water Impact Assessment for Mapleton WPCP Upgrade
BRM-00605325-A0 October 13, 2017
Appendix E: 7Q20 Calculation Table and Graphs
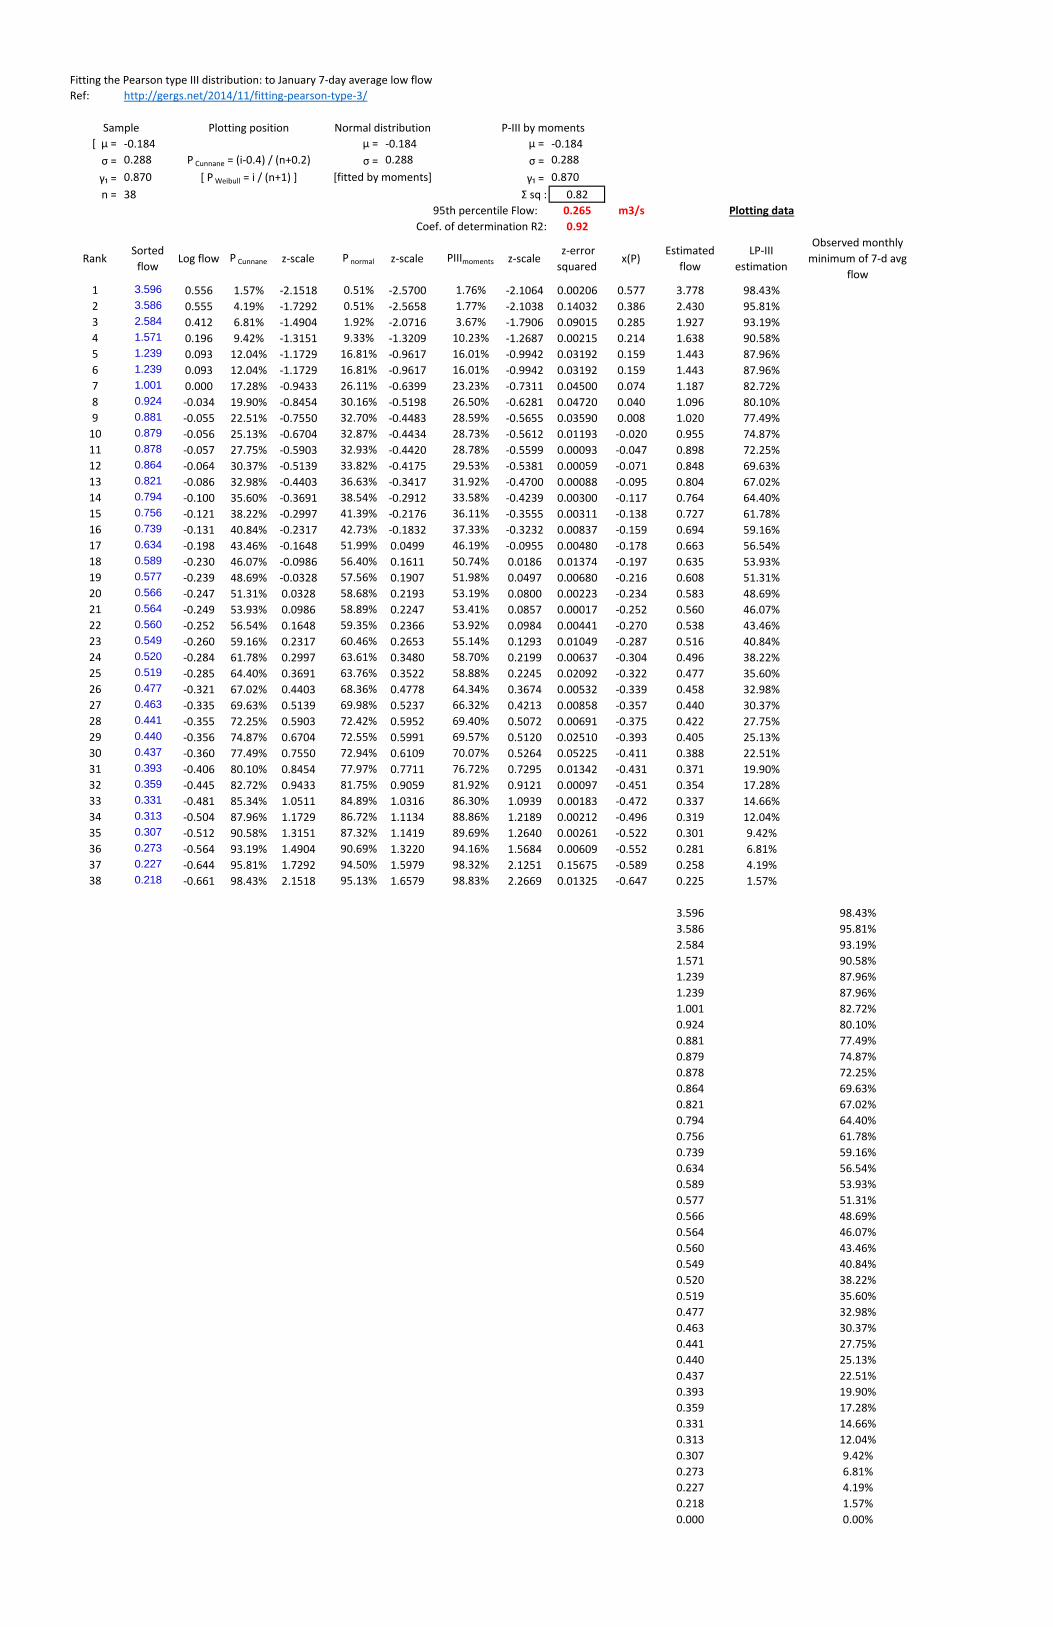
Fitting the Pearson type III distribution: to January 7-day average low flow
Ref: http://gergs.net/2014/11/fitting-pearson-type-3/
Sample Plotting position Normal distribution P-III by moments
[ μ = -0.184 μ = -0.184 μ = -0.184
σ = 0.288 P Cunnane = (i-0.4) / (n+0.2) σ = 0.288 σ = 0.288
γ₁ = 0.870 [ P Weibull = i / (n+1) ] [fitted by moments] γ₁ = 0.870
n = 38 Σ sq : 0.82
95th percentile Flow: 0.265 m3/s Plotting data
Coef. of determination R2: 0.92
RankSorted
flowLog flow P Cunnane z-scale P normal z-scale PIIImoments z-scale
z-error
squaredx(P)
Estimated
flow
LP-III
estimation
Observed monthly
minimum of 7-d avg
flow
1 3.596 0.556 1.57% -2.1518 0.51% -2.5700 1.76% -2.1064 0.00206 0.577 3.778 98.43%
2 3.586 0.555 4.19% -1.7292 0.51% -2.5658 1.77% -2.1038 0.14032 0.386 2.430 95.81%
3 2.584 0.412 6.81% -1.4904 1.92% -2.0716 3.67% -1.7906 0.09015 0.285 1.927 93.19%
4 1.571 0.196 9.42% -1.3151 9.33% -1.3209 10.23% -1.2687 0.00215 0.214 1.638 90.58%
5 1.239 0.093 12.04% -1.1729 16.81% -0.9617 16.01% -0.9942 0.03192 0.159 1.443 87.96%
6 1.239 0.093 12.04% -1.1729 16.81% -0.9617 16.01% -0.9942 0.03192 0.159 1.443 87.96%
7 1.001 0.000 17.28% -0.9433 26.11% -0.6399 23.23% -0.7311 0.04500 0.074 1.187 82.72%
8 0.924 -0.034 19.90% -0.8454 30.16% -0.5198 26.50% -0.6281 0.04720 0.040 1.096 80.10%
9 0.881 -0.055 22.51% -0.7550 32.70% -0.4483 28.59% -0.5655 0.03590 0.008 1.020 77.49%
10 0.879 -0.056 25.13% -0.6704 32.87% -0.4434 28.73% -0.5612 0.01193 -0.020 0.955 74.87%
11 0.878 -0.057 27.75% -0.5903 32.93% -0.4420 28.78% -0.5599 0.00093 -0.047 0.898 72.25%
12 0.864 -0.064 30.37% -0.5139 33.82% -0.4175 29.53% -0.5381 0.00059 -0.071 0.848 69.63%
13 0.821 -0.086 32.98% -0.4403 36.63% -0.3417 31.92% -0.4700 0.00088 -0.095 0.804 67.02%
14 0.794 -0.100 35.60% -0.3691 38.54% -0.2912 33.58% -0.4239 0.00300 -0.117 0.764 64.40%
15 0.756 -0.121 38.22% -0.2997 41.39% -0.2176 36.11% -0.3555 0.00311 -0.138 0.727 61.78%
16 0.739 -0.131 40.84% -0.2317 42.73% -0.1832 37.33% -0.3232 0.00837 -0.159 0.694 59.16%
17 0.634 -0.198 43.46% -0.1648 51.99% 0.0499 46.19% -0.0955 0.00480 -0.178 0.663 56.54%
18 0.589 -0.230 46.07% -0.0986 56.40% 0.1611 50.74% 0.0186 0.01374 -0.197 0.635 53.93%
19 0.577 -0.239 48.69% -0.0328 57.56% 0.1907 51.98% 0.0497 0.00680 -0.216 0.608 51.31%
20 0.566 -0.247 51.31% 0.0328 58.68% 0.2193 53.19% 0.0800 0.00223 -0.234 0.583 48.69%
21 0.564 -0.249 53.93% 0.0986 58.89% 0.2247 53.41% 0.0857 0.00017 -0.252 0.560 46.07%
22 0.560 -0.252 56.54% 0.1648 59.35% 0.2366 53.92% 0.0984 0.00441 -0.270 0.538 43.46%
23 0.549 -0.260 59.16% 0.2317 60.46% 0.2653 55.14% 0.1293 0.01049 -0.287 0.516 40.84%
24 0.520 -0.284 61.78% 0.2997 63.61% 0.3480 58.70% 0.2199 0.00637 -0.304 0.496 38.22%
25 0.519 -0.285 64.40% 0.3691 63.76% 0.3522 58.88% 0.2245 0.02092 -0.322 0.477 35.60%
26 0.477 -0.321 67.02% 0.4403 68.36% 0.4778 64.34% 0.3674 0.00532 -0.339 0.458 32.98%
27 0.463 -0.335 69.63% 0.5139 69.98% 0.5237 66.32% 0.4213 0.00858 -0.357 0.440 30.37%
28 0.441 -0.355 72.25% 0.5903 72.42% 0.5952 69.40% 0.5072 0.00691 -0.375 0.422 27.75%
29 0.440 -0.356 74.87% 0.6704 72.55% 0.5991 69.57% 0.5120 0.02510 -0.393 0.405 25.13%
30 0.437 -0.360 77.49% 0.7550 72.94% 0.6109 70.07% 0.5264 0.05225 -0.411 0.388 22.51%
31 0.393 -0.406 80.10% 0.8454 77.97% 0.7711 76.72% 0.7295 0.01342 -0.431 0.371 19.90%
32 0.359 -0.445 82.72% 0.9433 81.75% 0.9059 81.92% 0.9121 0.00097 -0.451 0.354 17.28%
33 0.331 -0.481 85.34% 1.0511 84.89% 1.0316 86.30% 1.0939 0.00183 -0.472 0.337 14.66%
34 0.313 -0.504 87.96% 1.1729 86.72% 1.1134 88.86% 1.2189 0.00212 -0.496 0.319 12.04%
35 0.307 -0.512 90.58% 1.3151 87.32% 1.1419 89.69% 1.2640 0.00261 -0.522 0.301 9.42%
36 0.273 -0.564 93.19% 1.4904 90.69% 1.3220 94.16% 1.5684 0.00609 -0.552 0.281 6.81%
37 0.227 -0.644 95.81% 1.7292 94.50% 1.5979 98.32% 2.1251 0.15675 -0.589 0.258 4.19%
38 0.218 -0.661 98.43% 2.1518 95.13% 1.6579 98.83% 2.2669 0.01325 -0.647 0.225 1.57%
3.596 98.43%
3.586 95.81%
2.584 93.19%
1.571 90.58%
1.239 87.96%
1.239 87.96%
1.001 82.72%
0.924 80.10%
0.881 77.49%
0.879 74.87%
0.878 72.25%
0.864 69.63%
0.821 67.02%
0.794 64.40%
0.756 61.78%
0.739 59.16%
0.634 56.54%
0.589 53.93%
0.577 51.31%
0.566 48.69%
0.564 46.07%
0.560 43.46%
0.549 40.84%
0.520 38.22%
0.519 35.60%
0.477 32.98%
0.463 30.37%
0.441 27.75%
0.440 25.13%
0.437 22.51%
0.393 19.90%
0.359 17.28%
0.331 14.66%
0.313 12.04%
0.307 9.42%
0.273 6.81%
0.227 4.19%
0.218 1.57%
0.000 0.00%
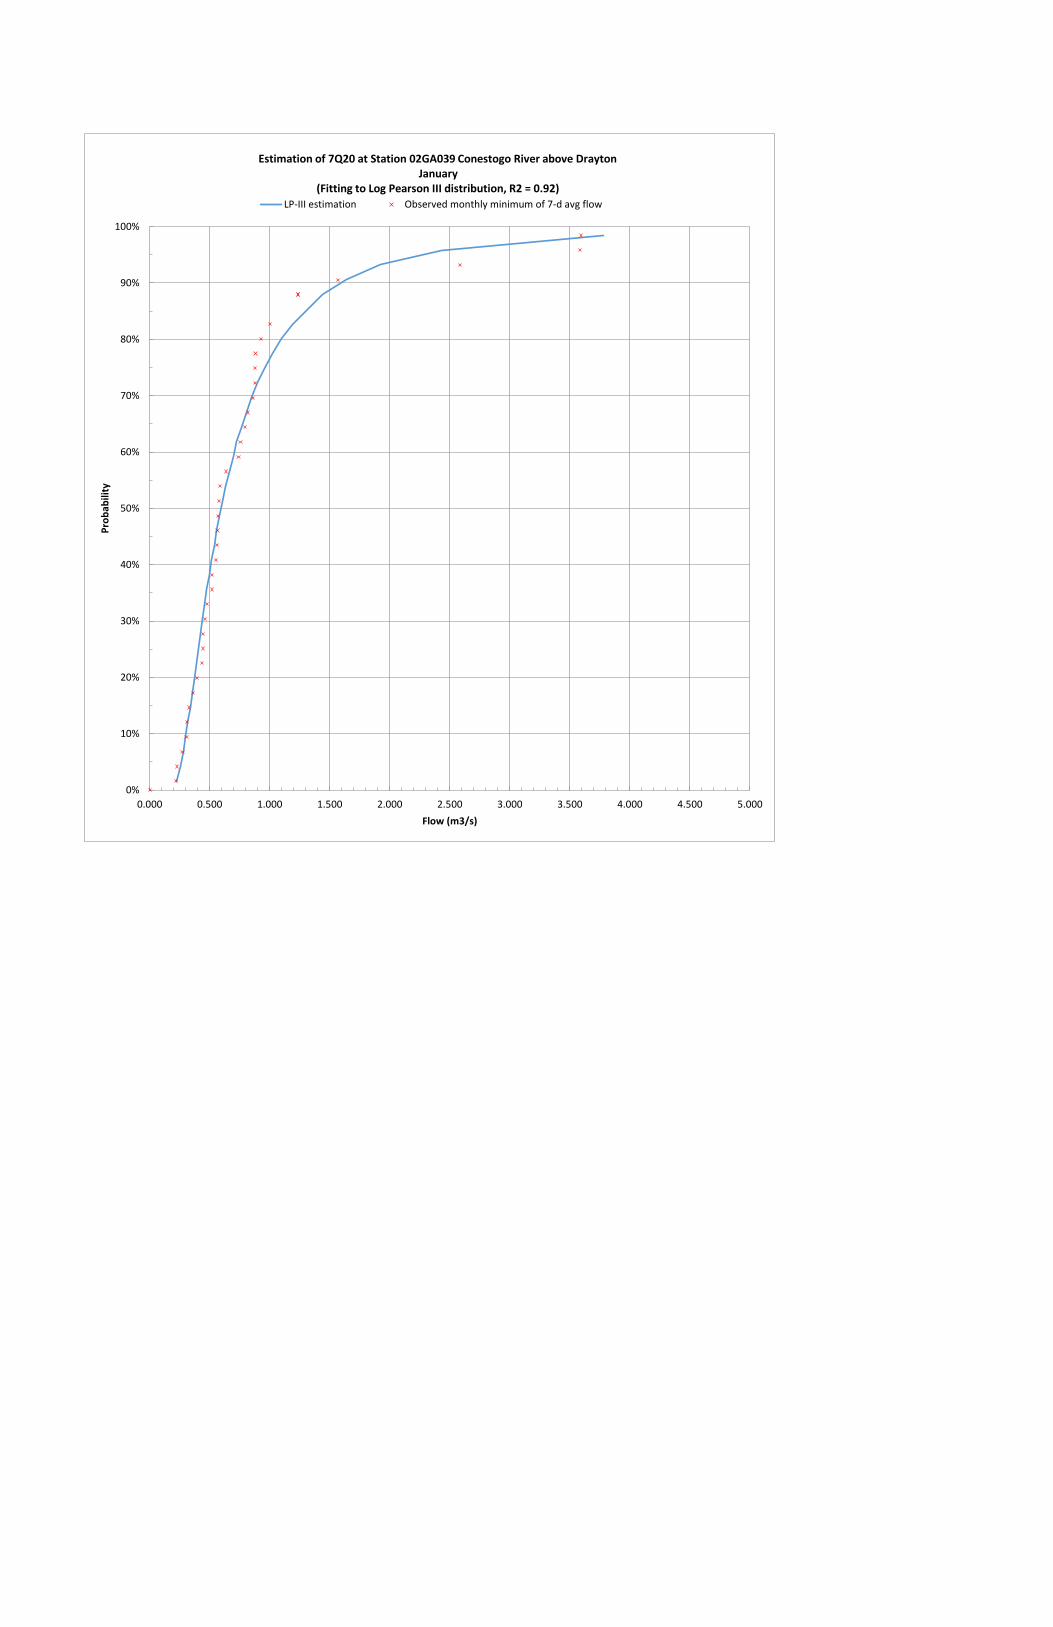
0%
10%
20%
30%
40%
50%
60%
70%
80%
90%
100%
0.000 0.500 1.000 1.500 2.000 2.500 3.000 3.500 4.000 4.500 5.000
Pro
bab
ility
Flow (m3/s)
Estimation of 7Q20 at Station 02GA039 Conestogo River above Drayton January
(Fitting to Log Pearson III distribution, R2 = 0.92)
LP-III estimation Observed monthly minimum of 7-d avg flow
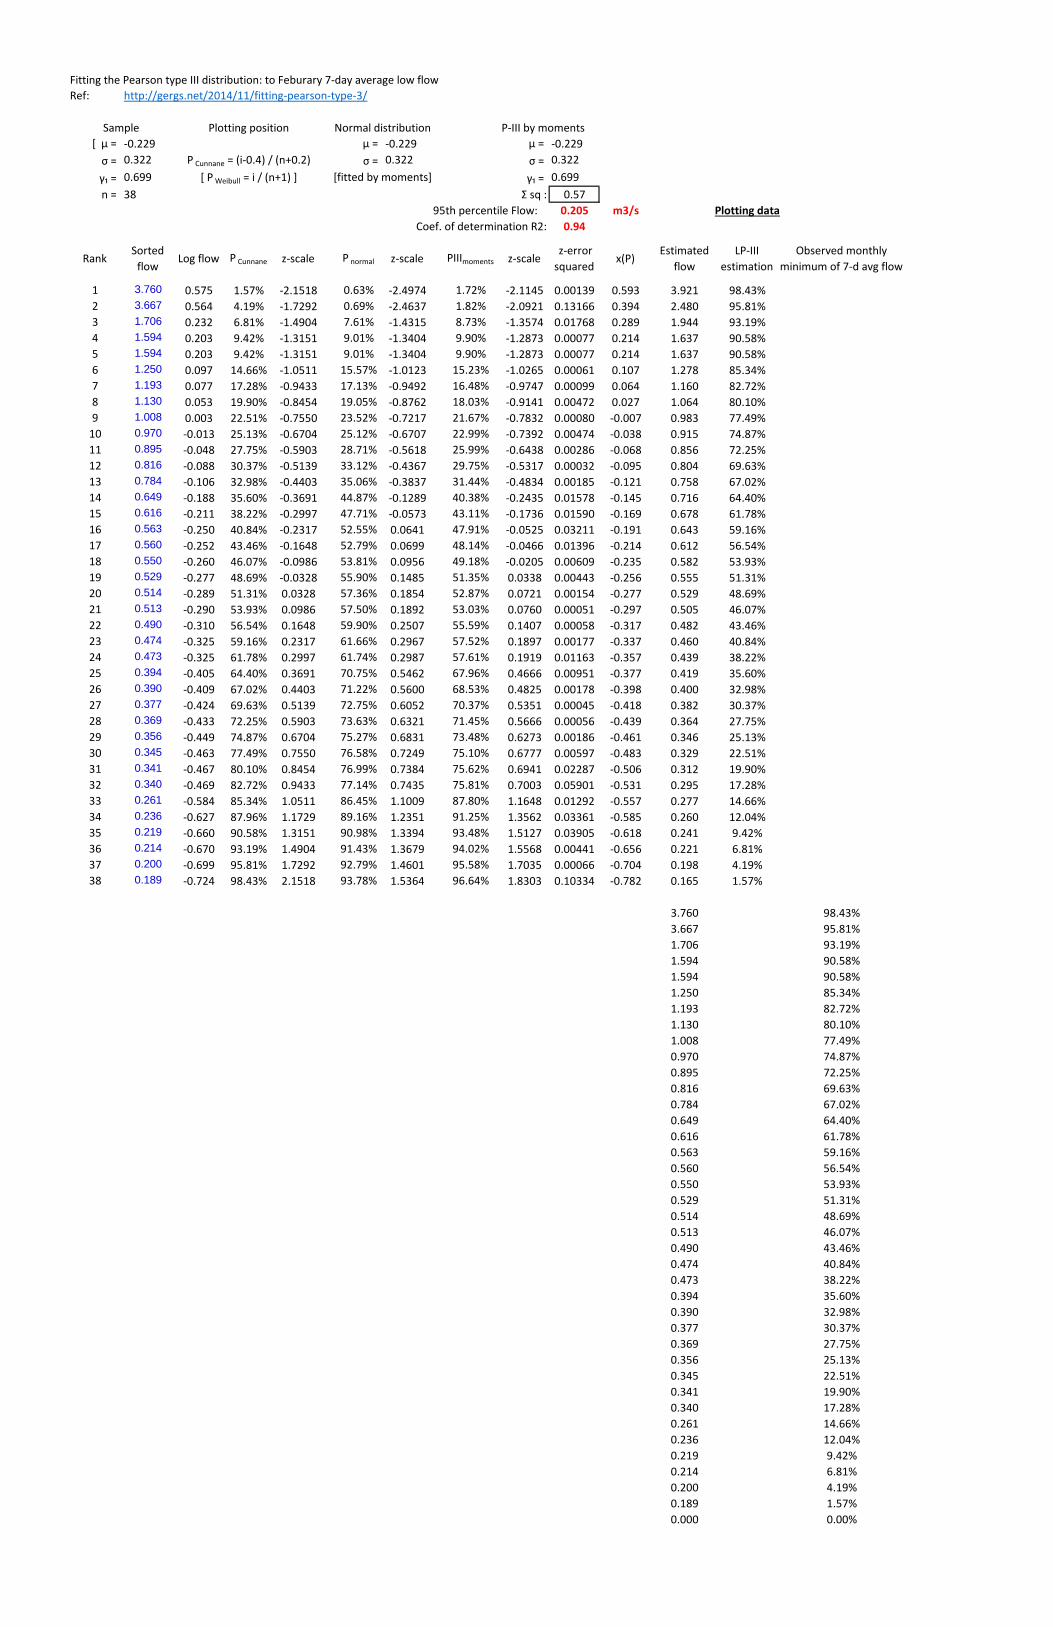
Fitting the Pearson type III distribution: to Feburary 7-day average low flow
Ref: http://gergs.net/2014/11/fitting-pearson-type-3/
Sample Plotting position Normal distribution P-III by moments
[ μ = -0.229 μ = -0.229 μ = -0.229
σ = 0.322 P Cunnane = (i-0.4) / (n+0.2) σ = 0.322 σ = 0.322
γ₁ = 0.699 [ P Weibull = i / (n+1) ] [fitted by moments] γ₁ = 0.699
n = 38 Σ sq : 0.57
95th percentile Flow: 0.205 m3/s Plotting data
Coef. of determination R2: 0.94
RankSorted
flowLog flow P Cunnane z-scale P normal z-scale PIIImoments z-scale
z-error
squaredx(P)
Estimated
flow
LP-III
estimation
Observed monthly
minimum of 7-d avg flow
1 3.760 0.575 1.57% -2.1518 0.63% -2.4974 1.72% -2.1145 0.00139 0.593 3.921 98.43%
2 3.667 0.564 4.19% -1.7292 0.69% -2.4637 1.82% -2.0921 0.13166 0.394 2.480 95.81%
3 1.706 0.232 6.81% -1.4904 7.61% -1.4315 8.73% -1.3574 0.01768 0.289 1.944 93.19%
4 1.594 0.203 9.42% -1.3151 9.01% -1.3404 9.90% -1.2873 0.00077 0.214 1.637 90.58%
5 1.594 0.203 9.42% -1.3151 9.01% -1.3404 9.90% -1.2873 0.00077 0.214 1.637 90.58%
6 1.250 0.097 14.66% -1.0511 15.57% -1.0123 15.23% -1.0265 0.00061 0.107 1.278 85.34%
7 1.193 0.077 17.28% -0.9433 17.13% -0.9492 16.48% -0.9747 0.00099 0.064 1.160 82.72%
8 1.130 0.053 19.90% -0.8454 19.05% -0.8762 18.03% -0.9141 0.00472 0.027 1.064 80.10%
9 1.008 0.003 22.51% -0.7550 23.52% -0.7217 21.67% -0.7832 0.00080 -0.007 0.983 77.49%
10 0.970 -0.013 25.13% -0.6704 25.12% -0.6707 22.99% -0.7392 0.00474 -0.038 0.915 74.87%
11 0.895 -0.048 27.75% -0.5903 28.71% -0.5618 25.99% -0.6438 0.00286 -0.068 0.856 72.25%
12 0.816 -0.088 30.37% -0.5139 33.12% -0.4367 29.75% -0.5317 0.00032 -0.095 0.804 69.63%
13 0.784 -0.106 32.98% -0.4403 35.06% -0.3837 31.44% -0.4834 0.00185 -0.121 0.758 67.02%
14 0.649 -0.188 35.60% -0.3691 44.87% -0.1289 40.38% -0.2435 0.01578 -0.145 0.716 64.40%
15 0.616 -0.211 38.22% -0.2997 47.71% -0.0573 43.11% -0.1736 0.01590 -0.169 0.678 61.78%
16 0.563 -0.250 40.84% -0.2317 52.55% 0.0641 47.91% -0.0525 0.03211 -0.191 0.643 59.16%
17 0.560 -0.252 43.46% -0.1648 52.79% 0.0699 48.14% -0.0466 0.01396 -0.214 0.612 56.54%
18 0.550 -0.260 46.07% -0.0986 53.81% 0.0956 49.18% -0.0205 0.00609 -0.235 0.582 53.93%
19 0.529 -0.277 48.69% -0.0328 55.90% 0.1485 51.35% 0.0338 0.00443 -0.256 0.555 51.31%
20 0.514 -0.289 51.31% 0.0328 57.36% 0.1854 52.87% 0.0721 0.00154 -0.277 0.529 48.69%
21 0.513 -0.290 53.93% 0.0986 57.50% 0.1892 53.03% 0.0760 0.00051 -0.297 0.505 46.07%
22 0.490 -0.310 56.54% 0.1648 59.90% 0.2507 55.59% 0.1407 0.00058 -0.317 0.482 43.46%
23 0.474 -0.325 59.16% 0.2317 61.66% 0.2967 57.52% 0.1897 0.00177 -0.337 0.460 40.84%
24 0.473 -0.325 61.78% 0.2997 61.74% 0.2987 57.61% 0.1919 0.01163 -0.357 0.439 38.22%
25 0.394 -0.405 64.40% 0.3691 70.75% 0.5462 67.96% 0.4666 0.00951 -0.377 0.419 35.60%
26 0.390 -0.409 67.02% 0.4403 71.22% 0.5600 68.53% 0.4825 0.00178 -0.398 0.400 32.98%
27 0.377 -0.424 69.63% 0.5139 72.75% 0.6052 70.37% 0.5351 0.00045 -0.418 0.382 30.37%
28 0.369 -0.433 72.25% 0.5903 73.63% 0.6321 71.45% 0.5666 0.00056 -0.439 0.364 27.75%
29 0.356 -0.449 74.87% 0.6704 75.27% 0.6831 73.48% 0.6273 0.00186 -0.461 0.346 25.13%
30 0.345 -0.463 77.49% 0.7550 76.58% 0.7249 75.10% 0.6777 0.00597 -0.483 0.329 22.51%
31 0.341 -0.467 80.10% 0.8454 76.99% 0.7384 75.62% 0.6941 0.02287 -0.506 0.312 19.90%
32 0.340 -0.469 82.72% 0.9433 77.14% 0.7435 75.81% 0.7003 0.05901 -0.531 0.295 17.28%
33 0.261 -0.584 85.34% 1.0511 86.45% 1.1009 87.80% 1.1648 0.01292 -0.557 0.277 14.66%
34 0.236 -0.627 87.96% 1.1729 89.16% 1.2351 91.25% 1.3562 0.03361 -0.585 0.260 12.04%
35 0.219 -0.660 90.58% 1.3151 90.98% 1.3394 93.48% 1.5127 0.03905 -0.618 0.241 9.42%
36 0.214 -0.670 93.19% 1.4904 91.43% 1.3679 94.02% 1.5568 0.00441 -0.656 0.221 6.81%
37 0.200 -0.699 95.81% 1.7292 92.79% 1.4601 95.58% 1.7035 0.00066 -0.704 0.198 4.19%
38 0.189 -0.724 98.43% 2.1518 93.78% 1.5364 96.64% 1.8303 0.10334 -0.782 0.165 1.57%
3.760 98.43%
3.667 95.81%
1.706 93.19%
1.594 90.58%
1.594 90.58%
1.250 85.34%
1.193 82.72%
1.130 80.10%
1.008 77.49%
0.970 74.87%
0.895 72.25%
0.816 69.63%
0.784 67.02%
0.649 64.40%
0.616 61.78%
0.563 59.16%
0.560 56.54%
0.550 53.93%
0.529 51.31%
0.514 48.69%
0.513 46.07%
0.490 43.46%
0.474 40.84%
0.473 38.22%
0.394 35.60%
0.390 32.98%
0.377 30.37%
0.369 27.75%
0.356 25.13%
0.345 22.51%
0.341 19.90%
0.340 17.28%
0.261 14.66%
0.236 12.04%
0.219 9.42%
0.214 6.81%
0.200 4.19%
0.189 1.57%
0.000 0.00%
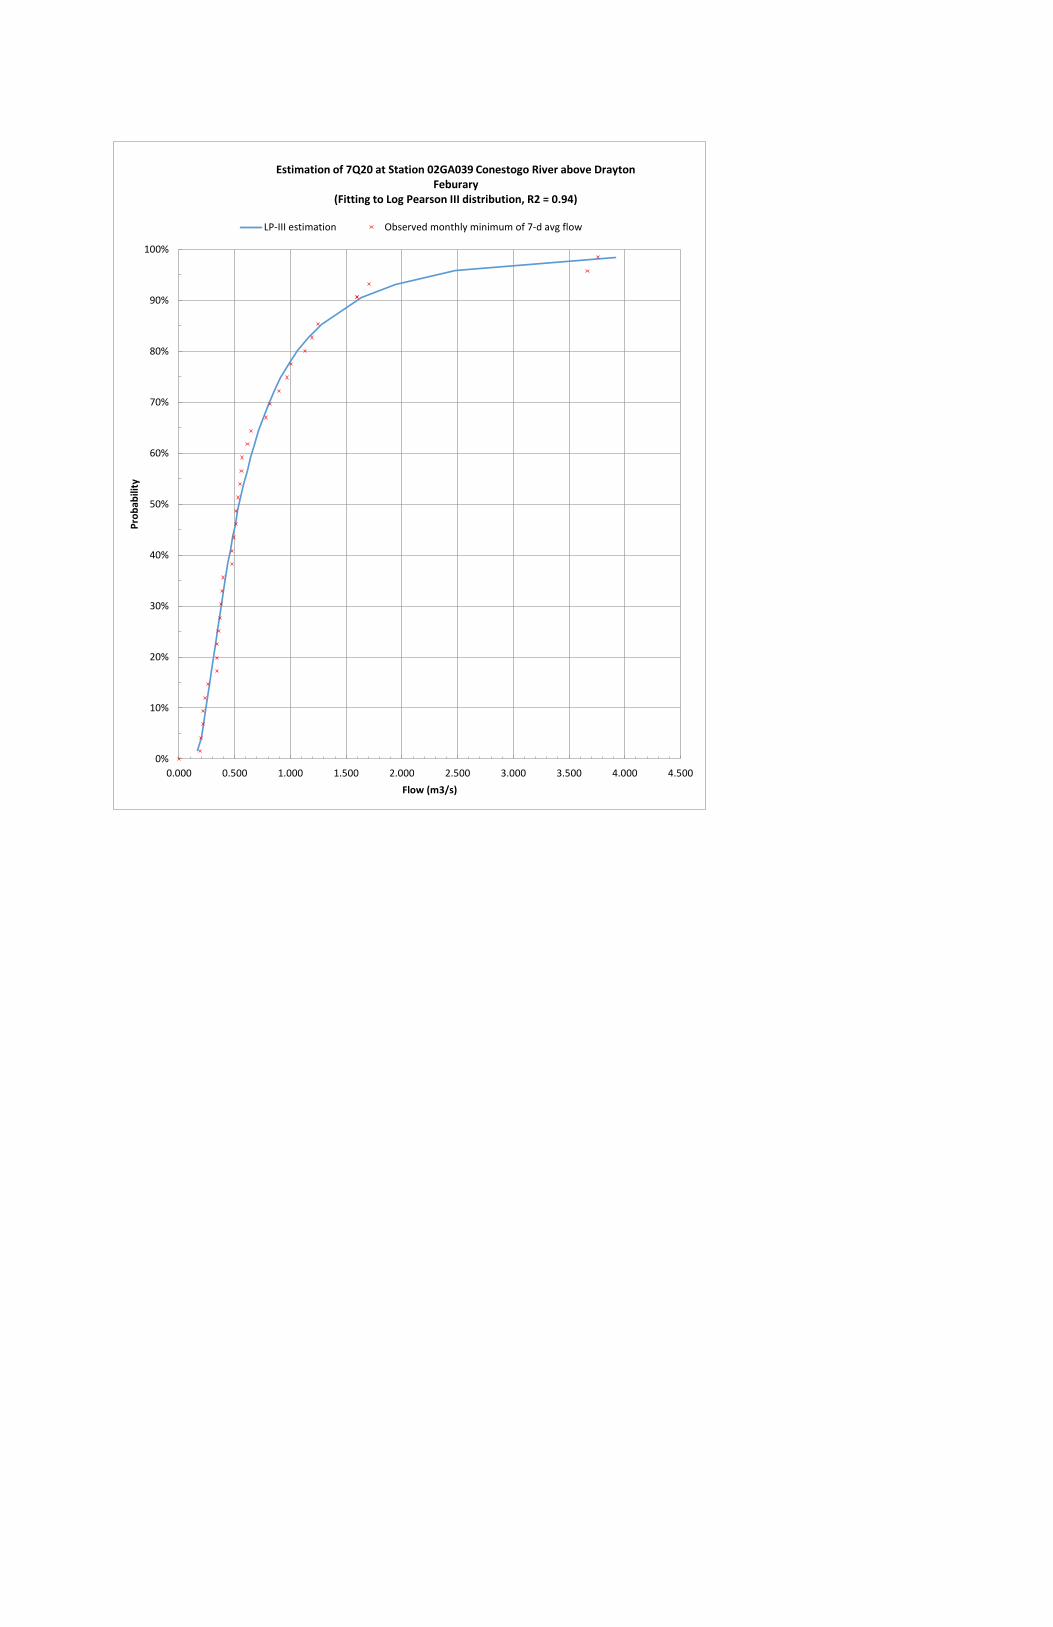
0%
10%
20%
30%
40%
50%
60%
70%
80%
90%
100%
0.000 0.500 1.000 1.500 2.000 2.500 3.000 3.500 4.000 4.500
Pro
bab
ility
Flow (m3/s)
Estimation of 7Q20 at Station 02GA039 Conestogo River above Drayton Feburary
(Fitting to Log Pearson III distribution, R2 = 0.94)
LP-III estimation Observed monthly minimum of 7-d avg flow
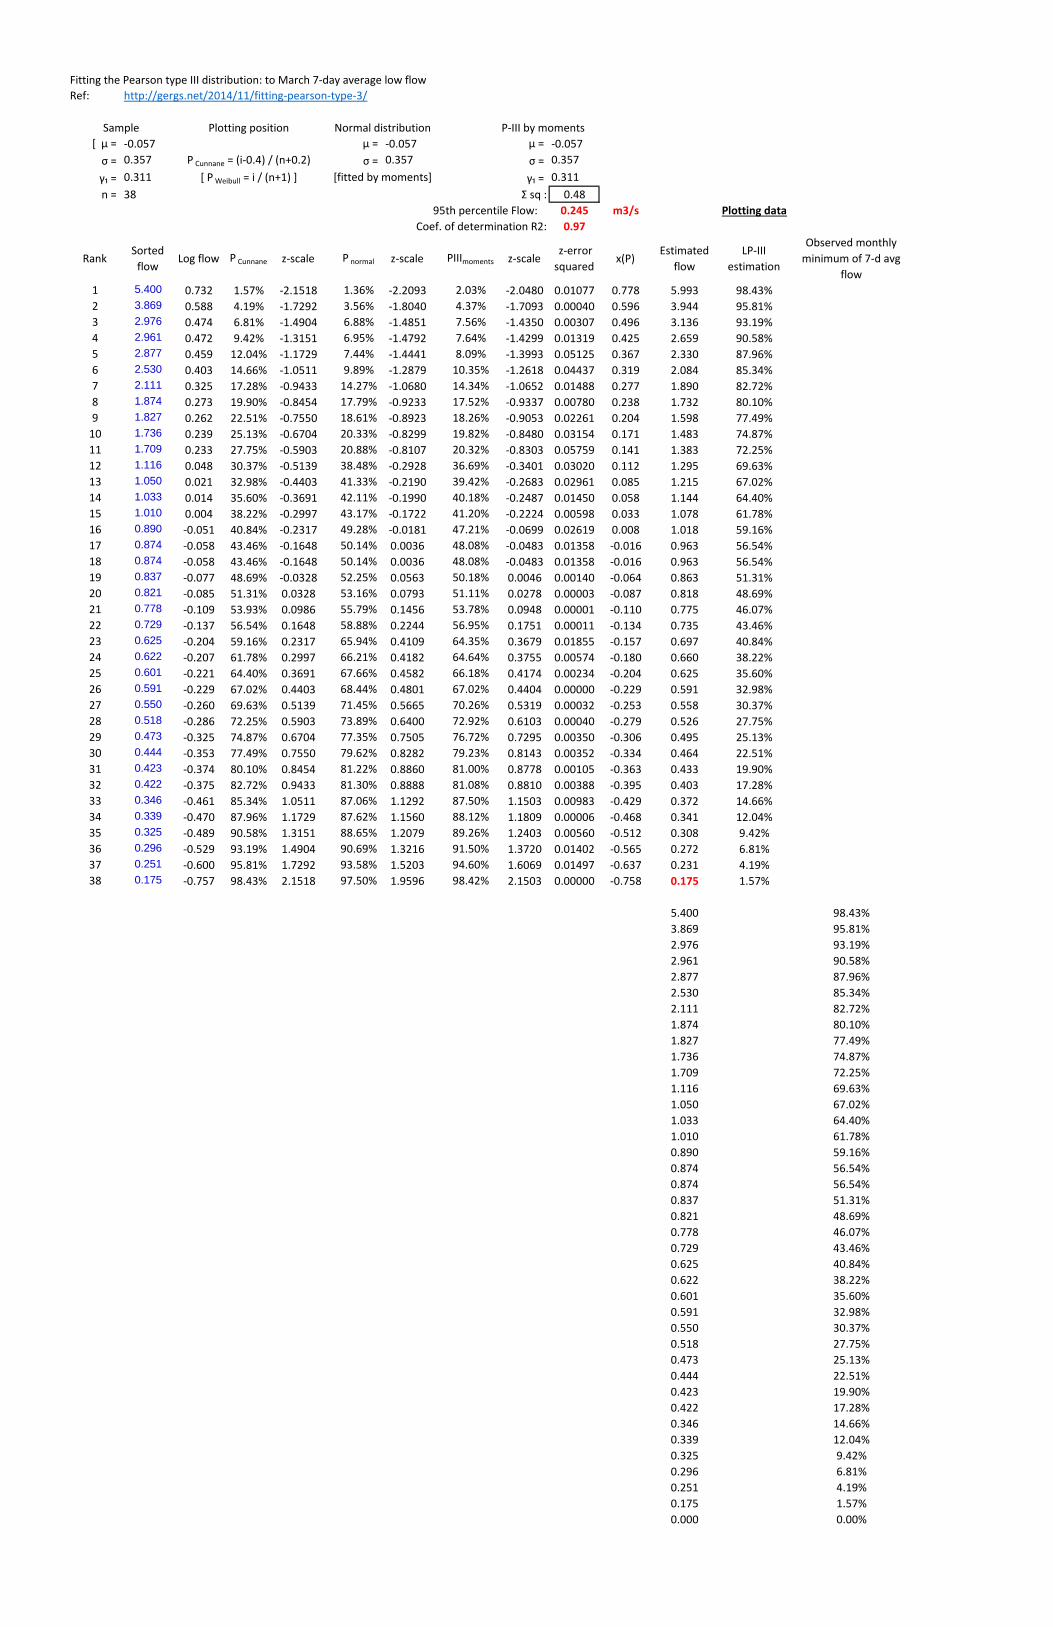
Fitting the Pearson type III distribution: to March 7-day average low flow
Ref: http://gergs.net/2014/11/fitting-pearson-type-3/
Sample Plotting position Normal distribution P-III by moments
[ μ = -0.057 μ = -0.057 μ = -0.057
σ = 0.357 P Cunnane = (i-0.4) / (n+0.2) σ = 0.357 σ = 0.357
γ₁ = 0.311 [ P Weibull = i / (n+1) ] [fitted by moments] γ₁ = 0.311
n = 38 Σ sq : 0.48
95th percentile Flow: 0.245 m3/s Plotting data
Coef. of determination R2: 0.97
RankSorted
flowLog flow P Cunnane z-scale P normal z-scale PIIImoments z-scale
z-error
squaredx(P)
Estimated
flow
LP-III
estimation
Observed monthly
minimum of 7-d avg
flow
1 5.400 0.732 1.57% -2.1518 1.36% -2.2093 2.03% -2.0480 0.01077 0.778 5.993 98.43%
2 3.869 0.588 4.19% -1.7292 3.56% -1.8040 4.37% -1.7093 0.00040 0.596 3.944 95.81%
3 2.976 0.474 6.81% -1.4904 6.88% -1.4851 7.56% -1.4350 0.00307 0.496 3.136 93.19%
4 2.961 0.472 9.42% -1.3151 6.95% -1.4792 7.64% -1.4299 0.01319 0.425 2.659 90.58%
5 2.877 0.459 12.04% -1.1729 7.44% -1.4441 8.09% -1.3993 0.05125 0.367 2.330 87.96%
6 2.530 0.403 14.66% -1.0511 9.89% -1.2879 10.35% -1.2618 0.04437 0.319 2.084 85.34%
7 2.111 0.325 17.28% -0.9433 14.27% -1.0680 14.34% -1.0652 0.01488 0.277 1.890 82.72%
8 1.874 0.273 19.90% -0.8454 17.79% -0.9233 17.52% -0.9337 0.00780 0.238 1.732 80.10%
9 1.827 0.262 22.51% -0.7550 18.61% -0.8923 18.26% -0.9053 0.02261 0.204 1.598 77.49%
10 1.736 0.239 25.13% -0.6704 20.33% -0.8299 19.82% -0.8480 0.03154 0.171 1.483 74.87%
11 1.709 0.233 27.75% -0.5903 20.88% -0.8107 20.32% -0.8303 0.05759 0.141 1.383 72.25%
12 1.116 0.048 30.37% -0.5139 38.48% -0.2928 36.69% -0.3401 0.03020 0.112 1.295 69.63%
13 1.050 0.021 32.98% -0.4403 41.33% -0.2190 39.42% -0.2683 0.02961 0.085 1.215 67.02%
14 1.033 0.014 35.60% -0.3691 42.11% -0.1990 40.18% -0.2487 0.01450 0.058 1.144 64.40%
15 1.010 0.004 38.22% -0.2997 43.17% -0.1722 41.20% -0.2224 0.00598 0.033 1.078 61.78%
16 0.890 -0.051 40.84% -0.2317 49.28% -0.0181 47.21% -0.0699 0.02619 0.008 1.018 59.16%
17 0.874 -0.058 43.46% -0.1648 50.14% 0.0036 48.08% -0.0483 0.01358 -0.016 0.963 56.54%
18 0.874 -0.058 43.46% -0.1648 50.14% 0.0036 48.08% -0.0483 0.01358 -0.016 0.963 56.54%
19 0.837 -0.077 48.69% -0.0328 52.25% 0.0563 50.18% 0.0046 0.00140 -0.064 0.863 51.31%
20 0.821 -0.085 51.31% 0.0328 53.16% 0.0793 51.11% 0.0278 0.00003 -0.087 0.818 48.69%
21 0.778 -0.109 53.93% 0.0986 55.79% 0.1456 53.78% 0.0948 0.00001 -0.110 0.775 46.07%
22 0.729 -0.137 56.54% 0.1648 58.88% 0.2244 56.95% 0.1751 0.00011 -0.134 0.735 43.46%
23 0.625 -0.204 59.16% 0.2317 65.94% 0.4109 64.35% 0.3679 0.01855 -0.157 0.697 40.84%
24 0.622 -0.207 61.78% 0.2997 66.21% 0.4182 64.64% 0.3755 0.00574 -0.180 0.660 38.22%
25 0.601 -0.221 64.40% 0.3691 67.66% 0.4582 66.18% 0.4174 0.00234 -0.204 0.625 35.60%
26 0.591 -0.229 67.02% 0.4403 68.44% 0.4801 67.02% 0.4404 0.00000 -0.229 0.591 32.98%
27 0.550 -0.260 69.63% 0.5139 71.45% 0.5665 70.26% 0.5319 0.00032 -0.253 0.558 30.37%
28 0.518 -0.286 72.25% 0.5903 73.89% 0.6400 72.92% 0.6103 0.00040 -0.279 0.526 27.75%
29 0.473 -0.325 74.87% 0.6704 77.35% 0.7505 76.72% 0.7295 0.00350 -0.306 0.495 25.13%
30 0.444 -0.353 77.49% 0.7550 79.62% 0.8282 79.23% 0.8143 0.00352 -0.334 0.464 22.51%
31 0.423 -0.374 80.10% 0.8454 81.22% 0.8860 81.00% 0.8778 0.00105 -0.363 0.433 19.90%
32 0.422 -0.375 82.72% 0.9433 81.30% 0.8888 81.08% 0.8810 0.00388 -0.395 0.403 17.28%
33 0.346 -0.461 85.34% 1.0511 87.06% 1.1292 87.50% 1.1503 0.00983 -0.429 0.372 14.66%
34 0.339 -0.470 87.96% 1.1729 87.62% 1.1560 88.12% 1.1809 0.00006 -0.468 0.341 12.04%
35 0.325 -0.489 90.58% 1.3151 88.65% 1.2079 89.26% 1.2403 0.00560 -0.512 0.308 9.42%
36 0.296 -0.529 93.19% 1.4904 90.69% 1.3216 91.50% 1.3720 0.01402 -0.565 0.272 6.81%
37 0.251 -0.600 95.81% 1.7292 93.58% 1.5203 94.60% 1.6069 0.01497 -0.637 0.231 4.19%
38 0.175 -0.757 98.43% 2.1518 97.50% 1.9596 98.42% 2.1503 0.00000 -0.758 0.175 1.57%
5.400 98.43%
3.869 95.81%
2.976 93.19%
2.961 90.58%
2.877 87.96%
2.530 85.34%
2.111 82.72%
1.874 80.10%
1.827 77.49%
1.736 74.87%
1.709 72.25%
1.116 69.63%
1.050 67.02%
1.033 64.40%
1.010 61.78%
0.890 59.16%
0.874 56.54%
0.874 56.54%
0.837 51.31%
0.821 48.69%
0.778 46.07%
0.729 43.46%
0.625 40.84%
0.622 38.22%
0.601 35.60%
0.591 32.98%
0.550 30.37%
0.518 27.75%
0.473 25.13%
0.444 22.51%
0.423 19.90%
0.422 17.28%
0.346 14.66%
0.339 12.04%
0.325 9.42%
0.296 6.81%
0.251 4.19%
0.175 1.57%
0.000 0.00%
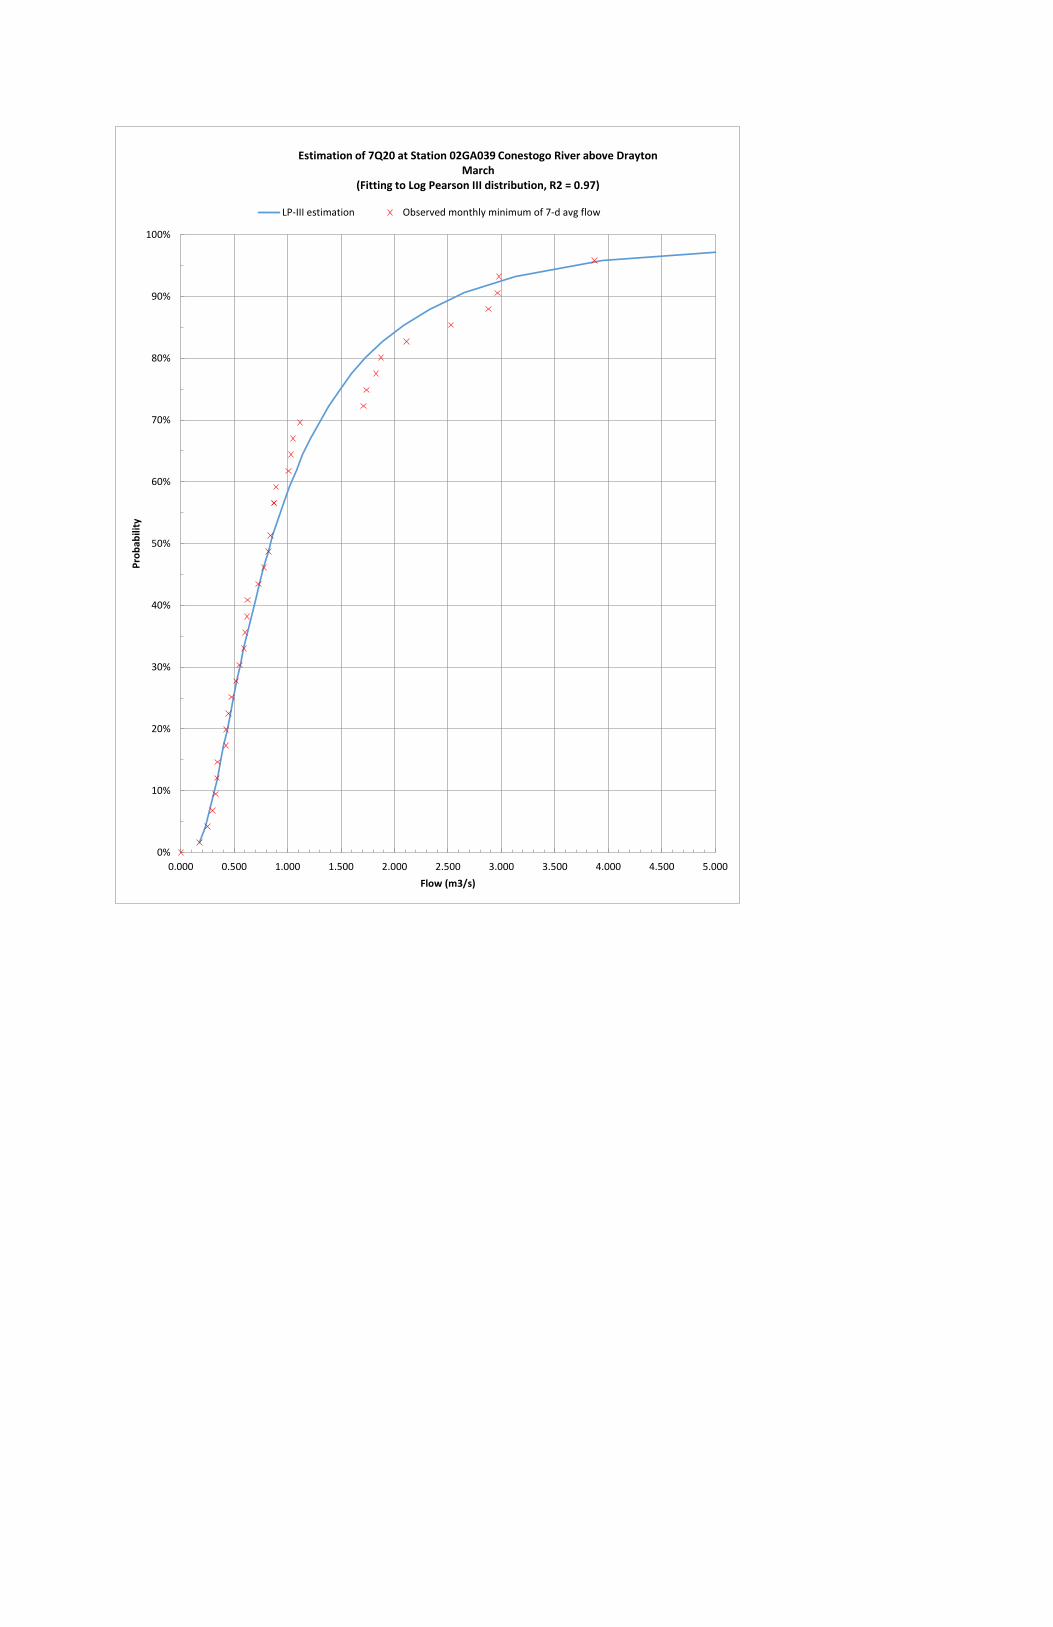
11.52286
5.4
3.868571
3.58
3.521429
3.082857
2.975714
2.961429
2.877143
2.817143
2.111429
1.917143
1.874286
1.827143
1.754286
1.708571
1.115714
1.05
1.035714
1.019143
0.89
0.874286
0.837143
0.821429
0.777857
0.729
0.669286
0.621571
0.604714
0.601429
0.55
0.423
0.346286
0.338714
0.329286
0.295571
0.251
0.174857
0%
10%
20%
30%
40%
50%
60%
70%
80%
90%
100%
0.000 0.500 1.000 1.500 2.000 2.500 3.000 3.500 4.000 4.500 5.000
Pro
bab
ility
Flow (m3/s)
Estimation of 7Q20 at Station 02GA039 Conestogo River above Drayton March
(Fitting to Log Pearson III distribution, R2 = 0.97)
LP-III estimation Observed monthly minimum of 7-d avg flow
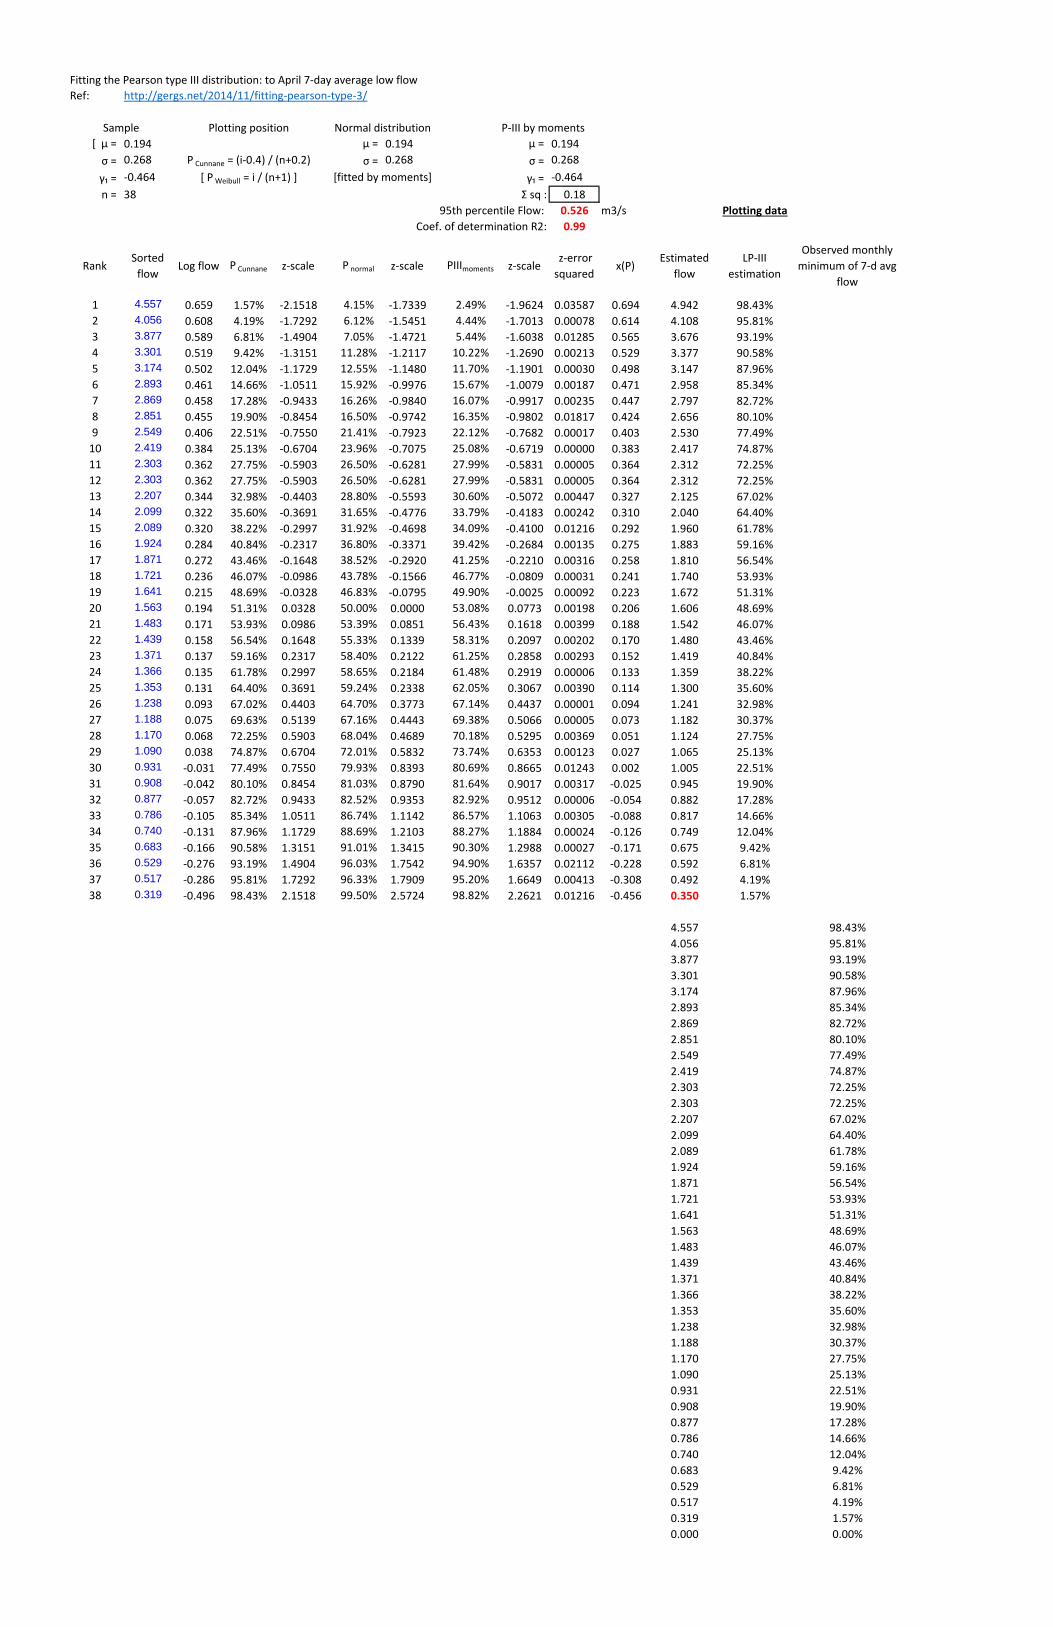
Fitting the Pearson type III distribution: to April 7-day average low flow
Ref: http://gergs.net/2014/11/fitting-pearson-type-3/
Sample Plotting position Normal distribution P-III by moments
[ μ = 0.194 μ = 0.194 μ = 0.194
σ = 0.268 P Cunnane = (i-0.4) / (n+0.2) σ = 0.268 σ = 0.268
γ₁ = -0.464 [ P Weibull = i / (n+1) ] [fitted by moments] γ₁ = -0.464
n = 38 Σ sq : 0.18
95th percentile Flow: 0.526 m3/s Plotting data
Coef. of determination R2: 0.99
RankSorted
flowLog flow P Cunnane z-scale P normal z-scale PIIImoments z-scale
z-error
squaredx(P)
Estimated
flow
LP-III
estimation
Observed monthly
minimum of 7-d avg
flow
1 4.557 0.659 1.57% -2.1518 4.15% -1.7339 2.49% -1.9624 0.03587 0.694 4.942 98.43%
2 4.056 0.608 4.19% -1.7292 6.12% -1.5451 4.44% -1.7013 0.00078 0.614 4.108 95.81%
3 3.877 0.589 6.81% -1.4904 7.05% -1.4721 5.44% -1.6038 0.01285 0.565 3.676 93.19%
4 3.301 0.519 9.42% -1.3151 11.28% -1.2117 10.22% -1.2690 0.00213 0.529 3.377 90.58%
5 3.174 0.502 12.04% -1.1729 12.55% -1.1480 11.70% -1.1901 0.00030 0.498 3.147 87.96%
6 2.893 0.461 14.66% -1.0511 15.92% -0.9976 15.67% -1.0079 0.00187 0.471 2.958 85.34%
7 2.869 0.458 17.28% -0.9433 16.26% -0.9840 16.07% -0.9917 0.00235 0.447 2.797 82.72%
8 2.851 0.455 19.90% -0.8454 16.50% -0.9742 16.35% -0.9802 0.01817 0.424 2.656 80.10%
9 2.549 0.406 22.51% -0.7550 21.41% -0.7923 22.12% -0.7682 0.00017 0.403 2.530 77.49%
10 2.419 0.384 25.13% -0.6704 23.96% -0.7075 25.08% -0.6719 0.00000 0.383 2.417 74.87%
11 2.303 0.362 27.75% -0.5903 26.50% -0.6281 27.99% -0.5831 0.00005 0.364 2.312 72.25%
12 2.303 0.362 27.75% -0.5903 26.50% -0.6281 27.99% -0.5831 0.00005 0.364 2.312 72.25%
13 2.207 0.344 32.98% -0.4403 28.80% -0.5593 30.60% -0.5072 0.00447 0.327 2.125 67.02%
14 2.099 0.322 35.60% -0.3691 31.65% -0.4776 33.79% -0.4183 0.00242 0.310 2.040 64.40%
15 2.089 0.320 38.22% -0.2997 31.92% -0.4698 34.09% -0.4100 0.01216 0.292 1.960 61.78%
16 1.924 0.284 40.84% -0.2317 36.80% -0.3371 39.42% -0.2684 0.00135 0.275 1.883 59.16%
17 1.871 0.272 43.46% -0.1648 38.52% -0.2920 41.25% -0.2210 0.00316 0.258 1.810 56.54%
18 1.721 0.236 46.07% -0.0986 43.78% -0.1566 46.77% -0.0809 0.00031 0.241 1.740 53.93%
19 1.641 0.215 48.69% -0.0328 46.83% -0.0795 49.90% -0.0025 0.00092 0.223 1.672 51.31%
20 1.563 0.194 51.31% 0.0328 50.00% 0.0000 53.08% 0.0773 0.00198 0.206 1.606 48.69%
21 1.483 0.171 53.93% 0.0986 53.39% 0.0851 56.43% 0.1618 0.00399 0.188 1.542 46.07%
22 1.439 0.158 56.54% 0.1648 55.33% 0.1339 58.31% 0.2097 0.00202 0.170 1.480 43.46%
23 1.371 0.137 59.16% 0.2317 58.40% 0.2122 61.25% 0.2858 0.00293 0.152 1.419 40.84%
24 1.366 0.135 61.78% 0.2997 58.65% 0.2184 61.48% 0.2919 0.00006 0.133 1.359 38.22%
25 1.353 0.131 64.40% 0.3691 59.24% 0.2338 62.05% 0.3067 0.00390 0.114 1.300 35.60%
26 1.238 0.093 67.02% 0.4403 64.70% 0.3773 67.14% 0.4437 0.00001 0.094 1.241 32.98%
27 1.188 0.075 69.63% 0.5139 67.16% 0.4443 69.38% 0.5066 0.00005 0.073 1.182 30.37%
28 1.170 0.068 72.25% 0.5903 68.04% 0.4689 70.18% 0.5295 0.00369 0.051 1.124 27.75%
29 1.090 0.038 74.87% 0.6704 72.01% 0.5832 73.74% 0.6353 0.00123 0.027 1.065 25.13%
30 0.931 -0.031 77.49% 0.7550 79.93% 0.8393 80.69% 0.8665 0.01243 0.002 1.005 22.51%
31 0.908 -0.042 80.10% 0.8454 81.03% 0.8790 81.64% 0.9017 0.00317 -0.025 0.945 19.90%
32 0.877 -0.057 82.72% 0.9433 82.52% 0.9353 82.92% 0.9512 0.00006 -0.054 0.882 17.28%
33 0.786 -0.105 85.34% 1.0511 86.74% 1.1142 86.57% 1.1063 0.00305 -0.088 0.817 14.66%
34 0.740 -0.131 87.96% 1.1729 88.69% 1.2103 88.27% 1.1884 0.00024 -0.126 0.749 12.04%
35 0.683 -0.166 90.58% 1.3151 91.01% 1.3415 90.30% 1.2988 0.00027 -0.171 0.675 9.42%
36 0.529 -0.276 93.19% 1.4904 96.03% 1.7542 94.90% 1.6357 0.02112 -0.228 0.592 6.81%
37 0.517 -0.286 95.81% 1.7292 96.33% 1.7909 95.20% 1.6649 0.00413 -0.308 0.492 4.19%
38 0.319 -0.496 98.43% 2.1518 99.50% 2.5724 98.82% 2.2621 0.01216 -0.456 0.350 1.57%
4.557 98.43%
4.056 95.81%
3.877 93.19%
3.301 90.58%
3.174 87.96%
2.893 85.34%
2.869 82.72%
2.851 80.10%
2.549 77.49%
2.419 74.87%
2.303 72.25%
2.303 72.25%
2.207 67.02%
2.099 64.40%
2.089 61.78%
1.924 59.16%
1.871 56.54%
1.721 53.93%
1.641 51.31%
1.563 48.69%
1.483 46.07%
1.439 43.46%
1.371 40.84%
1.366 38.22%
1.353 35.60%
1.238 32.98%
1.188 30.37%
1.170 27.75%
1.090 25.13%
0.931 22.51%
0.908 19.90%
0.877 17.28%
0.786 14.66%
0.740 12.04%
0.683 9.42%
0.529 6.81%
0.517 4.19%
0.319 1.57%
0.000 0.00%
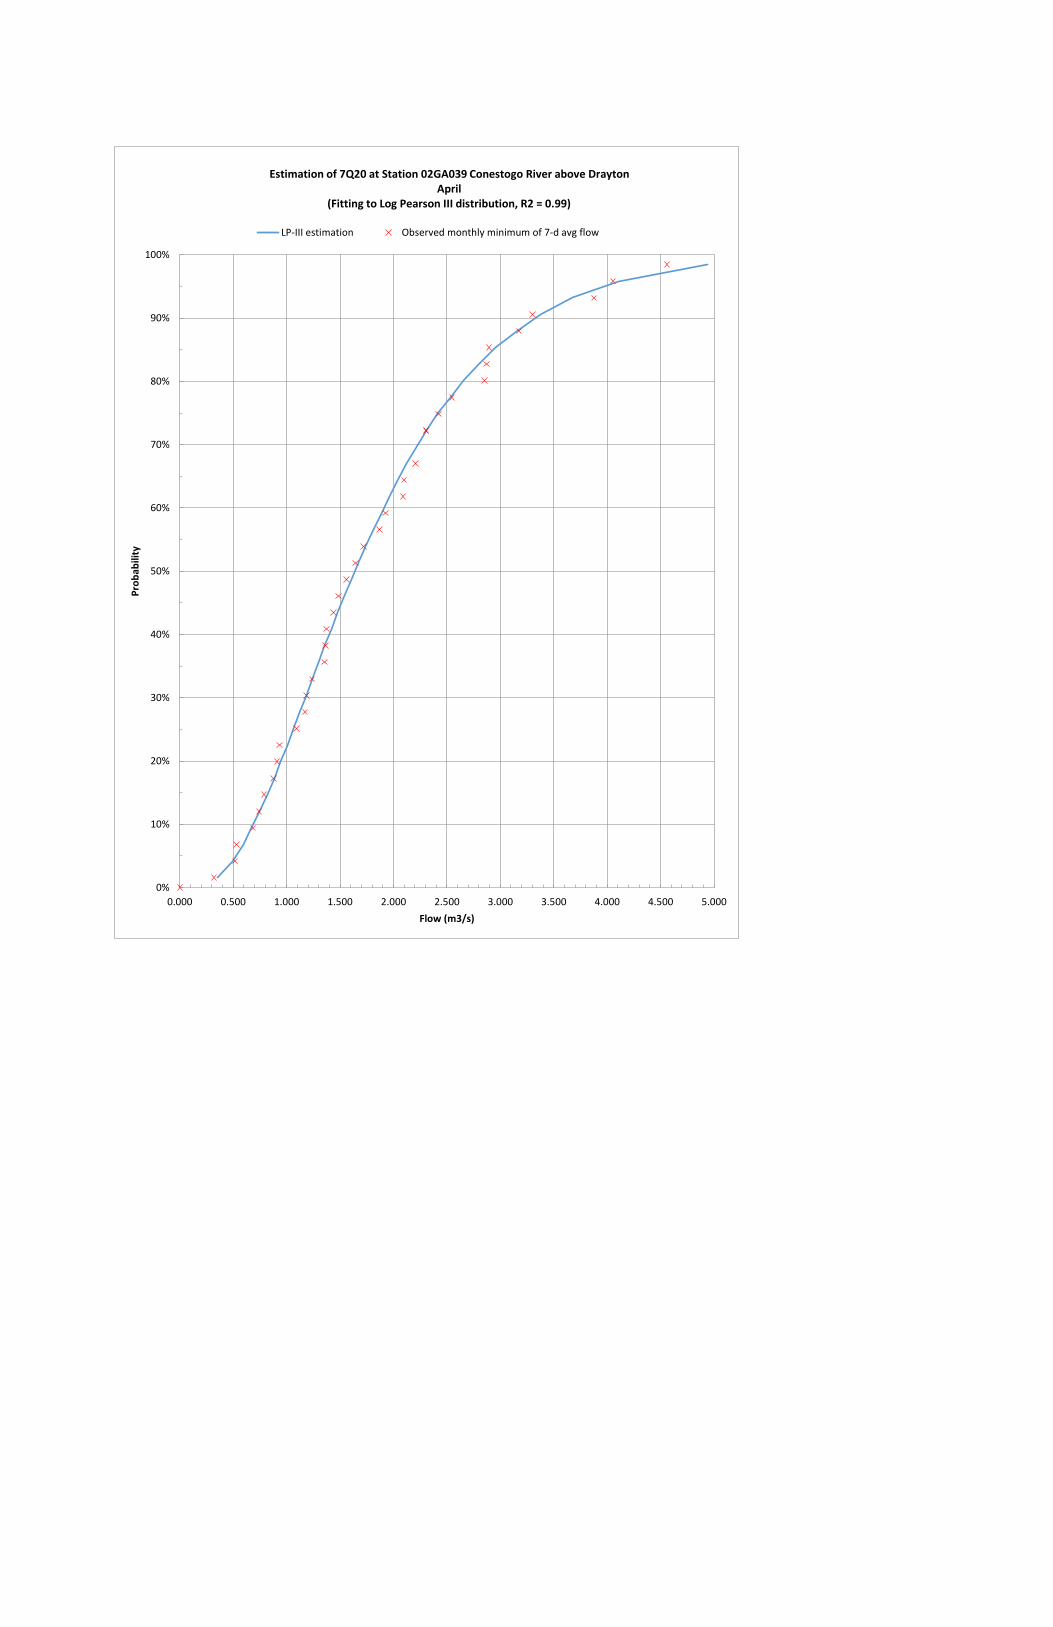
m3/s
4.557143
4.055714
3.877143
3.578571
3.371429
3.301429
3.174286
2.892857
2.868571
2.548571
2.418571
2.302857
2.207143
2.098571
2.088571
1.924286
1.871429
1.721429
1.641429
1.562857
1.482857
1.438857
1.371
1.365714
1.352857
1.238143
1.188
1.170143
1.090429
0.909571
0.908429
0.877429
0.785714
0.740429
0.682857
0.529286
0.517429
0.3194290%
10%
20%
30%
40%
50%
60%
70%
80%
90%
100%
0.000 0.500 1.000 1.500 2.000 2.500 3.000 3.500 4.000 4.500 5.000
Pro
bab
ility
Flow (m3/s)
Estimation of 7Q20 at Station 02GA039 Conestogo River above Drayton April
(Fitting to Log Pearson III distribution, R2 = 0.99)
LP-III estimation Observed monthly minimum of 7-d avg flow
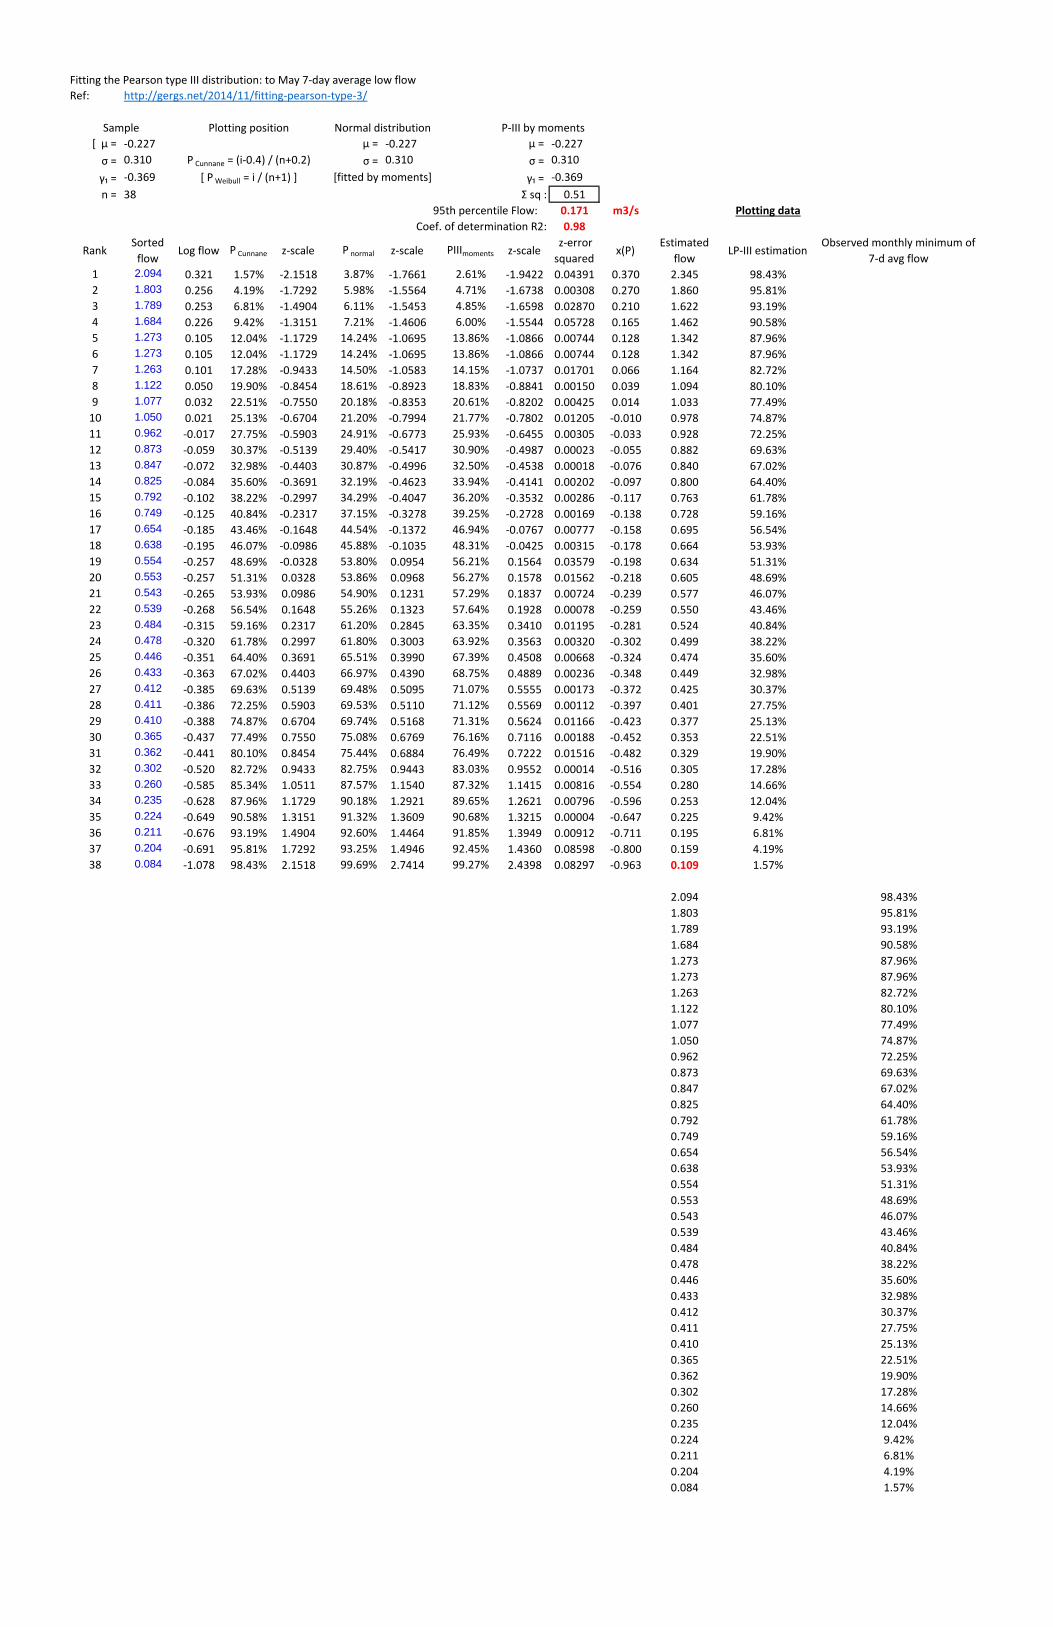
Fitting the Pearson type III distribution: to May 7-day average low flow
Ref: http://gergs.net/2014/11/fitting-pearson-type-3/
Sample Plotting position Normal distribution P-III by moments
[ μ = -0.227 μ = -0.227 μ = -0.227
σ = 0.310 P Cunnane = (i-0.4) / (n+0.2) σ = 0.310 σ = 0.310
γ₁ = -0.369 [ P Weibull = i / (n+1) ] [fitted by moments] γ₁ = -0.369
n = 38 Σ sq : 0.51
95th percentile Flow: 0.171 m3/s Plotting data
Coef. of determination R2: 0.98
RankSorted
flowLog flow P Cunnane z-scale P normal z-scale PIIImoments z-scale
z-error
squaredx(P)
Estimated
flowLP-III estimation
Observed monthly minimum of
7-d avg flow
1 2.094 0.321 1.57% -2.1518 3.87% -1.7661 2.61% -1.9422 0.04391 0.370 2.345 98.43%
2 1.803 0.256 4.19% -1.7292 5.98% -1.5564 4.71% -1.6738 0.00308 0.270 1.860 95.81%
3 1.789 0.253 6.81% -1.4904 6.11% -1.5453 4.85% -1.6598 0.02870 0.210 1.622 93.19%
4 1.684 0.226 9.42% -1.3151 7.21% -1.4606 6.00% -1.5544 0.05728 0.165 1.462 90.58%
5 1.273 0.105 12.04% -1.1729 14.24% -1.0695 13.86% -1.0866 0.00744 0.128 1.342 87.96%
6 1.273 0.105 12.04% -1.1729 14.24% -1.0695 13.86% -1.0866 0.00744 0.128 1.342 87.96%
7 1.263 0.101 17.28% -0.9433 14.50% -1.0583 14.15% -1.0737 0.01701 0.066 1.164 82.72%
8 1.122 0.050 19.90% -0.8454 18.61% -0.8923 18.83% -0.8841 0.00150 0.039 1.094 80.10%
9 1.077 0.032 22.51% -0.7550 20.18% -0.8353 20.61% -0.8202 0.00425 0.014 1.033 77.49%
10 1.050 0.021 25.13% -0.6704 21.20% -0.7994 21.77% -0.7802 0.01205 -0.010 0.978 74.87%
11 0.962 -0.017 27.75% -0.5903 24.91% -0.6773 25.93% -0.6455 0.00305 -0.033 0.928 72.25%
12 0.873 -0.059 30.37% -0.5139 29.40% -0.5417 30.90% -0.4987 0.00023 -0.055 0.882 69.63%
13 0.847 -0.072 32.98% -0.4403 30.87% -0.4996 32.50% -0.4538 0.00018 -0.076 0.840 67.02%
14 0.825 -0.084 35.60% -0.3691 32.19% -0.4623 33.94% -0.4141 0.00202 -0.097 0.800 64.40%
15 0.792 -0.102 38.22% -0.2997 34.29% -0.4047 36.20% -0.3532 0.00286 -0.117 0.763 61.78%
16 0.749 -0.125 40.84% -0.2317 37.15% -0.3278 39.25% -0.2728 0.00169 -0.138 0.728 59.16%
17 0.654 -0.185 43.46% -0.1648 44.54% -0.1372 46.94% -0.0767 0.00777 -0.158 0.695 56.54%
18 0.638 -0.195 46.07% -0.0986 45.88% -0.1035 48.31% -0.0425 0.00315 -0.178 0.664 53.93%
19 0.554 -0.257 48.69% -0.0328 53.80% 0.0954 56.21% 0.1564 0.03579 -0.198 0.634 51.31%
20 0.553 -0.257 51.31% 0.0328 53.86% 0.0968 56.27% 0.1578 0.01562 -0.218 0.605 48.69%
21 0.543 -0.265 53.93% 0.0986 54.90% 0.1231 57.29% 0.1837 0.00724 -0.239 0.577 46.07%
22 0.539 -0.268 56.54% 0.1648 55.26% 0.1323 57.64% 0.1928 0.00078 -0.259 0.550 43.46%
23 0.484 -0.315 59.16% 0.2317 61.20% 0.2845 63.35% 0.3410 0.01195 -0.281 0.524 40.84%
24 0.478 -0.320 61.78% 0.2997 61.80% 0.3003 63.92% 0.3563 0.00320 -0.302 0.499 38.22%
25 0.446 -0.351 64.40% 0.3691 65.51% 0.3990 67.39% 0.4508 0.00668 -0.324 0.474 35.60%
26 0.433 -0.363 67.02% 0.4403 66.97% 0.4390 68.75% 0.4889 0.00236 -0.348 0.449 32.98%
27 0.412 -0.385 69.63% 0.5139 69.48% 0.5095 71.07% 0.5555 0.00173 -0.372 0.425 30.37%
28 0.411 -0.386 72.25% 0.5903 69.53% 0.5110 71.12% 0.5569 0.00112 -0.397 0.401 27.75%
29 0.410 -0.388 74.87% 0.6704 69.74% 0.5168 71.31% 0.5624 0.01166 -0.423 0.377 25.13%
30 0.365 -0.437 77.49% 0.7550 75.08% 0.6769 76.16% 0.7116 0.00188 -0.452 0.353 22.51%
31 0.362 -0.441 80.10% 0.8454 75.44% 0.6884 76.49% 0.7222 0.01516 -0.482 0.329 19.90%
32 0.302 -0.520 82.72% 0.9433 82.75% 0.9443 83.03% 0.9552 0.00014 -0.516 0.305 17.28%
33 0.260 -0.585 85.34% 1.0511 87.57% 1.1540 87.32% 1.1415 0.00816 -0.554 0.280 14.66%
34 0.235 -0.628 87.96% 1.1729 90.18% 1.2921 89.65% 1.2621 0.00796 -0.596 0.253 12.04%
35 0.224 -0.649 90.58% 1.3151 91.32% 1.3609 90.68% 1.3215 0.00004 -0.647 0.225 9.42%
36 0.211 -0.676 93.19% 1.4904 92.60% 1.4464 91.85% 1.3949 0.00912 -0.711 0.195 6.81%
37 0.204 -0.691 95.81% 1.7292 93.25% 1.4946 92.45% 1.4360 0.08598 -0.800 0.159 4.19%
38 0.084 -1.078 98.43% 2.1518 99.69% 2.7414 99.27% 2.4398 0.08297 -0.963 0.109 1.57%
2.094 98.43%
1.803 95.81%
1.789 93.19%
1.684 90.58%
1.273 87.96%
1.273 87.96%
1.263 82.72%
1.122 80.10%
1.077 77.49%
1.050 74.87%
0.962 72.25%
0.873 69.63%
0.847 67.02%
0.825 64.40%
0.792 61.78%
0.749 59.16%
0.654 56.54%
0.638 53.93%
0.554 51.31%
0.553 48.69%
0.543 46.07%
0.539 43.46%
0.484 40.84%
0.478 38.22%
0.446 35.60%
0.433 32.98%
0.412 30.37%
0.411 27.75%
0.410 25.13%
0.365 22.51%
0.362 19.90%
0.302 17.28%
0.260 14.66%
0.235 12.04%
0.224 9.42%
0.211 6.81%
0.204 4.19%
0.084 1.57%
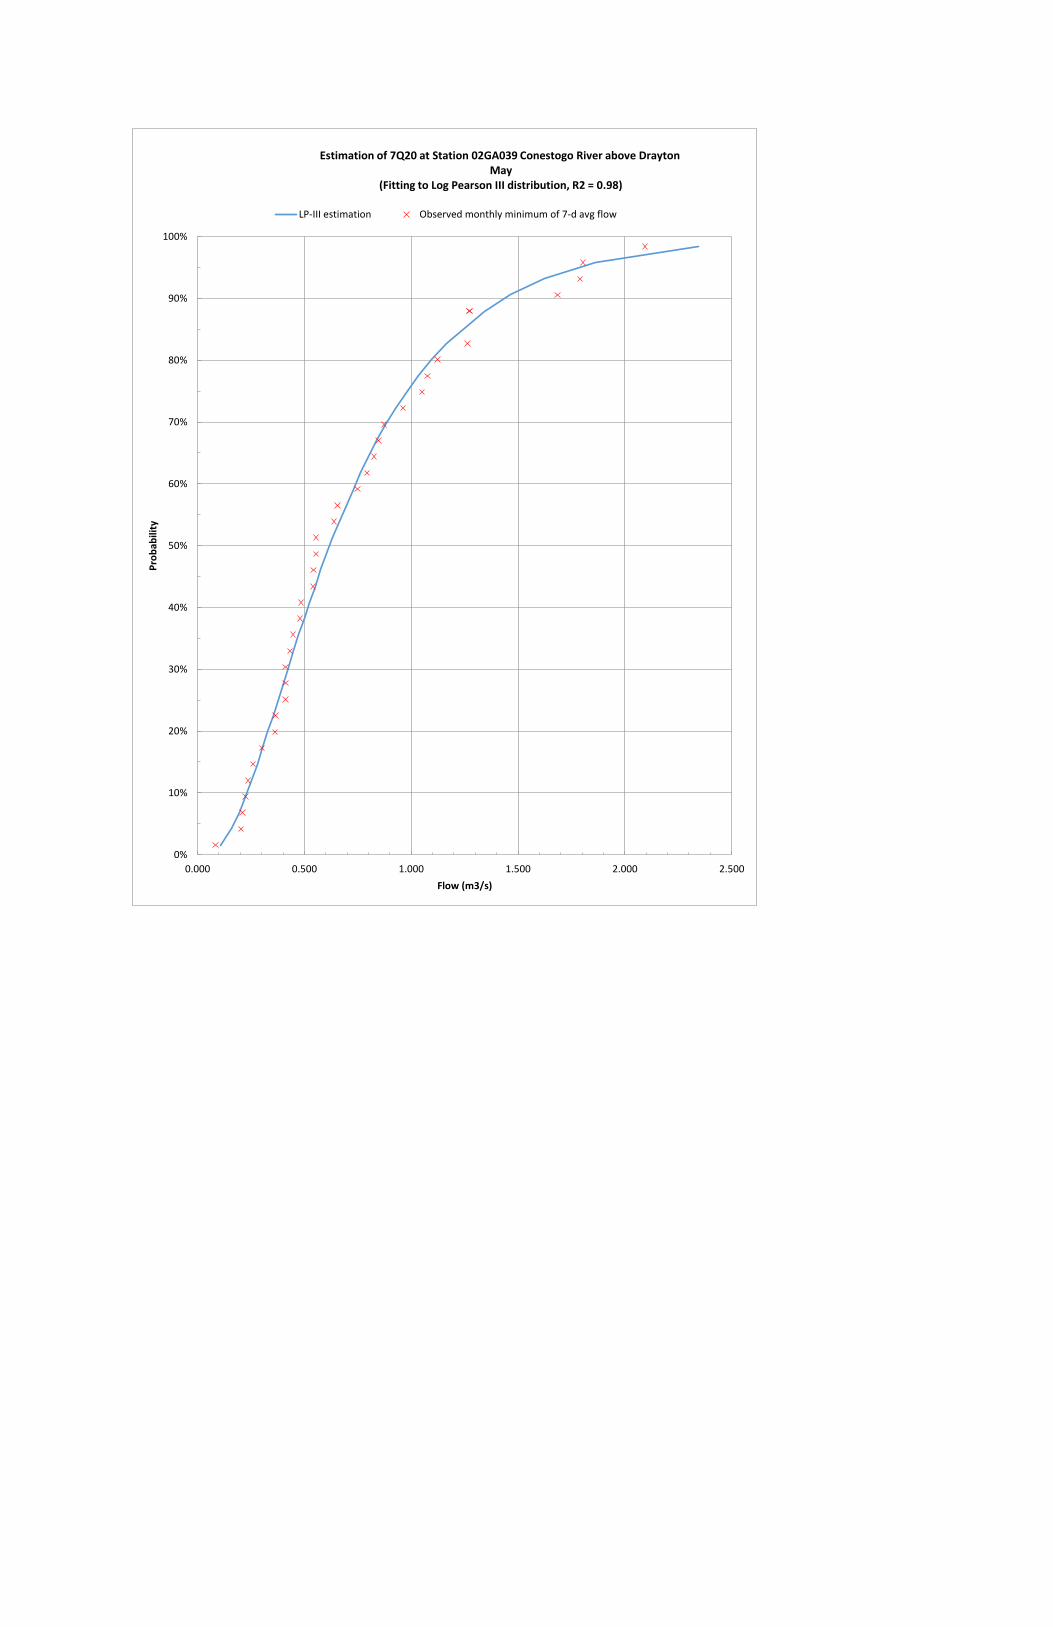
2.67
1.802857
1.788571
1.683571
1.273
1.262857
1.121571
1.076857
1.049571
0.961857
0.919571
0.914429
0.873
0.824857
0.791571
0.749286
0.738857
0.638286
0.553714
0.553143
0.542857
0.539286
0.483714
0.478286
0.445714
0.433143
0.432714
0.411857
0.411429
0.365429
0.362429
0.301857
0.259857
0.235429
0.224143
0.210857
0.203714
0.0835710%
10%
20%
30%
40%
50%
60%
70%
80%
90%
100%
0.000 0.500 1.000 1.500 2.000 2.500
Pro
bab
ility
Flow (m3/s)
Estimation of 7Q20 at Station 02GA039 Conestogo River above Drayton May
(Fitting to Log Pearson III distribution, R2 = 0.98)
LP-III estimation Observed monthly minimum of 7-d avg flow
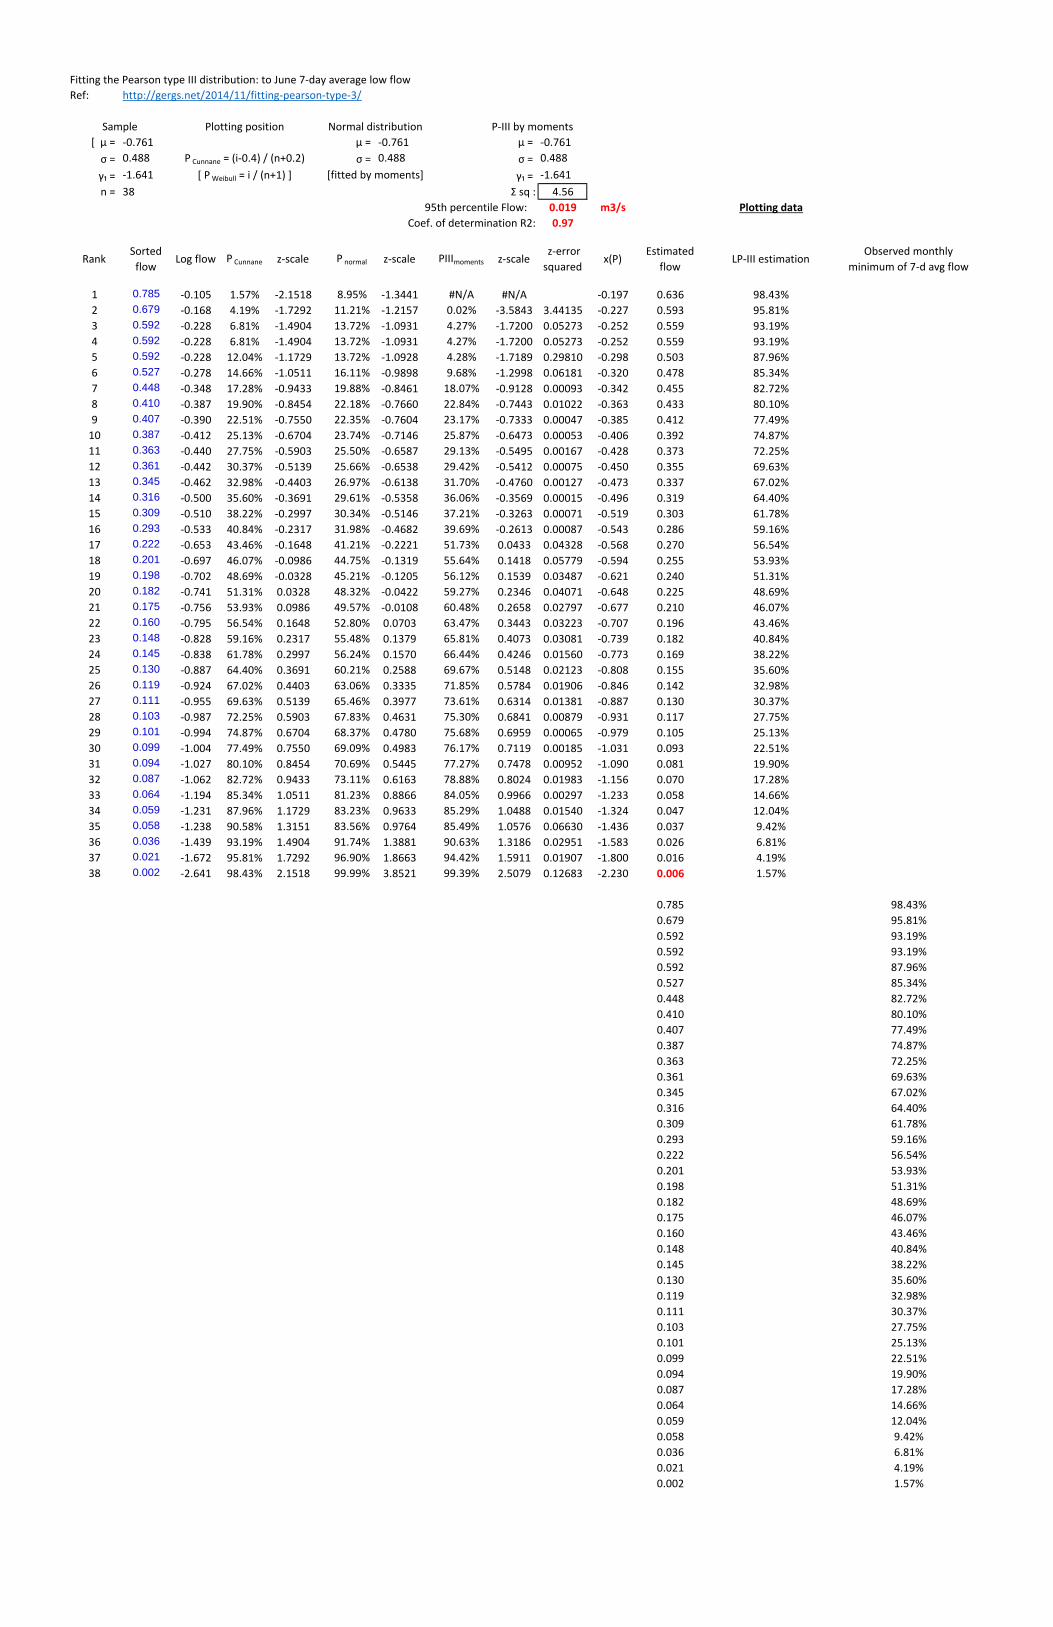
Fitting the Pearson type III distribution: to June 7-day average low flow
Ref: http://gergs.net/2014/11/fitting-pearson-type-3/
Sample Plotting position Normal distribution P-III by moments
[ μ = -0.761 μ = -0.761 μ = -0.761
σ = 0.488 P Cunnane = (i-0.4) / (n+0.2) σ = 0.488 σ = 0.488
γ₁ = -1.641 [ P Weibull = i / (n+1) ] [fitted by moments] γ₁ = -1.641
n = 38 Σ sq : 4.56
95th percentile Flow: 0.019 m3/s Plotting data
Coef. of determination R2: 0.97
RankSorted
flowLog flow P Cunnane z-scale P normal z-scale PIIImoments z-scale
z-error
squaredx(P)
Estimated
flowLP-III estimation
Observed monthly
minimum of 7-d avg flow
1 0.785 -0.105 1.57% -2.1518 8.95% -1.3441 #N/A #N/A -0.197 0.636 98.43%
2 0.679 -0.168 4.19% -1.7292 11.21% -1.2157 0.02% -3.5843 3.44135 -0.227 0.593 95.81%
3 0.592 -0.228 6.81% -1.4904 13.72% -1.0931 4.27% -1.7200 0.05273 -0.252 0.559 93.19%
4 0.592 -0.228 6.81% -1.4904 13.72% -1.0931 4.27% -1.7200 0.05273 -0.252 0.559 93.19%
5 0.592 -0.228 12.04% -1.1729 13.72% -1.0928 4.28% -1.7189 0.29810 -0.298 0.503 87.96%
6 0.527 -0.278 14.66% -1.0511 16.11% -0.9898 9.68% -1.2998 0.06181 -0.320 0.478 85.34%
7 0.448 -0.348 17.28% -0.9433 19.88% -0.8461 18.07% -0.9128 0.00093 -0.342 0.455 82.72%
8 0.410 -0.387 19.90% -0.8454 22.18% -0.7660 22.84% -0.7443 0.01022 -0.363 0.433 80.10%
9 0.407 -0.390 22.51% -0.7550 22.35% -0.7604 23.17% -0.7333 0.00047 -0.385 0.412 77.49%
10 0.387 -0.412 25.13% -0.6704 23.74% -0.7146 25.87% -0.6473 0.00053 -0.406 0.392 74.87%
11 0.363 -0.440 27.75% -0.5903 25.50% -0.6587 29.13% -0.5495 0.00167 -0.428 0.373 72.25%
12 0.361 -0.442 30.37% -0.5139 25.66% -0.6538 29.42% -0.5412 0.00075 -0.450 0.355 69.63%
13 0.345 -0.462 32.98% -0.4403 26.97% -0.6138 31.70% -0.4760 0.00127 -0.473 0.337 67.02%
14 0.316 -0.500 35.60% -0.3691 29.61% -0.5358 36.06% -0.3569 0.00015 -0.496 0.319 64.40%
15 0.309 -0.510 38.22% -0.2997 30.34% -0.5146 37.21% -0.3263 0.00071 -0.519 0.303 61.78%
16 0.293 -0.533 40.84% -0.2317 31.98% -0.4682 39.69% -0.2613 0.00087 -0.543 0.286 59.16%
17 0.222 -0.653 43.46% -0.1648 41.21% -0.2221 51.73% 0.0433 0.04328 -0.568 0.270 56.54%
18 0.201 -0.697 46.07% -0.0986 44.75% -0.1319 55.64% 0.1418 0.05779 -0.594 0.255 53.93%
19 0.198 -0.702 48.69% -0.0328 45.21% -0.1205 56.12% 0.1539 0.03487 -0.621 0.240 51.31%
20 0.182 -0.741 51.31% 0.0328 48.32% -0.0422 59.27% 0.2346 0.04071 -0.648 0.225 48.69%
21 0.175 -0.756 53.93% 0.0986 49.57% -0.0108 60.48% 0.2658 0.02797 -0.677 0.210 46.07%
22 0.160 -0.795 56.54% 0.1648 52.80% 0.0703 63.47% 0.3443 0.03223 -0.707 0.196 43.46%
23 0.148 -0.828 59.16% 0.2317 55.48% 0.1379 65.81% 0.4073 0.03081 -0.739 0.182 40.84%
24 0.145 -0.838 61.78% 0.2997 56.24% 0.1570 66.44% 0.4246 0.01560 -0.773 0.169 38.22%
25 0.130 -0.887 64.40% 0.3691 60.21% 0.2588 69.67% 0.5148 0.02123 -0.808 0.155 35.60%
26 0.119 -0.924 67.02% 0.4403 63.06% 0.3335 71.85% 0.5784 0.01906 -0.846 0.142 32.98%
27 0.111 -0.955 69.63% 0.5139 65.46% 0.3977 73.61% 0.6314 0.01381 -0.887 0.130 30.37%
28 0.103 -0.987 72.25% 0.5903 67.83% 0.4631 75.30% 0.6841 0.00879 -0.931 0.117 27.75%
29 0.101 -0.994 74.87% 0.6704 68.37% 0.4780 75.68% 0.6959 0.00065 -0.979 0.105 25.13%
30 0.099 -1.004 77.49% 0.7550 69.09% 0.4983 76.17% 0.7119 0.00185 -1.031 0.093 22.51%
31 0.094 -1.027 80.10% 0.8454 70.69% 0.5445 77.27% 0.7478 0.00952 -1.090 0.081 19.90%
32 0.087 -1.062 82.72% 0.9433 73.11% 0.6163 78.88% 0.8024 0.01983 -1.156 0.070 17.28%
33 0.064 -1.194 85.34% 1.0511 81.23% 0.8866 84.05% 0.9966 0.00297 -1.233 0.058 14.66%
34 0.059 -1.231 87.96% 1.1729 83.23% 0.9633 85.29% 1.0488 0.01540 -1.324 0.047 12.04%
35 0.058 -1.238 90.58% 1.3151 83.56% 0.9764 85.49% 1.0576 0.06630 -1.436 0.037 9.42%
36 0.036 -1.439 93.19% 1.4904 91.74% 1.3881 90.63% 1.3186 0.02951 -1.583 0.026 6.81%
37 0.021 -1.672 95.81% 1.7292 96.90% 1.8663 94.42% 1.5911 0.01907 -1.800 0.016 4.19%
38 0.002 -2.641 98.43% 2.1518 99.99% 3.8521 99.39% 2.5079 0.12683 -2.230 0.006 1.57%
0.785 98.43%
0.679 95.81%
0.592 93.19%
0.592 93.19%
0.592 87.96%
0.527 85.34%
0.448 82.72%
0.410 80.10%
0.407 77.49%
0.387 74.87%
0.363 72.25%
0.361 69.63%
0.345 67.02%
0.316 64.40%
0.309 61.78%
0.293 59.16%
0.222 56.54%
0.201 53.93%
0.198 51.31%
0.182 48.69%
0.175 46.07%
0.160 43.46%
0.148 40.84%
0.145 38.22%
0.130 35.60%
0.119 32.98%
0.111 30.37%
0.103 27.75%
0.101 25.13%
0.099 22.51%
0.094 19.90%
0.087 17.28%
0.064 14.66%
0.059 12.04%
0.058 9.42%
0.036 6.81%
0.021 4.19%
0.002 1.57%
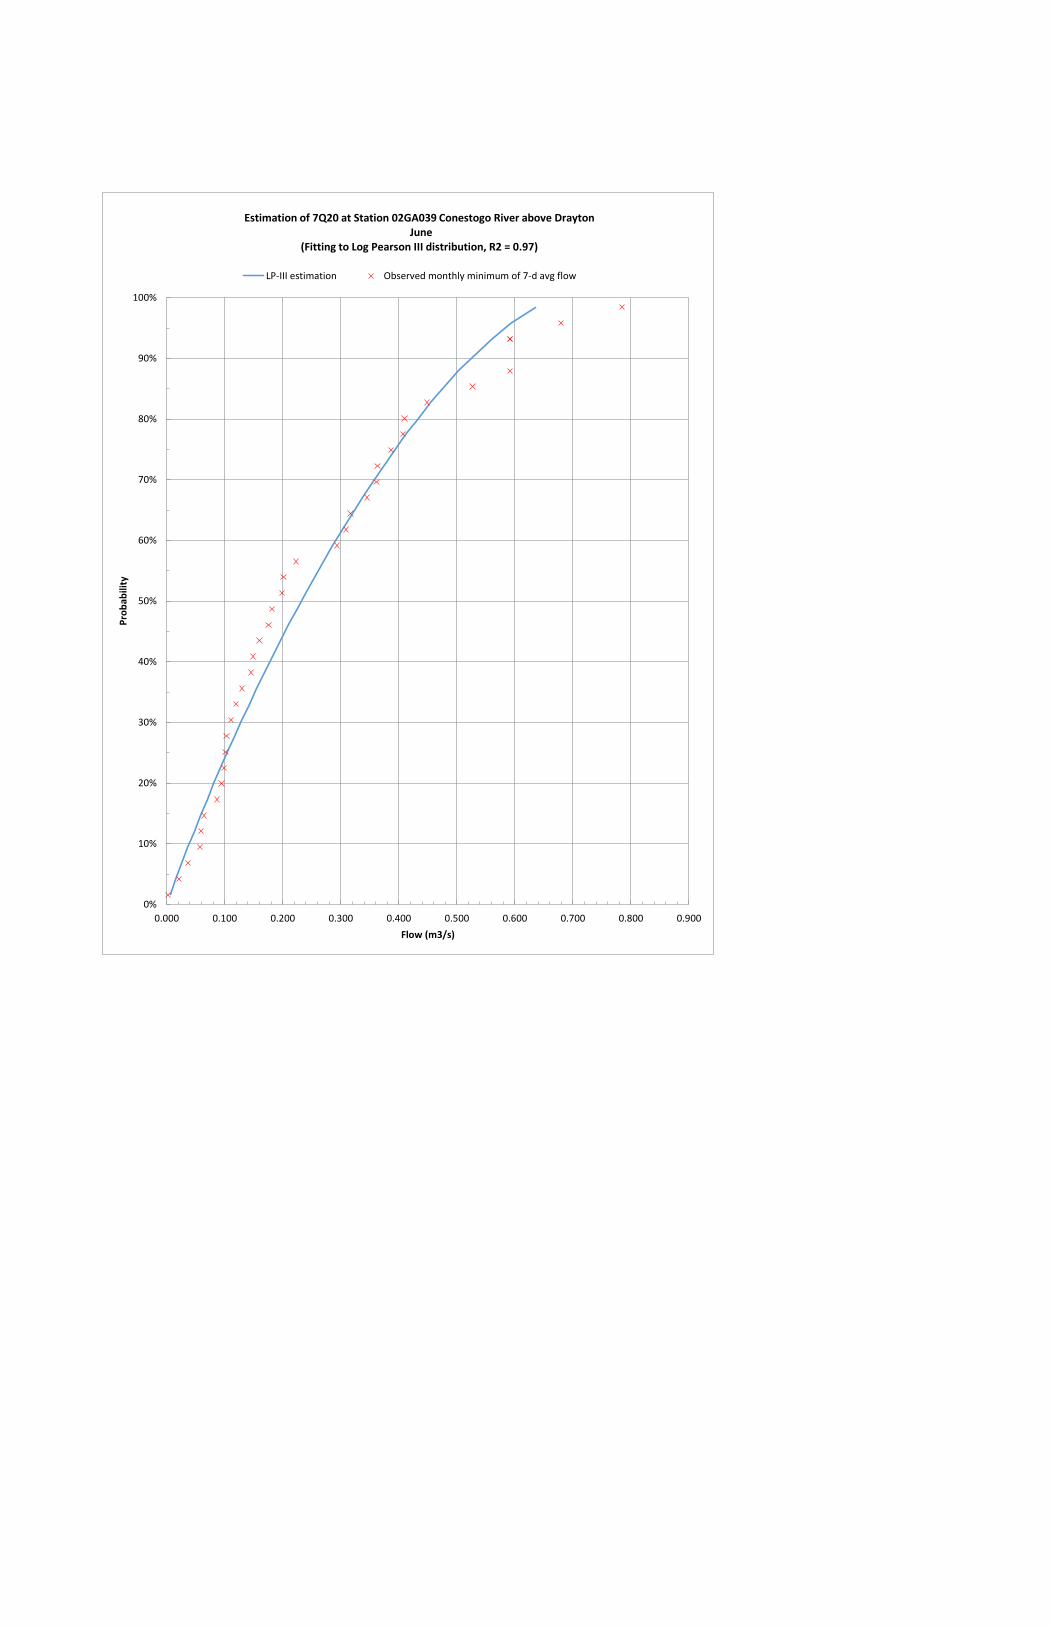
0.856429
0.784714
0.766143
0.591857
0.591714
0.543571
0.527
0.448429
0.409857
0.407286
0.386857
0.363286
0.361286
0.345429
0.316429
0.309
0.222429
0.201
0.198429
0.181714
0.175429
0.160143
0.148429
0.145286
0.129571
0.119143
0.110857
0.103
0.101286
0.099
0.094
0.086714
0.064
0.058714
0.057857
0.036429
0.021286
0.002286
0%
10%
20%
30%
40%
50%
60%
70%
80%
90%
100%
0.000 0.100 0.200 0.300 0.400 0.500 0.600 0.700 0.800 0.900
Pro
bab
ility
Flow (m3/s)
Estimation of 7Q20 at Station 02GA039 Conestogo River above Drayton June
(Fitting to Log Pearson III distribution, R2 = 0.97)
LP-III estimation Observed monthly minimum of 7-d avg flow
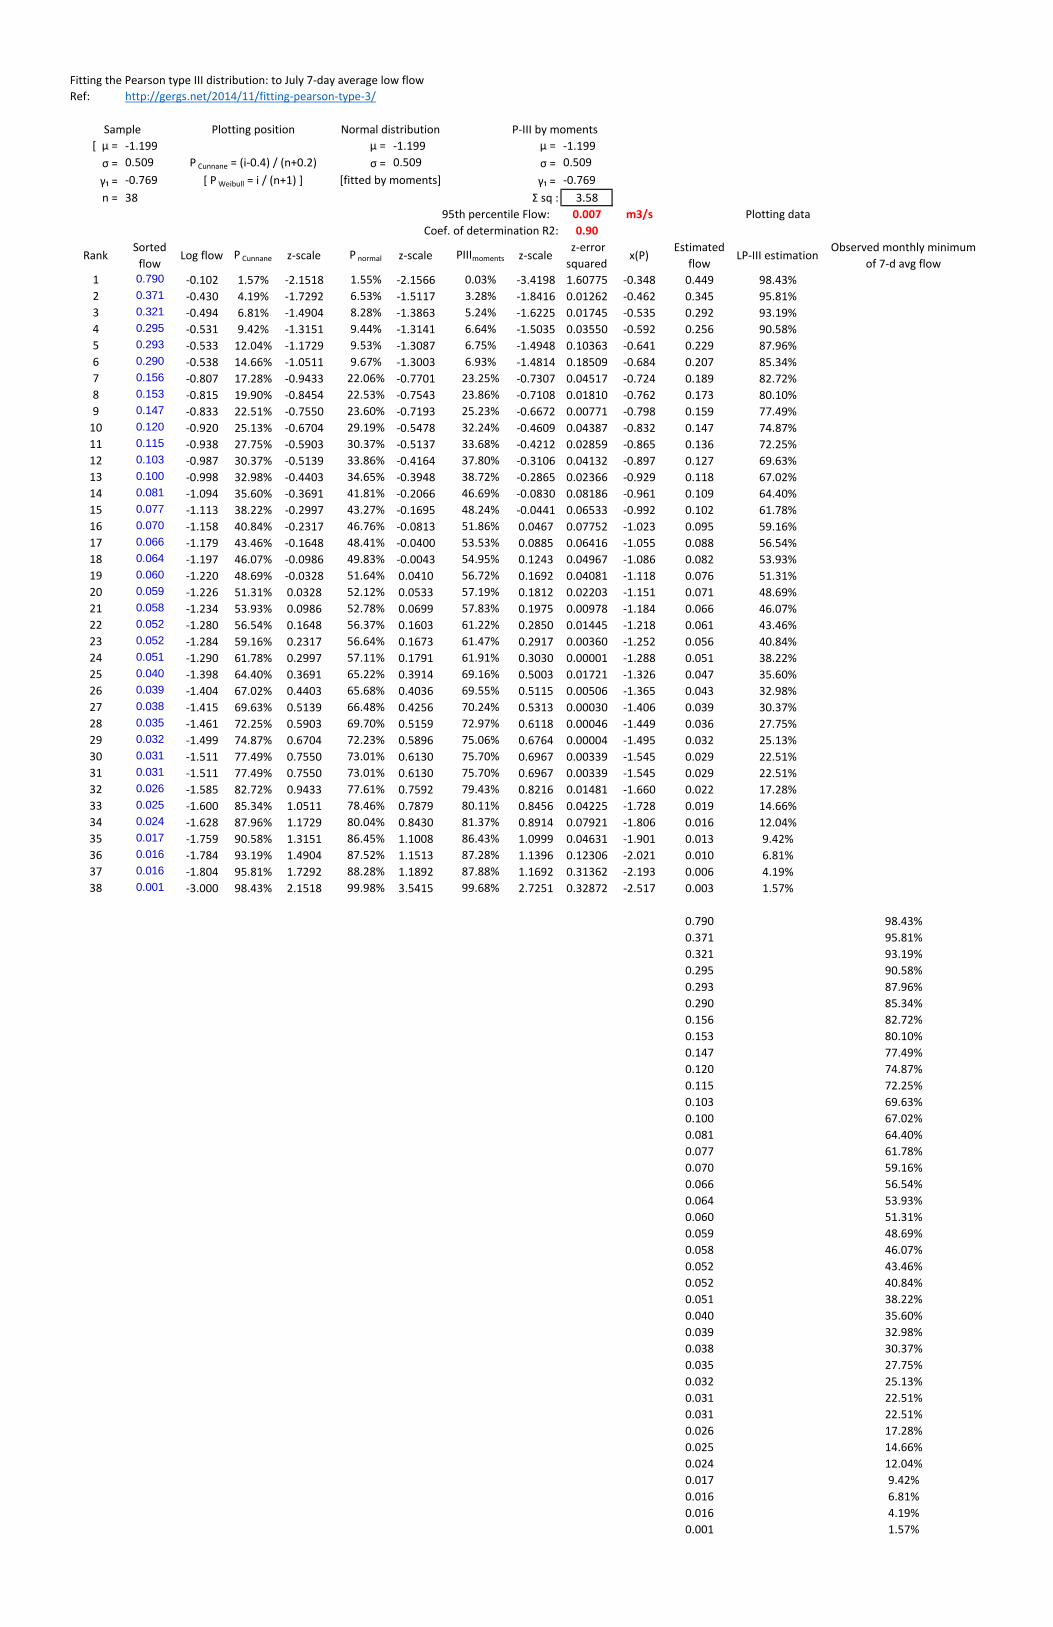
Fitting the Pearson type III distribution: to July 7-day average low flow
Ref: http://gergs.net/2014/11/fitting-pearson-type-3/
Sample Plotting position Normal distribution P-III by moments
[ μ = -1.199 μ = -1.199 μ = -1.199
σ = 0.509 P Cunnane = (i-0.4) / (n+0.2) σ = 0.509 σ = 0.509
γ₁ = -0.769 [ P Weibull = i / (n+1) ] [fitted by moments] γ₁ = -0.769
n = 38 Σ sq : 3.58
95th percentile Flow: 0.007 m3/s Plotting data
Coef. of determination R2: 0.90
RankSorted
flowLog flow P Cunnane z-scale P normal z-scale PIIImoments z-scale
z-error
squaredx(P)
Estimated
flowLP-III estimation
Observed monthly minimum
of 7-d avg flow
1 0.790 -0.102 1.57% -2.1518 1.55% -2.1566 0.03% -3.4198 1.60775 -0.348 0.449 98.43%
2 0.371 -0.430 4.19% -1.7292 6.53% -1.5117 3.28% -1.8416 0.01262 -0.462 0.345 95.81%
3 0.321 -0.494 6.81% -1.4904 8.28% -1.3863 5.24% -1.6225 0.01745 -0.535 0.292 93.19%
4 0.295 -0.531 9.42% -1.3151 9.44% -1.3141 6.64% -1.5035 0.03550 -0.592 0.256 90.58%
5 0.293 -0.533 12.04% -1.1729 9.53% -1.3087 6.75% -1.4948 0.10363 -0.641 0.229 87.96%
6 0.290 -0.538 14.66% -1.0511 9.67% -1.3003 6.93% -1.4814 0.18509 -0.684 0.207 85.34%
7 0.156 -0.807 17.28% -0.9433 22.06% -0.7701 23.25% -0.7307 0.04517 -0.724 0.189 82.72%
8 0.153 -0.815 19.90% -0.8454 22.53% -0.7543 23.86% -0.7108 0.01810 -0.762 0.173 80.10%
9 0.147 -0.833 22.51% -0.7550 23.60% -0.7193 25.23% -0.6672 0.00771 -0.798 0.159 77.49%
10 0.120 -0.920 25.13% -0.6704 29.19% -0.5478 32.24% -0.4609 0.04387 -0.832 0.147 74.87%
11 0.115 -0.938 27.75% -0.5903 30.37% -0.5137 33.68% -0.4212 0.02859 -0.865 0.136 72.25%
12 0.103 -0.987 30.37% -0.5139 33.86% -0.4164 37.80% -0.3106 0.04132 -0.897 0.127 69.63%
13 0.100 -0.998 32.98% -0.4403 34.65% -0.3948 38.72% -0.2865 0.02366 -0.929 0.118 67.02%
14 0.081 -1.094 35.60% -0.3691 41.81% -0.2066 46.69% -0.0830 0.08186 -0.961 0.109 64.40%
15 0.077 -1.113 38.22% -0.2997 43.27% -0.1695 48.24% -0.0441 0.06533 -0.992 0.102 61.78%
16 0.070 -1.158 40.84% -0.2317 46.76% -0.0813 51.86% 0.0467 0.07752 -1.023 0.095 59.16%
17 0.066 -1.179 43.46% -0.1648 48.41% -0.0400 53.53% 0.0885 0.06416 -1.055 0.088 56.54%
18 0.064 -1.197 46.07% -0.0986 49.83% -0.0043 54.95% 0.1243 0.04967 -1.086 0.082 53.93%
19 0.060 -1.220 48.69% -0.0328 51.64% 0.0410 56.72% 0.1692 0.04081 -1.118 0.076 51.31%
20 0.059 -1.226 51.31% 0.0328 52.12% 0.0533 57.19% 0.1812 0.02203 -1.151 0.071 48.69%
21 0.058 -1.234 53.93% 0.0986 52.78% 0.0699 57.83% 0.1975 0.00978 -1.184 0.066 46.07%
22 0.052 -1.280 56.54% 0.1648 56.37% 0.1603 61.22% 0.2850 0.01445 -1.218 0.061 43.46%
23 0.052 -1.284 59.16% 0.2317 56.64% 0.1673 61.47% 0.2917 0.00360 -1.252 0.056 40.84%
24 0.051 -1.290 61.78% 0.2997 57.11% 0.1791 61.91% 0.3030 0.00001 -1.288 0.051 38.22%
25 0.040 -1.398 64.40% 0.3691 65.22% 0.3914 69.16% 0.5003 0.01721 -1.326 0.047 35.60%
26 0.039 -1.404 67.02% 0.4403 65.68% 0.4036 69.55% 0.5115 0.00506 -1.365 0.043 32.98%
27 0.038 -1.415 69.63% 0.5139 66.48% 0.4256 70.24% 0.5313 0.00030 -1.406 0.039 30.37%
28 0.035 -1.461 72.25% 0.5903 69.70% 0.5159 72.97% 0.6118 0.00046 -1.449 0.036 27.75%
29 0.032 -1.499 74.87% 0.6704 72.23% 0.5896 75.06% 0.6764 0.00004 -1.495 0.032 25.13%
30 0.031 -1.511 77.49% 0.7550 73.01% 0.6130 75.70% 0.6967 0.00339 -1.545 0.029 22.51%
31 0.031 -1.511 77.49% 0.7550 73.01% 0.6130 75.70% 0.6967 0.00339 -1.545 0.029 22.51%
32 0.026 -1.585 82.72% 0.9433 77.61% 0.7592 79.43% 0.8216 0.01481 -1.660 0.022 17.28%
33 0.025 -1.600 85.34% 1.0511 78.46% 0.7879 80.11% 0.8456 0.04225 -1.728 0.019 14.66%
34 0.024 -1.628 87.96% 1.1729 80.04% 0.8430 81.37% 0.8914 0.07921 -1.806 0.016 12.04%
35 0.017 -1.759 90.58% 1.3151 86.45% 1.1008 86.43% 1.0999 0.04631 -1.901 0.013 9.42%
36 0.016 -1.784 93.19% 1.4904 87.52% 1.1513 87.28% 1.1396 0.12306 -2.021 0.010 6.81%
37 0.016 -1.804 95.81% 1.7292 88.28% 1.1892 87.88% 1.1692 0.31362 -2.193 0.006 4.19%
38 0.001 -3.000 98.43% 2.1518 99.98% 3.5415 99.68% 2.7251 0.32872 -2.517 0.003 1.57%
0.790 98.43%
0.371 95.81%
0.321 93.19%
0.295 90.58%
0.293 87.96%
0.290 85.34%
0.156 82.72%
0.153 80.10%
0.147 77.49%
0.120 74.87%
0.115 72.25%
0.103 69.63%
0.100 67.02%
0.081 64.40%
0.077 61.78%
0.070 59.16%
0.066 56.54%
0.064 53.93%
0.060 51.31%
0.059 48.69%
0.058 46.07%
0.052 43.46%
0.052 40.84%
0.051 38.22%
0.040 35.60%
0.039 32.98%
0.038 30.37%
0.035 27.75%
0.032 25.13%
0.031 22.51%
0.031 22.51%
0.026 17.28%
0.025 14.66%
0.024 12.04%
0.017 9.42%
0.016 6.81%
0.016 4.19%
0.001 1.57%
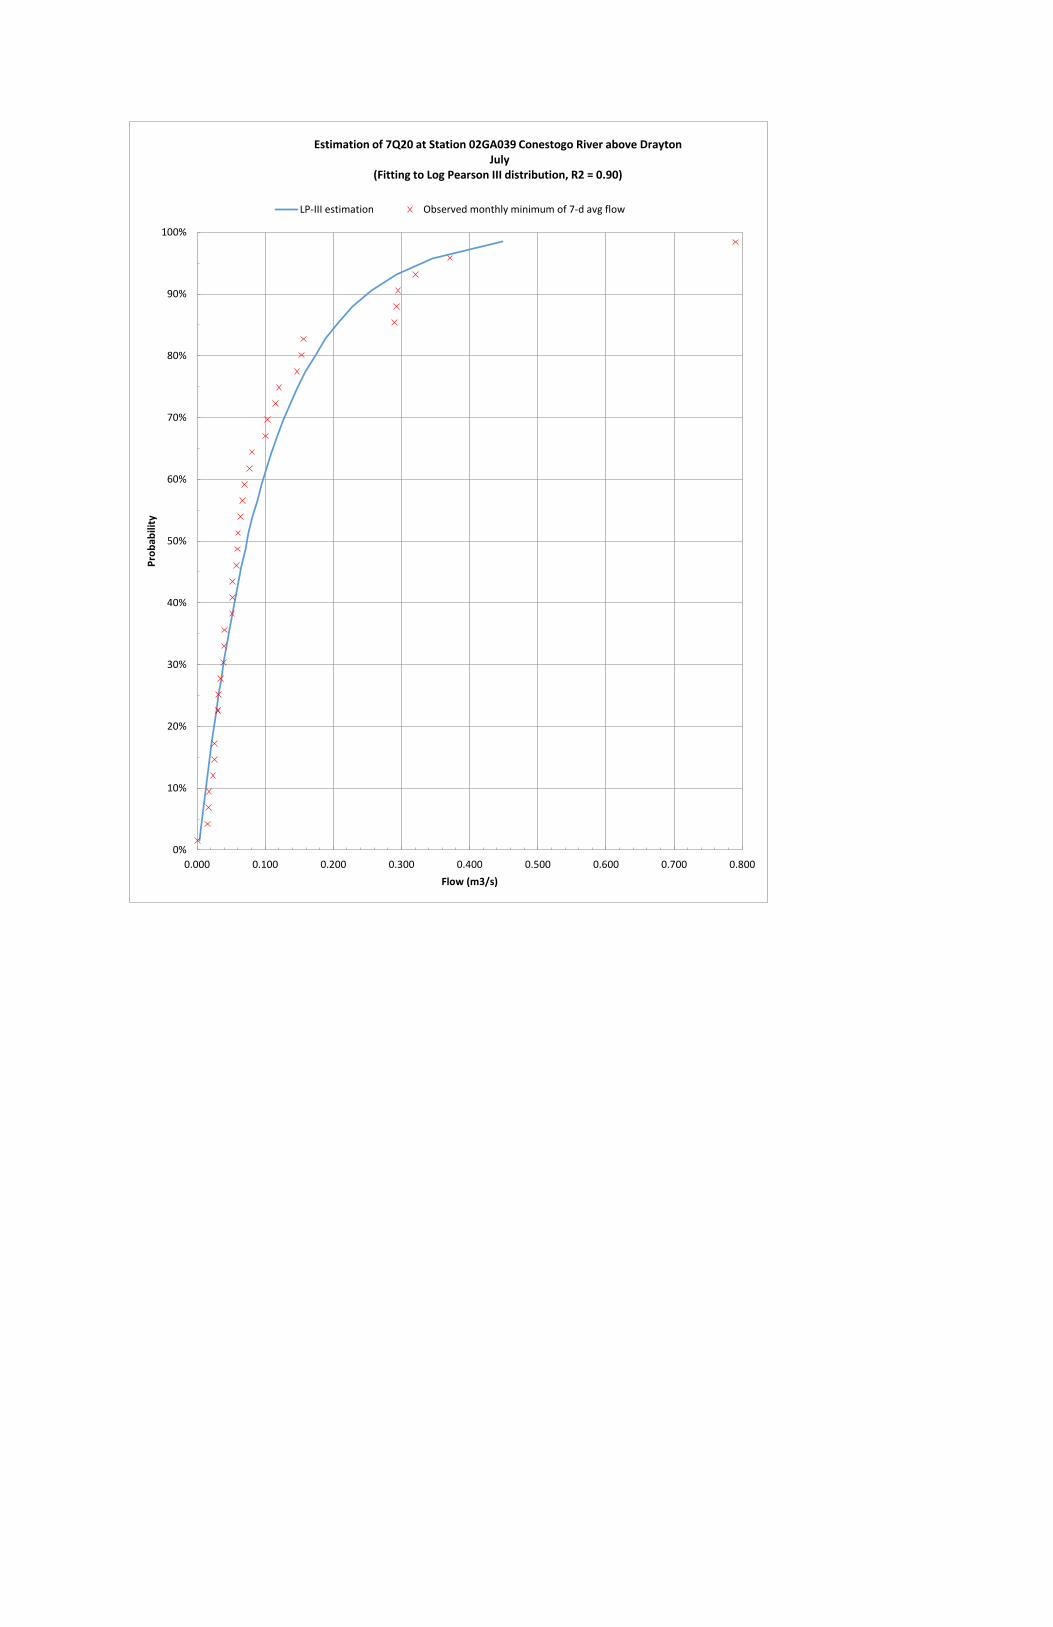
0.790429
0.371429
0.364857
0.320714
0.292857
0.29
0.162143
0.155857
0.146857
0.120143
0.116429
0.115429
0.108
0.100429
0.086857
0.080571
0.077143
0.069571
0.066286
0.063571
0.060286
0.059429
0.058286
0.052429
0.052
0.051286
0.04
0.039429
0.038429
0.038143
0.034571
0.031714
0.030857
0.026
0.025143
0.023571
0.015714
0
0%
10%
20%
30%
40%
50%
60%
70%
80%
90%
100%
0.000 0.100 0.200 0.300 0.400 0.500 0.600 0.700 0.800
Pro
bab
ility
Flow (m3/s)
Estimation of 7Q20 at Station 02GA039 Conestogo River above Drayton July
(Fitting to Log Pearson III distribution, R2 = 0.90)
LP-III estimation Observed monthly minimum of 7-d avg flow
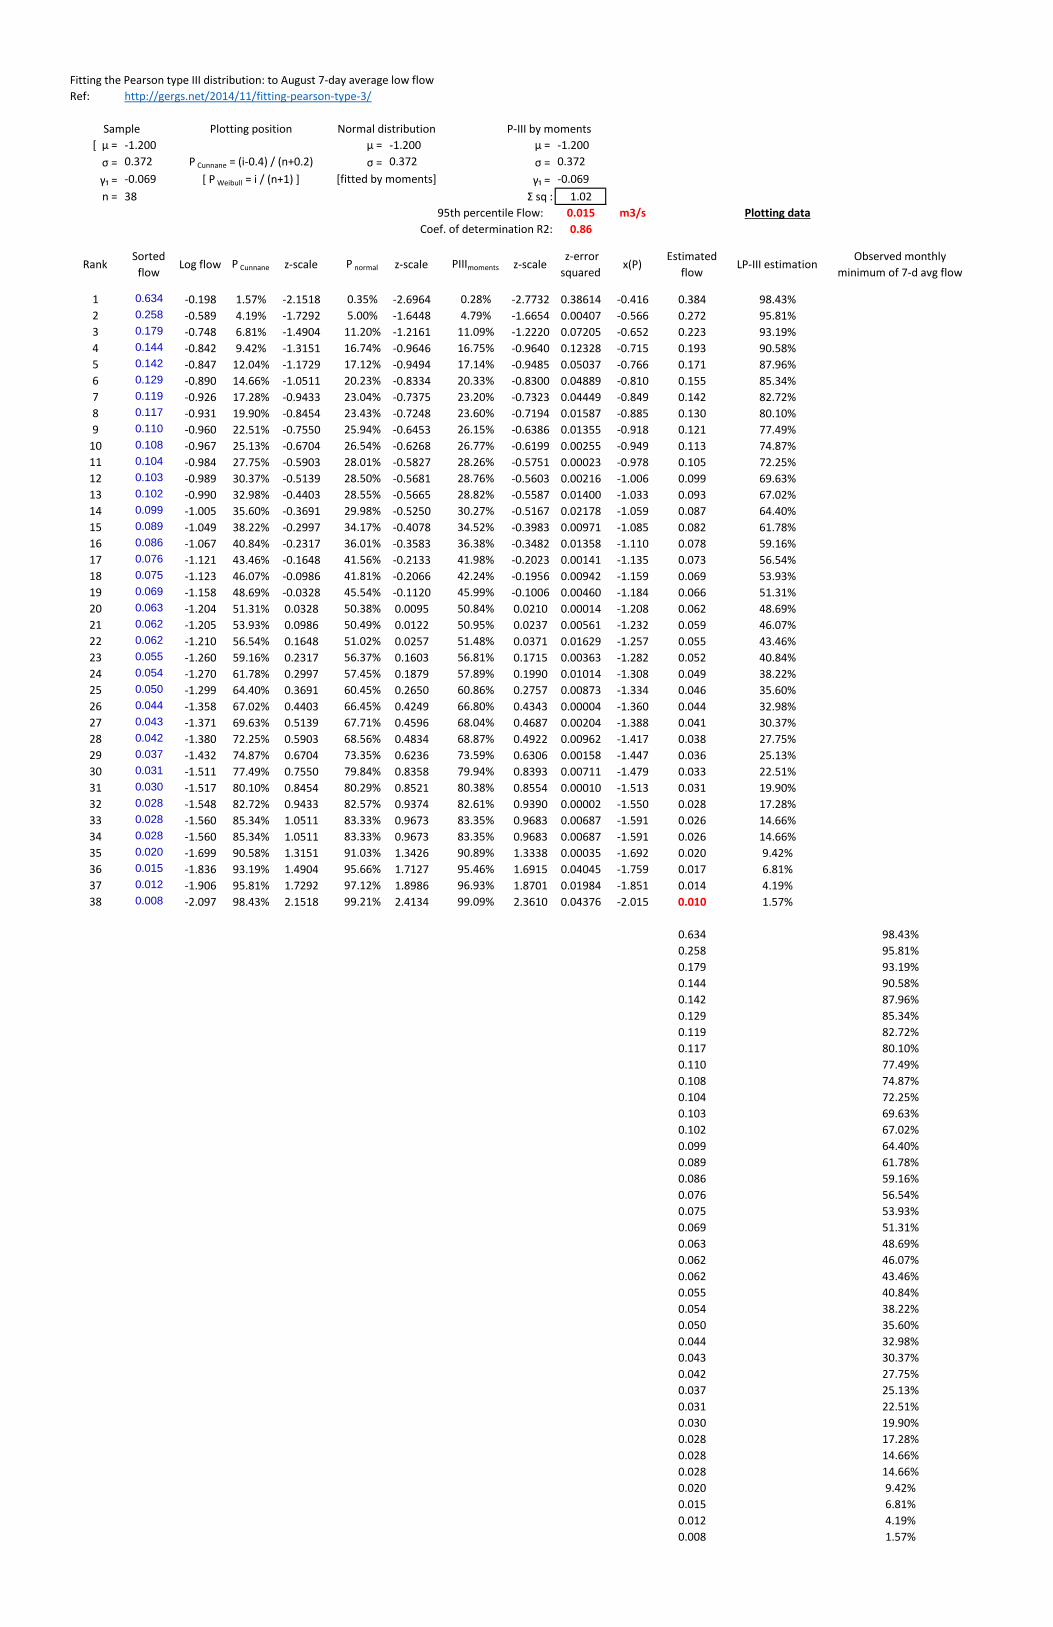
Fitting the Pearson type III distribution: to August 7-day average low flow
Ref: http://gergs.net/2014/11/fitting-pearson-type-3/
Sample Plotting position Normal distribution P-III by moments
[ μ = -1.200 μ = -1.200 μ = -1.200
σ = 0.372 P Cunnane = (i-0.4) / (n+0.2) σ = 0.372 σ = 0.372
γ₁ = -0.069 [ P Weibull = i / (n+1) ] [fitted by moments] γ₁ = -0.069
n = 38 Σ sq : 1.02
95th percentile Flow: 0.015 m3/s Plotting data
Coef. of determination R2: 0.86
RankSorted
flowLog flow P Cunnane z-scale P normal z-scale PIIImoments z-scale
z-error
squaredx(P)
Estimated
flowLP-III estimation
Observed monthly
minimum of 7-d avg flow
1 0.634 -0.198 1.57% -2.1518 0.35% -2.6964 0.28% -2.7732 0.38614 -0.416 0.384 98.43%
2 0.258 -0.589 4.19% -1.7292 5.00% -1.6448 4.79% -1.6654 0.00407 -0.566 0.272 95.81%
3 0.179 -0.748 6.81% -1.4904 11.20% -1.2161 11.09% -1.2220 0.07205 -0.652 0.223 93.19%
4 0.144 -0.842 9.42% -1.3151 16.74% -0.9646 16.75% -0.9640 0.12328 -0.715 0.193 90.58%
5 0.142 -0.847 12.04% -1.1729 17.12% -0.9494 17.14% -0.9485 0.05037 -0.766 0.171 87.96%
6 0.129 -0.890 14.66% -1.0511 20.23% -0.8334 20.33% -0.8300 0.04889 -0.810 0.155 85.34%
7 0.119 -0.926 17.28% -0.9433 23.04% -0.7375 23.20% -0.7323 0.04449 -0.849 0.142 82.72%
8 0.117 -0.931 19.90% -0.8454 23.43% -0.7248 23.60% -0.7194 0.01587 -0.885 0.130 80.10%
9 0.110 -0.960 22.51% -0.7550 25.94% -0.6453 26.15% -0.6386 0.01355 -0.918 0.121 77.49%
10 0.108 -0.967 25.13% -0.6704 26.54% -0.6268 26.77% -0.6199 0.00255 -0.949 0.113 74.87%
11 0.104 -0.984 27.75% -0.5903 28.01% -0.5827 28.26% -0.5751 0.00023 -0.978 0.105 72.25%
12 0.103 -0.989 30.37% -0.5139 28.50% -0.5681 28.76% -0.5603 0.00216 -1.006 0.099 69.63%
13 0.102 -0.990 32.98% -0.4403 28.55% -0.5665 28.82% -0.5587 0.01400 -1.033 0.093 67.02%
14 0.099 -1.005 35.60% -0.3691 29.98% -0.5250 30.27% -0.5167 0.02178 -1.059 0.087 64.40%
15 0.089 -1.049 38.22% -0.2997 34.17% -0.4078 34.52% -0.3983 0.00971 -1.085 0.082 61.78%
16 0.086 -1.067 40.84% -0.2317 36.01% -0.3583 36.38% -0.3482 0.01358 -1.110 0.078 59.16%
17 0.076 -1.121 43.46% -0.1648 41.56% -0.2133 41.98% -0.2023 0.00141 -1.135 0.073 56.54%
18 0.075 -1.123 46.07% -0.0986 41.81% -0.2066 42.24% -0.1956 0.00942 -1.159 0.069 53.93%
19 0.069 -1.158 48.69% -0.0328 45.54% -0.1120 45.99% -0.1006 0.00460 -1.184 0.066 51.31%
20 0.063 -1.204 51.31% 0.0328 50.38% 0.0095 50.84% 0.0210 0.00014 -1.208 0.062 48.69%
21 0.062 -1.205 53.93% 0.0986 50.49% 0.0122 50.95% 0.0237 0.00561 -1.232 0.059 46.07%
22 0.062 -1.210 56.54% 0.1648 51.02% 0.0257 51.48% 0.0371 0.01629 -1.257 0.055 43.46%
23 0.055 -1.260 59.16% 0.2317 56.37% 0.1603 56.81% 0.1715 0.00363 -1.282 0.052 40.84%
24 0.054 -1.270 61.78% 0.2997 57.45% 0.1879 57.89% 0.1990 0.01014 -1.308 0.049 38.22%
25 0.050 -1.299 64.40% 0.3691 60.45% 0.2650 60.86% 0.2757 0.00873 -1.334 0.046 35.60%
26 0.044 -1.358 67.02% 0.4403 66.45% 0.4249 66.80% 0.4343 0.00004 -1.360 0.044 32.98%
27 0.043 -1.371 69.63% 0.5139 67.71% 0.4596 68.04% 0.4687 0.00204 -1.388 0.041 30.37%
28 0.042 -1.380 72.25% 0.5903 68.56% 0.4834 68.87% 0.4922 0.00962 -1.417 0.038 27.75%
29 0.037 -1.432 74.87% 0.6704 73.35% 0.6236 73.59% 0.6306 0.00158 -1.447 0.036 25.13%
30 0.031 -1.511 77.49% 0.7550 79.84% 0.8358 79.94% 0.8393 0.00711 -1.479 0.033 22.51%
31 0.030 -1.517 80.10% 0.8454 80.29% 0.8521 80.38% 0.8554 0.00010 -1.513 0.031 19.90%
32 0.028 -1.548 82.72% 0.9433 82.57% 0.9374 82.61% 0.9390 0.00002 -1.550 0.028 17.28%
33 0.028 -1.560 85.34% 1.0511 83.33% 0.9673 83.35% 0.9683 0.00687 -1.591 0.026 14.66%
34 0.028 -1.560 85.34% 1.0511 83.33% 0.9673 83.35% 0.9683 0.00687 -1.591 0.026 14.66%
35 0.020 -1.699 90.58% 1.3151 91.03% 1.3426 90.89% 1.3338 0.00035 -1.692 0.020 9.42%
36 0.015 -1.836 93.19% 1.4904 95.66% 1.7127 95.46% 1.6915 0.04045 -1.759 0.017 6.81%
37 0.012 -1.906 95.81% 1.7292 97.12% 1.8986 96.93% 1.8701 0.01984 -1.851 0.014 4.19%
38 0.008 -2.097 98.43% 2.1518 99.21% 2.4134 99.09% 2.3610 0.04376 -2.015 0.010 1.57%
0.634 98.43%
0.258 95.81%
0.179 93.19%
0.144 90.58%
0.142 87.96%
0.129 85.34%
0.119 82.72%
0.117 80.10%
0.110 77.49%
0.108 74.87%
0.104 72.25%
0.103 69.63%
0.102 67.02%
0.099 64.40%
0.089 61.78%
0.086 59.16%
0.076 56.54%
0.075 53.93%
0.069 51.31%
0.063 48.69%
0.062 46.07%
0.062 43.46%
0.055 40.84%
0.054 38.22%
0.050 35.60%
0.044 32.98%
0.043 30.37%
0.042 27.75%
0.037 25.13%
0.031 22.51%
0.030 19.90%
0.028 17.28%
0.028 14.66%
0.028 14.66%
0.020 9.42%
0.015 6.81%
0.012 4.19%
0.008 1.57%
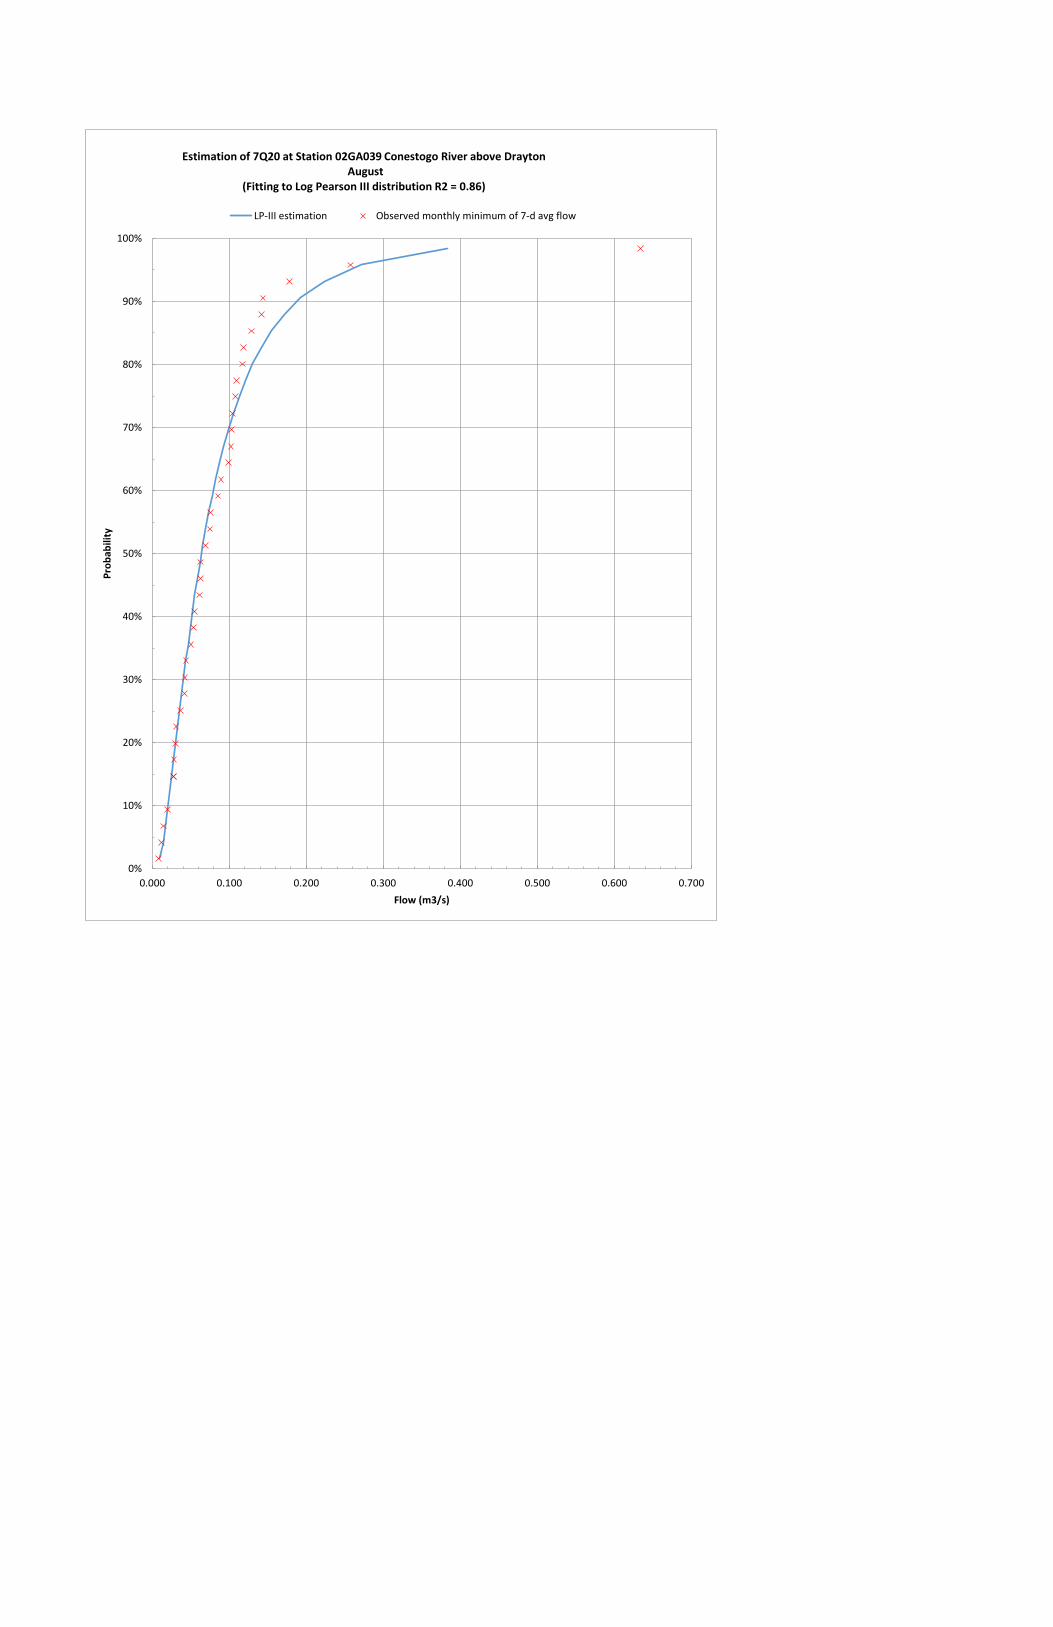
0.633714
0.339714
0.303571
0.257714
0.183286
0.178571
0.144
0.142143
0.132571
0.128714
0.117286
0.107857
0.103857
0.102571
0.102429
0.098857
0.089429
0.085714
0.075714
0.075286
0.069429
0.062571
0.061714
0.058
0.055
0.053714
0.050286
0.043857
0.042571
0.041714
0.037
0.030857
0.030429
0.027571
0.02
0.014571
0.012429
0.008
0%
10%
20%
30%
40%
50%
60%
70%
80%
90%
100%
0.000 0.100 0.200 0.300 0.400 0.500 0.600 0.700
Pro
bab
ility
Flow (m3/s)
Estimation of 7Q20 at Station 02GA039 Conestogo River above Drayton August
(Fitting to Log Pearson III distribution R2 = 0.86)
LP-III estimation Observed monthly minimum of 7-d avg flow
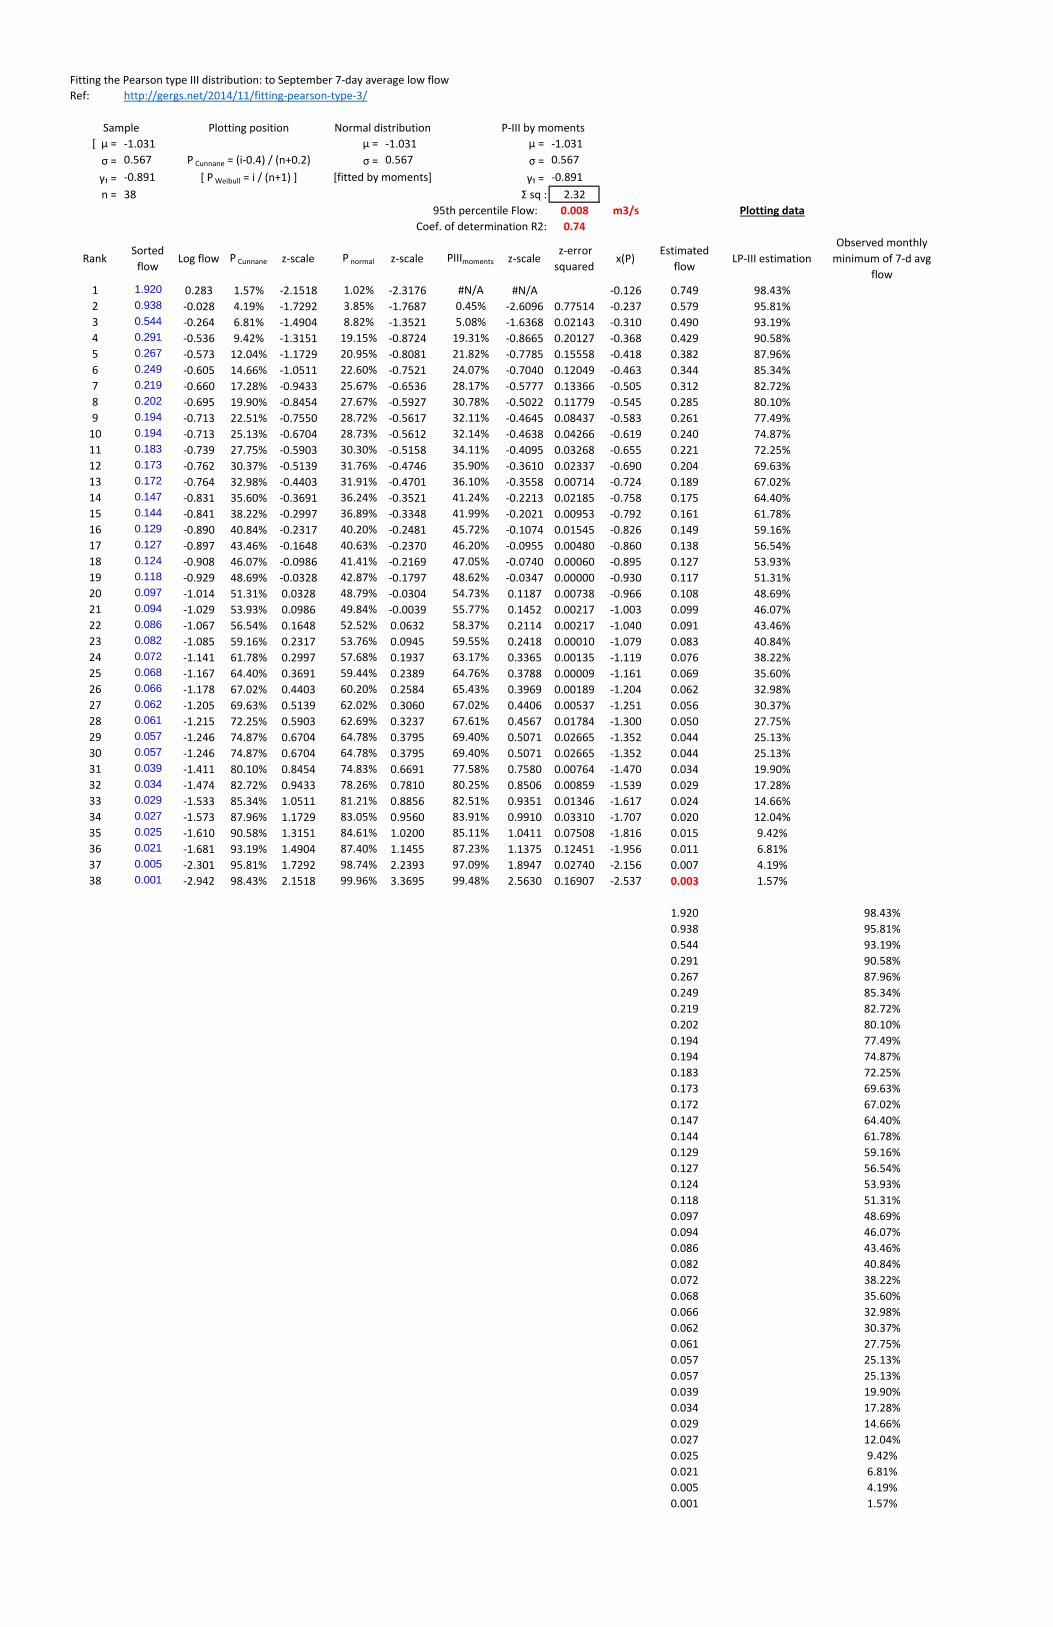
Fitting the Pearson type III distribution: to September 7-day average low flow
Ref: http://gergs.net/2014/11/fitting-pearson-type-3/
Sample Plotting position Normal distribution P-III by moments
[ μ = -1.031 μ = -1.031 μ = -1.031
σ = 0.567 P Cunnane = (i-0.4) / (n+0.2) σ = 0.567 σ = 0.567
γ₁ = -0.891 [ P Weibull = i / (n+1) ] [fitted by moments] γ₁ = -0.891
n = 38 Σ sq : 2.32
95th percentile Flow: 0.008 m3/s Plotting data
Coef. of determination R2: 0.74
RankSorted
flowLog flow P Cunnane z-scale P normal z-scale PIIImoments z-scale
z-error
squaredx(P)
Estimated
flowLP-III estimation
Observed monthly
minimum of 7-d avg
flow
1 1.920 0.283 1.57% -2.1518 1.02% -2.3176 #N/A #N/A -0.126 0.749 98.43%
2 0.938 -0.028 4.19% -1.7292 3.85% -1.7687 0.45% -2.6096 0.77514 -0.237 0.579 95.81%
3 0.544 -0.264 6.81% -1.4904 8.82% -1.3521 5.08% -1.6368 0.02143 -0.310 0.490 93.19%
4 0.291 -0.536 9.42% -1.3151 19.15% -0.8724 19.31% -0.8665 0.20127 -0.368 0.429 90.58%
5 0.267 -0.573 12.04% -1.1729 20.95% -0.8081 21.82% -0.7785 0.15558 -0.418 0.382 87.96%
6 0.249 -0.605 14.66% -1.0511 22.60% -0.7521 24.07% -0.7040 0.12049 -0.463 0.344 85.34%
7 0.219 -0.660 17.28% -0.9433 25.67% -0.6536 28.17% -0.5777 0.13366 -0.505 0.312 82.72%
8 0.202 -0.695 19.90% -0.8454 27.67% -0.5927 30.78% -0.5022 0.11779 -0.545 0.285 80.10%
9 0.194 -0.713 22.51% -0.7550 28.72% -0.5617 32.11% -0.4645 0.08437 -0.583 0.261 77.49%
10 0.194 -0.713 25.13% -0.6704 28.73% -0.5612 32.14% -0.4638 0.04266 -0.619 0.240 74.87%
11 0.183 -0.739 27.75% -0.5903 30.30% -0.5158 34.11% -0.4095 0.03268 -0.655 0.221 72.25%
12 0.173 -0.762 30.37% -0.5139 31.76% -0.4746 35.90% -0.3610 0.02337 -0.690 0.204 69.63%
13 0.172 -0.764 32.98% -0.4403 31.91% -0.4701 36.10% -0.3558 0.00714 -0.724 0.189 67.02%
14 0.147 -0.831 35.60% -0.3691 36.24% -0.3521 41.24% -0.2213 0.02185 -0.758 0.175 64.40%
15 0.144 -0.841 38.22% -0.2997 36.89% -0.3348 41.99% -0.2021 0.00953 -0.792 0.161 61.78%
16 0.129 -0.890 40.84% -0.2317 40.20% -0.2481 45.72% -0.1074 0.01545 -0.826 0.149 59.16%
17 0.127 -0.897 43.46% -0.1648 40.63% -0.2370 46.20% -0.0955 0.00480 -0.860 0.138 56.54%
18 0.124 -0.908 46.07% -0.0986 41.41% -0.2169 47.05% -0.0740 0.00060 -0.895 0.127 53.93%
19 0.118 -0.929 48.69% -0.0328 42.87% -0.1797 48.62% -0.0347 0.00000 -0.930 0.117 51.31%
20 0.097 -1.014 51.31% 0.0328 48.79% -0.0304 54.73% 0.1187 0.00738 -0.966 0.108 48.69%
21 0.094 -1.029 53.93% 0.0986 49.84% -0.0039 55.77% 0.1452 0.00217 -1.003 0.099 46.07%
22 0.086 -1.067 56.54% 0.1648 52.52% 0.0632 58.37% 0.2114 0.00217 -1.040 0.091 43.46%
23 0.082 -1.085 59.16% 0.2317 53.76% 0.0945 59.55% 0.2418 0.00010 -1.079 0.083 40.84%
24 0.072 -1.141 61.78% 0.2997 57.68% 0.1937 63.17% 0.3365 0.00135 -1.119 0.076 38.22%
25 0.068 -1.167 64.40% 0.3691 59.44% 0.2389 64.76% 0.3788 0.00009 -1.161 0.069 35.60%
26 0.066 -1.178 67.02% 0.4403 60.20% 0.2584 65.43% 0.3969 0.00189 -1.204 0.062 32.98%
27 0.062 -1.205 69.63% 0.5139 62.02% 0.3060 67.02% 0.4406 0.00537 -1.251 0.056 30.37%
28 0.061 -1.215 72.25% 0.5903 62.69% 0.3237 67.61% 0.4567 0.01784 -1.300 0.050 27.75%
29 0.057 -1.246 74.87% 0.6704 64.78% 0.3795 69.40% 0.5071 0.02665 -1.352 0.044 25.13%
30 0.057 -1.246 74.87% 0.6704 64.78% 0.3795 69.40% 0.5071 0.02665 -1.352 0.044 25.13%
31 0.039 -1.411 80.10% 0.8454 74.83% 0.6691 77.58% 0.7580 0.00764 -1.470 0.034 19.90%
32 0.034 -1.474 82.72% 0.9433 78.26% 0.7810 80.25% 0.8506 0.00859 -1.539 0.029 17.28%
33 0.029 -1.533 85.34% 1.0511 81.21% 0.8856 82.51% 0.9351 0.01346 -1.617 0.024 14.66%
34 0.027 -1.573 87.96% 1.1729 83.05% 0.9560 83.91% 0.9910 0.03310 -1.707 0.020 12.04%
35 0.025 -1.610 90.58% 1.3151 84.61% 1.0200 85.11% 1.0411 0.07508 -1.816 0.015 9.42%
36 0.021 -1.681 93.19% 1.4904 87.40% 1.1455 87.23% 1.1375 0.12451 -1.956 0.011 6.81%
37 0.005 -2.301 95.81% 1.7292 98.74% 2.2393 97.09% 1.8947 0.02740 -2.156 0.007 4.19%
38 0.001 -2.942 98.43% 2.1518 99.96% 3.3695 99.48% 2.5630 0.16907 -2.537 0.003 1.57%
1.920 98.43%
0.938 95.81%
0.544 93.19%
0.291 90.58%
0.267 87.96%
0.249 85.34%
0.219 82.72%
0.202 80.10%
0.194 77.49%
0.194 74.87%
0.183 72.25%
0.173 69.63%
0.172 67.02%
0.147 64.40%
0.144 61.78%
0.129 59.16%
0.127 56.54%
0.124 53.93%
0.118 51.31%
0.097 48.69%
0.094 46.07%
0.086 43.46%
0.082 40.84%
0.072 38.22%
0.068 35.60%
0.066 32.98%
0.062 30.37%
0.061 27.75%
0.057 25.13%
0.057 25.13%
0.039 19.90%
0.034 17.28%
0.029 14.66%
0.027 12.04%
0.025 9.42%
0.021 6.81%
0.005 4.19%
0.001 1.57%
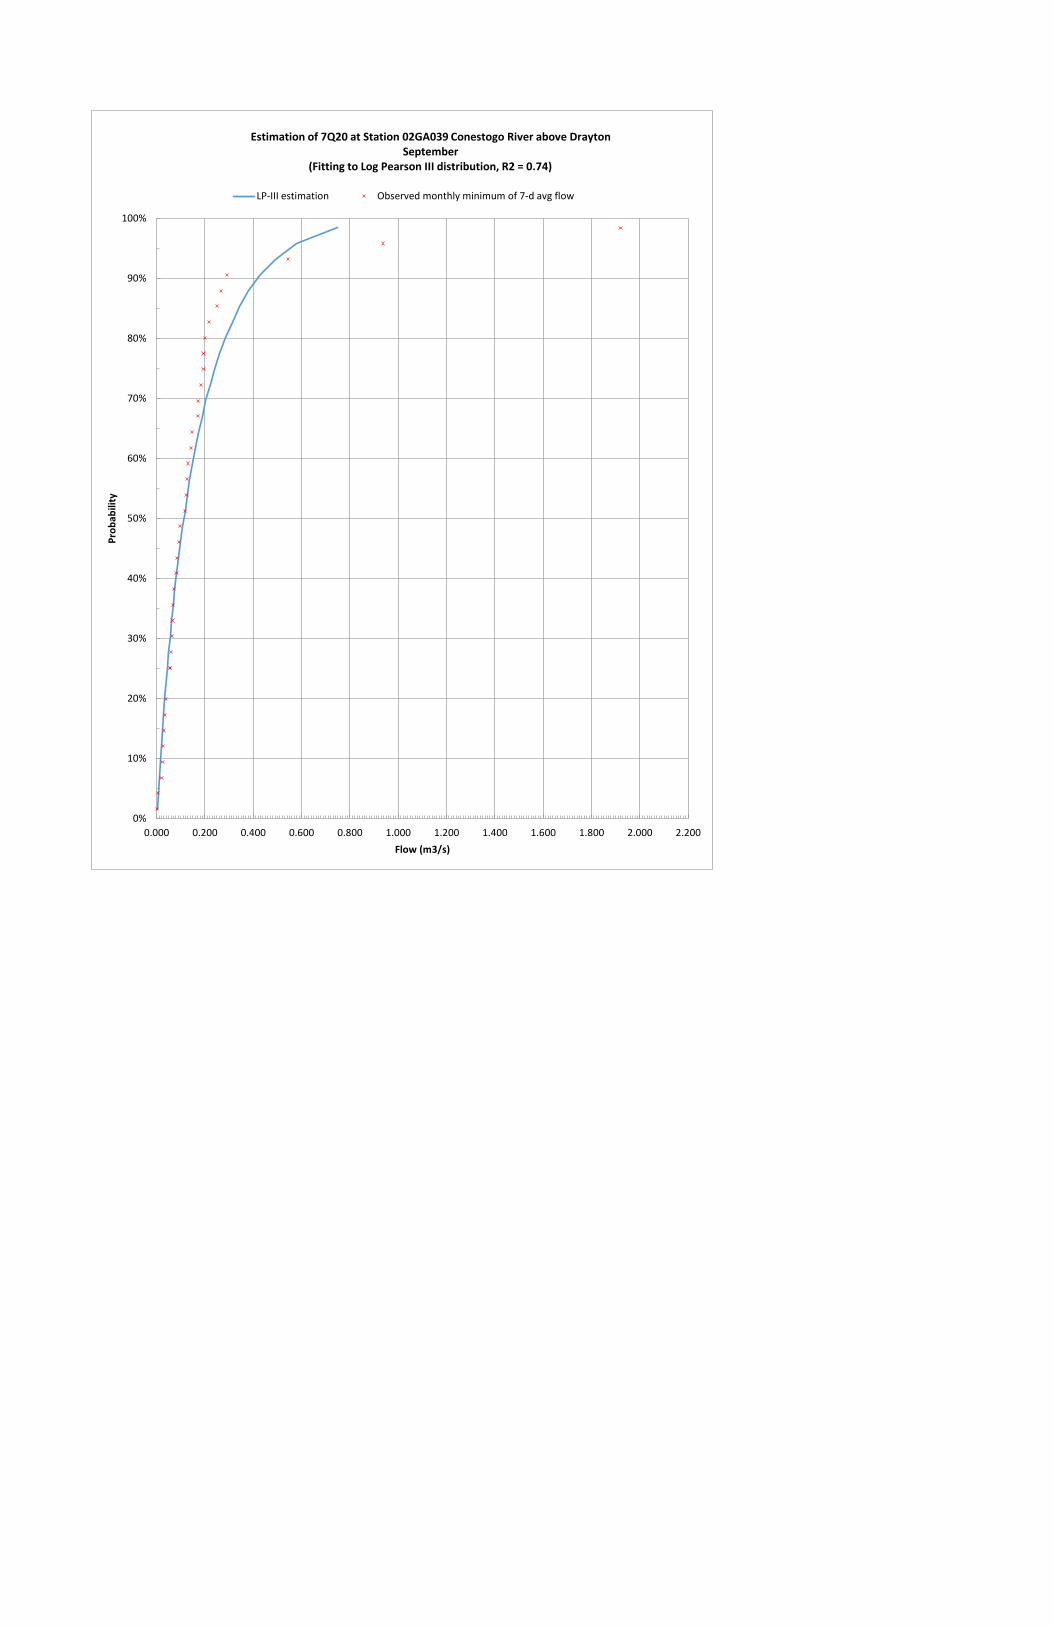
0%
10%
20%
30%
40%
50%
60%
70%
80%
90%
100%
0.000 0.200 0.400 0.600 0.800 1.000 1.200 1.400 1.600 1.800 2.000 2.200
Pro
bab
ility
Flow (m3/s)
Estimation of 7Q20 at Station 02GA039 Conestogo River above Drayton September
(Fitting to Log Pearson III distribution, R2 = 0.74)
LP-III estimation Observed monthly minimum of 7-d avg flow
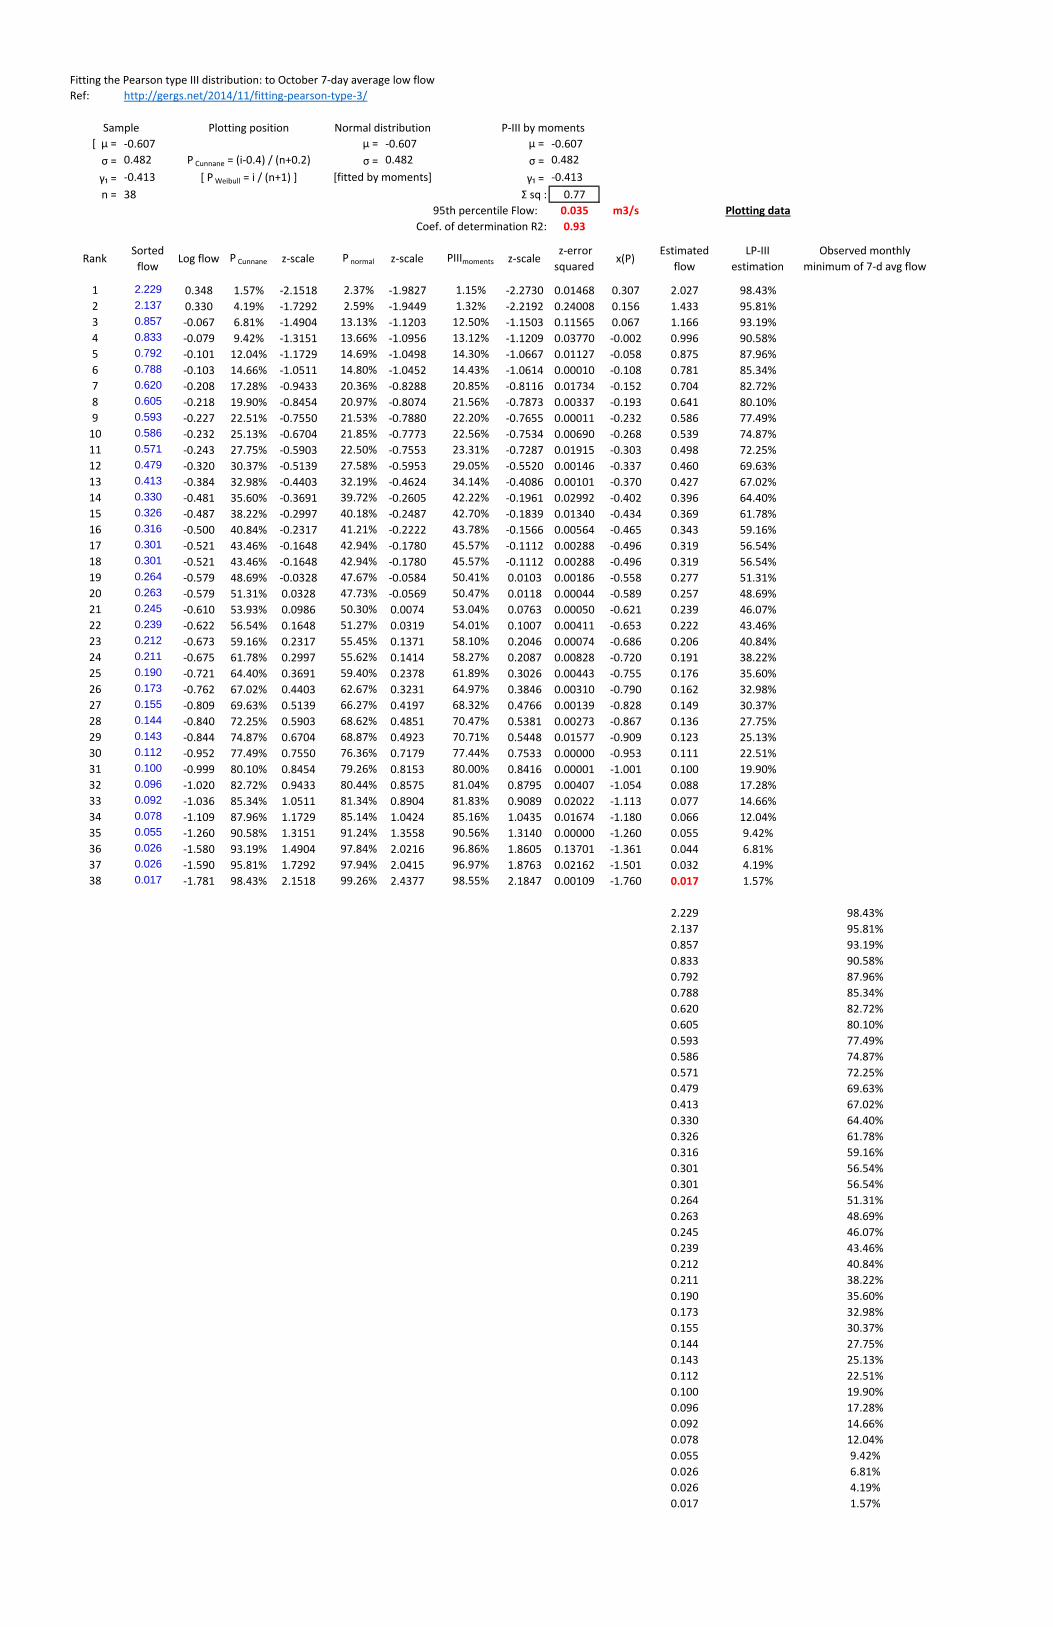
Fitting the Pearson type III distribution: to October 7-day average low flow
Ref: http://gergs.net/2014/11/fitting-pearson-type-3/
Sample Plotting position Normal distribution P-III by moments
[ μ = -0.607 μ = -0.607 μ = -0.607
σ = 0.482 P Cunnane = (i-0.4) / (n+0.2) σ = 0.482 σ = 0.482
γ₁ = -0.413 [ P Weibull = i / (n+1) ] [fitted by moments] γ₁ = -0.413
n = 38 Σ sq : 0.77
95th percentile Flow: 0.035 m3/s Plotting data
Coef. of determination R2: 0.93
RankSorted
flowLog flow P Cunnane z-scale P normal z-scale PIIImoments z-scale
z-error
squaredx(P)
Estimated
flow
LP-III
estimation
Observed monthly
minimum of 7-d avg flow
1 2.229 0.348 1.57% -2.1518 2.37% -1.9827 1.15% -2.2730 0.01468 0.307 2.027 98.43%
2 2.137 0.330 4.19% -1.7292 2.59% -1.9449 1.32% -2.2192 0.24008 0.156 1.433 95.81%
3 0.857 -0.067 6.81% -1.4904 13.13% -1.1203 12.50% -1.1503 0.11565 0.067 1.166 93.19%
4 0.833 -0.079 9.42% -1.3151 13.66% -1.0956 13.12% -1.1209 0.03770 -0.002 0.996 90.58%
5 0.792 -0.101 12.04% -1.1729 14.69% -1.0498 14.30% -1.0667 0.01127 -0.058 0.875 87.96%
6 0.788 -0.103 14.66% -1.0511 14.80% -1.0452 14.43% -1.0614 0.00010 -0.108 0.781 85.34%
7 0.620 -0.208 17.28% -0.9433 20.36% -0.8288 20.85% -0.8116 0.01734 -0.152 0.704 82.72%
8 0.605 -0.218 19.90% -0.8454 20.97% -0.8074 21.56% -0.7873 0.00337 -0.193 0.641 80.10%
9 0.593 -0.227 22.51% -0.7550 21.53% -0.7880 22.20% -0.7655 0.00011 -0.232 0.586 77.49%
10 0.586 -0.232 25.13% -0.6704 21.85% -0.7773 22.56% -0.7534 0.00690 -0.268 0.539 74.87%
11 0.571 -0.243 27.75% -0.5903 22.50% -0.7553 23.31% -0.7287 0.01915 -0.303 0.498 72.25%
12 0.479 -0.320 30.37% -0.5139 27.58% -0.5953 29.05% -0.5520 0.00146 -0.337 0.460 69.63%
13 0.413 -0.384 32.98% -0.4403 32.19% -0.4624 34.14% -0.4086 0.00101 -0.370 0.427 67.02%
14 0.330 -0.481 35.60% -0.3691 39.72% -0.2605 42.22% -0.1961 0.02992 -0.402 0.396 64.40%
15 0.326 -0.487 38.22% -0.2997 40.18% -0.2487 42.70% -0.1839 0.01340 -0.434 0.369 61.78%
16 0.316 -0.500 40.84% -0.2317 41.21% -0.2222 43.78% -0.1566 0.00564 -0.465 0.343 59.16%
17 0.301 -0.521 43.46% -0.1648 42.94% -0.1780 45.57% -0.1112 0.00288 -0.496 0.319 56.54%
18 0.301 -0.521 43.46% -0.1648 42.94% -0.1780 45.57% -0.1112 0.00288 -0.496 0.319 56.54%
19 0.264 -0.579 48.69% -0.0328 47.67% -0.0584 50.41% 0.0103 0.00186 -0.558 0.277 51.31%
20 0.263 -0.579 51.31% 0.0328 47.73% -0.0569 50.47% 0.0118 0.00044 -0.589 0.257 48.69%
21 0.245 -0.610 53.93% 0.0986 50.30% 0.0074 53.04% 0.0763 0.00050 -0.621 0.239 46.07%
22 0.239 -0.622 56.54% 0.1648 51.27% 0.0319 54.01% 0.1007 0.00411 -0.653 0.222 43.46%
23 0.212 -0.673 59.16% 0.2317 55.45% 0.1371 58.10% 0.2046 0.00074 -0.686 0.206 40.84%
24 0.211 -0.675 61.78% 0.2997 55.62% 0.1414 58.27% 0.2087 0.00828 -0.720 0.191 38.22%
25 0.190 -0.721 64.40% 0.3691 59.40% 0.2378 61.89% 0.3026 0.00443 -0.755 0.176 35.60%
26 0.173 -0.762 67.02% 0.4403 62.67% 0.3231 64.97% 0.3846 0.00310 -0.790 0.162 32.98%
27 0.155 -0.809 69.63% 0.5139 66.27% 0.4197 68.32% 0.4766 0.00139 -0.828 0.149 30.37%
28 0.144 -0.840 72.25% 0.5903 68.62% 0.4851 70.47% 0.5381 0.00273 -0.867 0.136 27.75%
29 0.143 -0.844 74.87% 0.6704 68.87% 0.4923 70.71% 0.5448 0.01577 -0.909 0.123 25.13%
30 0.112 -0.952 77.49% 0.7550 76.36% 0.7179 77.44% 0.7533 0.00000 -0.953 0.111 22.51%
31 0.100 -0.999 80.10% 0.8454 79.26% 0.8153 80.00% 0.8416 0.00001 -1.001 0.100 19.90%
32 0.096 -1.020 82.72% 0.9433 80.44% 0.8575 81.04% 0.8795 0.00407 -1.054 0.088 17.28%
33 0.092 -1.036 85.34% 1.0511 81.34% 0.8904 81.83% 0.9089 0.02022 -1.113 0.077 14.66%
34 0.078 -1.109 87.96% 1.1729 85.14% 1.0424 85.16% 1.0435 0.01674 -1.180 0.066 12.04%
35 0.055 -1.260 90.58% 1.3151 91.24% 1.3558 90.56% 1.3140 0.00000 -1.260 0.055 9.42%
36 0.026 -1.580 93.19% 1.4904 97.84% 2.0216 96.86% 1.8605 0.13701 -1.361 0.044 6.81%
37 0.026 -1.590 95.81% 1.7292 97.94% 2.0415 96.97% 1.8763 0.02162 -1.501 0.032 4.19%
38 0.017 -1.781 98.43% 2.1518 99.26% 2.4377 98.55% 2.1847 0.00109 -1.760 0.017 1.57%
2.229 98.43%
2.137 95.81%
0.857 93.19%
0.833 90.58%
0.792 87.96%
0.788 85.34%
0.620 82.72%
0.605 80.10%
0.593 77.49%
0.586 74.87%
0.571 72.25%
0.479 69.63%
0.413 67.02%
0.330 64.40%
0.326 61.78%
0.316 59.16%
0.301 56.54%
0.301 56.54%
0.264 51.31%
0.263 48.69%
0.245 46.07%
0.239 43.46%
0.212 40.84%
0.211 38.22%
0.190 35.60%
0.173 32.98%
0.155 30.37%
0.144 27.75%
0.143 25.13%
0.112 22.51%
0.100 19.90%
0.096 17.28%
0.092 14.66%
0.078 12.04%
0.055 9.42%
0.026 6.81%
0.026 4.19%
0.017 1.57%
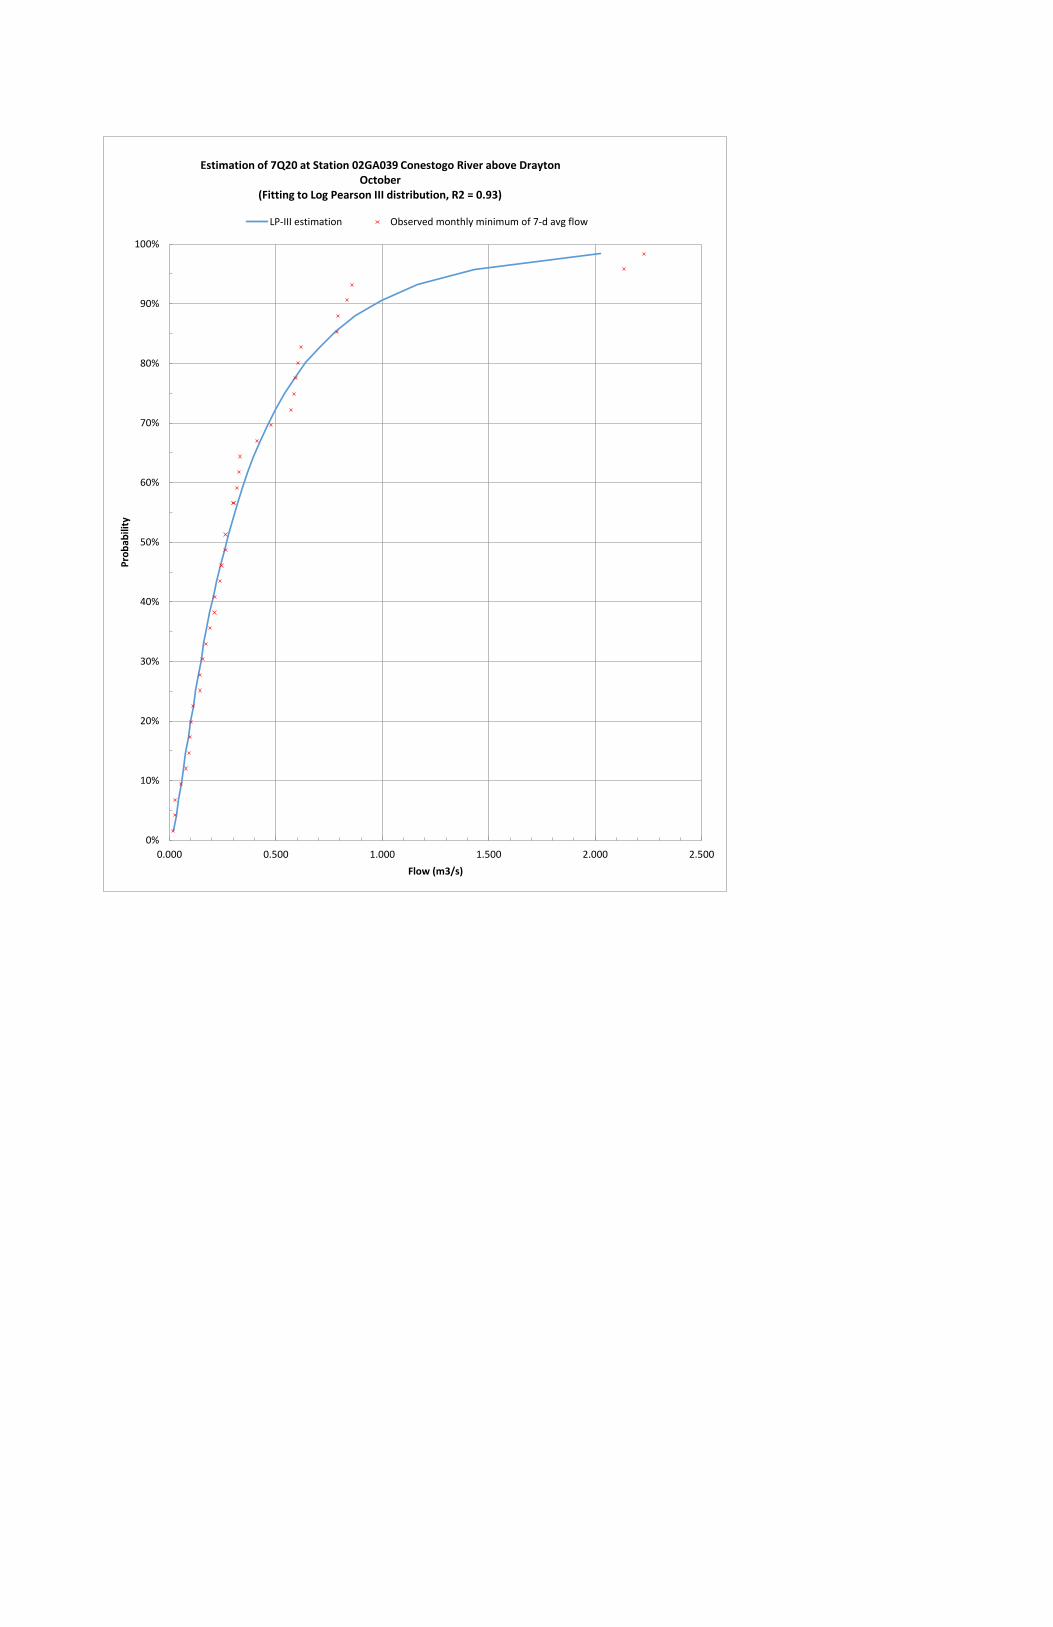
3.604286
2.228571
2.137143
1.29
1.187571
1.045714
0.976857
0.854571
0.833429
0.813286
0.646143
0.62
0.605429
0.592571
0.508286
0.489571
0.462429
0.384
0.335714
0.330143
0.325857
0.296857
0.263857
0.263429
0.245286
0.238714
0.211429
0.174429
0.160143
0.155286
0.143286
0.136571
0.100143
0.089571
0.085571
0.068571
0.067429
0.016571
0%
10%
20%
30%
40%
50%
60%
70%
80%
90%
100%
0.000 0.500 1.000 1.500 2.000 2.500
Pro
bab
ility
Flow (m3/s)
Estimation of 7Q20 at Station 02GA039 Conestogo River above Drayton October
(Fitting to Log Pearson III distribution, R2 = 0.93)
LP-III estimation Observed monthly minimum of 7-d avg flow
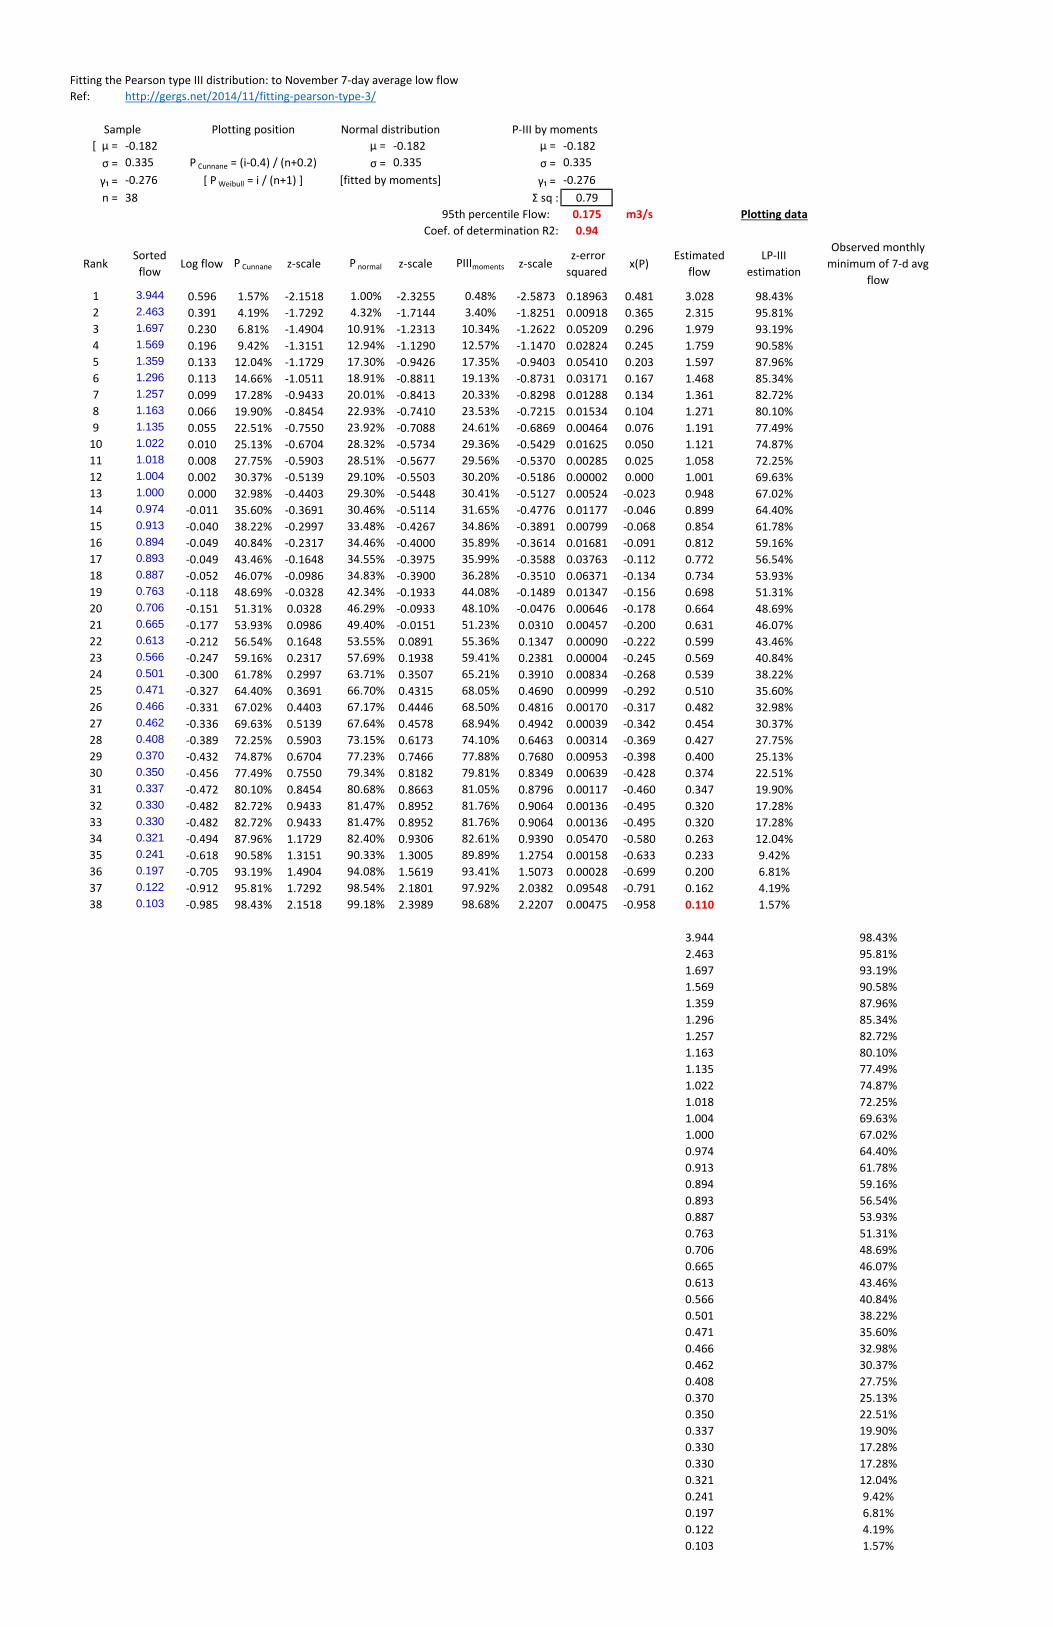
Fitting the Pearson type III distribution: to November 7-day average low flow
Ref: http://gergs.net/2014/11/fitting-pearson-type-3/
Sample Plotting position Normal distribution P-III by moments
[ μ = -0.182 μ = -0.182 μ = -0.182
σ = 0.335 P Cunnane = (i-0.4) / (n+0.2) σ = 0.335 σ = 0.335
γ₁ = -0.276 [ P Weibull = i / (n+1) ] [fitted by moments] γ₁ = -0.276
n = 38 Σ sq : 0.79
95th percentile Flow: 0.175 m3/s Plotting data
Coef. of determination R2: 0.94
RankSorted
flowLog flow P Cunnane z-scale P normal z-scale PIIImoments z-scale
z-error
squaredx(P)
Estimated
flow
LP-III
estimation
Observed monthly
minimum of 7-d avg
flow
1 3.944 0.596 1.57% -2.1518 1.00% -2.3255 0.48% -2.5873 0.18963 0.481 3.028 98.43%
2 2.463 0.391 4.19% -1.7292 4.32% -1.7144 3.40% -1.8251 0.00918 0.365 2.315 95.81%
3 1.697 0.230 6.81% -1.4904 10.91% -1.2313 10.34% -1.2622 0.05209 0.296 1.979 93.19%
4 1.569 0.196 9.42% -1.3151 12.94% -1.1290 12.57% -1.1470 0.02824 0.245 1.759 90.58%
5 1.359 0.133 12.04% -1.1729 17.30% -0.9426 17.35% -0.9403 0.05410 0.203 1.597 87.96%
6 1.296 0.113 14.66% -1.0511 18.91% -0.8811 19.13% -0.8731 0.03171 0.167 1.468 85.34%
7 1.257 0.099 17.28% -0.9433 20.01% -0.8413 20.33% -0.8298 0.01288 0.134 1.361 82.72%
8 1.163 0.066 19.90% -0.8454 22.93% -0.7410 23.53% -0.7215 0.01534 0.104 1.271 80.10%
9 1.135 0.055 22.51% -0.7550 23.92% -0.7088 24.61% -0.6869 0.00464 0.076 1.191 77.49%
10 1.022 0.010 25.13% -0.6704 28.32% -0.5734 29.36% -0.5429 0.01625 0.050 1.121 74.87%
11 1.018 0.008 27.75% -0.5903 28.51% -0.5677 29.56% -0.5370 0.00285 0.025 1.058 72.25%
12 1.004 0.002 30.37% -0.5139 29.10% -0.5503 30.20% -0.5186 0.00002 0.000 1.001 69.63%
13 1.000 0.000 32.98% -0.4403 29.30% -0.5448 30.41% -0.5127 0.00524 -0.023 0.948 67.02%
14 0.974 -0.011 35.60% -0.3691 30.46% -0.5114 31.65% -0.4776 0.01177 -0.046 0.899 64.40%
15 0.913 -0.040 38.22% -0.2997 33.48% -0.4267 34.86% -0.3891 0.00799 -0.068 0.854 61.78%
16 0.894 -0.049 40.84% -0.2317 34.46% -0.4000 35.89% -0.3614 0.01681 -0.091 0.812 59.16%
17 0.893 -0.049 43.46% -0.1648 34.55% -0.3975 35.99% -0.3588 0.03763 -0.112 0.772 56.54%
18 0.887 -0.052 46.07% -0.0986 34.83% -0.3900 36.28% -0.3510 0.06371 -0.134 0.734 53.93%
19 0.763 -0.118 48.69% -0.0328 42.34% -0.1933 44.08% -0.1489 0.01347 -0.156 0.698 51.31%
20 0.706 -0.151 51.31% 0.0328 46.29% -0.0933 48.10% -0.0476 0.00646 -0.178 0.664 48.69%
21 0.665 -0.177 53.93% 0.0986 49.40% -0.0151 51.23% 0.0310 0.00457 -0.200 0.631 46.07%
22 0.613 -0.212 56.54% 0.1648 53.55% 0.0891 55.36% 0.1347 0.00090 -0.222 0.599 43.46%
23 0.566 -0.247 59.16% 0.2317 57.69% 0.1938 59.41% 0.2381 0.00004 -0.245 0.569 40.84%
24 0.501 -0.300 61.78% 0.2997 63.71% 0.3507 65.21% 0.3910 0.00834 -0.268 0.539 38.22%
25 0.471 -0.327 64.40% 0.3691 66.70% 0.4315 68.05% 0.4690 0.00999 -0.292 0.510 35.60%
26 0.466 -0.331 67.02% 0.4403 67.17% 0.4446 68.50% 0.4816 0.00170 -0.317 0.482 32.98%
27 0.462 -0.336 69.63% 0.5139 67.64% 0.4578 68.94% 0.4942 0.00039 -0.342 0.454 30.37%
28 0.408 -0.389 72.25% 0.5903 73.15% 0.6173 74.10% 0.6463 0.00314 -0.369 0.427 27.75%
29 0.370 -0.432 74.87% 0.6704 77.23% 0.7466 77.88% 0.7680 0.00953 -0.398 0.400 25.13%
30 0.350 -0.456 77.49% 0.7550 79.34% 0.8182 79.81% 0.8349 0.00639 -0.428 0.374 22.51%
31 0.337 -0.472 80.10% 0.8454 80.68% 0.8663 81.05% 0.8796 0.00117 -0.460 0.347 19.90%
32 0.330 -0.482 82.72% 0.9433 81.47% 0.8952 81.76% 0.9064 0.00136 -0.495 0.320 17.28%
33 0.330 -0.482 82.72% 0.9433 81.47% 0.8952 81.76% 0.9064 0.00136 -0.495 0.320 17.28%
34 0.321 -0.494 87.96% 1.1729 82.40% 0.9306 82.61% 0.9390 0.05470 -0.580 0.263 12.04%
35 0.241 -0.618 90.58% 1.3151 90.33% 1.3005 89.89% 1.2754 0.00158 -0.633 0.233 9.42%
36 0.197 -0.705 93.19% 1.4904 94.08% 1.5619 93.41% 1.5073 0.00028 -0.699 0.200 6.81%
37 0.122 -0.912 95.81% 1.7292 98.54% 2.1801 97.92% 2.0382 0.09548 -0.791 0.162 4.19%
38 0.103 -0.985 98.43% 2.1518 99.18% 2.3989 98.68% 2.2207 0.00475 -0.958 0.110 1.57%
3.944 98.43%
2.463 95.81%
1.697 93.19%
1.569 90.58%
1.359 87.96%
1.296 85.34%
1.257 82.72%
1.163 80.10%
1.135 77.49%
1.022 74.87%
1.018 72.25%
1.004 69.63%
1.000 67.02%
0.974 64.40%
0.913 61.78%
0.894 59.16%
0.893 56.54%
0.887 53.93%
0.763 51.31%
0.706 48.69%
0.665 46.07%
0.613 43.46%
0.566 40.84%
0.501 38.22%
0.471 35.60%
0.466 32.98%
0.462 30.37%
0.408 27.75%
0.370 25.13%
0.350 22.51%
0.337 19.90%
0.330 17.28%
0.330 17.28%
0.321 12.04%
0.241 9.42%
0.197 6.81%
0.122 4.19%
0.103 1.57%
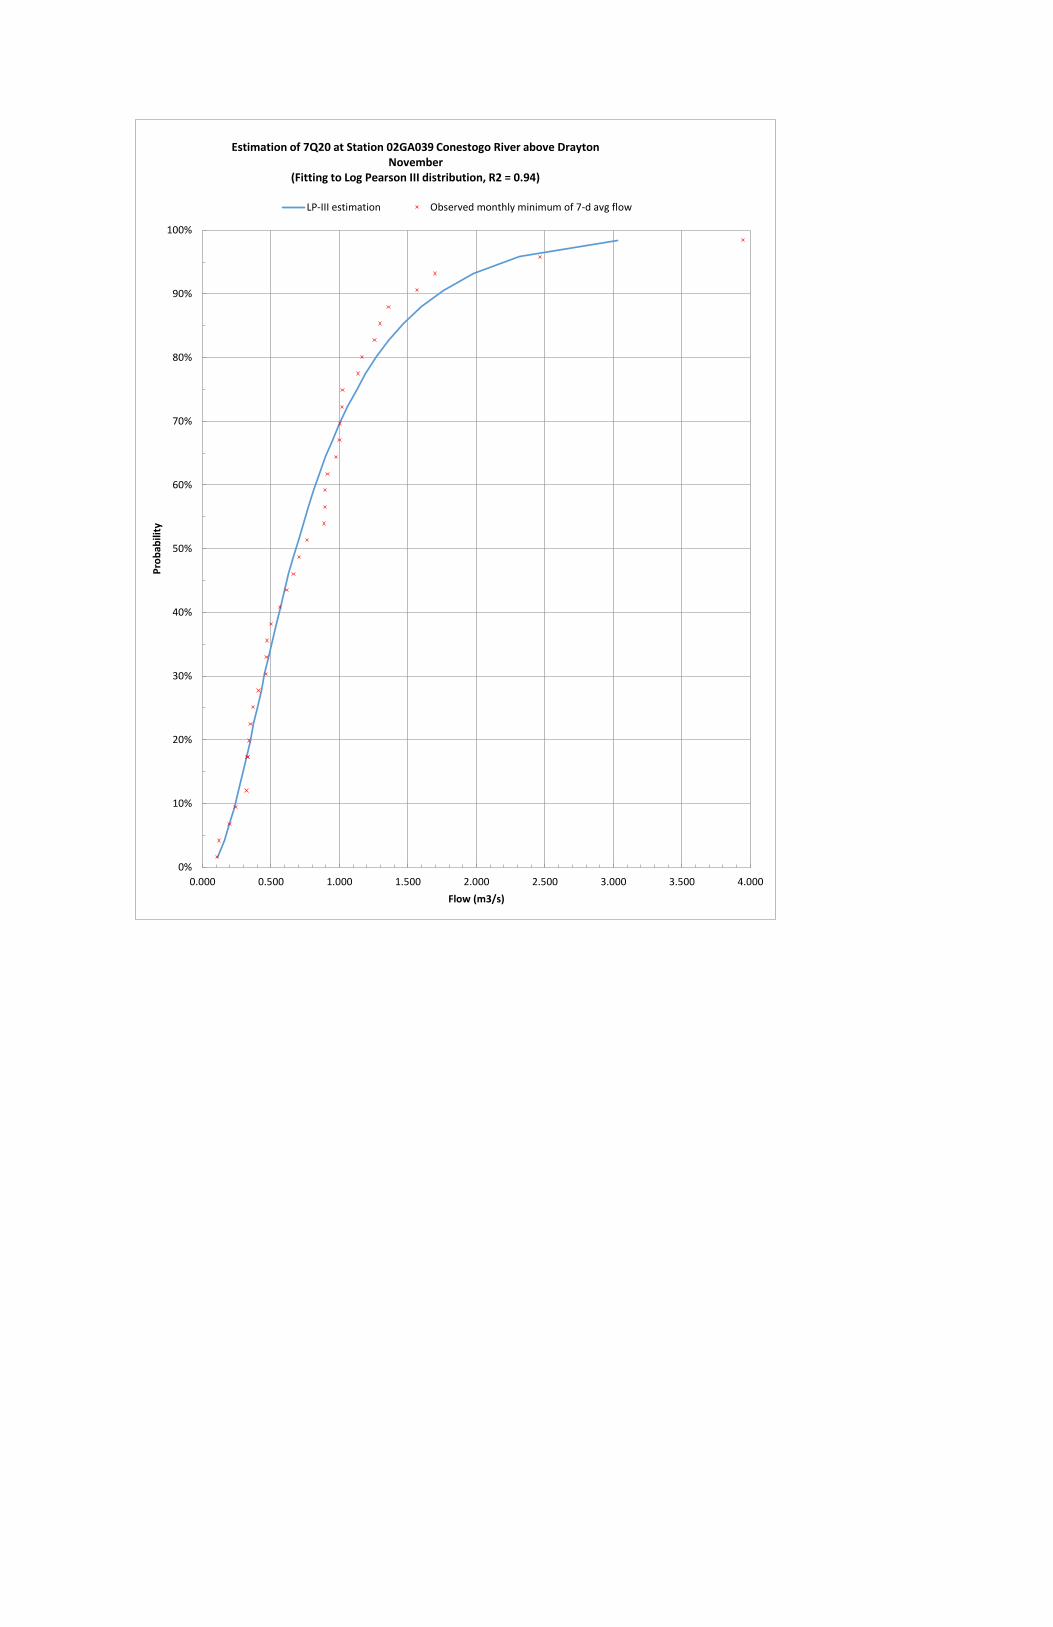
5.184286
5.072857
4.877143
3.944286
3.177143
2.53
2.462857
2.327143
2.052857
1.697143
1.358571
1.322857
1.295714
1.134571
1.052429
1.017714
1.007
1.004143
0.974429
0.892571
0.887429
0.807
0.789286
0.706
0.700143
0.664714
0.655429
0.613429
0.565857
0.454571
0.387429
0.385286
0.368429
0.349714
0.320714
0.246
0.241143
0.205286
0%
10%
20%
30%
40%
50%
60%
70%
80%
90%
100%
0.000 0.500 1.000 1.500 2.000 2.500 3.000 3.500 4.000
Pro
bab
ility
Flow (m3/s)
Estimation of 7Q20 at Station 02GA039 Conestogo River above Drayton November
(Fitting to Log Pearson III distribution, R2 = 0.94)
LP-III estimation Observed monthly minimum of 7-d avg flow
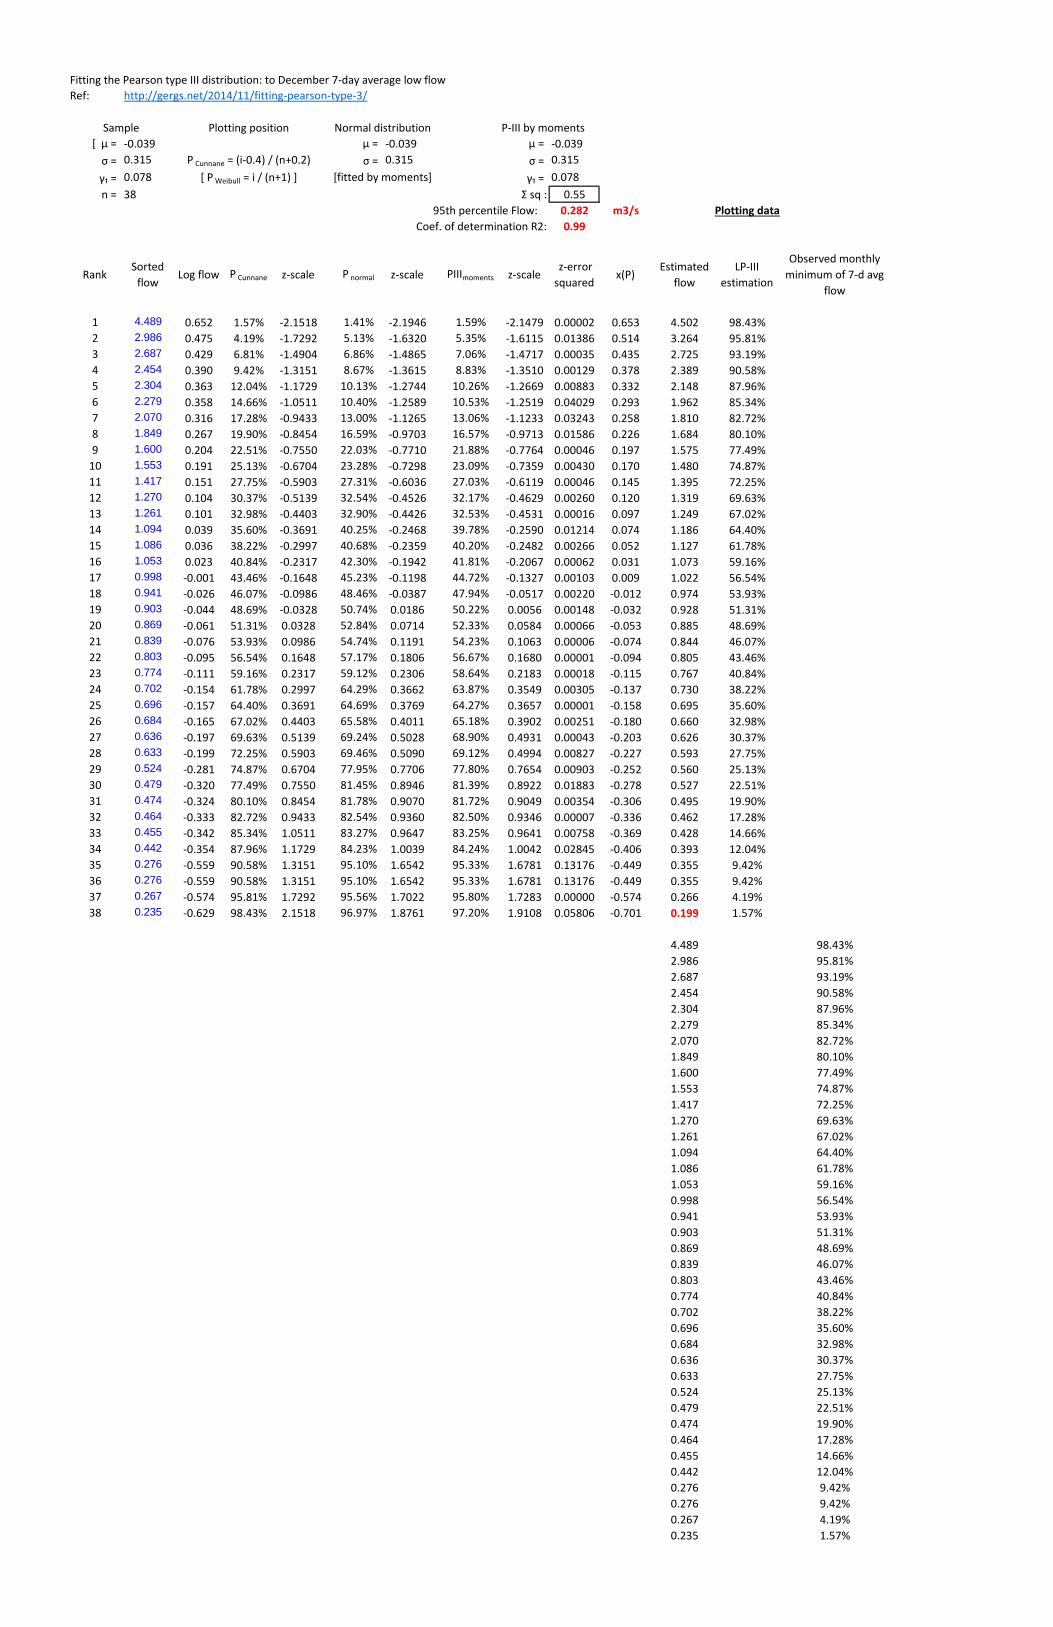
Fitting the Pearson type III distribution: to December 7-day average low flow
Ref: http://gergs.net/2014/11/fitting-pearson-type-3/
Sample Plotting position Normal distribution P-III by moments
[ μ = -0.039 μ = -0.039 μ = -0.039
σ = 0.315 P Cunnane = (i-0.4) / (n+0.2) σ = 0.315 σ = 0.315
γ₁ = 0.078 [ P Weibull = i / (n+1) ] [fitted by moments] γ₁ = 0.078
n = 38 Σ sq : 0.55
95th percentile Flow: 0.282 m3/s Plotting data
Coef. of determination R2: 0.99
RankSorted
flowLog flow P Cunnane z-scale P normal z-scale PIIImoments z-scale
z-error
squaredx(P)
Estimated
flow
LP-III
estimation
Observed monthly
minimum of 7-d avg
flow
1 4.489 0.652 1.57% -2.1518 1.41% -2.1946 1.59% -2.1479 0.00002 0.653 4.502 98.43%
2 2.986 0.475 4.19% -1.7292 5.13% -1.6320 5.35% -1.6115 0.01386 0.514 3.264 95.81%
3 2.687 0.429 6.81% -1.4904 6.86% -1.4865 7.06% -1.4717 0.00035 0.435 2.725 93.19%
4 2.454 0.390 9.42% -1.3151 8.67% -1.3615 8.83% -1.3510 0.00129 0.378 2.389 90.58%
5 2.304 0.363 12.04% -1.1729 10.13% -1.2744 10.26% -1.2669 0.00883 0.332 2.148 87.96%
6 2.279 0.358 14.66% -1.0511 10.40% -1.2589 10.53% -1.2519 0.04029 0.293 1.962 85.34%
7 2.070 0.316 17.28% -0.9433 13.00% -1.1265 13.06% -1.1233 0.03243 0.258 1.810 82.72%
8 1.849 0.267 19.90% -0.8454 16.59% -0.9703 16.57% -0.9713 0.01586 0.226 1.684 80.10%
9 1.600 0.204 22.51% -0.7550 22.03% -0.7710 21.88% -0.7764 0.00046 0.197 1.575 77.49%
10 1.553 0.191 25.13% -0.6704 23.28% -0.7298 23.09% -0.7359 0.00430 0.170 1.480 74.87%
11 1.417 0.151 27.75% -0.5903 27.31% -0.6036 27.03% -0.6119 0.00046 0.145 1.395 72.25%
12 1.270 0.104 30.37% -0.5139 32.54% -0.4526 32.17% -0.4629 0.00260 0.120 1.319 69.63%
13 1.261 0.101 32.98% -0.4403 32.90% -0.4426 32.53% -0.4531 0.00016 0.097 1.249 67.02%
14 1.094 0.039 35.60% -0.3691 40.25% -0.2468 39.78% -0.2590 0.01214 0.074 1.186 64.40%
15 1.086 0.036 38.22% -0.2997 40.68% -0.2359 40.20% -0.2482 0.00266 0.052 1.127 61.78%
16 1.053 0.023 40.84% -0.2317 42.30% -0.1942 41.81% -0.2067 0.00062 0.031 1.073 59.16%
17 0.998 -0.001 43.46% -0.1648 45.23% -0.1198 44.72% -0.1327 0.00103 0.009 1.022 56.54%
18 0.941 -0.026 46.07% -0.0986 48.46% -0.0387 47.94% -0.0517 0.00220 -0.012 0.974 53.93%
19 0.903 -0.044 48.69% -0.0328 50.74% 0.0186 50.22% 0.0056 0.00148 -0.032 0.928 51.31%
20 0.869 -0.061 51.31% 0.0328 52.84% 0.0714 52.33% 0.0584 0.00066 -0.053 0.885 48.69%
21 0.839 -0.076 53.93% 0.0986 54.74% 0.1191 54.23% 0.1063 0.00006 -0.074 0.844 46.07%
22 0.803 -0.095 56.54% 0.1648 57.17% 0.1806 56.67% 0.1680 0.00001 -0.094 0.805 43.46%
23 0.774 -0.111 59.16% 0.2317 59.12% 0.2306 58.64% 0.2183 0.00018 -0.115 0.767 40.84%
24 0.702 -0.154 61.78% 0.2997 64.29% 0.3662 63.87% 0.3549 0.00305 -0.137 0.730 38.22%
25 0.696 -0.157 64.40% 0.3691 64.69% 0.3769 64.27% 0.3657 0.00001 -0.158 0.695 35.60%
26 0.684 -0.165 67.02% 0.4403 65.58% 0.4011 65.18% 0.3902 0.00251 -0.180 0.660 32.98%
27 0.636 -0.197 69.63% 0.5139 69.24% 0.5028 68.90% 0.4931 0.00043 -0.203 0.626 30.37%
28 0.633 -0.199 72.25% 0.5903 69.46% 0.5090 69.12% 0.4994 0.00827 -0.227 0.593 27.75%
29 0.524 -0.281 74.87% 0.6704 77.95% 0.7706 77.80% 0.7654 0.00903 -0.252 0.560 25.13%
30 0.479 -0.320 77.49% 0.7550 81.45% 0.8946 81.39% 0.8922 0.01883 -0.278 0.527 22.51%
31 0.474 -0.324 80.10% 0.8454 81.78% 0.9070 81.72% 0.9049 0.00354 -0.306 0.495 19.90%
32 0.464 -0.333 82.72% 0.9433 82.54% 0.9360 82.50% 0.9346 0.00007 -0.336 0.462 17.28%
33 0.455 -0.342 85.34% 1.0511 83.27% 0.9647 83.25% 0.9641 0.00758 -0.369 0.428 14.66%
34 0.442 -0.354 87.96% 1.1729 84.23% 1.0039 84.24% 1.0042 0.02845 -0.406 0.393 12.04%
35 0.276 -0.559 90.58% 1.3151 95.10% 1.6542 95.33% 1.6781 0.13176 -0.449 0.355 9.42%
36 0.276 -0.559 90.58% 1.3151 95.10% 1.6542 95.33% 1.6781 0.13176 -0.449 0.355 9.42%
37 0.267 -0.574 95.81% 1.7292 95.56% 1.7022 95.80% 1.7283 0.00000 -0.574 0.266 4.19%
38 0.235 -0.629 98.43% 2.1518 96.97% 1.8761 97.20% 1.9108 0.05806 -0.701 0.199 1.57%
4.489 98.43%
2.986 95.81%
2.687 93.19%
2.454 90.58%
2.304 87.96%
2.279 85.34%
2.070 82.72%
1.849 80.10%
1.600 77.49%
1.553 74.87%
1.417 72.25%
1.270 69.63%
1.261 67.02%
1.094 64.40%
1.086 61.78%
1.053 59.16%
0.998 56.54%
0.941 53.93%
0.903 51.31%
0.869 48.69%
0.839 46.07%
0.803 43.46%
0.774 40.84%
0.702 38.22%
0.696 35.60%
0.684 32.98%
0.636 30.37%
0.633 27.75%
0.524 25.13%
0.479 22.51%
0.474 19.90%
0.464 17.28%
0.455 14.66%
0.442 12.04%
0.276 9.42%
0.276 9.42%
0.267 4.19%
0.235 1.57%
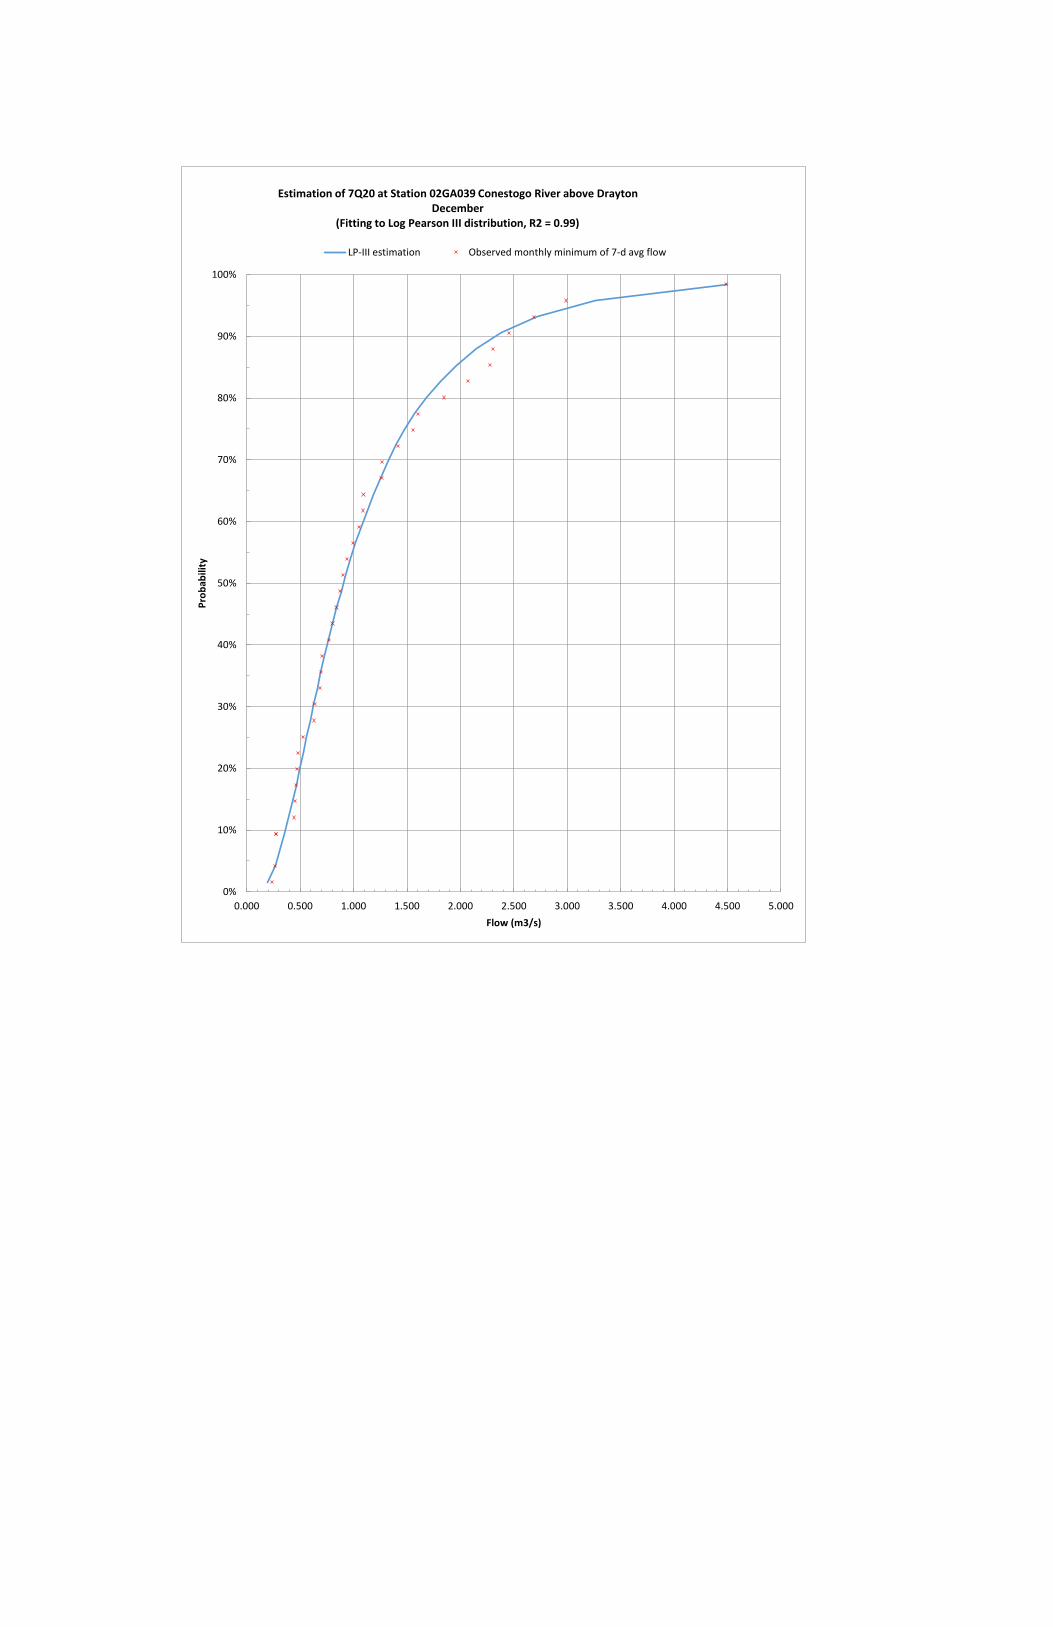
5.457143
4.488571
3.12
2.985714
2.687143
2.454286
2.304286
2.278571
1.848571
1.6
1.552857
1.417143
1.270286
1.261143
1.094286
1.085714
1.053429
0.998143
0.941143
0.940571
0.902857
0.869
0.839429
0.802857
0.774286
0.701857
0.696429
0.684286
0.635714
0.632857
0.478571
0.474286
0.464429
0.454857
0.442143
0.276
0.266571
0.235
0%
10%
20%
30%
40%
50%
60%
70%
80%
90%
100%
0.000 0.500 1.000 1.500 2.000 2.500 3.000 3.500 4.000 4.500 5.000
Pro
bab
ility
Flow (m3/s)
Estimation of 7Q20 at Station 02GA039 Conestogo River above Drayton December
(Fitting to Log Pearson III distribution, R2 = 0.99)
LP-III estimation Observed monthly minimum of 7-d avg flow
Township of Mapleton Receiving Water Impact Assessment for Mapleton WPCP Upgrade
BRM-00605325-A0 October 13, 2017
Page F-1
Appendix F: Ontario Provincial Water Quality Network Data
Stations:
• Station ID: 16018410002 (data from 1990 to 2006)
• Station ID: 16018407502 (data from 2007 to 2014)
Parameters:
• Table F-1
o Total ammonia nitrogen (AMMONIUM, TOTAL UNFIL.REAC; NNHTUR)
o Total nitrates
o Nitrite
o Nitrate (calculated)
o Total Kjeldahl Nitrogen
o pH (PH FIELD; FWPH)
o Water temperature (TEMPERATURE, WATER; FWTEMP)
• Table F-2
• Total Phosphorus (PHOSPHORUS, UNFILTERED TOTAL; PPUT) o Dissolved oxygen
o TSS (Residue, Particulate; RSP)
Graphs are presented for select parameters.
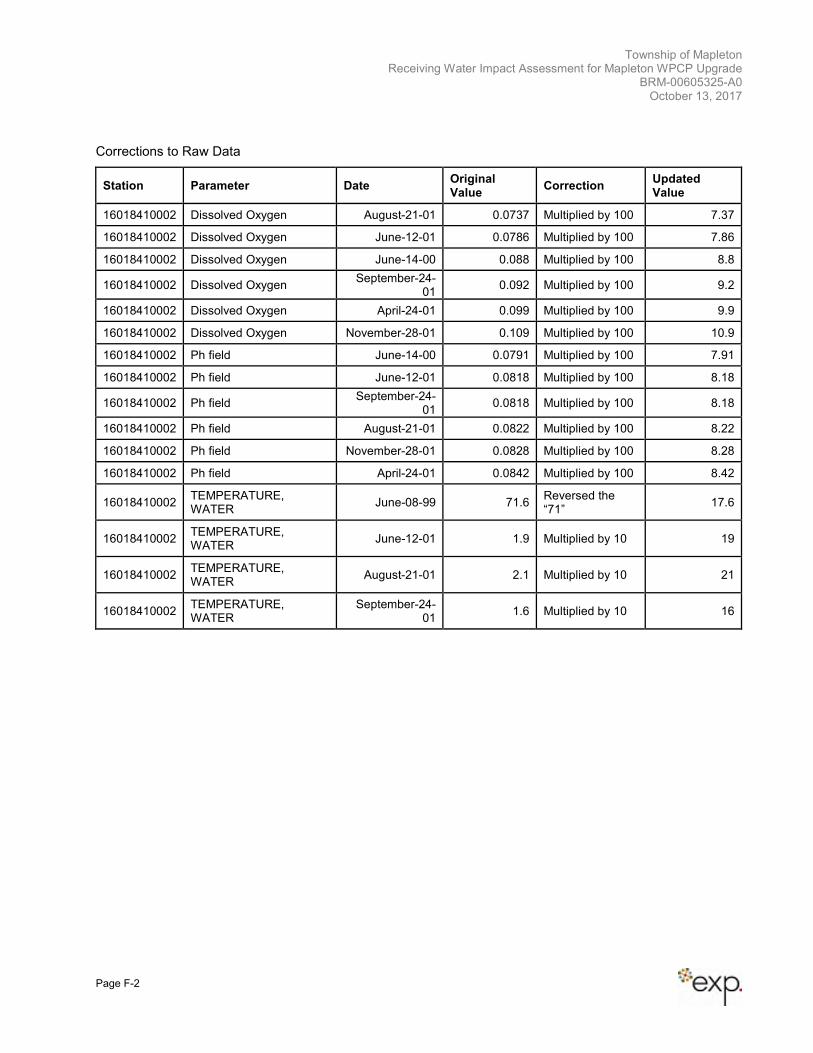
Township of Mapleton Receiving Water Impact Assessment for Mapleton WPCP Upgrade
BRM-00605325-A0 October 13, 2017
Page F-2
Corrections to Raw Data
Station Parameter Date Original Value
Correction Updated Value
16018410002 Dissolved Oxygen August-21-01 0.0737 Multiplied by 100 7.37
16018410002 Dissolved Oxygen June-12-01 0.0786 Multiplied by 100 7.86
16018410002 Dissolved Oxygen June-14-00 0.088 Multiplied by 100 8.8
16018410002 Dissolved Oxygen September-24-
01 0.092 Multiplied by 100 9.2
16018410002 Dissolved Oxygen April-24-01 0.099 Multiplied by 100 9.9
16018410002 Dissolved Oxygen November-28-01 0.109 Multiplied by 100 10.9
16018410002 Ph field June-14-00 0.0791 Multiplied by 100 7.91
16018410002 Ph field June-12-01 0.0818 Multiplied by 100 8.18
16018410002 Ph field September-24-
01 0.0818 Multiplied by 100 8.18
16018410002 Ph field August-21-01 0.0822 Multiplied by 100 8.22
16018410002 Ph field November-28-01 0.0828 Multiplied by 100 8.28
16018410002 Ph field April-24-01 0.0842 Multiplied by 100 8.42
16018410002 TEMPERATURE, WATER
June-08-99 71.6 Reversed the “71”
17.6
16018410002 TEMPERATURE, WATER
June-12-01 1.9 Multiplied by 10 19
16018410002 TEMPERATURE, WATER
August-21-01 2.1 Multiplied by 10 21
16018410002 TEMPERATURE, WATER
September-24-01
1.6 Multiplied by 10 16
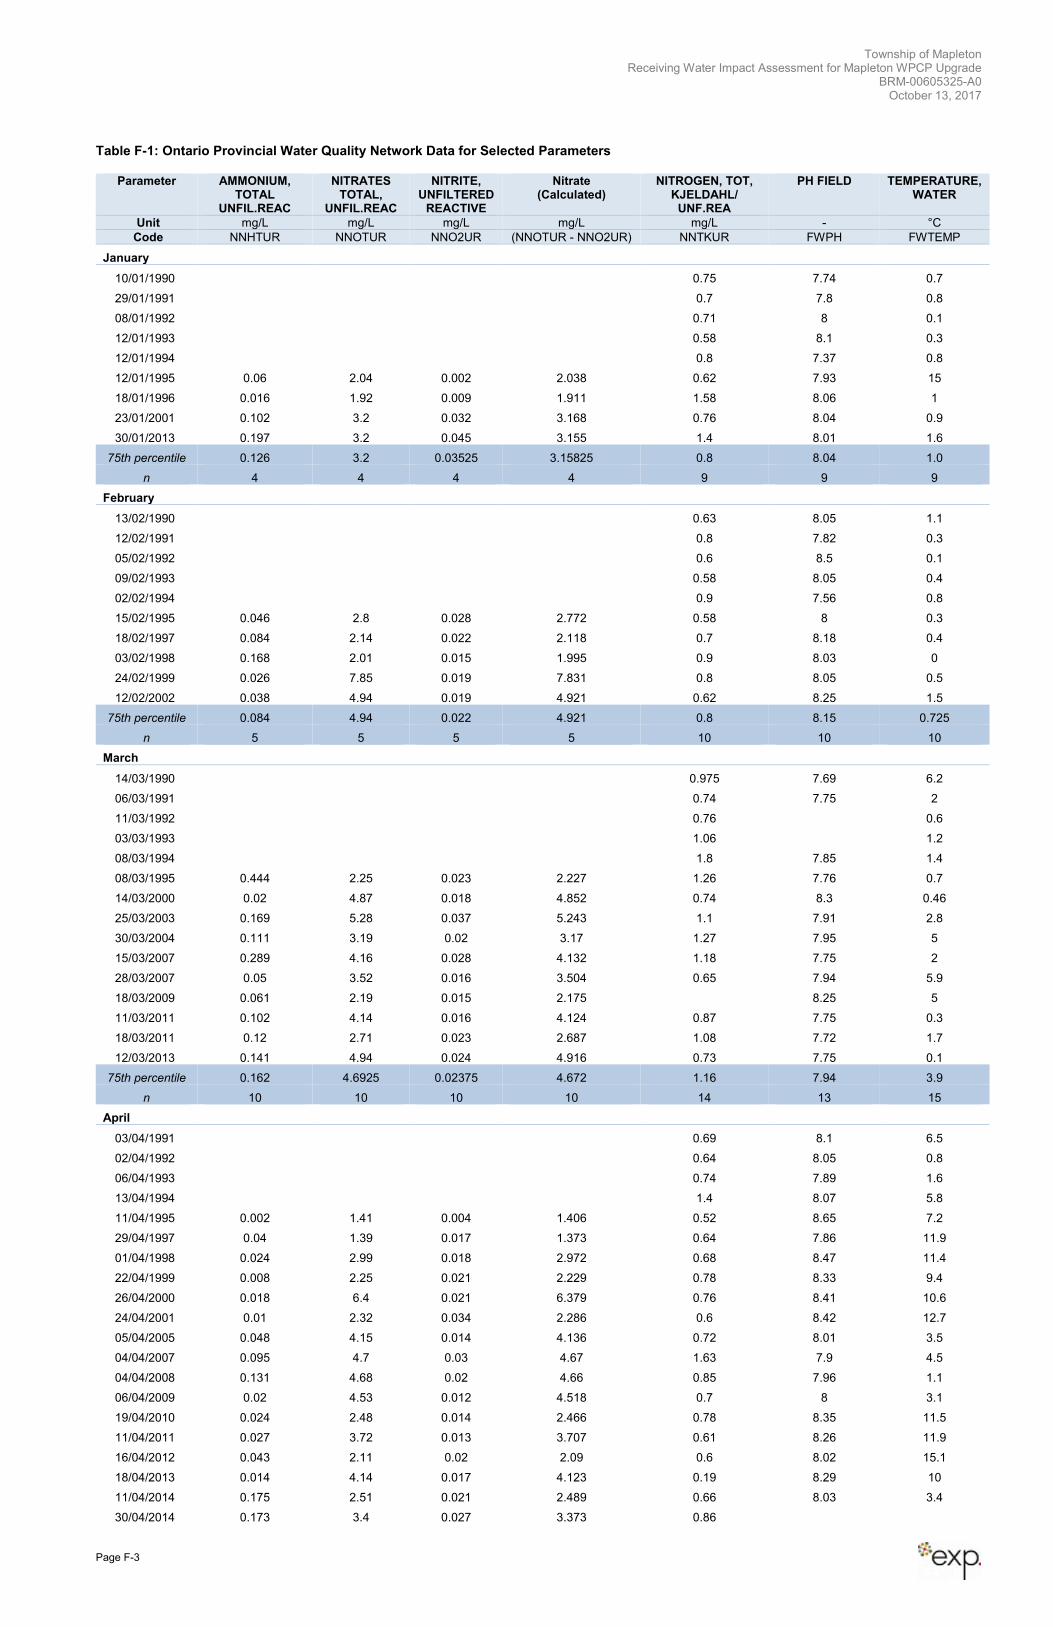
Township of Mapleton Receiving Water Impact Assessment for Mapleton WPCP Upgrade
BRM-00605325-A0 October 13, 2017
Page F-3
Table F-1: Ontario Provincial Water Quality Network Data for Selected Parameters
Parameter AMMONIUM, TOTAL
UNFIL.REAC
NITRATES TOTAL,
UNFIL.REAC
NITRITE, UNFILTERED
REACTIVE
Nitrate (Calculated)
NITROGEN, TOT, KJELDAHL/
UNF.REA
PH FIELD TEMPERATURE, WATER
Unit mg/L mg/L mg/L mg/L mg/L - °C
Code NNHTUR NNOTUR NNO2UR (NNOTUR - NNO2UR) NNTKUR FWPH FWTEMP
January
10/01/1990 0.75 7.74 0.7
29/01/1991 0.7 7.8 0.8
08/01/1992 0.71 8 0.1
12/01/1993 0.58 8.1 0.3
12/01/1994 0.8 7.37 0.8
12/01/1995 0.06 2.04 0.002 2.038 0.62 7.93 15
18/01/1996 0.016 1.92 0.009 1.911 1.58 8.06 1
23/01/2001 0.102 3.2 0.032 3.168 0.76 8.04 0.9
30/01/2013 0.197 3.2 0.045 3.155 1.4 8.01 1.6
75th percentile 0.126 3.2 0.03525 3.15825 0.8 8.04 1.0
n 4 4 4 4 9 9 9
February
13/02/1990 0.63 8.05 1.1
12/02/1991 0.8 7.82 0.3
05/02/1992 0.6 8.5 0.1
09/02/1993 0.58 8.05 0.4
02/02/1994 0.9 7.56 0.8
15/02/1995 0.046 2.8 0.028 2.772 0.58 8 0.3
18/02/1997 0.084 2.14 0.022 2.118 0.7 8.18 0.4
03/02/1998 0.168 2.01 0.015 1.995 0.9 8.03 0
24/02/1999 0.026 7.85 0.019 7.831 0.8 8.05 0.5
12/02/2002 0.038 4.94 0.019 4.921 0.62 8.25 1.5
75th percentile 0.084 4.94 0.022 4.921 0.8 8.15 0.725
n 5 5 5 5 10 10 10
March
14/03/1990 0.975 7.69 6.2
06/03/1991 0.74 7.75 2
11/03/1992 0.76 0.6
03/03/1993 1.06 1.2
08/03/1994 1.8 7.85 1.4
08/03/1995 0.444 2.25 0.023 2.227 1.26 7.76 0.7
14/03/2000 0.02 4.87 0.018 4.852 0.74 8.3 0.46
25/03/2003 0.169 5.28 0.037 5.243 1.1 7.91 2.8
30/03/2004 0.111 3.19 0.02 3.17 1.27 7.95 5
15/03/2007 0.289 4.16 0.028 4.132 1.18 7.75 2
28/03/2007 0.05 3.52 0.016 3.504 0.65 7.94 5.9
18/03/2009 0.061 2.19 0.015 2.175 8.25 5
11/03/2011 0.102 4.14 0.016 4.124 0.87 7.75 0.3
18/03/2011 0.12 2.71 0.023 2.687 1.08 7.72 1.7
12/03/2013 0.141 4.94 0.024 4.916 0.73 7.75 0.1
75th percentile 0.162 4.6925 0.02375 4.672 1.16 7.94 3.9
n 10 10 10 10 14 13 15
April
03/04/1991 0.69 8.1 6.5
02/04/1992 0.64 8.05 0.8
06/04/1993 0.74 7.89 1.6
13/04/1994 1.4 8.07 5.8
11/04/1995 0.002 1.41 0.004 1.406 0.52 8.65 7.2
29/04/1997 0.04 1.39 0.017 1.373 0.64 7.86 11.9
01/04/1998 0.024 2.99 0.018 2.972 0.68 8.47 11.4
22/04/1999 0.008 2.25 0.021 2.229 0.78 8.33 9.4
26/04/2000 0.018 6.4 0.021 6.379 0.76 8.41 10.6
24/04/2001 0.01 2.32 0.034 2.286 0.6 8.42 12.7
05/04/2005 0.048 4.15 0.014 4.136 0.72 8.01 3.5
04/04/2007 0.095 4.7 0.03 4.67 1.63 7.9 4.5
04/04/2008 0.131 4.68 0.02 4.66 0.85 7.96 1.1
06/04/2009 0.02 4.53 0.012 4.518 0.7 8 3.1
19/04/2010 0.024 2.48 0.014 2.466 0.78 8.35 11.5
11/04/2011 0.027 3.72 0.013 3.707 0.61 8.26 11.9
16/04/2012 0.043 2.11 0.02 2.09 0.6 8.02 15.1
18/04/2013 0.014 4.14 0.017 4.123 0.19 8.29 10
11/04/2014 0.175 2.51 0.021 2.489 0.66 8.03 3.4
30/04/2014 0.173 3.4 0.027 3.373 0.86
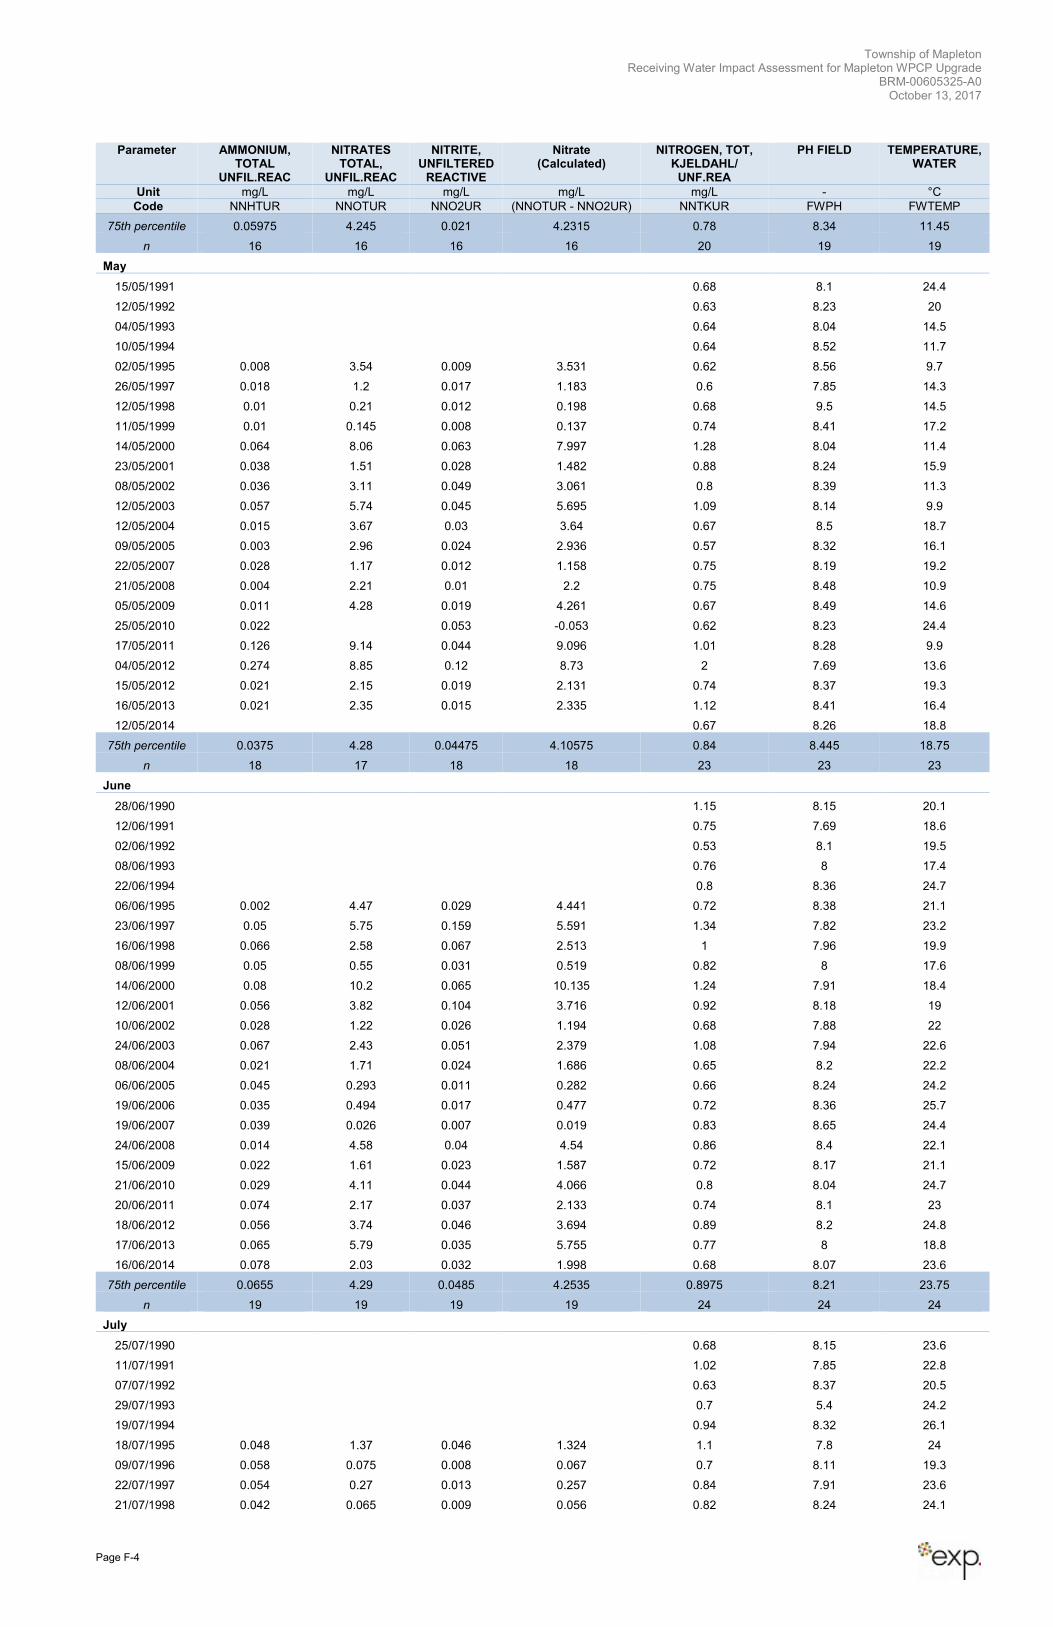
Township of Mapleton Receiving Water Impact Assessment for Mapleton WPCP Upgrade
BRM-00605325-A0 October 13, 2017
Page F-4
Parameter AMMONIUM, TOTAL
UNFIL.REAC
NITRATES TOTAL,
UNFIL.REAC
NITRITE, UNFILTERED
REACTIVE
Nitrate (Calculated)
NITROGEN, TOT, KJELDAHL/
UNF.REA
PH FIELD TEMPERATURE, WATER
Unit mg/L mg/L mg/L mg/L mg/L - °C
Code NNHTUR NNOTUR NNO2UR (NNOTUR - NNO2UR) NNTKUR FWPH FWTEMP
75th percentile 0.05975 4.245 0.021 4.2315 0.78 8.34 11.45
n 16 16 16 16 20 19 19
May
15/05/1991 0.68 8.1 24.4
12/05/1992 0.63 8.23 20
04/05/1993 0.64 8.04 14.5
10/05/1994 0.64 8.52 11.7
02/05/1995 0.008 3.54 0.009 3.531 0.62 8.56 9.7
26/05/1997 0.018 1.2 0.017 1.183 0.6 7.85 14.3
12/05/1998 0.01 0.21 0.012 0.198 0.68 9.5 14.5
11/05/1999 0.01 0.145 0.008 0.137 0.74 8.41 17.2
14/05/2000 0.064 8.06 0.063 7.997 1.28 8.04 11.4
23/05/2001 0.038 1.51 0.028 1.482 0.88 8.24 15.9
08/05/2002 0.036 3.11 0.049 3.061 0.8 8.39 11.3
12/05/2003 0.057 5.74 0.045 5.695 1.09 8.14 9.9
12/05/2004 0.015 3.67 0.03 3.64 0.67 8.5 18.7
09/05/2005 0.003 2.96 0.024 2.936 0.57 8.32 16.1
22/05/2007 0.028 1.17 0.012 1.158 0.75 8.19 19.2
21/05/2008 0.004 2.21 0.01 2.2 0.75 8.48 10.9
05/05/2009 0.011 4.28 0.019 4.261 0.67 8.49 14.6
25/05/2010 0.022 0.053 -0.053 0.62 8.23 24.4
17/05/2011 0.126 9.14 0.044 9.096 1.01 8.28 9.9
04/05/2012 0.274 8.85 0.12 8.73 2 7.69 13.6
15/05/2012 0.021 2.15 0.019 2.131 0.74 8.37 19.3
16/05/2013 0.021 2.35 0.015 2.335 1.12 8.41 16.4
12/05/2014 0.67 8.26 18.8
75th percentile 0.0375 4.28 0.04475 4.10575 0.84 8.445 18.75
n 18 17 18 18 23 23 23
June
28/06/1990 1.15 8.15 20.1
12/06/1991 0.75 7.69 18.6
02/06/1992 0.53 8.1 19.5
08/06/1993 0.76 8 17.4
22/06/1994 0.8 8.36 24.7
06/06/1995 0.002 4.47 0.029 4.441 0.72 8.38 21.1
23/06/1997 0.05 5.75 0.159 5.591 1.34 7.82 23.2
16/06/1998 0.066 2.58 0.067 2.513 1 7.96 19.9
08/06/1999 0.05 0.55 0.031 0.519 0.82 8 17.6
14/06/2000 0.08 10.2 0.065 10.135 1.24 7.91 18.4
12/06/2001 0.056 3.82 0.104 3.716 0.92 8.18 19
10/06/2002 0.028 1.22 0.026 1.194 0.68 7.88 22
24/06/2003 0.067 2.43 0.051 2.379 1.08 7.94 22.6
08/06/2004 0.021 1.71 0.024 1.686 0.65 8.2 22.2
06/06/2005 0.045 0.293 0.011 0.282 0.66 8.24 24.2
19/06/2006 0.035 0.494 0.017 0.477 0.72 8.36 25.7
19/06/2007 0.039 0.026 0.007 0.019 0.83 8.65 24.4
24/06/2008 0.014 4.58 0.04 4.54 0.86 8.4 22.1
15/06/2009 0.022 1.61 0.023 1.587 0.72 8.17 21.1
21/06/2010 0.029 4.11 0.044 4.066 0.8 8.04 24.7
20/06/2011 0.074 2.17 0.037 2.133 0.74 8.1 23
18/06/2012 0.056 3.74 0.046 3.694 0.89 8.2 24.8
17/06/2013 0.065 5.79 0.035 5.755 0.77 8 18.8
16/06/2014 0.078 2.03 0.032 1.998 0.68 8.07 23.6
75th percentile 0.0655 4.29 0.0485 4.2535 0.8975 8.21 23.75
n 19 19 19 19 24 24 24
July
25/07/1990 0.68 8.15 23.6
11/07/1991 1.02 7.85 22.8
07/07/1992 0.63 8.37 20.5
29/07/1993 0.7 5.4 24.2
19/07/1994 0.94 8.32 26.1
18/07/1995 0.048 1.37 0.046 1.324 1.1 7.8 24
09/07/1996 0.058 0.075 0.008 0.067 0.7 8.11 19.3
22/07/1997 0.054 0.27 0.013 0.257 0.84 7.91 23.6
21/07/1998 0.042 0.065 0.009 0.056 0.82 8.24 24.1
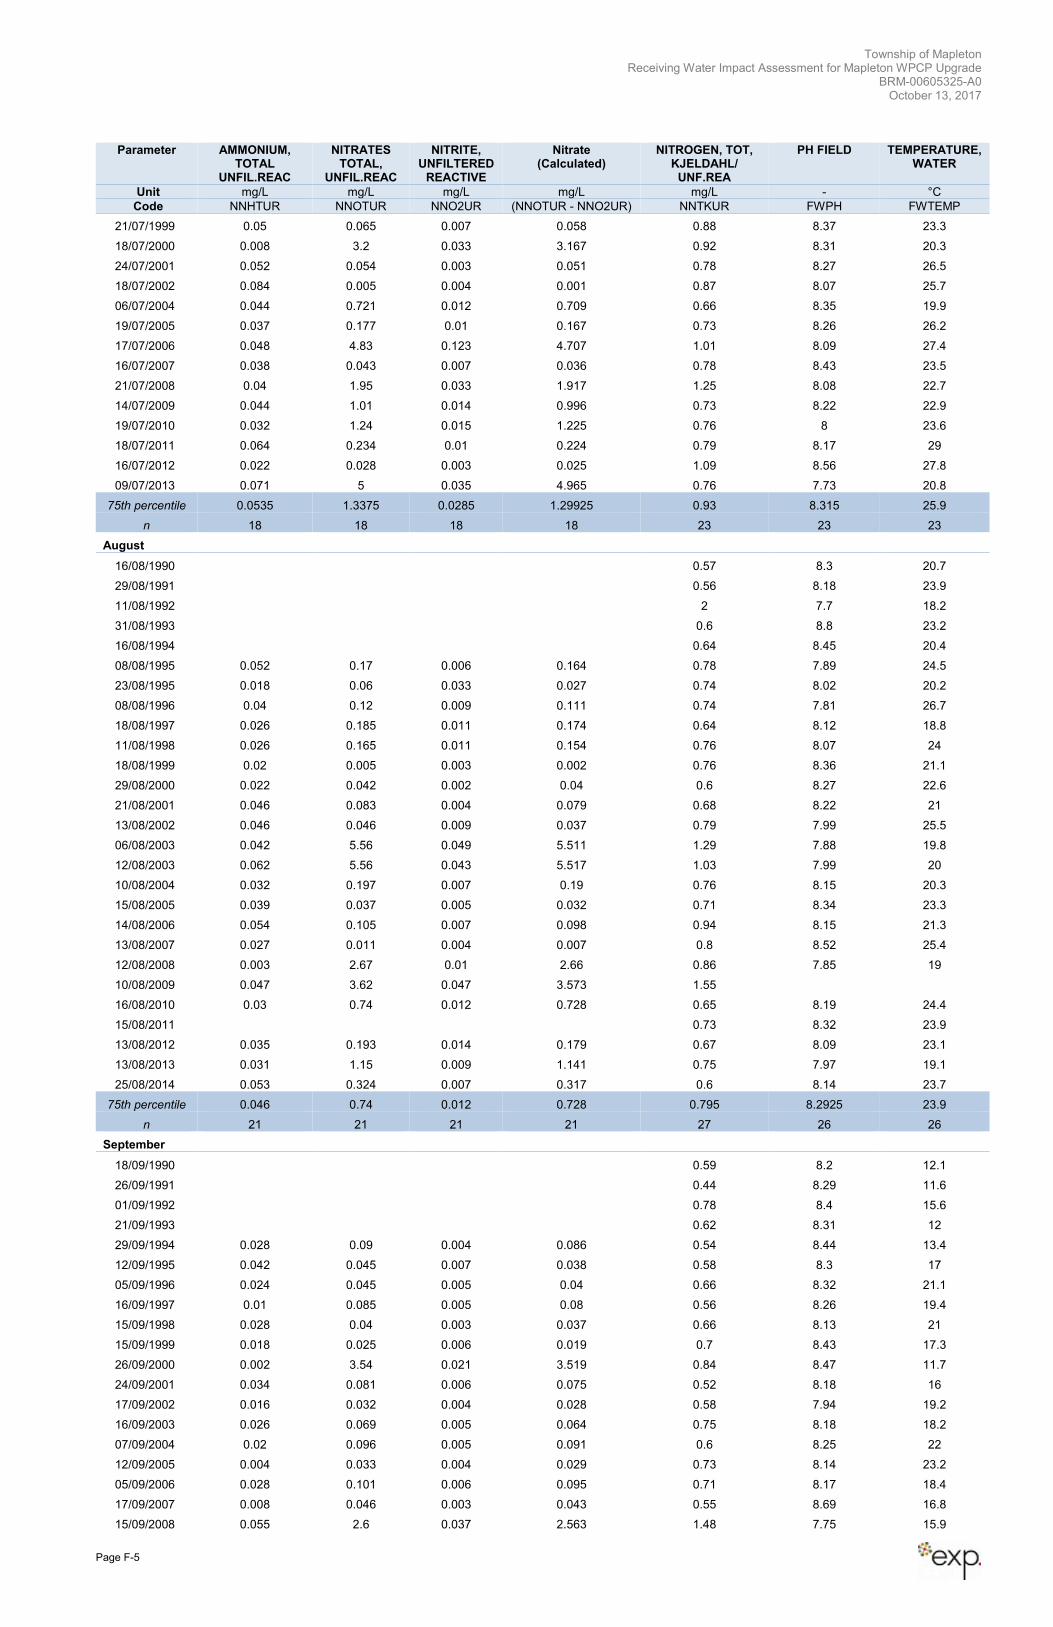
Township of Mapleton Receiving Water Impact Assessment for Mapleton WPCP Upgrade
BRM-00605325-A0 October 13, 2017
Page F-5
Parameter AMMONIUM, TOTAL
UNFIL.REAC
NITRATES TOTAL,
UNFIL.REAC
NITRITE, UNFILTERED
REACTIVE
Nitrate (Calculated)
NITROGEN, TOT, KJELDAHL/
UNF.REA
PH FIELD TEMPERATURE, WATER
Unit mg/L mg/L mg/L mg/L mg/L - °C
Code NNHTUR NNOTUR NNO2UR (NNOTUR - NNO2UR) NNTKUR FWPH FWTEMP
21/07/1999 0.05 0.065 0.007 0.058 0.88 8.37 23.3
18/07/2000 0.008 3.2 0.033 3.167 0.92 8.31 20.3
24/07/2001 0.052 0.054 0.003 0.051 0.78 8.27 26.5
18/07/2002 0.084 0.005 0.004 0.001 0.87 8.07 25.7
06/07/2004 0.044 0.721 0.012 0.709 0.66 8.35 19.9
19/07/2005 0.037 0.177 0.01 0.167 0.73 8.26 26.2
17/07/2006 0.048 4.83 0.123 4.707 1.01 8.09 27.4
16/07/2007 0.038 0.043 0.007 0.036 0.78 8.43 23.5
21/07/2008 0.04 1.95 0.033 1.917 1.25 8.08 22.7
14/07/2009 0.044 1.01 0.014 0.996 0.73 8.22 22.9
19/07/2010 0.032 1.24 0.015 1.225 0.76 8 23.6
18/07/2011 0.064 0.234 0.01 0.224 0.79 8.17 29
16/07/2012 0.022 0.028 0.003 0.025 1.09 8.56 27.8
09/07/2013 0.071 5 0.035 4.965 0.76 7.73 20.8
75th percentile 0.0535 1.3375 0.0285 1.29925 0.93 8.315 25.9
n 18 18 18 18 23 23 23
August
16/08/1990 0.57 8.3 20.7
29/08/1991 0.56 8.18 23.9
11/08/1992 2 7.7 18.2
31/08/1993 0.6 8.8 23.2
16/08/1994 0.64 8.45 20.4
08/08/1995 0.052 0.17 0.006 0.164 0.78 7.89 24.5
23/08/1995 0.018 0.06 0.033 0.027 0.74 8.02 20.2
08/08/1996 0.04 0.12 0.009 0.111 0.74 7.81 26.7
18/08/1997 0.026 0.185 0.011 0.174 0.64 8.12 18.8
11/08/1998 0.026 0.165 0.011 0.154 0.76 8.07 24
18/08/1999 0.02 0.005 0.003 0.002 0.76 8.36 21.1
29/08/2000 0.022 0.042 0.002 0.04 0.6 8.27 22.6
21/08/2001 0.046 0.083 0.004 0.079 0.68 8.22 21
13/08/2002 0.046 0.046 0.009 0.037 0.79 7.99 25.5
06/08/2003 0.042 5.56 0.049 5.511 1.29 7.88 19.8
12/08/2003 0.062 5.56 0.043 5.517 1.03 7.99 20
10/08/2004 0.032 0.197 0.007 0.19 0.76 8.15 20.3
15/08/2005 0.039 0.037 0.005 0.032 0.71 8.34 23.3
14/08/2006 0.054 0.105 0.007 0.098 0.94 8.15 21.3
13/08/2007 0.027 0.011 0.004 0.007 0.8 8.52 25.4
12/08/2008 0.003 2.67 0.01 2.66 0.86 7.85 19
10/08/2009 0.047 3.62 0.047 3.573 1.55
16/08/2010 0.03 0.74 0.012 0.728 0.65 8.19 24.4
15/08/2011 0.73 8.32 23.9
13/08/2012 0.035 0.193 0.014 0.179 0.67 8.09 23.1
13/08/2013 0.031 1.15 0.009 1.141 0.75 7.97 19.1
25/08/2014 0.053 0.324 0.007 0.317 0.6 8.14 23.7
75th percentile 0.046 0.74 0.012 0.728 0.795 8.2925 23.9
n 21 21 21 21 27 26 26
September
18/09/1990 0.59 8.2 12.1
26/09/1991 0.44 8.29 11.6
01/09/1992 0.78 8.4 15.6
21/09/1993 0.62 8.31 12
29/09/1994 0.028 0.09 0.004 0.086 0.54 8.44 13.4
12/09/1995 0.042 0.045 0.007 0.038 0.58 8.3 17
05/09/1996 0.024 0.045 0.005 0.04 0.66 8.32 21.1
16/09/1997 0.01 0.085 0.005 0.08 0.56 8.26 19.4
15/09/1998 0.028 0.04 0.003 0.037 0.66 8.13 21
15/09/1999 0.018 0.025 0.006 0.019 0.7 8.43 17.3
26/09/2000 0.002 3.54 0.021 3.519 0.84 8.47 11.7
24/09/2001 0.034 0.081 0.006 0.075 0.52 8.18 16
17/09/2002 0.016 0.032 0.004 0.028 0.58 7.94 19.2
16/09/2003 0.026 0.069 0.005 0.064 0.75 8.18 18.2
07/09/2004 0.02 0.096 0.005 0.091 0.6 8.25 22
12/09/2005 0.004 0.033 0.004 0.029 0.73 8.14 23.2
05/09/2006 0.028 0.101 0.006 0.095 0.71 8.17 18.4
17/09/2007 0.008 0.046 0.003 0.043 0.55 8.69 16.8
15/09/2008 0.055 2.6 0.037 2.563 1.48 7.75 15.9
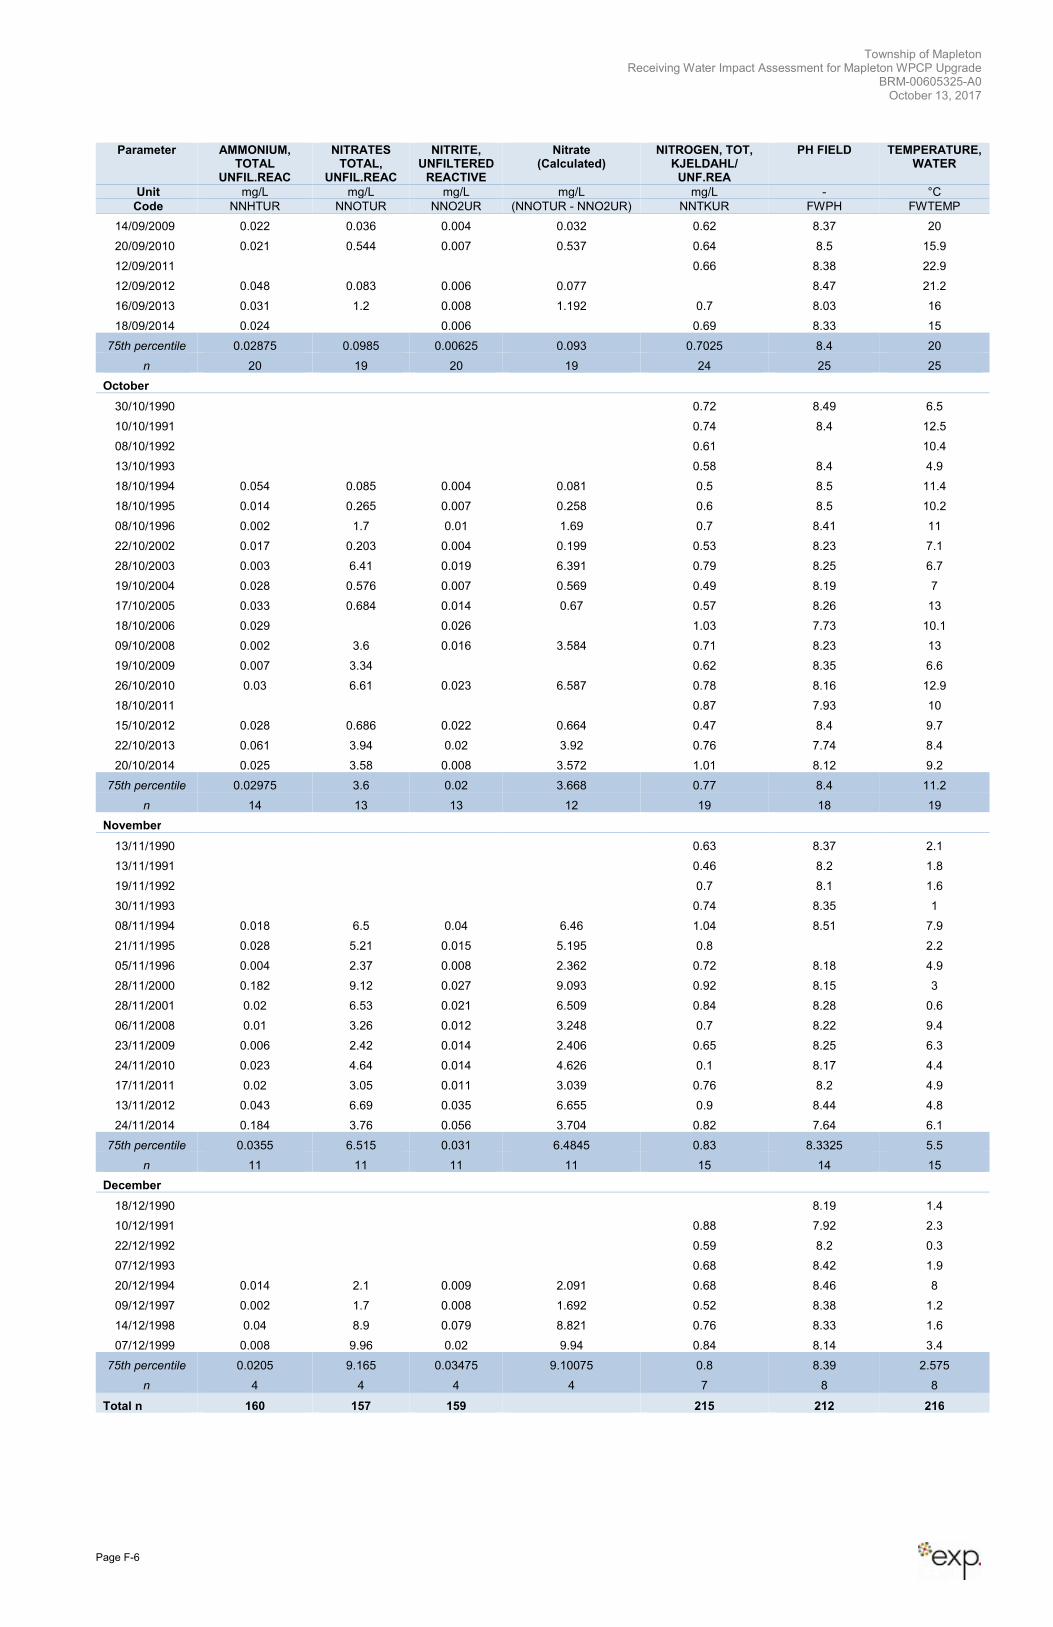
Township of Mapleton Receiving Water Impact Assessment for Mapleton WPCP Upgrade
BRM-00605325-A0 October 13, 2017
Page F-6
Parameter AMMONIUM, TOTAL
UNFIL.REAC
NITRATES TOTAL,
UNFIL.REAC
NITRITE, UNFILTERED
REACTIVE
Nitrate (Calculated)
NITROGEN, TOT, KJELDAHL/
UNF.REA
PH FIELD TEMPERATURE, WATER
Unit mg/L mg/L mg/L mg/L mg/L - °C
Code NNHTUR NNOTUR NNO2UR (NNOTUR - NNO2UR) NNTKUR FWPH FWTEMP
14/09/2009 0.022 0.036 0.004 0.032 0.62 8.37 20
20/09/2010 0.021 0.544 0.007 0.537 0.64 8.5 15.9
12/09/2011 0.66 8.38 22.9
12/09/2012 0.048 0.083 0.006 0.077 8.47 21.2
16/09/2013 0.031 1.2 0.008 1.192 0.7 8.03 16
18/09/2014 0.024 0.006 0.69 8.33 15
75th percentile 0.02875 0.0985 0.00625 0.093 0.7025 8.4 20
n 20 19 20 19 24 25 25
October
30/10/1990 0.72 8.49 6.5
10/10/1991 0.74 8.4 12.5
08/10/1992 0.61 10.4
13/10/1993 0.58 8.4 4.9
18/10/1994 0.054 0.085 0.004 0.081 0.5 8.5 11.4
18/10/1995 0.014 0.265 0.007 0.258 0.6 8.5 10.2
08/10/1996 0.002 1.7 0.01 1.69 0.7 8.41 11
22/10/2002 0.017 0.203 0.004 0.199 0.53 8.23 7.1
28/10/2003 0.003 6.41 0.019 6.391 0.79 8.25 6.7
19/10/2004 0.028 0.576 0.007 0.569 0.49 8.19 7
17/10/2005 0.033 0.684 0.014 0.67 0.57 8.26 13
18/10/2006 0.029 0.026 1.03 7.73 10.1
09/10/2008 0.002 3.6 0.016 3.584 0.71 8.23 13
19/10/2009 0.007 3.34 0.62 8.35 6.6
26/10/2010 0.03 6.61 0.023 6.587 0.78 8.16 12.9
18/10/2011 0.87 7.93 10
15/10/2012 0.028 0.686 0.022 0.664 0.47 8.4 9.7
22/10/2013 0.061 3.94 0.02 3.92 0.76 7.74 8.4
20/10/2014 0.025 3.58 0.008 3.572 1.01 8.12 9.2
75th percentile 0.02975 3.6 0.02 3.668 0.77 8.4 11.2
n 14 13 13 12 19 18 19
November
13/11/1990 0.63 8.37 2.1
13/11/1991 0.46 8.2 1.8
19/11/1992 0.7 8.1 1.6
30/11/1993 0.74 8.35 1
08/11/1994 0.018 6.5 0.04 6.46 1.04 8.51 7.9
21/11/1995 0.028 5.21 0.015 5.195 0.8 2.2
05/11/1996 0.004 2.37 0.008 2.362 0.72 8.18 4.9
28/11/2000 0.182 9.12 0.027 9.093 0.92 8.15 3
28/11/2001 0.02 6.53 0.021 6.509 0.84 8.28 0.6
06/11/2008 0.01 3.26 0.012 3.248 0.7 8.22 9.4
23/11/2009 0.006 2.42 0.014 2.406 0.65 8.25 6.3
24/11/2010 0.023 4.64 0.014 4.626 0.1 8.17 4.4
17/11/2011 0.02 3.05 0.011 3.039 0.76 8.2 4.9
13/11/2012 0.043 6.69 0.035 6.655 0.9 8.44 4.8
24/11/2014 0.184 3.76 0.056 3.704 0.82 7.64 6.1
75th percentile 0.0355 6.515 0.031 6.4845 0.83 8.3325 5.5
n 11 11 11 11 15 14 15
December
18/12/1990 8.19 1.4
10/12/1991 0.88 7.92 2.3
22/12/1992 0.59 8.2 0.3
07/12/1993 0.68 8.42 1.9
20/12/1994 0.014 2.1 0.009 2.091 0.68 8.46 8
09/12/1997 0.002 1.7 0.008 1.692 0.52 8.38 1.2
14/12/1998 0.04 8.9 0.079 8.821 0.76 8.33 1.6
07/12/1999 0.008 9.96 0.02 9.94 0.84 8.14 3.4
75th percentile 0.0205 9.165 0.03475 9.10075 0.8 8.39 2.575
n 4 4 4 4 7 8 8
Total n 160 157 159 215 212 216
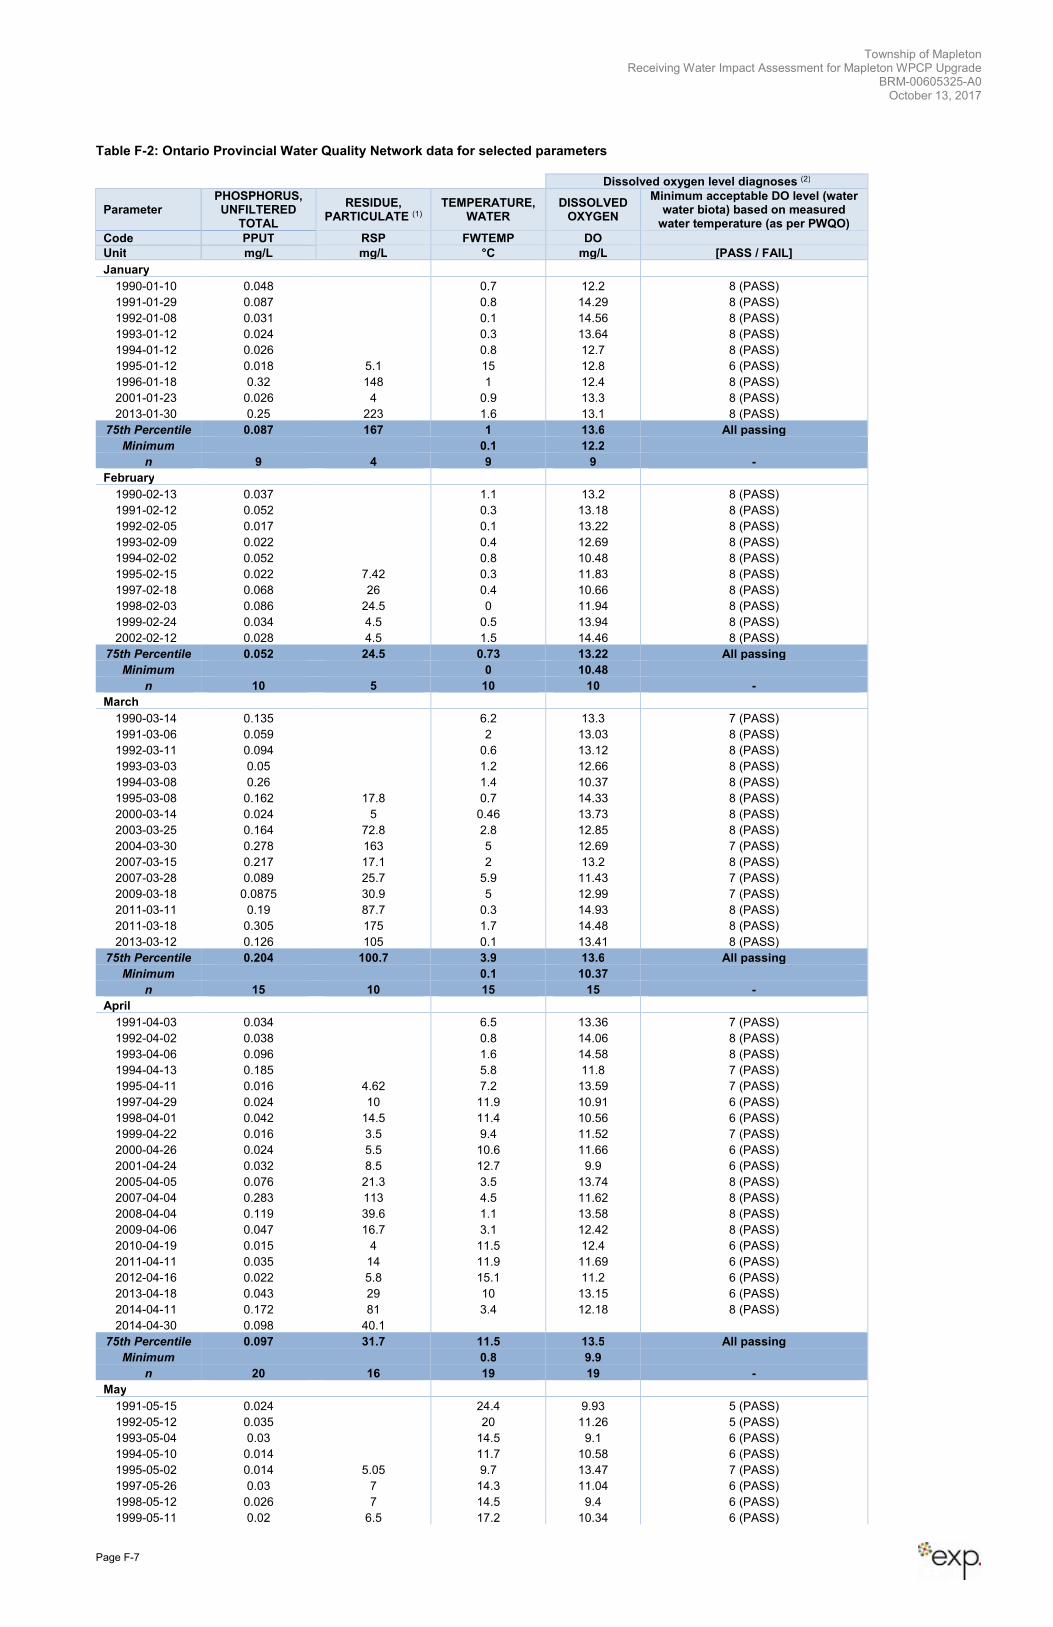
Township of Mapleton Receiving Water Impact Assessment for Mapleton WPCP Upgrade
BRM-00605325-A0 October 13, 2017
Page F-7
Table F-2: Ontario Provincial Water Quality Network data for selected parameters
Dissolved oxygen level diagnoses (2)
Parameter PHOSPHORUS, UNFILTERED
TOTAL
RESIDUE, PARTICULATE (1)
TEMPERATURE, WATER
DISSOLVED OXYGEN
Minimum acceptable DO level (water water biota) based on measured
water temperature (as per PWQO)
Code PPUT RSP FWTEMP DO
Unit mg/L mg/L °C mg/L [PASS / FAIL]
January
1990-01-10 0.048 0.7 12.2 8 (PASS)
1991-01-29 0.087 0.8 14.29 8 (PASS)
1992-01-08 0.031 0.1 14.56 8 (PASS)
1993-01-12 0.024 0.3 13.64 8 (PASS)
1994-01-12 0.026 0.8 12.7 8 (PASS)
1995-01-12 0.018 5.1 15 12.8 6 (PASS)
1996-01-18 0.32 148 1 12.4 8 (PASS)
2001-01-23 0.026 4 0.9 13.3 8 (PASS)
2013-01-30 0.25 223 1.6 13.1 8 (PASS)
75th Percentile 0.087 167 1 13.6 All passing
Minimum 0.1 12.2
n 9 4 9 9 -
February
1990-02-13 0.037 1.1 13.2 8 (PASS)
1991-02-12 0.052 0.3 13.18 8 (PASS)
1992-02-05 0.017 0.1 13.22 8 (PASS)
1993-02-09 0.022 0.4 12.69 8 (PASS)
1994-02-02 0.052 0.8 10.48 8 (PASS)
1995-02-15 0.022 7.42 0.3 11.83 8 (PASS)
1997-02-18 0.068 26 0.4 10.66 8 (PASS)
1998-02-03 0.086 24.5 0 11.94 8 (PASS)
1999-02-24 0.034 4.5 0.5 13.94 8 (PASS)
2002-02-12 0.028 4.5 1.5 14.46 8 (PASS)
75th Percentile 0.052 24.5 0.73 13.22 All passing
Minimum 0 10.48
n 10 5 10 10 -
March
1990-03-14 0.135 6.2 13.3 7 (PASS)
1991-03-06 0.059 2 13.03 8 (PASS)
1992-03-11 0.094 0.6 13.12 8 (PASS)
1993-03-03 0.05 1.2 12.66 8 (PASS)
1994-03-08 0.26 1.4 10.37 8 (PASS)
1995-03-08 0.162 17.8 0.7 14.33 8 (PASS)
2000-03-14 0.024 5 0.46 13.73 8 (PASS)
2003-03-25 0.164 72.8 2.8 12.85 8 (PASS)
2004-03-30 0.278 163 5 12.69 7 (PASS)
2007-03-15 0.217 17.1 2 13.2 8 (PASS)
2007-03-28 0.089 25.7 5.9 11.43 7 (PASS)
2009-03-18 0.0875 30.9 5 12.99 7 (PASS)
2011-03-11 0.19 87.7 0.3 14.93 8 (PASS)
2011-03-18 0.305 175 1.7 14.48 8 (PASS)
2013-03-12 0.126 105 0.1 13.41 8 (PASS)
75th Percentile 0.204 100.7 3.9 13.6 All passing
Minimum 0.1 10.37
n 15 10 15 15 -
April
1991-04-03 0.034 6.5 13.36 7 (PASS)
1992-04-02 0.038 0.8 14.06 8 (PASS)
1993-04-06 0.096 1.6 14.58 8 (PASS)
1994-04-13 0.185 5.8 11.8 7 (PASS)
1995-04-11 0.016 4.62 7.2 13.59 7 (PASS)
1997-04-29 0.024 10 11.9 10.91 6 (PASS)
1998-04-01 0.042 14.5 11.4 10.56 6 (PASS)
1999-04-22 0.016 3.5 9.4 11.52 7 (PASS)
2000-04-26 0.024 5.5 10.6 11.66 6 (PASS)
2001-04-24 0.032 8.5 12.7 9.9 6 (PASS)
2005-04-05 0.076 21.3 3.5 13.74 8 (PASS)
2007-04-04 0.283 113 4.5 11.62 8 (PASS)
2008-04-04 0.119 39.6 1.1 13.58 8 (PASS)
2009-04-06 0.047 16.7 3.1 12.42 8 (PASS)
2010-04-19 0.015 4 11.5 12.4 6 (PASS)
2011-04-11 0.035 14 11.9 11.69 6 (PASS)
2012-04-16 0.022 5.8 15.1 11.2 6 (PASS)
2013-04-18 0.043 29 10 13.15 6 (PASS)
2014-04-11 0.172 81 3.4 12.18 8 (PASS)
2014-04-30 0.098 40.1
75th Percentile 0.097 31.7 11.5 13.5 All passing
Minimum 0.8 9.9
n 20 16 19 19 -
May
1991-05-15 0.024 24.4 9.93 5 (PASS)
1992-05-12 0.035 20 11.26 5 (PASS)
1993-05-04 0.03 14.5 9.1 6 (PASS)
1994-05-10 0.014 11.7 10.58 6 (PASS)
1995-05-02 0.014 5.05 9.7 13.47 7 (PASS)
1997-05-26 0.03 7 14.3 11.04 6 (PASS)
1998-05-12 0.026 7 14.5 9.4 6 (PASS)
1999-05-11 0.02 6.5 17.2 10.34 6 (PASS)
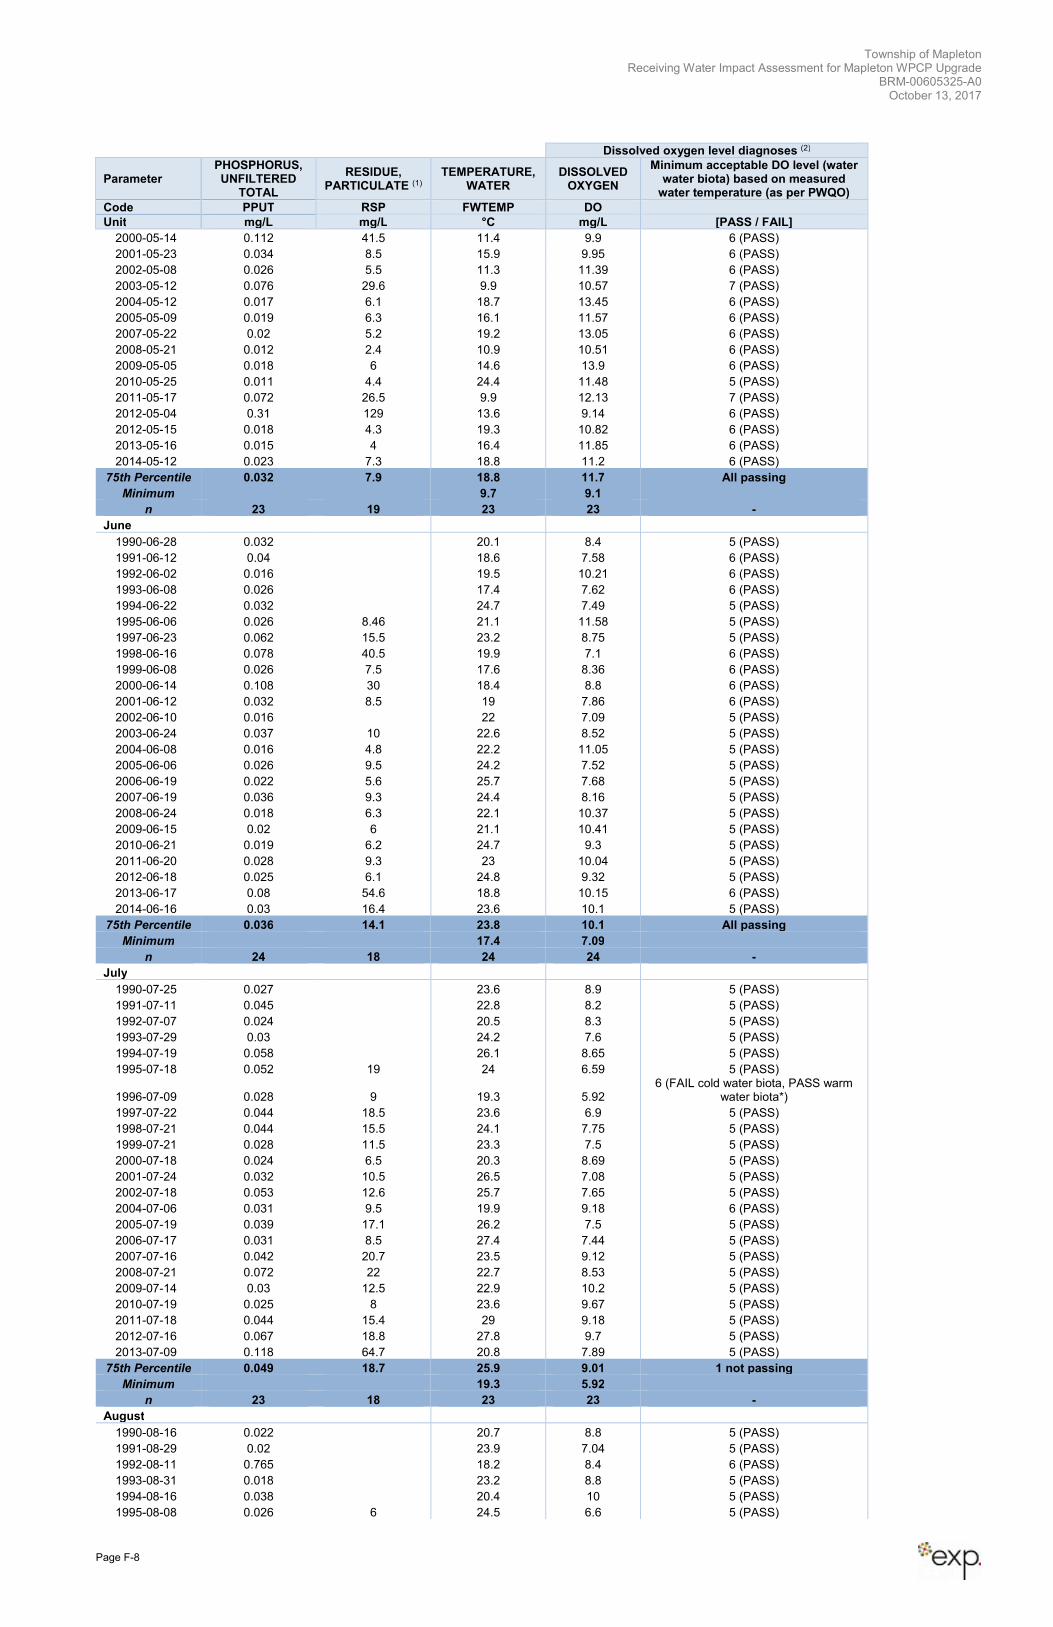
Township of Mapleton Receiving Water Impact Assessment for Mapleton WPCP Upgrade
BRM-00605325-A0 October 13, 2017
Page F-8
Dissolved oxygen level diagnoses (2)
Parameter PHOSPHORUS, UNFILTERED
TOTAL
RESIDUE, PARTICULATE (1)
TEMPERATURE, WATER
DISSOLVED OXYGEN
Minimum acceptable DO level (water water biota) based on measured
water temperature (as per PWQO)
Code PPUT RSP FWTEMP DO
Unit mg/L mg/L °C mg/L [PASS / FAIL]
2000-05-14 0.112 41.5 11.4 9.9 6 (PASS)
2001-05-23 0.034 8.5 15.9 9.95 6 (PASS)
2002-05-08 0.026 5.5 11.3 11.39 6 (PASS)
2003-05-12 0.076 29.6 9.9 10.57 7 (PASS)
2004-05-12 0.017 6.1 18.7 13.45 6 (PASS)
2005-05-09 0.019 6.3 16.1 11.57 6 (PASS)
2007-05-22 0.02 5.2 19.2 13.05 6 (PASS)
2008-05-21 0.012 2.4 10.9 10.51 6 (PASS)
2009-05-05 0.018 6 14.6 13.9 6 (PASS)
2010-05-25 0.011 4.4 24.4 11.48 5 (PASS)
2011-05-17 0.072 26.5 9.9 12.13 7 (PASS)
2012-05-04 0.31 129 13.6 9.14 6 (PASS)
2012-05-15 0.018 4.3 19.3 10.82 6 (PASS)
2013-05-16 0.015 4 16.4 11.85 6 (PASS)
2014-05-12 0.023 7.3 18.8 11.2 6 (PASS)
75th Percentile 0.032 7.9 18.8 11.7 All passing
Minimum 9.7 9.1
n 23 19 23 23 -
June
1990-06-28 0.032 20.1 8.4 5 (PASS)
1991-06-12 0.04 18.6 7.58 6 (PASS)
1992-06-02 0.016 19.5 10.21 6 (PASS)
1993-06-08 0.026 17.4 7.62 6 (PASS)
1994-06-22 0.032 24.7 7.49 5 (PASS)
1995-06-06 0.026 8.46 21.1 11.58 5 (PASS)
1997-06-23 0.062 15.5 23.2 8.75 5 (PASS)
1998-06-16 0.078 40.5 19.9 7.1 6 (PASS)
1999-06-08 0.026 7.5 17.6 8.36 6 (PASS)
2000-06-14 0.108 30 18.4 8.8 6 (PASS)
2001-06-12 0.032 8.5 19 7.86 6 (PASS)
2002-06-10 0.016 22 7.09 5 (PASS)
2003-06-24 0.037 10 22.6 8.52 5 (PASS)
2004-06-08 0.016 4.8 22.2 11.05 5 (PASS)
2005-06-06 0.026 9.5 24.2 7.52 5 (PASS)
2006-06-19 0.022 5.6 25.7 7.68 5 (PASS)
2007-06-19 0.036 9.3 24.4 8.16 5 (PASS)
2008-06-24 0.018 6.3 22.1 10.37 5 (PASS)
2009-06-15 0.02 6 21.1 10.41 5 (PASS)
2010-06-21 0.019 6.2 24.7 9.3 5 (PASS)
2011-06-20 0.028 9.3 23 10.04 5 (PASS)
2012-06-18 0.025 6.1 24.8 9.32 5 (PASS)
2013-06-17 0.08 54.6 18.8 10.15 6 (PASS)
2014-06-16 0.03 16.4 23.6 10.1 5 (PASS)
75th Percentile 0.036 14.1 23.8 10.1 All passing
Minimum 17.4 7.09
n 24 18 24 24 -
July
1990-07-25 0.027 23.6 8.9 5 (PASS)
1991-07-11 0.045 22.8 8.2 5 (PASS)
1992-07-07 0.024 20.5 8.3 5 (PASS)
1993-07-29 0.03 24.2 7.6 5 (PASS)
1994-07-19 0.058 26.1 8.65 5 (PASS)
1995-07-18 0.052 19 24 6.59 5 (PASS)
1996-07-09 0.028 9 19.3 5.92 6 (FAIL cold water biota, PASS warm
water biota*)
1997-07-22 0.044 18.5 23.6 6.9 5 (PASS)
1998-07-21 0.044 15.5 24.1 7.75 5 (PASS)
1999-07-21 0.028 11.5 23.3 7.5 5 (PASS)
2000-07-18 0.024 6.5 20.3 8.69 5 (PASS)
2001-07-24 0.032 10.5 26.5 7.08 5 (PASS)
2002-07-18 0.053 12.6 25.7 7.65 5 (PASS)
2004-07-06 0.031 9.5 19.9 9.18 6 (PASS)
2005-07-19 0.039 17.1 26.2 7.5 5 (PASS)
2006-07-17 0.031 8.5 27.4 7.44 5 (PASS)
2007-07-16 0.042 20.7 23.5 9.12 5 (PASS)
2008-07-21 0.072 22 22.7 8.53 5 (PASS)
2009-07-14 0.03 12.5 22.9 10.2 5 (PASS)
2010-07-19 0.025 8 23.6 9.67 5 (PASS)
2011-07-18 0.044 15.4 29 9.18 5 (PASS)
2012-07-16 0.067 18.8 27.8 9.7 5 (PASS)
2013-07-09 0.118 64.7 20.8 7.89 5 (PASS)
75th Percentile 0.049 18.7 25.9 9.01 1 not passing
Minimum 19.3 5.92
n 23 18 23 23 -
August
1990-08-16 0.022 20.7 8.8 5 (PASS)
1991-08-29 0.02 23.9 7.04 5 (PASS)
1992-08-11 0.765 18.2 8.4 6 (PASS)
1993-08-31 0.018 23.2 8.8 5 (PASS)
1994-08-16 0.038 20.4 10 5 (PASS)
1995-08-08 0.026 6 24.5 6.6 5 (PASS)
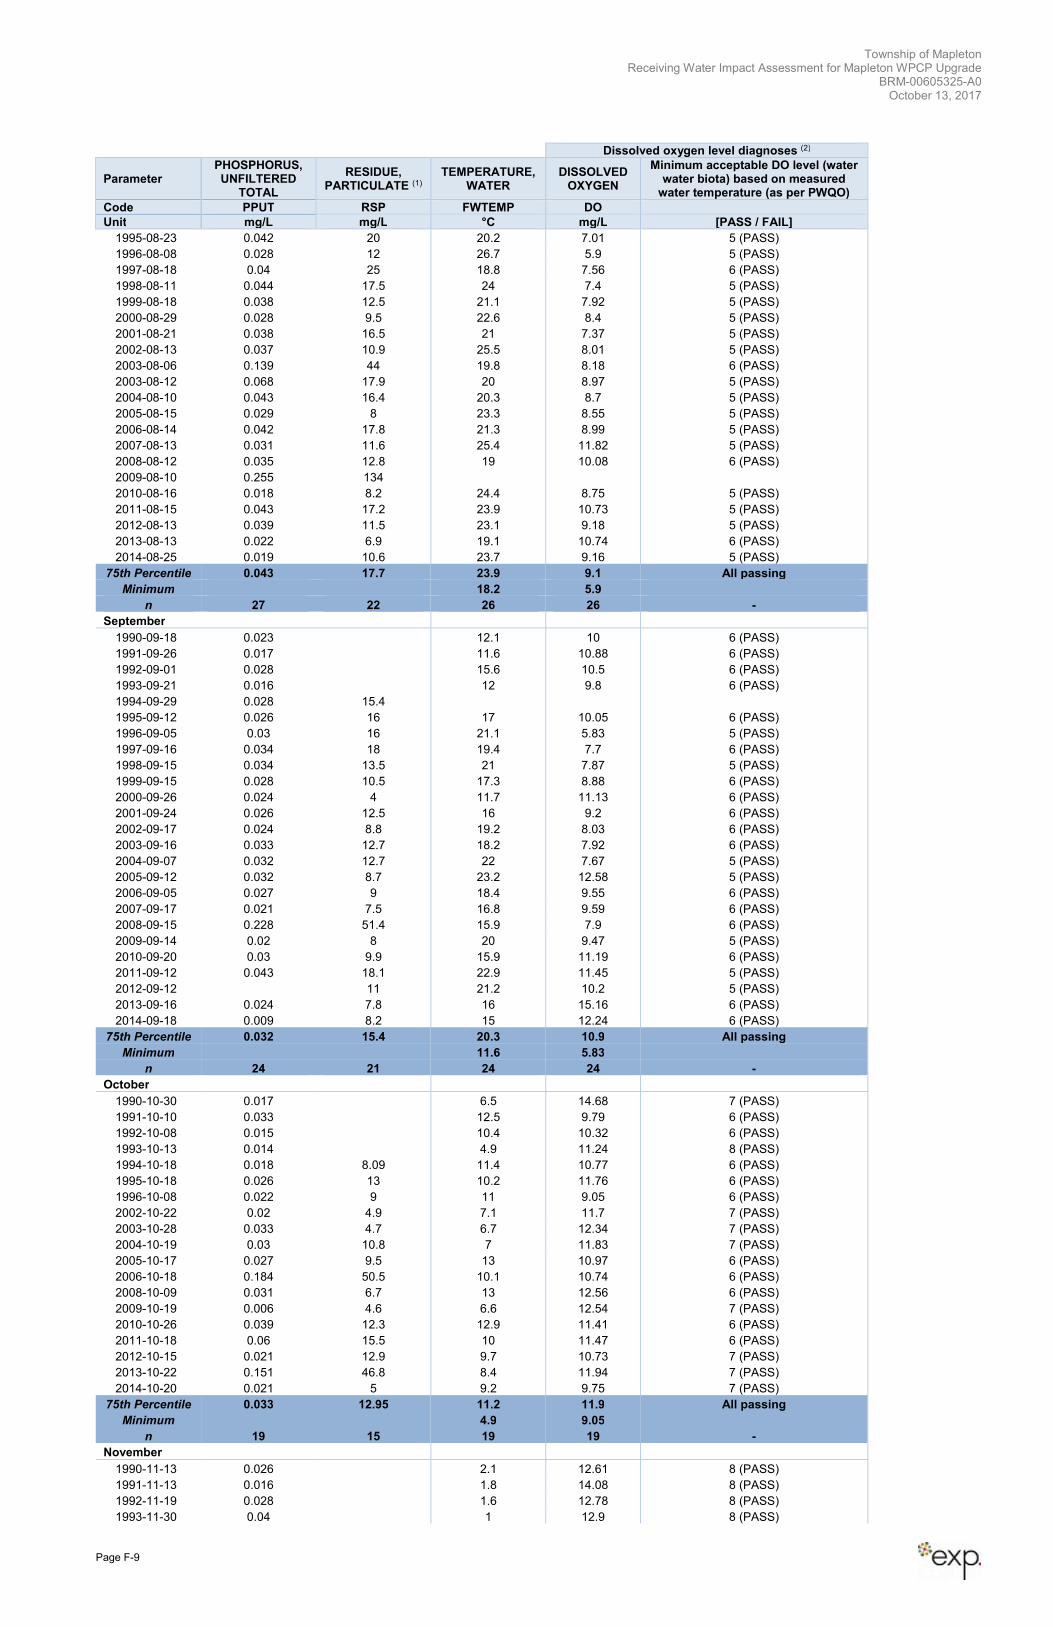
Township of Mapleton Receiving Water Impact Assessment for Mapleton WPCP Upgrade
BRM-00605325-A0 October 13, 2017
Page F-9
Dissolved oxygen level diagnoses (2)
Parameter PHOSPHORUS, UNFILTERED
TOTAL
RESIDUE, PARTICULATE (1)
TEMPERATURE, WATER
DISSOLVED OXYGEN
Minimum acceptable DO level (water water biota) based on measured
water temperature (as per PWQO)
Code PPUT RSP FWTEMP DO
Unit mg/L mg/L °C mg/L [PASS / FAIL]
1995-08-23 0.042 20 20.2 7.01 5 (PASS)
1996-08-08 0.028 12 26.7 5.9 5 (PASS)
1997-08-18 0.04 25 18.8 7.56 6 (PASS)
1998-08-11 0.044 17.5 24 7.4 5 (PASS)
1999-08-18 0.038 12.5 21.1 7.92 5 (PASS)
2000-08-29 0.028 9.5 22.6 8.4 5 (PASS)
2001-08-21 0.038 16.5 21 7.37 5 (PASS)
2002-08-13 0.037 10.9 25.5 8.01 5 (PASS)
2003-08-06 0.139 44 19.8 8.18 6 (PASS)
2003-08-12 0.068 17.9 20 8.97 5 (PASS)
2004-08-10 0.043 16.4 20.3 8.7 5 (PASS)
2005-08-15 0.029 8 23.3 8.55 5 (PASS)
2006-08-14 0.042 17.8 21.3 8.99 5 (PASS)
2007-08-13 0.031 11.6 25.4 11.82 5 (PASS)
2008-08-12 0.035 12.8 19 10.08 6 (PASS)
2009-08-10 0.255 134
2010-08-16 0.018 8.2 24.4 8.75 5 (PASS)
2011-08-15 0.043 17.2 23.9 10.73 5 (PASS)
2012-08-13 0.039 11.5 23.1 9.18 5 (PASS)
2013-08-13 0.022 6.9 19.1 10.74 6 (PASS)
2014-08-25 0.019 10.6 23.7 9.16 5 (PASS)
75th Percentile 0.043 17.7 23.9 9.1 All passing
Minimum 18.2 5.9
n 27 22 26 26 -
September
1990-09-18 0.023 12.1 10 6 (PASS)
1991-09-26 0.017 11.6 10.88 6 (PASS)
1992-09-01 0.028 15.6 10.5 6 (PASS)
1993-09-21 0.016 12 9.8 6 (PASS)
1994-09-29 0.028 15.4
1995-09-12 0.026 16 17 10.05 6 (PASS)
1996-09-05 0.03 16 21.1 5.83 5 (PASS)
1997-09-16 0.034 18 19.4 7.7 6 (PASS)
1998-09-15 0.034 13.5 21 7.87 5 (PASS)
1999-09-15 0.028 10.5 17.3 8.88 6 (PASS)
2000-09-26 0.024 4 11.7 11.13 6 (PASS)
2001-09-24 0.026 12.5 16 9.2 6 (PASS)
2002-09-17 0.024 8.8 19.2 8.03 6 (PASS)
2003-09-16 0.033 12.7 18.2 7.92 6 (PASS)
2004-09-07 0.032 12.7 22 7.67 5 (PASS)
2005-09-12 0.032 8.7 23.2 12.58 5 (PASS)
2006-09-05 0.027 9 18.4 9.55 6 (PASS)
2007-09-17 0.021 7.5 16.8 9.59 6 (PASS)
2008-09-15 0.228 51.4 15.9 7.9 6 (PASS)
2009-09-14 0.02 8 20 9.47 5 (PASS)
2010-09-20 0.03 9.9 15.9 11.19 6 (PASS)
2011-09-12 0.043 18.1 22.9 11.45 5 (PASS)
2012-09-12 11 21.2 10.2 5 (PASS)
2013-09-16 0.024 7.8 16 15.16 6 (PASS)
2014-09-18 0.009 8.2 15 12.24 6 (PASS)
75th Percentile 0.032 15.4 20.3 10.9 All passing
Minimum 11.6 5.83
n 24 21 24 24 -
October
1990-10-30 0.017 6.5 14.68 7 (PASS)
1991-10-10 0.033 12.5 9.79 6 (PASS)
1992-10-08 0.015 10.4 10.32 6 (PASS)
1993-10-13 0.014 4.9 11.24 8 (PASS)
1994-10-18 0.018 8.09 11.4 10.77 6 (PASS)
1995-10-18 0.026 13 10.2 11.76 6 (PASS)
1996-10-08 0.022 9 11 9.05 6 (PASS)
2002-10-22 0.02 4.9 7.1 11.7 7 (PASS)
2003-10-28 0.033 4.7 6.7 12.34 7 (PASS)
2004-10-19 0.03 10.8 7 11.83 7 (PASS)
2005-10-17 0.027 9.5 13 10.97 6 (PASS)
2006-10-18 0.184 50.5 10.1 10.74 6 (PASS)
2008-10-09 0.031 6.7 13 12.56 6 (PASS)
2009-10-19 0.006 4.6 6.6 12.54 7 (PASS)
2010-10-26 0.039 12.3 12.9 11.41 6 (PASS)
2011-10-18 0.06 15.5 10 11.47 6 (PASS)
2012-10-15 0.021 12.9 9.7 10.73 7 (PASS)
2013-10-22 0.151 46.8 8.4 11.94 7 (PASS)
2014-10-20 0.021 5 9.2 9.75 7 (PASS)
75th Percentile 0.033 12.95 11.2 11.9 All passing
Minimum 4.9 9.05
n 19 15 19 19 -
November
1990-11-13 0.026 2.1 12.61 8 (PASS)
1991-11-13 0.016 1.8 14.08 8 (PASS)
1992-11-19 0.028 1.6 12.78 8 (PASS)
1993-11-30 0.04 1 12.9 8 (PASS)
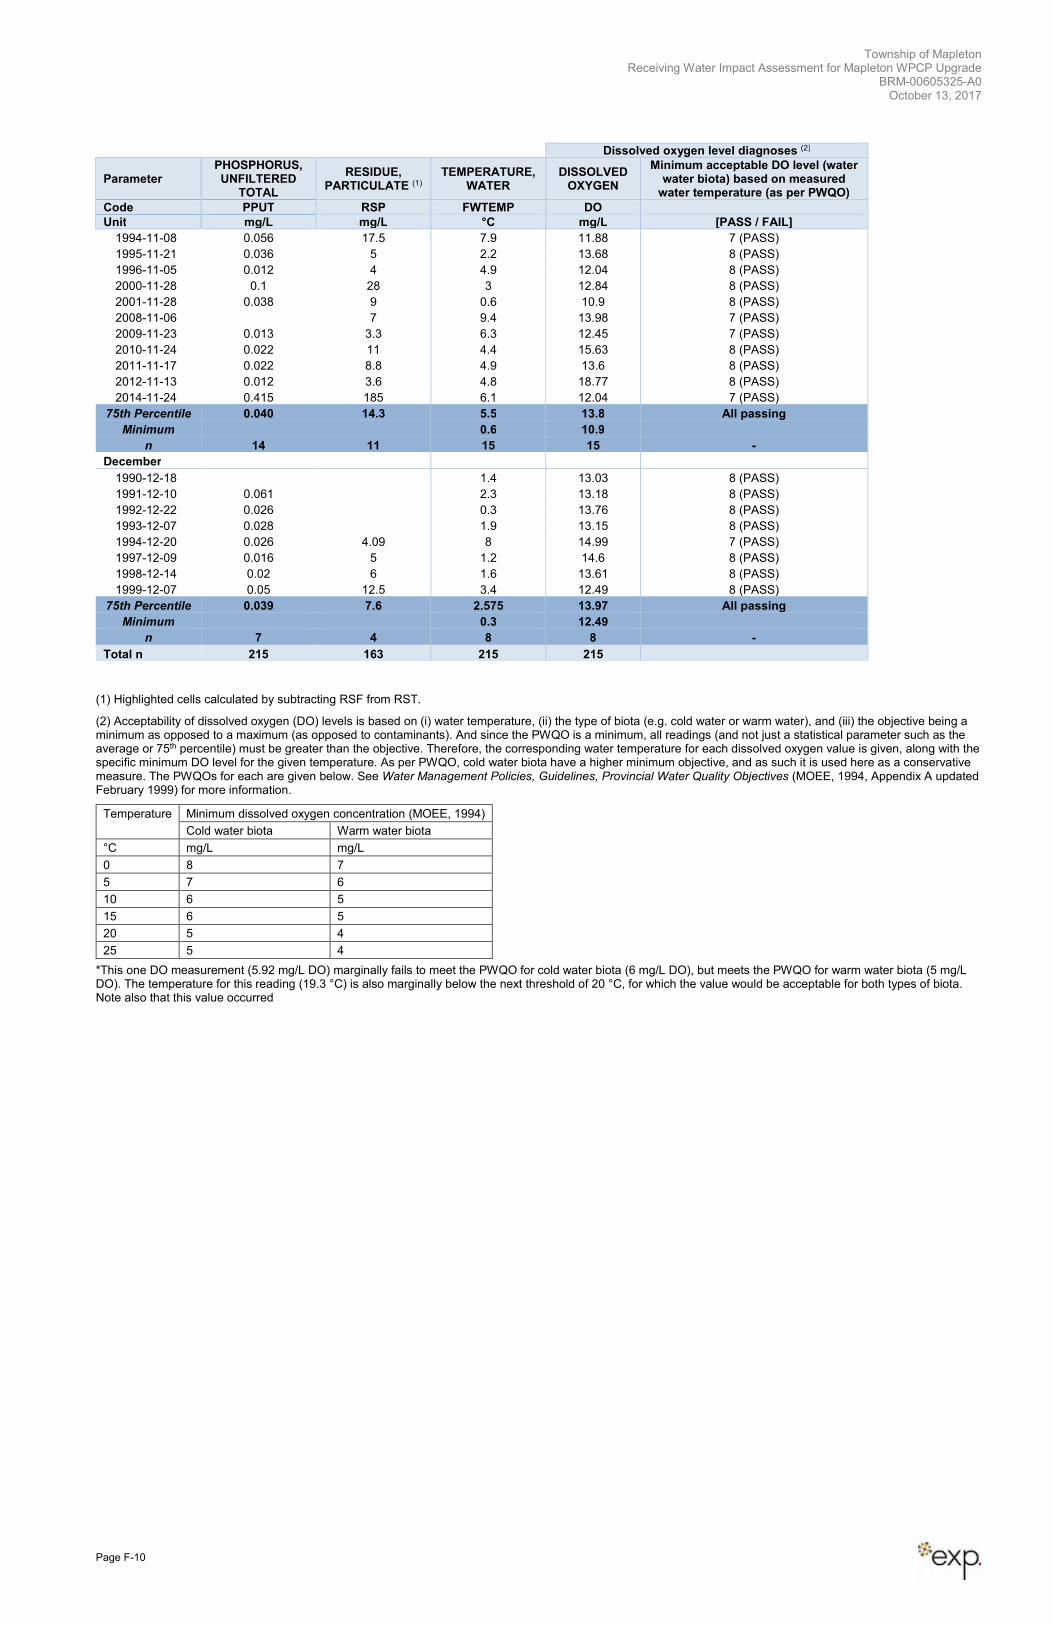
Township of Mapleton Receiving Water Impact Assessment for Mapleton WPCP Upgrade
BRM-00605325-A0 October 13, 2017
Page F-10
Dissolved oxygen level diagnoses (2)
Parameter PHOSPHORUS, UNFILTERED
TOTAL
RESIDUE, PARTICULATE (1)
TEMPERATURE, WATER
DISSOLVED OXYGEN
Minimum acceptable DO level (water water biota) based on measured
water temperature (as per PWQO)
Code PPUT RSP FWTEMP DO
Unit mg/L mg/L °C mg/L [PASS / FAIL]
1994-11-08 0.056 17.5 7.9 11.88 7 (PASS)
1995-11-21 0.036 5 2.2 13.68 8 (PASS)
1996-11-05 0.012 4 4.9 12.04 8 (PASS)
2000-11-28 0.1 28 3 12.84 8 (PASS)
2001-11-28 0.038 9 0.6 10.9 8 (PASS)
2008-11-06 7 9.4 13.98 7 (PASS)
2009-11-23 0.013 3.3 6.3 12.45 7 (PASS)
2010-11-24 0.022 11 4.4 15.63 8 (PASS)
2011-11-17 0.022 8.8 4.9 13.6 8 (PASS)
2012-11-13 0.012 3.6 4.8 18.77 8 (PASS)
2014-11-24 0.415 185 6.1 12.04 7 (PASS)
75th Percentile 0.040 14.3 5.5 13.8 All passing
Minimum 0.6 10.9
n 14 11 15 15 -
December
1990-12-18 1.4 13.03 8 (PASS)
1991-12-10 0.061 2.3 13.18 8 (PASS)
1992-12-22 0.026 0.3 13.76 8 (PASS)
1993-12-07 0.028 1.9 13.15 8 (PASS)
1994-12-20 0.026 4.09 8 14.99 7 (PASS)
1997-12-09 0.016 5 1.2 14.6 8 (PASS)
1998-12-14 0.02 6 1.6 13.61 8 (PASS)
1999-12-07 0.05 12.5 3.4 12.49 8 (PASS)
75th Percentile 0.039 7.6 2.575 13.97 All passing
Minimum 0.3 12.49
n 7 4 8 8 -
Total n 215 163 215 215
(1) Highlighted cells calculated by subtracting RSF from RST.
(2) Acceptability of dissolved oxygen (DO) levels is based on (i) water temperature, (ii) the type of biota (e.g. cold water or warm water), and (iii) the objective being a minimum as opposed to a maximum (as opposed to contaminants). And since the PWQO is a minimum, all readings (and not just a statistical parameter such as the average or 75th percentile) must be greater than the objective. Therefore, the corresponding water temperature for each dissolved oxygen value is given, along with the specific minimum DO level for the given temperature. As per PWQO, cold water biota have a higher minimum objective, and as such it is used here as a conservative measure. The PWQOs for each are given below. See Water Management Policies, Guidelines, Provincial Water Quality Objectives (MOEE, 1994, Appendix A updated February 1999) for more information.
Temperature Minimum dissolved oxygen concentration (MOEE, 1994)
Cold water biota Warm water biota
°C mg/L mg/L
0 8 7
5 7 6
10 6 5
15 6 5
20 5 4
25 5 4
*This one DO measurement (5.92 mg/L DO) marginally fails to meet the PWQO for cold water biota (6 mg/L DO), but meets the PWQO for warm water biota (5 mg/L DO). The temperature for this reading (19.3 °C) is also marginally below the next threshold of 20 °C, for which the value would be acceptable for both types of biota. Note also that this value occurred
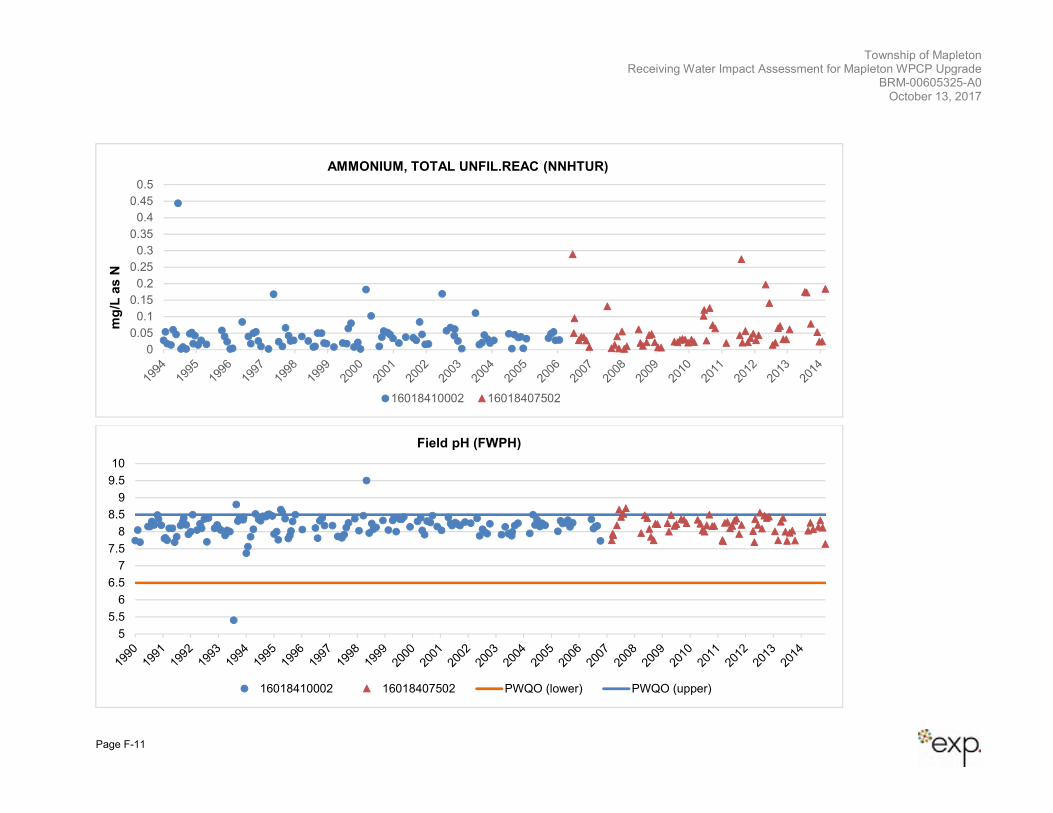
Township of Mapleton Receiving Water Impact Assessment for Mapleton WPCP Upgrade
BRM-00605325-A0 October 13, 2017
Page F-11
0
0.05
0.1
0.15
0.2
0.25
0.3
0.35
0.4
0.45
0.5
mg
/L a
s N
AMMONIUM, TOTAL UNFIL.REAC (NNHTUR)
16018410002 16018407502
5
5.5
6
6.5
7
7.5
8
8.5
9
9.5
10
Field pH (FWPH)
16018410002 16018407502 PWQO (lower) PWQO (upper)
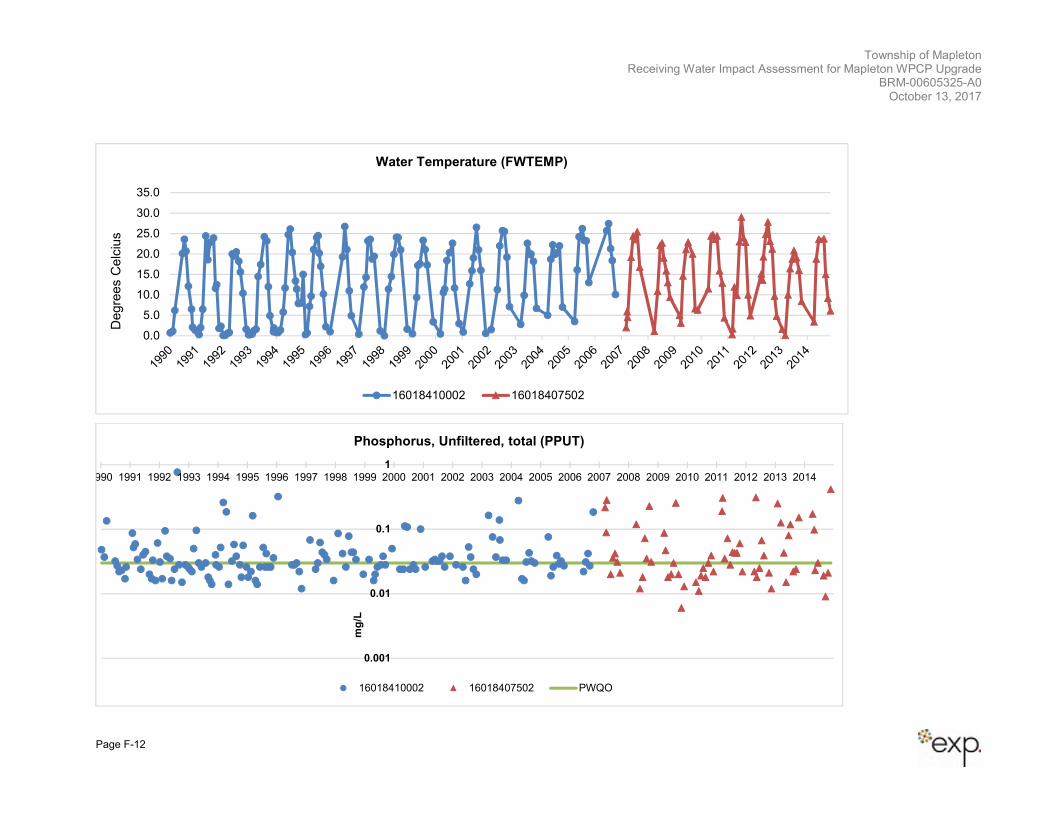
Township of Mapleton Receiving Water Impact Assessment for Mapleton WPCP Upgrade
BRM-00605325-A0 October 13, 2017
Page F-12
0.0
5.0
10.0
15.0
20.0
25.0
30.0
35.0
Degre
es C
elc
ius
Water Temperature (FWTEMP)
16018410002 16018407502
0.001
0.01
0.1
1
1990 1991 1992 1993 1994 1995 1996 1997 1998 1999 2000 2001 2002 2003 2004 2005 2006 2007 2008 2009 2010 2011 2012 2013 2014
mg
/L
Phosphorus, Unfiltered, total (PPUT)
16018410002 16018407502 PWQO
Township of Mapleton Receiving Water Impact Assessment for Mapleton WPCP Upgrade
BRM-00605325-A0 October 13, 2017
Page G-1
Appendix G: NH3 Calculation Table
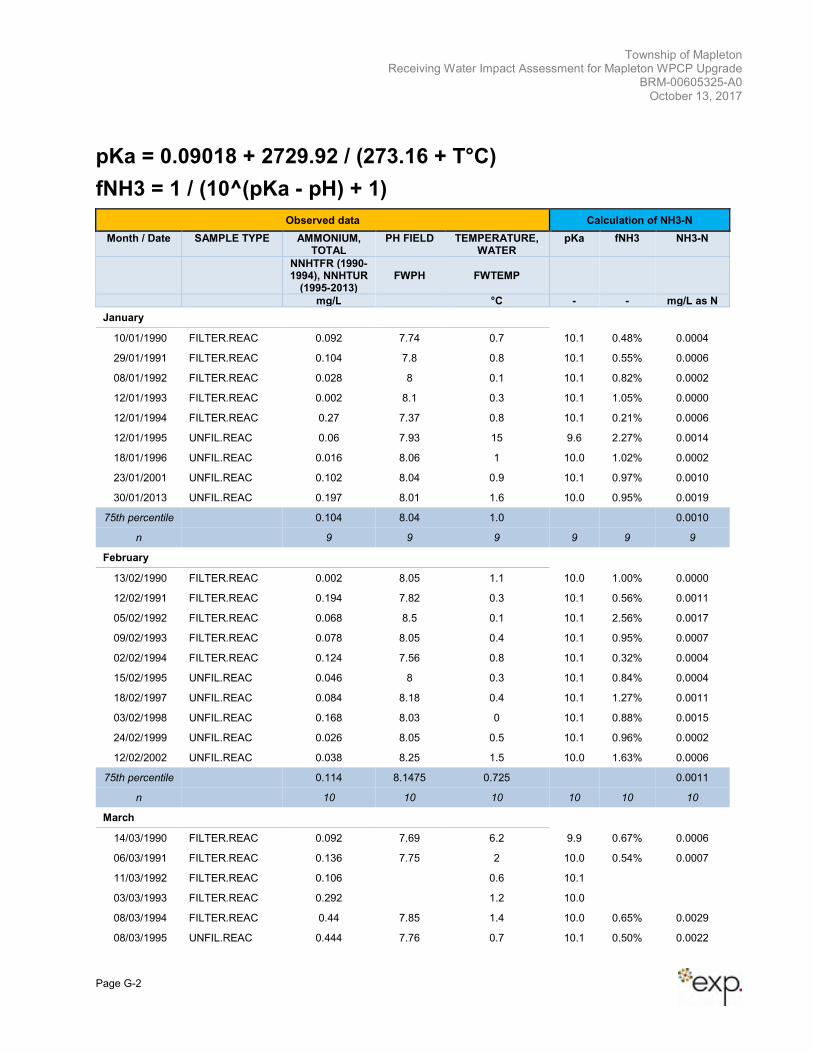
Township of Mapleton Receiving Water Impact Assessment for Mapleton WPCP Upgrade
BRM-00605325-A0 October 13, 2017
Page G-2
pKa = 0.09018 + 2729.92 / (273.16 + T°C)
fNH3 = 1 / (10^(pKa - pH) + 1)
Observed data Calculation of NH3-N
Month / Date SAMPLE TYPE AMMONIUM, TOTAL
PH FIELD TEMPERATURE, WATER
pKa fNH3 NH3-N
NNHTFR (1990-1994), NNHTUR
(1995-2013) FWPH FWTEMP
mg/L °C - - mg/L as N
January
10/01/1990 FILTER.REAC 0.092 7.74 0.7 10.1 0.48% 0.0004
29/01/1991 FILTER.REAC 0.104 7.8 0.8 10.1 0.55% 0.0006
08/01/1992 FILTER.REAC 0.028 8 0.1 10.1 0.82% 0.0002
12/01/1993 FILTER.REAC 0.002 8.1 0.3 10.1 1.05% 0.0000
12/01/1994 FILTER.REAC 0.27 7.37 0.8 10.1 0.21% 0.0006
12/01/1995 UNFIL.REAC 0.06 7.93 15 9.6 2.27% 0.0014
18/01/1996 UNFIL.REAC 0.016 8.06 1 10.0 1.02% 0.0002
23/01/2001 UNFIL.REAC 0.102 8.04 0.9 10.1 0.97% 0.0010
30/01/2013 UNFIL.REAC 0.197 8.01 1.6 10.0 0.95% 0.0019
75th percentile 0.104 8.04 1.0 0.0010
n 9 9 9 9 9 9
February
13/02/1990 FILTER.REAC 0.002 8.05 1.1 10.0 1.00% 0.0000
12/02/1991 FILTER.REAC 0.194 7.82 0.3 10.1 0.56% 0.0011
05/02/1992 FILTER.REAC 0.068 8.5 0.1 10.1 2.56% 0.0017
09/02/1993 FILTER.REAC 0.078 8.05 0.4 10.1 0.95% 0.0007
02/02/1994 FILTER.REAC 0.124 7.56 0.8 10.1 0.32% 0.0004
15/02/1995 UNFIL.REAC 0.046 8 0.3 10.1 0.84% 0.0004
18/02/1997 UNFIL.REAC 0.084 8.18 0.4 10.1 1.27% 0.0011
03/02/1998 UNFIL.REAC 0.168 8.03 0 10.1 0.88% 0.0015
24/02/1999 UNFIL.REAC 0.026 8.05 0.5 10.1 0.96% 0.0002
12/02/2002 UNFIL.REAC 0.038 8.25 1.5 10.0 1.63% 0.0006
75th percentile 0.114 8.1475 0.725 0.0011
n 10 10 10 10 10 10
March
14/03/1990 FILTER.REAC 0.092 7.69 6.2 9.9 0.67% 0.0006
06/03/1991 FILTER.REAC 0.136 7.75 2 10.0 0.54% 0.0007
11/03/1992 FILTER.REAC 0.106 0.6 10.1
03/03/1993 FILTER.REAC 0.292 1.2 10.0
08/03/1994 FILTER.REAC 0.44 7.85 1.4 10.0 0.65% 0.0029
08/03/1995 UNFIL.REAC 0.444 7.76 0.7 10.1 0.50% 0.0022
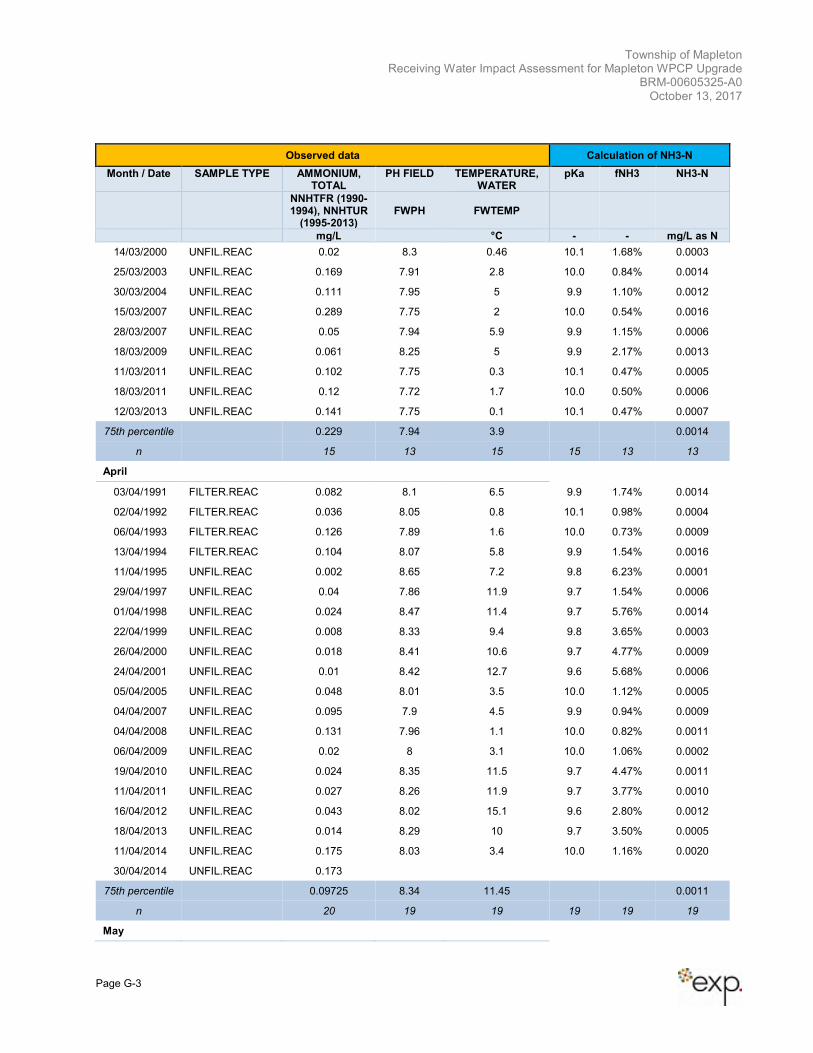
Township of Mapleton Receiving Water Impact Assessment for Mapleton WPCP Upgrade
BRM-00605325-A0 October 13, 2017
Page G-3
Observed data Calculation of NH3-N
Month / Date SAMPLE TYPE AMMONIUM, TOTAL
PH FIELD TEMPERATURE, WATER
pKa fNH3 NH3-N
NNHTFR (1990-1994), NNHTUR
(1995-2013) FWPH FWTEMP
mg/L °C - - mg/L as N
14/03/2000 UNFIL.REAC 0.02 8.3 0.46 10.1 1.68% 0.0003
25/03/2003 UNFIL.REAC 0.169 7.91 2.8 10.0 0.84% 0.0014
30/03/2004 UNFIL.REAC 0.111 7.95 5 9.9 1.10% 0.0012
15/03/2007 UNFIL.REAC 0.289 7.75 2 10.0 0.54% 0.0016
28/03/2007 UNFIL.REAC 0.05 7.94 5.9 9.9 1.15% 0.0006
18/03/2009 UNFIL.REAC 0.061 8.25 5 9.9 2.17% 0.0013
11/03/2011 UNFIL.REAC 0.102 7.75 0.3 10.1 0.47% 0.0005
18/03/2011 UNFIL.REAC 0.12 7.72 1.7 10.0 0.50% 0.0006
12/03/2013 UNFIL.REAC 0.141 7.75 0.1 10.1 0.47% 0.0007
75th percentile 0.229 7.94 3.9 0.0014
n 15 13 15 15 13 13
April
03/04/1991 FILTER.REAC 0.082 8.1 6.5 9.9 1.74% 0.0014
02/04/1992 FILTER.REAC 0.036 8.05 0.8 10.1 0.98% 0.0004
06/04/1993 FILTER.REAC 0.126 7.89 1.6 10.0 0.73% 0.0009
13/04/1994 FILTER.REAC 0.104 8.07 5.8 9.9 1.54% 0.0016
11/04/1995 UNFIL.REAC 0.002 8.65 7.2 9.8 6.23% 0.0001
29/04/1997 UNFIL.REAC 0.04 7.86 11.9 9.7 1.54% 0.0006
01/04/1998 UNFIL.REAC 0.024 8.47 11.4 9.7 5.76% 0.0014
22/04/1999 UNFIL.REAC 0.008 8.33 9.4 9.8 3.65% 0.0003
26/04/2000 UNFIL.REAC 0.018 8.41 10.6 9.7 4.77% 0.0009
24/04/2001 UNFIL.REAC 0.01 8.42 12.7 9.6 5.68% 0.0006
05/04/2005 UNFIL.REAC 0.048 8.01 3.5 10.0 1.12% 0.0005
04/04/2007 UNFIL.REAC 0.095 7.9 4.5 9.9 0.94% 0.0009
04/04/2008 UNFIL.REAC 0.131 7.96 1.1 10.0 0.82% 0.0011
06/04/2009 UNFIL.REAC 0.02 8 3.1 10.0 1.06% 0.0002
19/04/2010 UNFIL.REAC 0.024 8.35 11.5 9.7 4.47% 0.0011
11/04/2011 UNFIL.REAC 0.027 8.26 11.9 9.7 3.77% 0.0010
16/04/2012 UNFIL.REAC 0.043 8.02 15.1 9.6 2.80% 0.0012
18/04/2013 UNFIL.REAC 0.014 8.29 10 9.7 3.50% 0.0005
11/04/2014 UNFIL.REAC 0.175 8.03 3.4 10.0 1.16% 0.0020
30/04/2014 UNFIL.REAC 0.173
75th percentile 0.09725 8.34 11.45 0.0011
n 20 19 19 19 19 19
May
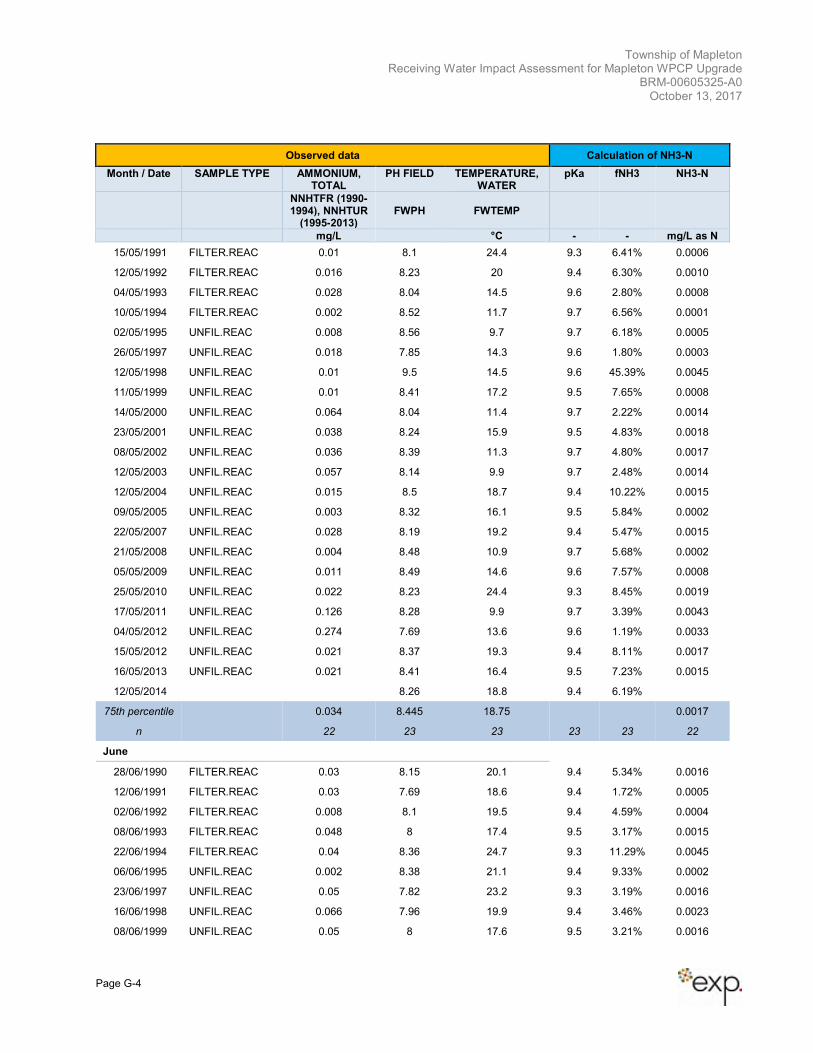
Township of Mapleton Receiving Water Impact Assessment for Mapleton WPCP Upgrade
BRM-00605325-A0 October 13, 2017
Page G-4
Observed data Calculation of NH3-N
Month / Date SAMPLE TYPE AMMONIUM, TOTAL
PH FIELD TEMPERATURE, WATER
pKa fNH3 NH3-N
NNHTFR (1990-1994), NNHTUR
(1995-2013) FWPH FWTEMP
mg/L °C - - mg/L as N
15/05/1991 FILTER.REAC 0.01 8.1 24.4 9.3 6.41% 0.0006
12/05/1992 FILTER.REAC 0.016 8.23 20 9.4 6.30% 0.0010
04/05/1993 FILTER.REAC 0.028 8.04 14.5 9.6 2.80% 0.0008
10/05/1994 FILTER.REAC 0.002 8.52 11.7 9.7 6.56% 0.0001
02/05/1995 UNFIL.REAC 0.008 8.56 9.7 9.7 6.18% 0.0005
26/05/1997 UNFIL.REAC 0.018 7.85 14.3 9.6 1.80% 0.0003
12/05/1998 UNFIL.REAC 0.01 9.5 14.5 9.6 45.39% 0.0045
11/05/1999 UNFIL.REAC 0.01 8.41 17.2 9.5 7.65% 0.0008
14/05/2000 UNFIL.REAC 0.064 8.04 11.4 9.7 2.22% 0.0014
23/05/2001 UNFIL.REAC 0.038 8.24 15.9 9.5 4.83% 0.0018
08/05/2002 UNFIL.REAC 0.036 8.39 11.3 9.7 4.80% 0.0017
12/05/2003 UNFIL.REAC 0.057 8.14 9.9 9.7 2.48% 0.0014
12/05/2004 UNFIL.REAC 0.015 8.5 18.7 9.4 10.22% 0.0015
09/05/2005 UNFIL.REAC 0.003 8.32 16.1 9.5 5.84% 0.0002
22/05/2007 UNFIL.REAC 0.028 8.19 19.2 9.4 5.47% 0.0015
21/05/2008 UNFIL.REAC 0.004 8.48 10.9 9.7 5.68% 0.0002
05/05/2009 UNFIL.REAC 0.011 8.49 14.6 9.6 7.57% 0.0008
25/05/2010 UNFIL.REAC 0.022 8.23 24.4 9.3 8.45% 0.0019
17/05/2011 UNFIL.REAC 0.126 8.28 9.9 9.7 3.39% 0.0043
04/05/2012 UNFIL.REAC 0.274 7.69 13.6 9.6 1.19% 0.0033
15/05/2012 UNFIL.REAC 0.021 8.37 19.3 9.4 8.11% 0.0017
16/05/2013 UNFIL.REAC 0.021 8.41 16.4 9.5 7.23% 0.0015
12/05/2014 8.26 18.8 9.4 6.19%
75th percentile 0.034 8.445 18.75 0.0017
n 22 23 23 23 23 22
June
28/06/1990 FILTER.REAC 0.03 8.15 20.1 9.4 5.34% 0.0016
12/06/1991 FILTER.REAC 0.03 7.69 18.6 9.4 1.72% 0.0005
02/06/1992 FILTER.REAC 0.008 8.1 19.5 9.4 4.59% 0.0004
08/06/1993 FILTER.REAC 0.048 8 17.4 9.5 3.17% 0.0015
22/06/1994 FILTER.REAC 0.04 8.36 24.7 9.3 11.29% 0.0045
06/06/1995 UNFIL.REAC 0.002 8.38 21.1 9.4 9.33% 0.0002
23/06/1997 UNFIL.REAC 0.05 7.82 23.2 9.3 3.19% 0.0016
16/06/1998 UNFIL.REAC 0.066 7.96 19.9 9.4 3.46% 0.0023
08/06/1999 UNFIL.REAC 0.05 8 17.6 9.5 3.21% 0.0016
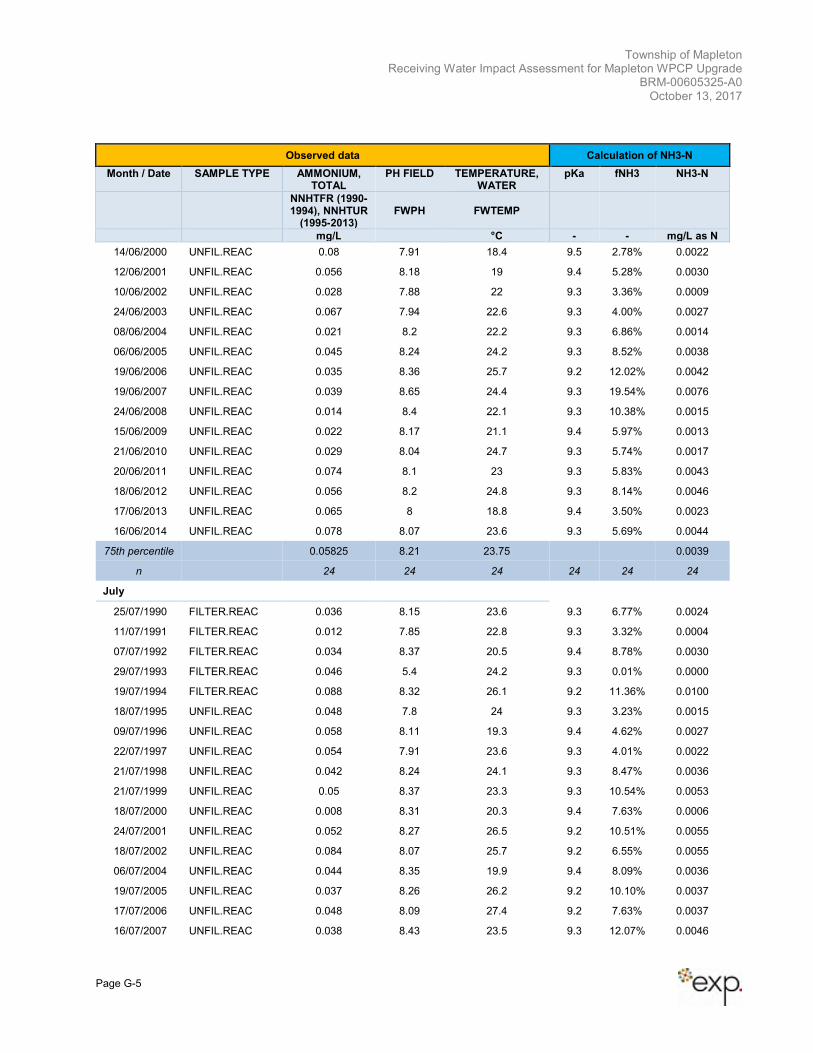
Township of Mapleton Receiving Water Impact Assessment for Mapleton WPCP Upgrade
BRM-00605325-A0 October 13, 2017
Page G-5
Observed data Calculation of NH3-N
Month / Date SAMPLE TYPE AMMONIUM, TOTAL
PH FIELD TEMPERATURE, WATER
pKa fNH3 NH3-N
NNHTFR (1990-1994), NNHTUR
(1995-2013) FWPH FWTEMP
mg/L °C - - mg/L as N
14/06/2000 UNFIL.REAC 0.08 7.91 18.4 9.5 2.78% 0.0022
12/06/2001 UNFIL.REAC 0.056 8.18 19 9.4 5.28% 0.0030
10/06/2002 UNFIL.REAC 0.028 7.88 22 9.3 3.36% 0.0009
24/06/2003 UNFIL.REAC 0.067 7.94 22.6 9.3 4.00% 0.0027
08/06/2004 UNFIL.REAC 0.021 8.2 22.2 9.3 6.86% 0.0014
06/06/2005 UNFIL.REAC 0.045 8.24 24.2 9.3 8.52% 0.0038
19/06/2006 UNFIL.REAC 0.035 8.36 25.7 9.2 12.02% 0.0042
19/06/2007 UNFIL.REAC 0.039 8.65 24.4 9.3 19.54% 0.0076
24/06/2008 UNFIL.REAC 0.014 8.4 22.1 9.3 10.38% 0.0015
15/06/2009 UNFIL.REAC 0.022 8.17 21.1 9.4 5.97% 0.0013
21/06/2010 UNFIL.REAC 0.029 8.04 24.7 9.3 5.74% 0.0017
20/06/2011 UNFIL.REAC 0.074 8.1 23 9.3 5.83% 0.0043
18/06/2012 UNFIL.REAC 0.056 8.2 24.8 9.3 8.14% 0.0046
17/06/2013 UNFIL.REAC 0.065 8 18.8 9.4 3.50% 0.0023
16/06/2014 UNFIL.REAC 0.078 8.07 23.6 9.3 5.69% 0.0044
75th percentile 0.05825 8.21 23.75 0.0039
n 24 24 24 24 24 24
July
25/07/1990 FILTER.REAC 0.036 8.15 23.6 9.3 6.77% 0.0024
11/07/1991 FILTER.REAC 0.012 7.85 22.8 9.3 3.32% 0.0004
07/07/1992 FILTER.REAC 0.034 8.37 20.5 9.4 8.78% 0.0030
29/07/1993 FILTER.REAC 0.046 5.4 24.2 9.3 0.01% 0.0000
19/07/1994 FILTER.REAC 0.088 8.32 26.1 9.2 11.36% 0.0100
18/07/1995 UNFIL.REAC 0.048 7.8 24 9.3 3.23% 0.0015
09/07/1996 UNFIL.REAC 0.058 8.11 19.3 9.4 4.62% 0.0027
22/07/1997 UNFIL.REAC 0.054 7.91 23.6 9.3 4.01% 0.0022
21/07/1998 UNFIL.REAC 0.042 8.24 24.1 9.3 8.47% 0.0036
21/07/1999 UNFIL.REAC 0.05 8.37 23.3 9.3 10.54% 0.0053
18/07/2000 UNFIL.REAC 0.008 8.31 20.3 9.4 7.63% 0.0006
24/07/2001 UNFIL.REAC 0.052 8.27 26.5 9.2 10.51% 0.0055
18/07/2002 UNFIL.REAC 0.084 8.07 25.7 9.2 6.55% 0.0055
06/07/2004 UNFIL.REAC 0.044 8.35 19.9 9.4 8.09% 0.0036
19/07/2005 UNFIL.REAC 0.037 8.26 26.2 9.2 10.10% 0.0037
17/07/2006 UNFIL.REAC 0.048 8.09 27.4 9.2 7.63% 0.0037
16/07/2007 UNFIL.REAC 0.038 8.43 23.5 9.3 12.07% 0.0046
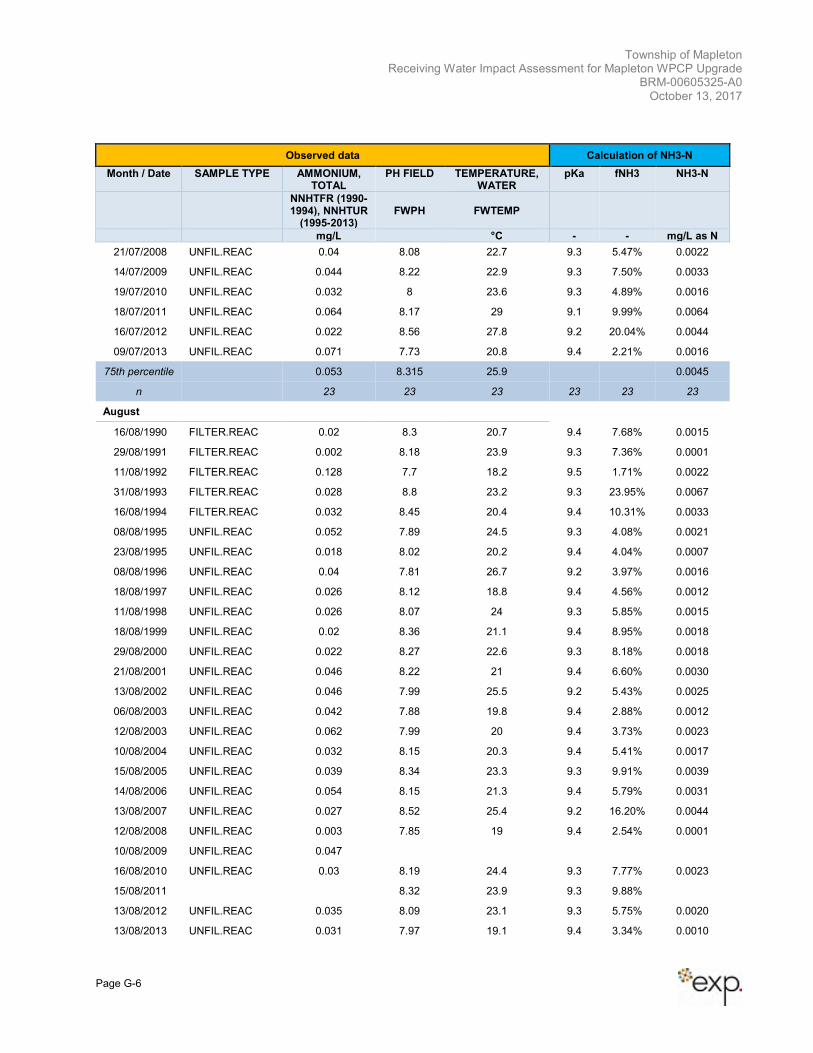
Township of Mapleton Receiving Water Impact Assessment for Mapleton WPCP Upgrade
BRM-00605325-A0 October 13, 2017
Page G-6
Observed data Calculation of NH3-N
Month / Date SAMPLE TYPE AMMONIUM, TOTAL
PH FIELD TEMPERATURE, WATER
pKa fNH3 NH3-N
NNHTFR (1990-1994), NNHTUR
(1995-2013) FWPH FWTEMP
mg/L °C - - mg/L as N
21/07/2008 UNFIL.REAC 0.04 8.08 22.7 9.3 5.47% 0.0022
14/07/2009 UNFIL.REAC 0.044 8.22 22.9 9.3 7.50% 0.0033
19/07/2010 UNFIL.REAC 0.032 8 23.6 9.3 4.89% 0.0016
18/07/2011 UNFIL.REAC 0.064 8.17 29 9.1 9.99% 0.0064
16/07/2012 UNFIL.REAC 0.022 8.56 27.8 9.2 20.04% 0.0044
09/07/2013 UNFIL.REAC 0.071 7.73 20.8 9.4 2.21% 0.0016
75th percentile 0.053 8.315 25.9 0.0045
n 23 23 23 23 23 23
August
16/08/1990 FILTER.REAC 0.02 8.3 20.7 9.4 7.68% 0.0015
29/08/1991 FILTER.REAC 0.002 8.18 23.9 9.3 7.36% 0.0001
11/08/1992 FILTER.REAC 0.128 7.7 18.2 9.5 1.71% 0.0022
31/08/1993 FILTER.REAC 0.028 8.8 23.2 9.3 23.95% 0.0067
16/08/1994 FILTER.REAC 0.032 8.45 20.4 9.4 10.31% 0.0033
08/08/1995 UNFIL.REAC 0.052 7.89 24.5 9.3 4.08% 0.0021
23/08/1995 UNFIL.REAC 0.018 8.02 20.2 9.4 4.04% 0.0007
08/08/1996 UNFIL.REAC 0.04 7.81 26.7 9.2 3.97% 0.0016
18/08/1997 UNFIL.REAC 0.026 8.12 18.8 9.4 4.56% 0.0012
11/08/1998 UNFIL.REAC 0.026 8.07 24 9.3 5.85% 0.0015
18/08/1999 UNFIL.REAC 0.02 8.36 21.1 9.4 8.95% 0.0018
29/08/2000 UNFIL.REAC 0.022 8.27 22.6 9.3 8.18% 0.0018
21/08/2001 UNFIL.REAC 0.046 8.22 21 9.4 6.60% 0.0030
13/08/2002 UNFIL.REAC 0.046 7.99 25.5 9.2 5.43% 0.0025
06/08/2003 UNFIL.REAC 0.042 7.88 19.8 9.4 2.88% 0.0012
12/08/2003 UNFIL.REAC 0.062 7.99 20 9.4 3.73% 0.0023
10/08/2004 UNFIL.REAC 0.032 8.15 20.3 9.4 5.41% 0.0017
15/08/2005 UNFIL.REAC 0.039 8.34 23.3 9.3 9.91% 0.0039
14/08/2006 UNFIL.REAC 0.054 8.15 21.3 9.4 5.79% 0.0031
13/08/2007 UNFIL.REAC 0.027 8.52 25.4 9.2 16.20% 0.0044
12/08/2008 UNFIL.REAC 0.003 7.85 19 9.4 2.54% 0.0001
10/08/2009 UNFIL.REAC 0.047
16/08/2010 UNFIL.REAC 0.03 8.19 24.4 9.3 7.77% 0.0023
15/08/2011 8.32 23.9 9.3 9.88%
13/08/2012 UNFIL.REAC 0.035 8.09 23.1 9.3 5.75% 0.0020
13/08/2013 UNFIL.REAC 0.031 7.97 19.1 9.4 3.34% 0.0010
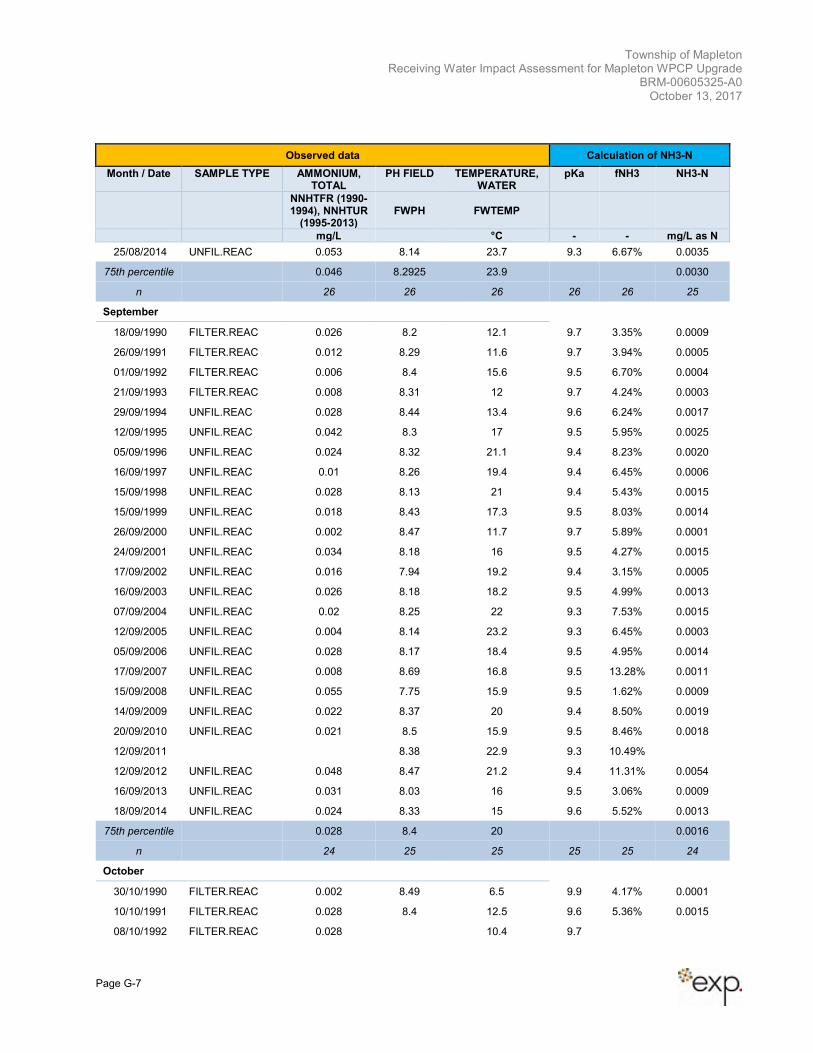
Township of Mapleton Receiving Water Impact Assessment for Mapleton WPCP Upgrade
BRM-00605325-A0 October 13, 2017
Page G-7
Observed data Calculation of NH3-N
Month / Date SAMPLE TYPE AMMONIUM, TOTAL
PH FIELD TEMPERATURE, WATER
pKa fNH3 NH3-N
NNHTFR (1990-1994), NNHTUR
(1995-2013) FWPH FWTEMP
mg/L °C - - mg/L as N
25/08/2014 UNFIL.REAC 0.053 8.14 23.7 9.3 6.67% 0.0035
75th percentile 0.046 8.2925 23.9 0.0030
n 26 26 26 26 26 25
September
18/09/1990 FILTER.REAC 0.026 8.2 12.1 9.7 3.35% 0.0009
26/09/1991 FILTER.REAC 0.012 8.29 11.6 9.7 3.94% 0.0005
01/09/1992 FILTER.REAC 0.006 8.4 15.6 9.5 6.70% 0.0004
21/09/1993 FILTER.REAC 0.008 8.31 12 9.7 4.24% 0.0003
29/09/1994 UNFIL.REAC 0.028 8.44 13.4 9.6 6.24% 0.0017
12/09/1995 UNFIL.REAC 0.042 8.3 17 9.5 5.95% 0.0025
05/09/1996 UNFIL.REAC 0.024 8.32 21.1 9.4 8.23% 0.0020
16/09/1997 UNFIL.REAC 0.01 8.26 19.4 9.4 6.45% 0.0006
15/09/1998 UNFIL.REAC 0.028 8.13 21 9.4 5.43% 0.0015
15/09/1999 UNFIL.REAC 0.018 8.43 17.3 9.5 8.03% 0.0014
26/09/2000 UNFIL.REAC 0.002 8.47 11.7 9.7 5.89% 0.0001
24/09/2001 UNFIL.REAC 0.034 8.18 16 9.5 4.27% 0.0015
17/09/2002 UNFIL.REAC 0.016 7.94 19.2 9.4 3.15% 0.0005
16/09/2003 UNFIL.REAC 0.026 8.18 18.2 9.5 4.99% 0.0013
07/09/2004 UNFIL.REAC 0.02 8.25 22 9.3 7.53% 0.0015
12/09/2005 UNFIL.REAC 0.004 8.14 23.2 9.3 6.45% 0.0003
05/09/2006 UNFIL.REAC 0.028 8.17 18.4 9.5 4.95% 0.0014
17/09/2007 UNFIL.REAC 0.008 8.69 16.8 9.5 13.28% 0.0011
15/09/2008 UNFIL.REAC 0.055 7.75 15.9 9.5 1.62% 0.0009
14/09/2009 UNFIL.REAC 0.022 8.37 20 9.4 8.50% 0.0019
20/09/2010 UNFIL.REAC 0.021 8.5 15.9 9.5 8.46% 0.0018
12/09/2011 8.38 22.9 9.3 10.49%
12/09/2012 UNFIL.REAC 0.048 8.47 21.2 9.4 11.31% 0.0054
16/09/2013 UNFIL.REAC 0.031 8.03 16 9.5 3.06% 0.0009
18/09/2014 UNFIL.REAC 0.024 8.33 15 9.6 5.52% 0.0013
75th percentile 0.028 8.4 20 0.0016
n 24 25 25 25 25 24
October
30/10/1990 FILTER.REAC 0.002 8.49 6.5 9.9 4.17% 0.0001
10/10/1991 FILTER.REAC 0.028 8.4 12.5 9.6 5.36% 0.0015
08/10/1992 FILTER.REAC 0.028 10.4 9.7
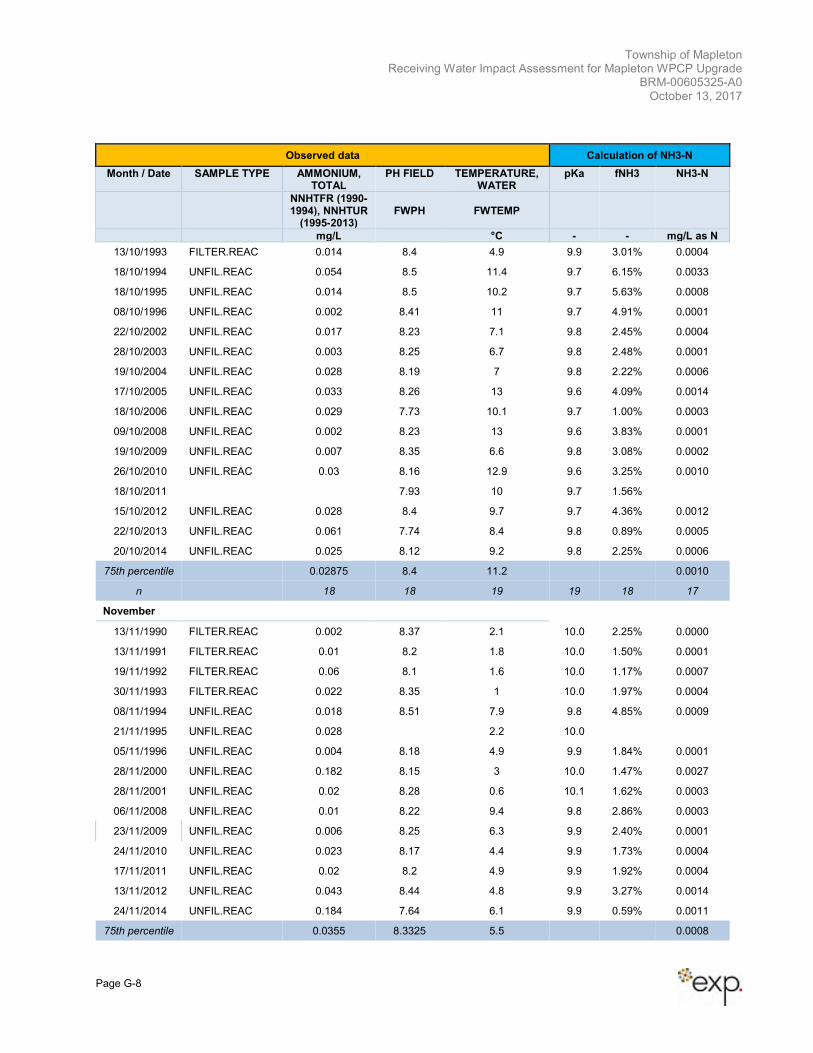
Township of Mapleton Receiving Water Impact Assessment for Mapleton WPCP Upgrade
BRM-00605325-A0 October 13, 2017
Page G-8
Observed data Calculation of NH3-N
Month / Date SAMPLE TYPE AMMONIUM, TOTAL
PH FIELD TEMPERATURE, WATER
pKa fNH3 NH3-N
NNHTFR (1990-1994), NNHTUR
(1995-2013) FWPH FWTEMP
mg/L °C - - mg/L as N
13/10/1993 FILTER.REAC 0.014 8.4 4.9 9.9 3.01% 0.0004
18/10/1994 UNFIL.REAC 0.054 8.5 11.4 9.7 6.15% 0.0033
18/10/1995 UNFIL.REAC 0.014 8.5 10.2 9.7 5.63% 0.0008
08/10/1996 UNFIL.REAC 0.002 8.41 11 9.7 4.91% 0.0001
22/10/2002 UNFIL.REAC 0.017 8.23 7.1 9.8 2.45% 0.0004
28/10/2003 UNFIL.REAC 0.003 8.25 6.7 9.8 2.48% 0.0001
19/10/2004 UNFIL.REAC 0.028 8.19 7 9.8 2.22% 0.0006
17/10/2005 UNFIL.REAC 0.033 8.26 13 9.6 4.09% 0.0014
18/10/2006 UNFIL.REAC 0.029 7.73 10.1 9.7 1.00% 0.0003
09/10/2008 UNFIL.REAC 0.002 8.23 13 9.6 3.83% 0.0001
19/10/2009 UNFIL.REAC 0.007 8.35 6.6 9.8 3.08% 0.0002
26/10/2010 UNFIL.REAC 0.03 8.16 12.9 9.6 3.25% 0.0010
18/10/2011 7.93 10 9.7 1.56%
15/10/2012 UNFIL.REAC 0.028 8.4 9.7 9.7 4.36% 0.0012
22/10/2013 UNFIL.REAC 0.061 7.74 8.4 9.8 0.89% 0.0005
20/10/2014 UNFIL.REAC 0.025 8.12 9.2 9.8 2.25% 0.0006
75th percentile 0.02875 8.4 11.2 0.0010
n 18 18 19 19 18 17
November
13/11/1990 FILTER.REAC 0.002 8.37 2.1 10.0 2.25% 0.0000
13/11/1991 FILTER.REAC 0.01 8.2 1.8 10.0 1.50% 0.0001
19/11/1992 FILTER.REAC 0.06 8.1 1.6 10.0 1.17% 0.0007
30/11/1993 FILTER.REAC 0.022 8.35 1 10.0 1.97% 0.0004
08/11/1994 UNFIL.REAC 0.018 8.51 7.9 9.8 4.85% 0.0009
21/11/1995 UNFIL.REAC 0.028 2.2 10.0
05/11/1996 UNFIL.REAC 0.004 8.18 4.9 9.9 1.84% 0.0001
28/11/2000 UNFIL.REAC 0.182 8.15 3 10.0 1.47% 0.0027
28/11/2001 UNFIL.REAC 0.02 8.28 0.6 10.1 1.62% 0.0003
06/11/2008 UNFIL.REAC 0.01 8.22 9.4 9.8 2.86% 0.0003
23/11/2009 UNFIL.REAC 0.006 8.25 6.3 9.9 2.40% 0.0001
24/11/2010 UNFIL.REAC 0.023 8.17 4.4 9.9 1.73% 0.0004
17/11/2011 UNFIL.REAC 0.02 8.2 4.9 9.9 1.92% 0.0004
13/11/2012 UNFIL.REAC 0.043 8.44 4.8 9.9 3.27% 0.0014
24/11/2014 UNFIL.REAC 0.184 7.64 6.1 9.9 0.59% 0.0011
75th percentile 0.0355 8.3325 5.5 0.0008
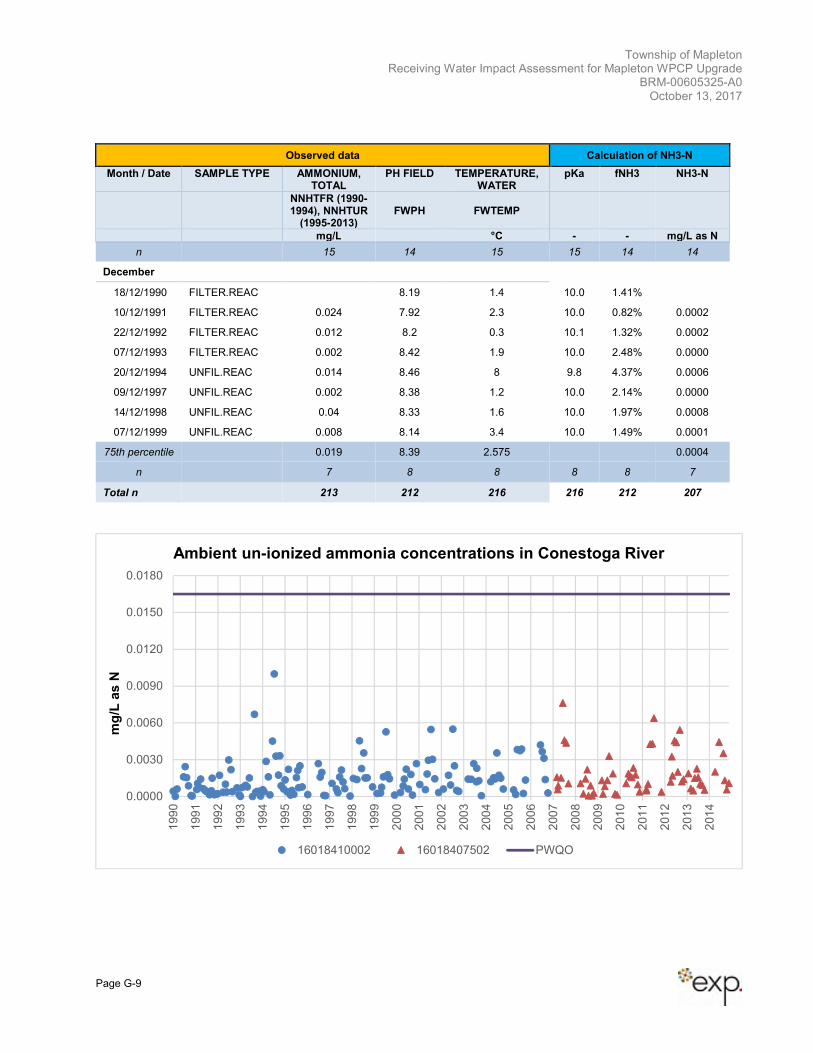
Township of Mapleton Receiving Water Impact Assessment for Mapleton WPCP Upgrade
BRM-00605325-A0 October 13, 2017
Page G-9
Observed data Calculation of NH3-N
Month / Date SAMPLE TYPE AMMONIUM, TOTAL
PH FIELD TEMPERATURE, WATER
pKa fNH3 NH3-N
NNHTFR (1990-1994), NNHTUR
(1995-2013) FWPH FWTEMP
mg/L °C - - mg/L as N
n 15 14 15 15 14 14
December
18/12/1990 FILTER.REAC 8.19 1.4 10.0 1.41%
10/12/1991 FILTER.REAC 0.024 7.92 2.3 10.0 0.82% 0.0002
22/12/1992 FILTER.REAC 0.012 8.2 0.3 10.1 1.32% 0.0002
07/12/1993 FILTER.REAC 0.002 8.42 1.9 10.0 2.48% 0.0000
20/12/1994 UNFIL.REAC 0.014 8.46 8 9.8 4.37% 0.0006
09/12/1997 UNFIL.REAC 0.002 8.38 1.2 10.0 2.14% 0.0000
14/12/1998 UNFIL.REAC 0.04 8.33 1.6 10.0 1.97% 0.0008
07/12/1999 UNFIL.REAC 0.008 8.14 3.4 10.0 1.49% 0.0001
75th percentile 0.019 8.39 2.575 0.0004
n 7 8 8 8 8 7
Total n 213 212 216 216 212 207
0.0000
0.0030
0.0060
0.0090
0.0120
0.0150
0.0180
199
0
199
1
199
2
199
3
199
4
199
5
199
6
199
7
199
8
199
9
200
0
200
1
200
2
200
3
200
4
200
5
200
6
200
7
200
8
200
9
201
0
201
1
201
2
201
3
201
4
mg
/L a
s N
Ambient un-ionized ammonia concentrations in Conestoga River
16018410002 16018407502 PWQO
Township of Mapleton Receiving Water Impact Assessment for Mapleton WPCP Upgrade
BRM-00605325-A0 October 13, 2017
Appendix H: Dye Tracer Study Report
202-501 Krug Street, Kitchener, ON N2B 1L3 │519-576-1711
www.environmentalsciences.ca
M200117_Mapleton Nov 2016 Dye Study-updated draft.docx
Memorandum – DRAFT
Date: January 20, 2017
To: Brad McRoberts (Township of Mapleton)
From: Tara Roumeliotis and Deborah Sinclair
Re: Mapleton WWTF – Dye Tracer Study in Conestoga River
1. Introduction
The Township of Mapleton (Township) is undertaking a Schedule C Class Environmental Assessment (EA)
of the Mapleton Wastewater Treatment Facility (WWTF) to meet predicted future wastewater demands. A
Receiving Water Impact Assessment (RWIA) was completed by Exp. Services Inc. (Exp) in April 2016. As
a condition of approval of the RWIA, the Ministry of the Environment and Climate Change (MOECC)
required that the Township undertake a dye tracer study to verify the mixing zone of the wastewater
discharge. Hutchinson Environmental Sciences Limited (HESL) was retained by the Township to complete
the dye tracer study. The purpose of the dye tracer study was to delineate the extent of the mixing zone in
the Conestoga River, and to measure the dilution of the effluent in the mixing zone.
1.1 Study Area
The Mapleton WWTF is located at 7101 Sideroad 15 in Drayton, Ontario. The Mapleton WWTF discharges
treated wastewater to a receiving channel located in a wetland area. The receiving channel discharges in
to the Conestoga River approximately 305 m downstream of the WWTF outfall. The receiving channel
enters the northern side of the Conestoga River at a widening of the river (Figure 1). At this location, a
small island (approximately 70 m long by 10 m wide) divides the Conestoga River into two distinct channels
with areas of connectivity between the two channels throughout the island (Photograph 1). The Conestoga
River flows approximately 950 m from its confluence with the WWTF-receiving channel before discharging
in to the north east arm of Conestoga Lake (at the Concession 8 bridge, Figure 1).
1.2 Mapleton WWTF Environmental Compliance Approval and AgencyConsultation
The Mapleton WWTF discharges on a seasonal basis, according to its Environmental Compliance Approval
(ECA) #0963-A4ZMVA, which sets out the following schedule:
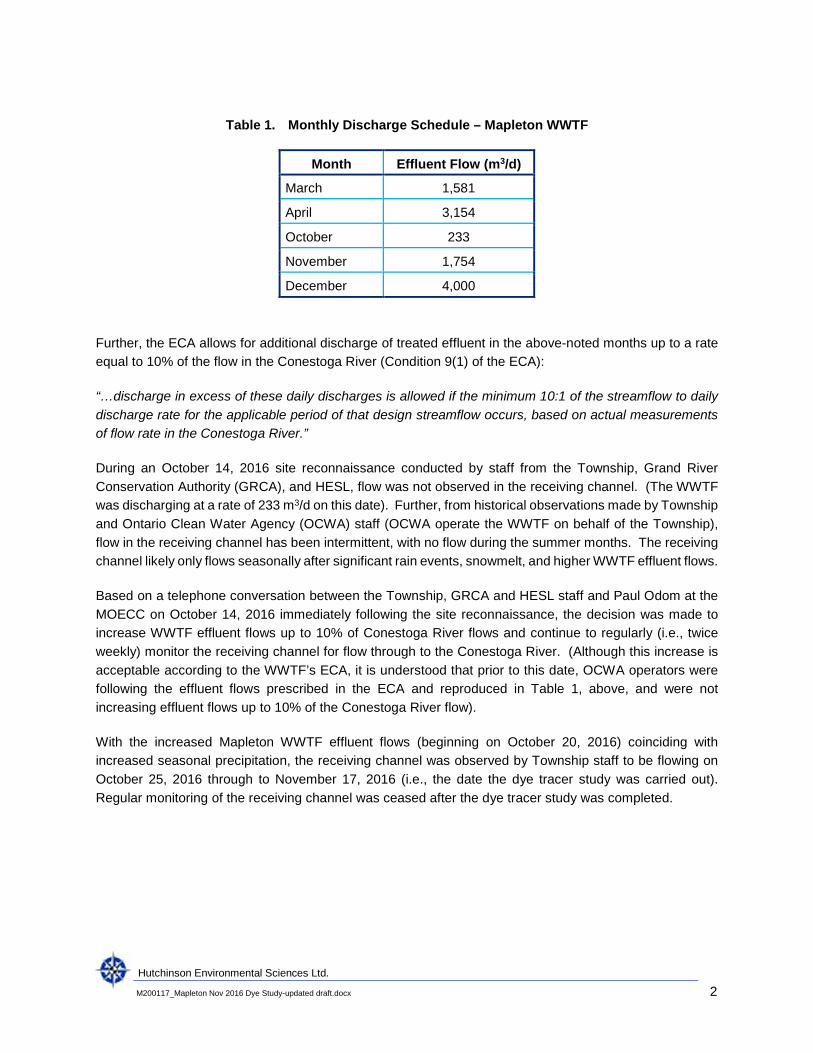
Hutchinson Environmental Sciences Ltd.
M200117_Mapleton Nov 2016 Dye Study-updated draft.docx 2
Table 1. Monthly Discharge Schedule – Mapleton WWTF
Month Effluent Flow (m3/d)
March 1,581
April 3,154
October 233
November 1,754
December 4,000
Further, the ECA allows for additional discharge of treated effluent in the above-noted months up to a rate
equal to 10% of the flow in the Conestoga River (Condition 9(1) of the ECA):
“…discharge in excess of these daily discharges is allowed if the minimum 10:1 of the streamflow to daily
discharge rate for the applicable period of that design streamflow occurs, based on actual measurements
of flow rate in the Conestoga River.”
During an October 14, 2016 site reconnaissance conducted by staff from the Township, Grand River
Conservation Authority (GRCA), and HESL, flow was not observed in the receiving channel. (The WWTF
was discharging at a rate of 233 m3/d on this date). Further, from historical observations made by Township
and Ontario Clean Water Agency (OCWA) staff (OCWA operate the WWTF on behalf of the Township),
flow in the receiving channel has been intermittent, with no flow during the summer months. The receiving
channel likely only flows seasonally after significant rain events, snowmelt, and higher WWTF effluent flows.
Based on a telephone conversation between the Township, GRCA and HESL staff and Paul Odom at the
MOECC on October 14, 2016 immediately following the site reconnaissance, the decision was made to
increase WWTF effluent flows up to 10% of Conestoga River flows and continue to regularly (i.e., twice
weekly) monitor the receiving channel for flow through to the Conestoga River. (Although this increase is
acceptable according to the WWTF’s ECA, it is understood that prior to this date, OCWA operators were
following the effluent flows prescribed in the ECA and reproduced in Table 1, above, and were not
increasing effluent flows up to 10% of the Conestoga River flow).
With the increased Mapleton WWTF effluent flows (beginning on October 20, 2016) coinciding with
increased seasonal precipitation, the receiving channel was observed by Township staff to be flowing on
October 25, 2016 through to November 17, 2016 (i.e., the date the dye tracer study was carried out).
Regular monitoring of the receiving channel was ceased after the dye tracer study was completed.
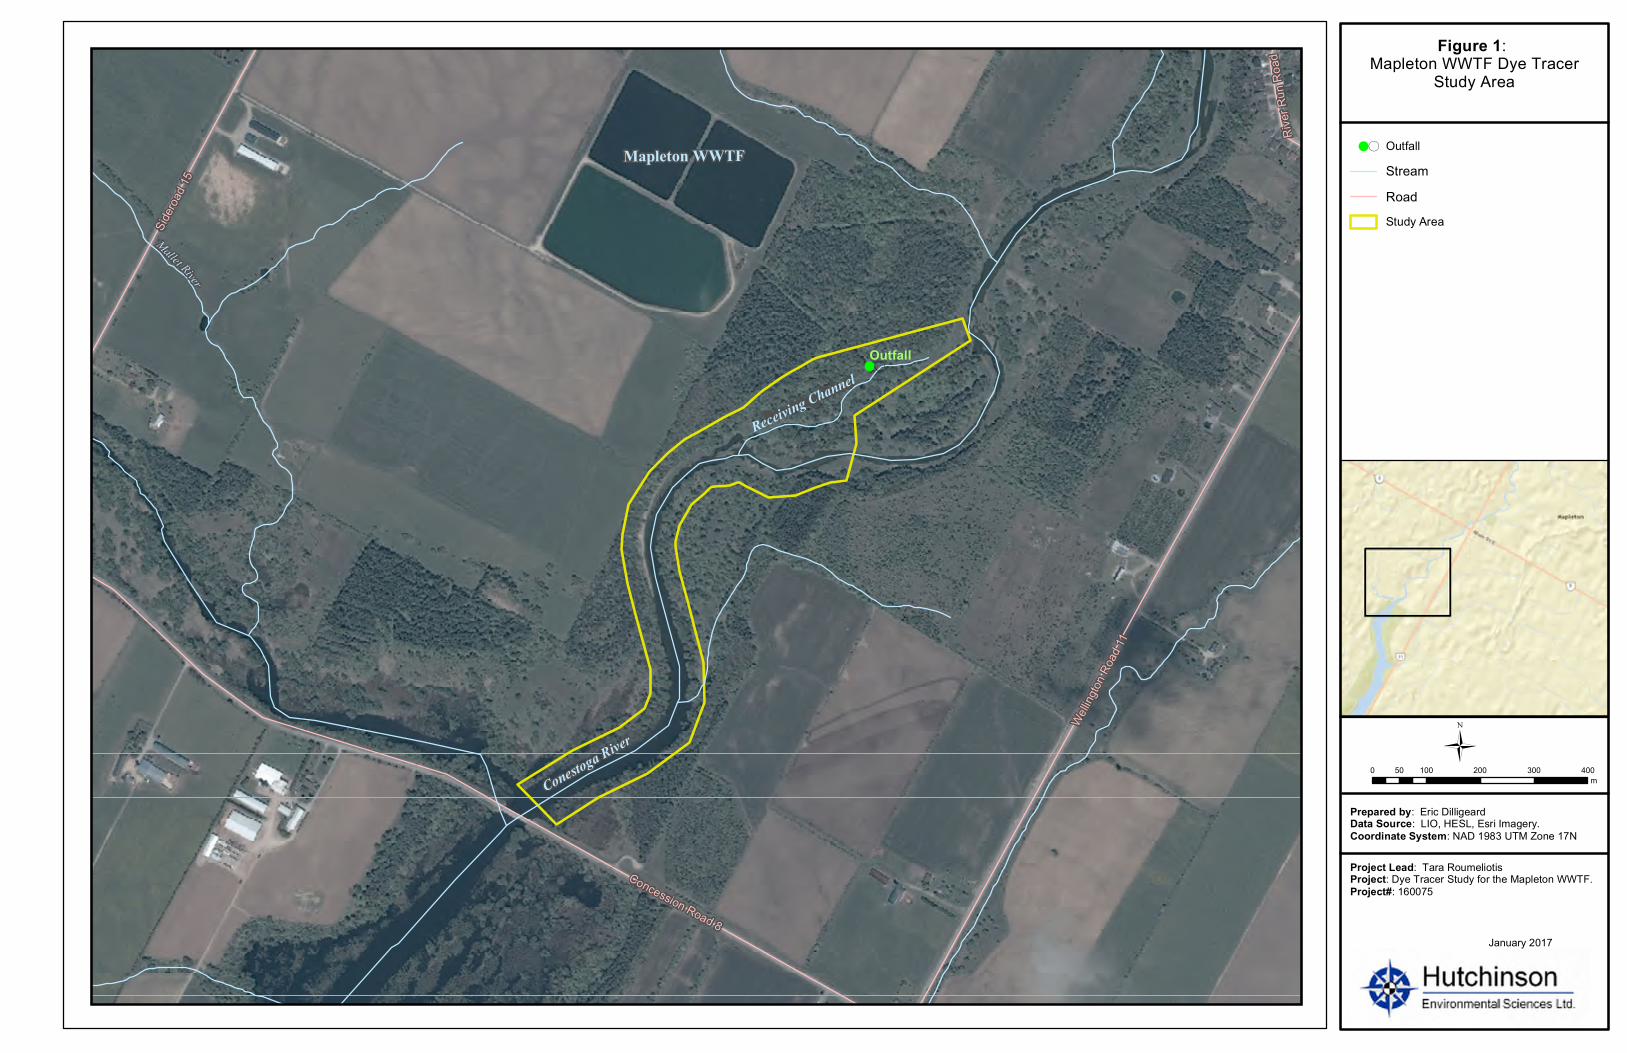
!(
Conestoga River
Receiving Channel
Mapleton WWTF
River
RunR
oad
Sidero
ad15
Welling
tonRo
ad11
Concession Road 8
Mallet River
Outfall
0 100 200 300 40050m
Figure 1: Mapleton WWTF Dye Tracer
Study Area
January 2017
Project Lead: Tara RoumeliotisProject: Dye Tracer Study for the Mapleton WWTF.Project#: 160075
Prepared by: Eric DilligeardData Source: LIO, HESL, Esri Imagery.Coordinate System: NAD 1983 UTM Zone 17N
Ü
!( OutfallStreamRoadStudy Area

Hutchinson Environmental Sciences Ltd.
M200117_Mapleton Nov 2016 Dye Study-updated draft.docx 4
2. Methodology
2.1 Dye Tracer Study
The dye tracer study was conducted on November 17, 2016. Rhodamine WT dye, a fluorescent xanthene
dye, was used as the dye tracer. Rhodamine dye was chosen because it is a stable, non-toxic, cost
effective tracer that is easily visible or measured in the field. Rhodamine dye tracers are also very robust
over a variety of different flow regimes. The MOECC’s Spills Action Centre was notified of the study on
November 17, 2016 prior to releasing the dye (Report #2284-AFSLZU).
Approximately 55 mL of Rhodamine WT 20% dye was mixed into 75 L of receiving channel-water, creating
a 150 mg/L Rhodamine WT dye solution. A peristaltic pump was used to discharge the solution at a
constant flow of 1 L/min. The dye was discharged into the receiving channel approximately 130 m
upstream of the confluence with the Conestoga River (Figure 2, Photograph 1). The location of the injection
point was selected to ensure that the dye was fully mixed in the receiving channel before discharging to the
Conestoga River. Once mixed, the concentration in the receiving channel was about 0.115 mg/L (115
µg/L).
On the morning of the study, Township staff breached two beaver dams that were located in the Conestoga
River, just downstream of the confluence with the receiving channel.
The test started at 11:20 am and ran for 5.5 hours. Rhodamine WT dye was first measured in the
Conestoga River upstream of the confluence with the receiving channel. Rhodamine WT dye
concentrations were then measured downstream in the Conestoga River along eight transects (Figure 2).
Transects were located: 2 m (cross-section 1), 28 m (cross-section 2), 63 m (cross-section 3), 114 m
(cross-section 4), 287 m (cross-section 5), 483 m (cross-section 6), 706 m (cross-section 7), and 845 m
(cross-section 8) downstream of the confluence with the receiving channel. At each downstream transect,
Rhodamine WT dye concentrations were measured across the channel, starting from the left bank moving
towards the right bank until background (upstream) concentrations were measured. Readings were
measured at 1 to 2 m intervals, depending on the river width at the cross-section. Dye measurements
began at cross-section 1 one and a half hours after the start of the dye study to give time to allow the dye
to mix with the Conestoga River, and progressed downstream.
All water depths at each cross-section location were less than 1 m, and all Rhodamine WT measurements
were taken mid-depth. (At water depths greater than 1 m, field measurements would have been collected
at 20% and 80% of the water depth). Rhodamine WT dye concentrations were measured using a calibrated
YSI OMS Sonde with Rhodamine probe (i.e., a fluorometer). The fluorometers were capable of measuring
concentrations of Rhodamine WT with a resolution of 0.1 µg/L. The Rhodamine WT optical sensors were
calibrated in the field on a 2-point scale that included 0 µg/L and 100 µg/L Rhodamine WT. The 100 µg/L
solution was mixed in the field from a 20% Rhodamine WT dye solution, which was obtained from a national
supplier, and Conestoga River water.
The coordinates of each transect were recorded with a GPS (Figure 2) and are provided in Appendix A.
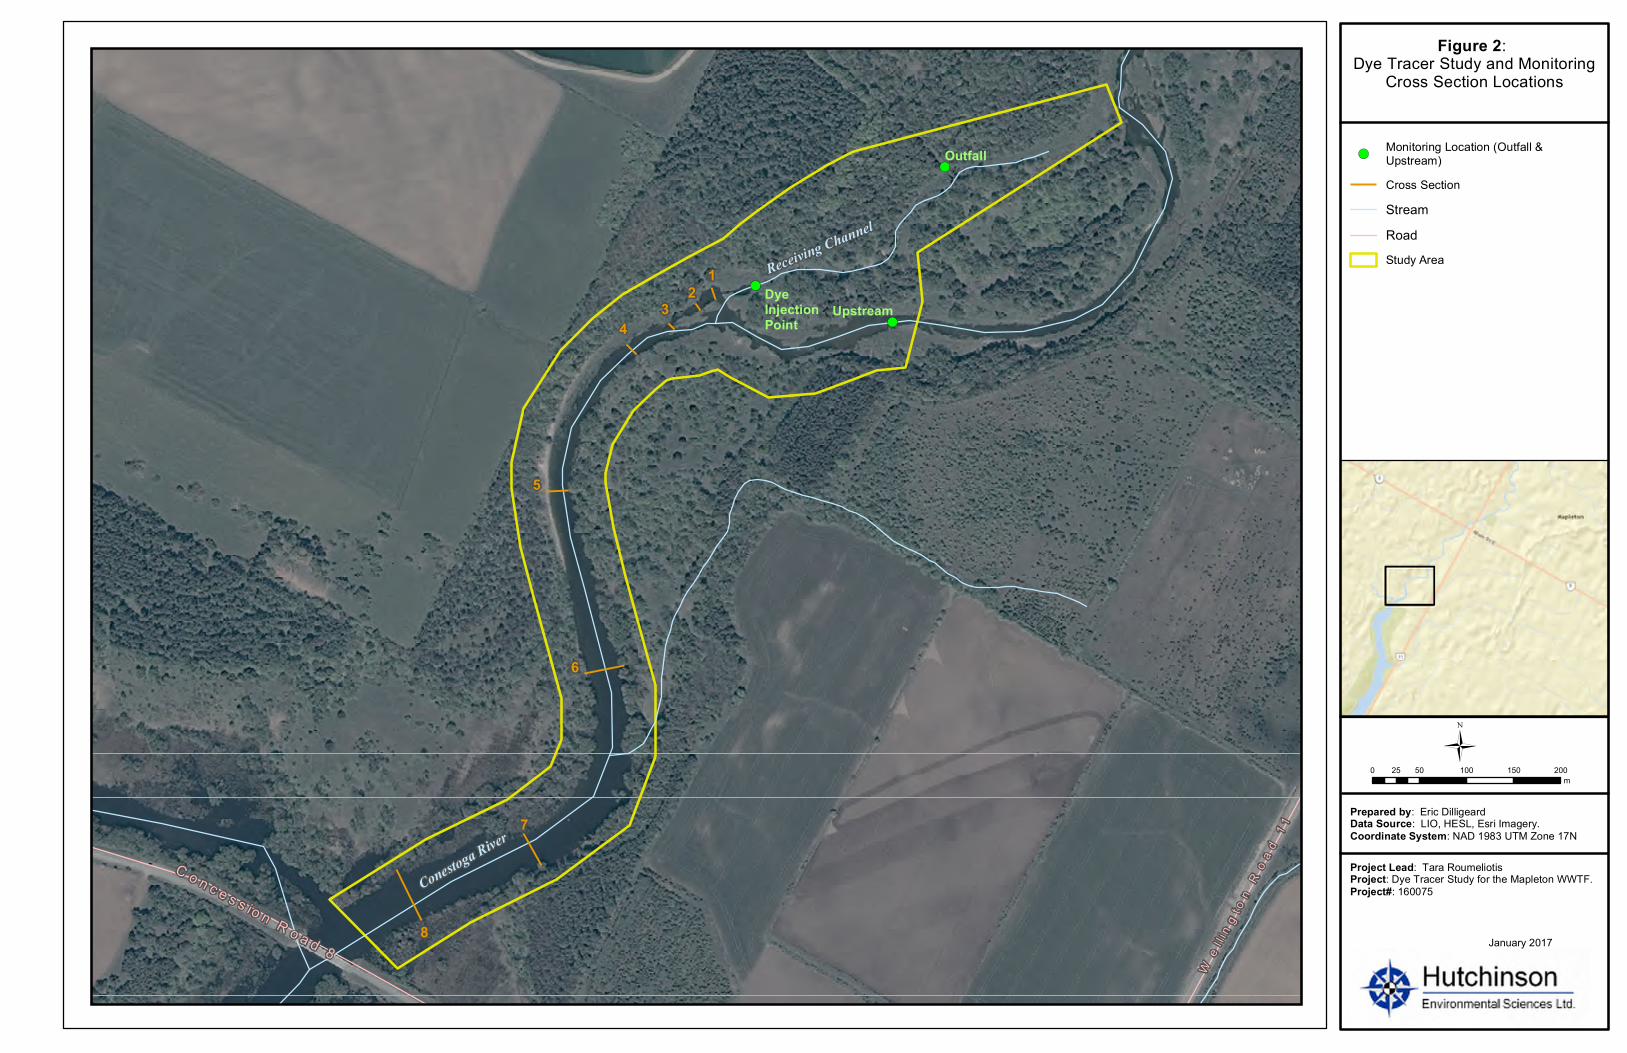
!(
!(
!(
Conestoga River
Receiving Channel
C o n c e s s io n R o a d 8
We l l i
n g t on
Ro a d
1 1
Outfall
UpstreamDyeInjectionPoint
0 50 100 150 20025m
Figure 2: Dye Tracer Study and Monitoring
Cross Section Locations
January 2017
Project Lead: Tara RoumeliotisProject: Dye Tracer Study for the Mapleton WWTF.Project#: 160075
Prepared by: Eric DilligeardData Source: LIO, HESL, Esri Imagery.Coordinate System: NAD 1983 UTM Zone 17N
Ü
!(Monitoring Location (Outfall &Upstream)Cross SectionStreamRoadStudy Area
12
7
6
5
43
8
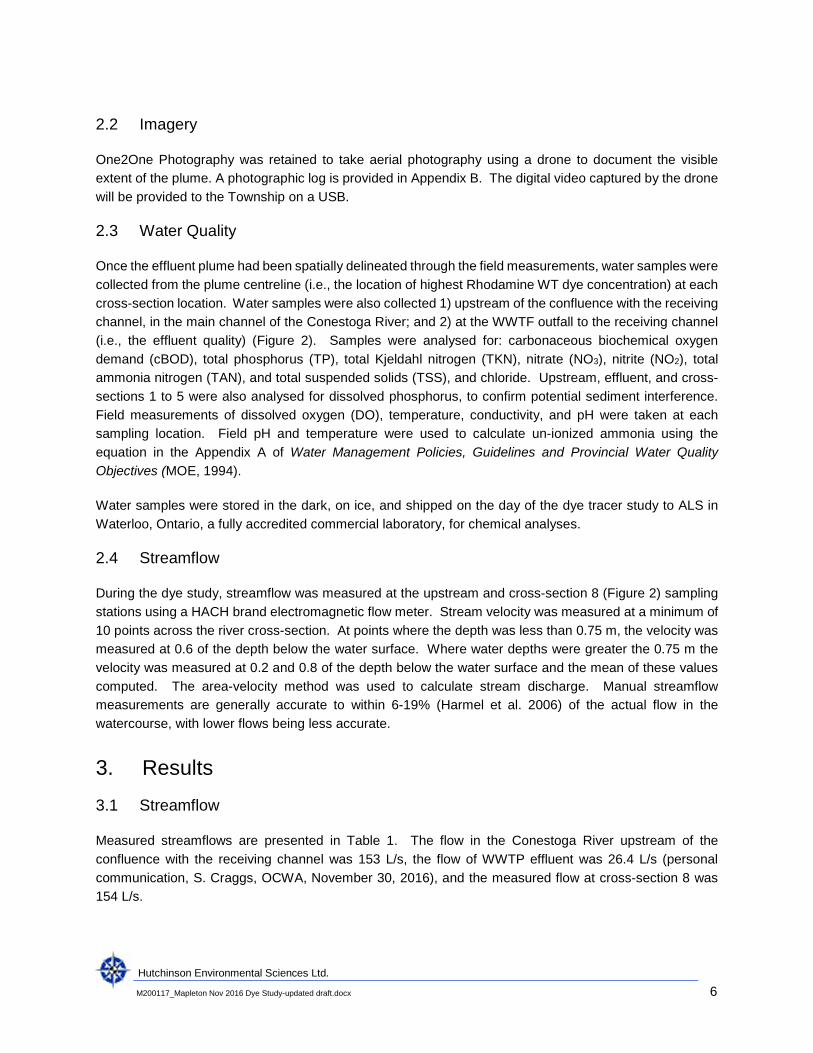
Hutchinson Environmental Sciences Ltd.
M200117_Mapleton Nov 2016 Dye Study-updated draft.docx 6
2.2 Imagery
One2One Photography was retained to take aerial photography using a drone to document the visible
extent of the plume. A photographic log is provided in Appendix B. The digital video captured by the drone
will be provided to the Township on a USB.
2.3 Water Quality
Once the effluent plume had been spatially delineated through the field measurements, water samples were
collected from the plume centreline (i.e., the location of highest Rhodamine WT dye concentration) at each
cross-section location. Water samples were also collected 1) upstream of the confluence with the receiving
channel, in the main channel of the Conestoga River; and 2) at the WWTF outfall to the receiving channel
(i.e., the effluent quality) (Figure 2). Samples were analysed for: carbonaceous biochemical oxygen
demand (cBOD), total phosphorus (TP), total Kjeldahl nitrogen (TKN), nitrate (NO3), nitrite (NO2), total
ammonia nitrogen (TAN), and total suspended solids (TSS), and chloride. Upstream, effluent, and cross-
sections 1 to 5 were also analysed for dissolved phosphorus, to confirm potential sediment interference.
Field measurements of dissolved oxygen (DO), temperature, conductivity, and pH were taken at each
sampling location. Field pH and temperature were used to calculate un-ionized ammonia using the
equation in the Appendix A of Water Management Policies, Guidelines and Provincial Water Quality
Objectives (MOE, 1994).
Water samples were stored in the dark, on ice, and shipped on the day of the dye tracer study to ALS in
Waterloo, Ontario, a fully accredited commercial laboratory, for chemical analyses.
2.4 Streamflow
During the dye study, streamflow was measured at the upstream and cross-section 8 (Figure 2) sampling
stations using a HACH brand electromagnetic flow meter. Stream velocity was measured at a minimum of
10 points across the river cross-section. At points where the depth was less than 0.75 m, the velocity was
measured at 0.6 of the depth below the water surface. Where water depths were greater the 0.75 m the
velocity was measured at 0.2 and 0.8 of the depth below the water surface and the mean of these values
computed. The area-velocity method was used to calculate stream discharge. Manual streamflow
measurements are generally accurate to within 6-19% (Harmel et al. 2006) of the actual flow in the
watercourse, with lower flows being less accurate.
3. Results
3.1 Streamflow
Measured streamflows are presented in Table 1. The flow in the Conestoga River upstream of the
confluence with the receiving channel was 153 L/s, the flow of WWTP effluent was 26.4 L/s (personal
communication, S. Craggs, OCWA, November 30, 2016), and the measured flow at cross-section 8 was
154 L/s.
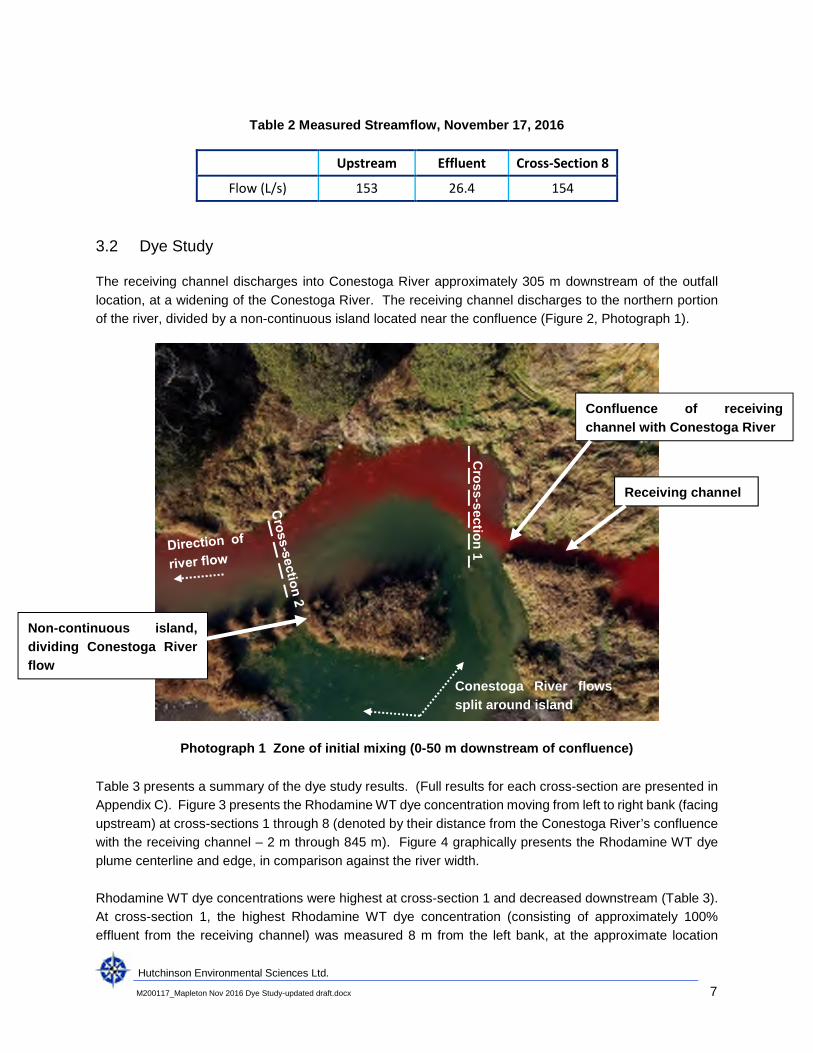
Hutchinson Environmental Sciences Ltd.
M200117_Mapleton Nov 2016 Dye Study-updated draft.docx 7
Table 2 Measured Streamflow, November 17, 2016
Upstream Effluent Cross-Section 8
Flow (L/s) 153 26.4 154
3.2 Dye Study
The receiving channel discharges into Conestoga River approximately 305 m downstream of the outfall
location, at a widening of the Conestoga River. The receiving channel discharges to the northern portion
of the river, divided by a non-continuous island located near the confluence (Figure 2, Photograph 1).
Photograph 1 Zone of initial mixing (0-50 m downstream of confluence)
Table 3 presents a summary of the dye study results. (Full results for each cross-section are presented in
Appendix C). Figure 3 presents the Rhodamine WT dye concentration moving from left to right bank (facing
upstream) at cross-sections 1 through 8 (denoted by their distance from the Conestoga River’s confluence
with the receiving channel – 2 m through 845 m). Figure 4 graphically presents the Rhodamine WT dye
plume centerline and edge, in comparison against the river width.
Rhodamine WT dye concentrations were highest at cross-section 1 and decreased downstream (Table 3).
At cross-section 1, the highest Rhodamine WT dye concentration (consisting of approximately 100%
effluent from the receiving channel) was measured 8 m from the left bank, at the approximate location
Receiving channel
Non-continuous island,
dividing Conestoga River
flow
Confluence of receiving
channel with Conestoga River
Cro
ss-s
ectio
n1
Conestoga River flows
split around island
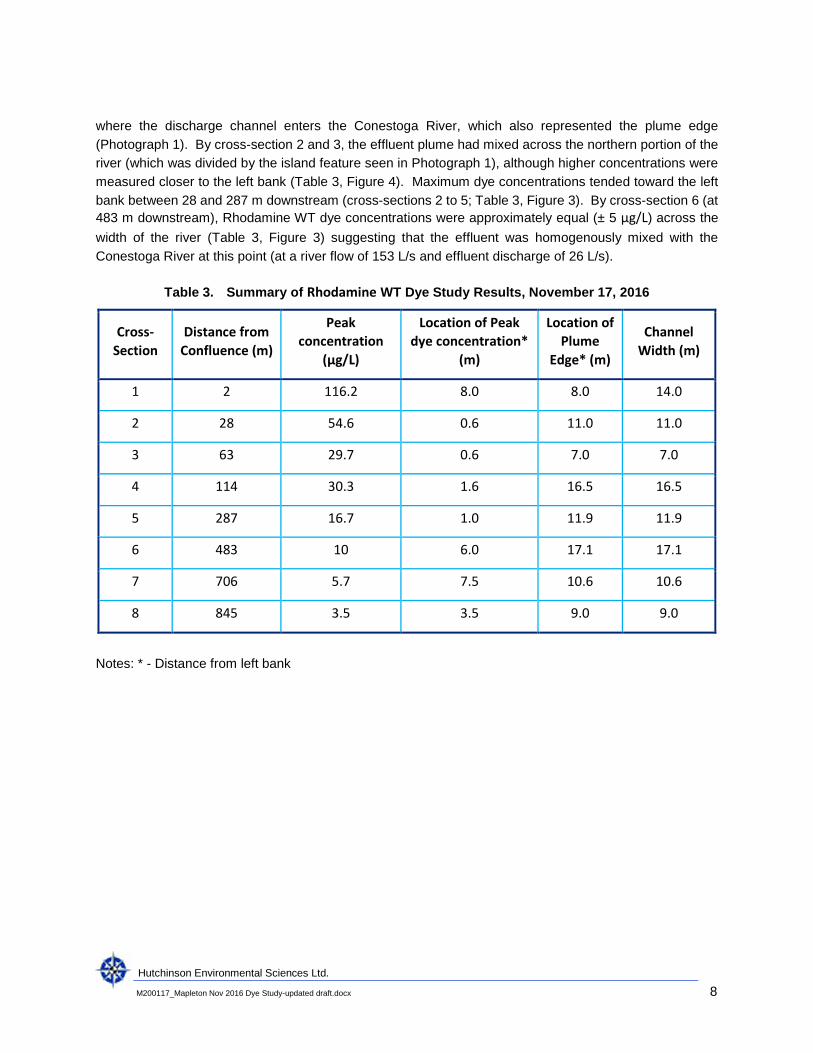
Hutchinson Environmental Sciences Ltd.
M200117_Mapleton Nov 2016 Dye Study-updated draft.docx 8
where the discharge channel enters the Conestoga River, which also represented the plume edge
(Photograph 1). By cross-section 2 and 3, the effluent plume had mixed across the northern portion of the
river (which was divided by the island feature seen in Photograph 1), although higher concentrations were
measured closer to the left bank (Table 3, Figure 4). Maximum dye concentrations tended toward the left
bank between 28 and 287 m downstream (cross-sections 2 to 5; Table 3, Figure 3). By cross-section 6 (at
483 m downstream), Rhodamine WT dye concentrations were approximately equal (± 5 µg/L) across the
width of the river (Table 3, Figure 3) suggesting that the effluent was homogenously mixed with the
Conestoga River at this point (at a river flow of 153 L/s and effluent discharge of 26 L/s).
Table 3. Summary of Rhodamine WT Dye Study Results, November 17, 2016
Cross-
Section
Distance from
Confluence (m)
Peak
concentration
(µg/L)
Location of Peak
dye concentration*
(m)
Location of
Plume
Edge* (m)
Channel
Width (m)
1 2 116.2 8.0 8.0 14.0
2 28 54.6 0.6 11.0 11.0
3 63 29.7 0.6 7.0 7.0
4 114 30.3 1.6 16.5 16.5
5 287 16.7 1.0 11.9 11.9
6 483 10 6.0 17.1 17.1
7 706 5.7 7.5 10.6 10.6
8 845 3.5 3.5 9.0 9.0
Notes: * - Distance from left bank
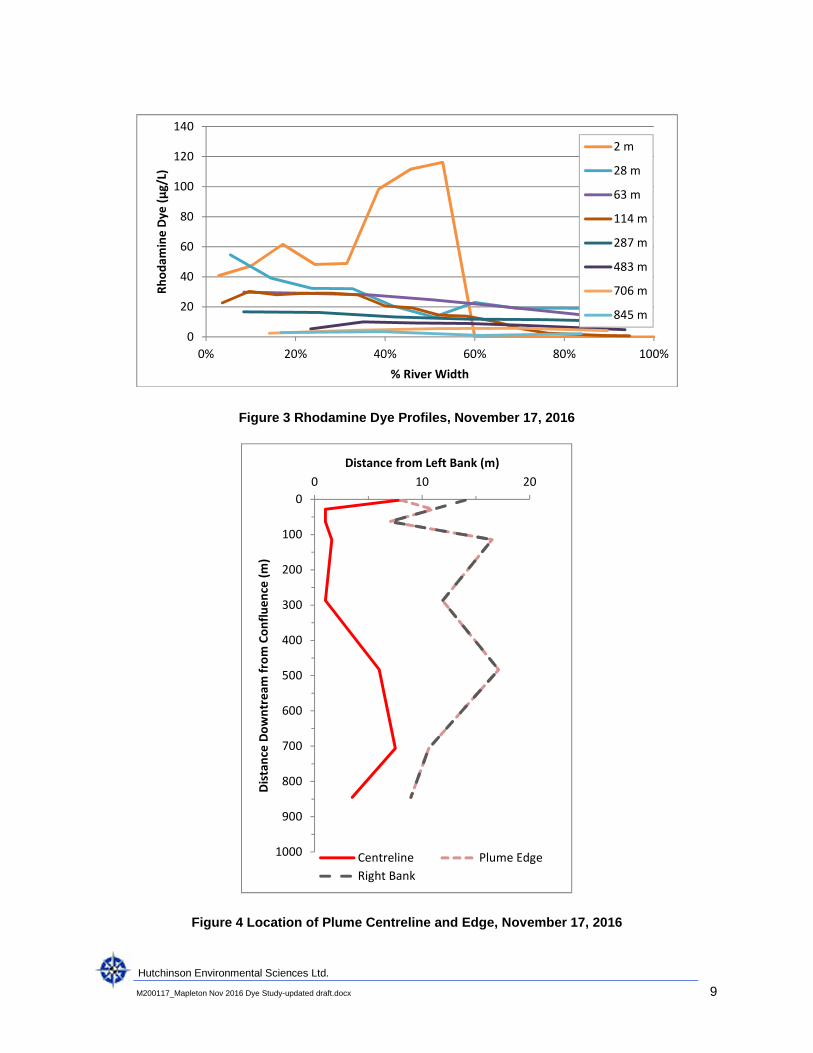
Hutchinson Environmental Sciences Ltd.
M200117_Mapleton Nov 2016 Dye Study-updated draft.docx 9
Figure 3 Rhodamine Dye Profiles, November 17, 2016
Figure 4 Location of Plume Centreline and Edge, November 17, 2016
0
20
40
60
80
100
120
140
0% 20% 40% 60% 80% 100%
Rh
od
amin
eD
ye(µ
g/L)
% River Width
2 m
28 m
63 m
114 m
287 m
483 m
706 m
845 m
0
100
200
300
400
500
600
700
800
900
1000
0 10 20
Dis
tan
ceD
ow
ntr
eam
fro
mC
on
flu
en
ce(m
)
Distance from Left Bank (m)
Centreline Plume Edge
Right Bank
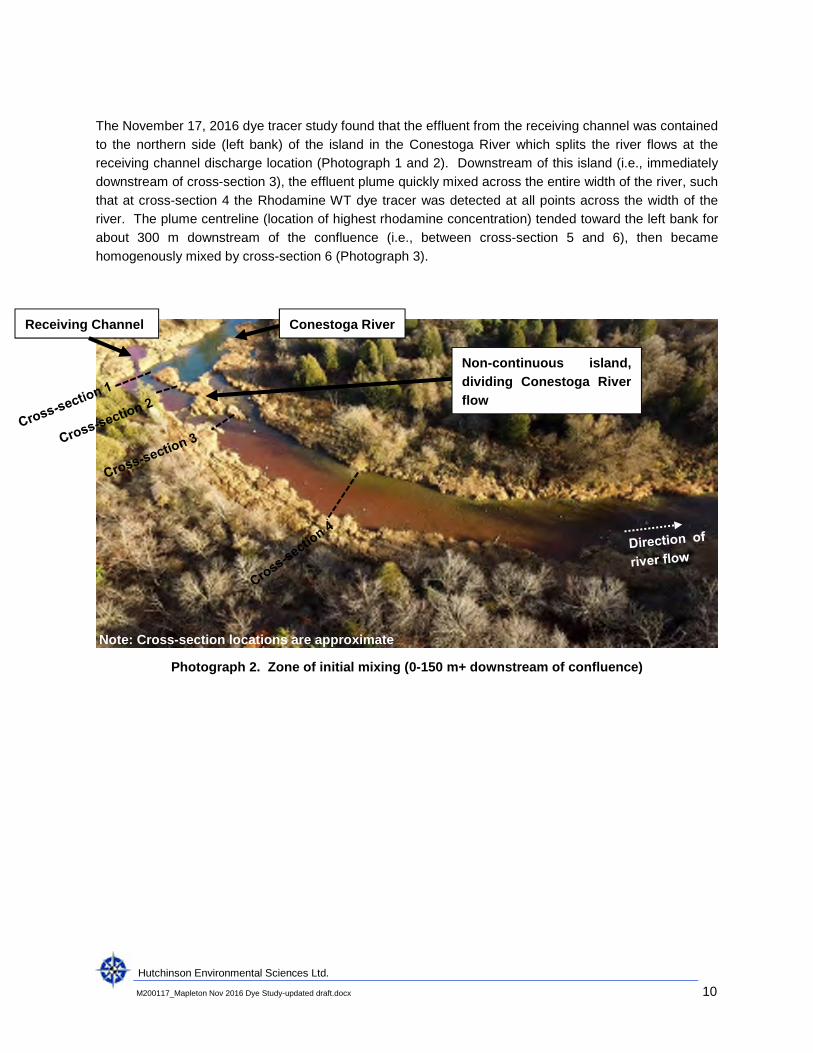
Hutchinson Environmental Sciences Ltd.
M200117_Mapleton Nov 2016 Dye Study-updated draft.docx 10
The November 17, 2016 dye tracer study found that the effluent from the receiving channel was contained
to the northern side (left bank) of the island in the Conestoga River which splits the river flows at the
receiving channel discharge location (Photograph 1 and 2). Downstream of this island (i.e., immediately
downstream of cross-section 3), the effluent plume quickly mixed across the entire width of the river, such
that at cross-section 4 the Rhodamine WT dye tracer was detected at all points across the width of the
river. The plume centreline (location of highest rhodamine concentration) tended toward the left bank for
about 300 m downstream of the confluence (i.e., between cross-section 5 and 6), then became
homogenously mixed by cross-section 6 (Photograph 3).
Photograph 2. Zone of initial mixing (0-150 m+ downstream of confluence)
Receiving Channel Conestoga River
Note: Cross-section locations are approximate
Non-continuous island,
dividing Conestoga River
flow
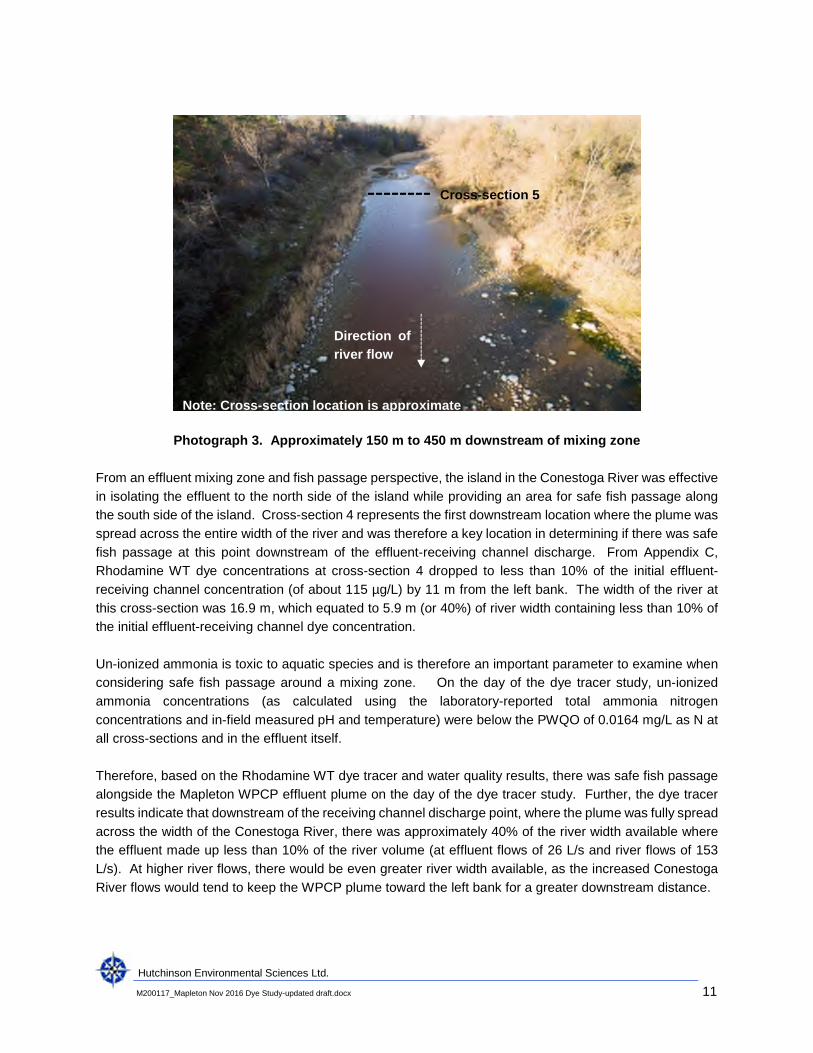
Hutchinson Environmental Sciences Ltd.
M200117_Mapleton Nov 2016 Dye Study-updated draft.docx 11
Photograph 3. Approximately 150 m to 450 m downstream of mixing zone
From an effluent mixing zone and fish passage perspective, the island in the Conestoga River was effective
in isolating the effluent to the north side of the island while providing an area for safe fish passage along
the south side of the island. Cross-section 4 represents the first downstream location where the plume was
spread across the entire width of the river and was therefore a key location in determining if there was safe
fish passage at this point downstream of the effluent-receiving channel discharge. From Appendix C,
Rhodamine WT dye concentrations at cross-section 4 dropped to less than 10% of the initial effluent-
receiving channel concentration (of about 115 µg/L) by 11 m from the left bank. The width of the river at
this cross-section was 16.9 m, which equated to 5.9 m (or 40%) of river width containing less than 10% of
the initial effluent-receiving channel dye concentration.
Un-ionized ammonia is toxic to aquatic species and is therefore an important parameter to examine when
considering safe fish passage around a mixing zone. On the day of the dye tracer study, un-ionized
ammonia concentrations (as calculated using the laboratory-reported total ammonia nitrogen
concentrations and in-field measured pH and temperature) were below the PWQO of 0.0164 mg/L as N at
all cross-sections and in the effluent itself.
Therefore, based on the Rhodamine WT dye tracer and water quality results, there was safe fish passage
alongside the Mapleton WPCP effluent plume on the day of the dye tracer study. Further, the dye tracer
results indicate that downstream of the receiving channel discharge point, where the plume was fully spread
across the width of the Conestoga River, there was approximately 40% of the river width available where
the effluent made up less than 10% of the river volume (at effluent flows of 26 L/s and river flows of 153
L/s). At higher river flows, there would be even greater river width available, as the increased Conestoga
River flows would tend to keep the WPCP plume toward the left bank for a greater downstream distance.
Direction of
river flow
Cross-section 5
Note: Cross-section location is approximate
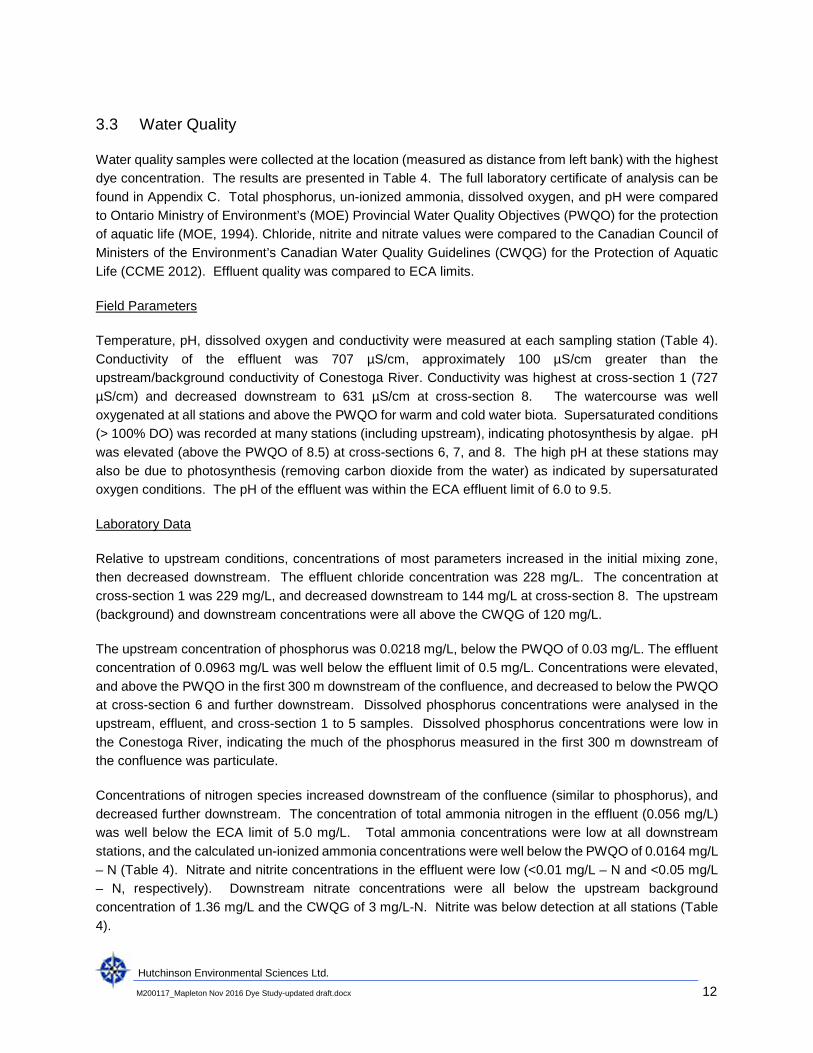
Hutchinson Environmental Sciences Ltd.
M200117_Mapleton Nov 2016 Dye Study-updated draft.docx 12
3.3 Water Quality
Water quality samples were collected at the location (measured as distance from left bank) with the highest
dye concentration. The results are presented in Table 4. The full laboratory certificate of analysis can be
found in Appendix C. Total phosphorus, un-ionized ammonia, dissolved oxygen, and pH were compared
to Ontario Ministry of Environment’s (MOE) Provincial Water Quality Objectives (PWQO) for the protection
of aquatic life (MOE, 1994). Chloride, nitrite and nitrate values were compared to the Canadian Council of
Ministers of the Environment’s Canadian Water Quality Guidelines (CWQG) for the Protection of Aquatic
Life (CCME 2012). Effluent quality was compared to ECA limits.
Field Parameters
Temperature, pH, dissolved oxygen and conductivity were measured at each sampling station (Table 4).
Conductivity of the effluent was 707 µS/cm, approximately 100 µS/cm greater than the
upstream/background conductivity of Conestoga River. Conductivity was highest at cross-section 1 (727
µS/cm) and decreased downstream to 631 µS/cm at cross-section 8. The watercourse was well
oxygenated at all stations and above the PWQO for warm and cold water biota. Supersaturated conditions
(> 100% DO) was recorded at many stations (including upstream), indicating photosynthesis by algae. pH
was elevated (above the PWQO of 8.5) at cross-sections 6, 7, and 8. The high pH at these stations may
also be due to photosynthesis (removing carbon dioxide from the water) as indicated by supersaturated
oxygen conditions. The pH of the effluent was within the ECA effluent limit of 6.0 to 9.5.
Laboratory Data
Relative to upstream conditions, concentrations of most parameters increased in the initial mixing zone,
then decreased downstream. The effluent chloride concentration was 228 mg/L. The concentration at
cross-section 1 was 229 mg/L, and decreased downstream to 144 mg/L at cross-section 8. The upstream
(background) and downstream concentrations were all above the CWQG of 120 mg/L.
The upstream concentration of phosphorus was 0.0218 mg/L, below the PWQO of 0.03 mg/L. The effluent
concentration of 0.0963 mg/L was well below the effluent limit of 0.5 mg/L. Concentrations were elevated,
and above the PWQO in the first 300 m downstream of the confluence, and decreased to below the PWQO
at cross-section 6 and further downstream. Dissolved phosphorus concentrations were analysed in the
upstream, effluent, and cross-section 1 to 5 samples. Dissolved phosphorus concentrations were low in
the Conestoga River, indicating the much of the phosphorus measured in the first 300 m downstream of
the confluence was particulate.
Concentrations of nitrogen species increased downstream of the confluence (similar to phosphorus), and
decreased further downstream. The concentration of total ammonia nitrogen in the effluent (0.056 mg/L)
was well below the ECA limit of 5.0 mg/L. Total ammonia concentrations were low at all downstream
stations, and the calculated un-ionized ammonia concentrations were well below the PWQO of 0.0164 mg/L
– N (Table 4). Nitrate and nitrite concentrations in the effluent were low (<0.01 mg/L – N and <0.05 mg/L
– N, respectively). Downstream nitrate concentrations were all below the upstream background
concentration of 1.36 mg/L and the CWQG of 3 mg/L-N. Nitrite was below detection at all stations (Table
4).
Hutchinson Environmental Sciences Ltd.
M200117_Mapleton Nov 2016 Dye Study-updated draft.docx 13
The total suspended solids concentration in the effluent (5.6 mg/L) was similar to the upstream
concentration in the Conestoga River (4 mg/L). Concentrations were higher (31.2 – 44.2 mg/L) downstream
of the confluence with the receiving channel at cross-sections 2 to 4, but decreased to upstream
concentrations at cross-section 6. The higher TSS concentrations at cross-sections 2 to 4 were likely due
to disruption of bottom sediments during removal of the beaver dam and cross-section measurements.
cBOD was below detection at all stations including the effluent, indicating little to no oxygen demand.
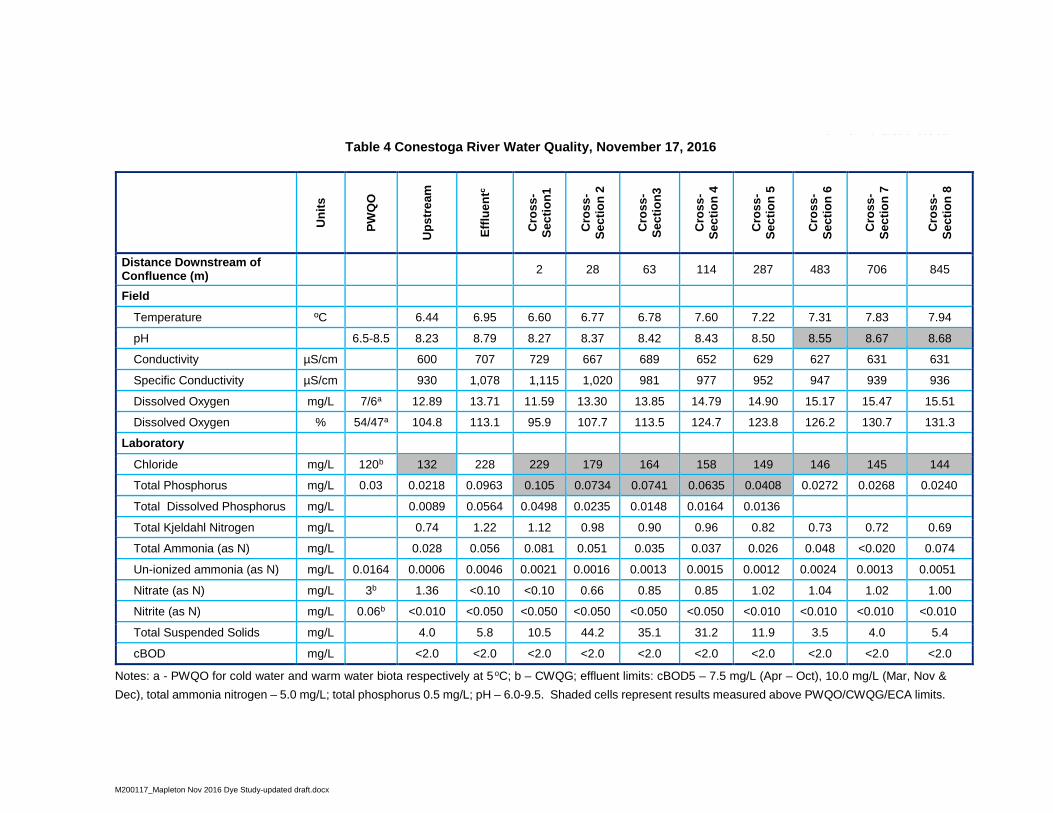
202-501 Krug Street, Kitchener, ON N2B 1L3 │519-576-1711
www.environmentalsciences.ca
M200117_Mapleton Nov 2016 Dye Study-updated draft.docx
Table 4 Conestoga River Water Quality, November 17, 2016
Un
its
PW
QO
Up
str
ea
m
Eff
lue
ntc
Cro
ss
-S
ec
tio
n1
Cro
ss
-S
ec
tio
n2
Cro
ss
-S
ec
tio
n3
Cro
ss
-S
ec
tio
n4
Cro
ss
-S
ec
tio
n5
Cro
ss
-S
ec
tio
n6
Cro
ss
-S
ec
tio
n7
Cro
ss
-S
ec
tio
n8
Distance Downstream ofConfluence (m)
2 28 63 114 287 483 706 845
Field
Temperature ºC 6.44 6.95 6.60 6.77 6.78 7.60 7.22 7.31 7.83 7.94
pH 6.5-8.5 8.23 8.79 8.27 8.37 8.42 8.43 8.50 8.55 8.67 8.68
Conductivity µS/cm 600 707 729 667 689 652 629 627 631 631
Specific Conductivity µS/cm 930 1,078 1,115 1,020 981 977 952 947 939 936
Dissolved Oxygen mg/L 7/6a 12.89 13.71 11.59 13.30 13.85 14.79 14.90 15.17 15.47 15.51
Dissolved Oxygen % 54/47a 104.8 113.1 95.9 107.7 113.5 124.7 123.8 126.2 130.7 131.3
Laboratory
Chloride mg/L 120b 132 228 229 179 164 158 149 146 145 144
Total Phosphorus mg/L 0.03 0.0218 0.0963 0.105 0.0734 0.0741 0.0635 0.0408 0.0272 0.0268 0.0240
Total Dissolved Phosphorus mg/L 0.0089 0.0564 0.0498 0.0235 0.0148 0.0164 0.0136
Total Kjeldahl Nitrogen mg/L 0.74 1.22 1.12 0.98 0.90 0.96 0.82 0.73 0.72 0.69
Total Ammonia (as N) mg/L 0.028 0.056 0.081 0.051 0.035 0.037 0.026 0.048 <0.020 0.074
Un-ionized ammonia (as N) mg/L 0.0164 0.0006 0.0046 0.0021 0.0016 0.0013 0.0015 0.0012 0.0024 0.0013 0.0051
Nitrate (as N) mg/L 3b 1.36 <0.10 <0.10 0.66 0.85 0.85 1.02 1.04 1.02 1.00
Nitrite (as N) mg/L 0.06b <0.010 <0.050 <0.050 <0.050 <0.050 <0.050 <0.010 <0.010 <0.010 <0.010
Total Suspended Solids mg/L 4.0 5.8 10.5 44.2 35.1 31.2 11.9 3.5 4.0 5.4
cBOD mg/L <2.0 <2.0 <2.0 <2.0 <2.0 <2.0 <2.0 <2.0 <2.0 <2.0
Notes: a - PWQO for cold water and warm water biota respectively at 5oC; b – CWQG; effluent limits: cBOD5 – 7.5 mg/L (Apr – Oct), 10.0 mg/L (Mar, Nov &
Dec), total ammonia nitrogen – 5.0 mg/L; total phosphorus 0.5 mg/L; pH – 6.0-9.5. Shaded cells represent results measured above PWQO/CWQG/ECA limits.
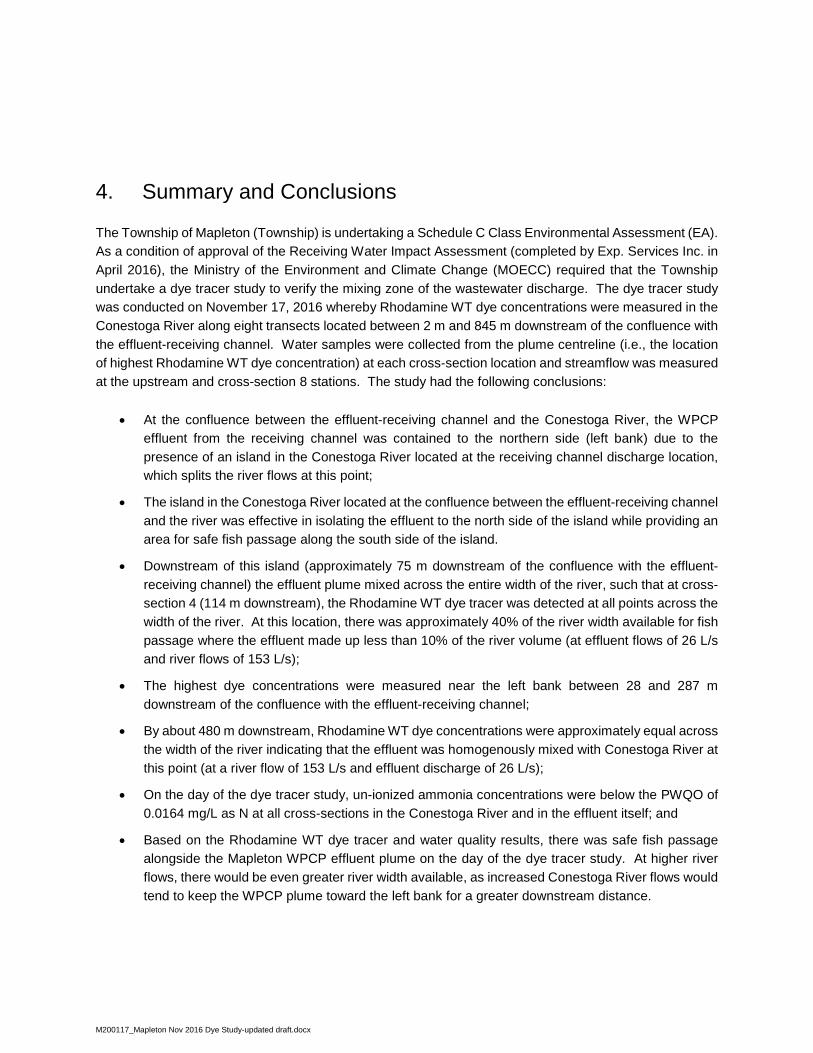
202-501 Krug Street, Kitchener, ON N2B 1L3 │519-576-1711
www.environmentalsciences.ca
M200117_Mapleton Nov 2016 Dye Study-updated draft.docx
4. Summary and Conclusions
The Township of Mapleton (Township) is undertaking a Schedule C Class Environmental Assessment (EA).
As a condition of approval of the Receiving Water Impact Assessment (completed by Exp. Services Inc. in
April 2016), the Ministry of the Environment and Climate Change (MOECC) required that the Township
undertake a dye tracer study to verify the mixing zone of the wastewater discharge. The dye tracer study
was conducted on November 17, 2016 whereby Rhodamine WT dye concentrations were measured in the
Conestoga River along eight transects located between 2 m and 845 m downstream of the confluence with
the effluent-receiving channel. Water samples were collected from the plume centreline (i.e., the location
of highest Rhodamine WT dye concentration) at each cross-section location and streamflow was measured
at the upstream and cross-section 8 stations. The study had the following conclusions:
• At the confluence between the effluent-receiving channel and the Conestoga River, the WPCP
effluent from the receiving channel was contained to the northern side (left bank) due to the
presence of an island in the Conestoga River located at the receiving channel discharge location,
which splits the river flows at this point;
• The island in the Conestoga River located at the confluence between the effluent-receiving channel
and the river was effective in isolating the effluent to the north side of the island while providing an
area for safe fish passage along the south side of the island.
• Downstream of this island (approximately 75 m downstream of the confluence with the effluent-
receiving channel) the effluent plume mixed across the entire width of the river, such that at cross-
section 4 (114 m downstream), the Rhodamine WT dye tracer was detected at all points across the
width of the river. At this location, there was approximately 40% of the river width available for fish
passage where the effluent made up less than 10% of the river volume (at effluent flows of 26 L/s
and river flows of 153 L/s);
• The highest dye concentrations were measured near the left bank between 28 and 287 m
downstream of the confluence with the effluent-receiving channel;
• By about 480 m downstream, Rhodamine WT dye concentrations were approximately equal across
the width of the river indicating that the effluent was homogenously mixed with Conestoga River at
this point (at a river flow of 153 L/s and effluent discharge of 26 L/s);
• On the day of the dye tracer study, un-ionized ammonia concentrations were below the PWQO of
0.0164 mg/L as N at all cross-sections in the Conestoga River and in the effluent itself; and
• Based on the Rhodamine WT dye tracer and water quality results, there was safe fish passage
alongside the Mapleton WPCP effluent plume on the day of the dye tracer study. At higher river
flows, there would be even greater river width available, as increased Conestoga River flows would
tend to keep the WPCP plume toward the left bank for a greater downstream distance.
Hutchinson Environmental Sciences Ltd.
M200117_Mapleton Nov 2016 Dye Study-updated draft.docx 3
5. Closing
Thank you for the opportunity to work on this interesting project. If you have any questions, or require any
further information please do not hesitate to contact us.
Hutchinson Environmental Sciences Ltd.
M200117_Mapleton Nov 2016 Dye Study-updated draft.docx 4
6. References
Canadian Council of Ministers of the Environment. 2012. Canadian water quality guidelines for the
protection of aquatic life: Nitrate. In: Canadian environmental quality guidelines, Canadian
Council of Ministers of the Environment, Winnipeg.
Exp. Services Inc. 2016. Receiving Water Impact Assessment.
Harmel, R. D., R. J. Cooper, R. M. Slade, R. L. Haney, J. G. Arnold. 2006. Cumulative uncertainty in
measured streamflow and water quality data for small watersheds. American Society of
Agricultural and Biological Engineers Vol. 49(3): 689-701 ISSN 0001-2351
Ontario Ministry of Environment and Energy. 1994. Water Management Policies, Guidelines and
Provincial Water Quality Objectives

Hutchinson Environmental Sciences Ltd.
M020117_Mapleton Nov 2016 Dye Study-draft.docx 4
Appendix A. Cross-Section GPS Co-ordinates
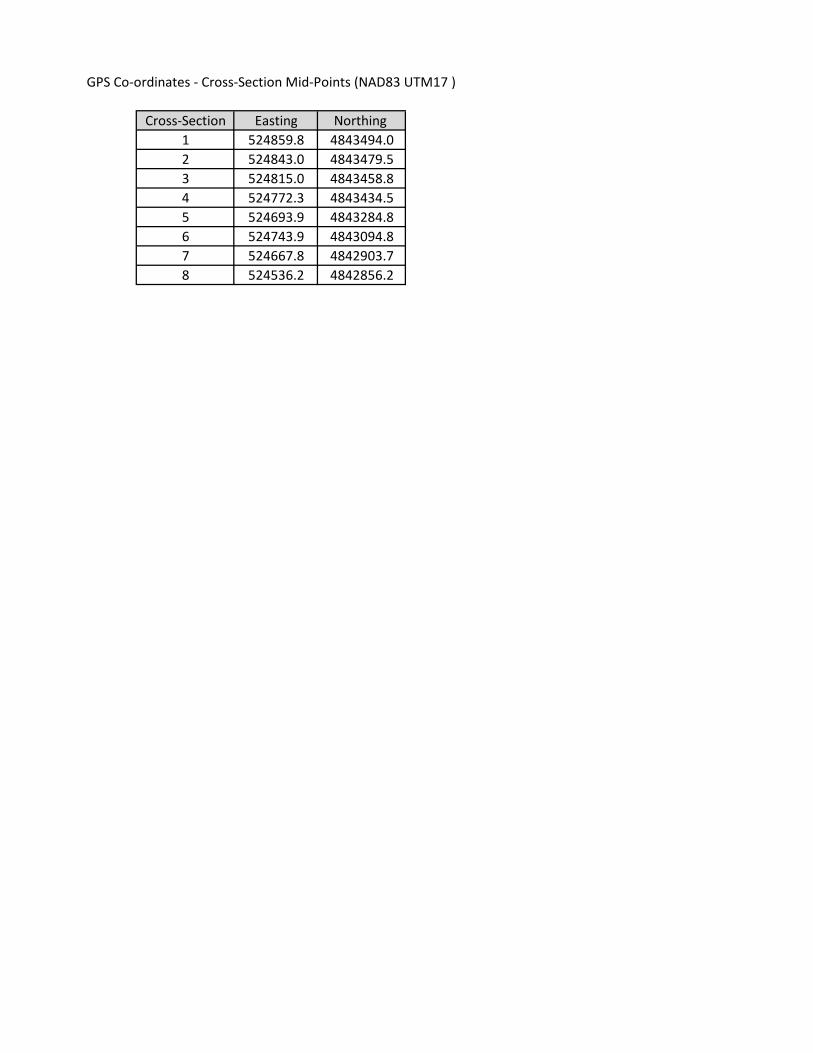
Cross-Section Easting Northing
1 524859.8 4843494.0
2 524843.0 4843479.5
3 524815.0 4843458.8
4 524772.3 4843434.5
5 524693.9 4843284.8
6 524743.9 4843094.8
7 524667.8 4842903.7
8 524536.2 4842856.2
GPS Co-ordinates - Cross-Section Mid-Points (NAD83 UTM17 )

Hutchinson Environmental Sciences Ltd.
M020117_Mapleton Nov 2016 Dye Study-draft.docx 5
Appendix B. Photographic Log
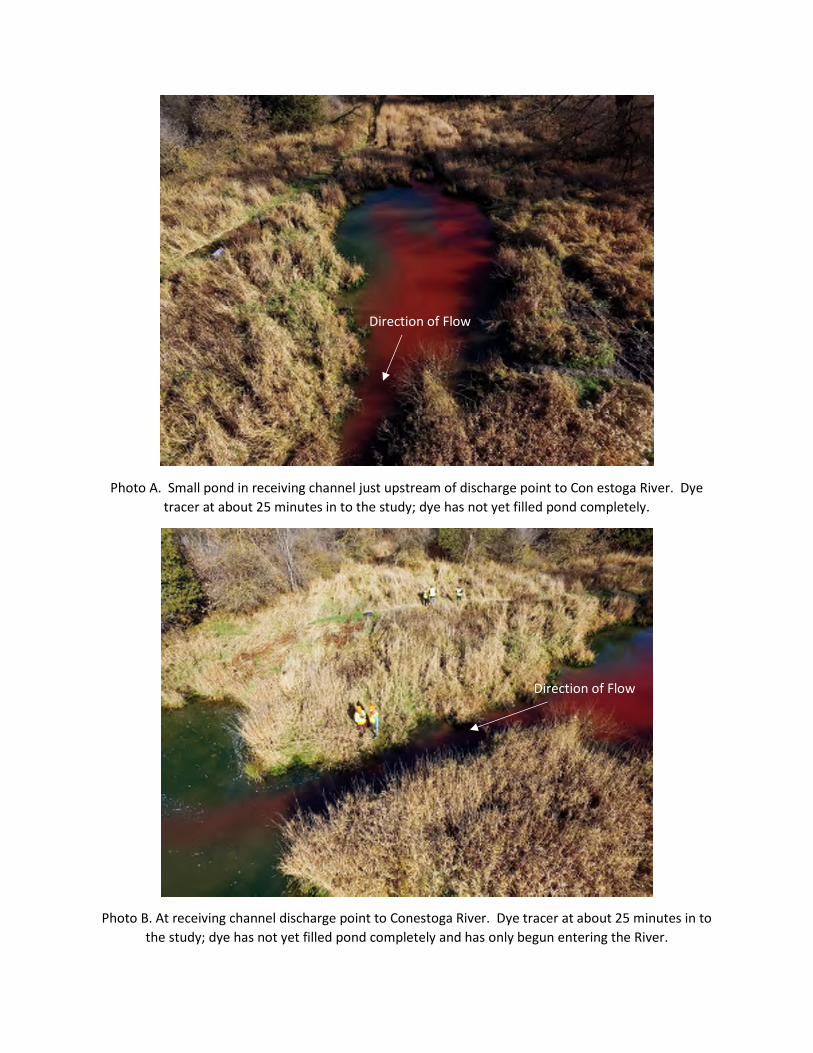
Photo A. Small pond in receiving channel just upstream of discharge point to Con estoga River. Dye
tracer at about 25 minutes in to the study; dye has not yet filled pond completely.
Photo B. At receiving channel discharge point to Conestoga River. Dye tracer at about 25 minutes in to
the study; dye has not yet filled pond completely and has only begun entering the River.
Direction of Flow
Direction of Flow
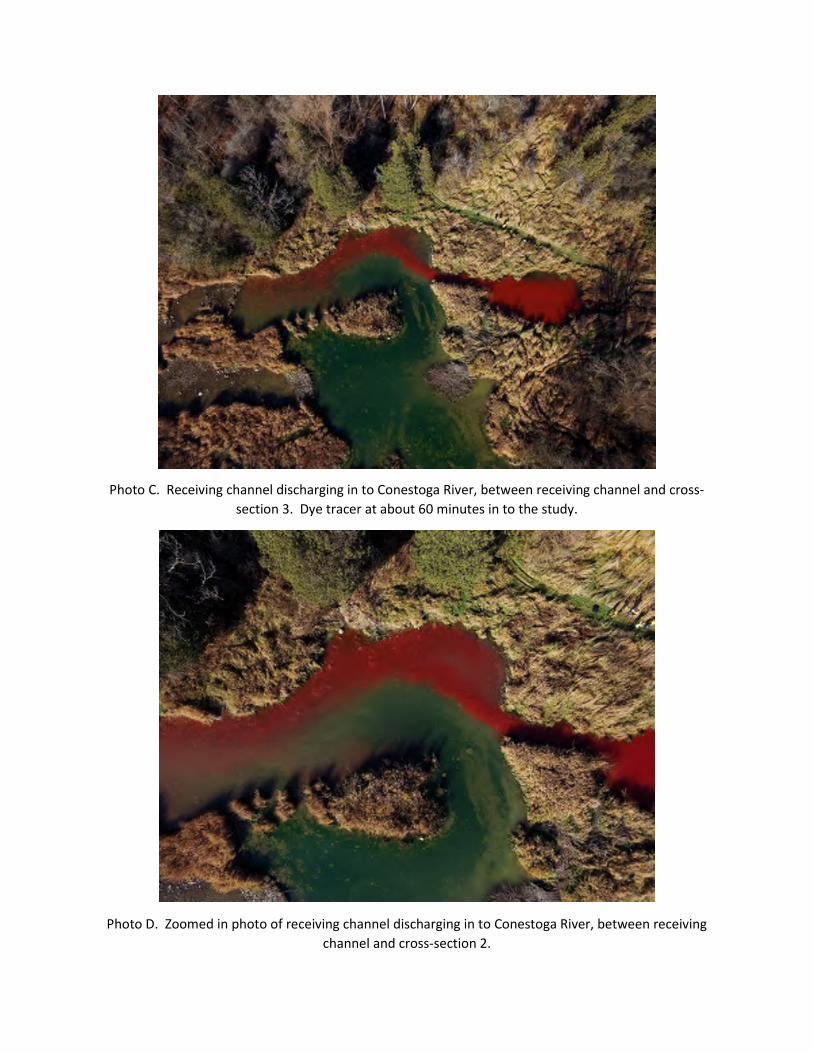
Photo C. Receiving channel discharging in to Conestoga River, between receiving channel and cross-
section 3. Dye tracer at about 60 minutes in to the study.
Photo D. Zoomed in photo of receiving channel discharging in to Conestoga River, between receiving
channel and cross-section 2.
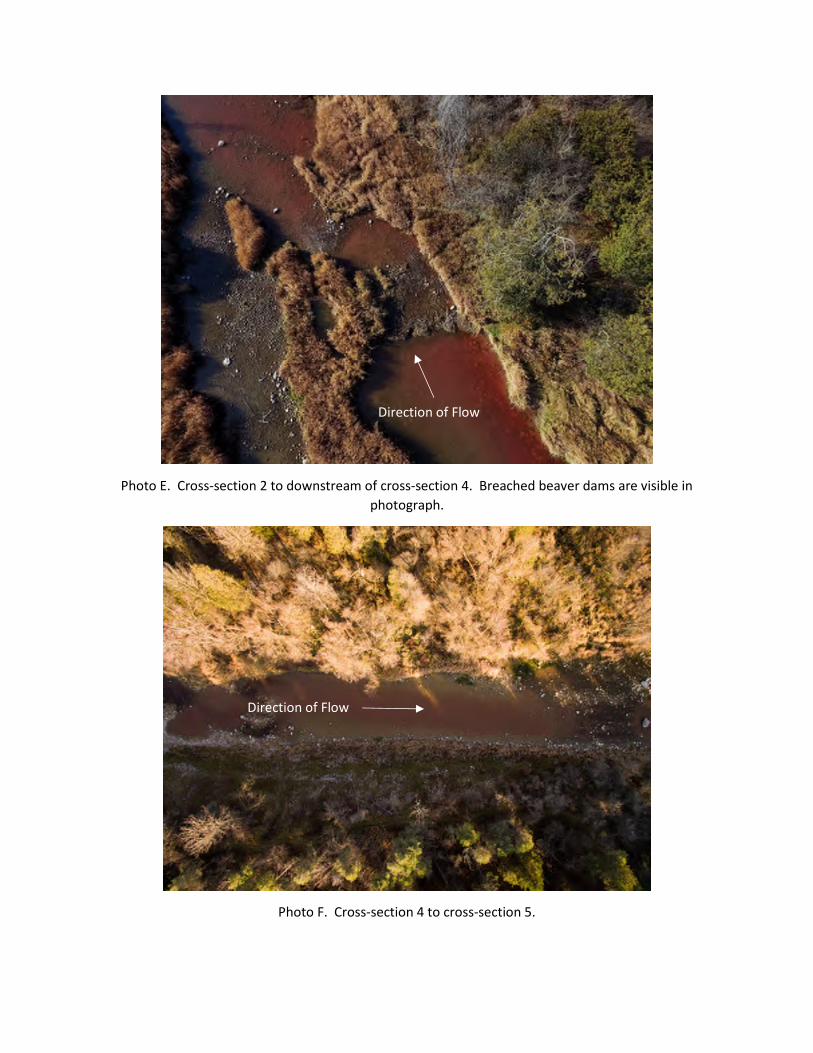
Photo E. Cross-section 2 to downstream of cross-section 4. Breached beaver dams are visible in
photograph.
Photo F. Cross-section 4 to cross-section 5.
Direction of Flow
Direction of Flow
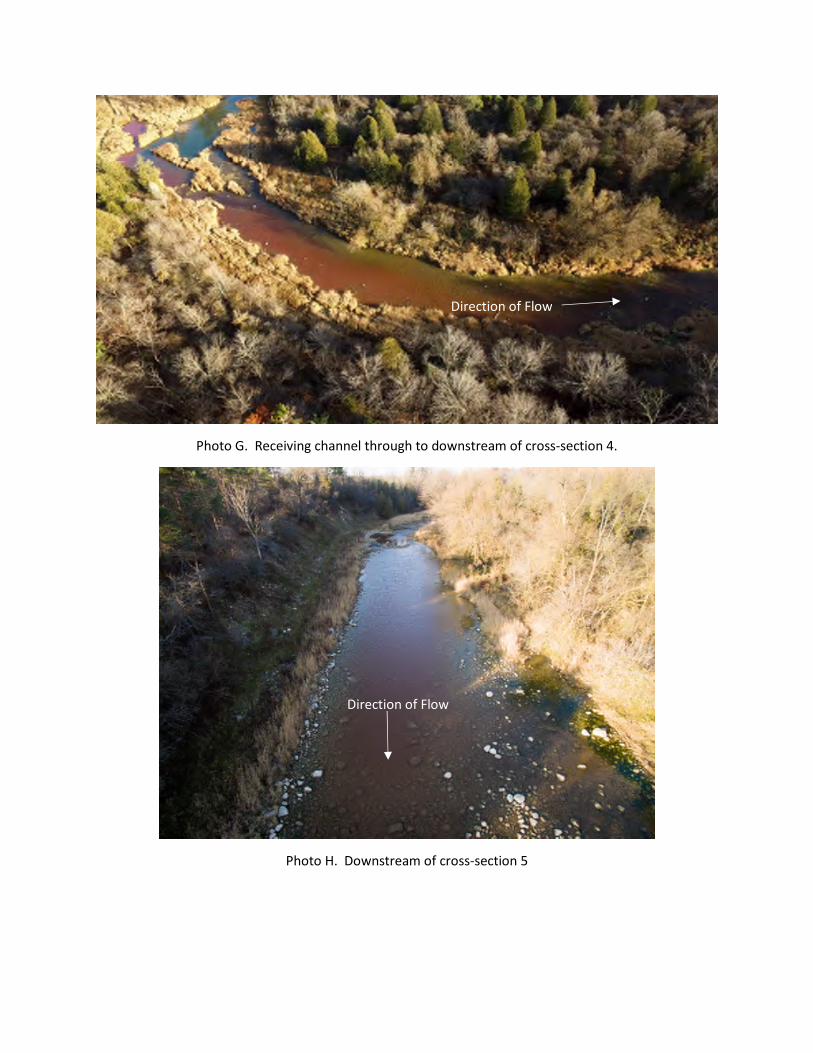
Photo G. Receiving channel through to downstream of cross-section 4.
Photo H. Downstream of cross-section 5
Direction of Flow
Direction of Flow
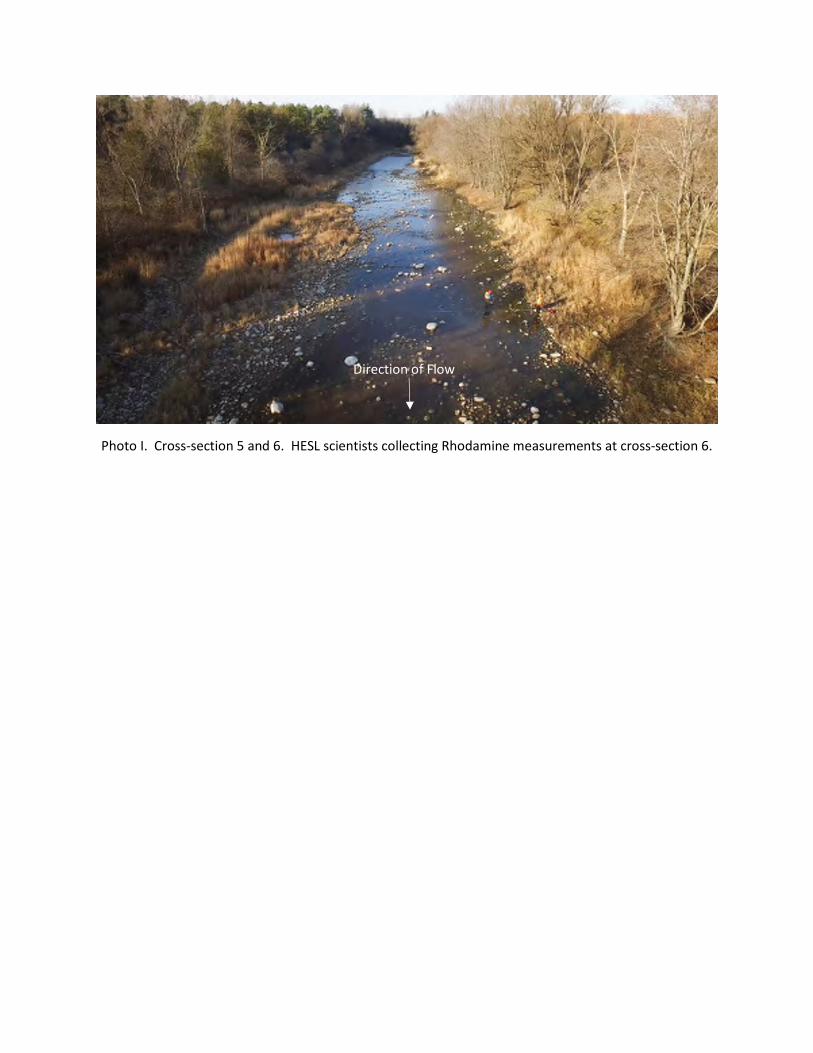
Photo I. Cross-section 5 and 6. HESL scientists collecting Rhodamine measurements at cross-section 6.
Direction of Flow
Hutchinson Environmental Sciences Ltd.
M020117_Mapleton Nov 2016 Dye Study-draft.docx 6
Appendix C. Full Rhodamine Dye Results and LaboratoryCertificate of Analysis
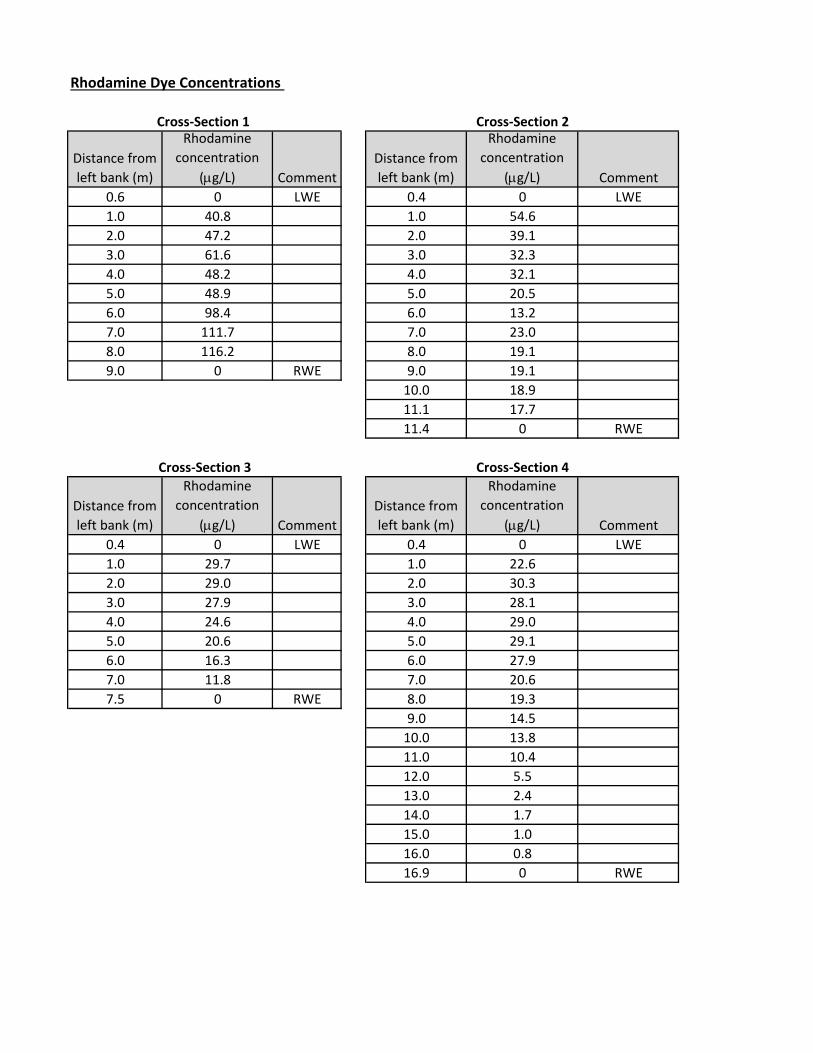
Rhodamine Dye Concentrations
Distance from
left bank (m)
Rhodamine
concentration
(mg/L) Comment
Distance from
left bank (m)
Rhodamine
concentration
(mg/L) Comment
0.6 0 LWE 0.4 0 LWE
1.0 40.8 1.0 54.6
2.0 47.2 2.0 39.1
3.0 61.6 3.0 32.3
4.0 48.2 4.0 32.1
5.0 48.9 5.0 20.5
6.0 98.4 6.0 13.2
7.0 111.7 7.0 23.0
8.0 116.2 8.0 19.1
9.0 0 RWE 9.0 19.1
10.0 18.9
11.1 17.7
11.4 0 RWE
Distance from
left bank (m)
Rhodamine
concentration
(mg/L) Comment
Distance from
left bank (m)
Rhodamine
concentration
(mg/L) Comment
0.4 0 LWE 0.4 0 LWE
1.0 29.7 1.0 22.6
2.0 29.0 2.0 30.3
3.0 27.9 3.0 28.1
4.0 24.6 4.0 29.0
5.0 20.6 5.0 29.1
6.0 16.3 6.0 27.9
7.0 11.8 7.0 20.6
7.5 0 RWE 8.0 19.3
9.0 14.5
10.0 13.8
11.0 10.4
12.0 5.5
13.0 2.4
14.0 1.7
15.0 1.0
16.0 0.8
16.9 0 RWE
Cross-Section 1 Cross-Section 2
Cross-Section 3 Cross-Section 4
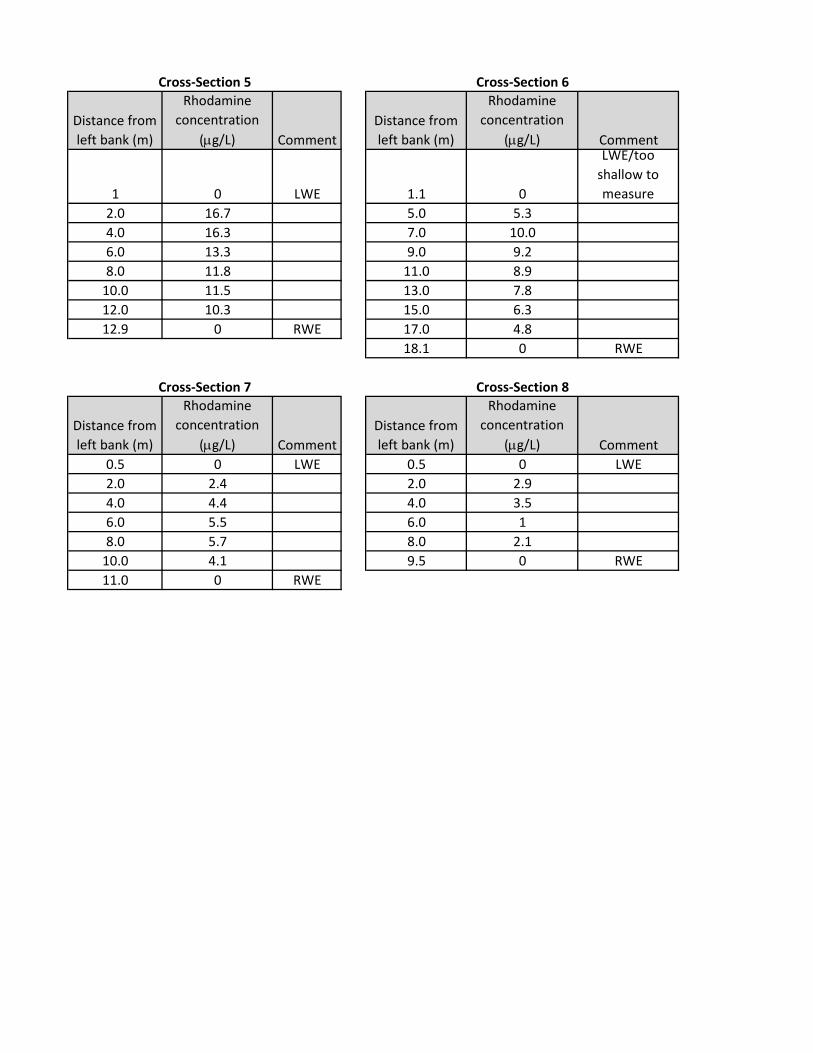
Distance from
left bank (m)
Rhodamine
concentration
(mg/L) Comment
Distance from
left bank (m)
Rhodamine
concentration
(mg/L) Comment
1 0 LWE 1.1 0
LWE/too
shallow to
measure
2.0 16.7 5.0 5.3
4.0 16.3 7.0 10.0
6.0 13.3 9.0 9.2
8.0 11.8 11.0 8.9
10.0 11.5 13.0 7.8
12.0 10.3 15.0 6.3
12.9 0 RWE 17.0 4.8
18.1 0 RWE
Distance from
left bank (m)
Rhodamine
concentration
(mg/L) Comment
Distance from
left bank (m)
Rhodamine
concentration
(mg/L) Comment
0.5 0 LWE 0.5 0 LWE
2.0 2.4 2.0 2.9
4.0 4.4 4.0 3.5
6.0 5.5 6.0 1
8.0 5.7 8.0 2.1
10.0 4.1 9.5 0 RWE
11.0 0 RWE
Cross-Section 7 Cross-Section 8
Cross-Section 5 Cross-Section 6
[This report shall not be reproduced except in full without the written authority of the Laboratory.]
18-NOV-16
Lab Work Order #: L1859958
Date Received:HUTCHINSON ENVIRONMENTAL SCIENCES LTD
501 Krug St.Suite 202Kitchener ON N2B 1L3
ATTN: TARA ROUMELIOTIS FINAL REV. 206-DEC-16 07:42 (MT)Report Date:
Version:
Certificate of Analysis
ALS CANADA LTD Part of the ALS Group A Campbell Brothers Limited Company
____________________________________________
LAURA ERMETAAccount Manager
ADDRESS: 60 Northland Road, Unit 1, Waterloo, ON N2V 2B8 Canada | Phone: +1 519 886 6910 | Fax: +1 519 886 9047
Client Phone: 519-576-1711
01-DEC-16 Total Dissolved Phosphorus added to samples L1859958-1 to -7.Comments:
J160075Job Reference: NOT SUBMITTEDProject P.O. #:
C of C Numbers:Legal Site Desc:
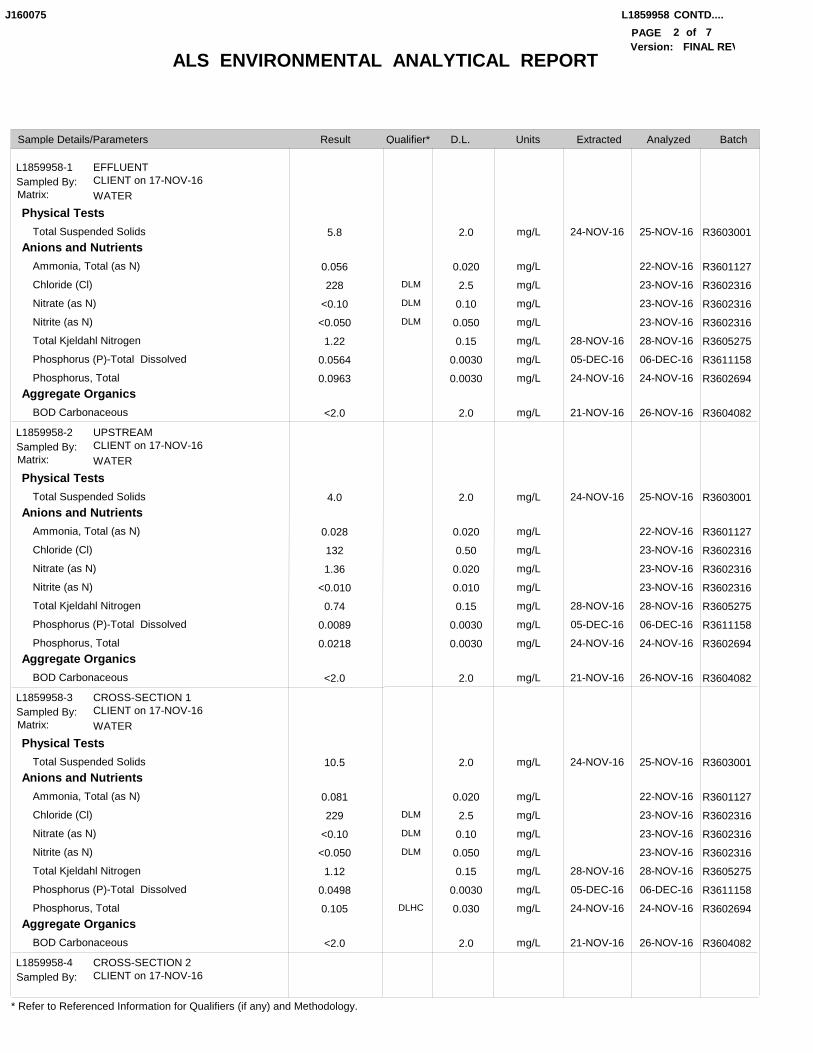
ALS ENVIRONMENTAL ANALYTICAL REPORT
L1859958 CONTD....
2PAGE
Result D.L. Units Extracted AnalyzedSample Details/Parameters
of
J160075
Qualifier* Batch
* Refer to Referenced Information for Qualifiers (if any) and Methodology.
Version: FINAL REV7
L1859958-1
L1859958-2
L1859958-3
L1859958-4
EFFLUENT
UPSTREAM
CROSS-SECTION 1
CROSS-SECTION 2
CLIENT on 17-NOV-16
CLIENT on 17-NOV-16
CLIENT on 17-NOV-16
CLIENT on 17-NOV-16
Sampled By:
Sampled By:
Sampled By:
Sampled By:
WATER
WATER
WATER
Matrix:
Matrix:
Matrix:
Physical Tests
Anions and Nutrients
Aggregate Organics
Physical Tests
Anions and Nutrients
Aggregate Organics
Physical Tests
Anions and Nutrients
Aggregate Organics
Total Suspended Solids
Ammonia, Total (as N)
Chloride (Cl)
Nitrate (as N)
Nitrite (as N)
Total Kjeldahl Nitrogen
Phosphorus (P)-Total Dissolved
Phosphorus, Total
BOD Carbonaceous
Total Suspended Solids
Ammonia, Total (as N)
Chloride (Cl)
Nitrate (as N)
Nitrite (as N)
Total Kjeldahl Nitrogen
Phosphorus (P)-Total Dissolved
Phosphorus, Total
BOD Carbonaceous
Total Suspended Solids
Ammonia, Total (as N)
Chloride (Cl)
Nitrate (as N)
Nitrite (as N)
Total Kjeldahl Nitrogen
Phosphorus (P)-Total Dissolved
Phosphorus, Total
BOD Carbonaceous
mg/L
mg/L
mg/L
mg/L
mg/L
mg/L
mg/L
mg/L
mg/L
mg/L
mg/L
mg/L
mg/L
mg/L
mg/L
mg/L
mg/L
mg/L
mg/L
mg/L
mg/L
mg/L
mg/L
mg/L
mg/L
mg/L
mg/L
24-NOV-16
28-NOV-16
05-DEC-16
24-NOV-16
21-NOV-16
24-NOV-16
28-NOV-16
05-DEC-16
24-NOV-16
21-NOV-16
24-NOV-16
28-NOV-16
05-DEC-16
24-NOV-16
21-NOV-16
25-NOV-16
22-NOV-16
23-NOV-16
23-NOV-16
23-NOV-16
28-NOV-16
06-DEC-16
24-NOV-16
26-NOV-16
25-NOV-16
22-NOV-16
23-NOV-16
23-NOV-16
23-NOV-16
28-NOV-16
06-DEC-16
24-NOV-16
26-NOV-16
25-NOV-16
22-NOV-16
23-NOV-16
23-NOV-16
23-NOV-16
28-NOV-16
06-DEC-16
24-NOV-16
26-NOV-16
5.8
0.056
228
<0.10
<0.050
1.22
0.0564
0.0963
<2.0
4.0
0.028
132
1.36
<0.010
0.74
0.0089
0.0218
<2.0
10.5
0.081
229
<0.10
<0.050
1.12
0.0498
0.105
<2.0
2.0
0.020
2.5
0.10
0.050
0.15
0.0030
0.0030
2.0
2.0
0.020
0.50
0.020
0.010
0.15
0.0030
0.0030
2.0
2.0
0.020
2.5
0.10
0.050
0.15
0.0030
0.030
2.0
DLM
DLM
DLM
DLM
DLM
DLM
DLHC
R3603001
R3601127
R3602316
R3602316
R3602316
R3605275
R3611158
R3602694
R3604082
R3603001
R3601127
R3602316
R3602316
R3602316
R3605275
R3611158
R3602694
R3604082
R3603001
R3601127
R3602316
R3602316
R3602316
R3605275
R3611158
R3602694
R3604082
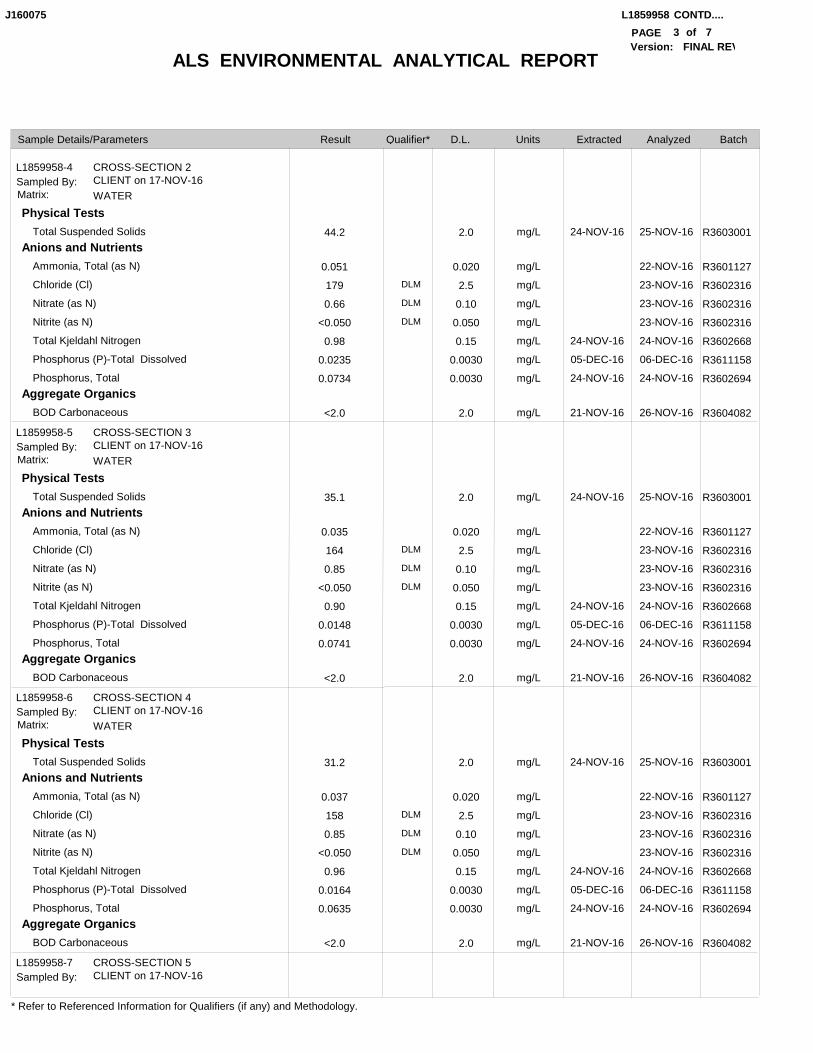
ALS ENVIRONMENTAL ANALYTICAL REPORT
L1859958 CONTD....
3PAGE
Result D.L. Units Extracted AnalyzedSample Details/Parameters
of
J160075
Qualifier* Batch
* Refer to Referenced Information for Qualifiers (if any) and Methodology.
Version: FINAL REV7
L1859958-4
L1859958-5
L1859958-6
L1859958-7
CROSS-SECTION 2
CROSS-SECTION 3
CROSS-SECTION 4
CROSS-SECTION 5
CLIENT on 17-NOV-16
CLIENT on 17-NOV-16
CLIENT on 17-NOV-16
CLIENT on 17-NOV-16
Sampled By:
Sampled By:
Sampled By:
Sampled By:
WATER
WATER
WATER
Matrix:
Matrix:
Matrix:
Physical Tests
Anions and Nutrients
Aggregate Organics
Physical Tests
Anions and Nutrients
Aggregate Organics
Physical Tests
Anions and Nutrients
Aggregate Organics
Total Suspended Solids
Ammonia, Total (as N)
Chloride (Cl)
Nitrate (as N)
Nitrite (as N)
Total Kjeldahl Nitrogen
Phosphorus (P)-Total Dissolved
Phosphorus, Total
BOD Carbonaceous
Total Suspended Solids
Ammonia, Total (as N)
Chloride (Cl)
Nitrate (as N)
Nitrite (as N)
Total Kjeldahl Nitrogen
Phosphorus (P)-Total Dissolved
Phosphorus, Total
BOD Carbonaceous
Total Suspended Solids
Ammonia, Total (as N)
Chloride (Cl)
Nitrate (as N)
Nitrite (as N)
Total Kjeldahl Nitrogen
Phosphorus (P)-Total Dissolved
Phosphorus, Total
BOD Carbonaceous
mg/L
mg/L
mg/L
mg/L
mg/L
mg/L
mg/L
mg/L
mg/L
mg/L
mg/L
mg/L
mg/L
mg/L
mg/L
mg/L
mg/L
mg/L
mg/L
mg/L
mg/L
mg/L
mg/L
mg/L
mg/L
mg/L
mg/L
24-NOV-16
24-NOV-16
05-DEC-16
24-NOV-16
21-NOV-16
24-NOV-16
24-NOV-16
05-DEC-16
24-NOV-16
21-NOV-16
24-NOV-16
24-NOV-16
05-DEC-16
24-NOV-16
21-NOV-16
25-NOV-16
22-NOV-16
23-NOV-16
23-NOV-16
23-NOV-16
24-NOV-16
06-DEC-16
24-NOV-16
26-NOV-16
25-NOV-16
22-NOV-16
23-NOV-16
23-NOV-16
23-NOV-16
24-NOV-16
06-DEC-16
24-NOV-16
26-NOV-16
25-NOV-16
22-NOV-16
23-NOV-16
23-NOV-16
23-NOV-16
24-NOV-16
06-DEC-16
24-NOV-16
26-NOV-16
44.2
0.051
179
0.66
<0.050
0.98
0.0235
0.0734
<2.0
35.1
0.035
164
0.85
<0.050
0.90
0.0148
0.0741
<2.0
31.2
0.037
158
0.85
<0.050
0.96
0.0164
0.0635
<2.0
2.0
0.020
2.5
0.10
0.050
0.15
0.0030
0.0030
2.0
2.0
0.020
2.5
0.10
0.050
0.15
0.0030
0.0030
2.0
2.0
0.020
2.5
0.10
0.050
0.15
0.0030
0.0030
2.0
DLM
DLM
DLM
DLM
DLM
DLM
DLM
DLM
DLM
R3603001
R3601127
R3602316
R3602316
R3602316
R3602668
R3611158
R3602694
R3604082
R3603001
R3601127
R3602316
R3602316
R3602316
R3602668
R3611158
R3602694
R3604082
R3603001
R3601127
R3602316
R3602316
R3602316
R3602668
R3611158
R3602694
R3604082
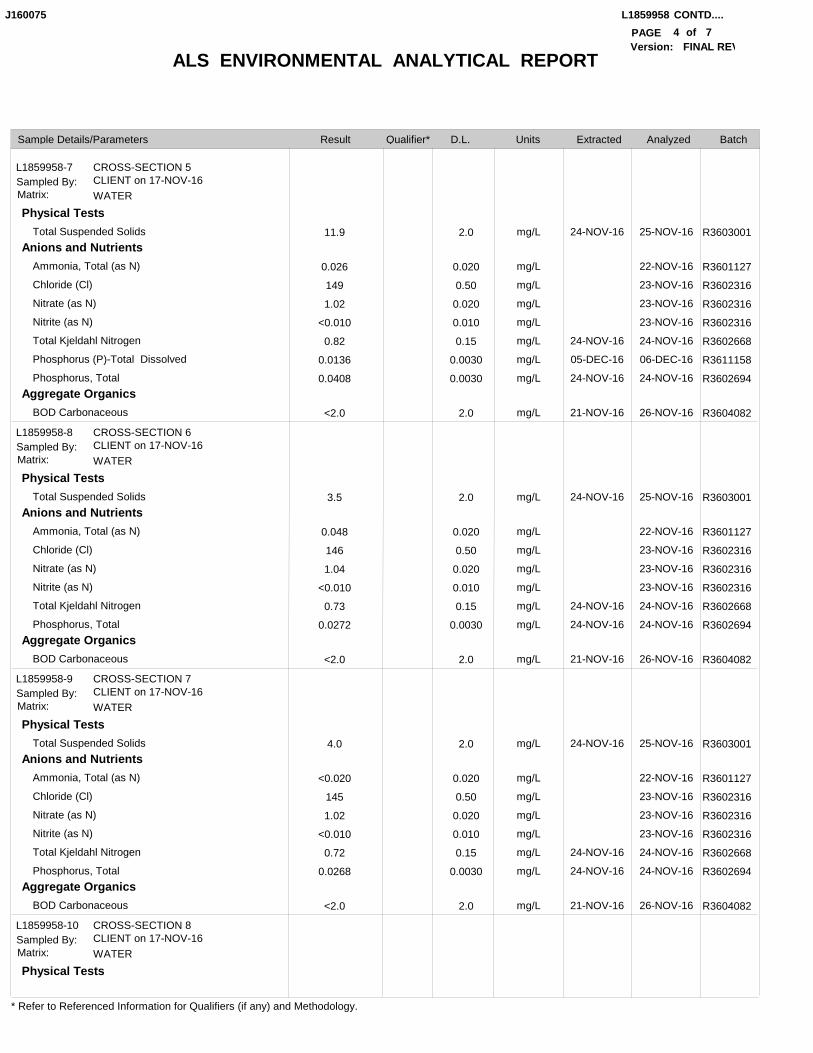
ALS ENVIRONMENTAL ANALYTICAL REPORT
L1859958 CONTD....
4PAGE
Result D.L. Units Extracted AnalyzedSample Details/Parameters
of
J160075
Qualifier* Batch
* Refer to Referenced Information for Qualifiers (if any) and Methodology.
Version: FINAL REV7
L1859958-7
L1859958-8
L1859958-9
L1859958-10
CROSS-SECTION 5
CROSS-SECTION 6
CROSS-SECTION 7
CROSS-SECTION 8
CLIENT on 17-NOV-16
CLIENT on 17-NOV-16
CLIENT on 17-NOV-16
CLIENT on 17-NOV-16
Sampled By:
Sampled By:
Sampled By:
Sampled By:
WATER
WATER
WATER
WATER
Matrix:
Matrix:
Matrix:
Matrix:
Physical Tests
Anions and Nutrients
Aggregate Organics
Physical Tests
Anions and Nutrients
Aggregate Organics
Physical Tests
Anions and Nutrients
Aggregate Organics
Physical Tests
Total Suspended Solids
Ammonia, Total (as N)
Chloride (Cl)
Nitrate (as N)
Nitrite (as N)
Total Kjeldahl Nitrogen
Phosphorus (P)-Total Dissolved
Phosphorus, Total
BOD Carbonaceous
Total Suspended Solids
Ammonia, Total (as N)
Chloride (Cl)
Nitrate (as N)
Nitrite (as N)
Total Kjeldahl Nitrogen
Phosphorus, Total
BOD Carbonaceous
Total Suspended Solids
Ammonia, Total (as N)
Chloride (Cl)
Nitrate (as N)
Nitrite (as N)
Total Kjeldahl Nitrogen
Phosphorus, Total
BOD Carbonaceous
mg/L
mg/L
mg/L
mg/L
mg/L
mg/L
mg/L
mg/L
mg/L
mg/L
mg/L
mg/L
mg/L
mg/L
mg/L
mg/L
mg/L
mg/L
mg/L
mg/L
mg/L
mg/L
mg/L
mg/L
mg/L
24-NOV-16
24-NOV-16
05-DEC-16
24-NOV-16
21-NOV-16
24-NOV-16
24-NOV-16
24-NOV-16
21-NOV-16
24-NOV-16
24-NOV-16
24-NOV-16
21-NOV-16
25-NOV-16
22-NOV-16
23-NOV-16
23-NOV-16
23-NOV-16
24-NOV-16
06-DEC-16
24-NOV-16
26-NOV-16
25-NOV-16
22-NOV-16
23-NOV-16
23-NOV-16
23-NOV-16
24-NOV-16
24-NOV-16
26-NOV-16
25-NOV-16
22-NOV-16
23-NOV-16
23-NOV-16
23-NOV-16
24-NOV-16
24-NOV-16
26-NOV-16
11.9
0.026
149
1.02
<0.010
0.82
0.0136
0.0408
<2.0
3.5
0.048
146
1.04
<0.010
0.73
0.0272
<2.0
4.0
<0.020
145
1.02
<0.010
0.72
0.0268
<2.0
2.0
0.020
0.50
0.020
0.010
0.15
0.0030
0.0030
2.0
2.0
0.020
0.50
0.020
0.010
0.15
0.0030
2.0
2.0
0.020
0.50
0.020
0.010
0.15
0.0030
2.0
R3603001
R3601127
R3602316
R3602316
R3602316
R3602668
R3611158
R3602694
R3604082
R3603001
R3601127
R3602316
R3602316
R3602316
R3602668
R3602694
R3604082
R3603001
R3601127
R3602316
R3602316
R3602316
R3602668
R3602694
R3604082
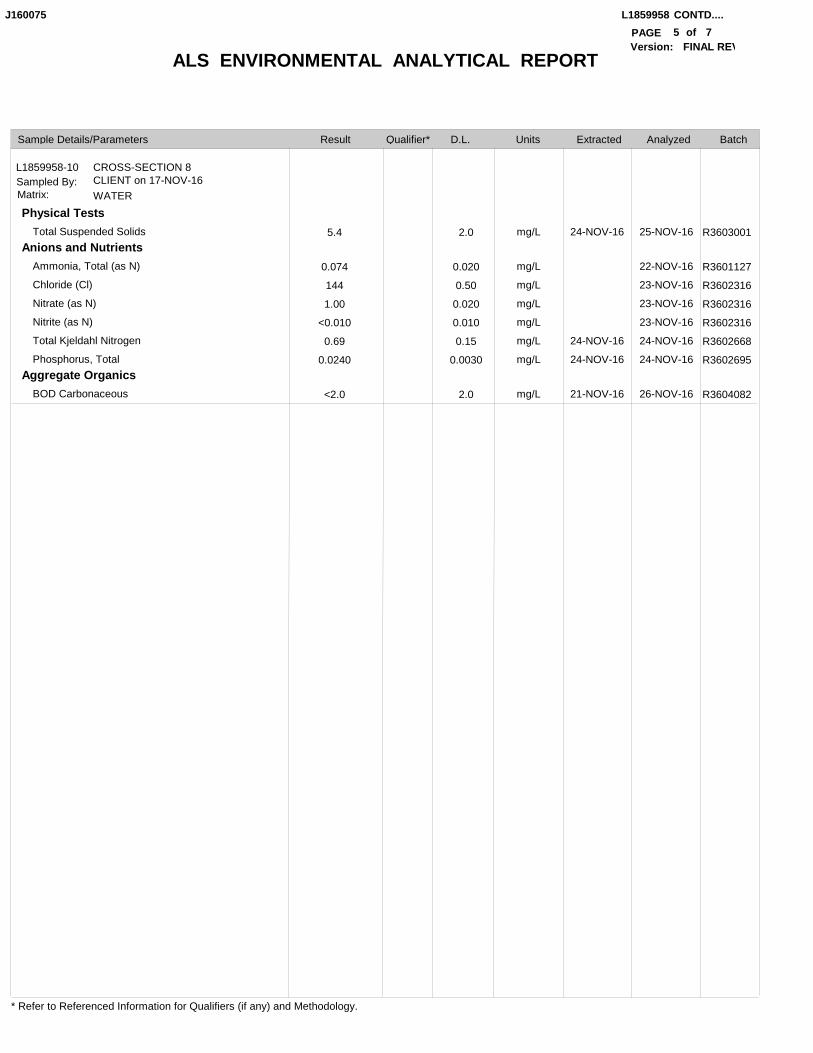
ALS ENVIRONMENTAL ANALYTICAL REPORT
L1859958 CONTD....
5PAGE
Result D.L. Units Extracted AnalyzedSample Details/Parameters
of
J160075
Qualifier* Batch
* Refer to Referenced Information for Qualifiers (if any) and Methodology.
Version: FINAL REV7
L1859958-10 CROSS-SECTION 8CLIENT on 17-NOV-16Sampled By:WATERMatrix:
Physical Tests
Anions and Nutrients
Aggregate Organics
Total Suspended Solids
Ammonia, Total (as N)
Chloride (Cl)
Nitrate (as N)
Nitrite (as N)
Total Kjeldahl Nitrogen
Phosphorus, Total
BOD Carbonaceous
mg/L
mg/L
mg/L
mg/L
mg/L
mg/L
mg/L
mg/L
24-NOV-16
24-NOV-16
24-NOV-16
21-NOV-16
25-NOV-16
22-NOV-16
23-NOV-16
23-NOV-16
23-NOV-16
24-NOV-16
24-NOV-16
26-NOV-16
5.4
0.074
144
1.00
<0.010
0.69
0.0240
<2.0
2.0
0.020
0.50
0.020
0.010
0.15
0.0030
2.0
R3603001
R3601127
R3602316
R3602316
R3602316
R3602668
R3602695
R3604082
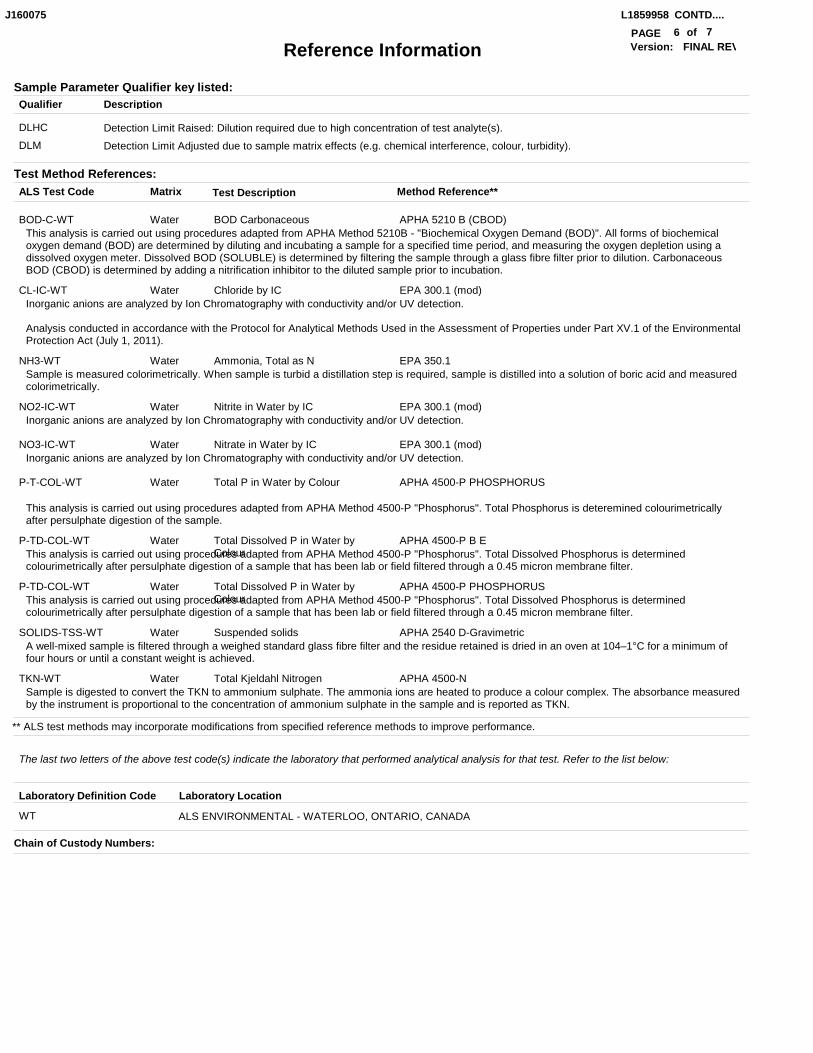
BOD-C-WT
CL-IC-WT
NH3-WT
NO2-IC-WT
NO3-IC-WT
P-T-COL-WT
P-TD-COL-WT
P-TD-COL-WT
SOLIDS-TSS-WT
TKN-WT
Reference Information
BOD Carbonaceous
Chloride by IC
Ammonia, Total as N
Nitrite in Water by IC
Nitrate in Water by IC
Total P in Water by Colour
Total Dissolved P in Water by Colour
Total Dissolved P in Water by Colour
Suspended solids
Total Kjeldahl Nitrogen
L1859958 CONTD....
6PAGE of
J160075
This analysis is carried out using procedures adapted from APHA Method 5210B - "Biochemical Oxygen Demand (BOD)". All forms of biochemical oxygen demand (BOD) are determined by diluting and incubating a sample for a specified time period, and measuring the oxygen depletion using a dissolved oxygen meter. Dissolved BOD (SOLUBLE) is determined by filtering the sample through a glass fibre filter prior to dilution. Carbonaceous BOD (CBOD) is determined by adding a nitrification inhibitor to the diluted sample prior to incubation.
Inorganic anions are analyzed by Ion Chromatography with conductivity and/or UV detection.
Analysis conducted in accordance with the Protocol for Analytical Methods Used in the Assessment of Properties under Part XV.1 of the Environmental Protection Act (July 1, 2011).
Sample is measured colorimetrically. When sample is turbid a distillation step is required, sample is distilled into a solution of boric acid and measured colorimetrically.
Inorganic anions are analyzed by Ion Chromatography with conductivity and/or UV detection.
Inorganic anions are analyzed by Ion Chromatography with conductivity and/or UV detection.
This analysis is carried out using procedures adapted from APHA Method 4500-P "Phosphorus". Total Phosphorus is deteremined colourimetrically after persulphate digestion of the sample.
This analysis is carried out using procedures adapted from APHA Method 4500-P "Phosphorus". Total Dissolved Phosphorus is determined colourimetrically after persulphate digestion of a sample that has been lab or field filtered through a 0.45 micron membrane filter.
This analysis is carried out using procedures adapted from APHA Method 4500-P "Phosphorus". Total Dissolved Phosphorus is determined colourimetrically after persulphate digestion of a sample that has been lab or field filtered through a 0.45 micron membrane filter.
A well-mixed sample is filtered through a weighed standard glass fibre filter and the residue retained is dried in an oven at 104–1°C for a minimum of four hours or until a constant weight is achieved.
Sample is digested to convert the TKN to ammonium sulphate. The ammonia ions are heated to produce a colour complex. The absorbance measured by the instrument is proportional to the concentration of ammonium sulphate in the sample and is reported as TKN.
ALS Test Code Test Description
Water
Water
Water
Water
Water
Water
Water
Water
Water
Water
DLHC
DLM
Detection Limit Raised: Dilution required due to high concentration of test analyte(s).
Detection Limit Adjusted due to sample matrix effects (e.g. chemical interference, colour, turbidity).
Sample Parameter Qualifier key listed:
APHA 5210 B (CBOD)
EPA 300.1 (mod)
EPA 350.1
EPA 300.1 (mod)
EPA 300.1 (mod)
APHA 4500-P PHOSPHORUS
APHA 4500-P B E
APHA 4500-P PHOSPHORUS
APHA 2540 D-Gravimetric
APHA 4500-N
Method Reference**
** ALS test methods may incorporate modifications from specified reference methods to improve performance.
Description Qualifier
Matrix
The last two letters of the above test code(s) indicate the laboratory that performed analytical analysis for that test. Refer to the list below:
Laboratory Definition Code Laboratory Location
WT ALS ENVIRONMENTAL - WATERLOO, ONTARIO, CANADA
Test Method References:
Chain of Custody Numbers:
Version: FINAL REV7
Reference Information
L1859958 CONTD....
7PAGE of
J160075
GLOSSARY OF REPORT TERMSSurrogates are compounds that are similar in behaviour to target analyte(s), but that do not normally occur in environmental samples. For applicable tests, surrogates are added to samples prior to analysis as a check on recovery. In reports that display the D.L. column, laboratory objectives for surrogates are listed there.mg/kg - milligrams per kilogram based on dry weight of samplemg/kg wwt - milligrams per kilogram based on wet weight of samplemg/kg lwt - milligrams per kilogram based on lipid weight of samplemg/L - unit of concentration based on volume, parts per million.< - Less than.D.L. - The reporting limit.N/A - Result not available. Refer to qualifier code and definition for explanation.
Test results reported relate only to the samples as received by the laboratory.UNLESS OTHERWISE STATED, ALL SAMPLES WERE RECEIVED IN ACCEPTABLE CONDITION.Analytical results in unsigned test reports with the DRAFT watermark are subject to change, pending final QC review.
Version: FINAL REV7
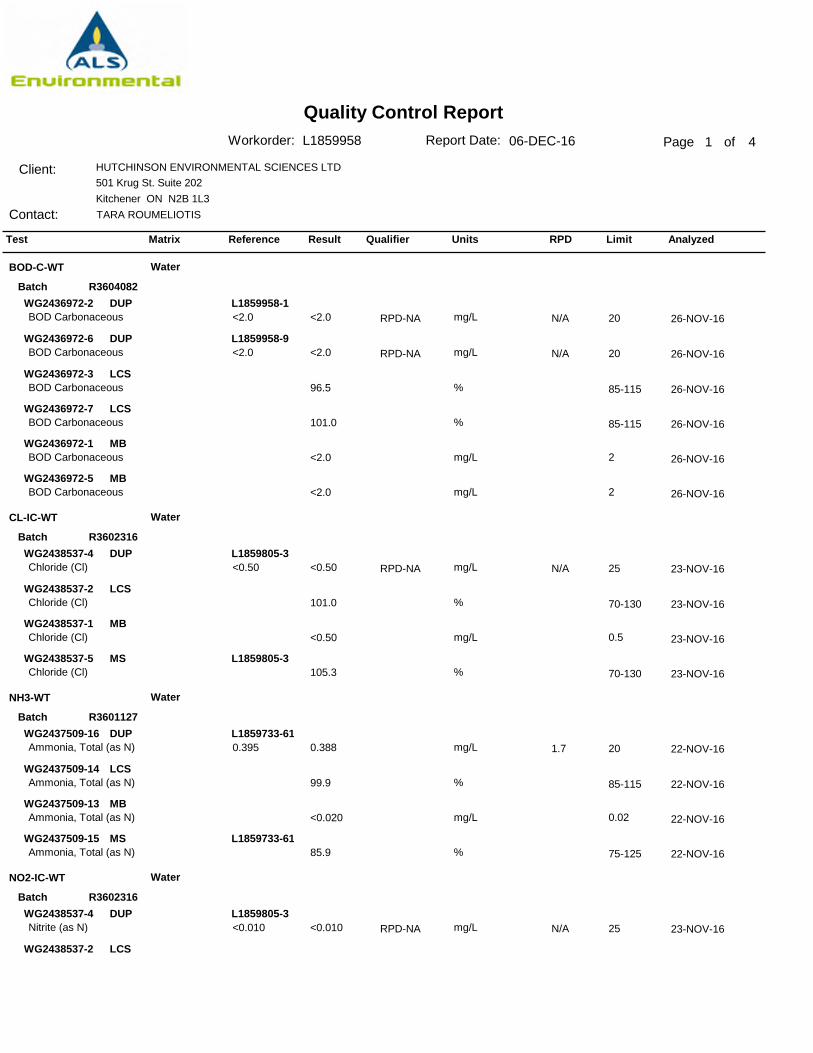
Quality Control ReportPage 1 of
Client:
Contact:
HUTCHINSON ENVIRONMENTAL SCIENCES LTD501 Krug St. Suite 202Kitchener ON N2B 1L3TARA ROUMELIOTIS
Report Date: 06-DEC-16Workorder: L1859958
Test Matrix Reference Result Qualifier Units RPD Limit Analyzed
BOD-C-WT
CL-IC-WT
NH3-WT
NO2-IC-WT
Water
Water
Water
Water
R3604082
R3602316
R3601127
R3602316
Batch
Batch
Batch
Batch
DUP
DUP
LCS
LCS
MB
MB
DUP
LCS
MB
MS
DUP
LCS
MB
MS
DUP
LCS
WG2436972-2
WG2436972-6
WG2436972-3
WG2436972-7
WG2436972-1
WG2436972-5
WG2438537-4
WG2438537-2
WG2438537-1
WG2438537-5
WG2437509-16
WG2437509-14
WG2437509-13
WG2437509-15
WG2438537-4
WG2438537-2
L1859958-1
L1859958-9
L1859805-3
L1859805-3
L1859733-61
L1859733-61
L1859805-3
BOD Carbonaceous
BOD Carbonaceous
BOD Carbonaceous
BOD Carbonaceous
BOD Carbonaceous
BOD Carbonaceous
Chloride (Cl)
Chloride (Cl)
Chloride (Cl)
Chloride (Cl)
Ammonia, Total (as N)
Ammonia, Total (as N)
Ammonia, Total (as N)
Ammonia, Total (as N)
Nitrite (as N)
<2.0
<2.0
96.5
101.0
<2.0
<2.0
<0.50
101.0
<0.50
105.3
0.388
99.9
<0.020
85.9
<0.010
26-NOV-16
26-NOV-16
26-NOV-16
26-NOV-16
26-NOV-16
26-NOV-16
23-NOV-16
23-NOV-16
23-NOV-16
23-NOV-16
22-NOV-16
22-NOV-16
22-NOV-16
22-NOV-16
23-NOV-16
N/A
N/A
N/A
1.7
N/A
20
20
25
20
25
85-115
85-115
70-130
70-130
85-115
75-125
mg/L
mg/L
%
%
mg/L
mg/L
mg/L
%
mg/L
%
mg/L
%
mg/L
%
mg/L
<2.0
<2.0
<0.50
0.395
<0.010
2
2
0.5
0.02
RPD-NA
RPD-NA
RPD-NA
RPD-NA
4
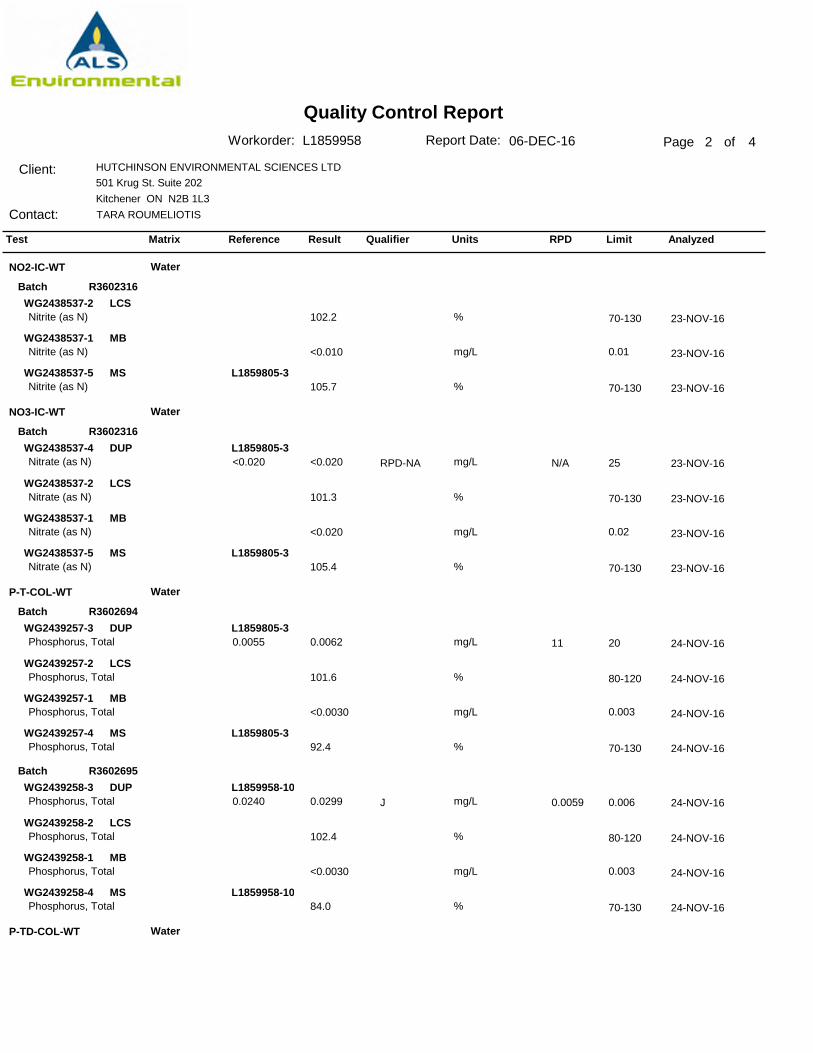
Quality Control ReportPage 2 of
Client:
Contact:
HUTCHINSON ENVIRONMENTAL SCIENCES LTD501 Krug St. Suite 202Kitchener ON N2B 1L3TARA ROUMELIOTIS
Report Date: 06-DEC-16Workorder: L1859958
Test Matrix Reference Result Qualifier Units RPD Limit Analyzed
NO2-IC-WT
NO3-IC-WT
P-T-COL-WT
P-TD-COL-WT
Water
Water
Water
Water
R3602316
R3602316
R3602694
R3602695
Batch
Batch
Batch
Batch
LCS
MB
MS
DUP
LCS
MB
MS
DUP
LCS
MB
MS
DUP
LCS
MB
MS
WG2438537-2
WG2438537-1
WG2438537-5
WG2438537-4
WG2438537-2
WG2438537-1
WG2438537-5
WG2439257-3
WG2439257-2
WG2439257-1
WG2439257-4
WG2439258-3
WG2439258-2
WG2439258-1
WG2439258-4
L1859805-3
L1859805-3
L1859805-3
L1859805-3
L1859805-3
L1859958-10
L1859958-10
Nitrite (as N)
Nitrite (as N)
Nitrite (as N)
Nitrate (as N)
Nitrate (as N)
Nitrate (as N)
Nitrate (as N)
Phosphorus, Total
Phosphorus, Total
Phosphorus, Total
Phosphorus, Total
Phosphorus, Total
Phosphorus, Total
Phosphorus, Total
Phosphorus, Total
102.2
<0.010
105.7
<0.020
101.3
<0.020
105.4
0.0062
101.6
<0.0030
92.4
0.0299
102.4
<0.0030
84.0
23-NOV-16
23-NOV-16
23-NOV-16
23-NOV-16
23-NOV-16
23-NOV-16
23-NOV-16
24-NOV-16
24-NOV-16
24-NOV-16
24-NOV-16
24-NOV-16
24-NOV-16
24-NOV-16
24-NOV-16
N/A
11
0.0059
25
20
0.006
70-130
70-130
70-130
70-130
80-120
70-130
80-120
70-130
%
mg/L
%
mg/L
%
mg/L
%
mg/L
%
mg/L
%
mg/L
%
mg/L
%
<0.020
0.0055
0.0240
0.01
0.02
0.003
0.003
RPD-NA
J
4
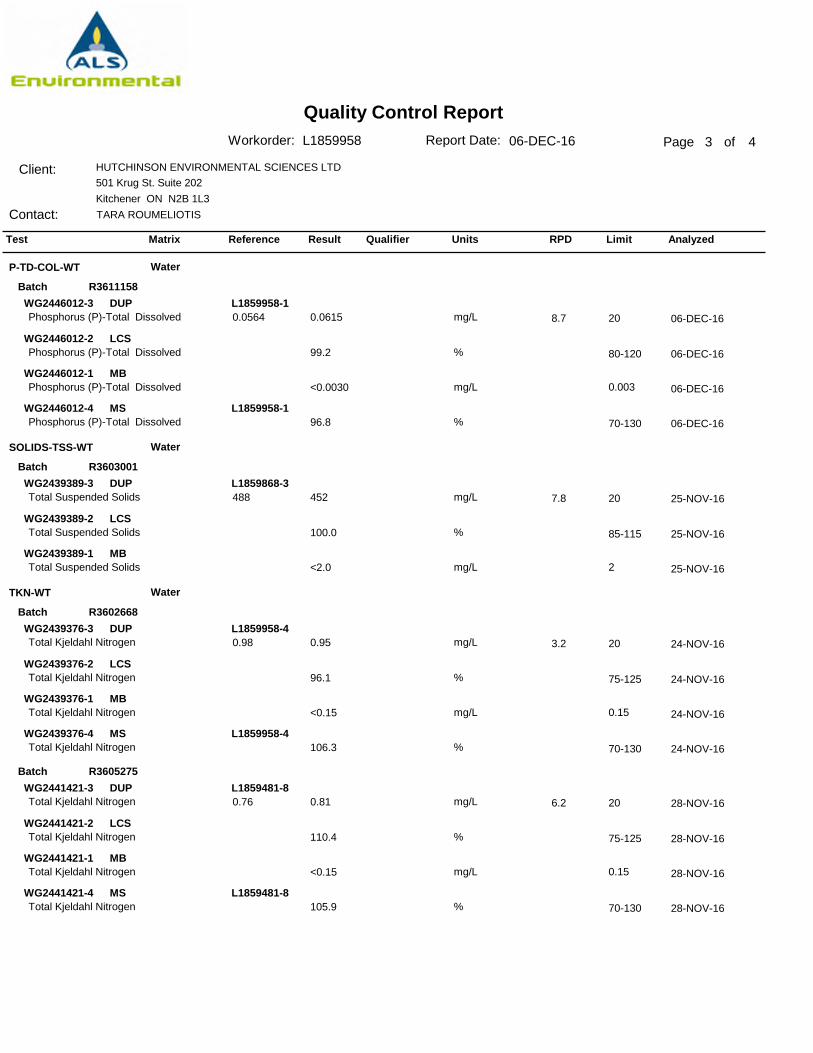
Quality Control ReportPage 3 of
Client:
Contact:
HUTCHINSON ENVIRONMENTAL SCIENCES LTD501 Krug St. Suite 202Kitchener ON N2B 1L3TARA ROUMELIOTIS
Report Date: 06-DEC-16Workorder: L1859958
Test Matrix Reference Result Qualifier Units RPD Limit Analyzed
P-TD-COL-WT
SOLIDS-TSS-WT
TKN-WT
Water
Water
Water
R3611158
R3603001
R3602668
R3605275
Batch
Batch
Batch
Batch
DUP
LCS
MB
MS
DUP
LCS
MB
DUP
LCS
MB
MS
DUP
LCS
MB
MS
WG2446012-3
WG2446012-2
WG2446012-1
WG2446012-4
WG2439389-3
WG2439389-2
WG2439389-1
WG2439376-3
WG2439376-2
WG2439376-1
WG2439376-4
WG2441421-3
WG2441421-2
WG2441421-1
WG2441421-4
L1859958-1
L1859958-1
L1859868-3
L1859958-4
L1859958-4
L1859481-8
L1859481-8
Phosphorus (P)-Total Dissolved
Phosphorus (P)-Total Dissolved
Phosphorus (P)-Total Dissolved
Phosphorus (P)-Total Dissolved
Total Suspended Solids
Total Suspended Solids
Total Suspended Solids
Total Kjeldahl Nitrogen
Total Kjeldahl Nitrogen
Total Kjeldahl Nitrogen
Total Kjeldahl Nitrogen
Total Kjeldahl Nitrogen
Total Kjeldahl Nitrogen
Total Kjeldahl Nitrogen
Total Kjeldahl Nitrogen
0.0615
99.2
<0.0030
96.8
452
100.0
<2.0
0.95
96.1
<0.15
106.3
0.81
110.4
<0.15
105.9
06-DEC-16
06-DEC-16
06-DEC-16
06-DEC-16
25-NOV-16
25-NOV-16
25-NOV-16
24-NOV-16
24-NOV-16
24-NOV-16
24-NOV-16
28-NOV-16
28-NOV-16
28-NOV-16
28-NOV-16
8.7
7.8
3.2
6.2
20
20
20
20
80-120
70-130
85-115
75-125
70-130
75-125
70-130
mg/L
%
mg/L
%
mg/L
%
mg/L
mg/L
%
mg/L
%
mg/L
%
mg/L
%
0.0564
488
0.98
0.76
0.003
2
0.15
0.15
4
Quality Control Report
Page 4 of
Report Date: 06-DEC-16Workorder: L1859958
Sample Parameter Qualifier Definitions:
Description Qualifier
J
RPD-NA
Duplicate results and limits are expressed in terms of absolute difference.
Relative Percent Difference Not Available due to result(s) being less than detection limit.
Limit ALS Control Limit (Data Quality Objectives)DUP DuplicateRPD Relative Percent DifferenceN/A Not AvailableLCS Laboratory Control SampleSRM Standard Reference MaterialMS Matrix SpikeMSD Matrix Spike DuplicateADE Average Desorption EfficiencyMB Method BlankIRM Internal Reference MaterialCRM Certified Reference MaterialCCV Continuing Calibration VerificationCVS Calibration Verification StandardLCSD Laboratory Control Sample Duplicate
Legend:
The ALS Quality Control Report is provided to ALS clients upon request. ALS includes comprehensive QC checks with every analysis to ensure our high standards of quality are met. Each QC result has a known or expected target value, which is compared against pre-determined data quality objectives to provide confidence in the accuracy of associated test results.
Please note that this report may contain QC results from anonymous Sample Duplicates and Matrix Spikes that do not originate from this Work Order.
Hold Time Exceedances:
All test results reported with this submission were conducted within ALS recommended hold times.
ALS recommended hold times may vary by province. They are assigned to meet known provincial and/or federal government requirements. In the absence of regulatory hold times, ALS establishes recommendations based on guidelines published by the US EPA, APHA Standard Methods, or Environment Canada (where available). For more information, please contact ALS.
Client:
Contact:
HUTCHINSON ENVIRONMENTAL SCIENCES LTD501 Krug St. Suite 202Kitchener ON N2B 1L3TARA ROUMELIOTIS
4
Township of Mapleton Mapleton Wastewater Servicing Class EA - Environmental Study Report
BRM-605325-A0 November 2017
Appendix C – Natural Heritage Report

Mapleton Water Pollution Control Plant Class Environmental Assessment Natural Environment Characterization Report
Prepared for: exp. Services Inc. 85 Edwin Street Kitchener, ON N2H 4N7
Project No. 1615 ӏ December 2015

Mapleton Water Pollution Control Plant Class Environmental Assessment
Natural Environment Characterization Report
Project Team: Elaine Gosnell Senior Terrestrial/Wetland Biologist, Project Manager Steve Burgin Aquatic Biologist Andrew Dean Terrestrial & Wetland Biologist Kaitlin Boddaert GIS Analyst
Report submitted on December 15, 2015
___________________________ Elaine Gosnell Project Manager Senior Terrestrial/Wetland Biologist
Natural Resource Solutions Inc. Mapleton WPCP Class EA Natural Environment Characterization Report 1
TABLE OF CONTENTS
1.0 Introduction ............................................................................................... 3
1.1 Study Area .......................................................................................................... 3
2.0 Methods ..................................................................................................... 4
2.1 Background Review and Habitat Screening ..................................................... 4
2.2 Field Studies ....................................................................................................... 5
3.0 Existing Conditions .................................................................................. 7
3.1 Physiography, Geology, Soils and Drainage .................................................... 7
3.2 Vegetation Communities .................................................................................... 7
3.3 Vascular Flora ..................................................................................................... 9
3.4 Wildlife ................................................................................................................. 9
3.5 Aquatic Habitat ................................................................................................. 13
3.6 Fish and Mussel Community ........................................................................... 14
4.0 Natural Feature Significance and Sensitivity ....................................... 16
4.1 Wetlands ........................................................................................................... 16
4.2 Woodlands ........................................................................................................ 16
4.3 Valleylands ........................................................................................................ 16
4.4 Significant Wildlife Habitat ............................................................................... 17
4.5 Fish Habitat ....................................................................................................... 18
4.6 Habitat of Provincially Endangered and Threatened Species ....................... 18
5.0 Summary of Natural Feature Constraints ............................................. 21
6.0 References ............................................................................................... 22
Natural Resource Solutions Inc. Mapleton WPCP Class EA Natural Environment Characterization Report 2
List of Tables Table 1. Vegetation Communities Identified within the Study Area ................................. 8 Table 2. Significant Vascular Flora Observed in the Study Area ................................... 11 Table 3. Significant Bird Species Observed in the Study Area ...................................... 11 List of Maps Map 1. Study Area Map 2. Vegetation Communities and Wildlife Surveys Locations Map 3. Aquatic Habitat Survey Locations Map 4. Natural Features Constraints List of Appendices Appendix I Species at Risk and Species of Conservation Concern Screening Results Appendix II Vascular Flora Observed within the Subject Property Appendix III Bird Species Reported From the Study Area Appendix IV Herpetofauna Reported From the Study Area Appendix V Mammals Reported From the Study Area Appendix VI Lepidoptera Reported From the Study Area Appendix VII Fish Species Reported From the Study Area
Natural Resource Solutions Inc. Mapleton WPCP Class EA Natural Environment Characterization Report 3
1.0 Introduction
Natural Resource Solutions Inc. (NRSI) was retained as part of a team with exp. Services of Brampton to prepare a Class Environmental Assessment (EA) for upgrades to the existing Mapleton Water Pollution Control Plant (WPCP) and servicing system, located southwest of the Town of Drayton, Ontario. Supporting infrastructure to the WPCP was also addressed in this study, including the Drayton and Moorefield Sewage Pumping Stations. The Mapleton Water Pollution Control Plant (WPCP) is located on the west side of the upper branch of the Conestogo River, just south of the town of Drayton (Map 1a). The property is dominated by the presence of the open water lagoons with the remainder of the site being agricultural land. The WPCP discharge flows are directed underground through a 600mm pipe and released overland into a wetland which then drains to the Conestogo River approximately 350m downstream from the outfall. The outlet pipe traverses the Conestogo Lake Conservation Area lands which are owned and managed by the Grand River Conservation Authority (GRCA). These lands are primarily forested with portions of deciduous and coniferous forest, and coniferous plantation. The receiving wetland is an unmapped and unevaluated natural feature which is regulated by GRCA. The Drayton Sewage Pumping Station (SPS) is located immediately to the west of the intersection of Mill Street and River Run Road within the town of Drayton, Ontario (Map 1b). The property is comprised of actively mown lawn, sewage pumping infrastructure, with nearby wetland and treed natural features associated with the Conestogo River. The Moorefield SPS is located approximately 225m east of the intersection of Booth Street and McGivern Street, in the town of Moorefield, Ontario (Map 1c). The property is comprised of actively mown lawn, sewage pumping infrastructure, with nearby agricultural fields and residential properties. This report summarizes background information on natural heritage features, as well as the results of field surveys including Ecological Land Classification (ELC), a spring vascular flora inventory, breeding bird and herpetofaunal surveys and a detailed aquatic habitat characterization. The detailed characterization of existing natural features was used to inform an analysis of natural feature significance and sensitivity within the study area with consideration for applicable County and provincial policies and legislation.
1.1 Study Area
The term “study area” refers to the subject property plus the surrounding area (approximately 120m) for which additional information was collected and reviewed (as could be gathered without direct access to these areas). Habitats between the Mapleton WPCP and the Conestogo River were surveyed in order to accurately characterize the natural features in the receiving habitats of the treated wastewater effluent. The study area also includes the pumping stations in Drayon and Moorefield where investigations of the natural area immediately adjacent to each of the pumping stations were carried out. Background data on wildlife species and Species At Risk (SAR) was collected from the local surrounding area (up to 10km).

Natural Resource Solutions Inc. Mapleton WPCP Class EA Natural Environment Characterization Report 4
2.0 Methods
2.1 Background Review and Habitat Screening
A review of existing natural heritage information was completed to identify key natural heritage features and species that are known or have potential to occur within the study area and the local vicinity (up to 10km). Requests for background information were sent to the Ministry of Natural Resources and Forestry (MNRF) - Guelph District as well as to the GRCA. Background information relevant to the study area was also collected and reviewed from sources including the following:
Natural Heritage Information Centre (NHIC) (MNRF 2015b); Land Information Ontario (LIO) data base mapping (MNRF 2015b); Wellington County Official Plan (2015); GRCA (J. Wagler, pers. comm. 2015); MNRF (J. Pinder, pers. comm. 2015); Department of Fisheries and Oceans Canada (DFO) (DFO 2015a,b); Wellington County Upper Tier Species At Risk List (MNRF 2014) Atlas of the Mammals of Ontario (Dobbyn 1994); Ontario Reptile and Amphibian Atlas (Ontario Nature 2015); Ontario Butterfly Atlas (Jones et al. 2015); and Ontario Breeding Bird Atlas (BSC et al. 2008).
Based on the results of the background information review, a total of 31 Species at Risk (SAR) and 21 Species of Conservation Concern (SCC) have been recorded from within 10km of the study area. For the purposes of this report, SAR are defined as species listed as Threatened or Endangered provincially which are afforded protection under the Endangered Species Act, 2007 (ESA). Within Ontario, SCC refers to:
Species designated provincially as Special Concern; Species that have been assigned a conservation status (S-Rank) of S1 to S3 or
SH by the NHIC; Species that are designated federally as Threatened or Endangered by the
Committee for the Status of Endangered Wildlife in Canada (COSEWIC) but not provincially by the Committee on the Status of Species at Risk in Ontario (COSSARO). These species are protected by the federal Species at Risk Act but not provincially by the ESA.
Habitat for SCC may be considered Significant Wildlife Habitat (SWH), which is afforded protection under the Provincial Policy Statement (MMAH 2014) and municipal natural heritage protection policies. A preliminary screening exercise was conducted on the list of SAR and SCC to determine which species have suitable habitat within the study area. This involved cross-referencing the preferred habitat for reported SAR and SCC (MNRF 2000, MNRF 2015c) against habitats known to occur in the study area. This was completed to ensure that the potential presence of all significant species within the study area was adequately assessed to inform the EA. Based on this screening exercise, potentially suitable habitat for 8 SAR and 9 SCC were identified within the study area. Full results of the SAR and SCC screening exercise are provided in Appendix I.
Natural Resource Solutions Inc. Mapleton WPCP Class EA Natural Environment Characterization Report 5
A preliminary screening for the presence of SWH was also completed for the study area. The Significant Wildlife Habitat Technical Guide (SWHTG) is a guideline document that outlines the types of habitats that the MNRF considers significant in Ontario as well as criteria to identify these habitats (MNRF 2000, MNRF 2015c). The SWHTG groups SWH into four broad categories: seasonal concentration areas, rare vegetation communities and specialized wildlife habitat, habitats of SCC, and animal movement corridors. This screening involved the comparison of criteria outlined in the SWHTG against habitats known to occur in the study area. Significant Wildlife Habitat is discussed further under Significance and Sensitivity below.
2.2 Field Studies
Aquatic and terrestrial field surveys were undertaken within the study area in 2015 to characterize natural features and identify those that are significant and sensitive and that have potential to be adversely affected by the proposed development. A total of six site visits were completed in 2015. Field investigations on the WPCP property focused on the natural areas southeast of the settling ponds, including the drainage channel at the outfall pipe and the Conestogo River at the eastern and western extents of the channel. Surveys were undertaken in accordance with provincial and local standards and guidance documents. The Drayton and Moorefield Sewage Pumping Stations were surveyed to characterize the adjacent natural habitats. NRSI biologists conducted an initial reconnaissance of the site on April 17, 2015 to note spring conditions. A full aquatic site assessment was completed on July 28, 2015 to characterize the aquatic features within the study area. This detailed aquatic habitat assessment was completed for the length of the existing swale that receives water from the WPCP, for a total of approximately 480m. From the outlet structure the swale extends approximately 180m downstream to the east and approximately 300m upstream to the west with both the inlet and outlet of the swale connecting with the Conestogo River. During the field work, detailed aquatic habitat information was recorded including the following:
adjacent lands (valley form, riparian habitat, canopy cover, land use etc.); channel morphology; substrate type and composition; water quality (including water temperature, dissolved oxygen, conductivity, pH,
and total dissolved solids); instream habitat and cover (including critical life stage areas); flow conditions; and suitability of the site for SAR freshwater mussels, particularly at the downstream
extent. Vegetation communities within the study area were described and mapped using the Ecological Land Classification (ELC) system for southern Ontario (Lee et al. 1998, Lee 2008) on May 27, 2015. A detailed spring vegetation inventory was completed with a focus on habitats within and adjacent to the effluent outlet pipe. Emphasis was placed on the identification of any federally, provincially, or locally significant vegetation species that may occur in the study area. Natural habitats within and adjacent to the Drayton and Moorefield Sewage Pumping Stations were similarly surveyed and mapped.
Natural Resource Solutions Inc. Mapleton WPCP Class EA Natural Environment Characterization Report 6
Due to the presence of wetland habitat within the study area, amphibian call surveys were conducted to characterize potential amphibian breeding habitat. Two evening field surveys were conducted in 2015 according to the Ontario Marsh Monitoring Protocol (BSC 2009): April 16 (20:36-20:39), and May 26 (21:55-21:58). One early morning breeding bird survey was conducted in 2015 to document breeding bird species according to the Ontario Breeding Bird Atlas standardized methods (OBBA 2001): June 9 (6:05-8:05). During all terrestrial field surveys, targeted reptile visual encounter surveys were conducted, including potential basking and nesting areas. Systematic area searches by ELC polygon were conducted within the study area natural features. All incidental observations of birds, mammals, herpetofauna, butterflies, dragonflies, and damselflies were documented on all field visits. This included direct observations of individuals, as well as signs of wildlife presence (i.e. tracks, scat, dens, nests, etc.).
Natural Resource Solutions Inc. Mapleton WPCP Class EA Natural Environment Characterization Report 7
3.0 Existing Conditions
3.1 Physiography, Geology, Soils and Drainage
The study area consists of agricultural tableland fronting onto Sideroad 15, with constructed settling ponds for municipal wastewater treatment at the rear of the subject property. Beyond the rear of the property and down gradient (i.e. east) from settling ponds is the wooded valley slope associated with the Conestogo River with the bottomland and riverine habitats at the base of the slope, associated with the river and floodplain. Surficial geology conditions in the study area vary from deposits of gravel and sand along the Conestogo River and floodplain, to deposits of diamicton in the upper valley slopes and tableland (GRCA 2015). Diamicton refers to a variety of unconsolidated materials of unknown origin. Drainage in the study area is flowing predominately southeast, towards the Conestogo River, and then south to Conestoga Lake approximately 1.5km downstream. Beyond the study area, topography is predominantly flat to gently-rolling, with slopes associated with riparian areas.
3.2 Vegetation Communities
A total of 8 vegetation communities were documented within the study area, including agricultural lands, treed areas (deciduous, coniferous, plantation), and a marsh wetland feature. Agricultural lands within the study area consist of annual row crops (OAGM1), and pasture (OAGM4). Vegetation communities identified within the study area are described in Table 1 below. Refer to Maps 2a-c for study area ELC communities and surrounding study area land uses.
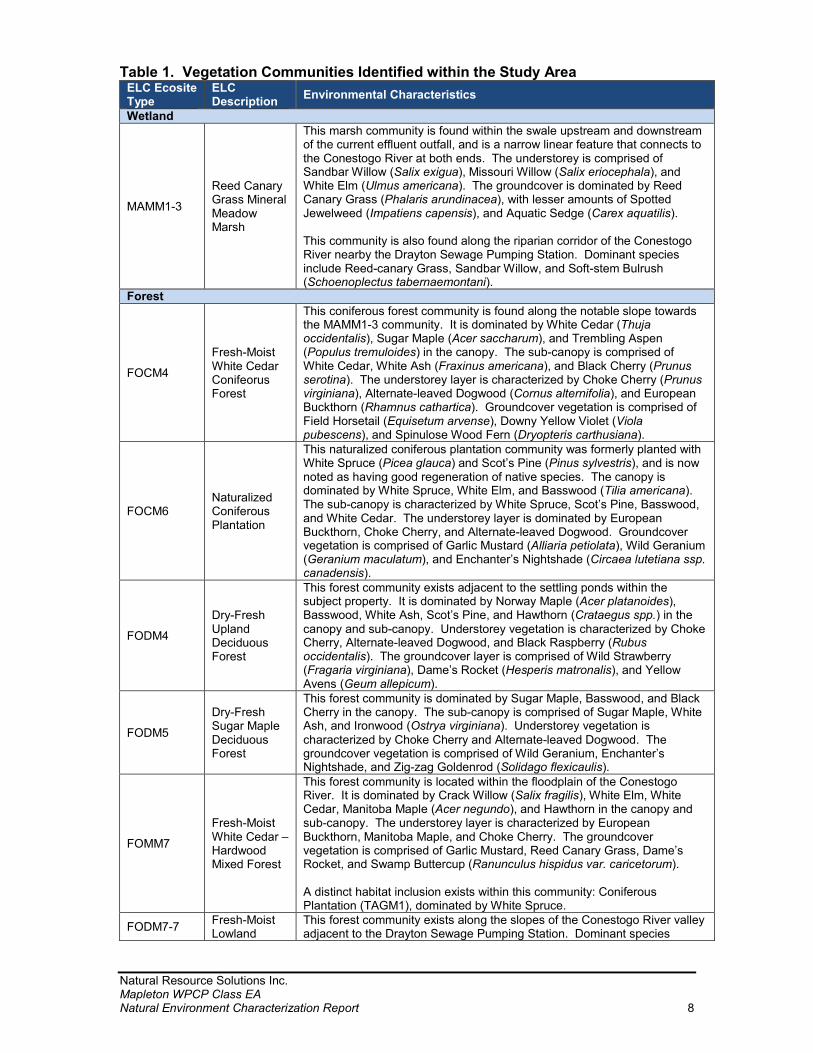
Natural Resource Solutions Inc. Mapleton WPCP Class EA Natural Environment Characterization Report 8
Table 1. Vegetation Communities Identified within the Study Area ELC Ecosite Type
ELC Description
Environmental Characteristics
Wetland
MAMM1-3
Reed Canary Grass Mineral Meadow Marsh
This marsh community is found within the swale upstream and downstream of the current effluent outfall, and is a narrow linear feature that connects to the Conestogo River at both ends. The understorey is comprised of Sandbar Willow (Salix exigua), Missouri Willow (Salix eriocephala), and White Elm (Ulmus americana). The groundcover is dominated by Reed Canary Grass (Phalaris arundinacea), with lesser amounts of Spotted Jewelweed (Impatiens capensis), and Aquatic Sedge (Carex aquatilis). This community is also found along the riparian corridor of the Conestogo River nearby the Drayton Sewage Pumping Station. Dominant species include Reed-canary Grass, Sandbar Willow, and Soft-stem Bulrush (Schoenoplectus tabernaemontani).
Forest
FOCM4
Fresh-Moist White Cedar Conifeorus Forest
This coniferous forest community is found along the notable slope towards the MAMM1-3 community. It is dominated by White Cedar (Thuja occidentalis), Sugar Maple (Acer saccharum), and Trembling Aspen (Populus tremuloides) in the canopy. The sub-canopy is comprised of White Cedar, White Ash (Fraxinus americana), and Black Cherry (Prunus serotina). The understorey layer is characterized by Choke Cherry (Prunus virginiana), Alternate-leaved Dogwood (Cornus alternifolia), and European Buckthorn (Rhamnus cathartica). Groundcover vegetation is comprised of Field Horsetail (Equisetum arvense), Downy Yellow Violet (Viola pubescens), and Spinulose Wood Fern (Dryopteris carthusiana).
FOCM6 Naturalized Coniferous Plantation
This naturalized coniferous plantation community was formerly planted with White Spruce (Picea glauca) and Scot’s Pine (Pinus sylvestris), and is now noted as having good regeneration of native species. The canopy is dominated by White Spruce, White Elm, and Basswood (Tilia americana). The sub-canopy is characterized by White Spruce, Scot’s Pine, Basswood, and White Cedar. The understorey layer is dominated by European Buckthorn, Choke Cherry, and Alternate-leaved Dogwood. Groundcover vegetation is comprised of Garlic Mustard (Alliaria petiolata), Wild Geranium (Geranium maculatum), and Enchanter’s Nightshade (Circaea lutetiana ssp. canadensis).
FODM4
Dry-Fresh Upland Deciduous Forest
This forest community exists adjacent to the settling ponds within the subject property. It is dominated by Norway Maple (Acer platanoides), Basswood, White Ash, Scot’s Pine, and Hawthorn (Crataegus spp.) in the canopy and sub-canopy. Understorey vegetation is characterized by Choke Cherry, Alternate-leaved Dogwood, and Black Raspberry (Rubus occidentalis). The groundcover layer is comprised of Wild Strawberry (Fragaria virginiana), Dame’s Rocket (Hesperis matronalis), and Yellow Avens (Geum allepicum).
FODM5
Dry-Fresh Sugar Maple Deciduous Forest
This forest community is dominated by Sugar Maple, Basswood, and Black Cherry in the canopy. The sub-canopy is comprised of Sugar Maple, White Ash, and Ironwood (Ostrya virginiana). Understorey vegetation is characterized by Choke Cherry and Alternate-leaved Dogwood. The groundcover vegetation is comprised of Wild Geranium, Enchanter’s Nightshade, and Zig-zag Goldenrod (Solidago flexicaulis).
FOMM7
Fresh-Moist White Cedar – Hardwood Mixed Forest
This forest community is located within the floodplain of the Conestogo River. It is dominated by Crack Willow (Salix fragilis), White Elm, White Cedar, Manitoba Maple (Acer negundo), and Hawthorn in the canopy and sub-canopy. The understorey layer is characterized by European Buckthorn, Manitoba Maple, and Choke Cherry. The groundcover vegetation is comprised of Garlic Mustard, Reed Canary Grass, Dame’s Rocket, and Swamp Buttercup (Ranunculus hispidus var. caricetorum). A distinct habitat inclusion exists within this community: Coniferous Plantation (TAGM1), dominated by White Spruce.
FODM7-7 Fresh-Moist Lowland
This forest community exists along the slopes of the Conestogo River valley adjacent to the Drayton Sewage Pumping Station. Dominant species
Natural Resource Solutions Inc. Mapleton WPCP Class EA Natural Environment Characterization Report 9
ELC Ecosite Type
ELC Description
Environmental Characteristics
Manitoba Maple Deciduous Forest
include Manitoba Maple, Crack Willow, Black Walnut (Juglans nigra), Garlic Mustard, and Common Burdock (Arctium minus ssp. minus). Strong slopes towards the river characterize this feature.
Cultural
TAGM1 Coniferous Plantation
This plantation community was formerly planted with White Pine (Pinus strobus), White Spruce, and Tamarack (Larix laricina), which comprises the canopy. The sub-canopy is dominated by regenerating White Ash, Alternate-leaved Dogwood, and European Buckthorn. The understorey layer is characterized by Choke Cherry, Black Raspberry, and Red Elderberry (Sambucus racemosa). The groundcover flora is comprised of Wild Strawberry, Dame’s Rocket, and Field Horsetail. Norway Maple was observed to be regenerating within this feature.
3.3 Vascular Flora
A total of 137 species of vascular flora were identified within the study area natural features shown on Maps 2a-c. A complete list of inventoried species is provided in Appendix II. Of the 137 species observed, approximately 24% were non-native species. Appendix I lists federally and provincially significant flora species known from the study area vicinity (within 1 km) based the results of background review and whether suitable habitat is present for each within the study area. During field surveys conducted by NRSI biologists, 1 provincially significant vascular flora species was observed within the study area: American Gromwell (Lithospermum latifolium). This species was observed throughout the wooded valleylands of the Conestoga River, along the outfall. In addition, 6 regionally significant plant species were observed in the study area. These significant species, their current status ranks, and a description of the habitat in which they occur are presented in Table 2.
3.4 Wildlife
Birds A total of 82 bird species have been recorded in the vicinity of the study area (BSC et al. 2008, MNRF 2015b). Of these, 35 were observed by NRSI during field surveys. Refer to Appendix III for a complete list of all bird species known and observed in the study area and vicinity, including highest breeding evidence codes in accordance with the OBBA (2001).
Appendix I lists federally and provincially significant bird species known from the study area vicinity (within 10 km) based the results of background review and whether suitable habitat is present for each within the study area. Habitat is present in the study area, but off-site for 5 SAR birds including Eastern Wood-pewee (Contopus virens), Bobolink (Dolichonyx oryzivorous), Bald Eagle (Haliaeetus leucocephalus), Wood Thrush (Hylocichla mustelina) and Eastern Meadowlark (Sturnella magna). A sixth SAR bird, Barn Swallow (Hirundo rustica), nests on buildings and man-made structures and has potential to nest on-site, but was not observed during any of the field visits. During field surveys conducted by NRSI biologists, 2 provincially significant bird species were observed within the study area: one bird SAR, Bobolink, and one bird SCC, Eastern Wood-pewee. In addition, a total of 10 regionally significant bird species were observed in the study area. These significant species, their current status ranks, and a description of the habitat in which they occur are presented in Table 3. Further
Natural Resource Solutions Inc. Mapleton WPCP Class EA Natural Environment Characterization Report 10
discussion of the Bobolink and Eastern Wood-pewee observations is provided in the Significance and Sensitivity section of this report. Herpetofauna A total of 6 reptile and amphibian species have been recorded form the vicinity of the study area (Ontario Nature 2015). American Toad (Anaxyrus americanus) and Spring Peeper (Pseudacris crucifer) were documented during the amphibian call surveys, whereas Gray Treefrog (Hyla versicolor) was recorded incidentally. A complete list of all herpetofauna species known from the study area is provided in Appendix IV. Appendix I lists federally and provincially significant herpetofauna species known from the study area vicinity (within 10 km) based the results of background review and whether suitable habitat is present for each within the study area. During field surveys conducted by NRSI biologists, one provincially and regionally significant herpetofauna species was observed within the study area: Snapping Turtle (Chelydra serpentina). This turtle was observed along the road in between the settling ponds and the treed areas at the eastern extent of the subject property. No evidence of turtle nesting evidence was documented within the study area. No other regionally, provincially or federally significant herpetofauna species were observed, but suitable habitat is present in the study area for Eastern Milksnake (Lampropeltis taylori triangulum) and Eastern Ribbonsnake (Thamnophis sauritus septentrionalis) in the meadow, forest and marsh habitats adjacent to the site. .
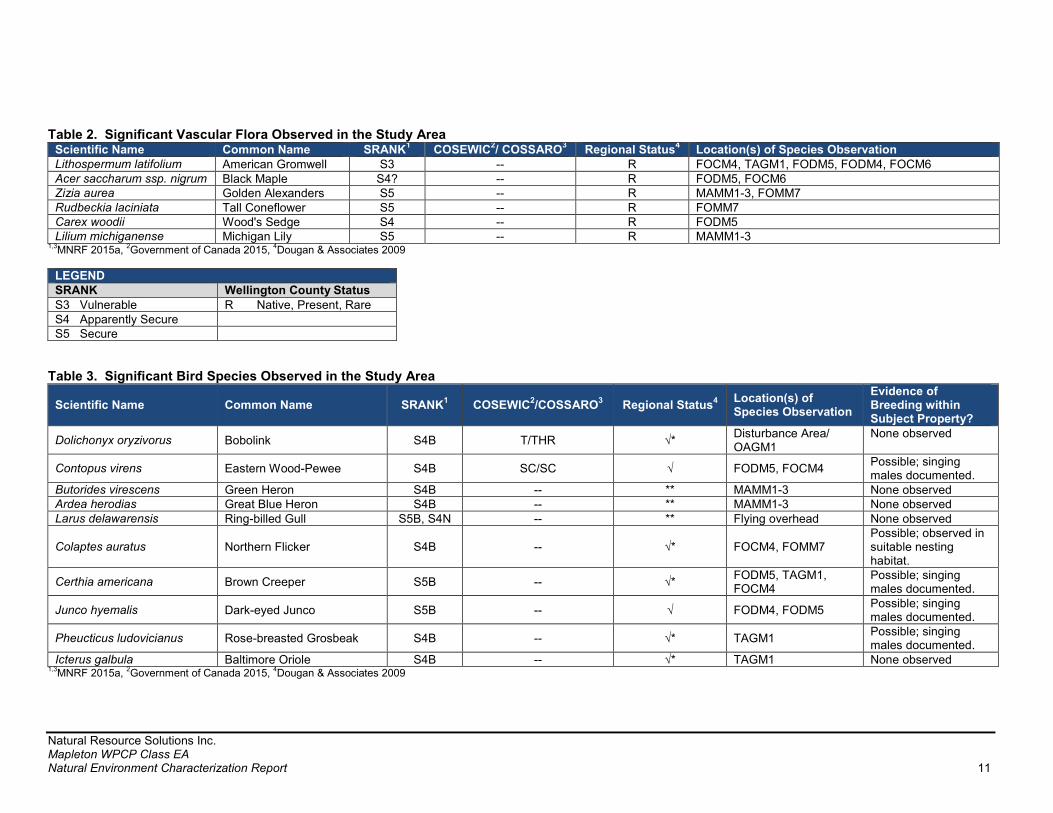
Natural Resource Solutions Inc. Mapleton WPCP Class EA Natural Environment Characterization Report 11
Table 2. Significant Vascular Flora Observed in the Study Area Scientific Name Common Name SRANK
1 COSEWIC
2/ COSSARO
3 Regional Status
4 Location(s) of Species Observation
Lithospermum latifolium American Gromwell S3 -- R FOCM4, TAGM1, FODM5, FODM4, FOCM6 Acer saccharum ssp. nigrum Black Maple S4? -- R FODM5, FOCM6 Zizia aurea Golden Alexanders S5 -- R MAMM1-3, FOMM7 Rudbeckia laciniata Tall Coneflower S5 -- R FOMM7 Carex woodii Wood's Sedge S4 -- R FODM5 Lilium michiganense Michigan Lily S5 -- R MAMM1-3
1,3MNRF 2015a, 2Government of Canada 2015, 4Dougan & Associates 2009
LEGEND SRANK Wellington County Status S3 Vulnerable R Native, Present, Rare S4 Apparently Secure S5 Secure
Table 3. Significant Bird Species Observed in the Study Area
Scientific Name Common Name SRANK1 COSEWIC
2/COSSARO
3 Regional Status
4
Location(s) of Species Observation
Evidence of Breeding within Subject Property?
Dolichonyx oryzivorus Bobolink S4B T/THR √* Disturbance Area/ OAGM1
None observed
Contopus virens Eastern Wood-Pewee S4B SC/SC √ FODM5, FOCM4 Possible; singing males documented.
Butorides virescens Green Heron S4B -- ** MAMM1-3 None observed Ardea herodias Great Blue Heron S4B -- ** MAMM1-3 None observed Larus delawarensis Ring-billed Gull S5B, S4N -- ** Flying overhead None observed
Colaptes auratus Northern Flicker S4B -- √* FOCM4, FOMM7 Possible; observed in suitable nesting habitat.
Certhia americana Brown Creeper S5B -- √* FODM5, TAGM1, FOCM4
Possible; singing males documented.
Junco hyemalis Dark-eyed Junco S5B -- √ FODM4, FODM5 Possible; singing males documented.
Pheucticus ludovicianus Rose-breasted Grosbeak S4B -- √* TAGM1 Possible; singing males documented.
Icterus galbula Baltimore Oriole S4B -- √* TAGM1 None observed 1,3MNRF 2015a, 2Government of Canada 2015, 4Dougan & Associates 2009
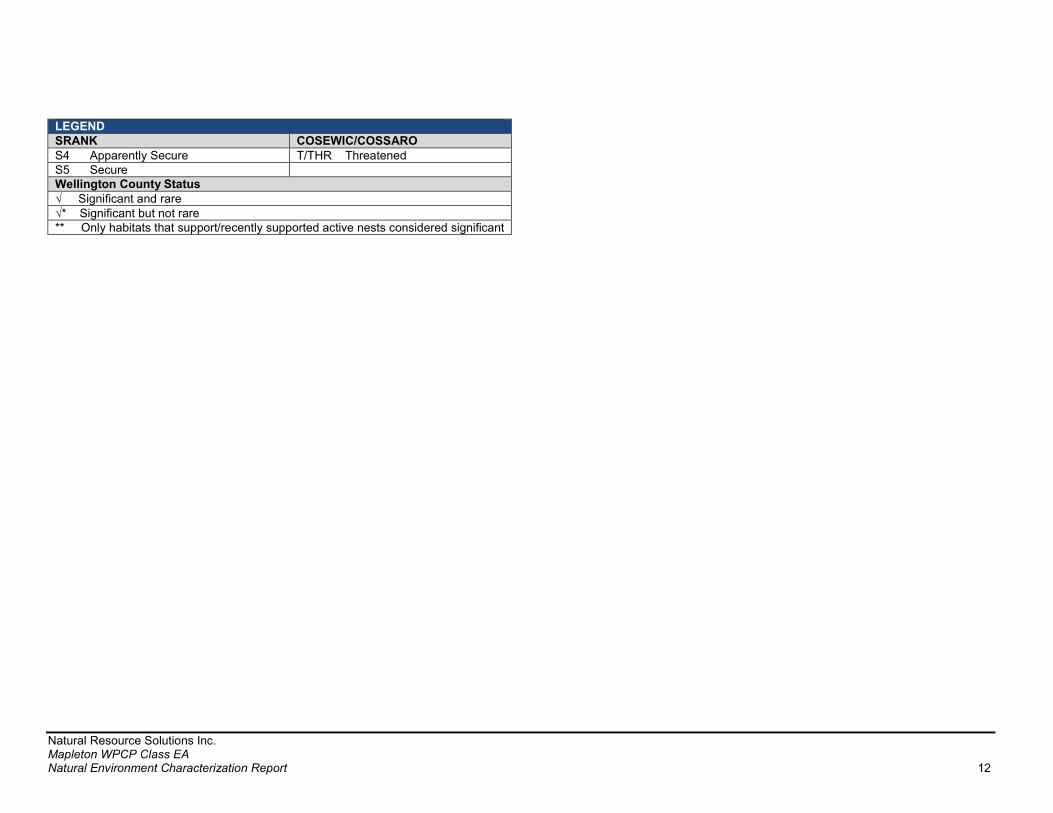
Natural Resource Solutions Inc. Mapleton WPCP Class EA Natural Environment Characterization Report 12
LEGEND SRANK COSEWIC/COSSARO S4 Apparently Secure T/THR Threatened S5 Secure Wellington County Status √ Significant and rare √* Significant but not rare ** Only habitats that support/recently supported active nests considered significant
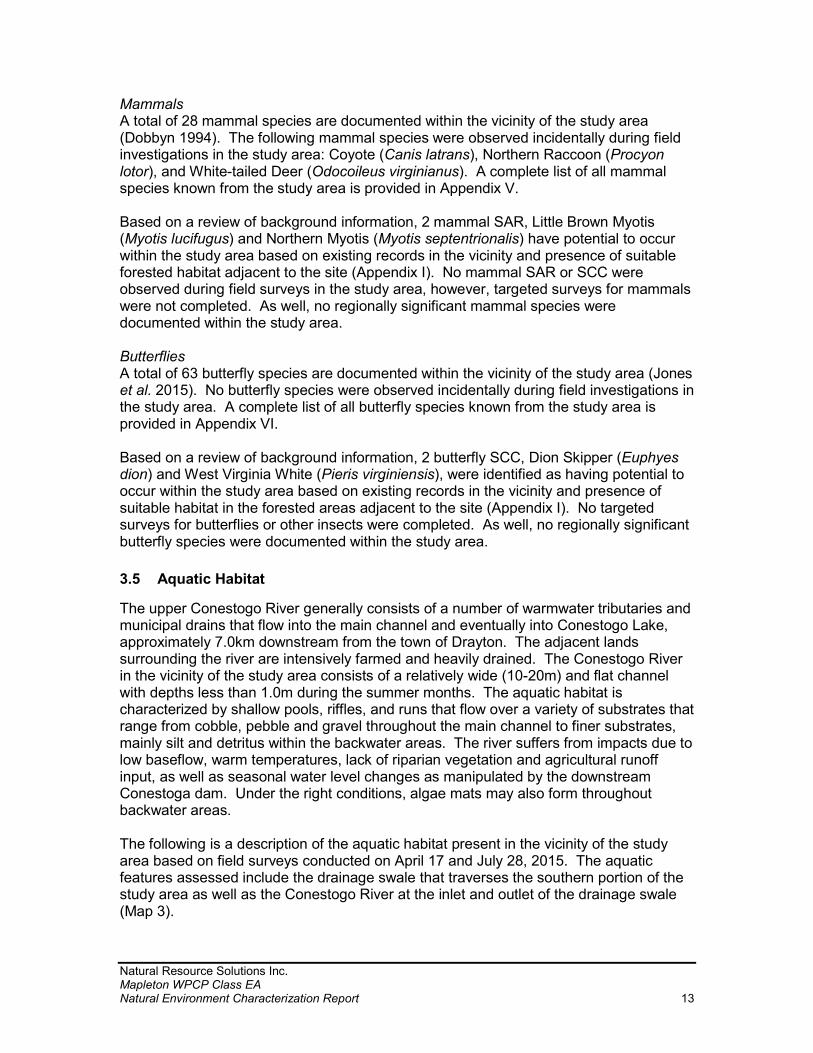
Natural Resource Solutions Inc. Mapleton WPCP Class EA Natural Environment Characterization Report 13
Mammals A total of 28 mammal species are documented within the vicinity of the study area (Dobbyn 1994). The following mammal species were observed incidentally during field investigations in the study area: Coyote (Canis latrans), Northern Raccoon (Procyon lotor), and White-tailed Deer (Odocoileus virginianus). A complete list of all mammal species known from the study area is provided in Appendix V. Based on a review of background information, 2 mammal SAR, Little Brown Myotis (Myotis lucifugus) and Northern Myotis (Myotis septentrionalis) have potential to occur within the study area based on existing records in the vicinity and presence of suitable forested habitat adjacent to the site (Appendix I). No mammal SAR or SCC were observed during field surveys in the study area, however, targeted surveys for mammals were not completed. As well, no regionally significant mammal species were documented within the study area. Butterflies A total of 63 butterfly species are documented within the vicinity of the study area (Jones et al. 2015). No butterfly species were observed incidentally during field investigations in the study area. A complete list of all butterfly species known from the study area is provided in Appendix VI. Based on a review of background information, 2 butterfly SCC, Dion Skipper (Euphyes dion) and West Virginia White (Pieris virginiensis), were identified as having potential to occur within the study area based on existing records in the vicinity and presence of suitable habitat in the forested areas adjacent to the site (Appendix I). No targeted surveys for butterflies or other insects were completed. As well, no regionally significant butterfly species were documented within the study area.
3.5 Aquatic Habitat
The upper Conestogo River generally consists of a number of warmwater tributaries and municipal drains that flow into the main channel and eventually into Conestogo Lake, approximately 7.0km downstream from the town of Drayton. The adjacent lands surrounding the river are intensively farmed and heavily drained. The Conestogo River in the vicinity of the study area consists of a relatively wide (10-20m) and flat channel with depths less than 1.0m during the summer months. The aquatic habitat is characterized by shallow pools, riffles, and runs that flow over a variety of substrates that range from cobble, pebble and gravel throughout the main channel to finer substrates, mainly silt and detritus within the backwater areas. The river suffers from impacts due to low baseflow, warm temperatures, lack of riparian vegetation and agricultural runoff input, as well as seasonal water level changes as manipulated by the downstream Conestoga dam. Under the right conditions, algae mats may also form throughout backwater areas. The following is a description of the aquatic habitat present in the vicinity of the study area based on field surveys conducted on April 17 and July 28, 2015. The aquatic features assessed include the drainage swale that traverses the southern portion of the study area as well as the Conestogo River at the inlet and outlet of the drainage swale (Map 3).
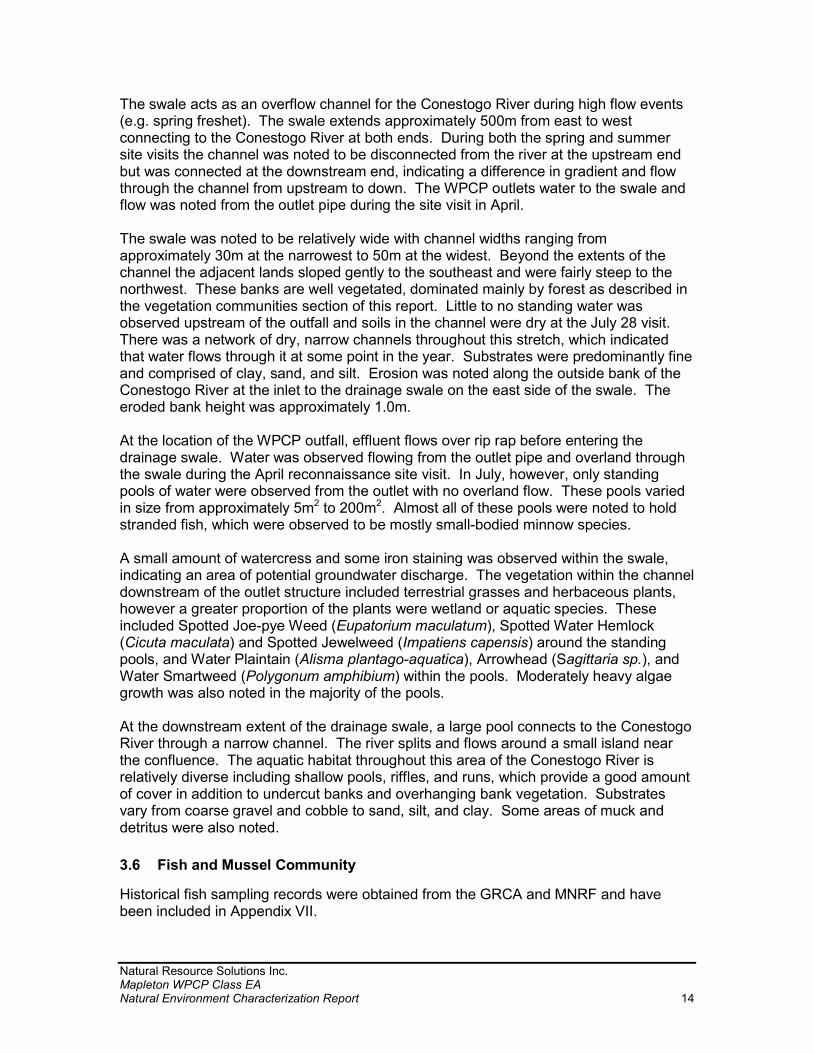
Natural Resource Solutions Inc. Mapleton WPCP Class EA Natural Environment Characterization Report 14
The swale acts as an overflow channel for the Conestogo River during high flow events (e.g. spring freshet). The swale extends approximately 500m from east to west connecting to the Conestogo River at both ends. During both the spring and summer site visits the channel was noted to be disconnected from the river at the upstream end but was connected at the downstream end, indicating a difference in gradient and flow through the channel from upstream to down. The WPCP outlets water to the swale and flow was noted from the outlet pipe during the site visit in April. The swale was noted to be relatively wide with channel widths ranging from approximately 30m at the narrowest to 50m at the widest. Beyond the extents of the channel the adjacent lands sloped gently to the southeast and were fairly steep to the northwest. These banks are well vegetated, dominated mainly by forest as described in the vegetation communities section of this report. Little to no standing water was observed upstream of the outfall and soils in the channel were dry at the July 28 visit. There was a network of dry, narrow channels throughout this stretch, which indicated that water flows through it at some point in the year. Substrates were predominantly fine and comprised of clay, sand, and silt. Erosion was noted along the outside bank of the Conestogo River at the inlet to the drainage swale on the east side of the swale. The eroded bank height was approximately 1.0m. At the location of the WPCP outfall, effluent flows over rip rap before entering the drainage swale. Water was observed flowing from the outlet pipe and overland through the swale during the April reconnaissance site visit. In July, however, only standing pools of water were observed from the outlet with no overland flow. These pools varied in size from approximately 5m2 to 200m2. Almost all of these pools were noted to hold stranded fish, which were observed to be mostly small-bodied minnow species. A small amount of watercress and some iron staining was observed within the swale, indicating an area of potential groundwater discharge. The vegetation within the channel downstream of the outlet structure included terrestrial grasses and herbaceous plants, however a greater proportion of the plants were wetland or aquatic species. These included Spotted Joe-pye Weed (Eupatorium maculatum), Spotted Water Hemlock (Cicuta maculata) and Spotted Jewelweed (Impatiens capensis) around the standing pools, and Water Plaintain (Alisma plantago-aquatica), Arrowhead (Sagittaria sp.), and Water Smartweed (Polygonum amphibium) within the pools. Moderately heavy algae growth was also noted in the majority of the pools. At the downstream extent of the drainage swale, a large pool connects to the Conestogo River through a narrow channel. The river splits and flows around a small island near the confluence. The aquatic habitat throughout this area of the Conestogo River is relatively diverse including shallow pools, riffles, and runs, which provide a good amount of cover in addition to undercut banks and overhanging bank vegetation. Substrates vary from coarse gravel and cobble to sand, silt, and clay. Some areas of muck and detritus were also noted.
3.6 Fish and Mussel Community
Historical fish sampling records were obtained from the GRCA and MNRF and have been included in Appendix VII.
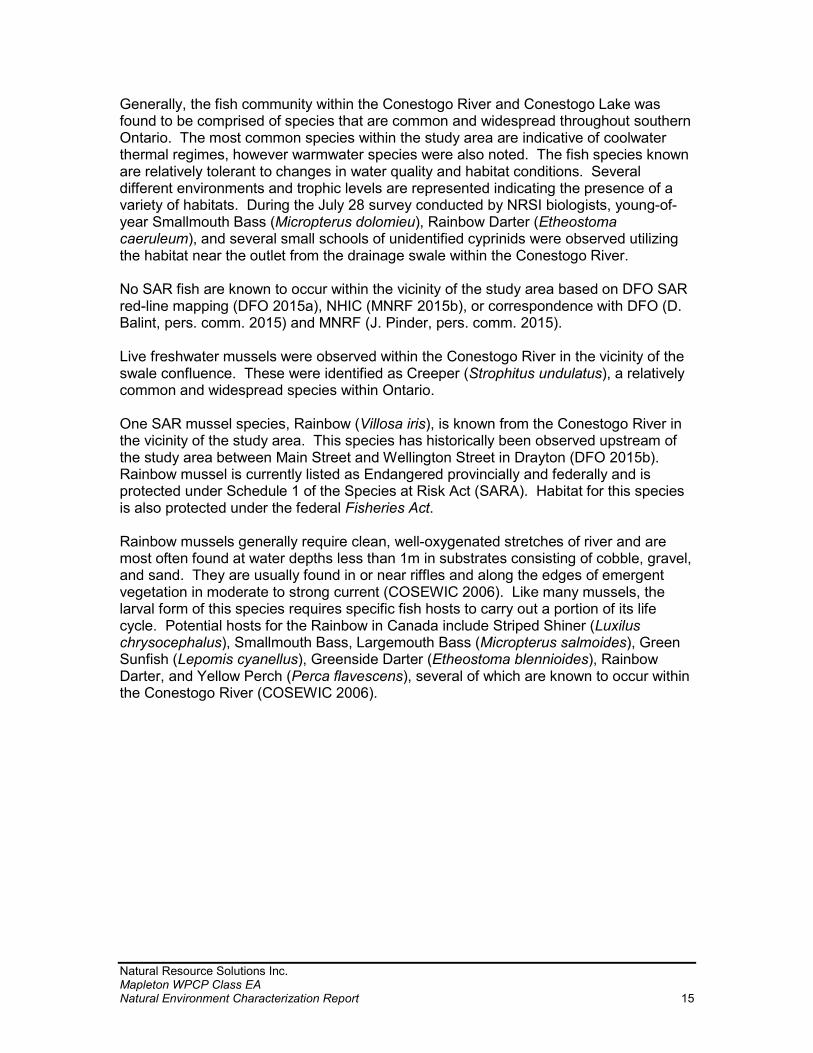
Natural Resource Solutions Inc. Mapleton WPCP Class EA Natural Environment Characterization Report 15
Generally, the fish community within the Conestogo River and Conestogo Lake was found to be comprised of species that are common and widespread throughout southern Ontario. The most common species within the study area are indicative of coolwater thermal regimes, however warmwater species were also noted. The fish species known are relatively tolerant to changes in water quality and habitat conditions. Several different environments and trophic levels are represented indicating the presence of a variety of habitats. During the July 28 survey conducted by NRSI biologists, young-of-year Smallmouth Bass (Micropterus dolomieu), Rainbow Darter (Etheostoma caeruleum), and several small schools of unidentified cyprinids were observed utilizing the habitat near the outlet from the drainage swale within the Conestogo River. No SAR fish are known to occur within the vicinity of the study area based on DFO SAR red-line mapping (DFO 2015a), NHIC (MNRF 2015b), or correspondence with DFO (D. Balint, pers. comm. 2015) and MNRF (J. Pinder, pers. comm. 2015). Live freshwater mussels were observed within the Conestogo River in the vicinity of the swale confluence. These were identified as Creeper (Strophitus undulatus), a relatively common and widespread species within Ontario. One SAR mussel species, Rainbow (Villosa iris), is known from the Conestogo River in the vicinity of the study area. This species has historically been observed upstream of the study area between Main Street and Wellington Street in Drayton (DFO 2015b). Rainbow mussel is currently listed as Endangered provincially and federally and is protected under Schedule 1 of the Species at Risk Act (SARA). Habitat for this species is also protected under the federal Fisheries Act. Rainbow mussels generally require clean, well-oxygenated stretches of river and are most often found at water depths less than 1m in substrates consisting of cobble, gravel, and sand. They are usually found in or near riffles and along the edges of emergent vegetation in moderate to strong current (COSEWIC 2006). Like many mussels, the larval form of this species requires specific fish hosts to carry out a portion of its life cycle. Potential hosts for the Rainbow in Canada include Striped Shiner (Luxilus chrysocephalus), Smallmouth Bass, Largemouth Bass (Micropterus salmoides), Green Sunfish (Lepomis cyanellus), Greenside Darter (Etheostoma blennioides), Rainbow Darter, and Yellow Perch (Perca flavescens), several of which are known to occur within the Conestogo River (COSEWIC 2006).
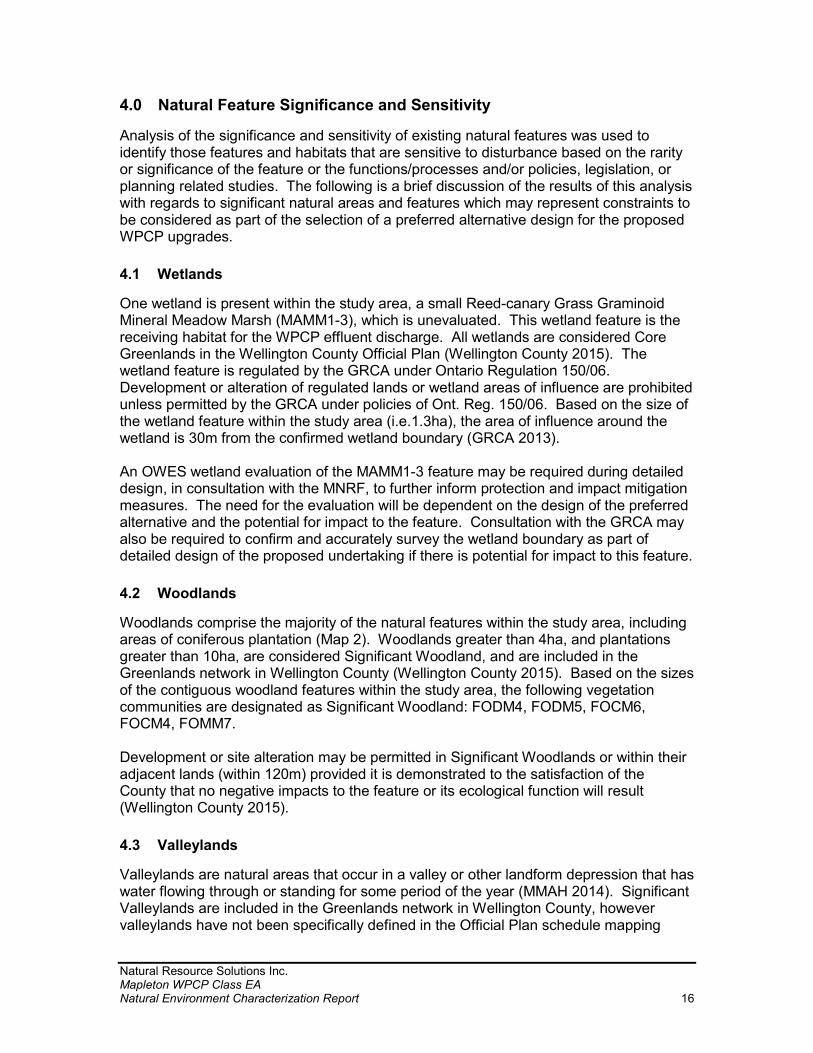
Natural Resource Solutions Inc. Mapleton WPCP Class EA Natural Environment Characterization Report 16
4.0 Natural Feature Significance and Sensitivity
Analysis of the significance and sensitivity of existing natural features was used to identify those features and habitats that are sensitive to disturbance based on the rarity or significance of the feature or the functions/processes and/or policies, legislation, or planning related studies. The following is a brief discussion of the results of this analysis with regards to significant natural areas and features which may represent constraints to be considered as part of the selection of a preferred alternative design for the proposed WPCP upgrades.
4.1 Wetlands
One wetland is present within the study area, a small Reed-canary Grass Graminoid Mineral Meadow Marsh (MAMM1-3), which is unevaluated. This wetland feature is the receiving habitat for the WPCP effluent discharge. All wetlands are considered Core Greenlands in the Wellington County Official Plan (Wellington County 2015). The wetland feature is regulated by the GRCA under Ontario Regulation 150/06. Development or alteration of regulated lands or wetland areas of influence are prohibited unless permitted by the GRCA under policies of Ont. Reg. 150/06. Based on the size of the wetland feature within the study area (i.e.1.3ha), the area of influence around the wetland is 30m from the confirmed wetland boundary (GRCA 2013). An OWES wetland evaluation of the MAMM1-3 feature may be required during detailed design, in consultation with the MNRF, to further inform protection and impact mitigation measures. The need for the evaluation will be dependent on the design of the preferred alternative and the potential for impact to the feature. Consultation with the GRCA may also be required to confirm and accurately survey the wetland boundary as part of detailed design of the proposed undertaking if there is potential for impact to this feature.
4.2 Woodlands
Woodlands comprise the majority of the natural features within the study area, including areas of coniferous plantation (Map 2). Woodlands greater than 4ha, and plantations greater than 10ha, are considered Significant Woodland, and are included in the Greenlands network in Wellington County (Wellington County 2015). Based on the sizes of the contiguous woodland features within the study area, the following vegetation communities are designated as Significant Woodland: FODM4, FODM5, FOCM6, FOCM4, FOMM7. Development or site alteration may be permitted in Significant Woodlands or within their adjacent lands (within 120m) provided it is demonstrated to the satisfaction of the County that no negative impacts to the feature or its ecological function will result (Wellington County 2015).
4.3 Valleylands
Valleylands are natural areas that occur in a valley or other landform depression that has water flowing through or standing for some period of the year (MMAH 2014). Significant Valleylands are included in the Greenlands network in Wellington County, however valleylands have not been specifically defined in the Official Plan schedule mapping
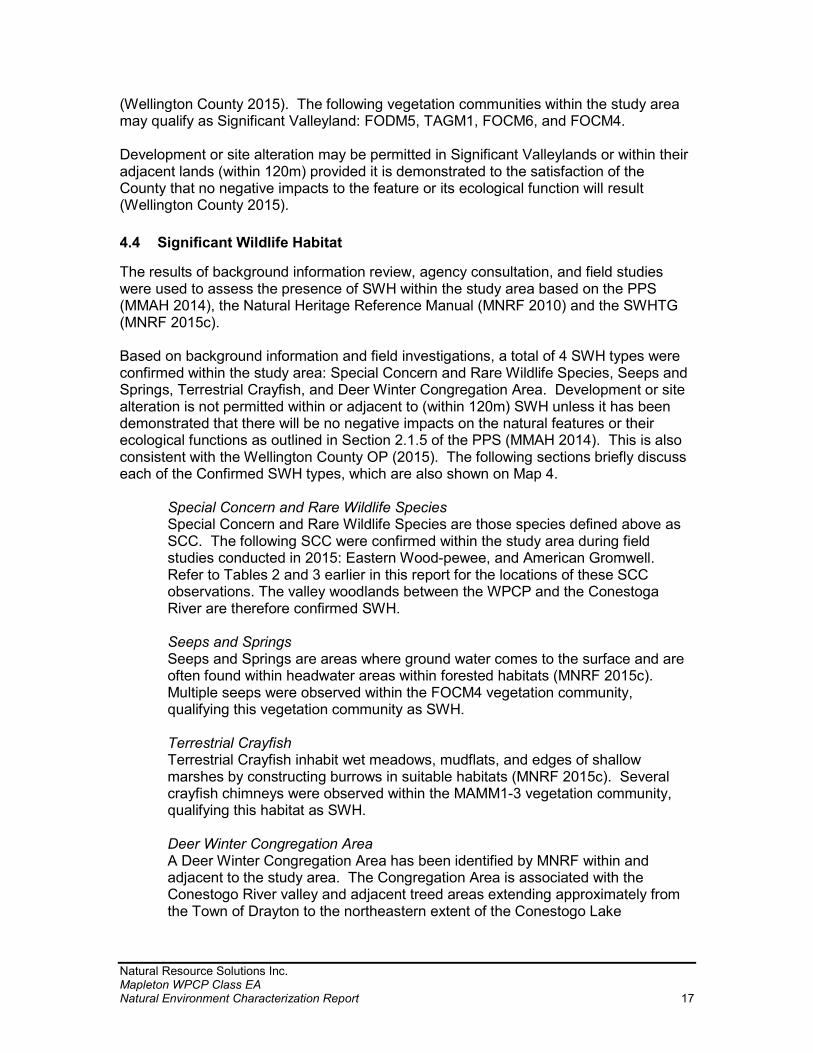
Natural Resource Solutions Inc. Mapleton WPCP Class EA Natural Environment Characterization Report 17
(Wellington County 2015). The following vegetation communities within the study area may qualify as Significant Valleyland: FODM5, TAGM1, FOCM6, and FOCM4. Development or site alteration may be permitted in Significant Valleylands or within their adjacent lands (within 120m) provided it is demonstrated to the satisfaction of the County that no negative impacts to the feature or its ecological function will result (Wellington County 2015).
4.4 Significant Wildlife Habitat
The results of background information review, agency consultation, and field studies were used to assess the presence of SWH within the study area based on the PPS (MMAH 2014), the Natural Heritage Reference Manual (MNRF 2010) and the SWHTG (MNRF 2015c). Based on background information and field investigations, a total of 4 SWH types were confirmed within the study area: Special Concern and Rare Wildlife Species, Seeps and Springs, Terrestrial Crayfish, and Deer Winter Congregation Area. Development or site alteration is not permitted within or adjacent to (within 120m) SWH unless it has been demonstrated that there will be no negative impacts on the natural features or their ecological functions as outlined in Section 2.1.5 of the PPS (MMAH 2014). This is also consistent with the Wellington County OP (2015). The following sections briefly discuss each of the Confirmed SWH types, which are also shown on Map 4.
Special Concern and Rare Wildlife Species Special Concern and Rare Wildlife Species are those species defined above as SCC. The following SCC were confirmed within the study area during field studies conducted in 2015: Eastern Wood-pewee, and American Gromwell. Refer to Tables 2 and 3 earlier in this report for the locations of these SCC observations. The valley woodlands between the WPCP and the Conestoga River are therefore confirmed SWH. Seeps and Springs Seeps and Springs are areas where ground water comes to the surface and are often found within headwater areas within forested habitats (MNRF 2015c). Multiple seeps were observed within the FOCM4 vegetation community, qualifying this vegetation community as SWH. Terrestrial Crayfish Terrestrial Crayfish inhabit wet meadows, mudflats, and edges of shallow marshes by constructing burrows in suitable habitats (MNRF 2015c). Several crayfish chimneys were observed within the MAMM1-3 vegetation community, qualifying this habitat as SWH. Deer Winter Congregation Area A Deer Winter Congregation Area has been identified by MNRF within and adjacent to the study area. The Congregation Area is associated with the Conestogo River valley and adjacent treed areas extending approximately from the Town of Drayton to the northeastern extent of the Conestogo Lake
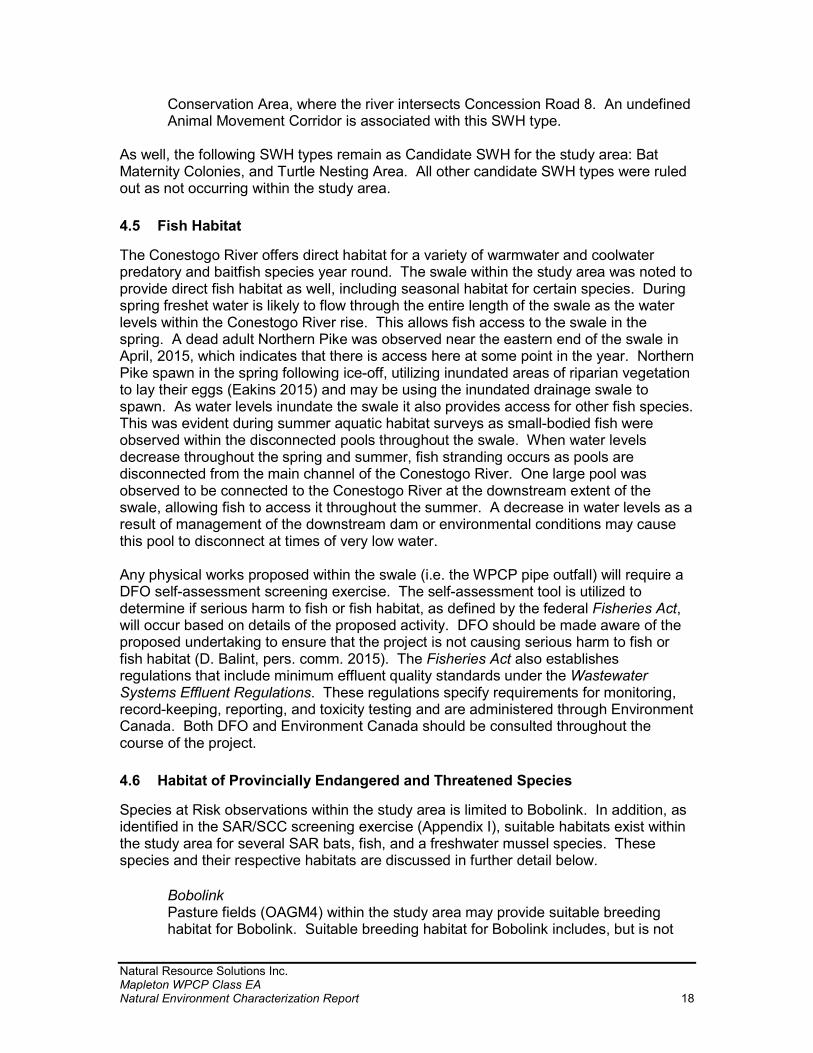
Natural Resource Solutions Inc. Mapleton WPCP Class EA Natural Environment Characterization Report 18
Conservation Area, where the river intersects Concession Road 8. An undefined Animal Movement Corridor is associated with this SWH type.
As well, the following SWH types remain as Candidate SWH for the study area: Bat Maternity Colonies, and Turtle Nesting Area. All other candidate SWH types were ruled out as not occurring within the study area.
4.5 Fish Habitat
The Conestogo River offers direct habitat for a variety of warmwater and coolwater predatory and baitfish species year round. The swale within the study area was noted to provide direct fish habitat as well, including seasonal habitat for certain species. During spring freshet water is likely to flow through the entire length of the swale as the water levels within the Conestogo River rise. This allows fish access to the swale in the spring. A dead adult Northern Pike was observed near the eastern end of the swale in April, 2015, which indicates that there is access here at some point in the year. Northern Pike spawn in the spring following ice-off, utilizing inundated areas of riparian vegetation to lay their eggs (Eakins 2015) and may be using the inundated drainage swale to spawn. As water levels inundate the swale it also provides access for other fish species. This was evident during summer aquatic habitat surveys as small-bodied fish were observed within the disconnected pools throughout the swale. When water levels decrease throughout the spring and summer, fish stranding occurs as pools are disconnected from the main channel of the Conestogo River. One large pool was observed to be connected to the Conestogo River at the downstream extent of the swale, allowing fish to access it throughout the summer. A decrease in water levels as a result of management of the downstream dam or environmental conditions may cause this pool to disconnect at times of very low water. Any physical works proposed within the swale (i.e. the WPCP pipe outfall) will require a DFO self-assessment screening exercise. The self-assessment tool is utilized to determine if serious harm to fish or fish habitat, as defined by the federal Fisheries Act, will occur based on details of the proposed activity. DFO should be made aware of the proposed undertaking to ensure that the project is not causing serious harm to fish or fish habitat (D. Balint, pers. comm. 2015). The Fisheries Act also establishes regulations that include minimum effluent quality standards under the Wastewater Systems Effluent Regulations. These regulations specify requirements for monitoring, record-keeping, reporting, and toxicity testing and are administered through Environment Canada. Both DFO and Environment Canada should be consulted throughout the course of the project.
4.6 Habitat of Provincially Endangered and Threatened Species
Species at Risk observations within the study area is limited to Bobolink. In addition, as identified in the SAR/SCC screening exercise (Appendix I), suitable habitats exist within the study area for several SAR bats, fish, and a freshwater mussel species. These species and their respective habitats are discussed in further detail below.
Bobolink Pasture fields (OAGM4) within the study area may provide suitable breeding habitat for Bobolink. Suitable breeding habitat for Bobolink includes, but is not
Natural Resource Solutions Inc. Mapleton WPCP Class EA Natural Environment Characterization Report 19
limited to, hayfields, pastures, old or abandoned fields, remnant prairies, savannahs, or alvar grasslands (MNRF 2013). This species is designated as provincially Threatened; therefore, this species and its general habitat is protected under the ESA. Similar to many grassland birds in Ontario, Bobolink populations are shrinking due to changes in land use and the loss of suitable habitat that has resulted from development and changes in agricultural practices. Habitat for Bobolink is protected under the General Habitat provisions of the ESA and is categorized as 1) a nest area and 10 m around the nest, 2) the area between 10 m and 60 m of the nest or center of approximated defended territory, and 3) the area of continuous suitable habitat between 60 m and 300 m of the nest or approximated center of defended territory (MNRF 2013). A total of 3 Bobolink individuals were observed on the subject property within the agricultural field (OAGM1) and the adjacent Disturbance Area (Map 2a) during the June 9 field visit. The OAGM1 polygon is characterized by annual row crops (i.e. corn, soy, wheat), whereas the Disturbance Area is characterized by sparse weedy vegetation resulting from past disturbance from the adjacent settling pond constructions. As such, suitable breeding habitat for Bobolink does not exist within the Mapleton WPCP subject property but is present within the study area in the pastures (OAGM4) on adjacent lands. Within the scope of this study, Bobolink nesting was not confirmed within the Mapleton WPCP subject property, however there is no suitable breeding habitat on-site. Little Brown Myotis and Northern Myotis Little Brown Myotis (Myotis lucifuga) will use buildings and occasionally tree cavities as maternity and day roost sites (MNRF 2000), both of which are present within the study area. Northern Myotis (Myotis septentrionalis) prefer tree cavities or spaces under loose bark and will occasionally use buildings for maternity and day roost sites (MNRF 2000), all of which are also present within the study area. These species are listed as Endangered in Ontario; therefore, these species and their general habitats are protected under the ESA. Myotis species are experiencing significant declines in population sizes throughout eastern North America due to the fungus, Pseuodogymnoascus destructans which causes “white nose syndrome”, and is terminal to bats. Bats are affected by the fungus during hibernation where it grows on their muzzles, ears, and wing membranes and results in the arousal of individuals from hibernation more frequently, and/or for longer periods than normal, and in the premature expenditure of fat reserves which they rely on for winter survival. Specific field surveys to identify suitable bat habitat were not conducted within the scope of this study. Trees and/or buildings within the study area may provide suitable maternity colony or roosting habitat for SAR bats. If the proposed undertaking includes removal of suitable bat habitat, additional targeted surveys may be required, in consultation with the MNRF, to assess the use of these habitats by SAR bats. The need for targeted surveys and MNRF consultation will be determined based on details of the preferred alternative design.
Natural Resource Solutions Inc. Mapleton WPCP Class EA Natural Environment Characterization Report 20
Rainbow Mussel The Conestogo River provides suitable habitat that may be utilized by Rainbow mussels in the vicinity of the study area. These habitats include gravel and cobble riffles and runs with moderate flow and water depths less than 1 m. No suitable habitat for Rainbow was found in the swale. The aquatic habitat in the swale was limited to shallow, standing pools of water that may dry up during summer months. Many of these pools were observed with algae mats and provided no riffle habitat or gravel/cobble substrates. Rainbow mussel is designated as Threatened provincially and Endangered federally; therefore, this species and its general habitat are protected provincially under the ESA and federally under the SARA. The MNRF and DFO should be involved throughout the design phase to ensure there are no impacts to Rainbow mussel or its habitat. Due to the nature of the project, there may be impacts related to water quality, which may have an effect of Rainbow mussels as a result of their feeding habits. Water quality objectives and best practices should be incorporated as per Environment Canada and MOECC to achieve the effluent quality standards as set out by the Wastewater Systems Effluent Regulations of the Fisheries Act, regulations under the Ontario Water Resources Act, and under the Environmental Protection Act (if applicable).
Natural Resource Solutions Inc. Mapleton WPCP Class EA Natural Environment Characterization Report 21
5.0 Summary of Natural Feature Constraints
A summary of natural features identified as constraints to the proposed Mapleton WPCP works are provided below and are shown on Map 4. Although many of these features are identified as significant, there are allowances in the provincial and local policies to permit activities that create or maintain infrastructure authorized under an EA process. The design of the preferred alternative should seek to minimize impacts to these features wherever possible. The swale wetland feature Reed-canary Grass Graminoid Mineral Meadow Marsh
(MAMM1-3, Map 2a) is protected under provincial and local policies and regulated by the GRCA.
Significant Woodlands are associated with portions of the forested area between the Mapleton WPCP settling ponds and the Conestogo River. Additional studies may be required once the preferred alternative is selected to inform potential impacts to these features (e.g. slope stability assessment).
The design of the preferred alternative should have regard for SWH; additional targeted surveys may be considered during detailed design to confirm/rule out Candidate SWH.
The Conestogo River upstream and downstream of the study area provides potential habitat for Rainbow mussel, a SAR. Potential effluent impacts to water quality will need to be considered and consultation with Environment Canada and DFO should occur once the preferred alternative is selected.
The Conestogo River upstream and downstream of the study area provides fish habitat. Limited fish habitat was also observed within the swale on a seasonal basis. If physical works within the Conestogo River or swale are planned as part of the preferred alternative, then consultation with DFO will be required to ensure there is no serious harm to fish as per the Fisheries Act.
Potential habitat for SAR bats is present within the forested portions of the study area. Potential impacts to these SAR will need to be considered in consultation with MNRF once the preferred alternative is selected.

Natural Resource Solutions Inc. Mapleton WPCP Class EA Natural Environment Characterization Report 22
6.0 References
Bird Studies Canada, Environment Canada's Canadian Wildlife Service, Ontario Nature,
Ontario Field Ornithologists and Ontario Ministry of Natural Resources. 2006. Ontario Breeding Bird Atlas Database, 31 January 2008. http://www.birdsontario.org/atlas/aboutdata.jsp?lang=en (Accessed September 2015)
Bird Studies Canada (BSC). 2009. Marsh Monitoring Program Participant’s Handbook
for Surveying Amphibians. 2009 Edition. Published by Bird Studies Canada in Cooperation with Environment Canada and the U.S. Environmental Protection Agency. February 2009.
COSEWIC. 2006. COSEWIC assessment and status report on the Rainbow mussel
Villosa iris in Canada. Committee on the Status of Endangered Wildlife in Canada. Ottawa. vii + 38 pp. www.sararegistry.gc.ca/status/status_e.cfm.
Department of Fisheries and Oceans Canada (DFO). 2015a. Aquatic Species at Risk
Red-line Mapping. http://www.conservation-ontario.on.ca/what-we-do/watershed-stewardship/aquatic-species-at-risk.
Department of Fisheries and Oceans Canada (DFO). 2015b. Species at Risk Site
Summary Report. Dobbyn, J.S. 1994. Atlas of the Mammals of Ontario. Don Mills, Federation of Ontario
Naturalists. Dougan and Associates. 2009. City of Guelph Natural Heritage Strategy Phase 2:
Terrestrial Inventory & Natural Heritage System Updates. Vol2. Appendices. Eakins, R. J. 2015. Ontario Freshwater Fishes Life History Database. Version 4.61. On-
line database. (http://www.ontariofishes.ca) (Accessed November 2015). Government of Canada. 2015. Species at Risk Public Registry: Species Index. Last
updated May 29, 2015. http://www.sararegistry.gc.ca/sar/index/default_e.cfm (Accessed November 2015)
Grand River Conservation Authority (GRCA). 2015. Grand River Conservation
Network: Interactive Mapping Tool. http://www.grandriver.ca/index/document.cfm?Sec=63&Sub1=0&sub2=0
Grand River Conservation Authority (GRCA). 2013. Policies for the Administration for
the Development Interference with Wetlands and Alterations of Shorelines and Watercourses Regulation: Ontario Regulation 150/06. January 25, 2013.
Grand River Conservation Authority (GRCA). 2005. GRCA’s EIS Guidelines and
Submissions Standards for Wetlands. August 26, 2005.

Natural Resource Solutions Inc. Mapleton WPCP Class EA Natural Environment Characterization Report 23
Jones, C., R. Layberry, and A. Macnaughton. 2015. Ontario Butterfly Atlas Online. Toronto Entomologists’ Association. Last updated June 1, 2015. http://www.ontarioinsects.org/atlas_online.htm (Accessed July 2015).
Layberry, R.A., P.W. Hall, and J.D. Lafontaine. 1998. The Butterflies of Canada.
University of Toronto Press, Toronto, Canada. Lee, H.T., W.D. Bakowsky, J. Riley, J. Bowles, M. Puddister, P. Uhlig and S. McMurray.
1998. Ecological Land Classification for Southern Ontario: First Approximation and its Application. Ontario Ministry of Natural Resources, Southcentral Science Section, Science Development and Transfer Branch. SCSS Field Guide FG-02.
Lee, H. 2008. Southern Ontario Ecological Land Classification - Vegetation Type List.
Ontario Ministry of Natural Resources: London, Ontario. Ontario Breeding Bird Atlas (OBBA). 2001. Guide for Participants. Atlas Management
Board, Federation of Ontario Naturalists, Don Mills. Ontario Ministry of Municipal Affairs and Housing (MMAH). 2014. Provincial Policy
Statement. Ontario Ministry of Natural Resources and Forestry (MNRF). 2015a. Species at Risk in
Ontario (SARO) List. Accessed November 2015. http://www.ontario.ca/environment-and-energy/species-risk-ontario-list
Ontario Ministry of Natural Resources and Forestry (MNRF). 2015b. Natural Heritage
Information Centre (NHIC): Biodiversity Explorer, Land Information Ontario. Accessed November 2015. http://www.giscoeapp.lrc.gov.on.ca/web/MNR/NHLUPS/NaturalHeritage/Viewer/Viewer.html
Ontario Ministry of Natural Resources and Forestry (MNRF). 2015c. Significant Wildlife
Habitat Ecoregion 6E Criterion Schedule: Addendum to Significant Wildlife Habitat Technical Guide. MNRF, January 2015.
Ontario Ministry of Natural Resources and Forestry (MNRF). 2014. Wellington County
Upper Tier Species At Risk List. September 25, 2014. Ontario Ministry of Natural Resources and Forestry (MNRF). 2013. General Habitat
Description for the Bobolink (Dolichonyx oryzivorus). Ontario Ministry of Natural Resources and Forestry (MNRF). 2010. Natural Heritage
Reference Manual for Policies of the Provincial Policy Statement, Second Edition. March 18, 2010.
Ontario Ministry of Natural Resources and Forestry (MNRF). 2000. Significant Wildlife
Habitat Technical Guide. October 2000.
Natural Resource Solutions Inc. Mapleton WPCP Class EA Natural Environment Characterization Report 24
Ontario Nature. 2015. Reptiles and Amphibians of Ontario Range Maps. Last Updated June 2015. http://www.ontarioinsects.org/herpatlas/herp_online.html (Accessed July 2015).
Reznicek, A.A., E.G. Voss, and B.S. Walters. 2011. Michigan Flora Online. University
of Michigan, February 2011. Accessed June 26, 2015. http://www.michiganflora.net/home.aspx
Wellington County. 2015. Wellington County Official Plan. Amendment made February
17, 2015. Authorities Consulted Balint, David. 2015. Species at Risk Coordinator, Department of Fisheries and Oceans
Canada. Personal Communication (e-mail correspondence to Steve Burgin), November 12, 2015.
Pinder, Jessica. 2015. Assistant Fisheries Technician, Ministry of Natural Resources
and Forestry, Guelph District. Personal Communication (e-mail correspondence to Todd Hagedorn), May 14, 2015.
Wagler, Jason. 2015. Resource Planner, Grand River Conservation Authority.
Personal Communication (e-mail correspondence to Todd Hagedorn), May 7, 2015.

Natural Resource Solutions Inc. Mapleton WPCP Class EA Natural Environment Characterization Report (Maps)
MAPS
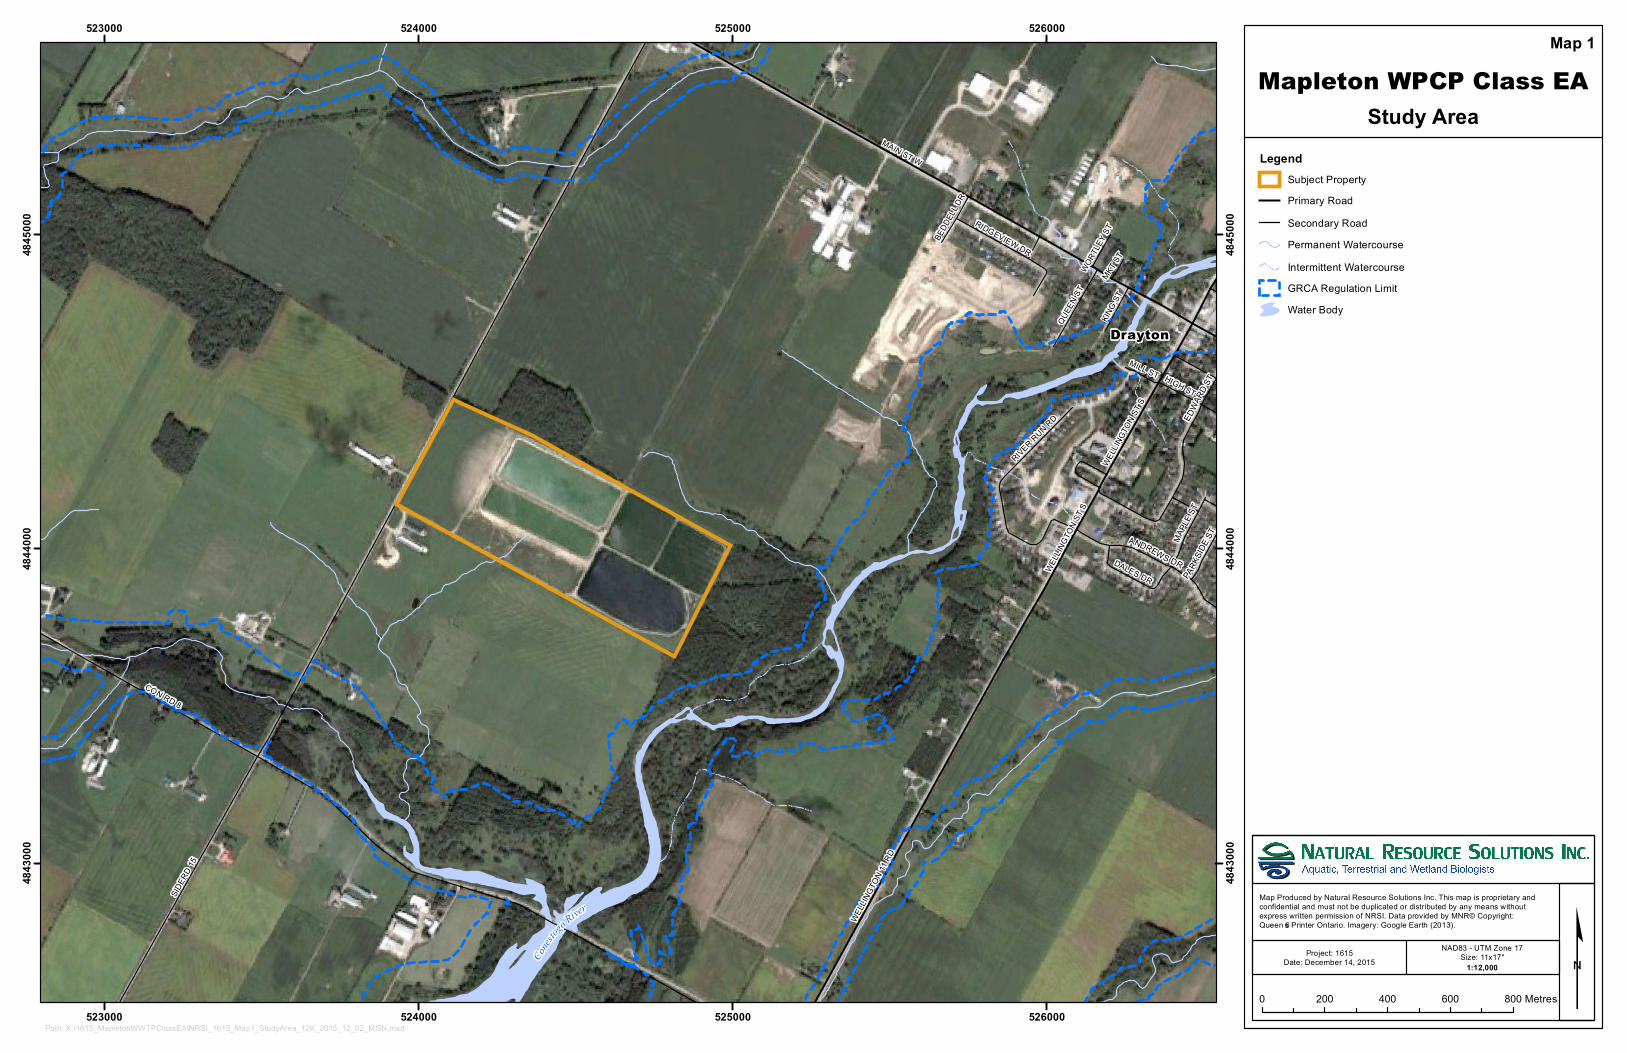
Drayton
Cones
togo River
S IDERD 15
CON RD 8
MAIN S T W
WELLINGTON 11 RD
EDWARDS T
ANDREWS DRWELLINGTON ST S
Q UEEN ST
HIGH S T
RIVER RUN RD
MAPLEST
RIDGEVIEW DR
DALES DR
KING S T
MILL S T
BEDDELL DR
PARKS IDEST
MKT ST
WORTLEY ST
WELLINGTON ST S
523000
523000
524000
524000
525000
525000
526000
526000
4843
000
4843
000
4844
000
4844
000
4845
000
4845
000
Mapleton WPCP Class EALegend
S ub jec t Prop ertyPrim a ry Roa dS ec onda ry Roa dPerm a nent Wa terc ourseInterm ittent Wa terc ourseGRCA Regula tion Lim itWa ter Body
Study Area
Map 1
Ma p Produc ed b y Na tura l Resourc e S olutions Inc . This m a p is p rop rieta ry a nd confidentia l a nd m ust not b e dup lic a ted or distributed b y a ny m ea ns withoutexp ress written p erm ission of NRS I. Da ta p rovided b y MNR© Cop yright: Q ueen’s Printer Onta rio. Im a gery: Google Ea rth (2013).
¢0 200 400 600 800Metres
Pa th: X:\1615_Ma p letonWWTPCla ssEA\NRS I_1615_Ma p 1_S tudyArea _12K_2015_12_02_MGN.m xd
Projec t: 1615Da te: Dec em b er 14, 2015
NAD83 - UTM Z one 17S ize: 11x17"
1:12,000
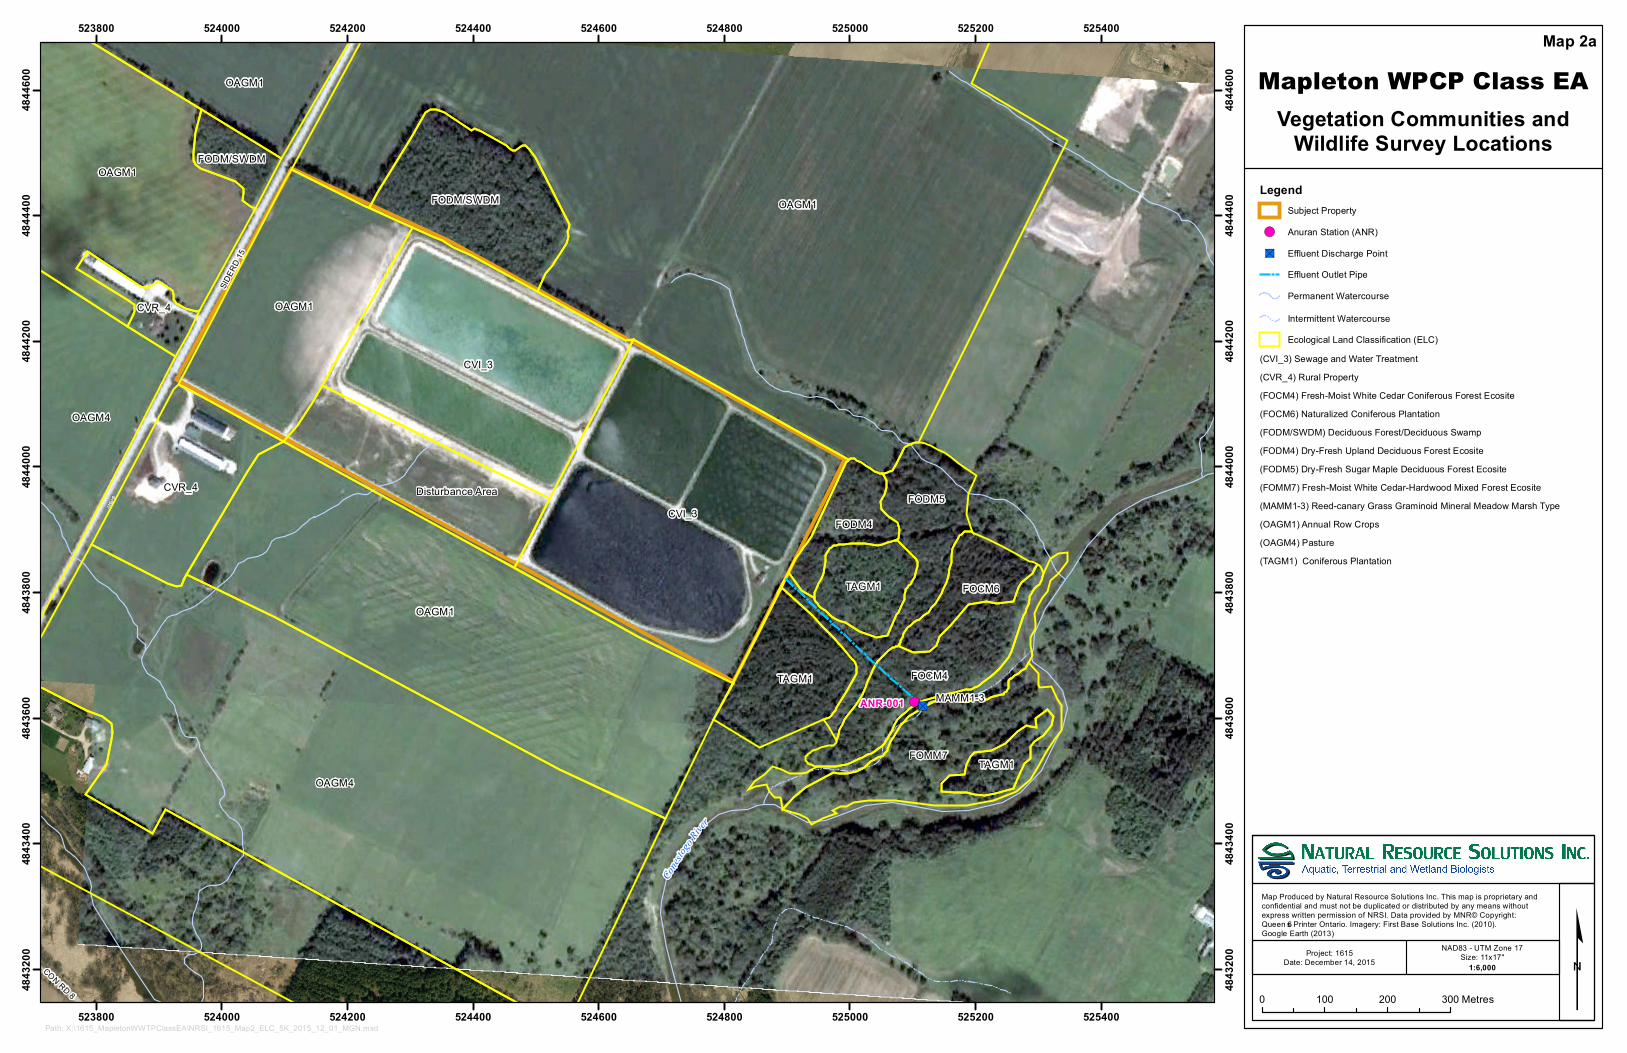
!("S
Cones
togo Riv
er
O AGM1
ANR-001
SIDERD 15
O AGM1
O AGM4
Disturb a nc e AreaCVI_ 3
CVI_ 3
O AGM1
O AGM1
O AGM4
CVR_ 4
O AGM1
FO DM/SW DM
CVR_ 4
FO DM/SW DM
FO MM7
FO DM5
FO CM4TAGM1
TAGM1 FO CM6
FO DM4
TAGM1
MAMM1-3
SIDERD 15
CO N RD 8
523800
523800
524000
524000
524200
524200
524400
524400
524600
524600
524800
524800
525000
525000
525200
525200
525400
525400
4843
200
4843
200
4843
400
4843
400
4843
600
4843
600
4843
800
4843
800
4844
000
4844
000
4844
200
4844
200
4844
400
4844
400
4844
600
4844
600 Mapleton WPCP Class EA
LegendSub jec t Pro perty
!( Anuran Statio n (ANR)
"S Effluent Disc ha rge Po intEffluent O utlet PipePerm a nent W aterc o urse
Interm ittent W aterc o urseEc o lo gic a l Land Cla ssific a tio n (ELC)
(CVI_ 3) Sewa ge and W a ter Trea tm ent(CVR_ 4) Rura l Pro perty(FO CM4) Fresh-Mo ist W hite Cedar Co nifero us Fo rest Ec o site(FO CM6) Na tura lized Co nifero us Plantatio n(FO DM/SW DM) Dec iduo us Fo rest/Dec iduo us Swa m p(FO DM4) Dry-Fresh Upla nd Dec iduo us Fo rest Ec o site(FO DM5) Dry-Fresh Suga r Maple Dec iduo us Fo rest Ec o site(FO MM7) Fresh-Mo ist W hite Ceda r-Hardwo o d Mixed Fo rest Ec o site(MAMM1-3) Reed-c a na ry Gra ss Gra m ino id Minera l Mea do w Marsh Type(O AGM1) Annua l Ro w Cro ps(O AGM4) Pasture(TAGM1) Co nifero us Planta tio n
Vegetation Communities andWildlife Survey Locations
Map 2a
Ma p Pro duc ed b y Na tura l Reso urc e So lutio ns Inc . This m a p is pro prieta ry and c o nfidentia l and m ust no t b e duplic a ted o r distrib uted b y any m ea ns witho utexpress written perm issio n o f NRSI. Da ta pro vided b y MNR© Co pyright: Q ueen’s Printer O ntario . Im a gery: First Ba se So lutio ns Inc. (2010).Go o gle Earth (2013)
¢0 100 200 300Metres
Pa th: X :\1615_ Ma pleto nW W TPCla ssEA\NRSI_ 1615_ Ma p2_ ELC_ 5K_ 2015_ 12_ 01_ MGN.m xd
Pro jec t: 1615Date: Dec em b er 14, 2015
NAD83 - UTM Zo ne 17Size: 11x17"
1:6,000
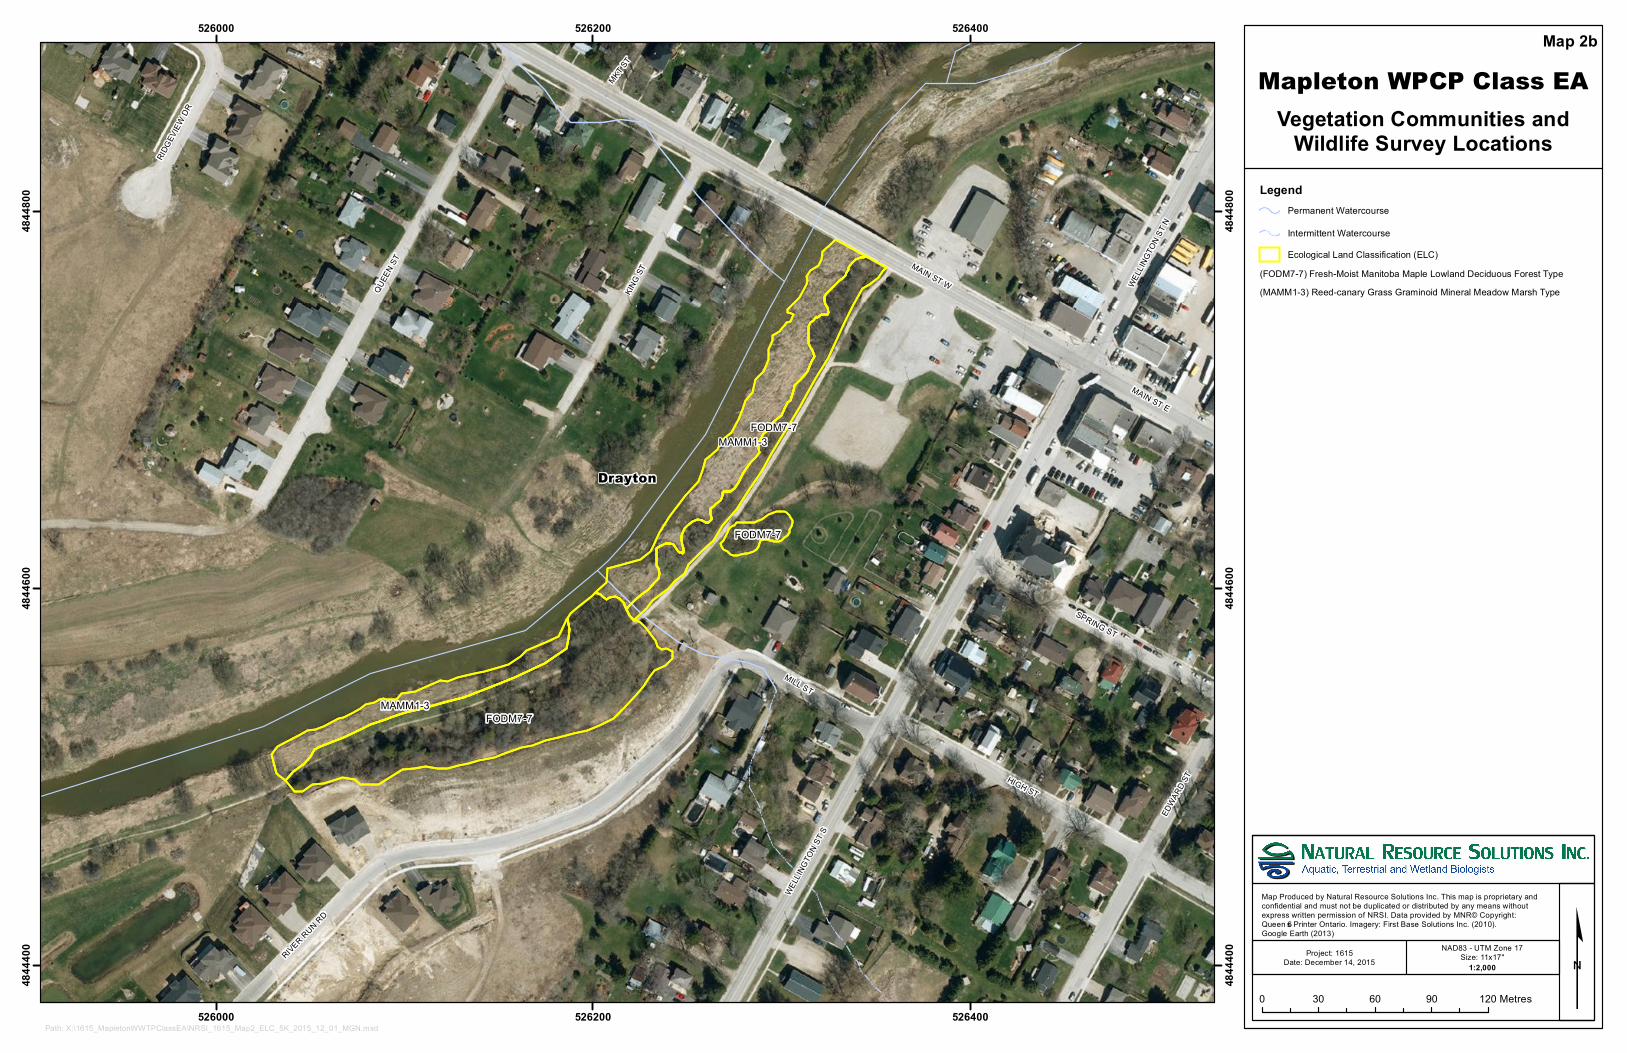
Drayton
FO DM7-7
MAMM1-3FO DM7-7
MAMM1-3
FO DM7-7
MAIN ST W
Q UEEN ST
HIGH STW ELLINGTON ST S
KING ST
MILL ST
EDW ARD ST
SPRING ST
W ELLINGTON ST N
MAIN ST E
RIVER RUN RD
RIDGEVIEW DR
MKT ST
526000
526000
526200
526200
526400
526400
4844
400
4844
400
4844
600
4844
600
4844
800
4844
800
Mapleton WPCP Class EA
LegendPerm a nent W aterco urse
Interm ittent W aterco urseEco lo gica l La nd Cla ssificatio n (ELC)
(FO DM7-7) Fresh-Mo ist Ma nito b a Maple Lo wla nd Deciduo us Fo rest Type(MAMM1-3) Reed-ca na ry Gra ss Gra m ino id Minera l Mea do w Marsh Type
Vegetation Communities andWildlife Survey Locations
Map 2b
Ma p Pro duced b y Na tura l Reso urce So lutio ns Inc. This m a p is pro prieta ry a nd co nfidentia l a nd m ust no t b e duplicated o r distrib uted b y a ny m ea ns witho utexpress written perm issio n o f NRSI. Da ta pro vided b y MNR© Co pyright: Q ueen’s Printer O ntario . Im a gery: First Ba se So lutio ns Inc. (2010).Go o gle Earth (2013)
¢0 30 60 90 120Metres
Pa th: X :\1615_ Ma pleto nW W TPCla ssEA\NRSI_ 1615_ Ma p2_ ELC_ 5K_ 2015_ 12_ 01_ MGN.m xd
Pro ject: 1615Date: Decem b er 14, 2015
NAD83 - UTM Zo ne 17Size: 11x17"
1:2,000
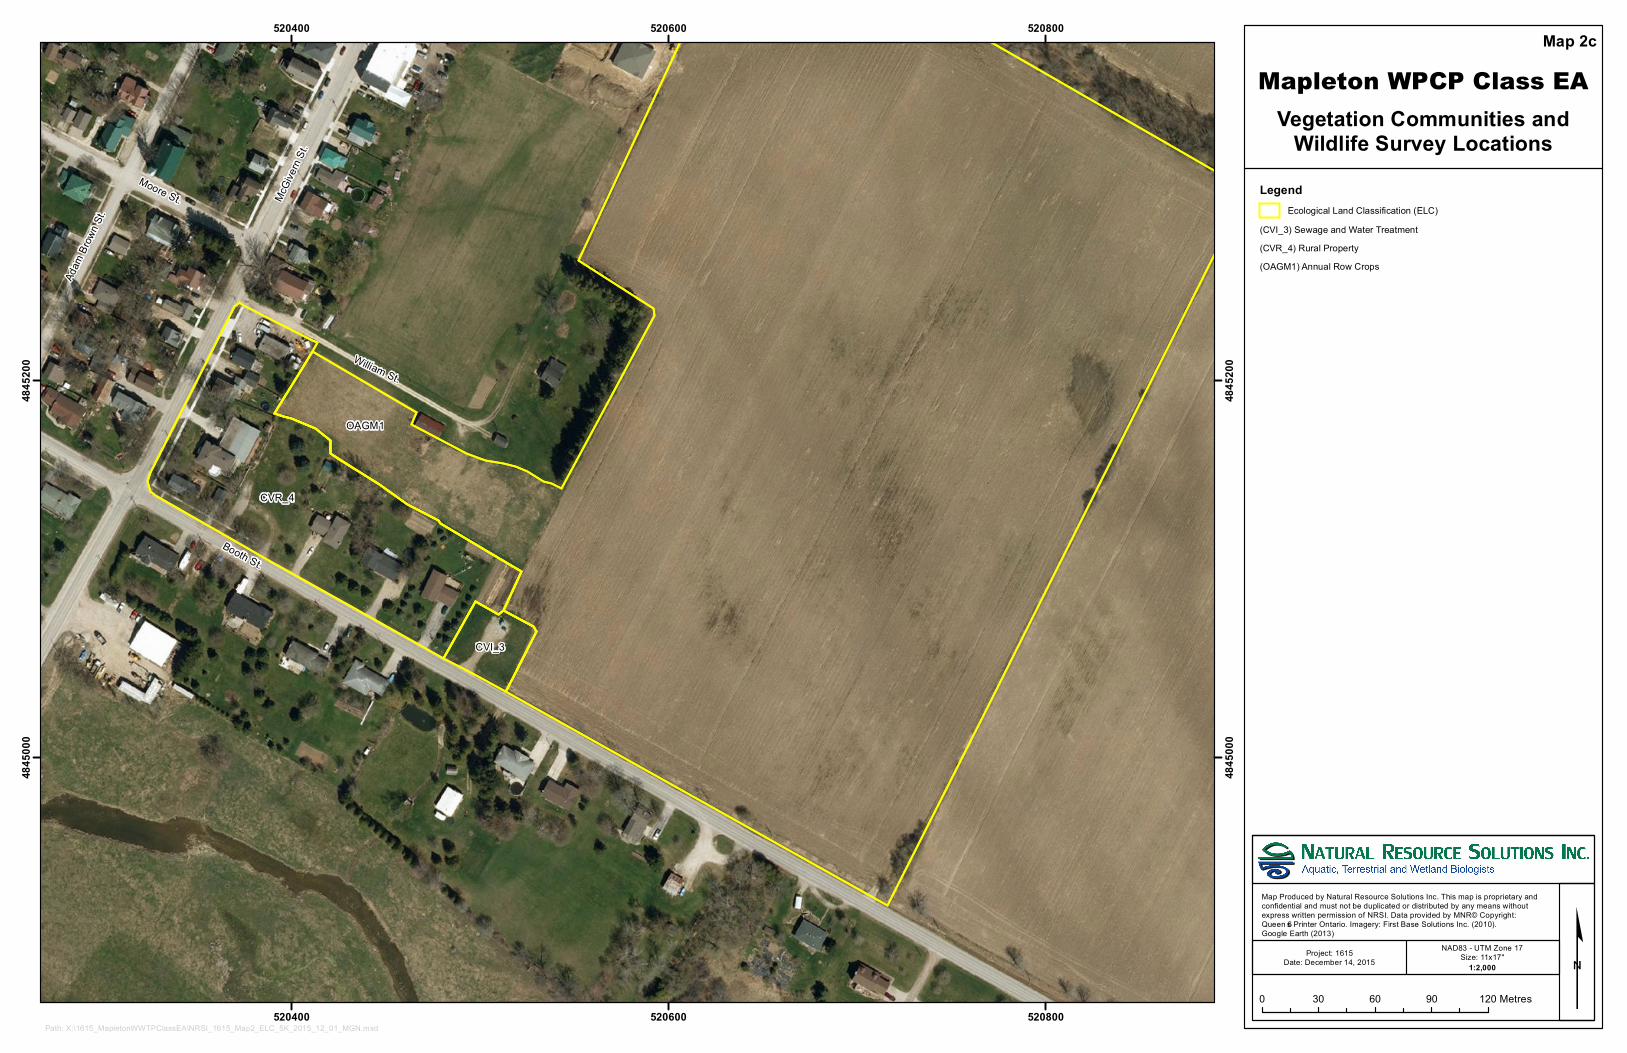
Booth St.
McGivern St.
Willia m St.
Moore St.
Ada m Brown St.
OAGM1
CVR _4
CVI_3
520400
520400
520600
520600
520800
520800
4845
000
4845
000
4845
200
4845
200
Mapleton WPCP Class EA
LegendEc ologic a l La nd Cla ssific a tion (ELC)
(CVI_3) Sewa ge a nd Wa ter Trea tm ent(CVR _4) R ura l P rop erty(OAGM1) Annua l R ow Crop s
Vegetation Communities andWildlife Survey Locations
Map 2c
Ma p P roduc ed b y Na tura l R esourc e Solutions Inc . This m a p is p rop rieta ry a nd c onfidentia l a nd m ust not b e dup lic a ted or distributed b y a ny m ea ns withoutexp ress written p erm ission of NR SI. Da ta p rovided b y MNR © Cop yright: Queen’s P rinter Onta rio. Im a gery: First Ba se Solutions Inc. (2010).Google Ea rth (2013)
¢0 30 60 90 120Metres
P a th: X :\1615_Ma p letonWWTP Cla ssEA\NR SI_1615_Ma p 2_ELC_5K_2015_12_01_MGN.m xd
P rojec t: 1615Da te: Dec em b er 14, 2015
NAD83 - UTM Z one 17Size: 11x17"
1:2,000
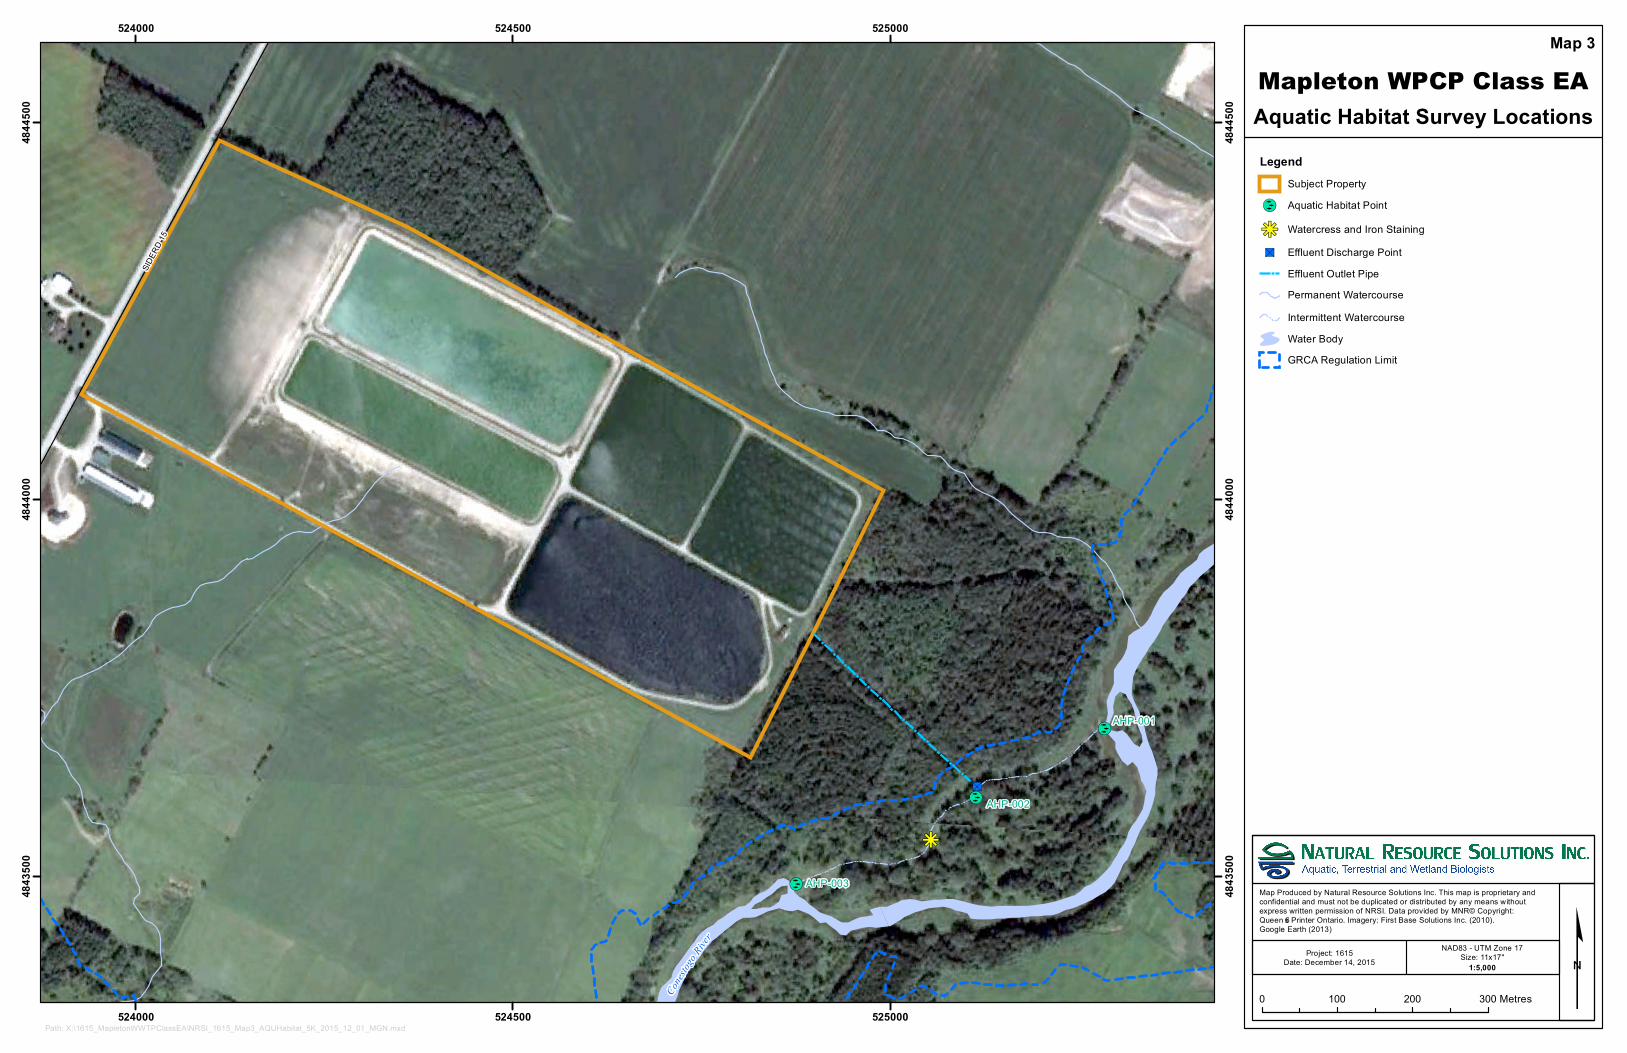
"S
[µ
[µ
[µ
kj
Cones
togo Riv
er
AHP -003
AHP -002
AHP -001
SIDERD 15
524000
524000
524500
524500
525000
525000
4843
500
4843
500
4844
000
4844
000
4844
500
4844
500
Mapleton WPCP Class EALegend
Sub ject P roperty[µ Aq uatic Hab itat P oint
kj Watercress and Iron Staining"S Effluent Disc harge P oint
Effluent Outlet P ipeP erm anent Waterc ourseInterm ittent Waterc ourseWater Bod yGR CA R egulation Lim it
Map 3
Map P rod uced b y Natural R esource Solutions Inc. This m ap is proprietary and c onfid ential and m ust not b e d uplicated or d istrib uted b y any m eans withoutexpress written perm ission of NR SI. Data provid ed b y MNR © Copyright: Queen’s P rinter Ontario. Im agery: First Base Solutions Inc. (2010).Google Earth (2013)
¢0 100 200 300Metres
P ath: X:\1615_MapletonWWTP ClassEA\NR SI_1615_Map3_AQUHab itat_5K_2015_12_01_MGN.m xd
P roject: 1615Date: Decem b er 14, 2015
NAD83 - UTM Z one 17Size: 11x17"
1:5,000
Aquatic Habitat Survey Locations
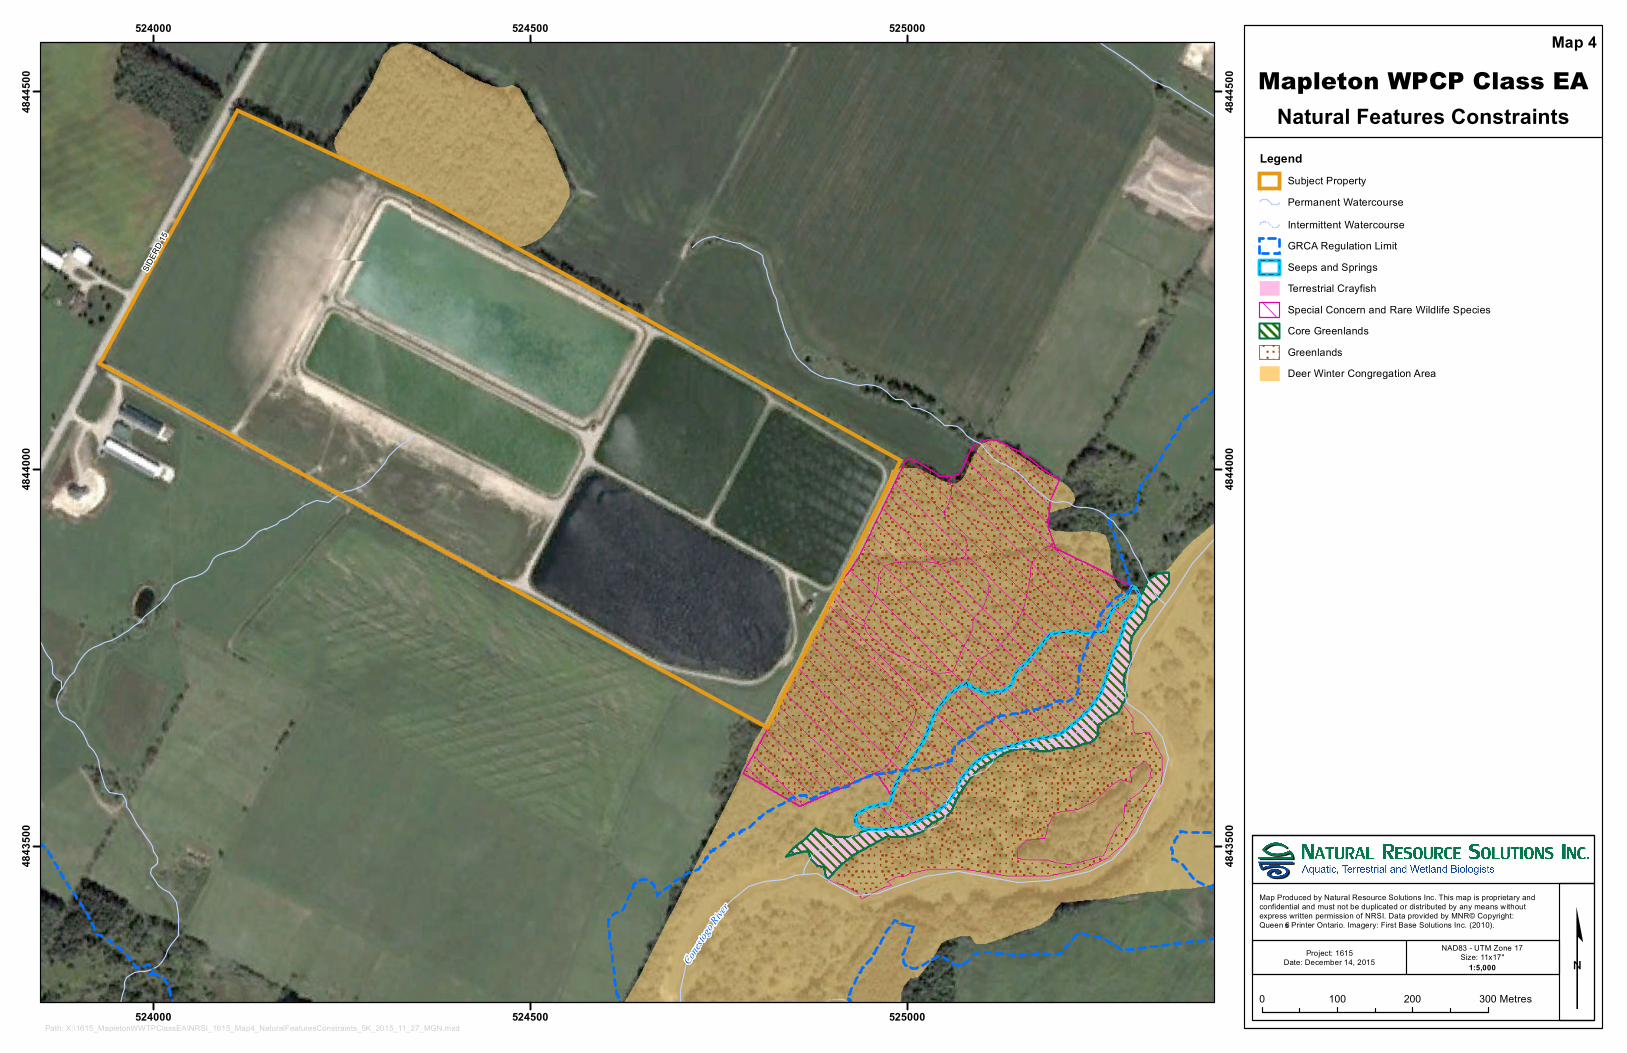
Cones
togo Rive
r
S IDERD 15
S IDERD 15
524000
524000
524500
524500
525000
525000
4843
500
4843
500
4844
000
4844
000
4844
500
4844
500 Mapleton WPCP Class EA
LegendS ubje c t Prope rtyPe rm ane nt Wate rc ours eInte rm itte nt Wate rc ours eGRCA Re gulation Lim itS e e ps and S pringsTe rre s trial Crayfis hS pe c ial Conc e rn and Rare Wild life S pe c ie sCore Gre e nland sGre e nland sDe e r Winte r Congre gation Are a
Map 4
Map Prod uc e d by Natural Re s ourc e S olutions Inc . This m ap is proprie tary and c onfid e ntial and m ust not be d uplic ate d or d is tribute d by any m e ans withoute xpre s s writte n pe rm is s ion of NRS I. Data provid e d by MNR© Copyright: Q ue e n’s Printe r Ontario. Im age ry: Firs t Bas e S olutions Inc. (2010).
¢0 100 200 300Me tre s
Path: X:\1615_ Maple tonWWTPClas s EA\NRS I_ 1615_ Map4_ NaturalFe ature s Cons traints _ 5K_ 2015_ 11_ 27_ MGN.m xd
Proje c t: 1615Date : De c e m be r 14, 2015
NAD83 - UTM Zone 17S ize : 11x17"
1:5,000
Natural Features Constraints

Natural Resource Solutions Inc. Mapleton WPCP Class EA Natural Environment Characterization Report (Appendices)
APPENDIX I Species at Risk and Species of Conservation Concern Habitat Screening Results
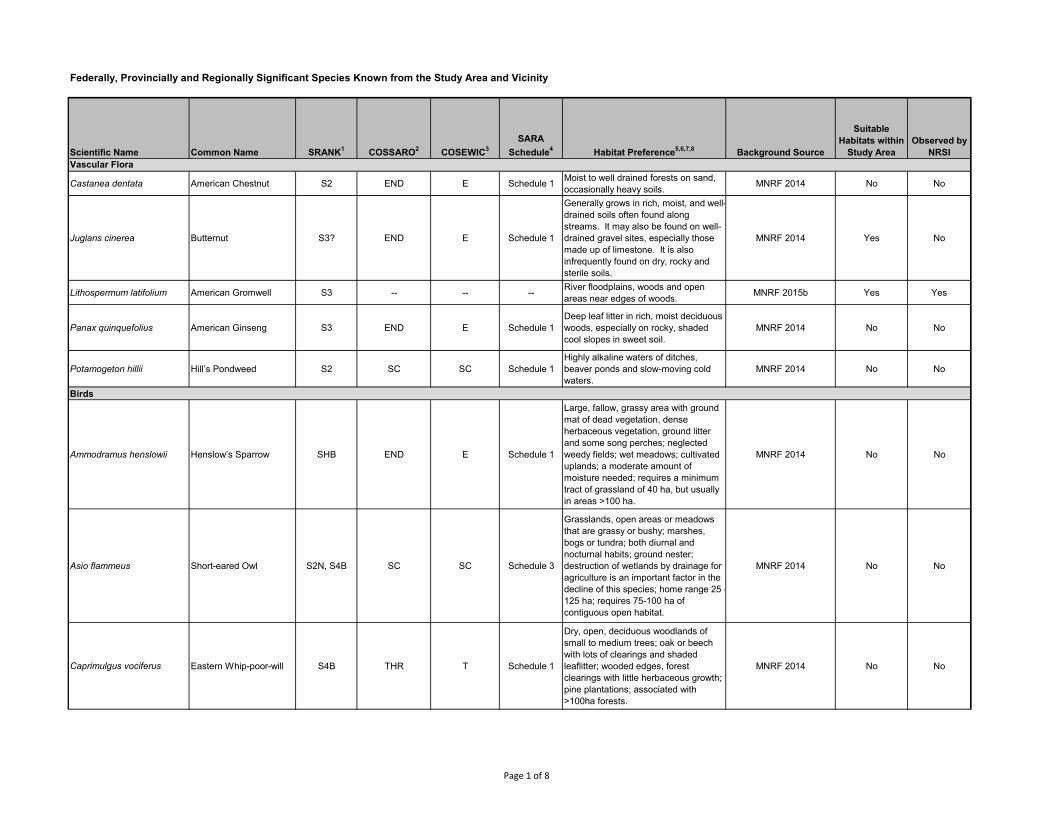
Federally, Provincially and Regionally Significant Species Known from the Study Area and Vicinity
Scientific Name Common Name SRANK1
COSSARO2
COSEWIC3
SARA
Schedule4
Habitat Preference5,6,7,8
Background Source
Suitable
Habitats within
Study Area
Observed by
NRSI
Castanea dentata American Chestnut S2 END E Schedule 1Moist to well drained forests on sand,
occasionally heavy soils.MNRF 2014 No No
Juglans cinerea Butternut S3? END E Schedule 1
Generally grows in rich, moist, and well-
drained soils often found along
streams. It may also be found on well-
drained gravel sites, especially those
made up of limestone. It is also
infrequently found on dry, rocky and
sterile soils.
MNRF 2014 Yes No
Lithospermum latifolium American Gromwell S3 -- -- --River floodplains, woods and open
areas near edges of woods.MNRF 2015b Yes Yes
Panax quinquefolius American Ginseng S3 END E Schedule 1
Deep leaf litter in rich, moist deciduous
woods, especially on rocky, shaded
cool slopes in sweet soil.
MNRF 2014 No No
Potamogeton hillii Hill’s Pondweed S2 SC SC Schedule 1
Highly alkaline waters of ditches,
beaver ponds and slow-moving cold
waters.
MNRF 2014 No No
Ammodramus henslowii Henslow’s Sparrow SHB END E Schedule 1
Large, fallow, grassy area with ground
mat of dead vegetation, dense
herbaceous vegetation, ground litter
and some song perches; neglected
weedy fields; wet meadows; cultivated
uplands; a moderate amount of
moisture needed; requires a minimum
tract of grassland of 40 ha, but usually
in areas >100 ha.
MNRF 2014 No No
Asio flammeus Short-eared Owl S2N, S4B SC SC Schedule 3
Grasslands, open areas or meadows
that are grassy or bushy; marshes,
bogs or tundra; both diurnal and
nocturnal habits; ground nester;
destruction of wetlands by drainage for
agriculture is an important factor in the
decline of this species; home range 25 -
125 ha; requires 75-100 ha of
contiguous open habitat.
MNRF 2014 No No
Caprimulgus vociferus Eastern Whip-poor-will S4B THR T Schedule 1
Dry, open, deciduous woodlands of
small to medium trees; oak or beech
with lots of clearings and shaded
leaflitter; wooded edges, forest
clearings with little herbaceous growth;
pine plantations; associated with
>100ha forests.
MNRF 2014 No No
Vascular Flora
Birds
Page 1 of 8
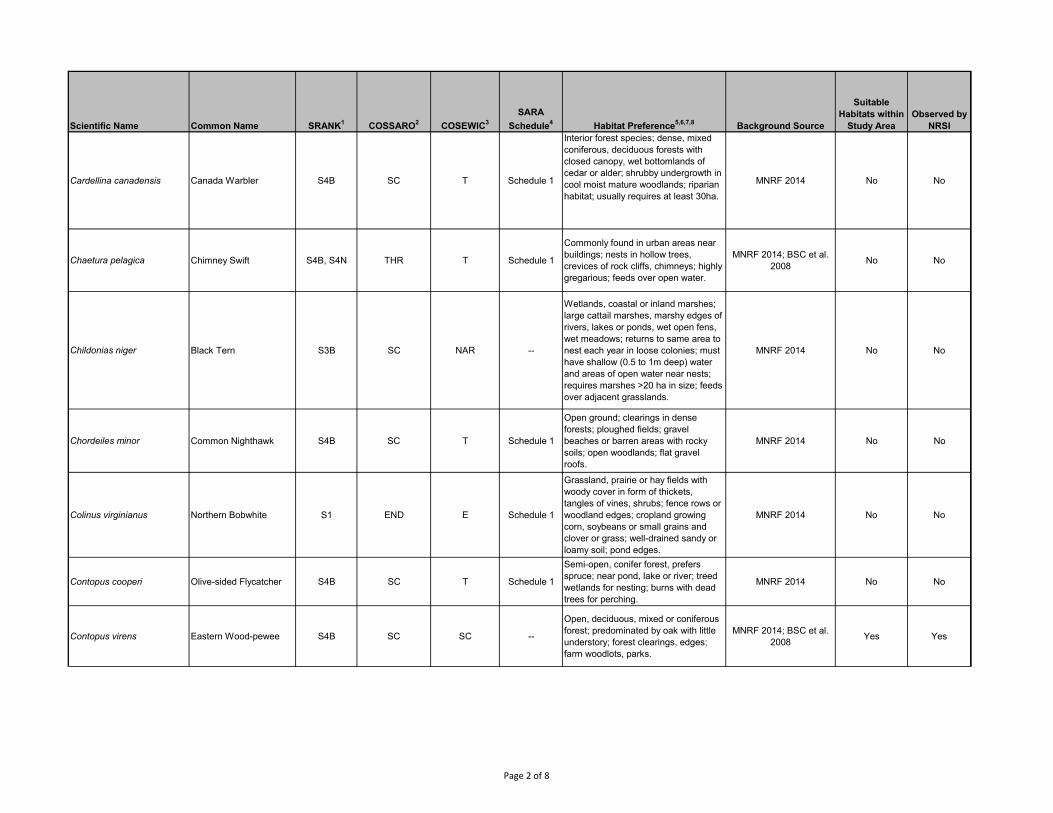
Scientific Name Common Name SRANK1 COSSARO2 COSEWIC3
SARA
Schedule4 Habitat Preference5,6,7,8 Background Source
Suitable
Habitats within
Study Area
Observed by
NRSI
Cardellina canadensis Canada Warbler S4B SC T Schedule 1
Interior forest species; dense, mixed
coniferous, deciduous forests with
closed canopy, wet bottomlands of
cedar or alder; shrubby undergrowth in
cool moist mature woodlands; riparian
habitat; usually requires at least 30ha.
MNRF 2014 No No
Chaetura pelagica Chimney Swift S4B, S4N THR T Schedule 1
Commonly found in urban areas near
buildings; nests in hollow trees,
crevices of rock cliffs, chimneys; highly
gregarious; feeds over open water.
MNRF 2014; BSC et al.
2008No No
Childonias niger Black Tern S3B SC NAR --
Wetlands, coastal or inland marshes;
large cattail marshes, marshy edges of
rivers, lakes or ponds, wet open fens,
wet meadows; returns to same area to
nest each year in loose colonies; must
have shallow (0.5 to 1m deep) water
and areas of open water near nests;
requires marshes >20 ha in size; feeds
over adjacent grasslands.
MNRF 2014 No No
Chordeiles minor Common Nighthawk S4B SC T Schedule 1
Open ground; clearings in dense
forests; ploughed fields; gravel
beaches or barren areas with rocky
soils; open woodlands; flat gravel
roofs.
MNRF 2014 No No
Colinus virginianus Northern Bobwhite S1 END E Schedule 1
Grassland, prairie or hay fields with
woody cover in form of thickets,
tangles of vines, shrubs; fence rows or
woodland edges; cropland growing
corn, soybeans or small grains and
clover or grass; well-drained sandy or
loamy soil; pond edges.
MNRF 2014 No No
Contopus cooperi Olive-sided Flycatcher S4B SC T Schedule 1
Semi-open, conifer forest, prefers
spruce; near pond, lake or river; treed
wetlands for nesting; burns with dead
trees for perching.
MNRF 2014 No No
Contopus virens Eastern Wood-pewee S4B SC SC --
Open, deciduous, mixed or coniferous
forest; predominated by oak with little
understory; forest clearings, edges;
farm woodlots, parks.
MNRF 2014; BSC et al.
2008Yes Yes
Page 2 of 8
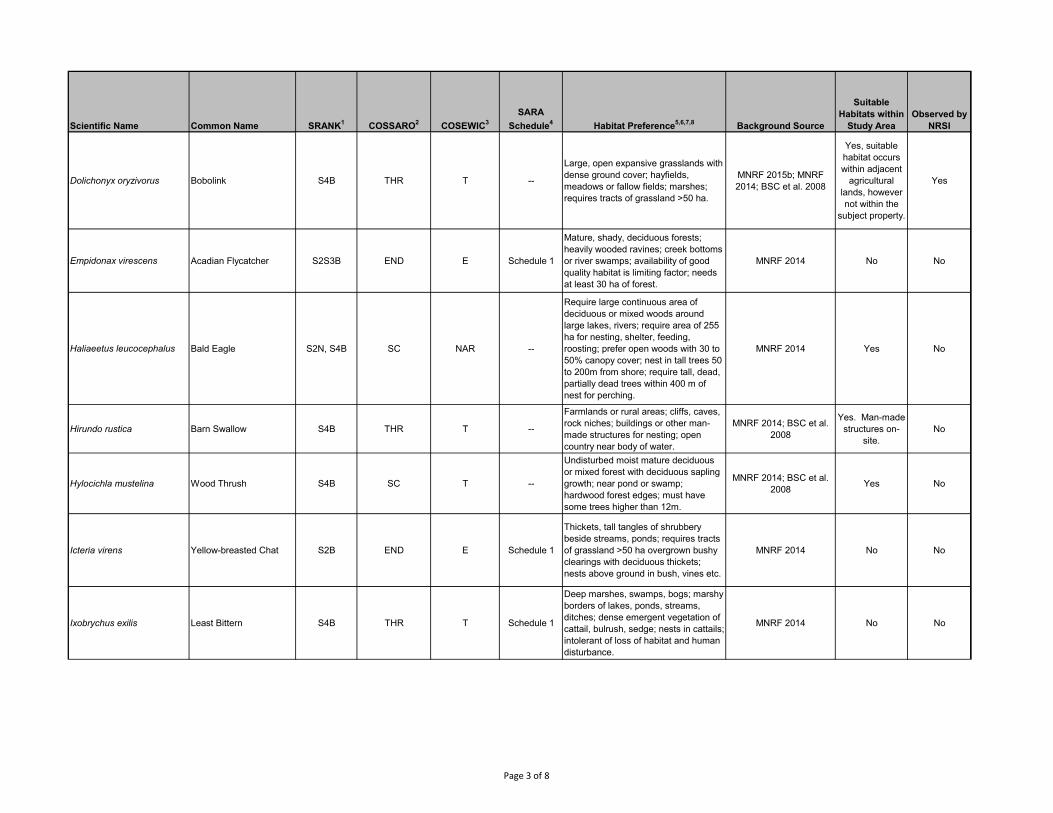
Scientific Name Common Name SRANK1 COSSARO2 COSEWIC3
SARA
Schedule4 Habitat Preference5,6,7,8 Background Source
Suitable
Habitats within
Study Area
Observed by
NRSI
Dolichonyx oryzivorus Bobolink S4B THR T --
Large, open expansive grasslands with
dense ground cover; hayfields,
meadows or fallow fields; marshes;
requires tracts of grassland >50 ha.
MNRF 2015b; MNRF
2014; BSC et al. 2008
Yes, suitable
habitat occurs
within adjacent
agricultural
lands, however
not within the
subject property.
Yes
Empidonax virescens Acadian Flycatcher S2S3B END E Schedule 1
Mature, shady, deciduous forests;
heavily wooded ravines; creek bottoms
or river swamps; availability of good
quality habitat is limiting factor; needs
at least 30 ha of forest.
MNRF 2014 No No
Haliaeetus leucocephalus Bald Eagle S2N, S4B SC NAR --
Require large continuous area of
deciduous or mixed woods around
large lakes, rivers; require area of 255
ha for nesting, shelter, feeding,
roosting; prefer open woods with 30 to
50% canopy cover; nest in tall trees 50
to 200m from shore; require tall, dead,
partially dead trees within 400 m of
nest for perching.
MNRF 2014 Yes No
Hirundo rustica Barn Swallow S4B THR T --
Farmlands or rural areas; cliffs, caves,
rock niches; buildings or other man-
made structures for nesting; open
country near body of water.
MNRF 2014; BSC et al.
2008
Yes. Man-made
structures on-
site.
No
Hylocichla mustelina Wood Thrush S4B SC T --
Undisturbed moist mature deciduous
or mixed forest with deciduous sapling
growth; near pond or swamp;
hardwood forest edges; must have
some trees higher than 12m.
MNRF 2014; BSC et al.
2008Yes No
Icteria virens Yellow-breasted Chat S2B END E Schedule 1
Thickets, tall tangles of shrubbery
beside streams, ponds; requires tracts
of grassland >50 ha overgrown bushy
clearings with deciduous thickets;
nests above ground in bush, vines etc.
MNRF 2014 No No
Ixobrychus exilis Least Bittern S4B THR T Schedule 1
Deep marshes, swamps, bogs; marshy
borders of lakes, ponds, streams,
ditches; dense emergent vegetation of
cattail, bulrush, sedge; nests in cattails;
intolerant of loss of habitat and human
disturbance.
MNRF 2014 No No
Page 3 of 8
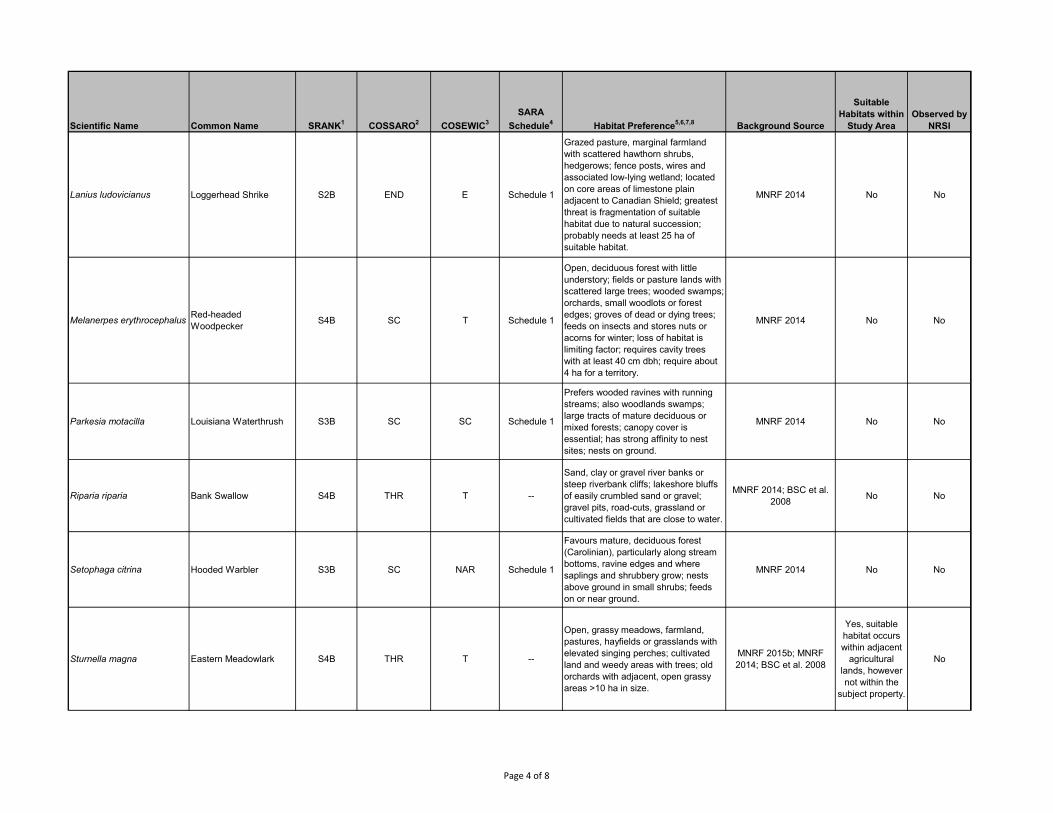
Scientific Name Common Name SRANK1 COSSARO2 COSEWIC3
SARA
Schedule4 Habitat Preference5,6,7,8 Background Source
Suitable
Habitats within
Study Area
Observed by
NRSI
Lanius ludovicianus Loggerhead Shrike S2B END E Schedule 1
Grazed pasture, marginal farmland
with scattered hawthorn shrubs,
hedgerows; fence posts, wires and
associated low-lying wetland; located
on core areas of limestone plain
adjacent to Canadian Shield; greatest
threat is fragmentation of suitable
habitat due to natural succession;
probably needs at least 25 ha of
suitable habitat.
MNRF 2014 No No
Melanerpes erythrocephalusRed-headed
WoodpeckerS4B SC T Schedule 1
Open, deciduous forest with little
understory; fields or pasture lands with
scattered large trees; wooded swamps;
orchards, small woodlots or forest
edges; groves of dead or dying trees;
feeds on insects and stores nuts or
acorns for winter; loss of habitat is
limiting factor; requires cavity trees
with at least 40 cm dbh; require about
4 ha for a territory.
MNRF 2014 No No
Parkesia motacilla Louisiana Waterthrush S3B SC SC Schedule 1
Prefers wooded ravines with running
streams; also woodlands swamps;
large tracts of mature deciduous or
mixed forests; canopy cover is
essential; has strong affinity to nest
sites; nests on ground.
MNRF 2014 No No
Riparia riparia Bank Swallow S4B THR T --
Sand, clay or gravel river banks or
steep riverbank cliffs; lakeshore bluffs
of easily crumbled sand or gravel;
gravel pits, road-cuts, grassland or
cultivated fields that are close to water.
MNRF 2014; BSC et al.
2008No No
Setophaga citrina Hooded Warbler S3B SC NAR Schedule 1
Favours mature, deciduous forest
(Carolinian), particularly along stream
bottoms, ravine edges and where
saplings and shrubbery grow; nests
above ground in small shrubs; feeds
on or near ground.
MNRF 2014 No No
Sturnella magna Eastern Meadowlark S4B THR T --
Open, grassy meadows, farmland,
pastures, hayfields or grasslands with
elevated singing perches; cultivated
land and weedy areas with trees; old
orchards with adjacent, open grassy
areas >10 ha in size.
MNRF 2015b; MNRF
2014; BSC et al. 2008
Yes, suitable
habitat occurs
within adjacent
agricultural
lands, however
not within the
subject property.
No
Page 4 of 8
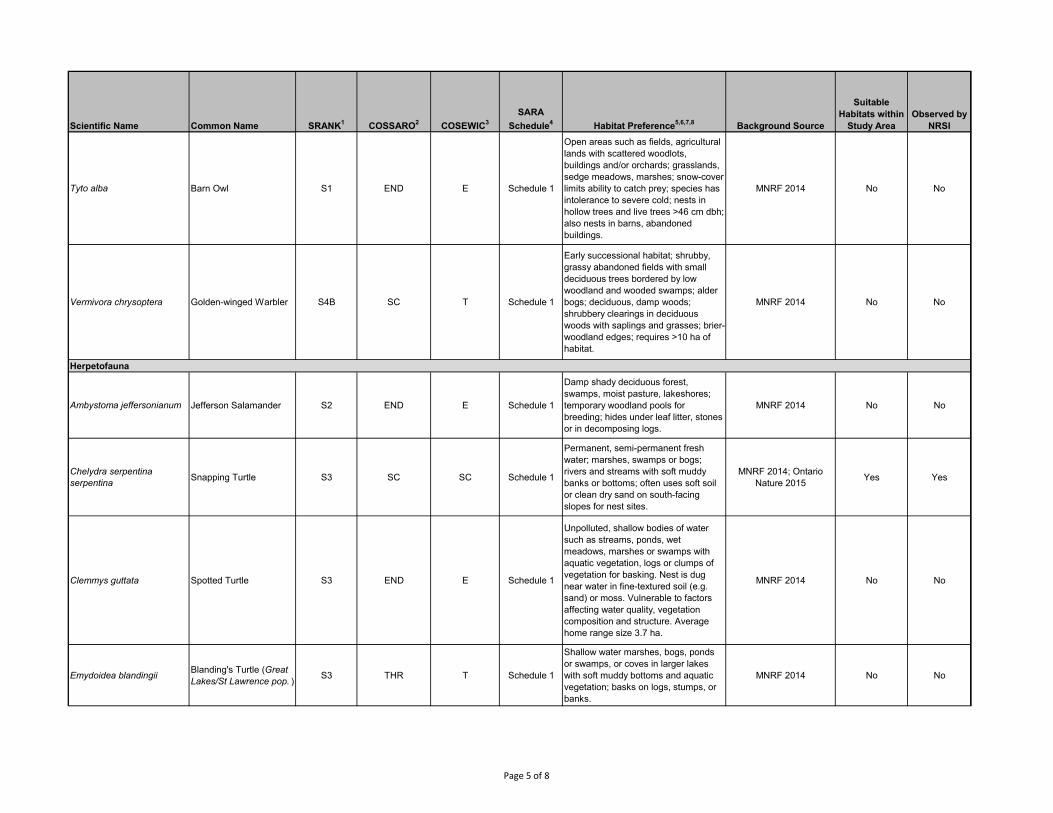
Scientific Name Common Name SRANK1 COSSARO2 COSEWIC3
SARA
Schedule4 Habitat Preference5,6,7,8 Background Source
Suitable
Habitats within
Study Area
Observed by
NRSI
Tyto alba Barn Owl S1 END E Schedule 1
Open areas such as fields, agricultural
lands with scattered woodlots,
buildings and/or orchards; grasslands,
sedge meadows, marshes; snow-cover
limits ability to catch prey; species has
intolerance to severe cold; nests in
hollow trees and live trees >46 cm dbh;
also nests in barns, abandoned
buildings.
MNRF 2014 No No
Vermivora chrysoptera Golden-winged Warbler S4B SC T Schedule 1
Early successional habitat; shrubby,
grassy abandoned fields with small
deciduous trees bordered by low
woodland and wooded swamps; alder
bogs; deciduous, damp woods;
shrubbery clearings in deciduous
woods with saplings and grasses; brier-
woodland edges; requires >10 ha of
habitat.
MNRF 2014 No No
Ambystoma jeffersonianum Jefferson Salamander S2 END E Schedule 1
Damp shady deciduous forest,
swamps, moist pasture, lakeshores;
temporary woodland pools for
breeding; hides under leaf litter, stones
or in decomposing logs.
MNRF 2014 No No
Chelydra serpentina serpentina
Snapping Turtle S3 SC SC Schedule 1
Permanent, semi-permanent fresh
water; marshes, swamps or bogs;
rivers and streams with soft muddy
banks or bottoms; often uses soft soil
or clean dry sand on south-facing
slopes for nest sites.
MNRF 2014; Ontario
Nature 2015Yes Yes
Clemmys guttata Spotted Turtle S3 END E Schedule 1
Unpolluted, shallow bodies of water
such as streams, ponds, wet
meadows, marshes or swamps with
aquatic vegetation, logs or clumps of
vegetation for basking. Nest is dug
near water in fine-textured soil (e.g.
sand) or moss. Vulnerable to factors
affecting water quality, vegetation
composition and structure. Average
home range size 3.7 ha.
MNRF 2014 No No
Emydoidea blandingiiBlanding's Turtle (Great
Lakes/St Lawrence pop. )S3 THR T Schedule 1
Shallow water marshes, bogs, ponds
or swamps, or coves in larger lakes
with soft muddy bottoms and aquatic
vegetation; basks on logs, stumps, or
banks.
MNRF 2014 No No
Herpetofauna
Page 5 of 8
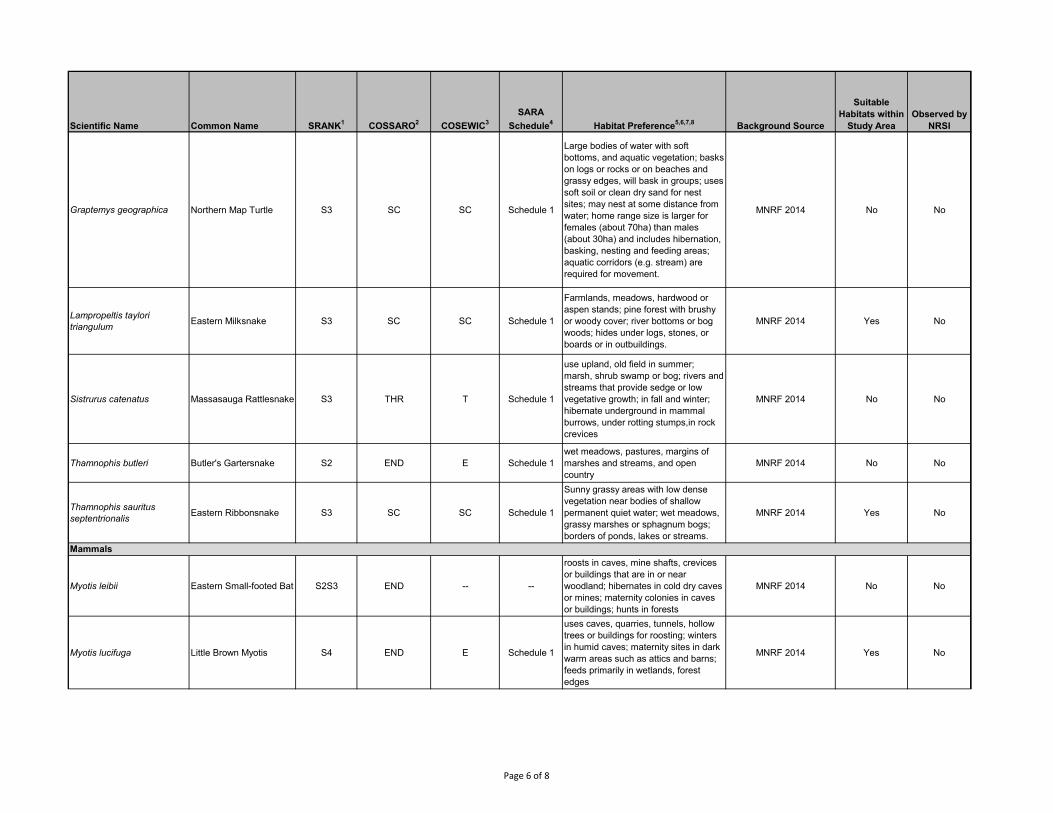
Scientific Name Common Name SRANK1 COSSARO2 COSEWIC3
SARA
Schedule4 Habitat Preference5,6,7,8 Background Source
Suitable
Habitats within
Study Area
Observed by
NRSI
Graptemys geographica Northern Map Turtle S3 SC SC Schedule 1
Large bodies of water with soft
bottoms, and aquatic vegetation; basks
on logs or rocks or on beaches and
grassy edges, will bask in groups; uses
soft soil or clean dry sand for nest
sites; may nest at some distance from
water; home range size is larger for
females (about 70ha) than males
(about 30ha) and includes hibernation,
basking, nesting and feeding areas;
aquatic corridors (e.g. stream) are
required for movement.
MNRF 2014 No No
Lampropeltis taylori triangulum
Eastern Milksnake S3 SC SC Schedule 1
Farmlands, meadows, hardwood or
aspen stands; pine forest with brushy
or woody cover; river bottoms or bog
woods; hides under logs, stones, or
boards or in outbuildings.
MNRF 2014 Yes No
Sistrurus catenatus Massasauga Rattlesnake S3 THR T Schedule 1
use upland, old field in summer;
marsh, shrub swamp or bog; rivers and
streams that provide sedge or low
vegetative growth; in fall and winter;
hibernate underground in mammal
burrows, under rotting stumps,in rock
crevices
MNRF 2014 No No
Thamnophis butleri Butler's Gartersnake S2 END E Schedule 1
wet meadows, pastures, margins of
marshes and streams, and open
country
MNRF 2014 No No
Thamnophis sauritus septentrionalis
Eastern Ribbonsnake S3 SC SC Schedule 1
Sunny grassy areas with low dense
vegetation near bodies of shallow
permanent quiet water; wet meadows,
grassy marshes or sphagnum bogs;
borders of ponds, lakes or streams.
MNRF 2014 Yes No
Myotis leibii Eastern Small-footed Bat S2S3 END -- --
roosts in caves, mine shafts, crevices
or buildings that are in or near
woodland; hibernates in cold dry caves
or mines; maternity colonies in caves
or buildings; hunts in forests
MNRF 2014 No No
Myotis lucifuga Little Brown Myotis S4 END E Schedule 1
uses caves, quarries, tunnels, hollow
trees or buildings for roosting; winters
in humid caves; maternity sites in dark
warm areas such as attics and barns;
feeds primarily in wetlands, forest
edges
MNRF 2014 Yes No
Mammals
Page 6 of 8
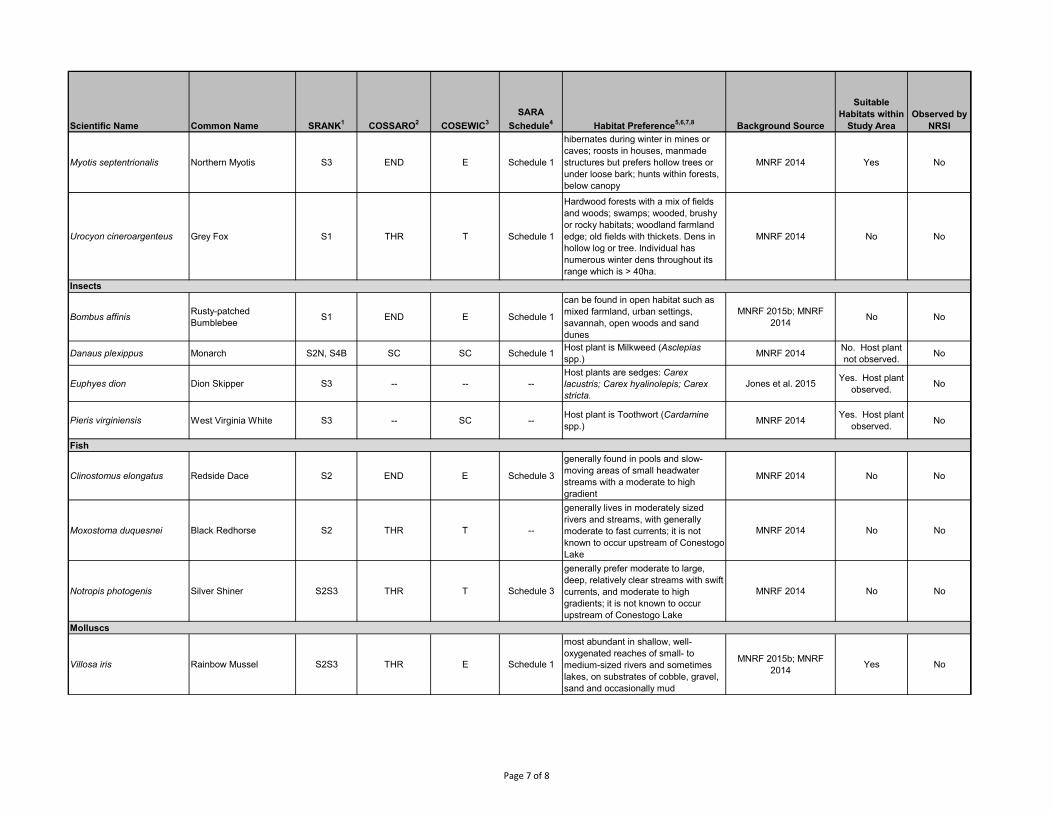
Scientific Name Common Name SRANK1 COSSARO2 COSEWIC3
SARA
Schedule4 Habitat Preference5,6,7,8 Background Source
Suitable
Habitats within
Study Area
Observed by
NRSI
Myotis septentrionalis Northern Myotis S3 END E Schedule 1
hibernates during winter in mines or
caves; roosts in houses, manmade
structures but prefers hollow trees or
under loose bark; hunts within forests,
below canopy
MNRF 2014 Yes No
Urocyon cineroargenteus Grey Fox S1 THR T Schedule 1
Hardwood forests with a mix of fields
and woods; swamps; wooded, brushy
or rocky habitats; woodland farmland
edge; old fields with thickets. Dens in
hollow log or tree. Individual has
numerous winter dens throughout its
range which is > 40ha.
MNRF 2014 No No
Bombus affinisRusty-patched
BumblebeeS1 END E Schedule 1
can be found in open habitat such as
mixed farmland, urban settings,
savannah, open woods and sand
dunes
MNRF 2015b; MNRF
2014No No
Danaus plexippus Monarch S2N, S4B SC SC Schedule 1Host plant is Milkweed (Asclepias
spp.)MNRF 2014
No. Host plant
not observed.No
Euphyes dion Dion Skipper S3 -- -- --Host plants are sedges: Carex lacustris; Carex hyalinolepis; Carex stricta.
Jones et al. 2015Yes. Host plant
observed.No
Pieris virginiensis West Virginia White S3 -- SC --Host plant is Toothwort (Cardamine
spp.)MNRF 2014
Yes. Host plant
observed.No
Clinostomus elongatus Redside Dace S2 END E Schedule 3
generally found in pools and slow-
moving areas of small headwater
streams with a moderate to high
gradient
MNRF 2014 No No
Moxostoma duquesnei Black Redhorse S2 THR T --
generally lives in moderately sized
rivers and streams, with generally
moderate to fast currents; it is not
known to occur upstream of Conestogo
Lake
MNRF 2014 No No
Notropis photogenis Silver Shiner S2S3 THR T Schedule 3
generally prefer moderate to large,
deep, relatively clear streams with swift
currents, and moderate to high
gradients; it is not known to occur
upstream of Conestogo Lake
MNRF 2014 No No
Villosa iris Rainbow Mussel S2S3 THR E Schedule 1
most abundant in shallow, well-
oxygenated reaches of small- to
medium-sized rivers and sometimes
lakes, on substrates of cobble, gravel,
sand and occasionally mud
MNRF 2015b; MNRF
2014Yes No
Molluscs
Fish
Insects
Page 7 of 8
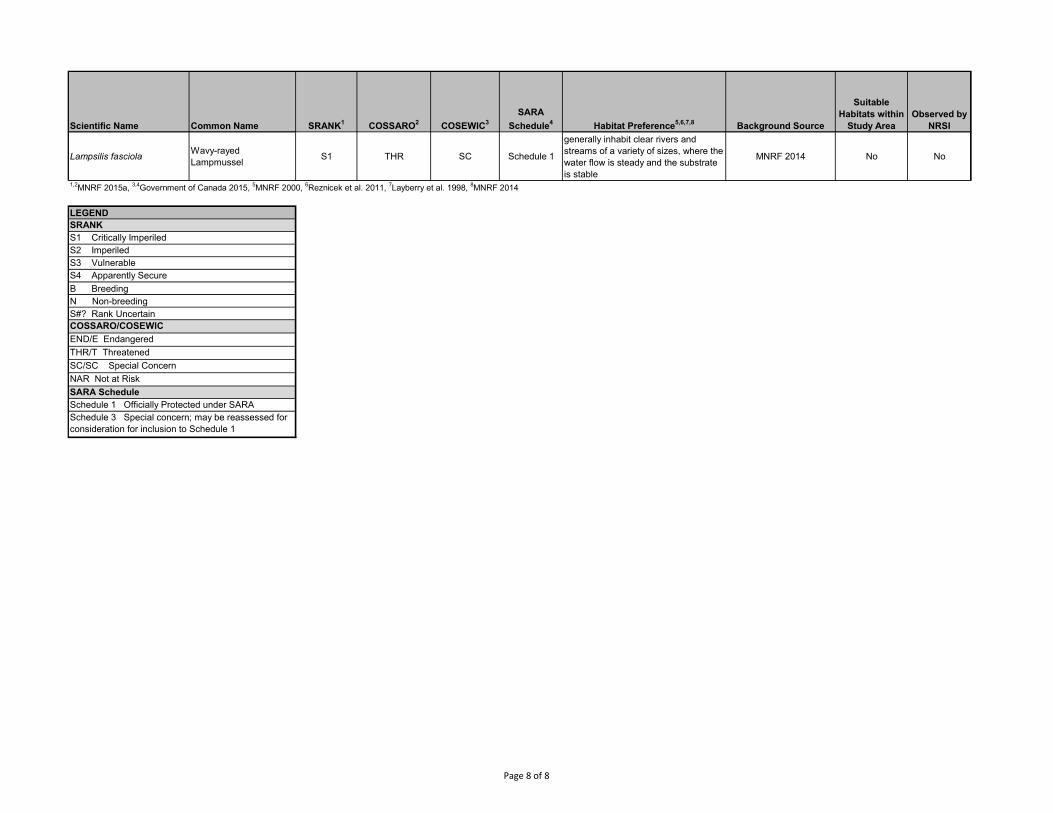
Scientific Name Common Name SRANK1 COSSARO2 COSEWIC3
SARA
Schedule4 Habitat Preference5,6,7,8 Background Source
Suitable
Habitats within
Study Area
Observed by
NRSI
Lampsilis fasciolaWavy-rayed
LampmusselS1 THR SC Schedule 1
generally inhabit clear rivers and
streams of a variety of sizes, where the
water flow is steady and the substrate
is stable
MNRF 2014 No No
1,2MNRF 2015a, 3,4Government of Canada 2015, 5MNRF 2000, 6Reznicek et al. 2011, 7Layberry et al. 1998, 8MNRF 2014
SRANK
S1 Critically Imperiled
S2 Imperiled
S#? Rank Uncertain
N Non-breeding
S3 Vulnerable
S4 Apparently Secure
B Breeding
LEGEND
Schedule 3 Special concern; may be reassessed for
consideration for inclusion to Schedule 1
SARA Schedule
Schedule 1 Officially Protected under SARA
COSSARO/COSEWIC
END/E Endangered
THR/T Threatened
SC/SC Special Concern
NAR Not at Risk
Page 8 of 8

Natural Resource Solutions Inc. Mapleton WPCP Class EA Natural Environment Characterization Report (Appendices)
APPENDIX II Vascular Flora Reported From the Subject Property
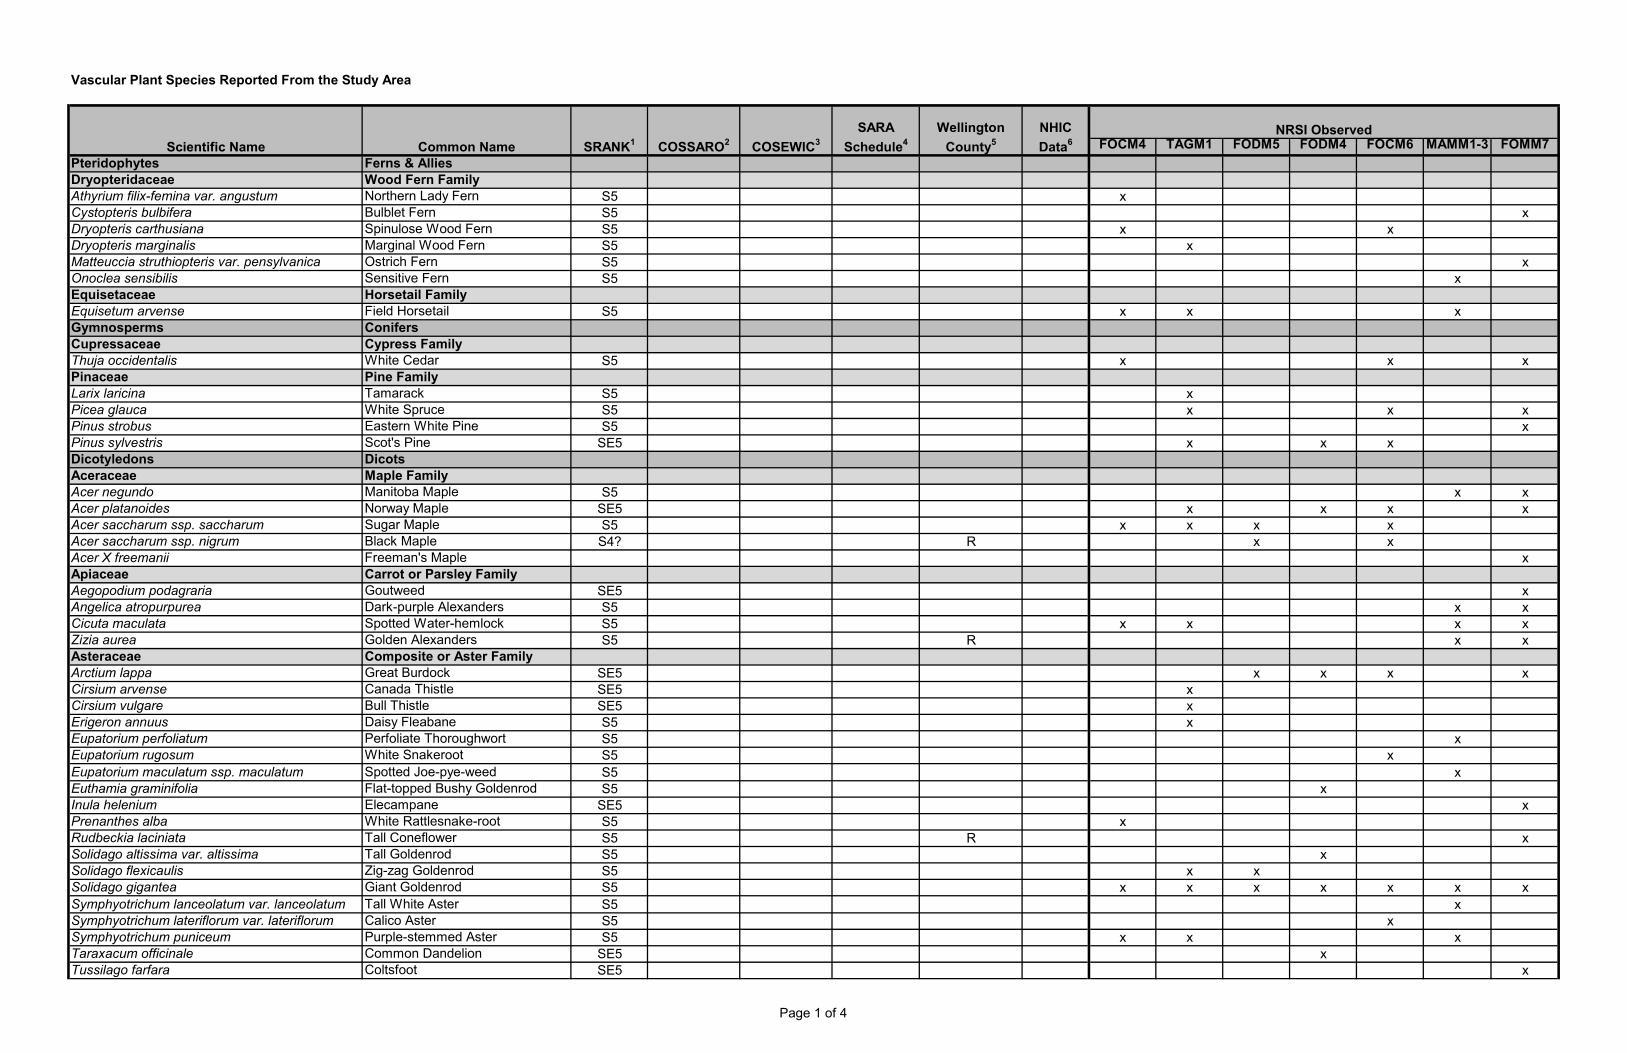
Vascular Plant Species Reported From the Study Area
FOCM4 TAGM1 FODM5 FODM4 FOCM6 MAMM1-3 FOMM7
Pteridophytes Ferns & AlliesDryopteridaceae Wood Fern FamilyAthyrium filix-femina var. angustum Northern Lady Fern S5 xCystopteris bulbifera Bulblet Fern S5 xDryopteris carthusiana Spinulose Wood Fern S5 x xDryopteris marginalis Marginal Wood Fern S5 xMatteuccia struthiopteris var. pensylvanica Ostrich Fern S5 xOnoclea sensibilis Sensitive Fern S5 xEquisetaceae Horsetail FamilyEquisetum arvense Field Horsetail S5 x x xGymnosperms ConifersCupressaceae Cypress FamilyThuja occidentalis White Cedar S5 x x xPinaceae Pine FamilyLarix laricina Tamarack S5 xPicea glauca White Spruce S5 x x xPinus strobus Eastern White Pine S5 xPinus sylvestris Scot's Pine SE5 x x xDicotyledons DicotsAceraceae Maple FamilyAcer negundo Manitoba Maple S5 x xAcer platanoides Norway Maple SE5 x x x xAcer saccharum ssp. saccharum Sugar Maple S5 x x x xAcer saccharum ssp. nigrum Black Maple S4? R x xAcer X freemanii Freeman's Maple xApiaceae Carrot or Parsley FamilyAegopodium podagraria Goutweed SE5 xAngelica atropurpurea Dark-purple Alexanders S5 x xCicuta maculata Spotted Water-hemlock S5 x x x xZizia aurea Golden Alexanders S5 R x xAsteraceae Composite or Aster FamilyArctium lappa Great Burdock SE5 x x x xCirsium arvense Canada Thistle SE5 xCirsium vulgare Bull Thistle SE5 xErigeron annuus Daisy Fleabane S5 xEupatorium perfoliatum Perfoliate Thoroughwort S5 xEupatorium rugosum White Snakeroot S5 x
Eupatorium maculatum ssp. maculatum Spotted Joe-pye-weed S5 xEuthamia graminifolia Flat-topped Bushy Goldenrod S5 xInula helenium Elecampane SE5 xPrenanthes alba White Rattlesnake-root S5 xRudbeckia laciniata Tall Coneflower S5 R xSolidago altissima var. altissima Tall Goldenrod S5 xSolidago flexicaulis Zig-zag Goldenrod S5 x xSolidago gigantea Giant Goldenrod S5 x x x x x x x
Symphyotrichum lanceolatum var. lanceolatum Tall White Aster S5 xSymphyotrichum lateriflorum var. lateriflorum Calico Aster S5 xSymphyotrichum puniceum Purple-stemmed Aster S5 x x xTaraxacum officinale Common Dandelion SE5 xTussilago farfara Coltsfoot SE5 x
SARA
Schedule4
Wellington
County5
NHIC
Data6NRSI Observed
Scientific Name Common Name SRANK1 COSSARO2 COSEWIC3
Page 1 of 4
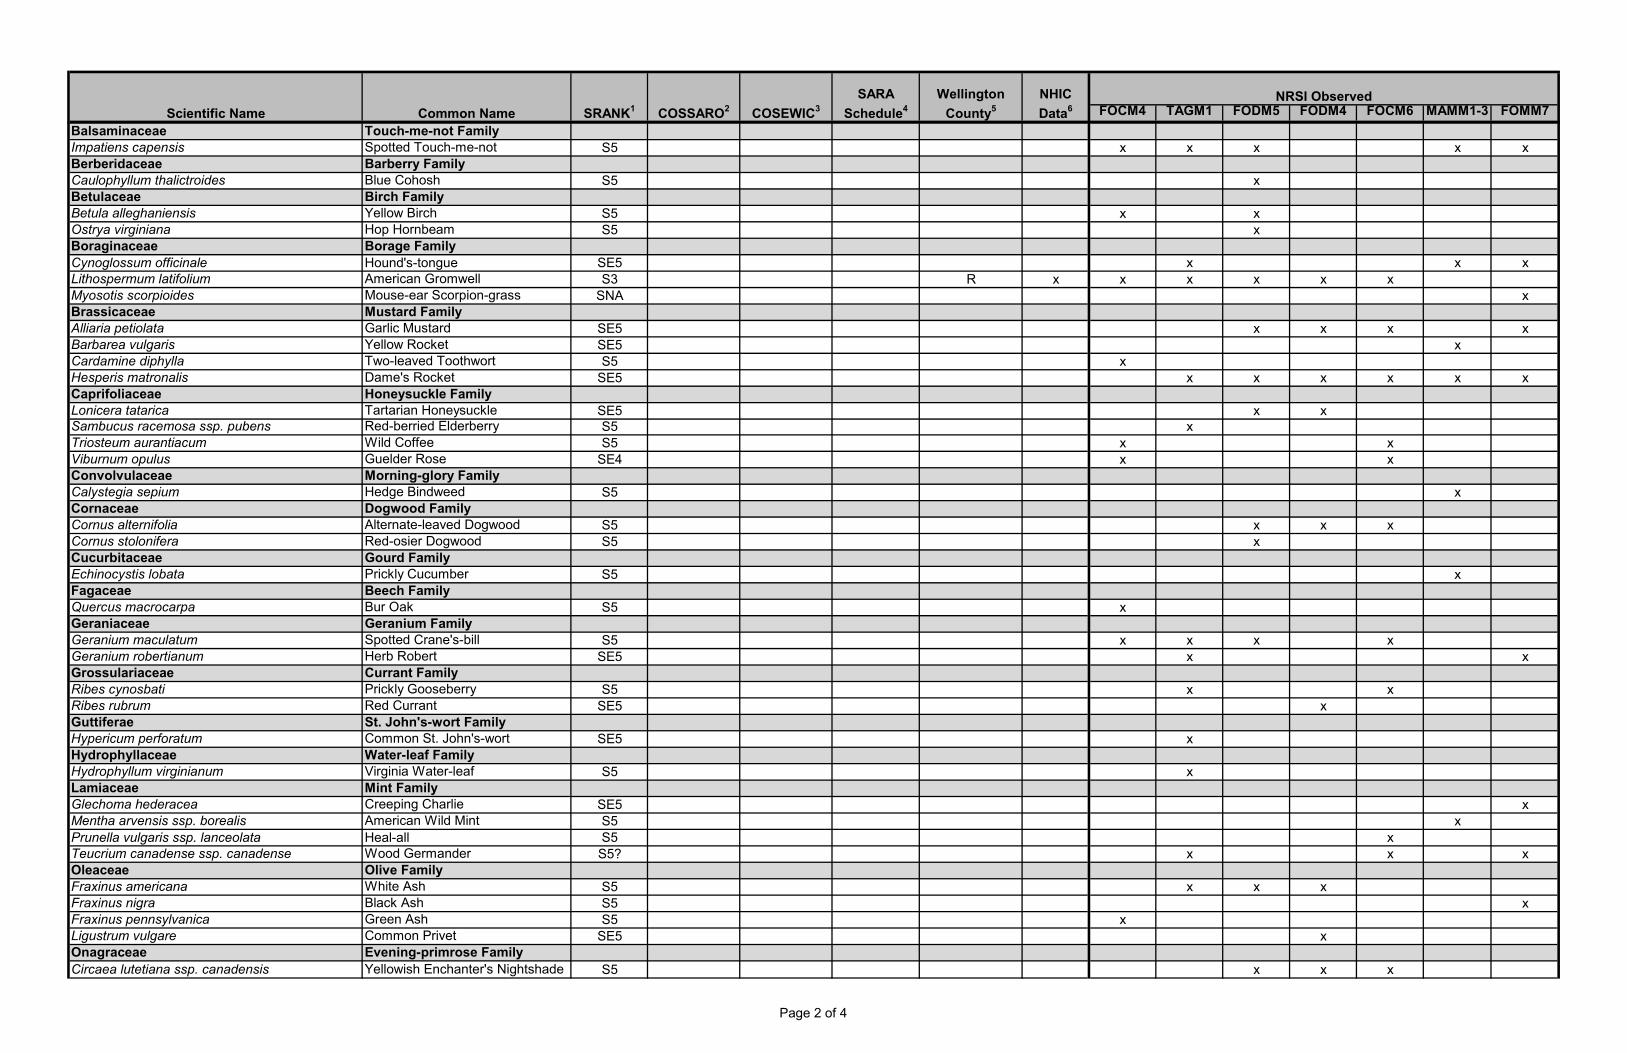
FOCM4 TAGM1 FODM5 FODM4 FOCM6 MAMM1-3 FOMM7
SARA
Schedule4
Wellington
County5
NHIC
Data6NRSI Observed
Scientific Name Common Name SRANK1 COSSARO2 COSEWIC3
Balsaminaceae Touch-me-not FamilyImpatiens capensis Spotted Touch-me-not S5 x x x x xBerberidaceae Barberry FamilyCaulophyllum thalictroides Blue Cohosh S5 xBetulaceae Birch FamilyBetula alleghaniensis Yellow Birch S5 x xOstrya virginiana Hop Hornbeam S5 xBoraginaceae Borage Family
Cynoglossum officinale Hound's-tongue SE5 x x xLithospermum latifolium American Gromwell S3 R x x x x x xMyosotis scorpioides Mouse-ear Scorpion-grass SNA xBrassicaceae Mustard FamilyAlliaria petiolata Garlic Mustard SE5 x x x xBarbarea vulgaris Yellow Rocket SE5 xCardamine diphylla Two-leaved Toothwort S5 xHesperis matronalis Dame's Rocket SE5 x x x x x xCaprifoliaceae Honeysuckle FamilyLonicera tatarica Tartarian Honeysuckle SE5 x xSambucus racemosa ssp. pubens Red-berried Elderberry S5 xTriosteum aurantiacum Wild Coffee S5 x xViburnum opulus Guelder Rose SE4 x xConvolvulaceae Morning-glory FamilyCalystegia sepium Hedge Bindweed S5 xCornaceae Dogwood FamilyCornus alternifolia Alternate-leaved Dogwood S5 x x xCornus stolonifera Red-osier Dogwood S5 xCucurbitaceae Gourd FamilyEchinocystis lobata Prickly Cucumber S5 xFagaceae Beech FamilyQuercus macrocarpa Bur Oak S5 xGeraniaceae Geranium FamilyGeranium maculatum Spotted Crane's-bill S5 x x x xGeranium robertianum Herb Robert SE5 x xGrossulariaceae Currant FamilyRibes cynosbati Prickly Gooseberry S5 x xRibes rubrum Red Currant SE5 xGuttiferae St. John's-wort FamilyHypericum perforatum Common St. John's-wort SE5 xHydrophyllaceae Water-leaf FamilyHydrophyllum virginianum Virginia Water-leaf S5 xLamiaceae Mint FamilyGlechoma hederacea Creeping Charlie SE5 xMentha arvensis ssp. borealis American Wild Mint S5 xPrunella vulgaris ssp. lanceolata Heal-all S5 xTeucrium canadense ssp. canadense Wood Germander S5? x x xOleaceae Olive FamilyFraxinus americana White Ash S5 x x xFraxinus nigra Black Ash S5 xFraxinus pennsylvanica Green Ash S5 xLigustrum vulgare Common Privet SE5 xOnagraceae Evening-primrose Family
Circaea lutetiana ssp. canadensis Yellowish Enchanter's Nightshade S5 x x x
Page 2 of 4
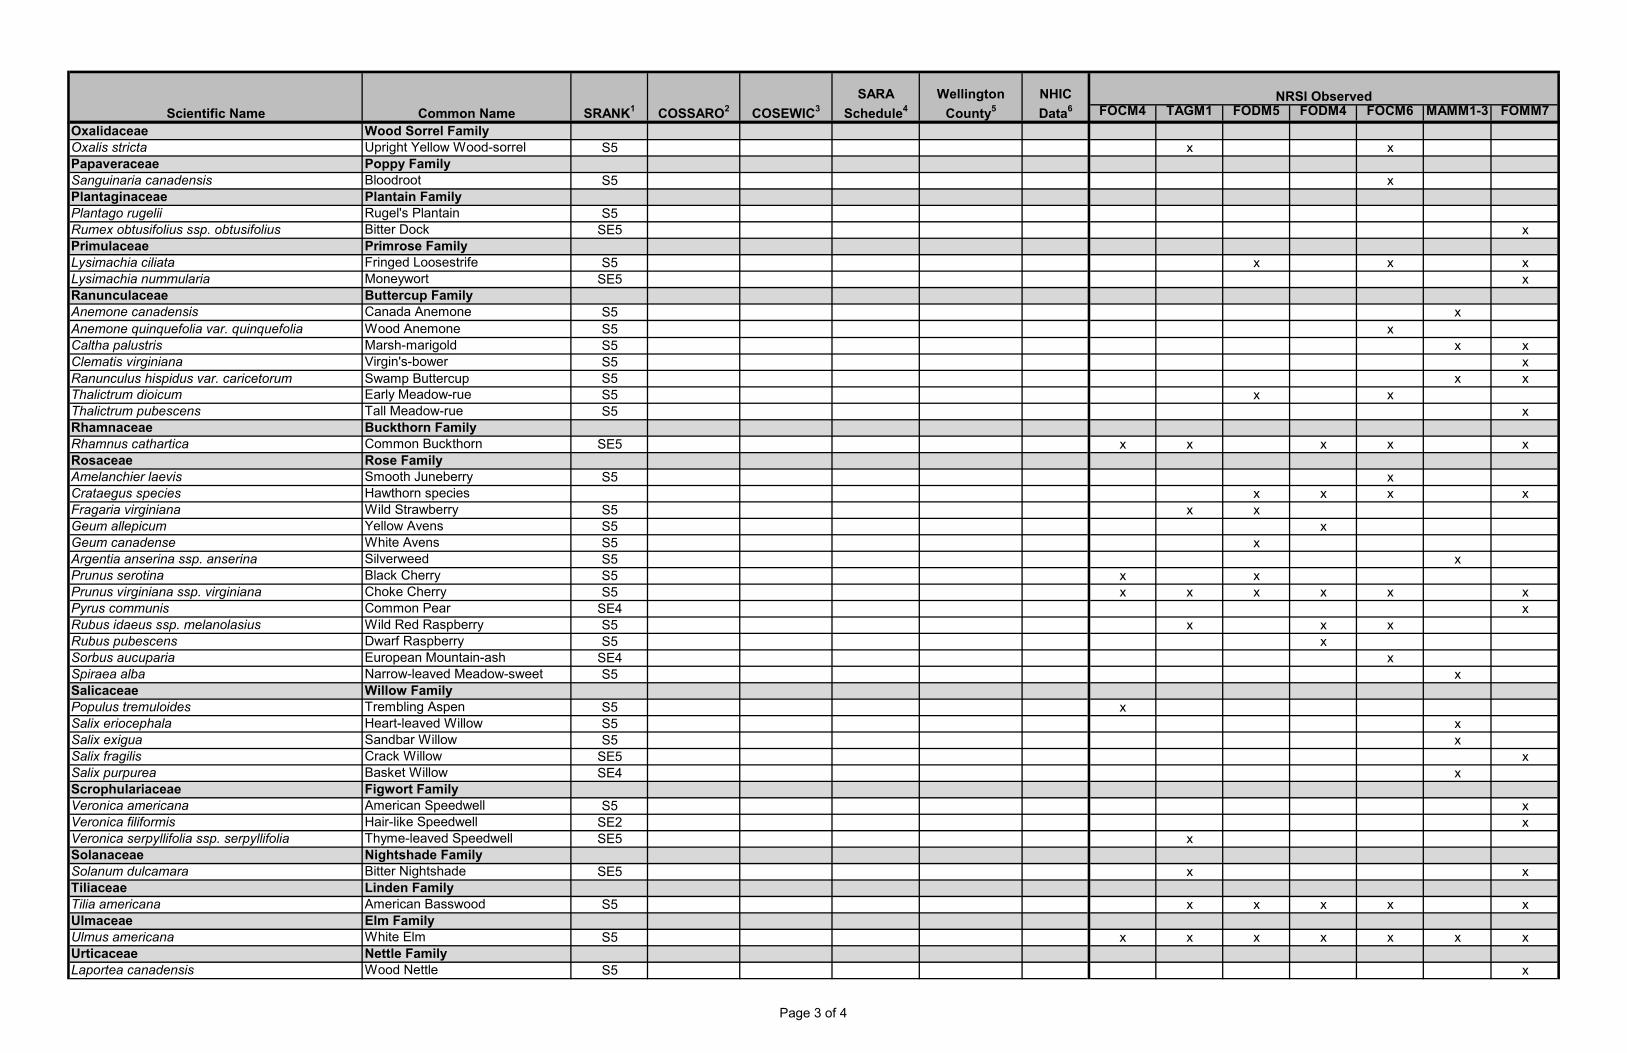
FOCM4 TAGM1 FODM5 FODM4 FOCM6 MAMM1-3 FOMM7
SARA
Schedule4
Wellington
County5
NHIC
Data6NRSI Observed
Scientific Name Common Name SRANK1 COSSARO2 COSEWIC3
Oxalidaceae Wood Sorrel FamilyOxalis stricta Upright Yellow Wood-sorrel S5 x xPapaveraceae Poppy FamilySanguinaria canadensis Bloodroot S5 xPlantaginaceae Plantain FamilyPlantago rugelii Rugel's Plantain S5Rumex obtusifolius ssp. obtusifolius Bitter Dock SE5 xPrimulaceae Primrose FamilyLysimachia ciliata Fringed Loosestrife S5 x x xLysimachia nummularia Moneywort SE5 xRanunculaceae Buttercup FamilyAnemone canadensis Canada Anemone S5 x
Anemone quinquefolia var. quinquefolia Wood Anemone S5 xCaltha palustris Marsh-marigold S5 x xClematis virginiana Virgin's-bower S5 xRanunculus hispidus var. caricetorum Swamp Buttercup S5 x xThalictrum dioicum Early Meadow-rue S5 x xThalictrum pubescens Tall Meadow-rue S5 xRhamnaceae Buckthorn FamilyRhamnus cathartica Common Buckthorn SE5 x x x x xRosaceae Rose FamilyAmelanchier laevis Smooth Juneberry S5 xCrataegus species Hawthorn species x x x xFragaria virginiana Wild Strawberry S5 x xGeum allepicum Yellow Avens S5 xGeum canadense White Avens S5 xArgentia anserina ssp. anserina Silverweed S5 xPrunus serotina Black Cherry S5 x xPrunus virginiana ssp. virginiana Choke Cherry S5 x x x x x xPyrus communis Common Pear SE4 xRubus idaeus ssp. melanolasius Wild Red Raspberry S5 x x xRubus pubescens Dwarf Raspberry S5 xSorbus aucuparia European Mountain-ash SE4 xSpiraea alba Narrow-leaved Meadow-sweet S5 xSalicaceae Willow FamilyPopulus tremuloides Trembling Aspen S5 xSalix eriocephala Heart-leaved Willow S5 xSalix exigua Sandbar Willow S5 xSalix fragilis Crack Willow SE5 xSalix purpurea Basket Willow SE4 xScrophulariaceae Figwort FamilyVeronica americana American Speedwell S5 xVeronica filiformis Hair-like Speedwell SE2 xVeronica serpyllifolia ssp. serpyllifolia Thyme-leaved Speedwell SE5 xSolanaceae Nightshade FamilySolanum dulcamara Bitter Nightshade SE5 x xTiliaceae Linden FamilyTilia americana American Basswood S5 x x x x xUlmaceae Elm FamilyUlmus americana White Elm S5 x x x x x x xUrticaceae Nettle FamilyLaportea canadensis Wood Nettle S5 x
Page 3 of 4
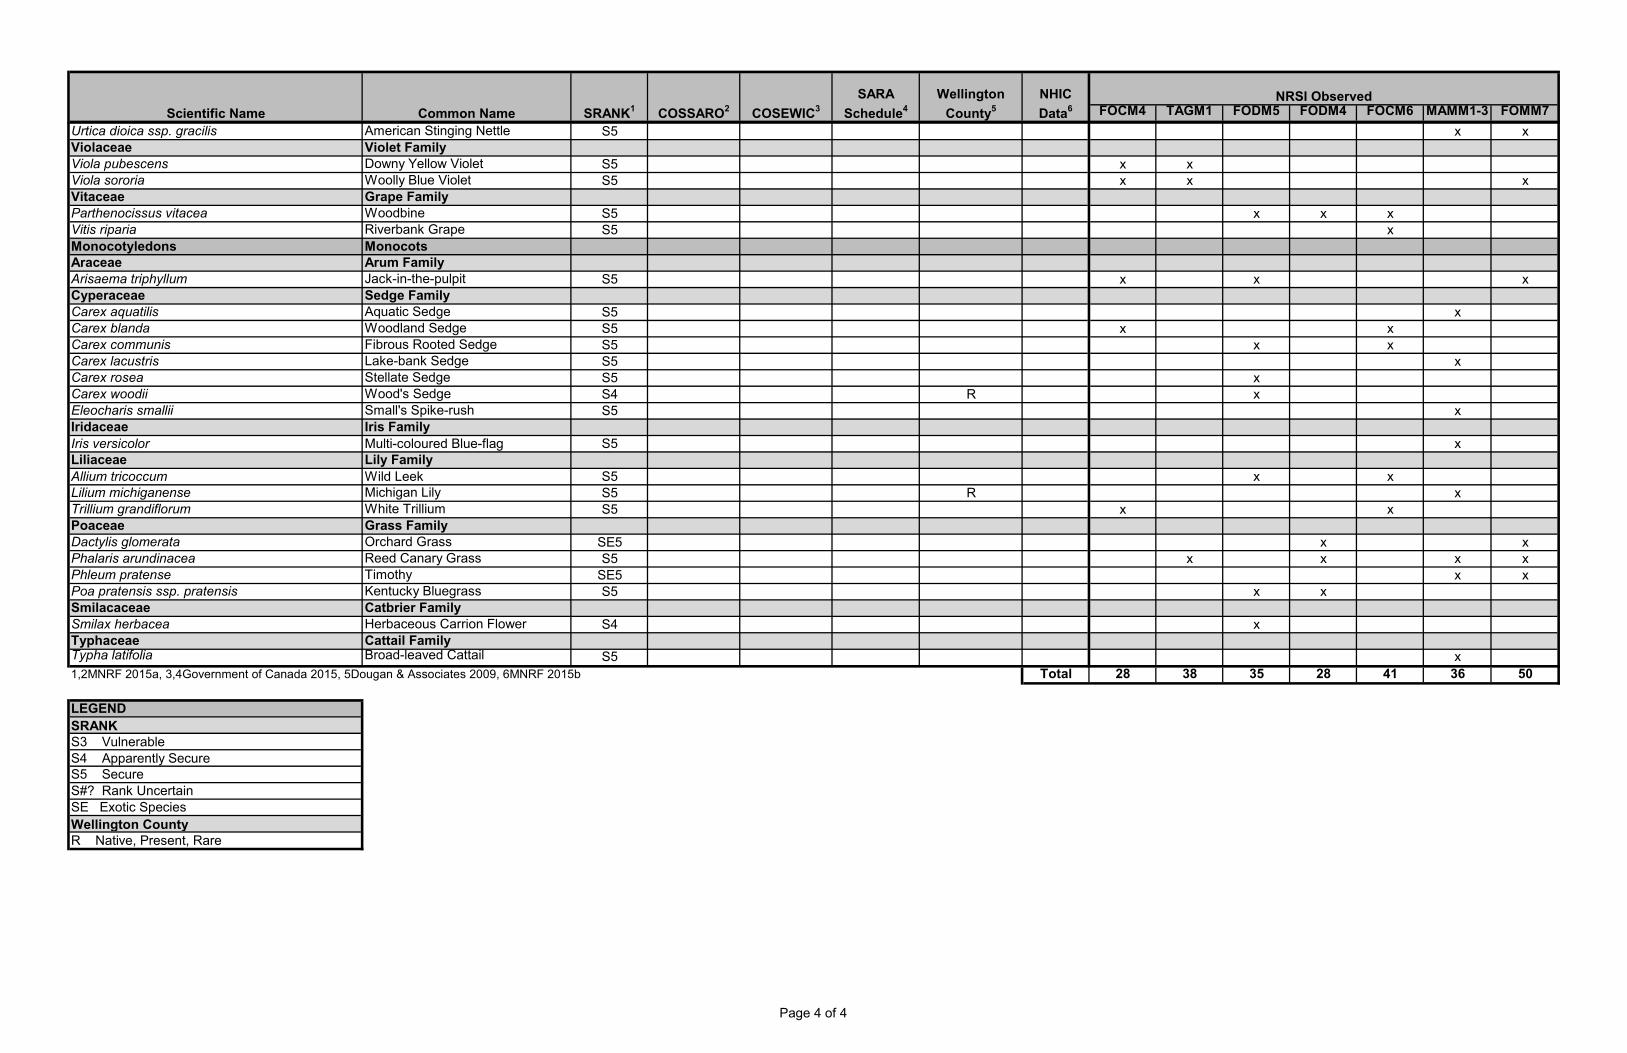
FOCM4 TAGM1 FODM5 FODM4 FOCM6 MAMM1-3 FOMM7
SARA
Schedule4
Wellington
County5
NHIC
Data6NRSI Observed
Scientific Name Common Name SRANK1 COSSARO2 COSEWIC3
Urtica dioica ssp. gracilis American Stinging Nettle S5 x xViolaceae Violet FamilyViola pubescens Downy Yellow Violet S5 x xViola sororia Woolly Blue Violet S5 x x xVitaceae Grape FamilyParthenocissus vitacea Woodbine S5 x x xVitis riparia Riverbank Grape S5 xMonocotyledons MonocotsAraceae Arum FamilyArisaema triphyllum Jack-in-the-pulpit S5 x x xCyperaceae Sedge FamilyCarex aquatilis Aquatic Sedge S5 xCarex blanda Woodland Sedge S5 x xCarex communis Fibrous Rooted Sedge S5 x xCarex lacustris Lake-bank Sedge S5 xCarex rosea Stellate Sedge S5 xCarex woodii Wood's Sedge S4 R xEleocharis smallii Small's Spike-rush S5 xIridaceae Iris Family
Iris versicolor Multi-coloured Blue-flag S5 xLiliaceae Lily Family
Allium tricoccum Wild Leek S5 x xLilium michiganense Michigan Lily S5 R xTrillium grandiflorum White Trillium S5 x xPoaceae Grass FamilyDactylis glomerata Orchard Grass SE5 x xPhalaris arundinacea Reed Canary Grass S5 x x x xPhleum pratense Timothy SE5 x xPoa pratensis ssp. pratensis Kentucky Bluegrass S5 x xSmilacaceae Catbrier FamilySmilax herbacea Herbaceous Carrion Flower S4 xTyphaceae Cattail FamilyTypha latifolia Broad-leaved Cattail S5 x
1,2MNRF 2015a, 3,4Government of Canada 2015, 5Dougan & Associates 2009, 6MNRF 2015b Total 28 38 35 28 41 36 50
LEGEND
SRANKS3 VulnerableS4 Apparently SecureS5 Secure S#? Rank UncertainSE Exotic Species
Wellington CountyR Native, Present, Rare
Page 4 of 4

Natural Resource Solutions Inc. Mapleton WPCP Class EA Natural Environment Characterization Report (Appendices)
APPENDIX III Bird Species Reported From the Study Area
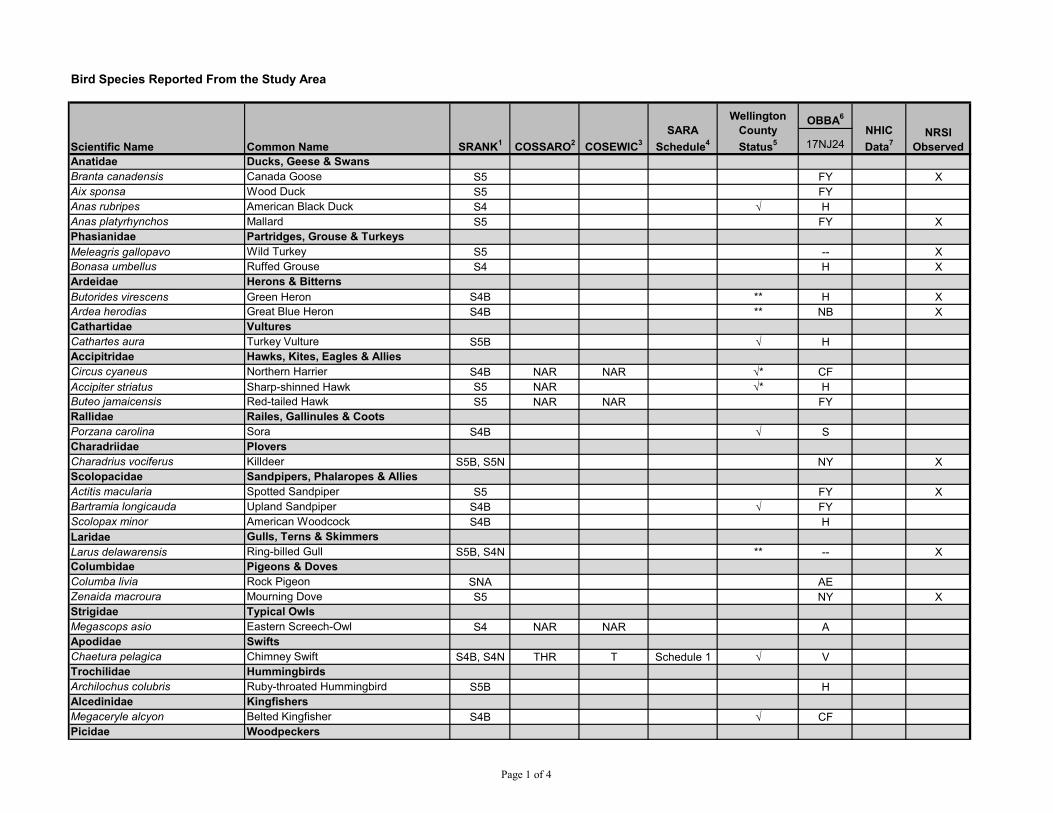
Bird Species Reported From the Study Area
OBBA6
17NJ24
Anatidae Ducks, Geese & Swans
Branta canadensis Canada Goose S5 FY X
Aix sponsa Wood Duck S5 FY
Anas rubripes American Black Duck S4 √ H
Anas platyrhynchos Mallard S5 FY X
Phasianidae Partridges, Grouse & Turkeys
Meleagris gallopavo Wild Turkey S5 -- X
Bonasa umbellus Ruffed Grouse S4 H X
Ardeidae Herons & Bitterns
Butorides virescens Green Heron S4B ** H X
Ardea herodias Great Blue Heron S4B ** NB X
Cathartidae Vultures
Cathartes aura Turkey Vulture S5B √ H
Accipitridae Hawks, Kites, Eagles & Allies
Circus cyaneus Northern Harrier S4B NAR NAR √* CF
Accipiter striatus Sharp-shinned Hawk S5 NAR √* H
Buteo jamaicensis Red-tailed Hawk S5 NAR NAR FY
Rallidae Railes, Gallinules & Coots
Porzana carolina Sora S4B √ S
Charadriidae Plovers
Charadrius vociferus Killdeer S5B, S5N NY X
Scolopacidae Sandpipers, Phalaropes & Allies
Actitis macularia Spotted Sandpiper S5 FY X
Bartramia longicauda Upland Sandpiper S4B √ FY
Scolopax minor American Woodcock S4B H
Laridae Gulls, Terns & Skimmers
Larus delawarensis Ring-billed Gull S5B, S4N ** -- X
Columbidae Pigeons & Doves
Columba livia Rock Pigeon SNA AE
Zenaida macroura Mourning Dove S5 NY X
Strigidae Typical Owls
Megascops asio Eastern Screech-Owl S4 NAR NAR A
Apodidae Swifts
Chaetura pelagica Chimney Swift S4B, S4N THR T Schedule 1 √ V
Trochilidae Hummingbirds
Archilochus colubris Ruby-throated Hummingbird S5B H
Alcedinidae Kingfishers
Megaceryle alcyon Belted Kingfisher S4B √ CF
Picidae Woodpeckers
Scientific Name Common Name SRANK1
COSSARO2
COSEWIC3
SARA
Schedule4
NRSI
Observed
Wellington
County
Status5
NHIC
Data7
Page 1 of 4
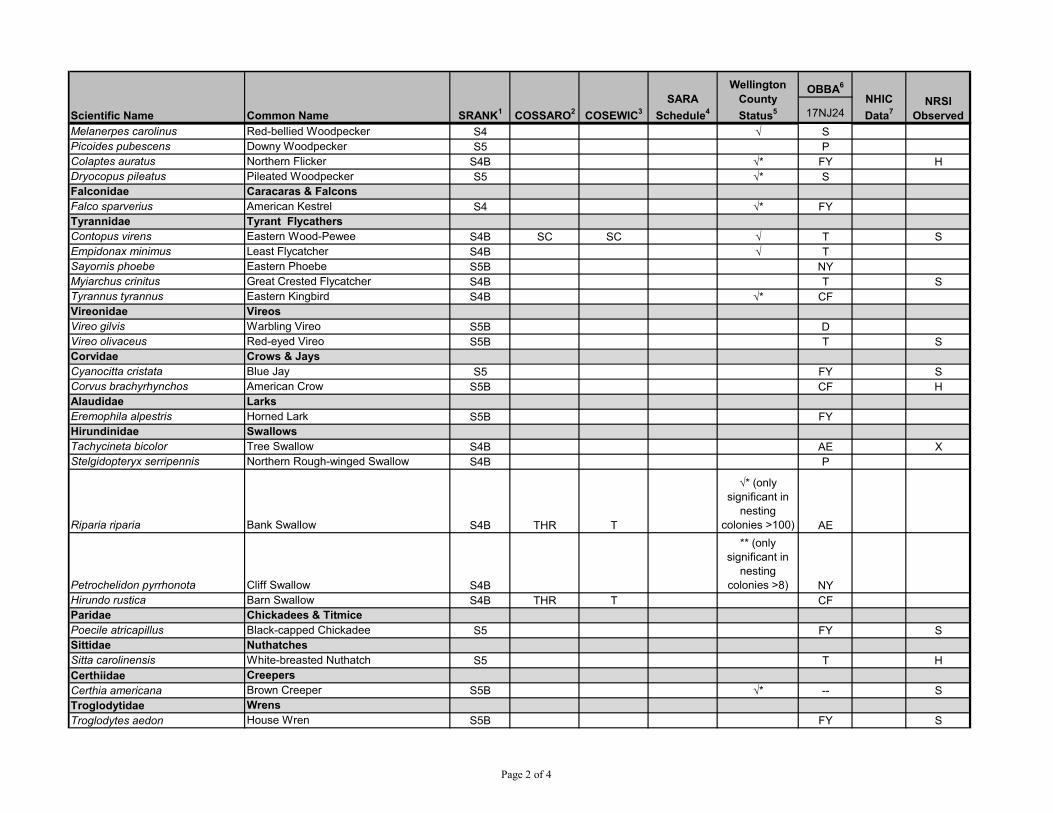
OBBA6
17NJ24Scientific Name Common Name SRANK1 COSSARO2 COSEWIC3
SARA
Schedule4NRSI
Observed
Wellington
County
Status5
NHIC
Data7
Melanerpes carolinus Red-bellied Woodpecker S4 √ S
Picoides pubescens Downy Woodpecker S5 P
Colaptes auratus Northern Flicker S4B √* FY H
Dryocopus pileatus Pileated Woodpecker S5 √* S
Falconidae Caracaras & Falcons
Falco sparverius American Kestrel S4 √* FY
Tyrannidae Tyrant Flycathers
Contopus virens Eastern Wood-Pewee S4B SC SC √ T S
Empidonax minimus Least Flycatcher S4B √ T
Sayornis phoebe Eastern Phoebe S5B NY
Myiarchus crinitus Great Crested Flycatcher S4B T S
Tyrannus tyrannus Eastern Kingbird S4B √* CF
Vireonidae Vireos
Vireo gilvis Warbling Vireo S5B D
Vireo olivaceus Red-eyed Vireo S5B T S
Corvidae Crows & Jays
Cyanocitta cristata Blue Jay S5 FY S
Corvus brachyrhynchos American Crow S5B CF H
Alaudidae Larks
Eremophila alpestris Horned Lark S5B FY
Hirundinidae Swallows
Tachycineta bicolor Tree Swallow S4B AE X
Stelgidopteryx serripennis Northern Rough-winged Swallow S4B P
Riparia riparia Bank Swallow S4B THR T
√* (only
significant in
nesting
colonies >100) AE
Petrochelidon pyrrhonota Cliff Swallow S4B
** (only
significant in
nesting
colonies >8) NY
Hirundo rustica Barn Swallow S4B THR T CF
Paridae Chickadees & Titmice
Poecile atricapillus Black-capped Chickadee S5 FY S
Sittidae Nuthatches
Sitta carolinensis White-breasted Nuthatch S5 T H
Certhiidae Creepers
Certhia americana Brown Creeper S5B √* -- S
Troglodytidae Wrens
Troglodytes aedon House Wren S5B FY S
Page 2 of 4
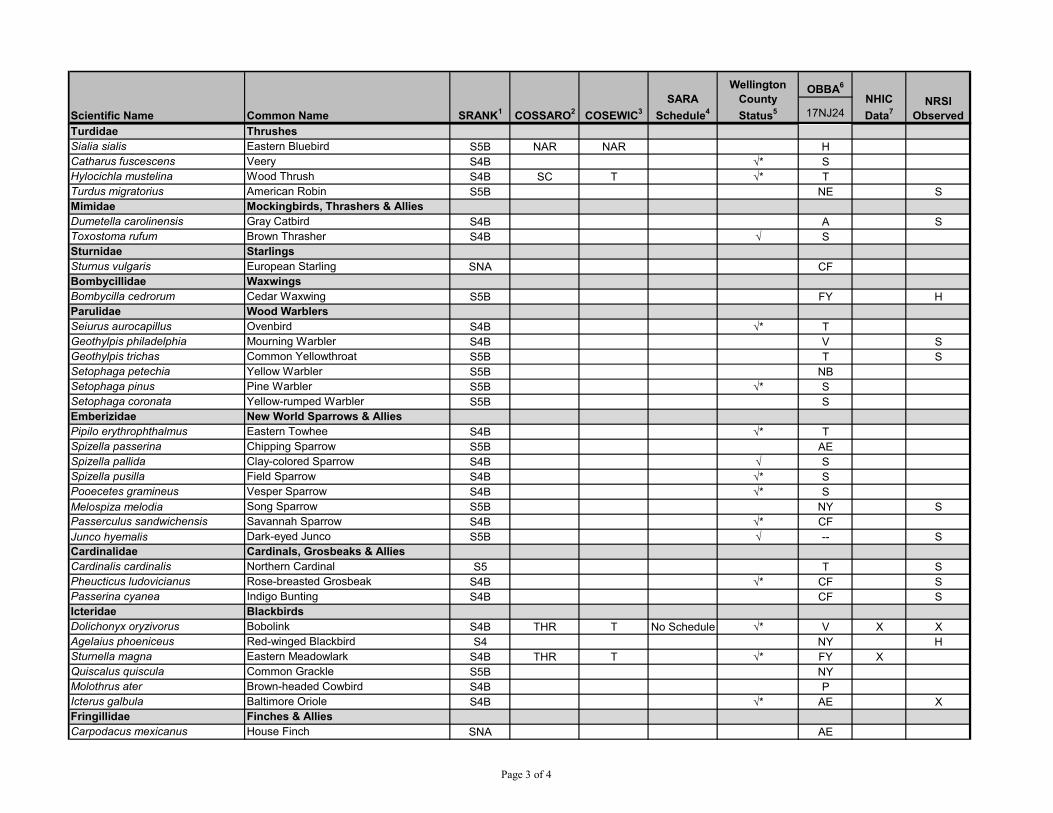
OBBA6
17NJ24Scientific Name Common Name SRANK1 COSSARO2 COSEWIC3
SARA
Schedule4NRSI
Observed
Wellington
County
Status5
NHIC
Data7
Turdidae Thrushes
Sialia sialis Eastern Bluebird S5B NAR NAR H
Catharus fuscescens Veery S4B √* S
Hylocichla mustelina Wood Thrush S4B SC T √* T
Turdus migratorius American Robin S5B NE S
Mimidae Mockingbirds, Thrashers & Allies
Dumetella carolinensis Gray Catbird S4B A S
Toxostoma rufum Brown Thrasher S4B √ S
Sturnidae Starlings
Sturnus vulgaris European Starling SNA CF
Bombycillidae Waxwings
Bombycilla cedrorum Cedar Waxwing S5B FY H
Parulidae Wood Warblers
Seiurus aurocapillus Ovenbird S4B √* T
Geothylpis philadelphia Mourning Warbler S4B V S
Geothylpis trichas Common Yellowthroat S5B T S
Setophaga petechia Yellow Warbler S5B NB
Setophaga pinus Pine Warbler S5B √* S
Setophaga coronata Yellow-rumped Warbler S5B S
Emberizidae New World Sparrows & Allies
Pipilo erythrophthalmus Eastern Towhee S4B √* T
Spizella passerina Chipping Sparrow S5B AE
Spizella pallida Clay-colored Sparrow S4B √ S
Spizella pusilla Field Sparrow S4B √* S
Pooecetes gramineus Vesper Sparrow S4B √* S
Melospiza melodia Song Sparrow S5B NY S
Passerculus sandwichensis Savannah Sparrow S4B √* CF
Junco hyemalis Dark-eyed Junco S5B √ -- S
Cardinalidae Cardinals, Grosbeaks & Allies
Cardinalis cardinalis Northern Cardinal S5 T S
Pheucticus ludovicianus Rose-breasted Grosbeak S4B √* CF S
Passerina cyanea Indigo Bunting S4B CF S
Icteridae Blackbirds
Dolichonyx oryzivorus Bobolink S4B THR T No Schedule √* V X X
Agelaius phoeniceus Red-winged Blackbird S4 NY H
Sturnella magna Eastern Meadowlark S4B THR T √* FY X
Quiscalus quiscula Common Grackle S5B NY
Molothrus ater Brown-headed Cowbird S4B P
Icterus galbula Baltimore Oriole S4B √* AE X
Fringillidae Finches & Allies
Carpodacus mexicanus House Finch SNA AE
Page 3 of 4
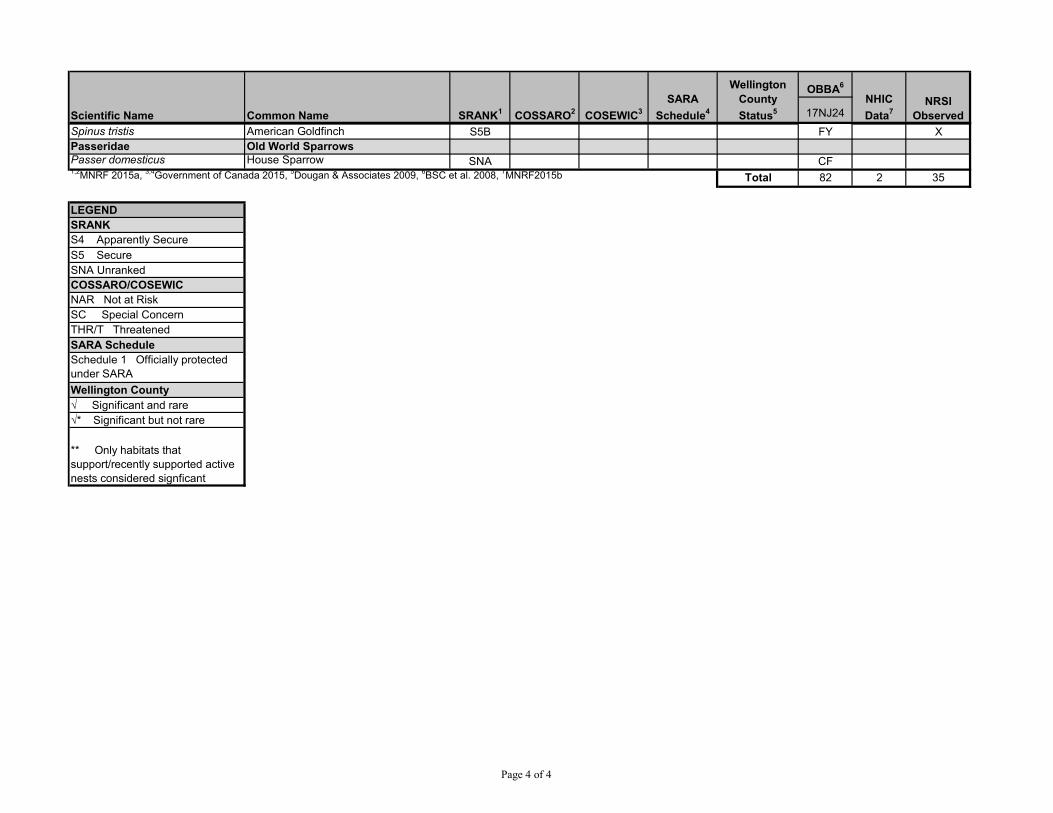
OBBA6
17NJ24Scientific Name Common Name SRANK1 COSSARO2 COSEWIC3
SARA
Schedule4NRSI
Observed
Wellington
County
Status5
NHIC
Data7
Spinus tristis American Goldfinch S5B FY X
Passeridae Old World SparrowsPasser domesticus House Sparrow SNA CF1,2MNRF 2015a, 3,4Government of Canada 2015, 5Dougan & Associates 2009, 6BSC et al. 2008, 7MNRF2015b Total 82 2 35
LEGEND
SRANK
S4 Apparently Secure
S5 Secure
SNA Unranked
COSSARO/COSEWIC
NAR Not at Risk
SC Special Concern
THR/T Threatened
SARA Schedule
Schedule 1 Officially protected
under SARA
Wellington County
√ Significant and rare
√* Significant but not rare
** Only habitats that
support/recently supported active
nests considered signficant
Page 4 of 4

Natural Resource Solutions Inc. Mapleton WPCP Class EA Natural Environment Characterization Report (Appendices)
APPENDIX IV Herpetofauna Reported From the Study Area
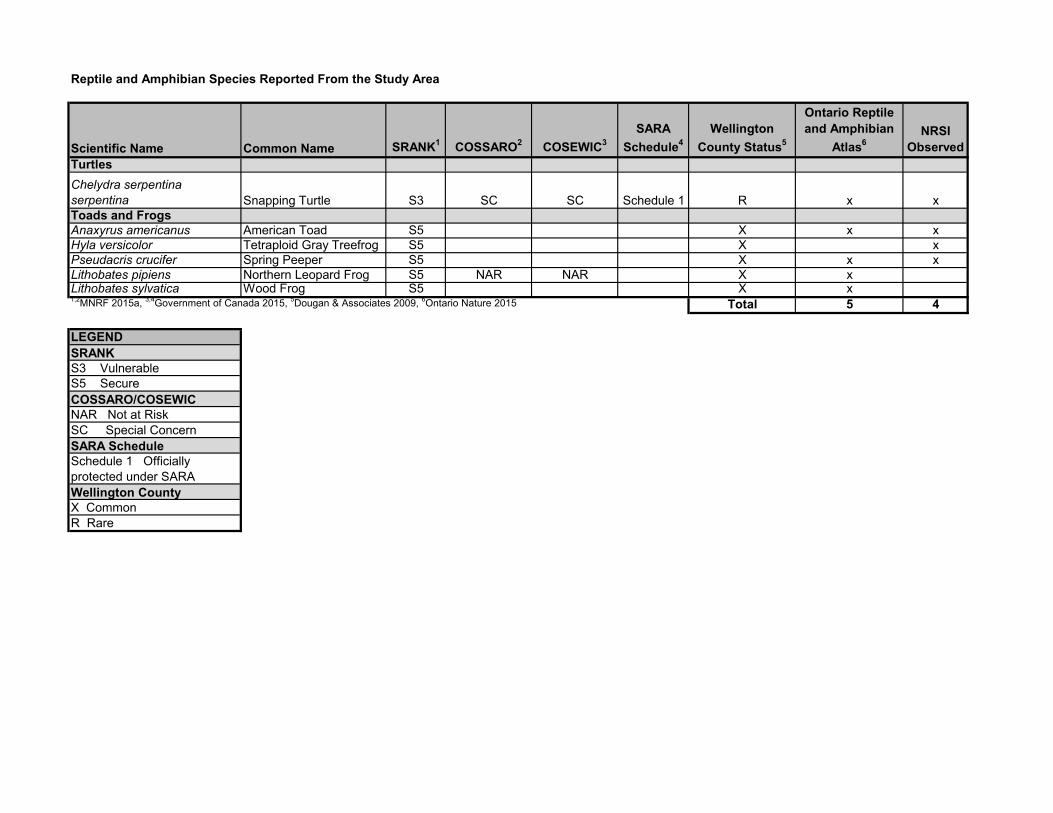
Reptile and Amphibian Species Reported From the Study Area
Scientific Name Common Name SRANK1
COSSARO2
COSEWIC3
SARA
Schedule4
Wellington
County Status5
Ontario Reptile
and Amphibian
Atlas6
NRSI
Observed
Turtles
Chelydra serpentina serpentina Snapping Turtle S3 SC SC Schedule 1 R x xToads and FrogsAnaxyrus americanus American Toad S5 X x xHyla versicolor Tetraploid Gray Treefrog S5 X xPseudacris crucifer Spring Peeper S5 X x xLithobates pipiens Northern Leopard Frog S5 NAR NAR X xLithobates sylvatica Wood Frog S5 X x1,2MNRF 2015a, 3,4Government of Canada 2015, 5Dougan & Associates 2009, 6Ontario Nature 2015 Total 5 4
LEGEND
SRANKS3 VulnerableS5 Secure
COSSARO/COSEWICNAR Not at RiskSC Special Concern
SARA ScheduleSchedule 1 Officially protected under SARA
Wellington CountyX CommonR Rare

Natural Resource Solutions Inc. Mapleton WPCP Class EA Natural Environment Characterization Report (Appendices)
APPENDIX V Mammals Reported From the Study Area
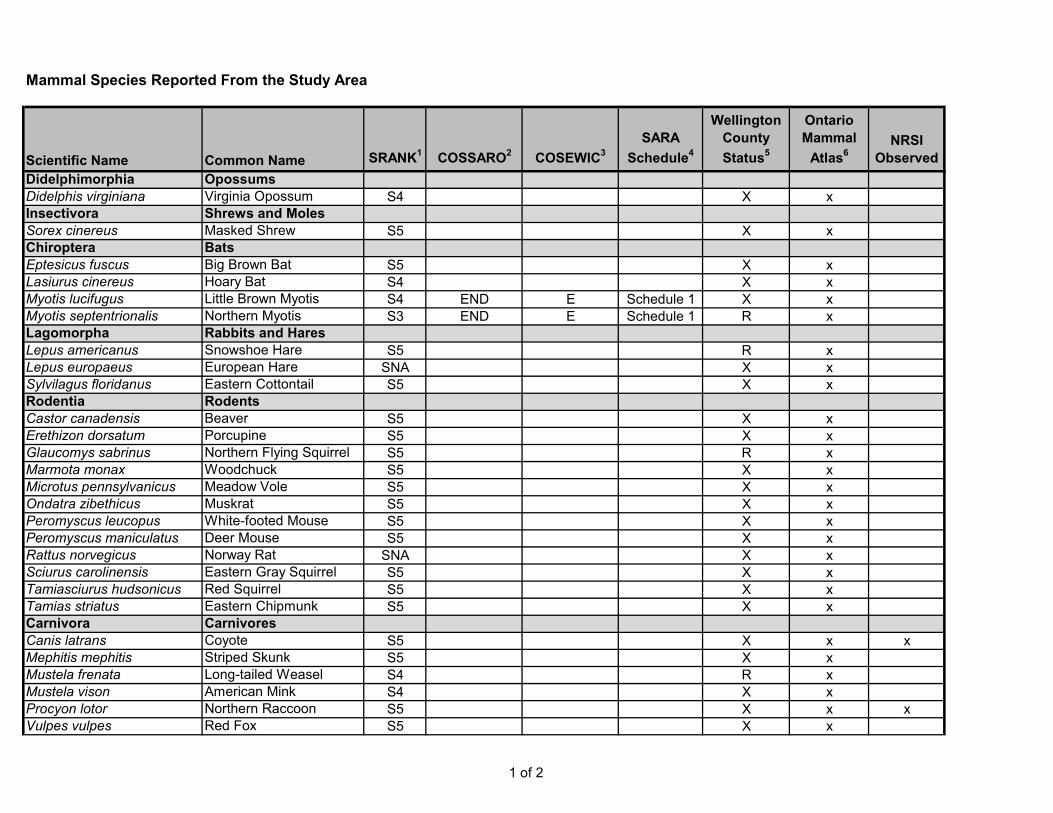
Mammal Species Reported From the Study Area
Scientific Name Common Name SRANK1
COSSARO2
COSEWIC3
SARA
Schedule4
Wellington
County
Status5
Ontario
Mammal
Atlas6
NRSI
Observed
Didelphimorphia Opossums
Didelphis virginiana Virginia Opossum S4 X xInsectivora Shrews and Moles
Sorex cinereus Masked Shrew S5 X xChiroptera Bats
Eptesicus fuscus Big Brown Bat S5 X xLasiurus cinereus Hoary Bat S4 X xMyotis lucifugus Little Brown Myotis S4 END E Schedule 1 X xMyotis septentrionalis Northern Myotis S3 END E Schedule 1 R xLagomorpha Rabbits and Hares
Lepus americanus Snowshoe Hare S5 R xLepus europaeus European Hare SNA X xSylvilagus floridanus Eastern Cottontail S5 X xRodentia Rodents
Castor canadensis Beaver S5 X xErethizon dorsatum Porcupine S5 X xGlaucomys sabrinus Northern Flying Squirrel S5 R xMarmota monax Woodchuck S5 X xMicrotus pennsylvanicus Meadow Vole S5 X xOndatra zibethicus Muskrat S5 X xPeromyscus leucopus White-footed Mouse S5 X xPeromyscus maniculatus Deer Mouse S5 X xRattus norvegicus Norway Rat SNA X xSciurus carolinensis Eastern Gray Squirrel S5 X xTamiasciurus hudsonicus Red Squirrel S5 X xTamias striatus Eastern Chipmunk S5 X xCarnivora Carnivores
Canis latrans Coyote S5 X x xMephitis mephitis Striped Skunk S5 X xMustela frenata Long-tailed Weasel S4 R xMustela vison American Mink S4 X xProcyon lotor Northern Raccoon S5 X x xVulpes vulpes Red Fox S5 X x
1 of 2
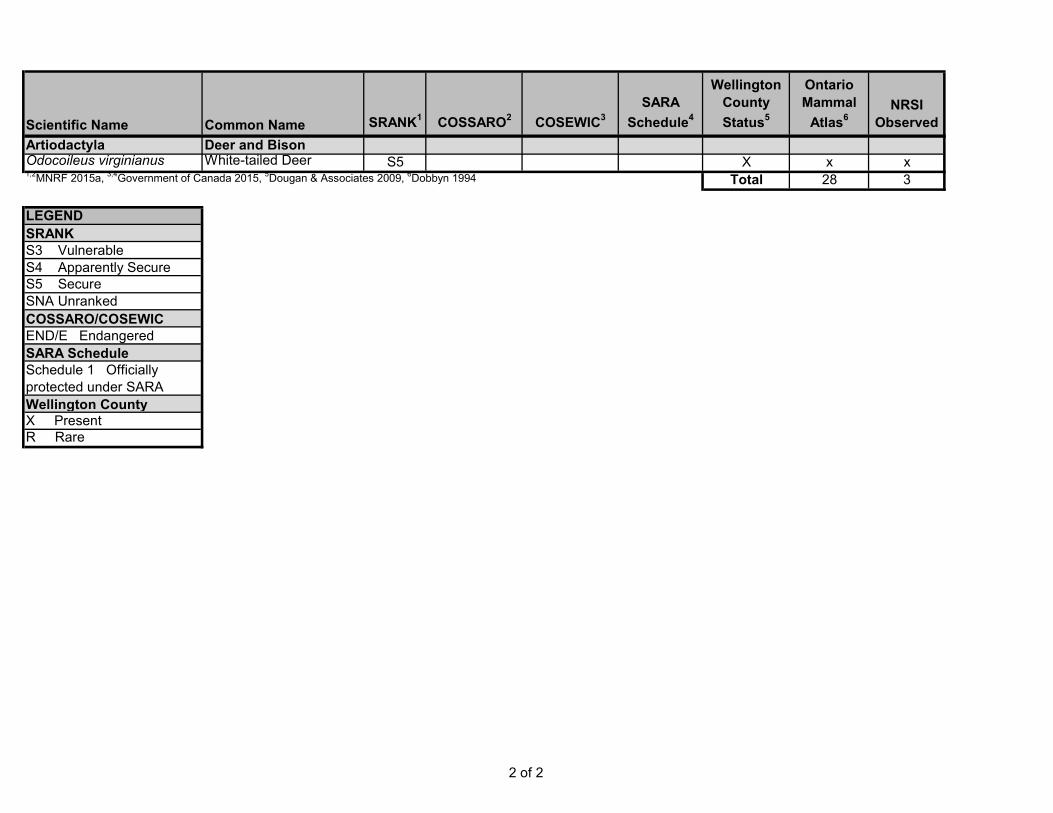
Scientific Name Common Name SRANK1 COSSARO2 COSEWIC3
SARA
Schedule4
Wellington
County
Status5
Ontario
Mammal
Atlas6NRSI
Observed
Artiodactyla Deer and BisonOdocoileus virginianus White-tailed Deer S5 X x x1,2MNRF 2015a, 3,4Government of Canada 2015, 5Dougan & Associates 2009, 6Dobbyn 1994 Total 28 3
LEGEND
SRANKS3 VulnerableS4 Apparently SecureS5 Secure SNA Unranked
COSSARO/COSEWICEND/E Endangered
SARA ScheduleSchedule 1 Officially protected under SARA
Wellington CountyX PresentR Rare
2 of 2

Natural Resource Solutions Inc. Mapleton WPCP Class EA Natural Environment Characterization Report (Appendices)
APPENDIX VI Lepidoptera Reported From the Study Area
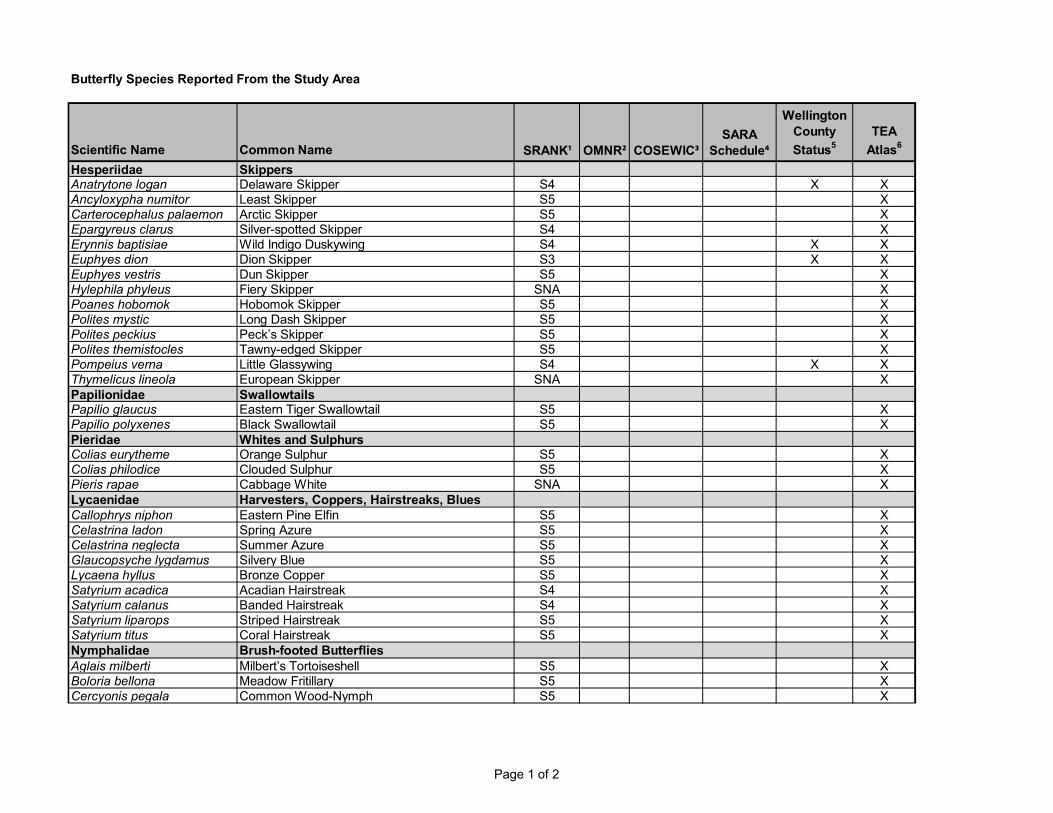
Scientific Name Common Name SRANK¹ OMNR² COSEWIC³SARA
Schedule⁴
Wellington
County
Status5
TEA
Atlas6
Hesperiidae SkippersAnatrytone logan Delaware Skipper S4 X XAncyloxypha numitor Least Skipper S5 XCarterocephalus palaemon Arctic Skipper S5 XEpargyreus clarus Silver-spotted Skipper S4 XErynnis baptisiae Wild Indigo Duskywing S4 X XEuphyes dion Dion Skipper S3 X XEuphyes vestris Dun Skipper S5 XHylephila phyleus Fiery Skipper SNA XPoanes hobomok Hobomok Skipper S5 XPolites mystic Long Dash Skipper S5 XPolites peckius Peck’s Skipper S5 XPolites themistocles Tawny-edged Skipper S5 XPompeius verna Little Glassywing S4 X XThymelicus lineola European Skipper SNA XPapilionidae SwallowtailsPapilio glaucus Eastern Tiger Swallowtail S5 XPapilio polyxenes Black Swallowtail S5 XPieridae Whites and SulphursColias eurytheme Orange Sulphur S5 XColias philodice Clouded Sulphur S5 XPieris rapae Cabbage White SNA XLycaenidae Harvesters, Coppers, Hairstreaks, BluesCallophrys niphon Eastern Pine Elfin S5 XCelastrina ladon Spring Azure S5 XCelastrina neglecta Summer Azure S5 XGlaucopsyche lygdamus Silvery Blue S5 XLycaena hyllus Bronze Copper S5 XSatyrium acadica Acadian Hairstreak S4 XSatyrium calanus Banded Hairstreak S4 XSatyrium liparops Striped Hairstreak S5 XSatyrium titus Coral Hairstreak S5 XNymphalidae Brush-footed ButterfliesAglais milberti Milbert’s Tortoiseshell S5 XBoloria bellona Meadow Fritillary S5 XCercyonis pegala Common Wood-Nymph S5 X
Butterfly Species Reported From the Study Area
Page 1 of 2
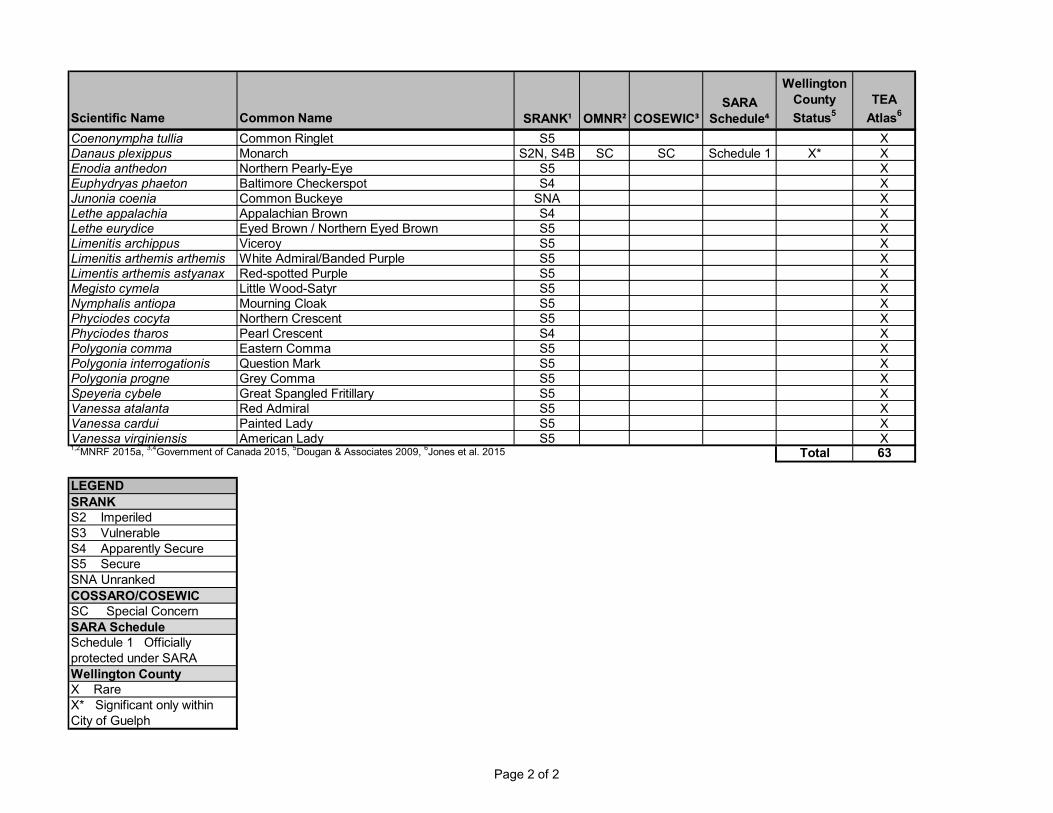
Scientific Name Common Name SRANK¹ OMNR² COSEWIC³SARA
Schedule⁴
Wellington County
Status5
TEA
Atlas6
Coenonympha tullia Common Ringlet S5 XDanaus plexippus Monarch S2N, S4B SC SC Schedule 1 X* XEnodia anthedon Northern Pearly-Eye S5 XEuphydryas phaeton Baltimore Checkerspot S4 XJunonia coenia Common Buckeye SNA XLethe appalachia Appalachian Brown S4 XLethe eurydice Eyed Brown / Northern Eyed Brown S5 XLimenitis archippus Viceroy S5 XLimenitis arthemis arthemis White Admiral/Banded Purple S5 XLimentis arthemis astyanax Red-spotted Purple S5 XMegisto cymela Little Wood-Satyr S5 XNymphalis antiopa Mourning Cloak S5 XPhyciodes cocyta Northern Crescent S5 XPhyciodes tharos Pearl Crescent S4 XPolygonia comma Eastern Comma S5 XPolygonia interrogationis Question Mark S5 XPolygonia progne Grey Comma S5 XSpeyeria cybele Great Spangled Fritillary S5 XVanessa atalanta Red Admiral S5 XVanessa cardui Painted Lady S5 XVanessa virginiensis American Lady S5 X1,2
MNRF 2015a, 3,4
Government of Canada 2015, 5Dougan & Associates 2009,
6Jones et al. 2015 Total 63
LEGEND
SRANKS2 ImperiledS3 VulnerableS4 Apparently SecureS5 Secure SNA Unranked
COSSARO/COSEWICSC Special ConcernSARA ScheduleSchedule 1 Officially protected under SARAWellington CountyX RareX* Significant only within City of Guelph
Page 2 of 2

Natural Resource Solutions Inc. Mapleton WPCP Class EA Natural Environment Characterization Report (Appendices)
APPENDIX VII Fish Species Reported From the Study Area
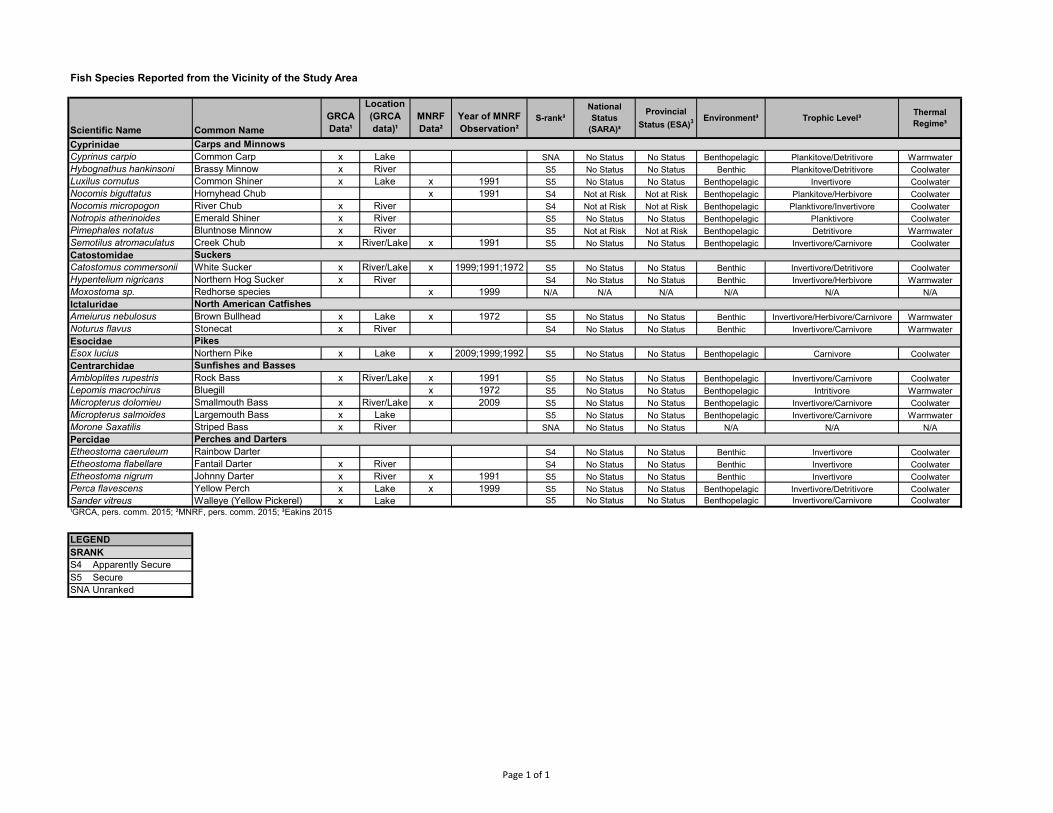
Fish Species Reported from the Vicinity of the Study Area
Scientific Name Common Name
GRCA
Data¹
Location
(GRCA
data)¹
MNRF
Data²
Year of MNRF
Observation²S-rank³
National
Status
(SARA)³
Provincial
Status (ESA)3 Environment³ Trophic Level³
Thermal
Regime³
CyprinidaeCyprinus carpio Common Carp x Lake SNA No Status No Status Benthopelagic Plankitove/Detritivore Warmwater
Hybognathus hankinsoni Brassy Minnow x River S5 No Status No Status Benthic Plankitove/Detritivore Coolwater
Luxilus cornutus Common Shiner x Lake x 1991 S5 No Status No Status Benthopelagic Invertivore Coolwater
Nocomis biguttatus Hornyhead Chub x 1991 S4 Not at Risk Not at Risk Benthopelagic Plankitove/Herbivore Coolwater
Nocomis micropogon River Chub x River S4 Not at Risk Not at Risk Benthopelagic Planktivore/Invertivore Coolwater
Notropis atherinoides Emerald Shiner x River S5 No Status No Status Benthopelagic Planktivore Coolwater
Pimephales notatus Bluntnose Minnow x River S5 Not at Risk Not at Risk Benthopelagic Detritivore Warmwater
Semotilus atromaculatus Creek Chub x River/Lake x 1991 S5 No Status No Status Benthopelagic Invertivore/Carnivore Coolwater
CatostomidaeCatostomus commersonii White Sucker x River/Lake x 1999;1991;1972 S5 No Status No Status Benthic Invertivore/Detritivore Coolwater
Hypentelium nigricans Northern Hog Sucker x River S4 No Status No Status Benthic Invertivore/Herbivore Warmwater
Moxostoma sp. Redhorse species x 1999 N/A N/A N/A N/A N/A N/A
IctaluridaeAmeiurus nebulosus Brown Bullhead x Lake x 1972 S5 No Status No Status Benthic Invertivore/Herbivore/Carnivore Warmwater
Noturus flavus Stonecat x River S4 No Status No Status Benthic Invertivore/Carnivore Warmwater
EsocidaeEsox lucius Northern Pike x Lake x 2009;1999;1992 S5 No Status No Status Benthopelagic Carnivore Coolwater
CentrarchidaeAmbloplites rupestris Rock Bass x River/Lake x 1991 S5 No Status No Status Benthopelagic Invertivore/Carnivore Coolwater
Lepomis macrochirus Bluegill x 1972 S5 No Status No Status Benthopelagic Intritivore Warmwater
Micropterus dolomieu Smallmouth Bass x River/Lake x 2009 S5 No Status No Status Benthopelagic Invertivore/Carnivore Coolwater
Micropterus salmoides Largemouth Bass x Lake S5 No Status No Status Benthopelagic Invertivore/Carnivore Warmwater
Morone Saxatilis Striped Bass x River SNA No Status No Status N/A N/A N/A
PercidaeEtheostoma caeruleum Rainbow Darter S4 No Status No Status Benthic Invertivore Coolwater
Etheostoma flabellare Fantail Darter x River S4 No Status No Status Benthic Invertivore Coolwater
Etheostoma nigrum Johnny Darter x River x 1991 S5 No Status No Status Benthic Invertivore Coolwater
Perca flavescens Yellow Perch x Lake x 1999 S5 No Status No Status Benthopelagic Invertivore/Detritivore Coolwater
Sander vitreus Walleye (Yellow Pickerel) x Lake S5 No Status No Status Benthopelagic Invertivore/Carnivore Coolwater
¹GRCA, pers. comm. 2015; ²MNRF, pers. comm. 2015; ³Eakins 2015
LEGEND
SRANK
S4 Apparently Secure
S5 Secure
SNA Unranked
Carps and Minnows
Perches and Darters
Sunfishes and Basses
Pikes
North American Catfishes
Suckers
Page 1 of 1

Township of Mapleton Mapleton Wastewater Servicing Class EA - Environmental Study Report
BRM-605325-A0 November 2017
Appendix D – Archaeological Screening Self Assessment