ap macro review sheet
TRANSCRIPT
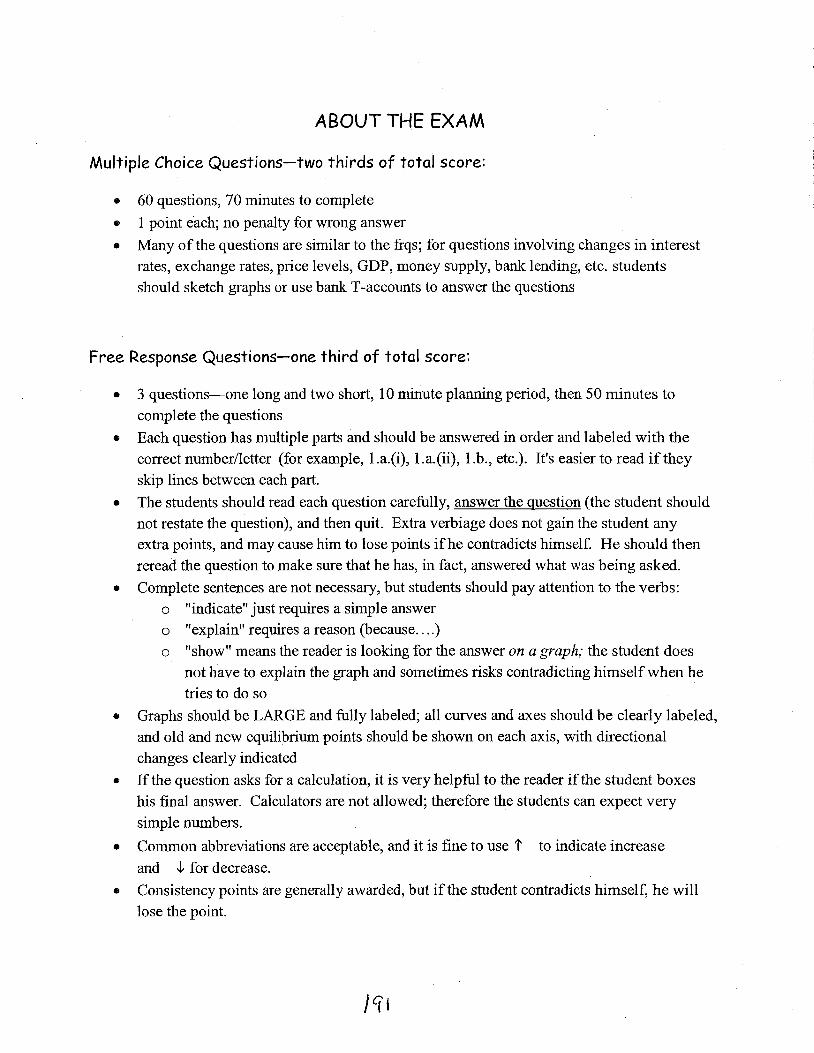
ABOUT THE EXAM
Multiple Choice Questions-two thirds of total score
bull 60 questions 70 minutes to complete
bull 1 point each no penalty for wrong answer
bull Many of the questions are similar to the frqs for questions involving changes in interest rates exchange rates price levels GDP money supply bank lending etc students should sketch graphs or use bank T-accounts to answer the questions
Free Response Questions-one third of total score
bull 3 questions-one long and two short 10 minute planning period then 50 minutes to complete the questions
bull Each question has multiple parts and should be answered in order and labeled with the correct numberletter (for example la(i) la(ii) lb etc) Its easier to read if they skip lines between each part
bull The students should read each question carefully answer the question (the student should not restate the question) and then quit Extra verbiage does not gain the student any extra points and may cause him to lose points ifhe contradicts himself He should then reread the question to make sure that he has in fact answered what was being asked
bull Complete sentences are not necessary but students should pay attention to the verbs o indicate just requires a simple answer o explain requires a reason (because ) o show means the reader is looking for the answer on a graph the student does
not have to explain the graph and sometimes risks contradicting himself when he tries to do so
bull Graphs should be LARGE and fully labeled all curves and axes should be clearly labeled and old and new equilibrium points should be shown on each axis with directional changes clearly indicated
bull If the question asks for a calculation it is very helpful to the reader if the student boxes his final answer Calculators are not allowed therefore the students can expect very
simple numbers
bull Common abbreviations are acceptable and it is fine to use 1 to indicate increase
and -I for decrease
bull Consistency points are generally awarded but if the student contradicts himself he will lose the point
Page 1 of 1
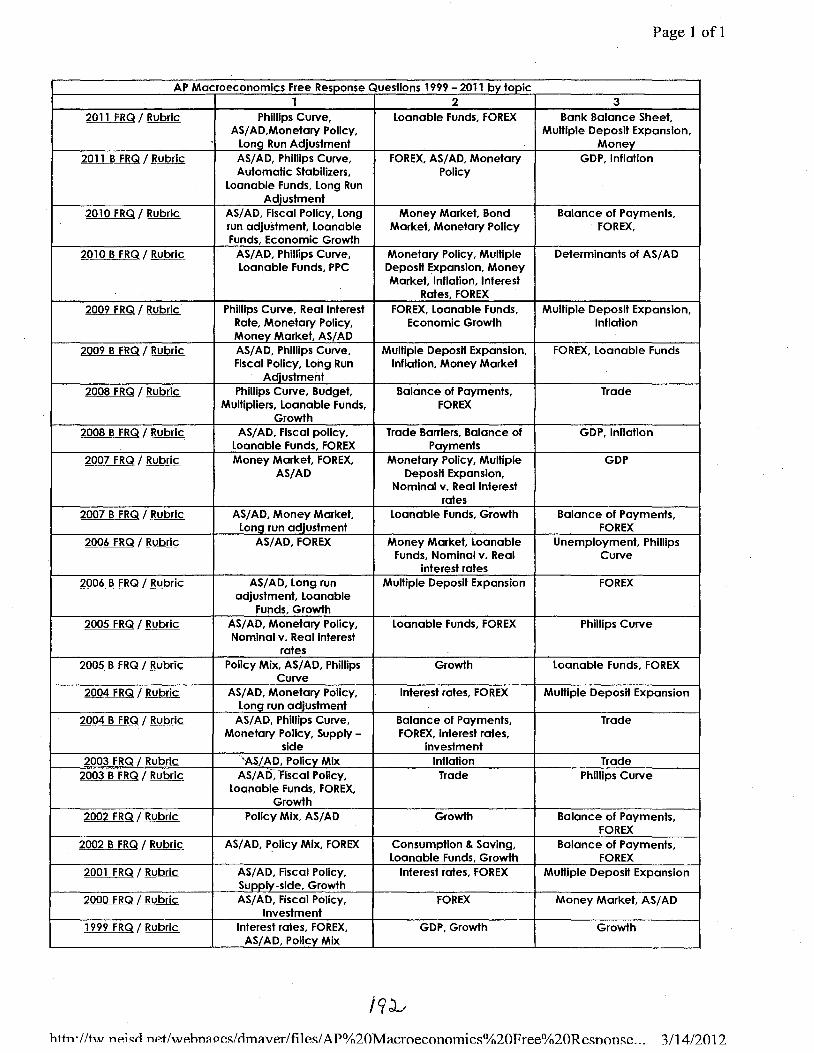
AP Macroeconomics Free Response Questions 1999 - 2011 by topic 1 2 3
2011 FRQ Rubric Phillips Curve ASADMonetary Policy
Long Run Adjustment
Loanable Funds FOREX Bank Balance Sheet Multiple Deposit Expansion
Money 2011 B FRQ _Rubric ASAD Phillips Curve
Automatic Stabilizers Loanable Funds Long Run
Adjustment
FOREX ASAD Monetary Policy
GDP Inflation
2010 FRQ Rubric ASAD Fiscal Policy Long run adjustment Loanable Funds Economic Growth
Money Market Bond Market Monetary Policy
Balance of Payments FOREX
2_010 B_Eill Rubric ASAD Phillips Curve Loanable Funds PPC
Monetary Policy Multiple Deposit Expansion Money Market Inflation Interest
Rates FOREX
Determinants of ASAD
2009 FRQ Rubric Phillips Curve Real Interest Rate Monetary Policy Money Market AS AD
FOREX Loanable Funds Economic Growth
Multiple Deposit Expansion Inflation
2009 B FRQ Rubric ASAD Phillips Curve Fiscal Policy Long Run
Adiustment
Multiple Deposit Expansion Inflation Money Market
FOREX Loanable Funds
2008 FRQ Rubric Phillips Curve Budget Multipliers Loanable Funds
Growth
Balance of Payments FOREX
Trade
2008 B FRQ Rubric ASAD Fiscal policy Loanable Funds FOREX
Trade Barriers Balance of Payments
GDP Inflation
2007 FRQ Rubric Money Market FOREX ASAD
Monetary Policy Multiple Deposit Expansion
Nominal v Real Interest rates
GDP
2007 B FRQ Rubric ASAD Money Market Lona run adiustment
Loanable Funds Growth Balance of Payments FOREX
2006 FRQ Rubric ASAD FOREX Money Market Loanable Funds Nominal v Real
interest rates
Unemployment Phillips Curve
2006 B FRQ Rubric ASAD Long run adjustment Loanable
Funds Growth
Multiple Deposit Expansion FOREX
2005 FRQ Rubric ASAD Monetary Policy Nominal v Real interest
rates
Loanable Funds FOREX Phillips Curve
2005 B FRQ Rubric Policy Mix ASAD Phillips Curve
Growth Loanable Funds FOREX
2004-__IBQ Rubric ASAD Monetary Policy Long run adjustment
Interest rates FOREX Multiple Deposit Expansion
2004 B FRQ Rubric ASAD Phillips Curve Monetary Policy Supply -
side
Balance of Payments FOREX interest rates
investment
Trade
2003 FRQ Rubric AS[AD Policy Mix Inflation Trade 2003 B FRQ Rubric ASAD Fiscal Policy
Loanable Funds FOREX Growth
Trade Phillips Curve
2002 FRQ Rubric Policy Mix AS AD Growth Balance of Payments FOREX
2002 B FRQ Rubri~ AS AD Policy Mix FOREX Consumption amp Saving Loanable Funds Growth
Balance of Payments FOREX
2001 FRQ Rubric ASAD Fiscal Policy Suooly-side Growth
Interest rates FOREX Multiple Deposit Expansion
2000 FRQ Rubric ASAD Fiscal Policy Investment
FOREX Money Market ASAD
1999 FRQ Rubric Interest rates FOREX ASAD Policy Mix
GDP Growth Growth
9 J_
httn- tur nP1~1 nPtw-Phnuresclmwerfiles A Pfrac3420Macroeconomics20Free20Resnonse 3142012
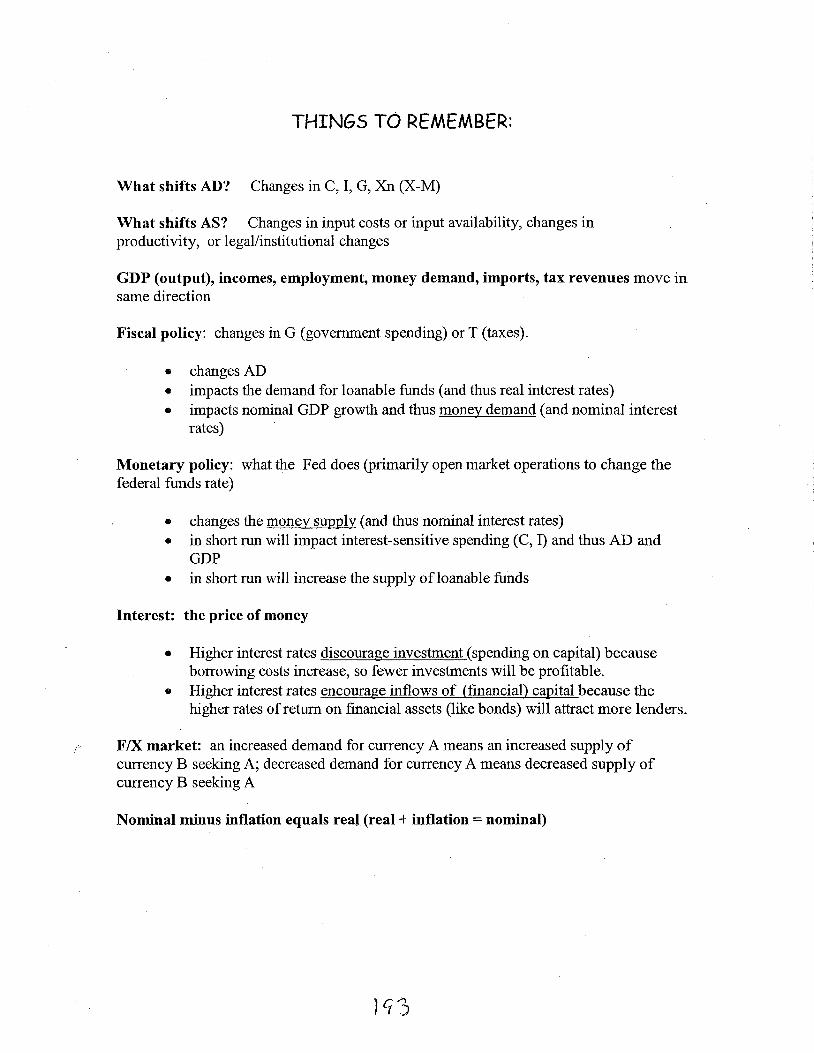
THINGS TO REMEMBER
What shifts AD Changes in C I G Xn (X-M)
What shifts AS Changes in input costs or input availability changes in productivity or legalinstitutional changes
GDP (output) incomes employment money demand imports tax revenues move in same direction
Fiscal policy changes in G (government spending) or T (taxes)
bull changes AD bull impacts the demand for loanable funds ( and thus real interest rates) bull impacts nominal GDP growth and thus money demand (and nominal interest
rates)
Monetary policy what the Fed does (primarily open market operations to change the federal funds rate)
bull changes the money supply (and thus nominal interest rates) bull in short run will impact interest-sensitive spending (C I) and thus AD and
GDP bull in short run will increase the supply ofloanable funds
Interest the price of money
bull Higher interest rates discourage investment (spending on capital) because borrowing costs increase so fewer investments will be profitable
bull Higher interest rates encourage inflows of (financial) capital because the higher rates ofretum on financial assets (like bonds) will attract more lenders
FIX market an increased demand for currency A means an increased supply of currency B seeking A decreased demand for currency A means decreased supply of currency B seeking A
Nominal minus inflation equals real (real+ inflation= nominal)
MWoltersUT AP Macroeconomics Institute
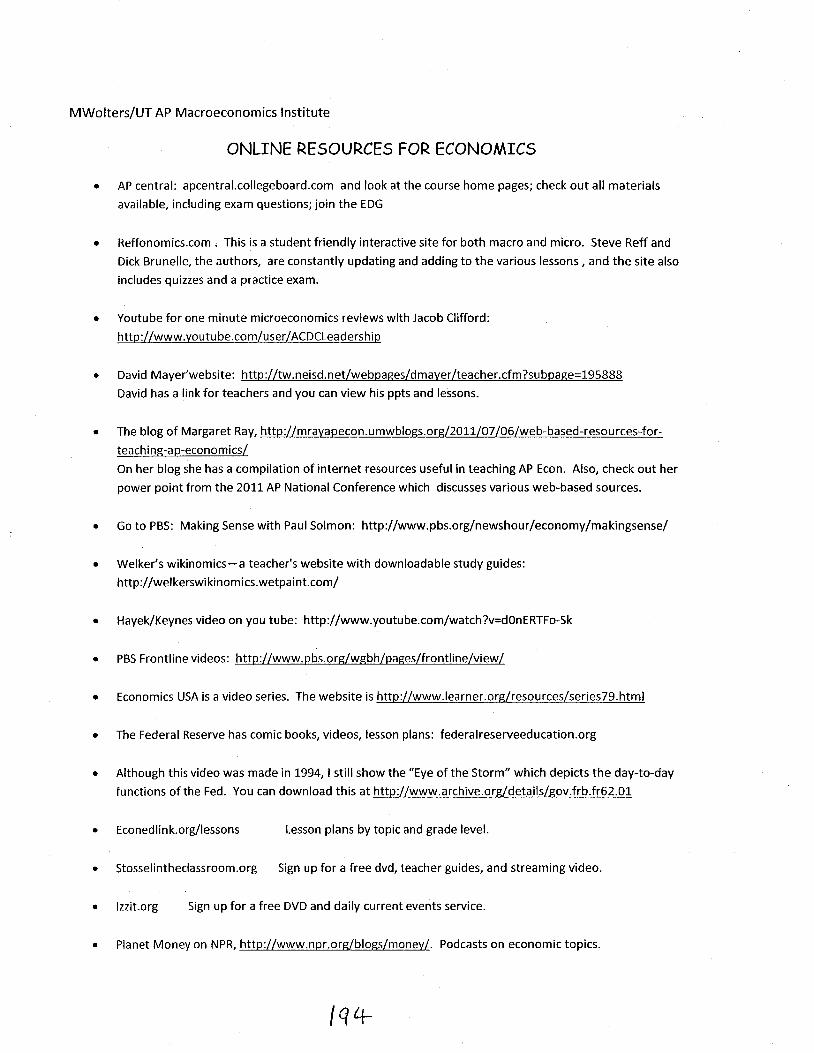
ONLINE RESOURCES FOR ECONOMICS
bull AP central apcentralcollegeboardcom and look at the course home pages check out all materials
available including exam questions join the EDG
bull Reffonomicscom This is a student friendly interactive site for both macro and micro Steve Reff and
Dick Brunelle the authors are constantly updating and adding to the various lessons and the site also
includes quizzes and a practice exam
bull Youtube for one minute microeconomics reviews with Jacob Clifford
httpwwwyoutubecomuserACDCLeadership
bull David Mayerwebsite httptwneisdnetwebpagesdmayerteachercfmsubpage=195888
David has a link for teachers and you can view his ppts and lessons
bull The blog of Margaret Ray httpmrayapeconumwblogsorg201107 06web-based-resources-forshy
teaching-ap-economics
On her blog she has a compilation of internet resources useful in teaching AP Econ Also check out her
power point from the 2011 AP National Conference which discusses various web-based sources
bull Go to PBS Making Sense with Paul Solman httpwwwpbsorgnewshoureconomymakingsense
bull Welkers wikinomics-a teachers website with downloadable study guides
httpwelkerswikinomicswetpaintcom
bull HayekKeynes video on you tube httpwwwyoutubecomwatchv=dOnERTFo-Sk
bull PBS Frontline videos httpwwwpbsorgwgbhpagesfrontlineview
bull Economics USA is a video series The website is httpljwwwlearnerorgresourcesseries79html
bull The Federal Reserve has comic books videos lesson plans federalreserveeducationorg
bull Although this video was made in 1994 I still show the Eye of the Storm which depicts the day-to-day
functions of the Fed You can download this at httpwwwarchiveorgdetailsgovfrbfr6201
bull Econedlinkorglessons Lesson plans by topic and grade level
bull Stosselintheclassroomorg Sign up for a free dvd teacher guides and streaming video
bull lzzitorg Sign up for a free DVD and daily current events service
bull Planet Money on NPR httpwwwnprorgblogsmoney Podcasts on economic topics
q 4-
--- Public GampS ---____ ---
MWoltersAP Macro
AP MACROECONOMICS REVIEW BASIC CONCEPTS AND GRAPHS
I INTRO CONCEPTS
A SCARCITY OPPORTUNITY COSTS FACTORS OF PRODUCTION (land labor capital entrepreneurship)
B PRODUCTION POSSIBILITIES - A shift to the right of the production possibilities curve is equivalent to a rightward shift of the LRAS curve In other words potential GDP (output) has increased or the productive capacity of the economy has increased This could be achieved through an increase in resources particularly capital (increases in NET investment resulting in an increase in the nations capital stock) as well as increases in productivity decreases in input prices and increases in human capital Remember that it is in increase in our potential output or long-run aggregate supply that will bring about increased real income per capita or in other words an increase in the standard of living
PriceCapital~ Level
Goods LSL lIampy y Consumer Goods real GDP
C CIRCULAR FLOW OF ECONOMIC ACTIVITY (closed economy with government)
----7DESOURCE (FACTOR)------MARKET
I p Ext L
Retmrces ~ Public Gamps----
GOVT-- _ HOUSEHOLDSl - Net Truces
Exl ampS PRODUCT MARKET
In an expanded circular-flow diagram leakages would include household savingswhich flow into the financial markets and money spent on imports
Additional injections into the domestic circular flow include the money earned from exports and foreign savings which flow into the financial markets
1
D DEMAND SUPPLY AND MARKET EQUILIBRIUM 1 Factors that shift demand--changes in consumer income tastes prices of related goods
future expectations number of buyers 2 Factors that shift supply--changes in production costs number of sellers expectation of
future prices taxes or subsidies technology prices of other goods 3 Difference in changes in quantity demanded or supplied vs change in demand or supply 4 Price ceilings--set below equilibrium price result in shortages 5 Price floors--set above equilibrium price result in surpluses
Price Price Floor
Price Ceiling
pe1------iX-
D
Qe Quantity
II ECONOMIC MEASUREMENTS
A MEASURING PRODUCTION 1 GDP - gross domestic product
a Expenditure approach = C + lg + G + Xn (household spending + business spending on capital inventories construction+ govt spending + exports minus imports) --excludes purely financial transactions transfer payments used goods do-itshyyourself underground economy
b Income approach= (wages+ rents+ interest+ profits= national income)+ depreciation + net foreign factor income
2 NDP - net domestic product C +In+ G + Xn (= GDP minus the consumption of fixed capital or GDP minus the amount spent to replace depreciated capital)
B MEASURING PRICE LEVELS
1 Inflation - increase in the average price level Unanticipated inflation hurts lenders savers fixed-nominal income receivers Helps borrowers with fixed nominal ir loans
a Demand-pull -too many dollars chasing too few goods increase in AD in intermediate or vertical range of AS curve Expectations of inflation may bring about demandshypull inflation--consumption increases and savings decrease
b Supply-side ( cost-push supply-shock) caused by increase in per-unit production costs-decrease of AS curve this causes stagflation
2 Deflation - decrease in the average price level (hurts borrowers)
3 Disinflation - decrease in the inflation rate
C ADJUSTING FOR INFLATIONDEFLATION 1 Real numbers - adjusted for inflation or deflation using an index like the CPI or GDP
deflator ( core indexes exclude food and oil prices)
Price index =[current-year cost of market basket) base-year cost of market basket J x 100
Real GDP =[ no~in~l GDPJ pnce mdex x 100
2
8
2 Nominal numbers - current prices not adjusted for inflation or deflation
3 Real interest rates= nominal interest rate minus inflation Lenders nominal interest rate will include an inflation premium to compensate for expected inflation-if actual inflation exceeds this premium real rate will decline
4 To calculate percentage changes new number - old number old number X 100
D EMPLOYMENT 1 Unemployment rate= unemployed (seeking work) divided by labor force (labor force=
unemployed+ employed 16 and over)
2 Kinds of unemployment a Frictional- shorter-term betweenjobsjust starting out b Structural - obsolete job skills results from changes in consumer demand or
technology or shifts ofjobs to other regions countries c Cyclical -- deficient-demand unemployment--not included in our natural rate
of unemployment
3 Full employment- no cyclical unemployment natural rate of unemployment about 5
4 Labor-force participation rate-the percentage of working-age population in the labor force
E BUSINESS CYCLE - EXP ANSI ON PEAK CONTRACTION TROUGH 1 recession loosely defined as two consecutive quarters of declining GDP 2 inflation more likely to occur in expansions than contractions
III NATIONAL INCOME AND PRICE DETERMINATION
A AGGREGATE DEMAND (AD) Shifts in AD caused by changes in
1 Consumption (C) caused by a change in wealth expectations indebtedness or personal taxes Consumption on durables will be affected by changes in interest rates because of borrowing costs
2 Investment spending (I) caused by a change in interest rates (borrowing costs) profit expectations business taxes technology or excess capacity (an increase in excess capacity will decrease I)
3 Government spending (G) Remember G spending not based on interest rates but interest payments on debt are impacted by interest rate changes
4 Net exports (Xn) caused by a change in national income abroad or exchange rates (which can be affected by relative real interest rates-which can be caused by fiscal or monetary policy) Other reasons listed in VC l
B AGGREGATE SUPPLY (AS) Shifts in SRAS caused by changes in
1 Input prices for land labor capital entrepreneurship (rent wages interest profits)shyinfluenced by domestic resource availability and prices of foreign inputs (positive and negative supply shocks)
2 Productivity 3 Legal-institutional environment (govt policies like taxes business regulations)
C LONG RUN AGGREGATE SUPPLY (LRAS)
1 LRAS will shift to right with increases in productivity of labor increases in technology increases in capital formation ( due to increased In) and improvements in human capital
) q l 3
rl1-r-c---v
2 LRAS could shift to left if negative supply shock resulted in a permanent decrease in resources
D EQUILIBRIUM
Price Level
PricePrice SRAS Level RAS Level
pit-----+-~P____-l~I
AD AD AD
Real GDP Real GDP Real GDP
Economy in a RECESSION Economy at FULL EMPLOYMENT Economy in INFLATION
E CLASSICAL THEORY - Assumes flexible prices theorizes that a laissez-faire economy will self-correct back to full employment in long run through responsiveness of SRAS curve to long-run price changes
F RATIONAL EXPECTATIONS THEORY argues that fully anticipated price level changes result in very quick or even instantaneous self-correction so there will be no change in real output
G FISCAL POLICY - Changes in government spending and taxing policies (by Congress and the Administration) designed to achieve a full-employment and non-inflationary level of GDP Fiscal policy created by John Maynard Keynes who contended that prices were sticky in a downward direction and economy would not automatically self-correct from recession to full employment
1 EXPANSIONARY-Gt TJ causes movement toward a budget deficit may cause increase in real interest rates due to increased demand by government for loanable fundsshycrowding out results which may reduce long-run growth Also adds to our national debt requiring substantial interest payments some going abroad
Real ir r2
rl
____~
___~
QI Q2 Quantity of loanable funds
2 CONTRACTIONARY-G J Tt causes movement toward a budget surplus may cause decrease in real interest rates due to decreased demand by governmentfor loanable funds
Real ir
DI
Q2 QI Quantity of loanable funds
4
3 MULTIPLIER EFFECT Changes in C I G and Xn have multiplied impact on GDP The following multipliers show how much a change in these will change GDP assuming no inflation and no leakages-in other words assuming the economy is operating in the horizontal (Keynesian) range of the AS curve
ME= 1MPS or 1(1-MPC) (This is the expenditure or spending multiplier)
MT= ME - 1 (Tax multiplier)
Me= ME - MT= 1 (Balanced budget multiplier)
For example Assume an MPC of 90 The ME would then be 1MPS = 10 If G increases by $2 million then GDP could increase by as much as $2 million x 10 = $20 million
Using the same MPC of 90 the MT would be ME minus I= 9 If taxes decreased by $2 million then GDP could increase by as much as $2 million x 9 = $18 million
To close a recessionary gap of $20 million while maintaining a balanced budget the government could increase both G and T by $20 million
H PHILLIPS CURVE - relationship showing the tradeoff between inflation and unemployment
1 Short-run - movement along the SRPC depicts short-run impact of an shift of AD along the SRAS for example increased AD brings about increased GDP and thus reduced unemployment but also brings about an increase in the inflation rate
Intl~Rat PC The short-run Phillips Curve will shift left if there is a shift rightward of the SRAS curve and it will shift right if the SRAS shifts left
SRPC
2 Long-run - a vertical line at full-employment (NRU) This curve would nru shift if the natural rate of unemployment (NRU) changed
Unempl Rate
I SUPPLY-SIDE ECONOMICS
1 Goal to increase LRAS 2 Achieved by reduction in marginal tax rates( which increase supply of loanable funds and
thus lower real interest rates) elimination of unnecessary govt regulations to stimulate work savings and investment incentives
IV FINANCIAL SECTOR
A MONETARY POLICY - changes in the rate of growth of the money supply (MI includes currency and demand deposits held by the public) by the Federal Reserve to assist the economy to achieve a fullshyemployment noninflationary level of GDP
1 EXPANSIONARY - Open Market Ops (OMO) Buy securities (to lower federal funds rate-bank to bank overnight lending rate) lower discount rate (Fed to bank lending rate) lower reserve requirement (which is a of demand deposits)
2 CONTRACTION ARY - OMO Sell securities (to raise federal funds rate) raise discount rate raise reserve requirement
5
B CREATION OF MONEY THROUGH BANK LENDING PROCESS
1 Banks can lend excess reserves (total reserves minus required reserves)
2 An increase in excess reserves can have a multiplied impact in the banking system as a whole equal to the deposit multiplier (Ireserve ratio) times the change in excess reserves assuming all excess reserves become loans and all loans become new demand deposits
C MONEY MARKET Nomir
1 Changes in demand (MD) caused by change in nominal GDP (money demand varies directly with nominal GDP) financial innovations (ATMs credit cards) precautionary motives ir1 +-----
2 Changes in Supply (MS) caused by central banks monetary policy MD
Ql Quantity of Money
a MS will increase if Fed enacts expansionary monetary policy and both nominal and real int rates will decrease in short run (in long run inflation could cause an increase in nominal ir and eventually real ir will return to long-run level)
b MS will decrease ifFed enacts contractionary monetary policy and both nominal and real int rates will increase in short run (in long run reduction of inflation could result in decrease in nominal ir and real rates will return to long-run level)
D LOANABLE FUNDS MARKET - supply influenced in the short run by money market but NOT the same market
1 Supply ofloanable funds determined by availability of savings--household savings business savings and government savings (if they ran a surplus and paid back some of their debt) as well as foreign savings By controlling bank lending activity Fed also influences supply ofloanable funds in the short run but not in the long run because prices adjust in the long run leaving real money supply unchanged (long-run money neutrality) middot
2 Demand for loanable funds from businesses (investment demand) households borrowing for durables and the government borrowing to finance deficit
Real ir s
D
QI Quantity of loanable funds
1oo
6
PL21-------llt
E IMPACT OF MONETARY POLICY ON OUTPUT AND PRICE LEVEL (example shows impact of easy monetary policy in the short run)
Norn ir r PL
i l-r---1----+--------+---- PL1
i2 I-L-~1-------------+-----+-~ MD
QI Q2 Q Q2
Q of Money Q of Investment
bull Interest-sensitive consumption (on durable goods) will also be impacted by changes in interest rates bull Net exports will be impacted through changes in demand for the dollar resulting from interest rate changes bull Government spending will be largely unaffected by interest rate changes
F MONETARISM (based on MV=PQ) bull Inflation caused by too much money in economy Fed should stick to monetary ruleshy
steady growth of the money supply consistent with real GDP growth bull Fiscal policy results in complete crowding out-so useless in the long run
G OTHER FINANCIAL ASSETS 1 Stocks (Equities) -a source of equity financing for corporations 2 Bonds-a source of debt financing for corporations and governments
a Current bond yield= annual interest payment ofbond divided by the market price of bond (annual rate ofretum on bond)
b Interest rates and bond prices vary inversely c Bond yields move with other market interest rates
H TIME VALUE OF MONEY bull Present value= Future value(1 +rt bull Future value= Present value (1 +r)
V INTERNATIONAL TRADE
A ABSOLUTE ADVANTAGE can produce more with same inputs or requires fewer inputs to produce
B COMPARATIVE ADV ANT AGE nation has lower opportunity cost should specialize in this and trade for rest (Output model- over Input model -under) Favorable terms of trade will fall between the opportunity costs of each nation
C FOREIGN EXCHANGE MARKET - An increase in the demand for the dollar will increase the price of the dollar relative to other currencies And an increase in the demand for the dollar implies an increase in the supply of other currencies seeking dollars (and an increase in quantity supplied of the dollar) Decreased demand for dollar means decreased supply of other currencies seeking dollars
USOYen
D
Q Q2
QofYen
~0-i
yl y2
Real GDP
QI Q2
QofUSD
7
l Increased demand for the dollar caused by the following (and decreased demand by the opposite of the following) a Relatively higher real interest rates in the US (resulting from expansionary fiscal
or contractionary monetary policy) which increases financial capital flows to the US to buy dollars to buy US securities which offer higher returns
b More demand for US goodsservices due to changing tastes or higher incomes abroad
c Relatively lower inflation rates in the US (so cheaper US goods) d Politicaleconomic instability abroad making the US a safe haven e Speculation
2 Impact of stronger dollar ( weaker dollar has opposite impact) a Decrease ofXn b Lower costs for US producers who use imported inputs c Helps keeps US price level lower because of cheaper imports d Hurts multinationals because of reduced foreign income when converted to $
D TRADE BARRIERS - protectionism (tariffs quotas embargoes)
1 Reduce amount and raise price of imported goods 2 Allow domestic producers to raise prices 3 Fail to consider comparative advantage resulting in less efficient allocation of resources
E BALANCE OF PAYMENTS
1 Balance of trade 2 Current account -exports and imports of goods and services net investment income 3 Financial (formerly Capital) account- purchase and sale of real and financial assets 4 In the absence of governmental or central bank intervention current account balance and
financialcapital account balance must sum to zero (a current account deficit will be matched by a financialcapital account surplus)
8
Page 1 of 1
AP Macroeconomics Free Response Questions 1999 - 2011 by topic 1 2 3
2011 FRQ Rubric Phillips Curve ASADMonetary Policy
Long Run Adjustment
Loanable Funds FOREX Bank Balance Sheet Multiple Deposit Expansion
Money 2011 B FRQ _Rubric ASAD Phillips Curve
Automatic Stabilizers Loanable Funds Long Run
Adjustment
FOREX ASAD Monetary Policy
GDP Inflation
2010 FRQ Rubric ASAD Fiscal Policy Long run adjustment Loanable Funds Economic Growth
Money Market Bond Market Monetary Policy
Balance of Payments FOREX
2_010 B_Eill Rubric ASAD Phillips Curve Loanable Funds PPC
Monetary Policy Multiple Deposit Expansion Money Market Inflation Interest
Rates FOREX
Determinants of ASAD
2009 FRQ Rubric Phillips Curve Real Interest Rate Monetary Policy Money Market AS AD
FOREX Loanable Funds Economic Growth
Multiple Deposit Expansion Inflation
2009 B FRQ Rubric ASAD Phillips Curve Fiscal Policy Long Run
Adiustment
Multiple Deposit Expansion Inflation Money Market
FOREX Loanable Funds
2008 FRQ Rubric Phillips Curve Budget Multipliers Loanable Funds
Growth
Balance of Payments FOREX
Trade
2008 B FRQ Rubric ASAD Fiscal policy Loanable Funds FOREX
Trade Barriers Balance of Payments
GDP Inflation
2007 FRQ Rubric Money Market FOREX ASAD
Monetary Policy Multiple Deposit Expansion
Nominal v Real Interest rates
GDP
2007 B FRQ Rubric ASAD Money Market Lona run adiustment
Loanable Funds Growth Balance of Payments FOREX
2006 FRQ Rubric ASAD FOREX Money Market Loanable Funds Nominal v Real
interest rates
Unemployment Phillips Curve
2006 B FRQ Rubric ASAD Long run adjustment Loanable
Funds Growth
Multiple Deposit Expansion FOREX
2005 FRQ Rubric ASAD Monetary Policy Nominal v Real interest
rates
Loanable Funds FOREX Phillips Curve
2005 B FRQ Rubric Policy Mix ASAD Phillips Curve
Growth Loanable Funds FOREX
2004-__IBQ Rubric ASAD Monetary Policy Long run adjustment
Interest rates FOREX Multiple Deposit Expansion
2004 B FRQ Rubric ASAD Phillips Curve Monetary Policy Supply -
side
Balance of Payments FOREX interest rates
investment
Trade
2003 FRQ Rubric AS[AD Policy Mix Inflation Trade 2003 B FRQ Rubric ASAD Fiscal Policy
Loanable Funds FOREX Growth
Trade Phillips Curve
2002 FRQ Rubric Policy Mix AS AD Growth Balance of Payments FOREX
2002 B FRQ Rubri~ AS AD Policy Mix FOREX Consumption amp Saving Loanable Funds Growth
Balance of Payments FOREX
2001 FRQ Rubric ASAD Fiscal Policy Suooly-side Growth
Interest rates FOREX Multiple Deposit Expansion
2000 FRQ Rubric ASAD Fiscal Policy Investment
FOREX Money Market ASAD
1999 FRQ Rubric Interest rates FOREX ASAD Policy Mix
GDP Growth Growth
9 J_
httn- tur nP1~1 nPtw-Phnuresclmwerfiles A Pfrac3420Macroeconomics20Free20Resnonse 3142012
THINGS TO REMEMBER
What shifts AD Changes in C I G Xn (X-M)
What shifts AS Changes in input costs or input availability changes in productivity or legalinstitutional changes
GDP (output) incomes employment money demand imports tax revenues move in same direction
Fiscal policy changes in G (government spending) or T (taxes)
bull changes AD bull impacts the demand for loanable funds ( and thus real interest rates) bull impacts nominal GDP growth and thus money demand (and nominal interest
rates)
Monetary policy what the Fed does (primarily open market operations to change the federal funds rate)
bull changes the money supply (and thus nominal interest rates) bull in short run will impact interest-sensitive spending (C I) and thus AD and
GDP bull in short run will increase the supply ofloanable funds
Interest the price of money
bull Higher interest rates discourage investment (spending on capital) because borrowing costs increase so fewer investments will be profitable
bull Higher interest rates encourage inflows of (financial) capital because the higher rates ofretum on financial assets (like bonds) will attract more lenders
FIX market an increased demand for currency A means an increased supply of currency B seeking A decreased demand for currency A means decreased supply of currency B seeking A
Nominal minus inflation equals real (real+ inflation= nominal)
MWoltersUT AP Macroeconomics Institute
ONLINE RESOURCES FOR ECONOMICS
bull AP central apcentralcollegeboardcom and look at the course home pages check out all materials
available including exam questions join the EDG
bull Reffonomicscom This is a student friendly interactive site for both macro and micro Steve Reff and
Dick Brunelle the authors are constantly updating and adding to the various lessons and the site also
includes quizzes and a practice exam
bull Youtube for one minute microeconomics reviews with Jacob Clifford
httpwwwyoutubecomuserACDCLeadership
bull David Mayerwebsite httptwneisdnetwebpagesdmayerteachercfmsubpage=195888
David has a link for teachers and you can view his ppts and lessons
bull The blog of Margaret Ray httpmrayapeconumwblogsorg201107 06web-based-resources-forshy
teaching-ap-economics
On her blog she has a compilation of internet resources useful in teaching AP Econ Also check out her
power point from the 2011 AP National Conference which discusses various web-based sources
bull Go to PBS Making Sense with Paul Solman httpwwwpbsorgnewshoureconomymakingsense
bull Welkers wikinomics-a teachers website with downloadable study guides
httpwelkerswikinomicswetpaintcom
bull HayekKeynes video on you tube httpwwwyoutubecomwatchv=dOnERTFo-Sk
bull PBS Frontline videos httpwwwpbsorgwgbhpagesfrontlineview
bull Economics USA is a video series The website is httpljwwwlearnerorgresourcesseries79html
bull The Federal Reserve has comic books videos lesson plans federalreserveeducationorg
bull Although this video was made in 1994 I still show the Eye of the Storm which depicts the day-to-day
functions of the Fed You can download this at httpwwwarchiveorgdetailsgovfrbfr6201
bull Econedlinkorglessons Lesson plans by topic and grade level
bull Stosselintheclassroomorg Sign up for a free dvd teacher guides and streaming video
bull lzzitorg Sign up for a free DVD and daily current events service
bull Planet Money on NPR httpwwwnprorgblogsmoney Podcasts on economic topics
q 4-
--- Public GampS ---____ ---
MWoltersAP Macro
AP MACROECONOMICS REVIEW BASIC CONCEPTS AND GRAPHS
I INTRO CONCEPTS
A SCARCITY OPPORTUNITY COSTS FACTORS OF PRODUCTION (land labor capital entrepreneurship)
B PRODUCTION POSSIBILITIES - A shift to the right of the production possibilities curve is equivalent to a rightward shift of the LRAS curve In other words potential GDP (output) has increased or the productive capacity of the economy has increased This could be achieved through an increase in resources particularly capital (increases in NET investment resulting in an increase in the nations capital stock) as well as increases in productivity decreases in input prices and increases in human capital Remember that it is in increase in our potential output or long-run aggregate supply that will bring about increased real income per capita or in other words an increase in the standard of living
PriceCapital~ Level
Goods LSL lIampy y Consumer Goods real GDP
C CIRCULAR FLOW OF ECONOMIC ACTIVITY (closed economy with government)
----7DESOURCE (FACTOR)------MARKET
I p Ext L
Retmrces ~ Public Gamps----
GOVT-- _ HOUSEHOLDSl - Net Truces
Exl ampS PRODUCT MARKET
In an expanded circular-flow diagram leakages would include household savingswhich flow into the financial markets and money spent on imports
Additional injections into the domestic circular flow include the money earned from exports and foreign savings which flow into the financial markets
1
D DEMAND SUPPLY AND MARKET EQUILIBRIUM 1 Factors that shift demand--changes in consumer income tastes prices of related goods
future expectations number of buyers 2 Factors that shift supply--changes in production costs number of sellers expectation of
future prices taxes or subsidies technology prices of other goods 3 Difference in changes in quantity demanded or supplied vs change in demand or supply 4 Price ceilings--set below equilibrium price result in shortages 5 Price floors--set above equilibrium price result in surpluses
Price Price Floor
Price Ceiling
pe1------iX-
D
Qe Quantity
II ECONOMIC MEASUREMENTS
A MEASURING PRODUCTION 1 GDP - gross domestic product
a Expenditure approach = C + lg + G + Xn (household spending + business spending on capital inventories construction+ govt spending + exports minus imports) --excludes purely financial transactions transfer payments used goods do-itshyyourself underground economy
b Income approach= (wages+ rents+ interest+ profits= national income)+ depreciation + net foreign factor income
2 NDP - net domestic product C +In+ G + Xn (= GDP minus the consumption of fixed capital or GDP minus the amount spent to replace depreciated capital)
B MEASURING PRICE LEVELS
1 Inflation - increase in the average price level Unanticipated inflation hurts lenders savers fixed-nominal income receivers Helps borrowers with fixed nominal ir loans
a Demand-pull -too many dollars chasing too few goods increase in AD in intermediate or vertical range of AS curve Expectations of inflation may bring about demandshypull inflation--consumption increases and savings decrease
b Supply-side ( cost-push supply-shock) caused by increase in per-unit production costs-decrease of AS curve this causes stagflation
2 Deflation - decrease in the average price level (hurts borrowers)
3 Disinflation - decrease in the inflation rate
C ADJUSTING FOR INFLATIONDEFLATION 1 Real numbers - adjusted for inflation or deflation using an index like the CPI or GDP
deflator ( core indexes exclude food and oil prices)
Price index =[current-year cost of market basket) base-year cost of market basket J x 100
Real GDP =[ no~in~l GDPJ pnce mdex x 100
2
8
2 Nominal numbers - current prices not adjusted for inflation or deflation
3 Real interest rates= nominal interest rate minus inflation Lenders nominal interest rate will include an inflation premium to compensate for expected inflation-if actual inflation exceeds this premium real rate will decline
4 To calculate percentage changes new number - old number old number X 100
D EMPLOYMENT 1 Unemployment rate= unemployed (seeking work) divided by labor force (labor force=
unemployed+ employed 16 and over)
2 Kinds of unemployment a Frictional- shorter-term betweenjobsjust starting out b Structural - obsolete job skills results from changes in consumer demand or
technology or shifts ofjobs to other regions countries c Cyclical -- deficient-demand unemployment--not included in our natural rate
of unemployment
3 Full employment- no cyclical unemployment natural rate of unemployment about 5
4 Labor-force participation rate-the percentage of working-age population in the labor force
E BUSINESS CYCLE - EXP ANSI ON PEAK CONTRACTION TROUGH 1 recession loosely defined as two consecutive quarters of declining GDP 2 inflation more likely to occur in expansions than contractions
III NATIONAL INCOME AND PRICE DETERMINATION
A AGGREGATE DEMAND (AD) Shifts in AD caused by changes in
1 Consumption (C) caused by a change in wealth expectations indebtedness or personal taxes Consumption on durables will be affected by changes in interest rates because of borrowing costs
2 Investment spending (I) caused by a change in interest rates (borrowing costs) profit expectations business taxes technology or excess capacity (an increase in excess capacity will decrease I)
3 Government spending (G) Remember G spending not based on interest rates but interest payments on debt are impacted by interest rate changes
4 Net exports (Xn) caused by a change in national income abroad or exchange rates (which can be affected by relative real interest rates-which can be caused by fiscal or monetary policy) Other reasons listed in VC l
B AGGREGATE SUPPLY (AS) Shifts in SRAS caused by changes in
1 Input prices for land labor capital entrepreneurship (rent wages interest profits)shyinfluenced by domestic resource availability and prices of foreign inputs (positive and negative supply shocks)
2 Productivity 3 Legal-institutional environment (govt policies like taxes business regulations)
C LONG RUN AGGREGATE SUPPLY (LRAS)
1 LRAS will shift to right with increases in productivity of labor increases in technology increases in capital formation ( due to increased In) and improvements in human capital
) q l 3
rl1-r-c---v
2 LRAS could shift to left if negative supply shock resulted in a permanent decrease in resources
D EQUILIBRIUM
Price Level
PricePrice SRAS Level RAS Level
pit-----+-~P____-l~I
AD AD AD
Real GDP Real GDP Real GDP
Economy in a RECESSION Economy at FULL EMPLOYMENT Economy in INFLATION
E CLASSICAL THEORY - Assumes flexible prices theorizes that a laissez-faire economy will self-correct back to full employment in long run through responsiveness of SRAS curve to long-run price changes
F RATIONAL EXPECTATIONS THEORY argues that fully anticipated price level changes result in very quick or even instantaneous self-correction so there will be no change in real output
G FISCAL POLICY - Changes in government spending and taxing policies (by Congress and the Administration) designed to achieve a full-employment and non-inflationary level of GDP Fiscal policy created by John Maynard Keynes who contended that prices were sticky in a downward direction and economy would not automatically self-correct from recession to full employment
1 EXPANSIONARY-Gt TJ causes movement toward a budget deficit may cause increase in real interest rates due to increased demand by government for loanable fundsshycrowding out results which may reduce long-run growth Also adds to our national debt requiring substantial interest payments some going abroad
Real ir r2
rl
____~
___~
QI Q2 Quantity of loanable funds
2 CONTRACTIONARY-G J Tt causes movement toward a budget surplus may cause decrease in real interest rates due to decreased demand by governmentfor loanable funds
Real ir
DI
Q2 QI Quantity of loanable funds
4
3 MULTIPLIER EFFECT Changes in C I G and Xn have multiplied impact on GDP The following multipliers show how much a change in these will change GDP assuming no inflation and no leakages-in other words assuming the economy is operating in the horizontal (Keynesian) range of the AS curve
ME= 1MPS or 1(1-MPC) (This is the expenditure or spending multiplier)
MT= ME - 1 (Tax multiplier)
Me= ME - MT= 1 (Balanced budget multiplier)
For example Assume an MPC of 90 The ME would then be 1MPS = 10 If G increases by $2 million then GDP could increase by as much as $2 million x 10 = $20 million
Using the same MPC of 90 the MT would be ME minus I= 9 If taxes decreased by $2 million then GDP could increase by as much as $2 million x 9 = $18 million
To close a recessionary gap of $20 million while maintaining a balanced budget the government could increase both G and T by $20 million
H PHILLIPS CURVE - relationship showing the tradeoff between inflation and unemployment
1 Short-run - movement along the SRPC depicts short-run impact of an shift of AD along the SRAS for example increased AD brings about increased GDP and thus reduced unemployment but also brings about an increase in the inflation rate
Intl~Rat PC The short-run Phillips Curve will shift left if there is a shift rightward of the SRAS curve and it will shift right if the SRAS shifts left
SRPC
2 Long-run - a vertical line at full-employment (NRU) This curve would nru shift if the natural rate of unemployment (NRU) changed
Unempl Rate
I SUPPLY-SIDE ECONOMICS
1 Goal to increase LRAS 2 Achieved by reduction in marginal tax rates( which increase supply of loanable funds and
thus lower real interest rates) elimination of unnecessary govt regulations to stimulate work savings and investment incentives
IV FINANCIAL SECTOR
A MONETARY POLICY - changes in the rate of growth of the money supply (MI includes currency and demand deposits held by the public) by the Federal Reserve to assist the economy to achieve a fullshyemployment noninflationary level of GDP
1 EXPANSIONARY - Open Market Ops (OMO) Buy securities (to lower federal funds rate-bank to bank overnight lending rate) lower discount rate (Fed to bank lending rate) lower reserve requirement (which is a of demand deposits)
2 CONTRACTION ARY - OMO Sell securities (to raise federal funds rate) raise discount rate raise reserve requirement
5
B CREATION OF MONEY THROUGH BANK LENDING PROCESS
1 Banks can lend excess reserves (total reserves minus required reserves)
2 An increase in excess reserves can have a multiplied impact in the banking system as a whole equal to the deposit multiplier (Ireserve ratio) times the change in excess reserves assuming all excess reserves become loans and all loans become new demand deposits
C MONEY MARKET Nomir
1 Changes in demand (MD) caused by change in nominal GDP (money demand varies directly with nominal GDP) financial innovations (ATMs credit cards) precautionary motives ir1 +-----
2 Changes in Supply (MS) caused by central banks monetary policy MD
Ql Quantity of Money
a MS will increase if Fed enacts expansionary monetary policy and both nominal and real int rates will decrease in short run (in long run inflation could cause an increase in nominal ir and eventually real ir will return to long-run level)
b MS will decrease ifFed enacts contractionary monetary policy and both nominal and real int rates will increase in short run (in long run reduction of inflation could result in decrease in nominal ir and real rates will return to long-run level)
D LOANABLE FUNDS MARKET - supply influenced in the short run by money market but NOT the same market
1 Supply ofloanable funds determined by availability of savings--household savings business savings and government savings (if they ran a surplus and paid back some of their debt) as well as foreign savings By controlling bank lending activity Fed also influences supply ofloanable funds in the short run but not in the long run because prices adjust in the long run leaving real money supply unchanged (long-run money neutrality) middot
2 Demand for loanable funds from businesses (investment demand) households borrowing for durables and the government borrowing to finance deficit
Real ir s
D
QI Quantity of loanable funds
1oo
6
PL21-------llt
E IMPACT OF MONETARY POLICY ON OUTPUT AND PRICE LEVEL (example shows impact of easy monetary policy in the short run)
Norn ir r PL
i l-r---1----+--------+---- PL1
i2 I-L-~1-------------+-----+-~ MD
QI Q2 Q Q2
Q of Money Q of Investment
bull Interest-sensitive consumption (on durable goods) will also be impacted by changes in interest rates bull Net exports will be impacted through changes in demand for the dollar resulting from interest rate changes bull Government spending will be largely unaffected by interest rate changes
F MONETARISM (based on MV=PQ) bull Inflation caused by too much money in economy Fed should stick to monetary ruleshy
steady growth of the money supply consistent with real GDP growth bull Fiscal policy results in complete crowding out-so useless in the long run
G OTHER FINANCIAL ASSETS 1 Stocks (Equities) -a source of equity financing for corporations 2 Bonds-a source of debt financing for corporations and governments
a Current bond yield= annual interest payment ofbond divided by the market price of bond (annual rate ofretum on bond)
b Interest rates and bond prices vary inversely c Bond yields move with other market interest rates
H TIME VALUE OF MONEY bull Present value= Future value(1 +rt bull Future value= Present value (1 +r)
V INTERNATIONAL TRADE
A ABSOLUTE ADVANTAGE can produce more with same inputs or requires fewer inputs to produce
B COMPARATIVE ADV ANT AGE nation has lower opportunity cost should specialize in this and trade for rest (Output model- over Input model -under) Favorable terms of trade will fall between the opportunity costs of each nation
C FOREIGN EXCHANGE MARKET - An increase in the demand for the dollar will increase the price of the dollar relative to other currencies And an increase in the demand for the dollar implies an increase in the supply of other currencies seeking dollars (and an increase in quantity supplied of the dollar) Decreased demand for dollar means decreased supply of other currencies seeking dollars
USOYen
D
Q Q2
QofYen
~0-i
yl y2
Real GDP
QI Q2
QofUSD
7
l Increased demand for the dollar caused by the following (and decreased demand by the opposite of the following) a Relatively higher real interest rates in the US (resulting from expansionary fiscal
or contractionary monetary policy) which increases financial capital flows to the US to buy dollars to buy US securities which offer higher returns
b More demand for US goodsservices due to changing tastes or higher incomes abroad
c Relatively lower inflation rates in the US (so cheaper US goods) d Politicaleconomic instability abroad making the US a safe haven e Speculation
2 Impact of stronger dollar ( weaker dollar has opposite impact) a Decrease ofXn b Lower costs for US producers who use imported inputs c Helps keeps US price level lower because of cheaper imports d Hurts multinationals because of reduced foreign income when converted to $
D TRADE BARRIERS - protectionism (tariffs quotas embargoes)
1 Reduce amount and raise price of imported goods 2 Allow domestic producers to raise prices 3 Fail to consider comparative advantage resulting in less efficient allocation of resources
E BALANCE OF PAYMENTS
1 Balance of trade 2 Current account -exports and imports of goods and services net investment income 3 Financial (formerly Capital) account- purchase and sale of real and financial assets 4 In the absence of governmental or central bank intervention current account balance and
financialcapital account balance must sum to zero (a current account deficit will be matched by a financialcapital account surplus)
8
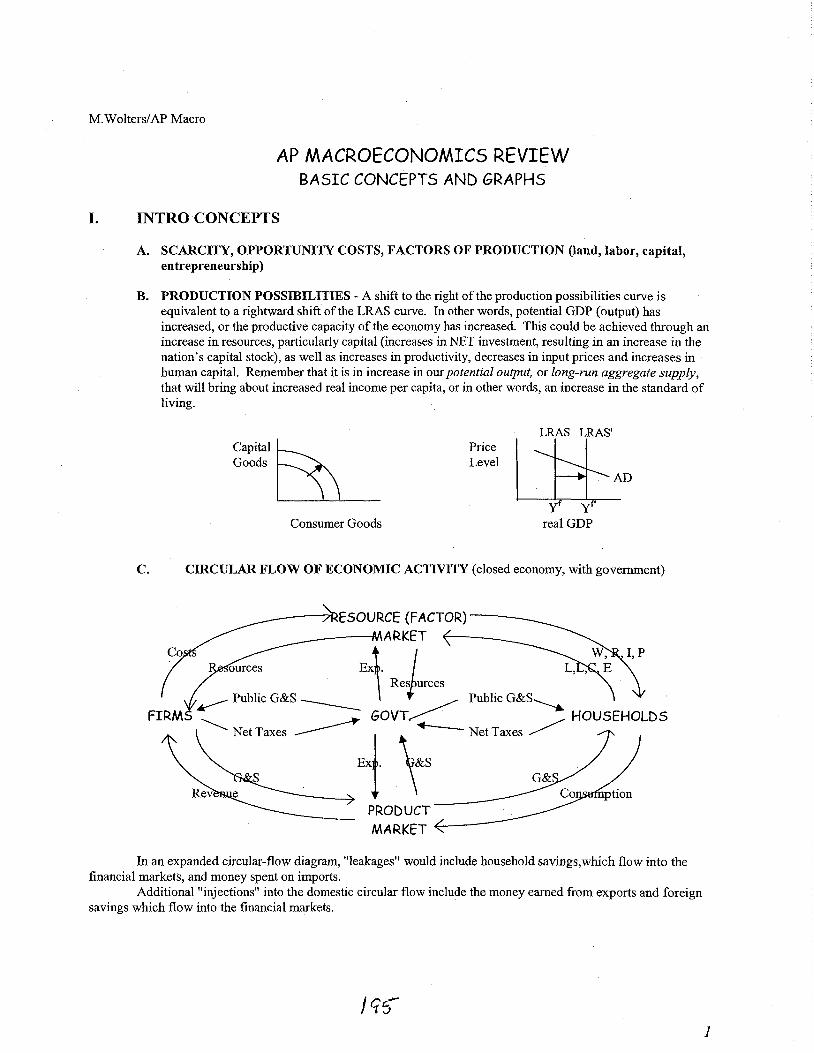
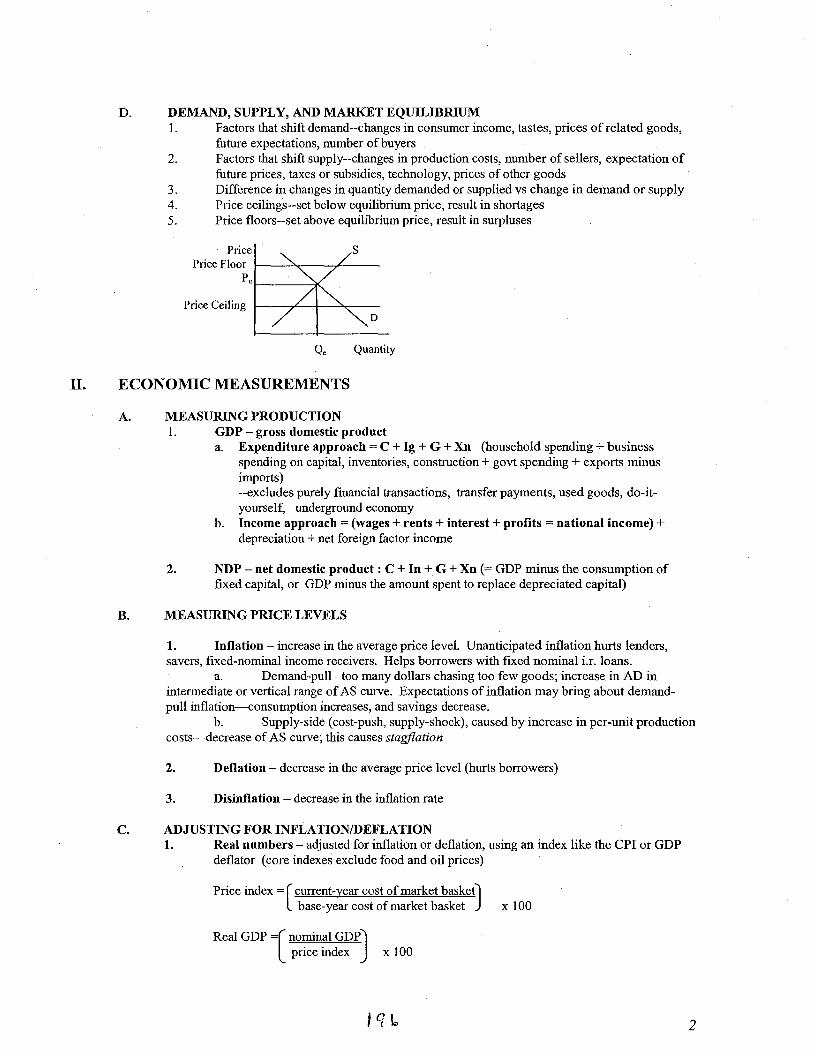
8
2 Nominal numbers - current prices not adjusted for inflation or deflation
3 Real interest rates= nominal interest rate minus inflation Lenders nominal interest rate will include an inflation premium to compensate for expected inflation-if actual inflation exceeds this premium real rate will decline
4 To calculate percentage changes new number - old number old number X 100
D EMPLOYMENT 1 Unemployment rate= unemployed (seeking work) divided by labor force (labor force=
unemployed+ employed 16 and over)
2 Kinds of unemployment a Frictional- shorter-term betweenjobsjust starting out b Structural - obsolete job skills results from changes in consumer demand or
technology or shifts ofjobs to other regions countries c Cyclical -- deficient-demand unemployment--not included in our natural rate
of unemployment
3 Full employment- no cyclical unemployment natural rate of unemployment about 5
4 Labor-force participation rate-the percentage of working-age population in the labor force
E BUSINESS CYCLE - EXP ANSI ON PEAK CONTRACTION TROUGH 1 recession loosely defined as two consecutive quarters of declining GDP 2 inflation more likely to occur in expansions than contractions
III NATIONAL INCOME AND PRICE DETERMINATION
A AGGREGATE DEMAND (AD) Shifts in AD caused by changes in
1 Consumption (C) caused by a change in wealth expectations indebtedness or personal taxes Consumption on durables will be affected by changes in interest rates because of borrowing costs
2 Investment spending (I) caused by a change in interest rates (borrowing costs) profit expectations business taxes technology or excess capacity (an increase in excess capacity will decrease I)
3 Government spending (G) Remember G spending not based on interest rates but interest payments on debt are impacted by interest rate changes
4 Net exports (Xn) caused by a change in national income abroad or exchange rates (which can be affected by relative real interest rates-which can be caused by fiscal or monetary policy) Other reasons listed in VC l
B AGGREGATE SUPPLY (AS) Shifts in SRAS caused by changes in
1 Input prices for land labor capital entrepreneurship (rent wages interest profits)shyinfluenced by domestic resource availability and prices of foreign inputs (positive and negative supply shocks)
2 Productivity 3 Legal-institutional environment (govt policies like taxes business regulations)
C LONG RUN AGGREGATE SUPPLY (LRAS)
1 LRAS will shift to right with increases in productivity of labor increases in technology increases in capital formation ( due to increased In) and improvements in human capital
) q l 3
rl1-r-c---v
2 LRAS could shift to left if negative supply shock resulted in a permanent decrease in resources
D EQUILIBRIUM
Price Level
PricePrice SRAS Level RAS Level
pit-----+-~P____-l~I
AD AD AD
Real GDP Real GDP Real GDP
Economy in a RECESSION Economy at FULL EMPLOYMENT Economy in INFLATION
E CLASSICAL THEORY - Assumes flexible prices theorizes that a laissez-faire economy will self-correct back to full employment in long run through responsiveness of SRAS curve to long-run price changes
F RATIONAL EXPECTATIONS THEORY argues that fully anticipated price level changes result in very quick or even instantaneous self-correction so there will be no change in real output
G FISCAL POLICY - Changes in government spending and taxing policies (by Congress and the Administration) designed to achieve a full-employment and non-inflationary level of GDP Fiscal policy created by John Maynard Keynes who contended that prices were sticky in a downward direction and economy would not automatically self-correct from recession to full employment
1 EXPANSIONARY-Gt TJ causes movement toward a budget deficit may cause increase in real interest rates due to increased demand by government for loanable fundsshycrowding out results which may reduce long-run growth Also adds to our national debt requiring substantial interest payments some going abroad
Real ir r2
rl
____~
___~
QI Q2 Quantity of loanable funds
2 CONTRACTIONARY-G J Tt causes movement toward a budget surplus may cause decrease in real interest rates due to decreased demand by governmentfor loanable funds
Real ir
DI
Q2 QI Quantity of loanable funds
4
3 MULTIPLIER EFFECT Changes in C I G and Xn have multiplied impact on GDP The following multipliers show how much a change in these will change GDP assuming no inflation and no leakages-in other words assuming the economy is operating in the horizontal (Keynesian) range of the AS curve
ME= 1MPS or 1(1-MPC) (This is the expenditure or spending multiplier)
MT= ME - 1 (Tax multiplier)
Me= ME - MT= 1 (Balanced budget multiplier)
For example Assume an MPC of 90 The ME would then be 1MPS = 10 If G increases by $2 million then GDP could increase by as much as $2 million x 10 = $20 million
Using the same MPC of 90 the MT would be ME minus I= 9 If taxes decreased by $2 million then GDP could increase by as much as $2 million x 9 = $18 million
To close a recessionary gap of $20 million while maintaining a balanced budget the government could increase both G and T by $20 million
H PHILLIPS CURVE - relationship showing the tradeoff between inflation and unemployment
1 Short-run - movement along the SRPC depicts short-run impact of an shift of AD along the SRAS for example increased AD brings about increased GDP and thus reduced unemployment but also brings about an increase in the inflation rate
Intl~Rat PC The short-run Phillips Curve will shift left if there is a shift rightward of the SRAS curve and it will shift right if the SRAS shifts left
SRPC
2 Long-run - a vertical line at full-employment (NRU) This curve would nru shift if the natural rate of unemployment (NRU) changed
Unempl Rate
I SUPPLY-SIDE ECONOMICS
1 Goal to increase LRAS 2 Achieved by reduction in marginal tax rates( which increase supply of loanable funds and
thus lower real interest rates) elimination of unnecessary govt regulations to stimulate work savings and investment incentives
IV FINANCIAL SECTOR
A MONETARY POLICY - changes in the rate of growth of the money supply (MI includes currency and demand deposits held by the public) by the Federal Reserve to assist the economy to achieve a fullshyemployment noninflationary level of GDP
1 EXPANSIONARY - Open Market Ops (OMO) Buy securities (to lower federal funds rate-bank to bank overnight lending rate) lower discount rate (Fed to bank lending rate) lower reserve requirement (which is a of demand deposits)
2 CONTRACTION ARY - OMO Sell securities (to raise federal funds rate) raise discount rate raise reserve requirement
5
B CREATION OF MONEY THROUGH BANK LENDING PROCESS
1 Banks can lend excess reserves (total reserves minus required reserves)
2 An increase in excess reserves can have a multiplied impact in the banking system as a whole equal to the deposit multiplier (Ireserve ratio) times the change in excess reserves assuming all excess reserves become loans and all loans become new demand deposits
C MONEY MARKET Nomir
1 Changes in demand (MD) caused by change in nominal GDP (money demand varies directly with nominal GDP) financial innovations (ATMs credit cards) precautionary motives ir1 +-----
2 Changes in Supply (MS) caused by central banks monetary policy MD
Ql Quantity of Money
a MS will increase if Fed enacts expansionary monetary policy and both nominal and real int rates will decrease in short run (in long run inflation could cause an increase in nominal ir and eventually real ir will return to long-run level)
b MS will decrease ifFed enacts contractionary monetary policy and both nominal and real int rates will increase in short run (in long run reduction of inflation could result in decrease in nominal ir and real rates will return to long-run level)
D LOANABLE FUNDS MARKET - supply influenced in the short run by money market but NOT the same market
1 Supply ofloanable funds determined by availability of savings--household savings business savings and government savings (if they ran a surplus and paid back some of their debt) as well as foreign savings By controlling bank lending activity Fed also influences supply ofloanable funds in the short run but not in the long run because prices adjust in the long run leaving real money supply unchanged (long-run money neutrality) middot
2 Demand for loanable funds from businesses (investment demand) households borrowing for durables and the government borrowing to finance deficit
Real ir s
D
QI Quantity of loanable funds
1oo
6
PL21-------llt
E IMPACT OF MONETARY POLICY ON OUTPUT AND PRICE LEVEL (example shows impact of easy monetary policy in the short run)
Norn ir r PL
i l-r---1----+--------+---- PL1
i2 I-L-~1-------------+-----+-~ MD
QI Q2 Q Q2
Q of Money Q of Investment
bull Interest-sensitive consumption (on durable goods) will also be impacted by changes in interest rates bull Net exports will be impacted through changes in demand for the dollar resulting from interest rate changes bull Government spending will be largely unaffected by interest rate changes
F MONETARISM (based on MV=PQ) bull Inflation caused by too much money in economy Fed should stick to monetary ruleshy
steady growth of the money supply consistent with real GDP growth bull Fiscal policy results in complete crowding out-so useless in the long run
G OTHER FINANCIAL ASSETS 1 Stocks (Equities) -a source of equity financing for corporations 2 Bonds-a source of debt financing for corporations and governments
a Current bond yield= annual interest payment ofbond divided by the market price of bond (annual rate ofretum on bond)
b Interest rates and bond prices vary inversely c Bond yields move with other market interest rates
H TIME VALUE OF MONEY bull Present value= Future value(1 +rt bull Future value= Present value (1 +r)
V INTERNATIONAL TRADE
A ABSOLUTE ADVANTAGE can produce more with same inputs or requires fewer inputs to produce
B COMPARATIVE ADV ANT AGE nation has lower opportunity cost should specialize in this and trade for rest (Output model- over Input model -under) Favorable terms of trade will fall between the opportunity costs of each nation
C FOREIGN EXCHANGE MARKET - An increase in the demand for the dollar will increase the price of the dollar relative to other currencies And an increase in the demand for the dollar implies an increase in the supply of other currencies seeking dollars (and an increase in quantity supplied of the dollar) Decreased demand for dollar means decreased supply of other currencies seeking dollars
USOYen
D
Q Q2
QofYen
~0-i
yl y2
Real GDP
QI Q2
QofUSD
7
l Increased demand for the dollar caused by the following (and decreased demand by the opposite of the following) a Relatively higher real interest rates in the US (resulting from expansionary fiscal
or contractionary monetary policy) which increases financial capital flows to the US to buy dollars to buy US securities which offer higher returns
b More demand for US goodsservices due to changing tastes or higher incomes abroad
c Relatively lower inflation rates in the US (so cheaper US goods) d Politicaleconomic instability abroad making the US a safe haven e Speculation
2 Impact of stronger dollar ( weaker dollar has opposite impact) a Decrease ofXn b Lower costs for US producers who use imported inputs c Helps keeps US price level lower because of cheaper imports d Hurts multinationals because of reduced foreign income when converted to $
D TRADE BARRIERS - protectionism (tariffs quotas embargoes)
1 Reduce amount and raise price of imported goods 2 Allow domestic producers to raise prices 3 Fail to consider comparative advantage resulting in less efficient allocation of resources
E BALANCE OF PAYMENTS
1 Balance of trade 2 Current account -exports and imports of goods and services net investment income 3 Financial (formerly Capital) account- purchase and sale of real and financial assets 4 In the absence of governmental or central bank intervention current account balance and
financialcapital account balance must sum to zero (a current account deficit will be matched by a financialcapital account surplus)
8
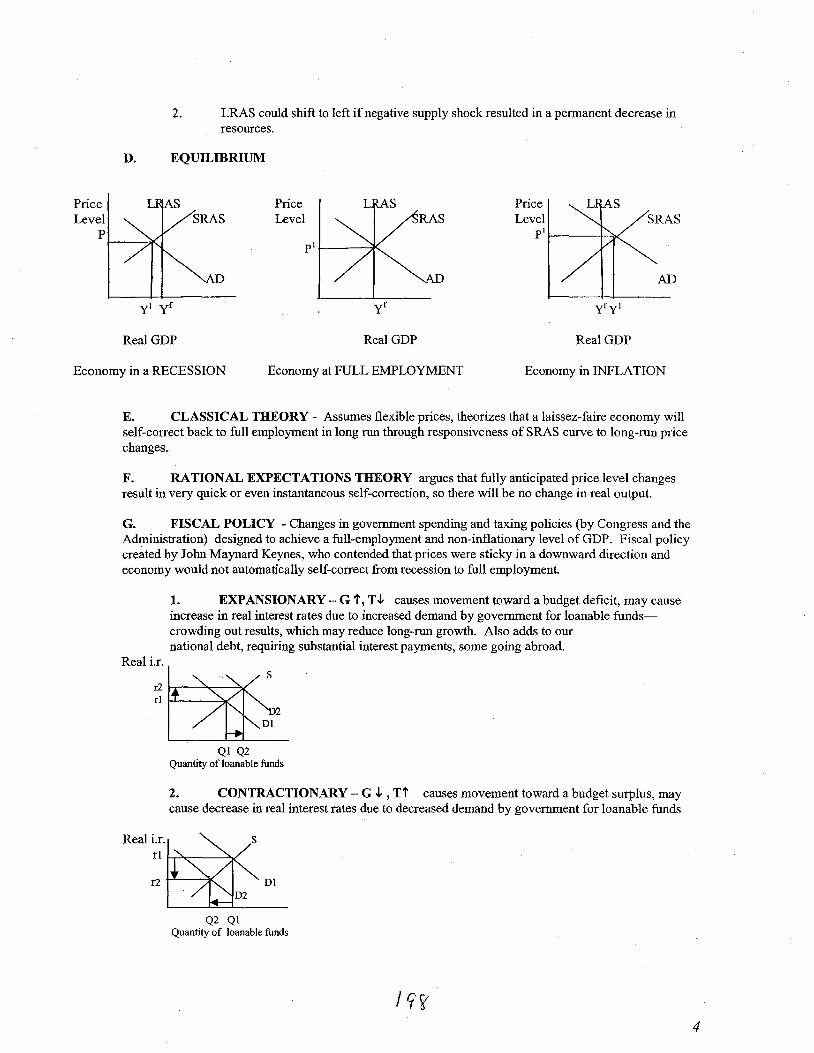
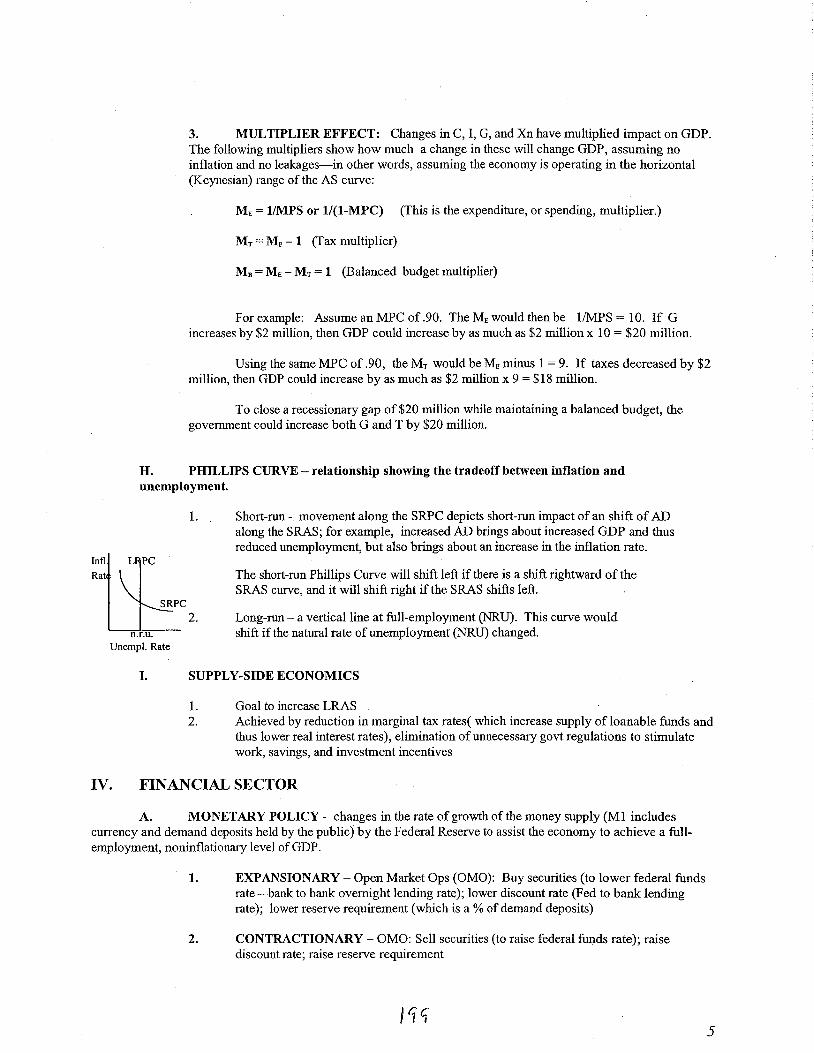
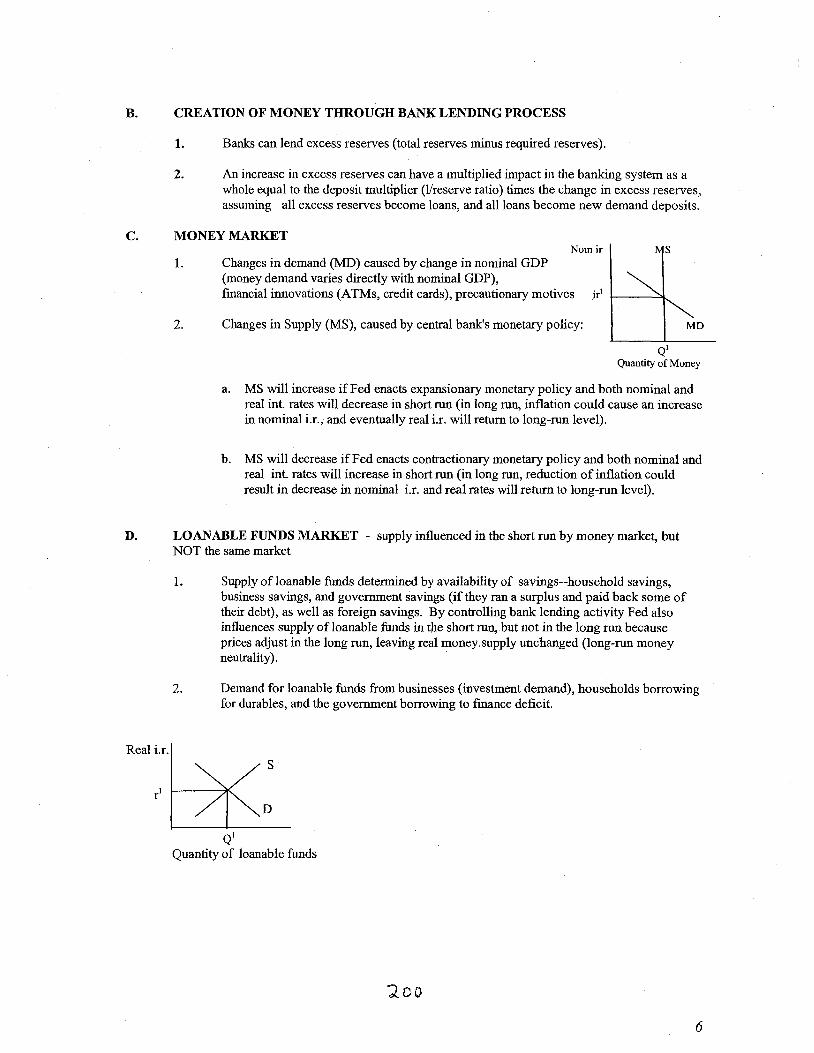
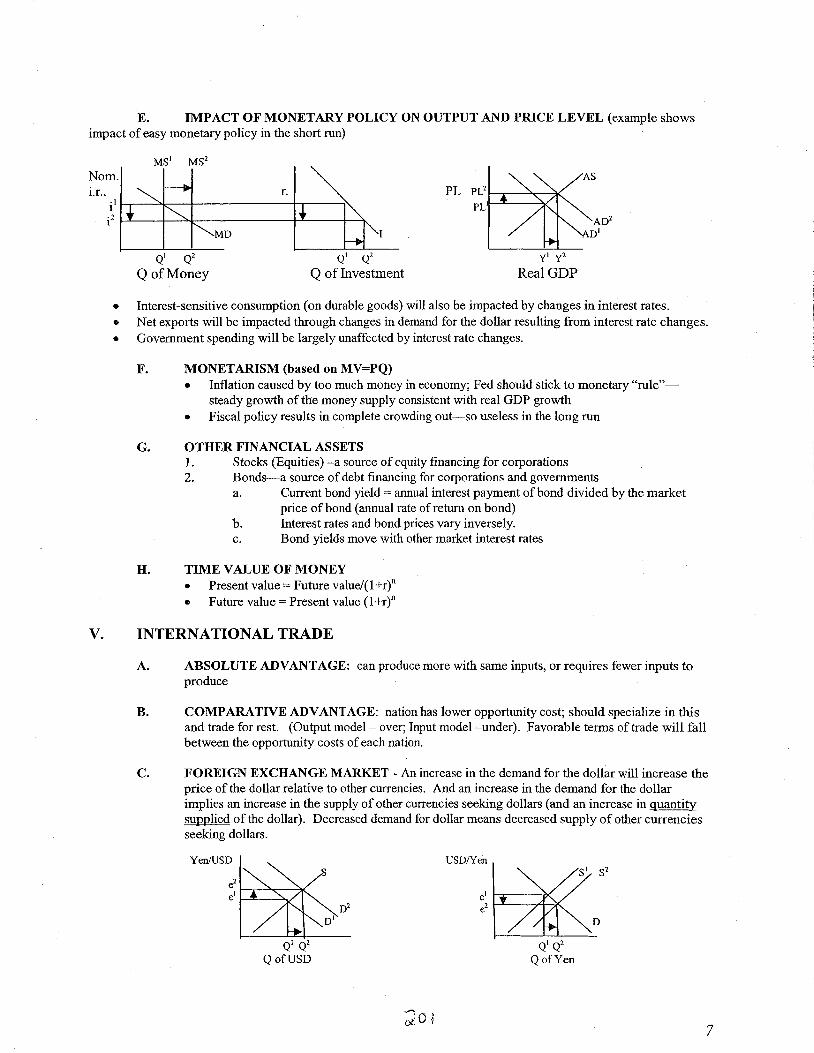