antimicrobial use of native and enzymatically degraded
TRANSCRIPT
The University of MaineDigitalCommons@UMaine
Electronic Theses and Dissertations Fogler Library
5-2003
Antimicrobial Use of Native and EnzymaticallyDegraded Chitosans for Seafood ApplicationsTodd Andrew Nicholas
Follow this and additional works at: http://digitalcommons.library.umaine.edu/etd
Part of the Food Chemistry Commons
This Open-Access Thesis is brought to you for free and open access by DigitalCommons@UMaine. It has been accepted for inclusion in ElectronicTheses and Dissertations by an authorized administrator of DigitalCommons@UMaine.
Recommended CitationNicholas, Todd Andrew, "Antimicrobial Use of Native and Enzymatically Degraded Chitosans for Seafood Applications" (2003).Electronic Theses and Dissertations. 81.http://digitalcommons.library.umaine.edu/etd/81
ANTIMICROBIAL USE OF NATIVE AND ENZYMATICALLY DEGRADED
CHITOSANS FOR SEAFOOD APPLICATIONS
BY
Todd Andrew Nicholas
B.S. University of Maine, 1992
A THESIS
Submitted in Partial Fulfillment of the
Requirements for the Degree of
Master of Science
(in Food Science and Human Nutrition)
The Graduate School
The Universtty of Maine
May, 2003
Advisory Committee:
Denise Skonberg, Associate Professor of Food Science and Human Nutrition, Advisor
Alfred A. Bushway, Professor of Food Science
Mary Ellen Camire, Professor of Food Science and Human Nutrition
ANTIMICROBIAL USE OF NATIVE AND ENZYMATICALLY DEGRADED
CHITOSANS FOR SEAFOOD APPLICATIONS
By Todd Andrew Nicholas
Thesis Advisor: Dr. Denise Skonberg
An Abstract of the Thesis Presented in Partial Fulfillment of the Requirements for the
Degree of Master of Science (in Food Science and Human Nutrition)
May, 2003
Millions of pounds of crab and shrimp shell waste are created every year
by the seafood industry. This waste is very resistant to biodegradation and
disposal is problematic. Crustacean shells are composed mainly of chitin that can
be converted to chitosan by deacetylation. Many current shelf life extension and
pathogen inhibition methods employ the use of various chemical preservatives.
Chitosan, an abundant natural polysaccharide, possesses antimicrobial as well
as functional properties that may be useful in improving quality of stored foods.
These properties may be influenced by a number of factors that must be studied
before determining the most useful food applications of chitosan.
The objectives of this research were to: 1) study the efficacy of powdered
chitosan and chitosan dips in enhancing the refrigerated shelf life of minced
salmon trim and salmon fillets; 2) determine the feasibility of degrading chitosan
with commercially available enzymes, alpha amylase and bromelain; and 3)
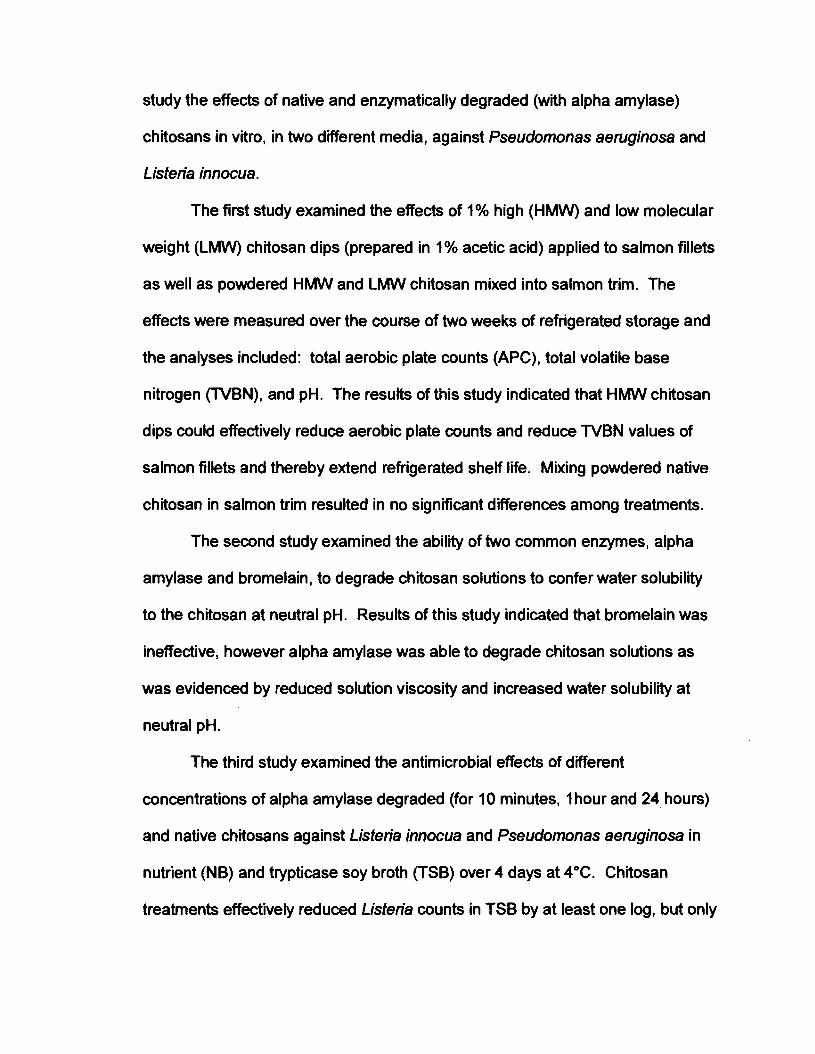
study the effects of native and enzymatically degraded (with alpha amylase)
chitosans in vitro, in two different media, against Pseudomonas aemginosa and
Listeria innocua.
The first study examined the effects of 1% high (HMW) and low molecular
weight (LMW) chitosan dips (prepared in 1% acetic acid) applied to salmon fillets
as well as powdered HMW and LMW chitosan mixed into salmon trim. The
effects were measured over the course of two weeks of refrigerated storage and
the analyses included: total aerobic plate counts (APC), total volatile base
nitrogen (TVBN), and pH. The results of this study indicated that HMW chitosan
dips could effectively reduce aerobic plate counts and reduce WBN values of
salmon fillets and thereby extend refrigerated shelf life. Mixing powdered native
chitosan in salmon trim resulted in no significant differences among treatments.
The second study examined the abilrty of two common enzymes, alpha
amylase and bromelain, to degrade chitosan solutions to confer water solubility
to the chitosan at neutral pH. Results of this study indicated that bromelain was
ineffective, however alpha amylase was able to degrade chitosan solutions as
was evidenced by reduced solution viscosity and increased water solubility at
neutral pH.
The third study examined the antimicrobial effects of different
concentrations of alpha amylase degraded (for 10 minutes, I hour and 24 hours)
and native chitosans against Listerie innocua and Pseudomonas aemginosa in
nutrient (NB) and trypticase soy broth (TSB) over 4 days at 4°C. Chitosan
treatments effectively reduced Listeria counts in TSB by at least one log, but only
significantly so on day three. The 24 hour degraded chitosan and lower
percentage chitosan treatments were the least effective. No significant
reductions in Pseudomonas counts were observed in TSB for any treatment. In
NB all the chitosan treatments had significantly ( ~ ~ 0 . 0 5 ) lower (up to 3.4 logs)
Pseudomonas counts than both controls on all four days. Log reductions
increased with increasing chitosan percent. Ten minute degraded chitosan had
slightly greater log reductions compared to other treatments. The results of this
experiment indicated that the antimicrobial effectiveness of chitosan depended
on the nutrient matrix, chitosan concentration, degradation time, and bacteria
type-
The results of this research indicate that chitosan must be solubilized to
act as an antimicrobial agent in salmon. Chitosan can be degraded successfully
by alpha amylase, producing a water soluble chitosan that may have a use in a
product such as minced salmon trim. In vitro antimicrobial action of the chitosan
decreased with increasing degree of degradation and depended greatly on the
type of media used, indicating that many factors may influence the effectiveness
of chitosan in a real food system. Future research should be done to determine if
the enzymatically produced water soluble chitosan can act as an antimicrobial
agent when incorporated into salmon trim or when used as a dip on salmon
fillets.
ACKNOWLEDGEMENTS
The author would like to gratitude to his advisor, Dr. Denise Skonberg.
Her advice, guidance and support regarding this research were very beneficial to
the author. The author would also like to thank the members of his committee for
their guidance with this project.
The author would also like to thank the other faculty, staff and students in
the Department of Food Science and Human Nutrition. The supportive and
friendly demeanor of everyone in the department made the last few years
enjoyable. Special thanks to those who devoted their time and effort during the
course of my research, namely Kathy Dentici-Davis, Barbara Gillman and Mark
Corey.
The author would also like to thank Eric Chapman for all of his editing
expertise during the writing phase of this endeavor. The author would also like to
thank his former friends and coworkers at Shaw's Supermarkets for their support
of my decision to continue my education.
iii
TABLE OF CONTENTS
ACKNOWLEDGEMENTS ..................................................................................... ii
LIST OF TABLES ................................................................................................. ix
LIST OF FIGURES .............................................................................................. xi
Chapter
1 . INTRODUCTION ....................................................................................... 1
Consumer Preferences for Fresh Fish .......................................................... 1
Fish Spoilage ................................................................................................ 2
Determination of Seafood Freshness ............................................................ 4
Shelf Life of Seafood ..................................................................................... 5
Seafood Preservation Techniques ................................................................ 7
Low Temperature Storage ................................................................. 8
.............................................................. DipsIChemical Treatments -10
..................................................................................... Chitin and Chitosan 15
............................................................. Production of Chitosan from Chitin 17
Applications of Chitosan ......................... .. ........................................... 1 7
Non-Meat Food Applications of Chitosan ......................................... 19
Use of Chitosan in Meat Products .................................................... 21
.............................................. Use of Chitosan in Seafood Products 25
................................................................. Antimicrobial Action of Chitosan 28
Enzymatic Degradation of Chitosan ............................................................ 33
Safety and Regulatory Status of Chitosan .................................................. 36
2 . MATERIALS AND METHODS: ANTIMICROBIAL EFFICACY OF CHITOSAN DIPS AND POWDERED CHITOSAN ON ATLANTIC SALMON PRODUCTS ............................................................................... 38
.................................................................................................. Objectives -38
................................................................................... Experimental Design 38
Salmon Trim Study ..................................................................................... 39
................................................................... Preparation of Chitosan 39
Application of Chitosan .................................................................... 39
................................... Chitosan Dip Preparation and Use on Salmon Fillet 40
Chemical Analyses ..................................................................................... 41
........................................................................................... Moisture 41
.................................................................................................. Ash -42
........................................................................................... Minerals 42
Total Volatile Base Nitrogen ............................................................. 43
Trimethylamine Analysis .................................................................. 44
....................................................................................... Microbial Analysis 46
...................................................................................... Statistical Analysis 47
3 . MATERIALS AND METHODS: ENZYMATIC DEGRADATION OF ............................................................................ CHITOSAN SOLUTIONS 48
................................................................................................... Objectives 48
.................................................................................. Experimental Design -48
..................................................................................................... Enzymes 49
................................................................................................ Procedures -49
Protein Determination of Enzyme Solutions ................................................ 50

........................................................................................... Specific Gravity 51
..................................................................................................... Viscosity 5 1
........................................................................................ Intrinsic Viscosity 52
Quantification of Insoluble Chitosan ............................................................ 53
Temperature .............................................................................................. -53
4 . MATERIALS AND METHODS: IN VlTRO ANTIMICROBIAL EFFICACY OF CHITOSAN AGAINST LlSTERlA INNOCUA AND PSEUDOMONAS AERUGINOSA ............................................................... 54
.................................................................................................. Objectives -54
................................................................................... Experimental Design 54
Preparation of Pour Plates .......................................................................... 54
Propagation of Bacterial Cultures ............................................................... 56
Preparation of Chitosan Solutions .............................................................. 57
Inoculation and Spread Plating ................................................................... 58
..................................................................................................... Viscosity -59
Statistical Analysis ..................................................................................... 59
5 . RESULTS: ANTIMICROBIAL EFFICACY OF CHITOSAN DIPS AND ............. POWDERED CHITOSAN ON ATLANTIC SALMON PRODUCTS 60
............................................................................................... Observations 60
..................................................................................... Salmon Trim 60
.................................................................................... Salmon Fillet 60
..................................................... Moisture. Ash and Mineral Composition 60
...................................................................................... Microbial Analyses 61
..................................................................................... Salmon Trim 61
.................................................................................... Salmon Fillet 61

Total Volatile Base Nitrogen ....................................................................... 64
Salmon Fillet ................................................................................... 64
Salmon Trim ..................................................................................... 69
pH ............................................................................................................... 69
Salmon Fillet .................................................................................... 69
Salmon Trim ..................................................................................... 69
Trimethylamine ........................................................................................... 73
Salmon Fillet .................................................................................... 73
Salmon Trim ..................................................................................... 73
6 . RESULTS: ENZYMATIC DEGRADATION OF CHITOSAN SOLUTIONS ............................................................................................... 76
Enzyme Effectiveness ................................................................................. 76
Observations ............................................................................................... 76
Gravimetric Measurements ......................................................................... 78
Viscosity ...................................................................................................... 80
Enzyme Concentration ................................................................................ 80
Intrinsic Viscosity ........................................................................................ 83
7 . RESULTS: IN VlTRO ANTIMICROBIAL EFFICACY OF CHITOSAN AGAINST LlSTERlA INNOCUA AND PSEUDOMONAS AERUGINOSA ........................................................................................... -87
Listena in Trypticase Soy Broth .................................................................. 87
....................................................... Pseudomonas in Trypticase Soy Broth 90
Pseudomonas in Nutrient Broth .................................................................. 93
vii
8 . DISCUSSION: ANTIMICROBIAL EFFICACY OF CHITOSAN DIPS AND POWDERED CHITOSAN ON ATLANTIC SALMON PRODUCTS ................................................................................................ 97
............................................................ Moisture. Ash and Mineral Analysis 97
..................................................................................... Salmon Trim 97
Salmon Fillet .................................................................................... 98
.................................................................................. Aerobic Plate Counts 99
'Salmon Trim ..................................................................................... 99
Salmon Fillet .............................................................................. 100
Total Volatile Base Nitrogen ................................................................. 1 0 2
Salmon Trim ................................................................................... 102
Salmon Fillet ................................................................................ 103
Trimethylamine ........................................................................................ 1 0 4
Salmon Trim .................................................................................. -104
Salmon Fillet .................................................................................. 105
9 . DISCUSSION: ENZYMATIC DEGRADATION OF CHITOSAN SOLUTIONS ............................................................................................. 106
............................................................................... Enzyme Effectiveness 106
Gravimetric Measurements ....................................................................... 108
Viscosity .................................................................................................... 109
10 . DISCUSSION: IN VITRO ANTIMICROBIAL EFFICACY OF CHITOSAN AGAINST LlSTERlA INNOCUA AND PSEUDOMONAS AERUGINOSA .......................................................................................... 112
Listeria in Trypticase Soy Broth ................................................................ 112
viii
Pseudomonas in Nutrient Broth and Trypticase Soy Broth ....................... 115
.................................................................................... 1 1 . CONCLUSIONS 1 1 8
.................................................................... Salmon Product Applications 118
Enzyme Degradation ................................................................................ 118
In Vitro Study ........................................................................................ 1 1 9
................................................................................................. REFERENCES 120
...................................................................... BIOGRAPHY OF THE AUTHOR 130
LIST OF TABLES
Table 1.
Table 2.
Table 3.
Table 4.
Table 5.
Table 6.
Table 7.
Table 8.
Table 9.
Table 10,
Table 1 1.
Table 12.
Table 13.
Table 14.
Table 15.
Treatment Codes for Salmon Trim Study ...................................... 40
Treatment Codes for Salmon Fillet Study ...................................... 41
In Vitro Treatment Codes .............................................................. 55
Broth Recipes for In Vitro Studies ................................................. 57
Mineral Concentrations (mgkg) of Salmon Trim and Fillet ........ .... 61
Aerobic Plate Counts (CFUIg) of Atlantic Salmon Trim With and Without Chitosan During Refrigerated (4°C) Storage ............. 62
Aerobic Plate Counts (CFUIg) of Atlantic Salmon Fillet Wrth and Wihout Chitosan During Refrigerated (4°C) Storage ............. 63
N B N (mg N11 OOg) Concentrations in Chitosan Treated Salmon Fillet During Refrigerated (4°C) Storage ........................... 67
N B N (mg N11 OOg) Concentrations in Chitosan Treated Salmon Trim During Refrigerated (4°C) Storage ........................... 70
pH of Chitosan Treated Salmon Fillets During Refrigerated (4°C) Storage . . . ......... .. . . . . . .. .. . . . ............. . ... . .. .... . . .... ... . . . . . . . .. ... ... . . . . . -71
pH of Chitosan Treated Salmon Trim During Refrigerated (4°C) Storage ........................................................................ ........ 72
Trimethylamine Concentrations (mg TMA-N1100g) of Chitosan Treated Salmon Fillet During Refrigerated (4°C) Storage ....................... .... ..... ........... .. .................................... ..,,. , ... 74
Trimethylamine Concentrations (mg TMA-N11 009) of Chitosan Treated Salmon Trim During Refrigerated (4°C) Storage ...... . .. .. . . .... .. .... . .. ... . ..... . .. . ... . ... . . .... ... ...... . .. . ... ... .... ........ . . . .. .. 75
Observations of 1 % Chitosan Solutions Degraded with 10% Alpha Amylase .......................................................... ................. . .. 77
Weight Measurements of 1 % LMW Chitosan Solutions Degraded with 10% Alpha Amylase for 8 Hours ...... ...................... 79
Table 16 . Weight Measurements of 1 % LMW Chitosan Solutions Degraded with 10% Alpha Amylase for 24 Hours .......................... 79
Table 17 . Listeria Counts of Control and Chitosan Treated Trypticase Soy Broth During Refrigerated (4°C) Storage ................................ 88
Table 18 . Pseudomonas Counts of Control and Chitosan Treated Trypticase Soy Broth During Refrigerated (4°C) Storage .............. 91
Table 19 . Pseudomonas Counts of Control and Chitosan Treated Nutrient Broth During Refrigerated (4°C) Storage ......................... 94
Table 20 . Average Log Reductions in Pseudomonas Counts Between ........................ CON1 and Chitosan Treatments in Nutrient Broth 96

LIST OF FIGURES
................. Figure 1. Chemical Structures of Cellulose, Chitin and Chitosan 16
Figure 2. Aerobic Plate Counts (LOG CFUlg) of Chitosan Treated .......................... Salmon Fillet During Refrigerated (4°C) Storage 65
Figure 3. TVBN (mg N1100g) Concentrations of Chitosan Treated ........................... Salmon Fillet During Refrigerated (4°C) Storage 66
Figure 4. Linear Regression of N B N and APC (LOG CFUIg) of Chitosan Treated Fillet .................................................................. 68
Figure 5. Effect of pH and Time on 1% LMW Chitosan Solutions Degraded with Alpha Amylase ..................................................... .81
Figure 6. Viscosity Reduction of 1% Chitosan Solution by 10% (whv of Chitosan) Alpha Amylase .............................................................. 82
Figure 7. Viscosity Reduction of 1 % Chitosan Solution by 5% (whv of Chitosan) Alpha Amylase ............................................................ 82
Figure 8. Viscosity Reduction of 1% LMW Chitosan Solutions at pH .............................. 4.0 by 10% ( w h of Chitosan) Alpha Amylase .84
Figure 9. Viscosity Reduction of 1% LMW Chitosan Solutions at pH 4.0 by 5% (whv of Chitosan) Alpha Amylase ................................. 85
Figure 10. Intrinsic Viscosity of Degraded and Undegraded 1 % Chitosan Solutions ......................................................................... 86
Figure 11. Four Day Mean Listeria Counts in Trypticase Soy Broth ............... 89
Figure 12. Four Day Mean Pseudomonas Counts in Trypticase Soy Broth .............................................................................................. 92
Figure 13. Four Day Mean Pseudomonas Counts in Nutrient Broth ............... 95
INTRODUCTION
Consumer Preferences for Fresh Fish
Buying patterns for fresh fish vary from one region of the country to the
other. There are many variables that affect consumer buying patterns (Hadlett
and Raab, 1990). Some of these factors include cost, availability, objection to
the smell, and fish quality. Quality can be an issue for those people who live in
remote parts of the country and have to have their fish shipped in. The longer
the supply chain, the more chance there is for temperature abuse, which can
cause many quality problems with fresh fish.
Hadlett and Raab (1 990) reported that 96 percent of the respondents to
their consumer buying pattern survey considered freshness to be very important.
Two thirds of the respondents thought it was difficult to determine the freshness
of fish by appearance and the same number of persons said they would buy fish
more often if they knew it was fresh. Quality was the most important factor when
purchasing fresh fish.
In a study conducted by Peavey et a/. (1 994, consumer attitudes toward
fresh fish were studied utilizing a survey. Freshness was the paramount concern
as well as appearance and smell when consumers were purchasing fresh
seafood with color of the fillet considered important as well. The survey results
indicated that consumers would not buy a fillet that was gray or yellow, for white-
fleshed fish, or a fillet of salmon that was "neon-redn or "funny-red." Texture and
smell were also deemed as important to fresh fish consumers. Results indicated
that the texture of the fish should be firm and no detectable "fishy smell" should
be present.
Fish Spoilage
Following death, all fish pass through the following stages: rigor mortis,
post rigor, autolysis, and degradation caused by bacteria (Ehira and Uchiyama,
1986). The pH of the flesh first falls as glycogen stores are converted to lactic
acid and then it rises as nucleotide compounds are broken down and bacteria
produce basic waste products such as ammonia. Adenosine triphosphate (ATP)
is catabolized during the spoilage process to the following components :
Adenosine diphosphate (ADP), adenosine monophosphate (AMP), inosine
monophosphate (IMP), inosine (I), hypoxanthine (Hx), xanthine and uric acid
(Ashie et a/., 1996). Initial breakdown of ATP to IMP results in a good, Yresh
fishn flavor component in the flesh. Further breakdown of IMP to the other
catabolic by-products results in detrimental changes in texture, color, odor and
flavor (Haard, 1992).
During storage of seafood, the enzymes produced by the bacterial flora
begin to break down the nitrogen rich nucleotides in the fish muscle (Jay, 2000a).
The result of this is production of volatile compounds. These volatile compounds
affect the flavor and odor of the fish. The major compound that is affected in
marine fish is trimethylamine oxide (TMAO), an osmoregulatory compound most
common in cold-water, white fish species such as cod (Regenstein and
Regenstein, 1991). When TMAO breaks down it is first converted to

trimethylamine (TMA) and then to di-methylamine and finally to formaldehyde.
Lipids in the fish can react with the TMA to produce off-odors and a fishy smell.
Many factors influence fish shelf life including temperature, handling stress
(Erikson et a/., 1997), storage conditions (Ashie et a/., 1996) and starvation of the
fish prior to capture (Einen and Thomassen, 1998). Spoilage of fish is the result
of microbial action and natural enzyme processes within the flesh (Ashie et a/.,
1996). Natural microbial flora exist on the surface of fish. Whole fish spoil more
slowly than fish that have undergone processing, gutting and filleting. Bacteria
can migrate from the gut of the fish into the flesh or may migrate through cuts in
the flesh or through the lateral line, a process that occurs more quickly with
temperature abuse. Once fish are processed, the bacterial load on the surface of
the fish is distributed to the inside of the fish by knives or other processing
equipment.
There are a few common classes of bacteria responsible for fish spoilage.
Fish from warm waters carry a different bacterial flora than those from colder
waters. Common cold water microbial flora include Pseudomonas, Aeromonas,
Flavobacterium, Shewanella, Listeria and Vibrio species (Jay, 2000a). Many of
these bacteria on cold-water species are gram-negative, psychrotrophic bacteria
and are more likely to grow in typical storage conditions because they grow well
in cold conditions (Jay, 2000b).
Determination of Seafood Freshness
Seafood freshness may be difficult to determine. Acceptability as
measured by bacterial load is the most primitive method. Each species of fish
may have different species of bacteria and a unique chemical makeup that will
vary the acceptable bacterial load from -1 0* to 10' CFU/g and unacceptable load
from -1 o6 to 1 O'CFUI~. Research has been performed to determine shelf life
and microbial spoilage levels for specific species of fish (Koutsoumanis and
Nychas, 2000). Additionally, several different chemical indices have been
developed to estimate the freshness of seafood. These methods include total
volatile base nitrogen [(TVBN) (Botta et a/., 1984)] determination, trimethylamine
(TMA) determination (Hungerford, 1998), and the K index and the P index. The
K index is defined by the following equation: [(inosine + hypoxanthine) / (ADP,
AMP, IMP, I, Hx and ATP)] (Ehira and Uchiyama, 1986). The P index, another
index used to determine fish freshness, is defined by the following equation:
(TMA concentration I TVBN concentration) x 100 (Malle and Poumeyrol, 1989).
Correlations that tie microbial counts to levels of degradation compounds (TVBN
and TMA, etc.) and sensory perceived freshness have had limited success and
are species specific. For example, N B N and K-value were found to be
inappropriate for determining freshness of carp that had been treated with
irradiation (Icekson etal., 1996). Emborg etal. (2002) discovered in a study of
modified atmosphere packaged salmon that TMA concentrations indicative of
unacceptablility in cod (30 mg1100 g fish) were inappropriate in salmon due to
low trimethylamine oxide in salmon. A K-value of 70 to 80% was suggested as a
"goodquality" indicator for Atlantic salmon (Erikson et a/., 1997) with values
lower than 40 to 50% indicating excellent quality. The authors also discovered
that the onset of rigor began within two to four hours after death in stressed fish
compared to 25 hours in unstressed fish. In contrast, Ehira and Uchiyama
(1 986) in a study of species of fish found in Japanese waters determined that, in
general, K-values of 20% or below are appropriate for sashimi grade fish
whereas K-values above 75% indicate poor quality fish.
Shelf Life of Seafood
Shelf life of seafood varies by species, method of kill and temperature
conditions. Reddy et a/. (1 997) found that the sensory shelf life of aquacultured
salmon fillets varied greatly depending on storage temperature. The shelf life of
salmon was between 16 and 20 days at 4°C but at 8°C the shelf life dropped to
between 8 and 10 days. At 16"C, shelf life was only three to four days.
Emborg et a/. (2002) conducted a study with salmon harvested at two
different seasonal periods, (SeptemberlOctober) and (February/March), and held
at modified atmosphere (MAP). Differences in the shelf life at 2°C of the MAP
(60% C02 140% N2) salmon were discovered based on season of harvest alone.
Shelf life of salmon harvested in the SeptemberlOctober time frame had a
sensory shelf life of 14 days whereas the sensory shelf life of the FebruaryIMarch
harvested salmon was approximately 21 days. The reason for this difference
was attributed to lower levels of the spoilage bacteria on the fish harvested in the
colder months compared to those harvested in the warmer months.
The shelf life of black skipjack stored in ice at 0°C was found by Manzano
et a/. (2000) to be approximately 18 days. This was determined by two methods,
sensory assessment and K-value (75%)) both of which were found to correlate
well to predict shelf life of this species of fish.
Koutsoumanis and Nychas (2000) studied the shelf life of Mediterranean
gilt-head seabream stored aerobically at temperatures of 0, 5, 10 and 15°C.
Multiple methods were used to determine the shelf life including trimethylamine
analysis, total volatile base nitrogen analysis, aerobic plate counts and sensory
analysis. Shelf life, as determined by sensory analysis, was 212 hours (-9 days )
at 0°C and 104 hours (-4 days) at 5°C. The Pseudomonas population at these
two times was log 7.1 for both treatments. TMA concentrations were very low
throughout the experiment and were determined not to be a good indicator of
quality for this fish. N B N concentrations at sensory rejection time for 0 and 5°C
storage were approximately 22 mgI100 g of fish for both treatments, which is
lower than rejection concentrations of N B N for other species of fish.
Jeon et a/. (2002) reported the TVBN concentrations of cod and herring
stored at at 4°C reached rejection levels (30 mgI100 g fish) at day six and eight,
respectively. Corresponding trimethylamine concentrations for cod and herring
on day six and eight were 5.1 and 3.07 mgI100 g, respectively. This, again,
demonstrates the variability of these shelf life indicators based on species.
Shelf life of minced fish products is often lower than that of intact fish
portions due to the greater surface area of the mince. Shelf life of catfish mince
was found to be only five days at 5°C and seven days at 0°C as researched by
Suvanich et a/. (2000a). Shelf life was determined by TVBN concentrations and
sensory analysis. Strong odor was detected at TVBN concentrations of 30
mgI100 g of fish. Aerobic plate counts in the same study (Suvanich et a/., 2000b)
were found to be log 5.5 in the fresh mince and those values rose to log 8 by day
three, prior to detection of sensory spoilage or TVBN indicated spoilage.
Seafood Preservation Techniques
Seafood is preserved in many ways including traditional methods such as
salting, drying, and smoking (Ashie et a/., 1996). Reduction of water activity is
the goal of all three of these methods. By reducing the water activity of the food,
the microorganisms find it difficult to proliferate on the surface of the food. These
three methods also result in cessation of normal autolytic enzymes in the fish but
do not preserve the fresh flavor qualities of the fish. In industrialized nations the
most common methods of seafood preservation are freezing and low
temperature storage. Shelf life extension of fresh fish usually begins with high
pressure spraying before applying a dip or chemical treatment. This method
involves spraying the whole fish to remove the bacteria that inhabit the slime on
the surface of the fish (Kosak and Toledo, 1981). The high-pressure wash
utilizes fresh seawater but this water needs to be decontaminated first. Often
chemicals such as chlorine dioxide are added to the seawater to accomplish this.
Low Temperature Storage
Low temperature storage involves storing fish, generally on ice, at low
temperatures, below 4"C, but as close to 0°C as possible as the shelf life can be
reduced by as much as one day for each hour the fish is kept above 0°C (Ashie
et a/. , 1996). Low temperature storage reduces the growth rate of the microbial
flora but other factors can counteract this reduction such as handling, storage
after catch, species of fish, the way the fish were caught, and the history of the
fish. Often the fish will not be held at the proper temperature at some point from
capture to the dinner plate, resulting in a rapid increase in the microbial growth.
Low temperature storage also selects for those organisms adapted to low
temperatures (Ashie et a/., 1996). Fish that live in cold waters have microbes
such as Listeria monocytogenes and Clostridium botulinum that are adapted to
cold environments. These two bacteria are human pathogens and can produce
toxins at all temperatures, including refrigerated temperatures.
Cold storage of fish on ice may be time consuming, labor intensive as well
as costly (Reppond et a/., 1983). A newer method of cold storage after catch on
board vessels is utilization of mechanically refrigerated seawater (RSW). One
study indicated that storing salmon in RSW reduced microbial growth compared
to storage on ice (Bronstein et a/. , 1985). It is assumed that storage on ice
allows aerobic bacteria to more easily grow because there is more exposure to
air in ice. A drawback of a RSW system is that if some of the fish do undergo
spoilage, all of the fish in the tank may be affected and the contents of the entire
tank may not be acceptable (Lee and Kolbe, 1982). Refrigerated seawater
technology has also been used in conjunction with Con. Addition of CO2 reduces
the pH and reduces bacterial growth. Drawbacks of this refrigerated seawater
technology include salt uptake by the fish, which results in flesh discoloration and
other sensory changes (Bullard and Collins, 1978).
Another temperature strategy to increase shelf life of fish is super chilling
at temperatures justunder the freezing point, generally between -3 and -4°C
(Ashie et a/., 1996). This method slows down the natural metabolic degradation
of the fish as well as seriously inhibiting microbial growth. Shelf life of sea bass
was found by Chang et a/. (1 998) to vary greatly depending on storage
temperature. Changes in microbial growth and nucleotide breakdown as
measured by K value and total volatile base nitrogen (NBN) were studied at
temperatures of 10, 5, 0 and -3°C over storage of up to 45 days. Maximum shelf
life cut-off values were defined as N B N greater than 15 mgI100 g fish, K-value
greater than 50% and aerobic plate counts exceeding 3 x lo6 (CFUIg). Shelf life
of partially frozen (-3°C) sea bass was found to be 37 days whereas at O°C, the
shelf life dropped to 14 days. At 5 and 10°C the shelf life decreased to three and
two days, respectively. The TVBN-based shelf life in this study was longer than
the microbial-based shelf life and K-value-based shelf life was the shortest of all
three indicators. The microbial count was only found to be an accurate
measurement of quality at or above 0°C. Superchilling may not be practical
though as the low temperatures required are difficult to maintain throughout the
distribution process.

Emborg et a/. (2002) identified Photobacterium phosphoreum as the major
spoilage organism in Atlantic salmon. The authors were able to extend the shelf
life of salmon stored at modified atmosphere (60% CO2/40% NP) by one or two
weeks by first freezing the product at -20°C or -30°C prior to storage at 2°C. The
researchers postulated that the freezing killed a sufficient number of the
Photobacterium phosphoreum to extend the shetf life of the packaged salmon.
DipslChemical Treatments
Much research has been done to study the feasibility of using various
organic acids such as acetic, lactic, malic and tartaric, as dips. Dips containing
organic acids may act as antimicrobials by causing the cell membrane of the
bacteria to become permeable. Phosphates such as trisodium phosphate (TSP),
sodium tripolyphosphate (STP), and sodium metaphosphate (SMP) (Marshall
and Jindal, 1997) have also been studied as seafood dips to extend shelf life.
Polyphosphates have been shown to enhance antimicrobial activity possibly
because they act as metal ion chelators causing changes in the cell membrane
of the bacteria which interferes with normal functioning (Ashie et a/., 1996).
' Phosphates may also act as pH buffers, prevent lipid oxidation and promote
water binding capacity. Other chemicals such as chlorine dioxide (Kim et a/.,
1999), sodium lactate (Williams et a/., 1995), sodium acetate and potassium
sorbate both with and without a lactic acid bacteria cultures (Kim and
Hearnsberger, 1994) have also been investigated as possible dips for seafood
products.
Sodium lactate at levels of 2% applied in a vacuum tumbler was able to
extend the shelf life of catfish fillets stored at 1 "C from four days to seven days
(Williams et at., 1995). Statistically lower (p<0.05) plate counts were evident
compared to the controls. In addition, pH and water activity were not affected by
the addition of the sodium lactate. Cooking yields were higher as well in the
sodium lactate treated fillets due to increased water retention. Sodium lactate
solutions at levels of 1% were not as effective as the 2% treatment.
Marshall and Kim (1 996) studied the effectiveness of acetic and lactic acid
dips on the sensory and microbiological qualities of catfish fillets. Fillets that
were treated with 3-4% acetic acid or a combination of 2% acetic and 2% lactic
acid for a total of 30-60 seconds showed suppressed growth of the normal
spoilage bacteria for up to four days. Acetic acid was found to be a better
antimicrobial agent than lactic acid. One drawback of the use of acids was they
were disliked by the sensory panel. The acetic acid resulted in flesh
discoloration and an acidic odor in the fish treated with levels of 2% acetic acid or
above. Exposure times to the dip were also advised to be no more than thirty
seconds to avoid the objectionable odor.
Bal'a and Marshall (1 998) investigated the effects on color, pH, aerobic
plate counts and growth of Listeria monocytogenes of several different 2%
organic acid (citric, malic, hydrochloric, lactic, tartaric and acetic) treatments on
catfish fillets for eight days at 4°C. The fillets were dipped for ten minutes in one
of the treatments or in distilled water (controls) and were then allowed to drip for
five minutes at 4°C. Fillets in the Listeria study were inoculated for five minutes
in a one-liter bath to which 0.1 mL of an eight-strain culture of Listeria had been
added prior to dipping in the other treatments. Results indicated the acid
treatments significantly reduced the surface pH of the catfish fillets throughout
the experiment with the hydrochloric acid resulting in the lowest pH values. A
gradual rise in pH over time was observed in all treatments. Hunter color
analysis revealed acid treatments caused a bleaching effect on the fish tissue,
with citric acid causing the most effect on color change and malic acid, the least
effect. All of the acid treatments also caused a yellowing of the fish flesh except
for hydrochloric acid, which actually reduced the yellow tones compared to the
control. Initial aerobic plate counts for all acid treatments were lower than the
control with hydrochloric acid producing the lowest counts. Control samples
reached log six by day eight of the study, indicating spoilage, while the acid
dipped samples remained below log four. Listeria counts on aciddipped fillets
were only one log lower during the study compared to the controls.
Marshall and Jindal (1 997) studied the antimicrobial effects of various
phosphate treatments on catfish frames. Ten percent phosphate (trisodium
phosphate (TSP), sodium tripolyp hosp hate (STPP), and sodium metap hosp hate
(SMP) solutions were prepared in autoclaved tap water. The solutions were
refrigerated to 5°C and the catfish frames (which had been packed in ice and
were used within four hours after death) were randomly chosen and dipped in
one of the treatments for five minutes. After dipping the frames were removed
and drained for two minutes on sterile muslin cloth. The frames were then
shaken manually with peptone diluent and were plated onto petri film to assess
aerobic plate counts. After determining that TSP was the most effective
treatment, a shelf life study was conducted at 5°C using TSP. Another treatment
involved dipping the frames in the 10% TSP solution followed by an additional
two minute rinse in tap water at 5°C. Controls in this study were frames that had
been dipped in autoclaved tap water at 5°C. Aerobic plate counts were analyzed
over an eight day period. Resutts of this study showed that the control frames
were above acceptable APC (log 7) at day four. The washed treatments had
shelf lives of three to four days past day four with counts of log 4 on day eight.
Frames that were rinsed after phosphate dip treatment had higher counts, log 7,
than the unrinsed frames on day eight.
Phosphates have also been used as dips on other meat products such as
chicken skin. Capita et a/. (2001) studied the effects of trisodium phosphate
(TSP) solutions on the Listeria microflora of chicken skin during refrigerated (2°C)
storage. Chicken skin was inoculated with Listeria monocytogenes and then
dipped in either distilled water (control) or TSP solutions of 8, 10 or 12% for 15
minutes. Microbial analyses were conducted on days 0, 1, 3 and 5. Resutts of
this experiment showed that initial log reductions for the TSP dips compared to
the control ranged from 1.5 to 2.7 for the 8 and 12% treatments, respectively. By
day five, the 12% TSP dip reduced Listeria counts by log 3.6 whereas the 8%
TSP treatment resutted in a log 2.1 reduction compared to the water dipped
control.
Chlorine dioxide, used as a drinking water sanitizer in Europe, has been
studied as a possible dip to extend shelf life of fish. Kim et a/. (1 999) studied the
effects of different concentrations (20,40, 100 and 200 ppm) chlorine dioxide
dips prepared in 3.5% salt solutions on two species of whole or filleted fish,
grouper and Atlantic salmon as well as shrimp and scallops. The fish were
dipped in one of the various solutions for five minutes. All seafood products were
stored in bags in crushed ice at 5°C for seven days except for the whole fish
which were stored in crushed ice in a display case at 3°C. Sensory and microbial
analysis were conducted on days zero, three and seven. Results varied for the
different types of seafood with no significant difference observed among the
treatments on day seven in the grouper fillet. However, there was a significant
difference among treatments in the salmon fillets on day seven; the APC of the
control fillet and 200 ppm chlorine treated fillet were log 7.6 and log 6.5,
respectively. Significantly lower APC were also observed on day seven for
chlorine dioxide treated scallops, whole grouper, and whole salmon (muscle, not
skin). The most effective antibacterial treatments in this study resulted in less
than desirable sensory effects. Chlorine dioxide at levels of 100 and 200 ppm
resulted in some discoloration (rust color) of the scallops. Negative sensory
effects, melanosis and chlorine odor were also observed in the shrimp treated
with 100 and 200 ppm chlorine dioxide. These levels of chlorine dioxide also
caused a rusty color to develop in the salmon fillets and resulted in a bleaching of
the grouper fillets.
The effects of both storage temperature (0-2, and 5°C) and 2.5%
potassium sorbate (only at 5°C) on the shelf life of whole freshwater silver perch
over the course of 25 days were studied by Gelman eta/. (2001). The potassium
sorbate dipped fish were dipped for a total of 30 minutes. Analyses conducted
on days 3, 5, 10, 15, 20 and 25 included sensory, aerobic plate counts (flesh and
skin), total volatile base nitrogen (TVBN), and hypoxanthine concentrations. At
day 25 sensory scores remained highest in the 0 to 2°C stored fillets but
potassium sorbate increased sensory scores compared to the 5°C treatment with
no potassium sorbate. No significant differences in N B N levels were observed
in the 5°C treatment compared to 5°C with potassium sorbate although N B N did
remain steady in the 0 to 2°C treatment throughout the 25 days. The same
observations were observed with the hypoxanthine concentrations. Addition of
potassium sorbate slowed the microbial growth during the first 15 days,
especially on the skin, compared to temperature conditions of 5°C with no
potassium sorbate. Overall, lower temperatures were more effective in improving
shelf life of the fish compared to the chemical treatment.
Chitin and Chitosan
Chitin is found in a variety of places in nature. Sources include fungi,
insect exoskeletons, and marine invertebrates (Hirano, 1997). Shellfish chitin
from crab and shrimp comprises from 17% to 32% of the dry weight of the shell
(Shahidi and Naczk, 1989). Other sources such as fungi contain more chitin per
weight and are more prevalent. It is estimated that fungi and microorganisms
produce more than a hundred billion tons of chitin per year.
Worldwide crab and shrimp processing waste, as of 1991, was estimated
to be 1.5~1 o6 metric tons a year (Knorr, 1991). This waste is mostly dumped at

sea or in landfills, but stricter laws are limiting this practice (Shahidi and Naczk,
1989) which causes a dilemma for the industry. Utilizing the shellfish waste for
' chitin production provides a solution for the waste disposal problem. It is
estimated that the chitin that could be produced from the worldwide shellfish
processing waste is 1 . 0 ~ 1 0 ~ metric tons annually (Jeon et a/., 2000).
The chemical name of chitin is poly-P-(l,4)-N-acetyl-D-glucosamine
(Tsugita, 1989). The chemical name of chitosan, which is derived from chitin by
deacetylation, is poly-p-(l,4)-glucosamine. The structure of both of these
compounds is similar to cellulose (Figure 1). Both chitin and chitosan are
insoluble in water but can be dissolved in organic acids.
Figure 1. Chemical Structures of Cellulose, Chitin and Chitosan
Production of Chitosan from Chitin
Preparation of chitosan from crustacean shells involves several steps,
alternating treatments of base and acid (Shahidi and Naczk, 1989; Skaugrud and
Sargent, 1990; Healy et a/., 1994; Jeon et a/., 2000). The first step is to remove
protein from the shells with a weak basic solution (usually sodium hydroxide or
potassium hydroxide). The shells are then treated to de-mineralized with an
acid, resulting in chitin. The chitin is then treated with a strong basic solution,
which causes de-acetylation. The precipitate formed in this step is crude
chitosan. The crude chitosan is washed with water and dissolved in dilute
aqueous acid. A clear supernatant results from this step and the addition of a
basic solution neutralizes the supernatant and pure chitosan precipitates out.
The traditional method of chitinlchitosan production involves the use of
large amounts of acids and bases which can be cost-prohibitive and
environmentalty unfriendly. As enzymatic (Ilyina et a/., 2000; Jeon and Kim,
2000; Gildberg and Stenberg, 2000) and microbiological (Healy eta/., 1994)
methods of chitosan production are perfected, the process could potentially
become more environmentally friendly and cost-efficient.
Applications of Chitosan
Chitosan can be used in a vast array of applications. Chitosan has
properties that allow it to be incorporated into films and gels. Chen et a/. (1996)
incorporated chitosan into a film with methylcellulose and potassium sorbate or
sodium benzoate. The resulting film released up to 49% of the incorporated
preservatives within four hours of application with no changes in physical
properties of the film.
Uses for chitosan have been found in other fields such as medicine,
wastewater treatment, agriculture, cosmetics, and in food (Knorr, 1991).
Chitosan has been found to be useful as a wound management aid to reduce
scar tissue (Lloyd eta/., 1998). Applications have also been discovered in
controlled release of lactic acid bacteria during butter and cottage cheese
production by encapsulating the bacteria in chitosan beads (Zhou et a/., 1998).
Recently, chitosan has also been studied as an antimicrobial agent in
foods. Chitosan films have been used to improve shelf life of strawbenies by
delaying fungal growth and preventing moisture loss (Ghaouth et a/. , 1991 a). In
agriculture, chitosan has been demonstrated to be useful for aflatoxin control
(Cuero et a/., 1991). Chitosan has also been used to coat cucumbers and bell
peppers and was effective in reducing the amount of moisture loss and allaying
fungal growth (Ghaouth et a/., 1991 b).
Chitosan has been studied extensively by Korean researchers as an
additive in many food products including sweet potato starch noodles (Baek et
a/. , 2001), whipping cream (Kim et a/. , 2000), shortened cake (Ha et a/., 1999),
sausage (Park et a/., 1999) and fish meat paste (Cho et a/., 1998) although only
the abstracts are available in English.

Non-Meat Food Ap~lications of Chitosan
Roller and Covill(2000) studied the antimicrobial properties of chitosan
glutamate, a chitosan derivative, in mayonnaise and mayonnaise-based shrimp
salad. The researchers initially tested the effects of chitosan glutamate on
controlling microbial growth in laboratory media. Afterwards, the derivative was
tested in mayonnaise that was inoculated with common fresh mayonnaise
spoilage organisms; Salmonella enteritidis, Z. bailii, and L. fructivorans. The
mayonnaise was prepared with acetic acid or lemon juice. Chitosan was added
to the mixtures at a level of 3 g/L. Growth of organisms in the chitosan dissolved
in lemon juice was only slightly inhibited, by one log cycle. When chitosan was
dissolved in acetic acid, the effects were much more significant, resulting in
bacterial reductions of three to four log cycles. The mayonnaise was reported to
have a gelled appearance at chitosan levels of 3 g/L.
Chitosan glutamate was also tested as an anti-fungal agent in apple juice
(Roller and Covill, 1999). In this study, chitosan glutamate was tested for its use
in controlling bacterial growth in laboratory media prior to use in apple juice. Eight
strains of molds and yeasts were tested in the apple juice trials. Levels of
chitosan glutamate in the apple juice ranged from 0.1 to 5 g/L. All eight species
tested were inhibited by chitosan glutamate. Viable organisms inoculated into
the apple juice were reduced by three log cycles initially and an extended lag
phase was observed. Some of the organisms showed normal growth after the
initial lag phase but others such as Zygosacchammyces bailii were completely
inhibited. The level of chitosan needed to inhibit the fungal species varied widely
as well. Z. bailii was inhibited at levels of 0.1 g/L whereas Sacchammyces
ludwigii required a level of 5 g/L for inhibition. These results demonstrated the
variability of chitosan action on microorganisms.
Degraded chitosan and its effects on antimicrobial action have also been
studied. Rhoades and Roller (2000) theorized that degrading chitosan enhances
its antimicrobial action. The investigators studied the effects of degraded
chitosan versus native chitosan in laboratory media, saline solution, and apple
juice. The investigators degraded the chitosan with lysozyme and crude papaya
latex. When mildly degraded chitosan was tested in laboratory media against
various strains of bacteria and fungi, an increase in antimicrobial action was
observed. Highly degraded chitosan displayed no antimicrobial action. When
the degraded chitosan was tested in hummus, a chickpea dip, at levels of 5 g/L
the total natural mesophilic organism counts were reduced between four and five
log cycles. According to the researchers, the slight increase in activity of the
degraded chitosan compared to the native chitosan was not enough to justify the
extra time and effort required to degrade the chitosan.
Since traditional chitosan can only be dissolved in an acid solution work is
being done to make chitosan applicable to non-acidic foods. Tsai et al. (2000)
evaluated the use of degraded chitosans, chitoligosaccharides, as antibacterial
agents in milk. Chitoligosaccharides prepared by enzymatic degradation of
chitosan by cellulase were used in this experiment. The chitoligosaccharides
were first tested in nutrient broth against common raw milk pathogens.
Subsequent testing took place in sterilized milk that was inoculated with the
same organisms used in the nutrient broth. The final test took place in raw milk
containing chitoligosaccharides.
In nutrient broth the minimal inhibitory concentrations of
chitoligosaccharides required for the organisms tested ranged from 5 to 29 ppm.
In contrast the native chitosan required concentrations from 50 to 100 ppm to be
effective. In raw milk samples inoculated with bacterial cultures
chitoligosaccharides were able to reduce counts by three log cycles. The use of
chitoligosaccharides extended the shetf life of the raw milk by four days at 4°C.
Use of Chitosan in Meat Products
Chitosan has recently been studied as an additive in meat products with
much more research being conducted in Korea and other Asian countries (Lin
and Chao; 2001; Jo et al., 2001). Earlier research was conducted incorporating
chitosan into ground beef (St. Angelo and Vercellotti, 1992; Darmadji and
Izumimoto, 1994).
Jo et al. (2001) researched the quality of a sausage product prepared with
water soluble chitosan oligomers (molecular weight of 5000 kDa). The sausage
was formulated with the chitosan oligomers at a level of 0.2% and then was
either vacuum packaged or stored in air at 4°C for three weeks. Each week, the
sausage was tested for microbial growth, lipid oxidation (TBARS), Hunter color
and sensory attributes. Results of this experiment indicated that the addition of
the chitosan oligomer had no effect on the microbial growth in the sausage,
regardless of storage conditions. At week three of storage under aerobic storage
conditions, lipid oxidation was significantly (p < 0.05) reduced compared to the
control sausage while no differences were observed in the vacuum packaged
sausage. Under aerobic conditions the sausage with the chitosan oligomer had
slightly higher L-values than the control sausage with the exception of day zero.
The L-values of the vacuum packaged sausage with chitosan oligomer showed
no difference compared to the control. No changes in the a-values were
observed with any packaging method or sausage treatment compared to the
controls. Addition of chitosan to the sausage resulted in higher b-values
compared to the controls. Sensory analysis revealed no significant differences
among treatments
Addition of chitosan to a low fat Chinese sausage was studied by Lin and
Chao (2001). Three different molecular weight chitosans [(LMW, 150 kDa),
(MMW, 600 kDa) and (HMW, 1250 kDa)] in 1% lactic acid were added to
sausage at a level of 0.1 %. The sausages were vacuum packaged and stored at
4°C for a period of nine weeks. Analyses conducted at week zero, three, six and
nine included: pH, water holding capacity, lipid oxidation, Hunter color, sensory
evaluation and aerobic plate counts. Results of this study revealed that pH of the
chitosan treated sausage were lower than the controls, probably due to the lactic
acid. Water holding capacity was greater in sausages formulated with MMW and
LMW chitosan compared to the control. Hunter color a values were lower,
compared to the control and the L and b values were higher than the control. No
differences were found among treatments for any sensory attributes. The
addition of the chitosan treatments did not reduce the microbial counts of the
sausage formulations throughout the storage period, compared to the control.
Ouattara et a/. (2000) took a different approach to applying chitosan to
meat products. The film-forming properties of chitosan were taken advantage of
by incorporating organic acids (acetic and propionic) alone or together with
cinnamaldehyde or lauric acid into a chitosan film. These films were studied in
contact with various processed meat products (bologna, ham and pastrami)
vacuum packaged at 4 or 10°C for 21 days. Microbial counts (of bacteria
inoculated onto the meats) and the release of acid from the film matrix were
determined on days 0, 7, 14, and 21. Release of the acetic acid from the
chitosan films was relatively slow with between 2 and 22% of the acid remaining
in the matrix after 168 hours of storage. Propionic acid was completely released
from the matrix within 48 hours of storage, regardless of meat product. The
growth of lactic acid bacteria were not inhibited by the chitosan film but the
growth of Entembacteriaceae and Serratia liguifaciens were either delayed or
completely inhibited by the films.
St. Angelo and Vercellotti (1 992) studied the effects of N-
carboxymethylchitosan as a flavor protector in ground beef. The purpose of this
study was to utilize N-carboxymethylchitosan to preserve the beefy flavor in
warmed over meat products. Some off flavors in meat products are due to lipid
oxidation. N-carboxymethylchitosan was used instead of chitosan because it is
water-soluble at all pH levels, and can chelate transition metals that catalyze lipid
oxidation. The N-carboxymethylchitosan was added directly to the meat at a

level of 0.5%. The hamburger meat patties were then cooked and refrigerated.
The control patties were frozen, then thawed, and re-heated.
After two days of refrigerated storage a trained sensory panel evaluated
the re-heated hamburger patties. It was discovered that N-
carboxymethylchitosan effectively prevented the formation of warmed over flavor
in the hamburger patties. No difference in the flavor of the patties with N-
carboxymethylchitosan compared to the freshly prepared control was detected.
A thiobarbituric acid assay (TBARS) was performed to determine the role of N-
carboxymethylchitosan in preventing lipid oxidation. When N-
carboxymethylchitosan was added at a level of 600 ppm lipid oxidation was
inhibited by 60%.
Darmadji and lzumimoto (1 994) also studied the effect of chitosan in meat
preservation. In this study minced beef was mixed with powdered chitosan at
levels of 0.2, 0.5 and 1 %. A multitude of tests were performed on the samples
including sensory, chemical, microbiological, and color attributes. After the
chitosan was mixed with the minced beef, the meat was wrapped in polyethylene
film (Glad Products Company; Oakland, CA) and incubated either at 30°C for 0,
12, 24, or 48 hours or at 4°C for 0, 3, 5, or 10 days. At all of the time intervals,
total volatile base nitrogen was tested as well as TBARS, microbial analysis,
color analysis and sensory analysis.
Microbiological inhibition was greatest at both temperatures in samples
with 1% chitosan. A reduction of two log cycles was evident in the refrigerated
samples at 1% chitosan levels compared to the untreated control. Inhibition of
bacteria by chitosan varied by species; Staphylococci were the most resistant.
Gram-negative bacteria were inhibited by up to two log cycles. Chitosan was
also able to inhibit the formation of total volatile basal nitrogen and was most
effective at the 1 % level.
Use of Chitosan in Seafood Products
The use of chitosan as a preservative in seafood products has been
studied to a small degree. Simpson et a/. (1997) studied the use of chitosan in
raw shrimp, both whole and beheaded. The dip consisted of sodium acetate and
Tween 80 and chitosan in levels of 0, 1 or 2%. The pH of the chitosan dip was
adjusted to 5.6 to assure full solubility. The raw shrimp was dipped and stored in
vacuum-sealed bags on ice at 4-7°C for a twentyday period.
During the course of the experiment the shrimp samples were subjected
to TVBN, nucleotide, and sensory analyses. The sensory analysis focused on
odor, appearance, and degree of melanosis. Microbiological sampling was
performed using inoculated samples. Natural spoilage bacteria in the shrimp
were not studied.
The resutts of this study indicated that chitosan was able to inhibit
microbial growth in all of the samples. However, the headless samples were not
as greatly affected by chitosan which was theorized by the researchers to be due
to higher initial bacterial levels in the shrimp due to contamination from the guts.
The total microbial counts for both whole and headless shrimp were significantly
reduced (~~0 .05 ) . Lag phases of all of the spoilage organisms tested were
extended as well. Some organisms such as 13. cereus had an initial lag phase
extension but then the growth of bacteria increased rapidly and surpassed the
control by 25 hours of incubation. Results of the TVBN analysis of the shrimp
samples indicated a significant reduction in the formation of total volatile bases
( ~ ~ 0 . 0 5 ) with the use of chitosan. Chitosan was able to prevent melanosis only
in samples that had not been beheaded.
This study demonstrated chitosan's varied effect on different organisms.
Differences in the molecular weight of the chitosan were theorized to be the
cause of some of the variability from this study compared to other studies
conducted using the same spoilage microorganisms. Low molecular weight
chitosan seemed to be a more effective inhibitor of microbial growth for some
organisms such as E. coli (Chang et a/. , 1989).
Jeon et al. (2002) studied the preservative effects of different molecular
weight chitosan coatings on Atlantic cud and herring for a 12 day period at
refrigerated temperature (4°C). Three different chitosans were prepared from
crab processing waste by altering the deacetylation times. Molecular weight and
apparent viscosity of these chitosans were determined by using a rotational
viscometer. The apparent viscosities of the three chitosans were 360, 57 and 14
centipoise (cP). The edible coatings were produced by first dissolving 1 %
chitosan in a 1% acetic acid solution. Glycerol was then added to the solutions
at a concentration of 1 mL per gram of chitosan. The resulting dips were applied
to the fish fillets for 30 seconds, then the fillets were allowed to stand for two
minutes at which time they were dipped again for 30 seconds. After dipping, the
fillets were dried for two hours at 40°C in a forced air oven to form a film. All
samples were then stored at 4°C for the rest of the experiment. Fillets were
tested at days four, six, eight, 10 and 12 for moisture loss, lipid oxidation, total
volatile base nitrogen, trimethylamine, hypoxanthine and microbial growth.
Results of this experiment indicated that the 360 and 57 cP chitosan
solutions were the most effective in preventing moisture loss, reducing lipid
oxidation, reducing N B N and TMA concentrations and lowering microbial
counts. The most highly degraded, 14 cP chitosan coating was not as effective
as the more viscous chitosan solutions. N B N concentrations were kept below
30 mg of N per 100 g of fish, the qualtty cutoff value, throughout the entire study
in both the cod and the herring with the 360 and 57 cP chitosan treatments
whereas the untreated cod fillet exceeded this value by day six. Bacterial counts
in the untreated and 1 % acetic acid dipped cod fillets exceeded the quality cutoff
of 10~CFlJlg between day six and day ten whereas counts in the chitosan treated
fillets stayed below this level throughout the 12 day experiment. The chitosan
treatments kept the bacteria in the stationary phase through day six whereas the
counts continued to climb in the control and acetic acid dipped treatment. This
study indicates that the degree of degradation of the chitosan may alter the
preservative power of chitosan treatments when used as a dip.
Chen et a/. (1 998) studied the preservation of oysters with two chitosan
derivatives, N-suifobenzoyl and N-sutfonated chitosan. It was discovered that N-
sulfobenzoyl was much more effective than N-suifonated chitosan at inhibiting
microbial growth. The authors theorized that sulfonating the chitosan created a
negative charge and thus repelled the cell membrane of the bacteria, which also
had a negative charge.
This study did not investigate natural flora within the oyster meat. The
oysters were inoculated with potential contaminants. Sulfobenzoyl chitosan at
2000 ppm was able to reduce bacterial counts between three and four log cycles.
Sulfobenzoyl chitosan was also found to be much more water soluble than native
chitosan. Water solubility is useful in food applications, atthough sensory
analyses were not conducted in this study to determine consumer acceptability.
Chitosan is currently being studied as an anti-oxidative agent in cooked
herring (Janak Kamil et a/., 2000). Over a ten day period the effects of chitosan
on lipid oxidation in cooked herring were studied using peroxide value analysis,
conjugated dienes, 2-thibarbituric acid-reactive substances, and headspace
propanol. Levels of 150 and 200 ppm of chitosan were effective in reducing lipid
oxidation products. Chitosan was demonstrated to be an effective tool for
reducing lipid oxidation in this high fat fish.
Antimicrobial Action of Chitosan
There has been much speculation on the mechanisms involved in
chitosan's antimicrobial properties. Antibacterial properties are thought to be a
result of several factors. Chitosan's chelating properties may remove metals
needed by bacterial enzymes (Muuarelli, 1977). Other theories postulate that
chitosan's cationic nature disrupts the cell membranes by reacting with the
negatively charged membrane (Chen et a/., 1998).
Wang (1 992) examined the antibacterial effects of chitosan in vitro against
a variety of bacteria typical in food. The organisms tested were Staphylococcus
aureus, Escherichia coli, Yersinia entercolitica, Listeria monocyfogenes and
Salmonella typhimurium. Chitosan, at levels of 0, 0.5, 1 .O, 1.5, 2.0 and 2.5% was
added to nutrient broth that had been acidified with acetic acid to a pH of either
5.5 or 6.5. The broths were inoculated with bacteria afier the mixtures had been
autoclaved and cooled. The inoculated flasks were incubated at 30°C for eight
days and were sampled and spread plated on each day of the experiment.
Results of the experiment indicated that chitosan was not effective in inhibiting
microbial growth in the pH 6.5 broths. However, the growth of most of the
organisms was significantly reduced at pH 5.5. Chitosan was most effective
against S. aureus, S. typhimurium, E. coli and Y. entemlitica but was not as
effective against L. monocytogenes.
Helander et a/. (2001) studied the effects of chitosan on the cell
membranes of gram-negative bacteria including Escherichia coli, Pseudomonas
aenrginosa and Salmonella typhimurium. The effects of chitosan on the outer
membrane of the bacteria were analyzed by studying the uptake of a
hydrophobic probe, 1-N-phenylnapthylamine (NPN), both in the presence and
absence of MgCI2 (which protects gram-negative bacteria from outer membrane
damage), and by electron microscopy. The chitosan concentrations used were
100 and 250 ppm at two different pH levels, 5.3 and 7.2. Results of the study
indicated that 250 ppm chitosan at a pH of 5.3 caused uptake of NPN by E. coli,
P. aenrginosa and S. typhimurium. * The uptake was reduced in the presence of
MgC12, in the case of E. coli and S. typhimurium, and was totally inhibited in P.
aemginosa. Electron microscopy revealed that 250 ppm of chitosan at a pH of
5.3 caused visible changes in the outer membrane of both E, coli and S.
typhimurium as evidenced by thickening and formation of vesicular structures on
the outer membrane, thereby affecting the barrier properties of the bacterial cell.
Chitosan derivatives have been demonstrated to have greater
antimicrobial activity than native chitosan (Sudarshan et al. , 1992). When
studying various gram-positive and gram-negative bacteria in media, it was
discovered that chitosan glutamate and chitosan lactate were able to reduce
bacterial log counts from one to five cycles in an hour for both types of bacteria.
(Sudarshan et al., 1992) also reported evidence that leakage of intracellular
material was one of the mechanisms of chitosan action at low concentrations. At
higher concentrations, antibacterial activity was attributed to chitosan coating the
surface of the bacteria, thereby impeding mass transfer across the cell
membrane in both directions.
Jeon and Kim (2000) studied the antimicrobial effects against E. coli of a
chitooligosaccharide (COS) mixture produced by chitinase in a bioreactor. A 1%
chitosan solution (89% degree of deacetylation) prepared in lactic acid was
adjusted to pH 5.5. After producing the COS mixture, the antibacterial effects of
the mixture against E. coli were analyzed by adding 0.5 mL of the 1 .O% mixture
in 0.05 M acetate buffer (pH 6.0) to 49 mL of trypticasease soy broth solution
containing 0.5 mL of cultured E. coli suspension. This mixture was incubated at
37°C with shaking, and inhibition was measured spectrophotometrically at 640
nm. The addition of native chitosan totally inhibited growth of E. coli compared to
the control and the addition of COS also inhibited growth but not to the same
degree. A study of just the COS in different percentages (0.01, 0.05, 0.1 and
0.5) revealed an increasing inhibition of growth linked to increasing COS
concentration.
The antibacterial effects of three different molecular weight chitosans were
further studied by Jeon et al. (2001). The three different chitoligosaccharides
defined as high molecular weight chitoligosaccharides (HMWCOS), medium
molecular weight chitoligosaccharides (MMWCOS) and low molecular weight
chitoligosaccharides (LMWCOS) were produced by enzymatically degrading
1 .O% chitosan (89% degree of deacetylation) solutions with chitosanase (694Ul g
protein) in a membrane reactor with three membranes of 10, 5 and 1 kDa
respectively. Four gram-neg ative (E. coli, E. coli 01 57-H7, Salmonella
typhimurium and Pseudomonas aenrginosa) and five gram-positive
(Streptococcus mutans, Micrococcus luteus, Staphylococcus autws,
Staphylococcus epidemidis and Bacillus subtilis) bacteria were tested. Both
minimum inhibitory concentrations and bactericidal activity of each COS fraction
were analyzed. A bactericidal study was conducted in which a bacterial culture
was added to acetate buffer at pH 6.0 and incubated at 37°C for one hour at
which time serial dilutions were made and plated onto trypticase soy agar.
Minimum inhibitory concentrations were determined in trypticase soy broth (no
pH stated). Results of the study showed that bactericidal activity was most
effective with the HMWCOS and undegraded chitosan. The most effective

treatment against P. aeruginosa was the undegraded chitosan, resulting in a
68% kill. The LMWCOS treatment resulted in only a 22% kill of P. aeruginosa.
All treatments performed better with the other gram-negative bacteria but were
more effective against the gram-postive bacteria. Bactericidal activity against all
bacteria decreased with decreasing molecular weight. Minimum inhibitory
concentrations (MIC) were lowest for the undegraded chitosan treatments for all
bacteria. Pseudomonas aeruginosa required the highest concentrations of every
treatment to inhibit growth. The most susceptible gram-positive organisms were
Streptococcus mutans, Micrococcus luteus and Staphylococcus aureus with MIC
for all treatments ranging from 0.01 to 0.1 %. The results of this experiment
indicate that the higher molecular weight chitosans had more antibacterial activity
and that gram-positive organisms were more susceptible to the effects of
chitosan.
Liu et al. (2000) also studied the antibacterial effects of
chitoligosaccharides on E.coli. The chitosan was placed in glass vials and was
degraded by using y irradiation at doses of up to 100 kGy under vacuum. The
chitosans were dissolved in 2M acetic acid and were added to the nutrient broth.
The E. coli culture was inoculated into the media at different pH levels and
concentrations and was incubated at 37°C for 24 hours. Every two hours the
growth was tracked with a spectrophotometer at 610 nm. The authors also
attached a fluorescent marker label (fluorescein isothiocyanate) to the chitosan
oligomers and the movement of the marker was tracked with a confocal laser
scanning microscope. Results of the experiment indicated that the water soluble
chitosan oligomers had a good antimicrobial effect against E.coli. Above pH 6.3
the antimicrobial activity decreased and no antimicrobial activity was observed
above pH 7.0. The reason for the inhibition was proposed to be the uptake of the
chitosan oligomers into the bacterial cell as evidenced by the labeled marker.
The authors proposed that the uptake of the chitosan caused the inhibition of
transcription from DNA.
Enzymatic Degradation of Chitosan
Enzymatic degradation of chitosan has been studied as a way to confer
solubility to chitosan at neutral pH. Many different enzymes and methods have
been successfully utilized (Ohtakara et a/., 1988; Muuarelli et a/., 1994;
Nordtveit et a/., 1994; Muzzarelli et a/., 1995; Kim et a/., 1997; llyina et a/., 2000;
Shin-ya et a/., 2001). Pantaleone eta/. (1992) studied the effects of some
commercially available enzymes on chitosan solutions prepared in either 5%
acetic acid or in acetate buffer at pH levels of 3.3, 3.6 4.0, and 5.5. Low and high
viscosrty chitosans, both with a declared 85% deacetylation level, were studied at
concentrations of 1.0 or 2.5% w/v for the low viscosity and 0.5 or 1 .O% for the
high viscosity chitosan prepared in the acetic acid solution or the acetate buffer.
The enzymes tested included glycanases, amylases, proteases, tannases and
lipases, 38 in total. The enzymes were tested at a 1% level by weight of the
chitosan. Enzymes were added to the chitosan solutions at ambient temperature
and the reduction in viscosity was measured after a 24 hour period using a
Brookfield DV II viscometer. Viscosity reductions varied widely by enzyme class
depending on the source of the enzyme. In the glycanase class viscosity
.reduction ranged from 68-99%. In the protease class viscosity reductions of 0 to
98% occurred, with papain achieving the greatest and most rapid viscosity
reductions. Viscosity reductions of 35 to 100% occurred in the lipase enzyme
class.
A more extensive study was conducted by Yalpani and Pantaleone (1 994)
who tested a number of factors including pH, temperature, original molecular
weight of the substrate, chitosan concentration (0.5, 1.0 and 2.0%) and degree of
chitosan acetylation. Many different enzymes were studied including cellulase,
lysozyme, lipase, hemicellulase, papain, chitinase, and a human saliva
preparation. The conversion of chitosan to degraded chitosan was measured
viscometrically and by a reducing sugar assay. Many commercial enzymes were
able to use chitosan as a substrate. In many cases the viscosity reduction was
much greater with some of the commericial enzymes rather than with chitinase.
Specific activity of the enzymes was highest with lower concentrations of
chitosan. The authors theorized that there was no common lytic agent shared by
the enzymes because there were different ideal pH, temperature, molecular
weight, degree of deacetylation and substrate concentrations for each enzyme.
Zhang and Neau (2001) studied the degradation of chitosan solutions (0.1,
0.3, 0.5 and 0.7%) with five different degrees of deacetylation (77.8, 76.0,77.0,
85.6 and 92.4%) by P-glucosidase (381 1 Ulmg) from an almond emulsion.
Hydrolysis was conducted in a 0.1M acetate buffer at pH 5.O.The enzyme was
added to the solution at a level of 0.02% wlv. The changes in viscosity were
measured over a five hour period using an Ubbelholde capillary viscometer.
Results of the experiment indicated that the initial degradation rate was
dependent on molecular weight of the chitosan and the degree of deacetylation.
Chitosans with a lower molecular weight and lower degree of deacetylation were
more susceptible to hydrolysis by the P-glucosidase. The most rapid
depolymerization occurred in the first two hours. The researchers theorized that
the enzyme complex may have included a chitinase which may have been
responsible for the hydrolytic activity.
Zhang et a/. (1 999) successfully degraded chitosan solutions with a
mixture of enzymes that included cellulase (0.8 Ulmg), alpha amylase (500
Ulmg) and proteinase (40 Ulmg). The conditions of hydrolysis were 0.5 g of
chitosan (molecular weight 1,500,000 and a degree of deacetylation of 76%)
dissolved in 10 mL of 2% acetic acid, pH adjusted to 5.6. Five mg of the enzyme
mixture (dissolved in 0.05 mol1L acetate buffer) was added to the chitosan
solution and the enzyme was allowed to act on the substrate for 40 minutes at
40°C. The reaction was stopped by boiling the mixture for 10 minutes. Water
solubility was confirmed when a portion of the mixture was removed and mixed
with concentrated sodium hydroxide, with no subsequent precipitate formation.
Characterization of the chitosan oligomers formed was conducted using a hollow
membrane filtration membrane to fraction off portions, followed by mass
spectrophotometer analysis. By continuous removal of degraded products of a
specific molecular weight range, a small scale continuous method of chitosan
degradation was developed.
Safety and Regulatory Status of Chitosan
Food ingredients must be generally recognized as safe (GRAS) by the
FDA in the United States before they can be used in food products. Chitosan
has not been proclaimed GRAS officially by the FDA but one company has tried
to get approval for their chitosan. Primex Ingredients ASA, a Norwegian shrimp-
derived chitosan manufacturer, proclaimed to the FDA self affirmed GRAS status
for their product on March 15,2001 (Food and Drug Association, 2001). After a
year, Primex withdrew this proclamation without receiving a response from the
FDA. However, the FDA has approved chitosan for medical uses such as
bandages and drug encapsulation. Although chitosan has not achieved GRAS
status in the United States, it is widely used in foods in Italy, Finland, Korea and
Japan.
Preliminary research studies indicate that chitosan ingestion has some
beneficial effects on health including an improved HDL-cholesterol/totaI
cholesterol ratio and lower total serum cholesterol (Maezaki et a/., 1993). Kim et
a/. (2001) studied the oral toxicity of chitosan oligosaccharides in rats. The
authors reported that the sub acute toxicity of chitosan oligosaccharides was low
even at the maximum dosage used in the study, 2000 mgkg by weight of the
rats. A double blind human study by Pittler et a/. (1 999) studied the effects of
chitosan supplementation on 34 overweight individuals. After four weeks, no
significant weight loss was observed and no differences in serum levels of
vitamin A, D, E and beta carotene were observed between the placebo group
and those who received chitosan. However, the group receiving chitosan
supplementation did have higher vitamin K levels than the placebo group. No
serious side effects of chitosan supplementation were noted. A review article by
Ylitalo et a/. (2002) reported that no significant symptoms have been observed in
any human studies, some lasting up to 12 weeks, other than mild constipation or
diarrhea in a small percentage of the participants. Conversely, there are some
concerns regarding chitosan ingestion including proliferation of bacterial
pathogens in the digestive system due to loss of beneficial flora (Tanaka et a/.,
1997), chelation of calcium and other minerals and possibly other metabolic
concerns (Deuchi et a/., 1995). Growth suppression has been reported in tilapia
(Shiau and Yu, 1999) fed chitosan-supplemented diets containing between two
and ten percent chitosan. Shellfish allergenicity may also be a concern since
chitosan is derived from crustacean shells.

MATERIALS AND METHODS: ANTIMICROBIAL EFFICACY OF CHITOSAN DIPS AND POWDERED
CHITOSAN ON ATLANTIC SALMON PRODUCTS
Objectives
The objectives of this study were to determine the antimicrobial efficacy of
a solubilized chitosan dip on Atlantic salmon fillets and powdered chitosan on
ground salmon trim. Differences in aerobic plate counts, total volatile base
nitrogen, trimethylamine levels and pH between salmon products treated with
high and low molecular weight chitosans were also studied.
Experimental Design
The experiment was designed to analyze the effects of different chitosan
treatments on pH, total volatile base nitrogen (TVBN), aerobic plate counts, and
levels of trimethylamine in Atlantic salmon during a two week storage period at
refrigerated temperatures. The experiment was also designed to test effects of
low and high molecular weight chitosan, chitosan percentages (0.5, 1.0 and 2.0),
and solubilized versus non-solubilized chitosan on fish quality. The chitosan dip
portion of the study consisted of four fillet treatments prepared in triplicate, and
the powdered chitosan portion of the experiment consisted of seven ground trim
treatments, also prepared in triplicate batches (Tables 1 and 2). Analyses were
conducted on days one, three, six, 10 and 13 of refrigerated storage.

Salmon Trim Study
Pre~aration of Chitosan
High and low molecular weight crab chitosan both with a declared
deacetylation percentage of 75-85% were purchased from Aldrich (Milwaukee,
WI). In order to achieve a greater surface area and greater distribution in the
salmon trim the chitosan flakes were ground in a Wiley mill (Arthur Thomas Co.;
Philadelphia, PA) with a size 20 sieve attachment two days prior to use. The
powdered chitosan was then weighed into small sample bags (VWR; West
Chester, PA) prior to mixing with the salmon trim.
Ap~lication of Chitosan
Fifty pounds of salmon, consisting of thirty pounds of trim (skinless
portions of salmon remaining after commercial filleting) and twenty pounds of
fillet were purchased from a commercial Atlantic salmon farm (Heritage Salmon;
Eastport, ME). The salmon trim was transported in styrofoam totes with ice to
Holmes Hall at the University of Maine the same day it was processed. The
salmon was then ground once through a commercial food grinder (Hobart
Manufacturing Corporation (Model 84141); Troy, OH). The ground salmon trim
was stored in metal bowls covered with Cling Wrap@ (Glad Products Company;
Oakland, CA) in the refrigerator at 4°C until further treatment. Each batch of
salmon was mixed with the previously prepared powdered chitosan in an electric
mixer (Kitchenaid; St. Joseph, MI) for one minute on speed four with the paddle
blade attachment. Both the mixer blade and bowl were washed between each

treatment. Each batch (625 g) was divided between five separate sample bags
(-125 g each), one for each day of analysis.
Table 1. Treatment Codes for Salmon Trim Study
Code Treatment
T Salmon Trim with no Chitosan Added
STL 0.5% Low Molecular Weight Chitosan in Salmon Trim
ITL 1 .O% Low Molecular Weight Chitosan in Salmon Trim
2TL 2.0% Low Molecular Weight Chitosan in Salmon Trim
STH '0.5%High Molecular Weight Chitosan in Salmon Trim
ITH 1 .O% High Molecular Weight Chitosan in Salmon Trim
2TH 2.0% High Molecular Weight Chitosan in Salmon Trim
Chitosan Dip Preparation and Use on Salmon Fillet
The remaining 20 pounds of salmon was in the form of whole fillets. Upon
arrival at the University of Maine, the fillets were cut into approximately 125 g
portions. The chitosan dips were prepared by mixing 10 g of either high or low
molecular weight chitosan (Aldrich Chemical Company Inc.; Milwaukee, WI) with
1 L of a 1 .O% acetic acid (EM Science; Gibbstown, NJ) solution. The dips were
mixed in a household Kitchenaid (Model KSMSO) mixer (Kitchenaid; St. Joseph,
MI) at a setting of four for five minutes with the paddle attachment. The
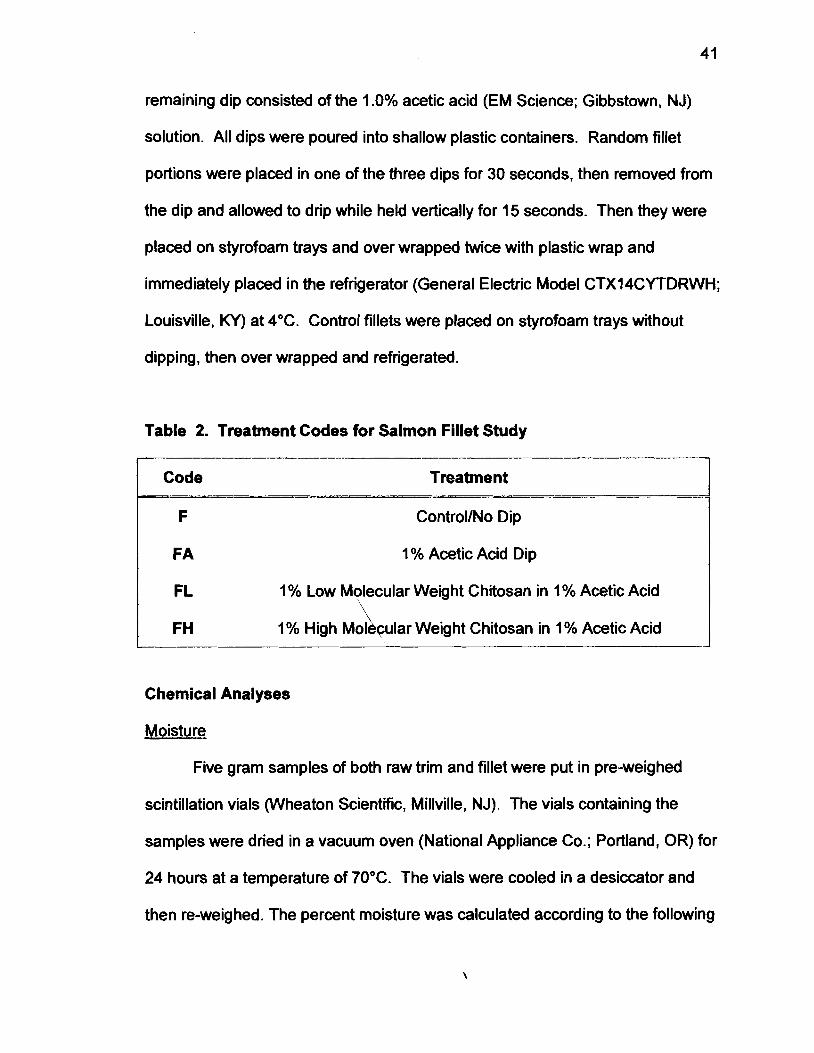
41
remaining dip consisted of the 1 .O% acetic acid (EM Science; Gibbstown, NJ)
solution. All dips were poured into shallow plastic containers. Random fillet
portions were placed in one of the three dips for 30 seconds, then removed from
the dip and allowed to drip while held vertically for 15 seconds. Then they were
placed on styrofoam trays and over wrapped twice with plastic wrap and
immediately placed in the refrigerator (General Electric Model CTX14CYTDRWH;
Louisville, KY) at 4°C. Control fillets were placed on styrofoam trays without
dipping, then over wrapped and refrigerated.
Table 2. Treatment Codes for Salmon Fillet Study
Code Treatment
F ControlINo Dip
FA 1 % Acetic Acid Dip
FL 1 % Low Molecular Weight Chitosan in 1 % Acetic Acid
FH 1
1 % High Moleqular Weight Chitosan in 1 % Acetic Acid
Chemical Analyses
Moisture
Five gram samples of both raw trim and fillet were put in pre-weighed
scintillation vials (Wheaton Scientific, Millville, NJ). The vials containing the
samples were dried in a vacuum oven (National Appliance Co.; Portland, OR) for
24 hours at a temperature of 70°C. The vials were cooled in a desiccator and
then re-weighed. The percent moisture was calculated according to the following
calculation: [((vial wt. + sample wt.) - (vial + dry sample wt))/sample wt.] x 100.
Both samples were analyzed in triplicate.
The dried samples from the moisture analysis were removed from the
vials and were ground with a mortar and pestle and at least one gram of sample
was weighed into pre-weighed scintillation vials. The vials were placed in a
muffle oven (Thermodyne F-A1730, Dubuque, IA) at a temperature of 550°C for
6 hours. The vials were then reweighed and the percent ash was determined
according to the following equation: [((vial wt. + ash wt.) - (vial wt.))l(sample
wt.)] x 100. Samples were analyzed in triplicate.
Minerals
Each ashed sample was dissolved in 1 mL each of concentrated nitric acid
(EM Science; Gibbstown, NJ) and hydrochloric acid (J.T. Baker; Phillipsburg, NJ)
in the scintillation vial. Ten mL of distilled water was then added to each vial and
the samples were then agitated with a vortexer (Vortex-Genie Model K-550-G;
Bohemia, NY). Each sample was transferred to a 100 mL quantitative flask and
was brought to volume with distilled water. Samples were analyzed utilizing an
Inductively Coupled Argon Emission Spectrophotometer (ICP) by the Analytical
Lab in Deering Hall at the University of Maine. The samples were tested for
aluminum, boron, calcium, copper, iron, potassium, magnesium, manganese,
sodium, phosphorous and zinc. Mineral concentrations were determined
according to the following calculation: (mineral ppm x dilution factor)/ wt. of wet
sample. Samples were analyzed in triplicate.
Total Volatile Base Nitrogen
Fillet and trim samples were removed from the refrigerator on each day of
analyses and a 25 g sample was taken for N B N analysis according to the
method of Botta et a/. (1984). Fifty mL of 7.5% trichloroacetic acid (Sigma; St.
Louis, MO) were added to 25 g of each sample and the mixture was
homogenized for 30 seconds in a microblender (Waring; New Hartford, CT).
The homogenized contents of the blender were transferred to 200 mL centrifuge
tubes (VWR; Boston, MA) and were placed in a centrifuge (Sorvall RC-5B;
Newtown, CT) for 20 minutes at 4000rpm (261 1 x g). The resulting supernatant
was collected in a Falcon screw top test tube by passing it through a funnel lined
with Whatman #1 fluted filter paper (Fisher Scientific; Pittsburgh, PA). The
extracted samples were refrigerated at approximately 5°C until they could be
analyzed. Fifteen mL of each sample were placed in the glass addition funnel of
a micro Kjeldahl rapid distillation unit (Labconco Corp.; St. Louis, MO) set on
seven. Four mL of a 10% sodium hydroxide solution were added to the funnel
and the resulting distillate was collected in 50 mL Erlenmeyer flasks containing
15 mL of 4% boric acid (Fisher Scientific; Fair Lawn, NJ) solution plus eight
drops of indicator solution (two parts 0.2% alcohol methyl red : one part 0.2%
alcohol methylene blue). The flasks containing the distilled sample were then
titrated with 0.25N hydrochloric acid until the color changed back to the color

prior to distillation. The number of mg of nitrogen per 100 g of fish was
calculated with the following equation: [(mL HCI titrated x Normality of HCI x
14.007 x (67.5 mL / 15 mL)] x (100 g / 25 g).
Trimethvlamine Analysis
Extracts of each sample were taken as described in the N B N method
and the analysis was conducted as described by Hungerford (1 998). Twenty five
grams of each sample were placed in microblender Waring; New Hartford, CT).
Fifty mL of a 7.5% trichloroacetic acid solution (Sigma; St. Louis, MO) were
added to the blender and the sample was blended for 30 seconds until
completely homogenized. The homogenized mixture was then poured into
centrifuge tubes W R ; Boston, MA) and centrifuged at 4000 rpm (261 1 x g) for
20 minutes. The supernatant was collected in Falcon tubes by passing it through
a funnel lined with fluted filter paper. The collected supernatant was kept
refrigerated at approximately 5°C until analysis. Between one and three mL of
filtrate were pipetted into large glass test tubes for each analysis, depending on
the day of collection. A stock solution of TMA was made consisting of 0.682 g of
trimethylamine hydrochloride, one mL of concentrated hydrochloric acid brought
to 100 mL with distilled water. A working solution was made with the standard
solution by taking one mL of stock solution and mixing it with one mL of
hydrochloric acid, diluted to 100 mL with distilled water. A standard curve was
made with the working solution by pipetting four volumes (0.5, 1, 2, and 3 mL) of
standard solution into test tubes. All samples were brought up to four mL with
distilled water. One mL of 20% formaldehyde solution (Mallinckrodt Baker Inc.;
Paris, KY), 10 mL of dried toluene (Burdick & Jackson Inc.; Muskegon, MI) and
three mL of a one g/mL potassium carbonate solution (Fisher Scientific;
Fairlawn, NJ) were added to each test tube and each test tube was capped with
a rubber stopper and shaken vigorously by hand forty times. Seven to nine mL
of the toluene layer was then pippetted into small test tubes containing
approximately 0.1 g of anhydrous sodium sulfate (Fisher Scientific; Fair Lawn,
NJ). The test tubes were capped and then mixed briefly with a vortexer (Vortex-
Genie Model K-550-G; Bohemia, NY). Five mL of the toluene layer in each small
test tube was transferred to another test tube and five mL of a 0.02% picric acid
in toluene working solution (EM Science; Gibbstown, NJ) was added. The test
tubes were then mixed on a vortexer and the absorbance was read at 410nm
against a blank (4mL of distilled water). Milligrams of TMA per 100 g of sample
were calculated according to the following equation: (Absorbance of sample/
Absorbance of Standard closest to sample absorbance) x (mg TMA-N/mL
standard solution) x mL standard solution used x 67.5 x (100 9/25 g).
DH Fifteen grams of each sample were weighed into a Falcon test tube to
which 15 mL of distilled water were added. Each sample was then homogenized
for 30 seconds with a polytron (Kinernatica; Switzerland) set at five. The pH of
the samples was measured utilizing an Orion Model 320 PerpHecTLogR meter
(Beverly, MA) calibrated with pH 4 and 7 buffer (Orion; Beverly, MA) range,
I
washing the probe thoroughly with distilled water between each sample.
Samples were analyzed in triplicate.
Microbial Analysis
Total plate counts were conducted with plate count agar (Difco; Detroit,
MI) using standard AOAC method (Maturin and Peeler, 1998). Aseptically,
twenty-five gram samples were removed from each fillet or trim treatment on
each day of analyses and were transferred to Whirl-Pak stomacher bags (Nasco;
Fort Atkinson, WI). Two hundred and twenty five mL of a 0.1% bactopeptone
solution (Difco; Detroit, MI) were added and the samples were mixed for two
minutes using a Model 400 stomacher-lab blender (Tekmar Co.; Cincinnati, OH).
Serial dilutions were prepared with 0.1 % bactopeptone and one mL aliquots were
asepectically transferred from the test tubes to sterile Petri dishes (Fisher
Scientific Co. LLC; Agawam, MA). Sterilized plate count agar cooled to
approximately 45 "C was poured into the plates and the plates were cooled and
then stored upside down for 48 hours at room temperature, approximately 23°C.
The bacterial colonies were hand counted with the aid of a Quebec colony
counter (American Optical Company; Buffalo, NY). Results were expressed as
colony forming units (CFU) per gram of sample. All samples were analyzed in
duplicate.
Statistical Analysis
Differences between treatments were evaluated using Systat 10 (SSPS
Inc.; 2001) to calculate one way analysis of variance (ANOVA) with the
confidence level set at p S 0.05. Tukey's post hoc test (Neter et a/., 1996) was
used to analyze differences among treatment means. Multiway ANOVA was
used to study the effects of chitosan type (high molecular weight, low molecular
weight, no chitosan) and day of storage (1, 3, 6, 10 and 13) on aerobic plate
counts (APC), total volatile base nitrogen (TVBN), and pH of the salmon fillets.
Mult iay ANOVA was also used to study the effects of chitosan percent (0.5, 1.0
and 2.0), chitosan type (high molecular weight and low molecular weight), and
day of storage (1, 3, 6, 10, and 13) on APC, TVBN and pH of salmon trim.
MATERIALS AND METHODS: ENZYMATIC DEGRADATION OF CHITOSAN SOLUTIONS
Objectives
The objectives of this study were to study the feasibility of degrading
chitosan to water soluble oligomers using the commercially available enzymes,
alpha amylase and bromelain, and to determine which pH and reaction length
were most effective for enzymatic degradation of chitosan. Once the optimal pH,
reaction length, and type of enzyme were established a more extensive study of
the enzymatic breakdown of chitosan was conducted using alpha amylase at pH
4. Enzymatic breakdown of chitosan was followed by measuring changes in
chitosan solution viscosity after 10, 30, and 60 minutes of degradation.
Experimental Design
The experiment was designed to first test the efficacy of the two enzymes
at degrading low molecular weight chitosan at three different pH levels (4, 5.5,
and 7) at ambient room temperature. Various enzyme concentrations were also
tested: 1, 5, and 10% by weight of the chitosan. Obsetvations and
measurements, temperature, pH and viscosity readings were taken at time 0, 8
hours and 24 hours of degradation. Time periods were 10 minutes, 30 minutes
and 60 minutes in the case of the second portion of the study with alpha
amylase.
Enzymes
Alpha amylase derived from Bacillus subtilis (lot number 71 53F) was
purchased from ICN (Costa Mesa, CA). The declared activity of this enzyme was
307,000 unitstgram defined as "one unit will dextrinize one mg of starch per min
at pH 6.6 at 30 "C." Bromelain derived from pineapple (lot number 86283) was
also purchased from ICN. The declared activity was 1169 unitstgram defined as
"one unit will hydrolyze one mg of amino nitrogen from gelatin in 20 minutes at
pH 4.5 at 45 "C."
Procedures
One percent acetic acid solutions were prepared and 50 mL of these
solutions were added to 100 mL beakers. The pH of the solutions was adjusted
with 20% NaOH solution to one log under the target pH (3.0 for 4.0, 4.5 for 5.5,
and 6.0 for 7.0). One half of a gram of low molecular weight chitosan (with a
declared viscosity of between 20 and 200 centipoise at a level of 1 % in a 1 %
acetic acid solution) that had been ground in a Wiley mill, as described earlier,
was added to the beakers. The powdered enzyme was added to the solutions
and the solutions were covered with plastic wrap and put on a lab rotator (Lab
Line Instruments; Melrose Park, IL) set at seven. Temperature and pH were
measured and observations were made at all of the time periods mentioned
before. An attempt to quantify the degree of water solubility afforded by
enzymatic activity was also attempted but was found to not be feasible. After

determining that alpha amylase was the most promising enzyme and that a pH of
4.0 yielded the best results, another experiment was performed to follow the
enzymatic degradation during the first hour by taking viscosity measurements at
0, 10, 30 and 60 minutes.
Protein Determination of Enzyme Solutions
A 10 mg/mL enzyme solution was made with both alpha amylase and
bromelain (ICN Biomedicals Inc.; Costa Mesa, CA) by adding 50 mg of enzyme
to 5 mL of water and mixing. Twenty, 100 and 200 microliters of each solution
were pipetted into test tubes in duplicate and evaluated for protein content using
the method of Lowry et a/. (1951). The volume in the tubes was brought up to
five mL with distilled water. Five mL of solution D which consisted of 100 mL of
solution A [(2% Na2C03 (Malinckrodt Baker; Paris, KY) in 0.4% NaOH)] plus
one mL of solution B [(I% cupric sulfate (Fisher Scientific; Fair Lawn, NJ) in
distilled water)] plus one mL of solution C [(2.7% sodium postassium tartrate
(Malinckrodt Baker; Paris, KY) in distilled water)] were added to each test tube.
After 10 minutes, 0.5 mL of solution E [(IN Folin and Ciocalteu's phenol reagent
(Sigma Chemical Company; St. Louis, MO)] was added to each test tube that
was then vortexed. The absorbance was read at 700 nm after at least 25 but no
more than 50 minutes had passed. A standard curve was established using
bovine serum albumin (BSA). The amount of protein in the enzyme samples was
calculated by extrapolating the micrograms of protein per milliliter (x) from the
absorbance data from the standard curve (y=0.0176x + 0.0188) where y = the
absorbance of the sample.
Specific Gravity
The specific gravity of the undegraded and enzymatically degraded (for 10
minutes, 60 minutes, 8 hours and 24 hours) low molecular weight chitosan
solutions, at pH levels of 4.0 and 5.5, was measured according to AOAC method
26.1.08 (AOAC, 1998) by preparing 200 mL of each 1 % chitosan solution. The
solutions were poured into the clear glass graduated cylinder and the 165 mm
hydrometer (VWR Brand; Boston, MA) was inserted into the liquid. The specific
gravity was read at the meniscus of the liquid on the hydrometer. No
- measurements were taken for the non-solubilized chitosan at pH seven.
Viscosity
Viscosity of the enzymatically degraded chitosan solutions was
determined at each time period (initial, 10 minutes, 30 minutes, 60 minutes, 8
hours and 24 hours) by utilizing four different sizes (#50, 75, 150 and 200) of a
Cannon-Fenske capillary type viscometer (Cannon; State College, PA)
according to ASTM method D445 (ASTM, 2000). Measurements were taken by
inverting the viscometer and inserting the receiving end into the chitosan
solution. A bulb type syringe was used on the other end of the viscometer to
draw the solution into the unit to a specified line. The unit was then inverted and
attached to a holding unit, suspending the bottom of the viscometer in a beaker

of distilled water at ambient temperature. The time required for the meniscus of
the solution to flow from the top line to the bottom line was measured in seconds
with a digital stopwatch. The calculation for the viscosity was as follows:
(number of seconds) x (viscometer constant) x (specific gravity of the solution).
Viscosity units were expressed as Centipoise (cP).
Intrinsic Viscosity
Intrinsic viscosity of degraded (10 min, 30 min, 60 min, 8 hrs, and 24 hrs)
and undegraded chitosan were calculated viscometrically according to the
method of Zhang and Neau (2001). The efflux time of the solvent (1 .O% acetic
acid solution) was measured for each size of viscometer used. The efflux time of
each chitosan solution was measured with the appropriate size viscometer. The
initial concentration of each chitosan solution was 1.0 g/dL. Dilutions of 0.125,
0.25, 0.50, and 0.75 g/dL were prepared for each degraded chitosan solution (0
min., 30 min., 60 min., 8 hr. and 24 hr. degradation time) and the undegraded
chitosan solution. The efflux time of each dilution was measured and the specific
viscosity was determined for each dilution by the following equation [(efflux time
of the solution) - (efflux time of the solvent)J/(efflux time of the solvent). The
reduced viscosity for each dilution was then determined by the following equation
(specific viscosity)/(concentration of solution in g/dL). The intrinsic viscosity was
determined for each solution by plotting the concentration (in g/dL) on the x-axis
against the corresponding value for reduced viscosity on the y-axis. The
equation for the line was determined and extrapolated back to a zero
concentration, which was the intrinsic viscosity [n].
Quantification of Insoluble Chitosan
The pH of the solutions were brought to seven by drop wise addition of
20% NaOH while stirring with an automatic stirrer. Adjusting the pH to seven
precipitated the insoluble chitosan. The whole solution was then transferred to
centrifuge tubes and centrifuged for 20 minutes at 6000 rpm (5875 x g). The
supernatant was then poured off and the insoluble chitosan pellet was
transferred to pre-weighed foil dishes (VWR Brand; Boston, MA) that were then
dried in a Fisher Isotemp, model 350, drying oven (Fisher Scientific, Fair Lawn,
NJ) for 24 hours at 95°C. The foil dishes were then cooled and re-weighed to
determine the amount of chitosan that was insoluble.
Temperature
The temperature of all enzymatically degraded chitosan solutions was
measured with a mercury in glass thermometer (VWR Brand; Boston, MA) at
each of the previously mentioned time periods.
MATERIALS AND METHODS: IN VlTRO ANTIMICROBIAL EFFICACY OF CHITOSAN AGAINST LISTERIA
INNOCUA AND PSEUDOMONAS AERUGINOSA
Objectives
The objectives of this study were to study the antimicrobial effects of
enzymatically (alpha amylase) degraded (for 10 min, 60 min and 24 hours) and
undegraded low molecular weight chitosan against two bacteria, Listeria innocua
and Pseudomonas aeruginosa, common in fish products. The Pseudomonas
study was conducted using both nutrient broth and trypticase soy broth to study
the effects of the two different broths on the antimicrobial efficacy of the chitosan.
Experimental Design
Factors studied included species of bacteria, chitosan addition (0.5, 1 .O
and 2.0% of chitosan solution added; vhr of the broth), and type of chitosan
(undegraded, 10 minute degraded, 60 minute degraded and 24 hour degraded).
In the Pseudomonas study, the effects of two different broths, nutrient broth
versus trypticase soy broth, were studied. Each of the 14 treatments was
prepared in triplicate with duplicate microbial analyses. Treatment codes are
listed in Table 3.
Preparation of Pour Plates
Trypticase Soy Agar (Becton Dickinson and Company; Cockeysville, MD)
was prepared according the directions on the container and was then autoclaved
and allowed to cool to approximately 45°C. The agar was then poured into
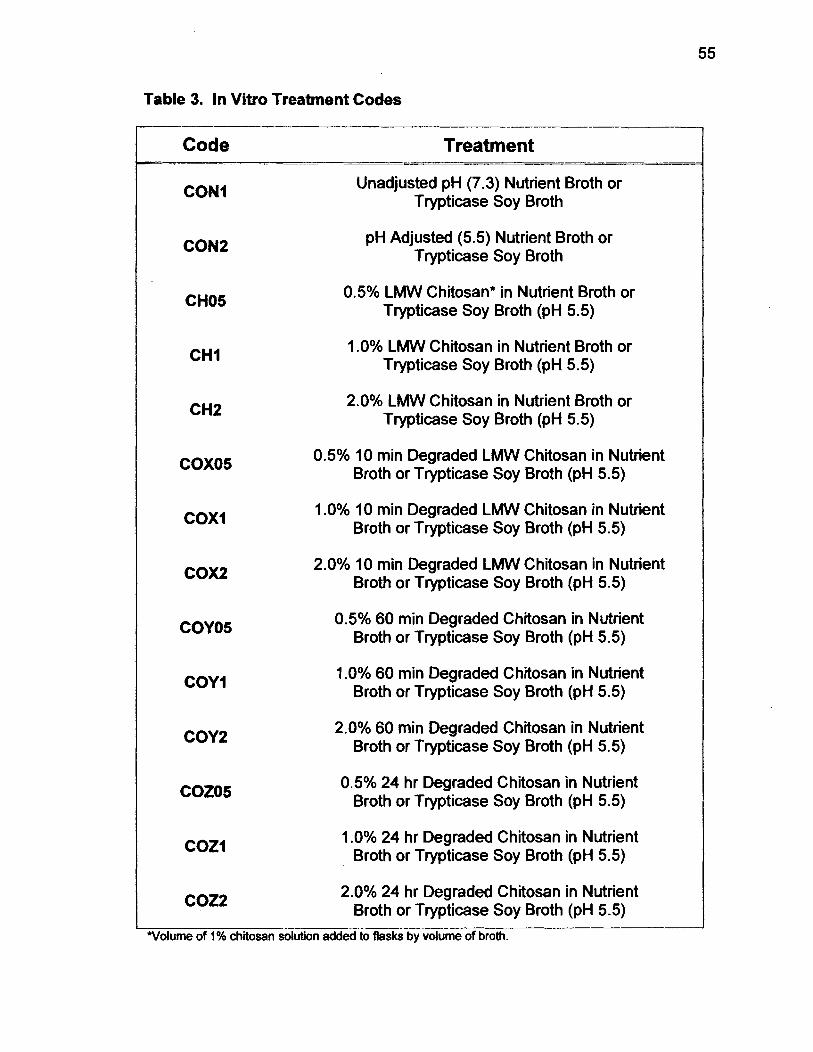
Table 3. In Vitro Treatment Codes
Code Treatment
CON1 Unadjusted pH (7.3) Nutrient Broth or Ttypticase Soy Broth
CON2 pH Adjusted (5.5) Nutrient Broth or Ttypticase Soy Broth
CH05 0.5% LMW Chitosan* in Nutrient Broth or Ttypticase Soy Broth (pH 5.5)
CHI 1 .O% LMW Chitosan in Nutrient Broth or Trypticase Soy Broth (pH 5.5)
CH2 2.0% LMW Chitosan in Nutrient Broth or Ttypticase Soy Broth (pH 5.5)
COX05 0.5% 10 rnin Degraded LMW Chitosan in Nutrient Broth or Ttypticase Soy Broth (pH 5.5)
COX1 1 .O% 10 rnin Degraded LMW Chitosan in Nutrient Broth or Trypticase Soy Broth (pH 5.5)
COX2 2.0% 10 rnin Degraded LMW Chitosan in Nutrient Broth or Ttypticase Soy Broth (pH 5.5)
COY05 0.5% 60 rnin Degraded Chitosan in Nutrient Broth or Ttypticase Soy Broth (pH 5.5)
COY1 I .O% 60 rnin Degraded Chitosan in Nutrient Broth or Trypticase Soy Broth (pH 5.5)
COY2 2.0% 60 rnin Degraded Chitosan in Nutrient Broth or Trypticase Soy Broth (pH 5.5)
COZ05 0.5% 24 hr Degraded Chitosan in Nutrient Broth or Trypticase Soy Broth (pH 5.5)
COZl I .O% 24 hr Degraded Chitosan in Nutrient Broth or Trypticase Soy Broth (pH 5.5)
coz2 2.0% 24 hr Degraded Chitosan in Nutrient Broth or Ttypticase Soy Broth (pH 5.5)
Volume of 1% chiiosan solution added to fbsks by volume of broth.
disposable plastic petri dishes which were immediately covered after being
poured. After cooling, the plates were inverted and reinserted into the original
plastic bags. The plates were stored at room temperature and were used within
a week of production (plates for the first trial of the Listeria study were stored in
the refrigerator prior to use but a condensation problem made this practice
unacceptable).
Propagation of Bacterial Cultures
The Listeria innocua culture was a teaching culture supplied by Dr. Al
Bushway (University of Maine). The Pseudomonas aeruginosa was supplied by
ATCC (American Type Culture Collection; Manassas, VA). The Pseudomonas
was a freeze dried culture (10145-U) and was propagated according the
directions given by the supplier. The bacteria were transferred into sterilized
nutrient broth (Difco; Detroit, MI) and were incubated at 37°C for 24 hours. The
culture was plated onto trypticase soy agar plates and was isolated from the
plate and re-inoculated into trypticase soy broth (Becton Dickinson and
Company; Cockeysville, MD). Plates with isolated colonies were stored in the
refrigerator for later propagation for each subsequent trial. Bacterial cultures
were transferred from broth to new broth exactly 17 hours before inoculation into
the flasks containing chitosan or the two control broths, see Table 4, and were
incubated at 37" C. Serial dilutions were made of the bacterial culture used to
inoculate the plates just prior to flask inoculations. The serial dilutions were
plated, incubated, and read in the same manner as with the flasks. Results were
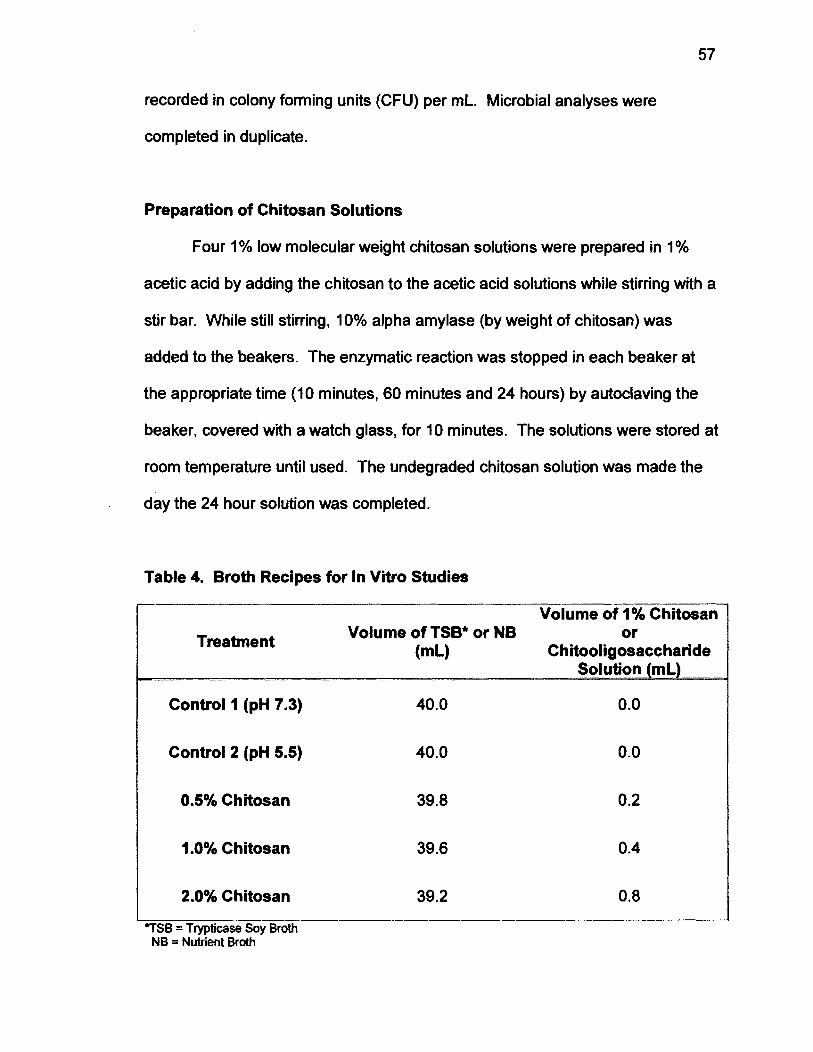
recorded in colony forming units (CFU) per mL. Microbial analyses were
completed in duplicate.
Preparation of Chitosan Solutions
Four 1 % low molecular weight chitosan solutions were prepared in 1 %
acetic acid by adding the chitosan to the acetic acid solutions while stirring with a
stir bar. While still stirring, 10% alpha amylase (by weight of chitosan) was
added to the beakers. The enzymatic reaction was stopped in each beaker at
the appropriate time (10 minutes, 60 minutes and 24 hours) by autoclaving the
beaker, covered with a watch glass, for 10 minutes. The solutions were stored at
room temperature until used. The undegraded chitosan solution was made the
day the 24 hour solution was completed.
Table 4. Broth Recipes for In Vitro Studies
Volume of 1% Chitosan
Treatment Volume of TSB* or NB or (mu Chitooligosaccharide
- ----A
Solution (mL) -
Control 1 (pH 7.3) 40.0 0.0
Control 2 (pH 5.5) 40.0 0.0
0.5% Chitosan 39.8 0.2
1.0% Chitosan 39.6 0.4
I 2.0% Chitosan 39.2 0.8 I I 7 S B = Trypticase soy Broth
I
NB = Nutrient Broth

Inoculation and Spread Plating
One tenth of one mL of bacterial culture in TSB or NB was removed
aseptically from the culture tube with a sterilized plastic tip on an automatic pipet-
man (VWR Brand; Boston, MA) and inoculated into each 50 mL Erlenmeyer flask
(14 in total) containing the sterilized cool broth and added chitosan solution
(Table 4). One tenth of one mL of the bacterial culture, Pseudomonas
aemginosa, was used for the TSB experiment in order to achieve the same
inoculation level (approximately l o7 CFUlmL) as the Listena experiment. After
inoculation the flasks were capped with #2 rubber stoppers and placed in the
refrigerator in a metal tray taped to the top of a lab rotator. The rotator was set
on seven to gently agitate the broth while incubating. The rotator was placed on
the bottom shetf of the refrigerator and the seal of the refrigerator was reinforced
with packing tape where the cord emerged from the refrigerator. The
temperature of the refrigerator was adjusted so it remained between four and six
degrees centigrade for the entire experiment. Each day of analysis (one, two,
three and four) each flask was randomly removed from the refrigerator and serial
dilutions were made in sterilized bactopeptone. One tenth of one mL aliquots of
the dilutions were aseptically transferred to TSA plates and were spread with
ethyl alcohol sterilized glass rods using an inoculating turntable (Fisher Scientific;
Fair Lawn, NJ). The plates were incubated at 37°C for 24 hours before being
counted with the aid of a Quebec colony counter (American Optical Company;
Buffalo, NY). Contents of each flask were plated and enumerated in duplicate.
Viscosity
The viscosity of the chitosan solutions was measured both before and
after autoclaving as described previously. The purpose was to estimate the
molecular weight and degree of degradation of the chitosan solutions and to test
the effect of autoclaving on molecular degradation.
Statistical Analysis
Differences between treatments were evaluated using Systat 10 (SSPS
Inc.; 2001) to calculate one way analysis of variance (ANOVA) with the
confidence level set at p I 0.05. Tukey's post hoc test (Neter et. a/., 1996) was
used to analyze differences among treatment means. Multiway ANOVA was
conducted to test the effects of chitosan addition (0.5, 1.0 and 2.0%) and
chitosan treatment (undegraded, 10 minute degraded, 60 minute degraded and
24 hour degraded) on both raw and log transformed data. Multiway analysis was
also used to analyze differences among treatments and time of refrigerated
incubation on both raw and log transformed data.
RESULTS: ANTIMICROBIAL EFFICACY OF CHITOSAN DIPS AND POWDERED
CHITOSAN ON ATLANTIC SALMON PRODUCTS
Observations
Salmon Trim
Visible flecks of chitosan could be seen in the trim, especially in the
treatments containing 2% powdered chitosan. By day six, visible differences in
color could be seen between the chitosan treated trim and the untreated trim.
Untreated samples were brown and those containing chitosan continued to
appear as they had on the first day of storage.
Salmon Fillet
The high molecular weight (HMW) chitosan dip was very viscous and
formed a thick coating on the salmon fillets. The low molecular weight chitosan
(LMW) dip was thinner and formed a thinner coating on the surface of the fillets.
As the study progressed the coating on the fillets degraded to some extent,
forming a pool of slightly yellow fluid on the foam trays.
Moisture, Ash and Mineral Composition
Average moisture content of the salmon fillet and the salmon trim were
67.9 A 0.56 and 70.2 & 4.59%, respectively. Ash contents were 4.2 A 0.79 and
5.0 & 0.41 % for the fillet and ground trim, respectively. Mineral concentrations in
both trim and fillet are recorded in Table 5.

Table 5. Mineral Concentrations (mglkg) of Salmon Trim and Fillet *
Element - - - - -- - -
Trim -- - -- -- - - - -
Fillet Aluminum 11.8 * 2.7 13.6 k 2.3 Boron 114.1 i 8.3 132.7 & 16.0 Calcium 127.8 & 20.2 138.3 * 8.3 Copper 2.119 * 1.8 0.9 & 0.4 Iron 9.783 * 1 .O 17.8 * 3.4 Potassium 81 17.6 k 1125.1 9616.6 & 997.8 Magnesium 642.8 * 77.2 707.9 59.5 Sodium 1261.2 * 90.5 1410.3 * 141.5 Phosphorous 5074.6 * 558.1 5760.3 * 451.5 Zinc 10.2 * 3.4 8.5 k 1 .O 'Each value is the average of three analyses * standard deviation on a wet weight basis.
Microbial Analyses
Salmon Trim
Aerobic plate counts started out at very low levels for all seven treatments,
ranging from 3.80~1 o3 to 6.95~1 o3 CFUIg (Table 6). Large increases in APC
counts occurred between day three and day six, rising from lo4 to 1 o6 CFUlg.
No significant differences (p>0.05) were observed among the different treatments
after day one. In some cases slightly higher APCs were observed in the chitosan
treated trim. On day one, the 0.5% HMW treated trim had significantly higher
(pc0.05) aerobic plate counts compared to 1 .O% LMW treated trim. No
differences were observed between low and high percentages of chitosan, based
on multiway ANOVA.
Salmon Fillet
No significant differences were observed among treatments on the first
day of analysis although values were very low, 1 o3 CFUIg (Table 7). Fillets
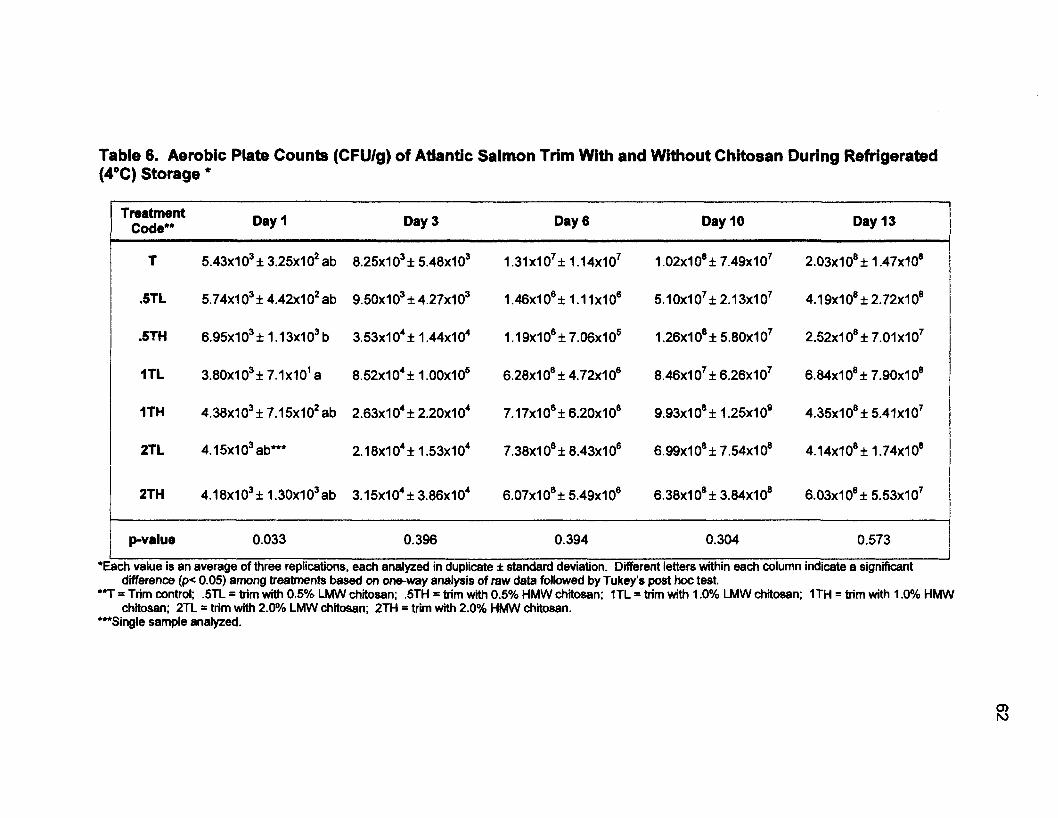
Table 6. Aerobic Plate Counts (CFUIg) of Atlantic Salmon Trim With and Without Chitosan During Refrigerated (4°C) Storage *
Treatment I Code*' Day 1 Day 3 Day 6 Day 10 Day 13
p-value 0.033 0.396 0.394 0.304 0.573
'Each value is an average of three replications, each analyzed in duplicate f standard deviation. Different letters within each column indicate a significant difference (p< 0.05)among treatments based on o&way analysis of raw data followed by Tukey's post hoc test.
-
'T = Trim control; .5TL = trim with 0.5% LMW chiosan; .5TH = trim with 0.5% HMW chiosan; ITL = bim with 1 .O% LMW chitosan; ITH = trim with 1 .OOh HMW chiosan; 2TL = trim with 2.0°/0 LMW chitosan; 2TH = trim with 2.0% HMW chitosan.
'"Single sample analyzed.
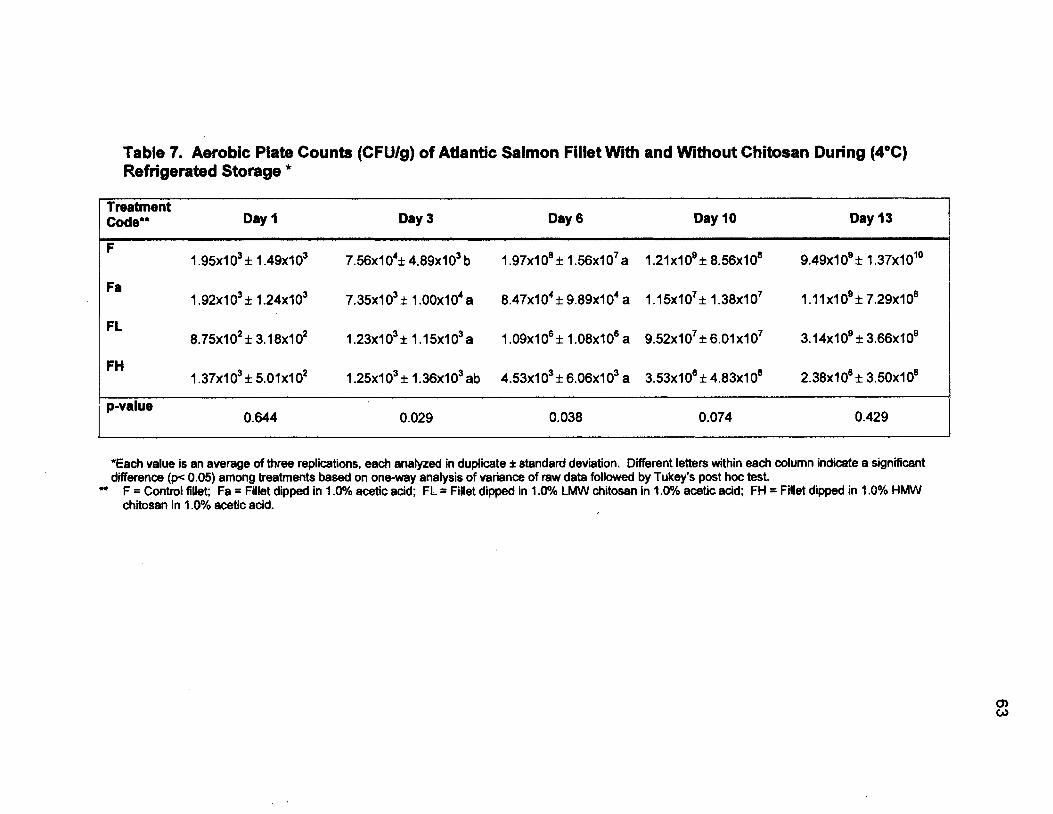
Table 7. Aerobic Plate Counts (CFUlg) of Atlantic Salmon Fillet With and Without Chibsan During (4°C) Refrigerated Storage *
Treatment Code** Day 1 Day S Day 6 Day 10 Day I S
p-value 0.644 0.029 0.038 0.074 0.429
'Each value is an average of three replications, each analyzed in duplicate * standard deviation. Different letters within each column indicate a significant difference (pc 0.05) among treatments based on one-way analysis of variance of raw data followed by Tukey's post hoc test. " F = Control fillet; Fa = Fillet dipped in 1 .O% acetic acid; FL = Fillet dipped in 1 .O% LMW chitosan in 1.0% acetic acid; FH = Fillet dipped in 1 .O% HMW
chitosan in 1 .O% acetic acid.
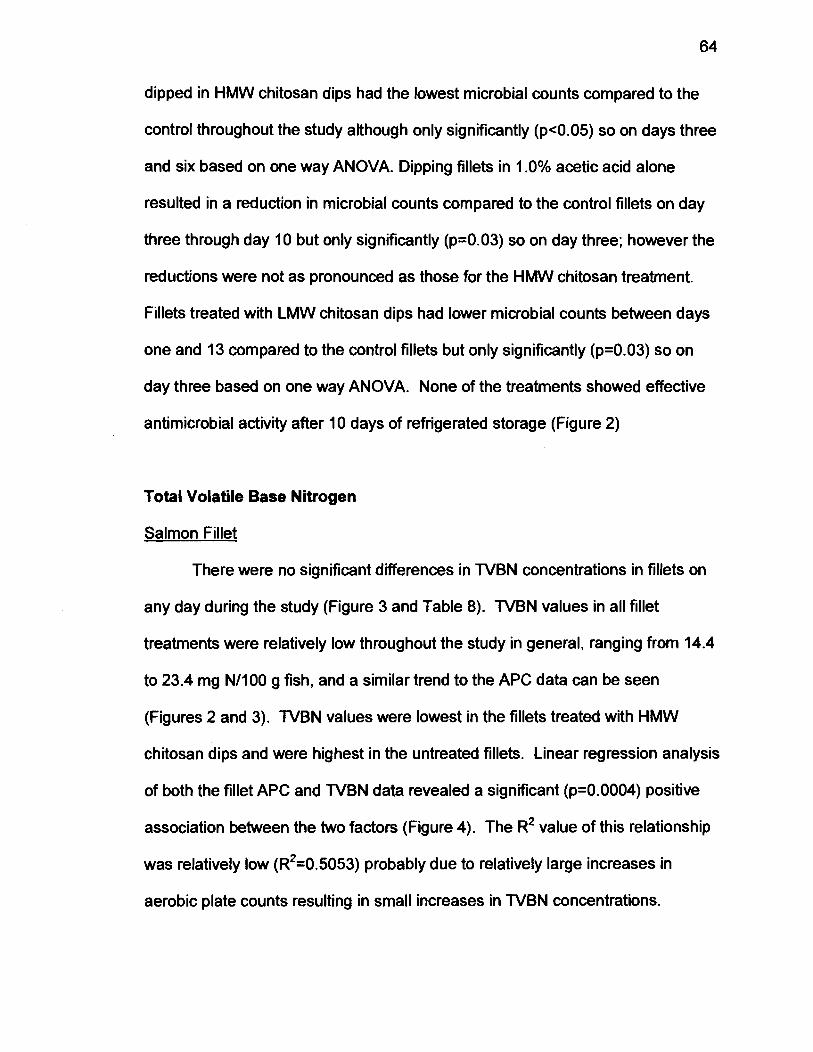
dipped in HMW chitosan dips had the lowest microbial counts compared to the
control throughout the study although only significantly ( ~ ~ 0 . 0 5 ) so on days three
and six based on one way ANOVA. Dipping fillets in I .O% acetic acid alone
resulted in a reduction in microbial counts compared to the control fillets on day
three through day 10 but only significantly (p=0.03) so on day three; however the
reductions were not as pronounced as those for the HMW chitosan treatment.
Fillets treated with LMW chitosan dips had lower microbial counts between days
one and 13 compared to the control fillets but only significantly (p=0.03) so on
day three based on one way ANOVA. None of the treatments showed effective
antimicrobial activity after 10 days of refrigerated storage (Figure 2)
Total Volatile Base Nitrogen
Salmon Fillet
There were no significant differences in N B N concentrations in fillets on
any day during the study (Figure 3 and Table 8). TVBN values in all fillet
treatments were relatively low throughout the study in general, ranging from 14.4
to 23.4 mg NIIOO g fish, and a similar trend to the APC data can be seen
(Figures 2 and 3). N B N values were lowest in the fillets treated with HMW
chitosan dips and were highest in the untreated fillets. Linear regression analysis
of both the fillet APC and N B N data revealed a significant (p=0.0004) positive
association between the two factors (Figure 4). The R2 value of this relationship
was relatively low (R2=0.5053) probably due to relatively large increases in
aerobic plate counts resulting in small increases in N B N concentrations.
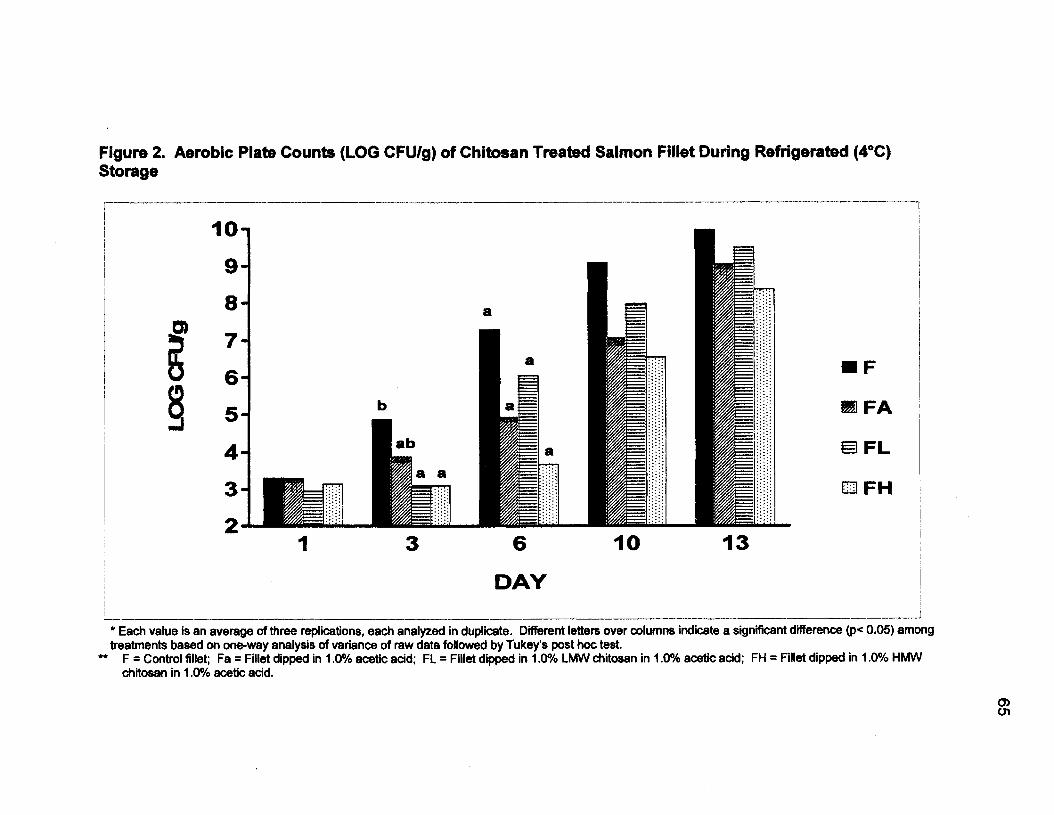
Figure 2. Aerobic Plate Counts (LOG CFUIg) of Chitosan Treated Salmon Fillet During Refrigerated (4°C) Storage
DAY
* Each value is an average of three redications. each analvzed in du~licate. Different letters over columns indicate a significant difference (p< 0.05) among treatments based on one-way analysis of variance of raw data folow&i by Tukey's post hoc test.
- " F = Control fillet; Fa = Fillet dipped in 1 .O% acetic acid; FL = Fillet dipped in 1 .O% LMW chitosan in 1 .O% acetic acid; FH = Fillet dipped in 1 .O% HMW
chitosan in 1 .O% acetic acid.
Figure 3. TVBN (mg N1100g) Concentrations of Chitosan Treated Salmon Fillet During Refrigerated (4°C) Storage*
6 DAY
Each value is an average of three replications, each analyzed singly. " F = Control fillet; Fa = Fillet dipped in 1 .O% acetic acid; FL = Fillet dipped in 1 .O% LMW chitosan in 1 .O% acetic acid; FH = Fillet dipped in 1 .O% HMW chitosan in 1 .O% acetic acid.

Table 8. N B N (mg NIlOOg) Concentrations in Chitosan Treated Salmon Fillet During Refrigerated (4°C) Storage*
p-value 0.396 0.080 0.513 0.066 0.124 I
Each value is the average of three replications * standard deviation, analyzed singly. " F = Fillet control; Fa = Fillet dipped in 1% acetic acid; FL = Fillet dipped in 1% LMW chitosan in 1% acetic acid; FH = Fillet dipped in 1% HMW chitosan in 1 % acetic acid.
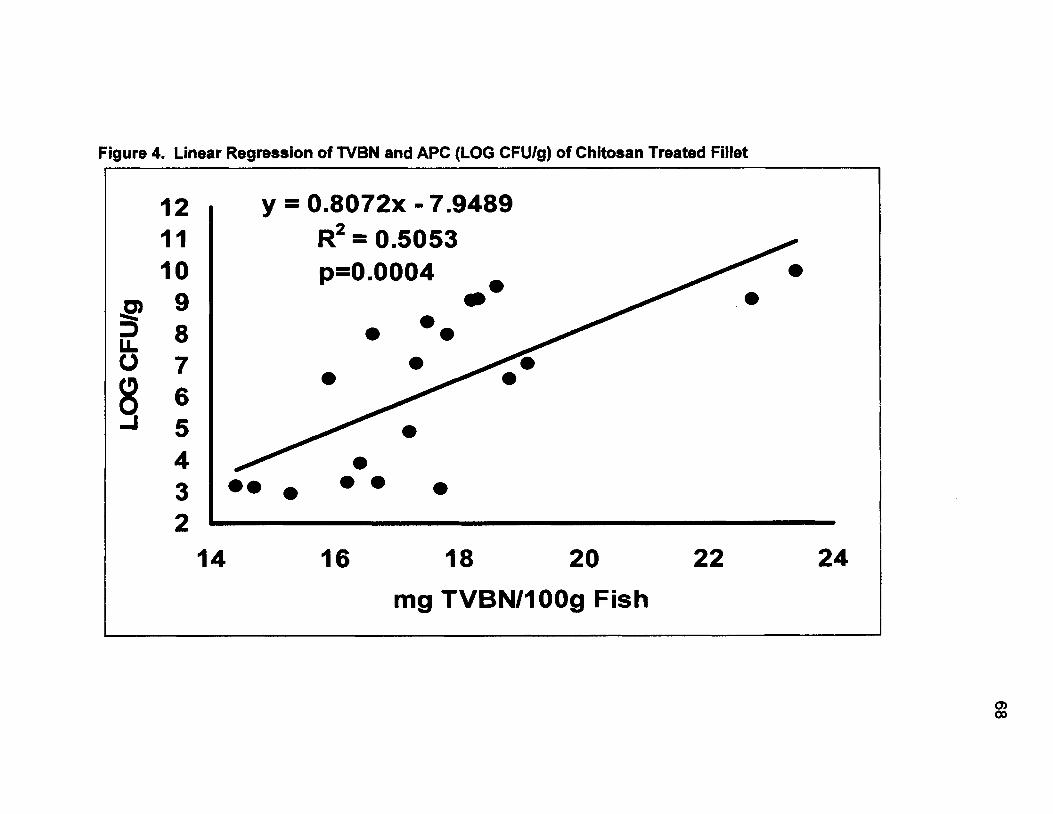
Figure 4. Linear Regression of TVBN and APC (LOG CFUIg) of Chitosan Treated Fillet
16 18 20
mg TVBN1100g Fish
Salmon Trim
There were no significant differences among any of the trim treatments on
any day throughout the study based on one way ANOVA (Table 9). TVBN
values were relatively low throughout the study, ranging from 15.4 to 23.0 mg
N1100 g of fish. The trim values were similar to those observed in the fillet study.
A slow increase in values occurred with increasing storage time.
pH
Salmon Fillet
pH values initially rose from day 1 to day 3 but then fell again till a rise
between days 10 and 13 (Table 10). Significant differences in the pH of the
different treatments only were present on days 1 (p=O.O19) and 10 (p=0.007). In
both cases, the pH of the high molecular weight chitosan dipped fillets were
lower than the pH of the untreated fillets. All of the treated fillets had lower pH
values than the untreated control including the 1 .O% acetic acid dipped fillets.
Salmon Trim
There were significant differences (pe0.05) among all of the treatments on
every day of the study (Table 11). Addition of powdered chitosan to the salmon
trim resulted in higher pH values compared to the control. The higher the
percentage of chitosan, the higher the resulting pH value.
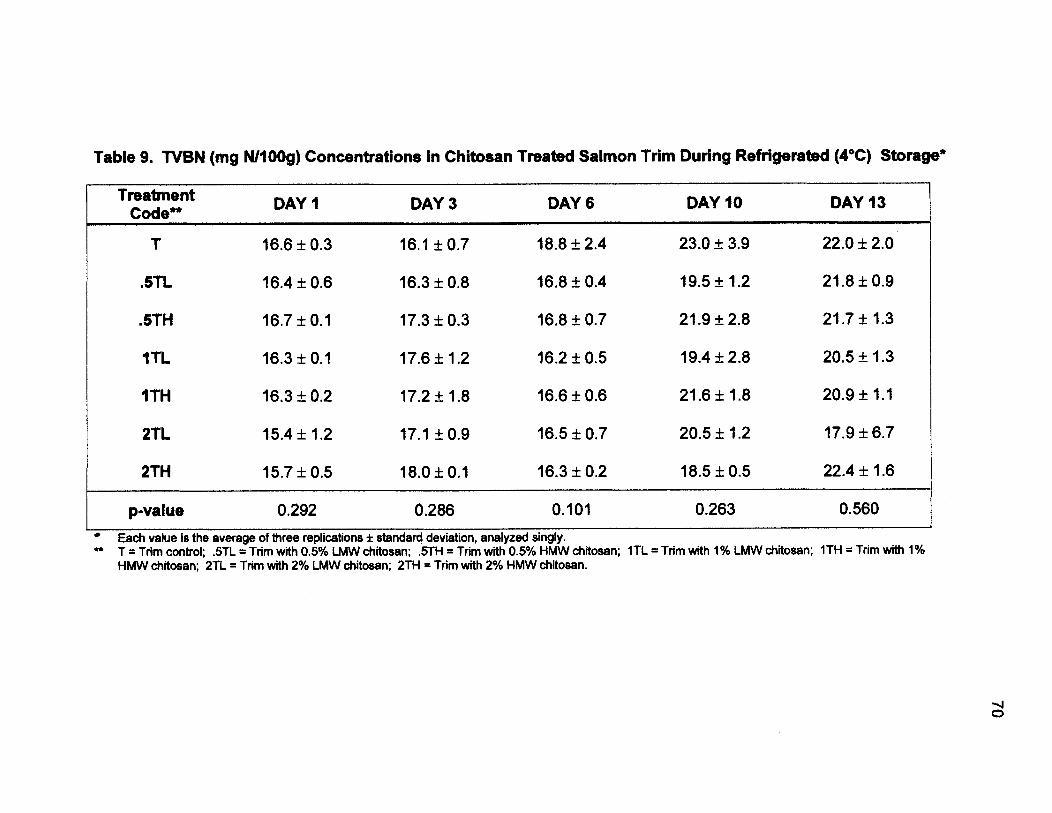
Table 9. WBN (mg N1100g) Concentrations in Chitosan Treated Salmon Trim During Refrigerated (4°C) Storage*
Treatment Coden DAY 1 DAY 3 DAY 6 DAY 10 DAY 13
p-value 0.292 0.286 0.101 0.263 0.560 - -
Each value is the average of three replications f standard deviation, analyzed singly. * T = Trim control; .5TL = Trim with 0.5% LMW chitosan; .5TH = Trim with 0.5% HMW chitosan; 1TL = Trim with 1 % LMW chiiosan; ITH = Trim with 1%
HMW chitosan; 2TL = Trim with 2% LMW chitosan; 2TH = Trim with 2% HMW chitosan.
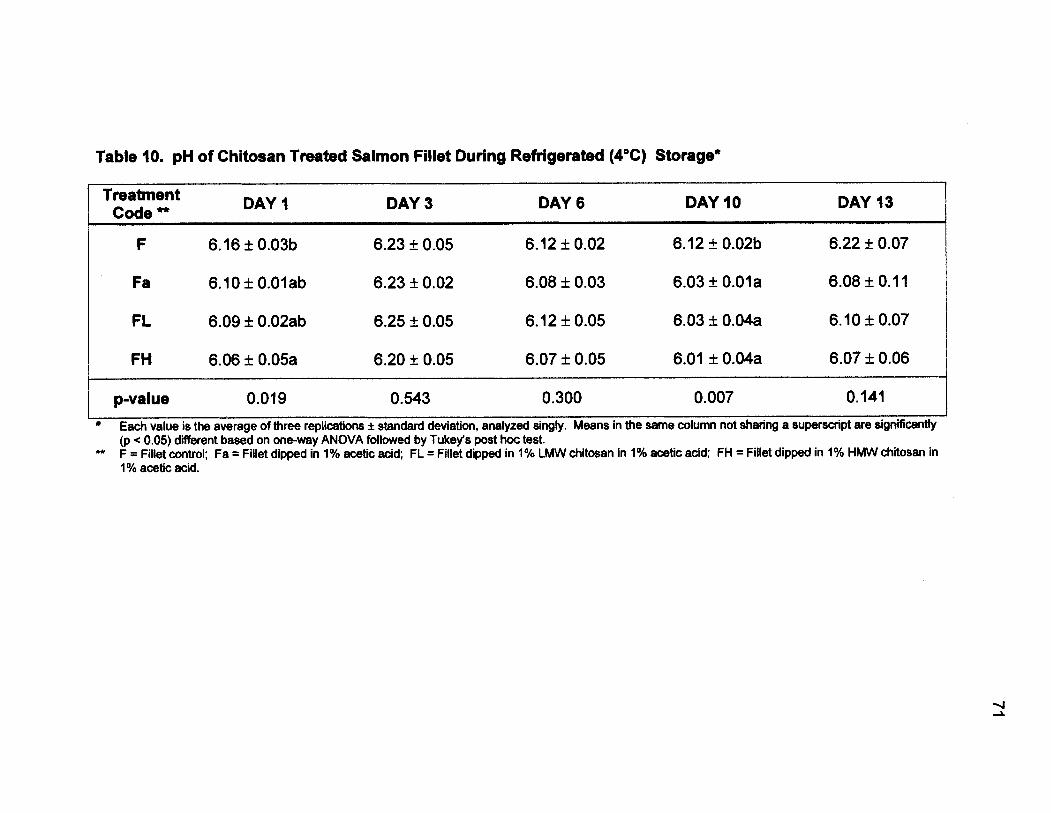
Table 10. pH of Chitosan Treated Salmon Fillet During Refrigerated (4°C) Storage*
Treatment Code " DAY 1 DAY 3 DAY 6 DAY 10 DAY 13
p-value 0.019 0.543 0.300 0.007 0.141
Each value is the average of three replications * standard deviation, analyzed singly. Means in the same column not sharing a superscript are significantly (p c 0.05) different based on one-way ANOVA followed by Tukey's post hoc test.
* F = Fillet control; Fa = Fillet dipped in 1% acetic acid; FL = Fillet dipped in 1% LMW chitosan in 1% acetic acid; FH = Fillet dipped in 1% HMW chitosan in 1 % acetic acid.
Trimethylamine
Salmon Fillet
TMA-N concentrations were undetectable until day 10 (Table 12). On day
10 the highest level of TMA-N, 1.21mg/100g of fish, was observed in the fillet
control. On day 13, the acetic acid dipped fillet was significantly (p=0.03) higher
in TfvlA-N than either chitosan dip treatment but not the control. Chitosan treated
fillets were lower in TfvlA-N than the control on both day 10 and 13.
Salmon Trim
TMA-N concentrations in salmon trim were also not detected until day 10
of storage (Table 13). There were no significant differences among the different
chitosan treatments on day 10 or 13. On day 10 the highest concentrations
occurred in the 1 .O% LMW chitosan treatment and the lowest concentration was
seen in the 2.0% HMW chitosan treatment. The highest value, 3.30mg TMA-
NI100g fish, on day 13 was the control trim treatment. High values were also
observed in trim treated with 2.0% HMW chitosan and the 0.5% HMW chitosan.
No visible trends regarding chitosan type or percent could be observed.
Table 12. Trimethylamine Concentrations (mg TMA-W100g) of Chitosan Treated Salmon Fillet During Refrigerated (4°C) Storage*
FH n.d. n.d. 0.44 k 0.12 0.29 k 0.26 b ****
p-value 0.190 0.030 Each value is the average of three replications * standard deviation, analyzed in duplicate. Means in the same column not sharing a superscript are
Treatment Code**
significantly (p c 0.05) different based on one-way ANOVA followed by Tukey's post hoc test. " F = Fillet control; Fa = Fillet dipped in 1% acetic add; FL = Fillet dipped in 1% LMW chitosan in 1% acetic acid; FH = Fillet dipped in 1% HMW chitosan in
1 % acetic acid. - n.d. indicates undetectable levels of TMA-N - Analyses not conducted.
Day 1 Day 3 Day 6 Day 10 Day 13
F n.d.*** n.d. 1.21 k 0.93 0.64 k 0.21 ab ****
Table 13. Trimethylamine Concentrations (mg TMA-N1100g) of Chitosan Treated Salmon f rim During Refrigerated (4°C) Storage*
Treatment Code " Day 1 Day 3 Day 6 Day 10 Day 13
- . ~ - .
p-val ue 0.750 0.1 10 Each value is the average of three replitions f. standard deviation, analyzed in duplicate.
" T = Trim control; .5TL i ~ r i m with 0.5% LMW chitosan; .5TH = Trim with 0.5% ~ M k d chitosan; ITL = Trim with 1% LMW chitosan; ITH = Trim with 1% HMW chitosan; 2TL = Trim with 2% LMW chitosan; 2TH = Trim with 2% HMW chitosan. " n.d. indicates undetectable levels of TMA-N
Ir.tc Analyses not conducted.

RESULTS: ENZYMATIC DEGRADATION OF CHITOSAN SOLUTIONS
Enzyme Effectiveness
The protein contents of the alpha amylase and bromelain were found to be
30.0% and 47.9%, respectively. Both alpha amylase and bromelain were initially
tested for breakdown of 1.0% chitosan solutions at pH 4.0 at a level of one
percent by weight of chitosan. White, cloudy precipitate formed in the beaker
after 24 hours of enzyme activity after the pH was adjusted to 7.0 with 10%
sodium hydroxide, indicating the chitosan solution was not made water soluble.
The enzyme level was then increased to 50% and it was discovered that the
alpha amylase produced a minute amount of precipitate after the pH was
adjusted to seven. However, bromelain appeared to produce the same amount
of white precipitate that it had at the 1 .O% enzyme level. The amount of
precipitate formation in the solution containing alpha amylase indicated that this
enzyme had effectively degraded the chitosan to afford water solubilrty. Based
on these results it was decided that the next phase of the quantification study
would continue only with alpha amylase.
Observations
Quantification studies conducted with a 10% level of alpha amylase at pH
levels of 4.0, 5.0 and 7.0 for time periods of 8 hours and 24 hours revealed that
the most visible indications (little precipitation when pH adjusted to 7.0) of water
solubility occurred in the pH 4.0 treatment (Table 14). The least amount of

Table 14. Observations of 1% Chitosan Solutions Dearaded with 10% A l~ha Amvlase
Treatment 8 Hour Appearance 24 Hour Appearance after Initial after p~ adjustment to 7.0 pH adjustment to 7.0
Control (no Thick, opaque Thick, gelatinous, white, Thick, gelatinous, white, enzyme) pH 4.0 clumpy precipitate clumpy precipitate
pH 4.0 Thick, opaque Cloudy liquid, white, smooth Slightly cloudy, small precipitate amount of fine precipitate
pH 5.5 Thinner, some undissolved Slightly cloudy liquid and Slightly cloudy liquid and flakes, opaque undissolved flakes, ropy undissolved flakes, ropy
pH 7.0 Thin, watery, all undissolved Thin, watery, all undissolved Thin, watery, all undissolved chitosan flakes chitosan flakes chitosan flakes

precipitate was formed after 24 hours of enzymatic degradation at pH 4.0 but a
slight amount of precipitate formed in the pH 5.5 treatment, probably due to the
lack of fully solubilized chitosan to begin with. A large amount of thick, clumpy
precipitate formed in the control treatment and no precipitate formed at all in the
pH 7.0 treatment when the pH was adjusted to 7.0.
Gravimetric Measurements
The results from the eight-hour degradation study indicate that none of the
treatments became completely water-soluble. All of the treatments displayed
either 100% or higher degree of insolubility when the amount of dried precipitate
(formed after pH adjustment to 7.0) was compared to the initial weight of chitosan
and enzyme used in each treatment (Table 15). This indicates that this method
used to quantify chitosan insolubility was inaccurate. The results from the 24
hour study indicated that the pH 4.0 enzymatic treatment resulted in the most
soluble chitosan. When the pH was brought back up to 7.0, only 11.4% of the
chitosan remained insoluble (Table16). Enzymatic degradation at pH 5.5 was
somewhat effective at producing water soluble chitosan. After 24 hours, 75% of
the chitosan remained insoluble based on the gravimetric measurements. Alpha
amylase appeared to have little enzymatic activity on chitosan that was not
solubilized, as was the case with the pH 7.0 treatment (Table 16).

Table 15. Weight Measurements of 1% LMW Chitosan Solutions Degraded with 10% A l ~ h a Amviase for 8 Hours
Initial Weight of Weight of lnsolubie Chitosan Treatment Chitosan + Enzyme Precipitpte+ Enzyme % Insolubility*
(9) (9)
Control (no 0.501 * 0.001 enzyme)
*Calculated by dividing (dried weight of the insdubb chitosan precipitate + enzyme) by (initial weight of chitosan + enzyme) x 100.
Table 16. Weight Measurements of 1% LMW Chitosan Solutions Degraded with 10% Alpha Amylase for 24 Hours
Weight of Insoluble Initial Weight of Chitosan Precipitate
Treatment Chitosan+Enzyme %
(9) + Enzyme Insolubility*
(9) - -
' *Calculated by dividing (dried weight of the insoluble chitosan precipitate + enzyme) by (initial weight of chitosan + enzyme) x 100.
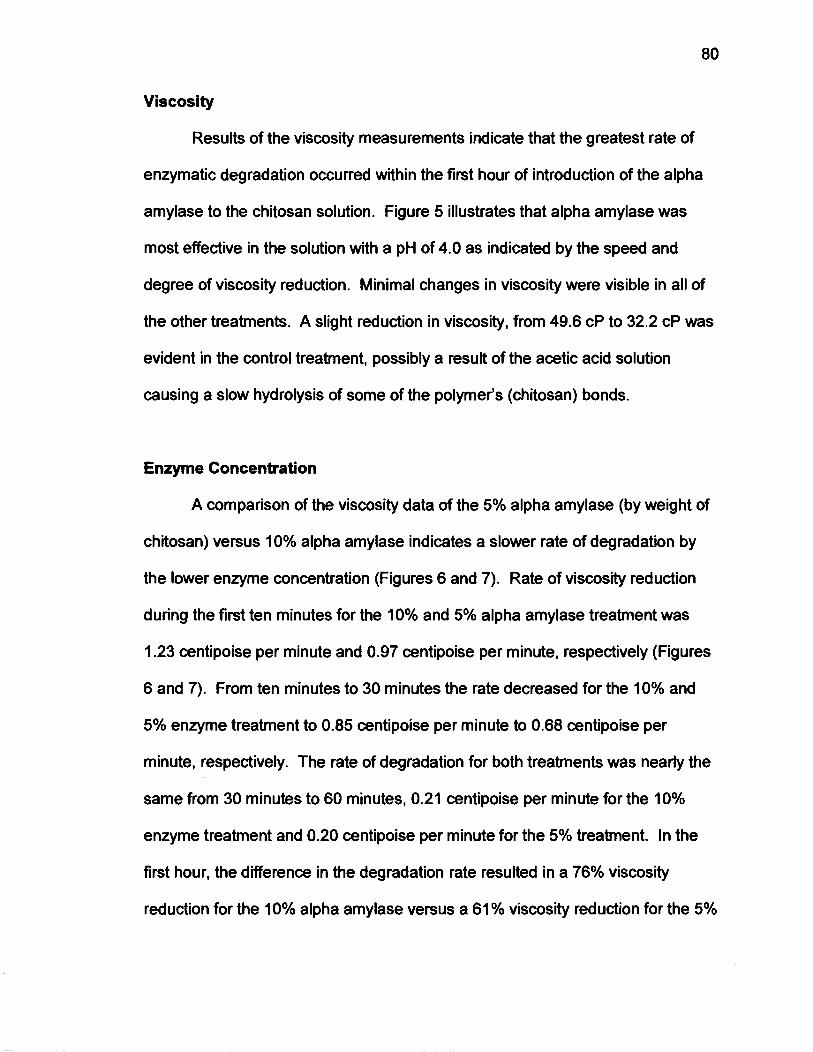
Viscosity
Results of the viscosity measurements indicate that the greatest rate of
enzymatic degradation occurred within the first hour of introduction of the alpha
amylase to the chitosan solution. Figure 5 illustrates that alpha amylase was
most effective in the solution with a pH of 4.0 as indicated by the speed and
degree of viscosity reduction. Minimal changes in viscosity were visible in all of
the other treatments. A slight reduction in viscosity, from 49.6 cP to 32.2 cP was
evident in the control treabnent, possibly a result of the acetic acid solution
causing a slow hydrolysis of some of the polymer's (chitosan) bonds.
Enzyme Concentration
A comparison of the viscosity data of the 5% alpha amylase (by weight of
chitosan) versus 10% alpha amylase indicates a slower rate of degradation by
the lower enzyme concentration (Figures 6 and 7). Rate of viscosity reduction
during the first ten minutes for the 10% and 5% alpha amylase treatment was
1.23 centipoise per minute and 0.97 centipoise per minute, respectively (Figures
6 and 7). From ten minutes to 30 minutes the rate decreased for the 10% and
5% enzyme treatment to 0.85 centipoise per minute to 0.68 centipoise per
minute, respectively. The rate of degradation for both treatments was nearly the
same from 30 minutes to 60 minutes, 0.21 centipoise per minute for the 10%
enzyme treatment and 0.20 centipoise per minute for the 5% treatment. In the
first hour, the difference in the degradation rate resulted in a 76% viscosity
reduction for the 10% alpha amylase versus a 61 % viscosity reduction for the 5%
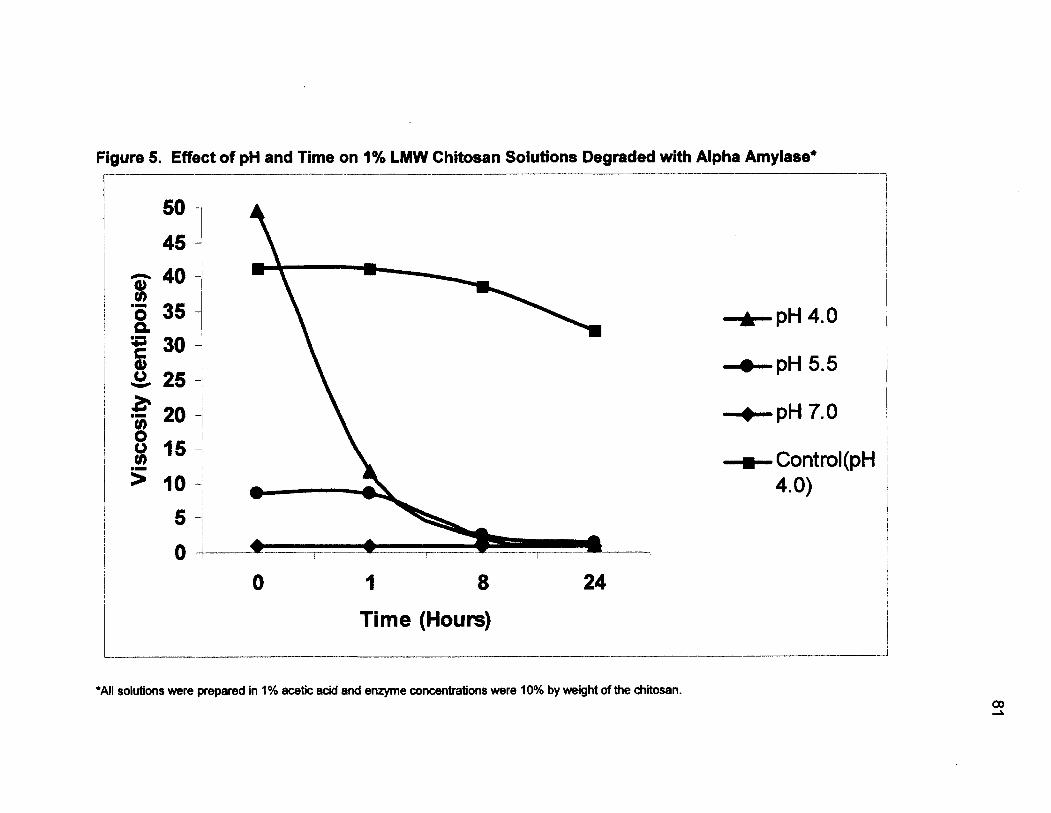
Figure 5. Effect of pH and Time on 1% LMW Chitosan Solutions Degraded with Alpha Amylase*
Time (Hours)
+All solutions were prepared in 1% acetic acid and enzyme concentrations were 10% by weight of the chitosan.
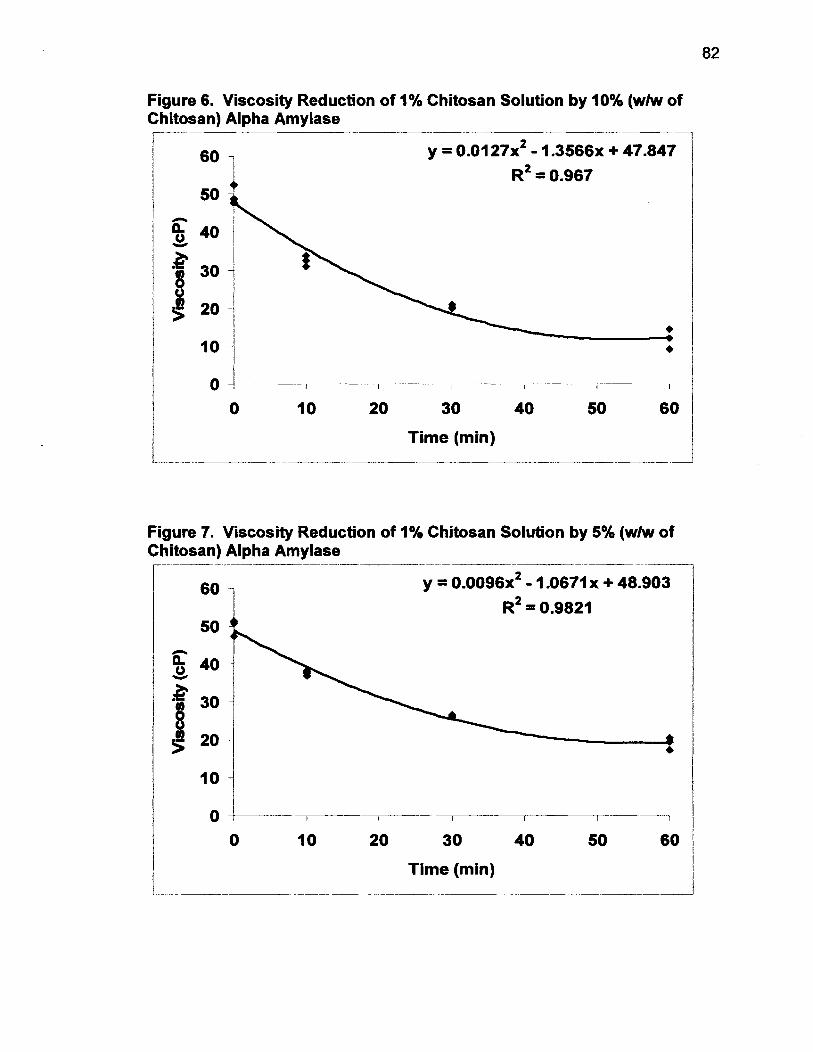
Figure 6. Viscosity Reduction of 1% Chitosan Solution by 10% (wlw of Chitosan) Alpha Amylase
0 10 20 30 40 50 60
Time (min)
Figure 7. Viscosity Reduction of 1°h Chitosan Solution by 5% (wlw of Chitosan) Alpha Amylase
20 30 40
Time (min)
alpha amylase treatment. The viscosity of the 5% enzyme treatment was 2.3
centipoise after 24 hours which was the same viscosity as the 10% enzyme
treatment after eight hours, indicating the degree of degradation achieved by the
5% treatment was not as high as that of the 10% treatment (Figures 8 and 9).
Intrinsic Viscosity
The undegraded chitosan had an intrinsic (reduced) viscosity of 25.67
(Figure 10). The degraded chitosan solutions; 10 min degraded, 30 min
degraded, 60 min degraded, 8 hour degraded and 24 hour degraded had intrinsic
viscosities of 12.83, 10.34, 8.75, 3.08 and 0.79 mug respectively (Figure 10)
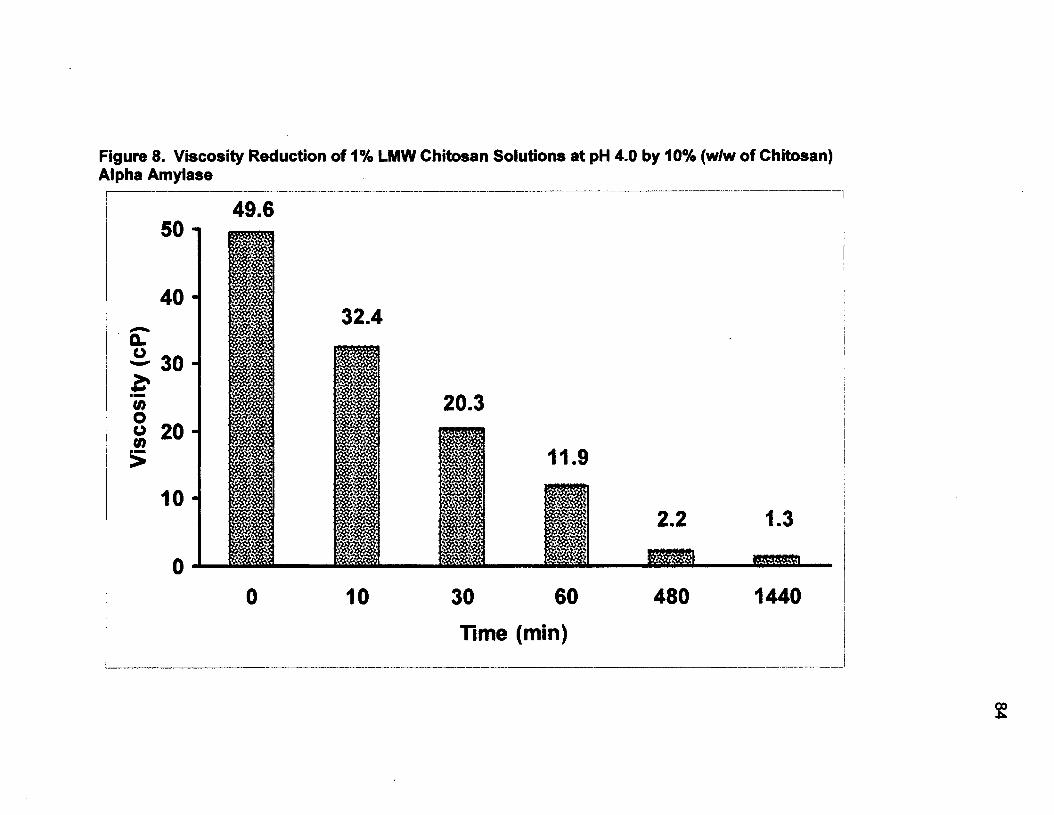
Figure 8. Viscosity Reduction of 1% LMW Chitosan Solutions at pH 4.0 by 10% (wlw of Chitosan) Alpha Amylase
30 60
Time (min)

Figure 9. Viscosity Reduction of 1% LMW Chitosan Solutions at pH 4.0 by 5% ( w h of Chitosan) Alpha Amylase
30 60
Time (min)

Figure 10. Intrinsic Viscosity of Degraded and Undegraded 1% Chitosan Solutions
0.4 0.6
Concentration gldL
10 --
0 10min Degraded A m
I 30min Degraded 6Omin Degraded
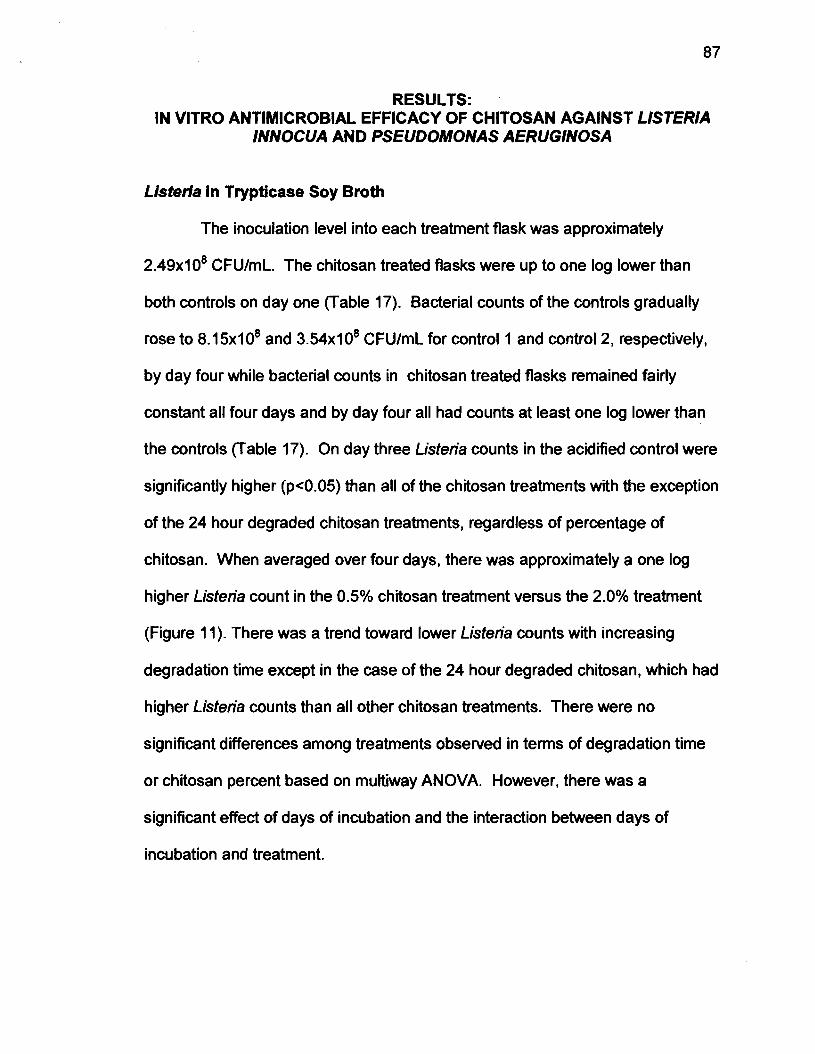
RESULTS: IN VlTRO ANTIMICROBIAL EFFICACY OF CHITOSAN AGAINST LlSTERlA
INNOCUA AND PSEUDOMONAS AERUGINOSA
Listeria in Trypticase Soy Broth
The inoculation level into each treatment flask was approximately
2.49~10' CFUImL. The chitosan treated flasks were up to one log lower than
both controls on day one (Table 17). Bacterial counts of the controls gradually
rose to 8.1 5x10' and 3 .54~10~ CFUImL for control 1 and control 2, respectively,
by day four while bacterial counts in chitosan treated flasks remained fairly
constant all four days and by day four all had counts at least one log lower than
the controls (Table 17). On day three Listeria counts in the acidified control were
significantly higher ( ~ ~ 0 . 0 5 ) than all of the chitosan treatments with the exception
of the 24 hour degraded chitosan treatments, regardless of percentage of
chitosan. When averaged over four days, there was approximately a one log
higher Listeria count in the 0.5% chitosan treatment versus the 2.0% treatment
(Figure 11). There was a trend toward lower Listeria counts with increasing
degradation time except in the case of the 24 hour degraded chitosan, which had
higher Listeria counts than all other chitosan treatments. There were no
significant differences among treatments observed in terms of degradation time
or chitosan percent based on mumway ANOVA. However, there was a
significant effect of days of incubation and the interaction between days of
incubation and treatment.
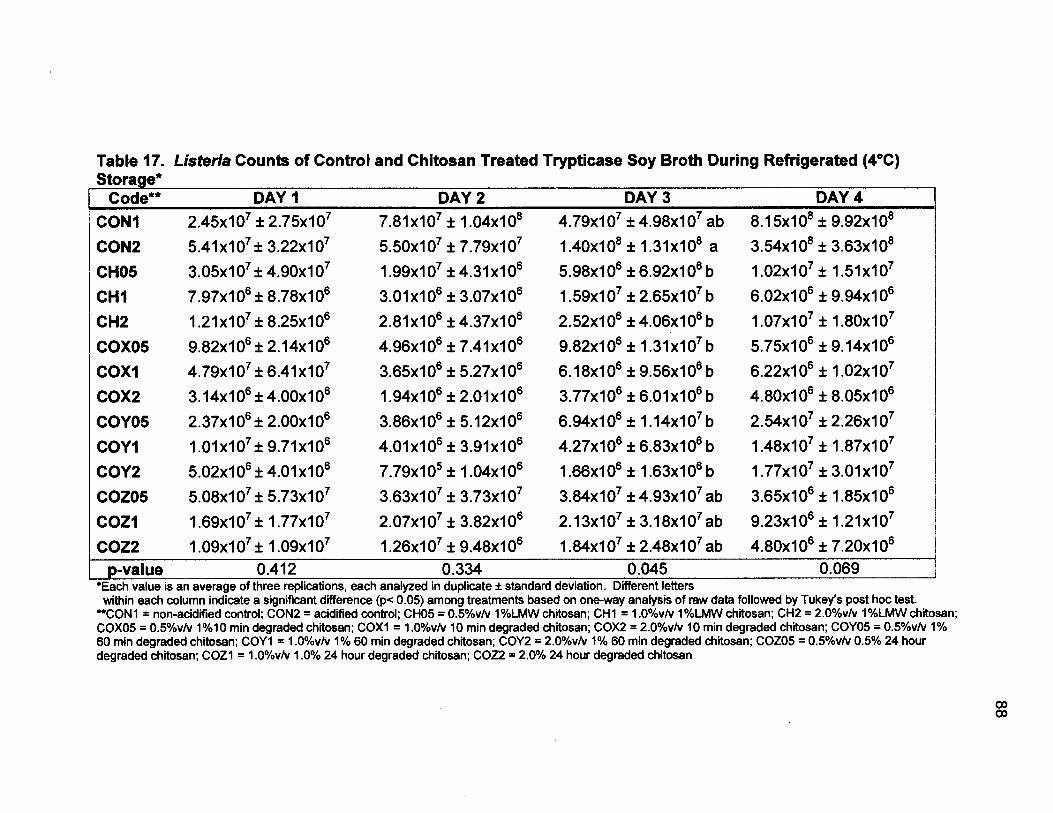
Table 17. Listeria Counts of Control and Chitosan Treated Trypticase Soy Broth During Refrigerated (4°C) Storage*
I Code** DAY 1 DAY 2 DAY 3 DAY 4
CHI 7.97~10~ f 8 .78~10~ 3.01 x1 o6 f 3.07~1 o6 1 -59x1 o7 f 2.65~1 o7 b 6 .02~10~ f 9 .94~10~
CH2 1 .21x107 f 8 .25~10~ 2 .81~10~ f 4 .37~10~ 2 .52~10~ f 4 .06~10~ b 1.07~1 o7 f 1.80~ 1 o7 COX05 9.82x10⁶f 2 .14~10~ 4 .96~10~ f 7 .41~10~ 9 .82~10~ f 1 .31x107 b 5 .75~10~ f 9 .14~10~
COX1 4 .79~10~ f 6.41x10⁷ 3.65~1 o6 f 5.27~1 o6 6.18~1 o6 f 9.56~1 o6 b 6.22~1 o6 f 1.02~1 o7
COY05 2.37x10⁶f 2 .00~10~ 3 .86~10~ f 5 .12~10~ 6 .94~10~ f 1 .14x107 b 2 .54~10~ f 2 .26~10~
COY1 1 .01 x i o7 f 9.71 x i o6 4.01 x1 o6 f 3.91 x1 o6 4.27~1 o6 f 6.83~1 o6 b 1.48~1 o7 f 1.87~1 o7 COY2 5.02~1 o6 f 4.01 XI o6 7.79~1 o5 f 1.04~1 o6 1.66~1 o6 f 1.63~1 o6 b 1 .77x107 f 3 .01~10~
COZO5 5.08~1 o7 f 5.73~1 o7 3.63~1 o7 f 3.73~1 o7 3.84~1 o7 f 4.93~1 o7 ab 3.65~1 o6 f 1.85~1 o6 I COZI 1.69~1 o7 f 1 .77x1 o7 2 .07~10~ f 3.82~10~ 2 .13~10~ f 3.18x10⁷ab 9 .23~10~ f 1 .21x107
p-value 0.412 0.334 0.045 0.069 *Each value is an averaae of three replications, each analyzed in duplicate * standard deviation. Different letters within each column indkate a significant difference (p< 005) among treatments based on one-way analysis of raw data followed by Tukey's post hoc test.
"CON1 = non-acidified control; CON2 = acidified control; CH05 = 0.5%v/v 1%LMW chitosan; CHI = l.OOhv/v l%LMW chitosan; CH2 = 2.O%v/v l%LMW chiiosan; COX05 = 0.5%v/v 1%10 min degraded chitosan; COXl = 1 .O%v/v 10 min degraded chitosan; COX2 = 2.O%v/v 10 min degraded chiiosan; COY05 = 0.5%v/v 1% 60 min degraded chitosan; COYl = l.O%v/v 1% 60 min degraded chitosan; COY2 = 2.O%v/v 1% 60 min degraded chitosan; COZ05 = 0.5%v/v 0.5% 24 hour degraded chitosan; COZl = 1 .O%v/v 1 .O% 24 hour degraded chitosan; COZ2 = 2.0% 24 hour degraded chitosan


Pseudomonas in Trypticase Soy Broth
Initial inoculation levels of Pseudomonas were approximately 2 .50~10~
CFUImL, which was less than the inoculation level of the Listeria. Pseudomonas
did not grow as well as Listeria, therefore a higher inoculation amount, one mL
compared to 0.1 mL, was required to achieve the desired level. Initial counts on
day one indicated an approximately one log reduction for all treatments, including
the controls, compared to the inoculum level (Table 18). CON2, the acidified
control, had approximately a half log higher Pseudomonas count compared to
CONl throughout the experiment. All chitosan treatments had a slightly lower
Pseudomonas count throughout the experiment compared to the CON2 but not
CONl which is apparent when evaluating the mean counts for all four days of the
experiment (Figure 12). One way ANOVA revealed no significant differences
among any treatment on any day of analysis (Table 18). There was a higher
amount of precipitate when chitosan was added to this broth compared to
nutrient broth. No significant differences were observed regarding chitosan
percent, day or degradation time based on multiway ANOVA.
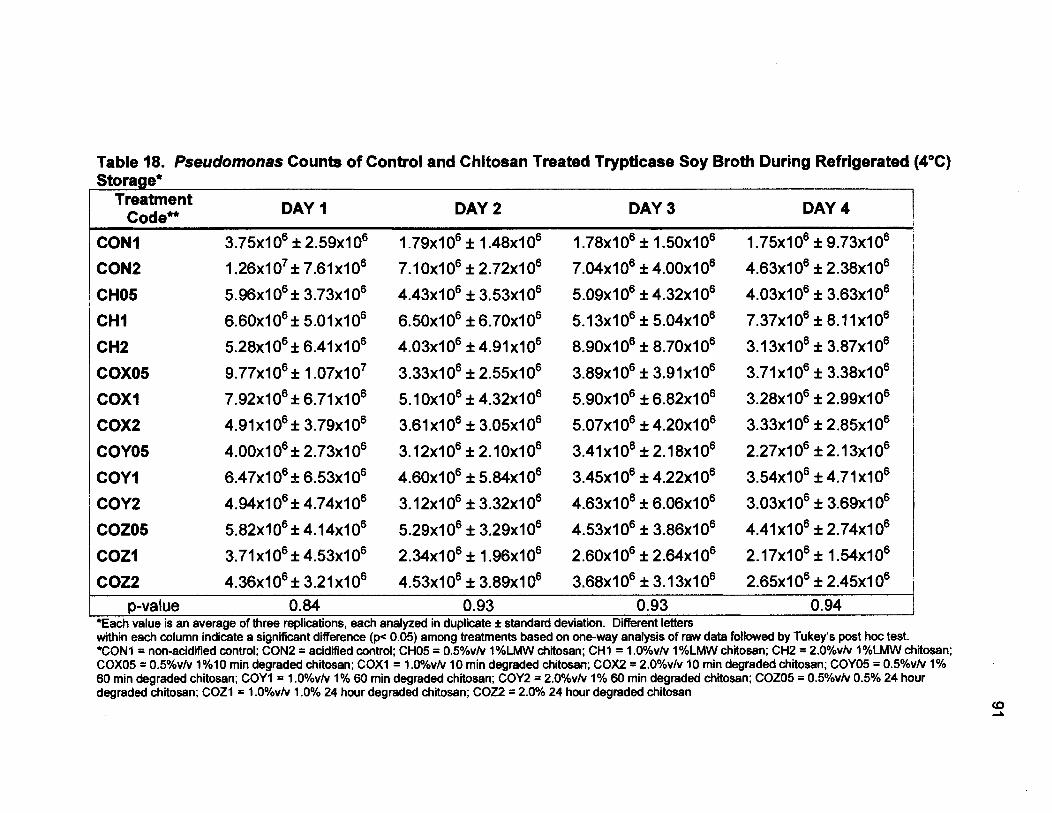
Table 18. Pseudomonas Counts of Control and Chitosan Treated Trypticase Soy Broth During Refrigerated (4°C) - -
Storage* Treatment
Code** DAY 1 DAY 2 DAY 3 DAY 4
CON1 3.75~1 o6 f 2.59~1 o6 1.79~1 o6 f 1.48~1 o6 1.78~1 o6 f 1.50~1 o6 1.75~1 o6 f 9.73~1 o6 CON2
CH05
CHI
CH2
COX05
COX1
COX2
COY05
COYl
COY2
COZO5
COZl
COZ2
I 'Each value is an average of three replications, each analyzed in duplicate * standard deviation. Different letters within each column indicate a significant difference (p< 0.05) among treatments based on one-way analysis of raw data followed by Tukey's post hoc test. 'CON1 = non-acidified control; 6 0 ~ 2 = acidified control; C H O ~ = 0.5%vhr 1°hLMW chitosan; CHI-= l .~%vlv 1%LMW chitosan; C H ~ = 2.0%vlv l%LMW chbsan; COX05 = 0.5OhvIv 1%10 rnin degraded chitosan; COX1 = l.O%v/v 10 min degraded chitosan; COX2 = 2.0%vlv 10 min degraded chitosan; COY05 = 0.5%vlv 1% 60 min degraded chitosan; COYl = 1 .O%vhr 1% 60 min degraded chitosan; COY2 = 2.Wvlv 1% 60 min degraded chiiosan; COZ05 = 0.5Ohvlv 0.5% 24 hour degraded chitosan; COZl = I .O%vhr 1 .O% 24 hour degraded chitosan; COZ2 = 2.0% 24 hour degraded chitosan
2

Figure 12. Four Day Mean Pseudomonas Counts in Trypticase Soy Broth* 7-
Treatment Code
'Each value is the averaae of four davs in tri~licate. CON1 = non-acidified cohrol; CON2 acidiied control; CH05 = 0.5%vh 1°hLMW chitosan; CHI = 1 .O%vlv 1%LMW chitosan; CH2 = 2.O%vh 1°hLMW chitosan; COX05 = 0.5%vh 1 %10 rnin degraded chitosan; COX1 = 1 .OOhvh 10 rnin degraded chitosan; COX2 = 2.0%vh 10 rnin degraded chitosan; COY05 = 0.5Ohvlv 1 % 60 rnin degraded chitosan; COY1 = 1 .OOhvh 1% 60 rnin degraded chitosan; COY2 = 2.0%vh 1% 60 rnin degraded chitosan; COZ05 = 0.5%vh 0.5% 24 hour degraded chitosan; COZl = 1 .O%vlv 1 .OOh 24 hour degraded chitosan; COZ2 = 2.0% 24 hour degraded chitosan
Pseudomonas in Nutrient Broth
An initial trial in nutrient broth at a lower inoculation level (3.14~10~
CFUImL) resulted in nearly total inhibition of Pseudomonas growth and
uncountable plates at all dilutions by day three for all chitosan treated flasks.
Pseudomonas counts in the controls started at log 5 and remained there all four
days of the experiment (Table 19). After completing another experiment in
triplicate in trypticase soy broth at a higher inoculation level (2.50~10~ CFUImL),
another experiment in nutrient broth was performed (in triplicate) at the higher
inoculation level (1 .98x107 CFUImL). The four day mean CON2 (acidified
nutrient broth) Pseudomonas counts were slightly higher than the four day mean
CON1 throughout the experiment (Figure 13). One way ANOVA revealed the
controls had significantly higher (p=O.OO) Pseudomonas counts than all of the
chitosan treatments from day one through day four of the experiment (Table 19).
Mult iay ANOVA revealed that there were significant effects of day (p=O.OO),
degradation time (p=O.OO), and chitosan percent (p=O.OO) on Pseudomonas
counts. The effects of chitosan percent on Pseudomonas counts can be clearly
observed in Figure 13. As chitosan percent increased from 0.5 to 1.0 to 2.0%,
there was a stepwise decrease in Pseudomonas counts. Two percent chitosan
treatments were approximately one log lower than 0.5% chitosan treatments.
Pseudomonas counts gradually fell in all chitosan treatments on each day of the
experiment. There was a slight decrease in Pseudomonas counts for the 10
minute degraded chitosan treatment compared to undegraded chitosan. The log
reductions of the 24 hour degraded chitosan treatment were slightly less than the
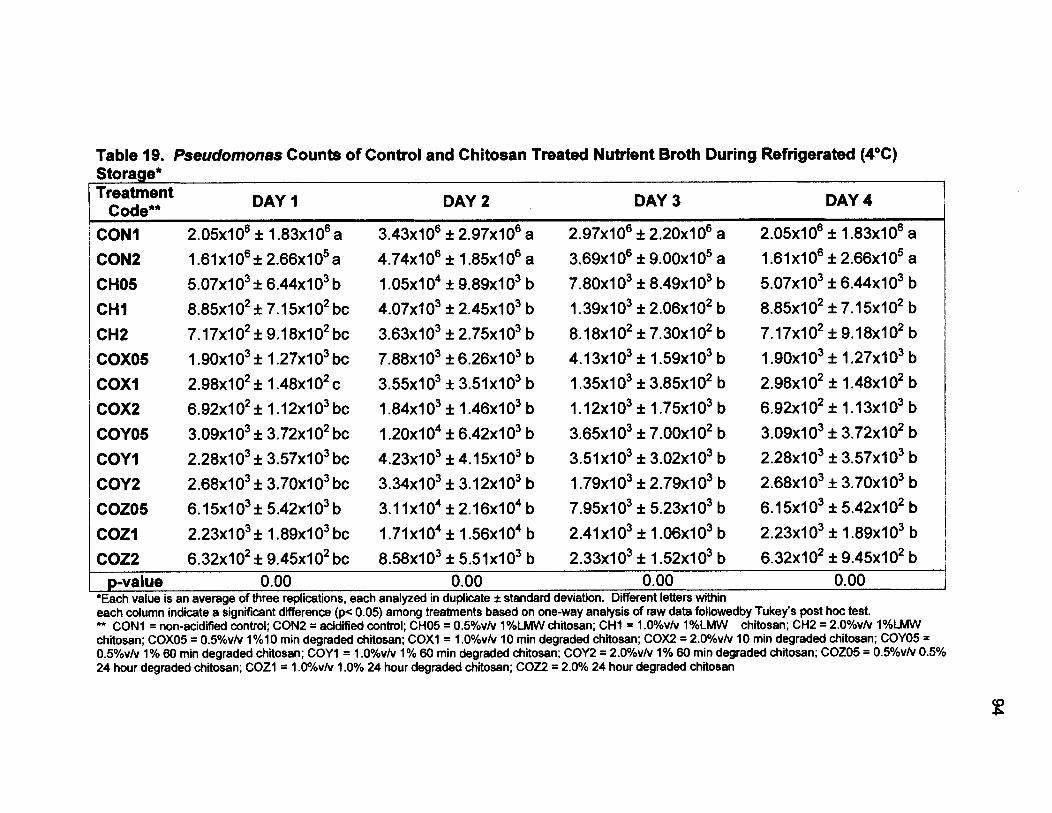
Table 19. Pseudomonas Counts of Control and Chitosan Treated Nutrient Broth During Refrigerated (4°C) Storage* Treatment
Code** DAY 1 DAY 2 DAY 3 DAY 4
CON1
CON2
CH05
CHI
CH2
COX05 COX1
COX2
COY05
COY1
COY2
COZ05
COZl
coz2 p-value 0.00 0.00 0.00 0.00
*Each value is an average of three replications, each analyzed in duplicate i standard deviation. Different letters within each column indicate a significant difference @< 0.05) among treatments based on one-way analysis of raw data followedby Tukey's post hoc test. " CON1 = non-acidified control; CON2 = acidified control; CH05 = 0.5%vhr 1 % L W chitosan; CHI = 1 .O%vhr l%LMW chitosan; CH2 = P.O%vhr I % L W chiiosan; COX05 = O.SOhvhr 1%1O min degraded chitosan; COX1 = 1 .OO/~vhr 10 min degraded chiiosan; COX2 = 2.0%vhr 10 min degraded chitosan; COY05 = 0.5%vhr'1°h 80 min degraded chitosan; COYI = 1 .OOhvhr 1% 60 min degraded chitosan; COY2 = 2.0%vlv 19'0 60 min degraded chitosan; COZ05 = 0.5%vlv 0.5% 24 hour degraded chitosan; COZl = 1 .OOhvhr 1 .O% 24 hour degraded chitosan; COZ2 = 2.0% 24 hour degraded chiiosan
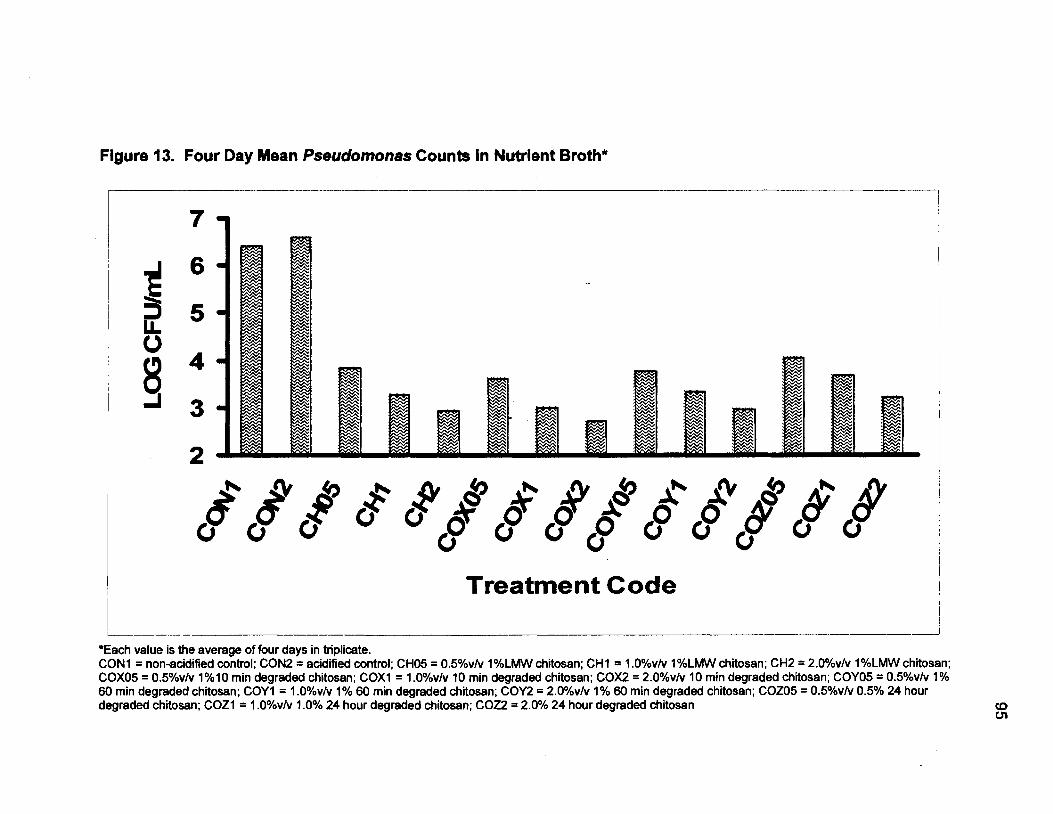
Figure 13. Four Day Mean Pseudomonas Counts in Nutrient Broth*
Treatment Code
*Each value is the averaae of four davs in tri~licate. CONI = non-acidified cokrol; CON2 acidiied control; CH05 = 0.5%vhr 1 % L W chitosan; CHI = 1 .O%v/v 1 % L W chitosan; CH2 = 2.0%v/v l%LMW chitosan; COX05 = 0.5%vhr 1 %10 min degraded chitosan; COX1 = 1 .O%v/v 10 min degraded chitosan; COX2 = 2.0%vhr 10 min degraded chiiosan; COY05 = O.S%vhr 1 % 60 min degraded chitosan; COY1 = 1 .O%v/v 1% 60 min degraded chitosan; COY2 = 2.O%vhr 1 % 60 min degraded chitosan; COZ05 = 0.5%vhr 0.5% 24 hour degraded chitosan; COZl = 1 .O%vhr 1 .O% 24 hour degraded chitosan; COZ2 = 2.0% 24 hour degraded chitosan
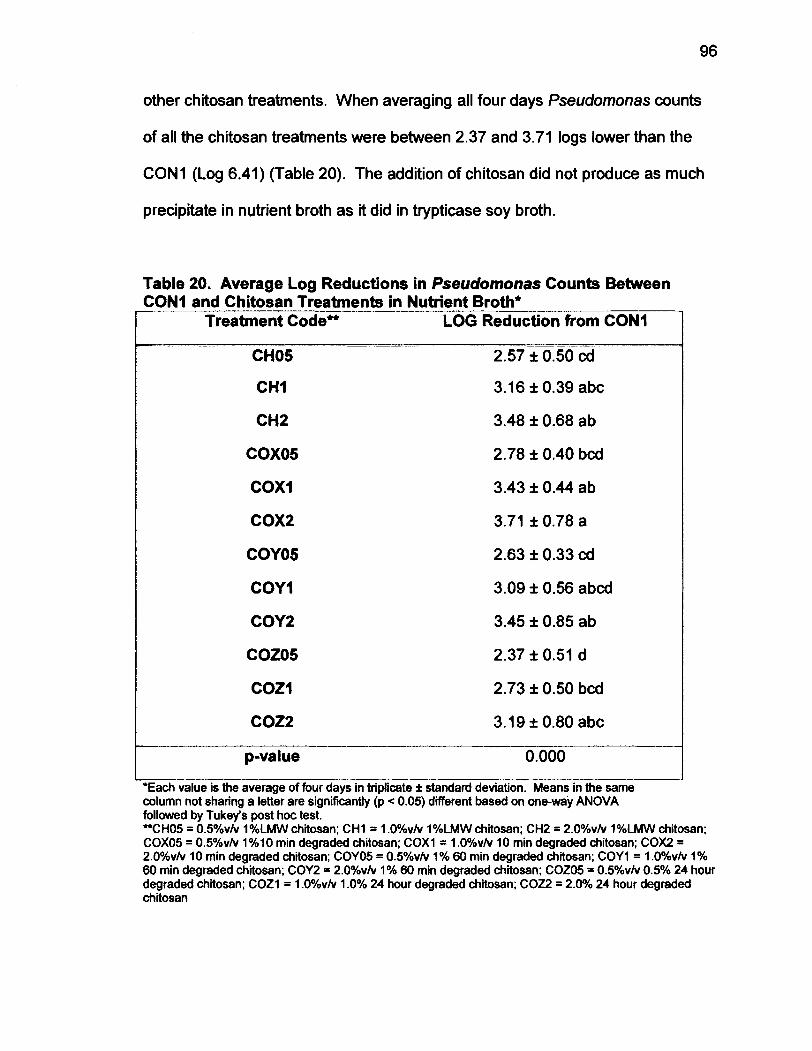
other chitosan treatments. When averaging all four days Pseudomonas counts
of all the chitosan treatments were between 2.37 and 3.71 logs lower than the
CONl (Log 6.41) (Table 20). The addition of chitosan did not produce as much
precipitate in nutrient broth as it did in trypticase soy broth.
Table 20. Average Log Reductions in Pseudomonas Counts Between CONl and Chitosan Treatments in Nutrient Broth*
Treatment Codef, LOG Reduction from CON1
CHI 3.16 & 0.39 abc
COX05 2.78 * 0.40 bcd
COZ05
COZl
2.37 * 0.51 d
2.73 * 0.50 bcd
COZZ 3.19 * 0.80 abc
p-value 0.000
'Each value is the average of four days in triplicate f standard deviation. Means in the same column not sharing a letter are significantly (p < 0.05) different based on one-way ANOVA followed by Tukey's post hoc test. "CH05 = 0.5%vh 1 %LW chitosan; CHI = 1 .O%vlv 1 %LMW chitosan; CH2 = 2.0%vlv 1 %LMW chitosan; COX05 = 0.5%vlv 1%10 min degraded chitosan; COX1 = 1 .O%vlv 10 min degraded chitosan; COX2 = 2.0%vlv 10 min degraded chiiosan; COY05 = 0.5%vlv 1% 60 min degraded chitosan; COY1 = 1 .O%vlv 1% 60 min degraded chitosan; COY2 = 2.O%vlv 1 % 60 min degraded chitosan; COZ05 = 0.5%vlv 0.5% 24 hour degraded chitosan; COZl = 1 .O%vlv 1 .O% 24 hour degraded chitosan; COZ2 = 2.0% 24 hour degraded chitosan

DISCUSSION: ANTIMICROBIAL EFFICACY OF CHITOSAN DIPS AND POWDERED
CHITOSAN ON ATLANTIC SALMON PRODUCTS
Moisture, Ash and Mineral Analysis
The moisture content of both the salmon fillet and trim were similar, both
approximately 70% and the ash content was close to 5%. Similar moisture
contents were reported by Suvanich et a/. (1 998) and Gomez-Guillen et a/.
(2000) for aquacultured salmon. Suvanich et a/. (1 998) reported Atlantic salmon
ash content as 1.6%. The slightly higher ash content of the salmon used in our
study may be attributed to either seasonal variations or possibly, not all of the
bones were removed. The trim samples had similar proximate composition
compared to the fillets because the salmon supplier had no actual trimmings
available. The trim supplied to us was actually skinless pieces of salmon fillet.
pH
Salmon Trim
The pH of the salmon trim (control) was 6.16 on day one of the experiment
and all of the chitosan treated trim samples had higher pH values, which
increased with chitosan percentage. A possible explanation for the higher pH
values in the chitosan treated trim may be due to residual base leftover from the
processing of the chitosan. This leftover base may have been released into the
water used to homogenize the sample, raising the pH. The chitosan did not
dissolve into the trim over time, as it was visible during the entire storage period.
This was because the pH of the salmon trim was over the point at which native
chitosan is soluble, 6.0. In a slightly more acidic food substance, the chitosan
may have been able to solubilize within the food matrix. The pH of all of the
samples, regardless of chitosan treatment, rose from day one to day three and
then gradually fell to the end of the study on day 13. One would expect the pH to
drop quickly as the glycogen in the muscle is converted to lactic acid and then
rise again as the microbial flora produces basic compounds. Reddy et a/., (1997)
reported that the surface pH of salmon fillets was 6.42 on day zero and then fell
to 6.32 after one day. By day three, the pH again rose to 6.53 and continued to
rise slightly till day 20, at which time the pH was 6.57. This is a fairly well
established pattern in fish fillets. On the day the treatments were applied to the
salmon in our study, pH was not measured so the pH may have started slightly
higher than at day one because rigor may have been over by the first day of
analysis. The rise in pH on day three was present in all samples, so calibration
of the pH meter may not have been done correctly on day three. Even so, this
does not explain the slow decrease or lack of change in pH over the following
days. It is also possible that not enough basic substances were produced to
raise the pH of the salmon trim by the end of the experiment.
Salmon Fillet
Initial pH level of the salmon fillet control (6.16) was the same as the trim
control. Just as with the salmon trim, the pH values rose to day three and then
fell again on day six. The fillet control did rise to 6.22 by day 13 but all of the
dipped fillets only rose slightly. The pattern of pH change was more typical of
what should be expected, except for day three. The pH of all of the dipped fillets
was lower than the control throughout the experiment, which may be due to
inhibition of bacteria or absorption of the acetic acid into the flesh of the fish.
Bal'a and Marshall (1998) reported similar reductions in the pH of fish flesh
dipped in various acid treatments. The pH of the chitosan dips was
approximately 4.3. In the case of the high molecular weight chitosan dip, the pH
values were the lowest throughout the experiment probably due to the high
viscosity of the dip, which caused the dip to cling to the fillet better than the other
treatments did. The low molecular weight dip was not as viscous and did not
cling as well and perhaps did not linger on the fillets as long as did the high
molecular weight dip, resulting in higher pH values.
Aerobic Plate Counts
Salmon Trim
Aerobic plate counts were higher in salmon trim treatments with chitosan.
No differences were observed between chitosan type; high molecular weight
versus low molecular weight. Treatments with higher percentages of chitosan
appeared to have higher aerobic plate counts than the lower percentage
treatments. This seems to indicate that the introduction of the chitosan may have
introduced bacteria into the salmon trim. Since the chitosan was ground in a
Wiley mill prior to use, it is possible that the grinding introduced bacteria into the
chitosan in addition to natural flora that was already present. Autoclaving the
chitosan prior to use would have sterilized the product and eliminated this
contamination factor. The expected reduction in microbial counts may also not
have occurred because the pH of the salmon mince was 6.16, which is above the
pH at which chitosan is soluble. Although the pH of the salmon was below the
pKa of chitosan, 6.3 (Helander et a/., 2001), throughout the experiment, it was
not low enough to solubilize the chitosan. This experiment confirmed that the
antimicrobial qualities of chitosan are dependent on the chitosan being
solubilized in the food matrix. Lin and Chao (2001) and Jo et a/. (2001) observed
no inhibition of bacteria, at similar storage temperatures to our study, in sausage
prepared with water soluble chitosan oligomers, which are lower in molecular
weight than the chitosan used in this study. However, Darmadji and lzumimoto
(1994) reported a two log reduction of bacterial counts in ground beef at storage
temperatures of 4°C and a chitosan percentage of 1 % although the type and
source of chitosan were not mentioned. They may have used a water-soluble
chitosan derivative because they also conducted an in-vitro antimicrobial study in
yeast extract peptone broth at a pH of 6.8; native chitosan would have been
insoluble in this broth. Based on a rejection limit of log six, all of the trim
treatments, with the exception of 0.5% low molecular weight chitosan treatment,
reached this level by day six which is consistent with the shelf life of caffish
mince (5 days at 5°C) as reported by Suvanich et a/. (2000a).
Salmon Fillet
Initial plate counts of the salmon fillet were relatively low (log 2 to log 3)
due to the short time period (1 2 hours) between processing and application of the

treatments. The untreated control reached a level of log seven and the low
molecular weight dip treatment reached log six by day six, which was in excess
of the acceptability level of log six. In contrast, the acetic acid and high
molecular weight chitosan (HMW) treated fillets did not surpass the acceptability
level until day 10, indicating approximately a four day extension of shelf life by
both treatments. Jeon et a/. (2002) reported that a 1 % acetic acid dip kept
microbial counts below log six up to day eight in cod fillets and up to day six on
herring fillets stored at 4°C. Shelf life of sea bass was reported to be
approximately three days at 5°C as reported by Chang et a/. (1998). In contrast,
the sensory shelf life of aquacuttured salmon as reported by Reddy et a/. (1997)
was reported to be between 16 and 20 days at 4"C, at which time the microbial
counts were log 8.84. In our study, treated salmon fillets did not reach log eight
until day 13, which is consistent with the results of Reddy et a/. (1997). The
application of the HMW dip to the salmon fillets suppressed microbial growth
through day six while the other dips appear to have delayed growth only until day
three.
No synergistic effect was observed between the acetic acid and the
chitosan. Sagoo et a1.(2002) reported a synergistic effect between sodium
benzoate and chitosan against spoilage yeasts in a saline solution. The authors
theorized the polycationic condition of the chitosan below its pKa caused a
reaction with the anionic portions of the bacterial cell membrane, allowing the
sodium benzoate to act upon the cells. Alakomi eta/., 2000 reported that lactic
acid was able to weaken the outer membrane of gram-negative bacteria. Acetic
acid was used in this experiment so it is possible that the acetic acid may have
allowed the solubilized chitosan in the dip to react with the bacterial cells
although only the high molecular weight dip exhibited lower microbial counts than
the acetic acid dipped control. The thicker coating of the HMW dip may have
been responsible for suppressing microbial growth by either preventing access to
oxygen or by keeping the antimicrobial components of the dip (acetic acid and
chitosan) in contact with the surface of the fillet.
Total Volatile Base Nitrogen
Salmon Trim
Initial concentrations of WBN on day one were approximately 16 mg
Ni l OOg for all treatments but then rose to higher levels -20 mg Ni l 00 g by day
13. The rise was not constant because for some treatments there was a drop in
concentrations between day three and six. Overall, the increases in
concentration throughout the experiment were not that large compared to the
initial concentrations. None of the treatments reached the proposed shelf-life
cut-off of 30 mg Nil00 g. Jeon eta/. (2002) reported initial WBN concentrations
of approximately 7 to 9 mg NI100 g for both cod and herring fillets stored at 4°C.
By the end of 12 days of storage the concentrations had risen to 53 and 49 mg
Nil00 g for cod and herring, respectively. The corresponding aerobic plate
counts for cod and herring on day 12 were log seven and log eight, respectively.
Since salmon is a different species of fish, it may not degrade in the same way or
at the same rate as cod or herring. The aerobic plate counts of the salmon trim

were relatively high by the end of the study, but the high number of bacteria did
not result in corresponding higher levels of TVBN, despite starting out at higher
concentrations than those found by Jeon etal. (2002) at the beginning of their
study.
Salmon Fillet
Initial TVBN levels were similar to those of the salmon trim, between 14.5
and 16.8 mg NI100 g. By day 13, the concentration of TVBN in the control
treatment had risen to approximately 23 mg N1100 g. All of the treatments that
had been dipped remained between 17 and 18 mg NI100 g. All of the treatments
appear to have inhibited the formation of TVBN. Similar findings were reported
by Jeon et a/. (2002) when chitosan dips were applied to cod and herring fillets.
After 12 days of storage, high molecular weight chitosan dips had TVBN
concentrations of 22 and 24 mg NI 1009 of fish for cod and herring, respectively.
Smaller reductions were observed in the lower molecular weight dips. The
difference between their experiment and ours was that glycerol was added to the
dips and after dipping, the fillets were dried in a drying oven at 40°C until a film
formed on the fillets. Despite the differences in application, the evidence for
inhibition of TVBN formation by application of the chitosan dip is similar to our
findings. The reduction in TVBN reported by Jeon etal. (2002) corresponded to
an inhibition of microbial growth, up to three logs lower by day 12 while our TVBN
values on day 13 corresponded with a one to two log reduction in aerobic plate
counts.
Trimethylamine
Salmon Trim
Trimethylamine analysis was made more difficult due to the presence of
chitosan in the salmon trim. The initial extraction was conducted with 7.5%
trichloroacetic acid, which solubilized the chitosan flakes in the trim, causing the
extraction fluid to be more viscous than normal. The chitosan was carried over
into the TMA procedure which caused emulsification with the toluene layer when
the test tubes were shaken, making removal of the toluene layer much more
difficult. Addition of salt to the test tubes broke down the emulsion to some
degree, but centrifugation was necessary to disperse the emulsion in the 2%
chitosan treatments. TMA analysis was not conducted on day three because the
analyses day one and six resulted in undetectable concentrations of
trimethylamine. TMA was detectable on days 10 and 13 but the highest
concentration detected was only 3.30 mg T W 100 g. The suggested TMA
concentration indicative of spoilage for fatty fish is 5 mg TMN 100 g (Jeon et a/.,
2002) and for other fish, 30 mg T W 100 g of fish (Reddy et a/., 1997). The
salmon trim never reached these concentrations. Reddy et a/. (1 997) reported
the initial concentration of TMA in aquacultured salmon to be 0.18 mg TWl00g .
When stored at 4°C TMA concentrations in their study slowly rose to 1.59 mg
TMN 100 g on day 10 and did not rise drastically till day 16 at which time the
concentration of TMA was 16.37 mg TMN 100 g. These results are consistent
with our study. Perhaps if the study had been extended for three more days,
higher concentrations would have been detected. The fish we obtained was very

fresh so it took a long time to produce TMA because it is produced by the
spoilage bacteria. Since initial bacterial counts were very low (log two to three), it
took longer to produce TMA. Reddy et a/. (1 997) reported initial aerobic plate
counts of log 4.5, but the counts on day 10 were log 8.9 which corresponded with
a TMA concentration of 1.59 mg I 100 g. This was also the aerobic plate count at
day 16 which corresponded with a TMA concentration of 16.37 mg1100 g of fish,
indicating it may take some time to build up the TMA concentration and that the
bacterial count does not necessarily correspond with TMA concentration.
Additionally, salmon does not have as much of the precursor of TMA,
trimethylamine oxide (TMAO), as some other marine fish (Reddy et a/. , 1997)
hence, TVBN concentrations may have been a better indicator of degradation in
our salmon samples.
Salmon Fillet
TMA concentrations were even lower in the salmon fillets. Even the
untreated control fillet only had a maximum TMA concentration of 1.21 mgI100 g,
and that occurred on day 10. Except for the acetic acid dipped fillets,
concentrations of TMA fell between day 10 and day 13. The TMA concentrations
in dipped fillets remained under 1 mgI100 g. Lower TMA concentrations were
found in intact fillet portions probably because the bacteria present were mainly
on the surface of the fillet, therefore only reacting with the TMAO present near
the surface of the fish.
DISCUSSION: ENZYMATIC DEGRADATION OF CHITOSAN SOLUTIONS
Enzyme Effectiveness
Our results indicated that the bromelain tested in this study was not
effective in degrading chitosan solutions as indicated by the formation of
precipitate at neutral pH after 24 hours of degradation even at 50% enzyme
levels. Although the protein content of the bromelain mixture was higher than
that of the alpha amylase mixture used, the alpha amylase activity was higher
than that of bromelain. Yalpani and Pantaleone (1 994) successfully degraded
chitosan solutions in acetic acid with bromelain at relatively low enzyme
concentrations, 0.0025 to 0.02% by weight of chitosan. The source of the
enzyme was given by the authors but no mention of the enzyme activity was
made. The enzyme mixture used by Yalpani and Pantaleone (1 994) may have
been much more active than the enzyme used in this study. The bromelain used
in this study may have slightly degraded the chitosan but not to full water
solubility. Viscosity changes made by the bromelain were not tested since the
goal was to produce a completely water soluble chitosan. Alpha amylase, in
contrast, was very effective in degrading the chitosan solution to water soluble
oligomers within 24 hours at enzyme levels of 5 and 10% by weight of chitosan.
Zhang et a/. (1999) also used alpha amylase with lower activity in an enzyme
complex with cellulase and proteinase to degrade chitosan. The alpha amylase
used by the authors had similar activity, 500 Ulmg, compared to this study, 307
U/mg. Alpha amylase was also studied indirectly by Yalpani and Pantaleone

(1994) in the form of human salivary excretions, which also contained other
enzymes such as lysozyme. The authors reported an 80% reduction of chitosan
solution viscosity after seven days of exposure to saliva. Alpha amylase is an
endo-enzyme that works on the alpha 1-4 linkages in starch molecules. Perhaps
the mode of action of alpha amylase on chitosan is the 1-4 linkages that exist in
this polysaccharide, although these linkages are beta rather than alpha. The
degree of deacetylation has also been proposed as a factor in enzyme
effectiveness in degrading chitosan solutions. Nordtveit et a/. (1994) and Shin-ya
eta/. (2001) both reported that highly deacetylated chitosan inhibited the
effectiveness of pectinase and lysozyrne, respectively, in degrading chitosan.
The degree of deacetylation of the chitosan in this study was 80%. Alpha
amylase and perhaps, bromelain may have been more effective reacting with the
chitosan if the degree of deacetylation had been lower.
pH
The optimal pH conditions for the degradation of chitosan by alpha
amylase was -4.3, the pH obtained when the 1% chitosan solution was prepared
in 1% acetic acid. Optimal conditions for function of alpha amylase on starch are
pH 6.6 at 30 "C. Yalpani and Panteleone (1994) studied the effects of pH on
numerous enzymes in several enzyme classes on the degradation of chitosan.
They reported that most of the enzymes they tested performed best at pH levels
between 3.0 and 4.5, which is consistent with the results in this study. In this
study, the lower pH conditions were necessary to degrade the chitosan with the
alpha amylase as indicated by the undissolved chitosan present in the pH 5.5
and 7.0 treatments. It seems that the chitosan must be fully solubilized in order
for the enzyme to be able to react with the chitosan substrate. Despite chitosan's
reported solubility limit, below pH 6.0, the chitosan in the pH 5.5 treatment never
fully solubilized and formed a ropy mass. Perhaps if chitosan had been fully
dissolved in 1 % acetic acid and then adjusted to pH 5.5, the alpha amylase may
have degraded the chitosan more effectively.
Gravimetric Measurements
The attempt to quantify the degree of water solubility of the chitosan
degraded by alpha amylase was, for the most part, unsuccessful. Quantification
was only possible for the chitosan solutions that had fully degraded to the point
where the chitosan was water soluble, alter 24 hours of degradation. No method
to measure solubility was found in the literature. In other studies, solubility was
usually measured by adding sodium hydroxide to chitosan solutions and
observing whether precipitate formed at neutral pH (Pantaleone et a/., 1992;
Zhang et a/., 1999). The attempt to quantrfy the chitosan solutions that were not
completely water-soluble most likely failed due to formation of a thick gel when
the pH was adjusted to 7.0. This thick gel probably did not dry completely in the
drying oven due to case hardening. The higher weights obtained after pH
adjustment and drying were probably a result of water trapped in the gel matrix
that could not be driven off.

Viscosity
In most of the literature enzyme degradation of chitosan was studied
viscometrically with a capillary-type (Nordtveit et a/., 1994; llyina et a/., 2000;
Zhang and Neau, 2001), Brookfield (Pantaleone et a/., 1992) or a Haake
Rotovisco RV-20 (Muuarelli et a/., 1994) viscometer. The capillary type
viscometer was used in this study because it was the most commonly used
method and relatively easy to use. The viscosity of the low molecular weight
chitosan used in this study was between 45 and 50 centipoise when prepared as
a 1 % solution in 1 % acetic acid. Muuarelli et a/. (1994) reported the initial
viscosity of their 1 % chitosan solution prepared in lactic acid as -500 centipoise.
Yalpani and Pantaleone (1 994) reported their chitosan had a viscosity of 1260
centipoise, but they used a 2% chitosan solution prepared in 3N acetic acid.
Despite the difference in concentration, this chitosan probably had a much higher
starting viscosity than the chitosan used in this study.
The solvent used in the preparation can also greatly influence the viscosity
of chitosan in solution. Skaugrud and Sargent (1990) reported viscosities of a
1 % chitosan solution ranging from 260 centipoise in acetic and propionic acid to
as low as 12 centipoise in oxalic acid. Solvent choice may also influence the
degradation of a chitosan solution. Muzzarelli et a/. (1994) reported a 40%
reduction in viscosity of a 1 % chitosan solution prepared in 1 % acetic acid after
one hour at 50°C and only 10% reductions in viscosity when malic, lactic and
citric acid were used as the solvent. We obsenred degradation due to acid
hydrolysis of our chitosan solution as well, but the reduction was 35% and this
occurred in 24 hours. The combination of heat and acetic acid probably acted
synergistically to degrade the chitosan. Because this study was conducted at
ambient room temperatures, usually between 20 and 25"C, this effect was
slowed greatly. The synergistic effect of heat and acid was also observed when
the chitosan solutions were autoclaved to deactivate the enzyme. A 55%
reduction in viscosity was observed for 10 minute degraded chitosan (10%
enzyme level). A 28% viscosity reduction was observed in the 60 minute
degraded chitosan.
Large viscosrty reductions were observed in this study with addition of
alpha amylase. More rapid reductions were observed with the 10% enzyme level
compared to the 5% level. The most rapid reduction in viscosity occurred in the
first hour of degradation at both enzyme concentrations. Similar findings were
reported by Pantaleone et a/. (1992) for a variety of enzymes (chitinase and
cellulase), rapid viscosity reductions in the first two hours were followed by a
more gradual reduction up to 24 hours. Muuarelli et a/. (1994) also reported that
the most rapid degradation of chitosan by papain occurred in the first hour.
Perhaps the rapid intial reductions may be due to the nature of the enzyme,
alpha amylase. Since this is an endo-enzyme the very long chains of chitosan in
solutions were broken in the middle, resufting in a rapid viscosity reduction. As
the number of sites the enzyme could hydrolyze decreased, the rate of
degradation slowed. Pantaleone et at. (1992) reported a more gradual viscosity
reduction pattern for less specific classes of enzymes, lipase and papain, that
have different modes of action for hydrolysis. In this study, after 24 hours of
degradation, the viscosity of the chitosan solution was getting close to that of the
solvent, indicating that a nearly complete hydrolysis had occurred.
Discrepancies exist in the literature regarding the effects of chitosan
(substrate) concentration on the enzymatic degradation rate. Yalpani and
Pantaleone (1994) reported higher enzyme activity in 0.5% chitosan solutions
compared to 2% solutions for a range of enzymes (cellulase, lipase, and papain),
which was theorized to have possibly been a result of inhibition by either
substrate or hydrolysis products. In contrast, Muzzarelli et a/. (1994) reported
more rapid viscosity reductions during the first hour, in higher concentration
chitosan solutions (12 cP/min at concentrations of 7g/L versus 110 cP/min at
concentrations of 19gIL) degraded with papain. This was probably because the
higher concentration chitosan solution had a higher viscosity to begin with and
the enzymes had more sites to act upon because of the higher concentration of
substrate. The rate of viscosity reduction in this study during the first hour for the
5 and 10% enzyme treatments was 0.49 cP/min and 0.59 cP/min, respectively.
The relatively small decreases in viscosity observed in this study compared to
Muzzarelli et a/. (1 994) may be attributed to the use of a low molecular weight
chitosan. The reported molecular weight of Muuarelli et a/. (1 994) chitosan was
698,340 kDa whereas the chitosan used in this study had an unspecified
molecular weight. Nonetheless, it was evident that higher concentrations of
alpha amylase in this study resulted in more rapid degradation of the chitosan
solution, but only during the first hour.
DISCUSSION: IN VlTRO ANTIMICROBIAL EFFICACY OF CHITOSAN AGAINST LlSTERlA
INNOCUA AND PSEUDOMONAS AERUGINOSA
Listeria in Trypticase Soy Broth
All chitosan treatments resulted in approximately a one log reduction in
Listeria counts in TSB. The acidification of the TSB with concentrated
hydrochloric acid appears to have had no effect in reducing the bacterial counts,
as evidenced by the acidified broth control, which had similar counts to the non-
acidified control throughout the experiment. Ita and Hutkins (1 991) reported that
hydrochloric acid exhibited the least antimicrobial activity toward Listeria
monocytogenes in trypticase soy broth. The authors also reported that Listeria
monocytogenes survived in acidified broths down as low as pH 3.5. In this study,
the broth pH was only reduced to 5.5 in order to fully solubilize the chitosan in
solution.
Listeria monocytogenes was reported (Wang, 1992) to be inhibited by
chitosan in NB at temperatures of 30°C. Wang also reported the best inhibitory
conditions occurred at a pH of 5.5 rather than 6.5, which was probably due to the
insolubility of chitosan at pH values above 6.0. The lower degree of inhibition,
one to two logs, in this study compared to that of Wang (1992), up to five logs,
could be the result of binding of the chitosan to proteins in the TSB despite the
higher temperatures used in Wang's study. Addition of chitosan to the TSB
caused formation of a cloudy precipitate, which increased with increasing
chitosan percentage. Precipitate also was evident in nutrient broth but not to the
extent that it was in TSB. Hansen and Gill (2000) have also reported this
phenomenon in an in vitro antimicrobial study in TSB with the compound
protamine against Listena monocytogenes and E. coli. Like chitosan, protamine
is a cationic compound with antimicrobial properties, but it is not a
polysaccharide. Hansen and Gill (2000) noted that the addition of protamine
formed a precipitate in TSB and the protamine available in the solution dropped,
most significantly above pH 6.0. However, the authors also reported that
protamine displayed the best antimicrobial activity toward Listena at pH levels of
6.5 and higher, despite the higher precipitate and thus, lower amounts of free
protamine. The authors theorized that the protamine was more able to bind to
the cell surface of Listena at higher pH levels, regardless of interactions with the
broth. Chitosan is a different compound than protamine, but a study of water-
soluble chitosan in TSB at higher pH levels or in nutrient broth may demonstrate
more antimicrobial activity than with the environmental parameters used in this
study. In addition, the binding displayed by chitosan to proteins in the TSB may
have ramifications when applied to a food system high in protein. The chitosan
may bind to proteins in the food, which may reduce its antimicrobial efficacy.
Support for this argument was reported by Jo et a/. (2001) and Lin and Chao
(2001), both of whom added water soluble chitosan oligomers to sausage
products and reported no significant aerobic plate count reductions. Conversely,
Darmadji and lzumimoto (1 994) reported a two-log reduction in aerobic plate
counts in ground beef that had 1 % chitosan (most likely a water-soluble
derivative) added to it. The differences in these studies possibly may be
attributed to chitosan addition level. Jo et al. (2001) and Lin and Chao (2001)
added chitosan to the sausage formulations at levels of 0.2 and 0.1 %,
respectively, whereas Darrnadji and lzumimoto (1 994) added chitosan at a 1 %
concentration.
Efficacy of chitosan against E. coli in phosphate buffer was reported by
Tsai and Su (1 999) to decrease with decreasing temperature. Conversely, Tsai
et al. (2000) reported that chitoligosaccharides were more effective in inoculated
sterilized milk at 4°C than at 37°C. The contrasting results of these two studies
indicate that the antimicrobial efficacy of chitosan varies with different substrates.
Although this factor was not tested in this study, it is possible that chitosan may
have been more effective against Listeria at temperatures higher than 4°C.
The 24 hour degraded, water-soluble, chitosan exhibited the least
antibacterial activity. Similar results were observed by both Jeon and Kim (2000)
and Jeon et a/. (2001), who reported decreasing antibacterial activity with
increasing degree of degradation. Jeon and Kim (2000) and Jeon et al. (2000)
also reported an increase in antibacterial activity against E. coli with increasing
chitosan percentage, regardless of degree of degradation. This was also the
case in this study. Rhoades and Roller (2000) reported a slight increase in
antimicrobial activity in slightly degraded chitosan, but not greatly so. The
authors reported more highly degraded chitosan oligomers were less effective
than undegraded chitosan. In this study, we did not observe this effect against
Listeria but did in the study with Pseudomonas aervginosa.
Jeon et a/. (2001) reported that many types of bacteria were killed by
chitosan and chitosan oligomers. Gram-positive strains were slightly more
affected by the chitosan compared to gram-negative strains. The authors also
reported that Pseudomonas was the most resistant to the antimicrobial effects of
chitosan and chitosan oligomers. In this study, the gram-negative Pseudomonas
were more affected by the chitosan treatment than the gram-positive Listeria.
Since the two studies were conducted in different broths, no conclusion regarding
susceptibility based on gram status can be assumed.
Pseudomonas in Nutrient Broth and Trypticase Soy Broth
Pseudomonas aenrginosa was not inhibited in TSB compared to NB. The
difference in antimicrobial efficacy based on broth choice was substantial.
Potential explanations for this difference were discussed in the previous section.
Pseudomonas aemginosa was reported by Jeon et a/. (2001) to be the
most resistant organism to the antimicrobial effects of chitosan at 37°C. That
study was conducted in TSB, and undegraded chitosan still resulted in a 68% kill,
as measured spectrophotometrically. The authors did not mention any
interference caused by chitosan precipitate. In this experiment with
Pseudomonas, significant log reductions, up to four logs, compared to the
controls were observed.
Helander et a/. (2001) reported that the antibacterial properties of chitosan
toward gram-negative bacteria could be attributed to binding on the outer
membrane of the bacteria, as evidenced by electron micrographs. In this study,
binding of the chitosan to the proteins in the TSB probably left less of the
chitosan to bind to the proteins in the outer membrane of the Pseudomonas,
reducing the efficacy of the chitosan.
Degree of deacetylation was reported by Liu et a/. (2000) to affect the
antimicrobial action of chitosan, which increased with increasing degree of
deacetylation. The authors theorized that the reason for this effect was an
increase of available NH2 groups and therefore, NH~concentrations, which bind
to the negative portions of the bacterial cell membrane. The chitosan used in this
study had a degree of deacetylation of approximately 80%. If the degree of
deacetylation had been higher, the chitosan may have been even more effective
against Pseudomonas, conversely, it may not have been as easily degraded by
alpha amylase, as discussed previously.
The pH of the broth may also play a role in the antimicrobial efficacy of
chitosan. The reported pKa of chitosan is 6.3 and Liu et a/. (2000) reported the
highest antibacterial activity at pH 6.3 because of the high amount of NH3'. The
authors also reported the antibacterial activity of the chitosan declined at pH
values below 6.3 because the amount of H' ions increased and competed for
binding sites on the bacterial membrane. This contradicts the findings of Wang
(1 992) who found chitosan was ineffective against a variety of bacteria at pH 6.5,
which is slightly above the pK, of chitosan. Sudarshan et a/. (1992) reported
water soluble chitosans were equally antimicrobial toward both gram-positive and
negative bacteria at pH values of 5.8, but were ineffective at pH levels of 7.0.
This study was conducted at pH 5.5, below the pKa of chitosan. An obvious
117
extension of this research would be to test the antibacterial effects of chitosan,
especially the fully degraded chitosan, at higher pH levels.
CONCLUSIONS
This study indicates that chitosan definitely possesses antimicrobial
properties and can be degraded easily by commercially available enzymes.
However, the food matrix and method of application is very important to achieve
the desired effect. More research is required to determine appropriate food
products and chitosan forms to add to those products.
Salmon Product Applications
Future research of chitosan's effects on salmon products should include
an analysis of lipid oxidation and color change over time in addition to the other
analyses already conducted. Another study with salmon trim should be
conducted either with a pre-solubilized chitosan or a water soluble chitosan
(without acetic acid) or chitosan derivative as solubility is an important factor
influencing the efficacy of chitosan. It would also be interesting to test chitosan
products in other foods, perhaps ones not as high in protein as the proteins may
interfere with chitosan's efficacy in a food system. A study of chitosan in food
systems in conjunction with other food preservatives such as nisin or sodium
benzoate may also be of interest since there may be synergistic effects.
Enzyme Degradation
A natural extension of the work already completed in this study would be
to quantify the end products of the enzymatic breakdown by alpha amylase. This
may be accomplished in a number of ways including high performance liquid
chromatography. Additionally, it would be of interest to develop a method that
uses alpha amylase to continuously produce water soluble or degraded chitosan.
In Vitro Study
This study should include another analysis of the effects of chitosan
against Lisferia innocua in nutrient broth to determine whether the broth played a
role in the results already obtained as it did in the Pseudomonas aenrginosa
study. Additionally, it would be of interest to study the enzymatically produced
water soluble chitosan at the pKa of chitosan and slightly below and above this
pH value as well as in broth at an unadjusted pH. A determination of the minimal
inhibitory concentration of chitosan required would be useful as well. A study at
elevated temperatures would also be necessary to determine if temperature
played a role in the results obtained in this study.
REFERENCES
Alakomi, H.L., Skytta, E., Saarela, M., Matilla-Sandholm, T., Latva-Kala, K. and Helander, I.M. 2000. Lactic acid permeabilizes gram-negative bacteria by disrupting the outer membrane. Applied and Environmental Microbiology. 66(5): 2001 -2005.
Ashie, I.N.A., Smith, J.P. and Simpson, B.K. 1996. Spoilage and shelf life extension of fresh fish and sheltfish. Criiical Reviews in Food Science and Nutrition. 36: 87-121.
ASTM. 2000. Petroleum products, lubricants, and fossil fuels. In: Annual Book of ASTM Standards Section 5. Philadelphia: American Society for Testing and Materials. p 188-1 96.
Baek, M.H.C., Lim, D.S. and Taikl, S. 2001. Effect of chitosan addition on textural properties of sweet potato starch noodle. Food Science and Biotechnology. 1 O(2): 161 -165.
Balsa, M.F.A. and Marshall, D.L. 1998. Organic acid dipping of catfish fillets: effect on color, microbial load, and Listeria monocytogenes. Journal of Food Protection. 61 (1 1): 1470-1474.
Botta, J.R., Lauder, J.T. and Jewer, M.A. 1984. Effect of methodology on total volatile basic nitrogen determination as an index of quality of fresh Atlantic cod (Gadus morhua). Journal of Food Science. 49: 734-736.
Bronstein, M.N., Price, R.J., Strange, E.M., Melvin, E.F., Dewees, C.M. and Wyatt, B.B. 1985. Storage of dressed Chinook salmon in refrigerated freshwater, diluted seawater, seawater and ice. Marine Fisheries Review. 47: 68-72.
Bullard, F.A. and Collins, J. 1978. Physical and chemical changes in pink shrimp held in C02-modified refrigerated seawater compared to pink shrimp held in ice. Fisheries Bulletin. 76: 73-76.
Capita, R., Alonso-Calleja, C., Garcia-Fernandez, C. and Moreno, B. 2001. Efficacy of trisodium phosphate solutions in reducing Listeria monocytogenes populations on chicken skin during refrigerated storage. Journal of Food Protection. 64(lO): 1627-1 630.
Chang, D.S., Cho, H.R., Goo, H.Y. and Choe, W.K. 1989. A development of food preservative with the waste of crab processing. Bulletin of the Korean Fish Society. 22: 70-78.
Chang, K.L.B., Chang, J., Shiau, C.Y. and Pan, B. 1998. Biochemical, microbiological, and sensory changes of sea bass (Lateolabrax japonicus) under partial freezing and refrigerated storage. Journal of Agricultural and Food Chemistry. 46: 682-686.
Chen, C.S., Liau, W.Y. and Tsai, G.J. 1998. Antibacterial effects of N-sutfonated and N-sutfobenzoyl chitosan and application to oyster preservation. Journal of Food Protection. 61 (9): 1 124-1 128.
Chen, M.C., Yeh, G.H.C.and Chiang, B.H. 1996. Antimicrobial and physiochemical properties of methylcellulose and chitosan films containing a preservative. Journal of Food Processing and Preservation. 20: 379- 390.
Cho, H.R.C., Lee, D.S., Jeong, W.D., Lee, E.T. and Woo, E. 1998. Utilization of chitosan hydrolysate as a natural food preservative for fish meat paste products. Korean Journal of Food Science and Technology. 30(4): 817- 822.
Choi, W.Y., Kim, K.M. and Park, H. J. Preparation of edible coating emulsions for fresh products. Institute of Food Technologists Annual Meeting, June, 2000, Anaheim, CA.
Cuero, R.G., Duffus, E., Osuji, G. and Pettii, R. 1991. Aflatoxin control in preharvest maize: Effects of chitosan and two microbial agents. Journal of Agricultural Science. 1 17: 165-169.
Darmadji, P. and Izumimoto, M. 1994. Effect of chitosan in meat preservation. Meat Science. 38: 243-254.
Deuchi, K., Kanauchi, O., Imasato, Y. and Kobayashi, E. 1995. Continuous and massive intake of chitosan affects mineral and fat-soluble vitamin status in rats fed on a high-fat diet. Bioscience, Biotechnology and Biochemistry. 59: 1211-1216.
Ehira, S. and Uchiyama, H. 1986. Determination of fish freshness using the K value and comments on some other biochemical changes in relation to freshness. In: Kramer, D.E., Liston, J. editors. Seafood Qualtty Determination. New York: Elsevier. p 186-209.
Einen, 0. and Thomassen, M.S. Starvation prior to slaughter in Atlantic salmon (Salmo salat) II. White muscle composistion and evaluation of freshness, texture and colour characteristics in raw and cooked fillets. Aquaculture. 169: 37-53.

Emborg, J., Laursen, B.G., Rathjen, T. and Dalgaard, P. 2002. Microbial spoilage and formation of biogenic amines in fresh and thawed modified atmosphere-packed salmon (Salmo salao at 2°C. Journal of Applied Microbiology. 92: 790-799.
Erikson, U., Beyer, A.R. and Sigholt, T. 1997. Muscle high-energy phosphates and stress affect K-values during ice storage of Atlantic salmon (Salmo salao. Journal of Food Science. 62(1): 43-47.
Food and Drug Association. 2001. "GRAS Notices Received in 2001 ." http:lhrm.cfsan.fda.~ovl-rdblopa-pol. html (71312001).
Gelman, A., Glatman, L., Drabkin, V. and Harpaz, S. 2001. Effects of storage temperature and preservative treatment on shelf life of the pond-raised freshwater fish, silver perch (Bidyanus bidyanus). Journal of Food Protection. 64(lO): 1584-1 591 .
Ghaouth, A.E., Arul, J., Ponnampalum, R. and Boulet, M. 1 Wla. , Chitosan coating effect on storability and quality of fresh strawberries. Journal of Food Science. 56(6): 1618-1 620.
Ghaouth, A.E., Arul, J. and Ponnampalum, R. 1991 b. Use of chitosan coating to reduce water loss and maintain quality of cucumber and bell pepper fruits. Journal of Food Processing and Preservation. 15: 359-368.
Gildberg, A. and Stenberg, E. 2001. A new process for advanced utilization of shrimp waste. Process Biochemistry. 36: 809-81 2.
Gomez-Guillen, M.C., Montero, P., Hurtado, 0. and Borderias, A.J. 2000. Biological characteristics affect the quality of farmed Atlantic salmon and smoked muscle. Journal of Food Science. 65(1): 53-57.
Ha, S.M.L., Lee, C., Kim, Y.C. and Ok, K. 1999. Properties of chitosan hydrolysates and their influence on the quality of shortened cake. Food Science and Biotechnology. 8(2): 1 13-1 17.
Haard, N.F. 1992. Technological aspects of extending prime quality of seafood: a review. Journal of Aquatic Food Product Technology. 1 : 9-26.
Hadlett, H.M., and Raab, C.A. 1990. Consumer perceptions of fresh fish quality. Journal of the American Dietetic Association. 98(8): 1 109-1 1 1 1.
Hansen, L.T. and Gill, T.A. 2000. Solubility and antimicrobial efficacy of protam ine on Listeria monocytogenes and Eschericia coli as influenced by pH. Journal of Applied Microbiology. 88: 1049-1 0%.
Healy, M.G., Romo, C.R. and Bustos, R. 1994. Bioconversion of marine crustacean shell waste. Resources, Conservation and Recycling. 11: 139-147.
Helander, I.M., Lassila, E.L., Ahvenainen, R., Rhoades, J. and Roller, S. 2001. Chitosan disrupts the outer membrane of gram-negative bacteria. International Journal of Food Microbiology. 71: 235-244.
Hirano, S. 1997. Applications of chitin and chitosan in the ecological and environmental fields. In: Goosen, M.F.A. Applications of Chitin and Chitosan. Lancaster, PA: Technomic Publishing. p 31-50.
Hungerford, J.M. 1998. Fish and other marine products. In: AOAC. 1 6 ~ ed. Gaithersburg, MD: AOAC. p 7.
Icekson, I., Pasteur, R., Drabkin, V., Lapidot, M., Eizenberg, E., Klinger, I. and Gelman, A. 1996. Prolonging shelf-life of carp by combined ionizing radiation and refrigeration. Journal of the Science of Food and Agriculture. 72: 353-358.
Ilyina, A.V., Tikhonov, V.E., Albulov, A.I. and Varlamov, V.P. 2000. Enzymatic preparation of acid-free-water-soluble chitosan. Process Biochemistry. 35: 563-568.
Ita, P.S. and Hutkins, R.W. 1991. lntracellular pH and survival of Listena monocytogenes Scott A in trypticase soy broth containing acetic, lactic, citric, and hydrochloric acids. Journal of Food Protection. 64(1): 15-1 9.
Janak Kamil, Y.V.A., Jeon, Y.J. and Shahidi, F. Control of oxidation of cooked herring by chitosan. Institute of Food Technologists Annual Meeting, June, 2002. Anaheim, CA.
Jay, J. 2000a. Seafoods. In Chapt. 6 'Modern Food Microbiology," 6' ed. Gaithersburg, Maryland: Aspen Publishers, Inc. p 101-1 12.
Jay, J. 2000b. Low Temperature Preservation and Characteristics of Psychrotrophic Microorganisms. In Chapt. 16 'Modern Food Microbiology," 6* ed. Gaithersburg, Maryland: Aspen Publishers, Inc. p 323-339.
Jeon, Y.J. and Kim, S.K. 2000. Production of chitoligosaccharides using an ultrafiltration membrane reactor and their antibacterial activity. Carbohydrate Polymers. 41 : 133-141.
Jeon, Y.J., Shahidi, F. and Kim, S. 2000. Preparation of chitin and chitosan oligomers and their applications in physiological functional foods. Food Reviews International. 16(2): 159-1 76.
Jeon, Y.J., Park, P.J. and Kim, S. 2001. Antimicrobial effect of chitoligosaccharides produced by bioreactor. Carbohydrate Polymers. 44: 71-76.
Jeon, Y.J., Janak Kamil, Y.V.A. and Shahidi, F. 2002. Chitosan as an edible invisible film for quality preservation of herring and Atlantic cod. Journal of Agricultural and Food Chemistry. 50: 51 67-51 78.
Jo, C., Lee, J.W., Lee, K.H. and Byun, M.W. 2001. Quality properties of pork sausage prepared with water-soluble chitosan oligomer. Meat Science. 59: 369-375.
Kim, C., Kim, S. and Choi, K. 1 997. Synthesis and antibacterial activity of water- soluble chitin derivatives. Polymers for Advanced Technologies. 8: 31 9- 325.
Kim, C.R. and Hearnsberger, J.O. 1994. Gram-negative bacteria inhibition by lactic acid culture and food preservatives on catfish fillets during refrigerated storage. Journal of Food Science. 59(3): 51 3-51 6.
Kim, D.H.L., Lee, C. and Chun, Y. 2000. Physiochemical and sensory properties of whipping cream with water soluble chitosan. Food Science and Biotechnology. 9(2): 1 1 1-1 15.
Kim, J.M., Huang, T.S., Marshall, M.R. and Wei, C.I. 1999. Chlorine dioxide treatment of seafoods to reduce bacterial loads. Journal of Food Science. 64: 1089-1093.
Kim, S.K., Park, P.J, Yang, H.P., and Han, S.S. 2001. Subacute toxicity of chitosan oligosaccharide in Sprague-Dawley rats. Arzneimittel- Forschung. 51 (9): 769-774.
Knorr, D. 1991. Recovery and utilization of chitin and chitosan in food processing waste management. Food Technology. 45: 1 14-1 22.
Kosak, P.H. and Toledo, R.T. 1981. Effects of microbial decontamination on the storage stability of fresh fish. Journal of Food Science. 46: 1012.
Koutsoumanis, K. and Nychas, G.E. 2000. Application of a systematic experimental procedure to develop a microbial model for rapid fish shetf life determinations. International Journal of Food Microbiology. 60: 171 - 184.
Lee, J.S., and Kolbe, E. 1982. Microbiological profile of Pacific shrimp stored under refrigerated seawater spray. Marine Fisheries Review. 44(3): 12- 17.
Lin, K. and Chao, J. 2001. Quality characteristics of reduced-fat Chinese-style sausage as related to chitosan's molecular weight. Meat Science. 59: 343-351.
Liu, X.F., Guan, Y.L., Yang, D.Z., Li, Z. and Yao, K.D. 2000. Antibacterial action of chitosan and carboxymethylated chitosan. Journal of Applied Polymer Science. 79: 1324-1 335.
Lloyd, L.L., Kennedy, J.F., Methacanon, P., Paterson, M. and Knill, C.J. 1998. Carbohydrate polymers as wound management aids. Carbohydrate Potymers. 37: 31 5-322.
Lowry, O.H., Rosebrough, N.J., Farr, A.L. and Randall, R. J. 1951. Protein measurement with the folin phenol reagent. Journal of Biological Chemistry. 193: 265-275.
Maezaki, Y., Tsuji, K., Nakagawa, Y., Kawai, Y., Akimoto, M., Tsugita, T., Takekawa, W., Terada, A., Hara, H., and Mitsuoka, T. 1993. Hypocholesterolemic effect of chitosan in adult males. Bioscience Biotechnology and Biochemistry. 57: 1439-1444.
Malle, P. and Poumeyrol, M. 1989. A new chemical criterion for the quality control of fish: trimethylaminehotal volatile basic nitrogen (%). Journal c Food Protection. 52(6): 41 9-423.
Manzano, M.A., Aguilar, R., Rojas, E.I. and Sanchez, M.E. 2000. Postmortem changes in black skipjack muscle during storage in ice. Journal of Food Science. 65(5): 774-779.
Marshall, D.L. and Kim, C.R. 1996. Microbiological and sensory analyses of refrigerated catfish fillets treated with acetic and lactic acids. Journal of Food Quality. 19: 317-329.
Marshall, D.L. and Jindal, V. 1997. Microbiological quality of catfish frames treated with selected phosphates. ~oumal of ~ood~~rotection. 60: 1081- 1083.
Maturin, L.J. and Peeler, J.T. 1998. Aerobic plate count. In: AOAC International. Bacteriological Analytical Manual. ern ed. Gaithersburg, MD. p 3-4.

Muuarelli, R.A.A. 1977. Chitin. Oxford: Permagon Press. p 139-1 50.
Muuarelli, R.A.A., Tomasetti, M. and Ilari, P. 1994. Depolymerization of chitosan with aid of papain. Enzyme and Microbial Technology. 16: 1 10- 113.
Muuarelli, R.A.A., Xia, W., Tomasetti, M. and Ilari, P. 1995. Depolymerization of chitosan and substituted chitosans with the aid of a wheat germ lipase preparation. Enzyme and Microbial Technology. 17: 541 -545.
Neter, J., Hunter, M., Nachtsheim, C. and Wasserman, W. 1996. Applied Linear Statistical Models. 4th ed. Chicago, Illinois: Irwin Publishing. 1408 p.
Nordtveit, R. J., Varum, K.M. and Smidsrod, 0. 1994. Degradation of fully water- soluble, partially N-acetylated chitosans with lysozyme. Carbohydrate Polymers. 25: 253-260.
Ohtakara, A., Izume, M. and Mitumtomi, M. 1988. Action of microbial chitinases on chitosan with different degrees of deacetylation. Agricultural and Biological Chemistry. 52: 31 81 -31 82.
Ouattara, B., Simard, R E , Piette, G., Begin, A. and Holley, R. 2000. Inhibition of surface spoilage bacteria in processed meats by application of antimicrobial films prepared with chitosan. International Journal of Food Microbiology. 62: 139-148.
Pantaleone, D., Yalpani, M. and Scollar, M. 1992. Unusual susceptibility of chitosan to enzymic hydrolysis. Carbohydrate Research. 237: 325-332.
Park, S.M.Y., Kim, S.K., Ahn, H.J. and Hyun, D. 1999. Studies on the improvement of storage property in meat sausage using chitosan. Journal of the Korean Society of Food Science and Nutrition. 28(1): 167-171.
Peavey, S., Work, T, and Riley, J. 1994. Consumer attitudes toward fresh and frozen fish. Journal of Aquatic Food Products Technology. 3: 71 -87.
Pittler, M.H., Abbot, N.C., Harkness, E.F., and Ernst, E. 1999. Randomized double-blind trial of chitosan for body weight reduction. European Journal of Clinical Nutrition. 53(5): 379-381.
Reddy, N.R., Solomon, H.M., Yep, H., Roman, M.G. and Rhodehamel, E.J. 1997. Shelf life and toxin development by Clostridium botulinum during storage of modified-atmosphere-packaged fresh aquacultured salmon fillets. Journal of Food Protection. 60(9): 1055-1 063.

Regenstein, J.M., and Regenstein, C.E. 1991. Introduction to Fish Technology. New York: Van Nostrand Reinhold. 257 p.
Reppond, K.D., Collins, J. and Markey, D. 1983. Walleye Pollock: changes in quality when held on ice, slush ice, refrigerated seawater then stored as block of fillets at -1 8OC. Journal of Food Science. 48: 1552-1 553.
Rhoades, J. and Roller, S. 2000. Antimicrobial actions of degraded and native chitosan against spoilage organisms in laboratory and media foods. Applied Environmental Microbiology. 66: 80-86.
Roller, S. and Covill, N. 1999. The antifungal properties of chitosan in laboratory media and apple juice. International Journal of Food Microbiology. 47: 67-77.
[
Roller, S. and Covill, N. 2000. The antimicrobial properties of chitosan in mayonnaise and mayonnaise based shrimp salads. Journal of Food Protection. 63: 202-209.
St. Angelo, A.J. and Vercellotti, J.R. 1992. Preparation and use of food grade N- carboxymethylchitosan to prevent meat flavor deterioration. In: Developments in Food Science. Amsterdam: Elsevier Scientific Publications. p 71 1-723.
Sagoo, S.K., Board, R. and Roller, S. 2002. Chitosan potentiates the antimicrobial action of sodium benzoate on spoilage yeasts. Letters in Applied Microbiology. 34: 168-1 72.
Shahidi, F. and Naczk, M. 1989. Chemical composition and chitin content of crustacean offal. In: Botta, R.J. Advances in fisheries technology and biotechnology for increased profitability: papers from the Atlantic fisheries technological conference and seafood biotechnology workshop, August 27 to September 1, 1989, St. John's, NF, Canada. Lancaster, PA: Technomic Publishing Co. p 229-304.
Shiau, S. and Yu, Y. 1999. Dietary supplementation of chitin and chitosan depresses growth in tilapia, Oreochromis niloticus X 0 . aureus. Aquaculture. 179: 439-446.
Shin-ya, Y., Lee, M., Hinode, H. and Kajiuchi, T. 2001. Effects of N-acetylation degree on N-acetylated chitosan hydrolysis with commercially available and modified pectinases. Biochemical Engineering Journal. 7: 85-88.
Simpson, B.K., Gagne, N., Ashie, I.N.A. and Noroozi, E. 1997. Utilization of chitosan for preservation of raw shrimp. Fopd Biotechnology. 11 : 25-44.
Skaugrud, 0. and Sargent, G. 1990. Chitin and chitosan: crustacean biopolymers with potential. In: Keller, Sue, editor. Making Profits out of Seafood Wastes Proceedings of the International Conference on Fish By- Products Anchorage, Alaska-April 25-27, 1990. p 61-70.
Sudarshan, N.R., Hoover, D.G. and Knorr, D. 1992. Antibacterial action of chitosan. Food Biotechnology. 6: 257-272.
Suvanich, V., Ghaedian, R., Chanamai, R., Decker, E.A. and McClements, D.J. 1998. Prediction of proximate fish composition from ultrasonic properties: catfish, cod, flounder, mackerel and salmon. Journal of Food Science. 63(6): 966-968.
Suvanich, V., Marshall, D.L. and Jahncke, M.L. 2000a. Microbiological and color quality changes of channel catfish frame mince during chilled and frozen storage. Journal of Food Science. 65(1): 151 -1 54.
Suvanich, V., Jahncke, M.L. and Marshall, D.L. 2000b. Changes in selected chemical quality characteristics of channel catfish frame mince during chill and frozen storage. Journal of Food Science. 65(1): 24-29.
Tanaka, Y, Tanioka, S., Tanaka, M., Tanigawa, T., Kitamura, Y., Minami, S., Okamoto, Y., Miyashita, M. and Nanno, M. 1997. Effects of chitin and chitosan particles on BALBIc mice by oral and parenteral administration. Biomaterials. 18: 591-595.
Tsai, G.J. and Su, W.H. 1999. Antibacterial activity of shrimp chitosan against Escherichia coli. Journal of Food Protection. 62(3): 239-243.
Tsai, G.J., Wu, Z.Y. and Su, W.H. 2000. Antibacterial activity of chitooligosaccharide mixture prepared by cellulase digestion of shrimp chitosan and its application to milk preservation. Journal of Food Protection. 63: 747-752.
Tsugita, T. 1989. Marine colloids biotechnology. In: ChitinIChitosan and its Applications. Tokyo: Gihodo Publishing Co. p 287-297.
Wang, G.H., 1992. Inhibition and inactivation of five species of foodborne pathogens by chitosan. Journal of Food Protection. 55: 916-919.
Williams, S.K., Rodick, G.E. and West, R.L. 1995. Sodium lactate affects shelf life and consumer acceptance of fresh catfish (Ictalurus nebulosus, marmoratus) fillets under simulated retail conditions. Journal of Food Science. 60: 636-639.
Yaplani, M. and Pantaleone, D. 1994. An examination of the unusual susceptibilities of aminoglycans to enzymatic hydrolysis. Carbohydrate Research. 256: 159-1 75.
Ylitalo, R., Lehtinen, S., Wuolijoki, E., Ylitalo, P., and Lehtimaki, T. 2002. Cholesterol-lowering properties and safety of chitosan. Arzneimittel- Forschung. 52(1): 1-7.
Zhang, H. and Neau, S.H. 2001. In vitro degradation of chitosan by a commercial enzyme preparation: effect of molecular weight and degree of deacetylation. Biomaterials. 22: 1653-1 658.
Zhang, H., Yuguang, D., Zingju, Y., Mitsutomi, M. and Aiba, S. 1999. Preparation of chitoligosaccharides from chitosan by a complex enzyme. Carbohydrate Research. 320: 257-260.
Zhou, Y., Martins, E., Groboillot, A., Champagne, C.P. and Neufeld, R.J. 1998. Spectrophotometric quanitification of lactic acid bacteria in alginate and control of cell release with chitosan coating. Journal of Applied Microbiology. 84: 342-348.

BIOGRAPHY OF AUTHOR
Todd Nicholas was born in Muskegon, Michigan on January 16, 1970. He
was raised in Michigan, Wisconsin, Alabama and Maine. He attended and
graduated from Waterville High School in Waterville, Maine in 1988. He attended
the University of Maine where he graduated with a Bachelor's degree in Biology
in December of 1992. He worked as a Deli Manager at Shawls Supermarkets in
both Bangor and Waterville, Maine till the fall of 2000. In the fall of 2000, he
entered the graduate program in the Department of Food Science and Human
Nutrition at the University of Maine.
While at the University of Maine, Todd has become a member of the
Institute of Food Technologists, Northeast IFT, and Phi Tau Sigma honorary
society. Todd is a candidate for the Master of Science degree in Food Science
and Human Nutrition from the University of Maine in May, 2003.