anticipating climate change: knowledge use in participatory flood management in the river meuse
TRANSCRIPT
Appeared in Sharing a common vision of our water resources. Conference proceedings of the 6th International Conference of the European Water
ssociation, Editions de la Boyère, Valbonne, France, 2005
1
Resources A Anticipating climate change: knowledge use in participatory flood management in the river Meuse
A.J. Wesselink1, J. Reuber2 and M.S. Krol1
1University of Twente, Dept. Water Management, Enschede, The Netherlands 2 Ministry of Transport, Public Works and Water Management, Dept. Limburg, Maastricht, The Netherlands
Abstract:
Given the latest knowledge on climate change, the Dutch government wants to anticipate the increased risk of flooding. For the river Meuse in The Netherlands, the design discharge is estimated to increase from 3800m3/s to 4600m3/s. With the existing policy of “Room for the River”, this increase is to be accommodated without raising the dikes. At the same time the floodplains are often claimed for other functions, e.g. new housing or industrial estates.
In 2001 the Ministry of Transport, Public Works and Water Management started the study “Integrated assessment of the river Meuse (IVM)” with the objectives of making an inventory of the probable physical effects of a design flood, assuming climate change, on the river Meuse in 2050, investigating possible spatial and technical measures to mitigate these effects, and finally combining various measures to create an integral strategy for flood protection, while at the same time increasing spatial quality. This paper presents the results of research into the decision making process that took place in order to achieve these objectives. Special attention was given to the role of scientific and technical knowledge in the decision making process, e.g. by investigating the effect of the quality of input data on acceptance by stakeholders, and the interactive use of a decision support system to visualise hydraulic effects. Conclusions on successes and pitfalls are drawn from observation and interviews with participants. It demonstrates how it is possible to integrate the necessary, technically complex knowledge in a political debate with stakeholders on how to deal with flood risk. Furthermore, the experience indicates in what area improvements could be made.
Key words:
Flood management, spatial quality, participatory decision making, knowledge use, hydraulic model, climate change
2 A.J.Wesselink, J.Reuber and M.S.Krol 1. THE DUTCH PREDICAMENT: CLIMATE
CHANGE IMPACT ON FLOOD PROTECTION
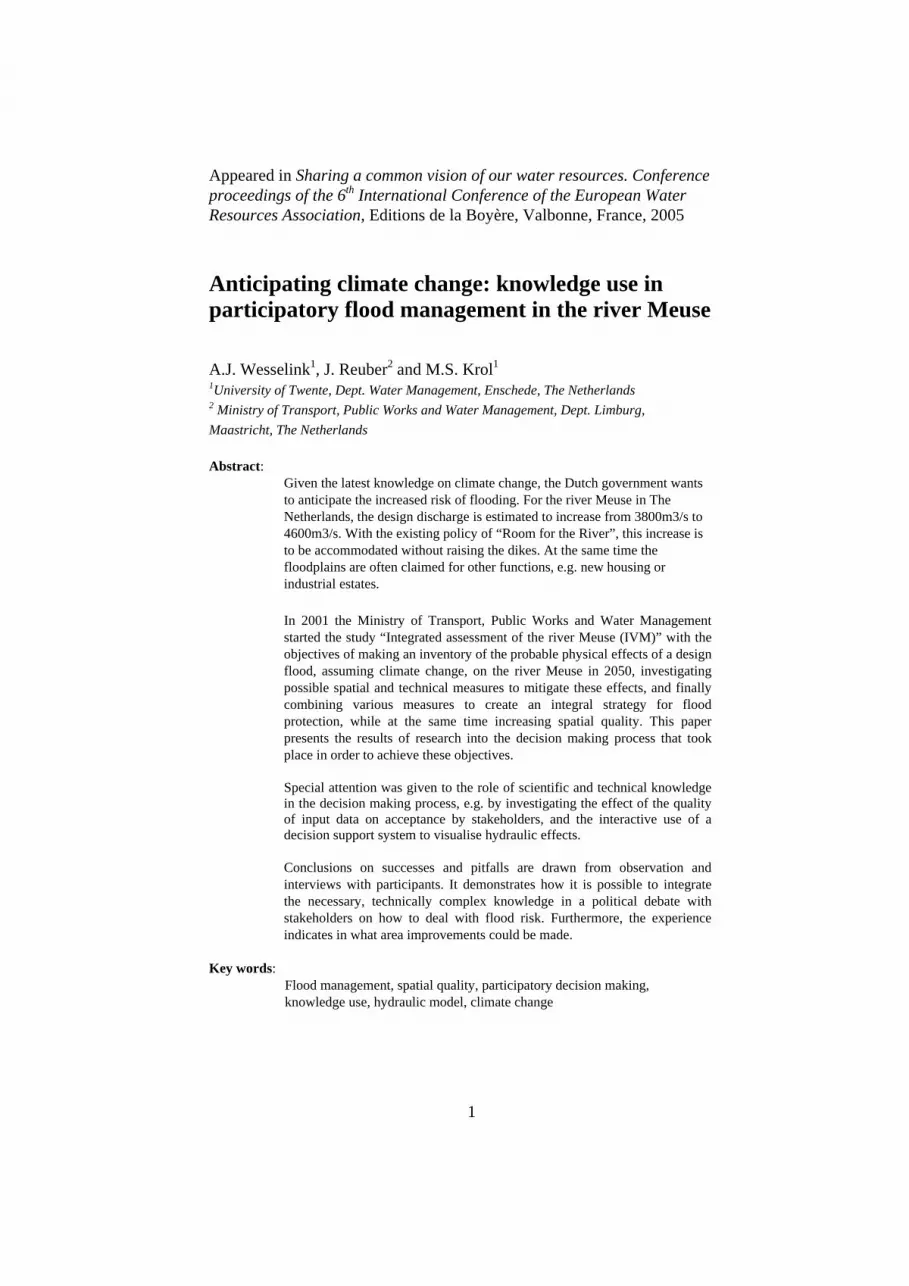
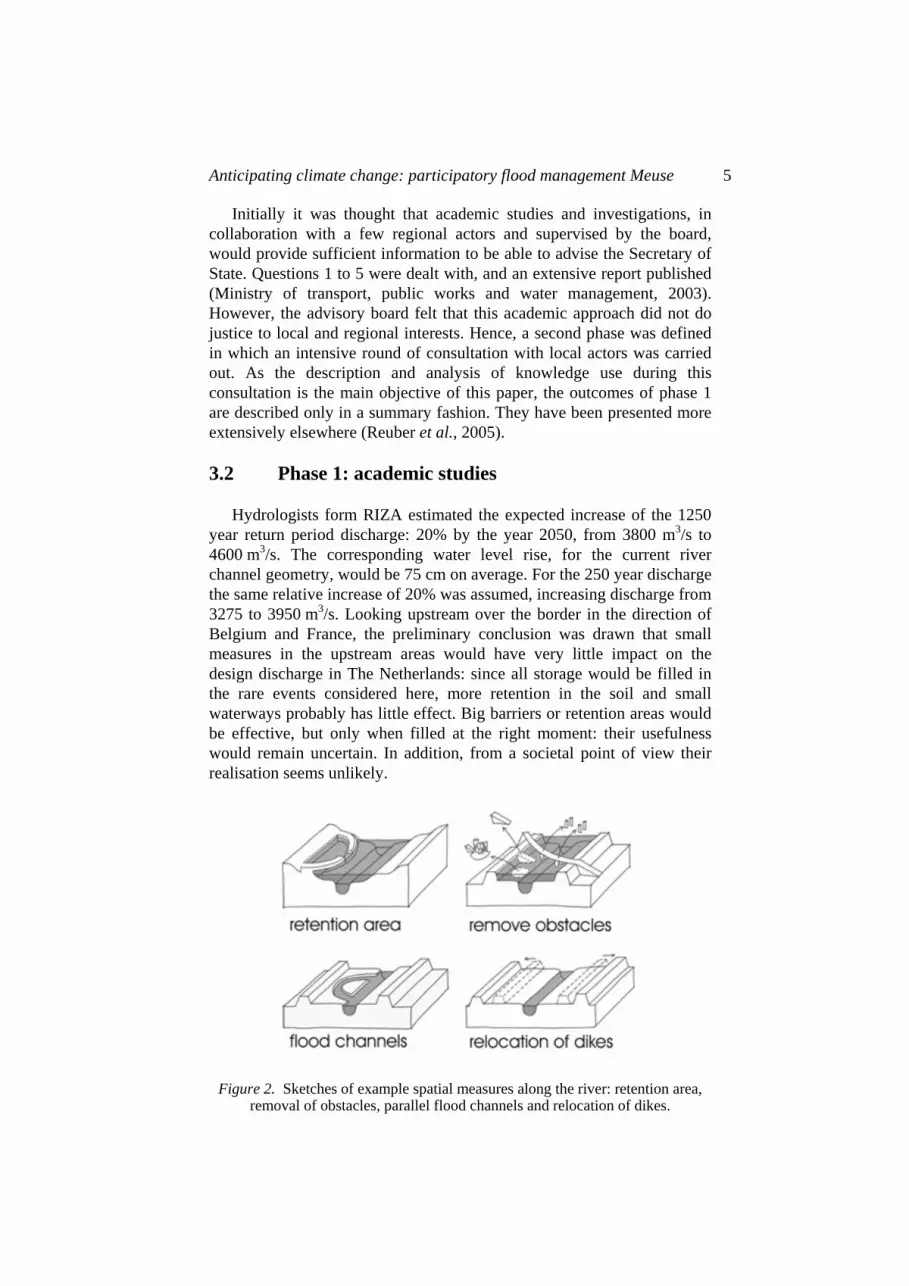
Most of The Netherlands is protected from flooding by dikes along the major rivers – Rhine and Meuse – and by dunes along the North Sea coast. At present, the required height of river dikes is calculated from the water level belonging to the design discharge. The return period of this discharge is between 4000 and 1250 year, depending on location. This system of flood protection has developed over the last millennium (e.g. Bijker, 1993; TeBrake, 2002). An exception to this is found in the southern part of the Meuse, where from the border with Belgium no dikes are present along the first 150 km. Only recently (after 1995) low embankments were constructed here to protect the population centres from flooding; historically the river had free access to the floodplain. A project is underway to achieve a return period of 250 year for these embankments. Further upstream in Belgium and France, a return period of 100 year is more usual in flood protection (Figure 1).
Figure 1. Catchment area of the river Meuse with tributaries, topography and typical cross
sections. Design return periods are indicated with HQ.
The Netherlands is the most densely populated country in the European Community. Pressure on available space is correspondingly high, and increasing with economic growth. In spite of recent peak water levels (1993 and 1995), to some politicians and developers flood plains seem nice empty spaces waiting to be built on. In an effort to control developments, planning regulations are strict. Only minor constructions are allowed in flood plains, and any increase in resistance to river flow has to be compensated for e.g. by excavations elsewhere. In this way, the Ministry of Transport, Public Works and Water Management ensures that the design discharge will still fit between the dikes. By law design
Anticipating climate change: participatory flood management Meuse 3 discharges are recalculated every 5 years, after which adjustments are made to dike levels and/or flood plain to guarantee the same protection level. Since the 1990’s national policy aims to accommodate any increased discharge by spatial measures in the flood plain instead of dike enlargement; this principle was translated as ‘Room for the River’ (De Bruijn & Klijn, 2001; Reuss, 2002).
Climate change predictions triggered investigations on how to handle
increased maximum flows within the existing flood protection system. The project Integrated Assessment of the river Meuse (in Dutch: IVM, Integrale Verkenning Maas) is the second study, after the completion of a similar investigation for the Rhine and its branches (‘Spankrachtstudie’, see Kors, 2004). First, the increased design discharges for different return periods were estimated. Next, possible ways to accommodate the increased flows were investigated, respecting the Room for the River principle.
2. PURPOSE OF THIS PAPER
In this paper we want to describe and analyse the use of expert knowledge in the IVM study, especially in the second phase of the project where a participatory process of consultation with local actors was set up. In recent years there has been a lot of discussion amongst scientists, engineers etc. on the use of knowledge during decision making processes; many feel that scientific outcomes are not sufficiently taken into account. However, if one looks at the amount of knowledge mobilized by policy makers to underpin decision making in The Netherlands, it is clear that this is an important factor in building support for a plan. The research this paper reports on aims to unravel what is happening during a decision making process, in order to understand the apparent contradiction described above.
A few theoretical notes are in order. Following Jasanoff et al. (1995)
we have chosen for an ethnographical approach. This means amongst other things that no a priori assumptions are made as to what ‘good decision making’ or ‘appropriate use of (scientific) knowledge’ implies. Instead, ‘the actors are followed’ (Latour & Woolgar, 1987). According to Bijker (p.19, 1990): ‘It is used as a slogan to express the methodological claim that it is more fruitful to follow the actors and see how they construct the various distinctions differently under different circumstances, than to start with one's own distinctions a priori and apply those to the empirical material.’
It is beyond the scope of this paper to present a discussion on the
(im)possibilities of distinguishing between ‘scientific’, ‘expert’ or other kinds of knowledge. These terms are used here in a casual way. The focal
4 A.J.Wesselink, J.Reuber and M.S.Krol point of this paper is the use of knowledge that is provided by the project team to the participants in a participatory decision making process, whether is its label would be scientific or other. A similar remark should be made on the terms ‘consultation’ and ‘participation’. A lot of literature is available discussing various degrees of participation, sometimes called consultation (e.g. Arnstein, 1969; Pretty, 1994). We do not wish to get involved in this discussion here; in this paper the words are used interchangeably.
This paper describes the first findings; a comprehensive analysis is
ongoing as the first author’s PhD research.
3. THE IVM PROJECT
3.1 Outline of the IVM study
The study Integrated assessment of the river Meuse (IVM) was initiated in 2001 by the Secretary of State for Transport, Public Works and Water Management. Its regional division Limburg, in charge of the management of the Meuse, was appointed project leader. A small internal project team was composed. Political and regional anchorage was ensured by a supervisory board comprising regional administrators and representatives from Ministries and regional Water Boards. Expert advice was provided by RIZA (Institute for Inland Water Management and Waste Water Treatment).
The IVM objectives were defined as follows:
1. to make an inventory of the probable physical effects of a design flood, assuming climate change, on the river Meuse in 2050;
2. to investigate possible spatial and technical measures for flood protection in the spirit of the policy ‘Room for the River’ along the river Meuse in the Netherlands;
3. to investigate spatial and technical measures for flood protection in France and Belgium;
4. to investigate the possibilities for improving the spatial quality along the river Meuse, taking account of e.g. agriculture, economy, ecology, housing and recreation;
5. to combine different measures to an integral strategy to combine flood protection with an increased spatial quality.
This last question also defines the overall objective of the study, which is therefore twofold: flood protection and spatial quality. The flood protection objective was specified as ‘no increase in water level at design discharge compared with the present situation’. The spatial quality objective was harder to operationalise; more details on this follow below.
Anticipating climate change: participatory flood management Meuse 5
Initially it was thought that academic studies and investigations, in collaboration with a few regional actors and supervised by the board, would provide sufficient information to be able to advise the Secretary of State. Questions 1 to 5 were dealt with, and an extensive report published (Ministry of transport, public works and water management, 2003). However, the advisory board felt that this academic approach did not do justice to local and regional interests. Hence, a second phase was defined in which an intensive round of consultation with local actors was carried out. As the description and analysis of knowledge use during this consultation is the main objective of this paper, the outcomes of phase 1 are described only in a summary fashion. They have been presented more extensively elsewhere (Reuber et al., 2005).
3.2 Phase 1: academic studies
Hydrologists form RIZA estimated the expected increase of the 1250 year return period discharge: 20% by the year 2050, from 3800 m3/s to 4600 m3/s. The corresponding water level rise, for the current river channel geometry, would be 75 cm on average. For the 250 year discharge the same relative increase of 20% was assumed, increasing discharge from 3275 to 3950 m3/s. Looking upstream over the border in the direction of Belgium and France, the preliminary conclusion was drawn that small measures in the upstream areas would have very little impact on the design discharge in The Netherlands: since all storage would be filled in the rare events considered here, more retention in the soil and small waterways probably has little effect. Big barriers or retention areas would be effective, but only when filled at the right moment: their usefulness would remain uncertain. In addition, from a societal point of view their realisation seems unlikely.
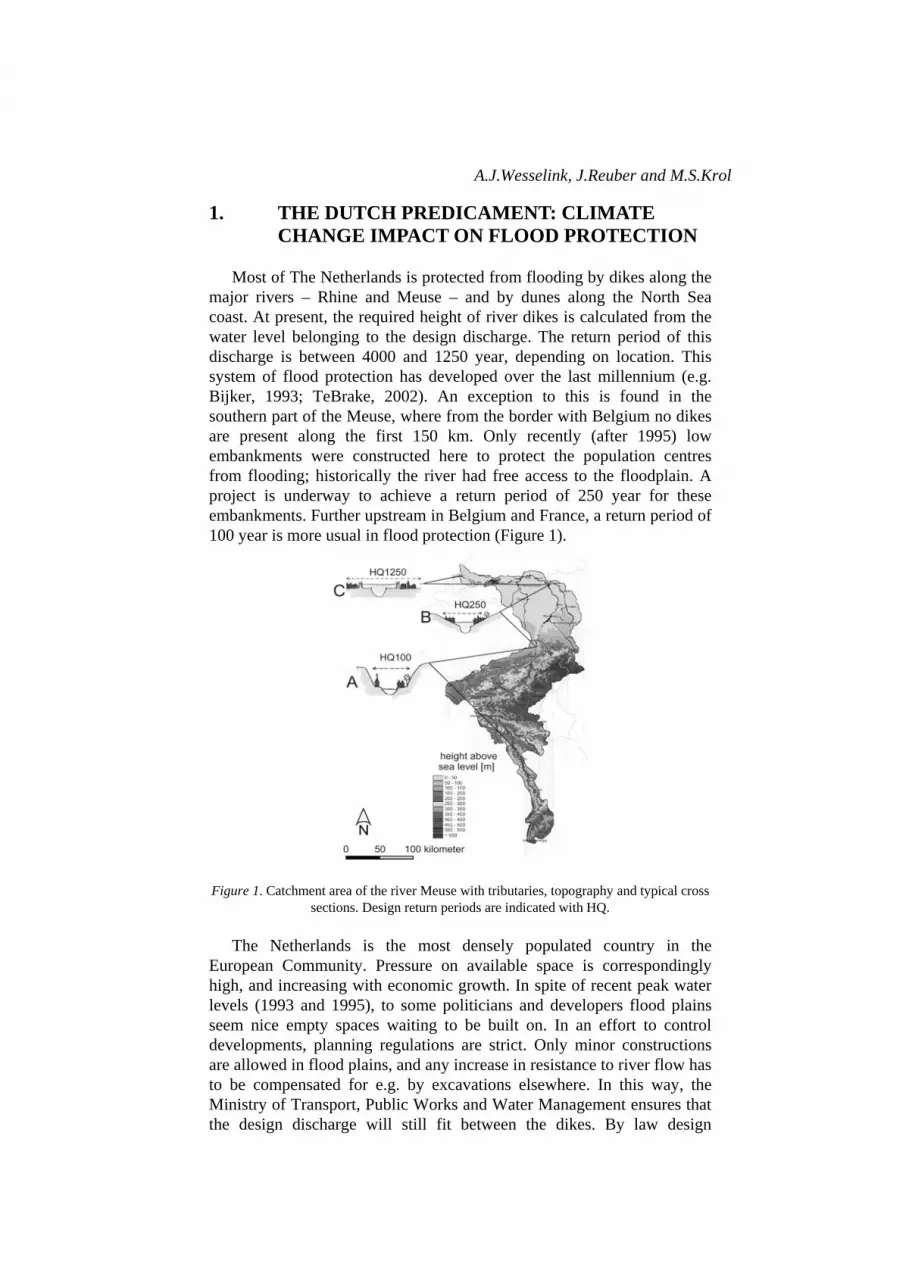
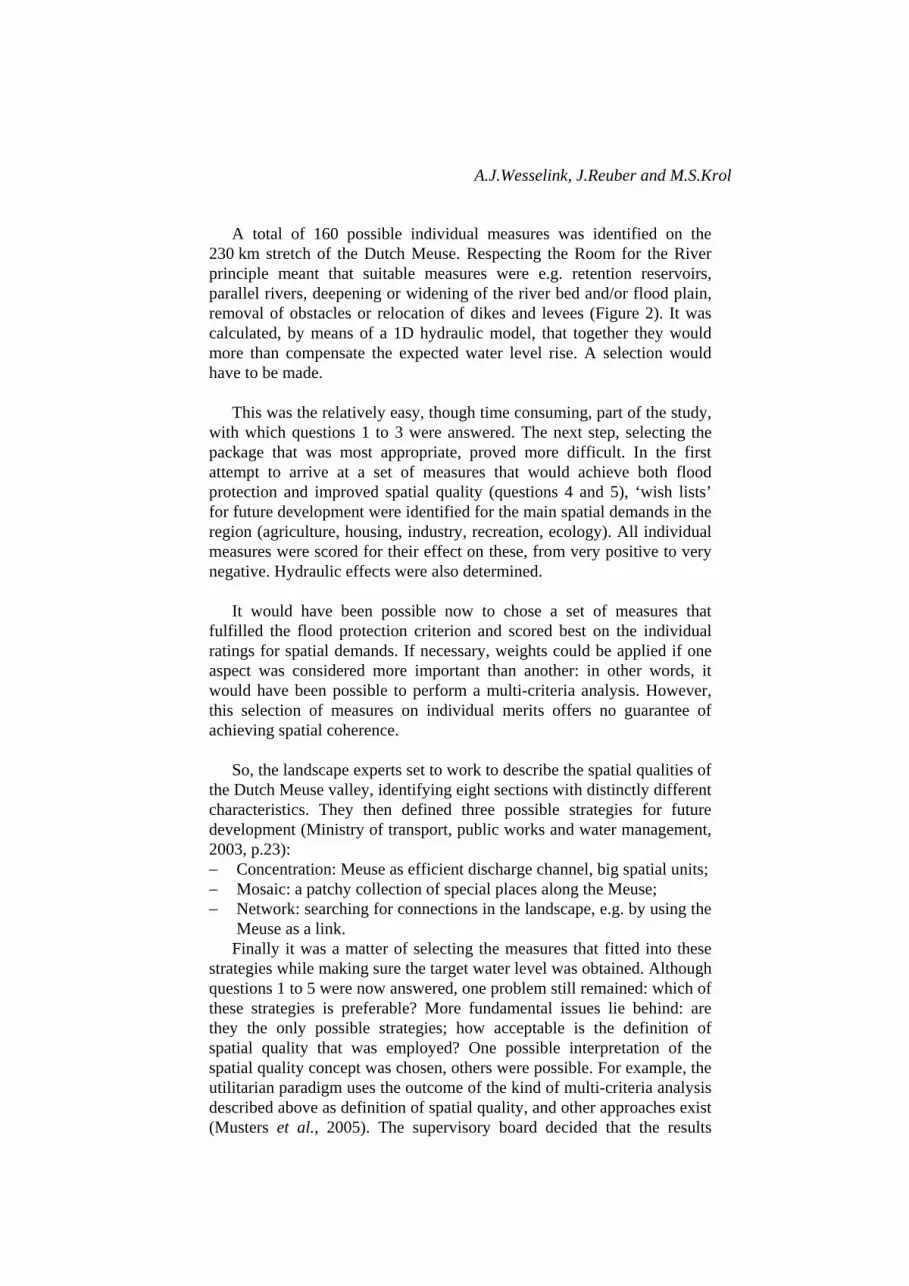
Figure 2. Sketches of example spatial measures along the river: retention area, removal of obstacles, parallel flood channels and relocation of dikes.
6 A.J.Wesselink, J.Reuber and M.S.Krol
A total of 160 possible individual measures was identified on the
230 km stretch of the Dutch Meuse. Respecting the Room for the River principle meant that suitable measures were e.g. retention reservoirs, parallel rivers, deepening or widening of the river bed and/or flood plain, removal of obstacles or relocation of dikes and levees (Figure 2). It was calculated, by means of a 1D hydraulic model, that together they would more than compensate the expected water level rise. A selection would have to be made.
This was the relatively easy, though time consuming, part of the study,
with which questions 1 to 3 were answered. The next step, selecting the package that was most appropriate, proved more difficult. In the first attempt to arrive at a set of measures that would achieve both flood protection and improved spatial quality (questions 4 and 5), ‘wish lists’ for future development were identified for the main spatial demands in the region (agriculture, housing, industry, recreation, ecology). All individual measures were scored for their effect on these, from very positive to very negative. Hydraulic effects were also determined.
It would have been possible now to chose a set of measures that
fulfilled the flood protection criterion and scored best on the individual ratings for spatial demands. If necessary, weights could be applied if one aspect was considered more important than another: in other words, it would have been possible to perform a multi-criteria analysis. However, this selection of measures on individual merits offers no guarantee of achieving spatial coherence.
So, the landscape experts set to work to describe the spatial qualities of
the Dutch Meuse valley, identifying eight sections with distinctly different characteristics. They then defined three possible strategies for future development (Ministry of transport, public works and water management, 2003, p.23): − Concentration: Meuse as efficient discharge channel, big spatial units; − Mosaic: a patchy collection of special places along the Meuse; − Network: searching for connections in the landscape, e.g. by using the
Meuse as a link. Finally it was a matter of selecting the measures that fitted into these
strategies while making sure the target water level was obtained. Although questions 1 to 5 were now answered, one problem still remained: which of these strategies is preferable? More fundamental issues lie behind: are they the only possible strategies; how acceptable is the definition of spatial quality that was employed? One possible interpretation of the spatial quality concept was chosen, others were possible. For example, the utilitarian paradigm uses the outcome of the kind of multi-criteria analysis described above as definition of spatial quality, and other approaches exist (Musters et al., 2005). The supervisory board decided that the results
Anticipating climate change: participatory flood management Meuse 7 should be seen as an exploration of the range of possibilities, and further work was necessary to arrive at a justifiable choice.
Implicitly the supervisory board recognised that spatial quality is only
partly based on facts but involves (societal) choices too, unlike hydraulic effects (assuming model calculations are correct). In other words: they realized that the choices that were made needed wider support. Much resistance to the proposals could be expected from regional stakeholders and the local population, who were not happy even with current plans to enlarge the river capacity. On the recommendation of the advisory board the Secretary of State decided to prolong the project with a second phase in order to set up an intensive round of consultation with local actors. The way in which this was done is uncommon in Dutch policy making on water management.
3.3 Phase 2: regional consultations
In effect, a third objective had now been included to the IVM project’s targets: besides flood protection and spatial quality, the aim was to achieve acceptance by the region as a result from the consultation, both on the need to do something and on what needed to be done. All municipalities were invited to participate, as well as NGO’s and citizen’s groups. The implication of regional administrators and their civil servants in the definition of the project could also be named participation, but for reasons of clarity this paper focuses on consultative sessions with local actors. In these, some of the same administrators and civil servants were present who were also involved in project preparations..
As the expected number of participants amounted to over 150, the
river was divided into four subsections. In each section, three consultative sessions of one day each were organised. The following main objectives were identified:
- Session 1: to create understanding for the problem, i.e. the need to prepare for increased discharge; to hear participants’ opinion about future flood management; to obtain a first assessment of the proposed measures;
- Session 2: to complete the assessment of the identified measures for technical feasibility and for compatibility with existing plans and views; to get an indication of the societal acceptability of the identified measures; to compose (a) preliminary package(s) which fulfil(s) the water level objective;
- Session 3: to present and discuss (a) package(s) of measures based on the comments from sessions 1 and 2 plus insights from phase 1, and to discuss the main recommendations to the Secretary of State.
For the purpose of this paper, we will focus on issues relating to the
use of knowledge, although many other interesting observations could be
8 A.J.Wesselink, J.Reuber and M.S.Krol made. Just to present one example of the latter: debates on the need to plan future measures were most intense in the south, where historically no flood protection took place. In this region, people are used to building in the flood plain, though the implied acceptance of the risk of flood damage has decreased dramatically in recent years. Here, a look across the border to Belgium for potential solutions is literally possible; not surprisingly, that was the first solution they proposed. Only after extensive discussions would they accept that at least the investigation into Dutch solutions should go ahead, even if proposed measures are only executed after the need has become apparent, i.e. the design discharge has indeed increased.
3.3.1 Session 1: design discharge and maps of measures
Estimate of design discharge In all three sessions, the participants repeatedly questioned the
estimate of the 2050 design discharges that were used (4600 m3/s for a return period of 1250 year, 3950 m3/s for 250 year). In this way, they expressed doubt about the need for the planned measures. A municipal administrator: ‘They need to show with facts that it is really necessary before we will accept more engineering in our area.’ The project team’s response was twofold: first, a note was produced by RIZA explaining the method and assumptions behind the outcomes. It was explained that the estimates are indeed uncertain, but some best guess figure had to be chosen as a working hypothesis. This was accepted.
Second, a modification to the study’s objective was proposed:
packages were also put together for two lower discharges of 4200 and 4400 m3/s to show what would be needed if the design discharge did not increase by 20% but less (10 and 15% respectively). In this way, the target of 4600 m3/s is less definite, and the added flexibility enables step-wise implementation. The results also show what would happen if a combined approach to flood management would be chosen: technical measures up to a certain level and financial compensation if this level would be surpassed. This was a suggestion originating from participants, who now felt they had been taken seriously on these points. They also realized that final decisions on these issues were beyond their immediate control.
Apart from these responses to their requests, we suspect that the main
reason the participants went along with the assumed design discharge is the exploratory character of the study. As a civil servant said: ‘This is not as serious as they like us to believe. In view of the political difficulties [...] a binding decision will not be taken.’ They knew that many studies and consultations will be necessary before the diggers move in, providing ample opportunity to oppose unwanted plans. At the same time, they considered it important to ensure that the interests of the organisation they represent are take into account even if this is a preliminary investigation:

Anticipating climate change: participatory flood management Meuse 9 ‘Everybody knows how these things go: it is a funnel, and before you know it, a solution has been defined’ (civil servant).
In conclusion, participants were willing to go along with the
hypothesis of an increase of 20% design discharge in 2050, even though many doubted the estimate’s truthfulness. It appears that factors that co-opted them into participating in the sessions were: − the project’s exploratory status; − the need to participate in preliminary discussions in order to represent
interests (’better safe than sorry’); − the flexibility shown by the project to add extra calculations, showing
the effect of alternative objectives suggested by participants. Altogether this seems to indicate that it would be very difficult to obtain cooperation for flood protection measures that were not based on an actually observed increase in design discharge; participants have said that the effects of climate change were too unpredictable to warrant concrete measures in the present time. As explained in Chapter 1, this is also the approach prescribed by law: design discharges are recalculated every 5 years, after which adjustments are made to dike levels and/or flood plain.
Maps of measures In the first session, all measures proposed in phase 1 were reviewed in
a preliminary fashion, using a comprehensive atlas with maps and descriptions produced by the project. An important difficulty occurred in participants’ understanding of the terminology that was used for types of measures. An added complication here is the use of different words in upstream and downstream stretches, which is related to the differing history of flood protection.. Also, many found it difficult to imagine from a map what a measure would do to the landscape. They affirmed that site visits would have clarified this and at the same time provided evidence where the proposals were unfeasible. More importantly, a major flood management project is in the pipeline for Limburg (Maaswerken), which will already change the landscape dramatically in some places. Since the post-Maaswerken situation was the starting point for the IVM analysis, a two-tiered imagining was asked from them: to image the result of changes to an imagined future landscape.
After a common understanding was created on the meaning of the
measures, the participants provided many detailed comments on the technical feasibility and on compatibility with other plans, to the project team’s satisfaction. (A more general assessment was also performed, see 3.3.3). Many measures had to be modified accordingly, often reducing the hydraulic effect. This applied especially to flood plain and/or river bed excavations: these were initially applied to the whole length of the river, but had to be adjusted according to local conditions. Also, participants provided completely new ideas, which were added to the list. Some participants expressed criticism on the apparent lack of detail in the
10 A.J.Wesselink, J.Reuber and M.S.Krol preparation of the measures, especially after it turned out that in session 3 not all comments had been processed.
On the whole, it is appeared that participants were very happy to
provide input, and that their input suited the objectives of the project. However, due to the highly technical nature, more time than foreseen had to be allowed to first create a common understanding. Second, it was important for the project team to get details right at this detailed level.
3.3.2 Session 2: use of the Blokkendoos (box of building blocks)
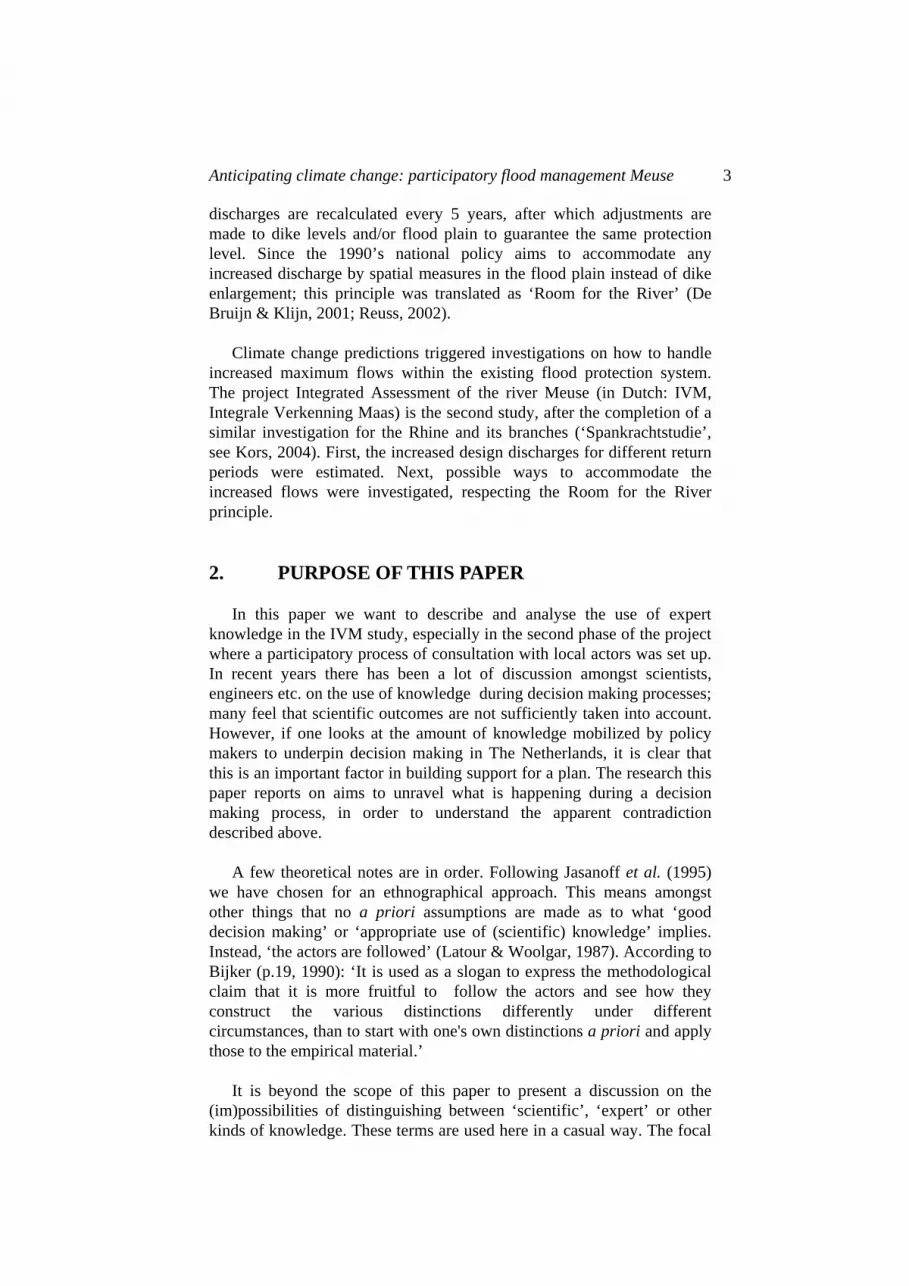
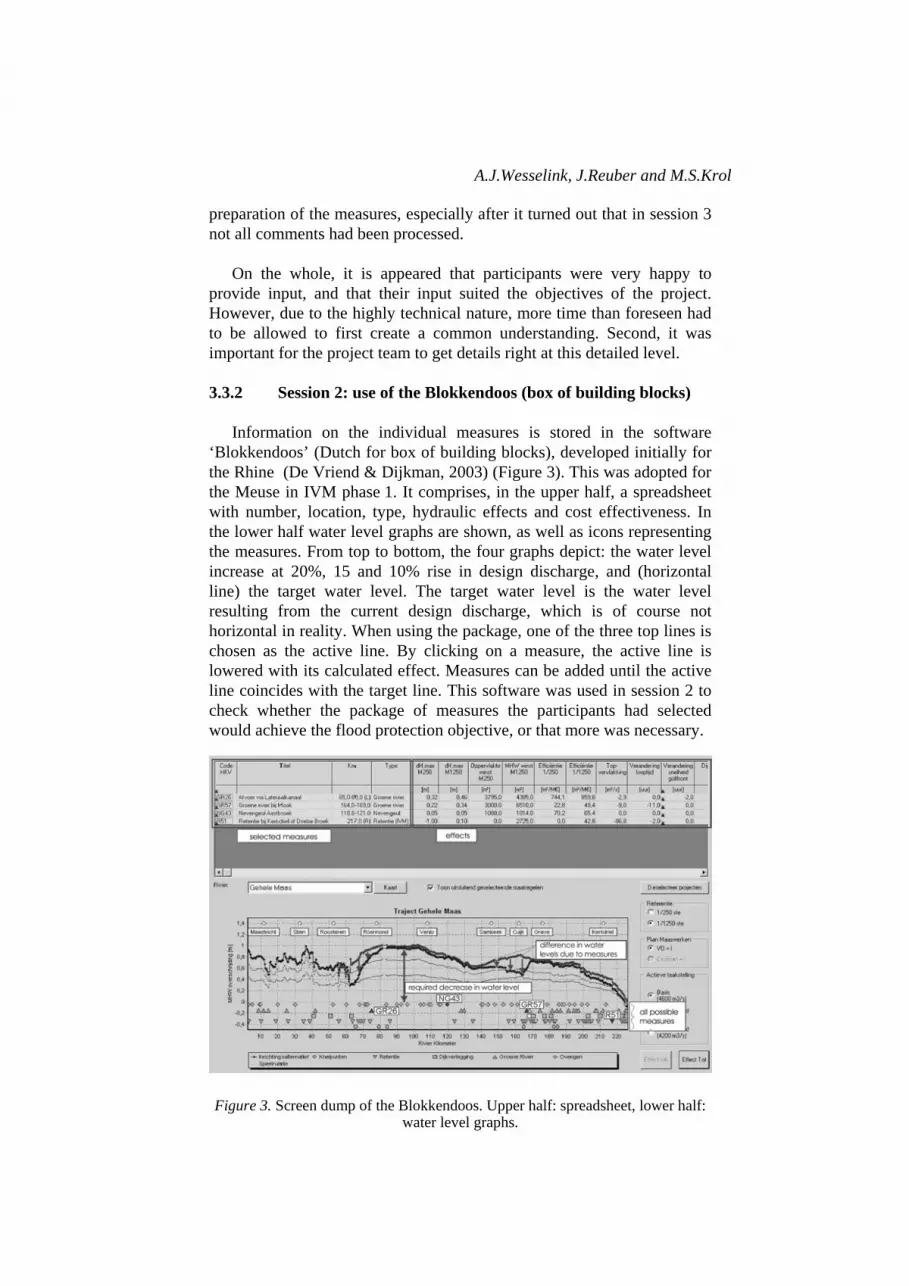
Information on the individual measures is stored in the software ‘Blokkendoos’ (Dutch for box of building blocks), developed initially for the Rhine (De Vriend & Dijkman, 2003) (Figure 3). This was adopted for the Meuse in IVM phase 1. It comprises, in the upper half, a spreadsheet with number, location, type, hydraulic effects and cost effectiveness. In the lower half water level graphs are shown, as well as icons representing the measures. From top to bottom, the four graphs depict: the water level increase at 20%, 15 and 10% rise in design discharge, and (horizontal line) the target water level. The target water level is the water level resulting from the current design discharge, which is of course not horizontal in reality. When using the package, one of the three top lines is chosen as the active line. By clicking on a measure, the active line is lowered with its calculated effect. Measures can be added until the active line coincides with the target line. This software was used in session 2 to check whether the package of measures the participants had selected would achieve the flood protection objective, or that more was necessary.
Figure 3. Screen dump of the Blokkendoos. Upper half: spreadsheet, lower half: water level graphs.

Anticipating climate change: participatory flood management Meuse 11
The basic principles of the Blokkendoos were understood quite quickly
by most participants, although some confessed they had found it hard at first. However, a number of complications arise when using the package, causing confusion on what exactly was being done. The first two have operational reasons only, but the last two are difficult to understand for theoretical grounds as well.
1. The modified and new measures were given new codes, adding extra
items to the long list and necessitating more care when choosing to avoid picking the wrong one. In practice, only the expert who set up the package was able to select the measures unhesitatingly.
2. Not all newly proposed measures were input into the Blokkendoos for budgetary reasons. Only for the measures thought effective the hydraulic calculations were performed. This created some irritation on the part of participants: their help was not taken into account. Maybe they needed proof that their suggestion was not helping to achieve water level reduction.
3. In phase 1 it was discovered that the sum of the effects of selected measures, which is the calculation performed by the Blokkendoos, is different from the total effect of the selection. The difference might amount to 70 cm (underestimation of the effect) on some stretches of the river, a number similar to the total target. Participants were generally willing to accept the hydraulic sensitivity of the Meuse system as an explanation of this imperfection, although some confused this correction with the uncertainty of the calculations and remained sceptical. Still, in practice this meant that once the target line was reached, many more measures had to be added in order to draw the water level down by another 50 cm, which was disappointing. Furthermore, during the session it remained uncertain whether the target was reached, as calculations of the total effect might show that more, or less, was necessary. On line calculation of total effects was considered by the RIZA experts but judged less practical: the calculation time was too slow (3-10 min for every change), results would still be imprecise so creating an unwarranted certainty.
4. The target line included the effects of other plans that would be completed by the time IVM measures had to be taken, in particular Maaswerken and Flemish proposals. It is still uncertain which part of these proposals will be actually implemented. For Maaswerken, the Blokkendoos included the official 2001 proposals, but no final decision had been taken in 2004 when the sessions were taking place. The Flemish plans were not yet politically approved either. As a result, a lot of discussion ensued in session 1 on the actual state of the proposals. Finally a choice was made, to be questioned again in the next session. While this problem reflects the reality of planning for the future, it caused confusion on the basic assumptions of the model
12 A.J.Wesselink, J.Reuber and M.S.Krol
that was used. Implementing several versions of the plans in the Blokkendoos turned out to be a good compromise, provided attention was paid to selecting the right options for the target line.
While in principle the Blokkendoos was a relatively simple tool to
visualize effects and to select packages that could be used by participants themselves, in practice the above pitfalls meant that only well-informed experts could manipulate it. This rendered the process of selection of measures during the sessions less transparent: participants had to trust that the expert was clicking on the right buttons. Initially the project team had wanted a hands-on session where participants would, through negotiation, compose an acceptable package; in the end this was not feasible as much more time would have had to be allowed for participants to operate the software themselves.
In can be concluded that if the objective had been to provide on line
estimates of the effect of packages in the context of a hand-on session, the Blokkendoos was unsuitable: first, because of the complexity of operation, and second, because the answers were unreliable in view of the necessary but unknown correction in the target line. Nevertheless, the Blokkendoos and the hydraulic calculations with SOBEK were generally accepted as providing facts, once basic choices such as starting situation had been discussed and agreed. The outcome of hydraulic calculations was even used to settle a disagreement between upstream and downstream regions: to both parties’ satisfaction, it was used to show that no negative effects were passed on to the lower region.
3.3.3 Session 3: implementation of spatial quality concept
All measures were assessed by the participants in group discussions. They were given colour codes from green: ‘possible’, to orange: ‘only conditionally’, to red: ‘don’t do this’. This assessment implicitly included technical feasibility, cost-benefit estimates, esthetical considerations and political desirability. The relative importance of each depended on the measure considered and on personal judgement of the people present. Several participants expressed their concern about the latter: they felt that the assessment should be objective, and the ‘random’ attendance did not ensure this (although at least four groups had looked at the same measures).
Consequently, participants were invited to join in discussions to
establish an objective assessment framework. They came to the conclusion that mixing technical ‘objective’ factors with societal ‘subjective’ reasons was too complex to be captured in a formal assessment frame. They also felt on balance that the colour-coded judgement was comprehensive, and it was sufficient to note the motives behind the codes so they could be traced and explained. At the same time,
Anticipating climate change: participatory flood management Meuse 13
they thought that the knowledge gathered in the first phase should not be unused. This meant that selecting measures on the basis of the colour-codes only was thought undesirable, as a non-cohesive package would result. Spatial quality should be used to compose the packages, but definition of spatial quality itself was not discussed in a systematic way with the participants.
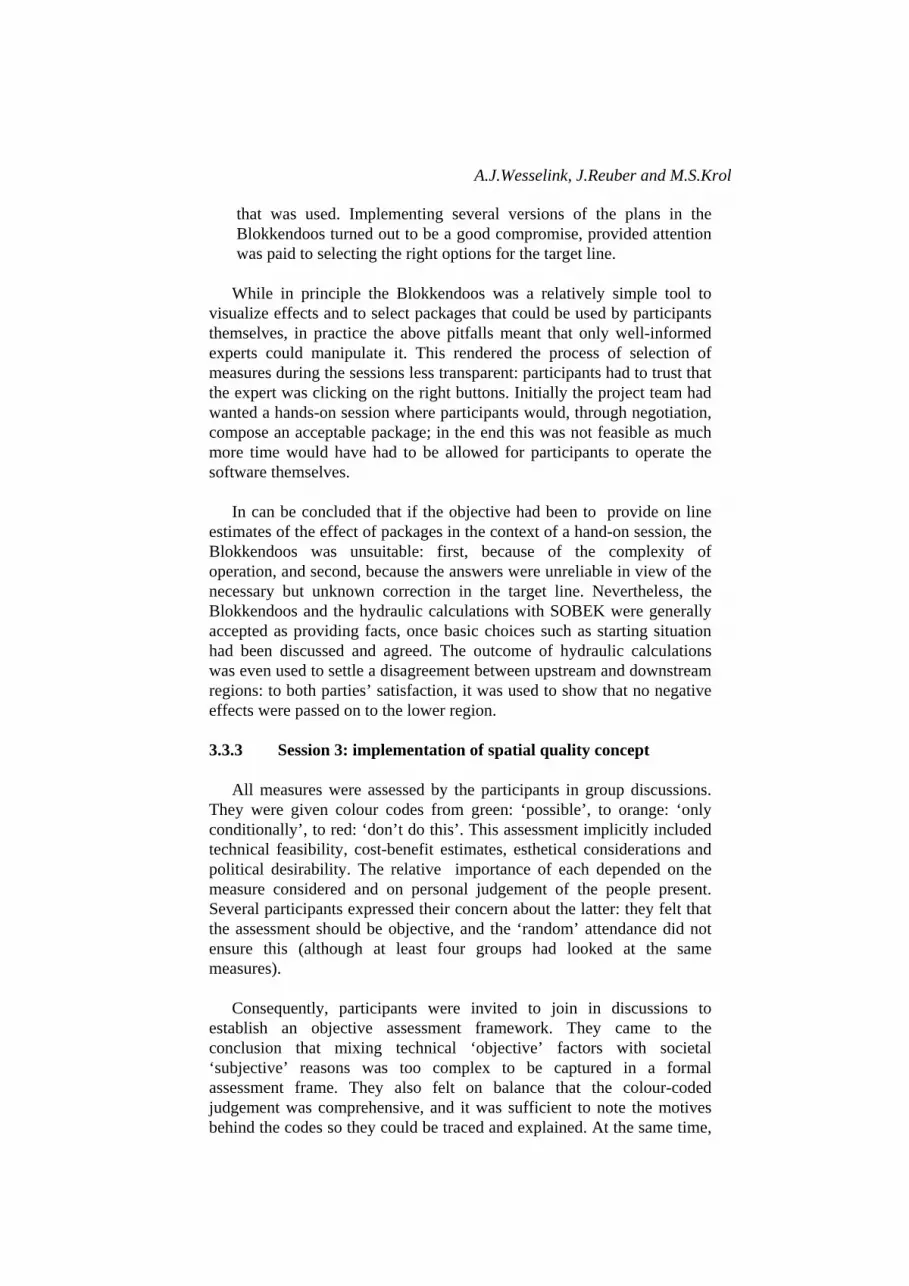
After some reflection, the landscape experts proposed to use the spatial
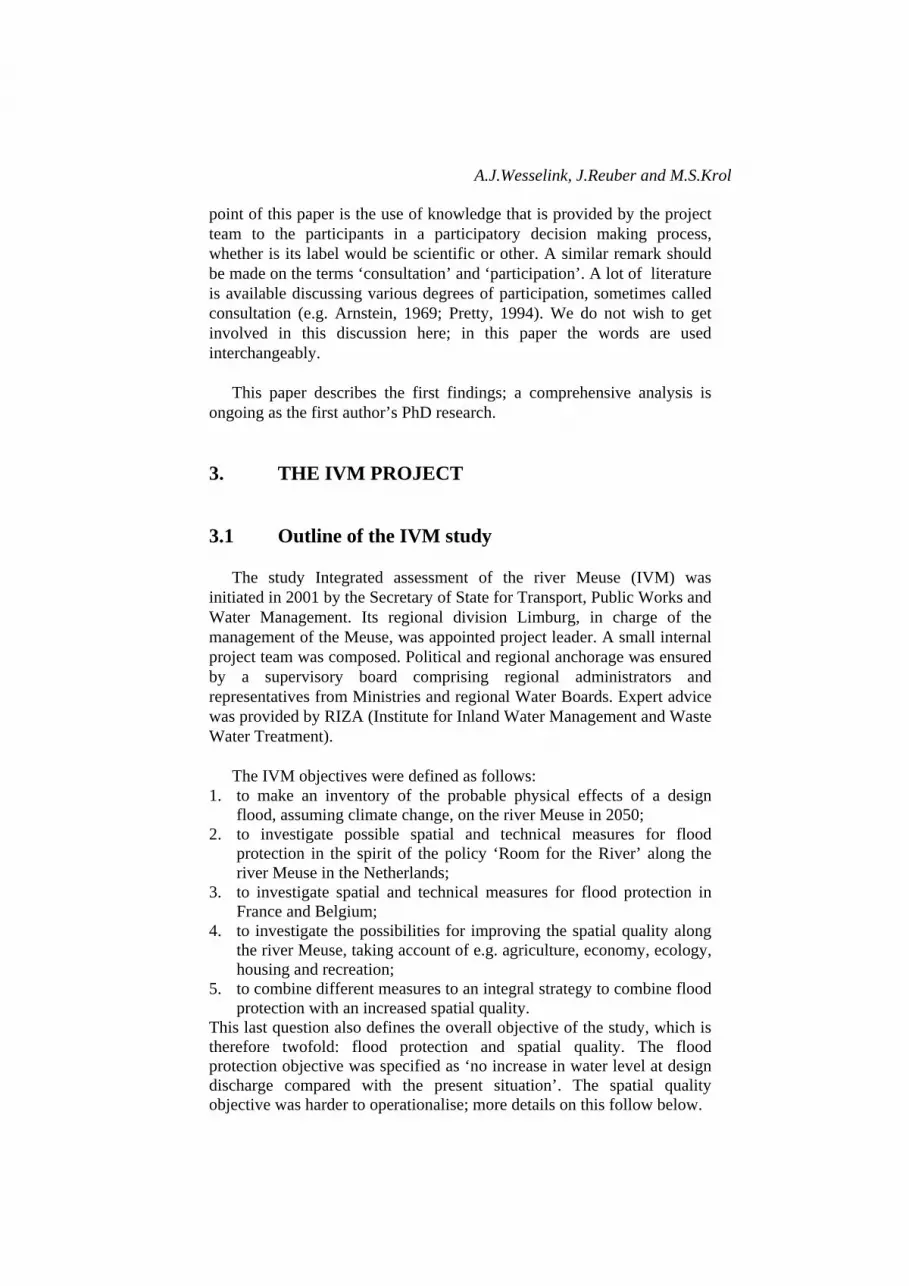
quality description from phase 1 as a framework for selecting first the ‘green’ measures, then ‘orange’ ones, in order to achieve the flood protection objective of unchanged water level at design discharge. A different characterisation was used for seven1 subsections of the river; one example is presented in Figure 4. This is the procedure that was used to create a package for the discharge of 4600 m3/s. For the two lower discharges, measures were removed from this package using an order of priority proposed by the landscape experts from comments in the sessions; it was the same for the whole river. This order of priority was questioned in the sessions in the southern part. These comments were only partly taken into account, because the project leader felt that consistency was important to be able to justify the procedure. Already, the Ministry’s representative had expressed doubts whether the colour-coded assessment described above was sufficiently justifiable.
Figure 4. Example of landscape characterisation used in participatory sessions In conclusion, the general interpretation of the concept of spatial
quality by the landscape experts was little questioned; the only comment from participants was a request to take local studies on landscape and its qualities into account. At the same time spatial quality arguments were used in the participants’ assessment of measures, and in this way included in the final package through the colour-codes. However, it was not always taken into account in this assessment. In order to operationalise the
1 instead of 8 as in IVM1
14 A.J.Wesselink, J.Reuber and M.S.Krol concept, it would have been possible to ask participants to describe how and why they appreciate their surroundings. This could have provided local input into the general spatial quality definition.
At a higher level of abstraction, the meaning of the concept ‘spatial
quality’ was not discussed explicitly in the project team or in other preparatory meetings. This mirrors current academic thinking, where different interpretations are circulating (see also 3.2).
3.3.4 Knowledge not employed
Cost-benefit analyses A recurring theme in the sessions was the need to consider costs and
benefits of the proposals. The Secretary of State chose to issue a carte blanche as far as costs were concerned, but participants recognised that budgetary considerations would be of primary concern in future decision making. Only towards the end of the consultations, the project team was able to provide estimates of costs and benefits of the most promising packages, by which time these data did not influence the chosen working method any more. Participants had also suggested, in session 1, that costs and benefits had to be taken into account in the selection of measures. In the colour-coded assessment this aspect was sometimes taken into account but not systematically.
Politicians, inspired by societal resistance to more floodplain
rearrangements, tried to ensure an exploration of alternative approaches to flood management, e.g. the establishment of a reimbursement fund. This could be supported by arguments of cost effectiveness. This topic was not explored further either: more discussions and calculations would have been necessary.
The perception of the study as an engineering project is likely to have
played a role, too. This is reflected in the composition of the project team, with a large majority of engineers. If economists would have had to answer a similar question, they would probably have started with the selection of measures based on cost-effectiveness, not on hydraulic efficiency.
4. LESSONS LEARNT
The following lessons can be learnt from the use of knowledge in this participatory process, based on observation of the sessions and interviews with participants. It is important to mention first that with very few exceptions, the participants gave the project a solid rating of 8 out of 10 for quality, judging process and contents in one figure. Still, this does not mean the process cannot be improved. The guiding idea for the comments
Anticipating climate change: participatory flood management Meuse 15 listed below is the stated project assignment: ‘a proposal that is to the largest extent possible acceptable to the region’. The suggestions listed below aim to increase the quality and/or quantity of participation and/or knowledge usage in a future investigation.
Maps of measures: Local participants often know the situation better
than the experts who provided the data input to the sessions. It is therefore important to ensure that ‘the facts are right’, and if they are not, to improve the material (maps, descriptions) before the next session. This can be done easily using GIS; failure to do this undermines the project’s credibility. Conversely, flexibility in adopting information originating from participants has the potential to support the process, so it is not necessary to produce high-quality documentation.. This also presents a risk that participants will interpret such a document as finished, and do not wish to engage if they consider the information is incorrect.
Estimate of design discharge: The project team showed flexibility by adding extra calculations. These underpinned some of the alternatives suggested by participants: what would need to be done if water levels would rise less and/or it flood risks would be dealt with by financial compensation. This flexibility was arguably necessary to keep everybody on board; it also resulted in a more complete final product. It would be a lesson that flexibility is needed with respect to the knowledge that is provided as input to a participatory process. This point is supported by the topic ‘financial deliberations’ below.
Blokkendoos & hydraulic calculations: The Blokkendoos has shaped,
and in this case lessened, the quality and quantity of participants’ input. The project team probably did not realize the detailed consequences when the work programme for phase 2 was defined, so a lesson would be to test the use of software with a few participants before finalising arrangements.
Spatial quality: A lesson to learn from the IVM project would be to
allow time in the preparations of the project for exploration of difficult concepts. The fact that most of the project team was not professionally initiated in landscape sciences meant that they could not take informed decisions on how to operationalise this concept and had to rely on the opinion of the experts. A more participatory approach could have been employed if discussions on spatial quality had been more extensive.
Financial deliberations: These were not foreseen when preparing the
project. The requests to investigate cost and benefits of packages, and subsequently to discuss the desirability of an non-technical way to deal with increased flooding, were only followed up by the provision of a few data, too late to change results. Apparently the flexibility in project set-up was not sufficient to allow this.
16 A.J.Wesselink, J.Reuber and M.S.Krol
Spatial demands of land use functions Most of the information on the main spatial demands in the region
(agriculture, housing, industry, recreation, ecology) that was gathered in phase 1 (see Section 3.2) was not used in phase 2. Because the results from phase 2 determine the final recommendations, this means that this work was in retrospect superfluous, though at the time is seemed necessary. In retrospect, it would have been better to spend the freed budget and time on the requested financial investigations.
5. CONCLUSION
In the IVM project, the participants in the consultative sessions were allowed to question project objectives, working methods and data input. Their input in refining the measures was considerable, as was explained in ‘session 1: design discharge and maps of measures’. After the colour-coded assessment to filter out impossible measures (from technical and/or societal points of view), the criteria for the composition of packages were largely defined by experts. More participation in this would have required potentially difficult discussions on spatial quality and preferences. This was elaborated in ‘session 3: implementation of spatial quality concept’. The achievement of the flood protection objective could be checked by participants; issues pertaining to this were described in ‘session 2: use of the Blokkendoos’. Participants’ suggestions for changing the project’s objectives were partially implemented, namely by considering different discharges, thus improving the overall result considerably (session 1: design discharge). Non-technical solutions to flood management were hardly explored, as was demonstrated in ‘knowledge not employed’.
If two parameters for marking knowledge input are defined as
flexibility and quantity, and the three main disciplines involved in this project are assessed using these parameters, the score is highest for hydraulics, lower for landscape architecture, and lowest for economics. This reflects the representation of these disciplines in the project team. Although this is certainly not the only reason for the observed knowledge input imbalance, a balanced set-up of this team would be the final recommendation. Together with a political mandate to do so, expressed both in time and money, this would have allowed full exploration of the suggestions contributed by the participants.
REFERENCES
Arnstein, S.R. (1969) A ladder of citizen participation. Journal of the American Institution of Planners 35(4)
Anticipating climate change: participatory flood management Meuse 17
Bijker, W.E. (1990) The social construction of technology. PhD dissertation, University of Twente, The Netherlands.
Bijker, W.E. (1993) Dutch, dikes and democracy: an argument against
democratic authoritarian, and neutral technologies. Technical Univ. of Denmark, Lyngby, Denmark
Bruijn, K.M. de & Klijn, F. (2001) Resilient flood risk management
strategies. Proc. XXIX IAHR Congress, Beijing 2001 Jasanoff, S., Markle, G.E., Petersen, J.C, Pinch, T. (1995) Handbook of
science and technology studies. Sage, Thousand Oaks, USA Kors, A. (2004) The DSS ‘planning kit’ and its application in the Spankracht
study. Lowland Technology International 6 (2) Latour, B. & Woolgar, S. (1987) Science in action: how to follow scientists
and engineers through society. Cambridge (MA), USA Ministry of transport, public works and water management (2003): Integrale
Verkenning Maas (Integrated Assessment of the River Meuse). Advice, report and background-information (37 reports on CD ROM). Ministry for Transport, Public Works and Water Management, The Hague, The Netherlands
Musters, K., Schot, P., Smidt, J. de, Stegewerns, C. (eds.) (2005). Special
issue Ruimtelijke kwaliteit als sturende kracht (Spatial quality as driving force) Landschap 22(1)
Pretty, J. (1994) Alternative systems of inquiry for sustainable agriculture.
IDS bulletin 25 (2) Reuber, J., Schielen, R., Barneveld, H.J. (2005) Preparing a river for the
future - The River Meuse in the year 2050. Proceedings of the 3rd International Symposium on Flood Defence. 25-27 May 2005, Nijmegen, The Netherlands
Reuss, M. (2002) Learning from the Dutch: Technology, Management, and
Water Resources Development. Technology and Culture 43 (3) TeBrake, W.H. (2002) Taming the Waterwolf: Hydraulic Engineering and
Water Management in the Netherlands During the Middle Ages. Technology and Culture 43 (3)
Vriend, H.J.; Dijkman, J.P.M. (2003): A new method of decision support to
river flood management; Proceedings of the 1st International Yellow River Forum Vol. III, 21-24 October 2003, Zhengzhou, China.