anti-proliferative activity of natural rubber latex sera on human cancer cell lines
TRANSCRIPT

World Anti-Cancer Congress and Exhibition, 11 – 12 January 2014, Universiti Sains Malaysia, Pulau Pinang
1
Anti-Proliferative Activity of Natural Rubber Latex Sera on
Human Cancer Cell Lines
E. Sunderasan1#
, Lam K.L.2, Yang K.L.
1,2, Norazreen Abd. Rahman
1, Ong M.T
2#
Natural rubber latex extracts are becoming increasingly visible in pharmaceutical and
therapeutical research. Anti-proliferative activity against a number of human cancer-origin cell
lines has been detected in latex B- and C-serum. The present report describes fractionation of
latex B- and C-serum using cell viability assay as a guide to narrow down on the active
constituents. Dialysis of B- and C-serum against distilled water caused some of its constituents
to precipitate, then a brief centrifugation was employed to separate their fractions – dialysed B-
serum precipitate (DBP), dialysed B-serum supernatant (DBS), dialysed C-serum precipitate
(DCP), and dialysed C-serum supernatant (DCS). Boiling of B- and C-serum resulted in
extensive precipitation, and then a brief centrifugation separated the boiled B- and C-serum
precipitate from their supernatant. Anti-proliferative activity markedly increased in dialysed B-
serum precipitate and dialysed C-serum fractions but diminished in the dialysed B-serum
supernatant and boiled B- and C-serum fractions. Among the active fractions, DCS revealed the
highest anti-proliferative activity, particularly against HepG2 - hepatocellular adenocarcinoma
cells. Molecular and cellular analyses indicated that dialysed C-serum fractions induce
autoschizic type of death to HepG2 cells.
Key words: Latex C-serum, dialysis, cell viability assay, cancer cell lines, cancer cell death
1Rubber Research Institute of Malaysia, Malaysian Rubber Board, P.O. Box 10150, K. Lumpur, Malaysia 2Institute for Research in Molecular Medicine (INFORMM), Universiti Sains Malaysia, 11800 Minden, P. Pinang, Malaysia # Correspondence: [email protected]; [email protected]
Natural rubber latex is a milky white sticky emulsion (cytoplasm) that exudes upon wounding of
articulated laticiferous canals in the soft bark of Hevea brasiliensis tree. Fresh latex, after tap-
ping from the tree, may be divided into three main fractions by high-speed centrifugation; these
are a white upper layer, an aqueous phase (C-serum) and the so-called 'bottom fraction'1,2
. The
top layer comprises rubber micro-particles stabilised by an adsorbed layer of protein and
phospholipids. The C-serum contains most of the soluble substances normally found in plant
cells, including amino acids, proteins, carbohydrates, organic acids, inorganic salts and
nucleotidic materials. The 'bottom fraction' consists largely of lutoid particles but also contains
varying amounts of other organelles or particulate components of normal plant cells having a
density greater than that of the C-serum3. The fluid content of the 'bottom fraction' is called B-
serum4. So far, investigations on natural rubber latex sera (B- and C- serum) and its constituents
have revealed multiple biological activities such as anti-fungal, anti-inflammatory, anti-oxidant,

World Anti-Cancer Congress and Exhibition, 11 – 12 January 2014, Universiti Sains Malaysia, Pulau Pinang
2
and lipolytic properties5–13
. Potential anti-cancer therapeutic application of natural rubber latex
was first suggested when B- and C-serum were shown to exert specific anti-proliferative activity
against a malignant cell line14
. This is encouraging as latex sera is a relatively low-cost resource
particularly in the rubber-producing regions vis-à-vis its potential use as an anti-cancer
therapeutic.
The present study is aimed at investigating anti-proliferative activity of natural rubber latex B-
and C-serum, dialysed B- and C-serum fractions, and boiled B- and C-serum fractions. An array
of human cancer-origin adherent cell lines was employed in the initial tests; subsequent cell
viability assay were focused on hepatocellular adenocarcinoma (HepG2) and foreskin fibroblast
(Hs27) - a non-cancer-origin cell line that served as control. An attempt was also made to
delineate the molecular mechanism that incapacitates HepG2, the cancer cell line of interest.
MATERIALS AND METHODS
Preparation of latex B- and C-serum
Latex was collected from field-grown RRIM 600 trees at the Rubber Research Institute of
Malaysia Research Station, Sungai Buloh. To prepare latex B- and C-serum, fresh latex
collected in chilled flasks was fractionated by centrifugation at 44,000 × g for 2 hours, at 4ºC.
The latex separates into three distinct parts on high-speed centrifugation, as shown in figure 1.
To prepare whole C-serum (WC), the upper layer (rubber cream), was carefully removed and
WC was prepared from the remaining supernatant, based on a method previously described1,2
.
Latex B-serum was prepared from the bottom fraction of the centrifuged latex based on a method
previously described15
. Briefly, after removal of the rubber cream and C-serum, the sediment at
the bottom of the centrifuge tube was collected and re-suspended in 0.4 M mannitol to aid the
removal of remnant C-serum while retaining the lutoid particles intact. The cleansed bottom
fraction was recovered after another centrifugation and subjected to alternate freezing and
thawing (four times) to rupture the lutoid particles. The clear brownish fluid from the lutoid
particles, the whole B-serum (WB) was recovered by centrifugation. Both WB and WC were and
lyophilized until completion and kept in a desiccator for subsequent use.
Figure 1. Fractionation of fresh latex by high speed centrifugation. The positions of rubber
cream, C-serum and bottom fraction are marked.
Rubber cream
C-serum
Bottom fraction

World Anti-Cancer Congress and Exhibition, 11 – 12 January 2014, Universiti Sains Malaysia, Pulau Pinang
3
Preparation of dialysed B- and C-serum fractions
A portion of the lyophilized WB and WC were reconstituted with 1 × phosphate-buffered saline
(PBS; AMRESCO, Solon, OH, USA). Serial dilutions of WB and WC were performed to
prepare working concentrations ranging from 2 to 2,000 µg/ml.
The subsequent fractions of WB and WC were prepared by dialysis using SnakeSkin™ (Pierce,
IL, USA) tubing with molecular weight cut-off 3,000 Da, against distilled water for 48 hours at
about 5°C. A whitish precipitate was recovered from dialysed B and C-serum by centrifugation
at 20,000 × g for 30 minutes; the precipitates (DBP and DCP) and the supernatants (DBS and
DCS) were then lyophilized and kept desiccated until further use. Working solutions for
dialysed fractions were prepared as described above.
Preparation of boiled B- and C-serum fractions
WB and WC were placed in a boiling water bath for 10 minutes. A centrifugation procedure at
20,000 × g for 30 minutes was employed to separate the boiled B- and C-serum fractions. The
recovered boiled B-serum precipitate (BBP), boiled B-serum supernatant (BBS), boiled C-serum
precipitate (BCP) and boiled C-serum supernatant (BCS) fractions, were then lyophilized until
completion. Reconstitution and working solutions of the lyophilized BBP, BBS, BCP and BCS
were as described above for WB and WC.
Cell culture
Cell line Hs27 (CRL-1634) – of human foreskin fibroblasts, that is not of malignant origin,
HepG2 (CRL-11997) – hepatocellular adenocarcinoma, MCF7 (HTB-22) and MDA MB231
(HTB26) – both breast cancer-origin cell lines, HeLa (CCL-2) – cervical cancer-origin cell line,
Caov-3 (CCL-247) – ovarian cancer-origin cell line, and HCT116 (CCL-247) – colorectal
adenocarcinoma cell line, were sourced from the American Type Culture Collection (Rockville,
MD, USA). Cells were cultured in Dulbecco’s modified Eagle’s medium (DMEM) (Gibco®
;
Invitrogen, Carlsbad, CA, USA) supplemented with foetal calf serum (10% v/v), penicillin (100
units/ml), streptomycin (100 µg/ml) and amphotericin B (0.025 µg/ml) (Gibco®
; Invitrogen);
Hs27 cells were supplemented with additional 4.5 g/l glucose. Cultures were maintained at 37°C
in a water-saturated atmosphere containing 5% CO2. Cell counts were performed using a
Neubauer haemocytometer under light microscope and living cells were identified by Trypan
blue (Gibco®
; Invitrogen) staining method. Approximately 2,500 cells were seeded in each well
of a 96-well culture plate and were starved in DMEM under cell culture incubation conditions
for 48 h prior to cell viability assay.
Measurement of cell proliferation inhibition
Cytotoxic effects were measured using standard 3-(4,5-dimethylthiazol-2-yl) 2,5-diphenyl
tetrazolium bromide (MTT) assay (Sigma Chemical Company, St. Louis, MO, USA) after cell
treatment with WC or its fractions, for a pre-determined time points i.e. 24, 48 and 72 h; the
assay was developed based on the method described by Mossman16
. Two thousand five hundred
cells were seeded into 96-well plates and cultured in a CO2 incubator at 37°C. After 48 h, cells
were treated with serially-diluted concentrations of WC, DCP, DCS, BCP, and BCS, and kept
again in the CO2 incubator at 37°C. Cell morphology was observed using reverse phase-contrast
microscopy (ApoTome; Carl Zeiss MicroImaging GmbH, Jena, Germany). Absorbance (OD) at
570 nm was read using a spectrophotometric plate reader (Multiskan spectrum; Thermo Electron
Co., Waltham, MA, USA) and proportions of surviving cells were calculated as:

World Anti-Cancer Congress and Exhibition, 11 – 12 January 2014, Universiti Sains Malaysia, Pulau Pinang
4
OD of drug-treated sample - OD of blank × 100%
OD of control - OD of blank
Dose–response curves were constructed using Probit analysis17
to obtain LC50 and LC80 values.
All experimental data were derived from at least three independent experiments.
Real-time quantitative RT-PCR analysis
Expression levels of Bax, Bcl-2 and caspase-3 mRNA were analysed using the real-time
quantitative reverse transcription-polymerase chain reaction (qRT-PCR) technique. Experimental
cells were treated with concentrations 0 and LC50 of WC, DCS and DCP. Cells were then
harvested at 48 h and total RNA was isolated using TriPure isolation reagent according to the
manufacturer’s instructions (Roche Diagnostics, Mannheim, Germany). Integrity and purity of
RNA were spectrophotometrically verified by measuring absorption ratio, OD 260 nm/OD 280
nm. Complementary DNA (cDNA) was synthesized with 1 µg total RNA using Transcriptor
First Strand cDNA Synthesis Kit according to the manufacturer’s instructions (Roche
Diagnostics). The reaction was performed at 25°C for 10 min, followed by 50°C for 60 min,
heated to 95°C for 5 min and chilled at 4°C using a MyCycler Thermal Cycler System (Bio-Rad
Laboratories, Hercules, CA, USA). cDNA stock was maintained at 20 ng/µl concentration and -
20°C until further use. Primer sequences for amplification of Bcl-2, Bax and caspase-3 genes by
real-time PCR were designed and synthesized by Primer Design Ltd. (Hampshire, UK). Primer
sequence for GADPH gene was designed using Primer 3 Input (version 0.4.0), and synthesized at
1st BASE Pte. Ltd. (Singapore).
Quantification of gene expression was performed using an ABI Prism 7700 Sequence Detector
(Perkin-Elmer Applied Biosystems, Foster, CA, USA). PCR solution (20 µl) was composed of
1× FastStart Universal SYBR Green Master (ROX) (Roche Diagnostics) containing 2.5 µl
cDNA of treated and untreated samples, and 0.3 µM of each primer (Table 1). Thermal cycle
parameters were the following: 1 cycle at 95°C for 10 min followed by 40 cycles at 95°C for 15
s, 60°C for 30 s, and 72°C for 15 s. In addition, real-time reaction of the products was checked
by melting point analysis, after each reaction. Standard curves for Bax, Bcl-2, caspase-3 and
GADPH were generated using serial dilution of cDNA derived from the cell lines. GADPH was
monitored as reference gene and Bcl-2, Bax and caspase-3 expression levels were normalized
with respect to GADPH transcript and calculated by the 2-ΔΔCt
method18
. A two-sided P-value
lower than 0.05 was considered to be statistically significant.
Table 1. The primers used for the amplification of the respective genes in the real-time
quantitative RT-PCR Gene Primer sequence PCR product
size (bp)
Bax Forward: 5′-ATG GAG CTG CAG AGG ATG AT-3′ Reverse: 5′-CAG TTG AAG TTG CCG TCA GA-3′
101
Bcl-2 Forward: 5′-GAG GTC ACG GGG GCT AAT T-3′ Reverse: 5′-GAG GCT GGG CAC ATT TAC TG-3′
88
Caspase-3 Forward: 5′-TGT AGA AAT GAT GAT GTG GAA GAA C-3′ Reverse: 5′-GCA GTT AAG TCA TCC GTG TAT ATC-3′
98

World Anti-Cancer Congress and Exhibition, 11 – 12 January 2014, Universiti Sains Malaysia, Pulau Pinang
5
GADPH Forward: 5′-GAG TCA ACG GAT TTG GTC GT-3’
Reverse: 5′-TTG ATT TTG GAG GGA TCT CG-3′ 234
Fluorescence and transmitted light microscopy
Approximately 50,000 cells/well were seeded in a 24-well culture plate under nutrient starvation
condition in DMEM and placed in a water saturated CO2 incubator at 37°C. After 48 hours, the
cells were treated with LC50 concentrations of DCS and DCP and returned to the CO2 incubator
at 37 °C for another 48 hours. Cell without undergoing latex subfraction treatment were used as
control in this experiment. Cell fixation was conducted using 4% ice-cold paraformaldehyde for
20 min at 4 °C. Treated and untreated cells were rinsed with 0.01M PBS and incubated with
Hoechst 33258 (0.5μg/ml) staining for 45 min in the dark at room temperature. Cells were rinsed
with 0.01M PBS again and treated with RNase A (10µg/ml) for 30 min to remove cytoplasmic
RNA. Annexin V/ propidium iodide (PI) staining was performed using an Annexin-V-FLUOS
staining kit (Roche Diagnostics GmbH, Mannheim, Germany) according to the manufacturer’s
protocol after rinsing with 0.01M PBS. Treated and untreated cells were incubated with
Annexin V/PI (1 µg/ml) mix for 15 min in the dark at room temperature. Cells were observed
and results were analyzed using an ApoTome Fluorescence Microscope equipped with an
AxioCam MRc5 digital camera controlled by the AxioVision software package, version 4.2 from
Carl Zeiss MicroImaging GmbH (Jena, Germany).
Electrophoresis and protein detection
Two-dimensional electrophoresis was carried out with isoelectric focusing for the first dimension
on IPGphor (GE Healthcare Life Sciences, Piscataway, NJ, USA), and SDS-PAGE for the
second dimension with Mini-Protean II apparatus (Bio-Rad Laboratories, Hercules, CA, USA),
according to the manufacturers’ instructions. Briefly, the 7 cm IPG strips, pH 3-10 L, containing
100 µg samples were dissolved in IPG buffer (with freshly added 18 mM DTT) were placed in
porcelain strip-holders. The strips were overlaid with ~1 ml mineral oil and rehydration was
performed at 20ºC for 16 h. This was followed by isoelectric focusing at constant voltage of 500
V for 30 minutes, 1000 V for 1 h and thereafter at 5000 V for 1 h. After isoelectric focusing, the
strips were soaked in equilibration buffer for 10 minutes before loading on to 12.5% SDS-
polyacrylamide slab gels and electrophoresed at constant current of 30 mA, for 45 minutes.
Upon completion, the gels were stained with Coomassie brilliant blue R250 to detect the
separated proteins.
Statistical analysis
Data are presented as mean ± SEM of triplicate determinations, except when results of plots are
shown, in which case, a representative experiment is depicted in each figure. Comparisons
between multiple groups were performed using one-way ANOVA with Tukey and Duncan
corrections. Statistical significance was indicated when P < 0.05.
RESULTS
Initial cell viability assay showed that whole B-serum (WB) and C-serum (WC) exerted anti-
proliferative activity on a number of cancer-origin cell lines. The anti-proliferative activity
improved after dialysis, while the killing of cancer-origin cells was observed in the dialysed B-

World Anti-Cancer Congress and Exhibition, 11 – 12 January 2014, Universiti Sains Malaysia, Pulau Pinang
6
serum precipitate (DBP), a higher killing activity was discerned with dialysed C-serum
supernatant (DCS) compared to dialysed C-serum precipitate (DCP). On the other hand, anti-
proliferative activity diminished in the boiled B- and C-serum fractions i.e. boiled B-serum
supernatant (BBS), boiled B-serum precipitate (BBP), boiled C-serum supernatant (BCS) and
boiled C-serum precipitate (BCP) (Table 2). It was also discerned that among the cancer-origin
cell lines, HepG2 was the most susceptible, while HCT116 was the most resistant to the
treatments. These findings justified further evaluation of WB, DBP, WC, DCS and DCP
fractions in view of targeting HepG2 - the most susceptible cancer-origin cell line.
Table 2. A summary of anti-proliferative activity of latex B- and C-serum and its fractions
WB DBS DBP BBS BBP
Control cell line Hs27 X X X X X
Cervical cancer HeLa X X √ X X
Liver cancer HepG2 √ X √√ X X
Breast cancer MCF-7 X X √
(72H)
X X
Breast cancer
MDA-
MB231 √ (72H)
X √ X X
Ovarian cancer Caov-3 X X √
(72H)
X X
Colorectal cancer HCT116 X X √ X X
WC DCS DCP BCS BCP
Control cell line Hs27 X X X X X
Cervical cancer HeLa √ (72H)
√ √ (72H)
√ (72H)
X
Liver cancer HepG2 √ √√ √ √ (72H)
X
Breast cancer MCF-7 X √ √ (72H)
√ (72H)
X
Breast cancer
MDA-
MB231 √ √√ √ X X
Ovarian cancer Caov-3 X √ X X X
Colorectal cancer HCT116 X √ (72H)
X X X
Oral cancer CAL27 X √ √ (72H)
X X

World Anti-Cancer Congress and Exhibition, 11 – 12 January 2014, Universiti Sains Malaysia, Pulau Pinang
7
X not susceptible
√√ very susceptible
√ susceptible
√ (72H)
susceptible at high concentrations (at 72 hours post-
treatment)
Specific anti-proliferative activity of WB, WC, DBP, DCS and DCP fractions on
HepG2 cells
Cell-based MTT assay with the pre-determined concentrations of WB, DBP, WC, DCS and DCP
showed that proliferation of Hs27 was not affected, whereas that of HepG2 were inhibited within
the test concentration range (0 - 1 µg/ml) at 48 h post-treatment (Fig. 2). Although HepG2 is of
malignant origin, a significant degree of difference in viability was discerned at all-time points
i.e. 24, 48 and 72 h post-treatment (data not shown), which reflects on the specificity of the test
fractions in exerting anti-proliferative activity against the cancer-origin cell line.
0%
20%
40%
60%
80%
100%
120%
Ce
ll V
iab
ility
(%
)
Concentrations (µg/ml) Hs27 HepG2

World Anti-Cancer Congress and Exhibition, 11 – 12 January 2014, Universiti Sains Malaysia, Pulau Pinang
8
0%
20%
40%
60%
80%
100%
120%C
ell
Via
bili
ty (
%)
Concentrations (µg/ml) Hs27 HepG2
0.0%
20.0%
40.0%
60.0%
80.0%
100.0%
120.0%
Ce
ll vi
abili
ty (
%)
Concentration (ng/ml)
MTT assay (WC_0-1000ng/ml) at 48 hours
Hs27 cells HepG2 cells
0.0%
20.0%
40.0%
60.0%
80.0%
100.0%
120.0%
140.0%
Ce
ll vi
abili
ty (
%)
Concentration (ng/ml)
MTT assay (DCS_0-1000ng/ml) at 48 hours
Hs27 cells HepG2 cells
World Anti-Cancer Congress and Exhibition, 11 – 12 January 2014, Universiti Sains Malaysia, Pulau Pinang
9
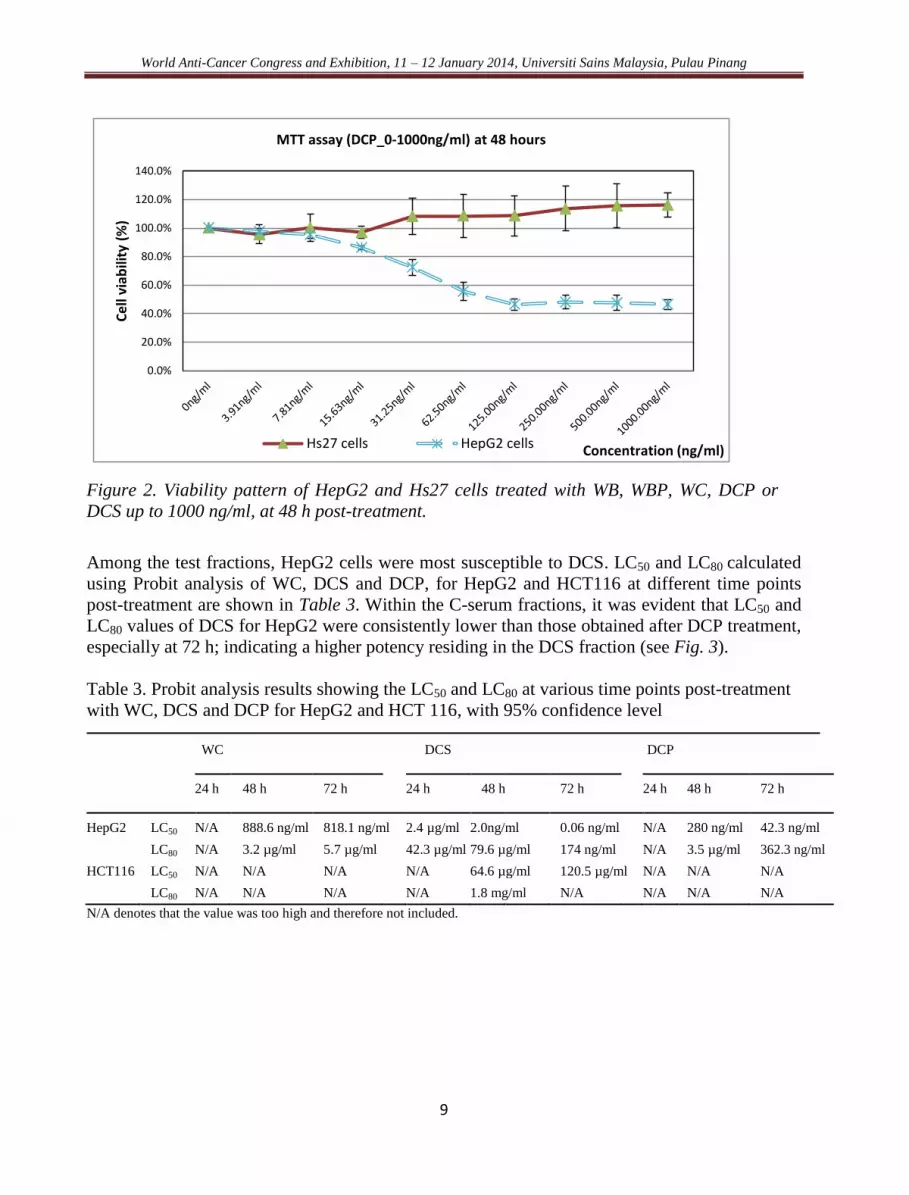
Figure 2. Viability pattern of HepG2 and Hs27 cells treated with WB, WBP, WC, DCP or
DCS up to 1000 ng/ml, at 48 h post-treatment.
Among the test fractions, HepG2 cells were most susceptible to DCS. LC50 and LC80 calculated
using Probit analysis of WC, DCS and DCP, for HepG2 and HCT116 at different time points
post-treatment are shown in Table 3. Within the C-serum fractions, it was evident that LC50 and
LC80 values of DCS for HepG2 were consistently lower than those obtained after DCP treatment,
especially at 72 h; indicating a higher potency residing in the DCS fraction (see Fig. 3).
Table 3. Probit analysis results showing the LC50 and LC80 at various time points post-treatment
with WC, DCS and DCP for HepG2 and HCT 116, with 95% confidence level
WC DCS DCP
24 h 48 h 72 h 24 h 48 h 72 h 24 h 48 h 72 h
HepG2 LC50 N/A 888.6 ng/ml 818.1 ng/ml 2.4 µg/ml 2.0ng/ml 0.06 ng/ml N/A 280 ng/ml 42.3 ng/ml
LC80 N/A 3.2 µg/ml 5.7 µg/ml 42.3 µg/ml 79.6 µg/ml 174 ng/ml N/A 3.5 µg/ml 362.3 ng/ml
HCT116 LC50 N/A N/A N/A N/A 64.6 µg/ml 120.5 µg/ml N/A N/A N/A
LC80 N/A N/A N/A N/A 1.8 mg/ml N/A N/A N/A N/A
N/A denotes that the value was too high and therefore not included.
0.0%
20.0%
40.0%
60.0%
80.0%
100.0%
120.0%
140.0%
Ce
ll vi
abili
ty (
%)
Concentration (ng/ml)
MTT assay (DCP_0-1000ng/ml) at 48 hours
Hs27 cells HepG2 cells

World Anti-Cancer Congress and Exhibition, 11 – 12 January 2014, Universiti Sains Malaysia, Pulau Pinang
10
Figure 3. Viability pattern of HepG2 cells treated with the different latex C-serum fractions i.e.
WC, DCS and DCP, at 72 h post-treatment.
Deciphering the susceptibility of HepG2 cells to WC-, DCP- and DCS-fractions
Generally, malignant cells treated with potent anti-cancer drugs undergo apoptosis – a type of
programmed cell death. In this study, real-time qRT-PCR revealed that pro-apoptotic genes such
as Bax and caspase-319
were not up-regulated in WC, DCP or DCS treated HepG2 cells. Instead,
expression of Bcl-2 remained high, although viability of HepG2 cells was compromised at 48
and 72 h. Bcl-2/Bax and Bcl-2/casp3 expression ratios in HepG2 cells also remained high
compared to those in Hs27 and HCT116 cells (Fig. 4). Expression ratios in these latter were
neither significantly different nor elevated between themselves. As Bcl-2 is an anti-apoptotic
gene20
, its high expression in HepG2 cells, and the concomitant low expression of Bax and
caspase-3 suggest that susceptibility to these treatments was not due to apoptosis.
In addition, agarose gel electrophoresis of total genomic DNA of WC-, DCP- and DCS- treated
HepG2 cells gave a smearing of ethidium bromide stain along the sample lanes (data not shown),
which indicates degraded DNA. The absence of distinct DNA fragmentation or laddering reflects
on the lack of caspase-induced endonuclease activity, otherwise would be evident in cells
undergoing apoptosis21
.
a.
6
5
4
3
2
1
0 WC-treated DCS-treated DCP-treated
0.0%
20.0%
40.0%
60.0%
80.0%
100.0%
120.0%
Ce
ll V
iab
ility
MTT assay on HepG2 cells at 72 h
WC
DCP
DCS
HepG2 HCT116 Hs27
Rel
ativ
e ex
pre
ssio
n
Bcl
-2/B
ax r
atio

World Anti-Cancer Congress and Exhibition, 11 – 12 January 2014, Universiti Sains Malaysia, Pulau Pinang
11
b.
8
7
6
5
4
3
2
1
0 WC-treated DCS-treated DCP-treated
Figure 4. Expression of Bcl-2/Bax (a) and that of Bcl-2/caspase-3 (b) in HepG2, HCT116 and
Hs27 cells after treatment with WC, DCS and DCP for 48 h.
HepG2 cells were positively stained with propidium iodide
DCS-treated cells were positively stained with Hoechst 33258 and PI but negatively stained with
Annexin V. However, DCP-treated cells were positively stained with Hoechst 33258, PI and
very slightly stained with Annexin V (Fig. 5). Morphology examination under microscope
revealed that DCS- and DCP-treated cells were dead or in the process of dying, with cells
detached from the coverslip surface, observation correlated to the cell nuclei stained with PI .
However, the non-treated control cells were positively stained for Hoechst 33258 and negatively
stained for both Annexin V and PI, indicating live cells.
Figure 5: DCS-treated HepG2 cells co-stained with Hoechst 33258 (blue) and Annexin-V/ PI
staining kit (green and red, respectively) at 48 hours post-treatment.
HepG2 HCT116 Hs27 R
elat
ive
exp
ress
ion
Bcl
-2/C
asp
3 r
atio

World Anti-Cancer Congress and Exhibition, 11 – 12 January 2014, Universiti Sains Malaysia, Pulau Pinang
12
DISCUSSION
Cell viability assay showed that a number of adherent human cancer-origin cell lines were
susceptible to whole C-serum (WC). Further analysis revealed that viability of WC treated
HepG2 cells were markedly reduced at 48 h, whereas HCT116 and Hs27 cells remained
unaffected within the tested concentration range (0 - 1 µg/ml). Hs27 and HCT116 cells were also
not affected by dialysed C-serum fractions (DCP and DCS) in subsequent cell viability assays,
indicating that inactivity of WC against these cell lines was not due to the presence of small
inhibitory molecule(s) that are eliminable by dialysis. As both DCP and DCS elicited slightly
different anti-proliferative patterns (Fig. 2), these fractions could be harbouring different active
constituents. Moreover, the anti-proliferative activity improved after dialysis, with DCS eliciting
a higher activity compared to DCP (Fig. 3), which suggests enrichment and at least a partial
separation of the active constituent(s), and perhaps removal of low molecular weight inhibitor(s).
On the other hand, diminished anti-proliferative activity in the boiled C-serum fractions reflects
on the heat sensitive nature of the active-constituents. Thus it’s tempting to speculate that the
active constituent(s) are of protein-origin – the predominant macromolecules (>3,000 Da) that
are retained in the dialysed C-serum fractions. The diversity of proteins in the dialysed C-serum
fractions is shown in figure 6. Chromatographic fractionation to narrow down on the active-
constituents of DCP and DCS is in progress. Subsequent cell viability assay will prove if further
enriched sub-fractions were attainable, and may be used to compare its efficacy with that of
known anti-cancer agents.
pH 3 10 3 10
a
.
b
.

World Anti-Cancer Congress and Exhibition, 11 – 12 January 2014, Universiti Sains Malaysia, Pulau Pinang
13
Figure 6. Coomassie blue staining of two-dimensional polyacrylamide gel electrophoresis (2D-
PAGE) of dialysed B-serum precipitate (a), dialysed B-serum supernatant (b), dialysed C-serum
precipitate (c) and dialysed C-serum supernatant (d).
Probit analysis revealed that LC50 values on HepG2 were significantly reduced to 2 ng/ml for
DCS and 280 ng/ml for DCP, compared to 818 ng/ml for WC. The LC50 values obtained in this
study were far lower than the 30 µg/ml standard benchmarked by the American National Cancer
Institute for crude plant extracts22
. With the specificity of dialysed C-serum fractions to HepG2,
there seems to be a potential for application in the treatment of hepatocellular carcinomas. It has
been reported that only 10 – 20% of hepatocellular carcinomas can be removed completely under
surgery23,24
. If dialysed C-serum fractions were specifically targeted to malignant cells in the
liver, population of the primary cancer cells could be suppressed, and then eliminated by surgical
intervention, or even without surgery, hence facilitating recovery of healthy hepatocytes.
Furthermore, the activity of DCS and DCP was shown to be prolonged, as the number of living
cells continued to decrease over time, without the need for introduction of a fresh dose of the
dialysed C-serum fractions (Fig. 3). Thus, a minimal effective dose would suffice to destroy
target malignant cells.
In the efforts to decipher the mechanism that leads to the destruction of cancer cells, we have
performed qRT-PCR, DNA fragmentation assay and preliminary morphological assessment on
the WC-, DCP- and DCS-treated HepG2 cells15
. For the most part, the results did not support
involvement of the classical apoptosis cell-death signalling pathway. More recently, DCP- and
DCS-treated HepG2 cells were observed under scanning electron microscope (SEM), subjected
to cell cycle analysis by flow cytometry, as well as Hoechst, Propidium Iodide (PI) and Annexin
V staining. These additional cellular and morphological examinations suggest involvement of
autoschizic programmed death pathway of treated HepG2 cells.
ACKNOWLEDGEMENTS
This work was supported by the Malaysian Rubber Board (SEAC grant S11BTP0373) and
Universiti Sains Malaysia (USM incentive grant 1001/CIPPM/82111). The skilled technical
assistance of Mr. Mony Rajan and Ms. Azlina Azharuddin is gratefully acknowledged.
c
..
.
d
..
.

World Anti-Cancer Congress and Exhibition, 11 – 12 January 2014, Universiti Sains Malaysia, Pulau Pinang
14
REFERENCES
1. MOIR, G.F.J. (1959) Ultracentrifugation and Staining of Hevea Latex. Nature, 184, 1626.
2. YEANG, H.Y. (1988) Characterisation of Rubber Particle Destabilisation by B-serum and
Bark Sap of Hevea brasiliensis. J. nat. Rubb. Res., 4, 47-55.
3. ARCHER, B.L., AUDLEY, B.G., MCSWEENEY, G.P. and TAN, C.H. (1969) Studies on the
composition of latex serum and ‘bottom fraction’ particles. J. Rubb. Res. Inst. Malaya, 21, 560 –
569.
4. YEANG, H.Y. (1988) Destabilisation of Hevea Latex by Bark Sap: Involvement of High
Density Rubber Particles in Latex. J. nat. Rubb. Res., 3, 115-126.
5. CHOW, C.K. and DRAPER, H.H. (1970) Isolation of Gamma-tocotrienol Dimers from Hevea
Latex. Biochemistry, 9,445–450.
6. BEALING, F.J. (1981) Quebrachitol Synthesis in Hevea brasiliensis. J. Rubb. Res. Inst.
Malaysia, 29, 111–112.
7. BURTON, G.W., WEBB, A. and INGOLD, K.U. (1985) A Mild, Rapid and Efficient Method
of Lipid Extraction for Use in Determining Vitamin E / Lipid Ratios. Lipids, 20, 29–39.
8. WAJANT, F. and FOSTER, S. (1996) Purification and Characterisation of Hydroxyl Nitrile
Lyase from Hevea brasiliensis. Plant Sci., 115, 25–31.
9. DAS, G., ALAM, B., RAJ, S., DEY, S.K., SETHURAJ, M.R. and SEN-MANDI, S. (2002)
Over-exploitation Associated Changes in Free Radicals and its Scavengers in Hevea brasiliensis.
J. Rubb. Res., 5, 28–40.
10. ARIF, S.A.M., HAMILTON, R.G., YUSOF, F., CHEW, N.-P., LOKE, Y.-H., NIMKAR, S.,
BEINTEMA, J.J. and YEANG, H.Y. (2004) Isolation and Characterisation of the Early Nodule
Specific Protein Homologue (Hev b 13), an Allergenic Lipolytic Esterase from Hevea
brasiliensis Latex. J Biol. Chem., 279, 23933-41.
11. DARULIZA, K.M.A., LAM, K.L., YANG, K.L., PRISCILLA, J.T., and SUNDERASAN,
E., AND ONG, M.T. (2011) Anti-Candida albicans Activity and Brine Shrimp Lethality Test of
Hevea brasiliensis Latex B-serum. Eur. Rev. Med. Pharmacol. Sci.15, 1163–1171.
12. DARULIZA, K.M.A., LAM, K.L., YANG, K.L., PRISCILLA, J.T., and SUNDERASAN,
E., AND ONG. M.T.(2011) Anti-fungal Effect of Hevea brasiliensis Latex C-serum on
Aspergillus niger. Eur. Rev. Med. Pharmacol. Sci. 15, 1027–1033.
13. TEIXEIRA, L.B., EPIFÂNIO, V.L.A.A., LACHAT, J.J., FOSS, N.T., and COUTINHO-
NETTO, J. (2012) Oral treatment with Hev b 13 Ameliorates Experimental Arthritis in Mice.
Clin. Exp. Immunol., 168, 285-290.

World Anti-Cancer Congress and Exhibition, 11 – 12 January 2014, Universiti Sains Malaysia, Pulau Pinang
15
14. ONG, M.T., YANG, K.L., LAM, K.L., ONG, G.A., and SUNDERASAN, E.(2009)
Susceptibility of HeLa (Cancer-origin) Cells to a Sub-fraction of Latex B-serum. J. Rubb. Res.,
12, 117–124.
15. LAM, K.L., YANG, K.L., SUNDERASAN, E. and ONG, M.T. (2012) Latex C-serum from
Hevea brasiliensis Induces Non-apoptotic Cell Death in Hepatocellular Carcinoma Cell-line
(HepG2). Cell prolif., 45, 577-585.
16. MOSSMAN, T. (1983) Rapid Colorimetric Assay for Cellular Growth and Survival:
Application to Proliferation and Cytotoxicity Assays. J. Immunol. Methods, 65, 55–63.
17. FINNEY, D.J. (1962) Probit Analysis: A Statistical Treatment of the Sigmoid Response
Curve. Cambridge University Press, Cambridge, 318–323.
18. LIVAK, K.J. and SCHMITTGEN, T.D. (2001) Analysis of Relative Gene Expression Data
Using Real-time Quantitative RT-PCR and 2-ΔΔCT
Method. Methods, 25, 402-408.
19. ISRAELS, L.G., and ISRAELS, E.D. (1999) Apoptosis. Stem cells, 17, 306-313.
20. LING, Y.H., LIEBES, L., NG, B., BUCKLEY, M., ELLIOT, P.J., ADAMS, J., JIANG, J.D.,
MUGGIA, F.M. and PERREZ-SOLER, R. (2002) PS-341, a Novel Proteasome Inhibitor,
Inhibitor, Induces Bcl-2 Phosphorylation and Cleavage in Association with G2-M Phase Arrest
and Apoptosis. Mol. Cancer Ther., 1, 541-549.
21. WYLLIE, A.H. (1980) Glucocorticoid-induced Thymocyte Apoptosis is Associated with
Endogenous Endonuclease Activation. Nature, 284, 555–556.
22. SUFFNESS, M., and PEZZUTO, J.M. (1990) Assays Related to Cancer Drug Discovery. In:
Hostettmann, K. (Ed.), Methods in Plant Biochemistry: Assays for Bioactivity. Academic Press,
London, pp. 71–133.
23. BOSCH, F.X., RIBES, J., DÍAZ, M., and CLÉRIES, R. (2004) Primary Liver Cancer:
Worldwide Incidence and Trends. Gastroenterology, 127, S5–S16.
24. SHAO, W., SUI, C., LIU, Z., YANG, J., and ZHOU, Y. (2011) Surgical Outcome of
Hepatocellular Carcinoma Patients with Biliary Tumor Thrombi. World J. Surg. Oncol., 9, 2.