annual report - bangladesh association of publicly
TRANSCRIPT
BANGLADESH ASSOCIATION OF PUBLICLY LISTED COMPANIES
ANNUALREPORT2 0 1 4
ANNUAL REPORT 201402
BANGLADESH ASSOCIATION OF PUBLICLY LISTED COMPANIES
August 29, 2015
All Member-Companies ofBangladesh Association of Publicly Listed Companies (BAPLC)
Subject : Annual Report for the year ended as at December 31, 2014.
Dear Sirs,
We are pleased to enclose a copy of the Annual Report 2014 together with the Audited Financial Statements including Balance Sheet as at December 31, 2014 and Income Statement, Cash Flow Statement for the year ended as at December 31, 2014 along with notes thereon of Bangladesh Association of Publicly Listed Companies (BAPLC).
Looking forward to your active participation in the AGM, we remain.
Yours sincerely,
K.M. Abdul HaiSecretary-General
04
05
07
08
28
29
30
31
32
33
NOTICE OF THE 16TH ANNUAL GENERAL MEETING
PHOTO GALLERY
CORPORATE STRUCTURE 2014-2015
REPORT OF THE EXECUTIVE COMMITTEE
FINANCIAL REPORT
AUDITORS’ REPORT
STATEMENT OF FINANCIAL POSITION
INCOME & EXPENDITURE STATEMENT
STATEMENT OF CASH FLOWS
NOTES TO THE FINANCIAL STATEMENTS
BANGLADESH ASSOCIATION OF PUBLICLY LISTED COMPANIES 03
TABLE OF CONTENTS
ANNUAL REPORT 201404
BANGLADESH ASSOCIATION OF PUBLICLY LISTED COMPANIES
Ref: AGM – BAPLC/16/2015 29th August, 2015
All Member-Companies of BAPLC
NOTICE OF THE 16TH ANNUAL GENERAL MEETING
Notice is hereby given that the 16th Annual General Meeting of the Mem-bers of Bangladesh Association of Publicly Listed Companies will be held on Monday, 14th September, 2015 at 5:00 P.M. at Patio Hall (2nd Floor), Gulshan Club, Road # 50, Gulshan-2, Dhaka–1212, to transact the following business:
AGENDA
To receive, consider and adopt the Annual Report of the Executive Committee of the Association for the year ended 31st December 2014.
To receive, consider and adopt the Financial Statements of the Asso-ciation and the Auditors’ Report thereon for the year ended 31st December 2014.
To appoint Auditors for the year 2015 and fix their remuneration.
By order of the Executive Committee
K. M. Abdul HaiSecretary-General
1.
2.
3.
NOTICEOF THE
16THANNUAL
GENERALMEETING
BANGLADESH ASSOCIATION OF PUBLICLY LISTED COMPANIES 05
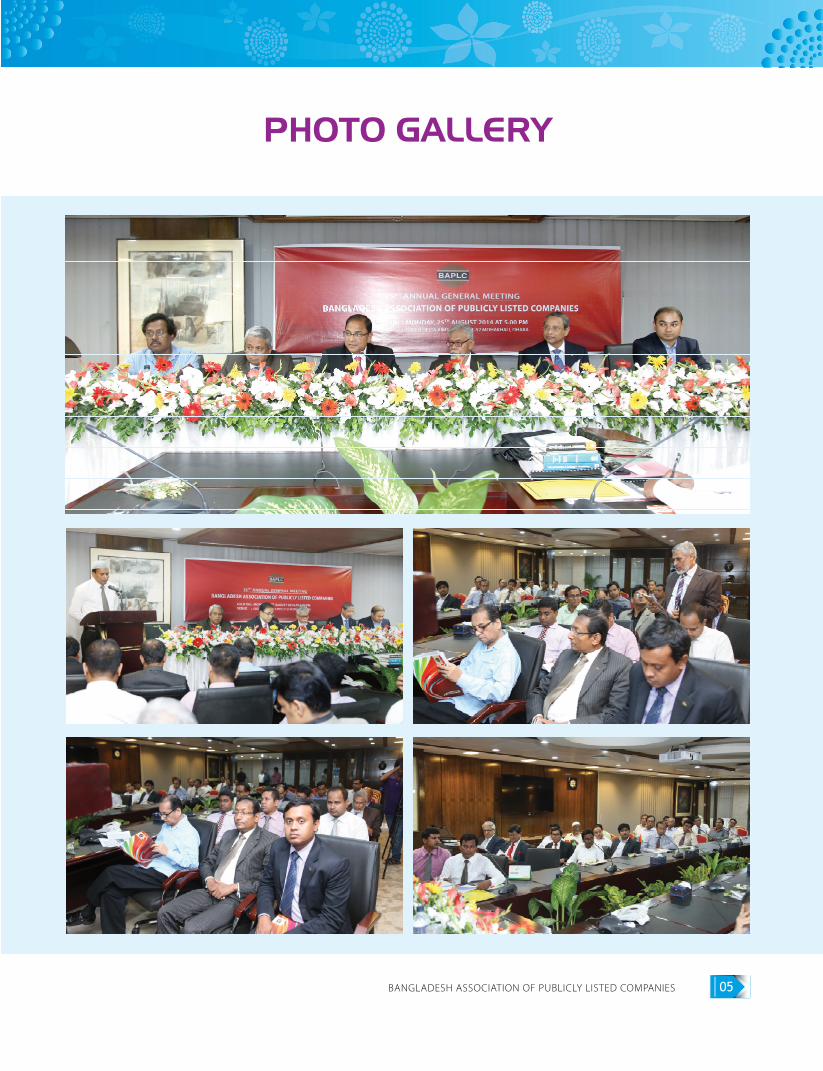
PHOTO GALLERY
ANNUAL REPORT 201406
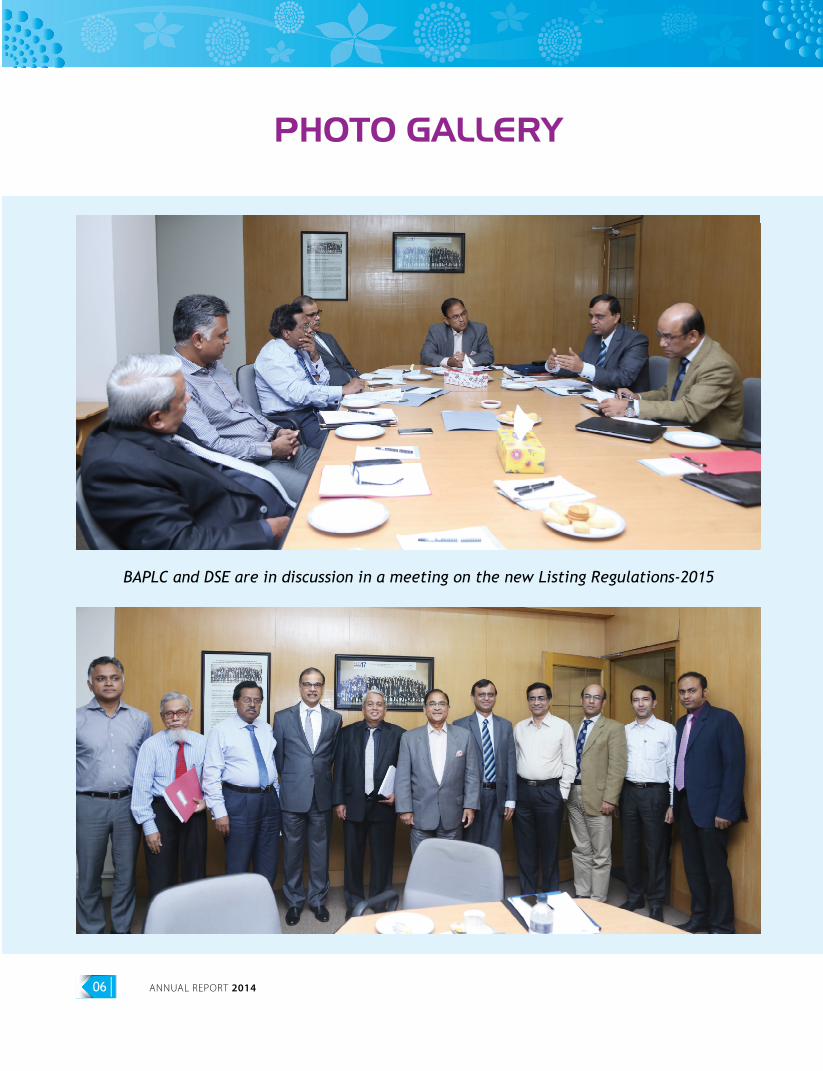
PHOTO GALLERY
BAPLC and DSE are in discussion in a meeting on the new Listing Regulations-2015
BANGLADESH ASSOCIATION OF PUBLICLY LISTED COMPANIES 07
President MR. TAPAN CHOWDHURY Managing Director, Square Textiles Ltd.
Vice-President MR. MOHAMMED YOUNUS Managing Director, Sonali Paper & Board Mills Ltd.
Members of the Executive Committee MR. AZAM J. CHOWDHURY Managing Director, MJL Bangladesh Ltd.
MR. SYED NASIM MANZUR Managing Director, Apex Footwear Ltd.
MR. A. MATIN CHOWDHURY Managing Director, Malek Spinning Mills Ltd.
MR. A.K.M. AZIZUR RAHMAN Chairman, Sonargaon Textiles Limited
MR. MANZURUL ISLAM Chairman, Eastern Housing Ltd.
MS. FARZANA CHOWDHURY Managing Director & CEO, Green Delta Insurance Co. Ltd.
MRS. ROKEYA QUADER Chairman, Desh Garments Limited
MR. MD. HASHMAT ALI Managing Director, Continental Insurance Ltd.
MR. MATIUR RAHMAN Vice-Chairman, Uttara Finance & Investments Ltd.
MR. MD. ABDUR ROB Managing Director, National Housing Finance and Inv. Ltd.
MR. SYED TAREQUE MD. ALI Managing Director, Modern Industries (Bangladesh) Ltd.
MR. MD. NAZRUL ISLAM Chairman, Fareast Islami Life Ins. Co. Ltd.
MR. ABUL BASHAR Deputy Managing Director, Prime Textile Spinning Mills Ltd.
MR. SHAHRIAR AHMED Director, Apex Spinning & Knitting Mills Ltd.
MR. ANWER HOSSAIN KHAN Director, Shahjalal Islami Bank Ltd.
Secretary-General MR. K.M. ABDUL HAI
Auditors A. QASEM & CO. Chartered Accountants, Pink City, Gulshan-2, Dhaka-1212
Banker MUTUAL TRUST BANK LTD. Panthapath Branch, Dhaka-1205
CORPORATE STRUCTURE(2014-2015)
ANNUAL REPORT 201408
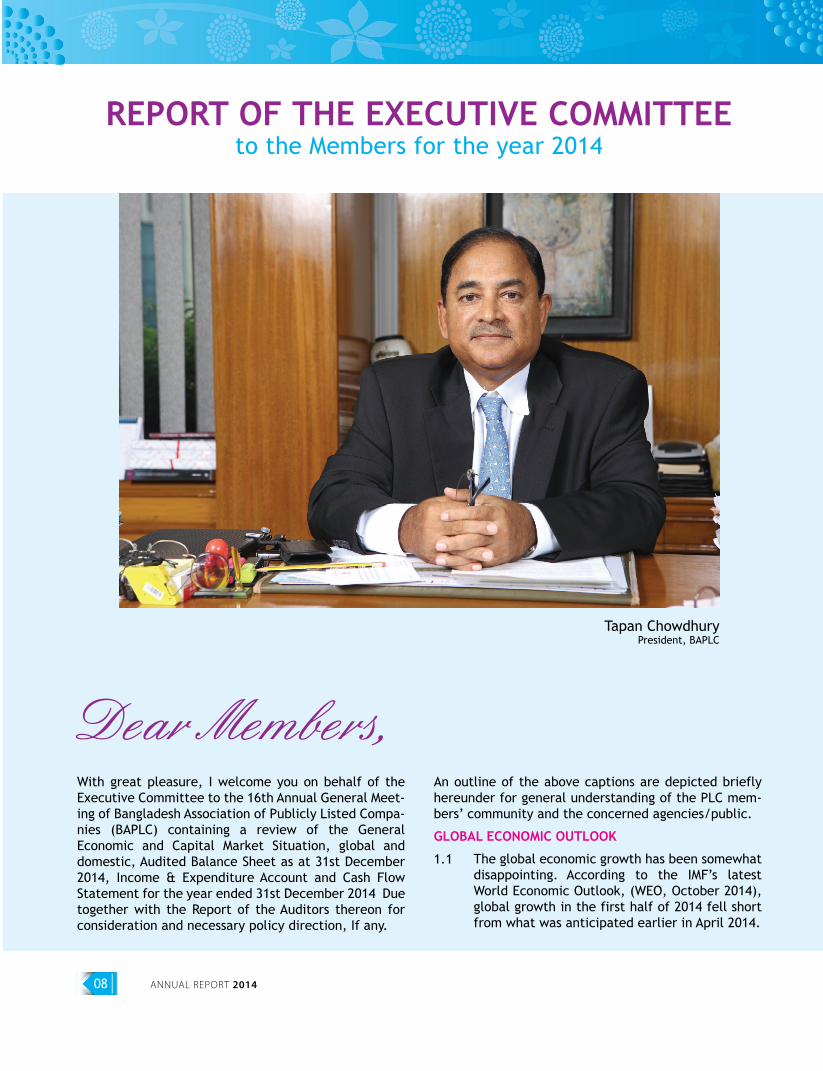
With great pleasure, I welcome you on behalf of the Executive Committee to the 16th Annual General Meet-ing of Bangladesh Association of Publicly Listed Compa-nies (BAPLC) containing a review of the General Economic and Capital Market Situation, global and domestic, Audited Balance Sheet as at 31st December 2014, Income & Expenditure Account and Cash Flow Statement for the year ended 31st December 2014 Due together with the Report of the Auditors thereon for consideration and necessary policy direction, If any.
An outline of the above captions are depicted briefly hereunder for general understanding of the PLC mem-bers’ community and the concerned agencies/public.
GLOBAL ECONOMIC OUTLOOK
The global economic growth has been somewhat disappointing. According to the IMF’s latest World Economic Outlook, (WEO, October 2014), global growth in the first half of 2014 fell short from what was anticipated earlier in April 2014.
1.1
Dear Members,
Tapan ChowdhuryPresident, BAPLC
REPORT OF THE EXECUTIVE COMMITTEEto the Members for the year 2014
BANGLADESH ASSOCIATION OF PUBLICLY LISTED COMPANIES 09
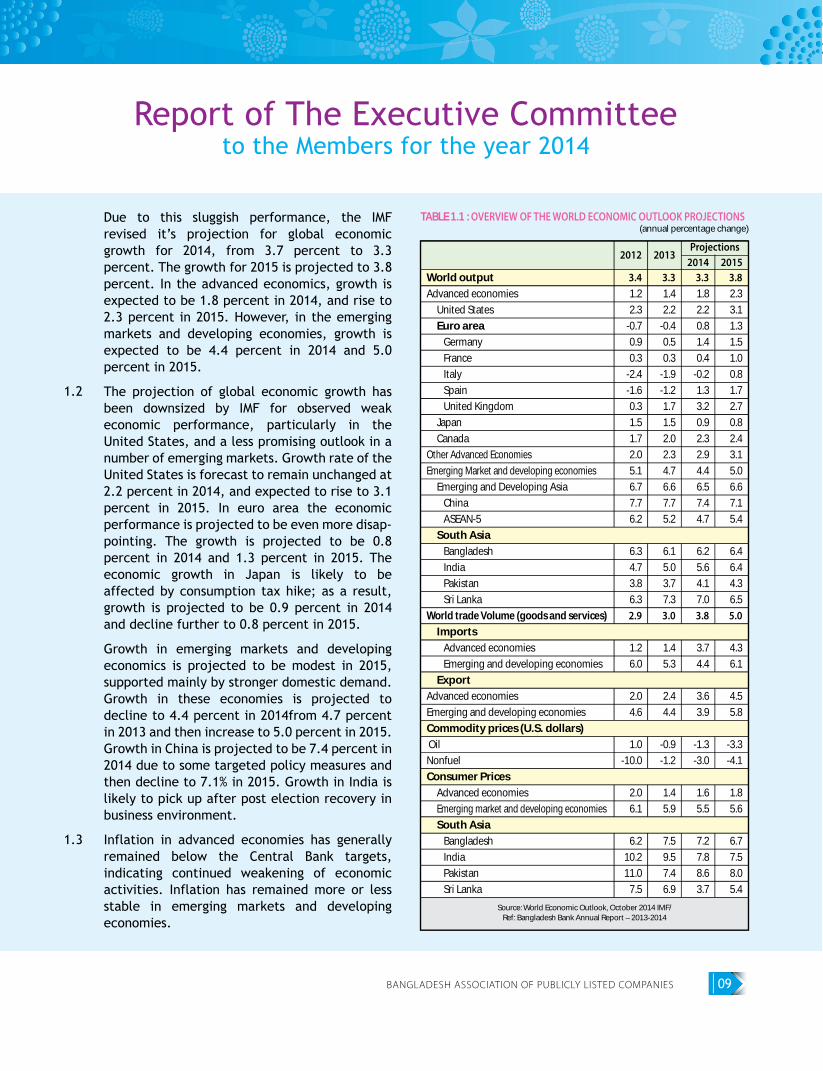
Due to this sluggish performance, the IMF revised it’s projection for global economic growth for 2014, from 3.7 percent to 3.3 percent. The growth for 2015 is projected to 3.8 percent. In the advanced economics, growth is expected to be 1.8 percent in 2014, and rise to 2.3 percent in 2015. However, in the emerging markets and developing economies, growth is expected to be 4.4 percent in 2014 and 5.0 percent in 2015.
The projection of global economic growth has been downsized by IMF for observed weak economic performance, particularly in the United States, and a less promising outlook in a number of emerging markets. Growth rate of the United States is forecast to remain unchanged at 2.2 percent in 2014, and expected to rise to 3.1 percent in 2015. In euro area the economic performance is projected to be even more disap-pointing. The growth is projected to be 0.8 percent in 2014 and 1.3 percent in 2015. The economic growth in Japan is likely to be affected by consumption tax hike; as a result, growth is projected to be 0.9 percent in 2014 and decline further to 0.8 percent in 2015.
Growth in emerging markets and developing economics is projected to be modest in 2015, supported mainly by stronger domestic demand. Growth in these economies is projected to decline to 4.4 percent in 2014from 4.7 percent in 2013 and then increase to 5.0 percent in 2015. Growth in China is projected to be 7.4 percent in 2014 due to some targeted policy measures and then decline to 7.1% in 2015. Growth in India is likely to pick up after post election recovery in business environment.
Inflation in advanced economies has generally remained below the Central Bank targets, indicating continued weakening of economic activities. Inflation has remained more or less stable in emerging markets and developing economies.
1.2
1.3
TABLE 1.1 : OVERVIEW OF THE WORLD ECONOMIC OUTLOOK PROJECTIONS(annual percentage change)
Source: World Economic Outlook, October 2014 IMF/Ref: Bangladesh Bank Annual Report – 2013-2014
Projections2012 2013
2014 20153.41.2
2.3
-0.7
0.9
0.3
-2.4
-1.6
0.3
1.5
1.7
2.0
5.1
6.7
7.7
6.2
6.3
4.7
3.8
6.3
2.9
1.2
6.0
2.0
4.6
1.0
-10.0
2.0
6.1
6.2
10.2
11.0
7.5
3.31.4
2.2
-0.4
0.5
0.3
-1.9
-1.2
1.7
1.5
2.0
2.3
4.7
6.6
7.7
5.2
6.1
5.0
3.7
7.3
3.0
1.4
5.3
2.4
4.4
-0.9
-1.2
1.4
5.9
7.5
9.5
7.4
6.9
3.31.8
2.2
0.8
1.4
0.4
-0.2
1.3
3.2
0.9
2.3
2.9
4.4
6.5
7.4
4.7
6.2
5.6
4.1
7.0
3.8
3.7
4.4
3.6
3.9
-1.3
-3.0
1.6
5.5
7.2
7.8
8.6
3.7
3.82.3
3.1
1.3
1.5
1.0
0.8
1.7
2.7
0.8
2.4
3.1
5.0
6.6
7.1
5.4
6.4
6.4
4.3
6.5
5.0
4.3
6.1
4.5
5.8
-3.3
-4.1
1.8
5.6
6.7
7.5
8.0
5.4
World outputAdvanced economies
United States
Euro area Germany
France
Italy
Spain
United Kingdom
Japan
Canada
Other Advanced Economies
Emerging Market and developing economies
Emerging and Developing Asia
China
ASEAN-5
South Asia Bangladesh
India
Pakistan
Sri Lanka
World trade Volume (goods and services) Imports Advanced economies
Emerging and developing economies
ExportAdvanced economies
Emerging and developing economies
Commodity prices (U.S. dollars) Oil
Nonfuel
Consumer Prices Advanced economies
Emerging market and developing economies
South Asia Bangladesh
India
Pakistan
Sri Lanka
Report of The Executive Committeeto the Members for the year 2014
ANNUAL REPORT 201410
Report of The Executive Committeeto the Members for the year 2014
World trade volume growth is projected to rise from 3.0% in 2013 to 3.8% in 2014 and then increase further to 5.0% in 2015. The growth rate of imports for advanced economies is expected to increase from 1.4% in 2013 to 3.7% in 2014, to 4.3% in2015. However, growth rate for imports in the emerging market / developing economies is projected to decline from 5.3% in 2013 to 4.4% in 2014 and then rise to 6.1% in 2015. Exports to advanced economies are expected to grow from 3.6% in 2014 to 4.5% in 2015 as against from 3.9% in 2014 to 5.8% in 2015 for emerging /developing economies.
The global financial system is undergoing through a number of challenging transition in its way to greater stability. The global economic recovery continues to rely heavily on accommo-dative monetary policies in advanced econo-mies. Emerging markets are more vulnerable to shocks from advanced economies, as they now absorb a much larger share of outward portfolio investment from advanced economies. Capital markets have become more significant providers of credit since the global economies and finan-cial erises, shifting the locus of risks to the shadow banking system.
The overall balance of risks to global growth outlook is still dominated by downside risks. Risks of oil price hike, asset price decline and further economic distress are higher due to increased gio-political tensions prevailing in many parts of the world. In some advanced economies, protracted low inflation or outright deflation poses risks to activity. In some emerg-ing market economies, especially those with domestic weakness and external vulnerabilities, the effects of the worsening of the financial conditions and negative growth could be more prolonged.
DEVELOPMENTS IN THE BANGLADESH ECONOMY
The Bangladesh economy maintained the growth momentum registering a 6.1 % growth of GDP in FY14, the growth in industrial sector was lower
in 2014 compared to the preceding year partly due to political problem and uncertainty. Moder-ate growth of agriculture sector along with satis-factory growth of services sector helped to achieve the 6.1% growth of the overall economy. During FY14, the average inflation showed an upward trend, mainly due to increase in food inflation although the non-food inflation declined during the same period. A cautious but inclusive growth and investment friendly mon-etary policy stance was implemented during FY14. Policy rates were kept unchanged due to the risks of inflationary pressure and to support economic growth. Broad money (M2) registered 16.1% growth in FY14 against the targeted growth of 17.0 % in FY13. Total domestic credit increased from 10.9% in FY13 to 11.6% in FY14. Private sector credit growth was 12.3 percent in FY14 which was lower against the targeted growth of 16.5% mainly due to sluggish credit demand, political uncertainty and stringent lending practices by banks following some scams in some banks. On the other hand, the growth of credit to the public sector declined to 8.8 percent in FY14 against the target growth of 22.9% due to significantly lower government borrowing from the banking sector. Instead of borrowing from banks, government collected a good amount of resources through selling National Savings Certificates. Export continued to grow from 10.7% in FY13 to 12.0 % in FY14. Almost imports of all items in the import basket increased last year pushing the overall growth of imports from 0.8% in FY13 to 8.9% in FY14. Trade deficit declined to USD 6806 million. Workers’ remittances stood lower at USD 144115 million in FY14 compared to the preceding fiscal year, registering a negative growth of 1.6 %. The current account balance showed a relatively small surplus of USD 1346 million in FY14 which is attributable to the negative growth of remit-tances. Supported by a significant surplus in the combined capital and financial account, the overall balance recorded a surplus of USD 5483 million in FY14.
1.4
1.5
1.6
1.7
BANGLADESH ASSOCIATION OF PUBLICLY LISTED COMPANIES 11
Report of The Executive Committeeto the Members for the year 2014
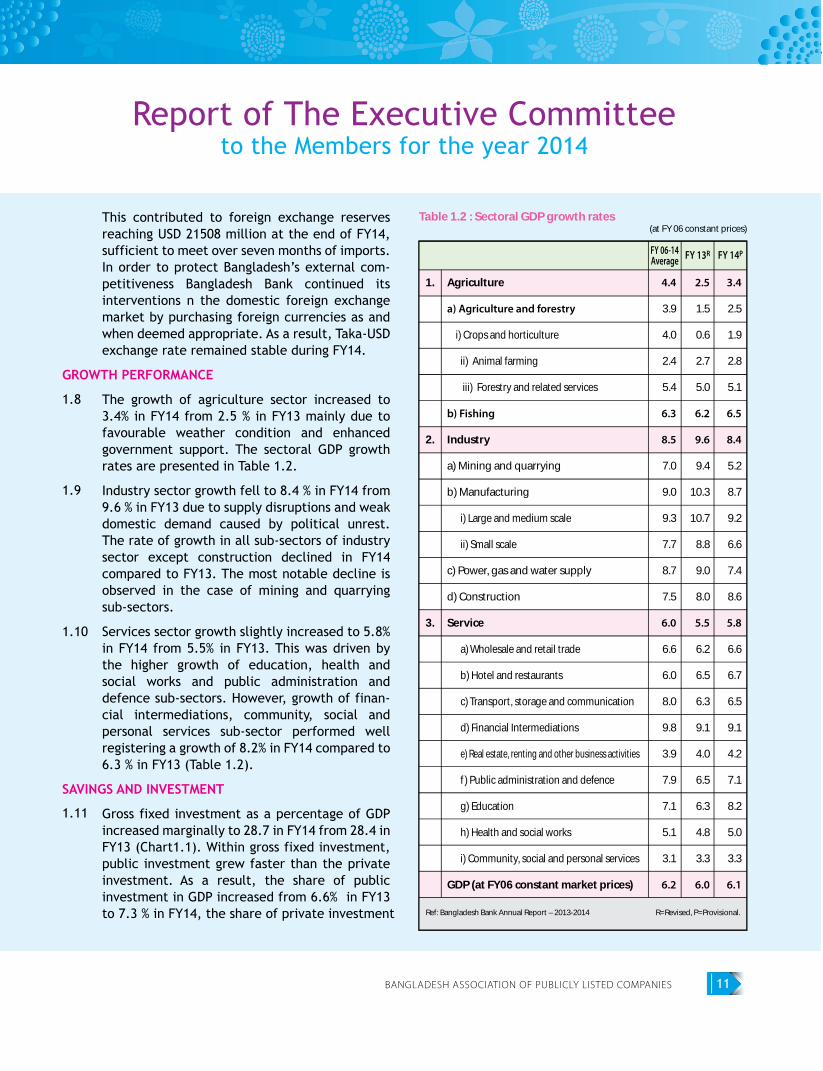
This contributed to foreign exchange reserves reaching USD 21508 million at the end of FY14, sufficient to meet over seven months of imports. In order to protect Bangladesh’s external com-petitiveness Bangladesh Bank continued its interventions n the domestic foreign exchange market by purchasing foreign currencies as and when deemed appropriate. As a result, Taka-USD exchange rate remained stable during FY14.
GROWTH PERFORMANCE
The growth of agriculture sector increased to 3.4% in FY14 from 2.5 % in FY13 mainly due to favourable weather condition and enhanced government support. The sectoral GDP growth rates are presented in Table 1.2.
Industry sector growth fell to 8.4 % in FY14 from 9.6 % in FY13 due to supply disruptions and weak domestic demand caused by political unrest. The rate of growth in all sub-sectors of industry sector except construction declined in FY14 compared to FY13. The most notable decline is observed in the case of mining and quarrying sub-sectors.
Services sector growth slightly increased to 5.8% in FY14 from 5.5% in FY13. This was driven by the higher growth of education, health and social works and public administration and defence sub-sectors. However, growth of finan-cial intermediations, community, social and personal services sub-sector performed well registering a growth of 8.2% in FY14 compared to 6.3 % in FY13 (Table 1.2).
SAVINGS AND INVESTMENT
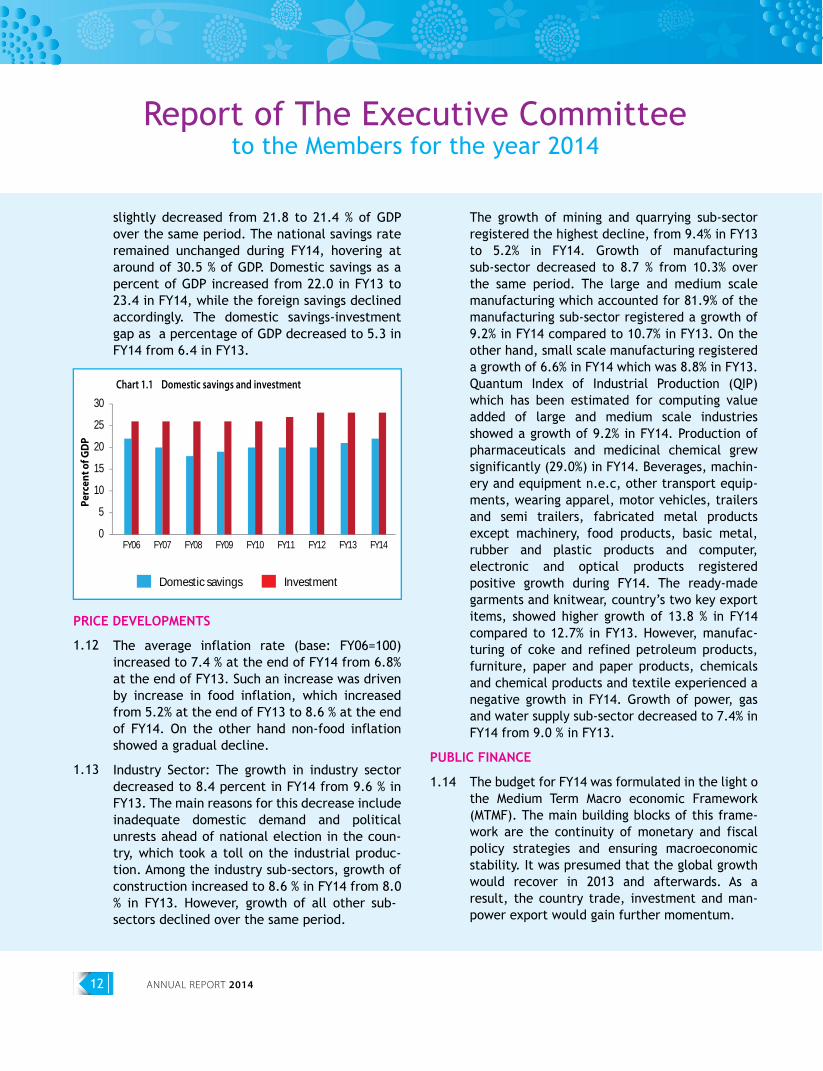
Gross fixed investment as a percentage of GDP increased marginally to 28.7 in FY14 from 28.4 in FY13 (Chart1.1). Within gross fixed investment, public investment grew faster than the private investment. As a result, the share of public investment in GDP increased from 6.6% in FY13 to 7.3 % in FY14, the share of private investment
1.8
1.11
1.10
1.9
Table 1.2 : Sectoral GDP growth rates (at FY 06 constant prices)
Ref: Bangladesh Bank Annual Report – 2013-2014 R=Revised, P=Provisional.
FY 13RFY 06-14Average FY 14P
4.4
3.9
4.0
2.4
5.4
6.3
8.5
7.0
9.0
9.3
7.7
8.7
7.5
6.0
6.6
6.0
8.0
9.8
3.9
7.9
7.1
5.1
3.1
6.2
2.5
1.5
0.6
2.7
5.0
6.2
9.6
9.4
10.3
10.7
8.8
9.0
8.0
5.5
6.2
6.5
6.3
9.1
4.0
6.5
6.3
4.8
3.3
6.0
3.4
2.5
1.9
2.8
5.1
6.5
8.4
5.2
8.7
9.2
6.6
7.4
8.6
5.8
6.6
6.7
6.5
9.1
4.2
7.1
8.2
5.0
3.3
6.1
1.
2.
3.
Agriculture
a) Agriculture and forestry
i) Crops and horticulture
ii) Animal farming
iii) Forestry and related services
b) Fishing
Industry
a) Mining and quarrying
b) Manufacturing
i) Large and medium scale
ii) Small scale
c) Power, gas and water supply
d) Construction
Service
a) Wholesale and retail trade
b) Hotel and restaurants
c) Transport, storage and communication
d) Financial Intermediations
e) Real estate, renting and other business activities
f ) Public administration and defence
g) Education
h) Health and social works
i) Community, social and personal services
GDP (at FY06 constant market prices)
ANNUAL REPORT 201412
Report of The Executive Committeeto the Members for the year 2014
slightly decreased from 21.8 to 21.4 % of GDP over the same period. The national savings rate remained unchanged during FY14, hovering at around of 30.5 % of GDP. Domestic savings as a percent of GDP increased from 22.0 in FY13 to 23.4 in FY14, while the foreign savings declined accordingly. The domestic savings-investment gap as a percentage of GDP decreased to 5.3 in FY14 from 6.4 in FY13.
PRICE DEVELOPMENTS
The average inflation rate (base: FY06=100) increased to 7.4 % at the end of FY14 from 6.8% at the end of FY13. Such an increase was driven by increase in food inflation, which increased from 5.2% at the end of FY13 to 8.6 % at the end of FY14. On the other hand non-food inflation showed a gradual decline.
Industry Sector: The growth in industry sector decreased to 8.4 percent in FY14 from 9.6 % in FY13. The main reasons for this decrease include inadequate domestic demand and political unrests ahead of national election in the coun-try, which took a toll on the industrial produc-tion. Among the industry sub-sectors, growth of construction increased to 8.6 % in FY14 from 8.0 % in FY13. However, growth of all other sub-sectors declined over the same period.
The growth of mining and quarrying sub-sector registered the highest decline, from 9.4% in FY13 to 5.2% in FY14. Growth of manufacturing sub-sector decreased to 8.7 % from 10.3% over the same period. The large and medium scale manufacturing which accounted for 81.9% of the manufacturing sub-sector registered a growth of 9.2% in FY14 compared to 10.7% in FY13. On the other hand, small scale manufacturing registered a growth of 6.6% in FY14 which was 8.8% in FY13. Quantum Index of Industrial Production (QIP) which has been estimated for computing value added of large and medium scale industries showed a growth of 9.2% in FY14. Production of pharmaceuticals and medicinal chemical grew significantly (29.0%) in FY14. Beverages, machin-ery and equipment n.e.c, other transport equip-ments, wearing apparel, motor vehicles, trailers and semi trailers, fabricated metal products except machinery, food products, basic metal, rubber and plastic products and computer, electronic and optical products registered positive growth during FY14. The ready-made garments and knitwear, country’s two key export items, showed higher growth of 13.8 % in FY14 compared to 12.7% in FY13. However, manufac-turing of coke and refined petroleum products, furniture, paper and paper products, chemicals and chemical products and textile experienced a negative growth in FY14. Growth of power, gas and water supply sub-sector decreased to 7.4% in FY14 from 9.0 % in FY13.
PUBLIC FINANCE
The budget for FY14 was formulated in the light o the Medium Term Macro economic Framework (MTMF). The main building blocks of this frame-work are the continuity of monetary and fiscal policy strategies and ensuring macroeconomic stability. It was presumed that the global growth would recover in 2013 and afterwards. As a result, the country trade, investment and man-power export would gain further momentum.
1.12
1.131.14
Chart 1.1 Domestic savings and investment
0
5
10
15
20
25
30
FY06 FY07 FY08 FY09 FY10 FY11 FY12 FY13 FY14
Domestic savings Investment
BANGLADESH ASSOCIATION OF PUBLICLY LISTED COMPANIES 13
Report of The Executive Committeeto the Members for the year 2014
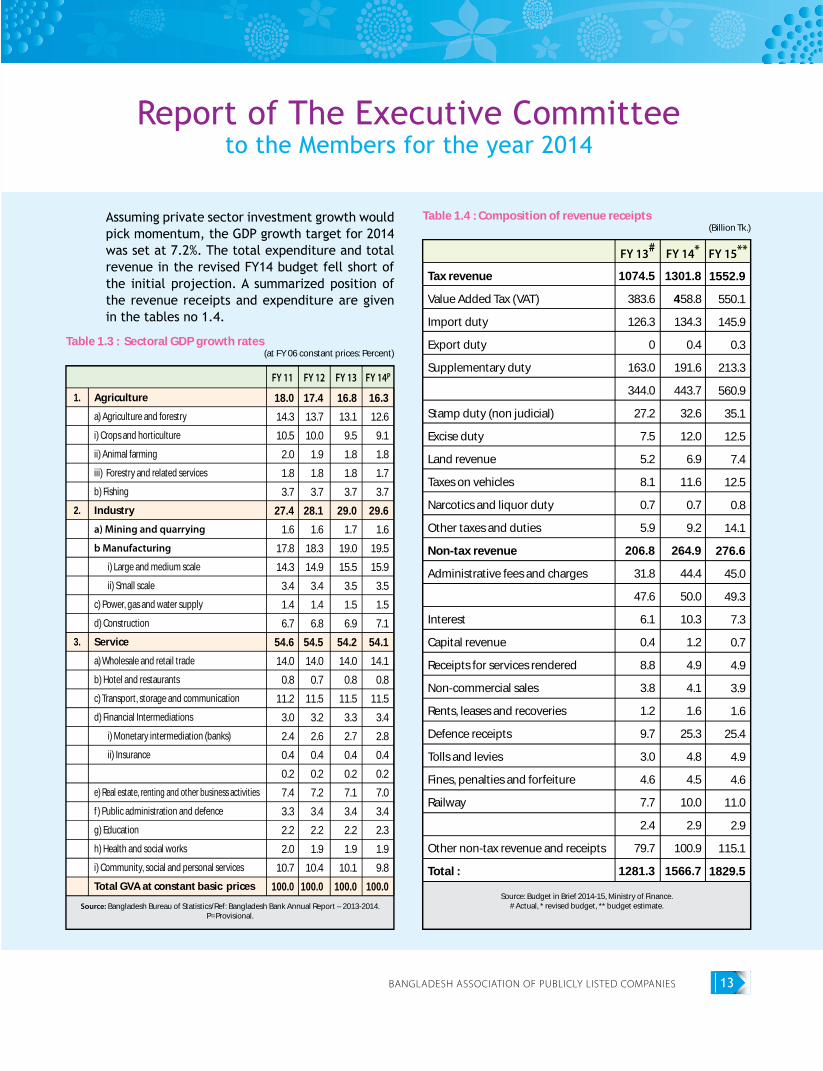
Assuming private sector investment growth would pick momentum, the GDP growth target for 2014 was set at 7.2%. The total expenditure and total revenue in the revised FY14 budget fell short of the initial projection. A summarized position of the revenue receipts and expenditure are given in the tables no 1.4.
Table 1.3 : Sectoral GDP growth rates(at FY 06 constant prices: Percent)
Source: Bangladesh Bureau of Statistics/Ref: Bangladesh Bank Annual Report – 2013-2014. P=Provisional.
FY 13FY 11 FY 12 FY 14P
17.4
13.7
10.0
1.9
1.8
3.7
28.1
1.6
18.3
14.9
3.4
1.4
6.8
54.5
14.0
0.7
11.5
3.2
2.6
0.4
0.2
7.2
3.4
2.2
1.9
10.4
100.0
18.0
14.3
10.5
2.0
1.8
3.7
27.4
1.6
17.8
14.3
3.4
1.4
6.7
54.6
14.0
0.8
11.2
3.0
2.4
0.4
0.2
7.4
3.3
2.2
2.0
10.7
100.0
16.8
13.1
9.5
1.8
1.8
3.7
29.0
1.7
19.0
15.5
3.5
1.5
6.9
54.2
14.0
0.8
11.5
3.3
2.7
0.4
0.2
7.1
3.4
2.2
1.9
10.1
100.0
16.3
12.6
9.1
1.8
1.7
3.7
29.6
1.6
19.5
15.9
3.5
1.5
7.1
54.1
14.1
0.8
11.5
3.4
2.8
0.4
0.2
7.0
3.4
2.3
1.9
9.8
100.0
1.
2.
3.
Agriculture
a) Agriculture and forestry
i) Crops and horticulture
ii) Animal farming
iii) Forestry and related services
b) Fishing
Industry
a) Mining and quarrying
b Manufacturing
i) Large and medium scale
ii) Small scale
c) Power, gas and water supply
d) Construction
Service
a) Wholesale and retail trade
b) Hotel and restaurants
c) Transport, storage and communication
d) Financial Intermediations
i) Monetary intermediation (banks)
ii) Insurance
iii) Other financial intermediation
e) Real estate, renting and other business activities
f ) Public administration and defence
g) Education
h) Health and social works
i) Community, social and personal services
Total GVA at constant basic prices
Table 1.4 : Composition of revenue receipts (Billion Tk.)
Source: Budget in Brief 2014-15, Ministry of Finance. # Actual, * revised budget, ** budget estimate.
FY 13#
Tax revenue
Value Added Tax (VAT)
Import duty
Export duty
Supplementary duty
Taxes on income and profit
Stamp duty (non judicial)
Excise duty
Land revenue
Taxes on vehicles
Narcotics and liquor duty
Other taxes and duties
Non-tax revenue
Administrative fees and charges
Dividend and profit
Interest
Capital revenue
Receipts for services rendered
Non-commercial sales
Rents, leases and recoveries
Defence receipts
Tolls and levies
Fines, penalties and forfeiture
Railway
Post offices
Other non-tax revenue and receipts
Total :
1074.5
383.6
126.3
0
163.0
344.0
27.2
7.5
5.2
8.1
0.7
5.9
206.8
31.8
47.6
6.1
0.4
8.8
3.8
1.2
9.7
3.0
4.6
7.7
2.4
79.7
1281.3
1301.8
458.8
134.3
0.4
191.6
443.7
32.6
12.0
6.9
11.6
0.7
9.2
264.9
44.4
50.0
10.3
1.2
4.9
4.1
1.6
25.3
4.8
4.5
10.0
2.9
100.9
1566.7
1552.9
550.1
145.9
0.3
213.3
560.9
35.1
12.5
7.4
12.5
0.8
14.1
276.6
45.0
49.3
7.3
0.7
4.9
3.9
1.6
25.4
4.9
4.6
11.0
2.9
115.1
1829.5
FY 14* FY 15**
ANNUAL REPORT 201414
Report of The Executive Committeeto the Members for the year 2014
EXPORTS
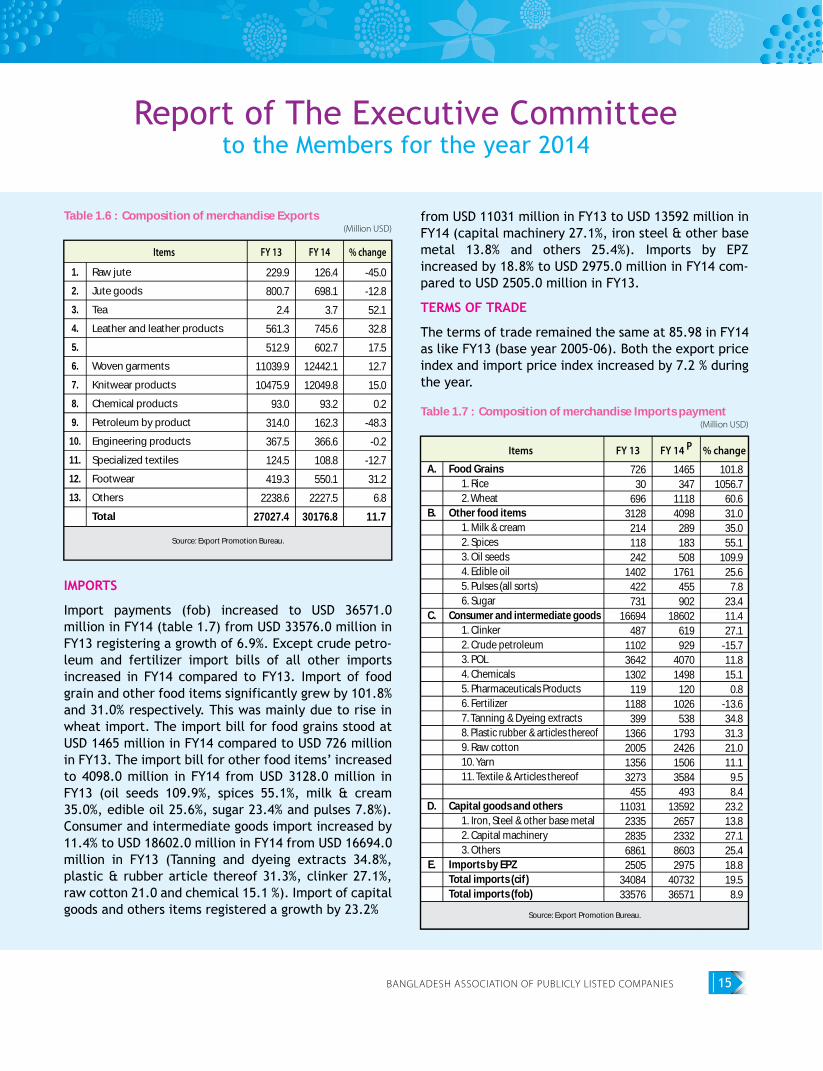
Table 1.6 shows that total exports in FY14 had a strong growth over FY13. Aggregate exports increased by 11.7 % in FY14 to USD 30176.8 million from USD 27027.4 million in FY13. Apparels (woven garments and knitwear products) continued to occupy an overwhelming (above four fifths) share of the export basket in FY14.
DESTINATION
The destination markets of exports, excluding those from EPZs, in FY14 are dominated by EU and NAFTA blocs. The EU bloc accounted for 54.3 % white NAFTA bloc accounted for 22.6% of total export of the country. Export to the ASEAN, SAARC and other regions accounted for about 1.5, 1.9 and 19.7 % respectively.
COMPOSITION
Readymade garments (woven and knitwear): Export earnings from woven and knitwear products, which accounts for about 81.2% of total export earnings, regis-tered an increase from USD 21515.8 million in FY13 to USD 24491.9 million in FY14. Woven and knitwear prod-
ucts showed the growth of 12.7% and 15.0 % respectively in FY14 compared to FY13.
Leather and leather Products: Export earnings from leather and leather products increased by 32.8% to USD 745.6 million in FY14 from USD 561.3 million in FY13.
Frozen Food : The export earnings of frozen foods sector comprising mainly of shrimps registered a signifi-cant increase in FY14. Receipt from exports of shrimps and fish increased by 17.5% to USD 602.7 million in FY14.
Footwear : Export earnings from footwear sector increased by 31.2% t USD 550.1 million in FY14 over FY13.
Chemical Products : Exports of Chemical products had marginally increased by only 0.2% in FY14 to USD 93.2 million over FY13.
Tea : Tea exports increased in FY14 to USD 3.7 million from DSD 2.4 million in FY13 by about 50%.
Jute Goods (excluding carpets) : Exports of this sector declined in FY14 to USD 698.1 million from USD 800.7 million in FY13.
Raw Jute : This sector also suffered a decline in FY14 where exports ware USD 126.6 million as against USD 229.9 in FY13.
Table 1.5 : Composition of revenue expenditure (Billion Tk.)
Source: Budget in Brief 2014-15, Ministry of Finance.# Actual, * revised budget, ** budget estimate.
FY 13#
283.1
59.9
223.2
90.7
83.8
15.9
159.6
39.4
23.2
8.2
6.8
993.8
Social sector
Public services
Interest on domestic debt
Defence
Public order and safety
Interest on foreign debt
Agriculture sector
Transfer and communication
Local Government & Rural development
Housing
Others
Total :
351.7
222.4
248.5
105.6
101.0
16.9
130.8
45.1
23.5
8.8
5.7
1160.0
389.5
145.6
293.1
112.7
104.3
17.4
131.8
48.7
25.0
9.2
5.1
1282.3
FY 14* FY 15**
BANGLADESH ASSOCIATION OF PUBLICLY LISTED COMPANIES 15
Report of The Executive Committeeto the Members for the year 2014
IMPORTS
Import payments (fob) increased to USD 36571.0 million in FY14 (table 1.7) from USD 33576.0 million in FY13 registering a growth of 6.9%. Except crude petro-leum and fertilizer import bills of all other imports increased in FY14 compared to FY13. Import of food grain and other food items significantly grew by 101.8% and 31.0% respectively. This was mainly due to rise in wheat import. The import bill for food grains stood at USD 1465 million in FY14 compared to USD 726 million in FY13. The import bill for other food items’ increased to 4098.0 million in FY14 from USD 3128.0 million in FY13 (oil seeds 109.9%, spices 55.1%, milk & cream 35.0%, edible oil 25.6%, sugar 23.4% and pulses 7.8%). Consumer and intermediate goods import increased by 11.4% to USD 18602.0 million in FY14 from USD 16694.0 million in FY13 (Tanning and dyeing extracts 34.8%, plastic & rubber article thereof 31.3%, clinker 27.1%, raw cotton 21.0 and chemical 15.1 %). Import of capital goods and others items registered a growth by 23.2%
from USD 11031 million in FY13 to USD 13592 million in FY14 (capital machinery 27.1%, iron steel & other base metal 13.8% and others 25.4%). Imports by EPZ increased by 18.8% to USD 2975.0 million in FY14 com-pared to USD 2505.0 million in FY13.
TERMS OF TRADE
The terms of trade remained the same at 85.98 in FY14 as like FY13 (base year 2005-06). Both the export price index and import price index increased by 7.2 % during the year.
Table 1.6 : Composition of merchandise Exports (Million USD)
Source: Export Promotion Bureau.
% changeFY 13 FY 14
126.4
698.1
3.7
745.6
602.7
12442.1
12049.8
93.2
162.3
366.6
108.8
550.1
2227.5
30176.8
229.9
800.7
2.4
561.3
512.9
11039.9
10475.9
93.0
314.0
367.5
124.5
419.3
2238.6
27027.4
-45.0
-12.8
52.1
32.8
17.5
12.7
15.0
0.2
-48.3
-0.2
-12.7
31.2
6.8
11.7
1.
2.
3.
4.
5.
6.
7.
8.
9.
10.
11.
12.
13.
Raw jute
Jute goods
Tea
Leather and leather products
Frozen shrimps and fish
Woven garments
Knitwear products
Chemical products
Petroleum by product
Engineering products
Specialized textiles
Footwear
Others
Total
Items
Table 1.7 : Composition of merchandise Imports payment (Million USD)
Source: Export Promotion Bureau.
% changeFY 13 FY 14 P
1465347
11184098
289183508
1761455902
18602619929
40701498
1201026
5381793242615063584
49313592
2657233286032975
4073236571
72630
6963128
214118242
1402422731
16694487
110236421302
1191188
3991366200513563273
45511031
2335283568612505
3408433576
101.81056.7
60.631.035.055.1
109.925.6
7.823.411.427.1
-15.711.815.1
0.8-13.634.831.321.011.1
9.58.4
23.213.827.125.418.819.5
8.9
A.
B.
C.
D.
E.
Food Grains 1. Rice 2. WheatOther food items 1. Milk & cream 2. Spices 3. Oil seeds 4. Edible oil 5. Pulses (all sorts) 6. SugarConsumer and intermediate goods 1. Clinker 2. Crude petroleum 3. POL 4. Chemicals 5. Pharmaceuticals Products 6. Fertilizer 7. Tanning & Dyeing extracts 8. Plastic rubber & articles thereof 9. Raw cotton 10. Yarn 11. Textile & Articles thereof 12. Staple fibreCapital goods and others 1. Iron, Steel & other base metal 2. Capital machinery 3. OthersImports by EPZTotal imports (cif)Total imports (fob)
Items
ANNUAL REPORT 201416
Report of The Executive Committeeto the Members for the year 2014
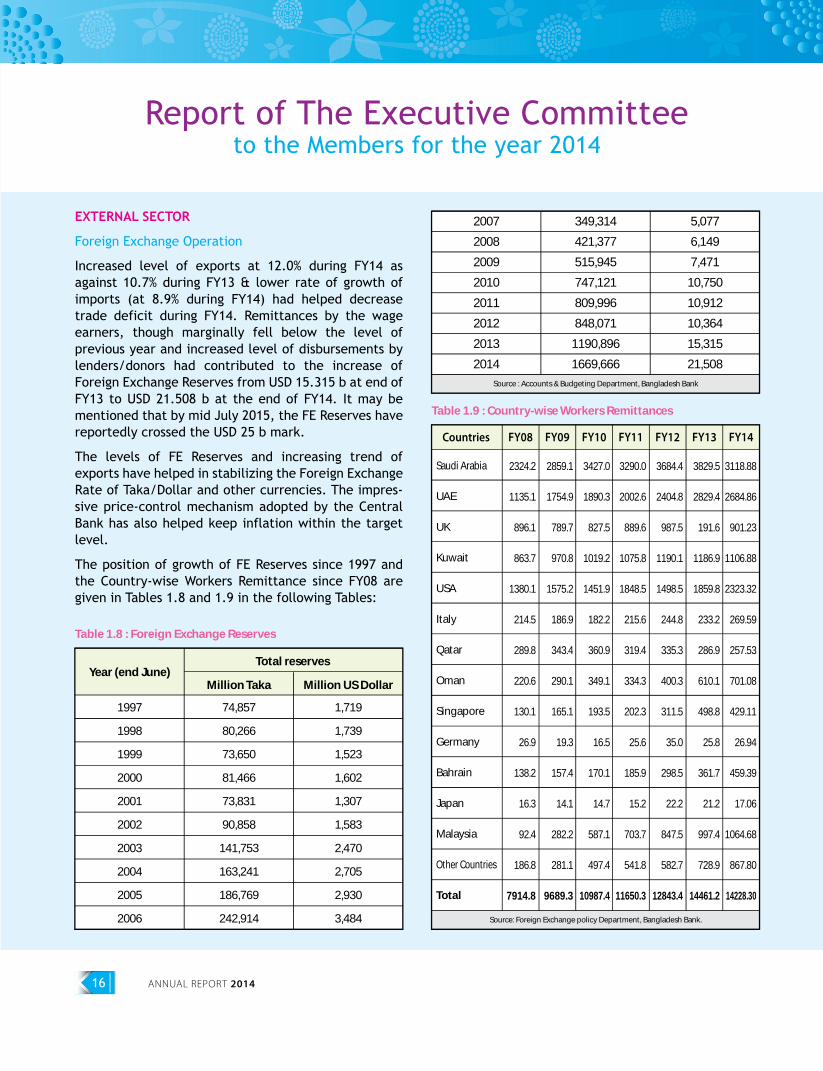
EXTERNAL SECTOR
Foreign Exchange Operation
Increased level of exports at 12.0% during FY14 as against 10.7% during FY13 & lower rate of growth of imports (at 8.9% during FY14) had helped decrease trade deficit during FY14. Remittances by the wage earners, though marginally fell below the level of previous year and increased level of disbursements by lenders/donors had contributed to the increase of Foreign Exchange Reserves from USD 15.315 b at end of FY13 to USD 21.508 b at the end of FY14. It may be mentioned that by mid July 2015, the FE Reserves have reportedly crossed the USD 25 b mark.
The levels of FE Reserves and increasing trend of exports have helped in stabilizing the Foreign Exchange Rate of Taka/Dollar and other currencies. The impres-sive price-control mechanism adopted by the Central Bank has also helped keep inflation within the target level.
The position of growth of FE Reserves since 1997 and the Country-wise Workers Remittance since FY08 are given in Tables 1.8 and 1.9 in the following Tables:
Table 1.8 : Foreign Exchange Reserves
Year (end June)
1997
1998
1999
2000
2001
2002
2003
2004
2005
2006
74,857
80,266
73,650
81,466
73,831
90,858
141,753
163,241
186,769
242,914
1,719
1,739
1,523
1,602
1,307
1,583
2,470
2,705
2,930
3,484
Total reserves
Million Taka Million US Dollar
Table 1.9 : Country-wise Workers Remittances
Source: Foreign Exchange policy Department, Bangladesh Bank.
Countries
Saudi Arabia
UAE
UK
Kuwait
USA
Italy
Qatar
Oman
Singapore
Germany
Bahrain
Japan
Malaysia
Other Countries
Total
FY08
2324.2
1135.1
896.1
863.7
1380.1
214.5
289.8
220.6
130.1
26.9
138.2
16.3
92.4
186.8
7914.8
2859.1
1754.9
789.7
970.8
1575.2
186.9
343.4
290.1
165.1
19.3
157.4
14.1
282.2
281.1
9689.3
3427.0
1890.3
827.5
1019.2
1451.9
182.2
360.9
349.1
193.5
16.5
170.1
14.7
587.1
497.4
10987.4
3290.0
2002.6
889.6
1075.8
1848.5
215.6
319.4
334.3
202.3
25.6
185.9
15.2
703.7
541.8
11650.3
3684.4
2404.8
987.5
1190.1
1498.5
244.8
335.3
400.3
311.5
35.0
298.5
22.2
847.5
582.7
12843.4
3829.5
2829.4
191.6
1186.9
1859.8
233.2
286.9
610.1
498.8
25.8
361.7
21.2
997.4
728.9
14461.2
3118.88
2684.86
901.23
1106.88
2323.32
269.59
257.53
701.08
429.11
26.94
459.39
17.06
1064.68
867.80
14228.30
FY09 FY10 FY11 FY12 FY13 FY14
2007
2008
2009
2010
2011
2012
2013
2014
349,314
421,377
515,945
747,121
809,996
848,071
1190,896
1669,666
5,077
6,149
7,471
10,750
10,912
10,364
15,315
21,508
Source : Accounts & Budgeting Department, Bangladesh Bank
BANGLADESH ASSOCIATION OF PUBLICLY LISTED COMPANIES 17
Report of The Executive Committeeto the Members for the year 2014
NATIONAL CAPITAL MARKET SITUATION:
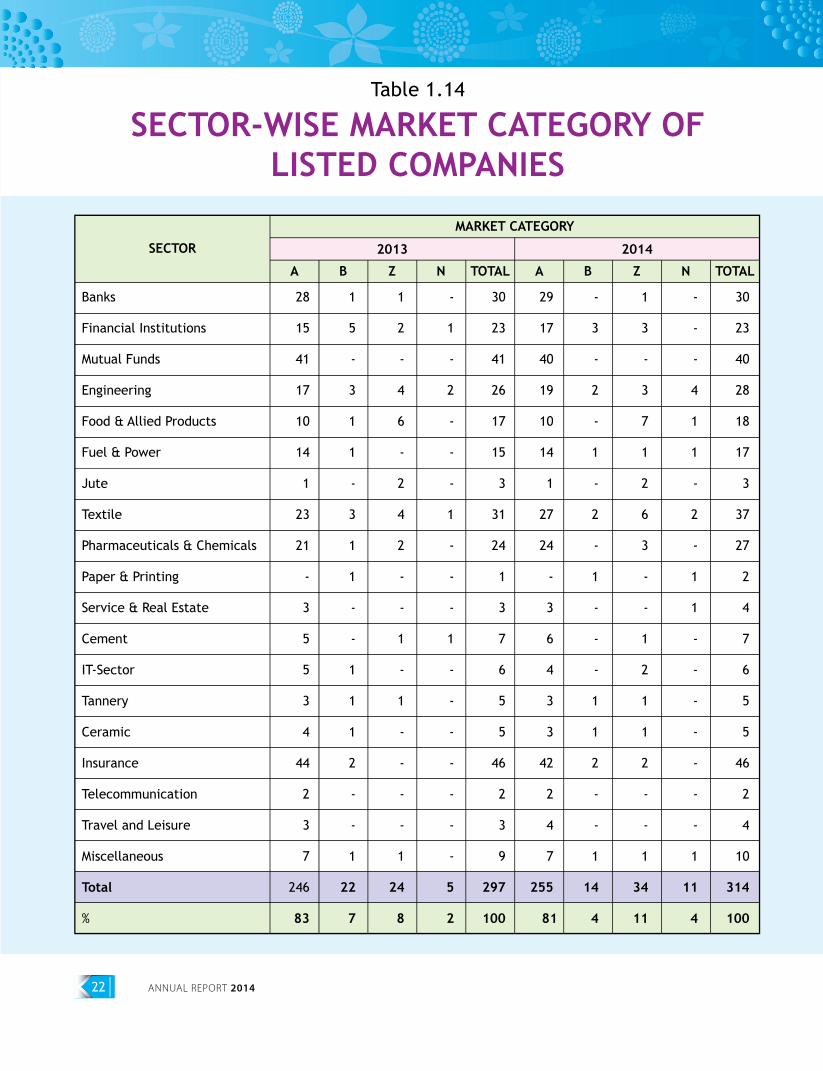
The year under review, which experienced an abnormal political turmoil and chaos during the first quarter of the year (2014), had shown signs of resilience and maintained reasonable rates of growth in its perfor-mance. The number of listed companies/securities with DSE, the prime bourse of the Country, increased by 17 to 314. The number of ‘A’ category companies/securities also increased from 246 in 2013 to 255 during 2014. Simultaneously the number of ‘Z’ category increased from 24 to 34 in 2014. However ‘B’ category decreased from 22 to 14 in 2014. While these numbers reflect signs of little progress, the market capitalization, volume of turnover and PER in DSE
indicate positive operations by growth rates of 23%, 25% and 18% respectively.
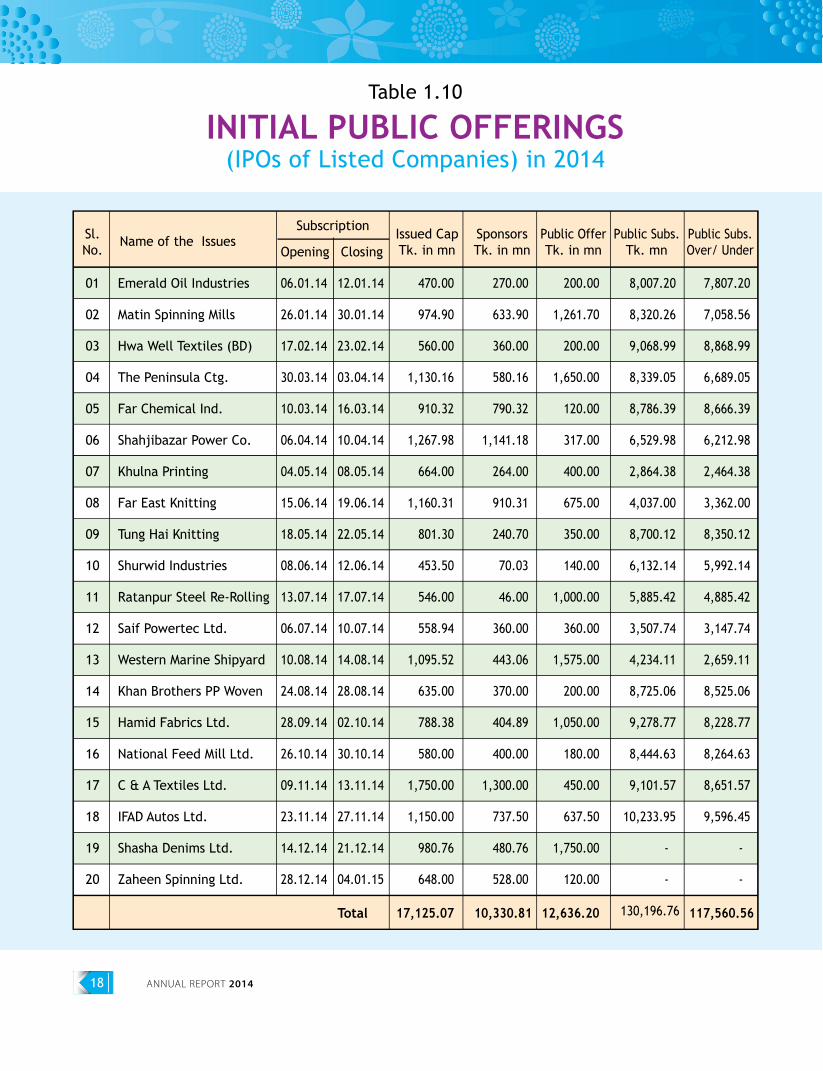
The capital market was also strengthened by new 20 IPOs with public offer of Tk. 12636.20 million with subscription of Tk. 130,196.76 million, about 10.3 times, during the year 2014, against 12 IPOs with public offer of Tk. 8305.00 million and subscription of Tk. 47,980.70 million, about 5.8 times, during 2013. The market capitalization, therefore, had increased due to new IPOs as well as increase in share prices as reflected by the increase in PERs during 2014 over the previous year. The following tables of various informa-tion would offer an overview of the stock market situation in the Country.
ANNUAL REPORT 201418
Table 1.10
INITIAL PUBLIC OFFERINGS(IPOs of Listed Companies) in 2014
01
02
03
04
05
06
07
08
09
10
11
12
13
14
15
16
17
18
19
20
06.01.14
26.01.14
17.02.14
30.03.14
10.03.14
06.04.14
04.05.14
15.06.14
18.05.14
08.06.14
13.07.14
06.07.14
10.08.14
24.08.14
28.09.14
26.10.14
09.11.14
23.11.14
14.12.14
28.12.14
12.01.14
30.01.14
23.02.14
03.04.14
16.03.14
10.04.14
08.05.14
19.06.14
22.05.14
12.06.14
17.07.14
10.07.14
14.08.14
28.08.14
02.10.14
30.10.14
13.11.14
27.11.14
21.12.14
04.01.15
470.00
974.90
560.00
1,130.16
910.32
1,267.98
664.00
1,160.31
801.30
453.50
546.00
558.94
1,095.52
635.00
788.38
580.00
1,750.00
1,150.00
980.76
648.00
17,125.07
270.00
633.90
360.00
580.16
790.32
1,141.18
264.00
910.31
240.70
70.03
46.00
360.00
443.06
370.00
404.89
400.00
1,300.00
737.50
480.76
528.00
10,330.81
200.00
1,261.70
200.00
1,650.00
120.00
317.00
400.00
675.00
350.00
140.00
1,000.00
360.00
1,575.00
200.00
1,050.00
180.00
450.00
637.50
1,750.00
120.00
12,636.20
8,007.20
8,320.26
9,068.99
8,339.05
8,786.39
6,529.98
2,864.38
4,037.00
8,700.12
6,132.14
5,885.42
3,507.74
4,234.11
8,725.06
9,278.77
8,444.63
9,101.57
10,233.95
-
-
130,196.76
7,807.20
7,058.56
8,868.99
6,689.05
8,666.39
6,212.98
2,464.38
3,362.00
8,350.12
5,992.14
4,885.42
3,147.74
2,659.11
8,525.06
8,228.77
8,264.63
8,651.57
9,596.45
-
-
117,560.56
Emerald Oil Industries
Matin Spinning Mills
Hwa Well Textiles (BD)
The Peninsula Ctg.
Far Chemical Ind.
Shahjibazar Power Co.
Khulna Printing
Far East Knitting
Tung Hai Knitting
Shurwid Industries
Ratanpur Steel Re-Rolling
Saif Powertec Ltd.
Western Marine Shipyard
Khan Brothers PP Woven
Hamid Fabrics Ltd.
National Feed Mill Ltd.
C & A Textiles Ltd.
IFAD Autos Ltd.
Shasha Denims Ltd.
Zaheen Spinning Ltd.
SubscriptionName of the Issues Issued Cap
Tk. in mnSponsorsTk. in mn
Public OfferTk. in mn
Public Subs.Tk. mn
Public Subs.Over/ Under
Sl.No. Opening Closing
Total
BANGLADESH ASSOCIATION OF PUBLICLY LISTED COMPANIES 19
Sector
2013
Total Turnover in million
2014
Total Turnover in million
Volume % Value % ofTurnover
% ofTurnoverVolume % Value
4,018.09
1,420.04
830.05
3,259.00
9,527.18
1,200.29
755.64
6.75
4,475.23
1,462.34
4.50
438.81
69.86
259.38
8,672.80
1,654.38
165.61
516.32
281.05
1,698.95
453.15
4,769.46
0.29
0.29
22,969.73
5,662.01
1,981.16
802.63
1,994.43
10,440.23
2,528.94
951.97
6.32
3,478.77
2,192.92
224.68
694.53
79.06
293.93
10,451.12
1,941.11
369.02
517.85
258.92
1,032.18
985.46
5,104.54
0.17
0.17
25,996.06
79,471.06
47196.72
51,420.11
38,946.17
217,034.06
82,552.98
41,824.65
861.88
152,081.59
96,549.57
137.07
38,727.39
9,529.09
7,150.21
429,414.43
141,434.57
7,337.66
14,936.43
57,740.06
53,170.14
30,287.54
304,906.40
274.12
274.12
951,629.01
109,009.36
62,916.03
51,507.39
19,933.59
243,366.37
146,283.84
66,521.16
864.19
111,995.85
160,217.60
7,170.13
71,573.31
15,424.32
9,898.63
589,949.03
176,957.69
21,421.90
15,602.97
64,768.24
22,541.87
53,743.99
355,036.66
166.58
166.58
1,188,518.64
8.35
4.96
5.40
4.09
22.81
8.67
4.40
0.09
15.98
10.15
0.01
4.07
1.00
0.75
45.12
14.86
0.77
1.57
6.07
5.59
3.18
32.04
0.03
0.03
100.00
9.17
5.29
4.33
1.68
20.48
12.31
5.60
0.07
9.42
13.48
0.60
6.02
1.30
0.83
49.64
14.89
1.80
1.31
5.45
1.90
4.52
29.87
0.01
0.01
100.00
41.48
37.76
20.76
0.00
100.00
40.16
40.20
19.64
0.00
100.00
Financial Sector
Banks
Financial Institutions
Insurance
Mutual Funds
Total :
Manufacturing Sector
Engineering
Foods
Jute
Textile
Pharmaceuticals
Paper & Printing
Cement
Tannery
Ceramics
Total :
Miscellaneous & Services
Fuel & Power
Services & Real Estate
IT
Telecommunication
Travel and Leisure
Miscellaneous
Total :
Bonds
Corporate Bond
Total :
Grand Total
Table 1.11
SECTOR-WISE TURNOVER PERFORMANCE
ANNUAL REPORT 201420
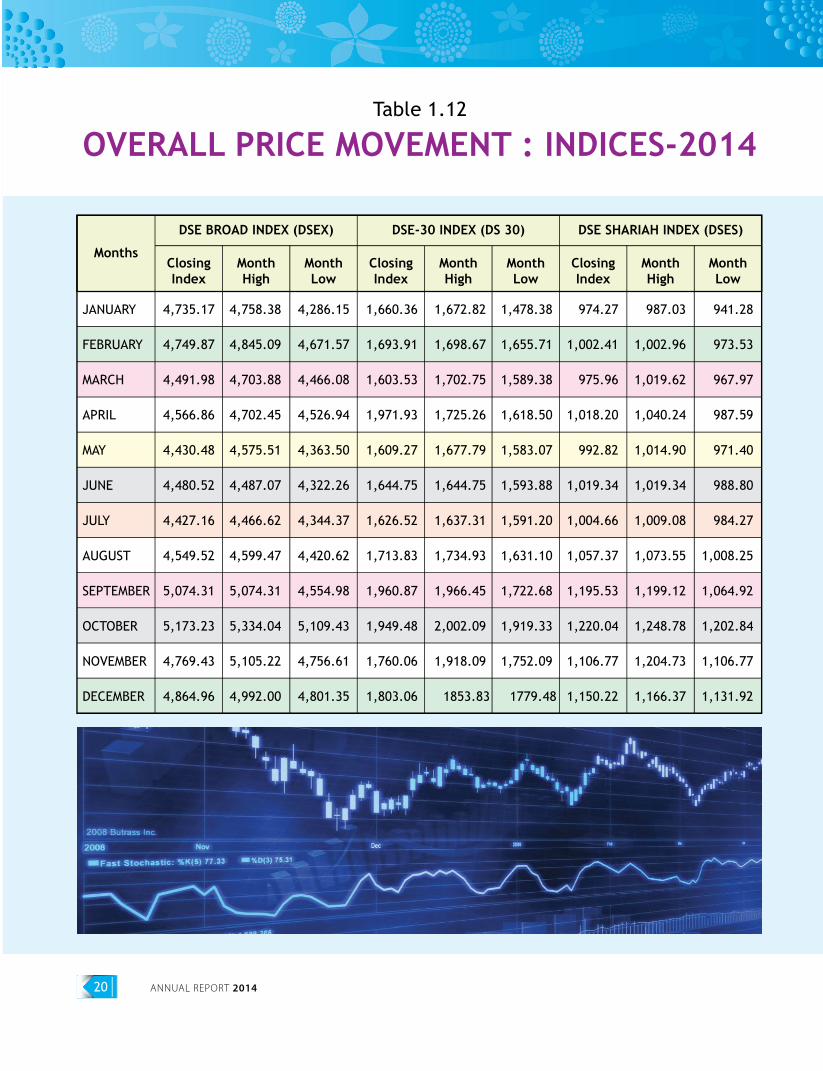
Months
JANUARY
FEBRUARY
MARCH
APRIL
MAY
JUNE
JULY
AUGUST
SEPTEMBER
OCTOBER
NOVEMBER
DECEMBER
4,735.17
4,749.87
4,491.98
4,566.86
4,430.48
4,480.52
4,427.16
4,549.52
5,074.31
5,173.23
4,769.43
4,864.96
4,758.38
4,845.09
4,703.88
4,702.45
4,575.51
4,487.07
4,466.62
4,599.47
5,074.31
5,334.04
5,105.22
4,992.00
4,286.15
4,671.57
4,466.08
4,526.94
4,363.50
4,322.26
4,344.37
4,420.62
4,554.98
5,109.43
4,756.61
4,801.35
1,660.36
1,693.91
1,603.53
1,971.93
1,609.27
1,644.75
1,626.52
1,713.83
1,960.87
1,949.48
1,760.06
1,803.06
1,672.82
1,698.67
1,702.75
1,725.26
1,677.79
1,644.75
1,637.31
1,734.93
1,966.45
2,002.09
1,918.09
1853.83
1,478.38
1,655.71
1,589.38
1,618.50
1,583.07
1,593.88
1,591.20
1,631.10
1,722.68
1,919.33
1,752.09
1779.48
974.27
1,002.41
975.96
1,018.20
992.82
1,019.34
1,004.66
1,057.37
1,195.53
1,220.04
1,106.77
1,150.22
941.28
973.53
967.97
987.59
971.40
988.80
984.27
1,008.25
1,064.92
1,202.84
1,106.77
1,131.92
987.03
1,002.96
1,019.62
1,040.24
1,014.90
1,019.34
1,009.08
1,073.55
1,199.12
1,248.78
1,204.73
1,166.37
DSE BROAD INDEX (DSEX) DSE-30 INDEX (DS 30) DSE SHARIAH INDEX (DSES)
ClosingIndex
MonthHigh
MonthLow
ClosingIndex
MonthHigh
MonthLow
ClosingIndex
MonthHigh
MonthLow
Table 1.12
OVERALL PRICE MOVEMENT : INDICES-2014
BANGLADESH ASSOCIATION OF PUBLICLY LISTED COMPANIES 21
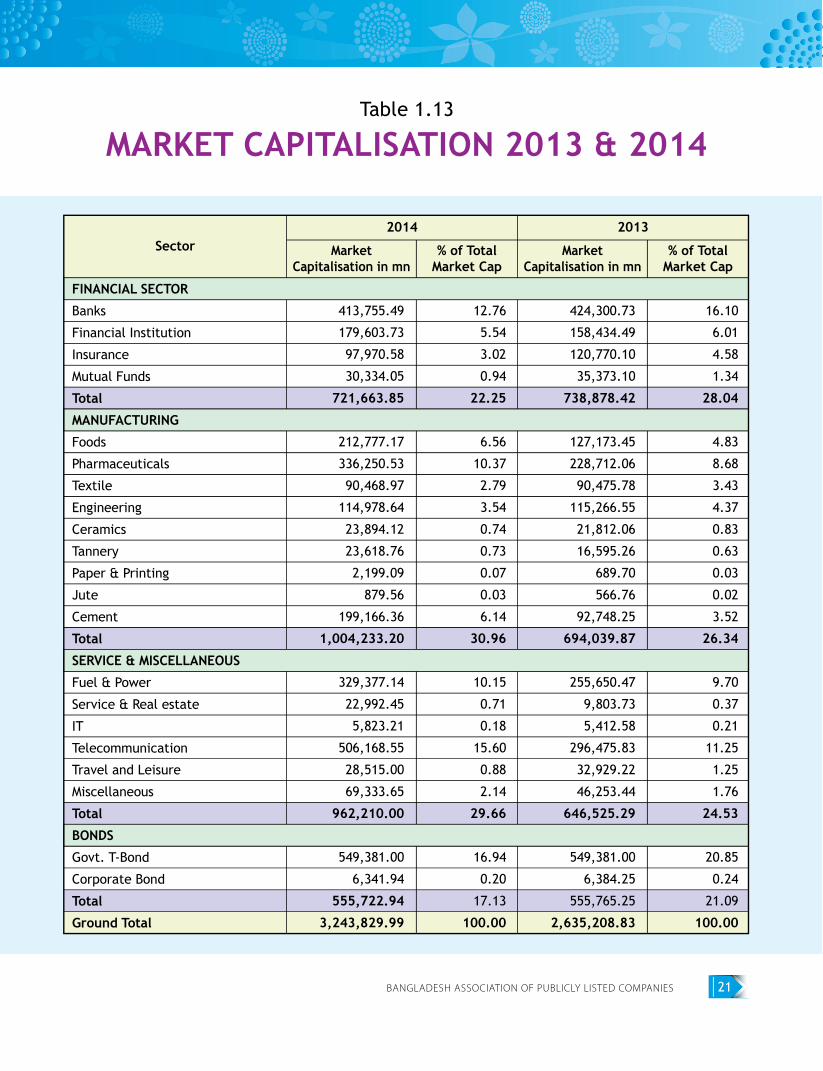
Sector
413,755.49
179,603.73
97,970.58
30,334.05
721,663.85
212,777.17
336,250.53
90,468.97
114,978.64
23,894.12
23,618.76
2,199.09
879.56
199,166.36
1,004,233.20
329,377.14
22,992.45
5,823.21
506,168.55
28,515.00
69,333.65
962,210.00
549,381.00
6,341.94
555,722.94
3,243,829.99
12.76
5.54
3.02
0.94
22.25
6.56
10.37
2.79
3.54
0.74
0.73
0.07
0.03
6.14
30.96
10.15
0.71
0.18
15.60
0.88
2.14
29.66
16.94
0.20
17.13
100.00
424,300.73
158,434.49
120,770.10
35,373.10
738,878.42
127,173.45
228,712.06
90,475.78
115,266.55
21,812.06
16,595.26
689.70
566.76
92,748.25
694,039.87
255,650.47
9,803.73
5,412.58
296,475.83
32,929.22
46,253.44
646,525.29
549,381.00
6,384.25
555,765.25
2,635,208.83
16.10
6.01
4.58
1.34
28.04
4.83
8.68
3.43
4.37
0.83
0.63
0.03
0.02
3.52
26.34
9.70
0.37
0.21
11.25
1.25
1.76
24.53
20.85
0.24
21.09
100.00
2014
MarketCapitalisation in mn
% of TotalMarket Cap
% of TotalMarket Cap
MarketCapitalisation in mn
2013
FINANCIAL SECTOR
Banks
Financial Institution
Insurance
Mutual Funds
Total
MANUFACTURING
Foods
Pharmaceuticals
Textile
Engineering
Ceramics
Tannery
Paper & Printing
Jute
Cement
Total
SERVICE & MISCELLANEOUS
Fuel & Power
Service & Real estate
IT
Telecommunication
Travel and Leisure
Miscellaneous
Total
BONDS
Govt. T-Bond
Corporate Bond
Total
Ground Total
Table 1.13
MARKET CAPITALISATION 2013 & 2014
ANNUAL REPORT 201422
Banks
Financial Institutions
Mutual Funds
Engineering
Food & Allied Products
Fuel & Power
Jute
Textile
Pharmaceuticals & Chemicals
Paper & Printing
Service & Real Estate
Cement
IT-Sector
Tannery
Ceramic
Insurance
Telecommunication
Travel and Leisure
Miscellaneous
Total
%
28
15
41
17
10
14
1
23
21
-
3
5
5
3
4
44
2
3
7
246
83
1
5
-
3
1
1
-
3
1
1
-
-
1
1
1
2
-
-
1
22
7
1
2
-
4
6
-
2
4
2
-
-
1
-
1
-
-
-
-
1
24
8
-
1
-
2
-
-
-
1
-
-
-
1
-
-
-
-
-
-
-
5
2
30
23
41
26
17
15
3
31
24
1
3
7
6
5
5
46
2
3
9
297
100
29
17
40
19
10
14
1
27
24
-
3
6
4
3
3
42
2
4
7
255
81
-
3
-
2
-
1
-
2
-
1
-
-
-
1
1
2
-
-
1
14
4
1
3
-
3
7
1
2
6
3
-
-
1
2
1
1
2
-
-
1
34
11
-
-
-
4
1
1
-
2
-
1
1
-
-
-
-
-
-
-
1
11
4
30
23
40
28
18
17
3
37
27
2
4
7
6
5
5
46
2
4
10
314
100
MARKET CATEGORY
2013
A B Z N TOTAL A B Z N TOTAL
SECTOR 2014
Table 1.14
SECTOR-WISE MARKET CATEGORY OFLISTED COMPANIES
BANGLADESH ASSOCIATION OF PUBLICLY LISTED COMPANIES 23
1
2
3
4
5
6
7
8
9
10
11
12
13
14
15
16
17
18
19
30
23
-
28
18
17
3
37
27
2
4
7
6
5
5
46
2
4
10
100
100
-
100
100
100
100
100
100
100
100
100
100
100
100
100
100
100
100
5 - 15
5 - 45
0.6 - 800
5 - 23
10 - 620
5 - 310
5 - 10
5 - 50
5 - 900
5
15
10 - 380
0
45 - 300
5 - 15
5 - 40
10 - 140
10 - 25
10 - 220
5 - 20
4 - 25
9 -50
5 - 25
5 - 50
5 - 20
0 - 5
5 - 100
5 - 30
10
10
10 - 15
15
5
10
5 - 38
0
10 - 15
5 - 15
314
30
23
40
28
18
17
3
37
27
2
4
7
6
5
5
46
2
4
10
Banks
Financial Institutions
Mutual Funds
Engineering
Food & Allied Products
Fuel & Power
Jute
Textile
Pharmaceuticals & Chemicals
Paper & Printing
Service & Real Estate
Cement
IT-Sector
Tannery Industries
Ceramic
Insurance
Telecommunication
Travel and Leisure
Miscellaneous
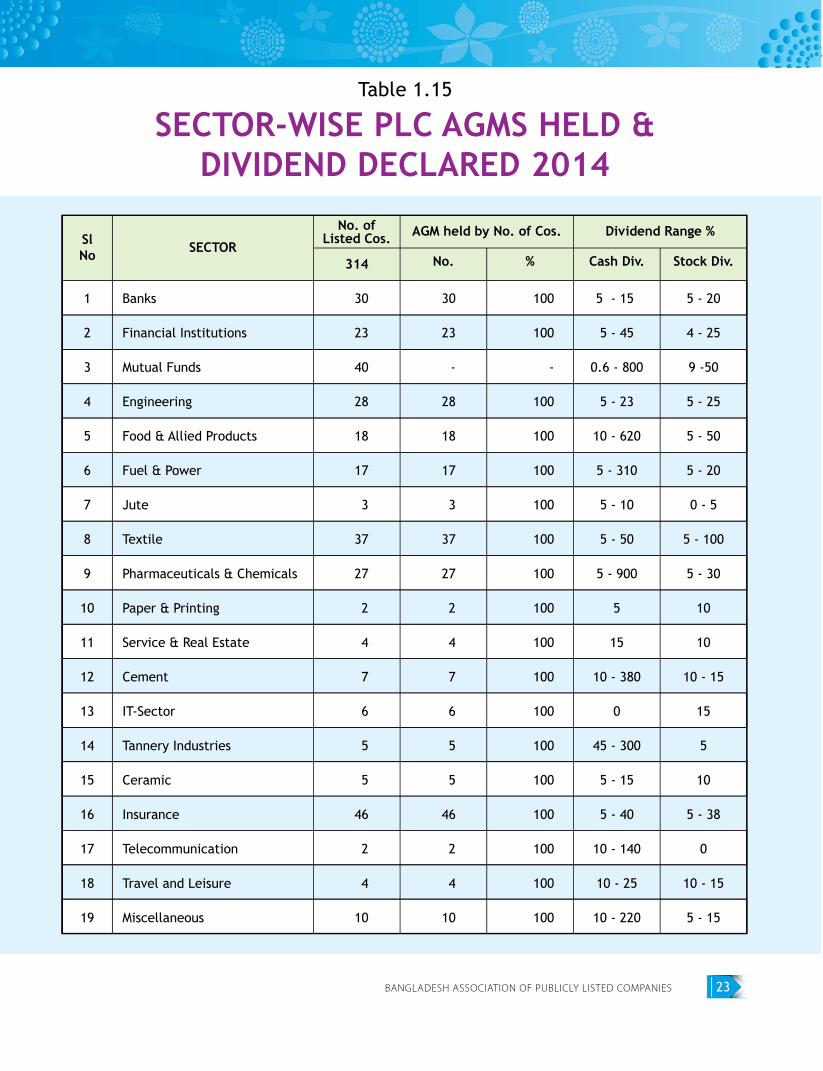
SlNo SECTOR
AGM held by No. of Cos.
No. % Cash Div. Stock Div.
Dividend Range %No. ofListed Cos.
Table 1.15
SECTOR-WISE PLC AGMS HELD &DIVIDEND DECLARED 2014
ANNUAL REPORT 201424
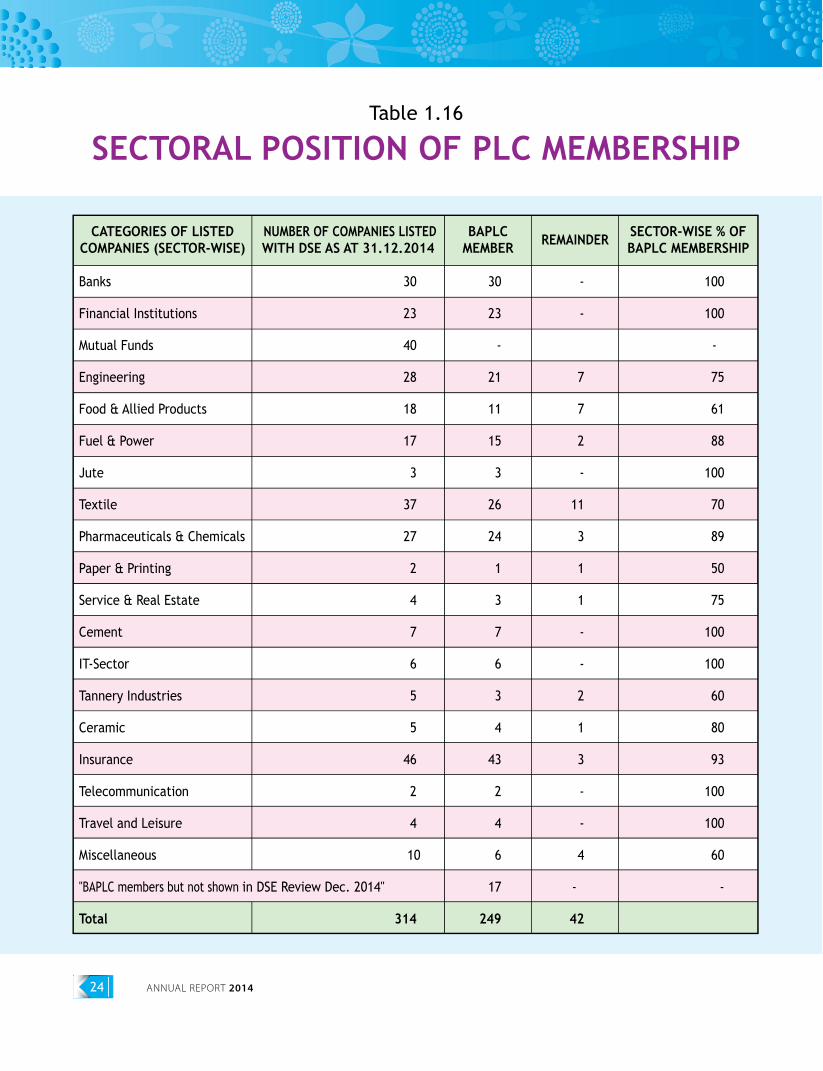
CATEGORIES OF LISTEDCOMPANIES (SECTOR-WISE)
NUMBER OF COMPANIES LISTEDWITH DSE AS AT 31.12.2014
BAPLCMEMBER REMAINDER SECTOR-WISE % OF
BAPLC MEMBERSHIP
Banks
Financial Institutions
Mutual Funds
Engineering
Food & Allied Products
Fuel & Power
Jute
Textile
Pharmaceuticals & Chemicals
Paper & Printing
Service & Real Estate
Cement
IT-Sector
Tannery Industries
Ceramic
Insurance
Telecommunication
Travel and Leisure
Miscellaneous
"BAPLC members but not shown in DSE Review Dec. 2014"
Total
30
23
40
28
18
17
3
37
27
2
4
7
6
5
5
46
2
4
10
314
30
23
-
21
11
15
3
26
24
1
3
7
6
3
4
43
2
4
6
17
249
-
-
7
7
2
-
11
3
1
1
-
-
2
1
3
-
-
4
-
42
100
100
-
75
61
88
100
70
89
50
75
100
100
60
80
93
100
100
60
-
Table 1.16
SECTORAL POSITION OF PLC MEMBERSHIP
BANGLADESH ASSOCIATION OF PUBLICLY LISTED COMPANIES 25
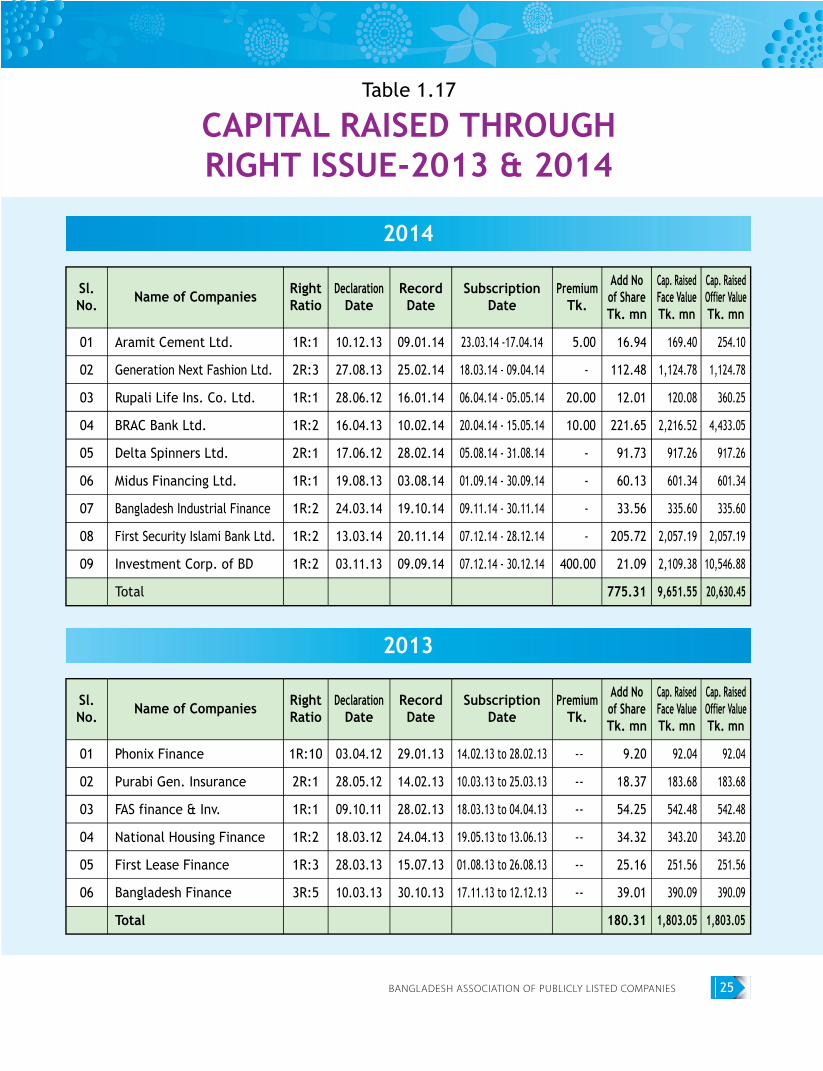
Aramit Cement Ltd.
Generation Next Fashion Ltd.
Rupali Life Ins. Co. Ltd.
BRAC Bank Ltd.
Delta Spinners Ltd.
Midus Financing Ltd.
Bangladesh Industrial Finance
First Security Islami Bank Ltd.
Investment Corp. of BD
Total
Sl.No.
RightRatio
RecordDate
Add Noof ShareTk. mn
Cap. RaisedFace ValueTk. mn
Cap. RaisedOffier ValueTk. mn
PremiumTk.
SubscriptionDate
DeclarationDateName of Companies
01
02
03
04
05
06
07
08
09
1R:1
2R:3
1R:1
1R:2
2R:1
1R:1
1R:2
1R:2
1R:2
5.00
-
20.00
10.00
-
-
-
-
400.00
16.94
112.48
12.01
221.65
91.73
60.13
33.56
205.72
21.09
775.31
169.40
1,124.78
120.08
2,216.52
917.26
601.34
335.60
2,057.19
2,109.38
9,651.55
254.10
1,124.78
360.25
4,433.05
917.26
601.34
335.60
2,057.19
10,546.88
20,630.45
10.12.13
27.08.13
28.06.12
16.04.13
17.06.12
19.08.13
24.03.14
13.03.14
03.11.13
09.01.14
25.02.14
16.01.14
10.02.14
28.02.14
03.08.14
19.10.14
20.11.14
09.09.14
23.03.14 -17.04.14
18.03.14 - 09.04.14
06.04.14 - 05.05.14
20.04.14 - 15.05.14
05.08.14 - 31.08.14
01.09.14 - 30.09.14
09.11.14 - 30.11.14
07.12.14 - 28.12.14
07.12.14 - 30.12.14
2014
Phonix Finance
Purabi Gen. Insurance
FAS finance & Inv.
National Housing Finance
First Lease Finance
Bangladesh Finance
Total
Sl.No.
RightRatio
RecordDate
Add Noof ShareTk. mn
Cap. RaisedFace ValueTk. mn
Cap. RaisedOffier ValueTk. mn
PremiumTk.
SubscriptionDate
DeclarationDateName of Companies
01
02
03
04
05
06
1R:10
2R:1
1R:1
1R:2
1R:3
3R:5
--
--
--
--
--
--
9.20
18.37
54.25
34.32
25.16
39.01
180.31
92.04
183.68
542.48
343.20
251.56
390.09
1,803.05
92.04
183.68
542.48
343.20
251.56
390.09
1,803.05
03.04.12
28.05.12
09.10.11
18.03.12
28.03.13
10.03.13
29.01.13
14.02.13
28.02.13
24.04.13
15.07.13
30.10.13
14.02.13 to 28.02.13
10.03.13 to 25.03.13
18.03.13 to 04.04.13
19.05.13 to 13.06.13
01.08.13 to 26.08.13
17.11.13 to 12.12.13
2013
Table 1.17
CAPITAL RAISED THROUGHRIGHT ISSUE-2013 & 2014
ANNUAL REPORT 201426
Report of The Executive Committeeto the Members for the year 2014
CONCLUSION & RECOMMENDATIONS :
As the country has moved from LDC position to lower-middle-income group of nations with a target for achieving full middle-income status within couple of years, the role of the capital market would need reinvigoration for an accelerated rate of growth in investments by the private sector. This can be attained through enhancing of opportunities to the private sector entrepreneurs for raising new capital resources for investments in physical and human resources/technological development. In view of the growth rate of GDP, Exports, Remittances and FE Reserves, the performance of the Stock Market is considered lagging behind. The Rules and Regulation of BSEC/DSE/CSE etc. should be congenial to the entre-preneurs for accelerated growth in the primary market segment of the capital market. The size and price of IPOs should be allowed to the Issuers and Underwriters for determination. The current regulations of BSEC relating to IPO/Right Issues and listing requirement with two Bourses are discouraging to issuers and hence to be left with them on the basis of market mechanism. GOB/BSEC may revisit these aspects so that the capital market does not remain seized by the secondary market segments alone.
Further reform is also required in respect of printing /publication of Annual Reports by PLCs and sending them to shareholders whose members have increased tremendously. It is suggested that each PLC should be allowed to establish its own web-site for the Annual Report so that each desirous investor may obtain necessary information there from.
Despite relief & incentives in taxation for PLCs, the number and amount of IPO is still very insignificant in comparison to long term loans raised from Banks/FIs. During the years 2013 & 2014 merely Tk. 830 crores and Tk. 1208 crores were raised by IPO. Though aggregate funds raised by PLCs from Banks/FIs during these (FY13 & FY14) are not available, they are assumed to run over tens of billions. The average daily transaction in the secondary market at DSE alone averages over Tk. 500 crores. The stock-market provide little scope for equity
investments through IPOs as compared to the transac-tion in the secondary market due to unusual /non-market oriented regulations by BSEC/Stock Exchange. As a result the listed stocks continue to be over-priced with PER at about 17 or 18 on average. Unless more IPOs are released through congenial regulations creat-ing increased supply of new investment securities, the secondary market would not stabilize with equilibrium and get out of the “Fatka-Bazar” status.
It may be observed that GOB was persuaded to reduce the Rate of Interest on Sanchaya Patra (SP) during the 2015-16 Budget in order to redirect the investment in SP to Stock Market which was already heated with short-term investors/traders resulting in manipulation and speculation in a large number of stocks as would be evident from their abnormal PER. The Regulatory Authorities seem to have ignored this aspect and yielded to the pressure of sly operators.
The year 2014 ended with 314 listed securities with Issued Capital of Tk. 499.138 billion and a market capitalization of Tk. 2688.107 billion which is 5.68 times. The total turnover during the year amounted to Tk. 1188.521 billion. Considering that about 50% of the Issued Capital is free-float, the turnover ration of the Issued Capital would stand at 4.8 times. On the other hand 20 companies made IPO of Tk. 12636.20 million which was oversubscribed at an amount of T. 130196.74 million i.e, 10.3 times. This indicates that investors are hungry for IPO more than their interest in secondary market securities. All these analyses critically suggest that BSEC has to do more for encouraging entrepreneurs to go public for raising long term capital funds from the market.
OUR SUGGESTIONS ARE BRIEFLY
IPO / Right Issue Regulations should be simplified.
BSEC may give attention to the extent of disclo-sure and authenticity of documents.
Pricing of shares should be left to the Issuers and Underwriters.
Directors’ holding of minimum 2% of issued stock should be withdrawn.
01.
02.
03.
04.
BANGLADESH ASSOCIATION OF PUBLICLY LISTED COMPANIES 27
Report of The Executive Committeeto the Members for the year 2014
Requirement of listing on two (2) bourses should be withdrawn.
CSE may be utilized for SME listing only.
Placement facilities for IPO should be allowed upto 50% level. Pricing of placement and IPO at different prices may be allowed on market mechanism/negotiation between Issuers, Buyers & Underwriters.
CDBL MEMBERSHIP
As on 31st December 2014, listed securities in the Central Depository System (CDS) of Central Depository Bangladesh Limited (CDBL) were 331 consisting of 3 corporate bonds, 40 mutual funds and 288 limited com-pany shares. Number of demated securities in the CDS was 46.52 billion out of total number of 49.22 billion listed securities issued. CDBL as on 31st December 2014 had 3,137,560operable BO Accounts and 2,759,305 closed BO Accounts as against 2,795,970 operable BO Accounts and 2,519,699 closed BO Accounts in the previous year as on 31st December 2013.
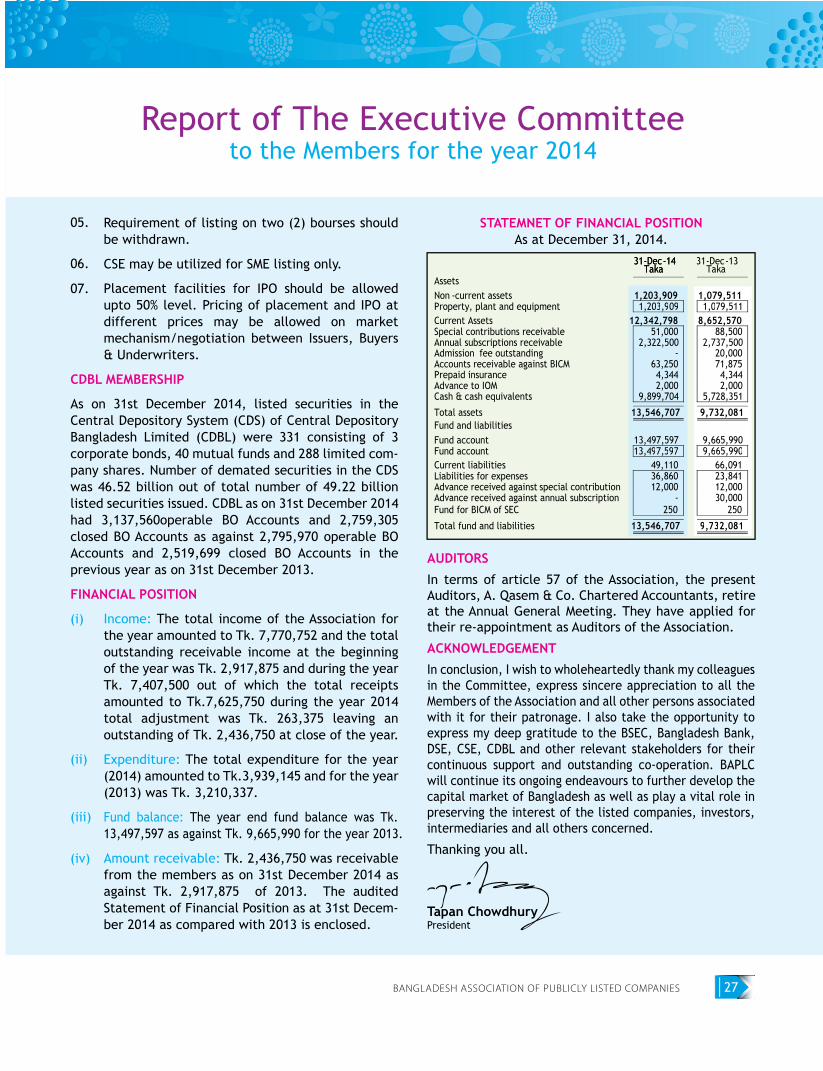
FINANCIAL POSITION
Income: The total income of the Association for the year amounted to Tk. 7,770,752 and the total outstanding receivable income at the beginning of the year was Tk. 2,917,875 and during the year Tk. 7,407,500 out of which the total receipts amounted to Tk.7,625,750 during the year 2014 total adjustment was Tk. 263,375 leaving an outstanding of Tk. 2,436,750 at close of the year.
Expenditure: The total expenditure for the year (2014) amounted to Tk.3,939,145 and for the year (2013) was Tk. 3,210,337.
Fund balance: The year end fund balance was Tk. 13,497,597 as against Tk. 9,665,990 for the year 2013.
Amount receivable: Tk. 2,436,750 was receivable from the members as on 31st December 2014 as against Tk. 2,917,875 of 2013. The audited Statement of Financial Position as at 31st Decem-ber 2014 as compared with 2013 is enclosed.
STATEMNET OF FINANCIAL POSITION As at December 31, 2014.
AUDITORS
In terms of article 57 of the Association, the present Auditors, A. Qasem & Co. Chartered Accountants, retire at the Annual General Meeting. They have applied for their re-appointment as Auditors of the Association.
ACKNOWLEDGEMENT
In conclusion, I wish to wholeheartedly thank my colleagues in the Committee, express sincere appreciation to all the Members of the Association and all other persons associated with it for their patronage. I also take the opportunity to express my deep gratitude to the BSEC, Bangladesh Bank, DSE, CSE, CDBL and other relevant stakeholders for their continuous support and outstanding co-operation. BAPLC will continue its ongoing endeavours to further develop the capital market of Bangladesh as well as play a vital role in preserving the interest of the listed companies, investors, intermediaries and all others concerned.
Thanking you all.
Tapan ChowdhuryPresident
06.
05.
07.
(i)
(ii)
(iii)
(iv)
Assets Non -current assets
Property, plant and equipment Current Assets
Special contributions receivable Annual subscriptions receivable Admission fee outstanding Accounts receivable against BICM Prepaid insurance Advance to IOM Cash & cash equivalents Total assets Fund and liabilities
Fund account Fund account Current liabilities Liabilities for expenses
Advance received against special contribution Advance received against annual subscription Fund for BICM of SEC Total fund and liabilities
1,079,511 8,652,570
88,500 2,737,500
20,000 71,875 4,344 2,000
5,728,351 9,732,081
9,665,990 9,665,990
66,091 23,841 12,000 30,000
250 9,732,081
1,079,511
31-Dec-13 Taka
1,203,909 12,342,798
51,000 2,322,500
- 63,250 4,344 2,000
9,899,704 13,546,707
13,497,597 13,497,597
49,110 36,860 12,000
- 250
13,546,707
31-Dec-14 Taka
31-Dec-14 Taka
1,203,909
ANNUAL REPORT 201428
BANGLADESH ASSOCIATION OF PUBLICLY LISTED COMPANIES 29
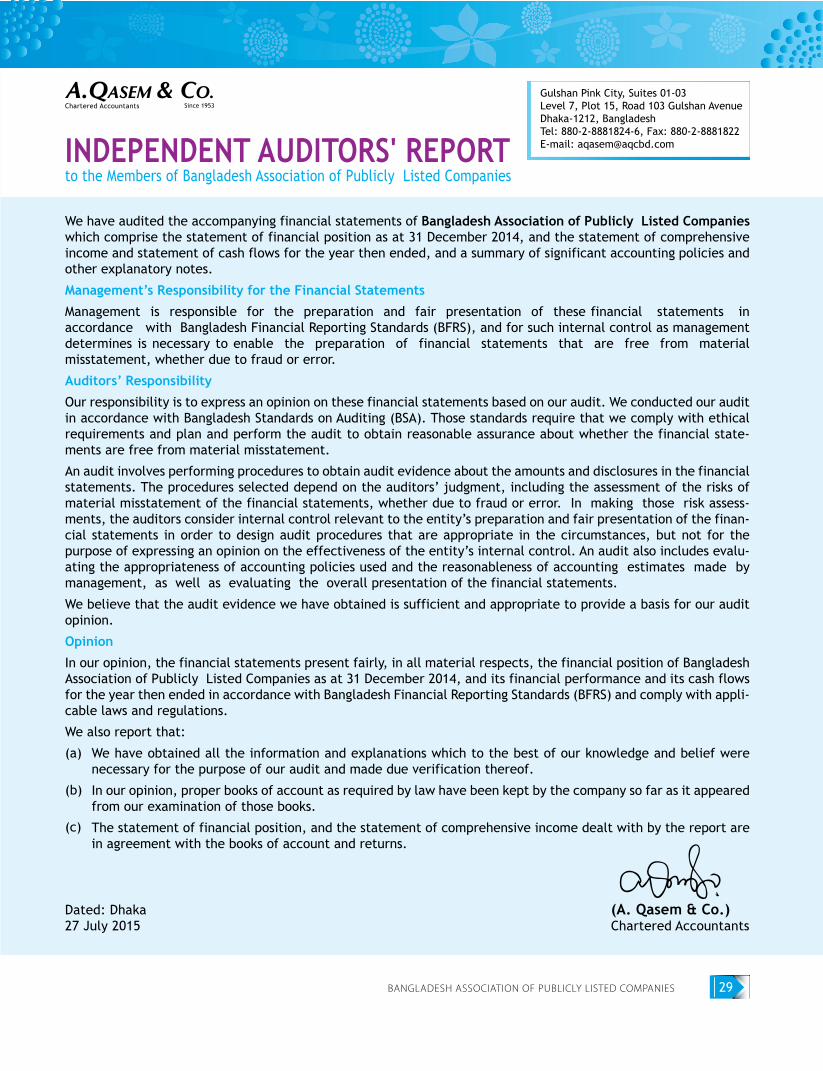
We have audited the accompanying financial statements of Bangladesh Association of Publicly Listed Companies which comprise the statement of financial position as at 31 December 2014, and the statement of comprehensive income and statement of cash flows for the year then ended, and a summary of significant accounting policies and other explanatory notes.
Management’s Responsibility for the Financial Statements
Management is responsible for the preparation and fair presentation of these financial statements in accordance with Bangladesh Financial Reporting Standards (BFRS), and for such internal control as management determines is necessary to enable the preparation of financial statements that are free from material misstatement, whether due to fraud or error.
Auditors’ Responsibility
Our responsibility is to express an opinion on these financial statements based on our audit. We conducted our audit in accordance with Bangladesh Standards on Auditing (BSA). Those standards require that we comply with ethical requirements and plan and perform the audit to obtain reasonable assurance about whether the financial state-ments are free from material misstatement.
An audit involves performing procedures to obtain audit evidence about the amounts and disclosures in the financial statements. The procedures selected depend on the auditors’ judgment, including the assessment of the risks of material misstatement of the financial statements, whether due to fraud or error. In making those risk assess-ments, the auditors consider internal control relevant to the entity’s preparation and fair presentation of the finan-cial statements in order to design audit procedures that are appropriate in the circumstances, but not for the purpose of expressing an opinion on the effectiveness of the entity’s internal control. An audit also includes evalu-ating the appropriateness of accounting policies used and the reasonableness of accounting estimates made by management, as well as evaluating the overall presentation of the financial statements.
We believe that the audit evidence we have obtained is sufficient and appropriate to provide a basis for our audit opinion.
Opinion
In our opinion, the financial statements present fairly, in all material respects, the financial position of Bangladesh Association of Publicly Listed Companies as at 31 December 2014, and its financial performance and its cash flows for the year then ended in accordance with Bangladesh Financial Reporting Standards (BFRS) and comply with appli-cable laws and regulations.
We also report that:
We have obtained all the information and explanations which to the best of our knowledge and belief were necessary for the purpose of our audit and made due verification thereof.
In our opinion, proper books of account as required by law have been kept by the company so far as it appeared from our examination of those books.
The statement of financial position, and the statement of comprehensive income dealt with by the report are in agreement with the books of account and returns.
Dated: Dhaka27 July 2015
(A. Qasem & Co.)Chartered Accountants
(a)
(b)
(c)
Gulshan Pink City, Suites 01-03Level 7, Plot 15, Road 103 Gulshan AvenueDhaka-1212, BangladeshTel: 880-2-8881824-6, Fax: 880-2-8881822E-mail: [email protected] AUDITORS' REPORT
to the Members of Bangladesh Association of Publicly Listed Companies
ANNUAL REPORT 201430
BANGLADESH ASSOCIATION OF PUBLICLY LISTED COMPANIES
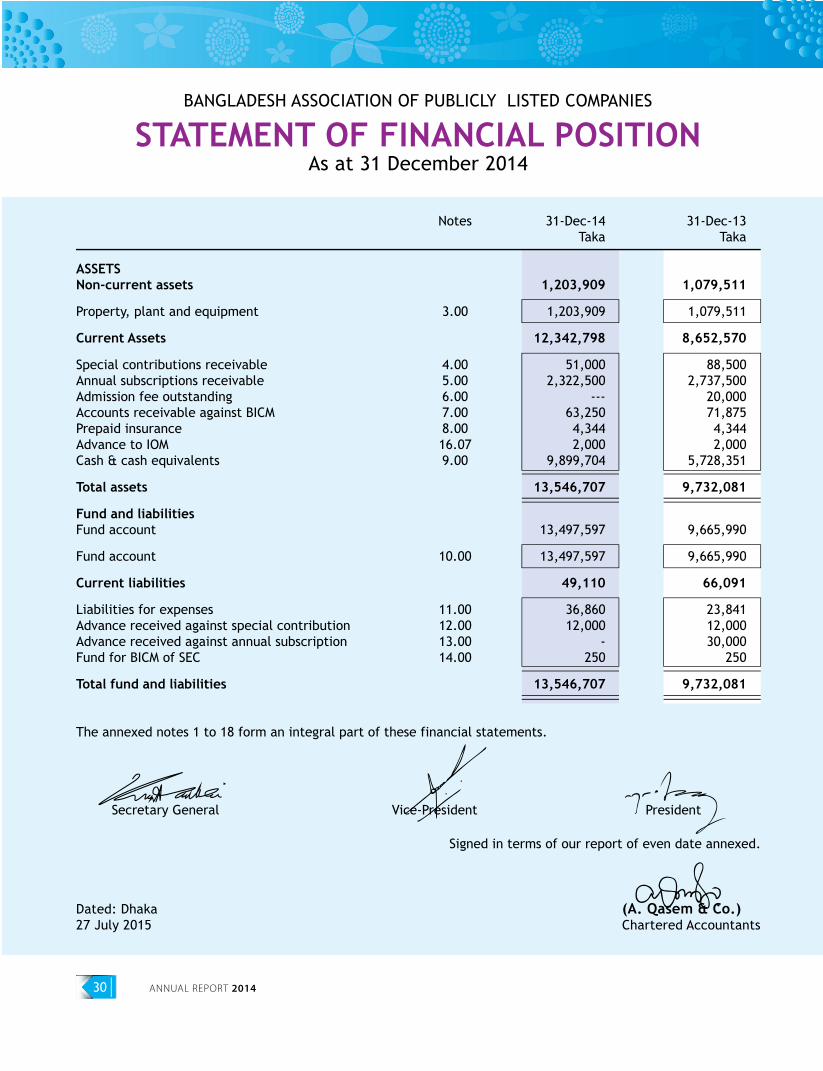
STATEMENT OF FINANCIAL POSITIONAs at 31 December 2014
Notes 31-Dec-14 31-Dec-13 Taka Taka
ASSETSNon-current assets 1,203,909 1,079,511
Property, plant and equipment 3.00 1,203,909 1,079,511
Current Assets 12,342,798 8,652,570
Special contributions receivable 4.00 51,000 88,500Annual subscriptions receivable 5.00 2,322,500 2,737,500Admission fee outstanding 6.00 --- 20,000Accounts receivable against BICM 7.00 63,250 71,875Prepaid insurance 8.00 4,344 4,344Advance to IOM 16.07 2,000 2,000Cash & cash equivalents 9.00 9,899,704 5,728,351
Total assets 13,546,707 9,732,081
Fund and liabilitiesFund account 13,497,597 9,665,990
Fund account 10.00 13,497,597 9,665,990
Current liabilities 49,110 66,091
Liabilities for expenses 11.00 36,860 23,841Advance received against special contribution 12.00 12,000 12,000Advance received against annual subscription 13.00 - 30,000Fund for BICM of SEC 14.00 250 250
Total fund and liabilities 13,546,707 9,732,081
The annexed notes 1 to 18 form an integral part of these financial statements.
Signed in terms of our report of even date annexed.
Dated: Dhaka27 July 2015
(A. Qasem & Co.)Chartered Accountants
Secretary General Vice-President President
BANGLADESH ASSOCIATION OF PUBLICLY LISTED COMPANIES 31
BANGLADESH ASSOCIATION OF PUBLICLY LISTED COMPANIES
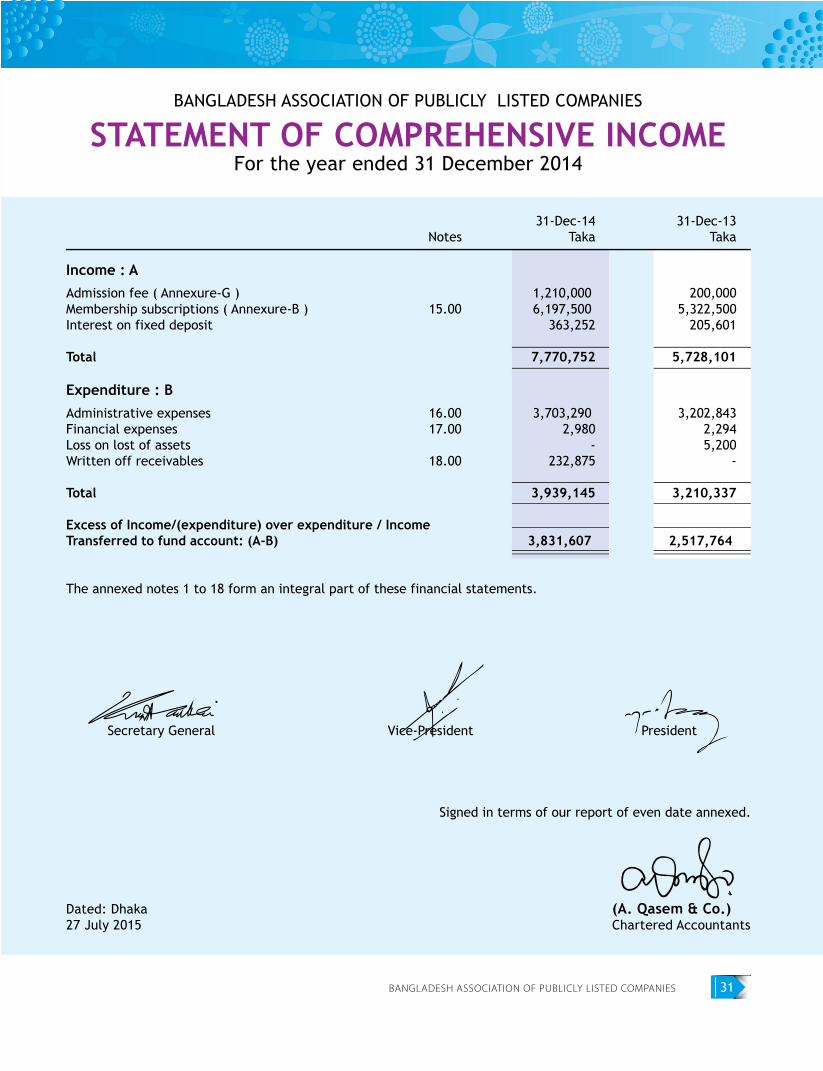
STATEMENT OF COMPREHENSIVE INCOMEFor the year ended 31 December 2014
31-Dec-14 31-Dec-13 Notes Taka Taka
Income : AAdmission fee ( Annexure-G ) 1,210,000 200,000Membership subscriptions ( Annexure-B ) 15.00 6,197,500 5,322,500Interest on fixed deposit 363,252 205,601
Total 7,770,752 5,728,101
Expenditure : BAdministrative expenses 16.00 3,703,290 3,202,843Financial expenses 17.00 2,980 2,294Loss on lost of assets - 5,200Written off receivables 18.00 232,875 - Total 3,939,145 3,210,337
Excess of Income/(expenditure) over expenditure / IncomeTransferred to fund account: (A-B) 3,831,607 2,517,764
The annexed notes 1 to 18 form an integral part of these financial statements.
Signed in terms of our report of even date annexed.
Dated: Dhaka27 July 2015
(A. Qasem & Co.)Chartered Accountants
Secretary General Vice-President President
ANNUAL REPORT 201432
BANGLADESH ASSOCIATION OF PUBLICLY LISTED COMPANIES
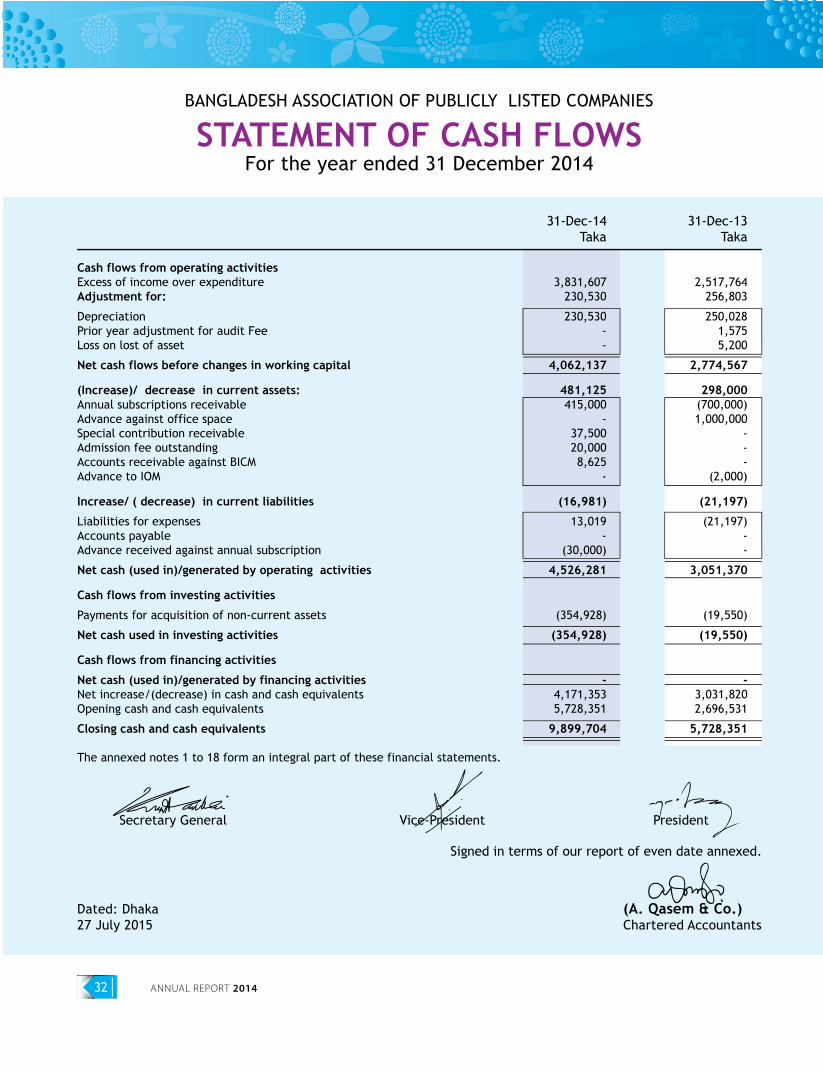
STATEMENT OF CASH FLOWSFor the year ended 31 December 2014
31-Dec-14 31-Dec-13 Taka Taka Cash flows from operating activitiesExcess of income over expenditure 3,831,607 2,517,764Adjustment for: 230,530 256,803
Depreciation 230,530 250,028Prior year adjustment for audit Fee - 1,575Loss on lost of asset - 5,200
Net cash flows before changes in working capital 4,062,137 2,774,567
(Increase)/ decrease in current assets: 481,125 298,000Annual subscriptions receivable 415,000 (700,000)Advance against office space - 1,000,000Special contribution receivable 37,500 -Admission fee outstanding 20,000 -Accounts receivable against BICM 8,625 -Advance to IOM - (2,000)
Increase/ ( decrease) in current liabilities (16,981) (21,197)
Liabilities for expenses 13,019 (21,197)Accounts payable - -Advance received against annual subscription (30,000) -
Net cash (used in)/generated by operating activities 4,526,281 3,051,370
Cash flows from investing activities
Payments for acquisition of non-current assets (354,928) (19,550)
Net cash used in investing activities (354,928) (19,550)
Cash flows from financing activities
Net cash (used in)/generated by financing activities - -Net increase/(decrease) in cash and cash equivalents 4,171,353 3,031,820Opening cash and cash equivalents 5,728,351 2,696,531
Closing cash and cash equivalents 9,899,704 5,728,351
The annexed notes 1 to 18 form an integral part of these financial statements.
Signed in terms of our report of even date annexed.
Dated: Dhaka27 July 2015
(A. Qasem & Co.)Chartered Accountants
Secretary General Vice-President President
BANGLADESH ASSOCIATION OF PUBLICLY LISTED COMPANIES 33
BANGLADESH ASSOCIATION OF PUBLICLY LISTED COMPANIES
NOTES TO THE FINANCIAL STATEMENTAs at 31 December 2014
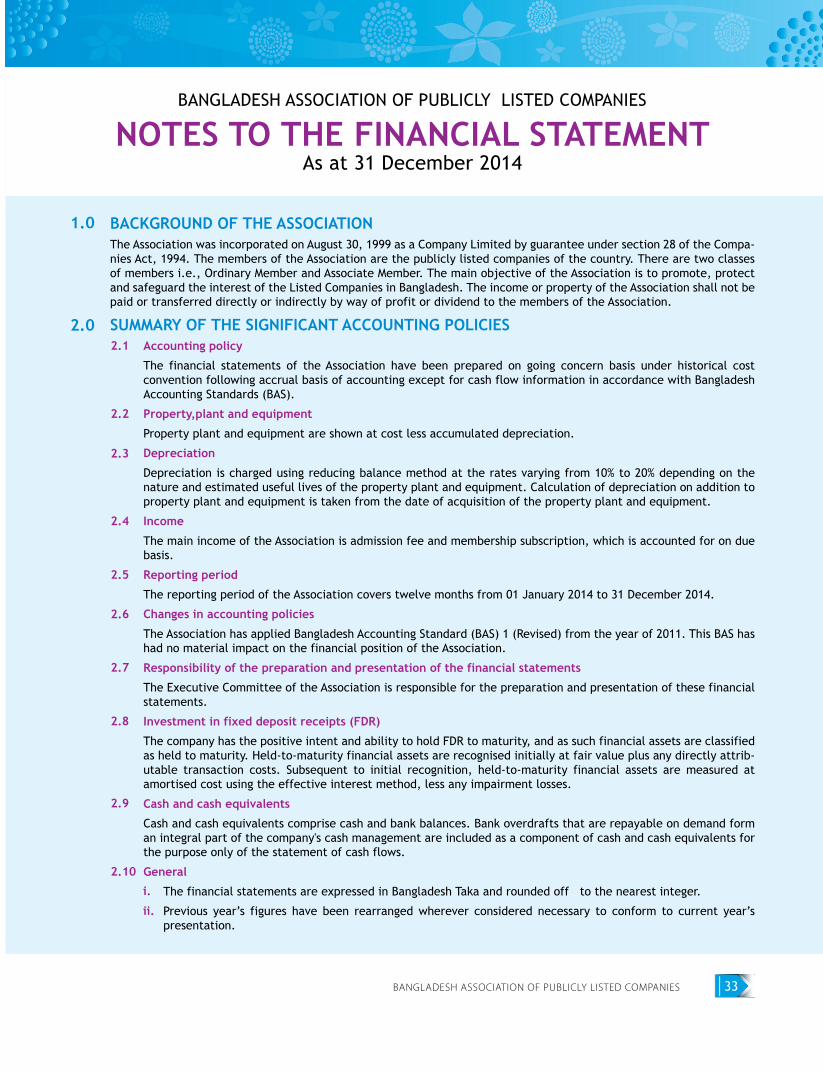
BACKGROUND OF THE ASSOCIATIONThe Association was incorporated on August 30, 1999 as a Company Limited by guarantee under section 28 of the Compa-nies Act, 1994. The members of the Association are the publicly listed companies of the country. There are two classes of members i.e., Ordinary Member and Associate Member. The main objective of the Association is to promote, protect and safeguard the interest of the Listed Companies in Bangladesh. The income or property of the Association shall not be paid or transferred directly or indirectly by way of profit or dividend to the members of the Association.
SUMMARY OF THE SIGNIFICANT ACCOUNTING POLICIESAccounting policy
The financial statements of the Association have been prepared on going concern basis under historical cost convention following accrual basis of accounting except for cash flow information in accordance with Bangladesh Accounting Standards (BAS).
Property,plant and equipment
Property plant and equipment are shown at cost less accumulated depreciation.
Depreciation
Depreciation is charged using reducing balance method at the rates varying from 10% to 20% depending on the nature and estimated useful lives of the property plant and equipment. Calculation of depreciation on addition to property plant and equipment is taken from the date of acquisition of the property plant and equipment.
Income
The main income of the Association is admission fee and membership subscription, which is accounted for on due basis.
Reporting period
The reporting period of the Association covers twelve months from 01 January 2014 to 31 December 2014.
Changes in accounting policies
The Association has applied Bangladesh Accounting Standard (BAS) 1 (Revised) from the year of 2011. This BAS has had no material impact on the financial position of the Association.
Responsibility of the preparation and presentation of the financial statements
The Executive Committee of the Association is responsible for the preparation and presentation of these financial statements.
Investment in fixed deposit receipts (FDR)
The company has the positive intent and ability to hold FDR to maturity, and as such financial assets are classified as held to maturity. Held-to-maturity financial assets are recognised initially at fair value plus any directly attrib-utable transaction costs. Subsequent to initial recognition, held-to-maturity financial assets are measured at amortised cost using the effective interest method, less any impairment losses.
Cash and cash equivalents
Cash and cash equivalents comprise cash and bank balances. Bank overdrafts that are repayable on demand form an integral part of the company's cash management are included as a component of cash and cash equivalents for the purpose only of the statement of cash flows.
General
The financial statements are expressed in Bangladesh Taka and rounded off to the nearest integer.
Previous year’s figures have been rearranged wherever considered necessary to conform to current year’s presentation.
1.0
2.02.1
2.2
2.3
2.4
2.5
2.6
2.7
2.8
2.9
2.10
i.
ii.
ANNUAL REPORT 201434
BANGLADESH ASSOCIATION OF PUBLICLY LISTED COMPANIES
Notes to The Financial StatementAs at 31 December 2014
31-Dec-14 31-Dec-13 Taka Taka
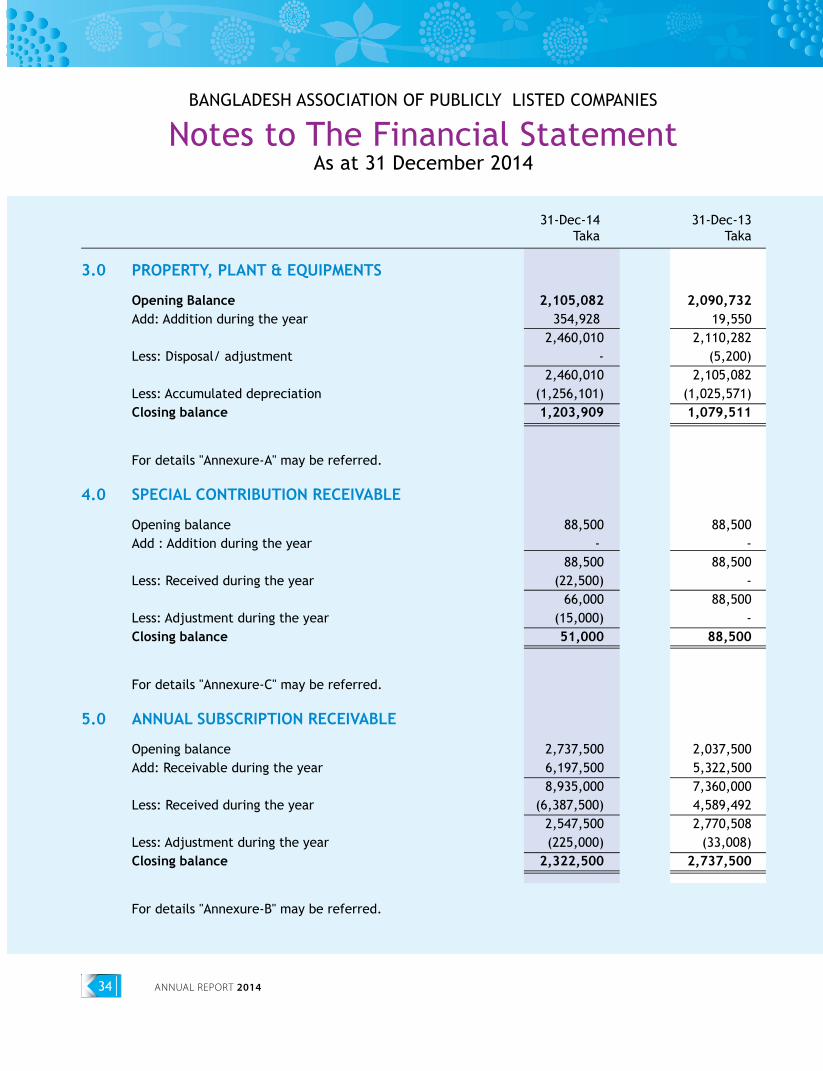
PROPERTY, PLANT & EQUIPMENTS
Opening Balance 2,105,082 2,090,732Add: Addition during the year 354,928 19,550 2,460,010 2,110,282Less: Disposal/ adjustment - (5,200) 2,460,010 2,105,082Less: Accumulated depreciation (1,256,101) (1,025,571)Closing balance 1,203,909 1,079,511
For details "Annexure-A" may be referred.
SPECIAL CONTRIBUTION RECEIVABLE
Opening balance 88,500 88,500Add : Addition during the year - - 88,500 88,500Less: Received during the year (22,500) - 66,000 88,500Less: Adjustment during the year (15,000) -Closing balance 51,000 88,500
For details "Annexure-C" may be referred.
ANNUAL SUBSCRIPTION RECEIVABLE
Opening balance 2,737,500 2,037,500Add: Receivable during the year 6,197,500 5,322,500 8,935,000 7,360,000Less: Received during the year (6,387,500) 4,589,492 2,547,500 2,770,508Less: Adjustment during the year (225,000) (33,008)Closing balance 2,322,500 2,737,500
For details "Annexure-B" may be referred.
3.0
4.0
5.0
BANGLADESH ASSOCIATION OF PUBLICLY LISTED COMPANIES 35
BANGLADESH ASSOCIATION OF PUBLICLY LISTED COMPANIES
Notes to The Financial StatementAs at 31 December 2014
31-Dec-14 31-Dec-13 Taka Taka
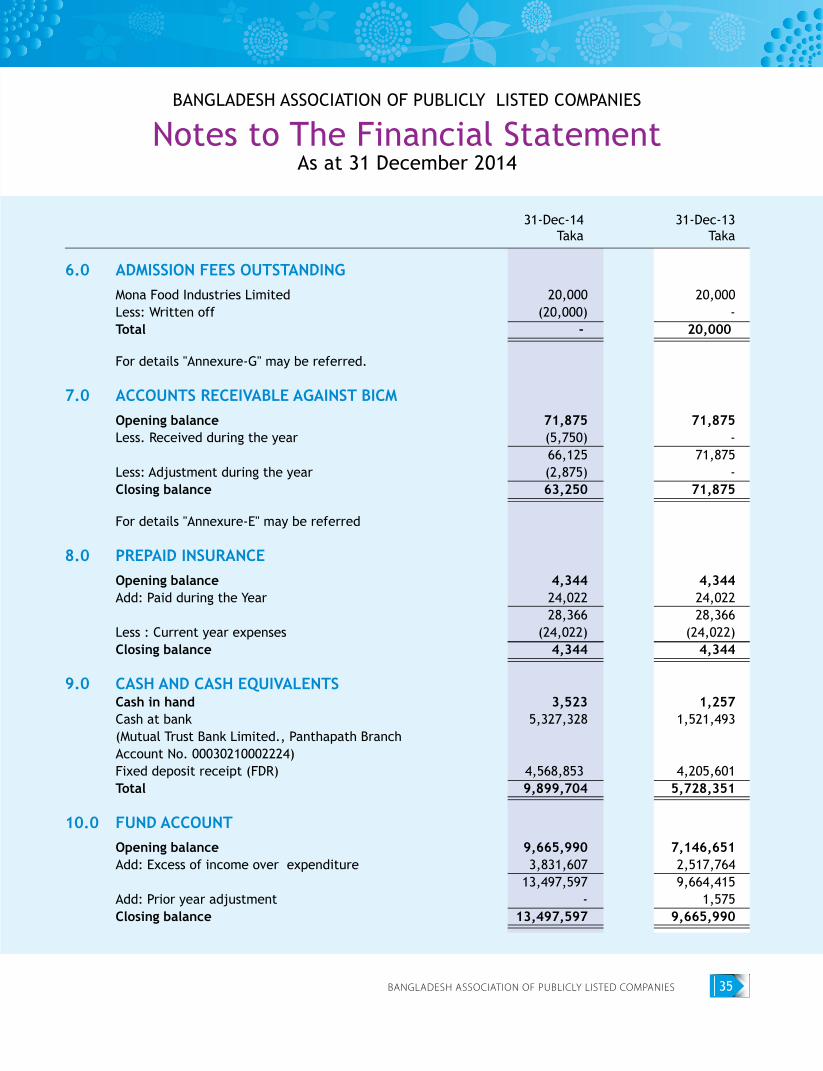
ADMISSION FEES OUTSTANDINGMona Food Industries Limited 20,000 20,000Less: Written off (20,000) -Total - 20,000
For details "Annexure-G" may be referred.
ACCOUNTS RECEIVABLE AGAINST BICMOpening balance 71,875 71,875Less. Received during the year (5,750) - 66,125 71,875Less: Adjustment during the year (2,875) -Closing balance 63,250 71,875
For details "Annexure-E" may be referred
PREPAID INSURANCEOpening balance 4,344 4,344Add: Paid during the Year 24,022 24,022 28,366 28,366Less : Current year expenses (24,022) (24,022)Closing balance 4,344 4,344
CASH AND CASH EQUIVALENTSCash in hand 3,523 1,257Cash at bank 5,327,328 1,521,493(Mutual Trust Bank Limited., Panthapath BranchAccount No. 00030210002224)Fixed deposit receipt (FDR) 4,568,853 4,205,601Total 9,899,704 5,728,351
FUND ACCOUNTOpening balance 9,665,990 7,146,651Add: Excess of income over expenditure 3,831,607 2,517,764 13,497,597 9,664,415Add: Prior year adjustment - 1,575Closing balance 13,497,597 9,665,990
6.0
7.0
8.0
9.0
10.0
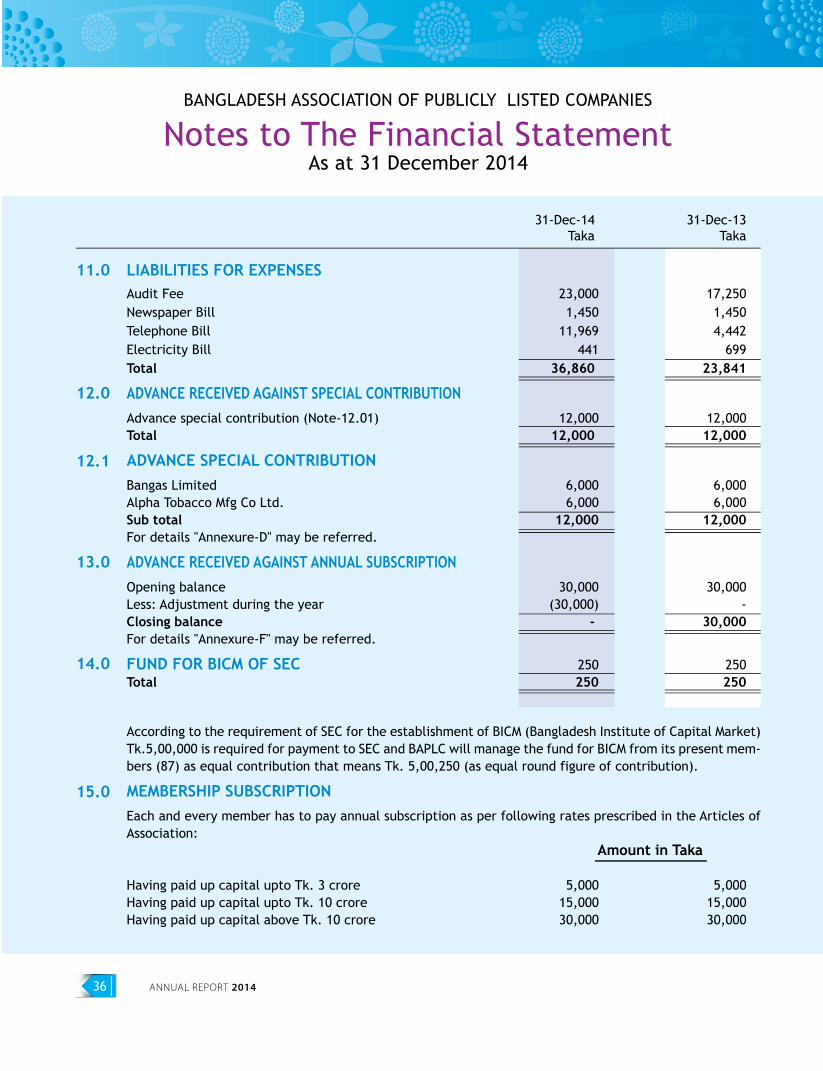
ANNUAL REPORT 201436
BANGLADESH ASSOCIATION OF PUBLICLY LISTED COMPANIES
Notes to The Financial StatementAs at 31 December 2014
31-Dec-14 31-Dec-13 Taka Taka
LIABILITIES FOR EXPENSESAudit Fee 23,000 17,250Newspaper Bill 1,450 1,450Telephone Bill 11,969 4,442Electricity Bill 441 699Total 36,860 23,841
ADVANCE RECEIVED AGAINST SPECIAL CONTRIBUTIONAdvance special contribution (Note-12.01) 12,000 12,000Total 12,000 12,000
ADVANCE SPECIAL CONTRIBUTIONBangas Limited 6,000 6,000Alpha Tobacco Mfg Co Ltd. 6,000 6,000Sub total 12,000 12,000For details "Annexure-D" may be referred.
ADVANCE RECEIVED AGAINST ANNUAL SUBSCRIPTIONOpening balance 30,000 30,000Less: Adjustment during the year (30,000) -Closing balance - 30,000For details "Annexure-F" may be referred.
FUND FOR BICM OF SEC 250 250Total 250 250
According to the requirement of SEC for the establishment of BICM (Bangladesh Institute of Capital Market) Tk.5,00,000 is required for payment to SEC and BAPLC will manage the fund for BICM from its present mem-bers (87) as equal contribution that means Tk. 5,00,250 (as equal round figure of contribution).
MEMBERSHIP SUBSCRIPTIONEach and every member has to pay annual subscription as per following rates prescribed in the Articles of Association: Amount in Taka
Having paid up capital upto Tk. 3 crore 5,000 5,000Having paid up capital upto Tk. 10 crore 15,000 15,000Having paid up capital above Tk. 10 crore 30,000 30,000
11.0
12.0
12.1
13.0
14.0
15.0
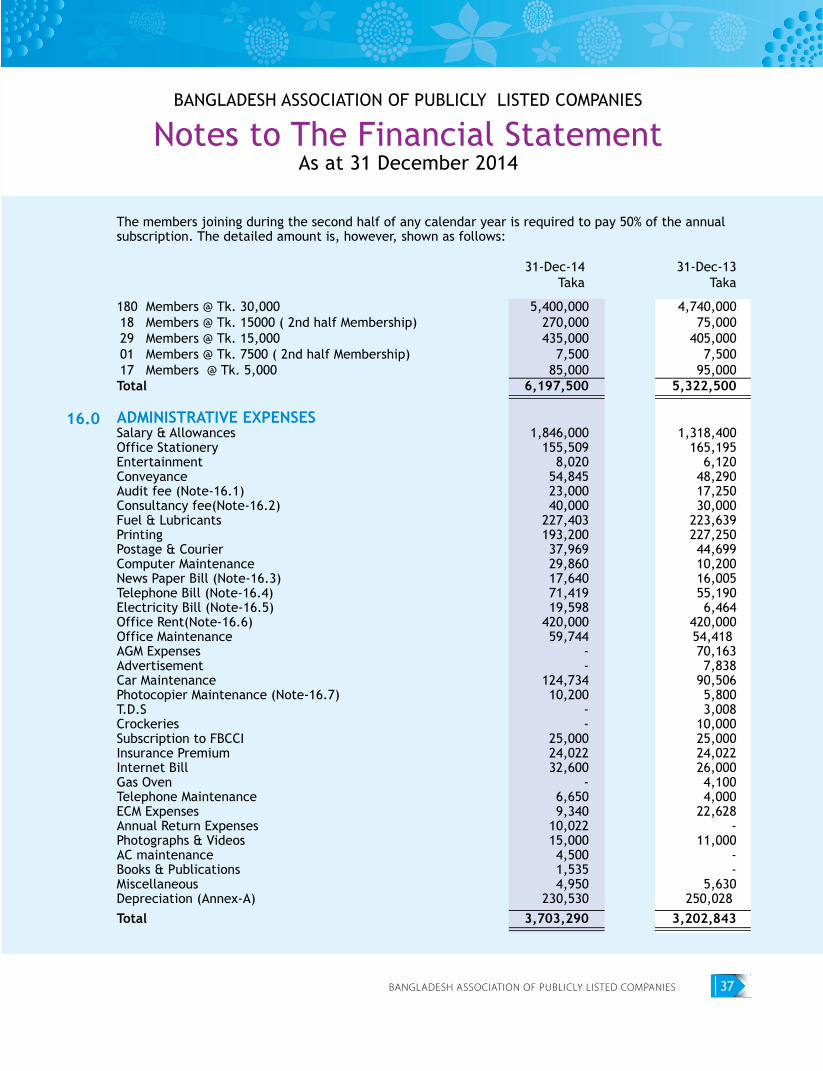
BANGLADESH ASSOCIATION OF PUBLICLY LISTED COMPANIES 37
BANGLADESH ASSOCIATION OF PUBLICLY LISTED COMPANIES
Notes to The Financial StatementAs at 31 December 2014
The members joining during the second half of any calendar year is required to pay 50% of the annual subscription. The detailed amount is, however, shown as follows:
31-Dec-14 31-Dec-13 Taka Taka
180 Members @ Tk. 30,000 5,400,000 4,740,000 18 Members @ Tk. 15000 ( 2nd half Membership) 270,000 75,000 29 Members @ Tk. 15,000 435,000 405,000 01 Members @ Tk. 7500 ( 2nd half Membership) 7,500 7,500 17 Members @ Tk. 5,000 85,000 95,000Total 6,197,500 5,322,500
ADMINISTRATIVE EXPENSESSalary & Allowances 1,846,000 1,318,400Office Stationery 155,509 165,195Entertainment 8,020 6,120Conveyance 54,845 48,290Audit fee (Note-16.1) 23,000 17,250Consultancy fee(Note-16.2) 40,000 30,000Fuel & Lubricants 227,403 223,639Printing 193,200 227,250Postage & Courier 37,969 44,699Computer Maintenance 29,860 10,200News Paper Bill (Note-16.3) 17,640 16,005Telephone Bill (Note-16.4) 71,419 55,190Electricity Bill (Note-16.5) 19,598 6,464Office Rent(Note-16.6) 420,000 420,000Office Maintenance 59,744 54,418 AGM Expenses - 70,163Advertisement - 7,838Car Maintenance 124,734 90,506Photocopier Maintenance (Note-16.7) 10,200 5,800T.D.S - 3,008Crockeries - 10,000Subscription to FBCCI 25,000 25,000Insurance Premium 24,022 24,022Internet Bill 32,600 26,000Gas Oven - 4,100Telephone Maintenance 6,650 4,000ECM Expenses 9,340 22,628Annual Return Expenses 10,022 -Photographs & Videos 15,000 11,000AC maintenance 4,500 -Books & Publications 1,535 -Miscellaneous 4,950 5,630Depreciation (Annex-A) 230,530 250,028 Total 3,703,290 3,202,843
16.0
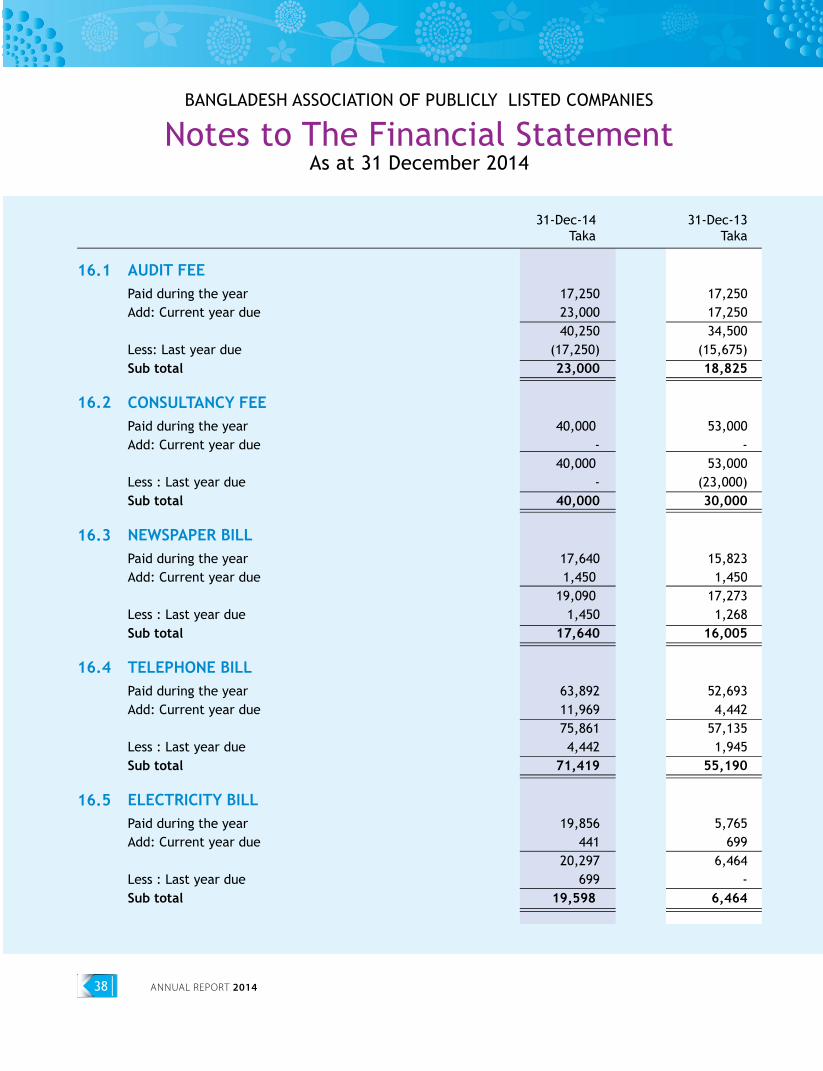
ANNUAL REPORT 201438
BANGLADESH ASSOCIATION OF PUBLICLY LISTED COMPANIES
Notes to The Financial StatementAs at 31 December 2014
31-Dec-14 31-Dec-13 Taka Taka
AUDIT FEEPaid during the year 17,250 17,250Add: Current year due 23,000 17,250 40,250 34,500Less: Last year due (17,250) (15,675)Sub total 23,000 18,825
CONSULTANCY FEEPaid during the year 40,000 53,000Add: Current year due - - 40,000 53,000Less : Last year due - (23,000)Sub total 40,000 30,000
NEWSPAPER BILL Paid during the year 17,640 15,823Add: Current year due 1,450 1,450 19,090 17,273Less : Last year due 1,450 1,268Sub total 17,640 16,005
TELEPHONE BILLPaid during the year 63,892 52,693Add: Current year due 11,969 4,442 75,861 57,135Less : Last year due 4,442 1,945Sub total 71,419 55,190
ELECTRICITY BILLPaid during the year 19,856 5,765Add: Current year due 441 699 20,297 6,464Less : Last year due 699 -Sub total 19,598 6,464
16.1
16.2
16.3
16.4
16.5
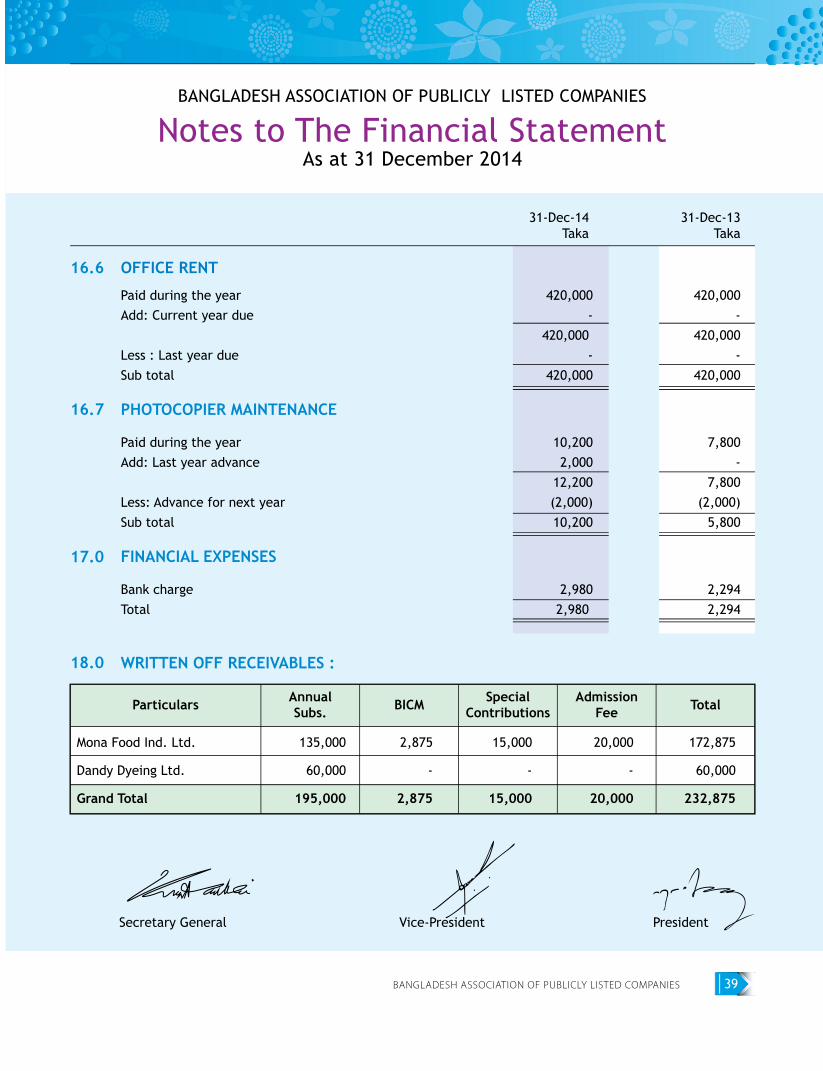
BANGLADESH ASSOCIATION OF PUBLICLY LISTED COMPANIES 39
BANGLADESH ASSOCIATION OF PUBLICLY LISTED COMPANIES
Notes to The Financial StatementAs at 31 December 2014
31-Dec-14 31-Dec-13 Taka Taka
OFFICE RENT
Paid during the year 420,000 420,000Add: Current year due - - 420,000 420,000Less : Last year due - -Sub total 420,000 420,000
PHOTOCOPIER MAINTENANCE
Paid during the year 10,200 7,800Add: Last year advance 2,000 - 12,200 7,800Less: Advance for next year (2,000) (2,000)Sub total 10,200 5,800
FINANCIAL EXPENSES
Bank charge 2,980 2,294Total 2,980 2,294
WRITTEN OFF RECEIVABLES :
16.6
16.7
17.0
18.0
Particulars AnnualSubs. BICM Special
ContributionsAdmission
Fee Total
Mona Food Ind. Ltd.
Dandy Dyeing Ltd.
Grand Total
135,000
60,000
195,000
2,875
-
2,875
15,000
-
15,000
20,000
-
20,000
172,875
60,000
232,875
Secretary General Vice-President President
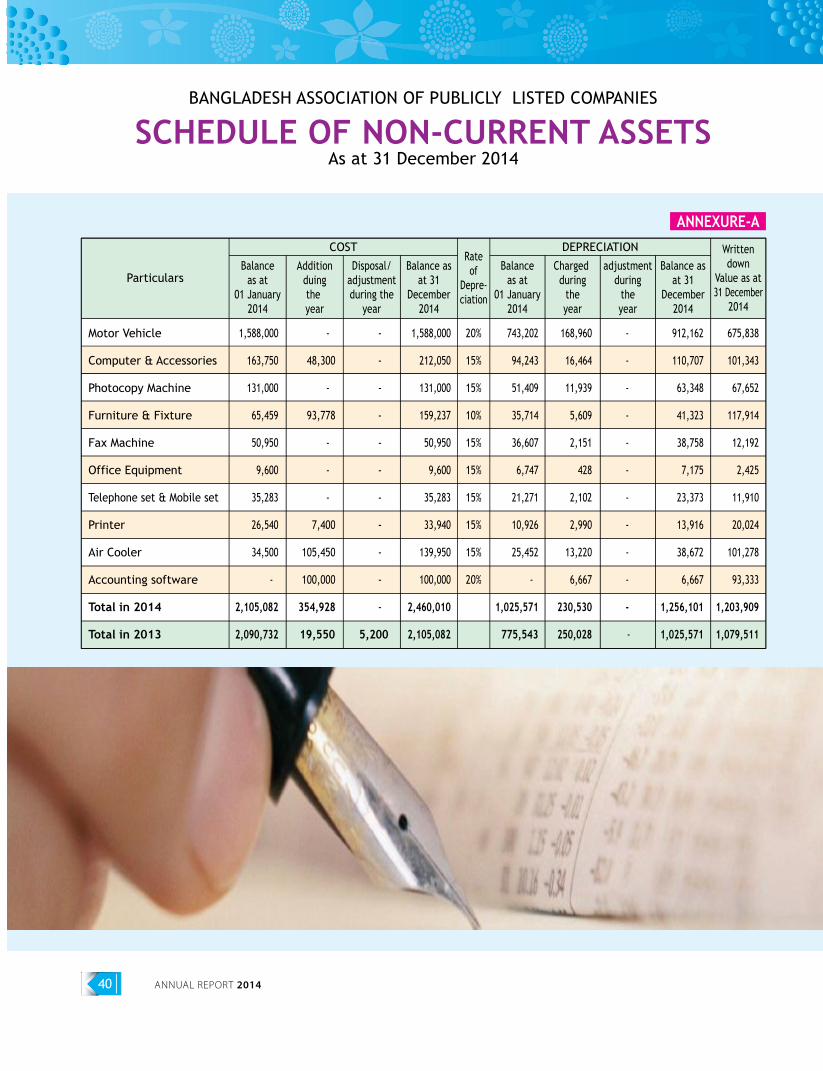
ANNUAL REPORT 201440
BANGLADESH ASSOCIATION OF PUBLICLY LISTED COMPANIES
SCHEDULE OF NON-CURRENT ASSETSAs at 31 December 2014
ANNEXURE-A
Particulars
COST DEPRECIATION
Balanceas at
01 January2014
Additionduingthe year
Disposal/adjustmentduring the
year
Rateof
Depre-ciation
Balance asat 31
December2014
Balanceas at
01 January2014
Charged during
theyear
adjustmentduring
theyear
Balance asat 31
December2014
Writtendown
Value as at31 December
2014
Motor Vehicle
Computer & Accessories
Photocopy Machine
Furniture & Fixture
Fax Machine
Office Equipment
Telephone set & Mobile set
Printer
Air Cooler
Accounting software
Total in 2014
Total in 2013
1,588,000
163,750
131,000
65,459
50,950
9,600
35,283
26,540
34,500
-
2,105,082
2,090,732
-
48,300
-
93,778
-
-
-
7,400
105,450
100,000
354,928
19,550
-
-
-
-
-
-
-
-
-
-
-
5,200
743,202
94,243
51,409
35,714
36,607
6,747
21,271
10,926
25,452
-
1,025,571
775,543
168,960
16,464
11,939
5,609
2,151
428
2,102
2,990
13,220
6,667
230,530
250,028
-
-
-
-
-
-
-
-
-
-
-
-
912,162
110,707
63,348
41,323
38,758
7,175
23,373
13,916
38,672
6,667
1,256,101
1,025,571
675,838
101,343
67,652
117,914
12,192
2,425
11,910
20,024
101,278
93,333
1,203,909
1,079,511
1,588,000
212,050
131,000
159,237
50,950
9,600
35,283
33,940
139,950
100,000
2,460,010
2,105,082
20%
15%
15%
10%
15%
15%
15%
15%
15%
20%
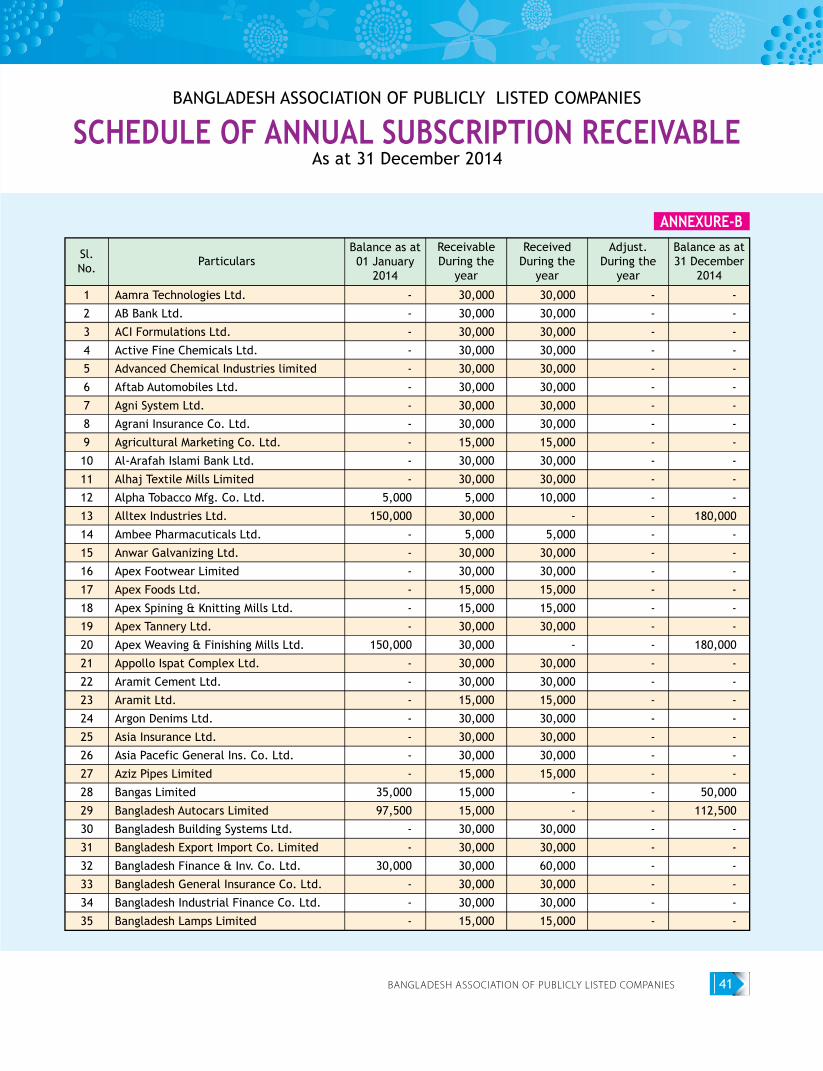
BANGLADESH ASSOCIATION OF PUBLICLY LISTED COMPANIES 41
BANGLADESH ASSOCIATION OF PUBLICLY LISTED COMPANIES
SCHEDULE OF ANNUAL SUBSCRIPTION RECEIVABLEAs at 31 December 2014
ANNEXURE-B
Sl.No.
ParticularsBalance as at01 January
2014
ReceivableDuring the
year
ReceivedDuring the
year
Adjust.During the
year
Balance as at31 December
2014
Aamra Technologies Ltd.
AB Bank Ltd.
ACI Formulations Ltd.
Active Fine Chemicals Ltd.
Advanced Chemical Industries limited
Aftab Automobiles Ltd.
Agni System Ltd.
Agrani Insurance Co. Ltd.
Agricultural Marketing Co. Ltd.
Al-Arafah Islami Bank Ltd.
Alhaj Textile Mills Limited
Alpha Tobacco Mfg. Co. Ltd.
Alltex Industries Ltd.
Ambee Pharmacuticals Ltd.
Anwar Galvanizing Ltd.
Apex Footwear Limited
Apex Foods Ltd.
Apex Spining & Knitting Mills Ltd.
Apex Tannery Ltd.
Apex Weaving & Finishing Mills Ltd.
Appollo Ispat Complex Ltd.
Aramit Cement Ltd.
Aramit Ltd.
Argon Denims Ltd.
Asia Insurance Ltd.
Asia Pacefic General Ins. Co. Ltd.
Aziz Pipes Limited
Bangas Limited
Bangladesh Autocars Limited
Bangladesh Building Systems Ltd.
Bangladesh Export Import Co. Limited
Bangladesh Finance & Inv. Co. Ltd.
Bangladesh General Insurance Co. Ltd.
Bangladesh Industrial Finance Co. Ltd.
Bangladesh Lamps Limited
1
2
3
4
5
6
7
8
9
10
11
12
13
14
15
16
17
18
19
20
21
22
23
24
25
26
27
28
29
30
31
32
33
34
35
-
-
-
-
-
-
-
-
-
-
-
5,000
150,000
-
-
-
-
-
-
150,000
-
-
-
-
-
-
-
35,000
97,500
-
-
30,000
-
-
-
30,000
30,000
30,000
30,000
30,000
30,000
30,000
30,000
15,000
30,000
30,000
5,000
30,000
5,000
30,000
30,000
15,000
15,000
30,000
30,000
30,000
30,000
15,000
30,000
30,000
30,000
15,000
15,000
15,000
30,000
30,000
30,000
30,000
30,000
15,000
30,000
30,000
30,000
30,000
30,000
30,000
30,000
30,000
15,000
30,000
30,000
10,000
-
5,000
30,000
30,000
15,000
15,000
30,000
-
30,000
30,000
15,000
30,000
30,000
30,000
15,000
-
-
30,000
30,000
60,000
30,000
30,000
15,000
-
-
-
-
-
-
-
-
-
-
-
-
-
-
-
-
-
-
-
-
-
-
-
-
-
-
-
-
-
-
-
-
-
-
-
-
-
-
-
-
-
-
-
-
-
-
-
180,000
-
-
-
-
-
-
180,000
-
-
-
-
-
-
-
50,000
112,500
-
-
-
-
-
-
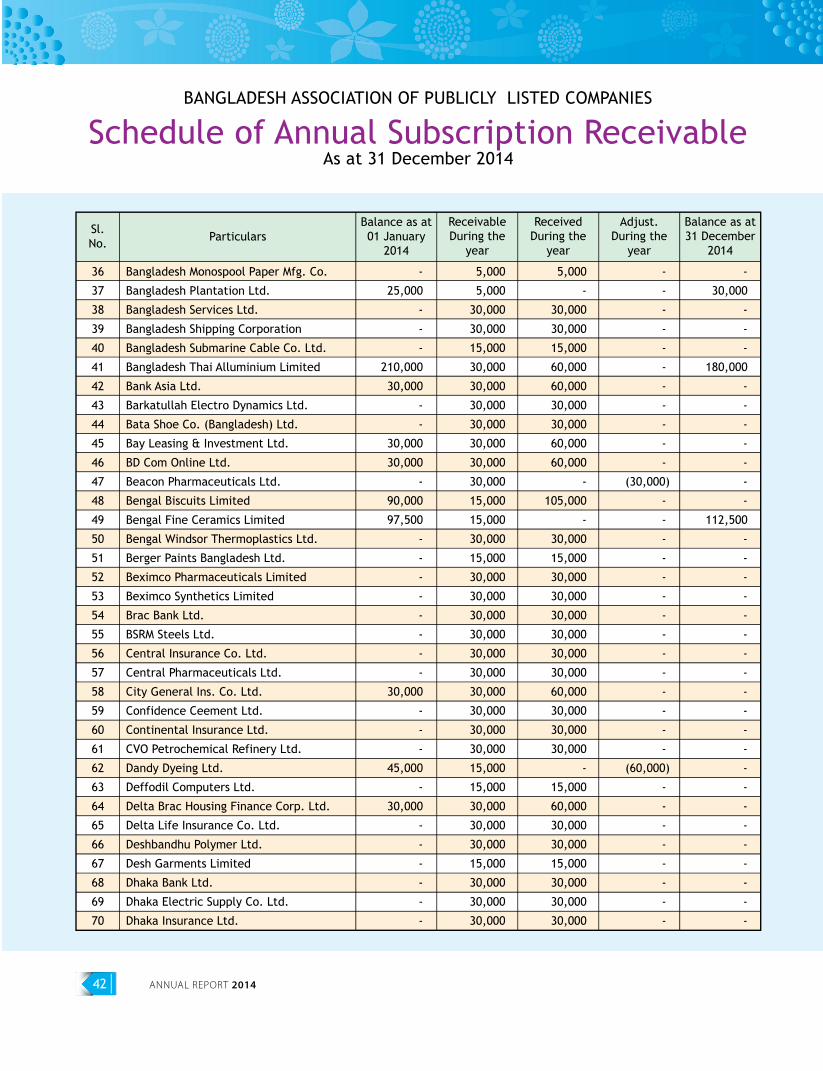
ANNUAL REPORT 201442
BANGLADESH ASSOCIATION OF PUBLICLY LISTED COMPANIES
Schedule of Annual Subscription ReceivableAs at 31 December 2014
Sl.No. Particulars
Balance as at01 January
2014
ReceivableDuring the
year
ReceivedDuring the
year
Adjust.During the
year
Balance as at31 December
2014
Bangladesh Monospool Paper Mfg. Co.
Bangladesh Plantation Ltd.
Bangladesh Services Ltd.
Bangladesh Shipping Corporation
Bangladesh Submarine Cable Co. Ltd.
Bangladesh Thai Alluminium Limited
Bank Asia Ltd.
Barkatullah Electro Dynamics Ltd.
Bata Shoe Co. (Bangladesh) Ltd.
Bay Leasing & Investment Ltd.
BD Com Online Ltd.
Beacon Pharmaceuticals Ltd.
Bengal Biscuits Limited
Bengal Fine Ceramics Limited
Bengal Windsor Thermoplastics Ltd.
Berger Paints Bangladesh Ltd.
Beximco Pharmaceuticals Limited
Beximco Synthetics Limited
Brac Bank Ltd.
BSRM Steels Ltd.
Central Insurance Co. Ltd.
Central Pharmaceuticals Ltd.
City General Ins. Co. Ltd.
Confidence Ceement Ltd.
Continental Insurance Ltd.
CVO Petrochemical Refinery Ltd.
Dandy Dyeing Ltd.
Deffodil Computers Ltd.
Delta Brac Housing Finance Corp. Ltd.
Delta Life Insurance Co. Ltd.
Deshbandhu Polymer Ltd.
Desh Garments Limited
Dhaka Bank Ltd.
Dhaka Electric Supply Co. Ltd.
Dhaka Insurance Ltd.
36
37
38
39
40
41
42
43
44
45
46
47
48
49
50
51
52
53
54
55
56
57
58
59
60
61
62
63
64
65
66
67
68
69
70
-
25,000
-
-
-
210,000
30,000
-
-
30,000
30,000
-
90,000
97,500
-
-
-
-
-
-
-
-
30,000
-
-
-
45,000
-
30,000
-
-
-
-
-
-
5,000
5,000
30,000
30,000
15,000
30,000
30,000
30,000
30,000
30,000
30,000
30,000
15,000
15,000
30,000
15,000
30,000
30,000
30,000
30,000
30,000
30,000
30,000
30,000
30,000
30,000
15,000
15,000
30,000
30,000
30,000
15,000
30,000
30,000
30,000
5,000
-
30,000
30,000
15,000
60,000
60,000
30,000
30,000
60,000
60,000
-
105,000
-
30,000
15,000
30,000
30,000
30,000
30,000
30,000
30,000
60,000
30,000
30,000
30,000
-
15,000
60,000
30,000
30,000
15,000
30,000
30,000
30,000
-
-
-
-
-
-
-
-
-
-
-
(30,000)
-
-
-
-
-
-
-
-
-
-
-
-
-
-
(60,000)
-
-
-
-
-
-
-
-
-
30,000
-
-
-
180,000
-
-
-
-
-
-
-
112,500
-
-
-
-
-
-
-
-
-
-
-
-
-
-
-
-
-
-
-
-
-
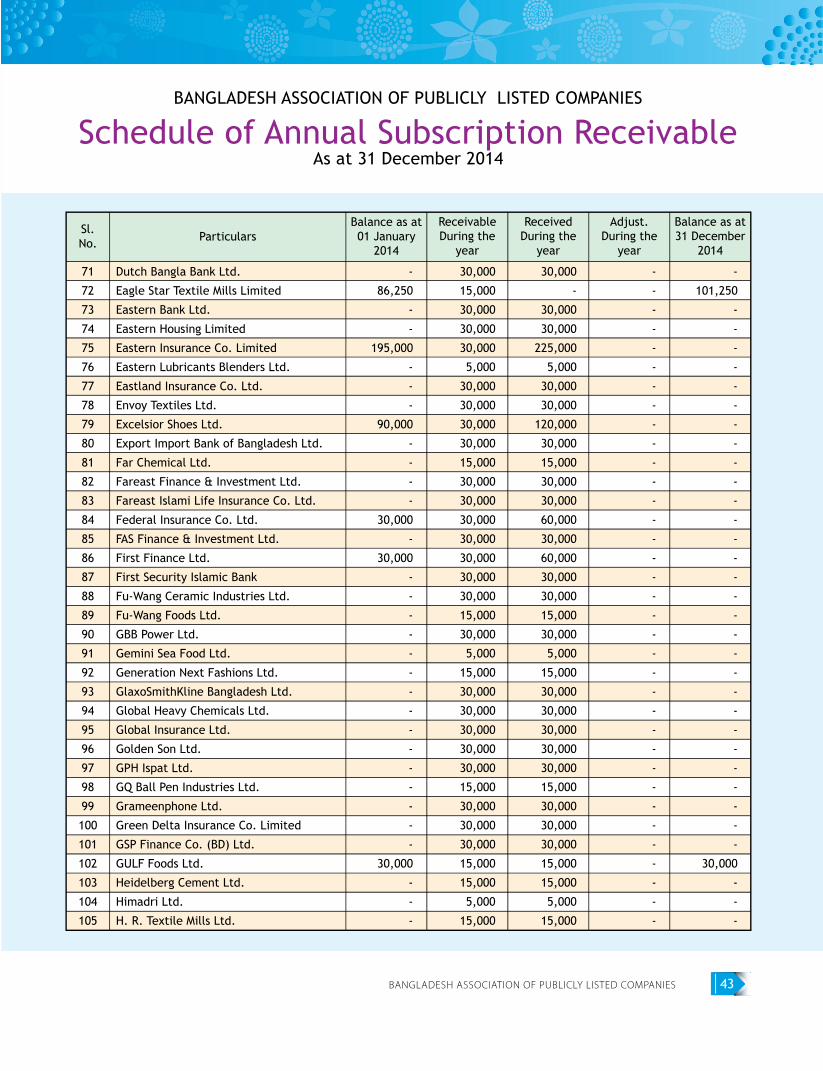
BANGLADESH ASSOCIATION OF PUBLICLY LISTED COMPANIES 43
BANGLADESH ASSOCIATION OF PUBLICLY LISTED COMPANIES
Schedule of Annual Subscription ReceivableAs at 31 December 2014
Sl.No. Particulars
Balance as at01 January
2014
ReceivableDuring the
year
ReceivedDuring the
year
Adjust.During the
year
Balance as at31 December
2014
Dutch Bangla Bank Ltd.
Eagle Star Textile Mills Limited
Eastern Bank Ltd.
Eastern Housing Limited
Eastern Insurance Co. Limited
Eastern Lubricants Blenders Ltd.
Eastland Insurance Co. Ltd.
Envoy Textiles Ltd.
Excelsior Shoes Ltd.
Export Import Bank of Bangladesh Ltd.
Far Chemical Ltd.
Fareast Finance & Investment Ltd.
Fareast Islami Life Insurance Co. Ltd.
Federal Insurance Co. Ltd.
FAS Finance & Investment Ltd.
First Finance Ltd.
First Security Islamic Bank
Fu-Wang Ceramic Industries Ltd.
Fu-Wang Foods Ltd.
GBB Power Ltd.
Gemini Sea Food Ltd.
Generation Next Fashions Ltd.
GlaxoSmithKline Bangladesh Ltd.
Global Heavy Chemicals Ltd.
Global Insurance Ltd.
Golden Son Ltd.
GPH Ispat Ltd.
GQ Ball Pen Industries Ltd.
Grameenphone Ltd.
Green Delta Insurance Co. Limited
GSP Finance Co. (BD) Ltd.
GULF Foods Ltd.
Heidelberg Cement Ltd.
Himadri Ltd.
H. R. Textile Mills Ltd.
71
72
73
74
75
76
77
78
79
80
81
82
83
84
85
86
87
88
89
90
91
92
93
94
95
96
97
98
99
100
101
102
103
104
105
-
86,250
-
-
195,000
-
-
-
90,000
-
-
-
-
30,000
-
30,000
-
-
-
-
-
-
-
-
-
-
-
-
-
-
-
30,000
-
-
-
30,000
15,000
30,000
30,000
30,000
5,000
30,000
30,000
30,000
30,000
15,000
30,000
30,000
30,000
30,000
30,000
30,000
30,000
15,000
30,000
5,000
15,000
30,000
30,000
30,000
30,000
30,000
15,000
30,000
30,000
30,000
15,000
15,000
5,000
15,000
30,000
-
30,000
30,000
225,000
5,000
30,000
30,000
120,000
30,000
15,000
30,000
30,000
60,000
30,000
60,000
30,000
30,000
15,000
30,000
5,000
15,000
30,000
30,000
30,000
30,000
30,000
15,000
30,000
30,000
30,000
15,000
15,000
5,000
15,000
-
-
-
-
-
-
-
-
-
-
-
-
-
-
-
-
-
-
-
-
-
-
-
-
-
-
-
-
-
-
-
-
-
-
-
-
101,250
-
-
-
-
-
-
-
-
-
-
-
-
-
-
-
-
-
-
-
-
-
-
-
-
-
-
-
-
-
30,000
-
-
-
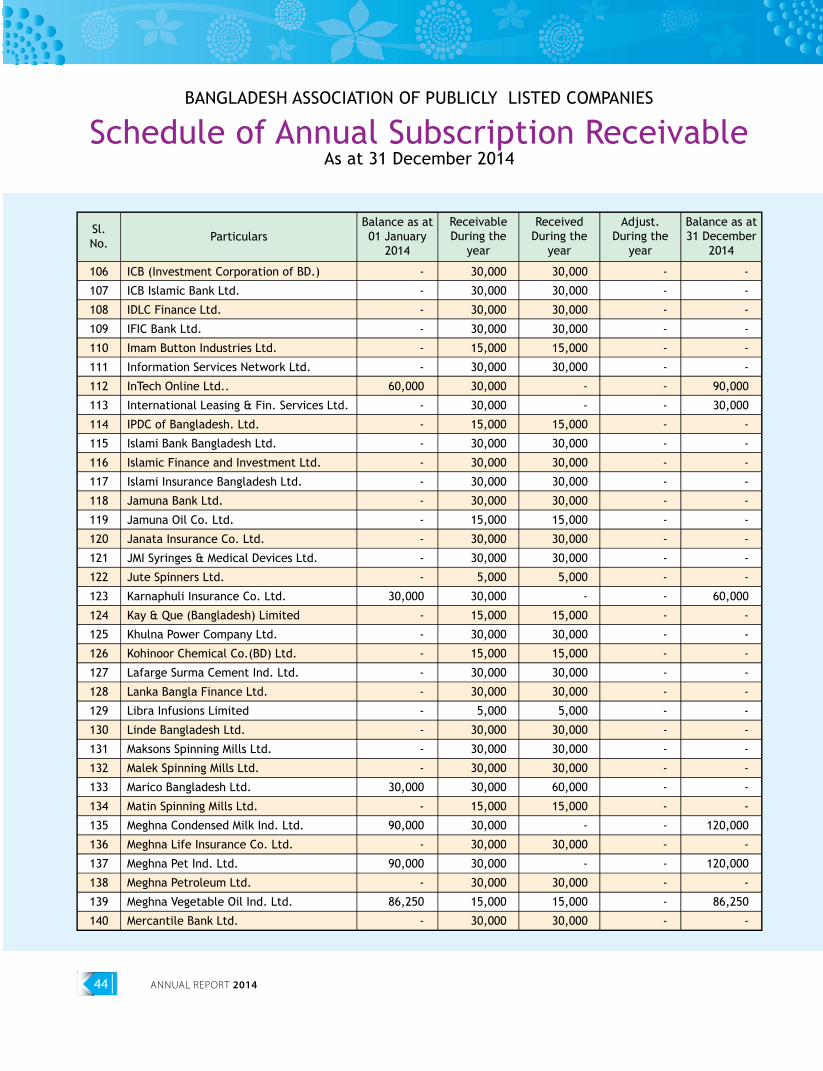
ANNUAL REPORT 201444
BANGLADESH ASSOCIATION OF PUBLICLY LISTED COMPANIES
Schedule of Annual Subscription ReceivableAs at 31 December 2014
Sl.No. Particulars
Balance as at01 January
2014
ReceivableDuring the
year
ReceivedDuring the
year
Adjust.During the
year
Balance as at31 December
2014
ICB (Investment Corporation of BD.)
ICB Islamic Bank Ltd.
IDLC Finance Ltd.
IFIC Bank Ltd.
Imam Button Industries Ltd.
Information Services Network Ltd.
InTech Online Ltd..
International Leasing & Fin. Services Ltd.
IPDC of Bangladesh. Ltd.
Islami Bank Bangladesh Ltd.
Islamic Finance and Investment Ltd.
Islami Insurance Bangladesh Ltd.
Jamuna Bank Ltd.
Jamuna Oil Co. Ltd.
Janata Insurance Co. Ltd.
JMI Syringes & Medical Devices Ltd.
Jute Spinners Ltd.
Karnaphuli Insurance Co. Ltd.
Kay & Que (Bangladesh) Limited
Khulna Power Company Ltd.
Kohinoor Chemical Co.(BD) Ltd.
Lafarge Surma Cement Ind. Ltd.
Lanka Bangla Finance Ltd.
Libra Infusions Limited
Linde Bangladesh Ltd.
Maksons Spinning Mills Ltd.
Malek Spinning Mills Ltd.
Marico Bangladesh Ltd.
Matin Spinning Mills Ltd.
Meghna Condensed Milk Ind. Ltd.
Meghna Life Insurance Co. Ltd.
Meghna Pet Ind. Ltd.
Meghna Petroleum Ltd.
Meghna Vegetable Oil Ind. Ltd.
Mercantile Bank Ltd.
106
107
108
109
110
111
112
113
114
115
116
117
118
119
120
121
122
123
124
125
126
127
128
129
130
131
132
133
134
135
136
137
138
139
140
-
-
-
-
-
-
60,000
-
-
-
-
-
-
-
-
-
-
30,000
-
-
-
-
-
-
-
-
-
30,000
-
90,000
-
90,000
-
86,250
-
30,000
30,000
30,000
30,000
15,000
30,000
30,000
30,000
15,000
30,000
30,000
30,000
30,000
15,000
30,000
30,000
5,000
30,000
15,000
30,000
15,000
30,000
30,000
5,000
30,000
30,000
30,000
30,000
15,000
30,000
30,000
30,000
30,000
15,000
30,000
30,000
30,000
30,000
30,000
15,000
30,000
-
-
15,000
30,000
30,000
30,000
30,000
15,000
30,000
30,000
5,000
-
15,000
30,000
15,000
30,000
30,000
5,000
30,000
30,000
30,000
60,000
15,000
-
30,000
-
30,000
15,000
30,000
-
-
-
-
-
-
-
-
-
-
-
-
-
-
-
-
-
-
-
-
-
-
-
-
-
-
-
-
-
-
-
-
-
-
-
-
-
-
-
-
-
90,000
30,000
-
-
-
-
-
-
-
-
-
60,000
-
-
-
-
-
-
-
-
-
-
-
120,000
-
120,000
-
86,250
-
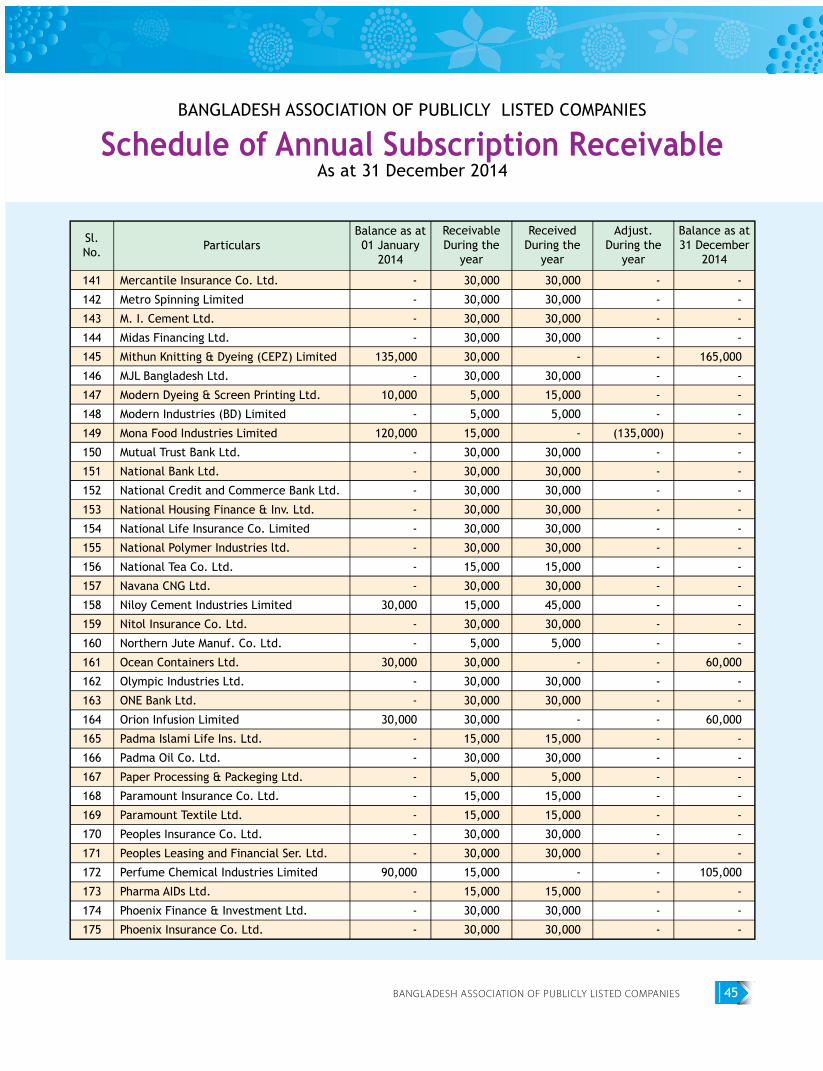
BANGLADESH ASSOCIATION OF PUBLICLY LISTED COMPANIES 45
BANGLADESH ASSOCIATION OF PUBLICLY LISTED COMPANIES
Schedule of Annual Subscription ReceivableAs at 31 December 2014
Sl.No. Particulars
Balance as at01 January
2014
ReceivableDuring the
year
ReceivedDuring the
year
Adjust.During the
year
Balance as at31 December
2014
Mercantile Insurance Co. Ltd.
Metro Spinning Limited
M. I. Cement Ltd.
Midas Financing Ltd.
Mithun Knitting & Dyeing (CEPZ) Limited
MJL Bangladesh Ltd.
Modern Dyeing & Screen Printing Ltd.
Modern Industries (BD) Limited
Mona Food Industries Limited
Mutual Trust Bank Ltd.
National Bank Ltd.
National Credit and Commerce Bank Ltd.
National Housing Finance & Inv. Ltd.
National Life Insurance Co. Limited
National Polymer Industries ltd.
National Tea Co. Ltd.
Navana CNG Ltd.
Niloy Cement Industries Limited
Nitol Insurance Co. Ltd.
Northern Jute Manuf. Co. Ltd.
Ocean Containers Ltd.
Olympic Industries Ltd.
ONE Bank Ltd.
Orion Infusion Limited
Padma Islami Life Ins. Ltd.
Padma Oil Co. Ltd.
Paper Processing & Packeging Ltd.
Paramount Insurance Co. Ltd.
Paramount Textile Ltd.
Peoples Insurance Co. Ltd.
Peoples Leasing and Financial Ser. Ltd.
Perfume Chemical Industries Limited
Pharma AIDs Ltd.
Phoenix Finance & Investment Ltd.
Phoenix Insurance Co. Ltd.
141
142
143
144
145
146
147
148
149
150
151
152
153
154
155
156
157
158
159
160
161
162
163
164
165
166
167
168
169
170
171
172
173
174
175
-
-
-
-
135,000
-
10,000
-
120,000
-
-
-
-
-
-
-
-
30,000
-
-
30,000
-
-
30,000
-
-
-
-
-
-
-
90,000
-
-
-
30,000
30,000
30,000
30,000
30,000
30,000
5,000
5,000
15,000
30,000
30,000
30,000
30,000
30,000
30,000
15,000
30,000
15,000
30,000
5,000
30,000
30,000
30,000
30,000
15,000
30,000
5,000
15,000
15,000
30,000
30,000
15,000
15,000
30,000
30,000
30,000
30,000
30,000
30,000
-
30,000
15,000
5,000
-
30,000
30,000
30,000
30,000
30,000
30,000
15,000
30,000
45,000
30,000
5,000
-
30,000
30,000
-
15,000
30,000
5,000
15,000
15,000
30,000
30,000
-
15,000
30,000
30,000
-
-
-
-
-
-
-
-
(135,000)
-
-
-
-
-
-
-
-
-
-
-
-
-
-
-
-
-
-
-
-
-
-
-
-
-
-
-
-
-
-
165,000
-
-
-
-
-
-
-
-
-
-
-
-
-
-
-
60,000
-
-
60,000
-
-
-
-
-
-
-
105,000
-
-
-
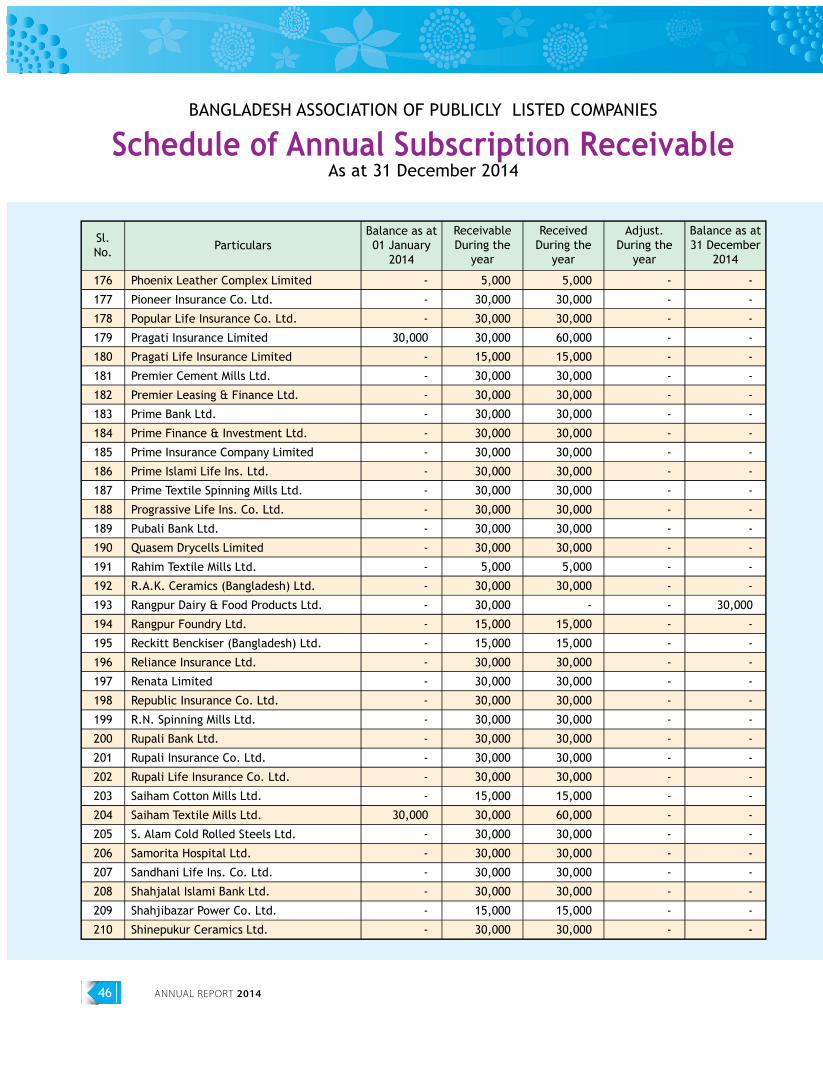
ANNUAL REPORT 201446
BANGLADESH ASSOCIATION OF PUBLICLY LISTED COMPANIES
Schedule of Annual Subscription ReceivableAs at 31 December 2014
Sl.No. Particulars
Balance as at01 January
2014
ReceivableDuring the
year
ReceivedDuring the
year
Adjust.During the
year
Balance as at31 December
2014
Phoenix Leather Complex Limited
Pioneer Insurance Co. Ltd.
Popular Life Insurance Co. Ltd.
Pragati Insurance Limited
Pragati Life Insurance Limited
Premier Cement Mills Ltd.
Premier Leasing & Finance Ltd.
Prime Bank Ltd.
Prime Finance & Investment Ltd.
Prime Insurance Company Limited
Prime Islami Life Ins. Ltd.
Prime Textile Spinning Mills Ltd.
Prograssive Life Ins. Co. Ltd.
Pubali Bank Ltd.
Quasem Drycells Limited
Rahim Textile Mills Ltd.
R.A.K. Ceramics (Bangladesh) Ltd.
Rangpur Dairy & Food Products Ltd.
Rangpur Foundry Ltd.
Reckitt Benckiser (Bangladesh) Ltd.
Reliance Insurance Ltd.
Renata Limited
Republic Insurance Co. Ltd.
R.N. Spinning Mills Ltd.
Rupali Bank Ltd.
Rupali Insurance Co. Ltd.
Rupali Life Insurance Co. Ltd.
Saiham Cotton Mills Ltd.
Saiham Textile Mills Ltd.
S. Alam Cold Rolled Steels Ltd.
Samorita Hospital Ltd.
Sandhani Life Ins. Co. Ltd.
Shahjalal Islami Bank Ltd.
Shahjibazar Power Co. Ltd.
Shinepukur Ceramics Ltd.
176
177
178
179
180
181
182
183
184
185
186
187
188
189
190
191
192
193
194
195
196
197
198
199
200
201
202
203
204
205
206
207
208
209
210
-
-
-
30,000
-
-
-
-
-
-
-
-
-
-
-
-
-
-
-
-
-
-
-
-
-
-
-
-
30,000
-
-
-
-
-
-
5,000
30,000
30,000
30,000
15,000
30,000
30,000
30,000
30,000
30,000
30,000
30,000
30,000
30,000
30,000
5,000
30,000
30,000
15,000
15,000
30,000
30,000
30,000
30,000
30,000
30,000
30,000
15,000
30,000
30,000
30,000
30,000
30,000
15,000
30,000
5,000
30,000
30,000
60,000
15,000
30,000
30,000
30,000
30,000
30,000
30,000
30,000
30,000
30,000
30,000
5,000
30,000
-
15,000
15,000
30,000
30,000
30,000
30,000
30,000
30,000
30,000
15,000
60,000
30,000
30,000
30,000
30,000
15,000
30,000
-
-
-
-
-
-
-
-
-
-
-
-
-
-
-
-
-
-
-
-
-
-
-
-
-
-
-
-
-
-
-
-
-
-
-
-
-
-
-
-
-
-
-
-
-
-
-
-
-
-
-
-
30,000
-
-
-
-
-
-
-
-
-
-
-
-
-
-
-
-
-
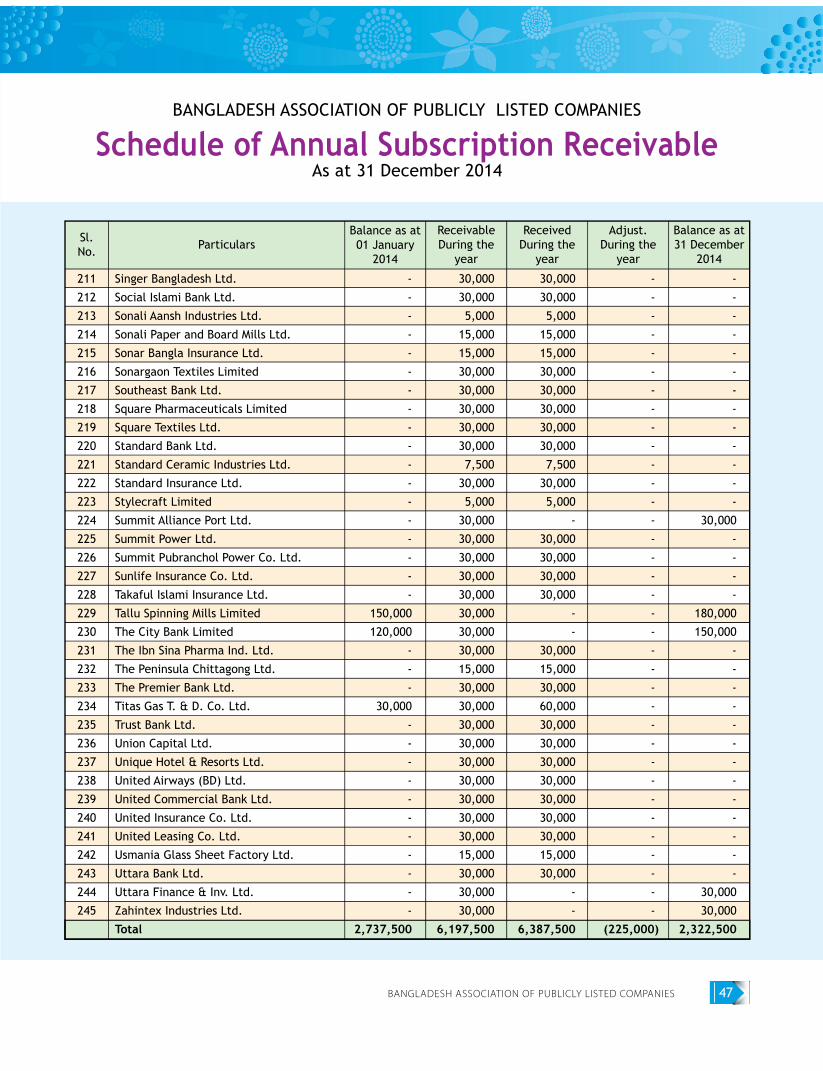
BANGLADESH ASSOCIATION OF PUBLICLY LISTED COMPANIES 47
BANGLADESH ASSOCIATION OF PUBLICLY LISTED COMPANIES
Schedule of Annual Subscription ReceivableAs at 31 December 2014
Sl.No. Particulars
Balance as at01 January
2014
ReceivableDuring the
year
ReceivedDuring the
year
Adjust.During the
year
Balance as at31 December
2014
Singer Bangladesh Ltd.
Social Islami Bank Ltd.
Sonali Aansh Industries Ltd.
Sonali Paper and Board Mills Ltd.
Sonar Bangla Insurance Ltd.
Sonargaon Textiles Limited
Southeast Bank Ltd.
Square Pharmaceuticals Limited
Square Textiles Ltd.
Standard Bank Ltd.
Standard Ceramic Industries Ltd.
Standard Insurance Ltd.
Stylecraft Limited
Summit Alliance Port Ltd.
Summit Power Ltd.
Summit Pubranchol Power Co. Ltd.
Sunlife Insurance Co. Ltd.
Takaful Islami Insurance Ltd.
Tallu Spinning Mills Limited
The City Bank Limited
The Ibn Sina Pharma Ind. Ltd.
The Peninsula Chittagong Ltd.
The Premier Bank Ltd.
Titas Gas T. & D. Co. Ltd.
Trust Bank Ltd.
Union Capital Ltd.
Unique Hotel & Resorts Ltd.
United Airways (BD) Ltd.
United Commercial Bank Ltd.
United Insurance Co. Ltd.
United Leasing Co. Ltd.
Usmania Glass Sheet Factory Ltd.
Uttara Bank Ltd.
Uttara Finance & Inv. Ltd.
Zahintex Industries Ltd.
Total
211
212
213
214
215
216
217
218
219
220
221
222
223
224
225
226
227
228
229
230
231
232
233
234
235
236
237
238
239
240
241
242
243
244
245
-
-
-
-
-
-
-
-
-
-
-
-
-
-
-
-
-
-
150,000
120,000
-
-
-
30,000
-
-
-
-
-
-
-
-
-
-
-
2,737,500
30,000
30,000
5,000
15,000
15,000
30,000
30,000
30,000
30,000
30,000
7,500
30,000
5,000
30,000
30,000
30,000
30,000
30,000
30,000
30,000
30,000
15,000
30,000
30,000
30,000
30,000
30,000
30,000
30,000
30,000
30,000
15,000
30,000
30,000
30,000
6,197,500
30,000
30,000
5,000
15,000
15,000
30,000
30,000
30,000
30,000
30,000
7,500
30,000
5,000
-
30,000
30,000
30,000
30,000
-
-
30,000
15,000
30,000
60,000
30,000
30,000
30,000
30,000
30,000
30,000
30,000
15,000
30,000
-
-
6,387,500
-
-
-
-
-
-
-
-
-
-
-
-
-
-
-
-
-
-
-
-
-
-
-
-
-
-
-
-
-
-
-
-
-
-
-
(225,000)
-
-
-
-
-
-
-
-
-
-
-
-
-
30,000
-
-
-
-
180,000
150,000
-
-
-
-
-
-
-
-
-
-
-
-
-
30,000
30,000
2,322,500
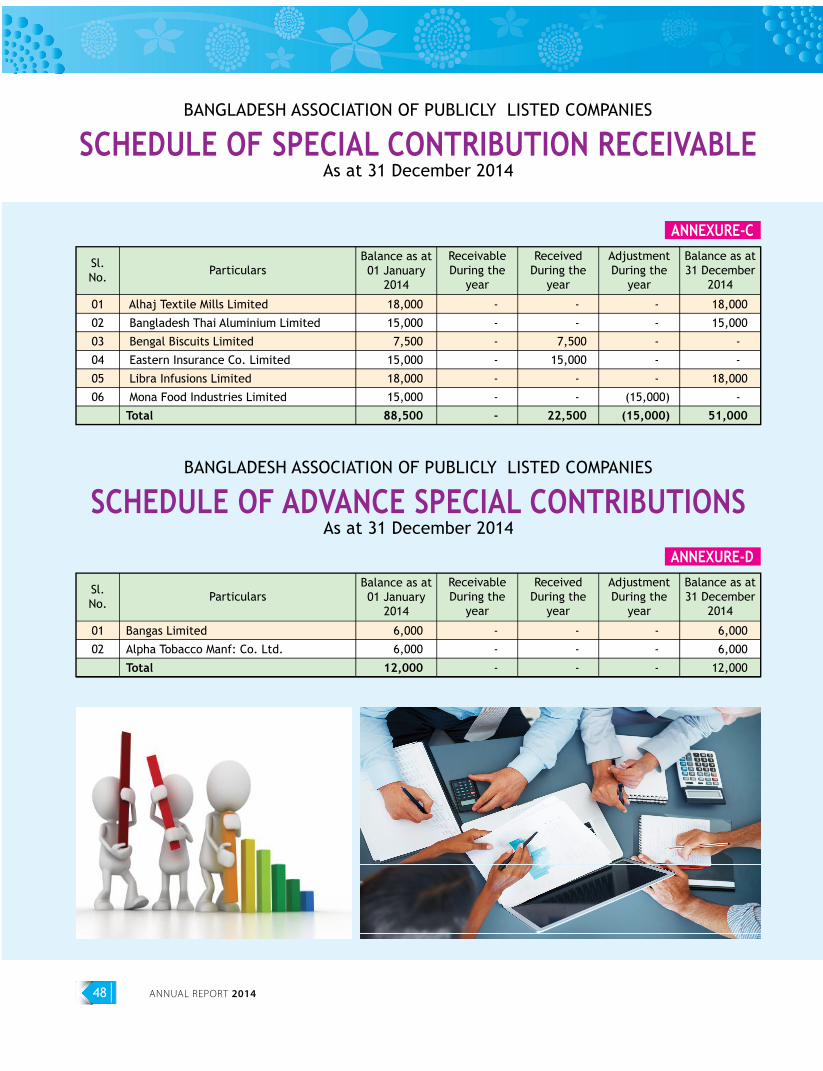
ANNUAL REPORT 201448
BANGLADESH ASSOCIATION OF PUBLICLY LISTED COMPANIES
SCHEDULE OF SPECIAL CONTRIBUTION RECEIVABLEAs at 31 December 2014
Sl.No. Particulars
Balance as at01 January
2014
ReceivableDuring the
year
ReceivedDuring the
year
AdjustmentDuring the
year
Balance as at31 December
2014
Alhaj Textile Mills Limited
Bangladesh Thai Aluminium Limited
Bengal Biscuits Limited
Eastern Insurance Co. Limited
Libra Infusions Limited
Mona Food Industries Limited
Total
01
02
03
04
05
06
18,000
15,000
7,500
15,000
18,000
15,000
88,500
-
-
-
-
-
-
-
-
-
7,500
15,000
-
-
22,500
-
-
-
-
-
(15,000)
(15,000)
18,000
15,000
-
-
18,000
-
51,000
ANNEXURE-C
BANGLADESH ASSOCIATION OF PUBLICLY LISTED COMPANIES
SCHEDULE OF ADVANCE SPECIAL CONTRIBUTIONSAs at 31 December 2014
Sl.No. Particulars
Balance as at01 January
2014
ReceivableDuring the
year
ReceivedDuring the
year
AdjustmentDuring the
year
Balance as at31 December
2014
Bangas Limited
Alpha Tobacco Manf: Co. Ltd.
Total
01
02
6,000
6,000
12,000
-
-
-
-
-
-
-
-
-
6,000
6,000
12,000
ANNEXURE-D
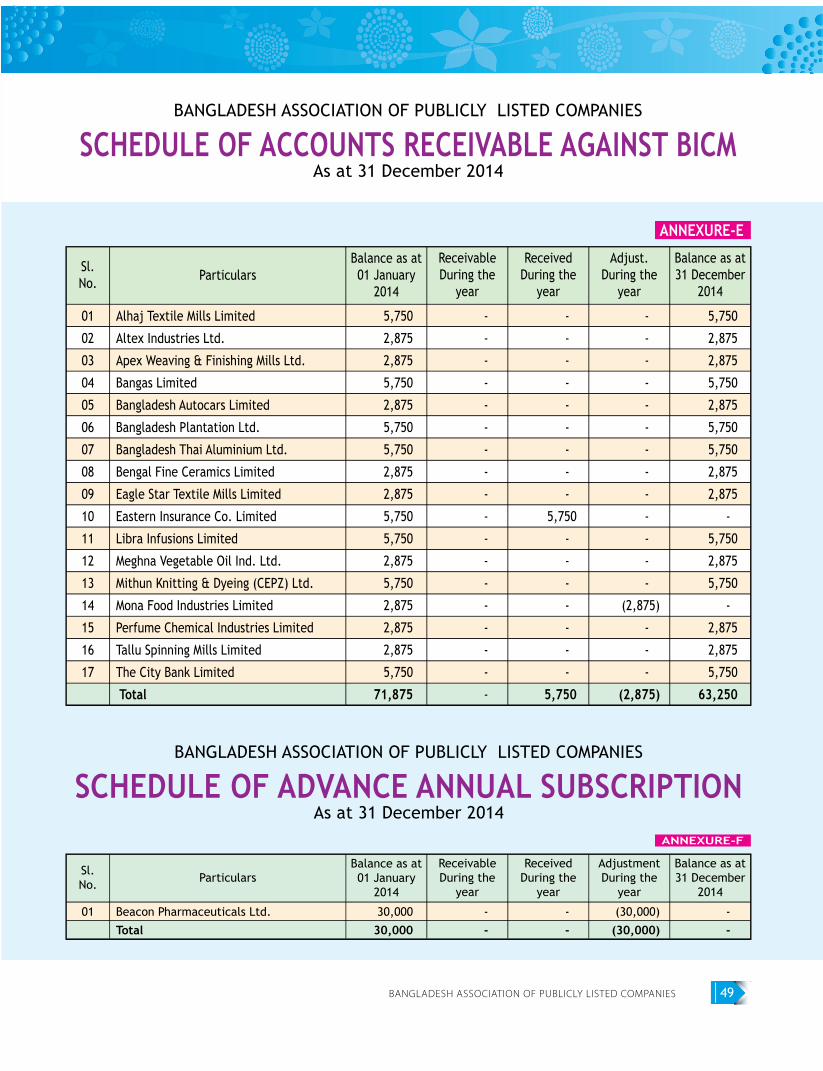
BANGLADESH ASSOCIATION OF PUBLICLY LISTED COMPANIES 49
BANGLADESH ASSOCIATION OF PUBLICLY LISTED COMPANIES
SCHEDULE OF ACCOUNTS RECEIVABLE AGAINST BICMAs at 31 December 2014
Sl.No. Particulars
Balance as at01 January
2014
ReceivableDuring the
year
ReceivedDuring the
year
Adjust.During the
year
Balance as at31 December
2014
Alhaj Textile Mills Limited
Altex Industries Ltd.
Apex Weaving & Finishing Mills Ltd.
Bangas Limited
Bangladesh Autocars Limited
Bangladesh Plantation Ltd.
Bangladesh Thai Aluminium Ltd.
Bengal Fine Ceramics Limited
Eagle Star Textile Mills Limited
Eastern Insurance Co. Limited
Libra Infusions Limited
Meghna Vegetable Oil Ind. Ltd.
Mithun Knitting & Dyeing (CEPZ) Ltd.
Mona Food Industries Limited
Perfume Chemical Industries Limited
Tallu Spinning Mills Limited
The City Bank Limited
Total
01
02
03
04
05
06
07
08
09
10
11
12
13
14
15
16
17
5,750
2,875
2,875
5,750
2,875
5,750
5,750
2,875
2,875
5,750
5,750
2,875
5,750
2,875
2,875
2,875
5,750
71,875
-
-
-
-
-
-
-
-
-
-
-
-
-
-
-
-
-
-
-
-
-
-
-
-
-
-
-
5,750
-
-
-
-
-
-
-
5,750
-
-
-
-
-
-
-
-
-
-
-
-
-
(2,875)
-
-
-
(2,875)
5,750
2,875
2,875
5,750
2,875
5,750
5,750
2,875
2,875
-
5,750
2,875
5,750
-
2,875
2,875
5,750
63,250
ANNEXURE-E
BANGLADESH ASSOCIATION OF PUBLICLY LISTED COMPANIES
SCHEDULE OF ADVANCE ANNUAL SUBSCRIPTIONAs at 31 December 2014
Sl.No. Particulars
Balance as at01 January
2014
ReceivableDuring the
year
ReceivedDuring the
year
AdjustmentDuring the
year
Balance as at31 December
2014
Beacon Pharmaceuticals Ltd.
Total 01 30,000
30,000 -
- -
- (30,000)
(30,000) -
-
ANNEXURE-F
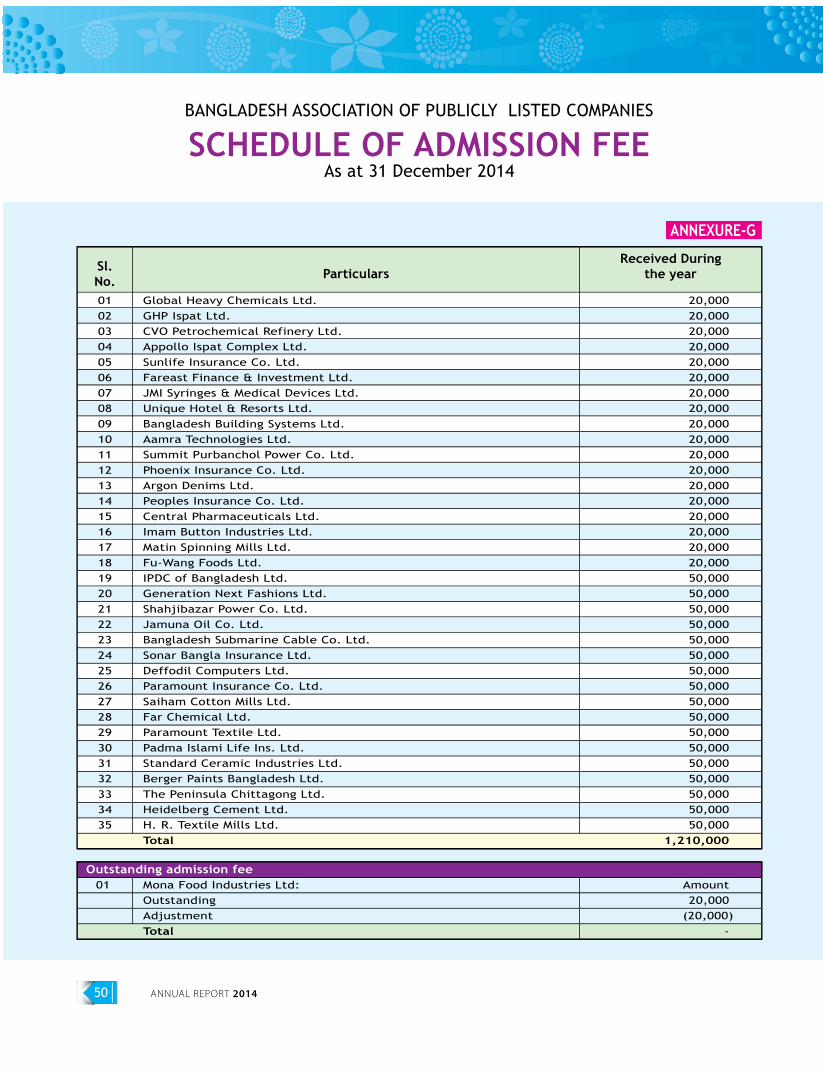
ANNUAL REPORT 201450
BANGLADESH ASSOCIATION OF PUBLICLY LISTED COMPANIES
SCHEDULE OF ADMISSION FEEAs at 31 December 2014
ANNEXURE-G
Received Duringthe yearParticularsSl.
No.0102030405060708091011121314151617181920212223242526272829303132333435
Global Heavy Chemicals Ltd.GHP Ispat Ltd.CVO Petrochemical Refinery Ltd.Appollo Ispat Complex Ltd.Sunlife Insurance Co. Ltd.Fareast Finance & Investment Ltd.JMI Syringes & Medical Devices Ltd.Unique Hotel & Resorts Ltd.Bangladesh Building Systems Ltd.Aamra Technologies Ltd.Summit Purbanchol Power Co. Ltd.Phoenix Insurance Co. Ltd.Argon Denims Ltd.Peoples Insurance Co. Ltd.Central Pharmaceuticals Ltd.Imam Button Industries Ltd.Matin Spinning Mills Ltd.Fu-Wang Foods Ltd.IPDC of Bangladesh Ltd.Generation Next Fashions Ltd.Shahjibazar Power Co. Ltd.Jamuna Oil Co. Ltd.Bangladesh Submarine Cable Co. Ltd.Sonar Bangla Insurance Ltd.Deffodil Computers Ltd.Paramount Insurance Co. Ltd.Saiham Cotton Mills Ltd.Far Chemical Ltd.Paramount Textile Ltd.Padma Islami Life Ins. Ltd.Standard Ceramic Industries Ltd.Berger Paints Bangladesh Ltd.The Peninsula Chittagong Ltd.Heidelberg Cement Ltd.H. R. Textile Mills Ltd.Total
20,000 20,000 20,000 20,000 20,000 20,000 20,000 20,000 20,000 20,000 20,000 20,000 20,000 20,000 20,000 20,000 20,000 20,000 50,000 50,000 50,000 50,000 50,000 50,000 50,000 50,000 50,000 50,000 50,000 50,000 50,000 50,000 50,000 50,000 50,000
1,210,000
Mona Food Industries Ltd:OutstandingAdjustmentTotal
Amount 20,000
(20,000) -
Outstanding admission fee01

BANGLADESH ASSOCIATION OF PUBLICLY LISTED COMPANIES 51
Notes

ANNUAL REPORT 201452
Notes

BANGLADESH ASSOCIATION OF PUBLICLY LISTED COMPANIESBlock B, Road 1, House 17, Unit A, Nilketan Eastern Housing Complex, Gulshan 1, Dhaka-1212, BangladeshTel: +(880) 2 - 8824926, Fax: +(880) 2 - 9887245, E-mail: [email protected], [email protected]