annual report 2018 - bank negara malaysia
TRANSCRIPT
Statutory Requirements
In accordance with section 13 of the Central Bank of Malaysia Act 2009, Bank Negara Malaysia hereby publishes and has transmitted to the Minister of Finance a copy of this Annual Report 2018 together with a copy of its Financial Statements for the year ended 31 December 2018, which have been examined and certified by the Auditor General. The Financial Statements will also be published in the Gazette.
For the purposes of section 115 of the Development Financial Institutions Act 2002, the annual report on the administration of the Development Financial Institutions Act 2002 and other related matters for the year ended 31 December 2018 is incorporated in Bank Negara Malaysia’s Financial Stability and Payment Systems Report 2018 which forms an integral part of this Annual Report 2018.
Nor Shamsiah YunusChairman
Board of Directors27 March 2019

Governor’s Statement
Key Highlights
Executive Summary
Economic Developments in 2018
13 The International Economic Environment16 The Malaysian Economy23 External Sector29 Inflation Developments35 Box Article: Are Malaysian Workers Paid Fairly?: An Assessment of Productivity and Equity48 Box Article: Malaysia’s Resilience in Managing External Debt Obligations and the Adequacy of International Reserves
Monetary and Financial Conditions in 2018
65 International Monetary and Financial Conditions 67 Domestic Monetary and Financial Conditions
Monetary Policy in 2018
77 Monetary Policy and Monetary Operations
Contents
Outlook and Policy in 2019
83 The International Economic Outlook83 The Malaysian Economy88 External Sector89 Inflation Outlook 90 Monetary Policy90 Fiscal Policy93 Box Article: When the Future Starts Today: Inflation Expectations of Malaysian Households
Contents
Board of Directors, Senior Management and Committees of the Bank
125 Board of Directors126 Senior Management127 Monetary Policy Committee128 Financial Stability Executive Committee129 Shariah Advisory Council130 Financial Stability Committee
Annual Financial Statements
139 Statement of Financial Position as at 31 December 2018140 Income Statement for the Year Ended 31 December 2018141 Notes to the Financial Statement for the Year Ended 31 December 2018
Governance and Organisational Development
109 The Board of Directors110 Risk Management and Internal Controls114 Our People117 Technology117 Engaging with Our Stakeholders121 Organisation Structure122 List of Senior Officers
Annex
Glossary, Acronyms and Abbreviations
The year ahead is being shaped by significant developments in the operating environment, both globally and domestically. In a marked departure from the optimistic start in 2018, the global economy is set to enter a period of moderating growth, with continued volatility in the financial markets. Domestically, the unprecedented change of government entails new fiscal, economic and reform priorities. Amid these shifts that are continuing to unfold, the Malaysian economy remains resilient, supported by strong fundamentals and policy flexibility.
Prospects for global growth will be contingent upon the outcome of several key risk factors. Trade tensions, if unresolved, will have a material impact on global trade and investments. Prolonged political and policy uncertainties could further weigh on global growth prospects. Meanwhile, lower commodity prices will continue to exert pressure on commodity-exporting countries. In this environment of heightened uncertainties, global financial markets could be subject to shifts in investor sentiments and bouts of volatile capital flows, with emerging market economies inevitably caught in the crosshairs.
As a highly open economy with an internationally integrated financial system, Malaysia will also be affected by these developments. Nevertheless, we face these headwinds from a position of strength, reinforced by a diversified economy, a resilient external position and a strong financial system. The Malaysian economy is expected to remain on a steady growth path, expanding between 4.3% – 4.8% in 2019. This growth will continue to be anchored by private sector activity, supported by stable income and employment growth, as well as sustained capacity expansion by businesses. The well-diversified export structure, in terms of products and markets, will help soften the impact of moderating global growth on external demand. New production facilities and the recovery from the supply disruptions in the commodity sector will provide additional impetus to domestic economic activity. The well-developed financial system with strong financial institutions will ensure that domestic financing conditions remain supportive of the changing needs of the economy.
In this environment of heightened risks, the focus of the Bank’s policy is on preserving monetary and financial stability by reinforcing the resilience of the economy and addressing vulnerabilities. The Bank strives to identify and manage risks before they become destabilising, while building policy space and buffers pre-emptively. The broad range of policy instruments available, which includes targeted prudential policies and financial market measures,
Governor’s Statement
provides the Bank with policy flexibility while avoiding an over-reliance on any particular policy tool. This in turn supports a forward-looking approach to macroeconomic management, with due regard to the multifaceted and complex nature of risks.
Recognising the downside risks to domestic growth, the thrust of monetary policy in 2019 is to remain accommodative to ensure supportive conditions for sustainable economic growth amid the subdued inflation outlook. Average headline inflation in 2019 is expected to be broadly stable relative to 2018. The current period of low headline inflation is due largely to key policy measures, rather than a sharp deterioration in demand conditions. Inflation expectations also remain well anchored. These policy measures would therefore have a transitory effect on headline inflation.
The flexible exchange rate regime continues to be a key source of strength for the Malaysian economy in managing more volatile capital flows and their effects on domestic financial conditions. The exchange rate flexibility acts as a shock absorber for the economy, increasing its resilience when faced with external shocks. Nevertheless, as the exchange rate represents an important price for economic and financial market activities, the Bank continues to ensure orderly market conditions and manage excessive volatility so that the intermediation process is not disrupted. The sustained current account surplus and adequate international reserves accord crucial buffers to flexibly manage the impact of volatile capital flows on the exchange rate and the overall economy. In addition, ongoing measures to deepen the onshore foreign exchange market have supported more efficient hedging activities by economic and financial market participants to better manage their foreign exchange risks.
The Government’s commitment to further strengthen fiscal management and reduce the fiscal deficit and debt, with clear outcomes, actions and timeline, will solidify the foundations for sustainable growth. Critically, the ongoing fiscal reforms to governance and institutional frameworks will serve to reinforce responsible and sustainable financial management. These reforms remain supportive of growth, while allowing fiscal consolidation efforts to continue.
At the same time, there is an urgent need to reinvigorate private investment, which is essential for Malaysia’s economic progress. Attracting high-quality investments should be a key focus of policy to enhance the productive capacity of the economy and create the right kind of jobs for people from all walks of life. This calls for a clear national investment policy thrust, supported by effective incentives, a coordinated promotional strategy, and efficient business-friendly regulatory and approval regimes. Such policies should encourage the exploration, cultivation and development of new growth areas, including the digital economy and green technology.
It is equally important that Malaysia’s economic progress is accompanied by inclusive growth, where the dividends accrue to all segments of society and vulnerable groups are appropriately protected. Within the boundaries of its mandate, the Bank has continued to focus on promoting the financial resilience and financial wellbeing of Malaysian households, and providing economic advice to the Government in areas concerning the rising cost of living, affordable housing and access to financial protection.
There are also ongoing collaborative efforts on the international front to further promote regional macroeconomic and financial stability. In an integrated global economy and financial system, these arrangements are necessary to build collective resilience. Such initiatives are being pursued
with strategic bilateral partners and through global and regional platforms. This will enhance our capacity to manage potential spillover risks from external developments through closer cooperation in macroeconomic and financial surveillance and strengthened financial safety net arrangements. Amid adjustments in the global trade configuration, the Bank remains committed to support the deepening of regional economic interlinkages and financial integration. This will be achieved through effective participation in a number of trade and investment agreements, closer banking and payment linkages, as well as increased settlement of trade and investment in local currencies. In response to the growing challenges and risks posed by environmental and climate change, the Bank became a member of the Central Banks and Supervisors Network for Greening the Financial System with a view to working collaboratively with other central banks and supervisors to support the transition towards a sustainable economy.
The Bank also continues to further strengthen the internal governance structure and practices to preserve the credibility of, and confidence in, the Bank. The Bank’s corporate culture is being actively enhanced to foster an open, agile and collaborative environment. Grounded by the values and traditions of trust, integrity and professionalism, the Bank also strives to position itself at the forefront of change. Business strategies are being reviewed and resources optimised to sharpen our focus and ensure we remain steadfast in the delivery of our mandates. At the same time, the Bank places high priority on the continued enhancement and modernisation of the internal organisational capacity, both in human capital and infrastructure development. Having a cohesive and talented workforce, equipped with progressive technology, is key in ensuring that the Bank is able to carry out its responsibilities effectively, efficiently and in a sustainable manner.
In 2019, we celebrate the 60th anniversary of Bank Negara Malaysia at a time of transformative change. While the operating environment continues to evolve, the Bank has remained steadfast throughout the years in serving the interest of the nation. The Malaysian economy has also consistently demonstrated the dynamism and agility to thrive and flourish in an ever-changing environment. As we move forward, the collective strength of our economic resilience and institutional arrangements will serve as an anchor in these testing times. At the heart of the Bank’s ability to fulfil our responsibilities is the expertise and commitment of our staff. On behalf of the Board and the management, I wish to express our utmost appreciation to all the staff of the Bank for their professionalism, dedication and hard work. I would also like to extend my gratitude to the Board of Directors for their support and guidance. The Bank will continue to strive towards achieving the highest standards of excellence in delivering our mandates and upholding the trust that is placed upon us.
Nor Shamsiah YunusGovernor
27 March 2019
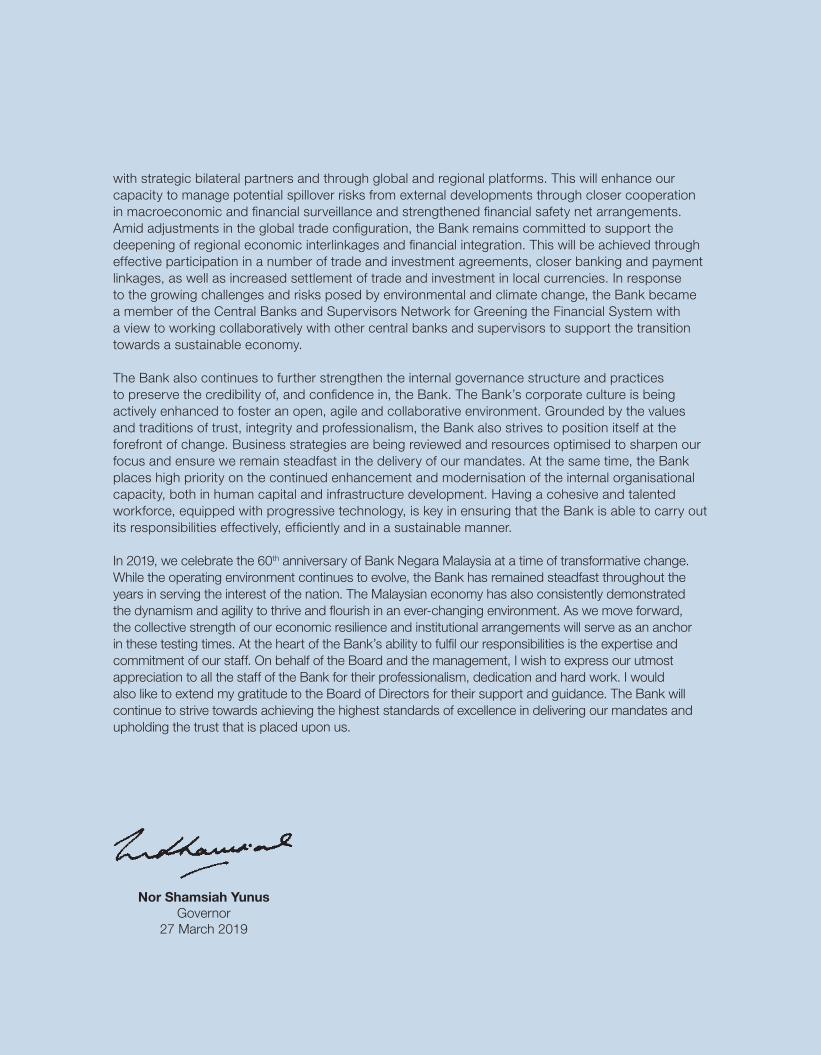
Key Highlights onEconomic Developments and Outlook
Sustained growth momentum in 2019
Broadly stable average headline inflation in 2019
The economy to expand by 4.3% – 4.8% in 2019...
(Annual growth, %)
Upward impact from cost factors offset by lower domestic retail fuel prices
Domestic cost factors, including those arising from policy developments
Price ceilings for RON95 petrol and diesel until mid-year
Lower global oil prices
Some cost pass-through from:
Offset by impact from:
Exports and current account balance to remain positive in 2019
Headline inflation (Annual growth, %)
Gross Exports (Annual growth, %)
Export growth supported by manufactured exports
Current account balance at RM28.0 bil or1.5% – 2.5% of GNI (2018p: 2.4%)
Current account surplus driven by goods surplus
Services deficit -RM19.8 bil
Income deficit-RM68.3 bil
Goods surplusRM116.2 bil
Real GDP (Annual growth, %)
2018p4.7%
2019f4.3% – 4.8%
2019f2015 2017
1.7
1.0
0.7
PrivateConsumption
PrivateInvestment
Commodity(Agriculture & Mining)
2019f
6.6%4.9%
2019f+1.8%
2018p-1.0%
p Preliminaryf Forecast
...supported by firm private sector activityand recovery in commodity sectors
Continueddemand from keytrade partners
Diversified manufacturedexport base
New productioncapacity2018p
2013-17average
2019f
6.1%
6.8%
3.4%
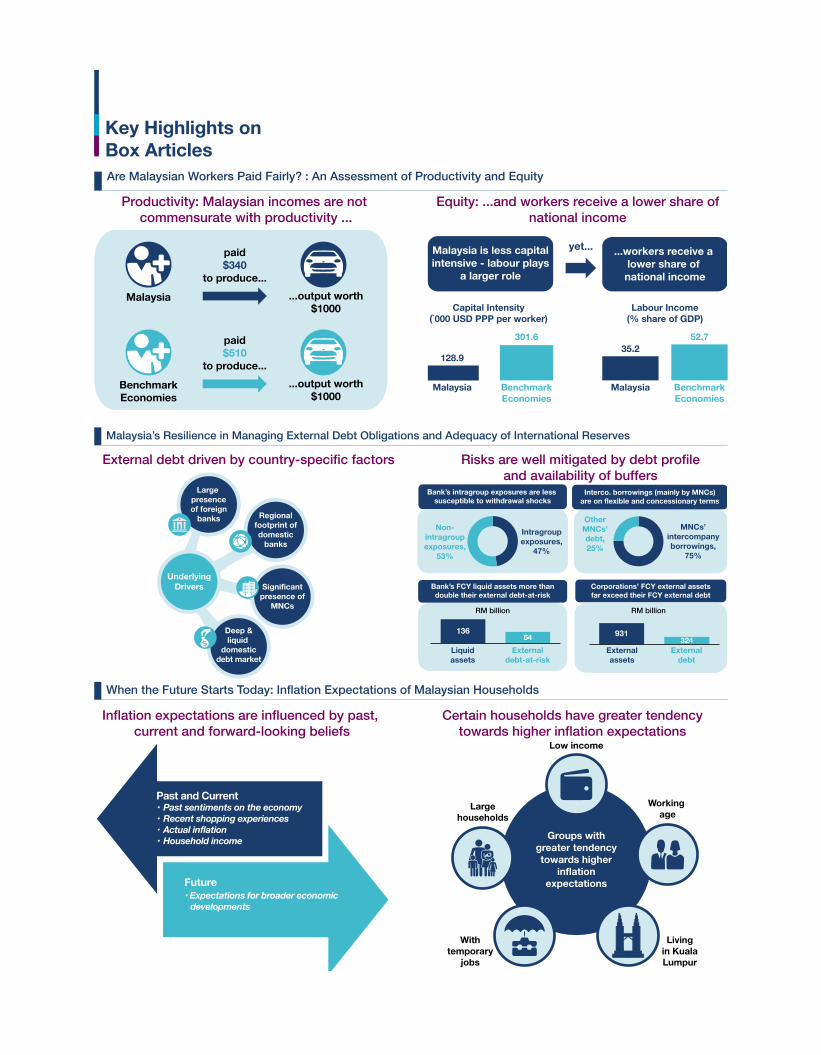
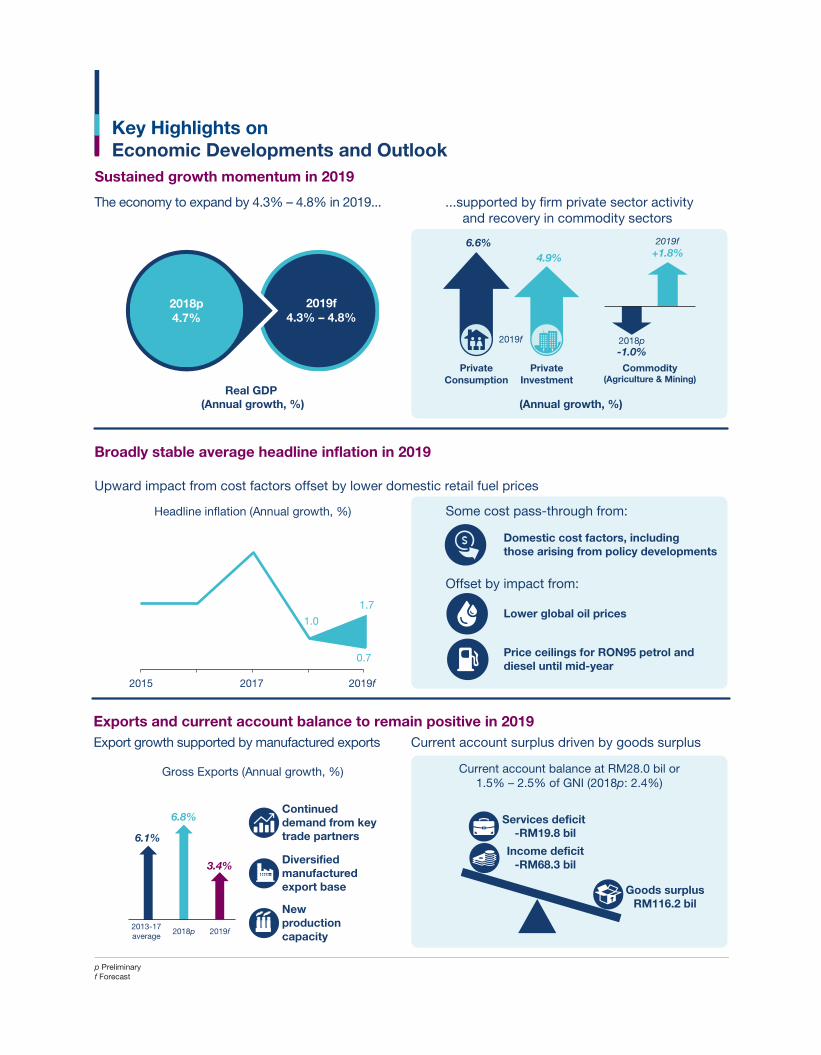
Are Malaysian Workers Paid Fairly? : An Assessment of Productivity and Equity
Malaysia’s Resilience in Managing External Debt Obligations and Adequacy of International Reserves
When the Future Starts Today: Inflation Expectations of Malaysian Households
Key Highlights onBox Articles
Productivity: Malaysian incomes are not commensurate with productivity ...
External debt driven by country-specific factors
Inflation expectations are influenced by past, current and forward-looking beliefs
Certain households have greater tendencytowards higher inflation expectations
Equity: ...and workers receive a lower share ofnational income
Malaysia
paid$340
to produce......output worth
$1000
BenchmarkEconomies
paid$510
to produce......output worth
$1000
Capital Intensity(`000 USD PPP per worker)
Malaysia
128.9
BenchmarkEconomies
301.6
Malaysia
35.2
BenchmarkEconomies
52.7
Labour Income(% share of GDP)
yet...Malaysia is less capitalintensive - labour plays
a larger role
...workers receive a lower share of national income
Large presenceof foreign
banks Regionalfootprint ofdomestic
banks
Significantpresence of
MNCs
UnderlyingDrivers
Deep &liquid
domesticdebt market
Risks are well mitigated by debt profileand availability of buffers
Bank’s intragroup exposures are less susceptible to withdrawal shocks
Bank’s FCY liquid assets more thandouble their external debt-at-risk
Interco. borrowings (mainly by MNCs)are on flexible and concessionary terms
Corporations’ FCY external assetsfar exceed their FCY external debt
Non-intragroupexposures,
53%
RM billion
13664
OtherMNCs’debt,25%
Intragroupexposures,
47%
Liquidassets
Externaldebt-at-risk
RM billion
931324
Externalassets
Externaldebt
MNCs’intercompanyborrowings,
75%
Low income
Largehouseholds
Withtemporary
jobs
Livingin KualaLumpur
Working age
Groups withgreater tendencytowards higher
inflationexpectationsFuture
• Expectations for broader economic developments
Past and Current• Past sentiments on the economy• Recent shopping experiences• Actual inflation• Household income


1Annual Report 2018
Executive S
umm
ary
Executive Summary

2 Annual Report 2018
Executive S
umm
ary
Executive Summary
3Annual Report 2018
The global economy started the year 2018 on a positive note following expectations for a stronger growth momentum from the previous year. In the earlier part of the year, both global trade and growth continued the upward trajectory which began since end-2016. As the year progressed, however, the global economy was confronted with multiple headwinds such as the escalation of trade conflicts, renewed volatility in commodity prices, and bouts of volatility in global financial markets. As a result, most major advanced and regional economies experienced a more moderate expansion during the year. In the advanced economies, improving labour market conditions lifted consumption activity. In Asian economies, GDP growth was predicated on continued resilience in domestic demand amid waning support from external demand. Global headline inflation in 2018 was higher, driven mainly by supply-related factors. Core inflation rates remained modest across both advanced and emerging market economies, reflecting moderating demand pressures.
Overall global financial conditions tightened in 2018, reflecting the normalisation of global monetary policy and heightened financial market volatility due to ongoing policy and economic uncertainties. Monetary policies in most advanced economies, particularly the US, remained on their normalisation paths. Emerging market economies also experienced tighter financial conditions as the monetary policy normalisation in advanced economies led to large portfolio outflows from emerging market financial assets. At the same time, ongoing risk-off developments such as the global trade tensions further contributed to sudden shifts in investor sentiments and episodes of financial market volatility. As funds shifted away from emerging market economies, pockets of vulnerabilities also emerged in some of these economies, which culminated in the currency sell-offs in Argentina and Turkey. A number of central banks in emerging market economies also tightened monetary policy due to concerns on higher inflation arising from the depreciation of their currencies
and the earlier increases in commodity prices. As a result of these developments, financial market performances in advanced economies, particularly the US, and emerging market economies diverged during the year.
Despite the challenging global economic and financial environment, the Malaysian economy demonstrated resilience and recorded a respectable growth of 4.7% in 2018. The Annual Report provides an analysis of the development in the Malaysian economy and outlines the future challenges. The report also highlights the Bank’s continuous efforts to strengthen its governance and organisational development.
The Malaysian Economy in 2018
The Malaysian economy expanded at a more moderate pace of 4.7% in 2018 (2017: 5.9%). Despite a positive start to 2018, the economy subsequently was confronted with several external and domestic challenges. Major policy and political shifts, arising partly from the global trade tensions and the historic change of government in Malaysia, became sources of uncertainty for the economy. Unanticipated supply disruptions in the mining and agriculture sectors, as well as commodity exports adversely affected Malaysia’s economic performance, resulting in a larger-than-expected moderation in growth.
Domestic demand continued to anchor growth, supported mainly by private sector expenditure. Private consumption growth, in particular, recorded the fastest rate since 2012 at 8.1% (2017: 7.0%). Favourable wage and employment growth continued to drive household spending with additional support from the three-month tax holiday (1 June – 31 August) following the zerorisation of the Goods and Services Tax (GST) rate, as well as other Government measures such as the fixing of the retail fuel price of RON95 petrol and special payments to civil servants and pensioners.
4 Annual Report 2018
Executive S
umm
ary
In line with the Government’s commitment to reprioritise expenditures, public consumption growth moderated to 3.3% (2017: 5.4%). Gross fixed capital formation (GFCF) expanded at a slower pace of 1.4% (2017: 6.2%) due to a contraction in public investment and the slower expansion in private investment. Public investment declined by 5.2% (2017: 0.1%) following lower spending by public corporations. Private investment grew at a slower pace of 4.5% (2017: 9.3%) amid heightened uncertainty stemming from both external and domestic developments. However, firms, particularly in the export-oriented sectors, continued to increase production capacity and improve efficiency to meet demand.
On the supply side, most economic sectors recorded an expansion, with the exception of commodity-related sectors. The services sector’s growth improved to 6.8% (2017: 6.2%), the highest since 2011, as better consumer sentiments and favourable labour market conditions spurred spending, in particular during the tax holiday period. The manufacturing sector expanded by 5.0% (2017: 6.0%) supported primarily by a continued expansion in the electrical and electronics (E&E) cluster. The construction sector recorded a moderate growth of 4.2% (2017: 6.7%) due to weaknesses in the property segment. Growth in the mining sector, however, contracted by 1.5% (2017: 1.0%) due to the decline in natural gas production, while adverse weather and production constraints that affected palm oil and rubber production led to a decline in growth in the agriculture sector (2018: -0.4%, 2017: 7.2%).
In the labour market, employment growth was strong at 2.5% (2017: 2.0%), amounting to an additional employment gain of 360,250 persons. Meanwhile, the labour force grew by 2.5% (2017: 1.9%), which amounted to 372,875 persons entering the labour force. The labour force participation rate also rose to 68.4% (2017: 68.0%). As a result, the unemployment rate remained unchanged at 3.4%. Net employment gains were driven mainly by high- and mid-skilled workers, which grew by 1.6% and 4.2% respectively. Reported retrenchments continued on its decreasing trend (23,168 persons; 2017: 35,097 persons), below the long-run average of 29,628 persons per annum. Aggregate nominal wages in the private and public sectors grew by 6.0% and 4.5% respectively (2017: 6.4% and 6.2%, respectively).
In 2018, headline inflation declined to 1.0% (2017: 3.7%). The moderation mainly reflected the impact of the fixing of retail fuel prices and the zerorisation of the GST rate. These factors more than offset upward cost pressures that remained present for some parts of 2018. Core inflation averaged lower at 1.6% (2017: 2.3%) amid smaller cost pass-through to retail prices and the absence of excessive demand pressures.
Malaysia’s external position remained resilient amid an increasingly challenging global economic environment. The current account of the balance of payments continued to register a healthy surplus of 2.4% of GNI (2017: 3.1% of GNI), contributed by a higher goods surplus and a smaller services deficit, which more than offset the deficit in the income accounts. Gross exports registered a more moderate growth of 6.8% in 2018 (2017: 18.8%) driven by manufactured exports which helped to partially offset the decline in commodity exports. Gross imports growth also moderated to 4.9% (2017: 19.7%), on account of weaker intermediate and capital imports.
During the year, movements in short-term flows dominated capital flow developments as the financial account of the balance of payments recorded a net inflow of RM18.6 billion (2017: net outflow of RM4.7 billion). A reversal of portfolio investments by non-residents, which took place amid increasingly more volatile global financial market conditions, were offset by substantial inflows in the other investment account. Meanwhile, long-term foreign direct investment (FDI) flows resumed at a more moderate pace, while domestic firms and institutional investors continued to undertake direct investments abroad (DIA).
The international reserves of Bank Negara Malaysia amounted to USD101.4 billion as at end-2018 compared to USD102.4 billion as at end-2017. As at 28 February 2019, international reserves amounted to USD102.4 billion and remain adequate to facilitate international transactions. The reserves position is sufficient to finance 7.4 months of retained imports and is 1.0 time the short-term external debt.
Malaysia’s external debt stood at RM924.9 billion as at end-2018, equivalent to USD221.0 billion or 64.7% of GDP (end-2017: RM885.2 billion, equivalent to USD215.9 billion or 65.4% of GDP). The higher external debt was driven mainly by the increase in interbank borrowings and corporate loans to finance investment activity as well as valuation effects following
5Annual Report 2018
Executive S
umm
ary
the weakening of ringgit against selected regional and major currencies, in particular, during the second and third quarters of the year. Malaysia’s external debt exposure remained manageable. Favourable external balance sheet profiles across instruments, maturity and currency were reinforced by external asset holdings of the domestic banks and corporates, further mitigating potential risks.
Overall, the strong fundamentals and highly diversified structure of the Malaysian economy have accorded Malaysia the ability to weather the headwinds and challenges. Policies were flexible and pre-emptive to ensure risks were minimised. Malaysia’s external position remained healthy, with a current account surplus, adequate international reserves and manageable external debt exposure. These strengths in the external position, along with a flexible exchange rate and a well-developed financial system, effectively mitigated the impact of volatile shifts in capital flows on domestic financial markets. Appropriate foreign exchange intervention and the implementation of financial market measures during this period of volatility also underscored the importance of pragmatic, timely policy responses in managing risks and supporting growth.
Economic and Monetary Management in 2018
The Monetary Policy Committee (MPC) normalised the degree of monetary accommodation at the January 2018 MPC meeting and raised the Overnight Policy Rate (OPR) by 25 basis points to 3.25%. In the MPC’s assessment, the economic conditions that had called for the previous OPR reduction in July 2016 had vastly improved. The OPR adjustment, however, did not constitute a tightening of monetary conditions, as the overall stance of monetary policy remained supportive of economic growth. The normalisation of the degree of monetary accommodation contributed towards preserving the sustainability of growth, while ensuring ample policy space in the event of shocks to the economy in the future. The MPC also recognised the need to prevent the build-up of risks that could arise from interest rates being too low for a prolonged period of time even as the risks of financial imbalances remained contained.
By mid-year, however, the prospects to both the global and domestic growth outlook shifted. Even though global economic expansion continued, there was increasing divergence across economies and signs of
moderating global growth momentum. Domestically, unanticipated commodity supply-side shocks and lower public sector spending led to slower GDP growth. However, better private consumption growth following increased household spending due to the zerorisation of the GST rate supported domestic growth during the period. On balance, the Malaysian economy was expected to remain on a steady growth path. Throughout 2018, underlying inflation was expected to moderate following expectations of smaller pass-through from external and domestic cost factors, and the absence of excessive demand pressures. Subsequent to the OPR increase in January, the OPR was maintained at the prevailing level for the remainder of the year. The degree of monetary accommodativeness was assessed to be consistent with the intended policy stance of ensuring that the domestic economy continued on a steady growth path with price stability.
Throughout the year, domestic financial markets experienced shifts in non-resident portfolio flows, largely reflecting changes in investor sentiments and risk appetite. In the first quarter, global financial markets continued their strong momentum from 2017 and investor sentiments remained buoyed by the positive economic outlook in emerging market economies. As a result, the demand for ringgit investment assets provided support to the ringgit exchange rate, as well as domestic bond and equity prices. However, this trend reversed from the second quarter onwards as global and domestic policy uncertainties weighed down on investor sentiments. For the year as a whole, the ringgit depreciated by 1.8% to end the year at RM4.1385 against the US dollar and remained as one of the better performing currencies in the region. The benchmark Malaysian Government Securities (MGS) yield curve shifted upwards, reflecting an increase in bond yields across all maturities.
The domestic financial markets performed relatively well and continued to intermediate shifts in capital flows in a stable and orderly manner. This was partly attributed to policies introduced by the Bank and the Financial Markets Committee (FMC) at end-2016. Foreign exchange liquidity improved following the introduction of the export conversion measure. In addition, the reinforcement of the non-facilitation of non-deliverable forward (NDF) transactions limited the spillovers from speculative activities in opaque offshore markets. The magnitude of adjustments in the domestic capital markets also remained
6 Annual Report 2018
Executive S
umm
ary
contained during the year due to sustained demand from domestic institutional investors, which partially offset the impact from these outflows.
During the year, domestic monetary and financial conditions, and continued healthy growth in financing to the private sector were supportive of economic activity. The Bank’s monetary operations ensured sufficient liquidity to support the orderly functioning of money and foreign exchange markets. The contractionary impact on liquidity arising from large capital outflows was offset by the Bank’s liquidity injection operations undertaken through the reverse repo and foreign exchange swap facilities. As a result, price discovery in the domestic money market remained uninterrupted and money market rates remained stable during the year. Overall banking system liquidity remained sufficient to support the financial intermediation process. Net financing to the private sector recorded an annual growth of 5.6% as at end-2018 (2017: 6.3%). Higher growth in outstanding loans of 4.8% was mainly driven by the business segment.
Outlook for the Malaysian Economy in 2019
In 2019, the global economy is projected to expand moderately, following slower growth in both advanced and major emerging market economies. In the advanced economies, economic activity is projected to moderate. While labour market strength will continue to support domestic demand, moderating investments and external demand will affect overall growth. In PR China, ongoing structural reforms to rebalance the economy are leading to slower, but more sustainable growth. In other Asian economies, growth will likely moderate despite stable domestic demand, as exports react to the slowdown in the advanced economies and PR China. Global trade developments will remain a key factor affecting the 2019 outlook. Prolonged policy uncertainty could adversely affect investment decisions and thus, longer-term productivity growth. Elevated investor uncertainty and bouts of volatility in the financial markets will pose further risks of greater volatility in capital flows to emerging market economies. Overall, the balance of risks to the global growth outlook is tilted to the downside.
Against the backdrop of a challenging global environment, the Malaysian economy is expected to sustain its growth momentum, expanding by 4.3% – 4.8% in 2019 (2018: 4.7%). Domestic demand
will remain the anchor of growth, underpinned by continued expansion in private sector activity. Private consumption growth is expected to moderate, but remain firm supported by stable labour market conditions and continued wage growth. The implementation of several government measures, particularly aimed at alleviating rising cost of living, is expected to further support consumption spending, especially by lower income households. Private investment activity will be supported by the implementation of on-going multi-year projects, particularly in the manufacturing and services sectors. The normalisation of destocking activities by firms after the strong demand during the tax holiday period in 2018 will serve as an additional support to growth. Public sector expenditure, however, is expected to weigh on growth. The projected contraction in public investment will be due mainly to lower investment by public corporations following the completion of large-scale projects, while the expectations for a moderate growth in public consumption reflect the continued reprioritisation of government spending.
The external sector is expected to register a more moderate growth. While the export sector will soften in line with the more moderate expansion in global growth and trade activity, Malaysia’s well-diversified export structure will contribute to sustain gross exports expansion. Gross imports are also expected to expand on account of a turnaround in intermediate and capital imports. Overall, the current account of the balance of payments is projected to remain in surplus, albeit narrowing to 1.5% – 2.5% of GNI.
On the supply side, all economic sectors are expected to expand with the services and manufacturing sectors remaining the key contributors to overall growth. Both the mining and agriculture sectors are projected to record positive growth rates amid recovery in natural gas production and higher palm oil output. Growth in the construction sector is expected to moderate due to the completion of large petrochemical projects in the civil engineering sub-sector.
Labour market conditions are expected to be stable, with continued employment and income growth, underpinned by steady expansion in services and manufacturing sectors. The unemployment rate is projected to be relatively unchanged. In the long run, the rollout of government policies such as the
7Annual Report 2018
Executive S
umm
ary
tiered levy and social security contribution for foreign workers is a positive step in reducing the reliance on foreign labour and spurring the creation of higher skilled, higher income jobs in the economy.
Headline inflation is expected to be broadly stable, with a projected annual average of 0.7% – 1.7% in 2019. The inflation projection incorporates some cost pass-through from domestic cost factors, but the upward impact will be offset by the expected lower global oil prices and the implementation of price ceilings on domestic retail fuel prices. Underlying inflation, as measured by core inflation, is expected to be sustained amid the steady expansion in economic activity and in the absence of excessive demand pressure.
Overall, the domestic growth projection is subject to several downside risks. As a small open economy, the unresolved trade tensions between the US and PR China, and a slower-than-expected global growth will affect Malaysia primarily via the trade and investment channel. The uncertain pace of the monetary policy normalisation in the US could heighten financial market volatility across emerging market economies, leading to volatile two-way capital flows and currency fluctuations. Volatility in global oil prices would also affect export performance and mining sector investment. On the domestic front, a re-occurrence of commodity supply disruptions, partly from unanticipated weather patterns, could affect the recovery in the mining and agriculture sectors. In addition, the oversupply situation in the property market could dampen activity in the construction sector.
Malaysia’s strong fundamentals and the diversified nature of the economy will help to weather these risks and vulnerabilities while preserving macroeconomic and financial stability. These strong fundamentals include a healthy labour market, stable inflation rate, continued surplus in the current account of the balance of payments, deep financial markets as well as a strong financial sector. Exchange rate flexibility and sufficient level of international reserves further enhance the economy’s capability to withstand external shocks. Moreover, commitment by the Government to fiscal, structural and institutional reforms will contribute to inclusive and sustainable growth going forward.
Economic and Monetary Management in 2019
Monetary policy in 2019 will focus on supporting the steady growth of the Malaysian economy amid an environment of relatively low inflation. At the same time, monetary policy will also consider the prevailing monetary and financial conditions. While risks of financial imbalances are expected to remain contained, the MPC is cognisant of challenges emanating from potential continued volatility in global capital flows. In this regard, the Bank will continue to ensure sufficient liquidity and orderly market conditions that remain supportive of financial intermediation activity. The broad range of policy options available that includes monetary policy, micro- and macroprudential measures provide the Bank with flexibility to manage emerging risks. Measures to further deepen the domestic financial markets will also contribute to orderly market conditions. The combined effect of these policies will ensure that the Bank’s policy efficacy is maintained without overburdening any single policy tool.
Fiscal policy in 2019 aims to strengthen the Government’s fiscal position by pursuing gradual fiscal consolidation while lending continued support for growth, paring down debt and liabilities, as well as promoting economic inclusiveness. Correspondingly, the medium term fiscal plan outlined the path towards consolidation with fiscal balances targeted at -3.4% and -3.0% of GDP in 2019 and 2020 respectively. The path towards fiscal consolidation is anchored in several key reform initiatives which include enhancing expenditure effectiveness, diversify and broaden the revenue base and encourage holistic and transparent debt management. The 2019 Budget also accorded emphasis to improving socio-economic wellbeing, strengthening social protection programmes, improving employability and initiatives to raise productivity, particularly for the Small and Medium Enterprises (SMEs). Going forward, the Government has indicated its commitment towards ensuring fiscal sustainability and a stronger governance framework through the implementation of holistic fiscal reforms.
Governance and Organisational Development
As the Central Bank for Malaysia, the Bank is mandated to promote monetary stability and financial stability conducive to the sustainable growth of the Malaysian economy.
8 Annual Report 2018
Executive S
umm
ary
The Bank therefore places priority in strengthening its governance and internal capabilities to ensure it is effective in discharging its principal objects and functions under the laws it administers, and that it is responsible in managing its resources.
The Board of Directors is responsible for overseeing the management and operations of the Bank and reviews the performance of the Bank in delivering its mandates. The Board comprises the Governor as Chairman, the Deputy Governors, the Secretary General of the Treasury and independent non-executive members, with the latter forming the majority within the Board. The year saw the appointment of a new Governor, Nor Shamsiah Yunus, on 1 July 2018, after Muhammad bin Ibrahim stepped down as Governor on 15 June 2018. Governor Nor Shamsiah was a Deputy Governor between 2010 and 2016, and was subsequently at the International Monetary Fund. During the year, the Board deliberated on a number of legislative reforms to facilitate the currency management operations and enforcement activities of the Bank. The Board also reviewed the overall performance of the Bank, and discussed the Bank’s corporate performance indicators for 2019. Additionally, the Board deliberated on various organisational development priorities including new demands on the Bank’s management of human capital, digital transformation journey, defences against cyberthreats, and initiatives to reinforce a strong culture of integrity, ethical conduct and professionalism among the Bank’s employees. The Bank also initiated an internal review to further strengthen its overall framework for governance. Accordingly, the Bank will take this opportunity to examine the efficacy of decision-making structures within the Bank and ensure its operations and priorities remain consistent with its mandates.
The Bank ensures prudent and responsible conduct of its operations and activities through effective risk management. In 2018, the enterprise risk appetite and tolerance statement was reviewed to give greater prominence to global digitalisation and the increased sophistication of cyberthreats. Adherence to high ethical standards underpins the Bank’s risk culture. This is reinforced through a whistleblowing framework that provides an avenue for reporting improper conduct involving the Bank. The framework was revised during the year to align it with the Whistleblower Protection Act 2010 and best practice. The Internal Audit Department conducts regular assessments on the activities of departments
and entities related to the Bank to identify and address risks. Audits in 2018 were conducted in a number of areas, which include cybersecurity, data protection, treasury and reserve management, business continuity management, procurement and risk governance.
In 2018, the Bank initiated a five-pronged cybersecurity strategy to further strengthen the protection of the organisation’s critical information assets. These efforts are supported by strengthened governance and operating structures that have been put in place to drive and oversee cybersecurity risk management across the Bank. Specifically, the Bank has established the Cybersecurity and Data Protection unit within the Digital and Technology Department to undertake enterprise-wide cybersecurity management function. In addition, a Cyber and Information Security Working Group was formalised to drive the implementation of the Bank’s cyber and information security initiatives.
Digital technologies are reshaping industries and organisations all over the world. On its part, the Bank began work to draw up a digital transformation strategy and roadmap to fully harness the potential and value of technology in supporting the effective delivery of the Bank’s mandates. In the near-term, enhancements are being made to the Bank’s technology infrastructure and services to support digital workplace improvements. At the same time, the Bank continues to lay the groundwork to modernise and put in place next generation technology infrastructure to form the core digital platform for the organisation to build on.
The Bank is committed to attracting and developing the best talents to deliver on its mandates. In keeping with this commitment, the Bank conducted a survey to ascertain employee engagement and enablement levels across the organisation. The Bank is committed to upholding the highest standards of professionalism. This involves ongoing efforts to promote organisation’s ethics and culture. In 2018, the Bank undertook specific initiatives to reinforce a positive culture of engagement at all levels of the organisation, centred on norms such as transparency and objectivity, constructive challenge and candid communication.
A key objective of the Bank’s communications and outreach agenda is to sustain the confidence of its external stakeholders in the Bank’s delivery of its
9Annual Report 2018
Executive S
umm
ary
mandates. This involves helping external stakeholders understand the Bank’s work and mission. The Bank also listens to and receives feedback on issues involving the economy and financial system through regular engagements and briefings conducted with the Government and other public sector agencies, Bank’s regulatees, investors and analysts, and the media.
The general public is an important stakeholder. The Bank therefore engages them closely on multiple fronts, and across a range of topics and issues including the promotion of financial knowledge and literacy, and to educate the public about financial scams and crimes. They are conducted through a range of traditional and digital channels, including through social media. The Bank also directly engages with the general public and businesses across the country through a network of five BNM Offices
in Penang, Kuala Terengganu, Johor Bahru, Kuching and Kota Kinabalu. While traditionally serving as regional hubs for managing currency operations, BNM Offices have since evolved to enable the Bank to have a clearer view on economic and financial conditions around the country.
Bank Negara Malaysia’s Audited Financial Statements for 2018
As audited and certified by the Auditor General, the financial position of Bank Negara Malaysia remained strong in 2018. Bank Negara Malaysia’s total assets amounted to RM447.6 billion, with a net profit of RM7.5 billion for the financial year ending 31 December 2018. Bank Negara Malaysia declared a dividend of RM2.5 billion to the Government for the year 2018.

10 Annual Report 2018
Executive S
umm
ary
11Annual Report 2018
Eco
nom
ic Develo
pm
ents in 2018
Economic Developments in 2018
13 The International Economic Environment16 The Malaysian Economy23 External Sector29 Inflation Developments35 Box Article: Are Malaysian Workers Paid Fairly?: An Assessment of Productivity and Equity48 Box Article: Malaysia’s Resilience in Managing External Debt Obligations and the Adequacy of International Reserves

12 Annual Report 2018
Eco
nom
ic Develo
pm
ents in 2018
13Annual Report 2018
Economic Developments in 2018
THE INTERNATIONAL ECONOMIC ENVIRONMENT
Positive start to global economic expansion in 2018 before moderating towards the second half
In 2018, there were expectations for a stronger growth momentum in the global economy from the previous year. At the beginning of the year, the International Monetary Fund (IMF) projected a global growth of 3.9%, marking the fastest expansion since 2011. As the year progressed, however, the global economy was confronted by multiple headwinds. First, the escalation of trade conflicts, which resulted in higher tariffs and generated greater uncertainties. This weighed on global trade and investment. Second, renewed volatility in commodity prices had some repercussions for the global growth momentum, as well as global inflation. Third, as central banks in advanced economies recalibrated their monetary policies, financial markets experienced bouts of volatility amid major uncertainties in key economies. Global financial conditions tightened. Some emerging market economies experienced large and persistent capital outflows. With the exception of the US, economic growth for most major advanced and emerging economies expanded at a slower pace. As a result, in October 2018, the IMF revised global growth for 2018 downward to 3.7%. This forecast, nonetheless, remained above the long-term average (1980-2017: 3.5%).
Moderating global economic growth
Global economic developments in 2018 could be characterised by two distinct phases. In the earlier part of the year, both global trade and growth continued the upward trajectory which began since the end of 2016. This trend reversed towards the second half of the year, due to a myriad of issues which included the escalation
of global trade tensions, continued policy uncertainty such as the outcome of Brexit negotiations and the degree and pace of US monetary policy normalisation, as well as volatile commodity prices. As a result, most major advanced and regional economies experienced a more moderate expansion during the year.
In the advanced economies, improving labour market conditions, as reflected by higher wage and employment growth, lifted consumption activity. Importantly, the unemployment rate in major advanced economies reached record-low levels, while consumer confidence remained upbeat during the year. The US economy was supported by robust labour market conditions and investment activity. Wage growth accelerated close to its peak before the Global Financial Crisis, as vacancies and hiring rates continued on an upward trajectory in 2018. In addition, tax reforms in 2017 boosted business spending and capital investment, including on industrial and transport equipment. In the euro area, favourable business sentiment and a continued need to expand capacity drove higher investments. However, in the second half of 2018, the euro area experienced a slowdown as some country-specific developments began to impact growth outcome. Regulatory changes in light vehicle emissions standards led to contractions in motor vehicle production during the second half of the year. Tensions over Italy’s budget reversed the improvement in consumer sentiments, leading to a slowdown in consumer spending. Likewise, external demand lost momentum as trade conflicts began to escalate, weighing on exports and industrial production growth in the euro area. In the UK, uncertainties surrounding the Brexit negotiations persisted throughout the year, affecting business sentiments and investment. Major corporates, especially UK-based operations of multinational companies reportedly deferred investments in 2018, leading to a sustained contraction in investments in the second half of the year.
14 Annual Report 2018
Eco
nom
ic Develo
pm
ents in 2018
In the Asian economies, GDP growth was predicated on continued domestic demand. Support from external demand waned as the year progressed, as the global technology cycle slowed from its peak, while demand from advanced economies turned more moderate. The cyclical slowdown in external demand was exacerbated by the escalation of trade tensions among major economies beginning April 2018. While the implementation of higher tariffs by the US and subsequent retaliation by major trade partners directly affected only about 1% of global trade, it led to higher uncertainty for businesses. As a result, export growth in most Asian economies more than halved in 2018 compared to the previous year. Shipments of electronics and electrical (E&E) products slowed. Major Asian E&E exporters such as PR China, C. Taipei, South Korea and Hong Kong SAR experienced weaker growth in E&E exports, especially in the fourth quarter of 2018. Nevertheless, domestic demand among Asian economies remained resilient, lending support to sustained momentum in headline GDP growth. Domestic demand was supported by strong employment and was augmented by spending on infrastructure, particularly in ASEAN countries. Thailand and the Philippines increased infrastructure spending through the “East Economic Corridor” and “Build, Build, Build” programmes, respectively. While the on-going structural reforms in PR China continued to lead to a more moderate expansion, counter-cyclical fiscal and monetary policies helped to prevent economic activity from slowing too quickly.
Higher global headline inflation in 2018 due mainly to supply factors
Despite moderating global demand conditions, global headline inflation accelerated to 3.7% in 2018 (2017: 3.2%), reflecting mainly supply-related factors. Global commodity supply conditions tightened due to geopolitical tensions in Latin America and the Middle East, pipeline constraints in the Permian Basin and output cuts made by OPEC. With prices being mostly affected by supply side factors, core inflation rates remained modest across both advanced and emerging market economies, reflecting moderating demand pressures.
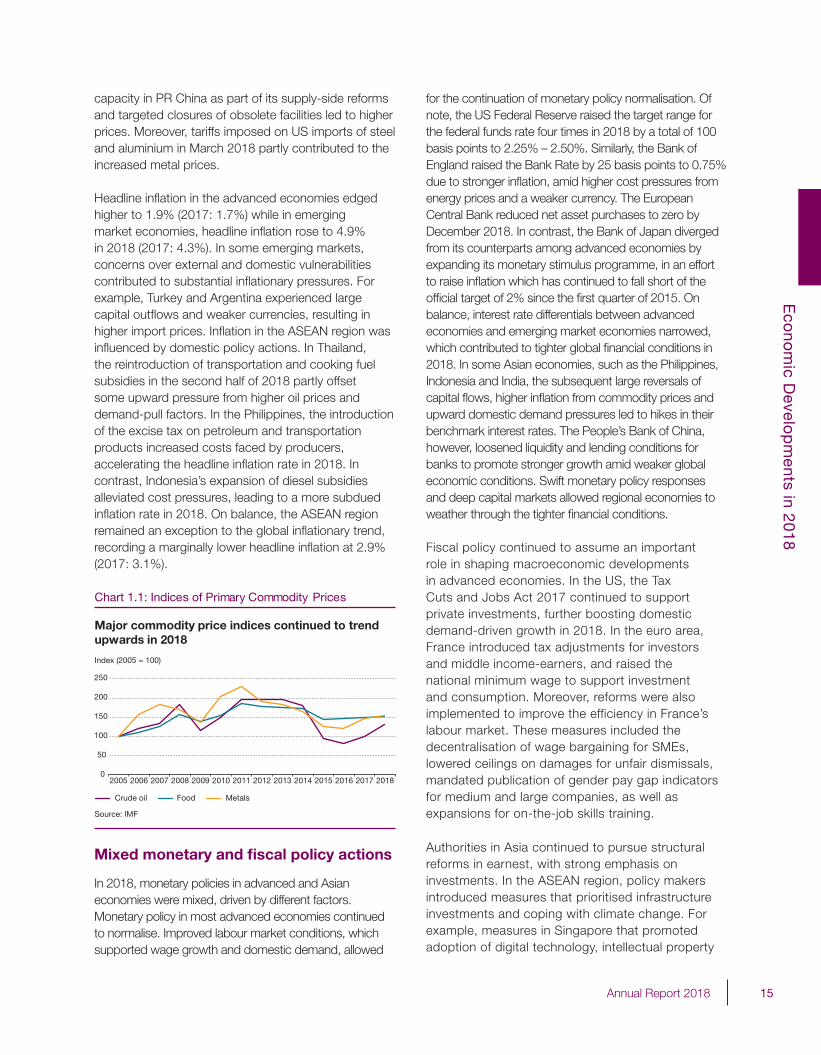
The IMF commodity price indices continued their upward trend in 2018. The higher commodity prices were attributed mainly to global crude oil supply pressures, cyclical mismatches in supply and demand as well as weather disruptions to food production.
The extension of OPEC output cuts, re-imposition of US sanctions on Iran and lower-than-expected Iranian oil exports lifted the oil price index for most of 2018. Towards the end of the year, however, Brent crude oil prices declined from a peak of USD76 per barrel to USD67 per barrel due mainly to a rebound in US oil production and sanction waivers for Iran’s trade partners. For the year 2018 as a whole, Brent crude oil price averaged higher at USD72 per barrel (2017: USD55 per barrel). A supply glut in global sugar and dairy markets, as well as moderating demand for palm oil led to a slower increase in the food price index. Adverse weather conditions in 2018 led to disruptions in the supply of cereal grains and livestock. Nevertheless, the supply of major cereal grains such as wheat remained mainly sufficient, leading to a more subdued increase in food prices. In the metals market, continued policy-driven reduction of production
Real GDP Growth(Annual change, %)
Infl ation(Annual change, %)
2017 2018e 2017 2018e
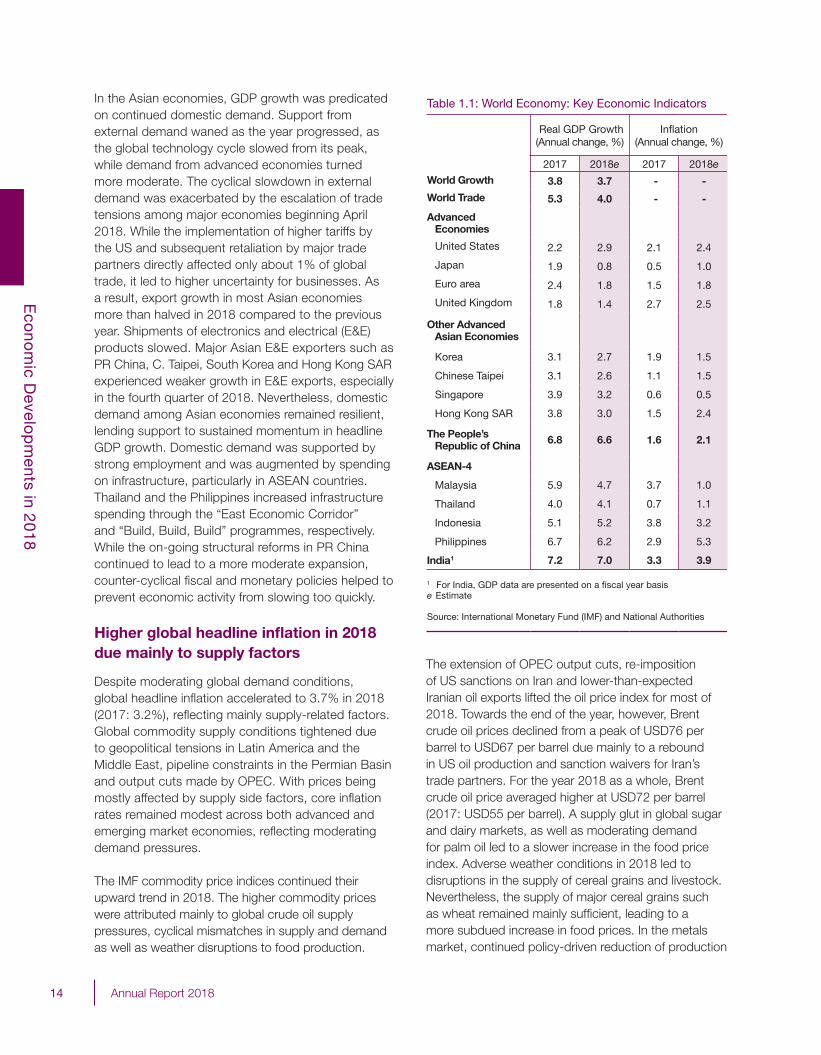
World Growth 3.8 3.7 - -
World Trade 5.3 4.0 - -
Advanced Economies
United States 2.2 2.9 2.1 2.4
Japan 1.9 0.8 0.5 1.0
Euro area 2.4 1.8 1.5 1.8
United Kingdom 1.8 1.4 2.7 2.5
Other Advanced Asian Economies
Korea 3.1 2.7 1.9 1.5
Chinese Taipei 3.1 2.6 1.1 1.5
Singapore 3.9 3.2 0.6 0.5
Hong Kong SAR 3.8 3.0 1.5 2.4
The People’s Republic of China 6.8 6.6 1.6 2.1
ASEAN-4
Malaysia 5.9 4.7 3.7 1.0
Thailand 4.0 4.1 0.7 1.1
Indonesia 5.1 5.2 3.8 3.2
Philippines 6.7 6.2 2.9 5.3
India1 7.2 7.0 3.3 3.9
1 For India, GDP data are presented on a fi scal year basise Estimate
Source: International Monetary Fund (IMF) and National Authorities
Table 1.1: World Economy: Key Economic Indicators
15Annual Report 2018
Eco
nom
ic Develo
pm
ents in 2018
capacity in PR China as part of its supply-side reforms and targeted closures of obsolete facilities led to higher prices. Moreover, tariffs imposed on US imports of steel and aluminium in March 2018 partly contributed to the increased metal prices.
Headline inflation in the advanced economies edged higher to 1.9% (2017: 1.7%) while in emerging market economies, headline inflation rose to 4.9% in 2018 (2017: 4.3%). In some emerging markets, concerns over external and domestic vulnerabilities contributed to substantial inflationary pressures. For example, Turkey and Argentina experienced large capital outflows and weaker currencies, resulting in higher import prices. Inflation in the ASEAN region was influenced by domestic policy actions. In Thailand, the reintroduction of transportation and cooking fuel subsidies in the second half of 2018 partly offset some upward pressure from higher oil prices and demand-pull factors. In the Philippines, the introduction of the excise tax on petroleum and transportation products increased costs faced by producers, accelerating the headline inflation rate in 2018. In contrast, Indonesia’s expansion of diesel subsidies alleviated cost pressures, leading to a more subdued inflation rate in 2018. On balance, the ASEAN region remained an exception to the global inflationary trend, recording a marginally lower headline inflation at 2.9% (2017: 3.1%).
for the continuation of monetary policy normalisation. Of note, the US Federal Reserve raised the target range for the federal funds rate four times in 2018 by a total of 100 basis points to 2.25% – 2.50%. Similarly, the Bank of England raised the Bank Rate by 25 basis points to 0.75% due to stronger inflation, amid higher cost pressures from energy prices and a weaker currency. The European Central Bank reduced net asset purchases to zero by December 2018. In contrast, the Bank of Japan diverged from its counterparts among advanced economies by expanding its monetary stimulus programme, in an effort to raise inflation which has continued to fall short of the official target of 2% since the first quarter of 2015. On balance, interest rate differentials between advanced economies and emerging market economies narrowed, which contributed to tighter global financial conditions in 2018. In some Asian economies, such as the Philippines, Indonesia and India, the subsequent large reversals of capital flows, higher inflation from commodity prices and upward domestic demand pressures led to hikes in their benchmark interest rates. The People’s Bank of China, however, loosened liquidity and lending conditions for banks to promote stronger growth amid weaker global economic conditions. Swift monetary policy responses and deep capital markets allowed regional economies to weather through the tighter financial conditions.
Fiscal policy continued to assume an important role in shaping macroeconomic developments in advanced economies. In the US, the Tax Cuts and Jobs Act 2017 continued to support private investments, further boosting domestic demand-driven growth in 2018. In the euro area, France introduced tax adjustments for investors and middle income-earners, and raised the national minimum wage to support investment and consumption. Moreover, reforms were also implemented to improve the efficiency in France’s labour market. These measures included the decentralisation of wage bargaining for SMEs, lowered ceilings on damages for unfair dismissals, mandated publication of gender pay gap indicators for medium and large companies, as well as expansions for on-the-job skills training.
Authorities in Asia continued to pursue structural reforms in earnest, with strong emphasis on investments. In the ASEAN region, policy makers introduced measures that prioritised infrastructure investments and coping with climate change. For example, measures in Singapore that promoted adoption of digital technology, intellectual property
Chart 1.1: Indices of Primary Commodity Prices
Major commodity price indices continued to trendupwards in 2018
Source: IMF
0
50
100
150
200
250
2005 2006 2007 2008 2009 2010 2011 2012 2013 2014 2015 2016 2017 2018
Crude oil Food Metals
Index (2005 = 100)
Mixed monetary and fiscal policy actions
In 2018, monetary policies in advanced and Asian economies were mixed, driven by different factors. Monetary policy in most advanced economies continued to normalise. Improved labour market conditions, which supported wage growth and domestic demand, allowed
16 Annual Report 2018
Eco
nom
ic Develo
pm
ents in 2018
investments and R&D in improving energy efficiency continued to support sustainable economic growth via improving productivity. In PR China, to reduce systemic financial stability risks, the government continued to tighten regulations on local government financing and public-private partnerships, leading to more moderate investments made by state-owned enterprises.
THE MALAYSIAN ECONOMY
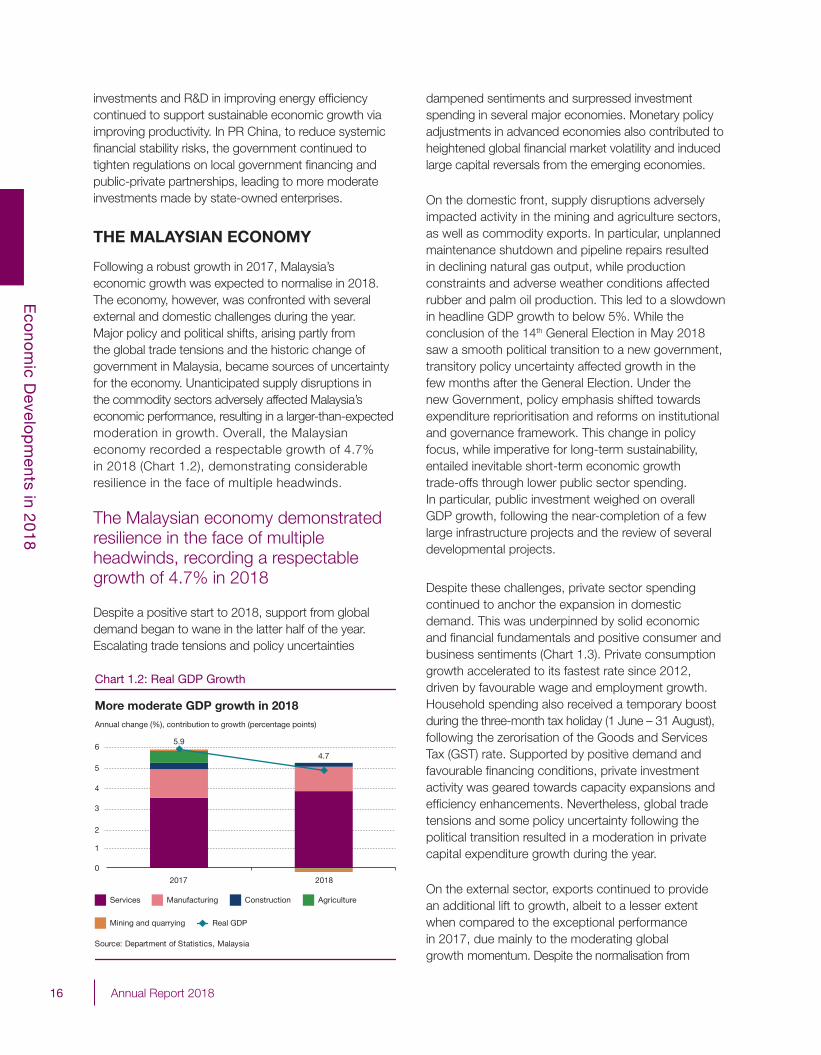
Following a robust growth in 2017, Malaysia’s economic growth was expected to normalise in 2018. The economy, however, was confronted with several external and domestic challenges during the year. Major policy and political shifts, arising partly from the global trade tensions and the historic change of government in Malaysia, became sources of uncertainty for the economy. Unanticipated supply disruptions in the commodity sectors adversely affected Malaysia’s economic performance, resulting in a larger-than-expected moderation in growth. Overall, the Malaysian economy recorded a respectable growth of 4.7% in 2018 (Chart 1.2), demonstrating considerable resilience in the face of multiple headwinds.
The Malaysian economy demonstrated resilience in the face of multiple headwinds, recording a respectable growth of 4.7% in 2018
Despite a positive start to 2018, support from global demand began to wane in the latter half of the year. Escalating trade tensions and policy uncertainties
dampened sentiments and surpressed investment spending in several major economies. Monetary policy adjustments in advanced economies also contributed to heightened global financial market volatility and induced large capital reversals from the emerging economies. On the domestic front, supply disruptions adversely impacted activity in the mining and agriculture sectors, as well as commodity exports. In particular, unplanned maintenance shutdown and pipeline repairs resulted in declining natural gas output, while production constraints and adverse weather conditions affected rubber and palm oil production. This led to a slowdown in headline GDP growth to below 5%. While the conclusion of the 14th General Election in May 2018 saw a smooth political transition to a new government, transitory policy uncertainty affected growth in the few months after the General Election. Under the new Government, policy emphasis shifted towards expenditure reprioritisation and reforms on institutional and governance framework. This change in policy focus, while imperative for long-term sustainability, entailed inevitable short-term economic growth trade-offs through lower public sector spending. In particular, public investment weighed on overall GDP growth, following the near-completion of a few large infrastructure projects and the review of several developmental projects.
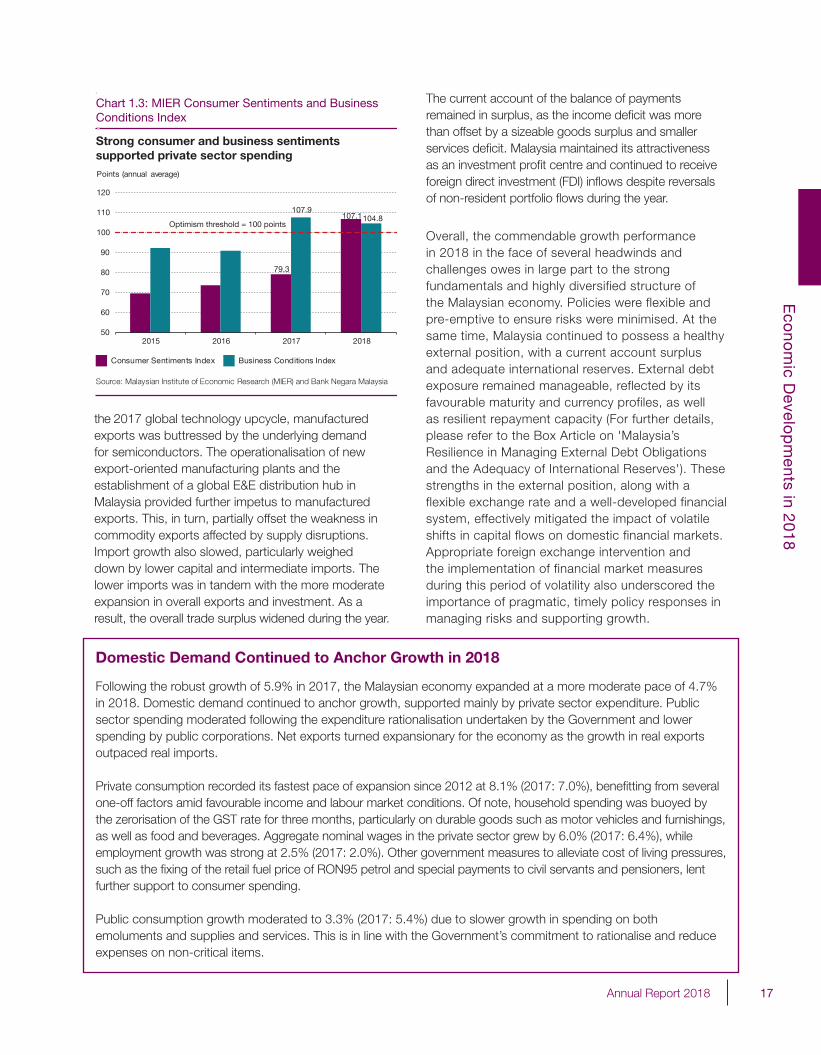
Despite these challenges, private sector spending continued to anchor the expansion in domestic demand. This was underpinned by solid economic and financial fundamentals and positive consumer and business sentiments (Chart 1.3). Private consumption growth accelerated to its fastest rate since 2012, driven by favourable wage and employment growth. Household spending also received a temporary boost during the three-month tax holiday (1 June – 31 August), following the zerorisation of the Goods and Services Tax (GST) rate. Supported by positive demand and favourable financing conditions, private investment activity was geared towards capacity expansions and efficiency enhancements. Nevertheless, global trade tensions and some policy uncertainty following the political transition resulted in a moderation in private capital expenditure growth during the year.
On the external sector, exports continued to provide an additional lift to growth, albeit to a lesser extent when compared to the exceptional performance in 2017, due mainly to the moderating global growth momentum. Despite the normalisation from
0
Chart 1.2: Real GDP Growth
More moderate GDP growth in 2018
Source: Department of Statistics, Malaysia
5.9
4.7
2017 2018
Services Manufacturing Construction Agriculture
Mining and quarrying Real GDP
Annual change (%), contribution to growth (percentage points)
2
4
3
1
6
5
17Annual Report 2018
Eco
nom
ic Develo
pm
ents in 2018
the 2017 global technology upcycle, manufactured exports was buttressed by the underlying demand for semiconductors. The operationalisation of new export-oriented manufacturing plants and the establishment of a global E&E distribution hub in Malaysia provided further impetus to manufactured exports. This, in turn, partially offset the weakness in commodity exports affected by supply disruptions. Import growth also slowed, particularly weighed down by lower capital and intermediate imports. The lower imports was in tandem with the more moderate expansion in overall exports and investment. As a result, the overall trade surplus widened during the year.
The current account of the balance of payments remained in surplus, as the income deficit was more than offset by a sizeable goods surplus and smaller services deficit. Malaysia maintained its attractiveness as an investment profit centre and continued to receive foreign direct investment (FDI) inflows despite reversals of non-resident portfolio flows during the year.
Overall, the commendable growth performance in 2018 in the face of several headwinds and challenges owes in large part to the strong fundamentals and highly diversified structure of the Malaysian economy. Policies were flexible and pre-emptive to ensure risks were minimised. At the same time, Malaysia continued to possess a healthy external position, with a current account surplus and adequate international reserves. External debt exposure remained manageable, reflected by its favourable maturity and currency profiles, as well as resilient repayment capacity (For further details, please refer to the Box Article on 'Malaysia’s Resilience in Managing External Debt Obligations and the Adequacy of International Reserves'). These strengths in the external position, along with a flexible exchange rate and a well-developed financial system, effectively mitigated the impact of volatile shifts in capital flows on domestic financial markets. Appropriate foreign exchange intervention and the implementation of financial market measures during this period of volatility also underscored the importance of pragmatic, timely policy responses in managing risks and supporting growth.
Source: Malaysian Institute of Economic Research (MIER) and Bank Negara Malaysia
Consumer Sentiments Index Business Conditions Index
Points (annual average)
79.3
107.1107.9
104.8
50
60
70
80
90
100
110
120
2015 2016 2017 2018
Optimism threshold = 100 points
Strong consumer and business sentiments supported private sector spending
Chart 1.3: MIER Consumer Sentiments and Business Conditions Index
Domestic Demand Continued to Anchor Growth in 2018
Following the robust growth of 5.9% in 2017, the Malaysian economy expanded at a more moderate pace of 4.7% in 2018. Domestic demand continued to anchor growth, supported mainly by private sector expenditure. Public sector spending moderated following the expenditure rationalisation undertaken by the Government and lower spending by public corporations. Net exports turned expansionary for the economy as the growth in real exports outpaced real imports. Private consumption recorded its fastest pace of expansion since 2012 at 8.1% (2017: 7.0%), benefitting from several one-off factors amid favourable income and labour market conditions. Of note, household spending was buoyed by the zerorisation of the GST rate for three months, particularly on durable goods such as motor vehicles and furnishings, as well as food and beverages. Aggregate nominal wages in the private sector grew by 6.0% (2017: 6.4%), while employment growth was strong at 2.5% (2017: 2.0%). Other government measures to alleviate cost of living pressures, such as the fixing of the retail fuel price of RON95 petrol and special payments to civil servants and pensioners, lent further support to consumer spending.
Public consumption growth moderated to 3.3% (2017: 5.4%) due to slower growth in spending on both emoluments and supplies and services. This is in line with the Government’s commitment to rationalise and reduce expenses on non-critical items.
18 Annual Report 2018
Eco
nom
ic Develo
pm
ents in 2018
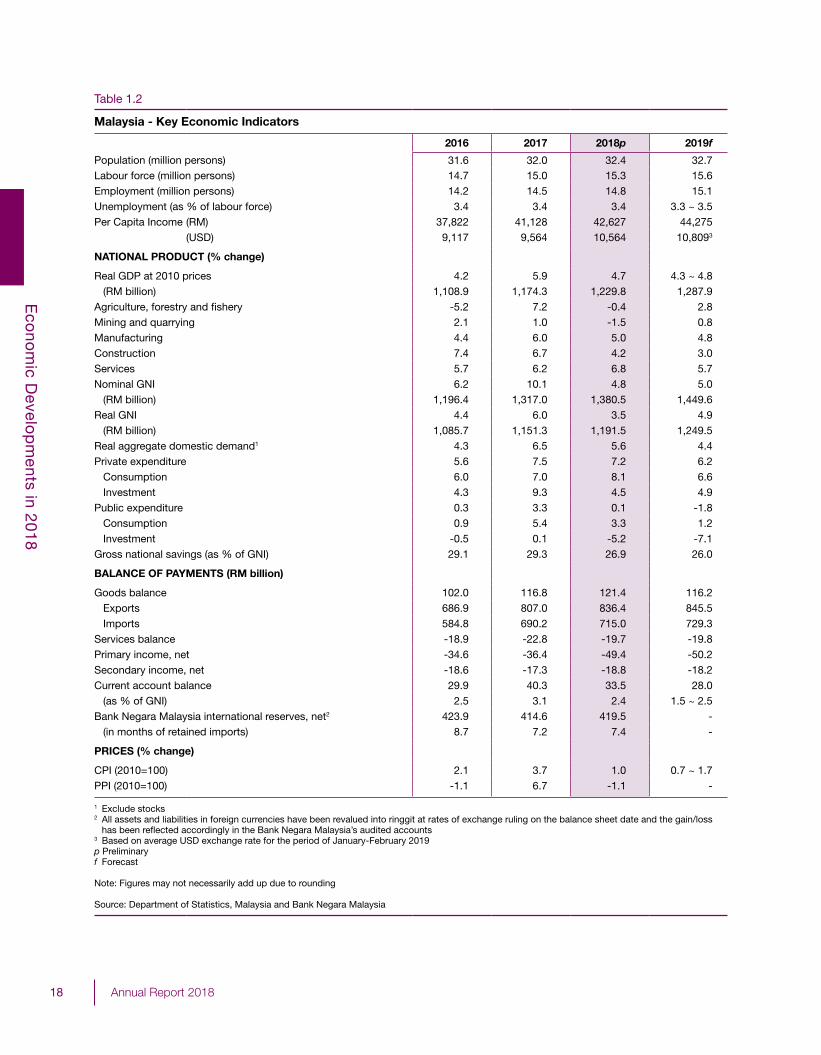
Table 1.2
Malaysia - Key Economic Indicators
2016 2017 2018p 2019f
Population (million persons) 31.6 32.0 32.4 32.7Labour force (million persons) 14.7 15.0 15.3 15.6Employment (million persons) 14.2 14.5 14.8 15.1Unemployment (as % of labour force) 3.4 3.4 3.4 3.3 ~ 3.5Per Capita Income (RM) 37,822 41,128 42,627 44,275
(USD) 9,117 9,564 10,564 10,8093
NATIONAL PRODUCT (% change)
Real GDP at 2010 prices 4.2 5.9 4.7 4.3 ~ 4.8 (RM billion) 1,108.9 1,174.3 1,229.8 1,287.9Agriculture, forestry and fi shery -5.2 7.2 -0.4 2.8Mining and quarrying 2.1 1.0 -1.5 0.8Manufacturing 4.4 6.0 5.0 4.8Construction 7.4 6.7 4.2 3.0Services 5.7 6.2 6.8 5.7Nominal GNI 6.2 10.1 4.8 5.0 (RM billion) 1,196.4 1,317.0 1,380.5 1,449.6Real GNI 4.4 6.0 3.5 4.9 (RM billion) 1,085.7 1,151.3 1,191.5 1,249.5Real aggregate domestic demand1 4.3 6.5 5.6 4.4Private expenditure 5.6 7.5 7.2 6.2 Consumption 6.0 7.0 8.1 6.6 Investment 4.3 9.3 4.5 4.9Public expenditure 0.3 3.3 0.1 -1.8 Consumption 0.9 5.4 3.3 1.2 Investment -0.5 0.1 -5.2 -7.1Gross national savings (as % of GNI) 29.1 29.3 26.9 26.0
BALANCE OF PAYMENTS (RM billion)
Goods balance 102.0 116.8 121.4 116.2 Exports 686.9 807.0 836.4 845.5 Imports 584.8 690.2 715.0 729.3Services balance -18.9 -22.8 -19.7 -19.8Primary income, net -34.6 -36.4 -49.4 -50.2Secondary income, net -18.6 -17.3 -18.8 -18.2Current account balance 29.9 40.3 33.5 28.0 (as % of GNI) 2.5 3.1 2.4 1.5 ~ 2.5Bank Negara Malaysia international reserves, net2 423.9 414.6 419.5 - (in months of retained imports) 8.7 7.2 7.4 -
PRICES (% change)
CPI (2010=100) 2.1 3.7 1.0 0.7 ~ 1.7PPI (2010=100) -1.1 6.7 -1.1 -
1 Exclude stocks 2 All assets and liabilities in foreign currencies have been revalued into ringgit at rates of exchange ruling on the balance sheet date and the gain/loss
has been refl ected accordingly in the Bank Negara Malaysia’s audited accounts 3 Based on average USD exchange rate for the period of January-February 2019p Preliminary f Forecast Note: Figures may not necessarily add up due to rounding
Source: Department of Statistics, Malaysia and Bank Negara Malaysia
19Annual Report 2018
Eco
nom
ic Develo
pm
ents in 2018
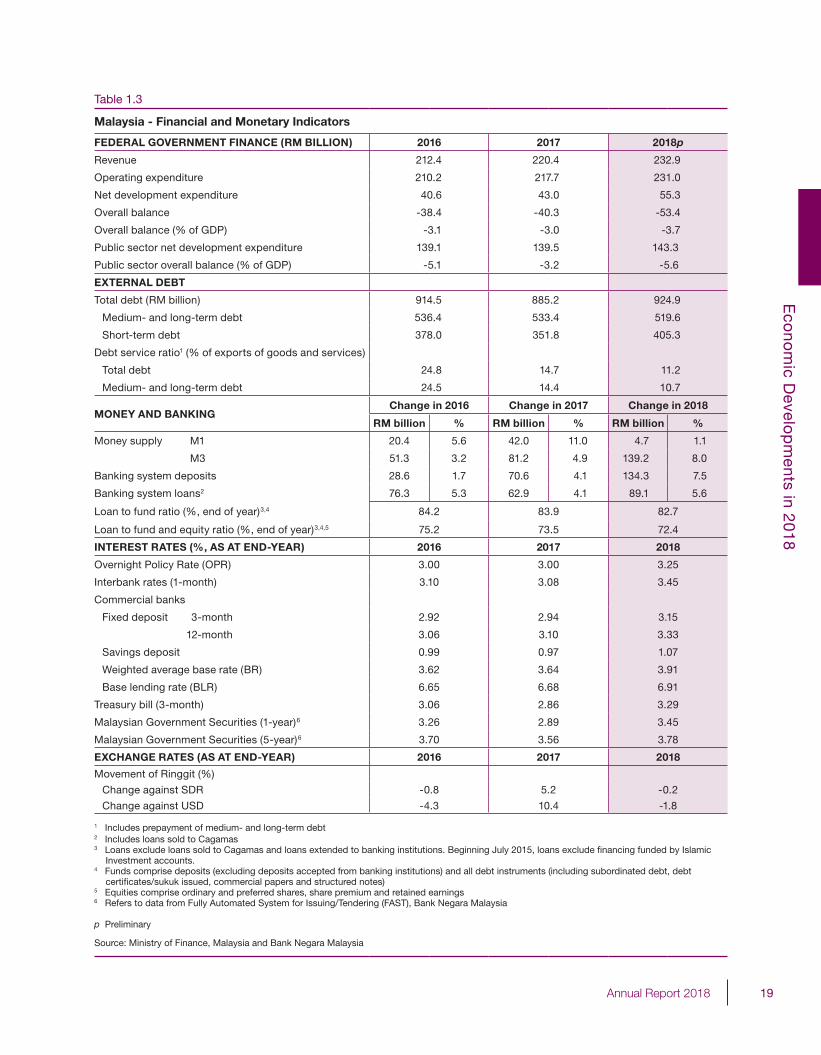
Malaysia - Financial and Monetary Indicators
FEDERAL GOVERNMENT FINANCE (RM BILLION) 2016 2017 2018p
Revenue 212.4 220.4 232.9
Operating expenditure 210.2 217.7 231.0
Net development expenditure 40.6 43.0 55.3
Overall balance -38.4 -40.3 -53.4
Overall balance (% of GDP) -3.1 -3.0 -3.7
Public sector net development expenditure 139.1 139.5 143.3
Public sector overall balance (% of GDP) -5.1 -3.2 -5.6
EXTERNAL DEBT
Total debt (RM billion) 914.5 885.2 924.9
Medium- and long-term debt 536.4 533.4 519.6
Short-term debt 378.0 351.8 405.3
Debt service ratio1 (% of exports of goods and services)
Total debt 24.8 14.7 11.2
Medium- and long-term debt 24.5 14.4 10.7
MONEY AND BANKINGChange in 2016 Change in 2017 Change in 2018
RM billion % RM billion % RM billion %
Money supply M1 20.4 5.6 42.0 11.0 4.7 1.1
M3 51.3 3.2 81.2 4.9 139.2 8.0
Banking system deposits 28.6 1.7 70.6 4.1 134.3 7.5
Banking system loans2 76.3 5.3 62.9 4.1 89.1 5.6
Loan to fund ratio (%, end of year)3,4 84.2 83.9 82.7
Loan to fund and equity ratio (%, end of year)3,4,5 75.2 73.5 72.4
INTEREST RATES (%, AS AT END-YEAR) 2016 2017 2018
Overnight Policy Rate (OPR) 3.00 3.00 3.25
Interbank rates (1-month) 3.10 3.08 3.45
Commercial banks
Fixed deposit 3-month 2.92 2.94 3.15
12-month 3.06 3.10 3.33
Savings deposit 0.99 0.97 1.07
Weighted average base rate (BR) 3.62 3.64 3.91
Base lending rate (BLR) 6.65 6.68 6.91
Treasury bill (3-month) 3.06 2.86 3.29
Malaysian Government Securities (1-year)6 3.26 2.89 3.45
Malaysian Government Securities (5-year)6 3.70 3.56 3.78
EXCHANGE RATES (AS AT END-YEAR) 2016 2017 2018
Movement of Ringgit (%)
Change against SDR -0.8 5.2 -0.2
Change against USD -4.3 10.4 -1.8
1 Includes prepayment of medium- and long-term debt 2 Includes loans sold to Cagamas 3 Loans exclude loans sold to Cagamas and loans extended to banking institutions. Beginning July 2015, loans exclude fi nancing funded by Islamic
Investment accounts. 4 Funds comprise deposits (excluding deposits accepted from banking institutions) and all debt instruments (including subordinated debt, debt
certifi cates/sukuk issued, commercial papers and structured notes) 5 Equities comprise ordinary and preferred shares, share premium and retained earnings 6 Refers to data from Fully Automated System for Issuing/Tendering (FAST), Bank Negara Malaysia
p Preliminary
Source: Ministry of Finance, Malaysia and Bank Negara Malaysia
Table 1.3
20 Annual Report 2018
Eco
nom
ic Develo
pm
ents in 2018
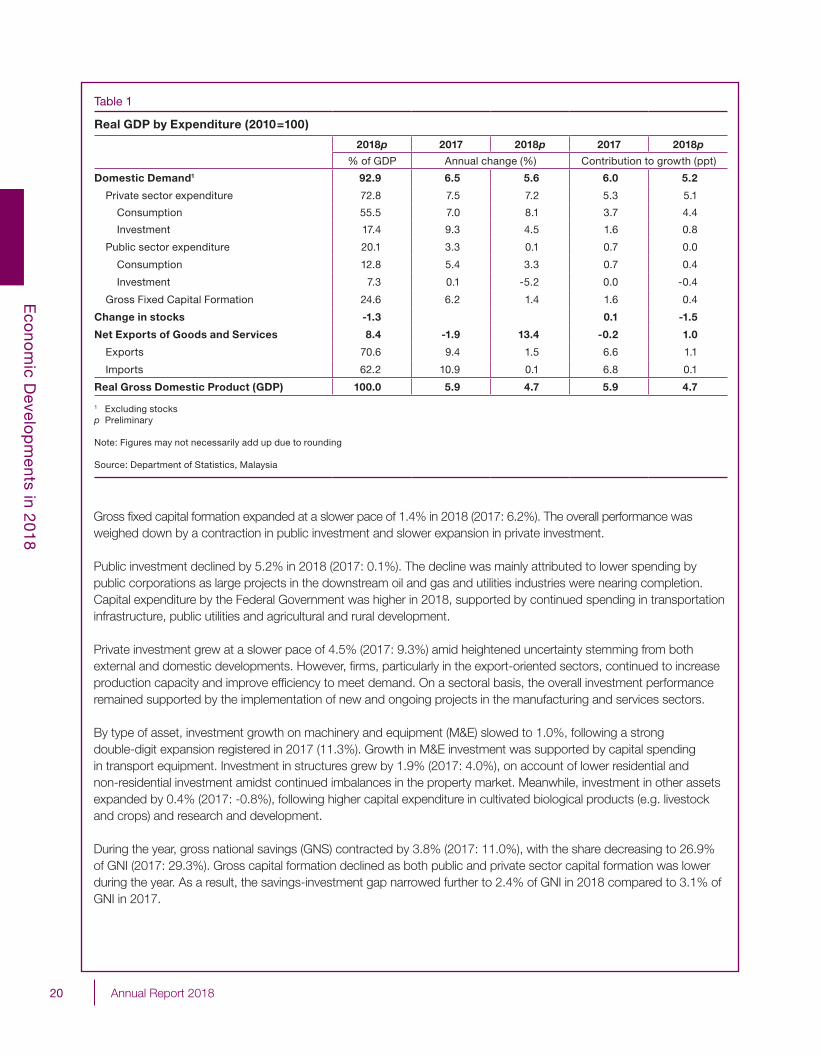
Gross fixed capital formation expanded at a slower pace of 1.4% in 2018 (2017: 6.2%). The overall performance was weighed down by a contraction in public investment and slower expansion in private investment.
Public investment declined by 5.2% in 2018 (2017: 0.1%). The decline was mainly attributed to lower spending by public corporations as large projects in the downstream oil and gas and utilities industries were nearing completion. Capital expenditure by the Federal Government was higher in 2018, supported by continued spending in transportation infrastructure, public utilities and agricultural and rural development.
Private investment grew at a slower pace of 4.5% (2017: 9.3%) amid heightened uncertainty stemming from both external and domestic developments. However, firms, particularly in the export-oriented sectors, continued to increase production capacity and improve efficiency to meet demand. On a sectoral basis, the overall investment performance remained supported by the implementation of new and ongoing projects in the manufacturing and services sectors.
By type of asset, investment growth on machinery and equipment (M&E) slowed to 1.0%, following a strong double-digit expansion registered in 2017 (11.3%). Growth in M&E investment was supported by capital spending in transport equipment. Investment in structures grew by 1.9% (2017: 4.0%), on account of lower residential and non-residential investment amidst continued imbalances in the property market. Meanwhile, investment in other assets expanded by 0.4% (2017: -0.8%), following higher capital expenditure in cultivated biological products (e.g. livestock and crops) and research and development. During the year, gross national savings (GNS) contracted by 3.8% (2017: 11.0%), with the share decreasing to 26.9% of GNI (2017: 29.3%). Gross capital formation declined as both public and private sector capital formation was lower during the year. As a result, the savings-investment gap narrowed further to 2.4% of GNI in 2018 compared to 3.1% of GNI in 2017.
Table 1
Real GDP by Expenditure (2010=100)
2018p 2017 2018p 2017 2018p
% of GDP Annual change (%) Contribution to growth (ppt)
Domestic Demand1 92.9 6.5 5.6 6.0 5.2
Private sector expenditure 72.8 7.5 7.2 5.3 5.1
Consumption 55.5 7.0 8.1 3.7 4.4
Investment 17.4 9.3 4.5 1.6 0.8
Public sector expenditure 20.1 3.3 0.1 0.7 0.0
Consumption 12.8 5.4 3.3 0.7 0.4
Investment 7.3 0.1 -5.2 0.0 -0.4
Gross Fixed Capital Formation 24.6 6.2 1.4 1.6 0.4
Change in stocks -1.3 0.1 -1.5
Net Exports of Goods and Services 8.4 -1.9 13.4 -0.2 1.0
Exports 70.6 9.4 1.5 6.6 1.1
Imports 62.2 10.9 0.1 6.8 0.1
Real Gross Domestic Product (GDP) 100.0 5.9 4.7 5.9 4.7
1 Excluding stocksp Preliminary
Note: Figures may not necessarily add up due to rounding
Source: Department of Statistics, Malaysia
21Annual Report 2018
Eco
nom
ic Develo
pm
ents in 2018
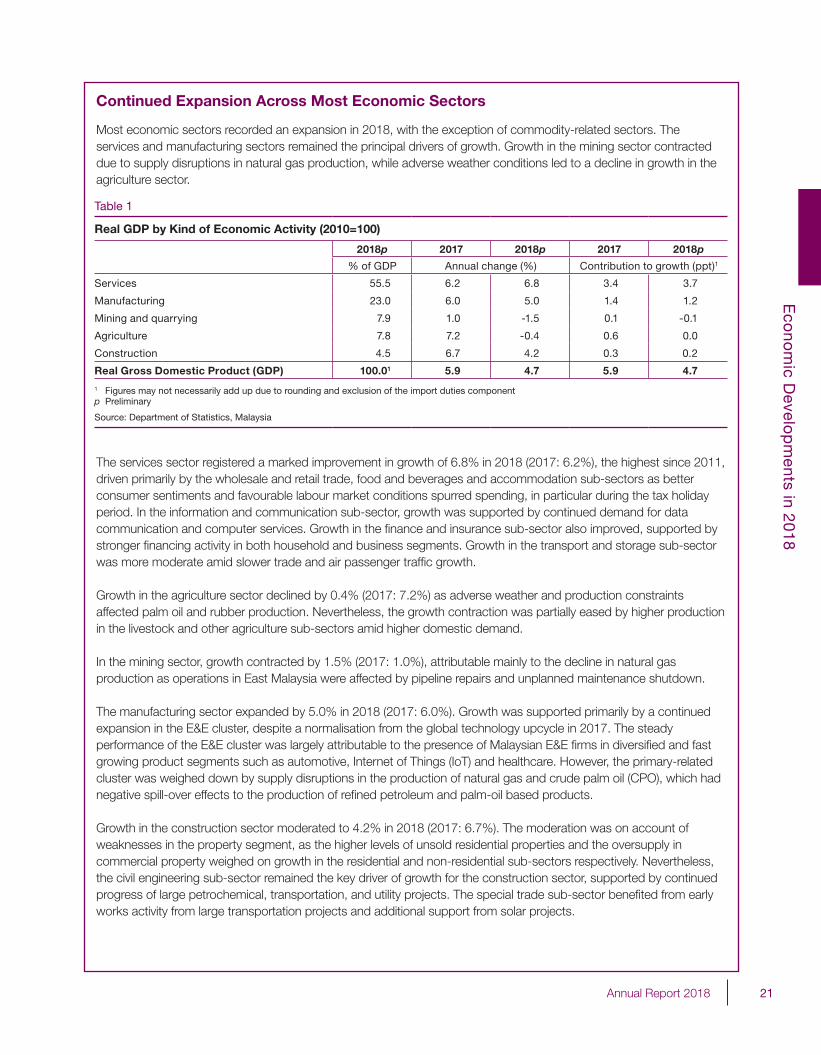
Continued Expansion Across Most Economic Sectors
Most economic sectors recorded an expansion in 2018, with the exception of commodity-related sectors. The services and manufacturing sectors remained the principal drivers of growth. Growth in the mining sector contracted due to supply disruptions in natural gas production, while adverse weather conditions led to a decline in growth in the agriculture sector.
The services sector registered a marked improvement in growth of 6.8% in 2018 (2017: 6.2%), the highest since 2011, driven primarily by the wholesale and retail trade, food and beverages and accommodation sub-sectors as better consumer sentiments and favourable labour market conditions spurred spending, in particular during the tax holiday period. In the information and communication sub-sector, growth was supported by continued demand for data communication and computer services. Growth in the finance and insurance sub-sector also improved, supported by stronger financing activity in both household and business segments. Growth in the transport and storage sub-sector was more moderate amid slower trade and air passenger traffic growth.
Growth in the agriculture sector declined by 0.4% (2017: 7.2%) as adverse weather and production constraints affected palm oil and rubber production. Nevertheless, the growth contraction was partially eased by higher production in the livestock and other agriculture sub-sectors amid higher domestic demand.
In the mining sector, growth contracted by 1.5% (2017: 1.0%), attributable mainly to the decline in natural gas production as operations in East Malaysia were affected by pipeline repairs and unplanned maintenance shutdown.
The manufacturing sector expanded by 5.0% in 2018 (2017: 6.0%). Growth was supported primarily by a continued expansion in the E&E cluster, despite a normalisation from the global technology upcycle in 2017. The steady performance of the E&E cluster was largely attributable to the presence of Malaysian E&E firms in diversified and fast growing product segments such as automotive, Internet of Things (IoT) and healthcare. However, the primary-related cluster was weighed down by supply disruptions in the production of natural gas and crude palm oil (CPO), which had negative spill-over effects to the production of refined petroleum and palm-oil based products.
Growth in the construction sector moderated to 4.2% in 2018 (2017: 6.7%). The moderation was on account of weaknesses in the property segment, as the higher levels of unsold residential properties and the oversupply in commercial property weighed on growth in the residential and non-residential sub-sectors respectively. Nevertheless, the civil engineering sub-sector remained the key driver of growth for the construction sector, supported by continued progress of large petrochemical, transportation, and utility projects. The special trade sub-sector benefited from early works activity from large transportation projects and additional support from solar projects.
Table 1
Real GDP by Kind of Economic Activity (2010=100)
2018p 2017 2018p 2017 2018p
% of GDP Annual change (%) Contribution to growth (ppt)1
Services 55.5 6.2 6.8 3.4 3.7
Manufacturing 23.0 6.0 5.0 1.4 1.2
Mining and quarrying 7.9 1.0 -1.5 0.1 -0.1
Agriculture 7.8 7.2 -0.4 0.6 0.0
Construction 4.5 6.7 4.2 0.3 0.2
Real Gross Domestic Product (GDP) 100.01 5.9 4.7 5.9 4.7
1 Figures may not necessarily add up due to rounding and exclusion of the import duties componentp Preliminary
Source: Department of Statistics, Malaysia
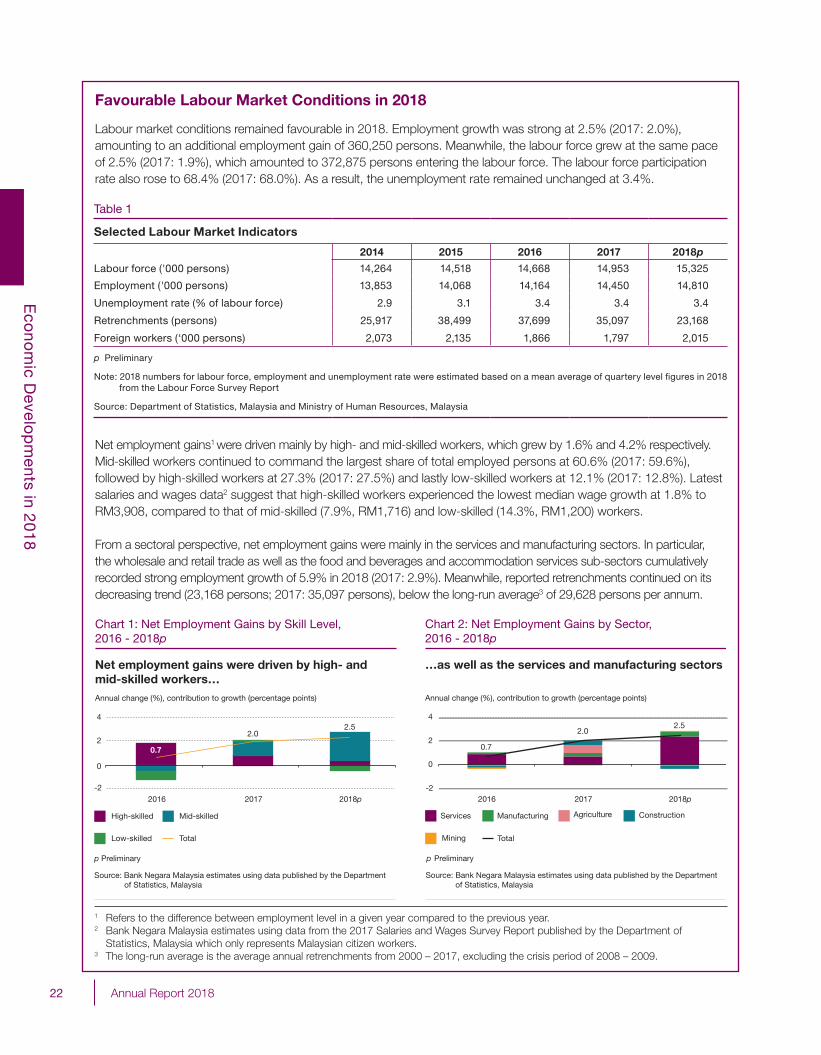
22 Annual Report 2018
Eco
nom
ic Develo
pm
ents in 2018
Favourable Labour Market Conditions in 2018
Labour market conditions remained favourable in 2018. Employment growth was strong at 2.5% (2017: 2.0%), amounting to an additional employment gain of 360,250 persons. Meanwhile, the labour force grew at the same pace of 2.5% (2017: 1.9%), which amounted to 372,875 persons entering the labour force. The labour force participation rate also rose to 68.4% (2017: 68.0%). As a result, the unemployment rate remained unchanged at 3.4%.
Net employment gains1 were driven mainly by high- and mid-skilled workers, which grew by 1.6% and 4.2% respectively. Mid-skilled workers continued to command the largest share of total employed persons at 60.6% (2017: 59.6%), followed by high-skilled workers at 27.3% (2017: 27.5%) and lastly low-skilled workers at 12.1% (2017: 12.8%). Latest salaries and wages data2 suggest that high-skilled workers experienced the lowest median wage growth at 1.8% to RM3,908, compared to that of mid-skilled (7.9%, RM1,716) and low-skilled (14.3%, RM1,200) workers.
From a sectoral perspective, net employment gains were mainly in the services and manufacturing sectors. In particular, the wholesale and retail trade as well as the food and beverages and accommodation services sub-sectors cumulatively recorded strong employment growth of 5.9% in 2018 (2017: 2.9%). Meanwhile, reported retrenchments continued on its decreasing trend (23,168 persons; 2017: 35,097 persons), below the long-run average3 of 29,628 persons per annum.
Table 1
Selected Labour Market Indicators
2014 2015 2016 2017 2018p
Labour force ('000 persons) 14,264 14,518 14,668 14,953 15,325
Employment ('000 persons) 13,853 14,068 14,164 14,450 14,810
Unemployment rate (% of labour force) 2.9 3.1 3.4 3.4 3.4
Retrenchments (persons) 25,917 38,499 37,699 35,097 23,168
Foreign workers (‘000 persons) 2,073 2,135 1,866 1,797 2,015
p Preliminary
Note: 2018 numbers for labour force, employment and unemployment rate were estimated based on a mean average of quartery level fi gures in 2018 from the Labour Force Survey Report
Source: Department of Statistics, Malaysia and Ministry of Human Resources, Malaysia
Chart 2: Net Employment Gains by Sector,2016 - 2018p
…as well as the services and manufacturing sectors
Annual change (%), contribution to growth (percentage points)
p Preliminary
0.7
2.02.5
-2
0
2
4
2016 2017 2018p
Services Manufacturing Agriculture Construction
Mining Total
Source: Bank Negara Malaysia estimates using data published by the Department of Statistics, Malaysia
Chart 1: Net Employment Gains by Skill Level,2016 - 2018p
Net employment gains were driven by high- andmid-skilled workers…Annual change (%), contribution to growth (percentage points)
p Preliminary
2016 2017 2018p
High-skilled Mid-skilled
Low-skilled Total
Source: Bank Negara Malaysia estimates using data published by the Department of Statistics, Malaysia
0.7
2.02.5
-2
0
2
4
1 Refers to the difference between employment level in a given year compared to the previous year.2 Bank Negara Malaysia estimates using data from the 2017 Salaries and Wages Survey Report published by the Department of
Statistics, Malaysia which only represents Malaysian citizen workers.3 The long-run average is the average annual retrenchments from 2000 – 2017, excluding the crisis period of 2008 – 2009.
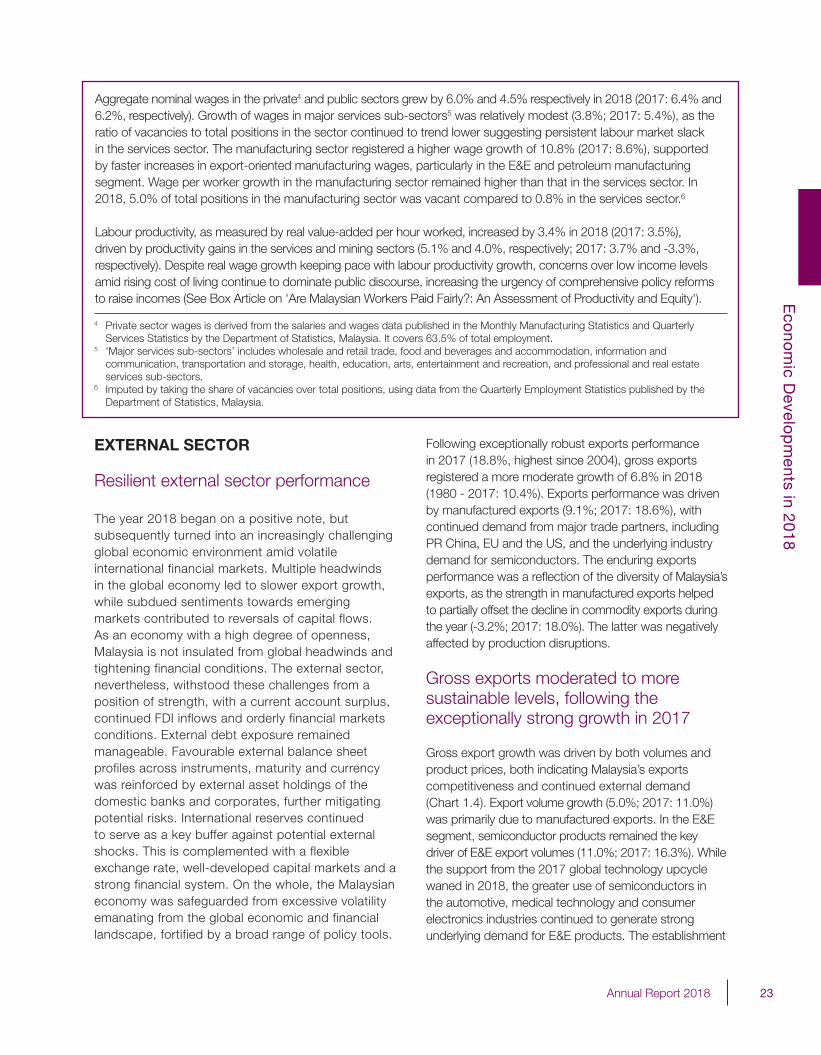
23Annual Report 2018
Eco
nom
ic Develo
pm
ents in 2018
Aggregate nominal wages in the private4 and public sectors grew by 6.0% and 4.5% respectively in 2018 (2017: 6.4% and 6.2%, respectively). Growth of wages in major services sub-sectors5 was relatively modest (3.8%; 2017: 5.4%), as the ratio of vacancies to total positions in the sector continued to trend lower suggesting persistent labour market slack in the services sector. The manufacturing sector registered a higher wage growth of 10.8% (2017: 8.6%), supported by faster increases in export-oriented manufacturing wages, particularly in the E&E and petroleum manufacturing segment. Wage per worker growth in the manufacturing sector remained higher than that in the services sector. In 2018, 5.0% of total positions in the manufacturing sector was vacant compared to 0.8% in the services sector.6
Labour productivity, as measured by real value-added per hour worked, increased by 3.4% in 2018 (2017: 3.5%), driven by productivity gains in the services and mining sectors (5.1% and 4.0%, respectively; 2017: 3.7% and -3.3%, respectively). Despite real wage growth keeping pace with labour productivity growth, concerns over low income levels amid rising cost of living continue to dominate public discourse, increasing the urgency of comprehensive policy reforms to raise incomes (See Box Article on 'Are Malaysian Workers Paid Fairly?: An Assessment of Productivity and Equity').
EXTERNAL SECTOR
Resilient external sector performance
The year 2018 began on a positive note, but subsequently turned into an increasingly challenging global economic environment amid volatile international financial markets. Multiple headwinds in the global economy led to slower export growth, while subdued sentiments towards emerging markets contributed to reversals of capital flows. As an economy with a high degree of openness, Malaysia is not insulated from global headwinds and tightening financial conditions. The external sector, nevertheless, withstood these challenges from a position of strength, with a current account surplus, continued FDI inflows and orderly financial markets conditions. External debt exposure remained manageable. Favourable external balance sheet profiles across instruments, maturity and currency was reinforced by external asset holdings of the domestic banks and corporates, further mitigating potential risks. International reserves continued to serve as a key buffer against potential external shocks. This is complemented with a flexible exchange rate, well-developed capital markets and a strong financial system. On the whole, the Malaysian economy was safeguarded from excessive volatility emanating from the global economic and financial landscape, fortified by a broad range of policy tools.
Following exceptionally robust exports performance in 2017 (18.8%, highest since 2004), gross exports registered a more moderate growth of 6.8% in 2018 (1980 - 2017: 10.4%). Exports performance was driven by manufactured exports (9.1%; 2017: 18.6%), with continued demand from major trade partners, including PR China, EU and the US, and the underlying industry demand for semiconductors. The enduring exports performance was a reflection of the diversity of Malaysia’s exports, as the strength in manufactured exports helped to partially offset the decline in commodity exports during the year (-3.2%; 2017: 18.0%). The latter was negatively affected by production disruptions.
Gross exports moderated to more sustainable levels, following the exceptionally strong growth in 2017
Gross export growth was driven by both volumes and product prices, both indicating Malaysia’s exports competitiveness and continued external demand (Chart 1.4). Export volume growth (5.0%; 2017: 11.0%) was primarily due to manufactured exports. In the E&E segment, semiconductor products remained the key driver of E&E export volumes (11.0%; 2017: 16.3%). While the support from the 2017 global technology upcycle waned in 2018, the greater use of semiconductors in the automotive, medical technology and consumer electronics industries continued to generate strong underlying demand for E&E products. The establishment
4 Private sector wages is derived from the salaries and wages data published in the Monthly Manufacturing Statistics and Quarterly Services Statistics by the Department of Statistics, Malaysia. It covers 63.5% of total employment.
5 ‘Major services sub-sectors’ includes wholesale and retail trade, food and beverages and accommodation, information and communication, transportation and storage, health, education, arts, entertainment and recreation, and professional and real estate services sub-sectors.
6 Imputed by taking the share of vacancies over total positions, using data from the Quarterly Employment Statistics published by the Department of Statistics, Malaysia.
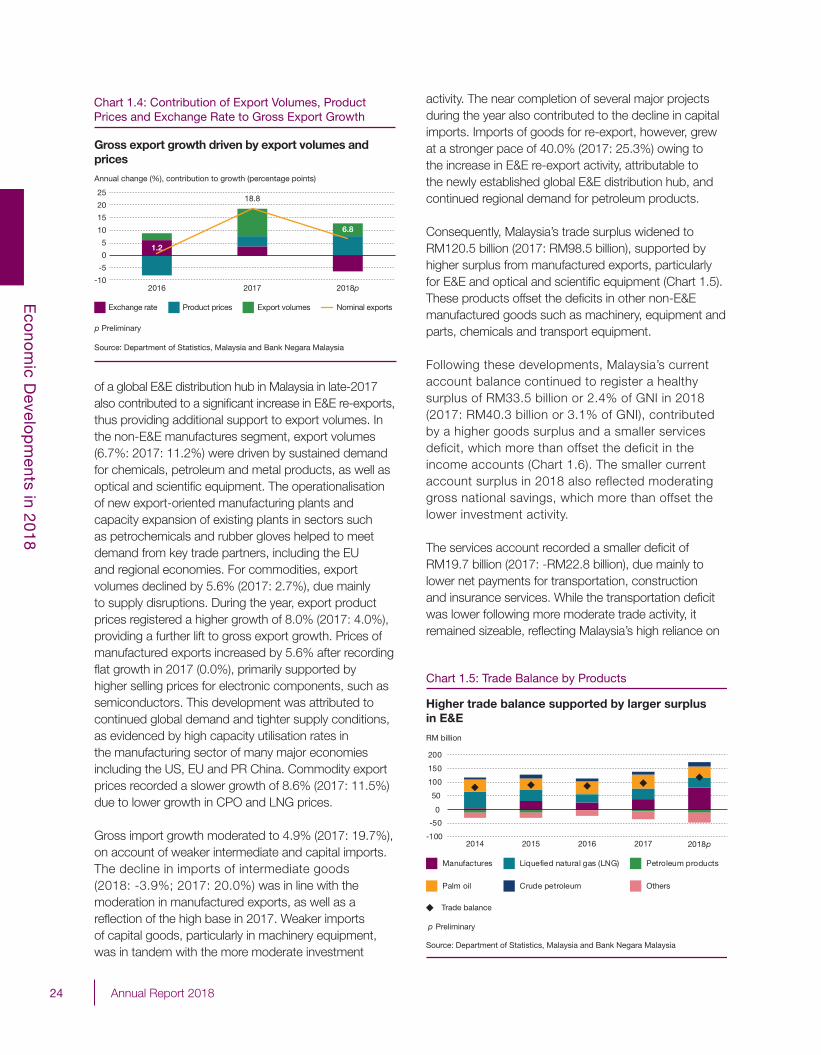
24 Annual Report 2018
Eco
nom
ic Develo
pm
ents in 2018
RM billion
Chart 1.5: Trade Balance by Products
Higher trade balance supported by larger surplus in E&E
-100
-50
0
50
100
150
200
2018p
Source: Department of Statistics, Malaysia and Bank Negara Malaysia
p Preliminary
2014 2015 2016 2017
Crude petroleumPalm oil Others
Trade balance
Petroleum productsManufactures Liquefied natural gas (LNG)
of a global E&E distribution hub in Malaysia in late-2017 also contributed to a significant increase in E&E re-exports, thus providing additional support to export volumes. In the non-E&E manufactures segment, export volumes (6.7%: 2017: 11.2%) were driven by sustained demand for chemicals, petroleum and metal products, as well as optical and scientific equipment. The operationalisation of new export-oriented manufacturing plants and capacity expansion of existing plants in sectors such as petrochemicals and rubber gloves helped to meet demand from key trade partners, including the EU and regional economies. For commodities, export volumes declined by 5.6% (2017: 2.7%), due mainly to supply disruptions. During the year, export product prices registered a higher growth of 8.0% (2017: 4.0%), providing a further lift to gross export growth. Prices of manufactured exports increased by 5.6% after recording flat growth in 2017 (0.0%), primarily supported by higher selling prices for electronic components, such as semiconductors. This development was attributed to continued global demand and tighter supply conditions, as evidenced by high capacity utilisation rates in the manufacturing sector of many major economies including the US, EU and PR China. Commodity export prices recorded a slower growth of 8.6% (2017: 11.5%) due to lower growth in CPO and LNG prices.
Gross import growth moderated to 4.9% (2017: 19.7%), on account of weaker intermediate and capital imports. The decline in imports of intermediate goods (2018: -3.9%; 2017: 20.0%) was in line with the moderation in manufactured exports, as well as a reflection of the high base in 2017. Weaker imports of capital goods, particularly in machinery equipment, was in tandem with the more moderate investment
activity. The near completion of several major projects during the year also contributed to the decline in capital imports. Imports of goods for re-export, however, grew at a stronger pace of 40.0% (2017: 25.3%) owing to the increase in E&E re-export activity, attributable to the newly established global E&E distribution hub, and continued regional demand for petroleum products.
Consequently, Malaysia’s trade surplus widened to RM120.5 billion (2017: RM98.5 billion), supported by higher surplus from manufactured exports, particularly for E&E and optical and scientific equipment (Chart 1.5). These products offset the deficits in other non-E&E manufactured goods such as machinery, equipment and parts, chemicals and transport equipment.
Following these developments, Malaysia’s current account balance continued to register a healthy surplus of RM33.5 billion or 2.4% of GNI in 2018 (2017: RM40.3 billion or 3.1% of GNI), contributed by a higher goods surplus and a smaller services deficit, which more than offset the deficit in the income accounts (Chart 1.6). The smaller current account surplus in 2018 also reflected moderating gross national savings, which more than offset the lower investment activity.
The services account recorded a smaller deficit of RM19.7 billion (2017: -RM22.8 billion), due mainly to lower net payments for transportation, construction and insurance services. While the transportation deficit was lower following more moderate trade activity, it remained sizeable, reflecting Malaysia’s high reliance on
Chart 1.4: Contribution of Export Volumes, Product Prices and Exchange Rate to Gross Export Growth
Gross export growth driven by export volumes and prices
1.2
18.8
6.8
-10
-5
0
5
10
15
20
25
2016 2017 2018p
Annual change (%), contribution to growth (percentage points)
p Preliminary
Source: Department of Statistics, Malaysia and Bank Negara Malaysia
Exchange rate Product prices Export volumes Nominal exports
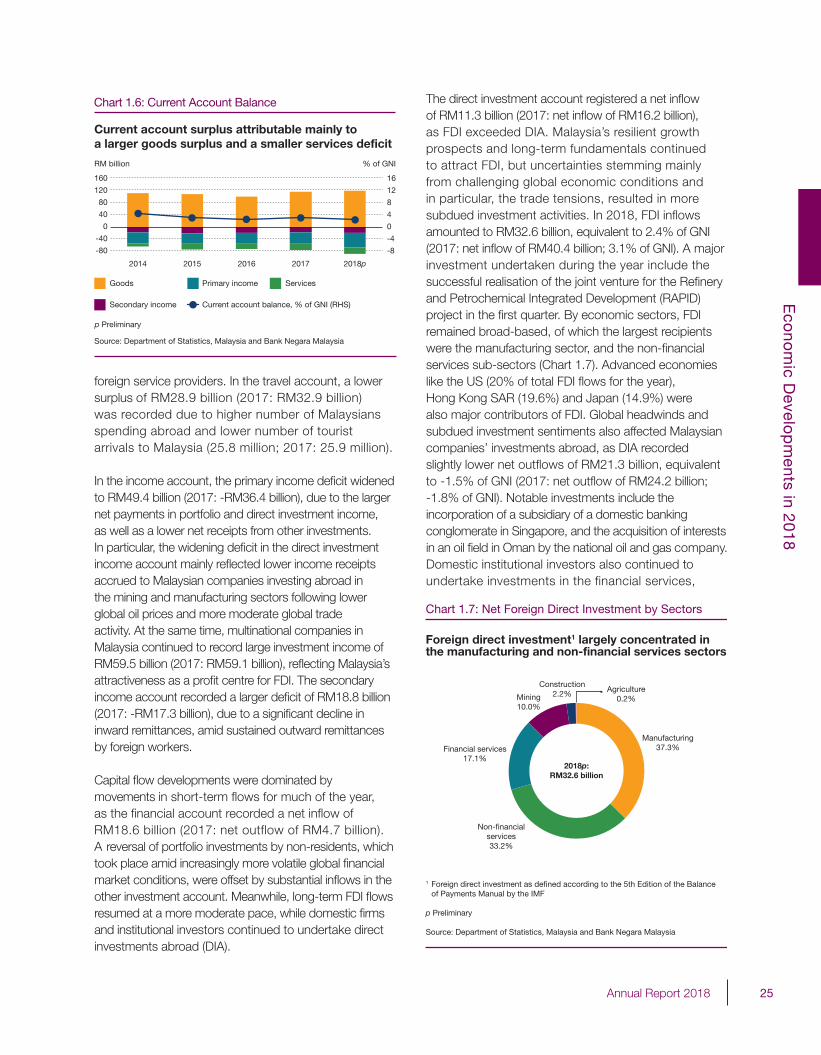
25Annual Report 2018
Eco
nom
ic Develo
pm
ents in 2018
Source: Department of Statistics, Malaysia and Bank Negara Malaysia
Current account balance, % of GNI (RHS)
Primary income
Secondary income
ServicesGoods
Current account surplus attributable mainly to a larger goods surplus and a smaller services deficit
Chart 1.6: Current Account Balance
p Preliminary
-8
-4
0
4
8
12
16
-80
-40
0
40
80
120
160
2014 2015 2016 2017 2018p
% of GNIRM billion
foreign service providers. In the travel account, a lower surplus of RM28.9 billion (2017: RM32.9 billion) was recorded due to higher number of Malaysians spending abroad and lower number of tourist arrivals to Malaysia (25.8 million; 2017: 25.9 million).
In the income account, the primary income deficit widened to RM49.4 billion (2017: -RM36.4 billion), due to the larger net payments in portfolio and direct investment income, as well as a lower net receipts from other investments. In particular, the widening deficit in the direct investment income account mainly reflected lower income receipts accrued to Malaysian companies investing abroad in the mining and manufacturing sectors following lower global oil prices and more moderate global trade activity. At the same time, multinational companies in Malaysia continued to record large investment income of RM59.5 billion (2017: RM59.1 billion), reflecting Malaysia’s attractiveness as a profit centre for FDI. The secondary income account recorded a larger deficit of RM18.8 billion (2017: -RM17.3 billion), due to a significant decline in inward remittances, amid sustained outward remittances by foreign workers.
Capital flow developments were dominated by movements in short-term flows for much of the year, as the financial account recorded a net inflow of RM18.6 billion (2017: net outflow of RM4.7 billion). A reversal of portfolio investments by non-residents, which took place amid increasingly more volatile global financial market conditions, were offset by substantial inflows in the other investment account. Meanwhile, long-term FDI flows resumed at a more moderate pace, while domestic firms and institutional investors continued to undertake direct investments abroad (DIA).
The direct investment account registered a net inflow of RM11.3 billion (2017: net inflow of RM16.2 billion), as FDI exceeded DIA. Malaysia’s resilient growth prospects and long-term fundamentals continued to attract FDI, but uncertainties stemming mainly from challenging global economic conditions and in particular, the trade tensions, resulted in more subdued investment activities. In 2018, FDI inflows amounted to RM32.6 billion, equivalent to 2.4% of GNI (2017: net inflow of RM40.4 billion; 3.1% of GNI). A major investment undertaken during the year include the successful realisation of the joint venture for the Refinery and Petrochemical Integrated Development (RAPID) project in the first quarter. By economic sectors, FDI remained broad-based, of which the largest recipients were the manufacturing sector, and the non-financial services sub-sectors (Chart 1.7). Advanced economies like the US (20% of total FDI flows for the year), Hong Kong SAR (19.6%) and Japan (14.9%) were also major contributors of FDI. Global headwinds and subdued investment sentiments also affected Malaysian companies’ investments abroad, as DIA recorded slightly lower net outflows of RM21.3 billion, equivalent to -1.5% of GNI (2017: net outflow of RM24.2 billion; -1.8% of GNI). Notable investments include the incorporation of a subsidiary of a domestic banking conglomerate in Singapore, and the acquisition of interests in an oil field in Oman by the national oil and gas company. Domestic institutional investors also continued to undertake investments in the financial services,
Chart 1.7: Net Foreign Direct Investment by Sectors
Foreign direct investment1 largely concentrated in the manufacturing and non-financial services sectors
1 Foreign direct investment as defined according to the 5th Edition of the Balance of Payments Manual by the IMF
p Preliminary
Source: Department of Statistics, Malaysia and Bank Negara Malaysia
Non-financialservices33.2%
Construction2.2%
Agriculture0.2%
Financial services17.1%
2018p:RM32.6 billion
Manufacturing37.3%
Mining10.0%
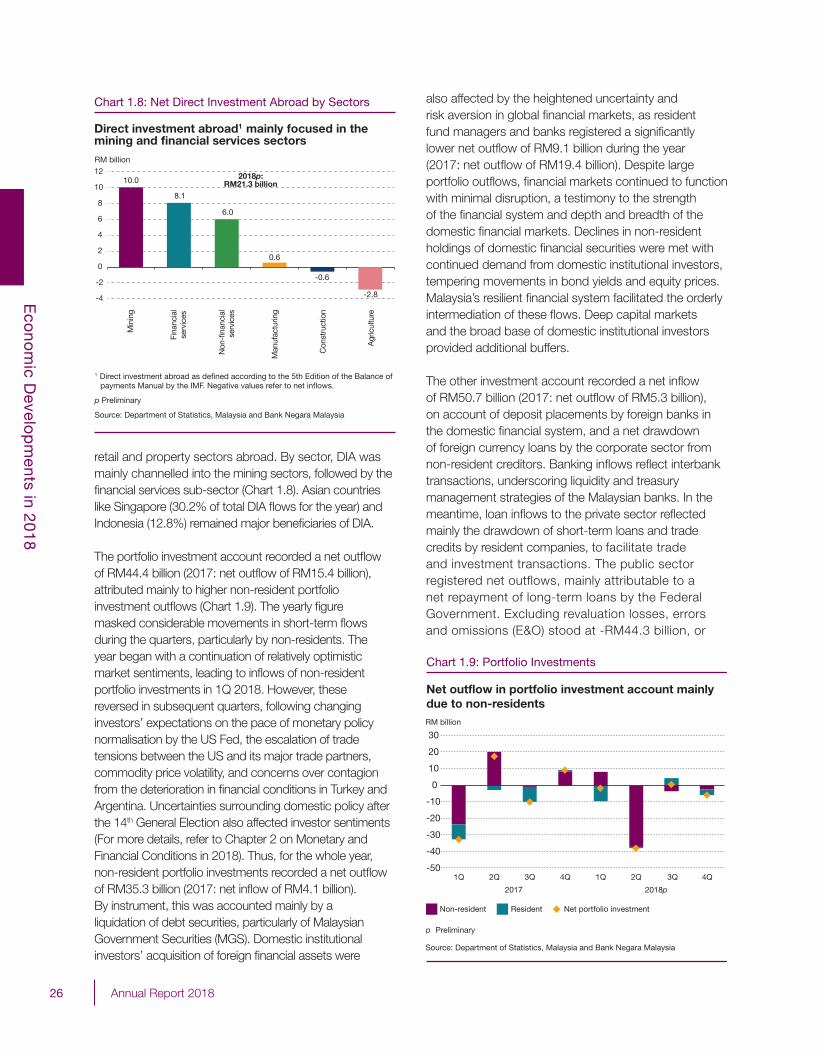
26 Annual Report 2018
Eco
nom
ic Develo
pm
ents in 2018
retail and property sectors abroad. By sector, DIA was mainly channelled into the mining sectors, followed by the financial services sub-sector (Chart 1.8). Asian countries like Singapore (30.2% of total DIA flows for the year) and Indonesia (12.8%) remained major beneficiaries of DIA.
The portfolio investment account recorded a net outflow of RM44.4 billion (2017: net outflow of RM15.4 billion), attributed mainly to higher non-resident portfolio investment outflows (Chart 1.9). The yearly figure masked considerable movements in short-term flows during the quarters, particularly by non-residents. The year began with a continuation of relatively optimistic market sentiments, leading to inflows of non-resident portfolio investments in 1Q 2018. However, these reversed in subsequent quarters, following changing investors’ expectations on the pace of monetary policy normalisation by the US Fed, the escalation of trade tensions between the US and its major trade partners, commodity price volatility, and concerns over contagion from the deterioration in financial conditions in Turkey and Argentina. Uncertainties surrounding domestic policy after the 14th General Election also affected investor sentiments (For more details, refer to Chapter 2 on Monetary and Financial Conditions in 2018). Thus, for the whole year, non-resident portfolio investments recorded a net outflow of RM35.3 billion (2017: net inflow of RM4.1 billion). By instrument, this was accounted mainly by a liquidation of debt securities, particularly of Malaysian Government Securities (MGS). Domestic institutional investors’ acquisition of foreign financial assets were
also affected by the heightened uncertainty and risk aversion in global financial markets, as resident fund managers and banks registered a significantly lower net outflow of RM9.1 billion during the year (2017: net outflow of RM19.4 billion). Despite large portfolio outflows, financial markets continued to function with minimal disruption, a testimony to the strength of the financial system and depth and breadth of the domestic financial markets. Declines in non-resident holdings of domestic financial securities were met with continued demand from domestic institutional investors, tempering movements in bond yields and equity prices. Malaysia’s resilient financial system facilitated the orderly intermediation of these flows. Deep capital markets and the broad base of domestic institutional investors provided additional buffers.
The other investment account recorded a net inflow of RM50.7 billion (2017: net outflow of RM5.3 billion), on account of deposit placements by foreign banks in the domestic financial system, and a net drawdown of foreign currency loans by the corporate sector from non-resident creditors. Banking inflows reflect interbank transactions, underscoring liquidity and treasury management strategies of the Malaysian banks. In the meantime, loan inflows to the private sector reflected mainly the drawdown of short-term loans and trade credits by resident companies, to facilitate trade and investment transactions. The public sector registered net outflows, mainly attributable to a net repayment of long-term loans by the Federal Government. Excluding revaluation losses, errors and omissions (E&O) stood at -RM44.3 billion, or
Chart 1.8: Net Direct Investment Abroad by Sectors
Direct investment abroad1 mainly focused in themining and financial services sectors
1 Direct investment abroad as defined according to the 5th Edition of the Balance of payments Manual by the IMF. Negative values refer to net inflows.
p Preliminary
Source: Department of Statistics, Malaysia and Bank Negara Malaysia
10.0
RM billion
8.1
6.0
0.6
-0.6
-2.8-4
-2
0
2
4
6
8
10
12
Min
ing
Fina
ncia
lse
rvic
es
Non
-fin
anci
alse
rvic
es
Man
ufac
turin
g
Con
stru
ctio
n
Agr
icul
ture
2018p:RM21.3 billion
Chart 1.9: Portfolio Investments
RM billion
p Preliminary
Source: Department of Statistics, Malaysia and Bank Negara Malaysia
-50
-40
-30
-20
-10
0
10
20
30
1Q 2Q 3Q 4Q 1Q 2Q 3Q 4Q
2017 2018p
Net outflow in portfolio investment account mainlydue to non-residents
Non-resident Resident Net portfolio investment
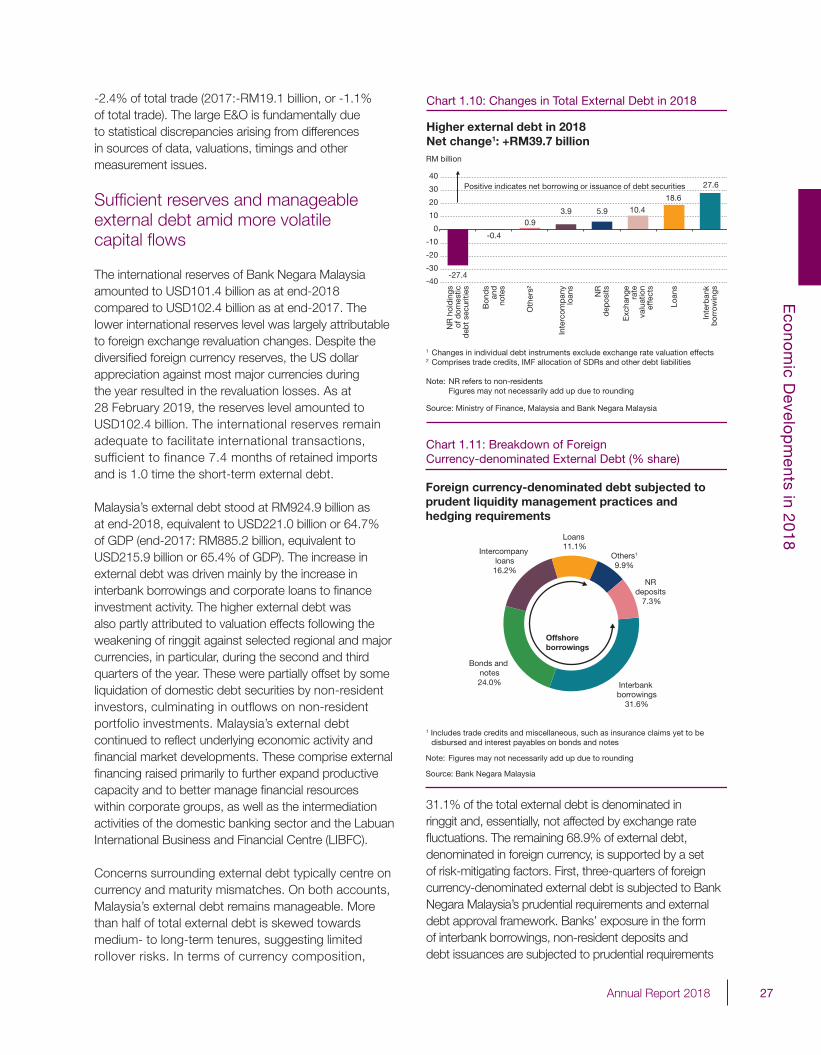
27Annual Report 2018
Eco
nom
ic Develo
pm
ents in 2018
-2.4% of total trade (2017:-RM19.1 billion, or -1.1% of total trade). The large E&O is fundamentally due to statistical discrepancies arising from differences in sources of data, valuations, timings and other measurement issues.
Sufficient reserves and manageable external debt amid more volatile capital flows
The international reserves of Bank Negara Malaysia amounted to USD101.4 billion as at end-2018 compared to USD102.4 billion as at end-2017. The lower international reserves level was largely attributable to foreign exchange revaluation changes. Despite the diversified foreign currency reserves, the US dollar appreciation against most major currencies during the year resulted in the revaluation losses. As at 28 February 2019, the reserves level amounted to USD102.4 billion. The international reserves remain adequate to facilitate international transactions, sufficient to finance 7.4 months of retained imports and is 1.0 time the short-term external debt.
Malaysia’s external debt stood at RM924.9 billion as at end-2018, equivalent to USD221.0 billion or 64.7% of GDP (end-2017: RM885.2 billion, equivalent to USD215.9 billion or 65.4% of GDP). The increase in external debt was driven mainly by the increase in interbank borrowings and corporate loans to finance investment activity. The higher external debt was also partly attributed to valuation effects following the weakening of ringgit against selected regional and major currencies, in particular, during the second and third quarters of the year. These were partially offset by some liquidation of domestic debt securities by non-resident investors, culminating in outflows on non-resident portfolio investments. Malaysia’s external debt continued to reflect underlying economic activity and financial market developments. These comprise external financing raised primarily to further expand productive capacity and to better manage financial resources within corporate groups, as well as the intermediation activities of the domestic banking sector and the Labuan International Business and Financial Centre (LIBFC).
Concerns surrounding external debt typically centre on currency and maturity mismatches. On both accounts, Malaysia’s external debt remains manageable. More than half of total external debt is skewed towards medium- to long-term tenures, suggesting limited rollover risks. In terms of currency composition,
31.1% of the total external debt is denominated in ringgit and, essentially, not affected by exchange rate fluctuations. The remaining 68.9% of external debt, denominated in foreign currency, is supported by a set of risk-mitigating factors. First, three-quarters of foreign currency-denominated external debt is subjected to Bank Negara Malaysia’s prudential requirements and external debt approval framework. Banks’ exposure in the form of interbank borrowings, non-resident deposits and debt issuances are subjected to prudential requirements
Source: Ministry of Finance, Malaysia and Bank Negara Malaysia
1 Changes in individual debt instruments exclude exchange rate valuation effects2 Comprises trade credits, IMF allocation of SDRs and other debt liabilities
Note: NR refers to non-residents Figures may not necessarily add up due to rounding
Chart 1.10: Changes in Total External Debt in 2018
Higher external debt in 2018Net change1: +RM39.7 billion
Inte
rban
kb
orro
win
gs
-27.4
-0.4
0.93.9 5.9 10.4
18.6
27.6
-40
-30
-20
-10
0
10
20
30
40
Oth
ers² NR
dep
osits
Loan
s
RM billion
Positive indicates net borrowing or issuance of debt securities
NR
hol
din
gsof
dom
estic
deb
t se
curit
ies
Bon
ds
and
note
s
Exc
hang
era
teva
luat
ion
effe
cts
Inte
rcom
pan
ylo
ans
Chart 1.11: Breakdown of Foreign Currency-denominated External Debt (% share)
Foreign currency-denominated debt subjected to prudent liquidity management practices and hedging requirements
1 Includes trade credits and miscellaneous, such as insurance claims yet to be disbursed and interest payables on bonds and notes
Source: Bank Negara Malaysia
Loans 11.1%
Offshoreborrowings
NR deposits
7.3%
Others1
9.9%
Interbank borrowings
31.6%
Bonds and notes24.0%
Intercompany loans
16.2%
Note: Figures may not necessarily add up due to rounding
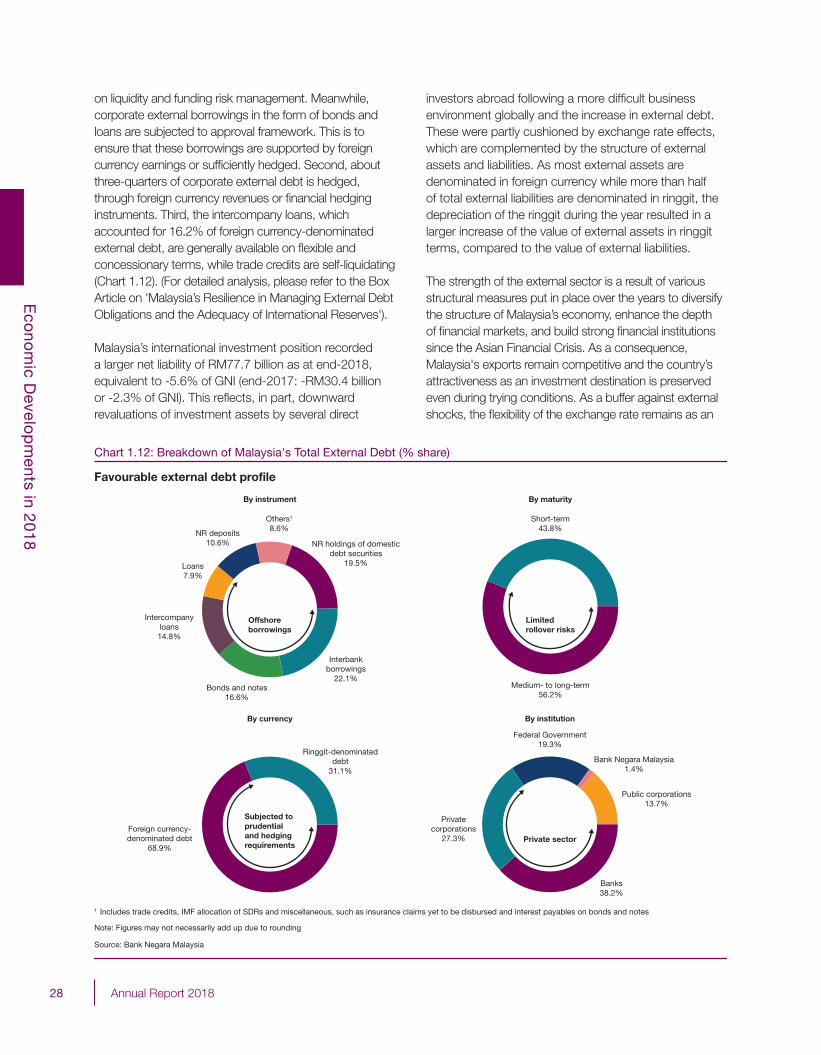
28 Annual Report 2018
Eco
nom
ic Develo
pm
ents in 2018
on liquidity and funding risk management. Meanwhile, corporate external borrowings in the form of bonds and loans are subjected to approval framework. This is to ensure that these borrowings are supported by foreign currency earnings or sufficiently hedged. Second, about three-quarters of corporate external debt is hedged, through foreign currency revenues or financial hedging instruments. Third, the intercompany loans, which accounted for 16.2% of foreign currency-denominated external debt, are generally available on flexible and concessionary terms, while trade credits are self-liquidating (Chart 1.12). (For detailed analysis, please refer to the Box Article on 'Malaysia’s Resilience in Managing External Debt Obligations and the Adequacy of International Reserves').
Malaysia’s international investment position recorded a larger net liability of RM77.7 billion as at end-2018, equivalent to -5.6% of GNI (end-2017: -RM30.4 billion or -2.3% of GNI). This reflects, in part, downward revaluations of investment assets by several direct
investors abroad following a more difficult business environment globally and the increase in external debt. These were partly cushioned by exchange rate effects, which are complemented by the structure of external assets and liabilities. As most external assets are denominated in foreign currency while more than half of total external liabilities are denominated in ringgit, the depreciation of the ringgit during the year resulted in a larger increase of the value of external assets in ringgit terms, compared to the value of external liabilities.
The strength of the external sector is a result of various structural measures put in place over the years to diversify the structure of Malaysia’s economy, enhance the depth of financial markets, and build strong financial institutions since the Asian Financial Crisis. As a consequence, Malaysia's exports remain competitive and the country’s attractiveness as an investment destination is preserved even during trying conditions. As a buffer against external shocks, the flexibility of the exchange rate remains as an
Chart 1.12: Breakdown of Malaysia's Total External Debt (% share)
Source: Bank Negara Malaysia
Favourable external debt profile
By currency
By instrument By maturity
By institution
Offshoreborrowings
Limitedrollover risks
Subjected toprudential and hedgingrequirements
Ringgit-denominateddebt
31.1%
Foreign currency-denominated debt
68.9%
Bank Negara Malaysia1.4%
Federal Government19.3%
Privatecorporations
27.3%
Public corporations13.7%
Banks38.2%
Private sector
Short-term43.8%
Medium- to long-term56.2%
NR deposits10.6%
Others1
8.6%
NR holdings of domesticdebt securities
19.5%Loans7.9%
Intercompanyloans14.8%
Bonds and notes16.6%
Interbankborrowings
22.1%
1 Includes trade credits, IMF allocation of SDRs and miscellaneous, such as insurance claims yet to be disbursed and interest payables on bonds and notes
Note: Figures may not necessarily add up due to rounding
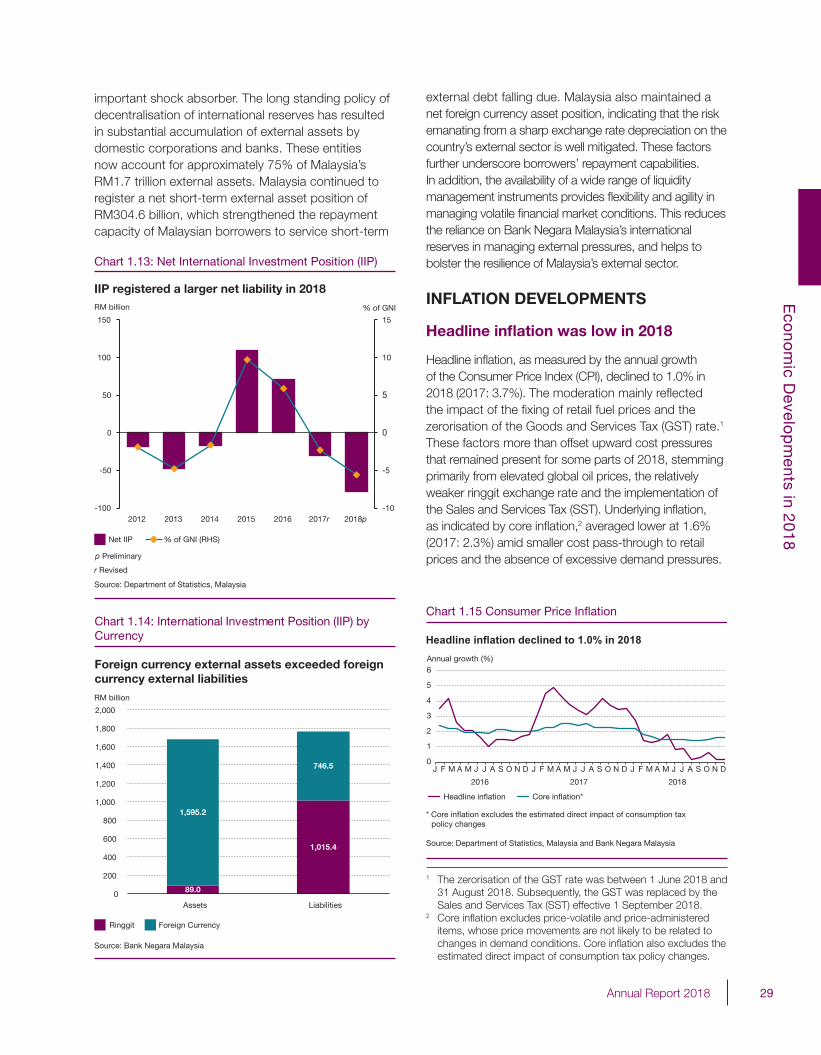
29Annual Report 2018
Eco
nom
ic Develo
pm
ents in 2018
important shock absorber. The long standing policy of decentralisation of international reserves has resulted in substantial accumulation of external assets by domestic corporations and banks. These entities now account for approximately 75% of Malaysia’s RM1.7 trillion external assets. Malaysia continued to register a net short-term external asset position of RM304.6 billion, which strengthened the repayment capacity of Malaysian borrowers to service short-term
external debt falling due. Malaysia also maintained a net foreign currency asset position, indicating that the risk emanating from a sharp exchange rate depreciation on the country’s external sector is well mitigated. These factors further underscore borrowers’ repayment capabilities. In addition, the availability of a wide range of liquidity management instruments provides flexibility and agility in managing volatile financial market conditions. This reduces the reliance on Bank Negara Malaysia’s international reserves in managing external pressures, and helps to bolster the resilience of Malaysia’s external sector.
INFLATION DEVELOPMENTS
Headline inflation was low in 2018
Headline inflation, as measured by the annual growth of the Consumer Price Index (CPI), declined to 1.0% in 2018 (2017: 3.7%). The moderation mainly reflected the impact of the fixing of retail fuel prices and the zerorisation of the Goods and Services Tax (GST) rate.1 These factors more than offset upward cost pressures that remained present for some parts of 2018, stemming primarily from elevated global oil prices, the relatively weaker ringgit exchange rate and the implementation of the Sales and Services Tax (SST). Underlying inflation, as indicated by core inflation,2 averaged lower at 1.6% (2017: 2.3%) amid smaller cost pass-through to retail prices and the absence of excessive demand pressures.
Chart 1.13: Net International Investment Position (IIP)
IIP registered a larger net liability in 2018RM billion % of GNI
-10
-5
0
5
10
15
-100
-50
0
50
100
150
2012 2013 2014 2015 2016 2017r 2018p
r Revised
p Preliminary
Source: Department of Statistics, Malaysia
Net IIP % of GNI (RHS)
Chart 1.14: International Investment Position (IIP) byCurrency
Foreign currency external assets exceeded foreigncurrency external liabilities
Source: Bank Negara Malaysia
89.0
1,015.4
1,595.2
746.5
0
200
400
600
800
1,000
1,200
1,400
1,600
1,800
2,000
Assets Liabilities
Ringgit Foreign Currency
RM billion
Chart 1.15 Consumer Price Inflation
Headline inflation declined to 1.0% in 2018
0
1
2
3
4
5
6
Headline inflation Core inflation*
Annual growth (%)
J F M A M J J A S O N D J F M A M J J A S O N D J F M A M J J A S O N D
2016 20182017
* Core inflation excludes the estimated direct impact of consumption tax policy changes
Source: Department of Statistics, Malaysia and Bank Negara Malaysia
1 The zerorisation of the GST rate was between 1 June 2018 and 31 August 2018. Subsequently, the GST was replaced by the Sales and Services Tax (SST) effective 1 September 2018.
2 Core inflation excludes price-volatile and price-administered items, whose price movements are not likely to be related to changes in demand conditions. Core inflation also excludes the estimated direct impact of consumption tax policy changes.
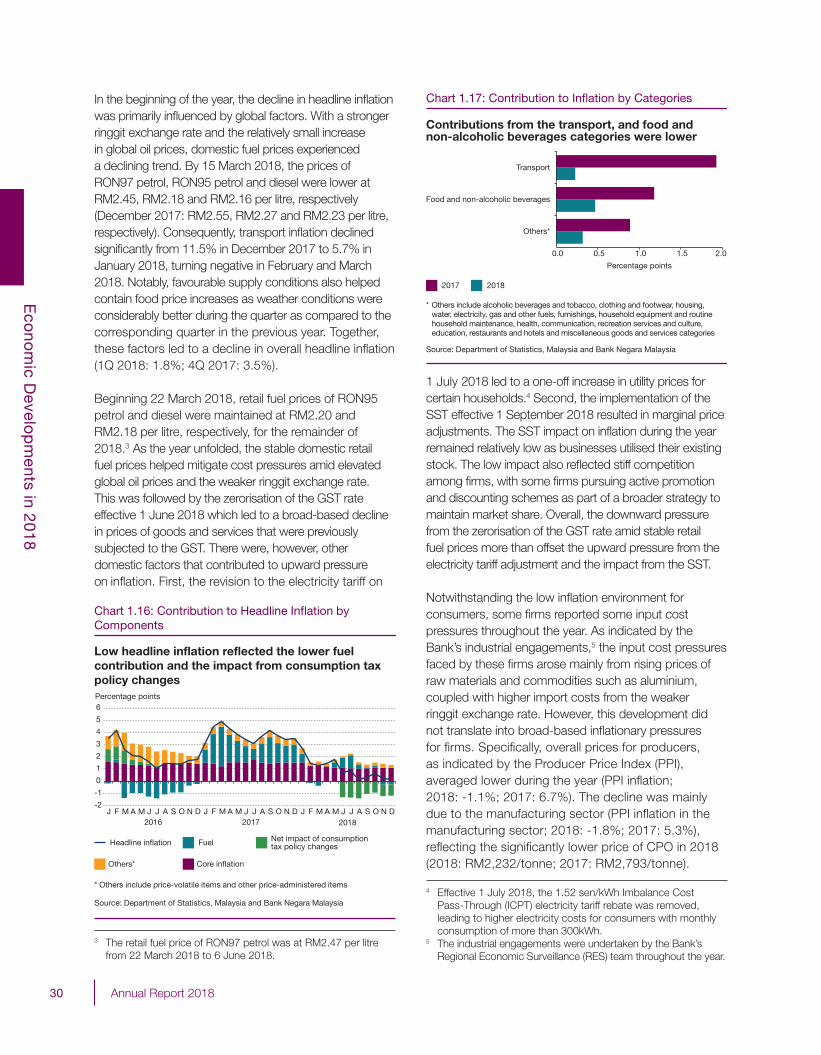
30 Annual Report 2018
Eco
nom
ic Develo
pm
ents in 2018
In the beginning of the year, the decline in headline inflation was primarily influenced by global factors. With a stronger ringgit exchange rate and the relatively small increase in global oil prices, domestic fuel prices experienced a declining trend. By 15 March 2018, the prices of RON97 petrol, RON95 petrol and diesel were lower at RM2.45, RM2.18 and RM2.16 per litre, respectively (December 2017: RM2.55, RM2.27 and RM2.23 per litre, respectively). Consequently, transport inflation declined significantly from 11.5% in December 2017 to 5.7% in January 2018, turning negative in February and March 2018. Notably, favourable supply conditions also helped contain food price increases as weather conditions were considerably better during the quarter as compared to the corresponding quarter in the previous year. Together, these factors led to a decline in overall headline inflation (1Q 2018: 1.8%; 4Q 2017: 3.5%).
Beginning 22 March 2018, retail fuel prices of RON95 petrol and diesel were maintained at RM2.20 and RM2.18 per litre, respectively, for the remainder of 2018.3 As the year unfolded, the stable domestic retail fuel prices helped mitigate cost pressures amid elevated global oil prices and the weaker ringgit exchange rate.This was followed by the zerorisation of the GST rate effective 1 June 2018 which led to a broad-based decline in prices of goods and services that were previously subjected to the GST. There were, however, other domestic factors that contributed to upward pressure on inflation. First, the revision to the electricity tariff on
1 July 2018 led to a one-off increase in utility prices for certain households.4 Second, the implementation of the SST effective 1 September 2018 resulted in marginal price adjustments. The SST impact on inflation during the year remained relatively low as businesses utilised their existing stock. The low impact also reflected stiff competition among firms, with some firms pursuing active promotion and discounting schemes as part of a broader strategy to maintain market share. Overall, the downward pressure from the zerorisation of the GST rate amid stable retail fuel prices more than offset the upward pressure from the electricity tariff adjustment and the impact from the SST.
Notwithstanding the low inflation environment for consumers, some firms reported some input cost pressures throughout the year. As indicated by the Bank’s industrial engagements,5 the input cost pressures faced by these firms arose mainly from rising prices of raw materials and commodities such as aluminium, coupled with higher import costs from the weaker ringgit exchange rate. However, this development did not translate into broad-based inflationary pressures for firms. Specifically, overall prices for producers, as indicated by the Producer Price Index (PPI), averaged lower during the year (PPI inflation; 2018: -1.1%; 2017: 6.7%). The decline was mainly due to the manufacturing sector (PPI inflation in the manufacturing sector; 2018: -1.8%; 2017: 5.3%), reflecting the significantly lower price of CPO in 2018 (2018: RM2,232/tonne; 2017: RM2,793/tonne).
Chart 1.17: Contribution to Inflation by Categories
Source: Department of Statistics, Malaysia and Bank Negara Malaysia
2017 2018
* Others include alcoholic beverages and tobacco, clothing and footwear, housing, water, electricity, gas and other fuels, furnishings, household equipment and routine household maintenance, health, communication, recreation services and culture, education, restaurants and hotels and miscellaneous goods and services categories
Contributions from the transport, and food and non-alcoholic beverages categories were lower
0.0 0.5 1.0 1.5 2.0
Others*
Food and non-alcoholic beverages
Transport
Percentage points
Chart 1.16: Contribution to Headline Inflation by Components
Low headline inflation reflected the lower fuel contribution and the impact from consumption tax policy changes
-2
-1
0
1
2
3
4
5
6
J F M A M J J A S O N D J F M A M J J A S O N D J F M A M J J A S O N D
Percentage points
2016 2017 2018
Core inflation
Fuel Net impact of consumptiontax policy changes
Others*
Headline inflation
* Others include price-volatile items and other price-administered items
Source: Department of Statistics, Malaysia and Bank Negara Malaysia
3 The retail fuel price of RON97 petrol was at RM2.47 per litre from 22 March 2018 to 6 June 2018.
4 Effective 1 July 2018, the 1.52 sen/kWh Imbalance Cost Pass-Through (ICPT) electricity tariff rebate was removed, leading to higher electricity costs for consumers with monthly consumption of more than 300kWh.
5 The industrial engagements were undertaken by the Bank’s Regional Economic Surveillance (RES) team throughout the year.
31Annual Report 2018
Eco
nom
ic Develo
pm
ents in 2018
This trend, together with strong competition among firms, supported the low inflation environment for consumers during the year.
In 2018, labour market indicators, such as the growth in real wage per worker in the private sector, improved amid a sustained unemployment rate (2018: 3.4%; 2017: 3.4%), while the capacity
utilisation rate in the manufacturing sector was relatively stable (2018: 81.3%; 2017: 82.6%). Yet, these developments did not translate into excessive demand pressures given the stronger growth in the labour force and continued investment for capacity expansion during the year. Against this backdrop, core inflation was lower for the year as a whole.
Inflation, the Cost of Living and the Living Wage
Globally, concerns surrounding living standards continue to attract much attention, as real income growth slowed or stagnated for some segments of society. In Malaysia, although headline inflation has been relatively low, concerns about the rising cost of living have been increasing and will likely persist over the near term. These pressures are wide-ranging, from housing to food, childcare, healthcare and education. For the lower-income households in particular, limited income buffers will render them more vulnerable to increases in living costs.1
This box aims to discuss the key concepts of the cost of living, inflation and the living wage, as well as how these concepts interrelate. It draws from the various analyses on households’ cost of living and income that the Bank has, since 2016, published in its Annual Reports and Quarterly Bulletins.
The cost of living reflects household expenditure on goods and services, including financial obligations, to maintain a certain standard of living. This expenditure is determined by each household’s spending patterns and prices, which are affected by factors such as household income, demography, family structure, area of residence and geographical factors (Bank Negara Malaysia, 2016). The cost of living therefore differs across different types of households.
The inflation rate, as measured by the change in the Consumer Price Index (CPI), measures the price increase for a basket of items that represents the average pattern of purchases among households in Malaysia. The CPI assumes homogenous spending patterns across households and holds the quantity and quality of the goods and services in the consumption basket constant over a fixed period of time (Bank Negara Malaysia, 2016). It can be used to approximate the change in the cost of living if there are little dispersions in the spending patterns and price changes faced by households across a country. However, in a situation where the dispersion in spending patterns and price changes are large, the inflation rate could be a weak approximation of the change in cost of living. Using the inflation rate as a proxy could consequently understate or overstate the change in cost of living for some segments of households. Therefore, it is very likely for different households to experience significant variations in the cost of living depending on the households’ composition and location as well as the prices of goods and services that pertain to the expenditure pattern of these households.
An added complexity is that households may also perceive that the increase in cost of living is vastly different (usually higher) than CPI inflation (Chart 1). This is because consumers use different sets of information when assessing the cost of living compared to that used to compute CPI inflation. Households’ views on the cost of living are mainly driven by the price changes on frequently purchased items, as compared to the full basket of goods and services that comprise the CPI. These frequent expenditures, such as fresh food items and eating out, typically experience higher inflation rates. This is called frequency bias, and it can be measured by the Everyday Price Index (EPI). It is an index that comprises households’ frequently purchased goods and services (at least once a month). There is also a tendency for households to only remember price increases and not decreases. This is called memory bias. Memory bias is measured by the Perceived Price Index (PePI). It is a further refinement to the EPI, where it attempts to incorporate memory bias in addition to frequency bias. Items in the PePI basket are exactly the same as in the EPI basket. However, the PePI only considers price increases, as consumers
1 See the Box Article titled ‘Divergence of Economic Performance and Public Sentiments’ in the Second Quarter 2018 BNM Quarterly Bulletin for more information.
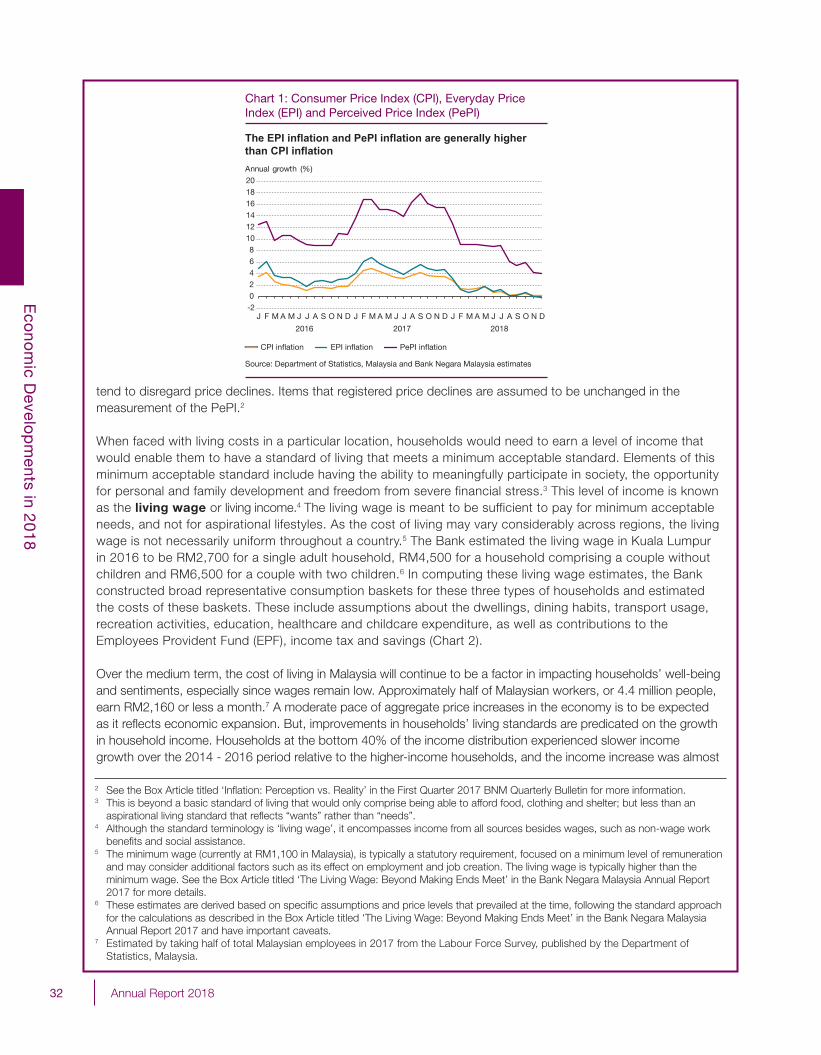
32 Annual Report 2018
Eco
nom
ic Develo
pm
ents in 2018
tend to disregard price declines. Items that registered price declines are assumed to be unchanged in the measurement of the PePI.2
When faced with living costs in a particular location, households would need to earn a level of income that would enable them to have a standard of living that meets a minimum acceptable standard. Elements of this minimum acceptable standard include having the ability to meaningfully participate in society, the opportunity for personal and family development and freedom from severe financial stress.3 This level of income is known as the living wage or living income.4 The living wage is meant to be sufficient to pay for minimum acceptable needs, and not for aspirational lifestyles. As the cost of living may vary considerably across regions, the living wage is not necessarily uniform throughout a country.5 The Bank estimated the living wage in Kuala Lumpur in 2016 to be RM2,700 for a single adult household, RM4,500 for a household comprising a couple without children and RM6,500 for a couple with two children.6 In computing these living wage estimates, the Bank constructed broad representative consumption baskets for these three types of households and estimated the costs of these baskets. These include assumptions about the dwellings, dining habits, transport usage, recreation activities, education, healthcare and childcare expenditure, as well as contributions to the Employees Provident Fund (EPF), income tax and savings (Chart 2).
Over the medium term, the cost of living in Malaysia will continue to be a factor in impacting households’ well-being and sentiments, especially since wages remain low. Approximately half of Malaysian workers, or 4.4 million people, earn RM2,160 or less a month.7 A moderate pace of aggregate price increases in the economy is to be expected as it reflects economic expansion. But, improvements in households’ living standards are predicated on the growth in household income. Households at the bottom 40% of the income distribution experienced slower income growth over the 2014 - 2016 period relative to the higher-income households, and the income increase was almost
-202468
101214161820
J F M A M J J A S O N D J F M A M J J A S O N D J F M A M J J A S O N D
Annual growth (%)
CPI inflation EPI inflation PePI inflation
2016 2017 2018
Chart 1: Consumer Price Index (CPI), Everyday Price Index (EPI) and Perceived Price Index (PePI)
The EPI inflation and PePI inflation are generally higher than CPI inflation
Source: Department of Statistics, Malaysia and Bank Negara Malaysia estimates
2 See the Box Article titled ‘Inflation: Perception vs. Reality’ in the First Quarter 2017 BNM Quarterly Bulletin for more information. 3 This is beyond a basic standard of living that would only comprise being able to afford food, clothing and shelter; but less than an
aspirational living standard that reflects “wants” rather than “needs”.4 Although the standard terminology is ‘living wage’, it encompasses income from all sources besides wages, such as non-wage work
benefits and social assistance.5 The minimum wage (currently at RM1,100 in Malaysia), is typically a statutory requirement, focused on a minimum level of remuneration
and may consider additional factors such as its effect on employment and job creation. The living wage is typically higher than the minimum wage. See the Box Article titled ‘The Living Wage: Beyond Making Ends Meet’ in the Bank Negara Malaysia Annual Report 2017 for more details.
6 These estimates are derived based on specific assumptions and price levels that prevailed at the time, following the standard approach for the calculations as described in the Box Article titled ‘The Living Wage: Beyond Making Ends Meet’ in the Bank Negara Malaysia Annual Report 2017 and have important caveats.
7 Estimated by taking half of total Malaysian employees in 2017 from the Labour Force Survey, published by the Department of Statistics, Malaysia.
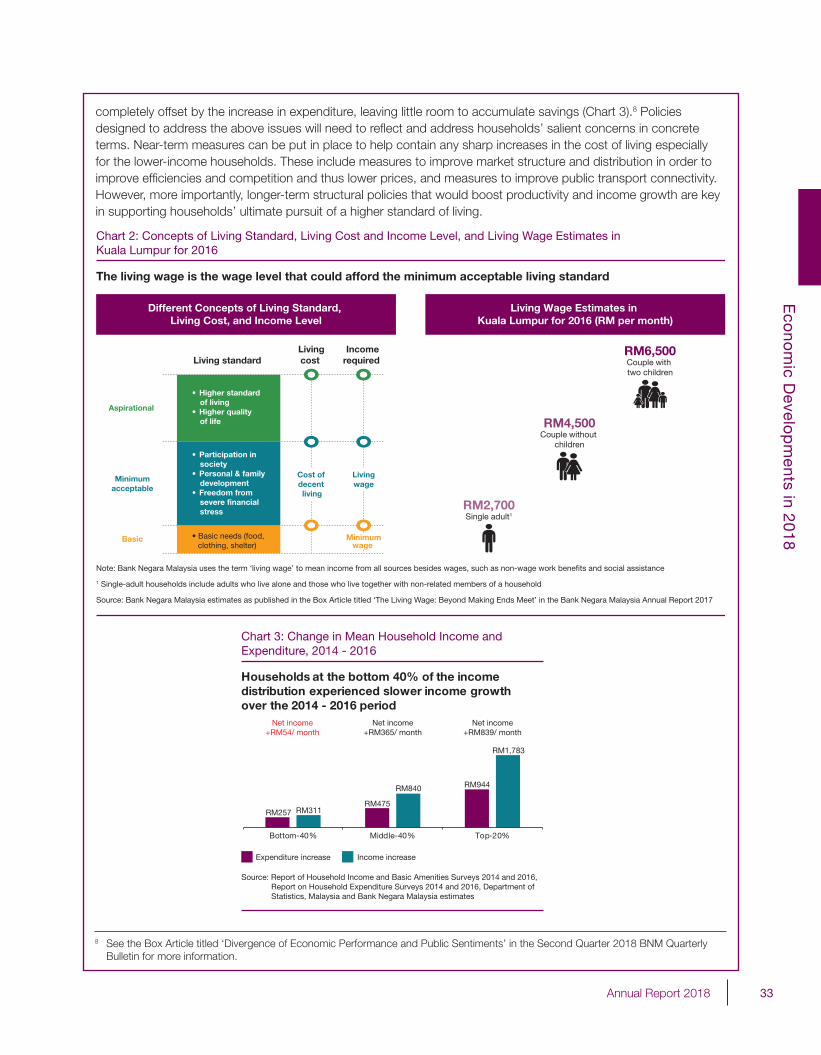
33Annual Report 2018
Eco
nom
ic Develo
pm
ents in 2018
completely offset by the increase in expenditure, leaving little room to accumulate savings (Chart 3).8 Policies designed to address the above issues will need to reflect and address households’ salient concerns in concrete terms. Near-term measures can be put in place to help contain any sharp increases in the cost of living especially for the lower-income households. These include measures to improve market structure and distribution in order to improve efficiencies and competition and thus lower prices, and measures to improve public transport connectivity. However, more importantly, longer-term structural policies that would boost productivity and income growth are key in supporting households’ ultimate pursuit of a higher standard of living.
Chart 2: Concepts of Living Standard, Living Cost and Income Level, and Living Wage Estimates inKuala Lumpur for 2016
The living wage is the wage level that could afford the minimum acceptable living standard
Different Concepts of Living Standard, Living Cost, and Income Level
Living Wage Estimates in Kuala Lumpur for 2016 (RM per month)
Living standard Income
required Livingcost
Livingwage
Cost of decent living
Note: Bank Negara Malaysia uses the term ‘living wage’ to mean income from all sources besides wages, such as non-wage work benefits and social assistance
1 Single-adult households include adults who live alone and those who live together with non-related members of a household
Source: Bank Negara Malaysia estimates as published in the Box Article titled ‘The Living Wage: Beyond Making Ends Meet’ in the Bank Negara Malaysia Annual Report 2017
RM4,500Couple without
children
RM6,500Couple with two children
RM2,700Single adult1
Basic
Aspirational
Minimumwage
• Participation in society
• Personal & family development
• Freedom from severe financial stress
• Higher standard of living
• Higher quality of life
• Basic needs (food, clothing, shelter)
Minimumacceptable
RM257 RM475
RM944
RM311
RM840
RM1,783
Bottom-40% Middle-40% Top-20%
Expenditure increase Income increase
Chart 3: Change in Mean Household Income and Expenditure, 2014 - 2016
Households at the bottom 40% of the income distribution experienced slower income growthover the 2014 - 2016 period
Source: Report of Household Income and Basic Amenities Surveys 2014 and 2016, Report on Household Expenditure Surveys 2014 and 2016, Department of Statistics, Malaysia and Bank Negara Malaysia estimates
Net income+RM54/ month
Net income+RM365/ month
Net income+RM839/ month
8 See the Box Article titled ‘Divergence of Economic Performance and Public Sentiments’ in the Second Quarter 2018 BNM Quarterly Bulletin for more information.
34 Annual Report 2018
Eco
nom
ic Develo
pm
ents in 2018
References
Bank Negara Malaysia (2016). ‘Updated Box Article: Inflation and the Cost of Living’, Annual Report 2015.
Bank Negara Malaysia (2017). ‘Box Article: Inflation: Perception vs. Reality’, BNM Quarterly Bulletin, First Quarter 2017.
Bank Negara Malaysia (2018). ‘Box Article: The Living Wage: Beyond Making Ends Meet’, Annual Report 2017.
Bank Negara Malaysia (2018). ‘Box Article: Divergence of Economic Performance and Public Sentiments’, BNM Quarterly Bulletin, Second Quarter 2018.
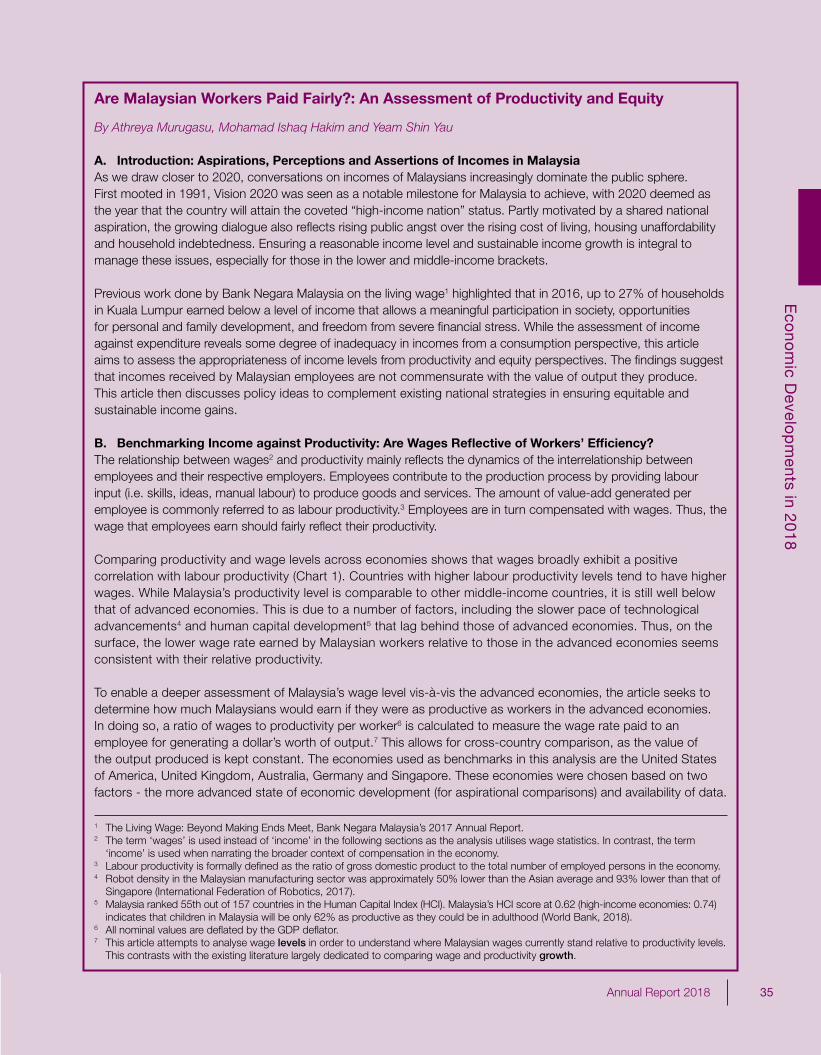
35Annual Report 2018
Eco
nom
ic Develo
pm
ents in 2018
77Annual Report 2018
Are Malaysian Workers Paid Fairly?: An Assessment of Productivity and Equity
By Athreya Murugasu, Mohamad Ishaq Hakim and Yeam Shin Yau
A. Introduction: Aspirations, Perceptions and Assertions of Incomes in MalaysiaAs we draw closer to 2020, conversations on incomes of Malaysians increasingly dominate the public sphere. First mooted in 1991, Vision 2020 was seen as a notable milestone for Malaysia to achieve, with 2020 deemed as the year that the country will attain the coveted “high-income nation” status. Partly motivated by a shared national aspiration, the growing dialogue also refl ects rising public angst over the rising cost of living, housing unaffordability and household indebtedness. Ensuring a reasonable income level and sustainable income growth is integral to manage these issues, especially for those in the lower and middle-income brackets.
Previous work done by Bank Negara Malaysia on the living wage1 highlighted that in 2016, up to 27% of households in Kuala Lumpur earned below a level of income that allows a meaningful participation in society, opportunities for personal and family development, and freedom from severe fi nancial stress. While the assessment of income against expenditure reveals some degree of inadequacy in incomes from a consumption perspective, this article aims to assess the appropriateness of income levels from productivity and equity perspectives. The fi ndings suggest that incomes received by Malaysian employees are not commensurate with the value of output they produce. This article then discusses policy ideas to complement existing national strategies in ensuring equitable and sustainable income gains. B. Benchmarking Income against Productivity: Are Wages Refl ective of Workers’ Effi ciency?The relationship between wages2 and productivity mainly refl ects the dynamics of the interrelationship between employees and their respective employers. Employees contribute to the production process by providing labour input (i.e. skills, ideas, manual labour) to produce goods and services. The amount of value-add generated per employee is commonly referred to as labour productivity.3 Employees are in turn compensated with wages. Thus, the wage that employees earn should fairly refl ect their productivity.
Comparing productivity and wage levels across economies shows that wages broadly exhibit a positive correlation with labour productivity (Chart 1). Countries with higher labour productivity levels tend to have higher wages. While Malaysia’s productivity level is comparable to other middle-income countries, it is still well below that of advanced economies. This is due to a number of factors, including the slower pace of technological advancements4 and human capital development5 that lag behind those of advanced economies. Thus, on the surface, the lower wage rate earned by Malaysian workers relative to those in the advanced economies seems consistent with their relative productivity.
To enable a deeper assessment of Malaysia’s wage level vis-à-vis the advanced economies, the article seeks to determine how much Malaysians would earn if they were as productive as workers in the advanced economies. In doing so, a ratio of wages to productivity per worker6 is calculated to measure the wage rate paid to an employee for generating a dollar’s worth of output.7 This allows for cross-country comparison, as the value of the output produced is kept constant. The economies used as benchmarks in this analysis are the United States of America, United Kingdom, Australia, Germany and Singapore. These economies were chosen based on two factors - the more advanced state of economic development (for aspirational comparisons) and availability of data.
1 The Living Wage: Beyond Making Ends Meet, Bank Negara Malaysia’s 2017 Annual Report.2 The term ‘wages’ is used instead of ‘income’ in the following sections as the analysis utilises wage statistics. In contrast, the term
‘income’ is used when narrating the broader context of compensation in the economy.3 Labour productivity is formally defi ned as the ratio of gross domestic product to the total number of employed persons in the economy.4 Robot density in the Malaysian manufacturing sector was approximately 50% lower than the Asian average and 93% lower than that of
Singapore (International Federation of Robotics, 2017).5 Malaysia ranked 55th out of 157 countries in the Human Capital Index (HCI). Malaysia’s HCI score at 0.62 (high-income economies: 0.74)
indicates that children in Malaysia will be only 62% as productive as they could be in adulthood (World Bank, 2018).6 All nominal values are defl ated by the GDP defl ator.7 This article attempts to analyse wage levels in order to understand where Malaysian wages currently stand relative to productivity levels.
This contrasts with the existing literature largely dedicated to comparing wage and productivity growth.
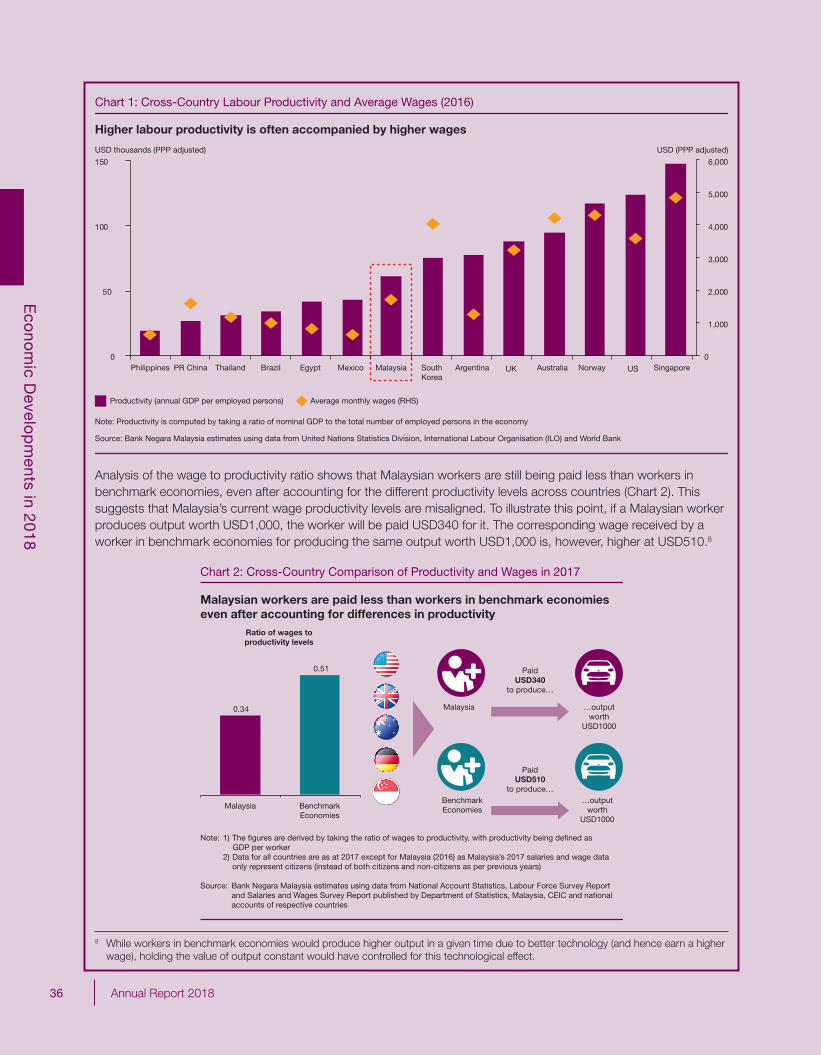
36 Annual Report 2018
Eco
nom
ic Develo
pm
ents in 2018
78 Annual Report 2018
Analysis of the wage to productivity ratio shows that Malaysian workers are still being paid less than workers in benchmark economies, even after accounting for the different productivity levels across countries (Chart 2). This suggests that Malaysia’s current wage productivity levels are misaligned. To illustrate this point, if a Malaysian worker produces output worth USD1,000, the worker will be paid USD340 for it. The corresponding wage received by a worker in benchmark economies for producing the same output worth USD1,000 is, however, higher at USD510.8
8 While workers in benchmark economies would produce higher output in a given time due to better technology (and hence earn a higher wage), holding the value of output constant would have controlled for this technological effect.
Productivity (annual GDP per employed persons)
USD thousands (PPP adjusted) USD (PPP adjusted)
Average monthly wages (RHS)
Note: Productivity is computed by taking a ratio of nominal GDP to the total number of employed persons in the economy
Source: Bank Negara Malaysia estimates using data from United Nations Statistics Division, International Labour Organisation (ILO) and World Bank
Philippines PR China Thailand Brazil Egypt Mexico Malaysia SouthKorea
Argentina UK Australia Norway US Singapore
Higher labour productivity is often accompanied by higher wages
Chart 1: Cross-Country Labour Productivity and Average Wages (2016)
0
1,000
2,000
3,000
4,000
5,000
6,000
0
50
100
150
Note: 1) The figures are derived by taking the ratio of wages to productivity, with productivity being defined as GDP per worker
2) Data for all countries are as at 2017 except for Malaysia (2016) as Malaysia’s 2017 salaries and wage data only represent citizens (instead of both citizens and non-citizens as per previous years)
Source: Bank Negara Malaysia estimates using data from National Account Statistics, Labour Force Survey Report and Salaries and Wages Survey Report published by Department of Statistics, Malaysia, CEIC and national accounts of respective countries
MalaysiaBenchmarkEconomiesBenchmark
Economies
…outputworth
USD1000
Malaysia0.34
0.51 PaidUSD340
to produce…
PaidUSD510
to produce…
…outputworth
USD1000
Ratio of wages toproductivity levels
Malaysian workers are paid less than workers in benchmark economies even after accounting for differences in productivity
Chart 2: Cross-Country Comparison of Productivity and Wages in 2017
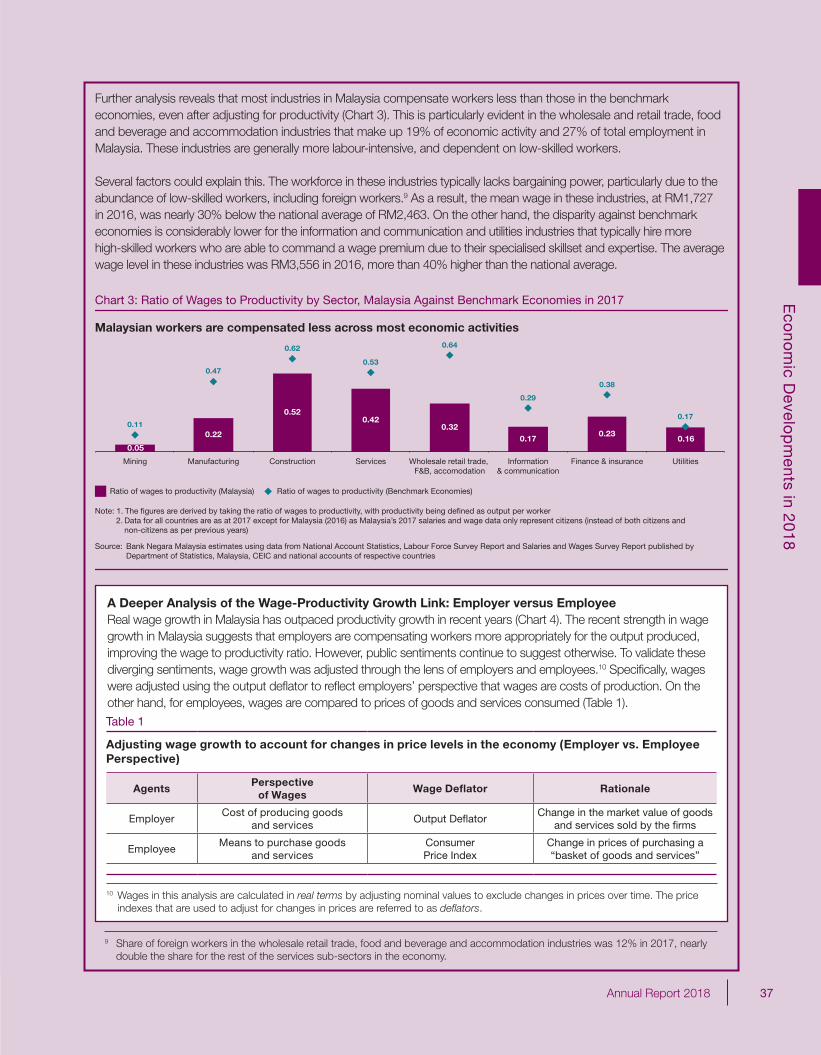
37Annual Report 2018
Eco
nom
ic Develo
pm
ents in 2018
78 Annual Report 2018
Analysis of the wage to productivity ratio shows that Malaysian workers are still being paid less than workers in benchmark economies, even after accounting for the different productivity levels across countries (Chart 2). This suggests that Malaysia’s current wage productivity levels are misaligned. To illustrate this point, if a Malaysian worker produces output worth USD1,000, the worker will be paid USD340 for it. The corresponding wage received by a worker in benchmark economies for producing the same output worth USD1,000 is, however, higher at USD510.8
8 While workers in benchmark economies would produce higher output in a given time due to better technology (and hence earn a higher wage), holding the value of output constant would have controlled for this technological effect.
Productivity (annual GDP per employed persons)
USD thousands (PPP adjusted) USD (PPP adjusted)
Average monthly wages (RHS)
Note: Productivity is computed by taking a ratio of nominal GDP to the total number of employed persons in the economy
Source: Bank Negara Malaysia estimates using data from United Nations Statistics Division, International Labour Organisation (ILO) and World Bank
Philippines PR China Thailand Brazil Egypt Mexico Malaysia SouthKorea
Argentina UK Australia Norway US Singapore
Higher labour productivity is often accompanied by higher wages
Chart 1: Cross-Country Labour Productivity and Average Wages (2016)
0
1,000
2,000
3,000
4,000
5,000
6,000
0
50
100
150
Note: 1) The figures are derived by taking the ratio of wages to productivity, with productivity being defined as GDP per worker
2) Data for all countries are as at 2017 except for Malaysia (2016) as Malaysia’s 2017 salaries and wage data only represent citizens (instead of both citizens and non-citizens as per previous years)
Source: Bank Negara Malaysia estimates using data from National Account Statistics, Labour Force Survey Report and Salaries and Wages Survey Report published by Department of Statistics, Malaysia, CEIC and national accounts of respective countries
MalaysiaBenchmarkEconomiesBenchmark
Economies
…outputworth
USD1000
Malaysia0.34
0.51 PaidUSD340
to produce…
PaidUSD510
to produce…
…outputworth
USD1000
Ratio of wages toproductivity levels
Malaysian workers are paid less than workers in benchmark economies even after accounting for differences in productivity
Chart 2: Cross-Country Comparison of Productivity and Wages in 2017
79Annual Report 2018
A Deeper Analysis of the Wage-Productivity Growth Link: Employer versus Employee Real wage growth in Malaysia has outpaced productivity growth in recent years (Chart 4). The recent strength in wage growth in Malaysia suggests that employers are compensating workers more appropriately for the output produced, improving the wage to productivity ratio. However, public sentiments continue to suggest otherwise. To validate these diverging sentiments, wage growth was adjusted through the lens of employers and employees.10 Specifi cally, wages were adjusted using the output defl ator to refl ect employers’ perspective that wages are costs of production. On the other hand, for employees, wages are compared to prices of goods and services consumed (Table 1).
Further analysis reveals that most industries in Malaysia compensate workers less than those in the benchmark economies, even after adjusting for productivity (Chart 3). This is particularly evident in the wholesale and retail trade, food and beverage and accommodation industries that make up 19% of economic activity and 27% of total employment in Malaysia. These industries are generally more labour-intensive, and dependent on low-skilled workers.
Several factors could explain this. The workforce in these industries typically lacks bargaining power, particularly due to the abundance of low-skilled workers, including foreign workers.9 As a result, the mean wage in these industries, at RM1,727 in 2016, was nearly 30% below the national average of RM2,463. On the other hand, the disparity against benchmark economies is considerably lower for the information and communication and utilities industries that typically hire more high-skilled workers who are able to command a wage premium due to their specialised skillset and expertise. The average wage level in these industries was RM3,556 in 2016, more than 40% higher than the national average.
Chart 3: Ratio of Wages to Productivity by Sector, Malaysia Against Benchmark Economies in 2017
Ratio of wages to productivity (Malaysia) Ratio of wages to productivity (Benchmark Economies)
Malaysian workers are compensated less across most economic activities
Mining Manufacturing Construction Services UtilitiesWholesale retail trade, F&B, accomodation
Information& communication
Finance & insurance
Note: 1. The figures are derived by taking the ratio of wages to productivity, with productivity being defined as output per worker2. Data for all countries are as at 2017 except for Malaysia (2016) as Malaysia’s 2017 salaries and wage data only represent citizens (instead of both citizens and non-citizens as per previous years)
Source: Bank Negara Malaysia estimates using data from National Account Statistics, Labour Force Survey Report and Salaries and Wages Survey Report published by Department of Statistics, Malaysia, CEIC and national accounts of respective countries
0.05
0.22
0.520.42
0.320.17
0.230.16
0.11
0.47
0.62
0.53
0.64
0.29
0.38
0.17
Table 1
Adjusting wage growth to account for changes in price levels in the economy (Employer vs. Employee Perspective)
AgentsPerspective
of WagesWage Defl ator Rationale
EmployerCost of producing goods
and servicesOutput Defl ator
Change in the market value of goods and services sold by the fi rms
EmployeeMeans to purchase goods
and servicesConsumerPrice Index
Change in prices of purchasing a “basket of goods and services”
10 Wages in this analysis are calculated in real terms by adjusting nominal values to exclude changes in prices over time. The price indexes that are used to adjust for changes in prices are referred to as defl ators.
9 Share of foreign workers in the wholesale retail trade, food and beverage and accommodation industries was 12% in 2017, nearly double the share for the rest of the services sub-sectors in the economy.
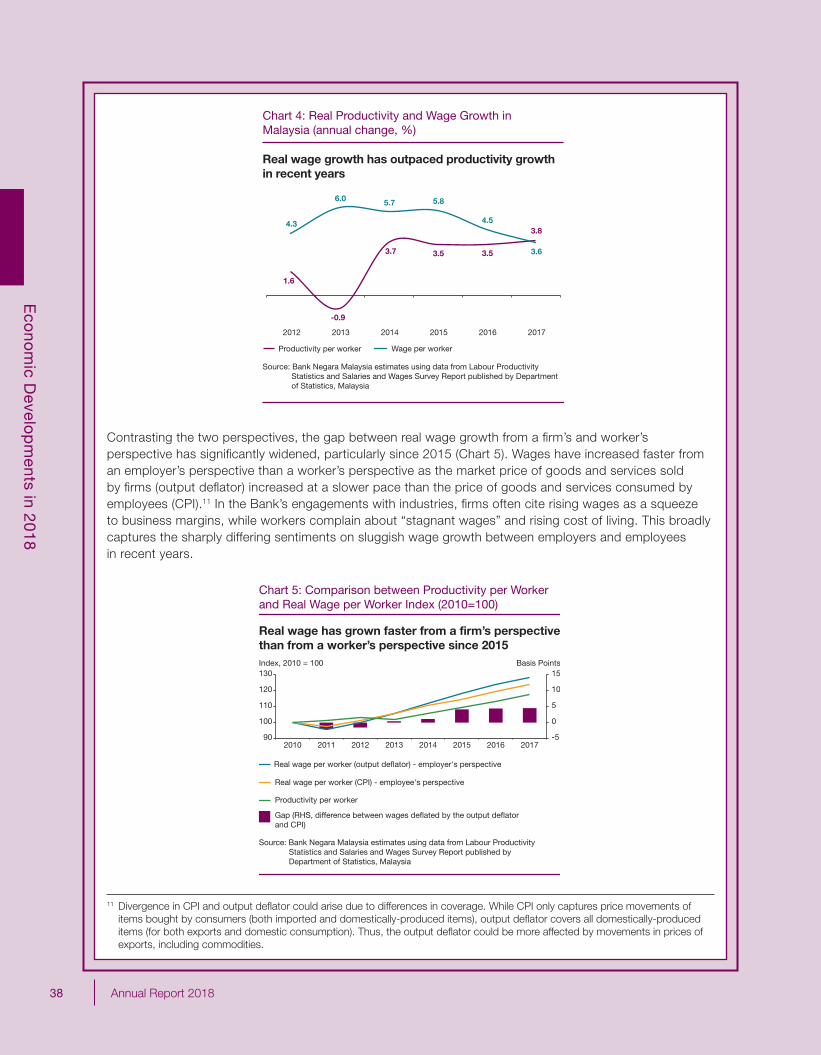
38 Annual Report 2018
Eco
nom
ic Develo
pm
ents in 2018
80 Annual Report 2018
Contrasting the two perspectives, the gap between real wage growth from a fi rm’s and worker’s perspective has signifi cantly widened, particularly since 2015 (Chart 5). Wages have increased faster from an employer’s perspective than a worker’s perspective as the market price of goods and services sold by fi rms (output defl ator) increased at a slower pace than the price of goods and services consumed by employees (CPI).11 In the Bank’s engagements with industries, fi rms often cite rising wages as a squeeze to business margins, while workers complain about “stagnant wages” and rising cost of living. This broadly captures the sharply differing sentiments on sluggish wage growth between employers and employees in recent years.
Chart 4: Real Productivity and Wage Growth in Malaysia (annual change, %)
Real wage growth has outpaced productivity growth in recent years
Source: Bank Negara Malaysia estimates using data from Labour Productivity Statistics and Salaries and Wages Survey Report published by Department of Statistics, Malaysia
1.6
-0.9
3.7 3.5 3.5
3.84.3
6.0 5.7 5.8
4.5
3.6
2012 2013 2014 2015 2016 2017
Productivity per worker Wage per worker
Real wage per worker (output deflator) - employer's perspective
Gap (RHS, difference between wages deflated by the output deflator and CPI)
Real wage per worker (CPI) - employee's perspective
Chart 5: Comparison between Productivity per Worker and Real Wage per Worker Index (2010=100)
Real wage has grown faster from a firm’s perspective than from a worker’s perspective since 2015Index, 2010 = 100 Basis Points
-5
0
5
10
15
90
100
110
120
130
2010 2011 2012 2013 2014 2015 2016 2017
Productivity per worker
Source: Bank Negara Malaysia estimates using data from Labour Productivity Statistics and Salaries and Wages Survey Report published by Department of Statistics, Malaysia
11 Divergence in CPI and output defl ator could arise due to differences in coverage. While CPI only captures price movements of items bought by consumers (both imported and domestically-produced items), output defl ator covers all domestically-produced items (for both exports and domestic consumption). Thus, the output defl ator could be more affected by movements in prices of exports, including commodities.
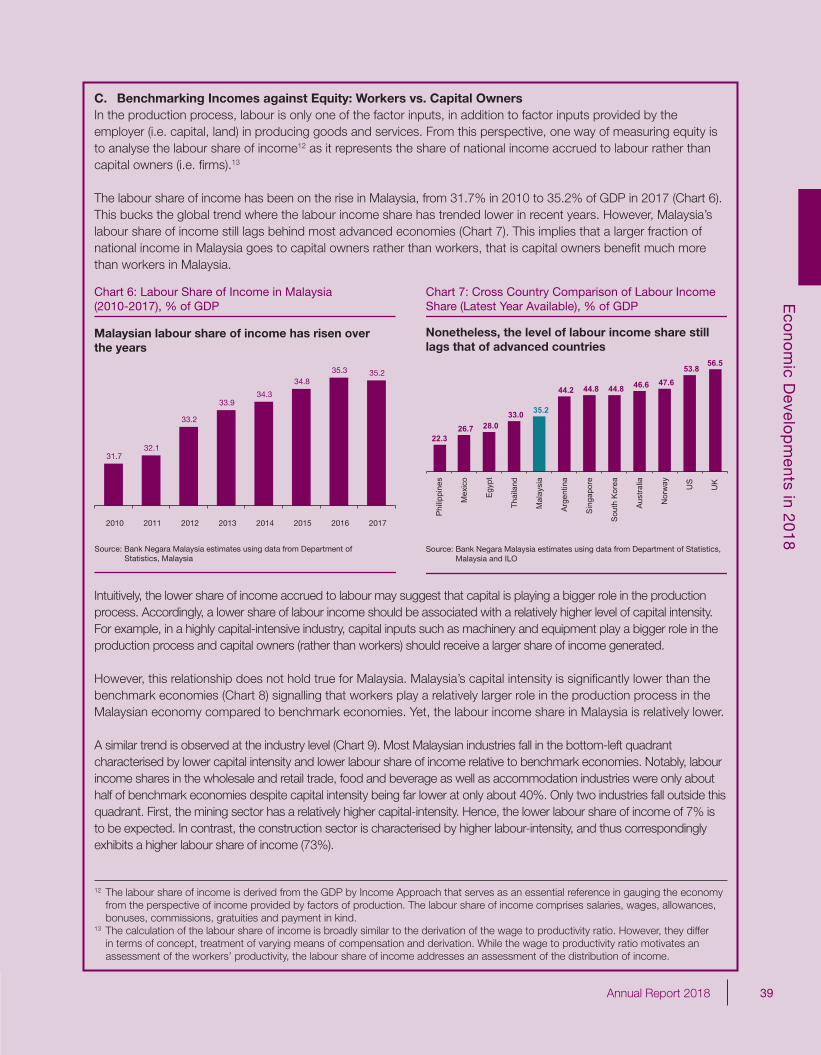
39Annual Report 2018
Eco
nom
ic Develo
pm
ents in 2018
81Annual Report 2018
C. Benchmarking Incomes against Equity: Workers vs. Capital OwnersIn the production process, labour is only one of the factor inputs, in addition to factor inputs provided by the employer (i.e. capital, land) in producing goods and services. From this perspective, one way of measuring equity is to analyse the labour share of income12 as it represents the share of national income accrued to labour rather than capital owners (i.e. fi rms).13
The labour share of income has been on the rise in Malaysia, from 31.7% in 2010 to 35.2% of GDP in 2017 (Chart 6). This bucks the global trend where the labour income share has trended lower in recent years. However, Malaysia’s labour share of income still lags behind most advanced economies (Chart 7). This implies that a larger fraction of national income in Malaysia goes to capital owners rather than workers, that is capital owners benefi t much more than workers in Malaysia.
31.732.1
33.2
33.934.3
34.835.3 35.2
2010 2011 2012 2013 2014 2015 2016 2017
Malaysian labour share of income has risen overthe years
Chart 6: Labour Share of Income in Malaysia (2010-2017), % of GDP
Source: Bank Negara Malaysia estimates using data from Department of Statistics, Malaysia
Source: Bank Negara Malaysia estimates using data from Department of Statistics, Malaysia and ILO
Nonetheless, the level of labour income share still lags that of advanced countries
Chart 7: Cross Country Comparison of Labour Income Share (Latest Year Available), % of GDP
22.3 26.7 28.0
33.0 35.2
44.2 44.8 44.8 46.6 47.6 53.8
56.5
Phi
lippi
nes
Mex
ico
Egy
pt
Thai
land
Mal
aysi
a
Arg
entin
a
Sin
gapo
re
Sou
th K
orea
Aus
tralia
Nor
way UKUS
Intuitively, the lower share of income accrued to labour may suggest that capital is playing a bigger role in the production process. Accordingly, a lower share of labour income should be associated with a relatively higher level of capital intensity. For example, in a highly capital-intensive industry, capital inputs such as machinery and equipment play a bigger role in the production process and capital owners (rather than workers) should receive a larger share of income generated.
However, this relationship does not hold true for Malaysia. Malaysia’s capital intensity is signifi cantly lower than the benchmark economies (Chart 8) signalling that workers play a relatively larger role in the production process in the Malaysian economy compared to benchmark economies. Yet, the labour income share in Malaysia is relatively lower.
A similar trend is observed at the industry level (Chart 9). Most Malaysian industries fall in the bottom-left quadrant characterised by lower capital intensity and lower labour share of income relative to benchmark economies. Notably, labour income shares in the wholesale and retail trade, food and beverage as well as accommodation industries were only about half of benchmark economies despite capital intensity being far lower at only about 40%. Only two industries fall outside this quadrant. First, the mining sector has a relatively higher capital-intensity. Hence, the lower labour share of income of 7% is to be expected. In contrast, the construction sector is characterised by higher labour-intensity, and thus correspondingly exhibits a higher labour share of income (73%).
12 The labour share of income is derived from the GDP by Income Approach that serves as an essential reference in gauging the economy from the perspective of income provided by factors of production. The labour share of income comprises salaries, wages, allowances, bonuses, commissions, gratuities and payment in kind.
13 The calculation of the labour share of income is broadly similar to the derivation of the wage to productivity ratio. However, they differ in terms of concept, treatment of varying means of compensation and derivation. While the wage to productivity ratio motivates an assessment of the workers’ productivity, the labour share of income addresses an assessment of the distribution of income.
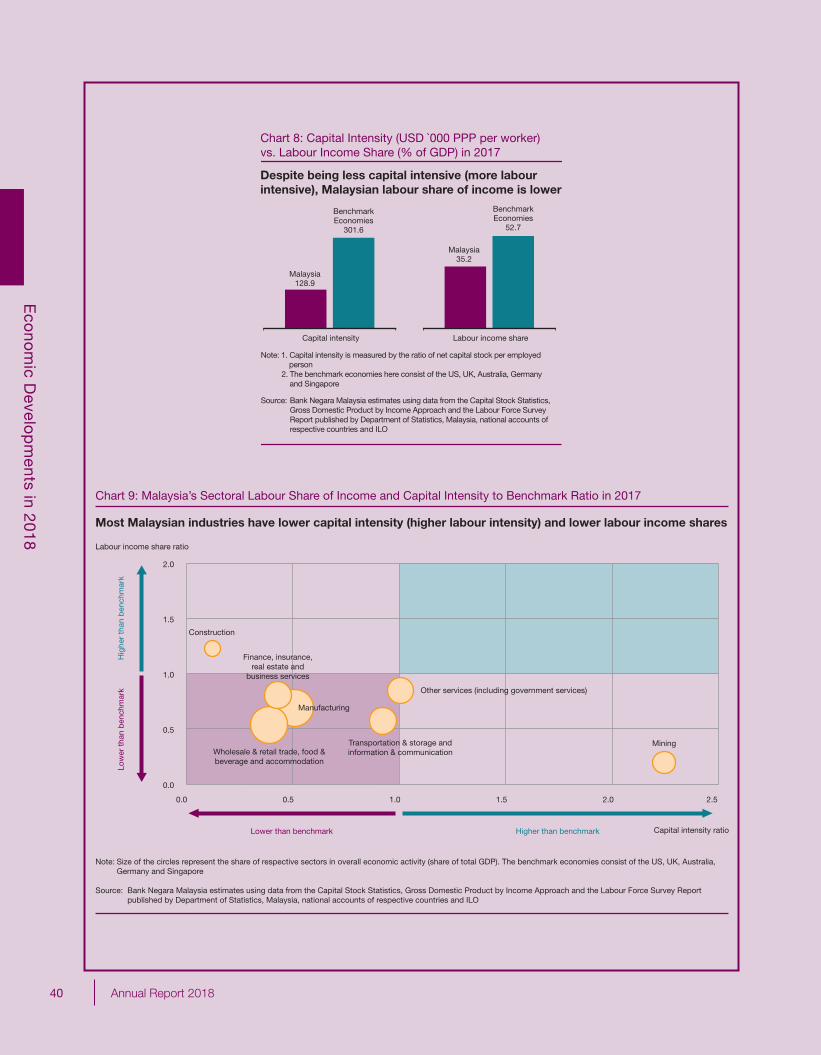
40 Annual Report 2018
Eco
nom
ic Develo
pm
ents in 2018
82 Annual Report 2018
Despite being less capital intensive (more labourintensive), Malaysian labour share of income is lower
Chart 8: Capital Intensity (USD `000 PPP per worker) vs. Labour Income Share (% of GDP) in 2017
Capital intensity Labour income share
Malaysia128.9
Malaysia35.2
BenchmarkEconomies
301.6
BenchmarkEconomies
52.7
Source: Bank Negara Malaysia estimates using data from the Capital Stock Statistics, Gross Domestic Product by Income Approach and the Labour Force Survey Report published by Department of Statistics, Malaysia, national accounts of respective countries and ILO
Note: 1. Capital intensity is measured by the ratio of net capital stock per employed person 2. The benchmark economies here consist of the US, UK, Australia, Germany and Singapore
Most Malaysian industries have lower capital intensity (higher labour intensity) and lower labour income shares
Note: Size of the circles represent the share of respective sectors in overall economic activity (share of total GDP). The benchmark economies consist of the US, UK, Australia, Germany and Singapore
Source: Bank Negara Malaysia estimates using data from the Capital Stock Statistics, Gross Domestic Product by Income Approach and the Labour Force Survey Report published by Department of Statistics, Malaysia, national accounts of respective countries and ILO
Chart 9: Malaysia’s Sectoral Labour Share of Income and Capital Intensity to Benchmark Ratio in 2017
Mining
Manufacturing
Construction
0.0
0.5
1.0
1.5
2.0
0.0 0.5 1.0 1.5 2.0 2.5
Labour income share ratio
Higher than benchmarkLower than benchmark Capital intensity ratio
Hig
her
than
ben
chm
ark
Low
er t
han
ben
chm
ark Other services (including government services)
Transportation & storage andinformation & communication Wholesale & retail trade, food &
beverage and accommodation
Finance, insurance, real estate and
business services
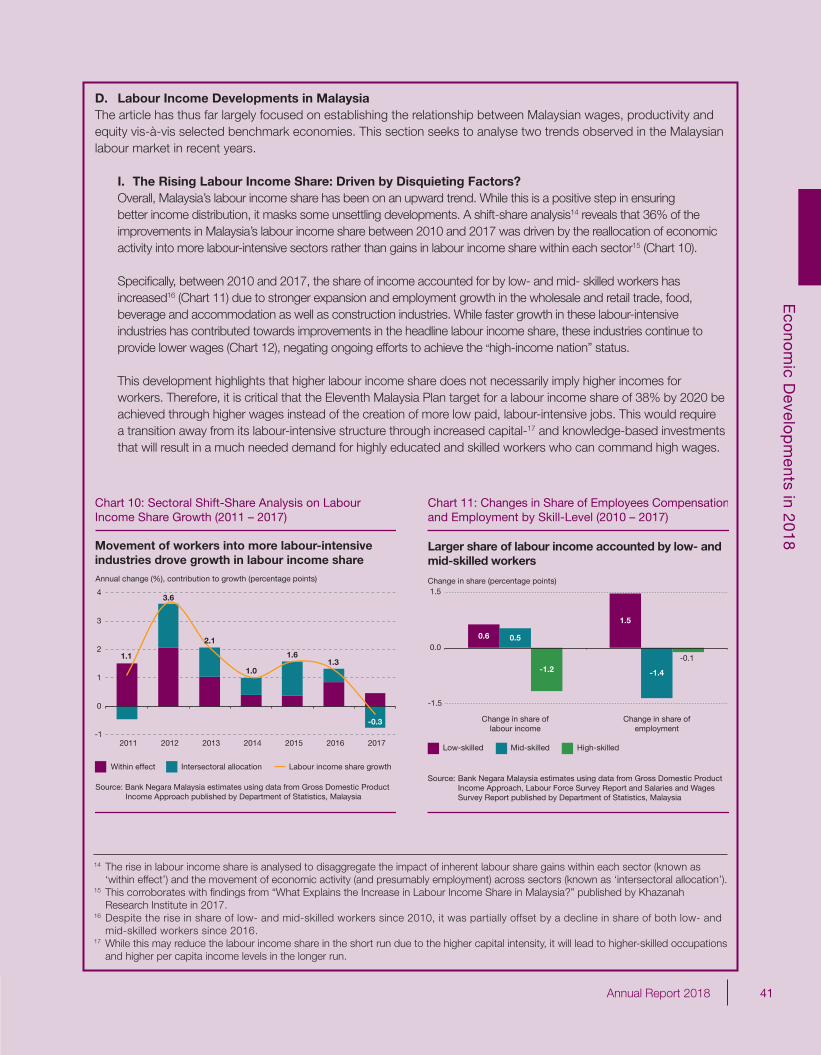
41Annual Report 2018
Eco
nom
ic Develo
pm
ents in 2018
82 Annual Report 2018
Despite being less capital intensive (more labourintensive), Malaysian labour share of income is lower
Chart 8: Capital Intensity (USD `000 PPP per worker) vs. Labour Income Share (% of GDP) in 2017
Capital intensity Labour income share
Malaysia128.9
Malaysia35.2
BenchmarkEconomies
301.6
BenchmarkEconomies
52.7
Source: Bank Negara Malaysia estimates using data from the Capital Stock Statistics, Gross Domestic Product by Income Approach and the Labour Force Survey Report published by Department of Statistics, Malaysia, national accounts of respective countries and ILO
Note: 1. Capital intensity is measured by the ratio of net capital stock per employed person 2. The benchmark economies here consist of the US, UK, Australia, Germany and Singapore
Most Malaysian industries have lower capital intensity (higher labour intensity) and lower labour income shares
Note: Size of the circles represent the share of respective sectors in overall economic activity (share of total GDP). The benchmark economies consist of the US, UK, Australia, Germany and Singapore
Source: Bank Negara Malaysia estimates using data from the Capital Stock Statistics, Gross Domestic Product by Income Approach and the Labour Force Survey Report published by Department of Statistics, Malaysia, national accounts of respective countries and ILO
Chart 9: Malaysia’s Sectoral Labour Share of Income and Capital Intensity to Benchmark Ratio in 2017
Mining
Manufacturing
Construction
0.0
0.5
1.0
1.5
2.0
0.0 0.5 1.0 1.5 2.0 2.5
Labour income share ratio
Higher than benchmarkLower than benchmark Capital intensity ratio
Hig
her
than
ben
chm
ark
Low
er t
han
ben
chm
ark Other services (including government services)
Transportation & storage andinformation & communication Wholesale & retail trade, food &
beverage and accommodation
Finance, insurance, real estate and
business services
83Annual Report 2018
14 The rise in labour income share is analysed to disaggregate the impact of inherent labour share gains within each sector (known as ‘within effect’) and the movement of economic activity (and presumably employment) across sectors (known as ‘intersectoral allocation’).
15 This corroborates with fi ndings from “What Explains the Increase in Labour Income Share in Malaysia?” published by Khazanah Research Institute in 2017.
16 Despite the rise in share of low- and mid-skilled workers since 2010, it was partially offset by a decline in share of both low- and mid-skilled workers since 2016.
17 While this may reduce the labour income share in the short run due to the higher capital intensity, it will lead to higher-skilled occupations and higher per capita income levels in the longer run.
Movement of workers into more labour-intensive industries drove growth in labour income share
Chart 10: Sectoral Shift-Share Analysis on Labour Income Share Growth (2011 – 2017)
Within effect Intersectoral allocation Labour income share growth
Annual change (%), contribution to growth (percentage points)
Source: Bank Negara Malaysia estimates using data from Gross Domestic Product Income Approach published by Department of Statistics, Malaysia
-0.3
-1
0
1
2
3
4
2011 2012 2013 2014 2015 2016 2017
1.1
3.6
2.1
1.0
1.61.3
Chart 11: Changes in Share of Employees Compensationand Employment by Skill-Level (2010 – 2017)
Larger share of labour income accounted by low- andmid-skilled workers
0.6
1.5
0.5
-1.4-1.2-0.1
-1.5
0.0
1.5
Low-skilled Mid-skilled High-skilled
Change in share (percentage points)
Change in share oflabour income
Change in share ofemployment
Source: Bank Negara Malaysia estimates using data from Gross Domestic Product Income Approach, Labour Force Survey Report and Salaries and Wages Survey Report published by Department of Statistics, Malaysia
D. Labour Income Developments in MalaysiaThe article has thus far largely focused on establishing the relationship between Malaysian wages, productivity and equity vis-à-vis selected benchmark economies. This section seeks to analyse two trends observed in the Malaysian labour market in recent years.
I. The Rising Labour Income Share: Driven by Disquieting Factors?Overall, Malaysia’s labour income share has been on an upward trend. While this is a positive step in ensuring better income distribution, it masks some unsettling developments. A shift-share analysis14 reveals that 36% of the improvements in Malaysia’s labour income share between 2010 and 2017 was driven by the reallocation of economic activity into more labour-intensive sectors rather than gains in labour income share within each sector15 (Chart 10).
Specifi cally, between 2010 and 2017, the share of income accounted for by low- and mid- skilled workers has increased16 (Chart 11) due to stronger expansion and employment growth in the wholesale and retail trade, food, beverage and accommodation as well as construction industries. While faster growth in these labour-intensive industries has contributed towards improvements in the headline labour income share, these industries continue to provide lower wages (Chart 12), negating ongoing efforts to achieve the “high-income nation” status.
This development highlights that higher labour income share does not necessarily imply higher incomes for workers. Therefore, it is critical that the Eleventh Malaysia Plan target for a labour income share of 38% by 2020 be achieved through higher wages instead of the creation of more low paid, labour-intensive jobs. This would require a transition away from its labour-intensive structure through increased capital-17 and knowledge-based investments that will result in a much needed demand for highly educated and skilled workers who can command high wages.
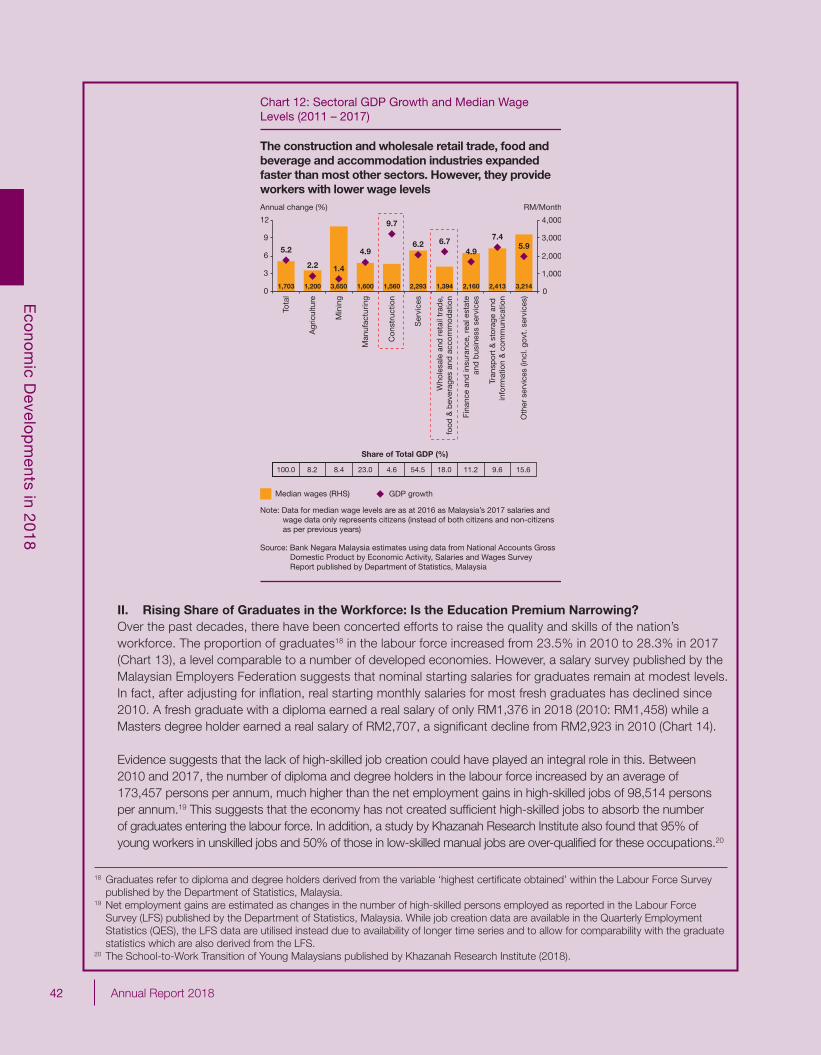
42 Annual Report 2018
Eco
nom
ic Develo
pm
ents in 2018
84 Annual Report 2018
18 Graduates refer to diploma and degree holders derived from the variable ‘highest certifi cate obtained’ within the Labour Force Survey published by the Department of Statistics, Malaysia.
19 Net employment gains are estimated as changes in the number of high-skilled persons employed as reported in the Labour Force Survey (LFS) published by the Department of Statistics, Malaysia. While job creation data are available in the Quarterly Employment Statistics (QES), the LFS data are utilised instead due to availability of longer time series and to allow for comparability with the graduate statistics which are also derived from the LFS.
20 The School-to-Work Transition of Young Malaysians published by Khazanah Research Institute (2018).
II. Rising Share of Graduates in the Workforce: Is the Education Premium Narrowing?Over the past decades, there have been concerted efforts to raise the quality and skills of the nation’s workforce. The proportion of graduates18 in the labour force increased from 23.5% in 2010 to 28.3% in 2017 (Chart 13), a level comparable to a number of developed economies. However, a salary survey published by the Malaysian Employers Federation suggests that nominal starting salaries for graduates remain at modest levels. In fact, after adjusting for infl ation, real starting monthly salaries for most fresh graduates has declined since 2010. A fresh graduate with a diploma earned a real salary of only RM1,376 in 2018 (2010: RM1,458) while a Masters degree holder earned a real salary of RM2,707, a signifi cant decline from RM2,923 in 2010 (Chart 14).
Evidence suggests that the lack of high-skilled job creation could have played an integral role in this. Between 2010 and 2017, the number of diploma and degree holders in the labour force increased by an average of 173,457 persons per annum, much higher than the net employment gains in high-skilled jobs of 98,514 persons per annum.19 This suggests that the economy has not created suffi cient high-skilled jobs to absorb the number of graduates entering the labour force. In addition, a study by Khazanah Research Institute also found that 95% of young workers in unskilled jobs and 50% of those in low-skilled manual jobs are over-qualifi ed for these occupations.20
Annual change (%) RM/Month
Median wages (RHS) GDP growth
Chart 12: Sectoral GDP Growth and Median Wage Levels (2011 – 2017)
The construction and wholesale retail trade, food and beverage and accommodation industries expanded faster than most other sectors. However, they provide workers with lower wage levels
1,703 1,200 1,6003,650 1,560 2,293 1,394 2,160 2,413 3,214
5.2
2.2 1.4
4.9
9.7
6.2 6.74.9
7.45.9
0
1,000
2,000
3,000
4,000
0
3
6
9
12
Tota
l
Agr
icul
ture
Min
ing
Man
ufac
turin
g
Con
stru
ctio
n
Ser
vice
s
Who
lesa
le a
nd r
etai
l tra
de,
food
& b
ever
ages
and
acc
omm
odat
ion
Fina
nce
and
insu
ranc
e, r
eal e
stat
ean
d b
usin
ess
serv
ices
Tran
spor
t &
sto
rage
and
in
form
atio
n &
com
mun
icat
ion
Oth
er s
ervi
ces
(incl
. gov
t. s
ervi
ces)
Note: Data for median wage levels are as at 2016 as Malaysia’s 2017 salaries and wage data only represents citizens (instead of both citizens and non-citizens as per previous years)
Source: Bank Negara Malaysia estimates using data from National Accounts Gross Domestic Product by Economic Activity, Salaries and Wages Survey Report published by Department of Statistics, Malaysia
100.0 8.2 8.4 23.0 4.6 54.5 18.0 11.2 9.6 15.6
Share of Total GDP (%)
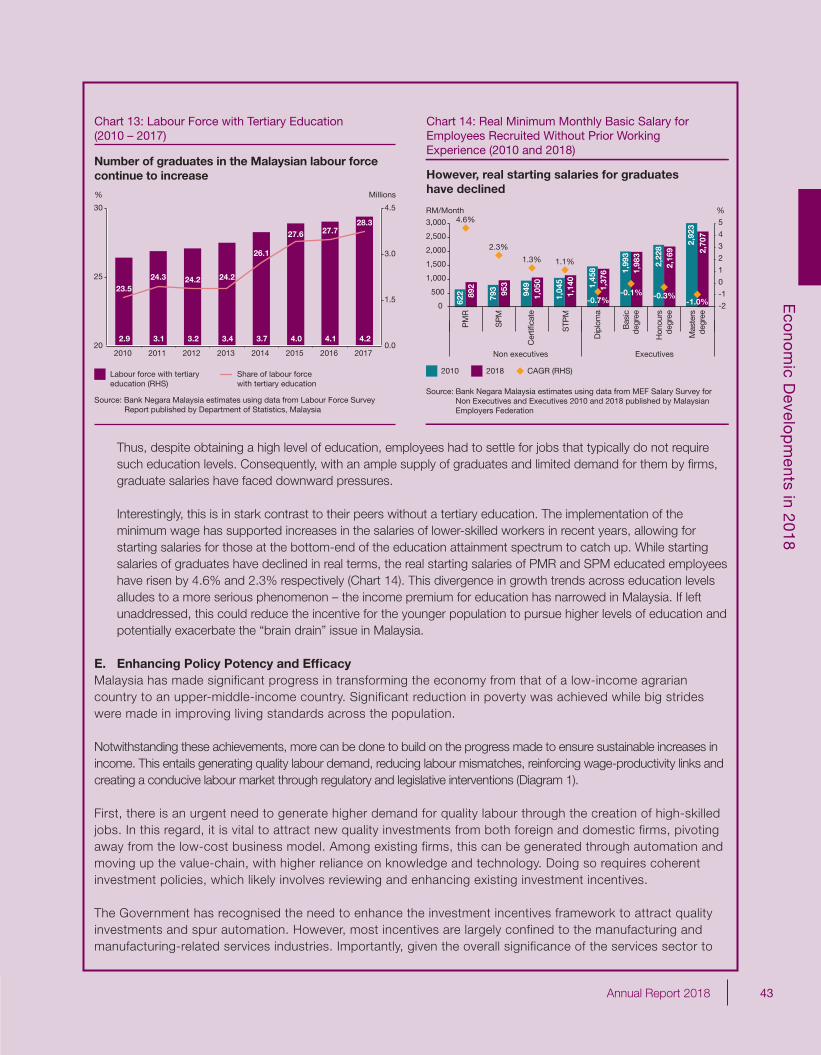
43Annual Report 2018
Eco
nom
ic Develo
pm
ents in 2018
85Annual Report 2018
%
Chart 13: Labour Force with Tertiary Education(2010 – 2017)
Number of graduates in the Malaysian labour force continue to increase
Source: Bank Negara Malaysia estimates using data from Labour Force Survey Report published by Department of Statistics, Malaysia
Labour force with tertiary education (RHS)
Share of labour force with tertiary education
2.9 3.1 3.2 3.4 3.7 4.0 4.1 4.2
23.524.3 24.2 24.2
26.1
27.727.628.3
0.0
1.5
3.0
4.5
20
25
30
2010 2011 2012 2013 2014 2015 2016 2017
Millions
However, real starting salaries for graduateshave declined
RM/Month %
Chart 14: Real Minimum Monthly Basic Salary forEmployees Recruited Without Prior WorkingExperience (2010 and 2018)
-2
-1
0
1
2
3
4
5
0
500
1,000
1,500
2,000
2,500
3,000
622 793 949
1,04
5 1,45
8 1,99
3
2,22
8
892
953
1,05
0
1,14
0
1,37
6 1,98
3
2,16
9 2,70
7
4.6%
2.3%
1.3% 1.1%
-0.7%-0.1% -0.3%
-1.0%
PM
R
SP
M
Cer
tific
ate
STP
M
Dip
lom
a
Bas
icde
gree
Hon
ours
degr
ee
Mas
ters
degr
ee2,
923
Non executives Executives
CAGR (RHS)
Source: Bank Negara Malaysia estimates using data from MEF Salary Survey for Non Executives and Executives 2010 and 2018 published by Malaysian Employers Federation
2010 2018
Thus, despite obtaining a high level of education, employees had to settle for jobs that typically do not require such education levels. Consequently, with an ample supply of graduates and limited demand for them by fi rms, graduate salaries have faced downward pressures.
Interestingly, this is in stark contrast to their peers without a tertiary education. The implementation of the minimum wage has supported increases in the salaries of lower-skilled workers in recent years, allowing for starting salaries for those at the bottom-end of the education attainment spectrum to catch up. While starting salaries of graduates have declined in real terms, the real starting salaries of PMR and SPM educated employees have risen by 4.6% and 2.3% respectively (Chart 14). This divergence in growth trends across education levels alludes to a more serious phenomenon – the income premium for education has narrowed in Malaysia. If left unaddressed, this could reduce the incentive for the younger population to pursue higher levels of education and potentially exacerbate the “brain drain” issue in Malaysia.
E. Enhancing Policy Potency and Effi cacyMalaysia has made significant progress in transforming the economy from that of a low-income agrarian country to an upper-middle-income country. Significant reduction in poverty was achieved while big strides were made in improving living standards across the population.
Notwithstanding these achievements, more can be done to build on the progress made to ensure sustainable increases in income. This entails generating quality labour demand, reducing labour mismatches, reinforcing wage-productivity links and creating a conducive labour market through regulatory and legislative interventions (Diagram 1).
First, there is an urgent need to generate higher demand for quality labour through the creation of high-skilled jobs. In this regard, it is vital to attract new quality investments from both foreign and domestic firms, pivoting away from the low-cost business model. Among existing firms, this can be generated through automation and moving up the value-chain, with higher reliance on knowledge and technology. Doing so requires coherent investment policies, which likely involves reviewing and enhancing existing investment incentives.
The Government has recognised the need to enhance the investment incentives framework to attract quality investments and spur automation. However, most incentives are largely confined to the manufacturing and manufacturing-related services industries. Importantly, given the overall significance of the services sector to
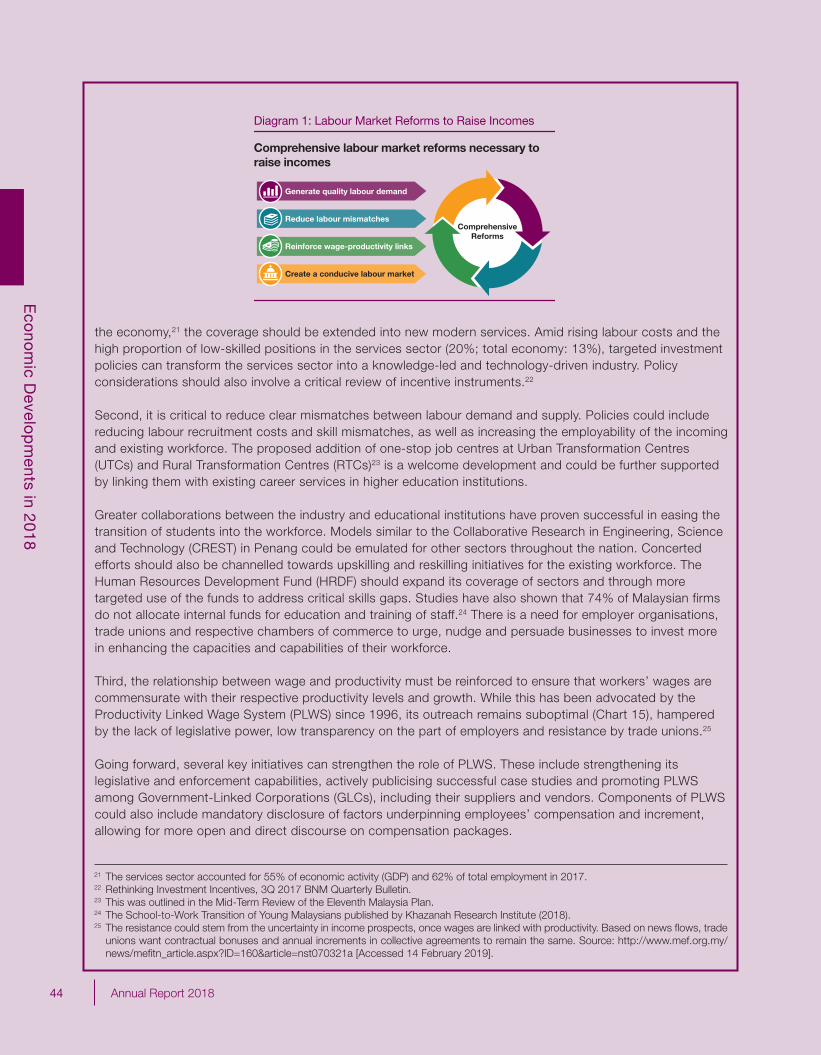
44 Annual Report 2018
Eco
nom
ic Develo
pm
ents in 2018
86 Annual Report 2018
the economy,21 the coverage should be extended into new modern services. Amid rising labour costs and the high proportion of low-skilled positions in the services sector (20%; total economy: 13%), targeted investment policies can transform the services sector into a knowledge-led and technology-driven industry. Policy considerations should also involve a critical review of incentive instruments.22
Second, it is critical to reduce clear mismatches between labour demand and supply. Policies could include reducing labour recruitment costs and skill mismatches, as well as increasing the employability of the incoming and existing workforce. The proposed addition of one-stop job centres at Urban Transformation Centres (UTCs) and Rural Transformation Centres (RTCs)23 is a welcome development and could be further supported by linking them with existing career services in higher education institutions.
Greater collaborations between the industry and educational institutions have proven successful in easing the transition of students into the workforce. Models similar to the Collaborative Research in Engineering, Science and Technology (CREST) in Penang could be emulated for other sectors throughout the nation. Concerted efforts should also be channelled towards upskilling and reskilling initiatives for the existing workforce. The Human Resources Development Fund (HRDF) should expand its coverage of sectors and through more targeted use of the funds to address critical skills gaps. Studies have also shown that 74% of Malaysian firms do not allocate internal funds for education and training of staff.24 There is a need for employer organisations, trade unions and respective chambers of commerce to urge, nudge and persuade businesses to invest more in enhancing the capacities and capabilities of their workforce.
Third, the relationship between wage and productivity must be reinforced to ensure that workers’ wages are commensurate with their respective productivity levels and growth. While this has been advocated by the Productivity Linked Wage System (PLWS) since 1996, its outreach remains suboptimal (Chart 15), hampered by the lack of legislative power, low transparency on the part of employers and resistance by trade unions.25
Going forward, several key initiatives can strengthen the role of PLWS. These include strengthening its legislative and enforcement capabilities, actively publicising successful case studies and promoting PLWS among Government-Linked Corporations (GLCs), including their suppliers and vendors. Components of PLWS could also include mandatory disclosure of factors underpinning employees’ compensation and increment, allowing for more open and direct discourse on compensation packages.
21 The services sector accounted for 55% of economic activity (GDP) and 62% of total employment in 2017.22 Rethinking Investment Incentives, 3Q 2017 BNM Quarterly Bulletin. 23 This was outlined in the Mid-Term Review of the Eleventh Malaysia Plan.24 The School-to-Work Transition of Young Malaysians published by Khazanah Research Institute (2018).25 The resistance could stem from the uncertainty in income prospects, once wages are linked with productivity. Based on news fl ows, trade
unions want contractual bonuses and annual increments in collective agreements to remain the same. Source: http://www.mef.org.my/news/mefi tn_article.aspx?ID=160&article=nst070321a [Accessed 14 February 2019].
Diagram 1: Labour Market Reforms to Raise Incomes
Comprehensive labour market reforms necessary to raise incomes
ComprehensiveReforms
Reinforce wage-productivity links
Generate quality labour demand
Create a conducive labour market
Reduce labour mismatches
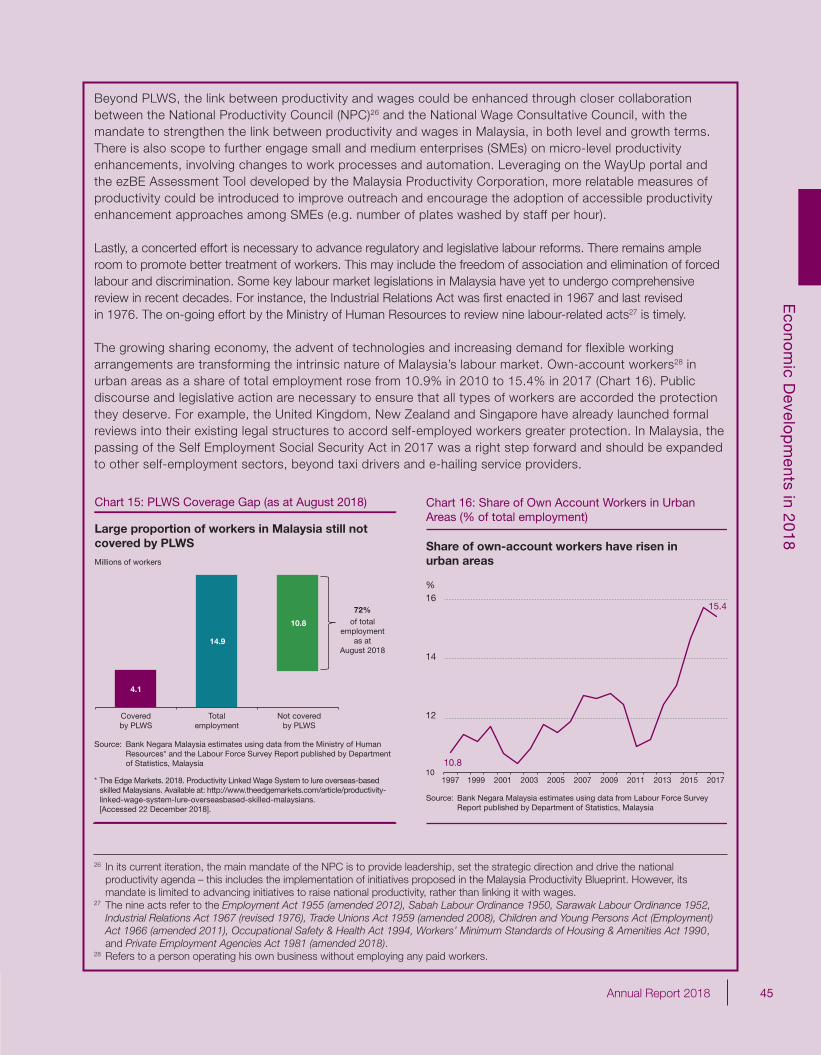
45Annual Report 2018
Eco
nom
ic Develo
pm
ents in 2018
87Annual Report 2018
Chart 15: PLWS Coverage Gap (as at August 2018)
Large proportion of workers in Malaysia still notcovered by PLWS
4.1
14.9
10.8
Millions of workers
72%
Coveredby PLWS
Totalemployment
Not coveredby PLWS
of totalemployment
as atAugust 2018
Source: Bank Negara Malaysia estimates using data from the Ministry of Human Resources* and the Labour Force Survey Report published by Department of Statistics, Malaysia
* The Edge Markets. 2018. Productivity Linked Wage System to lure overseas-based skilled Malaysians. Available at: http://www.theedgemarkets.com/article/productivity- linked-wage-system-lure-overseasbased-skilled-malaysians. [Accessed 22 December 2018].
Beyond PLWS, the link between productivity and wages could be enhanced through closer collaboration between the National Productivity Council (NPC)26 and the National Wage Consultative Council, with the mandate to strengthen the link between productivity and wages in Malaysia, in both level and growth terms. There is also scope to further engage small and medium enterprises (SMEs) on micro-level productivity enhancements, involving changes to work processes and automation. Leveraging on the WayUp portal and the ezBE Assessment Tool developed by the Malaysia Productivity Corporation, more relatable measures of productivity could be introduced to improve outreach and encourage the adoption of accessible productivity enhancement approaches among SMEs (e.g. number of plates washed by staff per hour).
Lastly, a concerted effort is necessary to advance regulatory and legislative labour reforms. There remains ample room to promote better treatment of workers. This may include the freedom of association and elimination of forced labour and discrimination. Some key labour market legislations in Malaysia have yet to undergo comprehensive review in recent decades. For instance, the Industrial Relations Act was fi rst enacted in 1967 and last revised in 1976. The on-going effort by the Ministry of Human Resources to review nine labour-related acts27 is timely.
The growing sharing economy, the advent of technologies and increasing demand for flexible working arrangements are transforming the intrinsic nature of Malaysia’s labour market. Own-account workers28 in urban areas as a share of total employment rose from 10.9% in 2010 to 15.4% in 2017 (Chart 16). Public discourse and legislative action are necessary to ensure that all types of workers are accorded the protection they deserve. For example, the United Kingdom, New Zealand and Singapore have already launched formal reviews into their existing legal structures to accord self-employed workers greater protection. In Malaysia, the passing of the Self Employment Social Security Act in 2017 was a right step forward and should be expanded to other self-employment sectors, beyond taxi drivers and e-hailing service providers.
26 In its current iteration, the main mandate of the NPC is to provide leadership, set the strategic direction and drive the national productivity agenda – this includes the implementation of initiatives proposed in the Malaysia Productivity Blueprint. However, its mandate is limited to advancing initiatives to raise national productivity, rather than linking it with wages.
27 The nine acts refer to the Employment Act 1955 (amended 2012), Sabah Labour Ordinance 1950, Sarawak Labour Ordinance 1952, Industrial Relations Act 1967 (revised 1976), Trade Unions Act 1959 (amended 2008), Children and Young Persons Act (Employment) Act 1966 (amended 2011), Occupational Safety & Health Act 1994, Workers’ Minimum Standards of Housing & Amenities Act 1990, and Private Employment Agencies Act 1981 (amended 2018).
28 Refers to a person operating his own business without employing any paid workers.
Chart 16: Share of Own Account Workers in UrbanAreas (% of total employment)
Share of own-account workers have risen inurban areas
10.8
15.4
10
12
14
16
1997 1999 2001 2003 2005 2007 2009 2011 2013 2015 2017
%
Source: Bank Negara Malaysia estimates using data from Labour Force Survey Report published by Department of Statistics, Malaysia
46 Annual Report 2018
Eco
nom
ic Develo
pm
ents in 2018
88 Annual Report 2018
Conclusion: Preserving and Enhancing the Welfare of Workers for the Future
In the current environment, income levels in Malaysia remain a highly contentious subject. Workers face signifi cant pressures due to the rise in living costs while fi rms continue to contend that the level of incomes remains appropriate and refl ective of productivity.
This article has highlighted that Malaysian workers receive lower compensations relative to their contribution to national income from productivity and equity perspectives. First, Malaysians are paid a lower wage compared to benchmark countries, even after taking into account productivity differences. Second, Malaysia has a lower labour share of income despite its labour-intensive nature. This suggests workers are not adequately compensated for their contributions.
While employers need to be fairly compensated for their respective factor inputs, the question remains, why is the share of compensation accrued to employers instead of employees higher relative to our aspirational peers? How can Malaysia’s taxation and distributive policies positively impact and enhance the division of incomes? These are hard questions that require judicious deliberation and committed action.
In totality, while these policy challenges seem daunting, the responsibility of advocating for a more equitable distribution of incomes among all economic agents remains. Over the past decades, the nation has successfully navigated its passage from a factor-driven to an effi ciency-driven economy.29 In its next evolutionary step towards an innovation-driven economy, it is important that the welfare of Malaysia’s labour force is well preserved, if not enhanced. This will ensure that workers continue to be properly incentivised to raise their productivity, thus achieving greater value creation in the economy.
References
Bank Negara Malaysia (2017). “Rethinking Investment Incentives”. Box article in 3Q 2017 BNM Quarterly Bulletin. Kuala Lumpur.
Bank Negara Malaysia (2018). “Divergence of Economics Performance and Public Sentiments”. Box article in 2Q 2018 BNM Quarterly Bulletin. Kuala Lumpur.
Bank Negara Malaysia (2018). “The Living Wage: Beyond Making Ends Meet”. Box article in Annual Report 2017. Kuala Lumpur.
International Federation of Robotic (2017). “World Robotics Report 2017”. Germany.
Khazanah Research Institute (2018). “The School-to-Work Transition of Young Malaysians”. Kuala Lumpur.
Khazanah Research Institute (2017). “What Explains the Increase in Labour Income Share in Malaysia?”. Kuala Lumpur.
Malaysian Employers Federation (2010). “MEF Salary Survey for Executives 2010”. Kuala Lumpur.
Malaysian Employers Federation (2010). “MEF Salary Survey for Non Executives 2010”. Kuala Lumpur.
Malaysian Employers Federation (2018). “MEF Salary Survey for Executives 2018”. Kuala Lumpur.
Malaysian Employers Federation (2018). “MEF Salary Survey for Non Executives 2018”. Kuala Lumpur.
29 Factor-driven economies are dominated by subsistence agriculture and extraction businesses, reliant on natural resources; Effi ciency-driven economies are increasingly competitive, with more effi cient production processes and increased product quality. Innovation-driven economies are the most developed. In this phase, businesses are more knowledge-intensive, and the service sector expands. According to the World Economic Forum (WEF), Malaysia is currently transitioning from an effi ciency-driven to an innovation-driven economy.
47Annual Report 2018
Eco
nom
ic Develo
pm
ents in 2018
89Annual Report 2018
Ministry of Economic Affairs, Malaysia (2018). “Mid-Term Review of the Eleventh Malaysia Plan 2016 - 2020”. Putrajaya.
New Straits Times (2007). MTUC ‘agreed to productivity wage system in 1996’. Available at: www.mef.org.my/news/mefi tn_article.aspx?ID=160&article=nst070321a. [Accessed 14 February 2019].
The Edge Markets (2018). Productivity Linked Wage System to lure overseas-based skilled Malaysians. Available at: http://www.theedgemarkets.com/article/productivity-linked-wage-system-lure-overseasbased-skilled-malaysians. [Accessed 22 December 2018].
Tun Dr. Mahathir Mohamad (1991), “Malaysia: The Way Forward (Vision 2020)”. Kuala Lumpur.
World Bank (2018). “Malaysian Economic Monitor: Realising Human Potential”.
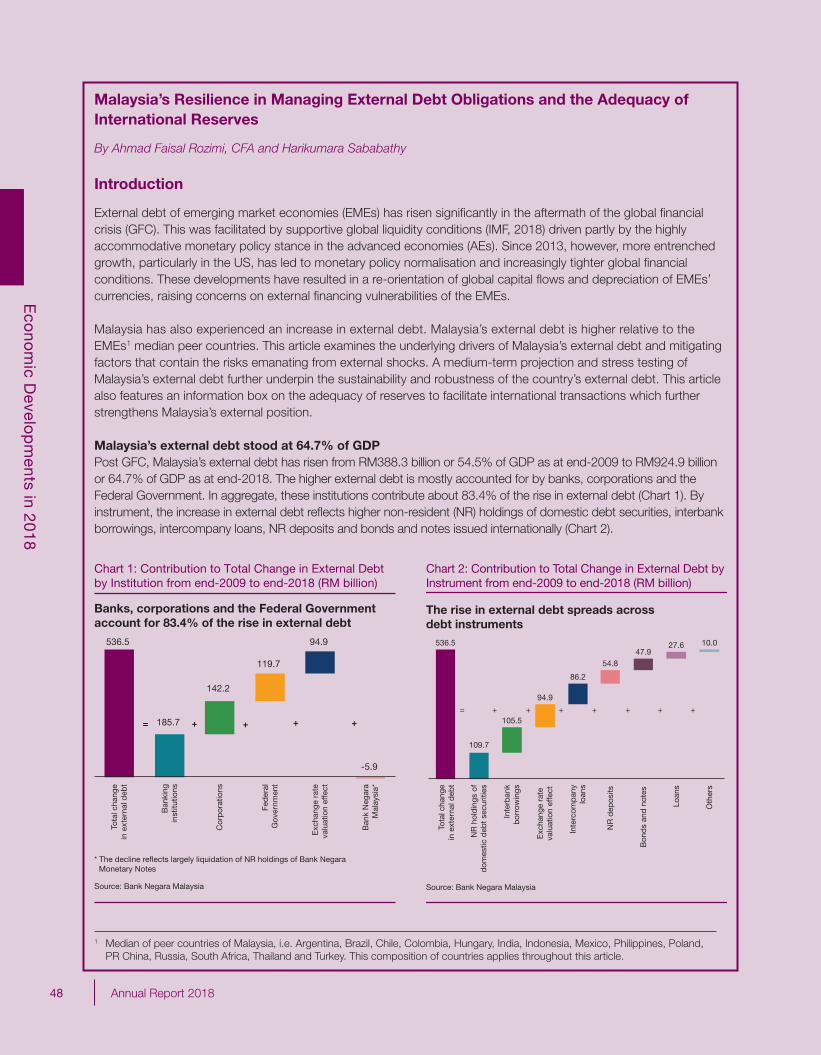
48 Annual Report 2018
Eco
nom
ic Develo
pm
ents in 2018
2 Annual Report 2018
Malaysia’s Resilience in Managing External Debt Obligations and the Adequacy of International Reserves
By Ahmad Faisal Rozimi, CFA and Harikumara Sababathy
Introduction
External debt of emerging market economies (EMEs) has risen signifi cantly in the aftermath of the global fi nancial crisis (GFC). This was facilitated by supportive global liquidity conditions (IMF, 2018) driven partly by the highly accommodative monetary policy stance in the advanced economies (AEs). Since 2013, however, more entrenched growth, particularly in the US, has led to monetary policy normalisation and increasingly tighter global fi nancial conditions. These developments have resulted in a re-orientation of global capital fl ows and depreciation of EMEs’ currencies, raising concerns on external fi nancing vulnerabilities of the EMEs. Malaysia has also experienced an increase in external debt. Malaysia’s external debt is higher relative to the EMEs1 median peer countries. This article examines the underlying drivers of Malaysia’s external debt and mitigating factors that contain the risks emanating from external shocks. A medium-term projection and stress testing of Malaysia’s external debt further underpin the sustainability and robustness of the country’s external debt. This article also features an information box on the adequacy of reserves to facilitate international transactions which further strengthens Malaysia’s external position.
Malaysia’s external debt stood at 64.7% of GDPPost GFC, Malaysia’s external debt has risen from RM388.3 billion or 54.5% of GDP as at end-2009 to RM924.9 billion or 64.7% of GDP as at end-2018. The higher external debt is mostly accounted for by banks, corporations and the Federal Government. In aggregate, these institutions contribute about 83.4% of the rise in external debt (Chart 1). By instrument, the increase in external debt refl ects higher non-resident (NR) holdings of domestic debt securities, interbank borrowings, intercompany loans, NR deposits and bonds and notes issued internationally (Chart 2).
1 Median of peer countries of Malaysia, i.e. Argentina, Brazil, Chile, Colombia, Hungary, India, Indonesia, Mexico, Philippines, Poland, PR China, Russia, South Africa, Thailand and Turkey. This composition of countries applies throughout this article.
Source: Bank Negara Malaysia
Chart 1: Contribution to Total Change in External Debt by Institution from end-2009 to end-2018 (RM billion)
Banks, corporations and the Federal Government account for 83.4% of the rise in external debt
* The decline reflects largely liquidation of NR holdings of Bank Negara Monetary Notes
536.5
185.7
142.2
119.7
94.9
-5.9
Cor
por
atio
ns
= + ++ +
Tota
l cha
nge
in e
xter
nal d
ebt
Ban
king
inst
itutio
ns
Fed
eral
Gov
ernm
ent
Exc
hang
e ra
teva
luat
ion
effe
ct
Ban
k N
egar
aM
alay
sia*
Chart 2: Contribution to Total Change in External Debt byInstrument from end-2009 to end-2018 (RM billion)
536.5
109.7
105.5
94.9
86.2
54.847.9
27.6 10.0
= + + ++ ++ +
The rise in external debt spreads acrossdebt instruments
Source: Bank Negara Malaysia
Tota
l cha
nge
in e
xter
nal d
ebt
NR
hol
din
gs o
fd
omes
tic d
ebt
secu
ritie
s
Inte
rban
kb
orro
win
gs
Exc
hang
e ra
teva
luat
ion
effe
ct
Inte
rcom
pan
ylo
ans
NR
dep
osits
Bon
ds
and
not
es
Loan
s
Oth
ers
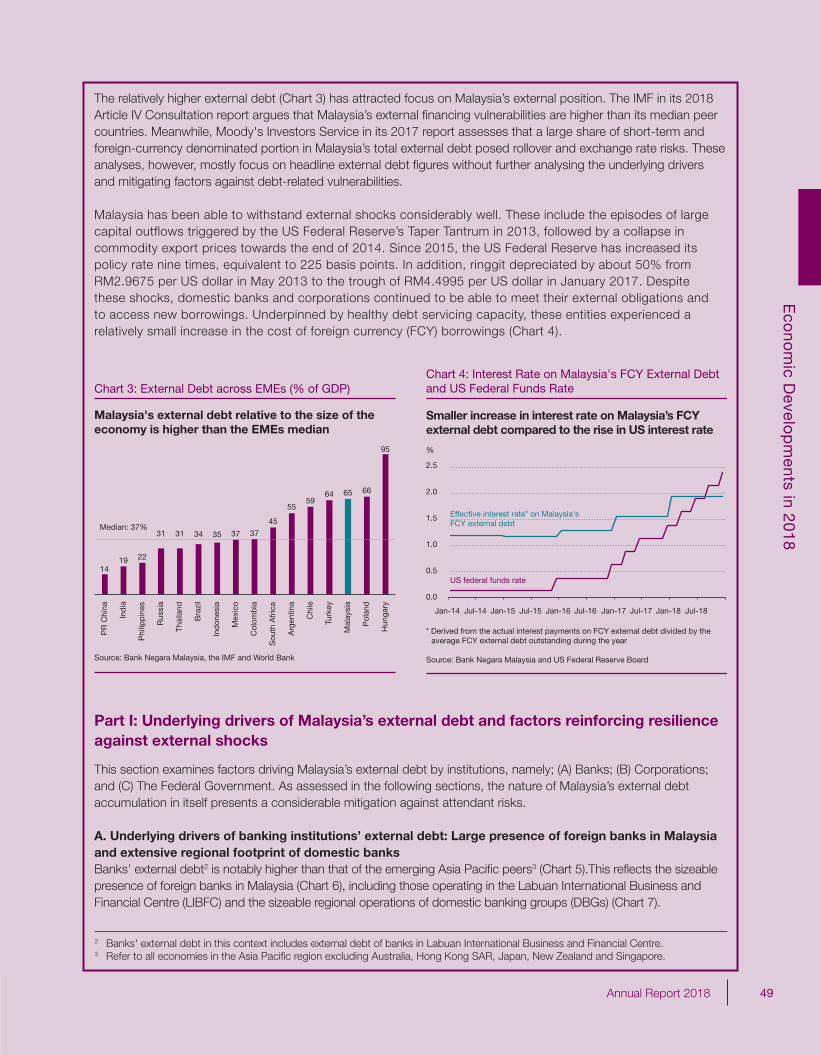
49Annual Report 2018
Eco
nom
ic Develo
pm
ents in 2018
3Annual Report 2018
The relatively higher external debt (Chart 3) has attracted focus on Malaysia’s external position. The IMF in its 2018 Article IV Consultation report argues that Malaysia’s external fi nancing vulnerabilities are higher than its median peer countries. Meanwhile, Moody's Investors Service in its 2017 report assesses that a large share of short-term and foreign-currency denominated portion in Malaysia’s total external debt posed rollover and exchange rate risks. These analyses, however, mostly focus on headline external debt fi gures without further analysing the underlying drivers and mitigating factors against debt-related vulnerabilities.
Malaysia has been able to withstand external shocks considerably well. These include the episodes of large capital outflows triggered by the US Federal Reserve’s Taper Tantrum in 2013, followed by a collapse in commodity export prices towards the end of 2014. Since 2015, the US Federal Reserve has increased its policy rate nine times, equivalent to 225 basis points. In addition, ringgit depreciated by about 50% from RM2.9675 per US dollar in May 2013 to the trough of RM4.4995 per US dollar in January 2017. Despite these shocks, domestic banks and corporations continued to be able to meet their external obligations and to access new borrowings. Underpinned by healthy debt servicing capacity, these entities experienced a relatively small increase in the cost of foreign currency (FCY) borrowings (Chart 4).
2 Banks' external debt in this context includes external debt of banks in Labuan International Business and Financial Centre.3 Refer to all economies in the Asia Pacifi c region excluding Australia, Hong Kong SAR, Japan, New Zealand and Singapore.
1419 22
37 37
45
5559
64 65 66
95
PR
Chi
na
Ind
ia
Phi
lipp
ines
Rus
sia
Thai
land
Bra
zil
Ind
ones
ia
Mex
ico
Col
omb
ia
Sou
th A
fric
a
Arg
entin
a
Chi
le
Turk
ey
Mal
aysi
a
Pol
and
Hun
gary
Chart 3: External Debt across EMEs (% of GDP)
Malaysia's external debt relative to the size of the economy is higher than the EMEs median
Source: Bank Negara Malaysia, the IMF and World Bank
Median: 37%31 34 3531
0.0
0.5
1.0
1.5
2.0
2.5
Jan-14 Jul-14 Jan-15 Jul-15 Jan-16 Jul-16 Jan-17 Jul-17 Jan-18 Jul-18
%
Chart 4: Interest Rate on Malaysia's FCY External Debt and US Federal Funds Rate
Smaller increase in interest rate on Malaysia’s FCY external debt compared to the rise in US interest rate
* Derived from the actual interest payments on FCY external debt divided by the average FCY external debt outstanding during the year
Source: Bank Negara Malaysia and US Federal Reserve Board
Effective interest rate* on Malaysia's FCY external debt
US federal funds rate
Part I: Underlying drivers of Malaysia’s external debt and factors reinforcing resilience against external shocks
This section examines factors driving Malaysia’s external debt by institutions, namely; (A) Banks; (B) Corporations; and (C) The Federal Government. As assessed in the following sections, the nature of Malaysia’s external debt accumulation in itself presents a considerable mitigation against attendant risks.
A. Underlying drivers of banking institutions’ external debt: Large presence of foreign banks in Malaysia and extensive regional footprint of domestic banksBanks’ external debt2 is notably higher than that of the emerging Asia Pacifi c peers3 (Chart 5).This refl ects the sizeable presence of foreign banks in Malaysia (Chart 6), including those operating in the Labuan International Business and Financial Centre (LIBFC) and the sizeable regional operations of domestic banking groups (DBGs) (Chart 7).
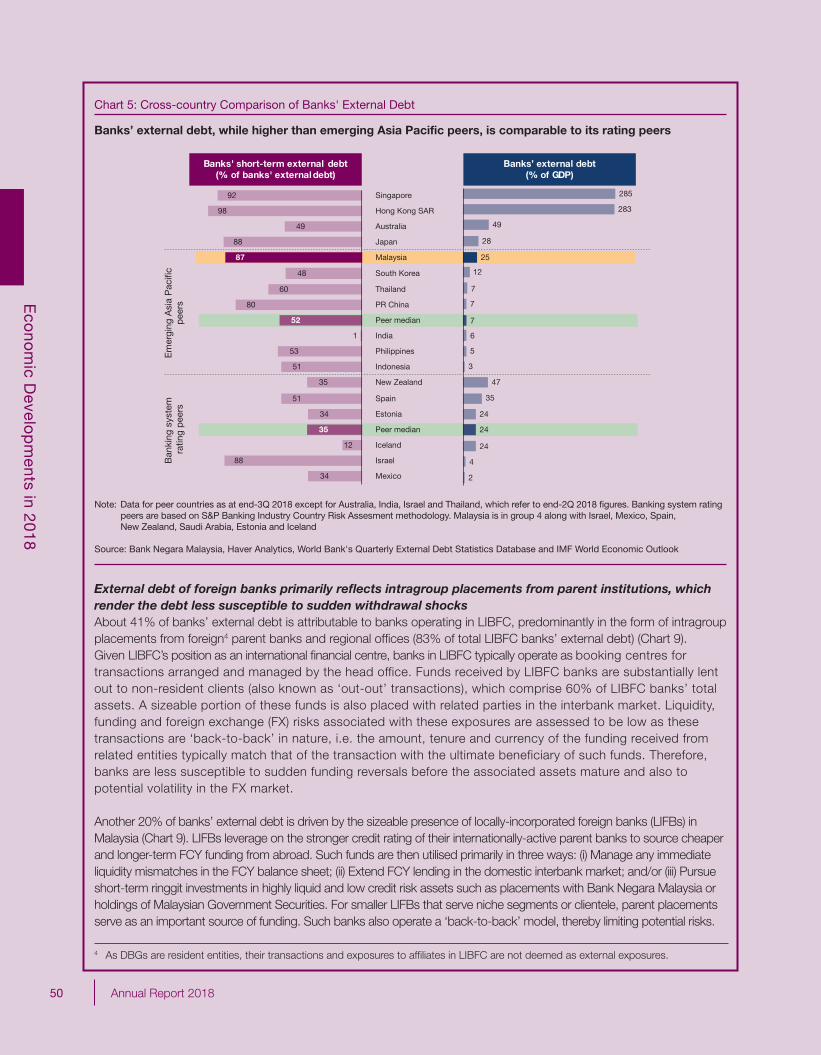
50 Annual Report 2018
Eco
nom
ic Develo
pm
ents in 2018
4 Annual Report 2018
4 As DBGs are resident entities, their transactions and exposures to affi liates in LIBFC are not deemed as external exposures.
Chart 5: Cross-country Comparison of Banks' External Debt
285
283
49
28
25
12
7
7
7
6
5
3
47
35
24
24
24
4
2
Em
ergi
ng A
sia
Pac
ific
pee
rs
1
92
98
49
88
87
48
60
80
52
53
51
35
51
34
12
35
88
34
Singapore
Hong Kong SAR
Australia
Japan
Malaysia
South Korea
Thailand
PR China
Peer median
India
Philippines
Indonesia
New Zealand
Spain
Estonia
Peer median
Iceland
Israel
Mexico
Banks' short-term external debt(% of banks' external debt)
Banks’ external debt(% of GDP)
Ban
king
sys
tem
ra
ting
pee
rs
Note: Data for peer countries as at end-3Q 2018 except for Australia, India, Israel and Thailand, which refer to end-2Q 2018 figures. Banking system rating peers are based on S&P Banking Industry Country Risk Assesment methodology. Malaysia is in group 4 along with Israel, Mexico, Spain, New Zealand, Saudi Arabia, Estonia and Iceland
Source: Bank Negara Malaysia, Haver Analytics, World Bank's Quarterly External Debt Statistics Database and IMF World Economic Outlook
Banks’ external debt, while higher than emerging Asia Pacific peers, is comparable to its rating peers
External debt of foreign banks primarily refl ects intragroup placements from parent institutions, which render the debt less susceptible to sudden withdrawal shocksAbout 41% of banks’ external debt is attributable to banks operating in LIBFC, predominantly in the form of intragroup placements from foreign4 parent banks and regional offi ces (83% of total LIBFC banks’ external debt) (Chart 9). Given LIBFC’s position as an international fi nancial centre, banks in LIBFC typically operate as booking centres for transactions arranged and managed by the head office. Funds received by LIBFC banks are substantially lent out to non-resident clients (also known as ‘out-out’ transactions), which comprise 60% of LIBFC banks’ total assets. A sizeable portion of these funds is also placed with related parties in the interbank market. Liquidity, funding and foreign exchange (FX) risks associated with these exposures are assessed to be low as these transactions are ‘back-to-back’ in nature, i.e. the amount, tenure and currency of the funding received from related entities typically match that of the transaction with the ultimate beneficiary of such funds. Therefore, banks are less susceptible to sudden funding reversals before the associated assets mature and also to potential volatility in the FX market.
Another 20% of banks’ external debt is driven by the sizeable presence of locally-incorporated foreign banks (LIFBs) in Malaysia (Chart 9). LIFBs leverage on the stronger credit rating of their internationally-active parent banks to source cheaper and longer-term FCY funding from abroad. Such funds are then utilised primarily in three ways: (i) Manage any immediate liquidity mismatches in the FCY balance sheet; (ii) Extend FCY lending in the domestic interbank market; and/or (iii) Pursue short-term ringgit investments in highly liquid and low credit risk assets such as placements with Bank Negara Malaysia or holdings of Malaysian Government Securities. For smaller LIFBs that serve niche segments or clientele, parent placements serve as an important source of funding. Such banks also operate a ‘back-to-back’ model, thereby limiting potential risks.
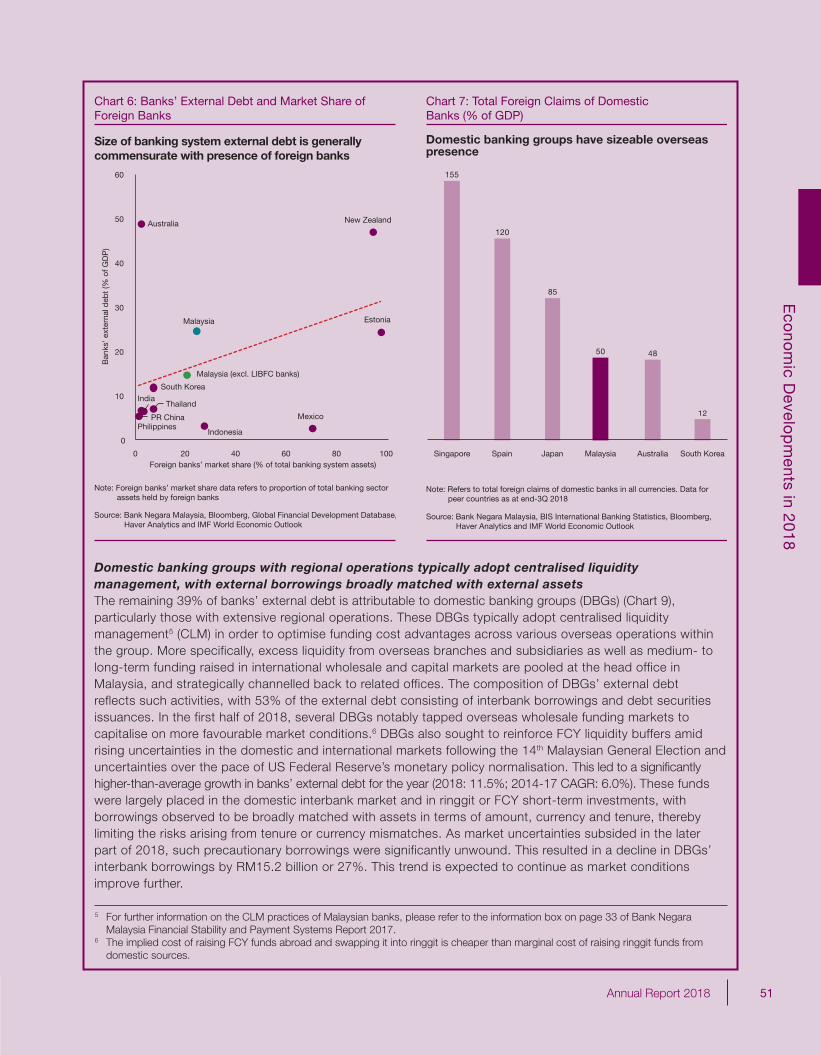
51Annual Report 2018
Eco
nom
ic Develo
pm
ents in 2018
5Annual Report 2018
Domestic banking groups with regional operations typically adopt centralised liquidity management, with external borrowings broadly matched with external assets The remaining 39% of banks’ external debt is attributable to domestic banking groups (DBGs) (Chart 9), particularly those with extensive regional operations. These DBGs typically adopt centralised liquidity management5 (CLM) in order to optimise funding cost advantages across various overseas operations within the group. More specifically, excess liquidity from overseas branches and subsidiaries as well as medium- to long-term funding raised in international wholesale and capital markets are pooled at the head office in Malaysia, and strategically channelled back to related offices. The composition of DBGs’ external debt reflects such activities, with 53% of the external debt consisting of interbank borrowings and debt securities issuances. In the first half of 2018, several DBGs notably tapped overseas wholesale funding markets to capitalise on more favourable market conditions.6 DBGs also sought to reinforce FCY liquidity buffers amid rising uncertainties in the domestic and international markets following the 14th Malaysian General Election and uncertainties over the pace of US Federal Reserve’s monetary policy normalisation. This led to a signifi cantly higher-than-average growth in banks’ external debt for the year (2018: 11.5%; 2014-17 CAGR: 6.0%). These funds were largely placed in the domestic interbank market and in ringgit or FCY short-term investments, with borrowings observed to be broadly matched with assets in terms of amount, currency and tenure, thereby limiting the risks arising from tenure or currency mismatches. As market uncertainties subsided in the later part of 2018, such precautionary borrowings were significantly unwound. This resulted in a decline in DBGs’ interbank borrowings by RM15.2 billion or 27%. This trend is expected to continue as market conditions improve further.
Chart 6: Banks’ External Debt and Market Share ofForeign Banks
Size of banking system external debt is generallycommensurate with presence of foreign banks
Malaysia (excl. LIBFC banks)
Malaysia
Australia
PR China
Estonia
India
Indonesia
South Korea
Mexico
New Zealand
Philippines
Thailand
0
10
20
30
40
50
60
0 20 40 60 80 100
Note: Foreign banks’ market share data refers to proportion of total banking sector assets held by foreign banks
Source: Bank Negara Malaysia, Bloomberg, Global Financial Development Database, Haver Analytics and IMF World Economic Outlook
Ban
ks' e
xter
nal d
ebt
(% o
f GD
P)
Foreign banks’ market share (% of total banking system assets)
Domestic banking groups have sizeable overseas presence
Chart 7: Total Foreign Claims of Domestic Banks (% of GDP)
155
120
85
50 48
12
Singapore Spain Japan Malaysia Australia South Korea
Note: Refers to total foreign claims of domestic banks in all currencies. Data for peer countries as at end-3Q 2018
Source: Bank Negara Malaysia, BIS International Banking Statistics, Bloomberg, Haver Analytics and IMF World Economic Outlook
5 For further information on the CLM practices of Malaysian banks, please refer to the information box on page 33 of Bank Negara Malaysia Financial Stability and Payment Systems Report 2017.
6 The implied cost of raising FCY funds abroad and swapping it into ringgit is cheaper than marginal cost of raising ringgit funds from domestic sources.
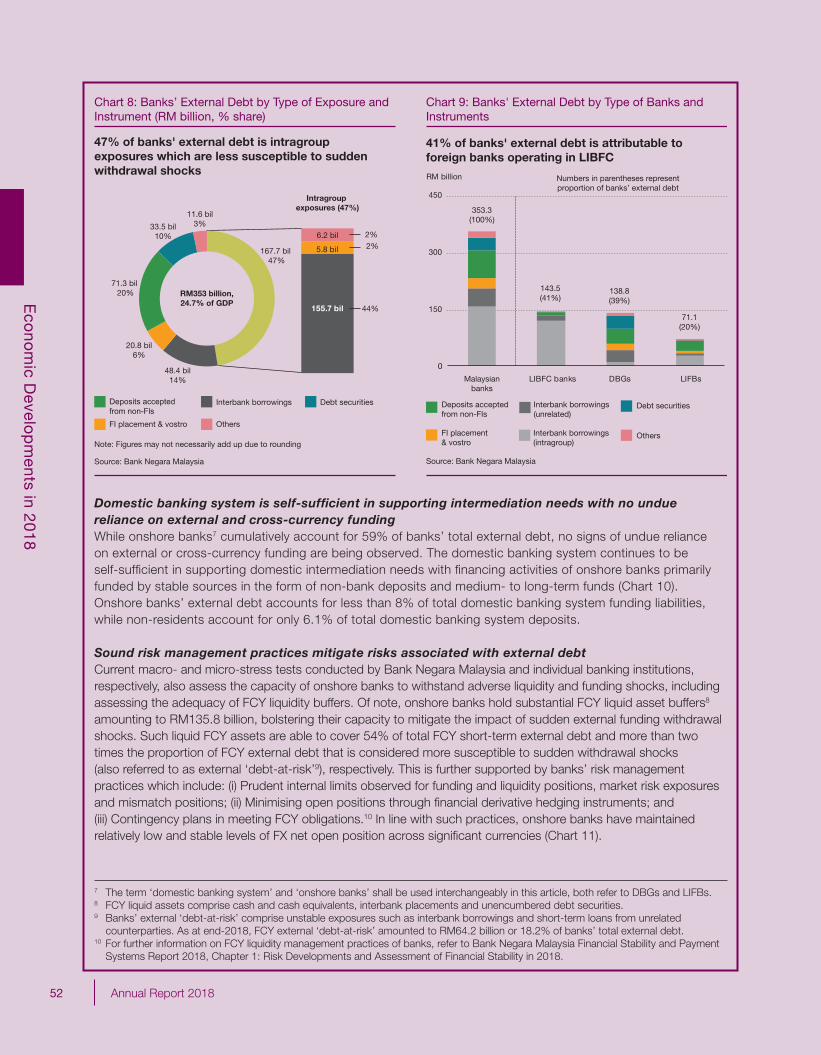
52 Annual Report 2018
Eco
nom
ic Develo
pm
ents in 2018
6 Annual Report 2018
Interbank borrowings
FI placement & vostro
Debt securities
Others
Deposits acceptedfrom non-Fls
Chart 8: Banks’ External Debt by Type of Exposure andInstrument (RM billion, % share)
47% of banks' external debt is intragroup exposures which are less susceptible to sudden withdrawal shocks
167.7 bil 47%
RM353 billion,24.7% of GDP
48.4 bil14%
20.8 bil6%
71.3 bil 20%
33.5 bil10%
11.6 bil3%
155.7 bil
5.8 bil
6.2 bil
Intragroup exposures (47%)
2%2%
44%
Note: Figures may not necessarily add up due to rounding
Source: Bank Negara Malaysia
Chart 9: Banks' External Debt by Type of Banks andInstruments
41% of banks' external debt is attributable toforeign banks operating in LIBFC
Source: Bank Negara Malaysia
0
150
300
450
LIBFC banks DBGs LIFBs
FI placement& vostro
Interbank borrowings(intragroup)
143.5(41%)
353.3(100%)
138.8(39%)
71.1(20%)
RM billion Numbers in parentheses representproportion of banks’ external debt
Malaysianbanks
Others
Debt securitiesDeposits acceptedfrom non-FIs
Interbank borrowings(unrelated)
Domestic banking system is self-suffi cient in supporting intermediation needs with no undue reliance on external and cross-currency fundingWhile onshore banks7 cumulatively account for 59% of banks’ total external debt, no signs of undue reliance on external or cross-currency funding are being observed. The domestic banking system continues to be self-suffi cient in supporting domestic intermediation needs with fi nancing activities of onshore banks primarily funded by stable sources in the form of non-bank deposits and medium- to long-term funds (Chart 10). Onshore banks’ external debt accounts for less than 8% of total domestic banking system funding liabilities, while non-residents account for only 6.1% of total domestic banking system deposits.
Sound risk management practices mitigate risks associated with external debtCurrent macro- and micro-stress tests conducted by Bank Negara Malaysia and individual banking institutions, respectively, also assess the capacity of onshore banks to withstand adverse liquidity and funding shocks, including assessing the adequacy of FCY liquidity buffers. Of note, onshore banks hold substantial FCY liquid asset buffers8 amounting to RM135.8 billion, bolstering their capacity to mitigate the impact of sudden external funding withdrawal shocks. Such liquid FCY assets are able to cover 54% of total FCY short-term external debt and more than two times the proportion of FCY external debt that is considered more susceptible to sudden withdrawal shocks (also referred to as external ‘debt-at-risk’9), respectively. This is further supported by banks’ risk management practices which include: (i) Prudent internal limits observed for funding and liquidity positions, market risk exposures and mismatch positions; (ii) Minimising open positions through fi nancial derivative hedging instruments; and (iii) Contingency plans in meeting FCY obligations.10 In line with such practices, onshore banks have maintained relatively low and stable levels of FX net open position across signifi cant currencies (Chart 11).
7 The term ‘domestic banking system’ and ‘onshore banks’ shall be used interchangeably in this article, both refer to DBGs and LIFBs.8 FCY liquid assets comprise cash and cash equivalents, interbank placements and unencumbered debt securities.9 Banks’ external ‘debt-at-risk’ comprise unstable exposures such as interbank borrowings and short-term loans from unrelated
counterparties. As at end-2018, FCY external ‘debt-at-risk’ amounted to RM64.2 billion or 18.2% of banks’ total external debt.10 For further information on FCY liquidity management practices of banks, refer to Bank Negara Malaysia Financial Stability and Payment
Systems Report 2018, Chapter 1: Risk Developments and Assessment of Financial Stability in 2018.
7Annual Report 2018
B. Underlying drivers of corporate external debt: Signifi cant presence of foreign MNCs
External debt of multinational corporations (MNCs) is predominantly in the form of intercompany loans. These loans are generally on fl exible and concessionary termsAs a highly open economy with attractive growth prospects and business-friendly operating environment, Malaysia is the benefi ciary of substantial and consistent infl ows of foreign direct investment (FDI). Since 2001, growth of FDI stock averaged 10% per annum and the outstanding position stood at 44.1% of GDP as at end-2018. Due to the nature of business strategy and operations, FDI investors, primarily MNCs, rely heavily on their parent companies for funding (Eiteman et al, 1991). Chart 12 corroborates this relationship across a group of selected economies.
Notably, for Malaysia, close to half of corporate external debt is accounted for by MNCs (Chart 13). Three quarters of this debt consists of intercompany borrowings, refl ecting extension of fi nancing from parent/affi liate companies overseas to their subsidiaries/affi liates operating in Malaysia (Chart 13). These loans are generally on fl exible or no contractual fi xed repayment schedules and zero or very low interest rates that are well below the prevailing market interest rates (Bank Negara Malaysia, 2015). Despite the ongoing global fi nancial tightening and rising external interest rate environment, the effective interest rate on Malaysia’s FCY intercompany loans has remained very low (Chart 14). These favourable terms largely mitigate the corporates’ risk exposure to a sharp rise in interest rates and thereby sustain their debt repayment capability.
Public corporations account for about one third of the corporate external debt (Chart 13). A signifi cant share of this is held by the national petroleum company which has a solid fi nancial position as affi rmed by major international credit rating agencies. A few other public corporations with external borrowings also have FCY earnings that mitigate currency mismatch. Thus, the strong repayment capability of these public corporations attenuates potential risks emanating from their external debt.
More than suffi cient FCY earnings and assets to naturally hedge FCY risk of corporate external debtExporters account for more than half of corporates with external borrowings (Chart 15). Essentially, with the export proceeds, exporters are naturally hedged. After accounting for imports, net foreign-currency earnings from trade are more than suffi cient to meet total corporate FCY external debt servicing obligations (Chart 16), even during periods of large ringgit depreciations. Moreover, Malaysia’s diversifi ed export structure across products and markets cushions export earnings against sharp external demand deteriorations. In addition, the sustained current account surplus since 1998 has contributed to the accumulation of RM931 billion of corporations’ FCY external assets. This is more than double the corporate FCY external borrowings (Chart 17) thus further reinforcing corporates’ repayment capacity.
Chart 10: Banking System – Malaysian Ringgit and FCY Loan-to-Fund Ratios
Banks maintain sufficient stable funds to support intermediation activities
Note: Funds comprise deposits accepted from non-banks and all debt instruments
Source: Bank Negara Malaysia
84
66
0
20
40
60
80
100
J F M A M J J A S O N D J F M A M J J A S O N D
2017 2018
Malaysian ringgit FCY
%
FX USD
Source: Bank Negara Malaysia
5.8
3.8
0
2
4
6
8
J F M A M J J A S O N D J F M A M J J A S O N D
2017 2018
% of banks’ capital
Overall FX and USD net open positions of banks remain low
Chart 11: Banking System - FX and USD Net Open Positions
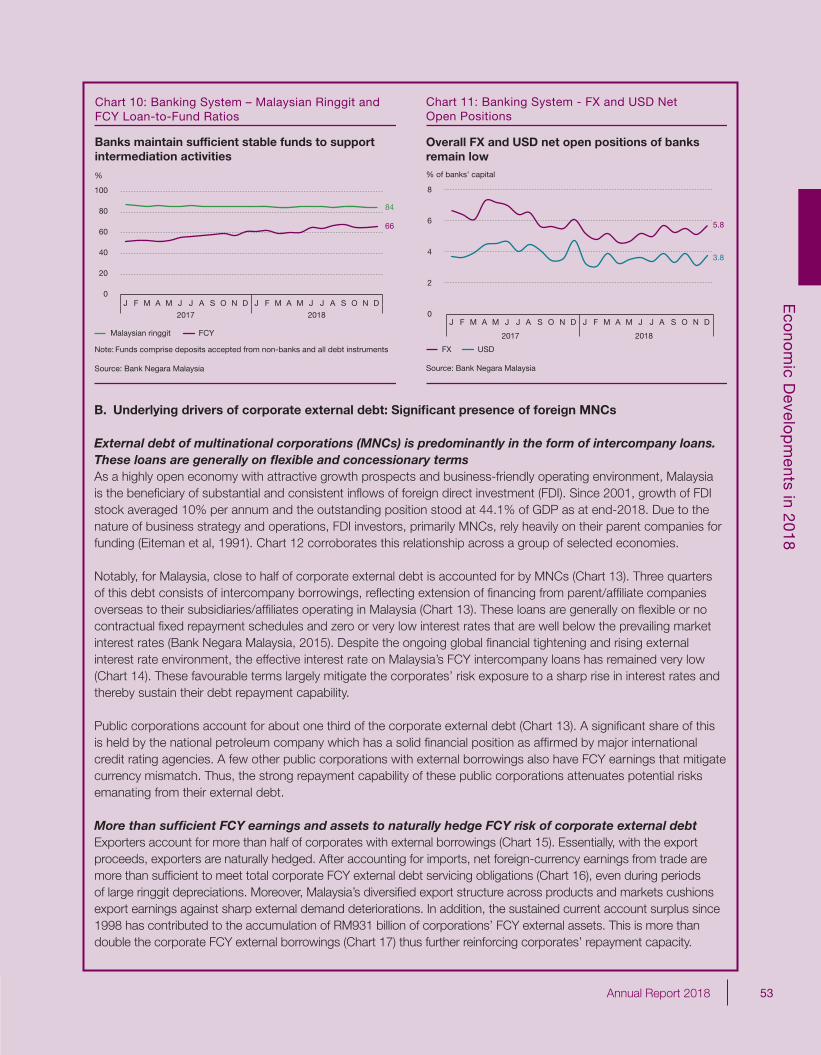
53Annual Report 2018
Eco
nom
ic Develo
pm
ents in 2018
7Annual Report 2018
B. Underlying drivers of corporate external debt: Signifi cant presence of foreign MNCs
External debt of multinational corporations (MNCs) is predominantly in the form of intercompany loans. These loans are generally on fl exible and concessionary termsAs a highly open economy with attractive growth prospects and business-friendly operating environment, Malaysia is the benefi ciary of substantial and consistent infl ows of foreign direct investment (FDI). Since 2001, growth of FDI stock averaged 10% per annum and the outstanding position stood at 44.1% of GDP as at end-2018. Due to the nature of business strategy and operations, FDI investors, primarily MNCs, rely heavily on their parent companies for funding (Eiteman et al, 1991). Chart 12 corroborates this relationship across a group of selected economies.
Notably, for Malaysia, close to half of corporate external debt is accounted for by MNCs (Chart 13). Three quarters of this debt consists of intercompany borrowings, refl ecting extension of fi nancing from parent/affi liate companies overseas to their subsidiaries/affi liates operating in Malaysia (Chart 13). These loans are generally on fl exible or no contractual fi xed repayment schedules and zero or very low interest rates that are well below the prevailing market interest rates (Bank Negara Malaysia, 2015). Despite the ongoing global fi nancial tightening and rising external interest rate environment, the effective interest rate on Malaysia’s FCY intercompany loans has remained very low (Chart 14). These favourable terms largely mitigate the corporates’ risk exposure to a sharp rise in interest rates and thereby sustain their debt repayment capability.
Public corporations account for about one third of the corporate external debt (Chart 13). A signifi cant share of this is held by the national petroleum company which has a solid fi nancial position as affi rmed by major international credit rating agencies. A few other public corporations with external borrowings also have FCY earnings that mitigate currency mismatch. Thus, the strong repayment capability of these public corporations attenuates potential risks emanating from their external debt.
More than suffi cient FCY earnings and assets to naturally hedge FCY risk of corporate external debtExporters account for more than half of corporates with external borrowings (Chart 15). Essentially, with the export proceeds, exporters are naturally hedged. After accounting for imports, net foreign-currency earnings from trade are more than suffi cient to meet total corporate FCY external debt servicing obligations (Chart 16), even during periods of large ringgit depreciations. Moreover, Malaysia’s diversifi ed export structure across products and markets cushions export earnings against sharp external demand deteriorations. In addition, the sustained current account surplus since 1998 has contributed to the accumulation of RM931 billion of corporations’ FCY external assets. This is more than double the corporate FCY external borrowings (Chart 17) thus further reinforcing corporates’ repayment capacity.
Chart 10: Banking System – Malaysian Ringgit and FCY Loan-to-Fund Ratios
Banks maintain sufficient stable funds to support intermediation activities
Note: Funds comprise deposits accepted from non-banks and all debt instruments
Source: Bank Negara Malaysia
84
66
0
20
40
60
80
100
J F M A M J J A S O N D J F M A M J J A S O N D
2017 2018
Malaysian ringgit FCY
%
FX USD
Source: Bank Negara Malaysia
5.8
3.8
0
2
4
6
8
J F M A M J J A S O N D J F M A M J J A S O N D
2017 2018
% of banks’ capital
Overall FX and USD net open positions of banks remain low
Chart 11: Banking System - FX and USD Net Open Positions
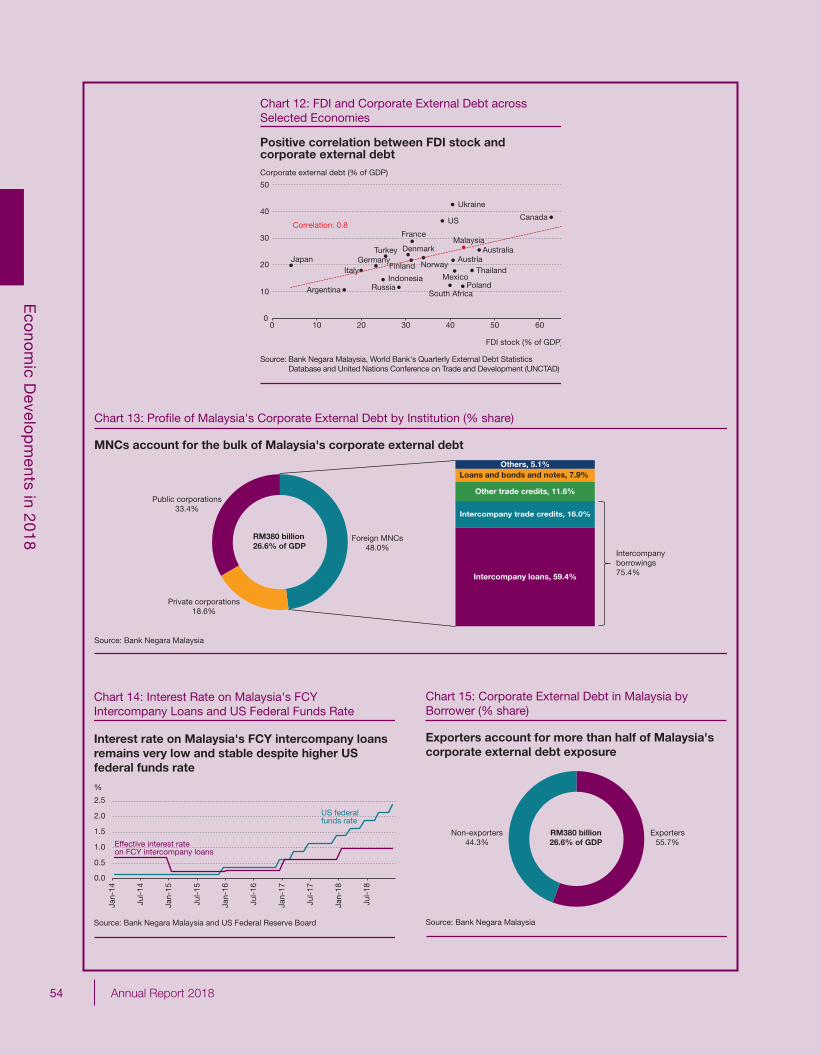
54 Annual Report 2018
Eco
nom
ic Develo
pm
ents in 2018
8 Annual Report 2018
Positive correlation between FDI stock and corporate external debt
Chart 12: FDI and Corporate External Debt across Selected Economies
ThailandIndonesia Mexico
South AfricaArgentina
TurkeyMalaysia
AustraliaJapan
Correlation: 0.8
Norway
Russia
Ukraine
Austria
Canada
Denmark
Finland
France
GermanyItaly
US
Poland
0
10
20
30
40
50
0 10 20 30 40 50 60
Corporate external debt (% of GDP)
Source: Bank Negara Malaysia, World Bank's Quarterly External Debt Statistics Database and United Nations Conference on Trade and Development (UNCTAD)
FDI stock (% of GDP)
Chart 13: Profile of Malaysia's Corporate External Debt by Institution (% share)
Source: Bank Negara Malaysia
RM380 billion26.6% of GDP
MNCs account for the bulk of Malaysia's corporate external debt
Public corporations 33.4%
Private corporations 18.6%
Foreign MNCs 48.0%
Intercompany loans, 59.4%
Intercompany trade credits, 16.0%
Other trade credits, 11.6%
Others, 5.1%Loans and bonds and notes, 7.9%
Intercompanyborrowings75.4%
Chart 14: Interest Rate on Malaysia's FCY Intercompany Loans and US Federal Funds Rate
Interest rate on Malaysia's FCY intercompany loans remains very low and stable despite higher US federal funds rate
Jan-
14
Jul-
14
Jan-
15
Jul-
15
Jan-
16
Jul-
16
Jan-
17
Jul-
17
Jan-
18
Jul-
18
Source: Bank Negara Malaysia and US Federal Reserve Board
US federal funds rate
Effective interest rate on FCY intercompany loans
%
0.0
0.5
1.0
1.5
2.0
2.5
Exporters account for more than half of Malaysia'scorporate external debt exposure
Chart 15: Corporate External Debt in Malaysia by Borrower (% share)
Source: Bank Negara Malaysia
Non-exporters44.3%
Exporters55.7%
RM380 billion26.6% of GDP
9Annual Report 2018
Prudential safeguards further enhance corporate borrowers’ repayment capacityMalaysia has always maintained a balanced need to ensure adequate prudential safeguards while creating a conducive business environment that enhances the competitiveness and flexibility of the economy. This is clearly outlined in Bank Negara Malaysia’s Foreign Exchange Administration (FEA) framework designed to support the country’s monetary and financial stability as well as ensuring external sector resilience. In this regard, corporate external borrowings from non-related parties require Bank Negara Malaysia’s approval to, among others, ascertain that the debt is supported by FCY earnings or sufficiently hedged and that the borrowings are utilised to finance productive investments. This prudential measure is critical in ensuring that corporate offshore borrowings are self-sustaining and do not pose a material risk to the economy. Of note, the favourable profile of corporate external borrowings as deliberated in the preceding section reflects to some extent the prudent stance of Bank Negara Malaysia. This is corroborated by Bank Negara Malaysia’s survey of approved corporate borrowings from 2015 to 2018 which indicates that three quarters of corporate’s foreign-currency external borrowings are hedged, either naturally or through financial derivatives. Overall, given these mitigating factors, risks surrounding corporate FCY external debt are largely contained.
C. Underlying driver of ringgit-denominated external debt: Deep and liquid domestic debt marketMalaysia has been highly successful in developing its domestic debt market. In Asia, Malaysia’s debt market relative to its economic size is the third largest11 after Japan and South Korea. The country’s deep, liquid and investor-friendly bond market attracts a high level of non-resident participation, primarily in the MGS market. This partly reflects non-resident investors’ confidence in the country’s economic prospects. Consequently, the share of domestic-currency external borrowings is comparatively high at almost one-third of external debt (Chart 18). This directly reduces the exchange rate mismatch of Malaysia’s external debt.
Large and sophisticated domestic institutional investor base attenuates rollover riskThe stability of Malaysia’s domestic debt market is observed during episodes of large capital outflows, namely the Taper Tantrum and commodity price shocks in 2013 and 2014-2015, respectively. Between 2015 and 2018 as the US Federal Reserve began normalising its policy rate, the 5-year MGS remained broadly stable (Chart 19). Ample capacity accorded by the large and diverse domestic institutional investor base (Chart 20) facilitated smooth absorption during periods of heightened risk aversion towards EMEs’ securities, thus containing rollover risk.
Source: Department of Statistics, Malaysia and Bank Negara Malaysia
Net exports are sufficient to cover the servicing of corporate FCY external debt
Chart 16: Corporate FCY External Debt Servicing and Net Exports
Net exports ofgoods and services
Servicing ofcorporate FCY external debt
RM billion
62.3
6.2
0
20
40
60
80
100
120
101.7
Repayments of medium- and
long-term principal
Interest payments
Corporate FCY external assets far exceed its FCYexternal debt
Chart 17: Corporate FCY External Assets and FCY External Debt
931.0
324.2
0
200
400
600
800
1,000
Corporate FCY external assets Corporate FCY external debt
RM billion
Source: Bank Negara Malaysia
11 Size of local currency bond market as a % of GDP as at end-3Q 2018 (Malaysia: 96.7%; South Korea: 127.0%; and Japan: 207.6%) (Source: Asia Bond Monitor, Asian Development Bank, November 2018).
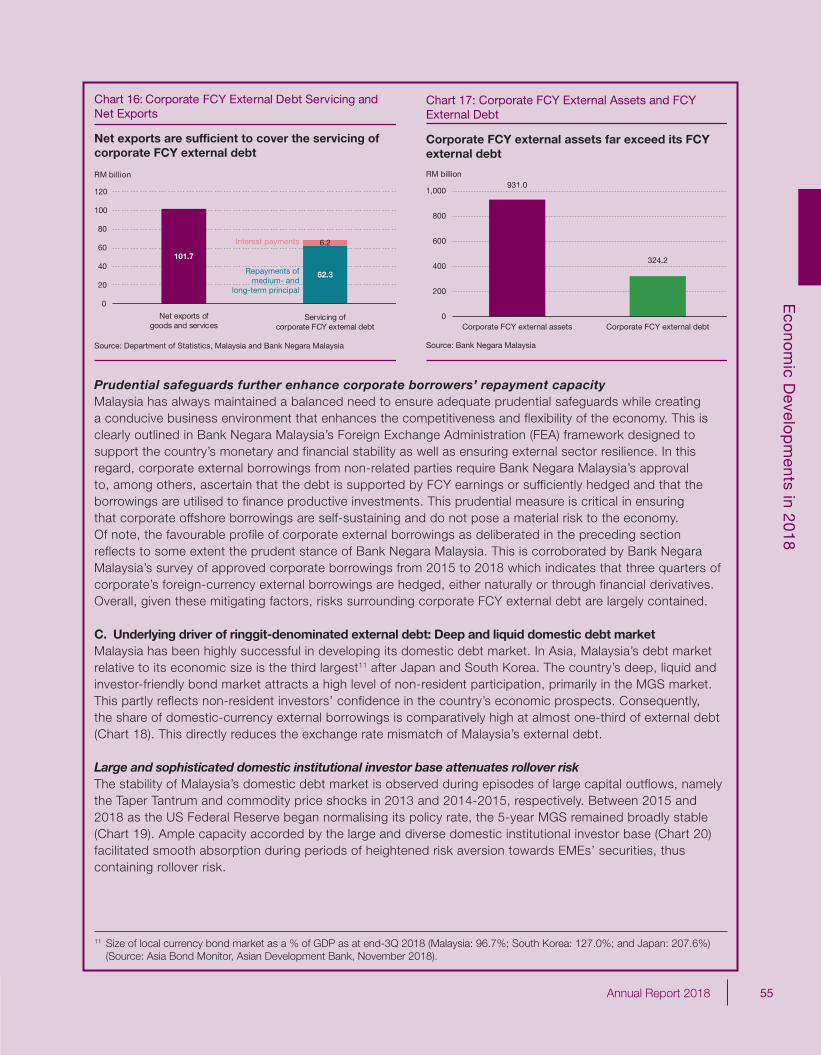
55Annual Report 2018
Eco
nom
ic Develo
pm
ents in 2018
9Annual Report 2018
Prudential safeguards further enhance corporate borrowers’ repayment capacityMalaysia has always maintained a balanced need to ensure adequate prudential safeguards while creating a conducive business environment that enhances the competitiveness and flexibility of the economy. This is clearly outlined in Bank Negara Malaysia’s Foreign Exchange Administration (FEA) framework designed to support the country’s monetary and financial stability as well as ensuring external sector resilience. In this regard, corporate external borrowings from non-related parties require Bank Negara Malaysia’s approval to, among others, ascertain that the debt is supported by FCY earnings or sufficiently hedged and that the borrowings are utilised to finance productive investments. This prudential measure is critical in ensuring that corporate offshore borrowings are self-sustaining and do not pose a material risk to the economy. Of note, the favourable profile of corporate external borrowings as deliberated in the preceding section reflects to some extent the prudent stance of Bank Negara Malaysia. This is corroborated by Bank Negara Malaysia’s survey of approved corporate borrowings from 2015 to 2018 which indicates that three quarters of corporate’s foreign-currency external borrowings are hedged, either naturally or through financial derivatives. Overall, given these mitigating factors, risks surrounding corporate FCY external debt are largely contained.
C. Underlying driver of ringgit-denominated external debt: Deep and liquid domestic debt marketMalaysia has been highly successful in developing its domestic debt market. In Asia, Malaysia’s debt market relative to its economic size is the third largest11 after Japan and South Korea. The country’s deep, liquid and investor-friendly bond market attracts a high level of non-resident participation, primarily in the MGS market. This partly reflects non-resident investors’ confidence in the country’s economic prospects. Consequently, the share of domestic-currency external borrowings is comparatively high at almost one-third of external debt (Chart 18). This directly reduces the exchange rate mismatch of Malaysia’s external debt.
Large and sophisticated domestic institutional investor base attenuates rollover riskThe stability of Malaysia’s domestic debt market is observed during episodes of large capital outflows, namely the Taper Tantrum and commodity price shocks in 2013 and 2014-2015, respectively. Between 2015 and 2018 as the US Federal Reserve began normalising its policy rate, the 5-year MGS remained broadly stable (Chart 19). Ample capacity accorded by the large and diverse domestic institutional investor base (Chart 20) facilitated smooth absorption during periods of heightened risk aversion towards EMEs’ securities, thus containing rollover risk.
Source: Department of Statistics, Malaysia and Bank Negara Malaysia
Net exports are sufficient to cover the servicing of corporate FCY external debt
Chart 16: Corporate FCY External Debt Servicing and Net Exports
Net exports ofgoods and services
Servicing ofcorporate FCY external debt
RM billion
62.3
6.2
0
20
40
60
80
100
120
101.7
Repayments of medium- and
long-term principal
Interest payments
Corporate FCY external assets far exceed its FCYexternal debt
Chart 17: Corporate FCY External Assets and FCY External Debt
931.0
324.2
0
200
400
600
800
1,000
Corporate FCY external assets Corporate FCY external debt
RM billion
Source: Bank Negara Malaysia
11 Size of local currency bond market as a % of GDP as at end-3Q 2018 (Malaysia: 96.7%; South Korea: 127.0%; and Japan: 207.6%) (Source: Asia Bond Monitor, Asian Development Bank, November 2018).
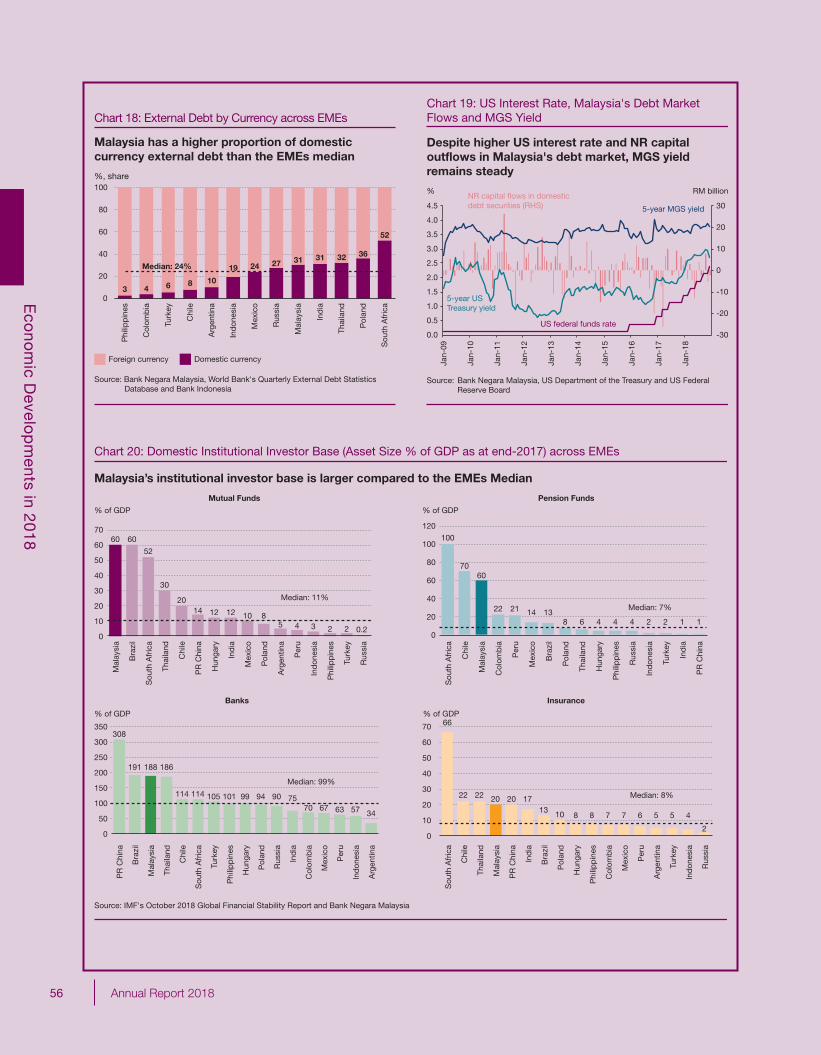
56 Annual Report 2018
Eco
nom
ic Develo
pm
ents in 2018
10 Annual Report 2018
%, share
Chart 18: External Debt by Currency across EMEs
3 4 6 8 10
19 24 27 31 31 32 36
52
0
20
40
60
80
100
Source: Bank Negara Malaysia, World Bank's Quarterly External Debt Statistics Database and Bank Indonesia
Domestic currencyForeign currency
Phi
lipp
ines
Col
omb
ia
Turk
ey
Chi
le
Arg
entin
a
Ind
ones
ia
Mex
ico
Rus
sia
Mal
aysi
a
Ind
ia
Thai
land
Pol
and
Sou
th A
fric
a
Median: 24%
Malaysia has a higher proportion of domestic currency external debt than the EMEs median
Despite higher US interest rate and NR capitaloutflows in Malaysia's debt market, MGS yield remains steady
Chart 19: US Interest Rate, Malaysia's Debt Market Flows and MGS Yield
-30
-20
-10
0
10
20
30
0.0
0.5
1.0
1.5
2.0
2.5
3.0
3.5
4.0
4.5
Jan-
09
Jan-
10
Jan-
11
Jan-
12
Jan-
13
Jan-
14
Jan-
15
Jan-
16
Jan-
17
Jan-
18
% RM billion
US federal funds rate
NR capital flows in domesticdebt securities (RHS)
Source: Bank Negara Malaysia, US Department of the Treasury and US Federal Reserve Board
5-year US Treasury yield
5-year MGS yield
Malaysia’s institutional investor base is larger compared to the EMEs Median
Chart 20: Domestic Institutional Investor Base (Asset Size % of GDP as at end-2017) across EMEs
Source: IMF's October 2018 Global Financial Stability Report and Bank Negara Malaysia
Mutual Funds
308
0
50
100
150
200
250
300
350
Banks
Sou
th A
fric
a
Chi
le
Thai
land
Mal
aysi
a
PR
Chi
na
Ind
ia
Bra
zil
Pol
and
Hun
gary
Phi
lipp
ines
Col
omb
ia
Mex
ico
Per
u
Arg
entin
a
Turk
ey
Ind
ones
ia
Rus
sia
Insurance
% of GDP
0
10
20
30
40
50
60
70
% of GDP
191 188 186
114 114 105 101 99 94 90 7570 67 63 57 34
PR
Chi
na
Bra
zil
Mal
aysi
a
Thai
land
Chi
le
Sou
th A
fric
a
Turk
ey
Phi
lipp
ines
Hun
gary
Pol
and
Rus
sia
Ind
ia
Col
omb
ia
Mex
ico
Per
u
Ind
ones
ia
Arg
entin
a
Median: 99%
66
22 22 20 20 1713 10 8 8 7 7 6 5 5 4
2
Median: 8%
60 60
52
30
2014 12 12 10 8
5 4 3 2 2 0.20
10
20
30
40
50
60
70
Mal
aysi
a
Bra
zil
Sou
th A
fric
a
Thai
land
Chi
le
PR
Chi
na
Hun
gary
Ind
ia
Mex
ico
Pol
and
Arg
entin
a
Per
u
Ind
ones
ia
Phi
lipp
ines
Turk
ey
Rus
sia
% of GDP
Median: 11%
Pension Funds
0
20
40
60
80
100
120
Sou
th A
fric
a
Chi
le
Mal
aysi
a
Col
omb
ia
Per
u
Mex
ico
Bra
zil
Pol
and
Thai
land
Hun
gary
Phi
lipp
ines
Rus
sia
Ind
ones
ia
Turk
ey
Ind
ia
PR
Chi
na
% of GDP
100
7060
22 21 14 138 6 4 4 4 2 2 1 1
Median: 7%
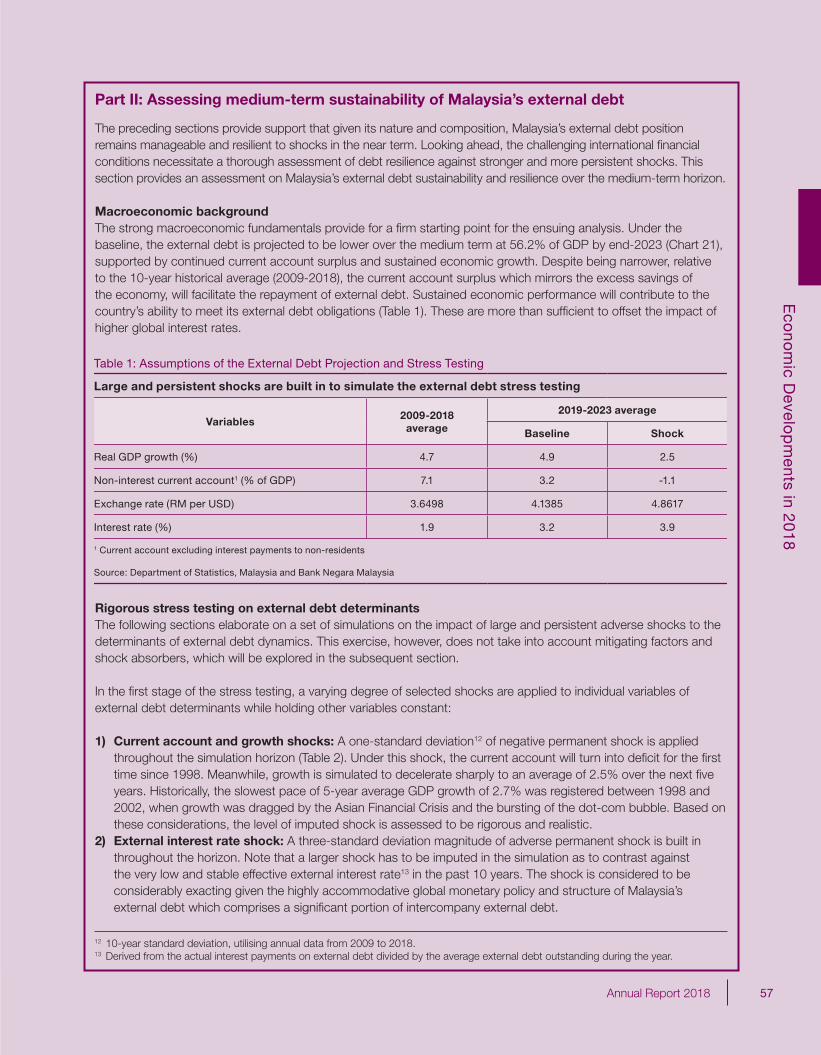
57Annual Report 2018
Eco
nom
ic Develo
pm
ents in 2018
11Annual Report 2018
Part II: Assessing medium-term sustainability of Malaysia’s external debt
The preceding sections provide support that given its nature and composition, Malaysia’s external debt position remains manageable and resilient to shocks in the near term. Looking ahead, the challenging international fi nancial conditions necessitate a thorough assessment of debt resilience against stronger and more persistent shocks. This section provides an assessment on Malaysia’s external debt sustainability and resilience over the medium-term horizon.
Macroeconomic backgroundThe strong macroeconomic fundamentals provide for a fi rm starting point for the ensuing analysis. Under the baseline, the external debt is projected to be lower over the medium term at 56.2% of GDP by end-2023 (Chart 21), supported by continued current account surplus and sustained economic growth. Despite being narrower, relative to the 10-year historical average (2009-2018), the current account surplus which mirrors the excess savings of the economy, will facilitate the repayment of external debt. Sustained economic performance will contribute to the country’s ability to meet its external debt obligations (Table 1). These are more than suffi cient to offset the impact of higher global interest rates.
12 10-year standard deviation, utilising annual data from 2009 to 2018.13 Derived from the actual interest payments on external debt divided by the average external debt outstanding during the year.
Table 1: Assumptions of the External Debt Projection and Stress Testing
Large and persistent shocks are built in to simulate the external debt stress testing
Variables2009-2018
average
2019-2023 average
Baseline Shock
Real GDP growth (%) 4.7 4.9 2.5
Non-interest current account1 (% of GDP) 7.1 3.2 -1.1
Exchange rate (RM per USD) 3.6498 4.1385 4.8617
Interest rate (%) 1.9 3.2 3.9
1 Current account excluding interest payments to non-residents
Source: Department of Statistics, Malaysia and Bank Negara Malaysia
Rigorous stress testing on external debt determinants The following sections elaborate on a set of simulations on the impact of large and persistent adverse shocks to the determinants of external debt dynamics. This exercise, however, does not take into account mitigating factors and shock absorbers, which will be explored in the subsequent section.
In the fi rst stage of the stress testing, a varying degree of selected shocks are applied to individual variables of external debt determinants while holding other variables constant:
1) Current account and growth shocks: A one-standard deviation12 of negative permanent shock is applied throughout the simulation horizon (Table 2). Under this shock, the current account will turn into defi cit for the fi rst time since 1998. Meanwhile, growth is simulated to decelerate sharply to an average of 2.5% over the next fi ve years. Historically, the slowest pace of 5-year average GDP growth of 2.7% was registered between 1998 and 2002, when growth was dragged by the Asian Financial Crisis and the bursting of the dot-com bubble. Based on these considerations, the level of imputed shock is assessed to be rigorous and realistic.
2) External interest rate shock: A three-standard deviation magnitude of adverse permanent shock is built in throughout the horizon. Note that a larger shock has to be imputed in the simulation as to contrast against the very low and stable effective external interest rate13 in the past 10 years. The shock is considered to be considerably exacting given the highly accommodative global monetary policy and structure of Malaysia’s external debt which comprises a signifi cant portion of intercompany external debt.
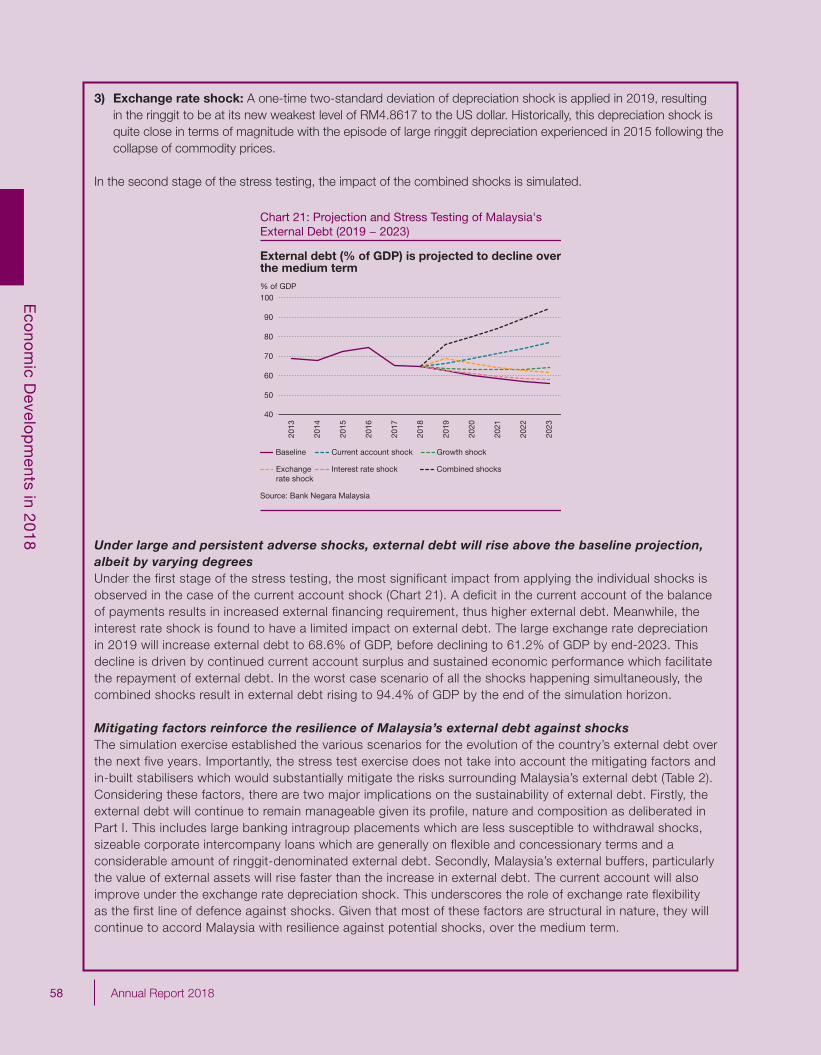
58 Annual Report 2018
Eco
nom
ic Develo
pm
ents in 2018
12 Annual Report 2018
3) Exchange rate shock: A one-time two-standard deviation of depreciation shock is applied in 2019, resulting in the ringgit to be at its new weakest level of RM4.8617 to the US dollar. Historically, this depreciation shock is quite close in terms of magnitude with the episode of large ringgit depreciation experienced in 2015 following the collapse of commodity prices.
In the second stage of the stress testing, the impact of the combined shocks is simulated.
Chart 21: Projection and Stress Testing of Malaysia's External Debt (2019 − 2023)
External debt (% of GDP) is projected to decline overthe medium term
Baseline Current account shock Growth shock
Exchange rate shock
Interest rate shock Combined shocks
Source: Bank Negara Malaysia
% of GDP
40
60
70
80
90
10020
13
2014
2015
2016
2017
2018
2019
2020
2021
2022
2023
50
Under large and persistent adverse shocks, external debt will rise above the baseline projection, albeit by varying degreesUnder the first stage of the stress testing, the most significant impact from applying the individual shocks is observed in the case of the current account shock (Chart 21). A deficit in the current account of the balance of payments results in increased external financing requirement, thus higher external debt. Meanwhile, the interest rate shock is found to have a limited impact on external debt. The large exchange rate depreciation in 2019 will increase external debt to 68.6% of GDP, before declining to 61.2% of GDP by end-2023. This decline is driven by continued current account surplus and sustained economic performance which facilitate the repayment of external debt. In the worst case scenario of all the shocks happening simultaneously, the combined shocks result in external debt rising to 94.4% of GDP by the end of the simulation horizon.
Mitigating factors reinforce the resilience of Malaysia’s external debt against shocksThe simulation exercise established the various scenarios for the evolution of the country’s external debt over the next five years. Importantly, the stress test exercise does not take into account the mitigating factors and in-built stabilisers which would substantially mitigate the risks surrounding Malaysia’s external debt (Table 2). Considering these factors, there are two major implications on the sustainability of external debt. Firstly, the external debt will continue to remain manageable given its profile, nature and composition as deliberated in Part I. This includes large banking intragroup placements which are less susceptible to withdrawal shocks, sizeable corporate intercompany loans which are generally on flexible and concessionary terms and a considerable amount of ringgit-denominated external debt. Secondly, Malaysia’s external buffers, particularly the value of external assets will rise faster than the increase in external debt. The current account will also improve under the exchange rate depreciation shock. This underscores the role of exchange rate flexibility as the first line of defence against shocks. Given that most of these factors are structural in nature, they will continue to accord Malaysia with resilience against potential shocks, over the medium term.
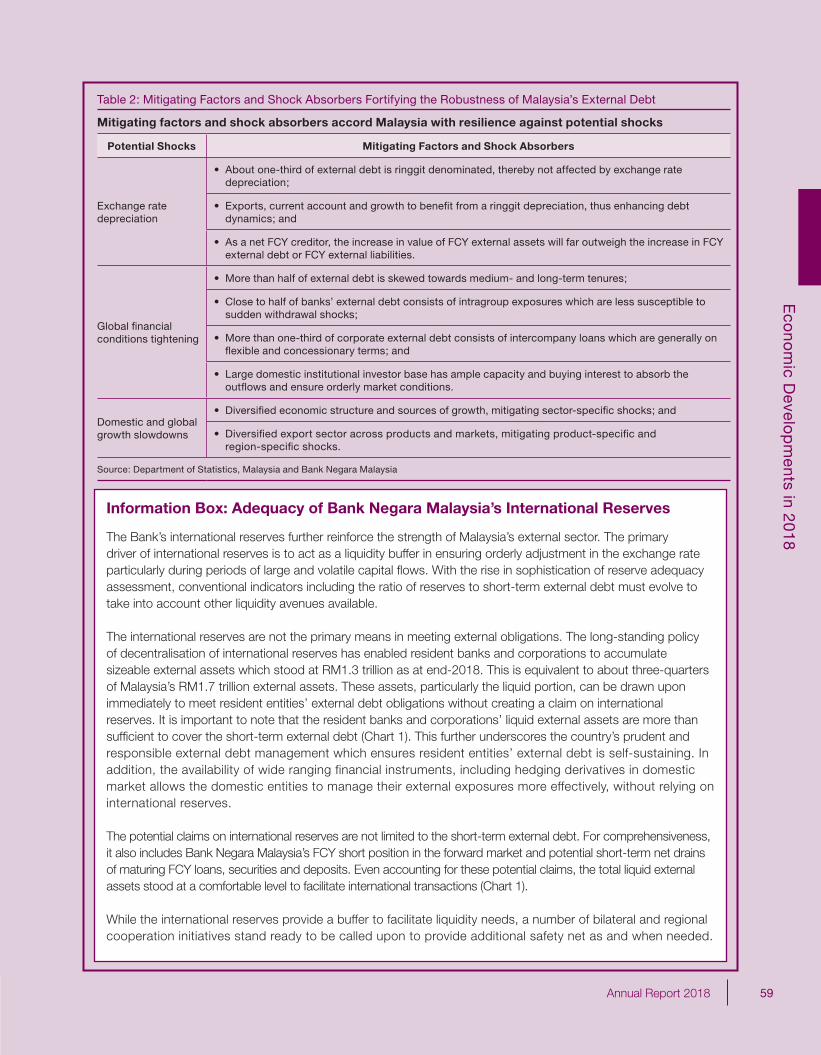
59Annual Report 2018
Eco
nom
ic Develo
pm
ents in 2018
13Annual Report 2018
Information Box: Adequacy of Bank Negara Malaysia’s International Reserves
The Bank’s international reserves further reinforce the strength of Malaysia’s external sector. The primary driver of international reserves is to act as a liquidity buffer in ensuring orderly adjustment in the exchange rate particularly during periods of large and volatile capital fl ows. With the rise in sophistication of reserve adequacy assessment, conventional indicators including the ratio of reserves to short-term external debt must evolve to take into account other liquidity avenues available.
The international reserves are not the primary means in meeting external obligations. The long-standing policy of decentralisation of international reserves has enabled resident banks and corporations to accumulate sizeable external assets which stood at RM1.3 trillion as at end-2018. This is equivalent to about three-quarters of Malaysia’s RM1.7 trillion external assets. These assets, particularly the liquid portion, can be drawn upon immediately to meet resident entities’ external debt obligations without creating a claim on international reserves. It is important to note that the resident banks and corporations’ liquid external assets are more than suffi cient to cover the short-term external debt (Chart 1). This further underscores the country’s prudent and responsible external debt management which ensures resident entities’ external debt is self-sustaining. In addition, the availability of wide ranging financial instruments, including hedging derivatives in domestic market allows the domestic entities to manage their external exposures more effectively, without relying on international reserves.
The potential claims on international reserves are not limited to the short-term external debt. For comprehensiveness, it also includes Bank Negara Malaysia’s FCY short position in the forward market and potential short-term net drains of maturing FCY loans, securities and deposits. Even accounting for these potential claims, the total liquid external assets stood at a comfortable level to facilitate international transactions (Chart 1).
While the international reserves provide a buffer to facilitate liquidity needs, a number of bilateral and regional cooperation initiatives stand ready to be called upon to provide additional safety net as and when needed.
Table 2: Mitigating Factors and Shock Absorbers Fortifying the Robustness of Malaysia’s External Debt
Mitigating factors and shock absorbers accord Malaysia with resilience against potential shocks
Potential Shocks Mitigating Factors and Shock Absorbers
Exchange rate depreciation
• About one-third of external debt is ringgit denominated, thereby not affected by exchange rate depreciation;
• Exports, current account and growth to benefi t from a ringgit depreciation, thus enhancing debt dynamics; and
• As a net FCY creditor, the increase in value of FCY external assets will far outweigh the increase in FCY external debt or FCY external liabilities.
Global fi nancial conditions tightening
• More than half of external debt is skewed towards medium- and long-term tenures;
• Close to half of banks’ external debt consists of intragroup exposures which are less susceptible to sudden withdrawal shocks;
• More than one-third of corporate external debt consists of intercompany loans which are generally on fl exible and concessionary terms; and
• Large domestic institutional investor base has ample capacity and buying interest to absorb the outfl ows and ensure orderly market conditions.
Domestic and global growth slowdowns
• Diversifi ed economic structure and sources of growth, mitigating sector-specifi c shocks; and
• Diversifi ed export sector across products and markets, mitigating product-specifi c and region-specifi c shocks.
Source: Department of Statistics, Malaysia and Bank Negara Malaysia
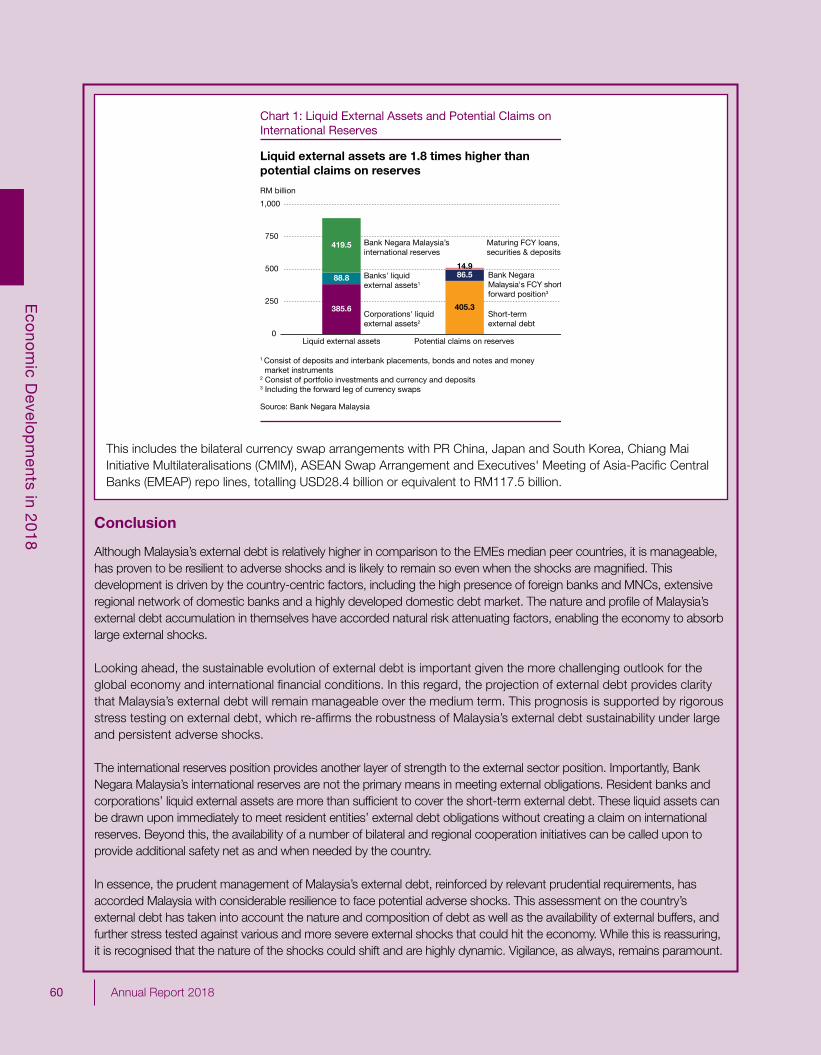
60 Annual Report 2018
Eco
nom
ic Develo
pm
ents in 2018
14 Annual Report 2018
This includes the bilateral currency swap arrangements with PR China, Japan and South Korea, Chiang Mai Initiative Multilateralisations (CMIM), ASEAN Swap Arrangement and Executives' Meeting of Asia-Pacifi c Central Banks (EMEAP) repo lines, totalling USD28.4 billion or equivalent to RM117.5 billion.
1 Consist of deposits and interbank placements, bonds and notes and money market instruments2 Consist of portfolio investments and currency and deposits3 Including the forward leg of currency swaps
RM billion
Source: Bank Negara Malaysia
385.6
88.8
419.5
405.3
86.514.9
0
250
500
750
1,000
Liquid external assets Potential claims on reserves
Chart 1: Liquid External Assets and Potential Claims on International Reserves
Liquid external assets are 1.8 times higher than potential claims on reserves
Bank Negara Malaysia’sinternational reserves
Maturing FCY loans, securities & deposits
Bank Negara Malaysia's FCY short forward position3
Short-term external debt
Corporations' liquidexternal assets2
Banks' liquid external assets1
Conclusion
Although Malaysia’s external debt is relatively higher in comparison to the EMEs median peer countries, it is manageable, has proven to be resilient to adverse shocks and is likely to remain so even when the shocks are magnifi ed. This development is driven by the country-centric factors, including the high presence of foreign banks and MNCs, extensive regional network of domestic banks and a highly developed domestic debt market. The nature and profi le of Malaysia’s external debt accumulation in themselves have accorded natural risk attenuating factors, enabling the economy to absorb large external shocks.
Looking ahead, the sustainable evolution of external debt is important given the more challenging outlook for the global economy and international fi nancial conditions. In this regard, the projection of external debt provides clarity that Malaysia’s external debt will remain manageable over the medium term. This prognosis is supported by rigorous stress testing on external debt, which re-affi rms the robustness of Malaysia’s external debt sustainability under large and persistent adverse shocks.
The international reserves position provides another layer of strength to the external sector position. Importantly, Bank Negara Malaysia’s international reserves are not the primary means in meeting external obligations. Resident banks and corporations’ liquid external assets are more than suffi cient to cover the short-term external debt. These liquid assets can be drawn upon immediately to meet resident entities’ external debt obligations without creating a claim on international reserves. Beyond this, the availability of a number of bilateral and regional cooperation initiatives can be called upon to provide additional safety net as and when needed by the country.
In essence, the prudent management of Malaysia’s external debt, reinforced by relevant prudential requirements, has accorded Malaysia with considerable resilience to face potential adverse shocks. This assessment on the country’s external debt has taken into account the nature and composition of debt as well as the availability of external buffers, and further stress tested against various and more severe external shocks that could hit the economy. While this is reassuring, it is recognised that the nature of the shocks could shift and are highly dynamic. Vigilance, as always, remains paramount.
61Annual Report 2018
Eco
nom
ic Develo
pm
ents in 2018
15Annual Report 2018
References
Bank Negara Malaysia (2015). ‘Deciphering Short-term External Debt’, Bank Negara Malaysia Annual Report.
Bank Negara Malaysia (2018). ‘Profi le of Malaysia’s External Debt’, 3Q 2018 Bank Negara Malaysia Quarterly Bulletin.
David Hargreaves and Elizabeth Watson (2011). ‘Sudden Stops, External Debt and the Exchange Rate’, Reserve Bank of New Zealand: Bulletin, Vol. 74, No. 4.
IMF (2018). ‘A Decade After the Global Financial Crisis: Are We Safer?’, IMF Global Financial Stability Report, Chapter 1.
IMF (2018). ‘Malaysia: 2018 Article IV Consultation’, IMF Country Report.
OECD (2017). ‘Resilience in a Time of High Debt’, OECD Economic Outlook, Volume 2017 Issue 2, Chapter 2.

63Annual Report 2018
Monetary and
Financial Cond
itions in 2018
Monetary and Financial Conditions
in 2018
65 International Monetary and Financial Conditions 67 Domestic Monetary and Financial Conditions

64 Annual Report 2018
Monetary and
Financial Cond
itions in 2018
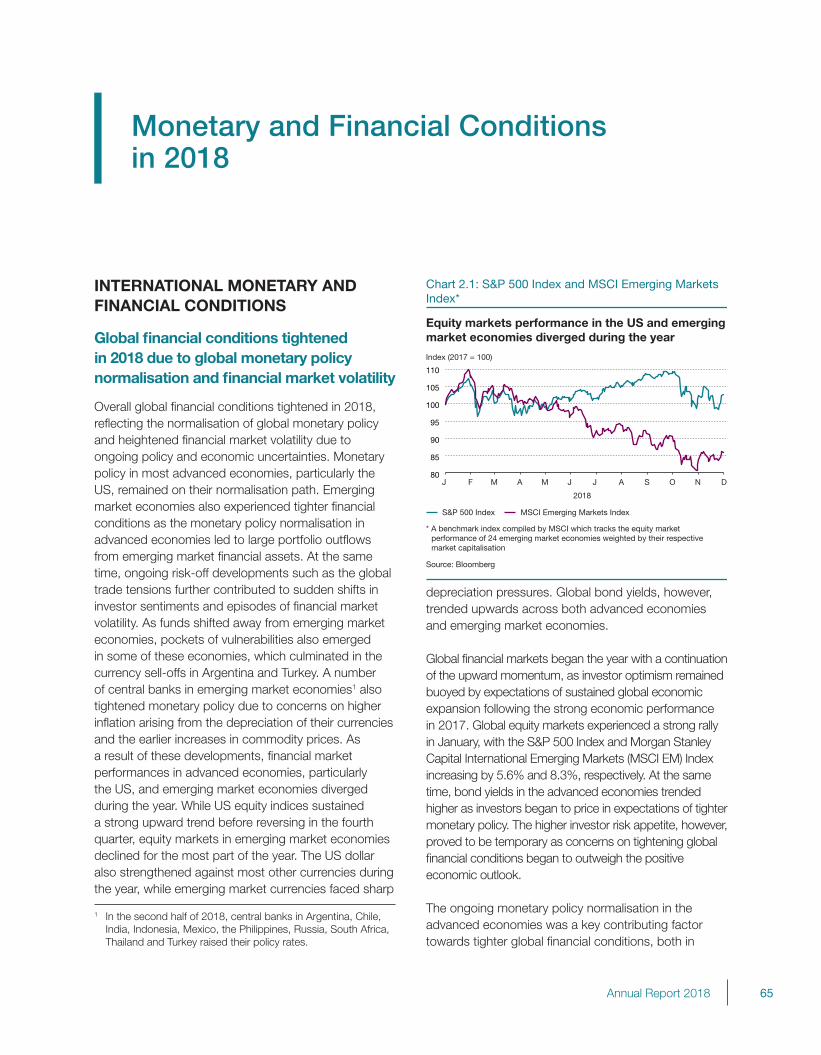
Monetary and Financial Conditions in 2018
INTERNATIONAL MONETARY AND FINANCIAL CONDITIONS
Global financial conditions tightened in 2018 due to global monetary policy normalisation and financial market volatility
Overall global financial conditions tightened in 2018, reflecting the normalisation of global monetary policy and heightened financial market volatility due to ongoing policy and economic uncertainties. Monetary policy in most advanced economies, particularly the US, remained on their normalisation path. Emerging market economies also experienced tighter financial conditions as the monetary policy normalisation in advanced economies led to large portfolio outflows from emerging market financial assets. At the same time, ongoing risk-off developments such as the global trade tensions further contributed to sudden shifts in investor sentiments and episodes of financial market volatility. As funds shifted away from emerging market economies, pockets of vulnerabilities also emerged in some of these economies, which culminated in the currency sell-offs in Argentina and Turkey. A number of central banks in emerging market economies1 also tightened monetary policy due to concerns on higher inflation arising from the depreciation of their currencies and the earlier increases in commodity prices. As a result of these developments, financial market performances in advanced economies, particularly the US, and emerging market economies diverged during the year. While US equity indices sustained a strong upward trend before reversing in the fourth quarter, equity markets in emerging market economies declined for the most part of the year. The US dollar also strengthened against most other currencies during the year, while emerging market currencies faced sharp
1 In the second half of 2018, central banks in Argentina, Chile, India, Indonesia, Mexico, the Philippines, Russia, South Africa, Thailand and Turkey raised their policy rates.
65Annual Report 2018
depreciation pressures. Global bond yields, however, trended upwards across both advanced economies and emerging market economies.
Global financial markets began the year with a continuation of the upward momentum, as investor optimism remained buoyed by expectations of sustained global economic expansion following the strong economic performance in 2017. Global equity markets experienced a strong rally in January, with the S&P 500 Index and Morgan Stanley Capital International Emerging Markets (MSCI EM) Index increasing by 5.6% and 8.3%, respectively. At the same time, bond yields in the advanced economies trended higher as investors began to price in expectations of tighter monetary policy. The higher investor risk appetite, however, proved to be temporary as concerns on tightening global financial conditions began to outweigh the positive economic outlook.
The ongoing monetary policy normalisation in the advanced economies was a key contributing factor towards tighter global financial conditions, both in
Index (2017 = 100)
2018
S&P 500 Index MSCI Emerging Markets Index
* A benchmark index compiled by MSCI which tracks the equity market performance of 24 emerging market economies weighted by their respective market capitalisation
Chart 2.1: S&P 500 Index and MSCI Emerging Markets Index*
80
85
90
95
100
105
110
J F M A M J J A S O N D
Equity markets performance in the US and emerging market economies diverged during the year
Source: Bloomberg
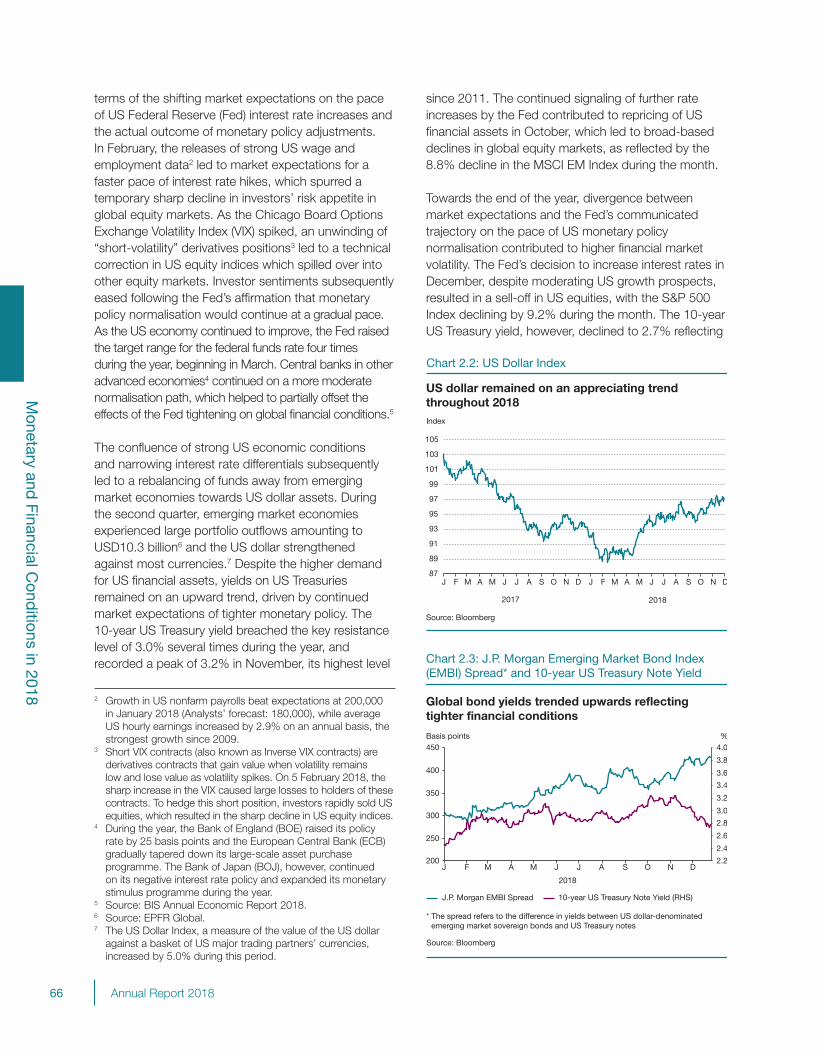
66 Annual Report 2018
Monetary and
Financial Cond
itions in 2018
terms of the shifting market expectations on the pace of US Federal Reserve (Fed) interest rate increases and the actual outcome of monetary policy adjustments. In February, the releases of strong US wage and employment data2 led to market expectations for a faster pace of interest rate hikes, which spurred a temporary sharp decline in investors’ risk appetite in global equity markets. As the Chicago Board Options Exchange Volatility Index (VIX) spiked, an unwinding of “short-volatility” derivatives positions3 led to a technical correction in US equity indices which spilled over into other equity markets. Investor sentiments subsequently eased following the Fed’s affirmation that monetary policy normalisation would continue at a gradual pace. As the US economy continued to improve, the Fed raised the target range for the federal funds rate four times during the year, beginning in March. Central banks in other advanced economies4 continued on a more moderate normalisation path, which helped to partially offset the effects of the Fed tightening on global financial conditions.5
The confluence of strong US economic conditions and narrowing interest rate differentials subsequently led to a rebalancing of funds away from emerging market economies towards US dollar assets. During the second quarter, emerging market economies experienced large portfolio outflows amounting to USD10.3 billion6 and the US dollar strengthened against most currencies.7 Despite the higher demand for US financial assets, yields on US Treasuries remained on an upward trend, driven by continued market expectations of tighter monetary policy. The 10-year US Treasury yield breached the key resistance level of 3.0% several times during the year, and recorded a peak of 3.2% in November, its highest level
since 2011. The continued signaling of further rate increases by the Fed contributed to repricing of US financial assets in October, which led to broad-based declines in global equity markets, as reflected by the 8.8% decline in the MSCI EM Index during the month.
Towards the end of the year, divergence between market expectations and the Fed’s communicated trajectory on the pace of US monetary policy normalisation contributed to higher financial market volatility. The Fed’s decision to increase interest rates in December, despite moderating US growth prospects, resulted in a sell-off in US equities, with the S&P 500 Index declining by 9.2% during the month. The 10-year US Treasury yield, however, declined to 2.7% reflecting
2 Growth in US nonfarm payrolls beat expectations at 200,000 in January 2018 (Analysts’ forecast: 180,000), while average US hourly earnings increased by 2.9% on an annual basis, the strongest growth since 2009.
3 Short VIX contracts (also known as Inverse VIX contracts) are derivatives contracts that gain value when volatility remains low and lose value as volatility spikes. On 5 February 2018, the sharp increase in the VIX caused large losses to holders of these contracts. To hedge this short position, investors rapidly sold US equities, which resulted in the sharp decline in US equity indices.
4 During the year, the Bank of England (BOE) raised its policy rate by 25 basis points and the European Central Bank (ECB) gradually tapered down its large-scale asset purchase programme. The Bank of Japan (BOJ), however, continued on its negative interest rate policy and expanded its monetary stimulus programme during the year.
5 Source: BIS Annual Economic Report 2018.6 Source: EPFR Global.7 The US Dollar Index, a measure of the value of the US dollar
against a basket of US major trading partners’ currencies, increased by 5.0% during this period.
Chart 2.2: US Dollar Index
Source: Bloomberg
Index
US dollar remained on an appreciating trendthroughout 2018
87
89
91
93
95
97
99
101
103
105
J F M A M J J A S O N D J F M A M J J A S O N D
20182017
2.2
2.4
2.6
2.8
3.0
3.2
3.4
3.6
3.8
4.0
200
250
300
350
400
450
J F M A M J J A S O N D
2018
J.P. Morgan EMBI Spread 10-year US Treasury Note Yield (RHS)
Chart 2.3: J.P. Morgan Emerging Market Bond Index (EMBI) Spread* and 10-year US Treasury Note Yield
Global bond yields trended upwards reflecting tighter financial conditions
Basis points %
* The spread refers to the difference in yields between US dollar-denominated emerging market sovereign bonds and US Treasury notes
Source: Bloomberg
67Annual Report 2018
Monetary and
Financial Cond
itions in 2018
the shift in sentiments as investors began pricing in a higher probability for a pause to further US monetary policy normalisation following the Fed’s lower growth and inflation forecast for 2019.
In addition to the ongoing US monetary policy normalisation, the heightened trade tensions further amplified risk aversion towards emerging market financial assets. The introduction of protectionist policies by a number of major economies8 was a key concern in global financial markets as investors expected the disruptions to global value chains to weigh on global growth prospects. The tariffs already implemented, along with the corresponding retaliatory measures, were estimated to result in a reduction in annual global growth by 0.3 percentage points, with a large portion of the impact to manifest in 2019.9
Amid concerns on moderating global growth, investors also began to place increased scrutiny on country-specific vulnerabilities within emerging market economies. A key concern was the sustainability of their US dollar-denominated debt. As a result, several emerging market economies with perceived vulnerabilities experienced sharp sell-offs of financial assets, which generated vicious cycles of portfolio outflows and exchange rate depreciation pressures. In August, the Argentine peso experienced a sharp depreciation of 26% against the US dollar as concerns on the country’s growing current account deficit, high inflation and large US dollar-denominated debt resulted in non-resident outflows. The Turkish lira also experienced a sell-off, depreciating by 25% against the US dollar in August due to similar concerns, which were further exacerbated by geopolitical tensions and sanctions imposed by the US. These episodes of currency sell-offs led to growing concerns on potential contagion risks among other vulnerable emerging market economies. Regional economies with twin deficits, such as India and Indonesia, were particularly affected and experienced sharp declines in their respective currencies and equity indices. As a result, some central banks in emerging market economies tightened monetary policy to address the impact of currency depreciation and earlier oil price increases on
inflation prospects.10 For the year as whole, the MSCI EM Index declined by 16.6% and the J.P. Morgan Emerging Markets Bond Index spread widened by 123.6 basis points.
Going forward, global financial markets will continue to face bouts of volatility, as many of the uncertainties that contributed to past episodes of volatility remain as potential risk factors in 2019. The materialisation of these downside risks could lead to a tightening of financial conditions globally, with implications on growth prospects. Firstly, moderating global growth conditions have led to diverging expectations on the trajectory of Fed interest rate hikes11 and increases the risks of disorderly financial market adjustments in response to potential policy surprises. Second, the ongoing trade tensions between the US and PR China will likely come into focus again following the end of a 90-day trade truce agreed upon at the 2018 G20 Summit.12 Escalation of tariff actions could cause further weakening in global growth prospects. Third, political developments in 2019 such as Brexit could lead to episodes of heightened volatility. Fourth, higher volatility in global crude oil prices could cast uncertainties in financial markets, particularly for commodity-exporting economies. For emerging market economies, the attractive valuations following the portfolio outflows in 2018 could support a reallocation of flows back into the asset class. This, however, could be limited by continued risk aversion amid tightening financial conditions and moderating macroeconomic conditions.
DOMESTIC MONETARY AND FINANCIAL CONDITIONS
Domestic financial markets were affected by shifts in non-resident portfolio flows, driven mainly by external developments
Amid the developments in global financial markets, the domestic financial markets experienced shifts in non-resident portfolio flows, largely reflecting changes in investor sentiments and risk appetite throughout the year. The trends observed in domestic financial markets
8 On 1 March 2018, the Trump administration announced a 25% tariff on steel and a 10% tariff on aluminium imports. Since then, additional tariffs were levied on USD250 billion worth of Chinese goods. Following these measures, several US trading partners responded with retaliatory tariffs, including PR China, which has applied tariffs on USD110 billion of US imports.
9 The impact of trade tensions to global growth in 2018 and 2019 was estimated as -0.02 and -0.26 percentage points, respectively. Source: BNM Quarterly Bulletin, Third Quarter 2018.
10 Source: IMF World Economic Outlook, January 2019.11 As at January 2019, the Federal Open Market Committee (FOMC)
Dot Plot projected that the Fed will raise the target range for the federal funds rate two times in 2019, whereas the Federal Funds Futures market priced in no policy rate changes for the year.
12 On 1 December 2018, the US and PR China agreed on a temporary 90-day truce with the intention of de-escalating the trade tensions, which ended on 1 March 2019. During this period, the US and PR China agreed not to increase or introduce new tariffs while the two countries negotiate on a new deal.
68 Annual Report 2018
Monetary and
Financial Cond
itions in 2018
were largely in line with most regional financial markets, driven mainly by external developments. Domestic policy uncertainties also affected investor sentiments following the results of the 14th General Election. For 2018 as a whole, non-resident outflows from the bond and equity markets amounted to USD5.5 billion and USD2.9 billion, respectively. As a result, the ringgit depreciated by 1.8% to end the year at RM4.1385 against the US dollar. The benchmark Malaysian Government Securities (MGS) yield curve shifted upwards, reflecting an increase in bond yields across all maturities. The 3-year, 5-year and 10-year MGS yields increased by 29, 22 and 17 basis points, respectively. The FTSE Bursa Malaysia Kuala Lumpur Composite Index (FBM KLCI) declined by 5.9% (2017: 9.4%) to close at 1,690.6 points.
Developments in the domestic financial markets can be delineated into two distinct phases. In the first quarter, global financial markets continued their strong momentum from 2017 and investor sentiments remained buoyed by the positive economic outlook in emerging market economies. This led to broad-based non-resident portfolio flows into the region, including Malaysia. As a result, the demand for ringgit investment assets provided support to the ringgit exchange rate, as well as domestic bond and equity prices. However, this trend reversed from the second quarter onwards as global uncertainties, particularly related to US monetary policy normalisation, escalating global trade tensions and contagion risks from vulnerable emerging market economies, began to weigh on investor sentiments.
In the first quarter of the year, Malaysia’s bond and equity markets experienced non-resident inflows amounting to USD0.9 billion and USD0.6 billion, respectively, as investors maintained a favourable outlook on emerging market economies, including Malaysia. This was amid continued optimism on global growth and market expectations for a gradual pace of monetary policy normalisation in the US. Investor sentiments were also buoyed by the strong domestic economic performance and growth prospects.13 Following this, the ringgit appreciated by 5.2% against the US dollar in the first quarter, with the ringgit reaching an annual high of RM3.8580 per US dollar at end-March. In the bond market, while MGS yields adjusted in line with the 25 basis point Overnight Policy Rate (OPR) increase during the
period, this was partially offset by the non-resident inflows. As a result, the 3-year and 10-year MGS yields increased by 10 and 3 basis points, respectively, and the 5-year MGS yield declined by 1 basis point. The equity market maintained its upward momentum well into April, supported by active buying by non-resident investors during the month.14 As a result, the FBM KLCI increased by 4.1% during the first four months of the year.
Several external developments took centre stage from the second quarter onwards, which led to shifting investor sentiments. These included investor expectations for a faster pace of monetary policy normalisation in the US, an escalation in global trade tensions and volatile global crude oil prices. Furthermore, incidences of currency sell-offs in several vulnerable emerging market economies contributed to the deterioration of sentiments as investors were concerned over contagion risks. Beyond these external factors, domestic policy uncertainties further weighed on investor sentiments, particularly following the unprecedented outcome of the 14th General Election. Nevertheless, the effects of domestic factors were temporary following improved policy clarity by the Government and expectations of supportive economic conditions.
This confluence of external and domestic factors led investors to rebalance their portfolios out of emerging market financial markets, including Malaysia. From April to December 2018, non-resident outflows from the domestic capital markets amounted to USD9.8 billion. As a result, the ringgit depreciated by 6.7% against the US dollar. Despite the outflows, bond market adjustments remained orderly due to sustained demand from domestic institutional investors, which partially offset the impact from these outflows. Notably, banks increased their holdings of MGS by RM22.8 billion during this period. The 3-year, 5-year and 10-year MGS yields increased by 19, 23 and 13 basis points, respectively.
The domestic equity market, however, only started to trend lower from May onwards. Along with the global investor risk aversion arising from the external factors, domestic policy uncertainties following the 14th General Election also contributed to the cautious sentiments. Consequently, domestic equities experienced declines as investors waited
13 In 2017, Malaysia’s GDP growth increased to 5.9% from 4.2% in 2016.
14 Unlike the bond market, the equity market continued to experience non-resident inflows in April amounting to USD0.4 billion.
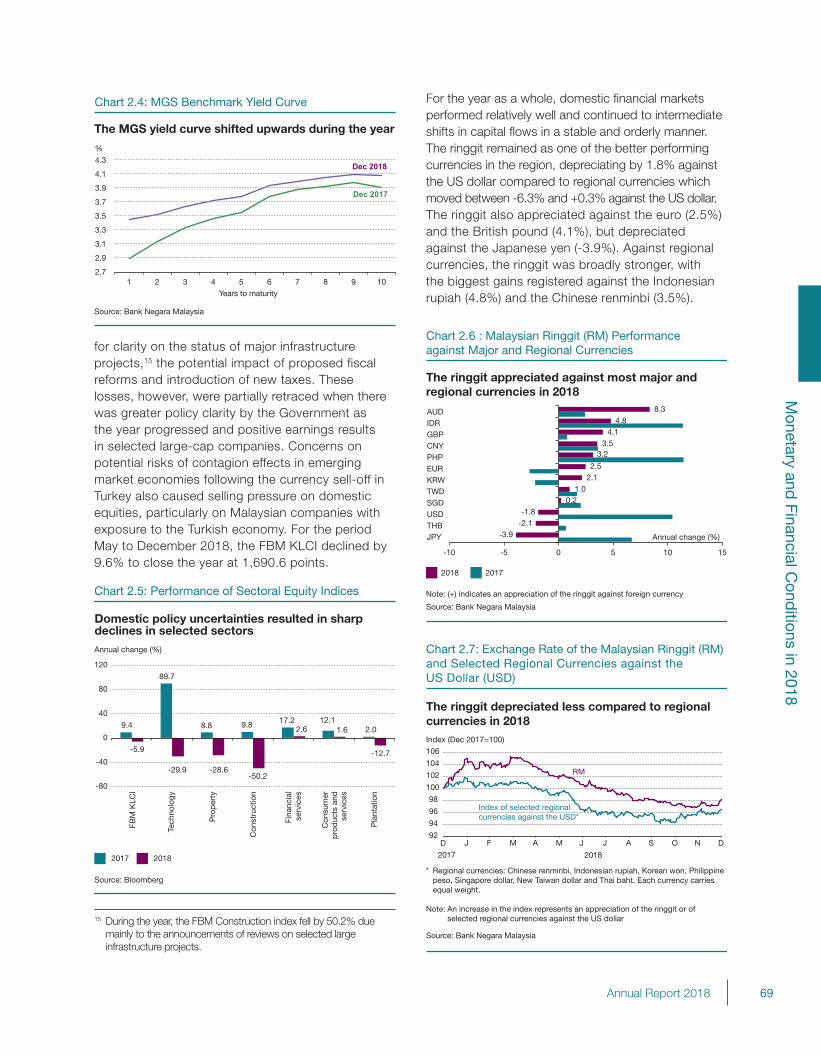
69Annual Report 2018
Monetary and
Financial Cond
itions in 2018
for clarity on the status of major infrastructure projects,15 the potential impact of proposed fiscal reforms and introduction of new taxes. These losses, however, were partially retraced when there was greater policy clarity by the Government as the year progressed and positive earnings results in selected large-cap companies. Concerns on potential risks of contagion effects in emerging market economies following the currency sell-off in Turkey also caused selling pressure on domestic equities, particularly on Malaysian companies with exposure to the Turkish economy. For the period May to December 2018, the FBM KLCI declined by 9.6% to close the year at 1,690.6 points.
For the year as a whole, domestic financial markets performed relatively well and continued to intermediate shifts in capital flows in a stable and orderly manner. The ringgit remained as one of the better performing currencies in the region, depreciating by 1.8% against the US dollar compared to regional currencies which moved between -6.3% and +0.3% against the US dollar. The ringgit also appreciated against the euro (2.5%) and the British pound (4.1%), but depreciated against the Japanese yen (-3.9%). Against regional currencies, the ringgit was broadly stronger, with the biggest gains registered against the Indonesian rupiah (4.8%) and the Chinese renminbi (3.5%).
Chart 2.4: MGS Benchmark Yield Curve
Source: Bank Negara Malaysia
The MGS yield curve shifted upwards during the year
2.7
2.9
3.1
3.3
3.5
3.7
3.9
4.1
4.3
1 2 3 4 5 6 7 8 9 10
%
Dec 2017
Dec 2018
Years to maturity
-3.9-2.1-1.8
0.21.0
2.12.5
3.23.5
4.14.8
8.3
-10 -5 0 5 10 15
JPYTHBUSDSGDTWDKRWEURPHPCNYGBPIDRAUD
2018 2017
Annual change (%)
Source: Bank Negara Malaysia
Note: (+) indicates an appreciation of the ringgit against foreign currency
The ringgit appreciated against most major and regional currencies in 2018
Chart 2.6 : Malaysian Ringgit (RM) Performance against Major and Regional Currencies
Source: Bank Negara Malaysia
* Regional currencies: Chinese renminbi, Indonesian rupiah, Korean won, Philippine peso, Singapore dollar, New Taiwan dollar and Thai baht. Each currency carries equal weight.
Note: An increase in the index represents an appreciation of the ringgit or of selected regional currencies against the US dollar
Chart 2.7: Exchange Rate of the Malaysian Ringgit (RM) and Selected Regional Currencies against theUS Dollar (USD)
The ringgit depreciated less compared to regional currencies in 2018Index (Dec 2017=100)
RM
92
94
96
98
100
102
104
106
D J F M A M J J A S O N D
2017 2018
Index of selected regionalcurrencies against the USD*
Chart 2.5: Performance of Sectoral Equity Indices
Domestic policy uncertainties resulted in sharpdeclines in selected sectors
Source: Bloomberg
9.4
89.7
8.8 9.8 17.2 12.12.0
-5.9
-29.9 -28.6-50.2
2.6 1.6
-12.7
-80
-40
0
40
80
120
Annual change (%)
2017 2018
FBM
KLC
I
Tech
nolo
gy
Pro
per
ty
Con
stru
ctio
n
Fina
ncia
lse
rvic
es
Con
sum
erp
rod
ucts
and
serv
ices
Pla
ntat
ion
15 During the year, the FBM Construction index fell by 50.2% due mainly to the announcements of reviews on selected large infrastructure projects.
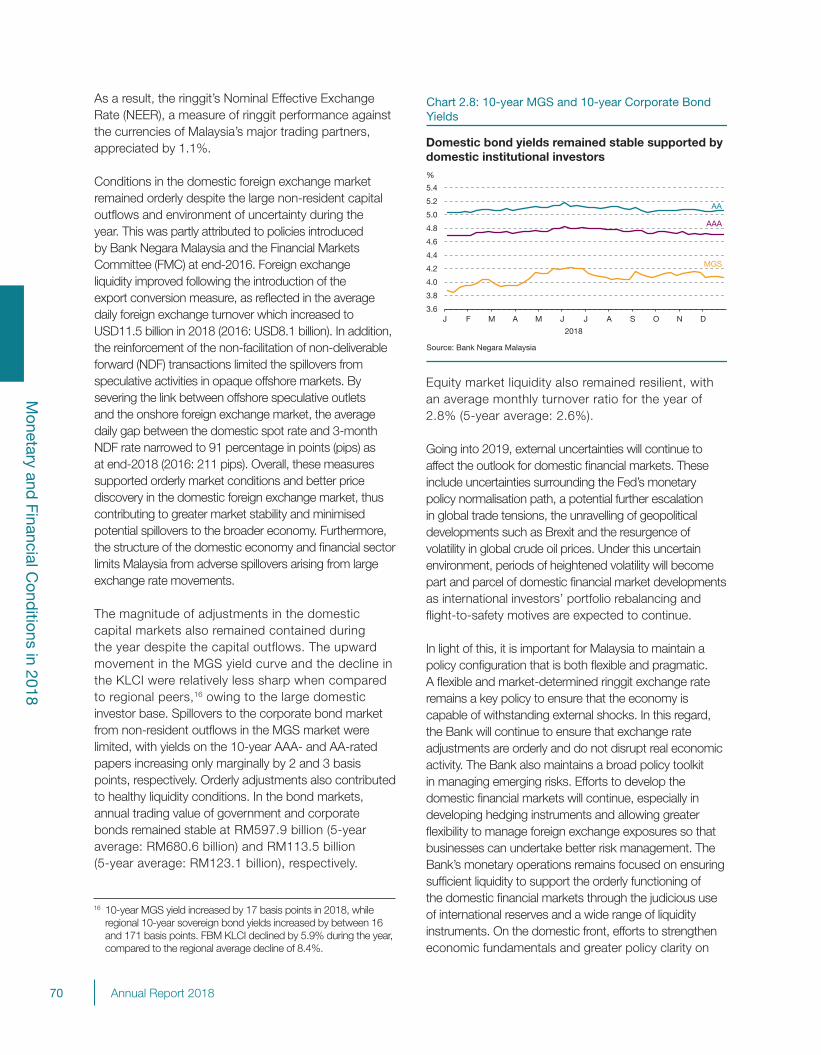
70 Annual Report 2018
Monetary and
Financial Cond
itions in 2018
As a result, the ringgit’s Nominal Effective Exchange Rate (NEER), a measure of ringgit performance against the currencies of Malaysia’s major trading partners, appreciated by 1.1%.
Conditions in the domestic foreign exchange market remained orderly despite the large non-resident capital outflows and environment of uncertainty during the year. This was partly attributed to policies introduced by Bank Negara Malaysia and the Financial Markets Committee (FMC) at end-2016. Foreign exchange liquidity improved following the introduction of the export conversion measure, as reflected in the average daily foreign exchange turnover which increased to USD11.5 billion in 2018 (2016: USD8.1 billion). In addition, the reinforcement of the non-facilitation of non-deliverable forward (NDF) transactions limited the spillovers from speculative activities in opaque offshore markets. By severing the link between offshore speculative outlets and the onshore foreign exchange market, the average daily gap between the domestic spot rate and 3-month NDF rate narrowed to 91 percentage in points (pips) as at end-2018 (2016: 211 pips). Overall, these measures supported orderly market conditions and better price discovery in the domestic foreign exchange market, thus contributing to greater market stability and minimised potential spillovers to the broader economy. Furthermore, the structure of the domestic economy and financial sector limits Malaysia from adverse spillovers arising from large exchange rate movements.
The magnitude of adjustments in the domestic capital markets also remained contained during the year despite the capital outflows. The upward movement in the MGS yield curve and the decline in the KLCI were relatively less sharp when compared to regional peers,16 owing to the large domestic investor base. Spillovers to the corporate bond market from non-resident outflows in the MGS market were limited, with yields on the 10-year AAA- and AA-rated papers increasing only marginally by 2 and 3 basis points, respectively. Orderly adjustments also contributed to healthy liquidity conditions. In the bond markets, annual trading value of government and corporate bonds remained stable at RM597.9 billion (5-year average: RM680.6 billion) and RM113.5 billion (5-year average: RM123.1 billion), respectively.
Equity market liquidity also remained resilient, with an average monthly turnover ratio for the year of 2.8% (5-year average: 2.6%). Going into 2019, external uncertainties will continue to affect the outlook for domestic financial markets. These include uncertainties surrounding the Fed’s monetary policy normalisation path, a potential further escalation in global trade tensions, the unravelling of geopolitical developments such as Brexit and the resurgence of volatility in global crude oil prices. Under this uncertain environment, periods of heightened volatility will become part and parcel of domestic financial market developments as international investors’ portfolio rebalancing and flight-to-safety motives are expected to continue.
In light of this, it is important for Malaysia to maintain a policy configuration that is both flexible and pragmatic. A flexible and market-determined ringgit exchange rate remains a key policy to ensure that the economy is capable of withstanding external shocks. In this regard, the Bank will continue to ensure that exchange rate adjustments are orderly and do not disrupt real economic activity. The Bank also maintains a broad policy toolkit in managing emerging risks. Efforts to develop the domestic financial markets will continue, especially in developing hedging instruments and allowing greater flexibility to manage foreign exchange exposures so that businesses can undertake better risk management. The Bank’s monetary operations remains focused on ensuring sufficient liquidity to support the orderly functioning of the domestic financial markets through the judicious use of international reserves and a wide range of liquidity instruments. On the domestic front, efforts to strengthen economic fundamentals and greater policy clarity on
16 10-year MGS yield increased by 17 basis points in 2018, while regional 10-year sovereign bond yields increased by between 16 and 171 basis points. FBM KLCI declined by 5.9% during the year, compared to the regional average decline of 8.4%.
Chart 2.8: 10-year MGS and 10-year Corporate BondYields
3.6
3.8
4.0
4.2
4.4
4.6
4.8
5.0
5.2
5.4
J F M A M J J A S O N D
%
Source: Bank Negara Malaysia
AAA
MGS
AA
2018
Domestic bond yields remained stable supported bydomestic institutional investors
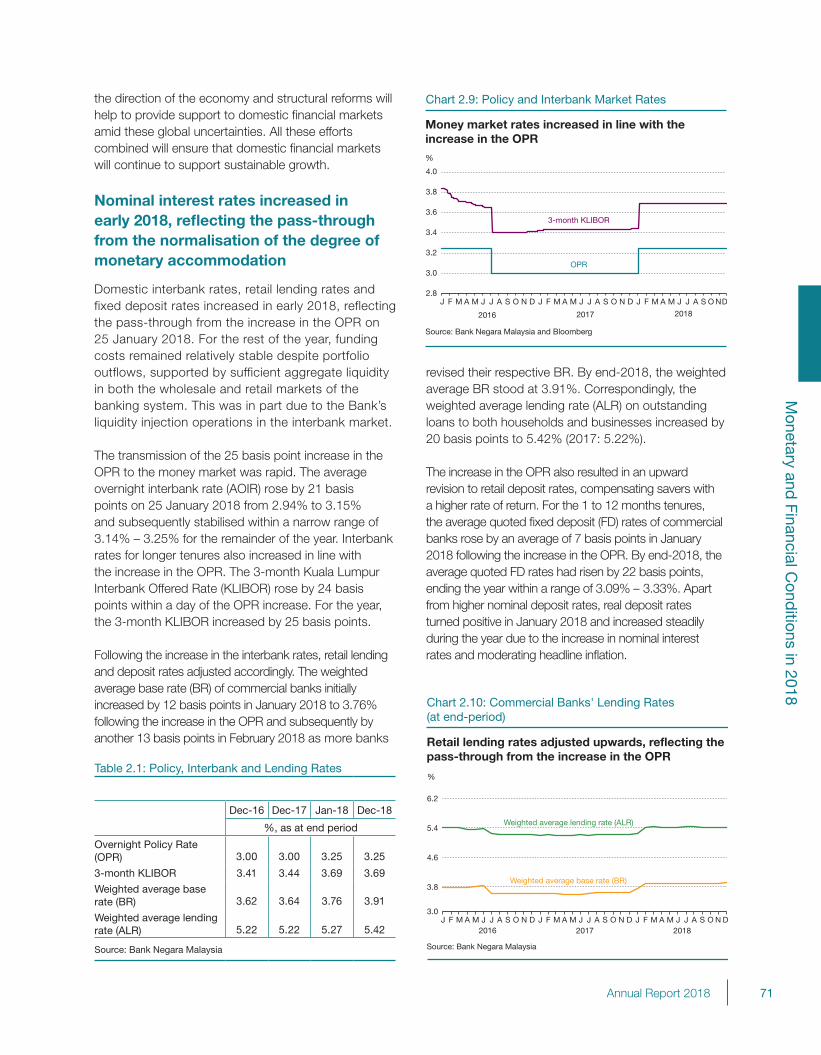
71Annual Report 2018
Monetary and
Financial Cond
itions in 2018
the direction of the economy and structural reforms will help to provide support to domestic financial markets amid these global uncertainties. All these efforts combined will ensure that domestic financial markets will continue to support sustainable growth.
Nominal interest rates increased in early 2018, reflecting the pass-through from the normalisation of the degree of monetary accommodation
Domestic interbank rates, retail lending rates and fixed deposit rates increased in early 2018, reflecting the pass-through from the increase in the OPR on 25 January 2018. For the rest of the year, funding costs remained relatively stable despite portfolio outflows, supported by sufficient aggregate liquidity in both the wholesale and retail markets of the banking system. This was in part due to the Bank’s liquidity injection operations in the interbank market.
The transmission of the 25 basis point increase in the OPR to the money market was rapid. The average overnight interbank rate (AOIR) rose by 21 basis points on 25 January 2018 from 2.94% to 3.15% and subsequently stabilised within a narrow range of 3.14% – 3.25% for the remainder of the year. Interbank rates for longer tenures also increased in line with the increase in the OPR. The 3-month Kuala Lumpur Interbank Offered Rate (KLIBOR) rose by 24 basis points within a day of the OPR increase. For the year, the 3-month KLIBOR increased by 25 basis points.
Following the increase in the interbank rates, retail lending and deposit rates adjusted accordingly. The weighted average base rate (BR) of commercial banks initially increased by 12 basis points in January 2018 to 3.76% following the increase in the OPR and subsequently by another 13 basis points in February 2018 as more banks
revised their respective BR. By end-2018, the weighted average BR stood at 3.91%. Correspondingly, the weighted average lending rate (ALR) on outstanding loans to both households and businesses increased by 20 basis points to 5.42% (2017: 5.22%).
The increase in the OPR also resulted in an upward revision to retail deposit rates, compensating savers with a higher rate of return. For the 1 to 12 months tenures, the average quoted fixed deposit (FD) rates of commercial banks rose by an average of 7 basis points in January 2018 following the increase in the OPR. By end-2018, the average quoted FD rates had risen by 22 basis points, ending the year within a range of 3.09% – 3.33%. Apart from higher nominal deposit rates, real deposit rates turned positive in January 2018 and increased steadily during the year due to the increase in nominal interest rates and moderating headline inflation.
Table 2.1: Policy, Interbank and Lending Rates
Dec-16 Dec-17 Jan-18 Dec-18
%, as at end period
Overnight Policy Rate (OPR) 3.00 3.00 3.25 3.25
3-month KLIBOR 3.41 3.44 3.69 3.69
Weighted average base rate (BR) 3.62 3.64 3.76 3.91
Weighted average lending rate (ALR) 5.22 5.22 5.27 5.42
Source: Bank Negara Malaysia
Chart 2.9: Policy and Interbank Market Rates
Money market rates increased in line with the increase in the OPR
Source: Bank Negara Malaysia and Bloomberg
2.8
3.0
3.2
3.4
3.6
3.8
4.0
J F M A M J J A S O N D J F M A M J J A S O N D J F M A M J J A S O ND
%
OPR
2016 2017 2018
3-month KLIBOR
Chart 2.10: Commercial Banks' Lending Rates(at end-period)
Source: Bank Negara Malaysia
3.0
3.8
4.6
5.4
6.2
J F M A M J J A S O N D J F M A M J J A S O N D J F M A M J J A S O N D
%
Weighted average lending rate (ALR)
2017 2018
Weighted average base rate (BR)
2016
Retail lending rates adjusted upwards, reflecting thepass-through from the increase in the OPR
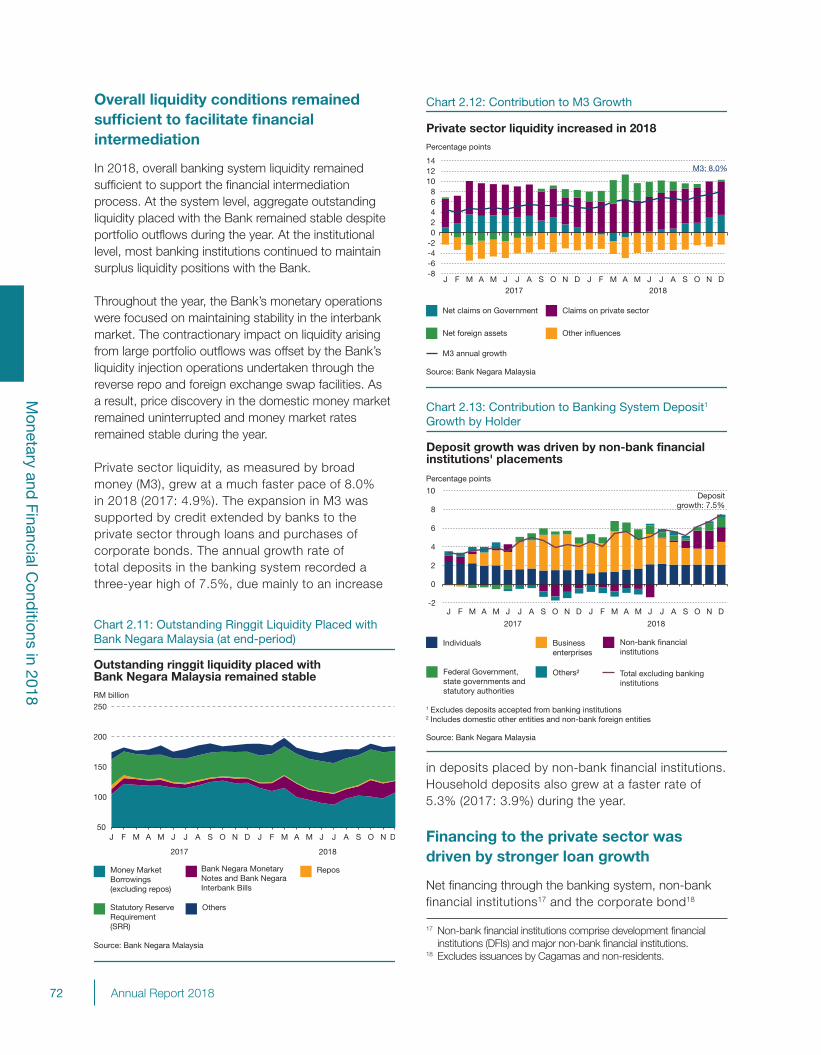
72 Annual Report 2018
Monetary and
Financial Cond
itions in 2018
Overall liquidity conditions remained sufficient to facilitate financial intermediation
In 2018, overall banking system liquidity remained sufficient to support the financial intermediation process. At the system level, aggregate outstanding liquidity placed with the Bank remained stable despite portfolio outflows during the year. At the institutional level, most banking institutions continued to maintain surplus liquidity positions with the Bank.
Throughout the year, the Bank’s monetary operations were focused on maintaining stability in the interbank market. The contractionary impact on liquidity arising from large portfolio outflows was offset by the Bank’s liquidity injection operations undertaken through the reverse repo and foreign exchange swap facilities. As a result, price discovery in the domestic money market remained uninterrupted and money market rates remained stable during the year.
Private sector liquidity, as measured by broad money (M3), grew at a much faster pace of 8.0% in 2018 (2017: 4.9%). The expansion in M3 was supported by credit extended by banks to the private sector through loans and purchases of corporate bonds. The annual growth rate of total deposits in the banking system recorded a three-year high of 7.5%, due mainly to an increase
in deposits placed by non-bank financial institutions. Household deposits also grew at a faster rate of 5.3% (2017: 3.9%) during the year.
Financing to the private sector was driven by stronger loan growth
Net financing through the banking system, non-bank financial institutions17 and the corporate bond18
Chart 2.11: Outstanding Ringgit Liquidity Placed withBank Negara Malaysia (at end-period)
Outstanding ringgit liquidity placed withBank Negara Malaysia remained stable
Source: Bank Negara Malaysia
50
100
150
200
250
J F M A M J J A S O N D J F M A M J J A S O N D
RM billion
OthersStatutory Reserve Requirement (SRR)
ReposMoney Market Borrowings (excluding repos)
2017 2018
Bank Negara Monetary Notes and Bank Negara Interbank Bills
Chart 2.12: Contribution to M3 Growth
Private sector liquidity increased in 2018
Source: Bank Negara Malaysia
-8-6-4-202468
101214
J F M A M J J A S O N D J F M A M J J A S O N D
Net claims on Government Claims on private sector
Net foreign assets Other influences
M3 annual growth
20182017
Percentage points
M3: 8.0%
Chart 2.13: Contribution to Banking System Deposit1
Growth by Holder
Deposit growth was driven by non-bank financial institutions' placements
-2
0
2
4
6
8
10
J F M A M J J A S O N D J F M A M J J A S O N D
Others²Federal Government, state governments and statutory authorities
Non-bank financial institutions
Individuals Business enterprises
Percentage points
D
Source: Bank Negara Malaysia
1 Excludes deposits accepted from banking institutions2 Includes domestic other entities and non-bank foreign entities
2017 2018
Depositgrowth: 7.5%
Total excluding banking institutions
17 Non-bank financial institutions comprise development financial institutions (DFIs) and major non-bank financial institutions.
18 Excludes issuances by Cagamas and non-residents.
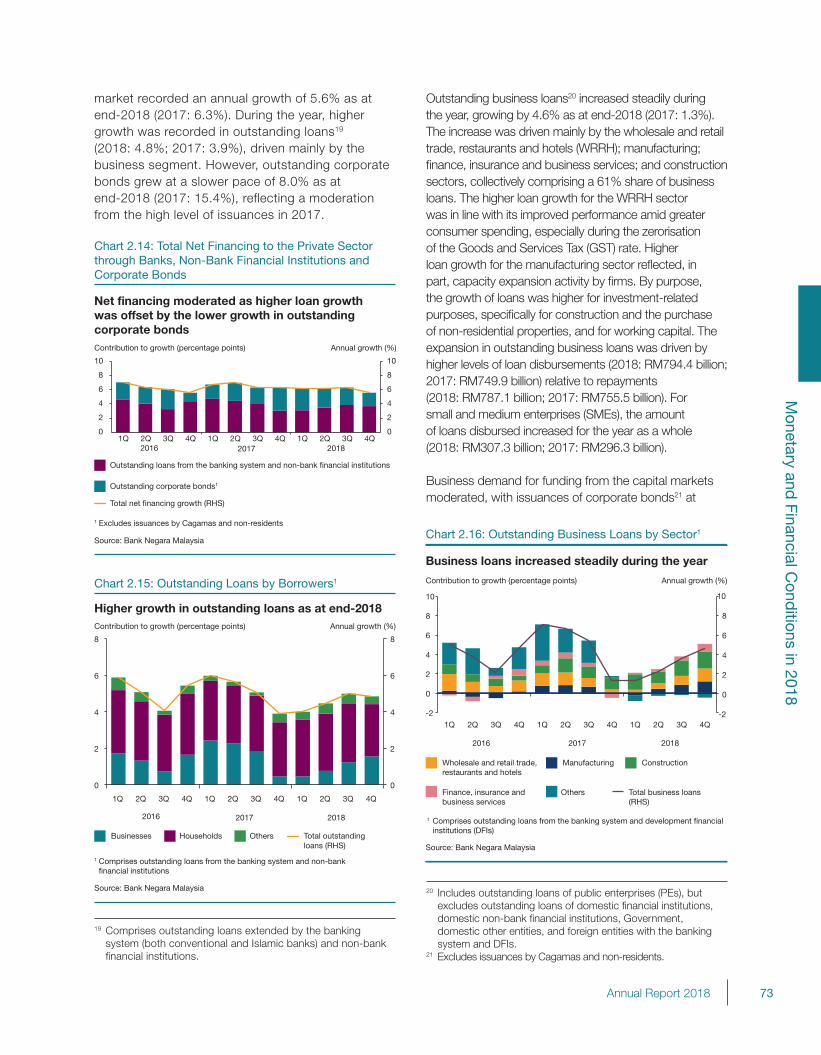
73Annual Report 2018
Monetary and
Financial Cond
itions in 2018
market recorded an annual growth of 5.6% as at end-2018 (2017: 6.3%). During the year, higher growth was recorded in outstanding loans19 (2018: 4.8%; 2017: 3.9%), driven mainly by the business segment. However, outstanding corporate bonds grew at a slower pace of 8.0% as at end-2018 (2017: 15.4%), reflecting a moderation from the high level of issuances in 2017.
19 Comprises outstanding loans extended by the banking system (both conventional and Islamic banks) and non-bank financial institutions.
Net financing moderated as higher loan growthwas offset by the lower growth in outstandingcorporate bonds
Outstanding corporate bonds1
Total net financing growth (RHS)
Source: Bank Negara Malaysia
Chart 2.14: Total Net Financing to the Private Sectorthrough Banks, Non-Bank Financial Institutions andCorporate Bonds
1 Excludes issuances by Cagamas and non-residents
Outstanding loans from the banking system and non-bank financial institutions
0
2
4
6
8
10
0
2
4
6
8
10
1Q 2Q 3Q 4Q 1Q 2Q 3Q 4Q 1Q 2Q 3Q 4Q2016 2017 2018
Contribution to growth (percentage points) Annual growth (%)
Higher growth in outstanding loans as at end-2018Contribution to growth (percentage points) Annual growth (%)
Source: Bank Negara Malaysia
Chart 2.15: Outstanding Loans by Borrowers1
Businesses Households Others
0
2
4
6
8
0
2
4
6
8
1Q 2Q 3Q 4Q 1Q 2Q 3Q 4Q 1Q 2Q 3Q 4Q
2016 2017 2018
1 Comprises outstanding loans from the banking system and non-bank financial institutions
Total outstanding loans (RHS)
Business loans increased steadily during the year
Chart 2.16: Outstanding Business Loans by Sector1
1Q 2Q 3Q 4Q 1Q 2Q 3Q 4Q 1Q 2Q 3Q 4Q
Contribution to growth (percentage points)
Source: Bank Negara Malaysia
Annual growth (%)
1 Comprises outstanding loans from the banking system and development financial institutions (DFIs)
Finance, insurance andbusiness services
Construction
Others
Wholesale and retail trade,restaurants and hotels
Manufacturing
Total business loans(RHS)
2016 2017 2018
-2
0
2
4
6
8
10
-2
0
2
4
6
8
10
20 Includes outstanding loans of public enterprises (PEs), but excludes outstanding loans of domestic financial institutions, domestic non-bank financial institutions, Government, domestic other entities, and foreign entities with the banking system and DFIs.
21 Excludes issuances by Cagamas and non-residents.
Outstanding business loans20 increased steadily during the year, growing by 4.6% as at end-2018 (2017: 1.3%). The increase was driven mainly by the wholesale and retail trade, restaurants and hotels (WRRH); manufacturing; finance, insurance and business services; and construction sectors, collectively comprising a 61% share of business loans. The higher loan growth for the WRRH sector was in line with its improved performance amid greater consumer spending, especially during the zerorisation of the Goods and Services Tax (GST) rate. Higher loan growth for the manufacturing sector reflected, in part, capacity expansion activity by firms. By purpose, the growth of loans was higher for investment-related purposes, specifically for construction and the purchase of non-residential properties, and for working capital. The expansion in outstanding business loans was driven by higher levels of loan disbursements (2018: RM794.4 billion; 2017: RM749.9 billion) relative to repayments (2018: RM787.1 billion; 2017: RM755.5 billion). For small and medium enterprises (SMEs), the amount of loans disbursed increased for the year as a whole (2018: RM307.3 billion; 2017: RM296.3 billion).
Business demand for funding from the capital markets moderated, with issuances of corporate bonds21 at
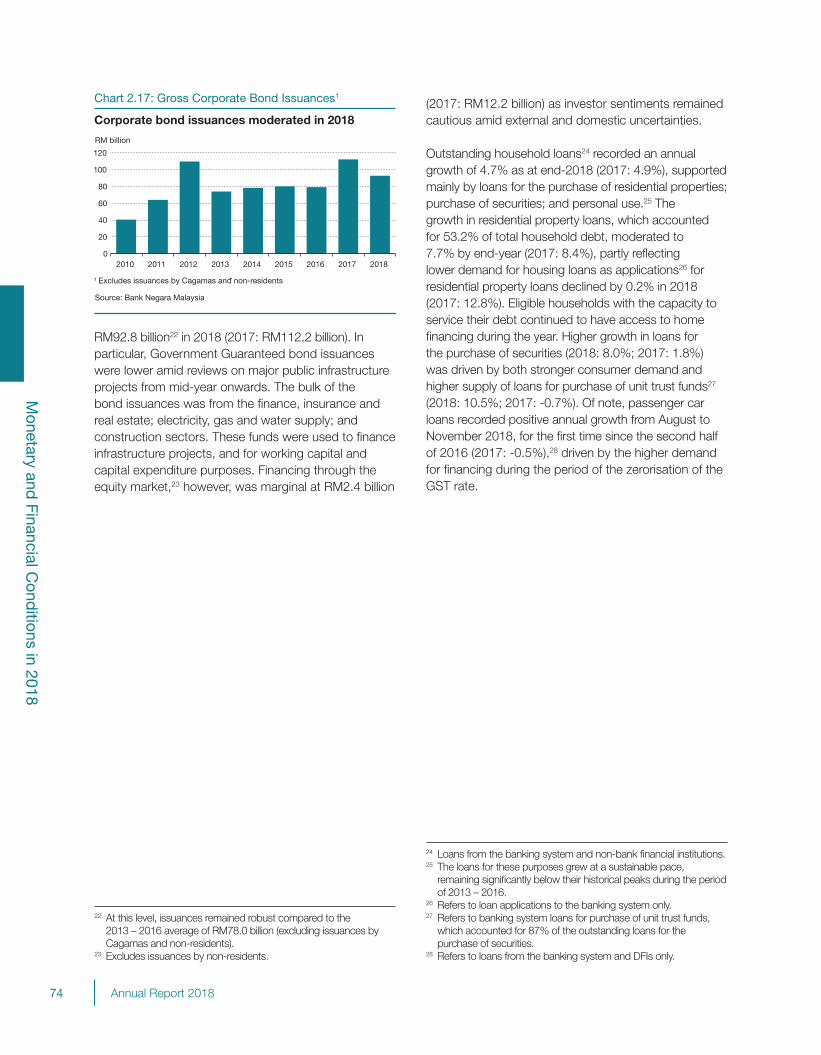
74 Annual Report 2018
Monetary and
Financial Cond
itions in 2018
RM92.8 billion22 in 2018 (2017: RM112.2 billion). In particular, Government Guaranteed bond issuances were lower amid reviews on major public infrastructure projects from mid-year onwards. The bulk of the bond issuances was from the finance, insurance and real estate; electricity, gas and water supply; and construction sectors. These funds were used to finance infrastructure projects, and for working capital and capital expenditure purposes. Financing through the equity market,23 however, was marginal at RM2.4 billion
(2017: RM12.2 billion) as investor sentiments remained cautious amid external and domestic uncertainties.
Outstanding household loans24 recorded an annual growth of 4.7% as at end-2018 (2017: 4.9%), supported mainly by loans for the purchase of residential properties; purchase of securities; and personal use.25 The growth in residential property loans, which accounted for 53.2% of total household debt, moderated to 7.7% by end-year (2017: 8.4%), partly reflecting lower demand for housing loans as applications26 for residential property loans declined by 0.2% in 2018 (2017: 12.8%). Eligible households with the capacity to service their debt continued to have access to home financing during the year. Higher growth in loans for the purchase of securities (2018: 8.0%; 2017: 1.8%) was driven by both stronger consumer demand and higher supply of loans for purchase of unit trust funds27 (2018: 10.5%; 2017: -0.7%). Of note, passenger car loans recorded positive annual growth from August to November 2018, for the first time since the second half of 2016 (2017: -0.5%),28 driven by the higher demand for financing during the period of the zerorisation of the GST rate.
24 Loans from the banking system and non-bank financial institutions.25 The loans for these purposes grew at a sustainable pace,
remaining significantly below their historical peaks during the period of 2013 – 2016.
26 Refers to loan applications to the banking system only.27 Refers to banking system loans for purchase of unit trust funds,
which accounted for 87% of the outstanding loans for the purchase of securities.
28 Refers to loans from the banking system and DFIs only.
Chart 2.17: Gross Corporate Bond Issuances1
Source: Bank Negara Malaysia
0
20
40
60
80
100
120
2010 2011 2012 2013 2014 2015 2016 2017 2018
Corporate bond issuances moderated in 2018
1 -Excludes issuances by Cagamas and non-residents
RM billion
22 At this level, issuances remained robust compared to the 2013 – 2016 average of RM78.0 billion (excluding issuances by Cagamas and non-residents).
23 Excludes issuances by non-residents.
75Annual Report 2018
Monetary P
olicy in 2018
Monetary Policy in 2018
77 Monetary Policy and Monetary Operations

76 Annual Report 2018
Monetary P
olicy in 2018
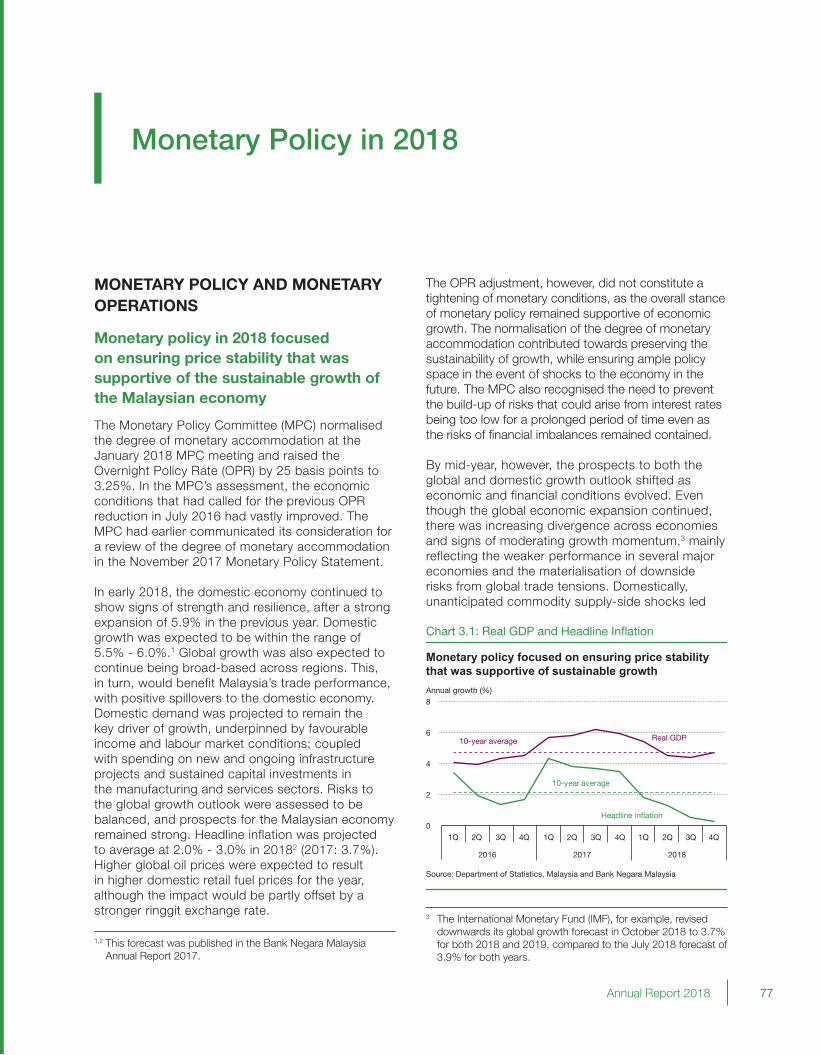
77Annual Report 2018
Monetary Policy in 2018
MONETARY POLICY AND MONETARY OPERATIONS
Monetary policy in 2018 focused on ensuring price stability that was supportive of the sustainable growth of the Malaysian economy
The Monetary Policy Committee (MPC) normalised the degree of monetary accommodation at the January 2018 MPC meeting and raised the Overnight Policy Rate (OPR) by 25 basis points to 3.25%. In the MPC’s assessment, the economic conditions that had called for the previous OPR reduction in July 2016 had vastly improved. The MPC had earlier communicated its consideration for a review of the degree of monetary accommodation in the November 2017 Monetary Policy Statement.
In early 2018, the domestic economy continued to show signs of strength and resilience, after a strong expansion of 5.9% in the previous year. Domestic growth was expected to be within the range of 5.5% - 6.0%.1 Global growth was also expected to continue being broad-based across regions. This, in turn, would benefit Malaysia’s trade performance, with positive spillovers to the domestic economy. Domestic demand was projected to remain the key driver of growth, underpinned by favourable income and labour market conditions; coupled with spending on new and ongoing infrastructure projects and sustained capital investments in the manufacturing and services sectors. Risks to the global growth outlook were assessed to be balanced, and prospects for the Malaysian economy remained strong. Headline inflation was projected to average at 2.0% - 3.0% in 20182 (2017: 3.7%). Higher global oil prices were expected to result in higher domestic retail fuel prices for the year, although the impact would be partly offset by a stronger ringgit exchange rate.
The OPR adjustment, however, did not constitute a tightening of monetary conditions, as the overall stance of monetary policy remained supportive of economic growth. The normalisation of the degree of monetary accommodation contributed towards preserving the sustainability of growth, while ensuring ample policy space in the event of shocks to the economy in the future. The MPC also recognised the need to prevent the build-up of risks that could arise from interest rates being too low for a prolonged period of time even as the risks of financial imbalances remained contained.
By mid-year, however, the prospects to both the global and domestic growth outlook shifted as economic and financial conditions evolved. Even though the global economic expansion continued, there was increasing divergence across economies and signs of moderating growth momentum,3 mainly reflecting the weaker performance in several major economies and the materialisation of downside risks from global trade tensions. Domestically, unanticipated commodity supply-side shocks led
1,2 This forecast was published in the Bank Negara Malaysia Annual Report 2017.
3 The International Monetary Fund (IMF), for example, revised downwards its global growth forecast in October 2018 to 3.7% for both 2018 and 2019, compared to the July 2018 forecast of 3.9% for both years.
Real GDP
0
2
4
6
8
1Q 2Q 3Q 4Q 1Q 2Q 3Q 4Q 1Q 2Q 3Q 4Q
2016 2017 2018
Chart 3.1: Real GDP and Headline Inflation
Annual growth (%)
Monetary policy focused on ensuring price stability that was supportive of sustainable growth
Source: Department of Statistics, Malaysia and Bank Negara Malaysia
10-year average
Headline inflation
10-year average
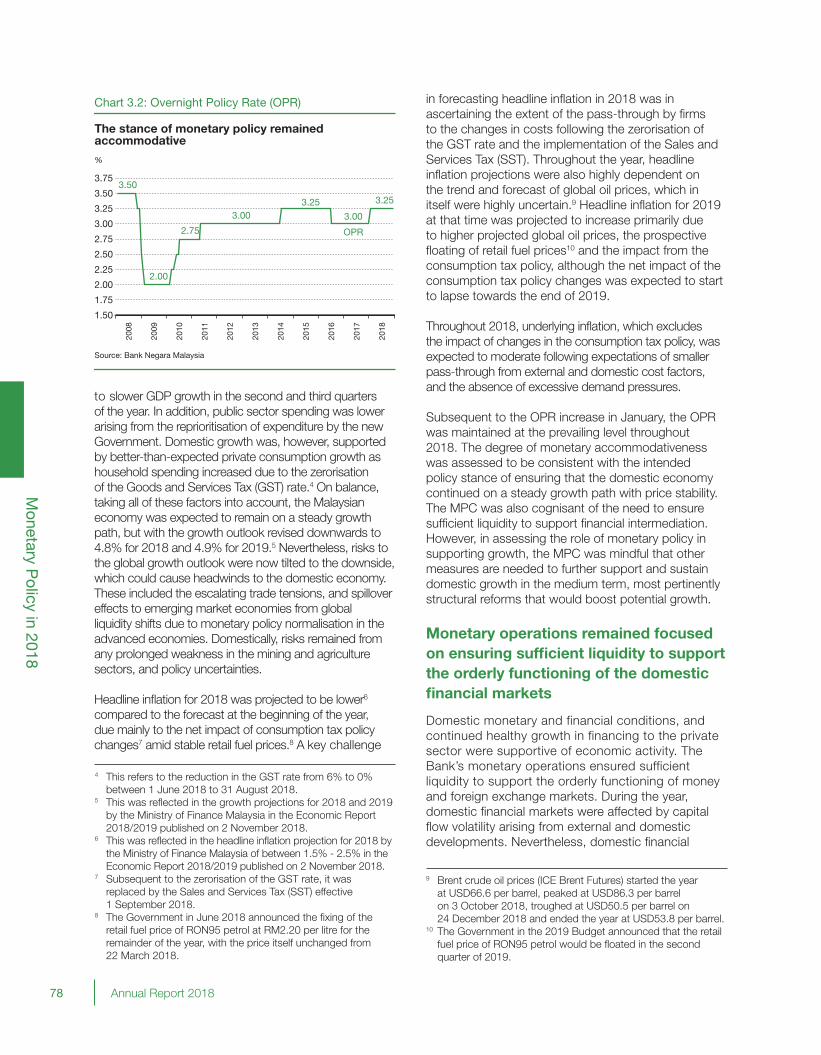
78 Annual Report 2018
Monetary P
olicy in 2018
to slower GDP growth in the second and third quarters of the year. In addition, public sector spending was lower arising from the reprioritisation of expenditure by the new Government. Domestic growth was, however, supported by better-than-expected private consumption growth as household spending increased due to the zerorisation of the Goods and Services Tax (GST) rate.4 On balance, taking all of these factors into account, the Malaysian economy was expected to remain on a steady growth path, but with the growth outlook revised downwards to 4.8% for 2018 and 4.9% for 2019.5 Nevertheless, risks to the global growth outlook were now tilted to the downside, which could cause headwinds to the domestic economy. These included the escalating trade tensions, and spillover effects to emerging market economies from global liquidity shifts due to monetary policy normalisation in the advanced economies. Domestically, risks remained from any prolonged weakness in the mining and agriculture sectors, and policy uncertainties.
Headline inflation for 2018 was projected to be lower6 compared to the forecast at the beginning of the year, due mainly to the net impact of consumption tax policy changes7 amid stable retail fuel prices.8 A key challenge
4 This refers to the reduction in the GST rate from 6% to 0% between 1 June 2018 to 31 August 2018.
5 This was reflected in the growth projections for 2018 and 2019 by the Ministry of Finance Malaysia in the Economic Report 2018/2019 published on 2 November 2018.
6 This was reflected in the headline inflation projection for 2018 by the Ministry of Finance Malaysia of between 1.5% - 2.5% in the Economic Report 2018/2019 published on 2 November 2018.
7 Subsequent to the zerorisation of the GST rate, it was replaced by the Sales and Services Tax (SST) effective 1 September 2018.
8 The Government in June 2018 announced the fixing of the retail fuel price of RON95 petrol at RM2.20 per litre for the remainder of the year, with the price itself unchanged from 22 March 2018.
Chart 3.2: Overnight Policy Rate (OPR)
The stance of monetary policy remained accommodative
Source: Bank Negara Malaysia
3.50
2.00
2.75
3.003.25
3.00
3.25
1.50
1.75
2.00
2.25
2.50
2.75
3.00
3.25
3.50
3.75
2008
2009
2010
2011
2012
2013
2014
2015
2016
2017
2018
%
OPR
in forecasting headline inflation in 2018 was in ascertaining the extent of the pass-through by firms to the changes in costs following the zerorisation of the GST rate and the implementation of the Sales and Services Tax (SST). Throughout the year, headline inflation projections were also highly dependent on the trend and forecast of global oil prices, which in itself were highly uncertain.9 Headline inflation for 2019 at that time was projected to increase primarily due to higher projected global oil prices, the prospective floating of retail fuel prices10 and the impact from the consumption tax policy, although the net impact of the consumption tax policy changes was expected to start to lapse towards the end of 2019.
Throughout 2018, underlying inflation, which excludes the impact of changes in the consumption tax policy, was expected to moderate following expectations of smaller pass-through from external and domestic cost factors, and the absence of excessive demand pressures.
Subsequent to the OPR increase in January, the OPR was maintained at the prevailing level throughout 2018. The degree of monetary accommodativeness was assessed to be consistent with the intended policy stance of ensuring that the domestic economy continued on a steady growth path with price stability. The MPC was also cognisant of the need to ensure sufficient liquidity to support financial intermediation. However, in assessing the role of monetary policy in supporting growth, the MPC was mindful that other measures are needed to further support and sustain domestic growth in the medium term, most pertinently structural reforms that would boost potential growth.
Monetary operations remained focused on ensuring sufficient liquidity to support the orderly functioning of the domestic financial markets
Domestic monetary and financial conditions, and continued healthy growth in financing to the private sector were supportive of economic activity. The Bank’s monetary operations ensured sufficient liquidity to support the orderly functioning of money and foreign exchange markets. During the year, domestic financial markets were affected by capital flow volatility arising from external and domestic developments. Nevertheless, domestic financial
9 Brent crude oil prices (ICE Brent Futures) started the year at USD66.6 per barrel, peaked at USD86.3 per barrel on 3 October 2018, troughed at USD50.5 per barrel on 24 December 2018 and ended the year at USD53.8 per barrel.
10 The Government in the 2019 Budget announced that the retail fuel price of RON95 petrol would be floated in the second quarter of 2019.
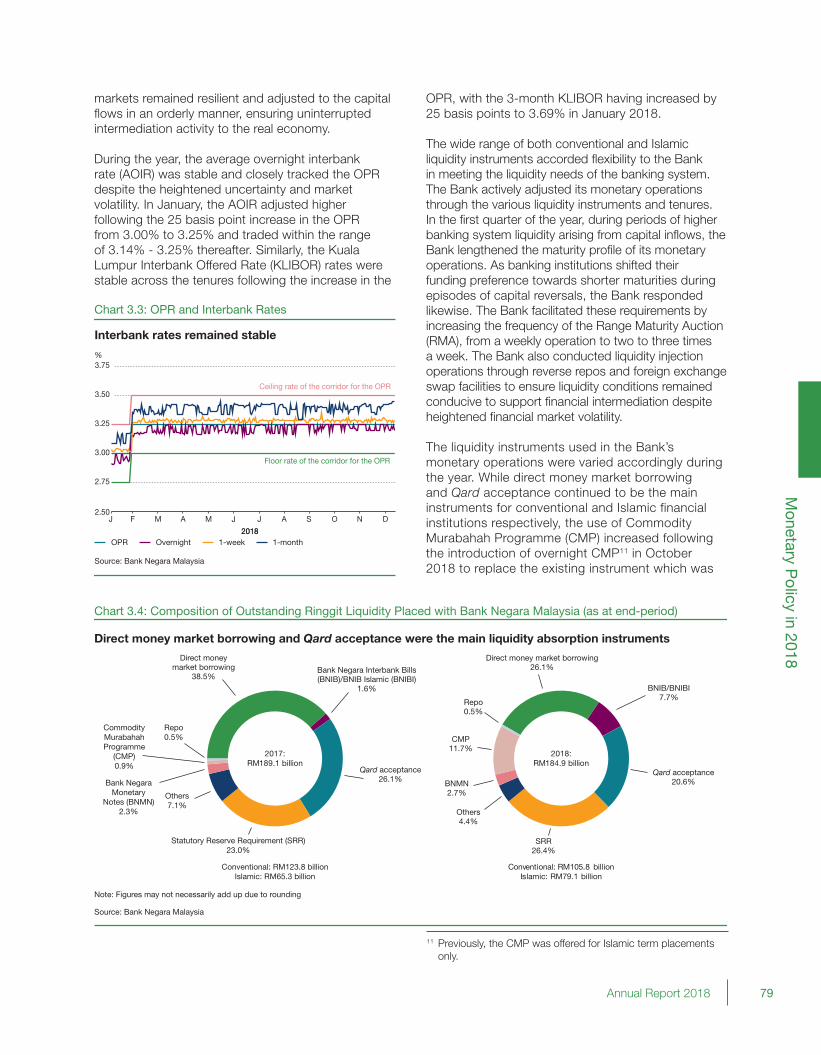
79Annual Report 2018
Monetary P
olicy in 2018
markets remained resilient and adjusted to the capital flows in an orderly manner, ensuring uninterrupted intermediation activity to the real economy.
During the year, the average overnight interbank rate (AOIR) was stable and closely tracked the OPR despite the heightened uncertainty and market volatility. In January, the AOIR adjusted higher following the 25 basis point increase in the OPR from 3.00% to 3.25% and traded within the range of 3.14% - 3.25% thereafter. Similarly, the Kuala Lumpur Interbank Offered Rate (KLIBOR) rates were stable across the tenures following the increase in the
OPR, with the 3-month KLIBOR having increased by 25 basis points to 3.69% in January 2018.
The wide range of both conventional and Islamic liquidity instruments accorded flexibility to the Bank in meeting the liquidity needs of the banking system. The Bank actively adjusted its monetary operations through the various liquidity instruments and tenures. In the first quarter of the year, during periods of higher banking system liquidity arising from capital inflows, the Bank lengthened the maturity profile of its monetary operations. As banking institutions shifted their funding preference towards shorter maturities during episodes of capital reversals, the Bank responded likewise. The Bank facilitated these requirements by increasing the frequency of the Range Maturity Auction (RMA), from a weekly operation to two to three times a week. The Bank also conducted liquidity injection operations through reverse repos and foreign exchange swap facilities to ensure liquidity conditions remained conducive to support financial intermediation despite heightened financial market volatility.
The liquidity instruments used in the Bank’s monetary operations were varied accordingly during the year. While direct money market borrowing and Qard acceptance continued to be the main instruments for conventional and Islamic financial institutions respectively, the use of Commodity Murabahah Programme (CMP) increased following the introduction of overnight CMP11 in October 2018 to replace the existing instrument which was
Chart 3.3: OPR and Interbank Rates
Interbank rates remained stable
Source: Bank Negara Malaysia
2.50
2.75
3.00
3.25
3.50
3.75%
OPR Overnight 1-week 1-month2018
Ceiling rate of the corridor for the OPR
Floor rate of the corridor for the OPR
2018
J F M A M J J A S NO D
Chart 3.4: Composition of Outstanding Ringgit Liquidity Placed with Bank Negara Malaysia (as at end-period)
Direct money market borrowing and Qard acceptance were the main liquidity absorption instruments
Direct moneymarket borrowing
38.5%Bank Negara Interbank Bills (BNIB)/BNIB Islamic (BNIBI)
1.6% BNIB/BNIBI7.7%
Qard acceptance20.6%
Direct money market borrowing26.1%
Repo0.5%
CMP11.7%
BNMN2.7%
Others4.4%
SRR26.4%
Qard acceptance26.1%
Others7.1%
Repo0.5%
Bank NegaraMonetary
Notes (BNMN)2.3%
Commodity Murabahah Programme
(CMP)0.9%
Statutory Reserve Requirement (SRR)23.0%
2017:RM189.1 billion
Conventional: RM123.8 billionIslamic: RM65.3 billion
Conventional: RM105.8 billionIslamic: RM79.1 billion
2018:RM184.9 billion
Note: Figures may not necessarily add up due to rounding
Source: Bank Negara Malaysia
11 Previously, the CMP was offered for Islamic term placements only.
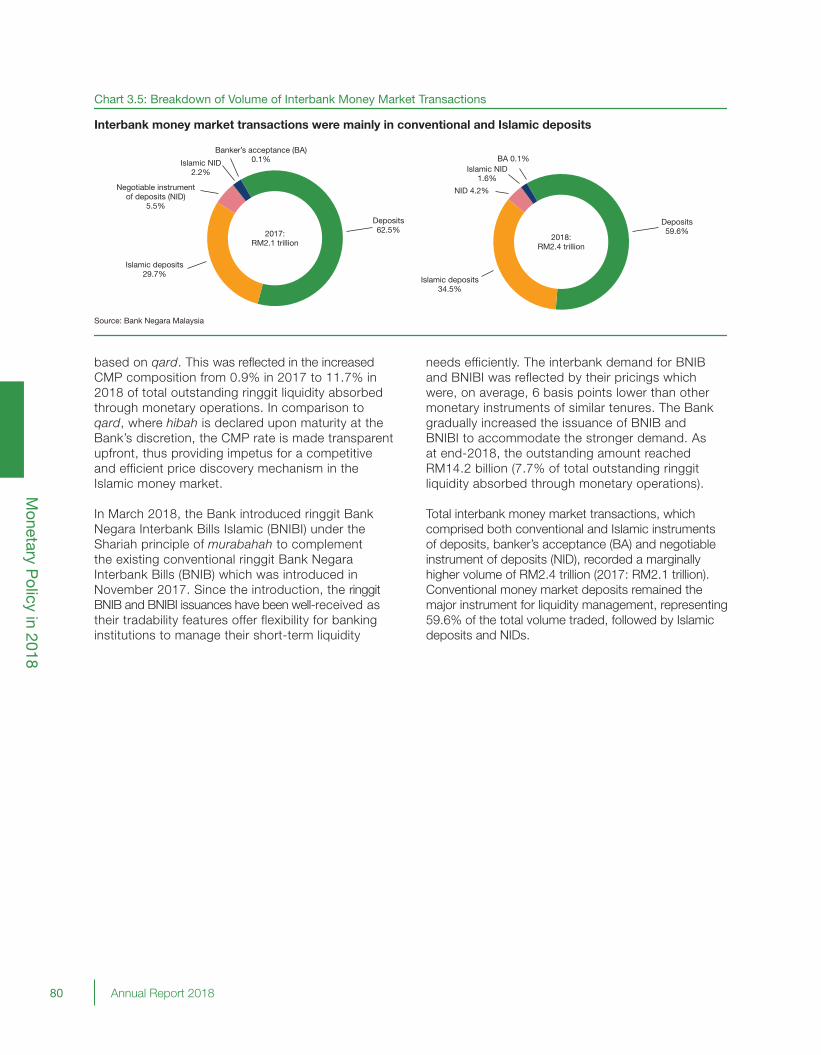
80 Annual Report 2018
Monetary P
olicy in 2018
Chart 3.5: Breakdown of Volume of Interbank Money Market Transactions
Interbank money market transactions were mainly in conventional and Islamic deposits
2017:RM2.1 trillion
2018:RM2.4 trillion
Source: Bank Negara Malaysia
Banker’s acceptance (BA) 0.1% BA 0.1%
Deposits62.5%
Deposits59.6%
Islamic NID 2.2% Islamic NID
1.6%Negotiable instrument
of deposits (NID)5.5%
NID 4.2%
Islamic deposits29.7%
Islamic deposits34.5%
based on qard. This was reflected in the increased CMP composition from 0.9% in 2017 to 11.7% in 2018 of total outstanding ringgit liquidity absorbed through monetary operations. In comparison to qard, where hibah is declared upon maturity at the Bank’s discretion, the CMP rate is made transparent upfront, thus providing impetus for a competitive and efficient price discovery mechanism in the Islamic money market.
In March 2018, the Bank introduced ringgit Bank Negara Interbank Bills Islamic (BNIBI) under the Shariah principle of murabahah to complement the existing conventional ringgit Bank Negara Interbank Bills (BNIB) which was introduced in November 2017. Since the introduction, the ringgit BNIB and BNIBI issuances have been well-received as their tradability features offer flexibility for banking institutions to manage their short-term liquidity
needs efficiently. The interbank demand for BNIB and BNIBI was reflected by their pricings which were, on average, 6 basis points lower than other monetary instruments of similar tenures. The Bank gradually increased the issuance of BNIB and BNIBI to accommodate the stronger demand. As at end-2018, the outstanding amount reached RM14.2 billion (7.7% of total outstanding ringgit liquidity absorbed through monetary operations).
Total interbank money market transactions, which comprised both conventional and Islamic instruments of deposits, banker’s acceptance (BA) and negotiable instrument of deposits (NID), recorded a marginally higher volume of RM2.4 trillion (2017: RM2.1 trillion). Conventional money market deposits remained the major instrument for liquidity management, representing 59.6% of the total volume traded, followed by Islamic deposits and NIDs.
81Annual Report 2018
Outlook and
Policy in 2019
Outlook and Policy in 2019
83 The International Economic Outlook83 The Malaysian Economy88 External Sector89 Inflation Outlook 90 Monetary Policy90 Fiscal Policy93 Box Article: When the Future Starts Today: Inflation Expectations of Malaysian Households

82 Annual Report 2018
Outlook and
Policy in 2019
83
Outlook and Policy in 2019
THE INTERNATIONAL ECONOMIC OUTLOOK
In 2019, the global economy is projected to moderate towards its long-term trend, characterised by slower growth in both advanced and major emerging economies. In the advanced economies, labour market strength will continue to support domestic demand, and improvements among selected emerging markets such as Brazil and India will provide some impetus to global growth. Nevertheless, uncertainty is likely to remain elevated, given the persistence of key risks, notably from global trade disputes, political uncertainty and sudden shifts in investor sentiment. These risks will pose headwinds to growth.
Global economy to expand moderately in 2019
In the advanced economies, economic activity is projected to moderate in 2019. Labour market conditions remain mixed. While unemployment rates in the United States and euro area are hovering at 50-year and decade lows respectively, wage growth has remained modest. Nevertheless, in the low inflation environment, this will support consumer confidence and household spending. Moderating investments and external demand will affect overall growth. In the US, fiscal policy will provide less support, while the accumulated effects of gradual monetary policy normalisation are expected to have an impact on economic activity. In the United Kingdom, the prolonged uncertainty surrounding Brexit developments will likely affect both consumer spending and investment decisions. In PR China, ongoing structural reforms to rebalance the economy are leading to slower, but more sustainable growth. Trade disputes, if unresolved, are expected to further dampen business sentiment in PR China. Proactive counter-cyclical monetary and fiscal policy interventions should help forestall the risk of a sharp slowdown in growth. In other Asian economies,
growth will likely moderate despite stable domestic demand, as exports react to the slowdown in the advanced economies and PR China.
Lower crude oil prices will reduce the energy import bill and pressure on inflation, which will support higher spending especially in net oil importing economies. Some economies will benefit from country-specific tailwinds. In India, the negative effects from past domestic policy adjustments (e.g. demonetisation and GST implementation) will continue to fade, while Brazil continues on a gradual recovery since 2017.
Despite the projected growth, prospects for the global economy will be contingent upon the outcome of several key risk factors. Central banks in major advanced economies are adopting a more patient and cautious approach to monetary policy normalisation given the uncertain growth prospects. Global trade developments will remain a key factor affecting the 2019 outlook. Beyond the economic impact of higher trade tariffs, prolonged policy uncertainty could adversely affect investment decisions and thus, longer-term productivity growth. In this environment, investor uncertainty will remain elevated and financial markets will likely experience bouts of volatility. This poses further risks of greater volatility in capital flows to emerging market economies. The overall balance of risks to the global growth outlook is tilted to the downside.
THE MALAYSIAN ECONOMY
Against the backdrop of a challenging global environment, the Malaysian economy is expected to sustain its growth momentum, expanding by 4.3% – 4.8% in 2019 (2018: 4.7%). The external sector is expected to register a more moderate expansion in tandem with the moderation in global growth. Private sector activity will remain the anchor of growth amid continued rationalisation in the public sector. Labour market conditions are
Annual Report 2018
84 Annual Report 2018
Outlook and
Policy in 2019
expected to remain supportive of growth, while inflation is projected to be broadly stable compared to 2018.
The Malaysian economy is projected to grow by 4.3% – 4.8% in 2019
Growth will be supported by the gradual recovery from the unanticipated commodity disruptions in 2018, which will also benefit the manufacturing sector and trade activity. In addition, output from new manufacturing production facilities that will begin operating in 2019 will lend further support to growth. These facilities include large oil refinery and petrochemical facilities, as well as E&E, chemicals and rubber plants. On the demand side, private sector spending will continue to drive growth. Following the lapse of one-off factors in 2018, private consumption growth is expected to moderate, but remain firm. Household spending will benefit from continued employment and income growth. Employers surveys indicate that salary increments are expected to be sustained between 4.9% – 5.2%1 in 2019 while the unemployment rate is projected to remain relatively unchanged (3.3% – 3.5%; 2018: 3.4%). Policy measures such as the price ceiling on retail fuel prices, minimum wage adjustment and targeted cash transfers will lend further support to household expenditure. The normalisation of destocking activities by firms will serve as an additional support to growth in 2019. This is partly due to firms readjusting their inventories after the strong demand during the tax holiday period in 2018, which led to firms drawing down from their inventories. In addition, E&E firms which had large stock drawdown towards
the end of 2018 in anticipation of weak demand, are less likely to have another significant drawdown in their inventories.
The growth projection is subject to several downside risks, mainly from the global environment. Unresolved trade tensions between the US and PR China, and a slower-than-expected global growth will affect Malaysia primarily via the trade and investment channel. The uncertain pace of the monetary policy normalisation in the US could heighten financial market volatility across emerging market economies, leading to volatile two-way capital flows and currency fluctuations. Volatility in the global oil price could also affect export performance and mining sector investment. On the domestic front, a re-occurrence of the commodity supply disruption, partly from unanticipated weather patterns, could affect the recovery in the mining and agriculture sectors. In addition, the oversupply situation in the property market could dampen activity in the construction sector.
The strong fundamentals and the diversified nature of the economy will help Malaysia weather these risks and vulnerabilities while preserving macroeconomic and financial stability. These include a healthy labour market, stable inflation rate, continued surplus in the current account of the balance of payments, deep financial markets, as well as a strong financial sector. Exchange rate flexibility and sufficient level of international reserves further enhance the economy’s capability to withstand external shocks. Moreover, commitment by the Government to fiscal, structural and institutional reforms will contribute to inclusive and sustainable growth going forward.
1 Based on Malaysian Employers Federation Salary Survey, as well as Korn Ferry’s and Mercer’s Total Remuneration Surveys.
Domestic Demand to Continue to be the Key Driver of Growth
Domestic demand will remain the anchor of growth in 2019, underpinned by continued expansion in private sector activity. Public sector expenditure, however, is expected to weigh on growth amid the completion of large-scale projects by public corporations and continued reprioritisation of government spending. The external sector is projected to register a more moderate growth in line with modest global growth and trade activity.
Private consumption is projected to expand by 6.6% in 2019. After recording a strong growth in 2018, household spending is expected to normalise closer to its long term average of 6.7%.1 Although consumer sentiments have moderated from the recent peak, growth will remain firm supported by key fundamental drivers, namely stable labour market conditions and continued wage growth. The implementation of several government measures, particularly in alleviating rising cost of living, is expected to lend further support to
1 The long term average of 6.7% refers to the period from 1990 to 2018.
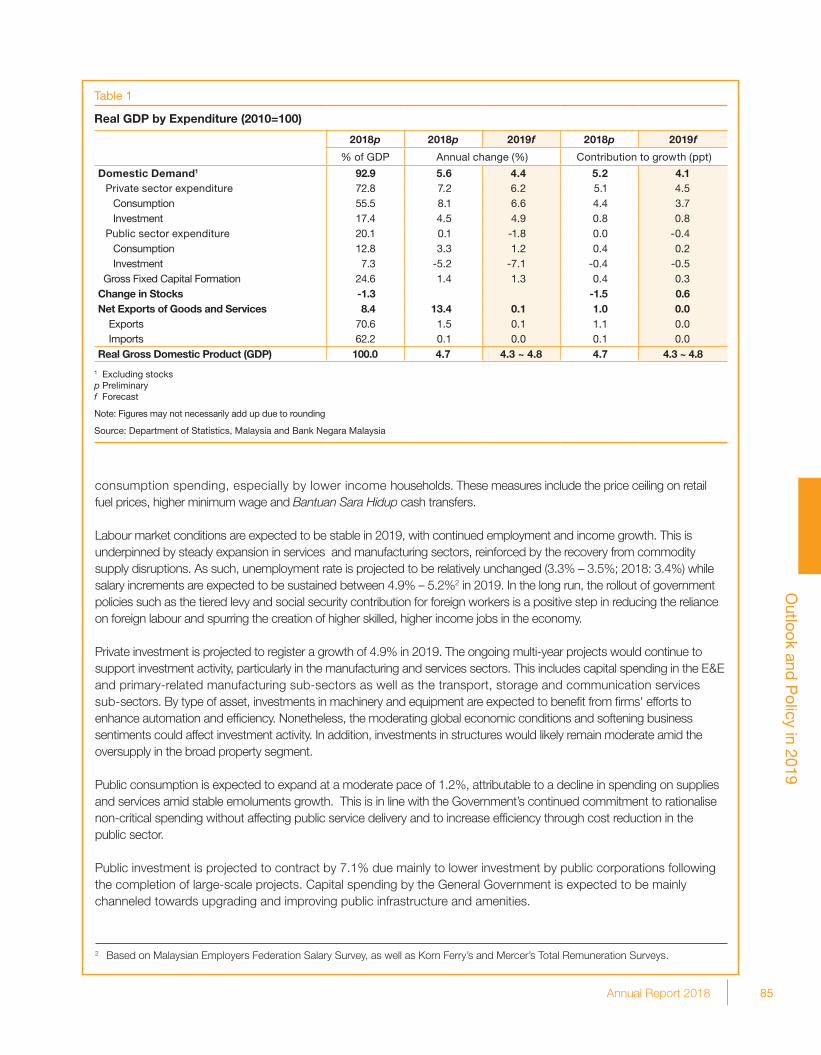
85Annual Report 2018
Outlook and
Policy in 2019
consumption spending, especially by lower income households. These measures include the price ceiling on retail fuel prices, higher minimum wage and Bantuan Sara Hidup cash transfers.
Labour market conditions are expected to be stable in 2019, with continued employment and income growth. This is underpinned by steady expansion in services and manufacturing sectors, reinforced by the recovery from commodity supply disruptions. As such, unemployment rate is projected to be relatively unchanged (3.3% – 3.5%; 2018: 3.4%) while salary increments are expected to be sustained between 4.9% – 5.2%2 in 2019. In the long run, the rollout of government policies such as the tiered levy and social security contribution for foreign workers is a positive step in reducing the reliance on foreign labour and spurring the creation of higher skilled, higher income jobs in the economy.
Private investment is projected to register a growth of 4.9% in 2019. The ongoing multi-year projects would continue to support investment activity, particularly in the manufacturing and services sectors. This includes capital spending in the E&E and primary-related manufacturing sub-sectors as well as the transport, storage and communication services sub-sectors. By type of asset, investments in machinery and equipment are expected to benefit from firms' efforts to enhance automation and efficiency. Nonetheless, the moderating global economic conditions and softening business sentiments could affect investment activity. In addition, investments in structures would likely remain moderate amid the oversupply in the broad property segment.
Public consumption is expected to expand at a moderate pace of 1.2%, attributable to a decline in spending on supplies and services amid stable emoluments growth. This is in line with the Government’s continued commitment to rationalise non-critical spending without affecting public service delivery and to increase efficiency through cost reduction in the public sector.
Public investment is projected to contract by 7.1% due mainly to lower investment by public corporations following the completion of large-scale projects. Capital spending by the General Government is expected to be mainly channeled towards upgrading and improving public infrastructure and amenities.
Table 1
Real GDP by Expenditure (2010=100)
2018p 2018p 2019f 2018p 2019f
% of GDP Annual change (%) Contribution to growth (ppt)
Domestic Demand1 92.9 5.6 4.4 5.2 4.1 Private sector expenditure 72.8 7.2 6.2 5.1 4.5 Consumption 55.5 8.1 6.6 4.4 3.7 Investment 17.4 4.5 4.9 0.8 0.8 Public sector expenditure 20.1 0.1 -1.8 0.0 -0.4 Consumption 12.8 3.3 1.2 0.4 0.2 Investment 7.3 -5.2 -7.1 -0.4 -0.5 Gross Fixed Capital Formation 24.6 1.4 1.3 0.4 0.3Change in Stocks -1.3 -1.5 0.6Net Exports of Goods and Services 8.4 13.4 0.1 1.0 0.0 Exports 70.6 1.5 0.1 1.1 0.0 Imports 62.2 0.1 0.0 0.1 0.0Real Gross Domestic Product (GDP) 100.0 4.7 4.3 ~ 4.8 4.7 4.3 ~ 4.8
1 Excluding stocksp Preliminaryf Forecast
Note: Figures may not necessarily add up due to rounding
Source: Department of Statistics, Malaysia and Bank Negara Malaysia
2 Based on Malaysian Employers Federation Salary Survey, as well as Korn Ferry’s and Mercer’s Total Remuneration Surveys.
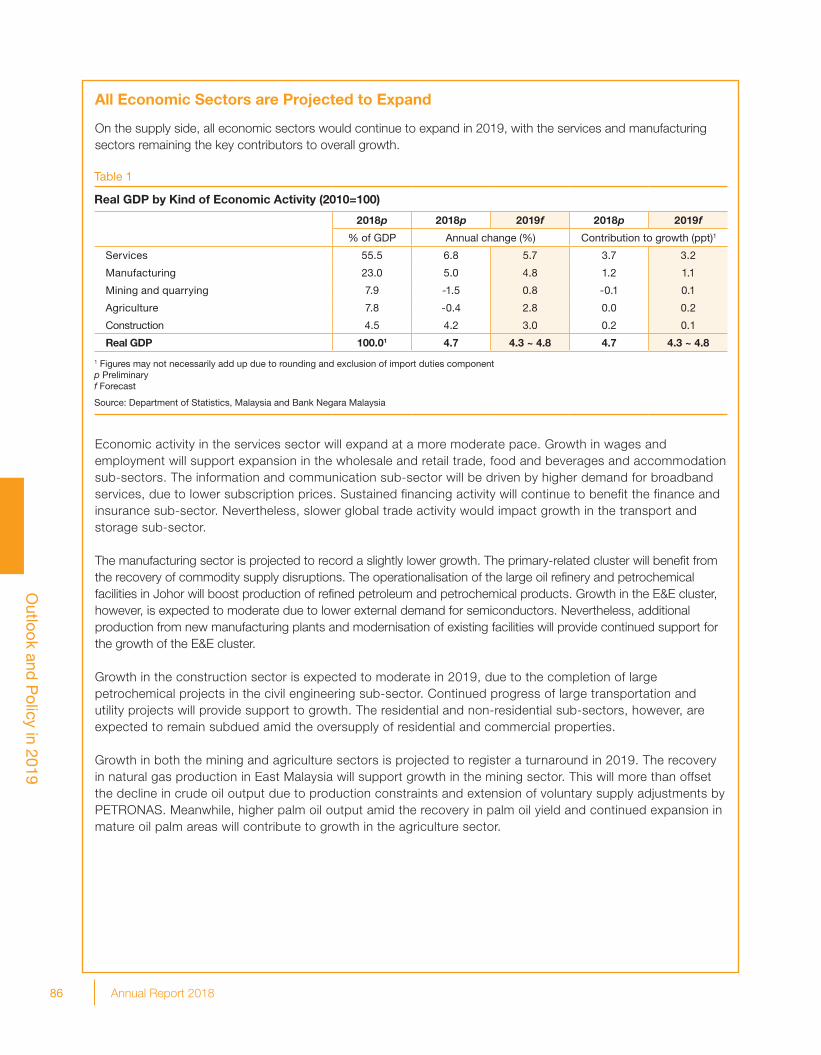
86 Annual Report 2018
Outlook and
Policy in 2019
All Economic Sectors are Projected to Expand
On the supply side, all economic sectors would continue to expand in 2019, with the services and manufacturing sectors remaining the key contributors to overall growth.
Economic activity in the services sector will expand at a more moderate pace. Growth in wages and employment will support expansion in the wholesale and retail trade, food and beverages and accommodation sub-sectors. The information and communication sub-sector will be driven by higher demand for broadband services, due to lower subscription prices. Sustained financing activity will continue to benefit the finance and insurance sub-sector. Nevertheless, slower global trade activity would impact growth in the transport and storage sub-sector.
The manufacturing sector is projected to record a slightly lower growth. The primary-related cluster will benefit from the recovery of commodity supply disruptions. The operationalisation of the large oil refinery and petrochemical facilities in Johor will boost production of refined petroleum and petrochemical products. Growth in the E&E cluster, however, is expected to moderate due to lower external demand for semiconductors. Nevertheless, additional production from new manufacturing plants and modernisation of existing facilities will provide continued support for the growth of the E&E cluster.
Growth in the construction sector is expected to moderate in 2019, due to the completion of large petrochemical projects in the civil engineering sub-sector. Continued progress of large transportation and utility projects will provide support to growth. The residential and non-residential sub-sectors, however, are expected to remain subdued amid the oversupply of residential and commercial properties.
Growth in both the mining and agriculture sectors is projected to register a turnaround in 2019. The recovery in natural gas production in East Malaysia will support growth in the mining sector. This will more than offset the decline in crude oil output due to production constraints and extension of voluntary supply adjustments by PETRONAS. Meanwhile, higher palm oil output amid the recovery in palm oil yield and continued expansion in mature oil palm areas will contribute to growth in the agriculture sector.
Table 1
Real GDP by Kind of Economic Activity (2010=100)
2018p 2018p 2019f 2018p 2019f
% of GDP Annual change (%) Contribution to growth (ppt)1
Services 55.5 6.8 5.7 3.7 3.2
Manufacturing 23.0 5.0 4.8 1.2 1.1
Mining and quarrying 7.9 -1.5 0.8 -0.1 0.1
Agriculture 7.8 -0.4 2.8 0.0 0.2
Construction 4.5 4.2 3.0 0.2 0.1
Real GDP 100.01 4.7 4.3 ~ 4.8 4.7 4.3 ~ 4.8
1 Figures may not necessarily add up due to rounding and exclusion of import duties component p Preliminary f Forecast Source: Department of Statistics, Malaysia and Bank Negara Malaysia
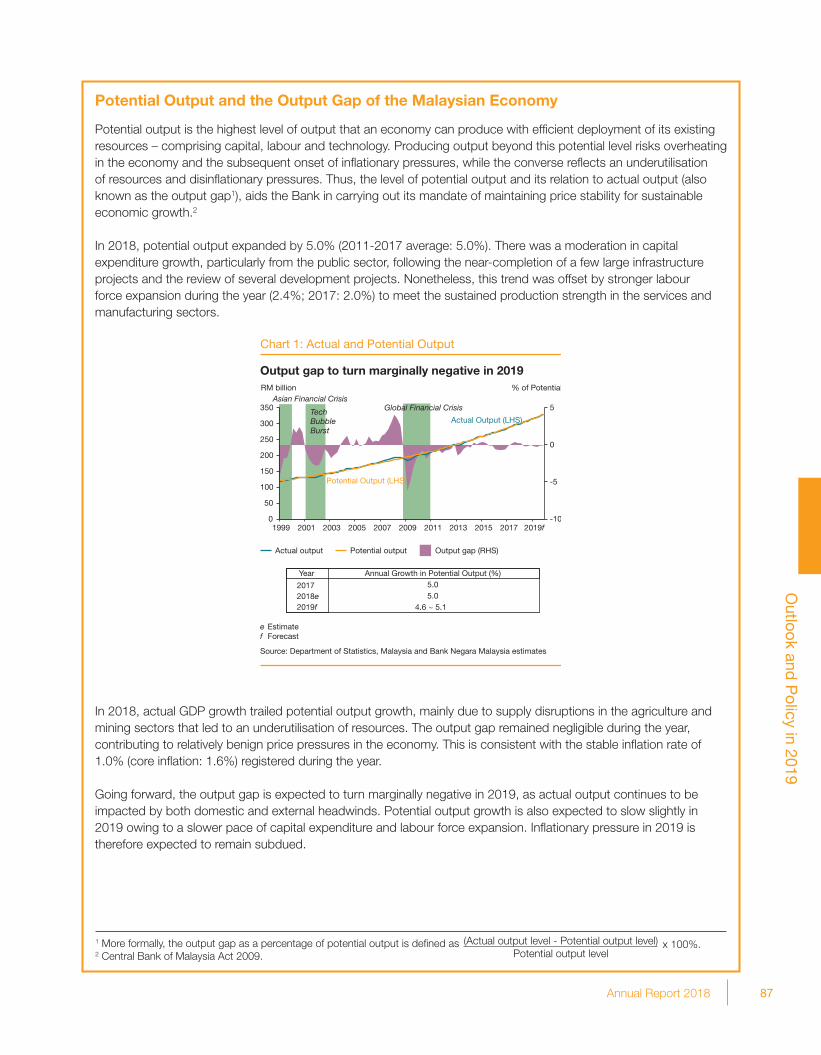
87Annual Report 2018
Outlook and
Policy in 2019
Potential Output and the Output Gap of the Malaysian Economy
Potential output is the highest level of output that an economy can produce with efficient deployment of its existing resources – comprising capital, labour and technology. Producing output beyond this potential level risks overheating in the economy and the subsequent onset of inflationary pressures, while the converse reflects an underutilisation of resources and disinflationary pressures. Thus, the level of potential output and its relation to actual output (also known as the output gap1), aids the Bank in carrying out its mandate of maintaining price stability for sustainable economic growth.2
In 2018, potential output expanded by 5.0% (2011-2017 average: 5.0%). There was a moderation in capital expenditure growth, particularly from the public sector, following the near-completion of a few large infrastructure projects and the review of several development projects. Nonetheless, this trend was offset by stronger labour force expansion during the year (2.4%; 2017: 2.0%) to meet the sustained production strength in the services and manufacturing sectors.
In 2018, actual GDP growth trailed potential output growth, mainly due to supply disruptions in the agriculture and mining sectors that led to an underutilisation of resources. The output gap remained negligible during the year, contributing to relatively benign price pressures in the economy. This is consistent with the stable inflation rate of 1.0% (core inflation: 1.6%) registered during the year.
Going forward, the output gap is expected to turn marginally negative in 2019, as actual output continues to be impacted by both domestic and external headwinds. Potential output growth is also expected to slow slightly in 2019 owing to a slower pace of capital expenditure and labour force expansion. Inflationary pressure in 2019 is therefore expected to remain subdued.
Chart 1: Actual and Potential Output
-10
-5
0
5
0
50
100
150
200
250
300
350
1999 2001 2003 2005 2007 2009 2011 2013 2015 2017 2019f
RM billion % of PotentialAsian Financial Crisis
Global Financial CrisisTechBubbleBurst
Potential Output (LHS)
Actual Output (LHS)
Output gap (RHS)
Year
20172018e2019f
Annual Growth in Potential Output (%)5.05.0
4.6 ~ 5.1
Actual output Potential output
Output gap to turn marginally negative in 2019
e Estimatef Forecast
Source: Department of Statistics, Malaysia and Bank Negara Malaysia estimates
1 More formally, the output gap as a percentage of potential output is defined as2 Central Bank of Malaysia Act 2009.
x 100%.(Actual output level - Potential output level)Potential output level
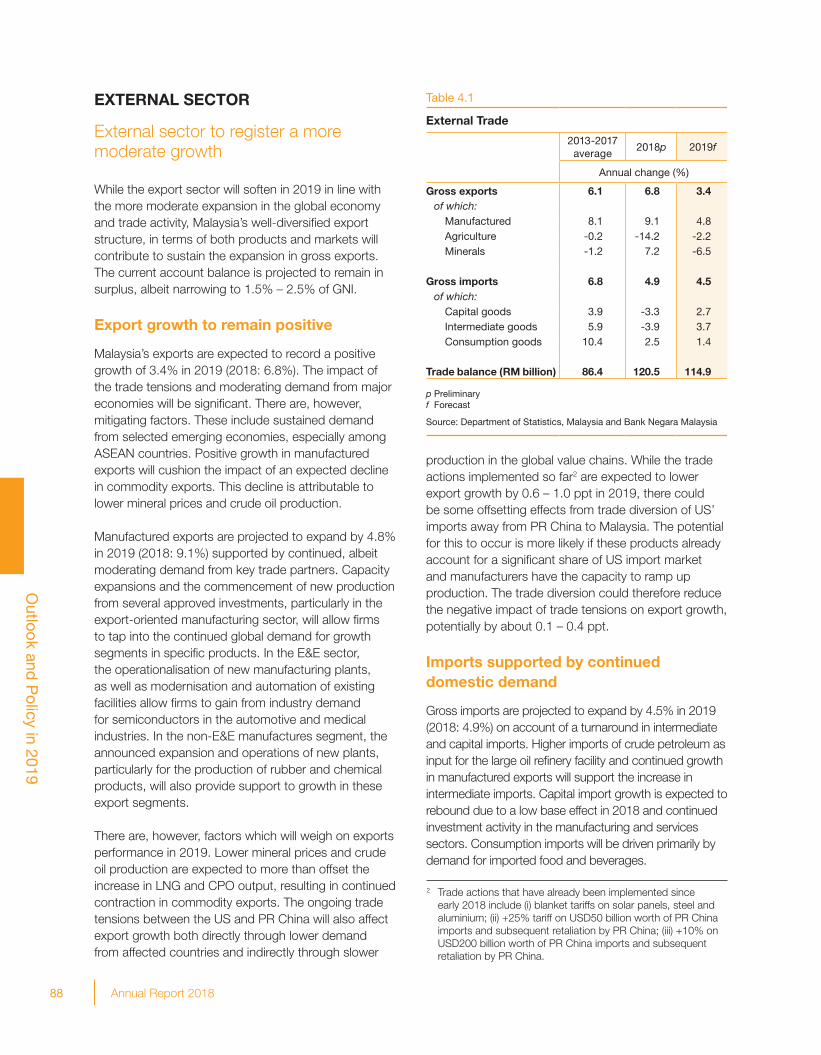
88 Annual Report 2018
Outlook and
Policy in 2019
EXTERNAL SECTOR
External sector to register a more moderate growth
While the export sector will soften in 2019 in line with the more moderate expansion in the global economy and trade activity, Malaysia’s well-diversified export structure, in terms of both products and markets will contribute to sustain the expansion in gross exports. The current account balance is projected to remain in surplus, albeit narrowing to 1.5% – 2.5% of GNI.
Export growth to remain positive
Malaysia’s exports are expected to record a positive growth of 3.4% in 2019 (2018: 6.8%). The impact of the trade tensions and moderating demand from major economies will be significant. There are, however, mitigating factors. These include sustained demand from selected emerging economies, especially among ASEAN countries. Positive growth in manufactured exports will cushion the impact of an expected decline in commodity exports. This decline is attributable to lower mineral prices and crude oil production.
Manufactured exports are projected to expand by 4.8% in 2019 (2018: 9.1%) supported by continued, albeit moderating demand from key trade partners. Capacity expansions and the commencement of new production from several approved investments, particularly in the export-oriented manufacturing sector, will allow firms to tap into the continued global demand for growth segments in specific products. In the E&E sector, the operationalisation of new manufacturing plants, as well as modernisation and automation of existing facilities allow firms to gain from industry demand for semiconductors in the automotive and medical industries. In the non-E&E manufactures segment, the announced expansion and operations of new plants, particularly for the production of rubber and chemical products, will also provide support to growth in these export segments.
There are, however, factors which will weigh on exports performance in 2019. Lower mineral prices and crude oil production are expected to more than offset the increase in LNG and CPO output, resulting in continued contraction in commodity exports. The ongoing trade tensions between the US and PR China will also affect export growth both directly through lower demand from affected countries and indirectly through slower
production in the global value chains. While the trade actions implemented so far2 are expected to lower export growth by 0.6 – 1.0 ppt in 2019, there could be some offsetting effects from trade diversion of US’ imports away from PR China to Malaysia. The potential for this to occur is more likely if these products already account for a significant share of US import market and manufacturers have the capacity to ramp up production. The trade diversion could therefore reduce the negative impact of trade tensions on export growth, potentially by about 0.1 – 0.4 ppt.
Imports supported by continued domestic demand
Gross imports are projected to expand by 4.5% in 2019 (2018: 4.9%) on account of a turnaround in intermediate and capital imports. Higher imports of crude petroleum as input for the large oil refinery facility and continued growth in manufactured exports will support the increase in intermediate imports. Capital import growth is expected to rebound due to a low base effect in 2018 and continued investment activity in the manufacturing and services sectors. Consumption imports will be driven primarily by demand for imported food and beverages.
Table 4.1
External Trade
2013-2017 average
2018p 2019f
Annual change (%)
Gross exports 6.1 6.8 3.4 of which: Manufactured 8.1 9.1 4.8 Agriculture -0.2 -14.2 -2.2 Minerals -1.2 7.2 -6.5
Gross imports 6.8 4.9 4.5 of which: Capital goods 3.9 -3.3 2.7 Intermediate goods 5.9 -3.9 3.7 Consumption goods 10.4 2.5 1.4
Trade balance (RM billion) 86.4 120.5 114.9
p Preliminaryf Forecast
Source: Department of Statistics, Malaysia and Bank Negara Malaysia
2 Trade actions that have already been implemented since early 2018 include (i) blanket tariffs on solar panels, steel and aluminium; (ii) +25% tariff on USD50 billion worth of PR China imports and subsequent retaliation by PR China; (iii) +10% on USD200 billion worth of PR China imports and subsequent retaliation by PR China.
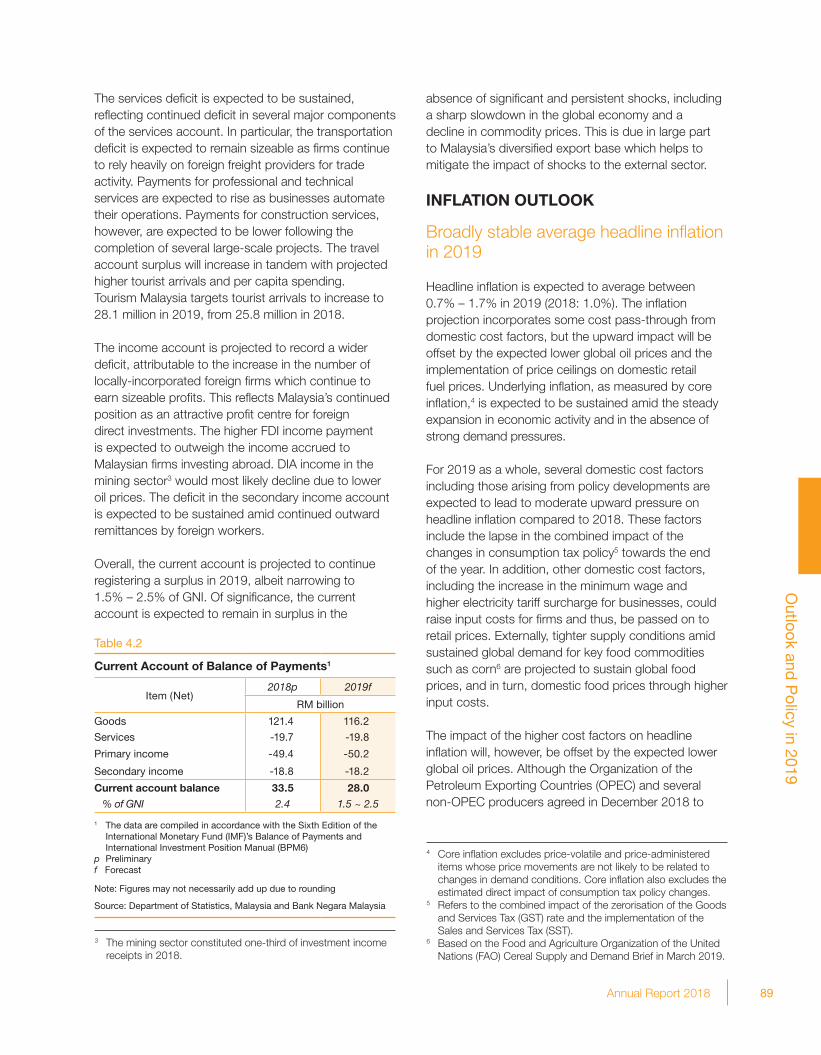
89Annual Report 2018
Outlook and
Policy in 2019
The services deficit is expected to be sustained, reflecting continued deficit in several major components of the services account. In particular, the transportation deficit is expected to remain sizeable as firms continue to rely heavily on foreign freight providers for trade activity. Payments for professional and technical services are expected to rise as businesses automate their operations. Payments for construction services, however, are expected to be lower following the completion of several large-scale projects. The travel account surplus will increase in tandem with projected higher tourist arrivals and per capita spending. Tourism Malaysia targets tourist arrivals to increase to 28.1 million in 2019, from 25.8 million in 2018.
The income account is projected to record a wider deficit, attributable to the increase in the number of locally-incorporated foreign firms which continue to earn sizeable profits. This reflects Malaysia’s continued position as an attractive profit centre for foreign direct investments. The higher FDI income payment is expected to outweigh the income accrued to Malaysian firms investing abroad. DIA income in the mining sector3 would most likely decline due to lower oil prices. The deficit in the secondary income account is expected to be sustained amid continued outward remittances by foreign workers.
Overall, the current account is projected to continue registering a surplus in 2019, albeit narrowing to 1.5% – 2.5% of GNI. Of significance, the current account is expected to remain in surplus in the
absence of significant and persistent shocks, including a sharp slowdown in the global economy and a decline in commodity prices. This is due in large part to Malaysia’s diversified export base which helps to mitigate the impact of shocks to the external sector.
INFLATION OUTLOOK
Broadly stable average headline inflation in 2019
Headline inflation is expected to average between 0.7% – 1.7% in 2019 (2018: 1.0%). The inflation projection incorporates some cost pass-through from domestic cost factors, but the upward impact will be offset by the expected lower global oil prices and the implementation of price ceilings on domestic retail fuel prices. Underlying inflation, as measured by core inflation,4 is expected to be sustained amid the steady expansion in economic activity and in the absence of strong demand pressures.
For 2019 as a whole, several domestic cost factors including those arising from policy developments are expected to lead to moderate upward pressure on headline inflation compared to 2018. These factors include the lapse in the combined impact of the changes in consumption tax policy5 towards the end of the year. In addition, other domestic cost factors, including the increase in the minimum wage and higher electricity tariff surcharge for businesses, could raise input costs for firms and thus, be passed on to retail prices. Externally, tighter supply conditions amid sustained global demand for key food commodities such as corn6 are projected to sustain global food prices, and in turn, domestic food prices through higher input costs.
The impact of the higher cost factors on headline inflation will, however, be offset by the expected lower global oil prices. Although the Organization of the Petroleum Exporting Countries (OPEC) and several non-OPEC producers agreed in December 2018 to
Table 4.2
Current Account of Balance of Payments1
Item (Net)2018p 2019f
RM billion
Goods 121.4 116.2
Services -19.7 -19.8
Primary income -49.4 -50.2
Secondary income -18.8 -18.2
Current account balance 33.5 28.0
% of GNI 2.4 1.5 ~ 2.5
1 The data are compiled in accordance with the Sixth Edition of the International Monetary Fund (IMF)’s Balance of Payments and International Investment Position Manual (BPM6)
p Preliminaryf Forecast
Note: Figures may not necessarily add up due to rounding
Source: Department of Statistics, Malaysia and Bank Negara Malaysia
4 Core inflation excludes price-volatile and price-administered items whose price movements are not likely to be related to changes in demand conditions. Core inflation also excludes the estimated direct impact of consumption tax policy changes.
5 Refers to the combined impact of the zerorisation of the Goods and Services Tax (GST) rate and the implementation of the Sales and Services Tax (SST).
6 Based on the Food and Agriculture Organization of the United Nations (FAO) Cereal Supply and Demand Brief in March 2019.
3 The mining sector constituted one-third of investment income receipts in 2018.
90 Annual Report 2018
Outlook and
Policy in 2019
cut oil production, the growth in global oil supply is expected to be supported by an expansion in US shale oil production. With moderate growth in global oil demand, the International Monetary Fund (IMF) projects crude oil prices to average at USD59 per barrel in 2019, a 14% decline from the 2018 average price of USD69 per barrel (2018: +30%).7 Along with the implementation of price ceilings for RON95 petrol and diesel until mid-2019,8 domestic fuel prices are expected to average lower in 2019 and have a downward impact on headline inflation.
Headline inflation declined to -0.7% in January 2019, reflecting mainly the lower domestic fuel prices. While headline inflation could remain low in the near term due to key policy measures, underlying inflation is expected to be sustained, supported by the steady expansion in economic activity. Meanwhile, improving labour productivity and ongoing investments for capacity expansion will help contain any excessive demand pressure on inflation. In the labour market, the unemployment rate is expected to be relatively unchanged at 3.3% – 3.5% in 2019 (2018: 3.4%) as employment growth will be matched by the expansion in the labour force. Nominal wage growth is also expected to remain stable. The Malaysian Employers Federation (MEF) reports that employers expect salary increments to average at 4.9% in 2019 (2018: 4.9%).9 Firms’ productive capacity will continue to expand, supported by sustained private investment growth of 4.9% in 2019 (2018: 4.5%).
There are several risks to the inflation outlook. First, the trajectory of headline inflation will be dependent on global oil prices. Second, domestic food prices are subject to the potential expansion in the list of controlled food items, weather conditions which could affect food supply, and the cost of imported inputs to food production. Third, the strength of growth in both Malaysia and its trading partners could affect the extent of demand pressure on domestic inflation.
MONETARY POLICY
Monetary policy in 2019 will focus on promoting steady growth of the Malaysian economy and price stability
Monetary policy in 2019 will focus on supporting the steady growth of the Malaysian economy amid an environment of relatively low inflation. Growth of the domestic economy is expected to be sustained with continued support from private sector spending. However, there remain downside risks to the domestic growth outlook. In addition to the downside risks emanating from the global environment, commodity-related supply disruptions could continue to weigh on domestic growth prospects. Headline inflation is projected to be broadly stable. Underlying inflation, as measured by core inflation, is expected to be sustained amid the steady expansion in economic activity and in the absence of strong demand pressures. The priority of the Monetary Policy Committee (MPC) would thus be to ensure that the stance of monetary policy remains accommodative and supportive of real economic activity amid relatively contained risks to inflation.
At the same time, monetary policy will also consider the prevailing monetary and financial conditions. While risks of financial imbalances are expected to remain contained, the MPC is cognisant of challenges emanating from potential continued volatility in global capital flows. In this regard, the Bank will continue to ensure sufficient liquidity and orderly market conditions that remain supportive of financial intermediation activity.
The broad range of policy options available provide the Bank with flexibility to manage emerging risks. This policy toolkit includes monetary policy, micro- and macroprudential measures. Measures to further deepen the domestic financial markets will also contribute to orderly market conditions. The combined effect of these policies will ensure that policy efficacy is maintained without the overburdening of any single policy tool.
FISCAL POLICY
The Government remains committed to fiscal consolidation
Fiscal policy in 2019 aims to strengthen the Government’s fiscal position by pursuing gradual fiscal consolidation while lending continued support for growth,
7 Average price of UK Brent, West Texas Intermediate (WTI) and Dubai Fateh crude oil, equally weighted, as published by the IMF in the January 2019 update to the World Economic Outlook.
8 Since March 2019, retail fuel prices are subject to price ceilings of RM2.08 per litre for RON95 petrol and RM2.18 per litre for diesel, until the implementation of the targeted fuel subsidy.
9 Based on the 2018 MEF Salary Surveys for Executives and Non-Executives. The salary increment figures used are simple averages of employers’ expectations of salary increments for both executives and non-executives.
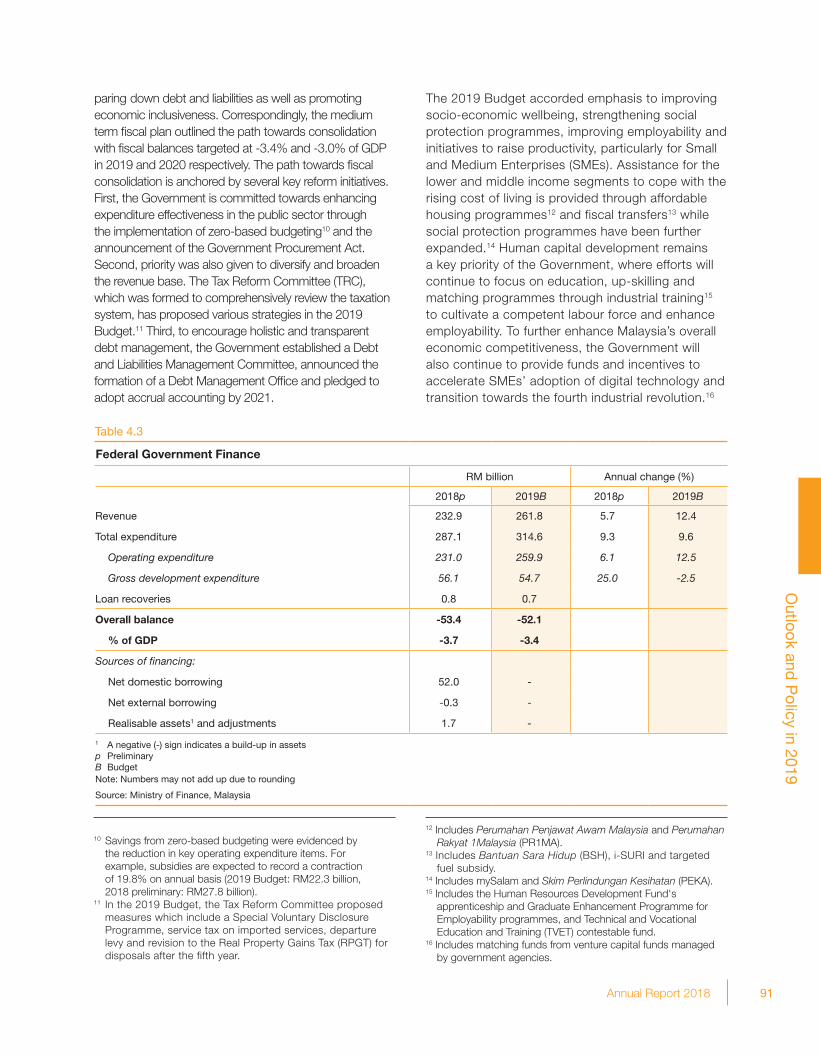
91Annual Report 2018
Outlook and
Policy in 2019
paring down debt and liabilities as well as promoting economic inclusiveness. Correspondingly, the medium term fiscal plan outlined the path towards consolidation with fiscal balances targeted at -3.4% and -3.0% of GDP in 2019 and 2020 respectively. The path towards fiscal consolidation is anchored by several key reform initiatives. First, the Government is committed towards enhancing expenditure effectiveness in the public sector through the implementation of zero-based budgeting10 and the announcement of the Government Procurement Act. Second, priority was also given to diversify and broaden the revenue base. The Tax Reform Committee (TRC), which was formed to comprehensively review the taxation system, has proposed various strategies in the 2019 Budget.11 Third, to encourage holistic and transparent debt management, the Government established a Debt and Liabilities Management Committee, announced the formation of a Debt Management Office and pledged to adopt accrual accounting by 2021.
Federal Government Finance
RM billion Annual change (%)
2018p 2019B 2018p 2019B
Revenue 232.9 261.8 5.7 12.4
Total expenditure 287.1 314.6 9.3 9.6
Operating expenditure 231.0 259.9 6.1 12.5
Gross development expenditure 56.1 54.7 25.0 -2.5
Loan recoveries 0.8 0.7
Overall balance -53.4 -52.1
% of GDP -3.7 -3.4
Sources of fi nancing:
Net domestic borrowing 52.0 -
Net external borrowing -0.3 -
Realisable assets1 and adjustments 1.7 -
1 A negative (-) sign indicates a build-up in assetsp PreliminaryB BudgetNote: Numbers may not add up due to rounding
Source: Ministry of Finance, Malaysia
Table 4.3
10 Savings from zero-based budgeting were evidenced by the reduction in key operating expenditure items. For example, subsidies are expected to record a contraction of 19.8% on annual basis (2019 Budget: RM22.3 billion, 2018 preliminary: RM27.8 billion).
11 In the 2019 Budget, the Tax Reform Committee proposed measures which include a Special Voluntary Disclosure Programme, service tax on imported services, departure levy and revision to the Real Property Gains Tax (RPGT) for disposals after the fifth year.
The 2019 Budget accorded emphasis to improving socio-economic wellbeing, strengthening social protection programmes, improving employability and initiatives to raise productivity, particularly for Small and Medium Enterprises (SMEs). Assistance for the lower and middle income segments to cope with the rising cost of living is provided through affordable housing programmes12 and fiscal transfers13 while social protection programmes have been further expanded.14 Human capital development remains a key priority of the Government, where efforts will continue to focus on education, up-skilling and matching programmes through industrial training15 to cultivate a competent labour force and enhance employability. To further enhance Malaysia’s overall economic competitiveness, the Government will also continue to provide funds and incentives to accelerate SMEs’ adoption of digital technology and transition towards the fourth industrial revolution.16
12 Includes Perumahan Penjawat Awam Malaysia and Perumahan Rakyat 1Malaysia (PR1MA).
13 Includes Bantuan Sara Hidup (BSH), i-SURI and targeted fuel subsidy.
14 Includes mySalam and Skim Perlindungan Kesihatan (PEKA).15 Includes the Human Resources Development Fund's
apprenticeship and Graduate Enhancement Programme for Employability programmes, and Technical and Vocational Education and Training (TVET) contestable fund.
16 Includes matching funds from venture capital funds managed by government agencies.
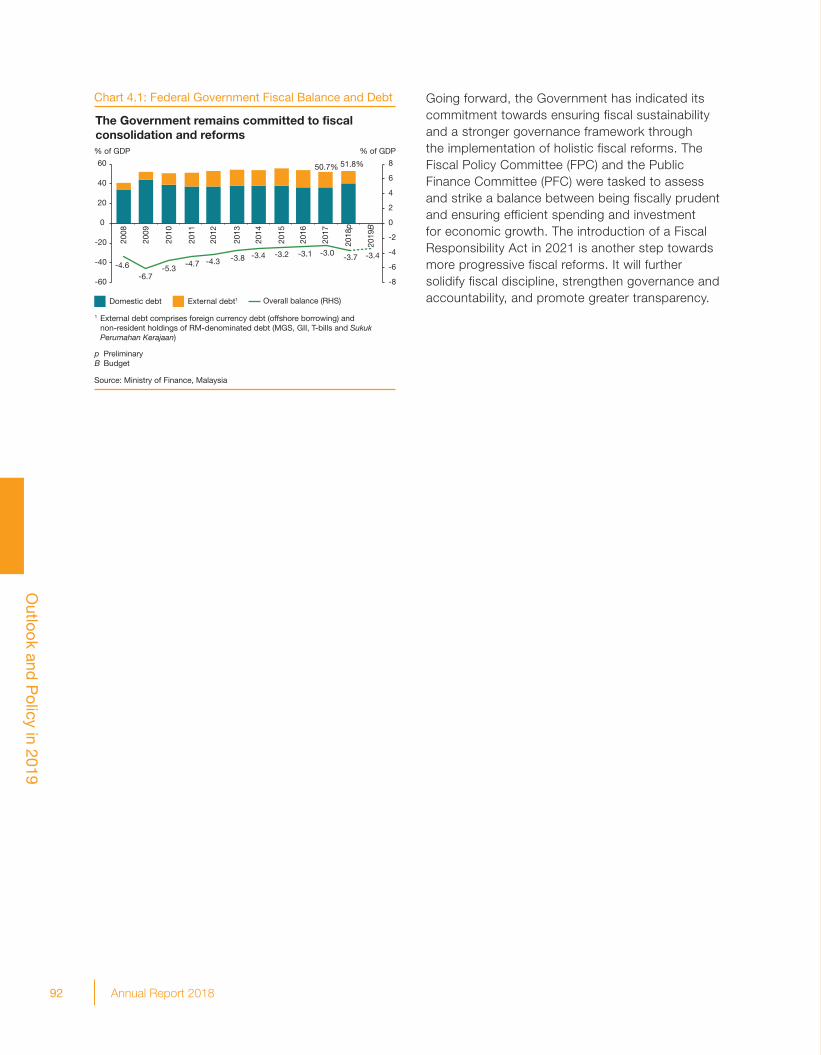
92 Annual Report 2018
Outlook and
Policy in 2019
Source: Ministry of Finance, Malaysia
% of GDP% of GDP
External debt1Domestic debt Overall balance (RHS)
Chart 4.1: Federal Government Fiscal Balance and Debt
The Government remains committed to fiscal consolidation and reforms
1 External debt comprises foreign currency debt (offshore borrowing) and non-resident holdings of RM-denominated debt (MGS, GII, T-bills and Sukuk Perumahan Kerajaan)
p PreliminaryB Budget
-4.6-6.7
-5.3-4.7 -4.3 -3.8 -3.4 -3.2 -3.1 -3.0 -3.7 -3.4
-8
-6
-4
-2
0
2
4
6
8
-60
-40
-20
0
20
40
60
2008
2009
2010
2011
2012
2013
2014
2015
2016
2017
2018
p
2019
B
50.7% 51.8%
Going forward, the Government has indicated its commitment towards ensuring fiscal sustainability and a stronger governance framework through the implementation of holistic fiscal reforms. The Fiscal Policy Committee (FPC) and the Public Finance Committee (PFC) were tasked to assess and strike a balance between being fiscally prudent and ensuring efficient spending and investment for economic growth. The introduction of a Fiscal Responsibility Act in 2021 is another step towards more progressive fiscal reforms. It will further solidify fiscal discipline, strengthen governance and accountability, and promote greater transparency.
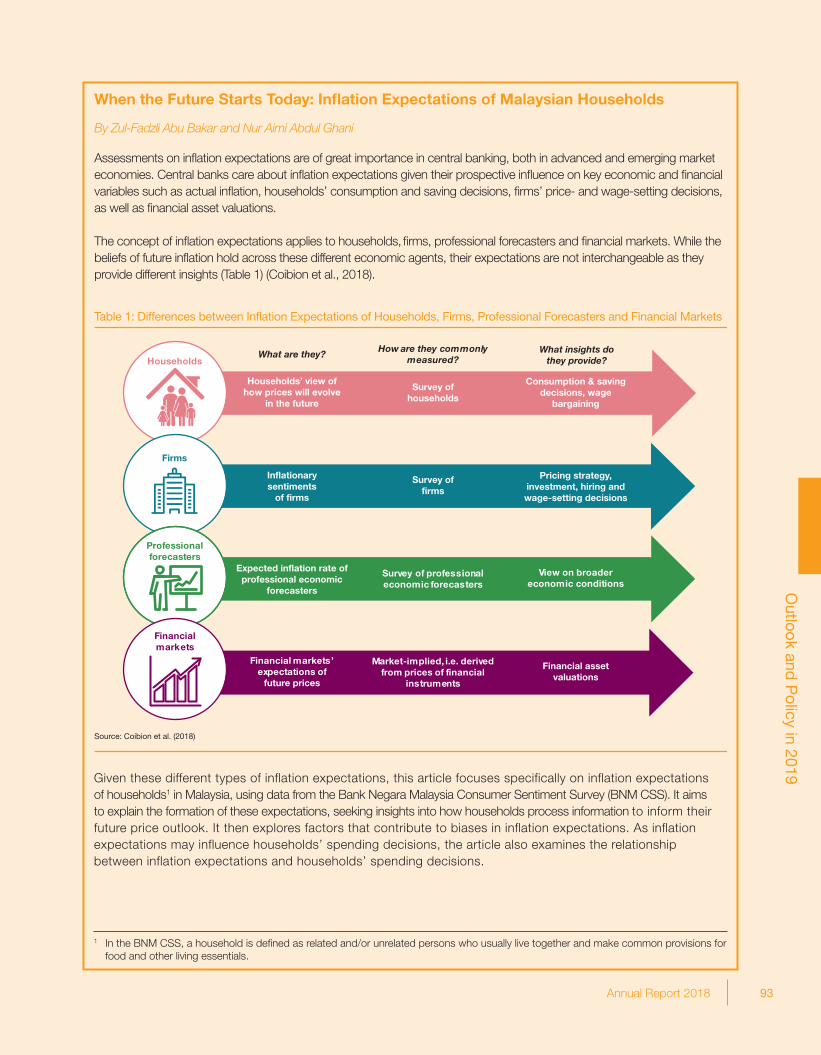
93Annual Report 2018
Outlook and
Policy in 2019
77Annual Report 2018
When the Future Starts Today: Infl ation Expectations of Malaysian Households
By Zul-Fadzli Abu Bakar and Nur Aimi Abdul Ghani
Assessments on infl ation expectations are of great importance in central banking, both in advanced and emerging market economies. Central banks care about infl ation expectations given their prospective infl uence on key economic and fi nancial variables such as actual infl ation, households’ consumption and saving decisions, fi rms’ price- and wage-setting decisions, as well as fi nancial asset valuations.
The concept of infl ation expectations applies to households, fi rms, professional forecasters and fi nancial markets. While the beliefs of future infl ation hold across these different economic agents, their expectations are not interchangeable as they provide different insights (Table 1) (Coibion et al., 2018).
Given these different types of inflation expectations, this article focuses specifically on inflation expectations of households1 in Malaysia, using data from the Bank Negara Malaysia Consumer Sentiment Survey (BNM CSS). It aims to explain the formation of these expectations, seeking insights into how households process information to inform their future price outlook. It then explores factors that contribute to biases in inflation expectations. As inflation expectations may influence households’ spending decisions, the article also examines the relationship between inflation expectations and households’ spending decisions.
1 In the BNM CSS, a household is defi ned as related and/or unrelated persons who usually live together and make common provisions for food and other living essentials.
Table 1: Differences between Inflation Expectations of Households, Firms, Professional Forecasters and Financial Markets
Households’ view of how prices will evolve
in the future
Survey ofhouseholds
Consumption & saving decisions, wage
bargaining
Inflationary sentiments
of firms
Survey of firms
Pricing strategy, investment, hiring and wage-setting decisions
Expected inflation rate of professional economic
forecasters
Survey of professional economic forecasters
View on broader economic conditions
Market-implied, i.e. derived from prices of financial
instruments
Financial markets’ expectations of
future prices
Financial asset valuations
How are they commonly measured?
What insights dothey provide?
What are they?
Source: Coibion et al. (2018)
Households
Financialmarkets
Professionalforecasters
Firms
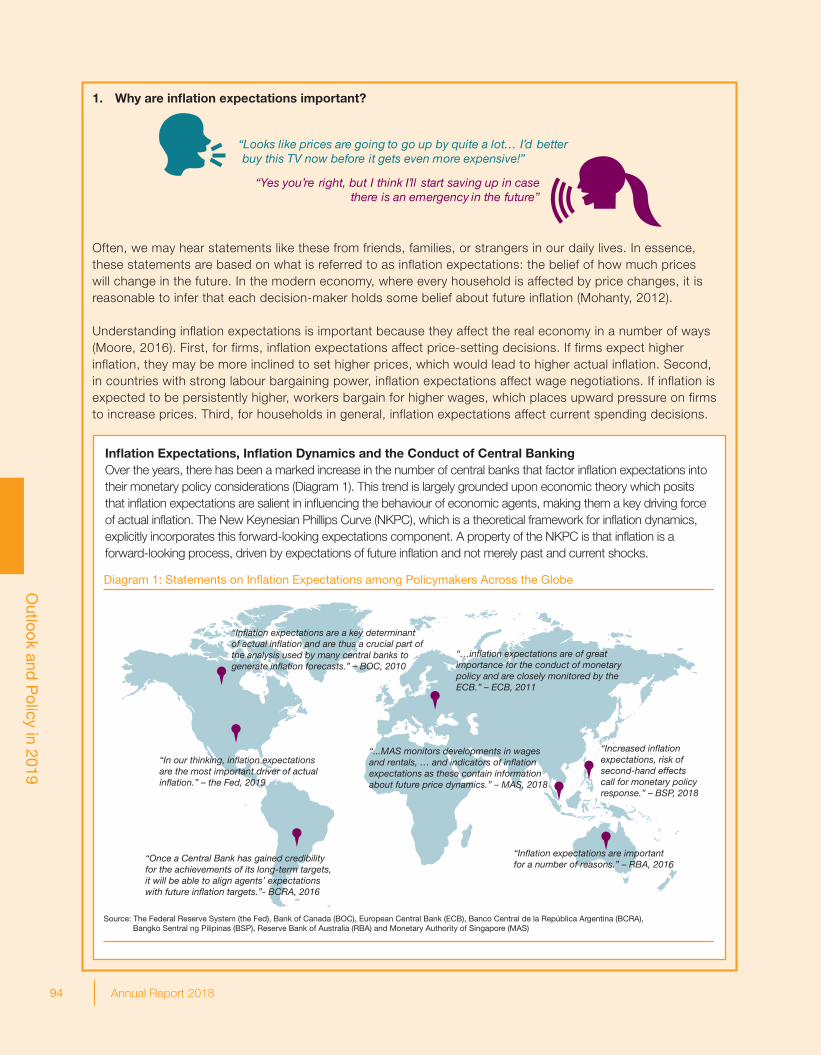
94 Annual Report 2018
Outlook and
Policy in 2019
78 Annual Report 2018
Infl ation Expectations, Infl ation Dynamics and the Conduct of Central BankingOver the years, there has been a marked increase in the number of central banks that factor infl ation expectations into their monetary policy considerations (Diagram 1). This trend is largely grounded upon economic theory which posits that infl ation expectations are salient in infl uencing the behaviour of economic agents, making them a key driving force of actual infl ation. The New Keynesian Phillips Curve (NKPC), which is a theoretical framework for infl ation dynamics, explicitly incorporates this forward-looking expectations component. A property of the NKPC is that infl ation is a forward-looking process, driven by expectations of future infl ation and not merely past and current shocks.
1. Why are infl ation expectations important?
Often, we may hear statements like these from friends, families, or strangers in our daily lives. In essence, these statements are based on what is referred to as inflation expectations: the belief of how much prices will change in the future. In the modern economy, where every household is affected by price changes, it is reasonable to infer that each decision-maker holds some belief about future inflation (Mohanty, 2012).
Understanding inflation expectations is important because they affect the real economy in a number of ways (Moore, 2016). First, for firms, inflation expectations affect price-setting decisions. If firms expect higher inflation, they may be more inclined to set higher prices, which would lead to higher actual inflation. Second, in countries with strong labour bargaining power, inflation expectations affect wage negotiations. If inflation is expected to be persistently higher, workers bargain for higher wages, which places upward pressure on firms to increase prices. Third, for households in general, inflation expectations affect current spending decisions.
Diagram 1: Statements on Inflation Expectations among Policymakers Across the Globe
“Inflation expectations are a key determinantof actual inflation and are thus a crucial part ofthe analysis used by many central banks togenerate inflation forecasts.” – BOC, 2010
“In our thinking, inflation expectationsare the most important driver of actualinflation.” – the Fed, 2019
“…inflation expectations are of great importance for the conduct of monetary policy and are closely monitored by the ECB.” – ECB, 2011
“...MAS monitors developments in wages and rentals, … and indicators of inflation expectations as these contain information about future price dynamics.” – MAS, 2018
“Increased inflation expectations, risk of second-hand effects call for monetary policy response.” – BSP, 2018
“Inflation expectations are important for a number of reasons.” – RBA, 2016
Source: The Federal Reserve System (the Fed), Bank of Canada (BOC), European Central Bank (ECB), Banco Central de la República Argentina (BCRA), Bangko Sentral ng Pilipinas (BSP), Reserve Bank of Australia (RBA) and Monetary Authority of Singapore (MAS)
“Once a Central Bank has gained credibility for the achievements of its long-term targets, it will be able to align agents’ expectations with future inflation targets.”- BCRA, 2016
“Looks like prices are going to go up by quite a lot… I’d better buy this TV now before it gets even more expensive!”
“Yes you’re right, but I think I’ll start saving up in case there is an emergency in the future”
“Ya betul, tapi saya rasa saya akan mula berjimat untuk kecemasan pada masa depan”
“Nampaknya harga akan semakin meningkat dengan lebih banyak... Baik saya beli TV ini sekarang sebelum harga jadi lebih mahal!”
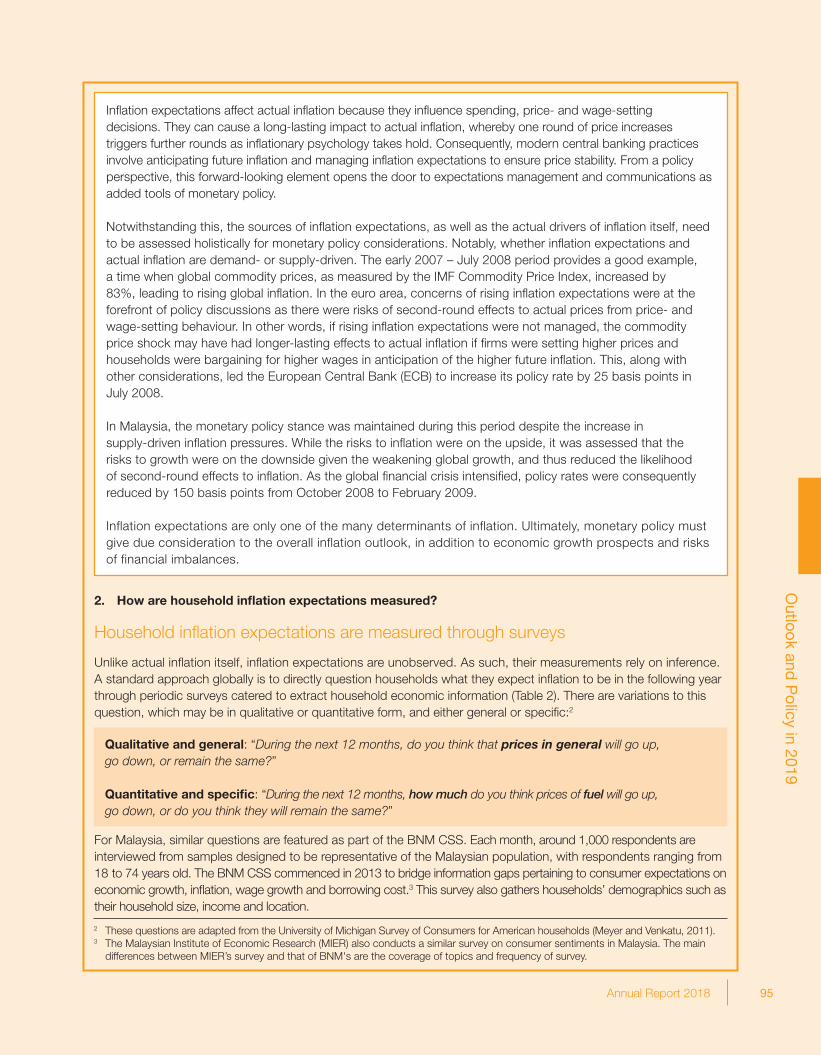
95Annual Report 2018
Outlook and
Policy in 2019
79Annual Report 2018
2. How are household infl ation expectations measured?
Household infl ation expectations are measured through surveys
Unlike actual infl ation itself, infl ation expectations are unobserved. As such, their measurements rely on inference. A standard approach globally is to directly question households what they expect infl ation to be in the following year through periodic surveys catered to extract household economic information (Table 2). There are variations to this question, which may be in qualitative or quantitative form, and either general or specifi c:2
For Malaysia, similar questions are featured as part of the BNM CSS. Each month, around 1,000 respondents are interviewed from samples designed to be representative of the Malaysian population, with respondents ranging from 18 to 74 years old. The BNM CSS commenced in 2013 to bridge information gaps pertaining to consumer expectations on economic growth, infl ation, wage growth and borrowing cost.3 This survey also gathers households’ demographics such as their household size, income and location.
Infl ation expectations affect actual infl ation because they infl uence spending, price- and wage-setting decisions. They can cause a long-lasting impact to actual infl ation, whereby one round of price increases triggers further rounds as infl ationary psychology takes hold. Consequently, modern central banking practices involve anticipating future infl ation and managing infl ation expectations to ensure price stability. From a policy perspective, this forward-looking element opens the door to expectations management and communications as added tools of monetary policy.
Notwithstanding this, the sources of infl ation expectations, as well as the actual drivers of infl ation itself, need to be assessed holistically for monetary policy considerations. Notably, whether infl ation expectations and actual infl ation are demand- or supply-driven. The early 2007 – July 2008 period provides a good example, a time when global commodity prices, as measured by the IMF Commodity Price Index, increased by 83%, leading to rising global infl ation. In the euro area, concerns of rising infl ation expectations were at the forefront of policy discussions as there were risks of second-round effects to actual prices from price- and wage-setting behaviour. In other words, if rising infl ation expectations were not managed, the commodity price shock may have had longer-lasting effects to actual infl ation if fi rms were setting higher prices and households were bargaining for higher wages in anticipation of the higher future infl ation. This, along with other considerations, led the European Central Bank (ECB) to increase its policy rate by 25 basis points in July 2008.
In Malaysia, the monetary policy stance was maintained during this period despite the increase in supply-driven infl ation pressures. While the risks to infl ation were on the upside, it was assessed that the risks to growth were on the downside given the weakening global growth, and thus reduced the likelihood of second-round effects to infl ation. As the global fi nancial crisis intensifi ed, policy rates were consequently reduced by 150 basis points from October 2008 to February 2009.
Inflation expectations are only one of the many determinants of inflation. Ultimately, monetary policy must give due consideration to the overall inflation outlook, in addition to economic growth prospects and risks of financial imbalances.
2 These questions are adapted from the University of Michigan Survey of Consumers for American households (Meyer and Venkatu, 2011).3 The Malaysian Institute of Economic Research (MIER) also conducts a similar survey on consumer sentiments in Malaysia. The main
differences between MIER’s survey and that of BNM's are the coverage of topics and frequency of survey.
Qualitative and general: “During the next 12 months, do you think that prices in general will go up, go down, or remain the same?”
Quantitative and specifi c: “During the next 12 months, how much do you think prices of fuel will go up, go down, or do you think they will remain the same?”
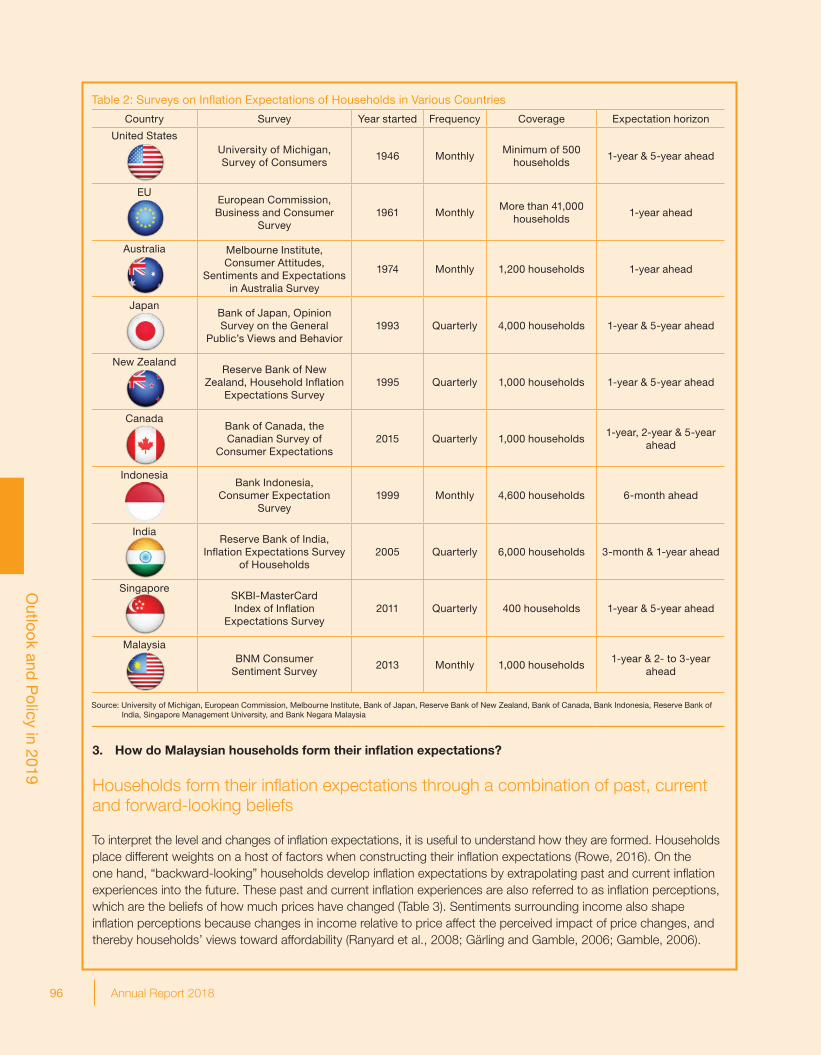
96 Annual Report 2018
Outlook and
Policy in 2019
80 Annual Report 2018
Table 2: Surveys on Infl ation Expectations of Households in Various Countries
Country Survey Year started Frequency Coverage Expectation horizon
United StatesUniversity of Michigan, Survey of Consumers
1946 MonthlyMinimum of 500
households 1-year & 5-year ahead
EUEuropean Commission, Business and Consumer
Survey1961 Monthly
More than 41,000 households
1-year ahead
Australia Melbourne Institute, Consumer Attitudes,
Sentiments and Expectations in Australia Survey
1974 Monthly 1,200 households 1-year ahead
JapanBank of Japan, Opinion Survey on the General
Public’s Views and Behavior1993 Quarterly 4,000 households 1-year & 5-year ahead
New ZealandReserve Bank of New
Zealand, Household Infl ation Expectations Survey
1995 Quarterly 1,000 households 1-year & 5-year ahead
CanadaBank of Canada, the Canadian Survey of
Consumer Expectations2015 Quarterly 1,000 households
1-year, 2-year & 5-year ahead
IndonesiaBank Indonesia,
Consumer Expectation Survey
1999 Monthly 4,600 households 6-month ahead
IndiaReserve Bank of India,
Infl ation Expectations Survey of Households
2005 Quarterly 6,000 households 3-month & 1-year ahead
SingaporeSKBI-MasterCard Index of Infl ation
Expectations Survey2011 Quarterly 400 households 1-year & 5-year ahead
MalaysiaBNM Consumer
Sentiment Survey2013 Monthly 1,000 households
1-year & 2- to 3-year ahead
Source: University of Michigan, European Commission, Melbourne Institute, Bank of Japan, Reserve Bank of New Zealand, Bank of Canada, Bank Indonesia, Reserve Bank of India, Singapore Management University, and Bank Negara Malaysia
3. How do Malaysian households form their infl ation expectations?
Households form their infl ation expectations through a combination of past, current and forward-looking beliefs
To interpret the level and changes of infl ation expectations, it is useful to understand how they are formed. Households place different weights on a host of factors when constructing their infl ation expectations (Rowe, 2016). On the one hand, “backward-looking” households develop infl ation expectations by extrapolating past and current infl ation experiences into the future. These past and current infl ation experiences are also referred to as infl ation perceptions, which are the beliefs of how much prices have changed (Table 3). Sentiments surrounding income also shape infl ation perceptions because changes in income relative to price affect the perceived impact of price changes, and thereby households’ views toward affordability (Ranyard et al., 2008; Gärling and Gamble, 2006; Gamble, 2006).
81Annual Report 2018
On the other hand, “forward-looking” households consider expectations of future broader economic developments, such as their sentiments on the economy. In reality, households can integrate both backward- and forward-looking factors in shaping their infl ation expectations.
On average, Malaysian households place weights on both backward- and forward-looking factors (Chart 1).4 Past sentiments on the domestic economy, recent shopping experiences and current income levels are important backward-looking factors, reflecting their role as easy, accessible and personal ways to form predictions. The forward-looking aspect is also important, with households also considering their expectations of the future strength of the Malaysian economy when forming inflation expectations.
4 The estimates are derived using an Ordinary Least Squares (OLS) regression of infl ation expectations against factors identifi ed in the literature to affect infl ation expectations. The regression also controls for time effects. The estimates shown are statistically signifi cant at the 1% level.
Table 3: Differences Between Infl ation Expectations, Infl ation Perceptions and Actual Infl ation
Infl ation expectations Infl ation perceptions Actual infl ation
Defi nitionThe belief of how much prices will
change in the future
The belief of howmuch prices have
changed from the past
How much prices have changed from last year, based on a single basket of goods and services in the Consumer Price Index (CPI)
Infl uenced byIndividual’s information
sets of the past, present and future
Individual’s information sets of the
past and present
Average consumption patterns of Malaysian households and
average prices in the economy
Source: Bank Negara Malaysia, Arioli et al. (2017)
Chart 1: Selected Factors Estimated to Determine Inflation Expectations of Malaysian Households
Households consider both backward- and forward-looking factors when forming inflation expectations
Note: Other factors that are considered include expectations for future interest rate on savings, expectations for future interest rates on loans and various sources of inflation information such as the mass media and internet. The factors chosen are based on Rowe (2016).
0 5 10 15 20
Expectations for future strengthof the Malaysian economy
Household income
Actual inflation1
Recent shopping experiences
Past sentiments about theMalaysian economy
Past and current
Future
Relative importance (%)2
1 Actual inflation refers to Consumer Price Index (CPI) inflation of the current and past three months2 Relative importance refers to how much the factors contribute to the movements in inflation expectations relative to other factors considered
Source: Bank Negara Malaysia estimates using data from the Bank Negara Malaysia Consumer Sentiment Survey and Department of Statistics, Malaysia
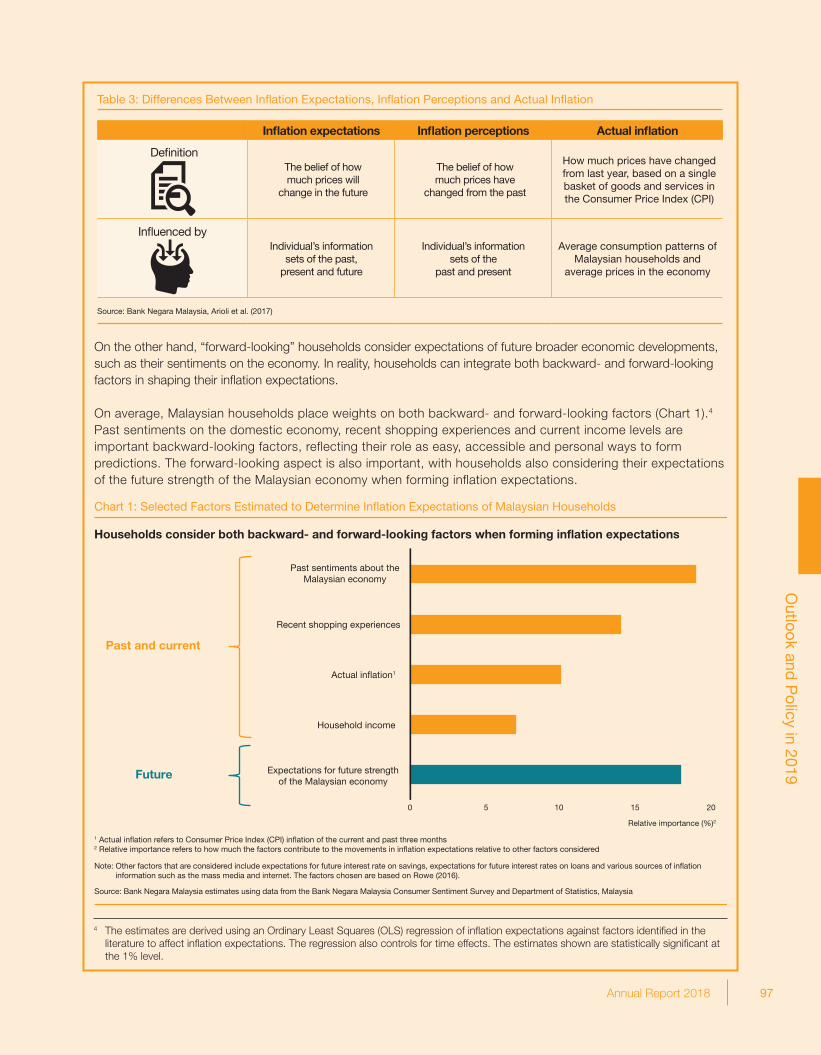
97Annual Report 2018
Outlook and
Policy in 2019
81Annual Report 2018
On the other hand, “forward-looking” households consider expectations of future broader economic developments, such as their sentiments on the economy. In reality, households can integrate both backward- and forward-looking factors in shaping their infl ation expectations.
On average, Malaysian households place weights on both backward- and forward-looking factors (Chart 1).4 Past sentiments on the domestic economy, recent shopping experiences and current income levels are important backward-looking factors, reflecting their role as easy, accessible and personal ways to form predictions. The forward-looking aspect is also important, with households also considering their expectations of the future strength of the Malaysian economy when forming inflation expectations.
4 The estimates are derived using an Ordinary Least Squares (OLS) regression of infl ation expectations against factors identifi ed in the literature to affect infl ation expectations. The regression also controls for time effects. The estimates shown are statistically signifi cant at the 1% level.
Table 3: Differences Between Infl ation Expectations, Infl ation Perceptions and Actual Infl ation
Infl ation expectations Infl ation perceptions Actual infl ation
Defi nitionThe belief of how much prices will
change in the future
The belief of howmuch prices have
changed from the past
How much prices have changed from last year, based on a single basket of goods and services in the Consumer Price Index (CPI)
Infl uenced byIndividual’s information
sets of the past, present and future
Individual’s information sets of the
past and present
Average consumption patterns of Malaysian households and
average prices in the economy
Source: Bank Negara Malaysia, Arioli et al. (2017)
Chart 1: Selected Factors Estimated to Determine Inflation Expectations of Malaysian Households
Households consider both backward- and forward-looking factors when forming inflation expectations
Note: Other factors that are considered include expectations for future interest rate on savings, expectations for future interest rates on loans and various sources of inflation information such as the mass media and internet. The factors chosen are based on Rowe (2016).
0 5 10 15 20
Expectations for future strengthof the Malaysian economy
Household income
Actual inflation1
Recent shopping experiences
Past sentiments about theMalaysian economy
Past and current
Future
Relative importance (%)2
1 Actual inflation refers to Consumer Price Index (CPI) inflation of the current and past three months2 Relative importance refers to how much the factors contribute to the movements in inflation expectations relative to other factors considered
Source: Bank Negara Malaysia estimates using data from the Bank Negara Malaysia Consumer Sentiment Survey and Department of Statistics, Malaysia
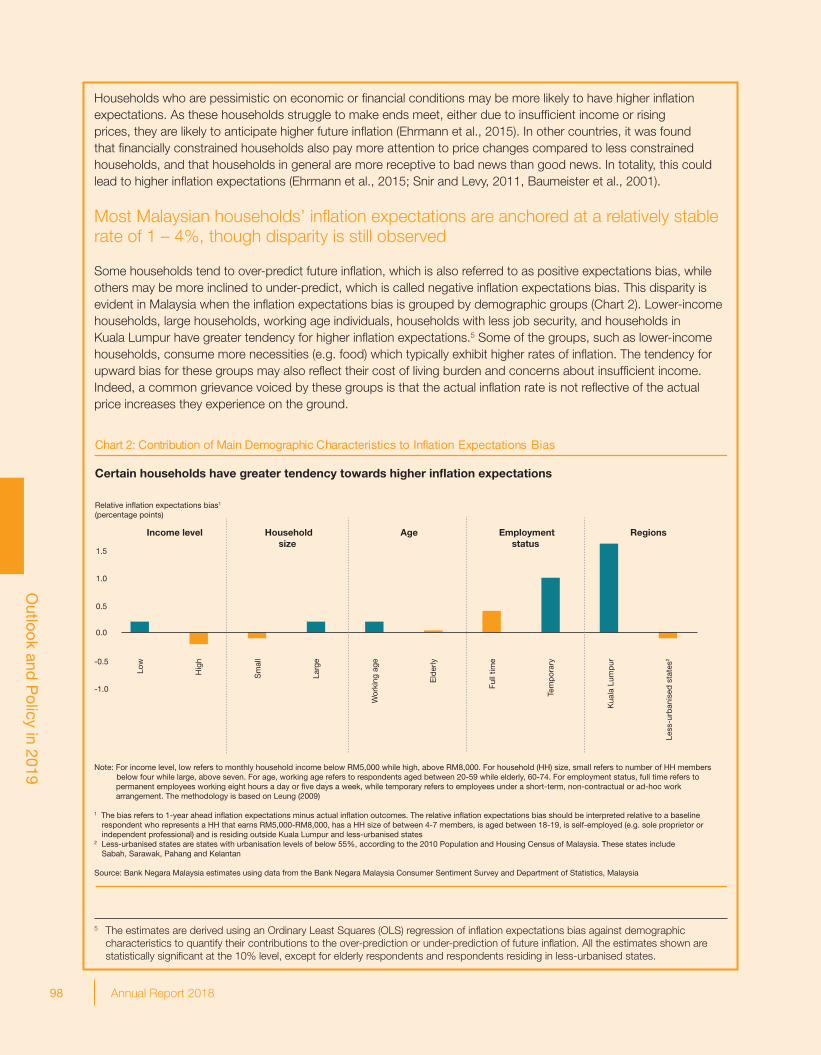
98 Annual Report 2018
Outlook and
Policy in 2019
82 Annual Report 2018
Households who are pessimistic on economic or fi nancial conditions may be more likely to have higher infl ation expectations. As these households struggle to make ends meet, either due to insuffi cient income or rising prices, they are likely to anticipate higher future infl ation (Ehrmann et al., 2015). In other countries, it was found that fi nancially constrained households also pay more attention to price changes compared to less constrained households, and that households in general are more receptive to bad news than good news. In totality, this could lead to higher infl ation expectations (Ehrmann et al., 2015; Snir and Levy, 2011, Baumeister et al., 2001).
Most Malaysian households’ infl ation expectations are anchored at a relatively stable rate of 1 – 4%, though disparity is still observed
Some households tend to over-predict future infl ation, which is also referred to as positive expectations bias, while others may be more inclined to under-predict, which is called negative infl ation expectations bias. This disparity is evident in Malaysia when the infl ation expectations bias is grouped by demographic groups (Chart 2). Lower-income households, large households, working age individuals, households with less job security, and households in Kuala Lumpur have greater tendency for higher infl ation expectations.5 Some of the groups, such as lower-income households, consume more necessities (e.g. food) which typically exhibit higher rates of infl ation. The tendency for upward bias for these groups may also refl ect their cost of living burden and concerns about insuffi cient income. Indeed, a common grievance voiced by these groups is that the actual infl ation rate is not refl ective of the actual price increases they experience on the ground.
5 The estimates are derived using an Ordinary Least Squares (OLS) regression of infl ation expectations bias against demographic characteristics to quantify their contributions to the over-prediction or under-prediction of future infl ation. All the estimates shown are statistically signifi cant at the 10% level, except for elderly respondents and respondents residing in less-urbanised states.
Chart 2: Contribution of Main Demographic Characteristics to Inflation Expectations Bias
Certain households have greater tendency towards higher inflation expectations
Relative inflation expectations bias1 (percentage points)
-1.0
-0.5
0.0
0.5
1.0
1.5
Low
Hig
h
Sm
all
Larg
e
Wor
king
age
Eld
erly
Full
time
Tem
por
ary
Kua
la L
ump
ur
Income level Householdsize
Age Employmentstatus
Regions
Less
-urb
anis
ed s
tate
s2
Note: For income level, low refers to monthly household income below RM5,000 while high, above RM8,000. For household (HH) size, small refers to number of HH members below four while large, above seven. For age, working age refers to respondents aged between 20-59 while elderly, 60-74. For employment status, full time refers to permanent employees working eight hours a day or five days a week, while temporary refers to employees under a short-term, non-contractual or ad-hoc work arrangement. The methodology is based on Leung (2009)
1 The bias refers to 1-year ahead inflation expectations minus actual inflation outcomes. The relative inflation expectations bias should be interpreted relative to a baseline respondent who represents a HH that earns RM5,000-RM8,000, has a HH size of between 4-7 members, is aged between 18-19, is self-employed (e.g. sole proprietor or independent professional) and is residing outside Kuala Lumpur and less-urbanised states2 Less-urbanised states are states with urbanisation levels of below 55%, according to the 2010 Population and Housing Census of Malaysia. These states include Sabah, Sarawak, Pahang and Kelantan
Source: Bank Negara Malaysia estimates using data from the Bank Negara Malaysia Consumer Sentiment Survey and Department of Statistics, Malaysia
83Annual Report 2018
Notwithstanding the disparity across groups, for most periods, overall households’ infl ation expectations deviate on the upside from the actual infl ation outcomes (Chart 3). This observation is not unique to Malaysia. Households, in both advanced and emerging economies, commonly display deviations in infl ation expectations from the actual infl ation outcomes (Coibion et al. 2018, Kliesen, 2015, Mohanty, 2012, Gnan et al. 2009, Deutsche Bundesbank, 2001). For countries with a longer history of household survey data, namely the United States, Australia, Japan and the Philippines, the positive bias can range between 1 and 4 percentage points. On average, most households’ infl ation expectations in Malaysia are broadly anchored at a relatively stable rate of 1 – 4%, close to the actual infl ation long-run average of 3% (1980 – 2018).
Chart 3: Inflation Expectations of Malaysian Households
Actual InflationInflation Expectations (as reported one year ago)
-2
0
2
4
6
8
A M J J A S O N D J F M A M J J A S O N D J F M A M J J A S O N D J F M A M J J A S O N D
Positive bias
2018 201920172016
Negative bias
Annual growth (%)
In line with experiences of other countries, inflation expectations of Malaysian households are typicallydifferent from the actual inflation outcomes
Note: The shaded area refers to the 1 standard deviation above and below the mean inflation expectations
Source: Bank Negara Malaysia estimates using data from the Bank Negara Malaysia Consumer Sentiment Survey and Department of Statistics, Malaysia
Average Household Inflation Expectations Bias Across Selected Countries Since 2015
0.0
0.5
1.0
1.5
2.0
2.5
3.0
3.5
4.0
Japan Australia New Zealand Malaysia Philippines United States2
Inflation expectations bias1 (percentage points)
United Kingdom2
1 The bias is calculated by taking 1-year ahead mean inflation expectations minus actual inflation outcomes2 Inflation expectations for the United States and the United Kingdom are based on the median instead of the mean
Source: Bank Negara Malaysia estimates using data from the Bank Negara Malaysia Consumer Sentiment Survey, Department of Statistics, Malaysia and the respective household surveys
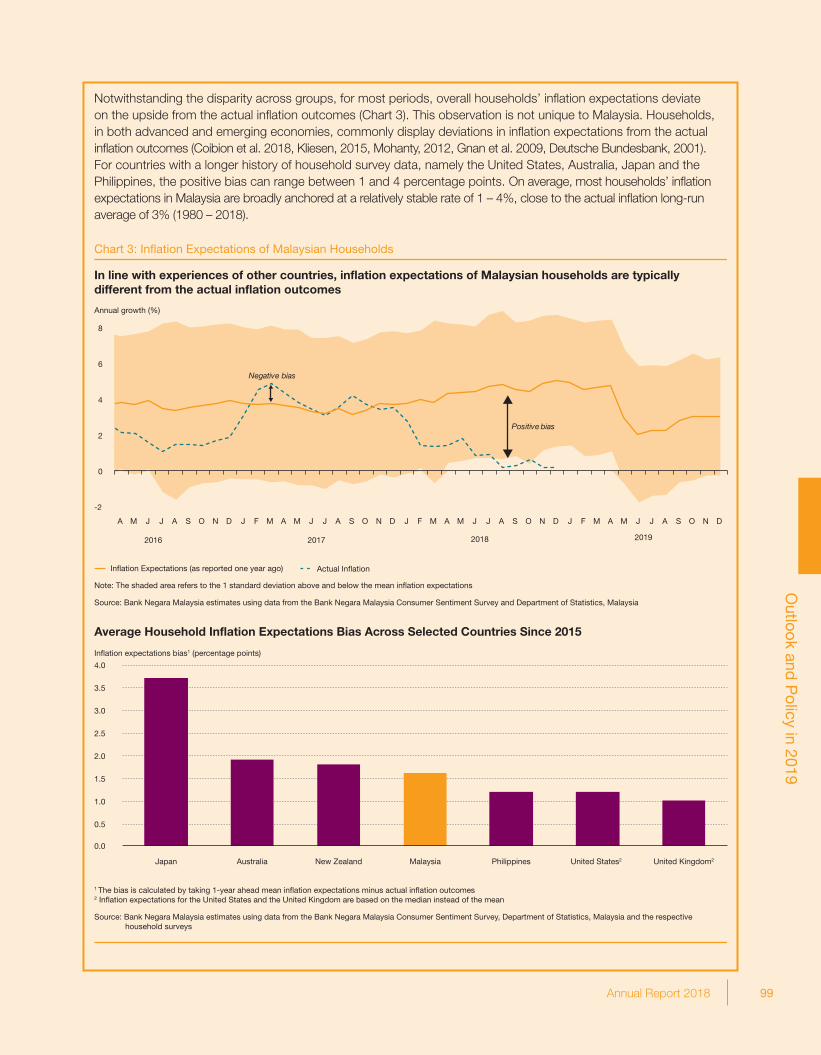
99Annual Report 2018
Outlook and
Policy in 2019
83Annual Report 2018
Notwithstanding the disparity across groups, for most periods, overall households’ infl ation expectations deviate on the upside from the actual infl ation outcomes (Chart 3). This observation is not unique to Malaysia. Households, in both advanced and emerging economies, commonly display deviations in infl ation expectations from the actual infl ation outcomes (Coibion et al. 2018, Kliesen, 2015, Mohanty, 2012, Gnan et al. 2009, Deutsche Bundesbank, 2001). For countries with a longer history of household survey data, namely the United States, Australia, Japan and the Philippines, the positive bias can range between 1 and 4 percentage points. On average, most households’ infl ation expectations in Malaysia are broadly anchored at a relatively stable rate of 1 – 4%, close to the actual infl ation long-run average of 3% (1980 – 2018).
Chart 3: Inflation Expectations of Malaysian Households
Actual InflationInflation Expectations (as reported one year ago)
-2
0
2
4
6
8
A M J J A S O N D J F M A M J J A S O N D J F M A M J J A S O N D J F M A M J J A S O N D
Positive bias
2018 201920172016
Negative bias
Annual growth (%)
In line with experiences of other countries, inflation expectations of Malaysian households are typicallydifferent from the actual inflation outcomes
Note: The shaded area refers to the 1 standard deviation above and below the mean inflation expectations
Source: Bank Negara Malaysia estimates using data from the Bank Negara Malaysia Consumer Sentiment Survey and Department of Statistics, Malaysia
Average Household Inflation Expectations Bias Across Selected Countries Since 2015
0.0
0.5
1.0
1.5
2.0
2.5
3.0
3.5
4.0
Japan Australia New Zealand Malaysia Philippines United States2
Inflation expectations bias1 (percentage points)
United Kingdom2
1 The bias is calculated by taking 1-year ahead mean inflation expectations minus actual inflation outcomes2 Inflation expectations for the United States and the United Kingdom are based on the median instead of the mean
Source: Bank Negara Malaysia estimates using data from the Bank Negara Malaysia Consumer Sentiment Survey, Department of Statistics, Malaysia and the respective household surveys
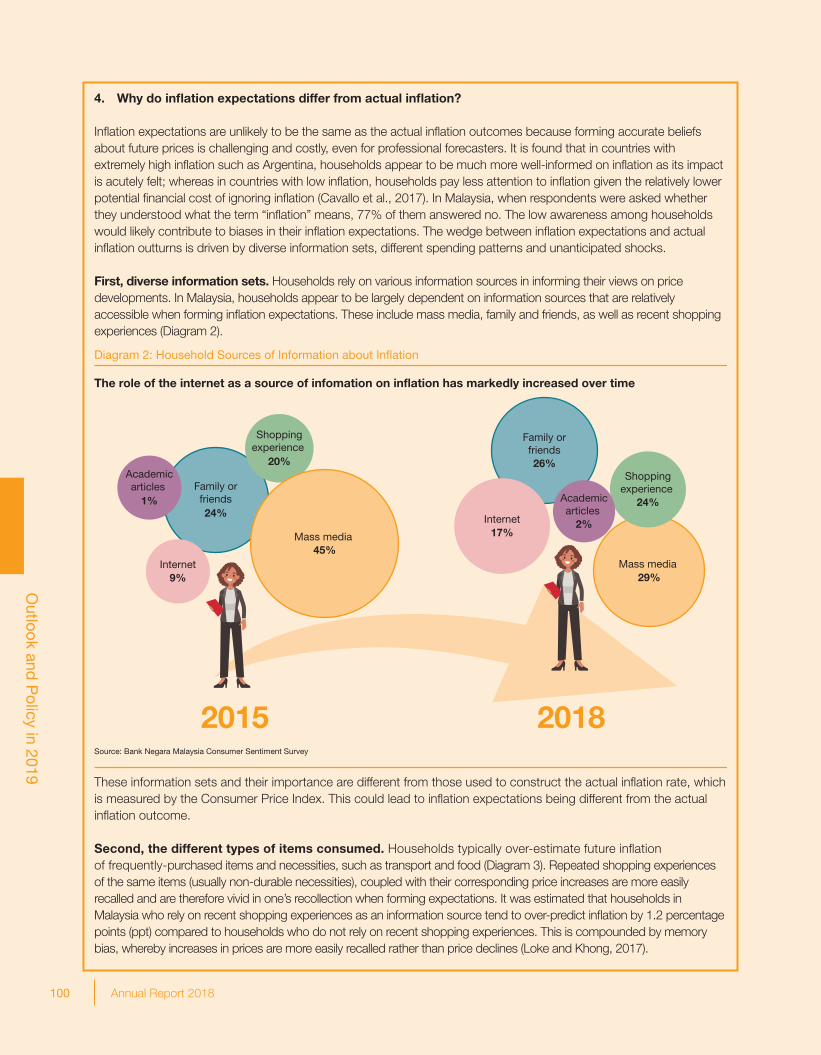
100 Annual Report 2018
Outlook and
Policy in 2019
84 Annual Report 2018
Source: Bank Negara Malaysia Consumer Sentiment Survey
Diagram 2: Household Sources of Information about Inflation
2015 2018
Family orfriends24%
Internet9%
Shoppingexperience
20%
Mass media 45%
Academicarticles
1%
29%Mass media
26%
Family orfriends
24%
Shoppingexperience
2%
Academicarticles
17%Internet
The role of the internet as a source of infomation on inflation has markedly increased over time
4. Why do infl ation expectations differ from actual infl ation?
Infl ation expectations are unlikely to be the same as the actual infl ation outcomes because forming accurate beliefs about future prices is challenging and costly, even for professional forecasters. It is found that in countries with extremely high infl ation such as Argentina, households appear to be much more well-informed on infl ation as its impact is acutely felt; whereas in countries with low infl ation, households pay less attention to infl ation given the relatively lower potential fi nancial cost of ignoring infl ation (Cavallo et al., 2017). In Malaysia, when respondents were asked whether they understood what the term “infl ation” means, 77% of them answered no. The low awareness among households would likely contribute to biases in their infl ation expectations. The wedge between infl ation expectations and actual infl ation outturns is driven by diverse information sets, different spending patterns and unanticipated shocks.
First, diverse information sets. Households rely on various information sources in informing their views on price developments. In Malaysia, households appear to be largely dependent on information sources that are relatively accessible when forming infl ation expectations. These include mass media, family and friends, as well as recent shopping experiences (Diagram 2).
These information sets and their importance are different from those used to construct the actual infl ation rate, which is measured by the Consumer Price Index. This could lead to infl ation expectations being different from the actual infl ation outcome.
Second, the different types of items consumed. Households typically over-estimate future infl ation of frequently-purchased items and necessities, such as transport and food (Diagram 3). Repeated shopping experiences of the same items (usually non-durable necessities), coupled with their corresponding price increases are more easily recalled and are therefore vivid in one’s recollection when forming expectations. It was estimated that households in Malaysia who rely on recent shopping experiences as an information source tend to over-predict infl ation by 1.2 percentage points (ppt) compared to households who do not rely on recent shopping experiences. This is compounded by memory bias, whereby increases in prices are more easily recalled rather than price declines (Loke and Khong, 2017).
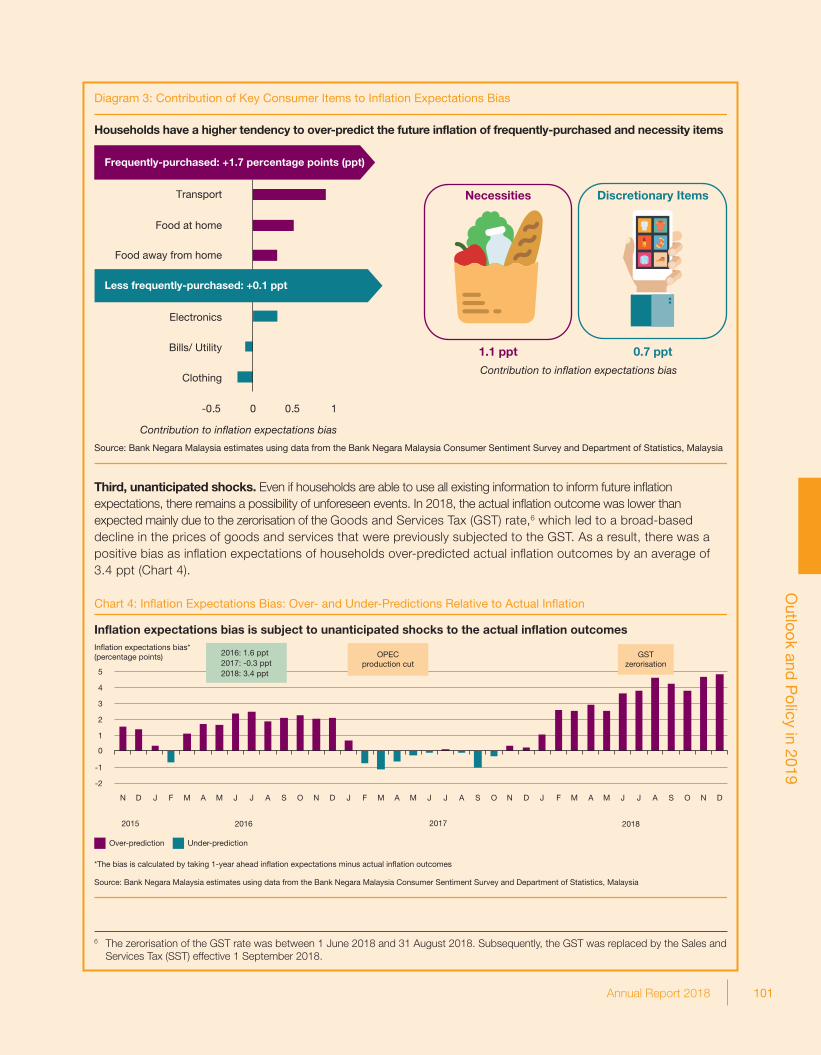
101Annual Report 2018
Outlook and
Policy in 2019
85Annual Report 2018
-0.5 0 0.5 1
Clothing
Bills/ Utility
Electronics
Food away from home
Food at home
Transport
Less frequently-purchased: +0.1 ppt
Frequently-purchased: +1.7 percentage points (ppt)
Source: Bank Negara Malaysia estimates using data from the Bank Negara Malaysia Consumer Sentiment Survey and Department of Statistics, Malaysia
Diagram 3: Contribution of Key Consumer Items to Inflation Expectations Bias
Households have a higher tendency to over-predict the future inflation of frequently-purchased and necessity items
Contribution to inflation expectations bias
Necessities Discretionary Items
1.1 ppt 0.7 ppt
Contribution to inflation expectations bias
Third, unanticipated shocks. Even if households are able to use all existing information to inform future infl ation expectations, there remains a possibility of unforeseen events. In 2018, the actual infl ation outcome was lower than expected mainly due to the zerorisation of the Goods and Services Tax (GST) rate,6 which led to a broad-based decline in the prices of goods and services that were previously subjected to the GST. As a result, there was a positive bias as infl ation expectations of households over-predicted actual infl ation outcomes by an average of 3.4 ppt (Chart 4).
6 The zerorisation of the GST rate was between 1 June 2018 and 31 August 2018. Subsequently, the GST was replaced by the Sales and Services Tax (SST) effective 1 September 2018.
Source: Bank Negara Malaysia estimates using data from the Bank Negara Malaysia Consumer Sentiment Survey and Department of Statistics, Malaysia
-2
-1
0
1
2
3
4
5
N D J F M A M J J A S O N D J F M A M J J A S O N D J F M A M J J A S O N D
2016 2017 20182015
Over-prediction
Inflation expectations bias*(percentage points)
Under-prediction
*The bias is calculated by taking 1-year ahead inflation expectations minus actual inflation outcomes
Inflation expectations bias is subject to unanticipated shocks to the actual inflation outcomes
GSTzerorisation
OPECproduction cut
2016: 1.6 ppt2017: -0.3 ppt2018: 3.4 ppt
Chart 4: Inflation Expectations Bias: Over- and Under-Predictions Relative to Actual Inflation
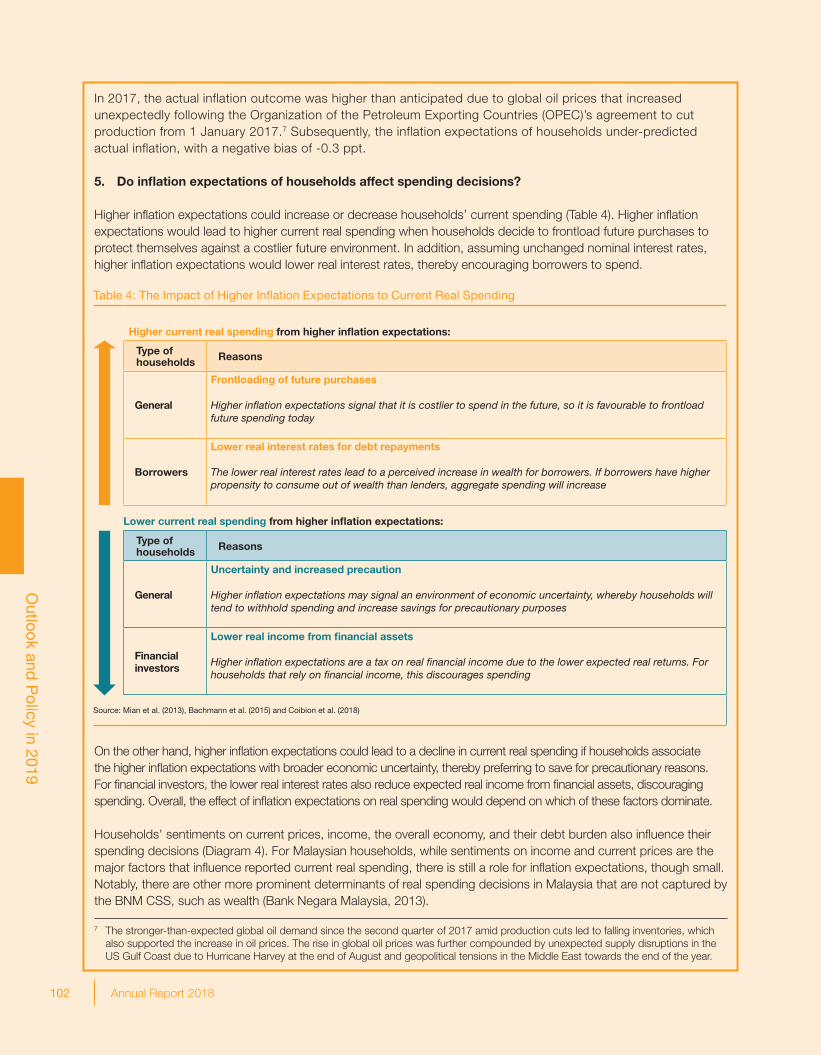
102 Annual Report 2018
Outlook and
Policy in 2019
86 Annual Report 2018
In 2017, the actual inflation outcome was higher than anticipated due to global oil prices that increased unexpectedly following the Organization of the Petroleum Exporting Countries (OPEC)’s agreement to cut production from 1 January 2017.7 Subsequently, the inflation expectations of households under-predicted actual inflation, with a negative bias of -0.3 ppt.
5. Do infl ation expectations of households affect spending decisions?
Higher infl ation expectations could increase or decrease households’ current spending (Table 4). Higher infl ation expectations would lead to higher current real spending when households decide to frontload future purchases to protect themselves against a costlier future environment. In addition, assuming unchanged nominal interest rates, higher infl ation expectations would lower real interest rates, thereby encouraging borrowers to spend.
Higher current real spending from higher infl ation expectations:
Type ofhouseholds Reasons
General
Frontloading of future purchases
Higher infl ation expectations signal that it is costlier to spend in the future, so it is favourable to frontload future spending today
Borrowers
Lower real interest rates for debt repayments
The lower real interest rates lead to a perceived increase in wealth for borrowers. If borrowers have higher propensity to consume out of wealth than lenders, aggregate spending will increase
Lower current real spending from higher infl ation expectations:
Type of households Reasons
General
Uncertainty and increased precaution
Higher infl ation expectations may signal an environment of economic uncertainty, whereby households will tend to withhold spending and increase savings for precautionary purposes
Financialinvestors
Lower real income from fi nancial assets
Higher infl ation expectations are a tax on real fi nancial income due to the lower expected real returns. For households that rely on fi nancial income, this discourages spending
Source: Mian et al. (2013), Bachmann et al. (2015) and Coibion et al. (2018)
Table 4: The Impact of Higher Infl ation Expectations to Current Real Spending
7 The stronger-than-expected global oil demand since the second quarter of 2017 amid production cuts led to falling inventories, which also supported the increase in oil prices. The rise in global oil prices was further compounded by unexpected supply disruptions in the US Gulf Coast due to Hurricane Harvey at the end of August and geopolitical tensions in the Middle East towards the end of the year.
On the other hand, higher infl ation expectations could lead to a decline in current real spending if households associate the higher infl ation expectations with broader economic uncertainty, thereby preferring to save for precautionary reasons. For fi nancial investors, the lower real interest rates also reduce expected real income from fi nancial assets, discouraging spending. Overall, the effect of infl ation expectations on real spending would depend on which of these factors dominate.
Households' sentiments on current prices, income, the overall economy, and their debt burden also infl uence their spending decisions (Diagram 4). For Malaysian households, while sentiments on income and current prices are the major factors that infl uence reported current real spending, there is still a role for infl ation expectations, though small. Notably, there are other more prominent determinants of real spending decisions in Malaysia that are not captured by the BNM CSS, such as wealth (Bank Negara Malaysia, 2013).
87Annual Report 2018
* Relative importance refers to how much the sentiments contribute to reported current real spending, relative to the other sentiments considered
Source: Bank Negara Malaysia estimates using data from the Bank Negara Malaysia Consumer Sentiment Survey
Households consider, among others, their sentiments on current prices and income when makingspending decisions
Diagram 4: Relative Importance* of Various Types of Sentiments to Reported Current Real Spending
Sentiments on Economic Conditions
10%
Sentiments on Current Price Changes
57%
Sentiments on Future Price Changes
9%Sentiments on Debt4%
Sentiments on Income
20%
Note: The methodology is based on Ichiue and Nishiguchi (2013)
6. Conclusion and policy discussions
Infl ation expectations matter because they affect key economic and fi nancial variables such as actual infl ation, wage, spending and fi nancial asset valuations. Looking specifi cally at infl ation expectations of households in Malaysia, households form their infl ation expectations by considering both backward- and forward-looking factors, such as recent shopping experiences and current income levels, as well as the future outlook of the domestic economy. Nevertheless, infl ation expectations differ across households, given the different compositions, priorities and experiences. Certain demographic groups that typically experience higher cost of living burden, such as lower-income and large households, tend to display higher infl ation expectations.
As commonly experienced by other countries, there is evidence of a wedge between households’ infl ation expectations and actual infl ation outturns. This refl ects households’ broad inattention to infl ation, varied information sets used to gain information about infl ation, different consumption patterns, as well as unanticipated shocks to the economy.
However, the impact of households’ infl ation expectations on their current spending decisions is small, refl ecting other more prominent determinants such as sentiments on income and current prices in driving consumption. The implication of this fi nding, therefore, needs to be considered with care and in the broader context of factors driving household consumption spending. Separately from consumption, higher infl ation expectations could result in higher actual future infl ation if they become entrenched, whereby one round of price increase triggers further rounds as infl ationary psychology takes hold. As such, it is important for central banks to place focus on ensuring that these expectations are stable and anchored, rather than engineering higher expectations to meet short-term economic goals. This goes back to the need for having a solid understanding of how households form infl ation expectations, in order for any expectation anchoring strategies to be effective.
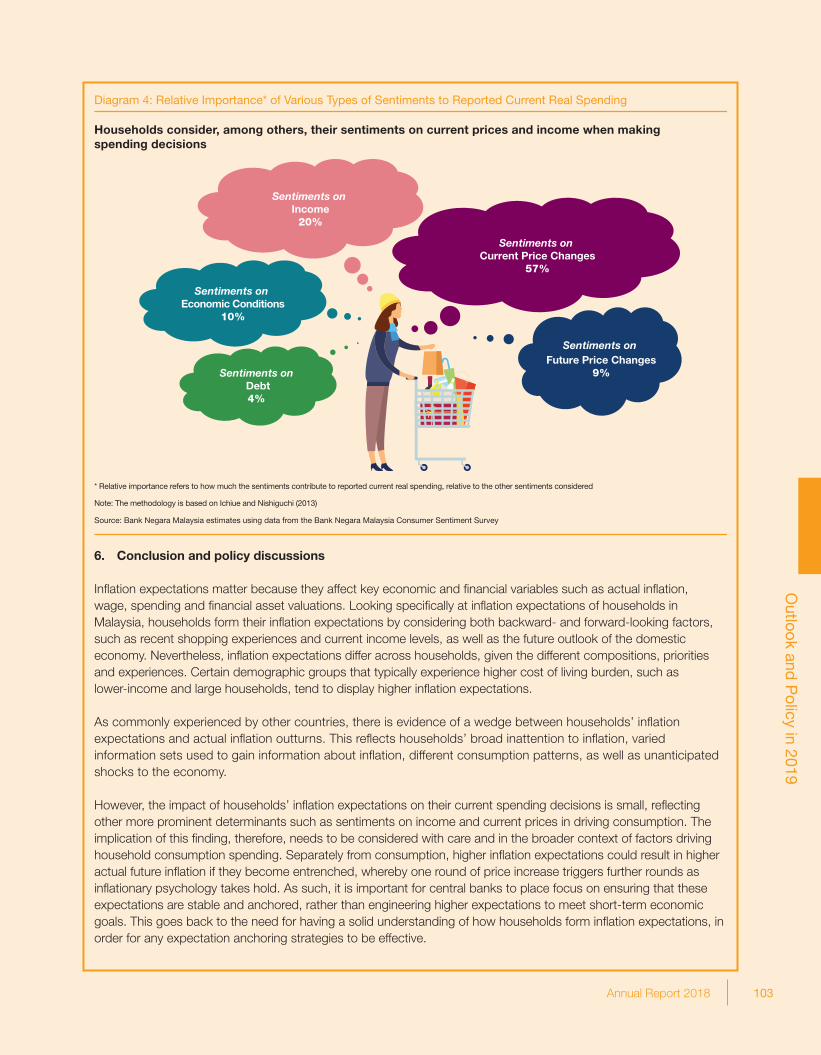
103Annual Report 2018
Outlook and
Policy in 2019
87Annual Report 2018
* Relative importance refers to how much the sentiments contribute to reported current real spending, relative to the other sentiments considered
Source: Bank Negara Malaysia estimates using data from the Bank Negara Malaysia Consumer Sentiment Survey
Households consider, among others, their sentiments on current prices and income when makingspending decisions
Diagram 4: Relative Importance* of Various Types of Sentiments to Reported Current Real Spending
Sentiments on Economic Conditions
10%
Sentiments on Current Price Changes
57%
Sentiments on Future Price Changes
9%Sentiments on Debt4%
Sentiments on Income
20%
Note: The methodology is based on Ichiue and Nishiguchi (2013)
6. Conclusion and policy discussions
Infl ation expectations matter because they affect key economic and fi nancial variables such as actual infl ation, wage, spending and fi nancial asset valuations. Looking specifi cally at infl ation expectations of households in Malaysia, households form their infl ation expectations by considering both backward- and forward-looking factors, such as recent shopping experiences and current income levels, as well as the future outlook of the domestic economy. Nevertheless, infl ation expectations differ across households, given the different compositions, priorities and experiences. Certain demographic groups that typically experience higher cost of living burden, such as lower-income and large households, tend to display higher infl ation expectations.
As commonly experienced by other countries, there is evidence of a wedge between households’ infl ation expectations and actual infl ation outturns. This refl ects households’ broad inattention to infl ation, varied information sets used to gain information about infl ation, different consumption patterns, as well as unanticipated shocks to the economy.
However, the impact of households’ infl ation expectations on their current spending decisions is small, refl ecting other more prominent determinants such as sentiments on income and current prices in driving consumption. The implication of this fi nding, therefore, needs to be considered with care and in the broader context of factors driving household consumption spending. Separately from consumption, higher infl ation expectations could result in higher actual future infl ation if they become entrenched, whereby one round of price increase triggers further rounds as infl ationary psychology takes hold. As such, it is important for central banks to place focus on ensuring that these expectations are stable and anchored, rather than engineering higher expectations to meet short-term economic goals. This goes back to the need for having a solid understanding of how households form infl ation expectations, in order for any expectation anchoring strategies to be effective.
104 Annual Report 2018
Outlook and
Policy in 2019
88 Annual Report 2018
To gain a complete understanding of the impact of infl ation expectations on the Malaysian economy, infl ation expectations of fi rms and fi nancial markets should also be assessed in order to obtain a comprehensive picture that includes insights on price- and wage-setting decisions, as well as fi nancial market valuations.
As ruminated by Tan Sri Dato’ Abdul Aziz bin Haji Taha, the second Malaysian Governor of Bank Negara Malaysia, nearly four decades ago – “Once businessmen and consumers discern an absence of will by the authorities to resist infl ation, their expectations of rising infl ation will be strengthened and they begin to act in a way that will make these expectations self-fulfi lling” (Bank Negara Malaysia, 1989).
Today, this statement remains highly relevant. For central banks, continuous research on the drivers of infl ation expectations, clarity in communication and educational pursuit in addressing inattention to infl ation – from the concept of infl ation to the technicalities of its formulation – will go a long way in preventing the unhinging of infl ation expectations.
References
Arioli, Rodolfo, Colm Bates, Heinz Dieden, Ioana Duca, Roberta Friz, Christian Gayer, Geoff Kenny, Aidan Meyler, Iskra Pavlova, “EU Consumers’ Quantitative Infl ation Perceptions and Expectations: An Evaluation,” European Central Bank Occasional Paper Series, 2017.
Bachmann, Rüdiger, Tim O. Berg, and Eric R. Sims, “Infl ation Expectations and Readiness to Spend: Cross-Sectional Evidence,” American Economic Journal: Economic Policy, 7(1), 1-35, 2015.
Bank Negara Malaysia, “Central Banking In An Era of Change, Landmark Speeches: 1959 –1988,” 1989.
Bank Negara Malaysia, “Evolving Household Balance Sheets and Implication for Private Consumption,” Annual Report, pages 70-73, 2013.
Baumeister, Roy F., Ellen Bratslavsky, Catrin Finkenauer, and Kathleen D. Vohs, “Bad is Stronger Than Good,” Review of General Psychology 5(4): 323-70, 2001.
Cavallo, Alberto, Guillermo Cruces, and Ricardo Perez-Truglia, “Infl ation Expectations, Learning, and Supermarket Prices: Evidence from Survey Experiments,” American Economic Journal: Macroeconomics 9(3): 1-35, 2017.
Coibion, Olivier, Yuriy Gorodnichenko, Saten Kumar, and Mathieu Pedemonte, “Infl ation Expectation as a Policy Tool?,” NBER Working Paper No. 24788, 2018.
Deutsche Bundesbank, “The Information Content of Survey Data on Expected Price Developments for Monetary Policy,” January Monthly Report 53(1), 35–49, 2001.
Doepke, Matthias, and Martin Schneider, “Infl ation and the Redistribution of Nominal Wealth,” Journal of Political Economy, Volume 114, (Number 6), 1069-109, 2006.
Ehrmann, Michael, Damjan Pfajar, and Emiliano Santoro, “Consumers’ Attitudes and Their Infl ation Expectations,” Finance and Economics Discussion Series, Divisions of Research & Statistics and Monetary Affairs, Federal Reserve Board, 2015.
Gamble, Amelie, “Euro Illusion or the Reverse? Effects of Currency and Income on Evaluation of Prices of Consumer Products,” Journal of Economics Psychology, 27(4), 531-540, 2006.
Gärling, Tommy, and Amelie Gamble, “Change in Perceived Value of Money without Change in Nominal Representation,” Göteborg Psychological Report No. 36:4, Göteborg University, Department of Psychology, 2006.
105Annual Report 2018
Outlook and
Policy in 2019
89Annual Report 2018
Gnan, Ernest, Johann Scharler, and Maria Antoinette Silgoner, “Infl ation Expectations – Role and Measurement for Monetary Policy,” Monetary Policy & the Economy, Oesterreichische Nationalbank (Austrian Central Bank), Issue 2, pages 41-67, 2009.
Hoover, Kevin D, “Phillips Curve,” The Concise Encyclopedia of Economics, 2008.
Ichiue, Hibiki, and Shusaku Nishiguchi, “Infl ation Expectations and Consumer Spending at the Zero Bound,” Bank of Japan Working Paper Series, 2013.
Kliesen, Kevin, “How Accurate Are Measures of Long-Term Infl ation Expectations?,” Federal Reserve Bank of St. Louis, 2015.
Leung, Christina, “The Demographics of Household Infl ation Perceptions and Expectations,” Reserve Bank of New Zealand, 2009.
Loke, Po Ling and Farina Adam Khong, “Infl ation: Perception vs. Reality,” Bank Negara Malaysia First Quarter 2017 Quarterly Bulletin, 2017.
Meyer, Brent, and Guhan Venkatu, “Demographic Differences in Infl ation Expectations: What Do They Really Mean?,” Federal Reserve Bank of Cleveland, 2011.
Mian, Atif, Rao Kamalesh, and Amir Sufi , “Household Balance Sheets, Consumption, and the Economic Slump,” The Quarterly Journal of Economics, Volume 128, Issue 4, Pages 1687–1726, 2013.
Mohanty, Deepak, “The Importance of Infl ation Expectations,” Speech at the S P Jain Institute of Management & Research, Mumbai, 2012.
Moore, Angus, “Measures of Infl ation Expectations in Australia,” Reserve Bank of Australia Bulletin, December 23-31, 2016.
Pasaogullari, Mehmet, and Timothy Bianco, “Survey-Based Measures of Infl ation Expectations,” Federal Reserve Bank of Cleveland, 2010.
Ranyard, Rob, Fabio Del Missier, Nicolao Bonini, Darren Duxbury, and Barbara Summers, “Perceptions and Expectations of Price Changes and Infl ation: A Review and Conceptual Framework,” Journal of Economic Psychology 29.4: 378-400, 2008.
Rowe, Jeremy, “How Are Households’ Infl ation Expectations Formed?,” Bank of England Quarterly Bulletin, vol. 56(2), pages 82-86, 2016.
Snir, Avichai and Daniel Levy, “Shrinking Goods and Sticky Prices: Theory and Evidence,” Working Paper Series 17/11, The Rimini Centre for Economic Analysis, 2011.

106 Annual Report 2018
Outlook and
Policy in 2019
107Annual Report 2018
Governance and
Organisational D
evelopm
ent
Governance andOrganisational Development
109 The Board of Directors110 Risk Management and Internal Controls114 Our People117 Technology117 Engaging with Our Stakeholders121 Organisation Structure122 List of Senior Officers

Governance and
Organisational D
evelopm
ent
109Annual Report 2018
Governance and Organisational Development
As the Central Bank for Malaysia, the Bank is mandated to promote monetary stability and financial stability conducive to the sustainable growth of the Malaysian economy. The Bank therefore places priority in strengthening its governance and internal capabilities to ensure it is effective in discharging its principal objects and functions under the laws it administers, and that it is responsible in managing its resources.
The Bank places priority in strengthening its governance and internal capabilities to ensure it is effective in discharging its principal objects and functions under the laws it administers, and that it is responsible in managing its resources
THE BOARD OF DIRECTORS
The Board of Directors is responsible for overseeing the management and operations of the Bank. It also reviews the performance of the Bank in delivering its mandates. The Board comprises the Governor as Chairman, the Deputy Governors, the Secretary General of the Treasury and independent non-executive members, with the latter forming the majority within the Board. The Board is further supported by three committees, namely the Board Governance Committee, Board Audit Committee and Board Risk Committee (Diagram 5.1). These committees – comprising solely of independent members – assist the Board in providing oversight of the administration of the Bank.
The year saw the appointment of a new Governor, Nor Shamsiah Yunus, on 1 July 2018, after Muhammad bin Ibrahim stepped down as Governor on 15 June 2018. Governor Nor Shamsiah was a Deputy Governor between 2010 and 2016, and was subsequently at the International Monetary Fund.
In discharging its responsibility, the Board engaged extensively with the Bank’s senior management on key economic and financial developments during the year that related to the Bank’s mandate. These included the economic challenges and priorities facing the country, the rising cost of living (and its implications for growth and the management of inflation), issues surrounding access to financing and insurance in particular for lower income households and innovative firms, and the Bank’s management of developments in financial technology. The Board also deliberated on a number of legislative reforms to facilitate the currency management operations and enforcement activities of the Bank.
The Board also reviewed the overall performance of the Bank, and discussed the Bank’s corporate performance indicators for 2019. Additionally, the Board deliberated on various organisational development priorities, including new demands on the Bank’s management of human capital, the Bank’s digital transformation journey, the Bank’s defences against cyberthreats, and initiatives to reinforce a strong culture of integrity, ethical conduct and professionalism among the Bank’s employees. The Board also deliberated on ways to strengthen project management within the Bank, including in project budgeting.
During the year, the Bank initiated an internal review to further strengthen the Bank’s overall framework for governance. The review will consider areas in which current practices of the Bank can be further enhanced to reflect global best practice, taking into account lessons from the Bank’s involvement in transactions that have come under scrutiny during the past year. As a central bank, confidence in the Bank is paramount to the effective performance of its mandate. Accordingly, the Bank will take this opportunity to examine the efficacy of decision-making structures within the Bank and ensure its operations and priorities remain consistent with its mandates.
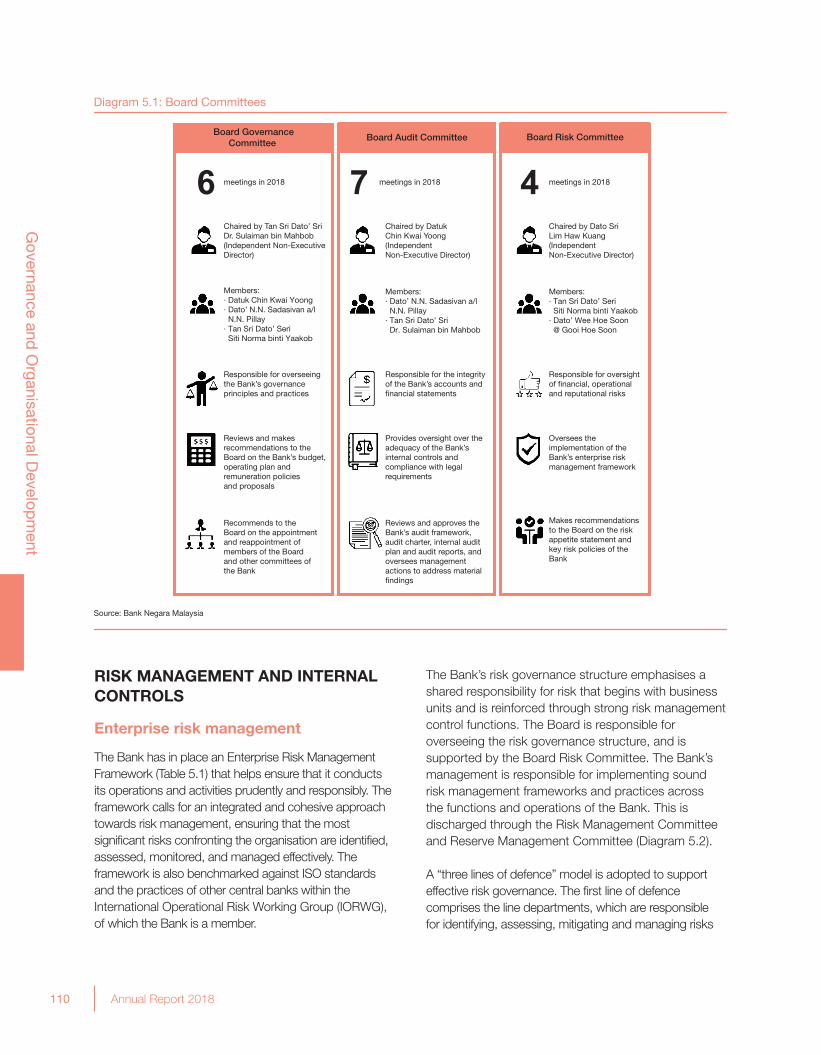
110 Annual Report 2018
Governance and
Organisational D
evelopm
ent
Diagram 5.1: Board Committees
Source: Bank Negara Malaysia
Board GovernanceCommittee
Board Risk CommitteeBoard Audit Committee
6 meetings in 2018 7 meetings in 2018
Reviews and makes recommendations to the Board on the Bank’s budget, operating plan and remuneration policies and proposals
4 meetings in 2018
Responsible for overseeing the Bank’s governance principles and practices
Responsible for the integrity of the Bank’s accounts and financial statements
Responsible for oversight of financial, operational and reputational risks
Chaired by Tan Sri Dato’ Sri Dr. Sulaiman bin Mahbob (Independent Non-Executive Director)
Recommends to the Board on the appointment and reappointment of members of the Board and other committees of the Bank
Chaired by Datuk Chin Kwai Yoong (Independent Non-Executive Director)
Provides oversight over the adequacy of the Bank’s internal controls and compliance with legal requirements
Chaired by Dato Sri Lim Haw Kuang (Independent Non-Executive Director)
Oversees the implementation of the Bank’s enterprise risk management framework
Members:· Dato’ N.N. Sadasivan a/l N.N. Pillay· Tan Sri Dato’ Sri Dr. Sulaiman bin Mahbob
Members:· Tan Sri Dato’ Seri Siti Norma binti Yaakob· Dato’ Wee Hoe Soon @ Gooi Hoe Soon
Makes recommendations to the Board on the risk appetite statement and key risk policies of the Bank
Reviews and approves the Bank’s audit framework, audit charter, internal audit plan and audit reports, and oversees management actions to address material findings
Members:· Datuk Chin Kwai Yoong· Dato’ N.N. Sadasivan a/l N.N. Pillay· Tan Sri Dato’ Seri Siti Norma binti Yaakob
RISK MANAGEMENT AND INTERNAL CONTROLS
Enterprise risk management
The Bank has in place an Enterprise Risk Management Framework (Table 5.1) that helps ensure that it conducts its operations and activities prudently and responsibly. The framework calls for an integrated and cohesive approach towards risk management, ensuring that the most significant risks confronting the organisation are identified, assessed, monitored, and managed effectively. The framework is also benchmarked against ISO standards and the practices of other central banks within the International Operational Risk Working Group (IORWG), of which the Bank is a member.
The Bank’s risk governance structure emphasises a shared responsibility for risk that begins with business units and is reinforced through strong risk management control functions. The Board is responsible for overseeing the risk governance structure, and is supported by the Board Risk Committee. The Bank’s management is responsible for implementing sound risk management frameworks and practices across the functions and operations of the Bank. This is discharged through the Risk Management Committee and Reserve Management Committee (Diagram 5.2).
A “three lines of defence” model is adopted to support effective risk governance. The first line of defence comprises the line departments, which are responsible for identifying, assessing, mitigating and managing risks
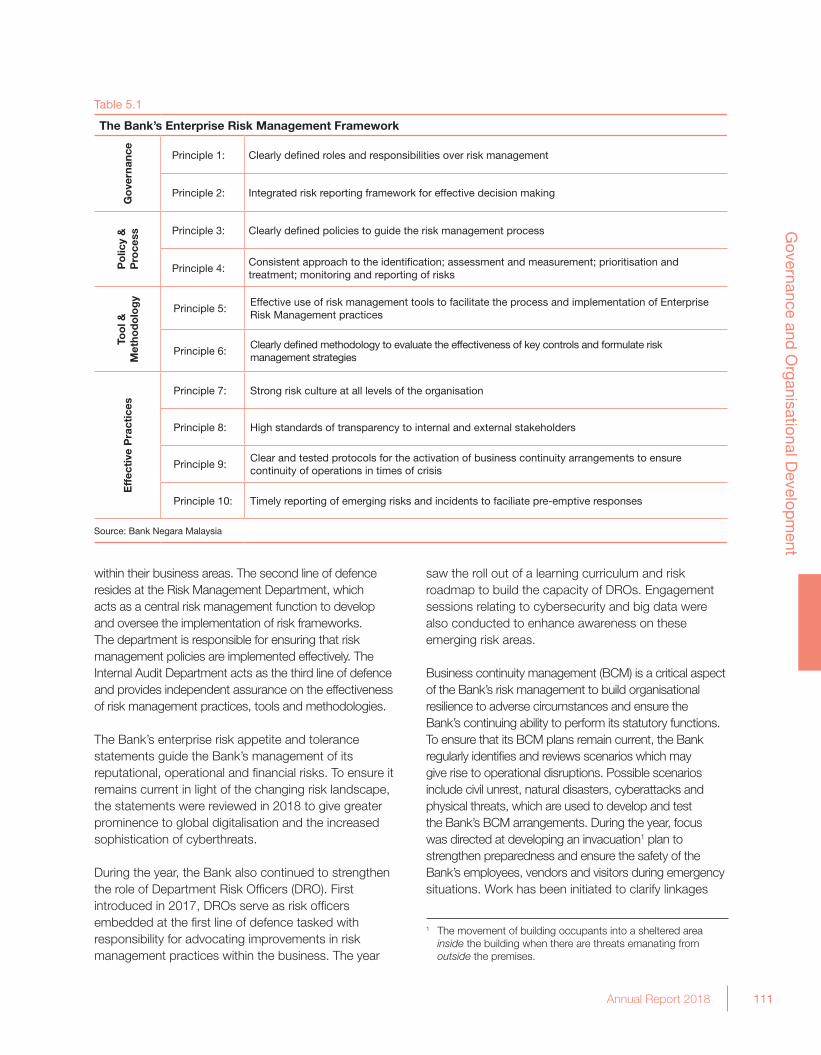
111Annual Report 2018
Governance and
Organisational D
evelopm
ent
within their business areas. The second line of defence resides at the Risk Management Department, which acts as a central risk management function to develop and oversee the implementation of risk frameworks. The department is responsible for ensuring that risk management policies are implemented effectively. The Internal Audit Department acts as the third line of defence and provides independent assurance on the effectiveness of risk management practices, tools and methodologies.
The Bank’s enterprise risk appetite and tolerance statements guide the Bank’s management of its reputational, operational and financial risks. To ensure it remains current in light of the changing risk landscape, the statements were reviewed in 2018 to give greater prominence to global digitalisation and the increased sophistication of cyberthreats. During the year, the Bank also continued to strengthen the role of Department Risk Officers (DRO). First introduced in 2017, DROs serve as risk officers embedded at the first line of defence tasked with responsibility for advocating improvements in risk management practices within the business. The year
saw the roll out of a learning curriculum and risk roadmap to build the capacity of DROs. Engagement sessions relating to cybersecurity and big data were also conducted to enhance awareness on these emerging risk areas.
Business continuity management (BCM) is a critical aspect of the Bank’s risk management to build organisational resilience to adverse circumstances and ensure the Bank’s continuing ability to perform its statutory functions. To ensure that its BCM plans remain current, the Bank regularly identifies and reviews scenarios which may give rise to operational disruptions. Possible scenarios include civil unrest, natural disasters, cyberattacks and physical threats, which are used to develop and test the Bank’s BCM arrangements. During the year, focus was directed at developing an invacuation1 plan to strengthen preparedness and ensure the safety of the Bank’s employees, vendors and visitors during emergency situations. Work has been initiated to clarify linkages
The Bank’s Enterprise Risk Management FrameworkG
ove
rnan
ce Principle 1: Clearly defi ned roles and responsibilities over risk management
Principle 2: Integrated risk reporting framework for effective decision making
Po
licy
&
Pro
cess Principle 3: Clearly defi ned policies to guide the risk management process
Principle 4:Consistent approach to the identifi cation; assessment and measurement; prioritisation and treatment; monitoring and reporting of risks
Too
l &M
etho
do
log
y
Principle 5:Effective use of risk management tools to facilitate the process and implementation of Enterprise Risk Management practices
Principle 6:Clearly defi ned methodology to evaluate the effectiveness of key controls and formulate risk management strategies
Eff
ecti
ve P
ract
ices
Principle 7: Strong risk culture at all levels of the organisation
Principle 8: High standards of transparency to internal and external stakeholders
Principle 9:Clear and tested protocols for the activation of business continuity arrangements to ensure continuity of operations in times of crisis
Principle 10: Timely reporting of emerging risks and incidents to faciliate pre-emptive responses
Source: Bank Negara Malaysia
Table 5.1
1 The movement of building occupants into a sheltered area inside the building when there are threats emanating from outside the premises.
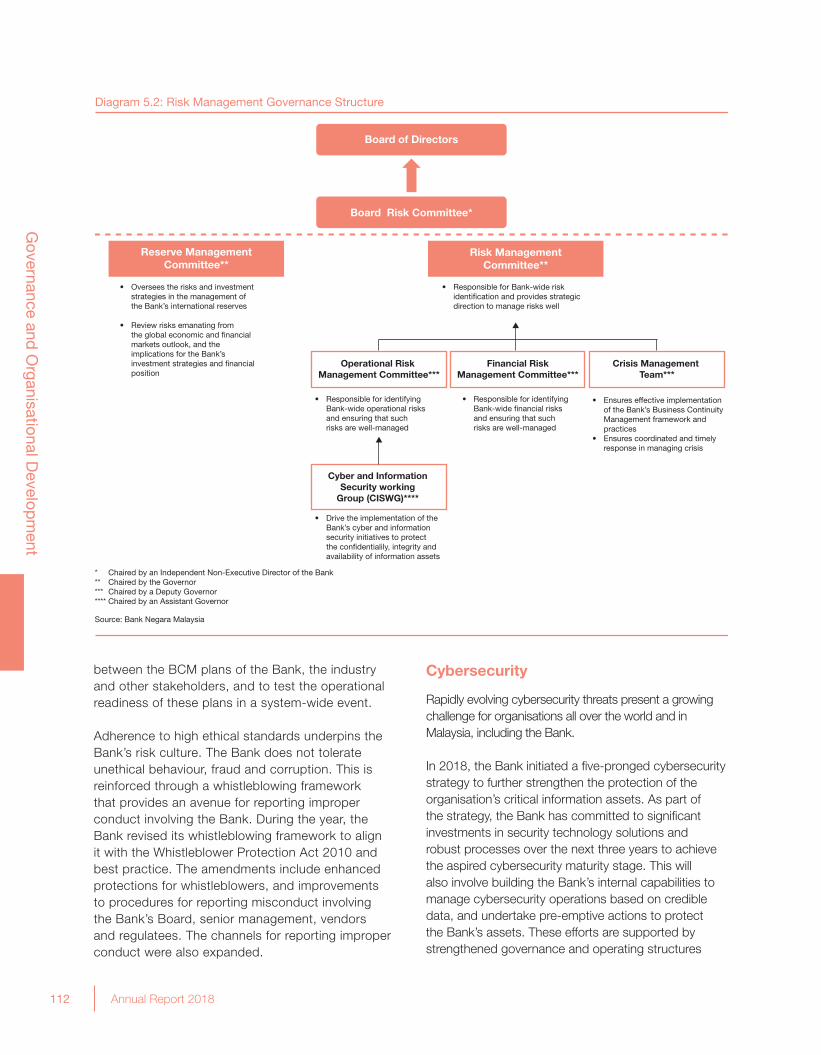
112 Annual Report 2018
Governance and
Organisational D
evelopm
ent
Diagram 5.2: Risk Management Governance Structure
Board of Directors
Board Risk Committee*
Reserve Management Committee**
Risk Management Committee**
• Oversees the risks and investment strategies in the management of the Bank’s international reserves
• Review risks emanating from the global economic and financial markets outlook, and the implications for the Bank’s investment strategies and financial position
* Chaired by an Independent Non-Executive Director of the Bank** Chaired by the Governor*** Chaired by a Deputy Governor**** Chaired by an Assistant Governor
• Responsible for identifying Bank-wide operational risks and ensuring that such risks are well-managed
• Responsible for identifying Bank-wide financial risks and ensuring that such risks are well-managed
• Responsible for Bank-wide risk identification and provides strategic direction to manage risks well
Financial RiskManagement Committee***
Operational Risk Management Committee***
• Drive the implementation of the Bank’s cyber and information security initiatives to protect the confidentialily, integrity and availability of information assets
Cyber and Information Security working
Group (CISWG)****
Crisis Management Team***
• Ensures effective implementation of the Bank’s Business Continuity Management framework and practices• Ensures coordinated and timely response in managing crisis
Source: Bank Negara Malaysia
between the BCM plans of the Bank, the industry and other stakeholders, and to test the operational readiness of these plans in a system-wide event.
Adherence to high ethical standards underpins the Bank’s risk culture. The Bank does not tolerate unethical behaviour, fraud and corruption. This is reinforced through a whistleblowing framework that provides an avenue for reporting improper conduct involving the Bank. During the year, the Bank revised its whistleblowing framework to align it with the Whistleblower Protection Act 2010 and best practice. The amendments include enhanced protections for whistleblowers, and improvements to procedures for reporting misconduct involving the Bank’s Board, senior management, vendors and regulatees. The channels for reporting improper conduct were also expanded.
Cybersecurity
Rapidly evolving cybersecurity threats present a growing challenge for organisations all over the world and in Malaysia, including the Bank.
In 2018, the Bank initiated a five-pronged cybersecurity strategy to further strengthen the protection of the organisation’s critical information assets. As part of the strategy, the Bank has committed to significant investments in security technology solutions and robust processes over the next three years to achieve the aspired cybersecurity maturity stage. This will also involve building the Bank’s internal capabilities to manage cybersecurity operations based on credible data, and undertake pre-emptive actions to protect the Bank’s assets. These efforts are supported by strengthened governance and operating structures
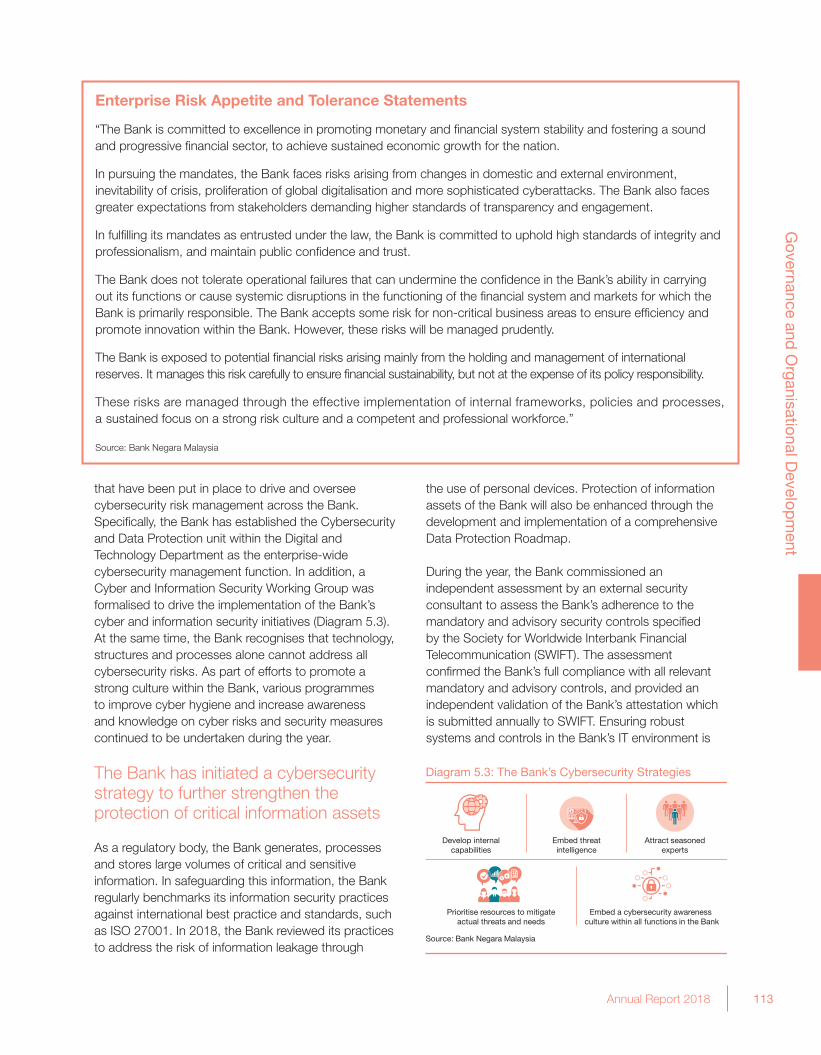
113Annual Report 2018
Governance and
Organisational D
evelopm
ent
that have been put in place to drive and oversee cybersecurity risk management across the Bank. Specifically, the Bank has established the Cybersecurity and Data Protection unit within the Digital and Technology Department as the enterprise-wide cybersecurity management function. In addition, a Cyber and Information Security Working Group was formalised to drive the implementation of the Bank’s cyber and information security initiatives (Diagram 5.3). At the same time, the Bank recognises that technology, structures and processes alone cannot address all cybersecurity risks. As part of efforts to promote a strong culture within the Bank, various programmes to improve cyber hygiene and increase awareness and knowledge on cyber risks and security measures continued to be undertaken during the year.
The Bank has initiated a cybersecurity strategy to further strengthen the protection of critical information assets
As a regulatory body, the Bank generates, processes and stores large volumes of critical and sensitive information. In safeguarding this information, the Bank regularly benchmarks its information security practices against international best practice and standards, such as ISO 27001. In 2018, the Bank reviewed its practices to address the risk of information leakage through
the use of personal devices. Protection of information assets of the Bank will also be enhanced through the development and implementation of a comprehensive Data Protection Roadmap.
During the year, the Bank commissioned an independent assessment by an external security consultant to assess the Bank’s adherence to the mandatory and advisory security controls specified by the Society for Worldwide Interbank Financial Telecommunication (SWIFT). The assessment confirmed the Bank’s full compliance with all relevant mandatory and advisory controls, and provided an independent validation of the Bank’s attestation which is submitted annually to SWIFT. Ensuring robust systems and controls in the Bank’s IT environment is
Enterprise Risk Appetite and Tolerance Statements
“The Bank is committed to excellence in promoting monetary and financial system stability and fostering a sound and progressive financial sector, to achieve sustained economic growth for the nation.
In pursuing the mandates, the Bank faces risks arising from changes in domestic and external environment, inevitability of crisis, proliferation of global digitalisation and more sophisticated cyberattacks. The Bank also faces greater expectations from stakeholders demanding higher standards of transparency and engagement.
In fulfilling its mandates as entrusted under the law, the Bank is committed to uphold high standards of integrity and professionalism, and maintain public confidence and trust.
The Bank does not tolerate operational failures that can undermine the confidence in the Bank’s ability in carrying out its functions or cause systemic disruptions in the functioning of the financial system and markets for which the Bank is primarily responsible. The Bank accepts some risk for non-critical business areas to ensure efficiency and promote innovation within the Bank. However, these risks will be managed prudently.
The Bank is exposed to potential financial risks arising mainly from the holding and management of international reserves. It manages this risk carefully to ensure financial sustainability, but not at the expense of its policy responsibility.
These risks are managed through the effective implementation of internal frameworks, policies and processes, a sustained focus on a strong risk culture and a competent and professional workforce.”
Source: Bank Negara Malaysia
Diagram 5.3: The Bank’s Cybersecurity Strategies
Attract seasonedexperts
Embed threatintelligence
Develop internalcapabilities
Prioritise resources to mitigateactual threats and needs
Embed a cybersecurity awareness culture within all functions in the Bank
Source: Bank Negara Malaysia
114 Annual Report 2018
Governance and
Organisational D
evelopm
ent
an ongoing process as underscored by an incident in March 2018 involving an unauthorised attempt to send fund transfer instructions through the Bank’s SWIFT platform. The attempt was foiled by the Bank, with no resulting operational disruption or financial loss. Key observations of the incident were shared with SWIFT and other relevant parties in order to strengthen industry resilience against cyberthreats.
Internal audit
The Board Audit Committee is responsible for reviewing the effectiveness of the Bank’s internal controls and compliance with legal and regulatory requirements. It also provides oversight over the internal audit function of the Bank. It is also responsible for the integrity of the Bank’s financial statements.
The Internal Audit Department provides independent assurance to the Board Audit Committee on the adequacy and effectiveness of the Bank’s governance, risk management and internal control processes. The department conducts regular assessments on the activities of departments and entities related to the Bank to identify and address risks. An audit plan is developed each year and reviewed quarterly to ensure that audit activities reflect changes in the Bank’s risk profile and emerging risks. Apart from providing assurance, the department also participates as an independent observer in several of the Bank’s key projects and committees. This allows the department to provide timely feedback for continuous enhancements of internal controls and governance to mitigate potential risks. The department also provides the Minister of Finance with an independent quarterly report on the Bank’s international reserve management activities. This is to assure the Minister that the reserves have been managed in accordance with the established policies and guidelines approved by the Board.
Audit activities are conducted in conformance with the requirements of the Institute of Internal Auditors’ International Standards for the Professional Practice of Internal Auditing. The principles espoused by the Committee of Sponsoring Organizations of the Treadway Commission (COSO) are embedded in the audit approaches for assessing the Bank’s control environment. The department further undertakes continuous efforts to implement quality assurance and improvement measures covering all aspects of the internal audit function. In 2018, these measures
focused on increasing the efficiency and rigour of the audit process, and leveraging on technology to improve audit documentation.
Audits conducted in 2018 are set out in Diagram 5.4 and include cybersecurity, data protection, treasury and reserve management, business continuity management, procurement and risk governance.
OUR PEOPLE
Sustaining a positive, progressive and productive work environment
The Bank is committed to attracting and developing the best people to deliver on its mandates. In keeping with this commitment, the Bank embarked on a number of initiatives in 2018 to create and sustain a positive, progressive and productive environment for its workforce of over 3,000 employees (Diagram 5.5). During the year, the Bank conducted a survey to ascertain employee engagement and enablement levels across the organisation. While employee engagement and enablement were at satisfactory levels, the survey also helped check the pulse of the organisation’s culture. The survey uncovered, among others, perspectives on the performance evaluation framework, career development, decision making processes and organisational climate. Following the conclusion of the exercise, a townhall was conducted to inform employees of the survey results and to set out the Bank’s near-term organisational priorities to create a more open and supportive work climate.
The Bank is enhancing its performance evaluation framework for employees to encourage a more holistic approach to performance, rewards and promotions
The Bank is committed to upholding the highest standards of professionalism. This involves ongoing efforts to promote the organisation’s ethics and culture. In 2018, the Bank undertook specific initiatives to reinforce a positive culture of engagement at all levels of the organisation, centred on norms such as transparency and objectivity, constructive challenge and candid communication. While strengthening culture involves changing deeply entrenched behaviours, beliefs and mindsets, measures are being introduced to further strengthen the alignment between the desired
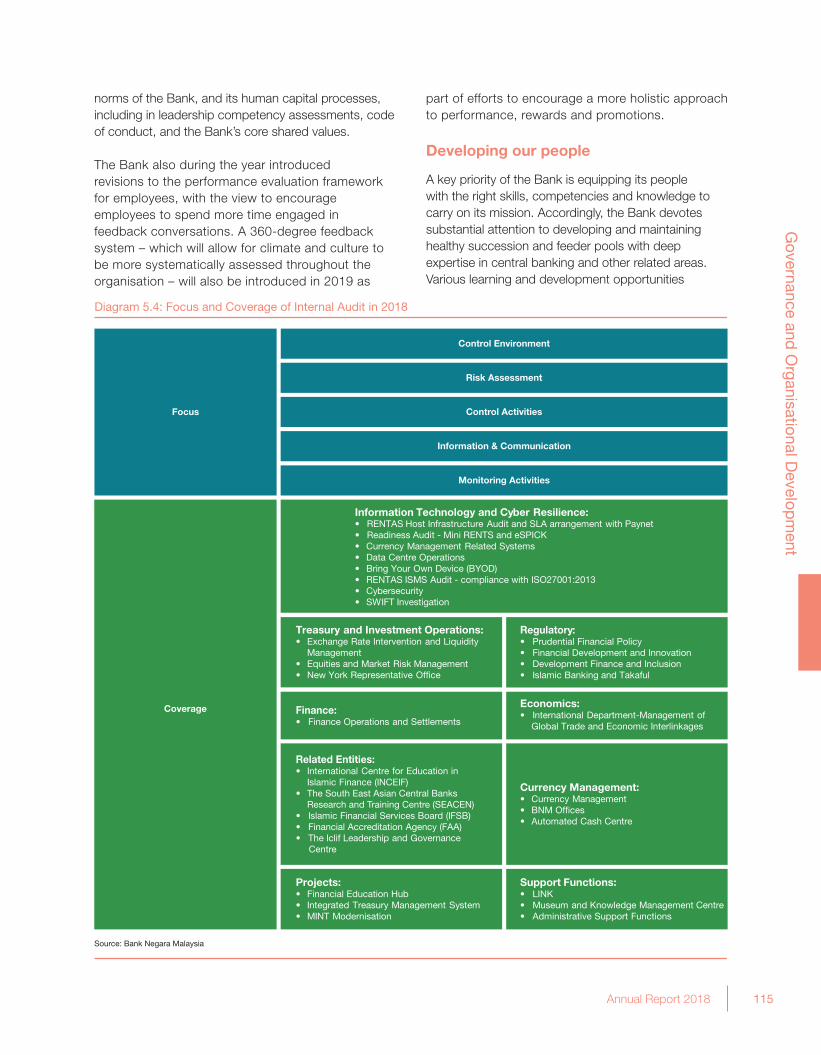
115Annual Report 2018
Governance and
Organisational D
evelopm
ent
Diagram 5.4: Focus and Coverage of Internal Audit in 2018
Source: Bank Negara Malaysia
Information Technology and Cyber Resilience:• RENTAS Host Infrastructure Audit and SLA arrangement with Paynet• Readiness Audit - Mini RENTS and eSPICK• Currency Management Related Systems• Data Centre Operations• Bring Your Own Device (BYOD)• RENTAS ISMS Audit - compliance with ISO27001:2013 • Cybersecurity• SWIFT Investigation
Regulatory:• Prudential Financial Policy• Financial Development and Innovation• Development Finance and Inclusion• Islamic Banking and Takaful
Treasury and Investment Operations:• Exchange Rate Intervention and Liquidity Management• Equities and Market Risk Management• New York Representative Office
Finance:• Finance Operations and Settlements
Economics:• International Department-Management of Global Trade and Economic Interlinkages
Projects:• Financial Education Hub• Integrated Treasury Management System• MINT Modernisation
Currency Management:• Currency Management• BNM Offices• Automated Cash Centre
Monitoring Activities
Information & Communication
Control Activities
Risk Assessment
Control Environment
Coverage
Support Functions:• LINK• Museum and Knowledge Management Centre• Administrative Support Functions
Related Entities:• International Centre for Education in Islamic Finance (INCEIF) • The South East Asian Central Banks Research and Training Centre (SEACEN)• Islamic Financial Services Board (IFSB)• Financial Accreditation Agency (FAA)• The Iclif Leadership and Governance Centre
Focus
norms of the Bank, and its human capital processes, including in leadership competency assessments, code of conduct, and the Bank’s core shared values.
The Bank also during the year introduced revisions to the performance evaluation framework for employees, with the view to encourage employees to spend more time engaged in feedback conversations. A 360-degree feedback system – which will allow for climate and culture to be more systematically assessed throughout the organisation – will also be introduced in 2019 as
part of efforts to encourage a more holistic approach to performance, rewards and promotions.
Developing our people
A key priority of the Bank is equipping its people with the right skills, competencies and knowledge to carry on its mission. Accordingly, the Bank devotes substantial attention to developing and maintaining healthy succession and feeder pools with deep expertise in central banking and other related areas. Various learning and development opportunities
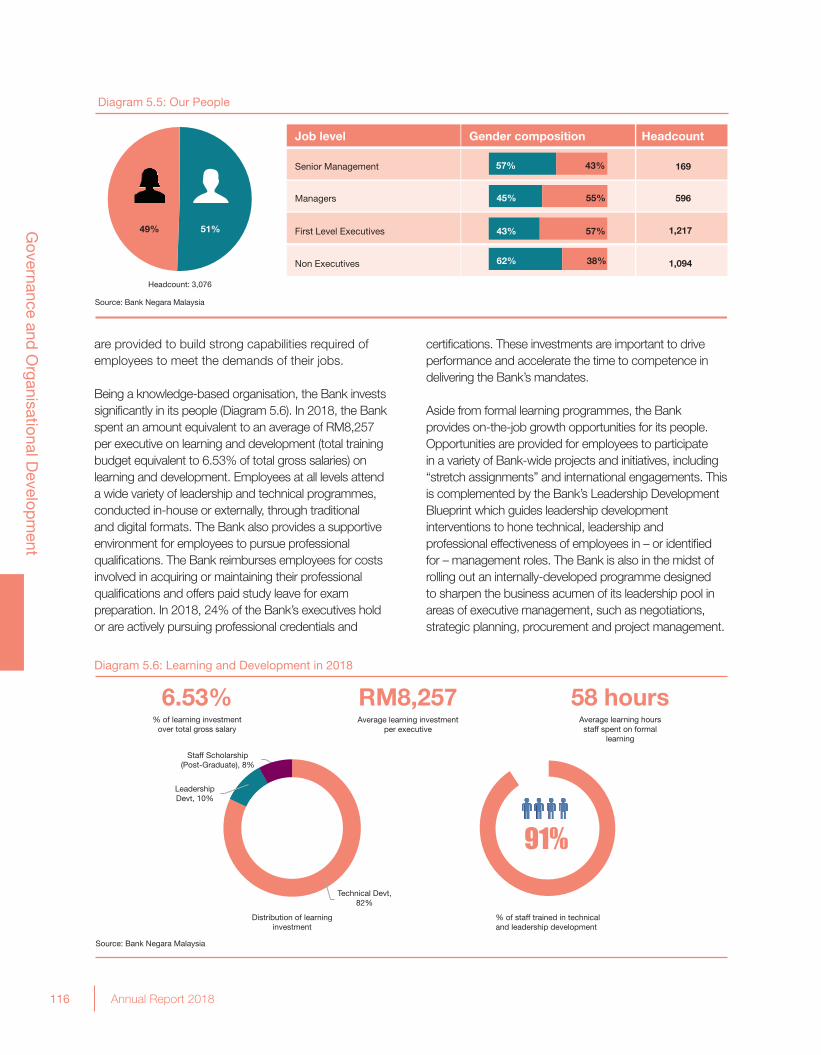
116 Annual Report 2018
Governance and
Organisational D
evelopm
ent
are provided to build strong capabilities required of employees to meet the demands of their jobs.
Being a knowledge-based organisation, the Bank invests significantly in its people (Diagram 5.6). In 2018, the Bank spent an amount equivalent to an average of RM8,257 per executive on learning and development (total training budget equivalent to 6.53% of total gross salaries) on learning and development. Employees at all levels attend a wide variety of leadership and technical programmes, conducted in-house or externally, through traditional and digital formats. The Bank also provides a supportive environment for employees to pursue professional qualifications. The Bank reimburses employees for costs involved in acquiring or maintaining their professional qualifications and offers paid study leave for exam preparation. In 2018, 24% of the Bank’s executives hold or are actively pursuing professional credentials and
certifications. These investments are important to drive performance and accelerate the time to competence in delivering the Bank’s mandates. Aside from formal learning programmes, the Bank provides on-the-job growth opportunities for its people. Opportunities are provided for employees to participate in a variety of Bank-wide projects and initiatives, including “stretch assignments” and international engagements. This is complemented by the Bank’s Leadership Development Blueprint which guides leadership development interventions to hone technical, leadership and professional effectiveness of employees in – or identified for – management roles. The Bank is also in the midst of rolling out an internally-developed programme designed to sharpen the business acumen of its leadership pool in areas of executive management, such as negotiations, strategic planning, procurement and project management.
Diagram 5.6: Learning and Development in 2018
6.53% RM8,257 58 hours% of learning investment
over total gross salaryAverage learning investment
per executiveAverage learning hoursstaff spent on formal
learning
Source: Bank Negara Malaysia
Distribution of learninginvestment
91%
% of staff trained in technicaland leadership development
Staff Scholarship(Post-Graduate), 8%
LeadershipDevt, 10%
Technical Devt,82%
Headcount: 3,076
51%49%
Source: Bank Negara Malaysia
Diagram 5.5: Our People
Managers
First Level Executives
Non Executives
Senior Management
45% 55%
43% 57%
62% 38%
57% 43%
Job level Gender composition Headcount
169
596
1,217
1,094
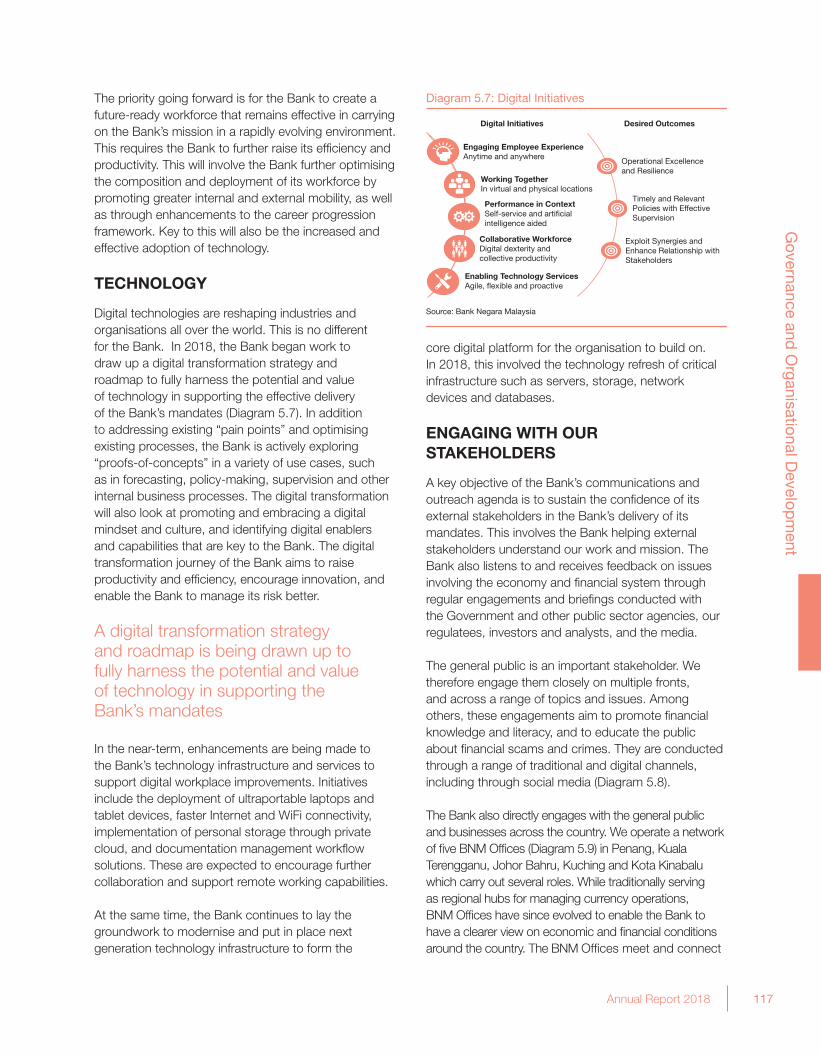
117Annual Report 2018
Governance and
Organisational D
evelopm
ent
The priority going forward is for the Bank to create a future-ready workforce that remains effective in carrying on the Bank’s mission in a rapidly evolving environment. This requires the Bank to further raise its efficiency and productivity. This will involve the Bank further optimising the composition and deployment of its workforce by promoting greater internal and external mobility, as well as through enhancements to the career progression framework. Key to this will also be the increased and effective adoption of technology.
TECHNOLOGY
Digital technologies are reshaping industries and organisations all over the world. This is no different for the Bank. In 2018, the Bank began work to draw up a digital transformation strategy and roadmap to fully harness the potential and value of technology in supporting the effective delivery of the Bank’s mandates (Diagram 5.7). In addition to addressing existing “pain points” and optimising existing processes, the Bank is actively exploring “proofs-of-concepts” in a variety of use cases, such as in forecasting, policy-making, supervision and other internal business processes. The digital transformation will also look at promoting and embracing a digital mindset and culture, and identifying digital enablers and capabilities that are key to the Bank. The digital transformation journey of the Bank aims to raise productivity and efficiency, encourage innovation, and enable the Bank to manage its risk better.
A digital transformation strategy and roadmap is being drawn up to fully harness the potential and value of technology in supporting the Bank’s mandates
In the near-term, enhancements are being made to the Bank’s technology infrastructure and services to support digital workplace improvements. Initiatives include the deployment of ultraportable laptops and tablet devices, faster Internet and WiFi connectivity, implementation of personal storage through private cloud, and documentation management workflow solutions. These are expected to encourage further collaboration and support remote working capabilities.
At the same time, the Bank continues to lay the groundwork to modernise and put in place next generation technology infrastructure to form the
core digital platform for the organisation to build on. In 2018, this involved the technology refresh of critical infrastructure such as servers, storage, network devices and databases.
ENGAGING WITH OUR STAKEHOLDERS
A key objective of the Bank’s communications and outreach agenda is to sustain the confidence of its external stakeholders in the Bank’s delivery of its mandates. This involves the Bank helping external stakeholders understand our work and mission. The Bank also listens to and receives feedback on issues involving the economy and financial system through regular engagements and briefings conducted with the Government and other public sector agencies, our regulatees, investors and analysts, and the media.
The general public is an important stakeholder. We therefore engage them closely on multiple fronts, and across a range of topics and issues. Among others, these engagements aim to promote financial knowledge and literacy, and to educate the public about financial scams and crimes. They are conducted through a range of traditional and digital channels, including through social media (Diagram 5.8). The Bank also directly engages with the general public and businesses across the country. We operate a network of five BNM Offices (Diagram 5.9) in Penang, Kuala Terengganu, Johor Bahru, Kuching and Kota Kinabalu which carry out several roles. While traditionally serving as regional hubs for managing currency operations, BNM Offices have since evolved to enable the Bank to have a clearer view on economic and financial conditions around the country. The BNM Offices meet and connect
Diagram 5.7: Digital Initiatives
Operational Excellence and Resilience
Digital Initiatives Desired Outcomes
Source: Bank Negara Malaysia
Engaging Employee ExperienceAnytime and anywhere
Working TogetherIn virtual and physical locations
Performance in ContextSelf-service and artificialintelligence aided
Collaborative WorkforceDigital dexterity andcollective productivity
Enabling Technology ServicesAgile, flexible and proactive
Timely and Relevant Policies with Effective Supervision
Exploit Synergies and Enhance Relationship with Stakeholders
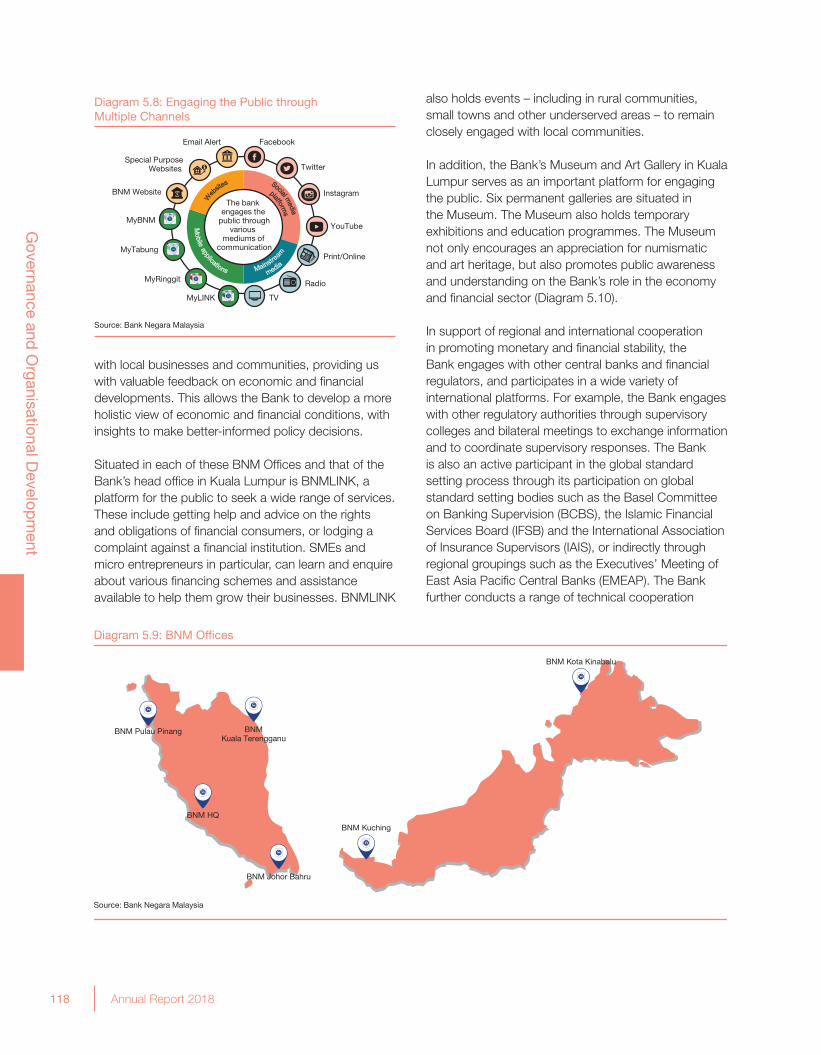
118 Annual Report 2018
Governance and
Organisational D
evelopm
ent
with local businesses and communities, providing us with valuable feedback on economic and financial developments. This allows the Bank to develop a more holistic view of economic and financial conditions, with insights to make better-informed policy decisions.
Situated in each of these BNM Offices and that of the Bank’s head office in Kuala Lumpur is BNMLINK, a platform for the public to seek a wide range of services. These include getting help and advice on the rights and obligations of financial consumers, or lodging a complaint against a financial institution. SMEs and micro entrepreneurs in particular, can learn and enquire about various financing schemes and assistance available to help them grow their businesses. BNMLINK
also holds events – including in rural communities, small towns and other underserved areas – to remain closely engaged with local communities.
In addition, the Bank’s Museum and Art Gallery in Kuala Lumpur serves as an important platform for engaging the public. Six permanent galleries are situated in the Museum. The Museum also holds temporary exhibitions and education programmes. The Museum not only encourages an appreciation for numismatic and art heritage, but also promotes public awareness and understanding on the Bank’s role in the economy and financial sector (Diagram 5.10).
In support of regional and international cooperation in promoting monetary and financial stability, the Bank engages with other central banks and financial regulators, and participates in a wide variety of international platforms. For example, the Bank engages with other regulatory authorities through supervisory colleges and bilateral meetings to exchange information and to coordinate supervisory responses. The Bank is also an active participant in the global standard setting process through its participation on global standard setting bodies such as the Basel Committee on Banking Supervision (BCBS), the Islamic Financial Services Board (IFSB) and the International Association of Insurance Supervisors (IAIS), or indirectly through regional groupings such as the Executives’ Meeting of East Asia Pacific Central Banks (EMEAP). The Bank further conducts a range of technical cooperation
Diagram 5.8: Engaging the Public through Multiple Channels
Source: Bank Negara Malaysia
YouTube
MyBNM
MyTabung
MyLINK
MyRinggit
BNM Website
Special Purpose Websites
Email Alert
Print/Online
Radio
TV
The bank engages the
public through various
mediums of communication
Diagram 5.9: BNM Offices
BNM Pulau Pinang BNMKuala Terengganu
BNM Johor Bahru
BNM Kuching
BNM Kota Kinabalu
BNM HQ
Source: Bank Negara Malaysia

119Annual Report 2018
Governance and
Organisational D
evelopm
ent
Diagram 5.10: The Museum and Art Gallery in 2018
The Art of Printmaking Exhibition
Tun Ismail Ali: Paragon of Trust and Integrity Exhibition
Children’s Festival
Financial LATeracy Exhibition at Muzium Darul Ridzuan
Source: Bank Negara Malaysia
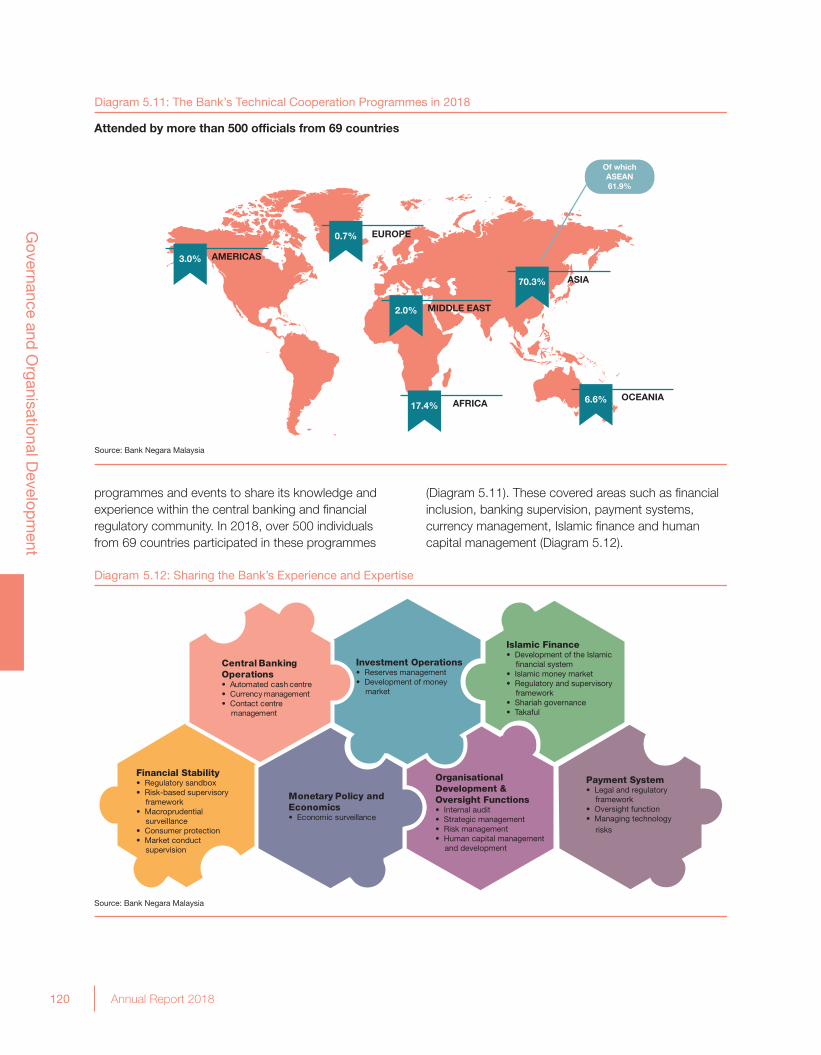
120 Annual Report 2018
Governance and
Organisational D
evelopm
ent
Source: Bank Negara Malaysia
Diagram 5.11: The Bank’s Technical Cooperation Programmes in 2018
Attended by more than 500 officials from 69 countries
AMERICAS3.0%
EUROPE0.7%
MIDDLE EAST2.0%
ASIA70.3%
OCEANIA6.6%AFRICA17.4%
Of whichASEAN61.9%
Source: Bank Negara Malaysia
Diagram 5.12: Sharing the Bank’s Experience and Expertise
Central Banking Operations• Automated cash centre• Currency management• Contact centre
management
Investment Operations• Reserves management • Development of money
market
Financial Stability• Regulatory sandbox• Risk-based supervisory
framework• Macroprudential
surveillance• Consumer protection• Market conduct
supervision
Organisational Development & Oversight Functions• Internal audit• Strategic management• Risk management• Human capital management
and development
Monetary Policy and Economics• Economic surveillance
Payment System • Legal and regulatory
framework• Oversight function• Managing technology
risks
Islamic Finance• Development of the Islamic
financial system• Islamic money market• Regulatory and supervisory
framework• Shariah governance• Takaful
programmes and events to share its knowledge and experience within the central banking and financial regulatory community. In 2018, over 500 individuals from 69 countries participated in these programmes
(Diagram 5.11). These covered areas such as financial inclusion, banking supervision, payment systems, currency management, Islamic finance and human capital management (Diagram 5.12).
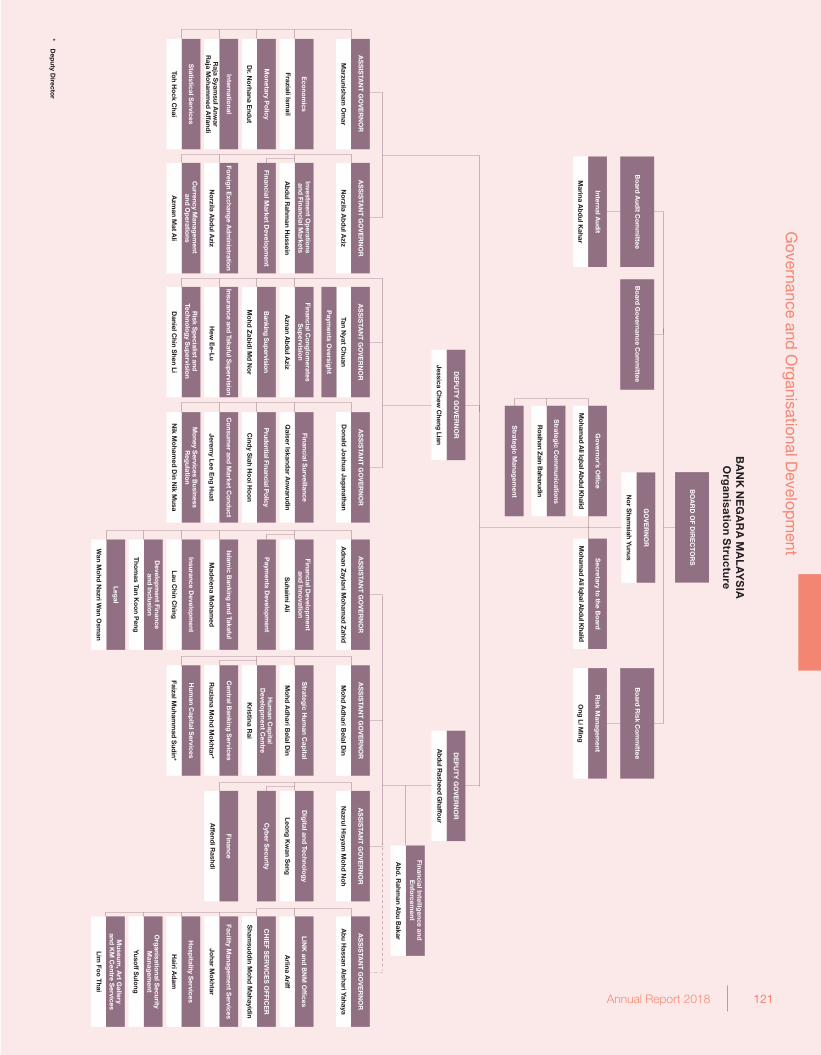
Governance and
Organisational D
evelopm
ent
* D
eputy D
irector
AS
SIS
TAN
T G
OV
ER
NO
R
Dr. N
orhana E
ndut
Mo
netary Po
licy
Fraziali Ismail
Eco
nom
ics
Raja S
yamsul A
nwar
Raja M
oham
med
Affand
i
International
Toh H
ock C
hai
Statistical S
ervices
Marzunisham
Om
arD
onald
Joshua Jag
anathan
AS
SIS
TAN
T G
OV
ER
NO
R
Qaiser Iskand
ar Anw
arudin
Financial Surveillance
Prudential Financial P
olicy
Cind
y Siah H
oo
i Ho
on
Jeremy Lee E
ng H
uat
Co
nsumer and
Market C
ond
uct
Nik M
oham
ed D
in Nik M
usa
Mo
ney Services B
usinessR
egulatio
n
Mo
hd A
dhari B
elal Din
AS
SIS
TAN
T G
OV
ER
NO
RA
SS
ISTA
NT
GO
VE
RN
OR
Legal
Wan M
ohd
Nazri W
an Osm
an
Suhaim
i Ali
Financial Develo
pm
ent and
Innovatio
n
Paym
ents Develo
pm
ent
Mad
elena Mo
hamed
Islamic B
anking and
Takaful
Lau Chin C
hing
Tho
mas Tan K
oo
n Peng
Develo
pm
ent Financeand
Inclusion
Insurance Develo
pm
ent
Ab
d. R
ahman A
bu B
akar
Financial Intelligence and
E
nforcem
ent
DE
PU
TY
GO
VE
RN
OR
Jessica Chew
Cheng
LianA
bdul Rasheed G
haffour
DE
PU
TY
GO
VE
RN
OR
AS
SIS
TAN
T G
OV
ER
NO
R
Financial Market D
evelop
ment
No
rzila Ab
dul A
ziz
Foreig
n Exchang
e Ad
ministratio
n
Azm
an Mat A
li
Currency M
anagem
ent and
Op
erations
Ab
dul R
ahman H
ussein
Investment O
peratio
ns and
Financial Markets
No
rzila Ab
dul A
ziz
Banking S
upervision
AS
SIS
TAN
T G
OV
ER
NO
R
Financial Co
nglo
merates
Sup
ervision
Aznan A
bd
ul Aziz
Insurance and Takaful S
upervisio
n
Hew
Ee-Lu
Daniel C
hin Shen Li
Risk S
pecialist and
Techno
log
y Sup
ervision
Mo
hd Z
abid
i Md
No
r
Tan Nyat C
huan
Paym
ents Oversig
ht
AS
SIS
TAN
T G
OV
ER
NO
R
Affend
i Rashd
i
Finance
Leong
Kw
an Seng
Dig
ital and Techno
log
y
Cyb
er Security
Nazrul H
isyam M
ohd
No
hA
bu H
assan Alshari Yahaya
Arlina A
riff
Johar M
okhtar
Hairi A
dam
Facility Manag
ement S
ervices
Yusoff S
ulong
Org
anisational S
ecurity M
anagem
ent
Lim Fo
o T
hai
Ho
spitality S
ervices
Museum
, Art G
alleryand
KM
Centre S
ervices
LINK
and B
NM
Offices
Sham
sudd
in Mo
hd M
ahayidin
CH
IEF S
ER
VIC
ES
OFFIC
ER
Ad
nan Zaylani M
oham
ad Z
ahid
Ruziana M
ohd
Mo
khtar*
Mo
hd A
dhari B
elal Din
Strateg
ic Hum
an Cap
ital
Hum
an Cap
ital D
evelop
ment C
entre
Central B
anking S
ervices
Faizal Muham
mad
Sud
in*
Hum
an Cap
ital Services
Kristina R
ai
BA
NK
NE
GA
RA
MA
LA
YS
IAO
rga
nisatio
n Stru
ctu
re
Bo
ard G
overnance C
om
mittee
Marina A
bd
ul Kahar
Internal Aud
it
Bo
ard A
udit C
om
mittee
Bo
ard R
isk Co
mm
ittee
Ong
Li Ming
Risk M
anagem
ent
Moham
ad Ali Iqbal A
bdul Khalid
Moham
ad Ali Iqbal A
bdul Khalid
Secretary to
the Bo
ard
GO
VE
RN
OR
No
r Sham
siah Yunus
Go
vernor’s O
ffice
Strateg
ic Manag
ement
Rosihan Z
ain Baharudin
Strateg
ic Co
mm
unications
BO
AR
D O
F DIR
EC
TO
RS
AS
SIS
TAN
T G
OV
ER
NO
R 121Annual Report 2018
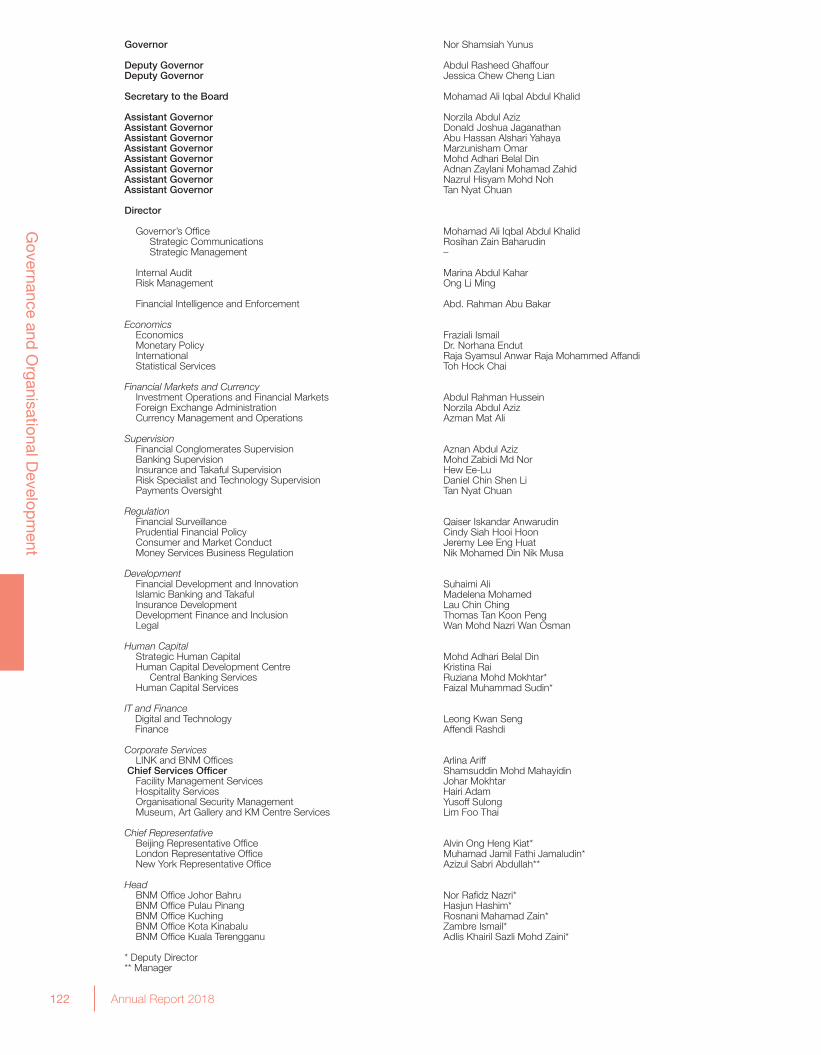
122 Annual Report 2018
Governance and
Organisational D
evelopm
ent
Governor
Deputy GovernorDeputy Governor
Secretary to the Board
Assistant GovernorAssistant GovernorAssistant GovernorAssistant GovernorAssistant GovernorAssistant GovernorAssistant GovernorAssistant Governor
Director
Governor’s Offi ce Strategic Communications Strategic Management
Internal Audit Risk Management
Financial Intelligence and Enforcement
Economics Economics Monetary Policy International Statistical Services
Financial Markets and Currency Investment Operations and Financial Markets Foreign Exchange Administration Currency Management and Operations
Supervision Financial Conglomerates Supervision Banking Supervision Insurance and Takaful Supervision Risk Specialist and Technology Supervision Payments Oversight
Regulation Financial Surveillance Prudential Financial Policy Consumer and Market Conduct Money Services Business Regulation Development Financial Development and Innovation Islamic Banking and Takaful Insurance Development Development Finance and Inclusion Legal
Human Capital Strategic Human Capital Human Capital Development Centre Central Banking Services Human Capital Services
IT and Finance Digital and Technology Finance
Corporate Services LINK and BNM Offi ces Chief Services Offi cer Facility Management Services Hospitality Services Organisational Security Management Museum, Art Gallery and KM Centre Services
Chief Representative Beijing Representative Offi ce London Representative Offi ce New York Representative Offi ce
Head BNM Offi ce Johor Bahru BNM Offi ce Pulau Pinang BNM Offi ce Kuching BNM Offi ce Kota Kinabalu BNM Offi ce Kuala Terengganu
* Deputy Director** Manager
Nor Shamsiah Yunus
Abdul Rasheed Ghaffour Jessica Chew Cheng Lian
Mohamad Ali Iqbal Abdul Khalid
Norzila Abdul AzizDonald Joshua Jaganathan Abu Hassan Alshari YahayaMarzunisham OmarMohd Adhari Belal Din Adnan Zaylani Mohamad ZahidNazrul Hisyam Mohd NohTan Nyat Chuan
Mohamad Ali Iqbal Abdul Khalid Rosihan Zain Baharudin–
Marina Abdul KaharOng Li Ming
Abd. Rahman Abu Bakar
Fraziali IsmailDr. Norhana Endut Raja Syamsul Anwar Raja Mohammed AffandiToh Hock Chai
Abdul Rahman HusseinNorzila Abdul AzizAzman Mat Ali
Aznan Abdul AzizMohd Zabidi Md NorHew Ee-LuDaniel Chin Shen LiTan Nyat Chuan
Qaiser Iskandar AnwarudinCindy Siah Hooi Hoon Jeremy Lee Eng Huat Nik Mohamed Din Nik Musa
Suhaimi AliMadelena MohamedLau Chin ChingThomas Tan Koon Peng Wan Mohd Nazri Wan Osman
Mohd Adhari Belal DinKristina RaiRuziana Mohd Mokhtar*Faizal Muhammad Sudin*
Leong Kwan SengAffendi Rashdi
Arlina AriffShamsuddin Mohd MahayidinJohar MokhtarHairi AdamYusoff SulongLim Foo Thai
Alvin Ong Heng Kiat*Muhamad Jamil Fathi Jamaludin*Azizul Sabri Abdullah**
Nor Rafi dz Nazri*Hasjun Hashim*Rosnani Mahamad Zain*Zambre Ismail*Adlis Khairil Sazli Mohd Zaini*
Board of Directors, Senior Management and Committees of the Bank
125 Board of Directors126 Senior Management127 Monetary Policy Committee128 Financial Stability Executive Committee129 Shariah Advisory Council130 Financial Stability Committee

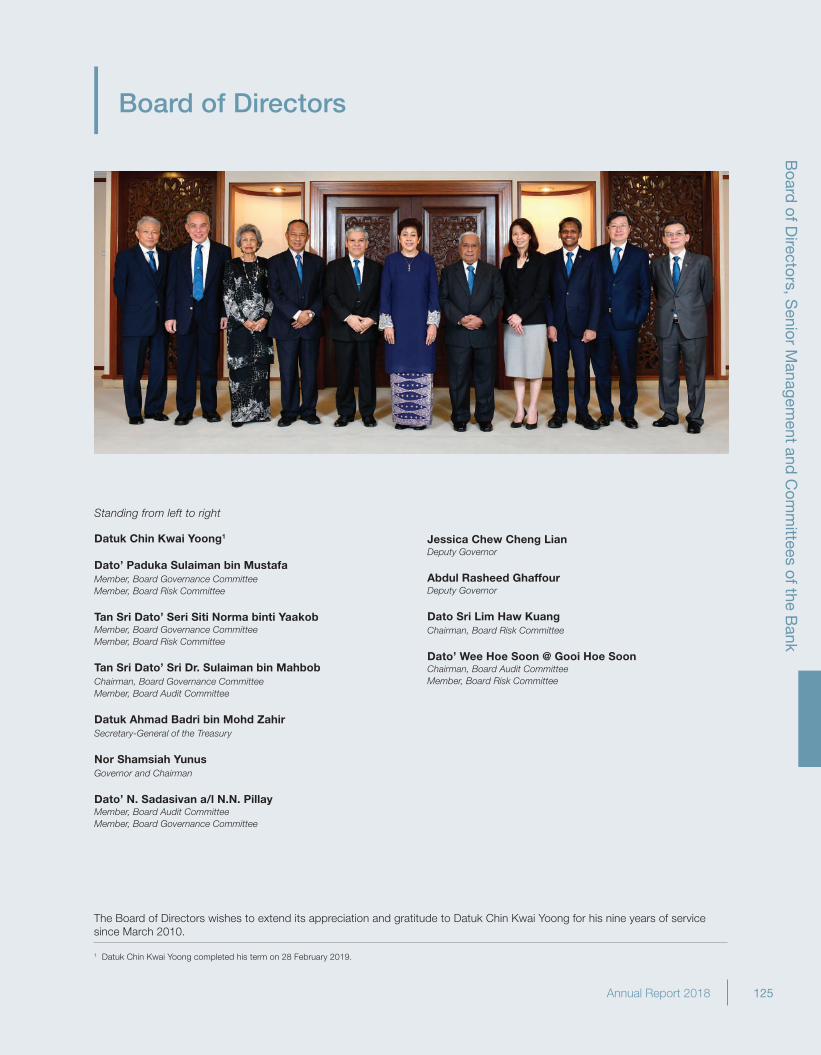
Board
of Directors, S
enior Managem
ent and C
omm
ittees of the Bank
125Annual Report 2018
Board of Directors
Datuk Chin Kwai Yoong1
Dato’ Paduka Sulaiman bin MustafaMember, Board Governance CommitteeMember, Board Risk Committee
Tan Sri Dato’ Seri Siti Norma binti YaakobMember, Board Governance CommitteeMember, Board Risk Committee
Tan Sri Dato’ Sri Dr. Sulaiman bin MahbobChairman, Board Governance CommitteeMember, Board Audit Committee
Datuk Ahmad Badri bin Mohd Zahir Secretary-General of the Treasury
Nor Shamsiah YunusGovernor and Chairman
Dato’ N. Sadasivan a/l N.N. PillayMember, Board Audit CommitteeMember, Board Governance Committee
Standing from left to right
Jessica Chew Cheng Lian Deputy Governor
Abdul Rasheed GhaffourDeputy Governor
Dato Sri Lim Haw Kuang Chairman, Board Risk Committee
Dato’ Wee Hoe Soon @ Gooi Hoe SoonChairman, Board Audit CommitteeMember, Board Risk Committee
1 Datuk Chin Kwai Yoong completed his term on 28 February 2019.
The Board of Directors wishes to extend its appreciation and gratitude to Datuk Chin Kwai Yoong for his nine years of service since March 2010.
Board
of Directors, S
enior Managem
ent and C
omm
ittees of the Bank
126 Annual Report 2018
Senior Management
Nor Shamsiah YunusGovernor
Abdul Rasheed GhaffourDeputy Governor
Jessica Chew Cheng Lian Deputy Governor
Norzila Abdul AzizAssistant Governor
Donald Joshua JaganathanAssistant Governor
Abu Hassan Alshari YahayaAssistant Governor
Marzunisham OmarAssistant Governor
Mohd. Adhari Belal DinAssistant Governor
Adnan Zaylani Mohamad ZahidAssistant Governor
Nazrul Hisyam Mohd NohAssistant Governor
Tan Nyat ChuanAssistant Governor
Senior Management Members
Board
of Directors, S
enior Managem
ent and C
omm
ittees of the Bank
127Annual Report 2018
Monetary Policy Committee
Monetary policy is formulated independently by the Monetary Policy Committee based on a sound governance framework
The primary objective of monetary policy in Malaysia is to maintain price stability while giving due regard to developments in the economy. Under the Central Bank of Malaysia Act 2009 (CBA 2009), the Monetary Policy Committee (MPC) of Bank Negara Malaysia is charged with the responsibility of formulating monetary policy and the policies for the conduct of monetary policy operations.1 In this regard, the MPC decides on the policy interest rate, the Overnight Policy Rate (OPR), to influence other interest rates in the economy.
In carrying out this mandate, the MPC determines the direction of monetary policy based on its assessment of the balance of risks to the outlook for both domestic growth and inflation. The MPC also monitors risks of destabilising financial imbalances given their implications for the prospects of the economy. The Committee meets at least six times a year to decide on the OPR and publishes the Monetary Policy Statement (MPS) following each meeting to explain its decisions.
The MPC comprises the Governor, the Deputy Governors, and not less than three but not more than seven other members, including external members who are appointed by the Minister of Finance upon recommendation by the Bank’s Board Governance Committee. At present, the MPC has seven members, two of which are external members. The membership of the MPC is intended to bring together a diversity of expertise and experiences that is critical for sound decision-making on monetary policy.
Nor Shamsiah YunusGovernor and Chairman
Abdul Rasheed GhaffourDeputy Governor
Jessica Chew Cheng Lian Deputy Governor
Norzila Abdul AzizAssistant Governor
Marzunisham Omar Assistant Governor
Prof. Tan Sri Dato’ Seri Dr. Noor Azlan GhazaliProfessor of Economics, Universiti Kebangsaan Malaysia
Prof. Dr. Yeah Kim LengProfessor of Economics, Sunway University Business School, Sunway University
1 For a detailed account of the evolution of the MPC, and its governance and processes, refer to the ‘Box Article: Evolution of the Monetary Policy Committee of Bank Negara Malaysia: Key Milestones over the Years’ in the Bank Negara Malaysia Annual Report 2015.
Monetary Policy Committee Members
Board
of Directors, S
enior Managem
ent and C
omm
ittees of the Bank
128 Annual Report 2018
Financial Stability Executive Committee
Nor Shamsiah YunusGovernor and Chairman
Abdul Rasheed GhaffourDeputy Governor
Datuk Ahmad Badri bin Mohd ZahirSecretary General to the Treasury
Datuk Syed Zaid AlbarChairman of Securities Commission Malaysia
Rafiz Azuan AbdullahChief Executive Officer of Perbadanan Insurans Deposit Malaysia
Datuk Johan bin IdrisExternal Expert
Yoong Sin MinExternal Expert
Financial Stability Executive Committee Members
The Financial Stability Executive Committee (Executive Committee) was established in 2010 pursuant to Section 37 of the Central Bank of Malaysia Act 2009 (CBA 2009). Its primary purpose is to contribute to the fulfilment of the Bank’s statutory mandate of preserving financial stability through its powers to decide on specific policy measures that may be taken by the Bank to avert or reduce risks to financial stability. These measures are:
• theissuanceoforderstoapersonorfinancialinstitutionthatisnotsupervisedbytheBanktoundertakespecificmeasures;• theextensionofliquidityassistancetoafinancialinstitutionthatisnotsupervisedbytheBank,ortooverseasoperationsofalicensed
financial institution in Malaysia; and• theprovisionofcapitalsupporttoanon-viablelicensedfinancialinstitutioninMalaysia.
The Executive Committee is a key component of the accountability framework that has been institutionalised for the exercise of the broad financial stability powers accorded to the Bank under the CBA 2009. It is responsible to ensure that proposed measures within its purview are appropriate, having regard to the Bank’s assessment of risks to financial stability. The Executive Committee meets at least twice a year.
The Executive Committee consists of seven members, a majority of whom must be non-executive members who are independent of the Bank’s Management. Members are subject to the Executive Committee’s Code of Ethics and Conflict of Interest, which serve to preserve the integrity of the Executive Committee’s decisions.
Board
of Directors, S
enior Managem
ent and C
omm
ittees of the Bank
129Annual Report 2018
Shariah Advisory Council
Datuk Dr. Mohd Daud bin Bakar (Chairman)Founder and Executive Chairman, Amanie Group
Prof. Dr. Ashraf bin Md. Hashim (Deputy Chairman)Chief Executive Officer, ISRA Consultancy
Tan Sri Sheikh Ghazali bin Abdul RahmanCouncil of Experts (Shariah), Attorney General Chambers
Sahibus Samahah Dato’ Seri Dr. Hj. Zulkifli bin Mohamad Al-BakriMufti of Wilayah Persekutuan
Dato’ A. Aziz bin A. RahimChairman, Enforcement Agencies Integrity Commission
Prof. Dr. Mohamad Akram bin LaldinExecutive Director, ISRA
Prof. Dr. Engku Rabiah Adawiah binti Engku AliProfessor, IIUM Institute of Islamic Banking and Finance (IIiBF), International Islamic University Malaysia (IIUM)
Prof. Dr. Asmadi bin Mohamed NaimProfessor, Islamic Business School, Universiti Utara Malaysia
Dr. Shamsiah binti MohamadSenior Researcher, ISRA
Burhanuddin bin LukmanHead of Takaful Unit, International Shariah Research Academy for Islamic Finance (ISRA)
Shariah Advisory Council Members
The Shariah Advisory Council of Bank Negara Malaysia (SAC) was established in May 1997 as the highest Shariah authority in Islamic banking and takaful in Malaysia. In the Central Bank of Malaysia Act 2009 (CBA 2009), the roles and functions of the SAC were further reinforced as the authority for the ascertainment of Islamic law for the purposes of Islamic financial activities which are supervised and regulated by the Bank.
The SAC assumes a pivotal role in ensuring the consistency of Shariah rulings applied in the Islamic banking and takaful industry. The Shariah rulings by the SAC serve as a main reference for Islamic financial institutions to ensure end-to-end Shariah compliance in the structure and implementation of their financial products and services. In addition, the CBA 2009 provides that, any questions on Shariah matters in a court or arbitration proceeding must be referred to the SAC, whose opinions shall be binding.
The SAC provides the Shariah basis for the development of a comprehensive Shariah contract-based regulatory framework for Islamic banking and takaful in Malaysia. In this regard, the SAC defines the essential features of the contracts taking into consideration the various Shariah views, research findings, as well as custom and market practices. Moving forward, the SAC, through its members, individually and collectively, will expand its sphere of influence to support more product innovation and encourage harmonisation of Shariah interpretation locally and globally.
The appointment of the SAC members is made upon approval by the Yang di-Pertuan Agong, on the advice of the Minister of Finance after consultation with the Bank. Currently, the SAC has ten (10) members consisting of prominent Shariah scholars, jurists and legal experts.
Board
of Directors, S
enior Managem
ent and C
omm
ittees of the Bank
130 Annual Report 2018
Financial Stability Committee
The Financial Stability Committee (FSC) is a high-level internal committee of the Bank. It is responsible for monitoring and taking actions to reduce or avert risks to financial stability stemming from both system-wide and institutional developments. Section 29 of the Central Bank of Malaysia Act 2009 defines “risk to financial stability” as a “risk which in the opinion of the Bank disrupts, or is likely to disrupt, the financial intermediation process including the orderly functioning of the money market and foreign exchange market, or affects, or is likely to affect, public confidence in the financial system or the stability of the financial system”.
The FSC reviews and decides on:• macroprudentialpoliciestoreduceoravertidentifiedriskstothefinancialsystemasawhole;• significantsupervisoryresponsestoaddressrisksarisinginindividualfinancialinstitutionswhichareregulatedbytheBank;• actionstoresolveafinancialinstitutionthathasceased,orisabouttocease,tobeviable.ThisincludesnotifyingPerbadananInsurans
Deposit Malaysia (PIDM) for the purpose of resolution actions by PIDM where applicable; and• recommendationstotheFinancialStabilityExecutiveCommitteeontheexerciseofpowerswithinitsremit.
An important part of the FSC’s role is to monitor the effectiveness of policies and actions taken; and ensure they remain appropriate, taking into account risk developments.
The FSC is chaired by the Governor and its members comprise all Deputy Governors and the Assistant Governors responsible for regulation, supervision, development and financial market and currency sectors. The meeting is generally held four times a year and is also attended by selected senior officers of the Bank.
Nor Shamsiah YunusGovernor and Chairman
Abdul Rasheed GhaffourDeputy Governor
Jessica Chew Cheng Lian Deputy Governor
Norzila Abdul AzizAssistant Governor
Donald Joshua JaganathanAssistant Governor
Adnan Zaylani Mohamad ZahidAssistant Governor
Tan Nyat ChuanAssistant Governor
Financial Stability Committee Members
Annual Report 2018
Annual F
inancial Statem
ents
131
Annual Financial Statements
139 Statement of Financial Position as at 31 December 2018140 Income Statement for the Year Ended 31 December 2018141 Notes to the Financial Statement for the Year Ended 31 December 2018

Annual Report 2018
Annual F
inancial Statem
ents
132
Annual Report 2018 133
Annual Financial Statements
REPORT OF THE AUDITOR GENERALON THE FINANCIAL STATEMENTS OF
BANK NEGARA MALAYSIAFOR THE YEAR ENDED 31 DECEMBER 2018
Report on the Financial Statements
Opinion
I have audited the Financial Statements of Bank Negara Malaysia which comprise the Statement of Financial Position as at 31 December 2018 and Income Statement for the year then ended, a summary of significant accounting policies and other explanatory information.
In my opinion, the accompanying financial statements give a true and fair view of the financial position of Bank Negara Malaysia as at 31 December 2018 and of their financial performance for the year then ended, in accordance with the Central Bank of Malaysia Act 2009 and Malaysian Financial Reporting Standards to the extent that it is, in the opinion of the Directors, appropriate to do so, having regard to the objects and functions of the Bank.
Basis for Opinion
I conducted the audit in accordance with the Audit Act 1957 and the International Standards of Supreme Audit Institutions. My responsibilities under those standards are further described in the Auditor’s Responsibilities for the Audit of the Financial Statements section of my report. I believe that the audit evidence I have obtained is sufficient and appropriate to provide a basis for my opinion.
Independence and Other Ethical Responsibilities
I am independent of Bank Negara Malaysia and have fulfilled other ethical responsibilities in accordance with the International Standards of Supreme Audit Institutions.
Annual Report 2018
Annual F
inancial Statem
ents
134
Information Other Than the Financial Statements and Auditor General’s Report Thereon
The Directors of Bank Negara Malaysia are responsible for other information in the Annual Report. My opinion on the Financial Statements of Bank Negara Malaysia does not cover the information other than the Financial Statements and the Auditor General’s Report thereon and I do not express any form of assurance conclusion thereon.
Responsibilities of the Directors’ for the Financial Statements
The Directors are responsible for the preparation of Financial Statements of BNM that give a true and fair view in accordance with the Central Bank of Malaysia Act 2009 and Malaysian Financial Reporting Standards to the extent that it is, in the opinion of the Directors, appropriate to do so, having regard to the objects and functions of the Bank. The Directors are also responsible for such internal control as the Directors determine is necessary to enable the preparation of the Financial Statements of BNM that are free from material misstatement, whether due to fraud or error.
In preparing the Financial Statements of Bank Negara Malaysia, the Directors are responsible for assessing Bank Negara Malaysia’s ability to continue as a going concern, disclosing as applicable matters related to going concern, and using the going concern basis of accounting.
Auditor’s Responsibilities for the Audit of the Financial Statements
My objectives are to obtain reasonable assurance about whether the Financial Statements of Bank Negara Malaysia as a whole are free from material misstatement, whether due to fraud or error, and to issue Auditor General’s Report that includes my opinion. Reasonable assurance is a high level of assurance, but is not a guarantee that an audit conducted in accordance with the International Standards of Supreme Audit Institutions will always detect a material misstatement when it exists. Misstatements can arise from fraud or error and are considered material if, individually or in aggregate, they could reasonably be expected to influence the economic decisions of users taken on the basis of these Financial Statements.
As part of an audit in accordance with the International Standards of Supreme Audit Institutions, I exercise professional judgement and maintain professional skepticism throughout the audit. I also:
a. Identify and assess the risks of material misstatement of the Financial Statements of Bank Negara Malaysia, whether due to fraud or error, design and perform audit procedures responsive to those risks, and obtain audit evidence that is sufficient and appropriate to provide a basis for my opinion. The risk of not detecting a material misstatement resulting from fraud is higher than for one resulting from error, as fraud may involve collusion, forgery, intentional omissions, misrepresentations, or the override of internal control.
b. Obtain an understanding of internal control relevant to the audit in order to design audit procedures that are appropriate in the circumstances, but not for the purpose of expressing an opinion on the effectiveness of Bank Negara Malaysia’s internal control.
c. Evaluate the appropriateness of accounting policies used and the reasonableness of accounting estimates and related disclosures made by the Directors.
d. Conclude on the appropriateness of the Directors’ use of the going concern basis of accounting and, based on the audit evidence obtained, whether a material uncertainty exists related to events or conditions that may cast significant doubt on Bank Negara Malaysia’s ability to continue as a going concern. If I conclude that a material uncertainty exists, I have to draw attention in my Auditor General’s Report to the related disclosures in the Financial Statements of Bank Negara Malaysia if such disclosures are inadequate, to modify my opinion. My conclusions are based on the audit evidence obtained up to the date of the Auditor General’s Report.
Annual Report 2018
Annual F
inancial Statem
ents
135
e. Evaluate the overall presentation of the Financial Statement of BNM including the disclosures that achieve fair presentation.
I communicate with the Directors regarding, among other matters, the planned scope, timing of the audit, and significant audit findings including internal control identified during my audit.
Report on Other Legal and Regulatory Requirements
In accordance with the requirements of Section 9, Central Bank of Malaysia Act 2009, I also report that in my opinion, the accounting and other records required by the Act to be kept by Bank Negara Malaysia have been properly kept in accordance with the provisions of the Act.
Other Matters
This report is made solely to the Directors and for no other purpose. I do not assume responsibility to any other person for the content of this report.
(DATO’ NIK AZMAN NIK ABDUL MAJID)AUDITOR GENERAL MALAYSIA
PUTRAJAYA18 MARCH 2019

Annual Report 2018
Annual F
inancial Statem
ents
137
We, Nor Shamsiah Yunus and Chin Kwai Yoong, being the Chairman and one of the Directors of Bank Negara Malaysia, do hereby state that in the opinion of the Directors, the financial statements are drawn up so as to give a true and fair view of the state of affairs of Bank Negara Malaysia as at 31 December 2018 and of the results of operations for the year ended on that date, in accordance with the Central Bank of Malaysia Act 2009 and the applicable Malaysian Financial Reporting Standards (MFRS) to the extent that it is, in the opinion of the Directors, appropriate to do so, having regard to the objects and functions of the Bank.
STATEMENT BY CHAIRMANAND ONE OF THE DIRECTORS
On behalf of the Board,
CHIN KWAI YOONGDIRECTOR
28 FEBRUARY 2019KUALA LUMPUR
On behalf of the Board,
NOR SHAMSIAH YUNUSCHAIRMAN
28 FEBRUARY 2019KUALA LUMPUR
BANK NEGARA MALAYSIA
Annual Report 2018
Annual F
inancial Statem
ents
138
DECLARATION BY THE OFFICER PRIMARILY RESPONSIBLEFOR THE FINANCIAL MANAGEMENT OF BANK NEGARA MALAYSIA
BANK NEGARA MALAYSIA
I, Affendi bin Rashdi, being the officer primarily responsible for the financial management of Bank Negara Malaysia, do solemnly and sincerely declare that the financial statements for the year ended 31 December 2018, are to the best of my knowledge and belief, correct and I make this solemn declaration conscientiously believing the same to be true and by virtue of the provisions of the Statutory Declarations Act, 1960.
Subscribed and solemnly declared )by the abovenamed at Kuala Lumpur )this 28 February 2019. )
Before me,
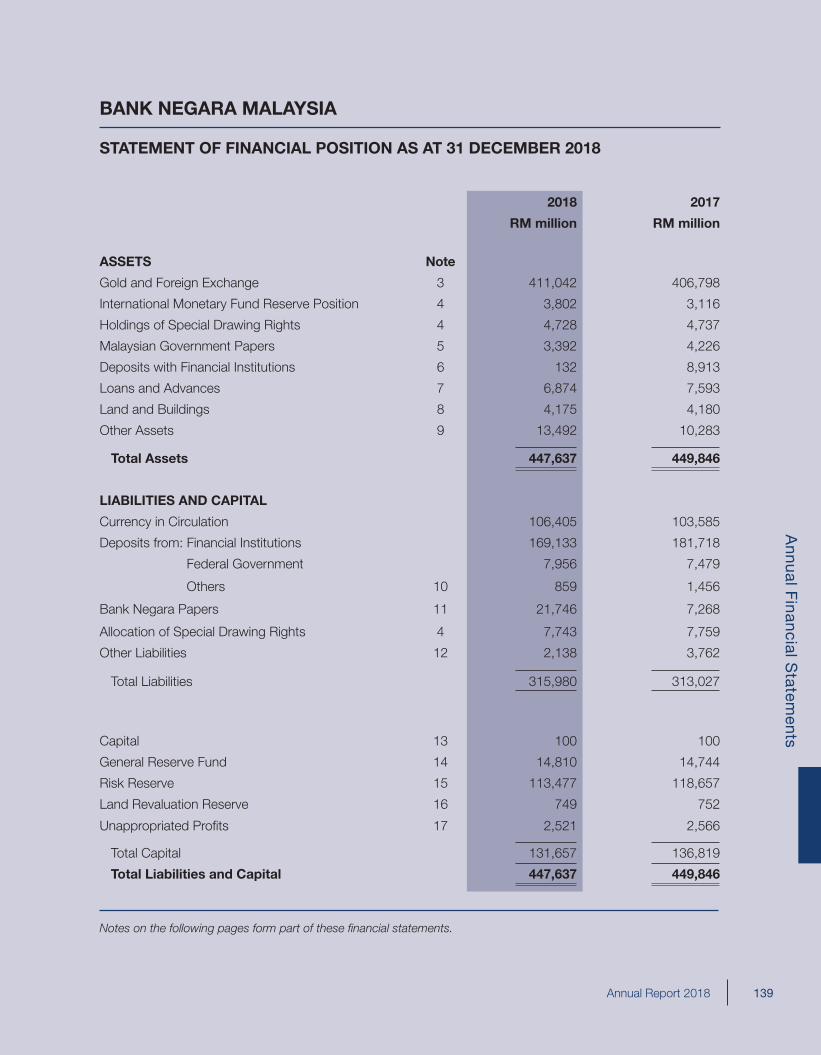
Annual Report 2018
Annual F
inancial Statem
ents
139
BANK NEGARA MALAYSIA
STATEMENT OF FINANCIAL POSITION AS AT 31 DECEMBER 2018
2018 2017
RM million RM million
ASSETS Note
Gold and Foreign Exchange 3 411,042 406,798
International Monetary Fund Reserve Position 4 3,802 3,116
Holdings of Special Drawing Rights 4 4,728 4,737
Malaysian Government Papers 5 3,392 4,226
Deposits with Financial Institutions 6 132 8,913
Loans and Advances 7 6,874 7,593
Land and Buildings 8 4,175 4,180
Other Assets 9 13,492 10,283
Total Assets 447,637 449,846
LIABILITIES AND CAPITAL
Currency in Circulation 106,405 103,585
Deposits from: Financial Institutions 169,133 181,718
Federal Government 7,956 7,479
Others 10 859 1,456
Bank Negara Papers 11 21,746 7,268
Allocation of Special Drawing Rights 4 7,743 7,759
Other Liabilities 12 2,138 3,762
Total Liabilities 315,980 313,027
Capital 13 100 100
General Reserve Fund 14 14,810 14,744
Risk Reserve 15 113,477 118,657
Land Revaluation Reserve 16 749 752
Unappropriated Profits 17 2,521 2,566
Total Capital 131,657 136,819
Total Liabilities and Capital 447,637 449,846
Notes on the following pages form part of these financial statements.
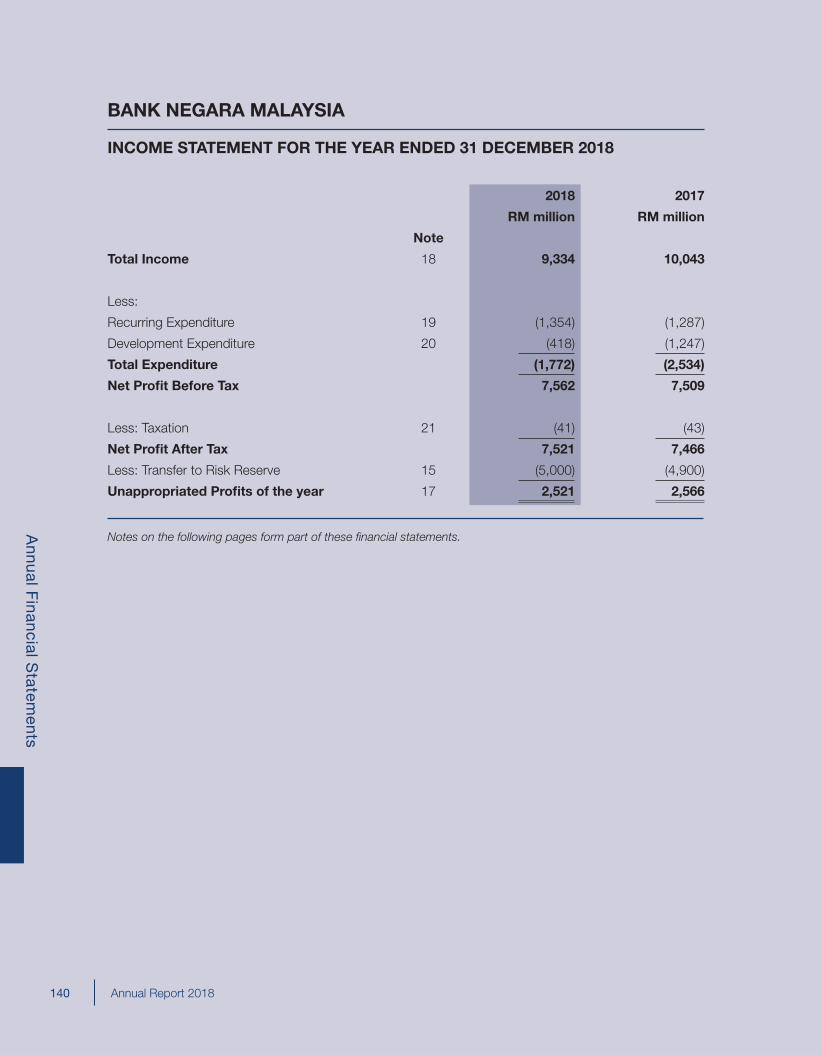
Annual Report 2018
Annual F
inancial Statem
ents
140
BANK NEGARA MALAYSIA
INCOME STATEMENT FOR THE YEAR ENDED 31 DECEMBER 2018
2018 2017
RM million RM million
Note
Total Income 18 9,334 10,043
Less:
Recurring Expenditure 19 (1,354) (1,287)
Development Expenditure 20 (418) (1,247)
Total Expenditure (1,772) (2,534)
Net Profit Before Tax 7,562 7,509
Less: Taxation 21 (41) (43)
Net Profit After Tax 7,521 7,466
Less: Transfer to Risk Reserve 15 (5,000) (4,900)
Unappropriated Profits of the year 17 2,521 2,566
Notes on the following pages form part of these financial statements.
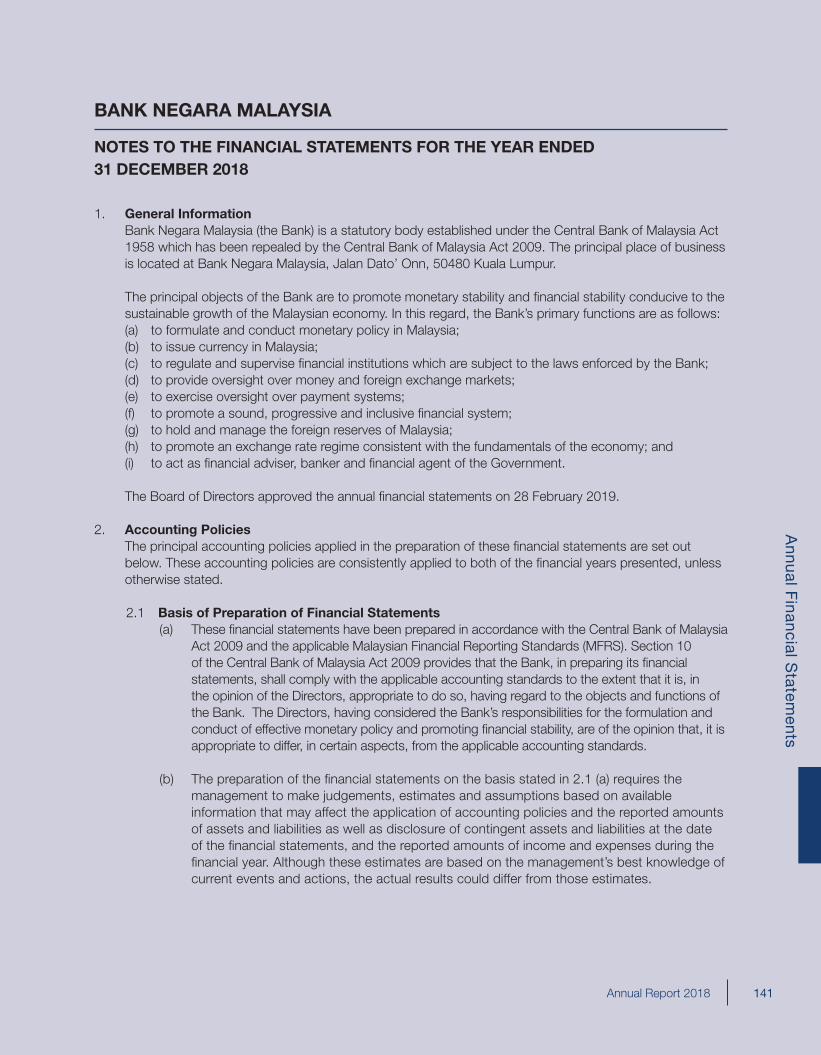
Annual Report 2018
Annual F
inancial Statem
ents
141
NOTES TO THE FINANCIAL STATEMENTS FOR THE YEAR ENDED 31 DECEMBER 2018
1. General Information Bank Negara Malaysia (the Bank) is a statutory body established under the Central Bank of Malaysia Act
1958 which has been repealed by the Central Bank of Malaysia Act 2009. The principal place of business is located at Bank Negara Malaysia, Jalan Dato’ Onn, 50480 Kuala Lumpur.
The principal objects of the Bank are to promote monetary stability and financial stability conducive to the sustainable growth of the Malaysian economy. In this regard, the Bank’s primary functions are as follows:
(a) to formulate and conduct monetary policy in Malaysia; (b) to issue currency in Malaysia; (c) to regulate and supervise financial institutions which are subject to the laws enforced by the Bank; (d) to provide oversight over money and foreign exchange markets; (e) to exercise oversight over payment systems; (f) to promote a sound, progressive and inclusive financial system; (g) to hold and manage the foreign reserves of Malaysia; (h) to promote an exchange rate regime consistent with the fundamentals of the economy; and (i) to act as financial adviser, banker and financial agent of the Government.
The Board of Directors approved the annual financial statements on 28 February 2019.
2. Accounting Policies The principal accounting policies applied in the preparation of these financial statements are set out
below. These accounting policies are consistently applied to both of the financial years presented, unless otherwise stated.
2.1 Basis of Preparation of Financial Statements
(a) These financial statements have been prepared in accordance with the Central Bank of Malaysia Act 2009 and the applicable Malaysian Financial Reporting Standards (MFRS). Section 10 of the Central Bank of Malaysia Act 2009 provides that the Bank, in preparing its financial statements, shall comply with the applicable accounting standards to the extent that it is, in the opinion of the Directors, appropriate to do so, having regard to the objects and functions of the Bank. The Directors, having considered the Bank’s responsibilities for the formulation and conduct of effective monetary policy and promoting financial stability, are of the opinion that, it is appropriate to differ, in certain aspects, from the applicable accounting standards.
(b) The preparation of the financial statements on the basis stated in 2.1 (a) requires the management to make judgements, estimates and assumptions based on available information that may affect the application of accounting policies and the reported amounts of assets and liabilities as well as disclosure of contingent assets and liabilities at the date of the financial statements, and the reported amounts of income and expenses during the financial year. Although these estimates are based on the management’s best knowledge of current events and actions, the actual results could differ from those estimates.
BANK NEGARA MALAYSIA
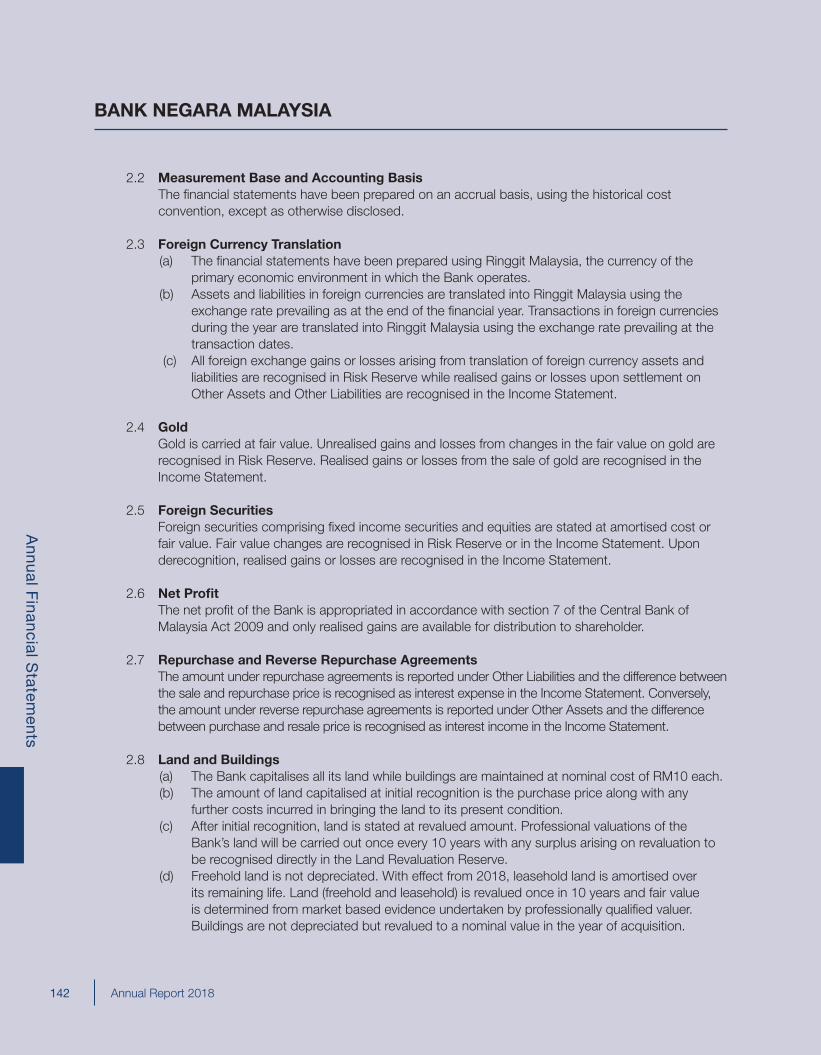
Annual Report 2018
Annual F
inancial Statem
ents
142
2.2 Measurement Base and Accounting BasisThe financial statements have been prepared on an accrual basis, using the historical cost convention, except as otherwise disclosed.
2.3 Foreign Currency Translation(a) The financial statements have been prepared using Ringgit Malaysia, the currency of the
primary economic environment in which the Bank operates.(b) Assets and liabilities in foreign currencies are translated into Ringgit Malaysia using the
exchange rate prevailing as at the end of the financial year. Transactions in foreign currencies during the year are translated into Ringgit Malaysia using the exchange rate prevailing at the transaction dates.
(c) All foreign exchange gains or losses arising from translation of foreign currency assets and liabilities are recognised in Risk Reserve while realised gains or losses upon settlement on Other Assets and Other Liabilities are recognised in the Income Statement.
2.4 Gold Gold is carried at fair value. Unrealised gains and losses from changes in the fair value on gold are
recognised in Risk Reserve. Realised gains or losses from the sale of gold are recognised in the Income Statement.
2.5 Foreign Securities Foreign securities comprising fixed income securities and equities are stated at amortised cost or
fair value. Fair value changes are recognised in Risk Reserve or in the Income Statement. Upon derecognition, realised gains or losses are recognised in the Income Statement.
2.6 Net Profit The net profit of the Bank is appropriated in accordance with section 7 of the Central Bank of
Malaysia Act 2009 and only realised gains are available for distribution to shareholder.
2.7 Repurchase and Reverse Repurchase Agreements The amount under repurchase agreements is reported under Other Liabilities and the difference between
the sale and repurchase price is recognised as interest expense in the Income Statement. Conversely, the amount under reverse repurchase agreements is reported under Other Assets and the difference between purchase and resale price is recognised as interest income in the Income Statement.
2.8 Land and Buildings(a) The Bank capitalises all its land while buildings are maintained at nominal cost of RM10 each.(b) The amount of land capitalised at initial recognition is the purchase price along with any
further costs incurred in bringing the land to its present condition.(c) After initial recognition, land is stated at revalued amount. Professional valuations of the
Bank’s land will be carried out once every 10 years with any surplus arising on revaluation to be recognised directly in the Land Revaluation Reserve.
(d) Freehold land is not depreciated. With effect from 2018, leasehold land is amortised over its remaining life. Land (freehold and leasehold) is revalued once in 10 years and fair value is determined from market based evidence undertaken by professionally qualified valuer. Buildings are not depreciated but revalued to a nominal value in the year of acquisition.
BANK NEGARA MALAYSIA
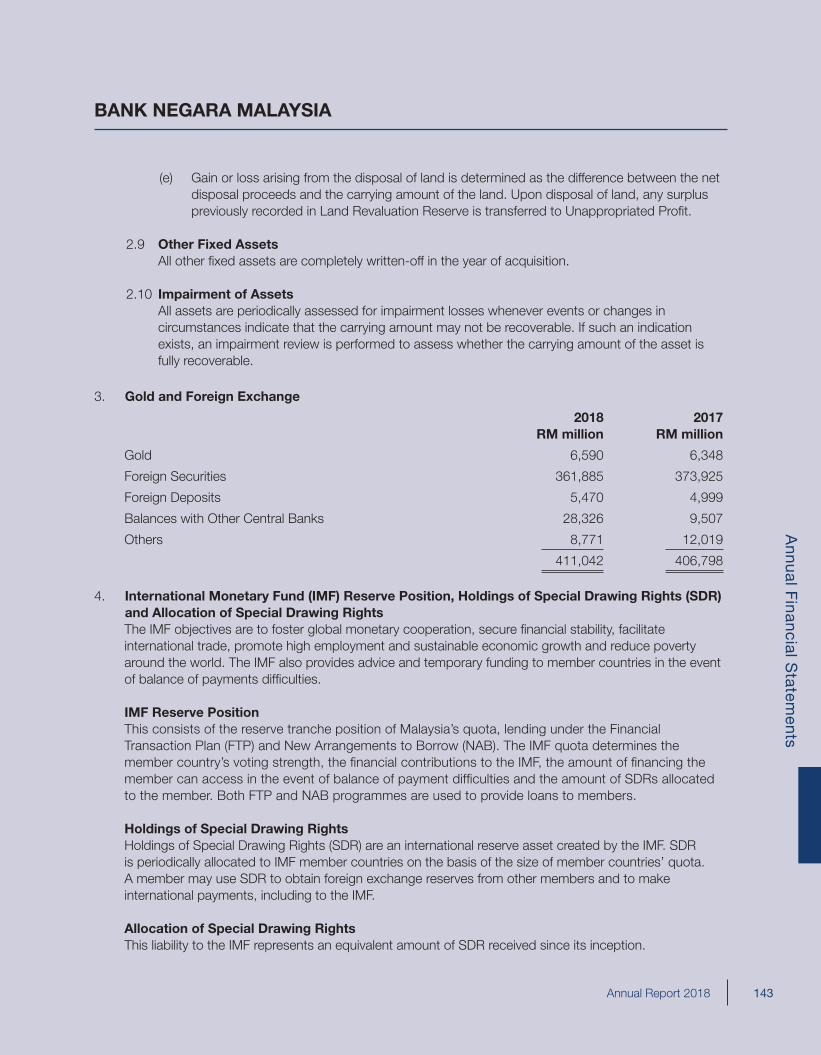
Annual Report 2018
Annual F
inancial Statem
ents
143
(e) Gain or loss arising from the disposal of land is determined as the difference between the net disposal proceeds and the carrying amount of the land. Upon disposal of land, any surplus previously recorded in Land Revaluation Reserve is transferred to Unappropriated Profit.
2.9 Other Fixed Assets All other fixed assets are completely written-off in the year of acquisition.
2.10 Impairment of Assets All assets are periodically assessed for impairment losses whenever events or changes in
circumstances indicate that the carrying amount may not be recoverable. If such an indication exists, an impairment review is performed to assess whether the carrying amount of the asset is fully recoverable.
3. Gold and Foreign Exchange
2018RM million
2017RM million
Gold 6,590 6,348
Foreign Securities 361,885 373,925
Foreign Deposits 5,470 4,999
Balances with Other Central Banks 28,326 9,507
Others 8,771 12,019
411,042 406,798
4. International Monetary Fund (IMF) Reserve Position, Holdings of Special Drawing Rights (SDR) and Allocation of Special Drawing RightsThe IMF objectives are to foster global monetary cooperation, secure financial stability, facilitate international trade, promote high employment and sustainable economic growth and reduce poverty around the world. The IMF also provides advice and temporary funding to member countries in the event of balance of payments difficulties.
IMF Reserve PositionThis consists of the reserve tranche position of Malaysia’s quota, lending under the Financial Transaction Plan (FTP) and New Arrangements to Borrow (NAB). The IMF quota determines the member country’s voting strength, the financial contributions to the IMF, the amount of financing the member can access in the event of balance of payment difficulties and the amount of SDRs allocated to the member. Both FTP and NAB programmes are used to provide loans to members.
Holdings of Special Drawing Rights Holdings of Special Drawing Rights (SDR) are an international reserve asset created by the IMF. SDR is periodically allocated to IMF member countries on the basis of the size of member countries’ quota. A member may use SDR to obtain foreign exchange reserves from other members and to make international payments, including to the IMF.
Allocation of Special Drawing RightsThis liability to the IMF represents an equivalent amount of SDR received since its inception.
BANK NEGARA MALAYSIA
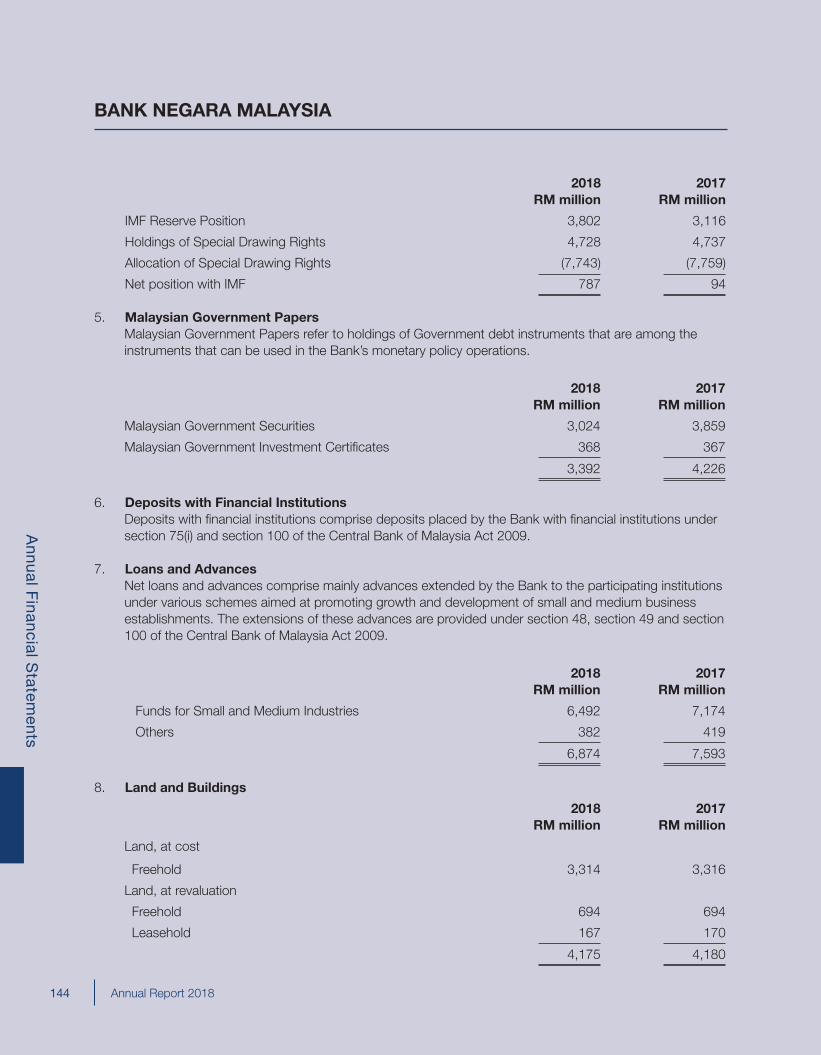
Annual Report 2018
Annual F
inancial Statem
ents
144
2018RM million
2017RM million
IMF Reserve Position 3,802 3,116
Holdings of Special Drawing Rights 4,728 4,737
Allocation of Special Drawing Rights (7,743) (7,759)
Net position with IMF 787 94
5. Malaysian Government PapersMalaysian Government Papers refer to holdings of Government debt instruments that are among the instruments that can be used in the Bank’s monetary policy operations.
2018RM million
2017RM million
Malaysian Government Securities 3,024 3,859
Malaysian Government Investment Certificates 368 367
3,392 4,226
6. Deposits with Financial Institutions Deposits with financial institutions comprise deposits placed by the Bank with financial institutions under section 75(i) and section 100 of the Central Bank of Malaysia Act 2009.
7. Loans and AdvancesNet loans and advances comprise mainly advances extended by the Bank to the participating institutions under various schemes aimed at promoting growth and development of small and medium business establishments. The extensions of these advances are provided under section 48, section 49 and section 100 of the Central Bank of Malaysia Act 2009.
2018RM million
2017RM million
Funds for Small and Medium Industries 6,492 7,174
Others 382 419
6,874 7,593
8. Land and Buildings
2018RM million
2017RM million
Land, at cost
Freehold 3,314 3,316
Land, at revaluation
Freehold 694 694
Leasehold 167 170
4,175 4,180
BANK NEGARA MALAYSIA
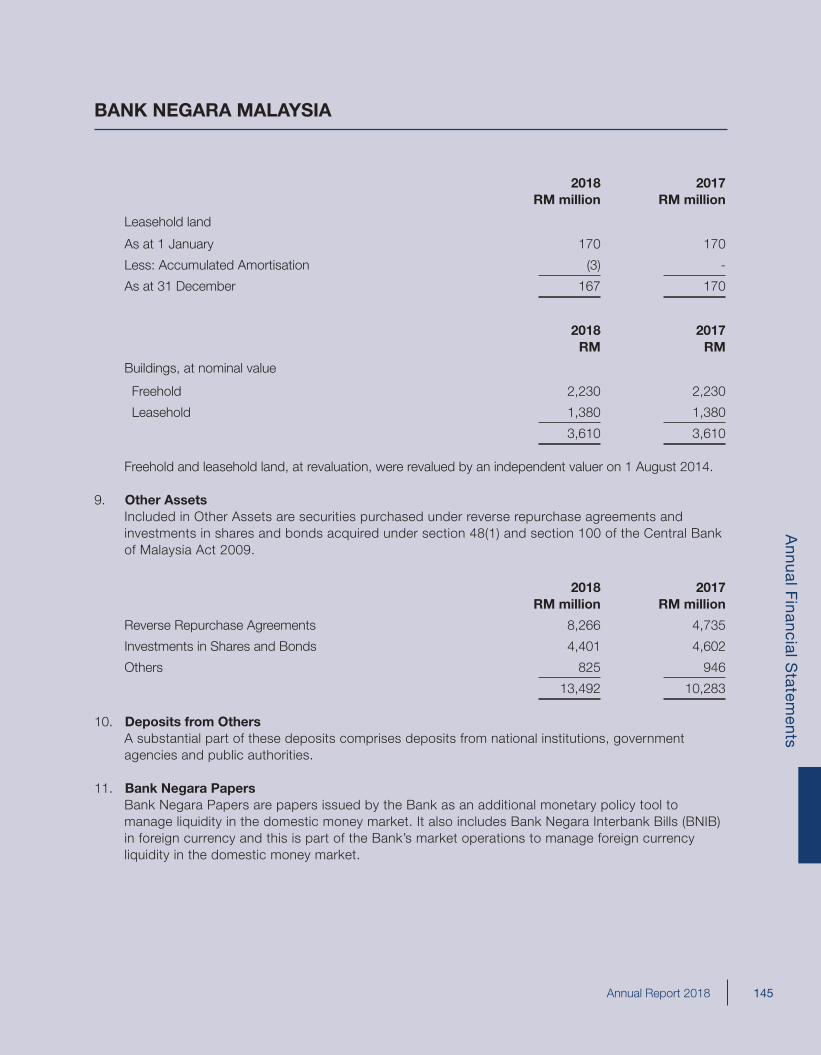
Annual Report 2018
Annual F
inancial Statem
ents
145
2018RM million
2017RM million
Leasehold land
As at 1 January 170 170
Less: Accumulated Amortisation (3) -
As at 31 December 167 170
2018RM
2017RM
Buildings, at nominal value
Freehold 2,230 2,230
Leasehold 1,380 1,380
3,610 3,610
Freehold and leasehold land, at revaluation, were revalued by an independent valuer on 1 August 2014.
9. Other AssetsIncluded in Other Assets are securities purchased under reverse repurchase agreements and investments in shares and bonds acquired under section 48(1) and section 100 of the Central Bank of Malaysia Act 2009.
2018RM million
2017RM million
Reverse Repurchase Agreements 8,266 4,735
Investments in Shares and Bonds 4,401 4,602
Others 825 946
13,492 10,283
10. Deposits from OthersA substantial part of these deposits comprises deposits from national institutions, government agencies and public authorities.
11. Bank Negara PapersBank Negara Papers are papers issued by the Bank as an additional monetary policy tool to manage liquidity in the domestic money market. It also includes Bank Negara Interbank Bills (BNIB) in foreign currency and this is part of the Bank’s market operations to manage foreign currency liquidity in the domestic money market.
BANK NEGARA MALAYSIA
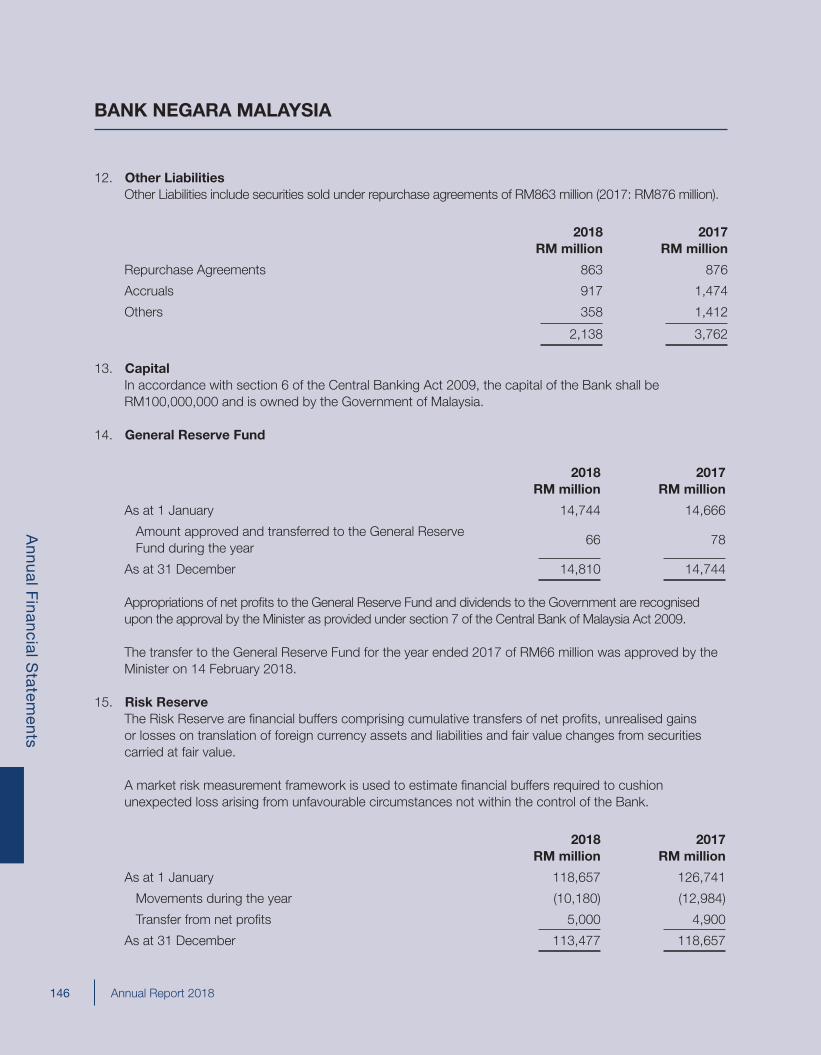
Annual Report 2018
Annual F
inancial Statem
ents
146
12. Other LiabilitiesOther Liabilities include securities sold under repurchase agreements of RM863 million (2017: RM876 million).
2018 RM million
2017RM million
Repurchase Agreements 863 876
Accruals 917 1,474
Others 358 1,412
2,138 3,762
13. CapitalIn accordance with section 6 of the Central Banking Act 2009, the capital of the Bank shall be RM100,000,000 and is owned by the Government of Malaysia.
14. General Reserve Fund
2018RM million
2017RM million
As at 1 January 14,744 14,666
Amount approved and transferred to the General Reserve Fund during the year
66 78
As at 31 December 14,810 14,744
Appropriations of net profits to the General Reserve Fund and dividends to the Government are recognised upon the approval by the Minister as provided under section 7 of the Central Bank of Malaysia Act 2009.
The transfer to the General Reserve Fund for the year ended 2017 of RM66 million was approved by the Minister on 14 February 2018.
15. Risk ReserveThe Risk Reserve are financial buffers comprising cumulative transfers of net profits, unrealised gains or losses on translation of foreign currency assets and liabilities and fair value changes from securities carried at fair value.
A market risk measurement framework is used to estimate financial buffers required to cushion unexpected loss arising from unfavourable circumstances not within the control of the Bank.
2018RM million
2017RM million
As at 1 January 118,657 126,741
Movements during the year (10,180) (12,984)
Transfer from net profits 5,000 4,900
As at 31 December 113,477 118,657
BANK NEGARA MALAYSIA
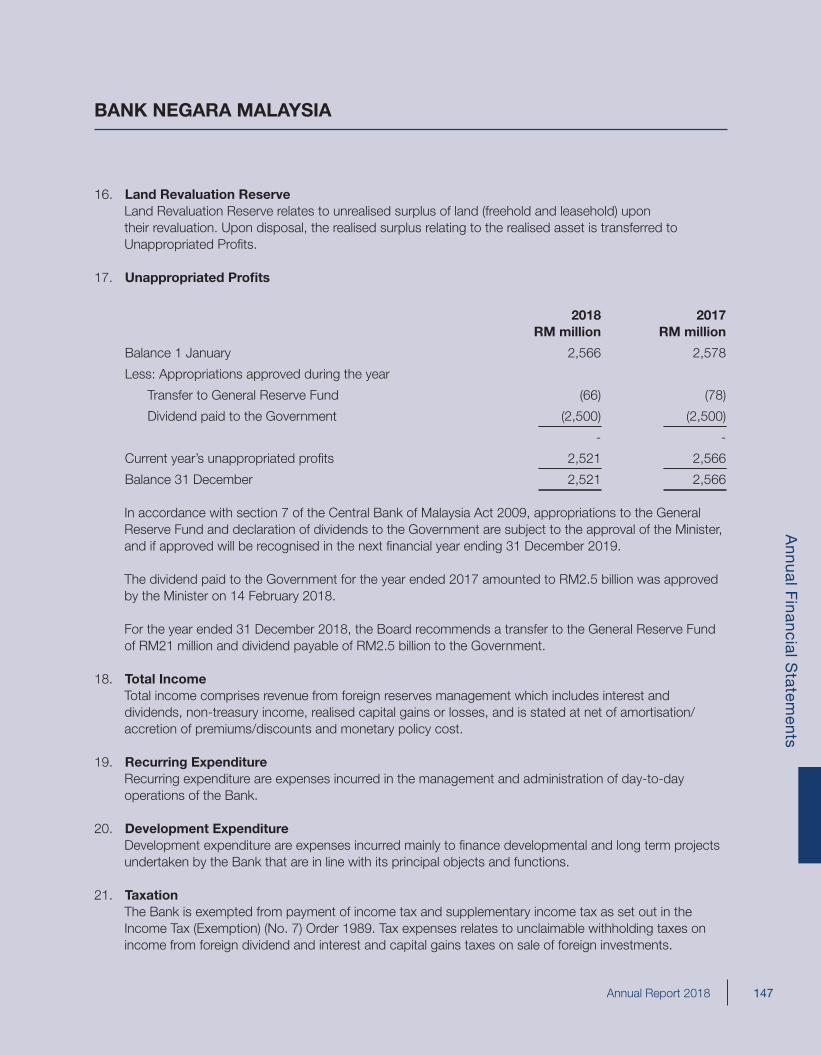
Annual Report 2018
Annual F
inancial Statem
ents
147
16. Land Revaluation ReserveLand Revaluation Reserve relates to unrealised surplus of land (freehold and leasehold) upon their revaluation. Upon disposal, the realised surplus relating to the realised asset is transferred to Unappropriated Profits.
17. Unappropriated Profits
2018RM million
2017RM million
Balance 1 January 2,566 2,578
Less: Appropriations approved during the year
Transfer to General Reserve Fund (66) (78)
Dividend paid to the Government (2,500) (2,500)
- -
Current year’s unappropriated profits 2,521 2,566
Balance 31 December 2,521 2,566
In accordance with section 7 of the Central Bank of Malaysia Act 2009, appropriations to the General Reserve Fund and declaration of dividends to the Government are subject to the approval of the Minister, and if approved will be recognised in the next financial year ending 31 December 2019.
The dividend paid to the Government for the year ended 2017 amounted to RM2.5 billion was approved by the Minister on 14 February 2018.
For the year ended 31 December 2018, the Board recommends a transfer to the General Reserve Fund of RM21 million and dividend payable of RM2.5 billion to the Government.
18. Total IncomeTotal income comprises revenue from foreign reserves management which includes interest and dividends, non-treasury income, realised capital gains or losses, and is stated at net of amortisation/accretion of premiums/discounts and monetary policy cost.
19. Recurring ExpenditureRecurring expenditure are expenses incurred in the management and administration of day-to-day operations of the Bank.
20. Development ExpenditureDevelopment expenditure are expenses incurred mainly to finance developmental and long term projects undertaken by the Bank that are in line with its principal objects and functions.
21. TaxationThe Bank is exempted from payment of income tax and supplementary income tax as set out in the Income Tax (Exemption) (No. 7) Order 1989. Tax expenses relates to unclaimable withholding taxes on income from foreign dividend and interest and capital gains taxes on sale of foreign investments.
BANK NEGARA MALAYSIA
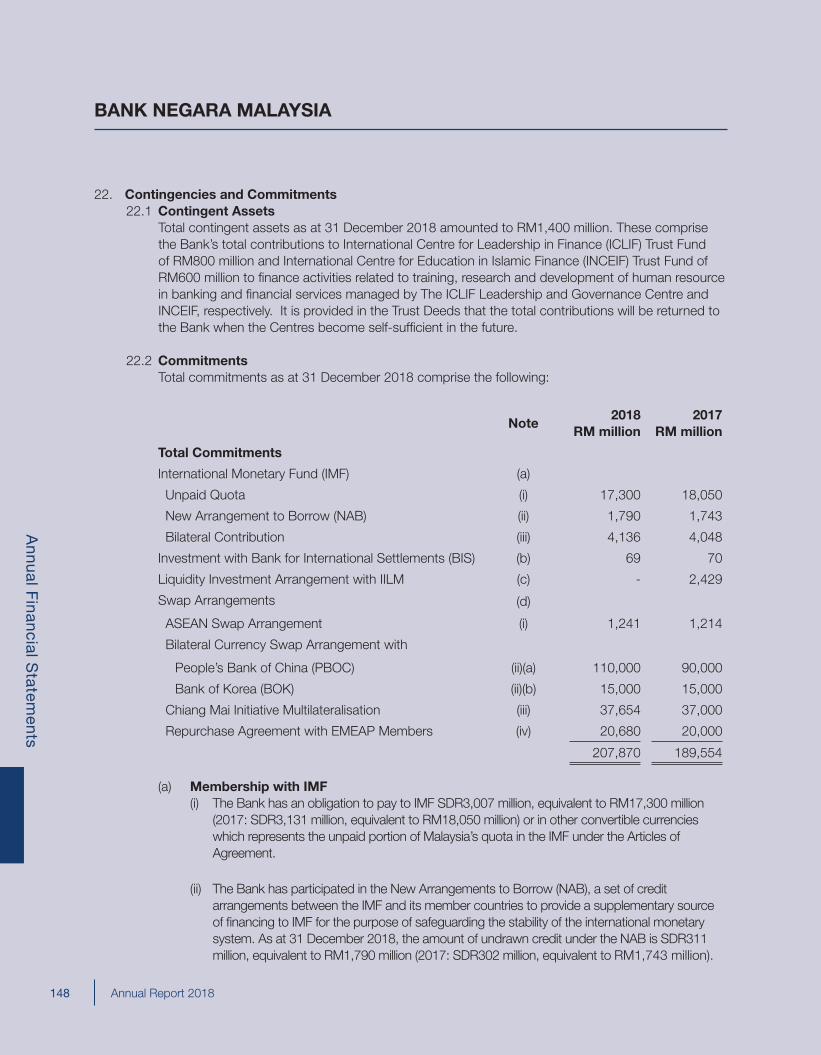
Annual Report 2018
Annual F
inancial Statem
ents
148
22. Contingencies and Commitments 22.1 Contingent Assets
Total contingent assets as at 31 December 2018 amounted to RM1,400 million. These comprise the Bank’s total contributions to International Centre for Leadership in Finance (ICLIF) Trust Fund of RM800 million and International Centre for Education in Islamic Finance (INCEIF) Trust Fund of RM600 million to finance activities related to training, research and development of human resource in banking and financial services managed by The ICLIF Leadership and Governance Centre and INCEIF, respectively. It is provided in the Trust Deeds that the total contributions will be returned to the Bank when the Centres become self-sufficient in the future.
22.2 Commitments Total commitments as at 31 December 2018 comprise the following:
Note2018
RM million2017
RM million
Total Commitments
International Monetary Fund (IMF) (a)
Unpaid Quota (i) 17,300 18,050
New Arrangement to Borrow (NAB) (ii) 1,790 1,743
Bilateral Contribution (iii) 4,136 4,048
Investment with Bank for International Settlements (BIS) (b) 69 70
Liquidity Investment Arrangement with IILM (c) - 2,429
Swap Arrangements (d)
ASEAN Swap Arrangement (i) 1,241 1,214
Bilateral Currency Swap Arrangement with
People’s Bank of China (PBOC) (ii)(a) 110,000 90,000
Bank of Korea (BOK) (ii)(b) 15,000 15,000
Chiang Mai Initiative Multilateralisation (iii) 37,654 37,000
Repurchase Agreement with EMEAP Members (iv) 20,680 20,000
207,870 189,554
(a) Membership with IMF(i) The Bank has an obligation to pay to IMF SDR3,007 million, equivalent to RM17,300 million
(2017: SDR3,131 million, equivalent to RM18,050 million) or in other convertible currencies which represents the unpaid portion of Malaysia’s quota in the IMF under the Articles of Agreement.
(ii) The Bank has participated in the New Arrangements to Borrow (NAB), a set of credit arrangements between the IMF and its member countries to provide a supplementary source of financing to IMF for the purpose of safeguarding the stability of the international monetary system. As at 31 December 2018, the amount of undrawn credit under the NAB is SDR311 million, equivalent to RM1,790 million (2017: SDR302 million, equivalent to RM1,743 million).
BANK NEGARA MALAYSIA
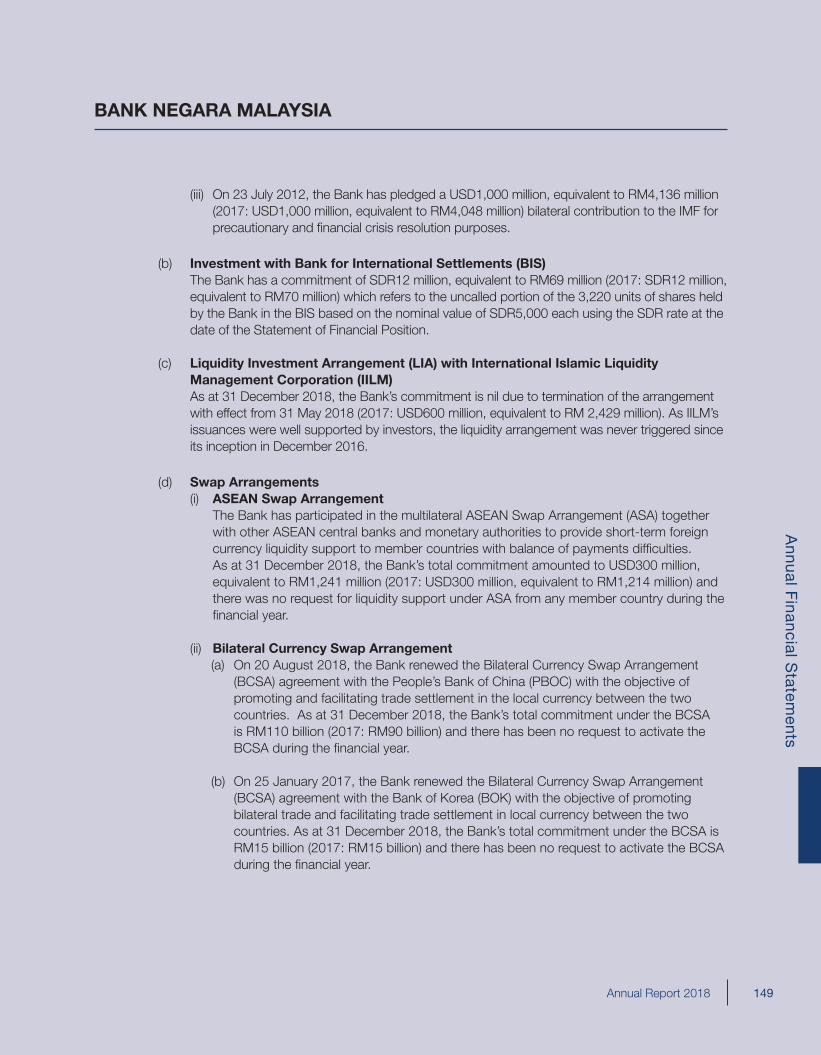
Annual Report 2018
Annual F
inancial Statem
ents
149
(iii) On 23 July 2012, the Bank has pledged a USD1,000 million, equivalent to RM4,136 million (2017: USD1,000 million, equivalent to RM4,048 million) bilateral contribution to the IMF for precautionary and financial crisis resolution purposes.
(b) Investment with Bank for International Settlements (BIS)The Bank has a commitment of SDR12 million, equivalent to RM69 million (2017: SDR12 million, equivalent to RM70 million) which refers to the uncalled portion of the 3,220 units of shares held by the Bank in the BIS based on the nominal value of SDR5,000 each using the SDR rate at the date of the Statement of Financial Position.
(c) Liquidity Investment Arrangement (LIA) with International Islamic Liquidity Management Corporation (IILM)As at 31 December 2018, the Bank’s commitment is nil due to termination of the arrangement with effect from 31 May 2018 (2017: USD600 million, equivalent to RM 2,429 million). As IILM’s issuances were well supported by investors, the liquidity arrangement was never triggered since its inception in December 2016.
(d) Swap Arrangements(i) ASEAN Swap Arrangement The Bank has participated in the multilateral ASEAN Swap Arrangement (ASA) together
with other ASEAN central banks and monetary authorities to provide short-term foreign currency liquidity support to member countries with balance of payments difficulties. As at 31 December 2018, the Bank’s total commitment amounted to USD300 million, equivalent to RM1,241 million (2017: USD300 million, equivalent to RM1,214 million) and there was no request for liquidity support under ASA from any member country during the financial year.
(ii) Bilateral Currency Swap Arrangement (a) On 20 August 2018, the Bank renewed the Bilateral Currency Swap Arrangement
(BCSA) agreement with the People’s Bank of China (PBOC) with the objective of promoting and facilitating trade settlement in the local currency between the two countries. As at 31 December 2018, the Bank’s total commitment under the BCSA is RM110 billion (2017: RM90 billion) and there has been no request to activate the BCSA during the financial year.
(b) On 25 January 2017, the Bank renewed the Bilateral Currency Swap Arrangement (BCSA) agreement with the Bank of Korea (BOK) with the objective of promoting bilateral trade and facilitating trade settlement in local currency between the two countries. As at 31 December 2018, the Bank’s total commitment under the BCSA is RM15 billion (2017: RM15 billion) and there has been no request to activate the BCSA during the financial year.
BANK NEGARA MALAYSIA
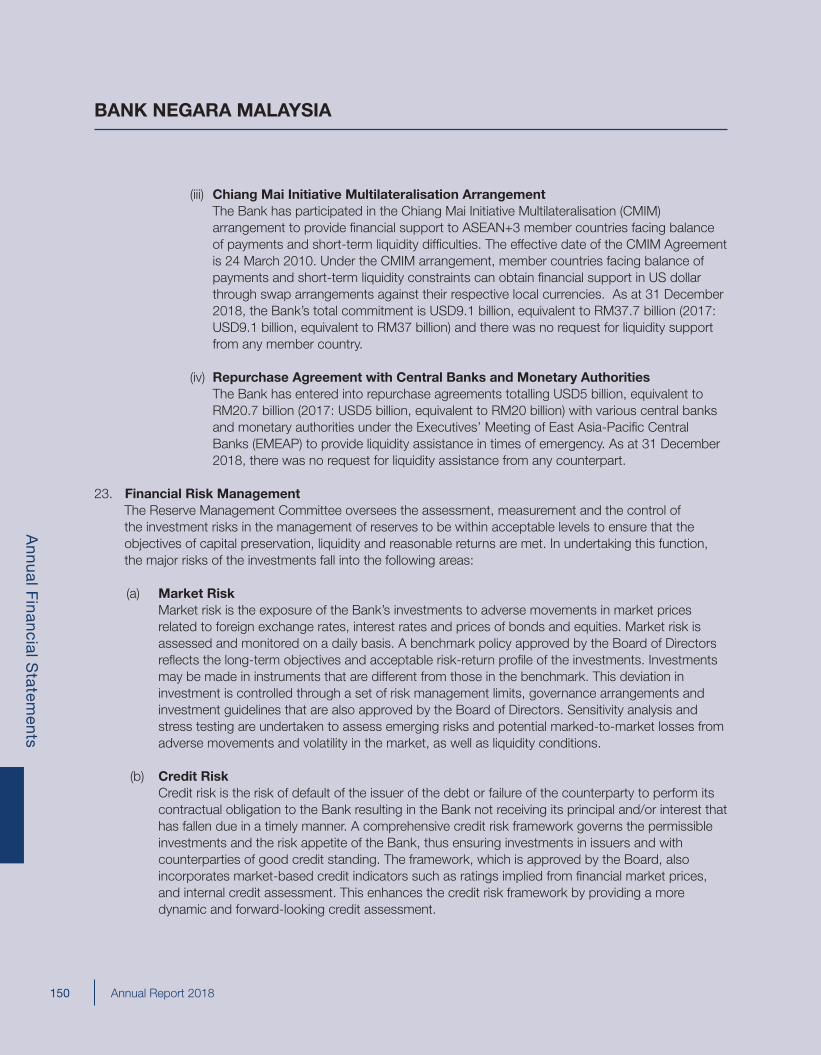
Annual Report 2018
Annual F
inancial Statem
ents
150
(iii) Chiang Mai Initiative Multilateralisation Arrangement The Bank has participated in the Chiang Mai Initiative Multilateralisation (CMIM)
arrangement to provide financial support to ASEAN+3 member countries facing balance of payments and short-term liquidity difficulties. The effective date of the CMIM Agreement is 24 March 2010. Under the CMIM arrangement, member countries facing balance of payments and short-term liquidity constraints can obtain financial support in US dollar through swap arrangements against their respective local currencies. As at 31 December 2018, the Bank’s total commitment is USD9.1 billion, equivalent to RM37.7 billion (2017: USD9.1 billion, equivalent to RM37 billion) and there was no request for liquidity support from any member country.
(iv) Repurchase Agreement with Central Banks and Monetary Authorities The Bank has entered into repurchase agreements totalling USD5 billion, equivalent to
RM20.7 billion (2017: USD5 billion, equivalent to RM20 billion) with various central banks and monetary authorities under the Executives’ Meeting of East Asia-Pacific Central Banks (EMEAP) to provide liquidity assistance in times of emergency. As at 31 December 2018, there was no request for liquidity assistance from any counterpart.
23. Financial Risk Management The Reserve Management Committee oversees the assessment, measurement and the control of the investment risks in the management of reserves to be within acceptable levels to ensure that the objectives of capital preservation, liquidity and reasonable returns are met. In undertaking this function, the major risks of the investments fall into the following areas:
(a) Market Risk Market risk is the exposure of the Bank’s investments to adverse movements in market prices
related to foreign exchange rates, interest rates and prices of bonds and equities. Market risk is assessed and monitored on a daily basis. A benchmark policy approved by the Board of Directors reflects the long-term objectives and acceptable risk-return profile of the investments. Investments may be made in instruments that are different from those in the benchmark. This deviation in investment is controlled through a set of risk management limits, governance arrangements and investment guidelines that are also approved by the Board of Directors. Sensitivity analysis and stress testing are undertaken to assess emerging risks and potential marked-to-market losses from adverse movements and volatility in the market, as well as liquidity conditions.
(b) Credit Risk Credit risk is the risk of default of the issuer of the debt or failure of the counterparty to perform its
contractual obligation to the Bank resulting in the Bank not receiving its principal and/or interest that has fallen due in a timely manner. A comprehensive credit risk framework governs the permissible investments and the risk appetite of the Bank, thus ensuring investments in issuers and with counterparties of good credit standing. The framework, which is approved by the Board, also incorporates market-based credit indicators such as ratings implied from financial market prices, and internal credit assessment. This enhances the credit risk framework by providing a more dynamic and forward-looking credit assessment.
BANK NEGARA MALAYSIA
Annual Report 2018
Annual F
inancial Statem
ents
151
BANK NEGARA MALAYSIA
(c) Operational Risk Operational risk is the risk of financial losses due to failed internal processes, inadequate controls
and procedures, or any other internal or external events that impede operations. Operational risk is mitigated through a governance framework and effective implementation of risk controls and limits. A comprehensive operational risk surveillance mechanism is in place to support the identification of emerging risks in the Bank’s operations to allow for action to be taken in managing gaps and in mitigating financial losses.
24. Bank Negara Malaysia Staff Welfare Account (SWA) and Bank Negara Malaysia Staff Welfare Account (Medical Fund) (termed as the ‘Medical Fund Account’)The SWA was established on 1 March 1991 under section 15 (5) and (6) of the Central Bank of Malaysia Act 1958 while the Medical Fund Account was established on 21 June 2006 under section 15 (6) of the Central Bank of Malaysia Act 1958. Both the SWA and the Medical Fund continue to exist under section 83 (4) and (5) of the Central Bank of Malaysia Act 2009.
The SWA is governed under the Bank Negara Malaysia Staff Welfare Account Trust Directions 1991. As stipulated in the Trust Directions 1991, the SWA shall be administered by a committee authorised by the Board (Authorised Committee of the Board). The accounts of the SWA are to be maintained separately from the other accounts of the Bank and shall be audited in the same manner of the Bank’s Account. The objective of the SWA is to provide loans to the staff for certain allowable activities, finance the activities of the staff associations and give education excellence awards to the children of staff. The SWA also manages the insurance compensation of the deceased staff received by beneficiaries who have yet to attain the legal age.
The Medical Fund Account is governed under the Bank Negara Malaysia Staff Welfare Account (Medical Fund) Trust Directions 2006 and Supplementary Trust Directions 2017. The objective is to assist the Bank to meet the medical expenses of eligible retirees and their dependents. As stipulated in the Staff Welfare Account (Medical Fund) Trust Directions 2006, the Medical Fund shall be administered by a Medical Fund Committee. The Medical Fund Account is to be maintained separately under the Staff Welfare Account and shall be audited in the same manner of the Staff Welfare Account.

Annual Report 2018
Annual F
inancial Statem
ents
152

Annex

Annex
P ii Annual Report 2018
P iiiAnnual Report 2018
Annex
CONTENTS
Key Economic and Financial Statistics
National AccountsA.1 Gross Domestic Product by Kind of Economic Activity at Constant 2010 Prices P 1A.2 Growth in Manufacturing Production (2015=100) P 2A.3 Services Sector Performance at Constant 2010 Prices P 2A.4 GNI by Demand Aggregates P 3A.5 Savings-Investment Gap P 4
External SectorA.6 Balance of Payments P 5A.7 Gross Exports P 6A.8 Gross Imports P 7A.9 Malaysia’s Trading Partners P 8A.10 Outstanding External Debt and Debt Servicing P 9
Consumer and Producer Prices IndexA.11 Consumer Price Index P 10A.12 Producer Price Index P 10
Monetary and Financial IndicatorsA.13 Broad Money (M3) P 11A.14 Money Supply: Annual Change and Growth Rates P 12A.15 Interest Rates (%) P 13A.16 Movements of the Ringgit P 14A.17 Financing of the Economy P 15
Public FinanceA.18 Consolidated Public Sector Finance P 16

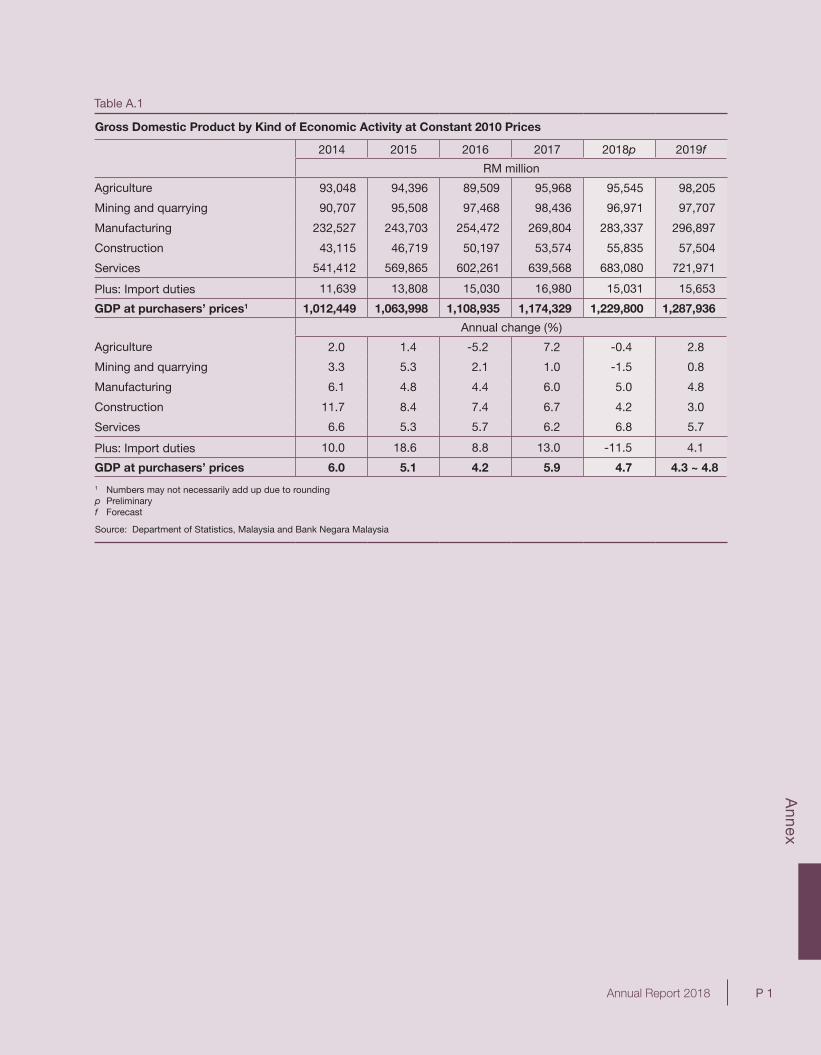
Annex
P 1Annual Report 2018
1
Gross Domestic Product by Kind of Economic Activity at Constant 2010 Prices
2014 2015 2016 2017 2018p 2019f
RM million
Agriculture 93,048 94,396 89,509 95,968 95,545 98,205
Mining and quarrying 90,707 95,508 97,468 98,436 96,971 97,707
Manufacturing 232,527 243,703 254,472 269,804 283,337 296,897
Construction 43,115 46,719 50,197 53,574 55,835 57,504
Services 541,412 569,865 602,261 639,568 683,080 721,971
Plus: Import duties 11,639 13,808 15,030 16,980 15,031 15,653
GDP at purchasers’ prices1 1,012,449 1,063,998 1,108,935 1,174,329 1,229,800 1,287,936
Annual change (%)
Agriculture 2.0 1.4 -5.2 7.2 -0.4 2.8
Mining and quarrying 3.3 5.3 2.1 1.0 -1.5 0.8
Manufacturing 6.1 4.8 4.4 6.0 5.0 4.8
Construction 11.7 8.4 7.4 6.7 4.2 3.0
Services 6.6 5.3 5.7 6.2 6.8 5.7
Plus: Import duties 10.0 18.6 8.8 13.0 -11.5 4.1
GDP at purchasers’ prices 6.0 5.1 4.2 5.9 4.7 4.3 ~ 4.8
1 Numbers may not necessarily add up due to roundingp Preliminaryf Forecast
Source: Department of Statistics, Malaysia and Bank Negara Malaysia
Table A.1
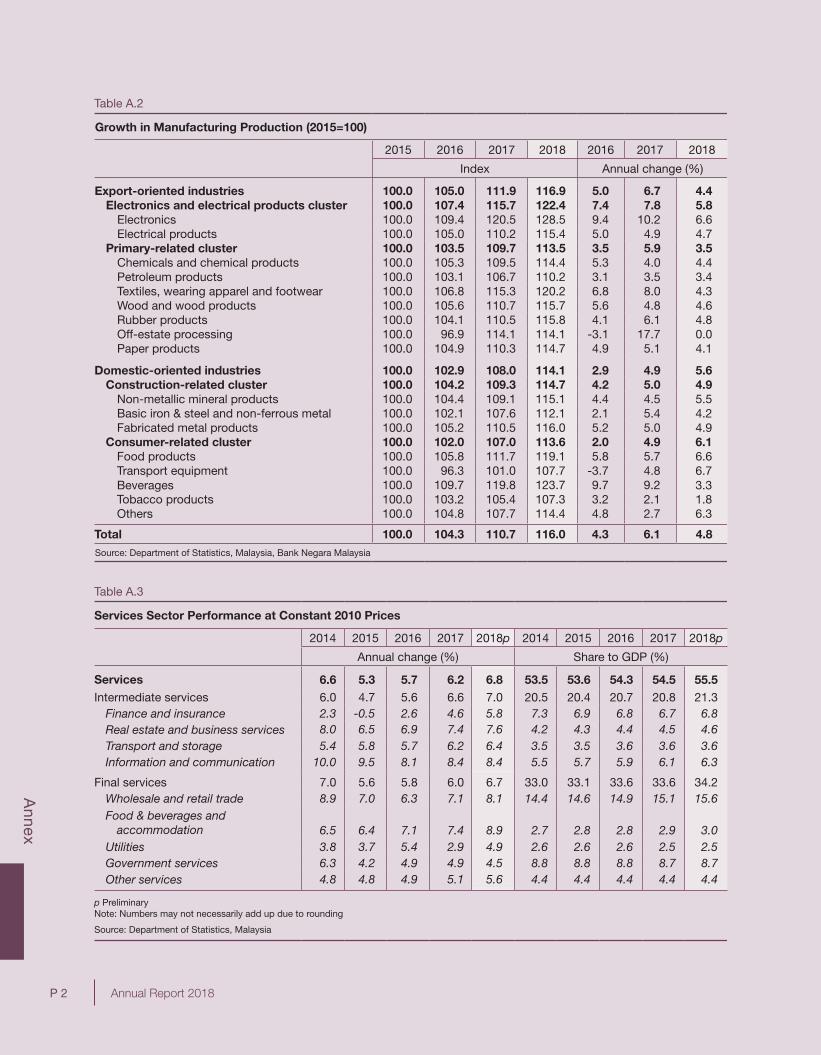
Annex
P 2 Annual Report 2018
1
Growth in Manufacturing Production (2015=100)
2015 2016 2017 2018 2016 2017 2018
Index Annual change (%)
Export-oriented industries 100.0 105.0 111.9 116.9 5.0 6.7 4.4Electronics and electrical products cluster 100.0 107.4 115.7 122.4 7.4 7.8 5.8
Electronics 100.0 109.4 120.5 128.5 9.4 10.2 6.6Electrical products 100.0 105.0 110.2 115.4 5.0 4.9 4.7
Primary-related cluster 100.0 103.5 109.7 113.5 3.5 5.9 3.5Chemicals and chemical products 100.0 105.3 109.5 114.4 5.3 4.0 4.4Petroleum products 100.0 103.1 106.7 110.2 3.1 3.5 3.4Textiles, wearing apparel and footwear 100.0 106.8 115.3 120.2 6.8 8.0 4.3Wood and wood products 100.0 105.6 110.7 115.7 5.6 4.8 4.6Rubber products 100.0 104.1 110.5 115.8 4.1 6.1 4.8Off-estate processing 100.0 96.9 114.1 114.1 -3.1 17.7 0.0Paper products 100.0 104.9 110.3 114.7 4.9 5.1 4.1
Domestic-oriented industries 100.0 102.9 108.0 114.1 2.9 4.9 5.6Construction-related cluster 100.0 104.2 109.3 114.7 4.2 5.0 4.9
Non-metallic mineral products 100.0 104.4 109.1 115.1 4.4 4.5 5.5Basic iron & steel and non-ferrous metal 100.0 102.1 107.6 112.1 2.1 5.4 4.2Fabricated metal products 100.0 105.2 110.5 116.0 5.2 5.0 4.9
Consumer-related cluster 100.0 102.0 107.0 113.6 2.0 4.9 6.1Food products 100.0 105.8 111.7 119.1 5.8 5.7 6.6Transport equipment 100.0 96.3 101.0 107.7 -3.7 4.8 6.7Beverages 100.0 109.7 119.8 123.7 9.7 9.2 3.3Tobacco products 100.0 103.2 105.4 107.3 3.2 2.1 1.8Others 100.0 104.8 107.7 114.4 4.8 2.7 6.3
Total 100.0 104.3 110.7 116.0 4.3 6.1 4.8Source: Department of Statistics, Malaysia, Bank Negara Malaysia
Table A.2
Services Sector Performance at Constant 2010 Prices
2014 2015 2016 2017 2018p 2014 2015 2016 2017 2018p
Annual change (%) Share to GDP (%)
Services 6.6 5.3 5.7 6.2 6.8 53.5 53.6 54.3 54.5 55.5Intermediate services 6.0 4.7 5.6 6.6 7.0 20.5 20.4 20.7 20.8 21.3
Finance and insurance 2.3 -0.5 2.6 4.6 5.8 7.3 6.9 6.8 6.7 6.8Real estate and business services 8.0 6.5 6.9 7.4 7.6 4.2 4.3 4.4 4.5 4.6Transport and storage 5.4 5.8 5.7 6.2 6.4 3.5 3.5 3.6 3.6 3.6Information and communication 10.0 9.5 8.1 8.4 8.4 5.5 5.7 5.9 6.1 6.3
Final services 7.0 5.6 5.8 6.0 6.7 33.0 33.1 33.6 33.6 34.2Wholesale and retail trade 8.9 7.0 6.3 7.1 8.1 14.4 14.6 14.9 15.1 15.6Food & beverages and
accommodation 6.5 6.4 7.1 7.4 8.9 2.7 2.8 2.8 2.9 3.0Utilities 3.8 3.7 5.4 2.9 4.9 2.6 2.6 2.6 2.5 2.5Government services 6.3 4.2 4.9 4.9 4.5 8.8 8.8 8.8 8.7 8.7Other services 4.8 4.8 4.9 5.1 5.6 4.4 4.4 4.4 4.4 4.4
p PreliminaryNote: Numbers may not necessarily add up due to rounding
Source: Department of Statistics, Malaysia
Table A.3
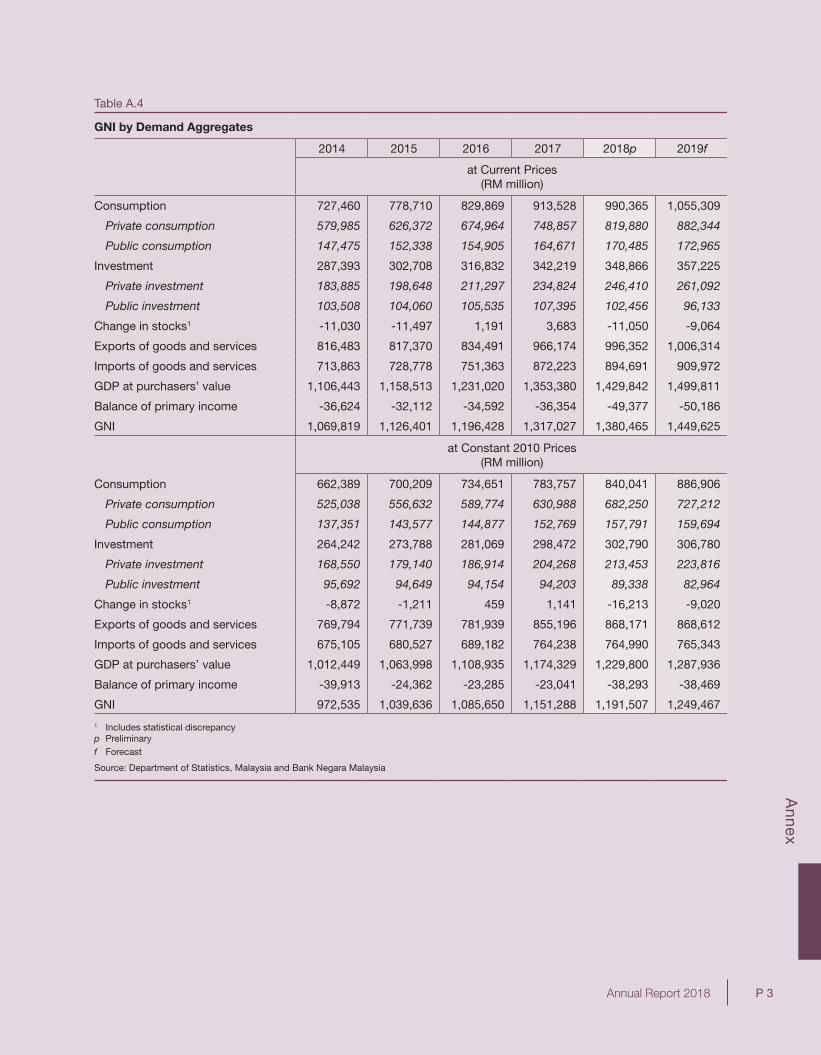
Annex
P 3Annual Report 2018
GNI by Demand Aggregates
2014 2015 2016 2017 2018p 2019f
at Current Prices(RM million)
Consumption 727,460 778,710 829,869 913,528 990,365 1,055,309
Private consumption 579,985 626,372 674,964 748,857 819,880 882,344
Public consumption 147,475 152,338 154,905 164,671 170,485 172,965
Investment 287,393 302,708 316,832 342,219 348,866 357,225
Private investment 183,885 198,648 211,297 234,824 246,410 261,092
Public investment 103,508 104,060 105,535 107,395 102,456 96,133
Change in stocks1 -11,030 -11,497 1,191 3,683 -11,050 -9,064
Exports of goods and services 816,483 817,370 834,491 966,174 996,352 1,006,314
Imports of goods and services 713,863 728,778 751,363 872,223 894,691 909,972
GDP at purchasers’ value 1,106,443 1,158,513 1,231,020 1,353,380 1,429,842 1,499,811
Balance of primary income -36,624 -32,112 -34,592 -36,354 -49,377 -50,186
GNI 1,069,819 1,126,401 1,196,428 1,317,027 1,380,465 1,449,625
at Constant 2010 Prices (RM million)
Consumption 662,389 700,209 734,651 783,757 840,041 886,906
Private consumption 525,038 556,632 589,774 630,988 682,250 727,212
Public consumption 137,351 143,577 144,877 152,769 157,791 159,694
Investment 264,242 273,788 281,069 298,472 302,790 306,780
Private investment 168,550 179,140 186,914 204,268 213,453 223,816
Public investment 95,692 94,649 94,154 94,203 89,338 82,964
Change in stocks1 -8,872 -1,211 459 1,141 -16,213 -9,020
Exports of goods and services 769,794 771,739 781,939 855,196 868,171 868,612
Imports of goods and services 675,105 680,527 689,182 764,238 764,990 765,343
GDP at purchasers’ value 1,012,449 1,063,998 1,108,935 1,174,329 1,229,800 1,287,936
Balance of primary income -39,913 -24,362 -23,285 -23,041 -38,293 -38,469
GNI 972,535 1,039,636 1,085,650 1,151,288 1,191,507 1,249,467
1 Includes statistical discrepancyp Preliminaryf Forecast
Source: Department of Statistics, Malaysia and Bank Negara Malaysia
Table A.4
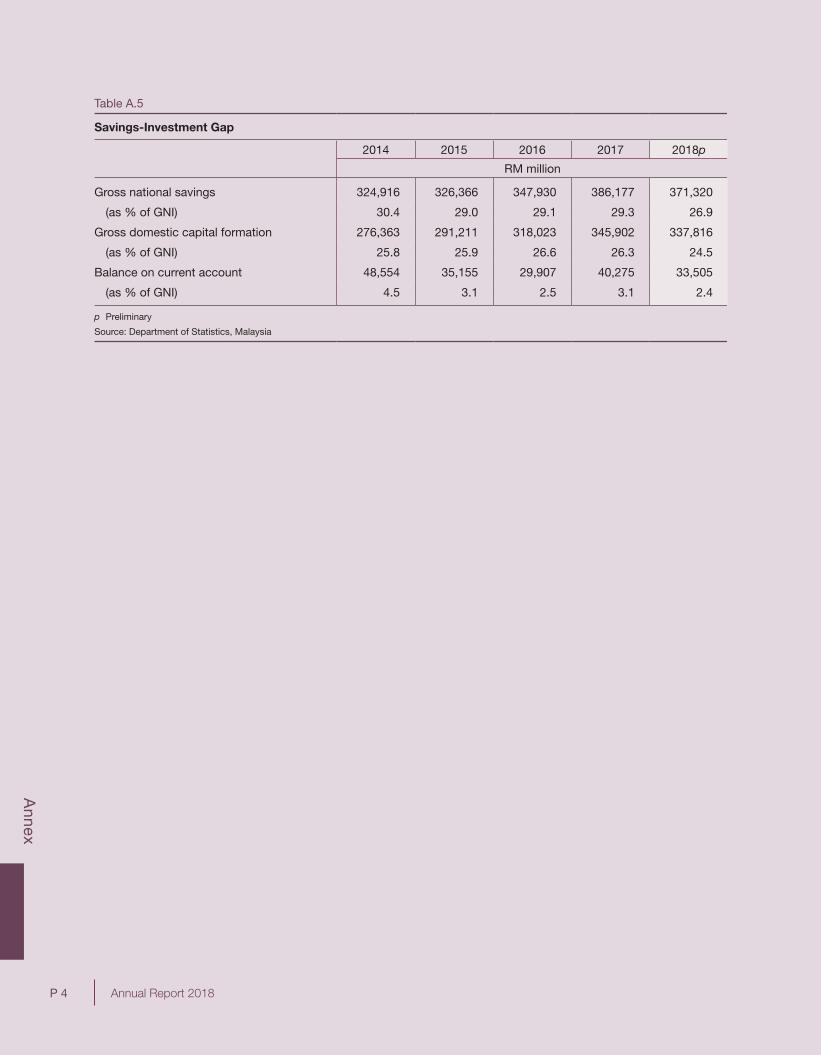
Annex
P 4 Annual Report 2018
1
Savings-Investment Gap
2014 2015 2016 2017 2018p
RM million
Gross national savings 324,916 326,366 347,930 386,177 371,320
(as % of GNI) 30.4 29.0 29.1 29.3 26.9
Gross domestic capital formation 276,363 291,211 318,023 345,902 337,816
(as % of GNI) 25.8 25.9 26.6 26.3 24.5
Balance on current account 48,554 35,155 29,907 40,275 33,505
(as % of GNI) 4.5 3.1 2.5 3.1 2.4
p Preliminary
Source: Department of Statistics, Malaysia
Table A.5
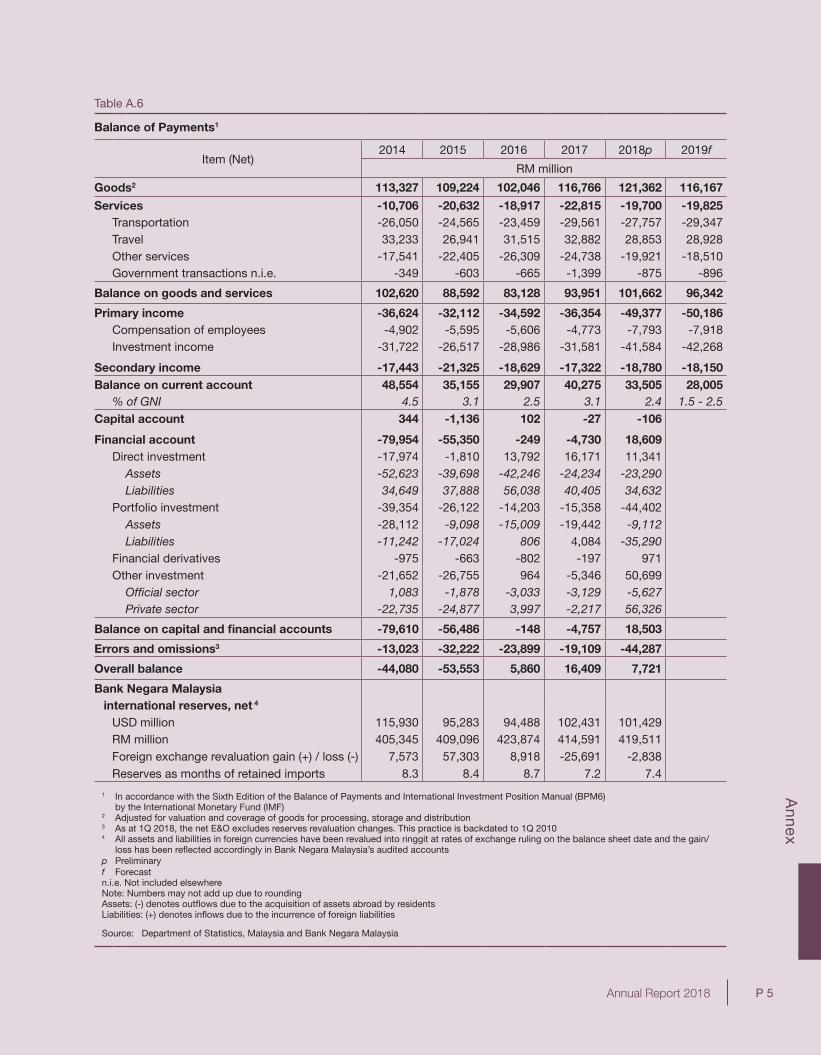
Annex
P 5Annual Report 2018
Balance of Payments1
Item (Net)2014 2015 2016 2017 2018p 2019f
RM million
Goods2 113,327 109,224 102,046 116,766 121,362 116,167
Services -10,706 -20,632 -18,917 -22,815 -19,700 -19,825Transportation -26,050 -24,565 -23,459 -29,561 -27,757 -29,347Travel 33,233 26,941 31,515 32,882 28,853 28,928Other services -17,541 -22,405 -26,309 -24,738 -19,921 -18,510Government transactions n.i.e. -349 -603 -665 -1,399 -875 -896
Balance on goods and services 102,620 88,592 83,128 93,951 101,662 96,342
Primary income -36,624 -32,112 -34,592 -36,354 -49,377 -50,186Compensation of employees -4,902 -5,595 -5,606 -4,773 -7,793 -7,918Investment income -31,722 -26,517 -28,986 -31,581 -41,584 -42,268
Secondary income -17,443 -21,325 -18,629 -17,322 -18,780 -18,150Balance on current account 48,554 35,155 29,907 40,275 33,505 28,005
% of GNI 4.5 3.1 2.5 3.1 2.4 1.5 - 2.5Capital account 344 -1,136 102 -27 -106
Financial account -79,954 -55,350 -249 -4,730 18,609Direct investment -17,974 -1,810 13,792 16,171 11,341
Assets -52,623 -39,698 -42,246 -24,234 -23,290Liabilities 34,649 37,888 56,038 40,405 34,632
Portfolio investment -39,354 -26,122 -14,203 -15,358 -44,402 Assets -28,112 -9,098 -15,009 -19,442 -9,112 Liabilities -11,242 -17,024 806 4,084 -35,290Financial derivatives -975 -663 -802 -197 971Other investment -21,652 -26,755 964 -5,346 50,699
Offi cial sector 1,083 -1,878 -3,033 -3,129 -5,627Private sector -22,735 -24,877 3,997 -2,217 56,326
Balance on capital and fi nancial accounts -79,610 -56,486 -148 -4,757 18,503
Errors and omissions3 -13,023 -32,222 -23,899 -19,109 -44,287
Overall balance -44,080 -53,553 5,860 16,409 7,721
Bank Negara Malaysia international reserves, net 4
USD million 115,930 95,283 94,488 102,431 101,429RM million 405,345 409,096 423,874 414,591 419,511Foreign exchange revaluation gain (+) / loss (-) 7,573 57,303 8,918 -25,691 -2,838Reserves as months of retained imports 8.3 8.4 8.7 7.2 7.4
1 In accordance with the Sixth Edition of the Balance of Payments and International Investment Position Manual (BPM6) by the International Monetary Fund (IMF)
2 Adjusted for valuation and coverage of goods for processing, storage and distribution
3 As at 1Q 2018, the net E&O excludes reserves revaluation changes. This practice is backdated to 1Q 2010
4 All assets and liabilities in foreign currencies have been revalued into ringgit at rates of exchange ruling on the balance sheet date and the gain/ loss has been refl ected accordingly in Bank Negara Malaysia’s audited accountsp Preliminaryf Forecast n.i.e. Not included elsewhere Note: Numbers may not add up due to rounding Assets: (-) denotes outfl ows due to the acquisition of assets abroad by residents Liabilities: (+) denotes infl ows due to the incurrence of foreign liabilities
Source: Department of Statistics, Malaysia and Bank Negara Malaysia
Table A.6
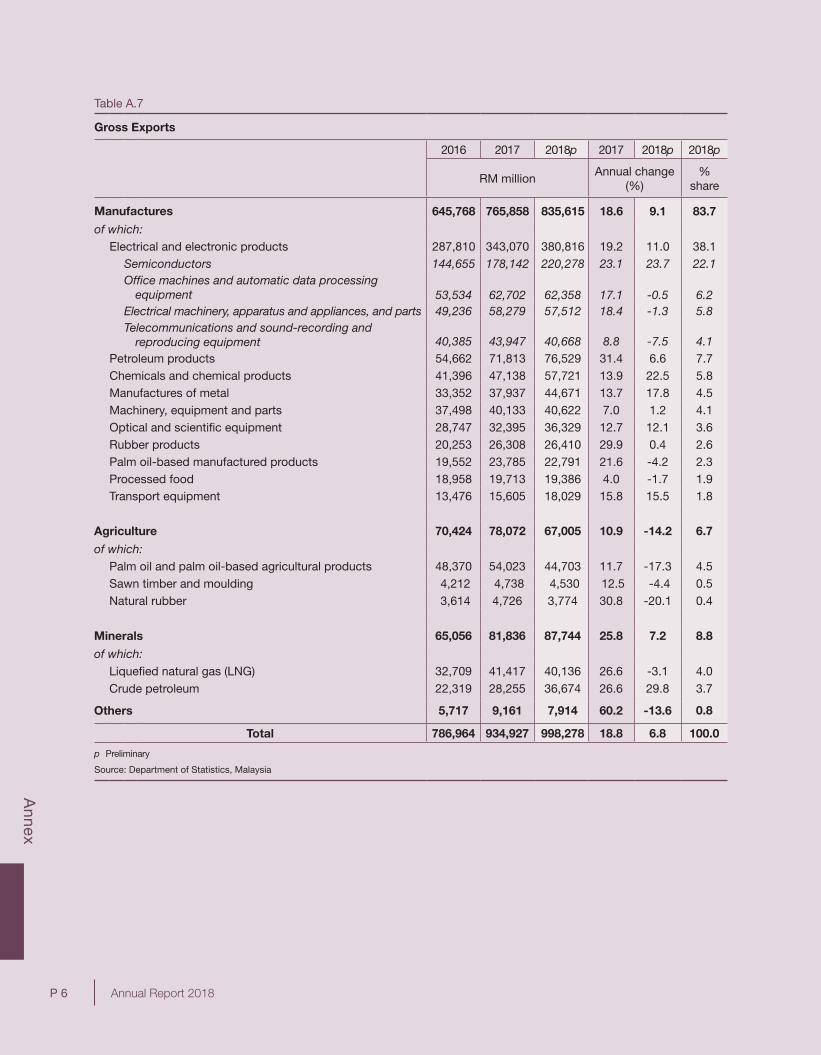
Annex
P 6 Annual Report 2018
Gross Exports
2016 2017 2018p 2017 2018p 2018p
RM millionAnnual change
(%)%
share
Manufactures 645,768 765,858 835,615 18.6 9.1 83.7
of which:Electrical and electronic products 287,810 343,070 380,816 19.2 11.0 38.1
Semiconductors 144,655 178,142 220,278 23.1 23.7 22.1Offi ce machines and automatic data processing
equipment 53,534 62,702 62,358 17.1 -0.5 6.2Electrical machinery, apparatus and appliances, and parts 49,236 58,279 57,512 18.4 -1.3 5.8Telecommunications and sound-recording and
reproducing equipment 40,385 43,947 40,668 8.8 -7.5 4.1Petroleum products 54,662 71,813 76,529 31.4 6.6 7.7Chemicals and chemical products 41,396 47,138 57,721 13.9 22.5 5.8Manufactures of metal 33,352 37,937 44,671 13.7 17.8 4.5Machinery, equipment and parts 37,498 40,133 40,622 7.0 1.2 4.1Optical and scientifi c equipment 28,747 32,395 36,329 12.7 12.1 3.6Rubber products 20,253 26,308 26,410 29.9 0.4 2.6Palm oil-based manufactured products 19,552 23,785 22,791 21.6 -4.2 2.3Processed food 18,958 19,713 19,386 4.0 -1.7 1.9Transport equipment 13,476 15,605 18,029 15.8 15.5 1.8
Agriculture 70,424 78,072 67,005 10.9 -14.2 6.7
of which:Palm oil and palm oil-based agricultural products 48,370 54,023 44,703 11.7 -17.3 4.5Sawn timber and moulding 4,212 4,738 4,530 12.5 -4.4 0.5Natural rubber 3,614 4,726 3,774 30.8 -20.1 0.4
Minerals 65,056 81,836 87,744 25.8 7.2 8.8
of which:Liquefi ed natural gas (LNG) 32,709 41,417 40,136 26.6 -3.1 4.0Crude petroleum 22,319 28,255 36,674 26.6 29.8 3.7
Others 5,717 9,161 7,914 60.2 -13.6 0.8
Total 786,964 934,927 998,278 18.8 6.8 100.0
p Preliminary
Source: Department of Statistics, Malaysia
Table A.7
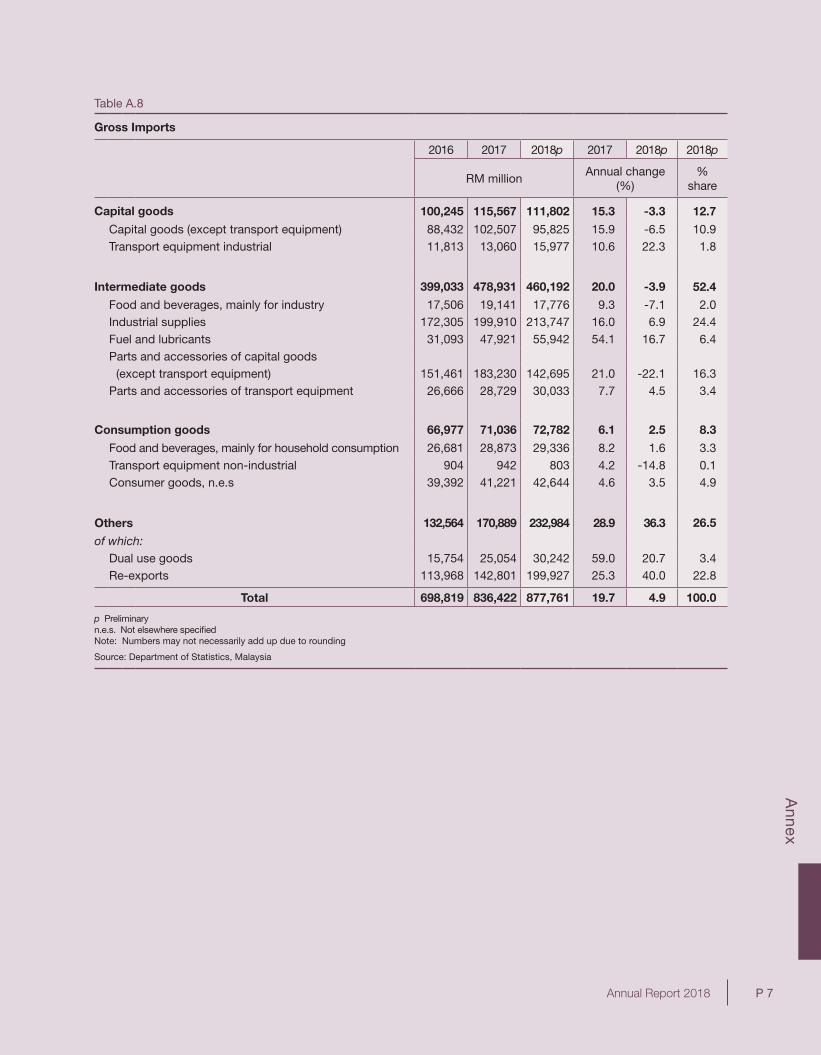
Annex
P 7Annual Report 2018
Annex
1
Gross Imports
2016 2017 2018p 2017 2018p 2018p
RM millionAnnual change
(%)%
share
Capital goods 100,245 115,567 111,802 15.3 -3.3 12.7
Capital goods (except transport equipment) 88,432 102,507 95,825 15.9 -6.5 10.9Transport equipment industrial 11,813 13,060 15,977 10.6 22.3 1.8
Intermediate goods 399,033 478,931 460,192 20.0 -3.9 52.4
Food and beverages, mainly for industry 17,506 19,141 17,776 9.3 -7.1 2.0Industrial supplies 172,305 199,910 213,747 16.0 6.9 24.4Fuel and lubricants 31,093 47,921 55,942 54.1 16.7 6.4Parts and accessories of capital goods (except transport equipment) 151,461 183,230 142,695 21.0 -22.1 16.3
Parts and accessories of transport equipment 26,666 28,729 30,033 7.7 4.5 3.4
Consumption goods 66,977 71,036 72,782 6.1 2.5 8.3
Food and beverages, mainly for household consumption 26,681 28,873 29,336 8.2 1.6 3.3Transport equipment non-industrial 904 942 803 4.2 -14.8 0.1Consumer goods, n.e.s 39,392 41,221 42,644 4.6 3.5 4.9
Others 132,564 170,889 232,984 28.9 36.3 26.5
of which:Dual use goods 15,754 25,054 30,242 59.0 20.7 3.4Re-exports 113,968 142,801 199,927 25.3 40.0 22.8
Total 698,819 836,422 877,761 19.7 4.9 100.0
p Preliminaryn.e.s. Not elsewhere specifi edNote: Numbers may not necessarily add up due to rounding
Source: Department of Statistics, Malaysia
Table A.8
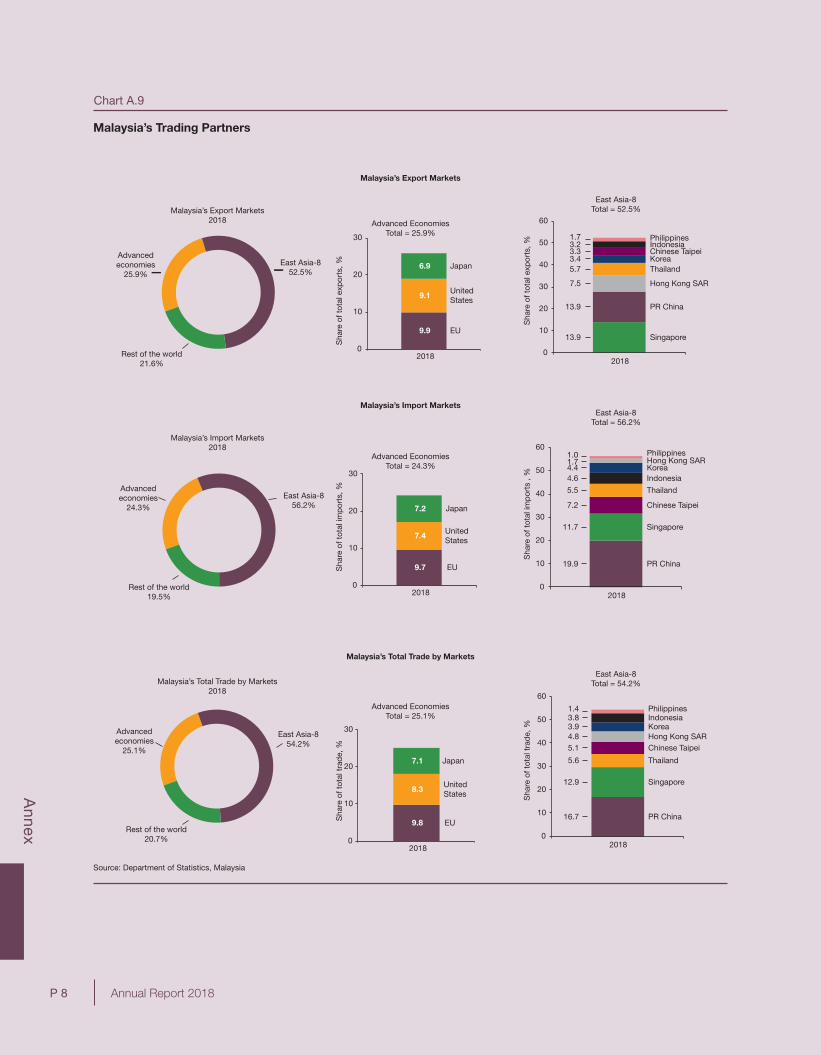
Annex
P 8 Annual Report 2018
Sha
re o
f tot
al t
rad
e, %
Sha
re o
f tot
al t
rad
e, %
Sha
re o
f tot
al im
por
ts ,
%
Sha
re o
f tot
al im
por
ts, %
Chart A.9
Malaysia’s Trading Partners
Malaysia’s Export Markets2018
Malaysia’s Import Markets2018
Malaysia’s Total Trade by Markets2018
Source: Department of Statistics, Malaysia
Malaysia’s Export Markets
Malaysia’s Import Markets
Malaysia’s Total Trade by Markets
East Asia-8Total = 52.5%
East Asia-8Total = 56.2%
East Asia-8Total = 54.2%
Sha
re o
f tot
al e
xpor
ts, %
Advanced EconomiesTotal = 25.9%
Advanced EconomiesTotal = 24.3%
Advanced EconomiesTotal = 25.1%
Sha
re o
f tot
al e
xpor
ts, %
Advancedeconomies
25.9%
East Asia-852.5%
Rest of the world21.6%
Advancedeconomies
24.3%
East Asia-856.2%
Rest of the world19.5%
Advancedeconomies
25.1%
East Asia-854.2%
Rest of the world20.7%
9.9
9.1
6.9
0
10
20
30
2018
Japan
EU
UnitedStates
9.7
7.4
7.2
0
10
20
30
2018
UnitedStates
Japan
EU
9.8
8.3
7.1
0
10
20
30
2018
Japan
UnitedStates
EU
PR China
Singapore
Thailand
Hong Kong SAR
IndonesiaKorea
Chinese Taipei
Philippines
19.9
11.7
7.2
5.5
4.64.41.71.0
0
10
20
30
40
50
60
2018
PR China
Singapore
Thailand
Hong Kong SAR
IndonesiaKorea
Chinese Taipei
Philippines
16.7
12.9
5.6
5.14.83.93.81.4
0
10
20
30
40
50
60
2018
PR China
Singapore
Thailand
Hong Kong SAR
Korea
Philippines
Chinese TaipeiIndonesia
13.9
13.9
7.5
5.73.43.33.21.7
0
10
20
30
40
50
60
2018
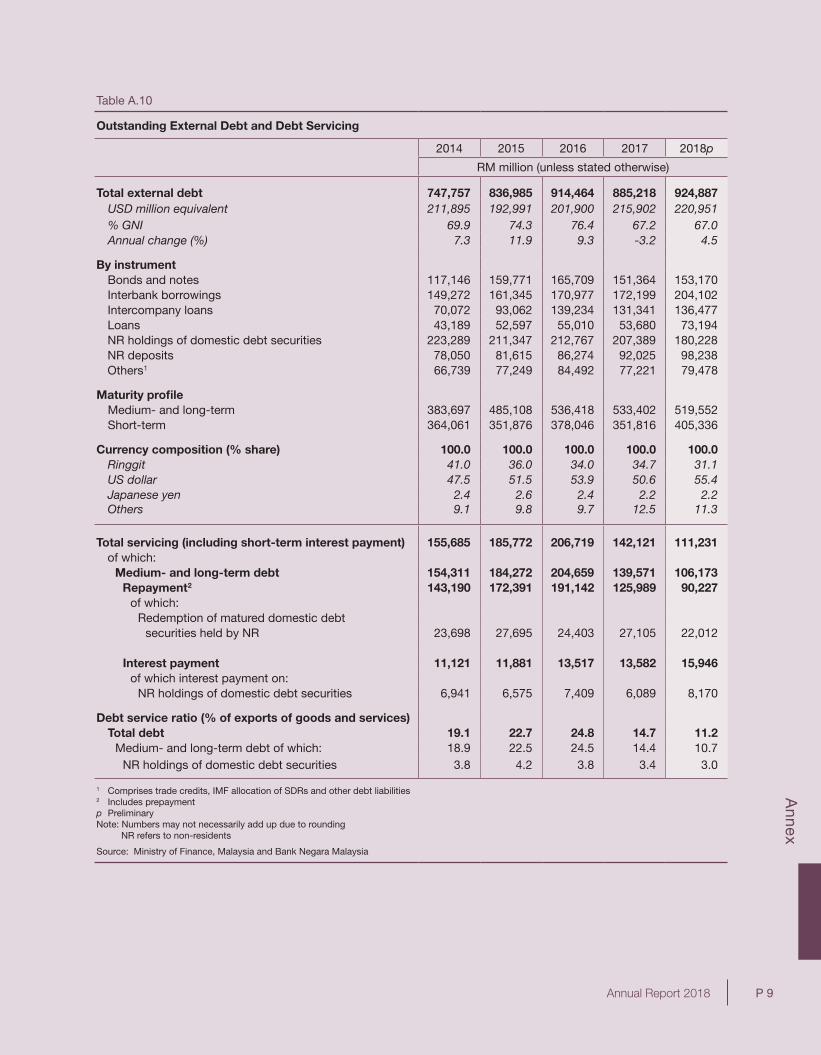
Annex
P 9Annual Report 2018
Table A.10
Outstanding External Debt and Debt Servicing
2014 2015 2016 2017 2018p
RM million (unless stated otherwise)
Total external debt 747,757 836,985 914,464 885,218 924,887USD million equivalent 211,895 192,991 201,900 215,902 220,951 % GNI 69.9 74.3 76.4 67.2 67.0Annual change (%) 7.3 11.9 9.3 -3.2 4.5
By instrumentBonds and notes 117,146 159,771 165,709 151,364 153,170 Interbank borrowings 149,272 161,345 170,977 172,199 204,102 Intercompany loans 70,072 93,062 139,234 131,341 136,477 Loans 43,189 52,597 55,010 53,680 73,194 NR holdings of domestic debt securities 223,289 211,347 212,767 207,389 180,228 NR deposits 78,050 81,615 86,274 92,025 98,238 Others1 66,739 77,249 84,492 77,221 79,478
Maturity profi leMedium- and long-term 383,697 485,108 536,418 533,402 519,552 Short-term 364,061 351,876 378,046 351,816 405,336
Currency composition (% share) 100.0 100.0 100.0 100.0 100.0 Ringgit 41.0 36.0 34.0 34.7 31.1US dollar 47.5 51.5 53.9 50.6 55.4Japanese yen 2.4 2.6 2.4 2.2 2.2Others 9.1 9.8 9.7 12.5 11.3
Total servicing (including short-term interest payment) 155,685 185,772 206,719 142,121 111,231 of which:
Medium- and long-term debt 154,311 184,272 204,659 139,571 106,173 Repayment2 143,190 172,391 191,142 125,989 90,227
of which:Redemption of matured domestic debt
securities held by NR 23,698 27,695 24,403 27,105 22,012
Interest payment 11,121 11,881 13,517 13,582 15,946 of which interest payment on:
NR holdings of domestic debt securities 6,941 6,575 7,409 6,089 8,170
Debt service ratio (% of exports of goods and services) Total debt 19.1 22.7 24.8 14.7 11.2
Medium- and long-term debt of which: 18.9 22.5 24.5 14.4 10.7NR holdings of domestic debt securities 3.8 4.2 3.8 3.4 3.0
1 Comprises trade credits, IMF allocation of SDRs and other debt liabilities2 Includes prepaymentp PreliminaryNote: Numbers may not necessarily add up due to rounding NR refers to non-residents
Source: Ministry of Finance, Malaysia and Bank Negara Malaysia
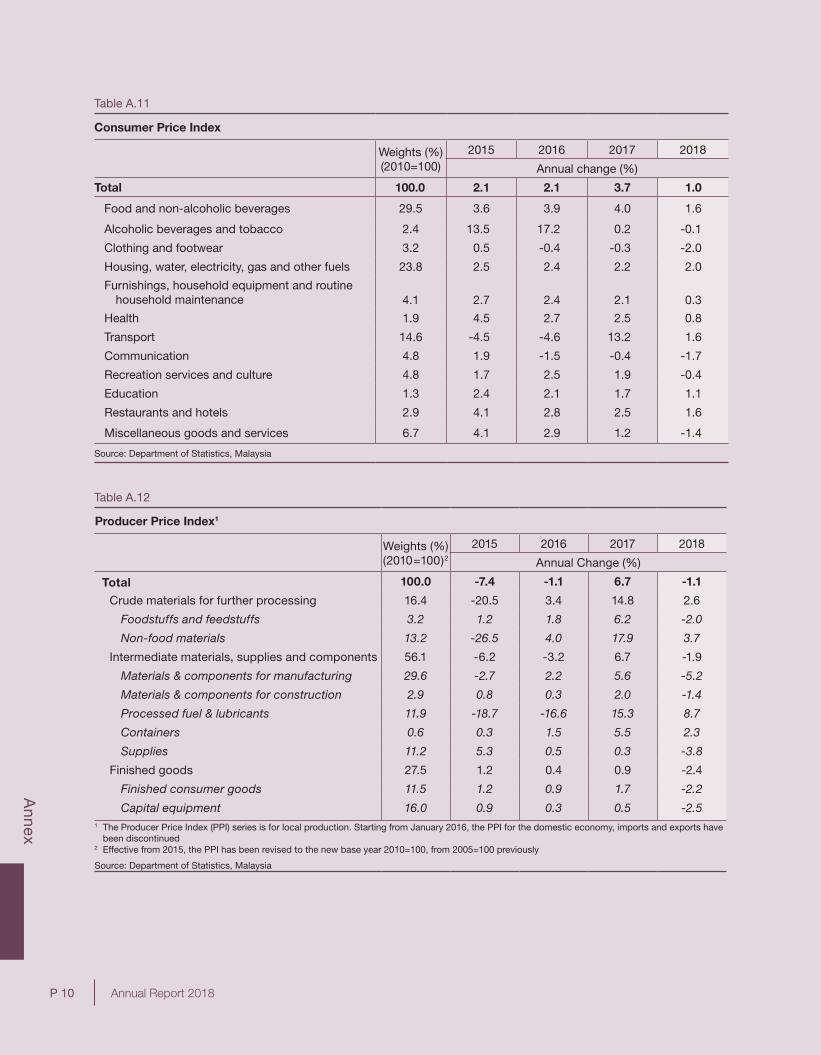
Annex
P 10 Annual Report 2018
Table A.11
Consumer Price Index
Weights (%) (2010=100)
2015 2016 2017 2018
Annual change (%)
Total 100.0 2.1 2.1 3.7 1.0
Food and non-alcoholic beverages 29.5 3.6 3.9 4.0 1.6
Alcoholic beverages and tobacco 2.4 13.5 17.2 0.2 -0.1
Clothing and footwear 3.2 0.5 -0.4 -0.3 -2.0
Housing, water, electricity, gas and other fuels 23.8 2.5 2.4 2.2 2.0
Furnishings, household equipment and routine household maintenance 4.1 2.7 2.4 2.1 0.3
Health 1.9 4.5 2.7 2.5 0.8
Transport 14.6 -4.5 -4.6 13.2 1.6
Communication 4.8 1.9 -1.5 -0.4 -1.7
Recreation services and culture 4.8 1.7 2.5 1.9 -0.4
Education 1.3 2.4 2.1 1.7 1.1
Restaurants and hotels 2.9 4.1 2.8 2.5 1.6
Miscellaneous goods and services 6.7 4.1 2.9 1.2 -1.4
Source: Department of Statistics, Malaysia
1
Table A.12
Producer Price Index1
Weights (%) (2010=100)2
2015 2016 2017 2018
Annual Change (%)
Total 100.0 -7.4 -1.1 6.7 -1.1
Crude materials for further processing 16.4 -20.5 3.4 14.8 2.6
Foodstuffs and feedstuffs 3.2 1.2 1.8 6.2 -2.0
Non-food materials 13.2 -26.5 4.0 17.9 3.7
Intermediate materials, supplies and components 56.1 -6.2 -3.2 6.7 -1.9
Materials & components for manufacturing 29.6 -2.7 2.2 5.6 -5.2
Materials & components for construction 2.9 0.8 0.3 2.0 -1.4
Processed fuel & lubricants 11.9 -18.7 -16.6 15.3 8.7
Containers 0.6 0.3 1.5 5.5 2.3
Supplies 11.2 5.3 0.5 0.3 -3.8
Finished goods 27.5 1.2 0.4 0.9 -2.4
Finished consumer goods 11.5 1.2 0.9 1.7 -2.2
Capital equipment 16.0 0.9 0.3 0.5 -2.51 The Producer Price Index (PPI) series is for local production. Starting from January 2016, the PPI for the domestic economy, imports and exports have been discontinued2 Effective from 2015, the PPI has been revised to the new base year 2010=100, from 2005=100 previously
Source: Department of Statistics, Malaysia
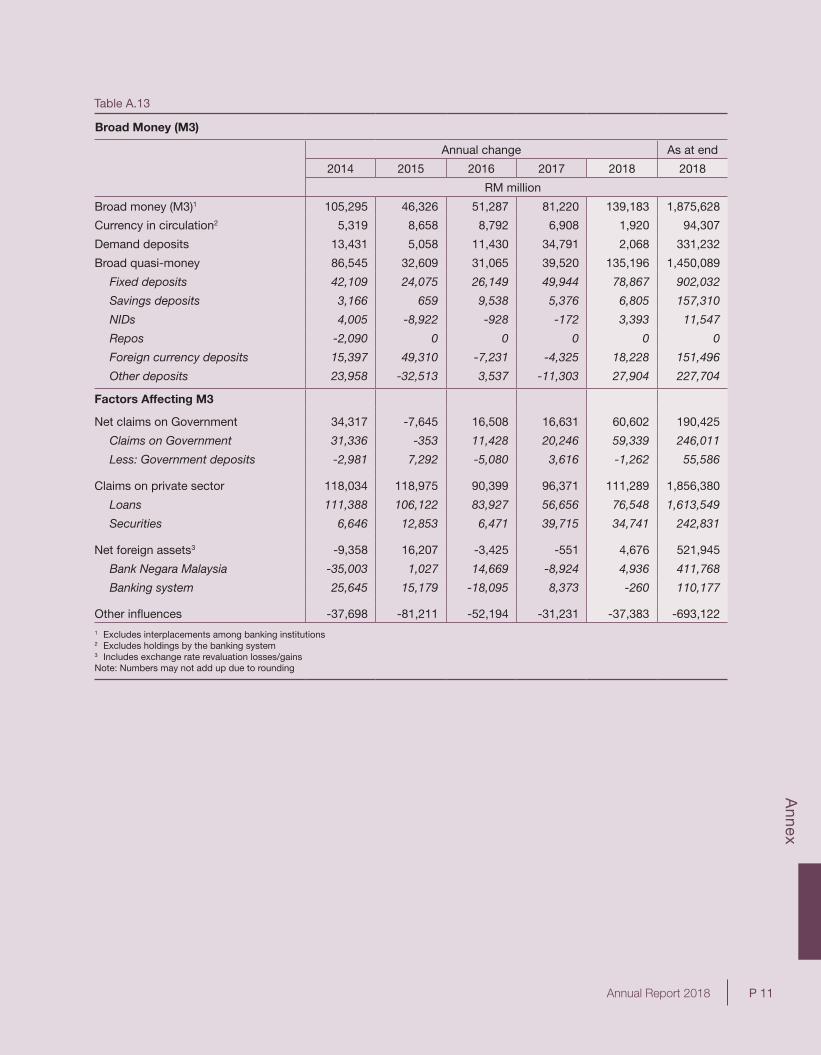
Annex
P 11Annual Report 2018
1
Broad Money (M3)
Annual change As at end
2014 2015 2016 2017 2018 2018
RM million
Broad money (M3)1 105,295 46,326 51,287 81,220 139,183 1,875,628
Currency in circulation2 5,319 8,658 8,792 6,908 1,920 94,307
Demand deposits 13,431 5,058 11,430 34,791 2,068 331,232
Broad quasi-money 86,545 32,609 31,065 39,520 135,196 1,450,089
Fixed deposits 42,109 24,075 26,149 49,944 78,867 902,032
Savings deposits 3,166 659 9,538 5,376 6,805 157,310
NIDs 4,005 -8,922 -928 -172 3,393 11,547
Repos -2,090 0 0 0 0 0
Foreign currency deposits 15,397 49,310 -7,231 -4,325 18,228 151,496
Other deposits 23,958 -32,513 3,537 -11,303 27,904 227,704
Factors Affecting M3
Net claims on Government 34,317 -7,645 16,508 16,631 60,602 190,425
Claims on Government 31,336 -353 11,428 20,246 59,339 246,011
Less: Government deposits -2,981 7,292 -5,080 3,616 -1,262 55,586
Claims on private sector 118,034 118,975 90,399 96,371 111,289 1,856,380
Loans 111,388 106,122 83,927 56,656 76,548 1,613,549
Securities 6,646 12,853 6,471 39,715 34,741 242,831
Net foreign assets3 -9,358 16,207 -3,425 -551 4,676 521,945
Bank Negara Malaysia -35,003 1,027 14,669 -8,924 4,936 411,768
Banking system 25,645 15,179 -18,095 8,373 -260 110,177
Other infl uences -37,698 -81,211 -52,194 -31,231 -37,383 -693,1221 Excludes interplacements among banking institutions 2 Excludes holdings by the banking system3 Includes exchange rate revaluation losses/gainsNote: Numbers may not add up due to rounding
Table A.13
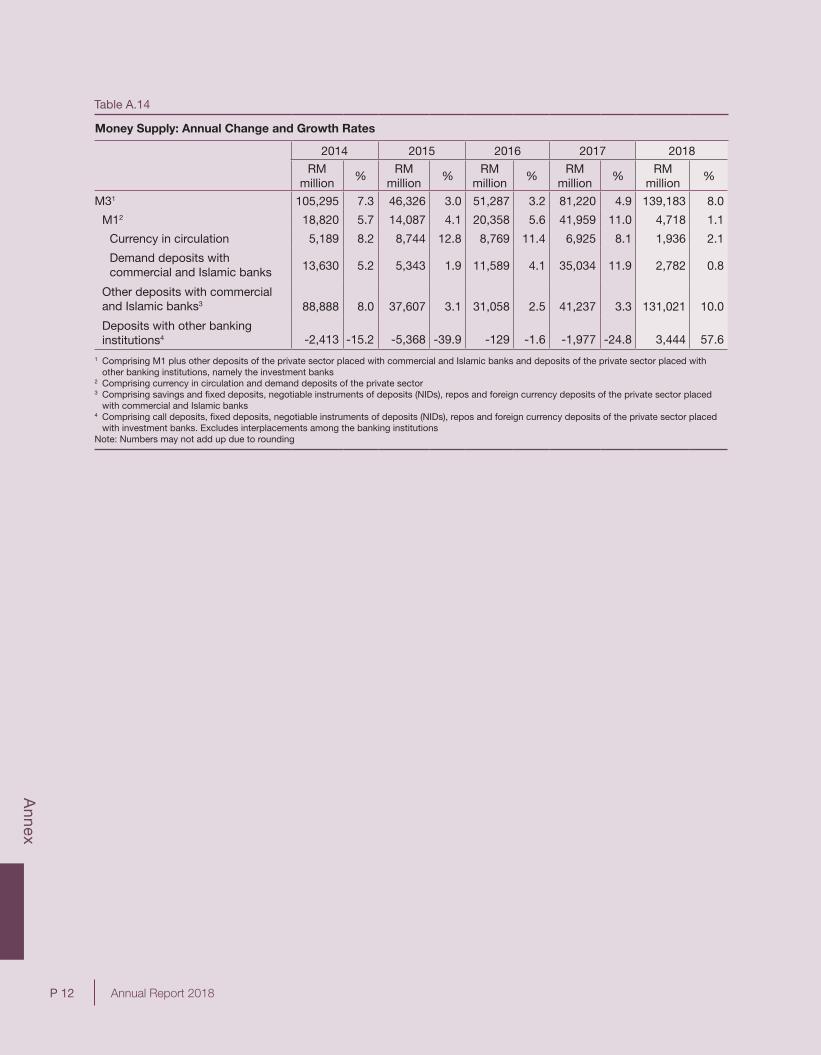
Annex
P 12 Annual Report 2018
1
Money Supply: Annual Change and Growth Rates
2014 2015 2016 2017 2018
RM million
% RM
million%
RM million
% RM
million%
RM million
%
M31 105,295 7.3 46,326 3.0 51,287 3.2 81,220 4.9 139,183 8.0
M12 18,820 5.7 14,087 4.1 20,358 5.6 41,959 11.0 4,718 1.1
Currency in circulation 5,189 8.2 8,744 12.8 8,769 11.4 6,925 8.1 1,936 2.1
Demand deposits with commercial and Islamic banks 13,630 5.2 5,343 1.9 11,589 4.1 35,034 11.9 2,782 0.8
Other deposits with commercialand Islamic banks3 88,888 8.0 37,607 3.1 31,058 2.5 41,237 3.3 131,021 10.0
Deposits with other banking institutions4 -2,413 -15.2 -5,368 -39.9 -129 -1.6 -1,977 -24.8 3,444 57.6
1 Comprising M1 plus other deposits of the private sector placed with commercial and Islamic banks and deposits of the private sector placed with other banking institutions, namely the investment banks
2 Comprising currency in circulation and demand deposits of the private sector3 Comprising savings and fi xed deposits, negotiable instruments of deposits (NIDs), repos and foreign currency deposits of the private sector placed
with commercial and Islamic banks4 Comprising call deposits, fi xed deposits, negotiable instruments of deposits (NIDs), repos and foreign currency deposits of the private sector placed
with investment banks. Excludes interplacements among the banking institutionsNote: Numbers may not add up due to rounding
Table A.14
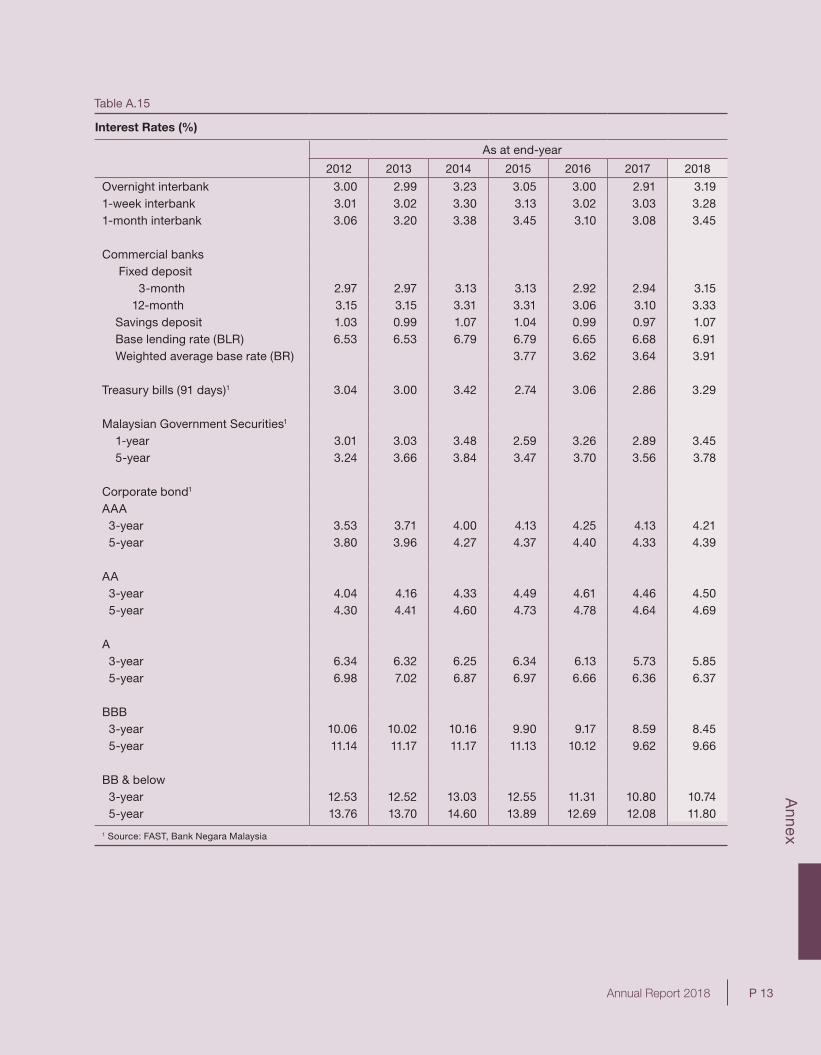
Annex
P 13Annual Report 2018 1
Table A.15
Interest Rates (%)
As at end-year
2012 2013 2014 2015 2016 2017 2018
Overnight interbank 3.00 2.99 3.23 3.05 3.00 2.91 3.191-week interbank 3.01 3.02 3.30 3.13 3.02 3.03 3.281-month interbank 3.06 3.20 3.38 3.45 3.10 3.08 3.45
Commercial banks Fixed deposit 3-month 2.97 2.97 3.13 3.13 2.92 2.94 3.15 12-month 3.15 3.15 3.31 3.31 3.06 3.10 3.33 Savings deposit 1.03 0.99 1.07 1.04 0.99 0.97 1.07 Base lending rate (BLR) 6.53 6.53 6.79 6.79 6.65 6.68 6.91 Weighted average base rate (BR) 3.77 3.62 3.64 3.91
Treasury bills (91 days)1 3.04 3.00 3.42 2.74 3.06 2.86 3.29
Malaysian Government Securities1
1-year 3.01 3.03 3.48 2.59 3.26 2.89 3.45 5-year 3.24 3.66 3.84 3.47 3.70 3.56 3.78
Corporate bond1
AAA 3-year 3.53 3.71 4.00 4.13 4.25 4.13 4.21 5-year 3.80 3.96 4.27 4.37 4.40 4.33 4.39
AA 3-year 4.04 4.16 4.33 4.49 4.61 4.46 4.50 5-year 4.30 4.41 4.60 4.73 4.78 4.64 4.69
A 3-year 6.34 6.32 6.25 6.34 6.13 5.73 5.85 5-year 6.98 7.02 6.87 6.97 6.66 6.36 6.37
BBB 3-year 10.06 10.02 10.16 9.90 9.17 8.59 8.45 5-year 11.14 11.17 11.17 11.13 10.12 9.62 9.66
BB & below 3-year 12.53 12.52 13.03 12.55 11.31 10.80 10.74 5-year 13.76 13.70 14.60 13.89 12.69 12.08 11.80
1 Source: FAST, Bank Negara Malaysia
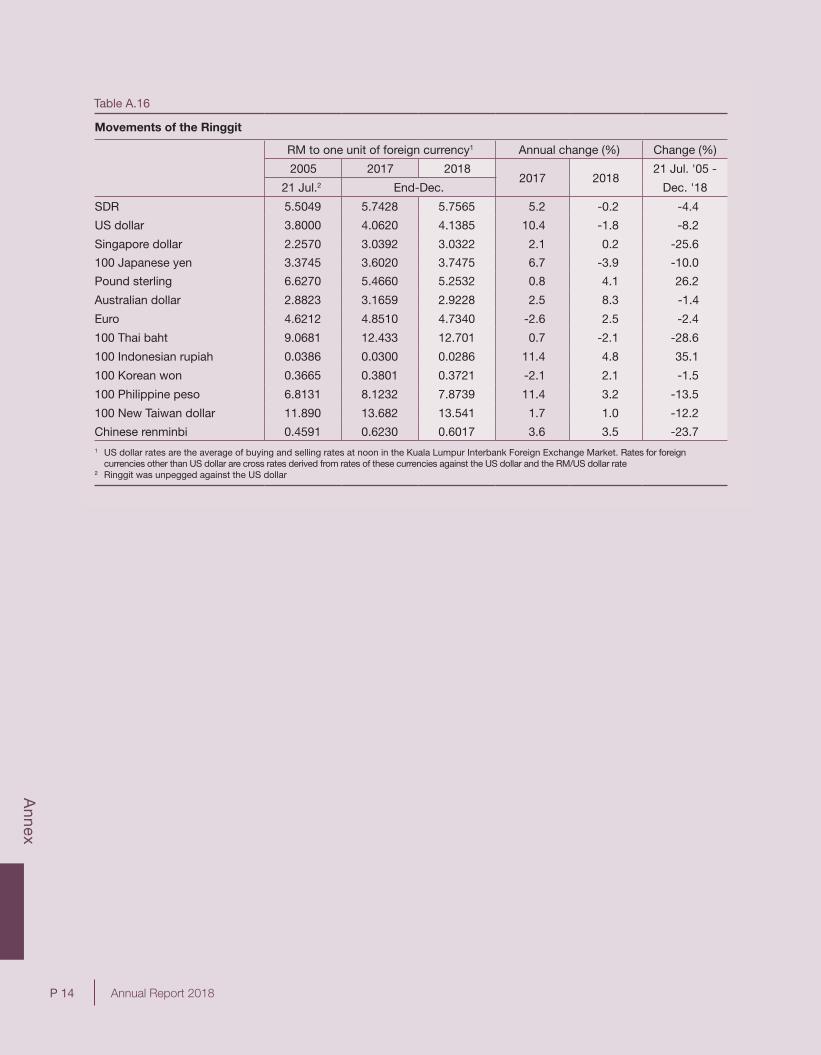
Annex
P 14 Annual Report 2018
Movements of the Ringgit
RM to one unit of foreign currency1 Annual change (%) Change (%)
2005 2017 20182017 2018
21 Jul. '05 -
21 Jul.2 End-Dec. Dec. '18
SDR 5.5049 5.7428 5.7565 5.2 -0.2 -4.4
US dollar 3.8000 4.0620 4.1385 10.4 -1.8 -8.2
Singapore dollar 2.2570 3.0392 3.0322 2.1 0.2 -25.6
100 Japanese yen 3.3745 3.6020 3.7475 6.7 -3.9 -10.0
Pound sterling 6.6270 5.4660 5.2532 0.8 4.1 26.2
Australian dollar 2.8823 3.1659 2.9228 2.5 8.3 -1.4
Euro 4.6212 4.8510 4.7340 -2.6 2.5 -2.4
100 Thai baht 9.0681 12.433 12.701 0.7 -2.1 -28.6
100 Indonesian rupiah 0.0386 0.0300 0.0286 11.4 4.8 35.1
100 Korean won 0.3665 0.3801 0.3721 -2.1 2.1 -1.5
100 Philippine peso 6.8131 8.1232 7.8739 11.4 3.2 -13.5
100 New Taiwan dollar 11.890 13.682 13.541 1.7 1.0 -12.2
Chinese renminbi 0.4591 0.6230 0.6017 3.6 3.5 -23.71 US dollar rates are the average of buying and selling rates at noon in the Kuala Lumpur Interbank Foreign Exchange Market. Rates for foreign currencies other than US dollar are cross rates derived from rates of these currencies against the US dollar and the RM/US dollar rate2 Ringgit was unpegged against the US dollar
Table A.16
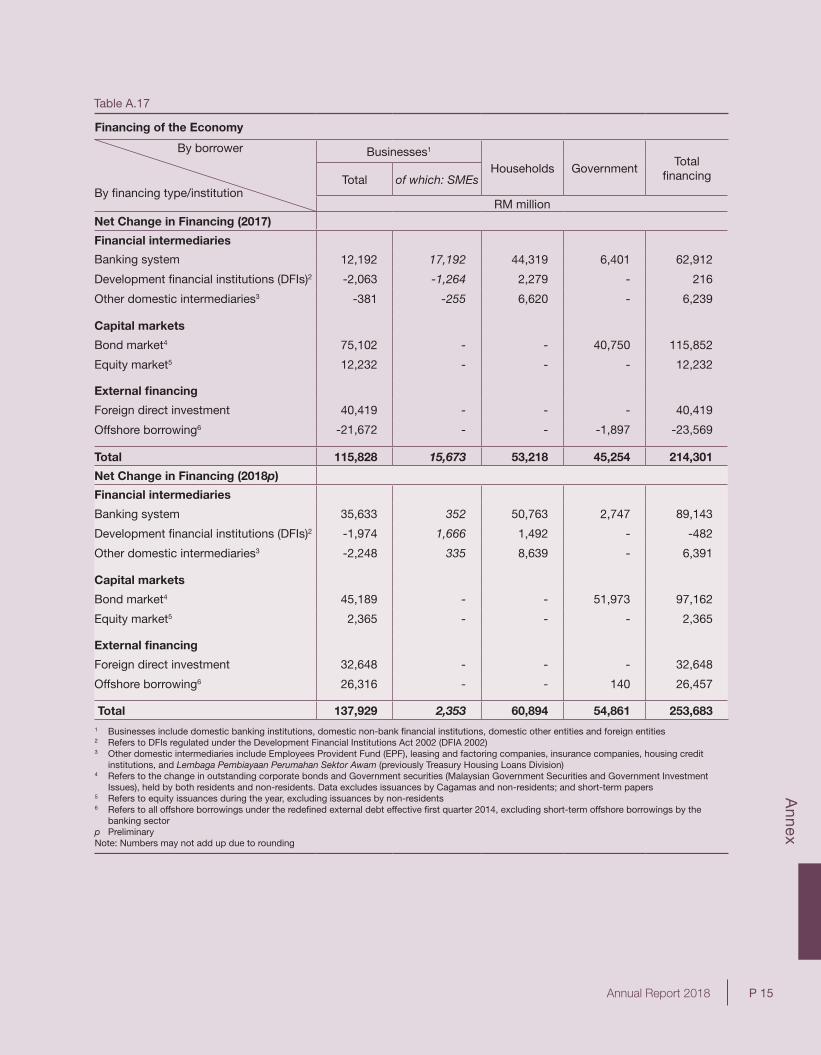
Annex
P 15Annual Report 2018
1
Financing of the Economy
By borrower Businesses1
Households GovernmentTotal
fi nancingBy fi nancing type/institution
Total of which: SMEs
RM millionNet Change in Financing (2017)
Financial intermediaries
Banking system 12,192 17,192 44,319 6,401 62,912
Development fi nancial institutions (DFIs)2 -2,063 -1,264 2,279 - 216
Other domestic intermediaries3 -381 -255 6,620 - 6,239
Capital markets
Bond market4 75,102 - - 40,750 115,852
Equity market5 12,232 - - - 12,232
External fi nancing
Foreign direct investment 40,419 - - - 40,419
Offshore borrowing6 -21,672 - - -1,897 -23,569
Total 115,828 15,673 53,218 45,254 214,301
Net Change in Financing (2018p)
Financial intermediaries
Banking system 35,633 352 50,763 2,747 89,143
Development fi nancial institutions (DFIs)2 -1,974 1,666 1,492 - -482
Other domestic intermediaries3 -2,248 335 8,639 - 6,391
Capital markets
Bond market4 45,189 - - 51,973 97,162
Equity market5 2,365 - - - 2,365
External fi nancing
Foreign direct investment 32,648 - - - 32,648
Offshore borrowing6 26,316 - - 140 26,457
Total 137,929 2,353 60,894 54,861 253,6831 Businesses include domestic banking institutions, domestic non-bank fi nancial institutions, domestic other entities and foreign entities 2 Refers to DFIs regulated under the Development Financial Institutions Act 2002 (DFIA 2002) 3 Other domestic intermediaries include Employees Provident Fund (EPF), leasing and factoring companies, insurance companies, housing credit
institutions, and Lembaga Pembiayaan Perumahan Sektor Awam (previously Treasury Housing Loans Division)4 Refers to the change in outstanding corporate bonds and Government securities (Malaysian Government Securities and Government Investment
Issues), held by both residents and non-residents. Data excludes issuances by Cagamas and non-residents; and short-term papers5 Refers to equity issuances during the year, excluding issuances by non-residents6 Refers to all offshore borrowings under the redefi ned external debt effective fi rst quarter 2014, excluding short-term offshore borrowings by the
banking sector p Preliminary Note: Numbers may not add up due to rounding
Table A.17
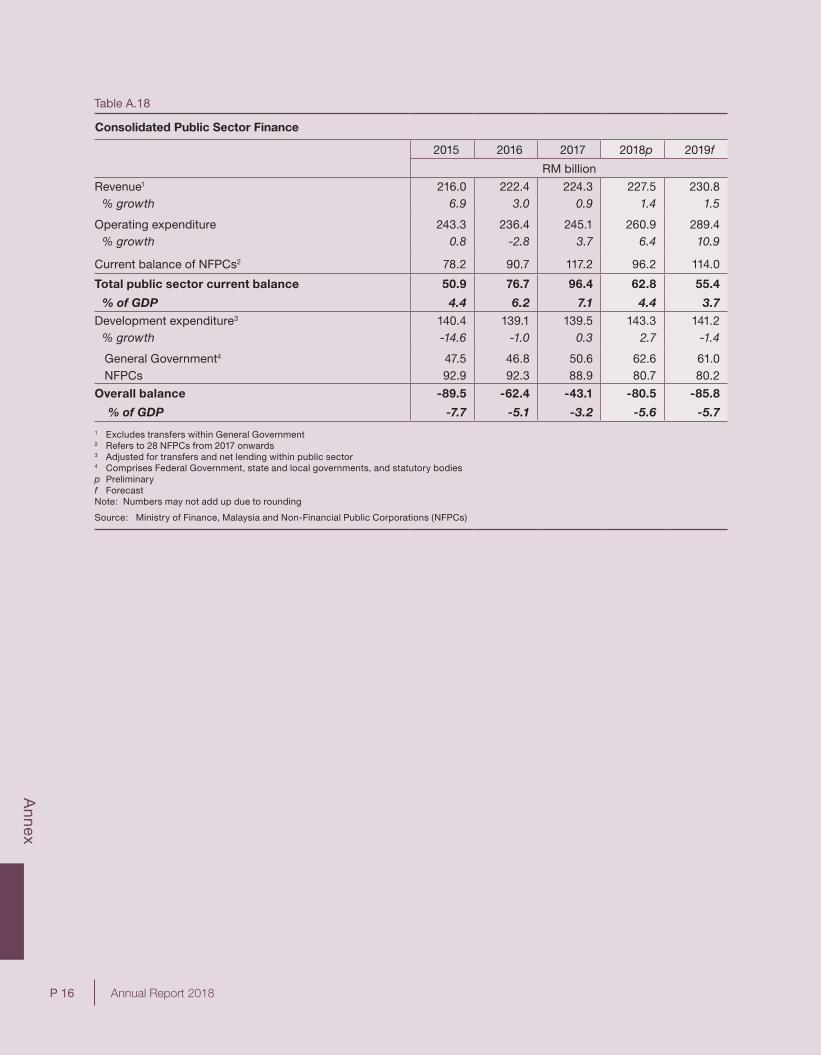
Annex
P 16 Annual Report 2018 1Annual Report 2016
Table A.18
Consolidated Public Sector Finance
2015 2016 2017 2018p 2019f
RM billion
Revenue1 216.0 222.4 224.3 227.5 230.8 % growth 6.9 3.0 0.9 1.4 1.5
Operating expenditure 243.3 236.4 245.1 260.9 289.4 % growth 0.8 -2.8 3.7 6.4 10.9
Current balance of NFPCs2 78.2 90.7 117.2 96.2 114.0
Total public sector current balance 50.9 76.7 96.4 62.8 55.4
% of GDP 4.4 6.2 7.1 4.4 3.7
Development expenditure3 140.4 139.1 139.5 143.3 141.2 % growth -14.6 -1.0 0.3 2.7 -1.4
General Government4 47.5 46.8 50.6 62.6 61.0 NFPCs 92.9 92.3 88.9 80.7 80.2
Overall balance -89.5 -62.4 -43.1 -80.5 -85.8
% of GDP -7.7 -5.1 -3.2 -5.6 -5.7
1 Excludes transfers within General Government2 Refers to 28 NFPCs from 2017 onwards 3 Adjusted for transfers and net lending within public sector 4 Comprises Federal Government, state and local governments, and statutory bodies p Preliminary f Forecast Note: Numbers may not add up due to rounding
Source: Ministry of Finance, Malaysia and Non-Financial Public Corporations (NFPCs)

Glossary, Acronyms and Abbreviations

Glossary
Accrual accounting
An accounting method that recognises revenues and
expenses based on the occurrence of economic events, rather
than that of cash transactions.
Aggregate outstanding ringgit liquidity placed with the Bank
Surplus liquidity absorbed by Bank Negara Malaysia, through
its monetary operations and Statutory Reserve Requirement (SRR).
The main borrowing instruments used for this purpose include
direct money market borrowing, repurchase agreements
(repo), Qard acceptance, Commodity Murabahah Programme
(CMP), sell-buy swaps, Bank Negara Monetary Notes (BNMN)
and Bank Negara Interbank Bills (BNIB).
Asset purchase programme
A form of expansionary monetary policy undertaken by central
banks through the purchase of predetermined amounts of
government bonds or other specified securities in order to
lower long-term interest rates and stimulate the economy.
Balance of payments
A statistical summary of economic transactions between
residents and non-residents of a country during a
specific time period.
Bank Negara Interbank Bills (BNIB)
A short-term discounted note with maturity of up to one year
and qualifies as Level 1 high-quality liquid assets (HQLA).
BNIB can only be purchased by and traded among licensed
banks and investment banks.
Banker’s acceptance (BA)
A bill of exchange drawn on and accepted by a bank in
Malaysia to finance the drawer’s business-related purchases
from or sales of goods to another person, evidenced by
proper and adequate documentation.
Bilateral currency swap arrangements
Agreements with other countries enabling for the exchange of
Malaysian ringgit for foreign currencies.
Booking centres
Banks’ offices which serve as a registry for transactions arranged
and managed in another location.
Brexit
The United Kingdom’s decision to leave the European Union.
Commodity Murabahah Programme (CMP)
A cash deposit product based on a globally accepted
Islamic concept. It utilises crude palm oil contracts and
other Shariah-compliant commodities as the underlying assets to
facilitate liquidity management.
Contagion risk
Risk that the impact of a financial shock or crisis in a particular
economy or region will spread to other economies with similar
vulnerabilities or significant interlinkages.
Core inflation
A measure of underlying inflation. One common method of
calculation is by excluding items whose price fluctuations are
deemed transitory from the Consumer Price Index (CPI) basket.
These items include price-volatile and price-administered
goods and services. Core inflation that is estimated by Bank
Negara Malaysia also excludes the estimated direct impact of
consumption tax policy changes.
Counter-cyclical policy
Monetary or fiscal policies aimed at reducing fluctuations in the
business cycle of the economy.
Demonetisation
The act of withdrawal of a currency unit from its status as legal
tender. For example, the Indian government announced the
withdrawal of INR500 and INR1,000 bank notes as legal tender
on November 2016, in exchange for new INR500 and INR2,000
bank notes.
Direct investment abroad (DIA)
A category of cross-border investment by a Malaysian resident
investor associated with the objective of establishing a lasting
interest in an enterprise abroad. A ‘lasting interest’ is when
there is a long-term relationship in which the direct investor
has a significant degree of influence on the management of the
enterprise (e.g. an ownership of at least 10% of the voting power).
Domestic institutional investors
Resident financial institutions with large holdings of financial
assets in domestic financial markets. These include banks,
pension funds and insurance companies.
Exchange rate valuation effect
The changes in ringgit equivalent value of Malaysia’s foreign-currency
denominated external assets and liabilities, and export and import
values due to changes in the ringgit exchange rate.
Export conversion measure
Financial market measure introduced by Bank Negara Malaysia
and the Financial Markets Committee (FMC) which requires
exporters to convert 75% of their foreign currency export
proceeds into ringgit, with sufficient flexibilities granted.
Financial Markets Committee (FMC)
The FMC was established in May 2016 with the objective to
broaden industry engagement with a focus in reviewing and
formulating comprehensive strategies for the wholesale financial
markets to meet the diverse and complex demands of a more
developed and internationally integrated economy. It comprises
participants/representatives from Bank Negara Malaysia, financial
institutions, corporations, financial service providers and other
institutions or stakeholders which have prominent roles or
participation in the financial markets.
Flight-to-safety
A broad-based shift of investors’ funds from riskier assets to
relatively safer assets such as sovereign bonds, safe-haven
currencies and selected commodities, such as gold. This typically
occurs during an increase in investor risk aversion. Safe-haven
currencies refers to currencies expected to appreciate or remain
stable during periods of volatility, such as the US dollar, Japanese
yen and Swiss franc.
Foreign currency forward position
The aggregated sum of future transactions to exchange foreign
currency for domestic currency. A long foreign currency forward
position indicates a net future obligation to purchase foreign
currency for domestic currency, resulting in potential inflow of
foreign currency. Conversely, a short foreign currency forward
position indicates a net future obligation to sell foreign currency for
domestic currency, resulting in potential outflow of foreign currency.
Foreign direct investment (FDI)
A category of cross-border investment by a non-resident investor
associated with the objective of establishing a lasting interest in
an enterprise in Malaysia. A ‘lasting interest’ is when there is a
long-term relationship in which the non-resident direct investor
has a significant degree of influence on the management of the
enterprise (e.g. an ownership of at least 10% of the voting power).
Foreign exchange net open position (NOP)
The aggregated sum of the net short or long positions across any
particular foreign currency or all foreign currencies for banks. A
long position indicates a net foreign currency asset position while
a short position indicates a net foreign currency liability position.
General Government
Refers to the Federal and State Governments as well as the
statutory bodies and local authorities.
Goods and Services Tax (GST)
A consumption tax based on the value-added concept, imposed
at every stage of production and distribution process. The GST
incurred on business inputs is claimable. In Malaysia, the GST
was imposed on taxable goods and services between April 2015
and May 2018 before the rate was zerorised.
Headline inflation
The annual price increase for a basket of items that are
commonly consumed by an average household. For Malaysia,
headline inflation is computed based on the Consumer Price
Index (CPI) basket.
Hedging
An investment strategy to reduce investment risk using financial
derivatives such as options, swaps and futures contracts.
International investment position (IIP)
The external balance sheet, detailing the country’s outstanding
financial assets and liabilities position relative to the rest of the
world. A positive net IIP denotes Malaysia’s position as a net
creditor nation, while a negative net IIP denotes Malaysia as a net
debtor nation.
Internet of Things (IoT)
The network of physical objects that contain embedded
technology to communicate and sense or interact with itself or the
external environment.
Liquidity injection operations
The use of monetary operations to provide liquidity to
the banking system through instruments such as reverse
repurchase agreements (reverse repos) and foreign exchange
swap facilities.
Monetary Policy Committee (MPC)
The body responsible for formulating monetary policy and
the policies for the conduct of monetary policy operations, as
stipulated in the Central Bank of Malaysia Act 2009.
Monetary policy normalisation
Actions by central banks to return the stance of monetary
policy back to more normal levels, which is consistent with the
medium-term objective of achieving macroeconomic stability.
Negotiable instrument of deposits (NID)
Interest-bearing deposit certificates issued by banks that can be
traded in the wholesale secondary money market. NIDs issued in
the Malaysian financial market can be based on either fixed, zero
coupon or floating rates or a combination of either of the three.
Net domestic borrowing of the Federal Government
The Federal Government’s gross domestic borrowings, in the
form of Malaysian Government Securities (MGS) and Malaysian
Government Investment Issues (MGII), less repayments.
Net errors and omission
Balancing or residual item which occurs when the current, capital
and financial accounts do not mirror the change in international
reserves due to imperfections in data source and compilation
(e.g. incomplete data sources, difference in timing of recording,
valuation factors).
Net external borrowing of the Federal Government
The Federal Government’s gross external borrowings, in the form
of project and market loans, less repayments.
Non-deliverable forward (NDF)
A cash-settled outright forward contract. In the case of a currency
NDF, the difference between the contracted NDF rate and the
prevailing spot rate determines the profit or loss on the notional
amount, and this difference is typically settled in US dollar (without
exchanging the notional amount itself, hence non-deliverable).
Non-resident entity
An institutional unit which engages in economic activities and
transactions for a period of one year or longer from a location
outside of Malaysia.
Outstanding corporate bonds
Current stock of corporate bonds plus net issuances of
corporate bonds during the period. Net issuances of corporate
bonds is the difference between corporate bonds issued and
corporate bonds redeemed.
Outstanding loans
Current stock of loans plus net loans disbursed during the period.
Net loans disbursed is the difference between loans disbursed
and loans repaid.
Overnight Policy Rate (OPR)
The indicator of the monetary policy stance for Malaysia. The level
of the OPR is decided by the MPC. It also serves as the target
rate for the day-to-day liquidity operations of the Bank, which will
influence other interest rates in the economy.
Portfolio investment
A category of cross-border transactions and positions involving
debt or equity securities in the capital markets, other than those
categorised as foreign direct investments, direct investments
abroad, or reserve asset transactions.
Portfolio rebalancing
A process whereby investors or fund managers reallocate the
weightings of financial assets in their investment portfolios. This
is achieved by buying and selling assets to align the investor’s
holdings with a target portfolio allocation.
Price ceiling
A Government-imposed maximum price for a good or service.
Primary income
Income earned from the contribution to production processes,
provision of financial assets and renting of natural resources.
These include compensation of employees (e.g. wages, salaries),
investment income (e.g. dividends), interest income and rent
transactions between residents and non-residents.
Producer price inflation
The annual change in Producer Price Index for local production,
which is an output-based index that measures the price of
goods sold to the domestic market charged by producers at the
ex-factory price.
Protectionist policies
Economic policies which restrict international trade through tariffs,
subsidies, quotas and/or other regulations aimed at reducing
the competitiveness of foreign imports relative to domestically
produced goods and services.
Public corporation
A corporation that is controlled by the Government. Control
can be determined by: the ownership of the majority of
the voting interest; control of the board or other governing
body; control of the appointment and removal of key
personnel; control of key committees of the entity; golden
share and options; regulation and control; control by a
dominant customer; and control attached to borrowing from
the Government.
Qard acceptance
A contract of lending money by a lender to a borrower where
the latter is bound to return an equivalent replacement amount
to the lender.

Resident entity
An institutional unit which engages in economic activities and
transactions for a period of one year or longer from a location
in Malaysia.
Risk-off
Periods of perceived high financial risk which encourage
investors to take on less risk or unwind their exposure to
riskier investments.
Secondary income
Current transfers (provision of goods, services, or financial assets)
between residents and non-residents with no corresponding
economic returns. These include transfers by the general
government, personal transfers (e.g. remittance by foreign
workers) and other transfers in cash or kind.
Sales and Services Tax (SST)
Refers to the consumption tax policy that was implemented
in Malaysia since September 2018. Sales tax is a single-stage
tax levied on taxable goods imported into Malaysia and those
locally manufactured in Malaysia by a taxable person, subject
to the Sales Tax Act 2018. Service tax is a tax charged on
taxable services provided by any taxable person in Malaysia
in the course and furtherance of business, subject to the
Service Tax Act 2018.
Technical correction
A sharp decline in the price of a financial asset following a
prolonged upward trend in valuations.
Terms of trade
The ratio of a country’s export prices to its import prices. It can
also be interpreted as the amount of imported goods a country
can purchase per unit of exported goods. Improving terms of
trade indicates that for every unit of exports sold, more units of
imported goods can be purchased, and vice-versa.
Trade openness
A country’s sum of gross exports and imports as a share of its
GDP, representing a country’s total exposure to international trade.
Turnover ratio
An indicator of financial market liquidity which measures the
trading volume of a financial asset during a specified period
relative to the total amount outstanding.
Twin deficit
A situation in which a country simultaneously records both a fiscal
and current account deficit.
Underlying inflation
The persistent trend component of inflation. It is typically
constructed by removing the transitory and seasonal components
from headline inflation.
Weighted average base rate
Effective 2 January 2015, the base rate (BR) is the main
reference rate for new retail floating rate loans. The BR is
determined by financial service providers’ (FSPs) benchmark
cost of funds and the Statutory Reserve Requirement (SRR).
Other components of loan pricing such as borrower credit risk,
liquidity risk premium, operating costs and profit margin would
be reflected in a spread above the BR. The average BR of FSPs
is weighted by the amount of outstanding floating rate loans.
Yield curve
A yield curve draws out the yields of a bond with respect to its
different maturities. For example, the yield curve for Malaysian
Government Securities (MGS) plots the yields from the 1-year to
30-year bond maturities.
Zero-based budgeting
A budgeting method in which annual allocations are decided
based on needs, independent of the previous year’s budget.
Acronyms and Abbreviations
AOIR average overnight interbank rate
AE advanced economies
ALR average lending rate
ASA ASEAN Swap Arrangement
ASEAN Association of Southeast Asian Nations
B40 Bottom 40% income group
BA banker’s acceptance
BCBS Basel Committee on Banking Supervision
BCM business continuity management
BCSA Bilateral Currency Swap Arrangement
BIS Bank of International Settlements
BNIB Bank Negara Interbank Bills
BNIBI Bank Negara Interbank Bills Islamic
BNM CSS Bank Negara Malaysia Consumer Sentiment Survey
BNMN Bank Negara Monetary Notes
BOE Bank of England
BOJ Bank of Japan
BR base rate
BSH Bantuan Sara Hidup
CBA 2009 Central Bank of Malaysia Act 2009
CLM centralised liquidity management
CMIM Chiang Mai Initiative Multilateralisations
CMP Commodity Murabahah Programme
COSO Committee of Sponsoring Organizations of the Treadway Commission
CPI Consumer Price Index
CPO crude palm oil
CREST Collaborative Research in Engineering, Science and Technology
DBGs domestic banking groups
DFIs development financial institutions
DIA direct investment abroad
DRO Departmental Risk Officer
E&E electronics and electrical
E&O errors and omissions
ECB European Central Bank
EME emerging market economies
EMEAP Executives’ Meeting of East Asia-Pacific Central Banks
EPI Everyday Price Index
EU European Union
FAO Food and Agriculture Organization of the United Nations
FBM KLCI FTSE Bursa Malaysia Kuala Lumpur Composite Index
FCY foreign currency
FD fixed deposit
FDI foreign direct investment
FEA foreign exchange administration
Fed Federal Reserve
FMC Financial Markets Committee
FPC Fiscal Policy Committee
FSC Financial Stability Committee
FTP Financial Transaction Plan
GDP Gross Domestic Product
GFC Global Financial Crisis
GFCF gross fixed capital formation
GLC government-linked companies
GNI gross national income
GNS gross national savings
GST Goods and Services Tax
HCI Human Capital Index
HRDF Human Resources Development Fund
IAIS Insurance Association of Insurance Supervisors
8 Annual Report 2016
ICLIF International Centre for Leadership in Finance
IFSB Islamic Financial Services Board
IILM International Islamic Liquidity Management Corporation
IIP International Investment Position
IMF International Monetary Fund
INCEIF International Centre for Education in Islamic Finance
IORWG International Operational Risk Working Group
IoT Internet of Things
KLIBOR Kuala Lumpur Interbank Offered Rate
KLSE Kuala Lumpur Stock Exchange
LIA Liquidity Investment Arrangement
LIBFC Labuan International Business and Financial Centre
LNG liquefied natural gas
LFS Labour Force Survey
M&E machinery and equipment
MEF Malaysian Employers Federation
MFRS Malaysian Financial Reporting Standards
MGII Malaysian Government Investment Issues
MGS Malaysian Government Securities
MIER Malaysian Institute of Economic Research
MNC multinational corporation
MPC Monetary Policy Committee
MPS Monetary Policy Statement
MSCI EM Morgan Stanley Capital International Emerging Market
NAB New Arrangements to Borrow
NDF non-deliverable forward
NEER nominal effective exchange rate
NID negotiable instrument of deposits
NPC National Productivity Council
NR non-resident
O&G oil and gas
OPEC Organization of Petroleum Exporting Countries
OPR Overnight Policy Rate
PBOC The People’s Bank of China
PEKA Skim Perlindungan Kesihatan
PePI Perceived Price Index
PFC Public Finance Committee
PLWS Productivity Linked Wage System
PPI Producer Price Index
PR China The People’s Republic of China
PRIMA Perumahan Rakyat 1Malaysia
QES Quarterly Employment Statistics
RAPID Refinery and Petrochemical Integrated Development
RENTAS Real-Time Electronic Transfer of Funds and Securities
RMA Range Maturity Auction
RPGT Real Property Gains Tax
RTC Rural Transformation Centres
SAC Shariah Advisory Council
SDR Special Drawing Rights
SMEs small and medium enterprises
SST Sales and Services Tax
SWA Staff Welfare Account
SWIFT Society for Worldwide Interbank Financial Transaction
TRC Tax Reform Committee
TVET Technical and Vocational Education and Training
UK United Kingdom
US United States
UTC Urban Transformation Centres
WTI West Texas Intermediate

9Annual Report 2016

10 Annual Report 2016