anemia and carnitine supplementation in hemodialyzed patients
TRANSCRIPT
Kidney International, Vol. 55, Suppl. 69 (1999), pp. S-93–S-106
Anemia and carnitine supplementation inhemodialyzed patients
JOSEF KLETZMAYR, GERT MAYER, ELISABETH LEGENSTEIN, GERTRAUD HEINZ-PEER,THOMAS LEITHA, WALTER HERMANN HORL, and JOSEF KOVARIK
Department of Medicine, Division of Nephrology and Dialysis; Department of Medical Chemistry; Department of Radiology;and University Clinic of Nuclear Medicine, University of Vienna, Vienna, Austria
identify those HD patients who might have a benefit of carni-Anemia and carnitine supplementation in hemodialyzed pa-tine supplementation, as well as studies concerning the optimaltients. Carnitine supplementation in hemodialyzed patients wasdosage, duration, and way of administration of carnitine sup-studied in a double-blinded, randomized, controlled trial inplementation and its mechanism of action, are required.order to elucidate the effect of intravenous carnitine on renal
anemia in patients treated with recombinant human erythro-poietin (rHuEPO).
Twenty stable hemodialysis (HD) patients received intrave-Anemia is a common finding in patients with end-nous L-carnitine after each dialysis session in a dosage of 5
(N 5 15) and 25 (N 5 5) mg/kg, respectively, together with stage renal failure and is present in a vast majority ofintravenous iron saccharate (20 mg/HD session) for four patients requiring maintenance hemodialysis (HD) ormonths and without iron for a further four months. Twenty peritoneal dialysis therapy. The most important reasonpatients received placebo instead of carnitine with an identical
for anemia is inadequate erythropoiesis caused by de-iron regimen. After a run-in phase of six months with a stablecreased erythropoietin production of the diseased kid-rHuEPO requirement, the rHuEPO dose was adjusted monthly
when necessary to maintain target hemoglobin levels. At study neys. The efficacy of recombinant human erythropoietinentry (T0), plasma and red blood cell carnitine levels did not (rHuEPO) in the treatment of renal anemia could becorrelate significantly with the rHuEPO requirement. How-
confirmed in numerous studies [1].ever, plasma free and total carnitine levels showed a significantHowever, as renal anemia is of multifactorial origin,negative correlation with erythrocyte survival time at T0. After
four months of coadministration of intravenous iron and a considerable proportion of patients shows rHuEPOL-carnitine (T4), the rHuEPO requirement decreased in 8 of hyporesponsiveness because of the presence of other19 evaluable HD patients. In these responders, the weekly
etiological factors. The most common is iron deficiency,rHuEPO dose was decreased significantly by 36.9 6 23.3%and iron supplementation has successfully been used to(183.7 6 131.7 at T0 vs. 126.6 6 127.9 U/kg/week at T4, P ,
0.001). The rHuEPO requirement, however, was unchanged reduce rHuEPO dosage [2]. Other mechanisms of de-when all carnitine-treated patients were compared between T0 creased erythropoiesis are folate and vitamin B12 defi-and T4 (T0: 172.0 6 118.0 vs. T4: 152.3 6 118.8 U/kg/week, P 5 ciency [3], secondary hyperparathyroidism [4], aluminum0.07, NS), but the erythropoietin resistance index decreased
toxicity [5], inflammation, malignancy [6], and circulatingsignificantly in this group (T0: 16.0 6 11.0 vs. T4: 13.6 6 10.5uremic factors, such as spermine [7]. In addition, de-U/kg/week/g of hemoglobin, P , 0.02).
The erythrocyte survival time was measured in five HD pa- creased red blood cell (RBC) survival by hemolysis ortients treated with iron and carnitine at T0 and T4. Two out hypersplenism and chronic intestinal blood loss as wellof these patients were carnitine responders and showed an
as multiple blood sampling are clinically significant rea-increase of erythrocyte survival time of 15 and 20%, respec-sons for rHuEPO hyporesponsiveness [8, 9].tively.
After the withdrawal of iron supplementation, the rHuEPO Furthermore, disturbances in carnitine metabolismrequirement increased comparably in both L-carnitine- and contribute to the development of renal anemia in HDplacebo-treated patients during four more months.
patients, and a beneficial effect of carnitine supplementa-According to our data, L-carnitine, in addition to iron supple-tion on renal anemia has been reported in studies beforementation, may have an effect on erythropoietin resistance and
erythrocyte survival time in HD patients. More than half of [10–13] and after [14–17] the introduction of rHuEPO.our patients, however, showed no benefit. Further studies to This article reviews the literature on carnitine metabo-
lism in HD patients, especially with respect to possiblemechanisms affecting anemia, and reports our own resultsKey words: erythropoietin, dialysis, vitamin supplements, end-stage
renal disease, renal anemia. concerning the effect of carnitine supplementation on therHuEPO requirement in maintenance dialysis patients. 1999 by the International Society of Nephrology
S-93
brought to you by COREView metadata, citation and similar papers at core.ac.uk
provided by Elsevier - Publisher Connector
Kletzmayr et al: Carnitine and anemiaS-94
CARNITINE METABOLISM AND acyl carnitines across the mitochondrial membrane. Inthe mitochondrial matrix, acyl carnitine transferase IIPHYSIOLOGICAL FUNCTIONSreconverts acyl carnitine esters to acylCoA, and acti-In humans, carnitine [L-(2)-3-hydroxy-4-thrimethyl-vated fatty acids can undergo b-oxidation [25].aminobutyrate, molecular weight 162 Da] is synthesized
Additionally, carnitine is required for the export ofin liver, kidney, and brain from the essential amino acidsshort-chain acyl residues from both the mitochondrialysine and methionine. Cofactors for L-carnitine synthe-and peroxisomes. The export of acetyl carnitine out ofsis are vitamin C, niacin, pyridoxal phosphate, 2-oxoglu-mitochondria predominantly occurs when acetylCoAtarate, NAD11, and iron. Only liver and kidney releaseformation exceeds its utilization in the Krebs cycle andnewly synthesized carnitine into systemic circulation [18].is dependent on the intramitochondrial availability ofL-carnitine is also obtained from diet almost exclusivelyfree carnitine. Accumulation of acetylCoA inhibits pyru-from foods of animal origin and is 54 to 87% bioavailablevate dehydrogenase activity, and the enzyme activity wasfrom normal Western diets, with an absorption rate de-shown to be stimulated by L-carnitine supplementationpending on the amount ingested. In part, dietary carni-[26]. Furthermore, carnitine modulates the intramitochon-tine is metabolized by gastrointestinal microorganisms,drial ratio of acylCoA to free CoA by the formation anddepending on the level of carnitine intake [19].export of acyl carnitine, thus increasing free CoA, which,Ninety-eight percent of total body carnitine is locatedin turn, modulates key mitochondrial processes [27].in cardiac and skeletal muscles, 1.5% in liver and kidney,
The export of branched chain acyl groups out of mito-and 0.5% in extracellular fluid [20]. In blood, carnitinechondria is critical in the catabolism of branched chainis present in plasma and cells, predominately RBCs [21].amino acids. Additionally, carnitine is involved in trap-Plasma and RBCs are considered to be metabolicallyping and elimination of unphysiological acyl groups asdistinct compartments. In both compartments, free carni-valproic acid [26]. In organic acid metabolism disorders,tine, short-chain acyl carnitine (predominantly acetyl),carnitine is required for the excretion of accumulatedand long-chain acyl carnitine are present [22].acylCoA compounds. Chalmers et al proposed a relative
Glomerulary filtered carnitine is highly conserved bylack of free carnitine compared with the metabolic needs
the kidney at normal concentrations in plasma, with re- in those pathologic states (“carnitine insufficiency”) andabsorption rates of more than 84%. In rat cortical brush demonstrated increased urinary specific acyl carnitineborder membrane vesicles, sodium gradient-dependent excretion with carnitine supplementation [27].carrier-mediated carnitine uptake could be demonstrated L-carnitine deficiency therefore leads to the accumula-[23]. Total urinary excretion varies between 100 and 400 tion of free fatty acids in cell cytoplasm and of acylCoAmmol/day and is higher in men than in women. The in the mitochondria, producing a toxic effect on the celldistribution of carnitine fractions in urine is 46% for free through a detergent action. As a consequence, the usecarnitine, 9% for acetyl carnitine, 29% for other short- of fatty acids for energy production is disturbed [18].chain acyl carnitine, and 16% for long-chain acyl carni- The significance and metabolic function of RBC carni-tine [24]. Intact kidney function therefore contributes to tine are not now completely understood, as its presencethe normal free to total carnitine ratio by preferential in a purely glycolytic cell lacking mitochondria was un-reabsorption of free carnitine. clear up to the 1990s. Cooper et al suggested that the
Plasma total carnitine levels in healthy adults are in- presence of carnitine in mature RBCs might be vestigalfluenced by age and sex: Males were reported to have from the process of hematopoiesis without further func-significantly higher levels compared with females, and tion [28].carnitine levels positively correlated to age in females. Ramsay et al, however, demonstrated RBCs to containThis might be attributable to an estradiol effect, as fe- carnitine palmitoyl transferase (CPT) catalyzing the re-males below the age of 40 display significantly lower versible transfer of acyl moiety form CoA to L-carnitinelevels compared with women above the age of 40 and [29]. Arduini et al showed L-carnitine to affect RBCcompared with men. Erythrocyte total carnitine levels membrane deformability [30], and Butterfield and Ran-did not show any age and sex difference [21]. gachari [31] confirmed their suggestion of an specific
The main physiological function of carnitine is the interaction of L-carnitine with cytoskeletal components,transport of long-chain fatty acids to the sites of b-oxida- strengthening the interaction between spectrin and actin.tion in the mitochondrial matrix involving several en- Furthermore, CPT affects the realcylation process ofzymes. Briefly, long-chain fatty acids are incorporated membrane phospholipids in RBCs by modulating theinto acyl coenzyme A (acylCoA) in the presence of CoA size of the acylCoA pool [32], which is a major part ofand adenosine triphosphate (ATP). Acyl carnitine trans- the membrane repair process. Activation of cytosolicferase I esterifies acylCoA and free carnitine to acyl long-chain fatty acids to their CoA esters by acylCoAcarnitines and carnitine translocase, located in the inner synthetase requires free CoA. The RBC acyl carnitine
pool additionally serves as a reservoir of activated acylmitochondrial membrane, and facilitates transport of
Kletzmayr et al: Carnitine and anemia S-95
groups in this process at no cost of ATP [32, 33]. The Data on changes in RBC carnitine levels during HDsessions are rare: Wanner et al reported unchanged RBCaddition of L-carnitine to RBCs stored at 48C had a
beneficial effect on in vivo viability, increasing signifi- total, free, and acyl carnitine levels in patients treatedwith 1 mg/kg intravenous L-carnitine after HD; in pa-cantly the life span of transfused RBCs [34].tients treated with 5 mg/kg who showed significantlyelevated values of all carnitine fractions compared with
CARNITINE DISTURBANCES INuntreated patients, HD caused a decrease of RBC short-
HEMODIALYSIS PATIENTSand long-chain acyl carnitines, whereas free carnitines
In 1974, Bohmer et al were the first to report increased and total carnitines remained unchanged [41].plasma free carnitine levels in chronic renal failure In maintenance HD patients, predialysis serum free(CRF) and carnitine deficiency (decreased plasma free carnitine levels were lower compared with healthy con-carnitine) in patients on maintenance HD. Free carnitine trols in a majority of published data [35–38]. Some au-decreased to 25% of predialysis values during hemodial- thors, in contrast, found levels comparable [42] or evenysis sessions [35]. Since that time, carnitine status of higher [43, 44] than in healthy controls [36].dialysis patients has been studied by numerous investiga- Considering only recently published studies evaluatingtors, and the relief of multiple uremic symptoms by carni- the whole pattern of carnitine, plasma predialysis totaltine supplementation has been reported in conflicting carnitine levels are equal or even higher than in controls,studies [36]. Up to 1983, mainly free plasma carnitine whereas free carnitine levels are decreased. Throughoutvalues were reported in the literature, and studies there- the literature, an increase in short-chain acyl carnitineafter revealed a profound difference in uremic patients levels has been reported, thus leading to a significantbetween total and free carnitine values. Therefore, care- increase in acyl to free carnitine ratio (decreased free toful attention must be paid in comparing different studies. total carnitine ratio) [36].
During HD sessions, a marked decrease in serum car- Erythrocyte carnitine levels behave differently in HDnitine values compromising all carnitine fractions has patients: Total carnitine is elevated because of a markedbeen reported [37], which resulted in a marked increase increase of intracellular free carnitine, whereas short-in acyl to free carnitine ratio (decreased free to total and long-chain acyl carnitines are unchanged, resultingcarnitine ratio). However, a preferential elimination of in an increased free to total carnitine ratio compared withfree carnitine could not be demonstrated, as investiga- controls [41].tions of dialysate carnitine did not show a higher free to Data on carnitine muscle stores in HD patients aretotal carnitine ratio compared with predialysis serum conflicting [36]. Bohmer et al found a significant decreasevalues [38]. in muscle carnitine during HD [35]. In a small study
In a recently published kinetic analysis, the reduction (N 5 4), Mingardi et al found predialysis free and totalof plasma free carnitine and plasma short-chain acyl car- muscle carnitine unchanged compared with healthy con-nitine was attributed to a loss into dialysate not con- trols and suggested that the carnitine lost during dialysistaining L-carnitine accompanied by loss of tissue carni- mainly originates from extracellular fluid [38].tine significantly higher in bicarbonate compared with Additionally, data on the correlation of plasma andacetate dialysis. However, even with a dialysate carnitine muscle carnitine in dialysis patients are conflicting [36].concentration higher than predialysis plasma concentra- In contrast to the findings of Reichmann et al [45], intion during acetate dialysis (in contrast to bicarbonate controls, Savica et al [46] reported muscle free carnitinedialysis), a decrease of free carnitine and an increase in to be significantly correlated to plasma free carnitine.acetyl carnitine occurred, whereas nonacetyl short-chain In their study, muscle free and acetyl carnitine wereacyl carnitine decreased independently of dialysate ace- decreased compared with healthy controls, and thetate content. This was due to a net tissue uptake of carni- depletion was more severe in long-term dialysis patientstine and an associated tissue output of acetyl carnitine [46]. Atrophy of type I and type IIa muscle fibers issignificantly higher in acetate dialysis compared with bi- probably related to carnitine deficiency [47].carbonate dialysis. RBC carnitine levels were not altered In adipose tissue of hyperlipidemic dialysis patients,during dialysis sessions [39]. long-chain acyl carnitine is elevated with total carnitine
Furthermore, the changes of predialysis carnitine lev- comparable to healthy controls [48].els observed in HD patients cannot simply be attributed Possible reasons for changed carnitine levels in HDto carnitine losses during HD therapy, as weekly carni- patients are the loss of preferential elimination of short-tine loss by dialysis therapy does not exceed urinary excre- chain acyl carnitine by the kidney, decreased intestinaltion in healthy subjects. The weekly loss of free carnitine carnitine uptake, or decreased carnitine synthesis. Inves-in hemofiltration patients (795 6 84 mmol) is even sig- tigations of precursors of endogenous carnitine synthesisnificantly lower compared with urinary excretion in did not reveal lower levels in HD patients compared
with controls. In contrary, predialysis trimethyllysine washealthy controls (1534 6 135 mmol) [40].
Kletzmayr et al: Carnitine and anemiaS-96
found to be fourfold increased compared with controls, tween hemolysis maximal point and hemolysis end pointand serum total and free carnitine levels [55]. They alsoalthough it is readily removed by dialysis [49].
Intestinal absorption seems to be unaffected in dialysis reported a significant negative correlation of erythropoi-etin requirements and serum total and free carnitinepatients, although data are limited because of the small
sample size and the unphysiologically high oral carnitine levels, respectively.Additionally, Albertazzi et al observed an increase ofload [40].
Another mechanism involved might be the disturbed erythrocyte Na1/K1 ATPase by L-carnitine supplemen-tation [11]. Donatelli et al found a decrease in the abnor-transport of carnitine between various compartments
and/or the decreased activity of enzymes involved in mally high ATP content of erythrocytes in HD patientstreated with carnitine and attributed this effect to thecarnitine metabolism.
Carnitine palmitoyl transferase activity is impaired in prevention of accumulation of long-chain acyl carni-tine, which inhibits the activity of erythrocyte Na1/K1CRF: In rats, the administration of intact parathyroid
hormone led to an significant decrease of CPT activity in ATPase [56].Recently, a significant negative correlation of erythro-heart mitochondria without significant changes in heart
muscle carnitine content leading to reduced long- and cyte fluidity and rHuEPO requirement could be demon-strated [57]. Treatment with low-dose L-carnitine (3 mg/short-chain fatty acid oxidation. Similar results were
found in CRF rats. Parathyroid hormone levels of CRF kg intravenously after each dialysis session) for fourmonths improved erythrocyte membrane fragility, asrats are not available in this study, but parathyroidecto-
mized CRF rats showed normal CPT activity [50]. tested by the acidified glycerol lysis test in a majority ofHD patients [58].Erythrocyte CPT activity is reduced in HD patients
[51]. In a case report, Uemura et al found reduced muscle In a double-blinded, randomized study, Labonia re-ported a significant decrease in the rHuEPO requirementCPT activity in CRF patients, possibly related to hyper-
parathyroidism [52]. in a subgroup of carnitine-treated HD patients and thusdemonstrated the clinical significance of the data citedAs CPT has a transport function not only for long-
chain fatty acids but also for carnitine, the carnitine trans- earlier here [15].port between various compartments might be compro-mised, contributing to the changes in carnitine pattern STUDY DESIGNobserved in CRF. On the other hand, CPT activity in
We conducted a placebo-controlled, randomized, dou-erythrocytes of HD patients is restored by L-carnitineble-blinded study in 40 patients on maintenance HD ther-supplementation [53]. Therefore, it is not clear up untilapy. Twenty HD patients received L-carnitine (L-Carnitinnow whether the disturbances in carnitine metabolism de-“Leopold”t; Leopold Pharma, Graz, Austria) intrave-scribed earlier here are linked primarily to a state of sec-nously after each dialysis session (carnitine), and 20 pa-ondary CPT abnormality in uremia or to the reduced avail-tients received placebo (0.9% saline). L-carnitine wasability of free carnitine in relation to increased demand.administered over a period of eight months. Two carni-tine dosages were used: 15 patients received 5 mg/kg and
CARNITINE AND ANEMIA IN 5 patients received 25 mg/kg. In placebo-treated patientsHEMODIALYSIS PATIENTS (controls), corresponding volumes of saline were admin-
istered to 15 and 5 patients, respectively.Trovato et al reported an increase in hematocrit inHD patients treated with oral L-carnitine for one year Only patients on maintenance HD for more than six
months with a stable rHuEPO requirement were eligible:[10]. Vacha et al found the same effect in patients treatedwith 1 g intravenous L-carnitine for 120 days [12]. The In a run-in phase of six months, a stable hemoglobin
level of 9 to 12 g/dl had to be obtained with a stableassumption of the authors—that L-carnitine might actvia stabilization of erythrocyte membranes by facilitating rHuEPO dose. Patients with documented blood loss for
any reason (for example, gastrointestinal bleeding, sur-the uptake of structural lipids—was supported by thefindings of Farrell et al, who reported an increased accu- gery, infection, or malignancy) were excluded. No trans-
fusions were allowed during six months before study entry.mulation of 14C in liver phospholipids and triacylglycerolsafter injection of 14C-labeled acetyl carnitine compared Intravenous iron (iron saccharate, Ferrivenint; Laevo-
san, Linz, Austria) was substituted after each dialysiswith 14C-labeled acetate [54]. Thus, the entry of acetate inmajor biosynthetic pathways is enhanced by L-carnitine, session in a dose of 20 mg per dialysis during the run-
in phase and the first four months of the study irrespec-and furthermore, especially lipids, which are major com-pounds of the erythrocyte membrane, are affected. tive of ferritin levels or transferrin saturation. Iron ther-
apy was withdrawn thereafter.Matsumura et al investigated the relationship of carni-tine levels and erythrocyte osmotic fragility in 26 HD In all patients, the RBC count was performed monthly,
and the rHuEPO dose was adjusted monthly accordingpatients and found a significant negative correlation be-
Kletzmayr et al: Carnitine and anemia S-97
to RBC results. rHuEPO dose was changed in steps of follow-up because of a change in dialysis unit for privateapproximately 25% when an alteration of hemoglobin reasons. Two more patients were excluded for evaluationof more than 1 g/dl compared with study entry was ob- at T8 because of surgical procedures during the secondserved. A response to carnitine treatment was defined phase of the study.as a decrease in rHuEPO requirement after four months Thus, at T4, 37 patient were evaluable (19 carnitine,of carnitine substitution. 18 placebo). Twenty-eight patients finished the study (12
Serum ferritin, transferrin, and transferrin saturation carnitine, 16 placebo) and were evaluable at T8.were measured every two months in order to monitoriron status. The rHuEPO resistance index (ERI; weekly Laboratory investigationsrHuEPO dose per gram of hemoglobin achieved with Blood samples for L-carnitine determination in plasmathat dose) was calculated to provide a more individual- and erythrocytes were obtained from the arteriovenousized measure of rHuEPO requirement. fistula before the dialysis procedure and were centri-
In a randomly selected subgroup of HD patients, fuged within one hour of sampling. L-carnitine was deter-erythrocyte survival time was determined by Cr-51 label- mined radioenzymatically according to the method of Ce-ing. In another subgroup, iron content of liver in relation
derblad and Lindestedt [59] with several modifications asto muscle iron was determined by magnetic resonance
described earlier here [60]. After deproteinization withimaging. These investigations were performed at studyperchloric acid (0.1 mol/liter), free carnitine reacts with 14-entry (T0), after four months of iron and carnitine substi-C-acetylcoenzyme A to 14-C-acetyl-L-carnitine, catalyzedtution (T4), and after four further months of carnitineby carnitine-acetyl-transferase. N-methyl-maleimide wassubstitution without iron therapy (T8), respectively.added for trapping free coenzyme A. The excess of 14-Standard bicarbonate dialysis was performed threeC-acetylcoenzyme A was bound by ion exchange resinetimes per week, with either high-flux or low-flux dialyz-(Dowex 1 3 8, chloride form 400 mesh). Residual radio-ers. Target Kt/V for urea was more than 1.3. The distribu-activity was proportional to the amount of 14-C-acetyl-tion of dialyzers used was comparable between bothL-carnitine and was measured in a liquid scintillationgroups, as was the application of hemodiafiltration. Dial-counter. The concentration was calculated from a cali-ysate acetate content was 3.0 mmol/liter in all patients.bration curve (5 to 50 mmol/liter) considering sampleThe study protocol was approved by the local ethicaldilution by pretreatment. Total L-carnitine is determinedcommittee. Written informed consent was obtained fromafter saponification. The portion of short-chain acyl car-each patient before T0. Informed consent additionallynitine (C3 to C10) is calculated by the difference betweenwas obtained for determination of erythrocyte survival
time and liver iron content by magnetic resonance im- L-carnitine content before and after saponification. Dataaging, respectively. for RBC carnitine were given as nmol per gram of hemo-
globin in the cell fraction.
METHODS Erythrocyte survival timePatient characteristics
The RBC survival test determined the functional half-Forty patients on maintenance HD were investigated. clearance time of Cr-51–labeled isologous red cells.
Patients received L-carnitine or placebo (controls) as Whole blood was drawn on day 1 into an acid-citrate-described earlier here. Patients and controls were com- dextrose containing syringe. One hundred mCi (3.7 MBq)parable with regard to age (54.3 6 17.0 vs. 51.3 6 15.2 of Cr-51 was added and incubated for 20 minutes. Theyears, NS), sex (8 females and 12 males vs. 11 females reaction was stopped by adding ascorbic acid and incu-and 9 males, NS), duration of dialysis therapy (30.0 6
bating the mixture for another 10 minutes.17.5 vs. 43.2 6 49.8 months, NS), and underlying renal
The tracer was injected intravenously. Anticoagulateddisease.whole plasma samples were drawn at 15 and 30 minutesVitamin B12 (279.7 6 137.5 vs. 288.8 6 71.3 pmol/liter,after injection from the contralateral arm and consecu-NS), folic acid (36.1 6 17.1 vs. 33.6 6 17.9 nmol/liter, NS),tively three times a week for three weeks immediatelyintact parathyroid hormone (266.2 6 204.5 vs. 218.6 6before dialysis. Based on the whole blood and plasma204.4 pg/ml, NS), and aluminum plasma levels (33.7 6counts and the individual sample hematocrit, the net23.7 vs. 27.1 6 14.6 mg/liter, NS) were comparable be-tagged RBC counts were expressed as the percentage oftween both groups.arithmetic mean of the two-day 1-values and plotted.Five patients received renal transplants during theHalf-time was calculated from the linear regression fit ofstudy. Three patients died (myocardial infarction, sepsis,these data points using Microcal Origin software (V 3.54;and postoperative complications after mitral valve sur-Nicrocal Inc., Nothhamptom, MA, USA). The range ofgery) without suspected relationship to the study. One
patient withdrew consent, and one patient was lost for normal values was set at 28 to 34 days [61].
Kletzmayr et al: Carnitine and anemiaS-98
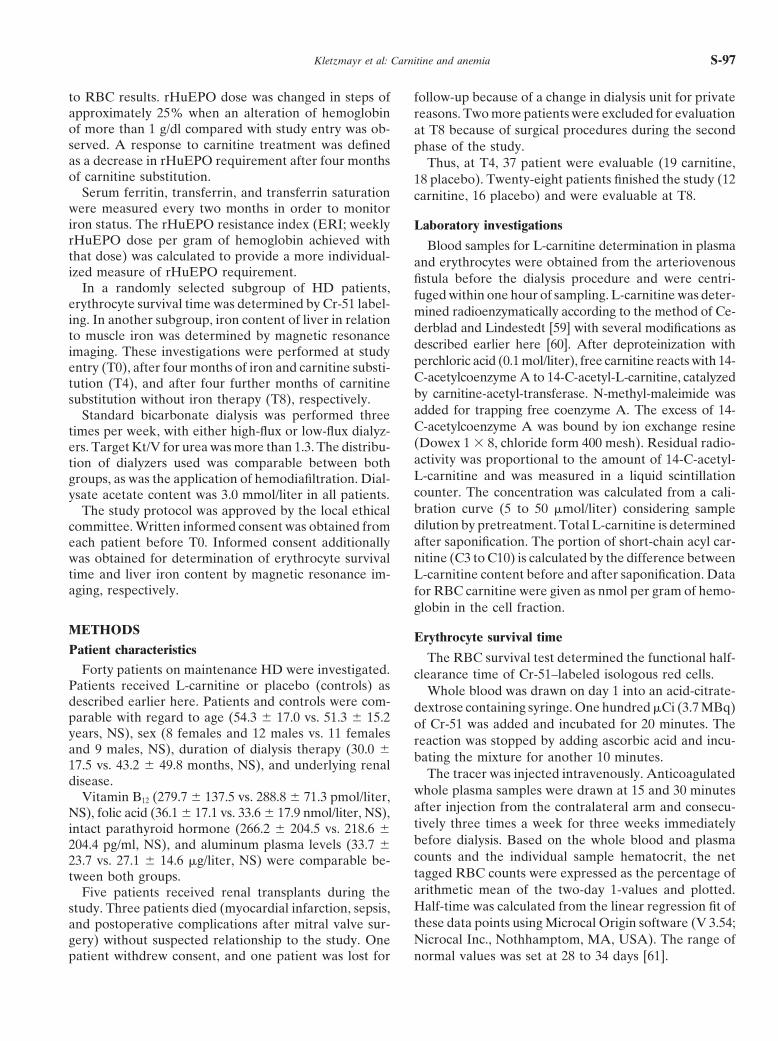
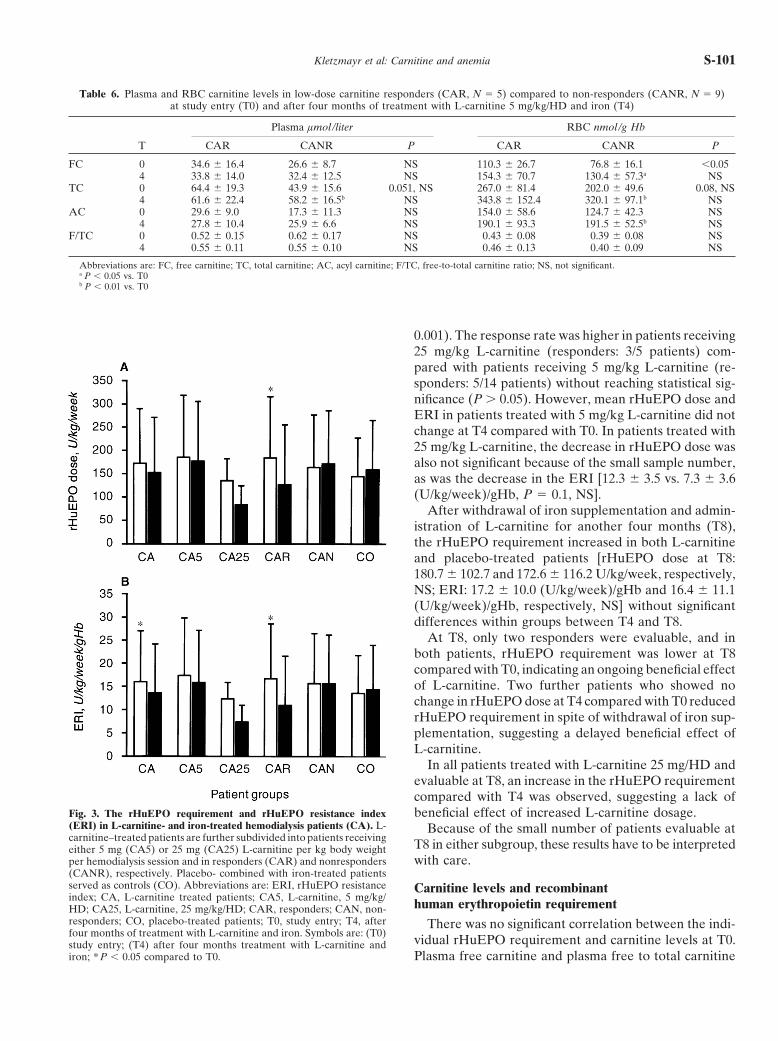
Fig. 1. The effect of L-carnitine and iron sup-plementation compared with placebo and ironon hemoglobin levels (g/dl) of patients on main-tenance hemodialysis at study entry (T0) andafter four (T4) and eight (T8) months. Carnitine-treated patients are further subdivided in re-sponders (N 5 8) and nonresponders (N 5 11).Abbreviations are: T0, study entry; T4, fourmonths of supplementation with L-carnitine orplacebo and iv iron; T8, four further monthsof supplementation with L-carnitine or placebowithout iv iron. Symbols are: ( ) placebo; (h)carnitine; ( ) responders; (j) non-responders.
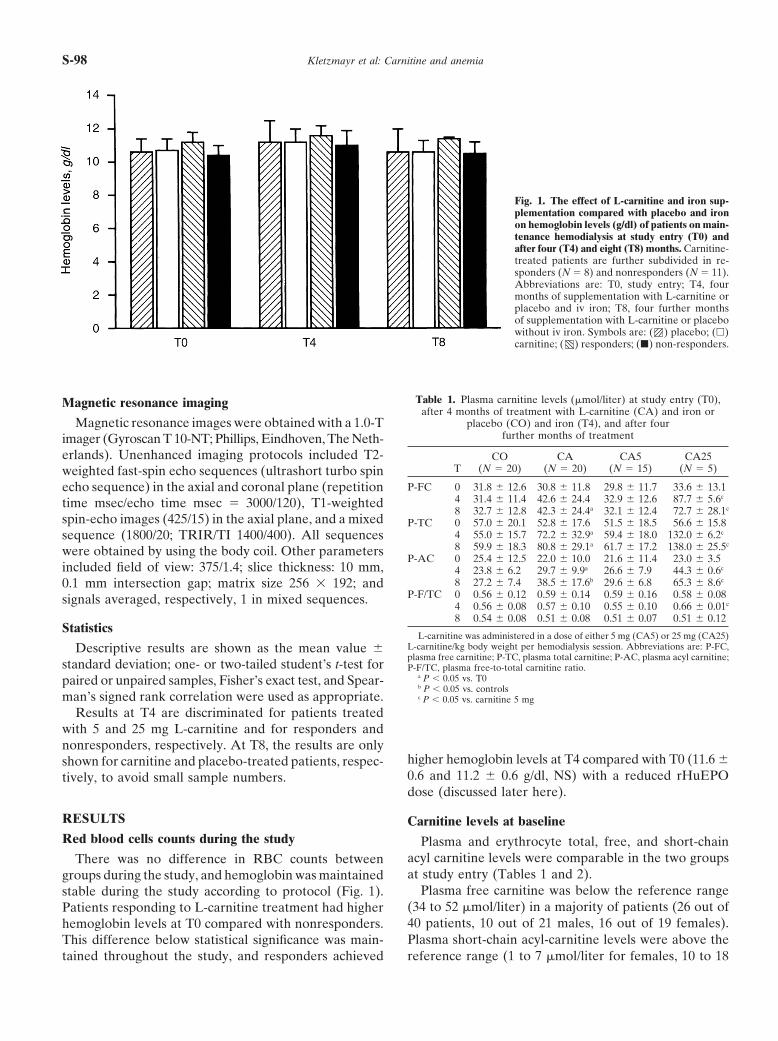
Table 1. Plasma carnitine levels (mmol/liter) at study entry (T0),Magnetic resonance imagingafter 4 months of treatment with L-carnitine (CA) and iron or
placebo (CO) and iron (T4), and after fourMagnetic resonance images were obtained with a 1.0-Tfurther months of treatmentimager (Gyroscan T 10-NT; Phillips, Eindhoven, The Neth-
erlands). Unenhanced imaging protocols included T2- CO CA CA5 CA25T (N 5 20) (N 5 20) (N 5 15) (N 5 5)weighted fast-spin echo sequences (ultrashort turbo spin
P-FC 0 31.8 6 12.6 30.8 6 11.8 29.8 6 11.7 33.6 6 13.1echo sequence) in the axial and coronal plane (repetition4 31.4 6 11.4 42.6 6 24.4 32.9 6 12.6 87.7 6 5.6c
time msec/echo time msec 5 3000/120), T1-weighted8 32.7 6 12.8 42.3 6 24.4a 32.1 6 12.4 72.7 6 28.1c
spin-echo images (425/15) in the axial plane, and a mixed P-TC 0 57.0 6 20.1 52.8 6 17.6 51.5 6 18.5 56.6 6 15.84 55.0 6 15.7 72.2 6 32.9a 59.4 6 18.0 132.0 6 6.2csequence (1800/20; TRIR/TI 1400/400). All sequences8 59.9 6 18.3 80.8 6 29.1a 61.7 6 17.2 138.0 6 25.5c
were obtained by using the body coil. Other parametersP-AC 0 25.4 6 12.5 22.0 6 10.0 21.6 6 11.4 23.0 6 3.5
included field of view: 375/1.4; slice thickness: 10 mm, 4 23.8 6 6.2 29.7 6 9.9a 26.6 6 7.9 44.3 6 0.6c
8 27.2 6 7.4 38.5 6 17.6b 29.6 6 6.8 65.3 6 8.6c0.1 mm intersection gap; matrix size 256 3 192; andP-F/TC 0 0.56 6 0.12 0.59 6 0.14 0.59 6 0.16 0.58 6 0.08signals averaged, respectively, 1 in mixed sequences. 4 0.56 6 0.08 0.57 6 0.10 0.55 6 0.10 0.66 6 0.01c
8 0.54 6 0.08 0.51 6 0.08 0.51 6 0.07 0.51 6 0.12Statistics
L-carnitine was administered in a dose of either 5 mg (CA5) or 25 mg (CA25)L-carnitine/kg body weight per hemodialysis session. Abbreviations are: P-FC,Descriptive results are shown as the mean value 6plasma free carnitine; P-TC, plasma total carnitine; P-AC, plasma acyl carnitine;
standard deviation; one- or two-tailed student’s t-test for P-F/TC, plasma free-to-total carnitine ratio.a P , 0.05 vs. T0paired or unpaired samples, Fisher’s exact test, and Spear-b P , 0.05 vs. controls
man’s signed rank correlation were used as appropriate. c P , 0.05 vs. carnitine 5 mg
Results at T4 are discriminated for patients treatedwith 5 and 25 mg L-carnitine and for responders andnonresponders, respectively. At T8, the results are only
higher hemoglobin levels at T4 compared with T0 (11.6 6shown for carnitine and placebo-treated patients, respec-0.6 and 11.2 6 0.6 g/dl, NS) with a reduced rHuEPOtively, to avoid small sample numbers.dose (discussed later here).
RESULTS Carnitine levels at baselineRed blood cells counts during the study Plasma and erythrocyte total, free, and short-chain
acyl carnitine levels were comparable in the two groupsThere was no difference in RBC counts betweenat study entry (Tables 1 and 2).groups during the study, and hemoglobin was maintained
Plasma free carnitine was below the reference rangestable during the study according to protocol (Fig. 1).(34 to 52 mmol/liter) in a majority of patients (26 out ofPatients responding to L-carnitine treatment had higher40 patients, 10 out of 21 males, 16 out of 19 females).hemoglobin levels at T0 compared with nonresponders.Plasma short-chain acyl-carnitine levels were above theThis difference below statistical significance was main-
tained throughout the study, and responders achieved reference range (1 to 7 mmol/liter for females, 10 to 18
Kletzmayr et al: Carnitine and anemia S-99
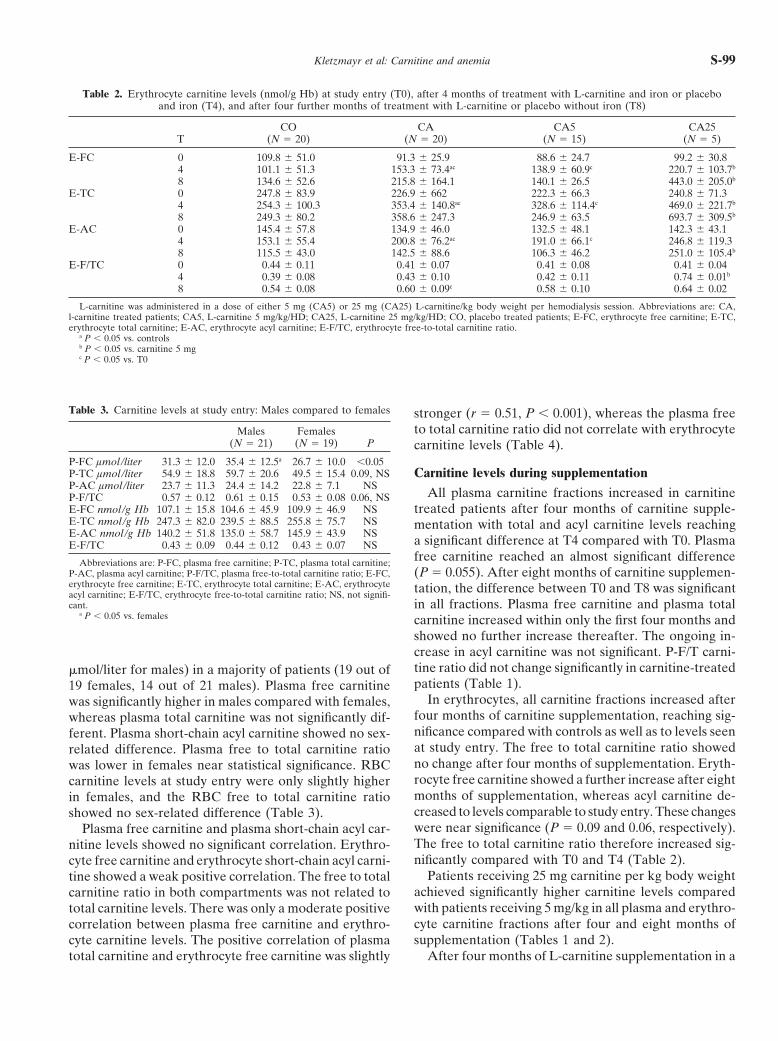
Table 2. Erythrocyte carnitine levels (nmol/g Hb) at study entry (T0), after 4 months of treatment with L-carnitine and iron or placeboand iron (T4), and after four further months of treatment with L-carnitine or placebo without iron (T8)
CO CA CA5 CA25T (N 5 20) (N 5 20) (N 5 15) (N 5 5)
E-FC 0 109.8 6 51.0 91.3 6 25.9 88.6 6 24.7 99.2 6 30.84 101.1 6 51.3 153.3 6 73.4ac 138.9 6 60.9c 220.7 6 103.7b
8 134.6 6 52.6 215.8 6 164.1 140.1 6 26.5 443.0 6 205.0b
E-TC 0 247.8 6 83.9 226.9 6 662 222.3 6 66.3 240.8 6 71.34 254.3 6 100.3 353.4 6 140.8ac 328.6 6 114.4c 469.0 6 221.7b
8 249.3 6 80.2 358.6 6 247.3 246.9 6 63.5 693.7 6 309.5b
E-AC 0 145.4 6 57.8 134.9 6 46.0 132.5 6 48.1 142.3 6 43.14 153.1 6 55.4 200.8 6 76.2ac 191.0 6 66.1c 246.8 6 119.38 115.5 6 43.0 142.5 6 88.6 106.3 6 46.2 251.0 6 105.4b
E-F/TC 0 0.44 6 0.11 0.41 6 0.07 0.41 6 0.08 0.41 6 0.044 0.39 6 0.08 0.43 6 0.10 0.42 6 0.11 0.74 6 0.01b
8 0.54 6 0.08 0.60 6 0.09c 0.58 6 0.10 0.64 6 0.02
L-carnitine was administered in a dose of either 5 mg (CA5) or 25 mg (CA25) L-carnitine/kg body weight per hemodialysis session. Abbreviations are: CA,l-carnitine treated patients; CA5, L-carnitine 5 mg/kg/HD; CA25, L-carnitine 25 mg/kg/HD; CO, placebo treated patients; E-FC, erythrocyte free carnitine; E-TC,erythrocyte total carnitine; E-AC, erythrocyte acyl carnitine; E-F/TC, erythrocyte free-to-total carnitine ratio.
a P , 0.05 vs. controlsb P , 0.05 vs. carnitine 5 mgc P , 0.05 vs. T0
Table 3. Carnitine levels at study entry: Males compared to females stronger (r 5 0.51, P , 0.001), whereas the plasma freeto total carnitine ratio did not correlate with erythrocyteMales Females
(N 5 21) (N 5 19) P carnitine levels (Table 4).P-FC lmol /liter 31.3 6 12.0 35.4 6 12.5a 26.7 6 10.0 ,0.05P-TC lmol /liter 54.9 6 18.8 59.7 6 20.6 49.5 6 15.4 0.09, NS Carnitine levels during supplementationP-AC lmol /liter 23.7 6 11.3 24.4 6 14.2 22.8 6 7.1 NS
All plasma carnitine fractions increased in carnitineP-F/TC 0.57 6 0.12 0.61 6 0.15 0.53 6 0.08 0.06, NSE-FC nmol /g Hb 107.1 6 15.8 104.6 6 45.9 109.9 6 46.9 NS treated patients after four months of carnitine supple-E-TC nmol /g Hb 247.3 6 82.0 239.5 6 88.5 255.8 6 75.7 NS mentation with total and acyl carnitine levels reachingE-AC nmol /g Hb 140.2 6 51.8 135.0 6 58.7 145.9 6 43.9 NS
a significant difference at T4 compared with T0. PlasmaE-F/TC 0.43 6 0.09 0.44 6 0.12 0.43 6 0.07 NSfree carnitine reached an almost significant differenceAbbreviations are: P-FC, plasma free carnitine; P-TC, plasma total carnitine;
P-AC, plasma acyl carnitine; P-F/TC, plasma free-to-total carnitine ratio; E-FC, (P 5 0.055). After eight months of carnitine supplemen-erythrocyte free carnitine; E-TC, erythrocyte total carnitine; E-AC, erythrocyte tation, the difference between T0 and T8 was significantacyl carnitine; E-F/TC, erythrocyte free-to-total carnitine ratio; NS, not signifi-cant. in all fractions. Plasma free carnitine and plasma total
a P , 0.05 vs. females carnitine increased within only the first four months andshowed no further increase thereafter. The ongoing in-crease in acyl carnitine was not significant. P-F/T carni-tine ratio did not change significantly in carnitine-treatedmmol/liter for males) in a majority of patients (19 out ofpatients (Table 1).19 females, 14 out of 21 males). Plasma free carnitine
In erythrocytes, all carnitine fractions increased afterwas significantly higher in males compared with females,four months of carnitine supplementation, reaching sig-whereas plasma total carnitine was not significantly dif-nificance compared with controls as well as to levels seenferent. Plasma short-chain acyl carnitine showed no sex-at study entry. The free to total carnitine ratio showedrelated difference. Plasma free to total carnitine rationo change after four months of supplementation. Eryth-was lower in females near statistical significance. RBCrocyte free carnitine showed a further increase after eightcarnitine levels at study entry were only slightly highermonths of supplementation, whereas acyl carnitine de-in females, and the RBC free to total carnitine ratiocreased to levels comparable to study entry. These changesshowed no sex-related difference (Table 3).were near significance (P 5 0.09 and 0.06, respectively).Plasma free carnitine and plasma short-chain acyl car-The free to total carnitine ratio therefore increased sig-nitine levels showed no significant correlation. Erythro-nificantly compared with T0 and T4 (Table 2).cyte free carnitine and erythrocyte short-chain acyl carni-
Patients receiving 25 mg carnitine per kg body weighttine showed a weak positive correlation. The free to totalachieved significantly higher carnitine levels comparedcarnitine ratio in both compartments was not related towith patients receiving 5 mg/kg in all plasma and erythro-total carnitine levels. There was only a moderate positivecyte carnitine fractions after four and eight months ofcorrelation between plasma free carnitine and erythro-supplementation (Tables 1 and 2).cyte carnitine levels. The positive correlation of plasma
total carnitine and erythrocyte free carnitine was slightly After four months of L-carnitine supplementation in a
Kletzmayr et al: Carnitine and anemiaS-100
Table 4. Carnitine levels at study entry: Correlation of carnitine fractionis in plasma and erythrocytes
P \ r P-FC P-TC P-AC P-F/TC E-FC E-TC E-AC E-F/TC
P-FC — 0.82 0.29 0.47 0.41 0.46 0.34 0.12P-TC c — 0.79 20.01 0.51 0.49 0.32 0.23P-AC NS (0.07) c — 20.66 0.41 0.33 0.17 0.25P-F/TC b NS c — 20.08 20.01 0.04 20.11E-FC b c c NS — 0.81 0.40 0.54E-TC b b a NS c — 0.86 0.02E-AC a a NS NS a c — 0.49E-F/TC NS a NS NS c NS b —
Abbreviations are: P-FC, plasma free carnitine; P-TC, plasma total carnitine; P-AC, plasma acyl carnitine; P-F/TC, plasma free-to-total carnitine ratio; E-FC,erythrocyte free carnitine; E-TC, erythrocyte total carnitine; E-AC, erythrocyte acyl carnitine; E-F/TC, erythrocyte free-to-total carnitine ratio; NS, not significant.
P, P value; r, correlation coefficient.a, P , 0.05; b, P , 0.01; c, P , 0.001
Table 5. Plasma and red blood cell (RBC) carnitine of all responders(CAR, N 5 8) compared to non-responders (CANR, N 5 11)
at study entry (T0) and after four months of treatmentwith L-carnitine and iron (T4)
CAR CANR CAR CANR
T Plasma lmol /liter RBC nmol /g Hb
FC 0 35.4 6 14.8 27.0 6 8.8 110.2 6 28.7a 77.9 6 14.74 49.4 6 29.2 37.8 6 20.6 156.5 6 58.9 151.2 6 85.1
TC 0 63.0 6 18.1a 45.1 6 14.6 263.4 6 78.3 204.5 6 46.94 82.0 6 39.5 65.4 6 27.5 343.4 6 125.9 360.3 6 156.6
AC 0 27.5 6 7.8a 18.1 6 10.2 151.9 6 52.6 126.2 6 40.14 32.6 6 11.8 27.7 6 8.5 186.8 6 76.7 210.7 6 78.4
F/TC 0 0.55 6 0.12 0.61 6 0.16 0.43 6 0.07 0.39 6 0.074 0.58 6 0.10 0.56 6 0.10 0.46 6 0.10 0.40 6 0.09
Abbreviations are: FC, free carnitine; TC, total carnitine; AC, acyl carnitine;F/TC, free-to-total carnitine ratio.
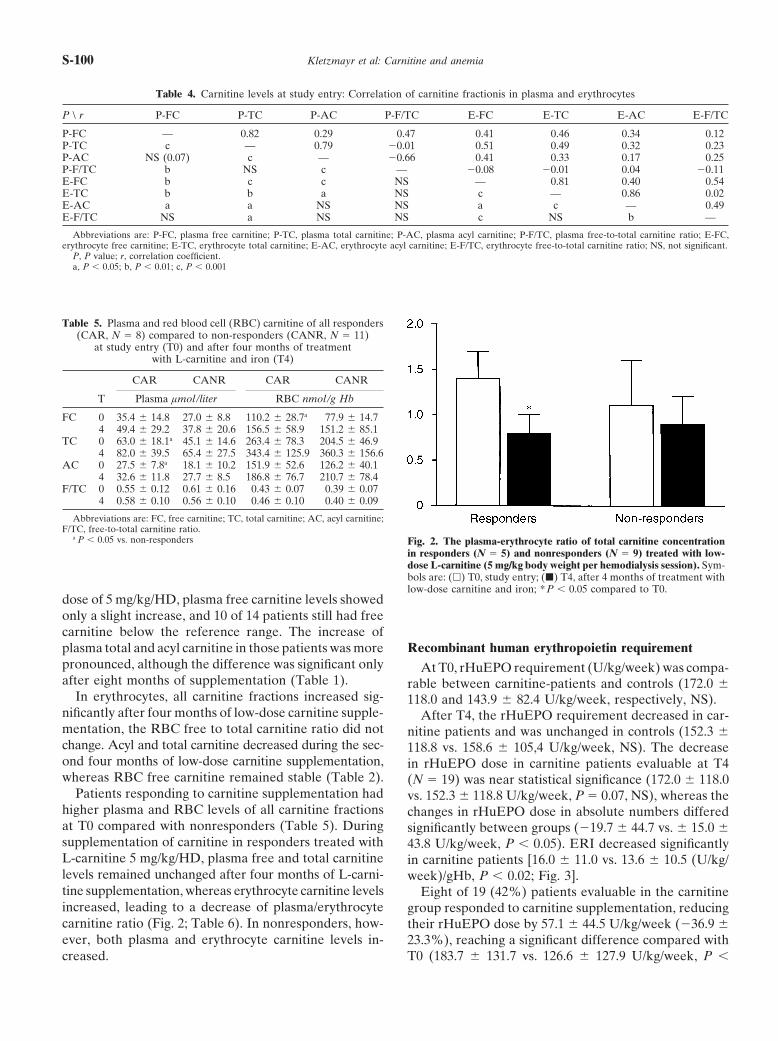
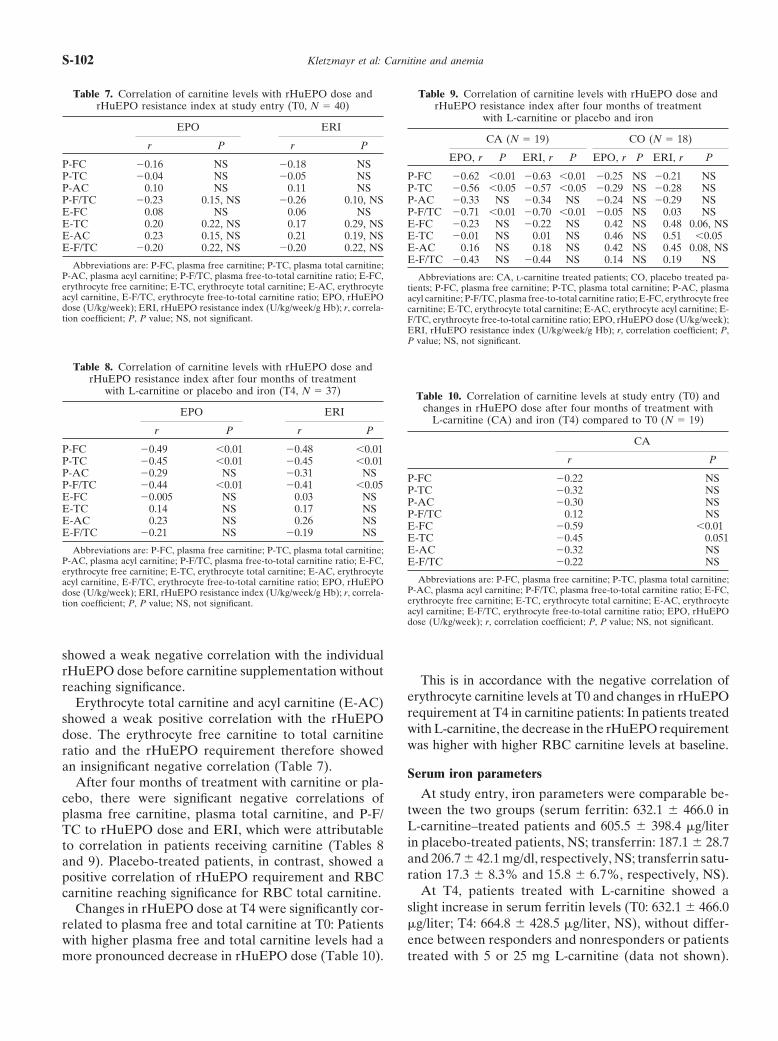
a P , 0.05 vs. non-responders Fig. 2. The plasma-erythrocyte ratio of total carnitine concentrationin responders (N 5 5) and nonresponders (N 5 9) treated with low-dose L-carnitine (5 mg/kg body weight per hemodialysis session). Sym-bols are: (h) T0, study entry; (j) T4, after 4 months of treatment withlow-dose carnitine and iron; * P , 0.05 compared to T0.
dose of 5 mg/kg/HD, plasma free carnitine levels showedonly a slight increase, and 10 of 14 patients still had freecarnitine below the reference range. The increase of
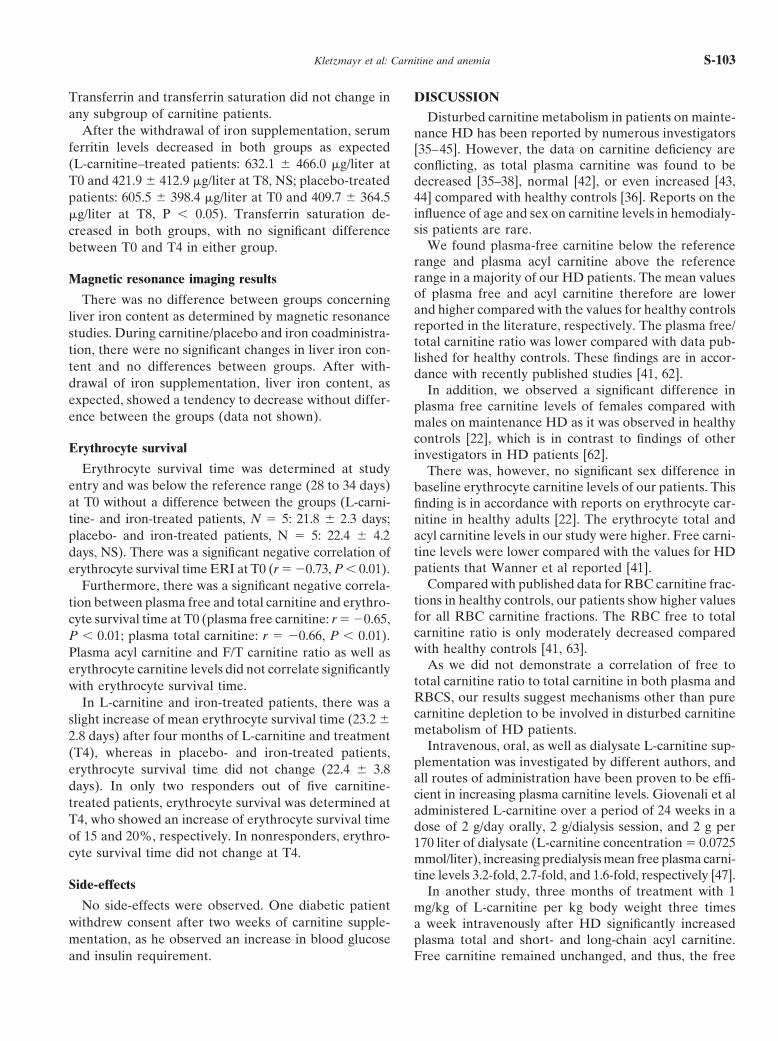
Recombinant human erythropoietin requirementplasma total and acyl carnitine in those patients was morepronounced, although the difference was significant only At T0, rHuEPO requirement (U/kg/week) was compa-after eight months of supplementation (Table 1). rable between carnitine-patients and controls (172.0 6
In erythrocytes, all carnitine fractions increased sig- 118.0 and 143.9 6 82.4 U/kg/week, respectively, NS).nificantly after four months of low-dose carnitine supple- After T4, the rHuEPO requirement decreased in car-mentation, the RBC free to total carnitine ratio did not nitine patients and was unchanged in controls (152.3 6change. Acyl and total carnitine decreased during the sec- 118.8 vs. 158.6 6 105,4 U/kg/week, NS). The decreaseond four months of low-dose carnitine supplementation, in rHuEPO dose in carnitine patients evaluable at T4whereas RBC free carnitine remained stable (Table 2). (N 5 19) was near statistical significance (172.0 6 118.0
Patients responding to carnitine supplementation had vs. 152.3 6 118.8 U/kg/week, P 5 0.07, NS), whereas thehigher plasma and RBC levels of all carnitine fractions changes in rHuEPO dose in absolute numbers differedat T0 compared with nonresponders (Table 5). During significantly between groups (219.7 6 44.7 vs. 6 15.0 6supplementation of carnitine in responders treated with 43.8 U/kg/week, P , 0.05). ERI decreased significantlyL-carnitine 5 mg/kg/HD, plasma free and total carnitine in carnitine patients [16.0 6 11.0 vs. 13.6 6 10.5 (U/kg/levels remained unchanged after four months of L-carni- week)/gHb, P , 0.02; Fig. 3].tine supplementation, whereas erythrocyte carnitine levels Eight of 19 (42%) patients evaluable in the carnitineincreased, leading to a decrease of plasma/erythrocyte group responded to carnitine supplementation, reducingcarnitine ratio (Fig. 2; Table 6). In nonresponders, how- their rHuEPO dose by 57.1 6 44.5 U/kg/week (236.9 6ever, both plasma and erythrocyte carnitine levels in- 23.3%), reaching a significant difference compared with
T0 (183.7 6 131.7 vs. 126.6 6 127.9 U/kg/week, P ,creased.
Kletzmayr et al: Carnitine and anemia S-101
Table 6. Plasma and RBC carnitine levels in low-dose carnitine responders (CAR, N 5 5) compared to non-responders (CANR, N 5 9)at study entry (T0) and after four months of treatment with L-carnitine 5 mg/kg/HD and iron (T4)
Plasma lmol /liter RBC nmol /g Hb
T CAR CANR P CAR CANR P
FC 0 34.6 6 16.4 26.6 6 8.7 NS 110.3 6 26.7 76.8 6 16.1 ,0.054 33.8 6 14.0 32.4 6 12.5 NS 154.3 6 70.7 130.4 6 57.3a NS
TC 0 64.4 6 19.3 43.9 6 15.6 0.051, NS 267.0 6 81.4 202.0 6 49.6 0.08, NS4 61.6 6 22.4 58.2 6 16.5b NS 343.8 6 152.4 320.1 6 97.1b NS
AC 0 29.6 6 9.0 17.3 6 11.3 NS 154.0 6 58.6 124.7 6 42.3 NS4 27.8 6 10.4 25.9 6 6.6 NS 190.1 6 93.3 191.5 6 52.5b NS
F/TC 0 0.52 6 0.15 0.62 6 0.17 NS 0.43 6 0.08 0.39 6 0.08 NS4 0.55 6 0.11 0.55 6 0.10 NS 0.46 6 0.13 0.40 6 0.09 NS
Abbreviations are: FC, free carnitine; TC, total carnitine; AC, acyl carnitine; F/TC, free-to-total carnitine ratio; NS, not significant.a P , 0.05 vs. T0b P , 0.01 vs. T0
0.001). The response rate was higher in patients receiving25 mg/kg L-carnitine (responders: 3/5 patients) com-pared with patients receiving 5 mg/kg L-carnitine (re-sponders: 5/14 patients) without reaching statistical sig-nificance (P . 0.05). However, mean rHuEPO dose andERI in patients treated with 5 mg/kg L-carnitine did notchange at T4 compared with T0. In patients treated with25 mg/kg L-carnitine, the decrease in rHuEPO dose wasalso not significant because of the small sample number,as was the decrease in the ERI [12.3 6 3.5 vs. 7.3 6 3.6(U/kg/week)/gHb, P 5 0.1, NS].
After withdrawal of iron supplementation and admin-istration of L-carnitine for another four months (T8),the rHuEPO requirement increased in both L-carnitineand placebo-treated patients [rHuEPO dose at T8:180.7 6 102.7 and 172.6 6 116.2 U/kg/week, respectively,NS; ERI: 17.2 6 10.0 (U/kg/week)/gHb and 16.4 6 11.1(U/kg/week)/gHb, respectively, NS] without significantdifferences within groups between T4 and T8.
At T8, only two responders were evaluable, and inboth patients, rHuEPO requirement was lower at T8compared with T0, indicating an ongoing beneficial effectof L-carnitine. Two further patients who showed nochange in rHuEPO dose at T4 compared with T0 reducedrHuEPO requirement in spite of withdrawal of iron sup-plementation, suggesting a delayed beneficial effect ofL-carnitine.
In all patients treated with L-carnitine 25 mg/HD andevaluable at T8, an increase in the rHuEPO requirementcompared with T4 was observed, suggesting a lack ofbeneficial effect of increased L-carnitine dosage.Fig. 3. The rHuEPO requirement and rHuEPO resistance index
(ERI) in L-carnitine- and iron-treated hemodialysis patients (CA). L- Because of the small number of patients evaluable atcarnitine–treated patients are further subdivided into patients receiving T8 in either subgroup, these results have to be interpretedeither 5 mg (CA5) or 25 mg (CA25) L-carnitine per kg body weight
with care.per hemodialysis session and in responders (CAR) and nonresponders(CANR), respectively. Placebo- combined with iron-treated patientsserved as controls (CO). Abbreviations are: ERI, rHuEPO resistance Carnitine levels and recombinantindex; CA, L-carnitine treated patients; CA5, L-carnitine, 5 mg/kg/ human erythropoietin requirementHD; CA25, L-carnitine, 25 mg/kg/HD; CAR, responders; CAN, non-responders; CO, placebo-treated patients; T0, study entry; T4, after There was no significant correlation between the indi-four months of treatment with L-carnitine and iron. Symbols are: (T0)
vidual rHuEPO requirement and carnitine levels at T0.study entry; (T4) after four months treatment with L-carnitine andiron; * P , 0.05 compared to T0. Plasma free carnitine and plasma free to total carnitine
Kletzmayr et al: Carnitine and anemiaS-102
Table 9. Correlation of carnitine levels with rHuEPO dose andTable 7. Correlation of carnitine levels with rHuEPO dose andrHuEPO resistance index at study entry (T0, N 5 40) rHuEPO resistance index after four months of treatment
with L-carnitine or placebo and ironEPO ERI
CA (N 5 19) CO (N 5 18)r P r P
EPO, r P ERI, r P EPO, r P ERI, r PP-FC 20.16 NS 20.18 NSP-TC 20.04 NS 20.05 NS P-FC 20.62 ,0.01 20.63 ,0.01 20.25 NS 20.21 NS
P-TC 20.56 ,0.05 20.57 ,0.05 20.29 NS 20.28 NSP-AC 0.10 NS 0.11 NSP-F/TC 20.23 0.15, NS 20.26 0.10, NS P-AC 20.33 NS 20.34 NS 20.24 NS 20.29 NS
P-F/TC 20.71 ,0.01 20.70 ,0.01 20.05 NS 0.03 NSE-FC 0.08 NS 0.06 NSE-TC 0.20 0.22, NS 0.17 0.29, NS E-FC 20.23 NS 20.22 NS 0.42 NS 0.48 0.06, NS
E-TC 20.01 NS 0.01 NS 0.46 NS 0.51 ,0.05E-AC 0.23 0.15, NS 0.21 0.19, NSE-F/TC 20.20 0.22, NS 20.20 0.22, NS E-AC 0.16 NS 0.18 NS 0.42 NS 0.45 0.08, NS
E-F/TC 20.43 NS 20.44 NS 0.14 NS 0.19 NSAbbreviations are: P-FC, plasma free carnitine; P-TC, plasma total carnitine;P-AC, plasma acyl carnitine; P-F/TC, plasma free-to-total carnitine ratio; E-FC, Abbreviations are: CA, l-carnitine treated patients; CO, placebo treated pa-erythrocyte free carnitine; E-TC, erythrocyte total carnitine; E-AC, erythrocyte tients; P-FC, plasma free carnitine; P-TC, plasma total carnitine; P-AC, plasmaacyl carnitine, E-F/TC, erythrocyte free-to-total carnitine ratio; EPO, rHuEPO acyl carnitine; P-F/TC, plasma free-to-total carnitine ratio; E-FC, erythrocyte freedose (U/kg/week); ERI, rHuEPO resistance index (U/kg/week/g Hb); r, correla- carnitine; E-TC, erythrocyte total carnitine; E-AC, erythrocyte acyl carnitine; E-tion coefficient; P, P value; NS, not significant. F/TC, erythrocyte free-to-total carnitine ratio; EPO, rHuEPO dose (U/kg/week);
ERI, rHuEPO resistance index (U/kg/week/g Hb); r, correlation coefficient; P,P value; NS, not significant.
Table 8. Correlation of carnitine levels with rHuEPO dose andrHuEPO resistance index after four months of treatment
with L-carnitine or placebo and iron (T4, N 5 37) Table 10. Correlation of carnitine levels at study entry (T0) andchanges in rHuEPO dose after four months of treatment withEPO ERI
L-carnitine (CA) and iron (T4) compared to T0 (N 5 19)r P r P
CAP-FC 20.49 ,0.01 20.48 ,0.01
r PP-TC 20.45 ,0.01 20.45 ,0.01P-AC 20.29 NS 20.31 NS P-FC 20.22 NSP-F/TC 20.44 ,0.01 20.41 ,0.05 P-TC 20.32 NSE-FC 20.005 NS 0.03 NS P-AC 20.30 NSE-TC 0.14 NS 0.17 NS P-F/TC 0.12 NSE-AC 0.23 NS 0.26 NS E-FC 20.59 ,0.01E-F/TC 20.21 NS 20.19 NS E-TC 20.45 0.051
E-AC 20.32 NSAbbreviations are: P-FC, plasma free carnitine; P-TC, plasma total carnitine;P-AC, plasma acyl carnitine; P-F/TC, plasma free-to-total carnitine ratio; E-FC, E-F/TC 20.22 NSerythrocyte free carnitine; E-TC, erythrocyte total carnitine; E-AC, erythrocyte
Abbreviations are: P-FC, plasma free carnitine; P-TC, plasma total carnitine;acyl carnitine, E-F/TC, erythrocyte free-to-total carnitine ratio; EPO, rHuEPOP-AC, plasma acyl carnitine; P-F/TC, plasma free-to-total carnitine ratio; E-FC,dose (U/kg/week); ERI, rHuEPO resistance index (U/kg/week/g Hb); r, correla-erythrocyte free carnitine; E-TC, erythrocyte total carnitine; E-AC, erythrocytetion coefficient; P, P value; NS, not significant.acyl carnitine; E-F/TC, erythrocyte free-to-total carnitine ratio; EPO, rHuEPOdose (U/kg/week); r, correlation coefficient; P, P value; NS, not significant.
showed a weak negative correlation with the individualrHuEPO dose before carnitine supplementation without
This is in accordance with the negative correlation ofreaching significance.erythrocyte carnitine levels at T0 and changes in rHuEPOErythrocyte total carnitine and acyl carnitine (E-AC)requirement at T4 in carnitine patients: In patients treatedshowed a weak positive correlation with the rHuEPOwith L-carnitine, the decrease in the rHuEPO requirementdose. The erythrocyte free carnitine to total carnitinewas higher with higher RBC carnitine levels at baseline.ratio and the rHuEPO requirement therefore showed
an insignificant negative correlation (Table 7). Serum iron parametersAfter four months of treatment with carnitine or pla-
At study entry, iron parameters were comparable be-cebo, there were significant negative correlations oftween the two groups (serum ferritin: 632.1 6 466.0 inplasma free carnitine, plasma total carnitine, and P-F/L-carnitine–treated patients and 605.5 6 398.4 mg/literTC to rHuEPO dose and ERI, which were attributablein placebo-treated patients, NS; transferrin: 187.1 6 28.7to correlation in patients receiving carnitine (Tables 8and 206.7 6 42.1 mg/dl, respectively, NS; transferrin satu-and 9). Placebo-treated patients, in contrast, showed aration 17.3 6 8.3% and 15.8 6 6.7%, respectively, NS).positive correlation of rHuEPO requirement and RBC
At T4, patients treated with L-carnitine showed acarnitine reaching significance for RBC total carnitine.slight increase in serum ferritin levels (T0: 632.1 6 466.0Changes in rHuEPO dose at T4 were significantly cor-mg/liter; T4: 664.8 6 428.5 mg/liter, NS), without differ-related to plasma free and total carnitine at T0: Patientsence between responders and nonresponders or patientswith higher plasma free and total carnitine levels had a
more pronounced decrease in rHuEPO dose (Table 10). treated with 5 or 25 mg L-carnitine (data not shown).
Kletzmayr et al: Carnitine and anemia S-103
Transferrin and transferrin saturation did not change in DISCUSSIONany subgroup of carnitine patients. Disturbed carnitine metabolism in patients on mainte-
After the withdrawal of iron supplementation, serum nance HD has been reported by numerous investigatorsferritin levels decreased in both groups as expected [35–45]. However, the data on carnitine deficiency are(L-carnitine–treated patients: 632.1 6 466.0 mg/liter at conflicting, as total plasma carnitine was found to beT0 and 421.9 6 412.9 mg/liter at T8, NS; placebo-treated decreased [35–38], normal [42], or even increased [43,
44] compared with healthy controls [36]. Reports on thepatients: 605.5 6 398.4 mg/liter at T0 and 409.7 6 364.5influence of age and sex on carnitine levels in hemodialy-mg/liter at T8, P , 0.05). Transferrin saturation de-sis patients are rare.creased in both groups, with no significant difference
We found plasma-free carnitine below the referencebetween T0 and T4 in either group.range and plasma acyl carnitine above the referencerange in a majority of our HD patients. The mean valuesMagnetic resonance imaging resultsof plasma free and acyl carnitine therefore are lowerThere was no difference between groups concerningand higher compared with the values for healthy controlsliver iron content as determined by magnetic resonancereported in the literature, respectively. The plasma free/studies. During carnitine/placebo and iron coadministra-total carnitine ratio was lower compared with data pub-
tion, there were no significant changes in liver iron con-lished for healthy controls. These findings are in accor-
tent and no differences between groups. After with- dance with recently published studies [41, 62].drawal of iron supplementation, liver iron content, as In addition, we observed a significant difference inexpected, showed a tendency to decrease without differ- plasma free carnitine levels of females compared withence between the groups (data not shown). males on maintenance HD as it was observed in healthy
controls [22], which is in contrast to findings of otherErythrocyte survival investigators in HD patients [62].
Erythrocyte survival time was determined at study There was, however, no significant sex difference inentry and was below the reference range (28 to 34 days) baseline erythrocyte carnitine levels of our patients. Thisat T0 without a difference between the groups (L-carni- finding is in accordance with reports on erythrocyte car-tine- and iron-treated patients, N 5 5: 21.8 6 2.3 days; nitine in healthy adults [22]. The erythrocyte total and
acyl carnitine levels in our study were higher. Free carni-placebo- and iron-treated patients, N 5 5: 22.4 6 4.2tine levels were lower compared with the values for HDdays, NS). There was a significant negative correlation ofpatients that Wanner et al reported [41].erythrocyte survival time ERI at T0 (r 5 20.73, P , 0.01).
Compared with published data for RBC carnitine frac-Furthermore, there was a significant negative correla-tions in healthy controls, our patients show higher valuestion between plasma free and total carnitine and erythro-for all RBC carnitine fractions. The RBC free to totalcyte survival time at T0 (plasma free carnitine: r 5 20.65,carnitine ratio is only moderately decreased comparedP , 0.01; plasma total carnitine: r 5 20.66, P , 0.01).with healthy controls [41, 63].Plasma acyl carnitine and F/T carnitine ratio as well as
As we did not demonstrate a correlation of free toerythrocyte carnitine levels did not correlate significantlytotal carnitine ratio to total carnitine in both plasma andwith erythrocyte survival time.RBCS, our results suggest mechanisms other than pureIn L-carnitine and iron-treated patients, there was acarnitine depletion to be involved in disturbed carnitineslight increase of mean erythrocyte survival time (23.2 6metabolism of HD patients.2.8 days) after four months of L-carnitine and treatment
Intravenous, oral, as well as dialysate L-carnitine sup-(T4), whereas in placebo- and iron-treated patients,plementation was investigated by different authors, anderythrocyte survival time did not change (22.4 6 3.8all routes of administration have been proven to be effi-
days). In only two responders out of five carnitine-cient in increasing plasma carnitine levels. Giovenali et al
treated patients, erythrocyte survival was determined at administered L-carnitine over a period of 24 weeks in aT4, who showed an increase of erythrocyte survival time dose of 2 g/day orally, 2 g/dialysis session, and 2 g perof 15 and 20%, respectively. In nonresponders, erythro- 170 liter of dialysate (L-carnitine concentration 5 0.0725cyte survival time did not change at T4. mmol/liter), increasing predialysis mean free plasma carni-
tine levels 3.2-fold, 2.7-fold, and 1.6-fold, respectively [47].Side-effects In another study, three months of treatment with 1
No side-effects were observed. One diabetic patient mg/kg of L-carnitine per kg body weight three timeswithdrew consent after two weeks of carnitine supple- a week intravenously after HD significantly increasedmentation, as he observed an increase in blood glucose plasma total and short- and long-chain acyl carnitine.
Free carnitine remained unchanged, and thus, the freeand insulin requirement.
Kletzmayr et al: Carnitine and anemiaS-104
to total carnitine ratio decreased. In RBCs, low-dose randomized, placebo-controlled study in 24 patients andcould demonstrate a 38% reduction in rHuEPO dose incarnitine supplementation decreased total carnitine by
reduction of RBC free carnitine [41]. 13 patients treated with 1 g L-carnitine after each HDsession (17.9 6 2.8 mg/kg) for six months [15]. GlobalL-carnitine treatment with 5 mg/kg increased all plasma
and erythrocyte carnitine fractions to values above those osmotic fragility and endogenous erythropoietin levelswere not affected by L-carnitine, therefore, not account-reported for healthy controls without changing de-
creased the plasma free to total carnitine ratio and in- ing for this effect of carnitine on anemia. Seven patientsresponded to carnitine-administration, whereas six pa-creased the RBC free to total carnitine ratio. Treatment
with 15 mg/kg increased plasma and RBC total, free, tients were nonresponders. At T0, responders had higherrHuEPO requirements and higher endogenous erythro-and acyl carnitine more than three times above normal.
Six weeks of wash-out did not normalize these elevated poietin levels than nonresponders, although statisticallynot significant. Thus, Labonia suggested rHuEPO resis-concentrations. Low RBC carnitine ester turnover was
suggested, and it was concluded that the L-carnitine tance as a consequence of carnitine deficiency, whichwas corrected by L-carnitine supplementation in a sub-doses used in clinical trials might be much too high [41].
Our results showed no normalization of decreased group of patients [15].In an uncontrolled study, Kavadias et al reported aplasma free carnitine after four or eight months of
L-carnitine supplementation in a dose of 5 mg/kg/HD. 50% reduction of rHuEPO requirement in all patientsstudied by intravenous coadministration of 2 g L-carni-After four months, a majority of patients still had free
carnitine levels below the reference range (10 of 14 pa- tine postdialysis [17]. Boran et al found a significantincrease in hematocrit levels after three months of intra-tients). Initially, increased P-AC levels showed a further
increase under therapy. Therefore, the plasma F/TC ra- venous L-carnitine supplementation (0.04 to 0.06 g/kg/week) and maintenance of the rHuEPO dose in 14 un-tio, which was initially decreased compared with healthy
controls, worsened further. Carnitine supplementation controlled HD patients [16]. With half of the formerrHuEPO dose and further carnitine supplementation,in a dose of 25 mg/kg/HD increased all plasma carnitine
fractions above the reference range in accordance to hematocrit decreased again, but was still significantlyhigher compared with T0.Wanner et al [41].
These data demonstrate that the disturbance of carni- Our data suggest that carnitine supplementation re-duces rHuEPO requirement in a subgroup of patientstine metabolism in HD patients is not simply a lack of
plasma free carnitine that can be restored with L-carni- on maintenance HD. The percentage of patients re-sponding to four months of carnitine supplementationtine supplementation.
There are two studies published so far that have found was comparable to the results of Labonia [15]; the reduc-tion in rHuEPO requirements, however, was lower, pos-a significant negative correlation of plasma total carni-
tine levels and rHuEPO requirement in HD patients [55, sibly related to different L-carnitine dosage [15].In the clinical studies currently published, the interde-64]. Plasma free carnitine and rHuEPO dose showed no
correlation. In anemic patients (hematocrit of less than pendence of carnitine and iron supplementation werenot investigated. In the study of Labonia, patients re-30% or rHuEPO therapy), plasma free and total carni-
tine were significantly lower compared to nonanemic ceived oral or intravenous iron supplementation as re-quired according to serum ferritin levels and transferrinpatients (hematocrit of more than 30% without rHuEPO
therapy) [64]. saturation throughout the study [15]. An influence ofiron parameters on carnitine response was not reported.In contrast to these findings, we could not confirm a
significant correlation of plasma or erythrocyte carnitine Our investigation of carnitine supplementation and ironparameters could not reveal an interdependence of theseand rHuEPO requirement at T0 (Table 7). Plasma free
carnitine showed a negative correlation near significance, metabolic processes. Neither an influence on iron utiliza-tion or on mobilization of body iron stores by L-carnitinewhereas plasma total carnitine did not show any correla-
tion to the rHuEPO requirement. supplementation could be demonstrated.Responders and nonresponders did not differ in ironAfter four months of L-carnitine supplementation,
there was a significant negative correlation of plasma parameters, rHuEPO requirement, age, duration of dial-ysis. At study entry, however, responders had higherfree and total carnitine to rHuEPO dose in our study,
whereas plasma carnitine levels did not correlate. plasma and RBC carnitine levels. Nonresponders achievedthose levels after four months of carnitine supplementa-In 1992, Berard et al [14] reported two cases of hemo-
dialyzed children with erythropoietin-hyporesponsive- tion. Therefore, our results may suggest that in HD pa-tients, higher plasma free carnitine levels are necessaryness (240 to 360 U/kg/week) whose hematocrit could be
improved by administration of 1 to 3 mg/kg L-carnitine for the desired therapeutic results than in healthy sub-jects because of the disturbed carnitine pattern of HDintravenously at the end of dialysis sessions.
Based on these observations, Labonia performed a patients. Thus, we perceived evidence that severely car-
Kletzmayr et al: Carnitine and anemia S-105
nitine-depleted patients might need a higher dosage or APPENDIXlonger supplementation of carnitine in order to reduce Abbreviations used in this article are: acylCoA, acyl coenzyme A;
ATP, adenosine triphosphate; CPT, carnitine palmitoyl transferase;the rHuEPO requirement.CRF, chronic renal failure; ERI, rHuEPO resistance index; HD, hemo-A shift of carnitine from plasma into RBCs was ob-dialysis; NS, not significant; RBCs, red blood cells; rHuEPO, recombi-
served only in responders supplemented with a low dose nant human erythropoietin; T0, study entry; T4, after four months ofiron and carnitine supplementation; T8, after four further months ofof L-carnitine. This effect was absent in nonresponders.carnitine supplementation without iron therapy.A disturbed carnitine transport between various com-
partments in addition to carnitine deficiency might con-REFERENCEStribute to rHuEPO hyporesponsiveness. The finding of
1. Winearls CG: Historical review on the use of recombinant humana negative correlation between plasma carnitine fractionserythropoietin in chronic renal failure. Nephrol Dial Transplantand RBC survival can be attributed to defective trans- 10(Suppl 2):3–9, 1995
port mechanism of carnitine from plasma into erythro- 2. Sunder-Plassmann G, Horl WH: Erythropoietin and iron. ClinNephrol 47:141–157, 1997cytes as well.
3. Hampers CL, Streiff R, Nathan DG, Snyder D, Merrill JP:The mechanism of action of carnitine supplementation Megaloblastic hematopoiesis in uremia and in patients on long-in anemia of HD patients still stays unclear. We could not term hemodialysis. N Engl J Med 276:551–554, 1967
4. Rao DS, Shih MS, Mohini R: Effect of serum parathyroid hormonedemonstrate a significant increase in erythrocyte survivaland bone marrow fibrosis on the response to erythropoietin in
time in our carnitine-treated patients probably because uremia. N Engl J Med 328:171–175, 19935. Touam M, Martinez F, Lacour B, Bourdon R, Zingraff J, Diof the small numbers of patients investigated, which
Giulio S, Drueke T: Aluminum-induced, reversible microcyticshould be the clinical result of any stabilization processanemia in chronic renal failure: Clinical and experimental studies.
of the erythrocyte membrane. However, two out of five Clin Nephrol 19:295–298, 19836. Macdougall IC, Coles GA, Williams JD: Inhibition of a re-patients of the L-carnitine-treated group were respond-
sponse to erythropoietin in the presence of infection or malignancy.ers. These patients showed an increase in erythrocyte Erythropoiesis 3:29–30, 1992survival time. In addition, there was a significant correla- 7. Radtke HW, Rege AB, La Merche MB, Bartos D, Campbell
RA, Fisher JW: Identification of spermine as an inhibitor of eryth-tion between RBC survival time and rHuEPO require-ropoiesis in patients with chronic renal failure. J Clin Investment at study entry. Thus, our data support the hypothe- 67:1623–1629, 1981
sis that carnitine may act via membrane stabilization, 8. Shaw AB: Haemolysis in chronic renal failure. BMJ 2:213–216, 19679. Drueke TB: R-HuEPO hyporesponsiveness: Who and why? Neph-but further studies are needed.
rol Dial Transplant 10(Suppl 2):62–68, 1995The suggestions of Labonia concerning possible mech- 10. Trovato GM, Ginardi V, Di Marco V, Dell’Aira EE, Corsi M:
Long-term L-carnitine treatment of chronic anaemia of patientsanisms of carnitine action are not necessarily in contrastwith endstage renal failure. Curr Ther Res 31:1042–1049, 1982to the membrane-stabilization hypothesis [15]. Membrane
11. Albertazzi A, Capelli P, Di Paolo B, Pola P, Tondi P, Vaccariostabilization could play a crucial role in reticulocytes. O: Endocrine metabolic effects of L-carnitine in patients on regular
dialysis treatment. Proc Eur Dial Transplant Assoc 19:302–307, 1982Increased viability of reticulocytes would decrease rHu-12. Vacha GM, Giorcelli G, Siliprandi N, Corsi M: Favorable effectsEPO resistance by decreasing inefficient erythropoiesis. of L-carnitine treatment on hypertriglyceridemia in hemodialysis
In conclusion, L-carnitine supplementation cannot re- patients: Decisive role of low levels of high-density lipoprotein-cholesterol. Am J Clin Nutr 38:532–540, 1983place iron therapy in HD patients, as in our patients,
13. Bellinghieri G, Savica V, Mallamace A, Di Stefano C, Consolothe rHuEPO requirement increased after four months F, Spagnoli LG, Villaschi S, Palmieri G, Corsi M, Macari F:
Correlation between increased serum and tissue L-carnitine levelsof iron withdrawal in both carnitine- and placebo-treatedand improved muscle symptoms in hemodialyzed patients. Am Jpatients. L-carnitine supplementation reduces the rHu-Clin Nutr 38:523–531, 1983
EPO requirement in a subgroup of HD patients and may 14. Berard E, Iordache A: Effect of low dose of L-carnitine on theresponse to recombinant human erythropoietin in hemodialyzedhave an effect on erythrocyte survival time. We couldchildren: About two cases. Nephron 62:368–369, 1992not demonstrate a clear advantage of low-dose or high- 15. Labonia WD: L-carnitine effects on anemia in hemodialyzed pa-
dose L-carnitine supplementation (5 vs. 25 mg/kg body tients treated with erythropoietin. Am J Kidney Dis 26:757–764,1995weight intravenously after each dialysis session). Dosage
16. Boran M, Dalca I, Gonenc F, Cetin S: Response to recombinantand duration of L-carnitine supplementation in HD pa- human erythropoietin (r-Hu EPO) and L-carnitine combinationtients, as well as the mechanism of action of L-carnitine in patients with anemia of end-stage renal disease. Nephron 73:314–
315, 1996on renal anemia, warrant further investigations.17. Kavadias D, Fourtounas C, Tsouchnikas J, Barboutis K: L-
carnitine and erythropoietin requirements in hemodialysis patients.(letter) Am J Kidney Dis 28:156, 1996ACKNOWLEDGMENTS
18. Haeckel R, Kaiser E, Oellerich M, Siliprandi N: Carnitine:We would like to thank Leopold Pharma, Austria, for providing Metabolism, function and clinical application. J Clin Chem Clin
study drug and randomization procedure, and Fresenius Austria for Biochem 28:291–295, 1990financial support. 19. Rebouche CJ, Chenard CA: Metabolic fate of dietary carnitine
in human adults: Identification and quantification of urinary andReprint requests to Josef Kletzmayr, M.D., Department of Medicine, fecal metabolites. J Nutr 121:539–546, 1991
Division of Nephrology and Dialysis, Wahringer Gurtel 18-20, A-1090 20. Engel AG, Rebouche CJ: Carnitine metabolism and inborn errors.J Inherit Metab Dis 7(Suppl 1):38–43, 1984Vienna, Austria
Kletzmayr et al: Carnitine and anemiaS-106
21. Borum PR, York CM, Bennett SG: Carnitine concentration of levels in human adults by chronic renal disease and dialysis therapy.Am J Clin Nutr 34:1314–1320, 1981red blood cells. Am J Clin Nutr 41:653–656, 1985
44. Bertoli M, Battistella PA, Vergani L, Naso A, Gasparotto22. Borum PR: Plasma carnitine compartment and red blood cell carni-ML, Romagnoli GF, Angelini C: Carnitine deficiency inducedtine compartment of healthy adults. Am J Clin Nutr 46:437–441,during hemodialysis and hyperlipidemia: Effect of replacement1987therapy. Am J Clin Nutr 34:1496–1500, 198123. Rebouche CJ, Mack DL: Sodium gradient-stimulated transport
45. Reichmann H, van Lindeneiner N: Carnitine analysis in normalof L-carnitine into renal brush border membrane vesicles: Kinetics,human red blood cells, plasma and muscle tissue. Eur Neurol 34:40–specificity, and regulation by dietary carnitine. Arch Biochem Bio-43, 1994phys 235:393–402, 1984
46. Savica V, Bellinghieri G, Di Stefano C, Corvaja E, Consolo24. Suzuki M, Tokuyama K, Kinoshita M: Urinary profile of L-carni-F, Corsi M, Maccari F, Spagnoli LG, Villaschi S, Palmieri G:tine and its derivates in starved normal persons and ACTH injectedPlasma and muscle carnitine levels in hemodialysis patients withpatients with myopathy. J Nutr Sci Vitaminol 29:303–312, 1983morphological-ultrastructural examination of muscle samples. Neph-25. Bremer J: The role of carnitine in intracellular metabolism. J Clinron 35:232–236, 1983Chem Clin Biochem 28:297–301, 1990
47. Giovenali P, Fenocchio D, Montanari G, Cancellotti C, D’Iddo26. Siliprandi N, Di Lisa F, Menabo R, Ciman M, Sartorelli L:S, Buoncristiani U, Pelaggia M, Ribacchi R: Selective trophicTransport and functions of carnitine in muscle. J Clin Chem Clineffect of L-carnitine in type I and II skeletal muscle fibers. KidneyBiochem 28:303–306, 1990Int 46:1616–1619, 199427. Chalmers RA, Roe CR, Stacey TE, Hoppel CL: Urinary excretion
48. Penn D, Schmidt-Sommerfeld E: Carnitine and carnitine estersof l-carnitine and acylcarnitines by patients with disorders of or-in plasma and adipose tissue of chronic uremic patients undergoingganic acid metabolism: Evidence for secondary insufficiency ofhemodialysis. Metabolism 32:806–809, 1983l-carnitine. Pediatr Res 12:1325–1328, 1984
49. Kohse KP, Graser TA, Furst P, Franz HE: Plasma levels of28. Cooper MB, Forte CA, Jones DA: Carnitine and acetylcarnitinecarnitine precursor 6-N-trimethyllysine and maintenance hemodi-in red blood cells. Biochim Biophys Acta 959:100–105, 1988alysis. Kidney Int 32(Suppl 22):S116–S127, 198729. Ramsay RR, Mancinelli G, Arduini A: Carnitine palmitoyltrans-
50. Smogorzewski M, Perna AF, Borum P, Massry SG: Fatty acidferase in human erythrocyte membrane: Properties and malonyl-oxidation in the myocardium: Effects of parathyroid hormone andCoA sensitivity. Biochem J 275:685–688, 1991CRF. Kidney Int 34:797–803, 198830. Arduini A, Rossi M, Mancinelli G: Effect of L-carnitine and
51. De los reyes B, Navarro JA, Perez-Garcia R, Liras A, Camposacetyl L-carnitine on the human erythrocyte membrane stabilityY, Bornstein B, Arenas J: Effects of L-carnitine on erythrocyteand deformability. Life Sci 47:2395–2400, 1990acyl-CoA, free CoA, and glycerophospholipid acyltransferase in31. Butterfield DA, Rangachari A: Acetylcarnitine increases mem-uremia. Am J Clin Nutr 67:386–390, 1988brane cytoskeletal protein-protein interactions. Life Sci 52:297–
52. Uemura O, Goto Y, Iwasa M, Ando T, Sato K, Tominaga Y,303, 1993Uchida K, Ichiki T, Sugiyama N: Secondary carnitine palmitoyl-32. Arduini A, Mancinelli G, Radatti GL, Dottori S, Molajoni F,transferase deficiency in chronic renal failure and secondary hyper-Ramsay RR: Role of carnitine and carnitine palmitoyltransferase parathyroidism. Tohoku J Exp Med 178:307–314, 1996as integral components of the pathway for membrane phospholipid 53. De los Reyes B, Perez-Garcia R, Liras A, Valdarrabano F,
fatty acid turnover in intact human erythrocytes. J Biol Chem Arenas J: L-carnitine normalizes the reduced carnitine palmitoyl267:12673–12681, 1992 transferase activity in red cells from hemodialysis patients. (letter)
33. Arduini A, Tyurin V, Tyuruna Y, Arrigoni-Martelli E, Mola- Nephrol Dial Transplant 12:1300–1301, 1997joni F, Dottori S, Federici G: Acyl-trafficking in membrane phos- 54. Farrell S, Vogel J, Bieber LL: Entry of acetyl-L-carnitine intopholipid fatty acid turnover: The transfer of fatty acid from the biosynthetic pathways. Biochim Biophys Acta 876:175–177, 1986acyl-L-carnitine pool to membrane phospholipids in intact human 55. Matsumura M, Hatakeyama S, Koni I, Mabuchi H, Muramotoerythrocytes. Biochem Biophys Res Commun 187:353–358, 1992 H: Correlation between serum carnitine levels and erythrocyte
34. Arduini A, Holme S, Sweeney JD, Dottori S, Sciarroni AF, osmotic fragility in hemodialysis patients. Nephron 72:574–578, 1996Calvani M: Addition of L-carnitine to additive solution-suspended 56. Donatelli A, Terrizzi C, Zummo G, Russo V, Bucalo ML,red cell stored at 48C reduces in vitro hemolysis and improves in Scarpinato A: Effects of L-carnitine on chronic anemia and eryth-vivo viability. Transfusion 37:166–174, 1997 rocyte adenosine triphosphate concentration in hemodialyzed pa-
35. Bahmer T, Rydning A, Solberg HE: Carnitine levels in human tients. Curr Ther Res 41:620–624, 1987serum in health and disease. Clin Chim Acta 57:55–61, 1974 57. Linde T, Sandhagen B, Wikstrom B, Danielson BG: The re-
36. Wanner C, Horl WH: Carnitine abnormalities in patients with quired dose of erythropoietin during renal anemia treatment isrenal insufficiency. Nephron 50:89–102, 1988 related to the degree of impairment in erythrocyte deformability.
37. Wanner C, Forstner-Wanner S, Rossle C, Furst P, Scholl- Nephrol Dial Transplant 12:2375–2379, 1997meyer P, Horl WH: Carnitine metabolism in patients with chronic 58. Berard E, Barillon D, Iordache A, Bayle J, Cassuto-Viguierrenal failure: Effects of L-carnitine supplementation. Kidney Int E: Low dose of L-carnitine impairs membrane fragility of erythro-32(Suppl 22):S132–S135, 1987 cytes in hemodialysis patients. (letter) Nephron 68:145, 1994
38. Mingardi G, Bizzi A, Cini M, Licini R, Mecca G, Garattini S: 59. Cederblad G, Lindstedt S: A method for the determination ofCarnitine balance in hemodialyzed patients. Clin Nephrol 13:269– carnitine in the picomole range. Clin Chim Acta 37:235–240, 1972270, 1980 60. Lohninger A, Kaiser E, Legenstein E, Staniek H: Carnitine,
39. Jackson JM, Lee HA: L-carnitine and acetyl-L-carnitine status metabolism and function, in Carnitine: Its Role in Heart and Lungduring hemodialysis with acetate in humans: A kinetic analysis. Disorders, edited by Kaiser E, Lohninger A, Basel, Karger, 1987,Am J Clin Nutr 64:922–927, 1996 pp 1–25
40. Leschke M, Rumpf KW, Eisenhauer T, Fuchs C, Becker K, 61. ISCH Panel On Diagnostic Applications of Radioisotopes inKothe U, Scheler F: Quantitative assessment of carnitine loss Haematology: Recommended methods for radioisotope red-cellduring hemodialysis and hemofiltration. Kidney Int 24(Suppl 16): survival studies. Br J Haematol 21:241–250, 1971S143–S146, 1983 62. Alhomida AS: Effect of chronic renal hemodialysis on serum total,
41. Wanner C, Wackerle B, Boeckle H, Schollmeyer P, Horl WH: free and acyl carnitine concentrations in adult chronic pyelonephri-Plasma and red cell carnitine esters during L-carnitine therapy in tis patients. Arch Med Res 28:101–107, 1997hemodialysis patients. Am J Clin Nutr 51:407–410, 1990 63. Deufel T: Determination of L-carnitine in biological fluids and
42. Moorthy AV, Rosenblum M, Rajaram R, Shug AL: A compari- tissues. J Clin Chem Clin Biochem 28:307–311, 1990son of plasma and muscle carnitine levels in patients on peritoneal 64. Kooistra MP, Struyvenberg A, van Es A: The response to recom-or hemodialysis for chronic renal failure. Am J Nephrol 3:205–208, binant human erythropoietin in patients with the anemia of end-1983 stage renal disease is correlated with serum carnitine levels. Neph-
ron 57:127–128, 199143. Bartel LL, Hussey JL, Shrago E: Perturbation of serum carnitine