andrews shannon b2013
TRANSCRIPT

AN ABSTRACT OF THE THESIS OF Shannon B. Andrews for the degree of Master of Science in Soil Science presented on May 10, 2013 Title: Quantifying the Fertilizer Value of Algal Meal: An Evaluation of an Integrated Dairy-Anaerobic Digester-Algae Production Facility Abstract approved:
David D. Myrold Algae have shown great potential as a source for renewable fuels. However,
current production schemes have not been able to prove a sustainable energy
return on investment due in part to the high costs of nutrient addition and the
energy required for drying the biomass. Integrated algae-dairy production systems
have been posited as a potential solution for algal production barriers as well as a
way to capture environmentally problematic nutrients excreted by animals in
concentrated animal feeding operations. As the organic food industry grows, so will
the need for organic nitrogen (N) fertilizers. Algal meal, the high protein co-product
of algal biodiesel production, could help meet this need. This work has two
objectives: 1) to quantify the fertilizer value of algal meal relative to an organic N
fertilizer, feather meal, and a conventional standard, urea; 2) to show that utilizing
the fertilizer value of algal meal at $800 Mg-1 will allow an integrated dairy-
anaerobic digester-algae production facility to be an economically viable manure
management system.
A laboratory incubation was carried out to characterize carbon (C) and N
mineralization of two different algal meal products. The N mineralization rate, C
respiration rate, and impact on pH and soluble salts were the same for feather meal
and one of the algal meals. A field trial was conducted to assess the overall crop
productivity of corn grown with algal meal fertilizer, feather meal, and urea. There
was no significant difference in corn ear yield or ear N uptake among any of the algal
meal treatment rates (101 kg N ha-1, 146 kg N ha-1, 190 kg N ha-1) and the high rate
of feather meal or urea (190 kg N ha-1) application. These results indicate that algal
meal is an effective N fertilizer that should be valued relative to feather meal on a
price per unit of nutrient basis. Considering environmental benefits and current
policy incentives, assigning a fertilizer value of algal meal of $800 Mg-1 for a 7-3-1
product adds enough income to make an integrated dairy-anaerobic digester-algae
system an economically viable, sustainable farm-energy production system.

©Copyright by Shannon B. Andrews May 10, 2013
All Rights Reserved
Quantifying the Fertilizer Value of Algal Meal: An Evaluation of an Integrated Dairy-
Anaerobic Digester-Algae Production Facility
by Shannon B. Andrews
A THESIS
submitted to
Oregon State University
in partial fulfillment of the requirements for the
degree of
Master of Science
Presented May 10, 2013 Commencement June, 2014
Master of Science thesis of Shannon B. Andrews presented on May 10, 2013 APPROVED:
Major Professor, representing Soil Science
Head of the Department of Crop and Soil Science
Dean of the Graduate School I understand that my thesis will become part of the permanent collection of Oregon State University libraries. My signature below authorizes release of my thesis to any reader upon request.
Shannon B. Andrews, Author

ACKNOWLEDGEMENTS
I would like to express my sincere gratitude to everyone who I have worked with
throughout my life. Each step has led me to this point.
A special thanks goes to:
My parents and family for their constant love, support, and chastisement
My friends all around the world for playing and engaging in meaningful
conversations
My co-workers who showed me how to climb many different ropes
My academic committee for giving me the freedom and guidance needed to pursue
this path
TABLE OF CONTENTS
Page
Introduction ............................................................................................................................................. 1
Chapter 1 Literature Review .............................................................................................................. 4
Introduction to the Problems ................................................................................................ 4
Problems with Land Application of Dairy Waste ........................................................... 7
High-N Alternatives .................................................................................................................10
Studies on Algal Fertilizer Use and Benefits ..................................................................11
Conclusion ...................................................................................................................................14
Literature Cited Chapter 1 ....................................................................................................15
Chapter 2 Quantification of the Fertilizer Value of Algal Meal ............................................21
Abstract ........................................................................................................................................21
Introduction ..............................................................................................................................21
Materials and Methods ...........................................................................................................26
Organic Amendment Analysis .................................................................................26
Field Trial ........................................................................................................................27
Site and Soil Information ............................................................................27
Experimental Design ....................................................................................27
Timeline ............................................................................................................28
Laboratory Incubation ...............................................................................................30
Analytical Methods ......................................................................................................31
Statistical Methods ......................................................................................................33
TABLE OF CONTENTS (continued)
Page
Results ..........................................................................................................................................34
Laboratory Incubation ...............................................................................................34
Field Trial ........................................................................................................................36
Harvest Data ....................................................................................................37
Plant Tissue Analysis ...................................................................................38
Discussion ...................................................................................................................................38
Algal Characteristics ...................................................................................................38
Nitrogen ...........................................................................................................................40
Carbon ..............................................................................................................................48
Potential Additional Benefits ..................................................................................50
Market Valuation .........................................................................................................51
Conclusions .................................................................................................................................52
Figures ..........................................................................................................................................54
Tables ............................................................................................................................................67
Literature Cited Chapter 2 ....................................................................................................75
Chapter 3 Comparative Analysis of an Integrated System Utilizing Algal meal as an Organic Fertilizer ..............................................................................................................................85
Abstract ........................................................................................................................................85
Introduction ..............................................................................................................................85
Materials and Methods ...........................................................................................................91
TABLE OF CONTENTS (continued)
Results and Discussion ...........................................................................................................92
Conclusions .................................................................................................................................95
Tables ............................................................................................................................................96
Literature Cited Chapter 3 ....................................................................................................97
Summary ............................................................................................................................................... 100
Bibliography ........................................................................................................................................ 102
Appendix .......................................................................................................................................... 117
LIST OF FIGURES
Figure Page
1. Integrated Dairy-Anaerobic Digester-Algae Production Schematic .......................... 3
2. Field Trial Soil Moisture Status ..............................................................................................54
3. Ammonium Production through Laboratory Incubation .............................................55
4. Nitrate Accumulation through Laboratory Incubation .................................................56
5. Amendment N Mineralization ............................................................................................... 57
6. Carbon Dioxide–C Production through Laboratory Incubation ............................. 58
7. Cumulative CO2-C Respiration through Laboratory Incubation ............................. 59
8. Extracellular Enzyme Activity in Laboratory Incubation and Field Trial ..............60
9. Nitrate Concentrations through Field Trial .......................................................................61
10. Ammonium Concentration through Field Trial ...............................................................62
11. Nitrate Concentration in Soil 3 Weeks After Harvest ....................................................63
12. Carbon Dioxide Concentration through Field Trial ........................................................64
13. Harvest Yield of Captain Sweet Corn 2013 ........................................................................65
14. Nitrogen Mineralization and Corn Uptake Timing .........................................................66
LIST OF TABLES
Table Page
1. Organic Fertilizer Nutrient Report for Amendments Used in Laboratory and Field Trial ........................................................................................................................................67
2. Metals Analysis of Organic Amendments Used in Laboratory and Field Trial ...68
3. Initial Soil Test Results .............................................................................................................69
4. Nitrogen Mineralization, Uptake, and Efficiency ............................................................70
5. Nitrate Concentration at End of Growing Season ..........................................................71
6. pH and EC of Laboratory Incubation ....................................................................................72
7. Plant Tissue Analysis for Macronutrients ..........................................................................73
8. Fertilizer Prices ............................................................................................................................74
9. Net Present Value Comparison with Zhang et al., 2013 for 100-Cow Dairy .........97
LIST OF APPENDIX FIGURES
Figure Page
A1. Accumulated Degree Days through 2012 Growing Season ...................................... 118
A2. Field Trial Atmospheric Temperature .............................................................................. 119
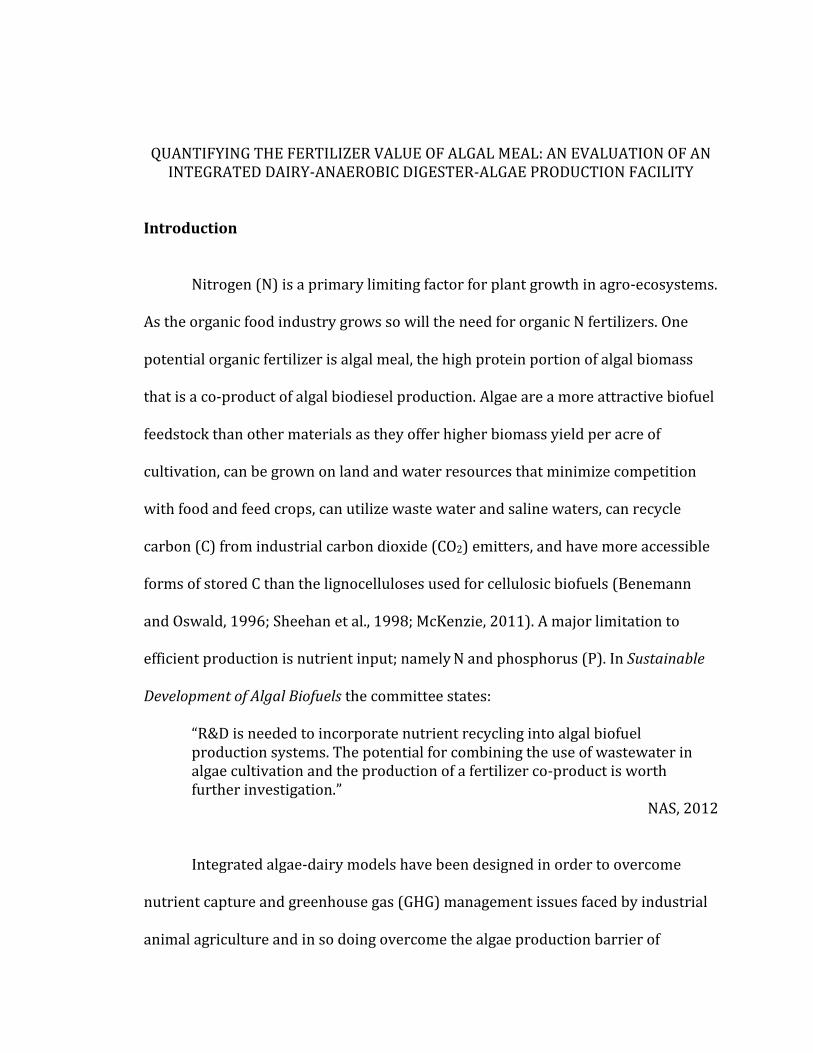
QUANTIFYING THE FERTILIZER VALUE OF ALGAL MEAL: AN EVALUATION OF AN INTEGRATED DAIRY-ANAEROBIC DIGESTER-ALGAE PRODUCTION FACILITY
Introduction
Nitrogen (N) is a primary limiting factor for plant growth in agro-ecosystems.
As the organic food industry grows so will the need for organic N fertilizers. One
potential organic fertilizer is algal meal, the high protein portion of algal biomass
that is a co-product of algal biodiesel production. Algae are a more attractive biofuel
feedstock than other materials as they offer higher biomass yield per acre of
cultivation, can be grown on land and water resources that minimize competition
with food and feed crops, can utilize waste water and saline waters, can recycle
carbon (C) from industrial carbon dioxide (CO2) emitters, and have more accessible
forms of stored C than the lignocelluloses used for cellulosic biofuels (Benemann
and Oswald, 1996; Sheehan et al., 1998; McKenzie, 2011). A major limitation to
efficient production is nutrient input; namely N and phosphorus (P). In Sustainable
Development of Algal Biofuels the committee states:
“R&D is needed to incorporate nutrient recycling into algal biofuel production systems. The potential for combining the use of wastewater in algae cultivation and the production of a fertilizer co-product is worth further investigation.”
NAS, 2012
Integrated algae-dairy models have been designed in order to overcome
nutrient capture and greenhouse gas (GHG) management issues faced by industrial
animal agriculture and in so doing overcome the algae production barrier of
2
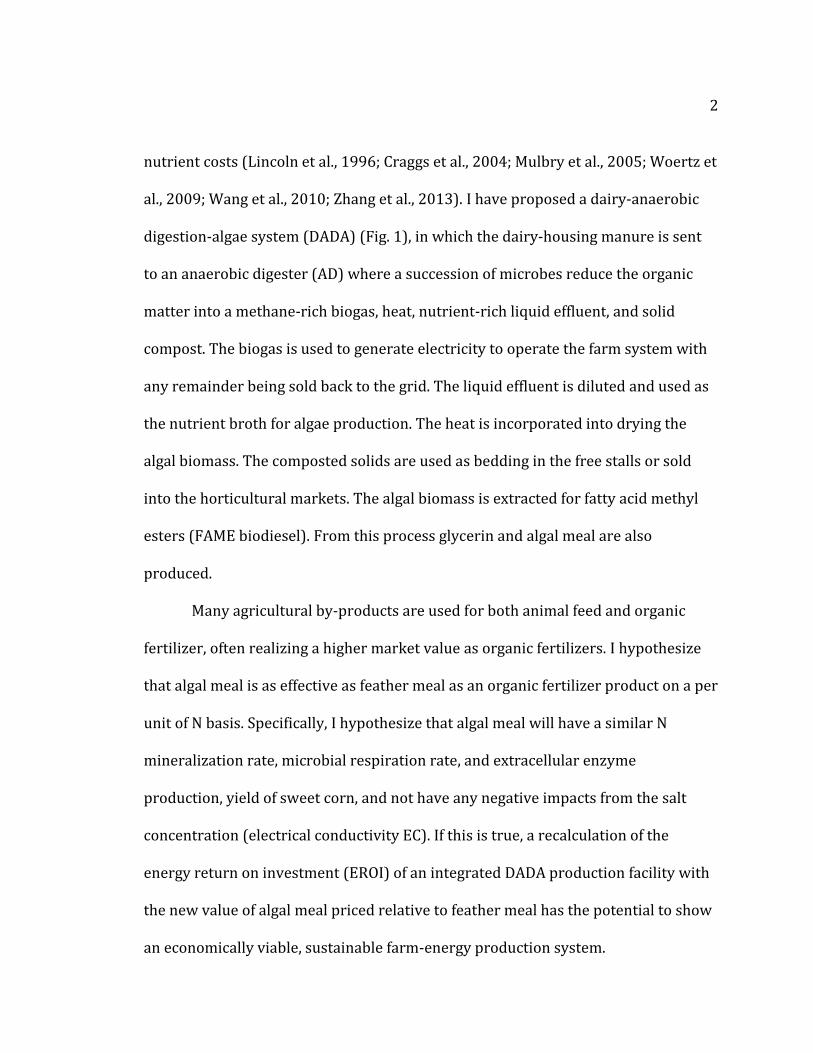
nutrient costs (Lincoln et al., 1996; Craggs et al., 2004; Mulbry et al., 2005; Woertz et
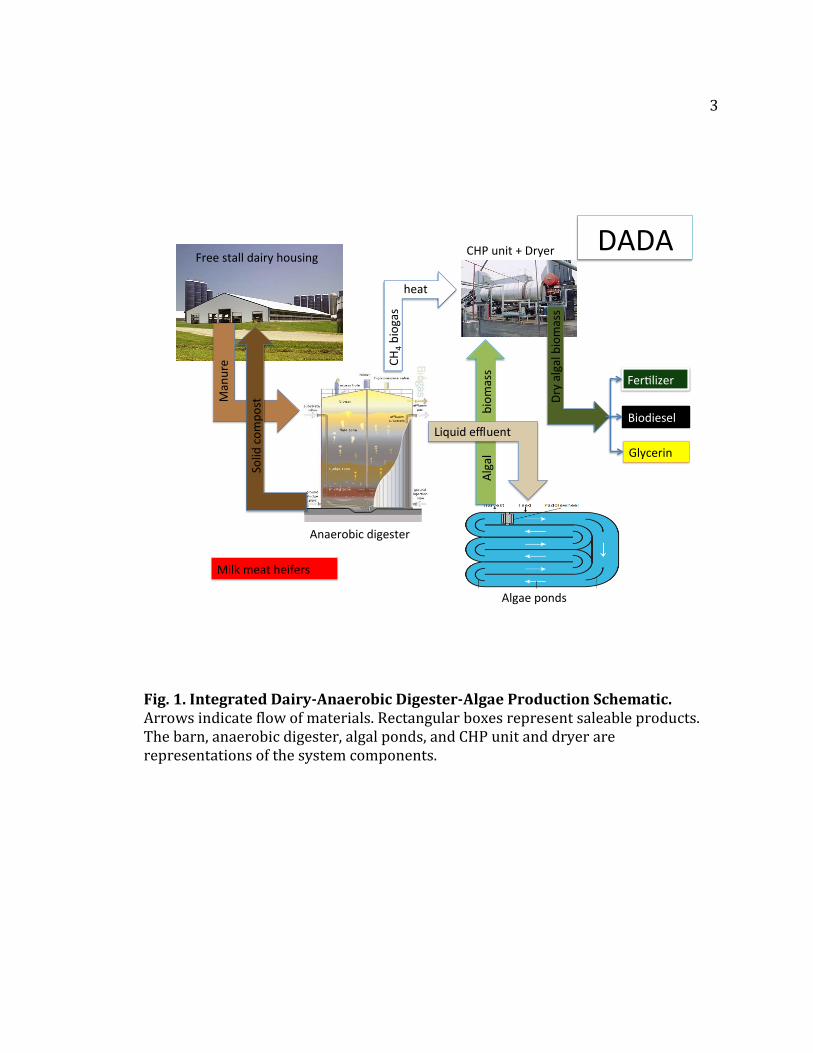
al., 2009; Wang et al., 2010; Zhang et al., 2013). I have proposed a dairy-anaerobic
digestion-algae system (DADA) (Fig. 1), in which the dairy-housing manure is sent
to an anaerobic digester (AD) where a succession of microbes reduce the organic
matter into a methane-rich biogas, heat, nutrient-rich liquid effluent, and solid
compost. The biogas is used to generate electricity to operate the farm system with
any remainder being sold back to the grid. The liquid effluent is diluted and used as
the nutrient broth for algae production. The heat is incorporated into drying the
algal biomass. The composted solids are used as bedding in the free stalls or sold
into the horticultural markets. The algal biomass is extracted for fatty acid methyl
esters (FAME biodiesel). From this process glycerin and algal meal are also
produced.
Many agricultural by-products are used for both animal feed and organic
fertilizer, often realizing a higher market value as organic fertilizers. I hypothesize
that algal meal is as effective as feather meal as an organic fertilizer product on a per
unit of N basis. Specifically, I hypothesize that algal meal will have a similar N
mineralization rate, microbial respiration rate, and extracellular enzyme
production, yield of sweet corn, and not have any negative impacts from the salt
concentration (electrical conductivity EC). If this is true, a recalculation of the
energy return on investment (EROI) of an integrated DADA production facility with
the new value of algal meal priced relative to feather meal has the potential to show
an economically viable, sustainable farm-energy production system.
3
Fig. 1. Integrated Dairy-Anaerobic Digester-Algae Production Schematic. Arrows indicate flow of materials. Rectangular boxes represent saleable products. The barn, anaerobic digester, algal ponds, and CHP unit and dryer are representations of the system components.
Manure
Freestalldairyhousing
Algaeponds
Algalbiomass
CHPunit+Dryer
Dryalgalbiomass
Glycerin
Biodiesel
Fer lizer
Milkmeatheifers
Anaerobicdigester
Solidcompost
Liquideffluent
CH4biogas
heat
DADA
4
CHAPTER 1
LITERATURE REVIEW
Introduction to the Problems
Nitrogen (N) is an essential nutrient required by all known organisms. In
agro-ecosystems, N is a primary limiting factor for plant growth. The United States
Department of Agriculture (USDA) Economic Research Service (ERS) reported that
11,144,000 Mg of N were applied to fields in 2010, which was roughly three times
higher than phosphorus (P) or potassium (K) inputs. In the same year, the organic
food industry grew 7.7% to contribute $26.7 billion in sales into the US economy
(Organic Trade Association, 2011). Certified organic land reached more than
2,000,000 ha in 2008 growing at a 15% annual rate from 2002 to 2008 (USDA ERS,
www.ers.usda.gov/data/organic). As the organic food industry grows, so will the
need for organic N fertilizers. One potential organic fertilizer is algal meal, the high
protein portion of algal biomass that is a co-product of algal biodiesel production.
Eukaryotic microalgae and cyanobacteria are responsible for more than 40%
of net primary productivity on Earth (McKenzie, 2011; NAS, 2012). Their high
productivity and rapid growth rates led to interest in their development as a
renewable fuel source since before World War II (Shelef and Soeder, 1980). After
the energy crisis in the early and mid-1970s, algal biofuel production became a topic
of national research interest. From 1978 until 1996, the US Department of Energy
invested in the Aquatic Species Program, compiling a vast database on algal species
5
suitable for production, growth efficiency, resource utilization, and possible
production, harvesting, and extraction methods (Sheehan et al., 1998). They
concluded that algae are a more attractive biofuel feedstock than others as they
offer higher biomass yield per acre of cultivation, can be grown on land and water
resources that minimize competition with food and feed crops, can utilize waste
water and saline waters, can recycle carbon (C) from industrial carbon dioxide (CO2)
emitters, and have more accessible forms of stored C than the lignocelluloses used
for cellulosic biofuels (Benemann and Oswald, 1996; Sheehan et al., 1998; US DOE,
2010; McKenzie, 2011). A major limitation to efficient production is nutrient input;
namely N and P. In Sustainable Development of Algal Biofuels the committee states:
“R&D is needed to incorporate nutrient recycling into algal biofuel production systems. The potential for combining the use of wastewater in algae cultivation and the production of a fertilizer co-product is worth further investigation.” NAS, 2012
Manufacture of urea for algal biodiesel production has been demonstrated to be the
major contributor to the total greenhouse gas (GHG) emissions of the system
(Clarens et al., 2010; NAS, 2012).
Algal fuel production research has focused on species selection, production
efficiency, and refining harvesting procedures. Although this work has proven great
potential, large-scale production schemes have only realized a 0.13-3.33 Energy
Return on Investment (EROI), where a minimum EROI of 3 is considered sustainable
(NAS, 2012). These models do not include an accurate market value of the co-
product. If any price is offered, it is often priced as the animal feed value, equivalent
6
to other biofuel co-products, such as dried distillers grains (Chisti, 2007; NAS,
2012).
Many agricultural by-products are used for both animal feed and organic
fertilizer: blood meal, feather meal, fish meal, shrimp meal, cottonseed meal, and
alfalfa meal, to name a few (Tavoletti, 2013). Animal producers have many feed
options and tend to operate on small margins with the feed bill being their largest
variable cost. Organic plant producers also manage tight margins but they have
limited choices for organic N, a very short fertilization window, and can see severe
negative economic consequences if their crops do not receive adequate N.
Consequently, organic growers are willing to pay more for high N or protein
products than animal producers, particularly for high value crops (Skinner, 2013).
I hypothesize that algal meal is as effective as feather meal as an organic
fertilizer product on a per unit of N basis. Specifically, I hypothesize that algal meal
will have a similar N mineralization rate, CO2-C respiration rate, extracellular
enzyme production, yield of sweet corn, and not have any negative impacts from
high salt concentration (electrical conductivity [EC]). If this is true, a recalculation of
the EROI of an integrated algae-dairy production facility with the new value of algal
meal priced relative to feather meal has the potential to show an economically
viable, sustainable farm-energy production system.
7
Problems with Land Application of Dairy Waste
The first argument against high-N specialty organic fertilizers is that
producers should be using composts to fertilize their land. There is no doubt
composts are beneficial for soil tilth and provide a rich C source but by the time the
material is composted anywhere from 20% to 40% of the N has volatilized (Eghball
et al., 1997). For a period of time after compost application, many soils will
experience a period of net N immobilization (Sullivan et al., 1999; Lashermes et al.,
2010) as the rush of readily-available C allows soil microbes to become active and
reproduce. In order to do this they must take up nutrients, needing one unit of N for
every five to ten units of C they take up, thereby stripping available N from the soil
solution and into their cells (Havlin et al., 1999; Kissel et al., 2008). While the soil is
in this period of net immobilization, many plants will show symptoms of N
deficiency: primarily chlorosis, a stunted yellow appearance. Chlorosis results in
decreased energy capture leading to reduced yield, grade, vigor, and fruit set (Havlin
et al., 1999). Therefore, when applying compost products the timing of available
nutrients needs to be carefully assessed.
Composts and manures are often applied using rates calculated to the most
limiting nutrient, typically N, using Liebig’s Law of the Minimum (Hart et al., 1997;
Bary et al., 2000). They are normally relatively balanced in NPK ranging from 1-1-1
to 4-4-3, leading to excess P and K additions (Hart et al., 1997). Phosphorus is
known to accumulate in soil when it is applied in excess of the crop harvest,
especially in areas of high-density livestock confinement operations (Mozaffari and
8
Sims, 1994; Simard et al., 1995; Whalen and Chang, 2001). Through time this can
increase the risk of P transport to water bodies through leaching, erosion, and
runoff (Sims et al., 1998; Sharpley and Tunney, 2000; Hooda et al., 2001). In a study
on the soil P dynamics after ten annual applications of mineral fertilizers and liquid
dairy manure, Zheng et al. (2004) found that repeated P additions (from manure
treatments) in excess of plant removal elevated soil test P and the potential of P
transfer from the soil to surface waters. They also found that labile P fractions were
significantly higher in the liquid dairy manure treatments than in the mineral
fertilizer treatments, further increasing chance of downstream eutrophication
events from overland flow.
Potassium poses little threat for waterway contamination but is a concern for
dairy operators. Animal nutritionists recommend that dietary K not exceed 3% of a
dairy cow ration to reduce the risk of milk fever, hypocalcemia, downer cow
syndrome, and even death (Hart et al., 1997). Perennial grasses repeatedly fertilized
with manure accumulate K in excess of growth requirements. One study from
British Columbia showed grass forage K increased from 2.7% in 1983 to 3.6% in
1992 with repeated dairy manure application (Schmidt, 1994).
In addition to contributing to the buildup of P and K in soils, manure
decomposition produces the GHGs: nitrous oxide (N2O) (global warming potential
relative to CO2 [CO2e] is 310), methane (CH4) (CO2e is 24 ), and CO2, as well as the
particulate forming ammonia (NH3). Manure storage systems are second only to
enteric fermentation gases in the total contribution of GHG coming from animal
9
production operations (Sneath et al. 2006; Pitesky et al., 2009; Leytem et al., 2011).
In an exhaustive study of GHG emissions from an open-lot dairy in Idaho, Leytem et
al. (2011) found CH4 ranged from 19.4 to 231 g CH4 m-2 d-1 with a mean of 103 g CH4
m-2 d-1 from the lagoon manure storage. Emissions increased as wind and
temperature increased with variability depending on volatile solids content. Others
reported mean CH4 emissions from lagoons ranging from 2 to 203 g CH4 m-2 d-1
(Kaharabata et al., 1998; Sneath et al., 2006; Bjorneberg et al., 2009). Carbon dioxide
emission rates ranged from 289 to 855 g CO2 m-2 d-1 with a mean of 637 g CO2 m-2
d-1, the NH3 emission rate from the lagoon was 2 g NH3 m-2 d-1, and N2O showed low
emission rates from the lagoons, averaging 0.49 g N2O m-2 d-1 (Leytem et al., 2011).
Flesch et al. (2009) reported 2.3 to 3.5 g NH3 m-2 d-1 from lagoons.
Ammonia losses from land-applied dairy slurry range from 10% to 50% of
applied N depending on application method (Moal et al., 1995). With more rapid and
complete incorporation of material resulting in lower volatilization rates (Wulf and
Clemens, 2000; Sullivan et al., 2010). Injection of slurry into soil is one method to
reduce NH3 losses but this can lead to increased N2O production (Wulf and Clemens,
2000). Nitrous oxide production is a result of incomplete microbial denitrification in
anaerobic soils with available NO3-. Dairy slurry sprayed onto a field in a virtual
sheet of nutrient-laden, high-viscosity liquid provides a prime habitat for
incomplete denitrification. Myrold et al. (1992) found denitrification losses were
increased with higher rates of manure applications and soils with higher clay
10
content. Denitrification losses ranged from 5-16% of applied N resulting in N2O
losses ranging from 33 to 108 kg N ha-1 y-1.
High-N Alternatives
Feather meal, a ground, hydrolyzed, and dried by-product of large-scale
poultry operations, has become a popular organic N source. Every day companies
such as Pilgrims Pride and Fosters produce upwards of 75 Mg of this material
(Skinner, 2013). It has long been used as a feed ingredient in cattle and hog rations
as it contains about 90% protein. The commodity value has historically been
calculated relative to other protein meals, such as soybean meal and canola meal,
with a discount for reduced palatability. However, around 2007 the value of feather
meal started to exceed its value relative to other protein meals as more companies
started producing pelletized products and recommending it as an organic fertilizer.
Comparing prices from a major producer in Texas; March 2007 feather meal prices
were $350 Mg-1 freight on board (FOB). By May of the same year, prices had jumped
to $580 Mg-1 FOB. March 2008 prices were $550 Mg-1 FOB and by May they were
about $725 Mg-1 FOB. In 2012 traders reported purchasing feather meal in the
spring for as high as $1,100 Mg-1 FOB (Skinner, 2013).
Feather meal is particularly desirable because N is the only macronutrient it
supplies N. It has an NPK grade of 12-0-0. This is desirable for producers dealing
with years of P and K buildup. Additionally, feather meal has a relatively fast
11
mineralization rate for an organic fertilizer, with 75-99% of the material
mineralized into plant-available N in the first year after application (Gale et al.,
2006). After price, the main drawback for producers who might want to use feather
meal is application difficulty. It has a bulk density around 0.6 g cm-3 making it light
and fluffy. This can cause problems with application as the material tends to bridge
in hopper bellies and drift from desired application placement. Further, it cannot be
solubilized to apply as a foliar fertilizer. Several companies have produced value-
added pelletized feather meal products to overcome these issues.
Many organic fertilizer products discuss stimulation of beneficial
microorganisms as an overarching benefit of their product with very little specific
academic research to back up the claims. Any fertilizer with substantial C will
provide an energy source, this energy will stimulate microbial growth, causing the
microbial population to produce more extracellular enzymes to break down soil
organic matter (SOM) into plant available nutrients (PAN). An organic fertilizer does
not select for beneficial or non-beneficial organisms, it simply provides various
nutrients, and the energetically-favorable metabolic pathways will progress.
Studies on Algae Fertilizer Use and Benefits
In a study by Mulbry et al. (2005), algal biomass grown on anaerobically
digested dairy manure was tested for N and P mineralization in a laboratory
incubation and as a fertilizer on corn and cucumbers in a greenhouse trial. This
12
product was not the same as algal meal because the lipid fraction had not been
extracted but it is the closest product to what I am testing. The algal biomass used
had an NPK grade of 4.5-0.7-0.9. Approximately 3% of total N was present as
mineral N at day 0. On average 26-30% of total N was mineralized in the first 21
days of a laboratory incubation held at 15oC. They concluded that it would be a
suitable commercial fertilizer in potting systems. Tripathi et al. (2008) provides
additional evidence that photoautotrophs may be beneficial as a fertilizer source.
They investigated the role of cyanobacteria in ameliorating the N demand and fly-
ash stress to growth and yield of rice. They found that rice paddies treated with
cyanobacteria, which are known to fix atmospheric N, lowered stress-induced thiols;
reduced accumulation of cadmium, nickel, and arsenic in the rice; increased growth
and yield; and reduced the N fertilizer demand.
Natural marine-grown seaweeds (macroalgae) have been used as fertilizers
and soil conditioners for centuries (Blunden and Gordon, 1986; Metting et al., 1988;
Temple and Bomke, 1988). Around 15 million Mgs are produced annually for use as
biostimulants or biofertilizers (Khan, 2009). The concentration of mineral nutrient
elements present (typically less than 1-1-1) in commercial seaweed concentrates
alone cannot account for the growth responses elicited by seaweed extracts
(Blunden, 1972; 1991). Many studies have been conducted to determine the modes
of action for a list of benefits, including: early seed germination and establishment,
improved crop performance and yield, elevated resistance to biotic and abiotic
stress, and enhanced postharvest shelf-life of perishable products (Beckett and van
13
Staden, 1989; Hankin and Hockey, 1990; Blunden, 1991; Norrie and Keathley,
2006). Results suggest seaweed components, such as macro- and micro-nutrients,
amino acids, vitamins, cytokinins, auxins, and abscisic acid-like growth substances
affect cellular metabolism in treated plants leading to enhanced performance,
growth, and yield (Crouch and van Staden, 1992; Crouch and van Staden, 1993;
Reitz and Trumble, 1996; Durand et al., 2003; Stirk et al., 2003).
Acadian Seaplants is one of the most aggressive marketers of Ascophyllum
nodosum, selling their dry kelp meal product above $1,600 Mg-1. In order to achieve
this market value, they have invested considerable resources in researching its
benefits on over 80 crops, for over 25 years. Their marketing campaign touts the
increased stress tolerance and stress recovery from drought, salinity, and
temperature. Two major modes of action that have been investigated are the role of
micronutrients and phytohormones. These are cited as reasons for improvements in
nutrient uptake as the micronutrients provide essential elements for enzyme
production and increase quality attributes such as firmness, color, size, and crop
uniformity. Algae are known to produce essentially all of the known phytohormones
of higher plants and they carry out similar physiological functions in algae as they
do in plants (Tarakhovskaya, 2006). Changes in the level of exogenous cytokinins
alter the regulation of physiological plant processes (Stirk and van Staden, 2010).
Acadian claims that phytohormones in their products elicit natural cytokin and
auxin production in plants resulting in better growth with more buds, healthier,
greener leaves, and increased tolerance to environmental stresses
14
(AcadianSeaplants.com). It is assumed these phytohormones would also be found in
algae meal (Brain, 1973); however, as the algal biofuel industry expands, more
research will be needed to elucidate whether or not the benefits can be extended to
crops grown with algal meal.
Conclusion
Algal meal offers an exciting opportunity for organic fertilizer production.
Several algal fuel companies have completed pilot scale facilities and are
demonstrating potential production at large scale, producing potentially significant
quantities of algal meal. Further, by providing the, N, P, K, S, Ca, Mg and the full
range of micronutrients needed for plant growth, algal meal could be a possible
solution for organic producers struggling to find adequate organic nutrients to meet
the ever growing demands on organic production.
15
Literature Cited Chapter 1
Acadian Sea Plants. http://www.acadianseaplants.com/plant-growth-development- products. Accessed Feb 2013. Bary, A.I., C.G. Cogger, and D.M. Sullivan. 2000. Fertilizing with manure. Pacific Northwest Extension Publication 533. Washington State University Cooperative Extension, Pullman, WA. Beckett, R.P., J. van Staden. 1989. The effect of seaweed concentrate on the growth and yield of potassium stressed wheat. Plant Soil 116:29–36. Benemann, J., W. Oswald. 1996. Updated 2009. Systems and economic analysis of microalgae ponds for conversion of CO2 to biomass – final report; Department of Energy: Pittsburg, PA pgs 214. Bjorneberg, D.L., A.B. Leytem, D.T. Westermann, P.R. Griffiths, L. Shao, and M.J. Pollard. 2009. Measurement of atmospheric ammonia, methane, and nitrous oxide at a concentrated dairy production facility in southern Idaho using open-path FT-IR spectrometry. Transactions of the ASABE 52:1749–1756. Blunden, G. 1972. The effects of aqueous seaweed extract as a fertilizer additive. Proceedings of the International Seaweed Symposium 7:584–589. Blunden, G. 1991. Agricultural uses of seaweeds and seaweed extracts. In: M.D. Guiry, G. Blunden (eds) Seaweed resources in Europe: uses and potential. Wiley, Chicester, pp 65–81. Blunden, G., S.M. Gordon. 1986. Betaines and their sulphono analogues in marine algae. In: F.E. Round, D.J. Chapman (Eds) Progress in phycological research, vol 4. Biopress Ltd, Bristol, pp 39–80. Brain K.R., M.C. Chalopin, T.D. Turner, G. Blunden, P.B. Wildgood. 1973. Cytokinin activity of commercial aqueous seaweed extract. Plant Science Letters 1:241- 245. Chisti, Y. 2007. Biodiesel from microalgae. Biotechnology Advances (25) 294-306. Clarens, A.F., E.P. Resurrection, M.A. White, L.M. Colosi. 2010. Environmental life cycle comparison of algae to other bioenergy feedstocks. Environmenal Science and Technology 44(5):1813-1819.
16
Craggs, R.J., J.P. Sukias, C.T. Tanner, R.J. Davies-Colley. 2004. Advanced pond system for dairy-farm effluent treatment. New Zealand Journal of Agricultural Research 47(4):449-460. Crouch, I.J., J. van Staden. 1992. Effect of seaweed concentrate on the establishment and yield of greenhouse tomato plants. Journal of Applied Phycology 4:291– 296. Crouch, I.J., J. van Staden. 1993. Evidence for the presence of plant growth regulators in commercial seaweed products. Plant Growth Regulation 13:21–29. Durand, N, X. Briand, C. Meyer. 2003. The effect of marine bioactive substances (NPRO) and exogenous cytokinins on nitrate reductase activity in Arabidopsis thaliana. Physiologia Plantarum 119:489–493. Eghball, B., R.A. Eigenberg, J.E. Gilley, B.J. Wienhold. 2002. Mineralization of manure nutrients. Journal of Soil and Water Conservation 57.6 (Nov-Dec ) p470. Flesch, T.K., L.A. Harper, J.M. Powell, and J.D. Wilson. 2009. Inverse-dispersion calculation of ammonia emissions from Wisconsin dairy farms. Trans. ASAE 52:253–265. Gale E.S., D.M. Sullivan, C.G. Cogger, A.I. Bary, D.D. Hemphill, E.A. Myhre. 2006. Estimating Plant-Available Nitrogen Release from Manures, Composts and Specialty Products. Journal of Environmental Quality 35:2321-2332. Hankins S.D., Hockey HP (1990) The effect of a liquid seaweed extract from Ascophyllum nodosum (Fucales, Phaeophyta) on the two spotted red spider mite Tetranychus urticae. Hydrobiologia 204(205):555–559. Hart, J.M., E.S. Marx, N.W. Christensen, J.A. Moore. 1997. Nutrient management strategies. Journal of Dairy Science 80:2659-2666. Hart, J.M., D.M. Sullivan, J.R. Myers, R.E. Peachey. Oct 2010. Sweet corn (Western Oregon) nutrient management guide. Oregon State University Extension EM9010-E. Havlin, J.L., J.D. Beaton, S.L. Tisdale, W.L. Nelson. 1999. Soil Fertility and Fertilizers, 6th Edition. Upper Saddle River, N.J. Prentice-Hall, Inc. 499p. Hooda, P. S., V.W. Truesdale, A.C. Edwards, P.J.A. Withers, M.N. Aitken, A. Miller, and A.R. Rendell. 2001. Manuring and fertilization effects on phosphorus
17
accumulation in soils and potential environmental implications. Advances in Environmental Resources 5:13–21. Kaharabata, S.K., P.H. Schuepp, and R.L. Desjardins. 1998. Methane emissions from above ground open manure slurry tanks. Global Biogeochemical Cycles 12:545–554. Khan, W., U.P. Rayirath, S. Subramanian, M.N. Jithesh, P. Rayorath, D.M. Hodges, A.T. Critchley, J.S. Craigie, J. Norrie, B. Prithiviraj. 2009. Seaweed extracts as biostimulants of plant growth and development. Journal of Plant Growth Regulation. 28:386-399. Kissel, D.E., M.L. Cabrera & S. Paramasivam. 2008. Ammonium, ammonia and urea reactions in soils. In: Nitrogen in Agricultural Systems (Eds. Schepers, J.S. & W.R. Raun), pp. 101–155. American Society of Agronomy Inc.; Crop Science Society of America Inc.; Soil Science Society of America Inc., Madison, WI. Lashermes, G. B. Nicolardot, V. Parnaudeau, L. Thuries, R. Chaussod, M.L. Guillotin, M. Lineres, B. Mary, L. Metzger, T. Morvan, A. Tricaud, C. Vellette, S. Houot. 2010. Typology of exogenous organic matters based on chemical and biochemical composition to predict potential nitrogen mineralization. Bioresource Technology 101:157-164. Leytem, A.B. R.S. Dungan, D.L. Bjorneberg, A.C. Koehn. 2011. Emissions of ammonia, methane, carbon dioxide, and nitrous oxide from dairy cattle housing and manure management systems. Journal of Environmental Quality 40:1383- 1394. McKenzie, F.T. 2011. Our changing planet: An introduction to earth system science and global environmental change, 4th edition. Upper Saddle, NJ: Prentice-Hall. Metting B, W.R. Rayburn, P.A. Reynaud. 1988. Algae and agriculture. In: C.A. Lembi,
J.R. Waaland (Eds) Algae and human affairs. Cambridge University Press, Cambridge, UK, pp 335–370.
Moal, J.F., J. Martinez, F. Guiziou, C.M. Coste. 1995. Ammonia volatilization following
surface applied pig and cattle slurry in France. Journal of Agricultural Science 125: 245-252.
Mozaffari, M., and J.T. Sims. 1994. Phosphorus availability and sorption in an Atlantic coastal plain watershed dominated by animal based agriculture. Soil Science 157:97–107.
18
Mulbry, W., E. Kebede-Westhead, C. Pizarro, L. Sikora. 2005. Recycling of manure nutrients: use of algal biomass from dairy manure treatment as a slow release fertilizer. Bioresource Technology. 96:451-458. Myrold, D.D., N.C. Baumeister, J.A. Moore. 1992. Quantifying Losses of Nitrogen from Land-Applied Dairy Manure. Oregon Water Resources Research Institute. Corvallis, OR. WRRI-115. National Academy of Sciences; Committee on the Sustainable Development of Algal Biofuels. 2012. Sustainable Development of Algal Biofuels in the United States. Board on Agriculture and Natural Resources, Board on Energy and Environmental Systems, National Research Council. The National Academies Press. Norrie, J., J.P. Keathley. 2006. Benefits of Ascophyllum nodosum marine-plant extract applications to ‘Thompson seedless’ grape production. (Proceedings of the Xth International Symposium on Plant Bioregulators in Fruit Production, 2005). Acta Horticulturae 727:243–247. Organic Trade Association. 2011. http://www.ota.com/organic/mt/business.html Accessed Feb, 12, 2013. Pitesky, M.E., K.R. Stackhouse, F.M. Mitloehner. Clearing the air: livestock’s contribution to climate change. In: Advances in Agronomy, Vol 103. Elselvier Inc. 2009. Reitz, S.R., J.T. Trumble. 1996. Effects of cytokinin-containing seaweed extract on Phaseolus lunatus L.: influence of nutrient availability and apex removal. Botanica Marina 39:33–38. Schmidt, O. 1994. The news spreader. Dairy Producers’ Conserv. Group Newslett.4:1. Sharpley, A.N., and H. Tunney. 2000. Phosphorus research strategies to meet agricultural and environmental challenges of the 21st century. Journal of Environmental Quality 29 :176–181. Sheehan, J., T. Dunahay, J. Benemann, P. Roessler. 1998. A look back at the US Department of Energy’s Aquatic Species Program – Biodiesel from Algae. Prepared for US DOE Office of Fuel Development. Prepared by National Renewable Energy Laboratory. Golden, CA.
19
Shelef, G., and Soeder, C.J., Eds. 1980. Algae biomass production and use. Elsevier/North-Holland Biomedical Press. Amsterdam, The Netherlands. Simard, R. R., D. Cluis, B. Gangbazo, and S. Beauchemin. 1995. Phosphorus status of forest and agricultural soils from a watershed of high animal density. Journal of Environmental Quality 24:1010–1017. Sims, J.T., R.R. Simard, and B.C. Joern. 1998. Phosphorus loss in agricultural drainage: historical perspective and current research. Journal of Environmental Qualilty 27:277–293. Skinner, Ted. Personal interview with long time organic fertilizer trader and owning partner of Advanced Marketing, Aurora, OR. Feb 12, 2013. Sneath, R.W., F. Beline, M.A. Hilhorst, P. Peu. 2006. Monitoring GHG from manure stores on organic and conventional dairy farms. Agriculture, Ecosystem and Environment 112:122-128. Stirk, W.A., M.S. Novak, J. van Staden. 2003. Cytokinins in macroalgae. Plant Growth Regulation 41:13–24. Stirk, W.A., J. van Staden. 2010. Flow of cytokinins through the environment. Plant Growth Regulation 62:101-116. Sullivan, D.M., A.I. Bary, C.G. Cogger, E.A. Myhre. 1999. Field microplot estimates of soil N mineralization for manured and non-manured soils. P 193-200. In: Proceedings of Western Nutrient Management Conference. Salt Lake City, UT. 4-5 mar. 1999. Potash & Phosphate Institute. Manhattan, KS. Sullivan, D.M., N.A. Andrews, J.M. Luna, J.P.G. McQueen. 2010. Estimating N contribution from organic fertilizers and cover crop residues using online calculators. 19th World Congress of Soil Science, Soil Solutions for a Changing World. Tarakhovskaya E.R., Y.I. Maslov, M.F. Shishova. 2007. Phytohormones in algae.
Russian Journal of Plant Physiology 54:163-170. Tavoletti, S. 2013. Critical evaluation of soybean role in animal production chains
based on the valoraization of locally produced feedstuff. Creative Commons Attribtuion License. Licensee InTech.
Temple W.D., A.A. Bomke. 1988. Effects of kelp (Macrocystis integrifolia) on soil chemical properties and crop responses. Plant Soil 105:213–222.
20
Tripathi, R.D., S. Dwivedi, M.K. Shukla, S. Mishra, S. Srivastava, R. Singh, U.N. Rai, D.K. Gupta. 2008. Role of blue green algae biofertilizer in ameliorating the nitrogen demand and fly-ash stress to the growth and yield of rice (Oryza sativa L.) plants. Chemosphere 70:119-1929. USDA ERS. 2010. Fertilizer TVA (Tennessee Valley Authority), AAPFCO (Association of American Plant Food Control Officials), TFI (The Fertilizer Institute). Wang, L., Y. Li, P. Chen, M. Min, Y. Chen, J. Zhu, R.R. Raun. 2010. Anaerobic digested dairy manure as a nutrient supplement for cultivation of oil-rich green microalgae Chlorella sp. Bioresource Technology 101:2623-2628. Whalen, J.K., C. Chang, B.M. Olson. 2001. Nitrogen and phosphorus mineralization potentials of soils receiving repeated annual cattle manure applications. Biology and Fertility of Soils. 34:334-341. Woertz, I., A. Feffer, T. Lundquist, Y. Nelson. 2009. Algae grown on dairy and municipal wastewater for simultaneous nutrient removal and lipid production for biofuel feedstock. Journal of Environmental Engineering 135:1115-1122. Wulf, S., R. Vandre, J. Clemens. Mitigation options for CH4, N2O, and NH3 emissions from slurry management. In “Non-CO2 Greenhouse Gases” Eds Guicherit & Williams-Jacobse. Institute of Agricultural Chemistry, University of Bonn, Germany. Zhang, Y., M.A. White, L.M. Colosi. 2013. Environmental and economic assessment of integrated systems for dairy manure treatment coupled with algae bioenergy production. Bioresource Technology 130:486-494. Zheng, Z., MacLeod, J.A., Sanderson J.B. and Lafond J. 2004. Soil phosphorus
dynamics after ten annual applications of mineral fertilizers and liquid dairy manure: fractionation and path analysis. Soil Science. Vol 169:6 pg 449-456.
21
CHAPTER 2
QUANTIFICATION OF THE FERTILIZER VALUE OF ALGAL MEAL
Abstract
As the organic food industry grows, so will the need for organic nitrogen (N)
fertilizers. Algal meal, the high protein co-product of algal biodiesel production,
could help meet this need. The objective of this work was to quantify the fertilizer
value of algal meal relative to an organic N fertilizer, feather meal, and a
conventional standard, urea. A laboratory incubation was carried out to characterize
the C and N mineralization of two different algal meal products. The N
mineralization rate, C respiration rate, and impact on pH and EC was the same for
feather meal and algal meal 2, while the mineralization rate of algal meal 1 was
significantly lower. A field trial was conducted to assess the overall crop
productivity of corn grown with algal meal 2, feather meal, and urea. No significant
difference in corn ear yield was found between the low rate of algal meal application
(101 kg N ha-1) and the high rate of urea (190 kg N ha-1). These results indicate that
algal meal is an effective N fertilizer that should be valued relative to feather meal
on a price per unit of nutrient basis.
Introduction
Nitrogen is an essential nutrient required by all organisms. In agro-
ecosystems N availability is a primary limiting factor for plant growth. The United
22
States Department of Agriculture (USDA) Economic Research Service (ERS)
reported that 11,144,000 Mg of N were applied to US fields in 2010, which was
roughly three times higher than phosphorus (P) or potassium (K) inputs. In the
same year the organic food industry grew 7.7% to contribute $26.7 billion in sales
into our national economy (Organic Trade Association, 2011). Certified organic
farmland reached more than 2,000,000 ha in 2008, growing at a 15% annual rate
from 2002 to 2008 (USDA ERS, www.ers.usda.gov/data/organic). As the organic
food industry grows so will the need for organic N fertilizers.
A myriad of academic and extension publications are aimed at
environmentally and economically sustainable methods to help organic growers and
animal producers meet the nutrient requirements of their plants with composts and
manures. Timing of nutrient mineralization and immobilization (Whalen et al.,
2001; Eghball et al., 2002; Norton et al., 2007), product moisture and nutrient
variability (Wander, 2010), emissions of the greenhouse gasses (GHGs)(Leytem et
al., 2011): nitrous oxide (N2O), methane (CH4), and carbon dioxide (CO2), ammonia
(NH3) volatilization (Chantigny et al., 2004), nutrient leaching (Pang and Letey,
2000; Ball-Coelho et al., 2004), nutrient buildup (Hart et al., 1997; Zheng et al.,
2004), and application methods (Moore and Hart, 1997) are all problems that have
been investigated. However, even when following the best management practices,
significant nutrient loss is inevitable causing negative environmental and economic
consequences.
23
Utilizing animal manure products as a feedstock for anaerobic digestion for
CH4 biogas production, and using the subsequent liquid effluent as the nutrient
broth for algae cultivation, could eliminate the current waste management
difficulties facing animal producers. Extensive work at the USDA labs in Beltsville,
MD has shown that algae grown on dairy effluent recovered 95% of N and 77% of P
nutrient inputs (Kebede-Westhead et al., 2006). Olguin (2003) found similar results
using swine effluent with 91% N removal and 87% P removal. After nutrient
capture the algae can be extracted for their lipids producing a biodiesel, glycerin,
and a stable high-N, organic product.
In a study by Mulbry et al. (2005), algal biomass grown on anaerobically
digested dairy manure was tested for N and P mineralization in a laboratory
incubation and as a fertilizer on corn and cucumbers in a greenhouse trial. The algal
biomass used had an NPK grade of 4.5 -0.7-0.9. Approximately 3% of total N was
present as mineral N at day 0. On average, 26-30% of total N was mineralized in the
first 21 days of a laboratory incubation performed at 15C. They concluded that it
would be a suitable commercial fertilizer in potting systems. This product was not
the same as algal meal because the lipid fraction had not been extracted but it is the
closest product tested to those I studied.
Marine-grown seaweeds have been used as fertilizers and soil conditioners
for centuries (Blunden and Gordon, 1986; Metting et al., 1988; Temple and Bomke,
1988). Around 15 million Mgs are marketed annually for use as biostimulants or
24
biofertilizers (Khan, 2009). The concentration of mineral nutrient elements present
in commercial seaweed concentrates alone cannot account for the growth responses
elicited by seaweed extracts (Blunden, 1972; 1991). Many studies have been
conducted to determine the mode of action for a list of benefits, including: early seed
germination and establishment, improved crop performance and yield, elevated
resistance to biotic and abiotic stress, and enhanced postharvest shelf-life of
perishable products (Beckett and van Staden, 1989; Hankin and Hockey, 1990;
Blunden, 1991; Norrie and Keathley, 2006). Results suggest seaweed components,
such as macro- and micronutrients, amino acids, vitamins, cytokinins, auxins, and
abscisic acid-like growth substances, affect cellular metabolism in treated plants
leading to enhanced performance, growth, and yield (Crouch and van Staden, 1992;
Crouch and van Staden, 1993; Reitz and Trumble, 1996; Durand et al., 2003; Stirk et
al., 2003). As the algal biofuel industry expands, more research will be needed to
elucidate whether or not the benefits can be extended to crops grown with algae
meal.
Many current life cycle assessments of algal fuel production do not include
the value of the co-product in the overall valuation as it is assumed to be low
(Pizarro et al., 2006; Chisti, 2007; Sanders and Murthy, 2009; Clarens et al., 2010),
or they use animal feed values (NAS, 2012). A proper value for the algal meal,
between 50-80% of the total algal biomass, could allow these operations to reach
financial profitability. Many agricultural by-products have realized higher values as
organic fertilizers than as feed ingredients (Skinner, 2013). Feather meal, once
25
primarily a high-protein cattle feedstuff has become popular and widely accepted as
an effective high-N organic fertilizer increasing in price from $350 Mg-1 to $1,100
Mg-1 in the last 6 years (Skinner, 2013). Algal meal lends itself to use as an organic
fertilizer as it has a C:N ratio of 5:1, an NPK grade around 7-3-1, and the full range of
micronutrients that are essential for plant growth (A&L Labs, 2013). It holds
potential as an exciting new option as a high-N organic fertilizer.
The goal of this research was to do a preliminary analysis of the viability of
algal meal as a fertilizer and to determine an appropriate agronomic value. I
hypothesized that algal meal is as effective as feather meal as an organic fertilizer
product on a per unit of N basis. Specifically, algal meal would have a similar N
mineralization rate, microbial respiration rate, extracellular enzyme production,
yield of sweet corn as feather meal fertilized plots, and not have any negative
impacts from the salt concentration (electrical conductivity EC). If this is true, a
recalculation of the EROI of an integrated dairy-anaerobic digester-algae (DADA)
production facility with the new value of algal meal priced relative to feather meal
may have the potential to show an economically viable, sustainable farm-energy
production system.
26
Materials and Methods
Organic Amendment Analyses
The algal meal products that were used in the laboratory incubation and field
trial were produced as the co-products of a hexane oil extraction from algal biomass.
Algal meal 1 (A1), used in the laboratory incubation, was supplied by the Center of
Excellence for Hazardous Materials Management (Carlsbad, NM). Algal meal 2 (A2),
used in the incubation and field trial, was made from Nannochlosis oceanus from a
10-ha, continuously operational facility. Feather meal 1 (F1) was a hydrolyzed,
ground feather product from Gallus gallus, purchased from Down to Earth (Eugene,
OR). The organic materials used in these trials were analyzed for nutrients and
metals (Table 1 and 2 respectively) at Western A & L Agricultural Laboratory
(Modesto, CA). Both algal meals used in this experiment were marine species
processed from algae grown in salt water. This resulted in high EC and caused
concern about potential stress. Three replicates of each amendment were tested for
pH and EC prior to the laboratory incubation (Table 1). The non-nutrient metals
analysis showed no analytes above the allowed levels for organic product
registration (Table 2). This is consistent with work by Mulbry et al. (2006), who
showed that algal biomass grown on animal manures does not contain heavy metals
at concentrations that would limit its use as a fertilizer or animal feed supplement.
27
Field Trial
Site and Soil Information
The sweet corn field trial was conducted in 2012 at Oregon State University’s
Lewis-Brown Horticultural Farm in Corvallis, OR (N 44o33’10”; W 123o13’16”). The
soil series is a Malabon silty clay loam (fine, mixed, superactive, mesic Pachic Ultic
Argixerolls) classified by NRCS as prime, well-drained farm land. Prior to the start of
the trial, the field was under a cover crop for two years. The cover crop used was the
commercially available, Feed and Seed Plow Down™, which is a mix of common
vetch, cereal rye, soybean, and Austrian pea. The cover crop was cut on April 28,
disked May 10, spaded (Tortella Spader, Brewt Power Systems, Merced, CA) May 14,
and power harrowed (Kuhn, Broadhead, WI) on May 15 and May 31. Soil samples
from each experimental unit (plot) were taken April 27 to assess site uniformity.
The area used was nearly level; each plot had the same gravimetric water content
(p>0.05) and showed uniform pH and EC (p>0.05).
Experimental Design
A randomized block design with four blocks was used in the field trial. Each
plot measured 6 m by 6 m with a 1.2-m buffer zone between plots. Soil samples
taken April 27 were tested for nutrients (Table 3). Given the previous legume-cereal
cover crop and these data it was determined that the soil had sufficient N for the
initial 30 days of corn growth, that K was non-limiting, therefore no K was added,
and that 100 kg P2O5 ha-1 were needed (Hart et al., 2010). Triple super phosphate
28
(TSP) was applied to every plot at the same time as N fertilizer treatments. Nitrogen
rates were calculated according to the recommendation of Pre-Sidedress Nitrate
Test (PSNT) (Hart et al., 2010). Using soil samples taken June 21, 2012 the NO3--N
concentration was 10 mg kg-1 indicating that 140 kg N ha-1 was needed for
maximum productivity. Six treatments were used: a control with no N addition
(CTL), a low rate of algal meal at 101 kg N ha-1 (A Low), a medium rate of algal meal
at 146 kg N ha-1 (A Med), a high rate of algal meal at 190 kg N ha-1 (A High), a high
rate of feather meal at 190 kg N ha-1 (F High), and a high rate of urea at 190 kg N ha-1
(U High).
Timeline
The sweet corn (Zea mays L.) variety Captain™ (SE) was planted on June 6
with a double-disk planter with rows spaced 76 cm apart. Seeds were drilled
approximately 20 cm apart and 4 cm deep. While planting, Lorsban™ (O,O-diethyl O-
3,5,6-trichloropyridin-2-yl phosphorothioate) (Dow Agro Science, EPA registration
62719-34) was sprayed at a rate of 74 g 100 m-2 of row to control seed corn maggot.
That evening the herbicides Outlook™ (dimethenamid-P: (S)-2-chloro-N-[91-
methyl-2-methoxy)ethyl]-N-(2,4-dimethyl-thien-3-yl)-acetamide) (BASF, EPA
registration 7969-156) and Atrazine™ (1-Chloro-3-ethylamino-5-isopropylamino-
2,4,6-triazine) (AgroSolutions, EPA registration 1381-158) were sprayed each at a
rate of 1.12 kg ha-1 for weed management. Fertilizers were weighed and bagged
individually for each 6-m row of corn, eight per plot. In order to band the fertilizers
29
by hand, a pointed hoe was used to dig a small channel approximately 5 cm from the
emerged corn, approximately 5 cm deep. Algal meal, feather meal, and TSP were
distributed as evenly as possible in respective channels and covered on June 29. On
July 4 urea was added. The difference in application timing was to account for
mineralization of the organic materials, so all treatments would be optimally timed
during peak N demand. Irrigation was not needed through June as there was
adequate regular precipitation. Irrigation was applied once per week from July
through September for one to three hours at a rate of approximately 0.84 cm hr-1
(Fig. 2). Using the evapotranspiration data maintained by AgriMet (Pacific
Northwest Cooperative Agricultural Weather Network) the water demand for sweet
corn was calculated. Four soil samples were collected and mixed from each plot
every week. Soil samples were taken directly in line with the corn row, a minimum
of 10 cm from any given stalk, to a depth of 15 cm.
On September 5, the plots were harvested by hand and measured for ear
count, ear yield, stalk count, and stalk yield. Three rows of the 3-m center sections of
each plot were collected for ear measurements and three rows of the 3-m center
sections of each plot were collected for stalk measurements. Harvesters were
instructed to bypass small sections of any row that did not germinate. Only ears
with a cob greater than 15 cm were collected. Only primary shoots were collected
for stalk measurements. Four ears and four stalks from their respective rows were
saved and coarsely chopped onsite. Samples were brought back to the laboratory,
dried, ground (Plant Grinder, Thomas Scientific, Philadelphia, PA ) to pass a 2-mm
30
sieve, and analyzed for N, P, K, S, Ca, Mg, and C by the Central Analytical Laboratory
at OSU. Three weeks following harvest, soil samples were collected for residual NO3-
in the soil at 0-15, 16-30, 31-45, and 46-60 cm depths using a soil auger.
Laboratory Incubation
The soil for the laboratory incubation came from the same field used for the
field trial at Lewis-Brown Horticultural Farm. Soil samples were collected April 27
and stored at 4C prior to incubation. The incubation consisted of eight treatments
with three replications of each: two algal meals, each applied at three different rates,
feather meal, and a control with no amendment. Using the bulk density of 1.21 g
cm-3 to calculate the weight of an acre-furrow slice of Malabon soil, amendment
levels were calculated to represent realistic agricultural application rates. The final
letter in each treatment abbreviation indicates the N application level, L (low)
represents 146 kg N ha-1, M (medium) represents 190 kg N ha-1, and H (high)
represents 235 kg N ha-1.
The soil was sieved through a 5-mm screen wet, to minimize aggregate and
biological disruption while still removing rocks and large pieces of organic matter.
The soil needed for each treatment type was weighed, spread on a mat, the
amendment was added, mixed thoroughly, and the amended soil was distributed
into 18, 50-mL centrifuge tubes. Each tube was tapped on the table 10 times to
approximate natural bulk density. Each experimental unit was contained in one-
quart sized canning jar that held six centrifuge tubes filled with soil and the
31
appropriate amendment. Jars were covered with gas permeable, water impermeable
polyethylene film and incubated at 25°C for six weeks. A sample of each treatment
was set aside for measurement of initial NO3-, NH4+, and H2O contents. One tube per
week was removed for measurement of NO3-, NH4+, and H2O contents. Samples were
extracted with 2N KCl for NO3- and NH4+ determination and stored at 4°C before
analysis.
Analytical Methods
Nitrate was tested using the vanadium chloride (VCl3) reduction and Griess
reagent method as described by Hood-Nowotny et al. (2010) based on the technique
described by Miranda et al. (2001). Ammonium was measured using the classical
Berthelot reaction (Kandeler and Gerber, 1988) using sodium salicylate, sodium
nitroprusside, and sodium hypochlorite. Plates for each were incubated for 60 min
at 37°C and measured colorimetrically on a microplate reader (BioTek, Synergy 2.0
Gen5™ multimode microplate reader. Winooski, WI). Nitrate was read at 540 nm;
NH4+ was read at 650 nm. Standards were prepared at each measurement using
dilutions of stock 1M NO3- and NH4 solutions.
The mineralization rate for each fertilizer treatment was calculated as the
difference between the total inorganic N at the end and beginning of the incubation,
divided by the days of incubation:
[Final (NO3- -N +NH4+ -N) – Beginning (NO3- -N +NH4+ -N)]/incubation days (1)
32
For each amendment, the inorganic N mineralized through the incubation
minus the inorganic N mineralized in the control was divided by the total N added to
the soil by the respective amendment to calculate the % N mineralized:
[Final (NO3- -N +NH4+ -N) - Control (NO3- -N +NH4+ -N)]/Total N added (2)
All CO2 measurements were made using a Picarro™ Isotopic CO2 Analyzer
model A0311 (Sunnyvale, CA). Each sample was sealed and CO2–C was measured for
two minutes at two different time points. In the laboratory incubation CO2-C was
measured weekly using all remaining tubes in the jar with one hour between
beginning and final measurements. For the field trial, a 30-g sample of field moist
soil was put in a 125-mL Erlenmeyer flask, with two hours between measurements.
The difference between second reading (sum of 13CO2-C + 12CO2-C) and the first
reading (sum of 13CO2-C + 12CO2-C) was used to calculate the total CO2-C evolution
rate.
For each amendment, the CO2-C respired through the incubation minus the
CO2-C respired from the control was divided by the total C added to the soil by the
respective amendment to calculate the % amendment C respired.
[Final (13CO2-C + 12CO2-C) - Control (13CO2-C + 12CO2-C)]/Total C added (3)
I estimated the amount of C remaining in the soil of the field trial from the
amendments using the total C added to the soil by each amendment minus the %
amendment C respired from the laboratory incubation.
33
Extracellular enzyme activity was measured at four time points for each
experiment. Alpha-glucosidase and beta-glucosidase were selected to assess
carbohydrate catabolism and leucine-aminopeptidase (LAP) was a proxy to assess
protein catabolism. Fluorescent methylumbelliferone was used for alpha- and beta-
glucosidase enzyme assays and fluorescent methylcoumarin substrate was used for
LAP enzyme assays according to German et al. (2011).
Wet soil was weighed, dried at 60°C for a minimum of 48 hr, and reweighed
to obtain the gravimetric moisture content of all soil samples. EC and pH were
measured using a 1:2 soil:water slurry. Samples were put on the shaker for 30
minutes, allowed to return to atmospheric conditions (Gavlak et al., 1997) and
measured with a Hanna™ GroCheck meter (Smithfield, RI).
Statistical Methods
Statistical results were computed using SAS 9.2 (SAS Institute Inc., Cary, NC).
Repeated measure tests for data with equal time between measurements were run
as multivariate with autoregression because compound symmetry could not be
assumed and autoregression was the best-fit model of correlation. Repeated
measure tests of the CO2 -C respiration from the laboratory incubation were run as
multivariate with unstructured regression because unequal spacing of
measurement times eliminated autoregression as an option. Data from a single time
were analyzed with a randomized block design ANOVA and LSD test for multiple
comparisons as treatment structures were not well defined. All harvest data was
34
analyzed as a randomized block design with subsamples. Results with a p-value <
0.05 are considered significant. Graphical representations were produced with
KaliedaGraph Synergy Software version 4.1.3 (Reading, PA).
Results
Laboratory Incubation
Ammonium-N concentrations were elevated for two weeks and subsequently
declined (Fig. 3). Nitrate-N accumulated throughout the incubation (Fig. 4).
Multivariate repeated measures tests of all the NO3- -N and the NH4+ -N
concentrations showed that there was a significant treatment effect, there was a
significant time effect, and there was a significant interaction. When testing NO3- -N
accumulation there was no significant difference in the regression line of F1M
against A2M or A2H treatments, all other treatments were significantly lower.
Nitrogen mineralization of the organic amendments, measured as the
accumulation of inorganic N minus the N mineralized by the control, proceeded
more or less linearly throughout the incubation (Fig. 5). The N mineralization rate
(Table 4) was the highest in F1M with no statistical differences among F1M and
A2M and A2H. A1 at all rates was lower than A2 and F1M. The fraction of N
mineralized of each amendment (Eqn. 2) was highest in F1M and A2L (Table 4). For
both A1 and A2, the efficiency was higher at the lower N application rates, though
not statistically different among A1 rates.
35
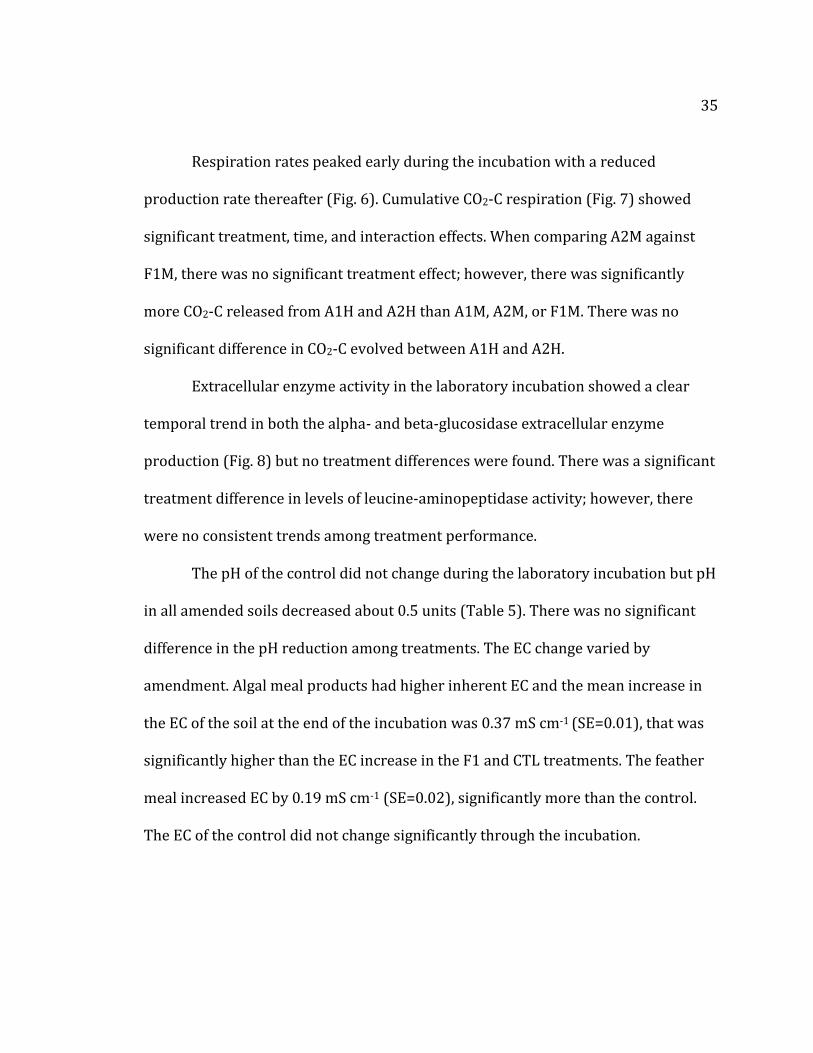
Respiration rates peaked early during the incubation with a reduced
production rate thereafter (Fig. 6). Cumulative CO2-C respiration (Fig. 7) showed
significant treatment, time, and interaction effects. When comparing A2M against
F1M, there was no significant treatment effect; however, there was significantly
more CO2-C released from A1H and A2H than A1M, A2M, or F1M. There was no
significant difference in CO2-C evolved between A1H and A2H.
Extracellular enzyme activity in the laboratory incubation showed a clear
temporal trend in both the alpha- and beta-glucosidase extracellular enzyme
production (Fig. 8) but no treatment differences were found. There was a significant
treatment difference in levels of leucine-aminopeptidase activity; however, there
were no consistent trends among treatment performance.
The pH of the control did not change during the laboratory incubation but pH
in all amended soils decreased about 0.5 units (Table 5). There was no significant
difference in the pH reduction among treatments. The EC change varied by
amendment. Algal meal products had higher inherent EC and the mean increase in
the EC of the soil at the end of the incubation was 0.37 mS cm-1 (SE=0.01), that was
significantly higher than the EC increase in the F1 and CTL treatments. The feather
meal increased EC by 0.19 mS cm-1 (SE=0.02), significantly more than the control.
The EC of the control did not change significantly through the incubation.
36
Field Trial
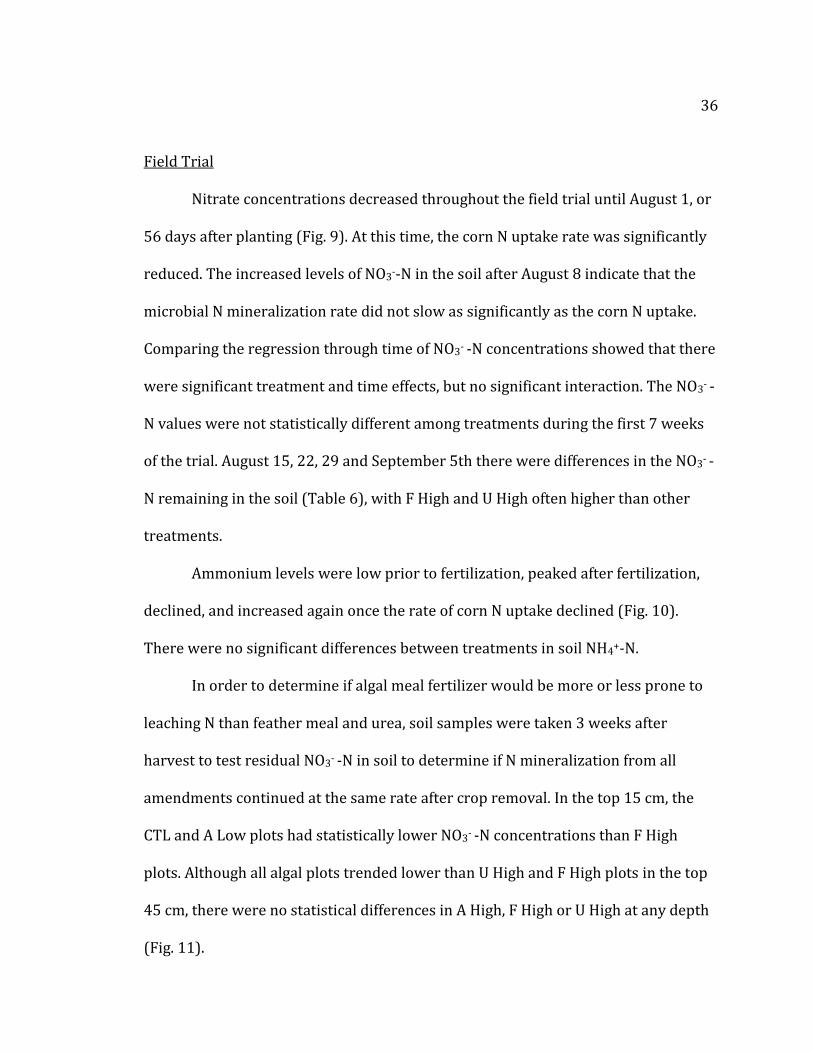
Nitrate concentrations decreased throughout the field trial until August 1, or
56 days after planting (Fig. 9). At this time, the corn N uptake rate was significantly
reduced. The increased levels of NO3--N in the soil after August 8 indicate that the
microbial N mineralization rate did not slow as significantly as the corn N uptake.
Comparing the regression through time of NO3- -N concentrations showed that there
were significant treatment and time effects, but no significant interaction. The NO3- -
N values were not statistically different among treatments during the first 7 weeks
of the trial. August 15, 22, 29 and September 5th there were differences in the NO3- -
N remaining in the soil (Table 6), with F High and U High often higher than other
treatments.
Ammonium levels were low prior to fertilization, peaked after fertilization,
declined, and increased again once the rate of corn N uptake declined (Fig. 10).
There were no significant differences between treatments in soil NH4+-N.
In order to determine if algal meal fertilizer would be more or less prone to
leaching N than feather meal and urea, soil samples were taken 3 weeks after
harvest to test residual NO3- -N in soil to determine if N mineralization from all
amendments continued at the same rate after crop removal. In the top 15 cm, the
CTL and A Low plots had statistically lower NO3- -N concentrations than F High
plots. Although all algal plots trended lower than U High and F High plots in the top
45 cm, there were no statistical differences in A High, F High or U High at any depth
(Fig. 11).
37
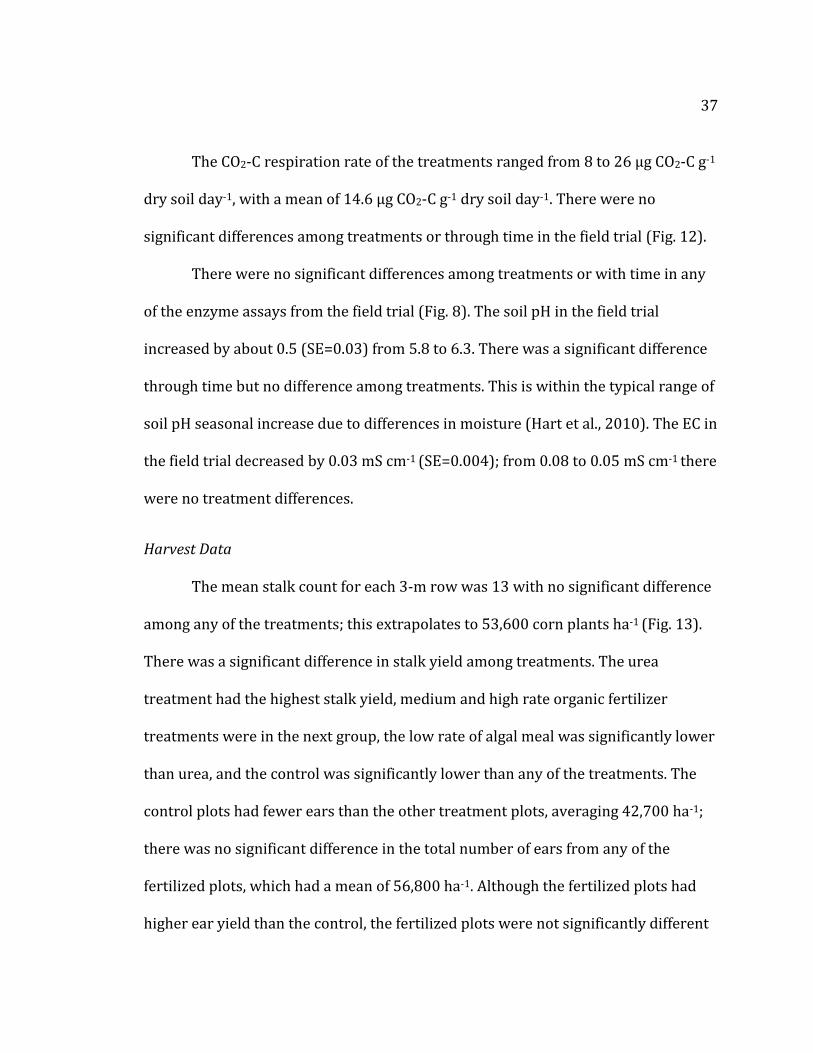
The CO2-C respiration rate of the treatments ranged from 8 to 26 μg CO2-C g-1
dry soil day-1, with a mean of 14.6 μg CO2-C g-1 dry soil day-1. There were no
significant differences among treatments or through time in the field trial (Fig. 12).
There were no significant differences among treatments or with time in any
of the enzyme assays from the field trial (Fig. 8). The soil pH in the field trial
increased by about 0.5 (SE=0.03) from 5.8 to 6.3. There was a significant difference
through time but no difference among treatments. This is within the typical range of
soil pH seasonal increase due to differences in moisture (Hart et al., 2010). The EC in
the field trial decreased by 0.03 mS cm-1 (SE=0.004); from 0.08 to 0.05 mS cm-1 there
were no treatment differences.
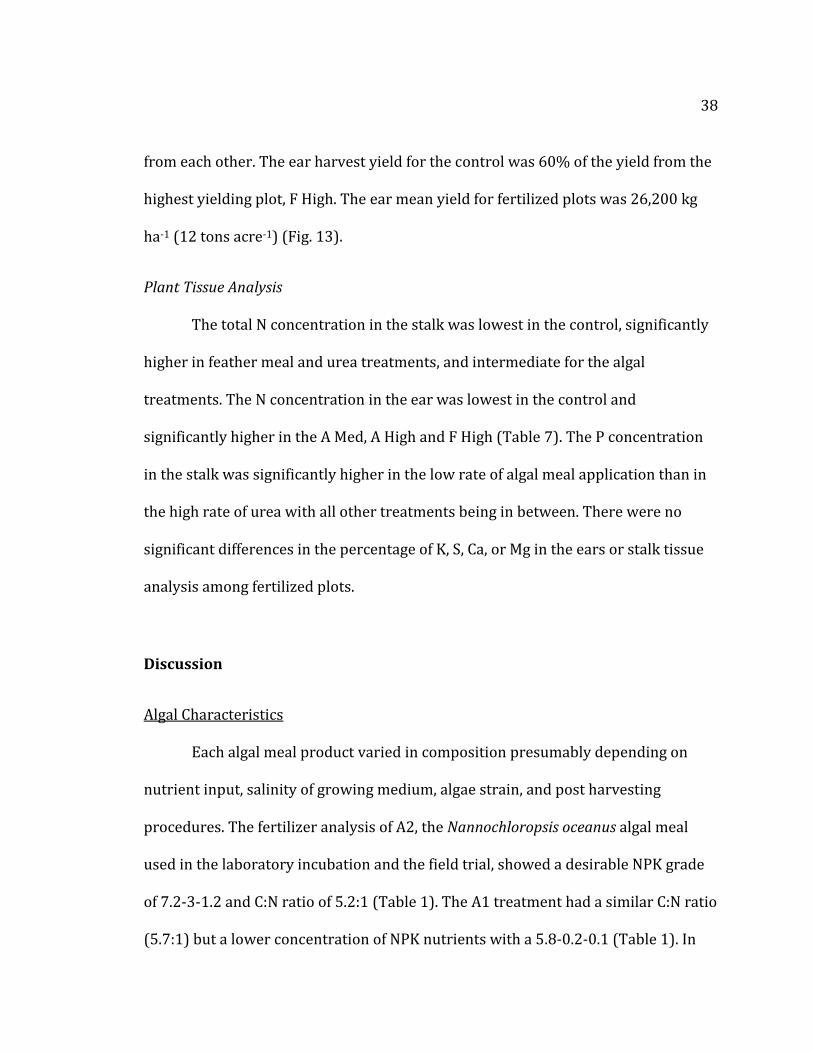
Harvest Data
The mean stalk count for each 3-m row was 13 with no significant difference
among any of the treatments; this extrapolates to 53,600 corn plants ha-1 (Fig. 13).
There was a significant difference in stalk yield among treatments. The urea
treatment had the highest stalk yield, medium and high rate organic fertilizer
treatments were in the next group, the low rate of algal meal was significantly lower
than urea, and the control was significantly lower than any of the treatments. The
control plots had fewer ears than the other treatment plots, averaging 42,700 ha-1;
there was no significant difference in the total number of ears from any of the
fertilized plots, which had a mean of 56,800 ha-1. Although the fertilized plots had
higher ear yield than the control, the fertilized plots were not significantly different
38
from each other. The ear harvest yield for the control was 60% of the yield from the
highest yielding plot, F High. The ear mean yield for fertilized plots was 26,200 kg
ha-1 (12 tons acre-1) (Fig. 13).
Plant Tissue Analysis
The total N concentration in the stalk was lowest in the control, significantly
higher in feather meal and urea treatments, and intermediate for the algal
treatments. The N concentration in the ear was lowest in the control and
significantly higher in the A Med, A High and F High (Table 7). The P concentration
in the stalk was significantly higher in the low rate of algal meal application than in
the high rate of urea with all other treatments being in between. There were no
significant differences in the percentage of K, S, Ca, or Mg in the ears or stalk tissue
analysis among fertilized plots.
Discussion
Algal Characteristics
Each algal meal product varied in composition presumably depending on
nutrient input, salinity of growing medium, algae strain, and post harvesting
procedures. The fertilizer analysis of A2, the Nannochloropsis oceanus algal meal
used in the laboratory incubation and the field trial, showed a desirable NPK grade
of 7.2-3-1.2 and C:N ratio of 5.2:1 (Table 1). The A1 treatment had a similar C:N ratio
(5.7:1) but a lower concentration of NPK nutrients with a 5.8-0.2-0.1 (Table 1). In
39
the laboratory incubation % C respired as CO2-C and the total N added were the
same but the % N mineralized through the lab incubation was significantly lower
with the A1 than the A2 treatment (Table 4).
There were several measured differences between the two algal meals that
could help to explain the discrepancy in N mineralization. A1 had a substantially
lower pH (2.47) than the other organic amendments (Table 1). However, the direct
pH of fertilizers is not typically measured. Rather, the potential acidity or basicity,
describing the pH reaction of the soil solution after the product is applied, is
reported as calculated by the Pierre equation in units of equivalent CaCO3
displacement or quantity of CaCO3 needed to neutralize (Pierre, 1928; Argo and
Fisher, 2008). Using the Pierre equation, A1 and A2 would have the same potential
acidity because they had the same influence on the pH of the soil. From this I would
not expect that the low pH of the amendment retarded the N mineralization.
The high concentration of sulfur (S) in A1 (7.8%) stands out as another major
nutritive difference but synthetic fertilizers such as ammonium sulfate (24% S) are
regularly used without observed adverse N mineralization effects (Havlin et al.,
1999). Amendment A1 had 5.5% Ca whereas each of the other organic amendments
had about 1% Ca. It has been shown that, in neutral to basic soils, Ca2+ can form
cation bridges between mineral surfaces and OM, leading to aggregation of clay
particles with OM stabilizing the soil structure and potentially decreasing the
availability for microbial use (Oades, 1988). In a field trial using isotopically labeled
C inputs the presence of Ca2+ increased the residual 14C in the soil for up to 6 months
40
(Oades, 1988). The soil used in this trial started with a pH of 5.7 and I did not
measure a difference in the CO2 evolution from equivalent rates of amendment
application; however, the high Ca in A1 may have formed cation bridges impacting
microbial availability and reducing the rate of N mineralization.
Extraction chemicals and processes, drying temperatures, and algal anatomy
and physiology have an impact on the molecular structure of algal meal (Van Der
Meulen, 2013). Structural differences impact the affinity of organic material to
adsorb to mineral soil and therefore their availability for microbial degradation
(Kleber and Johnson, 2010). For instance, diatomaceous algae species have silica
dioxide in their cell walls, whereas most others rely on cellulose for cellular
structural stability (Shelef and Soeder, 1980). These differences impart different
bonding structures and a different consortium of soil biota would be responsible for
the decomposition of the cellular components. The preliminary data from the
incubation give reason to believe that different algal production methods may yield
co-products of varying value. Each production facility may be able to market an algal
meal that meets the needs of soils that are deficient in specific nutrients. Further
testing is necessary to determine the resulting chemical composition of algal meals
from different technologies.
Nitrogen
It has been recorded for more than 2,000 years that OM is an important
aspect of soil fertility (Long, 1842). In recent years, it has become generally accepted
41
that the balance between N mineralization and immobilization is a function of the
relative availability of C and N in a substrate and the metabolic needs of the
microbial biomass (Myrold and Bottomley, 2008), and is driven by the
depolymerization of N-containing OM by microbial extracellular enzymes (Chapin et
al., 2002; Schimel and Bennett, 2004). Bacterial cells have a generally accepted C:N
ratio of 5:1 (Myrold and Bottomley, 2008). Since the fungal community can have C:N
ratios up to 15:1, a general C:N ratio of 8:1 for total microbial biomass is typically
used (Myrold and Bottomley, 2008). With C:N ratios ranging from 4:1 to 5.7:1 I am
confident that none of the organic amendments used in these trials induced net N
immobilization.
In a study on potential methods for estimating the N fertilizer value of
organic residues, Delin et al. (2012) used 15 common agricultural by-products and a
mineral N source (ammonium nitrate) in a ryegrass greenhouse trial. The above-
ground N uptake for each treatment was plotted against the mineral N fertilizer rate.
From this regression, the mineral N fertilizer rate corresponding to the above-
ground plant N uptake for each treatment with organic fertilizer was derived to
determine the mineral fertilizer equivalent (MFE), expressed as the percentage of
total N applied. Considering several possible predictors, they concluded that the C:N
ratio was the best predictor of a product’s MFE. An aerobic incubation of the organic
amendments also correlated well (r2 = 0.78).
MFE = 0.87 - 0.05*(C:N ratio of product) (r2 = 0.83) (4)
Using Eqn. 4, the calculated MFE value of A1 was 59%, A2 was 61%, and F1
42
was 67%. This over-predicts net N mineralization for A1 but is a reasonable
estimate for A2 and F1 in the laboratory incubation (Table 4). The accuracy of an
MFE value should be assessed based on plant N uptake; as it was determined in the
Delin et al. (2012) study.
The predicted MFE does not agree with the plant tissue analysis or the yield
results from the field trial (Table 4). Using the MFE, one would expect the N uptake
from A High to be 61% that of U High; however, total N uptake with A High was 92%
of uptake from U High and there was no significant difference. Meaning that A High
was as effective at delivering N to the corn as U High. The difference could be a
result of the range of products tested by Delin et al. (2012), as products with higher
C:N ratios impacted the slope of the C:N regression, possibly under-predicting the N
mineralization from these low C:N products.
The N use efficiency (NUE) (treatment N uptake-control N uptake divided by
total N applied) was relatively high in this trial, ranging from 61% to 88% of total N
applied (Table 4). The more typical range is from 30% to 70% (Legg and Meisinger,
1982) depending on N loss from denitrification, NH3–N volatilization, NO3--N
leaching, and sampling and analysis errors with variability ranges dependent on the
mineral soil constituents (Hargrove, 1988; Nannipieri et al., 1990; Nannipieri et al.,
1999). However, it has been shown that NUE can be in this range (70-80%) if the N
is applied below the soil surface and in phase with crop demand (Meisinger et al.,
2008). It has been shown that applying the correct rate of N is the single most
important factor in improved NUE (Power and Scheper, 1989; Magdoff, 1991;
43
Freeman et al., 2008), leading to a possible conclusion that 100 kg N ha-1 (equivalent
to the A Low treatment) was the optimal rate in this field trial.
As every effort was made to reduce N losses, I am confident in these NUE
calculations. I assume minimal loss from NH3 volatilization as all N fertilizers were
banded at a depth of 5 cm, irrigated that evening, and had a pH of 5.7 (Bouwmeester
et al., 1985; Hargrove, 1988; Meisinger et al., 2008). Denitrification can also be
assumed to be minimal, because the soils were well drained and the soil was not
saturated, even when sampled shortly after a heavy irrigation event. Urea hydrolysis
occurs rapidly, with peak NH4+-N concentrations measured after 2 days (Nannipieri
et al., 1990). The trend toward lower NUE in urea treatments may have been a result
of the initial NH4+-N release rate being greater than the corn N uptake rate, causing
more N to be lost to the environment. I did see elevated NH4+-N concentrations after
fertilization but U High was not different than other fertilizer treatments one week
after application. Nitrate-N was not measured at depth throughout this trial but the
reduction of surface soil NO3--N levels through the growing season, coupled with the
results that all post-harvest NO3--N concentration values were below 10 μg g-1 dry
soil indicating low leaching potential (Marx et al., 1999), led me to conclude that
little N was lost by leaching. A portion of the additional N could also have gone into
microbial biomass; however, the literature would suggest that soils fertilized with
synthetic N may decrease microbial biomass N, as well as microbial respiration and
potential enzymatic activity (Treseder, 2008; Ramirez et al., 2012). Any N not lost
44
from the system is considered sorbed to the mineral surface with typical ranges
from 20% to 60% (Hargrove, 1988; Francis et al., 2008).
One assumption pervasive throughout N mineralization efficiency
calculations (Eqn. 2) is that the microbial population responsible for mineralization
of organic matter to inorganic N mineralizes the same amount of N from the soil
organic matter (SOM) regardless of the rate at which N is added. However, Zaman et
al. (1999) and Ramirez et al. (2012) have shown that during periods of luxury N
availability, less of the SOM N is mineralized. Without isotopic labeling of
amendments, it is impossible to calculate how the N mineralization dynamics of the
SOM changed with increased N application; however, looking at the NUE of plots
fertilized with different rates, one can see that in plots with lower application rates
more of the “amendment N” was taken up, so it would appear that more was
mineralized (Table 4). It is possible that at lower rates of N addition more N was
mineralized from the SOM in order to meet the total N demand. Whereas at high
application rates the microbial community did not need to invest as much energy in
extracellular enzyme production to acquire the same amount of N. Further, reports
showing net N immobilization during the entire growing season (Nadelhoffer et al.
1984; Giblin et al., 1991; Polglase et al., 1992), and N mineralization rates well
below estimates of plant uptake based on N accumulation in plants (Dyck et al.,
1987; Chapin et al., 1988), suggest that, at least, in low-N ecosystems the core
assumption underlying N mineralization assays may be invalid. Further testing with
45
isotopic labeling is needed to quantify the difference in SOM N mineralization
dynamics under varying levels of C and N additions.
There was no significant difference between the ear yield, ear count, or ear N
concentration (Fig. 13, Table 7) of the amended treatments. This raises questions
about the N application rates, which were based on PSNT values. The PSNT, done
with samples taken on June 22, when the plants had five leaves, indicated that 140
kg N ha-1 were needed for optimal crop performance. The PSNT protocol
recommends taking a 30 cm soil sample for NO3- analysis in between rows, away
from the fertilizer band (Hart et al., 2010); however, soil was sampled to a depth of
15 cm, as it was during all soil samples collected during the growing season. This
difference in sampling depth probably did not affect the PSNT because no statistical
difference was found post-harvest in soil NO3- -N between the 0-15 cm and 16-30
cm depths. The A High, F High, and U High treatments were applied above the
recommendation for optimal yield. This was done because I estimated that 75% of
the N applied (Gilmour, 1998; Gale et al., 2006; Sullivan et al., 2010) would be
mineralized from the organic amendments, resulting in expected PAN of 76 kg N ha-
1, 117 kg N ha-1, and 143 kg N ha-1 for the low, medium, and high rates, respectively.
The urea was applied at the same N rate as the high rate for organic amendments to
capture a maximum productivity value and for statistical representation. In future
work multiple rates of urea should be used for comparison.
One of the most significant economic concerns for organic producers is the
timing of N mineralization of organic amendments (Pang and Letey, 2000). Compost
46
and manures have a relatively slow N mineralization rate, with means around 0.6-1
mg N kg-1 day-1 with immobilization periods of one month being typical (Sullivan et
al., 1999). For this reason, it is often recommended that composts and manures are
applied substantially before peak crop N demand in order to build up the available
N. However, if too much mineralization occurs before peak crop N demand the
potential for NO3- -N leaching increases. In order to reduce N inputs to the whole
system and increase NUE, N should be applied so as to be available only when the
crop needs it (Raun and Johnson, 1999). The N uptake curve for corn follows a
sigmoidal pattern with a very slow uptake and growth for the first month after
emergence until it reaches a critical mass for leaf area and photosynthetic activity
(Freeman, 2008; Hart et al., 2010). The next 4-week period is marked by rapid N
uptake and rapid biomass growth (Richie and Hanway, 1982; Hart et al., 2010). This
is the most critical period for N nutrition; if adequate N is not available during this
period it will result in a significant loss of yield (Richie and Hanway, 1982). After
silking, the rate of N uptake slows to a more moderate pace and the N in the corn is
reallocated from the leaves into the grain. In order to assess the timing of N
mineralization relative to corn N uptake demands, the % N mineralized during the
laboratory incubation (26o C) was plotted relative to growing degree-days (GDDs)
(data from Hyslop weather station, 3455 NE Granger Rd, Corvallis, OR, 97330), such
that one month of GDDs in the field was equivalent to 21 GDDs in the laboratory.
During this period the A2L mineralized the equivalent of 100 kg N ha-1, A2M
mineralized 107 kg N ha-1, A2H mineralized 105 kg N ha-1, and F1M mineralized 81
47
kg N ha-1 from the fertilizers alone. The estimated crop N uptake during this month
is 146 kg N ha-1 (Freeman, 2008). Charting the N release from the laboratory
incubation, including the N mineralized from SOM over the growing season, the N
mineralized in the lab incubation from treatment A2M and F1M align closely with a
corn N uptake curve modeled by Richie et al. (2005) while the N mineralized from
the control soil and the N mineralized from A1 would not meet the sweet corn N
demand (Fig. 14).
In a paper on the mechanisms and controls on stabilization and
destabilization of soil organic matter, Sollins et al. (1996) reported the percent of
degradation of many different polymers, including proteins from Chlorella, a green
alga. In the non-allophanic soils (which caused increased OM sorption and
decreased mineralization), the proteins were 58-67% degraded after 12 weeks of
laboratory incubation as measured by 14C-labeled substrates (Zunino et al., 1982).
This is similar to our results from the A2 and F1 treatments, which showed 51-73%
of the applied N was mineralized (Table 4). Our results are also similar to rates
reported in Delin et al. (2012), who found up to 5% N mineralization per day during
the first few days and about 14% per week for the first month. Gale et al. (2006) also
found similar weekly mineralization of the feather meal tested through a 70-day
laboratory incubation where 65% and 74% of the total N added was mineralized.
The organic amendments tested here, with C:N ratios lower than that of the
total microbial population, mineralized about 25 μg inorganic N g-1 dry soil in the
first week after application. Though a large quantity of inorganic N was not
48
immediately available the mineralization rate kept pace with the corn N uptake, this
allows growers to time the application of these products similarly to how they
would use a conventional fertilizer, possibly at lower than conventionally-
recommended rates. Further testing with multiple rates of feather meal, urea, and
algal meal is necessary to determine if the low rate of algal meal can sustainably
induce N uptake equal to the higher rates that experience N abundance scenarios.
Carbon
Soils can be a source or a sink for C as they represent one of the largest
reservoirs of organic C on the global scale (Schlesinger, 1995). The amount of soil C
storage is dependent on inputs by net primary production and organic amendments,
and their decomposition rates (Lutzow et al., 2006). There is uncertainty about how
OM will respond to climate change (Heimann and Reichstein, 2008); however, it is
expected that as global average temperatures increase, the rate of microbial
respiration will increase, further tipping the C balance from the soil to the
atmosphere (Schlesinger, 1995; IPCC, 2007). Long-term agricultural soil microbial
populations tend to be dominated by heterotrophic bacteria that obtain C, energy,
and reducing equivalents from SOM (Sylvia et al., 2005). The rate at which these
organisms reproduce, produce enzymes, and turn over nutrients is dependent upon
the quantity and quality of organic matter available (Schneider et al., 2012; Booth et
al., 2005). Since nutrient mineralization is dependent on the activity of microbial
49
communities, adding organic matter to the soil is considered necessary to sustain
soil fertility (Stewart et al., 2007; Freeman et al., 2008). Organic materials with low
C:N ratios are typically considered high quality, leading to rapid decomposition and
mineralization (Manzoni and Porporato, 2009; Booth et al., 2005).
To measure the rate of organic matter decomposition and calculate the
residual C remaining in the soil, CO2-C respiration was measured in both the
laboratory and field trials. The method used to measure the CO2-C in the field was
not frequent enough and did not provide enough precision to detect differences
among treatments; however, the lab incubation had lower variability and was not
confounded by plant interactions. The control soil respired roughly 75% as much
CO2–C as the amended soils. The total CO2-C respiration from each treatment was
69%, 71%, 63%, and 91% of the total C added in the A2L, A2M, A2H, and F1M
treatments respectively (data not shown). When the respiration from the control
soil was subtracted from that of the amended soils, about 20% of the added C was
calculated as lost as CO2, leaving about 80% of the amendment C in the soil.
Applying these percentages of added C remaining in the soil from the laboratory
incubation to the field scale I estimated the amount of the net C input: A Low (441
kg C ha-1), A Med (673 kg C ha-1), A High (810 kg C ha-1), and F High (635 kg C ha-1).
These additions represent 0.2-1.3% of the total C in the soil, a marginal increase that
must be tested further before credits for C sequestration can be determined.
The high percentage of N mineralized from the amendment relative to the C
respired from the amendment would suggest that C was limiting to the microbial
50
decomposers. It is generally thought that N limits plant growth and C limits
microbial growth (Schimel and Bennett, 2004; Myrold and Bottomley, 2008). This is
consistent with the high corn NUE and optimized corn yield found in this trial.
Because a low percentage of the C was respired, one would expect that C would
accumulate in the soil, becoming less limiting to microorganisms in the future
(Kleber and Johnson, 2010). However, the C could also become sorbed to the
mineral soil surfaces becoming protected from future microbial degradation (Kleber
and Johnson, 2010).
Potential Additional Benefits
Although the focus of my study was primarily on the potential of algal meal
to supply plant available N, and to a lesser extent, microbially available C, it is
important to remember that there may be additional benefits of algal meal
additions. Research on agricultural use of organic amendments has consistently
shown soil bulk density and penetration resistance decreasing with increasing
amendment rate, while aggregate stability, porosity, and infiltration rate increase
with amendment rate (Cogger et al., 2004). In a field trial with corn, Paul and
Beauchamp (1996) showed that a single application of dairy cattle slurry increased
the microbial biomass C, resulting in greater N mineralization, and greater corn N
uptake than treatments amended with urea. In an extensive review on the effects of
organic amendments on soil physical properties Khaleel et al. (1981) found that
organic C content increased and bulk density decreased as organic amendment
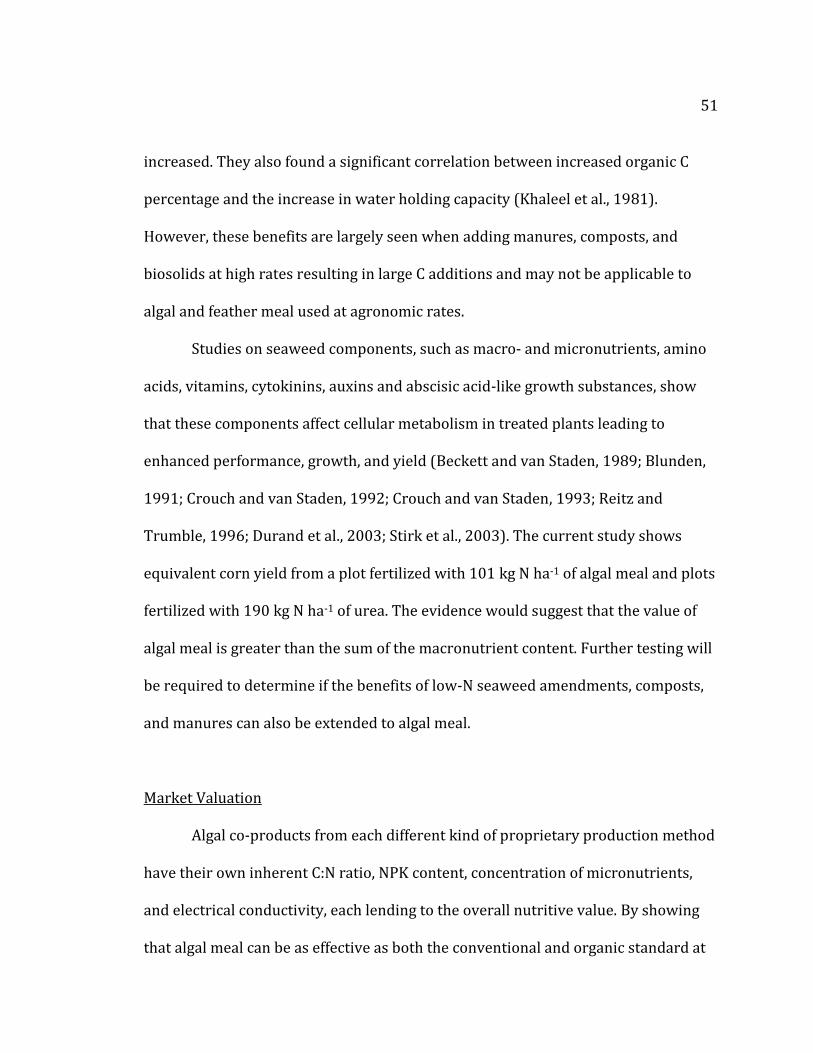
51
increased. They also found a significant correlation between increased organic C
percentage and the increase in water holding capacity (Khaleel et al., 1981).
However, these benefits are largely seen when adding manures, composts, and
biosolids at high rates resulting in large C additions and may not be applicable to
algal and feather meal used at agronomic rates.
Studies on seaweed components, such as macro- and micronutrients, amino
acids, vitamins, cytokinins, auxins and abscisic acid-like growth substances, show
that these components affect cellular metabolism in treated plants leading to
enhanced performance, growth, and yield (Beckett and van Staden, 1989; Blunden,
1991; Crouch and van Staden, 1992; Crouch and van Staden, 1993; Reitz and
Trumble, 1996; Durand et al., 2003; Stirk et al., 2003). The current study shows
equivalent corn yield from a plot fertilized with 101 kg N ha-1 of algal meal and plots
fertilized with 190 kg N ha-1 of urea. The evidence would suggest that the value of
algal meal is greater than the sum of the macronutrient content. Further testing will
be required to determine if the benefits of low-N seaweed amendments, composts,
and manures can also be extended to algal meal.
Market Valuation
Algal co-products from each different kind of proprietary production method
have their own inherent C:N ratio, NPK content, concentration of micronutrients,
and electrical conductivity, each lending to the overall nutritive value. By showing
that algal meal can be as effective as both the conventional and organic standard at
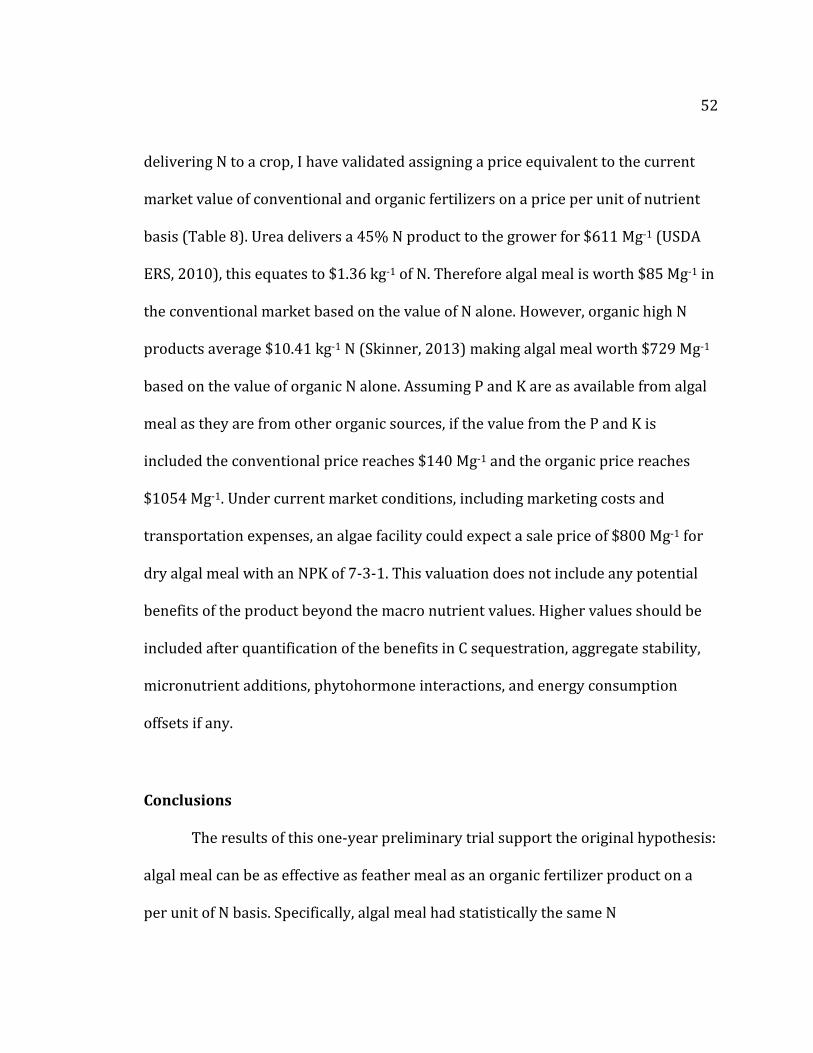
52
delivering N to a crop, I have validated assigning a price equivalent to the current
market value of conventional and organic fertilizers on a price per unit of nutrient
basis (Table 8). Urea delivers a 45% N product to the grower for $611 Mg-1 (USDA
ERS, 2010), this equates to $1.36 kg-1 of N. Therefore algal meal is worth $85 Mg-1 in
the conventional market based on the value of N alone. However, organic high N
products average $10.41 kg-1 N (Skinner, 2013) making algal meal worth $729 Mg-1
based on the value of organic N alone. Assuming P and K are as available from algal
meal as they are from other organic sources, if the value from the P and K is
included the conventional price reaches $140 Mg-1 and the organic price reaches
$1054 Mg-1. Under current market conditions, including marketing costs and
transportation expenses, an algae facility could expect a sale price of $800 Mg-1 for
dry algal meal with an NPK of 7-3-1. This valuation does not include any potential
benefits of the product beyond the macro nutrient values. Higher values should be
included after quantification of the benefits in C sequestration, aggregate stability,
micronutrient additions, phytohormone interactions, and energy consumption
offsets if any.
Conclusions
The results of this one-year preliminary trial support the original hypothesis:
algal meal can be as effective as feather meal as an organic fertilizer product on a
per unit of N basis. Specifically, algal meal had statistically the same N
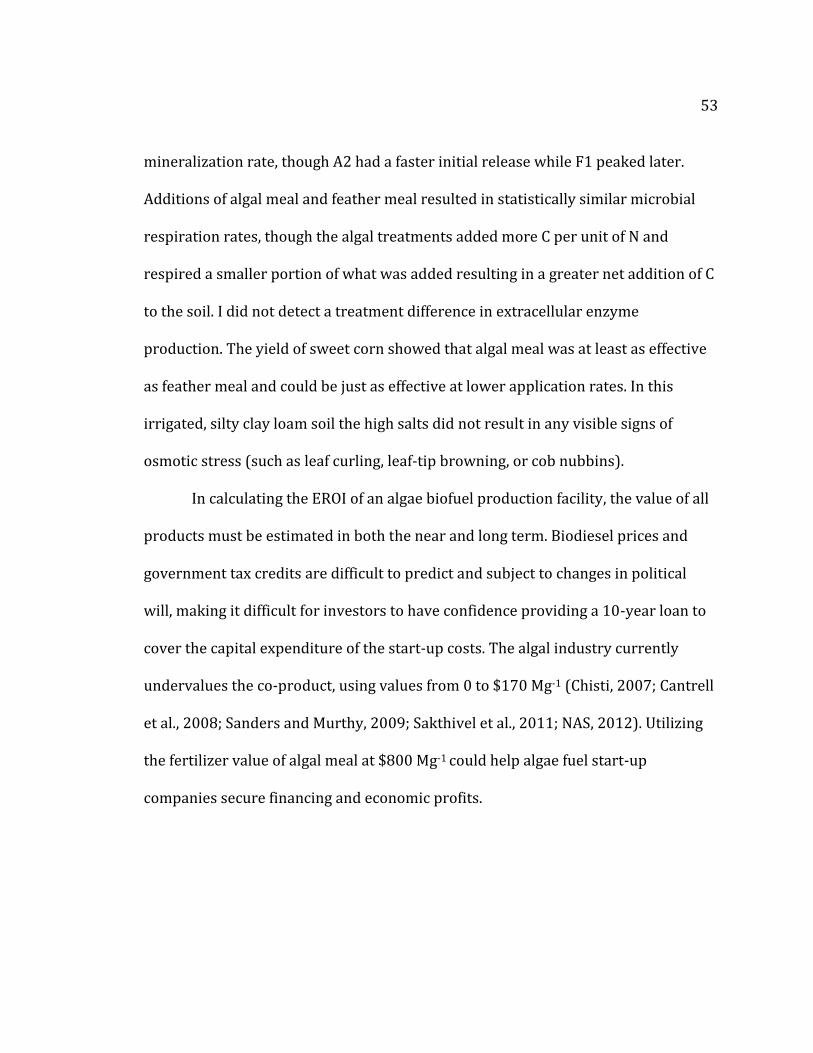
53
mineralization rate, though A2 had a faster initial release while F1 peaked later.
Additions of algal meal and feather meal resulted in statistically similar microbial
respiration rates, though the algal treatments added more C per unit of N and
respired a smaller portion of what was added resulting in a greater net addition of C
to the soil. I did not detect a treatment difference in extracellular enzyme
production. The yield of sweet corn showed that algal meal was at least as effective
as feather meal and could be just as effective at lower application rates. In this
irrigated, silty clay loam soil the high salts did not result in any visible signs of
osmotic stress (such as leaf curling, leaf-tip browning, or cob nubbins).
In calculating the EROI of an algae biofuel production facility, the value of all
products must be estimated in both the near and long term. Biodiesel prices and
government tax credits are difficult to predict and subject to changes in political
will, making it difficult for investors to have confidence providing a 10-year loan to
cover the capital expenditure of the start-up costs. The algal industry currently
undervalues the co-product, using values from 0 to $170 Mg-1 (Chisti, 2007; Cantrell
et al., 2008; Sanders and Murthy, 2009; Sakthivel et al., 2011; NAS, 2012). Utilizing
the fertilizer value of algal meal at $800 Mg-1 could help algae fuel start-up
companies secure financing and economic profits.
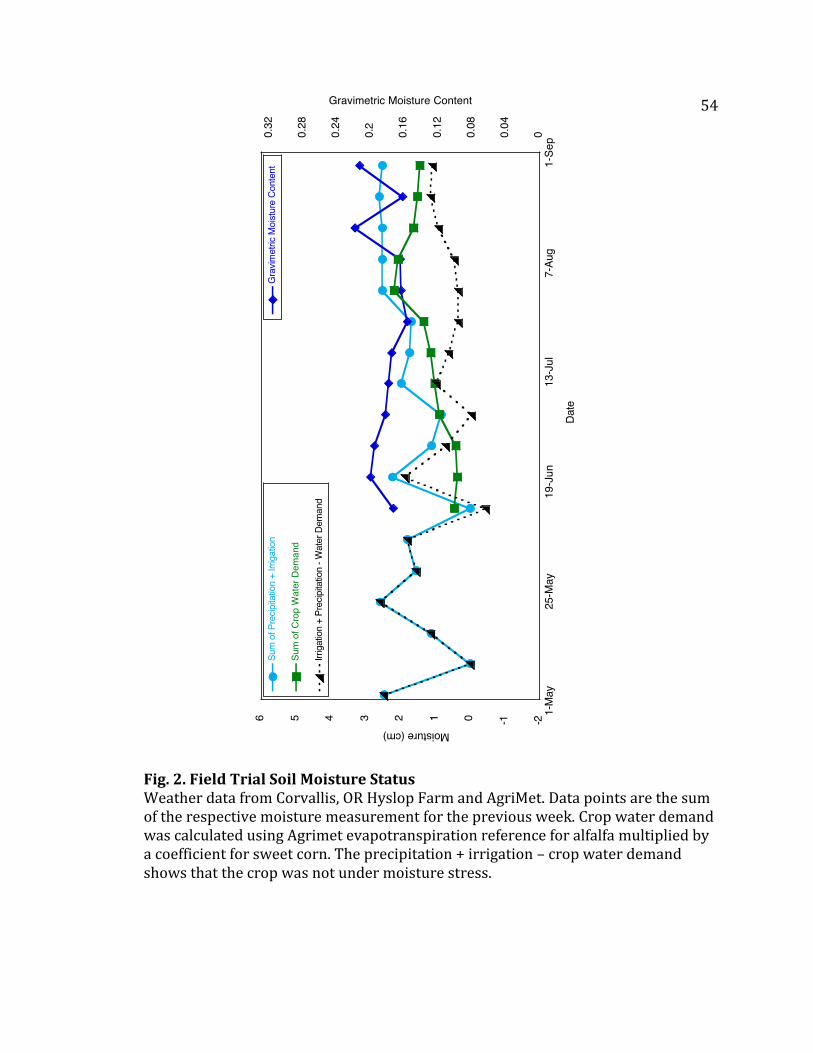
54
Fig. 2. Field Trial Soil Moisture Status Weather data from Corvallis, OR Hyslop Farm and AgriMet. Data points are the sum of the respective moisture measurement for the previous week. Crop water demand was calculated using Agrimet evapotranspiration reference for alfalfa multiplied by a coefficient for sweet corn. The precipitation + irrigation – crop water demand shows that the crop was not under moisture stress.
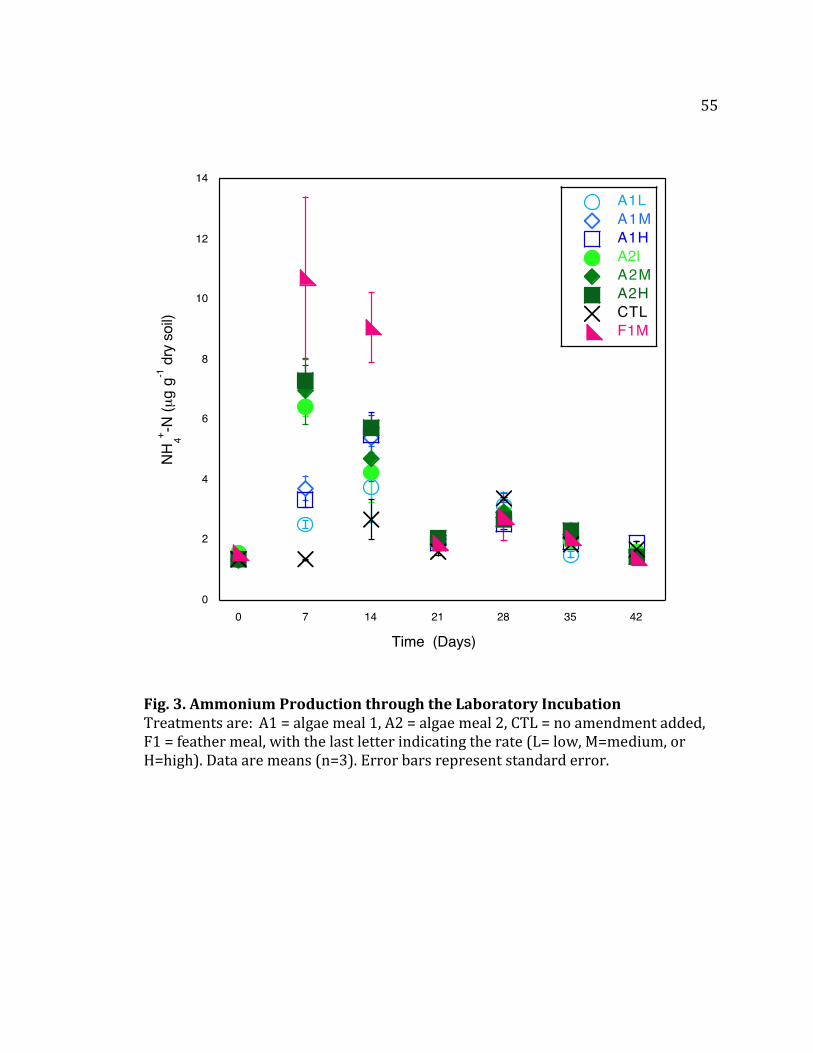
55
Fig. 3. Ammonium Production through the Laboratory Incubation Treatments are: A1 = algae meal 1, A2 = algae meal 2, CTL = no amendment added, F1 = feather meal, with the last letter indicating the rate (L= low, M=medium, or H=high). Data are means (n=3). Error bars represent standard error.
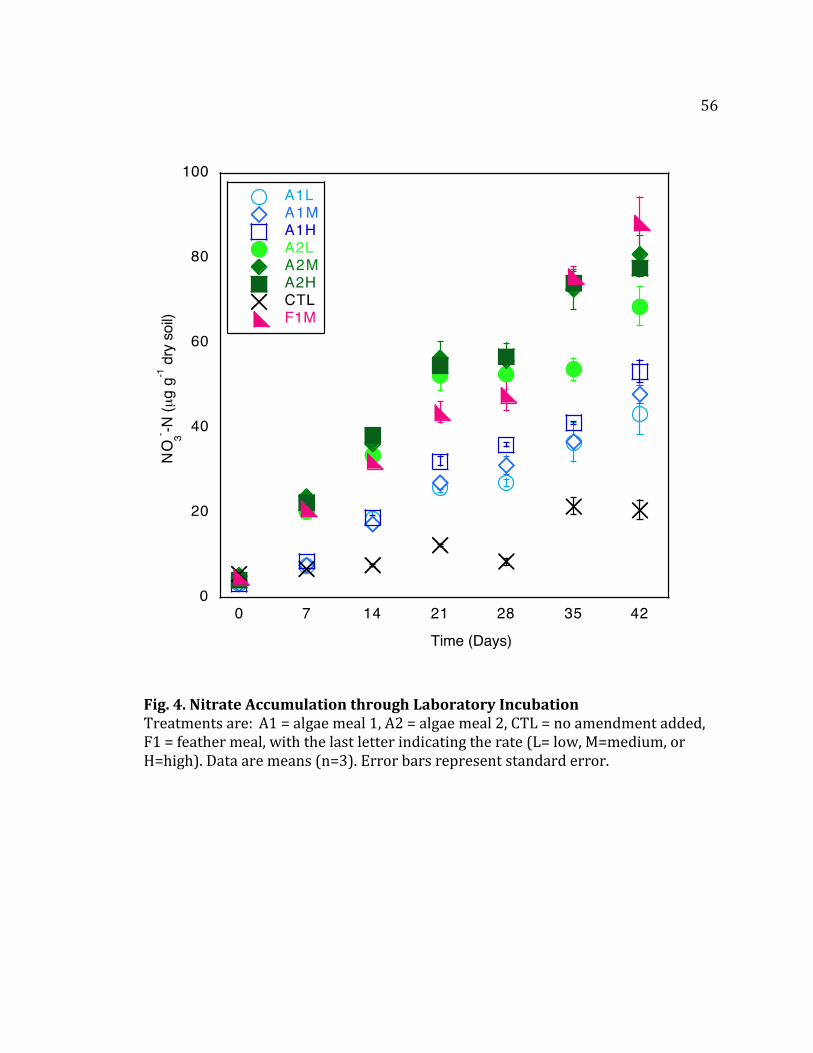
56
Fig. 4. Nitrate Accumulation through Laboratory Incubation Treatments are: A1 = algae meal 1, A2 = algae meal 2, CTL = no amendment added, F1 = feather meal, with the last letter indicating the rate (L= low, M=medium, or H=high). Data are means (n=3). Error bars represent standard error.
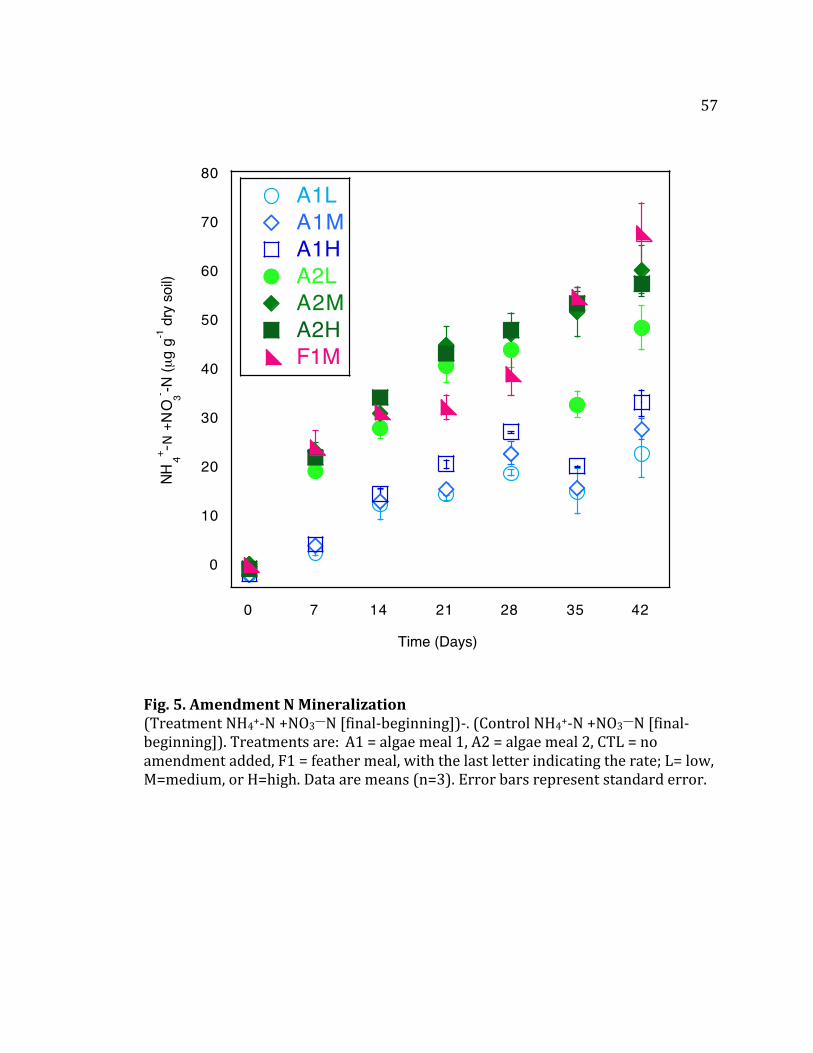
57
Fig. 5. Amendment N Mineralization (Treatment NH4+-N +NO3—N [final-beginning])-. (Control NH4+-N +NO3—N [final-beginning]). Treatments are: A1 = algae meal 1, A2 = algae meal 2, CTL = no amendment added, F1 = feather meal, with the last letter indicating the rate; L= low, M=medium, or H=high. Data are means (n=3). Error bars represent standard error.
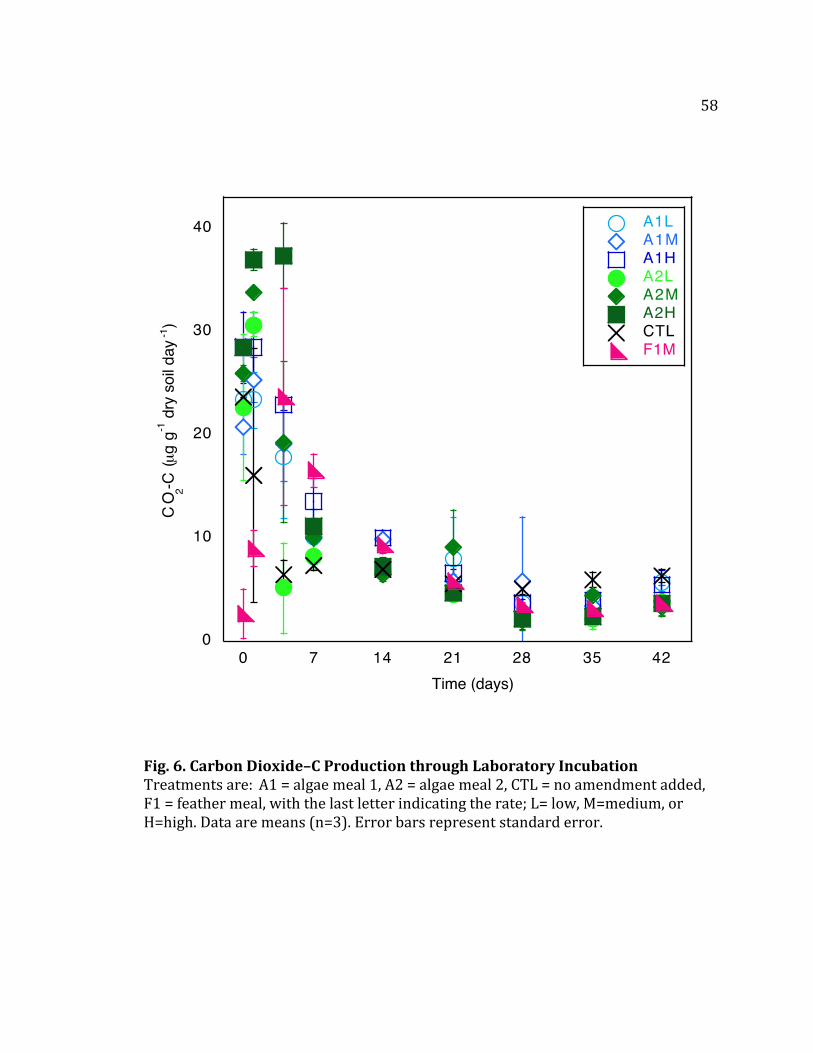
58
Fig. 6. Carbon Dioxide–C Production through Laboratory Incubation Treatments are: A1 = algae meal 1, A2 = algae meal 2, CTL = no amendment added, F1 = feather meal, with the last letter indicating the rate; L= low, M=medium, or H=high. Data are means (n=3). Error bars represent standard error.
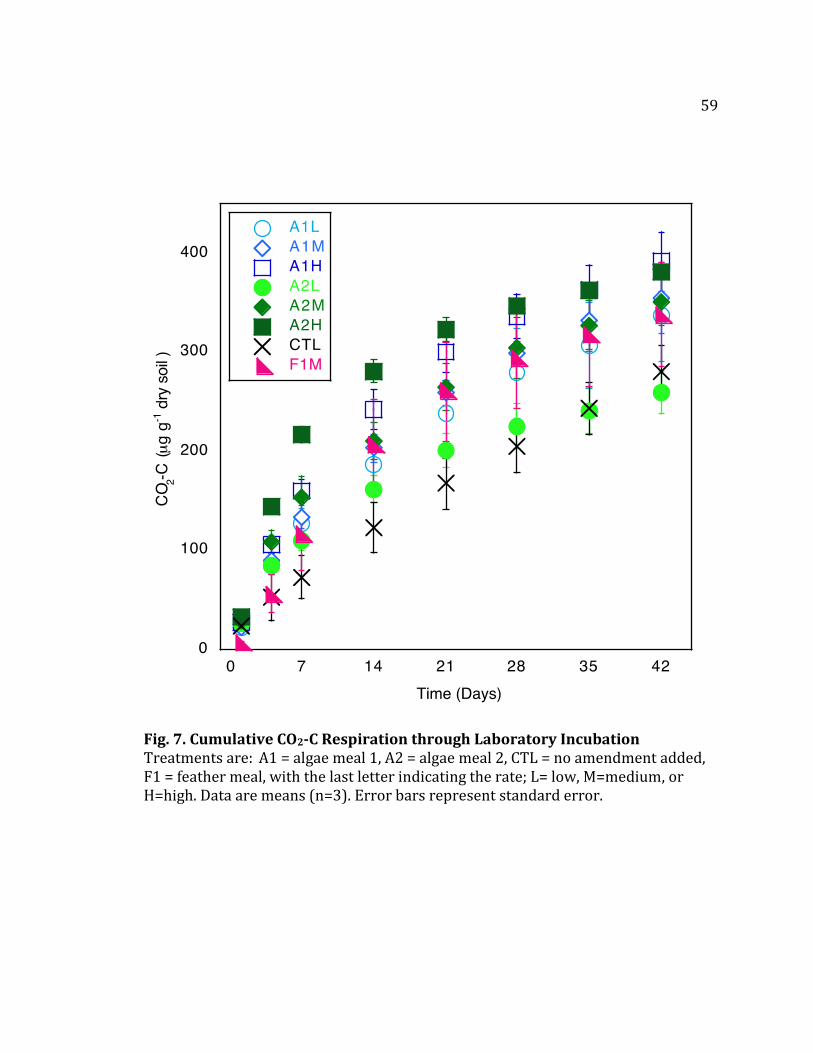
59
Fig. 7. Cumulative CO2-C Respiration through Laboratory Incubation Treatments are: A1 = algae meal 1, A2 = algae meal 2, CTL = no amendment added, F1 = feather meal, with the last letter indicating the rate; L= low, M=medium, or H=high. Data are means (n=3). Error bars represent standard error.
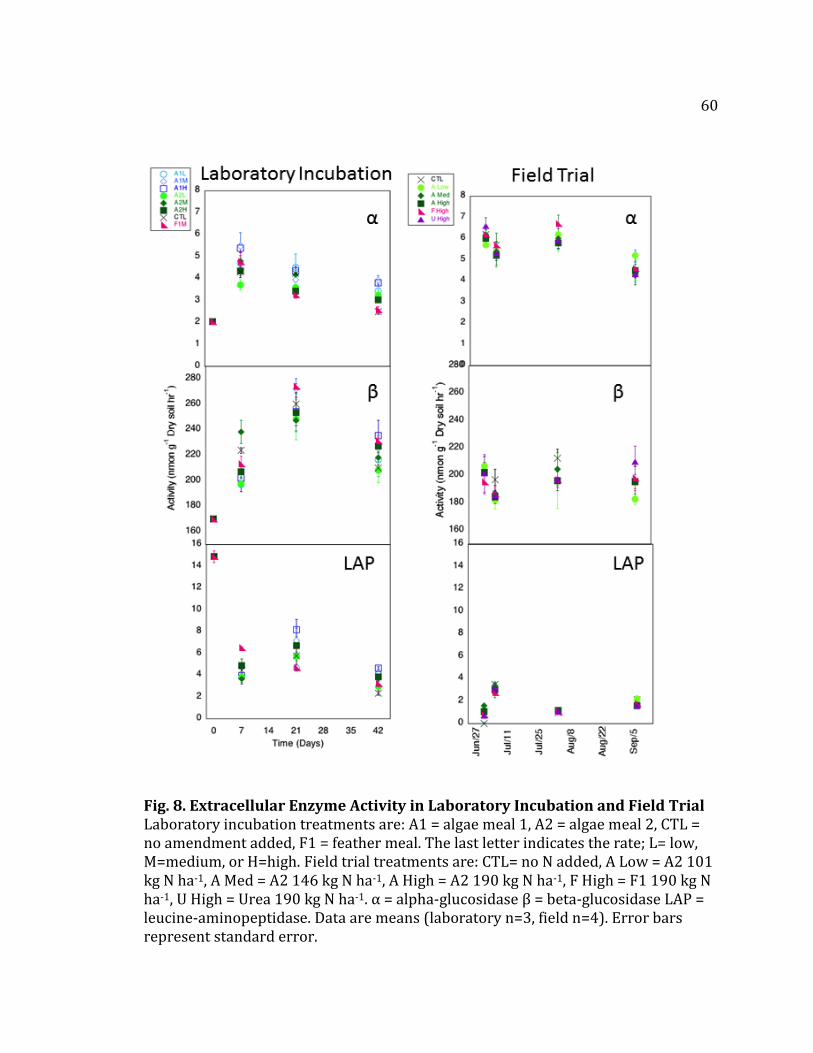
60
Fig. 8. Extracellular Enzyme Activity in Laboratory Incubation and Field Trial Laboratory incubation treatments are: A1 = algae meal 1, A2 = algae meal 2, CTL = no amendment added, F1 = feather meal. The last letter indicates the rate; L= low, M=medium, or H=high. Field trial treatments are: CTL= no N added, A Low = A2 101 kg N ha-1, A Med = A2 146 kg N ha-1, A High = A2 190 kg N ha-1, F High = F1 190 kg N ha-1, U High = Urea 190 kg N ha-1. α = alpha-glucosidase β = beta-glucosidase LAP = leucine-aminopeptidase. Data are means (laboratory n=3, field n=4). Error bars represent standard error.
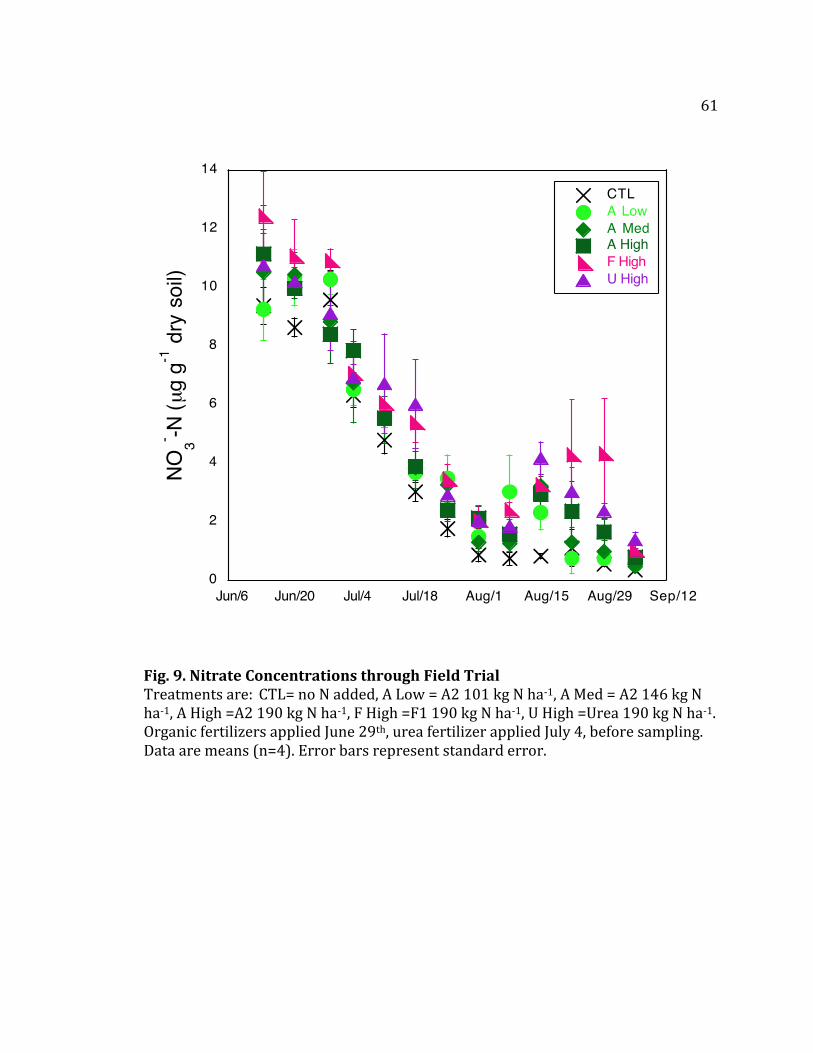
61
Fig. 9. Nitrate Concentrations through Field Trial Treatments are: CTL= no N added, A Low = A2 101 kg N ha-1, A Med = A2 146 kg N ha-1, A High =A2 190 kg N ha-1, F High =F1 190 kg N ha-1, U High =Urea 190 kg N ha-1. Organic fertilizers applied June 29th, urea fertilizer applied July 4, before sampling. Data are means (n=4). Error bars represent standard error.
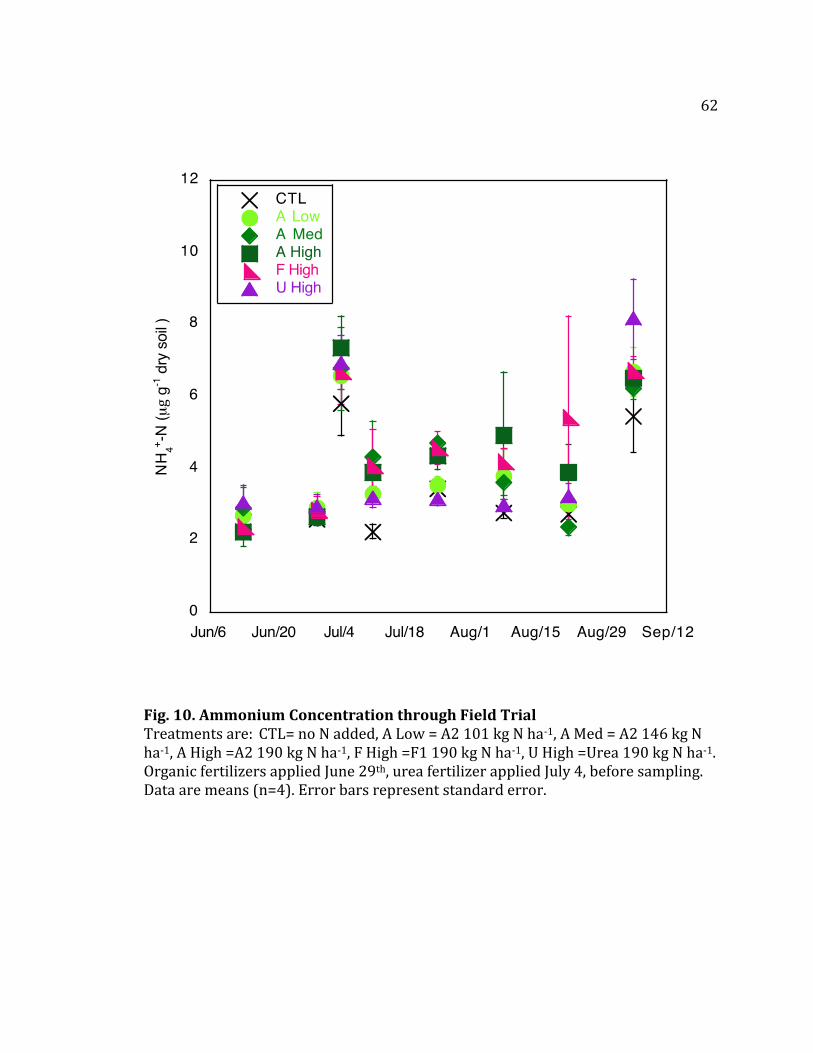
62
Fig. 10. Ammonium Concentration through Field Trial Treatments are: CTL= no N added, A Low = A2 101 kg N ha-1, A Med = A2 146 kg N ha-1, A High =A2 190 kg N ha-1, F High =F1 190 kg N ha-1, U High =Urea 190 kg N ha-1. Organic fertilizers applied June 29th, urea fertilizer applied July 4, before sampling. Data are means (n=4). Error bars represent standard error.
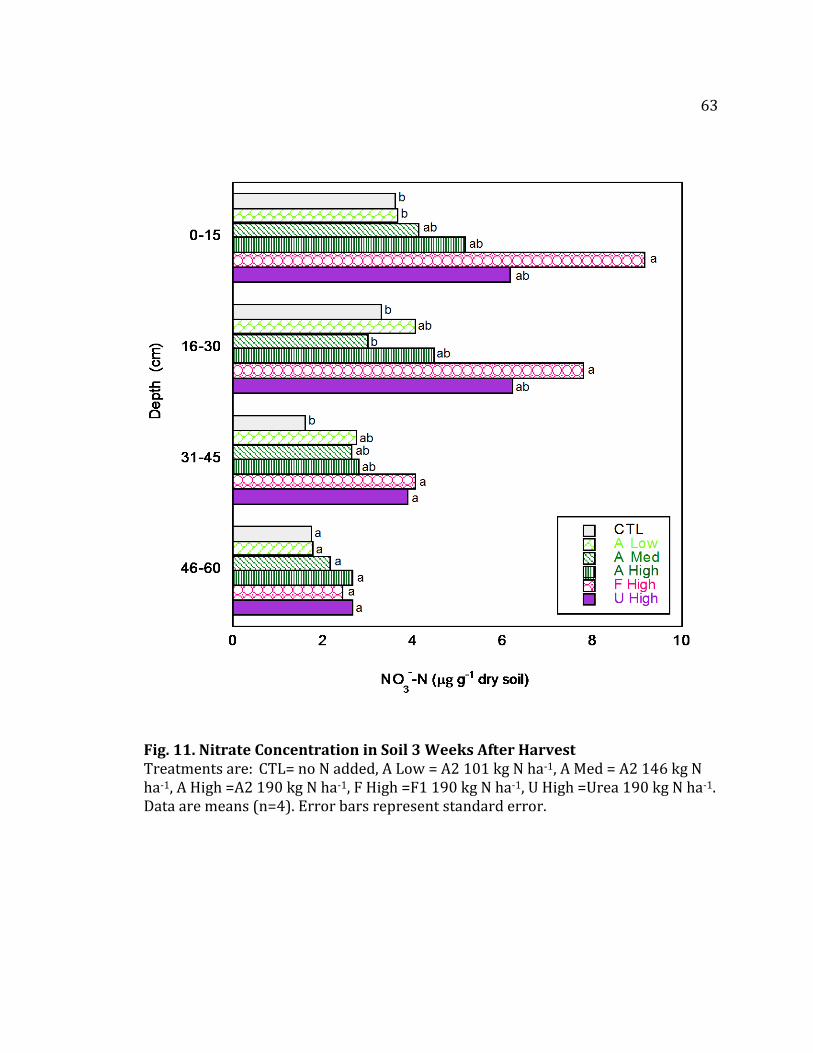
63
Fig. 11. Nitrate Concentration in Soil 3 Weeks After Harvest Treatments are: CTL= no N added, A Low = A2 101 kg N ha-1, A Med = A2 146 kg N ha-1, A High =A2 190 kg N ha-1, F High =F1 190 kg N ha-1, U High =Urea 190 kg N ha-1. Data are means (n=4). Error bars represent standard error.
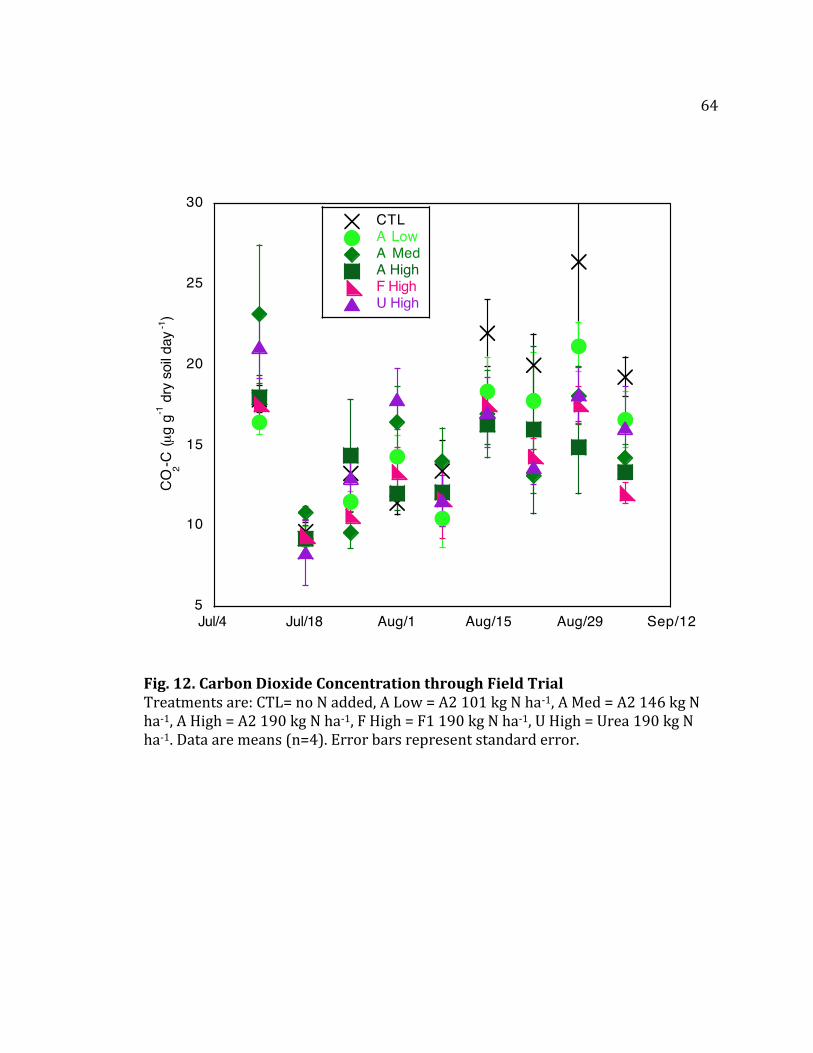
64
Fig. 12. Carbon Dioxide Concentration through Field Trial Treatments are: CTL= no N added, A Low = A2 101 kg N ha-1, A Med = A2 146 kg N ha-1, A High = A2 190 kg N ha-1, F High = F1 190 kg N ha-1, U High = Urea 190 kg N ha-1. Data are means (n=4). Error bars represent standard error.
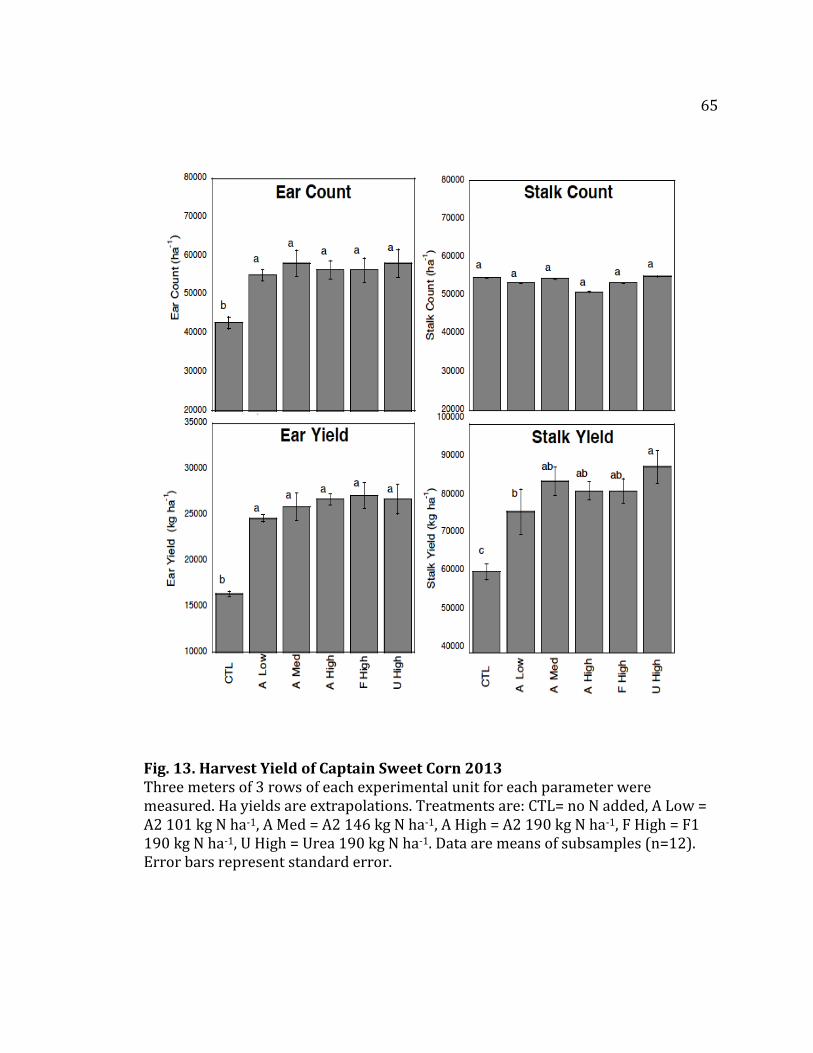
65
Fig. 13. Harvest Yield of Captain Sweet Corn 2013 Three meters of 3 rows of each experimental unit for each parameter were measured. Ha yields are extrapolations. Treatments are: CTL= no N added, A Low = A2 101 kg N ha-1, A Med = A2 146 kg N ha-1, A High = A2 190 kg N ha-1, F High = F1 190 kg N ha-1, U High = Urea 190 kg N ha-1. Data are means of subsamples (n=12). Error bars represent standard error.
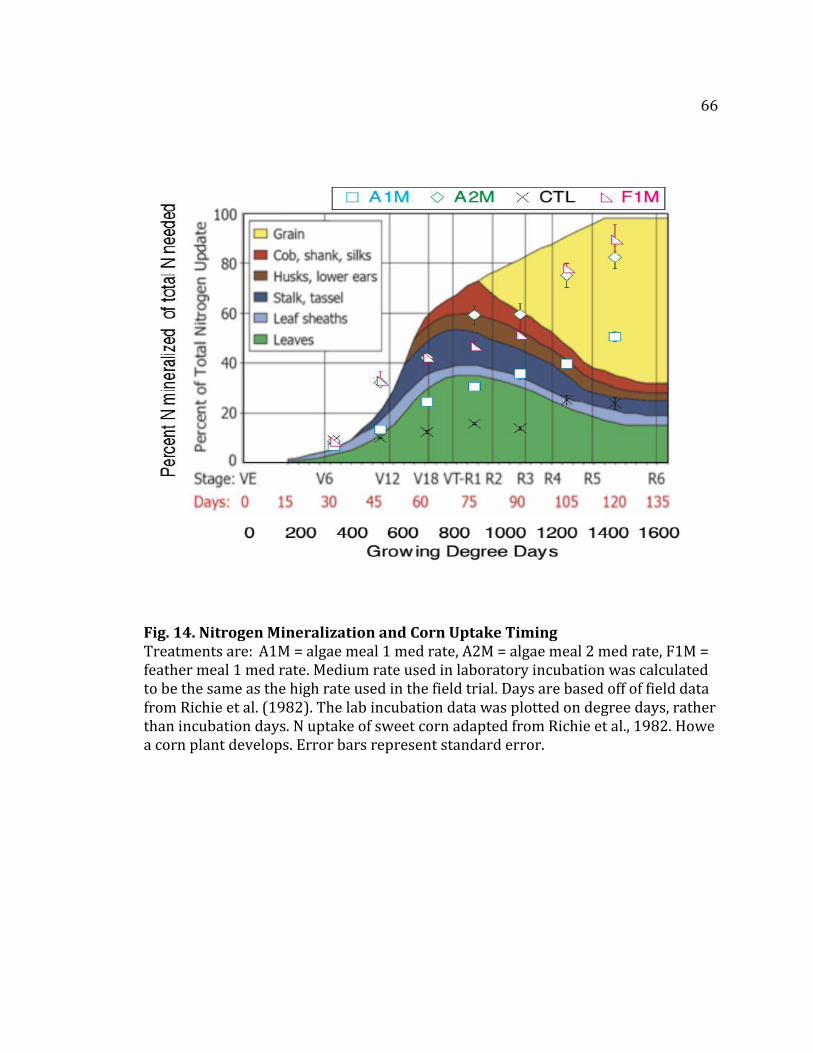
66
Fig. 14. Nitrogen Mineralization and Corn Uptake Timing Treatments are: A1M = algae meal 1 med rate, A2M = algae meal 2 med rate, F1M = feather meal 1 med rate. Medium rate used in laboratory incubation was calculated to be the same as the high rate used in the field trial. Days are based off of field data from Richie et al. (1982). The lab incubation data was plotted on degree days, rather than incubation days. N uptake of sweet corn adapted from Richie et al., 1982. Howe a corn plant develops. Error bars represent standard error.
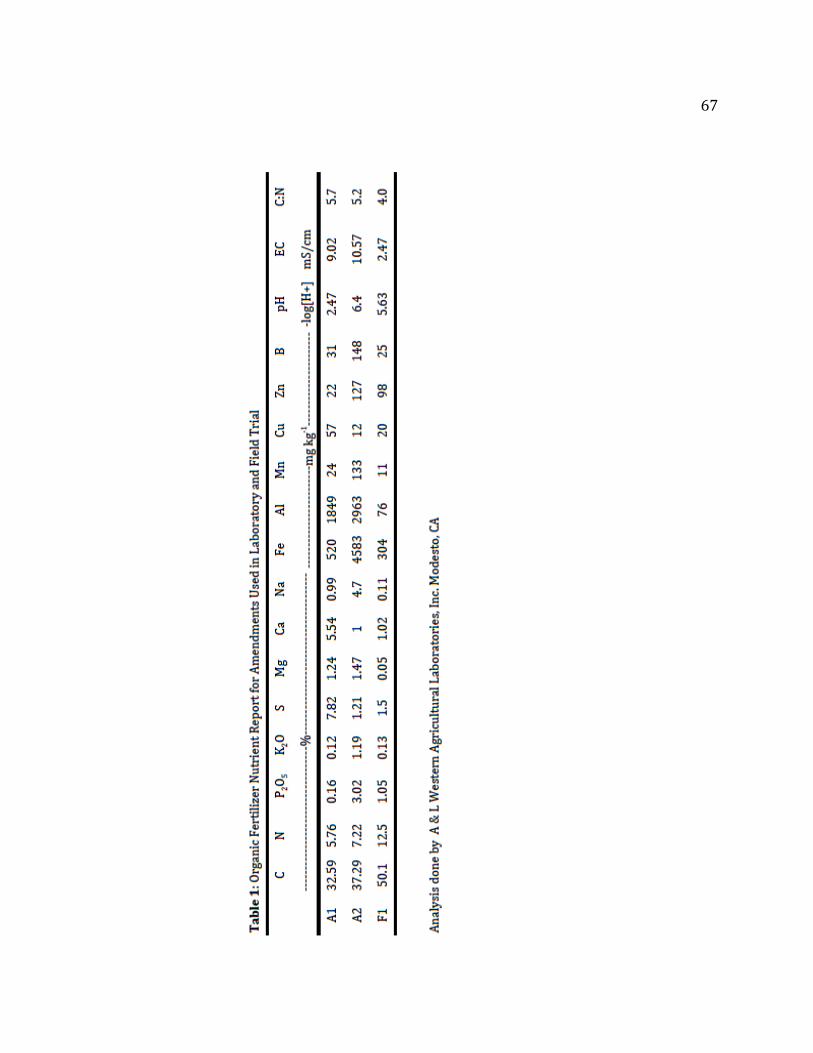
67
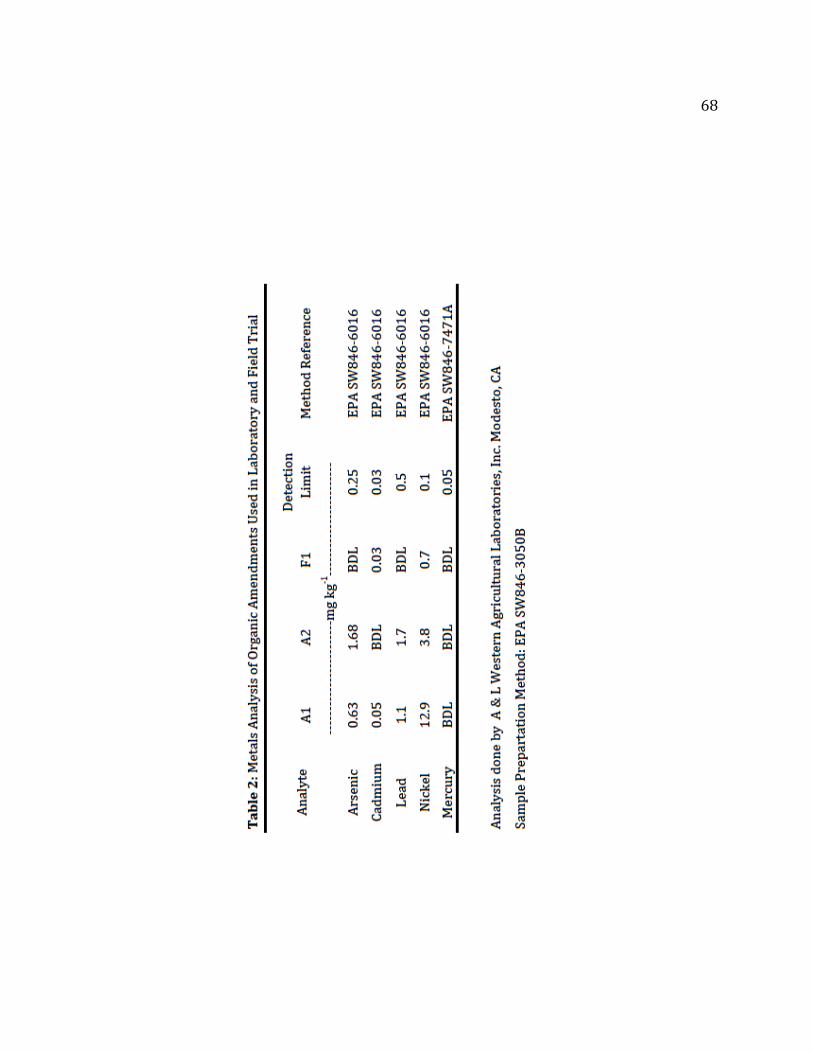
68
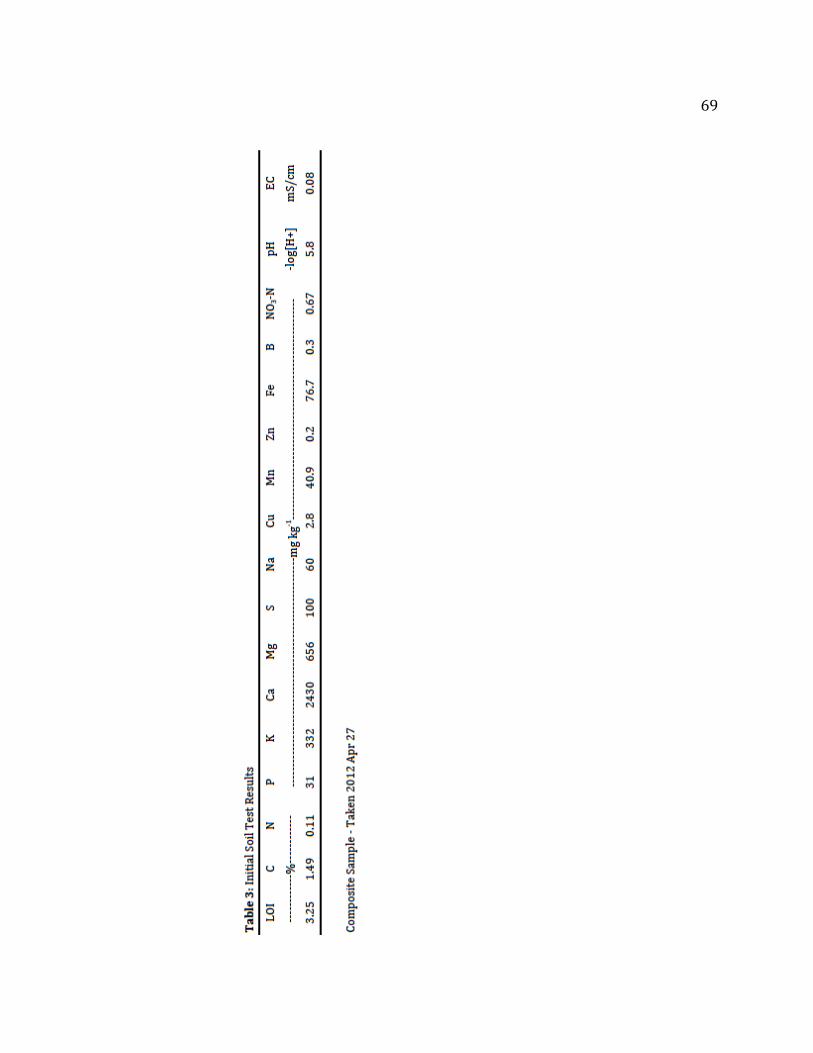
69
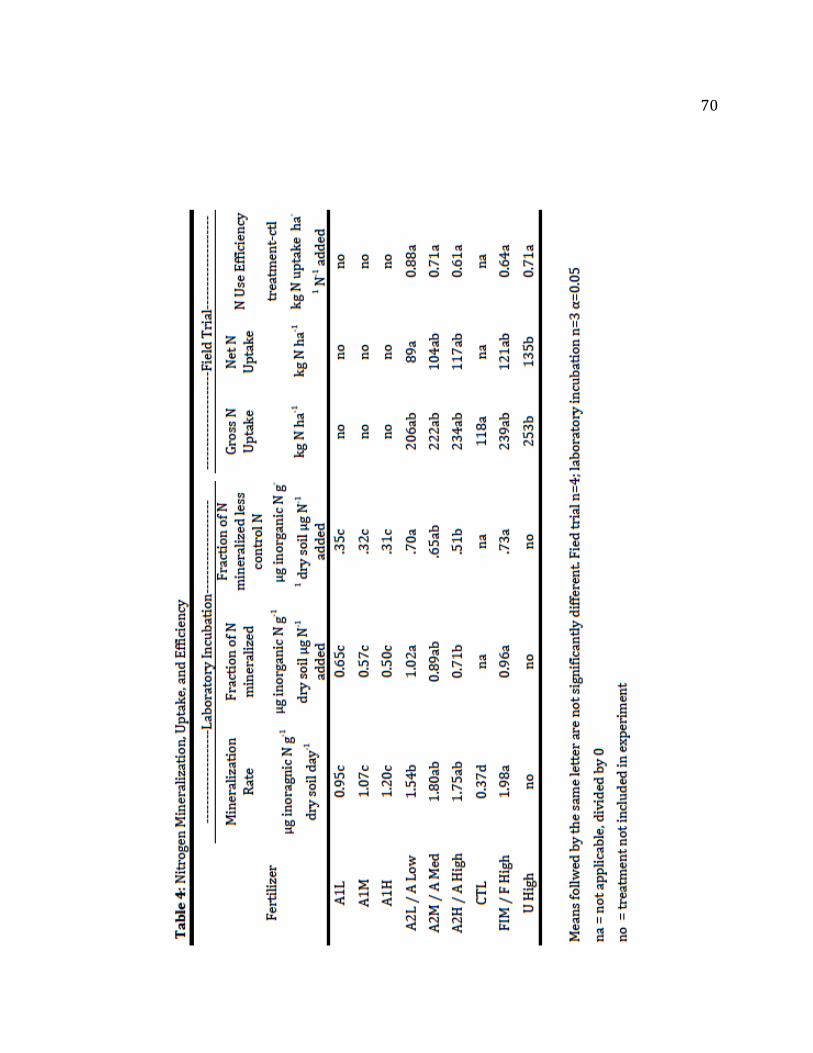
70
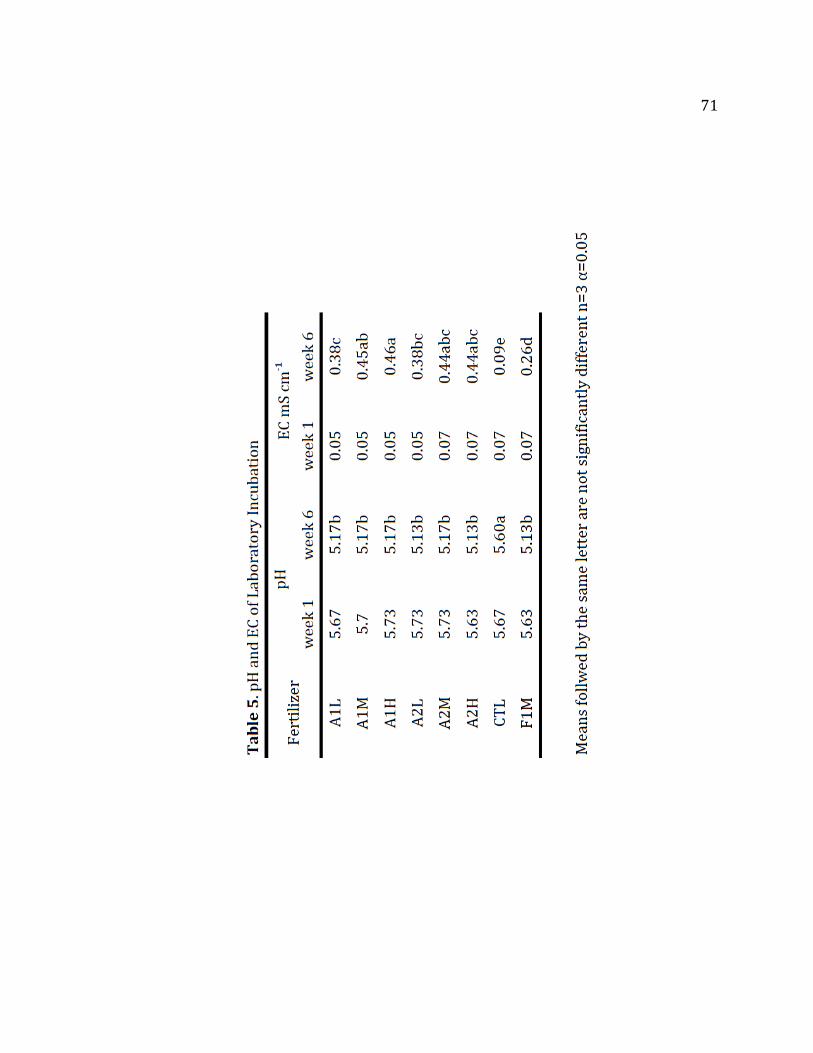
71
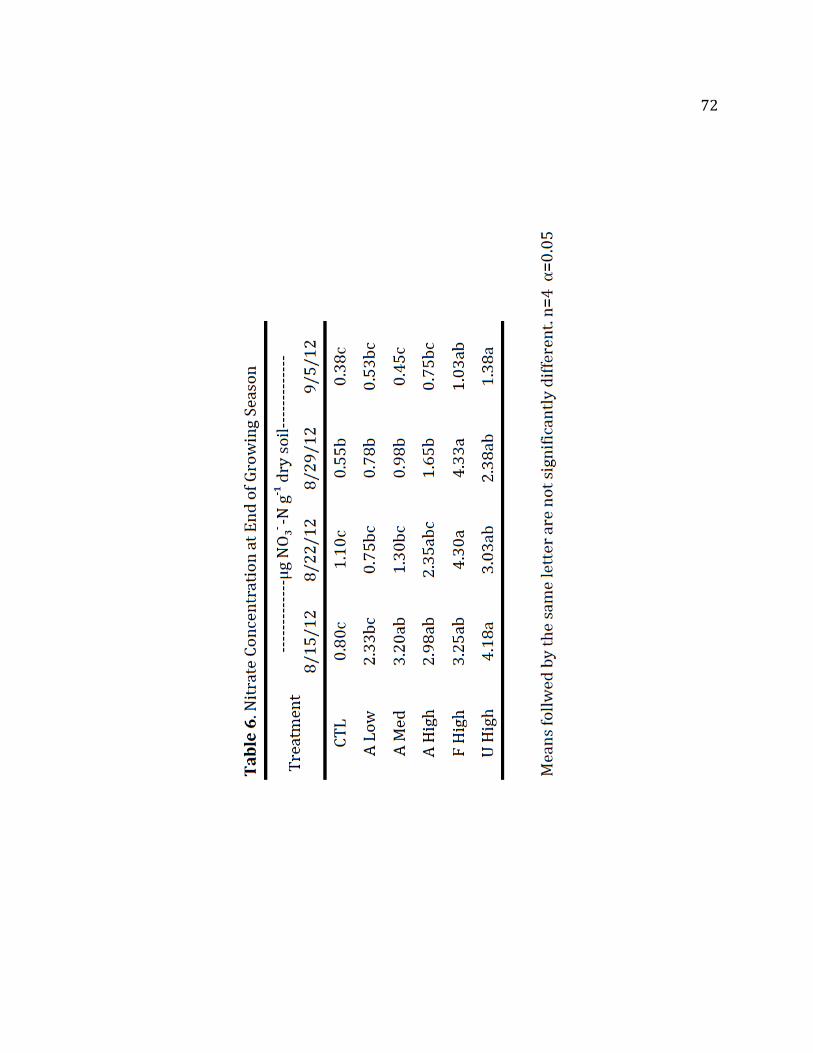
72
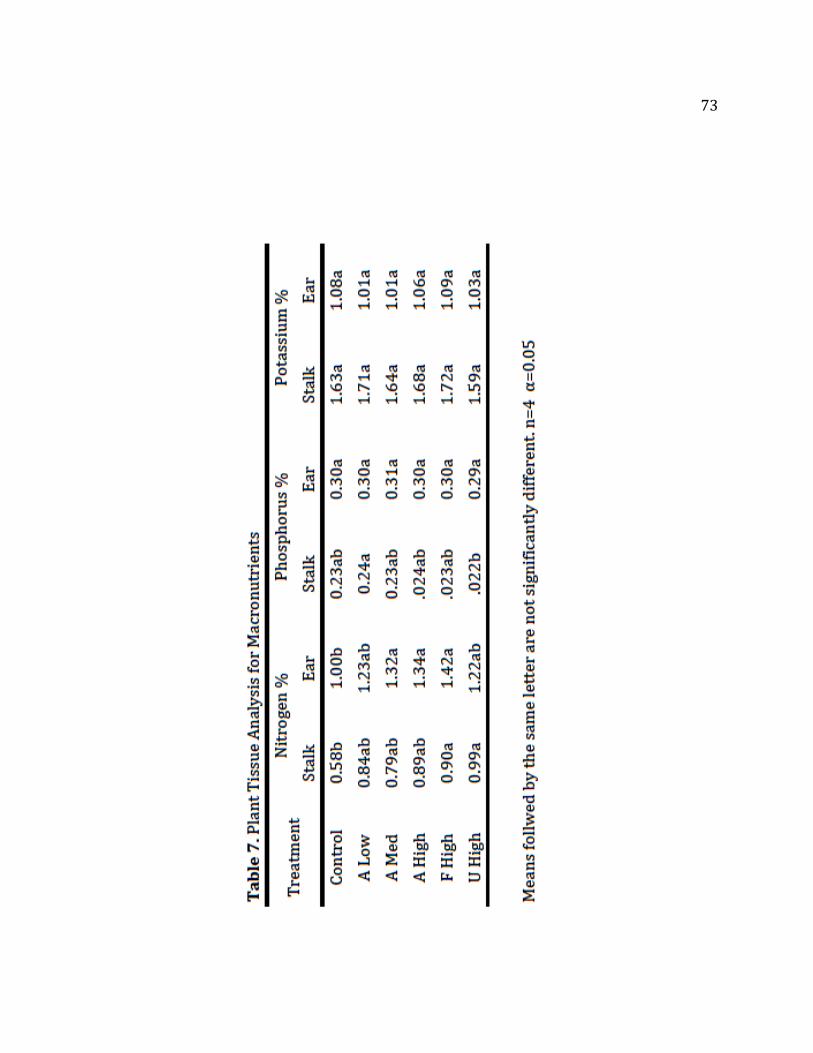
73
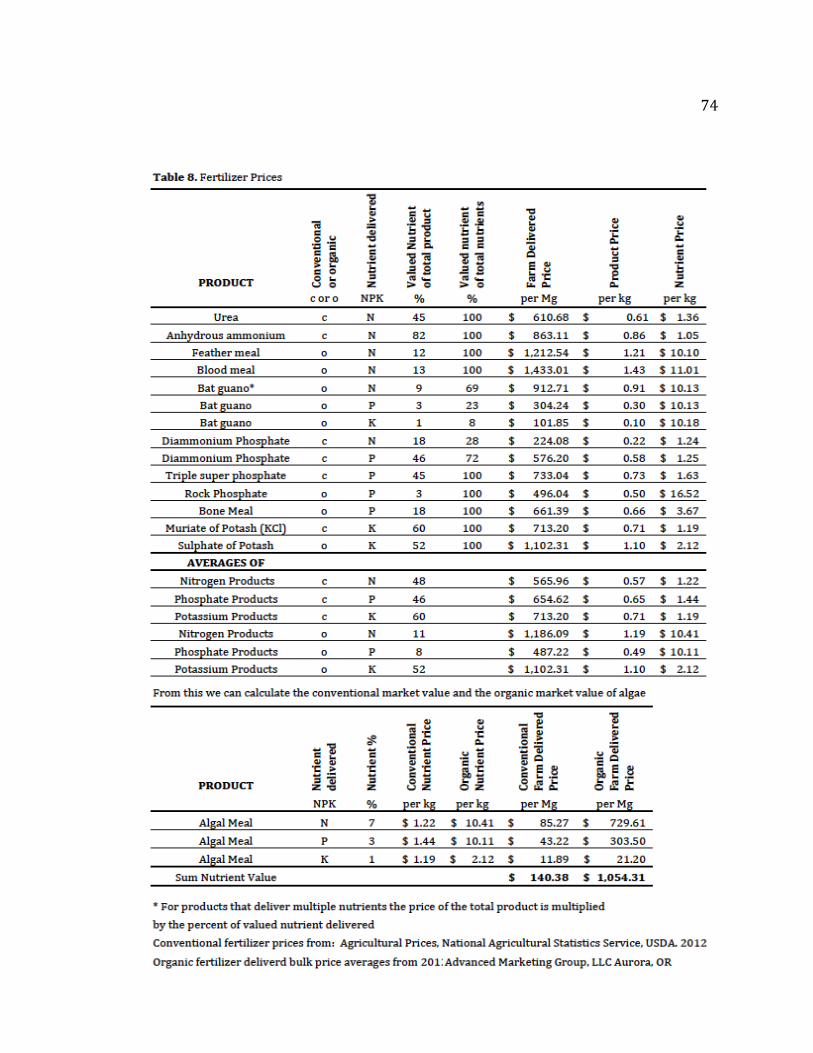
74
75
Literature Cited Chapter 2
AgriMet, The Pacific Northwest Cooperative Agricultural Weather Network. http://www.usbr.gov/pn/agrimet/. Accessed 5-16-13. Argo, B., P. Fisher. 2008. Understanding Plant Nutrition: Fertilizers and media pH. Greenhouse grower. http://www.greenhousegrower.com/article/4049/understanding-plant- nutrition-fertilizers-and-media-ph. Accessed 3-17-13. Ball-Coelho, B.R., R.C. Roy, A.J. Bruin. 2004. Nitrate leaching as affected by liquid swine manure and cover cropping in sandy soil of Southwestern Ontario. Canadian Journal of Soil Science 84:187. BASF The Chemical Company. Outlook. http://agproducts.basf.us/products/outlook-herbicide.html. Accessed May 25, 2012. Beckett, R.P., J. van Staden. 1989. The effect of seaweed concentrate on the growth and yield of potassium stressed wheat. Plant Soil 116:29–36. Blunden, G. 1972. The effects of aqueous seaweed extract as a fertilizer additive. Proceedings of the International Seaweed Symposium 7:584–589. Blunden, G. 1991. Agricultural uses of seaweeds and seaweed extracts. In: (Eds. M.D. Guiry, G. Blunden) Seaweed resources in Europe: uses and potential. Wiley, Chicester, pp 65–81. Blunden, G., S.M. Gordon. 1986. Betaines and their sulphono analogues in marine algae. In: F.E. Round, D.J. Chapman (Eds) Progress in phycological research, vol 4. Biopress Ltd, Bristol, pp 39–80. Booth, M., J.M. Stark, E. Rastetter. 2005. Controls on nitrogen cycling in terrestrial ecosystems: a synthetic analysis of literature data. Ecological Monographs. 75(2):139-157. Bouwmeester, R.J.B., P.L.G. Vlek, J.M. Stumpe. 1985. Effect of environmental factors on ammonia volatilization from urea-fertilized soil. Soil Science Society of America Journal. 49:376–381.doi:10.2136/sssaj 1985.03615995004900020021x.
76
Cantrell, K.B., T. Ducey, R.S. Ro, P.G. Hunt. 2008. Livestock waste-to-bioenergy generation opportunities. Bioresource Technology. 99:7941-7953. Chantigny, M.H., P. Rochette, D.A. Angers, D. Masse, D. Cote. 2004. Ammonia volatilization and selected soil characteristics following application of anaerobically digested pig slurry. Soil Science Society of American Journal 68:306-312. Chapin, F.S. III., N. Fetcher, K. Kielland, K.R. Everett, A.E. Kinkings. 1988. Productivity and nutrient cycling of Alaskan tundra. Enhancement by flowing water. Ecology 69:693-702. Chapin, F.S. III., P. Matson, H. Monney. 2002. Principles of terrestrial ecosystem ecology. Springer-Verlag, New York, NY, USA. Chisti, Y. 2007. Biodiesel from microalgae. Biotechnology Advances (25) 294-306. Clarens, A.F., E.P. Resurrection, M.A. White, L.M. Colosi. 2010. Environmental life cycle comparison of algae to other bioenergy feedstocks. Environmental Science and Technology 44(5):1813-1819. Cogger, C.G., A.I. Bary, D.M. Sullivan, E.A. Myhre. 2004. Biosolids processing effects on first- and second- year available nitrogen. Soil Science Society of America Journal 68:162-167. Crouch, I.J., J. van Staden. 1992. Effect of seaweed concentrate on the establishment and yield of greenhouse tomato plants. Journal of Applied Phycology 4:291– 296. Crouch, I.J., J. van Staden. 1993. Evidence for the presence of plant growth regulators in commercial seaweed products. Plant Growth Regulation 13:21–29. Delin, S., B. Stenberg, A. Nyberg, L. Brohede. 2012. Potential methods for estimating fertilizer value of organic residues. Soil Use and Management 28:283-291. Dow AgroSciences http://www.dowagro.com/usag/prod/034.htm. Accessed May 25, 2012. Durand, N., X. Briand, C. Meyer. 2003. The effect of marine bioactive substances (NPRO) and exogenous cytokinins on nitrate reductase activity in Arabidopsis thaliana. Physiologia Plantarum 119:489–493.
77
Dyck, W., C. Mees, P. Hodgkiss. 1987. Nitrogen availability and comparison to uptake in two New Zealand Pinus radiata forests. New Zealand Journal of Forest Science 17: 38–352. Eghball, B., R.A. Eigenberg, J.E. Gilley, B.J. Wienhold. 2002. Mineralization of manure nutrients. Journal of Soil and Water Conservation 57.6 (Nov-Dec ) p470. Francis, D.D., M.F. Vigil, A.R. Mosier. 2008. Gaseous losses of nitrogen other than through denitrification. In: Nitrogen in Agricultural Systems (Eds. Schepers, J.S. & W.R. Raun), pp. 157-172. American Society of Agronomy Inc.; Crop Science Society of America Inc.; Soil Science Society of America Inc., Madison, WI. Freeman, K.W., K. Girma, R.K. Teal, D.B. Amall, B. Tubana, S. Holtz, J. Mosali, W.R. Raun. 2008. Long-term effects of nitrogen management practices on grain yield, nitrogen uptake, and efficiency in irrigated corn. Journal of Plant Nutrition 30:2021-2036. Gale E.S., D.M. Sullivan, C.G. Cogger, A.I. Bary, D.D. Hemphill, E.A. Myhre. 2006. Estimating plant-available nitrogen release from manures, composts and specialty products. Journal of Environmental Quality 35:2321-2332. Gavlak, R.G., D.A. Horneck, R.O. Miller. 1994. Plant, soil, and water reference methods for the western region. Produced in cooperation with the Far West Fertilizer and Agrichemical Association. German, D.P., M.N. Weintraub, A.S. Grandy, C.L. Lauber, Z.L. Rinkes, S.D. Allison. 2011. Optimization of hydrolytic and oxidative enzyme methods for ecosystem studies. Soil Biology and Biochemistry 43(7): 1387–1397. Giblin, A.E., K.J. Nadelhoffer, G.R. Shaver, J.A. Laundre, and A.J. McKerrow. 1991. Biogeochemical diversity along a riverside toposequence in arctic Alaska. Ecological Monographs 61:415–435. Gilmour, J.T. 1998. Carbon and nitrogen mineralization during co-utilization of biosolids and composts. p. 89–112. In Beneficial co-utilization of agricultural, municipal and industrial by-products. (Eds. S. Brown, J.S. Angle, and L. Jacobs) Kluwer Academic Publ., Dordrecht, the Netherlands. Hankins S.D., H.P. Hockey. 1990. The effect of a liquid seaweed extract from Ascophyllum nodosum (Fucales, Phaeophyta) on the two spotted red spider mite Tetranychus urticae. Hydrobiologia 204(205):555–559.
78
Hargrove, W.L. 1988. Soil, environmental, and management factors influencing ammonia volatilization under fi eld conditions. p. 17–36. In B.R. Bock and D.E. Hart, J.M., E.S. Marx, N.W. Christensen, J.A. Moore. 1997. Nutrient management strategies. Journal of Dairy Science 80:2659-2666. Hart, J.M., D.M. Sullivan, J.R. Myers, R.E. Peachey. Oct 2010. Sweet corn (Western Oregon) nutrient management guide. Oregon State University Extension EM9010-E. Havlin, J.L., J.D. Beaton, S.L. Tisdale, W.L. Nelson. 1999. Soil Fertility and Fertilizers, 6th Edition. Upper Saddle River, N.J. Prentice-Hall, Inc. 499p. Heimann, M., and M. Rechstein. 2008. Terrestrial ecosystem carbon dynamics and climatefeedbacks. Nature 451: 289-292. Hood-Nowotny, R., N.H.N. Uman, E. Inselbacher, P. Oswald-Lachoani, W. Wanek. 2010. Alternative methods for measuring inorganic, organic and total dissolved nitrogen in soil. Soil Science Society of America Journal 74:1018- 1027. Hyslop weather station managed by Oregon State University. http://agsci.oregonstate.edu/farmunit/weather/archive. Accessed Mar 1, 2013. IPCC. 2007. Fourth Assessment Report (AR4). Intergovernmental Panel on Climate Change (IPCC), http://ipcc-wg1.ucar.edu/index.html. Kalieda Graph Synergy Software version 4.1.3. Copyright 1986-2011, purchased Nov 10, 2011. Kandeler, E., and H. Gerber. 1988. Short-term assay of soil urease activity using colorimetric determination of ammonium. Biology and Fertility of Soils 6:68- 72. Kebede-Westhead, E., C. Pizarro, W. Mulbry. 2006. Treatment of swine manure effluent using freshwater algae: Production, nutrient recovery, and elemental composition of algal biomass at four effluent loading rates. Journal of Applied Phycology 18(1), 41. Khaleel, R., K.R. Reddy, M.R. Overcash. 1981. Changes in soil physical properties due to organic waste applications: a review. Journal of Environmental Quality 10:133-141.
79
Khan, W., U.P. Rayirath, S. Subramanian, M.N. Jithesh, P. Rayorath, D.M. Hodges, A.T. Critchley, J.S. Craigie, J. Norrie, B. Prithiviraj. 2009. Seaweed extracts as biostimulants of plant growth and development. Journal of Plant Growth Regulation. 28:386-399. Kleber, M., M.G. Johnson. 2010. Advances in understanding the molecular structure of soil organic matter: implications for interactions in the environment. In: Advances in Agronomy, (Ed Sparks, D.) vol 106, pg 77-142 Elsevier. Burlington: Academic Press. Legg J.O., and J.J. Meisinger. 1982. Soil nitrogen budgtes. In Nitrogen in Agricultural soils. Eds. F.J. Stevenson. pp 503–566. American Society of Agronomy, Madison, WI. Leytem, A.B., R.S. Dungan, D.L. Bjorneberg, A.C. Koehn. 2011. Emissions of ammonia, methane, carbon dioxide, and nitrous oxide from dairy dattle housing and manure management systems. Journal of Environmental Quality 40:1383- 1394. Long, G. (ed.). 1842. Penny Cyclopaedia of the Society for the Diffusion of Useful Knowledge. 1842(24) 332-334. Lutzow, M.V., I. Kogel-Knabner, K. Ekschmitt, E. Matzner, G. Guggenberger. 2006. Stabilization of organic matter in temperate soils: mechanisms and their relevance under different soil conditions – a review. European Journal of Soil Science. 57:426-445. Magdoff, F.R. 1991. Managing nitrogen for sustainable corn systems: Problems and possibilities. American Journal of Alternative Agriculture 6: 3–8. Manzoni, S., A. Porporator. 2009. Soil carbon and nitrogen mineralization: Theory and models across scales. Soil Biology & Biochemistry 41:1355-1379. Marx, E.S., J. Hart, R.G. Stevens. 1999. Soil test interpretation guide. Oregon State University Extension Service EC 1478. Meisinger, J.J., F.J. Calderon, D.S. Jenkinson. 2008 Soil nitrogen budgets. In: Nitrogen in Agricultural Systems (Eds. Schepers, J.S. & W.R. Raun), pp. 505-562. American Society of Agronomy Inc.; Crop Science Society of America Inc.; Soil Science Society of America Inc., Madison, WI.
80
Metting B., W.R. Rayburn, P.A. Reynaud. 1988. Algae and agriculture. In: C.A. Lembi, J.R. Waaland (Eds) Algae and human affairs. Cambridge University Press, Cambridge, UK, pp 335–370. Miranda, K.M., M.G. Espey, D.A. Wink. 2001. A rapid, simple and spectrophotometric method for simultaneous detection of nitrate and nitrite. Nitric Oxide 5:62-71. Moore, J.A., J.M. Hart. 1997. Manure management system design strategies: How and why. Journal of Dairy Science. 80:2655-2658. Mulbry, W., E. Kebede-Westhead, C. Pizarro, L. Sikora. 2005. Recycling of manure nutrients: use of algal biomass from dairy manure treatment as a slow release fertilizer. Bioresource Technology. 96:451-458. Mulbry, W., S. Kondrad, P. Pizarro. 2006. Biofertilizers from algal treatment of dairy and swine manure effluents: characterization of algal biomass as slow release fertilizer. Journal of Vegetable Science 12:107–125. Mulbry, W., S. Konrad, C. Pizarro, E. Kebede-Westhead. 2008. Treatment of dairy manure effluent using freshwater algae: Algal productivity and recovery of manure nutrients using pilot-scale turf scrubbers. Bioresouce Technology 99:8137-8142. Myrold, D.D., P.J. Bottomley. 2008. Nitrogen mineralization and immobilization. In: Nitrogen in Agricultural Systems (Eds. Schepers, J.S. & W.R. Raun), pp. 157- 172. American Society of Agronomy Inc.; Crop Science Society of America Inc.; Soil Science Society of America Inc., Madison, WI. Nadelhoffer, K.J., J.D. Aber, and J.M. Melillo. 1983. Leaf litter production and soil organic matter dynamics along a nitrogen-availability gradient in Southern Wisconsin (USA). Canadian Journal of Forest Research 13:12–21. Nadelhoffer, K.J., J.D. Aber, and J.M. Melillo. 1984. Seasonal patterns of ammonium and nitrate uptake in nine temperate forest ecosystems. Plant and Soil 80:321–335. Nannipieri P., C. Ciardi, T. Palazzi, L. Badalucco. 1990. Short term nitrogen reactions following the addition of urea to a grass-legume association. Soil Biology Biochemisty 22, 549–553. Nannipieri, P., L. Falchini, L. Landi, A. Benedetti, S. Canali, F. Tittarelli, D. Ferri, G. Convertini, L. Badalucco, S. Grego, L. Vittori-Antisari, M. Raglione and
81
D.Barraclough. 1999. Nitrogen uptake by crops, soil distribution and recovery of urea-N in a sorghum–wheat rotation in different soils under Mediterranean conditions. Plant and Soil 208:43-56. National Academy of Sciences; Committee on the Sustainable Development of Algal Biofuels. 2012. Sustainable Development of Algal Biofuels in the United States. Board on Agriculture and Natural Resources, Board on Energy and Environmental Systems, National Research Council. The National Academies Press. Natural Resources Conservation Service. United States Department of Agriculture. Soil Survey of Benton County, Oregon. Accessed April, 23, 2012. Norrie, J., J.P. Keathley. 2006. Benefits of Ascophyllum nodosum marine-plant extract applications to ‘Thompson seedless’ grape production. (Proceedings of the Xth International Symposium on Plant Bioregulators in Fruit Production, 2005). Acta Horticulturae 727:243–247. Norton, J., M. Habteselassie, J. Stark, B. Miller. 2007. Manure treatments change nitrogen cycling in soils receiving repeated applications of dairy-wastes. Western Nutrient Management Conference Vol. 7. Salt Lake City. UT. Oades, J.M. 1988. The retention of organic matter in soils. Biogeochemistry 5:35-70. Olguin, E.J. 2003. Phycoremediation: key issues for cost-effective nutrient removal processes. Biotechnological Advances 22, 81–91. Organic Trade Association. 2011. http://www.ota.com/organic/mt/business.html Accessed Feb, 12, 2013. Pang, X.P., J. Letey. 2000. Organic farming: challenge of timing nitrogen availability to crop nitrogen requirements. Soil Science Society of America Journal 64:247-253. Paul, J.W., E.G. Beauchamp. 1996. Soil microbial biomass, C, N mineralization, and N uptake by corn in dairy cattle slurry- and urea-amended soils. Canadian Journal of Soil Science 469:472. Pierre, W.H. 1928. Nitrogen fertilizers and soil acidity: I. Effect of various nitrogenous fertilizers on soil reaction. Journal of American Society of Agronomy. 20:254-269.
82
Pizarro, C., W. Mulbry, D. Blersch, P. Kangas. 2006. An economic assessment of algal turf scrubber technology for treatment of dairy manure effluent. Ecological Engineering 26:321-327. Polglase, P.J., P.M. Attiwill, M.A. Adams. 1992. Nitrogen and phosphorus cycling in relation to stand age of Eucalyptus regnans F. Muell. II. N mineralization and nitrification. Plant and Soil 142:167–176. Power, J.F., and J.S. Schepers. 1989. Nitrate contamination of groundwater in North America. Agricultural Ecosystems and Environment 26: 165–187. Raun, W.R., G.V. Johnson. 1999. Improving nitrogen use efficiency for cereal production. Agronomy Journal 91:357-363. Ramirez, K.S., J.M. Craine, N. Fierer. 2012. Consistent effects of nitrogen amendments on soil microbial communities and processes across biomes. Global Change Biology 18:1918-1927. Reitz, S.R., J.T. Trumble. 1996. Effects of cytokinin-containing seaweed extract on Phaseolus lunatus L.: influence of nutrient availability and apex removal. Botanica Marina 39:33–38. Richie, S.W., J.J. Hanway. Revised 1982. How a corn plant develops. (Ed. J. Clayton Herman). Cooperative Extension Service, Iowa State University. Sakthivel, R., S. Elumalai, M. Mohommad arif, 2011. Microalgae lipid research, past, present: A critical review for biodiesel production, in the future. Journal of Experimental Sciences 2(10):29-49. Sander, K., G.S. Murthy. 2010. Life cycle analysis of algae biodiesel. International Journal of Life Cycle Assessment 15:704-714. SAS Institute. 2013. Statistical analysis software. Version 9.2 ed. SAS Institute, Cary, NC. Schimel, J.P., J. Bennet. 2004. Nitrogen mineralization: challenges of a changing paradigm. Ecology, 85(3):591-602. Schlesinger, W.H. 1995. An overview of the C cycle. In: Soils and Global Change (eds R., Lal J. Kimble, J. Levin and B.A. Stewart) pp. 9-26. Lewis Publishers, Boca Raton, FL.
83
Schneider, T., K.M. Keiblinger, E.S. Katja Sterflinger-Gleixner, G. Ellersdorfer, B. Roschitzki, A. Richter, L. Eberl, S. Zechmeister-Boltenstern, and K. Riedel. 2012. Who is who in litter decomposition? Metaproteomics reveals major microbial players and their biogeochemical functions. International Society for Microbial Ecology Journal 6:1749-1762. Sheehan, J., T. Dunahay, J. Benemann, P. Roessler. 1998. A look back at the US Department of Energy’s Aquatic Species Program – biodiesel from algae. Prepared for US DOE Office of Fuel Development. Prepared by National Renewable Energy Laboratory. Golden, CA. Shelef, G., and C.J. Soeder (Eds.). 1980. Algae biomass production and use. Elsevier/North-Holland Biomedical Press. Amsterdam, The Netherlands. Skinner, Ted. Personal interview with long time organic fertilizer trader and owning partner of Advanced Marketing, Aurora, OR. Feb 12, 2013. Sollins, P., P. Homann, B.A. Caldwell. 1996. Stabilization and destabilization of soil organic matter: mechanisms and controls. Geoderma 74:65-105 Stewart, C.E., K. Paustian, R.T. Conant, A.F. Plante, J. Six. 2007. Soil carbon saturation: Concept, evidence and evaluation. Biogeochemistry 86: 19-31. Stirk, W.A., M.S. Novak, J. van Staden. 2003. Cytokinins in macroalgae. Plant Growth Regulation 41:13–24. Sullivan, D.M., A.I. Bary, C.G. Cogger, E.A. Myhre. 1999. Field microplot estimates of soil N mineralization for manured and non-manured soils. P 193-200. In: Proceedings of Western Nutrient Management Conference. Salt Lake City, UT. 4-5 mar. 1999. Potash & Phosphate Institute. Manhattan, KS. Sullivan, D.M., N.A. Andrews, J.M. Luna, J.P.G. McQueen. 2010. Estimating N contribution from organic fertilizers and cover crop residues using online Calculators. 19th World Congress of Soil Science, Soil Solutions for a Changing World. Sylvia, D.M., J.J. Fuhrmann, P.G. Hartel, D.A. Zuberer (Eds.). 2005. Principles and Applications of Soil Microbiology 2nd Ed. Pearson-Prentice Hall, Upper Saddle River, New Jersey. Syngenta. Atrazine. http://agproducts.basf.us/products/outlook-herbicide.html. Accessed May 25, 2012.
84
Temple W.D., A.A. Bomke. 1988. Effects of kelp (Macrocystis integrifolia) on soil chemical properties and crop responses. Plant Soil 105:213–222. Treseder, K.K. 2008. Nitrogen additions and microbial biomass: a meta-analysis of ecosystem studies. Ecology Letters 11:1111-1120. USDA ERS. 2010. Fertilizer TVA (Tennessee Valley Authority), AAPFCO (Association of American Plant Food Control Officials), TFI (The Fertilizer Institute). Van Der Meulen, L. Personal interview with scientific business development partner at Aurora Algae. Hawyard, CA. Mar 10, 2013. Wander, M. 2010. Managing manure fertilizers in organic systems. eOrganic Oregon State University extension. Last Updated March 22, 2010. Washington State Department of Agriculture. 2012. Fertilizer Registration Guidance Document. PUB 90 (R/11/30/2012). Wershaw, R.L. 2004. Evaluation of conceptual models of natural organic matter (Humus) from a consideration of the chemical and biological process of humification. US Geological Survey, Reston, VA. Scientific Investigations Report No. 2004-5121. Whalen, J.K., C. Chang, B.M. Olson. 2001. Nitrogen and phosphorus mineralization potentials of soils receiving repeated annual cattle manure applications. Biology and Fertility of Soils. 34:334-341. Zaman, M., J.J. Di, K.C. Cameron. 1999. Gross nitrogen mineralization and nitrification rates and their relationships to enzyme activities and the soil microbial biomass in soils treated with diary shed effluent and ammonium fertilizer at different water potentials. Biology and Fertility of Soils 29:178- 186. Zheng, Z., MacLeod, J.A., J.B. Sanderson, and J. Lafond. 2004. Soil phosphorus dynamics after ten annual applications of mineral fertilizers and liquid dairy manure: fractionation and path analysis. Soil Science. Vol 169:6 pg 449-456. Zunino, M., F. Borie, S. Aguilera, J.P. Martin, K.M. Haider. 1982. Decomposition of 14C-labeled glucose, plant and microbial products and phenols in volcanic ash-derived soils of Chile. Soil Biology and Biochemistry 14: 37-43.
85
CHAPTER 3
COMPARATIVE ANALYSIS OF AN INTEGRATED SYSTEM UTILIZING ALGAL MEAL AS AN ORGANIC FERTILIZER
Abstract
Algae have shown great potential as a source for renewable fuels; however,
current production schemes have not been able to prove a sustainable energy
return on investment due to the high costs of nutrient addition and the energy
required for drying the biomass. Integrated algae-dairy production systems have
been posited as a potential solution for algal production barriers as well as a way to
capture environmentally problematic nutrients excreted by animals in concentrated
animal feeding operations. I hypothesized that, when considering environmental
benefits and current policy incentives, utilizing the fertilizer value of algal meal at
$800 Mg-1 will show the integrated production facility to be an economically viable
manure management system. Utilizing data from similar operations, I calculated the
potential net present value, showing that the fertilizer value of algal meal adds
enough income to make the system profitable.
Introduction
The impetus for quantifying the fertilizer value of algal meal was that the
algal fuel industry is leaving money on the table by undervaluing 50-80% of their
product. The protein-rich biomass, algal meal, has received little attention in the
algal energy research world. Economic assessments (Chisti, 2007; Cantrell et al.,
86
2008; Sanders and Murthy, 2009; Sakthivel et al., 2011) have expressly stated that
the value of the co-product has not been included in the overall valuation. Algal by-
products from each different kind of proprietary production method have their own
inherent C:N ratio, NPK content, concentration of micronutrients, and electrical
conductivity, each lending to the overall nutritive value. By showing that algal meal
can be as effective as both the conventional and organic standard at delivering N to
a crop (Andrews, 2013) I have validated assigning a price equivalent to the current
market value of conventional and organic fertilizers on a price per unit of nutrient
basis (Table 8). Under current market conditions the conventional nutrient
equivalent delivered to the grower was $140 Mg-1 and the value to an organic
grower was $1054 Mg-1. Including marketing costs and transportation expenses, an
algae facility could expect a sale price of $800 Mg-1 of dry algal meal with an NPK of
7-3-1 (Andrews, 2013). This valuation does not include any potential benefits of the
product beyond the macro nutrient values.
Though increasing the assigned market value of 50-80% of the total biomass
produced (algal meal) may go a long way toward economic feasibility, there are
bigger issues facing the algal fuel industry that need to be addressed. The
production of nutrients for algal biodiesel production has been demonstrated to be
the major contributor to the total greenhouse gas emissions of the system (Clarens
et al., 2010; NAS, 2012). In order to meet the US Department of Energy goal of 136
billion L (17% of total fuel consumption) of biofuel production by 2022, with only
57 billion L from corn ethanol, the current methods of algae oil production would
87
use an estimated 14-36 million Mg of N and 2-5.5 million Mg of P (NAS, 2012). The
largest energy input of algae production, 89% of total energy requirements, is in the
drying of the algal cake in preparation for extraction (Sander and Murthy, 2009).
Further, evaporative losses during algae growth are the largest quantity of water
consumption. The NAS (2012) estimated that the mean US evaporation rate from a
raceway pond is 0.9 m3 m-2 yr-1.
Integrated algae-dairy models have been designed in order to overcome
nutrient capture and greenhouse gas (GHG) management issues faced by industrial
animal agriculture and in so doing, overcome the algae production barrier of
nutrient costs (Lincoln et al., 1996; Craggs et al., 2004; Mulbry et al., 2005; Woertz et
al., 2009; Wang et al., 2010; Zhang et al., 2013). I have proposed a dairy-anaerobic
digestion-algae system (DADA) in which the dairy-housing manure is sent to an
anaerobic digester (AD) where a succession of microbes transform the organic
matter into a methane-rich biogas, heat, nutrient-rich liquid effluent, and solid
compost. The liquid effluent is diluted and used as the nutrient broth for the algae
production. The heat is incorporated into drying of the algal biomass. The
composted solids are used as bedding in the free stalls or sold into the horticultural
markets. The algal biomass is extracted for fatty acid methyl esters (FAME
biodiesel). From this process glycerin and “biomass” are also produced. The biomass
co-product, algal meal, is used on farm or sold as an organic fertilizer. Logistically,
the actual biodiesel refinery should not be co-located on a dairy. Instead the dairy
88
will produce the total dry biomass and sell it to a biorefinery for extraction, at a
price that accounts for the total value of each of the co-products.
The methane biogas can be used to power algae, dairy, and AD operations on
farm with any remainder being sold back to the energy grid. The biodiesel is used to
operate large farm equipment with the remainder sold as transportation fuel. The
glycerin can be used to optimize the AD performance. Amon et al. (2006)
demonstrated a three-fold increase in biogas yield when glycerol (at 6% of total
biomass) was added to pig manure slurry. It has been shown to be a suitable
replacement for corn as a feed energy source (at least up to 15% of the ration)
without adverse effects on milk production or milk composition (Donkin et al.,
2009). The solid effluent from the AD is ready-made compost and is reused as dairy
bedding, as is commonly the practice of dairymen utilizing an AD and solids
separator systems (Meyer et al., 2011). The size of the algal raceway can be scaled
based on the optimal concentration of P addition and the characteristics of the
liquid effluent from the AD. Several studies have shown P removal from dairy waste
by algae is nearly 100%, commonly greater than removal of N (70-90%), indicating
P is the limiting algal growth factor when using dairy effluent as the nutrient media
(Lincoln et al., 1996; Mulbry et al., 2008; Woertz et al., 2009).
In a non-integrated production models the cost of drying the algal biomass
for lipid extraction has been one of the cost prohibitive steps in the life cycle
analysis. However, the heat and energy produced in the AD has been calculated to be
more than enough to cover the energy requirements of drying the algal cake
89
(Pizarro et al., 2006). If we assume we can dry algal biomass to 20% solids through
a screw press or solar drying (Kadam, 2001; Pizarro et al., 2006; Mulbry et al., 2008)
and 220kg of dried algal biomass is produced on each hectare, the energy required
to dry the biomass is 3900 MJ ha-1 d-1 to 90% DM. Using the 11 ha treatment area
needed for 1000 cows, producing algae 270 days a year the total energy needed is
1.17 x 10⁷ MJ yr-1 (Pizarro et al., 2006). Assuming each cow produces 5.7 kg of
manure VS d-1 (Van Horn et al., 1994) and anaerobic digestion yields 350 L of biogas
kg-1 VS (Amon et al., 2006; Homan et al., 2013), biogas production should be 2000 L
cow-1 d-1. Methane has an energy content of 0.037 MJ L-1, the biogas is composed of
60% methane. Therefore, the total energy provided by the AD would be 1.63 x 10⁷
MJ yr-1 (Pizarro et al., 2006). The energy requirement for drying is met as well as the
estimated 30% of total heat production that is needed to keep the AD at 35oC.
Seventy-five percent of the energy produced by the AD is heat (Wright, 2001).
Further biogas is difficult to store, compress, or liquefy, requiring low temperatures
(-83oC) and high pressure (5000psi) (Homan et al., 2013). Therefore in order to
utilize the energy efficiently it would be very difficult to use the biogas for anything
but continuous on site consumption.
The primary difference between this project and others who have evaluated
integrated algae-dairy operations is that I use the algae, not just to capture
nutrients, but also to extract the biomass for biodiesel, yielding high value co-
products. It has been posited that unless algal lipid content is at least 40% of the
biomass, the total biomass will yield more energy as a feedstock for AD than from
90
biodiesel extraction (Sialve et al., 2009). Farm-scale work by the USDA ARS lab in
Beltsville, MD has only realized 12% lipid content using algal turf scrubber (ATS)
technology to capture nutrients from dairy wastes (Mulbry, 2007). These works are
cited as the driving reason that Zhang et al., (2013) evaluated their integrated
system utilizing the total algal biomass as AD feedstock for their life cycle analysis
and life cycle costing. However, in outdoor bench-scale cultures of algae grown on
dairy wastewater, Woertz et al., (2009) was able to reach a maximum lipid
productivity of 29% (not at peak biomass production). In the Mulbry system, the
primary goal was dairy waste nutrient capture, therefore they allowed an
indigenous algal consortia, dominated by Rhizoclonium hieroglyphicum, to naturally
colonize the ATS in early spring (Mulbry et al., 2008) instead of selecting for species
with high lipid productivity. The use of controlled seeding with benthic algae, such
as Amphora, which have demonstrated 40% lipid content, (Griffiths and Harrison,
2009) is a possible way to increase the total value of the ATS system.
The recent paper by Zhang et al. (2013) reported a complete “cradle to gate”
life cycle analysis (LCA) and life cycle costing (LCC) of four different dairy manure
management practices calculating the net present value (NPV) of each. A reference
land application scenario (REF), an AD with land-application of liquid digestate
operation (ADO), an AD with recycling of liquid digestate to an open-pond algae
cultivation system (OPS), and an AD with recycling of liquid digestate to an algae
turf scrubber system (ATS) were evaluated for net energy output, reductions in net
eutrophication potential, and reductions in global warming potential. They found
91
that all three “improved” systems were environmentally favorable. Further, if robust
nutrient credits, valued at $20 kg-1 N in Chesapeake Bay Watershed are available,
the algae systems are much more financially attractive considering: initial outlay,
annual operating costs, and annual revenue (Table 9).
I hypothesize that when considering environmental benefits (nutrient
capture, GHG emissions reduction, and energy displacement), and current policy
incentives of integrating algal biodiesel and AD into dairy production, utilizing the
fertilizer value of algal meal at $800 Mg-1 (Andrews, 2013) to the producer will show
the integrated DADA production facility to be an economically viable manure
management system. More field trials using algal meal as a fertilizer are needed
before this value is firmly established. Following price validation, a complete life
cycle analysis must be performed in order to assess this hypothesis. In order to
evaluate the potential viability of DADA, the detailed, supplemental production and
accounting data by Zhang et al. (2013), will be used for estimates and comparison.
Materials and Methods
Utilizing the supplemental data from the LCC of Zhang et al. (2013), I
estimated the NPV of the DADA system (Table 9). To calculate the capital
expenditure, I used the cost of the anaerobic digester from the ADO scenario as well
as the cost of the algae cultivation. I subtracted the cost of the pretreatment of algae
for the AD and added $50,000 as an estimated cost for a dryer being built into the
system. To estimate the operational cost, I used reported values from the ADO AD
92
operation and the ATS algae operation. For the total revenues, I excluded the corn
productivity from the area that the algal facility occupied and any profit from the
sale of bio-electricty as the AD energy generation will likely be completely used on
farm for the algae drying process. The value of the digestate is the same as from the
ADO. Using Zhang’s published ATS algal productivity of 1.53 Mg cow-1 yr-1,
estimating 25% of the total algal biomass is FAME, using 0.883 g cm-3 as the density
(www.biofuelsb2b.com), and using a sale price of $3.00 gal-1 (Chisti, 2007), I
calculated the profit from the sale of biodiesel for 100 cows-1 yr-1. The algal meal
value was calculated as 70% of the total biomass at $800 Mg-1. Additional revenue
from glycerin and omega-3 oils were not included in this preliminary analysis but
offer additional potential revenue sources. The total capital cost was amortized over
20 years without accounting for a discount rate and subtracted from the annual
profit to achieve the NPV (Table 9).
Results and Discussion
Utilizing robust nutrient trading programs, all of the algae systems returned
a net profit to the dairyman (Table 9). However, nutrient trading programs are only
established in the highly-sensitive Chesapeake Bay Watershed states of MD, PA, VA,
and WV. Without the nutrient credits for the OPS and ATS systems, an operator
would spend roughly 40 times as much for their annual manure management
system as the potential operator of a DADA system. The additional monetary gain
93
for the energy provided by the algal biomass in the AD system was $9,954 and
$12,439 for OPS and ATS. This is less than the calculated economic benefit of the
biodiesel product and considerably less when including the $82,600 100 cow-1 yr-1
generated by the sale of organic fertilizer.
As reported in Zhang et al. (2013), the environmental benefits of each of the
systems was far greater than from the reference scenario for both global warming
potential and eutrophication potential. These benefits will also apply to the DADA
system. Economic benefits of accounting for positive environmental externalities
are currently possible through government tax credits, infrastructure grants, and C
trading markets. The production tax credit reduces the federal income tax of
qualified owners of renewable energy projects, paying $22 MW h-1 based on total
electrical output for the first 10 years of operation (Goodward and Gonzalez, 2010).
The Investment Tax Credit (ITC) allows tax payers to deduct 10-30% (depending on
facility type) of their capital investment from their federal income tax when the
equipment is placed into service (Goodward and Gonzalez, 2010). California has
established a C trading market with current values for short-term trades at $14 Mg-1
CO2e (e=equivalence) reduction (Weisberg, 2013). If the fuel is sold to
transportation fuel refiners, biodiesel from the algal production is also eligible for
Renewable Identification Numbers (RINs). One caveat is that the RIN (1 RIN=77,000
BTUs) is owned by the fueling station and should be included in the contracted sale
price of the fuel. The current RIN price average is $0.52 RIN-1 (Weisberg, 2013).
Biogas and biodiesel both have lower C intensity than crude oil, qualifying both for
94
credits in the California markets under the Low Carbon Fuel Standard (Weisberg,
2013). Regardless of the fact that there are many potential policy incentives for the
DADA system, most cannot be presented to a loan board because they are too
volatile in price and the expiration dates for each program tend to have moving
targets (Weisberg, 2013). Additionally the frequency of fraudulent claims and the
lack of set metrics for assessing improvement parameters have infused doubt into
the market, all but eliminating long-term contracts or anything other than spot
market prices (Weisberg, 2013).
The original analysis by Zhang, et al. (2013), was done on a 100-cow dairy
that is typical in the Chesapeake watershed. The theory of economies of scale is
based on the cost advantages that businesses obtain due to increased size. The cost
per unit of output generally decreases with increasing scale as fixed costs are spread
out over more units of output, to a point (McConnell and Brue, 2002). Often
operational efficiency is also greater with increasing scale, leading to lower variable
cost as well (McConnell and Brue, 2002). Goodrich (2005) calculated that for a 100-
cow herd the capital expenditure for an AD setup is over $60,000. Increasing the
herd size to 200 or 300 would increase the capital and operational costs by 1.4 and
1.6 times respectively (Goodrich, 2005) reducing the total cost per animal. Dairies
with small herds do not have a large appetite for high capital investment for manure
management, while larger operators may see greater incentive and lower marginal
risk. The US EPA Climate Change Division of the Office of Atmospheric Programs
mandates that facilities produce aggregate GHG emissions greater than 27,500 Mgs
95
of CO2e per year monitor and report emissions, whereas a facility with less than
3,200 mature dairy cows are not currently required to report emissions (US EPA,
2009). For these reasons future work should be modeled with more than 3200 cows
in order provide data to those who will face nutrient and GHG management
challenges caused by changing regulations.
Conclusions
This rough accounting, relying heavily upon the work of Zhang, et al. (2013),
shows that including the fertilizer value of algal meal into the overall economic
assessment pushes an environmentally favorable practice toward economic
viability. In a recent phone interview with an algae industry professional I was told
that these results will have a significant impact on the industry, potentially changing
the single-minded lipid focus (Van Der Meulen, 2013). This gives me confidence that
an integrated dairy-anaerobic digester-algae production facility has the potential to
address a variety of management, environmental, and economic issues faced by
large-scale animal agriculture while addressing the issues facing an industry that
has been shown to have the greatest potential for bioenergy production efficiency.
In addition to diversified production opportunities; the sale of biodiesel, electrical
energy, and high value fertilizers, this system would create high-tech jobs on farms,
potentially enhancing rural economic development.
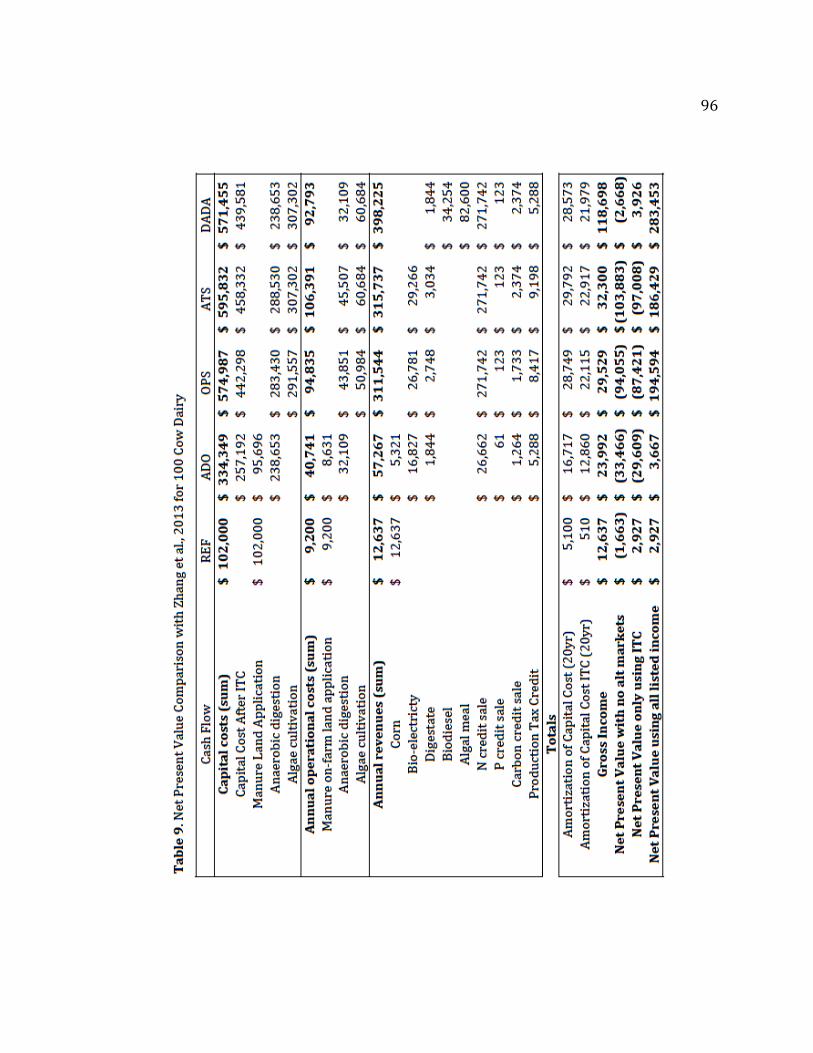
96
97
Literature Cited Chapter 3
Amon, T.H., B. Amon, V. Kryvoruchko, V. Bodiroza, E. Potsch, W. Zollitsch. 2006. Optimising methane yield from anaerobic digestion of manure: Effects of dairy systems and of glycerine supplementation. International Congress Series 1293:217-220. Biofuelsb2b. The online market for Biofuels and Biomass. http://www.biofuelsb2b.com/useful_info.php?page=Energy accessed April 10, 2013. Cantrell, K.B., T. Ducey, R.S. Ro, P.G. Hunt. 2008. Livestock waste-to-bioenergy generation opportunities. Bioresource Technology. 99:7941-7953. Chisti, Y. 2007. Biodiesel from microalgae. Biotechnology Advances (25) 294-306. Clarens, A.F., E.P. Resurrection, M.A. White, L.M. Colosi. 2010. Environmental life cycle comparison of algae to other bioenergy feedstocks. Environmenal Science and Technology (2010) 44(5), pp 1813-1819. Craggs, R.J., J.P. Sukias, C.T. Tanner, R.J. Davies-Colley. 2004. Advanced pond system for dairy-farm effluent treatment. New Zealand Journal of Agricultural Research 47(4):449-460. Donkin, S.S., S.L. Koser, H.M. White, P.H. Doane, M.J. Cecava. 2009. Feeding value of glycerol as a replacement for corn grain in rations fed to lactating dairy cows. Journal of Dairy Science 92:5111-5119 Goodrich, P. 2005. Anaerobic digester systems for mid-sized dairy farms. The AgStar Fund for Rural America. The Minnesota Project. Goodward, J., M. Gonzalez. 2010. The bottom line on … renewable energy tax credits. World Resource Institute, issue 18. Washington, DC, USA. Giffiths, M.J., S.T.L. Harrison. 2009. Lipid productivity as a key characteristic for choosing algal species for biodiesel production. Journal of Applied Phycology. 21:493-507. Homan, E., M.D. Shaw, H. Bartlett, S. Persson. 2013. Biogas from Manure – Special Circular 260. Penn State Extension. Extension.psu.edu/energy/waste-to- energy/biogas/projects/biogas-from-manure. Accessed on 3-1-13. Kadam, K.L. 2001. Microalgae production from power plant flue gas: environmental
98
implications on a life cycle basis. Tech. Rep. NREL/TP-510-29417, National Renewable Energy Laboratory. Lincoln, E.P., A.C. Wilkie, B.T. French. 1996. Cyanobacterial process for renovating dairy wastewater. Biomass Bioenergy, 10(1)63-68. McConnell, C.R., S.L. Brue. 2002. Economics 15th ed. Boston. McGraw-Hill Irwin. Print. Meyer, D., P.L. Price, H.A. Rossow, N. Silva-del-Rio, B.M. Karly, P.H. Robinson, E.J. DePeters, J.G. Fadel. 2011. Survey of dairy housing and manure management practices in California. Journal of Dairy Science 94:4744-4750. Mulbry, W., E. Kebede-Westhead, C. Pizarro, L. Sikora. 2005. Recycling of manure nutrients: use of algal biomass from dairy manure treatment as a slow release fertilizer. Bioresource Technology. 96:451-458. Mulbry, W., S. Konrad, C. Pizarro, E. Kebede-Westhead. 2008. Treatment of dairy manure effluent using freshwater algae: Algal productivity and recovery of manure nutrients using pilot-scale algal turf scrubbers. Bioresource Technology. 99:8137-8142. National Academy of Sciences; Committee on the Sustainable Development of Algal Biofuels. 2012. Sustainable Development of Algal Biofuels in the United States. Board on Agriculture and Natural Resources, Board on Energy and Environmental Systems, National Research Council. The National Academies Press. Pizarro, C., W. Mulbry, D. Blersch, P. Kangas. 2006. An economic assessment of algal turf scrubber technology for treatment of dairy manure effluent. Ecological Engineering 26:321-327. Sakthivel, R., S. Elumalai, M. Mohommad arif, 2011. Microalgae lipid research, past, present: A critical review for biodiesel production, in the future. Journal of Experimental Sciences 2(10):29-49. Sander, K, G.S. Murthy. 2010. Life cycle analysis of algae biodiesel. International Journal of Life Cycle Assessment. 15:704-714. Sialve, B., N. Bernet, O. Bernard. 2009. Anaerobic digestion of microalgae as a necessary step to make microalgal biodiesel sustainable. Biotechnology Advances 27:409-416.
99
United States of America, Environmental Protection Agency, Mandatory Reporting of Greenhouse Gases; Final Rule Part 2. Federal Register Vol. 74 No. 209. Oct 30, 2009. Van der Muelen, Leslie. Personal interview with business development manager at an algae company. Mar 15, 2013. Van Horn, H.H., A. C. Wilke, J. Powers, R.A. Nordstedt. 1994. Components of Dairy Manure Management Systems. Journal of Dairy Science 77:2008-2030. Wang, L., Y. Li, P. Chen, M. Min, Y. Chen, J. Zhu, R.R. Raun. 2010. Anaerobic digested dairy manure as a nutrient supplement for cultivation of oil-rich green microalgae Chlorella sp. Bioresource Technology 101:2623-2628. Weisberg, Peter. “Biogas and Environmental Markets.” BioCycle West Coast Conference. Town and Country Resort, San Diego, CA. April 10, 2013. Conference Presentation. Woertz, I., A. Feffer, T. Lundquist, Y. Nelson. 2009. Algae grown on dairy and municipal wastewater for simultaneous nutrient removal and lipid production for biofuel feedstock. Journal of Environmental Engineering 135:1115-1122. Wright, P. Overview of Anaerobic Digestion Systems for Dairy Farms. Natural Resource, Agriculture and Engineering Service (NRAES-143), March 2001. Zhang, Y., M.A. White, L.M. Colosi. 2013. Environmental and economic assessment of integrated systems for dairy manure treatment coupled with algae bioenergy production. Bioresource Technology 130:486-494.
100
SUMMARY
Algae have shown great potential as a source for renewable fuels. The 2012
report by the National Academy of Sciences recommends further research into the
use of wastewater and fertilizer to meet algal production sustainability. My
objective was to quantify the fertilizer value of the co-product, algal meal, for the
economic evaluation of an integrated dairy-anaerobic digester-algae production
facility. The algal meal performed similarly to the feather meal in the laboratory
incubation mineralization tests. In the field trial the algal meal treatments, 101 kg N
ha-1, 146 kg N ha-1, and 190 kg N ha-1 produced the same corn yield and ear N
concentration as both feather meal treatments and urea treatments fertilized at the
highest rate. This gave me confidence to quantify the fertilizer value of this algal
meal relative to feather meal on a price per unit of nutrient basis. This 7-3-1 NPK
algal meal is worth $800 Mg-1 to the producer at current market prices. This price
only includes the value of the macronutrients N, P, and K. Each algal biomass will
vary depending on processing, extraction, algal strain, and nutrient media. After
further testing to fully quantify the value of the micronutrients, phytohormones, C
sequestration, and required application rates, a higher market value is expected.
Integrated algae-dairy production systems have been posited as a potential
solution for algal production barriers as well as a way to capture environmentally
problematic nutrients excreted by animals in concentrated animal feeding
101
operations. In a preliminary accounting, the inclusion of the fertilizer value of algal
meal for an integrated dairy-anaerobic digester-algae production facility takes it
from a system that shows great environmental impact reduction that may work
with the right policy incentives, to a system that is profitable even with few
government incentives. Future work should include a life cycle analysis and life
cycle costing of the proposed farm facility to confirm that an integrated dairy-
anaerobic digester-algae system can be an economically viable, manure-
management, farm-energy production system.
102
BIBLIOGRAPHY
Acadian Sea Plants. http://www.acadianseaplants.com/plant-growth-development- products. Accessed Feb 2013. AgriMet, The Pacific Northwest Cooperative Agricultural Weather Network. http://www.usbr.gov/pn/agrimet/. Accessed 5-16-13 Amon, T.H.. B. Amon, V. Kryvoruchko, V. Bodiroza, E. Potsch, W. Zollitsch. 2006. Optimising methane yield from anaerobic digestion of manure: Effects of dairy systems and of glycerine supplementation. International Congress Series 1293:217-220. Argo, B., P. Fisher. 2008. Understanding plant nutrition: fertilizers and media pH. Greenhouse grower. http://www.greenhousegrower.com/article/4049/understanding-plant- nutrition-fertilizers-and-media-ph. Accessed 3-17-13. Ball-Coelho, B.R., R.C. Roy, A.J. Bruin. 2004. Nitrate leaching as affected by liquid swine manure and cover cropping in sandy soil of Southwestern Ontario. Canadian Journal of Soil Science 84:187. Bary, A.I., C.G. Cogger, and D.M. Sullivan. 2000. Fertilizing with manure. Pacific Northwest Extension Publication 533. Washington State University Cooperative Extension, Pullman, WA. BASF The Chemical Company. Outlook. http://agproducts.basf.us/products/outlook-herbicide.html. Accessed May 25, 2012. Beckett, R.P., J. van Staden. 1989. The effect of seaweed concentrate on the growth and yield of potassium stressed wheat. Plant Soil 116:29–36. Benemann, J., W. Oswald. 1996. Updated 2009. Systems and economic analysis of microalgae ponds for conversion of CO2 to biomass – final report; Department of Energy: Pittsburg, PA pgs 214. Biofuelsb2b. The online market for Biofuels and Biomass. http://www.biofuelsb2b.com/useful_info.php?page=Energy. Accessed April 10, 2013
103
Bjorneberg, D.L., A.B. Leytem, D.T. Westermann, P.R. Griffiths, L. Shao, and M.J. Pollard. 2009. Measurement of atmospheric ammonia, methane, and nitrous oxide at a concentrated dairy production facility in southern Idaho using open-path FT-IR spectrometry. Transactions of the ASABE 52:1749–1756. Blunden, G. 1972. The effects of aqueous seaweed extract as a fertilizer additive. Proceedings of the International Seaweed Symposium 7:584–589. Blunden, G. 1991. Agricultural uses of seaweeds and seaweed extracts. In: (Eds. M.D. Guiry, G. Blunden) Seaweed resources in Europe: uses and potential. Wiley, Chicester, pp 65–81. Blunden, G., S.M. Gordon. 1986. Betaines and their sulphono analogues in marine algae. In: F.E. Round, D.J. Chapman (Eds) Progress in phycological research, vol 4. Biopress Ltd, Bristol, pp 39–80. Booth, M., J.M. Stark, E. Rastetter. 2005. Controls on nitrogen cycling in terrestrial ecosystems: a synthetic analysis of literature data. Ecological Monographs. 75(2):139-157. Bouwmeester, R.J.B., P.L.G. Vlek, J.M. Stumpe. 1985. Effect of environmental factors on ammonia volatilization from urea-fertilized soil. Soil Science Society of America Journal. 49:376–381.doi:10.2136/sssaj 1985.03615995004900020021x. Brain K.R., M.C. Chalopin, T.D. Turner, G. Blunden, P.B. Wildgood. 1973. Cytokinin activity of commercial aqueous seaweed extract. Plant Science Letters 1:241- 245. Cantrell, K.B., T. Ducey, R.S. Ro, P.G. Hunt. 2008. Livestock waste-to-bioenergy generation opportunities. Bioresource Technology. 99:7941-7953. Chantigny, M.H., P. Rochette, D.A. Angers, D. Masse, D. Cote. 2004. Ammonia volatilization and selected soil characteristics following application of anaerobically digested pig slurry. Soil Science Society of American Journal 68:306-312. Chapin, F.S. III, N. Fetcher, K. Kielland, K.R. Everett, A.E. Kinkings. 1988. Productivity and nutrient cycling of Alaskan tundra. Enhancement by flowing water. Ecology 69:693-702. Chapin, F.S. III, P. Matson, H. Monney. 2002. Principles of terrestrial ecosystem ecology. Springer-Verlag, New York, NY, USA.
104
Chisti, Y. 2007. Biodiesel from microalgae. Biotechnology Advances (25) 294-306. Clarens, A.F., E.P. Resurrection, M.A. White, L.M. Colosi. 2010. Environmental life cycle comparison of algae to other bioenergy feedstocks. Environmental Science and Technology 44(5):1813-1819. Cogger, C.G., A.I. Bary, D.M. Sullivan, E.A. Myhre. 2004. Biosolids processing effects on first- and second- year available nitrogen. Soil Science Society of America Journal 68:162-167. Craggs, R.J., J.P. Sukias, C.T. Tanner, R.J. Davies-Colley. 2004. Advanced pond system for dairy-farm effluent treatment. New Zealand Journal of Agricultural Research 47(4):449-460. Crouch, I.J., J. van Staden. 1992. Effect of seaweed concentrate on the establishment and yield of greenhouse tomato plants. Journal of Applied Phycology 4:291– 296. Crouch, I.J., J. van Staden. 1993. Evidence for the presence of plant growth regulators in commercial seaweed products. Plant Growth Regulation 13:21–29. Delin, S., B. Stenberg, A. Nyberg, L. Brohede. 2012. Potential methods for estimating fertilizer value of organic residues. Soil Use and Management 28:283-291. Donkin, S.S., S.L. Koser, H.M. White, P.H. Doane, M.J. Cecava. 2009. Feeding value of glycerol as a replacement for corn grain in rations fed to lactating dairy cows. Journal of Dairy Science 92:5111-5119. Dow AgroSciences. http://www.dowagro.com/usag/prod/034.htm. Accessed May 25, 2012. Durand, N., X. Briand, C. Meyer. 2003. The effect of marine bioactive substances (NPRO) and exogenous cytokinins on nitrate reductase activity in Arabidopsis thaliana. Physiologia Plantarum 119:489–493. Dyck, W., C. Mees, P. Hodgkiss. 1987. Nitrogen availability and comparison to uptake in two New Zealand Pinus radiata forests. New Zealand Journal of Forest Science 17: 38–352. Eghball, B., R.A. Eigenberg, J.E. Gilley, B.J. Wienhold. 2002. Mineralization of manure nutrients. Journal of Soil and Water Conservation 57.6 (Nov-Dec ) p470.
105
Flesch, T.K., L.A. Harper, J.M. Powell, and J.D. Wilson. 2009. Inverse-dispersion calculation of ammonia emissions from Wisconsin dairy farms. Trans. ASAE 52:253–265. Francis, D.D., M.F. Vigil, A.R. Mosier. 2008. Gaseous losses of nitrogen other than through denitrification. In: Nitrogen in Agricultural Systems (Eds. Schepers, J.S. & W.R. Raun), pp. 157-172. American Society of Agronomy Inc.; Crop Science Society of America Inc.; Soil Science Society of America Inc., Madison, WI. Freeman, K.W., K. Girma, R.K. Teal, D.B. Amall, B. Tubana, S. Holtz, J. Mosali, W.R. Raun. 2008. Long-term effects of nitrogen management practices on grain yield, nitrogen uptake, and efficiency in irrigated corn. Journal of Plant Nutrition 30:2021-2036. Gale E.S., D.M. Sullivan, C.G. Cogger, A.I. Bary, D.D. Hemphill, E.A. Myhre. 2006. Estimating plant-available nitrogen release from manures, composts and specialty products. Journal of Environmental Quality 35:2321-2332. Gavlak, R.G., D.A. Horneck, R.O. Miller. 1994. Plant, soil, and water reference methods for the western region. Produced in cooperation with the Far West Fertilizer and Agrichemical Association. German, D.P., M.N. Weintraub, A.S. Grandy, C.L. Lauber, Z.L. Rinkes, S.D. Allison. 2011. Optimization of hydrolytic and oxidative enzyme methods for ecosystem studies. Soil Biology and Biochemistry 43(7): 1387–1397. Giblin, A.E., K.J. Nadelhoffer, G.R. Shaver, J.A. Laundre, and A.J. McKerrow. 1991. Biogeochemical diversity along a riverside toposequence in arctic Alaska. Ecological Monographs 61:415–435. Gilmour, J.T. 1998. Carbon and nitrogen mineralization during co-utilization of biosolids and composts. p. 89–112. In Beneficial co-utilization of agricultural, municipal and industrial by-products. _Eds. S. Brown, J.S. Angle, and L. Jacobs) Kluwer Academic Publ., Dordrecht, the Netherlands. Goodrich, P. 2005. Anaerobic Digester Systems for Mid-Sized Dairy Farms. The AgStar Fund for Rural America. The Minnesota Project. Goodward, J., M. Gonzalez. 2010. The bottom line on … renewable energy tax credits. World Resource Institute, issue 18. Washington, DC, USA.
106
Griffiths, M.J., S.T.L. Harrison. 2009. Lipid productivity as a key characteristic for choosing algal species for biodiesel production. Journal of Applied Phycology. 21:493-507. Hankins, S.D., H.P. Hockey. 1990. The effect of a liquid seaweed extract from Ascophyllum nodosum (Fucales, Phaeophyta) on the two spotted red spider mite Tetranychus urticae. Hydrobiologia 204(205):555–559. Hargrove, W.L. 1988. Soil, environmental, and management factors infl uencing ammonia volatilization under fi eld conditions. p. 17–36. In B.R. Bock and D.E. Hart, J.M., E.S. Marx, N.W. Christensen, J.A. Moore. 1997. Nutrient management strategies. Journal of Dairy Science 80:2659-2666. Hart, J.M., D.M. Sullivan, J.R. Myers, R.E. Peachey. Oct 2010. Sweet corn (Western Oregon) nutrient management guide. Oregon State University Extension EM9010-E. Havlin, J.L., J.D. Beaton, S.L. Tisdale, W.L. Nelson. 1999. Soil Fertility and Fertilizers, 6th Edition. Upper Saddle River, N.J. Prentice-Hall, Inc. 499p. Heimann, M., and Rechstein, M. 2008. Terrestrial ecosystem carbon dynamics and climatefeedbacks. Nature 451: 289-292. Homan, E., Shaw, M.D., Bartlett, H., Persson, S. 2013. Biogas from Manure – Special Circular 260. Penn State Extension. Extension.psu.edu/energy/waste-to- energy/biogas/projects/biogas-from-manure. Accessed on 3-1-13 Hood-Nowotny, R., N. Hink-Najera Uman, E. Inselbacher, P. Oswald-Lachoani, W. Wanek. 2010. Alternative methods for measuring inorganic, organic and total dissolved nitrogen in soil. Soil Science Society of America Journal 74:1018- 1027. Hooda, P. S., V.W. Truesdale, A.C. Edwards, P.J.A. Withers, M.N. Aitken, A. Miller, and A.R. Rendell. 2001. Manuring and fertilization effects on phosphorus accumulation in soils and potential environmental implications. Advances in Environmental Resources 5:13–21. Hyslop weather station managed by Oregon State University. http://agsci.oregonstate.edu/farmunit/weather/archive. Accessed Mar 1, 2013.
107
Indexmundi.com 2013 http://www.indexmundi.com/commodities/?commodity=soybean-meal. Accessed April 30, 2013. IPCC. 2007. Fourth Assessment Report (AR4). Intergovernmental Panel on Climate Change (IPCC), http://ipcc-wg1.ucar.edu/index.html. Kadam, K.L. 2001. Microalgae production from power plant flue gas: environmental implications on a life cycle basis. Tech. Rep. NREL/TP-510-29417, National Renewable Energy Laboratory. Kaharabata, S.K., P.H. Schuepp, and R.L. Desjardins. 1998. Methane emissions from above ground open manure slurry tanks. Global Biogeochemical Cycles 12:545–554. Kalieda Graph Synergy Software version 4.1.3. Copyright 1986-2011, purchased Nov 10, 2011. Kandeler, E., and H. Gerber. 1988. Short-term assay of soil urease activity using colorimetric determination of ammonium. Biology and Fertility of Soils 6:68- 72. Kebede-Westhead, E., C. Pizarro, W. Mulbry. 2006. Treatment of swine manure effluent using freshwater algae: Production, nutrient recovery, and elemental composition of algal biomass at four effluent loading rates. Journal of Applied Phycology 18(1), 41. Khaleel, R., K.R. Reddy, M.R. Overcash. 1981. Changes in soil physical properties due to organic waste applications: a review. Journal of Environmental Quality 10:133-141. Khan, W., U.P. Rayirath, S. Subramanian, M.N. Jithesh, P. Rayorath, D.M. Hodges, A.T. Critchley, J.S. Craigie, J. Norrie, B. Prithiviraj. 2009. Seaweed extracts as biostimulants of plant growth and development. Journal of Plant Growth Regulation. 28:386-399. Kissel, (ed.). Ammonia volatilization from urea fertilizers. Bull. Y-206. Natl. Fert.
Dev. Ctr., Muscle Shoals, AL. Kissel, D.E., M.L. Cabrera, S. Paramasivam. 2008. Ammonium, ammonia and urea reactions in soils. In: Nitrogen in Agricultural Systems (Eds. Schepers, J.S. & W.R. Raun), pp. 101–155. American Society of Agronomy Inc.; Crop Science Society of America Inc.; Soil Science Society of America Inc., Madison, WI.
108
Kleber, M., M.G. Johnson. 2010. Advances in understanding the molecular structure of soil organic matter: implications for interactions in the environment. In: Advances in Agronomy, (Ed Sparks, D.) vol 106, pg 77-142 Elsevier. Burlington: Academic Press. Lashermes, G., B. Nicolardot, V. Parnaudeau, L. Thuries, R. Chaussod, M.L. Guillotin, M. Lineres, B. Mary, L. Metzger, T. Morvan, A. Tricaud, C. Vellette, S. Houot. 2010. Typology of exogenous organic matters based on chemical and biochemical composition to predict potential nitrogen mineralization. Bioresource Technology 101:157-164. Legg J.O., and J.J. Meisinger. 1982. Soil nitrogen budgtes. In Nitrogen in Agricultural Soils. Eds. F.J. Stevenson. pp 503–566. American Society of Agronomy, Madison, WI. Leytem, A.B., R.S. Dungan, D.L. Bjorneberg, A.C. Koehn. 2011. Emissions of ammonia, methane, carbon dioxide, and nitrous oxide from dairy cattle housing and manure management systems. Journal of Environmental Quality 40:1383- 1394. Lincoln, E.P., A.C. Wilkie, B.T. French. 1996. Cyanobacterial process for renovating dairy wastewater. Biomass Bioenergy, 10(1)63-68. Long, G. ed. 1842. Penny Cyclopaedia of the Society for the Diffusion of Useful Knowledge. 1842(24) 332-334. Lutzow, M.V., I. Kogel-Knabner, K. Ekschmitt, E. Matzner, G. Guggenberger. 2006. Stabilization of organic matter in temperate soils: mechanisms and their relevance under different soil conditions – a review. European Journal of Soil Science. 57:426-445. Magdoff, F.R. 1991. Managing nitrogen for sustainable corn systems: Problems and possibilities. American Journal of Alternative Agriculture 6: 3–8. Manzoni, S., A. Porporator. 2009. Soil carbon and nitrogen mineralization: Theory and models across scales. Soil Biology & Biochemistry 41:1355-1379. Marx, E.S., J. Hart, R.G. Stevens. 1999. Soil test interpretation guide. Oregon State University Extension Service EC 1478. McConnell, C.R., S.L. Brue. 2002. Economics 15th ed. Boston. McGraw-Hill Irwin. Print.
109
McKenzie, F.T. 2011. Our changing planet: An introduction to earth system science and global environmental change, 4th edition. Upper Saddle, NJ: Prentice- Hall. McKinsey & Company. 2009. Pathways to a low-carbon economy: Version 2 of the Global Greenhouse Gas Abatement Cost Curve. Copyright McKinsey & Company. Meisinger, J.J., F.J. Calderon, D.S. Jenkinson. 2008 Soil nitrogen budgets. In: Nitrogen in Agricultural Systems (Eds. Schepers, J.S. & W.R. Raun), pp. 505-562. American Society of Agronomy Inc.; Crop Science Society of America Inc.; Soil Science Society of America Inc., Madison, WI. Metting B., W.R. Rayburn, P.A. Reynaud. 1988. Algae and agriculture. In: C.A. Lembi,
J.R. Waaland (Eds) Algae and human affairs. Cambridge University Press, Cambridge, UK, pp 335–370.
Meyer, D., P.L. Price, H.A. Rossow, N. Silva-del-Rio, B.M. Karly, P.H. Robinson, E.J.
DePeters, J.G. Fadel. 2011. Survey of dairy housing and manure management practices in California. Journal of Dairy Science 94:4744-4750.
Miranda, K.M., M.G. Espey, and D.A. Wink. 2001. A rapid, simple and spectrophotometric method for simultaneous detection of nitrate and nitrite. Nitric Oxide 5:62-71. Moal, J.F., J. Martinez, F. Guiziou, C.M. Coste. 1995. Ammonia volatilization following
surface applied pig and cattle slurry in France. Journal of Agricultural Science 125: 245-252.
Montalba, R., C. Arriagada, M. Alvear, G.E. Zunia. 2010. Effects of conventional and organic nitrogen fertilizers on soil microbial activity, mycorrhizal colonization, leaf antioxidant content, and Fusarium wilt in highbush blueberry (Vaccinium corymbosum L.). Scientia Horticulturae 125: 775-778. Moore, J.A., J.M. Hart. 1997. Manure management system design strategies: how and why. Journal of Dairy Science. 80:2655-2658. Mozaffari, M., and J.T. Sims. 1994. Phosphorus availability and sorption in an Atlantic coastal plain watershed dominated by animal based agriculture. Soil Science 157:97–107.
110
Mulbry, W., E. Kebede-Westhead, C. Pizarro, L. Sikora. 2005. Recycling of manure nutrients: use of algal biomass from dairy manure treatment as a slow release fertilizer. Bioresource Technology. 96:451-458. Mulbry, W., S. Kondrad. P. Pizarro. 2006. Biofertilizers from algal treatment of dairy and swine manure effluents: characterization of algal biomass as slow release fertilizer. Journal of Vegetable Science 12:107–125. Mulbry, W., S. Konrad, C. Pizarro, E. Kebede-Westhead. 2008. Treatment of dairy manure effluent using freshwater algae: Algal productivity and recovery of manure nutrients using pilot-scale turf scrubbers. Bioresouce Technology 99:8137-8142. Myrold, D.D., N.C. Baumeister, J.A. Moore. 1992. Quantifying losses of nitrogen from land-applied dairy manure. Oregon Water Resources Research Institute. Corvallis, OR. WRRI-115. Myrold, D.D., P.J. Bottomley. 2008. Nitrogen mineralization and immobilization. In: Nitrogen in Agricultural Systems (Eds. Schepers, J.S. & W.R. Raun), pp. 157- 172. American Society of Agronomy Inc.; Crop Science Society of America Inc.; Soil Science Society of America Inc., Madison, WI. Nadelhoffer, K.J., J.D. Aber, and J. Melillo. 1983. Leaf litter production and soil organic matter dynamics along a nitrogen-availability gradient in Southern Wisconsin (USA). Canadian Journal of Forest Research 13:12–21. Nadelhoffer, K.J., J.D. Aber, and J. M. Melillo. 1984. Seasonal patterns of ammonium and nitrate uptake in nine temperate forest ecosystems. Plant and Soil 80:321–335. Nannipieri P., C. Ciardi, T. Palazzi, L. Badalucco. 1990. Short term nitrogen reactions following the addition of urea to a grass-legume association. Soil Biology Biochemisty 22, 549–553. Nannipieri, P., L. Falchini, L. Landi, A. Benedetti, S. Canali, F. Tittarelli, D. Ferri, G. Convertini, L. Badalucco, S. Grego, L. Vittori-Antisari, M. Raglione and D.Barraclough. 1999. Nitrogen uptake by crops, soil distribution and recovery of urea-N in a sorghum–wheat rotation in different soils under Mediterranean conditions. Plant and Soil 208:43-56. National Academy of Sciences; Committee on the Sustainable Development of Algal Biofuels. 2012. Sustainable Development of Algal Biofuels in the United States. Board on Agriculture and Natural Resources, Board on Energy and
111
Environmental Systems, National Research Council. The National Academies Press. Natural Resources Conservation Service. United States Department of Agriculture. Soil Survey of Benton County, Oregon. Accessed April 23, 2012. Norrie, J., J.P. Keathley. 2006. Benefits of Ascophyllum nodosum marine-plant extract applications to ‘Thompson seedless’ grape production. (Proceedings of the Xth International Symposium on Plant Bioregulators in Fruit Production, 2005). Acta Horticulturae 727:243–247. Norton, J., M. Habteselassie, J. Stark, B. Miller. 2007. Manure treatments change nitrogen cycling in soils receiving repeated applications of dairy-wastes. Western Nutrient Management Conference Vol. 7. Salt Lake City. UT. Oades, J.M. 1988. The retention of organic matter in soils. Biogeochemistry 5:35-70. Olguin, E.J. 2003. Phycoremediation: key issues for cost-effective nutrient removal processes. Biotechnological Advances 22, 81–91. Organic Trade Association. 2011. http://www.ota.com/organic/mt/business.html Accessed Feb 12, 2013. Pang, X.P., J. Letey. 2000. Organic farming: challenge of timing nitrogen availability to crop nitrogen requirements. Soil Science Society of America Journal 64:247-253. Paul, J.W., E.G. Beauchamp. 1996. Soil microbial biomass, C, N mineralization, and N uptake by corn in dairy cattle slurry- and urea-amended soils. Canadian Journal of Soil Science 469:472. Pierre, W. H. 1928. Nitrogen fertilizers and soil acidity: I. Effect of various nitrogenous fertilizers on soil reaction. Journal of American Society of Agronomy. 20:254-269. Pitesky, M.E., K.R. Stackhouse, F.M. Mitloehner. 2009. Clearing the air: livestock’s contribution to climate change. In: Advances in Agronomy, Vol 103. Elselvier Inc. Pizarro, C., W. Mulbry, D. Blersch, P. Kangas. 2006. An economic assessment of algal turf scrubber technology for treatment of dairy manure effluent. Ecological Engineering 26:321-327.
112
Polglase, P.J., P.M. Attiwill, M.A. Adams. 1992. Nitrogen and phosphorus cycling in relation to stand age of Eucalyptus regnans F. Muell. II. N mineralization and nitrification. Plant and Soil 142:167–176. Power, J.F., and J.S. Schepers. 1989. Nitrate contamination of groundwater in North America. Agricultural Ecosystems and Environment 26: 165–187. Ramirez, K.S., J.M. Craine, N. Fierer. 2012. Consistent effects of nitrogen amendments on soil microbial communities and processes across biomes. Global Change Biology 18:1918-1927. Raun, W.R., G.V. Johnson. 1999. Improving nitrogen use efficiency for cereal production. Agronomy Journal 91:357-363. Reitz, S.R., J.T. Trumble. 1996. Effects of cytokinin-containing seaweed extract on Phaseolus lunatus L.: influence of nutrient availability and apex removal. Botanica Marina 39:33–38. Richie, S.W., J.J. Hanway. Revised 1982. How a corn plant develops. (Ed. J. Clayton Herman). Cooperative Extension Service, Iowa State University. Sakthivel, R., S. Elumalai, M. Mohommad arif. 2011. Microalgae lipid research, past, present: A critical review for biodiesel production, in the future. Journal of Experimental Sciences 2(10):29-49. Sander, K., G.S. Murthy. 2010. Life cycle analysis of algae biodiesel. International Journal of Life Cycle Assessment 15:704-714. SAS Institute. 2013. Statistical analysis software. Version 9.2 ed. SAS Institute, Cary, NC. Schimel, J.P., J. Bennet. 2004. Nitrogen mineralization: challenges of a changing Paradigm. Ecology, 85(3):591-602. Schlesinger, W.H. 1995. An overview of the C cycle. In: Soils and Global Change (eds R., Lal J. Kimble, J. Levin and B.A. Stewart) pp. 9-26. Lewis Publishers, Boca Raton, FL. Schmidt, O. 1994. The news spreader. Dairy Producers’ Conserv. Group Newslett.4:1. Schneider, T., K.M. Keiblinger, E.S. Katja Sterflinger-Gleixner, G. Ellersdorfer, B. Roschitzki, A. Richter, L. Eberl, S. Zechmeister-Boltenstern, and K. Riedel. 2012. Who is who in litter decomposition? Metaproteomics reveals major
113
microbial players and their biogeochemical functions. International Society for Microbial Ecology Journal 6:1749-1762. Sharpley, A.N., and H. Tunney. 2000. Phosphorus research strategies to meet agricultural and environmental challenges of the 21st century. Journal of Environmental Quality 29 :176–181. Sheehan, J., T. Dunahay, J. Benemann, P. Roessler. 1998. A look back at the US Department of Energy’s Aquatic Species Program – Biodiesel from Algae. Prepared for US DOE Office of Fuel Development. Prepared by National Renewable Energy Laboratory. Golden, CA. Shelef, G., and Soeder, C.J., Eds. 1980. Algae biomass production and use. Elsevier/North-Holland Biomedical Press. Amsterdam, The Netherlands. Sialve, B., N. Bernet, O. Bernard. 2009. Anaerobic digestion of microalgae as a necessary step to make microalgal biodiesel sustainable. Biotechnology Advances 27:409-416. Simard, R.R., D. Cluis., B. Gangbazo, and S. Beauchemin. 1995. Phosphorus status of forest and agricultural soils from a watershed of high animal density. Journal of Environmental Quality 24:1010–1017. Sims, J.T., R.R. Simard, and B.C. Joern. 1998. Phosphorus loss in agricultural drainage: historical perspective and current research. Journal of Environmental Qualilty 27:277–293. Skinner, Ted. Personal interview with long time organic fertilizer trader and owning partner of Advanced Marketing, Aurora, OR. Feb 12, 2013. Sneath, R.W., F. Beline, M.A. Hilhorst, P. Peu. 2006. Monitoring GHG from manure stores on organic and conventional dairy farms. Agriculture, Ecosystem and Environment 112:122-128. Sollins, P., P. Homann, B.A. Caldwell. 1996. Stabilization and destabilization of soil organic matter: mechanisms and controls. Geoderma 74:65-105. Stewart, C.E., K. Paustian, R.T. Conant, A.F. Plante, J. Six. 2007. Soil carbon saturation: Concept, evidence and evaluation. Biogeochemistry 86: 19-31. Stirk, W.A., M.S. Novak, J. van Staden. 2003. Cytokinins in macroalgae. Plant Growth Regulation 41:13–24.
114
Stirk, W.A., J. van Staden. 2010. Flow of cytokinins through the environment. Plant Growth Regulation 62:101-116. Sullivan, D.M., A.I. Bary, C.G. Cogger, E.A. Myhre. 1999. Field microplot estimates of soil N mineralization for manured and non-manured soils. P 193-200. In: Proceedings of Western Nutrient Management Conference. Salt Lake City, UT. 4-5 mar. 1999. Potash & Phosphate Institute. Manhattan, KS. Sullivan, D.M., N.A. Andrews, J.M. Luna, J.P.G. McQueen. 2010. Estimating N contribution from organic fertilizers and cover crop residues using online Calculators. 19th World Congress of Soil Science, Soil Solutions for a Changing World. Sylvia, D.M., J.J. Fuhrmann, P.G. Hartel, D.A. Zuberer Eds. 2005. Principles and Applications of Soil Microbiology 2nd Ed. Pearson-Prentice Hall, Upper Saddle River, New Jersey. Syngenta. Atrazine. http://agproducts.basf.us/products/outlook-herbicide.html. Accessed May 25, 2012. Tarakhovskaya E.R., Y.I.Maslov, M.F. Shishova. 2007. Phytohormones in algae.
Russian Journal of Plant Physiology 54:163-170. Tavoletti, S. 2013. Critical evaluation of soybean role in animal production chains
based on the valoraization of locally produced feedstuff. Creative Commons Attribution License. Licensee InTech.
Temple W.D., A.A. Bomke. 1988. Effects of kelp (Macrocystis integrifolia) on soil chemical properties and crop responses. Plant Soil 105:213–222. Treseder, K.K. 2008. Nitrogen additions and microbial biomass: a meta-analysis of ecosystem studies. Ecology Letters 11:1111-1120. Tripathi, R.D., S. Dwivedi, M.K. Shukla, S. Mishra, S. Srivastava, R. Singh, U.N. Rai, D.K. Gupta. 2008. Role of blue green algae biofertilizer in ameliorating the nitrogen demand and fly-ash stress to the growth and yield of rice (Oryza sativa L.) plants. Chemosphere 70:119-1929. United States of America, Environmental Protection Agency (US EPA), Mandatory
Reporting of Greenhouse Gases; Final Rule Part 2. Federal Register Vol. 74 No. 209. Oct 30, 2009.
115
USDA ERS. 2010. Fertilizer TVA (Tennessee Valley Authority), AAPFCO (Association of American Plant Food Control Officials), TFI (The Fertilizer Institute). Van Der Meulen, L. Personal interview with scientific business development partner at Aurora Algae. Hawyard, CA. Mar 10, 2013.
Van Kessel, J.S., J.B. Reeves III. 2002. Nitrogen mineralization potential of dairy manures and its relationship to composition. Biology and Fertility of Soils 36:118-123.
Wander, M. 2010. Managing manure fertilizers in organic systems. eOrganic Oregon State University extension. Last Updated March 22, 2010. Wang, L., Y. Li, P. Chen, M. Min, Y. Chen, J. Zhu, R.R. Raun. 2010. Anaerobic digested dairy manure as a nutrient supplement for cultivation of oil-rich green microalgae Chlorella sp. Bioresource Technology 101:2623-2628. Washington State Department of Agriculture. 2012. Fertilizer registration guidance document. PUB 90 (R/11/30/2012). Weisberg, Peter. “Biogas and Environmental Markets.” BioCycle West Coast Conference. Town and Country Resort, San Diego, CA. April 10, 2013. Conference Presentation. Wershaw, R.L. 2004. Evaluation of conceptual models of natural organic matter (Humus) from a consideration of the chemical and biological process of humification. US Geological Survey, Reston, VA. Scientific Investigations Report No. 2004-5121. Whalen, J.K., C. Chang, B.M. Olson. 2001. Nitrogen and phosphorus mineralization potentials of soils receiving repeated annual cattle manure applications. Biology and Fertility of Soils. 34:334-341. Woertz, I., A. Feffer, T. Lundquist, Y. Nelson. 2009. Algae grown on dairy and municipal wastewater for simultaneous nutrient removal and lipid production for biofuel feedstock. Journal of Environmental Engineering 135:1115-1122. Wright, P. Overview of Anaerobic Digestion Systems for Dairy Farms. Natural Resource, Agriculture and Engineering Service (NRAES-143), March 2001.
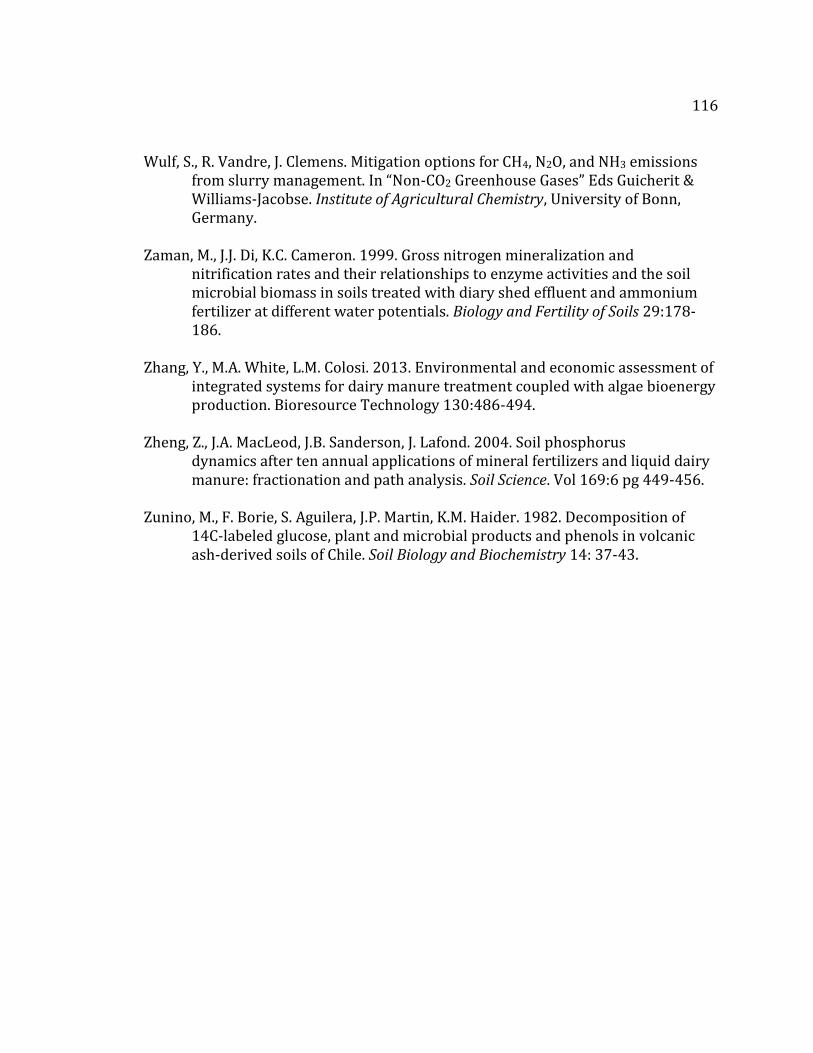
116
Wulf, S., R. Vandre, J. Clemens. Mitigation options for CH4, N2O, and NH3 emissions from slurry management. In “Non-CO2 Greenhouse Gases” Eds Guicherit & Williams-Jacobse. Institute of Agricultural Chemistry, University of Bonn, Germany. Zaman, M., J.J. Di, K.C. Cameron. 1999. Gross nitrogen mineralization and nitrification rates and their relationships to enzyme activities and the soil microbial biomass in soils treated with diary shed effluent and ammonium fertilizer at different water potentials. Biology and Fertility of Soils 29:178- 186. Zhang, Y., M.A. White, L.M. Colosi. 2013. Environmental and economic assessment of integrated systems for dairy manure treatment coupled with algae bioenergy production. Bioresource Technology 130:486-494. Zheng, Z., J.A. MacLeod, J.B. Sanderson, J. Lafond. 2004. Soil phosphorus dynamics after ten annual applications of mineral fertilizers and liquid dairy manure: fractionation and path analysis. Soil Science. Vol 169:6 pg 449-456. Zunino, M., F. Borie, S. Aguilera, J.P. Martin, K.M. Haider. 1982. Decomposition of 14C-labeled glucose, plant and microbial products and phenols in volcanic ash-derived soils of Chile. Soil Biology and Biochemistry 14: 37-43.

117
APPENDIX
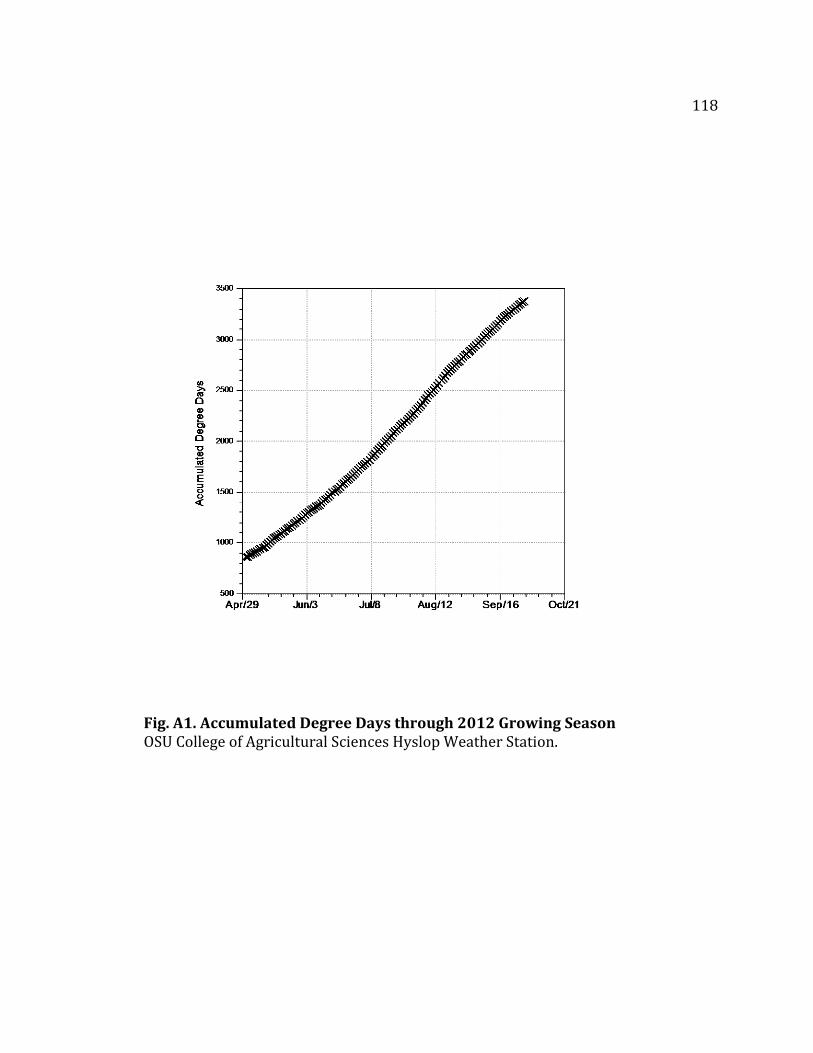
118
Fig. A1. Accumulated Degree Days through 2012 Growing Season OSU College of Agricultural Sciences Hyslop Weather Station.
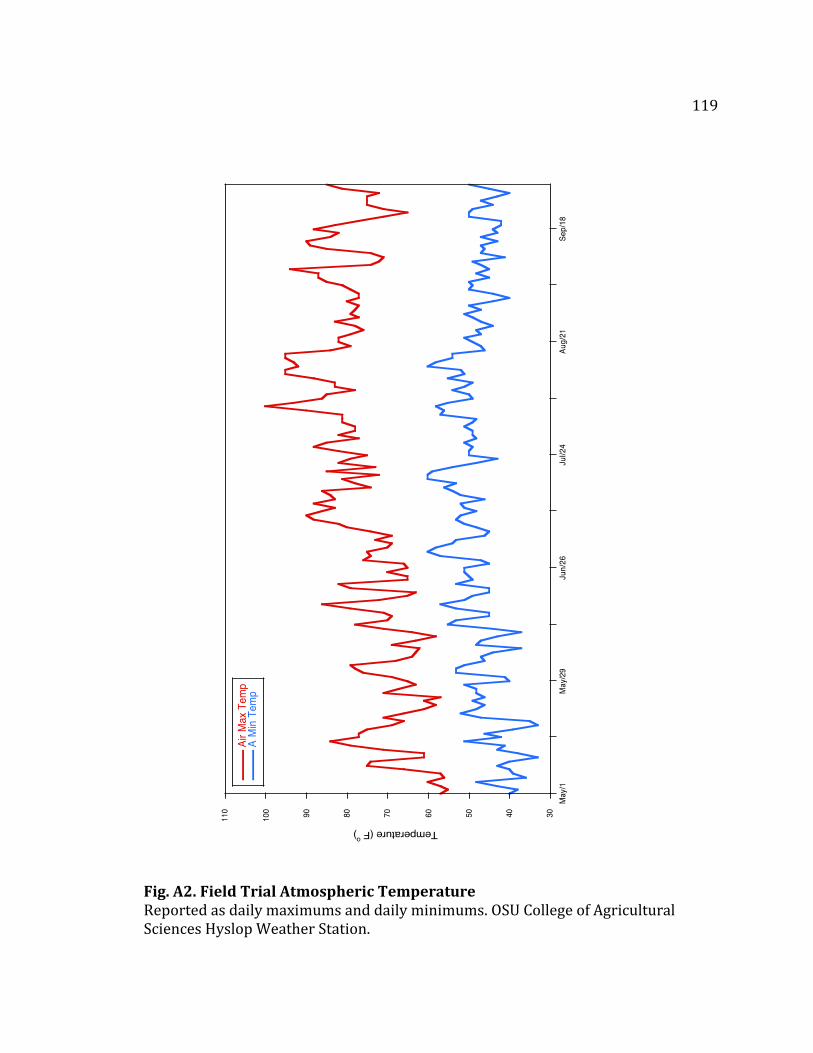
119
Fig. A2. Field Trial Atmospheric Temperature Reported as daily maximums and daily minimums. OSU College of Agricultural Sciences Hyslop Weather Station.
