analyzing product development task networks to examine organizational change
TRANSCRIPT
IEEE TRANSACTIONS ON ENGINEERING MANAGEMENT, VOL. 57, NO. 3, AUGUST 2010 513
Analyzing Product Development Task Networks toExamine Organizational Change
Shawn T. Collins, Joe A. Bradley, and Ali A. Yassine
Abstract—This paper uses network analysis (NA) to study taskinteractions in the product development process (PDP) at a smallengineering company (Smallcomp). We examine Smallcomp’s or-ganizational changes by comparing its PDP network propertiesat two points in time. The analysis identifies patterns of central-ization, role specialization, and formalized control. This validatesthemes from organizational behavior and quality management lit-erature regarding how organizations learn from experience, growin size, and control their process variation. It demonstrates severalinsights to manage the PDP as both a second (i.e., effectively exe-cuting) and third order (i.e., highlighting underlying premises andassumptions) form of organizational control. First, reducing varia-tion in task outputs is an understandable approach to controlling aPDP. However, it is important to reduce variation in task inputs aswell. Second, tasks have varying roles and burdens in terms of howthey share information with other tasks in the PDP. Companiesseeking to support multiple concurrent projects must align theirorganizational resources to the distribution of labor created by theinformation flow among PDP tasks. Finally, an NA metric calledSimmelian ties can measure effective concurrency in a PDP byidentifying both valuable and ineffective iteration among groupsof tasks.
Index Terms—Brokerage, centrality, concurrent task execu-tion, design structure matrix (DSM), information flow, key playermeasures, network analysis (NA), organizational change, productdevelopment (PD).
I. INTRODUCTION
ORGANIZATIONS that must make decisions and managerisk in contexts of uncertainty and ambiguous informa-
tion often advocate a philosophy of total quality learning. Thisapproach seeks to adapt to operational uncertainty by provid-ing opportunities to learn, make mistakes, and pursue novelsolutions [1], [2]. It often entails a shift away from focus onoperations and production to improving efficiency and effec-tiveness in product development (PD) [3], [4]. The PD pro-cess (PDP) is a complex system composed of an integrated
Manuscript received July 3, 2008; revised December 30, 2008, April 8, 2009,and May 21, 2009; accepted July 25, 2009. Date of publication November 10,2009; date of current version July 21, 2010. Review of this manuscript wasarranged by Department Editor J. K. Pinto. This paper was presented in part atthe Proceedings of the Eighteenth Annual International Symposium of the Inter-national Council on Systems Engineering (INCOSE) Utrecht, the Netherlands.
S. T. Collins is with the Systems Engineering Department, Aero Engine Con-trols, Indianapolis, IN 46206 USA (e-mail: [email protected]).
J. A. Bradley is with the Software Engineering Department, Applied Re-search Associates-Transportation Sector, Champaign, IL 61820 USA (e-mail:[email protected]).
A. A. Yassine is with the Product Development Research Laboratory, Depart-ment of Industrial and Enterprise Systems Engineering, University of Illinois atUrbana-Champaign, Urbana, IL 61801 USA (e-mail: [email protected]).
Color versions of one or more of the figures in this paper are available onlineat http://ieeexplore.ieee.org.
Digital Object Identifier 10.1109/TEM.2009.2033047
set of tasks that collectively accomplish a defined objective—e.g., developing a new product through a stage-gate sequence[5], [6]. The stage-gate system [7]–[9] is a common approachfor managing decision making during a PDP. Existing systemsengineering tools can improve our understanding and analy-sis of these kinds of systems. Graph-based techniques likeCPM/PERT [10],1 IDEF [11],2 flowcharts, and matrix-basedtechniques, such as the design structure matrix (DSM) and theN2 method, were successful in capturing the relationships be-tween the tasks in a PDP and in scheduling these tasks accord-ingly [12]–[14]. However, almost all these approaches lack thesophistication to uncover the underlying statistical propertiesof the PDP and its constituent tasks. Furthermore, as the num-ber of tasks or relationships between tasks increases, the cor-responding complexity makes these systems increasingly dif-ficult to analyze. As such, standard system engineering toolsprovide only a partial view of the development processes theyanalyze.
Stage gates and PDPs are second-order forms of organiza-tional control [15] that define the programs and routines for anorganization’s members to follow. We can enhance our under-standing of these systems by using established network analysis(NA) techniques. These methods help uncover previously un-noticed trends and properties of second-order organizationalcontrol in the PDP. For example, it is possible to look at patternsof the overall PDP structure and the location of individual taskswithin this structure. This is an important analytical shift fromviewing a task as having individually-determined characteristics(as is the case in the aforementioned systems engineering tools)to viewing it as representing emergent properties—emergingfrom patterns of information flow between tasks.
Using NA techniques to measure properties of informationflow provides a methodology to identify critical PD tasks andinteractions that constrain PDP execution. Project managerscan use these data to structure their team integration mecha-nisms based on the information-sharing characteristics of theirPDP [16], [17]. They can also use these data to identify coordi-nating mechanisms for groups of concurrently scheduled PDPtasks [18]. Functional managers and process architects can usethese data to identify critical or overloaded tasks [19]. They canalso evaluate whether tasks defined as critical in the systemsengineering literature, such as stage gates, exercise significantcontrol over information flow in their specific PDP [20].
Beyond executing existing processes, total quality learningrequires that changes to a PDP help the organization learn from
1Critical path method/program evaluation and review technique.2Integrated definition (IDEF) is a family of methods designed to model the
decisions, actions, and activities of a system.
0018-9391/$26.00 © 2009 IEEE
514 IEEE TRANSACTIONS ON ENGINEERING MANAGEMENT, VOL. 57, NO. 3, AUGUST 2010
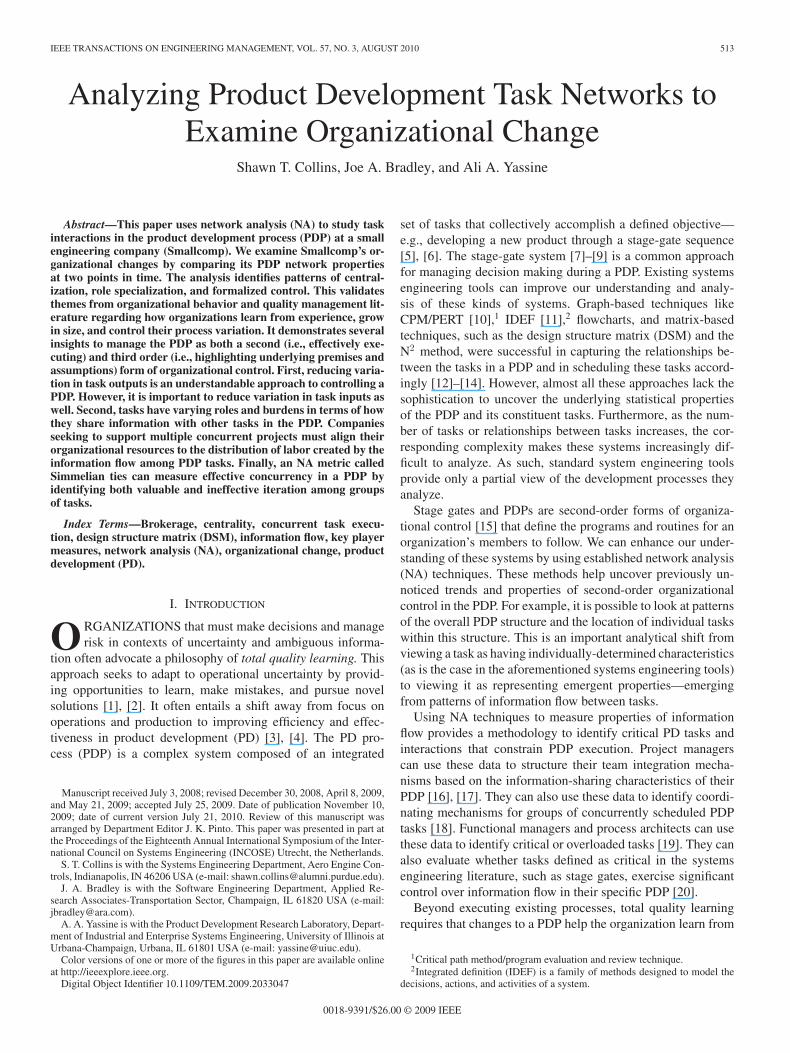
Fig. 1. Sample task network matrix and map.
experience. This lets the organization effectively apply preexist-ing knowledge to new situations and develop new knowledge,as novices become experts. However, learning from experienceso that past mistakes are avoided and successes are repeated isextremely difficult [21]–[25]. Using PDP changes to effectivelyhelp an organization learn from recent experiences requires thatprocess architects and functional managers proactively considerseveral findings cited in the organizational behavior and qualitymanagement literature. First, individuals in organizations learnfrom experience under conditions where goals are conflicting orambiguous, and causal relationships between events are difficultto distinguish. Consequently, interpreting what just happenedfrom a series of events is often unclear [13]. Decision makersregularly interpret history in ways that maintain prior beliefsabout the world and emphasize the role of intentional actionrather than chance [21], [26]. Second, individuals, groups, andorganizations tend to “behave rigidly in threatening situations”by narrowing their field of attention and centralizing formal con-trol of their activities. This reduces the variation or flexibilityof their behavior [27]–[30]. Third, a social system that grows insize tends to increase the role of specialists in its distribution oflabor [31], [32]. Finally, effective quality management requirescontrolling variation of both the inputs and outputs for a givenprocess [33].
Using NA techniques to compare properties of informationflow in a PDP at different points in time provides insight tothe basic premises, or third-order, forms of organizational con-trol [15]. In particular, it is possible to measure the degree towhich execution of a given PDP is purposeful or random, iden-tify measures of threat rigidity, relate specialized or distributedknowledge in the PDP to required changes in team-integrationmechanisms, and confirm whether the PDP is effectively con-trolling variation in both its task inputs and task outputs. Thisprovides an empirical method for PDP designers to determinewhether their desired changes are reinforcing, not addressing,or proactively mitigating the negative aspects of the themes inthe previous paragraph.
This paper examines the response of a small engineering com-pany (Smallcomp) to challenges caused by a significant industrydownturn, workforce reduction, change in market focus, and in-
creasing its number of products being developed. The industrydownturn and change in market focus created ambiguous envi-ronmental conditions to which Smallcomp’s process architectsand senior managers must respond in part by defining their pol-icy for future PD activities in the PDP. The industry downturnand workforce reduction also provided a threatening situationthat must be addressed. Finally, the increased number of prod-ucts represented growth in both organizational scale (number ofemployees) and required attention span (number of PD activitiesbeing executed).
The rest of the paper proceeds as follows. We begin witha methods overview of NA, followed by background informa-tion about Smallcomp and discussion of our research method-ology. We then examine Smallcomp’s organizational changesby comparing its PDP network properties at two points intime. We use the structured properties of idealized informa-tion flow in Smallcomp’s PDP to quantitatively explore theabove mentioned themes from organizational behavior andquality management literature. We demonstrate that NA met-rics provide insight that help manage the PDP as both a sec-ond (i.e., effectively executing) and third order (i.e., high-lighting underlying premises and assumptions) form of or-ganizational control. We close by applying these findingsto the general areas of managing PDP execution and teamperformance.
II. NA OVERVIEW
The basic element of NA is a data matrix that defines relation-ships between each row and column element. For a matrix ofproduct-development tasks collected in the left half of Fig. 1, thematrix indicates the input/output flow of information betweeneach task. The right half of Fig. 1 shows the network drawn fromthe data matrix. The arrows indicate a dependency relationship,or tie from the row task to the column task. For example, taskA receives output from task D, while task B provides output totasks C, F, and G.
NA methods contain a wide variety of analytic techniquesonce data are collected in matrix form [34]–[37] that havebeen used to study topics as diverse as world systems [38],
COLLINS et al.: ANALYZING PRODUCT DEVELOPMENT TASK NETWORKS TO EXAMINE ORGANIZATIONAL CHANGE 515
TABLE IUSING NA METRICS TO IDENTIFY ORGANIZATIONAL BEHAVIOR THEMES IN A PDP
[39], diffusion of innovation [40], [41], production of scientificknowledge [42], and organizational influence [43], [44]. Thesemethods target three different levels of analysis [45]. First,they examine patterns of how individual elements affect insti-tutions they are part of, and how institutions constrain their in-dividual elements. Second, they examine substructures (groupsof nodes that are closer to each other than to other groups)based on patterns of relations in the overall network. Exam-ples are blocks, factions, cliques, and bridges. Third, they ex-amine the positions of individuals within the structure. Thisis an analytical shift from viewing a node as having individ-ually unique characteristics (e.g., a task is critical because ofhow long it takes or how much it costs to complete) to view-ing it as representing relational characteristics that emerge fromits ties to other nodes (e.g., a task is critical because of itsposition in specific patterns of information flow with othertasks).
We define the key NA terms [35], [46] used in the rest of thispaper as follows.
1) Node: Any single element of the data matrix. This is tasksA–G in Fig. 1.
2) Link: Any tie between two nodes in a network. This is anonzero value in Fig. 1, which indicates information flowbetween two tasks.
3) Indegree centrality: The number of links entering a node.This is the number of tasks providing input to a PDP task.
4) Outdegree centrality: The number of links exiting a node.This is the number of tasks receiving output from a PDPtask.
5) Cluster: Divide a network into n specified separate groupsthat maximizes the density of ties within a group, and min-imizes the density of ties to other groups. This identifieswhich concurrent tasks in a PDP can be allocated to sep-arate stages (e.g., system definition, preliminary design,etc.).
6) Density: For a given network, the ratio of the actual num-ber of links divided by the maximum number of possiblelinks. This describes the concurrency within a cluster, aswell as the strength of coupling between clusters.
7) Brokerage: For three nodes B, E, and G in Fig. 1, B hasthree potential brokerage roles to pass information be-tween nodes E and G. B is a coordinator if all three nodesare in the same PD stage. B is a gatekeeper if E is in adifferent stage from B and G. B is a representative if G isin a different stage from E and B.
8) Key fragment node: Identify a set of n nodes, which,if removed, would maximally disrupt communicationamong the remaining nodes. These are PDP tasks,which, if omitted or done incorrectly, have great-est potential to cause project rework from incorrectinformation.
9) Key reach node: Identify the set of n nodes that is maxi-mally connected to all other nodes. These PDP tasks arethe most efficient points to introduce new information tothe PD activities.
10) Transitivity: Three nodes form a transitive triple when onenode receives input from both another node and the inputto that node. Nodes B, E, and G in Fig. 1 are transitive be-cause G receives input from B and E (which also providesinput to B).
11) Simmelian ties: A Simmelian tie is reciprocal and part ofa transitive triple. The reciprocal tie between nodes F andG is Simmelian because both F and G have ties to node D.
12) Path: Any route between two nodes. In Fig. 1, the pathsfrom E to F are E-B-G-F, E-B-F, and E-G-F.
13) Geodesic distance: Shortest path between two nodes. Thegeodesic distance between nodes E and F is two links,where either B or G is an intermediate node. In a PDP, thisis the fewest intermediate tasks that transmit informationbetween two given tasks.
14) Individual node analysis: Identify key tasks based on theirrelational roles as information transmitters in the PDP.
15) Node group analysis: Identify and measure groups of tasksthat interact more with each other than with other tasks inthe PDP.
16) Overall NA: Identify trends from treating the entire PDPas a single entity of tasks that share information.
One benefit of NA is that the overall structure tends to beemergent, in that no individual must understand the entire sys-tem. NA uses patterns of ties to define and analyze the emer-gent structure. This is a significant benefit when there is no“right answer” about what the structure should look like, or(as in the case of process architecting) when multiple opin-ions exist about what the “right PDP structure” should be.Finally, in Table I, we propose and show how NA metricscan be used to provide a mechanism to quantitatively testPDP characteristics for the organizational behavior themes dis-cussed in Section 1. We revisit the content of Table I with ourdiscussion and conclusions after validating it using real PDPdata from Smallcomp.
516 IEEE TRANSACTIONS ON ENGINEERING MANAGEMENT, VOL. 57, NO. 3, AUGUST 2010
III. COMPANY OVERVIEW OF SMALLCOMP
The data for this paper were collected from the PDP at Small-comp. Smallcomp formalized a stage-gate system [47], [48] forits PD activity during an initiative to expand its product linefrom demonstration units to increased volume. Smallcomp’sstage-gate system contained a series of business and technicalreviews held after each stage of PD to ensure that the maturingtechnical design still matched the expected market characteris-tics. Concurrent to this formalization, Smallcomp’s EngineeringManagement group began investigating matrix based projectmanagement tools during a quality improvement initiative tostreamline its PD task execution. This group is responsible fordefining and maintaining the company procedures controllingSmallcomp’s PD, safety, and reliability practices.3 The inves-tigation was driven by two needs for a process-mapping tool.The first was a need to highlight beneficial feedback that ac-curately reflected Smallcomp’s desire to document planned de-sign iterations. Second, based on anticipated project-to-projectvariation, the tool needed to provide project managers withinsight into which tasks were critical, which could be omit-ted, and which had slack in terms of when they were actuallyexecuted.
As a result of that investigation, Smallcomp captured andevaluated their PDP with a DSM [12], [14], [20] in 2002 usingtwo steps. The first step was to talk with process architects andknowledgeable experts (functional managers, senior engineers,and team leads in the Engineering department) to identify allthe tasks and functional owners required to conduct a programfrom stage 0 to stage 4. Because this was being done for thefirst time at Smallcomp, the gist of the discussions tended to be“How do we think a formal process should work to conduct aprogram based on our experience to date?” The second step wasto identify the tasks that provided input and tasks that receivedoutput for each task.
Shortly after this formalization, Smallcomp cancelled twohigh profile programs, lost contract bids with major cus-tomers, and significantly reduced its workforce. After the re-sulting downturn, Smallcomp changed its market focus, ex-panded the number of programs from 1–2 at a time to 4–5 at a time, and initiated a quality improvement program toimprove its overall PD effectiveness. During this time frame,as part of the quality improvement program, the first author(Collins) worked with Smallcomp’s process architects, func-tional managers, and team leads to regularly update its PDPdocumentation. The goal in performing these updates wasto avoid the undesirable information flow patterns exhibitedbefore the 2002 downturn, and to incorporate improvementsor changes necessitated by the subsequent changes at Small-comp. The revisions between 2002 and 2006 used the followingsteps.
1) Review the existing documentation with the process archi-tects and knowledgeable experts who captured the originalPDP, as well as individuals who had gained expertise, inlight of Smallcomp’s recent project experiences. The gist
3Collins was a Smallcomp employee in the Systems Engineering group from2002 to 2004, and in the Engineering Management group from 2004 to 2006.
of these discussions was how well the original PDP de-scribed the programs executed in the last four years, whichchanges to institutionalize in the PDP documentation, andwhich changes to leave out if the documentation alreadycaptured the desired behavior.
2) Confirm which tasks and information dependencies arecorrect.
3) Identify new tasks and information dependencies.4) Identify tasks and/or information dependencies that are
not valid based on recent project experience (assumingthat experience is normative).
5) Update the PDP documentation to capture the results ofsteps 1 through 4.
IV. NA OF CHANGES TO SMALLCOMP’S PDP
A. Overall PDP Structure
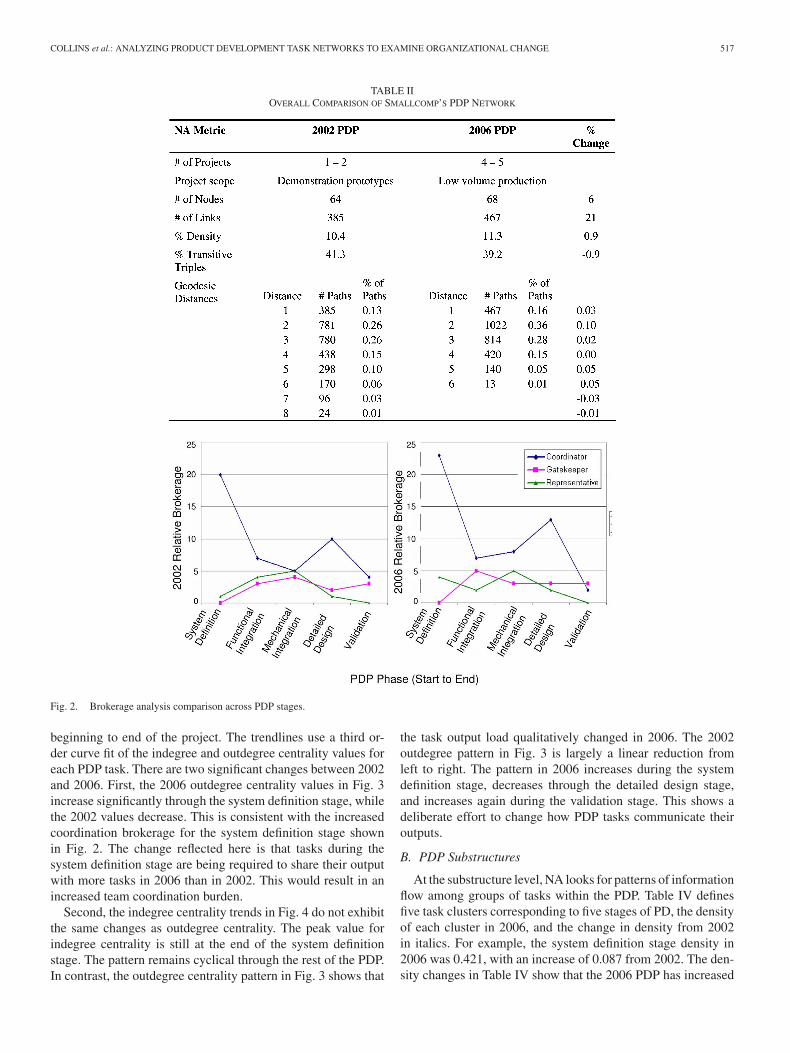
Table II compares overall network measures of Smallcomp’sPDP between 2002 and 2006. The primary change is towardincreased centralization and reduced use of intermediate tasksto transmit information. This is shown by the drop in longestpath distance from 8 to 6, by the increased number of paths oflength 2 or less, and by the decreased number of paths of length5 or 6. The 21% increase in the number of links between tasksalso indicates increased centralization.
Other network parameters explore the nature of this central-ization on the structure of overall communication flow and in-formation transfer within the PDP. Brokerage analysis considersinformation-sharing load within and between PD stages. Fig. 2shows the number of tasks in each PD stage that exceeded a rel-ative brokerage value of 3. In both cases the high coordinationis expected because this is when the concept is taking shape. Itdecreases as the PDP progresses into later stages. For a projectmanager, the value of this information is to highlight criticalbrokerage tasks during a given stage, as well as tasks that areimportant for managing interfaces between PD stages. In 2006,there is increased coordination within the system definition,mechanical integration and detailed design stages. This showsmore iteration within the particular stage before passing infor-mation to the next stage. The increased representation from thesystem definition stage also shows an emphasis on controllingthe information leaving that stage. The increased gatekeepingin functional integration and detailed design show a focus oncontrolling information entering these two stages.
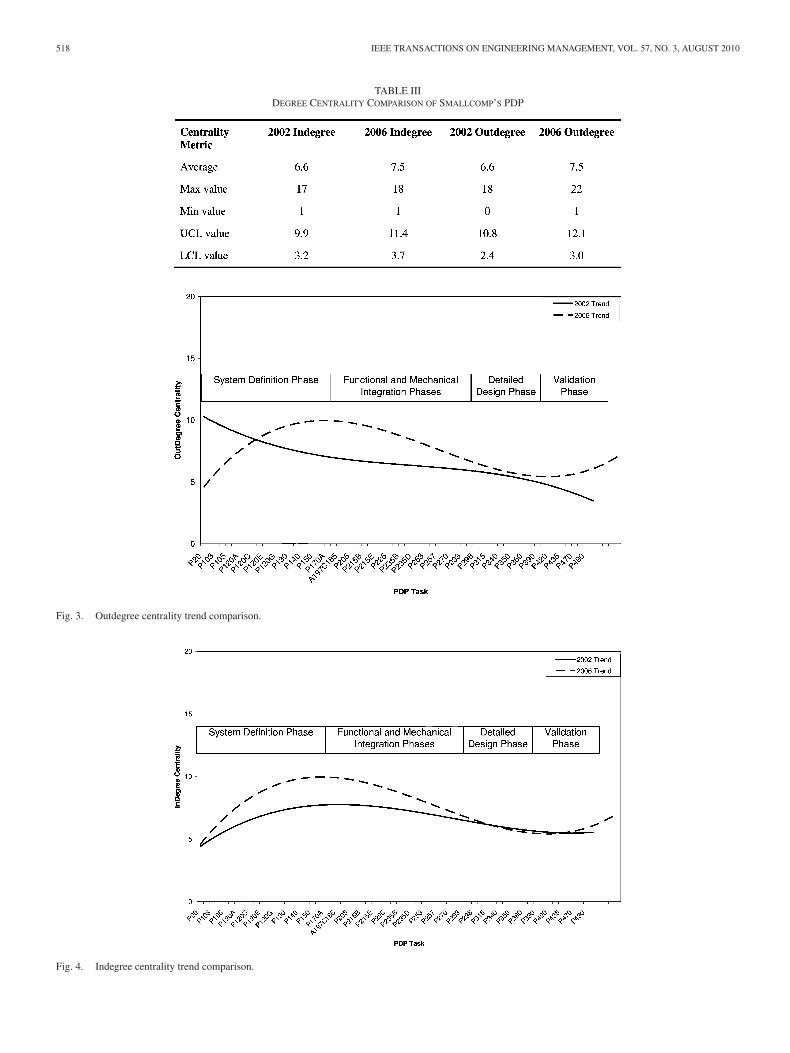
Table III uses degree centrality to measure information-sharing load based on the number of inputs and outputs thateach task has. The upper and lower control limits (UCL, LCL)are calculated from the two-sigma point around the averagevalue. As a general trend, the PDP tasks in 2006 receive in-put from and provide output to one more task than in 2002,with the LCL shifting up by 0.5. The primary difference is inthe tasks that lie between the average and UCL. The maximumindegree value increases by 1, but the UCL increases by 1.5.The maximum outdegree value increases by 4, but the UCLincreases by 1.3.
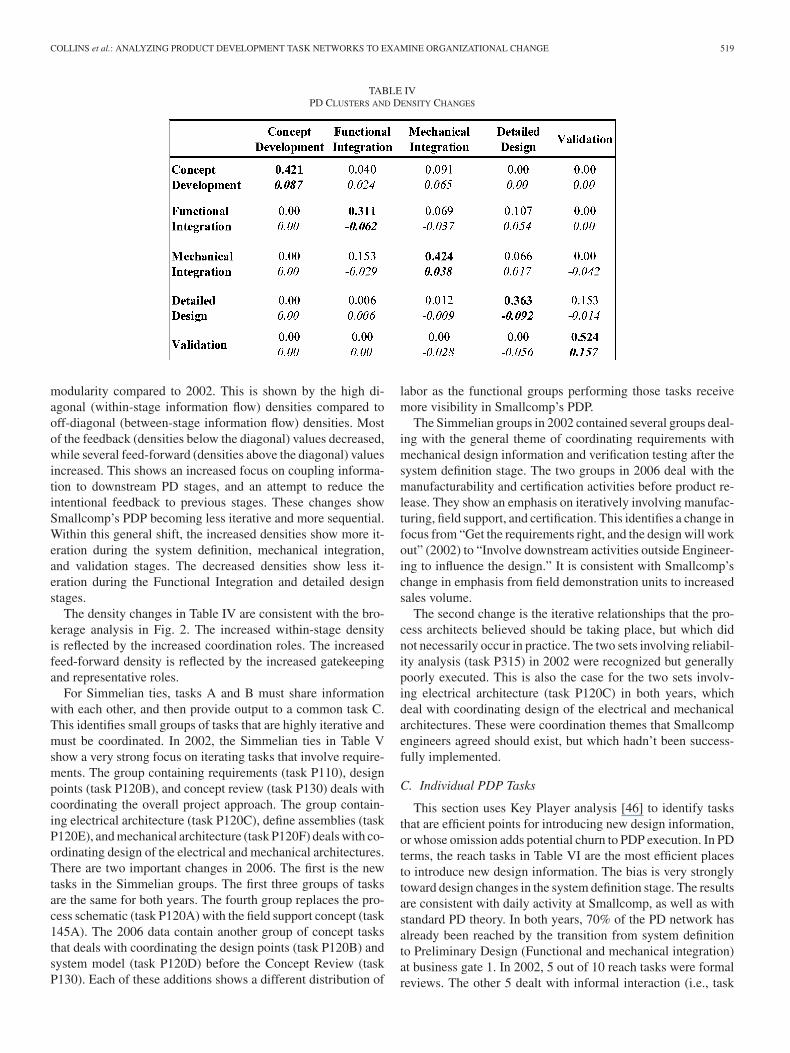
Figs. 3 and 4 compare the changing degree centralitytrends through the entire PDP. The X-axis progression is from
COLLINS et al.: ANALYZING PRODUCT DEVELOPMENT TASK NETWORKS TO EXAMINE ORGANIZATIONAL CHANGE 517
TABLE IIOVERALL COMPARISON OF SMALLCOMP’S PDP NETWORK
Fig. 2. Brokerage analysis comparison across PDP stages.
beginning to end of the project. The trendlines use a third or-der curve fit of the indegree and outdegree centrality values foreach PDP task. There are two significant changes between 2002and 2006. First, the 2006 outdegree centrality values in Fig. 3increase significantly through the system definition stage, whilethe 2002 values decrease. This is consistent with the increasedcoordination brokerage for the system definition stage shownin Fig. 2. The change reflected here is that tasks during thesystem definition stage are being required to share their outputwith more tasks in 2006 than in 2002. This would result in anincreased team coordination burden.
Second, the indegree centrality trends in Fig. 4 do not exhibitthe same changes as outdegree centrality. The peak value forindegree centrality is still at the end of the system definitionstage. The pattern remains cyclical through the rest of the PDP.In contrast, the outdegree centrality pattern in Fig. 3 shows that
the task output load qualitatively changed in 2006. The 2002outdegree pattern in Fig. 3 is largely a linear reduction fromleft to right. The pattern in 2006 increases during the systemdefinition stage, decreases through the detailed design stage,and increases again during the validation stage. This shows adeliberate effort to change how PDP tasks communicate theiroutputs.
B. PDP Substructures
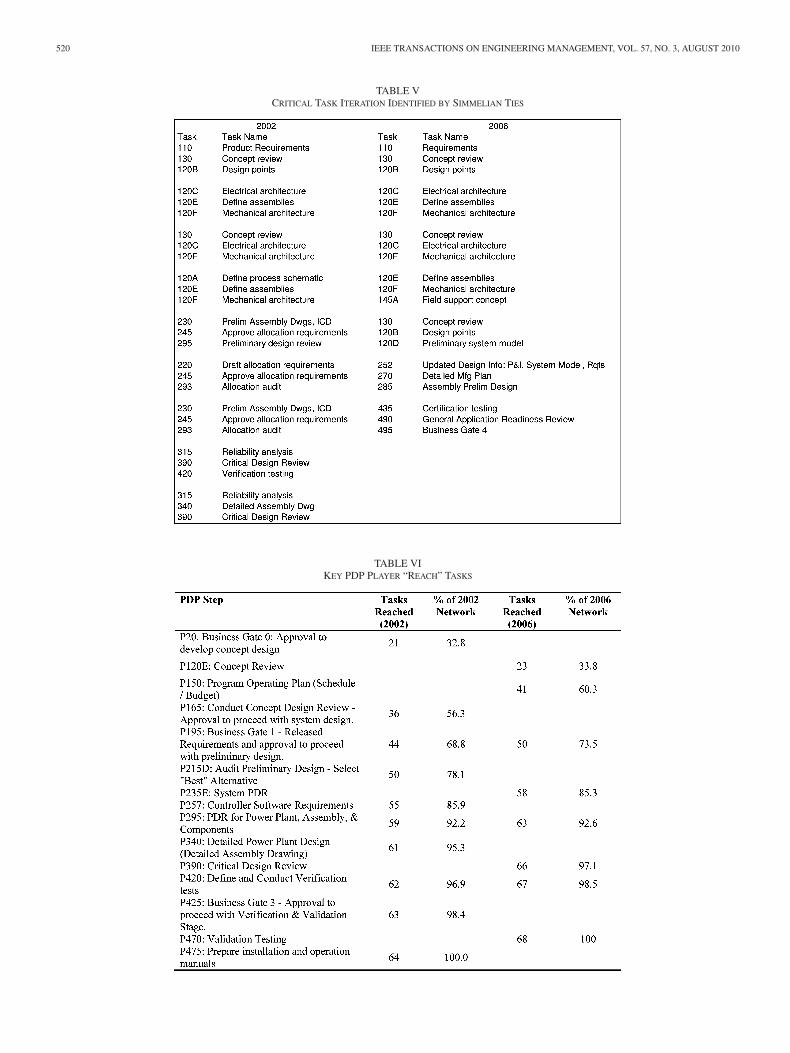
At the substructure level, NA looks for patterns of informationflow among groups of tasks within the PDP. Table IV definesfive task clusters corresponding to five stages of PD, the densityof each cluster in 2006, and the change in density from 2002in italics. For example, the system definition stage density in2006 was 0.421, with an increase of 0.087 from 2002. The den-sity changes in Table IV show that the 2006 PDP has increased
518 IEEE TRANSACTIONS ON ENGINEERING MANAGEMENT, VOL. 57, NO. 3, AUGUST 2010
TABLE IIIDEGREE CENTRALITY COMPARISON OF SMALLCOMP’S PDP
Fig. 3. Outdegree centrality trend comparison.
Fig. 4. Indegree centrality trend comparison.
COLLINS et al.: ANALYZING PRODUCT DEVELOPMENT TASK NETWORKS TO EXAMINE ORGANIZATIONAL CHANGE 519
TABLE IVPD CLUSTERS AND DENSITY CHANGES
modularity compared to 2002. This is shown by the high di-agonal (within-stage information flow) densities compared tooff-diagonal (between-stage information flow) densities. Mostof the feedback (densities below the diagonal) values decreased,while several feed-forward (densities above the diagonal) valuesincreased. This shows an increased focus on coupling informa-tion to downstream PD stages, and an attempt to reduce theintentional feedback to previous stages. These changes showSmallcomp’s PDP becoming less iterative and more sequential.Within this general shift, the increased densities show more it-eration during the system definition, mechanical integration,and validation stages. The decreased densities show less it-eration during the Functional Integration and detailed designstages.
The density changes in Table IV are consistent with the bro-kerage analysis in Fig. 2. The increased within-stage densityis reflected by the increased coordination roles. The increasedfeed-forward density is reflected by the increased gatekeepingand representative roles.
For Simmelian ties, tasks A and B must share informationwith each other, and then provide output to a common task C.This identifies small groups of tasks that are highly iterative andmust be coordinated. In 2002, the Simmelian ties in Table Vshow a very strong focus on iterating tasks that involve require-ments. The group containing requirements (task P110), designpoints (task P120B), and concept review (task P130) deals withcoordinating the overall project approach. The group contain-ing electrical architecture (task P120C), define assemblies (taskP120E), and mechanical architecture (task P120F) deals with co-ordinating design of the electrical and mechanical architectures.There are two important changes in 2006. The first is the newtasks in the Simmelian groups. The first three groups of tasksare the same for both years. The fourth group replaces the pro-cess schematic (task P120A) with the field support concept (task145A). The 2006 data contain another group of concept tasksthat deals with coordinating the design points (task P120B) andsystem model (task P120D) before the Concept Review (taskP130). Each of these additions shows a different distribution of
labor as the functional groups performing those tasks receivemore visibility in Smallcomp’s PDP.
The Simmelian groups in 2002 contained several groups deal-ing with the general theme of coordinating requirements withmechanical design information and verification testing after thesystem definition stage. The two groups in 2006 deal with themanufacturability and certification activities before product re-lease. They show an emphasis on iteratively involving manufac-turing, field support, and certification. This identifies a change infocus from “Get the requirements right, and the design will workout” (2002) to “Involve downstream activities outside Engineer-ing to influence the design.” It is consistent with Smallcomp’schange in emphasis from field demonstration units to increasedsales volume.
The second change is the iterative relationships that the pro-cess architects believed should be taking place, but which didnot necessarily occur in practice. The two sets involving reliabil-ity analysis (task P315) in 2002 were recognized but generallypoorly executed. This is also the case for the two sets involv-ing electrical architecture (task P120C) in both years, whichdeal with coordinating design of the electrical and mechanicalarchitectures. These were coordination themes that Smallcompengineers agreed should exist, but which hadn’t been success-fully implemented.
C. Individual PDP Tasks
This section uses Key Player analysis [46] to identify tasksthat are efficient points for introducing new design information,or whose omission adds potential churn to PDP execution. In PDterms, the reach tasks in Table VI are the most efficient placesto introduce new design information. The bias is very stronglytoward design changes in the system definition stage. The resultsare consistent with daily activity at Smallcomp, as well as withstandard PD theory. In both years, 70% of the PD network hasalready been reached by the transition from system definitionto Preliminary Design (Functional and mechanical integration)at business gate 1. In 2002, 5 out of 10 reach tasks were formalreviews. The other 5 dealt with informal interaction (i.e., task
520 IEEE TRANSACTIONS ON ENGINEERING MANAGEMENT, VOL. 57, NO. 3, AUGUST 2010
TABLE VCRITICAL TASK ITERATION IDENTIFIED BY SIMMELIAN TIES
TABLE VIKEY PDP PLAYER “REACH” TASKS
COLLINS et al.: ANALYZING PRODUCT DEVELOPMENT TASK NETWORKS TO EXAMINE ORGANIZATIONAL CHANGE 521
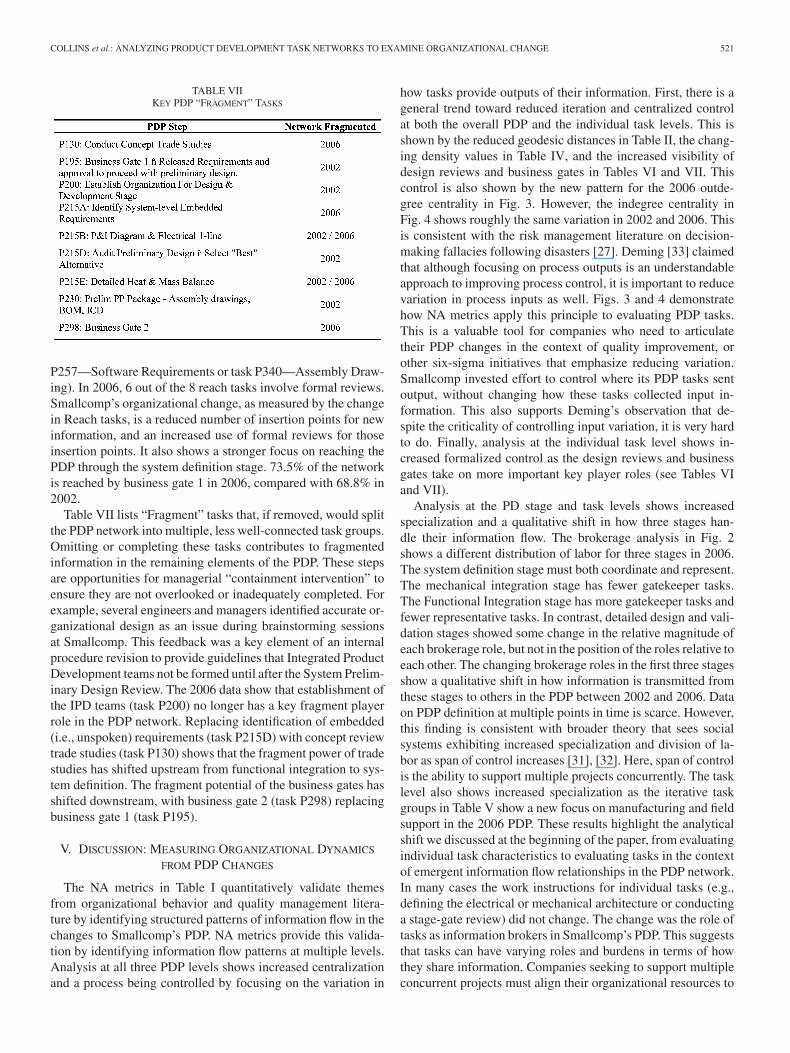
TABLE VIIKEY PDP “FRAGMENT” TASKS
P257—Software Requirements or task P340—Assembly Draw-ing). In 2006, 6 out of the 8 reach tasks involve formal reviews.Smallcomp’s organizational change, as measured by the changein Reach tasks, is a reduced number of insertion points for newinformation, and an increased use of formal reviews for thoseinsertion points. It also shows a stronger focus on reaching thePDP through the system definition stage. 73.5% of the networkis reached by business gate 1 in 2006, compared with 68.8% in2002.
Table VII lists “Fragment” tasks that, if removed, would splitthe PDP network into multiple, less well-connected task groups.Omitting or completing these tasks contributes to fragmentedinformation in the remaining elements of the PDP. These stepsare opportunities for managerial “containment intervention” toensure they are not overlooked or inadequately completed. Forexample, several engineers and managers identified accurate or-ganizational design as an issue during brainstorming sessionsat Smallcomp. This feedback was a key element of an internalprocedure revision to provide guidelines that Integrated ProductDevelopment teams not be formed until after the System Prelim-inary Design Review. The 2006 data show that establishment ofthe IPD teams (task P200) no longer has a key fragment playerrole in the PDP network. Replacing identification of embedded(i.e., unspoken) requirements (task P215D) with concept reviewtrade studies (task P130) shows that the fragment power of tradestudies has shifted upstream from functional integration to sys-tem definition. The fragment potential of the business gates hasshifted downstream, with business gate 2 (task P298) replacingbusiness gate 1 (task P195).
V. DISCUSSION: MEASURING ORGANIZATIONAL DYNAMICS
FROM PDP CHANGES
The NA metrics in Table I quantitatively validate themesfrom organizational behavior and quality management litera-ture by identifying structured patterns of information flow in thechanges to Smallcomp’s PDP. NA metrics provide this valida-tion by identifying information flow patterns at multiple levels.Analysis at all three PDP levels shows increased centralizationand a process being controlled by focusing on the variation in
how tasks provide outputs of their information. First, there is ageneral trend toward reduced iteration and centralized controlat both the overall PDP and the individual task levels. This isshown by the reduced geodesic distances in Table II, the chang-ing density values in Table IV, and the increased visibility ofdesign reviews and business gates in Tables VI and VII. Thiscontrol is also shown by the new pattern for the 2006 outde-gree centrality in Fig. 3. However, the indegree centrality inFig. 4 shows roughly the same variation in 2002 and 2006. Thisis consistent with the risk management literature on decision-making fallacies following disasters [27]. Deming [33] claimedthat although focusing on process outputs is an understandableapproach to improving process control, it is important to reducevariation in process inputs as well. Figs. 3 and 4 demonstratehow NA metrics apply this principle to evaluating PDP tasks.This is a valuable tool for companies who need to articulatetheir PDP changes in the context of quality improvement, orother six-sigma initiatives that emphasize reducing variation.Smallcomp invested effort to control where its PDP tasks sentoutput, without changing how these tasks collected input in-formation. This also supports Deming’s observation that de-spite the criticality of controlling input variation, it is very hardto do. Finally, analysis at the individual task level shows in-creased formalized control as the design reviews and businessgates take on more important key player roles (see Tables VIand VII).
Analysis at the PD stage and task levels shows increasedspecialization and a qualitative shift in how three stages han-dle their information flow. The brokerage analysis in Fig. 2shows a different distribution of labor for three stages in 2006.The system definition stage must both coordinate and represent.The mechanical integration stage has fewer gatekeeper tasks.The Functional Integration stage has more gatekeeper tasks andfewer representative tasks. In contrast, detailed design and vali-dation stages showed some change in the relative magnitude ofeach brokerage role, but not in the position of the roles relative toeach other. The changing brokerage roles in the first three stagesshow a qualitative shift in how information is transmitted fromthese stages to others in the PDP between 2002 and 2006. Dataon PDP definition at multiple points in time is scarce. However,this finding is consistent with broader theory that sees socialsystems exhibiting increased specialization and division of la-bor as span of control increases [31], [32]. Here, span of controlis the ability to support multiple projects concurrently. The tasklevel also shows increased specialization as the iterative taskgroups in Table V show a new focus on manufacturing and fieldsupport in the 2006 PDP. These results highlight the analyticalshift we discussed at the beginning of the paper, from evaluatingindividual task characteristics to evaluating tasks in the contextof emergent information flow relationships in the PDP network.In many cases the work instructions for individual tasks (e.g.,defining the electrical or mechanical architecture or conductinga stage-gate review) did not change. The change was the role oftasks as information brokers in Smallcomp’s PDP. This suggeststhat tasks can have varying roles and burdens in terms of howthey share information. Companies seeking to support multipleconcurrent projects must align their organizational resources to
522 IEEE TRANSACTIONS ON ENGINEERING MANAGEMENT, VOL. 57, NO. 3, AUGUST 2010
TABLE VIIINA INSIGHTS FOR PDP CONTROL AND EXECUTION
the distribution of labor created by the information flow amongPDP tasks. We discuss how task distribution of labor impactsteam resource profiles and training in the next section.
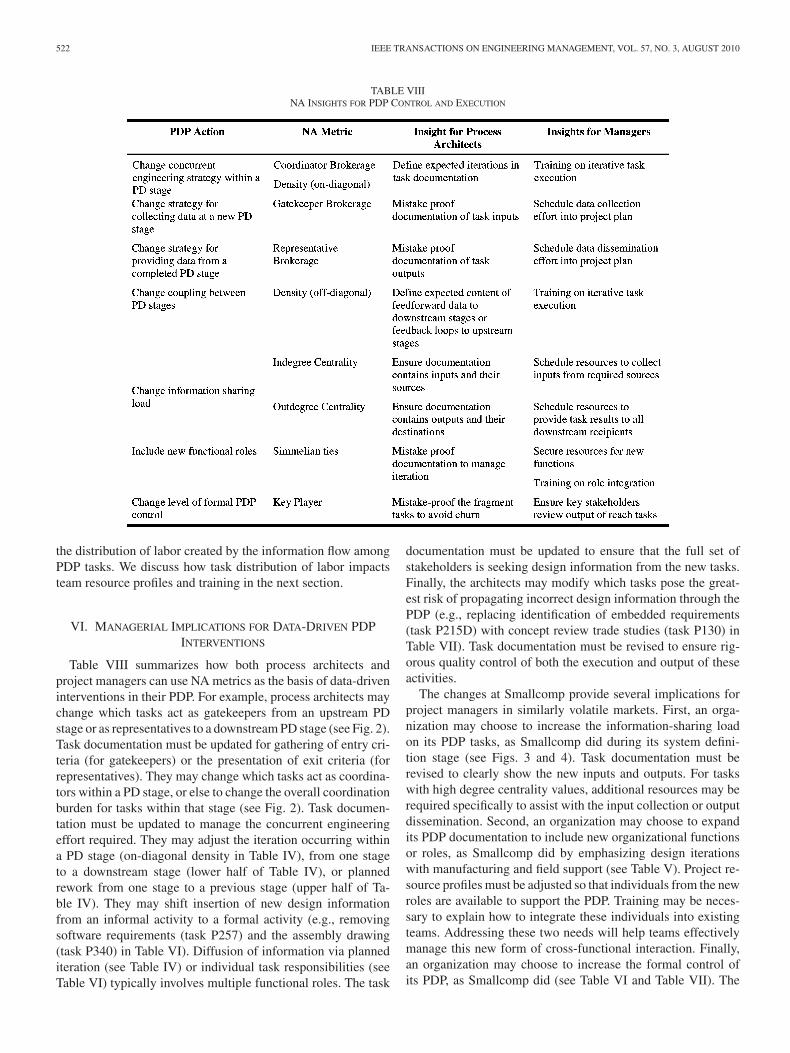
VI. MANAGERIAL IMPLICATIONS FOR DATA-DRIVEN PDPINTERVENTIONS
Table VIII summarizes how both process architects andproject managers can use NA metrics as the basis of data-driveninterventions in their PDP. For example, process architects maychange which tasks act as gatekeepers from an upstream PDstage or as representatives to a downstream PD stage (see Fig. 2).Task documentation must be updated for gathering of entry cri-teria (for gatekeepers) or the presentation of exit criteria (forrepresentatives). They may change which tasks act as coordina-tors within a PD stage, or else to change the overall coordinationburden for tasks within that stage (see Fig. 2). Task documen-tation must be updated to manage the concurrent engineeringeffort required. They may adjust the iteration occurring withina PD stage (on-diagonal density in Table IV), from one stageto a downstream stage (lower half of Table IV), or plannedrework from one stage to a previous stage (upper half of Ta-ble IV). They may shift insertion of new design informationfrom an informal activity to a formal activity (e.g., removingsoftware requirements (task P257) and the assembly drawing(task P340) in Table VI). Diffusion of information via plannediteration (see Table IV) or individual task responsibilities (seeTable VI) typically involves multiple functional roles. The task
documentation must be updated to ensure that the full set ofstakeholders is seeking design information from the new tasks.Finally, the architects may modify which tasks pose the great-est risk of propagating incorrect design information through thePDP (e.g., replacing identification of embedded requirements(task P215D) with concept review trade studies (task P130) inTable VII). Task documentation must be revised to ensure rig-orous quality control of both the execution and output of theseactivities.
The changes at Smallcomp provide several implications forproject managers in similarly volatile markets. First, an orga-nization may choose to increase the information-sharing loadon its PDP tasks, as Smallcomp did during its system defini-tion stage (see Figs. 3 and 4). Task documentation must berevised to clearly show the new inputs and outputs. For taskswith high degree centrality values, additional resources may berequired specifically to assist with the input collection or outputdissemination. Second, an organization may choose to expandits PDP documentation to include new organizational functionsor roles, as Smallcomp did by emphasizing design iterationswith manufacturing and field support (see Table V). Project re-source profiles must be adjusted so that individuals from the newroles are available to support the PDP. Training may be neces-sary to explain how to integrate these individuals into existingteams. Addressing these two needs will help teams effectivelymanage this new form of cross-functional interaction. Finally,an organization may choose to increase the formal control ofits PDP, as Smallcomp did (see Table VI and Table VII). The
COLLINS et al.: ANALYZING PRODUCT DEVELOPMENT TASK NETWORKS TO EXAMINE ORGANIZATIONAL CHANGE 523
team must ensure that appropriate scheduling mechanisms arein place so that critical stakeholders are actively reviewing keytasks. Deciding how to implement these changes will determineinterventions that project managers must make on a day-to-daybasis to execute their specific designs.
VII. CONCLUSION AND FUTURE WORK
The importance of data-driven decisions for process controlis a fundamental tenet of quality management [33], [49]–[52].With the shift in emphasis upstream of manufacturing to prod-uct design [53], a growing body of literature emphasizes theimportance of improving processes that create and transfer de-sign knowledge [3], [47], [48], [54], [55]. In this context, trans-mitting information between groups is a significant elementof engineering program execution. Managers seeking to makemeaningful improvements in the PD cycle may often incorrectlyidentify actual interdependencies because of the complex andinteracting nature of their organizational processes, tasks, andrelationships [56]–[59]. In many cases, this misperception oc-curs because they lack the tools to identify the key interactionsthat create this complexity.
The NA metrics described in this paper provide a way toanalytically determine the key relationships in complex PDenvironments, rather than relying on an individual or set ofindividuals to accurately understand the entire PDP. This al-lows PDPs to be emergent, rather than pre-defined phenomena.Real-time adjustment to ideal PDP sequences is often a fact oflife due to schedule, budget, and expertise constraints. Theseadjustments create differences between the “ideal” sequencein the PDP, and the actual PDP that a given team executes.While it is important to understand the actual information flowas embodied in an organization’s day-to-day interactions, theargument in this paper is that process architects and projectmanagers need tools to understand the implications of task re-lationships defined in their PDP. Specifically, they need toolsthat enable data-driven decisions about information flow pat-terns in the PDP so that they can determine when and where todiverge for their specific project. This can improve the produc-tivity of discussions when, for example, projects are audited forprocess compliance during stage gate or certification reviews.We believe that using NA metrics to evaluate information flowamong PDP tasks provides tools that help managers responsi-ble for negotiating these differences to effectively execute theirprojects.
One area of future work is to evaluate the use of transi-tivity as a PDP metric. At the overall PDP level, the transi-tivity value of 40% in Table II is relatively constant between2002 and 2006. This level of transitivity in a network of peo-ple would show vulnerability to error because individuals re-ceive the same information from multiple sources. For a PDP,transitivity means that a task receives input from both anothertask, and that task’s input. This could be a sign of inefficiency.However, it could also be used as a measure of concurrencyin the PDP. The task groups in Table V show both valuable(involve field support, manufacturing, or certification) and in-effective (coordinate with the reliability model and the elec-
trical architecture) iteration. This suggests that transitivity ina PDP network is not inherently undesirable. We hypothesizethat Simmelian ties, a special case of transitivity, could be usedas a design criterion to measure effective concurrency in thePDP.
A second area of future work is to examine which PDPchanges affect overall team effectiveness. The increased cen-tralization in Smallcomp’s 2006 PDP suggests a structure wherecommunication between groups is “purposeful.” This structureis consistent with the previously cited literature on decisionmaking under ambiguous conditions [21], [26], [28]. It lesslikely to stimulate random or informal communication betweenfunctional groups, especially if the groups are working on mul-tiple projects simultaneously. At Smallcomp, there was limiteddocumentation on how Integrated Product Development teamsshould form and function in 2002 or 2006. Smallcomp’s pro-cess architects expected that engineers working on the sameproject would collaborate informally as part of their daily ac-tivities. Based on that expectation, they chose not to revise theprocesses governing IPD team interaction when they made thePDP changes discussed in this paper. The potential to con-tain costs and improve organizational effectiveness via team-oriented interventions rather than changes to task documen-tation has been identified in several disciplines [60]–[66]. Itwas a recurring finding at Smallcomp [67], [68]. Consequently,we suggest that in addition to understanding information flowamong tasks in a PDP, process architects and managers en-gaged in PD would further benefit from systematic methodsto formalize problem solving across functional groups as op-posed to expecting that team members would initiate informaldiscussions.
ACKNOWLEDGMENT
This paper is based on a previous conference presentation[19]. The authors thank J. Pinto and three anonymous reviewersfor helpful comments on earlier drafts of this paper.
REFERENCES
[1] T. D. Wall, J. L. Cordery, and C. W. Clegg, “Empowerment, performance,and operational uncertainty: A theoretical integration,” Appl. Psychol.Int. Rev., vol. 51, pp. 146–169, 2002.
[2] J. P. MacDuffie, “The Road to “Root cause”: Shop-floor problem-solvingat three auto assembly plants,” Manage. Sci., vol. 43, pp. 479–502, 1997.
[3] R. G. Cooper, “Perspective: Third-generation new product processes,” J.Prod. Innov. Manage., vol. 11, pp. 3–14, 1994.
[4] M. J. Benner and M. Tushman, “Process management and technologicalinnovation: A longitudinal study of the photography and paint industries,”Admin. Sci. Q., vol. 47, pp. 676–706, 2002.
[5] T. R. Browning, F. Fricke, and H. Negele, “Key concepts in modelingproduct development processes,” Syst. Eng., vol. 9, pp. 104–128, 2006.
[6] INCOSE, Systems Engineering Handbook: A “What to” Guide for all SEPractitioners. San Diego, CA: Int. Council Syst. Eng., 2004.
[7] R. G. Cooper, “How to launch a new product successfully,” CMA Mag.,vol. 69, pp. 20–23, 1995.
[8] K. T. Ulrich and S. D. Eppinger, Product Design and Development, 3rded. New York: McGraw-Hill, 2004.
[9] R. G. Cooper and E. J. Kleinschmidt, “Benchmarking the firm’s criticalsuccess factors in new product development,” J. Prod. Innov. Manage.,vol. 12, pp. 374–391, 1995.
[10] M. Spinner, Improving Project Management Skills and Techniques. En-glewood Cliffs, NJ: Prentice-Hall, 1989.
524 IEEE TRANSACTIONS ON ENGINEERING MANAGEMENT, VOL. 57, NO. 3, AUGUST 2010
[11] A. Kusiak, Engineering Design: Products, Processes, and Systems. SanDiego, CA: Academic, 1999.
[12] T. R. Browning, “Applying the design structure matrix to system decom-position and integration problems: A review and new directions,” IEEETrans. Eng. Manage., vol. 48, no. 3, pp. 292–306, Aug. 2001.
[13] T. Bustnay and J. Ben-Asher, “How many systems are there?—Using theN2 method for systems partitioning,” Syst. Eng., vol. 8, pp. 109–118,2005.
[14] A. A. Yassine and D. Braha, “Four complex problems in concurrent engi-neering and the design structure matrix method,” Concurrent Eng. Res.Appl., vol. 11, pp. 165–176, 2003.
[15] K. E. Weick, Sensemaking in Organizations. Thousand Oaks, CA: Sage,1995.
[16] T. R. Browning, “Integrative mechanisms for multiteam integration: Find-ings from five case studies,” Syst. Eng., vol. 1, pp. 95–112, 1998.
[17] T. R. Browning, “Designing system development projects for organiza-tional integration,” Syst. Eng., vol. 2, pp. 217–225, 1999.
[18] D. Batallas and A. Yassine, “Information leaders in product developmentorganizational networks: Social network analysis of the design structurematrix,” IEEE Trans. Eng. Manage., vol. 43, no. 4, pp. 570–582, Nov.2006.
[19] S. T. Collins, J. A. Bradley, and A. A. Yassine, “Measuring organizationalresponses to stress: A longitudinal study of product development tasknetworks,” in Proc. 18th Annu. Int. Symp. Int. Council Syst. Eng. (Utrecht,The Netherlands). Seattle, WA: INCOSE, 2008.
[20] S. T. Collins, A. A. Yassine, and S. P. Borgatti, “Evaluating product devel-opment systems using network analysis,” Syst. Eng., vol. 12, pp. 55–68,2009.
[21] J. G. March, A Primer on Decision Making: How Decisions Happen.New York: Free Press, 1994.
[22] L. Clarke and C. Perrow, “Prosaic organizational failures,” Amer. Behav.Sci., vol. 39, pp. 1040–1056, 1996.
[23] J. S. Carroll, “Organizational learning activities in high-hazard industries:The logics underlying self-analysis,” J. Manage. Stud., vol. 35, pp. 699–717, 1998.
[24] B. A. Turner, “The organizational and interorganizational development ofdisasters,” Admin. Sci. Q., vol. 21, pp. 378–397, 1976.
[25] C. M. Christenson and J. L. Bower, “Customer power, strategic investment,and the failure of leading firms,” Strateg. Manage. J., vol. 17, pp. 197–218,1996.
[26] J. G. March, Decisions and Organizations. New York: Blackwell, 1988.[27] B. M. Staw, L. E. Sandelands, and J. E. Dutton, “Threat rigidity effects in
organizational behavior: a multilevel analysis,” Admin. Sci. Q., vol. 26,pp. 501–524, 1981.
[28] K. E. Weick and K. M. Sutcliffe, Managing the Unexpected: Assuring HighPerformance in an Age of Complexity. San Francisco, CA: Jossey-Bass,2001.
[29] J. E. Dutton, “The processing of crisis and non-crisis strategic issues,” J.Manage. Stud., vol. 23, pp. 501–517, 1986.
[30] K. E. Weick, Making Sense of the Organization. Malden, MA: Black-well, 2001.
[31] R. L. Bee, Patterns and Processes: An Introduction to AnthropologicalStrategies for the Study of Sociocultural Change. New York: Free Press,1974.
[32] U. Hannerz, Cultural Complexity: Studies in the Social Organization ofMeaning. New York: Columbia Univ. Press, 1992.
[33] W. E. Deming, Out of the Crisis. Cambridge, MA: MIT Center Ad-vanced Eng. Studies, 1986.
[34] R. A. Hanneman and M. Riddle. (2005). Introduction to Social NetworkMethods. Riverside, CA: Univ. California [Online]. Available: http://faculty.ucr.edu/∼hanneman/
[35] S. Wasserman and K. Faust, Social Network Analysis Methods and Appli-cations. Cambridge, U.K.: Cambridge Univ. Press, 1999.
[36] J. Scott, Social Network Analysis: A Handbook. London, U.K.: Sage,2000.
[37] G. Chartrand, Introductory Graph Theory. Mineola, NY: Dover, 1985.[38] R. L. Brieger and P. E. Pattison, “Structures of economic interdependence
among nations,” in Continuities in Structural Inquiry, P. M. Blau andR. Merton, Eds. New York: Free Press, 1981, pp. 353–380.
[39] D. Snyder and E. L. Kick, “Structural position in the world system and eco-nomic growth, 1955–1970: A multiple-network analysis of transnationalinteractions,” Amer. J. Sociol., vol. 84, pp. 1096–1126, 1979.
[40] R. S. Burt, “Cohesion versus structural equivalence as a basis for networksubgroups,” Sociol. Methods Res., vol. 7, pp. 189–212, 1978.
[41] R. S. Burt, “Social contagion and innovation: Cohesion versus structuralequivalence,” Amer. J. Sociol., vol. 92, pp. 1287–1335, 1987.
[42] R. J. Brymn, “Structural location and ideological divergence: JewishMarxist intellectuals in turn-of-the-century Russia,” in Social Structures,B. Wellman and S. D. Berkowitz, Eds. Cambridge, U.K.: CambridgeUniv. Press, 1988, pp. 359–379.
[43] J. Galaskiewicz and K. R. Krohn, “Positions, roles, and dependencies in acommunity integration system,” Sociol. Q., vol. 25, pp. 527–550, 1984.
[44] F. J. Roethlisberger and W. J. Dickson, Management and the Worker.Cambridge, MA: Harvard Univ. Press, 1939.
[45] M. Kilduff and W. Tsai, Social Networks and Organizations. ThousandOaks, CA: Sage, 2003.
[46] S. P. Borgatti, “Identifying sets of key players in a social network,” Com-put. Math. Org. Theory, vol. 12, pp. 21–34, 2006.
[47] R. G. Cooper, S. J. Edgett, and E. J. Kleinschmidt, “Optimizing the stage-gate process: What best practice companies do—II,” Res. Technol. Man-age., vol. 45, pp. 21–27, 2002.
[48] R. G. Cooper and E. J. Kleinschmidt, “Stage gate systems for new productsuccess,” Marketing Manage., vol. 1, pp. 10–29, 1993.
[49] R. E. Devor, T. Chang, and J. W. Sutherland, Statistical Quality Designand Control. Upper Saddle River, NJ: Prentice-Hall, 1992.
[50] W. A. Shewhart, Economic Control of Quality of Manufactured Product.Princeton, NJ: Van Nostrand, 1931.
[51] G. Taguchi and Y. Wu, Introduction to Off-Line Quality Control. No-goya, Japan: Central Japan Quality Control Assoc., 1980.
[52] F. Taylor, The Principles of Scientific Management. New York: Harper,1911.
[53] K. Nichols, “Better, cheaper, faster products—By design,” J. Eng. Design,vol. 3, pp. 217–228, 1992.
[54] D. Tapping and T. Shuker, Value Stream Management for the Lean Office.New York: Productivity Press, 2003.
[55] S. Thomke and D. Reinersten, “Agile product development: Managingdevelopment flexibility in uncertain environments,” Calif. Manage. Rev.,vol. 41, pp. 8–30, 1998.
[56] N. Siggelkow, “Misperceiving interactions among complements and sub-stitutes: Organizational consequences,” Manage. Sci., vol. 48, pp. 900–917, 2002.
[57] J. D. Sterman, “Modeling managerial behavior: Misperceptions of feed-back in a dynamic decision making experiment,” Manage. Sci., vol. 35,pp. 321–339, 1989.
[58] B. Brehmer, “Dynamic decision making: Human control of complex sys-tems,” Acta Psychol., vol. 81, pp. 211–241, 1992.
[59] N. P. Repenning, P. Goncalves, and L. J. Black, “Past the tipping point:The persistence of fire-fighting in product development,” Calif. Manage.Rev., vol. 43, pp. 44–63, 2001.
[60] B. S. Caldwell, “Components of information flow to support coordinatedtask performance,” Int. J. Cogn. Econ., vol. 1, pp. 25–41, 1997.
[61] B. S. Caldwell, “Analysis and modeling of information flow and dis-tributed expertise in space related operations,” Acta Astronautica, vol. 56,pp. 996–1004, 2005.
[62] S. T. Collins, B. S. Caldwell, and S. K. Garrett, “Managing distributedexpertise and knowledge foraging to reduce unplanned redesigns,” in Proc.7th Annu. Conf. Syst. Eng. Res. (CSER) (Loughborough, U.K.), Seattle,WA: INCOS, 2009.
[63] J. E. Mathieu, M. A. Marks, and S. J. Zaccaro, “Multi-team Systems,” inInternational Handbook of Work and Organizational Psychology, N. An-derson, D. Ones, H. K. Sinangil, and C. Viswesvaran, Eds., ThousandOaks, CA: Sage Publications, 2001, pp. 289–313.
[64] G. I. Susman and J. M. Ray, “Test of a model of organizational contributorsto product development team effectiveness,” J. Eng. Technol. Manage.,vol. 16, pp. 223–245, 1999.
[65] D. Gerwin and N. J. Barrowman, “An evaluation of research on inte-grated product development teams,” Manage. Sci., vol. 48, pp. 938–953,2002.
[66] S. K. Garrett, B. S. Caldwell, E. C. Harris, and M. C. Gonzalez, “Sixdimensions of expertise: A more comprehensive definition of cognitiveexpertise for team coordination,” Theor. Issues Ergon. Sci., vol. 10, pp. 93–105, 2009.
[67] S. T. Collins, “Expertise, disagreement, and bad things: Turbulent knowl-edge amidst organizational stress in engineering R&D,” unpublished Ph.D.dissertation, Univ. Connecticut, Storrs, CT, 2007.
[68] S. T. Collins, “We both must change: Rethinking process improvement innew product development,” presented at the Presidential Sessions Amer.Anthropol. Assoc. Annu. Meetings, San Francisco, CA, 2008.
COLLINS et al.: ANALYZING PRODUCT DEVELOPMENT TASK NETWORKS TO EXAMINE ORGANIZATIONAL CHANGE 525
Shawn T. Collins received the B.S. degree in me-chanical engineering from Purdue University, Wash-ington, DC, in 1999, the M.S. degree in mechanicalengineering from Rensselaer Polytechnic Institute,Troy, NY, in 2004, and the M.A. and Ph.D. degreesin anthropology from the University of Connecticut,Storrs, CT, in 2003 and 2007, respectively.
He is currently with the Control Systems Engi-neering Department, Rolls-Royce, Indianapolis, IN.He is engaged in applying anthropological insightto engineering product development. His current re-
search interests include ethnographic methods, social network analysis, cog-nitive anthropology, product development methods, process control, systemsengineering, and team performance.
Dr. Collins is a member of the International Symposium of the InternationalCouncil on Systems Engineering and the Society for Applied Anthropology.
Joe A. Bradley received the B.S.E. degree inaerospace engineering from the University of Michi-gan, Ann Arbor, in 1995, the M.S. degree in mechan-ical engineering and the Graduate Minor in electri-cal engineering from Iowa State University, Ames,in 2001, and the MBA degree and the Ph.D. degreein systems and entrepreneurial engineering from theUniversity of Illinois at Urbana-Champaign, Urbana,in 2004 and 2009, respectively.
He is currently with the Software DevelopmentGroup, Applied Research Associates, Champaign,
IL. He is engaged in product development systems and network-based sys-tem modeling techniques.
Ali A. Yassine received the B.E. degree in mechanicalengineering from the American University of Beirut,in 1988, the M.S. and Ph.D. degrees in industrial andmanufacturing engineering from Wayne State Uni-versity in Detroit, Michigan, in 1989 and 1994, re-spectively.
He is currently an Assistant Professor with the De-partment of Industrial and Enterprise Systems Engi-neering, University of Illinois at Urbana-Champaign,Urbana, where he is the Director of the Product De-velopment Research Laboratory. His current research
interests include managing the development process of complex engineeringsystems, design-process modeling, and IT-enabled concurrent engineering.
Dr. Yassine is a member of the Institute for Operations Research and theManagement Sciences, the American Society of Mechanical Engineers, andProduct Development and Management Association (PDMA).