analytical model of salinity risk from groundwater discharge in semi-arid, lowland floodplains
TRANSCRIPT
HYDROLOGICAL PROCESSESHydrol. Process. 23, 3428–3439 (2009)Published online 16 September 2009 in Wiley InterScience(www.interscience.wiley.com) DOI: 10.1002/hyp.7447
Analytical model of salinity risk from groundwater dischargein semi-arid, lowland floodplains
Kate L. Holland,* Ian D. Jolly, Ian C. Overton and Glen R. WalkerCSIRO Land and Water, PMB 2, Glen Osmond, South Australia 5064, Australia
Abstract:
River regulation and irrigated agricultural developments have increased saline groundwater discharge to semi-arid floodplainenvironments, resulting in soil salinization and vegetation dieback. There is a need for rapid assessment tools to identify areas offloodplain vegetation at risk from salinization. This article describes the development and testing of a simple, one-dimensionalanalytical model that distributes floodplain groundwater discharge as seepage at the break of slope, evapotranspiration acrossthe floodplain and as groundwater flow into and out of the river. The analytical model provided comparable estimatesof groundwater discharge to MODFLOW (R2 D 0Ð998) over a broad range of floodplain scenarios. Using regional scalegeographic information system (GIS) data along an 85-km long reach of the lower River Murray in South Australia, themodel predicted the location of most (66%) of the unhealthy trees affected by seepage and soil salinization near the edge ofthe river valley and more than 75% of the unhealthy trees across the broader floodplain. The model predicted 98% of theobserved variance in measured kilometre-by-kilometre river salt loads, identifying ‘hotspots’ of salt input to the river. It cantherefore be used as a rapid assessment tool to assess the potential salinity risk to the floodplain vegetation and river fromirrigation developments and river management. This approach can be applied more broadly, although the impact of wetlandsand oxbows, which may act to intercept groundwater within the floodplain, is not taken into account. Copyright 2009 JohnWiley & Sons, Ltd.
KEY WORDS groundwater; modelling; salinity; irrigation; floodplain; discharge; River Murray
Received 9 June 2009; Accepted 17 July 2009
INTRODUCTION
In the lower River Murray in South Australia, there arenatural inflows of saline regional groundwater to thefloodplains, wetlands and river channel. However, thesehave greatly increased as a result of the developmentof large areas of irrigated horticulture (predominantlycitrus, grapes, vegetables, stone fruits and nut crops)immediately adjacent to the river and its floodplain.High rates of recharge occur in these irrigation areas,which leads to the formation of groundwater moundswith elevations of up to 20 m above those of the riverand the groundwater levels within the floodplain. Thesegroundwater mounds cause significant increases in theinflow of groundwater to the river valley.
When combined with river regulation by flow controlweirs/locks that hold the river at higher average levelsthan under natural conditions, the increased groundwaterinflows to the river valley have led to raised water tablesbeneath the floodplain. In some areas, the inflows are nowso high that the water table at the break in slope of theriver valley has reached the floodplain surface causinggroundwater seepage to occur.
The raised water tables beneath the floodplain have ledto increased rates of evapotranspiration of groundwater,and in the case of seepage areas, waterlogging as well.
* Correspondence to: Kate L. Holland, CSIRO Land and Water, PMB 2,Glen Osmond SA 5064, Australia. E-mail: [email protected]
Because the groundwater is naturally saline, the increasedevapotranspiration and seepage results in floodplain salin-ization, which consequently affects the health of flood-plain vegetation. These problems are further exacerbatedby less frequent removal of the accumulated salt in thefloodplain by large floods, the frequency and durationof which has been greatly reduced by upstream storagesand irrigation diversions (Jolly, 1996). Although a num-ber of other factors such as clearing and coppicing oftrees, grazing of livestock and feral animals, insect attackand parasite infestation can contribute to floodplain veg-etation health decline, these are generally second-ordereffects in the lower River Murray compared with thoseof salinization (Jolly, 1996).
Estimates derived from Department for Environ-ment and Heritage (South Australia) floodplain vege-tation floristic and tree health mapping in 2002–2003(Smith and Kenny, 2005) suggest that approximately40% (40 000 ha) of the floodplain in South Australiais severely degraded by soil salinization (Walker et al.,2005), and this is expected to increase in the future.In response, the South Australian River Murray SalinityStrategy (DWR, 2001a) has proposed several manage-ment options to ameliorate floodplain salinization, includ-ing groundwater lowering, improved flooding and theestablishment of floodplain protection zones to ensurenew irrigation development will not affect floodplains ofhigh conservation value. There is a need for decision sup-port tools that use published regional scale information
Copyright 2009 John Wiley & Sons, Ltd.
FLOODPLAIN SALINITY RISK ASSESSMENT 3429
to assist in the development and implementation of theseoptions. These decision support tools should identifywhere floodplain salinization can be minimized by saltinterception schemes or floodplain irrigation protectionzones and where floodplain groundwater levels can belowered to protect valuable floodplain communities fromsalinization.
ANALYTICAL MODEL DEVELOPMENT
The mathematical development of the model is summa-rized below and complete derivations can be found inHolland et al. (2004). The definitions and units of vari-ables used in the model are described in Table I.
Conceptual model of the floodplain and regional aquifers
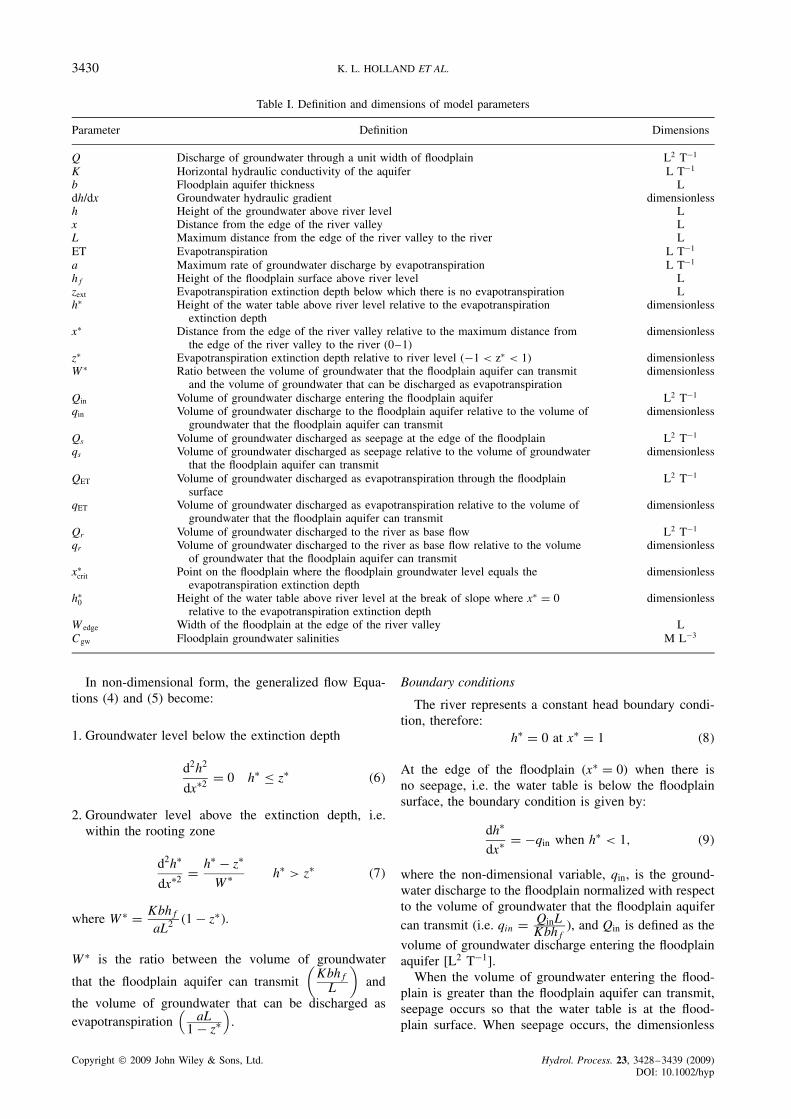
The floodplains have been conceptualized in a simplecross-sectional model, comprising a surface layer ofCoonambidgal Clay overlying a layer of Monoman Sands(Figure 1). This is based on drilling records (AWE,1999) and modelling studies around the Bookpurnongand Loxton Irrigation Areas (Armstrong et al., 1999;Barnett et al., 2002). The highland area is represented bythe unconfined Upper Loxton (Pliocene) Sands aquifer.Both the highland and floodplain are underlain by theLower Loxton Sands, a relatively impermeable clayeysand formation.
The arrows in Figure 1 represent groundwater flowdirections and potential groundwater discharge sites.Groundwater flow in the Upper Loxton Sands is a com-bination of irrigation recharge and regional groundwaterflow. Groundwater flow into the floodplain is dischargedas either seepage at the break of slope if the groundwaterlevel is above the floodplain surface, evapotranspirationthrough the floodplain when the water table is withinthe evapotranspiration extinction depth (vegetation root-ing depth), or as base flow to or from the river.
Model assumptions
The following assumptions are made:
1. Groundwater flow within the floodplain is one-dimen-sional, under steady-state conditions with no recharge,and the floodplain aquifer is homogenous and isotropic;and
2. Groundwater flow under the floodplain is defined byDarcy’s Law (Equation 1), where Q is the dischargeof groundwater through a unit width of floodplain [L2
T�1]; K is the horizontal hydraulic conductivity of theaquifer [L T�1]; b is the aquifer thickness [L]; anddh/dx is the groundwater hydraulic gradient, where his the height of the groundwater above river level [L]and x is the distance from the edge of the river valley[L] to a maximum distance L at the river [L];
Q D �Kbdh
dx; �1�
3. Loss of groundwater through evapotranspiration, ET[L T�1] is calculated using the simple linear func-tion described by Equations (2) and (3); where a isthe maximum rate of groundwater discharge by evapo-transpiration at the floodplain surface on an areal basis[L T�1]. This maximum groundwater evapotranspira-tion rate declines to zero at zext, which corresponds tothe average vegetation rooting depth; hf is the heightof the floodplain above river level [L]; and zext isthe evapotranspiration extinction depth [L], or rootingdepth, below which there is no evapotranspiration.
ET D a[h � �hf � zext�]
zexth > hf � zext, �2�
ET D 0 h � hf � zext; and �3�
4. A sharp cliff and a flat floodplain characterize the shapeof the river valley.
Governing equations
Under the above assumptions, the generalizsed flowEquation (1) can be simplified by considering groundwa-ter flow in terms of changes in the slope of the watertable between the edge of the floodplain and the river.
1. When the groundwater level is below the extinctiondepth, groundwater flow is controlled by the hydraulicgradient between the edge of the floodplain and theriver and therefore the slope of the water table isconstant, i.e.
Kbd2h
dx2 h � �hf � zext� �4�
2. When the groundwater level is above the extinctiondepth, groundwater flow is controlled by the hydraulicgradient and evapotranspiration across the floodplainand therefore the slope of the water table changes withevapotranspiration across the floodplain, i.e.
Kbd2h
dx2 D a�zext � hf C h�
zexth > �hf � zext�. �5�
Non-dimensional equations
The above equations can be written in non-dimensionalform to minimize the number of variables, and toput into perspective the balance between the differentfloodplain groundwater discharge processes. To do this,we substitute the following:
hŁ D h
hf, xŁ D x
Land zŁ D 1 � zext
hf.
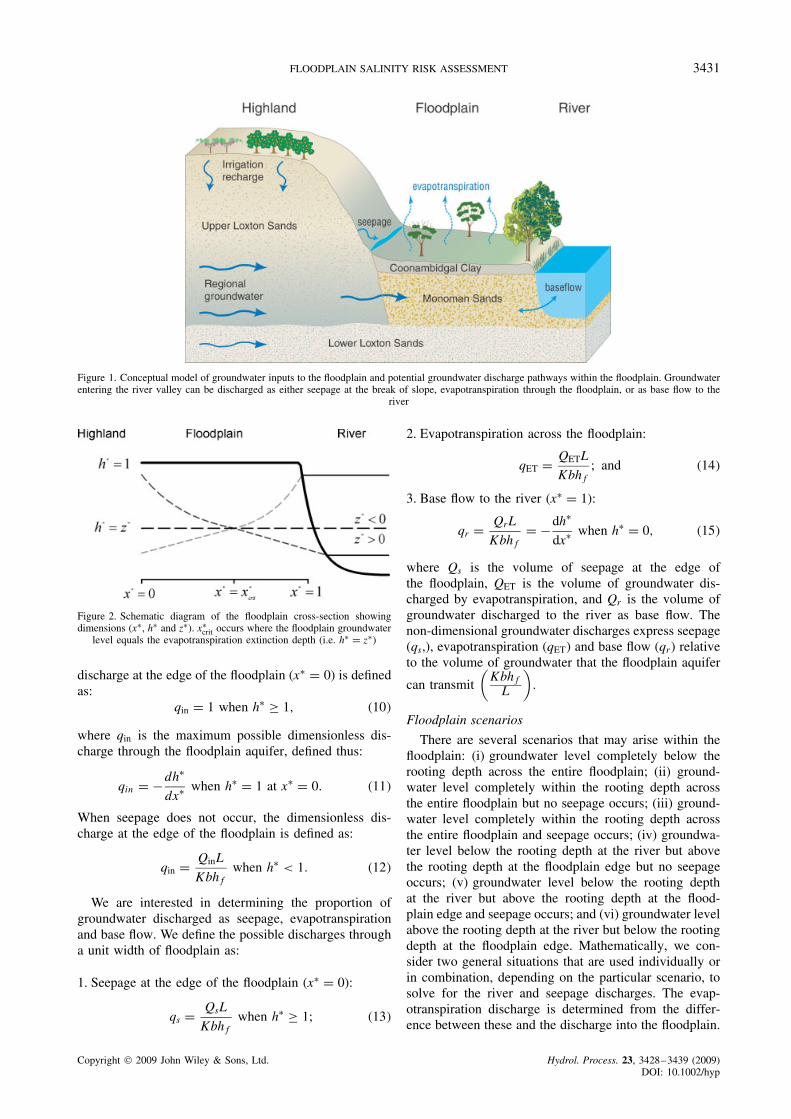
The non-dimensional variables hŁ and xŁ normalizewater table elevation, location between the edge of thefloodplain and the river to values between 0 and 1,respectively (Figure 2). The non-dimensional variable zŁexpresses evapotranspiration extinction depth in relationto the river level, with the extinction depth above riverlevel when 0 < zŁ < 1 and below river level when �1 <zŁ < 0.
Copyright 2009 John Wiley & Sons, Ltd. Hydrol. Process. 23, 3428–3439 (2009)DOI: 10.1002/hyp
3430 K. L. HOLLAND ET AL.
Table I. Definition and dimensions of model parameters
Parameter Definition Dimensions
Q Discharge of groundwater through a unit width of floodplain L2 T�1
K Horizontal hydraulic conductivity of the aquifer L T�1
b Floodplain aquifer thickness Ldh/dx Groundwater hydraulic gradient dimensionlessh Height of the groundwater above river level Lx Distance from the edge of the river valley LL Maximum distance from the edge of the river valley to the river LET Evapotranspiration L T�1
a Maximum rate of groundwater discharge by evapotranspiration L T�1
hf Height of the floodplain surface above river level Lzext Evapotranspiration extinction depth below which there is no evapotranspiration LhŁ Height of the water table above river level relative to the evapotranspiration
extinction depthdimensionless
xŁ Distance from the edge of the river valley relative to the maximum distance fromthe edge of the river valley to the river (0–1)
dimensionless
zŁ Evapotranspiration extinction depth relative to river level (�1 < zŁ < 1) dimensionlessWŁ Ratio between the volume of groundwater that the floodplain aquifer can transmit
and the volume of groundwater that can be discharged as evapotranspirationdimensionless
Qin Volume of groundwater discharge entering the floodplain aquifer L2 T�1
qin Volume of groundwater discharge to the floodplain aquifer relative to the volume ofgroundwater that the floodplain aquifer can transmit
dimensionless
Qs Volume of groundwater discharged as seepage at the edge of the floodplain L2 T�1
qs Volume of groundwater discharged as seepage relative to the volume of groundwaterthat the floodplain aquifer can transmit
dimensionless
QET Volume of groundwater discharged as evapotranspiration through the floodplainsurface
L2 T�1
qET Volume of groundwater discharged as evapotranspiration relative to the volume ofgroundwater that the floodplain aquifer can transmit
dimensionless
Qr Volume of groundwater discharged to the river as base flow L2 T�1
qr Volume of groundwater discharged to the river as base flow relative to the volumeof groundwater that the floodplain aquifer can transmit
dimensionless
xŁcrit Point on the floodplain where the floodplain groundwater level equals the
evapotranspiration extinction depthdimensionless
hŁ0 Height of the water table above river level at the break of slope where xŁ D 0
relative to the evapotranspiration extinction depthdimensionless
Wedge Width of the floodplain at the edge of the river valley LCgw Floodplain groundwater salinities M L�3
In non-dimensional form, the generalized flow Equa-tions (4) and (5) become:
1. Groundwater level below the extinction depth
d2h2
dxŁ2 D 0 hŁ � zŁ �6�
2. Groundwater level above the extinction depth, i.e.within the rooting zone
d2hŁ
dxŁ2 D hŁ � zŁ
WŁ hŁ > zŁ �7�
where WŁ D Kbhf
aL2 �1 � zŁ�.
WŁ is the ratio between the volume of groundwater
that the floodplain aquifer can transmit(
KbhfL
)and
the volume of groundwater that can be discharged asevapotranspiration
(aL
1 � zŁ)
.
Boundary conditions
The river represents a constant head boundary condi-tion, therefore:
hŁ D 0 at xŁ D 1 �8�
At the edge of the floodplain (xŁ D 0) when there isno seepage, i.e. the water table is below the floodplainsurface, the boundary condition is given by:
dhŁ
dxŁ D �qin when hŁ < 1, �9�
where the non-dimensional variable, qin, is the ground-water discharge to the floodplain normalized with respectto the volume of groundwater that the floodplain aquifercan transmit (i.e. qin D QinL
Kbhf), and Qin is defined as the
volume of groundwater discharge entering the floodplainaquifer [L2 T�1].
When the volume of groundwater entering the flood-plain is greater than the floodplain aquifer can transmit,seepage occurs so that the water table is at the flood-plain surface. When seepage occurs, the dimensionless
Copyright 2009 John Wiley & Sons, Ltd. Hydrol. Process. 23, 3428–3439 (2009)DOI: 10.1002/hyp
FLOODPLAIN SALINITY RISK ASSESSMENT 3431
Figure 1. Conceptual model of groundwater inputs to the floodplain and potential groundwater discharge pathways within the floodplain. Groundwaterentering the river valley can be discharged as either seepage at the break of slope, evapotranspiration through the floodplain, or as base flow to the
river
Figure 2. Schematic diagram of the floodplain cross-section showingdimensions (xŁ, hŁ and zŁ). xŁ
crit occurs where the floodplain groundwaterlevel equals the evapotranspiration extinction depth (i.e. hŁ D zŁ)
discharge at the edge of the floodplain (xŁ D 0) is definedas:
qin D 1 when hŁ ½ 1, �10�
where qin is the maximum possible dimensionless dis-charge through the floodplain aquifer, defined thus:
qin D �dhŁ
dxŁ when hŁ D 1 at xŁ D 0. �11�
When seepage does not occur, the dimensionless dis-charge at the edge of the floodplain is defined as:
qin D QinL
Kbhfwhen hŁ < 1. �12�
We are interested in determining the proportion ofgroundwater discharged as seepage, evapotranspirationand base flow. We define the possible discharges througha unit width of floodplain as:
1. Seepage at the edge of the floodplain (xŁ D 0):
qs D QsL
Kbhfwhen hŁ ½ 1; �13�
2. Evapotranspiration across the floodplain:
qET D QETL
Kbhf; and �14�
3. Base flow to the river (xŁ D 1):
qr D QrL
KbhfD �dhŁ
dxŁ when hŁ D 0, �15�
where Qs is the volume of seepage at the edge ofthe floodplain, QET is the volume of groundwater dis-charged by evapotranspiration, and Qr is the volume ofgroundwater discharged to the river as base flow. Thenon-dimensional groundwater discharges express seepage(qs,), evapotranspiration (qET) and base flow (qr) relativeto the volume of groundwater that the floodplain aquifer
can transmit(
KbhfL
).
Floodplain scenarios
There are several scenarios that may arise within thefloodplain: (i) groundwater level completely below therooting depth across the entire floodplain; (ii) ground-water level completely within the rooting depth acrossthe entire floodplain but no seepage occurs; (iii) ground-water level completely within the rooting depth acrossthe entire floodplain and seepage occurs; (iv) groundwa-ter level below the rooting depth at the river but abovethe rooting depth at the floodplain edge but no seepageoccurs; (v) groundwater level below the rooting depthat the river but above the rooting depth at the flood-plain edge and seepage occurs; and (vi) groundwater levelabove the rooting depth at the river but below the rootingdepth at the floodplain edge. Mathematically, we con-sider two general situations that are used individually orin combination, depending on the particular scenario, tosolve for the river and seepage discharges. The evap-otranspiration discharge is determined from the differ-ence between these and the discharge into the floodplain.
Copyright 2009 John Wiley & Sons, Ltd. Hydrol. Process. 23, 3428–3439 (2009)DOI: 10.1002/hyp
3432 K. L. HOLLAND ET AL.
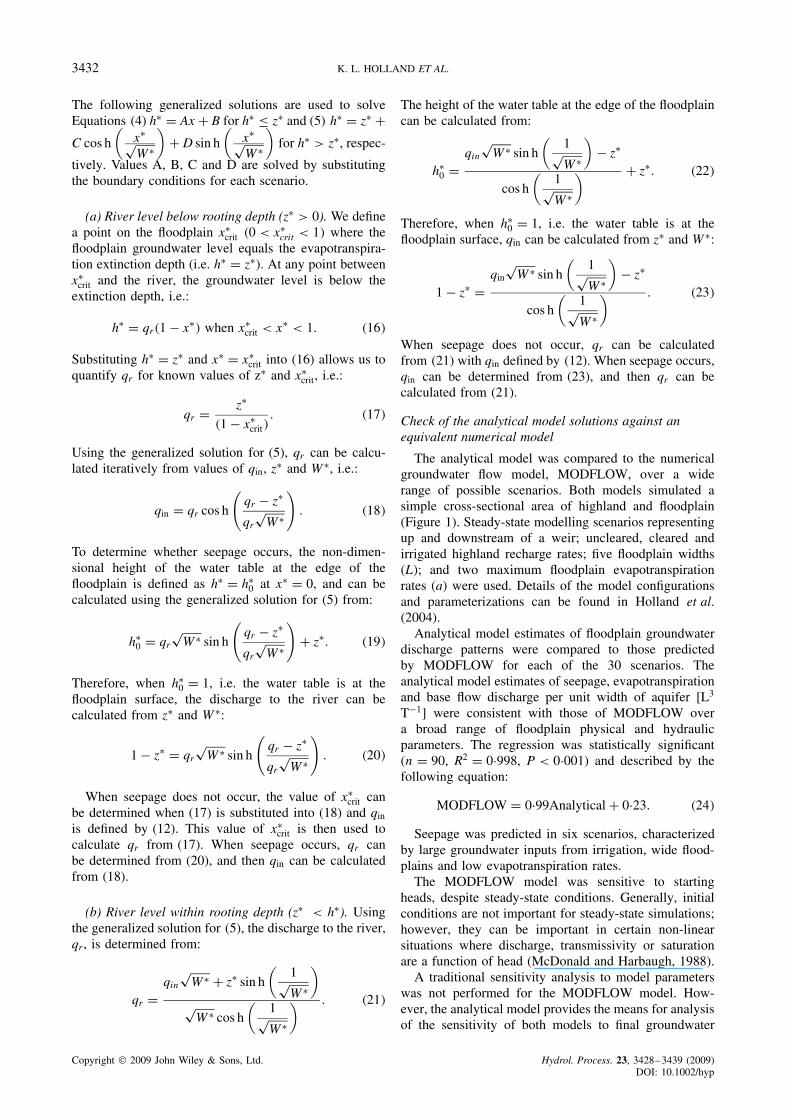
The following generalized solutions are used to solveEquations (4) hŁ D Ax C B for hŁ � zŁ and (5) hŁ D zŁ CC cos h
(xŁpWŁ
)C D sin h
(xŁpWŁ
)for hŁ > zŁ, respec-
tively. Values A, B, C and D are solved by substitutingthe boundary conditions for each scenario.
(a) River level below rooting depth (zŁ > 0). We definea point on the floodplain xŁ
crit �0 < xŁcrit < 1� where the
floodplain groundwater level equals the evapotranspira-tion extinction depth (i.e. hŁ D zŁ). At any point betweenxŁ
crit and the river, the groundwater level is below theextinction depth, i.e.:
hŁ D qr�1 � xŁ� when xŁcrit < xŁ < 1. �16�
Substituting hŁ D zŁ and xŁ D xŁcrit into (16) allows us to
quantify qr for known values of zŁ and xŁcrit, i.e.:
qr D zŁ
�1 � xŁcrit�
. �17�
Using the generalized solution for (5), qr can be calcu-lated iteratively from values of qin, zŁ and WŁ, i.e.:
qin D qr cos h
(qr � zŁ
qr
pWŁ
). �18�
To determine whether seepage occurs, the non-dimen-sional height of the water table at the edge of thefloodplain is defined as hŁ D hŁ
0 at xŁ D 0, and can becalculated using the generalized solution for (5) from:
hŁ0 D qr
pWŁ sin h
(qr � zŁ
qr
pWŁ
)C zŁ. �19�
Therefore, when hŁ0 D 1, i.e. the water table is at the
floodplain surface, the discharge to the river can becalculated from zŁ and WŁ:
1 � zŁ D qr
pWŁ sin h
(qr � zŁ
qr
pWŁ
). �20�
When seepage does not occur, the value of xŁcrit can
be determined when (17) is substituted into (18) and qin
is defined by (12). This value of xŁcrit is then used to
calculate qr from (17). When seepage occurs, qr canbe determined from (20), and then qin can be calculatedfrom (18).
(b) River level within rooting depth (zŁ < hŁ). Usingthe generalized solution for (5), the discharge to the river,qr , is determined from:
qr Dqin
pWŁ C zŁ sin h
(1pWŁ
)p
WŁ cos h(
1pWŁ
) . �21�
The height of the water table at the edge of the floodplaincan be calculated from:
hŁ0 D
qin
pWŁ sin h
(1pWŁ
)� zŁ
cos h(
1pWŁ
) C zŁ. �22�
Therefore, when hŁ0 D 1, i.e. the water table is at the
floodplain surface, qin can be calculated from zŁ and WŁ:
1 � zŁ Dqin
pWŁ sin h
(1pWŁ
)� zŁ
cos h(
1pWŁ
) . �23�
When seepage does not occur, qr can be calculatedfrom (21) with qin defined by (12). When seepage occurs,qin can be determined from (23), and then qr can becalculated from (21).
Check of the analytical model solutions against anequivalent numerical model
The analytical model was compared to the numericalgroundwater flow model, MODFLOW, over a widerange of possible scenarios. Both models simulated asimple cross-sectional area of highland and floodplain(Figure 1). Steady-state modelling scenarios representingup and downstream of a weir; uncleared, cleared andirrigated highland recharge rates; five floodplain widths(L); and two maximum floodplain evapotranspirationrates (a) were used. Details of the model configurationsand parameterizations can be found in Holland et al.(2004).
Analytical model estimates of floodplain groundwaterdischarge patterns were compared to those predictedby MODFLOW for each of the 30 scenarios. Theanalytical model estimates of seepage, evapotranspirationand base flow discharge per unit width of aquifer [L3
T�1] were consistent with those of MODFLOW overa broad range of floodplain physical and hydraulicparameters. The regression was statistically significant(n D 90, R2 D 0Ð998, P < 0Ð001) and described by thefollowing equation:
MODFLOW D 0Ð99Analytical C 0Ð23. �24�
Seepage was predicted in six scenarios, characterizedby large groundwater inputs from irrigation, wide flood-plains and low evapotranspiration rates.
The MODFLOW model was sensitive to startingheads, despite steady-state conditions. Generally, initialconditions are not important for steady-state simulations;however, they can be important in certain non-linearsituations where discharge, transmissivity or saturationare a function of head (McDonald and Harbaugh, 1988).
A traditional sensitivity analysis to model parameterswas not performed for the MODFLOW model. How-ever, the analytical model provides the means for analysisof the sensitivity of both models to final groundwater
Copyright 2009 John Wiley & Sons, Ltd. Hydrol. Process. 23, 3428–3439 (2009)DOI: 10.1002/hyp
FLOODPLAIN SALINITY RISK ASSESSMENT 3433
discharge estimates. This analysis was carried out bycomparing the discharge to the river relative to the dis-charge entering the floodplain normalized with respect tothe evapotranspiration extinction depth. This showed thatboth models were sensitive to situations where dischargeto the floodplain was greater than aquifer transmissiv-ity normalized with respect to evapotranspiration extinc-tion depth (i.e. high discharge into the floodplain relativeto floodplain aquifer transmissivity) and where potentialevapotranspiration rates greatly exceed floodplain aquifertransmissivity (i.e. wide floodplains, high discharge intothe floodplain and river levels within the evapotranspira-tion extinction depth). Conversely, they were insensitivewhen the floodplain aquifer transmissivity was greaterthan the potential evapotranspiration rate (i.e. groundwa-ter below the evapotranspiration extinction depth) andso all discharges were transmitted to the river and noseepage or evapotranspiration occurred.
APPLICATION TO LOWER RIVER MURRAYFLOODPLAINS
Site description
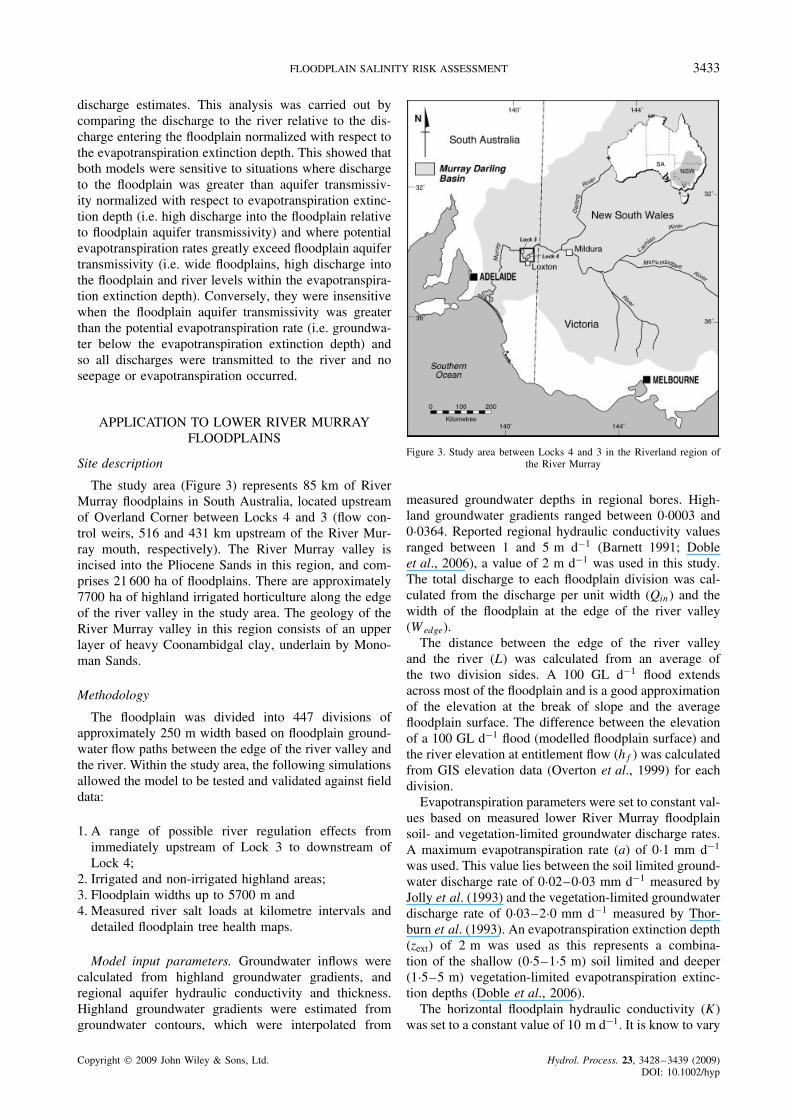
The study area (Figure 3) represents 85 km of RiverMurray floodplains in South Australia, located upstreamof Overland Corner between Locks 4 and 3 (flow con-trol weirs, 516 and 431 km upstream of the River Mur-ray mouth, respectively). The River Murray valley isincised into the Pliocene Sands in this region, and com-prises 21 600 ha of floodplains. There are approximately7700 ha of highland irrigated horticulture along the edgeof the river valley in the study area. The geology of theRiver Murray valley in this region consists of an upperlayer of heavy Coonambidgal clay, underlain by Mono-man Sands.
Methodology
The floodplain was divided into 447 divisions ofapproximately 250 m width based on floodplain ground-water flow paths between the edge of the river valley andthe river. Within the study area, the following simulationsallowed the model to be tested and validated against fielddata:
1. A range of possible river regulation effects fromimmediately upstream of Lock 3 to downstream ofLock 4;
2. Irrigated and non-irrigated highland areas;3. Floodplain widths up to 5700 m and4. Measured river salt loads at kilometre intervals and
detailed floodplain tree health maps.
Model input parameters. Groundwater inflows werecalculated from highland groundwater gradients, andregional aquifer hydraulic conductivity and thickness.Highland groundwater gradients were estimated fromgroundwater contours, which were interpolated from
Figure 3. Study area between Locks 4 and 3 in the Riverland region ofthe River Murray
measured groundwater depths in regional bores. High-land groundwater gradients ranged between 0Ð0003 and0Ð0364. Reported regional hydraulic conductivity valuesranged between 1 and 5 m d�1 (Barnett 1991; Dobleet al., 2006), a value of 2 m d�1 was used in this study.The total discharge to each floodplain division was cal-culated from the discharge per unit width (Qin) and thewidth of the floodplain at the edge of the river valley(Wedge).
The distance between the edge of the river valleyand the river (L) was calculated from an average ofthe two division sides. A 100 GL d�1 flood extendsacross most of the floodplain and is a good approximationof the elevation at the break of slope and the averagefloodplain surface. The difference between the elevationof a 100 GL d�1 flood (modelled floodplain surface) andthe river elevation at entitlement flow (hf) was calculatedfrom GIS elevation data (Overton et al., 1999) for eachdivision.
Evapotranspiration parameters were set to constant val-ues based on measured lower River Murray floodplainsoil- and vegetation-limited groundwater discharge rates.A maximum evapotranspiration rate (a) of 0Ð1 mm d�1
was used. This value lies between the soil limited ground-water discharge rate of 0Ð02–0Ð03 mm d�1 measured byJolly et al. (1993) and the vegetation-limited groundwaterdischarge rate of 0Ð03–2Ð0 mm d�1 measured by Thor-burn et al. (1993). An evapotranspiration extinction depth(zext) of 2 m was used as this represents a combina-tion of the shallow (0Ð5–1Ð5 m) soil limited and deeper(1Ð5–5 m) vegetation-limited evapotranspiration extinc-tion depths (Doble et al., 2006).
The horizontal floodplain hydraulic conductivity (K)was set to a constant value of 10 m d�1. It is know to vary
Copyright 2009 John Wiley & Sons, Ltd. Hydrol. Process. 23, 3428–3439 (2009)DOI: 10.1002/hyp
3434 K. L. HOLLAND ET AL.
between 10 and 35 m d�1, however, the value used byDoble et al. (2006) to model the Bookpurnong floodplainwas adopted in this study. Floodplain aquifer thickness(b) was set to a constant value of 7 m following Dobleet al. (2006). Floodplain groundwater salinities (Cgw)were interpolated from measured values in highland boresalong the edge of the river valley (MDBC, 2005). Thesevalues represent the long-term spatial distribution ofnatural salt loads to the river valley. Modelled salinitiesrange from 10 650 to 42 450 mg L�1.
Ideally, model estimates of groundwater dischargewould be compared to measured, field validated ground-water discharge. However, field measurements of seep-age, groundwater losses by evapotranspiration and baseflow groundwater discharge are not available or easilymeasured at a regional scale. Instead, surrogate measuresof groundwater discharge: observed seepage areas, treehealth and river salt loads, were used to evaluate modelpredictions.
Groundwater inflows from interpolated contours werecalibrated against known conditions to assist in determin-ing accurate groundwater inflows. In many areas, ground-water depths were missing, so groundwater inflows wereestimated from irrigation history and by matching theobserved patterns and magnitude of salt loads. These cur-rent groundwater inflows represent the best estimate forthe study area.
Floodplain vegetation health. Floodplain vegetationhealth was mapped in approximately 40% of the studyarea (PPK, 1997, 1998; AWE, 2000). This GIS coverageincludes approximately 3500 ha of trees and approxi-mately 5000 ha of other vegetation, including shrubs,ground covers and wetland species.
The vegetation mapping was completed over all of thefloodplain to the south of the river and several flood-plains on the northern side of the river. Predominanttree communities in the study area include black box(Eucalyptus largiflorens, F. Muell.), red gum (E. camald-ulensis, Dehnh.) and cooba (Acacia stenophylla, A.Cunn.ex Benth.). Tree communities were mapped as healthy(>75% canopy cover), poor health (25–75% canopycover) and dead (<25% canopy cover) from ground sur-veys and aerial photography. Because of the complexityof floodplain vegetation associations, only tree health wasused in this analysis.
Areas where seepage was observed, including seep-age faces and areas of emergent aquatic vegetation weremapped from ground surveys and aerial photography.Observed seepage areas were compared to predicted seep-age areas for a range of groundwater inflow scenarios.Seepage assessments of tree health were limited to within100 m of the edge of the river valley. Areas where thefloodplain was <100 m wide were considered separatelydue to possible bank recharge influences on vegetationhealth.
The parameter xŁcrit was used to assess when vegetation
was at risk of salinization associated with groundwaterdischarge. For divisions where xŁ
crit > 0, the floodplain
aquifer cannot transmit incoming groundwater and evapo-transpiration occurs, causing the floodplain water tableto rise to within 2 m (zext) of the surface. Evapotrans-piration predictions were compared to tree health in themiddle of the floodplain, excluding a buffer within 100 mof the river and 100 m from the edge of the river valley.These buffer zones represent areas where floodplain treehealth is influenced by proximity to the river or edge ofthe river valley, rather than salinization associated withgroundwater discharge by evapotranspiration.
River salt loads. Model estimates of base flow wereconverted from the volume of groundwater dischargedto the river per division (m3 d�1) to tons of salt usinginterpolated floodplain groundwater salinities (mg L�1).These salt loads were assigned to the nearest riverkilometre for each division as tons of salt entering theriver per kilometre per day for each river kilometre.
Modelled salt loads were compared to measured ‘Runof River’ salt loads determined from river flow rates andin-stream salinity measurements taken over 5 years atlow flows (DWR, unpublished data, 2001b; Porter, 2001).An average of five ‘Run of River’ salt loads was usedto estimate long-term salt accessions. The variability ofsalt loads measured depended on recent (6–18 months)flow history, particularly in areas with large permanentlyinundated wetlands upstream of Lock 3.
Sensitivity analysis. Model sensitivity to input param-eters was tested by varying groundwater inflows tothe river valley. Equation (12) shows that changes togroundwater inflows (Qin) are proportional to changesto other important model parameters: aquifer hydraulicconductivity (K), aquifer thickness (b) and height ofthe floodplain surface above river level (hf). It is alsoinversely proportional to the length of the groundwaterflow path (L), which can be accurately estimated in theGIS model. Therefore, model sensitivity was tested byvarying groundwater inflows, which is the same as vary-ing K, or b or hf by the same amount.
RESULTS
Model results for different groundwater inflow scenarioswere compared to observed seepage areas, mapped treehealth and measured river salt loads between Locks 4 and3 in the lower River Murray.
Seepage
Seepage was observed in 68 floodplain divisions nearirrigation areas over a total distance of 17Ð6 km at theedge of the river valley. Seepage predictions were sen-sitive to changes in groundwater inflows, hydraulic con-ductivity, aquifer thickness and height of the floodplainsurface above river level. The number of divisions whereseepage was observed and predicted rose with increas-ing inflows, as did erroneous predictions where seepagewas modelled, but not observed (Table II). Increasing
Copyright 2009 John Wiley & Sons, Ltd. Hydrol. Process. 23, 3428–3439 (2009)DOI: 10.1002/hyp
FLOODPLAIN SALINITY RISK ASSESSMENT 3435
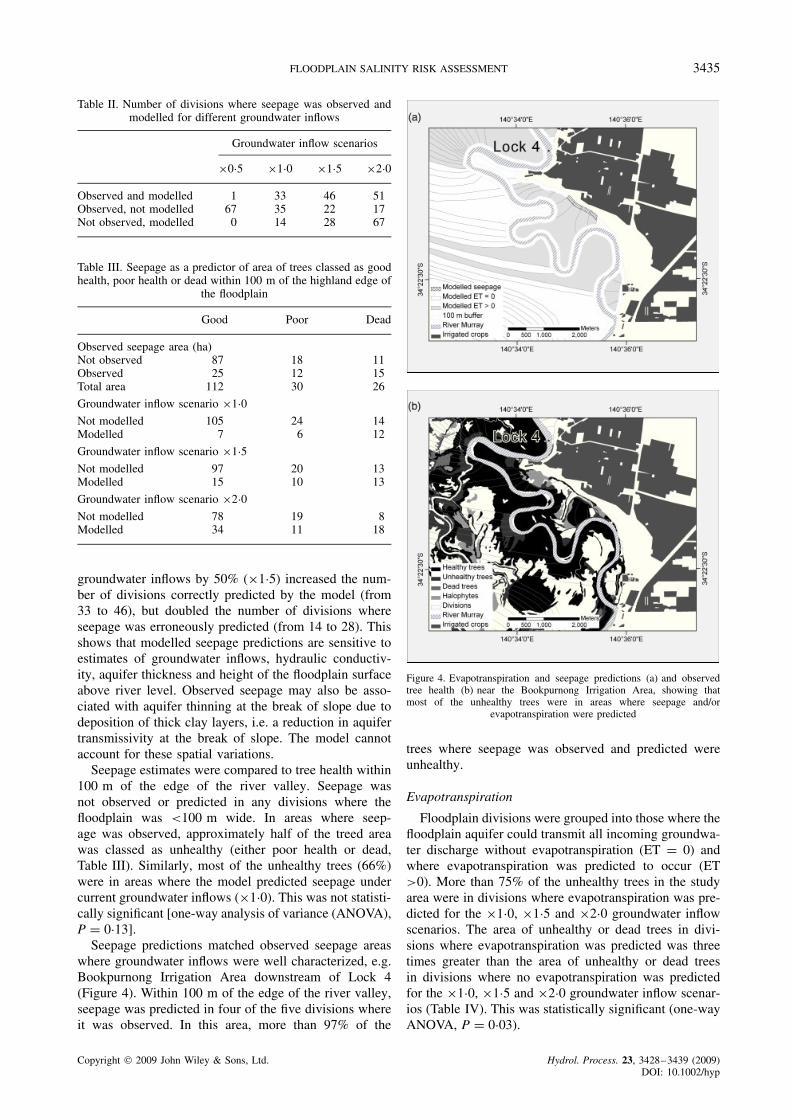
Table II. Number of divisions where seepage was observed andmodelled for different groundwater inflows
Groundwater inflow scenarios
ð0Ð5 ð1Ð0 ð1Ð5 ð2Ð0
Observed and modelled 1 33 46 51Observed, not modelled 67 35 22 17Not observed, modelled 0 14 28 67
Table III. Seepage as a predictor of area of trees classed as goodhealth, poor health or dead within 100 m of the highland edge of
the floodplain
Good Poor Dead
Observed seepage area (ha)Not observed 87 18 11Observed 25 12 15Total area 112 30 26
Groundwater inflow scenario ð1Ð0Not modelled 105 24 14Modelled 7 6 12
Groundwater inflow scenario ð1Ð5Not modelled 97 20 13Modelled 15 10 13
Groundwater inflow scenario ð2Ð0Not modelled 78 19 8Modelled 34 11 18
groundwater inflows by 50% (ð1Ð5) increased the num-ber of divisions correctly predicted by the model (from33 to 46), but doubled the number of divisions whereseepage was erroneously predicted (from 14 to 28). Thisshows that modelled seepage predictions are sensitive toestimates of groundwater inflows, hydraulic conductiv-ity, aquifer thickness and height of the floodplain surfaceabove river level. Observed seepage may also be asso-ciated with aquifer thinning at the break of slope due todeposition of thick clay layers, i.e. a reduction in aquifertransmissivity at the break of slope. The model cannotaccount for these spatial variations.
Seepage estimates were compared to tree health within100 m of the edge of the river valley. Seepage wasnot observed or predicted in any divisions where thefloodplain was <100 m wide. In areas where seep-age was observed, approximately half of the treed areawas classed as unhealthy (either poor health or dead,Table III). Similarly, most of the unhealthy trees (66%)were in areas where the model predicted seepage undercurrent groundwater inflows (ð1Ð0). This was not statisti-cally significant [one-way analysis of variance (ANOVA),P D 0Ð13].
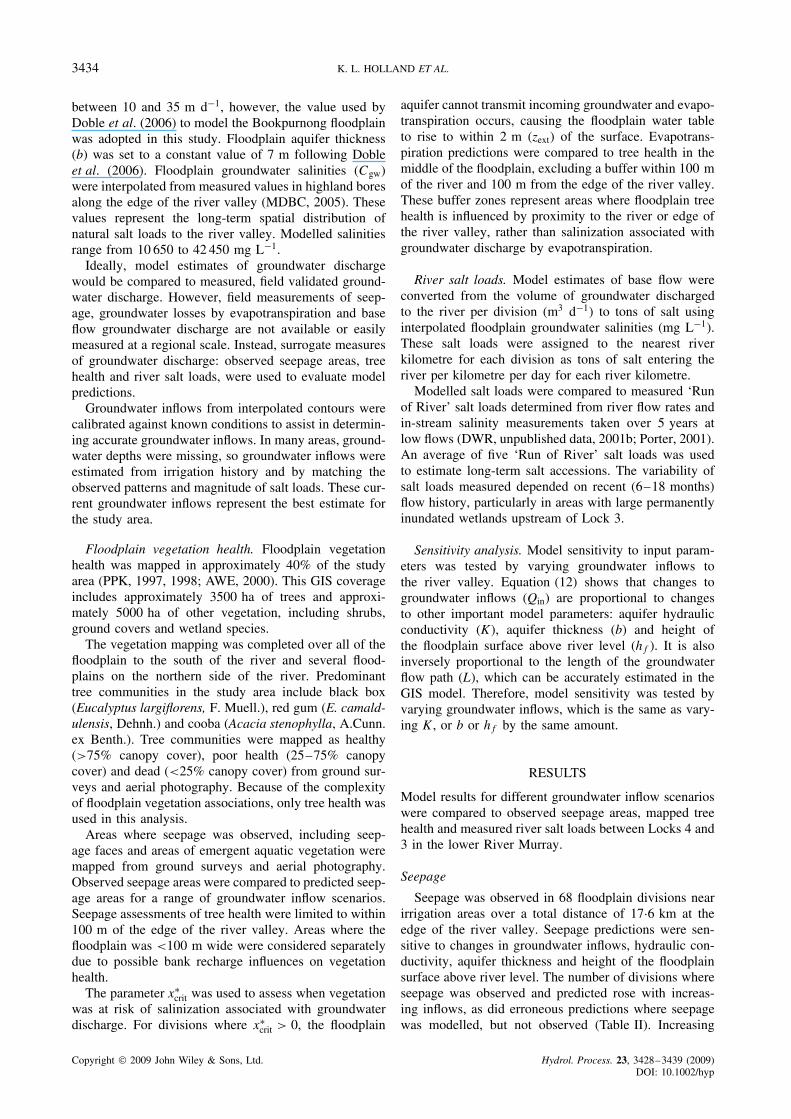
Seepage predictions matched observed seepage areaswhere groundwater inflows were well characterized, e.g.Bookpurnong Irrigation Area downstream of Lock 4(Figure 4). Within 100 m of the edge of the river valley,seepage was predicted in four of the five divisions whereit was observed. In this area, more than 97% of the
Figure 4. Evapotranspiration and seepage predictions (a) and observedtree health (b) near the Bookpurnong Irrigation Area, showing thatmost of the unhealthy trees were in areas where seepage and/or
evapotranspiration were predicted
trees where seepage was observed and predicted wereunhealthy.
Evapotranspiration
Floodplain divisions were grouped into those where thefloodplain aquifer could transmit all incoming groundwa-ter discharge without evapotranspiration (ET D 0) andwhere evapotranspiration was predicted to occur (ET>0). More than 75% of the unhealthy trees in the studyarea were in divisions where evapotranspiration was pre-dicted for the ð1Ð0, ð1Ð5 and ð2Ð0 groundwater inflowscenarios. The area of unhealthy or dead trees in divi-sions where evapotranspiration was predicted was threetimes greater than the area of unhealthy or dead treesin divisions where no evapotranspiration was predictedfor the ð1Ð0, ð1Ð5 and ð2Ð0 groundwater inflow scenar-ios (Table IV). This was statistically significant (one-wayANOVA, P D 0Ð03).
Copyright 2009 John Wiley & Sons, Ltd. Hydrol. Process. 23, 3428–3439 (2009)DOI: 10.1002/hyp
3436 K. L. HOLLAND ET AL.
Table IV. Evapotranspiration (ET) as a predictor of area of treesclassed as good health, poor health or dead in the middle of the
floodplain (>100 m from the highland and river’s edge)
Good Poor Dead
Observed tree health (ha)
Total area 1689 323 532
Groundwater inflow scenario ð0Ð5ET D 0 1040 155 186ET >0 648 168 346
Groundwater inflow scenario ð1Ð0ET D 0 841 87 121ET >0 847 236 411
Groundwater inflow scenario ð1Ð5ET D 0 816 80 120ET >0 872 243 412
Groundwater inflow scenario ð2Ð0ET D 0 802 78 119ET >0 886 245 413
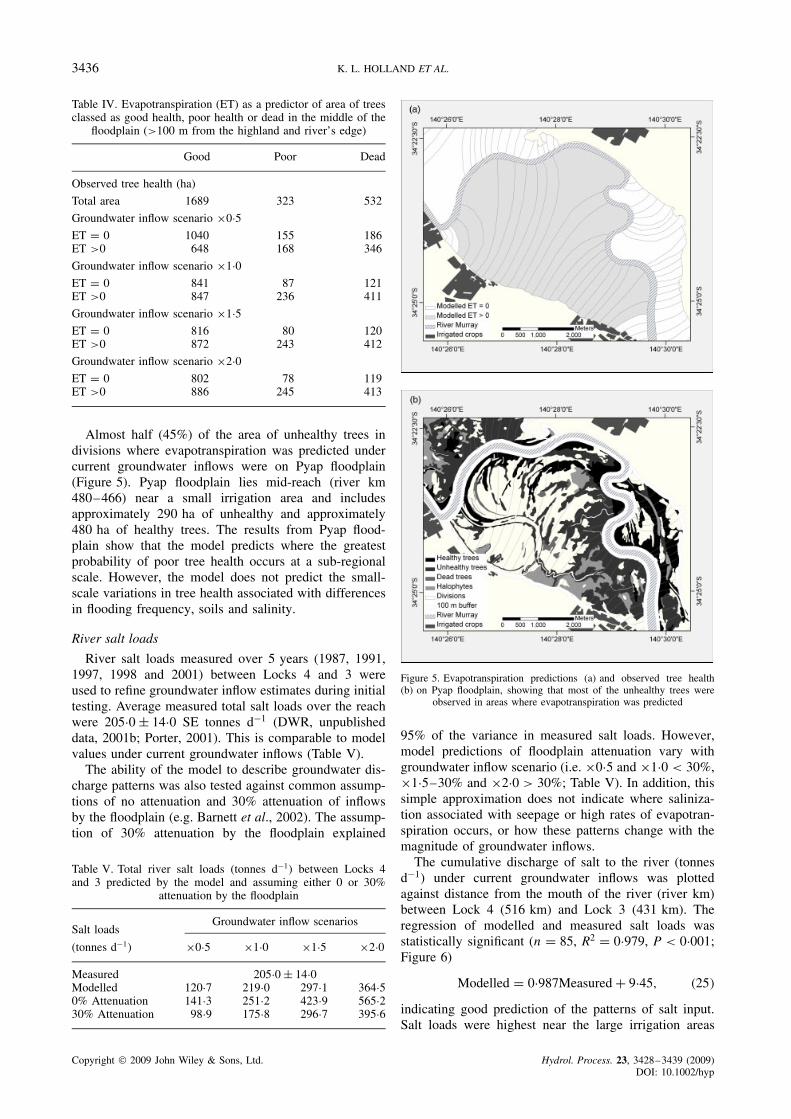
Almost half (45%) of the area of unhealthy trees indivisions where evapotranspiration was predicted undercurrent groundwater inflows were on Pyap floodplain(Figure 5). Pyap floodplain lies mid-reach (river km480–466) near a small irrigation area and includesapproximately 290 ha of unhealthy and approximately480 ha of healthy trees. The results from Pyap flood-plain show that the model predicts where the greatestprobability of poor tree health occurs at a sub-regionalscale. However, the model does not predict the small-scale variations in tree health associated with differencesin flooding frequency, soils and salinity.
River salt loads
River salt loads measured over 5 years (1987, 1991,1997, 1998 and 2001) between Locks 4 and 3 wereused to refine groundwater inflow estimates during initialtesting. Average measured total salt loads over the reachwere 205Ð0 š 14Ð0 SE tonnes d�1 (DWR, unpublisheddata, 2001b; Porter, 2001). This is comparable to modelvalues under current groundwater inflows (Table V).
The ability of the model to describe groundwater dis-charge patterns was also tested against common assump-tions of no attenuation and 30% attenuation of inflowsby the floodplain (e.g. Barnett et al., 2002). The assump-tion of 30% attenuation by the floodplain explained
Table V. Total river salt loads (tonnes d�1) between Locks 4and 3 predicted by the model and assuming either 0 or 30%
attenuation by the floodplain
Groundwater inflow scenariosSalt loads
(tonnes d�1) ð0Ð5 ð1Ð0 ð1Ð5 ð2Ð0
Measured 205Ð0 š 14Ð0Modelled 120Ð7 219Ð0 297Ð1 364Ð50% Attenuation 141Ð3 251Ð2 423Ð9 565Ð230% Attenuation 98Ð9 175Ð8 296Ð7 395Ð6
Figure 5. Evapotranspiration predictions (a) and observed tree health(b) on Pyap floodplain, showing that most of the unhealthy trees were
observed in areas where evapotranspiration was predicted
95% of the variance in measured salt loads. However,model predictions of floodplain attenuation vary withgroundwater inflow scenario (i.e. ð0Ð5 and ð1Ð0 < 30%,ð1Ð5–30% and ð2Ð0 > 30%; Table V). In addition, thissimple approximation does not indicate where saliniza-tion associated with seepage or high rates of evapotran-spiration occurs, or how these patterns change with themagnitude of groundwater inflows.
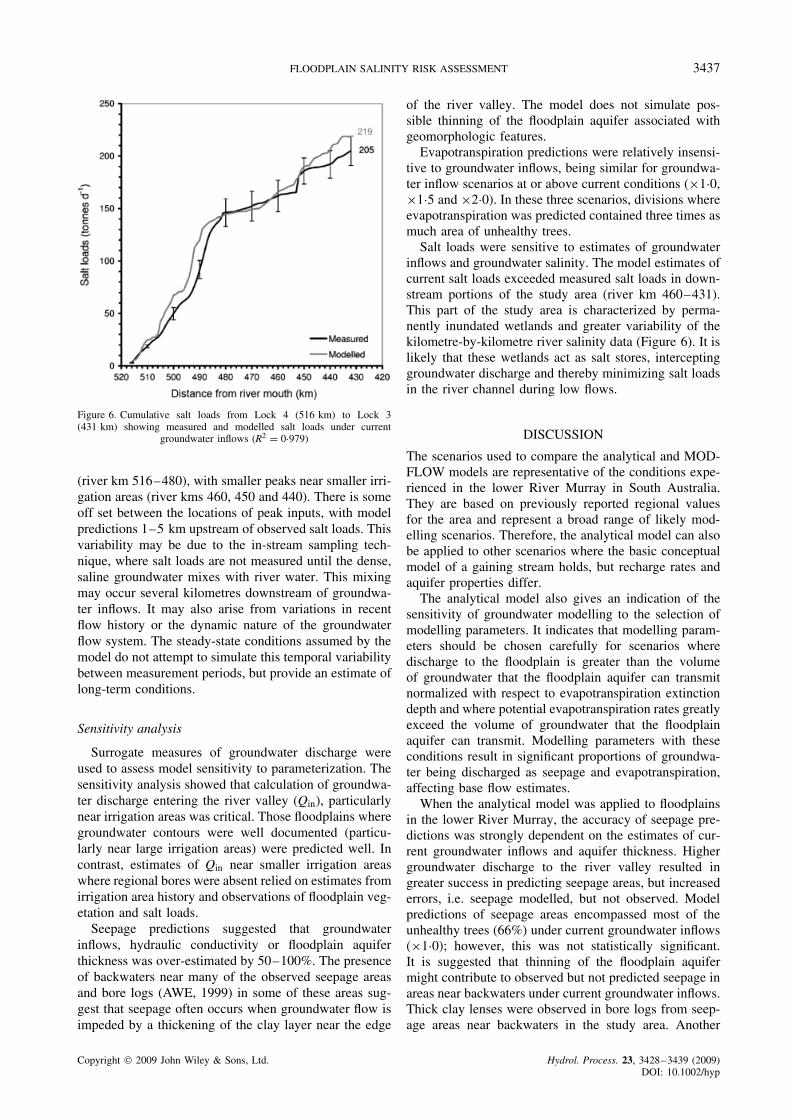
The cumulative discharge of salt to the river (tonnesd�1) under current groundwater inflows was plottedagainst distance from the mouth of the river (river km)between Lock 4 (516 km) and Lock 3 (431 km). Theregression of modelled and measured salt loads wasstatistically significant (n D 85, R2 D 0Ð979, P < 0Ð001;Figure 6)
Modelled D 0Ð987Measured C 9Ð45, �25�
indicating good prediction of the patterns of salt input.Salt loads were highest near the large irrigation areas
Copyright 2009 John Wiley & Sons, Ltd. Hydrol. Process. 23, 3428–3439 (2009)DOI: 10.1002/hyp
FLOODPLAIN SALINITY RISK ASSESSMENT 3437
Figure 6. Cumulative salt loads from Lock 4 (516 km) to Lock 3(431 km) showing measured and modelled salt loads under current
groundwater inflows (R2 D 0Ð979)
(river km 516–480), with smaller peaks near smaller irri-gation areas (river kms 460, 450 and 440). There is someoff set between the locations of peak inputs, with modelpredictions 1–5 km upstream of observed salt loads. Thisvariability may be due to the in-stream sampling tech-nique, where salt loads are not measured until the dense,saline groundwater mixes with river water. This mixingmay occur several kilometres downstream of groundwa-ter inflows. It may also arise from variations in recentflow history or the dynamic nature of the groundwaterflow system. The steady-state conditions assumed by themodel do not attempt to simulate this temporal variabilitybetween measurement periods, but provide an estimate oflong-term conditions.
Sensitivity analysis
Surrogate measures of groundwater discharge wereused to assess model sensitivity to parameterization. Thesensitivity analysis showed that calculation of groundwa-ter discharge entering the river valley (Qin), particularlynear irrigation areas was critical. Those floodplains wheregroundwater contours were well documented (particu-larly near large irrigation areas) were predicted well. Incontrast, estimates of Qin near smaller irrigation areaswhere regional bores were absent relied on estimates fromirrigation area history and observations of floodplain veg-etation and salt loads.
Seepage predictions suggested that groundwaterinflows, hydraulic conductivity or floodplain aquiferthickness was over-estimated by 50–100%. The presenceof backwaters near many of the observed seepage areasand bore logs (AWE, 1999) in some of these areas sug-gest that seepage often occurs when groundwater flow isimpeded by a thickening of the clay layer near the edge
of the river valley. The model does not simulate pos-sible thinning of the floodplain aquifer associated withgeomorphologic features.
Evapotranspiration predictions were relatively insensi-tive to groundwater inflows, being similar for groundwa-ter inflow scenarios at or above current conditions (ð1Ð0,ð1Ð5 and ð2Ð0). In these three scenarios, divisions whereevapotranspiration was predicted contained three times asmuch area of unhealthy trees.
Salt loads were sensitive to estimates of groundwaterinflows and groundwater salinity. The model estimates ofcurrent salt loads exceeded measured salt loads in down-stream portions of the study area (river km 460–431).This part of the study area is characterized by perma-nently inundated wetlands and greater variability of thekilometre-by-kilometre river salinity data (Figure 6). It islikely that these wetlands act as salt stores, interceptinggroundwater discharge and thereby minimizing salt loadsin the river channel during low flows.
DISCUSSION
The scenarios used to compare the analytical and MOD-FLOW models are representative of the conditions expe-rienced in the lower River Murray in South Australia.They are based on previously reported regional valuesfor the area and represent a broad range of likely mod-elling scenarios. Therefore, the analytical model can alsobe applied to other scenarios where the basic conceptualmodel of a gaining stream holds, but recharge rates andaquifer properties differ.
The analytical model also gives an indication of thesensitivity of groundwater modelling to the selection ofmodelling parameters. It indicates that modelling param-eters should be chosen carefully for scenarios wheredischarge to the floodplain is greater than the volumeof groundwater that the floodplain aquifer can transmitnormalized with respect to evapotranspiration extinctiondepth and where potential evapotranspiration rates greatlyexceed the volume of groundwater that the floodplainaquifer can transmit. Modelling parameters with theseconditions result in significant proportions of groundwa-ter being discharged as seepage and evapotranspiration,affecting base flow estimates.
When the analytical model was applied to floodplainsin the lower River Murray, the accuracy of seepage pre-dictions was strongly dependent on the estimates of cur-rent groundwater inflows and aquifer thickness. Highergroundwater discharge to the river valley resulted ingreater success in predicting seepage areas, but increasederrors, i.e. seepage modelled, but not observed. Modelpredictions of seepage areas encompassed most of theunhealthy trees (66%) under current groundwater inflows(ð1Ð0); however, this was not statistically significant.It is suggested that thinning of the floodplain aquifermight contribute to observed but not predicted seepage inareas near backwaters under current groundwater inflows.Thick clay lenses were observed in bore logs from seep-age areas near backwaters in the study area. Another
Copyright 2009 John Wiley & Sons, Ltd. Hydrol. Process. 23, 3428–3439 (2009)DOI: 10.1002/hyp
3438 K. L. HOLLAND ET AL.
source of error arises from the model assumption thatthe floodplain surface is horizontal and flat. If the flood-plain is sloping then the model will not accurately predictwhether or not seepage will occur at the break of slope.Similarly, the model is unable to predict seepage areaswhich, in part, may be due to topographical low points inthe vicinity of the break in slope, i.e. ephemeral wetlandsand oxbows.
More than 75% of the unhealthy trees in the studyarea were in divisions where evapotranspiration was pre-dicted. These divisions contained a significantly greaterarea of unhealthy or dead trees compared to divisionswhere no evapotranspiration was predicted. The modelpredicts evapotranspiration when floodplain water levelsare within the extinction depth (zext). This occurs whengroundwater inflows exceed the volume of groundwa-ter that the floodplain aquifer can transmit without dis-charge by evapotranspiration. In both situations, soil lim-ited groundwater discharge becomes a significant compo-nent of the water balance. This suggests that salinizationassociated with groundwater discharge by evapotranspira-tion is the principal process driving floodplain vegetationhealth (along with salinization and waterlogging due toseepage) despite the complex interactions between flood-plain geomorphology, flooding and land use history onvegetation health. This result indicates the usefulness ofthis modelling approach for predicting floodplain vegeta-tion responses to management.
The overall pattern and magnitude of modelled saltload predictions are comparable to the measured values,which is more accurate than simply assuming that 30%of groundwater inflows are attenuated by the floodplain.This means that the model can be used to predict futuresalt loads from new irrigation developments and canalso be used as a planning tool to identify the impactof proposed developments on floodplain and wetlandhealth and river salinity. However, accurate estimates ofgroundwater inflows are crucial.
In areas upstream from locks, where the river levelis within the evapotranspiration extinction depth, highevapotranspiration rates across the floodplain are pre-dicted. Not surprisingly, in these scenarios the model issensitive to small changes in parameterization and con-ceptualization. Small changes to model parameters (hf,zext, L, and a) can change model predictions from smalldischarges to the river, to large discharges from the riverinto the floodplain. Therefore, model predictions needto be tested against independently measured field data(observed seepage, tree health and river salt loads) toensure that accurate predictions are made.
The model presented in this article does not attemptto simulate floodplain wetlands, backwaters or oxbows,which occur as the river meanders across the floodplain.This is because the role that these water bodies playin intercepting saline groundwater flowing towards theriver is still unknown. The analysis of seepage predic-tions under current groundwater inflows also highlightedthe need to determine the role that aquifer thinning nearbackwaters and local topographical low points play in
groundwater being discharged as seepage. This is anarea of future research, and has the potential to refinethe model’s estimates of seepage, salt loads and evapo-transpiration discharge through the floodplains. Airbornegeophysics could play an important role in mapping sub-surface geological features within the floodplains, as hasbeen shown for the highland areas of the lower RiverMurray.
CONCLUSIONS
A simple, one-dimensional, cross-sectional analyticalmodel of a low land river floodplain was comparable toMODFLOW numerical estimates of patterns of ground-water discharge. The models predicted groundwater dis-charge as seepage at the break of slope, evapotranspira-tion through the floodplain and base flow to the river.However, the analytical model computing requirementswere lower and the required data inputs could be obtainedfrom published regional scale information.
The model was applied to a study area compris-ing 85 km of floodplains in the lower River Murray.The model’s predictions provided good correlations withobserved seepage areas, vegetation health data and mea-sured salt loads to the river. Model predictions of seep-age areas were sensitive to estimates of groundwaterinflows. Observations of floodplain geomorphology andpoor prediction of some seepage areas suggested thatseepage might be associated with floodplain aquifer thin-ning near backwaters and local topographical low points.This requires further investigation and conceptualization.Airborne geophysics could play an important role inmapping sub-surface geological features within the flood-plains.
More than 75% of the unhealthy trees in the study areawere in divisions where evapotranspiration was predicted.This suggests that salinization associated with ground-water discharge by evapotranspiration is the principalprocess driving floodplain vegetation health, despite thecomplex interactions between floodplain geomorphology,flooding and land use history on vegetation health.
The model has shown that with good groundwaterinflow data, it is capable of predicting kilometre-by-kilometre salt loads to identify ‘hotspots’ of salt inputto the river. Model predictions of salt loads are moreaccurate under a range of groundwater inflow scenariosthan simply assuming that 30% of groundwater inflowsare attenuated by the floodplain.
The model highlights the physical relationships thatexist between floodplain variables in the calculation ofinterception of groundwater by the floodplain. The modelis sensitive to parameterization when the river level orfloodplain water level is within the evapotranspirationextinction depth. This is typical of conditions upstreamof weirs and near irrigation areas.
The approach described in this article can be appliedmore broadly, although the impact of wetlands andoxbows, which may act to intercept groundwater within
Copyright 2009 John Wiley & Sons, Ltd. Hydrol. Process. 23, 3428–3439 (2009)DOI: 10.1002/hyp
FLOODPLAIN SALINITY RISK ASSESSMENT 3439
the floodplain, is not taken into account. The modelprovides a tool to address the management of floodplainand wetland health and river salinity. It can also be usedto identify environmental protection zones for a range ofgroundwater inflow scenarios.
ACKNOWLEDGEMENTS
The first author was supported by an Australian Post-graduate Award scholarship and Centre for Ground-water Studies bursary at the time of the project,under the supervision of Glen Walker, Steve Tyerman,Craig Simmons, Lisa Mensforth and Andrew Telfer.Land and Water Australia (Project CWS8-Guidelinesfor Managing Groundwater for Vegetation Health inSaline Areas), the River Murray Catchment WaterManagement Board, and the South Australian Salin-ity Mapping and Management Support Project providedfunding towards this project. Craig Simmons, NevilleRobinson, Anthony Barr and David Rassam provideduseful suggestions and comments that improved thisarticle.
REFERENCES
Armstrong D, Yan W, Barnett SR. 1999. Loxton Irrigation Area—Groundwater Modelling of Groundwater/River Interaction. Departmentof Primary Industries and Resources: Adelaide.
AWE 1999. Clarks Floodplain Investigations. Prepared for the Loxtonto Bookpurnong Local Action Planning Committee. Australian WaterEnvironments Report No. 98Ð031-2, Adelaide.
AWE. 2000. Pyap to Overland Corner Floodplain Assessment Report .Prepared for the Loxton to Bookpurnong Local Action PlanningCommittee, Australian Water Environments Report No. 98027,Adelaide.
Barnett SR. SA Department of Mines and Energy. 1991. RenmarkHydrogeological Map (1 : 250000 Scale), Bureau of Mineral Resources,Geology and Geophysics: Canberra.
Barnett SR, Yan Y, Watkins NR, Woods JA, Hyde KM. 2002. MurrayDarling Basin Salinity Audit: Groundwater Modelling to Predict FutureSalt Loads to the River Murray in South Australia. Department forWater Resources Report DWR 2001/017, Adelaide.
Doble RC, Simmons CT, Jolly ID, Walker GR. 2006. Spatial relation-ships between vegetation cover and irrigation-induced groundwaterdischarge on a semi-arid floodplain, Australia. Journal of Hydrology329: 75–97.
DWR. 2001a. South Australian River Murray Salinity Strategy 2001-2015 . Department for Water Resources, Government of SouthAustralia: Adelaide.
Holland KL, Overton IC, Jolly ID, Walker GR. 2004. An Analyt-ical Model to Predict Regional Groundwater Discharge Pat-terns on the Floodplains of a Semi-Arid Lowland River , CSIROLand and Water Technical Report 06/04. CSIRO: Adelaide.http://www.clw.csiro.au/publications/technical2004/tr6-04.pdf.
Jolly ID. 1996. The effects of river management on the hydrologyand hydroecology of arid and semi-arid floodplains. In FloodplainProcesses , Anderson MG, Walling DE, Bates PD (eds). John Wiley& Sons: New York; 577–609.
Jolly ID, Walker GR, Thorburn PJ. 1993. Salt accumulation in semi-arid floodplain soils with implications for forest health. Journal ofHydrology 150: 589–614.
McDonald MC, Harbaugh AW. 1988. A Modular Three-DimensionalFinite-Difference Ground-Water Flow Model , Chapter A1, Book6, United States Geological Survey Technical Water ResourcesInvestestigation: Washington, DC.
MDBC. 2005. Basin Salinity Management Strategy , SIMRAT v2Ð0Ð1Final Report. Murray-Darling Basin Commission: Canberra.
Overton IC, Newman B, Erdmann B, Sykora N, Slegers S. 1999.Modelling floodplain inundation under natural and regulated flows inthe Lower River Murray. Proceedings of the 2nd Australian StreamManagement Conference, Adelaide, February, 1999.
Porter B. 2001. Run of River Salinity Surveys. A method of measuringsalt load accessions to the River Murray on a kilometre bykilometre basis. Proceedings of the Murray Darling Basin GroundwaterWorkshop, Victor Harbour, September, 2001.
PPK. 1997. Assessment of the Impact of the Loxton IrrigationDistrict on Floodplain Health and Implications for Future Options ,PPK Environment and Infrastructure Report No. 27J121A 97–542,Adelaide.
PPK. 1998. Assessment of the Impact of the Bookpurnong/Lock 4Irrigation District on Floodplain Health and Implications for FutureOptions , PPK Environment and Infrastructure Report No. 27K055A98–422, Adelaide.
Smith F, Kenny S. 2005. Floristic vegetation and tree health mapping,River Murray floodplain, South Australia. Department for Environmentand Heritage Internal Report, Adelaide.
Thorburn PJ, Hatton TJ, Walker GR. 1993. Combining measurements oftranspiration and stable isotopes of water to determine groundwaterdischarge from forests. Journal of Hydrology 150: 563–587.
Walker GR, Doble RC, Mech T, Lavis T, Bluml M, MacEwan R, Sten-son M, Wang E, Jolly ID, Miles M, McEwan KM, Bryan B, Ward J,Rassam D, Connor J, Smith C, Munday TJ, Nancarrow B, Williams S.2005. Lower Murray Landscape Futures Phase One Report . CSIROLand and Water Final Year 1 Technical Report to the Centrefor Natural Resource Management, the Victorian NAP Office andthe CSIRO Water for a Healthy Country Flagship Program, Ade-laide. http://www.clw.csiro.au/publications/consultancy/2005/LMLFProject Phase One report.pdf.
Copyright 2009 John Wiley & Sons, Ltd. Hydrol. Process. 23, 3428–3439 (2009)DOI: 10.1002/hyp