analytical chemistry september 1951 vol.23 no.9
TRANSCRIPT


Have you
-copy of thisvaluable
new catalog?
-
FIN E
Baker ChemicalsREAGENT
" H, ,, 'h e comp le,e Hoe oE D' ke, La Ix ,,", 0'" Chemi"
", ' 0" " give, "OU
'1=<I'c"io
o,
Eo, , " 'D'ke, "-'''I""",1<e, geO<' _'he ),ho,,,o,,, chemical, "'''I,,I" ac'u,1 1o, ' O'I"'i' 0 0 e"ee" label. L" e" P"ce> fo, , " chemical, are inclUded.
Constant lISc.
JE "0" haveo ', ,ecei, ed a "'p", " od Eo , OOe "gh, ",vay. The" I, 00 ch,,",_j"" " k Eo, ' he Ne", Dakee P"C<'.SI~cific,,,oo COcal
og
.
A.dd',,,, .T. T. Bakec
CI>cmka/ Co., Del'" 50, Phill;psb",g, N'w .Tecsey.
Copyright 1951 by Amerlean Chemical Soc iety
Editorial Ass istants
EDITOR: WALTER J. MURPHY
Assoclere Ed ito r: LA WRENCE T. H A LLETT
Contri b u ting Edi tor: R. H. M uLLER
Illued September \21, 1951
A dvisor y Board
S . E. O . A SH LEY GORDO N M A C KIN N EY
K. K. CHEN C. J . RODDEN
P. J . ELV IN G J . W . S TILLMAN
W . A. KIRKLIN W. J . S WEENEY
I. M . KOLTHOFF G~ANT W ERNIMONT
H . A. LA ITINEN EDWAR D WIC H ERS
MARY R. CARLS
BETTY V. KIEFFER
DO RIS L. KROUT
KA TH ERIN E I. BIGGS
RUTH CORNETTE
EILEEN G . HOFFEN
A ssocidte Edit ors
G . G LADYS G O RDO N
STELLA ANDERSON
C HA RLO TTE C. SAYRE
Executive Editor: JAMES M . CROWE
A ssistent to Ed ito r: N . A. PA RKINSON
Volume 23 , No .9
J . L. Lambe rt
NOTES ON ANALYTICAL PROCEDURES
Rapid Method lor D.t.rmln.tion 01 B.laln. • • • • • • • • • • • •H . G. Walker, Jr ., and Roberta Erlandson
Slability 01 F."ate(VI) Ion in Aqu.ous Solution • • • • • • • • • •J. M. Schreyer and L. T, Ockerman
S.par.tlon 01 Colton and Rayon or Colton .nd Acelat. lor An.lytlcalPurpo s.s-Add.ndum . . • • • • • • • • • • • • .Osker H olm
D.t.rmin.tlon 01 Acid Number 01Oils .nd R.sins In Aqueous M.dlum •Ganapathl Narsiiilhan and S. A . Seletore
Prop.rti• • ollnlerl.ci.1 Film.. • •• G. Narsi mhan and S. A. Selete re
T•• t lor Tr.c •• 01 Org.nlc M.lter in W.t.r. , • • ••• A . I. Mo dali a
Colorimetric Dol.rmin.tlon 01 Gluco•• mln. . • • • • •Benlamln Schlo..
Appllc.tion 01 L••d Reduetor to Indirect Det.rmln.tlon 01 Sodium • •W. M. McNabb, J. F. Hezel, and H. F. Dantro
Determln.tlon 01 We ight Curve. In Column Proc..... • • • • • • • •L. C. Craig , We rner Hausmann, E. H. A hrens, Jr., and E. J . H.rfonl.t
H igh Fr.quency Titr.tlon. of C.lcium .nd M.gneslum Ion. In Aqu.ou.Solution • ••• •• F. W. Jensen, G. M. Wats o n, and L. G . V ola
Det.rmln.tlon 01 Rotenone by Use 01 Mercuric Ac.late • • • • • • •Irw in Hornste/ n
Determln.tion 01 Rotenone • • Impurity In Dihydrorotenone . • • • • •Irwi n Hornstoln
Det.rmin.tion of Chlorid. in Pre.ence ollod.te . • • • • L. S. Stanton
Sodium T.rIr.te Dihydr.te •• Prim.ry Sland.rd lor K.rt Fisch.r Re.g.nt • •J . D. N euss, M. G. O'Brien, and H. A . Fred l.nl
Re.ldu.1 Mot.1 In Disch.rged M.gne.lum Boltorlo.. • • • • B. J. Sturm
Determln.tion 01 Froe Sullur In G •• oline • Karl Uhrls and Harry Lovin
Dot.rmin.tlon 01 Boron in Stool. • • • • • • • • • • • M. W . Kelly
Ultraviolot Spoelrophotometric D.tormln.tion 01 Styrone In Ethylbenzen.Ni na Hadden and J . A. POrry
Dotormin. tion 01 Nitrilo.Type Nitrogon with Ordln.ry K/old.hl DigestionC. H . Va nEtton and M. B. W lelo
CRYSTALLOGRAPHIC DATA . •W . C. McCr o no
BOOK REVIEWS ••• •••
THE ANALYST'S CALENDAR
AIDS FOR THE ANALYST
Autemetle Roceiver Ch.ngor lor Vacuum Distill.lion . • • • • • • • •D. A. Simpson and M . D. Sutherland
L.bor.tory Sol.ont Dogr.a.or L. C. Kinney
EDITORIAL • .• .
Principle. 01 Precision Colorimetry ••. •c. F. H iskey and I. G . You ng
Role 01 Heterogeneou. Equilibria in Analytical Chemistry • • P. J . Elving
L1quld·L1quid Extraetlon Analysis • • • • • • • • • .Celvtn Golumbic
Polarographic Behavior 01 Organic Cemeeunds , • • • • • • • • , • •P. J. Elving, J. C. Komyathy, R. E. Van Atta, C hing·Slang Tang, and
Isadore Rose nthal
Derl.atlve Pol.rographic Tltr.tlons • • • • • • . • • • • • • • • • •C. N. Reilley, W. D. Cooke , and N. H. Furman
Three·Dlmenslon.1 Model lor Interpreting Eleelrometric Processes • • • •C. N . Reilley, W. D. Cooke, and N . H . Furman
Variability in Bec~m.n Sp.elrophotom.t.r. • . • • • • • W . O . Caste r
Autom.tlc Ceuntereurrent Distribution Equlpm.nt. • • • • • • • , • •L. C. Cr aig, We rner Hau smann, E. H. A hrens, Jr ., and E. J . Harfenlst
Quantilallv. Application of KiII.nl R.actlon. . • • . • • • • • • • •V . L. Frampton, L. P. Fo ley, L. L. Smith, and J. G . Malone
Lin.ar Slarch Re.g.ntsCadmium 10dlde-L1n••r Slarch R.ag.nt . • • • • • •
LInear Slarcft-lodate Re.gent S.I.ctive lor lodld. Ion
Evelu.tlng Dynamic Fatlgu. 01 Adhesion 01 Tlr. Cords to Rubb.! Stoc~s
D.termlnatlon 01 Z irconium-Hafnium Ratio. with p.Bromomand.lic AcidR. B. Hahn
D.terminatlon 01 B.ryllium by Photodi.lnl.gration . • • • • • • • • • •A. M. Gaudin and J : H. Pann ell
Amp.rom.trlc Tilrotlon. with H...mmlnecobalt(lII) Chlorld. • • • • • •H. A . Laitinen and L. W . Burdet t
lodom.tric D.termlnation of Cobalt. • •H . A . Laitinen end L. W . Burde tt
Continuous W.ighlng In Analytical Ch.mlstry • • • , • , Cle ment Duval
Ph.nyl M.rcuric or Ethyl M.rcuric Compounds • • • • • • • • • • • .V . L. Miller, Dorothy Po lley, ...d C. J . G o uld
Str.ptomycln and M.nnosldostr.plomycin In F.rm.nlation Broths • • • •c. V. St. J ohn , D. E. Flick, and J. B. Teoe
D.t.rmlnation 01 Lead as Chlorid. , •••• •• •• • •Sllve Kallma nn
D.t.rmlnation olT.traethyll.ad in Gasolin. by X-Ray Absorption • • • •S. W . Levine and A . H . Okamoto
D.termlnation 01 Oxygen.Consum.d V.lu.s 01 O,ganlc Wast.. . • • • •W . A . Moore F. J. l.udzeck, and C. C. Ruchhoft
MICROCHEMISTRY
D.t.rminatlon 01 Glut.mine .nd Asparagln. in Plant Tissue Extracts • .G. W . Butler
Determination 01 Traces 01Chlorid.. • . 1.M. Koltho ff and P. K. Kuroda
Arg.nlom.tric Amp.rom.~ic Titration of Trac•• 01 Chlorid. • • • • •I. M. Kolthoff and P. K. Kurod a
1195
1196
1202
1210
1218
1223
1226
1229
1236
1244
1247
1251
1255
1259
1 261
1 26 5
1268
1271
1286
1289
1291
1293
1297
1300
1304
1306
THE ANALYST'S COLUMN
INSTRUMENTATION ... •
NEW PRODUCTS FOR ANALYSTS
MANUFACTURERS' LITERATURE.
R. H . Ma ller
1309
1312
1314
1315
1317
131B
1321
1325
1326
1327
1329
1330
1331
1332
1333
1334
1335
1337
133B
1339
1340
1 344
1345
1346
17 A
23A
31 A
34A
The Amertcen Ch emica l Socie ty assumes no respo nsib ility for the sta te ment s endopinions adva nced by con tributors to its publ ications . Vi ews expressed in th eed itor ials ere tho se of the ed itors and do not necesserily repr esent the official posi t ionof the American Ch emica I Sccretv.
Published by the American Chemical Society, Irom 20th and Northampton Sts .,Easton" Pd . Execut ive Office.s, Editorial H eedquerters, end C irculation Departm ent,11 55 ~ix teenth St ., N . W ., Wa shington 6 , D. C. Advertising Off ice: 33 2 W est 42ndSr., Ne w York 18, N . Y. Branch Editorial Offices: Chicago 4,111..Room 819, 25 EastJa ckson Blvd., H ouston 2, Tex., 623 W est Bldg. , New York 17 , N. Y., 60 East 42 ndSt., San Francisco 2, Ce ltl., Room 454, 760 Market St . Entered as seco nd-class matt erat the Post Office a t Easton, Pd., U.S.A., February 18, 1948, under the Act of Ma rch3,1879, as 12 times a year mon thl y on the 15th. Acc eptanc e lo r mailing at specia lrate of postage pro vided for in Sect ion 1103J Act of Oct. 3, 1917, author ized Ju ly13,1918. A nnual subscriptions: members ) 3 .50 , r.onmembers $4 .00. Postas e tocount ries not in th e Pan-Am erican Union $1 .20 , Canddian postage $0 .35. Combina-
tio n rate For A nelvtice l C hemistry and Industri<J J end Engineering Chemistry: members$7.00 . nonmembers $8.00 . Postage fo r th e combinat ion : cou ntri es not In the PanAmerican Union $3.90, Ccmadian postege $1.10. Sinsl e copies: cur rent Issues,members $0.40, non members $0 .50; beck numbers , pr ices on request, soec lal rates tomembers . Cle tms fo r missins numbers wil l no t b e allow ed if received more the n 60de vs from dere of issue . No c laims 4110wed from subscr ibers in centre ] Europ e, A si4or the PaciRc Islands oth er then Ha waiibor because of failure to noti fy the Circulati onDepartm en t of 4 chdns e of edd ress, o r eceuse copy is " missing from files:·
C HANGE OF ADDRESS: Notify the A merican Chemical Socie ty at 115 5 Sixteent h St. , N. W ., Washington 6, D. c., of dny change of address. Such no tificatio n should incl ud e bo th o ld and new addr esses and postal zon e number,if any. of the new add ress.
The American C hemical Soci ety a lso publish es Chemi cal and EngIneering New s,Industridl dnd Enginee ring Chemistry, Chemical I1bslrdcls, and the Jovrna l of theA mericdn ChemicdJ Society. Rdtes on requ est.
Write for thisinf ormat ional
brochure
4A ANALYTICA L CHEMISTRY
Only ARL Production Control
Quantometer* gives you direct
reading, pen-and-ink records of
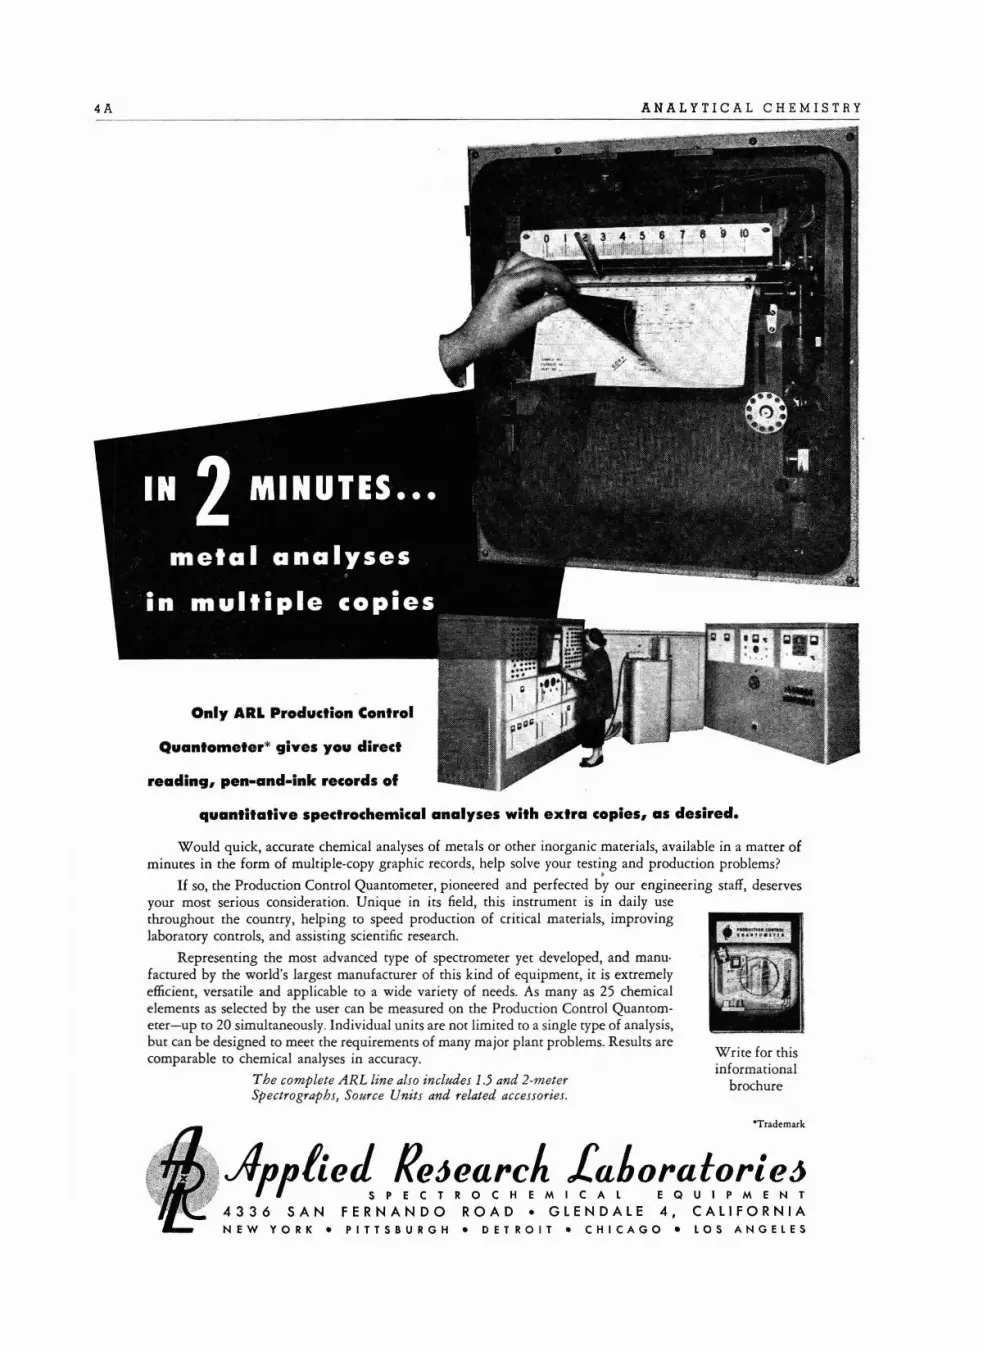
quantitative spectrochemical analyses with extra copies, as desired.
Would quick, accurate chem ical analyses of metals or other inorg anic materials, available in a matter ofminutes in the form of multiple-copy graphic records, help solve your testing and production problems?
. ,If so, the Production Control Quantomerer, pio neered and perfected by our engineering staff, deserves
your most serious consideration. Unique in its field, this instrument is in daily usethroughout the country, helping to speed production of crit ical materials, improvinglabor arory controls, and assisting scientific research.
Representing the most advanced type of spectrometer yet developed, and manufactured by the world 's largest manufacturer of this kind of equ ipment, it is extremelyefficient, versatile and applicable to a wide variety of needs. As many as 25 chemicalelements as selected by the user can be measured on the Product ion Control Quanrorneter-up to 20 simultaneously. Indi vidu al units are not limited to a single type of analysis,but can be designed to meet the requirements of many major plant problems. Results arecomparable to chemical analyses in accuracy.
The comp lete ARL line also includes 1,5 and 2-meterSpectrographs, Source Units and related accessories.
'Trademark
Applie~ p~~~~f!!'~A 1"f,!~Or!'u~o,,:~e..~4336 SAN FERNANDO ROAD. GLENDALE 4, CALIFORNIANEW Y O R K . P ITTSBURGH. DETRO IT. C H I C A G O . lO S A NG E LES
VOL U M E 2 3, N O. 9, SE PTE M B E R 1 9 5 1 5A
Elecfr onk Relay Ma de l E- l e a. 35.00Ele ctro nic Re lay Ma del E-2 ea . 45.00Ele ctronic Relay Model E.3 _ e~. 62.50
. three models will meet every requirement 'o f tlie. ~
laboratory as far as price and performance.• •
E. G. Co.
E. G. Co.
E. G. Co.
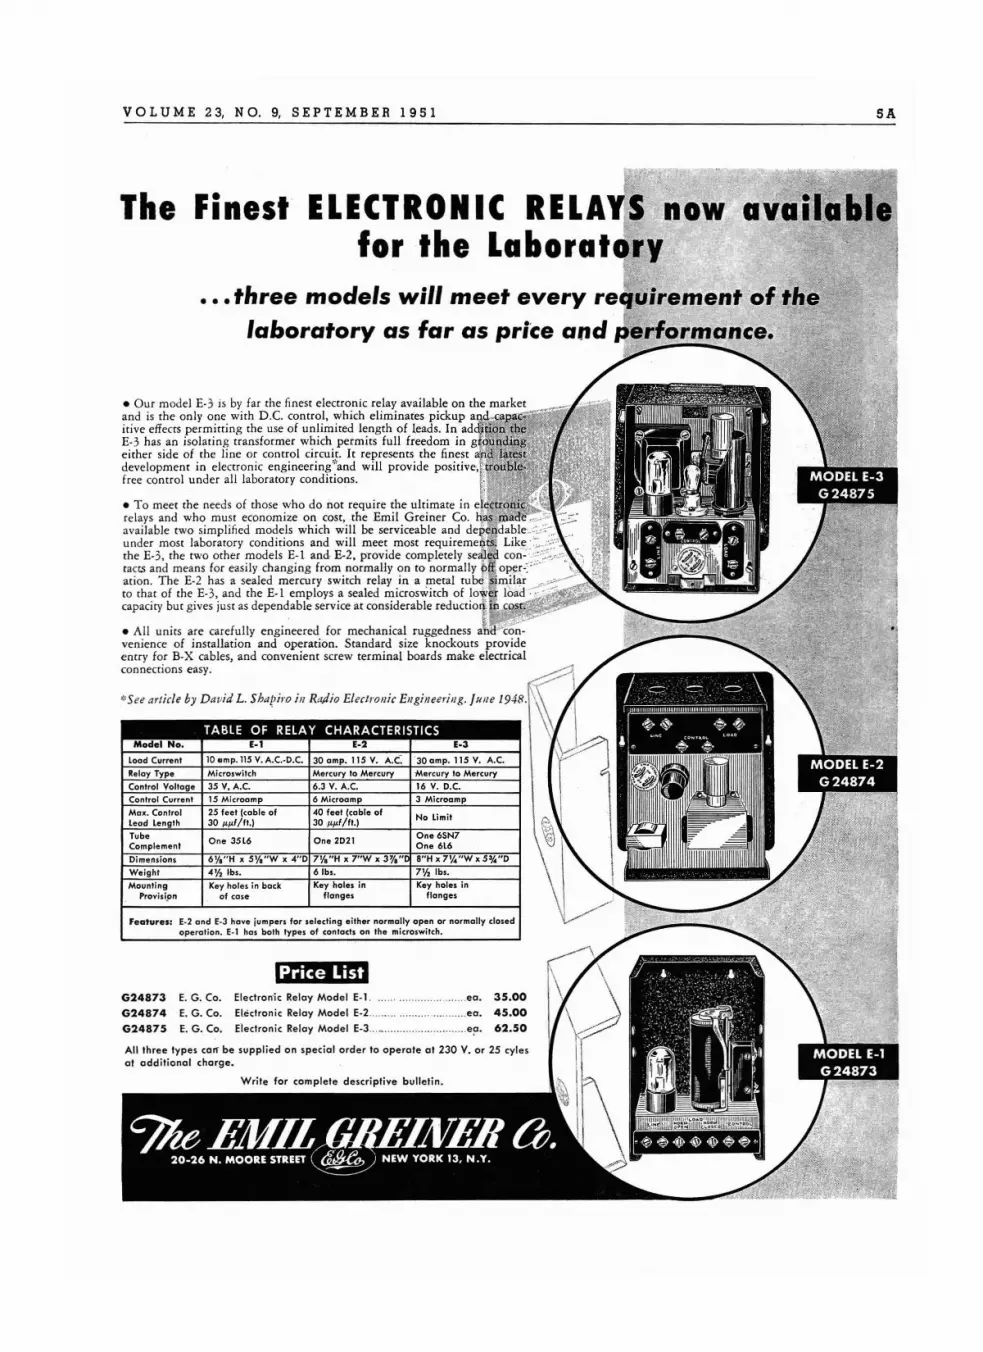
Model No . E-l E-2 E-3
l oad Current 10 Gmp. 115 V. A.C.·D.C. 30 a mp. 115 V. A.C: 30 a mp. 115 V. A.C.
Relay Type Microswilch Me rcury to M ercury Mercu ry 10 Mercury
Contro l Voltag e 35 V. A.C. 6.3 V. A.C. 16 V. D.C.Conlro l Current 15 Micr oamp 6 Microamp 3 Microamp
Max. Control 25 feet [coble of 40 feel [coble of No Li mitlead le ngth 30 I'l'f/ft. ) 30 l' l' f/ft.)Tube O ne 3516 One 20 21 One 6SN7Complement One 616
Dimensions 6 Y, "H x 5 Y, "W x 4" 0 7 Y."H x 7"W x 3 % " 8" H x 7 Y, 'W x 5'.4"0
Weight 4Y, lb•• 6 lb•. 7 ,!, lb•.
Mo unting Key holes in bac k Key holes in Key holes inProvisipn of ca se fla nge. flan ge .
TABLE OF RELAY CHARACTERISTICS
All thr ee types calf be supplie d o n special o rder to opera te ot 230 V. or 25 cylesat add it ional charge.
Feature s: E.2 and E·J have jumpers for selecting either normally open or normally closedoperatio n. E·l has both type s of contacts on the microswitch.
• Our model £ ·3 is by far the finest electronic re lay available on the marketand is the only one with D.C. control, which eliminates pickup and.irive effects permitting the use of unlimited length of leads. In ad •£· 3 has an isolating transformer which perm its full freedom in g 'ei ther side of the line or control circuit. It represents the finest adevelopment in electronic engineeringfand will prov ide positive,free control und er all laboratory conditions.
G24873G24874
G24875
The Finest ELECTRONIC RELA1S' now ·ava.for the Laborator.y
6A
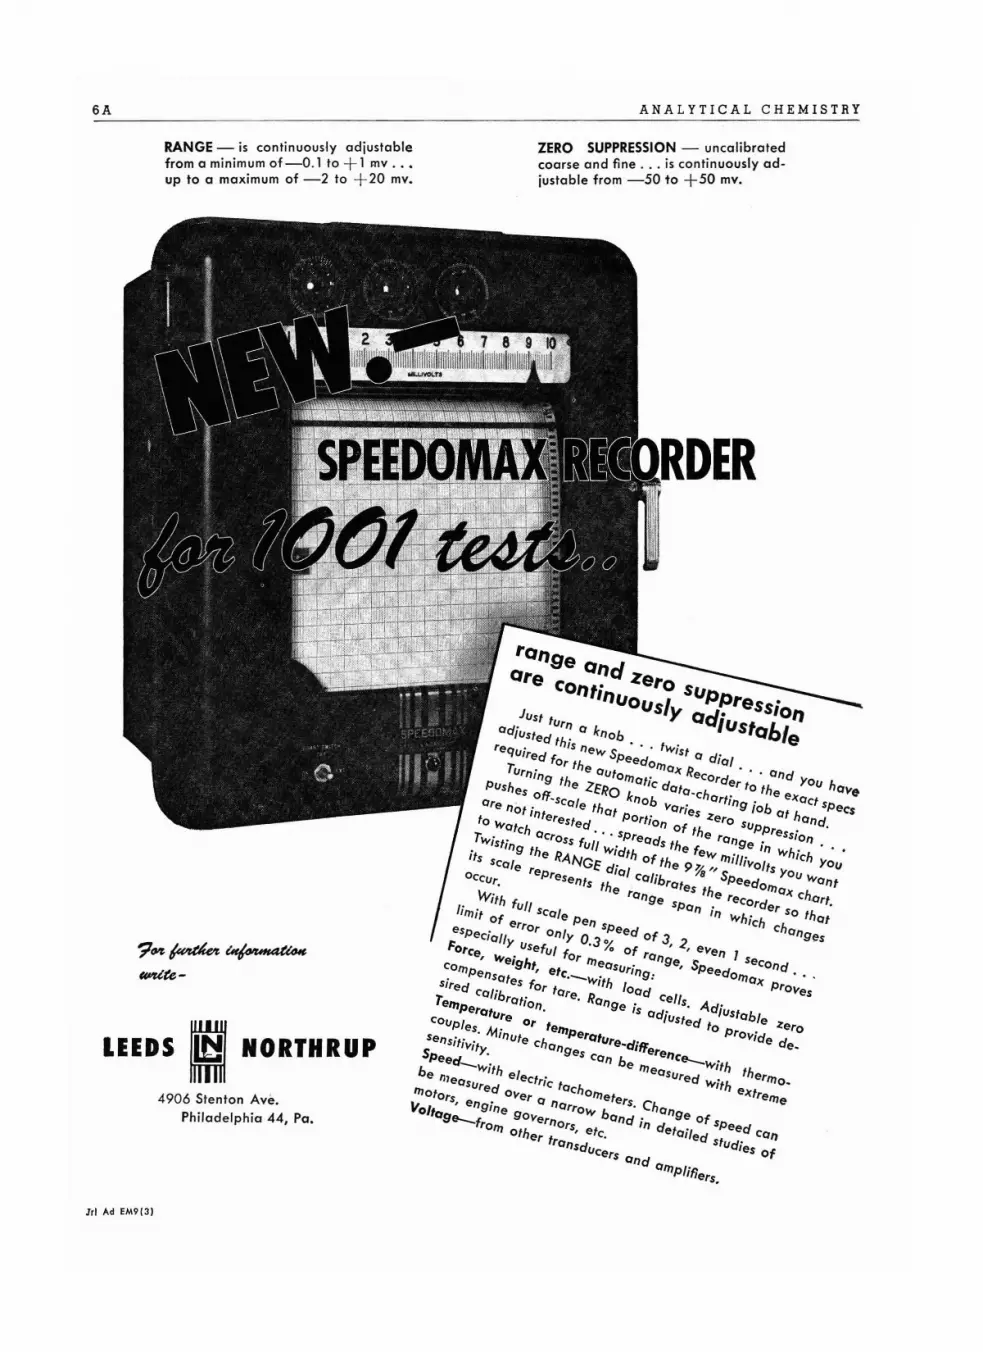
RANGE - is continuously adjustablefrom a minimum of-O.l to +1 mv . .•up to a maximum of -2 to + 20 mv.
LEEDS 1/ NORTHRUP
4906 Sten ton Ave.Philadelphia 44, Pa.
J II Ad EM9(3l
ANALYTICA L CHEMISTRY
ZERO SUPPRESSION - uncalibra tedcoarse and fine . . . is continuously adjustable from -50 to + 50 my.
VOL U M E 2 3, N O. 9, S E PTE M B E R 1 9 5 1
SA ANALYTICAL CHEMISTRY
Scientific Instruments • Laboratory Supplies
SCIENTIFIC COMPANY
~ Refinery Supply Company~ Tulsa, Oklahoma
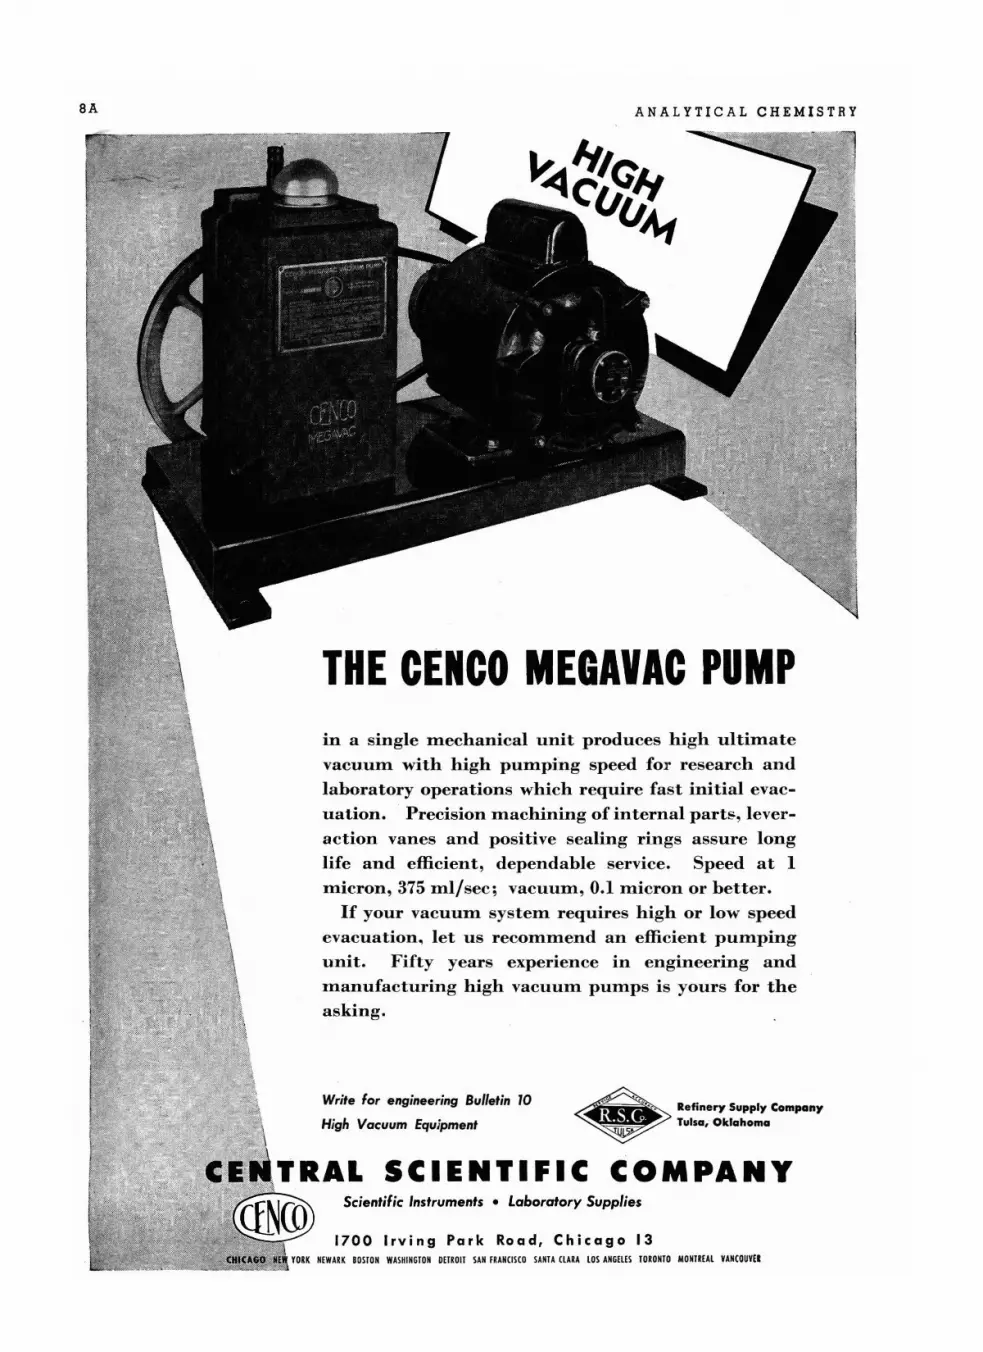
in a single mechanical unit produces high 'uf tirnate
vacirurn with high purnping speed for research and
laboratory operations which require fast initial evac
uation. . Precision rnaclrirririg of internal par-ts, lever
action vanes and positive sealing rings assure long
life and efficient, dependable service. Speed at 1
rnicrori, 375 Illl/sec; vacuum, D.Lrrricron or better.
If your vacutrm systern requires high or low speed
evacuation. let us recorrrmerrd an efficient pumping
unit. Fifty years experience in engineering and
Inanufacturing high vacuum pumps is yours for the
asking.
Write for engineering Bulletin 10
High Vacuum Equipment
THE CENCO MEGAVAC PUMP
1700 Irving Park Road, Chicago 13YORK NEWARK BOSION WASHINGTON DETROIT SAN FRANCISCO SANTA CLARA lOS ANGELES TORONTO MONTREAL YANCOUYEI
V OLUME 23, NO.9, SEPTEMBER 1951
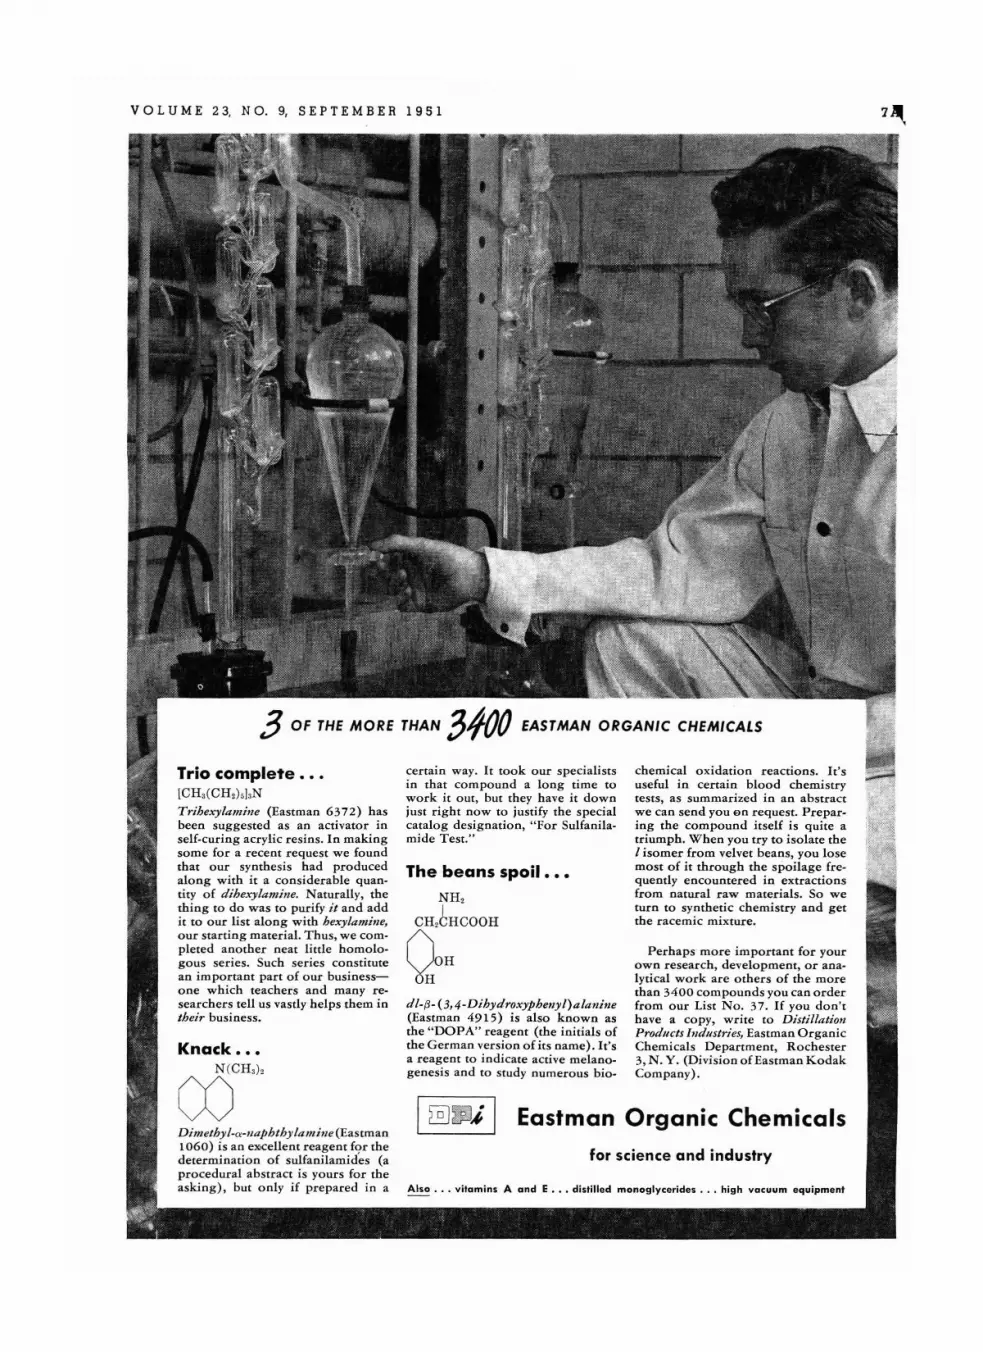
•In
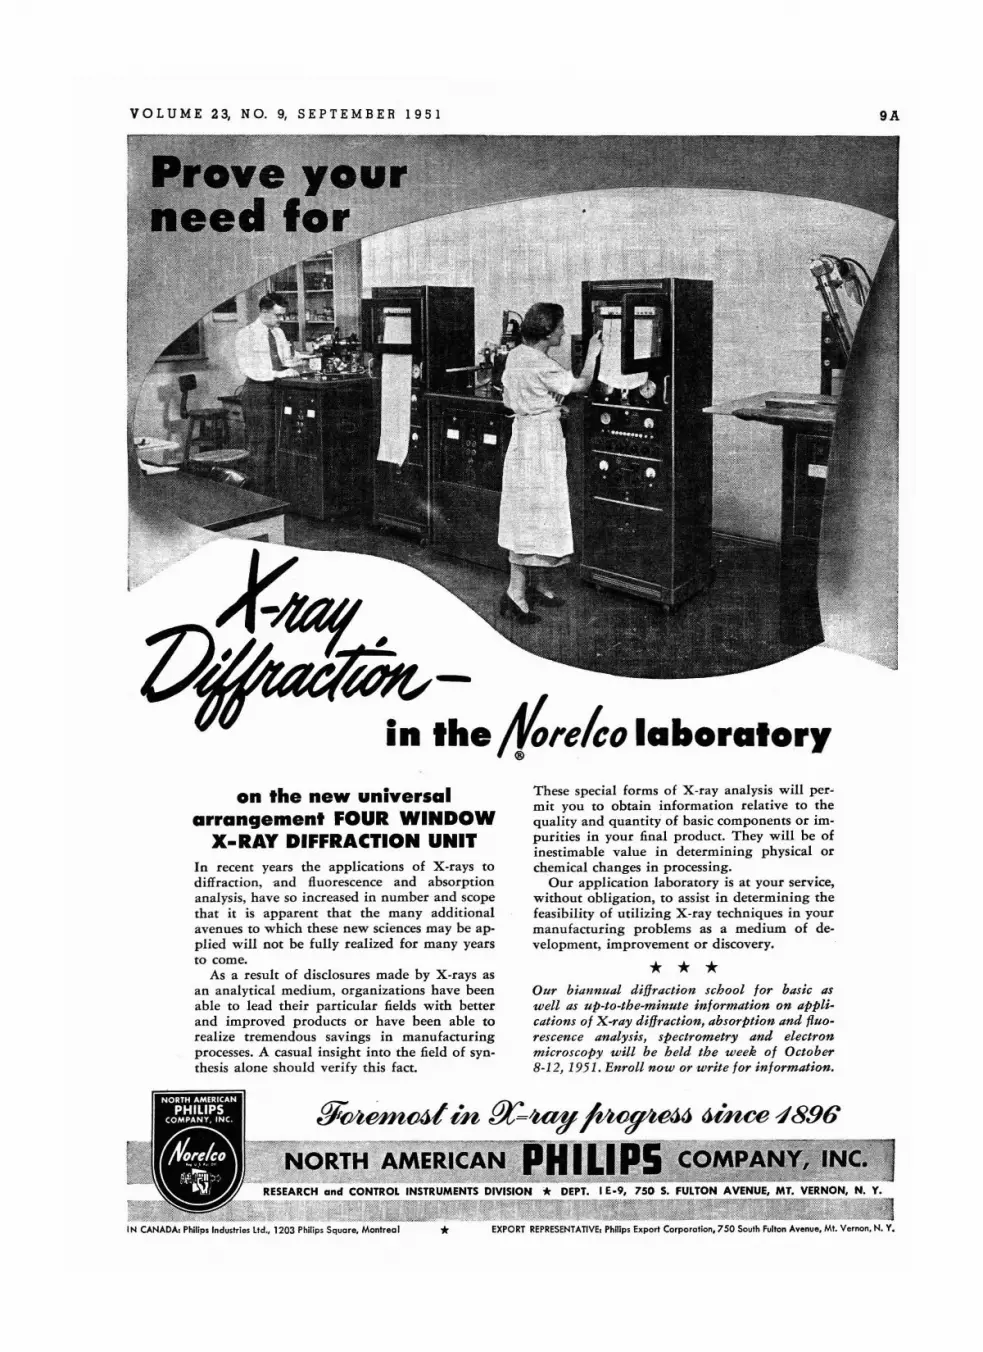
on the new universalarrangement FOUR WINDOW
X-RAY DIFFRACTION UNITIn recent years the applications of X-rays todiffraction, and fluorescence and absorptionanalysis, have so increased in number and scopethat it is apparent that the many additionalavenues to which these new sciences may be applied will not be fully realized for many yearsto come.
As a result of disclosures made by X -rays asan analytical medium, organizations have beenable to lead their particular fields with betterand improved products or have been able torealize tremendous savings in manufacturingprocesses. A casual insight into the field of synthesis alone should verify this fact .
These special forms of X -ray analysis will permit you to ob tain information relative to thequality and quantity of basic components or im purities in your final product. They will be ofinestimable va lue in determining physical orchem ical changes in processing.
Our application laboratory is at your service,without obligation, to assist in determining thefeasibility of utilizing X-ray techniques in yourmanufacturing problems as a medium of development, improvement or discovery.
* * *Our biannual diffraction school for basic aswell as up-to-the-minute information on applications of X-ray diffraction, absorption and fluorescence analysis, spectrometry and electronmicroscopy will be held the week of October8-12,1951. Enroll now or write for information.
9A
IN CANADA. Philips Industries ltd., 1203 Philips Square, Man lre al * EXPORT REPRESENTATIVE. Philips Export Corporation. 750 South Fullon Ayenue. MI. Vernon , N. Y.

ANALYTICAL CHEMISTRY
For New
CfJNVENIENCEin Laboratory Apparatus
more ease, range, speed-
----------------------5pe41f *precision
-tok5'~
PRECISION-Interchemical Rotational Viscometeris the only practical instrument for thixotropic studiesof such a wide range of substances (viscosities from1 to 2500 poises, yield values to 180,000 dynes / cm2 ) .
Changeable exact speeds for full-curve measuring,temperature control to 0.1°C. Bulletin 1-945
PRECISION-Dow Dual Recordomatic Titrometer(A.S.T.M. 0-664; 0-939; 0-8111 saves time of technical personnel, avo ids human errors, handles organicand opaque fluids, makes chart record. Accurate, fullyautomatic. "Paid for itself in 3 months"; "Cuts coststo scarcely V3fd". Bulletin 1· 640A
Other pre-tested products in the broad
Precision line- Itutilities" to highly specialized
instruments-can make your work easier,
surer, more economical. Think which of your
equipment needs replacement, where your
facilities should be extended •••
O'Uielt~~ 'Deaktc NOWI. .. or write us for details on above or
your individual problem . . . today .
--------~-------------
precision Scientific Companq3737 W. CORTLAND STREET-CHICAGO 47
*FINEST Research and Production Control Apparatus
NEW YORK' PHILADelPHIA' ST. LOUIS' HOUSTON' SAN FRANCISCO
VOL U M E 23, NO.9, S E PTE M B E R 1 95 1 llA
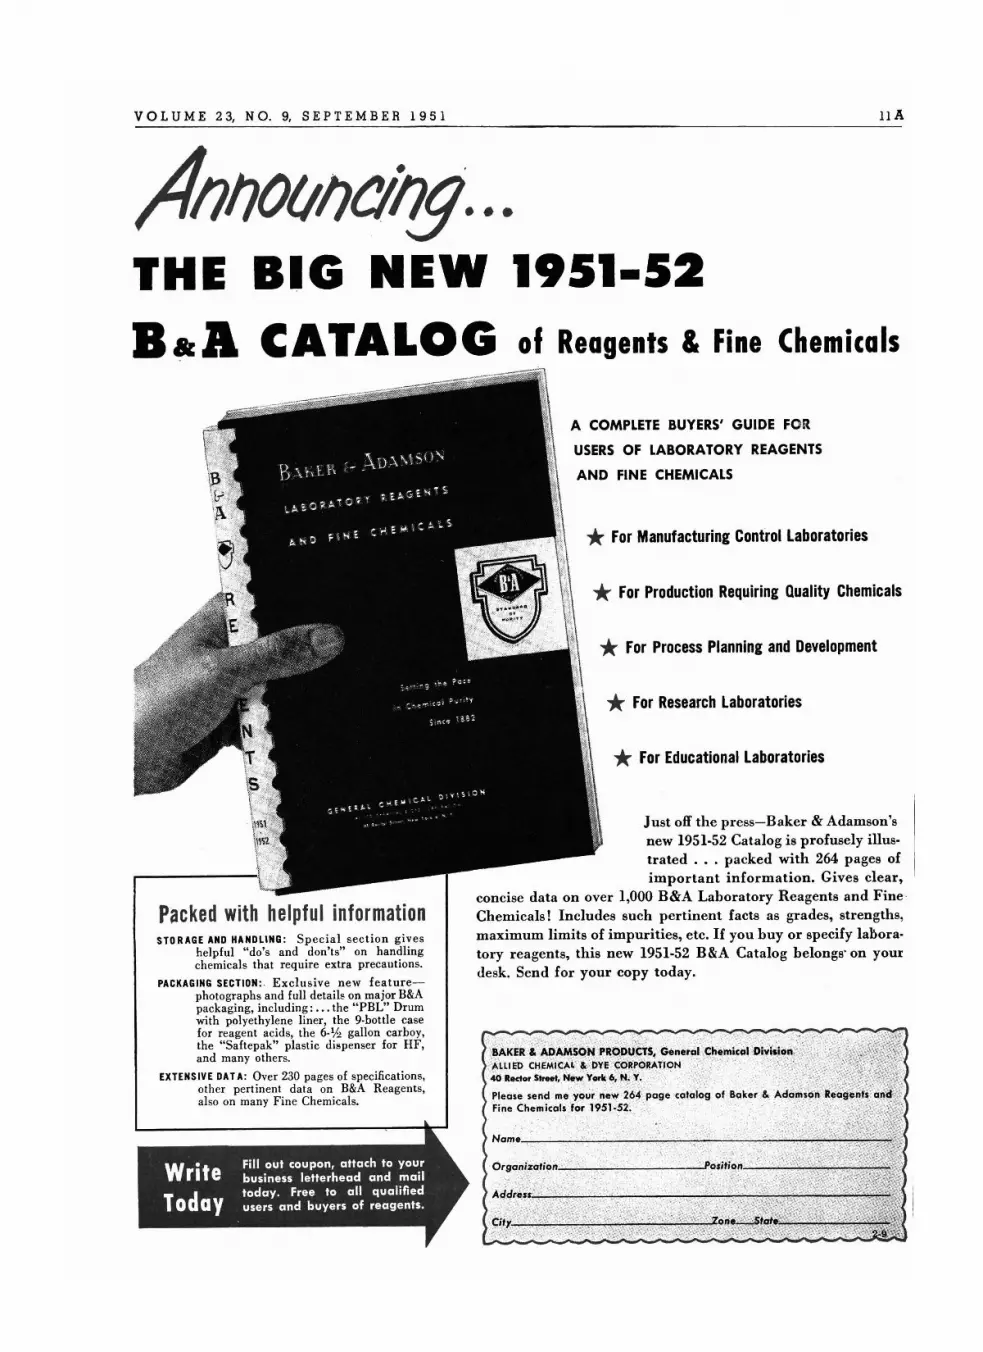
;1IJI70ltIJetiJg. ··THE BIG NEW 1951-52BaA. CATALOG of Reagents & Fine Chemicals
* For Educational Laboratories
* For Research Laboratories
* For Process Planning and Development
* For Production Requiring Quality Chemicals
* For Manufacturing Control Laboratories
A COMPLETE BUYERS' GUIDE FOR
USERS OF LABORATORY REAGENTS
AND FINE CHEMICALS
"" BAK~R &:..oAMSONPROD~CTS, General Ch.mic~1ALLIED CHEMICAL"'; DYE CORPORATION " ,"'40 Rector 51-', New York 6,N. Y. "
Please send me your n~~ 264 page calalogaf Bak~r &Fine Chemicals for 1951·52. "
Just off the press-Baker & Adamson'snew 1951-52 Catalog is profusely illustrated ... packed with 264 pages ofimportant information. Gives clear,
concise data on over 1,000 B&A Laboratory Reagents and Fine Chemicals! Includes such pertinent facts as grades, strengths,maximum limits of impurities, etc. If you buy or specify lahoratory reagents, this new 1951-52 B&A Catalog belongs' on yourdesk. Send for your copy today.
Packed with helpful informationSTORAGE AND HANDLING: Spec ia l sect ion giv es
helpful "do's and don't s" on handlingchemicals that require extra precautions.
PACKAGING SECTION: . Exclusive new featurephot ographs and full details on maj or B&Apacka ging, including: ... the "PBL" Drumwith polyethyl ene liner, the 9-bottl e casefor reagent acid s, the 6·% gallon carboy,the "Saftepak" plastic dispenser for HF,and many oth ers.
EXTENSIVE DATA: Over 230 pages of specifications,other pertinent data on B&A Reag ent s,al so on many Fin e Chemicals.
Get the Sensational New
BECKMANModel N
ph METERfrom
WILL
ANALYTIC AL CHEMISTRY
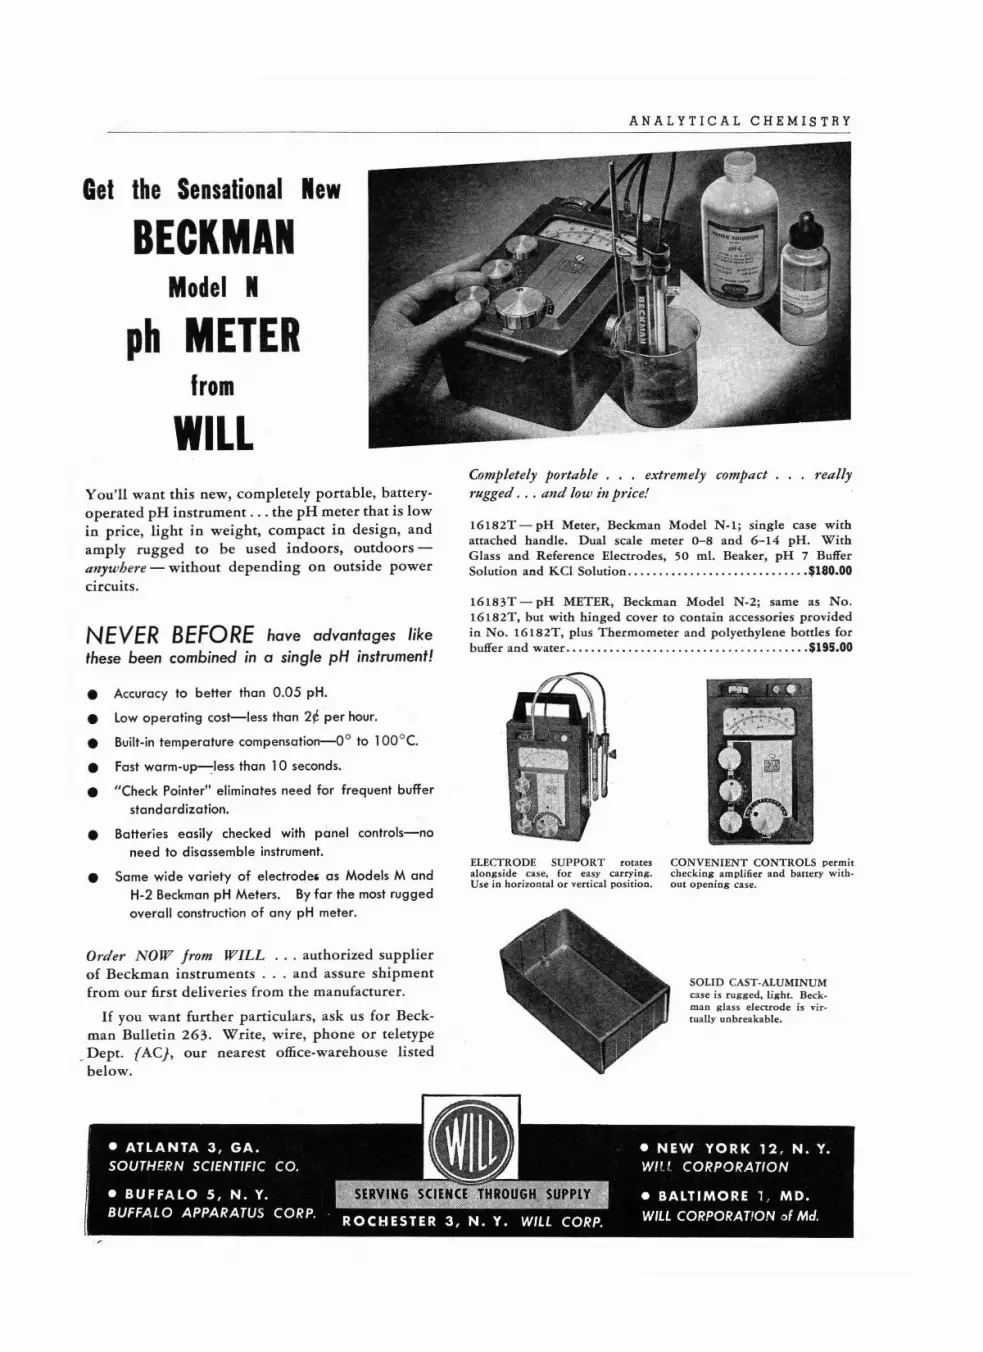
You' ll wa nt this new, completely portable, batt eryoper ated pH in strument . .. the pH meter th at is lo win p rice, li ght in weight, compact in design, andamply ru gged to be used indoors, outdoorsanywhere - w ithout depending on outside powercircuits.
NEVER BEFORE have advantages likethese been combined in a single pH instrument!
Completely portable . . . extremely compact . . . reallyrugged . . . and low in price!
16182T - pH Meter, Beckman Mod el N -1; single case withattached handl e. Dual scale meter 0- 8 and 6-14 pH . WithGlass and Reference Electrodes, 50 ml , Beaker, pH 7 BufferSolution and K CI Solution $180.00
16183T - pH MET ER, Beckm an Mo de l N-2; same as No.16 182T, but with hinged cover to co ntai n access ories pro videdin No. 16 182T , plus T hermom eter and polyethylene bot tles forbuffer and water .•. ..... .. .... .. .. .. . .. . . .. ... ... . . .. ..$195.00
• Accuracy to better than 0.05 pH.
• low operating cost-less than 2¢ per hour.
• Built-in temperature compensation-a D to 100°e.
• Fast warm-up---:less than 10 seconds.
• "Check Pointer" eliminates need for frequent bufferstandardization.
• Batteries easily checked with panel controls-noneed to disassemble instrument.
• Same wide variety of electrode, as Models M andH-2 Beckman pH Meters. By far the most ruggedoverall const ruction of any pH meter.
Order N OW from WIL L . . . authorized sup plie rof Beckman ins truments : . . and ass ure shi pme ntfrom our first deli veries from the manufacturer.
If you want furt her part iculars, ask us for Beckman Bullet in 263. Write, wi re, phone or teletype
_D ept. (ACj, our nearest office-warehouse li stedbel ow.
ELECT RO DE SUPPORT rotatesalo ngside case, fo r easy carrying .Use in horizon tal or vertica l po sitio n.
CONVENIENT CONTRO LS per mi tchec king amplifier and batt ery witho ut opening case.
SOLID CAST .ALUM INUMcase is rugged, light. Beck man gl ass electrode is virtu ally unbreakable.

V OL U M E 2 3, N O. 9, S E PTE M B E R 1 9 5 1
AVAILABLE NOWISend for Your Personal Copy Today
13A
This 1951 edition of the Merck Laboratory Chemicals Price List is filled withup-to-date, practical information onthe purity and packaging of over 600Merck Reagent and Laboratory Chemicals. Specifications given for all ReagentChemicals have been amended to conform
to the latest revisions of A CS puritystandards. Also included are useful suggest ions on storage of sensitive finechemicals.
Your local laboratory chemicals distributor has a copy for you. Why notsend f or it today? Or write us directly,using the coupon below.
MERCK LABORATORY CHEMICALS
MERCK & CO.. INC.
Manlffieturin!J ChemistsRAHW AY . NEW J ERS EY
In Canada : MERCK & CO . Limited-Montreal
r- - - - - - - - - -- - - - - - - -,I MERCK & CO., I NC. I
Rahway, New Jersey, Dept . AN-9I Please send new 1951 M erck Loboratoru Chemicals II Price List: II II Nam e , I
(P LEASE PRINT)I II Street , . . . . I
I City Zone State , ., IL ~
14A
1M /I~"",COLORIMETRIC AND
ANALYTICAL CH EMISTRY
TURBIDIMETRIC
//~l4
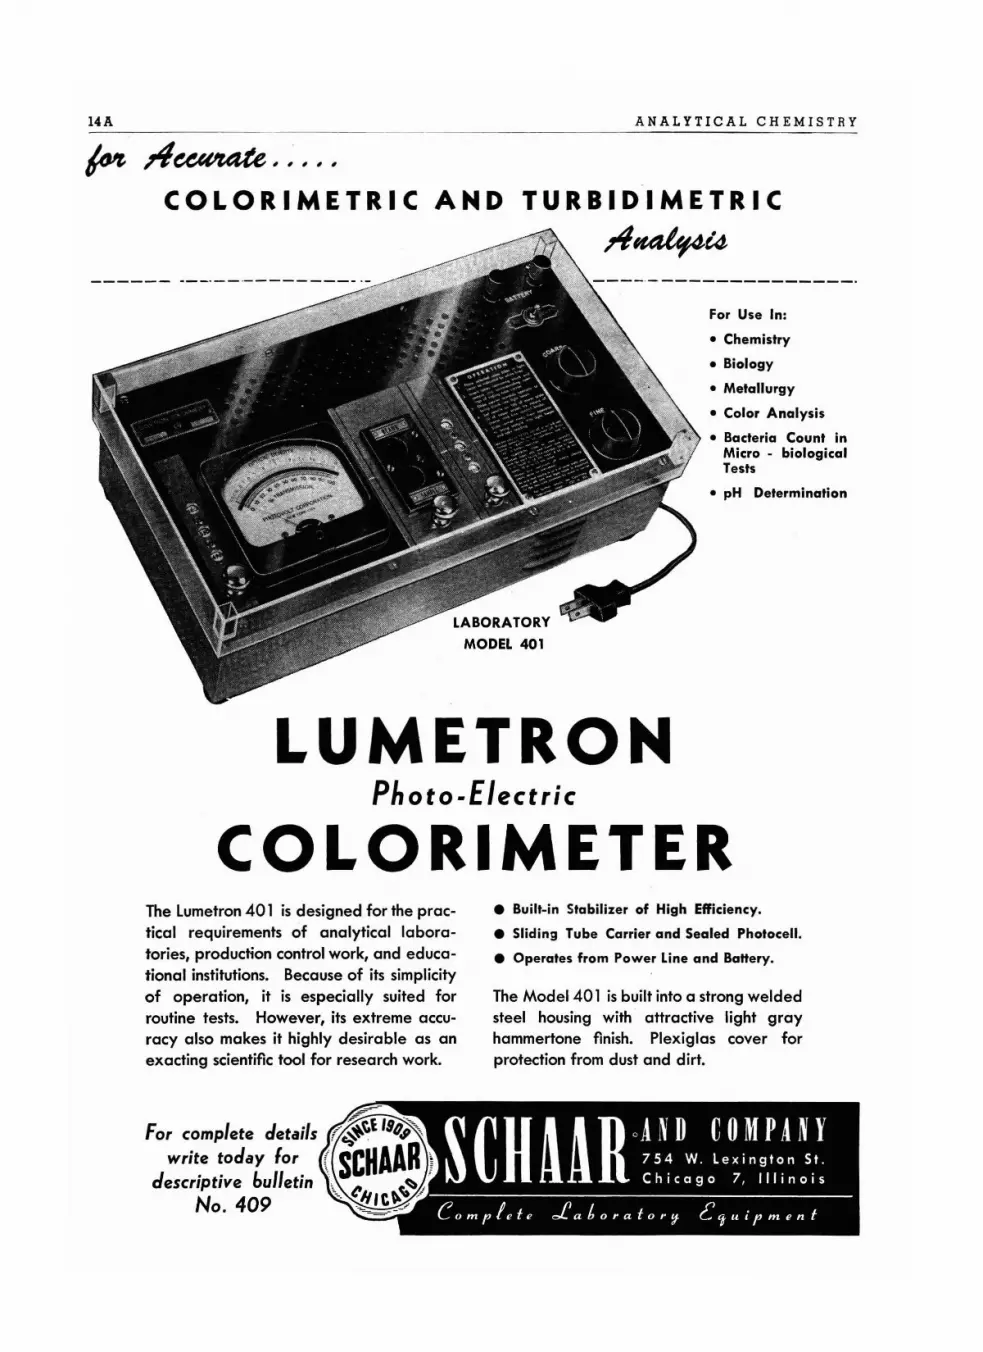
For Use In:
• Chemistry
• Biology
• Metallurgy
• Color Analysis
• Bacteria Count inMicro - biologicalTests
• pH Determination
LUMETRONPhoto-Electric
COLORIMETERThe Lumetron401 is designed for the practical requirements of analytical laboratories, production control work, and educational institutions. Because of its simplicityof operation, it is especially suited forroutine tests. However, its extreme accuracy also makes it highly desirable as anexacting scientific tool for research work.
• Built-in Stabilizer of High Efficiency.
• Sliding Tube Carrier and Sealed Photocell.
• Operates from Power Line and Ba"ery.
The Model 401 is built into a strong weldedsteel housing with attractive light grayhammertone finish. Plexiglas cover forprotection from dust and dirt.
. .. ' ''. ''.write tOday for
descriptive bulletinNo. 409 •
':'1 Sf1H IIRO~5N~Dw. ~e~;~g~~AnNs.!" \J llll. Chicago 7, I l l i n o I s\
C omplet e oCatorat o r 'J G lj uipm ent
•<
*TRADEMARK • NALYTICAL • EAGENTS
• The chemist is one of the world's most exacting buyers. He has to be . ..
his work often depends wholly upon the purity of the laboratory chemicals
he uses. That's why more chemists than ever before choose from the over
400 Mallinckrodt Analytical Reagents.
MAlLiNCKRODT CHEMICAL WORKSMallinckradt s... T lOUIS 7, MO • 72 Gold Street, NEW YORK 8, N Y.
C h i c a g o· Cincinna t i · Cleveland · los AngelesPh il a d el p h i a. San fran c i s c o. Mont real · To r onto
16 A A N A L YTIC ALe HEM 1ST R Y
THE PERKIN -ELMER
INSTRUMENT DIGESTA co ndensa tion of some o f the a rt icl es a pp ea ri ng in the Summer issue of THEPERKIN -ELMER INSTRUMENT NEWS, a q uarte rly publica tion of The PerkinElmer Co rporation , manufa ctur er s of scie ntific instrument s-In frar ed Spec trom eters, Tiselius Electroph ores is Appara tus, Univer sal Monochromator,
Flame Photometer s, Continuous Infra red Anal yzer , low-level Amplifiers-oswe ll as Astronomic al Equ ipment, Repl i ca G ra tings, Thermocoupl es, Pho to graphic l enses, Cry stal Opti cs, and Special Instruments fo r the Go vernmen t.For fu rther information, w rite The Per kin- Elme r Corp., Norwalk, Conn .
Norwalk, Conn. Sep tember. 1951 Vol. 2. No.9
Cell Co m p o u n ds St u d ied b y Monochromatic L ight
New Meteor Camera Track s "Cosmic Dust'
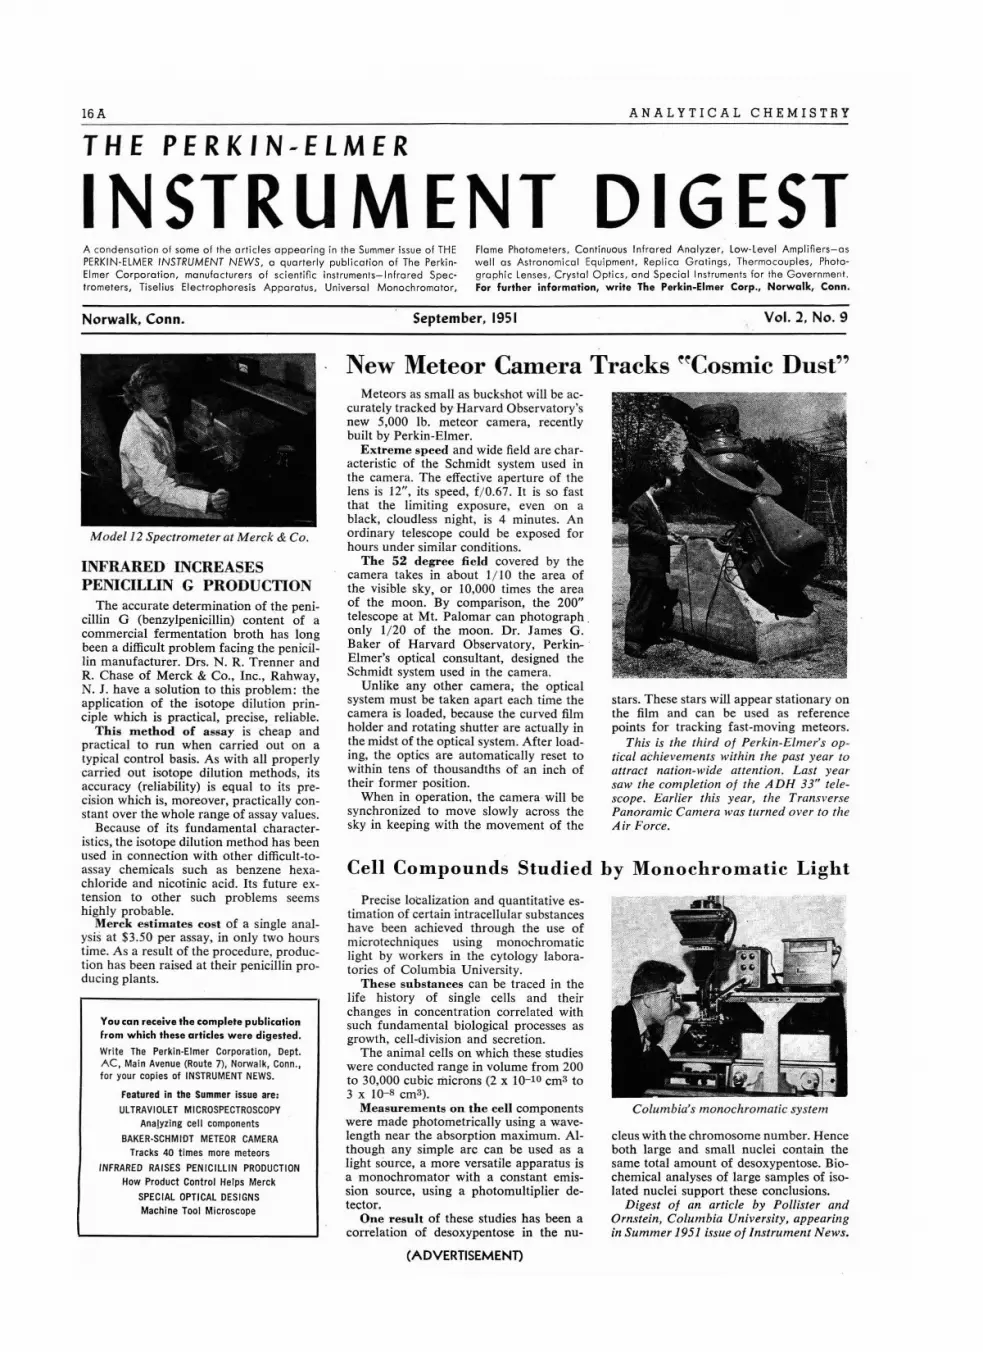
stars. These stars will appe ar stationar y onthe film and can be used as referenc epoint s for tr acking fast-moving meteors.
Th is is the third of Perkin -Elm er's optical achievem ents within the past year toattract nation- wide attent ion. Last yearsaw the com pletion of the A DH 33" telescope. Earlier this year, the TransversePanoramic Cam era was turn ed ove r to theAir Force.
Columbia's monochromatic system
deus with the chromosom e numb er. Henceboth large and small nuclei contain thesame total amount of desoxypentose. Biochemical analyses of large samples of isolated nuclei support these conclusions.
Digest of an article by Pollister andOrnstein , Columbia University, appearingin Summer 1951 issue of Instrument News.
Meteors as sma ll as buckshot will be accurately tracked by Harvard Obser vatory'snew 5,000 lb. meteor camera, recentlybuilt by Perkin-Elmer.
Extreme speed and wide field are characteristic of the Schmidt system used inthe camera. Th e effective aperture of thelens is 12", its speed, f; 0.67. It is so fastthat the limiting exposure, even on ablack , cloudless night, is 4 minutes. Anordinary telescope could be exposed forhours under similar conditions.
The 52 degree field covered by thecamera takes in about 1/ 10 the area ofthe visible sky, or 10,000 times the areaof the moon. By compari son , the 200"telescope at Mt. Palomar can photograph .only 1/20 of the moon . Dr. James G.Baker of Harvard Observatory, Perkin- ·Elmer's optical consult ant , designed theSchmidt system used in the camera.
Unlike any other camera; the optic alsystem must be taken apart each time thecamera is loaded, becau se the curv ed filmholder and rotat ing shutter are actua lly inthe midst of the optic al system. After loading, the optics are automatica lly reset towith in tens of thousandths of an inch oftheir former position.
When in operation, the camera will besynchronized to move slowly across thesky in keeping with the movement of the
Pr ecise localizat ion and quant itative estimation of certa in intracellul ar substanceshave been achieved through the use ofmicro techniques using monochromat iclight by workers in the cytolog y laboratori es of Columbia Uni versity.
These su bs tances can be traced in thelife histor y of single cells and theirchanges in concentration correlated withsuch fund amental biological processes asgrowth, cell-division and secret ion.
The anima l cells on which these studieswere conducted range in volume from 200to 30,000 cubic microns (2 x 10- 10 em" to3 x 10-8 ern").
Mea surements on the ce ll componentswere made photometrically using a wavelength near the absorption maximum. Although any simple arc can be used as alight source, a more versatile apparatus isa monochromator with a con stant emission source, using a photomultiplie r detector.
One result of these studies has been acorrelation of desoxypentose in the nu-
You can recei ve th e complete publicationfrom wh ich these articles w ere digested .
Write The Perkin·Elmer Corporat ion, Dept .A C , Main Avenue (Route 7), Norwalk , Conn.,for your copies of INSTRUMENTNEWS.
Featur ed in the Summer issue are:
ULTRAVIOLET MICROSPECTROSCOPYAnalYzing cell components
BAKER-SCHMIDT METEOR CAMERA
Tracks 40 times more meteors
INFRARED RAISES PENICILLIN PRODUCTION
How Product Cont rol Helps Merck
SPECIAL OPTICAL DESIGNS
Machine Tool Microscope
Model 12 Spectrometer at Merck & Co.
INFRARED INCREASESPENICILLIN G PRODUCTION
Th e accurate determination of the peniciIlin G (benzylpenicillin) content of acommercial fermentation broth has longbeen a difficult problem facing the penicil lin manufacturer. Drs. N. R. Trenner andR. Ch ase of Merck & Co ., Inc., Rahway,N. J. have a solution to this problem : theapplication of the isotope dilution pr inciple which is pr actic al, precise, reliable .
This method of assa y is che ap andpractical to run when carried out on atypical control basis. As with all properlycarried out isotope dilution methods, itsaccuracy (reliability) is equal to its precision which is, moreover, pr actic ally con stant over the whole range of assay value s.
Because of its fund amental characteristics, the isotope dilution method has beenused in connection with other difficult-t oassay chemicals such as benzene hexachloride and nicotinic acid. Its future extension to other such problems seemshighl y probable.
Merck estimates cost of a single analysis at $3.50 per assay, in onl y two hourstime. As a result of the pr ocedu re, produ ction has been ra ised at the ir penicillin produc ing plant s.
(A DVERTISEMEND
VO L U M E 23, NO.9, S E PTE M B E R I 95 I 17 A
E.MACHLETT fj SON
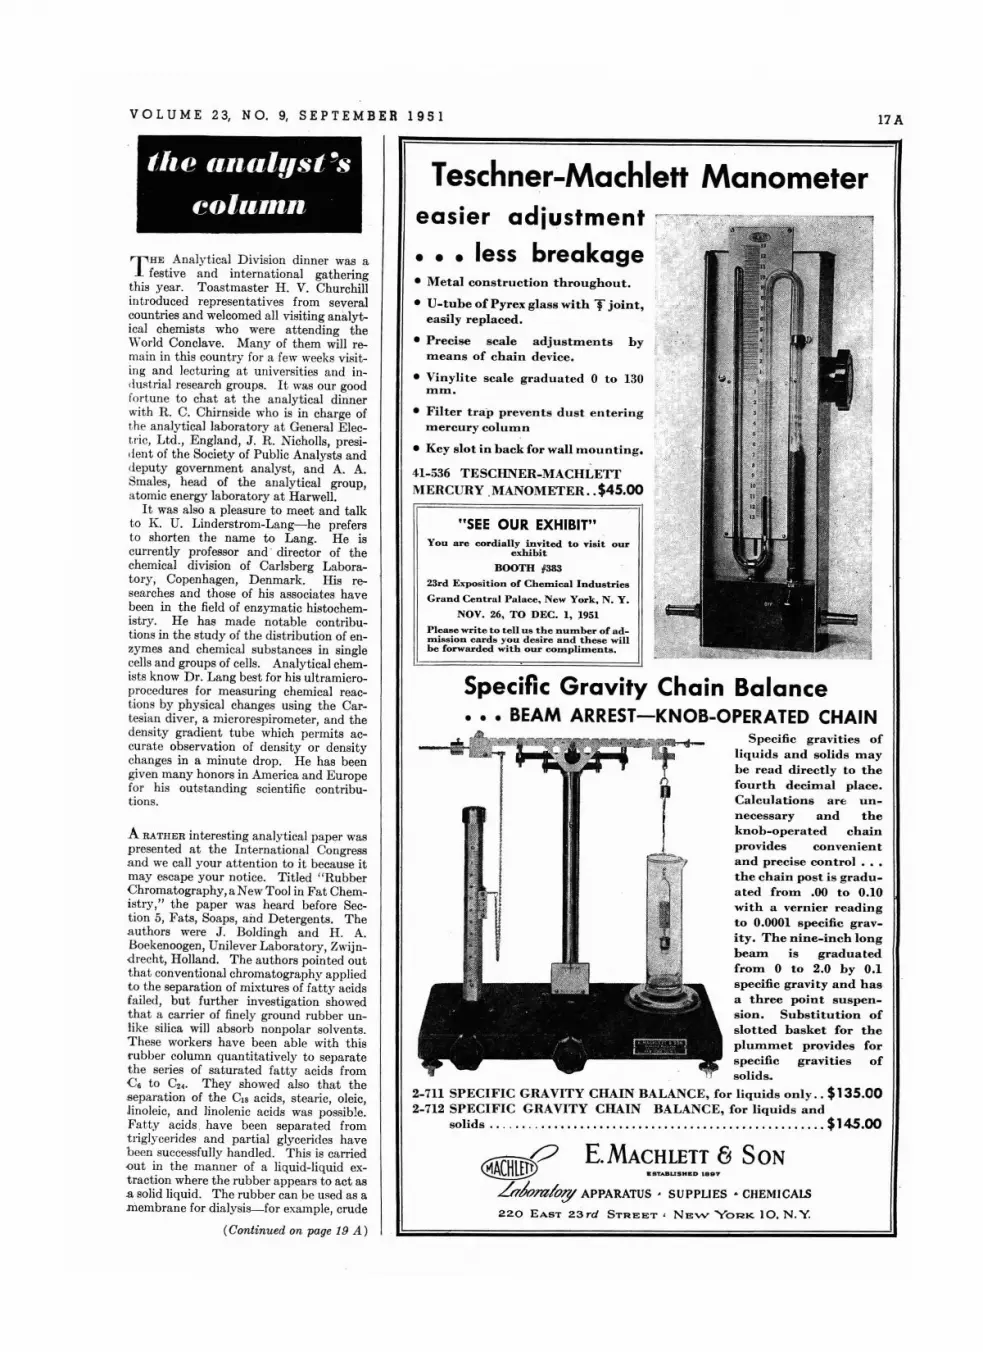
Teschner-Machlett Manometer
.8TABUSH&D 188T@CHl~LnJomlo(Y APPARATUS' SUPPLIES' CHEMICAlS
220 EAST 23 rd STREET ' N EVV YORK 10. N . Y.
"SEE OUR EXHIBIT"
easier adiustment
• • • less breakage
Specific Gravity Chain Balance•• • BEAM ARREST-KNOB-OPERATED CHAIN
Yo u a re cordially invited to visit ourex hibi t
BOOTH #383
23rd Expos it io n of Chem ical Industries
Grand Cen t ra l Palac e , Ne w York , N . Y.
NOV. 26, TO DEC. 1, 1951
Pl ease wr ite to tell u s t h e number of ad m iss ion caede yo u d esire an d these willbe forwarded with our com pli ments.
• Metal construction throughout.
• U-tube of Pyrex glass with T joint,easily replaced.
• P recise scale adjustmen t s b ymeans of chain d e vice.
• Vi n yli te sca le g raduated 0 to 130mm.
• Filter trap p revents dust e nte r ingmercury col u m n
• Key slo t in back for wall mount ing.
Speci fic g ravit ies ofliquids and solids mayb e read directly to thefo urth d ecimal place.Calculations are unnecessary and theknob-operated chainprovides convenientand precise control •••the ch a in post is gra d u ated from .00 to 0.10with a ve r n ier readingto 0.0001 specific gravity. The nine-inch longbeam is gr a d u a tedfrom 0 to 2.0 b y 0.1s peci fic gravity and h a sa three point suspen s ion. Substitution ofslo tted basket for theplummet provides forspeci fic gravitie s ofsoli ds.
2-711 SPECIFIC GRAVITY CHAIN BALANC E, fo r liquids o n ly . . $135.002-712 SP EC I F IC GRAVITY CHAIN BALANC E, for liquids and
solids . . . , .. , . . . . . . . . . . • • . . . . . . • . . . . . . . . . . . . . • . . . . . . . . . . . . $145.00
41-536 TESC HNER-MACHLETT
MERCUR Y .MANOMETE R ..$45.oo
'-r HE Analytical Division dinner was afestive and internationa l gather ing
th is yea r. T oastmaster H . V. Churchillintroduced representat ives from severalcountries and welcomed all visit ing analytical chemists who were attending theWorld Conclave . Many of them will remain in this country for a few weeks visiting and lectu ring ;t univ ersiti es and industrial research groups. It was our goodfor tune to chat at the analytical dinnerwith R. C. Chirns ide who is in charge ofthe ana lvtical lab oratory at General E lect.ric, Ltd., E ngland, J . R. Nicholls, president of th e Society of Publi c Analysts anddeputy government analyst, and A. A.Smales, head of the analytical group,atomic energy laboratory at Har well.
I t was also a pleasure to meet and ta lkto K. U. Lind erstrom-Lang-he prefersto shorten the name to Lang . He iscurrently professor and ' directo r of thechemical division of Carlsberg Laboratory, Copenhagen, Denmark. His researc hes and tho se of his associates havebeen in th e field of enzyma tic histo chemistry. He has made notab le contr ibutions in the st udy of the dist rib ution of enzymes and chemical substances in singlecells and groups of cells. Analytical chemists know Dr. Lang best for his ultramicroprocedures for measuring chemical reactions by physical changes using the Cartesian diver, a microrespirometer, and thedensity gradient tu be which permits accurate observation of density or densitychanges in a minute drop. He has beengiven many honors in America and Europefor his outstanding scientific contribut ions.
tl,@ a"alyst~s
eotumr
A RATHER interesting ana lyt ica l paper waspresented at the Internat ional Cong ressa nd we call your attention to it because itmay escape your not ice. Ti tled " RubberChromatograp hy, a New Tool in Fat Chemistry ," the paper was heard before Section 5, Fats, Soaps, and Detergents. Thea uthors were J . Boldingh and H . A.Boekenoogen, Unileve r Laboratory, Zwijndrecht, Holland. The authors pointed outt hat conventional chroma tograp hy appliedto the sepa ration of mixtures of fatty acidsfailed, but fur th er investigation showedthat a carrier of finely ground rubber unlike silica will absorb nonpolar solvents.T hese workers have been able with thisrubb er column quanti ta tiv ely to sepa ratet he series of saturated fatty acids fromC 6 to C2, . T hey showed also that theseparation of the CIS acids, stearic, oleic,linoleic, and linolenic acids was possible.Fat ty acids , have been sepa ra ted fromtriglyeerides and parti al glycer ides havebeen successfully han dled. This is carried{Jut in the manner of a liquid-liquid extraction where the ru bber appea rs to ac t as.a solid liqu id. The rubber can be used as am embrane for dialysis-for examp le, crude
(Continued on page 19 A)
18A ANALYTICAL CHEMISTRY
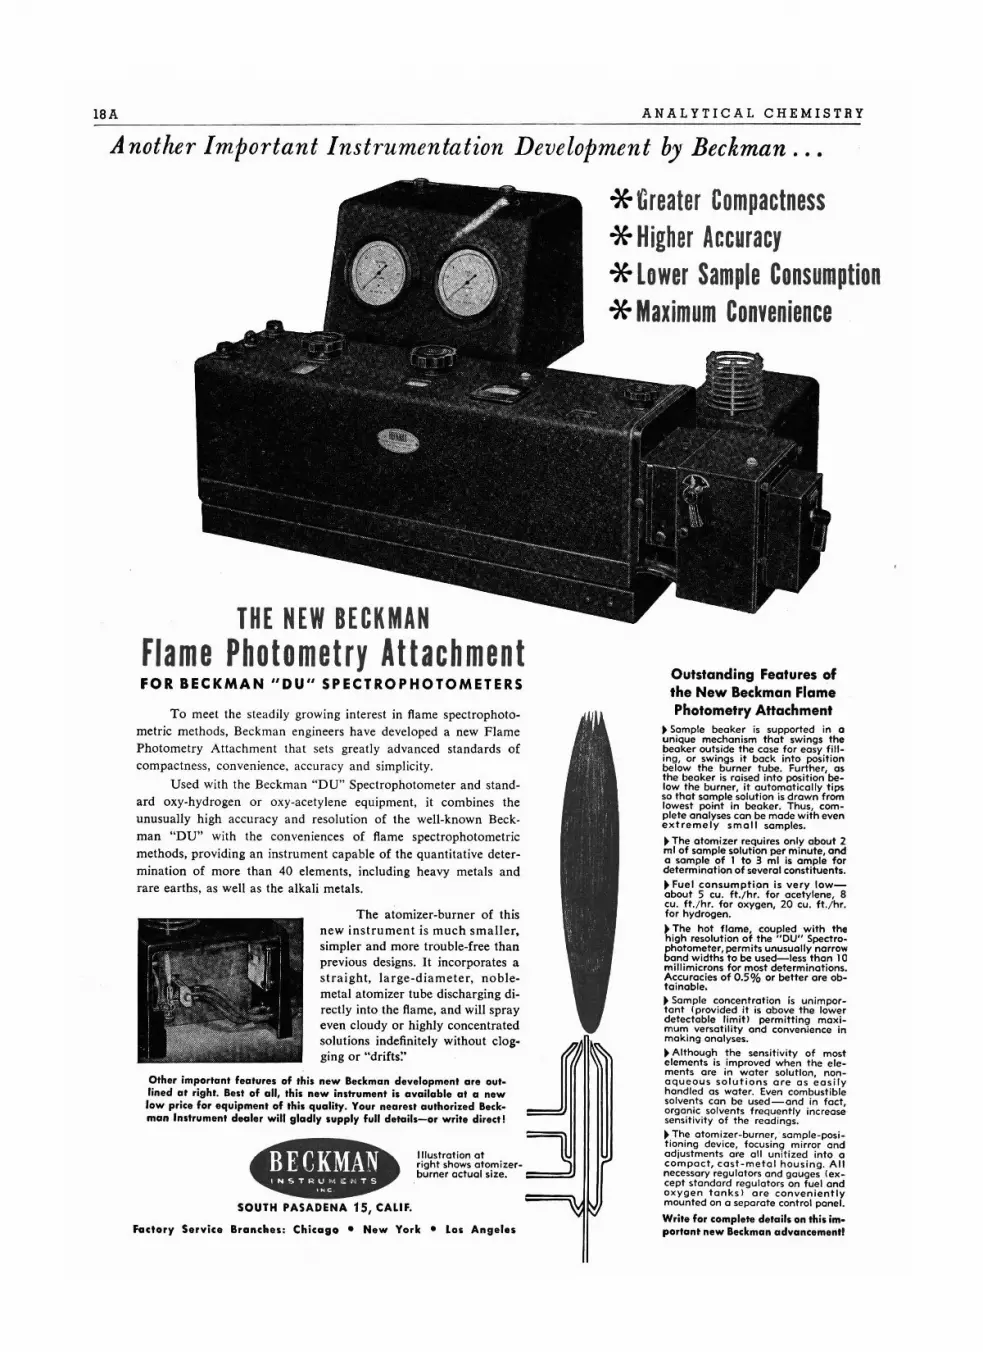
A nother Important Instrumentation Development by Beckman . . .
Outstanding Features ofthe New Beckman FlamePhotometry Attachment
• Sample beaker is supported in aunique mechanism that sw ings thebeaker outside the case for easy filling, or swings it bock into positionbelow the burner tube. Further, asthe beaker is raised into position below the burner, it automatically tipsso that sample solution is drown fromlowest point in beaker. Thus, complete analyses can be mode with evenextremely small samples.
• The atomizer requires only about 2ml of sample solution per minute, anda sample of 1 to 3 ml is ample fordetermination of several constituents.
• Fuel cansumpti.on is very lowabout 5 cu. ft./hr. for acetylene, 8cu. ft ./hr. for oxygen, 20 cu . ft ./hr.for hydrogen.
• The hot flame, coupled with thehigh resolution of the "DU" Spectrophotometer, permits unusually narrowbond widths to be used-less than '0millimicrons for most determinations.Accuracies of 0.5% or better are obtainable.• Sample concentration is unimportant (prov ided it is above the lowerdetectable limit) perm itting maximum versatil ity and convenience inmaking analyses.
• Although the sensitivity of mostelements is improved when the elements ore in water solution, nonaqueous solutions are as easilyhandled as water. Even combustiblesolvents can be used-and in fact,organic solvents frequently increasesensitivity of the readings.• The otomizer-bumer.:sample-position ing device, fo cusing mirror andadjustments are all unit ized into acompact. cost-metal hous ing. Allnecessary regulators and gouges (except standard regulators on fuel andoxygen tanks I are convenientlymounted on a separate control panel.
Write for complete details on this important new Beckman advancementl
*Greater Compactness*Higher Accuracy*Lower Sample Consumption*Maximum Convenience
Illustration atright shOWS atomizerburner actual size. ===~
THE NEW BECKMANFlame Photometry AttachmentFOR BECKMAN "DU" SPECTROPHOTOMETERS
To meet the steadily growing interest in flame spectrophotometric methods, Beckm an engineers have developed a new FlamePhotometry Att achment that sets greatly advanced standards ofcompactness, convenience, accuracy and simplicity.
Used with the Beckman "DU" Spectrophotometer and standard oxy-hyd rogen or oxy-acetylene equipment, it combines theunusual1y high accuracy and resolution of the well-known Beckman " DU" with the conveniences of flame spectrophotometricmethods, prov iding an instrument capable of the quantitative determination of more than 40 elements, including heavy metals andrare earths, as wel1 as the alkali metals.
The atomizer-burner of thisnew instrument is much smaller,simpler and more trouble-free thanprevious designs. It incorporates as t ra ight, large-diameter, noblemetal atomizer tube discharging directly into the flame, and wil1 sprayeven cloudy or highly concentratedsolutions indefinitely without clogging or "drifts:'
Other important features of this new Beckman development are outlined at right. Best of all. this new instrument is available at a newlow price for equipment of this quality. Your nearest authorized Beckman Instrument dealer will gladly supply full details-or write direct!
SOUTH PASADENA 15, CALIF.
Factory Service Branches: Chicago • New York • Los Angeles

VOL U M E 2 3, N O. 9, S E PTE M B E R 1 9 5 1
ANALYST'S COLUMN
oil will pass through, leaving behind phosph olipides, mu cilage, and polymers.
WE HAn; mentioned before in th iscolumn th e lack of informati on on the costof analysis of industri a l produ cts . Suchcosts are usually hidd en in produ ctioncha rges or general research budgets. Itwas extremely encouraging to listen tosome papers on this subject a t the ACSAnalytical Symposium on Economic Aspects of Chem ical Analysis in Manufactur ing. Chester M. Alter decr ied the lackof specific inform ation on a breakdown ofwhat ana lysis is costing industry. Whilemanagement is alert to the need forquality cont rol by analysis, it ra rely givescrit ical consideration to wheth er by resear ch in ana ly tical procedu res it mighthave more rapid and less costly methods.
C. J. van Nieuwenburg, D elft , Holland,pointed out that the use of micro andsemimicromethods in indust ry had beenst rikingly limited when compared toscientific research. The larger scient ificindustrial labora tory , of course, uses micromethod s but usually not for routine control. The speaker felt that sernirnieromethod s were easier to handle and gave almost th e same cost and space advantagesas microprocedures.
R. C. Chirns ide, mentioned earlier,pointed out in his paper on "T he Coordination of Analyti cal T echniques in Industrial R esear ch" that mod ern industry ismaking increasing demands on analyt icalcontrol an d that with ou t such control thenewer technologists would break downcomplete ly. He stressed the need for abroad concept of analytical resear ch embracing all approaches and tools, withou twhich the modern team in research anddevelopment may find itself expending useless effort because of inad equate analyticalda ta.
Clement Duval, The Sorbonn e, Pari s,spoke on "Automatic Gra vimetry." Theauthor has been particularly concernedwith developm ent of a recording th ermobalance which t races a curve showing as afunct ion of the temperature or time thegain or loss in weight of a material whileit is being heated (see page 1271 of thi sissue). Th e pyro lysis curves of a th ousandinorganic precipitates have been studied.By such studies it has been possible toesta blish more rapid met hods of analysisand even in some cases to make determinations on mixtur es without pr evioussepa ra tions.
This symposium focused th e attention ofana lytical chemists on the cost and th eefficiency of their labo ratories. Management should also make 'sure by periodicchecks an d breakdown of costs tha t thi s impor tant part of their operation is adequate ly and efficiently staffed and equipped.
A ssociate Editor
19 A
20A ANALYTICAL CHEMISTRY
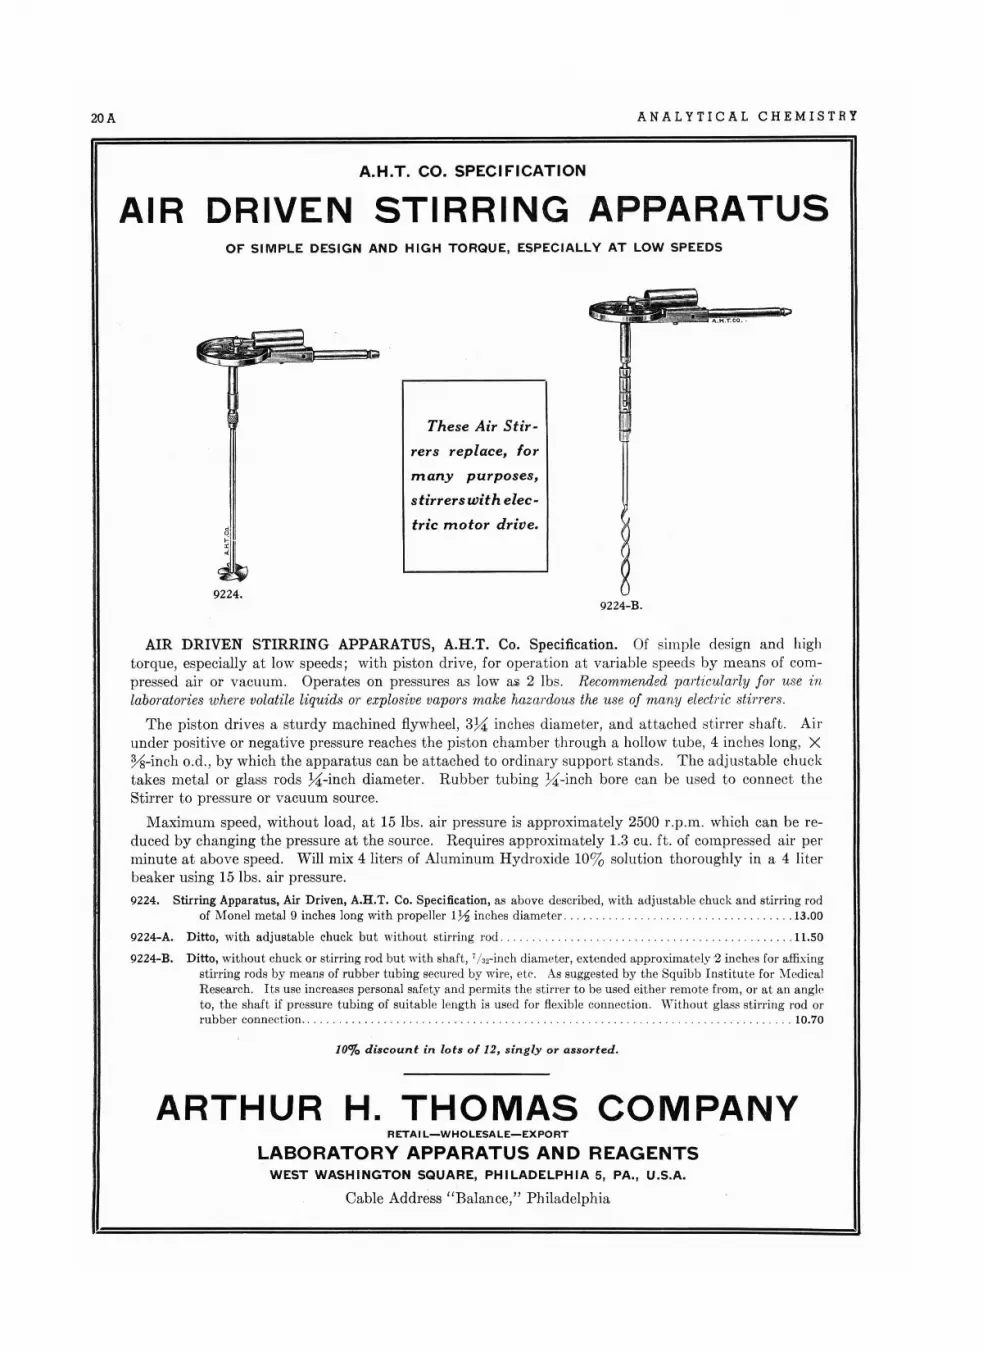
A.H.T. CO. SPECI FICATION
AIR DRIVEN STIRRING APPARATUSOF SIMPLE DESIGN AND HIGH TORQUE, ESPECIALLY AT LOW SPE EDS
A .H .T.CO • •
These Air Stir -
rers replace, for
many purposes,
stirrers with elec
tric motor drive.
9224.9224-B.
AIR DRIVEN STIRRING APPARATUS, A.H.T. Co. Specification. Of simple design and hightorque, especially at low speeds; with piston drive , for operation at variable speeds by means of compressed air or vacuum. Operates on pressures as low alii 2 lbs. Recommended porticularlu [or use inlaboratories where volatile liquids 01' explosive vapors make hazardoue the use of many electric stir rers.
Th e piston drives a sturdy machined flywheel, 3~ inches diame ter, and attached st irrer shaft . Airunder positive or negative pressure reaches the piston chamber through a hollow tube, 4 inches long, X%-inch o.d. , by which the apparatus can be attached to ordinary support stands. The adjustable chucktakes metal or glass rods ~-inch diam eter. Rubber tubing ~-inch bore can be used to connect theStirrer to pressure or vacuum sour ce.
Maximum speed, without load, at 15 lbs. air pressure is approximately 2500 r.p.m . which can be reduced by changing the pressure at the source. Requires approximately 1.3 cu. ft . of compressed air perminute at above speed . Will mix 4 liters of Aluminum Hydroxide 10% solution thoroughly in a 4 literbeaker using 15 lbs. air pressure .
9224. Stirring Apparatus, Air Driven, A.H.T. Co. Specification, as above described, with adjustable chuck and stirring rodof Monel metal 9 inches long with propeller 172 inches diameter 13.00
922 4-A. Ditto , with adjustable chuck but without stirr ing rod 11.50
9224-B. Ditto , without chu ck or stirring rod but with shaft , 7In-inch diameter, ext end ed approxima tely 2 inches for affixingstirring rods by means of rubber tubing secured by wire, etc . As suggest ed by the Squibb Institute for MedicalR esearch. Its usc increases persona l safety and permi ts the sti rrer to be used eit her remote from, or at an ang loto, th e shaft if pr essure tubing of suita ble length is used for flexible connection. Without glass stirr ing rod orrubber connect ion 10.70
10"/0 disco u n t in lots of 12, singly o r asso r t ed.
ARTHUR H. THOMAS COMPANYRETAI L-WHOLESALE-EXPORT
LABORATORY APPARATUS AND REAGENTSWEST WASHINGTON SQUARE, PHILADELPHIA 5, PA. , U.S.A.
Cab le Address " Balance," Phi lade lphia


Van Nieuwenburg Discusses· International Cooperationthan for spiritual ends like university teaching and the development of science, the more so if the commercial directors can bemade to believe that it saves more on wages, which indeed insome cases it does. In my opinion it is no use crying over it. Letus rather try to make a virtue of necessity by building up anorganized cordial cooperation between the big industrial researchinstitutes with their unlimited supply of means, and the university laboratories, these latter as a rule poorer but as oftenas.not with a better supply of brains. And this also requires international guidance. So I am glad that from the very beginningtaking initiative for international meetings has been set forth asone of the foremost tasks of the section committees.
But there is so much more to do. We are all badly in need oftrustworthy data of a physicochemical nature, redox potentials,complex constants, and so many more. One committee of oursection, under the presidency of your fellow countryman, Professor Kolthoff, hopes to see to that part of our task.
Last year, during the first international gathering of micro.analysts in Graz, Austria, the. birthplace of quantitative microanalysis,' a special Committee on Microchemistry within our section was created. \Ve cannot be content so long as we see thatthere are in use at least ten different ways of determining organicnitrogen, all according to the principle laid down by Dumas,One of them must be the best, or perhaps two or three of themaccording to circumstances. Let us hope that the committeeunder the leadership of Professor Zackerl from 'Vienna will beable to find them. "J.
A third Committee on New Reagents, under the presidency ofProfessor Gillis from Belgium, laid down its studies: in four reports, giving a comprehensive bibliographic survey as well as achoice of the most commendable reagents according to the bestopinion. A fifth report on colorimetric reagents is ready forprinting. And finally, the section is organizing a committee underProfessor Forbes, on terminology and nomenclature, both subjects which undeniably require international unification. Incidentally, it can be pointed out that industrial analysis in theproper sense does not come under our section but under the Sec-tion of Applied Chemistry. .
Besides all these concrete and fairly simple problems there areof course a great many more questions of general policy on whichsome central stimulation might be useful. Among these I wouldlike to point out to you two which have always been very near myheart. One is the neglect of the so-called rare, or less commonelements.
And the other point is our detestable habit of first of all pulverizing and irreparably messing up and destroying the structureof every sample which happens to fall into our hands. Isn't itabout time that at least in qualitative analysis, we paid moreattention to the possibility of showing the presence of the elements "in situ," or "in loco," in the original sample itself?
I should like to express the sincere hope that in the years to.eome the Section may enjoy the full interest of American analysts.Let us forget the past and build together for a better future alwayskeeping in mind Goethe's wise words: "Let us turn our faces towards the sun, so that the shadows will fall behind us."
MANY who attended the World Conclave of Chemistry inNew York City this month had the pleasure and privi
lege of meeting for the first time co11eagues from other lands.The we11-attended analytical sessions took on this international color to a marked degree 'because of many visitingspeakers. The high point for analytical chemistry was thedivision dinner. Hans Lieb presented the scroll and medalawarded to Professor Feigl in absentia at the internationalmicrochemical meeting held in Graz last year, for his outstanding contributions to spot test analysis. Earlier in the weekProfessor Me110n was announced as the 1952 Fisher medalist.Our congratulations to him in this well-deserved honor for hiscontributions to analytical chemistry over many years.
C. J. van Nieuwenburg gave the address at the analyticaldivision banquet and we quote parts of his speech, whichcontinued the international thinking of a11 those who werefortunate enough to attend these two memorable weeks ofscientific stimulation. .
I dare say that I should never have been invited to address youat this festive banquet if I hadn't happened to fill, for the timebeing, the post of president of the Analytical Section within theInternational Union of Pure and Applied Chemistry. So I take itfor granted that you expect me to give you my personal views onthe possibilities of international cooperation in the domain ofanalytical chemistry, as indeed I am very happy to do.
During the second world war and some years after, 'from 1938to 1947, the Union had an excellent U. S. president, ProfessorMarston T. Bogert. Under his guidance, and certainly no lessthanks to the initiative of his successor, Professor Kruyt, anumber of reforms of the Union have been considered, aimingboth at an increase of its efficiency and at assuring a closer cooperation with American chemists, which up to some years agoindeed left very much to be desired. It is here not the properplace to enter into details about this reservedness. I prefer tolook into the future. By far the most important reform is thecreation of the six sections, on Physical Chemistry, InorganicChemistry, Organic Chemistry, Biochemistry, Analytical Chernistry, and Applied Chemistry. From now on the activities of theUnion will he spread over these sections. The task of provisionally starting the Analytical Section was allotted to me, so that iswhy I felt it my very special duty to consider what is internationally desirable and possible in this domain.
Before all I want to emphasize that scientific cooperation,either national or international, must be completely voluntary.Any form of coercion is utterly unthinkable. Compulsory teamwork is extremely efficient for special purposes, and desirablein its right place, but not in the front line of scientific creation.
The-speaker dealt at some length with the changes whichhave produced the new broad concepts of analysis and referring to the manner of future developments, said:
Formerly the stimulus of essential analytical progress camefrom the universities and from these only. It still does, butmoney is more readily given for a well defined industrial purpose
1195
Principles of Precision ColorimetryAbsorption Law Deviations in Measurements of Relative Transmittance
C. F. HISKEY AND IRVING G. YOUNG'Polytechnic Institute of Brooklyn, Brooklyn, N. Y.
Then the slope of the curve of transmittance versus concentrationfor any given concentration would be
At any particular concentration e, where the absorbance is A"the absorptivity coefficient may be represented as
(3)
(2)
(1)
;'
I/
.'. ~AIIIIIII_______ -1III
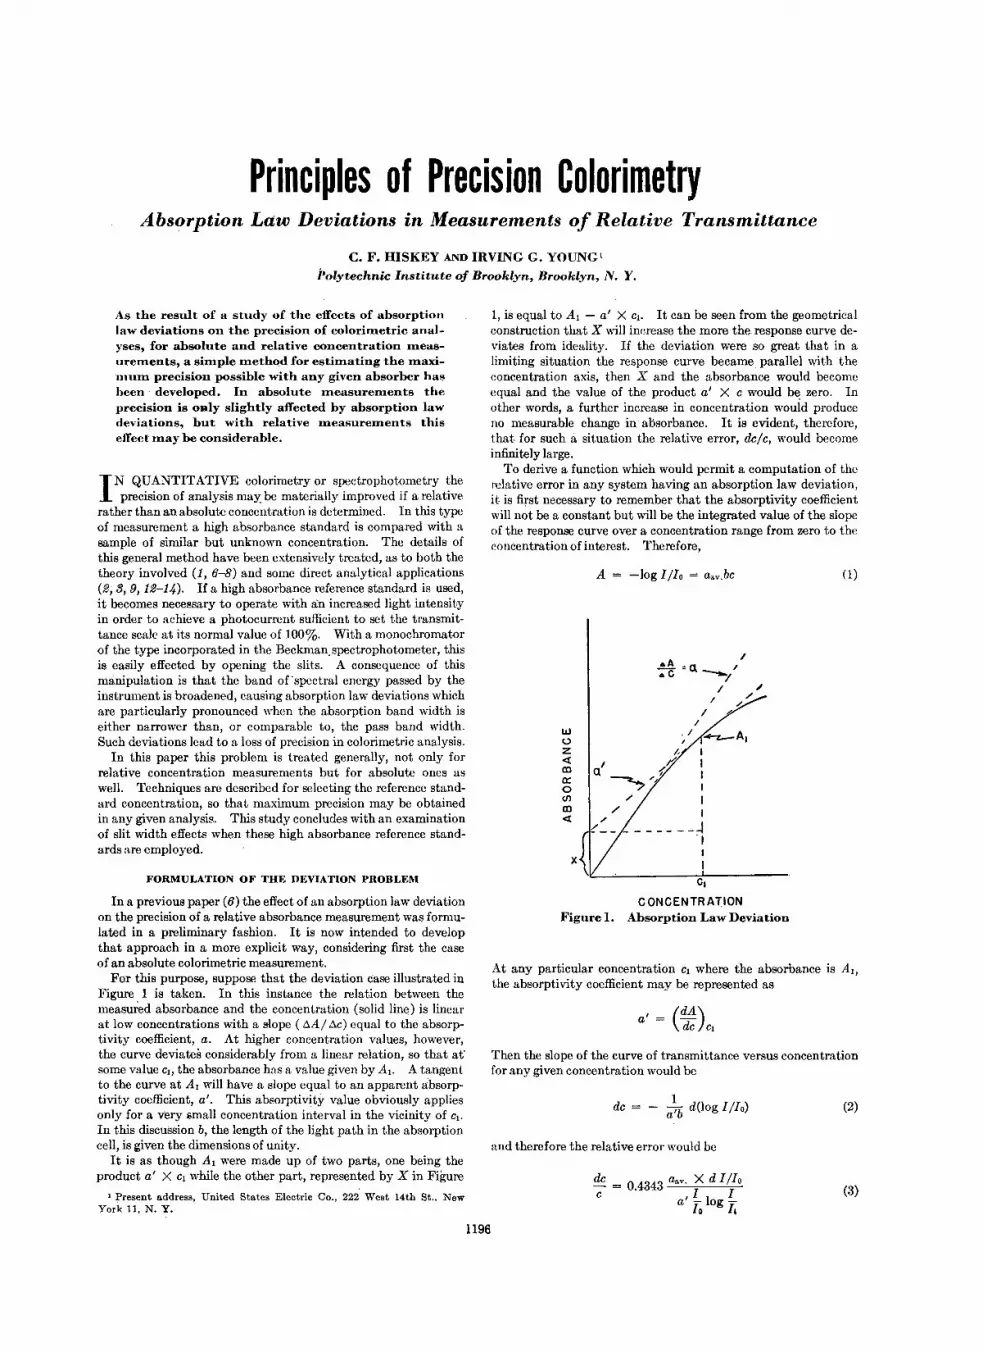
A = -log 1/10 = a.v.be
de = 0.4343 a.v. X d 1/10
e I I I Ia - og-10 II
1de = - a'b dOog 1/10)
x
woz<trn0:o(/l
m<t
c.CONCENTRATION
Figure 1. Absorption Law Deviation
and therefore the relative error would be
, (dA)a = de el
1, is equal to A, - a' X Cl. It can be seen from the geometricalconstruction that X will increase the more the response curve deviates from ideality. If the deviation were so great that in alimiting situation the response curve became parallel with theconcentration axis, then X and the absorbance would becomcequal and the value of the product a' X e would be zero. Inother words, a further increase in concentration would produceno measurable change in absorbance. It is evident, therefore,that for such a situation the relative error, de/e, would becomeinfinitely large.
To derive a function which would permit a computation of therelative error in any system having an absorption law deviation,it is first necessary to remember that the absorptivity coefficientwill not be a constant but will be the integrated value of the slopeof the response curve over a concentration range from zero to theconcentration of interest. Therefore,
1 Present address, United States Electric Cc., 222 West 14th St .. NewYork 11, N. Y.
As the result of a study of the effects of absorptionlaw deviations on the precision of colorhnetric analyses, for absolute and relative concentration measurements, a simple ruet.hod for estimating the maximum precision possible with any given absorber hasheen· developed. In absolute measurements theprecision is oRly slightly affected by absorption lawdeviations, but with relative measurements thiseffect may be considerable.
FORMULATION OF THE DEVIATION PROBLEM
In a previous paper (6) the effect of an absorption law deviationon the precision of a relative absorbance measurement was formulated in a preliminary fashion. It is now intended to developthat approach in a more explicit way, considering first the caseof an absolute colorimetric measurement.
For this purpose, suppose that the deviation case illustrated inFigure 1 is taken. In this instance the relation between themeasured absorbance and the concentration (solid line) is linearat low concentrations with a slope (IlA/ Ac) equal to the absorptivity coefficient, a. At higher concentration values, however,the curve deviates considerably from a linear relation, so that at"some value C" the absorbance has a value given by A,. A tangentto the curve at A, will have a slope equal to an apparent absorptivity coefficient, a'. This absorptivity value obviously appliesonly for a very small concentration interval in the vicinity of Ct.
In this discussion b, the length of the light path in the absorptioncell, is given the dimensions of unity.
It is as though A, were made up of two parts, one being theproduct a' X ci while the other part, represented by X in Figure
I N QUANTITATIVE colorimetry or spectrophotometry theprecision of analysis may' be materially improved if a relative
rather than an absolute concentration is determined. In this typeof measurement a high absorbance standard is compared with asample of similar but unknown concentration. The details ofthis general method have been extensively treated, as to both thetheory involved (1, 6-8) and some direct analytical applications(2,3,9,12-14). If a high absorbance reference standard is used,it becomes necessary to operate with an increased light intensityin order to achieve a photocurrent sufficient to set the transmittance scale at its normal value of 100%. With a monochromatorof the type incorporated in the Beckmanspectrophotometer, thisis easily effected by opening the slits. A consequence of thismanipulation is that the band of ·spectral energy passed by theinstrument is broadened, causing absorption law deviations whichare particularly pronounced when the absorption band width iseither narrower than, or comparable to, the pass band width.Such deviations lead to a loss of precision in colorimetric analysis.
In this paper this problem is treated generally, not only forrelative concentration measurements but for absolute ones aswell. Techniques are described for selecting the reference standard concentration, so that maximum precision may be obtainedin any given analysis. This study concludes with an examinationof slit width effects when these high absorbance reference standards are employed.
1196
VOL U M E 2 3, N O. 9, SE PTE M B E R 1 9 5 1 1197
If the standard and unknown have nearly equal concentrations,12111 will nearly equal unity, log Iz/II will be practically zero, andconsequently the value of the denominator will be about equal toAl - X = a' X CI. It will be a matter of concern to the analystto have this latter quantity maximal, for only then will the relative error be minimal. Recalling that a' diminishes as the concentration increases, it is at once evident that should this termfall at a faster rate than the rate of increase of the concentration,a' X C would decline with increasing concentration. This wouldmean that the relative error would increase with increasing concentration of.the reference standard rather than the opposite.
The problem for the analyst is to discover (a' X C)max. for anyparticular system, as this will allow the most precise analyses.
EXPERIMEN1:AL EVALUATION OF MAXIMUM PRECISION
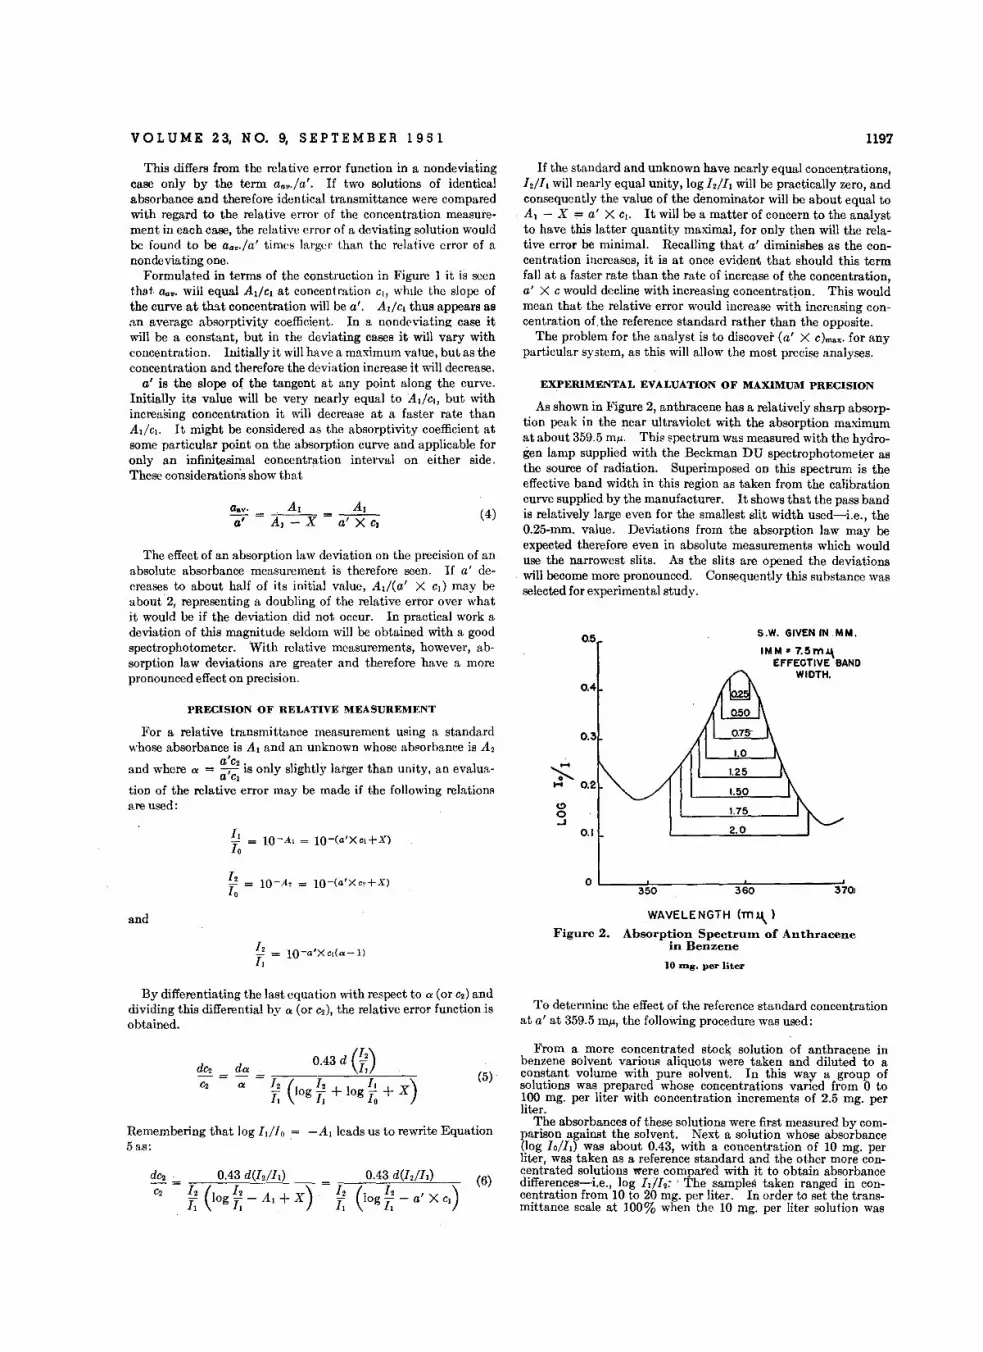
As shown in Figure 2, anthracene has a relatively sharp absorption peak in the near ultraviolet with the absorption maximumat about 359.5 mu. This spectrum was measured with the hydrogen lamp supplied with the Beckman DU spectrophotometer asthe source of radiation. Superimposed on this spectrum is theeffective band width in this region as taken from the calibrationcurve supplied by the manufacturer. It shows that the pass bandis relatively large even for the smallest slit width used-Le., the0.25-mm. value. Deviations from the absorption law may beexpected therefore even in absolute measurements which woulduse the narrowest slits. As the slits are opened the deviationswill become more pronounced. Consequently this substance wasselected for experimental study.
370)
S.W. GIVEN IN MM.
IMM.7.5rt'l.l.\EFFECTIVE BAND
WIDTH.
360
2.0
1.50
1.75
0.5
0.4
0.3
~.... 0.2
CI0..J
0.1
0350
(4)
The effect of an absorption law deviation on the precision of anabsolute absorbance measurement is therefore seen. If a' decreases to about half of its initial value, At/(a' X CI) may beabout 2, representing a doubling of the relative error over whatit would be if the deviation did not occur. In practical work adeviation of this magnitude seldom will be obtained with a goodspectrophotometer. With relative measurements, however, absorption law deviations are greater and therefore have a morepronounced effect on precision.
PRECISION OF RELATIVE MEASUREMENT
This differs from the relative error function in a nondeviatingcase only by the term aB•./a'. If two solutions of identicalabsorbance and therefore identical transmittance were comparedwith regard to the relative error of the concentration measurement in each case, the relative error of a deviating solution wouldbe found to be aB•./a' times larger than the relative error of anondeviating one.
Formulated in terms of the construction in Figure 1 it is seenthat aa•. will equal At/ci at concentration c., while the slope ofthe curve at that concentration will be a'. AdcI thus appears asan average absorptivity coefficient. In a nondcviating case itwill be a constant, but in the deviating cases it will vary withconcentration. Initially it will have a maximum value, but as theconcentration and therefore the deviation increase it will decrease.
a' is the slope of the tangent at any point along the curve.Initially its value will be very nearly equal to AdcI, but withincreasing concentration it will decrease at a faster rate thanAt/ci. It might be considered as the absorptivity coefficient atsome particular point on the absorption curve and applicable foronly an infinitesimal concentration interval on either side.These considerations show that
lO-A, = lO-(a'Xc.+X)
For a relative transmittance measurement using a standardwhose absorbance is Aland an unknown whose absorbance is A 2
and where 0/ = a;c2 is only slightly larger than unity, an evalua-a~ .
tion of the relative error may be made if the following relationsare used:
and
12
1;10-a'X c,(a-I)
WAVELENGTH (mJ..l.)Figure 2. Absorption Spectr-um of Anthracene
in Benzene
10 Ing. per liter
By differentiating the last equation with respect to 0/ (or C2) anddividing this differential by 0/ (or C2), the relative error function isobtained.
To determine the effect of the reference standard concentrationat a' at 359.5 mu, the following procedure was used:
-AI leads us to rewrite Equation
From a more concentrated stock solution of anthracene inbenzene solvent various aliquotswcre taken and diluted to aconstant volume with pure solvent. In this way a group ofsolutions was prepared whose concentrations varied from 0 to100 mg. per liter with concentration increments of 2.5 mg. perliter.
The absorbances of these solutions were first measured by comparison against the solvent. Next a solution whose absorbance(log 10/11) was about 0.43, with a concentration of 10 mg. perliter, was taken as a reference standard and the other more concentrated solutions were compared with it to obtain absorbancedifferences-Le., log IdI2~ , The samples taken ranged in concentration from 10 to 20 mg. per liter. In order to set the transmittance scale at 100% when the 10 mg. per liter solution was
(5)
(6)0.43 d(IdI,)
0.43 d (~)
~ (lOg ¥, + log fo + X)
0.43 d(IdII)
~ (log ~ - Al + X)
Remembering that log Idlo5as:

1198 ANALYTICAL CHEMISTRY
100
graph. In the third column the values of a' X c are given; theyrise to a maximum of 1.08, after which a further increase in concentration has little effect.
This indicates that a reference standard having a concentrationin the range of 30 to 40 mg. per liter will give maximum precision.Higher concentrations are to be avoided, as there would be furtherloss of resolution without any advantage. Indeed, errors due tooverlapping absorption bands might often be introduced. Undercertain circumstances it might even be advantageous to work witha standard whose concentration is only 20 mg. per liter, sincethere is only a small increase in the value of a' X c beyond thatpoint. For a colorimetric determination in which the unknown
and standard concentrations are equal, the relative error in the first four cases would be about1.0,0.56,0.47, and 0040times the value of A(IdI,),so that beyond the 20-mg. standard very littleprecision is gained for the resolution which is lost.
The considerations presented above indicate theprocedure to be followed by the analyst whenusing a monochromator instrument of this sortfor the determination of other substances.Operating with the instrument in its most sensitive setting-Le., with the smallest value ofA(IdI,) possible-the absorption spectrum of thesubstance under consideration should be measured. From a knowledge of the dispersion ofthe instrument in the wave-length region of theabsorption maximum it can - then be decided
-whether a pronounced deviation will occur whenthe slit aperture is given the largest possible valuefor the system under study. If it appears thatthe deviation may be serious, the maximumapparent absorbance should be evaluated.
This may be effected by preparing a series of solutions in whichthe concentrations vary according to the simple arithmetic series1, 2, 3, 4 ..... etc., choosing the first concentration so that itsabsorbance will be about 0043. In .this way it will be necessaryto make only about five solutions to test a range of standarddensities from 0 to 1.74. If pronounced deviations occur around0.43, it will be advisable to make a new set of standards whosedensities cover a smaller range. The proper standard may thenbe selected according to the technique described above.
In general, it is not necessary to go to densities above 2, as thegain in precision beyond that point is small. A precision in excess of 1 part per 1000 or 2000, which theoretically could be realized at densities of 004and 0.8 respectively, if A(IdI,) has a valueof 0.001, is not easy to achieve because of difficulties with theabsorption cell optics.
Reference to Table I shows that after the apparent absorbancereaches a maximum value, it does not stay fixed as the concentration is increased further, but instead declines perceptibly. Thisdecline is real and very definitely outside the limits of experimental uncertainty. The variation of a' X c with concentrationis a function of the shape of the spectral band and of the instrumental response in the wave-length region being used. It willvary considerably from case to case, but can easily be determinedby the technique outlined above.
Occasionally a situation arises, as in the case of rare earthspectra, where the peaks are so sharp that the apparent absorb
.ance declines as soon as the most dilute reference standard is substituted for the solvent. In such circumstances little can be doneto improve the precision, unless the absorption band coincideswith the wave length of some monochromatic source and thatsource can deliver sufficient flux for the purpose in hand. Thenby making a proper optical substitution of this source, the approach previously described may be applied. There is, of course,the further possibility of using a more sensitive detector than thatsupplied with the instrument. With such a detector it would bepossible to narrow the slits substantially and thus minimize the
0.440.780.931.081.000.900.980.960.99
a' Xc
6050
a'
0.0460.0440.0390.0310.0270.0200.0150.0140.0120.011
40302010
Table I. Computation of Best Concentration forReference Standard
Concn. of ReferenceStandard, Mg.jL.
o102030405060708090
c. =CONCENTRATION OF REFERENCE STANDARD! MG.lLITER )
Figure 3. Absorption Law Relations for Different Concentrationsof Anthracene in Benzene at 359.5 Dll'
used as reference standard, it was necessary to open the slits somewhat and therefore suffer a small loss of resolution.
The 20 mg. per liter sample was next chosen as the referencestandard and the range of 20 to 30 mg. per liter was studied in amanner similar in every respect to that applied to the precedingstandard. This process was continued until the last referencestandard had a concentration of 90 mg. per liter and was used overthe 90- to 100-mg. range.
The data obtained in this way are summarized in Figure 3where the absorbance differences are plotted as a function of theconcentration. As each reference standard was used for a concentration interval of 10 mg. per liter, there are ten curves plottedin this composite graph.
The data of Figure 3 show a number of items of interest. Inthe first place, all the curves are very nearly straight lines-or maybe represented as such to simplify the computations which follow. This permits an easy assessment of a' for each referencestandard. For each 10-mg. interval it is only necessary to takethe maximum absorptivity difference and divide it by the concentration difference to obtain the corresponding approximatevalue of a'.
b.I~ 0.4«mIt:
g 0.3m«
~ 0.2b.IoZb.I::i 0.1ILILQ
It can also be seen that profound changes of the apparentabsorptivity coefficient are occurring with increase in concentration. These changes are reflected by the change in the maximumvalue on the ordinate which is obtained for each 10 mg. of concentration difference. Even with the introduction of the veryfirst reference standard, the effect of opening the slits is perceptible for a spectrum such as this. Were there no alteration in thevalue of the absorptivity coefficient, the slopes of all these lineswould be identical and therefore they would all terminate withthe same ordinate value.
Taking these data it is now possible to compute a set of a' X cvalues for this system (Table I). .
The concentrations referred to in the first column are those ofthe reference standard. The values of a' are taken from the

VOL U M E 2 3, N O. 9, S E PTE M B E R 1 9 5 1
apparent deviation. Photomultiplier circuits capable of doingjust that are currently available.
1199
etc., have been obtained, a' may be computed approximatelyfrom any two successive sets of values for slits and concentrationsusing the derived relation. '
ALTERNATIVE METHOD OF SELECTING MAXIMUMABSORBANCE
, (t1A)a = t;C Cn + 1/2
r I S« + I-og--b t1c s; (9)
An alternative method for determining the maximum absorbance to be used in the reference standard is based upon measurements of the slit width apertures required for balancing standardsof various concentrations. The relation between the slit widthof the monochromator and the absorbance of the reference standard was treated in a previous paper (8). In the course of thatinvestigation a group of nondeviating absorbers was placed inthe absorption cell, the transmittances were determined, andthen the size of the slit opening required for balancing the spectrophotometer at 100% transmittance was determined. For the.. II (So)r. IIIdeal cases it was observed that To = S where To was the trans-
mittance of the sample, So was the slit width required to balancethe instrument at 100% when the absorption cell contained solvent only, 8 was the slit width value when the absorber wasplaced in the beam, and r was the instrumental term whose valuefor a properly aligned monochromator having equal entrant andexit slits would be 2.0. In practice r may have some other valuethan 2, but this does not affect the method described here.
Table II. Reference Standard Concentration CornputedfrOID Slit Width Data
Concn. of ReferenceStandard. Mg./L. S,Mm: a' a' X c
0 0.1180.046 0.23
10 0.2000.043 0.65
20 0.3280.037 0.93
30 0.5000.028 0.98
40 0.6830.023 1.04
50 0.8900.017 0.94
60 1.080
This method is somewhat simpler than that previously given,as fewer measurements are necessary. Some data taken on theanthracene spectrum with the Beckman DU spectrophotometerare presented in Table II along with the computations of a' anda' XC.
As the value of a' is computed from two successive slit values, itapproximates the slope of the response curve at the intermediateconcentration-i.e., 5, 15, 25, etc., mg. per liter. The values ofa' X C are also for standards of intermediate values. Comparison of these data with those of Table I shows that the twomethods give essentially the same values for the maximum effective absorbance which may be obtained.
The value of r in these computations was 2.0. Had it beensome other value, the a' X C values of Table II would have differed numerically by a constant fraction equal to the ratio of thetwo values of r. This would have no effect on the selection of theproper concentration of the reference standard.
SLIT PROBLEM IN RELATIVE ABSORBANCEMEASUREMENTS
The response curve, for relative absorbance measurements in II
spectrophotometer where balance is achieved by adjusting theslit width for each reference standard, differs from that obtainedin absolute measurements whenever an absorption law deviationoccurs. This is caused by the peculiar energy distribution acrossthe pass band interval which occurs in such cases. It may behelpful to the analyst, therefore, if this problem is examined insufficient detail to provide at least a qualitative picture of theproblem.
For a finite pass band covering the wave-length interval t1Athe absorbance as measured by a spectrophotometer is exactlygiven by the expression:
The absorptivitycoefficient may be expressed in terms of theseslit settings and for the nondeviating case becomes:
A 1>'0>(E)>. (M)>. (S)>. (t , )>. dA
Suppose that the group of reference standards referred toabove were placed one at a time in the light beam and the instrument was balanced at 100% transmittance. Because a deviationwill result, it follows that the value of the absorptivity coefficientcomputed by Equation 7 will not be constant but will show thedeviation characteristic of these relative measurements. Therelation shown in Equation 8 will be observed:
A r Sbe = be log So
(7)
(8)
where E, M, and S are, respectively, the intensity of the energyfrom the source, the transmittance of the monochromator, andthe sensitivity of the receptor for an infinitesimal wave-lengthinterval in the pass band. The corresponding transmittances forthe solution and solvent are given as tl and to. A similar expression may be written for an absorbance difference measurement,except that ~ and tl , respectively, would be substituted.
Now if in an actual measurement the wave-length interval t1},.could be reduced very nearly to zero, radiation would becomenearly monochromatic and the absorbance or absorbance difference thus determined would be a true one equal to -log ti/to or-log tdtl , respectively.
On the other hand, if the various terms in the integral could becorrectly evaluated, the measured absorbance might be suitablyseparated into a true value and a number of deviation terms.
The tangent to this relation will, of course, be a' and experimentally it may be approximated in the following manner.
After a group of reference standards of concentrations CI, C2,C3 ••• c", c" + I ••. etc., have been interposed in the light beam.and the corresponding slit settings, SI, 8 2, 8 3 ••• 8n, S« + I •••
Hardy and Young (5) recently have obtained a general solutionof this problem, permitting in some cases an easy experimentalmeasurement of the important deviation terms. Eberhardt (4)and others (11) have developed some empirical equations forcomputing absorbances as a function of slit widths when thesehave small values. .
1200 ANALYTICAL CHEMISTRY
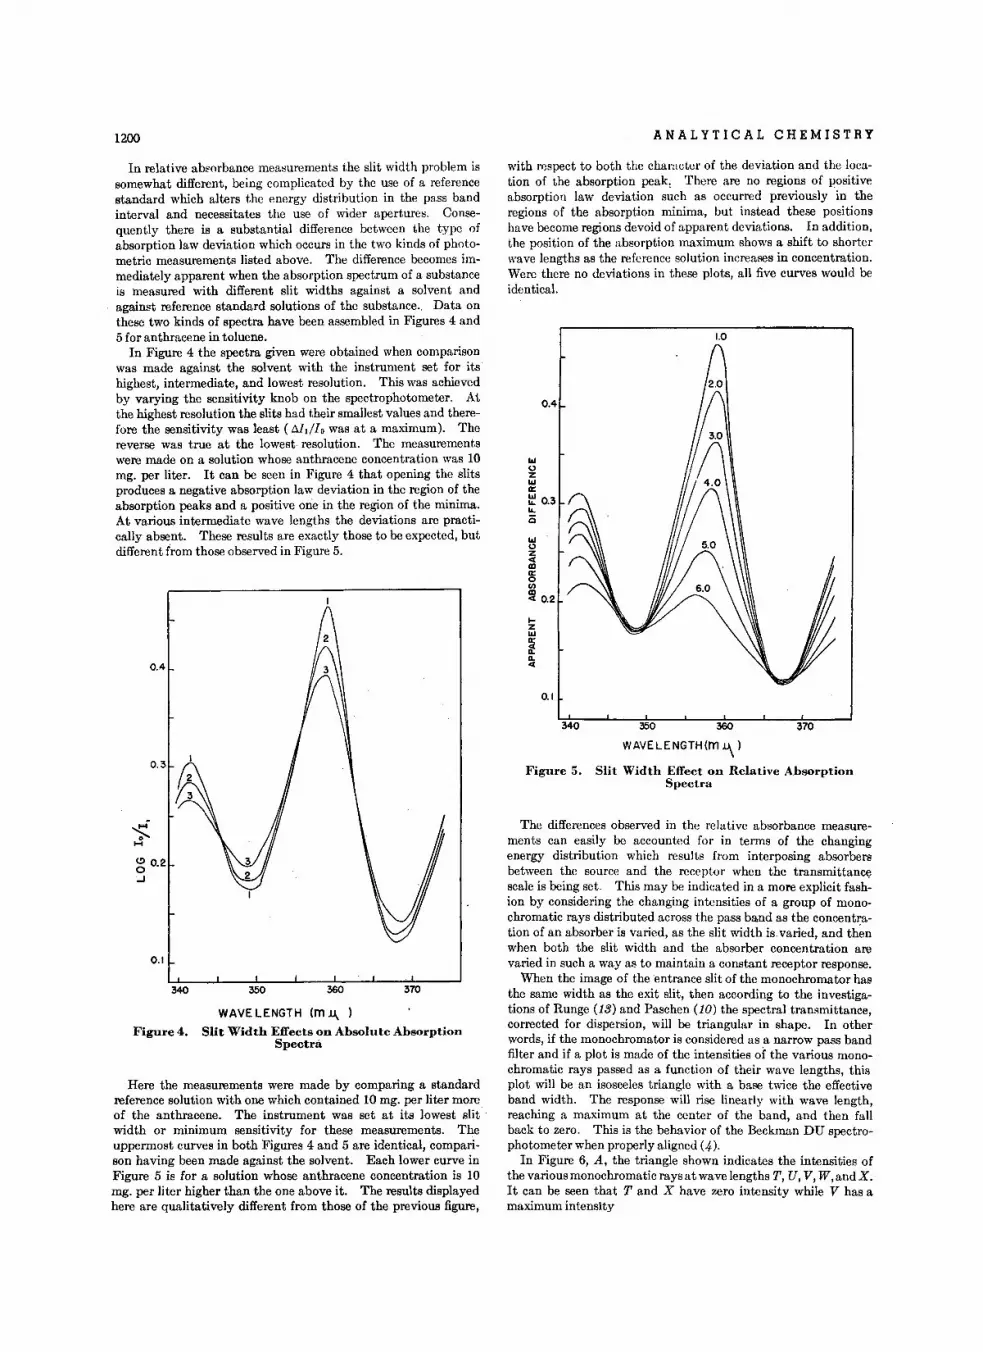
WAVELENGTH (rn u, )Figure 4. Slit Width Effects on Absolute Absorption
Spectra
Here the measurements were made by comparing a standardreference solution with one which contained 10 mg. per liter moreof the anthracene. The instrument was set at its lowest slit :width or minimum sensitivity for these measurements. Theuppermost curves in both Figures 4 and 5 are identical, comparison having been made against the solvent. Each lower curve inFigure 5 is for a solution whose anthracene concentration is 10mg. per liter higher than the one above it. The results displayedhere are qualitatively different from those of the previous figure,
370360350340
0.1
1.0
WAVELENGTH(m~ )
Figure 5. Slit Width Effect on Relative AbsorptionSpectra
with respect to both the character of the deviation and the location of the absorption peak, There are no regions of positiveabsorption law deviation such as occurred previously in theregions of the absorption minima, but instead these positionshave become regions devoid of apparent deviations. In addition,the position of the absorption maximum shows a shift to shorterwave lengths as the reference solution increases in concentration.Were there no deviations in these plots, all five curves would beidentical.
ILloZ<lCDIt:o(J)CD<l 0.2
0.4
IZILl
~Q.<l
ILloZILlIt:
~ 0.3II.
Q
The differences observed in the relative absorbance measurements can easily be accounted for in terms of the changingenergy distribution which results from interposing absorbersbetween the source and the receptor when the transmittancescale is being set. This may be indicated in a more explicit fash~ion by considering the changing intensities of a group of monochromatic rays distributed across the pass band as the concentration of an absorber is varied, as the slit width is varied, and th~nwhen both the slit width and the absorber concentration arevaried in such a way as to maintain a constant receptor response.
When the image of the entrance slit of the monochromator hasthe same width as the exit slit, then according to the investigations of Runge (13) and Paschen (10) the spectral transmittance,corrected for dispersion, will be triangular in shape. In otherwords, if the monochromator is considered as a narrow pass bandfilter and if a plot is made of the intensities of the various monochromatic rays passed as a function of their wave lengths, thisplot will be an isosceles triangle with a base twice the effectiveband width. The response will rise linearly with wave length,reaching a maximum at the center of the band, and then fallback to zero. This is the behavior of the Beckman DU spectrophotometer when properly aligned (4).
In Figure 6, A, the triangle shown indicates the intensities ofthe various monochromatic rays at wave lengths T, U, V, W, and X.It can be seen that T and X have zero intensity while V has amaximum intensity
370360350340
0.1
~o....g 0.2
oJ
0.4
In relative absorbance measurements the slit width problem issomewhat different, being complicated by the use of a referencestandard which alters the energy distribution in the pass bandinterval and necessitates the use of wider apertures. Consequently there is a substantial difference between the type ofabsorption law deviation which occurs in the two kinds of photometric measurements listed above. The difference becomes immediately apparent when the absorption spectrum of a substanceis measured with different slit widths against a solvent andagainst reference standard solutions of the substance. Data onthese two kinds of spectra have been assembled in Figures 4 and5 for anthracene in toluene.
In Figure 4 the spectra given were obtained when comparisonwas made against the solvent with the instrument set for itshighest, intermediate, and lowest resolution. This was achievedby varying the sensitivity knob on the spectrophotometer. Aithe highest resolution the slits had their smallest values and therefore the sensitivity was least (DJ,flo was at a maximum). Thereverse was true at the lowest. resolution. The measurementswere made on a solution whose anthracene concentration was 10mg. per liter. It can be seen in Figure 4 that opening the slitsproduces a negative absorption law deviation in the region of theabsorption peaks and a positive one in the region of the minima.At various intermediate wave lengths the deviations are practically absent. These results are exactly those to be expected, butdifferent from those observed in Figure 5.

VOL U M E 2 3, N O. 9, S E PTE M B E R 1 95 1 12:Jl
Suppose that an absorber showing no deviation is placed infront of this beam. Then each of the wave lengths being passedwill be reduced a proportionate amount and, as shown in the diagram, each will be reduced to '25% of its initial value. Theintensity distribution across the wave-length interval whichemerges from the absorber and passes to the photocell is thatshown by the smaller triangle, The cross-hatched area represents the light that has been absorbed.
If the slit width is doubled, this same type of intensity distribution persists, except that the response at the peak has beendoubled and the base of the triangle is now twice as wide. Thetotal energy passed by the slits will, of course, be four times greaterthan in the previous case. (If the instrument is properly aligned,the total energy changes as the second power of the slit width.)
Thus, changing the slit setting not only varies the band width butalters the relative intensity relations among the rays passed insuch a way as to increase those at the edge of the band relativeto those in the center. This fact must be recalled when the effects of varying slit and concentration are considered simultaneously.
These new relations are diagrammed in Figure 6, B, where it isnow seen that the intensity at wave length T is just one halfthat of wave length V, which still is the peak intensity. Thus relative to V, T has grown considerably as a result of doubling the slitwidth. The cross-hatched area still represents that fraction ofthe new pass band which has been absorbed by the ideal referencestandard, while the area enclosed by the smaller triangle represents the intensity distribution of the light which has passedthrough this absorbing solution. The area of this small triangleis obviously equal to the area of the larger triangle in Figure 6, A.This will be true if the photoelectric response is constant acrossthe wave-length interval under consideration. Such an assumption is often justified by experimental data at a good many wavelength positions and is used here to simplify the discussion. Nowit will be useful to consider the energy relations across the passband when an absorber is used which shows apparent deviations.
For this purpose it may be assumed that the center of the passband coincides with the absorption peak. On either side of that
wave length the absorptivity coefficients decrease. This willmean that as the concentration of the absorber is increased, therelative intensity distribution in the pass band will change. Thecenter of the band will be most strongly absorbed and thereforeat any absorber concentration will be reduced proportionatelymore than the outer regions. Should the absorption band be arelatively sharp one as with the rare earth spectra, it would bepossible for the center of the band to be completely absorbedwith only the band edges being transmitted.
As the central ray diminishes the main energy, absorptionoccurs at wave lengths where the absorptivity coefficient is less
and therefore a deviation becomes app arent. Suchrelations as these have been diagrammed in Figure 6,e, which illustrates the differences between this caseand the unknown deviating case.
When the slit is opened to compensate for theenergy lost by absorption in the central region, theeffect of a changed energy distribution becomes muchmore pronounced, because the main source of radiantenergy effective in rebalancing the transmittance scalecomes from those portions of the pass band which havethe smallest absorptivity coefficients. Proportionately,therefore, these wave lengths are enriched in the passband used for measuring the absorbance difference.This situation is shown in Figure 6, D, where it can beseen that the most intense rays occur at wave lengthsT and X. The peculiar results of Figure 5 can beeasily associated with these changes of energy distribution across the slit and it is this aspect which makesthis type of apparent deviation different from that ofabsolute absorptiometry.
LITERATURE CITED
(1) Allen, E., and Hammaker, E. M., ANAL. CHEM., 22, 370 (1950).(2.) Bastian, R., ius; 21, 974 (1949).(3) Bastian, R., Weberling, R., and Palilla, F., ius; 22, 160 (1950).(4) Eberhardt, W. H., J. Optical Soc. Am., 40, 172 (1950).(5) Hardy, A. C., and Young, F. M., ius; 39, 265 (1949).(6) Hiskey, C. F., ANAL. CHEM., 21, 1440 (1949).(7) Hiskey, C. F., Trans. N. Y. Acad. Sci., 11, 223 (1949).(8) Hiskey, C. F., Rabinowitz, J., and Young, I. G., ANAL. CHEM.,
22, 1464 (1950).(9) Lykken, L., and Rae, J., Ibid., 21, 787 (1949).
(10) Paschen, F., Wied. Ann., 60, 712 (1897).(11) Philpotts, A. R., Thain, Wm., and Smith, P. G., ANAL. CHEM.,
23,268 (1951).(12) Robinson, D. Z., Ibid., 23, 273 (1951).(13) Runge, C., Z. Math., 42, 205 (1897).(14) Young, I. G., and Hiskey, C. F., ANAL. CHEM., 23, 506 (1951).
ACKNOWLEDGMENT
The authors acknowledge the very considerable assistance given to this study by Willard P. Tyler andDonald W. Beesing, B. F. Goodrich Research Center,Brecksville, Ohio. They supplied the authors with a
voluminous body of. data on the anthracene system and thusmade this study comparatively easy to effect. In addition, thecritical assistance of R. A. Harrington is gratefully acknowledged.
RECEIVED March 22, 1951. Presented in part before the Second Meetingin-Miniature of the Metropolitan-Long Island Seetion of the AMERICANCHEMICAL SOCIETY, Brooklyn, N. Y., March 1951. The nomenclature andmethod of approach used in this article are in conformity with those given ina previous paper (6). Reading of the above artiele will facilitate the understanding of many points which are treated only briefly in this paper.
T U V W x71.-
<'£0.)
RSTUVWXYZ
1\Energy Relations across a Slit
71.Figure 6.
RSTUVWXYZ
r--'-Y-YYVV\/V\AAAlL,lUa_lo-~~--.----r--T-""t-
e.)
'~[~~[-~AT U v W X
1\ -

Role of Heterogeneous Equilibria in Analytical ChemistryPHILIP J. ELVING
The Pennsylvania State College, State College, Pa,
THE purpose of the present paper is to evaluate the roleplayed by heterogeneous equilibria as reflected in their utili
zation in effecting separation and other desired ends in analyticalchemistry. The importance of separation is evident in the factthat if it were not for the problem of interference, measurementin analytical chemistry would be a relatively simple matter.Analytical methods could be devised and checked on almost amoment's notice. Much of the contemporary development inanalytical chemistry has been along the lines of securing morespecific means of measurement in order as far as possible to avoidseparation in preparing the sample for measurement. Thus, weare now able by means of infrared absorption spectrophotometry,aided by iterative approximation calculators, to analyze with asuitable degree of accuracy an eight-component C, hydrocarbonsample. However, if a better order of accuracy is wanted, thesample must be separated into fractions and each fraction examined separately. Moreover, the original C, sample must havebeen isolated previous to measurement, usually by fractional distillation of the original mixture.
To obtain the proper perspective on the place of heterogeneousequilibria in analytical chemistry, it is first necessary to considerthe essential operations in any analytical process. The basicoperations in an analytical method can be conceived as consistingof the following four essential stages of procedure (11): (1)sampling-i.e., the obtaining of a sample representative of themass of material concerning which information is desired; (2)conversion of the desired constituent present in the sample intoa measurable state; (3) measurement of the desired constituent;and (4) calculation of the experimental data and interpretationin terms of the information desired.
In discussing the function of a typical technique of separationinvolving heterogeneous equilibria, Schubert (31) pointed outthat the chief service of ion exchange technique to analyticalchemistry is to provide a simple, rapid, and effective tool forseparating, concentrating, and isolating substances so that adirect gravimetric, titrimetric, or radiometric operation will complete the analysis.
PREPARATION FOR MEASUREMENT
In the present discussion, attention is focused on the secondstep of the analytical process, the conversion of the desired constituent to a measurable state. In many or most analyticalprocesses this stage, involving the preparation of the sample formeasurement, is the most time-consuming and involves thegreatest amount of chemistry and of physics.
After a suitable sample has been secured, subsequent operationsare usually concerned with the preparation of the sample formeasurement. In essence, this process represents for the analytical chemist an attempt to separate the measurable properties ofthe desired constituent from those of the other constituentspresent, and, in general, involves segregation of the desired constituent with or without actual disengagement or isolation. Suchoperation can be based only on the distinguishing properties,chemical or physical, of the substances concerned. If actualisolation of a portion of the sample containing the desired constituent is necessary, methods of physical segregation or separation must be used. Thus there will be two general types ofprocesses involved, one of which will be based on chemical reactivity of the substances present and will involve immobilizationor sequestration of the interfering materials by alteration ofchemical reactivity through control of the chemical environment.The second general approach to the problem will involve the
actual physical differentiation of phases, which is obviously asituation involving heterogeneous equilibria.
The major problem of any analytical method is then thepreparation of a fraction of the sample or the sample itself insuch a state that the desired constituent can be measured freeof interference or with suitable compensation for interference.The segregation or isolation of a fraction of the original samplefor measurement does not necessarily imply that the fractioncontains only the desired constituent or some derivative of it;the requirement is rather that the fraction does not contain anyuncorrectable source of interference with the subsequent measurement. When phases are separated, the desired constituent,depending on the particular situation, may be in any phase.
The extensive development of analytical techniques based onheterogeneous equilibria in the past decade or two has been largelythe result of the need for the more exacting analysis of complexmixtures and therefore for better methods of separation. It isinteresting that the greatest development in separation techniqueshas been from the rather dissimilar fields of petroleum, isotopepreparation, and biochemistry.
Separation processes involving heterogeneous equilibria are ofimportance not only to analytical chemistry but to chemicalengineering. There are significant examples of analytical separations based on chemical engineering processes--e.g., countercurrent extraction-and, conversely, of production processesbased on analytical techniques. Synthetic organic chemistry isto a great extent dependent upon the ability of an investigator toseparate the mixtures resulting from his syntheses. Further-
The iInportance of heterogeneous equilibria inanalytical chemistry is considered with particularattention to the problem of separation-i.e., theisolation of the desired constituent in a state andform in which it can be measured free of interference. The process of separation is usually the mostdifficult in an analytical method. Aside from thepossible immobilization of interfering substancesby chemical treatment, the types of separation possible are those based on the phase rule. In general,the chemist utilizes a mechanical separation ofphases, such as filtration, which is usually precededby phase formation or phase competition. Theformer involves such processes as crystallization,volatilization, and condensation; the latter includesphase-equilibration processes involving partitionand distribution or the transfer of a solute from onephase to another-e.g., extraction. The efficiencyof a separation process can be increased by repetitionin a stagewise or continuous fashion; the partsplayed by fractionation and countercurrent modesof operation are indicated. In addition to separation operations preliminary to measurement, heterogeneous equilibria are utilized analytically in ascertaining purity and homogeneity, in identificationand characterization, in the separation of traceamounts by coprecipitation, in preparing primary
.standards, in consolute methods of analysis, and inst.udyfngcornplex compounds.
1202
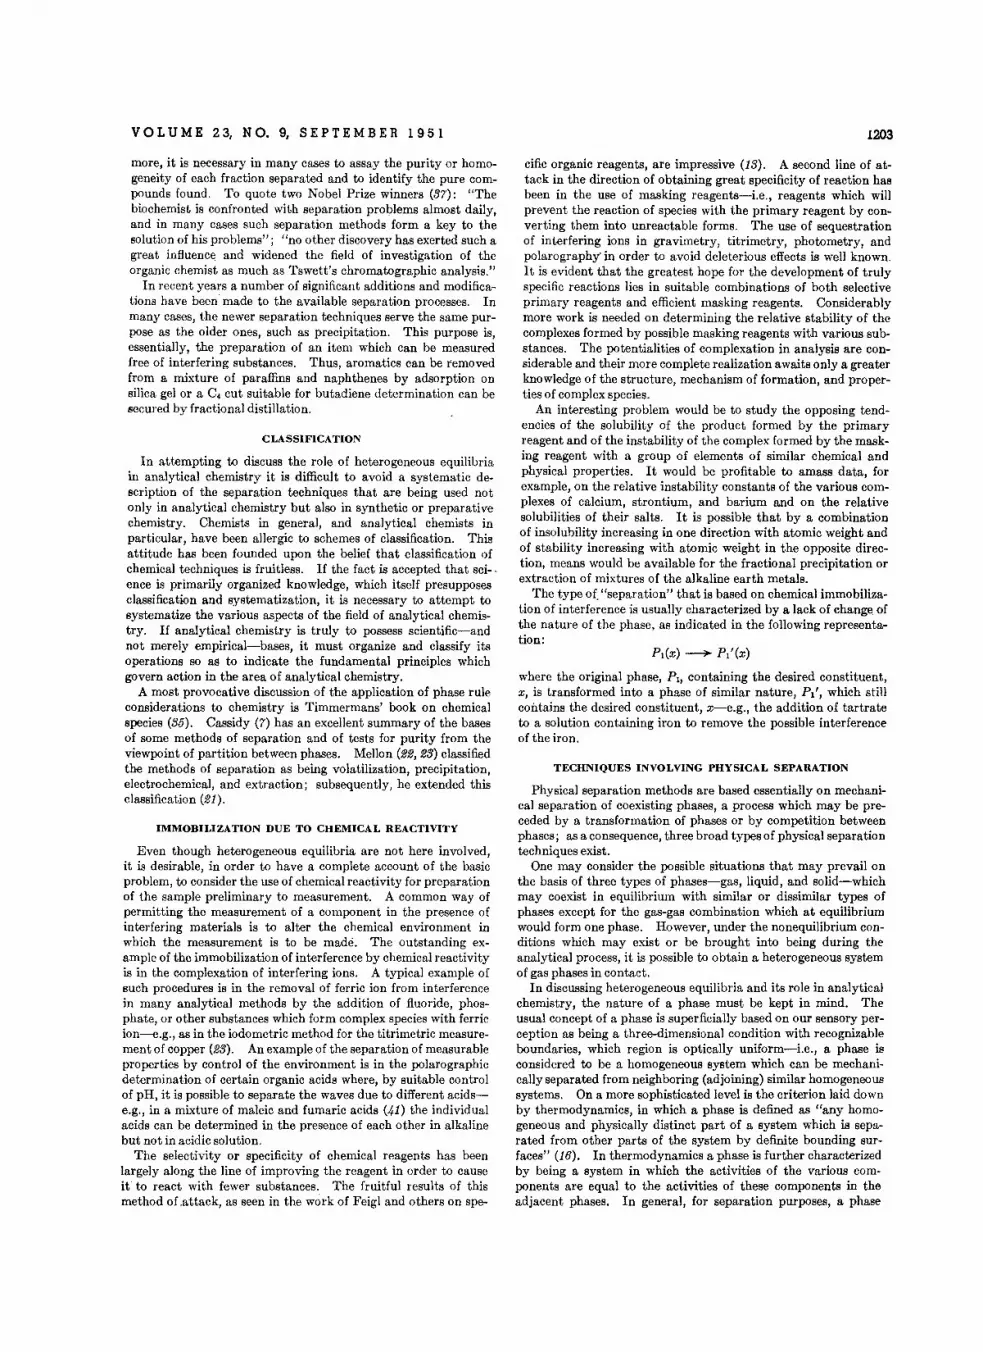
VOL U M E 2 3, N O. 9, S E PTE M B E R 1 9 5 1
more, it is necessary in many cases to assay the purity or homogeneity of each fraction separated and to identify the pure compounds found. To quote two Nobel Prize winners (37): "Thebiochemist is confronted with separation problems almost daily,and in many cases such separation methods form a key to thesolution of his problems"; "no other discovery has exerted such agreat influence and widened the field of investigation of theorganic chemist as much as Tswett's chromatographic analysis."
In recent years a number of significant additions and modifications have been made to the available separation processes. Inmany cases, the newer separation techniques serve the same purpose as the older ones, such as precipitation. This purpose is,essentially, the preparation of an item which can be measuredfree of interfering substances. Thus, aromatics can be removedfrom a mixture of paraffins and naphthenes by adsorption onsilica gel or a C4 cut suitable for butadiene determination can besecured by fractional distillation.
CLASSIFICATION
In attempting to discuss the role of heterogeneous equilibriain analytical chemistry it is difficult to avoid a systematic description of the separation techniques that are being used notonly in analytical chemistry but also in synthetic or preparativechemistry. Chemists in general, and analytical chemists inparticular, have been allergic to schemes of classification. Thisattitude has been founded upon the belief that classification ofchemical techniques is fruitless. If the fact is accepted that sci- .ence is primarily organized knowledge, which itself presupposesclassification and systematization, it is necessary to attempt tosystematize the various aspects of the field of analytical chemistry. If analytical chemistry is truly to possess scientific-andnot merely empirical-bases, it must organize and classify itsoperations so as to indicate the fundamental principles whichgovern action in the area of analytical chemistry.
A most provocative discussion of the application of phase ruleconsiderations to chemistry is Timmermans' book on chemicalspecies (35). Cassidy (7) has an excellent summary of the basesof some methods of separation and of tests for purity from theviewpoint of partition between phases. Mellon (22, 23) classifiedthe methods of separation as being volatilization, precipitation,electrochemical, and extraction; subsequently, he extended thisclassification (21).
IMMOBILIZATION DUE TO CHEMICAL REACTIVITY
Even though heterogeneous equilibria are not here involved,it is desirable, in order to have a complete account of the basicproblem, to consider the use of chemical reactivity for preparationof the sample preliminary to measurement. A common way ofpermitting the measurement of a component in the presence ofinterfering materials is to alter the chemical environment inwhich the measurement is to be made. The outstanding example of the immobilization of interference by chemical reactivityis in the complexation of interfering ions. A typical example ofsuch procedures is in the removal of ferric ion from interferencein many analytical methods by the addition of fluoride, phosphate, or other substances which form complex species with ferricion-e.g., as in the iodometric method for the titrimetric measurement of copper (23). An example of the separation of measurableproperties by control of the environment is in the polarographicdetermination of certain organic acids where, by suitable controlof pH, it is possible to separate the waves due to different acidse.g., in a mixture of maleic and fumaric acids (41) the individualacids can be determined in the presence of each other in alkalinebut not in acidic solution.
The selectivity or specificity of chemical reagents has beenlargely along the line of improving the reagent in order to causeit to react with fewer substances. The fruitful results of thismethod of .attack, as seen in the work of Feigl and others on spe-
1203
cific organic reagents, are impressive (13). A second line of attack in the direction of obtaining great specificity of reaction hasbeen in the use of masking reagents-Le., reagents which willprevent the reaction of species with the primary reagent by converting them into unreactable forms. The use of sequestrationof interfering ions in gravimetry, titrimetry, photometry, andpolarography' in order to avoid deleterious effects is well known.It is evident that the greatest hope for the development of trulyspecific reactions lies in suitable combinations of both selectiveprimary reagents and efficient masking reagents. Considerablymore work is needed on determining the relative stability of thecomplexes formed by possible masking reagents with various substances. The potentialities of complexation in analysis are considerable and their more complete realization awaits only a greaterknowledge of the structure, mechanism of formation, and properties of complex species.
An interesting problem would be to study the opposing tendencies of the solubility of the product formed by the primaryreagent and of the instability of the complex formed by the masking reagent with a group of elements of similar chemical andphysical properties. It would be profitable to amass data, forexample, on the relative instability constants of the various complexes of calcium, strontium, and barium and on the relativesolubilities of their salts. It is possible that by a combinationof insolubility increasing in one direction with atomic weight andof stability increasing with atomic weight in the opposite direction, means would be available for the fractional precipitation orextraction of mixtures of the alkaline earth metals.
The type of."separation" that is based on chemical immobilization of interference is usually characterized by a lack of change ofthe nature of the phase, as indicated in the following representation:
where the original phase, PI, containing the desired constituent,x, is transformed into a phase of similar nature, PI', which stillcontains the desired constituent, x-e.g., the addition of tartrateto a solution containing iron to remove the possible interferenceof the iron.
TECHNIQUES INVOLVING PHYSICAL SEPARATION
Physical separation methods are based essentially on mechanical separation of coexisting phases, a process which may be preceded by a transformation of phases or by competition betweenphases; as a consequence, three broad types of physical separationtechniques exist.
One may consider the possible situations that may prevail onthe basis of three types of phases-gas, liquid, and solid-whichmay coexist in equilibrium with similar or dissimilar types ofphases except for the gas-gas combination which at equilibriumwould form one phase. However, under the nonequilibrium conditions which may exist or be brought into being during theanalytical process, it is possible to obtain a heterogeneous systemof gas phases in contact.
In discussing heterogeneous equilibria and its role in analyticalchemistry, the nature of a phase must be kept in mind. Theusual concept of a phase is superficially based on our sensory perception as being a three-dimensional condition with recognizableboundaries, which region is optically uniform-Le., a phase isconsidered to be a homogeneous system which can be mechanically separated from neighboring (adjoining) similar homogeneoussystems. On a more sophisticated level is the criterion laid downby thermodynamics, in which a phase is defined as "any homogeneous and physically distinct part of a system which is separated from other parts of the system by definite bounding surfaces" (16). In thermodynamics a phase is further characterizedby being a system in which the activities of the various components are equal to the activities of these components in theadjacent phases. In general, for separation purposes, a phase

1204 ANALYTICAL CHEMISTRY
Table II. Separation Processes Based on Phase For-rrra t iora
Example
Removal of entrained gases
Separation of uranium isotopesRemoval of higher boiling componentsRemoval of higher boiling componentsRemoval of lower melting componentsDetermination of moistureSeparation of waterPrecipitation of BaSO.Removal of dissolved componentsRemoval of naphthalenePurification by fractional melting
Phases Typical SeparationOriginal Final Technique
G GIG CentrifugationG GIL CondensationG GIS CondensationG LIS CondensationL L/G VaporizationL L/L CoolingL LIS CrystallizationL GIS FreezingS SIG SublimationS S/L FusionS SIS DecompositionS GIL Fusion
SEPARATION BASED ON PHASE FORMATION
Isolation of the desired constituent in a procedure of this typeis based on the transformation of the original phase into a mixture of two phases, one of which is the only phase to contain thedesired constituent or contains the desired constituent in a concentration greater than in the original phase. Schematically,this type of separation may be characterized by the equations
form. A suggestive means of separation is the use by Barrer (.~)
of zeolites as molecular sieves in the separation of various typesof inorganic and organic molecules. This represents an interesting example of the conversion of one gas phase into two differentones of lesser complexity.
The methods of mechanical separation can be divided into twotypes, based on whether or not there is present an externallyapplied gradient as in thermal diffusion and in ultracentrifugation.In many of the techniques of mechanical separation advantage ~taken of a differential environment--e.g., the use of a liquid ofintermediate specific gravity to separate two solid substances.
. Another example of the latter type of process is in sedimentation,where the medium has an effective flotation power close to thatof some of the phases present and considerably different fromthat of other phases present.
Flotation, as used for a mechanical separation, applies essentially to the utilization of a liquid of density close to or intermediateto those of the phases to be separated.
In the other two types of physical separation, the principlesinvolved are those of meclianical separation preceded either byphase transformation or by phase competition.
where x denotes the desired constituent, present in phase PI, ina process by which a mixture of phases is separated by a suitabletechnique into less heterogeneous groups. A familiar example isthat in which PI, a solid phase (precipitate) containing the desired constituent, is separated by filtration from the solution withwhich it was in contact. This type of separation is a simple andfundamental one in chemical operations and includes such familiar operations as filtration, diffusion (both thermal and gravitational), sedimentation, and magnetic and hand "picking."
may be considered as being a homogeneous region in three dimensions of uniform distribution or concentration gradient.
In usual practice the thermodynamic definition of a phasemay be insufficient, since certain external factors may disturbthe situation pictured as prevailing in an ideal thermodynamicphase. For example, air is clearly recognized as being one phaseif one excepts the suspended smog, fog, and dirt ;: however, thechemical composition of air is not uniform but is a function ofdistance above the earth's surface, Furthermore, the Maxwelldistribution law, when applied to the velocity of molecules, indicates a possible breakdown for the homogeneity of a gaseous system if the development of analysis on an ultramicro scale continues.
An important analytical situation in which a heterogeneousgaseous mixture exists is flue or stack gas. Because of the natureof the combustion process, the construction of the furnace andstack, and the temperature gradients that exist in the averagesmoke stack, the flue gas from the usual combustion processesinvolving coal or oil is rather heterogeneous in nature. A considerable amount of ingenuity has been spent in devising methodsfor obtaining a representative sample of such a heterogeneousmixture. Obviously, such a sample as the stack gas is not inthermodynamic equilibrium; hence, it is possible to have a gaseous mixture with different concentrations in different parts of thematerial.
MECHANICAL SEPARATION OF PHASES
In any heterogeneous mixture of phases it is possible by suitablemechanical manipulation to separate the mixture into more homogeneous phases. Schematically, the isolation of a phase containing. the desired constituent in a measurable form may be represented as follows:
Table I. Processes Involving Mechanical ~eparation ofPhases
The types of mechanical separations involving only two-phasemixtures are summarized in Table I together with examples ofthe various techniques. There are many other known approachesfor the mechanical separation of heterogeneous mixtures, involving mechanical, thermal, electrical, electrostatic, and centrifugation techniques, as well as such techniques as dialysis forcolloidal systems and electrophoresis. One of the most famousexamples of the mechanical type of separation is the well-knownisolation of the optically active forms of tartaric acid by Pasteur,involving the manual sorting out of particles of similar crystal
OriginalMixture
of Phases
(GIG)GIL
GISL/LLIS
SIS
TypicalSeparationTechnique
Thermal diffusionFiltration
ImpingerDecantationFiltration
Flotation
Example
Separation of isotopesRemoval of entrained spray from a
gasRemoval of dust from airSeparation of immiscible liquidsRemoval of precipitate from
mother liquorDensity gradient method of sepa
rating solid mixtures
PI(x) ---+ P 2(x), P a
P2(x), P3 ---+ P2(X) + P 3
where the essential operation involves the transformation or production of a new phase-e-i.e., the emergence of a phase from a persisting or existing phase. This process of phase transformationor formation is then followed by the appropriate mechanicalseparation of the phases formed in order to obtain the suitablyenriched portion containing the desired constituent. This typeof separation is exemplified by such well-known processes as precipitation and crystallization, eloctrodeposition, and volatilization and condensation.
Various types of separations based on this principle are outlinedin Table II. It would probably be appropriate to include underseparation based on biological action, an example of which wouldbe the removal of an undesired component through consumptionby bacterial action.
Another example of this type of separation which should serveas a prototype for further study is that described by Willard andFowler (.~4) for the quantitative separation of anhydrous mixturesof metal sulfates by thermal decomposition. Under proper conditions only one or a restricted group of the sulfates can be com-
VOL U M E 23, NO.9, S E PTE M B E R 1951
pletely converted into insoluble basic sulfate or oxide, thus permitting a ready separation from the unchanged sulfate by dissolution of the latter in water.
Precipitation. Precipitation is one of the oldest and most frequently used separation techniques in analytical chemistry.Because of the stress placed on it in elementary courses and itshistorical position, it has almost come to symbolize what somecall "old-fashioned" analysis. Yct, there is currently a need forimproved precipitation techniques, since precipitation can be oneof the most efficient and rapid means of separation. An interesting example of development in this area is the technique of precipitation in homogeneous solution which was largely pioneeredby Willard (43). The principle of precipitation in a homogeneous medium is that of generation of the precipitating reagent insitu. This is usually accomplished by means of a hydrolytic reaction which produces the desired reagent by the hydrolysis of anoninterfering substance-e.g., the sulfate ion required for theprecipitation of barium ion as barium sulfate can be supplied bythe hydrolysis of dimethyl sulfate (12). Because such a processessentially involves the molecular addition of the reagent uniformly throughout the reaction medium without the introductionof a second phase as in the conventional method of adding thereagent solution to the reaction solution, a considerably purerprecipitate is obtained. In addition, owing to the slow rate ofprecipitation, the particles obtained are considerably larger andconsequently more readily filtered than those obtained in theconventional method of precipitation.
In the usual procedure for precipitation, the precipitant solution, which is usually concentrated in the reactive species, isadded dropwise to the sample solution. Accordingly, at the pointwhere the drop of reagent enters the solution there is momentarilypresent, even with the most efficient stirring, a relatively largeexcess of the reactive ion which may result in the precipitation ofsubstances present in the sample which would normally be solublein the mixture of the sample and reagent solutions. This phenomenon of local excess is the cause of considerable entrainmentcontamination as exemplified in coprecipitation phenomena. Inthe ordinary procedure for precipitating barium ion by the addition of sulfuric acid, even a few milligrams of calcium will resultin the contamination of the barium sulfate precipitate by coprecipitated calcium sulfate. However, in the precipitation ofbarium sulfate through the generation of sulfate ion by hydrolysisof dimethyl sulfate, barium can be precipitated free of contamination in the presence of as much as 500 mg. of calcium.
pH has long been used to control selective precipitation of hydroxides and basic salts. More work should probably be doneon fractional precipitation of other salts. An interesting andpossibly highly useful technique based on stepwise precipitationhas been described under the name of riptographic analysis (39).The separations potentially available through hydrolytic precipitation have been summarized in a masterful study by Gilchrist (14), in which the possible analytical separation of someforty chemical elements through controlled hydrolytic precipita-.tion is discussed.
Another recently developed precipitation method is based uponthe demonstration that urea possesses the rather unique propertyof forming solid complex compounds with straight-chain organiccompounds; these solid urea adducts can be used to separatestraight-chain compounds from their isomeric branched-chaincompounds. The use of urea extraction seems of great promisein the analysis of hydrocarbon mixtures containing normalalkanes (45).
The importance of precipitation as a separation operation isamply illustrated by the success achieved in classical chemicalanalysis by the systematic procedure for the analysis of a silicateor limestone-type rock. The efficiency of separation by any technique has rarely been as high as is achieved in the scheme of rockanalysis set forth by Washington (42) or Hillebrand and Lundell(19).
1205
Electrcdeposition. Electrodeposition as a separation technique has been known for a long time, but its use had almostreached a standstill several decades ago because of the limitationsin separation possible when using the familiar largely nonselectiveconstant current method of operation. The development of themercury cathode helped to increase the usefulness of the technique in isolating impurities. However, new life has been givento this type of separation by the development within the pastdecade of graded controlled cathode potential deposition whichpermits separations to be made that were formerly unobtainable.In a narrower field, the development of internal electrolysis hasalso increased the use of electrodeposition as a means of separation.
Mass Spectrometer. The case of the mass spectrometer isunique from the viewpoint of its purpose in analytical chemistry.Although developed primarily as an analytical tool, it was untilrather recently applied only for its original purpose of determiningisotopic ratios of elements. With the demand for the rapidanalysis of complex and difficultly separable hydrocarbon mixtures in the synthetic rubber and high octane gasoline fields, themass spectrometer was developed into an instrument for organicanalysis. The mass spectrometer is primarily a mealj1s of separation, as can be seen, for example, in its use in the preparation ofpure isotopes where there is separation without measurement.In the mass spectrometer the homogeneous sample existing in thegaseous state is ionized and converted into a still homogeneousstream of gaseous ions:
This gas stream is then passed through a magnetic field where thehomogeneous stream of gaseous ions is separated into a series ofadjacent gaseous phases which differ from each other by theirratio of mass to charge and which can be isolated by placing suitable collection chambers at the locus of each more or less integralmass to charge value:
SEPARATION BASED ON PHASE COMPETITION
The final and numerically the largest group of methods involving actual physical transfer includes those based on a transferbetween phases. In a process of this type, which may be represented as
a phase, PI, containing the desired constituent, x, is brought intocontact with a second phase, P2, in which the desired constituentis more "soluble" than in phase PI. As a result of the contact ofthese two phases, competition occurs between the two phases forthe desired constituent; the latter is transferred to a greater orless extent to the second phase; the final operation involvesmechanical separation of the phases. By contacting successivelyfresh portions of phase P 2 with portions of PI which have beendepleted of the desired constituent, phase PI is eventually totallydepleted of the desired constituent.
The transfer of x from one phase to another may be purelyphysical in nature or may be due to chemical reaction with thenew phase, P2• Processes based on phase competition include allof the so-called distribution and partition processes; this type ofprocess ultimately involves equilibration between phases and theequilibrium distribution of the desired constituent between the

1206 ANALYTICAL CHEMISTRY
Table III. Separation Processes Based on TransferBetween Phases
This type of separation by fractional distillation is well knownfor its versatility and efficiency, and, in large part because of thedemands of the petroleum industry, has become a powerfulanalytical tool, both for the separation of fractions for measurement by other analytical techniques and for analysis per se. Ithas been discussed in detail by Rose (27). The operation of fractional distillation was the first example of an analytical separationprocess to be instrumented for fully automatic operation. Reference is, of course, made to the well-known Podbielniak apparatusfor low temperature distillation. Greater emphasis is needed inthe area of fractional distillation on the more extensive investigation of the inorganic applicability of the technique. The Use ofthe Scherrer method (30) for separating arsenic, antimony, andtin by distillation from hydrohalic acid solution is standard innonferrous metal alloy analysis. The separations involved hereare probably azeotropic in nature, constant boiling mixtures beingformed between the metal halide or the polyhalometal acid, andthe halogen acid. Another example is the separation of germanium by distillation as the tetrachloride. It would be worthwhile further to investigate the use of the volatility of metalliccompounds in the analysis of inorganic materials. The use ofhalogen, carbonyl, and organic j3-carbonyl compounds offersintriguing possibilities in separating the metallic transitionelements.
Fractional crystallization with or without the aid of a solventhas long been advantageously used for separation. The most
two phases. In Table III are listed various types of partitionprocesses as well as other types of processes which involve thetransfer of the desired constituent from one phase to another.
Fractionation in Separation. In considering separations basedon phase formation and phase competition it is important to recall that the principle of fractionation can be applied to rendersuch techniques increasingly efficient by a stepwise or continuousrepetition of the process through the countercurrent flowofphases.Such an arrangement takes advantage of the completeness oftransfer possible when concentrations are arranged in suitablegradation. A countercurrent fractionation process involves twophases moving in opposite directions and having similar concentration gradients in reference to the constituent being transferredbetween the two phases.
One method of obtaining added efficiency of separation bymeans of countercurrent contact is by the use of reflux, in whichgeneralized operation, part of the product is returned to the system for further transfer of material out of the returned phase. Afamiliar example of the use of the reflux principle is in rectificationor fractional distillation, in which there is an alternation of thecomplementary processes of vaporization and condensation. Theascending v,:apor (gaseous phase) is transformed by a process ofheat exchange into a phase (gaseous) which is enriched in themore volatile desired components and a condensed phase (liquid)which is richer in the undesired higher boiling components. Thecomplementary process occurs via the same process of heat exchange for the descending reflux stream of liquid.
Table IV. Classification of Separation Processes(Benedict, 5)
Type of Potentially PartiallyProcess Reversible Reversible Irreversible
Mass diffusion.Electrolysis
Thermaldiffusion
Countercurrentgas centrifuge
Gaseousdiffusion
Absorption
Solvent extractionin packed column
Azeotropicdistillation
Extractiondistillation
Chemicalexchange
Solvent extractionin separate units
Distillation
Reversibleabsorption
Column (Countercurrentgas centrifuge)
notorious of such processes was the tedious separation of the rareearths by fractional crystallization of their salts. The morerecently developed technique of ion exchange has now made fractional crystallization largely obsolete for separation of rare earthelements.
Multistage separation processes as applied to present status andprobable future usefulness in engineering have been provocativelydiscussed by Benedict (5). All separation processes are considered to be based on the development of a concentration difference between an enriched stream and a depleted stream, andthe multiplication of this process by countercurrent flow of thetwo streams. In stage processes the streams are mixed andseparated repeatedly on individual stages, while in differential orcolumn processes the streams remain in continuous. contact andexchange material gradually. Benedict classifies separationprocesses (Table IV) on the basis of the degree-of reversibility ofnetwork required in the process or the extent to which the network approaches the thermodynamically required minimum toeffect separation. Potentially reversible processes are those inwhich the network required can be reduced to that required bvthermodynamics for the separation.
In the continuous or countercurrent embodiments of partitionprocesses,. the partition is usually between a fluid phase such as agas or liquid and a fixed phase which is usually a solidi the latterfixed phase is in many cases actually an interfacial region or phasewhich is more or less firmly held on the solid phase.
Graphical Records of Fractionation Separation. As a generalprinciple, it is not advisable to use as a qualitative measure ofidentity or of homogeneity in fractionation processes the propertyon which the separation is based-for example, boiling pointvolume curves in fractional distillation are much less informativethan are refractive index-volume curves for the same fractions.The property utilized in separation changes constantly in a singledirection, as it has to in order to furnish a modus operandi for theneeded separation. As a consequence of this unidirectionalchange, the identity of relatively minor fractions is often lost inthe overwhelming influence of major fractions on the property.On the other hand, a property which may increase or decrease asthe separation proceeds will usually permit the detection of aminute amount of material. The small amount of carbon dioxideindicated in Figure 1 would not be revealed by a temperaturevolume plot, as it would be lost in the change between the largeflats due to methane and ethane; on the other hand, the measurement of thermal conductivity clearly reveals its presence.
Techniques and Processes. During recent years there havebeen originated and developed intermediate separation techniqueswhich combine two or more individual types of heterogeneousequilibria to effect more efficient separation. Such hybrids in-
Separate Multistagestage compression
distillation
Example
Orsat gas analysisTurner-Burrell apparatusDrying in an air streamOrganic separationsChromatographyDrying in an air streamSoxhlet processCarrier action
TypicalSeparationTechnique
AbsorptionAdsorptionEvaporationExtractionAdsorptionEvaporationDissolutionSolid solution
Phases in ContactOriginal Added
G GG LG SL GL LL SS GS LS S

VOL U M E 23, N O. 9, SE PTE M B E R 1 95 1
elude the use of vapor-liquid extraction; this particular techniquewas largely developed during the first half of the past decade inconnection with difficult hydrocarbon separation problems andhas been largely confined to plant production. Partition chromatography is another hybrid technique of great utility.
1207
Extraction. Liquid-liquid extraction has long been practicedin the separation of organic compounds on both a laboratory andon a plant scale, and for both analytical and synthetic purposes.The use of liquid-liquid extraction in separating inorganic constituents has long been known but has been much less extensively
I I I' I C I" _CO2 J J N'C4 "'o 5 12
'~0'C4 "'0 IC"H eIJ -I MO~E
I--C2"6 PERCENT
CH4 andI--,.., LIGHTER 8398
CO2 17 r--C2 H6 8 88
C3 He 3.24 I--CH4 ond LIGHTER ISO-C4 HIO III
I--I I N- C4 HIO 2 31
CSHI2 3' '--~2 TOTAL iOOO6
o>- 10...>: 20
530::l0 4 0
~ 50V 60....« 70
~ 80UJJ: 90...
1005 6 8 9 '0 II 12 4 567
VOLUME8 9 10 II 12 4 6
COURTESY BURREU CORP.
8
Figure 1. Record of a Fractionation Separation by Desorption of a Sample of Dry Natural Gas (6)
A rather specialized example of separation is the process reported by Smyth (33) for the concentration of deuterium by thecatalyzed reaction:
In this process a mixture of steam and hydrogen flows through acatalyst bed countercurrent to a stream of water; the deuteriumconcentrates in the water phase.
It is possible to consider both distillation and crystallizaton aspartition processes involving the distribution of the desired constituent and the undesired constituent between the liquid andvapor phases, and the liquid and solid phases, respectively.
Adsorption. No attempt is made here to describe the successachieved during the past decade by chromatographic adsorptionas a separation technique; this important technique is discussedin a recent critical review by Strain (34). Accordingly, an attempt is made to indicate some of its offspring.
'While adsorption means of separation have been extensivelydeveloped in the chromatography of solutions of inorganic andorganic substances, the work on the analytical separation of gasesby fractional adsorption and desorption is less well known. Extensive studies have been made by Harteck (18) on the separationof light hydrocarbons by fractional desorption. The automaticTurner-Burrell apparatus (6, 40) for the analysis by fractionaldesorption of gaseous mixtures is commercially available. Thesample of gases ranging in boiling point from hydrogen to C. hydrocarbons is adsorbed on a long column of charcoal, along whoselength the compounds arrange themselves approximately in theorder of boiling point, the lowest boiling components being uppermost in the column. Hot mercury is passed up the column,sweeping out the "column" of gas before it. As each gas leavesthe column, it passes through a thermal conductivity cell whosemeasurement serves to identify the gas. The volume of the gasis then measured by a device in which the gas pushes a smallslug of mercury around a standard path; the number of timesthe slug passes an electromagnetic field in the path is counted.The record obtained (Figure 1).is analogous to that obtained inanalytical distillation. Where the low-temperature Podbielniakdistillation apparatus plots pressure (quantitative measure)against temperature (qualitative indication), the Turner-Burrell apparatus records volume in terms of number of circuit pathstraversed (quantitative axis) against thermal conductivity(qualitative axis). As thermal conductivity does not necessarilyincrease with boiling point, the curve tends to have sharper"breaks" and minor components are more readily detected thanin fractional distillation,
used, although a few methods such as the Rothe separation foriron have been of considerable application. In recent years,however, the benefits to be derived from liquid-liquid extractionas a means of separation, especially in concentrating minuteamounts of material, have caused it to be more widely used in theinorganic field, particularly in handling the nonionic complexcompounds found by inorganic ions with organic reagents. Therevived interest in inorganic separation is exemplified by the factthat the first description of the preferential extraction of antimonic chloride over antimonous chloride by an ether was in 1911(25), but a workable analytical method was not published until1949 (9).
The area of extraction analysis is thoroughly discussed byGolumbic (17). The utilization of liquid-liquid extraction infractionation separation is exemplified in repetition of a discontinuous process as in countercurrent distribution by discretestages and continuous countercurrent operation as in partitionchromatography.
Partition chromatography, as originally developed, was thefirst practical application to analytical chemistry of the principleof continuous countercurrent liquid-liquid extraction. In thistechnique the sample solution is spread onto a so-called inertadsorbent which apparently holds the solution solvent fixed inplace, forming an immobile liquid layer or stationary phase.The solution is then extracted with a second liquid phase, themobile or moving phase. The latter extraction solution must notbe fixed by the adsorbent, tt must be immiscible with the stationary phase, and it must be a better solvent for the solute compounds than the stationary phase. If the distribution or partition coefficients of the solute species are sufficiently different, theeluate from the column is, successively, a pure solution of thevarious solute compounds. The process is, accordingly, essentially countercurrent liquid-liquid extraction with one liquid phasefixed in position. A solution of the C1 to C. saturated fattyacids, which is very difficult to analyze by other methods, can bereadily analyzed by partition chromatography (10). The acidsare separated on a chromatographic column of silica gel, saturatedwith an aqueous solution of bromocresol green indicator. Theextraction solvent is 1% butanol in chloroform. The indicatorserves to indicate the position and movement of the acid bands inthe column. Partition chromatography is particularly valuablefor separations involving the whole molecule rather than for thoseinvolving position isomerism. Craig (8) has found that the process is not the simple liquid-liquid partition it has been thought tobe; adsorption effects appear to playa considerable if not a majorrole both directly and indirectly.
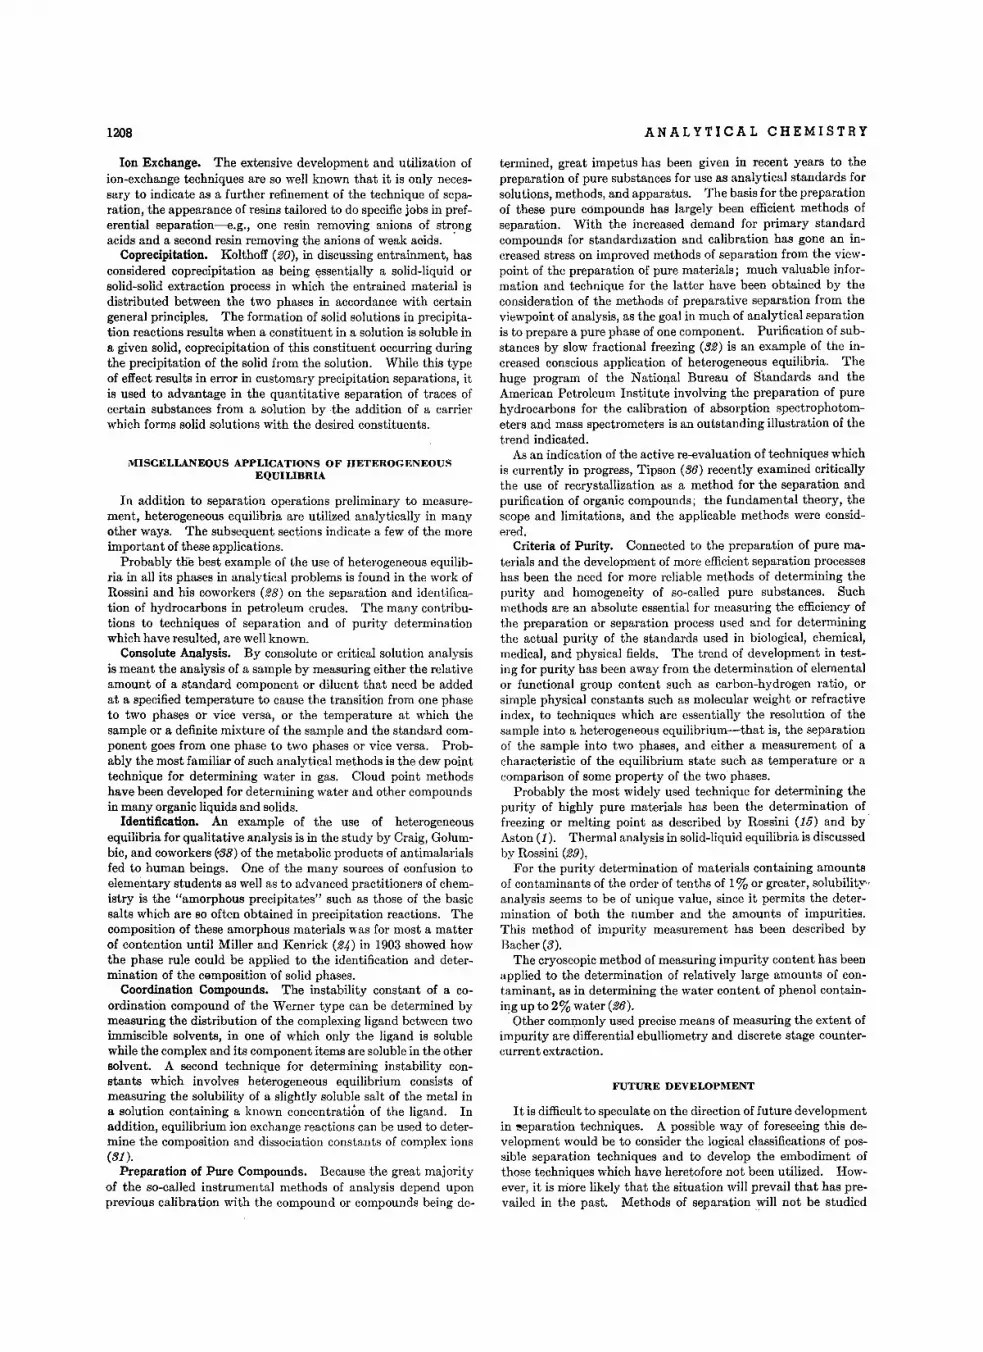
1208
Ion Exchange. The extensive development and utilization ofion-exchange techniques are so well known that it is only necessary to indicate as a further refinement of the technique of separation, the appearance of resins tailored to do specific jobs in preferential separation---e.g., one resin removing anions of strongacids and a second resin removing the anions of weak aoids. .
Coprecipitation. Kolthoff (20), in discussing entrainment, hasconsidered coprecipitation as being essentially a solid-liquid orsolid-solid extraction process in which the entrained material isdistributed between the two phases in accordance with certaingeneral principles. The formation of solid solutions in precipitation reactions results when a constituent in a solution is soluble ina given solid, coprecipitation of this constituent occurring duringthe precipitation of the solid from the solution. While this typeof effect results in error in customary precipitation separations, itis used to advantage in the quantitative separation of traces ofcertain substances from a solution by -the addition of a carrierwhich forms solid solutions with the desired constituents.
MISCELLANEOUS APPLICATIONS OF HETEROGENEOUSEQUILIBRIA
In addition to separation operations preliminary to measurement, heterogeneous equilibria are utilized analytically in manyother ways. The subsequent sections indicate a few of the moreimportant of these applications.
Probably tile best example of the use of heterogeneous equilibria in all its phases in analytical problems is found in the work ofRossini and his coworkers (28) on the separation and identification of hydrocarbons in petroleum crudes. The many contributions to techniques of separation and of purity determinationwhich have resulted, are well known.
Consolute Analysis. By consolute or critical solution analysisis meant the analysis of a sample by measuring either the relativeamount of a standard component or diluent that need be addedat a specified temperature to cause the transition from one phaseto two phases or vice versa, or the temperature at which thesample or a definite mixture of the sample and the standard component goes from one phase to two phases or vice versa. Probably the most familiar of such analytical methods is the dew pointtechnique for determining water in gas. Cloud point methodshave been developed for determining water and other compoundsin many organic liquids and solids.
Identification. An example of the use of heterogeneousequilibria for qualitative analysis is in the study by Craig, Golumbic, and coworkers ~38) of the metabolic products of antimalarialsfed to human beings. One of the many sources of confusion toelementary students as well as to advanced practitioners of chemistry is the "amorphous precipitates" such as those of the basicsalts which are so often obtained in precipitation reactions. Thecomposition of these amorphous materials was for most a matterof contention until Miller and Kenrick (24) in 1903 showed howthe phase rule could be applied to the identification and determination of the cemposition 'Of solid phases.
Coordination Compounds. The instability constant of a coordination compound of the Werner type can be determined bymeasuring the distribution of the complexing ligand between twoimmiscible solvents, in one of which only the ligand is solublewhile the complex and its component items are soluble in the othersolvent. A second technique for determining instability constants which involves heterogeneous equilibrium consists ofmeasuring the solubility of a slightly soluble salt of the metal ina solution containing a known concentration of the ligand. Inaddition, equilibrium ion exchange reactions can be used to determine the composition and dissociation constants of complex ions(31).
Preparation of Pure Compounds. Because the great majorityof the so-called instrumental methods of analysis depend uponprevious calibration with the compound or compounds being de-
ANALYTICAL CHEMISTRY
termined, great impetus has been given in recent years to thepreparation of pure substances for use as analytical standards forsolutions, methods, and apparatus. The basis for the preparationof these pure compounds has largely been efficient methods ofseparation. With the increased demand for primary standardcompounds for standardization and calibration has gone an increased stress on improved methods of separation from the viewpoint of the preparation of pure materials; much valuable information and technique for the latter have been obtained by theconsideration of the methods of preparative separation from theviewpoint of analysis, as the goal in much of analytical separationis to prepare a pure phase of one component. Purification of substances by slow fractional freezing (32) is an example of the increased conscious application of heterogeneous equilibria. Thehuge program of the N ational Bureau of Standards and theAmerican Petroleum Institute involving the preparation of purehydrocarbons for the calibration of absorption spectrophotometers and mass spectrometers is an outstanding illustration of thetrend indicated.
As an indication of the active re-evaluation of techniques whichis currently in progress, Tipson (36) recently examined criticallythe use of recrystallization as a method for the separation andpurification of organic compounds; the fundamental theory, thescope and limitations, and the applicable methods were considered.
Criteria of Purity. Connected to the preparation of pure materials and the development of more efficient separation processeshas been the need for more reliable methods of determining thepurity and homogeneity of so-called pure substances. Suchmethods are an absolute essential for measuring the efficiency ofthe preparation or separation process used and for determiningthe actual purity of the standards used in biological, chemical,medical, and physical fields. The trend of development in testing for purity has been away from the determination of elementalor functional group content such as carbon-hydrogen ratio, orsimple physical constants such as molecular weight or refractiveindex, to techniques which are essentially the resolution of thesample into a heterogeneous equilibrium-that is, the separationof the sample into two phases, and either a measurement of acharacteristic of the equilibrium state such as temperature or acomparison of some property of the two phases.
Probably the most widely used technique for determining thepurity of highly pure materials has been the determination offreezing or melting point as described by Rossini (15) and byAston (1). Thermal analysis in solid-liquid equilibria is discussedby Rossini (29).
For the purity determination of materials containing amountsof contaminants of the order of tenths of 1% or greater, solubilityanalysis seems to be of unique value, since it permits the determination of both the number and the amounts of impurities.This method of impurity measurement has been described byBacher (3).
The cryoscopic method of measuring impurity content has beenapplied to the determination of relatively large amounts of contaminant, as in determining the water content of phenol containing up to 2% water (26).
-Other commonly used precise means of measuring the extent ofimpurity are differential ebulliometry and discrete stage countercurrent extraction.
FUTURE DEVELOPMENT
It is difficult to speculate on the direction of future developmentin 1!eparation techniques. A possible way of foreseeing this development would be to consider the logical classifications of possible separation techniques and to develop the embodiment ofthose techniques which have heretofore not been utilized. However, it is more likely that the situation will prevail that has prevailed in the past. Methods of separation will not be studied

VOL U M E 23, N O. 9, SE PTE M B E R 1 95 1
until there is a tremendous accumulated demand for the betterisolation of certain materials in a state suitable for measurement.At that point, development of separation techniques utilizingour knowledge of heterogeneous equilibria will again prove itsvalue.
CONCLUSION
An attempt has been made to indicate the role of heterogeneousequilibria in providing means of obtaining desired constituents ina state suitable for measurement free of interference.
As Mellon (21) has so well stated it, no analyst would voluntarily select a method involving separative operations if an otherwise equally satisfactory nonseparative method were available.Besides the fact that separations are apt to be expensive and timeconsuming, it is generally recognized that with the exception ofthe probable hazard involved in sampling heterogeneous materials, separations are most likely to be the source of the seriouserrors in many analytical methods. As it is apparently impossible to he rid of all separations, the field of separation offers awell-nigh inexhaustible supply of analytical research problemsaimed at the improvement of operations of separation. It iscertainly pertinent to end by again reiterating several sentencesfrom a recent semiannual report of the U. S. Atomic EnergyCommission (2).
Much of the chemist's work in the field of atomic energy comesunder the deceptively simple heading "chemical separation."The separation or extraction of one material from another, ormore often from a mixture of others, had to be resolved in order tomake the bomb possible. Similarly, future progress is dependenton more effective means of carrying out complex separations. Inthis work, the chemists have studied all known methods for separations, including selective solvent extraction, distillation, precipitation, ion exchange, and liquid-liquid extraction.
The present author takes a more modest view than that expressed in the last line; he feels that much still remains to bedonein exploring the field of application of heterogeneous equilibria to the problem of separation in analytical chemistry.
ACKNOWLEDGMENT
The author would like to acknowledge the debt owed to themany people with whom he has discussed the problem of separation in analytical chemistry; he is especially grateful to M. G.Mellon for conversations on the topic extending over a period ofmany years.
LITERATURE CITED
Surveys of current development in separation techniques such as;"nexchange, extraction, distillation, etc., will be found in the January review issues of ANALYTICAL CHEMISTRY.
(1) Aston, J. G., Fink, H. L., Tooke, J. W., and Cines, M. R., ANAL.CHEM., 19,218 (1947). ,
(2) Atomic Energy Commission, Chern; Eng. News, 28, 538 (1950).(3) Bacher, F. A., Division of Physical and Inorganic Chemistry,
Symposium on Analytical Methods Based on HeterogeneousEquilibria, 118th Meeting, AM. CHEM. Soc., Chicago, IlL,1950.
(4) Barrel', R. M., J. Soc. Chem, Ind., 64, 130 (1945).
1209
(5) Benedict, M., Chern, Eng. Progress, 43, 41 (1947).(6) Burrell Technical Supply Co., Bull. 205 (1946).(7) Cassidy, H. G., J. Chern; Education, 23, 427 (1946).(8) Craig, L. C., ANAL. CHEM., 22, 1346 (1950).(9) Edwards, F. C., and Voigt, A. F., Ibid., 21, 1204 (1949).
(10) Elsdon, S. R., Biochem. J., 40, 252 (1946).(11) -Elving, P. J., ANAL. CHEM., 22, 962 (1950).(12) Elving, P. J., and Van Atta, R. E., Ibid., 22, 1375 (1950).(13) Feigl, F., Ibid., 21,1298 (949).(14) Gilchrist, R., J. Research Natl. Bur. Standards, 30, 89 (1943).(15) Glasgow, A. R., Streiff, A. J., and Rossini, F. D., Ibid., 35, 355
(1945). .(16) Glasstone, S., "Textbook of Physical Chemistry," p, 466, New
York, D. Van Nostrand Co., 1940.(17) Golumbic, C., ANAL. CHEM., 23, 1210 (1951).(18) Harteck, P., et al., Angew. Chem., 52, 32 (1939); 53,210 (1940);
56,120 (1943).(19) Hillebrand, W. F., and Lundell, G. E. F., "Applied Inorganic
Analysis," New York, John Wiley & Sons, 1929.(20) Kolthoff, I. M., Third Summer Symposium, Division of Ana
lytical Chemistry, AMERICAN CHEMICAL SOCIETY, and ANALYTICAL CHEMISTRY, Columbus, Ohio, June 16 and 17, 1950.
(21) Mellon, M. G., ANAL. CHEM., 22, 1342 (1950).(22) Mellon, M. G., J. Chern, Education, 14, 365 (1937); 25, 610
(1948); 26,468 (1949).(23) Mellon, M. G., "Methods of Quantitative Chemical Analysis,"
New York, Macmillan Co., 1937.(24) Miller, W. L., and Kenrick, B., J. PhY8. Chem., 7, 259 (1903).(25) Mylius, F., and Huttner, C., Ber., 44, 1315 (1911).(26) Pollack, L. R., ANAL. CHEM., 19, 241 (1947).(27) Rose, A., Ibid., 21, 81 (1949); 22, 59, 1369 (1950); 23, 38
(1951).(28) Rossini, F. D., in "Frontiers in Chemistry," Vol. VII, "Recent
Advances in Analytical Chemistry," pp. 157-82, New York,Interscience Publishers, 1949.
(29) Rossini, F. D., Division of Physical and Inorganic Chemistry,Symposium on Analytical Methods Based on HeterogeneousEquilibria, 118th Meeting, AM. CHEM. SOC., Chicago, Ill.,1950.
(30) Scherrer, J. A., J. Reeearch. Natl. Bur. Standards, 16,253 (1936).(31) Schubert, J., ANAL. CHEM., 22, 1359 (1950).(32) Schwab, F. W., and Wichers, E., J. Research Natl. Bur. Stand-
, ards, 22, 253 (1944).(33) Smyth, H. C., "Atomic Energy for Military Purposes," Wash
ington, Government Printing Office, 1945.(34) Strain, H. H., ANAL. CHEM., 23, 25 (1951).(35) Timmermans, J., "Chemical Species," New York, Chemical
Publishing ce., 1940.(36) Tipson, R. S., ANAL. CHEM., 22, 628 (1950).(37) Tiselius, A., Chem. Eng. News, 27, 1041 (1949).(38) Titus, E. 0., Craig, L. C., Golumbic, C., Mighton, H. R.,
Wempen, I. M., and Elderfeld, R. C., J. Bioi. Chem., 13, 39(1948).
(39) Toffoli, C., Gazz. chim. ital., 68, 277 (1938); 74,207,219 (1944).(40) Turner, N. C., Petroleum Refiner, 22, 98-102, 140--4 (1943).(41) Warshowsky, B., Elving, P. J., and Mandel, J., ANAL. CHEM.,
19,101 (1947).(42) Washington, H. S., "Manual of the Chemical Analysis of
Rocks," 4th ed., New York, John Wiley & Sons, 1930.(43) Willard, H. H., ANAL. CHEM., 22, 1372 (1950).(44) Willard, H. H., and Fowler, R. D., J. Am. Chern; Soc., 54,496
(1932).(45) Zimmerschied, W. J., Bigley W. S., and Lien, A. P., American
Petroleum Institute, Division of Refining, 15th MidyearMeeting, May 1950.
RECEIVED April 4, 1951. Presented before the Divisions of Physical andInorganic Chemistry and Analytical Chemistry, Symposium on AnalyticalMethods Based on Heterogeneous Equilibria, at the 118th Meeting of theAMERICAN CHEMICAL SOCIETY, Chicago, Ill.

Liquid-Liquid Extraction AnalysisCALVIN GOLUMBIC
Office of Synthetic Liquid Fuels, U. S. Bureau of Mines, Bruceton, Pa,
The technique of liquid-liquid extraction, lnore particularly the partition of suhstances between pairsof inuniscihle solvents, is a very convenient tool foranalysis of a great diversity of eornpourids, To review the present status of the subject, the basictheory of fractionation hy partition between Irnrntscible solvents, usually called countercurrent distribution, was developed. Frrrrdaruerrta] data on thepartition of pure substances were obtained and usedin the qualitative and quantitative analysis of rrrixtures of organic cornpou.nds, The accuracy of theDl.ethod cornpared favorably with spectroscopicnlethods. The lDOSt diverse types of rntxt.ures-e-
EVE R Y chemist is familiar with the technique of resolvingmixtures by distributing the components between immisci
ble solvents. The qualitative and quantitative analysis of solutions by this technique may be called liquid-liquid extractionanalysis. For "ideal" or "perfect" solutions, the ratio of theconcentration of a component in the two liquid phases (C I andC2 ) is a constant at constant temperature, CdC2 = k; k is calledthe distribution constant or partition coefficient. If more thanone component is involved in an ideal solution, Nernst's law ofindependent distribution applies-i.e., each component distributes itself independently of the others.
Extraction techniques are fundamentally of two types: singleor multiple contact (sometimes called co-current contact) andcountercurrent. The former is a tool for removal or recovery ofa constituent from a mixture; the latter may also be employedfor this purpose, but it is primarily a fractionation procedure,suitable for separating the individual components of a mixture.Both techniques can be applied to almost any substance that iscapable of distribution in an immiscible solvent system.
S S S STotol ~ t l ISolute -O-R-Q-R-Q-R-Q
~ ~ ~ lE E E E
Figure 1. Scheme of Multiple ContactExtraction
E. ExtractR. RaffinateS. Solvent
Both procedures can be arranged as discontinuous-i.e., batchwise-or continuous processes. For large scale applications,attention is, of course, focused on continuous operation. Recentimprovements in the design of continuous liquid-liquid fractionation equipment (49) undoubtedly will increase the number ofindustrial applications, particularly in tae antibiotic field, inwhich separation by extraction offers many advantages (6, 7).In the laboratory, however, the discontinuous techniques arepreferred, because the equilibrium stages are more easily observed. For this reason only the discontinuous techniques of theco-eurrent and countercurrent extraction procedures are disccussed in this paper.
SINGLE AND MULTII'LE CONTACT EXTRACTION
Single contact extraction is the simplest form of extraction;two immiscible phases containing dissolved solute are equilibrated
phenols, hererocycltc bases, and polynuclear hydrocarbons-were successfully analyzed, Even verysensitive mutertals, such as the antibiotics, can beanalyzed without undergoing change. The basictechnique can he applied to diverse substances withonly rn irror changes in procedure. The rnet.hod doesnot require prior knowledge of the type of substances in the rnixt.ure or calibration data on puresubstances of known identity, which is a requisitefor lDOSt rnerbods. As it can be used for actual isolation of the cornponerrts of a rmxt.ure, the techniqueis very useful to the organic ehetuist and the ehernfcal engineer.
once and are separated. In multiple contact extraction, one ofthese phases, defined as the raffinute, is succeasively extractedwith fresh portions of the other phase, the solvent, as shown inFigure 1. The phase withdrawn at each stage is the extractant.The circles represent the mixing vessels. Eaeh operation ofmixing and separation of layers constitutes an equilibrium stage.
To illustrate the operation of the method, the case may beconsidered in which the raffinate layer is denser than the extractlayer, and the partition isotherm of solute is linear. After nstages, the fraction of the solute remaining in the raffinate phase
is given by the relation (kR ~ I) ",where k and R are ratios of the
concentrations and volumes, respectively, of the two phases (32).At each stage a fraction kR(I/kR + I)" of solute is removed inthe extractant. When the raffinate is the lighter phase, (kR/kR + I)" of solute will remain in the raffinate and each nth extract will contain (l/kR + I) (kR/kR + 1)"-1 of solute.
These relations constitute the basis for the application of multiple contact extraction in the quantitative analysis of the lowerhomologous fatty acids (63, 6.8). Thus, by repeated extractionof an aqueous solution of the fatty acids with an immiscible solvent (n components require n - 1 extractions), followed by titration of the aqueous phase initially and after each extraction, sufficient information is obtained for setting up simultaneous equations, which are solved to determine the quantity of each acid.Conceivably, this procedure could be applied to other homologousseries in which the individual components are distributed in accordance with the distribution law and, in addition, have appreciably different partition coefficients.
Multiple contact extraction finds important application in problems involved in the recovery of a valuable constituent from amixture or in the removal of a troublesome impurity. In fact.large scale liquid-liquid extraction is seldom undertaken for purposes other than these. Solvent extraction and refining processesare examples of multiple contact extraction. Recent uses of thismethod, which are of possible technical importance, are the removal of fatty acids from aqueous solution by extraction withderivatives of furan (31) and the removal of mineral acids fromacid hydrolyzates of proteins by extraction with long-chain aliphatic tertiary amines, such as methyldioctylamine (51). In thelaboratory, also, multiple contact extraction is a short-cut solution to many problems of recovery and purification. To cite onerecent example (44), preparations of tetrahydro-2-naphthol,made by catalytic reduction of 2-naphthol and containing smallbut difficultly removable quantities of the parent compound, werereadily and completely freed of the contaminant, 2-naphthol, byselective extraction with a buffer solution of appropriate pH.
1210

VOL U M E 2 3, N O. 9, SE PTE M B E R 1 9 5 1 1211
As a quantitative 'analytical method, multiple contact extraction has one major failing, in that all the constituents of a mixturemust be known qualitatively. It should, therefore, be employedas a routine procedure only after the qualitative information hasbeen obtained by some other method.
If the volumes of the phases are unequal, k must be multipliedby the volume ratio, R. Expansion of Equation 2 for any givendistribution of n transfers results in a series of terms, each ofwhich denotes the fraction of the original substance in a tube.The values of adjacent terms (Tr and Tr + 1) are related to eachother and to the partition coefficient by the expression:
(4)
fotol SOlute],
Tr~f~: ~~s
\ U L 5
t----------------~ ~\ U L U L 5
2-.--~--------~ ~ ~\UL UL UL 5
3---- -------.-@ 'd V ~r>. /\ r<. />;
p\ U L. U L . U L U L 5
4--------@ t5' ¥ ~ ~Figure 2. Scherne of Countercurrent Distribution
L. Lower layerP. Denser sofveertS. Light solventU. Upper layer
~ = (n + 1- r)k or~ = (11) + 1) ~ (3)Tr-l r Tr+l n-l k
The value of any single term is given by Equation 4
Tn,r = r!(nn~ r)! (k ~ It kr
where T is the fraction of the original solute in tube r (for simplification of the equation, numbering of tubes starts with 0 ratherthan 1). This relation permits us to calculate the distribution ofa solute among the tubes after any given number of transfershas been made. The partition coefficient may be calculated byEquation 3. In Figure 3, the dots represent the theoretical distribution for a compound with a partition coefficient of 0.8 after53 transfers have been applied. The open circles are experimental points for the actual distribution of 3-methyl-5-ethylphenol between cyclohexane and alkaline phosphate buffer. Theexperimental values were determined by ultraviolet spectroscopy.
o Experi:rnental• Theoretieal
16 24 32 40 48TUBE NUMBER
Distribution of 3-Methyl-5-ethylphenol
tI~\
1 \I \
I
} \J \
'i/' I\.
Figure 3.
o 8
:L.E1/)5ocoN
,c!;i4
>t-en~3c...J<[o
bo
7
6
In this respect, countercurrent extraction is superior to multiplecontact extraction, for countercurrent extraction can be used tofurnish both qualitative and quantitative information. Hence,the major emphasis in this discussion is placed on countercurrentextraction, particularly the discontinuous type known as countercurrent distribution,
COUNTERCURRENT DISTRmUTION
Theory. The current realization of the potentialities of countercurrent distribution stems from the introductory work ofCraig in 1944 (12, 13). In principle, countercurrent distributionis identical with the classical triangular scheme of fractionalcrystallization. Equal volumes of two immiscible solvents (previously saturated with each other) are placed in a separatory funnel, tube, or other appropriate vessel, as indicated by the circlenumbered 0 in Figure 2; the compound or mixture to be distributed is then added. After equilibration, the denser phase is'drawn off into tube 1, and fresh lighter solvent is added to tube O.At this point, one transfer or stage has been completed. Theprocess can then be continued for any number of transfers byseparation of phases after each equilibration, systematic combination of separated phases from adjacent tubes, and additionof fresh solvents to the end tubes.
It has been shown by Williamson and Craig (69) that this fractionation scheme, like that postulated for the partition chromatograph (39), follows the mathematics of binomial expansion:
where Y is the fraction of solute transferred in the upper phase,X is the fraction of solute remaining in the lower phase, and n isthe number of transfers or stages applied. When equal volumesof the immiscible phases are employed, these fractions may beexpressed in terms of the partition coefficient, k, as follows:
:t'
(5)
For countercurrent distributions involving large numbers oftransfers, the mathematics of probability can also be applied tocalculation of the theoretical curve. The fraction of the originalsolute in any tube will now be given by an expression (Equation5) which is that of the normal curve of error (12):
kk + 1
1X = k + 1 and Y
then, by Equation 1,
(1 k)n
k+l+k+l(2)
In this expression, y (equivalent to Tn, r of Equation 4) is thefraction of the original solute in any tube that is x tubes removedfrom the maximum; n is the total number of transfers, and k isthe partition coefficient. The partition coefficient may be cal-

1212 ANALYTICAL CHEMISTRY
Table I. Cornparfsorr of Countercurrent Distribution andInfrared Analyses of Phenolic Mixtures
culated from the relation (Equation 6) that governs the exactposition, N, of the peak of the distribution curve.
(Weight of component in tube r) _1_ X 100 = 0/< (7)
Weight of sample Tn, r 0
(8)
(9)
(10)
1 ...1kAopt. = R" fJ
1Ropt. = VkAkB
1 ...11and kBopt. = R" ~
If this is inconvenient, the partition coefficients may be adjusted for optimum separation as follows:
oil was analyzed by countercurrent distribution and by infraredspectroscopy. The agreement is satisfactory, despite the factthat the distribution results were usually lower than the infraredvalues. The latter would tend to be high because suitable correction for interfering substances could not be made. The infrared analyses were not possible until the countercurrent proceduredetected these compounds and indicated a scheme for isolatingthem (29).
Adjustment of Partition Coefficients. In the separation andanalysis of mixtures by countercurrent distribution, it is customary to describe the separability of components in terms of theirfJ value; this is defined as the ratio of partition coefficients of twosubstances in a given system. However, not only the fJ value butalso the absolute value of the. individual partition coefficients isimportant in countercurrent extraction. It was shown by vanDijck and Schaafsma (20) and others (10, 55) that maximumseparation of a pair of components is obtained when the geomctricmean of their partition coefficients is equal to 1, or, in general, ifR is the ratio of the volumes of the phases:
In effect, this relation means that partition coefficients should'be adjusted to values close to 1. To obtain the most efficientseparation, it may be necessary, then, to adjust the phase volumesto the value obtained by the equation:
For acids, bases, and amphoteric compounds in which buffersolutions can be employed as one of the immiscible solvents, thepartition coefficient is readily adjusted by changing the pH.Addition of a suitable "carrier" to the solvent system also may beemployed for this purpose. The carrier can be a substance thatreacts reversibly with the substances being distributed (42) oracts merely as a "salting-in" agent (30) in the same way thatalkyl phenols, for example, promote the extraction of mercaptans(73). In nonaqueous systems in which one of the organic phasesis miscible with water, it often suffices to add a requisite amountof water to this phase'(49).
Variations in Countercurrent Distribution Scheme. Varia..tions in the countercurrent distribution procedure have been employed for special purposes. The single withdrawal technique(12), which in effect makes countercurrent distribution similar inoperation to chromatographic adsorption, is useful when partitioncoefficients are very high or very low. The alternate withdrawal
, technique (17), called multiple fractional distribution by Hunterand Nash (35), is useful for increasing resolution if the number ofextraction tubes is fixed, as in the Craig distribution instrumen t(19). This procedure is similar to that employed by Jantzen (37)in his pioneer work on liquid-liquid extraction.
Bush and Densen (9) have described the mathematical development for an ingenious "diamond" pattern of fractional distribution. In this scheme, stepwise countercurrent extraetionsare not terminated at a horizontal stage, as in the triangularscheme, but, instead, they are continued by setting aside endfractions through a "diagonal" stage. This results in a diamondshaped pattern. By this technique it is possible to separate apair of solutes so that each will accumulate in a different phase.
(6)
Infrared, %5316
17
4125
Analysis
4418
4611
145
Countercurrent, %
nkN = k + 1
Components
4-Indanol3-Methyl-5-ethylphenol
4-Indanol5-Indanol
5-Indanol5-Indanol
93
99102
Fraction
85
For r, a tube is selected from a region of the distribution pattern free from overlapping bands. Frequently, however, someoverlapping occurs. If the experimental curve cannot be separated into two or three theoretical curves, it may be necessary toincrease the resolution by use of more transfers or to isolate andredistribute enriched portions of the distributed sample. Nichols(41) has recently derived a useful equation relating the partitioncoefficients and desired degree of separation to the number oftransfers required.
Skewing of the experimental distribution bands is an indicationthat the substance has a nonlinear partition isotherm. By properchoice of the size of the initial sample, this disturbing effect usually can be eliminated (14).
Recent work has shown that fatty acids (48), phenols (64), andheterocyclic bases (26) can be estimated with an accuracy within3 to 5%. The fact that such diverse substances can be analyzedby countercurrent distribution clearly demonstrates that thistechnique is a quantitative method of wide applicability,
It is of interest to compare analyses by countercurrent distribution with those by other methods. The data of Table I showresults obtained when a phenolic fraction of a coal hydrogenation
When a comparison is made between calculations by binomialexpansion and by the probability equation, the correspondenceis found to be very close for the transfers above 40 (69).
Quantitative Analysis. The calculations involved in obtainingtheoretical curves have been stressed because such curves are anessential part of the countercurrent distribution method. Theyimmediately give an indication of the complexity of a mixtureand provide the means for quantitative determination of theamounts of components in a mixture. Detailed descriptions ofthese calculations have been published (41, 48, 64, 69). Briefly,the quantitative calculations involve three steps. The first stepis the plotting of a distribution pattern resulting from the performance of a distribution of a sufficiently large number of transfers to resolve the mixture into more or less discrete distributionbands. The experimental points of the distribution pattern maybe determined by ultraviolet spectroscopy or any other convenient method; direct weighing is best of all (17). In the secondstep, the partition coefficients of the individual components of themixture are calculated either from the position of the maxima ofthe distribution curves (Equation 6) or from the experimentalvalues at adjacent tubes (Equation 3). Theoretical distributioncurves for pure substances with these, partition coefficients arethen calculated by means of Equation 4 or 5. Finally, if goodagreement between theory and experiment is manifest, the percentage of each component is then calculated by Equation 7.
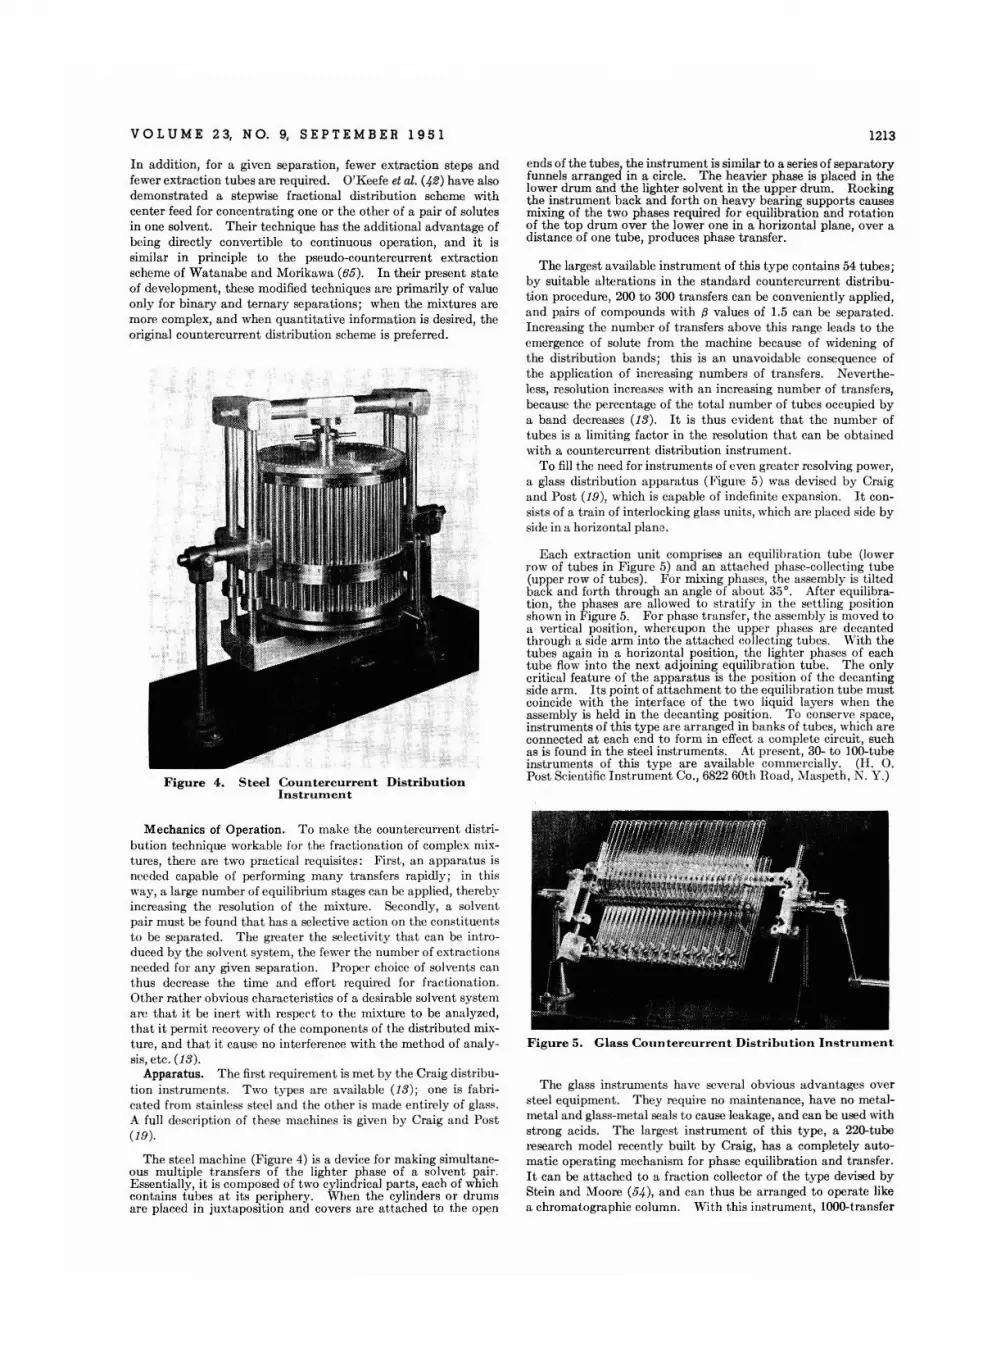
VOL U M E 2 3, N O. 9, SE PTE M B E R 1 9 5 1
In addition, for a given sepa ra tion, fewer extraction steps andfewer extrac tion tubes are required. O'Keefe et al. (42) have alsodemonstrated a stepwise fractional distribution scheme withcente r feed for concentrating one or the other of a pair of solutesin one solvent. Their technique has the additional advantage ofbeing directly convertible to continuous operation, and it issimilar in principle to the pseudo-countercurrent extractionscheme of Watanabe and Morikawa (65). In their present stateof development, these modified techniques arc primarily of valueonly for binary and ternary separations ; when the mixtures aremore complex, and when quantitative information is desired, theoriginal countercurrent distribution scheme is preferred.
Figure 4. Steel Countercurrent DistributionInstrument
Mechanics of Operation. To make the countercurrent distribution technique workable for the fra ctionation of complex mixtures, there are two practi cal requisite s: First" an apparatus isneeded capa ble of performing many transfers rapidly ; in thi sway, a large number of equilibrium stages ca n be applied, t herebyincreasing the resolution of the mixture. Secondly , a solvent.pair mu st be found that has a select ive action on t he const it uentsto be sepa rated. The greater the select ivity that can be introdu ced by th e solvent system, the fewer the num ber of ext ract ionsneeded for an y given separa tio n. Proper choice of solvents ca nthus decrease the time and effort required for fra ct ionati on .Other rather obvious characteristics of a desirable solvent syste mam that it be inert with respect to the mixture to be analyzed,that it permit recovery of the component s of the distributed mixture, and that it cause no interferenc e with the method of an alysis, etc . (13 ).
Apparatus. The first requirement is met by t he Craig distribution instrumen ts. Two types are ava ila ble (13); one is fab rica te d from stainless stee l and t he other is ma de enti rely of glass.A full description of t hese machin es is given by Craig and Post(19) .
The steel machin e (Figure 4) is a devi ce for making simultaneous multiple transfers of th e lighter phase of a solvent pair.Essentially, it is composed of two cylindrical parts, each of whichcontains tubes at its periphery. When the cylinders or drumsare plac ed in juxtaposition and covers ar c attached to the open
1213
ends of the tubesl the instrument is similar to a series of separatoryfunnels arranged in a circle . The heavier phase is plac ed in thelower drum and the lighter solvent in the upper drum. Rockingthe instrument back and forth on heavy bearing supports causesmixing of the two phases required for equilibra t ion and rotationof the top drum over the lower one in a horizontal plane, over adistance of one tube, produces phase transfer.
The largest available instrument of this typc contains 54 tubes;by suitable alterations in the standard counte rcurrent distribution pro cedure, 200 to 300 transfers can be conveniently applied,and pairs of compounds with {3 values of 1.5 can be sepa ra ted.Increa sing the number of transfers above this range lead s to th eemergence of solute from th e machine because of widening ofthe distribution bands; this is an unavoidabl e consequence ofth e application of increasing numbers of tran sfer s. Nevertheless, resolution increases with an increasing number of tran sfers,because thc percentage of the total number of tubes occupi ed bya band decreases (13). It is thus evident that the number oftubes is a limiting factor in the resolution that can be obtainedwith a countercurrent distribution instrument.
To fill the need for instruments of even greater resolving power,a glass distribution apparat us (Figure 5) was devi sed by Craigand Pos t (19 ), which is capa ble of indefini te expa nsion. It consist s of a t rain of interlockin g glass units, which are placed side byside in a horiz ontal plane.
Each extrac tion unit comprises an equilibrat ion tube (lowerrow of tubes in Figure 5) and an at t ac hed phase-collecting tube(upper row of tubes) . For mixing phases, th e assembly is t ilte dback and forth through an angl e of about 35°. After equilibration, the phases ar e allowed to stratify in th e settling positionshown in Figure 5. For phase transfer, th e asse mbly is moved toa vertical position, whereupon the upper phases are decantedthrough a side arm into th e attached collecting tubes. With thetubes again in a horizontal position, the lighter phases of eachtube flow into the next adjoining equilibration tube. The onlycritical feature of the apparatus is th e positi on of th e decantingside arm. Its point of attachment to th e equilibra t ion tube mustcoin cide with the interface of the two liquid layers when theassembly is held in the decanting position . To conserve space,instruments of this type are arranged in banks of tubes, which areconnected at eac h end to form in effect a complete circuit, suchas is found in the ste el instruments. At present , 30- to IOO-tubeinstruments of this t yp e are available commerc ially. (II. O.Pos t Scientific In strument Co., 6822 60th Road, Maspeth, K Y.)
Figure 5. Glass Countercurrent Distribution Instrument
The glass instrumen ts have severa l obvious advantages overstee l equipment . They require no maintenance, have no metalmetal and glass-metal sea ls to cau se leakage, and can be used withstrong acids. The largest instrument of this type, a 220-tuberesearch mod el recently built by Craig, has a compl etely automatic operating mechanism for phase equilibration and transfer .It can be attached to a fraction collector of the type devised byStein and Moore (54), and can thus be arranged to operate likea chromatographic column. With this instrument, looO-transfer
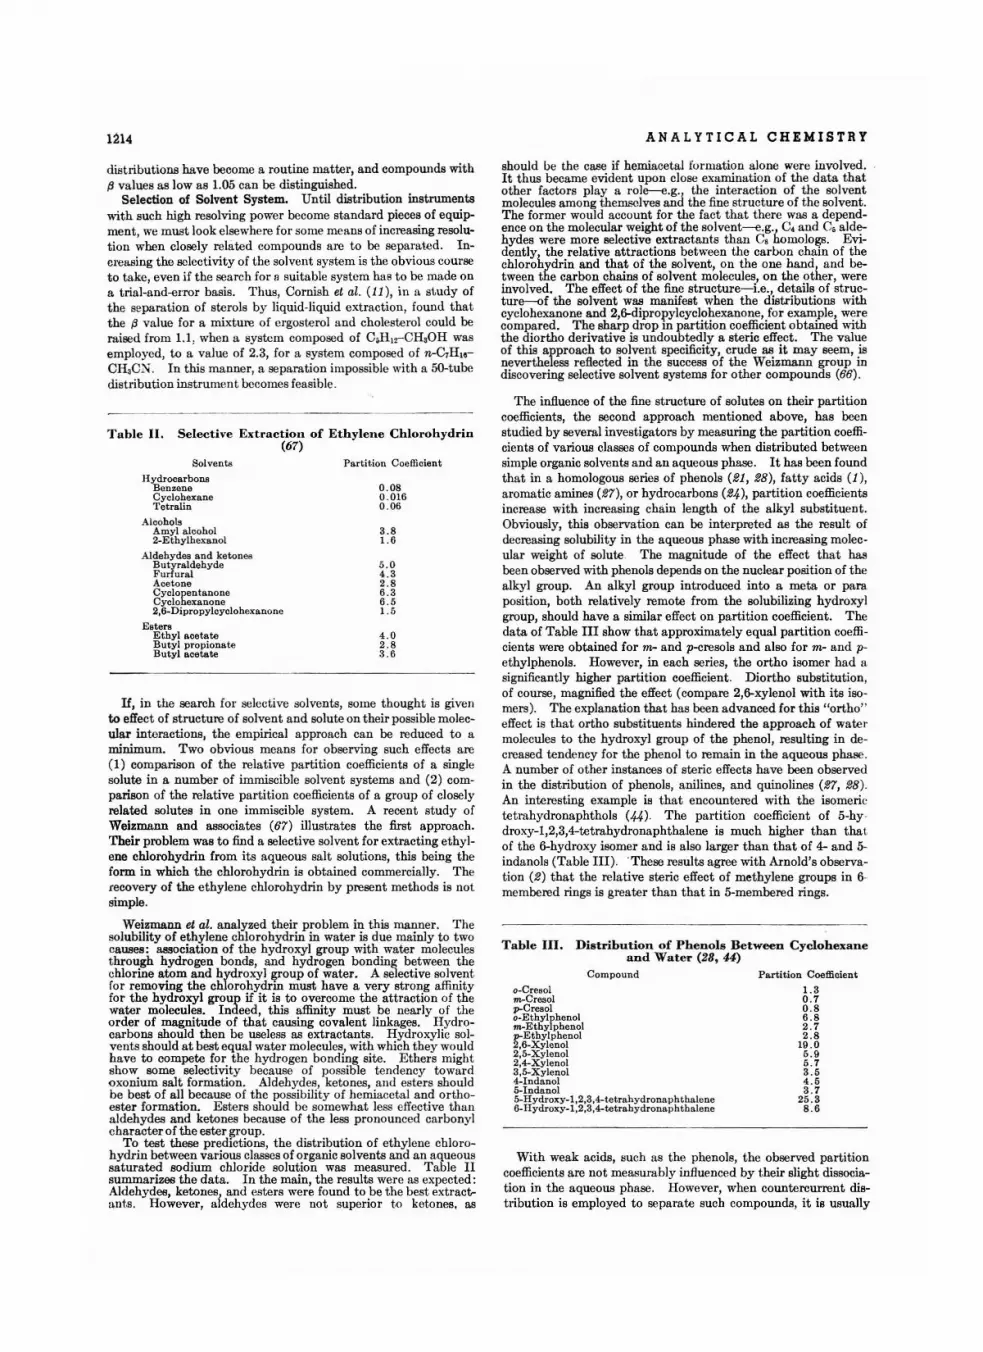
1214 ANALYTICAL CHEMISTRY
Table II. Selective Extraction of Ethylene Chlorohydrin(67)
distributions have become a routine matter, and compounds withf3 values as low as 1.05 can be distinguished.
Selection of Solvent System. Until distribution instrumentswith such high resolving power become standard pieces of equipment, we must look elsewhere for some means of increasing resolution when closely related compounds are to be separated. Increasing the selectivity of the solvent system is the obvious courseto take, even if the search for 9 suitable system has to be made ona trial-and-error basis. Thus, Cornish et al. (11), in a study ofth e separation of sterols by liquid-liquid extraction, found thatthe f3 value for a mixture of ergosterol and cholesterol could beraised from 1.1, when a system composed of C.HI2-CHaOH wasemployed, to a value of 2.3, for a system composed of n-C7H1G
CHaC?Il . In this manner, a separa tion impossible with a 5O-tubcdistribution instrumen t becomes feasible.
If, in the search for selective solvents, some thought is givento effect of structure of solvent and solute on their possible molecular interactions, the empirical approach can be reduced to aminimum. Two obvious means for observing such effects are(1) comparison of the relative partition coefficients of a singlesolute in a number of immiscible solvent systems and (2) comparison of the relative partition coefficients of a group of closelyrelated solutes in one immiscible system. A recent study ofWeizmann and associates (67) illustrates the first approach.Their problem was to find a selective solvent for extracting ethylene chlorohydrin from its aqueous salt solutions, this being theform in which the chlorohydrin is obtained commercially. Therecovery of the ethylene chlorohydrin by present methods is notsimple.
Weizmann et al. analyzed their problem in this manner. Thesolubility of ethylene chlorohydrin in water is due mainly to twocauses : association of the hydroxyl group with water moleculesthrough hydrogen bonds, and hydrogen bonding between thechlorine atom and hydroxyl group of water. A selective solventfor removing the chlorohydrin must have a very strong affinityfor the hydroxyl group if it is to overcome the attraction of thewater molecules. Indeed, this affinity must be nearly of theorder of magnitude of that causing covalent linkages. Hydrocarbons should then be useless as extractants. Hydroxylic solvents should at best equal water molecules, with which they wouldhave to compete for the hydrogen bonding site. Ethers mightshow some selectivity because of possible tend ency towardoxonium salt formation. Aldehydes, ketones, and esters shouldbe best of all because of the possibility of hemiacetal and orthoester formation. Esters should be somewhat less effective thunaldehydes and ketones because of the less pronounced carbonylcharacter of the ester ~roup.
To test these predictions, the distribution of ethylene chlorohydrin between various classes of organic solvents and an aqueoussaturated sodium chloride solution was measured. Table IIsummarizes the data. In the main, the results were as expected :Aldehydes, ketones! and esters were found to be the best extractants. However, a dehydes were not superior to ketones. as
Table III. Distribution of Phenols Between Cyclohexaneand Water (28, 44)
Compound Partition Coefficient
1.30 .70 .86 .82 .72.8
IIl.O5.1l5 .73 .54 .53 .7
25.38 .6
o-Cresolm-Cresolp-CreBolo-Ethylphenolm-Ethylphenolp-Ethylphenol2,6-Xylenol2,5-Xylenol2,4-Xylenol3.5-Xylenol4-Indanol5-Indanol5-Hydroxy-l .2,3 .4-tetrahydronaphth al ene6-Hydroxy-I,2,3,4-tetrahydronaphthalene
With weak acids, such as the phenols , the observed partitioncoefficients are not measurably influenced by their slight dissociation in the aqueous phase. However, when countercurrent distribution is employed to separate such compounds, it is usually
should be the case if hemiacetal formation alone were involved.It thus became evident upon close examination of the data thatother factors play a role-e.g., the interaction of the solventmolecules among themselves and the fine structure of the solvent.The former would accuunt for the fact that there was a dependence on the molecular weight of the solvent--e.g., C. and C. aldehydes were more selective extractants than Cg homologs. Evidently! the relative attractions between the carbon chain of thechlorohydrin and that of the solvent, on the one hand, and between the carbon chains of solvent molecules, on the other, wereinvolved. The effect of the fine structure-i.e., details of structure-of the solvent was manifest when the distributions withcyclohexanone and 2,6-dipropylcyclohexanone, for example, werecompared. The sharp drop in partition coefficient obtained withthe diortho derivative is undoubtedly a steric effect. The valueof this approach to solvent specificity, crude as it may seem, isnevertheless reflected in the success of the Weizmann group indiscovering selective solvent systems for other compounds (66).
The influence of the fine structure of solutes on their partitioncoefficients, the second approach mentioned above, has beenstudied by several investigators by measuring the partition coefficients of various classes of compounds when distributed betweensimple organic solvents and an aqueous phase . It has been foundthat in a homologous series of phenols (21, 28), fatty acids (l),aromatic amines (27), or hydrocarbons (24), partition coefficientsincrease with increasing chain length of the alkyl substituent.Obviously, this observation can be interpreted as the result ofdecreasing solubility in the aqueous phase with increasing molecular weight of solute . The magnitude of the effect that hasbeen observed with phenols depends on the nuclear position of thealkyl group. An alkyl group introduced into a meta or paraposition, both relatively remote from the solubilizing hydroxylgroup, should have a similar effect on partition coefficient. Thedata of Table III show that approximately equal partition coefficients were obtained for m- and p-cresols and also for m- and pethylphenols. However, in each series, the ortho isomer had asignificantly higher partition coefficient. Diortho substitution,of course, magnified the effect (compare 2,6-xylenol with its isomers). The explanation that has been advanced for this "ortho"effect is that ortho substituents hindered the approach of watermolecules to the hydroxyl group of the phenol, resulting in decreased tendency for the phenol to remain in the aqueous phase .A number of other instances of steric effects have been observedin the distribution of phenols, anilines, and quinolines (27, 28).An interesting example is that encountered with the isomerictetrahydronaphthols (44). The partition coefficient of 5-hy ·droxy-l,2,3,4-tetrahydronaphthalene is much higher than thatof the 6-hydroxy isomer and is also larger than that of 4- and 5indanols (Table III). "These results agree with Arnold's observation (2) that the relative steric effect of methylene groups in 6·membered rings is greater than that in 5-membered rings.
3.81.6
4 .02.83 .6
5 .04 .32 .86 .36 .51.5
0 .080 .0160 .06
Partirion CoefllcientSolvents
HydrocarbonsBenzeneOyelohexaneTetralin
AlcoholsAmyl al cohol2-Ethylhexanol
Aldehydes and ketonesButyraldehydeF urfuralAcetoneCyclopentanoneCyelohexanone2.6-Dipropylcyclohexanone
EstersEthyl aoetateButyl propionateButyl acetate
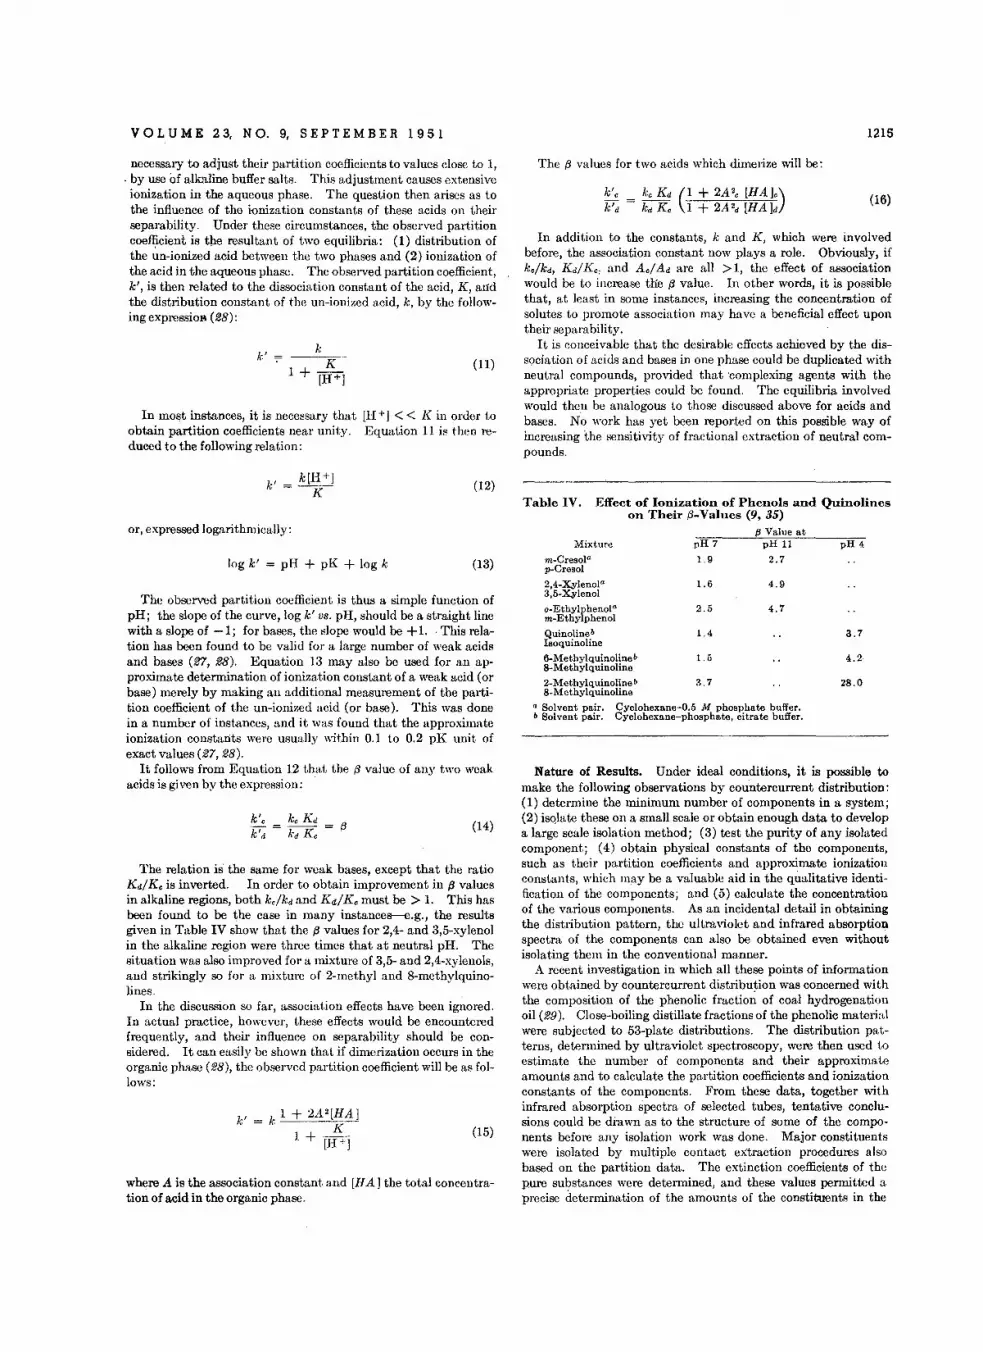
VOL U M E 23, N O. 9, S E PTE M B E R I 95 I 1215
necessary to adjust their partition coefficients to values close to 1,. by use of alkaline buffer salts. This adjustment causes extensiveionization in the aqueous phase. The question then arises as tothe influence of the ionization constants of these acids on theirseparability. Under these circumstances, the observed partitioncoefficient is the resultant of two equilibria: (1) distribution ofthe un-ionized acid between the two phases and (2) ionization ofthe acid in the aqueous phase. The observed partition coefficient,k', is then related to the dissociation constant of the acid, K, andthe distribution constant of the un-ionized acid, k, by the following expression (28):
In most instances, it is necessary thatobtain partition coefficients near unity.duced to the following relation:
In addition to the constants, k and K, which were involvedbefore, the association constant now plays a role. Obviously, ifke/kd, Kd/K; and A e/Ad are all >1, the effect of associationwould be to increase We {3 value. In other words, it is possiblethat, at least in some instances, increasing the concentration ofsolutes to promote association may have a beneficial effect upontheir separability.
It is conceivable that the desirable effects achieved by the dissooiation of acids and bases in one phase could be duplicated withneutral compounds, provided that 'complexing agents with theappropriate properties could be found. The equilibria involvedwould then be analogous to those discussed above for acids andbases. No work has yet been reported on this possible way ofincreasing the sensitivity of fractional extraction of neutral compounds.
k'k
K1 + [H+]
(11)
[H+J << K in order toEquation 11 is then re-
The {3 values for two acids which dimerize will be:
k'c = ke Kd (1 + 2A2e [HA]e)kid kd s. 1 + 2A2d [HAld
(16)
or, expressed logarithmically:
(12)Table IV. Effect of Ionization of Phenols and Quinolines
on Their {3-Values (9, 35)fJ Value at
where A is the association constant and [H A] the total concentration of acid in the organic phase.
The observed partition coefficient is thus a simple function ofpH; the slope of the curve, log k' V8. pH, should be a straight linewith a slope of -1; for bases, the slope would be +1. This relation has been found to be valid for a large number of weak acidsand bases (27, 28). Equation 13 may also be used for an approximate determination of ionization constant of a weak acid (orbase) merely by making an additional measurement of the partition coefficient of the un-ionized acid (or base). This was donein a number of instances, and it was found that the approximateionization constants were usually within 0.1 to 0.2 pK unit ofexact values (27,28).
It follows from Equation 12 t.hat the {3 value of any two weakacids is given by the expression:
The relation is the same for weak bases, except that the ratioKd/Ke is inverted. In order to obtain improvement in {3 valuesin alkaline regions, both kclkd and Kd/Ke must be > 1. This hasbeen found to be the case in many instances-e-e.g., the resultsgiven in Table IV show that the {3 values for 2,4- and 3,5-xylenolin the alkaline region were three times that at neutral pH. Thesituation was also improved for a mixture of 3,5- and 2,4-xylenols,and strikingly so for a mixture of 2-methyl and 8-methylquinolines.
In the discussion so far, association effects have been ignored.In actual practice, however, these effects would be encounteredfrequently, and their influence on separability should be considered. It can easily be shown that if dimerization occurs in theorganic phase (28), the observed partition coefficient will be as follows:
log k' = pH + pK + log k
4.2
3.7
28.0
pH 4
4.9
4.7
pH 11
2.7
2.5
1.4
1.6
3.7
1.5
pH 7
1.9
Mixture
m-Cresolap-Cresol
2.4-X,ylenola
3,5-Xylenol
o-Ethylphenolam-Ethylphenol
Quinoline blsoquinoline
6-Methylquinolineb8-Methylquinoline
2-Methylquinoline b8-Methylquinoline
a Solvent pair. Cyclohexane-o.5 M: phosphate buffer.b Solvent pair. Cyelohexane-phosphate, citrate buffer.
Nature of Results. Under ideal conditions, it is possible tomake the following observations by countercurrent distribution:(1) determine the minimum number of components in a system;(2) isolate these on a small scale or obtain enough data to developa large scale isolation method; (3) test the purity of any isolatedcomponent; (4) obtain physical constants of the components,such as their partition coefficients and approximate ionizationconstants, which may be a valuable aid in the qualitative identification of the components; and (5) calculate the concentrationof the various components. As an incidental detail in obtainingthe distribution pattern, the ultraviolet and infrared absorptionspectra of the components can also be obtained even withoutisolating them in the conventional manner.
A recent investigation in which all these points of informationwere obtained by countercurrent distribution was concerned withthe composition of the phenolic fractio~ of coal hydrogenationoil (29). Close-boiling distillate fractions of the phenolic materialwere subjected to 53-plate distributions. The distribution patterns, determined by ultraviolet spectroscopy, were then used toestimate the number of components and their approximateamounts and to calculate the partition coefficients and ionizationconstants of the components. From these data, together withinfrared absorption spectra of selected tubes, tentative conclusions could be drawn as to the structure of some of the components before any isolation work was done. Major constituentswere isolated by multiple contact extraction procedures alsobased on the partition data. The extinction coefficients of thepure substances were determined, and these values permitted aprecise determination of the amounts of the constituents in the
(13)
(15)
(14)13
k1 + 2A2[HA]'. K
1 + [H+]
k'e ke u:k'd = kd K e
k'
1216 ANALYTICAL CHEMISTRY
Table V. Types of Cornpourids Studied by Countercurrent Distribution
original fraction. Whenever there was doubt about the purityof an isolated compound, a homogeneity test (25) was carriedout,as described by Craig et al. (18).
The many points of information, already mentioned, that areavailable from a distribution pattern may be cited among theadvantages of countercurrent distribution. In addition to these,the countercurrent distribution technique wastes no material;all material put into a distribution machine can be recoveredquantitatively. The distribution treatment is a mild one andcan be employed at low temperatures, so that the most sensitivetypes of material can be handled. The distribution techniquerequires, as a rule, little development work; once a suitable solvent system is known, countercurrent distribution can be carriedout immediately and the results interpreted as discussed abovefor example, all that was really needed in the recent applicationef distribution to phenolic compounds was to consult a handbookto select the appropriate buffers.
With neutral compounds, the search for a suitable solvent system may be prolonged. This may be construed as a drawbackto the use of the method; however, an amazing variety of immiscible solvent systems exists. Any work on critical-solution temperature phenomena, for instance. will divulge a number of unusual systems (22).
The necessity for working at low concentration in order toapproach ideal conditions is a disadvantage of the distributionmethod. Various means of circumventing this difficulty havebeen employed (13). If a distribution machine with a large
SCOPE. ADVANTAGES. AND LIMITATIONS OFCOUNTERCURRENT DISTRIBUTION
Countercurrent distribution is a fractionation technique thatcan be applied with equal facility to the most diverse substances.Its wide scope is evident from the list of compounds for which ithas yielded valuable qualitative information (Table V). Conspicuously absent from this list are aliphatic hydrocarbons, aldehydes, ketones, and esters. Whether countercurrent distributionwill prove useful for these classes of compounds is a questionwhich cannot be answered until appropriate investigations havebeen made. Published reports on the countercurrent separationof mercaptans also are lacking; however, data in the literatureon the partition coefficients of alkyl mercaptans (72) leave nodoubt that homologous members of this class of compounds canbe separated and analyzed.
Unfortunately, the quantitative aspects of countercurrent distribution have been utilized in comparatively few instances.This technique is eminently suitable for quantitative as well asqualitative analysis of mixtures. For routine quantitative work,it is necessary to obtain only one complete distribution curve fora given series of analyses; thereafter the analyses can be confinedto a few tubes. From work done at the Bureau of Mines, itappears that the distribution method is particularly applicableto the quantitative analysis of isomers and homologs when usedin conjunction with ultraviolet and infrared spectral measurements(71).
number of units is available, the sample can be divided and placedamong several tubes at the start with no loss in resolution orsignificant interference with interpretation of the distributionpattern. Samples of 20 to 30 grams are used regularly in the22Q-tube Craig machine. Preliminary fractionation in largeseparatory funnels has also been used for increasing the quantityof material treated.
The possibilities for separation in regions of high concentrationsshould be explored. Certainly, ideal conditions that result insymmetrical distribution curves and precise mathematical analysis can be sacrificed for the sake of utility. If distribution bandsare skewed instead of symmetrical, the separation is no less satisfactory, provided that the bands are well separated.
The customary countercurrent distribution procedure is carried out in equilibrium stages. Increased resolution may bepossible by operating under conditions of disequilibrium. Thisaspect is being explored by Craig (.4).
The complexity of the mixtures that can be treated by thecountercurrent distribution method is limited by the number ofextracting units in the distribution instrument. For example,with the 54-tube instrument, a maximum of about four or fivecomponents can be segregated into definite bands. However, ifthe partition coefficients of the components are very close to eachother, even fewer components can be distinguished because ofsevere overlapping of the distribution bands. The shape of thedistribution pattern will thus signal the need for greater resolution, which can be accomplished by a number of alternativeprocedures already discussed.
Recent Applications. The first extensive application ofcountercurrent distribution dealt with such complex molecules asthe antimalarials and penicillins rather than with simple substances (14, 17,59). In the past year or two successful effortshave been made to extend its use from the analysis of chemicalsof purely biological interest to simple organic compounds. Thus,it has been found a valuable adjunct to precise fractional distillation in unraveling the exceedingly complex mixtures obtainedupon hydrogenation of coal (29). It should prove equally usefulin the examination of coal tar and petroleum chemicals. Recentwork reported by two laboratories (48, 50) indicates its applicability to the chemistry of fats and oils. Marvel and Richards(40) have recently used the countercurrent distribution techniqueto advantage in separating oxidative cleavage products of polymers. Its possible application to the fractionation of polymersmay be foreshadowed in a recent investigation of high-molecularweight phenols in a coal- hydrogenation asphalt (36). It is nottoo much to expect that eventually proteins will also be examinedby this method; the analysis of high-molecular-weight polypeptides has already proved feasible (16). Polypeptides of this typecannot be handled even by the most refined chromatographictechniques (53).
The use of "carriers" for adjustment of unfavorable partitioncoefficients was initiated only recently (42). By this means, the
. distribution technique was extended to such hydrophilic substances as streptomycin (42, 46, 56) and heparin (43).
The possibility of employing countercurrent distribution forthe study of tautomerism is a new development. From evidencebased on countercurrent distribution studies, Titus and Fried(61) demonstrated that streptomycin exists in several tautomericmodifications, the relative proportions of which depend on thepH.
No work has been reported on the countercurrent distributionof inorganic compounds. Very likely, some of the recent strikingseparations in this field (61, 62) that were achieved by partitionchromatography on paper and by ion exchange resins could beduplicated in liquid-liquid extraction. Whether any practicaladvantage would be gained by the extension of countercurrentdistribution to this field is another matter. A chromatographictube can be set up in any laboratory, but distribution separationsof great sensitivity require special equipment. On the other
Aromatic amines (26)Heterocyclic bases (27, 58)Antimalarial bases (14, 18, 59)Veratrine alkaloids (23)Polynuclear hydrocarbons (15,24)Azulene hydrocarbons (45)N ucleotides (33)Heparin (43)Vitamins
Biotin (8)Hormones
Pituitary oxytocic factor (38)
Fatty acids (3, 48)Amino acids (16)Aromatic acids (34, 47)Polypeptides (16, 70)Phenols (27, 28, 64)Antibiotics
Penicillins (5, 6, 17)StreptomycIns (42,46,56,60,61)Xanthornycins (55)
VOL U M E 23, N O. 9, S E PTE M B E R 1 95 1
hand, the latter procedure is simpler in theory and interpretationand is not subject to as many variables. In the selection of thepreferred fractionation technique in any given instance, it seemsbest to base the decision on the properties of the compounds tobe treated and on the particular type of information desired.
ACKNOWLEDGMENT
The author wishes to thank L. C. Craig for many helpful discussions.
BIBLIOGRAI'HY
(1) Archibald, R C., J. Am. Chem. Soc., 54, 3178 (1932).(2) Arnold, R. T., and Richter, J., Ibid., 70, 3505 (1948).(3) Atchley, W. A., J. Bioi. Chem., 176, 123 (1948).(4) Barry, G. T., Sato, Y., and Craig, L. C., Ibid.• 174, 209 (1948).(5) tus., p. 221.(6) Bartels, C. R, and Dolliver, M. A., J. Am. Chem, Soc. 72 11
(1950). ' ,(7) Bartels, C. R., and Kleiman, G., Chem. Eng. Progress, 45, 589
(1949).(8) Bowden, J. P., and Peterson, W. H., J. Bioi. Chem., 178, 533
(1948).(9) Bush, M. T., and Denson, P. M., ANAL. CHEM., 20, 121 (1948).
(10) Bush, M. T., Goth, A., and Dickison, H. L., J. Pharmacal.Exptl. Therap., 84, 262 (1945 .
(11) Cornish, R. E., Archibald, R C., Murphy, E. A., and Evans,H. M., Ind. Eng. Chem., 26, 397 (1934).
(12) Craig, L. C., J. Bioi. Chem., 155, 519 (1944).(13) Craig, L. C., and Craig, D., in Weissberger, ed., "Technique of
Organic Chemistry," Vol. III, Chap. IV New York Inter-science Publishers, 1950. ' ,
(14) Craig, L. C., Golumbic, C., Mighton, H., and Titus, E., J. Bioi.Chem., 161,321 (1950). .
(15) Craig, L. C., Golumbic, C., Mighton, H., and Titus, E., Science,103,587 (1946).
(16) Craig, L. C., Gregory, J. D., and Barry, G. T., Cold Spring Harbor Symp., 14,24 (1950).
(17) Craig, L. C., Hogeboom, G. H., Carpenter, F. H., and du Vigneaud, V., J. Bioi. Chem., 168, 665 (1947).
(18) Craig, L. C., Mighton, H., Titus, E., and Golumbic, C., ANAL.CHEM., 20, 134 (1948).
(19) Craig', L. C., and Post, H. 0., Ibid., 21, 500 (1949).(20) Dijck, W. J. D. van, and Schaafsma, A., U. S; Patent 2,245,945
(1941).(21) Fieser, L. F., Ettlinger, M. G., and Fawaz, G., J. Am. Chem.
Soc., 70, 3228 (1948).(22) Francis, A. W., Ind. Eng. Chem., 36, 764 (1944).(23) Fried, J., White, H. L., and Wintersteiner, 0., J. Am. Chem,
Soc., 71, 3260 (1949).(24) Golumbic, C., ANAL. CHEM., 22, 578 (1950).(25) Golumbic, C., J. Am. Chern, Soc., 71, 2627 (1949).(26) Golumbic, C., and Goldbach, G., Ibid., 73, 3966 (1951).(27) Golumbic, C., and Or chin, M., Ibid., 72, 4145 (1950).(28) Golumbic, C., Orchin, M., and Weller S., Ibid., 71, 2624 (1949).(29) Golumbic, C., Woolfolk, E. 0., Friedel, R A., and Orchin, M.,
Ibid., 72, 1939 (1950).(30) Gross, P. M., Chem. Rev., 13, 91 (1933).(31) Guinot, H. M., and Chassaing, P., U. S. Patent 2,437,519 (1948).(32) Hill, in Taylor, ed., "Treatise on Physical Chemistry," 2nd ed.,
p. 467, New York, D. Van Nostrand Co., 1930.(33) Hogeboom, G. H., and Barry, G. T., J. Bioi. Chem., 176, 935
(1948).(34) Hogeboom, G. H., and Craig, L. C., Ibid., 162, 363 (1946).
1217
(35) Hunter, T. G., and Nash, A. W., Ind. Eng. Chem., 27, 836(1935).
(36) Husaek, R, and Golumbic, C., J. Am. Chem, Soe., 73, 1567 (1951).(37) Jantzen, E .• "Dasfractionierte Distillieren und das fractionierte
Verteilen," Dechema Monographic, Vol. V, No. 48, p. 81,Berlin, Verlag Chemie, 1932.
(38) Livermore, A. H .• and du Vigneaud, V., J. Bioi. Chem., 180, 365(1949).
(39) Martin, A. J. P., and Synge, R L. M., Biochem, J., 35, 1358(1941).
(40) Marvel, C. S., and Richards, J. C., ANAL. CHEM., 21, 1480(1949).
(41) Nichols, P. L., Ibid., 22, 915 (1950).(42) O'Keefe, A. E., Dolliver, M. A., and Stiller, E. T., J. Am. Chem,
Soc., 71, 2452 (1949).(43) O'Keefe, A. E., Russo-Alesi, F. M., Dolliver, M. A., and Stiller,
E. T., Ibid., 71, 1517 (1949).(44) Orcbin, M., and Golumbic, C., Ibid., 71, 4151 (1949).(45) Plattner, A., Heilbronner, E., and Weber, S., Helv. Chim. Acta,
32,574 (1949).(46) Plaut, G. W., and McCormack, D. R, J. Am. Chem, Soc., 71
2264 (1949). . '(47) Rudkin, G. 0., and Nelson, J. M., tua.. 69, 1470 (1947).(48) Sato, Y., Barry, G. T., and Craig, L. C., J. BioI. Chem., 170,501
(1947).(49) Scheibel, E. G., Chern, Eng. Progress, 44, 681 (1948).(50) Scholfield, C. R., Dutton, H. J., Tanner, F. W., Jr., and Cowan,
J. C., Am. Oil Chemists' Soc., 25, 368 (1948).(51) Smith, E. L., and Page, J. E., J. Soc. Chem, Ind. (London), 67,
48 (1948).(52) Spedding, F. H., Voight, A. F., Gladrow, E. M., and Sleight,
N. R, J. Am. Chem, Soc., 69, 2777 (1947).(53) Stein, W. H., and Moore, S., Cold Spring Harbor Symp., 14, 179
(1950).(54) Stein, W. H., and Moore, S., J. Bioi. Chem., 176,337 (1948).(55) Stene, S., Ark. Kem, Mineral. Geol., 18H, No. 18 (1944).(56) Swart, E. A., J. Am. Chem. Soc., 71, 2942 (1949).(57) Thorne, C. B., and Peterson, W. H., J. Bioi. Chem., 176, 413
(1948).(58) Tinker, J. F., and Brown, G. B., Ibid., 173,585 (1948).(59) Titus, E. 0., Craig, L. C., Golumbic, C., Mighton, H. R.,
, Wempen, 1. M., and Elderfield, R C., J. Ora. Chem., 13, 39(1948).
(60) Titus, E. 0., and Fried, J., J. Bioi. Chem., 168, 393 (1947).(61) Ibid., 174,57 (1948).(62) Tompkins, E. R, Khym, J. X., and Cohn, W. E., J. Am. Chem.
Soc., 69, 2769 (1947).(63) Tsai, K. R, and Fu, Y., ANAL. CHEM., 21, 818 (1949).(64) Warshowsky, B., and Schantz, E. J., Ibid., 20, 951 (1948).(65) Watanabe, S., and Morikawa, K., J. Soc. Chern: Ind., Japan, 36,
585B (1933).(66) Weizmann, C., Brit. Patent Application 4346/43.(67) Weizmann, C., Bergmann, E., Chandler, E. F., Steiner. H.,
Sulzbacher, M., and Zimkin, E., J. Soc. Chem. Ind. (London),67, 203 (1948).
(68) Werkman, C. H., IND. ENG. CHEM., ANAL. ED., 2, 302 (1930).(69) Williamson, B., and Craig, L. C., J. Bioi. Chem.,16B, 687 (1947).(70) Wooley, D. W.,Ibid., 179,593 (1949).(71) Woolfolk, E. 0., Golumbic, C., Friedel, R A., Orchin, M., and
Storch, H. H., Bur. Mines Bull. 487 (in press).(72) Yabroff, D. L., Ind. Eng. Chem., 32, 950 (1940).(73) Yabroff, D. L., and White, E. R., Ibid., 32, 950 (1940).
RECEIVED September 2, 1950. Presented before the Division of Physicaland Inorganic Chemistry, Symposium on Analytical Methods Based onHeterogeneous Equilibria, at the 118th Meeting of the AMERICAN CHEMICALSOCIETY, Chicago, III.
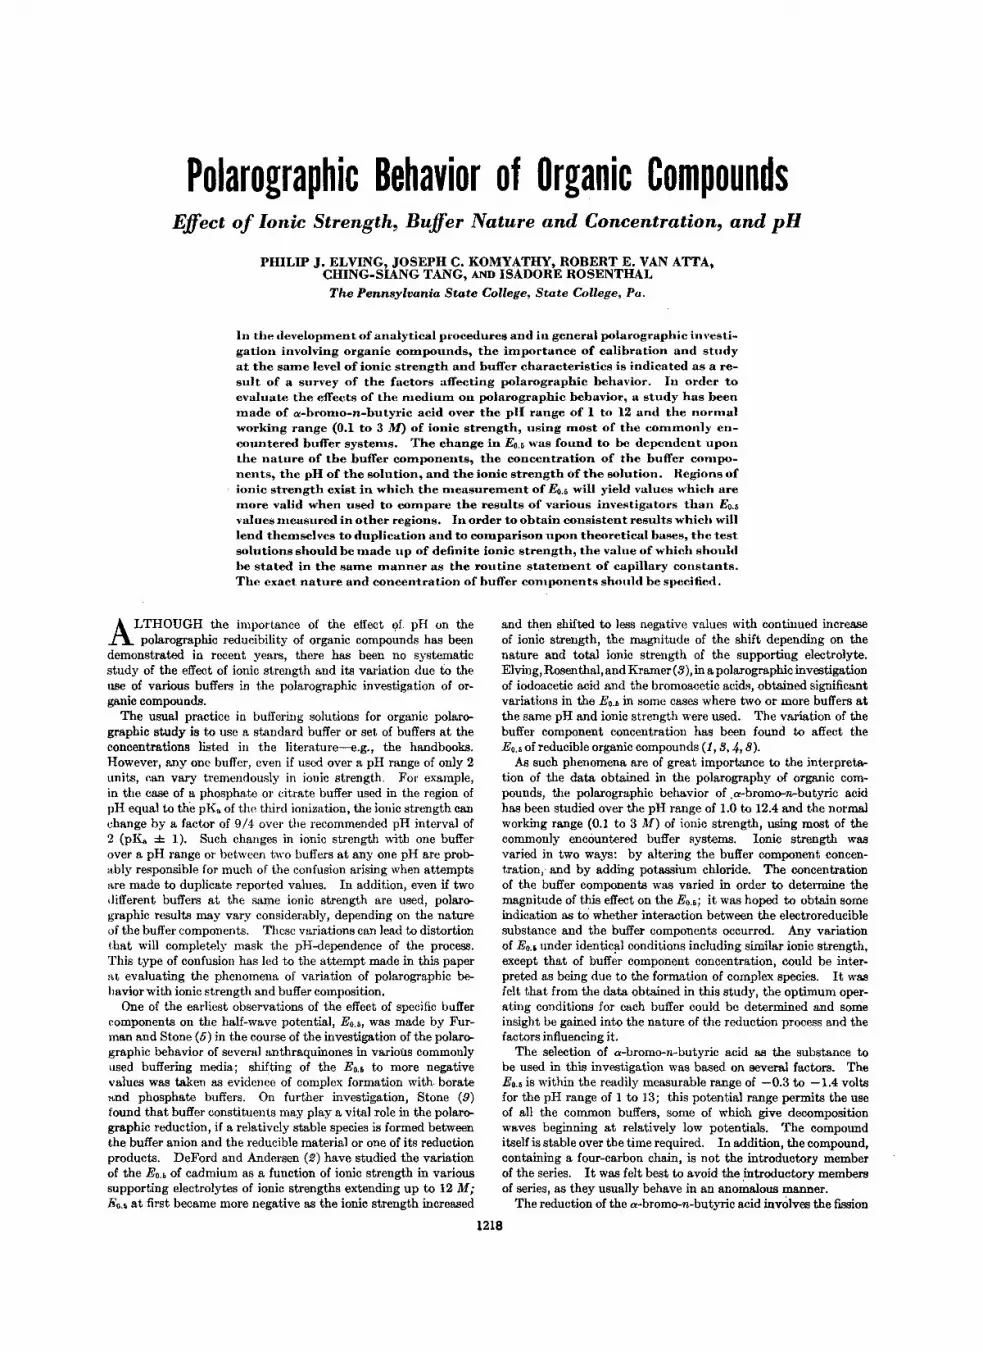
Polarographic Behavior of Organic CompoundsEffect of Ionic Strength, Buffer Nature and Concentration, and pH
PHILIP J. ELVING, JOSEPH C. KOMYATHY, ROBERT E. VAN ATTA,CHING-SIANG TANG, AND ISADORE ROSENTHAL
The Pennsylvania State College, State College, Pa.
In the developm.ent of analytical puooeduees and in general polarographic investigation involving organic com.pounds, the importance of calibration and studyat the sam.e level of ionic strength and buffer characteristics is indicated as a resuIt of a survey of the factors affecting polarographic behavior. In order toevaluate the effects of the m.edium on polarographic behavior, a study has beenmade of a-bromo-n-butyric acid over the pH range of 1 to 12 and the norm.alworking range (0.1 to 3 M) of ionic strength, using most of the eornmorrly encountered buffer systems. The change in Eo.s was found to be dependent uponthe nature of the buffer com.ponents, the concentration of the buffer cornponents, the pH of the solution, and the ionic strength of the solution. Regions ofionic strength exist in which the m.easurem.ent of Eo.s will yield values which arerrrore valid when used to compare the results of various investigators than Eo.svalues measured in other regions. In order to obtain consistent results which willlend themselves to dnplication and to comparison upon theoretical bases, the testsolutions should be rnade up of definite ionic strength, the value of which shouldbe stated in the same manner as the routine stuteruenr of capillary constants.Thcl exact nature and concentration of buffer eorrrpcrrerrt.s should be spclcified.
ALTHOUGH the importance of the effect ef. pH on thepolarographic reducibility of organic compounds has been
demonstrated in recent years, there has been no systematicstudy of the effect of ionic strength and its variation due to theUSe of various buffers in the polarographic investigation of organic compounds.
The usual practice in buffering solutions for organic polarographic study is to use a standard buffer or set of buffers at theconcentrations listed in the literature-e-e.g., the handbooks.However, anyone buffer, even if used over a pH range of only 2units, can vary tremendously in ionic strength. For example,in the ease of a phosphate or citrate buffer used in the region ofpH equal to the pK a of the third ionization, the ionic strength canchange by a factor of 9/4 over the recommended pH interval of2 (pIL. ± 1). Such changes in ionic strength with one bufferover a pH range or between two buffers at anyone pH are probably responsible for much of the confusion arising when attemptsare made to duplicate reported values. In addition, even if twodifferent buffers at the same ionic strength are used, polarographic results may vary considerably, depending on the natureof the buffer components. These variations can lead to distortionthat will completely mask the pH-dependence of the process.This type of confusion has led to the attempt made in this paperat evaluating the phenomena of variation of polarographic behavior with ionic strength and buffer composition.
One of the earliest observations of the effect of specific buffercomponents on the half-wave potential, Eo.5, was made by Furman and Stone (5) in the course of the investigation of the polarographic behavior of several anthraquinones in various commonlyused buffering media; shifting of the E o.s to more negativevalues was taken as evidence of complex formation with. borateand phosphate buffers, On further investigation, Stone (9)found that buffer constituents may playa vital role in the polarographic reduction, if a relatively stable species is formed betweenthe buffer anion and the reducible material or one of its reductionproducts. DeFord and Andersen (2) have studied the variationof the Eo.s of cadmium as a function of ionic strength in varioussupporting electrolytes of ionic strengths extending up to 12 M;Eo.s at first became more negative as the ionic strength increased
and then shifted to less negative values with continued increaseof ionic strength, the magnitude of the shift depending on thenature and total ionic strength of the supporting electrolyte.Elving, Rosenthai, and Kramer (3), in a polarographic investigationof iodoacetic acid and the bromoacetic acids, obtained significantvariations in the Eo.• in some cases where two or more buffers atthe same pH and ionic strength Wereused. The variation of thebuffer component concentration has been found to affect theEo.sof reducible organic compounds (1,3,4,8).
AB such phenomena are of great importance to the Interpretation of the data obtained in the polarography of organic compounds, the polarographic behavior of ,a-bromo-n--butyric acidhas been studied over the pH range of 1.0 to 12.4 and the normalworking range (0.1 to 3 M) of ionic strength, using most of thecommonly encountered buffer systems. Ionic strength wasvaried in two ways: by altering the buffer component concentration, and by adding potassium chloride. The concentrationof the buffer components was varied in order to determine themagnitude of this effect on the Eo.•; it was hoped to obtain someindication as to whether interaction between the electroreduciblesubstance and the buffer components occurred. Any variationof Eo.i under identical conditions including similar ionic strength,except that of buff~r component concentration, could be interpreted as being due to the formation of complex species. It wasfelt that from the data obtained in this study, the optimum operating conditions for each buffer could be determined and someinsight be gained into the nature of the reduction process and thefactors influencing it.
The selection of a-bromo-n-butyric acid as the substance tobe used in this investigation was based on several factors. TheEo.• is within the readily measurable range of -0.3 to -1.4 voltsfor the pH range of 1 to 13; this potential range permits the useof all the common buffers, some of which give decompositionwaves beginning at relatively low potentials. The compounditself is stable OVer the time required. In addition, the compound,containing a four-carbon chain, is not the introductory memberof the series. It was felt best to avoid the introductory membersof series, as they usually behave in an ano~ous manner.
The reduction of the o-bromo-n-butyric acid involves the fission
1218
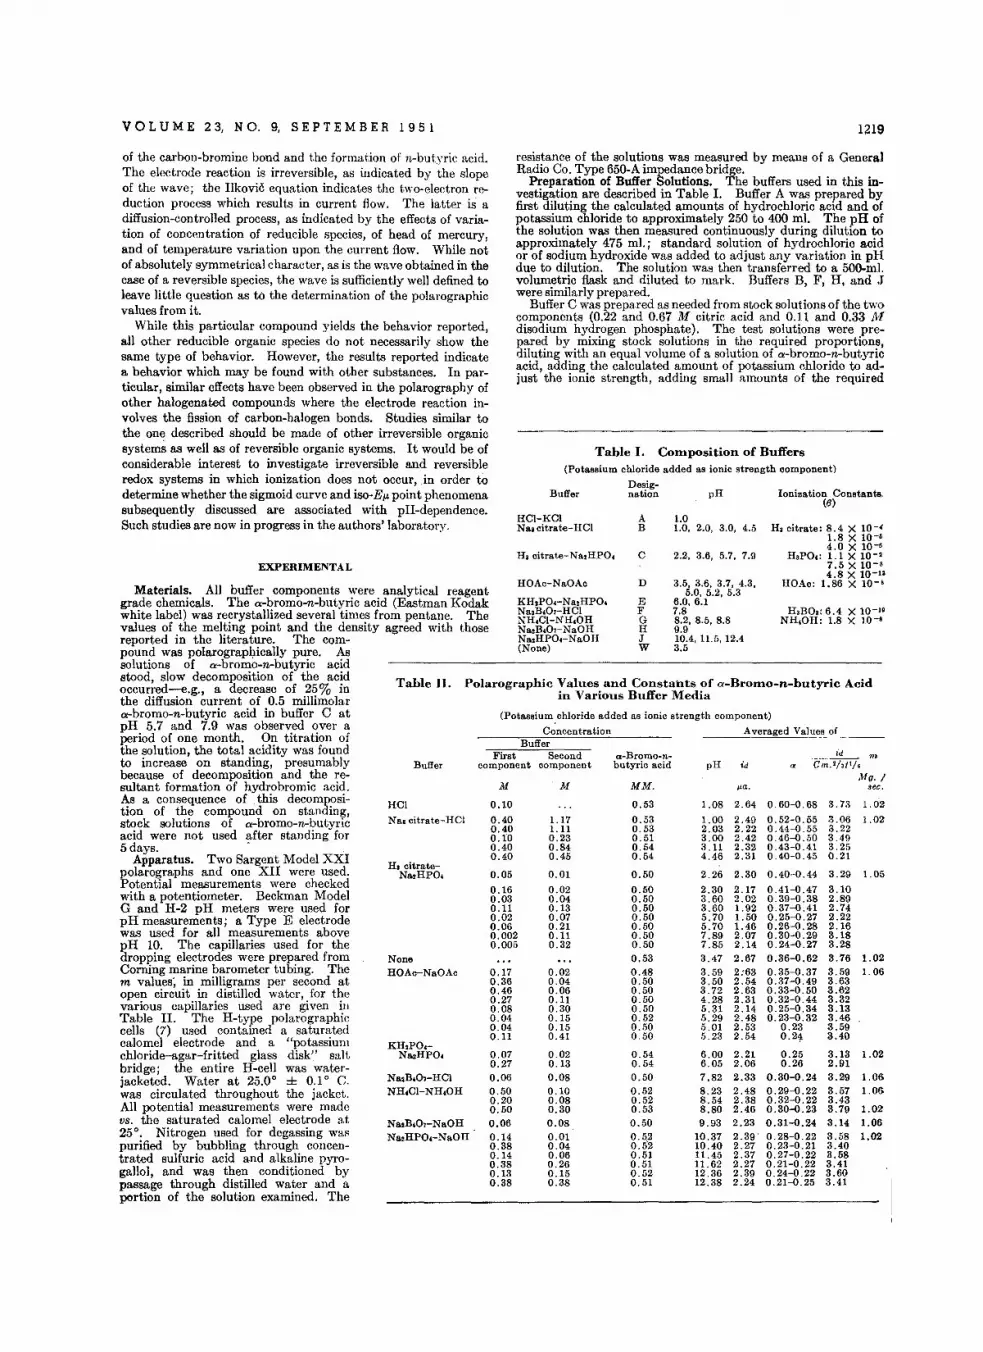
VOL U M E 23, NO.9, S E PTE M B E R 1951 1219
1.05
1.02
1.02
1.02
1.021.06
1.061.06
1.02
1.061.02
. .. _'_·d_ mem.'ht'j.
Mo. jsec.
0.60-0.68 3.73
0.52-0.55 3.060.44-0.55 3.220.46-0.50 3.490.43-0.41 3.250.40-0.45 0.21
0.40-0.44 3.29
0.41-0.47 3.100.39-0.38 2.890.37-0.41 2.740.25-0.27 2.220.26-0.28 2.160.30-0.29 3.180.24-0.27 3.280.36-0.62 3.760.35-0.37 3.590.37-0.49 3.630.33-0.50 3.620.32-0.44 3.320.25-0.34 3.130.23-0.32 3.46
0.23 3.590.21- 3.40
0.25 3.130.26 2.91
0.30-0.24 3.290.29-0.22 3.570.32-0.22 3.430.30-0.23 3.790.31-0.24 3.140.28-0.22 3.580.23-0.21 3.400.27-0.22 3.580.21-0.22 3.410.24-0.22 3.600.21-0.25 3.41
pHa-Bromo-nbutyric acid
HCI-KCI A 1.0Na, citrate-HCI B 1.0. 2.0, 3.0, 4.5 H, citrate: 8.4 X 10-<
1.8 X 10-'4.0 X 10-'
H, citrate-Na,HPO. C 2.2, 3.6, 5.7, 7.9 R,PO" 1. 1 X 10-'7.5 X 10-'4.8 X 10-"
HOAc-NaOAc D 3.5, 3.6, 3.7, 4.3, HOAc: 1.86 X 10-'5.0, 5.2, 5.3
KH,PO.-Na,HPO. E 6.0,6.1Na,B.O,-HCI F 7.8 R,BO,: 6.4 X 10⁻¹⁰
NH.CI-NH.OH G 8.2, 8.5, 8.8 NH.OH: 1.8 X 10-'Na,B.O,-NaOH H 9.9N.,HPO.-NaOH J lOA, 11.5, 12.4(None) W 3.5
resistance of the solutions was measured by means of a GeneralRadio Co. Type 650-A impedance bridge.
Preparation of Buffer Solutions. The buffers used in this investigation are described in Table 1. Buffer A was prepared byfirst diluting the calculated amounts of hydrochloric acid and ofpotassium chloride to approximately 250 to 400 ml, The pH ofthe solution was then measured continuously during dilution toapproximately 475 ml.; standard solution of hydrochloric acidor of sodium hydroxide was added to adjust any variation in pHdue to dilution. The solution was then transferred to a 50Q-ml.volumetric flask and diluted to mark. Buffers B, F, H, and Jwere similarly prepared.
Buffer C was prepared as needed from stock solutions of the twocomponents (0.22 and 0.67 M citric acid and 0.11 and 0.33 JYEdisodium hydrogen phosphate). The test solutions were prepared by mixing stock solutions in the required proportions,diluting with an equal volume of a solution of a-bromo-n-butyricacid, adding the calculated amount of potassium chloride to adjust the ionic strength, adding small amounts of the required
Table I. Composition of Buffers(Potassium chloride added as ionic strength component)
Desig-Buffer nation pH Ionization Constants.
(8)
(Potassium chloride added as ionic strength component)
Concentration Averaged Value."-ofBuffer
M M MM. ua,
0.10 0.53 1.08 2.64
0.40 1.17 0.53 1.00 2.490.40 1.11 0.53 2.03 2.220.10 0.23 0.51 3.00 2.420.40 0.84 0.54 3.11 2.320.40 0.45 0.54 4.46 2.31
0.05 0.01 0.50 2.26 2.30
0.16 0.02 0.50 2.30 2.170.03 0.04 0.50 3.60 2.020.11 0.13 0.50 3.60 1.920.02 0.07 0.50 5.70 1.500.06 0.21 0.50 5.70 1.460.002 0.11 0.50 7.89 2.070.005 0.32 0.50 7.85 2.14
0.53 3.47 2.670.17 0.02 0.48 3.59 2:630.36 0.04 0.50 3.50 2.540.46 0.06 0.50 3.72 2.630.27 0.11 0.50 4.28 2.310.08 0.30 0.50 5.31 2.140.04 0.15 0.52 05.29 2.480.04 0.15 0.50 5.01 2.530.11 0.41 0.50 5.23 2.54
0.07 0.02 0.54 6.00 2.210.27 0.13 0.54 6.05 2.060.06 0.08 0.50 7.82 2.330.50 0.10 0.52 8.23 2.480.20 0.08 0.52 8.54 2.380.50 0.30 0.53 8.80 2.46
0.06 0.08 0.50 9.93 2.23
0.14 0.01 0.5,2 10.37 2.390.38 0.04 0.52 10.40 2.270.14 0.06 0.51 11.45 2.370.38 0.26 0.51 11.62 2.270.13 0.15 0.52 12.36 2.390.38 0.38 0.51 12.38 2.24
First Secondcomponent component
Polarographic Values and Constahts of «-Brorno-rr-buf.yr!c Acidin Various Buffer Media
Buffer
Table II.
Na. citrate-HCI
H, citrateNaaHPO.
HCI
NoneHOAc-NaOAc
Na,B.o,-RCINR.CI-NR.OH
Na,B.O,-NaOHNa,RPO.-NaOH
EXPERIMENTAL
of the carbon-bromine bond and the formation of n-butyric acid.The electrode reaction is irreversible, as indicated by the slopeof the wave; the Ilkovic equation indicates the two-electron reduction process which results in current flow. The latter is adiffusion-controlled process, as indicated by the effects of variation of concentration of reducible species, of head of mercury,and of temperature variation upon the current flow. While notof absolutely symmetrical character, as is the wave obtained in thecase of a reversible species, the wave is sufficiently well defined toleave little question as to the determination of the polarographicvalues from it.
While this particular compound yields the behavior reported,all other reducible organic species do not necessarily show thesame type of behavior. However, the results reported indicatea behavior which may be found with other substances. In particular, similar effects have been observed in the polarography ofother halogenated compounds where the electrode reaction involves the fusion of carbon-halogen bonds. Studies similar tothe one described should be made of other irreversible organicsystems as well as of reversible organic systems. It would be ofconsiderable interest to investigate irreversible and reversibleredox systems in which ionization does not occur, in order todetermine whether the sigmoid curve and iso-Ep. point phenomenasubsequently discussed are associated with pH-dependence.Such studies are now in progress in the authors' laboratory.
Materials. All buffer components were analytical reagentgrade chemicals. The a-bromo-n-butyric acid (Eastman Kodakwhite label) was recrystallized several times from pentane. Thevalues of the melting point and the density agreed with thosereported in the literature. The com-pound was polarographically pure. Ai>solutions of e-bromo-s-butyric acidstood, slow decomposition of the acidoccurred--e.g., a decrease of 25% inthe diffusion current of 0.5 millimolara-bromo-n-butyric acid in buffer C atpH 5.7 and 7.9 was observed over aperiod of one month. On titration ofthe solution, the total acidity was foundto increase on standing, presumablybecause of decomposition and the resultant formation of hydrobromic acid.Ai> a consequence of .this decomposition of the compound on standing,stock solutions of e-bromo-n-butyricacid were not used after standing for5 days. 0 •
Apparatus. Two Sargent Model XXIpolarographs and one XII were used.Potential measurements were checkedwith a potentiometer. Beckman ModelG and H-2 pH meters were used forpH measurements; a Type E electrodewas used for all measurements abovepH 10. The capillaries used for thedropping electrodes were prepared fromCorning marine barometer tubing. Them values; in milligrams per second atopen circuit in distilled water, for thevarious capillaries used are given illTable II. The H-type polarographiccelIs (7) used contained a saturatedcalomel electrode and a "potassiumchloride-agar-fritted glass disk" saltbridge; the entire H-ceIl was waterjacketed. Water at 25.0° ± 0.1° C.was circulated throughout the jacket.All potential measurements were madeV8. the saturated calomel electrode at25°. Nitrogen used for degassing waspurified by bubbling through concentrated sulfuric acid and alkaline pyro-gallol, and was then conditioned bypassage through distilled water and aportion of the solution examined. The

Fig
ure
1.V
ari
ati
on
inE
o.s
wit
hIo
nic
Str
en
gth
,p
H,
Bu
ffer,
an
dB
uff
erC
om
po
nen
tC
on
cen
trati
on
Lett
ers
co
rresp
on
dto
bu
ffer
desi
gn
ati
on
so
fT
ab
leI.
Nu
rneri
cal
valu
es
co
rresp
on
dto
pH
of
solu
tio
nele
ctr
oly
zed
.S
oli
dli
nes
inan
yp
art
icu
lar
set
ind
icate
hig
her
co
ncen
trati
on
of
main
bu
ffer
eo
mp
on
en
sth
an
inre
su
lts
co
nn
ecte
db
yd
ash
ed
lin
e.
en >-i !:l:l ><.... N ~ :.;l Z > t-' >< >-i ... o > t-' o :x: M ~
3.5.~
1.0 T 2
.03.
14
.55
.3
3.01
t-II
11
\13
.0
c::J='
, , ,6.
1
2.51
1-II
II
II, , , , , ,
6.0
,~
, ,,
2.01
1-<=
?I
I
fil+I
1'T
', ,
,,
f-!II
I/1
,, \
,,
,\ ,
,\
,~
,,
1.51~
.,
c:s
II
\A
BB
BW
DOB
0B
o0
EE
~J
•
1,
\I
\\
,,
\I
,\
I\
I,
5.7
\
IT
"I.OI~
,I
\
I\
I\
I\
3.6
\~
T\
I
4='
\I
\,
~I
\,
"*\
, ,C
GI
CC
\
~J~
\t\
\ \
+\ \
5.7
94
.3
oIt
1.0
2.2
2.2
5.0
5.2
II
,I
,0
.30
.40
.50
.60
.70
.8
E0
.5
0.9
1.0.
1.1
1.2
1.3
1.4

VOL U M E 23, N O. 9, SE PTE M B E R 1 9 5 1 1221
Figure 2. 'Variation of pH with Eo.5 at Known Values of Ionic Strength
Curves are identified by Roman n\nDcrals; values in parentheses indicat.e ionic strength. Broken ~ines indic~teprobable location of curves. Short lines at pH 8 to 9 indicate values in the NH4C!-NH40H hufl'c:.: sys'tclD. LineI represents low eonceutration of tnain buffer co:rnponent; all others represent hIgh concentratIons.
stock solutions needed to adjust the test solution to the desiredpH, and diluting to volume. .
Buffer D was prepared by dissolving the calculated amountsof sodium acetate and potassium chloride in 450 m!. of distilledwater. The pH was measured continuously while standardacetic acid was added until the desired pH was obtained. Thesolution was then diluted to 500 ml.
Buffer E was prepared by diluting the necessary amounts ofthe two components and of potassium chloride to 400 ml. ThepH of the solution was then adjusted by adding stock solution ofthe requisite components. On dilution to 475 m!., the pH wasagain adjusted. The solution was then diluted to 500 m!.Buffer G was similarly prepared.
Procedure. Solutions for electrolysis were prepared bypipetting 5 m!. of 10 millimolar a-bromo-n-butyric acid stock solution into a 10Q-m!.volumetric flask and diluting to the mark withthe buffer being investigated. The electrolysis cell was rinsedwith a portion of this solution and another portion was added
The change in Eo.s ofa-bromo-n-butyric acidwas found to be dependent upon the nature ofthe buffer components,the -concentra.tion of thebuffer components, thepH of the solution, andthe ionic strength of thesolution. In general, avariation in the concentration of the buffer components of anyonebuffer system caused noappreciable difference inthe slope of the curveof Eo.s vs. ionic strength;this slope shows a slightbut systematic changewith variation of pHe.g., buffers Band D ofFigure 1.
Ionic .strength generally seemed to haveonly slight if any effect
DISCUSSION
where J10 is the ionicstrength, M is the actualcalculated concentrationof the ion in moles perliter, and z is the numberof unit charges on theion. Where the concentration of a particularspecies was found to bevery slight, as in the caseof the a - b rom 0 - nbutyric acid, the contribution of such specieswas neglected in the calculation of the ionicstrength.
12.011.010.09.0
11(0.8)
The experimental results obtained are summarized in Table IIand Figures 1 and 2. Complete data containing individual averaged.results may be obtained from the authors.
Calculation of Ionic Strength. Values of the ionic strengthwere calculated on the basis of the constants given in Table 1.Using the values of the ionization constants of the particularbuffer component being considered, the concentrations of the
various ionic species derived from the mainbuffer component werecalculated. After determination of the concentrations of the ions, theionic strength was calculated by the relation:
to the final bubbler in the nitrogen purification train. Nitrogenwas then passed through the solution for 10 minutes, after whichthe tube was withdrawn and nitrogen allowed to pass over thesurface of the solution during electrolysis. Values of t, the lifetime of the mercury drop, were determined for the limiting current portion of each curve. The pH of the test solution wasmeasured after electrolysis. The polarographic values and constants were calculated in the usual manner.
8.0
__---<1---,-.-- 1(0.8)
/''V
/,I'
Iii,Iii
8.0. H 7.0
PD.O4.03.02.01.0
I.S
u
1.2
1.0
0.4
0.9
0.11
0.7
0.8
0..

1222
on the diffusion current constant. There is a variation of thisconstant with pH, which may be associated with a change in themagnitude of the diffusion coefficient in solutions of differentbuffer systems or buffer components.
Effect of Ionic Strength. Variation in ionic strength had amarked effect on the E o.cof .a-bromo-n-butyric acid for most of thebuffers investigated. In general, buffers used in the alkaline region caused a greater shift of E o.c with change in ionic strengththan buffers used in the acidic region. While an increase in ionicstrength shifted Eu to more negative values in the low pH region,the opposite was found to be true in the remaining pH region.With the sodium citrate-hydrochloric acid buffer at pH 2.0 andwith the acetic acid-sodium acetate buffer at pH 3.5 and 3.7,Eu was practically independent of ionic strength. The variation of Eo.cwith ionic strength was not the same with all buffers,nor was the variation uniform over the ionic strength range forevery buffer investigated. With the sodium citrate-hydrochloricacid buffer at pH 1.0, 3.0, 3.1, and 4.5, the hydrochloric acidpotassium chloride buffer at pH 1.0, the acetic acid-sodium acetate buffer at pH 5.3, and the disodium hydrogen phosphatesodium hydroxide buffer at pH 10.4, 11.5, and 12.4, the shift ofEo.cwas appreciable at low ionic strengths but less pronounced asthe ionic strength was increased. With the sodium citratehydrochloric buffer at pH 3.1 and 4.5, as the ionic strength increased, Eo. shifted to more negative values at first and then,with continued addition of potassium chloride to increase theionic strength, shifted to less negative values.
The general shape of the Eo.s V8. ionic strength curves produced by varying ionic strength is in agreement with the resultsobtained for cadmium by DeFord and Andersen (2).
A slight shift was observed in the value of 0", the apparentnumber of electrons involved in the potential-determining step,as the ionic strength of the solution was varied. The value of0" was calculated by means of the relation: E
'/ 4 - E3/ 4 = 0 -,056/0'.
In most cases, the value of a increased as the ionic strength increased. The variation reached a maximum in the unbufferedsolution. In a few cases, the variation of a with ionic strengthwas random. In all cases, a was less than 1, which indicated thatthe reaction at the electrode was irreversible. The calculation ofn in the Ilkovie equation gave a value of 2.
Effect of Buffer Component Concentration. Care was takenthat the concentrations of buffer systems used provided adequatebuffering capacity. Buffer systems were used within the pHranges recommended and, in general, within the pH range ofpKa ± 1. Buffer systems which have been described as beingsluggish in reaching equilibrium were avoided; some questionin this respect has been raised concerning the borate system whichwas investigated, as it has been extensively used in polarographicstudies.
It can be seen from Figure 1 that a variation of the concentration of the buffer component itself will cause a shift in theEo.s even though solutions of equal ionic strength and pH areelectrolyzed. If pH and ionic strength are kept constant and achange in Eo.s still occurs, this change is presumably due to sometype of interaction between the reducible species and the maincomponent of the buffer. This behavior can be noted with several of the buffers investigated. In the case of the sodium citrate-hydrochloric acid and the hydrochloric acid-potassiumchloride buffers, the essential difference between these two buffersat pH 1.0 is the presence of undissociated citric acid in the former.This undissociated citric acid makes no contribution to the ionicstrength. Consequently, the shift of Eo.• to more negative valueswith the sodium citrate-hydrochloric acid buffer is due to someeffect other than that of ionic strength. This effect may possibly be due to some form of interaction. Similar effects havebeen found with other reducible compounds (3).
In order to stress the significance of the experimental data, thefollowing points should be emphasized:
ANALYTICAL CHEMISTRY
In the absence of predominant ionic strength effects, if anyinteraction occurs between the buffer components and the reducible species, the Eo-s will be shifted to more negative values.
At low pH values, a plot of Eo.•V8. ionic strength shows greatercurvature for the lower concentration of the main buffer component, while the opposite is apparently true in respect to thecurvature at high pH values. Depending on the magnitude ofthe shift of Eo.s as a function of the main buffer component concentration and the degree of curvature existing for the high andlow concentrations, the two curves mayor may not intersecyt./as illustrated by buffers D at pH 5.3, E at pH 6.0, and J at prt12.4, and indicated by buffers C at pH 2.2, 3.6, 5.7, and 7.9, andD at pH 3.6 and 5.0.
At the intersection point of all curves on Figure 2, which hasbeen designated as the "iso-B« point," the Eo.s is independent ofionic strength and main buffer component concentration.
In alkaline solution, the increase in ionic strength with increasing pH, due to dissociation of the buffer components to formmore highly charged anions, causes the Eo.s to become less negative; this is opposed to the usual effect of the Eo.s, becomingmore negative as the pH is increased. In the more acidic region, the two effects reinforce each other.
Effect of pH. On plotting Eo.s V8. pH (Figure 2) for lines ofequal ionic strength, a family of S-shaped curves is obtained whichintersect at pH 4.8. This S-shaped relation of Eo.s and pH ischaracteristic of acids (3). The significance of the conunonpoint, the iso-ElL point, is not clear in reference to the fundamentalphysical processes involved; its significance for experimentalwork is evident. At this pH the observed Eo.s is independent ofthe nature of the buffer components and of the ionic strength.Analytical measurement should be made at this pH value unlessother factors--e.g., need to separate Eo.• values-dictate a different pH region.
Behavior in Nonbuffered Solution. Solutions of o-bromo-abutyric acid in distilled water containing potassium chloride butno buffer system were electrolyzed in order to observe the behavior in unbuffered solutions (W in Table I and Figure 1).The pH of these solutions was 3.5. The change in Eo.swith ionicstrength was found to be slight and the Eo.•of o-bromo-n-butyricacid at any ionic strength was less negative than in buffered solutions of equal pH, indicating the lack of interaction betweenelectroactive species and supporting electrolyte component.
CONCLUSION
There are regions (Figure 1) for each buffer over which thechange in Eo.s is relatively slight for a given change in ionicstrength. It is obvious that the measurement of E o.f, in theseranges of ionic strength will yield values which arc more validwhen used to compare the results of various investigators than results obtained at other levels of ionic strength. For the compound used in this investigation, O"-bromo-n-butyric acid, theparticular region of the ionic strength at which to compare Eo.sat any pH is between 1.0 and 1.5, as this region would encompasssections of each curve where the change in Eo.cwith ionic strengthis relatively slight. It is recommended that in future investigations of the polarographic behavior of organic compounds, thetest solutions examined be made up to definite ionic strength, thevalU'e of which should be stated in the same manner as the routinestatement of the capillary constants. Such a procedure wouldincrease the facility of duplication and comparison of results.
Although the present paper does not deal with any specificanalytical methods, the more precise evaluation of several of thefactors affecting the results obtained in observing organic compounds polarographically has emphasized the need of controllingsuch factors when developing an analytical procedure. Theneed is obvious of operating in a region of ionic strength and bufferconcentration where the wave is relatively unaffected by suchfactors. -Where large samples are taken for the determination ofminor components, the effect of the contribution of the sampleto the ionic strength must be considered and a method of calibration used which is at the same level of ionic strength as thatexpected in the actual analytical sample solution.
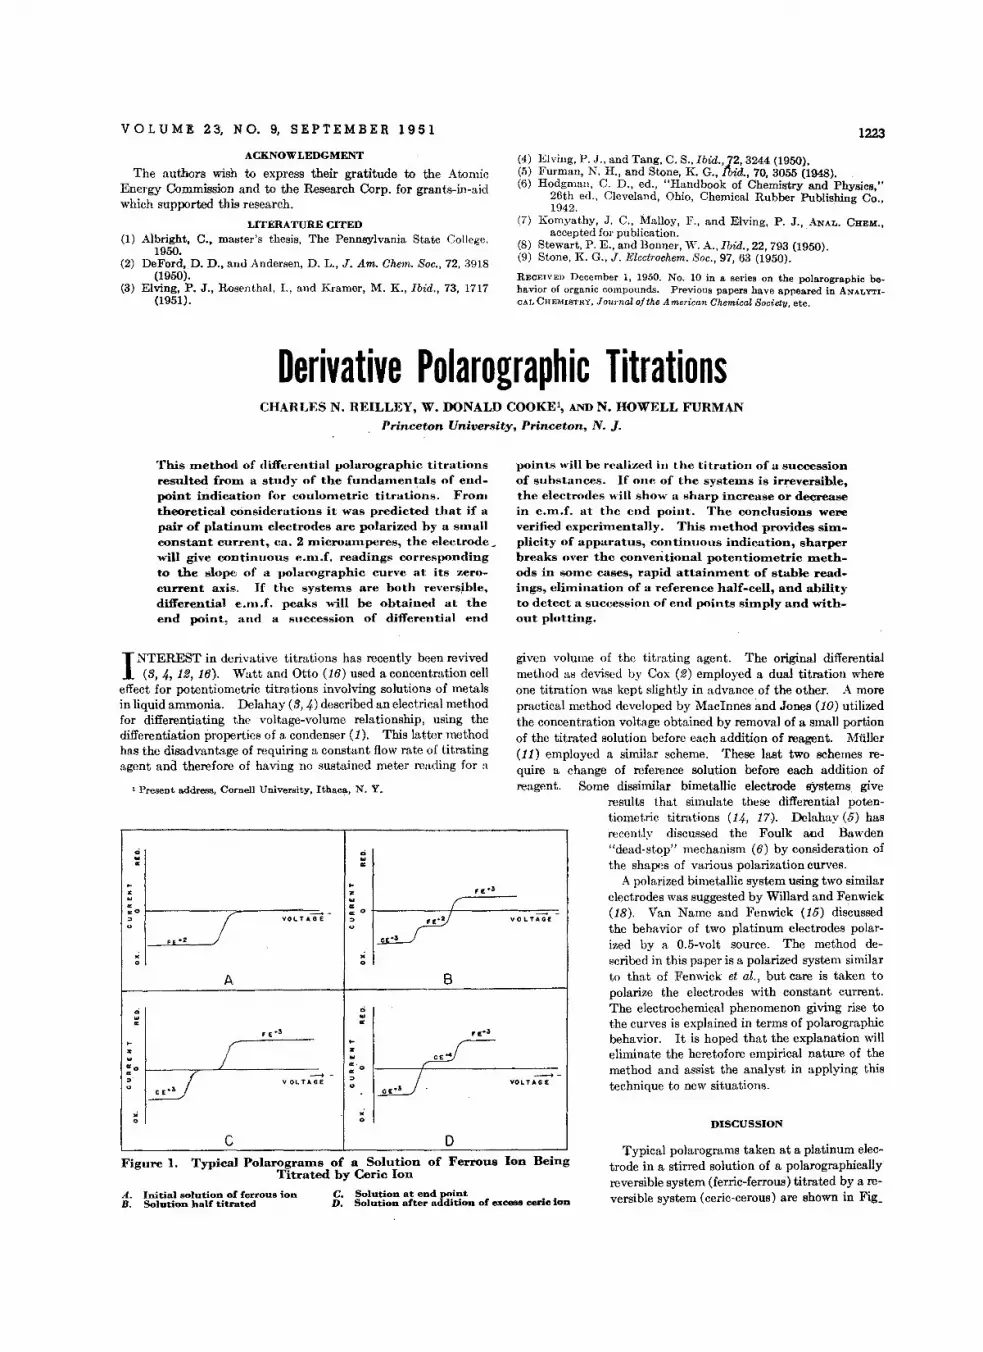
VOL U ME 2 3, N O. 9, SE PTE M B E R 1 9 5 1 1223
ACKNOWLEDGMENT
The authors wish to express their gratitude to the AtomicEnergy Commission and to the Research Corp. for grants-in-aidwhich supported this research.
LITERATURE CITED(1) Albright, C., master's thesis, The Pennsylvania State College,
1950.(2) DeFord,D. D., and Andersen, D. L., J. Am. Chem. Soo., 72, 3918
(1950).(3) Elving, P. J., Rosenthal, 1., and Kramer, M. K., Ibid., 73, 1717
(1951).
(4) Elving, P. ,J., and Tang, C. S.,Ibid., 72, 3244 (1950).(5) Furman, N. n., and Stone, K. G., Ibid., 70, 3055 (1948).(6) Hodgman, C. D., ed., "Handbook of Chemistry and Physics,"
26th ed., Cleveland, Ohio, Chemical Rubber Publishing Co.,1942.
(il Komyathy, J. C., Malloy, F., and Elving, P. J., ANAL. CHEM.,accepted for publication. .
(8) Stewart, P. E., and Bonner, W. A., Ibid., 22,793 (1950).(9) Stone, K. G., J. Electrochem. Soc., 97, 63 (1950).
RECEIVED December I, 1950. No. 10 in a series on the polarographic behavior of organic compounds. Previous papers have appeared in ANALYTI
CAL CHEMISTRY. J ow"nal oj the A merican Chemical Society, etc.
Derivative Polarographic TitrationsCHARI,ES N. REILLEY, W. DONALD COOKEl, AND N. HOWELL FURMAN
Princeton University, Princeton, N. ].
This rrienhod of diffeI'ential polarographic titrationsresulted from a study of the fundamentals of endpoint indication for coulometric titrati~ns. Fromtheoretical cOnsiderations it was predicted that if apair of platinum electrodes are polarized by a smallconstant current, ca. 2 rrricroampcres, tbe electrode_will give continuous e.m .f, readings correspondingto the slope of a polarographic curve at its zerocurrent axis. If the systerns are both reversjble,differential c.m.f. peaks will he obtained at theend point, and a succession of differential end
points will be reaH,,~d in the titration of a successionof substances. If one of the systems is irreversible,the electrodes will show a sharp increase or decreasein e.m.f. at the end point. The conclusions wereverified experimentally. This method provides simplicity of apparatus, continuous indication, sharperbreaks over the conventional potentiometric rnet.hods in some cases, rapid attainment of stable readings, elin1ination of a reference half-cell, and abilityto detect a succession of cnd points simply and without plotting.
Figure 1. Typical Polarogeams of a Solution of Ferrous Ion BeingTitrated by Certc Ion
A.. Initial solution of ferrous ion C. Solution at end point:B. Solution half titrated D. Solution after addition of exeess eerie ion
o
l Present address, Cornell University, Ibhaca, N. Y.
Typical polarograms taken at a platinum electrode in a stirred solution of a polarographicallyreversible system (ferric-ferrous) titrated by a reversible system (oeric-cerous) are shown in Fig;
DISCUSSION
given volume of the titrating agent. The original differentialmethod as devised by Cox (2) employed a dual titration whereone titration was kept slightly in advance of the other. A morepractical method developed by MacInnes and Jones (10) utilizedthe concentration voltage obtained by removal of a small portionof the titrated solution before each addition of reagent. Muller(11) employed a similar scheme. These last two schemes require a change of reference solution before each addition ofreagent. Some dissimilar bimetallic electrode systems give
results that simulate these differential potentiometrie titrations (14, 17.). Delahay (5) hasrecently discussed the Foulk and Bawden"dead-stop" mechanism (6) by consideration ofthe shapes of various polarization curves.
A polarized bimetallic system using two similarelectrodes was suggested by Willard and Fenwick(18). Van Name and Fenwick (15) discussedthe behavior of two platinum electrodes polarized by a O.5-volt source. The method described in this paper is a polarized system similarto that of Fenwick et al., but care is taken topolarize the electrodes with constant current.The electrochemical phenomenon giving rise tothe curves is explained in terms of polarographicbehavior. It is hoped that the explanation willeliminate the heretofore empirical nature of themethod and assist the analyst in applying thistechnique to new situations.
VOLTAGE -
---+ VOLTAGE
Q....~
f E:. 3z.. /'..0..
VOl-TAGE ~ F£·2u
C .."0
B
Q...., E·3 F E+;t..
z..c·
--+ - CO
VOLTAGE~
" CE·;l
~
0
Q..c
~
z..ccO~
"FE'''z, /
~
0
A
Q..c
~
z..:0~.
" C E";'\
..0
C
I NT E REST in derivative titrations has recently been revived(3, 4, 12, 16). Watt and Otto (16) used a concentration cell
effect for potentiometric titrations involving solutions of metalsin liquid ammonia, Delahay (3, 4) described an electrical methodfor differentiating the voltage-volume relationship, using thedifferentiation properties of a condenser (1). This latter methodhas the disadvantage of requiring a constant flow rate of titratingagent and therefore of having no sustained meter reading for a

1224 ANALYTICAL CHEMISTRY
~
:~)0'z..
or ./'
-:" 3
or .' ---+ -" VOLTAGEu
A
~ :1;2 )H3O.z..oror
" ---> -u VOLTAGE
o OH.
B
~
:1
'. JHrz.. (oror
" ?---> -
c y OLTAO E
COH
Figure 3. Polarograrns of IrreversibleSyatern
........
d I,
-dE.-!Es
:....---,-- dE T---......
Q
lIJII:
I-ZlIJ
II:
II: 0 f----;-----:-=--~.jL--7;:,.._-:+__--
:>o
ure 1. A complete treatment of the theory underlying the shape ofthese polarograms is given by Kolthoff and Lingane (9). Figure1, A, is typical of the initial solution of ferrous iron. B shows thepolarogram of the solution when half titrated with eerie ion. Cshows the polarogram at the end point, and D shows the polarogram after excess eerie has been added. The slope of the polarographic curve as it crosses the zero current axis is seen to varyconsiderably during the titration and it is upon this variation thatthis method is based. Initially, the slope is very low, becominglarger upon addition of a small amount of reagent, th~n decreasing considerably in the vicinity of the end point, and again increasing rapidly upon addition of excess titrant. If the functiondE / dI could be followed through a titration., the curve wouldhave a shape not unlike that of the differential potentiometrictitrations.
xo
--+ VOLTAGE
Figure 2. Enfargernerrt of Polarograrns in Vicinityof Zero Current
How experimental attainment of such curves is reached, isshown in Figure 2, which is an enlargement of the curves of Figure1 in the vicinity of zero current.
A. Polarogratn of solution containing no electrolytically active substance (solid line). Dottedline shows presence of an irreversible electro"lytically active substance.
B. Poleeogeam at end point of titration by iodineC. Polaeogxam of solution after addition of excess
iodine
the irreversible system may be able to undergo reduction at thecathode. At the end point (Figure 3, B) the slope is still small,although the iodide is shown to give a wave. As the end pointis passed (Figure 3, C) the slope suddenly increases. Thus up toand at the end point, dE/dI is large, and a sudden drop of dE/dIoccurs at the end point (Figure 6).
A platinum electrode when immersed in a solution assumes thepotential of the solution, E.. If the potential of this electrode isdecreased by an amount dEI, a reduction current, dI I, will flow.Similarly, if the potential of this electrode is increased above E.by an amount dE., oxidation current dI. will result. Conversely,if a fixed amount of current (dI equals dI I equals dI.) is forcedthrough the solution by way of two identical platinum electrodes,one will assume a potential more positive, dE., and one morenegative, dEI, than that of solution E,. Thus the net potential,dE" across the two electrodes will serve as an indication ofdE,/dI, since the current, dI, is constant. The linearity of thevoltage-current plot, discussed by Delahay (5) will break downat high current densities as in region D (Figure 2). This hasbeen observed by Myers and Swift (13) for their polarized endpoint method.
APPARATUS
The apparatus shown in Figure 4 is simple and easily set up.
A small B battery of 45 volts (Burgess No. Z30-NX)~is connected through an inexpensive I/.-watt, 22-megohm carbon radioresistor to two similar platinum wire electrodes. A high inputresistance potentiometer (Beckman Model G) was used becausethe current through the solution was small (around 2 microamperes). A less sensitive potentiometer may be used by employ-
45V."B"B"TTERY 22MEGOHMS
.1 'I,·..--I'I-..l\I\N\I\Ir---.,Irreversible systems may be treated in a similar manner by
consideration of polarograms at different points in a titration. Atypical set is shown in Figure 3 for the titration of a nonreversiblesystem such as thiosulfate-arsenite with iodine, the latter beingreversible. In the original solution (Figure 3, A) reduction ofH,O+ and oxidation of OH- may be the only electrode reactionsfor a solution containing some irreversible system. In this casethe small amount of current (approximately 2 microamperes) willcause the derivative voltage to increase until the hydronium ion isdischarged at one electrode and hydroxyl ion at the other. Theaddition of any substance more easily discharged will lower thisvoltage. In some cases oxidation and/or reduction of the irreversible component may be possible, as indicated by the dottedlines in Figure 3, A. In any case, the slope is initially small;thus dE/dI is large. As 'the titration proceeds, the productis)of the reagent-iodide for example-is formed, which may beoxidizable at the anode. It is possible, too, that the products of
...': :-:.::: ::~ PL"T1NUM WIREELECTRODES
BE.CKM"N
MODE L G
pH METER
Figure 4. Apparatus for DerivativePolarographic Titration

VOL U M E 23, NO.9, S EPTE M B E R 1 95 1 1225
,S>
.75
.....65~
o>
~.. .5O..'":E0 .'S-..z
'"..0 .3'..
,2'
~ ..
M L. 0.115 N KZC'\PT
19 20 21I.17
.0'
•03 II:
w·
.09 =..o>
>.0& :
c>
,07
,II --_. POTENTIOMETRIC
-DER I VAT IVE
.13
Figure 7. End Points for 0.09 N Ferrous AmmoniumSulfate Titration by Potassium Dichrornnte
The two results shown in Figure 6 are for the titration of thiosulfate in potassium iodide medium by ;means of 0.08 Nand 0,008N eerie sulfate as in the method of Furman and Wallace (7).The derivative method here gives very sharp breaks in coincidencewith the smaller potentiometric breaks. The high derivativevoltage at the approach to the end point is due to the irreversibility of the thiosulfate-tetrathionate couple. The sudden decreaseis due to the reversibility of the iodine-iodide couple as illustratedin Figure 3, C.
.s
1.0
1.1
..z .•w..o..
........o
> "
35••
;0:'
lolL. 0 ,08 NeE (5°412
2.
_... PO T E H T 10M £ T RIC
. - DERIVATIVE
,"
2.
.' ......0>
.3 ..>..<~..
• 1 ..0
,•0
..
..
ing alower value resistor (1 megohm) and platinum foil electrodes.For most of the titrations, even the wire electrodes could be usedwith the higher current arrangement, but the sensitivity is decreased. A magnetic stirrer was used to pass the solution by theelectrodes, as well as for mixing. .
EXPERIMENTAL
All the solutions titrated contained a supporting electrolyte of3 N sulfuric acid, except the thiosulfate solution which contained3 grams of potassium iodide per 100 ml. The net volume of solution was approximately 60 ml. The end points were followedpotentiometrically with a platinum electrode-saturated calomelelectrode pair (potential of calomel + 0.25 volt vs. standard hydrogen) and differentially with two other platinum wire electrodes (as in Figure 4) at the same' time.
As dcterntined by potentioJnctric and differential polarographicrnet.hods
A. 0.09 N ferrousB. 0.009 N ferrous
The result for the titration of a polarographically reversiblesystem with a reversible titrant is shown in Figure 5. In A andB where 0,1 and 0,01 N, respectively, ferrous ammonium sulfateare titrated, the sharp approach of the end points is due to theelectrode reversibility of the ferrous-ferric couple as contrastedto the less steep decline after the end points due to the slight irreversibility of the cerous-ceric couple. The derivative endpoint coincides with the potentiometric end point and, in addition,can be directly determined, without plotting.
Figure 5. Corrrparfsorr of End Points Figure 7 shows the titration of a reversible system (ferrousferric) with an irreversible system (chromic-dichromate), Initially the derivative voltage is high, as might be expected fromFigure 1, A, faIling rapidly as the dichromate is added. At theend point, there is a sudden rise which remains past the end pointbecause of the irreversibility of the chromic-dichromate couple(8).
.1
..
.. ,3..o>
..'"..
..>..<> .2
I
'«.
~:;
I...:
".'......,,:11' ..
vo
63 64 65 6&
Vohune rat:io, 1 1;0 25
•••• POTEN TIOMETRIC
_DERIYATIVE
Figure 8. Titration of 0.09 N Ferrous AmmoniumSulfate and 0.2 N Vanadyl Sulfate by Cerie Sulfate
1,0
..
.. ......e>
0"......:E .2e..z.... .1e..
••• >1
-- DERIVATIVE
-_ ••_-- POTENTIOMETRIC
«"..:'
"»
..<>..
.1 ....
...2 >
.... '..•3 ~
"
Figure 6. End Points for Thiosulfate Titration by CerieSulfate in Presence of Potassium Iodide
ML, CE (S04)2 0,008 N.........
ML. 0.09 N CE (504)2
43 44 45 3. '0 "
.0Figure 8 shows the results of a two-component system, ferrous
and vanadyl sulfates, in ratio 1 to 25 m!' The first end point,due to ferrous exhaustion, is accompanied by a rapid rise in derivative voltage which remains high because of the irreversibility
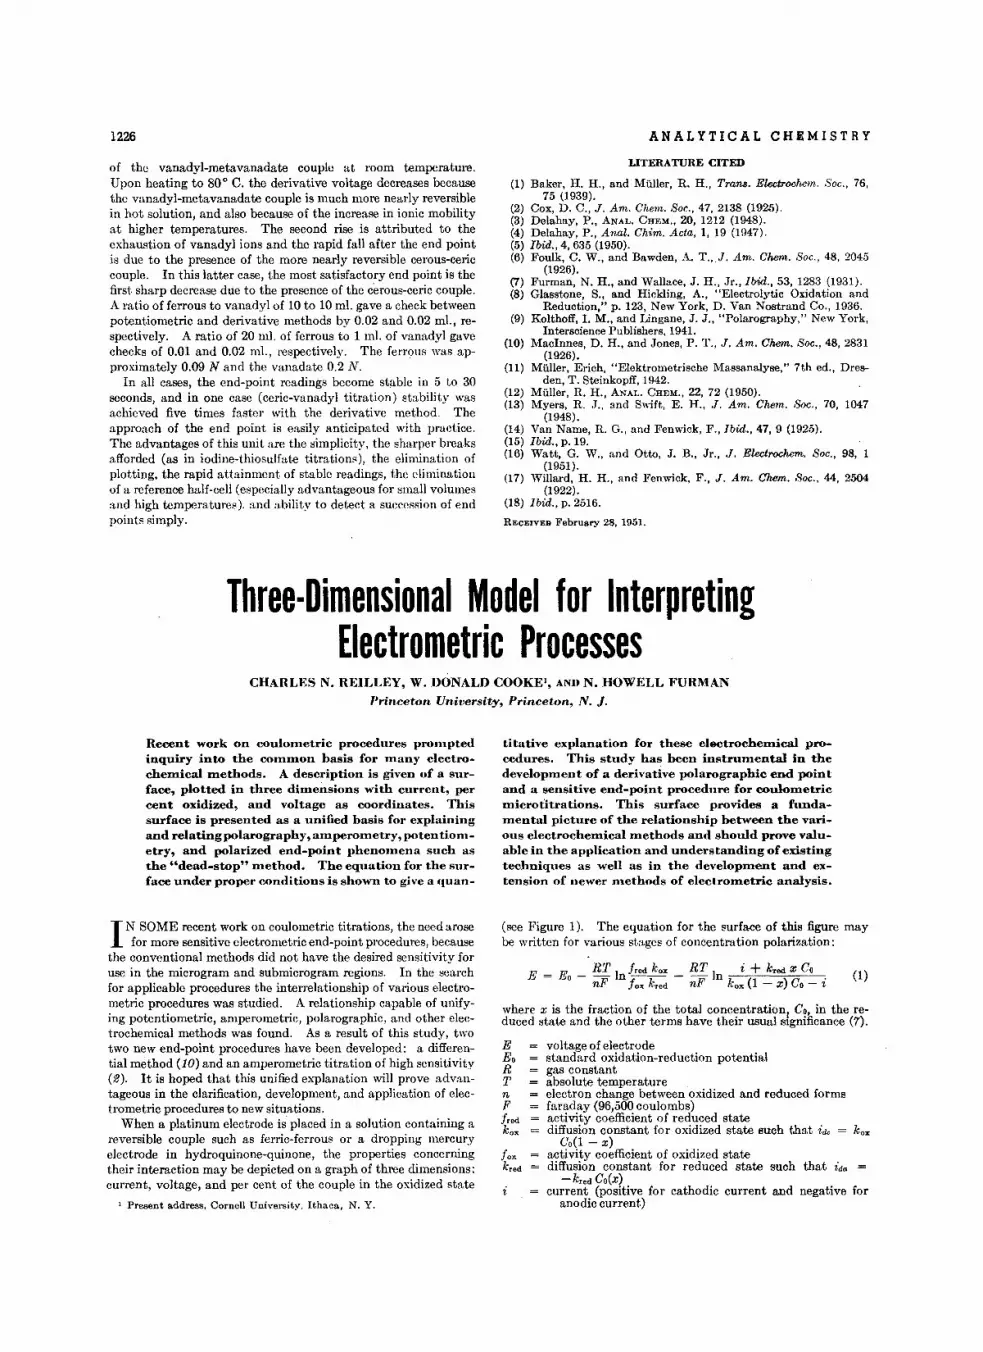
1226
of the vanadyl-metavanadate couple at room temperature.Upon heating to 80 0 C. the derivative voltage decreases becausethe vanadyl-rnetavanadate couple is much more nearly reversiblein hot solution, and also because of the increase in ionic mobilityat higher temperatures. The second rise is attributed to theexhaustion of vanadyl ions and the rapid fall after the end pointis due to the presence of the more nearly reversible cercus-eeriecouple. In this latter case, the most satisfactory end point is thefirst sharp decrease due to the presence of the cercus-eerie couple.A ratio of ferrous to vanadyl of 10 to 10 m!. gave a check betweenpotentiometric and derivative methods by 0.02 and 0.02 m!., respectively. A ratio of 20 m!. of ferrous to 1 m!. of vanadyl gavechecks of 0.01 and 0.02 mI., respectively. The ferrous was approximately 0.09 N and the vanadate 0.2 N.
In all cases, the end-point readings become stable in 5 to 30seconds, and in one case (ceric-vanadyl titration) stability wasachieved five times faster with the derivative method. Theapproach of the end point is easily anticipated with practice.The advantages of this unit are the simplicity, the sharper breaksafforded (as in iodine-thiosulfate titrations), the elimination ofplotting, the rapid attainment of stable readings, the eliminationof a reference half-cell (especially advantageous for small volumesand high temperatures). and ability to detect a succession of endpoints simply.
ANALYTICAL CHEMISTRY
LITERATURE CITED
(1) Baker, H. H., and Muller, R. H., Trans. Electrochem . Soc., 76,75 (1939).
(2) Cox, D. C., J. Am. Chem. Soe., 47, 2138 (1925).(3) Delahay, P., ANAL. CHEM., 20, 1212 (1948).(4) Delahay, P., Anal. Chim. Acta, I, 19 (1947).(5) Ibid., 4, 635 (1950).(6) Foulk, C. W., and Bawden, A. T.,J. Am. Chem . Soc., 48, 2045
(1926).(7) Furman, N. H., and Wallace, J. H., Jr., ius; 53, 1283 (1931).(8) Glasstone, S., and Hickling, A., "Electrolytic Oxidation and
Reduction," p. 123, New York, D. Van Nostrand Co., 1936.(9) Kolthoff,1. M., and Lingane, J. J., "Polarography," New York,
Interscience Publishers, 1941.(10) MacInnes, D. H., and Jones, P. T., J. Am. Chem.. Soc., 48, 2831
(1926).(11) Muller, Erich, "Elektrometrische Massanalyse," 7th ed., Dres
den, T. Steinkopff, 1942.(12) Muller, R. H., ANAL. CHEM., 22, 72 (1950).(13) Myers, R. J.. and Swift, E. H., J. Am. Chern. Soc., 70, 1047
(1948).(14) Van Name, R. G., and Fenwick, F., tua.. 47, 9 (1925).(15) tua., p. 19.(16) Watt, G. W., and Otto, J. B., Jr., J. Blectrochem.. Soc., 98, 1
(1951).(17) Willard, H. H., and Fenwick, F., J. Am. (J/wm. Soc., 44, 2504
(1922).(18) tua., p, 2516.
RECEIVED February 28. 1951.
Three-Dimensional Model for InterpretingElectrometric Processes
CHARLES N. REILLI<:Y, W. DONALD COOKEl, AND N. HOWEIJL FURMAN
Princeton. University, Princeton, N. J.
Recent work on coulometric procedures prorrrpnedinquiry into the cOinmon basis for many electrochemical methods. A description is given of a surface, plotted in three dimensions with current, percent oxidized, and voltage as coordinates. Thissurface is presented as a unified basis for explainingand relating polarography, amperometry, poterrtiornetry, and polarized end-point phenornenu such asthe "dead-stop" method. The equation for the surface under proper conditions is shown to give a quan-
I N SOME recent work on couIometric titrations, the need arosefor more sensitive electrometric end-point procedures, because
the conventional methods did not have the desired sensitivity foruse in the microgram and submiorograrn regions. In the searchfor applicable procedures the interrelationship of various electrometric procedures was studied. A relationship capable of unifying potentiometric, amperometric, polarographic, and other electrochemical methods was found. As a result of this study, twotwo new end-point procedures have been developed: a differential method (10) and an amperometric titration of high sensitivity(2). It is hoped that this unified explanation will prove advantageous in the clarification, development, and application of electrometric procedures to new situations.
When a platinum electrode is placed in a solution containing areversible couple such as ferric-ferrous or a dropping mercuryelectrode in hydroquinone-quinone, the properties concerningtheir interaction may be depicted on a graph of three dimensions:current, voltage, and per cent of the couple in the oxidized state
1 Present address. Cornell Urrivereit.y, Ithaca, N. Y.
titative explanation for these electrochenrical procedures. This study has been instrumental in thedevelopment of a derivative polarographic end pointand a sensitive end-point procedure for eoulometricmicrodtrations. This surface provides a fundamental picture of the relationship between the various electrochemical methods and should prove valuable in the application and understanding of existingtechniques as well as in the development and extension of newer methods of electrOlnetric analysis.
(see Figure 1). The equation for the surface of this figure maybe written for various stages of concentration polarization:
E = Eo _ RT In fred kox _ RT In i + kred X Co. (I)nF fox k-,« nF kox (1 - z) Co - t
where x is the fraction of the total concentration! Co, in the reduced state and the other terms have their usual SIgnificance (7).
E voltage of electrodeEo standard oxidation-reduction potentialR gas constantT absolute temperaturen electron change between oxidized and reduced formsF faraday (96,500 coulombs)fred activity coefficient of reduced statekox diffusion constant for oxidized state such that ide kox
Co(1 - z)fox activity coefficient of oxidized statekr ed diffusion constant for reduced state such that ida =
-kr ed Co(x)current (positive for cathodic current and negative for
anodic current)
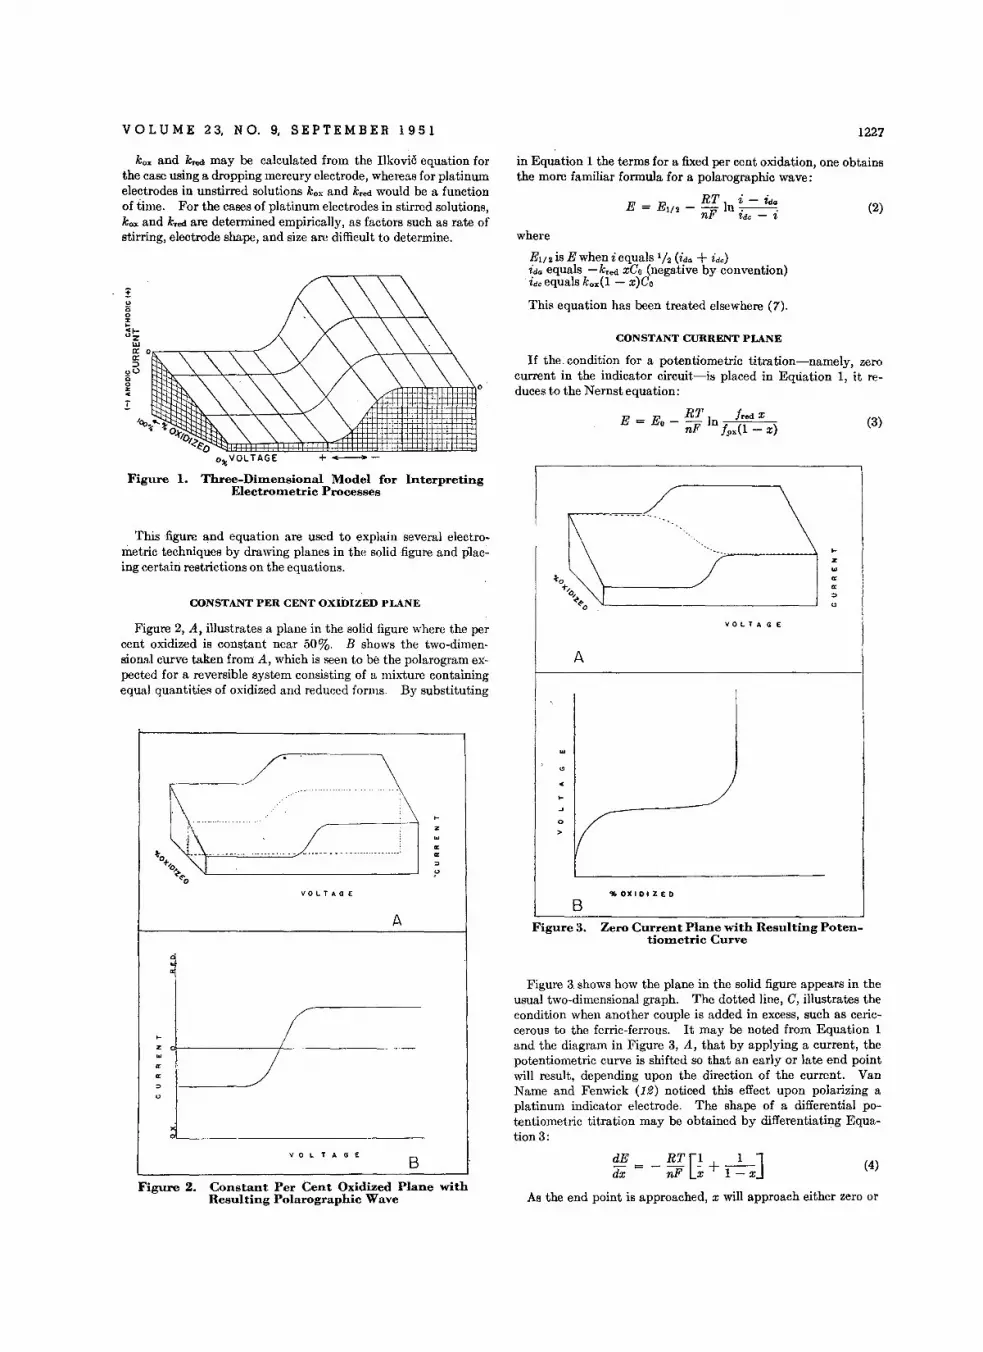
VOL U M E 2 3, N O. 9, SE PTE M B E R 1 9 5 1 1227
CONSTANT CURRENT PLANE
If the. condition for a potentiometric titration-namely, zerocurrent in the indicator circuit-is placed in Equation 1, it reduces to the Nernst equation:
(2)
(3)R/I' fred X
E = Eo - nF In 1.ox(1 _ x)
in Equation 1 the terms for a fixed per cent oxidation, one obtainsthe more familiar formula for a polarographic wave:
RT i - i.u.E = E1/ 2 - -In -.--.nF tdc - t
where
Ell 2 is E when i equals 1/2 (ida + ide)ida equals -kr ed xCo (negative by convention)ide equals kox(1 - x)Co
This equation has been treated elsewhere (7).!"QoxI"I"z
w0: o~-<--~--...---<:""0:=>
,,0Qox"J
kox and kr.,d may be calculated from the Ilkovie equation forthe case using a dropping mercury electrode, whereas for platinumelectrodes in unstirred solutions k ox and kred would be a functionof time. For the cases of platinum electrodes in stirred solutions,kox and "'ed are determined empirically, as factors such as rate ofstirring, electrode shape, and size are difficult to determine.
CONSTANT PER CENT OXIDIZED PLANE
This figure and equation are used to explain several electrometric techniques by drawing planes in the solid figure and placing certain restrictions on the equations.
Fignre 1.
O%VOLTAGE + ---"'-
Three-DiInensional Model for InterpretingEleetroruetzle Processes \
0
X...a:a:
"
Figure 2, A, illustrates a plane in the solid figure where the percent oxidized is constant near 50%. B shows the two-dimensional curve taken from A, which is seen to be the polarogram expected for a reversible system consisting of a mixture containingequal quantities of oxidized and reduced forms. By substituting
t=-~~-'=':':':":':':":"':'.C'-'. _ ••••••••••••.••••••••••••••
..
o
VOLTAGE
A
VOLTAGE % ox I 01 ZED
AB
Figure 3. Zero Current Plane with Resulting PotentiOinetric Curve
xw
a:a:
Figure 3.shows how the plane in the solid figure appears in theusual two-dimensional graph. The dotted line, C, illustrates thecondition when another couple is added in excess, such as eeriecerous to the ferric-ferrous. It may be noted from Equation 1and the diagram in Figure 3, A, that by applying a current, thepotentiometric curve is shifted so that an early or late end pointwill result, depending upon the direction of the current. VanName and Fenwick (12) noticed this effect upon polarizing aplatinum indicator electrode. The shape of a differential potentiometric titration may be obtained by differentiating Equation 3:
Figure 2. Constant Per Cent Oxidized Plane withResulting Polarographic Wave As the end point is approached, x will approach either zero or
VOLTAGE
B dE RT[1 1 ]dx = -nF ;;+l-x (4)
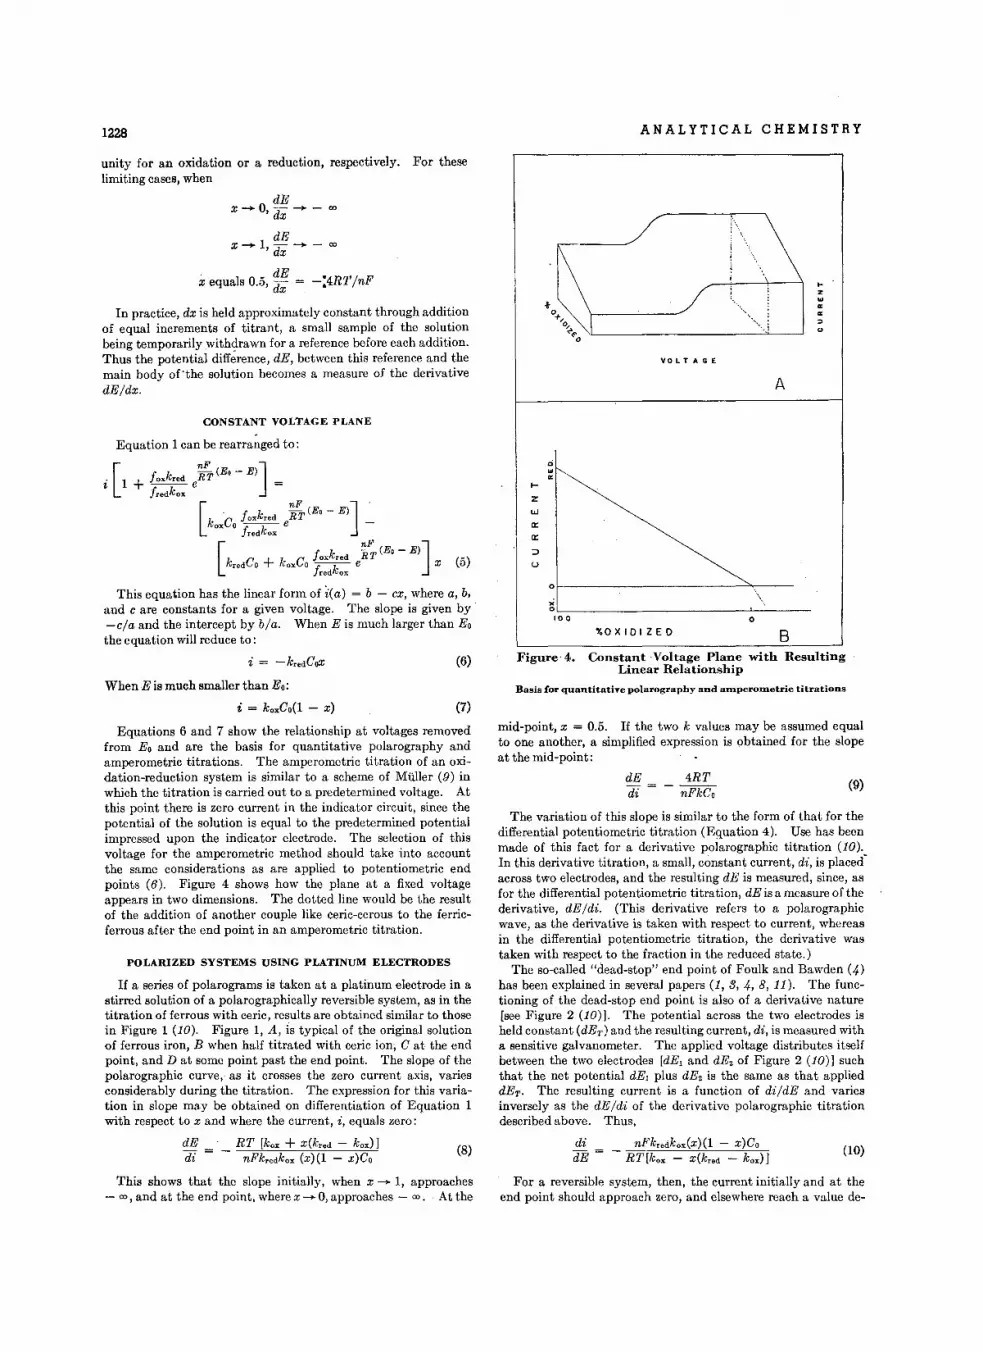
1228 ANALYTICAL CHEMISTRY
unity for an oxidation or a reduction, respectively. For theselimiting cases, when
dEx-O, dx - - ex>
dEx-I, dx - - ex>
, dEx equals 0.5, dx = -:4RT/nF
In practice, dx is held approximately constant through additionof equal increments of titrant, a small sample of the solutionbeing temporarily withdrawn for a reference before each addition.Thus the potential difference, dE, between this reference and themain body ofthe solution becomes a measure of the derivativedE/dx.
""-'"-.,1
VOLTAGE
A
..z...a:a::lu
This equation has the linear form of i(a) = b - CX, where a, b.and C are constants for a given voltage. The slope is given by .-cia and the intercept by b/a. When E is much larger than Eothe equation will reduce to:
i = -kredCoX (6)
Basis lor quantitatiye polarography and atnperometric titrations
of-----------------"..,---
ci
'"a:
Bo
'"OXIDIZED
Constant -Voftage Plane with ResultingLinear Relationship
xOL- '-- _
'00
f
Z
W
0::
0::
::J
U
Figure' 4.
(7)
(5)
When E is much smaller than Eo:
i = koxCo(I - z)
CONSTANT VOLTAGE PLANE
Equation 1 can be rearranged to:
[
nF (Eo - ElJi 1 + foxkred eR T =
fredkox
[ko~Co foxkred e~~(EO - ElJ _fredkox
[f k nF (Eo - ElJ
kredCO + koxCo f,0x kred
eR T
xred ox
(9)
Equations 6 and 7 show the relationship at voltages removedfrom Eo and are the basis for quantitative polarography andamperometric titrations. The amperometric titration of an oxidation-reduction system is similar to a scheme of Muller (9) inwhich the titration is carried out to a predetermined voltage. Atthis point there is zero current in the indicator circuit, since thepotential of the solution is equal to the predetermined potentialimpressed upon the indicator electrode. The selection of thisvoltage for the amperometric method should take into accountthe same considerations as are applied to potentiometric endpoints (6). Figure 4 shows how the plane at a fixed voltageappears in two dimensions. The dotted line would be the resultof the addition of another couple like cerio-eerous to the ferricferrous after the end point in an amperometric titration.
POLARIZED SYSTEMS USING PLATINUM ELECTRODES
If a series of polarograms is taken at a platinum electrode in astirred solution of a polarographically reversible system, as in thetitration of ferrous with eerie, results are obtained similar to thosein Figure 1 (10). Figure 1, A, is typical of the original solutionof ferrous iron, B when half titrated with eerie ion, C at the endpoint, and D at some point past the end point. The slope of thepolarographic curve,' as it crosses the zero current axis, variesconsiderably during the titration. The expression for this variation in slope may be obtained on differentiation of Equation 1with respect to x and where the current, i, equals zero:
mid-point, x = 0.5. If the two k values may be assumed equalto one another, a simplified expression is obtained for the slopeat the mid-point:
dE 4RTdi = - nFkCo
The variation of this slope is similar to the form of that for thedifferential potentiometric titration (Equation 4). Use has beenmade of this fact for a derivative polarographic titration (10).In this derivative titration, a small, constant current, di, is placedacross two electrodes, and the resulting dE is measured, since, asfor the differential potentiometric titration, dE is a measure of thederivative, dE Idi. (This derivative refers to a polarographicwave, as the derivative is taken with respect to current, whereasin the differential potentiometric titration, the derivative wastaken with respect to the fraction in the reduced state.)
The so-called "dead-stop" end point of Foulk and Bawden (4)has been explained in several papers (1, 3, 4, 8, 11). The functioning of the dead-stop end point is also of a derivative nature[see Figure 2 (10)]. The potential across the two electrodes isheld constant (dET ) and the resulting current, di, is measured witha sensitive galvanometer. The applied voltage distributes itselfbetween the two electrodes [dE, and dE. of Figure 2 (10)] suchthat the net potential dE, plus dE. is the same as that applieddET • The resulting current is a function of di/dE and variesinversely as the dEldi of the derivative polarographic titrationdescribed above. Thus,
(8) (10)dE RT [ko,", + x(kred - kox)Jdi = - nFkredkox (x)(1 - x)Co
This shows that the slope initially, when x-I, approaches- ex>, and at the end point. where x - 0, approaches - ex>. At the
di nFkredkox(x)(I - x)CodE = - RT [kox - x(k red - kox)J
For a reversible system, then, the current initially and at theend point should approach zero, and elsewhere reach a value de-
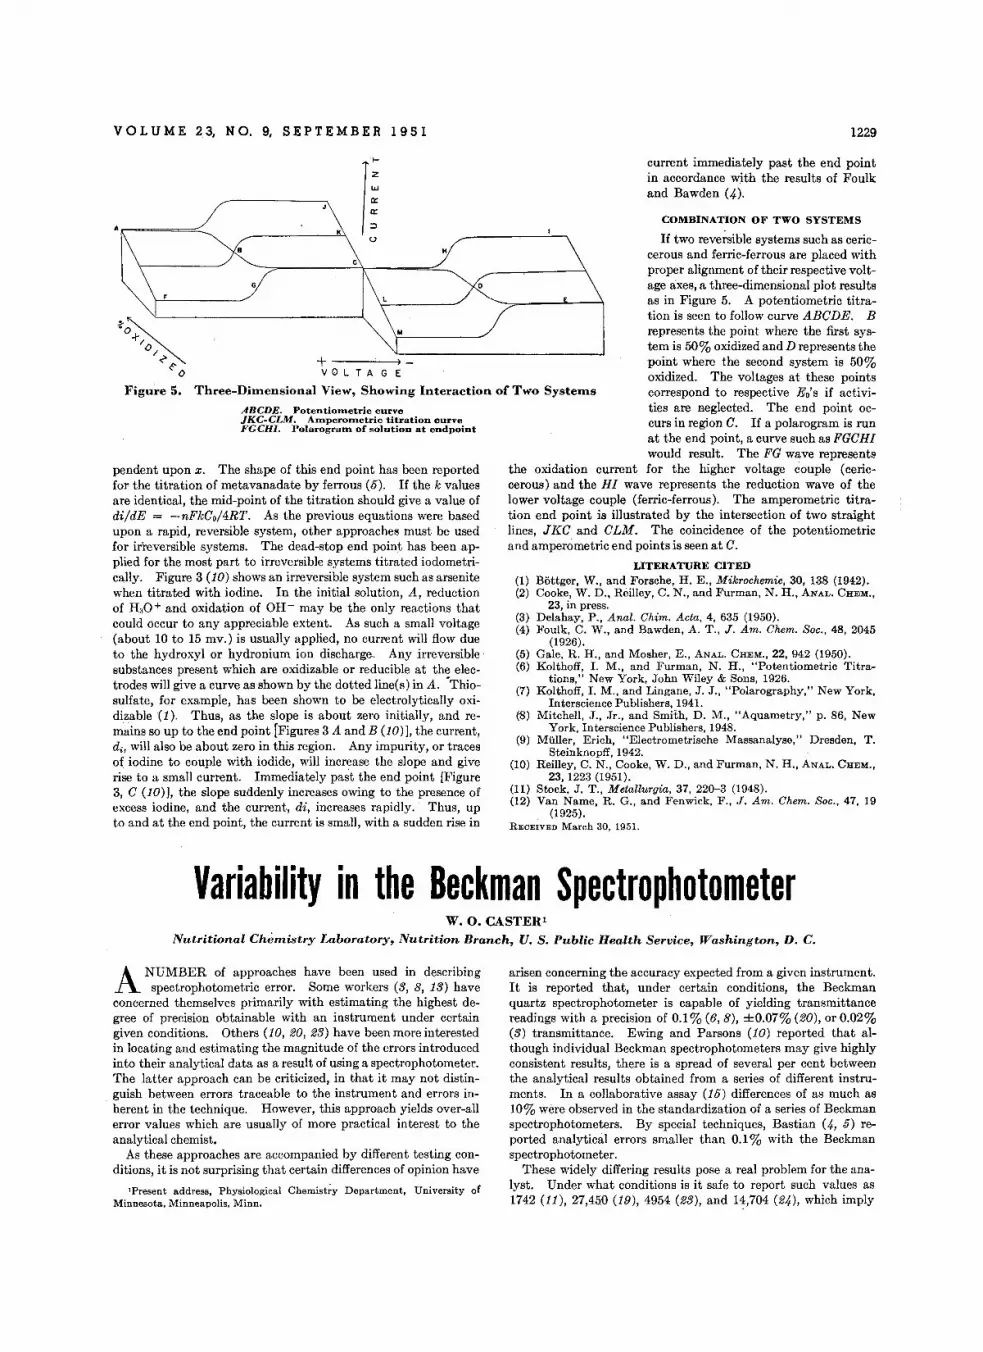
VOLUME 23, NO.9, SEPTEMBER 1951 1229
current immediately past the end pointin accordance with the results of Foulkand Bawden (,.0.
LITERATURE CITED
(1) Bottger, W., and Forsche, H. E., Mikrochemie, 30, 138 (1942).(2) Cooke, W. D., Reilley, C. N., and Furman, N. H., ANAL. CHEM.,
23, in press.(3) Delahay, P., Anal. Chim. Acta, 4, 635 (1950).(4) Foulk, C. W., and Bawden, A. T., J. Am. Chem. Soc., 48, 2045
(1926).(5) Gale, R. H., and Mosher, E., ANAL. CHEM., 22, 942 (1950).(6) Kolthoff, I. M., and Furman, N. H., "Potentiometric Titra
tiona," New York, John Wiley & Sons, 1926.(7) Kolthoff,1. M., and Lingane, J. J., "Polarography," New York,
Interscience Publishers, 1941.(8) Mitchell, J.,Jr., and Smith, D. M., "Aquametry," p. 86, New
York, IntersciencePublishers, 1948.(9) MUller, Erich, "Electrometrische Massanalyse," Dresden, T.
Steinknopff,1942.(10) Reilley, C. N., Cooke, W. D., and Furman, N. H., ANAL. CHEM.,
23, 1223 (1951).(11) Stock, J. T., Meiallurqia, 37, 220-3 (1948).(12) Van Name, R. G., and Fenwick, F., J. Am. Chem. Soc., 47, 19
(1925).RECEIVED March 30, 1951.
COMBINATION OF TWO SYSTEMS
If two reversible systems such as eeriecerous and ferric-ferrous are placed withproper alignment of their respective voltage axes, a three-dimensional plot resultsas in Figure 5. A potentiometric titration is seen to follow curve ABCDE. Brepresents the point where the first system is 50% oxidized and D represents thepoint where the second system is 50%oxidized. The voltages at these pointscorrespond to respective Eo's if activities are neglected. The end point oc-curs in region C. If a polarogram is runat the end point, a curve such as FGCHIwould result. The FG wave represents
the oxidation current for the higher voltage couple (eeriecerous) and the HI wave represents the reduction wave of thelower voltage couple (ferric-ferrous). The amperometric titration end point is illustrated by the intersection of two straightlines, JKC and CLM. The coincidence of the potentiometricand arnperometric end points is seen at C.
ABCDE. Poeeerttometefc curveJKC-CLM. ArnperoIIletric titration curveFGCHI. Pofar-ogr-ajm of solution at endpoint
+ )-VOLTAGE
Three-Dhnensional View, Showing Interaction of Two Systems
~~·0-r/
0/e~o
Figure 5.
pendent upon z, The shape of this end point has been reportedfor the titration of metavanadate by ferrous (5). If the k valuesare identical, the mid-point of the titration should give a value ofdi/dE = -nFkCo/4RT. As the previous equations were basedupon a rapid, reversible system, other approaches must be usedfor irreversible systems. The dead-stop end point has been applied for the most part to irreversible systems titrated iodometrically, Figure 3 (10) shows an irreversible system such as arsenitewhen titrated with iodine. In the initial solution, A, reductionof H:.O+ and oxidation of OH- may be the only reactions thatcould occur to any appreciable extent. As such a small voltage(about 10 to 15 mv.) is usually applied, no current will flow dueto the hydroxyl or hydronium ion discharge. Any irreversiblesubstances present which are oxidizable or reducible at the electrodes will give a curve as shown by the dotted line(s) in A. "Thiosulfate, for example, has been shown to be electrolytically oxidizable (1). Thus, as the slope is about zero initially, and remains so up to the end point [Figures 3 A and B (10)], the current,di, will also be about zero in this region. Any impurity, or tracesof iodine to couple with iodide, will increase the slope and giverise to a small current. Immediately past the end point [Figure3, C (10)], the slope suddenly increases owing to the presence ofexcess iodine, and the current, di, increases rapidly. Thus, upto and at the end point, the current is small, with a sudden rise in
Variability in the Beckman Spectrophotometerw.O. CASTER!
Nutritional Chemistry Laboratory, Nutrition Branch, U. S. Public Health Service, Washington, D. C.
ANUMBER of approaches have been used in describingspectrophotometric error. Some workers (3, 8, 13) have
concerned themselves primarily with estimating the highest degree of precision obtainable with an instrument under certaingiven conditions. Others (10, 20, 23) have been more interestedin locating and estimating the magnitude of the errors introducedinto their analytical data as a result of using a spectrophotometer.The latter approach can be criticized, in that it may not distinguish between errors traceable to the instrument and errors inherent in the technique. However, this approach yields over-allerror values which are usually of more practical interest to theanalytical chemist.
As these approaches are accompanied by different testing conditions, it is not surprising that certain differences of opinion have
'Present address, Physiological Chemistry Department, University ofMinnesota. Minneapolis, Minn.
arisen concerning the accuracy expected from a given instrument.It is reported that, under certain conditions, the Beckmanquartz spectrophotometer is capable of yielding transmittancereadings with a precision of 0.1% (6, 8), ±0.07% (20), or 0.02%(3) transmittance. Ewing and Parsons (10) reported that although individual Beckman spectrophotometers may give highlyconsistent results, there is a spread of several per cent betweenthe analytical results obtained from a series of different instruments. In a collaborative assay (15) differences of as much as10% were observed in the standardization of a series of Beckmanspectrophotometers. By special techniques, Bastian (4, 5) reported analytical errors smaller than 0.1 % with the Beckmanspectrophotometer.
These widely differing results pose a real problem for the analyst. Under what conditions is it safe to report such values as1742 (11), 27,450 (19), 4954 (23), and 14,704 (24), which imply

1230 ANALYTICAL CHEMISTRY
accuracy to within 0.1% relative analytical error? Under whatconditions may errors of several per cent appear in the data?
The microanalyst has an even greater problem in this respect.As it is necessary to modify the Beckman spectrophotometerslightly to adapt it for micro work, it is possible that the accuracy has likewise been modified. Several vitamin microprocedures (7, 17), using the Beckman spectrophotometer equippedwith microcells, are being used more extensively.
In a study of vitamin micromethods it appeared advisable firstto evaluate the performance of the Beckman spectrophotometer.The resulting data were studied by analysis of variance methods(21). A number of distinct sources of variation were thus located. The statistical procedures used are discussed by Alexanderand Caster (1). All the analytical work was carried out on asingle Beckman spectrophotometer (Model DU, Serial No. 1304,purchased in the fall of 1946). The microcells used in this workare obtainable from the Pyroeell Manufacturing Co., 207 East84th St., New York 28. They are not manufactured by or approved by the National Technical Laboratories (12). Preliminary results have been discussed (9).
In asrudy of vitamin micromethods it seemed necessary to evaluate the sources of variability in theBeckm.an spectrophotometer. Though duplicatedeterminations checked Within 0.1 to 0.5%, consistent errors of as much as 3 to 5% were observed underdifferent conditions. The largest vflriations wereassociated with the phototube or with factors suchas slit width, lamp intensity, and aging which directly affected phototube response. Deviations fromBeer's law were found to depend upon a choice ofphototube and slit width, and to change with age inthe same phototube. Other potential sources oferror were located and statistically evaluated. Thesefactors must be kept in mind in the interpretation ofextinction coefficients and other absolute spectrophotometric values. They may also serve as a guidein the evaluation of instrumental procedures. Theuse of this instrument in establisbing deviationsfrom Beer's law is questioned.
CELL CORRECTIONS
Four quartz microcells were carefully cleaned, filled with distilled water, and placed in the instrument. Exact agreement between cells was not observed. The data in Table I demonstratethe effect of changing wave length and optical density scale reading upon the apparent "cell correction" (6). After each columnof readings in Table I the slit width was changed to allow progressively smaller amounts of light to reach the phototube. Inorder to accomplish this, the optical density knob was adjustedin such a manner that the optical density scale reading-i.e., thezero point for each series of four readings-was changed progressively from 0.000 to 0.100, 0.200, etc. Duplicate readings weremade in each case. For every slit width, one reading was madefor each cell. When all single readings were completed at bothwave lengths, they were repeated, giving the duplicate resultsshown in Table I. As the duplicate readings were independentlyobtained, these data give an estimate of the repeatability of duplicate readings as well as of the effect of changing wave lengthand optical density scale reading (or slit width) upon cell constants. The dark current drift was approximately 1 scale divisionin 5 minutes when these readings were taken. Readings weremade at approximately 30-second intervals.
The analysis of variance summarized in Table II demonstratesthat there are two distinct sources of variation represented in thedata in Table I: differences between duplicate readings made
0.64
0.8000.800
0.8030.804
0.8000.799
0.8020.800
0.05
0.8000.800
0.8000.800
0.7980.799
0.8000.800
0.70
0.7000.700
0.7030.704
0.7000.700
0.7020.701
0.06
0.7000.700
0.7020.702
0.7000.701
0.6990.702
under substantially identical conditions amounting to a = 0.00077on the optical density scale; and consistent changes which appearin the cell correction factors as the wave length is changed from350 to 550 mit, resulting in an observed variation of a = 0.00226on the optical density scale (interaction of cells by wave lengths).
In Table II the F-test values were obtained by the compositemethod (2). Because one of the interaction terms was significant, and the second, though not significant, was somewhat largerthan the between-duplicates mean square, the first three variableswere also tested by the approximate method (2). The results ofthis are shown in Table III, and are in good agreement with theconclusions of Table II. By both methods it is concluded thatnone of the first three variations listed in Table II is significant.
It is of particular interest to note that the variation betweencells is nonsignificant. In other words, the apparent differencesbetween cells, or the cell corrections (6), observed in these dataare entirely explained by the two sources of variation describedabove (variations between duplicate readings, and cells by wavelengths' interaction). Thus, general cell correction factors, foruse at all wave lengths and slit widths, would be of no value inimproving the accuracy of these results. If cell correction
factors are to be used at all, theyshould be specifically determined foreach wave length and slit width used.Whenever the cells are matched, undera given set of conditions, so as to showa range of difference between them nogreater than 0.002 in optical densityvalue [a range of approximately 3times the replicate standard deviation(21, page 98) I, cell correction factors areof questionable value.
A repeatability between duplicates ofa = 0.00077 on the optical density scaleis little more than the error to be expected in reading the scale of the instrument. Assuming one had the improbable ability to estimate with complete accuracy to l/looth of a scale division and would record the result in eachcase to the closest l/loth of a scale division, the error in reading the opticaldensity scale would be a = 0.00015,0.00030, and 0.00058 at optical densi-
0.77
0.6000.600
0.6030.604
0.6000.601
0.6000.601
0.06
0.6000.600
0.6000.600
0.6000.600
0.6000.600
0.83
0.5000.500
0.5020.503
0.4990.501
0.5000.502
0.07
0.5000.500
0.5020.500
0.5000.500
0.5000.500
1.08
0.2000.200
0.2030.202
0.1990.198
0.1990.199
0.10
0.2000.200
0.2010.200
0.1990.199
0.1980.200
1.15
0.1000.100
0.1030.102
0.0980.100
0.0990.100
0.12
0.1000.100
0.0990.100
0.0990.099
0.0990.099
1.26
0.0000.000
0.0030.003
0.0000.000
0.0020.001
0.13
0.0000.000
0.000+0.001
-0.0010.000
-0.001+0.001
Table I. Optical Densities(Variations in cell correction observed when wave length and slit width were changed)
350 m"0.99 0.91
0.300 0.4000.300. 0.400
0.302 0.4030.301 00402
0.300 0.3990.299 0.400
0.300 004010.300 0.401
550 m"0.09 0.08
0.300 0.4000.300 0.400
0.301 004000.301 0.400
0.299 0.3990.300 0.399
0.300 0.3980.300 0.399
Hlit.mm.
Blank
Slit,mm.
Cell 3
Cell 2
Celli
Blank
Celli
Cell 2
Cell 3
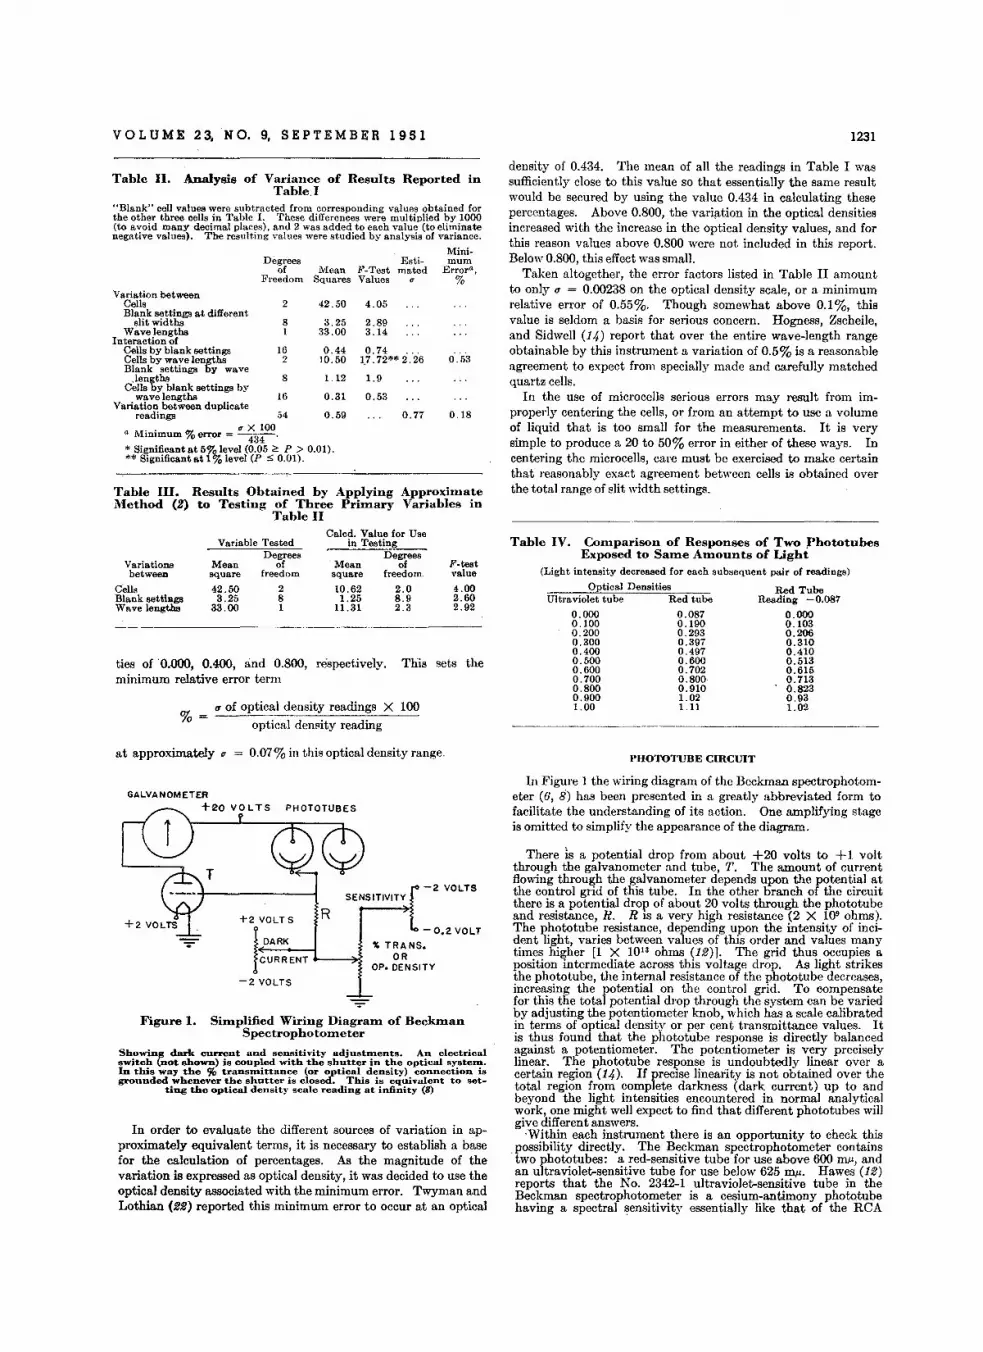
VOL U M E 2 3, N O. 9, S EPTE M B E R 1 9 5 1 1231
Table II. Analysis of Variance of Results Reported inTable. I
Table III. Results Obtained by Applying ApproximateMethod (2) to Testing of Three Primary Variables in
Table II
density of 0.434. The mean of all the readings in Table I wassufficiently close to this value so that essentially the same resultwould be secured by using the value 0.434 in calculating thesepercentages. Above 0.800, the variation in the optical densitiesincreased with the increase in the optical density values, and forthis reason values above 0.800 were not included in this report.Below 0.800, this effect was small.
Taken altogether, the error factors listed in Table II amountto only a = 0.00238 on the optical density scale, or a minimumrelative error of 0.55%. Though somewhat above 0.1%, thisvalue is seldom a basis for serious concern. Hogness, Zscheile,and Sidwell (1,,0 report that over the entire wave-length rangeobtainable by this instrument a variation of 0.5% is a reasonableagreement to expect from specially made and carefully matchedquartz cells.
In the use of microcells serious errors may result from improperly centering the cells, or from an attempt to use a volumeof liquid that is too small for the measurements. It is verysimple to produce a 20 to 50% error in either of these ways. Incentering the microcells, care must be exercised to make certainthat reasonably exact agreement between cells ill obtained overthe total range of slit width settings.
0.18
0.53
0.77
4.05
2.893.14
0.74 ...I}. 72** 2.26
1.9
0.53
0.59
1.12
0.31
0.4410.50
42.50
3.2533.00
EstiMean F-Test mated
Squares Values
2
81
8
16
162
Degreesof
Freedom
"Blank" cell values were subtracted from corresponding values obtained forthe other three cells in Table 1. These differences were multiplied by 1000(to avoid many decimal places). and 2 was added to each value (to eliminatenegative values). The resulting values were studied by analysis of variance.
Mini-mum
Error",%
Variation betweenCellsBlank settings at different
slit widthsWavelengths
Interaction ofCelie by blank settingsCelie by wave lengthsBlank settings by wave
,lengthsCells by blank settings by
wave lengthsVariation between duplicate
readings ,54, '(ff fT X 100
a Minimum /0 error=~.
* Significant at 5o/9Jevel (0,05 ;;" P > 0.01).** Significant at 1lro level (P :;; 0.01).
Calcd, Value for UseVariable Tested in Testing
Degrees DegreesF-teetVariatione Mean of Mean of
between square freedom square freedom. value
Cells 42.50 2 10,62 2.0 4.00Blank setti»gs 3.25 8 1.25 8.9 2.60Wave lengths 33,00 1 11.31 2.3 2.92
ties of 0.000, 0.400, and 0.800, respectively. This sets theminimum relative error term
a of optical density readings X 100%=_---'0-- -"--_--''''---__optical density reading
Table IV. Comparison of Responses of Two ,PhototubesExposed to Same Amounts of Light
(Light intensity decreased for each subsequent pair of readings)
Optical Densities Red TubeUltraviolet tube Red tube Reading -0.087
0.000 0.087 0.0000.100 0.190 0.1030.200 0.293 0.2060.300 0.397 0.3100.400 0.497 0.4100.500 0.600 0.5130.600 0.702 0.6150.700 0.800 0.7130.800 0.910 0.8230.900 1.02 0,931. 00 1. 11 1. 02
ShowinfJ dark current and sensitivity adjustntents. An electricalswitch (not shown) is coupled with the shutter in the optical syslelD.In this way 'the % transmittance (or optical density) connection isgrounded whenever the shutter is closed. This is equivalent to set-
ting 'the optical density scale reading at infinity (8)
In order to evaluate the different sources of variation in approximately equivalent terms, it is necessary to establish a basefor the calculation of percentages. As the magnitude of thevariation is expressed as optical density, it was decided to use theoptical density associated with the minimum error. Twyman andLothian (22) reported this minimum error to occur at an optical
Simplified Wiring Diagram of BeckmanSpectrophotometer
PHOTOTUBE CIRCUIT
In Figure 1 the wiring diagram of the Beckman spectrophotometer (6, 8) has been presented in a greatly abbreviated form tofacilitate the understanding of its action. One amplifying stageis omitted to simplify the appearance of the diagram.
There IS a potential drop from about +20 volts to +1 voltthrough the galvanometer and tube, T. The amount of currentflowing through the galvanometer depends upon the potential atthe control grid of this tube. In the other branch of the circuitthere is a potential drop of about 20 volts through the phototubeand resistance, R. R IS a very high resistance (2 X 10⁹ ohms).The phototube resistance, depending upon the intensity of incident light, varies between values of this order and values manytimes higher [1 X 10¹³ ohms (12)J. The grid thus occupies aposition intermediate across this voltage drop. As light strikesthe phototube, the internal resistance of the phototube decreases,increasing the f0tential on the control grid. To compensatefor this the tota potential drop through the system can be variedby adjusting the potentiometer knob, which has a scale calibratedin terms of optical density or per cent transmittance values. Itis thus found that the phototube response is directly balancedagainst a potentiometer. The potentiometer is very preciselylinear. The phototube response is undoubtedly linear over acertain region (14). If precise linearity is not obtained over thetotal region from complete darkness (dark current) up to andbeyond the light intensities encountered in normal analyticalwork, one might well expect to find that different phototubes willgive different answers.
·Within each instrument there is an opportunity to check thispossibility directly. The Beckman spectrophotometer containstwo phctotubes: a red-sensitive tube for use above 600 IIlJ.', andan ultraviolet-sensitive tube for use below 625 IIlJ.'. Hawes (12)reports that the No. 2342-1 ultraviolet-sensitive tube in theBeckman spectrophotometer is a cesium-antimony phototubehaving a spectral sensitivity essentially like that of the RCA
(
- 2 VOLTSSENSITIVITY
- 0.2 VOLT
" TRA NS.OR
OP. DENSITY
R
0.07% in this optical density range,
+2 VOLTS
I::::", --~~-2 VOLTS
Figure 1.
at approximately Cf
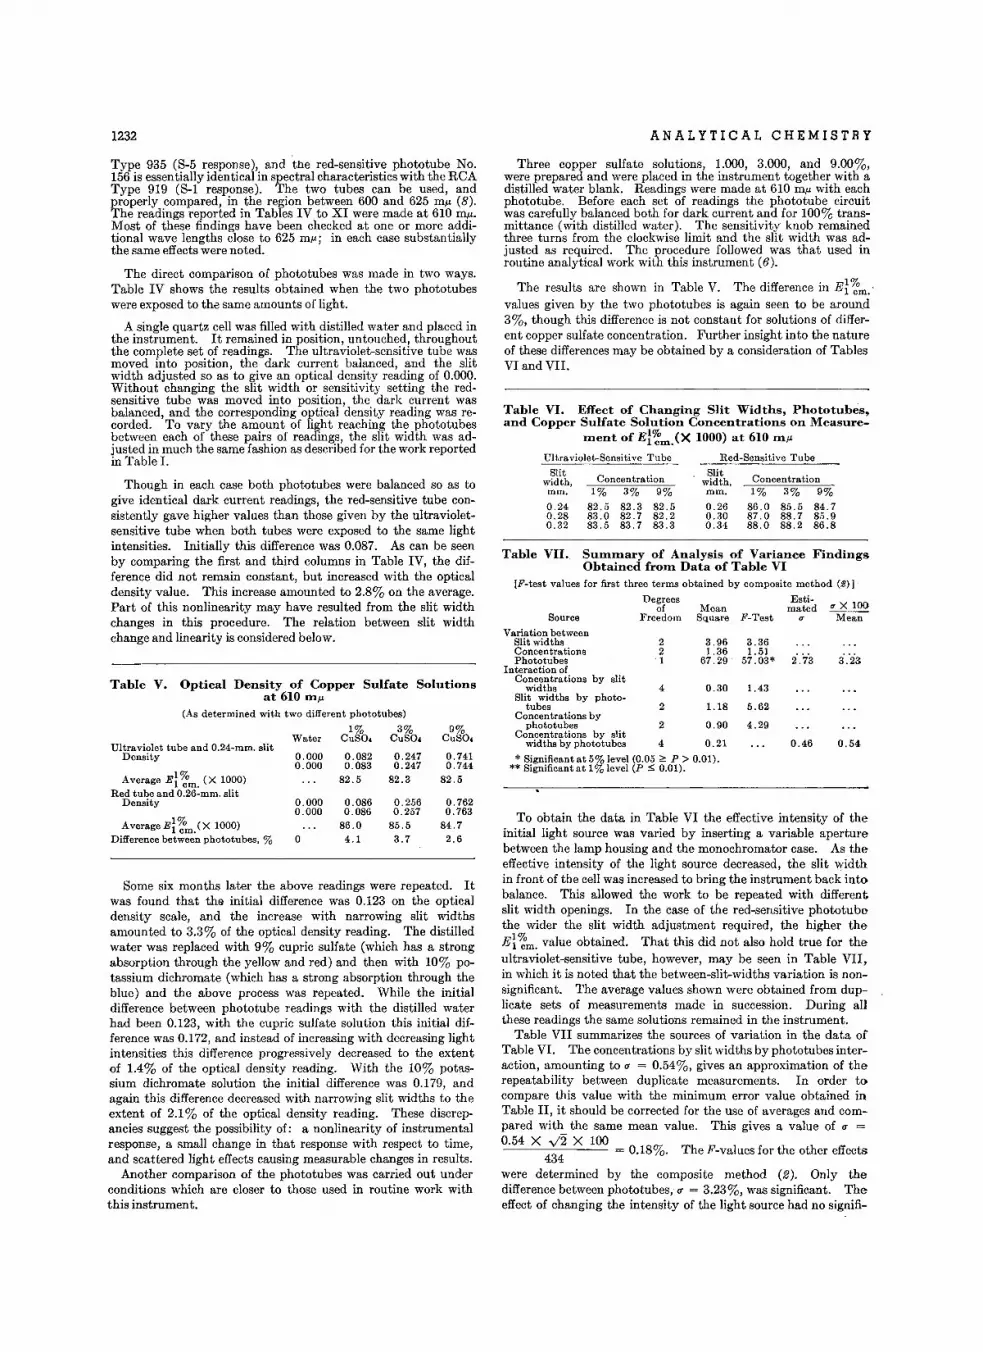
1232 ANALYTICAL CHEMISTRY
Table VI. Effect of Changing Slit Widths, Phototubes,and Copper Sulfate Solution Concentrations on Measure-
ment of E~~m..(X 1000) at 610 m«
Three copper sulfate solutions, 1.000, 3.000, and 9.00%,were prepared and were placed in the instrument together with adistilled water blank. Readings were made at 610 mj.t with eachphototube. Before each set of readings the phototube circuitwas carefully balanced both for dark current and for 100% transmittance (with distilled water). The sensitivity knob remainedthree turns from the clockwise limit and the slit width was adjusted as required. The procedure followed was that used inroutine analytical work with this instrument (6).
The results are shown in Table V. The difference in E~~m.·values given by the two phototubes is again seen to be around3%, though this difference is not constant for solutions of different copper sulfate concentration. Further insight into the natureof these differences may be obtained by a consideration of TablesVI and VII.
Type 935 (8-5 response), and the red-sensitive phototube No.156 is essentially identical in spectral characteristics with the RCAType 919 (8-1 response). The two tubes can be used, andproperly compared, in the region between 600 and 625 mu (8).The readings reported in Tables IV to XI were made at 610 mil.Most of these findings have been checked at one or more additional wave lengths close to 625 mz ; in each case substantiallythe same effects were noted.
The direct comparison of phototubes was made in two ways.Table IV shows the results obtained when the two phototubeswere exposed to the same amounts of light.
A single quartz cell was filled with distilled water and placed inthe instrument. It remained in position, untouched, throughoutthe complete set of readings. The ultraviolet-sensitive tube wasmoved into position, the dark current balanced, and the slitwidth adjusted so as to give an optical density reading of 0.000.Without changing the slit width or sensitivity setting the redsensitive tube was moved into position, the dark current wasbalanced, and the corresponding optical density reading was recorded. To vary the amount of light reaching the phototubesbetween each of these pairs of readings, the slit width was adjusted in much the same fashion as described for the work reportedin Table I. Ultraviolet-Sensitive Tube Red-Sensitive Tube
Table VII. Summary of Analysis of Variance FindingsObtained from Data of Table VI
[F-test values for first three terms obtained by composite method (11)]
Degrees Esti-of Mean mated cr X 100
Source Freedom Square F-Test a Mean
To obtain the data in Table VI the effective intensity of theinitial light source was varied by inserting a variable aperturebetween the lamp housing and the monochromator case. As theeffective intensity of the light source decreased, the slit widthin front of the cell was increased to bring the instrument back intobalance. This allowed the work to be repeated with differentslit width openings. In the case of the red-sensitive phototubethe wider the slit width adjustment required, the higher theE~~m. value obtained. That this did not also hold true for theultraviolet-sensitive tube, however, may be seen in Table VII,in which it is noted that the between-slit-widths variation is nonsignificant. The average values shown were obtained from duplicate sets of measurements made in succession. During allthese readings the same solutions remained in the instrument.
Table VII summarizes the sources of variation in the data ofTable VI. The concentrations by slit widths by phototubes interaction, amounting to (J = 0.54%, gives an approximation of therepeatability between duplicate measurements. In order tocompare this value with the minimum error value obtained inTable II, it should be corrected for the use of averages and compared with the same mean value. This gives a value of (J =0.54 X v'2 X 100
434 = 0.18%. The F-values for the other effects
were determined by the composite method (2). Only thedifference between phototubes, (J = 3.23%, was significant. Theeffect of changing the intensity of the light source had no signifi-
Variation betweenSlit widths 2 3.96 3.36Concentrations 2 1.36 1.51
2'.'7'3Phototubes '1 67.29 57.03*Interaction of
Concentrations by slitwidths 4 0.30 1.43
Slit widths by photo-tubes 2 1.18 5.62
Concentrations byphototubes 2 0.90 4.29
Concentrations by slitwidths by phototubes 4 0.21 0.46
* Significant at 5% level (0.05 ;" P > 0.01).** Significant at 1% level (P ,,; 0.01).
Though in each case both phototubes were balanced so as togive identical dark current readings, the red-sensitive tube consistently gave higher values than those given by the ultravioletsensitive tube when both tubes were exposed to the same lightintensities. Initially this difference was 0.087. As can be seenby comparing the first and third columns in Table IV, the difference did not remain constant, but increased with the opticaldensity value. This increase amounted to 2.8% on the average.Part of this nonlinearity may have resulted from the slit widthchanges in this procedure. The relation between slit widthchange and linearity is considered below.
Table V. Optical Density of Copper Sulfate Solutionsat 610 mj.t
(As determined with two different phototubes)
1% 3% 9%Water ceso, ceso, ceso,
Ultraviolet tube and 0.24-mm. slitDensity 0.000 0.082 0.247 0.741
0.000 0.083 0.247 0.744
Average E~~m. (X 1000) 82.5 82.3 82.5
Red tube and 0.26-mm. slitDensity 0.000 0.086 0.256 0.762
0.000 0.086 0.257 0.763
Average E~~m.(X 1000) 86.0 85.5 84.7
Difference between phototubes, % 0 4.1 3.7 2.6
Some six months later the above readings were repeated. Itwas found that ths initial difference was 0.123 on the opticaldensity scale, and the increase with narrowing slit widthsamounted to 3.3% of the optical density reading. The distilledwater was replaced with 9% cupric sulfate (which has a strongabsorption through the yellow and red) and then with 10% potassium dichromate (which has a strong absorption through theblue) and the above process was repeated. While the initialdifference between phototube readings with the distilled waterhad been 0.123, with the cupric sulfate solution this initial difference was 0.172, and instead of increasing with decreasing lightintensities this difference progressively decreased to the extentof 1.4% of the optical density reading. With the 10% potassium dichromate solution the initial difference was 0.179, andagain this difference decreased with narrowing slit widths to theextent of 2.1% of the optical density reading. These discrepancies suggest the possibility of: a nonlinearity of instrumentalresponse, a small change in that response with respect to time,and scattered light effects causing measurable changes in results.
Another comparison of the phototubes was carried out underconditions which are closer to those used in routine work withthis instrument.
Slitwidth,mm.
0.240.280.32
Concentration1% 3% 9%
82.5 82.3 82.583.0 82.7 82.283.5 83.7 83.3
Slitwidth,mrn.
0.260.300.34
Concentration1% 3% 9%
86.0 85.5 84.787.0 88.7 85.988.0 88.2 86.8
3.23
0.54
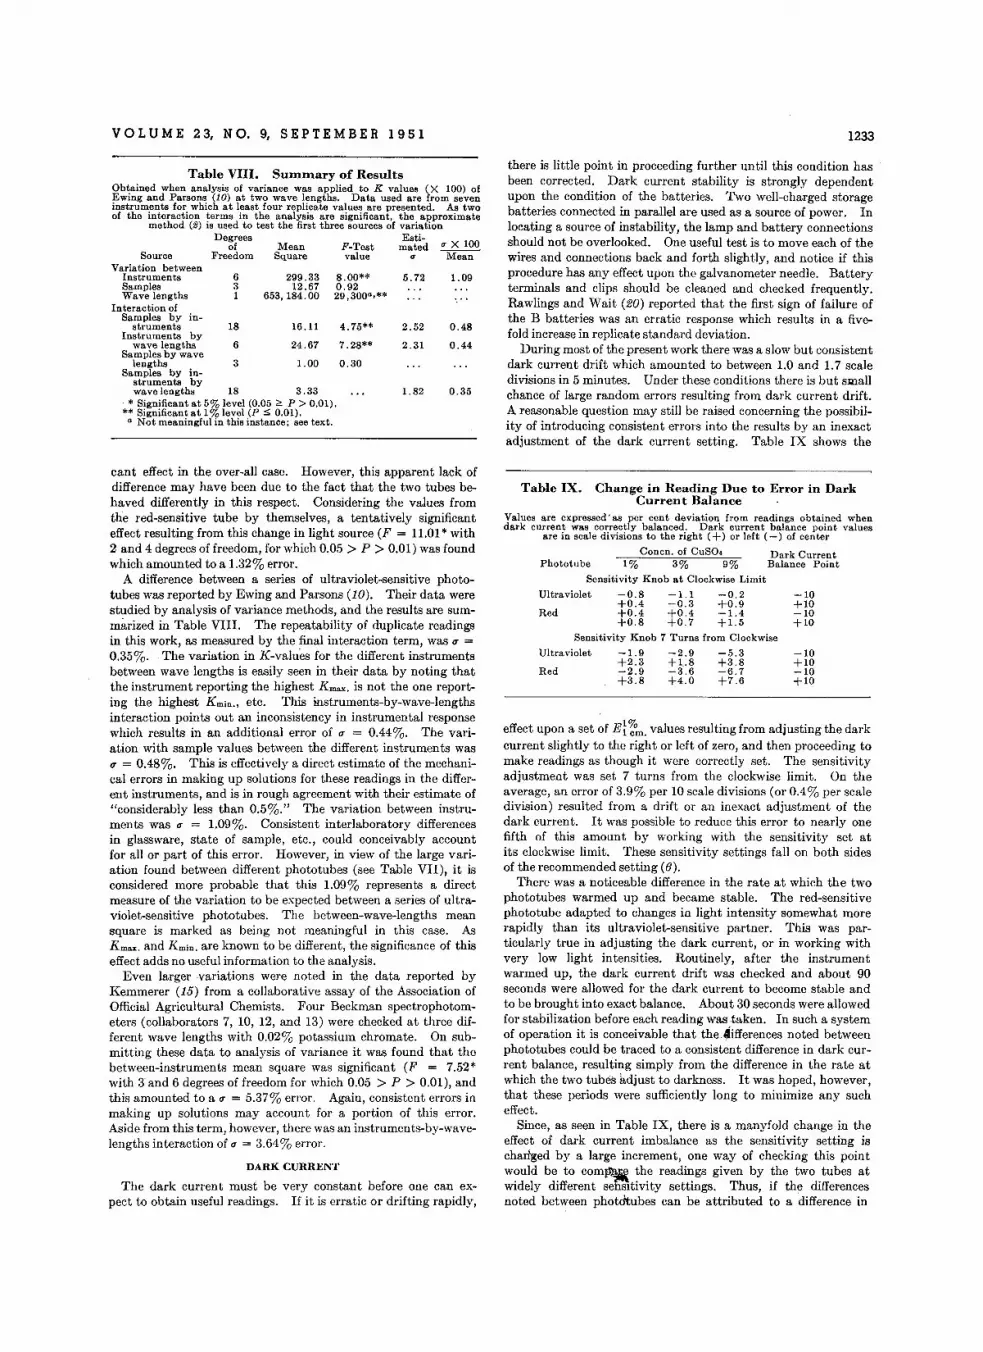
VOL U M E 2 3, N O. 9, SE PTE M B E R 1 9 5 1 1233
there is little point in proceeding further until this condition hasbeen corrected. Dark current stability is strongly dependentupon the condition of the batteries. Two well-charged storagebatteries connected in parallel are used as a source of power. Inlocating a source of instability, the lamp and battery connectionsshould not be overlooked. One useful test is to move each of thewires and connections back and forth slightly, and notice if thisprocedure has any effect upon the galvanometer needle. Batteryterminals and clips should be cleaned and checked frequently.Rawlings and Wait (20) reported that the first sign of failure ofthe B batteries was an erratic response which results in a fivefold increase in replicate standard deviation.
During most of the present work there was a slow but consistentdark current drift which amounted to between 1.0 and 1.7 scaledivisions in 5 minutes. Under these conditions there is but smallchance of large random errors resulting from dark current drift.A reasonable question may still be raised concerning the possibility of introducing consistent errors into the results by an inexactadjustment of the dark current setting. Table IX shows the
1.09
0.48
0.44
0.35
5.72
2.52
2.31
1.82
0.30
4.75**
7.28**
8.00**0.9229.300·.**
1.00
16.11
24.67
299.3312.67
653.184.00
6
3
631
18
Table VIII. Summary of ResultsObtained when analysis of variance was applied to K values (X 100) ofEwing and Parsons (10) at two wave lengths. Data used are from seveninstruments for which at least four replicate values are presented. As twoof the interaction ~erms in the analysis are significant, the approximate
method (2) 1S used to test the first three sources of variationDegrees Esti-
of Mean F-Test mated IT X 100Freedom Square value IT MeanSource
Variation betweenInstrumentsSamplesWave lengths
Interaction ofSamples by in
strumentsInstruments by
wave lengthsSamples by wave
lengthsSamples by in
struments bywave lengths 18 3.33
* Significant at 5% level (0.05 ;;,; P > 0.01).** Significant at 1% level (P ,;; 0.01).
a Not meaningful in this instance; see text.
-10+10-10+10
-10+10-10+10
Red
Red
Table IX. Change in Reading Due to Error in DarkCurrent Balance
Values are expressed' as per cent deviation from readings obtained whendark current was correctly balanced. Dark current balance point values
are in scale divisions to the right (+) or left (-) of center
Concn. of CuSO. Dark CurrentPhototube 1% 3% 9% Balance Point
Sensitivity Knob at Clockwise Limit
Ultraviolet -0.8 -1.1 -0.2+0.4 -0.3 +0.9+0.4 +0.4 -1.4+0.8 +0.7 +1.5
Sensitivity Knob 7 Turns from Clockwise
Ultraviolet -1.9 -2.9 -5.3+2.3 +1,.8 +3.8-2.9 -3.6 -6.7+3.8 +4.0 +7.6
effect upon a set of Et r':n. values resulting from adjusting the darkcurrent slightly to the right or left of zero, and then proceeding tomake readings as though it were correctly set. The sensitivityadjustment was set 7 turns from the clockwise limit. On theaverage, an error of 3.9% per 10 scale divisions (or 0.4% per scaledivision) resulted from a drift or an inexact adjustment of thedark current. It was possible to reduce this error to nearly onefifth of this amount by working with the sensitivity set atits clockwise limit. These sensitivity settings fall on both sidesof the recommended setting (6).
There was a noticeable difference in the rate at which the twophototubes warmed up and became stable. The red-sensitivephototube adapted to changes in light intensity somewhat morerapidly than its ultraviolet-sensitive partner. This was particularly true in adjusting the dark current, or in working withvery low light intensities. Routinely, after the instrumentwarmed up, the dark current drift was checked and about 90seconds were allowed for the dark current to become stable andto be brought into exact balance. About 30 seconds were allowedfor stabilization before each reading was taken. In such a systemof operation it is conceivable that the~ifferencesnoted betweenphototubes could be traced to a consistent difference in dark current balance, resulting simply from the difference in the rate atwhich the two tubes adjust to darkness. It was hoped, however,that these periods were sufficiently long to minimize any sucheffect.
Since, as seen in Table IX, there is a manyfold change in theeffect of dark current imbalance as the sensitivity setting ischanged by a large increment, one way of checking this pointwould be to com. the readings given by the two tubes atwidely different sehsitivity settings. Thus, if the differencesnoted between phototubes can be attributed to a difference in
cant effect in the over-all case. However, this apparent lack ofdifference may have been due to the fact that the two tubes behaved differently in this respect. Considering the values fromthe red-sensitive tube by themselves, a tentatively significanteffect resulting from this change in light source (F = 11.01* with2 and 4 degrees of freedom, for which 0.0.5 > P > 0.01) was foundwhich amounted to a 1.32% error.
A difference between a series of ultraviolet-sensitive phototubes was reported by Ewing and Parsons (10). Their data werestudied by analysis of variance methods, and the results are summarized in Table VIII. The repeatability of duplicate readingsin this work, as measured by the final interaction term, was IT =0.35%. The variation in K-values for the different instrumentsbetween wave lengths is easily seen in their data by noting thatthe instrument reporting the highest K max • is not the one reporting the highest Kmin , , etc. This instruments-by-wave-lengthsinteraction points out an inconsistency in instrumental responsewhich results in an additional error of IT = 0.44%. The variation with sample values between the different instruments wasIT = 0.48%. This is effectively a direct estimate of the mechanical errors in making up solutions for these readings in the different instruments, and is in rough agreement with their estimate of"considerably less than 0.5%." The variation between instruments was IT = 1.09%. Consistent interlaboratory differencesin glassware, state of sample, etc., could conceivably accountfor all or part of this error. However, in view of the large variation found between different phototubes (see Table VII), it isconsidered more probable that this 1.09% represents a directmeasure of the variation to be expected between a series of ultraviolet-sensitive phototubes. The between-wave-lengths meansquare is marked as being not meaningful in this case. AsK m• x. and Kmin , are known to be different, the significance of thiseffect adds no useful information to the analysis.
Even larger variations were noted in the data reported byKemmerer (15) from a collaborative assay of the Association ofOfficial Agricultural Chemists. Four Beckman spectrophotometers (collaborators 7, 10, 12, and 13) were checked at three different wave lengths with 0.02% potassium chromate. On submitting these data to analysis of variance it was found that thebetween-instruments mean square was significant (F = 7.52*with 3 and 6 degrees of freedom for which 0.05 > P > 0.01), andthis amounted to a IT = 5.37% error. Again, consistent errors inmaking up solutions may account for a portion of this error.Aside from this term, however, there was an instruments-by-wavelengths interaction of IT = 3.64% error.
DARK CURRENT
The dark current must be very constant before one can expect to obtain useful readings. If it is erratic or drifting rapidly,
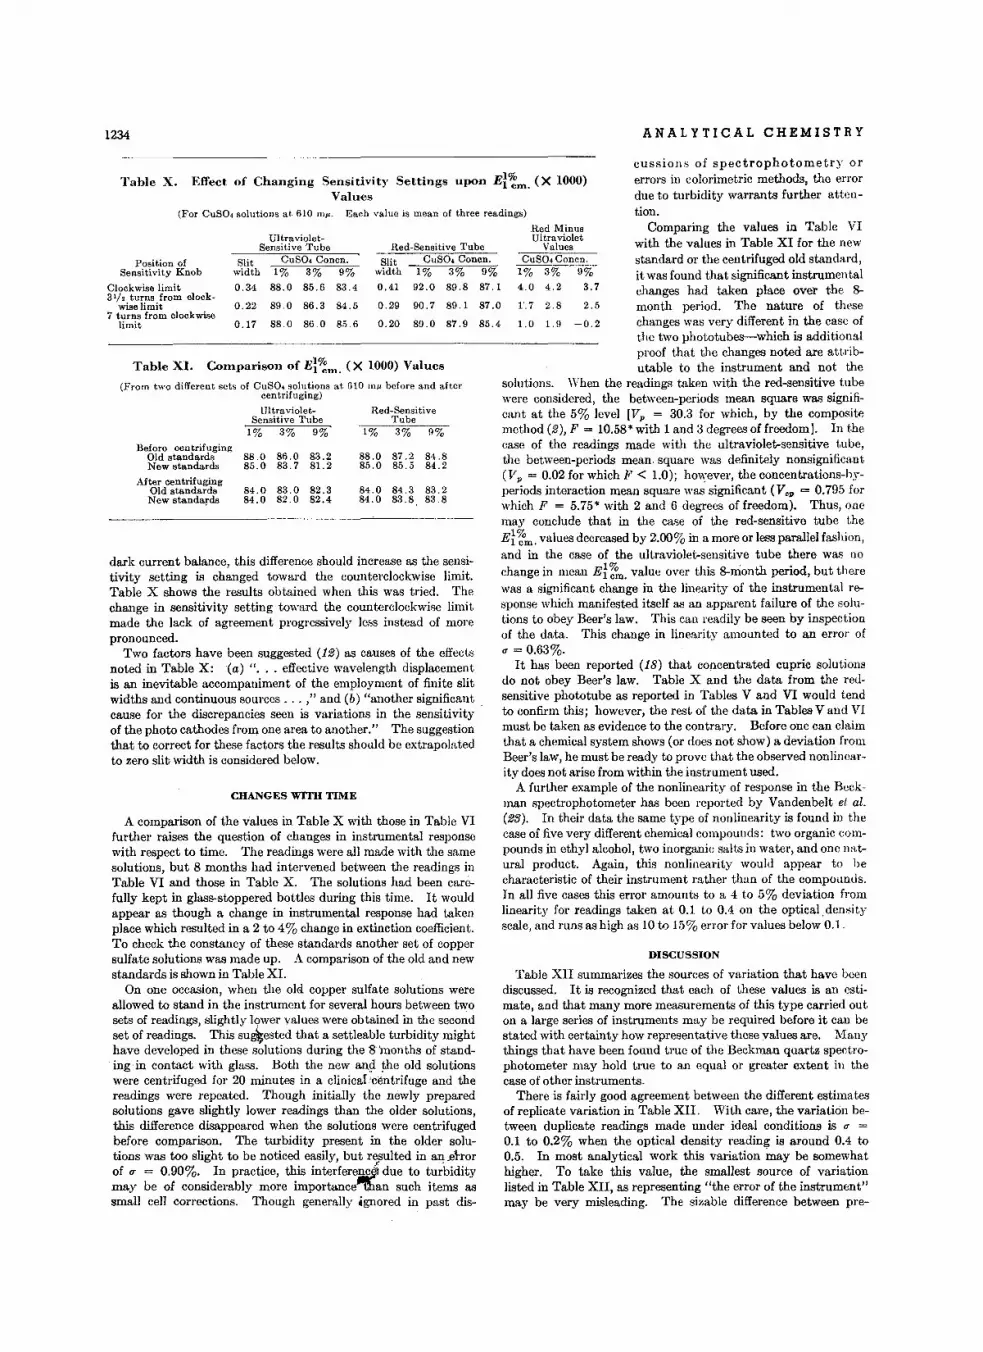
1234 ANALYTICAL CHEMISTRY
Effect of Changing Sensitivity Settings upon Et~m. (X 1000)Values
Before centrifugingOld standards 88.0 86.0 83.2 88.0 87.2 84.8New standards 85.0 83.7 81.2 85.0 85.5 84.2
After centrifugingOld standards 84.0 83.0 82.3 84.0 84.3 83.2New standards 84,0 82.0 82.4 84,0 83.8 83.8
2,5
-0,2
Red MinusUltraviolet
Values
1'.7 2.8
1.0 1.9
CuSO, Concn,1% 3% 9%
4.0 4,2 3,7
DISCUSSION
Table XII summarizes the sources of variation that have beendiscussed. It is recognized that each of these values is an estimate, and that many more measurements of this type carried outon a large series of instruments may be required before it can bestated with certainty how representative these values are. Manythings that have been found true of the Beckman quartz spectrophotometer may hold true to an equal or greater extent ill thecase of other instruments.
There is fairly good agreement between the different estimatesof replicate variation in Table XII. With care, the variation between duplicate readings made under ideal conditions is (J' =0.1 to 0.2% when the optical density reading is around 0.4 to0.5. In most analytical work this variation may be somewhathigher. To take this value, the smallest source of variationlisted in Table XII, as representing lithe error of the instrument"may be very misleading. The sizable difference between pre-
cussions of spectrophotometry orerrol's in colorimetric methods, the errordue to turbidity warrants further attention.
Comparing the values in Table VIwith the values in Table XI for the newstandard or the centrifuged old standard,it was found that significant instrumentalchanges had taken place over the 8month period. The nature of thesechanges was very different in the case ofthe two phototubes-which is additionalproof that the changes noted are attributable to the instrnment and not the
solutions. When the readings taken with the red-sensitive tubewere considered, the between-periods mean square was significant at the 5% level [Vp = 30.3 for which, by the compositemethod (2), F = 10.58* with 1 and 3 degrees of freedom]. In thecase of the readings made with the ultraviolet-sensitive tube,the between-periods mean, square was definitely nonsignificant(Vp = 0.02 for which F < 1.0); however, the concentrations-byperiods interaction mean square was significant (V"" = 0.795 forwhich F = 5.75* with 2 and 6 degrees offreedom). Thus, onemay conclude that in the case of the red-sensitive tube theEt~m. values decreased by 2.00% in a more or less parallel fashion,and in the case of the ultraviolet-sensitive tube there was nochange in mean Etr'in. value over this 8-month period, but therewas a significant change in the linearity of the instrumental response which manifested itself as an apparent failure of the solutions to obey Beer's law. This can readily be seen by inspectionof the data. This change in linearity amounted to an error of(J" = 0.63%.
It has been reported (18) that concentrated cupric solutionsdo not obey Beer's law. Table X and the data from the redsensitive phototube as reported in Tables V and VI would tendto confirm this; however, the rest of the data in Tables V and VImust be taken as evidence to the contrary. Before one can claimthat a chemical system shows (or does not show) a deviation fromBeer's law, he must be ready to prove that the observed nonlinearity does not arise from within the instrument used.
A further example of the nonlinearity of response in the Beckman spectrophotometer has been reported by Vandenbelt et 01.(23). In their data the same type of nonlinearity is found in thecase of five very different chemical compounds: two organic compounds in ethyl alcohol, two inorganic salts in water, and one natural product. Again, this nonlinearity would appear to hecharacteristic of their instrument rather than of the compounds.In all five cases this error amounts to a 4 to 5% deviation fromlinearity for readings taken at 0.1 to 0.4 on the optical. densi tyseale, and runs as high as 10 to 15% error for values below 0.1.
89.0 87,9 85.4
90.7 89, 1 87.0
Red-Sensitive Tube
0.29
0.20
Slit CuSO, Concn.width 1% 3% 9%
0.41 92.0 89,8 87,1
Red-SensitiveTube
1% 3% 9%
Each value is mean of three readings)
89.0 86,3 84.5
88.0 86.0 8.5.6
UltravioletSensiti ve Tube
0,22
0,17
Slit CuSO, Conen.width 1% 3% 9%
0,34 88.0 85.6 83.4
CHAl"'GES WITH TIME
Cornparison of E}~1T1. (X 10(0) Values
(For CuSO, solutions at 610 ma.
Table XI.
Table X.
(From two different sets of CUSOolo solutions at G10 mil before and aftercentrifuging)
UltravioletSensitive Tube
1% 3% 9%
A comparison of the values in Table X with those in Table VIfurther raises the question of changes in instrumental responsewith respect to time. The readings were all made with the samesolutions, but 8 months had intervened between the readings illTable VI and those in Table X. The solutions had been carefully kept in glass-stoppered bottles during this time. It wouldappear as though a change in instrumental response had takenplace which resulted in a 2 to 4% change in extinction coefficient.To check the constancy of these standards another set of coppersulfate solutions was made up. A comparison of the old and newstandards is shown in Table XI.
On one occasion, when the old copper sulfate solutions wereallowed to stand in the instrument for several hours between twosets of readings, slightly lower values were obtained in the secondset of readings. This su~ested that a settleable turbidity mighthave developed in these solutions during the 8' 'months of standingin contact with glass. Both the new and the old solutionswere centrifuged for 20 minutes in a clinicalcentrifuge and thereadings were repeated, Though initially the newly preparedsolutions gave slightly lower readings than the older solutions,this difference disappeared when the solutions were centrifugedbefore comparison. The turbidity present in the older solutions was too slight to be noticed easily, but resulted in an .ehorof (T = 0.90%. In practice, this interfere~due to turbiditymay be of considerably more importance"'lhan such items assmall cell corrections. Though generally .ignored in past dis-
dark current balance, this difference should increase as the sensitivity setting is changed toward the counterclockwise limit.Table X shows the results obtained when this was tried. Thechange in sensitivity setting toward the counterclockwise limitmade the lack of agreement progressively less instead of morepronounced.
Two factors have been suggested (12) as causes of the effectsnoted in Table X: (a) " ... effeetive wavelength displacementis an inevitable accompaniment of the employment of finite slitwidths and continuous sources ... ," and (b) "another significantcause for the discrepancies seen is variations in the sensitivityof the photo cathodes from one area to another." The suggestionthat to correct for these factors the results should be extrapolatedto zero slit width is considered below.
Position ofSensitivity Knob
Clockwise limit3 1;' turns from clock
wise limit7 turns from clockwise
limit
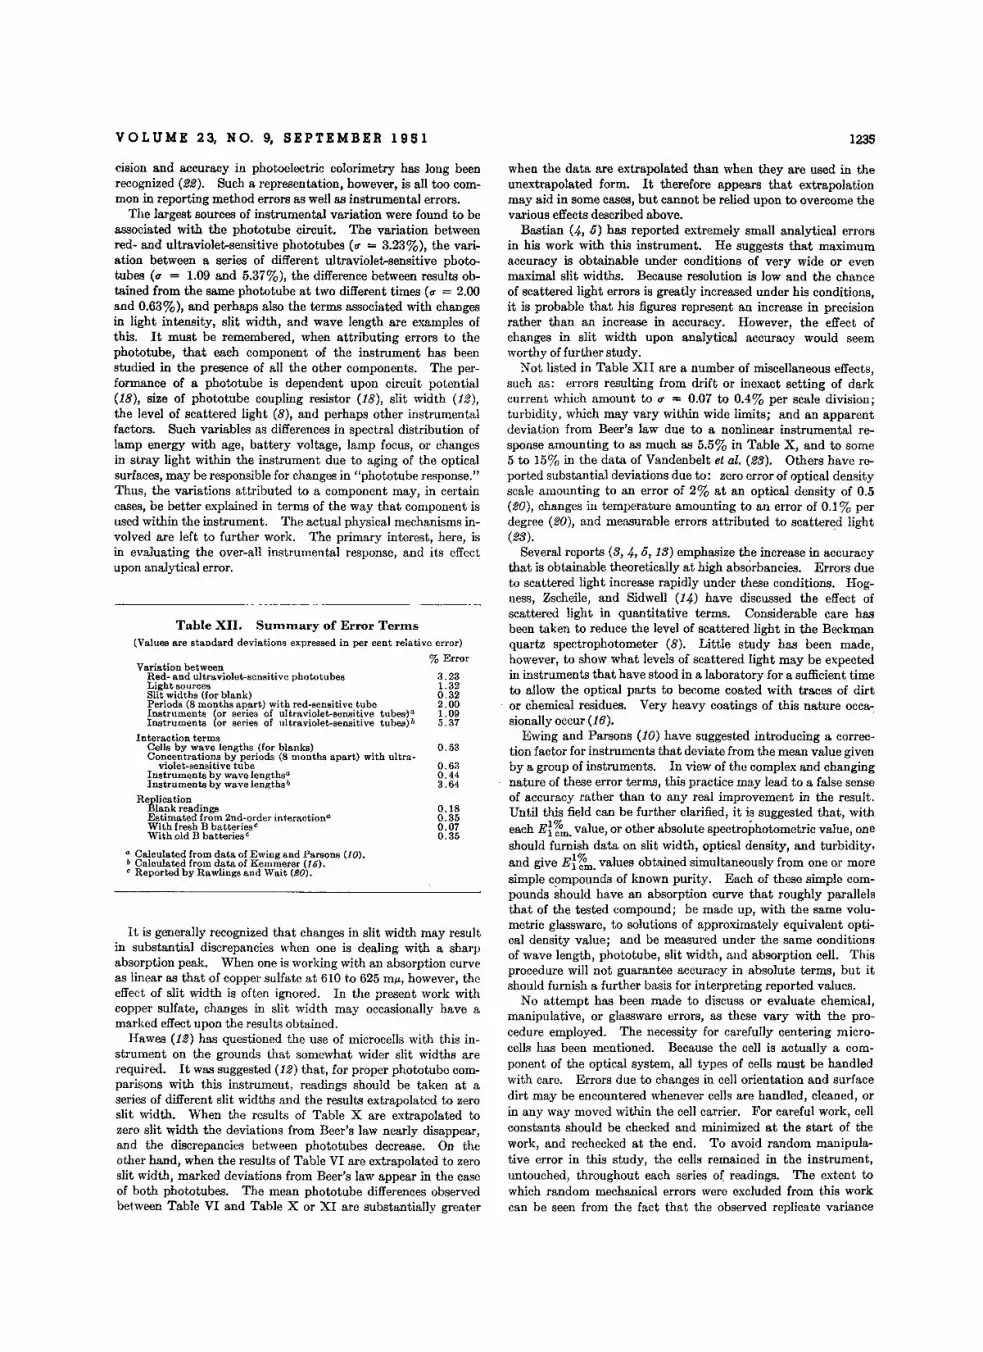
VOLUME 23, NO.9, SEPTEMBER 1951 1235
a Calculated from data of Ewing and Parsons (10).b Calculated from data of Kemmerer (15).C Reported by Rawlings and Wait (eO).
when the data are extrapolated than when they are used in theunextrapolated form. It therefore appears that extrapolationmay aid in some cases, but cannot be relied upon to overcome thevarious effects described above.
Bastian (4, 5) has reported extremely small analytical errorsin his work with this instrument. He suggests that maximumaccuracy is obtainable under conditions of very wide or evenmaximal slit widths. Because resolution is low and the chanceof scattered light errors is greatly increased under his conditions,it is probable that his figures represent an increase in precisionrather than an increase in accuracy. However, the effect ofchanges in slit width upon analytical accuracy would seemworthy of further study.
Not listed in Table XII are a number of miscellaneous effects,such as: errors resulting from drift or inexact setting of darkcurrent which amount to 0" = 0.07 to 0.4% per scale division;turbidity. which may vary within wide limits; and an apparentdeviation from Beer's law due to a nonlinear instrumental response amounting to as much as 5.5% in Table X, and to some5 to 15% in the data of Vandenbelt et al. (23). Others have reported substantial deviations due to: zero error of optical densityscale amounting to an error of 2% at an optical density of 0.5(20), changes in temperature amounting to an error of 0.1% perdegree (20), and measurable errors attributed to scattered light(23). .
Several reports (3, 4, 6, 13) emphasize the increase in accuracythat is obtainable theoretically at high absorbancies. Errors dueto scattered light increase rapidly under these conditions. Hogness, Zscheile, and Sidwell (14) have discussed the effect ofscattered light in quantitative terms. Considerable care hasbeen taken to reduce the level of scattered light in the Beckmanquartz spectrophotometer (8). Little study has been made,however, to show what levels of scattered light may be expectedin instruments that have stood in a laboratory for a sufficient timeto allow the optical parts to become coated with traces of dirtor chemical residues. Very heavy coatings of this nature occasionally occur (16).
Ewing and Parsons (10) have suggested introducing a correction factor for instruments that deviate from the mean value givenby a group of instruments. In view of the complex and changingnature of these error terms, this practice may lead to a false senseof accuracy rather than to any real improvement in the result.Until this field can be further clarified, it is suggested that, witheach E~ r'::n. value, or other absolute spectrophotometric value, oneshould furnish data on slit width, optical density, and turbidity.and give E~ r'::n. values obtained simultaneously from one or moresimple compounds of known purity. Each of these simple compounds ~hould have an absorption curve that roughly parallelsthat of the tested compound; be made up, with the same volumetric glassware, to solutions of approximately equivalent optical density value; and be measured under the same conditionsof wave length, phototube, slit width, and absorption cell. Thisprocedure will not guarantee accuracy in absolute terms, but itshould furnish a further basis for interpreting reported values.
No attempt has been made to discuss or evaluate chemical,manipulative, or glassware errors, as these vary with the procedure employed. The necessity for carefully centering microcells has been mentioned. Because the cell is actually a component of the optical system, all types of cells must be handledwith care. Errors due to changes in cell orientation and surfacedirt may be encountered whenever cells are handled, cleaned, orin any way moved within the cell carrier. For careful work, cellconstants should be checked and minimized at the start of thework, and rechecked at the end. To avoid random manipulative error in this study, the cells remained in the instrument,untouched, throughout each series of readings. The extent towhich random mechanical errors were excluded from this workcan be seen from the fact that the observed replicate variance
0.53
0.630.443.64
0.180.350.070.35
3.231.320.322.001.095.37
Variation betweenRed- and ultraviolet-sensitive phototubesLight sourcesSlit widths (for blank)Periods (8 months apart) with red-sensitive tubeInstruments (or series of ultraviolet-sensitive tubes)·Instruments (or series of ultraviolet-sensitive tubes) b
Interaction termsCells by wavs lengths (for blanks)Concentrations by periods (8 months apart) with ultra
violet-sensitive tubeInstruments by wave lengths"Instruments by wave Iengths«
ReplicationBlank readingsEstimated from 2nd-order interaction?With fresh B batteries"With old B batteries?
Table XII. Smnmary of Error Terms(Values are standard deviations expressed in per cent relative error)
% Error
It is generally recognized that changes in slit width may resultin substantial discrepancies when one is dealing. with a sharpabsorption peak. When one is working with an absorption curveas linear as that of copper sulfate at 610 to 625 m«, however, theeffect of slit width is often ignored. In the present work withcopper sulfate, changes in slit width may occasionally have amarked effect upon the results obtained.
Hawes (12) has questioned the use of microcells with this instrument on the grounds that somewhat wider slit widths arerequired. It was suggested (12) that, for proper phototube comparisons with this instrument, readings should be taken at aseries of different slit widths and the results extrapolated to zeroslit width. When the results of Table X are extrapolated tozero slit width the deviations from Beer's law nearly disappear,and the discrepancies between phototubes decrease. On theother hand, when the results of Table VI are extrapolated to zeroslit width, marked deviations from Beer's law appear in the caseof both phototubes. The mean phototube differences observedbetween Table VI and Table X or XI are substantially greater
cision and accuracy in photoelectric colorimetry has long beenrecognized (22). Such a representation, however, is all too common in reporting method errors as well as instrumental errors.
The largest sources of instrumental variation were found to beassociated with the phototube circuit. The variation betweenred- and ultraviolet-sensitive phototubes (0" = 3.23%), the variation between a series of different ultraviolet-sensitive phototubes (0" = 1.09 and 5.37%), the difference between results obtained from the same phototube at two different times (0" = 2.00and 0.63%), and perhaps also the terms associated with changesin light intensity, slit width, and wave length are examples ofthis. It must be remembered, when attributing errors to thephototube, that each component of the instrument has beenstudied in the presence of all the other components. The performance of a phototube is dependent upon circuit potential(18), size of phototube coupling resistor (18), slit width (12),the level of scattered light (8), and perhaps other instrumentalfactors. Such variables as differences in spectral distribution oflamp energy with age, battery voltage, lamp focus, or changesin stray light within the instrument due to aging of the opticalsurfaces, may be responsible for changes in "phototube response."Thus, the variations attributed to a component may, in certaincases, be better explained in terms of the way that component isused within the instrument. The actual physical mechanisms involved are left to further work. The primary interest, here, isin evaluating the over-all instrumental response, and its effectupon analytical error.
1236
approaches the theoretical minimum for the instrument. In thecourse of most analytical procedures it is necessary to remove thecell carrier from the instrument, and refill the individual cellsmany times. In such cases it is necessary to keep these mechanical factors in mind if reasonably high precision is to be attained.
After considering the nature and size of the variations observable within the Beckman spectrophotometer, it seems allowableto draw certain conclusions concerning its use in chemical semimicro procedures (7, 17).
If the instrument is to be used only to yield relative valuesi.e., to compare a series of unknowns with a set of comparablestandards as in many routine analyses-very good and consistentresults can be expected, as far as instrumental error is concerned.A variation of the order of (J" = 0.5% is reasonable, and in certain cases lower values may be reported.
If extinction coefficients are to be used as a basis for calculation, as is common in vitamin A methods, for example, or if thefinal result is to be expressed in absolute terms, considerable caution must be used. Repeatability and error are far from identicalin such a case. One should be slow to attribute significance todiscrepancies of 5% or less in the E{f~. values reported by different laboratories or even between different sets of absolute valuesobtained within the same laboratory at markedly differenttimes.
In studying apparent deviations from Beer's law it must bedefinitely established that the nonlinearity observed in the workdoes not arise from the instrument.
In all careful work special precautions should be taken to ruleout the possible effect?f turbidity.
ACKNOWLEDGMENT
The author wishes to express his thanks to Howard Alexander,Mathematics Department, Adrian College, and Warren Gilleran,radio technician, for their comments, and to Olaf Mickelsen, chiefchemist of the Division of Chronic Disease of the U. S. Public
ANALYTICAL CHEMISTRY
Health Service, for his suggestions and encouragement in thiswork.
LITERATURE CITED
(1) Alexander, H., and Caster, W.O., in preparation.(2) Anderson, R. L., J. Am. Statist. Assoc., 42, 612 (1947).(3) Ayers, G. H., ANAL. CHEM., 21,652 (1949).(4) Bastian, R., Ibid., 21, 972 (1949).(5) Bastian, R., Weberling, R., and Palilla, F., Ibid., 22, 160 (1950).(6) Beckman Bull. 91-D, National Technical Laboratories.(7) Bessey, O. A., Lowry, O. H., Brock, J. J., and Lopez, J. A.,
J. Bioi. Chem., 166, 177.(8) Cary, H. H., and Beckman, A. 0., J. Optical Soc. Am., 31, 682
(1941); Beckman Bull. 144.(9) Caster, W.O., and Mickelsen, 0., Federation Proc., 8, 190 (1949).
(10) Ewing, G. E., and Parsons, T., ANAL. CHEM., 20, 423 (1948).(11) Hanze, A. R., Conger, T. W., Wise, E. C., and Weisblat, D. I.,
J. Am. Chem. Soc., 68, 1389 (1946).(12) Hawes, R. C., National Technical Laboratories, personal com
munication.(13) Hiskey, C. F., ANAL. CHEM., 21,1440 (1949).(14) Hogness, T. R., Zscheile, F. P., Jr., and Sidwell, A. E., Jr., J.
Phys. Chem., 41, 379 (1937).(15) Kemmerer, A. R" J. Assoc. Offic. Agr. Chemists, 29, 18 (1946).(16) Kincaid, G., National Technical Laboratories, personal com
munication.(17) Lowry, O. H., Lopez, J. A., and Bessey, O. A., J. Bioi. Chem.,
160,609 (1945).(18) Muller, R. H., IND. ENG. CHEM., ANAL. ED., 11, 1 (1939).(19) Oroshirik, W., J. Am. Chern: Soc., 67, 1627 (1945).(20) Rawlings, H. W., and Wait, G. H., Oil and Soap, 23, 83 (1946).(21) Snedecor, G. W., "Statistical Methods," 4th ed., Ames,
Iowa State College Press, 1946.(22) Twyman, F., and Lothian, G. F., Proc. Phys. Soc. (London),
45,643 (1933).(23) Vandenbelt, J. M., Forsyth, J., and Garrett, A., IND. ENG.
CHEM.,ANAL. ED., 17,235 (1945).(24) Wilke, J. B., J. Assoc. Offic, Agr. Chemists, 30, 382 (1947).
RECEIVED March 30,1950,
Automatic Countercurrent Distribution EquipmentLYMAN C. CRAIG, WERNER HAUSMANN, EDWARD H. AHRENS, JR., AND ELIZABETH J. HARFENIST
The Rockefeller Institutefor Medical Research, New York, N. Y.
For several years it has been obvious that an extraction eobarrrn : capable of applying several hundredequilibriulll stages or their equivalent would be avery useful tool, particularly for separation of theeornplex rrrixt.ur-es of rather poor stability so oftenencountered in biochelllistry. At ternpts to developsuch an apparatus have oufrntrrated in the equiprrrerrt described here. The apparatus is a strictly
TRUE progress in elucidation of the structures of the morecomplicated substances of biological interest can be made in
the sense of classical organic chemistry only when experimentalmeans are provided for the isolation of single chemical individualsirrespective of their complexity. No less a problem is the meansat hand for recognizing whether or not a single individual compound actually has been isolated. Even though certain physicalmeasurements, such as those involving phase rule study, are veryhelpful, if not decisive, in this regard, final evidence of purity depends to a great extent on strenuous fractionation attempts withthe most favorable separation procedure and failure to achievefurther resolution. It is therefore imperative that constantefforts be made to improve the separation tools available and thatas many as possible different separation methods of high resolvingpower be brought to bear on a single problem.
At the outset, it is granted that purity in the absolute sense cannever be proved or achieved (8). In fact, a few per cent of an
discontinuous extraction train containing 220 glassequilibration cells. The train is operated by autorrrat.ie equjprnerrt, In 24 hours 800 equilibriulllstages (roughly 150,000 extractions) are obtainable.As a "recycling" feature perrnrts several thousandequilibriulll stages to be applied, the question of"purity" can be decided with a considerable degreeof certainty.
impurity, especially when it is known to be present, may havelittle bearing on the problem of structure. Nonetheless, it isalways desirable to decrease the likelihood of significant impurityas far as is experimentally possible. Because of the steady progress in the improvement of methods for separation of mixtures,this requires continual re-examination of the "purity" question.
Among the available separation methods, countercurrent distribution offers a method unique in the sense that in actual practice for most solutes it can be operated so that theory and practicecoincide to a high degree. It is strictly a discontinuous process.Other countercurrent processes of high resolving power are continuous in nature and are generally interpreted in terms of theideal discontinuous process. Our understanding of them is intheory only, is partly based on analogy, and involves certain basicassumptions which mayor may not hold in actual practice. Suchan uncertainty implies, as far as the problem of purity is concerned, that the sample may not have had as high a number oftheoretical stages applied (or perhaps higher) as calculated.

VOL U M E 23, N O. 9, S E PTE M B E R 1 95 1
Thus far the chief disadvantage of counte rcurrent distributionhas been th e labor involved in th e applicat ion of high numbers oft ransfers to a given separa tion . Recently th is disadvantage hasbeen overcome by the developm ent of fully automa tic equipmentand a type of equilibration cell which can be assembled to forman ext raction t ra in of any length desired.
Figure 1. Comp le te Extracto r
The ap paratus has been in satisfactory operation for nearly ayear and has proved very useful , a ltho ugh certain small detailshave been improved from tim e to tim e. It permits several thousan d actua l equilibrium stages (220 extractions per sta ge) to bebrought to bear on the p roblem of th e purity of a given pr epara tion. At the same time it has sufficient capac ity to serve as apr eparative too l for small-scale st ructura l investigations .
D ESCRIPTION O F TIl E Al' l 'A RATUS
Th e glass case shown in Figure 1 houses an extraction t rain contain ing 220 equilibra t ion cells joined glass to glass with no rubberor plast ic connect ions. Th e case, which ha s a st ain less st eelfra me, pr otects the glass t rain. Aut omatic filling devices supplysolvents to th e train and an automat ic fract ion collecto r collectsthe effluent phases. The rear end view in F igur e 2 shows th eseparts . A mechani cal robot energizes the dri ving motors for th emovemen ts of th e cells and fraction collecto r and th us contro lsthe ent ire operation.
Equil ibratlon Cells. The cell shown in Figure 3 is mad efrom l S-mm. glass t ubing and is ap prox imately 32 cm. in length .T he th ree tubes attached to it are mad e from 7-mm . glass tub ing.T he overflow tube, c, is 10 cm. in length. It passes th rough th elower wall of the decan ta tion compa rt ment, d, at a ring seal an dextends nearl y to the opposite wall. A sha llow enlargement isblown in d opposite the opening of c. Like the cell, d is mad efrom I5-mm. tub ing. Its opening at e is either sealed to th enext equilibration cell of the series or joined to it by a flat groundglass joint.
Access to each equilibration cell is permitted through b, whichis a flat ground-gla ss sto pper designed to close f . The openingtube , f, is 4 ern. in length on the pr esent appa ra tus. However ,experience now suggests tha t a length of 8 ern. would be pr eferab le. The sto pper , b, is held in posit ion by a simple spring clamp,D. Any device for opening and closing f must be simple andextre mely rapid ; otherwise, with 220 tubes in th e series, excessivetime is requir ed for th e open ing or closing operation.
The two phases in th e equilibrat ion cell are brought to equilibrium by rocking from position A to B an d back again. Each
1237
position is abo ut 40 0 fro m th e hor izontal. After a pr edetermined number of strokes, 5 to 50, depending on the ra te at whichequilibrium is established (1), t he phases a re permitted to separate at position B. Upon til ti ng fur th er to position C, the upperphase decan ts through c to d. The length of the lower part of thecell is adjusted at the time of construc tion, so that with a Io-ml.lower phase th e meniscus sepa rating the two phases only reachespoint a. When th e cell is til ted back to position A , th e contentsof d flow thro ugh e into the next ad joining cell of the series.
The cells a re suppo rted on two 4 X 4 ern. Dural umin bars,each 180 cm. in length. T wo rows of cells a re thus pr ovid ed.The upper row is as close to the lower row as the height of thedeca ntation tube wiII permit, hut the former is placed slightly tothe rear , so that the sto ppers closing the lower tubes are readilyaccessible.
F igure 2. Filli n g E n d of Ex t ract o r
Th e cells are held on th e metal bar bv means of thin metalst ra ps of stainless stee l attached to small bolts . The st raps passover the glass tubes an d pr ess them against th e Du raluminbar. The bolts pass through th e bar to nuts on the other side.Notc hes have been cut in th e ba r spaced to receive each cell an dhold it in posit ion.
~D
c
Equ ili b rat io n Cell Design
In th e apparatus cur rently in use a ll th e cells are sealed together through each over flow tube, e, except that at every tenthcell th ey are joined by flat glass joints. The cells can thereforebe handled and re moved from the ba r in banks of 10. Less opportunity for leakage is thus pr esented and it is necessary to use
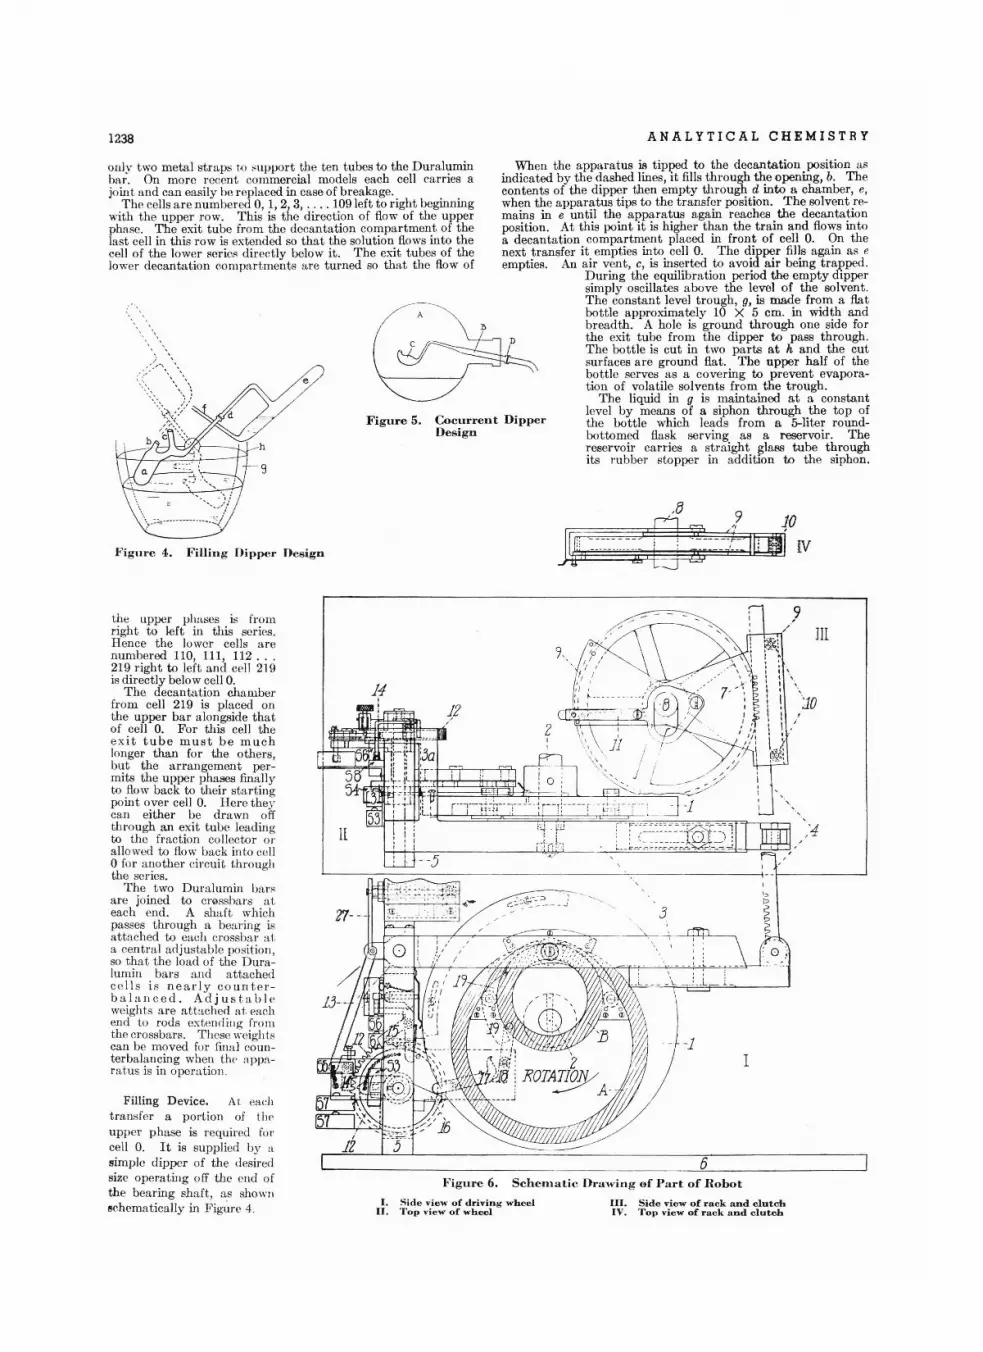
1238 ANALYT ICAL CHEMISTRY
only t wo metal straps I,) support th e ten tubes to th e Duraluminbar. On more recent commercia l models each cell carries ajoin t an d can easil y be replaced in case of breakage.
The cells are number ed 0,1 ,2,3, . . .. 109 left to right beginningwith t he upper row. This is the direction of flow of th e upperpha se. The exit tube from the decantation compartment of thelast cell in this row is extended so that th e solution flows into thecell of the lower series dir ectly below it. The exit tubes of thelower decantation compartments are turned so that th e flow of
.8 9. /, 10
i: fJ :---;:1m tv
When the apparatus is tipped to the decantation position asindi cated by the dashed lines, it fills through the opening, b. Thecontents of th e dipper then empty through d into a chamber, e,when the apparatus tips to the transfer position. The solvent remains in e until the a ppa ra tus again reaches the decantationposition . At this point it is higher than the train and flows intoa decantation compart ment placed in front of cell O. On thenext transfer it empties into cell O. The dipper fills again as eempties. An air vent, c, is inserted to avoid ai r being trapped.
D uring the equilibration period the empty dippersimply oscillates a bove the levol of the solvent.The constant levol trough, 0, is made from a flatbottle approximately 10 X 5 em. in width andbreadth. A hole is ground through one side fortho exit tube from the dipper to pass through.The bottle is cut in two parts at h and the cutsurfaces are ground flat. The upper half of thebottle serves as a covering to pr event evaporation of volatile solvents from the t rough.
Th e liquid in g is maintained at a constantlevel by means of a siphon through the top ofthe bottle which lead s from a 5-liter roundbottomed flask serving as a reservoir. Thereservo ir ca rr ies a st ra ight glass tube throughits rubber sto pper in addition to the siphon .
Coc u r -rer r t Dippe rHes ign
F igure 5.
e
Figure 4. F illi ug Di pper Design
F igure 6 . Schematic Hr a win g of P a r t of Robot
the upper phases is fromright to !eft in this series.B ence the lower cells arenumbered 110,111,112 . . .219 right to left an d c<>11 219is directly below cell 0.
The decantation chamberfrom cell 219 is pla ced onth e upper bar alongside th a tof cell O. Fo r this cell theex i t tube must b e muchlonger than for th e othe rs,but the arrangement permits th e upper phases finallyto flow back to th eir startin gpoint over cell O. Here theycan eith er be drawn offthrough an exit tube leadingto the fra cti on collecto r orallowed to flow back into cello for anot her circuit thro ughthe ser ies.
The t wo Duralumin barsar e joined to crossbars a teach end . A shaft, whichpasses thro ugh a bea ring isattached to eac h crossbar a ta cen tra l adjustab le position ,so that the load of the Duralurnin bars an d at tachodce l Is i s n e arl y co u n t.e rbala nce d . Ad j u s ta h l eweights a re attached at. eachend to rods extend ing fromthe crossba rs . These weightscan be moved for final counterbalancing when th o apparat us is in operation.
Filling Device. A I eachtran sfer a portion of t i ll '
upper phase is req uired forcell O. It is supplied by asimple dipper of th e desiredsize operating off th e end ofth e bearing shaft, as shownsch ematically in Figure 4. I . Side vi ew o f drivinJi: whe el
II . Top vi ew of w heelIII . Side view o f rack and cl utchIV . Top view of rack nnd clutch
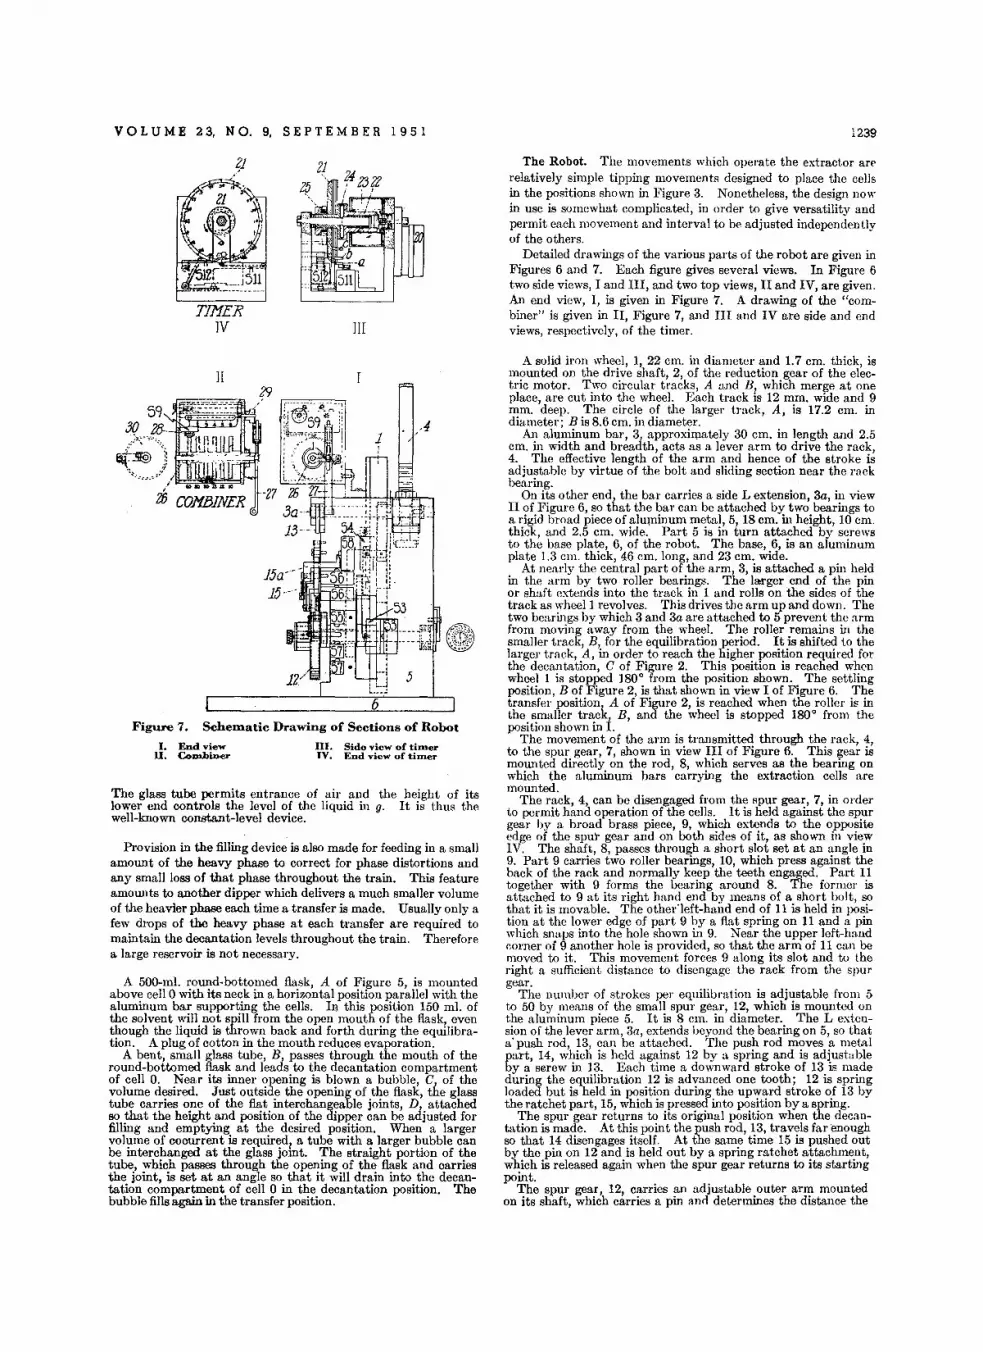
VOL U M E 23, N O. 9, SE PTE M B E R 1 9 5 1 1239
TJl'1ER]V III
The Robot. The movements which operate the extractor arerelatively simple tipping movements designed to place the cellsin the positions shown in Figure 3. Nonetheless, the design nowin use is somewhat complicated, ill order to give versatility andpermit each movement and interval to be adjusted independentlyof the others.
Detailed drawings of the various parts of the robot are given inFigures 6 and 7. Each figure gives several views. In Figure 6two side views, I and III, and two top views, II and IV, are given.An end view, I, is given in Figure 7. A drawing of the "combiner" is given in II, Figure 7, and III and IV are side and endviews, respectively, of the timer.
The glass tube permits entrance of air and the height of itslower end controls the level of the liquid in g. It is thus thewell-known constant-level device.
Figure 7. Schematic Drawing of Sections of Robot
I. End view III. Side view of timerU. CoD:Jbiner IV. End view of timer
Provision in the filling device is also made for feeding in a smallamount of the heavy phase to correct for phase distortions andany small loss of that phase throughout the train. This featureamounts to another dipper which delivers a much smaller volumeof the heavier phase each time a transfer is made. Usually only afew drops of the heavy phase at each transfer are required tomaintain the decantation levels throughout the train. Thereforea large reservoir is not necessary.
A solid iron wheel, 1, 22 em. in diameter and 1.7 cm. thick, ismounted on the drive shaft, 2, of the reduction gear of the electric motor. Two circular tracks, A and B, which merge at oneplace, are cut into the wheel. Each track is 12 mm. wide and 9mm. deep. The circle of the larger track, A, is 17.2 cm. indiameter; B is 8.6 em, in diameter.
An aluminum bar, 3, approximately 30 em. in length and 2.5cm. in width and breadth, acts as a lever arm to drive the rack,4. The effective length of the arm and hence of the stroke isadjustable by virtue of the bolt and sliding section near the rackbearing.
On its other end the bar carries a side L extension, 3a, in viewII of Figure 6, so that the bar can be attached by two bearings toa rigid broad piece of aluminum metal, 5, 18 em, in height, 10 cm.thick, and 2.5 em. wide. Part 5 is in turn attached by screwsto the base plate, 6, of the robot. The base, 6, is an aluminumplate 1.3 cm. thick, 46 em. long, and 23 em. wide.
At nearly the central part of the arm, 3, is attached a pin heldin the arm by two roller bearings. The larger end of the pinor shaft extends into the track in 1 and rolls on the sides of thetrack as wheel 1 revolves. This drives the arm up and down. Thetwo bearings by which 3 and 3a are attached to 5 prevent the armfrom moving away from the wheel. The roller remains in thesmaller track, B, for the equilibration period. It is shifted to thelarger track, A, in order to reach the higher position required forthe decantation, C of Figure 2. This position is reached whenwheel 1 is stopped 180 0 from the position shown. The settlingposition, B of Figure 2, is that shown in view I of Figure 6. Thetransfer position, A of Figure 2, is reached when the roller is inthe smaller track-l B, and the wheel is stopped 180 0 from theposition shown in 1.
The movement of the arm is transmitted through the rack, 4,to the spur gear, 7, shown in view III of Figure 6. This gear ismounted directly on the rod, 8, which serves as the bearing onwhich the aluminum bars carrying the extraction cells aremounted.
The rack, 4, can be disengaged from the spur gear, 7, in orderto permit hand operation of the cells. It is held against the spurgear by a broad brass piece, 9, which extends to the oppositeedgc of the spur gear and on both sides of it, as shown in viewIV. The shaft, 8, passes through a short slot set at an angle in9. Part 9 carries two roller bearings, 10, which press against theback of the rack and normally keep the teeth engaged. Part 11together with 9 forms the bearing around 8. The former isattached to 9 at its right hand end by means of a short bolt, sothat it is movable. The otherleft-hand end of 11 is held in position at the lower edge of part 9 by a flat spring on 11 and a pinwhich snaps into the hole shown in 9. Near the upper left-handcorner of 9 another hole is provided, so that the arm of 11 can bemoved to it. This movement forces 9 along its slot and to theright a sufficient distance to disengage the rack from the spurgear.
The number of strokes per equilibration is adjustable from 5to 50 by means of the small spur gear, 12, which is mounted onthe aluminum piece 5. It is 8 cm. in diameter. The L extension of the lever arm, 3a, extends beyond the bearing on 5, so thata' push rod, 13, can be attached. The push rod moves a metalpart, 14, which is held against 12 by a spring and is adjustableby a serew in 13. Each time a downward stroke of 13 is madeduring the equilibration 12 is advanced one tooth; 12 is springloaded but is held in position during the upward stroke of 13 bythe ratchet part, 15, which is pressed into position by a spring.
The spur gear returns to its original position when the decantation is made. At this point the push rod, 13, travels far 'enoughso that 14 disengages itself. At the same time 15 is pushed outby the pin on 12 and is held out by a spring ratchet attachment,which is released again when the spur gear returns to its startingpoint.
The spur gear, 12, carries an adjustable outer arm mountedon its shaft, which carries a pin and determines the distance the
5
6
,,,--,L::~
29][
A 50D-m!. round-bottomed flask, A of Figure 5, is mountedabove cell 0 with its neck in a horizontal position parallel with thealuminum bar supporting the cells. In this position 150 ml. ofthe solvent will not spill from the open mouth of the flask, eventhough the liquid is thrown back and forth during the equilibration. A plug of cotton in the mouth reduces evaporation.
A bent, small glass tube, B, passes through the mouth of theround-bottomed flask and leads to the decantation compartmentof cell O. Near its inner opening is blown a bubble, C, of thevolume desired. Just outside the opening of the flask, the glasstube carries one of the flat interchangeable joints, D, attachedso that the height and position of the dipper can be adjusted forfilling and emptying at the desired position. When a largervolume of coourrent is required, a tube with a larger bubble canbe interchanged at the glass joint. The straight portion of thetube, which passes through the opening of the flask and oarriesthe joint, is set at an angle so that it will drain into the decantation compartment of cell 0 in the decantation position. Thebubble fills again in the transfer position.
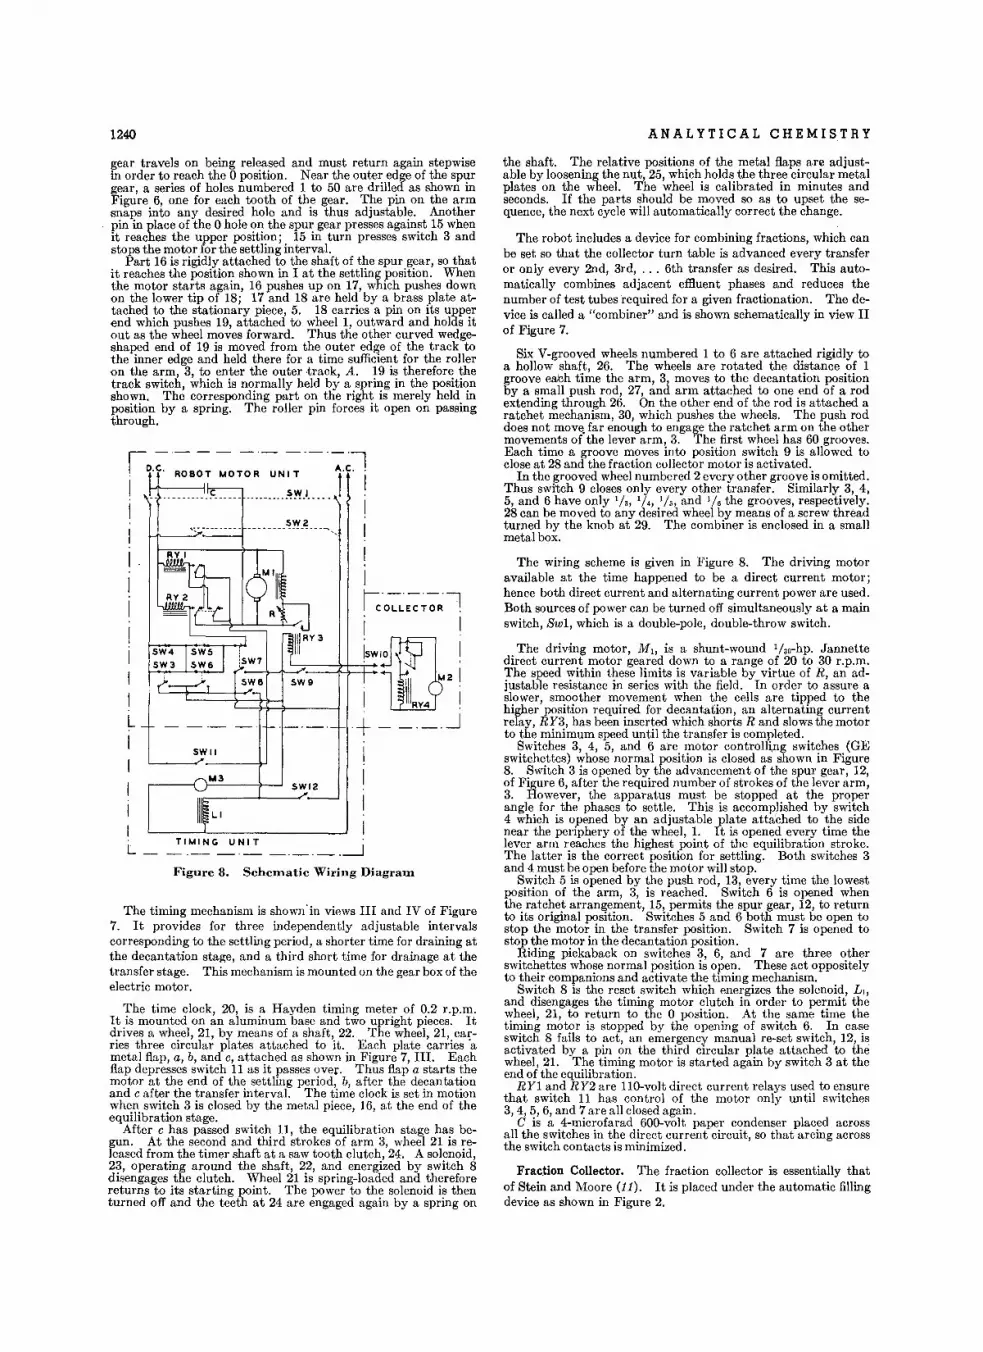
1240
gear travels on being released and must return again stepwisein order to reach the 0 position. Near the outer edge of the spurgear, a series of holes numbered 1 to 50 are drilled as shown inFigure 6, one for each tooth of the gear. The pin on the armsnaps into any desired hole and is thus adjustable. Anotherpin in place of the 0 hole on the spur gear presses against 15 whenit reaches the upper position; 15 in turn presses switch 3 andstops the motor for the settling interval.
Part 16 is rigidly attached to the shaft of the spur gear, so thatit reaches the position shown in I at the settling position. Whenthe motor starts again, 16 pushes up on 17, which pushes downon the lower tip of 18; 17 and 18 are held by a brass plate attached to the stationary piece, 5. 18 carries a pin on its upperend which pushes 19, attached to wheel 1, outward and holds itout as the wheel moves forward. Thus the other curved wedgeshaped end of 19 is moved from the outer edge of the track tothe inner edge and held there for a time sufficient for the rolleron the arm, 3, to enter the outer track, A. 19 is therefore thetrack switch, which is normally held by a spring in the positionshown. The corresponding part on the right is merely held inposition by a spring. The roller pin forces it open on passingthrough.
i'~~'~,~'_"'"N;:,~1'1· II .· ':---------- s.'!!_2: ~ II .· II .· I
I ~L~~~l· I II .'I ,swID': !I M2 II I IIIRY4 !L .____+ ..JI .I SWII !
I~3 I
SW'2
Figure 8. Schernatic Wiring Diagram
The timing mechanism is shownin views III and IV of Figure7. It provides for three independently adjustable intervalscorresponding to the settling period, a shorter time for draining atthe decantation stage, and a third short time for drainage at thetransfer stage. This mechanism is mounted on the gear box of theelectric motor.
The time clock, 20, is a Hayden timing meter of 0.2 r.p.m.It is mounted on an aluminum base and two upright pieces. Itdrives a wheel, 21, by means of a shaft, 22. The wheel, 21, carries three circular plates attached to it. Each plate carries 'ametal flap, a, b, and c, attached as shown in Figure 7, III. Eachflap depresses switch 11 as it passes over. Thus flap a starts themotor at the end of the settling period, b, after the decantationand c after the transfer interval. The time clock is set in motionwhen switch 3 is closed by the metal piece, 16, at the end of theequilibration stage.
After c has passed switch 11, the equilibration stage has begun. At the second and third strokes of arm 3, wheel 21 is released from the timer shaft at a saw tooth clutch, 24. A solenoid,23, operating around the shaft, 22, and energized by switch 8disengages the clutch. Wheel 21 is spring-loaded and thereforereturns to its starting point. The power to the solenoid is thenturned off and the teeth at 24 are engaged again by a spring on
ANALYTICAL CHEMISTRY
the shaft. The relative positions of the metal flaps are adjustable by loosening the nut, 25, which holds the three circular metalplates on the wheel. The wheel is calibrated in minutes andseconds. If the parts should be moved so as to upset the sequence, the next cycle will automatically correct the change.
The robot includes a device for combining fractions, which canbe set so that the collector turn table is advanced every transferor only every 2nd, 3rd, ... 6th transfer as desired. This automatically combines adjacent effluent phases and reduces thenumber of test tubes required for a given fractionation. The device is called a "combiner" and is shown schematically in view IIof Figure 7.
Six V-grooved wheels numbered 1 to 6 are attached rigidly toa hollow shaft, 26. The wheels are rotated the distance of 1groove each time the arm, 3, moves to the decantation positionby a small push rod, 27, and arm attached to one end of a rodextending through 26. On the other end of the rod is attached aratchet mechanism, 30, which pushes the wheels. The push roddoes not move. far enough to engage the ratchet arm on the othermovements of the lever arm, 3. The first wheel has 60 grooves.Each time a groove moves into position switch 9 is allowed toclose at 28 and the fraction collector motor is activated.
In the grooved wheel numbered 2 every other groove is omitted.Thus switch 9 closes only every other transfer. Similarly 3, 4,5, and 6 have only I/" 1/" 1/5, and 1/6the grooves, respectively.28 can be moved to any desired wheel by means of a screw threadturned by the knob at 29. The combiner is enclosed in a smallmetal box.
The wiring scheme is given in Figure 8. The driving motoravailable at the time happened to be a direct current motor;hence both direct current and alternating current power are used.Both sources of power can be turned off simultaneously at a mainswitch, Sw1, which is a double-pole, double-throw switch.
The driving motor, M I , is a shunt-wound l/ao-hp. Jannettedirect current motor geared down to a range of 20 to 30 r.p.m,The speed within these limits is variable by virtue of R, an adjustable resistance in series with the field. In order to assure aslower, smoother movement when the cells are tipped to thehigher position required for decantation, an alternating currentrelay, RY3, has been inserted which shorts R and slows the motorto the minimum speed until the transfer is completed.
Switches 3, 4, 5, and 6 ate motor controlling switches (GEswitchettes) whose normal position is closed as shown in Figure8. Switch 3 is opened by the advancement of the spur gear, 12,of Figure 6, after the required number of strokes of the lever arm,3. However, the apparatus must be stopped at the properangle for the phases to settle. This is accomplished by switch4 which is opened by an adjustable plate attached to the sidenear the periphery of the wheel, 1. It is opened every time thelever arm reaches the highest point of the equilibration stroke.The latter is the correct position for settling. Both switches 3and 4 must be open before the motor will stop.
Switch 5 is opened by the push rod, 13, every time the lowestposition of the arm, 3, is reached. Switch 6 is opened whenthe ratchet arrangement, 15, permits the spur gear, 12, to returnto its original position. Switches 5 and 6 both must be open tostop the motor in the transfer position. Switch 7 is opened tostop the motor in the decantation position.
Riding pickaback on switches 3, 6, and 7 are three otherswitchettes whose normal position is open. These act oppositelyto their companions and activate the timing mechanism.
Switch 8 is the reset switch which energizes the solenoid, L I ,
and disengages the timing motor clutch in order to permit thewheel, 21, to return to the 0 position. At the same time thetiming motor is stopped by the opening of switch 6. In caseswitch 8 fails to act, an emergency manual re-set switch, 12, isactivated by a pin on the third circular plate attached to thewheel, 21. The timing motor is started again by switch 3 at theend of the equilibration.
RY1 and RY2 are 110-volt direct current relays used to ensurethat switch 11 has control of the motor only until switches3,4,5,6, and 7 are all closed again.
C is a 4-microfarad 600-volt paper condenser placed acrossall the switches in the direct current circuit, so that arcing acrossthe switch contacts is minimized.
Fraction Collector. The fraction collector is essentially thatof Stein and Moore (11). It is placed under the automatic fillingdevice as shown in Figure 2.
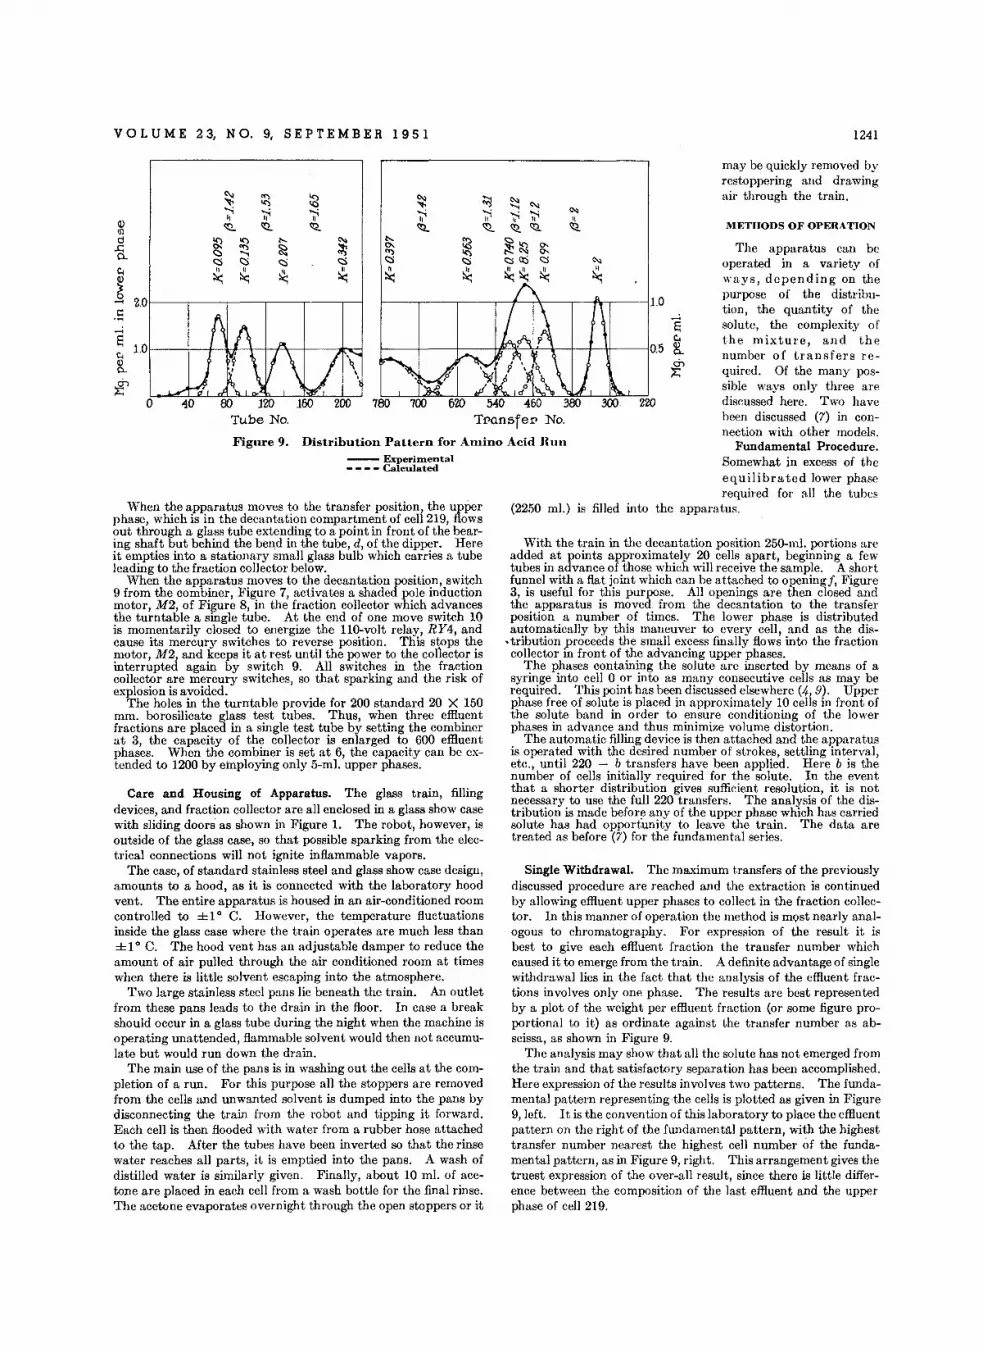
VOL U M E 23, N O. 9, S E PTE M B E R 1 95 1 1241
METHODS OF OPERATION
may be quickly removed byrestoppering and drawingair through the train.
The apparatus can beoperated in a variety ofways, depending on thepurpose of the distribu-tion, the quantity of thesolute, the complexity ofthe mixture, and thenumber of transfers required. Of the many possible ways only three arediscussed here. Two havebeen discussed (7) in connection with other models.
Fundamental Procedure.Somewhat in excess of theequilibrated lower phaserequired for all the tubes
apparatus.
220
(2250 m!.) is filled into the
Single Withdrawal. The maximum transfers of the previouslydiscussed procedure are reached and the extraction is continuedby allowing effluent upper phases to collect in the fraction collector. In this manner of operation the method is most nearly analogous to chromatography. For expression of the result it isbest to give each effluent fraction the transfer number whichcaused it to emerge from the train. A definite advantage of singlewithdrawal lies in the fact that the analysis of the effluent fractions involves only one phase. The results are best representedby a plot of the weight pel' effluent fraction (or some figure proportional to it) as ordinate against the transfer number as abscissa, as shown in Figure 9.
The analysis may show that all the solute has not emerged fromthe train and that satisfactory separation has been accomplished.Here expression of the results involves two patterns. The fundamental pattern representing the cells is plotted as given in Figure9, left. It is the convention of this laboratory to place the effluentpattern on the right of the fundamental pattern, with the highesttransfer number nearest the highest cell number of the fundamental pattern, as in Figure 9, right. This arrangement gives thetruest expression of the over-all result, since there is little difference between the composition of the last effluent and the upperphase of cell 219.
With the train in the decantation position 250-m!. portions areadded at points approximately 20 cells apart, beginning a fewtubes in advance of those which will receive the sample. A shortfunnel with a flat joint which can be attached to opening j', Figure3, is useful for this purpose. All openings are then closed andthe apparatus is moved. from the decantation to the transferposition a number of times. The lower phase is distributedautomatically by this maneuver to every cell, and as the dis-
•tribution proceeds the small excess finally flows into the fractioncollector in front of the advancing upper phases.
The phases containing the solute are inserted by means of asyringe into cell 0 or into as many consecutive cells as may berequired. This point has been discussed elsewhere (4,9). Upperphase free of solute is placed in approximately 10 cells in front ofthe solute band in order to ensure conditioning of the lowerphases in advance and thus minimize volume distortion.
The automatic filling device is then attached and the apparatusis operated with the desired number of strokes, settling interval,ete., until 220 - b transfers have been applied. Here b is thenumber of cells initially required for the solute. In the eventthat a shorter distribution gives sufficient resolution, it is notnecessary to use the full 220 transfers. The analysis of the distribution is made before any of the upper phase which has carriedsolute has had opportunity to leave the train. The data aretreated as before (7) for the fundamental series.
~f---+--f---M4,--';/-:--\--+-+-tt-------iO.5 g,
t
1----,----,--,----f----r\,---------,--1'r,---j1.0
-- Experintental- - - - Calculated
Distribution Pattern for Amino Acid nunFigure 9.
~ ~ ~ ~ ~ <'<l
""......--;~ 'ii' .... ~ ? ~Q)
II "(l) 'Q Itt \Q Itt. 'Q \Q \Qd ~ ~
e-, '" ~~ o--a. ~ ...... ~ ~ o-,
<s ~ c:::i es ~a:i csC< " " ~ ~ ~~ ~j :>< :><
2.0.S-i1:;
1.0c.(1)0-
f!'0
Care and Housing of Apparatus. The glass train, fillingdevices, and fraction collector are all enclosed in a glass show casewith sliding doors as shown in Figure 1. The robot, however, isoutside of the glass case, so that possible sparking from the electrical connections will not ignite inflammable vapors.
The case, of standard stainless steel and glass show case design,amounts to a hood, as it is connected with the laboratory hoodvent. The entire apparatus is housed in an air-conditioned roomcontrolled to ±1° C. However, the temperature fluctuationsinside the glass case where the train operates are much less than±1° C. The hood vent has an adjustable damper to reduce theamount of air pulled through the air conditioned room at timeswhen there is little solvent escaping into the atmosphere.
Two large stainless steel pans lie beneath the train. An outletfrom these pans leads to the drain in the floor. In case a breakshould occur in a glass tube during the night when the machine isoperating unattended, flammable solvent would then not accumulate but would run down the drain.
The main use of the pans is in washing out the cells at the completion of a run. For this purpose all the stoppers are removedfrom the eells and unwanted solvent is dumped into the pans bydisconnecting the train from the robot and tipping it forward.Each cell is then flooded with water from a rubber hose attachedto the tap. After the tubes have been inverted so that the rinsewater reaches all parts, it is emptied into the pans. A wash ofdistilled water is similarly given. Finally, about 10 m!. of acetone are placed in each cell from a wash bottle for the final rinse.The acetone evaporates overnight through the open stoppers or it
When the apparatus moves to the transfer position, the upperphase, which is in the decantation compartment of cell 219, flowsout through a glass tube extending to a point in front of the bearing shaft but behind the bend in the tube, d, of the dipper. Hereit empties into a stationary small glass bulb which carries a tubeleading to the fraction collector below.
When the apparatus moves to the decantation position, switch9 from the combiner, Figure 7, activates a shaded pole inductionmotor, M2, of Figure 8, in the fraction collector which advancesthe turntable a single tube. At the end of one move switch 10is momentarily closed to energize the Ll.O-volt relay, RY4, andcause its mercury switches to reverse position. This stops themotor, M2, and keeps it at rest until the power to the collector isinterrupted again by switch 9. All switches in the fractioncollector are mercury switches, so that sparking and the risk ofexplosion is avoided.
The holes in the turntable provide for 200 standard 20 X 150mm. borosilicate glass test tubes. Thus, when three effluentfractions are placed in a single test tube by setting the combinerat 3, the capacity of the collector is enlarged to 600 effluentphases. When the combiner is set at 6, the capacity can be extended to 1200 by employing only 5-ml. upper phases.
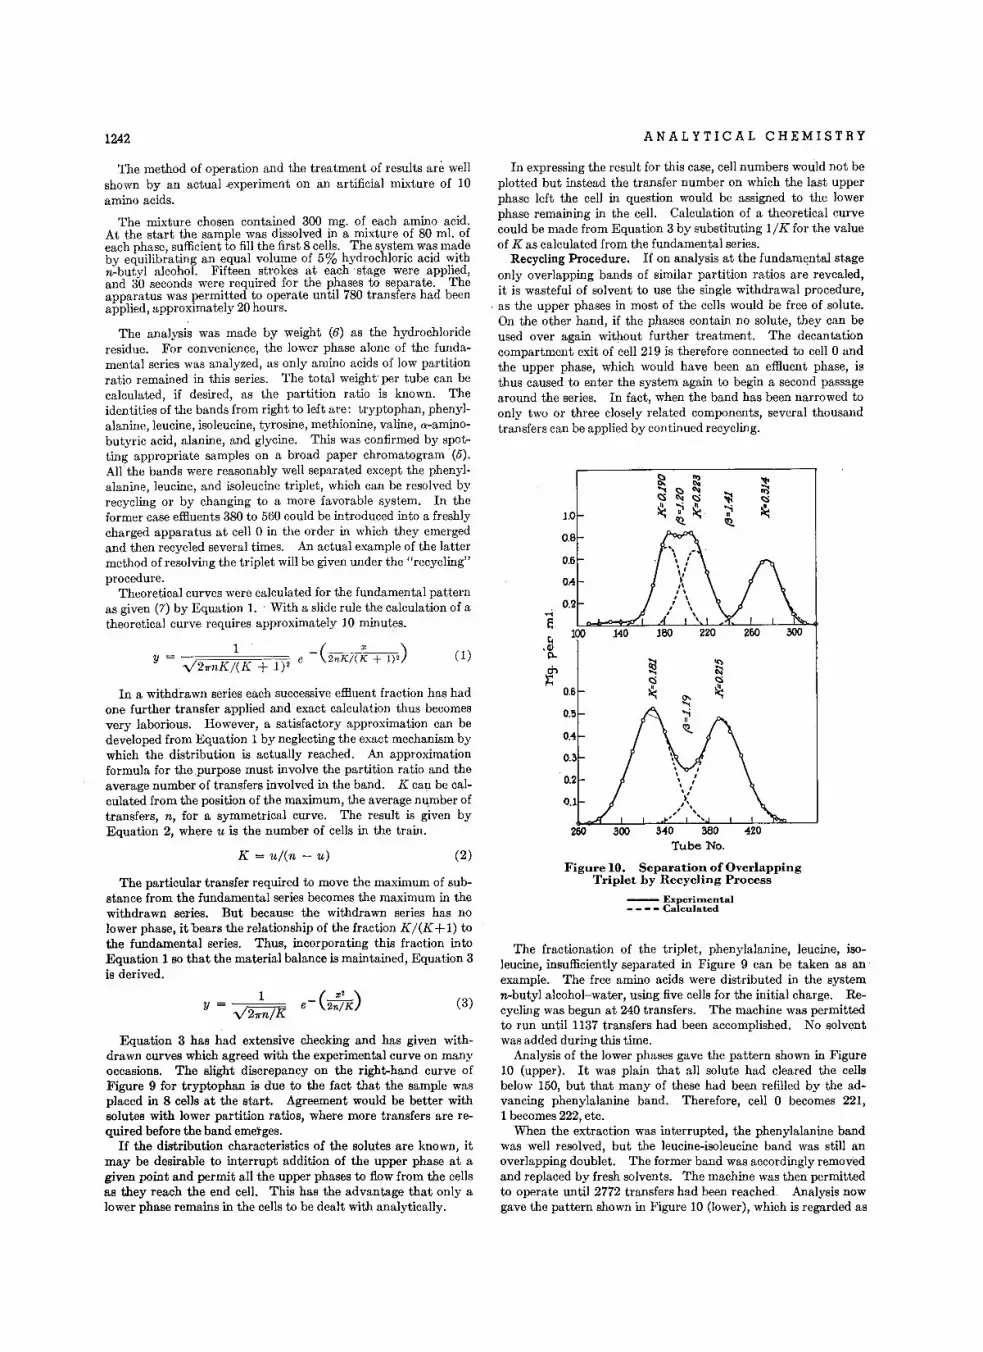
1242 ANALYTICAL CHEMISTRY
The method of operation and the treatment of results ani wellshown by an actual .experiment on an artificial mixture of 10amino acids.
The mixture chosen contained 300 mg. of each amino acid.At the start the sample was dissolved in a mixture of 80 ml. ofeach phase, sufficient to fill the first 8 cells. The system was madeby equilibrating an equal volume of 5% hydrochloric acid withn-butyl alcohol. Fifteen strokes at each stage were applied,and 30 seconds were required for the phases to separate. Theapparatus was permitted to operate until 780 transfers had beenapplied, approximately 20 hours.
The analysis was made by weight (6) as the hydrochlorideresidue. For convenience, the lower phase alone of the fundamental series was analyzed, as only amino acids of low partitionratio remained in this series. The total weight: per tube can becalculated, if desired, as the partition ratio is known. Theidentities of the bands from right to left are: tryptophan, phenylalanine, leucine, isoleucine, tyrosine, methionine, valine, a-aminobutyric acid, alanine, and glycine. This was confirmed by spotting appropriate samples on a broad paper chromatogram' (5).All the bands were reasonably well separated except the phenylalanine, leucine, and isoleucine triplet, which can be resolved byrecycling or by changing to a more favorable system. In theformer case effluents 380 to 560 could be introduced into a freshlycharged apparatus at cell 0 in the order in which they emergedand then recycled several times. An actual example of the lattermethod of resolving the triplet will be given under the "recycling"procedure.
Theoretical curves were calculated for the fundamental patternas given (7) by Equation 1. . With a slide rule the calculation of atheoretical curve requires approximately 10 minutes.
In expressing the result for this case, cell numbers would not beplotted but instead the transfer number on which the last upperphase left the cell in question would be assigned to the lowerphase remaining in the cell. Calculation of a theoretical curvecould be made from Equation 3 by substituting 11K for the valueof K as calculated from the fundamental series.
Recycling Procedure. If on analysis at the fundamental stageonly overlapping bands of similar partition ratios are revealed,it is wasteful of solvent to use the single withdrawal procedure,
. as the upper phases in most of the cells would be free of solute.On the other hand, if the phases contain no solute, they can beused over again without further treatment. The decantationcompartment exit of cell 219 is therefore connected to cell 0 andthe upper phase, which would have been an effluent phase, isthus caused to enter the system again to begin a second passagearound the series. In fact, when the band has been narrowed toonly two or three closely related components, several thousandtransfers can be applied by continued recycling.
~ ~ "It....<:::> '" ~
;;:j(S
'" (S <:>~
~ II "'i :l::'lie: nIQ IQ
The particular transfer required to move the maximum of substance from the fundamental series becomes the maximum in thewithdrawn series. But because the withdrawn series has nolower phase, it bears the relationship of the fraction KI(K+1) tothe fundamental series. Thus, incorporating this fraction intoEquation 1 so that the material balance is maintained, Equation 3is derived.
340 380Tube No.
Figure 10. Separation of OverlappingTriplet by Recycling Process
The fractionation of the triplet, phenylalanine, leucine, isoleucine, insufficiently separated in Figure 9 can be taken as anexample. The free amino acids were distributed in the systemn-butyl alcohol-water, using five cells for the initial charge. Recycling was begun at 240 transfers. The machine was permittedto run until 1137 transfers had been accomplished. No solventwas added during this time.
Analysis of the lower phases gave the pattern shown in Figure10 (upper). It was plain that all solute had cleared the cellsbelow 150, but that many of these had been refilled by the advancing phenylalanine band. Therefore, cell 0 becomes 221,1 becomes 222, etc.
When the extraction was interrupted, the phenylalanine bandwas well resolved, but the leucine-isoleucine band was still anoverlapping doublet. The former band was accordingly removedand replaced by fresh solvents. The machine was then permittedto operate until 2772 transfers had been reached. Analysis nowgave the pattern shown in Figure 10 (lower), which is regarded as
-- Experimental- - - - Calculated
(3)
(2)K = ul(n - u)
1Y = -=''===
V27rnIK
In a withdrawn series each successive effluent fraction has hadone further transfer applied and exact calculation thus becomesvery laborious. However, a satisfactory approximation can bedeveloped from Equation 1 by neglecting the exact mechanism bywhich the distribution is actually reached. An approximationformula for thepurpose must involve the partition ratio and theaverage number of transfers involved in the band. K can be calculated from the position of the maximum, the average number oftransfers, n, for a symmetrical curve. The result is given byEquation 2, where u is the number of cells in the train.
Equation 3 has had extensive checking and has given withdrawn curves which agreed with the experimental curve on manyoccasions. The slight discrepancy on the right-hand curve ofFigure 9 for tryptophan is due to the fact that the sample wasplaced in 8 cells at the start. Agreement would be better withsolutes with lower partition ratios, where more transfers are required before the band emerges.
If the distribution characteristics of the solutes are known, itmay be desirable to interrupt addition of the upper phase at agiven point and permit all the upper phases to flow from the cellsas they reach the end cell. This has the advantage that only alower phase remains in the cells to be dealt with analytically.

VOL U M E 2 3, N O. 9, S E PTE M B E R 1 9 5 1
a sufficiently good separation, even though further separationonly involves permitting the machine to continue.
In the event of a binary mixture with beta values of 1.1 or less,the width of the overlapping bands would extend over more than220 cells before complete separation had been achieved. Butthe advancing edge of the band would contain A of satisfactorypurity while the trailing edge would contain B of satisfactorypurity. Perhaps 20 cells of each might be withdrawn. Afterfilling with fresh solvents, a calculated number of transferscould be made before repeating the double withdrawal. Thismethod of accomplishing alternate or double withdrawal doesnot require the constant attention of the procedure proposed(7) for the fewer cells in the series.
DISCUSSION
The separation and characterization of complex mixtures oforganic compounds have always been more or less of an art to theorganic chemist. Often the reason for a favorable separationhas not been well understood because of many interdependentfactors which could not be dissociated clearly from each other.Just as mysteriously, the same set of conditions often were foundto fail on a different mixture.
One of the advantages of countercurrent distribution is thatthe nature of the process lends itself to experimental analysis ofthe separate factors involved in the fractionation and in the interpretation of the data. This in turn permits a reproducible fractionation of high efficiency. These considerations may conveniently be grouped under three main headings:
The numbers of actual transfers at equilibrium or otherwisewhich can profitably be applied.
The study of systems and their modifications by specific solutesin order to obtain the required selectivity.
Supporting analytical methods.
All three of these considerations are interrelated. For instance,if an automatic apparatus is available whereby high numbers oftransfers can be accomplished easily, it may not be necessary tosearch for a system which is of maximum selectivity for a givenseparation. On the other hand, with high numbers of transfers,a system must adhere much more closely to the ideal with respectto the partition isotherm. High numbers of transfers also require more analytical work and therefore more rapid methods aredesirable.
Part of the objective in developing the apparatus describedhere was trying to find the maximum number of cells which mightprofitably be employed by a single worker in a laboratory beforethe whole procedure would become unwieldy. Although thatstage would long since have been passed, without proper organization, the experience gained with the present equipment wouldindicate that even higher numbers of cells than 220 would appearentirely workable.
High fractionating power in general requires relatively moresolvent. Obviously, assuming a standard sized cell, the volumeof solvent required is directly proportional to the number of cellsinvolved. Thus, the 220 cells of the present apparatus require2.2 liters of each phase to complete the "fundamental" series."Single withdrawal" might require tenfold this amount where ahigher degree of separation is desired. Unless solvent is extremelycheap and pure, it would appear best to develop some procedurefor using the same solvent again and again. The "reflux" principle of fractional distillation is brought to mind.
In a general way, the effect of the reflux of distillation might beviewed in the following manner. Interchange between vaporand liquid takes place only at the surface of the liquid. Thereis a fixed length of the column to be traveled by the vapor, butbecause the liquid is constantly flowing back down the column ata rapid rate, the vapors contact a much longer liquid surfacethan is presented by only the length of the column. The lengthactually contacted is a function of the speed of back flow, althoughat higher speeds a point is reached where efficiency falls due to
1243
other factors. The proper state of affairs is conveniently createdby the concentrating action of the reflux condenser.
It is theoretically possible to simulate an analogous stateof affairs with regard to the movement of the individual solutesin an extraction column and likewise provide more opportunityfor repeated interchange. Such a procedure involves removalof the solute from the appropriate fractions and movement of itsystematically backward in the column. Obviously, this wouldbe very laborious. However, a different approach accomplishingnearly the same purpose is practical.
Fractionation according to the binomial expansion methodically divides and repeatedly subdivides a unit quantity intofractions each becoming smaller as the process continues. Thefractions, beyond a certain point on each side of the "band"become so small that they may be neglected entirely. The solvent in these can therefore be regarded as free of solute and reintroduced into the system again. The "recycling process" doesthis work automatically. The effect achieved is that of greatlyincreasing the number of transfers or contacts. When appliedto complex mixtures, a preliminary distribution can be made forthe purpose of sorting the mixture into groups each containingsolutes with similar partition ratios. A distribution is thenmade on each group by the "recycling" process as outlined in theexample with leucine, isoleucine, and phenylalanine. At theend of the distribution, the solute can be recovered in a few simpleoperations from the dilute solutions comprising the appropriatelycombined fractions. The net effect here is not greatly differentfrom reflux. Thus, with the 220-tube apparatus, recycling tentimes would give nearly the same effect as the "fundamental"procedure in a train with 2200 cells in it.
Recycling approaches experimentally the ideal more nearlywith large numbers of cells in the train. In the original steelmachines of 25 tubes (7), recycling to 50 transfers would be theupper limit, since a single solute with a partition ratio of 1 wouldthen yield a significant amount of solute in every tube. Therewould be little room for throwing off impurity. A significantamount of solute for purposes of discussion may be defined (3)arbitrarily as an amount greater than 1.0% of the solute presentin the cell containing maximum material. However, with 220tubes in the series, 5260 transfers can be applied to the samesolute by recycling before significant amounts of solute wouldbe in every tube. The upper phase here has passed throughthe train 24 times. The concept of band spread with increasingnumbers of transfers has been treated elsewhere (3).
The band spread, in terms of transfers applied, is a functionof the value of K. Thus with a K of 0.2 the band spread wouldnot be 220 tubes until 8000 transfers had been reached and14,800 transfers would be required for a K of 0.1. As pointedout earlier (2, 4), the best separation of a binary mixture interms of transfers is obtained when the geometric mean of theK's is 1. However, with automatic equipment a different emphasis is reached, since there is no labor involved in makingtransfers. K's with a geometric mean of 0.2 will give a betterresolution, even though a somewhat longer time will be required.Even better resolution is obtained with lower K values, but herethe migration rate becomes slow. By way of analogy, it isinteresting that the high resolutions recently obtained in chromatography (12) and ion exchange (10, 13) require slow migrationof the solute through the column and relatively large volumes ofeffluent. There is thus offered the opportunity for many moreinterchanges between the phases.
With automatic equipment in general there need be less emphasis on the selectivity of the system and the range of K values.Likewise adjustment of relative phase volumes is less important.With the hand-operated equipment, a practical K range appearedto be 0.2 to 5, whereas with the equipment reported here thesatisfactory K range is extended to a range of 0.01 to 100. Thisnaturally means that mixtures containing a dozen or more components can be separated in a single run.

1244
Other considerations in selecting a system are those of adherence to ideality and capacity. These factors are interrelated,as adherence to ideality is nearly always more closely approachedfor the more dilute solutions. When many cells are in the series,the solute can be scattered in a larger number of cells at thebeginning and thus larger capacity is. reached as well as higherseparating power. The problem of deviations from ideality willbe taken up in a separate publication.
More analytical work at the end of a distribution is requiredfor the higher number of transfers in which more components arerevealed. However, the number of analyses is not in direct proportion to the number of transfers or cells. Only a sufficientnumber of analyses per band is required to show definitely itsposition, height, and width. Approximately 10 analyses orpoints on the pattern are adequate per component, whether 100or 1000 transfers have been applied. This obtains because theconcentration changes are more gradual with the broader bandsproduced by higher numbers of transfers. In cases of overlappingbands, a few more points may be required.
As far as the quantitative aspects go, agreement between thecalculated and the experimental curves in Figure 10 is all thatcould be expected. The automatic distribution apparatus cantherefore be regarded as fully calibrated and perfectly reliable.
ACKNOWLEDGMENT
The cells, clamps, ground stoppers, cell supports, ete., werebuilt by Otto Post. The clamps, ground stoppers, and cell
ANALYTICAL CHEMISTRY
supports were of his design. The authors are also indebted tohim for constant advice on all the mechanical features of the apparatus, exclusive of the robot and fraction collector.
The robot is a completely original design drawn up by JosefBlum and Richard Janes. It and the fraction collector weremade under their direction in the Rockefeller Institute instrument shop. Much of the credit for the success of the wholeundertaking is due them.
LITERATUR E CITED
(1) Barry, G. T., Sato, Y., and Craig, L. C., J. Bioi. Chem., 174,209 (1948).
(2) Bush, M., and Densen, P., ANAL.CHEM., 20,121 (1948).(3) Craig, L. C., Ibid., 22, 1347 (1950).(4) Craig, L. C., and Craig, D., in "Technique of Organic Chem
istry," Vol. III, p. 200, New York, Interscience Publishers,1950.
(5) Craig, L. C., Gregory, J. D., and Barry, G. T., J. CUn. Tnoest.,28, 1014 (1949).
(6) Craig, L. C., Hausmann, W., Ahrens, E. H., Jr., and Harfenist,E. J., ANAL.CHEM., 23, 1326 (1951).
(7) Craig, L. C., and Post, 0., Ibid., 21,500 (1949).(8) Eyring, H., Ibid., 20, 98 (1948).(9) Gregory, J. D., and Craig, L. C., Ann. N. Y. Acad. Sci., in press.
(10) Schubert, .I., ANAL.CHEM., 22,1358 (1950).(11) Stein, W. H., and Moore, S., J. Bioi. Chem., 176,337 (1948).(12) Ibid., 178,79 (1949).(13) Tompkins, E. R., ANAl,. CHEM.. 22, 1352 (1950).
RECEIVED February 20, 1951.
Quantitative Application of the Kiliani ReactionVERNON L. FRAMPTON, LUCIA PEI<:PLES FOLEY, LI<:LAND L. SMITH!, AND JANE G, MALONE
Basic Cotton Research Laboratory, Unioersity of Texas, Austin, Tex.
An analytical procedure, which is dependent upon the quantitative addition byaldoses of hydrocyanic acid at pH 8.5, and 39°C., and which is capable of a highdegree of precision, is described for aldoses, The nitrile resulting from the addition is hydrolyzed in an alkaline rnedrurn to stotchfornet.r!c proportions of ammorrin, which is trapped and deterlllined titrillletrically. An arnrnorria blankrrruat be deterrnrned with the reagents because of the spontaneous hydrolysisof hydrocyanic acid solutions. The rnenhod was applied to several sim.ple sugars,to plant saps and juices, and to cellulose. The procedure rrray be used satisfactorily in end group determinations with cellulose.
T HERE have been very few studies devoted to the quantitative aspects of the Kiliani reaction. The more significant
studies are the papers by Lippich (3) and by Militzer en. Bothworkers used the Liebig-Deniges method for the determinationof unreacted cyanide; Lippich distilled off the excess cyanide,whereas Militzer determined the excess cyanide in the presence ofthe cyanohydrin. The authors find, however, that more satisfactory results may be obtained if the cyanohydrin is hydrolyzedin an alkaline medium, and the ammonia liberated is determinedquantitatively. '
The addition of hydrocyanic acid to glucose is not quantitativeunder the conditions employed by Lippich; the time is too briefand the temperature is unfavorable. The precision of the determination involving Militzer's procedure is low because of the reversal of the reaction
Glucose + HCN +--+- cyanohydrin
in an alkaline medium, because of the polymerization of cyanideunder the conditions employed, and because ammonium hydroxide will not satisfactorily retain hydrocyanic acid under thesesame conditions. These factors that reduce the precision with
1 Present address, Columbia University, New York, N. Y.
Militzer's procedure do not affect the stoichiometric recovery ofammonia under the conditions outlined in this communication.
METHOD
A known quantity of glucose (2.0 to 600 mg.) in 3 ml. of wateris placed in a 500-m!. round-bottomed flask. Five milliliters of0.4 N acetic acid solution and 5 ml. of 0.8 N potassium cyanideare added and the flask, stoppered with a T stopper, is placed in athermostatically controlled bath at 3Ho C. After 3 hours thecontents of the flask are acidified to the methyl red end point, andthe unreacted cyanide is driven off by passing air through thesolution. After the odor of hydrocyanic acid can no longer bedetected (15 to 30 minutes) the flask is attached to a steam distillation apparatus (see Figure 1), 10 ml. of a 20% sodium hydroxidesolution are added, and the solution is steam-distilled until approximately 50 ml. of distillate have been condensed. Theammonia evolved is trapped in standard hydrochloric acid, andback-titrated with standard sodium hydroxide solution. Methylpurple is used as the indicator. An ammonia blank is determinedin precisely the same manner, except that no substrate is added.Satisfactory results are not obtained unless the pH is in therange 8.5 to 9.
The data for glucose in Table I, obtained following the procedure outlined above, are completely satisfactory. [No differences were observed in the four lots of glucose used in this study.
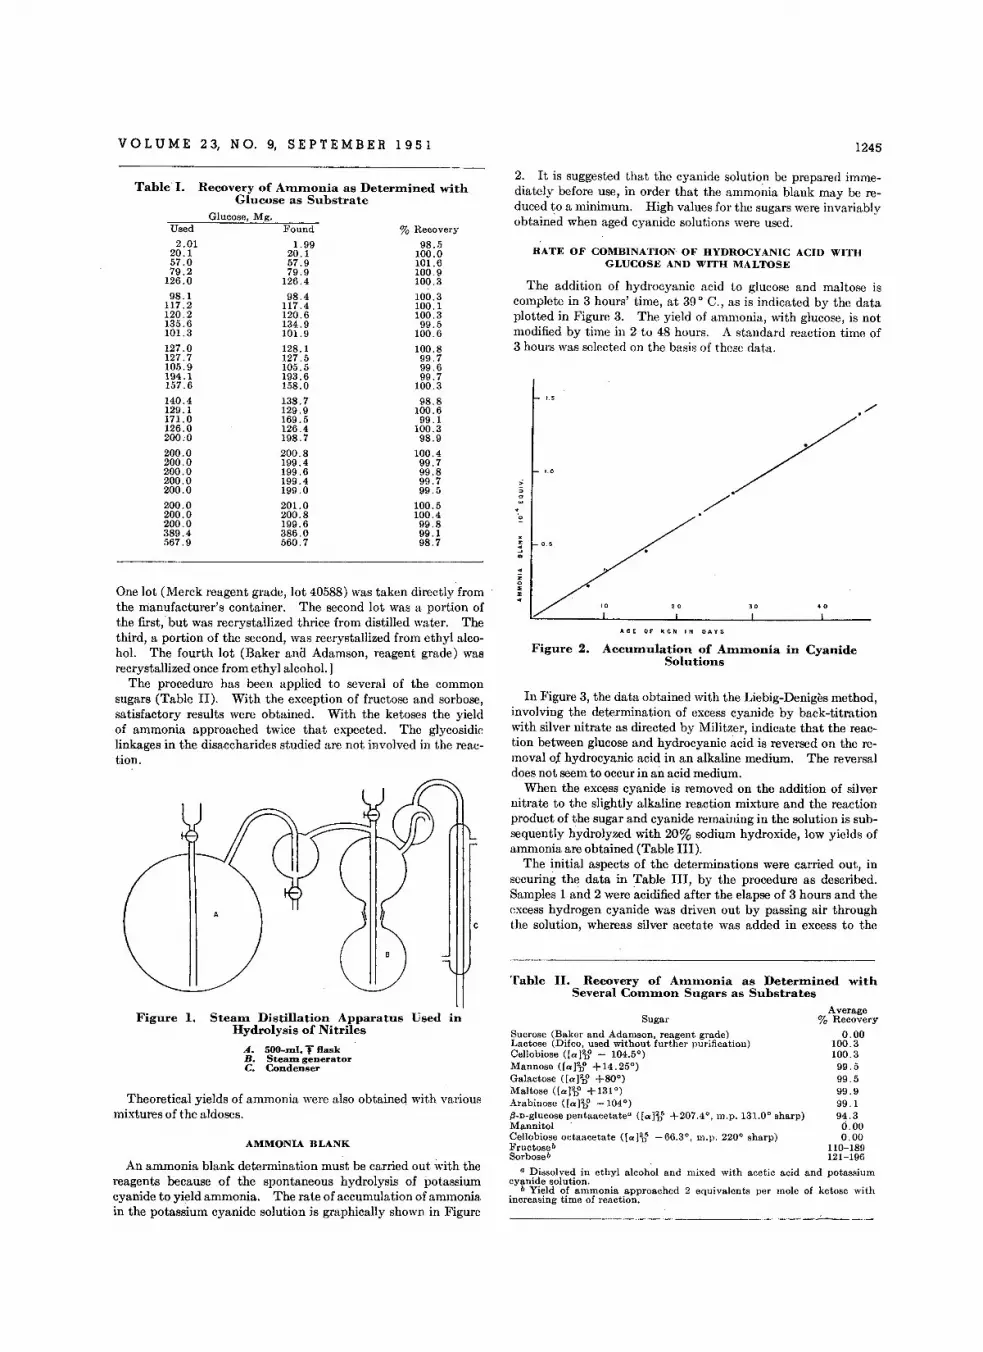
VOLUME 23, NO.9, SEPTEMBER 1951 1245
1.5
2. It is suggested that the cyanide solution be prepared immediately before use, in order that the ammoiJ.ia blank may be reduced to a minimum. High values for the sugars were invariablyobtained when aged cyanide solutions were used.
RATE OF COMBINATION' 01<' HYDROCYANIC ACID WITHGLUCOSE AND WITH MALTOSE
The addition of hydrocyanic acid to glucose and maltose iscomplete in 3 hours' time, at 39 ° C., as is indicated by the dataplotted in Figure 3. The yield of ammonia, with glucose, is notmodified by time in 2 to 48 hours. A standard reaction time of3 hours was selected on the basis of these data.
0.5
";a
·z·m
Used Found % Recovery
2.01 1.99 98.,520.1 20.1 100.0,57.0 57.9 101.679.2 79.9 100.9
126.0 126.4 100.398.1 98.4 100.3
117.2 117.4 100.1120.2 120.6 100.313,5.6 134.9 99.,5101.3 101.9 100.6127.0 128.1 100.8127.7 127.,5 99.710,5.9 10,5.5 99.6194.1 193.6 99.7157.6 158.0 100..3140.4 138.7 98.8129.1 129.9 100.6171.0 169.5 99.1126.0 126.4 100.3200.0 198.7 98.9200.0 200.8 100.4200.0 199.4 99.7200.0 199.6 99.8200.0 199.4 99.7200.0 199.0 99.5200.0 201.0 100.5200.0 200.8 100.4200.0 199.6 99.8389.4 386.0 99.1,567.9 560.7 98.7
Table I. Recovery of Arnrnorua as Deter-mrned withGlucose as Substrate
Glucose, Mg.
Table II. Recovery of Amrnonfa as Determined withSeveral Corrrmon Sugars as Substrates
In Figure 3, the data obtained with the Liebig-Deniges method,involving the determination of excess cyanide by back-titrationwith silver nitrate as directed by Militzer, indicate that the reaction between glucose and hydrocyanic acid is reversed on the removal of. hydroeyanic acid in an alkaline medium. The reversaldoes not seem to occur in an acid medium.
When the excess cyanide is removed on the addition of silvernitrate to the slightly alkaline reaction mixture and the reactionproduct of the sugar and cyanide remaining in the solution is subsequently hydrolyzed with 20% sodium hydroxide, low yields ofammonia are obtained (Table III).
The initial aspects of the determinations were carried out, insecuring the data in Table III, by the procedure as described.Samples 1 and 2 were acidified after the elapse of 3 hours and theexcess hydrogen cyanide was driven out by passing air throughthe solution, whereas silver acetate was added in excess to the
One lot (Merck reagent grade, lot 40588) was taken directly fromthe manufacturer's container. The second lot was a portion ofthe first, but was recrystallized thrice from distilled water. Thethird, a portion of the second, was recrystallized from ethyl alcohol. The fourth lot (Baker ana Adamson, reagent grade) wasrecrystallized once from ethyl alcohol.]
The procedure has been applied to several of the commonsugars (Table II). With the exception of fructose and sorbose,satisfactory results were obtained. With the ketoses the yieldof ammonia approached twice that expected. The glycosidiclinkages in the disaccharides studied are not involved in the reaction.
·zo~
~· '0
AGE or l(eN IN DAYS
Figure 2. AccuInulation of AInlllonia in CyanideSolutions
Average% Recovery
0.00100.3100.399.599.599.999.194.30.000.00
110-189121-196
Figure 1. Stearn Distillation Apparatus Used inHydrolysis of Nitriles
A. 500-...1. T flaskB. Stearn genera'torC. Condenser
Theoretical yields of ammonia were also obtained with variousmixtures of the aldoses.
AMMONIA BLANK
An ammonia blank determination must be carried out with thereagents because of the spontaneous hydrolysis of potassiumcyanide to yield ammonia. The rate of accumulation of ammonia,in the potassium cyanide solution is graphicalIy shown in Figure
Sugar
Sucrose (Baker and Adamson, reagent grade)Lactose (Difco, used without further purification)Cellobiose ([aJ2,j' - 104.5°)Mannosc ([aI2,j' +14.25°)Galactose ([aJZ,j' +80°)Maltose ([albO +131°)Arabinose ([albO -104°)fI-D-glucose pentaacetate'' ([albS +207.4°, m.p, 131.0° sharp)Mannitol .Cellobiose octaacetate ([aJZJ -66.3°, m.p. 220° sharp)Fructose"Sorbose"
a Dissolved in ethyl alcohol and mixed with acetic acid and potassiumcyanide solution.
" Yield of ammonia approached 2 equivalents per mole of ketose withincreasing time of reaction.

1246 ANALYTICAL CHEMISTRY
Rate of Addition of Hydrogen Cyanide to Glucose and toMaltose
H 0 U R SIN
KCN method K,Fe(CNlo Method
i2.56 91.0291. 0 35i223.0 288252.0 390
TIME
0-
48
Table IV. Comparison of Potassium Cyanide andHagedorn-Jensen Methods with Plant Material
Glucose Found, Mg.
KaroApple juiceOnion juiceGrapefruit juice
Figure 4. Comparison of Degree of Polymerization ofCellulose Hydrolyzates as Determined by Kiliani
Procedure and by Viscosity Dete.rminations
saps were then carried out as indicated above, using 5 mI. of sap.Ammonia blanks were determined with the sap and proper corrections were made in the calculations.
It is not known why the values obtainedwith the cyanide method are lower than thoseobtained with the Hagedorn-Jensen method.The differences were not accounted for on thebasis of the pH of the solutions. The authorsprefer the lower values in Table IV because ofthe feeling that many more substances in theclarified preparations will reduce the alkalineferricyanide reagent (and other oxidizing agents)than will react with hydrocyanic acid to givea product which yields ammonia on alkaline hydrolysis.
The addition of known amounts of glucoseto plant saps allowed quantitative recovery ofthe glucose added in terms of ammonia. Forexample, values for glucose in cotton, Indiantobacco and fig leaf preparations were 2.2, '13.6,and 10.2 mg. per mI., respectively. (The cytoplasmic sap was used. The leaves were cytolyzedwith diethyl ether and the sap was pressedoutwith a hydraulic press. These saps were than de-proteinized with lead acetate, and were concentrated about fivefold by freezing out a major
portion of the water.) Glucose amounting to 3.9 mg. per ml,was added to each sample. The values for glucose found in thesamples subsequent to the additions were 6.3, 17.6, and 14.2 mg.,respectively.
0.018i0.1524
0.15240.1596
0.05120.0564
o.rzzs0.2633
0.Oi610.196i
0.19220.1153'
1210
0.1038"0.845i"
0.845i"0.8856"
0.2814"0.3130
0.98661.461
0.42231.091
1.06i0.6398
Equivalents ofNHI recovered, Glucose
X 10 -, calcd., mg.
8
H 0 U R SIN
6
0.20310.260i
o GLUCOSE NH, DETN.
V MALTOSE NH, DETN.
X GLUCOSE LIE8IG-DENIGES
TIM E
4
Aeration of AcidifiedSolution
2
Equivalents ofNHI recovered, Glucose
X 1O~' calcd., mg.
1.12i1.44i
III. Reversal of Reaction between Glucose andPotassium Cyanide in Alkaline Medium
Extent of Reaction Calculated from Data Obtained WhenExcess HCN Was Removed by:
Precipitation as Silver Saltfrom Alkaline Solution
",0-0-°-'9-0---------0
/~ _x-e /x
!/'
o__....'-__J....__..L.-__...l..__....l..__-l._'-I
a Silver acetate added after 2 hours of contact with cyanide solution.
GlucoseUsed, Mg.
0.20330.2608
0.03360.198i
0.2365o.198i
0.0583O.OiOi
0.21690.30i2
0.09230.2220
0.21320.1386
100
0
"' 80t-o.."' 60a:
a:..<!J
~..at
Table
Figure 3.
slightly alkaline solutions in the other flasks. The silver cyanidewas removed by filtration, the filtrates, together with the washings, were subsequently hydrolyzed in the normal manner with20% sodium hydroxide, and the liberated ammonia was trappedin standard hydrochloric acid.
There is believed to be a slow spontaneous hydrolysis of thenitrile to the amide, under the experimental conditions requiredin the determination of aldoses described in this report. Thelower curve is interpreted as representing that portion of the sugarthat has been converted to the amide, while the upper curve inFigure 3 is interpreted as representing the sum of amide and nitrileportions. Therefore, heavy reliance may not be placed on theLiebig-Deniges or Volhard procedure in the quantitative application of the Kiliani reaction unless ample time has elapsed for thecomplete spontaneous hydrolysis of the nitrile.
Reaction between Hydrogen Cyanide andUpland Cotton Cellulose
Equivalents of NH, per Gram of Cellulose RecoveredAfter initial exposure After alkaline hydrolysis
to cyanide in of nitrile, and re-exposurenormal manner to cyanide
COMPARISON WITH HAGEDORN-JENSEN METHOD
Data are included in Table IV for several plant materials, in acomparison of the current method with that of Hagedorn andJensen (1), as modified by Hanes (2), for reducing sugars. Thedata refer to the final preparations, and they do not represent theper cent of glucose in the respective species of plants used. Theplant fluids were deproteinized with lead acetate, and the leadwas removed with oxalic acid. The determinations with the
Table V.
CottonSpecimen
12345
2.5 X 10⁻⁶
2.0 X 10-'2.3 X 10⁻⁵
2.4 X 10-'2.3 X 10-'
0.0 X 10-60.0 X 10-'0.0 X 10-'0.0 X 10-'0.0 X 10⁻⁶
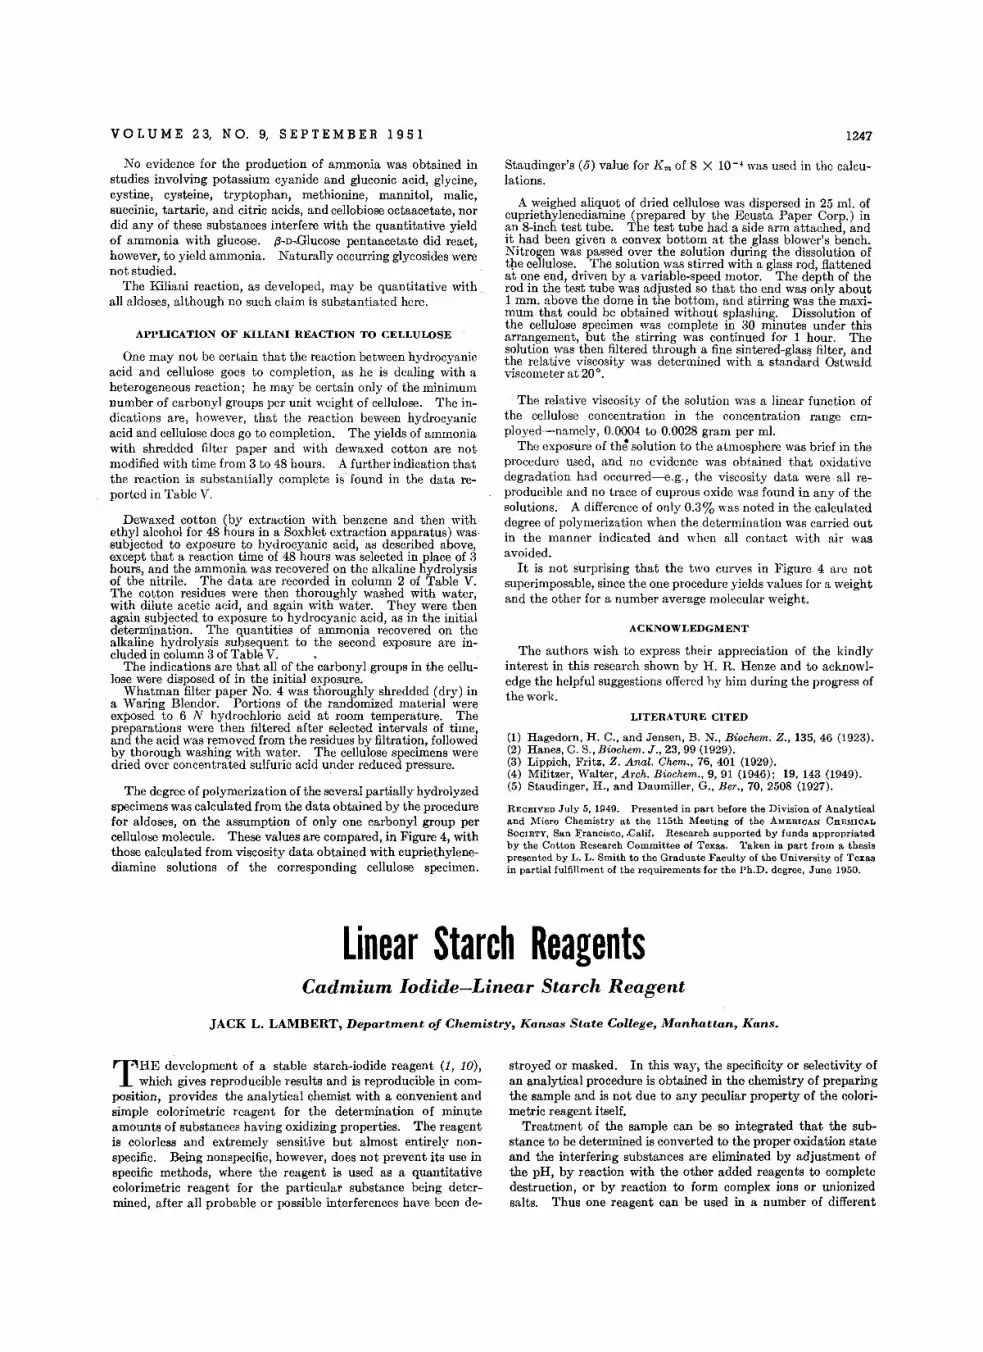
VOL U M E 23, N O. 9, S E PTE M B E R 1 9 5 1
No evidence for the production of ammonia was obtained instudies involving potassium cyanide and gluconic acid, glycine,cystine, cysteine, tryptophan, methionine, mannitol, malic,succinic, tartaric, and citric acids, and cellobiose octaacetate, nordid any of these substances interfere with the quantitative yieldof ammonia with glucose. {3-D-Glucose pentaacetate did react,however, to yield ammonia. Naturally occurring glycosides werenot studied.
The Kiliani reaction, as developed, may be quantitative withall aldoses, although no such claim is substantiated here.
APPLICATION OF KILIANI REACTION TO CELLULOSE
One may not be certain that the reaction between hydrocyanicacid and cellulose goes to completion, as he is dealing with aheterogeneous reaction; he may be certain only of the minimumnumber of carbonyl groups per unit weight of cellulose. The indications are, however, that the reaction beween hydrocyanicacid and cellulose does go to completion. The yields of ammoniawith shredded filter paper and with dewaxed cotton are notmodified with time from 3 to 48 hours. A furtherindication thatthe reaction is substantially complete is found in the data reported in Table V.
Dewaxed cotton (by extraction with benzene and then withethyl alcohol for 48 hours in a Soxhlet extraction apparatus) wassubjected to exposure to hydrocyanic acid, as described above,except that a reaction time of 48 hours was selected in place of 3hours, and the ammonia was recovered on the alkaline hydrolysisof the nitrile. The data are recorded in column 2 of Table V.The cotton residues were then thoroughly washed with water,with dilute acetic acid, and again with water. They were thenagain subjected to exposure to hydrocyanic acid, as in the initialdetermination. The quantities of ammonia recovered on thealkaline hydrolysis subsequent to the second exposure are in-cluded in column 3 of Table V. .
The indications are that all of the carbonyl groups in the cellulose were disposed of in the initial exposure.
Whatman filter paper No.4 was thoroughly shredded (dry) ina Waring Blendor. Portions of the randomized material wereexposed to 6 N hydrochloric acid at room temperature. Thepreparations were then filtered after selected intervals of time,and the acid was removed from the residues by filtration, followedby thorough washing with water. The cellulose specimens weredried over concentrated sulfuric acid under reduced pressure.
The degree of polymerization of the several partially hydrolyzedspecimens was calculated from the data obtained by the procedurefor aldoses, on the assumption of only one carbonyl group percellulose molecule. These values are compared, in Figure 4, withthose calculated from viscosity data obtained with cupriethylenediamine solutions of the corresponding cellulose specimen.
1247
Staudinger's (5) value for K m of 8 X 10⁻⁴ was used in the calculations.
A weighed aliquot of dried cellulose was dispersed in 25 ml. ofcupriethylenediamine (prepared by the Ecusta Paper Corp.) inan 8-inch test tube. The test tube had a side arm attached, andit had been given a convex bottom at the glass blower's bench.Nitrogen was passed over the solution during the dissolution ofthe cellulose. The solution was stirred with a glass rod, flattenedat one end, driven by a variable-speed motor. The depth of therod in the test tube was adjusted so that the end was only about1 mm. above the dome in the bottom, and stirring was the maximum that could be obtained without splashing. Dissolution ofthe cellulose specimen was complete in 30 minutes under thisarrangement, but the stirring was continued for 1 hour. Thesolution was then filtered through a fine sintered-glass filter, andthe relative viscosity was determined with a standard Ostwaldviscometer at 20°.
The relative viscosity of the solution was a linear function ofthe cellulose concentration in the concentration range employed-namely, 0.0004 to 0.0028 gram per ml.
The exposure of the solution to the atmosphere was brief in theprocedure used, and no evidence was obtained that oxidativedegradation had occurred---e.g., the viscosity data were all reproducible and no trace of cuprous oxide was found in any of thesolutions. A difference of only 0.3% was noted in the calculateddegree of polymerization when the determination was carried outin the manner indicated and when all contact with air wasavoided.
It is not surprising that the two curves in Figure 4 are notsuperimposable, since the one procedure yields values for a weightand the other for a number average molecular weight.
ACKNOWLEDGMENT
The authors wish to express their appreciation of the kindlyinterest in this research shown by H. R. Henze and to acknowledge the helpful suggestions offered by him during the progress ofthe work.
LITERATURE CITED
(1) Hagedorn, H. C., and Jensen, B. N., Biochem. Z., 135, 46 (1923).(2) Hanes, C. S., Biochem. J., 23, 99 (1929).(3) Lippich, Fritz, Z. Anal. Chem., 76, 401 (1929).(4) Militzer, Walter, Arch. Biochem., 9, 91 (1946); 19,143 (1949).(5) Staudinger, H., and Daumiller, G., Ber., 70, 2508 (1927).
RECEIVEDJuly 5. 1949. Presented in part before the Division of Analyticaland Micro Chemistry at the 115th Meeting of the AMERICAN CHEMICALSOCIETY, San Francisco, .Calif, Research supported by funds appropriatedby the Cotton Research Committee of Texas. Taken in part from a thesispresented by L. L. Smith to the Graduate Faculty of the University of Texasin partial fulfillment of the requirements for the Ph.D. degree, June 1950.
Linear Starch ReagentsCadmium Iodide-Linear Starch Reagent
JACK L. LAMBERT, Department of Chemistry, Kansas State College, Manhattan, Kans.
T H E development of a stable starch-iodide reagent (1, 10),which gives reproducible results and is reproducible in com
position, provides the analytical chemist with a convenient andsimple colorimetric reagent for the determination of minuteamounts of substances having oxidizing properties. The reagentis colorless and extremely sensitive but almost entirely nonspecific. Being nonspecific, however, does not prevent its use inspecific methods, where the reagent is used as a quantitativecolorimetric reagent for the particular substance being determined, after all probable or possible interferences have been de-
stroyed or masked. In this way, the specificity or selectivity ofan analytical procedure is obtained in the chemistry of preparingthe sample and is not due to any peculiar property of the colorimetric reagent itself.
Treatment of the sample can be so integrated that the substance to be determined is converted to the proper oxidation stateand the interfering substances are eliminated by adjustment ofthe pH, by reaction with the other added reagents to completedestruction, or by reaction to form complex ions or unionizedsalts. Thus one reagent can be used in a number of different
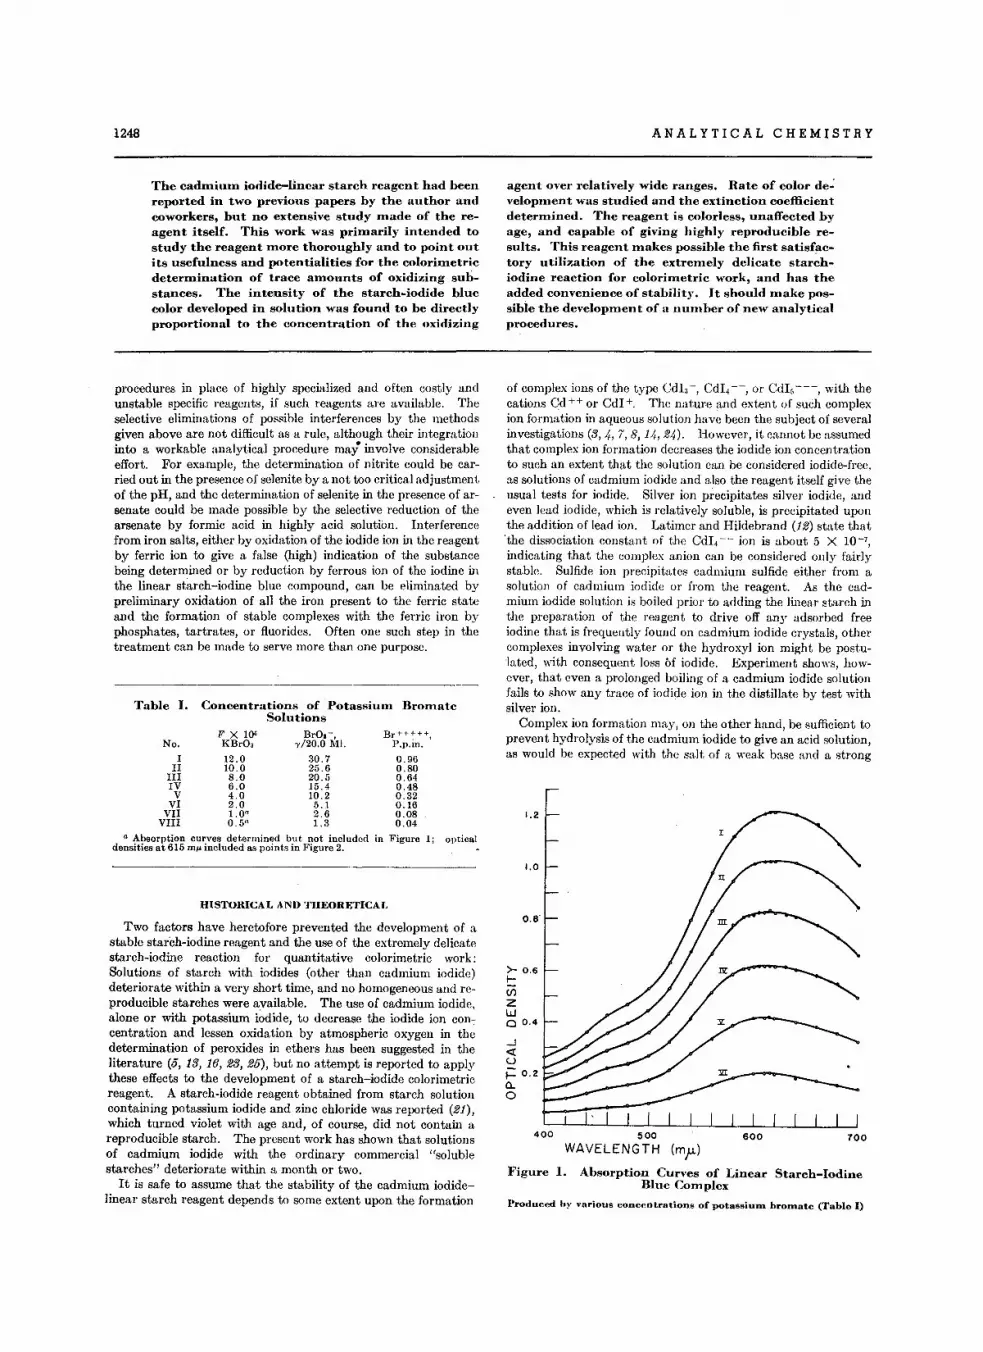
1248 ANALYTICAL CHEMISTRY
The cadmium iodide-linear starch reagent had beenreported in two previous papers by the author andcoworkers, but no extensive study made of the reagent itself. This work was primarily intended tostudy the reagent more thoroughly and to point outits usefulness and potentialities for the colorimetricdetermination of trace amounts of oxidizing substances. The intensity of the starch-iodide bluecolor developed in solution was found to be directlyproportional to the concentration of the oxidizing
agent over relatively wide ranges. Rate of color de":velopmerrt was studied and the extinction coefficientdetermined. The reagent is colorless, unaffected byage, and capable of giving highly reproducible results. This reagent makes possible the first satisfactory utilization of the extremely delicate starchiodine reaction for colorimetric work, and has theadded convenience of stability. It should make possible the development of a number of new analyticalprocedures.
a Absorption curves determined but not included in Figure L: opticaldensities at 615 Ill" included as points in Figure 2.
procedures in place of highly specialized and often costly andunstable specific reagents, if such reagents are available. Theselective eliminations of possible interferences by the methodsgiven above are not difficult as a rule, although their integrationinto a workable analytical procedure may involve considerableeffort. For example, the determination of nitrite could be carried out in the presence of selenite by a not too critical adjustmentof the pH, and the determination of selenite in the presence of arsenate could be made possible by the selective reduction of thearsenate by formic acid in highly acid solution. Interferencefrom iron salts, either by oxidation of the iodide ion in the reagentby ferric ion to give a false (high) indication of the substancebeing determined or by reduction by ferrous ion of the iodine inthe linear starch-iodine blue compound, can be eliminated bypreliminary oxidation of all the iron present to the ferric stateand the formation of stable complexes with the ferric iron byphosphates, tartrates, or fluorides. Often one such step in thetreatment can be made to serve more than one purpose.
HISTORICAL ANI) THEORETICAL
Two factors have heretofore prevented the development of astable starch-iodine reagent and the use of the extremely delicatestarch-iodine reaction for quantitative colorimetric work:Solutions of starch with iodides (other than cadmium iodide)deteriorate within a very short time, and no homogeneous and reproducible starches were available. The use of cadmium iodide.alone or with potassium iodide, to decrease the iodide ion conecentration and lessen oxidation by atmospheric oxygen in thedetermination of peroxides in ethers has been suggested in theliterature (5, 13, 16, 23, 25), but no attempt is reported to applythese effects to the development of a starch-iodide colorimetricreagent. A starch-iodide reagent obtained from starch solutioncontaining potassium iodide and zinc chloride was reported (21),which turned violet with age and, of course, did not contain areproducible starch. The present work has shown that solutionsof cadmium iodide with the ordinary commercial "solublestarches" deteriorate within a month or two.
It is safe to assume that the stability of the cadmium iodidelinear starch reagent depends to some extent upon the formation
O.S"
1,0
1.2
Produced hy various concentrations of potassiunl bromate (Table I)
500 600 100WAVELENGTH (mjl)
Figure 1. Absorption Curves of Linear Starch-IodineBlue Complex
>- 0.6.....(/)
ZW0 0.4
-l«Uj:: 0.2a.o
of complex ions of the type CdI, -, CdI4--, or CdI.---, with thecations Cd ++ or CdI+. The nature and extent of such complexion formation in aqueous solution havc been the subject of severalinvestigations (3,4,7,8,14,24). However, it cannot be assumedthat complex ion formation decreases the iodide ion concentrationto such an extent that thc solution can be considercd iodide-free.as solutions of cadmium iodide and also the reagent itself give theusual tests for iodide. Silver ion precipitates silver iodide, andeven lead iodide, which is relatively soluble, is precipitated uponthe addition of lead ion. Latimer and Hildebrand (12) state that'the dissociation constant of thc CdI, -- ion is about 5 X 10⁻⁷,
indicating that the complex anion can be considered only fairlystable. Sulfide ion precipitates cadmium sulfide either from asolution of cadmium iodide or from the reagent. As the cadmium iodide solution is boiled prior to adding the linear starch inthe preparation of the reagent to drive off any adsorbed freeiodine that is frequently found on cadmium iodide crystals, othercomplexes involving water or the hydroxyl ion might be postulated, with consequent loss Of iodide. Experiment shows, however, that even a prolonged boiling of a cadmium iodide solutionfails to show any trace of iodide ion in the distillate by test withsilver ion.
Complex ion formation may, on the other hand, be sufficient toprevent hydrolysis of the cadmium iodide to give an acid solution,as would be expected with the salt of a weak base and a strong0.96
0.800.640.480.320.160.080.04
Br+++++Pip.in, '
F X 10<KBrO,
12.010.08.06.04.02.01.0"0.5"
Concentrations of Potassium BromateSolutions
BrO.-.'Y/20.O MI.
30.725.620.515.410.25.12.61.3
No.I
IIIIIIVV
VIVII
VIII
Table I.
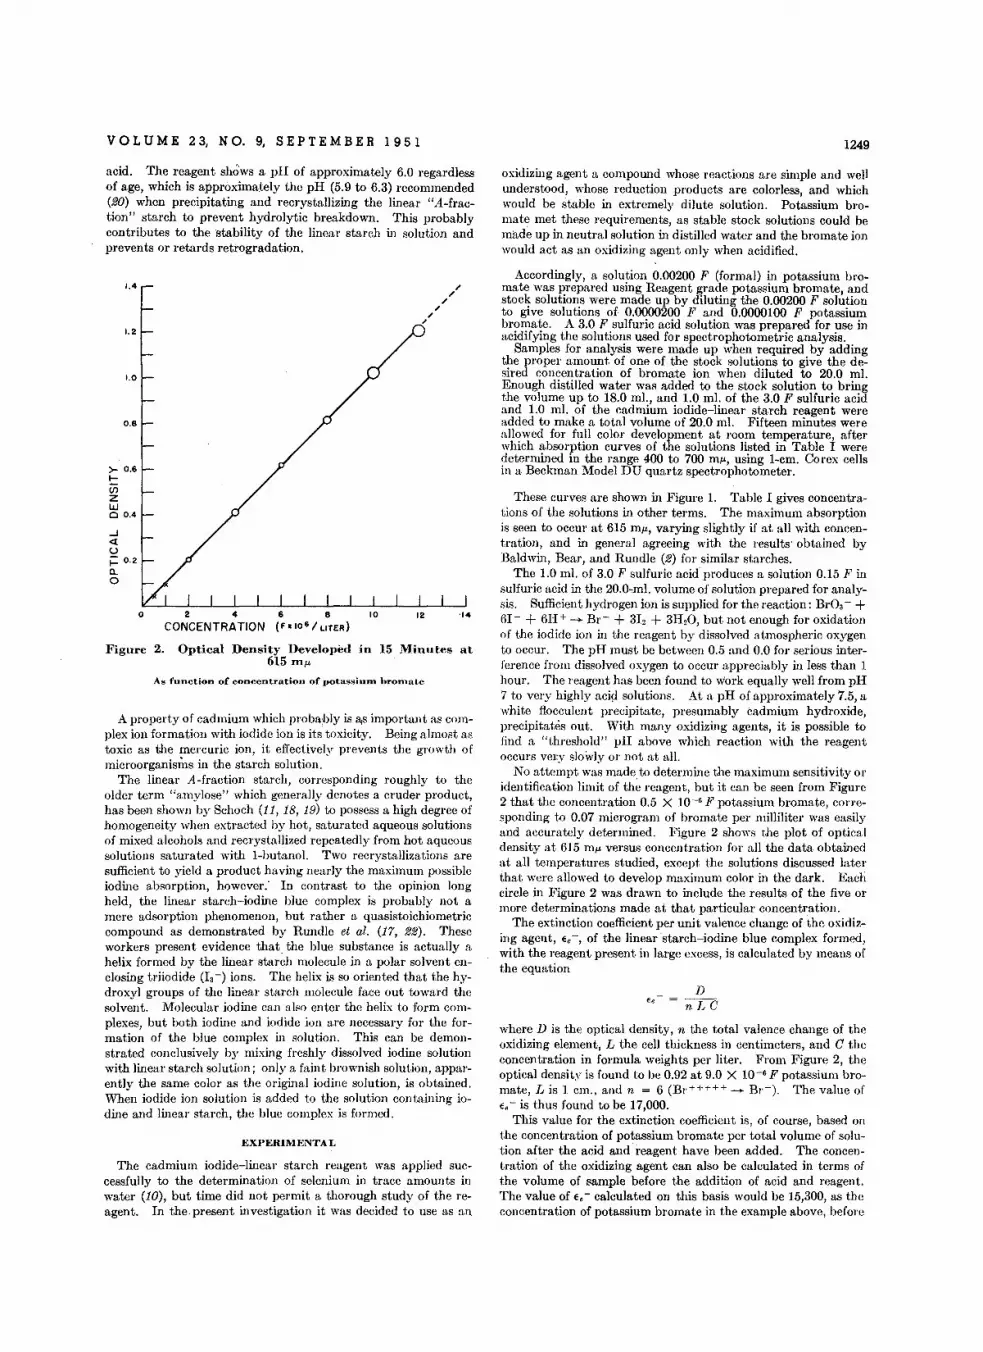
VOL U M E 2 3, N O. 9, S E PTE M B E R 1 9 5 1 1249
acid. The reagent shows a pH of approximately 6.0 regardlessof age, which is approximately the pH (5.9 to 6.3) recommended(20) when precipitating and recrystallizing the linear "A-fraction" starch to prevent hydrolytic breakdown. This probablycontributes to the stability of the linear starch in solution andprevents or retards retrogradation.
oxidizing agent a compound whose reactions are simple and wellunderstood, whose reduction products are colorless, and whichwould be stable in extremely dilute solution. Potassium bromate met these requirements, as stable stock solutions could bemade up in neutral solution in distilled water and the bromate ionwould act as an oxidizing agent only when acidified.
As function of concentration of potass'iUDl hronlute
EXPERIMENTAL
The cadmium iodide-linear starch reagent was applied successfully to the determination of selenium in trace amounts inwater (10), but time did not permit a thorough studyof the reagent. In the. present investigation it was decided to use as an.
A property of cadmium which probably is as important as complex ion formation with iodide ion is its toxicity. Being almost astoxic as the mercuric ion, it effectively prevents the growth ofmicroorganisms in the starch solution.
The linear A-fraction starch, corresponding roughly to theolder term "amylose" which generally denotes a cruder product,has been shown by Schoch (11, 18, 19) to possess a high degree ofhomogeneity when extracted by hot, saturated aqueous solutionsof mixed alcohols and recrystallized repeatedly from hot aqueoussolutions saturated with l-butanol, Two recrystallizations aresufficient to yield a product having nearly the maximum possibleiodine absorption, however: In contrast to the opinion longheld, the linear starch-iodine blue complex is probably not amere adsorption phenomenon, but rather a quasistoichiometriccompound as demonstrated by Rundle et ol. (17, 22). Theseworkers present evidence that the blue substance is actually ahelix formed by the linear starch molecule in a polar solvent enclosing triiodide (13-) ions. The helix is so oriented that the hydroxyl groups of the linear starch molecule face out toward thesolvent. Molecular iodine can also enter the helix to form complexes, but both iodine and iodide ion are necessary for the formation of the blue complex in solution. This can be demonstrated conclusively by mixing freshly dissolved iodine solutionwith linear starch solution; only a faint brownish solution, apparently the same color as the original iodine solution, is obtained.When iodide ion solution is added to the solution containing iodine and linear starch, the blue complex is formed.
These curves are shown in Figure 1. Table I gives concentrations of the solutions in other terms. The maximum absorptionis seen to occur at 615 mu, varying slightly if at all with concentration, and in general agreeing with the results' obtained byBaldwin, Bear, and Rundle (2) for similar starches.
The 1.0 ml. of 3.0 F sulfuric acidproduces a solution 0.15 F insulfuric acid in the 20.0_ml. volume of solution prepared for analysis. Sufficient hydrogen ion is supplied for the reaction: 131'03 - +61- + 6H+ -... 131'- + 31, + 3H 20 , but not enough for oxidationof the iodide ion in the reagent by dissolved atmospheric oxygento occur. The pH must be between 0.5 and 0.0 for serious interference from dissolved oxygen to occur appreciably in less than 1hour. The reagent has been found to work equally well from pH7 to very highly acid solutions. At a pH of approximately 7.5, awhite flocculent precipitate, presumably cadmium hydroxide,precipitates out. With many oxidizing agents, it is possible tofind a "threshold" pH above which reaction with the reagentoccurs very slowly or not at all.
No attempt was made to determine the maximum sensitivity oridentification limit of th~ reagent, but it can be seen from Figure2 that the concentration 0.5 X 10⁻⁶ P potassium bromate, corresponding to 0.07 microgram of bromate per milliliter was easilyand accurately determined. Figure 2 shows the plot of opticaldensity at 61.5 m,u versus concentration for all the data obtainedat all temperatures studied, except the solutions discussed laterthat were allowed to develop maximum color in the dark. Eachcircle in Figure 2 was drawn to include the results of the five ormore determinations made at that particular concentration.
The extinction coefficient per unit valence change of the oxidizing agent, €e -, of the linear starch-iodine blue complex formed,with the reagent present in large excess, is calculated by means ofthe equation
where D is the optical density, n the total valence change of theoxidizing element, L the cell thickness in centimeters, and C theconcentration in formula weights per liter. From Figure 2, theoptical density is found to be 0.92 at 9.0 X 10⁻⁶ F potassium bromate, Lis 1 cm., and n = 6 (Br+++++ -- 131'-). The value of€. - is thus found to be 17,000.
This value for the extinction coefficient is, of course, based onthe concentration of potassium bromate per total volume of solution after the acid and reagent have been added. The concentration of the oxidizing agent can also be calculated in terms ofthe volume of sample before the addition of acid and reagent.The value of e, - calculated on this basis would be 15,300, as theconcentration of potassium bromate in the example above, before
fe
Accordingly, a solution 0.00200 F (formal) in potassium bromate was prepared using Reagent grade potassium bromate, andstock solutions were made up by diluting the 0.00200 F solutionto give solutions of. 0.0000200 F and 0.0000100 F potassiumbromate. A 3.0 F sulfuric acid solution was prepared for use inacidifying the solutions used for spectrophotometric analysis.
Samples for analysis were made up when required by addingthe proper amount of one of the stock solutions to give the desired concentration of bromate ion when diluted to 20.0 ml.Enough distilled water was added to the stock solution to bringthe volume up to 18.0 mI., and 1.0 ml. of the 3.0 F sulfuric acidand 1.0 ml. of the cadmium iodide-linear starch reagent wereadded to make a total volume of 20.0 ml. Fifteen minutes wereallowed for full color development at room temperature
fafter
which absorption curves of the solutions listed in Table weredetermined in the range 400 to 700 m«, using l-cm, Corex cellsin a Beckman Model DU quartz spectrophotometer.
12
Optical Density Developed in 15 M.inutes at615 Ill,u
2 4 6 8
CONCENTRATION (F. 106/ LITER)
o
...J<l:Uf= 0.2o,o
Figure 2.
1.2
1.0
r 0.6t-enzw00.4
1.4
0.8

1250 ANALYTICAL CHEMISTRY
the addition of 1.0 mJ. each of 3.0 F sulfuric acid and reagent tothe IS.0-ml. sample, would have been 10.0 X 10⁻⁶ F instead of9.0 X 10-6 F.
The effect of temperature on the intensity or" the blue starchiodine color was investigated in the work of Pieters and Hanssen(15) who, however, used starch of doubtful homogeneity. Figure3 shows the effect of temperature on the rate of color developmentin solutions of the same concentrations given in Table I, in whicha more intense color is eventually developed at the cooler temperature. It is fortunate that, regardless of the temperature,the color developed in 15 to 20 minutes under these particular conditions of pH and electrolyte concentration is approximately thesame. Thus, except for the most precise work, temperature control is not critical.
Table II. Comparison of Optical Densities of FreshlyPrepared and 9-Months-Old Reagent
(15-minute color development at 61.5 mu)
Concn. KBrO" Freshly Prepared 9-Months-Old. F X 10' Reagent Reagent
2.0 0.210 0.2064.0 0.416 0.4116.0 0.616 0.6128.0 0.821 0.814
10.0 1.045 1.03012.0 1.230 1.210
A very slight turbidity was apparent in a sample of the reagentthat was 9 months old, but no difference was observed in the efficacy of the freshly prepared reagent over that of the older.Simultaneous determinations were made at the same temperature(2S 0 ± 10 C.) with the results shown in Table II. The differences in optical densities recorded are almost negligible.
DISCUSSION
The data presented here are intended to demonstrate the behavior, possibilities, .and limitations of the reagent. The bluelinear starch-iodine colloid is affected little by weak acids, and bystrong acids only when they are present in high concentrations.High concentrations of polyvalent cations tend to precipitate theblue colloid, but this can be largely overcome by the use of complexing agents such as tartrates and phosphates.
1.2
F-
1.0 ....
0.8 1II
Without 'tempeeat.ure control
605040.30
~-----....t. _
~.....-----_..........._----o
>- 0.6I-ifjZW0 0 .4
.....l«uf= 0.2a..o
PREPARATION OF THE REAGENT
To prepare 1 liter of the reagent, 11.00 grams of cadmiumiodide are dissolved in 300 to 400 mJ. of distilled water and the
It would be advisable when applying the reagent to a particularprocedure to determine the rate of color development in the solution used. By using the extinction coefficient, <, -, obtainedabove, the straight-line plot of optical density versus concentration can be obtained without redetermining a number of points.In procedures where the conditions are considerably different fromthose described here, it might be well to check the extinction coefficient experimentally..
10 20
MI N UTESIFigure 4. Color Intensity at 615 mIL Developed in Dark
As visible precipitation of the linear starch-iodine complexoccurs in about 45 minutes under these conditions at the highestconcentration of potassium bromate used (12.0 X 10⁻⁶ F), agreatervariation of color intensity is to be expected at the higherconcentrations. That it is only the starch-iodine complex thatprecipitates can be demonstrated by intentionally precipitatingthe blue complex by means of a very low pH and a very high electrolyte concentration and filtering with suction through a mat offreshly precipitated barium sulfate. The linear starch-iodineblue complex is retained by the mat, while the unreacted starch isapparently able to pass through the mat without difficulty.
The effect of temperature on color development (Figure 3) wasinvestigated by keeping solutions of the same concentrations asin Table I in water baths of the desired temperature and analyzing samples at definite time intervals. Another set of determinations was made on the rate of color development withouttemperature control by keeping the samples being analyzed in thespectrophotometer continuously. Except when the absorptionwas being measured,the sample was in total darkness. Maximum color intensity was reached in the same time and to aboutthe same extent in 15 to 20 minutes, but fell off somewhat afterthat time to rise again slightly at the end of an hour, as shown inFigure 4. From this it may be concluded that color developmentshould be allowed to take place in the light. No difference wasnoted, however, in samples lighted by natural or by artificial(tungsten filament and fluorescent) sources:
o 10 20 30 40 50
MINUTESFigure 3. Effect of Temperature on Color
Intensity at 615 mIL Developed in Light
VOL U M E 23, N O. 9, S E PTE M B E R 1 95 1
solution is boiled gently for 15 minutes, while the volume is keptapproximately constant. Enough water is then added to bringthe volume to about 800 ml. and 2.50 grams of twice-recrystallizedlinear A-fraction potato starch are added slowly with stirringto the gently boiling solution. After complete solution of thestarch, or after approximately 5 minutes of stirring, the solutionis filtered with suction through several thicknesses of dense("barium sulfate retention" grade) filter paper. Enough wateris added to bring the volume to exactly 1 liter, after the solutionhas cooled to room temperature.
Inasmuch as the extraction of the crude linear A-fraction starchmay exceed the facilities of some laboratories, the simpler methoddescribed by Krishnaswamy and Sreenivasan (9) might provesatisfactory, although this method has not been attempted. Atany rate, two recrystallizations from hot aqueous solution saturated with I-butanol should follow any extraction method used.Detailed directions for the extraction and recrystallization are tobe found in publications by Schoch (11, 18, 19). The crystallinelinear starch so prepared is stable when kept dry.
As the concentrations of starch and of cadmium iodide adoptedin the original recipe for the reagent proved satisfactory in everyrespect, no changes have been attempted. The amounts ofstarch and iodide found by Gross, Wood, and McHargue (6) togive the optimum conditions for color development with arrowroot starch and. potassium iodide, were transposed by using aweight of cadmium iodide equivalent to that of the potassiumiodide in potential iodide ion concentration.
The linear A-fraction potato starch used throughout this workwas supplied by T. J. Schoch, Corn Products Refining Co., Argo,Ill. Undoubtedly the linear starch fractions would become commercially available if there was sufficient demand for them.The reagent should be stored in brown glass bottles if it is to bekept for long periods of 'time, but small amounts may be kept inclear glass bottles for convenience.
ACKNOWLEDGMENT
The author wishes to acknowledge especially the"contributionsof Paul Arthur and Thomas E. Moore, Oklahoma Agricultural
1251
and Mechanical College, Stillwater, Okla., with whom he workedon a research project supported by a grant from the NationalInstitutes of Health, United States Public Health Service, duringwhich the cadmium iodide-linear starch reagent was developed.
LITERATURE CITED
(1) Arthur, Moore, and Lambert, J. Am. Chem, Soc., 71, 3260(1949).
(2) Baldwin, Bear, and Rundle, Ibid., 66,111-5 (1944).(3) Doucet, Conipt, rend., 207, 362-4 (1938).(4) Gooding and Walton, J. Phys. Chem., 35, 3612-7 (1931).(5) Green and Schoetzow, J. Am. Pharm, Assoc., 22, 412-3 (1933).(6) Gross, Wood, and McHargue, ANAL. CHEM., 20, 900-1 (1948).(7) Haldar, J. Indian Chern, Soc., 23, 205-10 (1946).(8) Howells, J. Chern, Soc., 1946, 203-6.(9) Krishnaswamy and Sreenivasan, J. Biol. Chem., 176, 1253-61
(1948).(10) Lambert, Arthur, and Moore, ANAL.CHEM. 23,1101 (1951).(11) Lansky, Kooi, and Schoch, J. Am. Chern, Soc., 71, 4066-75
(1949).(12) Latimer and Hildebrand, "Reference Book of Inorganic Chem-
istry," revised ed., p, 132, New York, Macmillan Co., 1940.(13) Liebhafsky and Sharkey, J. Am. 'Chem: Soc., 62. 190-2 (1940).(14) McBain, Z. Elektrochem., 11, 215 (1905).(15) Pieters and Hanssen,.Anal. Chim, Acta, 2, 712-26 (1948).(16) Rowe and Phelps, J. Am: Chern, Soc., 46, 2078-85 (1924).(17) Rundle, Foster, and Baldwin, Ibid., 66, 2116-20 (1944).(18) Schoch, "Advances in Carbohydrate Chemistry," Vol. I, ed. by
Pigman and Wolfrom, pp. 247-77, New York, AcademicPress, 1945.
(19) Schoch, J. Am. Chem, Soc., 64, 2957-61 (1942).(20) Schoch and Jensen, ANAL. CHEM., 12, 531-2 (1940).(21) Scott, J. Am. Water Works Assoc., 26, 634-40 (1934).(22) Stein and Rundle, J. Chern, Phys., 16, 195-207 (1948).(23) U. S. Pharmacopoeia, Tenth Decennial Revision, p. 35, Phila
delphia, J. B. Lippincott ce., 1926.(24) Van Name and Brown, Am. J. Sci., 44, 105-23 ·(1917); 44,
453-68 (1917).(25) Van Winkle and Christiansen, J. Am. Pharm. Assoc., 18, 1247
50 (1929).
RECEIVED December 26, 1950. Contribution C ·438 from the Department ofChemistry, Kansas State College.
Linear Starch ReagentsLinear Starch-Iodate Reagent Selective for Iodide Ion
JACK L. LAMBERT, Department of Chemistry, Kansas State College, Manhattan, Kans.
This study was made on a colorfrneta-ic reagent containing linear A-fraction potato starch, iodate ion,and eadrnfum ion which, at the proper pH, indicateda selectivity for iodide ion. The colorless reagent soprepared proved to he stahle for periods up to 6weeks and to he selective for iodide ion when usedin a solution of a weak acid such as forrrrie, The reaction of iodate ion and iodide ion to produce triiodide ion (I3 -), which reacts wi,th the linear starchto forrn the well-known blue corrrplex, gives repro-
THE development and application of a stable and reproduciblelinear starch-cadmium iodide colorimetric reagent (J) sug
gested the possibility of a reagent containing linear "A-fraction"starch and iodate ion which would be selective for iodide ion.In previous work (2)involving the study of iodate ion (producedby oxidation of iodide ion) as an interference, it was observedthat iodate ion is a particularly sluggish oxidizing agent towardmost reducing substances except iodide ion when the pH is notextremely low.
The chemistry involving the use of iodate ion to oxidize iodide
duciblc and quantitative results. Very few substances were found to interfere under such conditions. The rate of color developrnerrt and the effectof ternperat.ure were studied, and the extinction coefficient was calculated. This reagent rnakes possiblethe selective colortrnerrfc dcterrnfnatfon of iodide ionin very dilute solution. Analytical procedures forvery srnatlamounts of iodide ion are of current interest in such fields as llledicinal chemlsrry and waterpurification.
ion to form iodine and the combining of the iodine with excessiodide ion to produce the color-forming triiodide (13 - ) ion is notstoichiometrically advantageous. However, the very intenseblue linear starch-triiodide ion complex permits the determination of iodide ion in concentrations of the magnitude of 10-4 F.A study of the reactions indicates that eight iodide ions are necessary to produce three triiodide ions:
51- + 103- + 6H+~ 312 + 3H.O31- + 31. ~ 313-

1252 ANALYTICAL CHEMISTRY
Further oxidation of the iodide in the triiodide ion proceeds at avery slow rate and is negligible under the conditions of the following procedure. Presumably the triiodide ion is somewhat protected from oxidation by its position inside the linear starchmolecule helix. The present study also shows that an excess ofiodide ion is not necessary for proper formation of the blue complex.
DEVELOPMENT OF THE REAGENT
Iodate ion is inert in solutions where the pH is not low and isan oxidizing agent only in acid solution. In order to obtain astable reagent containing linear starch, the resulting solutionshould not only have the pH (5.9 to 6.3) recommended by Schoch(4) to prevent hydrolytic breakdown of the starch on long standing, but must also be protected against the growth of microorganisms. Cadmium iodide had been found to meet both requirements in the development of the linear starch-cadmiumiodide reagent, but could not be used in this reagent. The chloride and bromide salts of cadmium appeared to permit more rapidretrogradation of the linear starch in solution than did cadmiumacetate. Cadmium acetate, which, in the concentration of 1.0gram of the trihydrate per liter of reagent specified for this reagent, produced a stable linear starch solution with a pH of 6.3to 6.5, was found to be satisfactory in retarding mold growth.Other mold inhibitors may prove superior to cadmium acetate.Potassium chloride in 15% concentration, which was suggestedby Beans in a personal communication to Schoch (3), is fairlysuccessful in preventing mold growth but introduces a concentration of chloride ion which is high enough to cause some precipitation of the linear starch-triiodide ion blue complex at thehigher concentrations of iodide ion studied.
Cadmium ion approaches mercuric ion in toxicity and has theimportant advantage of not precipitating an insoluble iodide salt.
In an accelerated test to determine the effectiveness of cadmium ion in preventing mold growth, 75 m!. of a solution containing the concentrations of linear potato starch and potassiumiodate specified for the reagent, together with 1.0 gram of CdCI2.21/ 2H,O per liter of solution, and 75 m!. of another solution containing the linear starch alone, were exposed together in opendishes for 6 hours. The solutions were then sealed in brown glassbottles and placed together in diffuse sunlight on a shelf. Thesolution without cadmium .chloride became highly turbid within3 weeks, whereas the one containing the cadmium chloride andiodate remained practically unchanged. On longer standing, cadmium acetate proved superior to cadmium chloride, perhaps because of the higher pH of the solution.
1.8,-----,.----,----...----,.----,.----,
1.6
1.4
1.2
1.0
2.00.8
I.8r---T""--"'T"--....---,---,----, 1.0
302520
o
1510
MINUTES
5
1.0 _
2.0
"r: r r I Io
o
>-.... 0.6l/lZWo..J 0,4«o....o,o 0.2
Temperut.ure and tot.al vobame of s8J'Dple constant.
Ff gure 2. Rate of Developrrrerrt of Absorption of BlueCornplex at 625 In!"
Crude linear A-fraction potato starch was recrystallized twicefrom aqueous solution saturated with l-butanol in the same manner as for the preparation of the cadmium iodide-linear starchreagent (1). To prepare 1 liter of the reagent, 2.5 grams of thetwice recrystallized linear starch are dissolved in somewhat lessthan I liter of boiling distilled water and the solution is allowedto coo!. C.P. grade potassium iodate, 0.40 gram, and 1.0 gram ofC.P. cadmium acetate trihydrate, Cd(C2H302)2.3H20, are dissolved in the starch solution and the volume is brought up to Iliter. The solution is then filtered with suction through severallayers of very dense ("barium sulfate retention" grade) filterpaper and stored in brown glass bottles. This solution IS stablefor 6 weeks or longer and can be refiltered if turbidity becomesmarked. A very slight precipitate, which can be filtered off orlen in the bottom of the bottle where it does no harm, is usuallynoticeable within the first week.
700600500
WAVELl;NGTH. mf'400
CONCE NTRATIONS
1.6 (x10 5 ,. rl
r 15.0II 12.5m 10.0Ill: 7.5JZ: 5.0
1.4
0.8
>-.... 0.6(j)ZW0..J 0.4«<.)
f=c,0
1.01----+---+----1--+-+----4-----1
1.2t----;----t---++--i7.....".,.~;::_-=,___4
Figure 1. Absorption Curves of Linear StarcbTriiodide Ion Blue Cornplex
Produced by various concent.ra:tioDs or iodide ion in earnpfe
EXI'ERIMENTAL
A stock solution of 2.0 X 10⁻⁴ F iodide ion was prepared bydissolving 0.0732 gram of cadmium iodide in 2000 m!. of distilled

VOL U M E 2 3, N O. 9, S E PTE M B E R 1 9 5 1 1253
As fun'ction of iodide ion concentration
Figure 3. Effect of Various Acids on Developrrrerrt ofOptical Density of Blue Corrrplex at 625 IllIL
water. Cadmium iodide had been found in previous work togive much more stable solutions at higher concentrations than didalkali metal iodides, in whose solutions iodide ion is oxidized toiodine after exposure to atmospheric oxygen for a time. As acheck during the course of the investigation, a month-old cadmium iodide stock solution was compared with a freshly prepared solution of potassium iodide made up to the same formalityof iodide ion. The two were found to be identical in iodide ion concentration as determined spectrophotometrically using the linearstarch-iodate reagent. The month-old cadmium iodide stocksolution gave no test for free iodine on testing with the cadmiumiodide-linear starch reagent (1).
The solutions prepared for use in obtaining the data presentedwere made up from the 2.0 X 10⁻⁴ F cadmium iodide stock solution and distilled water to give 20.0-m!. total volume of thcproper iodide ion concentration. This solution was then acidifiedwith 1.0 m!' of 98 to 100% formic acid and 1.0 m!' of the linearstarch-iodate reagent was added.
15.012.52.5 ~5 IQO
CONCENTRATION, X 105 Fo
>-f- 0.61----+---+---(f)
zwo...J 0.4f-----f----+«oi=0..o 0.21----+----
Figure 4. Effect of Temperature on AbsorptionA,t 625 lll.,u. of blue eornpdex for-rraed alter 15 :m.inutes at various
concentrations of iodide ion
1.41-----i---+---+---+----
1.61-----i---+---+---+-----i--
O.8f-----f----+----f--
1.8.__---,.--~"'T'"---,.-----.__---,.---....,
sequent formation of more of the blue starch-triiodide ion complex, or merely an equilibrium effect.
In order to determine the effect of pH and the nature of theacid used for acidification, several acids were studied with the results shown in Figure 3. The values for the optical densitieswere obtained at 625 mIL at the end of 15 minutes allowed foreolor development at approximately the same temperature(23 0 ± 1 0 C.). Only the results obtained using 3.0 F sulfuricacid differed significantly from the others. This might be explained as a result of either the lower pH of the solution or thetendency of the blue starch-triiodide ion complex to precipitatein the presence of sulfuric acid, especially at the higher concentrations of iodide ion. Formic acid was chosen as the acidifyingagent in the determinations made in this study, because aeidsstronger than formic--e.g., oxalic-lower the pH to a pointwhere iodate ion begins to oxidize chloride ion at an appreciablerate and causes rapid decolorization of the blue complex formed.
1.01-----i---+---+---
1.21-----i---+---+---+--
Formic acid is also desirable because of its strong reducing properties; by being present in relatively large amount, formic acidwould tend to be preferentially oxidized instead of iodide ion bytraces of oxidizing substances. At the pH obtained using formicacid, no oxidation of iodide ion by dissolved atmospheric oxygenoccurs. Acetic acid, added in the amount of 1.0 ml. of the concentrated acid, does not permit full color development within areasonable time. If enough concentrated acetic acid is added togive rapid enough color development, the color of the blue complexis altered slightly, probably because of change in the nature of thesolvent.
Temperature had small effect on the color intensities developedin the study of the cadmium iodide-linear starch reagent, where
15.012.52.5 5.0 7.5 10.0
CONCENTRATiON, X lOll F
6
I I I I
Ii41-- X 3.0 F SULFURIC ACID
A SATURATED OXALIC. ACID It• 85 % LACTIC ACID
o SAT, TARTARIC ACID- • 98-100% FORMIC ACID
:IJjt-Ii
/,~
>r<II 0.6
ZWa...J 0.4«<.)
to.00.2
o
I.
I.
1.2
0.8
1.0
Figure 1 shows the typical absorption curves of the blue lineal'stareh-triiodide ion complex produced by several concentrationsof iodide ion. The maximum optical density is seen to occur at625 mu, All measurements in this study were obtained with aBeckman Model DU quartz spectrophotometer using l-cm.matched Corex cells and a tungsten filament light source.
The rate of color development is indicated in Figure 2, whichalso shows the effect of adding twice as much reagent to the solution, keeping the total volume the same in all cases. Thesecurves indicate that the optimum time for color development is15 to 20 minutes, considering the convenience for the operatorand the desirability of keeping side reactions at a minimum.Flocculation of the blue complex does not occur under these conditions in that period of time. While the absorption is uniformlyhigher when twice as much lineal' starch-iodate reagent is added,it is also apparent that the amount of reagent added need not bemeasured with more accuracy than is used in the other measurements. The higher absorption may be the result of the slow reduction of iodate ion and iodine by the formic acid, with the sub-
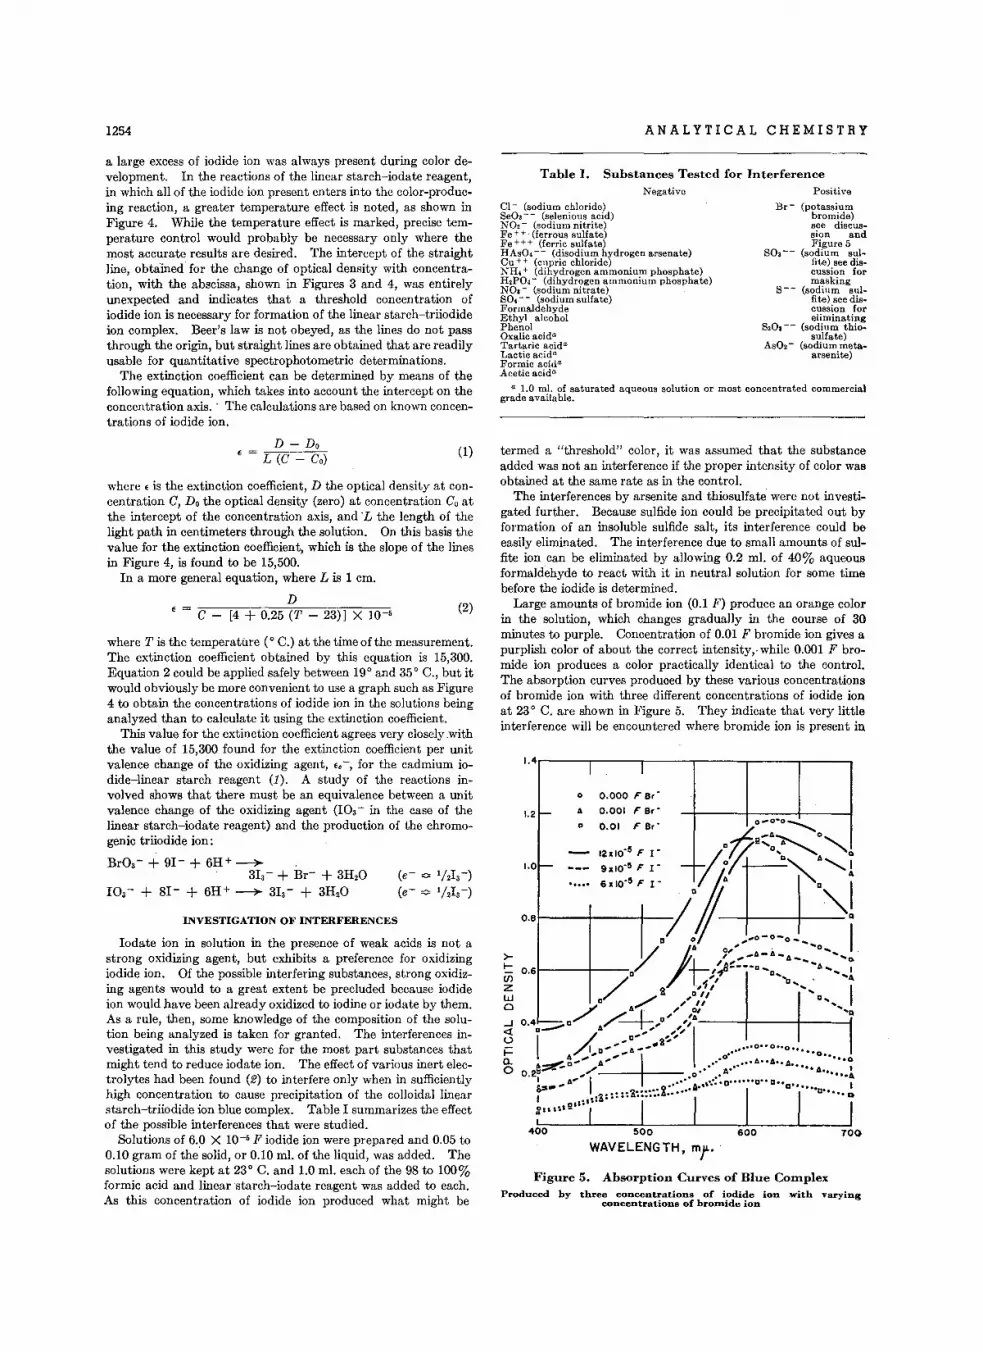
1254 ANALYTICAL CHEMISTRY
Table I. Substances Tested for InterferencePositive
Br - (potassiumbromide)see discussion andFigure 5
80,-- (sodium sullite) see discussion formasking
8-- (sodium suilite) see discussion foreliminating
8,0,-- (sodium thiosulfate)
AsO, - (sodium metaarsenite)
Negative
CI- (sodium chloride)8eO, - - (selenicua acid)NO, - (sodium nitrite)Fe + +. (ferrous sulfate)Fe + + + (ferric sulfate)HAsO.-- (disodium hydrogen arsenate)Cu + + (cupric chloride)NH. + (dihydrogen ammonium phosphate)H,PO. - (dihydrogen ammonium phosphate)NO. - (sodium nitrate)80. -- (sodium sulfate)FormaldehydeEthyl alcoholPhenolOxalic acid>Tartaric aeid''Lactic acid?Formic acid"Acetic acid"
a 1.0 ml. of saturated aqueous solution or most concentrated commercialgrade available.
a large excess of iodide ion was always present during color development. In the reactions of the linear starch-iodate reagent,in which all of the iodide ion present enters into the color-producing reaction, a greater temperature effect is noted, as shown inFigure 4. While the temperature effect is marked, precise temperature control would probably be necessary only where themost accurate results are desired. The intercept of the straightline, obtained for the change of optical density with concentration, with the abscissa, shown in Figures 3 and 4, was entirelyunexpected and indicates that a threshold concentration ofiodide ion is necessary for formation of the linear starch-triiodideion complex. Beer's law is not obeyed, as the lines do not passthrough the origin, but straight lines are obtained that are readilyusable for quantitative spectrophotometric determinations.
The extinction coefficient can be determined by means of thefollowing equation, which takes into account the intercept on theconcentration axis ." The calculations are based on known concentrations of iodide ion.
I
0.000 F" Br·
0.001 F" Br·
0.01 F Br·
I
A
o
1.2-
1.4r------.---r----,-----.-----.---~
termed a "threshold" color, it was assumed that the substanceadded was not an interference if the proper intensity of color wasobtained at the same rate as in the control.
The interferences by arsenite and thiosulfate were not investigated further. Because sulfide ion could be precipitated out byformation of an insoluble sulfide salt, its interference could beeasily eliminated. The interference due to small amounts of sulfite ion can be eliminated by allowing 0.2 ml. of 40% aqueousformaldehyde to react with it in neutral solution for some timebefore the iodide is determined.
Large amounts of bromide ion (0.1 F) produce an orange colorin the solution, which changes gradually in the course of 30minutes to purple. Concentration of 0.01 F bromide ion gives apurplish color of about the correct intensity,· while 0.001 F bromide ion produces a color practically identical to the control.The absorption curves produoed by these various concentrationsof bromide ion with three different concentrations of iodide ionat 23° C. are shown in Figure 5. They indicate that very littleinterference will be encountered where bromide ion is present in
Figure 5. Absorption Curves of Blue Co:mplexProduced by three concentra"tions of iodide ion with varying
concentrations of bromide ion
(2)
(1)
(e- "" 1/2I a- )
(e- "" 1/2I a- )
D - Doe = L (C - Co)
e = C - [4 + 0.25 (T - 23) 1 X 10--5
where e is the extinction coefficient, D the optical density at concentration C, Do the optical density (zero) at concentration Co atthe intercept of the concentration axis, and "L the length of thelight path in centimeters through the solution. On this basis thevalue for the extinction coefficient, which is the slope of the linesin Figure 4, is found to be 15,500.
In a more general equation, where L is 1 em.
D
where T is the temperature (0 C.) at the time of the measurement.The extinction coefficient obtained by this equation is 15,300.Equation 2 could be applied safely between 19° and 35° C., but itwould obviously be more convenient to use a graph such as Figure4 to obtain the concentrations of iodide ion in the solutions beinganalyzed than to calculate it using the extinction coefficient.
This value for the extinction coefficient agrees very closely.withthe value of 15,300 found for the extinction coefficient per unitvalence change of the oxidizing agent, e. -, for the cadmium iodide-linear starch reagent (1). A study of the reactions involved shows that there must be an equivalence between a unitvalence change of the oxidizing agent (lOa-in the case of thelinear starch-iodate reagent) and the production of the chromogenic triiodide ion:
BrOa- + 91- + 6H+-+3Ia- + Br" + 3H20
1Oa- + 81- + 6H+ -+ 3Ia- + 3H20
INVESTIGATION OF INTERFERENCES
Iodate ion in solution in the presence of weak acids is not astrong oxidizing agent, but exhibits a preference for oxidizingiodide ion. Of the possible interfering substances, strong oxidizing agents would to a great extent be precluded because iodideion would have been already oxidized to iodine or iodate by them.As a rule, then, some knowledge of the composition of the solution being analyzed is taken for granted. The interferences investigated in this study were for the most part substances thatmight tend to reduce iodate ion. The effect of various inert electrolytes had been found (2) to interfere only when in sufficientlyhigh concentration to cause precipitation of the colloidal linearstarch-triiodide ion blue complex. Table I summarizes the effectof the possible interferences that were studied.
Solutions of 6.0 X 10⁻⁵ F iodide ion were prepared and 0.05 to0.10 gram of the solid, or 0.10 ml. of the liquid, was added. Thesolutions were kept at 23° C. and 1.0 ml. each of the 98 to 100%formic acid and linear starch-iodate reagent was added to each.As this concentration of iodide ion produced what might be

VOLUME 23, NO.9, SEPTEMBER 1951
concentrations less than one hundred t imes that of th e iodide ion.From th e apparent enhancement at th e violet end of the visiblespectrum, and the shift ing of th e absorption peak , the presen ceof the iodine bromide (I2Br-) ion might be inferr ed.
DISCU SSION OF RESULTS
Th e reagent can be used with solutions th at do not containconcentra tions of interfering substances large enough to causeer roneous results and with solutions that have had the inter feringsubstances marked or removed. Th e st udy of inter ferences indicates th at small amo unts of many common inorganic and organicsubstances can be tolerated . Th e peculiar interference introdu ced by bromide ion is of such a nature that some knowledge ofits concent ra tion must be known before ana lyzing with this reagent. Large concent rations of bromide ion, however , will makeits pr esence known by the orange or purp lish color developed.
1255
Th e failure of th e line of opt ical density versus concentrationto pass through th e origin sets a lower limit of iodide ion concentration th at can be determined. No explana tion is immediatelyava ilab le to explain why no absorpt ion occurs until a thre sholdconcentration of triiodide ion is present.
Further work is contemplated both on the nature of possibleinterhalogen ions, such as I2Br - , and on the nature of th e formati on of the blue linear sta rch- tr iiodide ion complex.
LITERATUR E CITED
(1) Lam ber t , ANAL. CHE~I ., 23 , 1251 (1951) .(2) Lam ber t, Arthu r , and Moore, Ibid. , 23, 1110 (1951) .(3) Schoc h, " Advances in Carbohy drate Chemist ry ," Vol. I , p. 257,
ed . by P igman an d Wolfr om , New York, Aca demic Press,1945 .
(4) Schoc h and Jensen, I ND. ENG. CHEM., ANAL. E D., 12, 531- 2 (1940).
R EC EI VE D Ap ril 20, 1951. Contribution C 450 fro m the Dep artment ofC hemist ry, Kansas Sta te Colle ge , M anhattan.
Evaluating Dynamic Fatigue of Adhesionof Tire Cords to Rubber Stocks
W. J AM ES LYONS
Chemical and Physical Research Laboratories, Firestone Tire & R u b b er Co ., Akron 17, Ohio
AVARIET Y Of tests have been devised in the laboratories ofthe tire and rubber and associated industries for measur
ing the adhesion of textile fabric, especially tire cord, to naturaland synthetic rubber stocks. [A few of these static tests andtheir variations have been briefly described by Lyons, Nelson,and Conrad (5 ).J Most of th e tests involve measurements,generally at room temperature, on specimens which are givenno special treatment after preparation. It has, however, beenwidely recognized for some time that the testing of unfatiguedspecimens at room temperature is an inadequate simulant offabri c conditions in a tire at th e time of adh esion failure.
For a decade or more, tests devised by Gibbons (2) and Lessig(4) have been used to evalua te the resistance to sepa ration ofcombination rubber and fabri c specimens. Th e results of th esetests, however, have been int erpreted more as eva luations of th efatigu e properties of rubber stocks and rubber-fabric st ructuresth an of fatigued adhesion per se. To overcome partially the deficiencies of th e simple, sta t ic tes t , on th e theory that the deterioration of adhesion in tire service is in par t due to the heatgenerated in th e flexing of the t ire, th ere was added to the H adhesion test at th e Southern Regional Research Laboratory (5 )a feature which consists of heating the specimens at 2750 F .for 1.5 hours before th e actual breaking test at that same temperature. A mechanical fatigue test, th e results of which dependmore near ly on the dynamic adhesion alone than do th ose in theforegoing tests , has been in use during recent years in the RubberLaboratory of the 1. G. Farb enindu strie in Germany (3, 7). Inthis test, the adh esive bond is fat igued by means of a periodicshearing force, until th e bond is ruptured and th e cord is pulledfree of the rubber strip. More recentl y Gardner and Williams(1) and Pi ttman and Thornley (6) have described tests in whichthe loss of adhesion between cord and rubber, as a resul t of flexing the test piece, is actually measured. In the Gar dner andWilliams test the flexing is done on a Goodrich Flexometer andconsists of th e periodic compression of a small rubber block conta ining a single test cord. After a period of flexing, on theorder of 10 to 40 minu tes, the force required to extract the cordaxially, against the residual adhesion, is measured on a standardcord-testing machine. The Pittman and Th omley methodsubj ects th e rubber-encased cord samp le to periodic flexure and
lateral compression for a definite number of cycles. The fatigueof adhesion is measured as in th e foregoing method.
D escribed in the present paper is a dynamic test in which thefatigu e or deterioration of adh esion is likewise measured. It hasbeen und er development and use at th e Firestone Research Laboratories since 1947. Th e well-known Goodyear H test (5) isemployed to measure the "pull-out" adhesion of cord to rubber, inboth unflexed and fatigu ed samples.
ROLLER:;
W EIGHT
/Figure 1. Schernat!c Side View of Single Unit of Roller
Flex Adhesion Fatigue Machine
In the convent iona l H specimen, the single cord which is pulledout is entirely surrounded by rubber, whereas in the plies of a tirethe cords lie side by side, very often in close contact . To simulateth is condition, it was decided to use a band of cords, so that eachtest cord could be extracted from between two cords, all embeddedin rubber. Flexing a band of parallel cords also would appearto be more realistic th an the flexing of a single cord cured inru bber.
APPARATUS AND METHOD
Adhe sion-Fatigue Machine. The nature of th e flexing towhich the specimen is sub jected is shown in the schematic drawing of Figur e 1.
The test strap, 6.5 X 1 X 0.1 inch, has a band of five cordspassing longitudinally through the middle. Affixed at one end(the right in Figure 1) to a stationa ry mounting, the st r ip passes
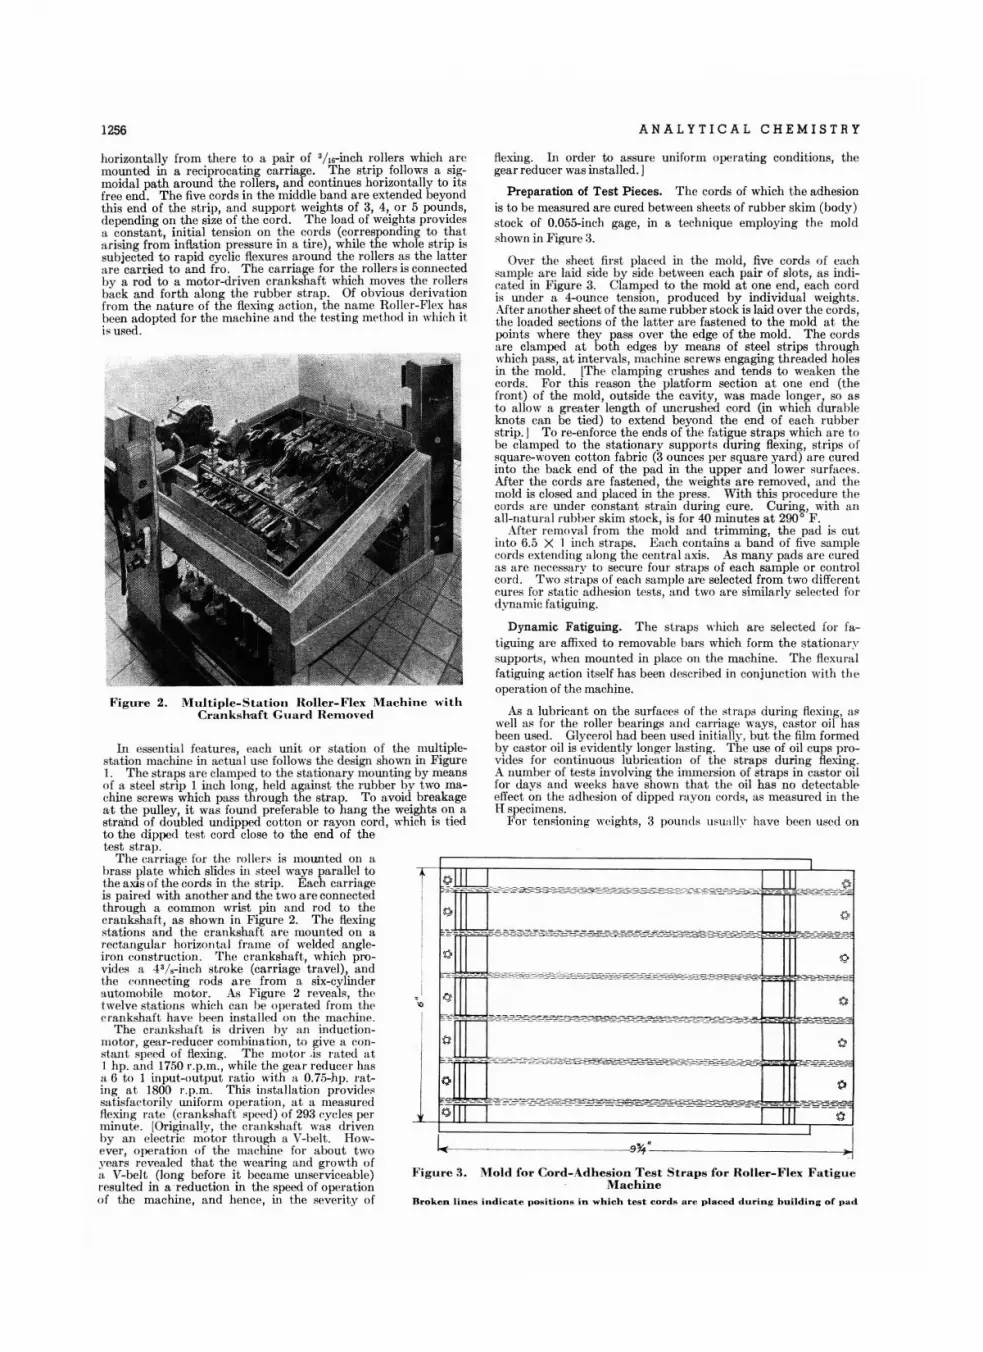
1256 ANALY TIC A L CHEM ISTRY
Bro k en HUCK indic ate I JOMit ionM in whic h test cord", arc placed d u rin g b u ilding or pad
~_ I
flexing. In order to assure uniform operating condit ions, th egear redu cer was installed. J
Preparation of Test P ieces. Th e cords of which th e adhesionis to be measured ar e cured between sheets of rubber skim (bod y )stock of 0.055-inch gage, in a techn ique employing the moldshown in Figure a.
Over the sheet first placed in the mold, five cords of eachsample a re laid side by side between each pair of slots , as indicated in Figure 3. Clamped to the mold at one end , each cordis Wider a -l-oun ce tension, produced by ind ividual weights.After another sheet of th e same rubber stock is laid over the cords,th e load ed sections of th e lat ter a re fastened to the mold at thepoints where they pass over th e edge of the mold. The cordsare clamped at both edges by means of stee l strips throughwhich pass, at int ervals, machine screws engaging threaded holesin the mold . [The clamping crushes and tends to weaken thecords. For this reason th e platform section at one end (thefront) of the mold , outside the cavity, was mad e longer, so asto allow a greater length of uncru shed cord (in which durahleknots can be tied) to extend beyond the end of eac h rubberst rip. I To re-enforce the ends of th e fatigue straps which are tobe clamped to th e stationary suppor ts during flexing, strips ofsquare- woven cotton fabric (3 oun ces per squa re yard) arc curedinto th e back end of th e pad in th e upper a nd lower sur faces .After th e cords a re fastened , th e weight '! a re removed, and themold is closed and placed in th e press. With this procedure thecords lire under consta nt strain during cure. Curing , with anall-natura l rubber skim stock, is for 40 minutes a t 290 0 F .
After removal from the mold and trimming, th e pad is cutinto 6.5 X 1 inch st ra ps. Eac h conta ins a band of five samplecords extending along th e central axis. A.s man y pad s are curedas are necessary to secure four stra ps of each sample or controlcon !' Two st raps of each sample are selected from two differentcures for sta tic adhesion tests , and t wo are simila rly selecte d fordynami c fatiguing.
Dynamic Fa tiguing. Th e straps which are selected for fatiguing arc affixed to removable bars which form th e sta t ionarvsupports , when moun ted in place on the machin e. The flexuralfatiguing act ion itself has been describ ed in conj unction with theopera tion of the machine.
As a lubricant on th e surfaces of t he st raps during flexing, aswell as for the roller bearings and carriage ways, casto r oil hasbeen used. Glycerol had been used initially. but the film form edby castor oil is evident ly longer lasting. The use of oil cups provides for continuous lubri cation of the straps during flexing.A number of tests involving th e immersion of straps in cast or oilfor dnvs and weeks have shown that the oil has no detectableeffect on the adhesion of dipp ed rayon cords, as measured in theH specimens.
For tensionin g weights, 3 pounds usu .rlly have been used on
!\Iold fo r Cord -Adhesion Test Straps for Holler- Flex Fatigu eMaeh ine
~-----------911'------------~
I ~ ~I .=-'Trr1;E~~~=~-=:""--=-C==-=","~=---o,:~~-~~=~..c_ -~-~ ~ - K ","",~-
~~ ~
I~ ~ 0
;illJ-~-~ --~~:
~~ - -- -- --~~~_x_=_~__,;;.=~~""'~~~~"""~-=-:-
t;--~--~~;;-~~-'<.=-=-~=-=:~~~~=-~~~-~---~~"§-~~
Figure 3.
M u l t ip le -Statio n Holler- Fl ex Mach ine w it hCrarrkshaf't G uard Herno ved
Fi gur e 2.
horizontally fro m there to a pair of 3/ lG-inch rollers which aremounted in a recipro cating carriage. The st rip follows a sigmoidal path around th e rollers, and continues horizontally to itsfree end . T he five cords in the midd le band are extended beyondth is end of thc strip, and suppor t weights of 3, 4, 01' 5 pounds,depending on the size of th e cord. The load of weights pr ovidesII constant, initi al tension on the cords (corresponding to thatarising from inflation pr essur e in a tire), while th e whole strip issubjecte d to rapid cyclic flexur es around the rollers as th e latterare carded to and fro. The ca rriage for th e rollers is connectedby a rod to a motor-driven cra nksha ft which moves th e rollersback and forth along th e rubber strap. Of obvious deriva tionfrom th e nature of th e flexing ac tion, th e nam e Holler -Flex hasbeen adopted for the machine a nd th e test ing meth od in which itis used.
In essent ia l feat ures , each uni t or station of th e multiplesta tion machine in actua I usc follows the design shown in Figure1. The straps are clamped to the stationa ry moun tin g by meansof a stee l st rip 1 inch long, held against th e ru bber by t wo machine screws which pass through the stra p. To avoid breakagea t th e pulley, it was found preferable to hang th e weights on astrand of doubled undipped cot ton or ra yon cord, which is tiedto the dipped test, cord close to the end of th etest st rap .
The oarriuge for the rollers is mounted on abra ss pla te which slides in stee l ways parallel tothe axi s of the cords in the st rip. Eac h ca rriageis pair ed with another and the t wo a re connectedthrough a common wrist pin and rod to thecra nkshaft , as shown in Figure 2. Th e flexingstations and th e cra nksha ft a rc mounted on arectangular hor izon tal fram e of welded ang le-iron construct ion . The crankshaft , which pro-vides a ·P/,-inch st ro ke (ca rriage travel), andthe connecting rods a rc from a six-cylinderauto mobile motor. As Figure 2 reveals, thetwelve stations which can be operated from till'erun kshaft. have been install ed on the machine.
Th e crun kshaft is driven In' an indu ctionmoto r, gear- redu cer combinat ion, to give a consta nt speed of flexing. Th e motor .is rated atI hp , and 1750 r. p.m., while the gear reducer hasa 6 to 1 input-output ratio with a 0.75-hp. ra ting a t 1800 r.p .m, Thi s install a tion providessa tisfacto rily uniform operation, at a measur edflexing rnte (cra n ksha ft speed) of 293 cycles perminute. [Originally, ti ll' cra nkshaft was drivenby an elect ric motor through a V-helt. However, ope ra tion of the machine for abo ut twoyea rs revealed th at the wearing and gro wth ofa V-belt (long before it became unservi ceabl e)resul ted in areduction in the speed of operationof the machin e, and hence, in th e severity of
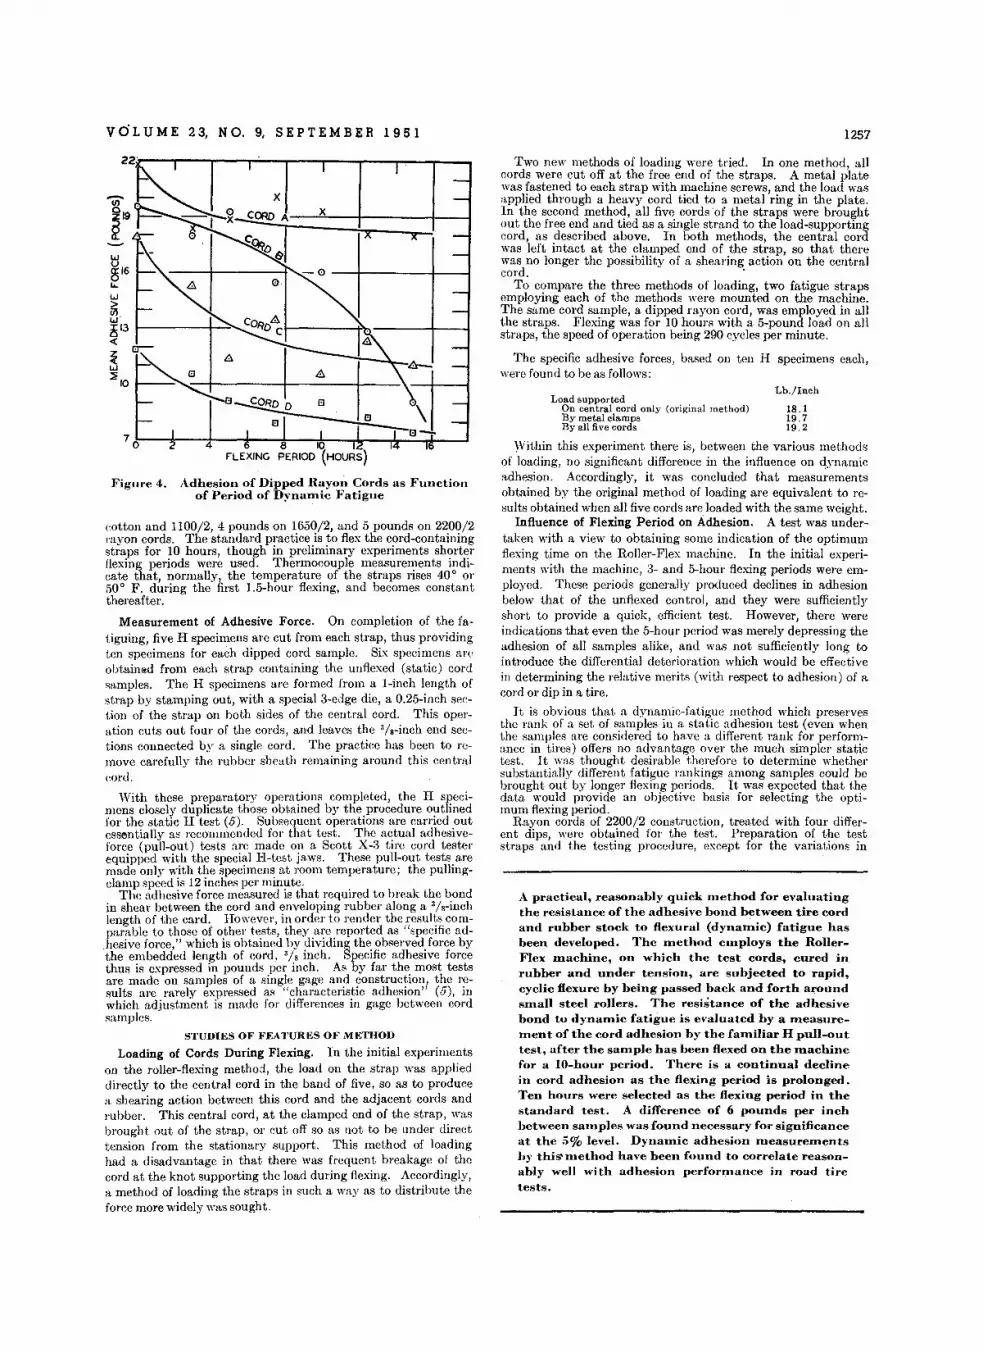
Lb./lnch
vO·L U M E 23, NO.9, S EPTE M B E R 1 95 1
en~19
-w~16&..
w
~-i!i13 I----+--=~-c~w::;;:10
J<'igllre 4. Adhesion of Dipped Rayon Cords as F'urrct.ioriof Period of Dynamic Fatigue
cotton and 1100/2,4 pounds on 1650/2, and 5 pounds on 2200/2rayon cords. The standard practice is to flex the cord-containingstraps for 10 hours, though in preliminary experiments shorterflexing periods were used. Thermocouple measurements indicate that, normally, the temperature of the straps rises 40° 01'
50° F. during the first 1.5-hour flexing, and becomes constantthereafter.
Measurement of Adhesive Force. On completion of the fatiguing, five H specimens arc cut from each strap, thus providingten specimens for each dipped cord sample. Six specimens arcobtained from each strap containing the unflexed (static) cordsamples. The H specimens are formed from a I-inch length ofstrap by stamping out, with a special 3-edge die, a 0.25-inch seetion of the strap on both sides of the central cord. This operation cuts out foul' of the cords, and leaves the 'Is-inch end sections connected by a single cord. The practice has been to remove carefully the rubber sheath remaining around this centraleOI'd.
With these preparatory operations completed, the II specimens closely duplicate those obtained by the procedure outlinedfor the static H test (5). Subsequent operations are carried outessentially as recommended for that test. The actual adhesiveforce (pull-out) tests are made on a Scott X-3 tire cord testerequipped with the special Hvtest jaws. These pull-out tests aremade only with the specimens at. room temperature: the pullingclamp speed is 12 inches per minute.
The adhesive force measured is that required to break the bondin shear between the cord and enveloping rubber along a 'Is-inchlength of the card. However, in order to render the results comparable to those of other tests, they are reported as "specific ad
.hesive force," which is obtained by dividing the observed force bythe embedded length of cord, 3/s inch. Specific adhesive forcethus is expressed in pounds per inch. As by far the most testsare made on samples of a single gage and construction, the results are rarely expressed as "characteristic adhesion" (5), inwhich adjustment is made for differences in gage between cordsamples.
STUDIES OF Jo'Jo:ATURES OJo' MJo;THOD
Loading of Cords During Flexing. In the initial experimentson the roller-flexing method, the load on the strap was applieddirectly to the central cord in the band of five, so as to producea shearing action between this cord and the adjacent cords andrubber. This central cord, at the clamped end of the strap, wasbrought out of the strap, or cut off so as not to be under directtension from the stationary support. This method of loadinghad a disadvantage in that there was frequent breakage of thecord at the knot supporting the load during flexing. Accordingly,a method of loading the straps in such a way as to distribute theforce more widely was sought.
1257
Two new methods of loading were tried. In one method, allcords were cut off at the free end of the straps. A metal platewas fastened to each strap with machine screws and the load wasapplied through a heavy cord tied to a metal 'ring in the plate.In the second metho~, all five cords of the straps were broughtout the free end and tied as a single strand to the load-supportingcord, as .described above. In both methods, the central cordwas left mtact at the clamped end of the strap so that therewas no longer the possibility of a shearing action' on the centralcord. .
To c<;,mpare the three methods of loading, two fatigue strapsemploying each of the methods were mounted on the machine.The same cord sa;mple, a dipped rayon cord, was employed in allthe straps. Flexmg was for 10 hours with a 5-pound load on allstraps, the speed of operation being 290 cycles per minute.
The specific adhesive forces, based on ten H specimens each,were found to be as follows:
Load supportedOn central cord only <original method) 18.1By metal clamps 19.7By all five cords 19.2
Within this experiment there is, between the various methodsof loading, no significant difference in the influence on dvnamicadhesion. Accordingly, it was concluded that measurementsobtained by the original method of loading are equivalent to results obtained when all five cords are loaded with the same weight.
Influence of Flexing Period on Adhesion. A test was undertaken with a view to obtaining some indication of the optimumflexing time on the Roller-Flex machine. In the initial experiments with the machine, :3- and 5-hoUl' flexing periods were employed. These periods generally produced declines in adhesionbelow that of the unflexed control, and they were sufficientlyshort to provide a quick, efficient test. However, there wereindications that even the 5-hour period was merely depressing theadhesion of all samples alike, and was not sufficiently long tointroduce the differential deterioration which would be effectivein determining the relative merits (with respect to adhesion) of acord or dip in a tire.
It is obvious that a dynamic-fatigue method which preservesthe rank of a set of samples in a static adhesion test (even whenthe samples are considered to have a different rank for performance in tires) offers no advantage over the much simpler statictest. It. was thought desirable therefore to determine whethersubstantially different fatigue rankings among samples could bebrought out by longer flexing periods. It was expected that, thedata would provide an objective basis for selecting the optimum flexing period.
Rayon cords of 2200/2 construction, treated with four different dips, were obtained for the test. Preparation of the teststraps and the testing procedure, except for the variations in
A practical, reasonably quick method for evaluatingthe .resistance of the adhesive bond between tire cordand rubber stock to flexural (dynalllic) fatigue hasbeen developed. The rnet.hod employs the RollerFlex lllachine, on which thc test cords, cured inrubber and under tension, are subjected to rapid,cyclic Hexure by being passed back and forth aroundsITlall steel rollers. The resistance of the adhesivebond to d yrrarrrle fatigue is evaluated by a rneastn-ement of the cord adhesion by the familiar H pull-outtest, after the sarnple has been flexed on the rnuehrncfor a IO-hour period. There is a continual declinein cord adhesion as the Hexing period is prolonged.Ten hours were selected as the flexing period in thestandard test. A difference of 6 pounds per inchbetween salnpIes was found necessary for significanceat the 5% level. Dyrrarrric adhesion rrreasrrrernontsby thiS'lllethod have been found to correlate reasonably well with adhesion performance in road tiretests.
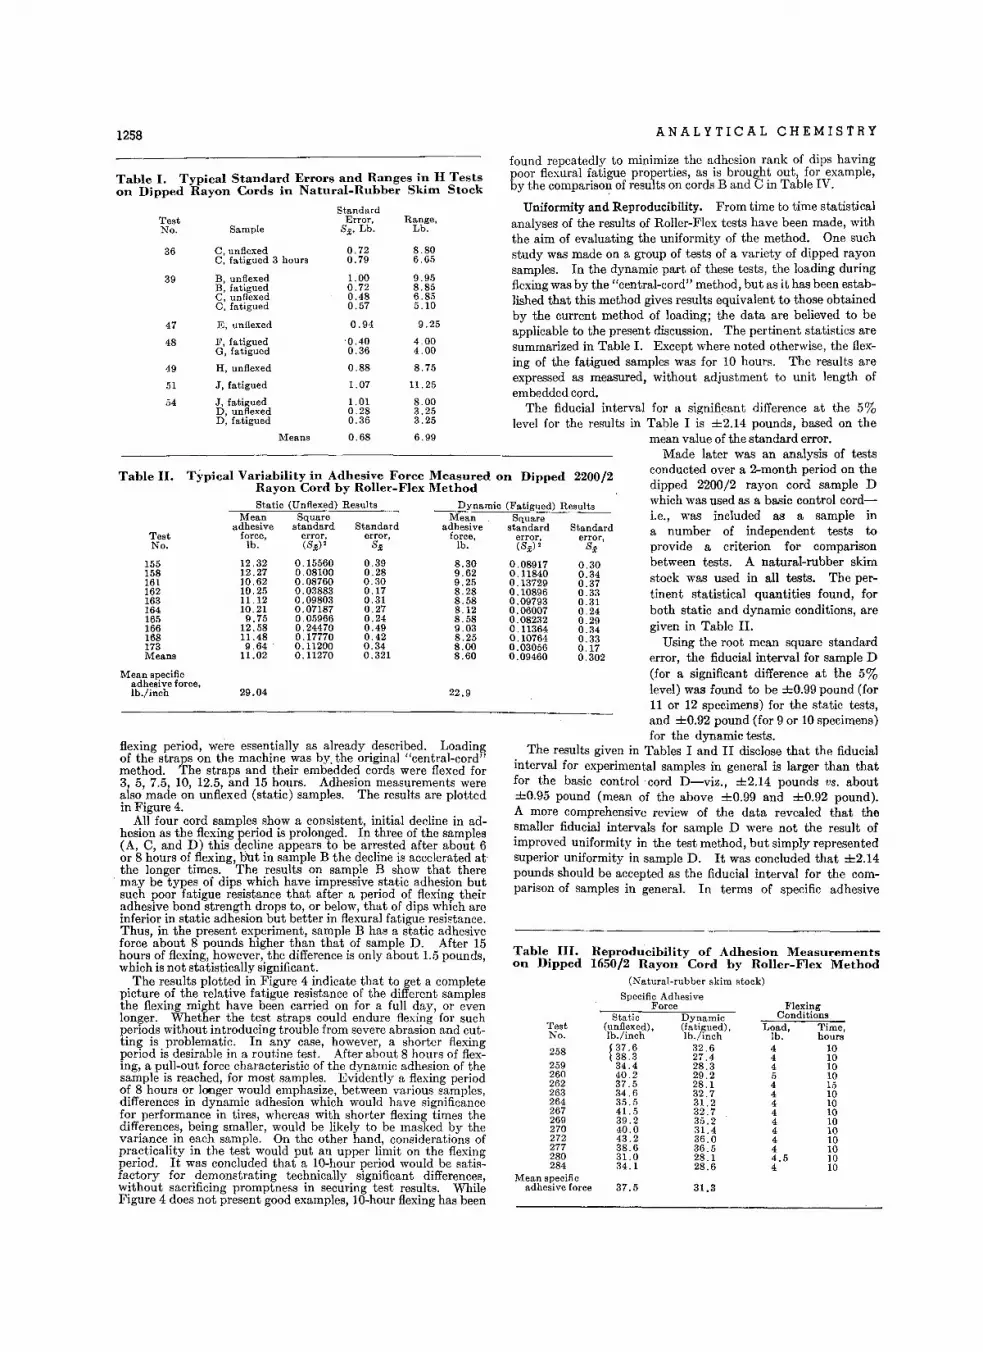
1258 ANALYTICAL CHEMISTRY
Table II. Typical Variability in Adhesive Force Measured on Dipped 2200/2Rayon Cord by Roller-Flex Method .
Time,hours
1010101015101010101010101010
FlexingConditions
Load,lb.4445444444444.54
31.3
Dynamic(fatigued) ,lb./inch
32.627.428.329.228.132.731.232.735.231.436.036.528.128.6
37.5
Static(unflexed) ,lb./inch
{37.638.334.440.237.534.635.S41. S39.240.043.238.631.034.1
Reproducibility of Adhesion Measurem.ents1650/2 Rayon Cord by Roller-Flex Method
(Natural-rubber skim stock)
Specific AdhesiveForce
0.300.340.370.330.310.240.290.340.330.170.302
Standarderror,
Sx
TestNo.
258259260262263264267269270272277280284
Mean specificadhesive force
Table III.on Dipped
found repeatedly to minimize the adhesion rank of dips havingpoor flexural fatigue properties, as is brought out, for example,by the comparison of results on cords Band C in Table IV.
Uniformity and Reproducibility. From time to time statisticalanalyses of the results of Roller-Flex tests have been made, withthe aim of evaluating the uniformity of the method. One suchstudy was made on a group of tests of a variety of dipped rayonsamples. In the dynamic part of these tests, the loading duringflexing was by the "central-cord" method, but as it has been established that this method gives results equivalent to those obtainedby the current method of loading; the data are believed to beapplicable to the present discussion. The pertinent statistics aresummarized in Table I. Except where noted otherwise, the flexing of the fatigued samples was for 10 hours. The results areexpressed as measured, without adjustment to unit length ofembedded cord.
The fiducial interval for a significant difference at the 5%level for the results in Table I is ±2.14 pounds, based on the
mean value of the standard error.Made later was an analysis of tests
conducted over a 2-month period on thedipped 2200/2 rayon cord sample Dwhich was used as a basic control cordi.e., was included as a sample ina number of independent tests toprovide a criterion for comparisonbetween tests. A natural-rubber skimstock was used in all tests. The pertinent statistical quantities found, forboth static and dynamic conditions, aregiven in Table II.
Using the root mean square standarderror, the fiducial interval for sample D(for a significant difference at the 5%level) was found to be ±0.99 pound (for11 or 12 specimens) for the static tests,and ±0.92 pound (for 9 or 10 specimens)for the dynamic tests.
The results given in Tables I and II disclose that the fiducialinterval for experimental samples in general is larger than thatfor the basic control cord D-viz., ±2.14 pounds VB. about±O.95 pound (mean of the above ±0.99 and ±0.92 pound).A more comprehensive review of the data revealed that thesmaller fiducial intervals for sample D were not the result ofimproved uniformity in the test method, but simply representedsuperior uniformity in sample D. It was concluded that ±2.14pounds should be accepted as the fiducial interval for the comparison of samples in general. In terms of specific adhesive
Squarestandard
error,(Sx)'
0.089170.118400.137290.108960.097930.060070.082320.113640.107640.030560.09460
Dynamic (Fatigued) Results
22.9
Mean .adhesive
force,lb.
8.309.629.258.288.588.128.589.038.258.008.60
StandardTest Error, Range,No. Sample Sx. Lb. Lb.
36 C t unfiexed 0.72 8.80C. fatigued 3 hours 0.79 6.65
39 B, unflexed 1.00 9.95B, fatigued 0.72 8.85C, unftexed 0.48 6.85C, fatigued 0.57 5.10
47 E, unflexed 0.94 9.25
48 F, fatigued '0.40 4.00G, fatigued 0.36 4.00
49 H. unflexed 0.88 8.75
51 J, fatigued 1.07 11.25
54 J, fatigued 1.01 8.00D, unflexed 0.28 3.25D, fatigued 0.36 3.25
Means 0.68 6.99
Static (Unflexed) ResultsMean Square
adhesive standard StandardTest force, error, error,No. lb. (Sx)' Sx
155 12.32 0.15560 0.39158 12.27 0.08100 0.28161 10.62 0.08760 0.30162 10.25 0.03883 0.17163 11.12 0.09803 0.31164 10.21 0.07187 0.27165 9.75 0.05966 0.24166 12.58 0.24470 0.49168 11.48 0.17770 0.42173 9.64 0.11200 0.34Means 11.02 0.11270 0.321
Mean specificadhesive force,lb./inch 29.04
Table I. Typical Standard Errors and Ranges in H Testson Dipped Rayon Cords in Natural-Rubber Skim. Stock
flexing period, were essentially as already described. Loadingof the straps on the machine was by. the original "central-cord"method. The straps and their embedded cords were flexed for3, 5, 7.5, 10, 12.5, and 15 hours. Adhesion measurements werealso made on unflexed (static) samples. The results are plottedin Figure 4.
All four cord samples show a consistent, initial decline in adhesion as the flexing period is prolonged. In three of the samples(A, C, and D) this decline appears to be arrested after about 6or 8 hours of flexing, but in sample B the decline is accelerated atthe longer times. The results on sample B show that there
. may be types of dips which have impressive static adhesion butsuch poor fatigue resistance that after a period of flexing theiradhesive bond strength drops to, or below, that of dips which areinferior in static adhesion but better in flexural fatigue resistance.Thus, in the present experiment, sample B has a static adhesiveforce about 8 pounds higher than that of sample D. After 15hours of flexing, however, the difference is only about 1.5 pounds,which is not statistically significant.
The results plotted in Figure 4 indicate that to get a completepicture of the relative fatigue resistance of the different samplesthe flexing might have been carried on for a full day, or evenlonger. Whether the test straps could endure flexing for suchperiods without introducing trouble from severe abrasion and cutting is problematic. In any case, however, a shorter flexingperiod is desirable in a routine test. After about 8 hours of flexing, a pull-out force characteristic of the dynamic adhesion of thesample is reached, for most samples. Evidently a flexing periodof 8 hours or longer would emphasize, between various samples,differences in dynamic adhesion which would have significancefor performance in tires, whereas with shorter flexing times thedifferences, being smaller, would be likely to be masked by thevariance in each sample. On the other hand, considerations ofpracticality in the test would put an upper limit on the flexingperiod. It was concluded that a lO-hour period would be satisfactory for demonstrating technically significant differences,without sacrificing promptness in securing test results. WhileFigure 4 does not present good examples, lO-hour flexing has been

VOL U M E 23, NO.9, S E PTE M B E R 1 95 1 1259
LITERATURE CITED
ACKNOWLEDGMENT
RECEIVED March 2, 1951. Presented before the Division of Rubber Chemistry, AMERICAN CHEMICAL SOCIETY, March 2,1951, Washington, D. C.
The interest and cooperation of the Firestone Research Management in promoting the publication of the present paper aregladly acknowledged. Credit is due Richard B. Esler, upon whosecareful and alert workmanship in the preparation of specimensand maintenance of equipment the results cited herein havedepended to considerable extent. Itwas largely through the enterprise of T. M. Kersker that cord fabric samples and road testdata, for the correlation study, were obtained.
(1) Gardner and Williams, Trans. Inst. Rubber Ind., 24, 284 (1949).(2) Gibbons, W. A., IND. ENG. CHEM., ANAL. ED., 2, 99 (1930).(3) Lee, W., U. S. Dept. Commerce, Office of Publication Board,
PB-27521 (1946).(4) Lessig, E. T., IND. ENG. CHEM., ANAL. ED., 9, 582 (1937).(5) Lyons, Nelson, and Conrad, U. S. Dept. Agr., Research Rept,
AIC-99 (October 1945); India Rubber World, 114,213 (1946).(6) Pittman and Thornley, Trans. Inst. Rubber Ind., 25, 116 (1949);
Rubber Chem. & Technol, 23, 921 (1950).(7) Watson, Blinkhorn, Hardman, and Webb, U. S. Dept. Com
merce, Office of Publication Board, PB-34046, 7, 18 (1945).
Flex method is its correlation with the performance (with respectto adhesion) of dips in tire service. Furthermore, an adequatecorrelation requires a rather wide range of values of the variableswhich are to be correlated. Not many road-service test data onthe adhesion performance of dips in tires, having low as weIl ashigh endurances (miles to failure) under comparable conditions,are available.
One of the best sets of test fleet results for correlation purposesis given in Table IV, along with RoIler-Flex test results. Thesame style of fabric and cord construction (2200/2 rayon) wereused in all experimental tires. The only feature that differedamong the cord samples was the dip. The tire tests were run ina way that was believed to accelerate adhesion failure, the evidence for which was taken to be "flex breaks." The same dataare plotted in Figure 5.
The results given in Table IV and Figure 5 indicate that thereis a correlation between residual adhesion after lO-hour flexingand endurance in test fleet service. While 5-hour flexing is notpart of the regular procedure, the same fabric samples werefatigued for this period also. In this particular experiment, evenbetter correlation with fleet-test results was found than for thelO-hour flexing, though in general 5-hour flexing was found to beinadequate.
Quantitatively, the comparison of the results in Table IV onsample B (having a stiff dip) with those on sample C confirms theindications of Figure 4-namely, that while cord B initiaIly hasadhesion superior to that of cord C, the former suffers a substantial loss during flexing, while the adhesion of the softer dipon sample C is weIl sustained.
30
Worn to fabric
Flex break
Typeof
failureWorn to fabric
Flex breakFlex breakWorn to fabricFlex breakFlex breakFlex breakBody breakFlex break
Mileageat failure
or removal,miles
-25,90126,49226,49226,73524,50024,50025,00025,23718,54020,29627,49523,64924,46926,39727,09011 ,40014,596·20,40322;060
14.8
13.7
13.9
11.3
19.9
19.7
16.0
16.8
Mean Adhesive ForceStatic Dynamic
(unllexed), (fatigued),lb. lb.
19.8 14.4
0= MEAN MILEAGE FORPARTICULAR TIRESPECIFICATION
CORD B
~ TIRE WORN TO FAB~C-O~-~--O---~-.:~~2;0REMOVED WITH NO FAILURE CORD C
B
K
C
L
II,LI------,-!-'~-----=':,.-------:!-:--------='
15 20 25ROAD TIRE TEST ENDURANCE~OSMILES)
Figure 5. Correlation of H-Test Adhesion After 10Hour Fatiguing with Endurance in Road Tests of Tires
15....------,-------,-----.,.--,----,
'fif"llJ2-w~141-----i------=---+::::....::....----;>;---)'+------::---l
12w>Ui~131-----i------+--/'----+--,-----lo«z-cw::!:121------+-----/--t------1---'-----f
CordSample
M
force the fiducial interval (5% level) is ±6 pounds per inch,given approximately by the quotient ±2.14 pounds + 3/8inch.
More recently a dipped 1650/2 rayon cord has been adoptedas a basic control cord. The results of a number of static anddynamic tests on this sample are assembled in Table III to demonstrate the reproducibility attainable with this sample.
CORRELATION WITH TIRE TESTS
The ultimate criterion of the value of such a test as the RoIler-
Table IV. Correlation of Static and Dyrrarnic Adhesion(lO-Hour Flexing) with Road Test Endurance
Road-Service Tire Tests
Determination of Zirconium-Hafnium Ratios withp-Bromomandelic Acid
RICHARD B. HAHN
Analytical Chemistry Division, Oak Ridge National Laboratory, Oak Ridge, Tenn.
Neutron Activation (9).Optical rotation of
complex tartrates (1).
BE CAUSE the chemical properties of zirconium and hafniumare so nearly identical, no analytical method is available
by which hafnium can be quantitatively separated from zirconium. Hence, to determine hafnium, one must always analyzea zirconium-hafnium mixture. The foIlowing methods (8) havebeen used for the determination of hafnium:
Physical Methods. Determination of the density of themixed oxides.
Determination of the density of (NH.)2ZrF6precipitate.
Optical spectroscopy (4).X-ray spectroscopy.X-ray fluorescence (2).
Indirect Chemical Methods. Determination of the ammoniacontent of (NH.)2ZrF6 + (NH.)2HfF6 precipitates.
Analysis of mixed bromides or chlorides.Conversion of mixed selenite precipitates to the oxide (3, 7).

1260
p-Bromornaudeltc acid can be used to determinethe hafnium content in mixtures of pure zirconiumand hafnium compounds. Under properly controlled conditions a precipitate of the ~etra-p
brOlllomandelates corresponding to the theoreticalcomposition, Zr(CSH60"Br), and Hf(CsH,03Br)" canbe obtained. The precipitate is dried at 120° to130° C., weighed, ignited to the oxide, and weighedagain. From these data the hafnium content of
The application of chemical methods is limited by the fact thatonly a few compounds of zirconium and hafnium can be prepared which have a definite, constant composition. Theselenite method, which is the best and most widely used of thechemical methods, was developed by Claassen (3) and latermodified by Schumb and Pittman (7). Its main disadvantage isthe""length of time required to complete an analysis (a digestionperiod of 12 to 15 hours is necessary and the precipitate mustbe dried 10 to 12 hours).t Recently Oesper and Klingenberg (6) showed that p-bromomandelic acid was a specific reagent for precipitating zirconiumand that it was possible to weigh directly the dried zirconiumtetra-p-bromomandelate precipitate. This reagent was therefore investigated for use in determining zirconium-hafnium ratios,I Initial experiments showed that hafnium is also precipitatedquantitatively by this reagent. It was found that precipitatesof definite constant composition could be obtained if the following factors were carefully controJled:
Acidity of solutionTemperature and rate of precipitation ..Size of sample and amount of p-bromomandehc acid addedTemperature and length of digestionMethod of washing and drying precipitate
I'RIo;PARATION AND STANDARDIZATION 010' Zl.RCONIUM ANDHAFNIUM SOLUTIONS
Samples of p~re zirconium oxide and hafnium ox!de were o.btained. The oxides were converted to the oxychlorides and dISsolved in 1 N hydrochloric: acid.
These solutions were standardized by precipitation with cupferron mandelic acid, and p-bromomandelic acid. The resultingprecipitates were ignited to the oxide and weighed. Analyses bythe three methods agreed to ±0.2 mg. .
The standard solutions were also analyzed spectrographically(4). The zirconium solution s!lOwed no. detectable a~oun~ ofhafnium. The hafnium solution contamed 4.10% zircoruumoxide.
Test solutions were prepared by mixing various aliquots of theabove standard solutions. After many experiments, the following procedure was developed.
PROCEnURE
Place the dissolved sample, which contains 50 to 100 mg. of thecombined oxides in a 150-m!. beaker, and add 15 m!. of concentrated (12 N) hydrochloric acid. Dilute to about 40 !I!-!. withdistiJJed water, then add 2 m!. of concentrated sulfuric acid.Heat the solution on a hot plate until the temperature reaches85° to 95° C. From a buret add 20 m!. of 0.1 N p-bromomandelicacid dropwise, stirring con~tantly. . Digest. f?r aPl?r?~imately10 minutes at 85° to 95 0 C. with occasional stirring to initiate precipitation. Add 30 m!. more of the p-bromomandelic acid reagent dropwise with stirring. After the addition is complete,digest at 85° to 95° C. for 15 to 20 minutes with occasionalstirring.
Remove the beaker from the hot plate and let it stand .for 15to 20 minutes with occasional stirring. Wash down the SIdes ofthe beaker with 10 to 15 ml, of 95% ethyl alcohol, (This causesthe floating precipitate to become wetted and to settle.) AJJowthe mixture to stand for 30 to 40 minutes.
CarefuJly decant the supernate and transfer the precipitate to
ANALYTICAL CHEMISTRY
the mixture can be computed. Data are presentedshowing an accuracy of about ±0.5% (absolute) forsamples containing more than 10% hafnia, whichcompares favorably with 'results obtained by theselenite method. In samples containing less hafnia,however, the selenite method gives more reliableresults. A determination can be made in 5 to 6hours by the p-bromomandelic acid method as compared with 25 to 30 hours by the selenite method.
a 50-m!. round-bottomed centrifuge tube, using about 25 ml.of 1 N hydrochloric acid (at room temperature) to complete thetransfer. Stir up the precipitate and wash solution in the centrifuge tube, add 1 to 2 ml. of 95% ethyl alcohol to wet the floatingprecipitate, centrifuge, and decant the supernate.
Add 25 ml. of 1 N hydrochloric acid (room temperature) stirvigorously for 1 minute, add 1 to 2 ml. of 95% ethyl alcohol, andcentrifuge again. Finally, add 25 ml. of 1 N hydrochloric acid,stir, and filter by suction, using a smaJJ Hirsch funnel fitted witha disk of No. 40 filter paper. Wash the precipitate in the funnelwith two 20-m!. portions of 95% ethyl alcohol (or acetone) andthen with two 20-m!. portions of anhydrous ethyl ether.
Transfer the precipitate to a tared platinum crucible, removethe disk of filter paper, dry to constant weight at 120 0 to 130 0 C.(about 1 hour), and weigh. Ignite the precipitate slowly at alow temperature and finally ignite to the oxide at 900 0 to 1000 0 C.(1 to 2 hours).
It is best to let the crucibles and contents stand for about 15minutes in the balance case before making weighings. Weighingsshould be made carefully, as an error of 0.1 mg. in the final weightof the oxides may cause an error of 0.2 to 0.5% in the final result.
Table J. Determination of Hafnium in ZirconiumHafnium Mixtures
HfO"
Individual Results. % HiO,Average, Calcd.,
Sample % %95.9 9.5.9 95.4 95.6 95.9095.6 95.0 •
2 84.4 84.9 84.5 84.5 84.2084.0 84.5 84.5
3 75.6 76.0 75.6 75.0075.2 75.7
4 56.9 57.0 56.9 56.4857.2 56.6
.5 39.7 40.2 40.1 40.0039.8 40.7
6 20.8 21.4 21.4 21.3621.2 22.1
7 12.5 12.6 cl.6r 12.9 12.6 12.0212.0 13.0 14.2 12.7
8 2.02 4.10 3.88 3.22 3.72 3.10 3.2 2.352.31 3.61 2.56 2.97 3.16 3.15
a Not included in average.
Calculation of Results. In the calculations the theoreticalfactors ZrOdZr(CsH60aBr), = 0.1218 and HfOdHf(CsH603Br),= 0.1917 were used. From the simultaneous equations,
Weight of Hf02 + weight of Zr02 = weight of oxides (1)
WeightofHf02 + weight of Zr02 weight of0.1917 0.1218
p-bromomandelates (2)
the following expression can be derived:
weight of p-bromomandelates% Hf02 = 274.2 - 33.40 X weight of oxides
RESULTS
The procedure was tested by determining the hafnium oxide

V OL U M E 2 3, N O. 9, S E PTE M B E R 1 9 5 1
content of various mixtur es of zirconium and ha fnium chloridesolutions. The results are given in Tab le 1.
CO M PAR ISON WITH OTHER METH OD S
Id enti cal samples were analyzed for hafn ia content spectrographically, by the selenite method , and by the p-bromomandelic acid meth od. The results given in Table II are averages ofat least two samples.
T able II. Co m par ison of Met hodsPer Cen t Hafniu m Oxide
p- Bromo-Calc ula te d Spectroscopic Selenite ma ndela te
95 .90 95 .9 95.4 95 .675.00 74 .1 75 .3 75 .640 .00 38 . 2 40 .7 40 .121.36 20 .7 22 .3 21.4
2 .35 2. 3.; 2 .2 3 .2
Av . deviation, % 0 . 68 0 . 56 0 .36
DISC US SION
If till' above procedu re is followed carefully, a pr eCISIOn andaccuracy within ± O.5% absolute can be expected in samplesr-ontaining more than 10% of hafnium oxide. In th e lower hafnium range th e precision and accuracy fall off. Th e method hasa tendency to give slight ly high results for hafnium, probablybecause of a very slight hyd rolysis of th e tetrabromoman dolateprecipitate.
Precipitates of theo reti cal composition ar e obtained only inhot solutions strongly acid with hydrochloric acid (about 2 N) andin the presence of a two- to threefold excess of p-b romomand elicacid. The presence of a certain amo unt of free sulfuric acid aidsin obtaining pr ecipitates of consta nt composition (5) .
1261
Determinations made in th e presence of alumi nu m, ferri c, andtitanium IV ions gave erra tic resu lts; hence, for best results determin ations should be mad e using a pure solution of zireony land hafnyl chlorides. A preliminary recrys ta lliza tion of th eoxychlorides from strong hydrochloric ac id (8 to 10 M ) willeliminate these interfering ions.
In spite of these shortcomings, the resu lts compare favora blvwith those by the selenite method, and require only one fourththe tim e, and the tox ic hazard s of selenium arc eliminated .
Experiments using mandelic acid and other glycolic acidderiva tives as reagents to determine zircon ium- hafn ium ratio!'are now in progress.
ACKNOWLEDG M ENT
The author wishes to thank Cy rus Feldman, Oak Ridge NationalLabora tory, for the spectrographic analyses, ,1. J . Kl ingenberg ,Xavier University , for his procedure of th e synt hesis of p-bromo·mandelic acid, and Boyd Weav er, Oak Ridge National Labora tory ,for supplying the pur e zirconium and hafnium compo unds usedin this study,
LITERATURE C IT E U
(1) Awn A. H . W. , Ned erland , TYdsch. Nu iuurkunde, 10, 257 (1943 ).(2) Birks, L, S., and Brooks, E. J ., AN.n. CHEM" 22, 1017 (1950).(3) Claassen, A. A., Z . anal . Chem ., 117, 252 (1939 ).(4 ) Feldman , C., ANAL. CHEM., 21 , 1211 (1949).(5) Gump, J . R., and Sherwood, G. R., I bid., 22 , 496 (1950 ).(6) Oesper, R. E., and Klingenberg, J . J ., I bid ., 21 , 1509 (1949 ).(7) Sehumb, W. C., and Pittman, F. K. , I bid ., 14, 512 (1942) .(8) Von Hevesy, Georg, "Chemical Analysis by X-Ray and Its Ap
plications," New York, McGraw-Hili Rook Co., 1932.(9) Wernimont, G., and De Vries, T ., J . Am. Chern. So c., 57, 2386
( 1935 ).
R ECEIVED May 16, 1951. Presented be fore t he D ivision of Analy ticalChemistry at tbe 119 th M eeting of t he AMERICAN C HEMICAL SOCIETY,Boston , Mass. Author is on loa n from " rayne U nive rai t y .
Determination of Beryllium by PhotodisintegrationA. M . GAU DIN AND J AM ES II . P ANNELL'
M ineral En gin eering Laboratory, Massachu se tts In stitute of Technology , Ca m bridge. Mass.
Analysi s of b eryllium. in low grade beryl ores ando re treatment products was found to b e difficultand tedious b y ordinary c hem ical or s pe c t rog ra p h ictechniques . The unique nuclear properties of Be 9
s u ggested exploitation of t h e 'Y,n r eaction and thiswas done by u sing oo nven tiorral electronic equipm.ent and a. portable , '- r a y so u r ce . Good r esuttswer e obt~ined in the arraly sf s of m.any sa m.p1es runh)' nonprofessional workers . Interference by elements with very high a bsor p t ion cross se c t ionsw a s studied a n d this effe c t of boron m easured. TheInelhod is rapid, sj m pl e , and nondestructive.
A P RE LI MI NAR Y invest igation into the determination ofberyllium by the 'Y ,n reaction has indicated the sensitivity
a nd genera] application of th e method. As it can be applieddirectly to practically any bery llium-containing material , without destruction of the sample, it gives promise of supplantingconventional chemical methods und er certain conditions.
A gamma source of at least 1.63 m.e.v . energy and about 1curie intensity is needed to irradiate the sample ; Sb 124 is suitableJor this purpose. Interaction of th e photons with Be9 libera tes
1 Prese nt address, A merican Cyanamid Co., Idah o Falls, Idaho.
neutrons which are moderated and th en counted in boron trifluoride-filled detectors. Wit h reproducible sample geometry,the neu tron counting rate is a measure of th e bery llium content,unless sufficient boron or cadmium be pr esent to cause interference by absorption. For utmost sensitivit y, large samples amused and in this way 1 to 2 p.p .m, of beryllium can be detected.
Beryllium is one of the less easily det ermined elements, generally becaus e of the difficulty attending its complete separationfrom interfering metals, especially if these are present in relativelylarge concent ra tions. Thus, th e colorimet ric methods (8) oft enrequire repetitious precipitat ions for the removal of iron andmanganese, and th e gravimetric met hod can be ted ious in thepresence of aluminum. Spectrographic met hods hav e pro vedsuccessful in certa in applications (1, 2). Th e unique prop ertiesof the bery llium nu cleus have suggested determination of th emetal by photodisintegration. Th e same nuclear reaction hasbeen proposed for sort ing bery l on th e industria l scale (3 ). As aphy sical method, the one described here has the advantage thatdissolution of the sample is unn ecessary : moreover , the samplingerrol', encountered in spect rography, is also minimiz ed.
T he pho tod isintegration or 'Y,n reaction consists of th e absorption by a nucleus of a high energy ph oton followed by th e releaseof a neutron ; the threshold energy for the reaction is the bindingenergy of the neutron. Fo r most elements the nu clear binding
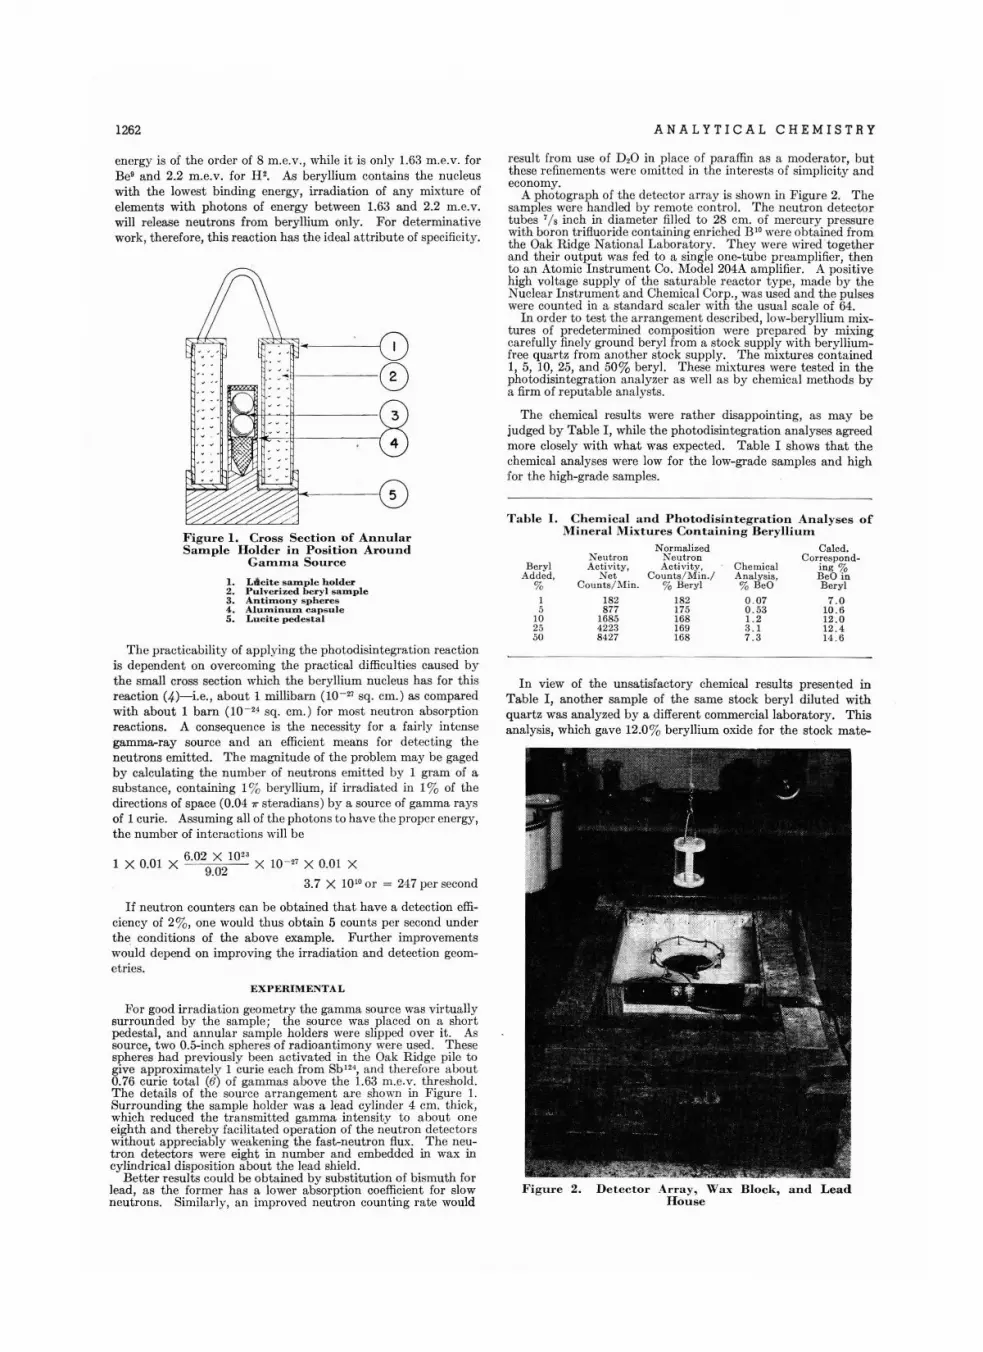
1262 ANAL YT ICAL CHE MISTRY
F ig urc 2. Detcc tor Array, Wax Block, and L ea dH ouse
182877
168 542238427
Ne ut ronActi vity,
NetCou nts / lIli n .
I. C hemical and P h o t odis in t e g r a t io n Arralyses of.M in c r a l Mixt ures Containing Beryllium
N or maliz ed Ca lcd .N eutron Correspond-Acti vity. Che mica l ing %
Cou nts/ M in'; An alysis . BeO in% Ber yl % BeO Beryl
182 0 . 07 7 . 0175 0 . 53 10 .6168 1. 2 12.0169 3 . 1 12 . 4168 7 . 3 14 . 6
Ber ylAdded.
%I5
102550
result from use of D20 in place of para ffin as a moderator, butthese refinements were omitt ed in the interests of simplicity andeconomy.
A photograph of the detector array is shown in Figure 2. Thesamples were handled by remote control. The neutron detectortubes 7/8inch in diameter filled to 28 em. of mercur y pr essur ewith boron tr ifluor ide containing enr iched B'owere obta ined fromth e Oak Ridge National Labora tory. They were wired 'to getherand th eir out put was fed to a single one-tube prea mpli fier, th ento an Atomi c Instrument Co. Mod el 204A a mplifier. A positivehigh voltage supply of th e satur ab le reacto r type, made by theNuclear In strument and Chemical Corp., was used and the pulseswere count ed in a sta nda rd scaler with the usua l scale of 64.
In ord er t<> test t he arrangement descr ibed, low-berylliu m mixtures of pr edeterm ined composition were pr epared by mixingcare fully finely ground beryl from a stock supply with berylliumfree quartz from another stock supply. The mixtures conta ined1, 5, 10, 25, and 50% beryl. These mixtures were tested in th ephotodisintegra tion analyzer as well as by chemical methods bya firm of repu table ana lysts .
The chemical results were rath er disappointing, as may bejudged by Table I, while th e photodisintegra tion analyses agreedmore closely with what was expected. T ab le I shows that th echemical analyses were low for th e low-grade samples and highfor the high- grad e samples.
Tablc
In view of the unsatisfactory chemical results pr esented inTable I, an oth er sample of th e same stock beryl diluted withquartz was analyzed by a different commercial labo ratory. Thisanalysis, which gave 12.0% beryllium oxide for the stock mate-
~-8
·-~1I--0
1 X 0.01 X 6 . 029~21023 X 10- 27 X 0.0 1 X
3.7 X 1010 or = 247 per second
If neutron counters can be obtained that have a detection efficiency of 2% , one would thus obtain 5 counts per second underthe conditions of the ab ove example. Furth er improvementswould depend on improving the irradi ation and detection geomet ries.
energy is of th e order of 8 m.e.v., while it is only 1.63 m.e.v. forBe9 and 2.2 m.e.v . for H2. As beryllium conta ins th e nu cleuswith th e lowest binding energy, irradi at ion of any mixture ofelements with photons of energy between 1.63 and 2.2 m.e.v ,will release neutrons from beryllium only. For determinativework , therefore, this reaction has the ideal attribute of specificity.
1. Ltlcite s a m p le holder2. P u dvee laed her)') s RDl p l e3 . Anti:rnony s p h e res4. Alurninuxn capsule5 . L u e i t e pedestal
EXPERIMENTAL
For good irradiation geometry the gamma sour ce was virtuallysurroun ded by the sample; the source was placed on a shortpedestal, and annular sample holders were slipped over it . Assource , two O.5-inch spheres of radioan timony were used. Thesespheres had previously been ac tivated in the Oak Rid ge pile togive approximately 1 cur ie each from Sb ' 24, and therefore about0.76 curie total (6) of gammas above the 1.63 m.e,v. threshold .The details of the source arrangement are shown in Figur e 1.Surrounding th e sample holder was a lead cylinder 4 cm. thick,which red uced th e t ra nsmit ted gamma intensity to about oneeighth and th ereby facilitated operation of th e neutr on detector swith out appreciably weakening th e fast-n eutron flux. The neutron detectors were eight in number and embedded in wax incylindrica l disposition abo ut the lead shield.
Better resul ts could be obt ained by substitution of bismuth forlead , as the former has a lower absorption coefficient for slowneutrons. Simi larl y, an improved neutron counting ra te would
F igu re 1. C ross Sect ion of Annu larSam p le Holder i n Position Arou n d
Gamlna Source
The practi cability of applying the photodisintegration reactionis dependent on overcoming th e pract ical difficul ties caused byth e small cross sect ion which the beryllium nu cleus has for thisreac tion (4)-Le., abou t 1 millibarn (10 - 27 sq. cm.) as comparedwith about 1 barn (10 - 24 sq. cm.) for most neut ron absorpt ionreactions. A consequence is th e necessity for a fairl y intensegamma-ray source and an efficient means for detectin g th eneutrons emitte d. The magnitude of the problem may be gagedby calcula ting th e number of neutrons emitted by 1 gram of asubstan ce, contain ing 1% beryllium, if irradiated in 1% of th edirection s of space (0.04 11"stera dians ) by a source of gamma raysof 1 curie. Assuming all of th e photons to have the proper energy,the number of interactions will be
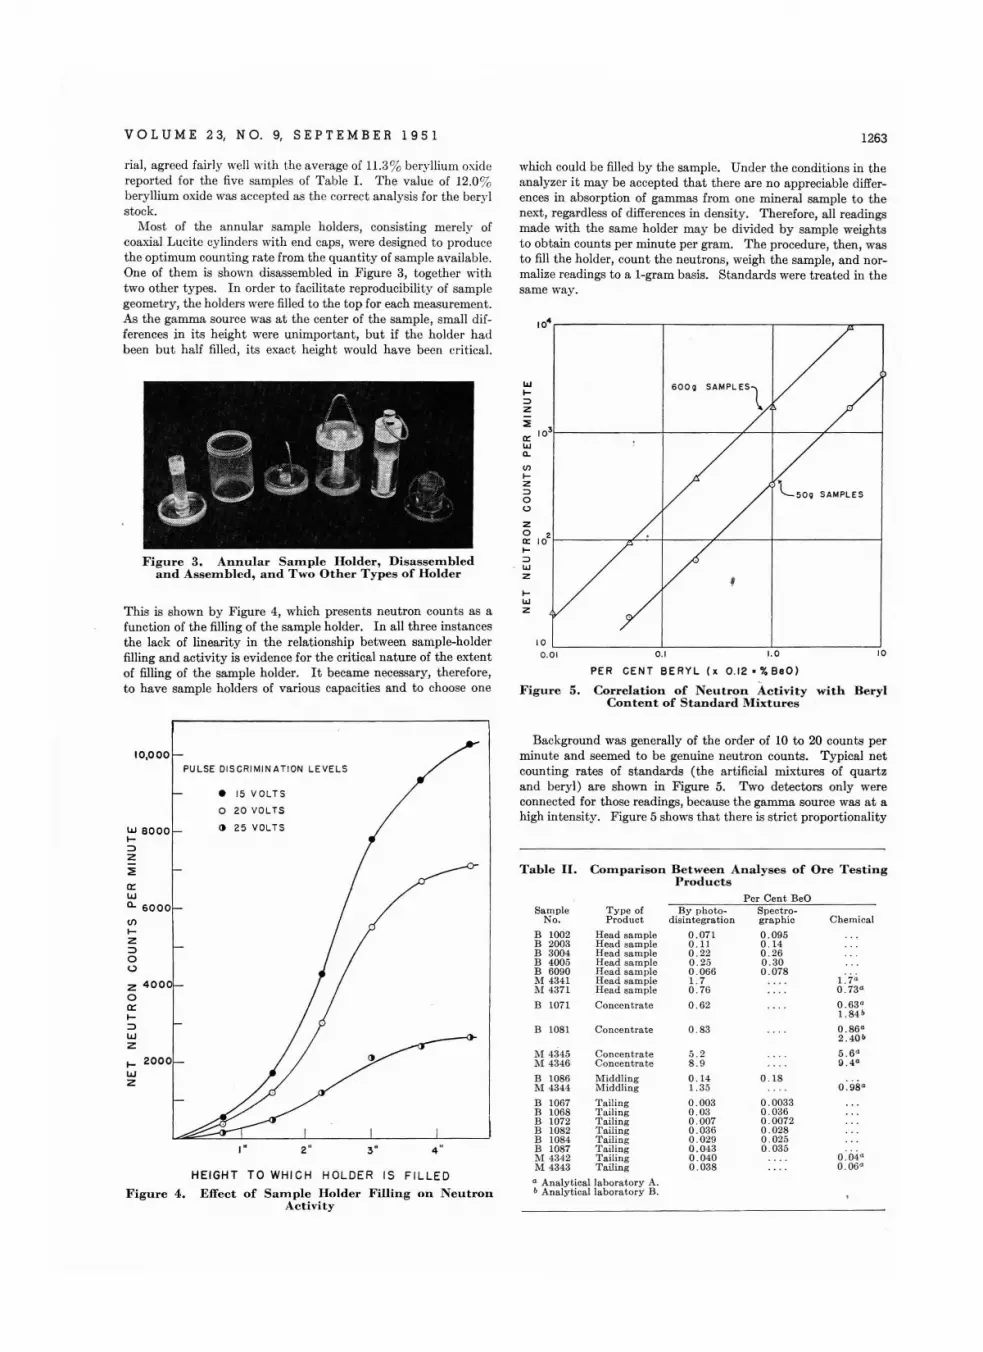
VOL U M E 23, N O. 9, S E PTE M B E R 1 95 1 1263
rial , agreed fairly well with th e average of 11.3% bery llium oxidereported for th e five samples of Table 1. The value of 12.0%beryllium oxide was accepted as the correct analysis for the berylstock.
Most of the annular sample holders, consisting merely ofcoaxial Lucite cylinders with end caps, were designed to prod ucethe optimum counting rate from th e quantity of sample availab le.One of th em is shown disassembled in Figure 3, togeth er withtwo oth er types. In order to facilitate reproducibility of samplegeometry, the holders were filled to the top for each measurement .As th e gamma source was at th e center of the sample, small differences in its height were unimportant , but if th e hold er hadbeen but half filled, it s exact height would have been critica l.
which could be filled by the sample. Under the conditions in theanalyzer it may be accept ed that th ere are no app reciable differences in absorption of gammas from one mineral samp le to thenext, regardl ess of differences in density. Therefore, all read ingsmad e with th e same holder may be divid ed by sampl e weightsto obtain counts per minute per gram. The procedure, then, wasto fill the holder, count th e neutr ons, weigh the sample, and normalize read ings to a I-gram basis. Standards were treated in th esame way.
104~ --,:-- --- - - ---r- ----."....--,
1.00 .1
PER CENT BE RYL (x 0 .12 ·% Be O)
Co r relat io n of Ne u t ro n Activity with Be r ylContent of S tan d a r d Mixture s
10 L - --------lL---- - - - ----,J.,,---- ---- - -:IO0 . 0 1
IWZ
Figure 5 .
UJl=>z::IE
a:UJ0-
(J)
IZ=>oozoa:l=>WZ
This is shown by Figure 4, which presents neutron counts as afunct ion of th e filling of the sample holder. In all th ree instancesthe lack of lineari ty in the relationship between sample-holderfilling and activity is evidence for the critical nature of the extentof filling of the sample holder. It became necessary, th erefore,to have sample holders of various capacit ies and to choose one
Figure 3 . An n u lar S a m ple Holder, Dis a ssembledand Assem b led , a n d T wo Other T ypes of Holder
PULSE DISCRIMINATION L EV ELS
HEIGHT T O WHI CH HOLDER I S F ILLED
Effect of Sa m ple Holder Filling on Ne u t ro nAct iv ity
0 .98"
0 .04"0 . 06"
1. 7"0 .73 "
0 .6 3"1.84 b
0 .86"2 .40 b
5 . 6"9.4"
C hemica l
P er Cent BeOSample Type of By photo- Sp ectre-
No. P rod uct disi nteg rati on gr aphic
B 1002 H ead sa m ple 0 .071 0 .095B 2003 Head sa mple 0 .11 0 .14B 3004 Head sa m ple 0 .2 2 0 . 26B 4005 Head sa m ple 0 .25 0. 30B 6090 Hea d sa mp le 0 . 066 0 .078M 434 1 Hea d sa mple 1.7M 437 1 Head sa mp le 0 .7 6
B 1071 Concentrate 0 . 62
B 1081 Conce nt rate 0 .83
l\l 4345 Concentra te 5 .2M 4346 Conc entra te 8 . 9
B 1086 Midd ling 0 .14 0 . 18M 43 44 M id dl ing 1. 35
B 1067 T ailin g 0 .003 0 .0033B 1068 T ai lin g 0 . 03 0 .036B 1072 Tailing 0 .007 0 .0072B 1082 T ailing 0 . 036 0 . 028B 1084 T a iling 0 .029 0 . 02 5B 1087 T ail ing 0 .043 0 .035l\l 4342 T a iling 0 . 04 01\14343 T ail ing 0 .038
c An alytica l la bor a tor y A.b An aly t ica l laboratory B .
Background was generally of the order of 10 to 20 counts perminute and seemed to be genuine neutron counts . Typical netcounting rates of standards (the artific ial mixtures of quartzand beryl) are shown in Figu re 5. Two detectors only wereconnected for those readings, because the gamma source was at ahigh inten sit y. Figure 5 shows th at there is strict proportionality
T able II. Com par is on Bctween A n alyses of Ore T estingProducts
2 ",.
• 15 VOLTS
o 2 0 VOL TS
() 2 5 VOLT S
Figure 4 .
w 8000l-=>z:::Ea:wa.. 6000(f)
I-Z=>oQ
Z 400oa:l-=>WZ
I- 2000wz
10,0 0 0
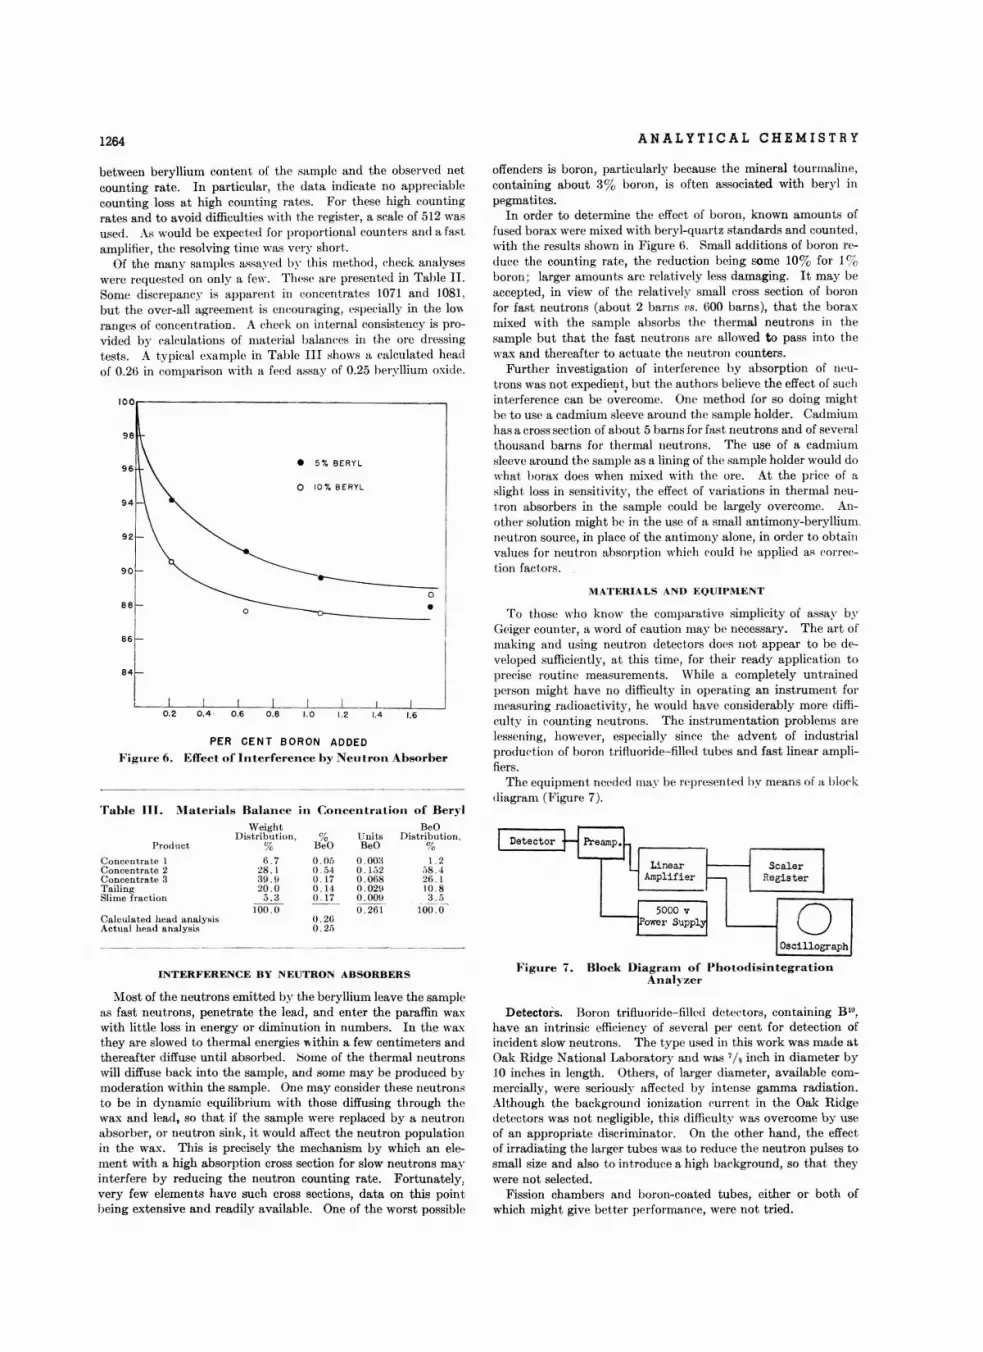
1264 ANALYTICAL CHEMISTRY
B6
oScaler
Reei s t er
offenders is boro n, particularl y becau se the mineral tourmaline,containing about 3% boron , is oft en associated with beryl inpegmatites.
In order to det ermine the effect of boron, kno wn amounts offused borax were mixed with bery l-qua rtz sta ndards and counted .with th e resul ts shown in Figure n. Sma ll additions of boron reduc e th e counting rate, th e reduct ion being some 10% for 1%boron ; larger amounts a re relatively less damaging. It. may beaccepted, in view of the relatively small cross sec t ion of boronfor fast neu trons (about 2 barns VB. 600 barns ), that the boraxmixed with the sample ab sorbs th o thermal neutrons in thesample but that th e fast neutrons a re a llowed to pa ss into thewax and th ereafter to actua te th e neu tron counte rs.
Further investigation of interference by absorption of 11l'U
t rons was not expedien t , bu t the autho rs believe the effect of suchinterference can be overcome. One met hod for so doing mightbe to use a cadmium sleeve aro und the sample holder. Cadmiumhas a cross section of abo ut 5 ba rns for fast neutrons and of severa lthousand barns for thermal neutrons. The use of a cadmiumsleeve around the sample as a lining of th e sample hold er woul d dowhat borax does when mixed with the ore. At the price of aslight. loss in sensit ivity, th e effect of variat ions in thermal neut ron absorbers in t he sample could be lar gely overcome. Anot her solut ion migh t be in the use of It small an t imony-bery llium.neu tron source, in place of th e antimon y alone, in order to ob tainvalu es for neu tron absorpt ion which could he applied as correct ion factors.
.\lATEtUALS ANn EQUt\'i\lENT
To th ose who kn ow th e compara ti ve simplicity of assay bvGeiger counte r, a word of caut ion may be necessar y. The ar t ofmaking and using neu tron detect ors do l'S not appear to be dl'veloped sufficien tly, at this time, for their read y application toprecise rou tin e measurements. While a complete ly unt rainedperson might have no difficul ty in operating an instrument formeasuring rad ioactivity , he would hav e conside rably more difficulty in counti ng neutrons. The inst ru mentation problems a relessening, however, especially since th e advent of industr ialproduction of boron tritluorid e-fi lled tubes and fast linea r amplifiers.
The equipment needed mav be rep resen ted by mean s of a blockdiagram (F igure 7).
BeODistrib ut ion ,
%1. 2
:,8 .~
26.110. 83 .;)
i oU':'o'
UnitsBeO
O.OO:l0 . 1520 . 0680 .02\10.00110 .2 61
0 .260. 2,;
Concentrat io n o f Beryl
%ileO0 . 0,;O. 'H0 . 17O . I ~
0 .1 7
l\Iaterials Il alancc ill
WeightDietribut.ion ,
%6 . 7
28. 139 .!120 .0
5 .aJOO.O
Prod uc t.
Ca lc ula te d head a nalyeisActua l hend a na ly sis
Co ncentrate 1Co nce nt ra te 2Co nce nt ra t e 3T a ilingSlime fr ac t ion
Tahle 111.
B4
between beryllium conte nt. of th e sample and th e observ ed netcount ing rate. In particular, th e da ta indi cate no appreciablecounting loss at high counting rates. For these high countingrates and t o avoid difficul ties with the registe r, a sca le of 512 wasused . As would be expect ed for proporti onal counte rs and a Iast.amplifier, th e resolving time was very shor t .
Of th e man y sa mples assaved by this method , check an a lyseswere request ed on only a few. Thr- s« a re present ed in T abl e II.Some discrepancy is appa rent in concentra tes 1071 and 1081.but the over-a ll agreement is encouraging, l'speeially in the 10\\
ran ges of concentra tion. A check on interna l consistency is provided by calcula tions of ma ter ial ba lances in th e ore d ressingtest s. A ty pical exa mple in Table III shows a culculatod headof 0.2ti in comparison with a fel,d assay of 0.25 bery llium oxide.
----oBB •
PER CENT BORON ADDED
Figlll 'c 6 . E ITee l of Ill t.e rfe r e n e e h y N e ll t ro n Absor-ber
9B
100,.--------------- - ------,
t NTERFI-:RENCE B Y N EU T R ON ABSORBERS
Most of the neutrons emit ted by the beryllium leave th e sampleas fast neutron s, pen etrate the lead , and ente r th e paraffin waxwith lit tle loss in energy or diminution in numbers. In the waxthey are slowed to thermal energies within a few centimeters andthereafte r diffuse un til abso rbed . Some of the thermal neutronswill diffuse back in to th e sample, and some may be produced bymoderation within the sample. One may conside r th ese neutronsto be in dyn amic equilib rium with those diffusing through th ewax and lead, so th at if th e sample were replaced by a neutronabsorber, or neu tron sink, it would affect the neutron pop ulationin the wax . This is precisely the mechanism by which an elemen t with a high ab sorption cross sect ion for slow neu trons mayinterfere by reducing the neutron counting rate. Fortunately ,very few elements have such cross sections, data on this poin tbeing extensive and read ily available. One of the worst possible
Oscillograph
F igure 7. Bloc k Dia gram of I' hotodis in t e g r a t io llAnalyze»
Detectors. Boron trifluor ide-fi lled dotect ors, con ta ining B'o,have an intrinsic efficiency of several per cen t for det ection ofincident slow neutrons . The type used in th is work was made atOak Ridge National Labora tory and was 7/~ inch in diamet er by10 inches in leng th . Others , of larger diameter, availabl e commercially , were seriously affected by in tense gamma radiation .Although th e ba ckground ionization eurren t in the Oak Ridgedet ectors was not negligib le, thi s difficul ty was overcome by useof an appropriate discriminator . On th e ot her hand, the effectof irradiating th e la rger tubes was to redu ce th e neutron pulses tosmall size and also to introdu ce a high background, so that theywere not selected .
Fission chambers and boron-coated tub es, either or both ofwhich might give better perfo rmance, were no t tried .
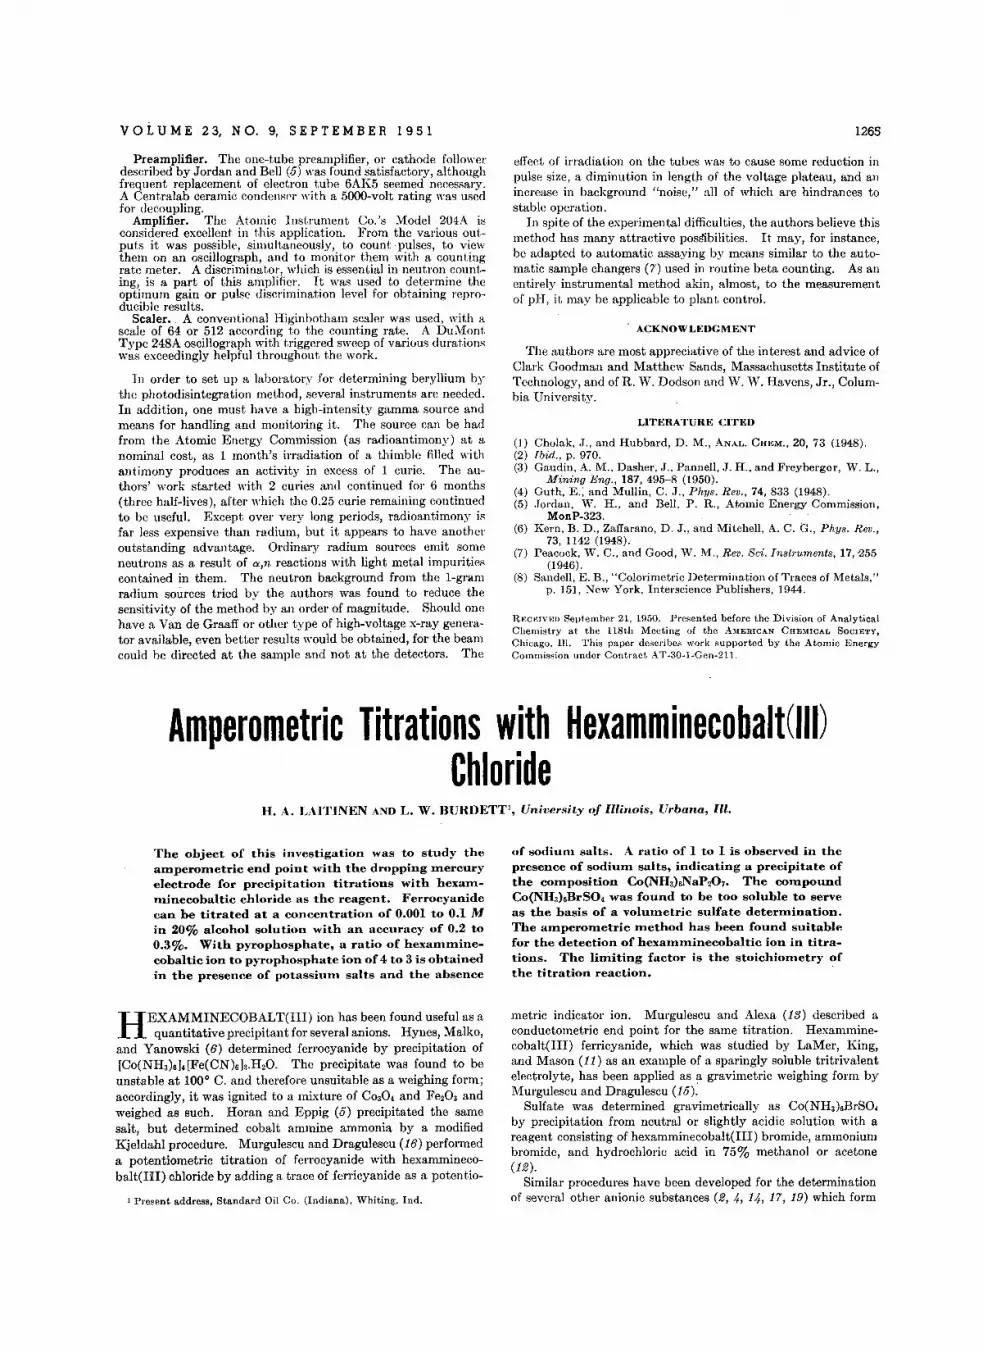
VOL U M E 23, N O. 9, S E PTE M B E R 195 1
Preamplifier. The one-tube preamplifier, or cathode followerdescribed by Jordan and Bell (5) was found satisfactory althoughfrequent replacement of electron tube 6AK5 seemed ~ecessary.A Cent.ralab ceramic condenser with a ,5()()()..volt rating was usedfor decoupling.
Amplifier. The Atomic Instrument Co.'s Model 204A isconsidered excellent in this application. From the various outputs it was possible, simultaneously, to count pulses, to viewthem on an oscillograph, and to monit.or them with a countingrate meter. A discriminator, which is essential in neutron counting, is a part of this amplifier. It was used to determine theoptimum gain or pulse discrimination level for obtaining reproducible results.
Scaler. A conventional Higinbotham scaler was used, with ascale of 64 or 512 according to the counting rate. A DuMontType 248A oscillograph with triggered sweep of various durationswas exceedingly helpful throughout the work.
III order to set up a laboratory for determining beryllium bythe photodisintegration method, several instruments are needed.In addition, one must have a high-intensity gamma source andmeans for handling and monitoring it. The source can be hadfrom the Atomic Energy Commission (as radioantimony) at anominal cost, as 1 month's irradiation of a thimble filled withantimony produces an activity in excess of 1 curie. The authors' work started with 2 curies and continued for 6 months(three half-lives), after which the 0.25 curie remaining continuedto be useful. Except over very long periods, radioantimony isfar less expensive than radium, but it appears to have anotheroutstanding advantage. Ordinary radium sources emit someneutrons as a result of "',n reactions with light metal impuritiescontained in them. The neutron background from the l-gramradium sources tried by the authors was found to reduce thesensitivity of the method by an order of magnitude. Should onehave a Van de Graaff or other type of high-voltage x-ray generator available, even better results would be obtained, for the beamcould he directed at the sample and not at the detectors. The
1265
effeet of irradiation on the tubes was to cause some reduction inpulse size, a diminution in length of the voltage plateau, and allincrease in background "noise," all of which are hindrances tostable operation.
In spite of the experimental difficulties, the authors believe thismethod has many attractive possibilities. It may, for instance,be adapted to automatic assaying by means similar to the automatie sample changers (7) used in routine beta counting. As anentirely instrumental method akin, almost, to the measurementof pH, it may be applicable to plant control.
ACKNOWLEDGMENT
The authors are most appreciative of the interest and advice ofClark Goodman and Matthew Sands, Massachusetts Institute ofTechnology, and of R. 'W. Dodson and IV. IV. Havens, Jr., Columbia University.
LITERATURE CITED
(1) Cholak, J., and Hubbard, D. M., ANAL. CHEM., 20, 73 (1948).(2) Ibid., p. 970.(3) Gaudin, A. M., Dasher, J., Pannell, J. H., and Freyberger, W. L.,
Mining Eng., 187, 495-8 (1950).(4) Guth, E.; and Mullin, C. J., Phys. Rev., 74, 833 (1948).(5) Jordan. W. H., and Bell, P. R., Atomic Energy Commission,
MonP-323.(6) Kern. B. D., Zaffarano, D. J., and Mitchell, A. C. 0., Phys. Rev.,
73, 1142 (1948).(7) Peacock, W. C., and Good, W. M., Rev. ss: l netruments. 17, '255
(1946).(8) Sandell, E. B., "Colorimetric Determination of Traces of Metals,"
p. 151, New York, Interscience Publishers, 1944.
RgC.:IVED September 21, 1950. Presented before the Division of AnalyticalChemistry at the 118th Meeting of the AMERICAN CHEMICAL SOCIETY,Chicago, Ill. This paper describes work supported by the Atomic EnergyCommission under Cont.rac t AT-30-l -Gen-211.
Amperometric Titrations with Hexamminecobalt(llI)Chloride
H. A. LAITINEN AND L. W. BURDETT" University of Illinois, Urbana, Ill.
The object of this investigation was to study theamperometric end point with the dropping rriercueyelectrode for precipitation titrations with bexarnminecobaltic chloride as the reagent. Ferrocyanidecan be titrated at a concentration of 0.001 to 0.1 Min 20% alcohol solution with an accuracy of 0.2 to0.3%. With pyrophosphate, a ratio of hexamminecobaltic ion to pyrophosphate ion of 4 to 3 is obtainedin the presence of potassiunt salts and the absence
H E X AM M INE COBALT (III ) ion has been found useful as aquantitative precipitant for several anions. Hynes, MaIko,
and Yanowski (6) determined ferrocyanide by precipitation of[Co(NH3)s14[:Fe(CN)6h.H20. The precipitate was found to beunstable at 100° C. and therefore unsuitable as a weighing form;accordingly, it was ignited to a mixture of COaO, and :Fe20a andweighed as such. Horan and Eppig (5) precipitated the samesalt, but determined cobalt ammine ammonia by a modifiedKjeldahl procedure. Murgulescu and Dragulescu (16) performeda potentiometric titration of ferro cyanide with hexamminecobalt(IH) chloride by adding a trace of ferricyanide as a potentio-
1 Present address, Standard Oil Co. (Indiana), Whiting, Ind.
of sodium salts. A ratio of 1 to 1 is observed in thepresence of sodium salts, indicating a precipitate ofthe composition Co(NHahNaP207. The compoundCo(NHa)6BrSO, was found to be too soluble to serveas the basis of a volumetric sulfate determination.The amperometric method has been found suitablefor the detection of hexamminecohaltic ion in titrations. The limiting factor is the stoichiometry ofthe titration reaction. .
metric indicator ion. Murgulescu and Alexa (13) described aconductometric end point for the same titration. Hexamminecobalt(III) ferricyanide, which was studied by LaMer, King,and Mason (11) as an example of a sparingly soluble tritrivalentelectrolyte, has been applied as a gravimetric weighing form byMurgulescu and Dragulescu (15):
Sulfate was determined gravimetrically as Co(NHa)6BrSO,by precipitation from neutral or slightly acidic solution with areagent consisting of hexamminecobalt(III) bromide, ammoniumbromide, and hydrochloric acid in 75% methanol or acetone(12).
Similar procedures have been developed for the determinationof several other anionic substances (2, 4, 14, 17, 19) which form
1266 ANALYTICAL CHEMISTRY
quantitatively insoluble precipitates with the ammines ofcobalt(III).
The object of the present investigation was to apply thedropping mercury electrode as a convenient indicator electrodefor the hexamminecobalt(III) ion in amperometric titrations.The reduction of hexamminecobalt(III) ion occurs in two steps,corresponding to reduction of trivalent cobalt to the divalentstate and to the metal amalgam (9, 20). The half-wave potentials,which are somewhat dependent on the nature of the indifferentelectrolyte (9), are, respectively, -0.244 and -1.207 volts (vs.the saturated calomel electrode) in 0.1 N potassium nitrate.
APPARATUS AND PROCEDURE
The amperometric titration cell designed for continuous passage of nitrogen and the simple titrimeter circuit which wereused in this work have previously been described (10).
Hexamminecobalt(III) chloride was prepared by the methodof Bjerrum and McReynolds (1) and recrystallized twice fromaqueous solution by the addition of an equal volume of ethylalcohol.
The applied potential was selected by a study of the polarogram of 5 X 10⁻⁴ M hexamminecobalt(III) chloride in 0.1 Mpotassium nitrate as indifferent electrolyte. For the presentwork an applied potential of -0.8 volt (vs. S.C.E.) was selected,in order that an appreciable iR drop in the cell would not shiftthe cathode potential from the diffusion current region.
[Later experiments by Andrew J. Frank of this laboratoryhave shown that at concentrations above 0.001 M hexamminecobalt(III) ion in 20% ethyl alcohol, irregularities are observedin the diffusion current region in the vicinity of -0.8 volt. Anapplied potential of -0.65 volt gives a more nearly linear titration curve. The addition of 0.01 % gelatin was also found beneficial in minimizing the irregularities.]
5(Ilwctwo,:::!4<l:sU~,,3
f--zwa:a:82
o 2 4 6 8 10
VOLUME Co(NH3)6CL3' ML.
Figure 1. Titration of 50 Ml. of 4 X 10⁻³ M Ferrocyanide Ion with 0.05 M Hexarnrnrnecobaluie Chloride
Solution is 0.1 Min pot.asstwrn nitrate and contains 20% ethylalcohol. Applied e.lll.f. is -0.8 vol t (vs. S.C.E.)
a Titrated with 0.01 M Co(NH,).CI,.
One group of titrations, carried out with 0.05 M hexam minecobalt(III) chloride in order to eliminate the necessity for correction of current readings for dilution, gave an average deviationof 0.33% from the true value. As the titration volumes wereonly 4 to 10 ml., an appreciable error could have arisen from thevolumetric readings. Another group, carried out with 0.01 Mhexamminecobalt(III) chloride to minimize this error, gave anaverage deviation of 0.2% in four determinations.
The optimum concentration range for the method, at leastwith the apparatus employed, was between 0.01 and 0.001 Mferro cyanide. With more dilute solutions, solubility equilibriumwas too slowly attained. More concentrated solutions gavevoluminous precipitates which impeded circulation in the cell.Using the present apparatus, with a sample volume of. 50 ml.,dilution of more concentrated solutions could be carried outwithout appreciable loss of accuracy.
Interfering substances for this determination fall into twogroups. The first is comprised of substances which give a polarographic diffusion current below the applied potential used in thetitration. Ferricyanide, in particular, if present in relatively largeconcentration would yield a correspondingly high diffusion current throughout the titration. -Because of the greater solubilityof hexamminecobalt(III) ferricyanide as compared with theferrocyanide, and its relatively slow precipitation from 20%ethyl alcohol, it does not interfere by direct reaction. Manyoxidants which would show early polarographic diffusion currentscould not exist in the presence of ferrocyanide.
The second group of interfering materials consists of substanceswhich are also precipitated by hexamminecobalt(III) ion. Itwas found that neither cadmium, mercury, nor nickel when present with an excess of cyanide in neutral or alkaline medium in20% ethyl alcohol gave a precipitate with hexamminecobalt(III) ion. The various anions mentioned above, as well asothers which precipitate but which have not been used as thebasis for quantitative methods, would interfere.
0.1999
0.4000
0.5018
4
8
10
Table I. Titration of Ferrocyanide in 20% Ethyl Alcohol[50-m!. solutions containing 0.1 M KNO., titrated at E = -0.8 volt v••
S.C.E. using 0.05 M Co(NH.)oCl, except as noted]
Approx. Concn, Ferrocvanide Ferrocyanide RelativeFerrocyanide, Present, Found, Error,
Millimolar Millimole Millimole %
4 0.2010 0.1999 -0.550.2006 -0.200.2002 -0.40
0.3975 -0.62
0.4965 -1.10.5018 0.00.5024 0.12
0.2010" 0.550.1997" -0.100.1997" -0.100.1999" 0.0
TITRATION OF FERROCYANIDE
Standard ferrocyanide solutions were prepared from Merckreagent grade potassium ferrocyanide. The ferro cyanide solutions were frequently standardized (before or after each amperometric titration) by potentiometric titration of 25-mI. portionsof the 0.05 M stock solution with standard cerium(IV) solution.(Accurately measured portions of p.05 M solution were pipettedinto the titration cell together with the desired supportingelectrolyte solution and diluted to approximately 50 ml. beforetitration.)
The cerium(IV) solution was prepared by accurate weighingof the desired amount of ammonium hexanitratocerate (G. F.Smith Chemical Co. reagent) and dissolving in sufficient sulfuricacid to give aiM solution when diluted to the correct volume(18). The normality of this solution as calculated from theweight of ammonium hexanitratocerate (0.05000 N) agreedclosely with the normality obtained by standardization againstpure arsenious oxide (0.04999 N).
Preliminary titrations of 4 X 10⁻³ M ferrocyanide with0.05 M hexamminecobalt(III) chloride, in the presence of 0.1 Mpotassium nitrate, gave satisfactory titration curves, but solubility equilibrium was reached rather slowly. In 20% ethylalcohol, solubility equilibrium was attained at a satisfactory rate.All subsequent titrations were carried out in this medium.A typical titration curve is shown in Figure 1.
The results of several titrations are given in Table 1.
VOL U M E 23, N O. 9, S E PTE M B E R 1 95 1 1267
0.250.40.0
0.25
RelativeError,
%0.0
-0.15-1.0-1.0
0.00.25
0.40101.0041.000
0.20000.19970.26400.26400.20000.2005
0.2005
LITERATURE CITED
(1) Bjerrum, J., and Mcfteynolds, J. P., "Inorganic Syntheses,"Vol. II, p. 216, New York, McGraw-Hill Book Co., 1946.
(2) Furman, N. H., and State, H. M., IND. ENG. CHEM., ANAL.ED.,8,356 (1936).
(3) Holtzclaw, H. F., Ph.D. thesis, University of Illinois, 1947.(4) Horan, H. A., J. Am. Chem, Soc., 61, 2022 (1939).(5) Horan, H. A., and Eppig, H. J., tua., 71, 581 (1949).(6) Hynes, W. A., MaIko, M. G., and Yanowski , L. K., IND. ENG.
CHEM., ANAL. ED., 8, 356 (1936).(7) Jorgensen, S. M., J. prakt. Chem., [2] 35, 440 (1887).(8) Kolthoff, 1. M., and Pan, Y. D., J. Am. Chem. Soc., 62, 3332
(1940).(9) Laitinen, H. A., Bailar, J. C., Holtzclaw, H. F., and Quagliano,
J. V., Ibid., 70, 2999 (1948).(10) Laitinen, H. A., and Burdett, L. W., ANAL. CHEM., 22, 833
(1950).(11) LaMer, V. K., King, C. V., and Mason, C. F., J. Am. Chem.
Soc., 49, 369 (1927).(12) Mahr, C., and Krauss, K., Z. anal. Chem., 128, 477 (1948).(13) Murgulescu, 1. G., and Alexa, M., tua.. 123, 338 (1942).(14) Ibid., p. 341.(15) Murgulescu, 1. G., and Dragulescu, C., Ibid., 123, 272 (1942).(16) tua., p. 346.(17) Parks, W. G., and Prebluda, H. J., J. Am. Chern; Soc., 57, 1676
(1935).(18) Smith, G. F., and Fry, W. H., ANAL. CHEM., 21, 1233 (1949).(19) Spaeu, G., and Pop, A., Z. anal. Chem., 71, 97 (1927).(20) Willis, J. B., Friend, J. A., and Mellor, D. P., J. Am. Chem.
Soc., 67, 1680 (1945).RECEIVED March 21, 1951.
Possible in terferen ces ofother phosphates were investigated briefly. Orthophosphatereacts with hexamminecobalt(III) ion, but 50 ml. of 4X 10⁻⁸ M pyrophosphate maybe satisfactorily determined inthe presence of ten times itsconcentration of orthophosphate if the alcohol concentration is lowered from 20 to 10%.Using 20% alcohol, all of thepyrophosphate precipitatesfirst and the current increasesas usual after the end point, butthen it decreases slowly, indi
cating that precipitation of orthophosphate is taking place.Sodium triphosphate, Na.P30lO , and sodium hypophosphite,NaH.PO., do not give precipitates in 0.1 M concentration even in20% alcohol.
Sodium hypophosphate, Na4P.0 6, however, gives a precipitatewhich may serve as the basis for an amperometric titration. Preliminary results with a sample of unknown purity showed acobalt-hypophosphate ratio of 2 to 3, indicating the formationof [Co(NH3)e].(H.P.06)3 or [Co(NH3)6].(Na.P.06)3.
Glassy sodium polymetaphosphate in moderate concentrationsdoes not give a precipitate, but it prevents the formation of thepyrophosphate because of its great sequestering power. Athigher concentrations a precipitate forms. In the presence ofalcohol, an orange-red liquid phase separates out, but no precipitate appears.
TITRATION OF SULFATE
An attempt was made to adapt the gravimetric sulfate determination of Mahr and Krauss (12) to an amperometric end point.Dilute sulfate solutions were titrated with hexamminecobalt(III)chloride in the presence of ammonium bromide. Even inthe presence of more than 50% methanol or acetone, the precipitate was found to be much too soluble for a practical titration,especially of dilute solutions.
The solubility of the precipitate would have to be less thanthat-of lead sulfate to offer any advantage over the amperometrictitration of sulfate with lead, which can be carried out successfully with 0.001 M sulfate in presence of 30% ethyl alcohol (8).
0.40001.0001.000
0.20000.20000.20000.20000.20000.2000
0.2000
OtherConditions
20% ethyl alcohol
20% ethyl alcohol
20% ethyl alcohol20% ethyl alcohol
20 m!. 0.2 M Na-HPO. added
10% ethyl alcohol10% ethyl alcoholNo alcohol
0.1 M NaNO,None
SupportingElectrolyte
01 M KNO,
o 1 M KNO,
0.1 M NaNO,0.1 M KNO.0.02 M NaNO.0.05 M KNO,
Table II. Titration of Pyrophosphate[50-m!. solution, titrated at E = -0.8 volt us. S.C.E. using 0.05 M Co(NH,)eCI,J
Pyrophosphate CobaltPresent, Added.
Millimole Millimoles
Na,P,O,
K,P,O,
K,P,O,K,P,O,
Na.P,O,
PyrophosphateAdded as
TITRATION OF PYROPHOSPHATE
The amperometric titration of pyrophosphate with hexamminecobalt(III) ion was suggested by the fact that Holtzclaw (3)had reported the formation of a precipitate when he attemptedtouse sodium pyrophosphate as a supporting electrolyte in studyingthe polarographic behavior of the hexamminecobalt(III) ion.The peach-colored, crystalline precipitate proved to be adaptableto such a determination.
Standard sodium pyrophosphate solution was prepared bydirect weight. The decahydrate was twice recrystallized fromwater and ignited to the anhydrous salt by heating it at 800 0 C.for 5 hours.
Potassium pyrophosphate was prepared by heating reagentgrade dipotassium hydrogen phosphate at 800 0 C. for 5 hours.The pyrophosphate was recrystallized by precipitation fromaqueous solution by the addition of alcohol. The precipitatewas dried and ignited again at 800 0 C. to give the anhydroussalt, which was weighed out to prepare a standard solution.
Preliminary titrations showed that if sodium ions were present,even in relatively small amounts, the cobalt-pyrophosphate ratiowas 1 to 1, whereas a ratio of 4 to 3 was obtained if potassiumpyrophosphate was used as the reagent and the indifferent electrolyte consisted solely of potassium nitrate.
The early work of Jorgensen (7) indicated that Co(NH3)6NaP.07.11l/.H.O and [Co(NH3)6]4(P.07)3.20H.O were precipitated, respectively, by sodium pyrophosphate and potassiumpyrophosphate.
The minimum amount of sodium required to give the 1 to 1product was not precisely determined, but it was the product inthe titration of 50 ml. of 4 X 10⁻³ M sodium pyrophosphate,using 0.1 M potassium nitrate as the indifferent 'electrolyte.Thus a sodium ion concentration of only four times that of thepyrophosphate was sufficient to yield the double salt quantitatively.
Because even a small concentration of sodium ion would prevent the quantitative formation of the 4 to 3 salt, it was decidedthat sodium nitrate should be used as the indifferent electrolyte,to ensure the formation of the 1 to 1 product.
A number of titrations were made in which the initial pyrophosphate concentration varied between 4 X 10⁻³ and 0.02 M(Table II). A 20% ethyl alcohol solution was again found to beadvantageous, especially for the more dilute solutions. Moreconcentrated solutions-e.g., 0.02 M-may be titrated satisfactorily without alcohol or supporting electrolyte. The titrationsmust be carried out in a solution of pH greater than 7, andpreferably between 9 and 12. A solution of tetrasodium pyrophosphate in water gives satisfactory titrations without adjustment of pH.
All the titrations described in Table II were carried out with0.05 M hexamminecobalt(III) chloride; hence only the moreconcentrated solutions gave a titration of as much as 20 ml.An average deviation of about 0.2% was found for all titrationsgiving a 1 to 1 titration ratio.
lodometric Determination of CobaltH. A. J"AITINEN AND L. W. BURDETT), University of Illinois, Urbana, Ill.
The object of this investigation was to find a simpleand convenient volumetric method for the determination of cobalt in complex compounds. Thesample is prepared by ignition to the oxide andfusion with pyrosulfate. The solution is treatedwith potassium bicarbonate and hydrogen peroxideto form a carbonato complex of cobalt(IIJ) which
reacts with iodide in acid solution to yield cobalt(ll)and iodine. The iodine is titrated with thiosulfate,using a visual starch or an arnperorneurfc end point.In the absence of interfering metals, cobalt can bedetermined accurately. The interference of moderate amounts of iron and of small amounts of nickelcan be prevented by the addition of fluoride.
a Amperometric titration of iodine.
AMPEROMETRIC TITRATION APPARATUS
A Fisher Elecdropode was used as a source of potential aswell as a means of current measurement.
investigation of the nature of the complex is under way in thislaboratory.
This same green complex served as a basis for a colorimetricprocedure by Ayres (1).
Mg. Mg.
0,05 73,61 73.5673.6173.6773,5073,61
0,01 14.72 14,7414.7314.7514.73
0,001 1.473 1.4851.4911. 503 a
1. 444 a
1.491 a1. 503 a
1.497a
1. 497 a
STANDARD SOLUTIONS
Standard Thiosulfate Solution. This solution was preparedfrom C.P. sodium thiosulfate and was standardized against astandard potassium iodate solution made from previously driedanalytical reagent grade potassium iodate which was used as aprimary standard.
Standard Cobalt Solution. This solution was prepared fromcarbonatotetramminecobaltic nitrate, for which a method ofpreparation is described by Walton (8). The compound wastwice recrystallized from aqueous solution by the addition of anequal volume of ethyl alcohol, washed with alcohol, and thendried at 90° C. for 1 hour. Its purity was verified by ignition toC030. as described by Brintzinger and Hesse (2). The purity,calculated from five ignitions, was 99.95 ± 0.07%.
The standard solution was prepared by ignition of the complexto C030., followed by pyrosulfate fusion. The melts from several such fusions were dissolved, transferred to a volumetricflask, and diluted to the mark.
Other solutions were prepared by dissolving C.P. grade saltswithout further purification.
EXPERIMENTAL
Details of Method Finally Adopted. To 20 to 25 ml. of solution in a 250- to 300-m!. Erlenmeyer flask containing from 1.5to 250 mg. of cobalt in sulfuric acid solution, add sufficient sodiumor potassium bicarbonate to neutralize the acid, then add 5grams in excess. Add 5 m!. of 30% hydrogen peroxide and aftereffervescence has subsided somewhat, wash down the sides of theflask with distilled water from a wash bottle to ensure completeoxidation of the cobalt. This also serves to wash down anyhydrogen peroxide which was splattered upon the walls of the
Table I. Analysis of Standard Cobalt Solution byIodometric Method
Normality of Cobalt Cobalt RelativeCobalt Solution Present Found Error
%-0.07
0.00,08
-0,150,0
0.130.070.200.070,81.22,0
-2.01.22,01.61.6
I N CONNECTION with the synthesis of various cobalt(III)complexes, a simple and rapid method for the determination of
cobalt in these compounds was desired. Lack of interferences wasof secondary importance because of the freedom from othermetals.
One of the simplest of the existing procedures was first investigated by Job (6), who oxidized the cobalt with hydrogenperoxide in the presence of potassium bicarbonate to give a soluble green carbonato complex. This he reduced with ferrous pyrophosphate, the excess of which was titrated with potassiumpermanganate solution.
Metzl (7) also formed this soluble green complex as a step inhis procedure. However, as a subsequent step he decomposedthe complex by boiling in sodium hydroxide solution to give cobalt(III) hydroxide. After the excess peroxide had been removedby boiling, the solution was made.acid in the presence of potassium iodide, which was oxidized as the precipitate dissolved.Engle and Gustavson (5) found that 0.5 to 2 hours were requiredto dissolve the cobaltic hydroxide completely, depending on theamount of cobalt in the sample, and therefore used a carbondioxide atmosphere to avoid air oxidation of iodide. Theyoxidized the cobalt directly to the hydroxide, avoiding the formation of the carbonato complex. Difficulty in dissolving the lasttraces of cobaltic hydroxide was reported by Willard and Hall(9).
Job's method has a number of objectionable features. Thelarge volume employed (150 m!.) requires a large amount ofpotassium bicarbonate (30-gram excess) in order to give a stablecomplex. This large excess must be carefully neutralized, toprevent loss due to effervescence. The large volume wouldprobably make complete removal of the excess peroxide difficult,as the concentration of cobalt, which catalyzes the decomposition,would be decreased. An excess of bicarbonate before addition ofthe hydrogen peroxide is desirable, so that the carbonato complexwill form immediately, rather than cobaltic hydroxide whichmust be dissolved by addition of excess bicarbonate.
The use of a carbon dioxide atmosphere complicates the methodand should be avoided.
An iodometric procedure would be simpler and more directthan the addition of ferrous iron followed by a titration of theexcess. Only one stable standard solution would be involved,rather than two solutions of lesser stability.
An increased number of interferences would no doubt resultfrom the use of iodide as a reducing agent. For the presentapplication, however, this is of no consequence.
The exact formula of the green carbonato complex in solutionhas not been determined. Job assigned it the formula KaCoOa,while Durrant (3) considered it to be (KC02-O)2CO-0Co(OC02K)2. Duval (4), in a more recent investigation, isolated from the green solution a green solid which he called cobalt(III)-triscarbonatocobaltiate, Co [CO(COa)3], on the basis ofdetermination of cobalt and carbon dioxide. In solution, however, it would appear plausible to assume all of the cobalt to bein the same form, possibly CO(C03) 3--- or CO(C03)2 -. An
1 Present address, Standard Oil Co. (Indiana), Whiting, Ind.
1268
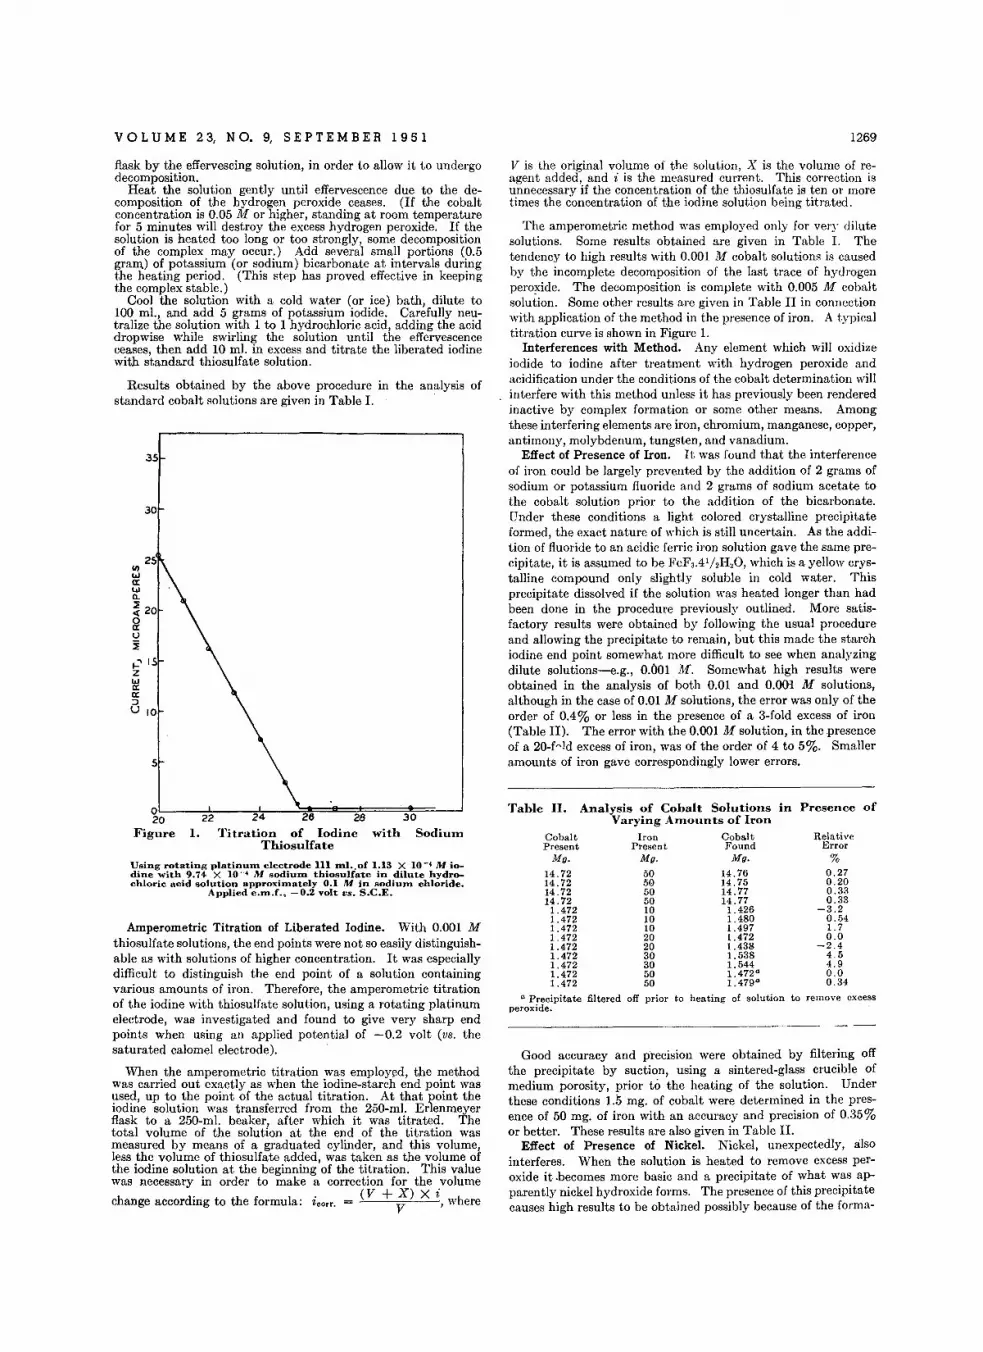
VOL U M E 2 3, N O. 9, S E PTE M B E R 1 9 5 1 1269
35
30
a Precipitate filtered off prior to heating of solution to remove excessperoxide.
V is the original volume of the solution, X is the volume of reagent added, and i is the measured current. This correction isunnecessary if the concentration of the thiosulfate is ten or moretimes the concentration of the iodine solution being titrated.
The amperometric method was employed only for very dilutesolutions. Some results obtained are given in Table 1. Thetendency to high results with 0.001 M cobalt solutions is causedby the incomplete decomposition of the last trace of hydrogenperoxide, The decomposition is complete with 0.005 M cobaltsolution. Some other results are given in Table II in connectionwith application of the method in the presence of iron. A typicaltitration curve is shown in Figure 1.
Interferences with Method. Any element which will oxidizeiodide to iodine after treatment with hydrogen peroxide andacidification under the conditions of the cobalt determination willinterfere with this method unless it has previously been renderedinactive by complex formation or some other means. Amongthese interfering elements are iron, chromium, manganese, copper,antimony, molybdenum, tungsten, and vanadium.
Effect of Presence of Iron. It was found that the interferenceof iron could be largely prevented by the addition of 2 grams ofsodium or potassium fluoride and 2 grams of sodium acetate tothe cobalt solution prior to the addition of the bicarbonate.Under these conditions a light colored crystalline precipitateformed, the exact nature of which is still uncertain. As the addition of fluoride to an acidic ferric iron solution gave the same precipitate, it is assumed to be FeF3.4
1/ 2H,O, which is a yellow crystalline compound only slightly soluble in cold water. Thisprecipitate dissolved if the solution was heated longer than hadbeen done in the procedure previously outlined. More satisfactory results were obtained by following the usual procedureand allowing the precipitate to remain, but this made the starchiodine end point somewhat more difficult to see when analyzingdilute solutions-e.g., O.OOl M. Somewhat high results wereobtained in the analysis of both 0.01 and 0.001 M solutions,although in the case of 0.01 M solutions, the error was only of theorder of 0.4% or less in the presence of a 3-fold excess of iron(Table II). The error with the 0.001 M solution, in the presenceof a 20-fAld excess of iron, was of the order of 4 to 5%. Smalleramounts of iron gave correspondingly lower errors.
Good accuracy and precision were obtained by filtering offthe precipitate by suction, using a sintered-glass crucible ofmedium porosity, prior to the heating of the solution. Underthese conditions 1.5 mg. of cobalt were determined in the presence of 50 mg. of iron with an accuracy and precision of 0.35%or better. These results are also given in Table II.
Effect of Presence of Nickel. Nickel, unexpectedly, alsointerferes. When the solution is heated to remove excess peroxide it .becomes more basic and a precipitate of what was apparently nickel hydroxide forms. The presence of this precipitatecauses high results to be obtained possibly because of the forma-
Table II. Analysis of Cobalt Solutions in Presence ofVarying Anlounts of Iron
Cobalt Iron Cobalt RelativePresent Present Found Error
Mg. Mg. Mg. %14.72 50 14.76 0.2714.72 50 14.75 0.2014.72 50 14.77 0.3314.72 50 14.77 0.33
1.472 10 1.426 -3.21.472 10 1.480 0.541.472 10 1.497 1.71.472 20 1.472 0.01.472 20 1.438 -2.41.472 30 1.538 4.51.472 30 1.544 4.91.472 50 1.472 0 0.01.472 50 1.479 0 0.34
30
with Sodium24 26 28
Titration of IodineThiosulfate
221.
oL_~__-:;J,-_~!i=::liI::=~====;~=---.J
20Figure
25CIlwa:wQ.
~ 20
~o~
f--",15zwa:a::::>U 10
Using rotat.ing platinunl electrode III mI.,of 1.13 X 10-' M iodine with 9.74 X lO~4 M sodiuJD thiosulfate in dilute hydrochloric acid solution approxi:rnately 0.1 M in sodiuDl chloride.
Applied e.Jn.f., -0.2 voh es, S.C.E.
5
flask by the effervescing solution, in order to allow it to undergodecomposition.
Heat the solution gently until effervescence due to the decomposition of the hydrogen peroxide ceases. (If the cobaltconcentration is 0.05 M or higher, standing at room temperaturefor 5 minutes will destroy the excess hydrogen peroxide. If thesolution is heated too long or too strongly, some decompositionof the complex may occur.) Add several small portions (0.5gram) of potassium (or sodium) bicarbonate at intervals duringthe heating period. (This step has proved effective in keepingthe complex stable.)
Cool the solution with a cold water (or ice) bath, dilute to100 mI., and add 5 grams of potassium iodide. Carefully neutralize the solution with 1 to 1 hydrochloric acid, adding the aciddropwise while swirling the solution until the effervescenceceases, then add 10 mI. in excess and titrate the liberated iodinewith standard thiosulfate solution.
Results obtained by the above procedure in the analysis ofstandard cobalt solutions are given in Table 1.
Amperometric Titration of Liberated Iodine. With 0.001 Mthiosulfate solutions, the end points were not so easily distinguishable as with solutions of higher concentration. It was especiallydifficult to distinguish the end point of a solution containingvarious amounts of iron. Therefore, the amperometric titrationof the iodine with thiosulfate solution, using a rotating platinumelectrode, was investigated and found to give very sharp endpoints when using an applied potential of -0.2 volt (V8. thesaturated calomel electrode).
When the amperometric titration was employed, the methodwas carried out exactly as when the iodine-starch end point wasused, up to the point of the actual titration. At that point theiodine solution was transferred from the 250-mI. Erlenmeyerflask to a 250-ml. beaker, after which it was titrated. Thetotal volume of the solution at the end of the titration wasmeasured by means of a graduated cylinder, and this volume,less the volume of thiosulfate added, was taken as the volume ofthe iodine solution at the beginning of the titration. This valuewas necessary in order to make a correction for the volume
change according to the formula: i.or r . = (V +;) X i, where

1270 ANALYTICAL CHEMISTRY
Table IV. Analysis of CarbonatotetraUlUlinecobalticNitrate
tion of some nickel dioxide from the nickel hydroxide in the presence of hydrogen peroxide. The modified method employed inthe presence of iron also gave improved results in the presence ofnickel, as the nickel was not readily precipitated, because ofcomplex formation with the fluoride. The values given inTable III were obtained using this modified procedure. Resultswere still high, however; 1.5 mg. of cobalt were determined withan accuracy of 3.7% in the presence of 50 mg. of nickel. Amperometric titration of the iodine with thiosulfate was made in eachof the analyses listed.
It is concluded that a preliminary separation of cobalt isnecessary if appreciable quantities of nickel are present.
Determination of Cobalt in Cobalt Complexes. The application of the method to the determination of cobalt in complexsalts requires first the complete decomposition of the complexsalt, in order that the carbonato complex can be formed.
The only satisfactory procedure investigated involved the destruction of.the complex by careful ignition, followed by fusion ofthe resulting oxide prior to analysis by the iodometric method.
Weigh out a sample large enough to give a suitable titrationinto a porcelain crucible and decompose it by careful heatingwith a gas burrier. Heat the sample from the top by carefullypointing the burner toward the crucible until all the visible material is decomposed. (This is to avoid loss of sample by beingblown out of the crucible as decomposition gases are evolved.)Gently heat the bottom of the crucible to complete the decomposition.
Fuse the resulting oxide with potassium pyrosulfate andallow the melt to cool somewhat. Loosen the melt by adding asmall amount of water and gently heating with a gas burner witha low flame. Transfer the contents of the crucible to a 25Q-ml.Erlenmeyer flask and complete the dissolution of the sample.Complete the analysis as described above.
Results obtained with this method in the analysis of a sampleof carbonatotetramminecobaltic nitrate are given in Table IV.The maximum deviation from theoretical is 0.15%, while theaverage deviation is only 0.05%.
CobaltPresent
Mg.
1.4721.4721.4721.4721.472
Concentration ofCobalt Solution, Conditions Employed Cobalt Found,
M for Peroxide Removal Me.
0.1 Sample heated till effervescence 2.472ceased 2.477
2.478
0.1 Sample allowed to stand at room 2.482temperature for 5 minutes 2.478after complex formation 2.480
0.1 Sample allowed to stand at room 2.477temperature for 10 minutes 2.478after complex formation 2.475
0.1 Sample allowed to stand at room 2.477temperature for 30 minutes 2.475after complex formation 2.478
0.1 Sample ~llowed to stand at room 2.478temperature for 18 hours after 2.479complex formation
0.01 Sample allowed to stand at room 0.2586temperature for 10 minutes 0.2571after complex formation
0.01 Sample heated till effervescence 0.2475ceased 0.2473
0.2473
0.005 Sample heated till effervescence 0.1236ceased 0.1236
0.1239
Table V. Effect of Various Conditions on Rerrrova] ofHydrogen Peroxide fnorn a Solution Containing the
Carbonatocobaltic Corrrplex
A preliminary separation of cobalt is necessary if large amountsof iron, or significant amounts of nickel, are present. An amperometric titration of the liberated iodine with thiosulfate solutionprovides a convenient method of determining the iodine contentin dilute solutions.
In the acidification step a relatively large excess of potassiumiodide is employed to avoid loss of iodine through volatilization.Hydrochloric acid is employed rather than sulfuric, as is specifiedin many iodometric methods, on the theory that any chlorineproduced by oxidation of chloride ion by the trivalent cobaltwould react with iodide to give an equivalent amount of iodinerather than being evolved, as would be the case with most of theoxygen liberated from a sulfuric acid solution.
Table V shows the results of a number of experiments made ondilutions of a single cobalt sulfate solution to determine the requirements for, and extent of, hydrogen peroxide removal.Complete removal of hydrogen peroxide is attained in solutionsas little as 0.005 M in cobalt, as shown by the agreement betweenthe results obtained with dilute and concentrated solutions.Solutions which were 0.01 M in cobalt gave high results whentitrated after standing for 10 minutes at room temperature, butgave the correct result after heating. Solutions which were morethan about 0.05 M in cobalt concentration did not even requireheating for peroxide removal, if they were allowed to stand atroom temperature for 10 minutes before titration.
RelativeError
%0.32.42.43.23.7
Analysis of Dilute Cobalt Solutions in Presenceof Varying AnlOunts of Nickel
Nickel CobaltPresent Found
Mg. Mg.
10 1.47910 1.50830 1.50830 1.51950 1.526
Table III.
. Weight ofSample
G.
0.82310.67690.75430.82390.7965
Weight ofOxide
G.
0.26540.2181
TheoreticalWeight of Oxide
G.
0.26520.2181
Purity fromIodometric
Analysis%
100.15100.0099.98
100.08100.01
Table V also shows the stability of the complex, as satisfactoryresults were obtained after the sample had stood for 18 hours aftercomplex formation.
LITERATURE CITED
Decomposition of cobalt complexes by wet oxidation withsulfuric and nitric acids or perchloric and nitric acids was unsuccessful, because it was difficult or impossible to remove thefinal traces of nitrogen oxides which interfere with the iodometricprocedure.
DISCUSSION AND SUMMARY
The procedure as outlined was found to be rapid and simple,especially when applied to samples containing no metallicions other than cobalt, such as the various complexes of cobalt.
(1) Ayres, G. H., Repi, New England Assoc. Chem. Teachers, 42,143-7 (1941).
(2) Brintzinger, H., and Hesse, B., Z. anal. Chem., 122, 241 (1941).(3) Durrant, C. H., J. Chem. Soc., 87, 1781 (1905).(4) Duval, C., Anal. Chim. Acta, 1, 201 (1947).(5) Engle, J., and Gustavson, G., J. Ind. Eng. Chem., 8, 901 (1916).(6) Job, A., Ann. chim. phys., 20, 214 (1900).(7) Metzl, G., Z. anal. Chem., 53, 537 (1914).(8) Walton, H. F., "Inorganic Preparations," p. 91, New York,
Prentice-Hall, 1948.(9) Willard, H. H., and Hall, 0., J. Am. Chern, Soc., 44, 2237 (1922).
RECEIVED March 21, 1951.

Continuous Weighing in Analytical ChemistryCLEMENT DUVAL
The Sorbon ne, Paris , France
With the collaboration of Pro Jean Besson, Pi erre Champ, Monique De Clercq, Therese Dupuis, Raymonde Duval,Pierre Fauconnier, Yvette Marin, Josette Morandat, Pro Andre Morette, Simonne Panchout, Simonne Peltier,
Janine Stachtchenko, Su za n n e Tribalat, and Ngu yen Dat Xuong
Translated by RALPH E. OESPER, University of Cincin n a t i, Cincinnati, Ohio
By registering, photographically or by pen, thecurve representing the loss or gain in wei ght undergone by a heated sub st ance, important facts arebrought to light, which are not revealed by theclassic :method of discontinuous weighing. In thisway it is possible to determine gravimetricallymany materials, either alone or in mixture, by anautomatic process which involves no personal errorin the weighing. The new method lends itself tonumerous determinations of humidity and ash
(grains, plaster, paper pulp, etc.), By this meansit is possible to set up a hierarchy among the methods in use; this order of excellence can u sually beestablished in a short time, and the results will berecorded in an indisputable permanent form. Thegreatest advance realized through the thermobalance is the fixing of the exact limits of temperature between which a given precipitate acquires aconstant weight, a condition indispensable to themaking of a su r e weighing.
APPARATUS
Zimmerm ann. From th at time, he was never free of the idea ofdeveloping rapid, auto mat ic gravimetric mineral ana lyses, whichwould require no preliminary separations , and whose resultswould be given by graphical inscription, as is done for infraredabsorption spectra. Fortunately, the Chevenard thermo balancehad progressed beyond the trial stage, but nonetheless a tremendous amount of work was required before the new methodology was ada pted to routine analyses that could be made by .atechnician . Three years of hard work went into these preparatory labors. This pap er gives an accoun t of certain fact s, diversein nature, which were encountered in the course of the daily experiences with our thermobalan ces, and which should convincethe reader of the incont estable advantages afforded by continuous weighing.
The th ermoponderal method is so simple that many investigators have thought it could be carried out with a more or less wornanalytical balance of the usual precision, by modifying the instrument somewhat-e.g., by drilling a hole in the base of thebalance; one of the pans is replaced by a rod extending into aheating device placed below, et c. These easy solutions hadnumerous defect s, the following being especially bad. The rod,which extends into the furnace, rubs if the orifice is too narrow,or it is subject to convection currents if the opening is too large;the effect becomes evident, particularly abo ve 6000 C. Moreover, the traditional knife-edge and agate plate of a balancecan no longer be recommended if th ere is continuous contactbetween them, instead of the intermittent contact employed inthe ordinary weighing procedure. The vibrations-so oft en anunavoid able problem in industrial laboratories-dull th e knifeedges. The bifunicular suspension, which involves no frictionbetween solids, is far superior to a knife-edge in providing aninvariant axis of orientation. The bell-shaped furnace, closedat the top and just covering the substance, which is placedabove the balanc e, makes the convec tion currents inoffensive.The bifilar winding, in the furnace, also contributes to removingany action of the field on heated magn etic materials.
Figure 1 is a diagram of the thermobalanc e, as developed byChevenard, WacM,and De la Tullaye (6), and used in the author'sstudies. He has dealt particularly with improvements and details tha t are of special interest to the problem of using thisinstrument in chemical analysis.
N OT ABLE advances in analytica l chemistry , especially ingravimetry, can be realized with the aid of the Chevenard
thermobalan ce. T his instrument automatically traces on photographic or ordinary paper a eurve showing as a function of thete mperature or ti me th e gain or loss in weight of a materia l whileit is being heated .
The pyrolysis curves of almost a th ousand precipitates (described in th e bibliography) hav e been discussed and interpreted .On th ese curves, the horizon tals indi cating constant weight andma rked out by precise temperatures, and regist ered by the apparatus itself, show what temperature domain the chemist shouldfinally employ to be sure of obtaining a weight that, if notconst ant, is never theless correct .
New compounds have been discovered by this method, and. it has also yielded about 80 new methods of determi nation.It has dr awn attent ion to numerous errors of interpretation,aid ed in the selection of methods, furnished sublimat ion curvesand diagrams of isotherms, disclosed new methods of separation,made possible a critical study of all the inorganic microgravimetric procedures and a comparison of the precipitants that yieldcolloidal hydroxides, followed the progress of the washing of precipitates, and est imated the quantity of adsorb ed materials andthe temperature at which they are desorbed. Finally, themethods of auto mat ic determination hav e now been selected fora ll the ions , afte r a patient and fastidious study of the choice offiltering crucibles. It is possible to make some determinationson mixtures without previous separation. In any case, th ean alyst, who does not run the risk of making a false weighing, hasa permanent record on which the measurement of the weight isreduced to a length, a measur ement which, if need be, may bemad e by th e operator long afte r the record is actually made.
A glance at the current reviews of an alytical chemistry , orsimply at the semimonthly "Analytical Chemistry" section ofChemical Abstracts, will show that gravimetry, at least in inorganic chemistry, is being superseded by methods which seemingly are mor e rapid, such as tittimetry, colorimetry, polarography, and spectrography. These branches of an alyticalchemistry have made wonderful progress in the past 20 years andit may well be asked whether th e funnel, the paper filter, thecrucible, and the balan ce with its knife-edges and discontinuousweighings, heritages of a long tradition, are not destined to disappear soon, and give way to other more modern devices capableof equal pr ecision.
While visiting Ludwigshafen on the Rhine in 1946, the authorwas impressed by the automatic execution of organic combustion The nonmagnetic beam, I, 23 cm. long and constructed ofanalyses by the methods that had recently been published by W. Duralumin, is supported by two sets of tun gsten wire (0.02 mm.
1271
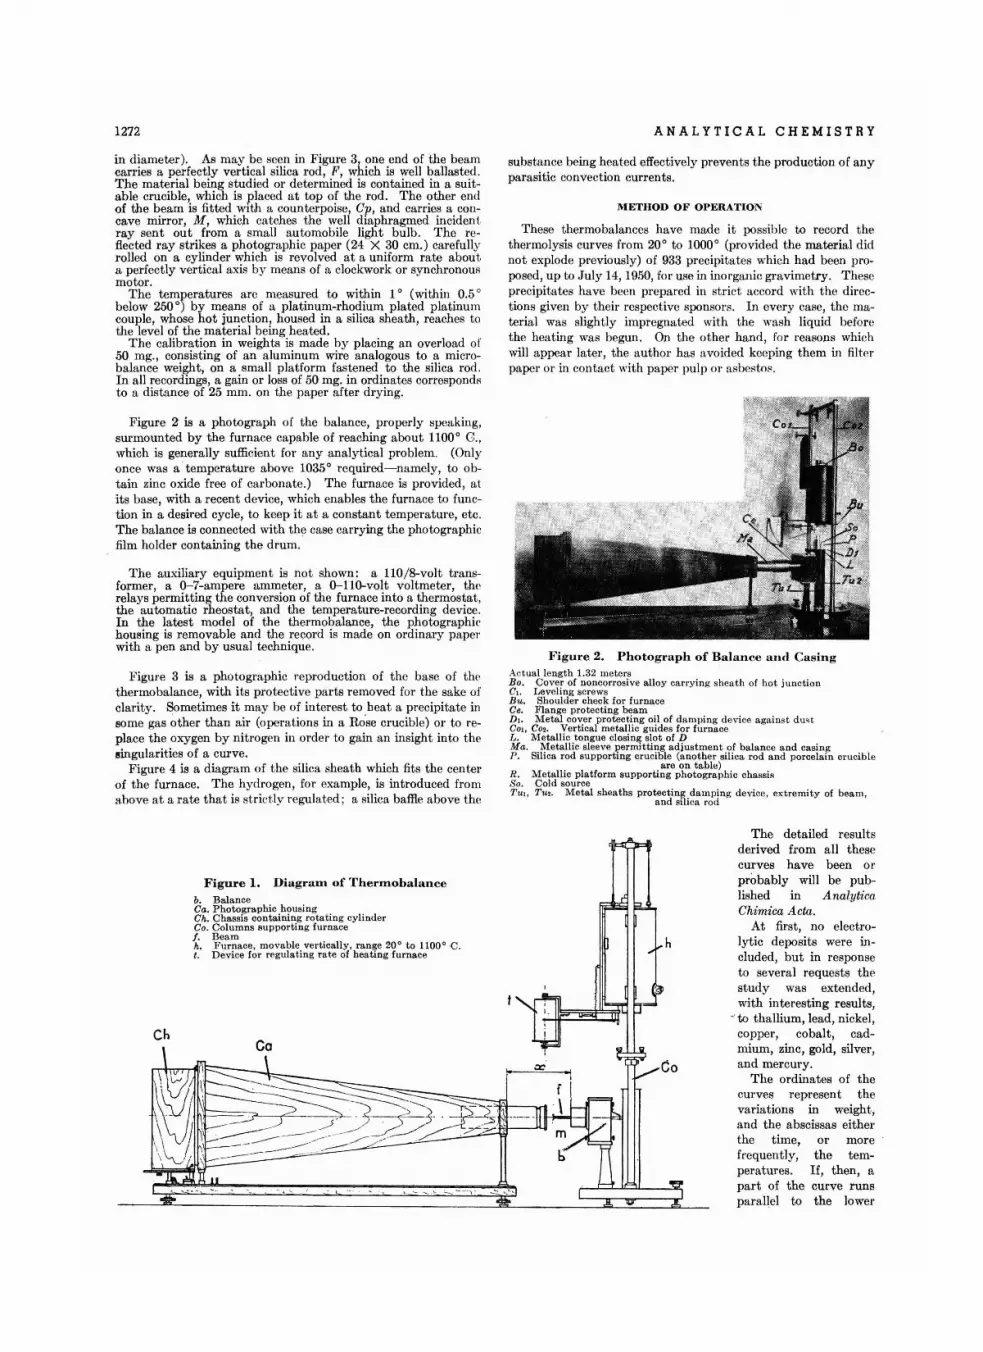
1272
in diameter). As may be seen in Figure 3, one end of the beamcarries a perfectly vertical silica rod, F, which is well ballasted.The material being stud ied or determined is conta ined in a suitable crucible, which is placed at top of the rod. The other endof the beam is fitted with a counterpoise, Cp, and carries a concave mirror , M, which catches the well diaphragmed incidentray sen t out from a small automobile light bulb. The reflected ray strikes a photograph ic paper (24 X 30 cm.) carefullyrolled on a cylinder which is revolved at a uniform rate abouta perfectly vertical axis by means of a clockwork or synchronousmotor.
The tempera tures are measured to within 1° (within 0.5°below 250 °) by means of a platinum-rhodium plated platinu mcouple, whose hot jun ction, housed in a silica sheath , reaches tothe level of the ma teri al being heated .
The calibration in weights is made by placing an overload of50 mg., consisting of an aluminum wire ana logous to a microba lance weight, on a small plat form fas tened to the silica rod.In all recordings, a gain or loss of 50 mg. in ord inates correspondsto a distan ce of 25 mm. on the paper afte r drying.
Figure 2 is a photograph of the balance, properly spea king,surmounted by the furn ace capable of reaching about 1100° G.,which is generally sufficient for any ana ly tica l problem. (Onlyonce was a ' temperature above 1035° required- na mely, to obtain zinc oxide free of carbonate .) The furn ace is provided, atit s base, with a recent device, which enables the furn ace to function in a desired cycle, to keep it at a constant tempera ture , etc .The balance is conn ected with the case ca rrying the photographicfilm holder containing th e drum.
The auxiliary equipment is not sho wn: a 1l0/ 8-volt transformer, a Q-7-ampere ammeter, a Q-llQ-volt voltmeter, thorelays permitting th e convers ion of the furn ace into a thermostat ,th e automati c rheostat, and the temperature-recording device.In th e latest model of the thermobalan ce, the photographichousing is removable and the record is made on ordinary paperwith a pen and by usual technique.
Figure 3 is a photographic reproduct ion of the base of thethermobalance, with its protecti ve parts removed for the sake ofclarity. Sometimes it may be of interest to heat a precipitate insome gas other tha n air (opera tions in a ROse crucible) or to replace the oxygen by nitrogen in order to gain an insight into thesingul arities of a curve.
Figure 4 is a diagram of the silica sheath which fit s the centerof the furn ace. The hydrogen, for example, is introdu ced fromabove at a rate that is at r ict.ly regulated ; a silica baffle above the
Figure 1. Diagram of Thermobalanceb. Bal an ceCa. Photographic housingCh. Chass is containin g rotat in g cyli nderCo. Columns auppor fiug furnacef . Beamh. Fu rnace , movable ver ticall y , ran ge 20° to 1100 ° C.t. Device for regulating ra te of hea ting furn ace
Ch
ANALYTICAL CHEMISTRY
substance being heat ed effect ively prevents the production of anyparasitic convect ion curren ts .
METHOD OF OI'ERATION
These therrnobalances hav e made it possible to record thether molysis curves from 20° to 1000° (provided the material didnot explode previously) of 933 precipita tes which had been proposed, up to .July 14,1950, for use in inorganic gravimetry. Theseprecipitates have been prepared in strict accord with the direct ions given by their respecti ve sponsors. In every case , th e material was slightly impregnated with the wash liquid beforethe heating was begun. On the other han d, for reasons whichwill appear later , t he aut hor has avoided keeping the m in filterpape r or in contact with paper pulp or asbestos .
Figure 2. Photograph of Balance and Ca singActual length 1.32 metersB o, Cove r of noncorrosive alloy carryin g sheat h of hot j unctionCt. Leveli ng screwsB u. Sho ulder eheek for fur na ceCeo Fla nge protecti ng bea mD I. Me tal cover pr otecting oil of d a mping dev ice against dustCOl , Co«. Vert ica l me talli e guide s for furnaceL . M etalli c tongue closing slot of DMa, Metalli c sleeve permitting ad jus tment of bal an ce an d casingP. Silica rod supporting crucible (ano t her siliea rod and po rce la in crucib le
are on ta ble)R. Metallie pla tform sup por ting ph otogra phi c chassisS o. Cold sourceTtH. Tu'l. M et al sheat hs pro tec ting damping devi ce, ext re mity of beam,
and silica rod
The detailed result sderived from all thesecurves have been orprobably will be published in A nalyticaChimica Acta.
At first, no electro lyti c deposit s were included, but in responseto severa l request s th estudy was exte nded,with interesting results,
.' to tha llium, lead , nickel,copper, coba lt, cadmium, zinc, gold, silver,and mercury.
The ordina tes of thecurves represent thevari ations in weight ,and th e ab scissas eitherth e t ime, or morefrequently, the temperatures. If, then, apart of the curve runsparallel to the lower
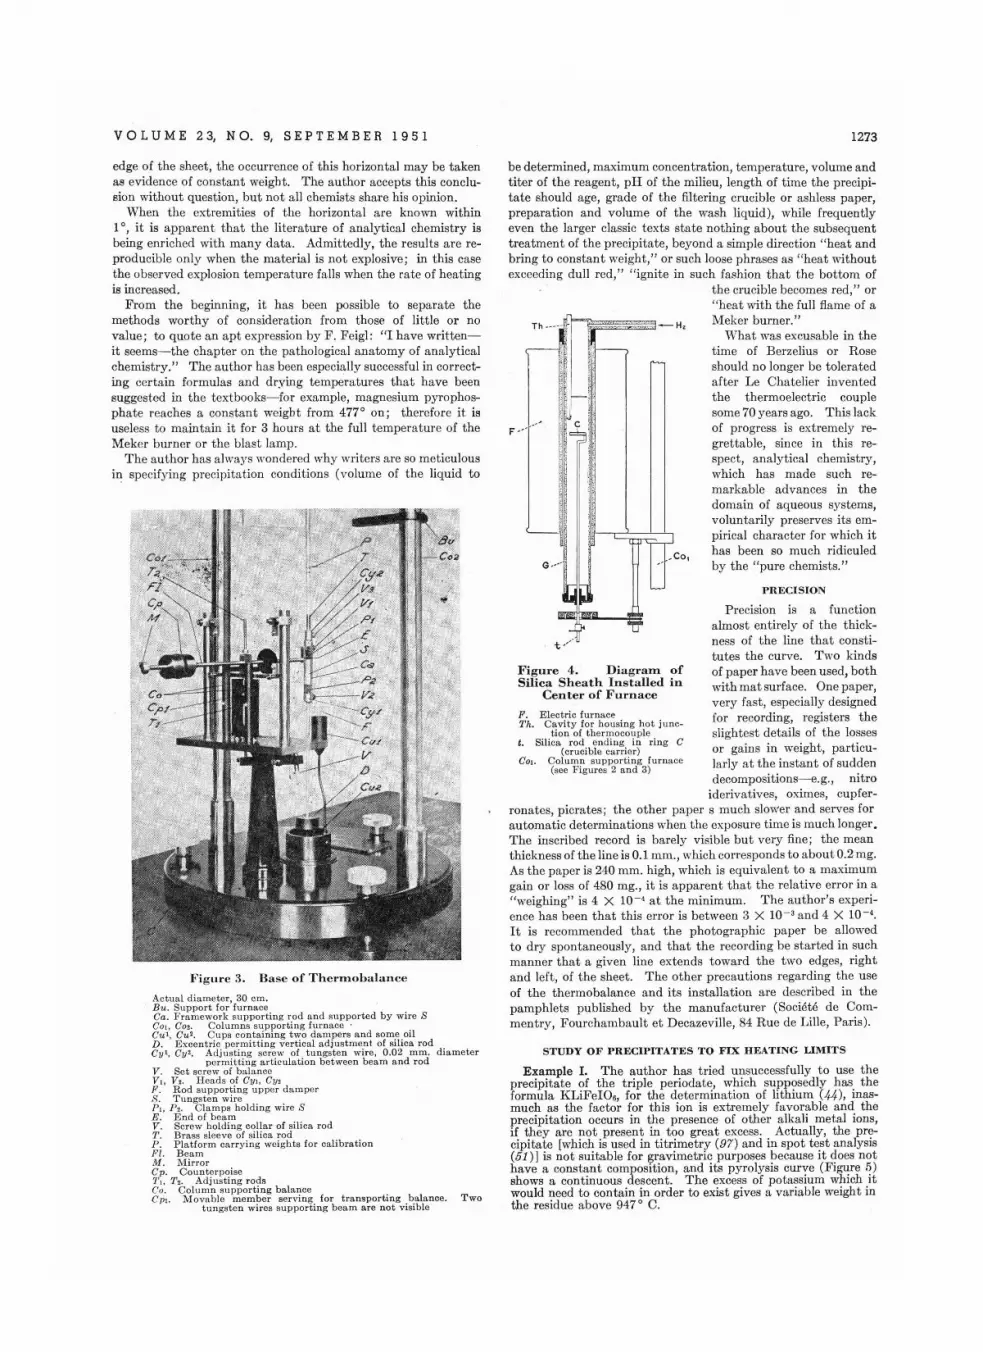
VO L U M E 2 3, N O. 9, S E PTE M B E R 1 95 1 1273
STUDY OF PRECII'ITATES TO FIX H EATING LIMITS
Example I. The author has tried un successfully to use theprec ipitate of the triple periodate, which supposedly has theformula K LiFeI06, for th e determination of lith ium (44), inasmuch as the factor for th is ion is extremely favo rable and theprecipitation occurs in th e presence of other alkali metal ions,if they are not present in too great excess. Actua lly, the precipitate [which is used in titrimetry (97) and in spot test analysis(51) ] is not suitable for gravimetric purposes because it does nothave a constant composition, and its pyr olysis curve (Figure 5)shows a continuous descent. T he excess of potassium which itwould need to contain in orde r to exist gives a variable weight inth e residue above 947 ° C.
PRECISION
H,
Co,
T h . • •--!,.
- , r---~ .
r-i ~~
,. ,~ : _ i:"
.'. ~1 \ C
~ i~j ,
J,
, ~
l
~- '--, P"r.---.J
G ···· -,
l.-
II II'""'" f-..
- }<., '
F . Electric furna ceTh. Cavi ty for housin g hot jun c
ti on of thermo cou plet , Sil ica rod en ding in rin g C
(cr ucible ca rrie r)COl . Column su pporting furna.ce
(see Figures 2 a nd 3)
F igure 4 . D ia gram ofSilica Shea t h Ins talled in
Center o f Fur n a ce
F ' -
P recision is a funct ionalmost enti rely of th e thickness of the line th at constitutes the curve. Two kindsof paper have been used, bothwith mat surface. One paper ,very fast , especially designedfor record ing, regist ers th eslightes t details of th e lossesor gain s in weigh t , particularly at th e inst ant of suddendecompo sitions- e.g., nitro
ideriva tives, oximes, cupferronates, picrates; the other paper s much slower and serves forautomati c det erminations when th e exposure t ime is much longer .T he inscribed record is barely visib le but very fine ; the meanthickness of the line is 0.1 mm., which corresponds to ab out 0.2 mg.As th e paper is 240 mm. high , which is equiv alent to a ma ximumgain or loss of 480 mg., it is appa rent that t he relative error in a"w eighing" is 4 X 10-' at th e minimum. The author's experience ha s been that this er ror is between 3 X 10- 3 and 4 X 10-'.It is recommend ed th at th e photographic paper be allowedto dry spontaneously, and that the record ing be started in suchmanner that a given line extends tow ard the two edges, rightand left, of the sheet. The other precautions regarding the useof th e thermobalance an d it s installa t ion are described in thepamphlets pub lished by the ma nufacturer (Societe de Commentry , Fourc harnb ault et D ecazev ille, 84 Rue de LiIle, Par is).
be determined, maximum concent ra tion, temp erature, volum e andt iter of the reagent, pH of the milieu, length of tim e the precipitate should age, grade of th e filtering cruc ible or ashless paper,preparation and volume of th e wash liquid), while freq uentlyeven th e larg er classic text s state nothing about th e subsequenttreatment of th e pr ecipitate, beyond a simpl e direct ion "heat andbring to consta nt weight, " or such loose ph rases as "hea t withoutexceeding dull red ," " ignite in such fashion th at the bottom of
th e cruc ible becomes red," or"hea t with the full flame of aMeker burner ."
What was excusable in thetim e of 13erzelius or Roseshould no longer be to leratedafter Le Cha te lier inventedthe th ermo electric coup lesome 70 years ago. This lackof pro gress is extremely regrettable, since in this respect, ana lyt ical chemistry,which has mad e such remarkabl e ad van ces in thedom ain of aqueous sys tems,voluntar ily pr eserves its empirical cha racter for which ithas been so much rid iculedby the "pure chemists ."
Act u al d iameter , 30 e m.B u . Su p po r t for furnace .Ca . Fra mew ork suppo r ting rod a n d su pport ed by wire SCO l. C02. Co lumns sup port ing fur nace 'CUI, Cu'/.. Cups co n taining t wo d a m per s a n d some oilD . Excen tric per mi ttin g ve r tical ad j us tmen t of si lica ro dCy l, Cy2, Ad ju sting scre w of tungsten wir e , 0 .0 2 mm, d iameter
pe rmitting a rticul ation between b eam a nd r odv . Se t screw of bal an ceV, . V . . H ea ds of Cy ,. Cy.F . R od suppor t ing up per d a m perS . T ungst e n w irePi, 1' . . Clamps hold in g wire SE . E n d of b eamV. Se re w hold in g col la r of silica rodT . Brass s leeve of silica rodP . Pl atfor m ca r ryi ng we ig h ts for cali bra ti onFl. Bea mM. MirrorCp, Cou n terpoise7\ . T.. Ad justing ro d sCo. Co lum n suppor t in g b alan ceCP l. M ov a bl e membe r se rving for transporbing b al ance . Two
t ungsten wires su p po rting bea m are not visib le
F igure 3. Ba se of T'herrn o balaucc
edge of the sheet , the occurrence of thi s horizontal may be takenas evidence of constant weight . The author accepts this conc lusion without question, but not all chemists share his opinion.
When th e ext remities of th e horizontal are known within1°, it is apparent th at th e literat ur e of analytical chemistry isbeing enr iched with many data. Admi ttedly, th e result s are reproducible only when the material is not explosive ; in this caseth e observed explosion temperature falls when th e rate of heatingis increased.
From the beginning, it has been possible to separate th emethods worthy of consideration from th ose of little or novalue ; to quote an apt expression by F . Feigl : "I have writtenit seems-the chapter on th e pathologica l anatomy of ana lyt icalchemistry." The author has been especially suecessful in correcting certain formulas and drying temperatures that have beensuggested in th e textbooks-for example, magnesium pyrophos phate reaches a constant weight from 477° on ; therefore it isuseless to ma intain it for 3 hours a t th e full t emp erature of theMeker burne r or the blast lamp.
The au thor has always wondered why writers are so meticulousin specifying pr ecipitation condit ions (volum e of th e liquid to
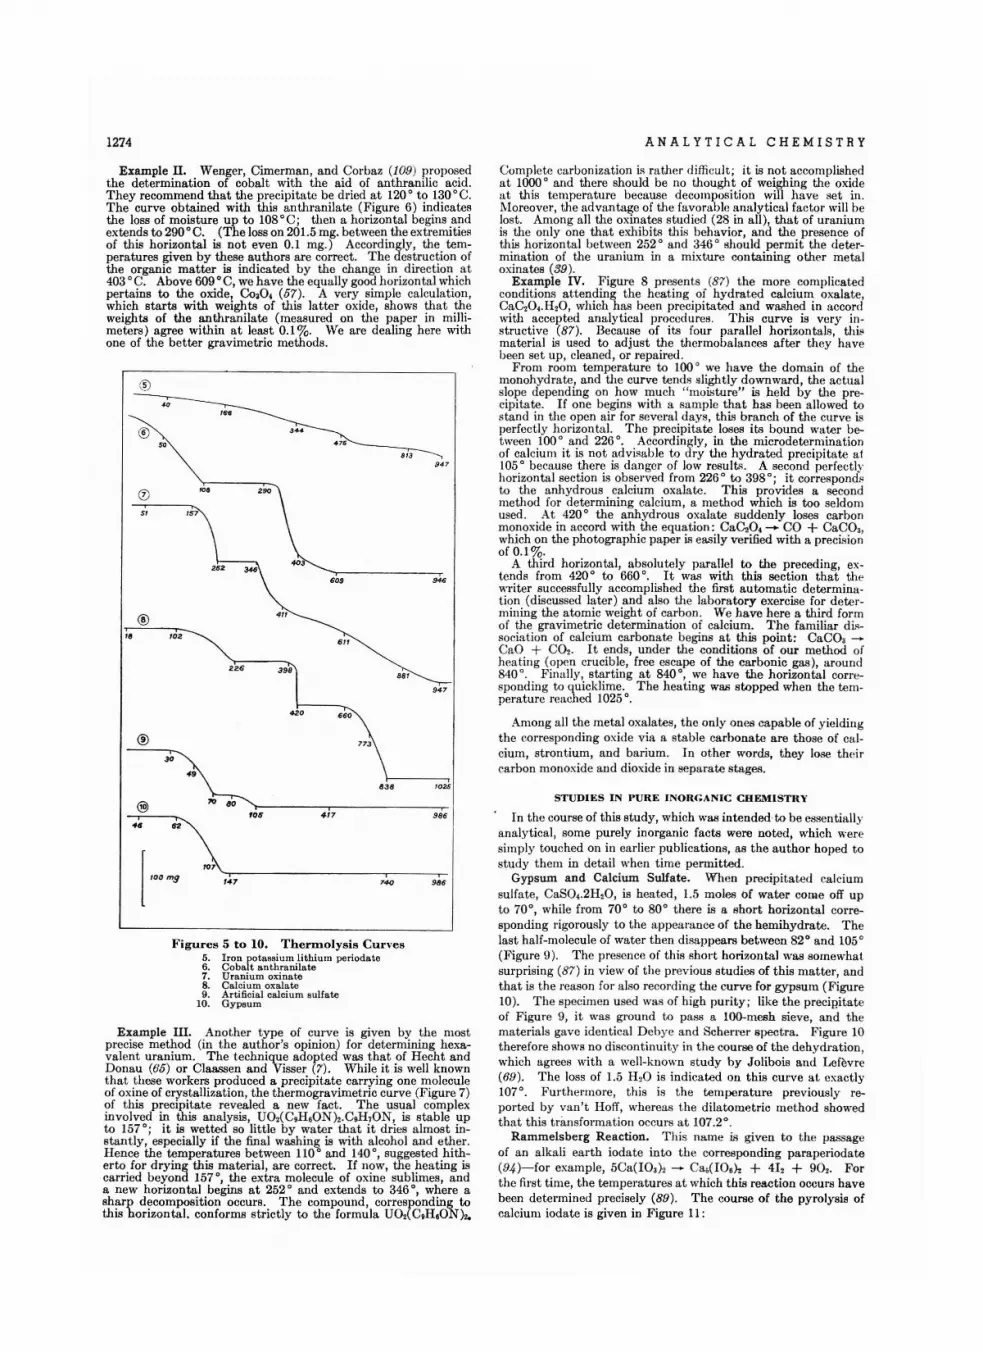
1274 A N A L YT I C A L CHEMI STRY
F igures 5 t o 10. T'herrnolysts Curves5. Iron potassium lithium periodate6. Cobalt anthranilate7. Uranium oxinate8. Cal cium oxal ate9. Artificial calcium sulfate
10. Gypsum
STUDIES IN I' UR E INORGANIC CHEMISTRY
In the course of this study, which was intended·to be essentia llyanalytical, some purely inorganic facts were noted, which wer esimpl y tou ched on in earlier publications, as the author hoped tostudy th em in detail when time permitted.
Gypsum and Calcium Sulfate. When precipitated ca lciumsulfate , CaSO,.2H.0 , is hea ted, 1.5 moles of water come off upto 70·, while from 70· to 80· there is a short horizontal corresponding rigoro usly to the appea ra nce of the hemihydrate. Thelast half-molecule of water then disappears between 82° and 1050
(Figure 9). The pres ence of this short horizontal was somewhatsurprising (87) in view of th e previous studies of this matter, andthat is th e reason for also record ing the curve for gypsum (Figure10). The specimen used was of high purity; like the precipitateof Figure 9, it was ground to pass a l00-mesh sieve, and thematerials gave identical Debye and Scherrer spectra. Figure 10therefore shows no discontinuity in the course of the dehydration ,which agrees with a well-known study by Jolibois and Lefevre(69). The loss of 1.5 H 20 is indicated on t his curve at exactly107·. Furthermore, this is the temperature previously reported by van't Hoff', whereas t he dilatometric method showedthat this transformation occu rs a t 107.2° .
Rarnrnels berg Reac tion . This name is given to the passageof an alka li earth iodate into th e corresponding paraperiodate(94 )- for example, 5Ca(IO,), -+ Ca,( IO ' h + 412 + 90,. Forthe first time, the temperatures at which this reaction occurs havebeen determined precisely (89) . The course of t he pyrolysis ofcalcium iodate is given in Figure 11:
Complete ca rboniza t ion is rather difficult; it is not accomplishedat 1000· and there should be no thought of weighing the oxideat th is temperature because decomposition will have set in.Moreover, the advantage of the favorab le analytical factor' will belost. Among all the oxinates studied (28 in all), that of uraniumis th e only one that exhibits thi s behavior, and the presence ofthis horizontal between 252 · and 346· should permit the determination of the uranium in a mixture containing other metaloxinates (39 ).
Example IV. Figure 8 pres ents (87) the mor e complica tedcondit ions attending the heating of hydrated calcium oxalate,CaC,O,.H,O, which has been precipitated and washed in accordwith accepted analytical proc edures. This curve is very instructive (87). Because of its four parallel horizontals, thismaterial L~ used to adjust the th ermobalances after they havebeen set up , cleaned, or repaired .
From room temperature to 100· we have the domain of themonohydrate, and the curve te nds sligh t ly downward, th e actualslope dep ending on how mu ch " moistu re" is he ld by the precipitate. If one begins with a sa mple that has been allowed tostand in the open air for several days, this branch of the curve isperfectly horizontal. The precipitate I08es its bound water between 100· and 226·. Accordingly, in the microdeterminationof calcium it is not advisab le to dry the hydrated precipitate at105· because there is danger of low resu lts. A second perfectlyhorizontal sect ion L~ observed from 226° to 398·; it correspond!'to the anhydrous calcium oxala te . This provides a secondmethod for determining ca lcium, a method which is too seldomused . At 420· the anhydrous oxalate suddenly loses carbonmonoxide in accord with the equation: Cac"O. -- CO + CaCO"which on the photographic paper is easily verified with a precisionof 0.1 %.
A third horizontal, absolutely parallel to the preceding, extends from 420· to 660·. It was with this section that thewriter successfully accomplished the first automatic determination (discussed la ter ) and also the laboratory exercise for determining the atomic weight of carbon. We have here a third formof the gravimetric determination of calcium. The familiar d issociat ion of calcium carbonate begins at this point: CaCO,-+Ca O + CO,. It ends, und er tile conditions of our method ofheating (open cru cible, free escape of the carbonic gas), around840 · . Filially, starting at 840 °, we have the horizontal correspond ing to quicklime. The heating was stopped when the temperature reached 1025·.
Among a ll the metal oxalates, the only ones capable of yieldingthe corresponding oxide via a stable carbonate are those of calcium, strontium, and barium. In other words, they lose thcircarbon monoxide and dioxide in sepa ra te stages.
1025
,986
9.'
I986
88'
,740
838\1------.1
773
6"
420
398
'02
®4.
®50 .7.
813347
0 10. 290
51 '57
®
®
@ ~~'l-_----'---------'-'os
~ ~[ ...~ "",~r-,---------'------'-
'.
Example II. Wenger, Cimerman, and Corbaz (l09 ) proposedthe determination of cobalt with the aid of anthranilic acid.They recommend that the precipitate be dried at 120· to 130·C.The curve obtained with this anthranilate (Figure 6) indicatesthe loss of moisture up to 108·C; then a horizontal begins andextends to 290·C. (The loss on 201.5 mg. between the extremitiesof this horizontal is not even 0.1 mg.) Accordingly, the temperatures given by these authors are correct. The destruction ofthe organic matter is indicated by the change in direction at403 ·C. Above 609·C, we have the equally good horizontal whichpertains to the oxide, CoaO. (57). A very simple calculation,which starts with weights of this latter oxide, shows that theweights of the anthranilate (measured on the paper in millimeters) agree within at leas t 0.1%. We are dealing here withone of the better gravimetric methods.
Example III. Another type of curve is given by th e mostprecise method (in the author's opinion) for determining hexaval ent uranium. The technique adopted was that of Hecht andDonau (65) or Claassen and Visser (7). Wh ile it is well knownthat these workers produced a precipitate carrying one moleculeof oxine of crystallization, the thermogravimetric curve (F igure 7)of this precipitate revealed a new fact. The usual complexinvolved in this analysis, UO,(C.H60NkC.H,ON, is stable upto 157·; it is wetted so little by water that it dries a lmost instantly, especially if the final washing is with a lcohol and ether.Hence the temperatures between 110· and 140 · , suggested hitherto for drying this material, are correct. If now, the heating iscarried beyond 157·, the extra molecule of oxin e sublimes, anda new horizontal begins at 252· and extends to 346·, where asharp decomposit ion occurs . The compound, corresponding tothis horizontal. conforms strictly to the formula UO,t C,H,ON)20
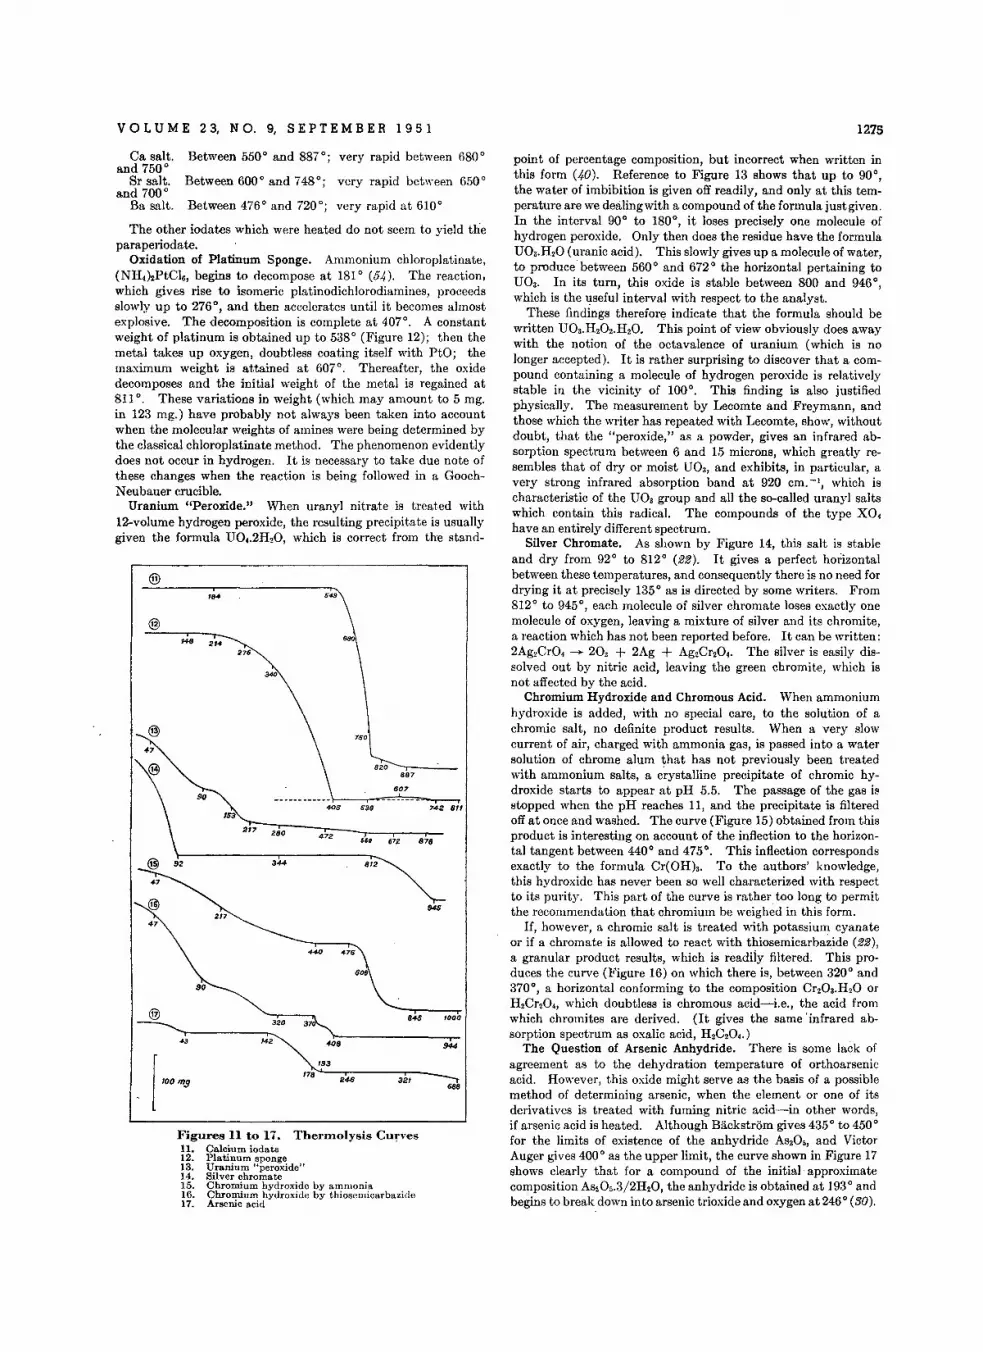
VOL U M E 2 3, N O. 9, S E PTE M B E R 1 9 5 1 1275
90
point of percentage composition, but incorrect when written inthis form (40). Reference to Figure 13 shows that up to 90°,the water of imbibition is given off readily, and only at this temperature are we dealing with a compound of the formula just given.In the interval 90° to 180°, it loses precisely one molecule ofhydrogen peroxide. Only then does the residue have the formulaU03.H20 (uranic acid). This slowly gives up a molecule of water,to produce between 560 ° and ()72° the horizontal pertaining toU03• In its turn, this oxide is stable between 800 and 946°,which is the useful interval with respect to the analyst.
These findings therefore indicate that the formula should bewritten U03.H202.H20. This point of view obviously does awaywith the notion of the octavalence of uranium (which is nolonger accepted). It is rather surprising to discover that a compound containing a molecule of hydrogen peroxide is relativelystable in the vicinity of 100°. This finding is also justifiedphysically. The measurement by Lecomte and Freymann, andthose which the writer has repeated with Lecomte, show, withoutdoubt, that the "peroxide," as a powder, gives an infrared absorption spectrum between 6 and 15 microns, which greatly resembles that of dry or moist U03, and exhibits, in particular, avery strong infrared absorption band at 920 em. -1, which ischaracteristic of the V03 group and all the so-called uranyl saltswhich contain this radical. The compounds of the type XO.have an entirely different spectrum.
Silver Chromate. As shown by Figure 14, this salt is stableand dry from 92° to 812° (22). It gives a perfect horizontalbetween these temperatures, and consequently there is no need fordrying it at precisely 135° as is directed by some writers. From812° to 945°, each molecule of silver chromate loses exactly onemolecule of oxygen, leaving a mixture of silver and its chromite,a reaction which has not been reported before. It can be written:2Ag2CrO. -- 20, + 2Ag + Ag2Cr20.. The silver is easily dissolved out by nitric acid, leaving the green chromite, which isnot affected by the acid.
Chromium Hydroxide and Chromous Acid. When ammoniumhydroxide is added, with no special care, to the solution of achromic salt, no definite product results. When a very slowcurrent of air, charged with ammonia gas, is passed into a watersolution of chrome alum that has not previously been treatedwith ammonium salts, a crystalline precipitate of chromic hydroxide starts to appear at pH 5.5. The passage of the gas isstopped when the pH reaches 11, and the precipitate is filteredoff at once and washed. The curve (Figure 15) obtained from thisproduct is interesting on account of the inflection to the horizontal tangent between 440° and 475°. This inflection correspondsexactly to the formula Cr(OH)a. To the authors' knowledge,this hydroxide has never been so well characterized with respectto its purity. This part of the curve is rather too long to permitthe recommendation that chromium be weighed in this form.
If, however, a chromic salt is treated with potassium cyanateor if a chromate is allowed to react with thiosemicarbazide (22),a granular product results, which is readily filtered. This produces the curve (Figure 1() on which there is, between 320° and370°, a horizontal conforming to the composition Cr203.H20 orH2Cr20., which doubtless is chromous acid-i.e., the acid fromwhich chromites are derived. (It gives the same 'infrared absorption spectrum as oxalic acid, H2C20•.)
The Question of Arsenic Anhydride. There is some lack ofagreement as to the dehydration temperature of orthoarsenicacid. However, this oxide might serve as the basis of a possiblemethod of determining arsenic, when the element or one of itsderivatives is treated with fuming nitric acid-in other words,if arsenic acid is heated. Although Backstrom gives 435° to 450°for the limits of existence of the anhydride As20" and VictorAuger gives 400° as the upper limit, the curve shown in Figure 17shows clearly that for a compound of the initial approximatecomposition AS~Ofi.3/2H20, the anhydride is obtained at 193° andbegins to break down into arsenic trioxide and oxygen at 246° (30).
846 ,{JOD
®'&4 549
@ - 2'.'76
®~""i -,..3'O 37"'\l-- --,r-
~.~ :8~~
178'"'--24S'-'----.,---
Figures II to 17. Thenllolysis Curves11. Calcium iodate12. Platinum sponge13. Uranium "peroxide"14. Silver chromate15. Chromium hydroxide by ammonia16. Chromium hydroxide by thiosemicarbazide17. Arsenic acid
Ca salt. Between 550° and 887°; very rapid between ()80°and 750°
Sr salt. Between ()OO ° and 748 0; very rapid between ()50°and 700°
Ba salt. Between 47()0 and 720°; very rapid at ()10°
The other iodates which were heated do not seem to yield theparaperiodate.
Oxidation of Platinum Sponge. Ammonium chloroplatinate,(NH.)2PtCI6, begins to decompose at 181° (54). The reaction,which gives rise to isomeric platinodichlorodiamines, proceedsslowly up to 276°, and then accelerates until it becomes almostexplosive. The decomposition is complete at 407°. A constantweight of platinum is obtained up to 538° (Figure 12); then themetal takes up oxygen, doubtless coating itself with PtO; themaximum weight is attained at ()07°. Thereafter, the oxidedecomposes and the initial weight of the metal is regained at811 0. These variations in weight (which may amount to 5 mg.in 123 mg.) have probably not always been taken into accountwhen the molecular weights of amines were being determined bythe classical chloroplatinate method. The phenomenon evidentlydoes not occur in hydrogen. It is necessary to take due note ofthese changes when the reaction is being followed in a GoochNeubauer crucible.
Uranium "Peroxide." When uranyl nitrate is treated with12-volume hydrogen peroxide, the resulting precipitate is usuallygiven the formula UO•.2H 20, which is correct from the stand-

1276 ANALYTICAL CHEMISTRY
~i 9597.2
~i ,
se '91
@270
65 10O 200 288
Pyrolysis of Copper Oxalate. When a boiling, neutral solutionof a cupric salt is treated with an oxalate, the precipitation isincomplete and the product is hard to filter. Its behavior towardheat is rather singular (74, 75). Figure 19 shows that, afterdehydration, the anhydrous copper oxalate is stable from 100°to 200°. It decomposes abruptly at 288° but, contrary to allexpectations, the pyrolysis does not proceed: CuC20, -+- CO +CO2 + CuO. The final product is cuprous oxide, doubtless be-
NEW FORMS OF GRAVIMETRIC DETERMINATION
The author has studied the pyrolysis curves of almost onethousand precipitates of interest to chemical analysis. Although
DISCOVERY OF NEW COMl'OUNDS
Frequently a thermolysis curve includes a level portionwhich corresponds to a compound whose existence has not beenrecorded in the literature. Its molecular weight can be obtainedby a simple calculation from the formula of the initial compoundand that of the residue. Then, as the extreme temperatures ofthe horizontal are known, it is permissible to heat another sampleto a temperature in the center, for instance, of the horizontal inquestion. The following illustrative examples have been selected from among the eighty cases studied.
Cerium Iodate. Chernikhov and Uspenkaya (5) proposedthat cerium be precipitated as 2Ce(I03),.KI03.8H20, which couldbe weighed after drying with ether. Actually, the pyrolysiscurve (Figure 20) shows a steady fall, and then a sudden dropbetween 410° and 650°, which corresponds to a loss of oxygenand iodine (analogous to the case of the alkali earth iodates).However, this is probably not a Rammelsberg reaction. A mixture of potassium iodide and cerium metaperiodate, Ce(IO,)"is present between 650° and 746°. The residue at 880° containscerium peroxide. Though this precipitate cannot be used ingravimetry, its pyrolysis curve gives promise of initiating newstudies in pure inorganic chemistry (56).
Reduced Silver. A more or less oxidizable deposit of metallicsilver is obtained from a silver nitrate solution by electrolysis,or by the reducing action of ammoniacal cuprous chloride,hypophosphorous acid, cadmium, aluminum, hydroxylamine,vitamin C, etc. However, if we select the classic instance of thesilvering of glass-e-i.e., the reduction by formaldehyde and 15%ammonia-no metallic silver is deposited in the cold. The blackprecipitate gives a curve (Figure 21) which, after a very shorthorizontal, has a slow fall from 40° to 160°, where sudden decomposition occurs. The constant weight for the silver is obtained from 500° on, and drying above this temperature is advisable when this method is used for quantitative purposes.
The original precipitate has attracted attention. It is knownthat the NH groups are specific in the detection of silver. Underthe present experimental conditions, one molecule of ammoniacombines with two molecules of formaldehyde, producing dihydroxymethylamine, HOCH2NHCH20H. Replacement ofthe central hydrogen atom by silver leads to a precipitate,HOCH2NAgCH20H, the so-called reduced silver (molecularweight 184), which has been decomposed by heat (75).
Cobaltous Acid. The thermolysis curve obtained from theproduct of the action of potassium persulfate or sodium hypochlorite on a cobaltous salt, gives no indication of a hydratedcobaltic oxide. The break in this curve (Figure 22) at 72 0
corresponds to C0203.H20 or H 2C020" the parent acid of the cobaltites. This is analogous to chromous acid and is the onlycompound of which there is positive evidence on the graph.It subsequently loses water and changes into C030, at 371 0.
Metaboric Acid. When orthoboric acid is heated progressively,it retains the composition H 3B0 3up to 55°. No part of the dehydration curve (Figure 23) indicates the existence of pyroboricacid, H 2B,07. On the contrary, the horizontal between 135.5°'and 168 ° represents the existence region of metaboric acid,HB02• This finding provided a simple method of isolating thelatter in a pure state. The molecular weight indicated by thegraph is 43.8 (calculated 43.828). Above 168°, the materialloses water steadily, and the perfectly level portion of the curvecorresponding to boric anhydride, B203, begins at 443 ° (41).
Metavanadic Acid. If slightly moist ammonium metavanadateis heated (59), a horizontal is obtained between 45° and 134 0
(Figure 24); this agrees closely to the composition NH,V03.From 134 ° to 198°, the loss of weight corresponds to the elimination of all the ammonia, and the residue consists of metavanadicacid, HV03. This finding suggests a method for the preparationof this acid, but the latter is not stable. It begins to lose water at206°, and the anhydride, V20" is obtained quantitatively at 448°.This oxide is very stable, up to 1000°, at least.
cause of the reducing action of the carbon monoxide. Consequently, the following equation is more in line with the facts:2CuC,O, -- CO + 3C02 + Cu 20. However, the cuprousoxide is not within its zone of stability and so it reoxidizes veryrapidly. From 494° on, we have the black oxide, CuO (which,in turn, regenerates the red oxide above 1030°).
283
371
/66
177
lfigures 18 to 23. Tber'molysis CurvesIS. Colloidal bismuth19. Copper oxalate20. Cerium iodate21. HReduced silver"22. Cobaltous acid23. Boric acid
72 --,----,---------------,.
55
®494-
363·655
:us 410
@i
~l ~4<1
@ , i676 746
880
i i167 28' 948
Suboxide of Bismuth. Inorganic chemists have often arguedthe question whether bismuth exhibits a valence below 3. Byfollowing the directions of Mawrow and Muthmann (76) theauthor obtained, from bismuth oxychloride and 50% hypophosphorous acid (specific gravity 1.27), a black precipitate, whichfiltered rather poorly and showed a marked tendency to assumethe colloidal condition. In that case it is necessary to heat thefiltrate to reprecipitate the product. The curve (Figure 18)has a horizontal from 92° to 191°, which indicates the existenceof a material with the empirical formula Bi 20 . However, as theDebye and Scherrer spectrum demonstrated, we were not dealingwith a definite compound, but with metallic bismuth, which carried adsorbed oxygen, and in fortuitous amounts. Above 230°,the mixture oxidized rapidly and yielded Bi 20 3 quantitativelybeyond 840°. Obviously, the determination of bismuth by thisprocedure is not recommended.
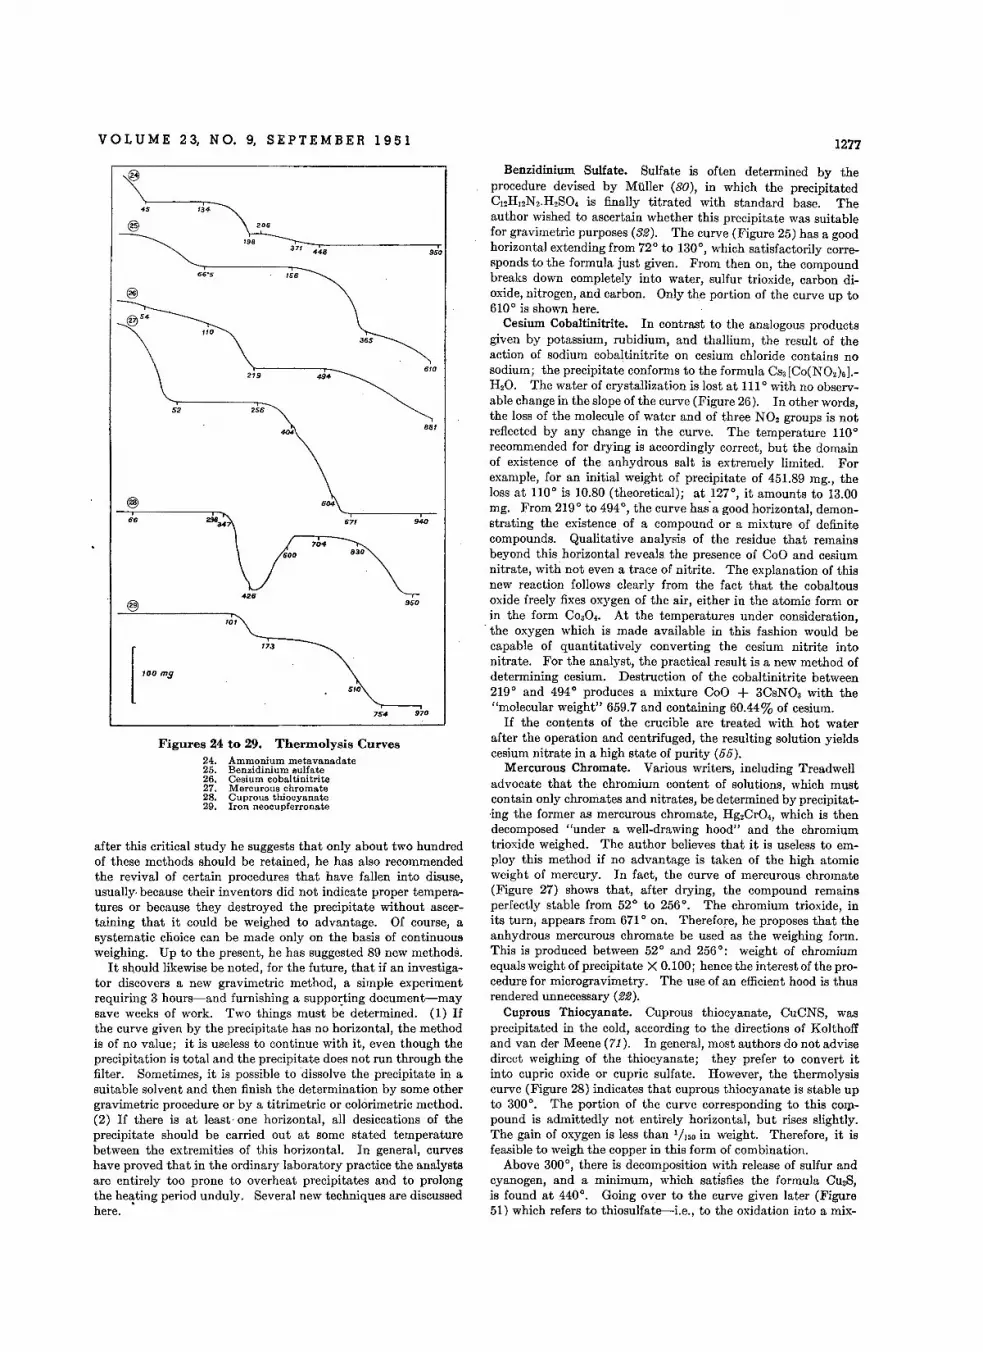
VOL U M E 2 3, N O. 9, S E PTE M B E R 1 9 5 1 1277
Benzidinium Sulfate. Sulfate is often determined by theprocedure devised by MUller (80), in which the precipitatedC12H12N2.H2S0. is finally titrated with standard base. Theauthor wished to ascertain whether this precipitate was suitablefor gravimetric purposes (32). The curve (Figure 25) has a goodhorizontal extending from 72° to 130°, which satisfactorily corresponds to the formula just given. From then on, the compoundbreaks down completely into water, sulfur trioxide, carbon dioxide, nitrogen, and carbon. Only the portion of the curve up to610° is shown here.
Cesium Cobaltinitrite. In contrast to the analogous productsgiven by potassium, rubidium, and thallium, the result of theaction of sodium cobaltinitrite on cesium chloride contains nosodium; the precipitate conforms to the formula CS3[Co(N02)6].H20. The water of crystallization is lost at 111° with no observable change in the slope of the curve (Figure 26). In other words,the loss of the molecule of water and of three NO. groups is notreflected by any change in the curve. The temperature 110°recommended for drying is accordingly correct, but the domainof existence of the anhydrous salt is extremely limited. Forexample, for an initial weight of precipitate of 451.89 mg., theloss at 110° is 10.80 (theoretical); at 127°, it amounts to 13.00mg. From 219° to 494°, the curve has'a good horizontal, demonstrating the existence. of a compound or a mixture of definitecompounds. Qualitative analysis of the residue that remainsbeyond this horizontal reveals the presence of CoO and cesiumnitrate, with not even a trace of nitrite. The explanation of thisnew reaction follows clearly from the fact that the cobaltousoxide freely fixes oxygen of the air, either in the atomic form orin the form C030.. At the temperatures under consideration,
. the oxygen which is made available in this fashion would becapable of quantitatively converting the cesium nitrite intonitrate. For the analyst, the practical result is a new method ofdetermining cesium. Destruction of the cobaltinitrite between219° and 494° produces a mixture CoO + 3CsN03 with the"molecular weight" 659.7 and containing 60.44% of cesium.
If the contents of the crucible are treated with hot waterafter the operation and centrifuged, the resulting solution yieldscesium nitrate in a high state of purity (55).
Mercurous Chromate. Various writers, including Treadwelladvocate that the chromium content of solutions, which mustcontain only chrorriates and nitrates, be determined by precipitat·ing the former as mercurous chromate, Hg2CrO., which is thendecomposed "under a well-drawing hood" and the chromiumtrioxide weighed. The author believes that it is useless to employ this method if no advantage is taken of the high atomicweight of mercury. In fact, the curve of mercurous chromate(Figure 27) shows that, after drying, the compound remainsperfectly stable from 52° to 256°. The chromium trioxide, inits turn, appears from 671° on. Therefore, he proposes that theanhydrous mercurous chromate be used as the weighing form.This is produced between 52° and 256°: weight of chromiumequals weight of precipitate X 0.100; hence the interest of the procedure for microgravimetry. The use of an efficient hood is thusrendered unnecessary (22).
Cuprous Thiocyanate. Cuprous thiocyanate, CuCNS, wasprecipitated in the cold, according to the directions of Kolthoffand van del' Meene (71). In general, most authors do not advisedirect weighing of the thiocyanate; they prefer to convert itinto cupric oxide or cupric sulfate. However, the thermolysiscurve (Figure 28) indicates that cuprous thiocyanate is stable upto 300°. The portion of the curve corresponding to this COIll
pound is admittedly not entirely horizontal, but rises slightly.The gain of oxygen is less than 1/160 in weight. Therefore, it isfeasible to weigh the copper in this form of combination.
Above 300°, there is decomposition with release of sulfur andcyanogen, and a minimum, which satisfies the formula Cu2S,is found at .440°. Going over to the curve given later (Figure51) which refers to thiosulfate-Le., to the oxidation into a mix-
950
88/
950
754 970
830
5/0
704
600
173
256
219
101
52
Figures 24 to 29. Tberrnolysls Curves24. Ammonium metavanadate25. Benzidinium sulfate26. Cesium cobaltinitrite27. Mercurous chromate28. Cuprous thiocyanate29. Iron neocupferronate
66
<5 134-
@ 206
19.371 ...
66-5 156
@
610
,,0
after this critical study he suggests that only about two hundredof these methods should be retained, he has also recommendedthe revival of certain procedures that have fallen into disuse,usually- because their inventors did not indicate proper temperatures or because they destroyed the precipitate without ascertaining that it could be weighed to advantage. Of course, asystematic choice can be made only on the basis of continuousweighing. Up to the present, he has suggested 89 new methods.
It should likewise be noted, for the future, that if an investigator discovers a new gravimetric method, a simple experimentrequiring 3 hours-and furnishing a supporting document-maysave weeks of work. Two things must be determined. (1) Ifthe curve given by the precipitate has no horizontal, the methodis of no value; it is useless to continue with it, even though theprecipitation is total and the precipitate does not run through thefilter. Sometimes, it is possible to dissolve the precipitate in asuitable solvent and then finish the determination by some othergravimetric procedure or by a titrimetric or colorimetric method.(2) If there is at least· one horizontal, all desiccations of theprecipitate should be carried out at some stated temperaturebetween the extremities of this horizontal. In general, curveshave proved that in the ordinary laboratory practice the analystsare entirely too prone to overheat precipitates and to prolongthe heating period unduly. Several new techniques are discussedhere .•
365
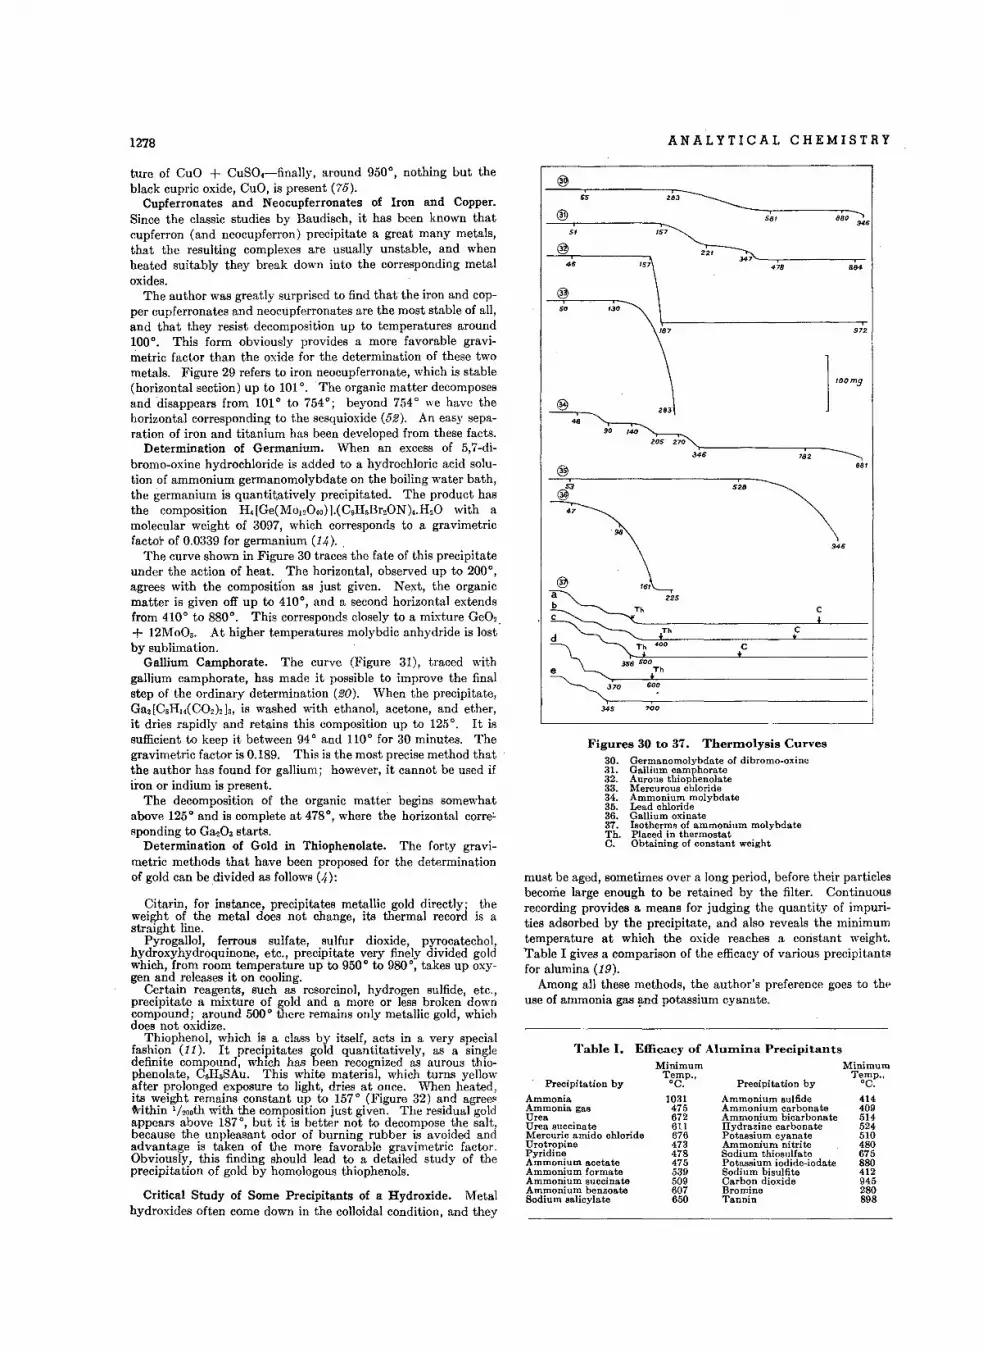
1278 ANALYTICAL CHEMISTRY
972
,884
8~0 --..,946
881
946
782
c*
f
c
*
2~~_.,.., ~_58'
Efficacy of AlulDina PrecipitantsMinimum Minimum
Temp., Temp..°C. Precipitation by °C.
1031 Ammonium sulfide 414475 Ammonium carbonate 409672 Ammonium bicarbonate 514611 Hydrazine carbonate 524676 Potassium cyanate 510473 Ammonium nitrite 480478 Sodium thiosulfate 675475 Potassium iodide-iodate 880539 Sodium bisulfite 412509 Carbon dioxide 945607 Bromine 280650 Tannin 898
Table I.
,~5
i51
$0 '30
@283
4B90 ,40
205 270
346
®~3
47
·98
Figures 30 to 37. Thermolysis Curves30. Germanomolvbdate of dibromo-oxine31. Gallium camphorate32. Aurous thiophenolate33. Mercurous chloride34. Ammonium molybdate35. Lead chloride36. Gallium oxinate37. Isotherms of ammonium molybdateTh. Placed in thermostatC. Obtaining of constant weight
Precipitation by
AmmoniaAmmonia gasUreaUrea succinateMercuric arnido chlorideUrotropinePyridineAmmonium acetateAmmonium formateAmmonium succinateAmmonium benzoateSodium salicylate
must be aged, sometimes over a long period, before their particlesbecome large enough to be retained by the filter. Continuousrecording provides a means for judging the quantity of impurities adsorbed by the precipitate, and also reveals the minimumtemperature at which the oxide reaches a constant weight.Table I gives a comparison of the efficacy of various precipitantsfor alumina (19).
Among all these methods, the author's preference goes to theuse of ammonia gas and potassium cyanate.
Citarin, for instance, precipitates metallic gold directly; theweight of the metal does not change, its thermal record is astraight line.
Pyrogallol, ferrous sulfate, sulfur dioxide, pyrocatechol,hydroxyhydroquinono, etc., precipitate very finely divided goldwhich, from room temperature up to 950° to 980°, takes up oxygen and releases it on cooling.
Certain reagents, such as resorcinol, hydrogen sulfide, etc.,precipitate a mixture of gold and a more or less broken downcompound; around 500° there remains only metallic gold, whichdoes not oxidize.
Thiophenol, which is a class by itself, acts in a very specialfashion (11). It precipitates gold quantitatively, as a singledefinite compound, which has been recognized as aurous thiophenolate, C6H6SAu. This white material, which turns yellowafter prolonged exposure to light, dries at once. When heated,its weight remains constant up to 157° (Figure 32) and agreesWithin 1;'ooth with the composition just given. The residual goldappears above 187°, but it is better not to decompose the salt,because the unpleasant odor of burning rubber is avoided andadvantage is taken of the more favorable gravimetric factor.Obviously, this finding should lead to a detailed study of theprecipitation of gold by homologous thiophenols,
Critical Study of Some Precipitants of a Hydroxide. Metalhydroxides often come down in the colloidal condition, and they
ture of CuO + CuSO.-finally, around 950°, nothing but theblack cupric oxide, CuO, is present (75).
Cupferronates and Neocupferronates of Iron and Copper.Since the classic studies by Baudisch, it has been known thatcupferron (and neocupferron) precipitate a great many metals,that the resulting complexes are usually unstable, and whenheated suitably they break down into the corresponding metaloxides.
The author was greatly surprised to find that the iron and copper cupferronates and neoctipferronates are the most stable of all,and that they resist decomposition up to temperatures around100°. This form obviously provides a more favorable gravimetric factor than the oxide for the determination of these twometals. Figure 29 refers to iron neocupferronate, which is stable(horizontal section) up to 1010. The organic matter decomposesand disappears from 101° to 754°; beyond 754° we have thehorizontal corresponding to the sesquioxide (52). An easy separation of iron and titanium has been developed from these facts.
Determination of Germanium. When an excess of 5,7-dibromo-oxine hydrochloride is added to a hydrochloric acid solution of ammonium germanomolybdate on the boiling water bath,the germanium is quantitatively precipitated. The product hasthe composition H.[Ge(Mo1,O.o)].(CgH.Br20N)•.H,O with amolecular weight of 3097, which corresponds to a gravimetricfactor of 0.0339 for germanium (14).
The curve shown in Figure 30 traces the fate of this precipitateunder the action of heat. The horizontal, observed up to 200°,agrees with the composition as just given. Next, the organicmatter is given off up to 410°, and a second horizontal extendsfrom 410° to 880°. This corresponds closely to a mixture GeO,.+ 12Mo03• At higher temperatures molybdic anhydride is lostby sublimation.
Gallium Camphorate. The curve (Figure 31), traced withgallium camphorate, has made it possible to improve the finalstep of the ordinary determination (20). When the precipitate,Ga, [CsH14(CO,), h, is washed with ethanol, acetone, and ether,it dries rapidly and retains this composition up to 1250. It issufficient to keep it between 94° and HO° for 30 minutes. Thegravimetric factor is 0.189. This is the most precise method thatthe author has found for gallium; however, it cannot be used ifiron or indium is present.
The decomposition of the organic matter begins somewhatabove 125° and is complete at 478°, where the horizontal corresponding to Ga,03 starts.
Determination of Gold in Thiophenolate. The forty gravimetric methods that have been proposed for the determinationof gold can be divided as follows (4):
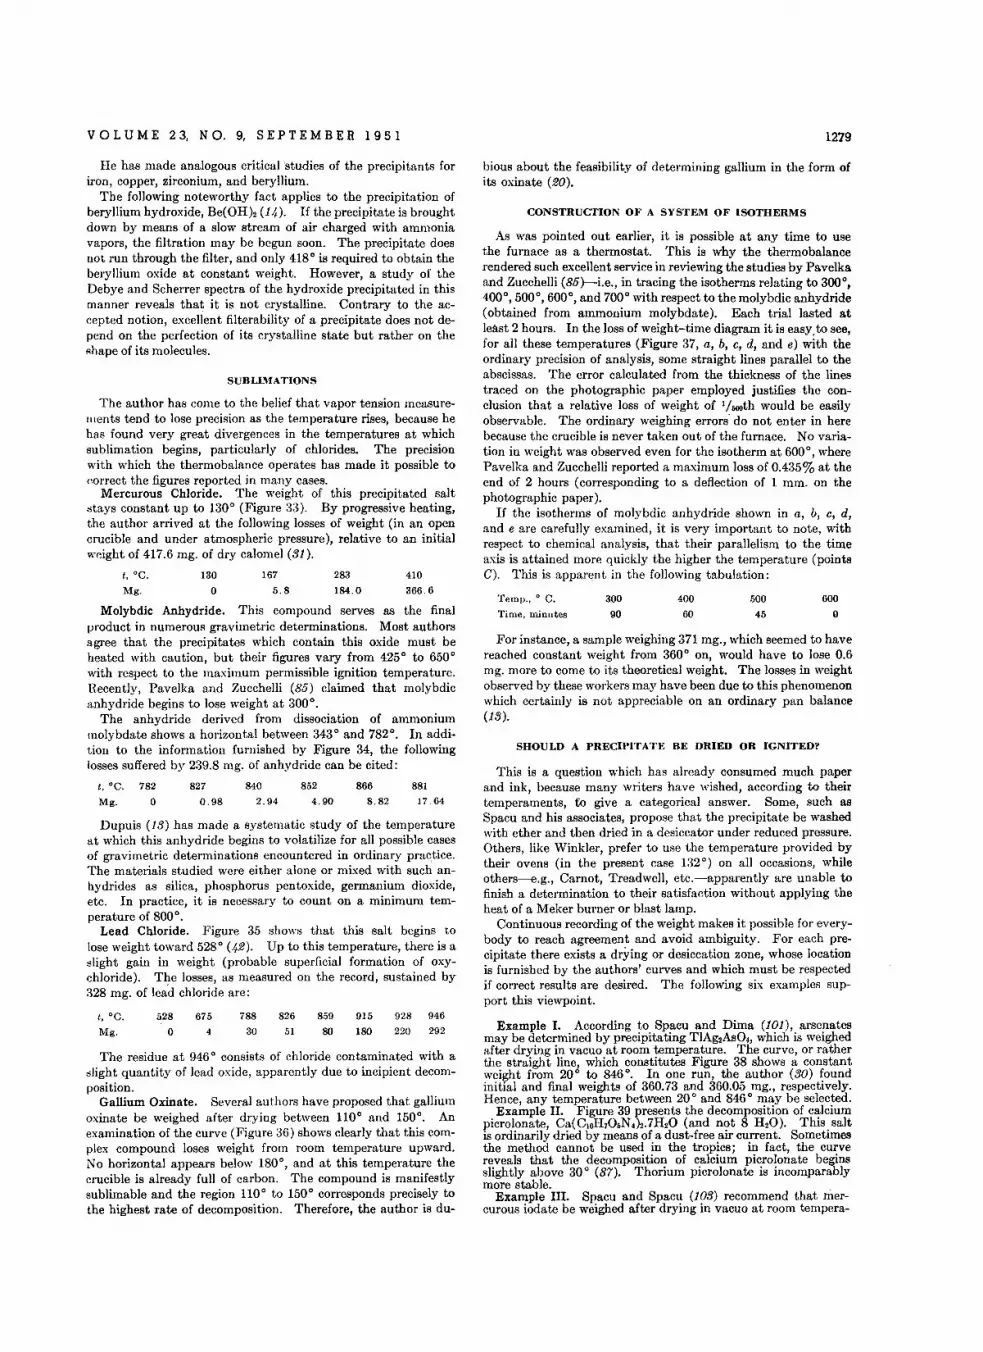
VOL U M E 2 3, N O. 9, S E PTE M B E R 1 95 1 1279
Molybdic Anhydride. This compound serves as the finalproduct in numerous gravimetric determinations. Most authorsagree that the precipitates which contain this oxide must beheated with caution, but their figures vary from 425° to 650°with respect to the maximum permissible ignition temperature.Recently, Pavelka and Zucchelli (85) claimed that molybdicanhydride begins to lose weight at 300°.
The anhydride derived from dissociation of ammoniummolybdate shows a horizontal between 343° and 782°. In addition to the information furnished by Figure 34, the followinglosses suffered by 239.8 mg. of anhydride can be cited:
Dupuis (13) has made a systematic study of the temperatureat which this anhydride begins to volatilize for all possible casesof gravimetric determinations encountered in ordinary practice.The materials studied were either alone or mixed with such anhydrides as silica, phosphorus pentoxide, germanium dioxide,etc. In practice, it is necessary to count on a minimum temperature of 800°.
Lead Chloride. Figure 35 shows that this salt begins tolose weight toward 528° (42). Up to this temperature, there is aslight gain in weight (probable superficial formation of oxychloride). The losses, as measured on the record, sustained by328 mg. of lead chloride are:
SUBLIMATIONS
The author has come to the belief that vapor tension measurements tend to lose precision as the temperature rises, because hehas found very great divergences in the temperatures at whichsublimation begins, particularly of chlorides. The precisionwith which the thermobalance operates has made it possible tocorrect the figures reported in many cases.
Mercurous Chloride. The weight of this precipitated saltstays constant up to 130° (Figure 33). By progressive heating,the author arrived at the following losses of weight (in an opencrucible and under atmospheric pressure), relative to an initialweight of 417.6 mg. of dry calomel (31).
He has made analogous critical studies of the precipitants foriron, copper, zirconium, and beryllium.
The following noteworthy fact applies to the precipitation ofberyllium hydroxide, Be(OHh (14). If the precipitate is broughtdown by means of a slow stream of air charged with ammoniavapors, the filtration may be begun soon. The precipitate doesnot run through the filter, and only 418° is required to obtain theberyllium oxide at constant weight. However, a study of theDebye and Scherrer spectra of the hydroxide precipitated in thismanner reveals that it is not crystalline. Contrary to the accepted notion, excellent filterability of a precipitate does not depend on the perfection of its crystalline state but rather on theshape of its molecules.
600
o500
45
400
60
300
90
Temp.• ° C.
Time, minutes
For instance, a sample weighing 371 mg., which seemed to havereached constant weight from 360° on, would have to lose 0.6mg. more to come to its theoretical weight. The losses in weightobserved by these workers may have been due to this phenomenonwhich certainly is not appreciable on an ordinary pan balance(13).
bious about the feasibility of determining gallium in the form ofits oxinate (20).
CONSTRUCTION OF A SYSTEM OF ISOTHERMS
As was pointed out earlier, it is possible at any time to usethe furnace as a thermostat. This is why the thermobalancerendered such excellent service in reviewing the studies by Pavelkaand Zucchelli (85}-i.e., in tracing the isotherms relating to 300°,400°,500°,600°, and 700° with respect to the molybdic anhydride(obtained from ammonium molybdate). Each trial lasted atleast 2 hours. In the loss of weight-time diagram it is easy, to see,for all these temperatures (Figure 37, a, b, c, d, and e) with theordinary precision of analysis, some straight lines parallel to theabscissas. The error calculated from the thickness of the linestraced on the photographic paper employed justifies the conclusion that a relative loss of weight of '/600th would be easilyobservable. The ordinary weighing errors' do not enter in herebecause the crucible is never taken out of the furnace. No variation in weight was observed even for the isotherm at 600°, wherePavelka and Zucchelli reported a maximum loss of 0.435% at theend of 2 hours (corresponding to a deflection of 1 mm. on thephotographic paper).
If the isotherms of molybdic anhydride shown in a, b, c, d,and e are carefully examined, it is very important to note, withrespect to chemical analysis, that their parallelism to the timeaxis is attained more quickly the higher the temperature (pointsC). This is apparent in the following tabulation:
This is a question which has already consumed much paperand ink, because many writers have wished, according to theirtemperaments, to give a categorical answer. Some, such asSpacu and his associates, propose that the precipitate be washedwith ether and then dried in a desiccator under reduced pressure.Others, like Winkler, prefer to use the temperature provided bytheir ovens (in the present case 132°) on all occasions, whileothers-e.g., Carnot, Treadwell, etc.-apparently are unable tofinish a determination to their satisfaction without applying theheat of a Meker burner or blast lamp.
Continuous recording of the weight makes it possible for everybody to reach agreement and avoid ambiguity. For each precipitate there exists a drying or desiccation zone, whose locationis furnished by the authors' curves and which must be respectedif correct results are desired. The following six examples support this viewpoint.
SHOULD A PRECIPITATE BE DRIED OR IGNITED?
88117.64
410
366.6
8668.82
283
184.0
852
4.90
167
5.8
8402.94
130
o
827
0.98
t,OC.
Mg.
t, °C. 782
Mg. 0
The residue at 946 ° consists of chloride contaminated with aslight quantity of lead oxide, apparently due to incipient decomposition.
Gallium Oxinate. Several authors have proposed that. galliumoxinate be weighed after drying between 110° and 150°. Anexamination of the curve (Figure 36) shows clearly that this complex compound loses weight from room temperature upward.No horizontal appears below 180°, and at this temperature thecrucible is already full of carbon. The compound is manifestlysublimable and the region HO° to 150° corresponds precisely tothe highest rate of decomposition. Therefore, the author is du-
t,OC.
Mg.
528
o675
4
788
30
826
51
859
80
915
180
928 946220 292 Example I. According to Spacu and Dima (101), arsenates
may be determined by precipitating TIA~As04,which is weighedafter drying in vacuo at room temperature. The curve, or ratherthe straight line, which constitutes Figure 38 shows a constantweight from 20° to 846°. In one run, the author (30) foundinitial and final weights of 360.73 and 360.05 mg., respectively.Hence, any temperature between 20 o and 846 ° may be selected.
Example II. Figure 39 presents the decomposition of calciumpicrolonate, Ca(CIOH70.N4)2.7H20 (and not 8 H 20). This saltis ordinarily dried by means of a dust-free air current. Sometimesthe method cannot be used in the tropics; in fact, the curvereveals that the decomposition of calcium picrolonate beginsslightly above 30° (87). Thorium picrolonate is incomparablymore stable.
Example III. Spacu and Spacu (103) recommend that mercurous iodate be weighed after drying in vacuo at room tempera-
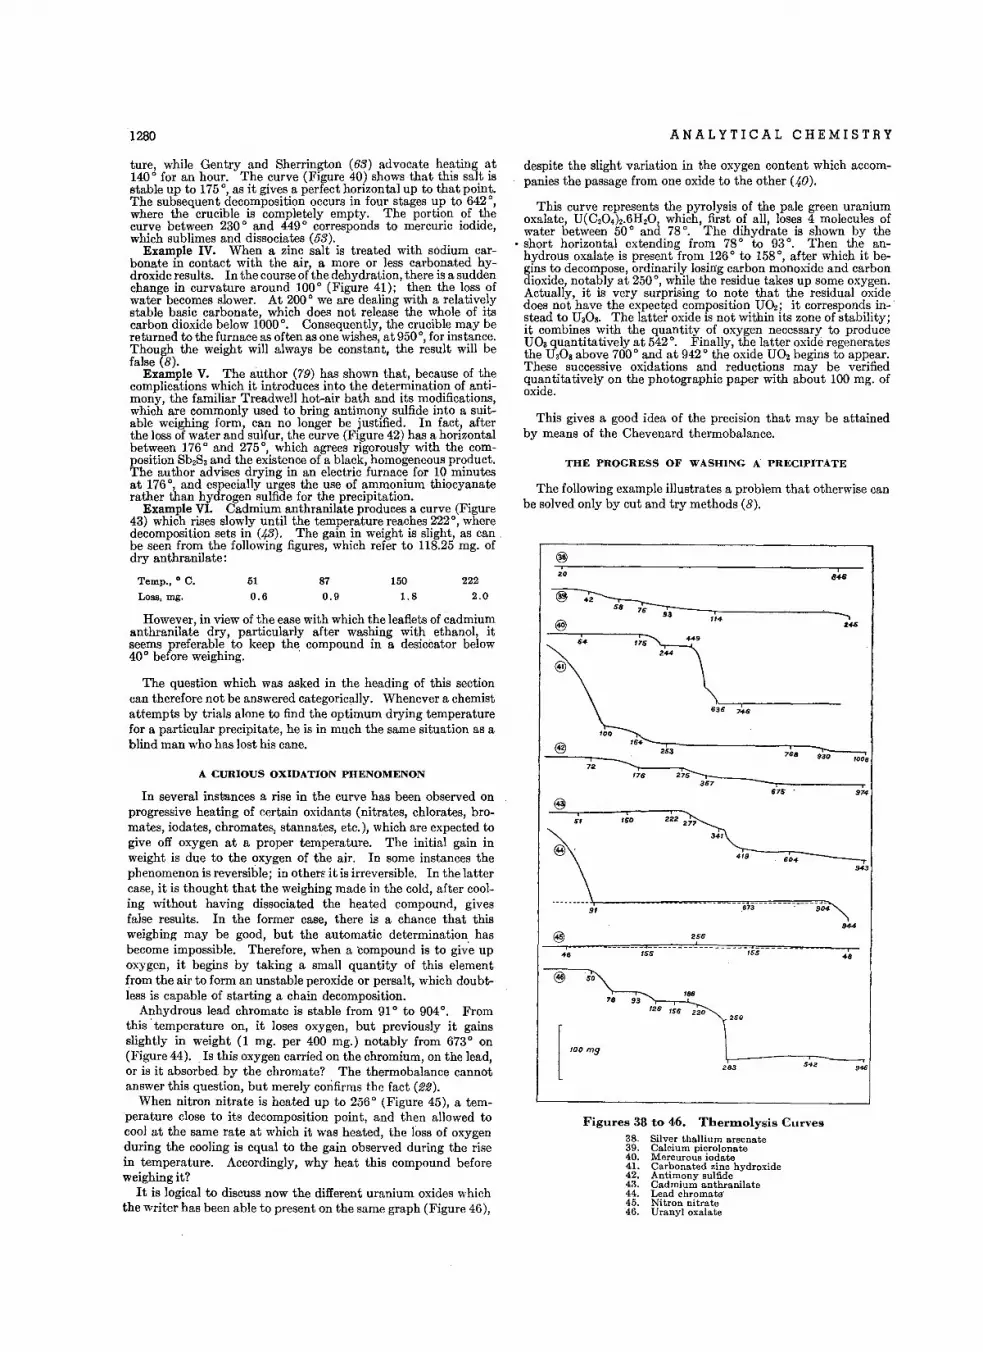
1280 ANALYTICAL CHEMISTRY
However in view of the ease with which the leaflets of cadmiumanthranilate dry, particularly after washing with. ethanol, itseems preferable to keep the compound in a desiccator below40° before weighing. '
The question which was asked in the heading of this sectioncan therefore not be answered categorically. Whenever a chemistattempts by trials alone to find the optimum drying temperaturefor a particular precipitate, he is in much the same situation as ablind man who has lost his cane.
,974
943
1008
'46
us
,48
'30
542
6044'9
250
283
34'
"4
222 277
253 768
is»
255
- ,~$---n --_.... _--------'55--- --
9'
7~ --..........__-t-r-
176 2~~357 "-T,--------.
675
,846
'\'ITS244
63'-6-746"------
Figures 38 to 46. Therm.olysis Curves38. Silver thallium arsenate39. Calcium picrolonate40. Mercurous iodate41. Carbonated zinc hydroxide42. Antimony sulfide43. Cadmium anthranilate44. Lead chromate-45. Nitron nitrate46. Uranyl oxalate
,48
20
@
This gives a good idea of the precision that may be attainedby means of the Chevenard thermobalance.
THE PROGRESS OF WASHING A PRECIPITATE
The following example illustrates a problem that otherwise canbe solved only by cut and try methods (8).
despite the slight variation in the oxygen content which accompanies the passage from one oxide to the other (.4-0).
This curve represents the pyrolysis of the pale green uraniumoxalate, V(C20.)..6H20, which, first of all, loses 4 molecules ofwater between 50 ° and 78°. The dihydrate is shown by the
• short horizontal extending from 78 ° to 93°. Then the anhydrous oxalate is presentfrom .126° to 1580, af~r which it begins to decompose, ordinarily losing carbon monoxide and carbondioxide, notably at 250°, while the residue takes up so~e oxyg~n.Actually it is very surprising to note that the residual OXidedoes not'have the expected composition VO,; it corresponds instead to V30g• The latter oxide is not within its zone of stability;it combines with the quantity of oxygen necessary to produceV03 quantitatively at 542°. Finally, the latter oxide regeneratesthe VgOgabove 700° and at 942° the oxide V02 begins to appear.These successive oxidations and reductions may be verifiedquantitatively on the photographic paper with about 100 mg. ofoxide.
2222.0
150
1.8
87
0.951
0.6
Temp., 0 C.
Loss. mg.
A CURIOUS OXIDATION PHENOMENON
In several instances a rise in the curve has been observed onprogressive heating of certain oxidants (nitrates, chlorates, bromates, iodates, chromates, stannates, etc.), which are expected togive off oxygen at a proper temperature. The initial gain inweight is due to the oxygen of the air. In some instances thephenomenon is reversible; in others it is irreversible. In the lattercase, it is thought that the weighing made in the cold, after cooling without having dissociated the heated compound, givesfalse results. In the former case, there is a chance that thisweighing may be good, but the automatic determination. hasbecome impossible. Therefore, when a compound is to give upoxygen, it begins by taking a small quantity of this elementfrom the air to form an unstable peroxide or persalt, which doubtless is capable of starting a chain decomposition.
Anhydrous lead chromate is stable from 91° to 904°. Fromthis' temperature on, it loses oxygen, but previously it gainsslightly in weight (1 mg. per 400 mg.) notably from 673° on(Figure 44). Is this oxygen carried on the chromium, on the lead,or is it absorbed by the chromate? The thermobalance cannotanswer this question, but merely confirms the fact (22).
When nitron nitrate is heated up to 256° (Figure 45), a temperature close to its decomposition point, and then allowed tocool at the same rate at which it was heated, the loss of oxygenduring the cooling is equal to the gain observed during the risein temperature. Accordingly, why heat this compound beforeweighing it?
It is logical to discuss now the different uranium oxides whichthe writer has been able to present on the same graph (Figure 46),
ture, while Gentry and Sherrington (63) advocate he:;tting ~t140° for an hour. The curve (Figure 40) shows that this salt ISstable up to 175°, as it gives a perfect horizontal up to that point,The subsequent decomposition occurs in four stages up to 642°,where the crucible is completely empty. The portion of thecurve between 230 ° and 449 ° corresponds to mercuric iodide,which sublimes and dissociates (53).
Example IV. When a zinc salt is treated with sodium carbonate in contact with the air, a more or less carbonated hydroxide results. In the course of the dehydration, there is a suddenchange in curvature around 100° (Figure 41); then the loss ofwater becomes slower. At 200° we are dealing with a relativelystable basic carbonate, which does not release the whole of itscarbon dioxide below 1000°. Consequently, the crucible may bereturned to the furnace as often as one wishes, at 950°, for instance.Though the weight will always be constant, the result will befalse (8).
Example V. The author (79) has shown that, because of thecomplications which it introduces into the determination of :;tntlmony, the familiar Treadwell hot-air bath and ItS modifications,which are commonly used to bring antimony sulfide into a SUItable weighing form, can no longer be justified. In fact, afterthe loss of water and sulfur, the curve (Figure 42) has a horizontalbetween 176° and 275°, which agrees rigorously with the composition Sb2S3 and the existence of a black, homogeneous product.The author advises drying in an electric furnace for 19 minutesat 176°, and especially urges the use of :;tn:m~mum thiocyanaterather than hydrogen sulfide for the precipitation.
Example VI. Cadmium anthranilate produces a curve (Figure43) which rises slowly until the temperature reaches 222°, wheredecomposition sets in (43). The gain in weight is slight, as can.be seen from the following figures, which refer to 118.25 mg. ofdry anthranilate:
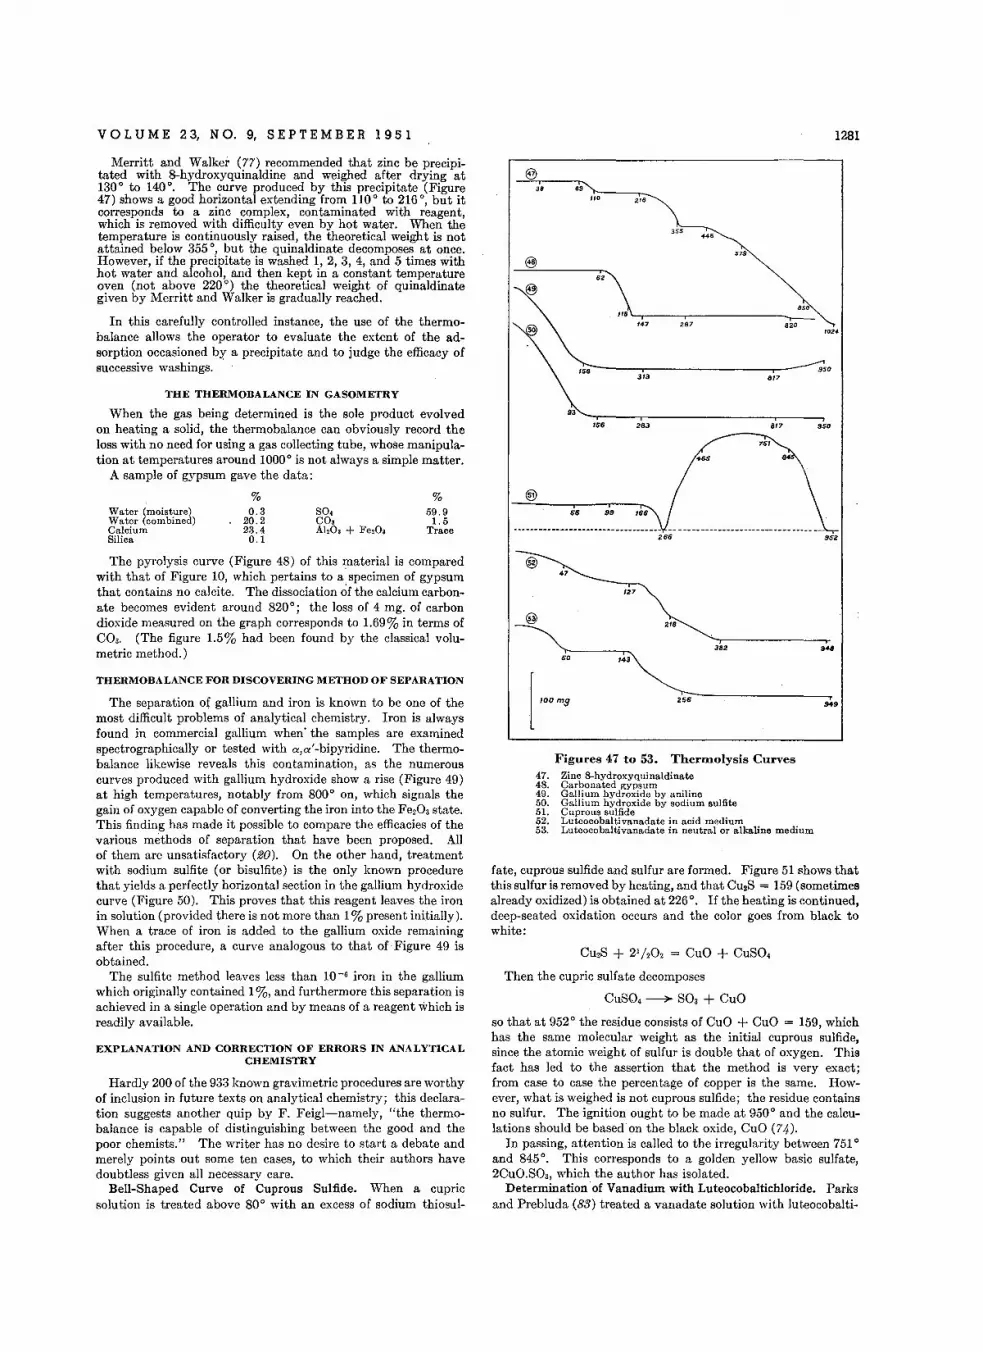
VOL U M E 23, N O. 9, S E PTE M B E R 1 95 1 1281
THE THERMOBALANCE IN GASOMETRY
When the gas being determined is the sole product evolvedon heating a solid, the thermobalance can obviously record theloss with no need for using a gas collecting tube, whose manipulation at temperatures around 1000° is not always a simple matter.
A sample of gypsum gave the data:
The pyrolysis curve (Figure 48) of this material is comparedwith that of Figure 10, which pertains to a specimen of gypsumthat contains no calcite. The dissociation of the calcium carbonate becomes evident around 820°; the loss of 4 mg. of carbondioxide measured on the graph corresponds to 1.69% in terms ofC03. (The figure 1.5% had been found by the classical volumetric method.)
,,.110
ee3.@
57'
@
d'\850
I , .....--147 '.7 8'0
'024-
9503'3 817
••• '63 817 '50
75'
465
®ee 99 '6.
266
@~ 2f8~
"-.1"------,,.., -3~r2-------r
SO '~3~
[ '''·S ass---,.
Figures 47 to 53. 'I'herrnolysis Curves47. Zinc 8-hydroxyquinaldinate48. Carbonated gypsum49. Gallium hydroxide by aniline50. Gallium hydroxide by sodium sulfite51. Cuprous sulfide52. Luteocobaltivanadate in acid medium53. Luteocobaltivanadate in neutral or alkaline medium
Cu,S + 21 / 202 = CuO + CuSO.
Then the cupric sulfate decomposes
CuSO.~ S03 + CuO
so that at 952° the residue consists of CuO + CuO = 159, whichhas the same molecular weight as the initial cuprous sulfide,since the atomic weight of sulfur is double that of oxygen. Thisfact has led to the assertion that the method is very exact;from case to case the percentage of copper is the same. However, what is weighed is not cuprous sulfide; the residue containsno sulfur. The ignition ought to be made at 950° and the calculations should be based on the black oxide, CuO (74).
In passing, attention is called to the irregularity between 751°and 845°. This corresponds to a golden yellow basic sulfate,2CUO.S03' which the author has isolated.
Determination of Vanadium with Luteocobaltichloride. Parksand Prebluda (83) treated a vanadate solution with luteocobalti-
fate, cuprous sulfide and sulfur are formed. Figure 51 shows thatthis sulfur is removed by heating, and that Cu,S = 159 (sometimesalready oxidized) is obtained at 226°. If the heating is continued,deep-seated oxidation occurs and the color goes from black towhite:
%59.91.5
Trace
so.CO,Aha, + Fe20.
%0.3
20.223.40.1
Water (moisture)Water (combined)CalciumSilica
THERMOBALANCE FOR DISCOVERING METHOD OF SEPARATION
The separation of gallium and iron is known to be one of themost difficult problems of analytical chemistry. Iron is alwaysfound in commercial gallium when' the samples are examinedspectrographically or tested with a,a'-bipyridine. The thermobalance likewise reveals this contamination, as the numerouscurves produced with gallium hydroxide show a rise (Figure 49)at high temperatures, notably from 800° on, which signals thegain of oxygen capable of converting the iron into the Fe,03 state.This finding has made it possible to compare the efficacies of thevarious methods of separation that have been proposed. Allof them are unsatisfactory (20). On the other hand, treatmentwith sodium sulfite (or bisulfite) is the only known procedurethat yields a perfectly horizontal section in the gallium hydroxidecurve (Figure 50). This proves that this reagent leaves the ironin solution (provided there is not more than 1% present initially).When a trace of iron is added to the gallium oxide remainingafter this procedure, a curve analogous to that of Figure 49 isobtained.
The sulfite method leaves less than 10-6 iron in the galliumwhich originally contained 1%, and furthermore this separation isachieved in a single operation and by means of a reagent which isreadily available.
Merritt and Walker (77) recommended that zinc be precipitated with 8-hydroxyquinaldine and weighed after drying at130° to 140°. The curve produced by this precipitate (Figure47) shows a good horizontal extending from 110 ° to 216°, but itcorresponds to a zinc complex, contaminated with reagent,which is removed with difficulty even by hot water. When thetemperature is continuously raised, the theoretical weight is notattained below 355°, but the quinaldinate decomposes at once.However, if the precipitate is washed 1, 2, 3, 4, and 5 times withhot water and alcohol, and then kept in a constant temperatureoven (not above 220°) the theoretical weight of quinaldinategiven by Merritt and Walker is gradually reached.
In this carefully controlled instance, the use of the thermobalance allows the operator to evaluate the extent of the adsorption occasioned by a precipitate and to judge the efficacy ofsuccessive washings.
EXPLANATION AND CORRECTION OF ERRORS IN ANALYTICALCHEMISTRY
Hardly 200 of the 933 known gravimetric procedures are worthyof inclusion in future texts on analytical chemistry; this declaration suggests another quip by F. Feigl-namely, "the thermobalance is capable of distinguishing between the good and thepoor chemists." The writer has no desire to start a debate andmerely points out some ten cases, to which their authors havedoubtless given all necessary care.
Bell-Shaped Curve of Cuprous Sulfide. When a cupricsolution is treated above 80° with an excess of sodium thiosul-
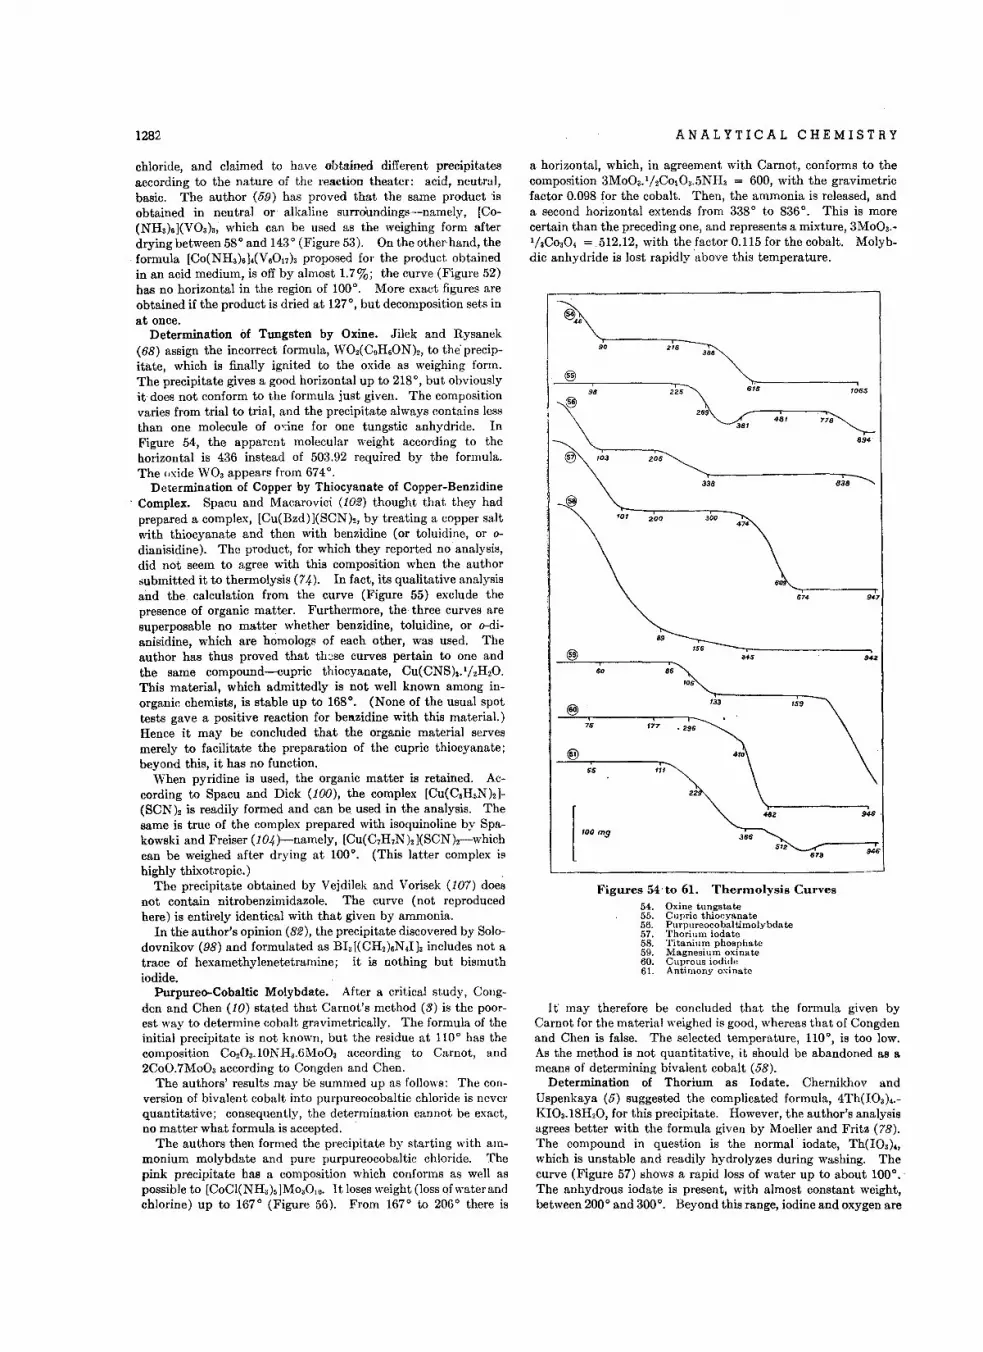
1282 ANALYTICAL CHEMISTRY
0,.
Figures 54'to 61. Thermolysis Curves54. Oxine tungstate55. Cupric thiocyanate56. Purpureocobaltimolybdate57. Thorium iodate58. Titanium phosphate59. Magnesium oxinate60. Cuprous iodide61. Antimony oxinate
894
,1065
@ ..5 942
60 BO
fas
@!133 159
75 '77 ·296
®55 ",
[,~~94$ ,
3BO512
946673
:: 2;B~3BB
®9B 225 615
®28'
481 778381
® 103 206
338 838
@'0' 200 300
47'
It' may therefore be concluded that the formula given byCarnot for the material weighed is good, whereas that of Congdenand Chen is false. The selected temperature, 110°, is too low.As the method is not quantitative, it should be abandoned as ameans of determining bivalent cobalt (58).
Determination of Thorium as Iodate. Chernikhov andUspenkaya (5) suggested the complicated formula, 4Th(IO,)•.KI03.18H20, for this precipitate. However, the author's analysisagrees better with the formula given by Moeller and Fritz (78).The compound in question is the normal iodate, Th(IO,).,which is unstable and readily hydrolyzes during washing. Thecurve (Figure 57) shows a rapid loss of water up to about 100°.'The anhydrous iodate is present, with almost constant weight,between 200 0 and 300°. Beyond this range, iodine and oxygen are
a horizontal, which, in agreement with Carnot, conforms to thecomposition 3MoO,.1!2C010a.5NH, = 600, with the gravimetricfactor 0.098 for the cobalt. Then, the ammonia is released, anda second horizontal extends from 338° to 836°. This is morecertain than the preceding one, and represents a mixture, 3MoO,.l!aCO,O, =512.12, with the factor 0.115 for the cobalt. Molybdic anhydride is lost rapidly 'above this temperature.
chloride, and claimed to have obtained different precipitatesaccording to the nature of the reaction theater: acid, neutral,basic. The author (59) has proved that the same product 'isobtained in neutral or alkaline surroundings-namely, [Co(NH3)6](V03) 3, which can be used as the weighing form afterdrying between 58° and 143° (Figure 53). On the other-hand, theformula [Co(NH3)6].(V6017) 3 proposed for the product obtainedin an acid medium, is off by almost 1.7%; the curve (Figure 52)has no horizontal in the region of 100°. More exact figures areobtained if the product is dried at 127°, but decomposition sets inat once.
Determination of Tungsten by Oxine. Jilek and Rysanek(68) assign the incorrect formula, W02(C.H60N)2, to the' precipitate, which is finally ignited to the oxide as weighing form.The precipitate gives a good horizontal up to 218°, but obviouslyit does not conform to the formula just given. The compositionvaries from trial to trial, and the precipitate always contains lessthan one molecule of oxine for one tungstic anhydride. InFigure 54, the apparent molecular weight according to thehorizontal is 436 instead of 503.92 required by the formula.The oxide W03 appears from 674°.
Determination of Copper by Thiocyanate of Copper-Benzidine'Complex. Spacu and Macarovici (102) thought that they had
prepared a complex, [Cu(Bzd) 1(SCN)2, by treating a copper saltwith thiocyanate and then with benzidine (or toluidine, or 0
dianisidine). The product, for which they reported no analysis,did not seem to agree with this composition when the authorsubmitted it to thermolysis (74). In fact, its qualitative analysisand the. calculation from the curve (Figure 55) exclude thepresence of organic matter. Furthermore, the' three curves aresuperposable no matter whether benzidine, toluidine, or o-dianisidine, which are homologs of each other, was used. Theauthor has thus proved that these curves pertain to one andthe same eompound-e-cupric thiocyanate, Cu(CNSh}!2H20.This material, which admittedly is not well known among inorganic chemists, is stable up to 168°. (None of the usual spottests gave a positive reaction for benzidine with this material.)Hence it may be concluded that the organic material servesmerely to facilitate the preparation of the cupric thiocyanate;beyond this, it has no function.
When pyridine is used, the organic matter is retained. According to Spacu and Dick (100), the complex [Cu(C.H.Nh](SCN)2 is readily formed and can be used in the analysis. Thesame is true of the complex prepared with isoquinoline by Spakowski and Freiser (104)-namely, [Cu(C7H7NhJ(SCN)2-whichcan be weighed after drying at 100°. (This latter complex ishighly thixotropic.)
The precipitate obtained by Vejdilek and Vorisek (107) doesnot contain nitrobenzimidazole. The curve (not reproducedhere) is entirely identical with that given by ammonia.
In the author's opinion (82), the precipitate discovered by Solodovnikov (98) and formulated as BI3[(CH2)6N,Ij, includes not atrace of hexamethylenetetramine; it is nothing but bismuthiodide.
Purpureo-Cobaltic Molybdate. After a critical study, Cougden and Chen (10) stated that Carnot's method (3) is the poorest way to determine cobalt gravimetrically. The formula of theinitial precipitate is not known, but the residue at 110° has thecomposition C0203.lONI-I,.6MoO, according to Carnot, and2CoO.7MoO, according to Congden and Chen.
The authors' results may be summed up as follows: The conversion of bivalent cobalt into purpureoeobaltie chloride is neverquantitative; consequently, the determination cannot be exact,no matter what formula is accepted. .
The authors then formed the precipitate by starting with ammonium molybdate and pure purpureocobaltic chloride. Thepink precipitate has a composition which conforms as well aspossible to [CoCl(NH,).]Mo,O,o. It loses weight (loss of water andchlorine) up to 167° (Figure 56). From 167° to 206° there is
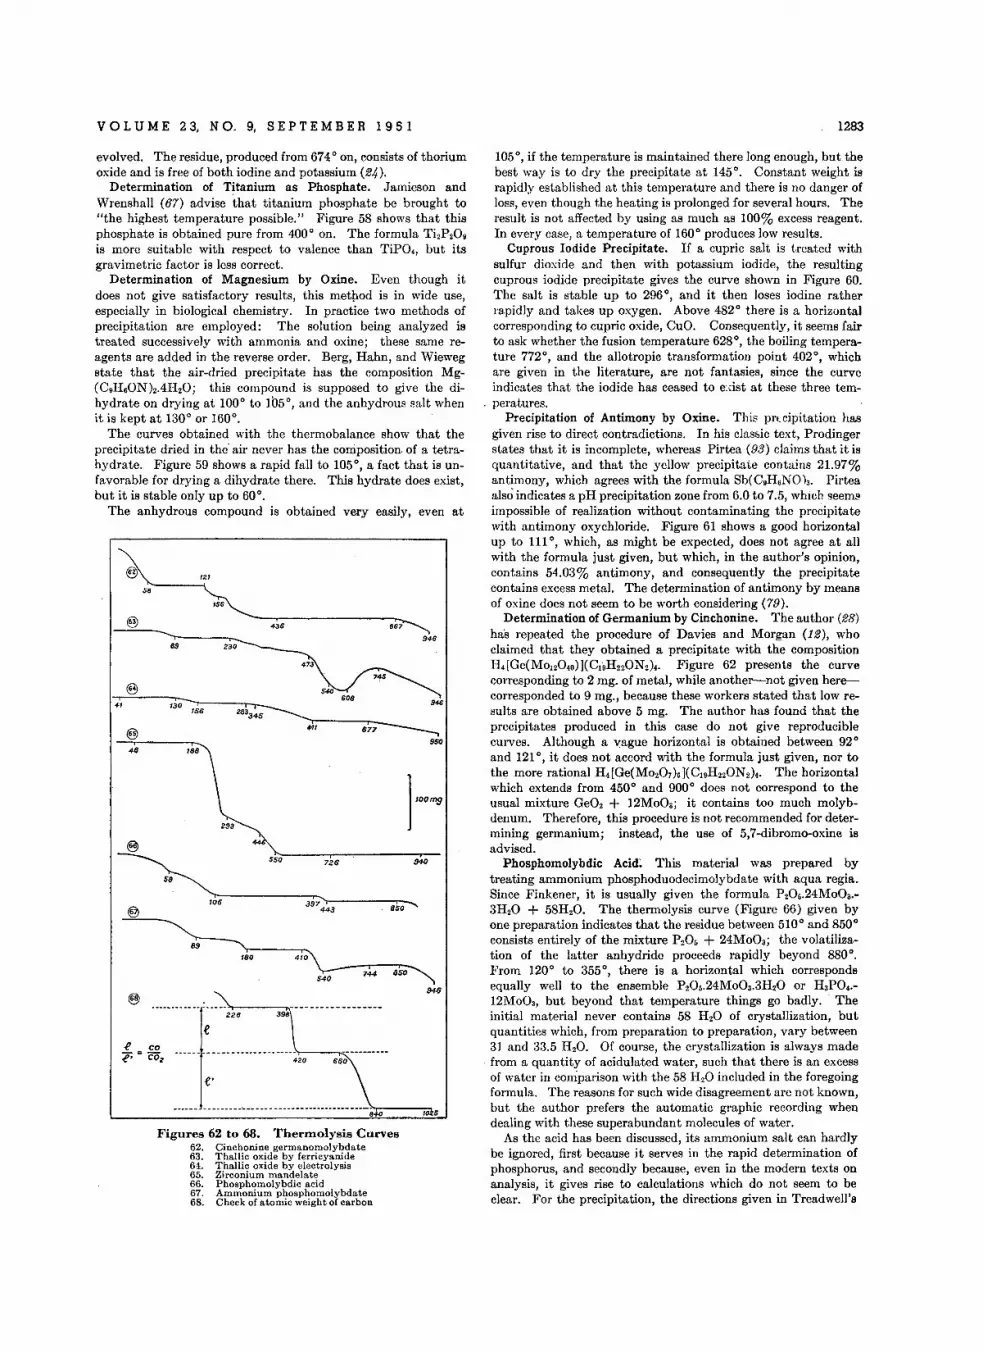
VOL U M E 2 3, N O. 9, S E PTE M B E R 195 1 1283
8.7
.-.-- - -- ---- -- p",,-- --- - ------------------ .....-.8 to S
105°, if the temperature is maintained there long enough, but thebest way is to dry the precipitate at 145°. Constant weight israpidly established at this temperature and there is no danger ofloss, even though the heating is prolonged for several hours. Theresult is not affected by using as much as 100% excess reagent.In every case, a temperature of 160° produces low results.
Cuprous Iodide Precipitate. If a cupric salt is treated withsulfur dioxide and then with potassium iodide, the resultingcuprous iodide precipitate gives the curve shown in Figure 60.The salt is stable up to 296°, and it then loses iodine ratherrapidly and takes up oxygen. Above 482° there is a horizontalcorresponding to cupric oxide, CuO. Consequently, it seems fairto ask whether the fusion temperature 628°, the boiling temperature 772°, and the allotropic transformation point 402°, whichare given in the literature, are not fantasies, since the curveindicates that the iodide has ceased to exist at these three temperatures.
Precipitation of Antimony by Oxine, This precipitation hasgiven rise to direct contradictions. In his classic text, Prodingerstates that it is incomplete, whereas Pirtea (93) claims that it isquantitative, and that the yellow precipitate contains 21.97%antimony, which agrees with the formula Sb(C.H6N Q)3. Pirteaalso indicates a pH precipitation zone from 6.0 to 7.5, which seemsimpossible of realization without contaminating the precipitatewith antimony oxychloride. Figure 61 shows a good horizontalup to 1110, which, as might be expected, does not agree at allwith the formula just given, but which, in the author's opinion,contains 54.03% antimony, and consequently the precipitatecontains excess metal. The determination of antimony by meansof oxine does not seem to be worth considering (79).
Determination of Germanium by Cinchonine. The author (28)has repeated the procedure of Davies and Morgan (12), whoclaimed that they obtained a precipitate with the compositionH.[Ge(MoI20.0»)(Cl-.H220N2).. Figure 62 presents the curvecorresponding to 2 mg. of metal, while another--not given herecorresponded to 9 mg., because these workers stated that low results are obtained above 5 mg. The author has found that theprecipitates produced in this case do not give reproduciblecurves. Although a vague horizontal is obtained between 92°and 121°, it does not accord with the formula just given, nor tothe more rational H.[Ge(M0207)6)(Cl.H220N2).. The horizontalwhich extends from 450° and 900° does not correspond to theusual mixture Ge02 + 12MoO,; it contains too much molybdenum. Therefore, this procedure is not recommended for determining germanium; instead, the use of 5,7-dibromo-oxine isadvised.
Phosphomolybdic Acid; This material was prepared bytreating ammonium phosphoduodecimolybdate with aqua regia.Since Finkener, it is usually given the formula P20,.24MoO,.3H20 + 58H 20. The thermolysis curve (Figure 66) given byone preparation indicates that the residue between 510° and 850°consists entirely of the mixture P20. + 24MoO,; the volatilization of the latter anhydride proceeds rapidly beyond 880°.From 120° to 355°, there is a horizontal which correspondsequally well to the ensemble P20,.24Mo03.3H20 or H,PO•.12Mo03, but beyond that temperature things go badly. Theinitial material never contains 58 H 20 of crystallization, butquantities which, from preparation to preparation, vary between31 and 33.5 H 20. Of course, the crystallization is always made
- from a quantity of acidulated water, such that there is an excessof water in comparison with the 58 H20 included in the foregoingformula. The reasons for such wide disagreement are not known,but the author prefers the automatic graphic recording whendealing with these superabundant molecules of water.
As the acid has been discussed, its ammonium salt can hardlybe ignored, first because it serves in the rapid determination ofphosphorus, and secondly because, even in the modern texts onanalysis, it gives rise to calculations which do not seem to beclear. For the precipitation, the directions given in Treadwell's
950
850"
744 860
680
726
840
420
398
850
180 4'0
22.
89
._---- _. --.- ------_.-. --------""
----.. ------ .-----"r----,,----- --- -- - -------.
~10,..5-------39.,-..'7.......,..'-----:r-
443
Figures 62 to 68. Thermolysis Curves62. Cinchonine germanomolybdate63. Thallic oxide by ferricyanide6-1. Thallic oxide by electrolysis65. Zirconium mandelate66. Phosphomolybdic acid67. Ammonium phospbomolvbdate68. Check of atomic weight of carbon
evolved. The residue, produced from 674° on, consists of thoriumoxide and is free of both iodine and potassium (24).
Determination of Titanium as Phosphate. Jamieson andWrenshall (67) advise that titanium phosphate be brought to"the highest temperature possible." Figure 58 shows that thisphosphate is obtained pure from 400° on. The formula Ti 2P20.is more suitable with respect to valence than TiPO., but itsgravimetric factor is less correct.
Determination of Magnesium by Oxine, Even though itdoes not give satisfactory results, this method is in wide use,especially in biological chemistry. In practice two methods ofprecipitation are employed: The solution being analyzed istreated successively with ammonia and oxine; these same reagents are added in the reverse order. Berg, Hahn, and Wiewegstate that the air-dried precipitate has the composition Mg(C.H60N)2.4H20; this compound is supposed to give the dihydrate on drying at 100° to 105°, and the anhydrous salt whenit is kept at 130° or 160°.
The curves obtained with the thermobalance show that theprecipitate dried in the- air never has the composition- of a tetrahydrate. Figure 59 shows a rapid fall to 105°, a fact that is unfavorable for drying a dihydrate there. This hydrate does exist,but it is stable only up to 60°.
The anhydrous compound is obtained very easily, even at
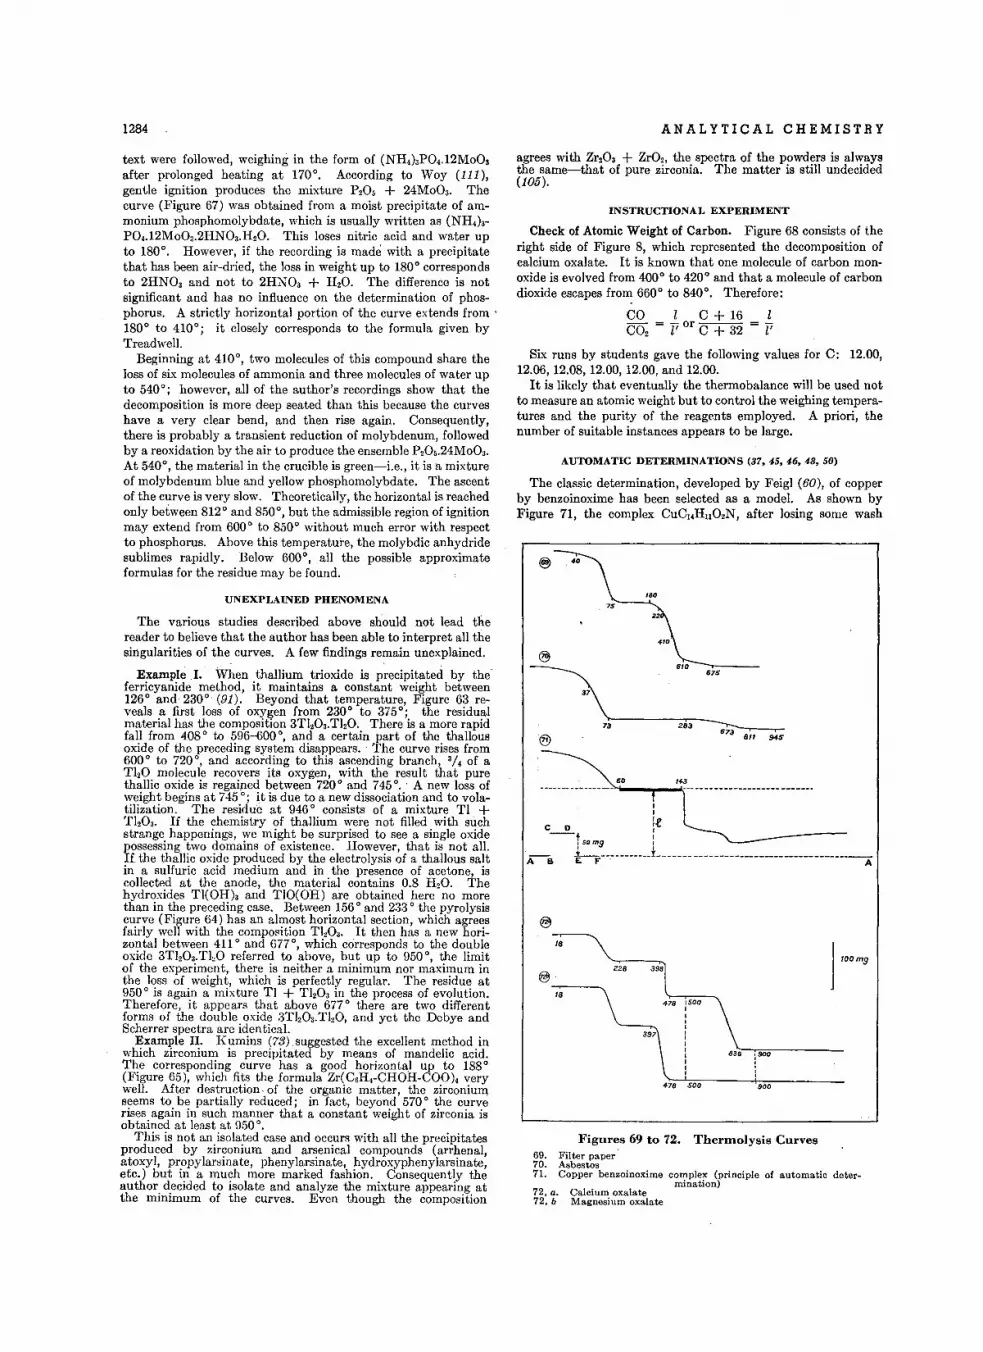
1284 ANALYTICAL CHEMISTRY
900
838 !900
673 811 945
875
283
810 --.-.---
478 sao
60
73
37
Calcium oxalateMagnesium oxalate
....._---------_.,:".........,..--'\.-------------------------_.
@
18 j,oom,ZZ8 398
@
'8
Figures 69 to 72. T'herrnolysts Curves69. Filter paper70. Asbestos71. Copper benzoinoxime complex (principle of automatic deter
mination)72, a.72, b
II
IeC D I--. I!50ms I
~B h--·---------I.-----------------------------------~
AUTOMATIC DETERMINATIONS (37,45,46,48,50)
The classic determination, developed by Feigl (60), of copperby benzoinoxime has been selected as a model. As shown byFigure 71, the complex CuC 14HIl02N, after losing some wash
INSTRUCTIONAL EXPERIMENT
Check of Atomic Weight of Carbon. Figure 68 consists of theright side of Figure 8, which represented the decomposition ofcalcium oxalate. It is known that one molecule of carbon monoxide is evolved from 400° to 420° and that a molecule of carbondioxide escapes from 660° to 840°. Therefore:
CO I C + 16 ICO2 = T' or C + 32 = T'
Six runs by students gave the following values for C: 12.00,12.06, 12.08, 12.00, 12.00, and 12.00.
It is likely that eventually the thermobalance will be used notto measure an atomic weight but to control the weighing temperatures and the purity of the reagents employed. A priori, thenumber of suitable instances appears to be large.
agrees with Zr203 + ZrO" the spectra of the powders is alwaysthe same-that of pure zirconia. The matter is still undecided(105).
text were followed, weighing in the form of (NH.),PO..l2Mo03after prolonged heating at 170°. According to Woy (111),gentle ignition produces the mixture P20. + 24MoO,. Thecurve (Figure 67) was obtained from a moist precipitate of ammonium phosphomolybdate, which is usually written as (NH.)sPO..l2MoO,.2HN03.H20. This loses nitric acid and water upto 180°. However, if the recording is made with a precipitatethat has been air-dried, the loss in weight up to 180° correspondsto 2HN03 and not to 2HN03 + H20. The difference is notsignificant and has no influence on the determination of phosphorus. A strictly horizontal portion of the curve extends from'180° to 410°; it closely corresponds to the formula given byTreadwell.
Beginning at 410°, two molecules of this compound share theloss of six molecules of ammonia and three molecules of water upto 540°; however, all of the author's recordings show that thedecomposition is more deep seated than this because the curveshave a very clear bend, and then rise again. Consequently,there is probably a transient reduction of molybdenum, followedby a reoxidation by the air to produce the ensemble P20•.24MoO,.At 540°, the material in the crucible is green-Le., it is a mixtureof molybdenum blue and yellow phosphomolybdate. The ascentof the curve is very slow. Theoretically, the horizontal is reachedonly between 812° and 850°, but the admissible region of ignitionmay extend from 600° to 850° without much error with respectto phosphorus. Above this temperature, the molybdic anhydridesublimes rapidly. Below 600°, all the possible approximateformulas for the residue may be found.
UNEXPLAINED PHENOMENA
The various studies described above should not lead thereader to believe that the author has been able to interpret all thesingularities of the curves. A few findings remain unexplained. @
Example I. When thallium trioxide is precipitated by theferricyanide method, it maintains a constant weight between126° and 230° (91). Beyond that temperature, Figure 63 reveals a first loss of oxygen from 230° to 375°; the residualmaterial has the composition 3Tl,03.TI20. There is a more rapidfall from 408 ° to 596-600°, and a certain part of the thallousoxide of the preceding system disappears. The curve rises from600° to 720°, and according to this ascending branch, 3/. of aThO molecule recovers ita oxygen, with the result that purethallic oxide is regained between 720° and 745°. A new loss ofweight begins at 745°; it is due to a new dissociation and to volatilization. The residue at 946 ° consists of a mixture Tl +TI,O,. If the chemistry of thallium were not filled with suchstrange happenings, we might be surprised to see a single oxidepossessing two domains of existence. However, that is not all.If the thallic oxide produced by the electrolysis of a thallous saltin a sulfuric acid medium and in the presence of acetone, iscollected at the anode, the material contains 0.8 H20. Thehydroxides Tl(OH)3 and TlO(OH) are obtained here no morethan in the preceding case. Between 156° and 233 ° the pyrolysiscurve (Figure 64) has an almost horizontal section, which agreesfairly well with the composition TI,O,. It then has a new horizontal between 411 ° and 677°, which corresponds to the doubleoxide 3TI,03.TI,O referred to above, but up to 950°, the limitof the experiment, there is neither a minimum nor maximum inthe loss of weight, which is perfectly regular. The residue at950° is again a mixture Tl + TI,O, in the process of evolution.Therefore, it appears that above 677° there are two differentforms of the double oxide 3TI,03.Tl,O, and yet the Debye andScherrer spectra are identical.
Example II. K umins (73) suggested the excellent method inwhich zirconium. is precipitated by means of mandelic acid.The corresponding curve has a good horizontal up to 188°(Figure 65), which fits the formula Zr(C6H.-CHOH-COO). verywell. After destruction. of the organic matter, the zirconiumseems to be partially reduced; in fact, beyond 570 ° the curverises again in such manner that a constant weight of zirconia isobtained at least at 950°.
This is not an isolated case and occurs with all the precipitatesproduced by zirconium and arsenical compounds (arrhenal,atoxyl, propylarsinate, phenylarsinate, hydroxyphenylarsinate,etc.) but in a much more marked fashion. Consequently theauthor decided to isolate and analyze the mixture appearing atthe minimum of the curves. Even though the composition
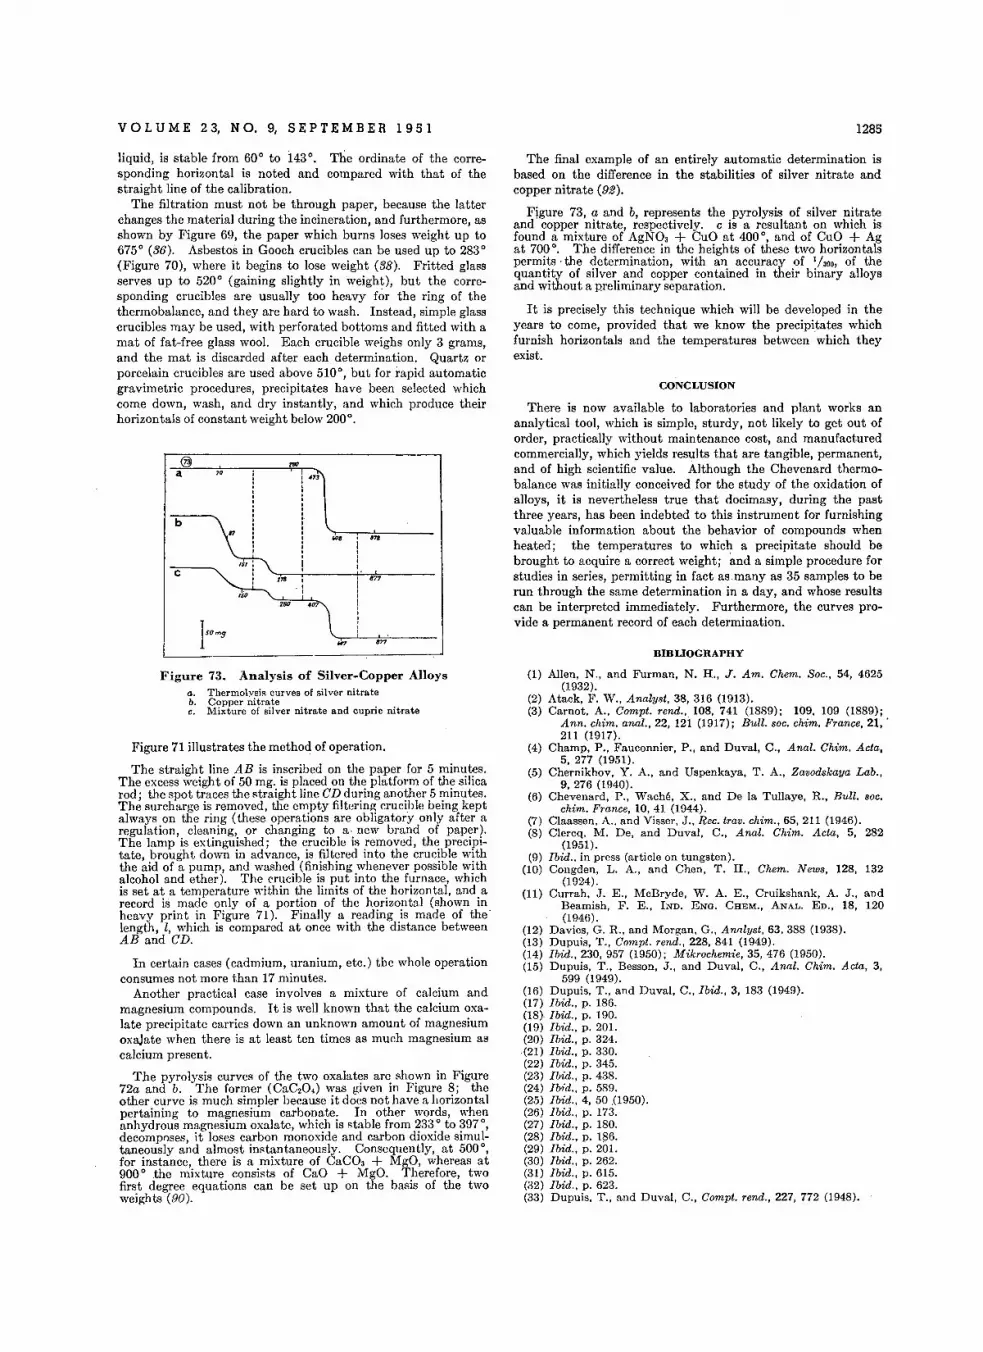
VOL U M E 2 3, N O. 9, S E PTE M B E R 1 9 5 1 1285
liquid, is stable from 60° to 143°. The ordinate of the corresponding horizontal is noted and compared with that of thestraight line of the calibration.
The filtration must not be through paper, because the latterchanges the material during the incineration, and furthermore, asshown by Figure 69, the paper which burns loses weight up to675° (36). Asbestos in Gooch crucibles can be used up to 283°(Figure 70), where it begins to lose weight (38). Fritted glassserves up to 520° (gaining slightly in weight), but the corresponding crucibles are usually too heavy for the ring of thethermobalance, and they are hard to wash. Instead, simple glasscrucibles may be used, with perforated bottoms and fitted with amat of fat-free glass wool. Each crucible weighs only 3 grams,and the mat is discarded after each determination. Quartz orporcelain crucibles are used above 510°, but for rapid automaticgravimetric procedures, precipitates have been selected whichcome down, wash, and dry instantly, and which produce theirhorizontals of constant weight below 200°.
a
b
c
ra
,SD
171
28lJ
"" 'n
'77
The final example of an entirely automatic determination isbased on the difference in the stabilities of silver nitrate andcopper nitrate (92).
Figure 73, a and b, represents the pyrolysis of silver nitrateand copper nitrate, respectively. c is a resultant on which isfound a mixture of AgNOa + CuO at 400°, and of CuO + Agat 700°. The difference in the heights of these two horizontalspermits' the determination, with an accuracy of 1hoo, of thequantity of silver and copper contained in their binary alloysand without a preliminary separation.
It is precisely this technique which will be developed in theyears to come, provided that we know the precipitates whichfurnish horizontals and the temperatures between which theyexist.
CONCLUSION
There is now available to laboratories and plant works ananalytical tool, which is simple, sturdy, not likely to get out oforder, practically without maintenance cost, and manufacturedcommercially, which yields results that are tangible, permanent,and of high scientific value. Although the Chevenard thermobalance was initially conceived for the study of the oxidation ofalloys, it is nevertheless true that docimasy, during the pastthree years, has been indebted to this instrument for furnishingvaluable information about the behavior of compounds whenheated; the temperatures to which a precipitate should bebrought to acquire a correct weight; and a simple procedure forstudies in series, permitting in fact as.many as 35 samples to berun through the same determination in a day, and whose resultscan be interpreted immediately. Furthermore, the curves provide a permanent record of each determination.
Figure 73. Analysis of Silver-Copper Alloysa. Thermolvsia curves of silver nitrateb. Copper nitratec. Mixture of silver nitrate and cupric nitrate
Figure 71 illustrates the method of operation.
The straight line AB is inscribed on the paper for 5 minutes.The excess weight of 50 mg. is placed on the platform of the silicarod; the spot traces the straight line CD during another 5 minutes.The surcharge is removed, the empty filtering crucible being keptalways on the ring (these operations are obligatory only after aregulation, cleaning, or changing to a. new brand of paper).The lamp is extinguished; the crucible is removed, the precipitate, brought down in advance, is filtered into the crucible withthe aid of a pump, and washed (finishing whenever possible withalcohol and ether). The crucible is put into the furnace, whichis set at a temperature within the limits of the horizontal, and arecord is made only of a portion of the horizontal (shown inheavy print in Figure 71). Finally a reading is made of thelength, I, which is compared at once with the distance betweenAB and CD.
In certain cases (cadmium, uranium, etc.) the whole operationconsumes not more than 17 minutes.
Another practical case involves a mixture of calcium andmagnesium compounds. It is well known that the calcium oxalate precipitate carries down an unknown amount of magnesiumoxalate when there is at least ten times as much magnesium ascalcium present.
The pyrolysis curves of the two oxalates are shown in Figure72a and b. The former (CaC20 .) was given in Figure 8; theother curve is much simpler because it does not have a horizontalpertaining to magnesium carbonate. In other words, whenanhydrous magnesium oxalate, which is stable from 233 ° to 397°,decomposes, it loses carbon monoxide and carbon dioxide simultaneouslyand almost instantaneously. Consequently, at 500°,for instance, there is a mixture of CaCOa + MgO, whereas at900° the mixture consists of CaO + MgO. Therefore, twofirst degree equations can be set up on the basis of the twoweights (90).
BIBLIOGRAPHY
(1) Allen, N., and Furman, N. R., J. Am. Chem. Soc., 54, 4625(1932).
(2) Atack, F. W., Analys!, 38, 316 (1913).(3) Carnot, A., Com/pt. rend., 108, 741 (1889); 109, 109 (1889);
Ann. chim. anal., 22, 12i (1917); Bull. soc. chim. France, 21, .211 (1917).
(4) Champ, P., Fauconnier, P., and Duval, C., Anal. Chim, Acta,5, 277 (1951).
(5) Chernikhov, Y. A., and Uspenkaya, T. A., Zavodskaya Lab.,9,276 (1940).
(6) Chevenard, P., WacM, X., and De la Tullaye, R., Bull. soc.chim. France, 10, 41 (1944).
(7) Claassen, A., and Visser, J., Rec. tro», chim., 65, 211 (1946).(8) Clercq, M. De, and Duval, C., Anal. Chim. Acta, 5, 282
(1951).(9) Ibid., in press (article on tungsten).
(10) Congden, L. A., and Chen, T. R., Chem. News, 128, 132(1924).
(11) Currah, J. E., McBryde, W. A. E., Cruikshank, A. J., andBeamish, F. E., IND. ENG. CHEM., ANAL. ED., 18, 120(1946).
(12) Davies, G. R., and Morgan, G., Analyst, 63, 388 (1938).(13) Dupuis, T., Com-pt. rerul., 228, 841 (1949).(14) Ibid., 230, 957 (1950); Mikrochemie, 35, 476 (1950).(15) Dupuis, T., Besson, J., and Duval, C., Anal. Chim. Acta, 3,
599 (1949).(16) Dupuis, T., and Duval, C., Ibid., 3, 183 (1949).(17) Ibid., p. 186.(18) Ibid., p. 190.(19) Ibid., p. 201.(20) Ibid., p. 324.(21) Ibid., p. 330.(22) Ibid., p. 345.(23) Ibid., p. 438.(24) tua.. p, 589.(25) Ibid., 4, 50.(1950).(26) Ibid., p. 173.(27) Ibid., p. 180.(28) Ibid., p. 1$6.(29) Ibid., p. 201.(30) tu«. p. 262.(31) Ibid., p. 615.(32) Ibid., p. 623.(33) Dupuis, T., and Duval, C., Com.pt. rend., 227, 772 (1948).
1286
(34) Ibid., 228, 401 (1949).(35) Ibid., 229, 51 (1949).(36) Duval, C., Anal. Chim. Acta, 2, 92 (1948).(37) Ibid., p. 432.(38) Ibid., 3, 163 (1949).(39) Ibid., p. 335.(40) Ibid., p. 338.(41) Ibid., 4, 55 (1950).(42) Ibid., p. 160.(43) Ibid., p. 190.(44) Duval, C., Chim. anal., 31, 177 (1949).(45) Duval, C., Campt. rend., 224, 1824 (1947).(46) Ibid., 226, 1276 (1948).(47) Ibid., 227, 679 (1948).(48) Duval, C., Conference held at Centre de Perfectionnement
technique, Nov. 22, 1948; Chim. anal., 31, 173,204 (1949).(49) Duval, C., Conference held at Ier Congres International de
Microchimie, Graz, July 6, 1950; Mikrochemie, 36, 425-65(1951).
(50) Ibid., 35, 242 (1950).(51) Duval, C., Troisieme Rapport de la Commission des reactifs
nouveaux, Paris, Librairie Istra, 1948.(52) Duval, C., and Dat Xuong, ·Ng., Anal. Chim. Acta, 5, 160
(1951).(53) Ibid., in press (article on mercury).(54) Duval, T., and Duval, C., Anal. Chim. Acta, 2, 103 (1948).(55) Ibid., p, 207.(56) Ibid., p. 223.(57) Duval, R., and Duval, C., Ibid., 5, 71 (1951).(58) tua., p. 84.(59) Duval, C., and Morette, A., Compt. rend., 230, 545 (1950);
Anal. Chim. Acta., 4,490 (1950).(60) Feigl, F., Ber., 56, 2083 (1923).(61) Friedrich, K., Metallurgie, 6, 175 (1909).
. (62) Garrido, J., Anales [ie. y quim, (Madrid), 43, 1195 (1947).
. (63) Gentry, C. H. R., and Sherrington, L. G., Analyst, 70, 419(1945).
(64) Girard, J., Chim. anal. 4, 382 (1899).(65) Hecht, F., and Donau, J., "Anorganische Mikrogewichts
analyse," p. 205, Vienna, Librairie Springer, 1940.(66) Herrmann-Gurfinkel, M., Bull. soc. chim. sa«; 48, 94 (1939).(67) Jamieson, G. S., and Wrenshall, R., J. Ind. Eng. Chem., 6, 203
(1914).(68) Jilek, A., and Rysanek, A., Collection Czechoelo». Chem, Com
muns., 10,518 (1938).(69) Jolibois, P., and Lefevre, H., Compt. rend., 176, 1317 (1923).(70) Kolthoff, I. M., and Bendix, G. H., IND. ENG. CHEM., ANAL.
ED., 11, 94 (1939).(71) Kolthoff, I. M., and Meene, G. H. P. van der, Z. anal. Chem.,
72, 337 (1927).(72) Krustinsons, J., Ibid., 125, 98 (1943).(73) Kumins, A., ANAL. CHEM., 19, 376 (1947).(74) Marin, Y., diplome d'etudes superieures, Paris, Nov. 28, 1949.
ANALYTICAL CHEMISTRY
(75) Marin, Y., and Duval, C., Anal. Chim. Acta, 4, 393 (1950).(76) Mawrow, W., and Muthmann, F., Z. anora. Chem., 13, 209
(1897).(77) Merritt, L. L., and Walker, J. x., IND. ENG. CHEM., ANAL. ED.,
16, 387 (1944).(78) Moeller, T., and Fritz, N. D., ANAL. CHEM., 20, 1055 (1948).(79) Morandat, J., and Duval, C., 4nal. Chim, Acta, 4,"498 (1950).(80) MUller, W., Ber., 35, 1587 (1902).(81) Nieuwenburg, C, J. Van, and Hoek, T. Van der, Mikrochemie,
18, 175 (1935).(82) Panchout, S., and Duval,. C., Anal. cu«. Acta, 5, 170
(1951).(83) Parks, W. G., and Prebluda, H. N., J. Am. Chern. Soc., 57,
1676 (1935).(84) Pauling, L., Ibid., 55, 1895,3052 (1933).(85) Pavelka, F., and Zucchelli, A., Mikrochernie, 31, 69 (1943).(86) Peltier, S., diplome d'etudes superieures, Paris, June II, 1947.(87) Peltier, S., and Duval, C., Anal. Chim. Acta, I, 346 (1947).(88) Ibid., p. 351.(89) Ibid., pp. 355, 348, 362.(90) Ibid., p. 408.(91) tua; 2, 211 (1948).(92) Peltier, S., and Duval, C., Compt. rend., 226, 1727 (1948).(93) Pirtea, T. 1., Z. anal. Chem., 118, 26 (1939).(94) Rarnmelsberg, C., Pogg. Ann., 44, 577 .(1838); Ber., 1, 70
(1868).(95) Ray, H. N., J. Indian Chern. Soc., 17,586 (1940).(96) Robinson, P. L., and Scott, W. E., Z. anal. Chem., 88, 417
(1932).(97) Rogers, L. B., and Caley, E. R., IND. ENG. CHEM., ANAL. ED.,
15,209 (1943).(98) Solodovnikov, P. P., Trans. Kirov. Inst. Chern. Tech. Kazan,
No.8, 57-60 (1940).(99) Soule, B. A., J. Am. Chern. Soc., 47, 981 (1925) .
(100) Spacu, G., and Dick, J., Z. anal. Chem., 78, 241 (1929) .(101) Spacu, G., and Dima, L., Ibid., 120, 317 (1940).(102) Spacu, G., and Macarovici, C.G., Ibid., 102, 350 (1935).(103) Spacu, G., and Spaou, P., Ibid., 96, 30 (1934).(104) Spakowski, A. E., and Freiser, H., ANAL. CHEM., 21, 986
(1949).(105) Stachtchenko, J., and Duval, C., Anal. Chim. Acta, in press
(article on zirconium). .(106) Vanino, L;, and Guyot, 0., Arch. Pharm., 264, 98 (1926).(107) Vejdilek, Z., and Vorisek, J., Chern. Obsor, 20, 138 (1945).(108) Voter, R. C., Banks, C. V., and Diehl, H., ANAL. CHEM., 20,
459 (1948).(109) Wenger, P. E., Cimerman, C., and Corbaz, A., Mikrochim.
Acta, 2, 314 (1938).(110) Willard, H. H., and Hall, D., J. Am. Chem. Soc., 44, 2219
(1922).(Ill) WOY, R., Chern. Ztg., 21, 441 (1897).
RECEIVED December 13, 1950.
PhenylMercuric or Ethyl Mercuric CompoundsDirect Determination of Several Compounds in Dilute Aqueous Solution
V. L. MILLER, DOROTHY POLLEY, ANDC. J. GOULD, Western Washington Experiment Station, Puyallup, Wash.
TH E diphenyIthiocarbazone (dithizone) procedures foranalysis of small amounts of metals are well known (2, 5),
but the use of the dithizone procedure for analysis of intactmetallo-organic compounds has not been previously reported.Webb et al. (10) prepared and made elemental analyses of severalcompounds resulting from the reaction of dithizone with organicmercurials. Earlier, Steiger (7) reported that diphenyl mercuryor copper acetylide rubbed with a crystal of dithizone gave ayellow or red color. However, in his methods of analysis oftetraethyllead or nickel carbonyl, the metallo-organic compoundwas first decomposed (8). Similarly, organic mercurials havebeen analyzed following decomposition (6, 9).' The methodhere recorded may be used to determine several ethyl mercuricor phenyl mercuric compounds directly in the presence of manymetal ions, including the mercury ions. Qualitative differentiation between phenyl and ethyl mercuric compounds is possible.
REAGENTS
Du Pont C.P. reagent hydrochloric acid is used without furtherpurification. All water and chloroform are redistilled from glass(5).
Reagent 1. Concentrated hydrochloric acid is diluted to 3.5N. To this is added 1 mi. of dithizone-extracted 20% hydroxylamine hydrochloride for each 17 ml, of the acid.
Reagent 2. Concentrated hydrochloric acid is diluted to 3 N.Reagent 3. A solution of sodium acetate is adjusted to pH
4.5 with glacial acetic acid, diluted to normal concentration withrespect to sodium acetate, and rigorously purified by dithizoneextraction.
Reagent 4. Eastman Kodak white label dithizone is dis-·solved in chloroform at the rate of 1 mg. per ml. This solution iskept refrigerated and diluted as needed.
Reagent 5. Standard phenyl mercuric compounds. Onehundred and fifty milligrams of C.P. phenyl mercuric acetate(Berk) are dissolved in 3 to 5 rnl. of glacial acetic acid and dilutedvolumetrically to 250 ml. The strength may be checked bytitrating with 0.005 N thiocyanate by the Volhard procedure.
VOL U M E 2 3, N O. 9, S E PTE M B E R 1 95 1 1287
C,H,Hg, 'Y
Table I. Effect of Copper Ion on Accuracy of AnalyticalProcedure
Errorfrom Cu ++
%+ 2+ 5+11+ 8+ 8+ 5+ 7
Original Recovered Cu ++ Added, 'Y
65 65 5065 68 10065 69 200
C,H,Hg, 'Y
Original Recovered
74 75 5074 79 10074 83 200
3.0 3 87.5 1003.0 2 87.5 1003.0 1 75.0 1002.5 2 87.5 1002.5 1 87.5 1002.0 3 75.0 702.0 2 75.0 70
Table II. Effect of Strength of Acid and Number ofExtractions on Interference of Copper
Added Cu++Acid No. of (C,H,Hg)aPO., _ Added,
Normality Extractions 'Y 'Y
DISCUSSION
Preliminary work indicated that, of the common metal ions,copper would be the most likely to interfere in the analysis ofphenyl or ethyl mercuric compounds by the above procedure(Table I). To determine the best concentration of acid to useto prevent interference of copper, a series of experiments wasconducted with several acid concentrations (Table II). Thenumber of extractions was varied. From the results of this trial,and as Klein (3) has reported that inorganic mercury may bepartially extracted from 2 N acid solutions, two extractions using3 N hydrochloric acid were selected. Although better resultswere obtained with three extractions, the slight improvement inaccuracy did not seem to justify the extra step for ordinary work.
Large amounts of mercuric compounds (approximately 1000micrograms of mercury) in 20 ml. of water will cause discolorationof the dithizone in the separatory funnel containing Reagent 1.However, the 3 N acid in the second separatory funnel extractsthe inorganic mercury from the chloroform solution of dithizone,The error caused by this dilution of Reagent 1 and contaminatingmercury caused a positive error of not greater than 2% in thefinal result.
photometric density of x micrograms of phenyl mercuric acetateand L2 is the photometric density of x micrograms of ethyl mercuric phosphate. Several other ethyl mercuric compounds canbe calculated from the percentage of ethyl mercury. The sameprinciple applies to phenyl mercuric compounds.
The method was developed to determine the stability of mercurial fungicide solutions in the presence of soil. Therefore,possible interference from traces of most metallic ions and thedecomposition products of the fungicides must be eliminated.Various ions were added singly at the first step in the procedureand carried through the extraction process. In the presence of 50to 80 micrograms of phenyl mercuric acetate, 1000 micrograms ofmanganese, iron, cobalt, nickel, zinc, silver, cadmium, tin (ous),mercury (ic), lead, or bismuth did not interfere. The noblemetals and thallium were not tested, but they are not likely tobe contaminants in ordinary work. If much copper is present,it gives an off-color to the dithizone solution. Mercury (ous)interferes to. a less extent than copper. Although mercurous ionsare reported to be a decomposition product of the organic mercurials (1), the low solubility of most of its compounds precludes interference from this source except in rare cases. Whenmercurous nitrate was added to the first separatory funnel andthen allowed to stand, the interference from mercury (ous) could
Known amounts of the compound to be tested are carriedthrough the procedure described and the results are recorded onsemilog graph paper. The curve follows Beer's law.
Ethyl mercuric compounds are not generally available in pureform. However, the amount of ethyl mercuric phosphate can bedetermined from the phenyl mercuric acetate curve with less
than 2% error from the formula L, - 5~6 = L2 , in which L, is the
Weighed amounts of other phenyl mercuric compounds, including the phthalate and salicylate, are dissolved in approximately 0.02 N sodium hydroxide. Phenyl mercuric borate isdissolved in water.
Reagent 6. Standard ethyl mercuric compounds. Fiftymilligrams of ethyl mercuric phosphate are dissolved by longshaking in about 300 m!. of water and diluted to 500 m!. Thissolution is discarded when a precipitate is formed.
Ethyl mercuric chloride and ethyl mercuric p-toluene sulfonanilide (supplied by G. F. Miles, E. 1. du Pont de Nemours &Co.) are dissolved at the rate of 50 mg. per 500 m!. of 0.02 Nsodium hydroxide by long shaking.
PREPARATION OF STANDARD CURVE
The investigation was begun to find a rnenhod ofanalysis that could be used to dcterrrrlne the stabilityof organic mercurial fungicides in the presence ofsoil and plant material. The rnet.hod may be usedto determine approximately 1 to 150 rrricrogrums ofphenyi mercuric or ethyl mercuric compounds indilute aqueous solution in the presence of manymetal ions, including inorganic mercury. Severalother organic mercurial fungicides do not interfere.The usual wet combustion or hydrolysis of this typeof mercury eorupounda is avoided. This is the firstreport of a method of analysis for intact organicmercury compounds using the dithizone reagent.It Illay lead to devefoprrren t of direct procedures forother organic rrrercuj-y cornpourrds, which are usedas fungicides, bactericides, and rrredjclrrals ,
PROCEDURE
Eighteen milliliters of Reagent 1, 20 m!. of Reagent 2, and 5m!. of Reagent 3 are placed in three small separatory funnelsfrom dispensing burets. To the funnel containing Reagent 3are added 15 to 20 m!. of water. Exactly 11 m!. of diluted dithizone solution containing approximately 10 micrograms per m!.are added to the funnel containing Reagent 1.
Between 50 and 100 micrograms of one of the ethyl or phenylmercuric compounds listed above, in 0.5 to 20 m!. of water orvery dilute acid or alkali, are accurately measured into the firstseparatory funnel and ths funnel is shaken vigorously for 1minute. When the layers have separated, the chloroform isdrained into the funnel containing Reagent 2. The shaking isrepeated, and after separation the chloroform layer is transferredto the separatory funnel containing Reagent 3. Following shaking and separation, the percentage transmittance is determinedin an Evelyn photoelectric colorimeter, using filter 620, with themacro model set for a 6-ml. volume with chloroform giving 100%transmittance. The green color of the unreacted dithizone isdetermined rather than the yellow of the organic mercury dithizonate. The values for unknown samples are determined bycomparison with a standard curve.
Although the method is designed to be used in the range of 50to 150 micrograms of several ethyl or phenyl mercuric compounds,by using 8 m!. of dithizone solution containing 3 micrograms perm!., 1 microgram can be determined by the above procedure.Percentage transmittance is determined immediately. However,these dithizonates seemed stable to ordinary laboratory light for3 hours. The color stability may have been improved by thepresence of acetic acid in the buffer, as suggested by Klein (3)for other dithizonates.
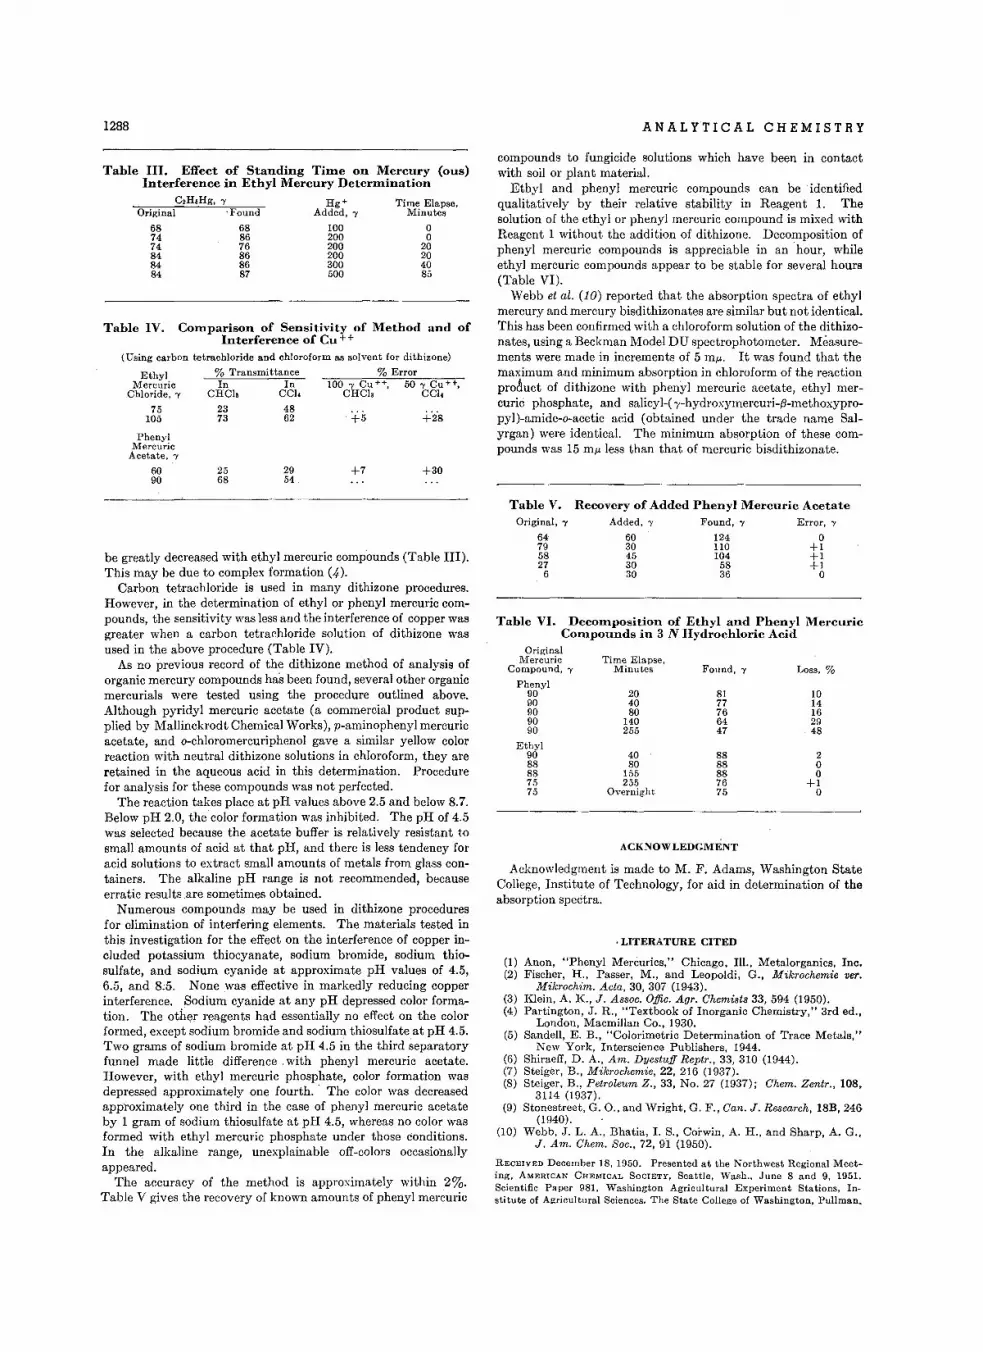
1288 A N A L YT I CAL C H EM 1ST R Y
Table IV. Cornparfsorr of Sensitivity of Method and ofInterference of Cu ++
compounds to fungicide solutions which have been in contactwith soil or plant material.
Ethyl and phenyl mercuric compounds can be identifiedqualitatively by their relative stability in Reagent 1. Thesolution of the ethyl or phenyl mercuric compound is mixed withReagent 1 without the addition of dithizone. Decomposition ofphenyl mercuric compounds is appreciable in an 'hour, whileethyl mercuric compounds appear to be stable for several hours(Table VI).
Webb et al. (10) reported that the absorption spectra of ethylmercury and mercury bisdithizonates are similar but not identical.This has been confirmed with a chloroform solution of the dithizonates, using a Beckman Model DU spectrophotometer. Measurements were made in increments of 5 m«. It was found that themaximum and minimum absorption in chloroform of the reactionproduct of dithizone with phenyl mercuric acetate, ethyl mercuric phosphate, and salicyl-( l'-hydroxymercuri-l3-methoxypropyl)-amide-o-acetic acid (obtained under the trade name Salyrgan) were identical. The minimum absorption of these compounds was 15 mu less than that of mercuric bisdithizonate.
+30
oo
20204085
Time Elapse,Minutes
+7
+5
Hg+Added, 'Y
100200200200300500
2954
688676868687
2568
687474848484
75105
Original . Found
PhenylMercuric
Acetate, 'Y
6090
EthylMercuric
.Chloride, 'Y
(Using carbon tetrachloride and chloroform as solvent for dithiaone)
% Transmittance % ErrorIn In 100 'Y Cu + +, 50 'Y Cu + +,
CHCla CCI. CHCla CCI •
23 4873 62
Table III. Effect of Standing Trme on Mercury (ous)Interference in Ethyl Mercury Deterrnfnat.lon
C,H,Hg, 'Y
be greatly decreased with ethyl mercuric compounds (Table III),This may be due to complex formation (4).
Carbon tetrachloride is used in many dithizone procedures.However, in the determination of ethyl or phenyl mercuric compounds, the sensitivity was less and the interference of copper wasgreater when a carbon tetrachloride solution of dithizone wasused in the above procedure (Table IV).
As no previous record of the dithizone method of analysis oforganic mercury compounds has been found, several other organicmercurials were tested using the procedure outlined above.Although pyridyl mercuric acetate (a commercial product supplied by Mallinckrodt Chemical Works), p-aminophenyl mercuricacetate, and o-chloromercuriphenol gave a similar yellow colorreaction with neutral dithizone solutions in chloroform, they areretained in the aqueous acid in this determination. Procedurefor analysis for these compounds was not perfected.
The reaction takes place at pH values above 2.5 and below 8.7.Below pH 2.0, the color formation was inhibited. The pH of 4.5was selected because the acetate buffer is relatively resistant tosmall amounts of acid at that pH, and there is less tendency foracid solutions to extract small amounts of metals from glass containers. The alkaline pH range is not recommended, becauseerratic results are sometimes obtained.
Numerous compounds may be used in dithizone proceduresfor elimination of interfering elements. The materials tested inthis investigation for the effect on the interference of copper included potassium thiocyanate, sodium bromide, sodium thiosulfate, and sodium cyanide at approximate pH values of 4.5,6.5, and 8;5, None was effective in markedly reducing copperinterference. Sodium cyanide at any pH depressed color formation. The other reagents had essentially no effect on the colorformed, except sodium bromide and sodium thiosulfate at pH 4.5.Two grams of sodium bromide at pH 4,5 in the third separatoryfunnel made little difference, with phenyl mercuric acetate.However, with ethyl mercuric phosphate, color formation wasdepressed approximately one fourth.. The color was decreasedapproximately one third in the case of phenyl mercuric acetateby 1 gram of sodium thiosulfate at pH 4.5, whereas no color wasformed with ethyl mercuric phosphate under those conditions.In the alkaline range, unexplainable off-colors occasionallyappeared.
The accuracy of the method is approximately within 2%.Table V gives the recovery of known amounts of phenyl mercuric
Table V. Recovery of Added Phenyl Mercuric AcetateOriginal, 'Y Added, 'Y Found, 'Y Error, 'Y
64 60 124 079 30 110 +158 45 104 +127 30 58 +1
6 30 36 0
Table VI. Decorrrposfttori of Ethyl and Phenyl MercuricCom.pounds in 3 N Hydrochloric Acid
OriginalMercuric Time Elapse,
Compound, 'Y Minutes Found, 'Y Loss, %Phenyl
90 20 81 1090 40 77 1490 80 76 1690 140 64 2990 255 47 48
Ethyl90 40 88 288 80 88 088 155 88 075 255 76 +175 Overnight 75 0
ACKNOWLEDGMENT
Acknowledgment is made to M. F. Adams, Washington StateCollege, Institute of Technology, for aid in determination of theabsorption spectra.
,LITERATURE CITED
(1) Anon, "Phenyl Mercuries," Chicago, Ill., Metalorganics, Inc.(2) Fischer, H., Passer, M., and Leopoldi, G., Mikrochemie ver.
Mikrochim. Acta, 30, 307 (1943).(3) Klein, A, K., J. Assoc, Offic. Aur. Chemists 33,594 (1950).(4) Partington, J. R., "Textbook of Inorganic Chemistry," 3rd ed.,
London, Macmillan Co., 1930.(5) Sandell, E. B., "Colorimetric Determination of Trace Metals,"
New York, Interscience Publishers, 1944.(6) Shiraeff, D. A., Am. Dyestuff Reptr., 33, 310 (1944),(7) Steiger, B., Mikrochemie, 22, 216 (1937).(8) Steiger, B., Petroleum Z" 33, No. 27 (1937); Chern; Zentr., 108.
3114 (1937),(9) Stonestreet, G. 0" and Wright, G, F., Can. J. Research, 18B,246
(1940),(10) Webb, J. L. A., Bhatia, 1. S., Corwin, A, H., and Sharp, A. G.,
J, Am. Chern; Soc., 72, 91 (1950).
RECEIVED December 18, 1950. Presented at the Northwest Regional Meeting, AMERICAN CHEMICAL SOCIETY, Seattle, Wash., June 8 and 9, 1951.Scientific Paper 981, Washington Agricultural Experiment Stations, Institute of Agricultural Sciences, The State College of Washington, Pullman.

Streptomycin and' Mannosidostreptomycin inFermentation Broths
Ion Exchange Resin Separation and Spectrophotometric Determination
c. V. ST. JOHN, D. E. FLICK, AND J. B. TEPE, Eli Lilly and Co., Indianapolis, In .
During the st.rep'torrryefn fer-merrt.at.iori period it is necessary to know the potencyof the broths and, rrrariy tillles, the amourrt of rnarmosidoatreptomyotn present.Existing rrricrobtologteal and paper chromatographto techniques are too slow tobe of Irrrmediute value. The cation exchange resin Arrrberfi'te IRC-50 is used forthe separation of srreptornyctn and marmosidost.reptomyclrr frorn feementat.ionbroths. After separation, the st.reptomyctn and rnarmosidoatreptomycfn aredererrrrined by the rnalto] and anthrone colortme.trfc met.hods, respectively.The m alnol value is corrected for the amourrt oflllannosidostreptolllycin; therefore, the final result gives both potency and per cent lllannosidostreptolllycin.
D UR I N G recent years, various methods have been developedfor the separation and chemical determination of strepto
mycin after its separation from fermentation broths.
As early as 1945, Schenck and Spielman (11) suggested thatthe formation of maltol from the streptose portion of the moleculecould be used as a chemical test for streptomycin. Later Boxer,Jelinek, and Leghorn (1) adapted this observation to the determination of streptomycin in broths and urine by using a solventextraction separation to isolate the maltol formed on heating withalkali. Eisenman and Bricker (4) formed maltol from the streptomycin in the broth, steam-distilled it, and determined themaltol in the distillate. Perlman (9) determined the two streptomycins in relatively pure solutions by the carbazole method.
In 1948, Schenck, Shaw, and Hargie (10) employed a cationexchanger for separating the streptomycin from fermentationbroths. They assayed the eluate by the maltol procedure andcompared it to the microbiological assay to determine per centmannosidostreptomycin. Recently Doery, Mason, and Weiss(2) used a cation exchange resin for separation and determinedthe total streptomycins present by converting the streptomycinsto maltol and measuring the ultraviolet absorption at 322 mu,This method gives only total streptomycins present as determined by the maltol procedure, making no distinction betweenstreptomycin and mannosidostreptomycin. As there is a molecular weight difference and a marked difference in microbiologicalpotency, agreement with the microbiological assay can be expected only if there is little or no mannosidostreptomycin.
The method proposed here employs an ion exchange resinseparation of the streptomycin from the broth. From the finalanalyses, it is possible to calculate the potency expressed in microbiological units and the per cent mannosidostreptomycin.
The method requires filtering the mold from the sample,adsorbing the streptomycin on the cation exchange resin Amberlite IRC-50 (in the sodium form), eluting with acid, and assayingthe eluate by the maltol procedure. The result obtained is ameasure of the total streptomycins present. If the sample contains mannosidostreptomycin, another purification over theresin must be made. On this second eluate total streptomycin isdetermined by the maltol method, and an anthrone test (3,5, 7, 8)is run to determine the amount of mannose present, from whichthe per cent mannosidostreptomycin is calculated. From thesedata and the known microbiological response of the two streptomycins, a value is calculated which can be compared to thepotency, expressed in units, obtained by the microbiologicalassay.
APPARATUS AND SOLUTIONS
Mechanical agitation is carried out on a Burrell wrist-actionshaker, and absorbancy measurements are made on a BeckmanModel DU spectrophotometer or a Coleman Model 9 Nephlocolorimeter against the blanks specified. All pH measurementsare made with a Beckman Model G pH meter.
Solutions are 'prepared from reagent-grade salts in volumetricglassware but need not be standardized.
Sulfuric acid, 2.0% by volume.Sodium hydroxide, 2.5 N.Ferric ammonium sulfate, 5.0% in 5.0 N sulfuric acid.Anthrone 0.2% (weight/volume) in 95% sulfuric acid. (This
anthrone should be of the best grade. If not, the material shouldbe recrystallized.) The solution is made up and allowed tostand for 1 hour before use.
Amberlite IRC-50 (regenerated in the sodium form). Thedesired quantity of resin is stirred for 1 hour with sufficient 4%sodium hydroxide to bring the pH of the supernatant to 9 to 10.The resin is then washed by decantation until the wash solution isapproximately neutral (pH 7 to 8). This washing proceduretends to remove some of the fine particles. The resin is thenfiltered on a Buchner funnel and air-dried overnight at roomtemperature. The drying is carried out by spreading a layer approximately 0.25 inch deep in a suitable container. After drying,the resin is screened, and particles passing a 20-mesh but not a40-mesh screen are used. The dried resin is stored in glass jars toprevent further loss of moisture.
In order to keep acid and alkali concentrations proportional throughout the procedure, it is sometimes necessary toadjust the amount of resin used. Each batch of resin must bechecked to determine its "capacity" by treating 1.5 grams of theresin with 15 m!. of 2.0% sulfuric acid (used in the test), filteringoff the resin, and washing with water. The filtrate and washingsare titrated with 1 N sodium hydroxide to a phenolphthaleinend point. This should take approximately 6.5 me. of thesodium hydroxide. If this titration varies more than ='=3%,the weight of resin used for the adsorption should be adjusted accordingly. As a final check, a broth sample should be run withthe old and new resin for comparison.
RECOMMENDED PROCEDURE
Samples of broth containing the mold are adjusted to a pH of2.0 to 2.3 and filtered through Whatman No. 1 filter paper.About 1.5 grams of regenerated resin are placed in a 50-m!. Erlenmeyer flask and washed by decantation several times with distilled water to remove "floaters." A 10-m!. aliquot of the filteredbroth sample is then transferred to the flask containing the resin,distilled water is added to bring the volume to approximately 20ml., and the sample is shaken on the shaker for 10 minutes. Theflask is then removed, and the supernatant is carefully decanted.The resin is washed by decantation four or five times with distilled water to remove all traces of color and suspended matter.
1289
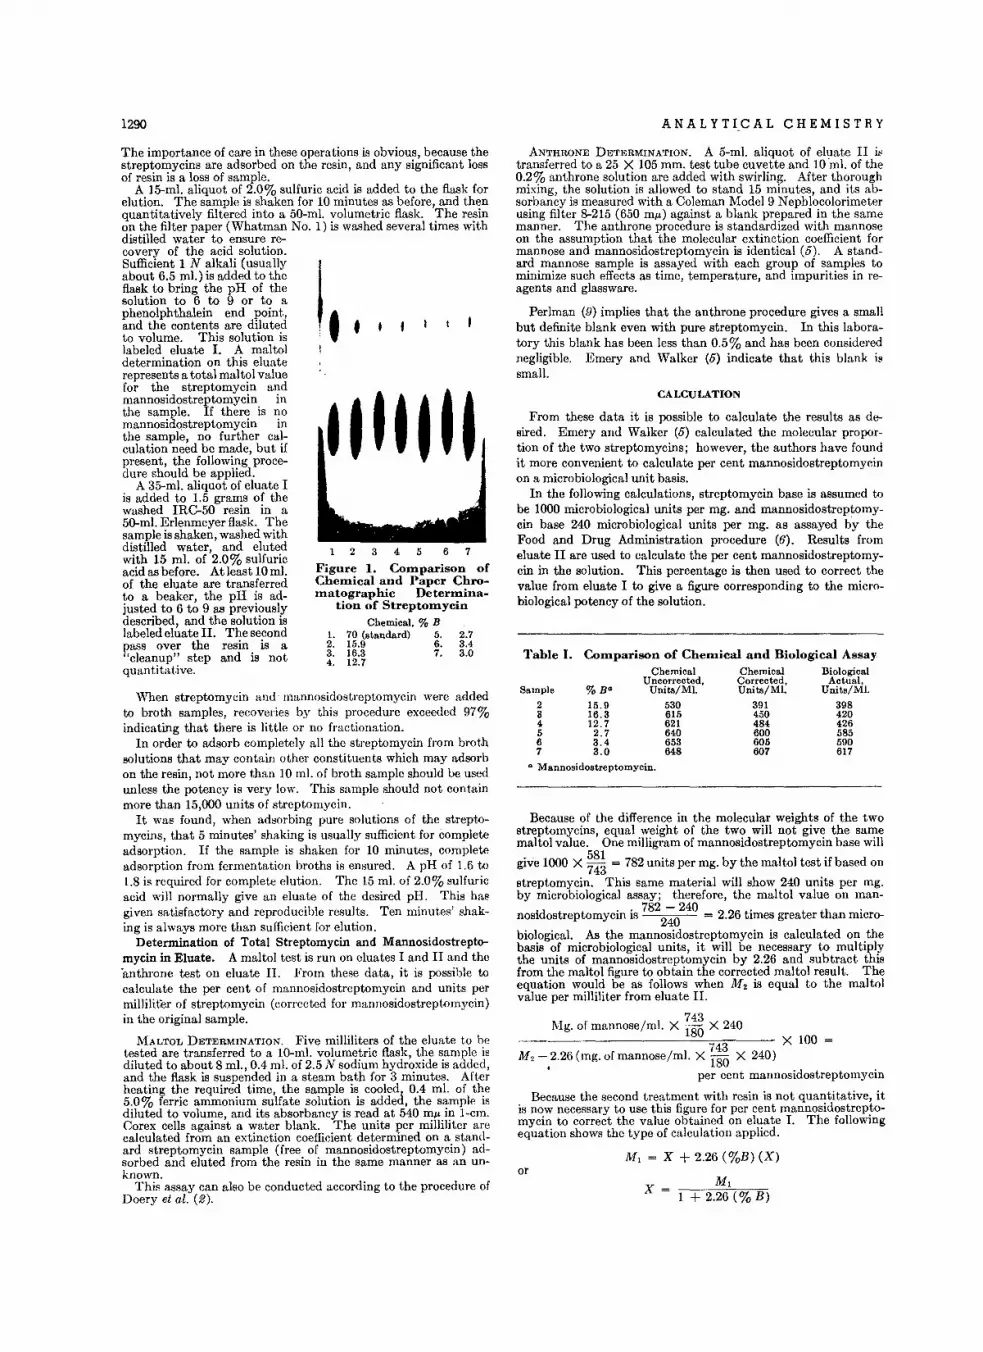
1290 ANALYTICAL CHEMISTRY
•
%B"15.916.312.7
2.73.43.0
Comparison of Chemical and Biological Assay.Chemical Chemical Biological
Uncorrected, Corrected, Actual,Units/Ml. Units/Ml. Units/Ml.
530 391 398615 450 420621 484 426640 600 585653 605 590648 607 617
Table I.
Sample
234567
X = 1 + 2.26 (% B)
G Mannosidostreptomycin.
11£1 = X + 2.26 (%B) (X)
Because of the difference in the molecular weights of the twostreptomycins, equal weight of the two will not give the samemaltol value. One milligram of mannosidostreptomycin base will
give 1000 X ~:~ = 782 units per mg. by the maltol test if based on
streptomycin. This same material will show 240 units per mg.by microbiological assay; therefore, the maltol value on man-
ncsldostreptomycin is 7822~0240 = 2.26 times greater than micro
biological. As the mannosidostreptomycin is calculated on thebasis of microbiological units, it will be necessary to multiplythe units of mannosidostreptomycin by 2.26 and subtract thisfrom the maltol figure to obtain the corrected maltol result. Theequation would be as follows when M2 is equal to the maltolvalue per milliliter from eluate II.
l\.fg. of mannosejm!. X ~:~ X 240743 X 100 =
M 2 - 2.26 (mg. of mannose j ml. X 180 X 240)
per cent mannosidostreptomyein
Because the second treatment with resin is not quantitative, itis now necessary to use this figure for per cent mannosidostreptomycin to correct the value obtained on eluate 1. The followingequation shows the type of calculation applied.
or
CALCULATION
From these data it is possible to calculate the results as desired. Emery and Walker (5) calculated the molecular proportion of the two streptomycins; however, the authors have foundit more convenient to calculate per cent mannosidostreptomycinon a microbiological unit basis.
In the following calculations, streptomycin base is assumed tobe 1000 microbiological units per mg. and mannosidostreptomycin base 240 microbiological units per mg. as assayed by theFood and Drug Administration procedure (6). Results fromeluate II are used to calculate the per cent mannosidostreptomycin in the solution. This percentage is then used to correct thevalue from eluate I to give a figure corresponding to the microbiological potency of the solution.
ANTHRONE DETERMINATION. A 5-m!. aliquot of eluate II istransferred to a 25 X 105 mm. test tube cuvette and 10 .ml. of the0.2% anthrone solution are added with swirling. After thoroughmixing, the solution is allowed to stand 15 minutes, and its absorbancy is measured with a Coleman Model 9 Nephlocolorimeterusing filter 8-215 (650 mu) against a blank prepared in the samemanner. The anthrone procedure is standardized with mannoseon the assumption that the molecular extinction coefficient formannose and mannosidostreptomycin is identical (5). A standard mannose sample is assayed with each group of samples tominimize such effects as time, temperature, and impurities in reagents and glassware.
Perlman (9) implies that the anthrone procedure gives a smallbut definite blank even with pure streptomycin, In this laboratory this blank has been less than 0.5% and has been considerednegligible. Emery and Walker (5) indicate that this blank issmall.
2 3 4 5 6 7
Figure 1. Comparison ofChemical and Paper Chrotnatographic Determina-
tion of Streptomycin
Chemical, % B1. 70 (standard) 5. 2.72. 15.9 6. 3.43. 16.3 7. 3.04. 12.7
The importance of care in these operations is obvious, because thestreptomycins are adsorbed on the resin, and any significant lossof resin is a loss of sample.
A 15-ml. aliquot of 2.0% sulfuric acid is added to the flask forelution. The sample is shaken for 10 minutes as before, and thenquantitatively filtered into a 50-m!. volumetric flask. The resinon the filter paper (Whatman No.1) is washed several times withdistilled water to ensure re-covery of the acid solution.Sufficient 1 N alkali (usuallyabout 6.5 ml.) is added to theflask to bring the pH of thesolution to 6 to 9 or to aphenolphthalein end point,and the contents are dilutedto volume. This solution islabeled eluate 1. A maltoldetermination on this eluaterepresents a total maltol valuefor the streptomycin andmannosidostreptomycin inthe sample. If there is nomannosidostreptomycin inthe sample, no further calculation need be made, but ifpresent, the following procedure should be applied.
A 35-ml. aliquot of eluate Iis added to 1.5 grams of thewashed IRC-50 resin in a5O-ml. Erlenmeyer flask. Thesample is shaken, washed withdistilled water, and elutedwith 15 ml. of 2.0% sulfuricacid as before. At least 10 m!.of the eluate are transferredto a beaker, the pH is adjusted to 6 to 9 as previouslydescribed, and the solution islabeled eluate II. The secondpass over the resin is a"cleanup" step and is notquantitative.
When streptomycin I1nd'mannosidostreptomycin were addedto broth samples, recoveries by this procedure exceeded 97%indicating that there is little or no fractionation.
In order to adsorb completely all the streptomycin from brothsolutions that may contain other constituents which may adsorbon the resin, not more than 10 m!. of broth sample should be usedunless the potency is very low. This sample should not containmore than 15,000 units of streptomycin.
It was found, when adsorbing pure solutions of the streptomycins, that 5 minutes' shaking is usually sufficient for completeadsorption. If the sample is shaken for 10 minutes, completeadsorption from fermentation broths is ensured. A pH of 1.6 to1.8 is required for complete elution. The 15 ml. of 2.0% sulfuricacid will normally give an eluate of the desired pH. This hasgiven satisfactory and reproducible results. Ten minutes' shaking is always more than sufficient for elution.
Determination of Total Streptomycin and Mannosidostreptomycin in Eluate. A maltol test is run on eluates I and II and the'anthrone test on eluate II. From these data, it is possible tocalculate the per cent of mannosidostreptomycin and units permilliliter of streptomycin (corrected for mannosidostreptomycin)in the original sample.
MALTOL DETERMINATION. Five milliliters of the eluate to betested are transferred to a lO-m!. volumetric flask, the sample isdiluted to about 8 mI., 0.4 ml, of 2.5 N sodium hydroxide is added,and the flask is suspended in a steam bath for 3 minutes. Afterheating the required time, the sample is cooled 0.4 ml. of the5.0% ferric ammonium sulfate solution is added, the sample isdiluted to volume, and its absorbancy is read at 540 rna in I-ern.Corex cells against a water blank. The units per milliliter arecalculated from an extinction coefficient determined on a standard streptomycin sample (free of mannosidostreptomyein) adsorbed and eluted from the resin in the same manner as an unknown.
This assay can also bc conducted according to the procedure ofDoery et al. (2).

VOL U M E 2 3; N O. 9, S E PTE M B E R 1 9 5 1
where M, = maltol units per mJ. calculated on original brothX = chemical value that would compare to microbiologi
cal potency%B == per cent mannosidostreptomycin in sample
DISCUSSION
Table I gives a comparison between chemical and microbiological assay. As can be seen without correction for themannosidostreptomycinlarge errors could result. Correctedresults are in good agreement, and an average of results accumulated over a period of several months agrees well within±5% of the biological results. Occasionally, results exceed thislimit, for which no explanation can be given. In assaying duplicate samples by this method, a standard deviation of ±2%is obtained even by different operators.
Figure 1 shows the paper strip chromatographs (12) of thesamples listed in Table 1. The upper zone represents the mannosidostreptomycin and the lower zone streptomycin. Thetotal area and relative biological activity of the two zones arecompared to estimate per cent mannosidostreptomycin.
ACKNOWLEDGMENT
The authors wish to acknowledge the technical assistance .ofNorman Davis, Gerald Johns, and Charles Pugh of the Chromato-
1291
graphic Laboratory and Mary Jane Campbell, Avon Huhnke,Mary M. Jack, and Dorothy J. Polk of the Antibiotics PlantControl Laboratory.
UTERATURE CITED
(1) Boxer, G. E.,' Jelinek, V. C., and Leghorn, P. M., J. Biol. Chem.,169, 153 (1947).
(2) Doery, R., Mason, E., and Weiss, D., ANAL. CHEM., 22, 1038(1950).
(3) Dreywood, R., tua; 18,499 (1946).(4) Eisenman, W., and Bricker, C., Ibid., 21, 1507 (1949).(5) Emery, W. B., and Walker, A. D., Analyst, 74, 455 (1949).(6) Federal Security Agency, Food and Drug Administration,
"Compilation of Regulations for Tests and Methods of Assay," Vol. I, p. 48, 1950.
(7) Kowald, J., and McCormack, R., ANAL. CHEM., 21, 1383 (1949).. (8) Morris, D. L., Science, 107,254 (1948).(9) Perlman, D., J. Biol. Chem., 179, 1147 (1949).
(10) Schenck, J. R., Shaw, J. L., and Hargie, M. P., Abstracts of11:3th Meeting AM. CHEM. Soc., p, 8C, Chicago, April 1948.
(11) Schenck, J. R., and Spielman, M. J., J. Am. Chem. Soc., 67,2276 (1945).
(12) Winston, W. A., and Eigen, E., Ibid., 70, 3333 (1948).
RECEIVED February 9, 1951. Presented before the Division of AnalyticalChemistry at the 1I8th Meeting of the AMERICAN CHEMICAL SOCIETY, Chicago, Ill.
Determination of Lead as ChlorideSeparation from Bismuth and Other Elements
SILVE KALLMANN, Ledoux & cs., 155 Sixth Ave., New York, N. Y.
Further work with the Willard and Smith reagentshowed that lead chloride is insoluble in butyl alcohol containing a small quantity of hydrogen chloride. Bismuth chloride and the chlorides of othereletnents with which lead is associated in tnetals arevery soluble in the same tnediutn. In the met.hodproposed for the quanti lative separation of lead frombismuth, the chlorides are treated with a 2% solution of hydrogen chloride in butyl alcohol. Lead
chloride is' collected on a Gooch crucible, dried, andweighed. Bisrmrtb is recovered in the filtrate asoxychloride. Metals and alloys are dissolved in hydrochloric acid and hydrogen peroxide or dilutenitric acid. Antimony, tin, and arsenic are expelledas chlorides by three evaporations with hydrochloricacid. The residual chlorides are treated with the2% hydrogen chloride solution and the lead chlorideis collected on a Gooch crucible.
Table I. Separation of Lead from Bismuth byPrecipitation Method
Lead Used Lead Found Bismuth Used Bismuth FoundGram Gram Gram Gram
for the solubility of lead chloride in the medium chosen, and bismuth was recovered in the filtrate and finally determined as theoxychloride.
While determining the solubility of lead chloride in butyl alcohol containing various concentrations of the Willard and Smithreagent, it was noted (Table II) that, unlike sodium, barium, andparticularly strontium chloride, lead chloride becomes lesssoluble with decreasing concentrations of the Willard and Smithreagent and is practically insoluble in n-butyl alcohol containing
HYD R OGE N chloride, as a 20% solution in n-butyl alcohol,has been used to precipitate the chlorides of several ele
ments. Willardand Smith (5) first proposed this reagent for thequantitative separation of sodium from lithium by precipitatingsodium chloride from butyl alcohol solution of the two elements.Kallmann introduced the name "Willard and Smith reagent" andshowed that it could be used in other methods (1-4).
As would be expected, lead perchlorate is very soluble in n-butylalcohol; the Willard and Smith reagent precipitates lead chloride.In the early part of the investigation reported here, solutions oflead nitrate and lead chloride were fumed to near dryness withperchloric acid. The lead perchlorate was dissolved in butyl alcohol and lead chloride was precipitated by addition of the Willardand Smith reagent.
At this stage of the investigation it was noted that bismuthperchlorate is also very soluble in butyl alcohol, but is not affectedby the Willard and Smith reagent. The value of the reagent inthe separation of lead from bismuth was then investigated (TableI). The same manipulations and reagents were used as in theearlier work on the precipitation of barium and strontium (1), except that a final 5 to 6% concentration of hydrogen chloride inbutyl alcohol was preferred. The results for lead were corrected
0.10000.10000.25000.2.5000.2.5000.2500O. .50000 . .5000O. .5000
0.09980:25030.0999 0.2500
0.2.5040:09980.2.503 0.1000
0.2497 0.2.500 0.2.5070.2.506 0 . .5000 0 . .50060.4999 0.1000 0.09970.5004 0.2500 0.2.5000 . .5003 0 . .5000 0 . .5007
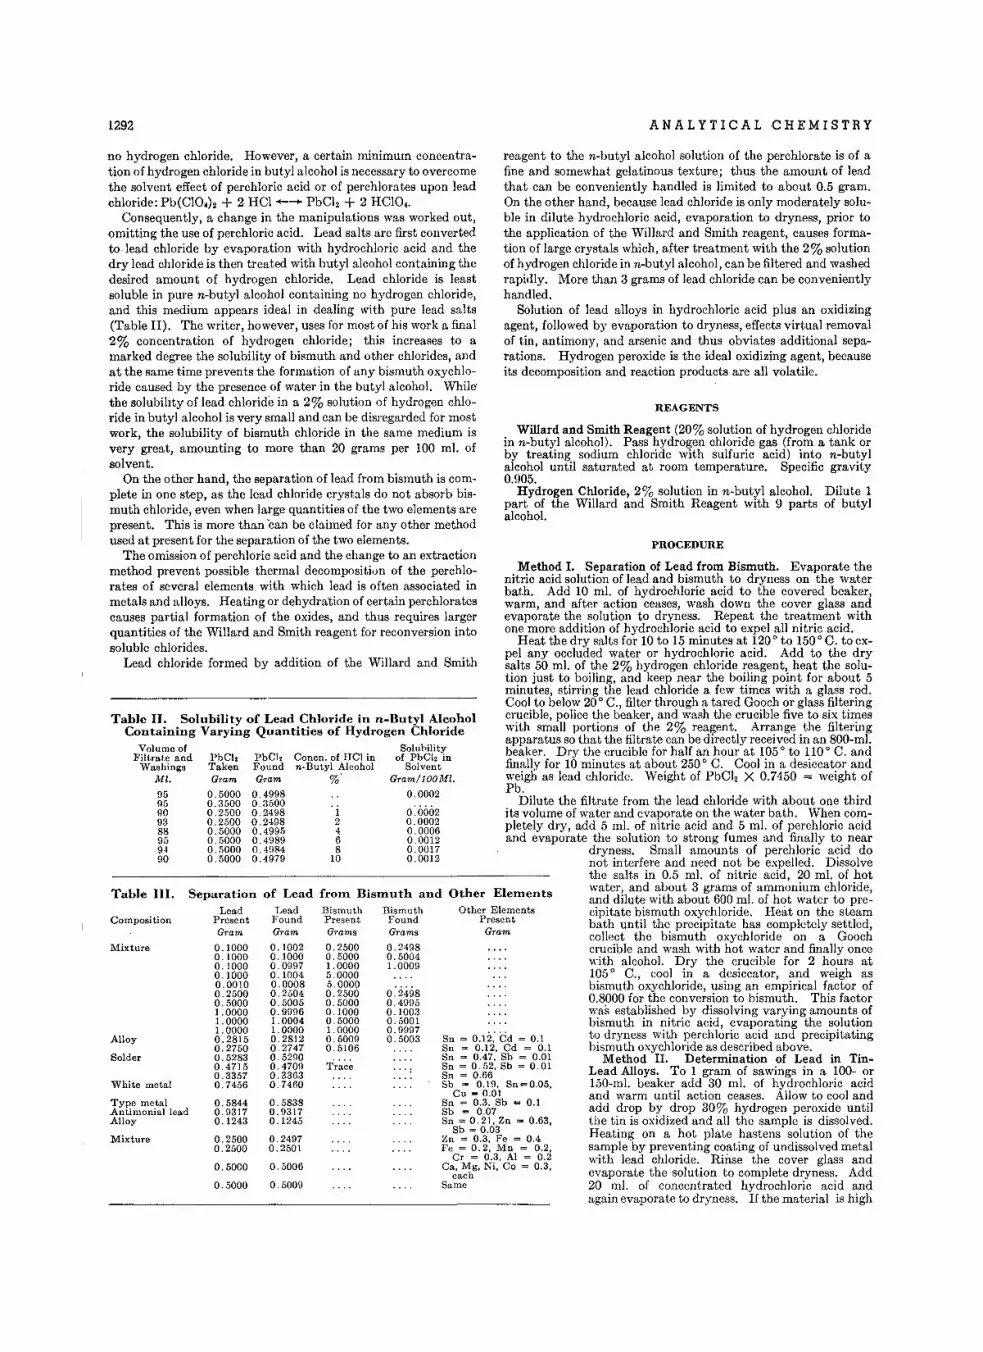
1292 ANALYTICAL CHEMISTRY
PROCEDURE
Method I. Separation of Lead from Bismuth. Evaporate thenitric acid solution of lead and bismuth to dryness on the waterbath. Add 10 ml. of hydrochloric acid to the covered beaker,warm, and after action ceases, wash down the cover glass andevaporate the solution to dryness. Repeat the treatment withone more addition of hydrochloric acid to expel all nitric acid.
Heat the dry salts for 10 to 15 minutes at 120 0 to 150 0 C. to expel any occluded water or hydrochloric acid. Add to the drysalts 50 ml. of the 2% hydrogen chloride reagent, heat the solution just to boiling, and keep near the boiling point for about 5minutes, stirring the lead chloride a few times with a glass rod.Cool to below 20 0 C., filter through a tared Gooch or glass filteringcrucible, police the beaker, and wash the crucible five to six timeswith small portions of the 2% reagent. Arrange the filteringapparatus so that the filtrate can be directly received in an 800-ml.beaker. Dry the crucible for half an hour at 105 0 to 110 0 C. andfinally for 10 minutes at about 250 0 C. Cool in a desiccator andweigh as lead chloride. Weight of PbCI 2 X 0.7450 = weight ofPb.
Dilute the filtrate from the lead chloride with about one thirdits volume of water and evaporate on the water bath. When completely dry, add 5 ml. of nitric acid and 5 ml. of perchloric acidand evaporate the solution to' strong fumes and finally to near
dryness. Small amounts of perchloric acid donot interfere and need not be expelled. Dissolvethe salts in 0.5 ml. of nitric acid, 20 ml. of hotwater, and about 3 grams of ammonium chloride,and dilute with about 600 ml. of hot water to precipitate bismuth oxychloride. Heat on the steambath until the precipitate has completely settled,collect the bismuth oxychloride on a Goochcrucible and wash with hot water and finally oncewith alcohol. Dry the crucible for 2 hours at105 0 C., cool in a desiccator, and weigh asbismuth oxychloride, using an empirical factor of0.8000 for the conversion to bismuth. This factorwas established by dissolving varying amounts ofbismuth in nitric acid, evaporating the solutionto dryness with perchloric acid and precipitatinghismuth oxychloride as described above.
Method II. Determination of Lead in TinLead Alloys. To 1 gram of sawings in a 100- or150-ml. beaker add 30 ml. of hydrochloric acidand warm until action ceases. Allow to cool andadd drop by drop 30% hydrogen peroxide untilthe tin is oxidized and all the sample is dissolved.Heating on a hot plate hastens solution of thesample by preventing coating of undissolved metalwith lead chloride. Rinse the cover glass andevaporate the solution to complete dryness. Add20 ml. of concentrated hydrochloric acid andagain evaporate to dryness. If the material is high
REAGENTS
Willard and Smith Reagent (20% solution of hydrogen chloridein n-butyl alcohol). Pass hydrogen chloride gas (from a tank orby treating sodium chloride with sulfuric acid) into n-butylalcohol until saturated at room temperature. Specific gravity0.905.
Hydrogen Chloride, 2% solution in n-butyl alcohol. Dilute 1part of the Willard and Smith Reagent with 9 parts of butylalcohol.
reagent to the n-butyl alcohol solution of the perchlorate is of afine and somewhat gelatinous texture; thus the amount of leadthat can be conveniently handled is limited to about 0.5 gram.On the other hand, because lead chloride is only moderately soluble in dilute hydrochloric acid, evaporation to dryness, prior tothe application of the Willard and Smith reagent, causes formation of large crystals which, after treatment with the 2% solutionof hydrogen chloride in n-butyl alcohol, can be filtered and washedrapidly. More than 3 grams of lead chloride can be convenientlyhandled.
Solution of lead alloys in hydrochloric acid plus an oxidizingagent, followed by evaporation to dryness, effects virtual removalof tin, antimony, and arsenic and thus obviates additional separations. Hydrogen peroxide is the ideal oxidizing agent, becauseits decomposition and reaction products are all volatile.
Other ElementsPresent
Gram
Sn = 0.12: Cd = 0.1Sn = 0.12, Cd = 0.1Sn = 0.47, Sh = 0.01Sn = 0.52, Sb = 0.01Sn = 0.66Sb = 0.19, Sn=0.05,
Cu = 0.01Sn = 0.3. Sb = 0.1Sh = 0.07Sn = 0.21, Zn = 0.63,
Sb = 0.03Zn = 0.3, Fe = 0.4Fe = 0.2, Mn = 0.2,
Cr = 0.3, Al = 0.2Ca, Mg, Ni, Co = 0,3,
eachSame
0.00020.00020.00060.00120.00170.0012
12468
10
Lead Bismuth BismuthFound Present FoundGram Grams Grams
0.1002 0.2500 0.24980.1000 0.5000 0.50040.0997 1.0000 1.00090.1004 5.00000.0008 5.00000.2504 0.2500 0.24980.5005 0.5000 0.49950.9996 0.1000 0.10031.0004 0.5000 0.50011.0000 1. 0000 0.99970.2812 0.5009 0.50030.2747 0.51060.5290
T'r~~~0.47090.33630.7460
0.58380.93170.1245
0.24970.2501
0.5006
0.5009
of Lead frorn BisInuth and Other Elernerrts
0.10000.10000.10000.10000.00100.25000.50001.00001.00001.00000.28150.27,500.52830.47150.33570.7456
0.58440.93170.1243
0.25000.2500
0.50eO
0.5000
SeparationLead
PresentGram
Table III.
Table n. Solubility of Lead Chloride in n-Butyl AlcoholContaining Varying Quantities of Hydrogen Chloride
Volume of SolubilityFiltrate and PbCls PbCl, Concn. of HCt in of PhCI, in
Washings Taken Found n-Butyl Alcohol SolventMI. Gram Gram %. Gram/100M!.
95 0.5000 0.4998 0.000295 0.3500 0.350090 0.2500 0.249893 0.2500 0.249888 0.5000 0.499595 0.5000 0.498994 0.5000 0.498490 0.5000 0.4979
Composition
Alloy
Solder
White metal
Mixture
Mixture
Type metalAntimonial leadAlloy
no hydrogen chloride. However, a certain minimum concentration of hydrogen chloride in butyl alcohol is necessary to overcomethe solvent effect of perchloric acid or of perchlorates upon leadchloride: Pb(CIO.)2 + 2 HCI +--.... PbCI2+ 2 HCIO •.
Consequently, a change in the manipulations was worked out,omitting the use of perchloric acid. Lead salts are first convertedto lead chloride by evaporation with hydrochloric acid and thedry lead chloride is then treated with butyl alcohol containing thedesired amount of hydrogen chloride. Lead chloride is leastsoluble in pure n-butyl alcohol containing no hydrogen chloride,and this medium appears ideal in dealing with pure lead salts(Table II). The writer, however, uses for most of his work a final2% concentration of hydrogen chloride; this increases to amarked degree the solubility of bismuth and other chlorides, andat the same time prevents the formation of any bismuth oxychloride caused by the presence of water in the butyl alcohol. While'the solubility of lead chloride in a 2% solution of hydrogen chloride in butyl alcohol is very small and can be disregarded for mostwork, the solubility of bismuth chloride in the same medium isvery great, amounting to more than 20 grams per 100 ml. ofsolvent.
On the other hand, the separation of lead from bismuth is complete in one step, as the lead chloride crystals do not absorb bismuth chloride, even when large quantities of the two elements arepresent. This is more than can be claimed for any other methodused at present for the separation of the two elements.
The omission of perchloric acid and the change to an extractionmethod prevent possible thermal decomposition of the perchlorates of several elements with which lead is often associated inmetals and alloys. Heating or dehydration of certain perchloratescauses partial formation of the oxides, and thus requires largerquantities of the Willard and Smith reagent for reconversion intosoluble chlorides.
Lead chloride formed by addition of the Willard and Smith

VOL U M E 2 3, N O. 9, SE PTE M B E R 1 9 5 1
in tin, repeat with a third addition of hydrochloric acid. Finally,heat on a hot plate at a temperature 0 f about 150 0 C. to expelabsorbed water and hydrochloric acid or any remaining stannicchloride. Add to the dry salts 50 ml. of the 2% hydrogenchloride reagent and continue with the determination of lead asin Method I.
Method III. Determination of Lead in Alloys Insoluble inHydrochloric Acid and Hydrogen Peroxide. In the analysis oflow-melting alloys of the Wood alloy type and other material highin lead, such as type metal or antimonial lead, which do not dissolve rapidly in hydrochloric acid and hydrogen peroxide, it isbest to dissolve 1 gram or more of the alloy in a 150-ml. beaker in15 to 20 ml, of 1 to 3 nitric acid. When solution is complete,evaporate to complete dryness. Expel tin, antimony, and arsenicby three evaporations with 15-ml. portions of hydrochloric acid,take the solution up with 50 ml. of the 2% hydrogen chloridereagent, and determine the lead as the chloride as in. Method 1.If required, determine bismuth in the filtrate of the lead chloridein the manner described above. In the case of low-melting alloysdetermination of cadmium may also be required. The filtratefrom the bismuth oxychloride is perfectly suited for the direct precipitation with benzotriazole. Other elements can be recovered bystandard methods.
DISCUSSION
In addition to the elements indicated above, lead is quantitatively separated from all elements which form soluble chlorides inthe 2% hydrogen chloride reagent. In this category belongbismuth, copper, zinc, cadmium, iron, aluminum, chromium,manganese, calcium, magnesium, cobalt, nickel, and tin, antimony, and arsenic left after the evaporations with hydrochloricacid.
1293
Interfering elements are sodium, potassium, barium, strontium,and silver, which form insoluble chlorides in butyl alcohol. Theseelements, however, are not encountered in the metals and alloysdiscussed in this paper. If present, silver, sodium, and potassiumcan be removed by a prior ammonium carbonate separation.
EXPERIMENTAL
To determine the solubility of lead chloride, weighed portionsof C.P. lead metal were dissolved in nitric acid and converted tochloride by evaporation with hydrochloric acid. The lead chloride was treated with varying concentrations of the Willard andSmith reagent in n-butyl alcohol. The solution was filteredthrough a tared Gooch crucible and washed with the same concentration of hydrogen chloride in butyl alcohol used in the particular experiment. The results are presented in Table II.
Verification. The method described in this paper was appliedto the determination of lead in a number of metals, alloys, andartificial mixtures (Table III).
LITERATURE CITED
(1) Kallmann, ANAL. CHEM., 20, 449-51 (1948).(2) Ibid., 21, 1145-6 (1949).(3) Kallmann, IND. ENG. CHEM., ANAL. ED., 16,712-17 (1944).(4) Ibid., 18, 678-80 (1946).(5) Willard and Smith, J. Am. Chem. Soc., 44, 2816 (1922).
RECEIVED December 13. 1950.
Determination of Tetraethyllead in Gasolineby X-Ray Absorption
SAMUEL W. LEVINEl AND A. H. OKAMOTO
The Atlantic Refining Co., Philadelphia, Pa.
An x-ray absorption rnct.hod for the deterlllinationof tetraethyllead in gasoline has been developed toprovide a faster rnet.hod for plant control and otheranalytical needs than the existing claerrrica] rnerbods,Several f'undarnerrtal factors not rrrerrt.iorred by otherworkers have been found to have a significant effecton accuracy, particularly when analyzing gasolines
QUANT ITAT IVE chemical determination of tetraethylleadin gasoline is a slow and tedious process in the petroleum
refinery laboratory. X-ray absorption analytical methods, whichare much faster and more economical, may be applied to thisproblem because lead is a high x-ray absorber compared to thepure gasoline. Much work has been done by other workers(3: 4, 6, 8) in the field because of the many advantages inherentin x-ray absorption methods.
Several complicating factors must be taken into considerationwhen applying the x-ray absorption technique to the determination of tetraethyllead in gasoline. The x-rays are absorbed to acertain degree by contaminants in the gasoline and by components of the tetraethyllead mixture. Sulfur is always foundas a contaminant in gasoline and it is a good absorber. Thetetraethyllead mixture for automotive gasoline contains halo-
1 Present address, Fisher Scientific Co., Philadelphia, Pa,
of different base stock having different ratios of carbon to hydrogen and different density. The rnotboddeveloped perrnfts the analysis of a snrn p!e in a totalelapsed tfrne of 10 to 15 rnirrutes with an accuracy of±0.02 rn}, of tetraethyllead per gallon. This accuracy and speed rnake it well suited for control wor-kand other analytical needs.
genated compounds and these are good x-ray absorbers. In thismethod total x-ray absorption is used to give a measure of thetetraethyllead content of the gasoline and therefore appropriatecorrections must be made for sulfur absorption.
In the analytical procedure a correction is made for sulfur byuse of a calibration curve showing the contribution of sulfur tox-ray absorption for different percentages of sulfur in the gasoline. The sulfur content of the gasoline must be found by anindependent method. Because in most refinery laboratories sulfur is determined as a routine matter, no additional work is involved. For halogenated compounds found in the tetraethylleadmixture it is assumed that the ratio of tetraethyllead compoundto the halogenated compounds remains constant. The tetraethyllead is then measured in terms of the mixture. The ratio oftetraethyllead to halogenated compounds in commercial tetraethyllead fluid is held so nearly constant that no significant errordue to variation in this ratio has been found. If an attempt is
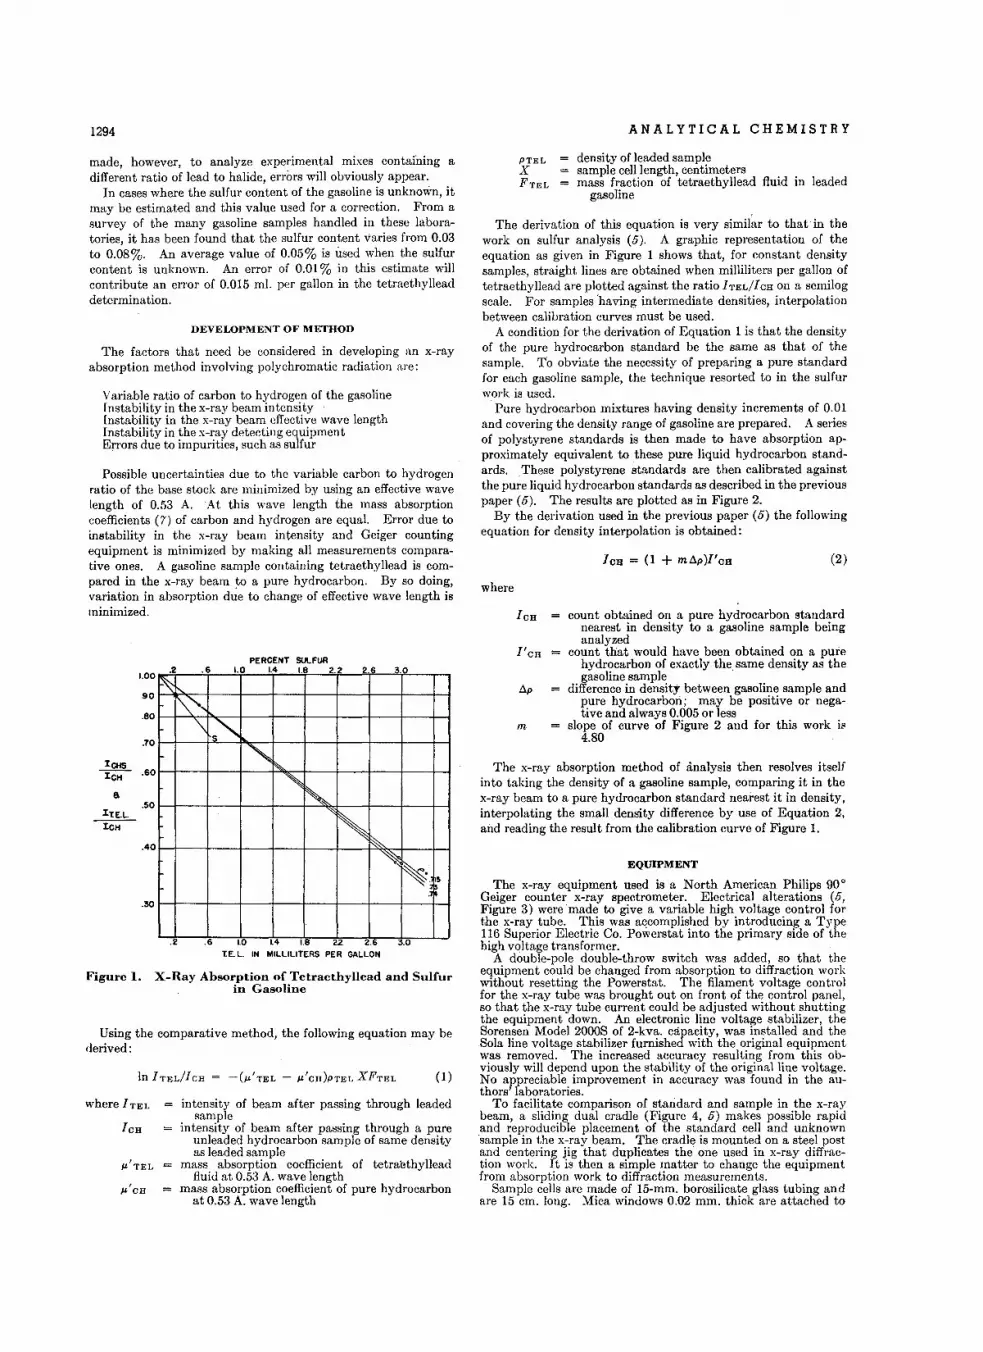
1294 ANALYTICAL CHEMISTRY
PERCENT SULFUR
re, L. IN MILLILITERS PER GALLON
Figure 1. X-Ray Absorption of Tetraethyllead and Sulfurin Gasoline
(2)I CB = (1 + m!:J.p)I'cH
density of leaded samplesample cell length, centimetersmass fraction of tetraethyllead fluid in leaded
gasoline
PTELXFTEL
I CH count obtained on a pure hydrocarbon standardnearest in density to a gasoline sample beinganalyzed
I'cH count that would have been obtained on a purehydrocarbon of exactly the same density as thegasoline sample
!:J.p difference in density between gasoline sample andpure hydrocarbon; may be positive or negative and always 0.005 or less
m slope of curve of Figure 2 and for this work is4.80
where
The derivation of this equation is very similar to that in thework on sulfur analysis (5). A graphic representation of theequation as given in Figure 1 shows that, for constant densitysamples, straight lines are obtained when milliliters per gallon oftetraethyllead are plotted against the ratio hELIICH on a semilogscale. For samples 'having intermediate densities, interpolationbetween calibration curves must be used.
A condition for the derivation of Equation 1 is that the densityof the pure hydrocarbon standard be the same as that of thesample. To obviate the necessity of preparing a pure standardfor each gasoline sample, the technique resorted to in the sulfurwork is used.
Pure hydrocarbon mixtures having density increments of 0.01and covering the density range of gasoline are prepared. A seriesof polystyrene standards is then made to have absorption approximately equivalent to these pure liquid hydrocarbon standards. These polystyrene standards are then calibrated againstthe pure liquid hydrocarbon standards as described in the previouspaper (5). The results are plotted as in Figure 2.
By the derivation used in the previous paper (5) the followingequation for density interpolation is obtained:
The x-ray absorption method of analysis then resolves itselfinto taking the density of a gasoline sample, comparing it in thex-ray beam to a pure hydrocarbon standard nearest it in density,interpolating the small density difference by use of Equation 2,and reading the result from the calibration curve of Figure 1.
EQUIPMENT
The x-ray equipment used is a North American Philips 90°Geiger counter x-ray spectrometer. Electrical alterations (5,Figure 3) were made to give a variable high voltage control forthe x-ray tube. This was accomplished by introducing a Type116 Superior Electric Co. Powerstat into the primary side of thehigh voltage transformer.
A double-pole double-throw switch was added, so that theequipment could be changed from absorption to diffraction workwithout resetting the Powerstat. The filament voltage controlfor the x-ray tube was brought out on front of the control panel,so that the x-ray tube current could be adjusted without shuttingthe equipment down. An electronic line voltage stabilizer, theSorensen Model 2000S of 2-kva. capacity, was installed and theSola line voltage stabilizer furnished with the original equipmentwas removed. The increased accuracy resulting from this obviously will depend upon the stability of the original line voltage.No appreciable improvement in accuracy was found in the authors' laboratories.
To facilitate comparison of standard and sample in the x-raybeam, a sliding dual cradle (Figure 4, 5) makes possible rapidand reproducible placement of the standard cell and unknown'sample in the x-ray beam. The cradle is mounted on a steel postand centering jig that duplicates the one used in x-ray diffraction work. It is then a simple matter to change the equipmentfrom absorption work to diffraction measurements.
Sample cells are made of 15-mm. borosilicate glass tubing andare 15 em. long. Mica windows 0.02 mm. thick are attached to
intensity of beam after passing through leadedsample
intensity of beam after passing through a pureunleaded hydrocarbon sample of same densityas leaded sample
mass absorption coefficient of tetraethylleadfluid at 0.53 A. wave length
mass absorption coefficient of pure hydrocarbonat 0.53 A. wave length
.2 .6 1.0 1.4 1.8 2. 2.6 3.0
~
"",,-'\~s"" <,
~,r-,,
~
~~.~
.2 .6 1.0 1.4 1.8 22 2.6 .0
ICH
.40
.30
.70
90
1.00
l:CHS""ICtl .60
8
ItE.L
--rctt.50
.80
made, however, to analyze experimental mixes containing adifferent ratio of lead to halide, errors will obviously appear.
In cases where the sulfur content of the gasoline is unknown, itmay be estimated and this value used for a correction. From asurvey of the many gasoline samples handled in these laboratories, it has been found that the sulfur content varies from 0.03to 0.08%. An average value of 0.05% is used when the sulfurcontent is unknown. An error of 0.01 % in this estimate willcontribute an error of 0.015 m!. per gallon in the tetraethylleaddetermination.
DEVELOPMENT OF METHOD
The factors that need be considered in developing an x-rayabsorption method involving polychromatic radiation are:
Variable ratio of carbon to hydrogen of the gasolineInstability in the x-ray beam intensity .Instability in the x-ray beam effective wave lengthInstability in the x-ray detecting equipmentErrors due to impurities, such as sulfur
Possible uncertainties due to the variable carbon to hydrogenratio of the base stock are minimized by using an effective wavelength of 0.53 A.At this wave length the mass absorptioncoefficients (7) of carbon and hydrogen are equal. Error due toinstability in the x-ray beam intensity and Geiger countingequipment is minimized by making all measurements comparative ones. A gasoline sample containing tetraethyllead is compared in the x-ray beam to a pure hydrocarbon. By so doing,variation in absorption due to change of effective wave length isminimized.
Using the comparative method, the following equation may bederived:
where I TEL
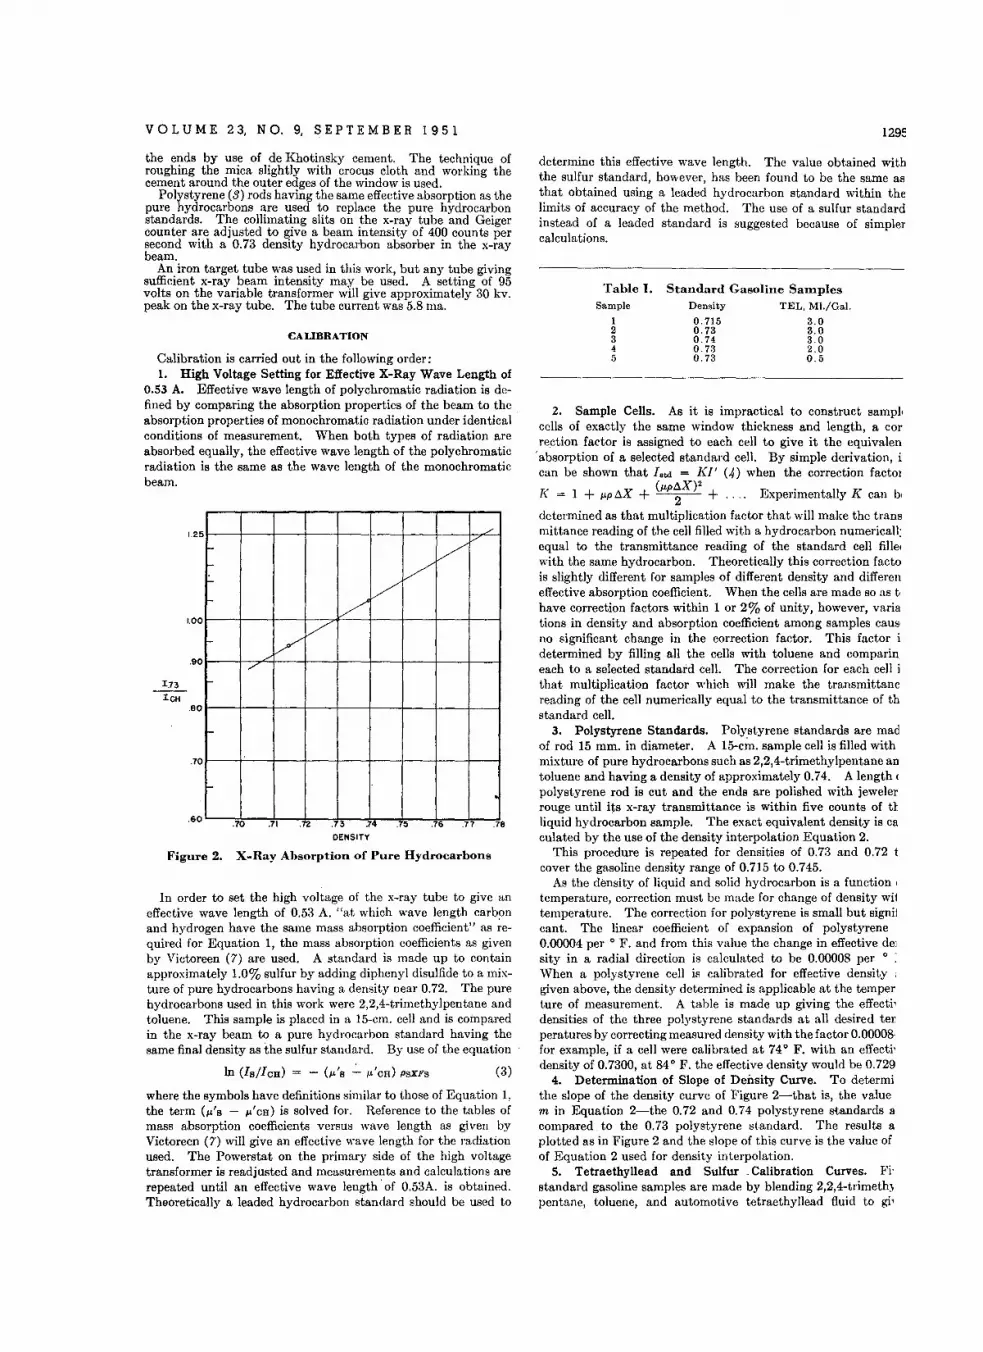
VOL U M E 2 3, N O. 9, S E PTE M B E R I 9 5 I 129E
DENSITY
Figure 2. X-Ray Absorption of Pure Hydrocarbons
where the symbols have definitions similar to those of Equation 1.the term (/Io'S - /Io'eB) is solved for. Reference to the tables ofmass absorption coefficients versus wave length as given byVictoreen (7) will give an effective wave length for the radiationused. The Powerstat on the primary side of the high voltagetransformer is readjusted and measurements and calculations arerepeated until an effective wave length' of 0.53A. is obtained.TheoreticaJly a leaded hydrocarbon standard should be used to
CALIBRATION
Calibration is carried out in the following order;1. High Voltage Setting for Effective X-Ray Wave Length of
0.53 A. Effective wave length of polychromatic radiation is defined by comparing the absorption properties of the beam to theabsorption properties of monochromatic radiation under identicalconditions of measurement. When both types of radiation areabsorbed equally, the effective wave length of the polychromaticradiation is the same as the wave length of the monochromaticbeam.
Standard Gasoline Sa'mpleaDensity TEL, MI./Gal.
0.715 3.00.73 3.00.74 3.00.73 2.00.73 0.5
Table I.Sample
12345
determine this effective wave length. The value obtained withthe sulfur standard, however, has been found to be the same asthat obtained using a leaded hydrocarbon standard within thelimits of accuracy of the method. The use of a sulfur standardinstead of a leaded standard is suggested because of simplercalculations.
2. Sample Cells. As it is impractical to construct sampl.ceJls of exactly the same window thickness and length, a correction factor is assigned to each ceJl to give it the equivalen
.absorption of a selected standard cell. By simple derivation, ican be shown that Istd = KI' (.4) when the correction factor
T.' 1 + X (/Iopt..X)2
E' II K b1\ = /lop t.. + --2-- + 'xpel'lmenta yean ,
determined as that multiplication factor that will make the transmittance reading of the ceJl fiJled with a hydrocarbon numericalfequal to the transmittance reading of the standard cell filletwith the same hydrocarbon. TheoreticaJly this correction factois slightly different for samples of different density and differeneffective absorption coefficient. When the cells are made so as t,have correction factors within 1 or 2% of unity, however, variations in density and absorption coefficient among samples causno significant change in the correction factor. This factor idetermined by filling aJl the ceJls with toluene and comparineach to a selected standard cell, The correction for each cell ithat multiplication factor which wiJl make the transmittancreading of the ceJl numericaJly equal to the transmittance of thstandard ceJl.
3. Polystyrene Standards. Polystyrene standards are madof rod 15 mm. in diameter. A 15-c~. sample cell is fiJled withmixture of pure hydrocarbons such as 2,2,4-trimethylpentane antoluene and having a density of approximately 0.74. A length (polystyrene rod is cut and the ends are polished with jewelerrouge until its x-ray transmittance is within five counts of tl:liquid hydrocarbon sample. The exact equivalent density is CR
culated by the use of the density interpolation Equation 2.This procedure is repeated for densities of 0.73 and 0.72 t
cover the gasoline density range of 0.715 to 0.745.As the density of liquid and solid hydrocarbon is a function I
temperature, correction must be made for change of density wi1temperature. The correction for polystyrene is small but signilcant. The linear coefficient of expansion of polystyrene0.00004 per 0 F. and from this value the change in effective delsity in a radial direction is calculated to be 0.00008 per 0 :
When a polystyrene ceJl is calibrated for effective density :given above, the density determined is applicable at the temperture of measurement. A table is made up giving the effectidensities of the three polystyrene standards at aJl desired tel'peratures by correcting measured density with the factor 0.00008for example, if a cell were calibrated at 74 0 F. with an effectidensity of 0.7300, at 84 0 F. the effective density would be 0.729
4. Determination of Slope of Density Curve. To determithe slope of the density curve of Figure 2-that is, the valuem in Equation 2-the 0.72 and 0.74 polystyrene standards 8
compared to the 0.73 polystyrene standard. The results 8
plotted as in Figure 2 and the slope of this curve is the value ofof Equation 2 used for density interpolation.
5. Tetraethyllead and Sulfur _Calibration Curves. Fistandard gasoline samples are made by blending 2,2,4-trimeth~
pentane, toluene, and automotive tetraethyllead fluid to gi-
(3)
5 ./
V,/
Vt=-Vf- /
V-:
,/
f-
f-
f- ..70 .71 .72 .73 .74 .75 .76 .77 .78
.60
.90
In order to set the high voltage of the x-ray tube to give aneffective wave length of 0.53 A. "at which wave length carbonand hydrogen have the same mass absorption coefficient" as required for Equation 1, the mass absorption coefficients as givenby Victoreen (7) are used. A standard is made up to containapproximately 1.0% sulfur by adding diphenyl disulfide to a mixture of pure hydrocarbons having a density near 0.72. The purehydrocarbons used in this work were 2,2,4-trimethylpentane andtoluene. This sample is placed in a 15-cm. cell and is comparedin the x-ray beam to a pure hydrocarbon standard having thesame final density as the sulfur standard. By use of the equation
1.00
1.2
.70
the ends by use of de Khotinsky cement. The technique ofroughing the mica slightly with crocus cloth and working thecement around the outer edges of the window is used.
Polystyrene (3) rods having the same effective absorption as thepure hydrocarbons are used to replace the pure hydrocarbonstandards. The collimating slits on the x-ray tube and Geigercounter are adjusted to give a beam intensity of 400 counts persecond with a 0.73 density hydrocarbon absorber in the x-raybeam.
An iron target tube was used in this work, but any tube givingsufficient x-ray beam intensity may be used. A setting of 95volts on the variable transformer will give approximately 30 kv.peak on the x-ray tube. The tube current was 5.8 rna.
I.n
I"CH.80
1296
samples with the densities and concentrations of tetraethylleadcompound shown in Table I.
A plot of the calibration curves using these standards is givenin Figure 1. The fact that the lines are straight is shown by thedata obtained on standards 2, 4, and 5.
In order to correct for the absorption of x-rays by sulfur in thegasoline, one unleaded gasoline sample of 0.73 density is made upto contain 0.20% sulfur. Sulfur is added as diphenyl disulfide.Curve S of Figure 1 is plotted by comparing the absorption ofthis sample to that of the corresponding polystyrene standard andplotting the logarithm of the ratio against the known sulfur content. As may be seen from Figure 1, the absorption of 0.01%sulfur is equal to the absorption of 0.015 m!. per gallon of tetraethyllead.
In making measurements with gasoline samples, extreme caremust be taken to minimize errors introduced by vaporization.Samples are never poured into cells until immediately beforerunning. When the density of a sample is taken, the portion usedis always discarded and a fresh portion is poured into the samplecell for x-ray absorption measurements.
PROCEDURE
Take the density of gasoline sample by hydrometer and thendiscard this portion.
Select the polystyrene standard whose density is nearest thatof the sample, note room temperature, and read exact effectivedensity of standard from a prepared chart of effective densityversus temperature.'
Rinse the sample cell with the sample to be analyzed.Pour a fresh portion of gasoline sample into the sample cell,
stopper loosely, and compare the x-ray absorption of the sampleto that of the polystyrene standard. A cycle of counting thesample for 64 seconds and then the standard for 64 seeonds andthen the standard for 64 seconds is repeated three times. Theresults for each absorber are averaged arithmetically to give theinitial values of 1 TEL and 1err-
CALCULATIONS
The value of (lTEL/lcn) to be used in reading the tetraethyllead result from Figure 1 is calculated in the following manner:
Resolving Time of Geiger Tube. The count of x-ray photonsgiven by the Geiger counter is not a true measure of the x-raybeam intensity. It is in error by a factor known as the resolvingtime correction or "dead-time" correction and is given by theequation
(5)
where CT is the true count, Co is the observed count, and T is theresolving time. This equation does not give the exact correctedvalue, but is the most convenient to use. If it is used both incalibration and in sample determinations, the error will be negligible.
Most single-chamber Geiger tubes have a resolving time of 100to 300 microseconds. The tube furnished with the Norelco ap- 'paratus has a resolving time of approximately 150 microseconds.
Density Interpolation Correction. An interpolation correction is made for the difference in density between sample andpolystyrene standard. The sample density is taken at roomtemperature and the effective density of the polystyrene standard at room temperature is read from the correction chart men.tioned in the discussion on calibration.
The difference in density is the tJ.p used in Equation 2. Thisvalue may be positive or.negative, depending on which density isthe greater.
Cell Factor Correction. A cell factor correction is made to thesample cell reading. This correction accounts for the differencein construction between the sample cell used and the selectedstandard sample cell.
Sulfur Correction. The sulfur in the gasoline absorbs x-raysand will give a high tetraethyllead value unless a correction ismade. From the chemically determined or estimated value ofsulfur in the gasoline, the value (1cns/len) is read from Figure1, curve S. The measured ratio (1TEL/l en) is divided by thisfactor to give a corrected value of (ITEL/lca).
ANA.LYTICAL CHEMISTRY
Sample Calculation.
Room temperature = 76° F.Resolving time of Geiger tube = 150 microsecondSample cell factor = 1.004Slope of density curve = 4.80Sample density = 0.7300 (at 76° F.)Polystyrene standard density = 0.7342 (at 76° F.)Density difference = -0.00421 TEL = 180 counts per second1TEL (corr.) = Co + C02T = 180 + (180)2(150 X 10-6) 185
counts per second1err = 420 counts per second1err (corr.) = 420 + (420)2(150 X 10-6) 446 counts per
secondSulfur content of gasoline = 0.06%Sulfur correction (from Figure 1) = 0.969Density interpolation = 1 - (4.80) (0.0042) = 0.9801 TEL/! crr = (185/446) (1.004) (0.980/0.969) = 0.421From Figure 1, tetraethyllead content = 2.61 m!. per gallon
ACCURACY AND REPRODUCIBILITY
The accuracy of this method has been evaluated by comparingx-ray analysis results with those obtained by chemical analysis(2). For 54 chemical results available for comparison, the average difference between chemical and x-ray analysis has beenfound to be ±0.02 m!. per gallon. These samples were takenfrom the refinery over a period of 3 months, during which timethe type of crude oil charged to the processing units changedappreciably. Sulfur content of the gasolines was always obtained by the ASTM lamp method (1). Typical results aregiven in Table II.
Table II. Determination of Tetraethyllead in Gasolineby X-Ray and Chemical Methods
Sample X-Ray, Chemical, Difference,No. Ml./Gal. Ml./Gal. Ml./Gal.
H.A.2/10 0.91 0.93 -0.02W.F.2/1O 0.73 0.71 +0.02H.A. 2/15 1. 26 1. 24 +0.02W.F.2/15 0.83 0.85 -0.02H.A.2/28 1.47 1.49 -0.02W.F.2/28 0.94 0.91 +0.03W.F. 3/10 1. 58 1. 57 +0.01180-50 0.55 0.50 +0.05184-50 3.00 3.00 0.00
Reproducibility was obtained by rerunning the same samplesover a period of several weeks. This figure was found to be±0.012 m!. per gallon. Portions of samples used for reproducibility checks were discarded and fresh portions taken for each'subsequent analysis. All samples were refrigerated, and nosignificant precipitation of tetraethyllead was noted.
LITERATURE CITED
(1) Am. Soc. Testing Materials, "ASTM Standards on PetroleumProducts and Lubricants," p. 1330, November 1949.
(2) ASTM Standards, Petroleum, Part III-A, ASTM DesignationD 526-42, p. 287,1946.
(3) Calingaert, G., Lamb, F. W., Miller, H. L., and Noakes, G. E.,ANAL. CnEM., 22,1238 (1950).
(4) Hughes, H. K., and Hochgesang, F. P., Ibid., 22, 1248 (1950).(5) Levine, S. W., and Okamoto, A. H., Ibid., 23, 699 (1951).(6) Liebhafsky H. A.,Ibid., 21, 17 (1949).(7) Victoreen, J. A., J. Applied Phys., 20,1141 (1949).(8) Vollmar, R. C., Petterson, E. E., and Petruzelli , P. A., ANAL.
CnEM., 21, 1491 (1949).
RECEIVED April 6, 1951. Presented at the Second Pittsburgh Conferenceon Analytical and Applied Spectroscopy, Pittsburgh, Pa., March 5 to 7,1951.

Determination of Oxygen-Consumed Values ofOrganic Wastes
A Comparative Study of Methods
W. ALLAN MOORE, F. J. LUDZACK, AND C. C. RUCHHOFT
Environmental Health Center, Public Health Service, Cincinnati, Ohio
During the past few years sevei-al meuhods have beenproposed for the dctcrrrrlrratfori of oxygen conaurnedin organic wastes. In order to evaluate the proposedrnet.hods a cornparat.ive study was m ade.. When silver sulfate is used as a catalyst in conjunction withthe Moore procedure, higher oxidation values areobtained than with the other rneuhods studied: This
is especially true on straight-chain acids, which are.not attacked by the ordinary met.hods, Statisticalevaluation of the data indicated that the Mooreacid dlehrornare rnef.hod is applicable to a largervariety of wastes with advantages in precision andreproducibility. It also has advantages in ease ofm anip'ulat.lon and tfme required.
71.876.490.7
79.480.481.8
6!;, 290.894.8
0.01200100013
39.4 110 0.04173.6 166 0.064
211 466 0.30633.3 75 0.07215.9 36 0.013
14.0 39 0.024 91.412.9 29.1 0.024 86.330.5 68.9 0.066 72.922.8 51.5 0.051 70.55.1 11.6 0.01 84.2
2,274 6,322 0.045874 1,976 0.019
2,838 6,413 0.0881,232 2,784 0.046
347 783 0.007742 1,676 0.013
1,634 4,543 0.060569 1,285 0.016204 461 0.006
for Deterrnfnfng Oxygen ConaurnedCoeffi.cient
Standard Confidence of % ofDeviation Limits, ± b Variation Theoretical
7980
174100
31
223591
1,184169113
Range
575543459443530
9601,153
690463
1,183
.. 4i7 76 .. is.s 41.4 0:044592 19 4.5 10.2 0.008607 20 4.5 10.2 0.007
356 38 14.8 33.4 0.041344 19 6.0 13.6 0.018902 24 5.3 11. 9 0.006
1,320 52 13.8 31.1 0.0101,336 25 6.1 13.9 0.0051,356 35 10.3 23.4 0.008
Mean
50,900 8,18246,000 3,68032,200 19,36029,100 10,04048,400 1,84357,500 3,230
27,477 6,67435,209 2,31336,599 786
495050505029
202020
10202020
202020
202020
99969998
100
99989999
100
run at the same time when the iodic acid method was used. In eachcase an equal number of blanks were run, except when the checkresults on blanks assured that a smaller number would be sufficient. Tests were run by each method on various sample volumeswithin the range permitted by the amount of available oxidizing
No. ofDetns."
Statistical Compar-ison of Methods
Compound or Wasteand Method Used
Organic dye wasteIodate? .IngelsMadisonPerrnanganate "Moore
Oil refinery caustic wasteIodate"IngolsMadisonPermanganate ?
MooreMoore-Ag,SO,
Textile dye wasteIodate"IngelsMooreMoore-Ag,SO,d
GlycocollIodatea, eIngelsMooreMoore-Ag,SO.
Distillery wasteIngelsMooreMoore-Ag,SO,
2-Amino-8-naphthol-6-sulfonic acid!
IngolsMooreMoore-Ag,SO,
o-CresolIodate"IngelsMadisonPermanganate "Moore
5
2
4
7
3
6
8
SampleNo.
Sodium lauryl sulfate g
Ingels 20 I .436 62 16.9 38.1Moore 20 1,527 68 15.3 34.9Moore-Ag,SO, 20 1,812 106 23.0 52.0
a Ten replicates were run on all methods except iodate, where five replicates were run.b 9.5% confidence limits of single determination.C American Public Health Association standard method.d Silver sulfate could not be used as a catalyst on this waste, resulted in 40 to 60% lower value than regular I
procedure. .e Replicate determinations varied from 45 to 133 p.p.m, and less than 10% of theory was obtained.! Technical grade.g Technical grade, probably a mixture of lauryl sulfates.
Table I.
EXPERIMENTAL
DURI NG the past few years several methods have been proposed for the determination of oxygen consumed in'organic
wastes. The shortcomings of the American Public Health Association's permanganate method are well known and there is adefinite need for a better method for determining oxygen consumed in stream sanitationand industrial waste studies.In order to evaluate the various proposed methods, a comparative study was made bythis laboratory. In additionto the permanganate or standard method (1), the methodsstudied included the dichromate method proposed by Ingols and Murray (.4), the dichromate method of Madison(6), the iodic acid method ofDzyadzio (2) as modified byJohnson, Halvorson, and Tsuchiya (5), and the dichromatemethod proposed by Moore,Kroner, and Ruchhoft (7) ofthis center. Shortly after thestudy was started; the use ofsilver sulfate as a catalyst asproposed by Muers (8) wasadded to the modificationsused.
In the present study, fourorganic compounds which aretypical of those that might befound in sewage and industrial wastes, and four industrial wastes, were used. Industrial wastes were selectedthat would be stable over theperiod necessary to carry outthe comparison.
Ten replicates at a time wererun by each of the methodsstudied, except that only fivereplicates could be conveniently
1297
1298 ANALYTICAL CHEMISTRY
Table II. Ninety-Five Per Cent Confidence Limits of Meanon Number of Replicates Indicated in Table I
±95% Confidence Limits of Mean
5 ..5 6.2 10.4 4.1 2.83.3 2.9 4.0 3.4 1.6
894 282 !l27 394 III 3111016 287 103
9.2 2.3 2.37 ..'> 3.1 2.6
7.0 3.1 5.2
8.5 8 11.6
Perman- Moore-Sample Iodate Ingols Madison ganate Moore Ag,SO.
~C:~e~~dye waste
Oil refinery ca us-tic waste
Textile dye wasteGlycocollDistillery waste2-Amino-8-
, naphthol-flsulfonic acid
Sodium laurylsulfate
agent. Over one half the samples were so tested in order tocheck the effect of sample size.
The effect of different reflux times on the oxygen-consumedvalues was evaluated by the Moore method to determine whetherthe specified 2-hour period could be shortened.
The iodic acid method was checked by adding various amountsof distilled water to the reaction mixture before refluxing, todetermine the effect of the volume of the reflux mixture (with aconstant sample volume) on oxygen-consumed results.
value. The use of the Moore procedure, modified by addition ofthe silver sulfate, on this waste, resulted in a reduction of oxygenconsumed of 40 to 60%. Definite signs of incompatibility between catalyst and sample were noted 1I8 soon as refluxing began.
The iodate method oxidized sample 5 from 5 to 20%, whereasthe dichromate methods resulted in uniform high oxidations.With two different standard solutions of iodate, the results onsample 5 ranged from 45 to 133 p.p.m. of oxygen consumed. Asimilar situation was evident in a filtrate from a waste containingnaphtholsulfonic acid. On the latter material, the iodate methodwould not give a consistent oxygen-consumed value, whereas thedichromate methods yielded consistent results on the order of60,000 p.p.m, As this sample changed from day to day, it couldnot be included in this study. After the work on these samples,the iodate procedure was dropped from the study.
A distillery waste, sample 6, was high in organic acids such 1I8
acetic, propionic, and lactic. Hence, the silver sulfate methodresponded very well from the standpoint of both recovery andreproducibility. The results obtained with samples 7 and 8 indicate no definite superiority for any of the dichromate refluxmethods used.
The minimum safe number of replicates (3), required to producea mean (95% confidence limits) within 2% of the mean of alarge number of determinations on the same sample, is given inTable III. The data presented in Table III were calculatedaccording to the following formula:
~ < 0.02xVn = 8
Table III. Minimum Safe Number of Replicates for EachMethod with Each Sample
where 8 = standard deviation on a large number of individualdeterminations, n = indicated minimum number of replicates,In = Fisher's I value for n replicates at 95% confidence limit, andx= mean of a large number of individual determinations.
FACTORS AFFECTING OXYGEN CONSUMED RESULTS
The time required for determination of the number of replicatesand blanks indicated is given in Table IV, which includes bothtotal elapsed time and manipulation time. The reflux time required no personal attention except in the iodate method, wherebath temperatures must be held at 1900 ± 50 C. In the Madisonmethod closer attention is required than in any of the others, as
5
5
3
33
MooreAg,SO.
54
3
33
'36
Moore
22
5228
Permanganate
75
100+45
Madison
189
2237
b
Iodate
4
66
2119
Ingels
428
Sample
~~:e~~ldye waste
Oil refinery caus-tic waste
Textile dye filtrateGlycocollDistillery waste2-Amino-8-
naphthol-6sulfonic acid
Sodium laurylsulfate 4 4
• No results obtained with silver catalyst on first two samples,b Iodate method too variable and gave less than 10% theoretical recovery.
The allowance of 2% of the mean is an arbitrary figure used onall samples; the remainder of the values are taken from tables orcalculated from the data obtained on the samples. This value isexacting in its evaluation of a method and rapidly increases illseverity when the degrees of freedom for n approach 1, as an inspection of a table of t values will show. For this reason a minimum safe number of replicates of less than three would beunusual.
The results as given in Table III indicate by the use of thisparameter that, with the exception of the last two samples, boththe unmodified Moore method and the catalyst modifiedmethod are statistically superior to any of the other methodstested. It was partially on the basis of these results that theiodate method was eliminated from further consideration.
The data on confidence limits included in Tables I and II are95% confidence limits, which means that either the singledetermination or the mean a.sindicated in the table will be withinthe limits stated 19 out of 20 times.
On the basis of the data assembled on the first three samples,the Madison and permanganate procedures were dropped andanother procedure, the basic Moore method modified by the!addition of silver sulfate in the reflux mixture, was added to the!list of methods given further study.
As a result of this work, it was judged feasible to decrease theInumber of replicates for each method to 20 for the remainder of
Ithe study with each group of five or ten replicates obtained ondifferent days. This made it possible to use industrial wasteswhich were not stable enough to be used over the long period oftime required for the greater number of determinations used inthe first three samples.
With sample 4 (Table I), the iodate method resulted not onlyIn very poor reproducibility but also in a lower oxygen-consumed
Sample 1 indicated an oxygen-consumed value of nearly thesame magnitude for both the Moore and Ingels procedures.However, the range of results of the Ingols and particularly theMadison method was excessive. Although the standard deviation of the permanganate method places it second on this sample,the order of magnitude of its coefficient of variation indicates thatit is inferior to all the methods except that of Madison.
On sample 2 the iodic acid method gave the highest percentagerecovery, although in reproducibility it was inferior to both theMoore and Ingols methods. As with the first sample, the orderlof magnitude of the coefficients of variation places the perrnanganate method fourth, only slightly better than the Madison procedure.
On sample 3 the iodate method again gave the highest oxygenconsumed value of all except the Moore procedure using silversulfate as a catalyst. The reproducibility of the iodate procedurewas very poor, poorer reproducibility being shown only by theMadison method. The coefficients of variation on this samplewere in the same order as with the previous two samples.
RESULTS
Table I presents the statistical data obtained on all samples.On the first two samples 100 replicates were run by each method.Because of accidental factors which gave results not representative of the method or sample, a few determinations were discarded and statistical data were calculated on the basis of theremaining replicates.
VOL U M E 23, N O. 9, S II PTE M B E R 1 95 1
the determination of the end point in the digestion cycle is vague,and the heating rate must be carefully controlled.
Other factors such as recognition of titration end points, size ofsample used, rate of heating, eto., are important in the selectionof the most efficacious method. The following discussion is designed to bring out points that would be noticeable only to thosewho used the methods repeatedly.
Table IV. 'I'irne Study on Methods for Det.errnirrirrgOxygen Consumed
Perman-Ingels Iodate Madison ganate Moore
No. of replicates deter-mined" 10 5 10 10 10
Total hours elapsed 3.75 7.75 7 3 4. 50 bManipulation time, hour. 2.75 7 7 2.50 2.50
a In each case an equal number of blanks were fun in time indicated.b Use of silver catalyst involves only solution of silver sulfate in concen
trated sulfuric acid stock; otherwise time and manipulation are same asregular procedure. Used 1 gram of Ag,SO, for each 75 ml. of acid.
Although the permanganate method requires less time thanany of the other methods, it is very difficult to obtain uniformityin results. Heating in a water bath is subject to variation,especially when a large number of replicates are run. In somecases a given sample may boil more rapidly than others and concentrate the mixture, with resulting difference in the oxygenconsumed value. The effect of agitation is also very noticeableon the oxygen consumed, as the. reaction mixture tends to precipitate manganese dioxide to a certain extent and if not agitatedfrequently variable results are obtained. In some cases, thisprecipitate is difficult to redissolve before the sample is titrated.The titration end point is definite, but because the permanganatecolor fades slowly the titration has to be conducted slowly andcarefully to obtain permanent end points. Different analystsfollowing the same methods of manipulation produce results whichvary appreciably. The effect of sample size is significant;hence the use of as close to 50% of the oxidizing agent as possibleis desirable in order to avoid variable results.
In the Madison method the amount of oxidizing agent availableis small, which limits the size of the sample that can be used.This tends toward large errors when strong industrial wastes aretested. The major objections to this method are in the closeattention required over a prolonged period and the difficulty indetecting the digestion end point. The digestion period is terminated when the concentrated sulfuric and phosphoric acid mixture has fumed for exactly 4 minutes. It is imperative that thefirst traces of fuming be detected; if fumed too long, the oxidizingreagent is decomposed. Blank determinations give poor agreement as a result of the difficulty in stopping the digestion at t.heright time. The titration using sodium diphenylamine sulfonateas an indicator requires a lapse of time between additions of theferrous ammonium sulfate before there is any noticeable changein the color of the indicator. There is no chance to judge whenthe end point is being approached, so that back-titration is frequently necessary. Use of different sample volumes gives goodreproducibility, if not more than 50% of the oxidizing agent isused.
The volatile acid iodate method requires more equipment, time,and manipulation than any of the other methods tried. The useof the phosphoric acid bath to control reflux temperature is adefinite hazard. The substitution of a bath wax reduces thishazard to a certain extent, although no improvement is effectedin manipulation or time involved. The large volume of solutionrequired for the steam distillation mak-es later cooling a problem,but if a smaller volume is used in this stage, recovery is low because of incomplete separation of the iodine formed during thereflux period. A 500-ml. aliquot of sample is cumbersome totitrate. Poor checks were obtained on blanks throughout the
1299
study. The agreement in oxygen-consumed values for differentsample volumes was good, providing total sample volume did notexceed 40 ml. Above this volume, there was a definite drop inthe oxygen consumed, even though only distilled water wasadded to the reaction mixture. This is due to the fact that sucbmixtures boiled vigorously below the 190 0 C. temperature specified in the method. The method is not applicable to as large avariety of samples as is the case in the dichromate oxidations;however, if the iodic acid is effective on a given sample its percentage recovery may be higher than those by other methods.
The Ingols method gives fair results with a wide variety ofsamples and requires little time and manipulation. However,reproducibility is poor, especially on strong wastes, where only asmall sample can be used. The reagent mixture is unstable andmust be freshly prepared about every 2 weeks. The titration ofiodine with thiosulfate to the starch-iodide end point in the presence of chromic salts is particularly poor, as the end point ismasked by the confusing colors. Different analysts can obtainappreciable differences due to this factor. To treat a blank differently from the sample itself is generally considered poor technique. However, in the case of the Ingols method if the blank isrefluxed, more or less of the dichromate is decomposed, theamount of such decomposition depending upon several factors.For this reason, the cold blank was used as recommended in theoriginal procedure and the results do not appear to be affected toany appreciable extent. The use of different sample volumes haslittle effect on the oxygen-consumed values.
The Moore method is intermediate in time required and apparatus involved. The end point is very sharp, and after a littleexperience an analyst knows approximately how close to the endpoint he is as the color changes from yellow through variousshades of green to blue, then sharply to red-blue at the end point.Very little effect on the results obtained is noted regardless ofsample size; in fact, close checks have been obtained when theback-titration was only 2 to 3 drops. The ferrous ammoniumsulfate requires standardization daily, as the acid concentrationis kept purposely low (20 m!. of concentrated sulfuric acid perliter) and its normality gradually decreases. However, thestandard dichromate solution is stable over long periods of time.The end point is sharp when the concentration of sulfuric acid inthe titrating mixture does not exceed 30%; hence the reactionmixture must be diluted before titration and the acid content ofthe standard ferrous ammonium sulfate must be controlled inorder to obtain a satisfactory end point. Little difference wasobserved in results obtained by different analysts. Sample volume is not critical, although results on purified effluents may notbe too reliable because of the small consumption of the oxidantwith the consequent high back-titration. Refluxed blanks checkvery well and normally do not show a depletion of more than 0.10m!.
As the 2-hour digestion period was subject to some question,digestion periods of 0.5, 1, and 2 hours were tried on severalsamples. On most samples, 0.5 or 1 hour would be sufficient;however, the 0.5-hour reflux time on sample 3 in Table I resultedin an 18% lower, and the I-hour digestion in an 11% lower oxygenconsumed than results obtained on the 2-hour reflux period.Glycocoll (aminoacetic acid) exhibited similar behavior. Therefore, it is well to check different reflux times on a given sample before attempting to shorten the 2-hour reflux period. If no significant difference in the results is obtained, the shorter time may beadopted.
EFFECT OF SILVER SULFATE AS A CATALYST
In Table V the effect of 1 gram of silver sulfate in conjunctionwith the regular Moore method was checked on 17 different compounds in order to evaluate its applicability. Acetic acid isvirtually unaffected by acid dichromate alone, whereas with thesilver sulfate oxidation is better than 95% theoretical. Other
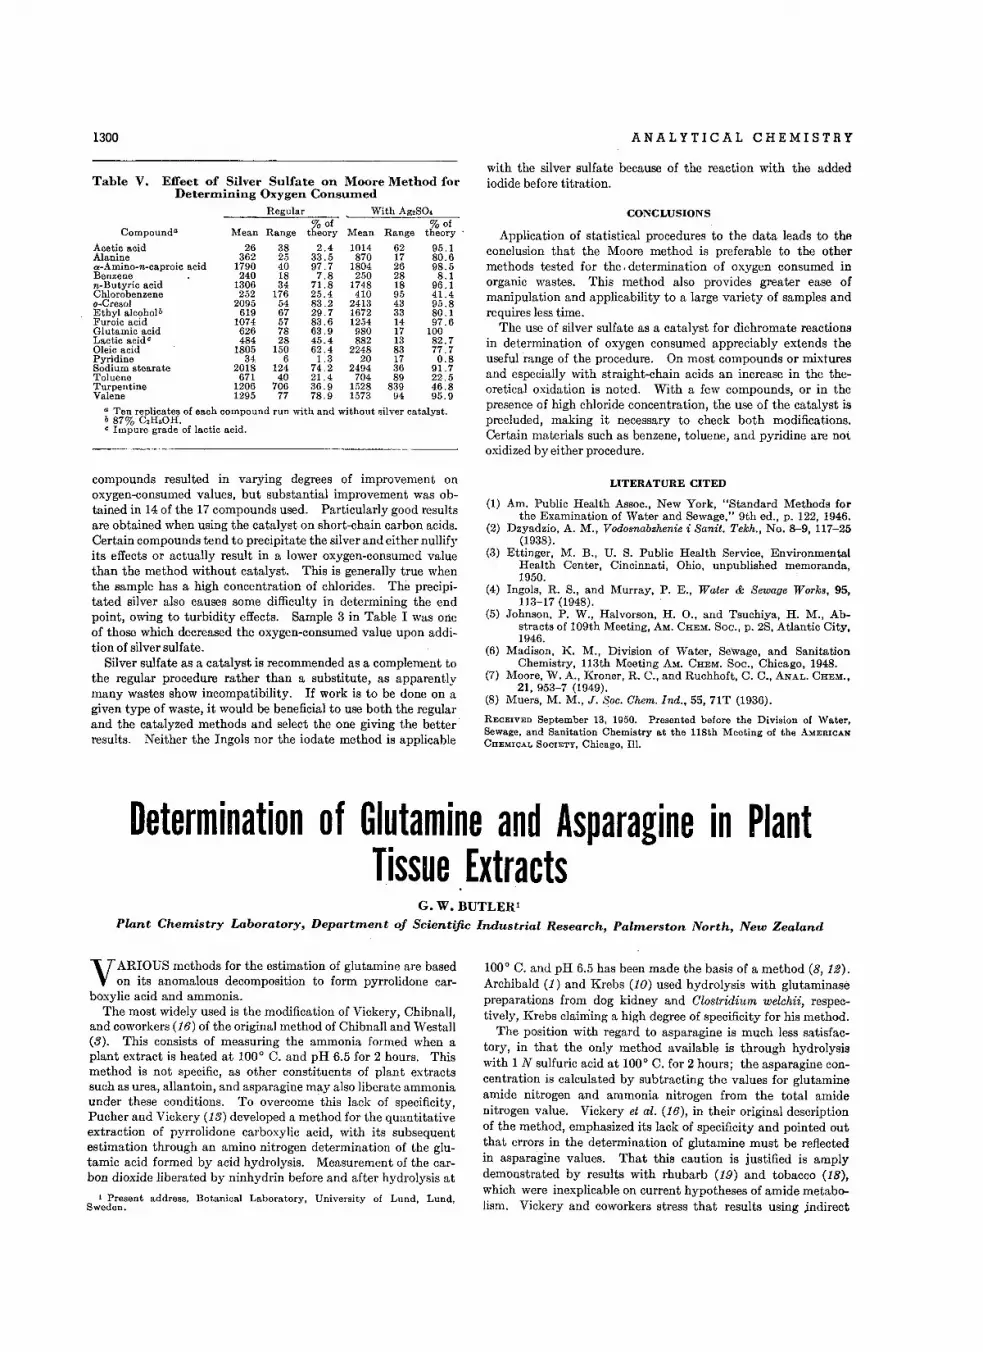
1300
Table V. Effect of Silver Sulfate on Moore Method forDeterrnrnfng Oxygen Consurned
Regular With Ag,SO.% of % of
Compounds Mean Range theory Mean Range theory'
Acetic acid 26 38 2.4 1014 62 95.1Alanine 362 25 33.5 870 17 80.6ee-Amino-u-caproic acid 1790 40 97.7 1804 26 98.5Benzene 240 18 7.8 250 28 8.1n-Butyric acid 1306 34 71.8 1748 18 96.1Chlorobenzene 252 176 25.4 410 95 41.4a-Cresol 2095 54 83.2 2413 43 95.8Ethyl alcohols 619 67 29.7 1672 33 80.1Furoic acid 1074 57 83.6 1254 14 97.6Glutamic acid 626 78 63.9 980 17 100Lactic acid? 484 28 45.4 882 13 82.7Oleic acid 1805 150 62.4 2248 83 77.7Pyridine 34 6 1.3 20 17 0.8Sodium stearate 2018 124 74.2 2494 36 91. 7Toluene 671 40 21.4 704 89 22.5Turpentine 1206 706 36.9 1528 839 46.8Valene 1295 77 78.9 1573 94 95.9
a Ten replicates of each compound run with and without silver catalyst.b 87% C,H,OH.c Impure grade of lactic acid.
compounds resulted in varying degrees of improvement onoxygen-consumed values, but substantial improvement was obtained in 14 of the 17 compounds used. Particularly good resultsare obtained when using the catalyst on short-chain carbon acids.Certain compounds tend to precipitate the silver and either nullifyits effects or actually result in a lower oxygen-consumed valuethan the method without catalyst. This is generally true whenthe sample has a high concentration of chlorides. The precipitated silver also causes some difficulty in determining the endpoint, owing to turbidity effects. Sample 3 in Table I was oneof those which decreased the oxygen-consumed value upon addition of silver sulfate.
Silver sulfate as a catalyst is recommended as a complement tothe regular procedure rather than a substitute, as apparentlymany wastes show incompatibility. If work is to be done on agiven type of waste, it would be beneficial to use both the regularand the catalyzed methods and select the one giving the betterresults. Neither the Ingols nor the iodate method is applicable
ANALYTICAL CHEMISTRY
with the silver sulfate because of the reaction with the addediodide before titration.
CONCLUSIONS
Application of statistical procedures to the data leads to theconclusion that the Moore method is preferable to the othermethods tested for the. determination of oxygen consumed inorganic wastes. This method also provides greater ease ofmanipulation and applicability to a large variety of samples andrequires less time.
The use of silver sulfate as a catalyst for dichromate reactionsin determination of oxygen consumed appreciably extends theuseful range of the procedure. On most compounds or mixturesand especially with straight-chain acids an increase in the theoretical oxidation is noted. With a few compounds, or in thepresence of high chloride concentration, the use of the catalyst isprecluded, making it necessary to check both modifications.Certain materials such as benzene, toluene, and pyridine are notoxidized by either procedure.
LITERATURE CITED
(1) Am. Public Health Assoc., New York, "Standard Methods forthe Examination of Water and Sewage," 9th ed., p. 122, 1946.
(2) Dzyadzio, A. M., Vodosnabzhenie i Sanit; Tekh., No. 8-9, 117-25(1938).
(3) Ettinger, M. B., U. S. Public Health Service, EnvironmentalHealth Center, Cincinnati, Ohio, unpublished memoranda,1950.
(4) Ingols, R. S., and Murray, P. E., Water & Sewage Works, 95,113-17 (1948).
(5) Johnson, P. W., Halvorson, H. 0., and Tsuohiya, H. M., Abstracts of 109th Meeting, AM. CHEM. Soc., p. 2S, Atlantic City,1946.
(6) Madison, K. M., Division of Water, Sewage, and SanitationChemistry, 113th Meeting AM. CHEM. Soc., Chicago, 1948.
(7) Moore, W. A., Kroner, R. C., and Ruchhoft, C. C., ANAL.CHEM.,21, 953-7 (1949).
(8) Muers, M. M., J. Soc. Chem. Ind., 55, 7lT (1936).
RECEIVED September 13, 1950. Presented before the Division of Water,Sewage, and Sanitation Chemistry at the 118th Meeting of the AMERICANCHEMICAL SOCIETY, Chicago, III.
Determination of Glutamine and Asparagine in PlantTissue Extracts
G. W. BUTLER I
Plant Chemistry Laboratory, Department of Scientific Industrial Research, Palmerston North, New Zealand
VAR IOUS methods for the estimation of glutamine are basedon its anomalous decomposition to form pyrrolidone car
boxylic acid and ammonia.The most widely used is the modification of Vickery, Chibnall,
and coworkers (16) of the original method of Chibnall and Westall(3). This consists of measuring the ammonia formed when aplant extract is heated at 100° C. and pH 6.5 for 2 hours. Thismethod is not specific, as other constituents of plant extractssuch as urea, allantoin, and asparagine may also liberate ammoniaunder these conditions. To overcome this lack of specificity,Pucher and Vickery (13) developed a method for the quantitativeextraction of pyrrolidone carboxylic acid, with its subsequentestimation through an amino nitrogen determination of the glutamic acid formed by acid hydrolysis. Measurement of the carbon dioxide liberated by ninhydrin before and after hydrolysis at
1 Present address, Botanical Laboratory, University of Lund, Lund,I Sweden.
100° C. and pH 6.5 has been made the basis of a method (8, 12).Archibald (1) and Krebs (10) used hydrolysis with glutaminasepreparations from dog kidney and Clostridium welchii, respectively, Krebs claiming a high degree of specificity for his method.
The position with regard to asparagine is much less satisfactory, in that the only method available is through hydrolysiswith 1 N sulfuric acid at 100° C. for 2 hours; the asparagine concentration is calculated by subtracting the values for glutamineamide nitrogen and ammonia nitrogen from the total amidenitrogen value. Vickery et aI. (16), in their original descriptionof the method, emphasized its lack of specificity and pointed outthat errors in the determination of glutamine must be reflectedin asparagine values. That this caution is justified is amplydemonstrated by results with rhubarb (19) and tobacco (18),which were inexplicable on current hypotheses of amide metabolism. Vickery and coworkers stress that results using jndirect

VOL U M E 2 3, N O. 9, SE PTE M B E R 1 9 5 1
The specificity of the rnerbods available for the est.irnat.iori of asparagine andghrramfne appeared open to question. Independent check rnerbods weretherefore devised. The am'ides were separated from each other and from otherinterfering substances by m eans of paper chromatography, Hydrolysis andestlrnatton of the arrrides were carried out in one operation in Conway units.In a eornpartson with other mef.hods, good agreernent was obtained with arnenhod for the est.irnat.iori of ghrtamine using a glutaminase preparation.The agreemerrt with a rnerbod based on differential acid hydrolysis was unsatisfactory for both amfdes, especially asparagine. Although the glrrtarnfnasemethod is suitable for the est.irnation of glutamme, the technique describedis the rnost specific at present available for the deterll1ination of asparagine.
1301
methods of analysis must be interpreted with reservations, andthat in doubtful cases substantiation of the results either by independent analytical methods or by direct isolation is necessary.
Further evidence of the danger of applying the standard indirect methods of analysis to the amide fraction has accumulated in this laboratory during the past 4 years (2, l.n. Somehundreds of determinations of glutamine, asparagine, and ureahave been performed on plant tissues grown under varying conditions of nitrogen nutrition and prepared for analysis by widelydifferent procedures. Although in most cases serious discrepancieshave not been apparent, a relatively large number of tissues haveyielded results that could not be explained by the known behavior of these compounds. It has become increasingly apparentthat progress towards a better understanding of the processesinvolved requires more specific methods of analysis than those sowidely used in investigations on plant nitrogen metabolism.
All the methods in current use are applied to the complexmixture resulting from an aqueous or alcoholic extraction of thefresh or dried tissue. The method described is based on the paperchromatography of plant extracts (6), so that a considerable purification is achieved before the final analysis is made.
REAGENTS
As a solvent for chromatography the phenol-water system wasused. The phenol was purified by distillation in vacuo from zincin an all-glass apparatus and was renewed for each determination.
The hydrolyzing agent was saturated potassium hydroxidesolution. .
Standard 0.001 N hydrochloric acid was prepared by thedilution of standard 0.1 N acid, incorporating ethyl alcohol andTaschiro's reagent (methyl red-methylene blue) according toConway (5).
The alkali was barium hydroxide solution, 0.002 N.Glutamine was prepared by the method of Vickery, Pucher,
and Clark (15). Purity was 91>% as determined by amideanalysis.
Asparagine was prepared by the method of Vickery, Pucher,and Deubel' (17). Its purity was 97% as determined by amideanalysis.
EQUIPMENT
Freeze-drying apparatus, a micrometer pipet (accuracy =0.05 ILI.), apparatus for chromatography, standard Conwayunits (No.1), and a 0.25-ml. Conway microburet.
EXTRACTION OF TISSUE
Perennial rye grass was used as the plant tissue. Ten grams offresh grass or the equivalent amount of dried grass was blendedfor 3 minutes in a Waring B1endor with 100 ml. of ethyl alcohol atroom temperature (2). Eighty-seven per cent alcohol was usedfor fresh tissue and 80% for dry" so that in each case the finalalcohol concentration was 80%. The fibrous material wascentrifuged off and the solution concentrated by vacuum distillation at 40° C. until all alcohol was removed. The residualaqueous solution was transferred to a measuring cylinder togetherwith washings from the vacuum distillation flask, made up to 25mI., and centrifuged. Twenty milliliters of this extract werepipetted into a large test tube and lyophilized for approximately20 hours. At the conclusion of drying, air was admitted gradu-
ally through a bubbler, in order not to disturb the residue in thetest tube. A known volume of water (0.5 to 5.0 ml., accordingto the probable amide content of the leaf), was added, the residue was carefully dissolved and the solution was filtered ifnecessary.
PROCEDURE
Strips of Whatman No.1 filter paper (11 X 46 cm.) weretaken and at 8 to 10 em. from one end of each strip a line 5.5ern. long was drawn parallel to the end and starting 1 cm. fromthe edge. A point was marked 1.5 cm. from the other edge,lying on an extension of the line. Twenty microliters of solutionwere applied in the form of a narrow band along the line and 3 ILLwere placed on the spot, using the micrometer pipet. Afterthe solution had been allowed to dry, the strips were placed inthe chromatography vessel, equilibrated with the vapor phase ofthe phenol-water mixture, and irrigated with solvent in the normal way, using the descending technique en.
The system phenol-water constituted a satisfactory solvent,as ammonia and the amides known to be present were well separated. Approximate RF values for relevant substances are ammonium ion 0 to 0.20, asparagine 0.40, glutamine 0.55, arginine0.55, alanine 0.55, and urea 0.73. It is obvious that the glutamine band will always contain such free alanine and arginine asare present. Alanine presents no difficulty, while preliminaryexperiments showed that arginine does not yield ammonia underthe conditions of hydrolysis employed (see Table II).
To obtain maximum resolution, the chromatograms wereirrigated with solvent for 40 hours, in which time the solventfront had usually passed off the end of the paper. The paperswere dried in a current of air at room temperature (20 ° C.).
A strip along the side of the paper containing the control spotwas cut out and developed in the usual way with ninhydrin.With the aid of this developed chromatogram, rectangular stripsof paper enclosing the glutamine and asparagine bands were cutout, with strips of comparable width to act as blanks. Thesesections were usually 4 cm. wide, though a 5-cm. cut was necessary if the amide concentration was high or if the band was somewhat diffuse owing to imperfect conditions during the chromatographic stage. It was advisable at this stage to label the papersin pencil. No difficulties arose from the application of a bandrather than a spot to the paper.
Hydrolysis of the amides and quantitative estimation of theammonia produced were done in one operation, using essentiallythe procedure described by Conway (5) for the determination ofammonia nitrogen in the range 0 to 14 micrograms. Preliminarytrials showed that various mixtures of saturated potassium carbonate solution with potassium hydroxide did not give quantitative recoveries of both amides when these were adsorbed onfilter paper. Saturated potassium hydroxide solution was foundsatisfactory and was used throughout the investigation.
Each paper strip was cut into small pieces, which were distributed about the outer chamber of a Conway unit. The paperwas moistened slightly with about 5 drops of water, 1 ml. ofstandard acid was delivered into the central chamber, and thecover was sealed on, using as fixative white petroleum jelly hardened with paraffin wax. Approximately 1 ml. of cold saturatedpotassium hydroxide solution was introduced from a quickdelivery pipet andthe unit was incubated for 3 hours at 37° C.Adding cold alkali to moistened paper was necessary to avoidexcessive mercerization, which tended to cause leakage of alkaliinto the middle compartment. After 3 hours, the units were
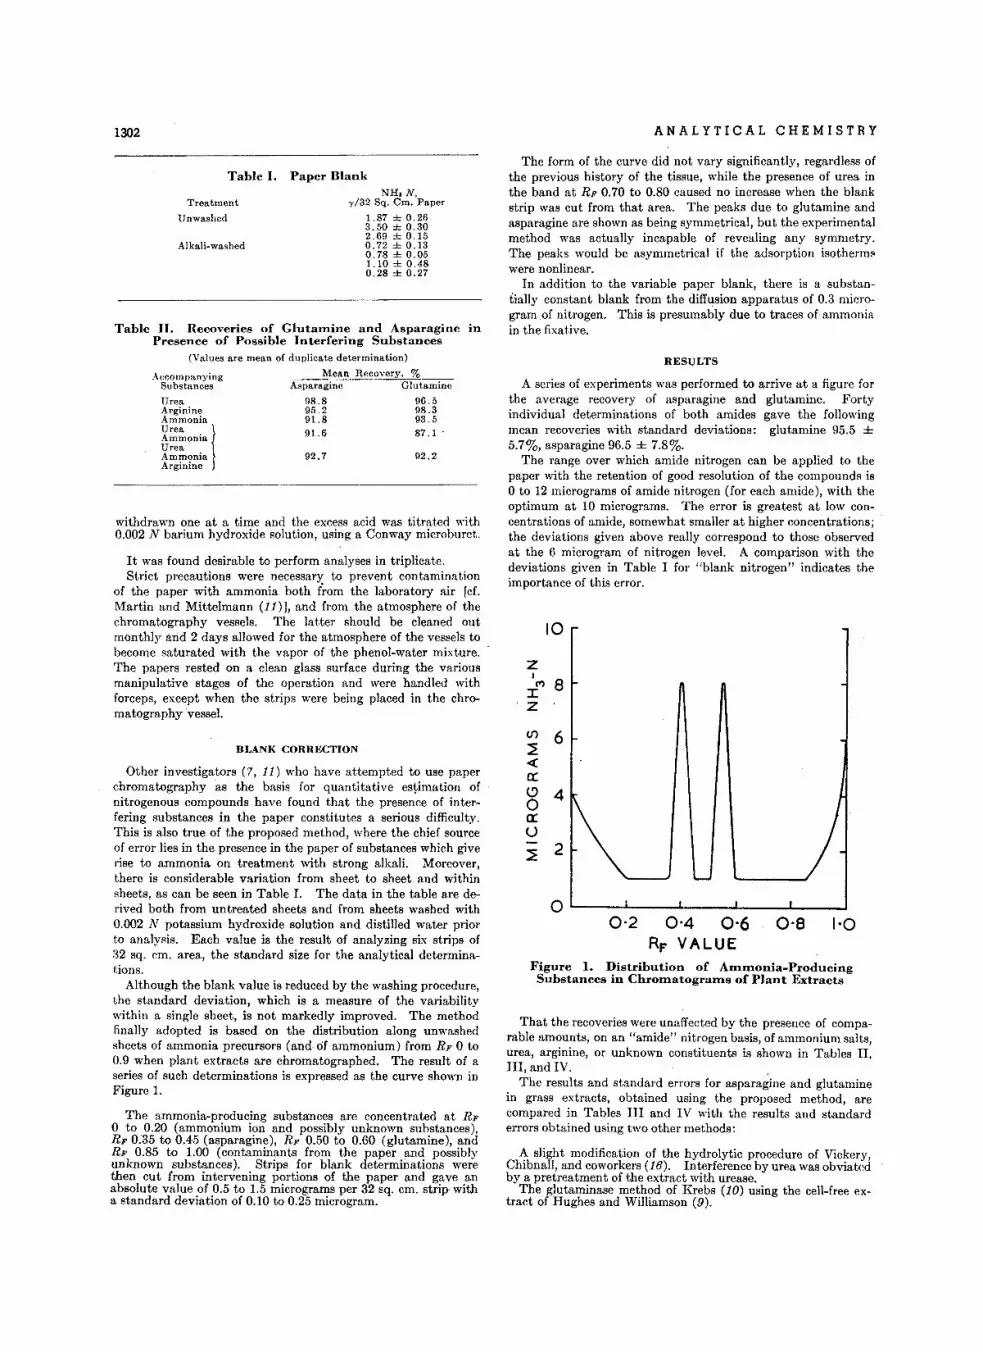
1302 ANALYTICAL CHEMISTRY
withdrawn one at a time and the excess acid was titrated with0.002 N barium hydroxide solution, using a Conway microburet.
Urea 98.8 96.5Arginine 95.2 98.3Ammonia 91.8 93.5
Urea I 91.6 87.1 .AmmoniaUreaAmmonia 92,7 92,2Arginine
Table n. Recoveries of Glutallline and Asparagine inPresence of Possible Interfering Substances
(Values are mean of duplicate determination)
Accompanying Mean Recovery, %Substances Asparagine Glutamine
1'00-80·2 0-4 0-6RF VALUE
2
6
4
O'----'-----I.--...L-_--L._---J
(/)
~-ca:ooa:U
~
A slight modification of the hydrolytic procedure of Vickery,Chibnall, and coworkers (16). Interference by urea was obviatedby a pretreatment of the extract with urease.
The glutaminase method of Krebs (10) using the cell-free extract of Hughes and Williamson (9).
Figure 1. Distribution of Alllmonia-ProducingSubstances in Chromatograms of Plant Extracts
ZIl"l 8
IZ
A series of experiments was performed to arrive at a figure forthe average recovery of asparagine and glutamine. Fortyindividual determinations of both amides gave the followingmean recoveries with standard deviations: glutamine 95.5 ±5.7%, asparagine 96.5 ± 7.8%.
The range over which amide nitrogen can be applied to thepaper with the retention of good resolution of the compounds isoto 12 micrograms of amide nitrogen (for each amide), with theoptimum at 10 micrograms. The error is greatest at low concentrations of amide, somewhat smaller at higher concentrations;the deviations given above really correspond to those observedat the 6 microgram of nitrogen level. A comparison with thedeviations given in Table I for "blank nitrogen" indicates theimportance of this error.
The form of the curve did not vary significantly, regardless ofthe previous history of the tissue, while the presence of urea inthe band at RF 0.70 to 0.80 caused no increase when the blankstrip was cut from that area. The peaks due to glutamine andasparagine are shown as being symmetrical, but the experimentalmethod was actuaJly incapable of revealing any symmetry.The peaks would be asymmetrical if the adsorption isothermswere nonlinear.
In addition to the variable paper blank, there is a substantially constant blank from the diffusion apparatus of 0.3 microgram of nitrogen. This is presumably due to traces of ammoniain the fixative.
RESULTS
10
That the recoveries were unaffected by the presence of comparable amounts, on an "amide" nitrogen basis, of ammonium salts,urea, arginine, or unknown constituents is shown in Tables II,III, and IV. .
The results and standard errors for asparagine and glutaminein grass extracts, obtained using the proposed method, arecompared in Tables III and IV with the results and standarderrors obtained using two other methods:
NH,N,1'/32 Sq. em. Paper
1.87 ± 0.263.50 ± 0.302.69 ± 0.150.72 ± 0.130.78 ± 0.051.10±0.480.28 ± 0.27
Paper BlankTable I.
Alkali-washed
Treatment
Unwashed
It was found desirable to perform analyses in triplicate.Strict precautions were necessary to prevent contamination
of the paper with ammonia both f~om the laboratory air fcf.Martin and Mittelmann (11)], and from the atmosphere of thechromatography vessels. The latter should be cleaned outmonthly and 2 days allowed for the atmosphere of the vessels tobecome saturated with the vapor of the phenol-water mixture.The papers rested on a clean glass surface during the variousmanipulative stages of the operation and were handled withforceps, except when the strips were being placed in the chromatographyvessel,
BLANK CORRECTION
Other investigators (7,11) who have attempted to use paperchromatography as the basis for quantitative estimation ofnitrogenous compounds have found that the presence of interfering substances in the paper constitutes a serious difficulty.This is also true of the proposed method, where the chief sourceof error lies in the presence in the paper of substances which giverise to ammonia on treatment with strong alkali. Moreover,there is considerable variation from sheet to sheet and withinsheets, as can be seen in Table 1. The data in the table are derived both from untreated sheets and from sheets washed with0.002 N potassium hydroxide solution and distilled water priorto analysis. Each value is the result of analyzing six strips of32 sq. em. area, the standard size for the analytical determinations,
Although the blank value is reduced by the washing procedure,the standard deviation, which is a measure of the variabilitywithin a single sheet, is not markedly improved. The methodfinally adopted is based on the distribution along unwashedsheets of ammonia precursors (and. of ammonium) from RF 0 to0.9 when plant extracts are chromatographed. The result of aseries of such determinations is expressed as the curve shown inFigure 1.
The ammonia-producing substances are concentrated at RFo to 0.20 (ammonium ion and possibly unknown substances),RF 0.35 to 0,405 (asparagine), RF 0.50 to 0.60 (glutamine), andRF 0.85 to 1.00 (contaminants from the paper and possiblyunknown substances). Strips for blank determinations werethen cut from intervening portions of the paper and gave anabsolute value of 0.5 to 1.5 micrograms per 32 sq. em. strip witha standard deviation of 0.10 to 0.25 microgram.
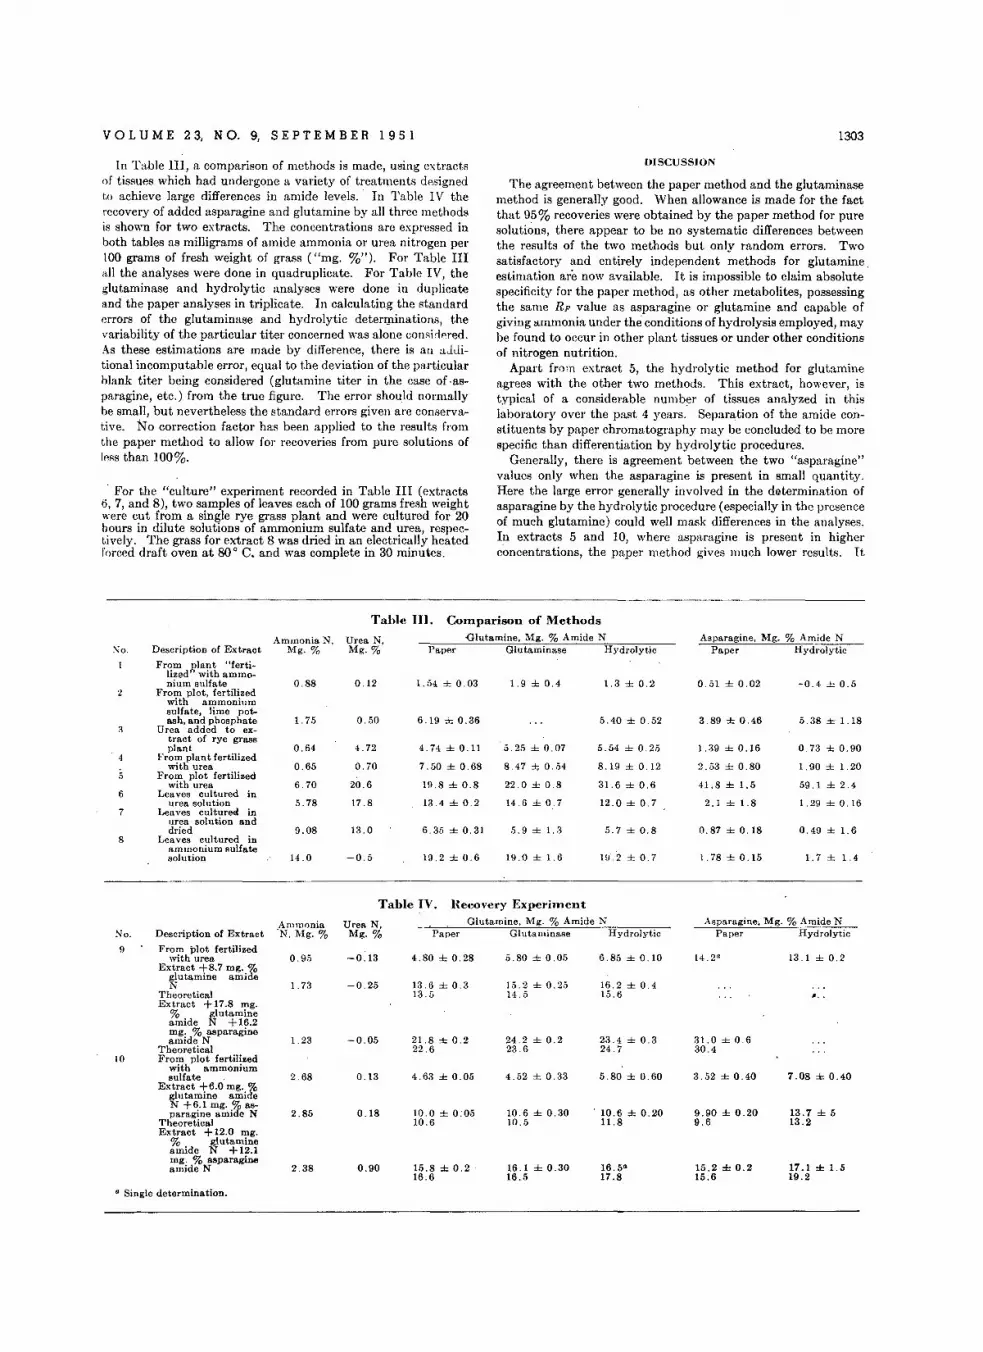
VOL U M E 2 3, N O. 9, S E PTE M B E R 1 9 5 1 1303
In Table III, a comparison of methods is made, using extractsof tissues which had undergone a variety of treatments designed1.0 achieve large differences ill amide levels. In Table I V therecovery of added asparagine and glutamine by all three methodsis shown for two extracts. The concentrations are expressed inboth tables as milligrams of amide ammonia or urea nitrogen per100 grams of fresh weight of grass ("mg. %"). For Table IIIall the analyses were done in quadruplicate. For Table IV, theglutaminase and hydrolytic analyses were done in duplicateand the paper analyses in triplicate. In calculating the standarderrors of the glutaminase and hydrolytic determinations, thevariability of the particular titer concerned was alone considered.As these estimations are made by difference, there is all aJJitional incomputable error, equal to the deviation of the particularblank titer being considered (glutamine titer in the case of ·asparagine, etc.) from the true figure. The error should normallybe small, but nevertheless the standard errors given are conservative. No correction factor has been applied to the results fromthe paper method to allow for recoveries from pure solutions ofIp,ss than 100%.
. For the "culture" experiment recorded in Table III (extracts0, 7, and 8), two samples of leaves each of 100 grams fresh weightwere cut from a srngle rye grass plant and were cultured for 20hours in dilute solutions of ammonium sulfate and urea, respectively. The grass for extract 8 was dried in an electrically heatedforced draft oven at 80° C. and was complete in 30 minutes.
I>ISCUSSJON
The agreement between the paper method and the glutaminasemethod is generally good. When allowance is made for the factthat 95% recoveries were obtained by the paper method for puresolutions, there appear to be no systematic differences betweenthe results of the two methods but only random errors. Twosatisfactory and entirely independent methods for glutamine.estimation are now available. It is impossible to claim absolutespecificity for the paper method, as other metabolites, possessingthe same RF value as asparagine or glutamine and capable ofgiving ammonia under the conditions of hydrolysis employed, maybe found to occur in other plant tissues or under other conditionsof nitrogen nutrition.
Apart from extract 5, the hydrolytic method for glutamineagrees with the other two methods. This extract, however, istypical of a considerable number of tissues analyzed in thislaboratory over the past 4 years. Separation of the amide constituents by paper chromatography may be concluded to be morespecific than differentiation by hydrolytic procedures.
Generally, there is agreement between the two "asparagine"values only when the asparagine is present in small quantity.Here the large error generally involved in the determination ofasparagine by the hydrolytic procedure (especially in the presenceof much glutamine) could well mask differences in the analyses.In extracts 5 and 10, where asparagine is present in higherconcentrations, the paper method gives much lower results. It
Tahle III. Comparison of Methods
Urea N. ·Glutamine. Mg. % Amide NMg. % Paper Glutaminase Hydrolytic
Asparagine. Mg. % Amide NPaper Hydrolytic~o.
5
6
7
8
AmmoniaN,Description of Extract Mg. %
Frli:'d},'\~iA ~~e~~~nium sulfate 0.88
From plot, fertilizedwith ammoniumsulfate, lime pot-ash. and phosphate 1.7f'
Urea added to ex-tract of rye grassplant 0.64
From plant fertilizedwith urea 0.65
From plot fertilizedwith urea 6.70
Leaves cultured inurea solution 5.78
Leaves cultured inurea solution anddried 9.08
Leaves cultured inammonium sulfatesolution 14.0
0.12
0.50
4.72
0.70
20.6
17.8
13.0
-0.5
54 ± 0.03
6.19 ± 0.36
4.74±0.1l
7.50 ± 0.68
19.8 ± 0.8
13.4 ± 0.2
6.35 ± 0.31
19.2 ± 0.6
1.9 ± 0.4
5 25 ± 0.07
8.47 ± 0 ..';4
22.0 ± 0.8
14 6 ± 0 7
9 ± 1..3
19.0 ± 1.6
1.3 ± 0.2
5.40 ± 0.52
5.54 ± 0.25
8.19±0.12
31.6 ± 0.6
12.0 ± 0.7
5.7±0.8
HJ2±0.7
o 51 ± 0.02
3 89 ± 0.46
1.39 ± 0.16
2.53 ± 0.80
41.8 ± 1.5
2.1±1.8
0.87 ± 0.18
1.78 ± 0.15
-0.4 ± 0.5
5.38 ± 1.18
073 ± 0.90
I. 90 ± 1.20
59.1 ± 2 4
1.29 ± 0.16
0.49 ± 1 6
1.7 ± 1.4
Recovery ExperiInentGlutamine. Mg. % Amide N
Table IV.
Glutaminase HydrolyticAsparagine, Mg. % Amide N
...
13.7 ± 513.2
13.1 ± 0.2
17.1 ± 1.519.2
7.08 ± 0.40
Paper Hydrolytic
31.0±0630.4
15.2 ± 0.215.6
9.90 ± 0.209.6
14 2"
3 ..';2 ± 0.40
10.6 ± 0.2011.8
23 4 ± 0 324.7
16.5"17.8
16.2±0415.6
5.80 ± 0.60
6.85±0.10
10.6 ± 0.3010.5
16.1 ± 0.3016.5
4.52 ± 0 33
242 ± 0.223.6
1.';.2 ± 0.2514.5
5.80 ± 0.05
Paper
15.8 ± 0 216.6
10.0 ± 0;0510.6
4.63 ± 0.05
21.8 ± 0 222.6
13 6 ± 0.313 5
4.80 ± 0.28
0.18
0.13
0.90
-0.25
-0.05
-0.13
Urea N,Mg. %
AmmoniaDescription of Extract. ·N. Mg. %From plot fertilized
with urea 0.95Extract +8.7 mg. %
glutamine amideN 1. 73
TheoreticalExtract + 17.8 mg.
% glutamineamide N + 16.2mg. % asparagineamide N 1.23
TheoreticalFrom plot fertilized
with ammoniumsulfate 2 68
Extract +6.0 mg. %glutamine amideN +6.1 mg. % as-paragine amide N 2. 85
TheoreticalExtract + 12.0 mg.
% glutamineamide N +12.1mg. % asparagineamide N 2.38
No.
9
10
o Single determination.
1304
would be highly desirable to have an independent analyticalmethod for asparagine of comparable specificity to the glutaminasemethod for glutamine.
The standard errors for the paper and glutaminase methodsare of the same order for the determination of glutamine.. Forasparagine, the standard errors for the paper method are considerably smaller than those for the hydrolytic method. Theerror would be diminished by the use of paper with a lower blankcorrection. No significant error appeared to result from theextra manipulative steps required in the paper method betweenthe extraction of the tissue and application of the concentrate tothe paper. If the rigorous standards of cleanliness necessary fora microchemical technique are observed, errors from contamination can be avoided.
An important advantage of the paper method is the ancillaryinformation it yields regarding the distribution of amino acidsand fluorescing substances in the extract. Its major disadvantageis that the analysis is spread over 4 days. The actual manipulative time amounts to 8 hours per extract, done in triplicate byone operator and including the tissue extraction step. On theother hand, a number of analyses can be made at the same time,depending only on the capacity of the freeze-dryer and chromatography apparatus. The rectangular strips of paper cut from thechromatograms can be stored without deterioration in a desiccator containing sulfuric acid until it is convenient to commencethe final step.
The "cold alcohol" extraction procedure of Bathurst and Allison (2) was found excellent for quantitative paper chromatographic purposes. The use of alcohol has the advantage that theextract is free of peptides and proteins and has a low concentration of inorganic salts. On removal of the alcohol, waxesseparate out, leaving a 'solution very suitable for paper chromatography. In the experimental method outlined, an extraction macroprocedure has been followed by a microchemicalestimation. Where the supply of biological material is limited,the extraction and concentration steps could be adapted to amicro scale.
The recoveries of glutamine and asparagine from paper chromatograms are interesting in the light of the observations ofWoiwod (20), who found, using Whatman No.4 paper, that therecoveries obtained for glycine, valine, and leucine decreaseswith increasing RFvalue and with increasing distance of migrationdown the paper. This effect was not apparent in the presentstudy, although it may be a partial explanation of the consistently low recoveries from pure solutions. The drying of thechromatograms at low temperatures is important because of theinteraction of phenol with amino acids above 50° C., as pointed
ANALYTICAL CHEMISTRY
out by Fowden and Penney (7), and also because of the instability of glutamine.
One of the factors possibly contributing to the success of theproposed method is that the hydrolysis of the amides is performed on the paper, using a reagent which mercerizes the cellulose and is likely to reach all the amide molecules inside the cellulose fibers. The necessity for an elution step is avoided, with asaving of manipulative time.
ACKNOWLEDGMENT
The author is deeply indebted to his colleague, J. L. Mangan,who, with the technical assistance of J. F. Fisher, conductedanalyses for the comparative work by two standard methods.Thanks are also due to J. G. Fraser for the preparation of theglutamine and asparagine samples used. Finally, he wishes toacknowledge the invaluable assistance of James Melville, both inthe preparation of the manuscript and from stimulating discussionsheld during the course of the investigation.
LITERATURE CITED
(1) Archibald, R. M., J. Bioi. Chem., 154, 643 (1944).(2) Bathurst, N. 0., and Allison, R. M., N. Z. J. Sci. Tech., in press.(3) Chibnall, A. C., and Westall, R. G., Biochem, J., 26, 122 (1932).(4) Consden, R., Gordon, A. H., and Martin, A. J. P., Ibid., 38, 224
(1944).(5) Conway, E. J., "Microdiffusion Analysis and Volumetric Error,"
rev. ed., London, Crosby Lockwood & Sons, 1947.(6) Dent, C. E., Stepka, W., and Steward, F. C., Nature, 160, 682
(1947),(7) Fowden, L., and Penney, J. R., Ibid., 165, 846 (1950).(8) Hamilton, P" J. Bioi. Chem., 158, 375 (1945).(9) Hughes, D. E., and Williamson, D. H., Biochem. J., 43, xlv
(1948).(10) Krebs, H. A., Ibid., 43, 51 (1948).em Martin, A. J. P., and Mittelmann, R., Ibid., 43, 353 (1948).(12) Neuberger, A., and Sanger, F., Ibid., 36, 662 (1942).(13) Pucher, G. W., and Vickery, H. B., IND. ENG. CHEM., ANAL. ED.,
12, 27 (1940).(14) Reifer, 1., and Melville, J., Trans. XIth Intern. Conf. Pure and
Applied Chern. (Supplement to Chemistry and Industry,1948).
(15) Vickery, H. B., Pucher, G. W., and Clark, H. E., J. Bioi. Chem.,109, 39 (1935).
(16) Vickery, H. B., Pucher, G. W., Clark, H. E., Chibnal!, A. C.,and Westall, R. G., Biochem. J., 29, 2710 (1935).
(17) Vickery, H. B., Pucher, G. W., and Deuber, C. G., J. Bioi.Chem., 145, 45 (1942).
(18) Vickery, H. B., Pucher, G. W., Leavenworth, C. S., and Wakeman, A. J., Conn. Agr. Expt. Sta., Bull. 374, (1935).
(19) Vickery, H. B., Pucher, G. W., Wakeman, A. J., and Leavenworth, C. S., Ibid., 424 (1939).
(20) Woiwod, A. J., Biochem. J., 45, 412 (1949),
RECEIVED October 13, 1950.
Determination of Traces of ChloridePotentiometric Titration to the Apparent Equivalence Potential
I. M. KOLTHOFF AND P. K. KURODASchool of Chemistry, University of Minnesota, Minneapolis, Minn.
I N THE classical method of potentiometric titrations the endpoint is taken at the location of the maximum in the tJ.E/tJ.c
curve. When the equilibrium constant of the reaction is unfavorable and the dilution is high, either no maximum occurs ortJ.E/ tJ.c changes so little at the end point that it cannot be determined with any degree of accuracy.
Under such conditions a potentiometric titration still can yieldrapid and accurate results when reagent is added until the apparent equivalence potential is attained. From the practicalpoint of view a serious limitation of this method is that the
equivalence potential, in general, changes with the ionic strengthand the kind of electrolyte in the solution titrated. Moreover,the exact determination of the equivalence potential is impossible,owing to an unknown liquid junction potential. From an analytical viewpoint these difficulties can be almost completely eliminated by carrying out the titration in a "supporting electrolyte"of high ionic strength and suitable composition. The "apparent"equivalence potential in such a medium can be found by classicalmethods. For practical purposes it may be desirable to usevarious supporting electrolytes.
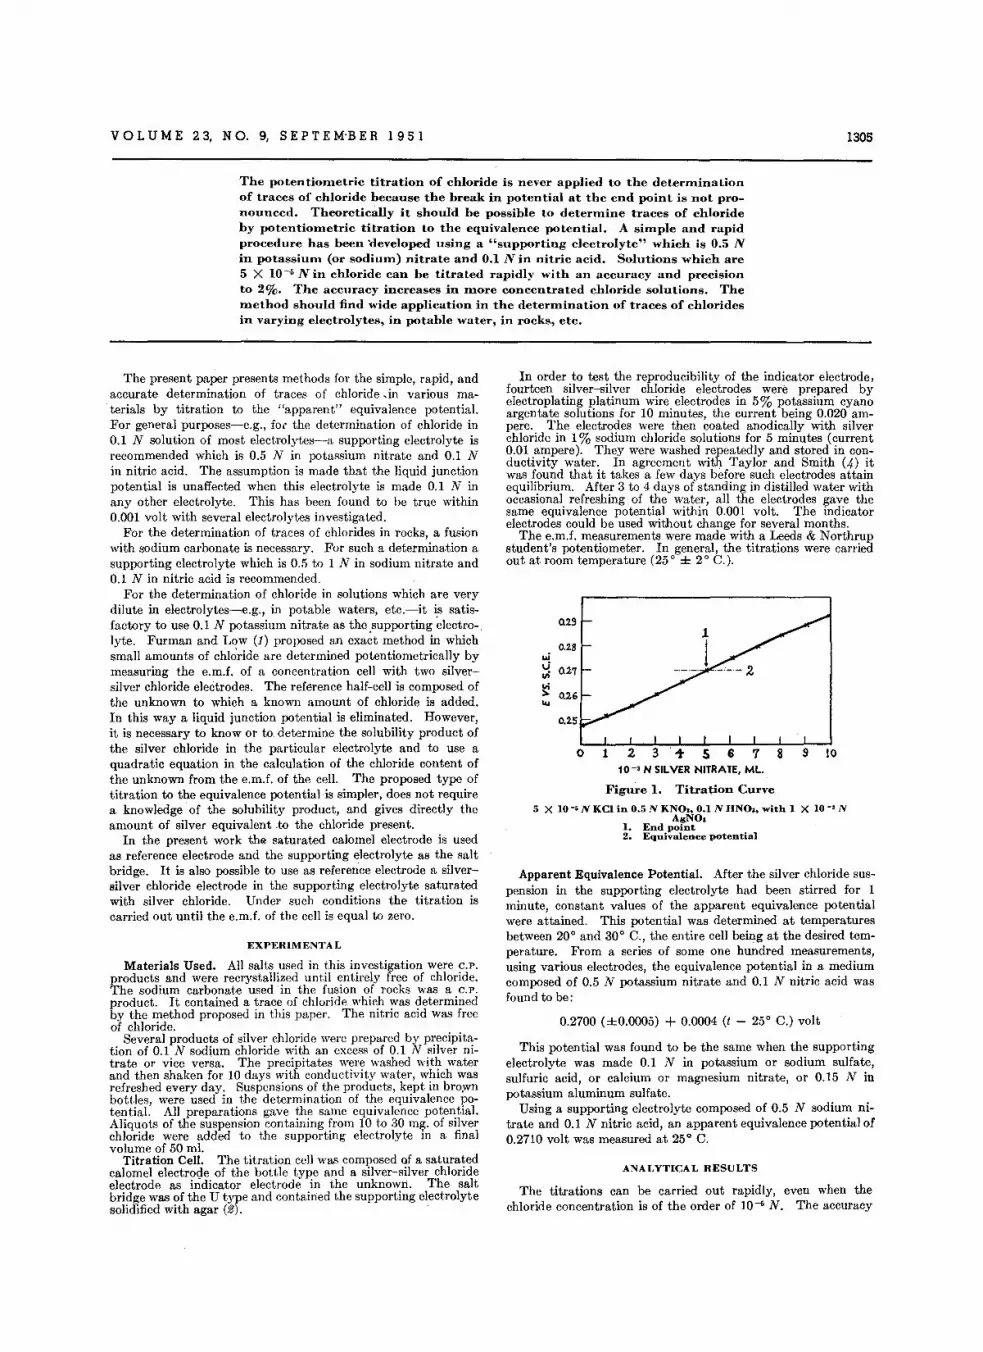
VOL U M E 23, NO.9, S E PTE M'B E R 1951
The potentiometric titration of chloride is never applied to the determinationof traces of chloride because the break in potential at the end point is not pronounced. Theoretically it should be possible to determine traces of chlorideby potentiometric titration to the equivalence potential. A simple and rapidprocedure has been 'developed using a "supporting electrolyte" which is 0.5 Nin potassium (or sodium) nitrate and 0.1 N in nitric acid. Solutions which are5 X 10-· N in chloride can be titrated rapidly with an accuracy and precisionto 2%. The accuracy increases in more concentrated chloride solutions. Themethod should find wide application in the determination of traces of chloridesin varying electrolytes, in potable water, in rocks, etc.
1305
The present paper presents methods for the simple, rapid, andaccurate determination of traces of chloride cin various materials by titration to the "apparent" equivalence potential.For general purposes-e.g., for the determination of chloride in0.1 N solution of most electrolytes-a supporting electrolyte isrecommended which is 0.5 N in potassium nitrate and 0.1 Nin nitric acid. The assumption is made that the liquid junctionpotential is unaffected when this electrolyte is made 0.1 N inany other electrolyte. This has been found to be true within0.001 volt with several electrolytes investigated.
For the determination of traces of chlorides in rocks, a fusionwith sodium carbonate is necessary. For such a determination asupporting electrolyte which is 0.5 to 1 N in sodium nitrate and0.1 N in nitric acid is recommended.
For the determination of chloride in solutions which are verydilute in electrolytes-e-e.g., in potable waters, etc.-it is satisfactory to use 0.1 N potassium nitrate as the .supporting ~lectro-.lyte. Furman and Low (1) proposed an exact method in whichsmall amounts of chl~ride are determined potentiometrically bymeasuring the e.m.f. of a concentration cell with two silversilver chloride electrodes. The reference half-cell is composed ofthe unknown to which a known amount of chloride is added.In this way a liquid junction potential is eliminated. However,it is necessary to know or to. determine the solubility product ofthe silver chloride in the particular electrolyte and to use aquadratic equation in the calculation of the chloride content ofthe unknown from the e.m.I. of the cell. The proposed type oftitration to the equivalence potential-is simpler, does not requirea knowledge of the solubility product, and gives directly theamount of silver equivalent .to the chloride present.
In the present work th@ saturated calomel electrode is usedas reference electrode and the supporting electrolyte as the saltbridge. It is also possible to use as reference electrode a silversilver chloride electrode in the supporting electrolyte saturatedwith silver chloride. Under such conditions the titration iscarried out until the e.mJ. of the cell is equal to zero.
EXPERIMENTAL
Materials Used. All salts used in this investigation were C.P.products and were recrystallized until entirely free of chloride.The sodium carbonate used in the fusion of rocks was a C.P.product. It contained a trace of chloride which was determinedby the method proposed in this paper. The nitric acid was freeof chloride.
Several products of silver chloride were prepared by precipitation of 0.1 N sodium chloride with an excess of 0.1 N silver nitrate or vice versa. The precipitates were washed with waterand then shaken for 10 days with conductivity water, which wasrefreshed every day. Suspensions of the products, kept in brownbottles, were used in the determination of the equivalence potential. All preparations gave the same equivalence potential.Aliquots of the suspension containing from 10 to 30 mg. of silverchloride were added to the supporting electrolyte in a finalvolume of 50 ml.
Titration Cell. The titration cell was composed of a saturatedcalomel electrode of the bottle type and a silver-silver chlorideelectrode as indicator electrode in the unknown, The saltbridge was of the U type and contained the supporting electrolytesolidified with agar (2).
In order to test the reproducibility of the indicator electrode,fourteen silver-silver chloride electrodes were prepared byelectroplating platinum wire electrodes in 5% potassium cyanoargentate solutions for 10 minutes, the current being 0.020 ampere. The electrodes were then coated anodically with silverchloride in 1% sodium chloride solutions for 5 minutes (current0.01 ampere). They were washed repeatedly and stored in conductivity water. In agreement with Taylor and Smith <'.0 itwas found that it takes a few days before such electrodes attainequilibrium. After 3 to 4 days of standing in distilled water withoccasional refreshing of the water, all the electrodes gave thesame equivalence potential within 0.001 volt. The indicatorelectrodes could be used without change for several months.
The e.m.f, measurements were made with a Leeds & Northrupstudent's potentiometer. In general, the titrations were carriedout at room temperature (25° ± 2° C.).
o 10
Figu~e 1. Titration Curve
5 X 10 -, N KCI in 0.5 N KNO" 0.1 N HNO•• with 1 X 10 -, NAgNO.
1. End point2. Equivalence potential
Apparent Equivalence Potential. After the silver chloride suspension in the supporting electrolyte had been stirred for 1minute, constant values of the apparent equivalence potentialwere attained. This potential was determined at temperaturesbetween 20° and 30° C., the entire cell being at the desired temperature. From a series of some one hundred measurements,using various electrodes, the equivalence potential in a mediumcomposed of 0.5 N potassium nitrate and 0.1 N nitric acid wasfound to be:
0.2700 (±0.0005) + 0.0004 (I - 25° C.) volt
This potential was found to be the same when the supportingelectrolyte was made 0.1 N in potassium or sodium sulfate,sulfuric acid, or calcium or magnesium nitrate, or 0.15 N inpotassium aluminum sulfate.
Using a supporting electrolyte composed of 0.5 N sodium nitrate and 0.1 N nitric acid, an apparent equivalence potential of0.2710 volt was measured at 25° C.
ANALYTICAL RESULTS
The titrations can be carried out rapidly, even when thechloride concentration is of the order of 10-6 N. The accuracy
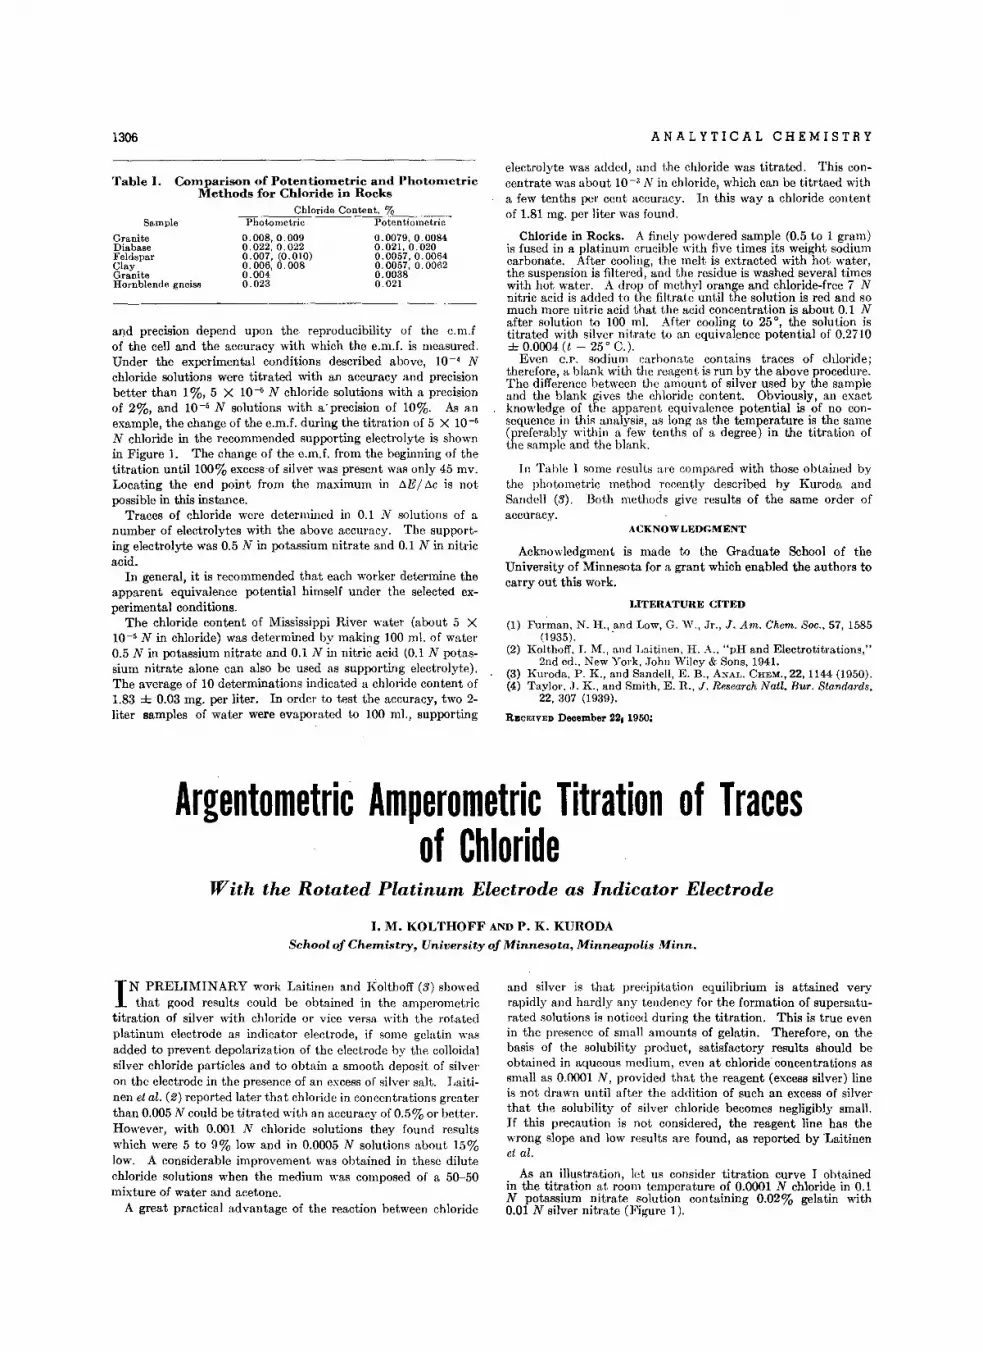
1306 ANALYTICAL CHEMISTRY
Table I. Cornpartsori of Potentiometric and PhotometricMethods for Chloride in Rocks
Chloride Content, %
and precision depend upon the reproducibility of the e.m.fof the cell and the accuracy with which the e.m.f. is measured.Under the experimental conditions described above, 10-4 Nchloride solutions were titrated with an accuracy and precisionbetter than 1%, 5 X 10--6 N chloride solutions with a precisionof 2%, and 10-5 N solutions with aprecision of 10%. As anexample, the change of the e.m.f. during the titration of 5 X 10--6N chloride in the recommended supporting electrolyte is shownin Figure 1. The change of the e.m.f. from the beginning of thetitration until 100% excess-of silver was present was only 45 mv.Locating the end point from the maximum in tiE! tic is notpossible in this instance.
Traces of chloride were determined in 0.1 N solutions of anumber of electrolytes with the above accuracy. The supporting electrolyte was 0.5 N in potassium nitrate and 0.1 N in nitricacid.
In general, it is recommended that each worker determine theapparent equivalence potential himself under the selected experimental conditions.
The chloride content of Mississippi River water (about 5 X10⁻⁵ N in chloride) was determined by making 100 ml. of water0.5 N in potassium nitrate and 0.1 N in nitric acid (0.1 N potassium nitrate alone can also be used as supporting electrolyte).The average of 10 determinations indicated a chloride content of1.83 ±0.03 mg. per liter. In order to test the accuracy, two 2liter samples of water were evaporated to 100 mI., supporting
Photometric PotentiometricSample
GraniteDiabaseFeldsparClayGraniteHornblende gneiss
0.008,0.0090.022,0.0220.007, (0.010)0.006, 0.0080.0040.023
0.0079,0.00840.021, 0.0200.0057,0.00640.0057, 0.00620.00380.021
electrolyte was added, and the chloride was titrated. This conccntrate was about 10-3 N in chloride, which can be titrtaed witha few tenths per cent accuracy. In this way a chloride contentof 1.81 mg. per liter was found.
Chloride in Rocks. A finely powdered sample (0.5 to 1 gram)is fused in a platinum crucible with five times its weight sodiumcarbonate. After cooling, the melt is extracted with hot water,the suspension is filtered, and the residue is washed several timeswith hot water. A drop of methyl orange and chloride-free 7 Nnitric acid is added to the filtrate until the solution is red and somuch more nitric acid that the acid concentration is about 0.1 Nafter solution to 100 ml. After cooling to 25°, the solution istitrated with silver nitrate to an equivalence potential of 0.2710± 0.0004 (t - 25° C.).
Even C.P. sodium carbonate contains traces of chloride;therefore, a blank with the reagent is run by the above procedure.The difference between the amount of silver used by the sampleand the blank gives the chloride content. Obviously, an exactknowledge of the apparent equivalence potential is of no consequence in this analysis, as long as the temperature is the same(preferably within a few tenths of a degree) in the titration ofthe sample and the blank.
In Table I some results arc compared with those obtained bythe photometric method rccently described by Kuroda andSandell (3). Both methocls give results of the same order ofaccuracy.
ACKNOWLEDGMENT
Acknowledgment is made to the Graduate School of theUniversity of Minnesota for a grant which enabled the authors tocarry out this work.
LITERATURE CITED
(1) Fur'man, N. lI., and Low, G. W., r-, J. Am. Chem. Soc., 57, 1585(1935). .
(2) Kolthoff, r. M., and Laitinen, H. A., "pH and Electrotitrations,"2nd ed., New York, .John Wiley & Sons, 1941.
(3) Kuroda, P. K, and Sandell, E. B., ANAL. CHEM., 22, 1144 (1950).(4) Taylor, ,J. K, and Smith, E. R, J. Research Natl. Bur. Standards,
22, 307 (1939).
RJIICEIVED December 22, 1950:
Argentometric Amperometric Titration of Tracesof Chloride
With the Rotated Platinum Electrode as Indicator Electrode
I. M. KOLTHOFF AND P. K. KURODASchool of Chemistry, University of Minnesota, Minneapolis Minn.
I N PRELIMINARY work Laitinen and Kolthoff (3) showedthat good results could be obtained in the amperometric
titration of silver with chloride or vice versa with the rotatedplatinum electrode as indicator electrode, if some gelatin wasadded to prevent depolarization of the electrode by the colloidalsilver chloride particles and to obtain a smooth deposit of silveron the electrode in the presence of an excess of silver salt. Laitinen et al. (2) reported later that chloride in concentrations greaterthan 0.005 N could be titrated with an accuracy of 0.5% or better.However, with 0.001 N chloride solutions they found resultswhich were 5 to 9% low and in 0.0005 N solutions about 15%low. A considerable improvement was obtained in these dilutechloride solutions when the medium was composed of a 50-50mixture of water and acetone.
A great practical advantage of the reaction between chloride
and silver is that precipitation equilibrium is attained veryrapidly and hardly any tendency for the formation of supersaturated solutions is noticed during the titration. This is true evenin the presence of small amounts of gelatin. Therefore, on thebasis of the solubility product, satisfactory results should beobtained in aqueous medium, even at chloride' concentrations assmall as 0.0001 N, provided that the reagent (excess silver) lineis not drawn until after the addition of such an excess of silverthat the solubility of silver chloride becomes negligibly small.If this precaution is not considered, the reagent line has thewrong slope and low results are found, as reported by 'Laitinenet al.
As an illustration, let us consider titration curve I obtainedin the titration at room temperature of 0.0001 N chloride in 0.1N potassium nitrate solution containing 0.02% gelatin with0.01 N silver nitrate (Figure 1).
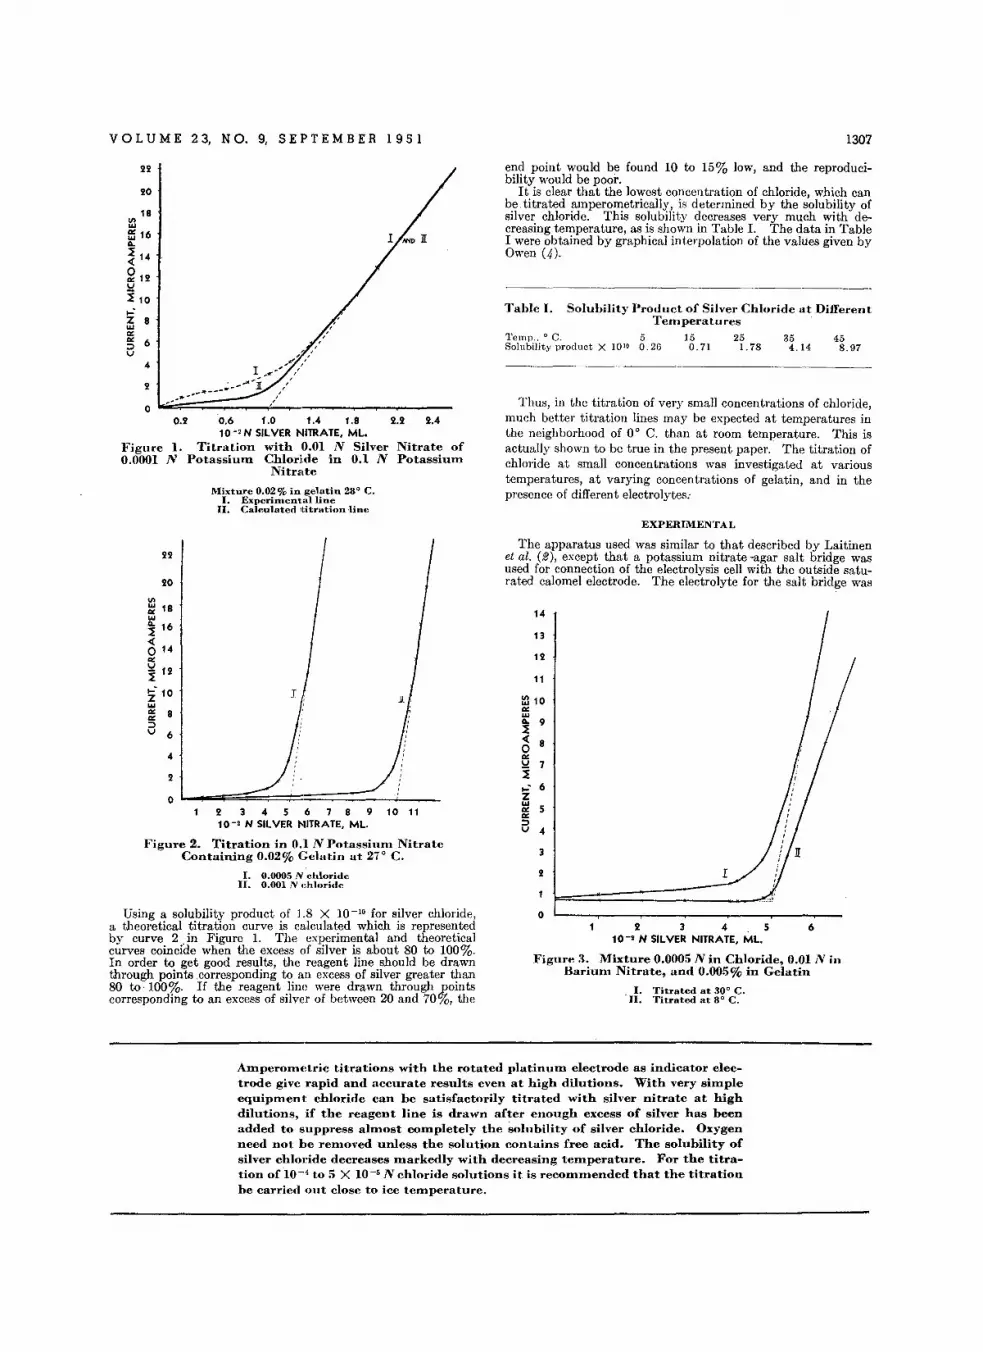
VOL U M E 2 3, N O. 9, S E PTE M B E R I 9 5 I 1307
22
20
18~ffi 16....:I 14«~ 12uj 10,.:Z 8...IX
~ 6u
4
2
o0.2 0.6 1.0 1.4 1.8
10 -, N SILVER NITRATE, ML.
F'igtrre 1. Titration with 0.01 N Silver0.0001 N Potassium Chloride in 0.1 N
Nitrate
Mixture 0.02% in gelatin 28° C.I. Experhnentalline
II. Calculated 1tit;ration line
2.2 2.4
Nitrate ofPotassium
end point would be found 10 to 15% low, and the reproducibility would be poor.
It is clear that the lowest concentration of chloride, which canbe titrated amperometrically, is determined by the solubility ofsilver chloride. This solubility decreases very much with decreasing temperature, as is shown in Table 1. The data in TableI were obtained by graphical interpolation of the values given byOwen (4).
Table I. Solubility Product of Silver Chloride at DifferentTernpeeat.u'res
Temp.. ° C. 5 15 25 35 45Solubility product X 10 10 0.2G 0.71 l. 78 4.14 8.97
Thus, in the titration of very small concentrations of chloride,much better titration lines may be expected at temperatures inthe neighborhood of 0° C. than at room temperature. This isactually shown to be true in the present paper.' The titration ofchloride at small concentrations was investigated at varioustemperatures, at varying concentrations of gelatin, and in thepresence of different electrolytes:
22
20
III... 18IX....... 16:I«140
IXu 12~
Z· 10...IX 8IX::;)u 6
4
2
o2 3 4 5 6 7 8 9 10 1110-' N SILVER NITRATE, ML.
Figure 2. Titration in 0.1 N Poj.assfu'm NitrateContaining 0.02% Gelatin at 2iO C.
I. 0.0005 N chlorideII. 0.001 N ehloridc
Using a solubility product of 1.8 X 10⁻¹⁰ for silver chloride,a theoretical titration curve is calculated which is representedby curve 2. in Figure 1. The experimental and theoreticalcurves coincide when the excess of silver is about 80 to 100%.In order to get good results, the reagent line should be drawnthrough points .corresponding to an excess of silver greater than80 to 100%. If the reagent line were drawn through ]Jointscorresponding to an excess of silver of between 20 and 70%, the
EXPERIMENTAL
The apparatus used was similar to that described by Laitinenet al. (2), except that a potassium nitrate-agar salt bridge wasused for connection of the electrolysis cell with the outside saturated calomel electrode. The electrolyte for the salt bridge was
14
13
12
11
~ 10IX...~ 9
« 8oIXU 7j..... 6Z...'" 5'"::;)u 4
2
o2 3 4 5 6
10-' N SILVER NITRATE, ML.
Figure 3. Mixture 0.0005 N in Chloride, 0.01 N inBarium Nitrate, and 0.005% in Gelatin
. I. Titrated at 30° C.II. Titrated at 8° C.
Amperorneteie titrations with the rotated platinuIll electrode as indicator electrode give rapid and accurate results even at high dilutions. With very simpleequfprnerrt chloride can be satisfactorily titrated with silver nitrate at highdilutions, if the reagent line is drawn after enough excess of silver has beenadded to suppress alrnost eorrrpbetoly the solubility of silver chloride. Oxygenneed not he removed unless the solution contains free acid. The solubility ofsilver chloride decreases markedly with decreasing teIllperature. For the titration of 10-4 to 5 X 10⁻⁵ N chloride solutions it is recommended that the titrationhe carried orrt close to ice temperature.
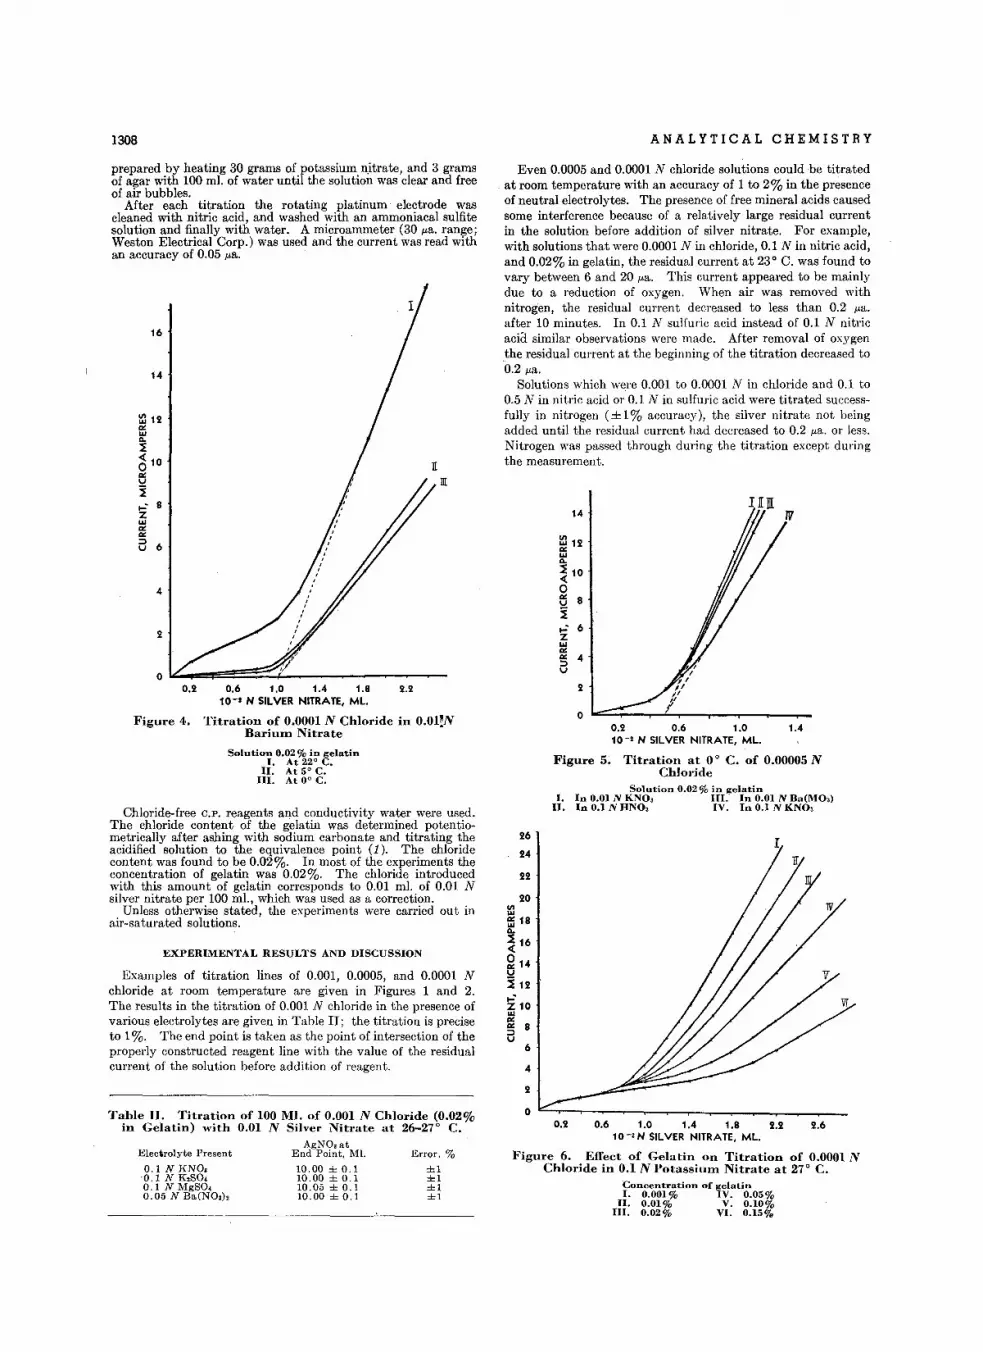
1308 ANALYTICAL CHEMISTRY
Soluti0'i.O'~to/~~~~~latin
II. At 5° C.III. At 0° C.
2.60.2 0.6 1.0 1.4 1.8 2.210-'N SILVER NITRATE, ML.
Figure 6. Effect of Gelatin on Titration of 0.0001 NChloride in 0.1 N Potasslum Nitrate at 27° C.
26
24
22
20~ffi 18ll.
:I 16«fil14u~ 12
'i 10'"IXIX 8a
Concentration of gelatinI. 0.001% IV. 0.05%
II. 0.01% V. 0.10%III. 0.02% VI. 0.15%
0.2 0.6 1.0 1.410-' N SILVER NITRATE, ML.
Figure 5; Titration at 0 ° C. of 0.00005 NChloride
6
4
2
o
Solution 0.02 % in gelatinI. In 0.01 N KNO, III. In 0.01 N Ba(MO,)
II. In 0.1 N HNO, [V. In 0.1 N KNO,
Even 0.0005 and 0.0001 N chloride solutions could be titratedat room temperature with an accuracy of 1 to 2% in the presenceof neutral electrolytes. The presence of free mineral acids causedsome interference because of a relatively large residual currentin the solution before addition of silver nitrate. For example,with solutions that were 0.0001 N in chloride, 0.1 N in nitric acid,and 0.02% in gelatin, the residual current at 23° C. was found tovary between 6 and 20 p,a. This current appeared to be mainlydue to a reduction of oxygen. When air was removed withnitrogen, the residual current decreased to less than 0.2 p,a.after 10 minutes. In 0.1 N sulfuric acid instead of 0.1 N nitricacid similar observations were made. After removal of oxygen.the residual current at the beginning of the titration decreased to0.2 p,a.
Solutions which were 0.001 to 0.0001 N in chloride and 0.1 to0.5 N in nitric acid or 0.1 N in sulfuric acid were titrated successfully in nitrogen (±1% accuracy), the silver nitrate not beingadded until the residual current had decreased to 0.2 p,a. or less.Nitrogen was passed through during the titration except duringthe measurement.
±1±1±1±1
Error, %0.1 N RNO.
'0.1 N K,SO.0.1 N MgSO.0.05 N Ba(NO.),
Electrolyte Present
16
0.2 0.6 1.0 1.4 1.8 2.210-' N SILVER NITRATE, ML.
Figure 4. Titration of 0.0001 N Chloride in O.OI!NBarrurn Nitrate
2
4
prepared by heating 30 grams of potassium nitrate, and 3 gramsof agar with 100 ml. of water until the solution was clear and freeof air bubbles.
After each titration the rotating platinum electrode wascleaned with nitric acid, and washed with an ammoniacal sulfitesolution and finally with water. A microammeter (30 p,a. range;Weston Electrical Corp.) was used and the current was read withan accuracy of 0.05 p,a.
~ 12IX
'"ll.:I~ 10IXU
~,.: 8Z'"IXIXa 6
14
Chloride-free C.P. reagents and conductivity water were used.The chloride content of the gelatin was determined potentiometrically after ashing with sodium carbonate and titrating theacidified solution to the equivalence point (1). The chloridecontent was found to be 0.02%. In most of the experiments theconcentration of gelatin was 0.02%. The chloride introducedwith this amount of gelatin corresponds to 0.01 ml. of 0.01 Nsilver nitrate per 100 mI., which was used as a correction.
Unless otherwise stated, the experiments were carried out inair-saturated solutions.
EXPERIMENTAL RESULTS AND DISCUSSION
Examples of titration lines of 0.001, 0.0005, and 0.0001 Nchloride at room temperature are given in Figures 1 and 2.The results in the titration of 0.001 N chloride in the presence ofvarious electrolytes are given in Table II; the titration is preciseto 1%. The end point is taken as the point of intersection of theproperly constructed reagent line with the value of the residualcurrent of the solution before addition of reagent.
Table II. Titration of 100 Ml. of 0.001 N Chloride (0.02%in Gelatin) with 0.01 N Silver Nitrate at 26-27° C.
AgNO.atEnd Point, Ml.
10.00 ± 0.110.00 ± 0.110.05 ± 0.110.00 ± 0.1

VOL U M E 2 3, N O. 9, s s r T E M B E R 1 9 5 1
High residual currents were also obtained at 0° C. in thepresence' of mineral acids. Upon removal of oxygen with nitrogen, these currents decreased to less than 0.1 }.La.
Titration at Low Temperatures. That the titration of verydilute chloride solutions should be more accurate and precise atlow temperatures than at room temperature is iIIustrated in Figures 3, 4, and 5.
18
V> 16...ffi 14'0.
~ 12
~ 10u~ 8,.:~ 6
'"~ 4u
2
o0.2 0.6 1.0 1.4 1.8 2.2
10-'N SILVER NITRATE, ML.
Figure 7. Titration of 0.0001 N Chloride in 0.1 NPotasstum Nitrate
I. Without gelatin; at A gelatin added t.o 0.02 %concentration
II. 0.02 % gelatin prescet feccm beginning of titrationIII. Calculated titration line in absence of gelati...
At 0° and 5° C. a 0.0001 N chloride solution in 0.01 to 0.1 Nnitrate solution (0.02% gelatin) could be titrated with an accuracy and precision of 1 to 2% when the excess of reagent linewas drawn after 25% excess of silver had been added. Thetitration gave equally good results in 0.1 N nitric acid whencarried out in a nitrogen atmosphere. In neutral medium in thepresence of air, a 0.00005 N chloride solution could be titrated at0° C. with an accuracy and precision of 3% (Figure 5), when thereagent line was drawn after more than 50% excess of silver hadbeen added. The exact temperature is immaterial, as long as it isbelow approximately 5° C.
From various titration lines the solubility product of silver
1309
chloride in 0.01 N barium nitrate containing 0.02% gelatin wascalculated at different temperatures. The following values werefound: SAgO I X 1010: 0.3 at 0°,0.5 at 5°,4 to 5 at 28°.
Effect of Concentration of Gelatin. The diffusion current ofsilver ions in neutral medium decreases with increasing concentration of gelatin. This is clearly seen from the slope of the excessof reagent lines in Figure 6. Thus, the accuracy and precisiondecrease with increasing concentrations of gelatin. In general, aconcentration of 0.02% of gelatin is satisfactory in the titrationof 0.001 N or more dilute chloride solutions.
At room temperature the solubility of silver chloride calculatedfrom the current at the equivalence point in the presence of0.02% (to 0.05%) gelatin is of the order of 50 to 80% greaterthan that calculated from the solubility product at the sametemperature in the absence of gelatin (see Figure 7). Apparently,the difference between the two values is not due to a supersaturation effect caused by the gelatin, because the current at theequivalence point remained unchanged even after a few days ofstanding. If the gelatin was added at the equivalence point(Figure 7), the current became practically equal to the valuecalculated from the solubility product. On the other hand, whenthe gelatin was added when 80% of the chloride had been titrated, the current at the equivalence point was about the sameas when the gelatin had been present from the very beginning ofthe titration. It seems that either the extremely small colloidalparticles of silver chloride formed in the presence of gelatin havea greater solubility than coarse silver chloride or the colloidalsilver chloride has a slight depolarizing effect on the electrode.
ACKNOWLEDGMENT
Acknowledgment is made to the Graduate School of theuniversity for a grant which enabled the authors to carry out thiswork.
LITERATURE CITED
(1) Kolthoff, I. M., and Kuroda, P. K., ANAL. CHEM., 23, 1304(1951).
(2) Laitinen, H. A., Jennings, W. P., and Parks, T. D., IND. ENG.
CHEM., ANAL. En., 18, 355 (1946).(3) Laitinen, H. A., and Kolthoff, I. M., J. Phys. Chem., 45, 1079
(1941).(4) Owen, B. B., J. Am. Chem. Soc., 60, 2229 (1938).
RECEIVED February 19, 1951.
Rapid Method for Determination of BetaineH. G. WALKER, JR., AND ROBERTA ERLANDSEN
Western Regional Research Laboratory, Albany, Calif.
IT HAS been known for many years. that betaine [carboxy-methyl trimethyl ammonium .salt] constitutes one of the
principal noncarbohydrate impurities in sugar-beet processingliquors, and recent interest in feed-supplement use and by-productrecovery has made the estimation of this compound of especialinterest to the sugar beet industry. At present, no Association ofOfficial Agricultural Chemists (1) method is available for betaine,and the present practice (4,5, 8) follows essentially the procedurefirst described by Stanek (9), which involves precipitation of thebetaine with potassium triiodide (periodide method), followedby titration with thiosulfate or determination of nitrogen by theKjeldahl method. The method is subject to serious error, because other naturally occurring nitrogenous substances are also
precipitated as complex iodides, especially in acid medium.Thus the preliminary removal of interfering materials, includingsucrose, makes the method laborious. Phosphotungstic acid as aprecipitant followed' by Kjeldahl analysis has been used (6),but the method is nonspecific and somewhat time-consuming.
Strack and Schwaneberg (10) suggested that compounds resembling betaine could be determined gravimetrically as betainereineckates in acid solution, but gave no quantitative analyticaldata for the determination of betaine itself. The use of Reineckesalt for the determination of choline (3, 11) and other substitutedamino compounds (2) is well established. In the authors' experience, however, the gravimetric or colorimetric determinationof betaine as the reineckate has not been successful because no

1310 ANALYTICAL CHEMISTRY
a Analysis run at room temperature.
These typical results were obtained from a pure solution ofbetaine chloride in water, following the procedure described.The variation in the results of different determinations is indicative of the accuracy obtainable. Samples containing more than20 mg. of betaine were apparently not completely precipitatedunder the conditions of this analysis, as the results were alwayslow. Similar low values were obtained when the solution containing betaine reineckate was not chilled to 50 C.
As an example of the application of this method to extractsfrom natural sources, some data are presented on sugar-beetprocessing liquors.
RESULTS
By the described technique, it was found possible to get reproducible analyses on known samples of betaine. The samplesvaried in size from 2 to 20 mg. in 10 ml. of water and the betainewas precipitated by 10 m!. of saturated ammonium reineckatewhich had been acidified to pH 1. The values shown in Table Iare representative of those obtained over the range of betaineconcentration of interest to this investigation. The precisionbetween duplicate determinations run at the same time by twodifferent operators was good, and the accuracy for analyses runat different times was within about 4%.
is collected in a clean beaker when the suction is turned on. Ifnecessary, this procedure can be repeated (not over about 10 m!.of acetone solution should be used), and the filter is finally washedwith distilled water. Water is added to the combined washingsto make a volume of about 20 m!. Then 10 ml. of silver nitratesolution and a small amount of filter aid are added and the resulting suspension is stirred and then filtered through a smallBuchner funnel with the aid of suction. The silver precipitateis washed thoroughly with water and the combined filtrate andwashings (volume about 40 to 45 m!.) are titrated with 0.02 Nsodium hydroxide to the disappearance of the acid color ofmethyl red. The number of milliequivalents of base requiredfor the titration is equal to the number of milliequivalents ofbetaine in the sample. .. For use on sugar-beet diffusion juices, a preliminary prepara
tion of the sample was found necessary. A sample of juice isheated quickly to 60 0C. with a small amount (2 to 3% by weight)of calcium oxide, filtered, and cooled to room temperature. A20-m!. aliquot of this filtrate is acidified to pH 1 with concentrated hydrochloric acid and made up to a volume of 25 m!.Analyses may be run on aliquots of the solution thus prepared.The processing liquors which had already been treated withlime gave satisfactory results when acidified and made to volumedirectly.
4.033.816.206.12
7.808.02
9.80 9.849.81 9.609.86 9.669.66 10.20
10.36 10.109.78
16.816.2
19.6 11).619.8 19 ..119.7 19.119.618.7 a
24.6 23.624.4 24.1
24.0
Analyst A Analyst B
1. 874.033.82
of Known Betaine SamplesBetaine Found, Mg.
10.00
26.0
20.0
16.0
30
Table I. Analysis
Betaine in Sample, Mg.
2.004.00
6.00
8.00
A saturated solution of Reinecke salt (ammonium reineckatc,Eastman No. 3806) is prepared by shaking an excess of the solidwith distilled water, using a mechanical shaker and allowing atleast 0.75 hour to ensure saturation. The authors have found noparticular advantage from the use of recrystallized material,although results obtained from using a bottle which had beenstanding open in the laboratory for several months were slightlylow. The saturated solution is filtered and adjusted to pH 1with concentrated hydrochloric acid. The solution should beused the same day as prepared. .
Reagent grade ether is used, and should be free of alcohol.Reagent acetone 'is used. A solution of 70 ml. of acetone and
30 mI. of water is used to dissolve the crude betaine reineckate.Conventionally prepared 0.02 N sodium hydroxide is used for
titration.A solution approximately 0.1 N with respect to both silver
nitrate and sodium nitrate was found satisfactory for the removal of reineckate ion, and is prepared by weighing the desiredamount of both solids and dissolving them in the calculatedamount of water.
A standard solution of betaine chloride is prepared by dissolving 260.2 mg. of the pure, solid, nonhygroscopie chloride in100 ml. of water. .This solution contains 2.00 mg. of betaineper ml., and may be checked by titration with the sodium hydroxide after dilution of an aliquot with water and a small amountof acetone to produce the conditions encountered experimentallyin the final titration.
way could be found to isolate betaine reineckate quantitatively,and, at the same time, analytically pure. In. contrast to cholinereineckate, betaine reineckate is slightly soluble in cold water oralcohols. Ether, benzene, chloroform, and similar organic solvents, on the other hand, fail to dissolve either betaine reineckateor the accompanying coprecipitated reineckates. In order toachieve quantitative removal of the betaine, the precipitationmust be carried out in the presence of a large excess of reineckateas common ion, even at a temperature of 50 C., so that the isolation of a pure precipitate represents a serious difficulty.
Because betaine salts are strong acids, they can be titrated withsodium hydroxide in the presence of methyl red indicator. Theauthors have found it satisfactory to precipitate crude betainereineckate from hydrochloric acid solution and wash it free ofinorganic acid with ether, on a sintercd-glass filter. After thewashed precipitate has been dissolved in aqueous acetone, thereineckate ion can be removed by addition of excess silver nitrate,and the soluble betaine nitrate determined by titration with sodium hydroxide with methyl red as indicator. Even thoughcholine or other nitrogenous materials might be precipitated atthe same time, they are not acidic enough to be titrated withalkali at pH 6. Most of the amino acids do not give precipitateswith the Reinecke reagent under the conditions of this procedure,although interference from proline, if present in sufficient quantity, might be expected.
REAGENTS
PROCEDURE
A sample containing from 4 to 20 mg. of betaine, in a volumeof not over 10 ml. of solution which has been acidified to pH 1with hydrochloric acid, is placed in a emall beaker. Ten milliliters of acidified reineckate solution are added at room temperature, and the sample is cooled to below 50 C. in an ice bath,after which it is filtered through a clean sintered-glass crucible(medium porosity) as rapidly as possible with suction. A rubberpoliceman aids in the transfer of the precipitate and stirringIII the subsequent washing operation. The original beaker iswashed with a small amount of ether, and the washings arepoured over the precipitate and sucked through the filter. Thesuction is turned off and another small portion of ether is pouredinto the filter, mixed well with the suspended solid, and finallysucked through the filter. The procedure is repeated untilabout 30 ml. of ether have been used. All droplets of water remaining on the sides of the filter crucible must be washed out atthis stage.
After the precipitate has been allowed to dry in air a fewminutes, it is dissolved in acetone-water by pouring a few milliliters of this solution on the filter without applied suction. Theprecipitate is stirred to produce an intensely red solution, which

VOL U M E 2 3, N O. 9, S E PTE M B E R 1 9 5 1 1311
11 Value of 1.32 mg. per ml. obtained when sample was treated with lime.
After Addition of 4.00 Added BetaineSample Originally Mg. to Sample Accounted for. Mg.
Table Ill. Recovery of Added Betaine from Diffusion JuiceTotal Betaine Found. Mg.
Table III shows that when a known amount of betaine isadded to a suitably prepared diffusion juice, it can be accountedfor satisfactorily in the determination of total betaine in thesample.
unknown sample was practically impossible. The authors haveconfirmed the observation (10) that ammonium rhodanilate isnot as satisfactory as ammonium reineckate for the precipitationof betaine. Pure R.einecke acid was not as satisfactory as anacidified solution of the ammonium salt.
The difficulties encountered in the gravimetric determinationof betaine are also inherent in any colorimetric procedure, because the red color of the solutions is apparently due to thereineckate ion alone. Consequently, unless a pure precipitateof betaine reineckate can be obtained, the colorimetric valueswill be just as erroneous as the gravimetric values.
The betaine determination reported here appears to have certain advantages over previously proposed methods, principallybecause most of the interfering substances do not have to be removed prior to the precipitation of the betaine; this reduces thetime required for analysis. The presence of sugar (in this study,the sugar concentration was about 12%) in the solution to beanalyzed does not appear to affect the results. The over-alltime required for a determination of duplicate samples, includingpreparation of the sample, is about one hour, which is somewhatfaster than the periodide procedure reported in the literature.Reifel' reports that an accuracy of 2% is possible with. the "periodide method" on pure betaine solutions (8) but that "the potassium triiodide also yields precipitates with dimethylamine, trimethylamine, certain cyclic bases, and many alkaloids." Theneed for extensive preliminary removal of impurities using thismethod is therefore understandable.
If it is assumed that the dissociation constant of betaine nitrate is of the same order of magnitude as that of the chloride(about 1 X 10⁻²) (7), and that the concentration of silver ionin the final solution is less than 0.01 N, it can be calculated thatthe betaine nitrate can be titrated quantitatively to about pH 6without interference from the silver ion. Experimentally determined titration curves indicate that these assumptions are apparently justified, even in the aqueous solutions containing someacetone obtained from the experimental procedure. The directtitration of the betaine reineckate in acetone-water with sodiumhydroxide, with a glass electrode to follow pH, was not satisfactory, presumably because the betaine reineckate is a fairlyweak acid.
3.924.03
10 . .52'11. 22
6.607.19
Sample
No.1, treated
No. z«, untreated
12
Table IV. Analysis of Jonnstown Waste Molasses H.eportedto Contain 9.0% Betaine Chloride
Betaine Chloride Found,Sample Size, MI. Weight %
2 8.94.5 9.03
10 8.86
Table II illustrates the difficulty arising from colloidal material in the solution analyzed. Sample 2 consisted of a raw diffusion juice which had had no preliminary treatment; the filtration was extremely slow and the precipitate discolored. Sample1 had been treated with lime and then analyzed; the figures indicate that consistent results could be achieved which were independent of sample size, within the limits already stated.
Tahle II. Analysis of Sugar-Beet Diffusion Juice, ShowingEffect of Preliminary Lime Teeat.men t
Sample Size, Betaine Found,MI. Mg./MI. .
3.00 1.32.5.00 1.33
10.00 1.34
3.00 1..5.55.00 1.34
lO.OO 1.121. 09
Table IV shows the result of a comparative analysis of Johnstown waste molasses. This sample had previously been analyzed (.4-) by a modified periodide procedure and the result corrected for accompanying purines. The authors' analysis of thematerial, after dilution, but with no. chemical removal of impurities, indicates good agreement with the values obtained by theother procedure.
ACKNOWLEDGJ\fENT
The authors wish to express their appreciation to H. S. Owensfor his interest and aid on this problem. They also wish to extend thanks to the International Minerals and Chemical Corp.,Amino Products Division, for a supply of betaine chloride, andto the Great Western Sugar Co. for a sample of waste molasses ofknown composition.
DISCUSSION
Some time was spent trying to develop It gravimetric determination of betaine with R.einecke salt as a precipitant. Theuse of ice water, methanol, ethyl alcohol, isopropyl alcohol,n- or tert-butyl alcohol, dioxane, or ethyl acetate for wash solutionsgave washings which were intensely colored at first, but all continued to give slightly colored solutions as washing proceeded,indicating that the betaine reineckate was being dissolved as themother liquor was washed out. The addition of a small amountof hydrochloric acid failed to decrease the solubility of betainereineckate suitably in these solvents. Various mixtures of etherand butanols failed to wash out the coprecipitated substances,or else dissolved so much of the betaine reineckate at the sametime that low analytical values were obtained. The resultsvaried from 10 to 15% high to 5 to 20% low, depending on theamount of washing and the solvent mixture used. The conditions necessary to establish the optimum washing conditions for aparticular sample size were so specific that the analysis of an
LITERATURE CITED
(1) Assoc. Offic. Agr. Chemists, "Official and Tentative Methods ofAnalysis," 6th ed., 1945.
(2) Bandelin, F. J., Slifer, E. D., and Pankratz, R.E., J. Am.Pharm. Assoc., 39, 277 (1950).
(3) Beattie, F. J. R., Biochem. J., 30, 1554 (1936).(4) Bennett, A. N., private communication.(5) Blood, J. W., and Cranfield, H. T., Analyst, 61, 829 (1936).(6) Davies, W. L., and Dowden, H. C., J. Soc. Chern. Ind., 55, 175T
(1936).(7) Gustafsson, e., Ber., 77B, 66 (1944).(8) Reifer, 1., New Zealand J. Sci. Technol., 22B, 111 (1941).(9) Stanek, V., Z. physiol. Chem., 47, 83 (1904); Z. Zuckerind.
Bohmen., 28, 578 (1904); J. Chem.. Soc., Abst., 86, II, 790(1904).
(10) Strack, E., and Schwaneberg, H., Z. pkysiol. Chem., 245, 11(1936).
(11) Wilson, J. B., and Keenan, G. L., J. Assoc. Offic. Agr. Chemist«,21, 474 (1938).
RECEIVED November 2.5, 19.50.

Stability of the Ferrate(VI) Ion in Aqueous SolutionJ. M. SCHREYER AND L. T. OCKERMANl, Unicersity of Kentucky, Lexington, Ky.
o
50
ORiGINAL CONCENTRATIONKzFeO.
Curve I 0.020 MOLALCurven 0.025 MOLALCurv"nrO.030 MOLALCur""l'lO.030 MOLALCurveJl 0.040 MOLALCurv<z11LO.086 MOLAL
40
Curve::SZ:
Curve I
Curve Jr
30
Curvent':
20
calibrated in this manner (technical data supplied with electrode). The solutions were agitated continuously and a constant temperature of 26 0 ± 0.5 0 C. was maintained during thecourse of the experiment. The concentrations investigatedcovered a range from 0.020 to 0.086 molal.
Results are shown in Figure 1. Readings were made at J-minute intervals, but many observations were omitted from the figurefor brevity. These data are reproducible only if constant conditions are maintained. Changes of conditions were found not tochange the general shape of the curves, but only the time requiredto reach the plateaus of constant pH and highest pH.
The slopes of the pH-time curves were observed to be a functionof the concentration. The curves for concentrations less than0.030 molal contained plateaus of relatively constant pH beforethe attainment of the highest pH.
The pH of the solutions containing concentrations greater than0.030 molal increased rapidly and no plateaus were observed priorto the highest pH.
It is apparent that a 0.030 molal solution represents a criticalconcentration, as evidenced by the nonreproducibility shown incurves III and IV.
At the end of 60 minutes the solutions of 0.020 and 0.025 molalconcentrations still contained approximately 89% of the originalferrate ion when analyzed by the chromite method. Analysis ofthe entire solution at the highest pH in the case of the 0.030 to0.086 molal concentrations revealed that complete decompositionhad occurred.
The observations of pH on the dilute concentrations were notcontinued throughout the time required for complete decomposition, but it is probable that these curves would likewise show asecond rapid rise in pH prior to the att,ainment of the highest pH,as is shown in Figure 2 on a solution of approximately the sameconcentration. These plateaus of relatively constant pH duringthe decomposition of dilute solutions of potassium ferrate are unexplained at present.
In agreement with Moser (2), these data revealed that the moredilute solutions of the ferrate ion are more stable.
'0
TIME. (MIN.l
Effect of Concentration of Pot.assrum Ferrate upon Deeompostt'ion inAqueous Solutions
Figure 1.
'!lollr---------------------------------------.,
JO.!lL---JL.---I_-:':_-L_....L_...L._.l-_I.---JL----I_--I._....L_-'-_...L-_.l-_L.---I_--I._-.1
1:..Q.
INFLUENCE OF CONCENTRATION ON STABILITY
RECENT publications (5, 6) have reported the use of the fer-rate ion as a new oxidizing agent in alkaline solution. In
connection with the development of quantitative oxidations involving the ferrate ion, an investigation of the factors influencingits stability was necessary.
When potassium ferrate is added to water, oxygen is evolvedand hydrous ferric oxide is precipitated. The resulting solutionis strongly alkaline. The decomposition reaction has been reported to be as follows (4):
4Fe04-- + 4H20~ 2Fe 20a + 80H- + 302
Moser (2) reported that dilute solutions of the ferrate ion weremore stable than concentrated solutions. The addition of potassium hydroxide, sodium hydroxide, potassium chloride, potassium bromide, potassium nitrate, potassium carbonate, potassiumchlorate, or sodium chlorate was said to retard the decompositionof the ferrate ion. Salts of calcium, strontium, and magnesium,metals and their oxides, peroxides, and organic materials weresaid to accelerate the decomposition.
Rose (3) stated that the addition of potassium chloride, potassium sulfate, sodium carbonate, sodium nitrate, potassium nitrate, or sodium tetraborate retarded the decomposition reaction,while sodium chloride appeared to accelerate the decomposition.
The conclusions of these investigators were based upon the results of nonquantitative experiments. In addition, both theavailable solid samples of potassium ferrate and solutions of thiscompound were contaminated to such an extent that such specificeffects of additive salts seemed questionable.
The availability of both highly purified samples of the solublesalt, potassium ferrate (7), and suitable methods of analysis (5, 6)made possible a quantitative investigation of the stability of theferrate ion in aqueous solutions.
I Deceased April 11. 19.50.
Weighed samples of potassium ferrate of known purity,as analyzed by the arsenite (5)and chromite (6) methods,were placed in a 50-m!.beaker. A weighed amountof conductivity water, at atemperature of 26 0 ± 0.5 0 C.,was added to the beaker containing the potassium ferrate.Zero time was arbitrarily assumed to be the time of contact between liquid and sample. Periodic observations ofpH were made using theBeckman Model G meter witha Beckman 1190-E high pHelectrode. The instrumentwas set at 9.5 in a pH 10.00± 0.05 buffer and a correction of +0.5 was applied toall experimental readings.The manufacturer statesthat this electrode is usefulup to a pH of 13.5 when
In order to test Moser's report that dilute solutions of the ferrate ion were more stable than concentrated solutions, it was decided to study the rates of decompssition by determining thechanges in hydroxyl ion ac-tivity as the decomposition
.proceeds in solutions of different concen tration of theferrate ion.
1312
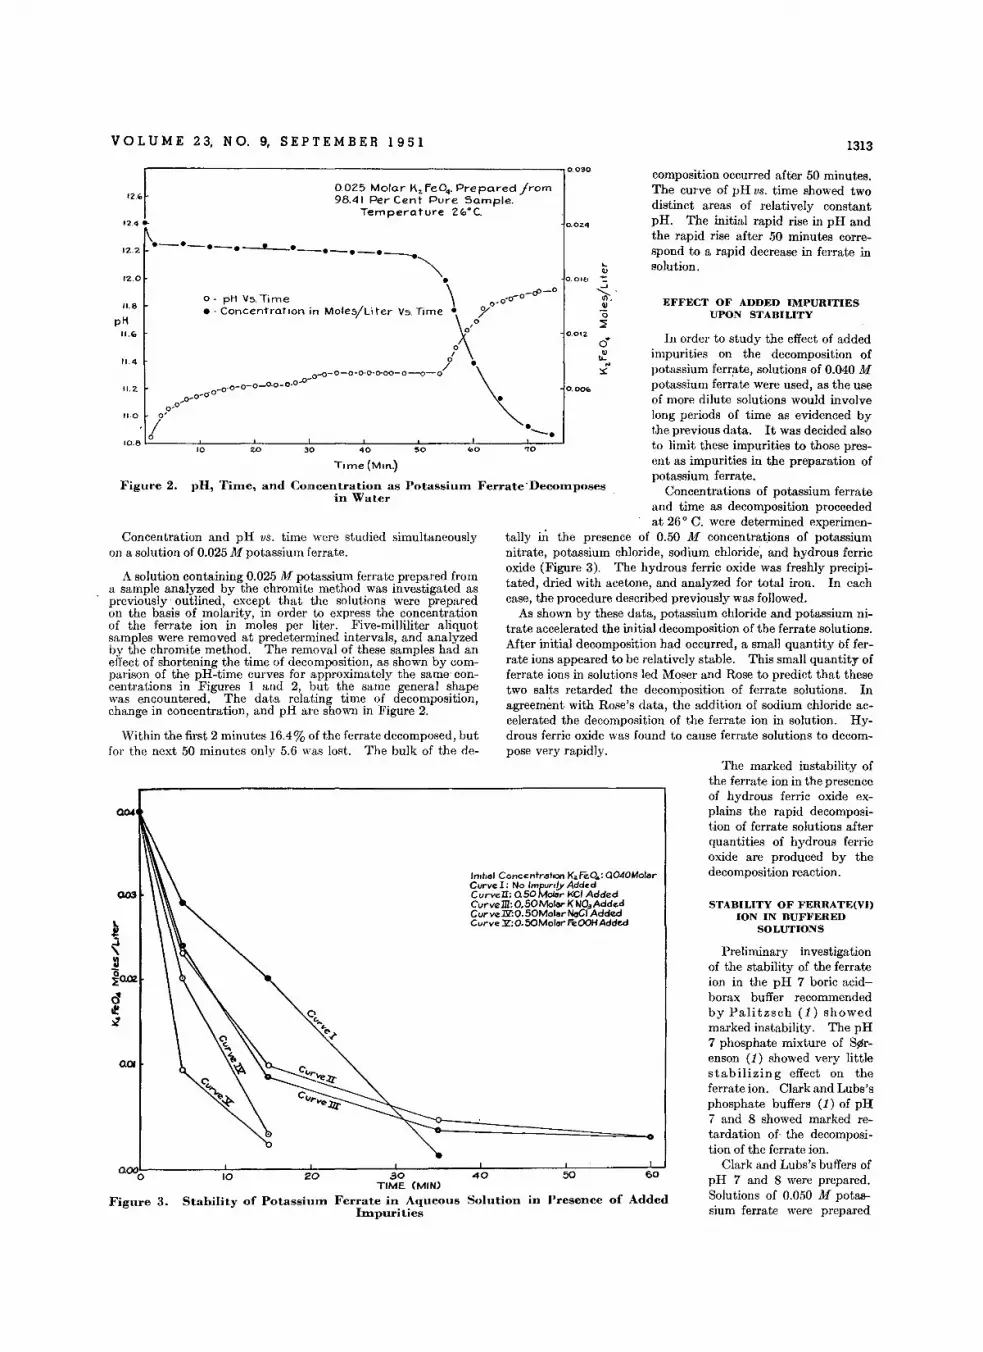
VOLUME 23, NO.9, SEPTEMBER 1951 1313
EFFECT OF ADDED IMPURITIESUPON STABILITY
composition occurred after 50 minutes.The curve of pH vs. time showed twodistinct areas of relatively constantpH. The initial rapid rise in pH andthe rapid rise after 50 minutes correspond to a rapid decrease in ferrate insolution .....,
...J,.<I).
~o~
0.024
O.ooc,
o.ore
In order to study the effect of addedimpurities on the decomposition ofpotassium ferrate, solutions of 0.040 Mpotassium ferr~te were used, as the useof more dilute solutions would involvelong periods of time as evidenced bythe previous data. It was decided alsoto limit these impurities to those pres-ent as impurities in the preparation ofpotassium ferrate.
Concentrations of potassium ferrateand time as decomposition proceededat 26 0 C. were determined experimen
tally in the presence of 0.50 M concentrations of potassiumnitrate, potassium chloride, sodium chloride, and hydrous ferricoxide (Figure 3). The hydrous ferric oxide was freshly precipitated, dried with acetone, and analyzed for total iron. In eachcase, the procedure described previously was followed.
As shown by these data, potassium chloride and potassium nitrate accelerated the initial decomposition of the ferrate solutions.After initial decomposition had occurred, a small quantity Offerrate ions appeared to be relatively stable. This small quantity offerrate ions in solutions led Moser and Rose to predict that thesetwo salts retarded the decomposition of ferrate solutions. Inagreement with Rose's data, the addition of sodium chloride accelerated the decomposition of the ferrate ion in solution. Hydrous ferric oxide was found to cause ferrate solutions to decompose very rapidly.
<0050
0.025 Molar K.FeO•. Prepared/rom98.41 Per Cent Pure Sample.
Temperature 2~·C.
.0
Trrrre (Mm.)
30
e
10
p'H, Ttrn.e, and Concentration as Potassium FcrrateDecomposcsin Water
e-_e-e_e--z.__e--e-e_e--.
<.00 pH V5.Time e\ ooo'o-o-cP_
o
.0 Concerrt rot ron in Mole5/Liter V5.Time e~l'
0'
oI
-<>-0-0 0 0 ' 0 ' 0 '00- 0 --0- 0 / e\..0-0
_0-0-0-0-°.0-°.0p_o",oo •
0·0o'
I e"""--e
IZ.O
10.8
11·0
r
- - - - - - - - - - - - - - - - - - - - - - - - - - - - - - - -, 0.030
'2"12.4 ..
11.2.
11.8
'1.4
12.2
F'igure 2.
pH'1.1.
Concentration and pH us, time were studied simultaneouslyon a solution of 0.025 M potassium ferrate.
A solution containing 0.025 M potassium ferrate prepared froma sample analyzed by the chromite method was investigated aspreviously outlined, except that the solutions were preparedon the basis of molarity, in order to express the concentrationof the ferrate ion in moles per liter. Five-milliliter aliquotsamples were removed at predetermined intervals, and analyzedby the chromite method. The removal of these samples had aneffect of shortening the time of decomposition, as shown by comparison of the pH-time eurves for approximately the same concentrations in Figures 1 and 2, but the same general shapewas encountered. The data relating time of decomposition,change in concentration, and pH are shown in Figure 2.
Within the first 2 minutes 16.4% of the ferrate decomposed, butfor the next 50 minutes only 5.6 was lost. The bulk of the de-
Preliminary investigationof the stability of the ferrateion in the pH 7 boric acidborax buffer recommendedby Palitzsch (1) showedmarked instability. The pH7 phosphate mixture of S9Irenson (1) showed very littlestabilizing effect on theferrate ion. Clark and Lubs'sphosphate buffers (1) of pH7 and 8 showed marked retardation of- the decomposition of the ferrate ion.
Clark and Lubs's buffers ofpH 7 and 8 were prepared.Solutions of 0.050 M potassium ferrate were prepared
The marked instability ofthe ferrate ion in the preseneeof hydrous ferric oxide explains the rapid decomposition of ferrate solutions afterquantities of hydrous ferricoxide are produced by thedecomposition reaction.
STABILITY OF FERRATE(VI)ION IN BUFFERED
SOLUTIONS
605040
'nit"" Concentrat"", K.FeO~:0040MolarCurve I: No Impurity Add.dCurveII: a50Mol.r Ke'AddedCvrveill: 0.50Molar KNO.AddedCurvellZ':O.50MolarNaCIAddedCurve JZ':O.50Molar",OOH Added
Solution in Presence of Added
,30TIME (MIN)
Ferrate in AqueousImpurities
2010
Stability of Potassium
aooOL------..,L------:::-:.------:!-.:--------:~----~;:;-------:;;_;::_'
Figure 3.

1314 ANALYTICAL CHEMISTRY
,-----------------------------------...,1200
0.05
0: 00 4
~..J
~~0.03o~
d41
~ 0.02
0.01
)[.
I0.050 MOLAR 1<0.1>.0.TEMPERATURE-26'"
o CHANGESINpHINpH 7.0BUFFER (X)@ CHANGES INCONC.lN pH 7.oBUFFER(][)• CHANGESINpHIN pH 8.0 BUFFER(11)o CHANGES IN CONC.lN pH 8.0 BUFFER(1ll')
11.00
10.90
10.80
....1070
10.60
10.50 i
1040
1030
10.20
10.10
"Figure 4. pH and Concentration VB, Trme
As pot.asafu'm fcrrate .decorn-,poses in pholilphat.e ])uffer
solutions
60504030TIME (MIN.)
2010O.OOO~----*------::~----~----___f:o_----~----~~---
using these buffer solutions and simultaneous determinations ofpH and concentration of potassium ferrate V8. time were madeusing the procedure previously described (Figure 4).
The solutions of potassium ferrate as shown by these data increased in pH, and showed two plateaus of constant pH. The initial decomposition as shown by the concentration-time curveswas rapid, attaining a relatively constant concentration corresponding to the area of constant pH. The potassium ferratesolution prepared from the pH 8 buffer was more stable than thesolution prepared from the pH 7 buffer. The solution preparedfrom the pH 7 buffer solution contained 49% of the originalpotassium ferrate after 8 hours; the solution prepared fromthe pH 8 buffer solution contained 71.4% of the original potassium ferrate after 10 hours. As these solutions did not remain buffered at pH 7 and 8, and no stabilizing effect was observed until a high pH was attained, it appears that the majorfactor influencing stability of the ferrate ion in aqueous solutionis a high alkalinity. It is believed that the presence of the phosphate ion has some stabilizing effect.
CONCLUSIONS
The initial concentration of potassium ferrate in aqueous solution exerts a marked influence upon the decomposition of the ferrate ion in solution. The more dilute solutions of the ferrate ionare more stable.
The addition of potassium chloride 01' potassium nitrate as animpurity in solutions containing the ferrate ion accelerated theinitial decomposition of the ferrate ion, but had the effect of stabilizing a small quantity of ferrate ions. Sodium chloride andhydrous ferric oxide as impurities caused complete decompositionof the ferrate ion in solutions at a rapid rate.
Solutions of the ferrate ion in Clark and Lubs's buffers of pH 7and pH 8 attained a relatively constant concentration after 10minutes. The solution prepared from the pH 8 buffer was morestable than the solution prepared from the pH 7 buffer.
LITlmATURE CITED
(1) Clark, W. M., "Determination of Hydrogen Ions," p. 106,Baltimore, Williams & Wilkins Co., 1927.
(2) Moser, L., J. prakt. Chem., (2) 56, 425 (1897).(3) Rose, H., Poqq. Ann., 59, 315-24 (1843).(4) Schreyer, J. M., thesis, "Higher Valence Compounds of Iron,"
Oregon State College, Corvallis, Ore., 1948.(5) Schreyer, J. M., Ockerman, L. T., and Thompson, G. W., ANAL.
CHEM., 22, 691 (1950).(6) Schreyer, .J. M., Thompson, G. "T., and Ockerman, L. T., ANAL.
CHEM., 22, 1426 (1950).(7) Thompson, G. W., Ockerman, L. T., and Schreyer, J. M., J. Am.
Chern, Soc., 73, 1379 (1951).
RECEIVED October 26, 1950. Presented in abstract before the Division ofPhysical and Inorganic Chemistry at the 118th Meeting of the AMERICANCHEMICAL SOCmTY, Chicago, III.
Separation of Cotton and Rayon or Cotton and Acetate forAnalytical Purposes-Addendum
IN RESPONSE to numerous requests for amplification of thedirections for preparation of the zincate solution [Heim,
Oskar, ANAL. CHEM., 22, 360 (1950)], the following details areprovided:
In making the stock solution containing 20 parts by weight ofsodium hydroxide, 9 of zinc oxide, and 51 of water, the zincoxide is slurried with 20 parts of water, and all the sodium hydroxide, preferably the technical flakes, is added stirring until dissolved. The heat evolved by these proportions, especially whenseveral pounds are prepared, is sufficient to effect solution.
Pouring a few drops of the milky solution into a tube holdinga tenfold volume of water determines completeness of solution.Scanning the bottom of the reaction vessel, preferably of stainless steel, through a flat-bottomed tube (Nessler, etc.) conveniently reveals any undissolved zinc oxide agglomerations, whichwill then go into solution upon either more stirring or heating;heating is rarely necessary. The remaining 31 parts of water areadded finally.
OSKAR HElM5943-48th Ave.Woodside, N. Y.
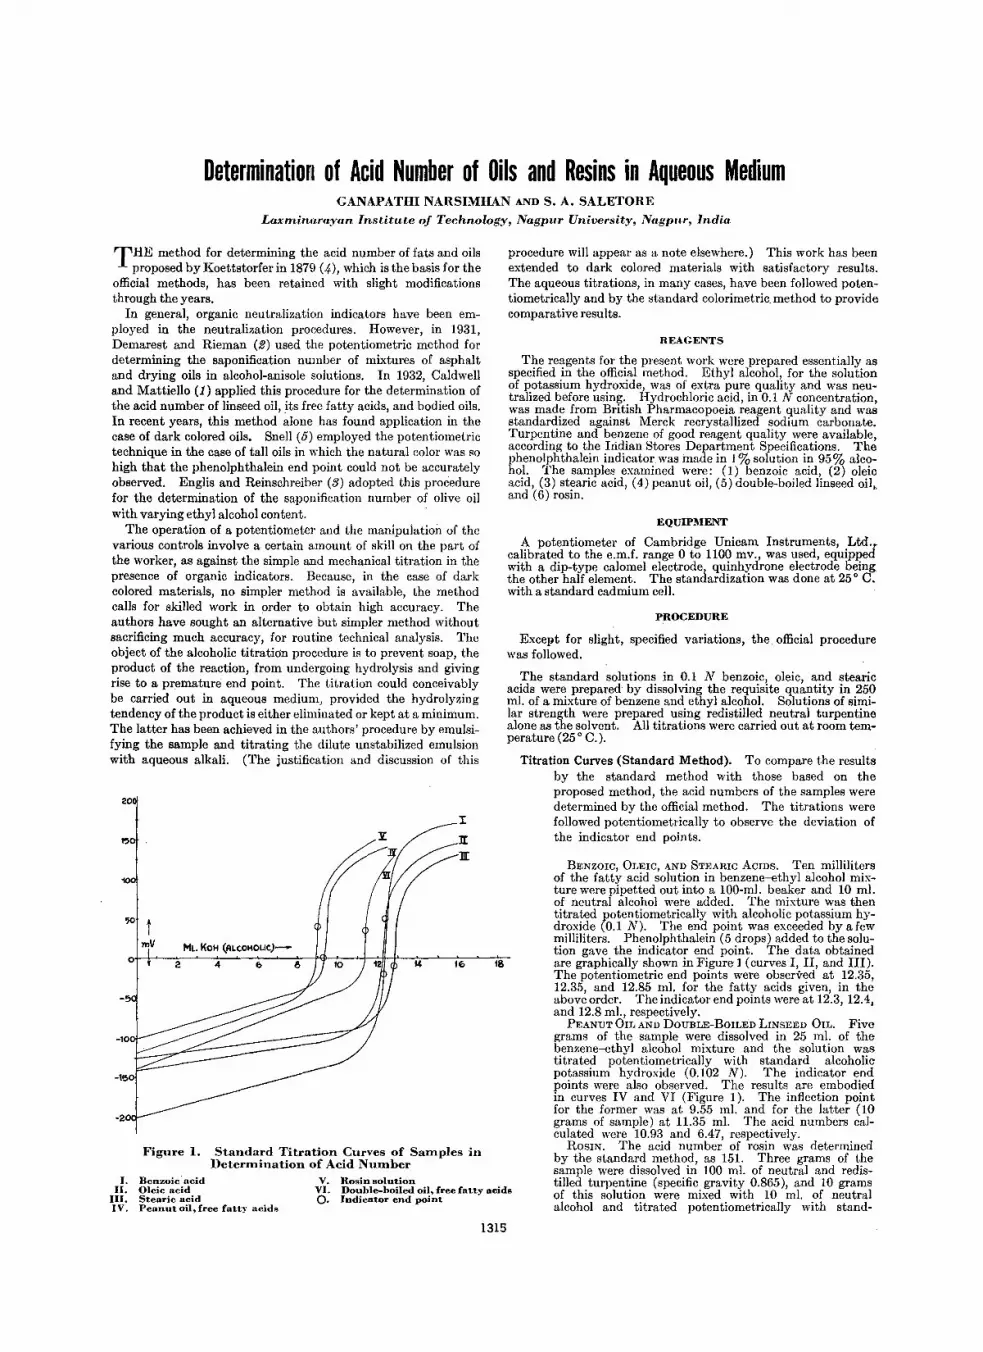
Determination of Acid Number of Oils and Resins in Aqueous MediumGANAPATHI NARSIMHAN AND S. A. SALETORE
Laxm.inarayan. Tn.st.it.u.te of Technology, Nagpur University, Nagpur, India
THE method for determining the acid number of fats and oilsproposed by Koettstorfer in 1879 (4), which is the basis for the
official methods, has been retained with slight modificationsthrough the years.
In general, organic neutralization indicators have been employed in the neutralization procedures. However, in 1931,Demarest and Rieman (2) used the potentiometric method fordetermining the saponification number of mixtures of asphaltand drying oils in alcohol-anisole solutions. In 1932, Caldwelland Mattiello (1) applied this procedure for the determination ofthe acid number of linseed oil, its free fatty acids, and bodied oils.In recent years, this method alone has found application in thecase of dark colored oils. Snell (5) employed the potentiometrictechnique in the case of tall oils in which the natural color was sohigh that the phenolphthalein end point could not be accuratelyobserved. Englis and Reinschreiber (3) adopted this procedurefor the determination of the saponification number of olive oilwith varying ethyl alcohol content.
The operation of a potentiometer and the manipulation of thevarious controls involve a certain amount of skill on the part ofthe worker, as against the simple and mechanical titration in thepresence of organic indicators. Because, in the case of darkcolored materials, no simpler method is available, the methodcalls for skilled work in order to obtain high accuracy. Theauthors have sought an alternative but simpler method withoutsacrificing much accuracy, for routine technical analysis. Theobject of the alcoholic titration procedure is to prevent soap, theproduct of the reaction, from undergoing hydrolysis and givingrise to a premature end point. The titration could conceivablybe carried out in aqueous medium, provided the hydrolyzingtendency of the product is either eliminated or kept at a minimum.The latter has been achieved in the authors' procedure by emulsifying the sample and titrating the dilute unstabilized emulsionwith aqueous alkali. (The justification and discussion of this
V. Rosin solutionVI.. Double-boiled oil, free fany aeddsO. Indicator end point
2 4 (, 6
BENZOIC, OLEIC, AND STEARIC ACIDS. Ten millilitersof the fatty acid solution in benzene--ethyl alcohol mixture were pipetted out into a 100-ml. beaker and 10 ml.of neutral alcohol were added. The mixture was thentitrated potentiometrically with alcoholic potassium hydroxide (0.1 N). The end point was exceeded by a fewmilliliters. Phenolphthalein (5 drops) added to the solution gave the indicator end point. The data obtainedare graphically shown in Figure 1 (curves I, II, and III).The potentiometric end points were observed at 12.35,12.35, and 12.85 ml. for the fatty acids given, in theabove order. The indicator end points were at 12.3, 12.4.and 12.8 mI., respectively.
PEANUT OIL AND DOUBLE-BOILED LINSEED OIL. Fivegrams of the sample were dissolved in 25 ml. of thebenzene--ethyl alcohol mixture and the solution wastitrated potentiometrically with standard alcoholicpotassium hydroxide (0.102 N). The indicator endpoints were also observed. The results are embodiedin curves IV and VI (Figure 1). The inflection pointfor the former was at 9.55 ml. and for the latter (10grams of sample) at 11.35 ml. The acid numbers calculated were 10.93 and 6.47, respectively.
ROSIN. The acid number of rosin was determinedby the standard method, as 151. Three grams of thesample were dissolved in 100 ml. of neutral and redistilled turpentine (specific gravity 0.865), and 10 gramsof this solution were mixed with 10 ml. of neutralalcohol and titrated potentiometrically with stand-
REAGENTS
The reagents for the present work were prepared essentially asspecified in the official method. Ethyl alcohol, for the solutionof potassium hydroxide, was of extra pure quality and was neutralized before using. Hydrochloric acid, in 0.1 N concentration,was made from British Pharmacopoeia reagent quality and wasstandardized against Merck recrystallized sodium carbonate.Turpentine and benzene of good reagent quality were available,according to the Iridian Stores Department Specifications. Thephenolphthalein indicator was made in 1% solution in 95% alcohol. The samples examined were: (1) benzoic acid, (2) oleicacid, (3) stearic acid, (4) peanut oil, (5) double-boiled linseed oil •.and (6) rosin.
procedure will appear as a note elsewhere.) This work has beenextended to dark colored materials with satisfactory results.The aqueous titrations, in many cases, have been followed potentiometrically and by the standard colorimetric. method to providecomparative results.
EQUIPMENT
A potentiometer of Cambridge Unicam Instruments, Ltd.,calibrated to the e.m.f', range 0 to 1100 mv., was used, equippedwith a dip-type calomel electrode, quinhydrone electrode beingthe other half element. The standardization was done at 25 0 C.with a standard cadmium cell.
PROCEDURE
Except for slight, specified variations, the. official procedurewas followed.
The standard solutions in 0.1 N benzoic, oleic, and stearicacids were prepared by dissolving the requisite quantity in 250ml. of a mixture of benzene and ethyl alcohol. Solutions of similar strength were prepared using redistilled neutral turpentinealone as the solvent. All titrations were carried out at room temperature (25 0 C.).
Titration Curves (Standard Method). To compare the resultsby the standard method with those based on theproposed method, the acid numbers of the samples weredetermined by the official method. The titrations werefollowed potentiometrically to observe the deviation ofthe indicator end points.
18
I
]I
]I[
Standard Titration Curves of Sarnples inDeterrnfnat.lon of Acid Nurnber
Ml. I<OH (ALtOHOUC)-
Figure 1.
Benzoic acidOleic acidStearic acidPeanut oil, free fatty acids
20
I.II.
III.IV.
1315

1316 ANALYTICAL CHEMISTRY
were at 6.75 and 6.5 ml., respectively.
FREE FATTY ACIDS O~'
PEANUT OIL, DOUBI,E-BOILED
OIL, AND ROSIN SOLUTION.
The emulsions of the abovesamples for titration, preparedaccording to the procedureoutlined above" were clear.The data obtained on thesesamples are shown as the "asreceived" readings in Table 1.The titrations were notfollowed potentiometrically.The saponification numbers asdetermined by the official procedure were 190 and 193, respectively, for peanut oil anddouble-boiled linseed oil.These values were used in thedetermination of the internalphase in the emulsions. Theacid number of rosin solutionwas 5.05.
-8.19-4.56-3.59-2.65
-1.40
-0.73
-13.7-5.95-3.11-4.57-2.74-1.38
6.32
10.85
5.3
6,5
Acid No. of Turpentine Solution 5.05
-3.96-3.36-2.97-0.79-0.39-2.18-1.00
Saponification No. 193
5.1 5.945.15 6.145.4 6.185.35 6.24
4.704
4.516 4.0 3.9 4.854.025 3.5 4.884.984 4,35 4.904,.704
3'.'6'54.2 5.01
3.956 3.55 5.034.094 3.6 4.943.864 3.45 5,0
3,36
Acid No. of Rosin 151.
280
230
0.168
0.1461
7.5
0.9
Double-Boiled Free Fatty Acids.. Acid No. 6.47.
18.6 0.172 280· 4.816 5,313.1 0.168 280 4,70410.9 0,175 280 4,907.9 0.172 280 4.816
0.8
11.5
16.214.213.112.5
Table I. Errrulslori Titration of Fatty Acids with Aqueous PotassiuItl Hydroxide
Color Index Total(Lovibond) Vol.
'/a-Inch Oil in Emulsion, Oil Acid No,Cell Emulsion, Titrated, Titrated, Aqueous KOH Used, Ml. (Based on Indi- %
Y R G./IO Ml. Ml. G. Pot. end pt. Ind. end pt. cater End Pt.) Deviation
Peanut Oil Free Fatty Acids. Acid No. 10.93 (Standard Method), Saponification No. 190
11.6 7.9 0.1750 180" 3,156 5.65 5.5 9.7810.2 6.3 0,1750 280· 4.91 9.1 9.0 10.289.1 5.4 0.1607 280 4.501 8.5 10.596.8 4.2 0.175 230 4.033 7.5 10.433.5 3.0 0.1607 230 3.697 7.0 10.632.0 1.0 0.1607 230 3.697 7.1 10.78
SampleNo.
12345
Asreceiveda Emulsions not clear.
1234.567
Asreceived
Rosin Fatty Acids in Turpentine Solution.
1 9.5 6.7 0.172 2802 6.5 4.9 0.175 2303 5.4 4.6 0.178 2804 2.4 2.8 0.168 2805 0.9 1.3 0.172 2306 0.5 0.8 0.178 23(l7 0,1 0,3 0.168 230
48
20
mV-40
lIls
APPLICATION OF METHOD TO DARK COLORED MATERIALS
As samples of varying shades of darkness were not readilyavailable, a procedure was adopted for discoloring the samplesartificially to varying shades. .
An oil-soluble dye (Oil Brown D: A. J.) was prepared by diazotizing I-naphthylamine and coupling with l-naphthol. The dyewas found to be completely insoluble in water and soluble in turpentine and oils, staining them reddish brown. Five hundredmilligrams of the dye were dissolved in 50 ml. of the original
ML KOH (Ro.)-
ard potassium hydroxide. The end point was observed at 9.0ml., with which the indicator end point also coincided. Thecalculated acid number was 5.05. The results are embodied incurve V (Figure 1). .
Titration Curves (Emulsion Method). OLEIC AND STEARICACIDS. Five grams of the turpentine solution of the fatty acidwere mixed with 5 ml. of neutral alcohol and the mixture wastitrated with standard alcoholic potassium hydroxide. The endpoints were observed at 7.2 and 6.9 m!' for oleic and stearic acids,respectively, the calculated acid number being 8.08 and 7.73.Ten milliliters of the same turpentine solution were mixed with250 ml. of distilled water in a 500-ml. Erlen-meyer flask and refluxed for 30 minutes undera water condenser. The contents were cooledand transferred to a separating funnel and, afterthe upper layer had separated, 100 ml. of thelower emulsion were withdrawn into a measuring cylinder. The turpentine layer was againmixed with 100 ml. of distilled water and thenrefluxed for 30 minutes. After cooling, as before, 100 ml. of the lower emulsion were withdrawn and added to the initial portion. Theoperation was repeated till 300 ml. of theemulsion were collected; then 10 ml. were immediately pipetted out from the middle portion,mixed with 10 ml. of alcoholic potassium hydroxide, and refluxed in a 100-ml. flask fittedwith an air condenser. .
This procedure was adopted for the estimation of the internal phase of the emulsion,whose acid number was known. After 10 ml.had been removed to serve as a blank, the remaining volume of the emulsion was rapidlytitrated potentiometrically with standardaqueous potassium hydroxide. The phenolphthalein end point was clearly observed. Theblank emulsion was found to be stable for 30minutes. The weight of the internal phase(turpentine solution of the fatty acid) in 10 ml.of the emulsion was estimated at 0.0172 gram,after back-titration of the excess potassiumhydroxide against standard acid. The weightof the turpentine solution titrated as emulsionwas, hence, 4.816 grams, in either case.
The data obtained are graphically shown ascarves I and II in Figure 2. The potentiometric end points were at 6.85 and 6.55 ml., respectively, for oleic and stearic acids, in turpentine solutions. The calculated acid numberswere 7.98 and 7.63, The indicator end points
Figure 2. Titration Curves of EItlulsions of SaItlples in DeterItlinationof Acid NuItlber
I. Oleic acid IVA, IVB. Rosin solutionII. Stearic acid V. Double-boiled oi\.
lIlA, IIIB. Peanut oil O. Indicator end point

VOL U M E 2 3, N O. 9, SE PTE M B E R 1 9 5 1
sample and six differently stained specimens were prepared byadding from 0.1 to 1.5 ml. of the stock sample to 50 ml. of thespecimen. The same procedure was adopted in the case of theother two samples. The discoloration so obtained was expressedin Lovibond tintometer units (in a '/a-inch cell). These valuesare given in column 2 of Table 1. The procedures for the preparation of emulsions of these samples have been given.
With a few exceptions (indicated in the table), emulsions wereclear and the indicator end points were easily observed duringthe aqueous titrations. In the case of the few rather stainedemulsions, difficulty in observing the indicator end point gaverise to a slightly higher deviation from the standard results. Thedata obtained are shown in Figure 2, curves IlIA, lIIB, IVA,IVB, and V. Only five specimens were titrated potentiometrically and the others with indicator only.
The aqueous titration curves show a striking similarity to thestandard curves of Figure 1. The indicator end points in theaqueous titration occur before the zero potential of the electrodecombination is reached and are consistently lower than thepotentiometric end points. In the aqueous titration curves foroleic and stearic acids, the potentiometric end points closelycorrespond to the acid numbers of the turpentine solution of thefatty acids, based on the standard method (7.98 and 7.63, 8.08and 7.73). In the other samples, except for extremely darkspecimens, the per cent deviation averages 2 to 3%. The factthat aqueous titration gives consistently lower results suggeststhat the hydrolysis of the soap is initiated only during the laststages of the titration.
CONCLUSIONS
The method outlined above hall certain limitations. It islikely to give low results in the case of oils containing steam-vola-
1317
tile fatty acids like coconut oil, palm kernel oil, and butter fat,and in the case of highly rancid oils which would have undergonebreakdown into volatile constituents. The method is not suitable for "materials having low acid numbers, and it also suffers bybeing time-consuming.' The refluxing with water would havebeen expected to give rise to some hydrolysis of the neutral fat,with a corresponding increase in the acid number, but the resultsdo not warrant such fears, as the acid number by the emulsionmethod does not show higher results.
The method dispenses with costly solvents like alcohol andether, gives a definite end point with phenolphthalein, and isparticularly suitable for dark colored oils and resins.
The present paper serves to indicate the possibilities of themethod described, using emulsions instead of solutions, and further work may help in making it simpler and more serviceable.Finally, while the present work tries to examine the possibilitiesof a new method, it also indirectly draws attention to one of themany peculiarities of emulsifying agents adsorbed at the emulsioninterface.
LITERATURE CITED
(1) Caldwell, B. P., and Mattiello, .T., IND. ENG. CHEM., ANAL. Eo ..4, 52 (1932).
(2) Demarest•.T. Y., and Rieman, Wm., III, Ibid., 3, 15 (1931).(3) Englis, D. T., and Reinschreiber, .J. E., ANH. CHEM., 21, 602
(1949).(4) Koettstorfer, .T., Z. anal. Chem., 18, 199,431 (1879).(5) Snell, C. A., J. Am. Oil Chemists Soc., 25, 103 (1948).
RECEIV>'O October 5, 19.50.
Properties of Interfacial FilmsG. NARSIMHAN AND S. A. SALETORE
Laxrniruirayan. Institute of Technology, Nugpur University, Nagpur, India
WHILE attempting to evolve a simple colorimetric methodfor the acid number determination of dark-colored oils and
resins, as an alternative method to the usual electrometric procedure, it was observed that an unstabilized dilute emulsion of theoil or that of a solution of the resin in a nonpolar solvent could besatisfactorily titrated with aqueous alkali to almost the equivalent end point (9). This observation led the authors to supposethat the product of the reaction, the soap, which was formed atthe interface, could remain in an un hydrolyzed condition till almost all the free fatty acid has been reacted, thus preventing apremature end point. Although a behavior does not appear tohave been specifically mentioned by previous workers, an examination of the published data and conclusions lends support tothis idea.
Bancroft (1) has suggested that the interfacial film in suchcases should be considered as a third phase, separating the oil andthe water phases. Ramsden (10) has shown the existence ofmembranes separated from liquid surface. According to Ramsden, before adsorption becomes too great, every saponin moleculecoming into the surface region is propelled to the actual interfaceand, although still soluble, is kept there permanently. The workof Briggs (2) on benzene-water-sodium oleate emulsions arrivesat an optimum concentration of the soap in the interfaeial films,influencing the stability of the system. Roberts (11), in histheory of emulsions, states that molecules are more readily adsorbed than ions and that the primary adsorption layer is monomolecular and remains undisturbed in streaming potential andcataphoresis measurements, whereas the adjacent diffuse layerof ions and molecules is mobile. Griffin (,.0, who worked on emulsions using fatty acid soaps as emulsifying agents, mentions thefact that such emulsions are stable where the soap is sufficient to
form a monomolecular layer. When there is excess soap, the excess remains dissolved in water.
The following conclusions can be drawn from the work of theauthors mentioned (1, 2, 4, 10, 11): The interfacial film observed by Ramsden (10) is insoluble in water, unlike the saponinin solution; the soap film observed by Briggs (2) is resistant, indicating a molecular structure with very little tendency to hydrolyze. Confirmation of this viewpoint is again found in thetheory of Roberts (11), according to which the interfacial filmconsists of stable unhydrolyzed molecules. Harkins and Beeman (6) have reported an instance of an interfacial film hydrolyzing; however, this was for an emulsion having a high concentration of the emulsifying agent and it was examined after a lapse of3 to 4 years. Hence it can be safely assumed that soap presentas a monomolecular layer at the interface shows little tendencyto hydrolyze, unlike soap present in the aqueous phase.
It is agreed by most of the physical chemists (4, 5), who haveworked on the nature and properties of interfacial films, that theadsorbed layer at the interface is monomolecular. The authorshave observed that in order that all the fatty acid molecules present in the oil, dispersed as an emulsion in water, should reactwith the hydroxyl ions, it is essential that either the degree of dispersion be sufficiently fine so that the interface is freely coveredby oriented fatty acid molecules, or in the case of a coarse dispersion where there exists a compressed layer of the fatty acid atthe interface, the chemical nature allow the reactant to diffusethrough the interfacial layer and bring the reaction to completion. The latter property of the interfacial film is of doubtfulsignificance, because the rate of reaction will be infinitely slowerthan at an equivalent area of free interfa~e (3). Hence the former condition should prevail if the aqueous titration of the fatty
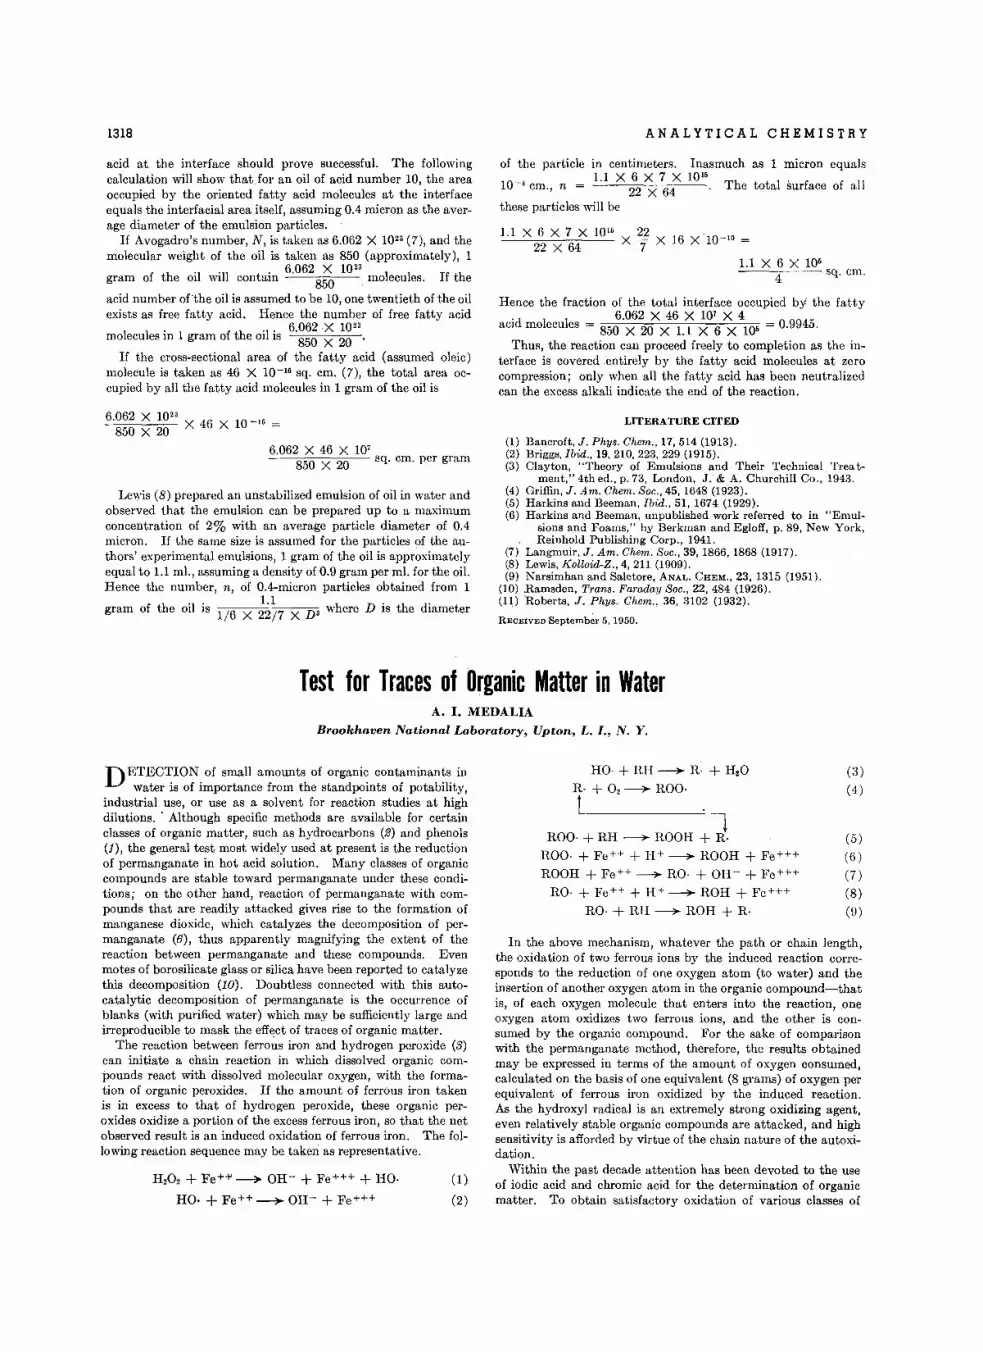
1318
acid at the interface should prove successful. The followingcalculation will show thatfor an oil of acid number 10, the areaoccupied by the oriented fatty acid molecules at the interfaceequals the interfacial area itself, assuming 0.4 micron as the average diameter of the emulsion particles.
If Avogadro's number, N, is taken as 6.062 X 10²³ (7), and themolecular weight of the oil is taken as 850 (approximately), 1
6062 X 1023
gram of the oil will contain' 850 molecules. If the
acid number ofthe oil is assumed to be 10, one twentieth of the oilexists as free fatty acid. Hence the number of free fatty acid
h '1' 6.062 X 10²³
molecules in 1 gram of t e 01 IS 850 X 20 .
If the cross-sectional area of the fatty acid (assumed oleic)molecule is taken as 46 X 10-16 sq. em. (7), the total area occupied by all the fatty acid molecules in 1 gram of the oil is
6.062 X 1023 X 46 X 10 -16 =850 X 20
6.062 X 46 X 107
850 X 20 sq. cm. per gram
Lewis (8) prepared an unstabilized emulsion of oil in water andobserved that the emulsion can be prepared up to a maximumconcentration of 2% with an average particle diameter of 0.4micron. If the same size is assumed for the particles of the authors' experimental emulsions, 1 gram of the oil is approximatelyequal to 1.1 mI., assuming a density of 0.9 gram per ml. for the oil.Hence the number, n, of O.4-micron particles obtained from 1
1.1 h D' h digram of the oil is 1/6 X 22/7 X D3 were IS t e iameter
ANALYTICAL CHEMISTRY
of the particle in centimeters. Inasmuch as 1 micron equals1.1 X 6 X 7 X 1016
10-' cm., n = 22 X 64 The total surface of all
these particles will be
1.1 X 6 X 7 X 1016 22 16 -10-10 =22X64 X 7 X . X
1.1 X 6 X 106
4 sq. em.
Hence the fraction of the total interface occupied by the fatty. . 6.062 X 46 X 107 X 4
acid molecules = 850 X 20 X 1.1 X 6 X 106 = 0.9945.
Thus, the reaction can proceed freely to completion as the interface is covered .entirely by the fatty acid molecules at zerocompression; only when all the fatty acid has been neutralizedcan the excess alkali indicate the end of the reaction.
LITERATURE CITED
(l) Bancroft, J. Phys. Chem., 17,514 (1913).(2) Briggs, Ibid., 19,210,223,229 (1915).(3) Clayton, "Theory of Emulsions and Their Technical Trea t-
ment," 4th ed., p. 73, London, J. & A. Churchill Co., 1943.(4) Griffin, J. Am. Chem, Soc., 45, 1648 (1923).(5) Harkins and Beeman, I1Jid., 51, 1674 (1929).(6) Harkins and Beeman, unpublished work referred to in "Emul
sions and Foams," by Berkman and Egloff, p. 89, New York,Reinhold Publishing Corp., 1941.
(7) Langmuir, J. Am. Chem, Soc., 39,1866,1868 (1917).(8) Lewis, KoZloid-Z., 4,211 (1909).(9) Narsimhan and Saletore, ANAL. CHEM., 23, 1315 (1951).
(10) Ramsden, Trans. Faraday Soc., 22, 484 (1926).(11) Roberts, J. Phys. Chem., 36, 3102 (1932).
RECEIVED September 5.1950.
Test for Traces of Organic Matter in WaterA. I. MEDALIA
Brookhaven National Laboratory, Upton, L. 1., N. Y.
In the above mechanism, whatever the path or chain length,the oxidation of two ferrous ions by the induced reaction corresponds to the reduction of one oxygen atom (to water) and theinsertion of another oxygen atom in the organic compound-thatis, of each oxygen molecule that enters into the reaction, oneoxygen atom oxidizes two ferrous ions, and the other is consumed by the organic compound. For the sake of comparisonwith the permanganate method, therefore, the results obtainedmay be expressed in terms of the amount of oxygen consumed,calculated on the basis of one equivalent (8 grams) of oxygen perequivalent of ferrous iron oxidized by the induced reaction.As the hydroxyl radical is an extremely strong oxidizing agent,even relatively stable organic compounds are attacked, and highsensitivity is afforded by virtue of the chain nature of the autoxidation.
Within the past decade attention has been devoted to the useof iodic acid and chromic acid for the determination of organicmatter. To obtain satisfactory oxidation of various classes of
DETECTION of small amounts of organic contaminants inwater is of importance from the standpoints of potability,
industrial use, or use as a solvent for reaction studies at highdilutions." Although specific methods are available for certainclasses of organic matter, such as hydrocarbons (2) and phenols(1), the general test most widely used at present is the reductionof perrnanganate in hot acid solution. Many classes of organiccompounds are stable toward permanganate under these conditions; on the other hand, reaction of permanganate with compounds that are readily attacked gives rise to the formation ofmanganese dioxide, which catalyzes the decomposition of permanganate (6), thus apparently magnifying the extent of thereaction between permanganate and these compounds. Evenmotes of borosilicate glass or silica have been reported to catalyzethis decomposition (10). Doubtless connected with this autocatalytic decomposition of permanganate is the occurrence ofblanks (with purified water) which may be sufficiently large andirreproducible to mask the effect of traces of organic matter.
The reaction between ferrous iron and hydrogen peroxide (3)can initiate a chain reaction in which dissolved organic compounds react with dissolved molecular oxygen, with the formation of organic peroxides. If the amount of ferrous iron takenis in excess to that of hydrogen peroxide, these organic peroxides oxidize a portion of the excess ferrous iron, so that the netobserved result is an induced oxidation of ferrous iron. The following reaction sequence may be taken as representative.
H 202 + Fe++'~ OR- + Fe+++ + RO· (1)
RO· + Fe++ ---'--+ OH- + Fe+++ (2)
RO- + RH _ R + H20
R· +02_ROO·
t---------'--tROO· + RH - ROOH + R·
ROO· + Fe " " + H+ _ ROOH + Fe+++
ROOH + Fe " " _ RO· + OH- + Fe+++
RO· + Fe " " + I-P _ ROH + Fe+++
RO· + RH _ ROH + R·
(3)
(4)
(5)
(6 )
(7)
(8)
(n)
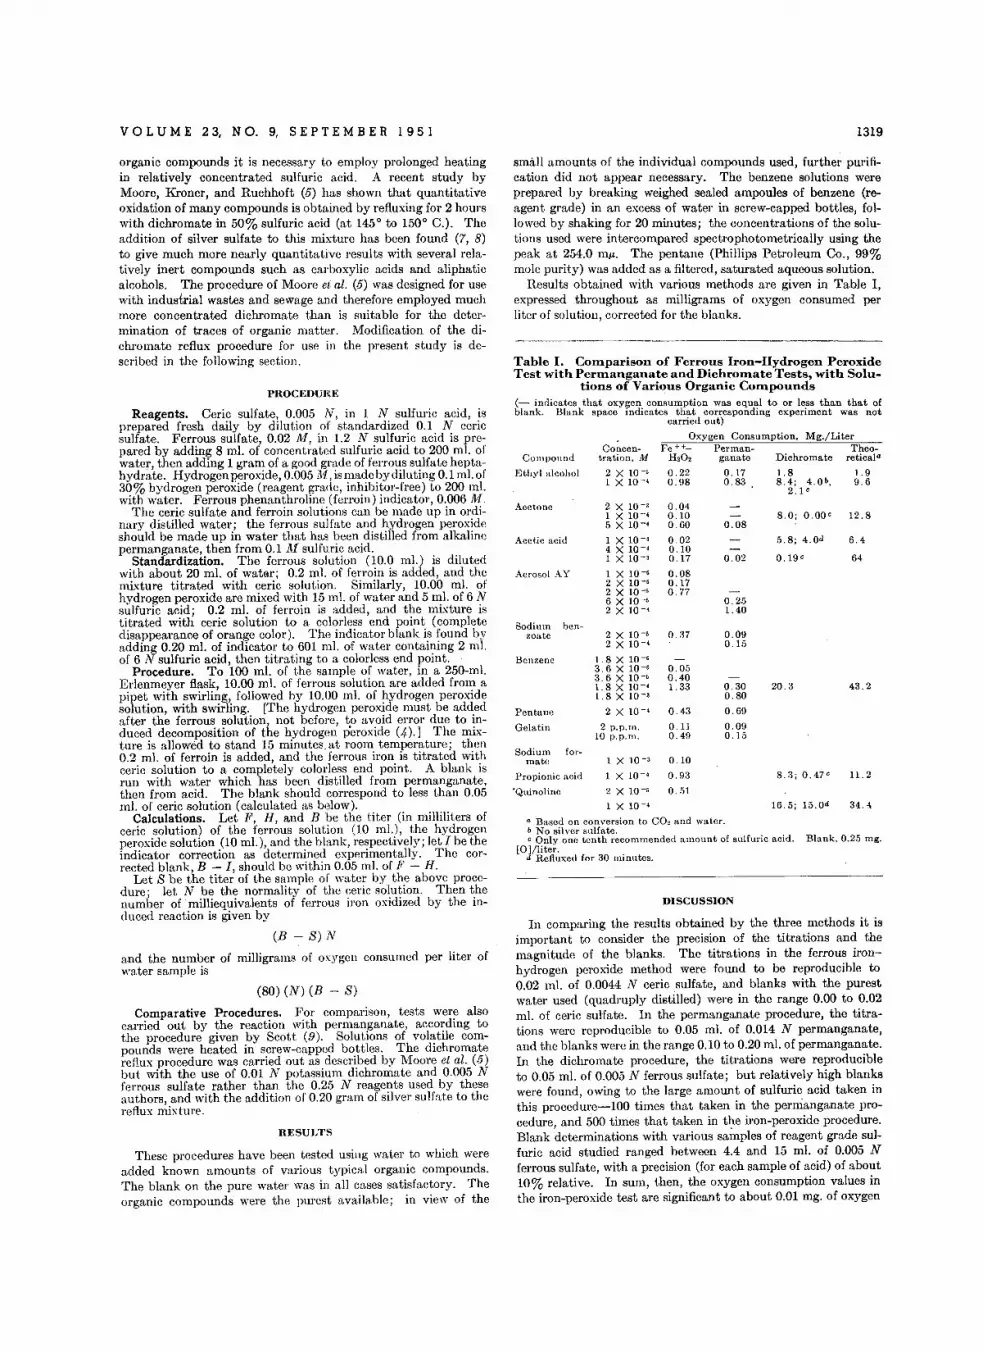
VOL U M E 23, NO.9, S E PTE M B E R 1951 1319
It Based on conversion to C02 and water.b No silver sulfate.c Only one tenth recommended amount of sulfuric acid. Blank, 0.25 mg.
[OJ/liter.d Refluxed for 30 minutes.
Table I. Comparison of Ferrous Iron-Hydrogen PeroxideTest with Permanganate and Dichromate Tests, with Solu
tions of Various Organic Compounds(- indicates that oxygen consumption was equal to or less than that ofblank. Blank space indicates that corresponding experiment was not
carried out)
Oxygen Consumption, Mg./Liter
small amounts of the individual compounds used, further purification did not appear necessary. The benzene solutions wereprepared by breaking weighed sealed ampoules of benzene (reagent grade) in an excess of water in screw-capped bottles, followed by shaking for 20 minutes; the concentrations of the solutions used were intercompared spectrophotometrically using thepeak at 254.0 me. The pentane (Phillips Petroleum Co., 99%mole purity) was added as a filtered, saturated aqueous solution.
Results obtained with various methods are given in Table I,expressed throughout as milligrams of oxygen consumed perliter of solution, corrected for the blanks.
DISCUSSION
In comparing the results obtained by the three methods it isimportant to consider the precision of the titrations and themagnitude of the blanks. The titrations in the ferrous ironhydrogen peroxide method were found to be reproducible to0.02 ml, of 0.0044 N eerie sulfate, and blanks with the purestwater used (quadruply distilled) were in the range 0.00 to 0.02ml, of eerie sulfate. In the permanganate procedure, the titrations were reproducible to 0.05 ml, of 0.014 N permanganate,and the blanks were in the range 0.10 to 0.20 ml. of permanganate.In the dichromate procedure, the titrations were reproducibleto 0.05 ml. of 0.005 N ferrous sulfate; but relatively high blankswere found, owing to the large amount of sulfuric acid taken inthis proeedure-IOO times that taken in the perrnanganate procedure and 500 times that taken in the iron-peroxide procedure.Blank determinations with various samples of reagent grade sulfuric acid studied ranged between 4.4 and 15 rnl, of 0.005 Nferrous sulfate, with a precision (for each sample of acid) of about10% relative. In sum, then, the oxygen consumption values inthe iron-peroxide test are significant to about 0.01 mg. of oxygen
1.99.6
34.4
11. 2
43.2
1.88.4; 4.0 b•
2.1<
8.0; 0.00' 12.8
5.8; 4.00 6.4
0.19' 64
8.3; 0.47'
20.3
16.5; 15.0d
0.090.15
0.2'31.40
0.02
0.08
0.300.80
0.69
0.090.15
0.170.83
0.43
0.110.49
0.10
0.93O..51
0.37
0.0.50.401. 33
0.040.100.60
0.020.100.17
0.080.170.77
0.220.98
Fe + +- Perman- Theo-H202 ganate Dichromate retical>
2 X 10-'1 X 10-'5 X 10-'
1 X 10-'4 X 10-'1 X 10-'
1 X 10-'2 X 10⁻⁶
2 X 10⁻⁵
6 X 10-'2 X 10-'
1 X 10-'
1 X 10-'
2 X 10⁻⁵
1 X 10-'
Concentration, M
2 X 10-'1 X 10-'
Compound
Aerosol AY
Acetone
Sodium ben-zoate 2 X 10-'
2 X 10-'
Benzene 1.8 X 10⁻⁶
3.6 X 10-'3.6 X 10-'1. 8 X 10-'1.8 X 10-'
Pentane 2 X 10⁻⁴
Gelatin 2 p.p.rn.10 p.p.rn.
Acetic acid
Ethyl 'Lleohol
Sodium formate
Propionic acid
·Quinolinc
RESULTS
These procedures have been tested using water to which wereadded known amounts of various typical organic compounds.The blank on the pure water was in all cases satisfactory. Theorganic compounds were the purest available; in view of the
(80) (N) (B - S)
Comparative Procedures. For comparison, tests were alsocarried out by the reaction with permanganate, according tothe procedure given by Scott (9). Solutions of volatile compounds were heated in screw-capped bottles. The dichromatereflux procedure was carried out as described by Moore et al. (5)but with the use of 0.01 N potassium dichromate and 0.005 Nferrous sulfate rather than the 0.25 N reagents used by theseauthors, and with the addition of 0.20 gram of silver sulfate to thereflux mixture.
(B - S) N
and the number of milligrams of oxygen consumed per liter ofwater sample is
PROCEDURE
Reagents. Ceric sulfate, 0.005 N, in 1 N sulfuric acid, isprepared fresh daily by dilution of standardized 0.1 N eeriesulfate. Ferrous sulfate, 0.02 M, in 1.2 N sulfuric acid is prepared by adding 8 m!. of concentrated sulfuric acid to 200 ml. ofwater, then adding 1 gram of a good grade of ferrous sulfate heptahydrate. Hydrogen peroxide, 0.005 M, ismade bydiluting 0.1 ml, of30% hydrogen peroxide (reagent grade, inhibitor-free) to 200 ml.with water. Ferrous phenanthroline (ferroin) indicator, 0.006 M.
The eerie sulfate and ferroin solutions can be made up in ordinary distilled water; the ferrous sulfate and hydrogen peroxideshould be made up in water that has been distilled from alkalinepermanganate, then from 0.1 M sulfuric acid.
Standardization. The ferrous solution (10.0 ml.) is dilutedwith about 20 ml. of water: 0.2 ml. of ferroin is added, and themixture titrated with eerie solution. Similarly, 10.00 ml. ofhydrogen peroxide are mixed with 15 ml. of water and 5 ml. of 6 Nsulfuric acid; 0.2 ml, of ferroin is added, and the mixture istitrated with eerie solution to a colorless end point (completedisappearance of orange color). The indicator blank is found byadding 0.20 ml, of indicator to 601 ml. of water containing 2 ml.of 6 N sulfuric acid, then titrating to a colorless end point. .
Procedure. To 100 ml, of the sample of water, in a 250-ml.Erlenmeyer flask, 10.00 ml, of ferrous solution are added from apipet with swirling, followed by 10.00 ml. of hydrogen peroxidesolution, with swirling. [The hydrogen peroxide must be addedafter the ferrous solution, not before, to avoid error due to induced decomposition of the hydrogen peroxide (4·).] The mixture is allowed to stand 15 minutes. at room temperature; then0.2 ml. of ferroin is added, and the ferrous iron is titrated witheerie solution to a completely colorless end point. A blank isrun with water which has been distilled from permanganate,then from acid. The blank should correspond to less than 0.05ml, of eerie solution (calculated as below).
Calculations. Let F, H, and B be the titer (in milliliters ofeerie solution) of the ferrous solution (10 ml.), the hydrogenperoxide solution (10 ml.), and the blank, respectively; let I be theindicator correction as determined experimentally. The corrected blank, B - I, should be within 0.05 ml. of F - H.
Let S be the titer of the sample of water by the above procedure' let N be the normality of the eerie solution. Then thenumber ofmilliequivalents of ferrous iron oxidized by the induced reaction is given by
organic compounds it is necessary to employ prolonged heatingin relatively concentrated sulfuric acid. A recent study byMoore, Kroner, and Ruchhoft (5) has shown that quantitativeoxidation of many compounds is obtained by refluxing for 2 hourswith dichromate in 50% sulfuric acid (at 145 0 to 150 0 C.). Theaddition of silver sulfate to this mixture has been found (7, 8)to give much more nearly quantitative results with several relatively inert compounds such as carboxylic acids and aliphaticalcohols. The procedure of Moore et al. (5) was designed for usewith industrial wastes and sewage and therefore employed muchmore concentrated dichromate than is suitable for the determination of traces of organic matter. Modification of the dichromate reflux procedure for use ill the present study is described in the following section.
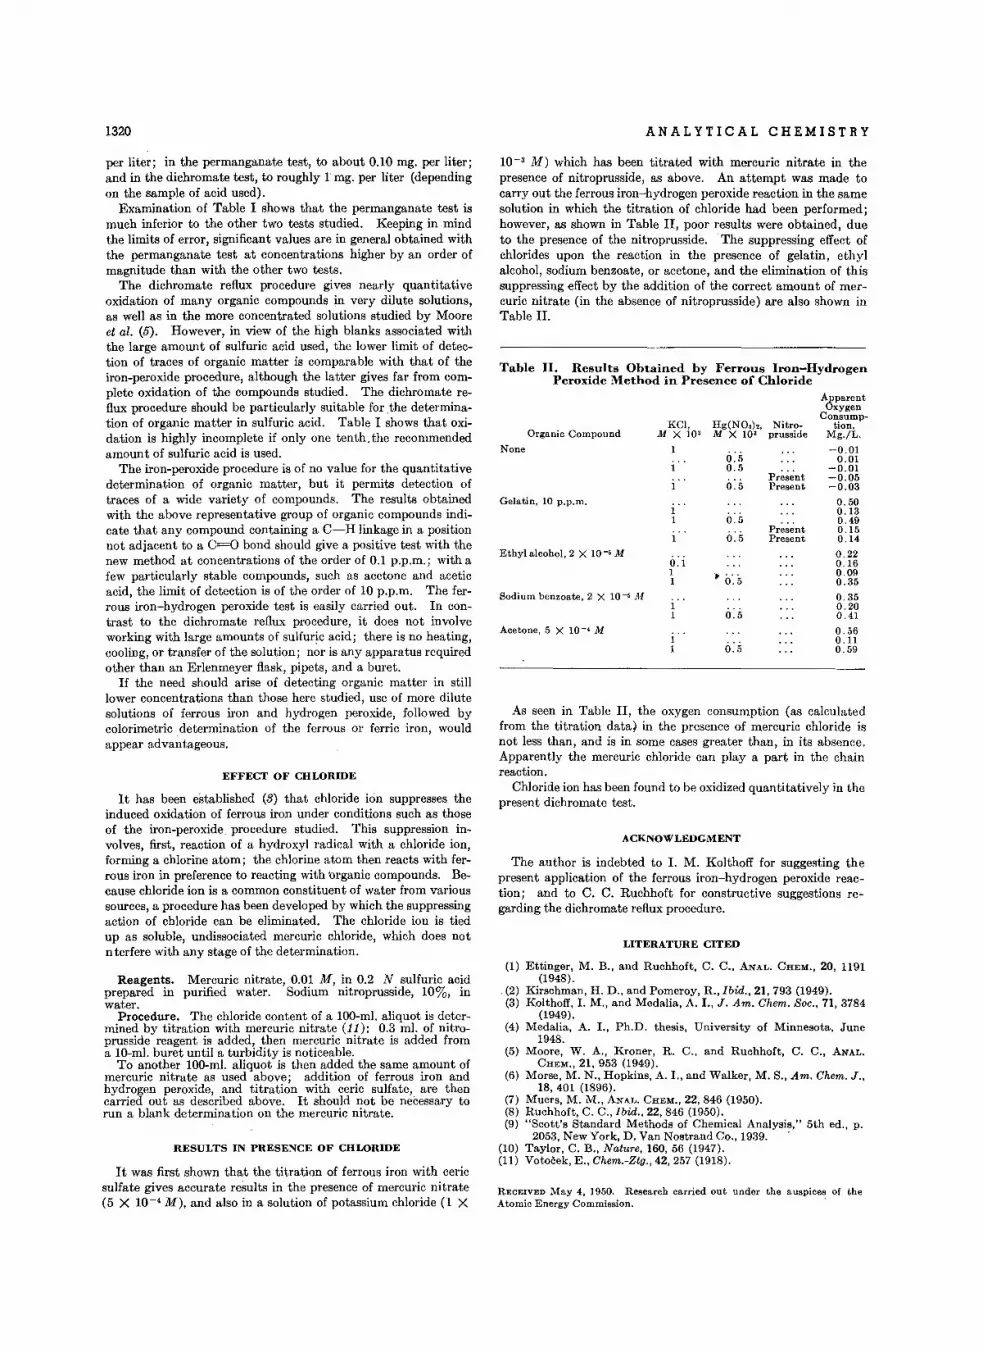
1320 ANALYTICAL CHEMISTRY
ACKNOWLEDGMENT
RECEIVED May 4, 1950. Research carried out under the auspices of theAtomic Energy Commission. .
Table II. Results Obtained by Ferrous Iron-HydrogenPeroxide Method in Presence of Chloride
The author is indebted to I. M. Kolthoff for suggesting thepresent application of the ferrous iron-hydrogen peroxide reaction; and to C. C. Ruchhoft for constructive suggestions regarding the dichromate reflux procedure.
AO'parentxygen
KCI, Hg(NO,)" Nitro-Consump-
tion,M X 10' M X 10' pruaside Mg./L.
1 0:5 -0.010.01
1 0.5Pr~~~nt
-0.01
0:5-0.05
1 Present -0.03
0.500.13
0.5Pr~~~nt
0.490.15
1 0.5 Present 0.14
0.220.1 0.161 .~ ... 0.091 0.5 0.35
0.350.20
0.5 0.41
0.560.11
0.5 0.59
Acetone, 5 X 10 -, M
Sodium benzoate, 2 X 10 -, M
Gelatin, 10 p.p.m.
Ethyl alcohol, 2 X 10 -s M
Organic Compound
None
As seen in Table II, the oxygen consumption (as calculatedfrom the titration datal in the presence of mercuric chloride isnot less than, and is in some cases greater than, in its absence.Apparently the mercuric chloride can play a part in the chainreaction.
Chloride ion has been found to be oxidized quantitatively in thepresent dichromate test.
10-3 M) which has been titrated with mercuric nitrate in thepresence of nitroprusside, as above. An attempt was made tocarry out the ferrous iron-hydrogen peroxide reaction in the samesolution in which the titration of chloride had been performed;however, as shown in Table II, poor results were obtained, dueto the presence of the nitroprusside. .The suppressing effect ofchlorides upon the reaction in the presence of gelatin, ethylalcohol, sodium benzoate, or acetone, and the elimination of thissuppressing effect by the addition of the correct amount of mercuric nitrate (in the absence of nitroprusside) are also shown inTable II.
LITERATURE CITED
(1) Ettinger, M. B., and Ruchhoft, C. C., ANAL. CHEM., 20, 1191(1948).
. (2) Kirschman, H. D., and Pomeroy, R., ius; 21, 793 (1949).(3) Kolthoff,1. M., and Medalia, A. 1., J. Am. Chem. Soc., 71, 3784
(1949).(4) Medalia, A. 1., Ph.D. thesis, University of Minnesota, June
1948.(5) Moore, W. A., Kroner, R. C., and Ruchhoft, C. C., ANAL.
CHEM., 21, 953 (1949).(6) Morse, M. N., Hopkins, A. 1., and Walker, M. S., Am. Chem, J.,
18, 401 (1896).(7) Muers, M. M., ANAL. CHEM., 22, 846 (1950).(8) Ruchhof't, C. C., Ibid., 22, 846 (1950).(9) "Scott's Standard Methods of Chemical Analysis," 5th ed., p,
2053, New York, D. Van Nostrand Co., 1939. .,(10) Taylor, C. B., Nature, 160, 56 (1947).(11) Votocek, E., Chem.-Ztg., 42, 257 (1918).
Reagents. Mercuric nitrate, 0.01 M, in 0.2 N sulfuric acidprepared in purified water. Sodium nitroprusside, 10%, inwater.
Procedure. The chloride content of a 100-m!. aliquot is determined by titration with mercuric nitrate (11): 0.3 ml. of nitroprusside reagent is added, then mercuric nitrate is added froma lO-m!. buret until a turbidity is noticeable.
To another 10o-m!. aliquot is then added the same amount ofmercuric nitrate as used above; addition of ferrous iron andhydrogen peroxide, and titration with eerie sulfate, are thencarried out as described above. It should not be necessary torun a blank determination on the mercuric nitrate.
EFFECT OF CHLORIDE
It has been established (3) that chloride ion suppresses theinduced oxidation of ferrous iron under conditions such as thoseof the iron-peroxide procedure studied. This suppression involves, first, reaction of a hydroxyl radical with a chloride ion,forming a chlorine atom; the chlorine atom then reacts with ferrous iron in preference to reacting with 'organic compounds. Because chloride ion is a common constituent of water from varioussources, a procedure has been developed by which the suppressingaction of chloride can be eliminated. The chloride ion is tiedup as soluble, undissociated mercuric chloride, which does notn terfere with any stage of the determination.
per liter; in the permanganate test, to about 0.10 mg. per liter;and in the dichromate test, to roughly 1 mg. per liter (dependingon the sample of acid used).
Examination of Table I shows that the permanganate test ismuch inferior to the other two tests studied. Keeping in mindthe limits of error, significant values are in general obtained withthe permanganate test at concentrations higher by an order ofmagnitude than with the other two tests.
The dichromate reflux procedure gives nearly quantitativeoxidation of many organic compounds in very dilute solutions,as well as in the more concentrated solutions studied by Mooreet al. (5). However, in view of the high blanks associated withthe large amount of sulfuric acid used, the lower limit of detection of traces of organic matter is comparable with that of theiron-peroxide procedure, although the latter gives far from complete oxidation of the compounds studied. The dichromate reflux procedure should be particularly suitable for ,the determination of organic matter in sulfuric acid. Table I shows that oxidation is highly incomplete if only one tenth. the recommendedamount of sulfuric acid is used.
The iron-peroxide procedure is of no value for the quantitativedetermination of organic matter, but it permits detection oftraces of a wide variety of compounds. The results obtainedwith the above representative group of organic compounds indicate that any compound containing a C-H linkage in a positionnot adjacent to a C=O bond should give a positive test with thenew method at concentrations of the order of 0.1 p.p.m.; with afew particularly stable compounds, such as acetone and aceticacid, the limit of detection is of the order of 10 p.p.m. The ferrous iron-hydrogen peroxide test is easily carried out. In contrast to the dichromate reflux procedure, it does not involveworking with large amounts of sulfuric acid; there is no heating,cooling, or transfer of the solution; nor is any apparatus requiredother than an Erlenmeyer flask, pipets, and a buret.
If the need should arise of detecting organic matter in stilllower concentrations than those here studied, use of more dilutesolutions of ferrous iron and hydrogen peroxide, followed bycolorimetric determination of the ferrous or ferric iron, wouldappear advantageous.
RESULTS IN PRESENCE OF CHLORIDE
It was first shown that the titration of ferrous iron with eeriesulfate gives accurate results in the presence of mercuric nitrate(5 X 10⁻⁴ M), and also in a solution of potassium chloride (1 X
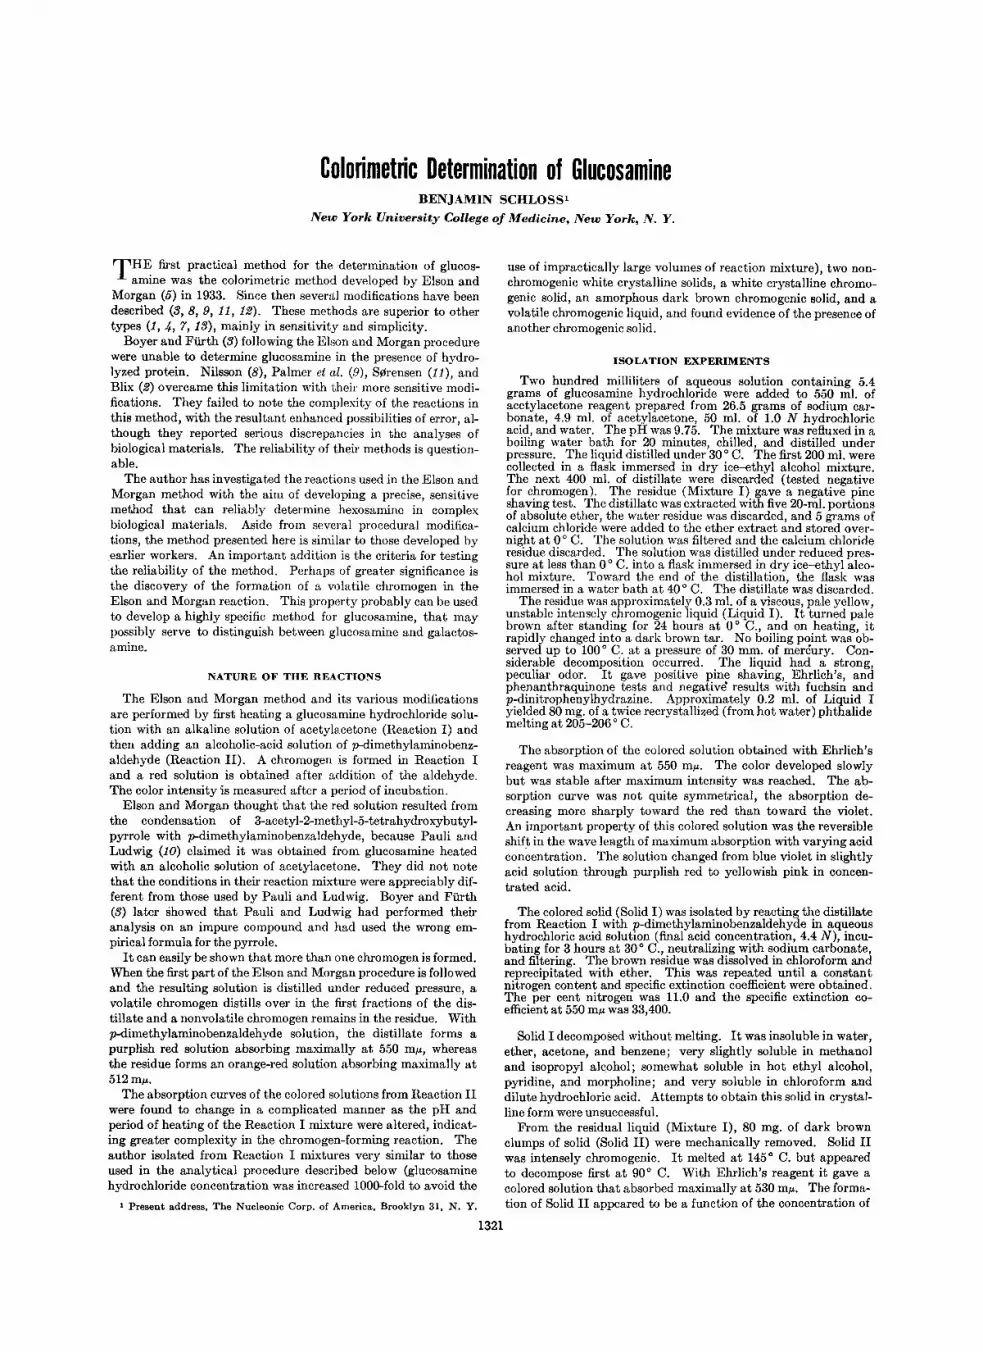
Colorimetric Determination of GlucosamineBENJAMIN SCHLOSS'
New York University College of Medicine, New York, N. Y.
THE first practical method for the determination of glucos-amine was the colorimetric method developed by Elson and
Morgan (5) in 1933. Since then several modifications have beendescribed (3,8,9,11,12). These methods are superior to othertypes (1,4,7,13), mainly in sensitivity and simplicity.
Boyer and Fiirth (3) following the Elson and Morgan procedurewere unable to determine glucosamine in the presence of hydrolyzed protein. Nilsson (8), Palmer et al, (9), Serensen (11), andBlix (2) overcame this limitation with their more sensitive modifications. They failed to note the complexity of the reactions inthis method, with the resultant enhanced possibilities of error, although they reported serious discrepancies in the analyses ofbiological materials. The reliability of their methods is questionable.
The author has investigated the reactions used in the Elson andMorgan method with the aim of developing a precise, sensitivemethod that can reliably determine hexosamine in complexbiological materials. Aside from several procedural modifications, the method presented here is similar to those developed byearlier workers. An important addition is the criteria for testingthe reliability of the method. Perhaps of greater significance isthe discovery of the formation of a volatile chromogen in theElson and Morgan reaction. This property probably can be usedto develop a highly specific method for glucosamine, that maypossibly serve to distinguish between glucosamine and galactosamine.
NATURE OF THE REACTIONS
The Elson and Morgan method and its various modificationsare performed by first heating a glucosamine hydrochloride solution with an alkaline solution of acetylacetone (Reaction I) andthen adding an alcoholic-acid solution of p-dimethylaminobenzaldehyde (Reaction II). A chromogen is formed in Reaction Iand a red solution is obtained after addition of the aldehyde.The color intensity is measured after a period of incubation.
Elson and Morgan thought that the red solution resulted fromthe condensation of 3-acetyl-2-methyl-5-tetrahydroxybutylpyrrole with p-dimethylaminobenzaldehyde, because Pauli andLudwig (10) claimed it was obtained from glucosamine heatedwith an alcoholic solution of acetylacetone. They did not noteth~t the conditions in their reaction mixture were appreciably different from those used by Pauli and Ludwig. Boyer and Fiirth(3) later showed that Pauli and Ludwig had performed theiranalysis on an impure compound and had used the wrong empirical formula for the pyrrole.
It can easily be shown that more than one chromogen is formed.When the first part of the Elson and Morgan procedure is followedand the resulting solution is distilled under reduced pressure, avolatile chromogen distills over in the first fractions of the distillate and a nonvolatile chromogen remains in the residue. Withp-dimethylaminobenzaldehyde solution, the distillate forms apurplish red solution absorbing maximally at 550 mil, whereasthe residue forms an orange-red solution absorbing maximally at512 mil.
The absorption curves of the colored solutions from Reaction IIwere found to change in a complicated manner as the pH andperiod of heating of the Reaction I mixture were altered, indicating greater complexity in the chromogen-forming reaction. Theauthor isolated from Reaction I mixtures very similar to thoseused in the analytical procedure described below (glucosaminehydrochloride concentration was increased 100Q..fold to avoid the
, Present address. The Nucleonic Corp. of America, Brooklyn 31. N. Y.
use of impractically large volumes of reaction mixture), two nonchromogenic white crystalline solids, a white crystalline chromogenic solid, an amorphous dark brown chromogenic solid, and avolatile chromogenic liquid, and found evidence of the presence ofanother chromogenic solid.
ISOLATION EXPERIMENTS
Two hundred milliliters of aqueous solution containing 5.4grams of glucosamine hydrochloride were added to 550 m!. ofacetylacetone reagent prepared from 26.5 grams of sodium carbonate, 4.9 m!. of acetylacetone, 50 m!. of 1.0 N hydrochloricacid, and water. The pH was 9.75. The mixture was refluxed in aboiling water bath for 20 minutes, chilled, and distilled underpressure. The liquid distilled under 30 0 C. The first 200 m!. werecollected in a flask immersed in dry ice-ethyl alcohol mixture.The next 400 m!. of distillate were discarded (tested negativefor chromogen). The residue (Mixture I) gave a negative pineshaving test. The distillate was extracted with five 20-m!. portionsof absolute ether, the water residue was discarded, and 5 grams ofcalcium chloride were added to the ether extract and stored overnight at 0 0 C. The solution was filtered and the calcium chlorideresidue discarded. The solution was distilled under reduced pressure at less than 0 0 C. into a flask immersed in dry ice-ethyl alcohol mixture. Toward the end of the distillation, the flask wasimmersed in a water bath at 40 0 C. The distillate was discarded.
The residue was approximately 0.3 m!. of a viscous, pale yellow,unstable intensely chromogenic liquid (Liquid I). It turned palebrown after standing for 24 hours at 0 0 C., and on heating, itrapidly changed into a dark brown tar. No boiling point was observed up to 100 0 C. at a pressure of 30 mm. of mercury. Considerable decomposition occurred. The liquid had a strong,peculiar odor. It gave positive pine shaving, Ehrlich's, andphenanthraquinone tests and negative results with fuchsin andp-dinitrophenylhydrazine. Approximately 0.2 m!. of Liquid Iyielded 80 mg. of a twice recrystallized (from hot water) phthalidemelting at 205-206 0 C.
The absorption of the colored solution obtained with Ehrlich'sreagent was maximum at 550 mil. The color developed slowlybut was stable after maximum intensity was reached. The absorption curve was not quite symmetrical, the absorption decreasing more sharply toward the red than toward the violet.An important property of this colored solution was the reversibleshift in the wave length of maximum absorption with varying acidcon~entration. The solution changed from blue violet in slightlyacid solution through purplish red to yellowish pink in concentrated acid.
The colored solid (Solid I) was isolated by reacting the distillatefrom Reaction I with p-dimethylaminobenzaldehyde in aqueoushydrochloric acid solution (final acid concentration, 4.4 N), incubating for 3 hours at 30 0 C., neutralizing with sodium carbonate,and filtering. The brown residue was dissolved in chloroform andreprecipitated with ether: Thi~ w~s repeate?- until a con~tantnitrogen content and specific extinction coefficient wer~ obtained.The per cent nitrogen was 11.0 and the specific extinction coefficient at 550 mil was 33,400.
Solid I decomposed without melting. It was insoluble in water,ether, acetone, and benzene; very slightly soluble in methanoland isopropyl alcohol; somewhat soluble in hot ethyl alcohol,pyridine, and morpholine ; and very soluble in chloroform anddilute hydrochloric acid. Attempts to obtain this solid in crystalline form were unsuccessfu!.
From the residual liquid (Mixture I), 80 mg. of dark brownclumps of solid (Solid II) were mechanically removed. Solid IIwas intensely chromogenic. It melted at 145 0 C. but appearedto decompose first at 90 0 C. With Ehrlich's reagent it gave acolored solution that absorbed maximally at 530 mil. The formation of Solid II appeared to be a function of the concentration of
1321
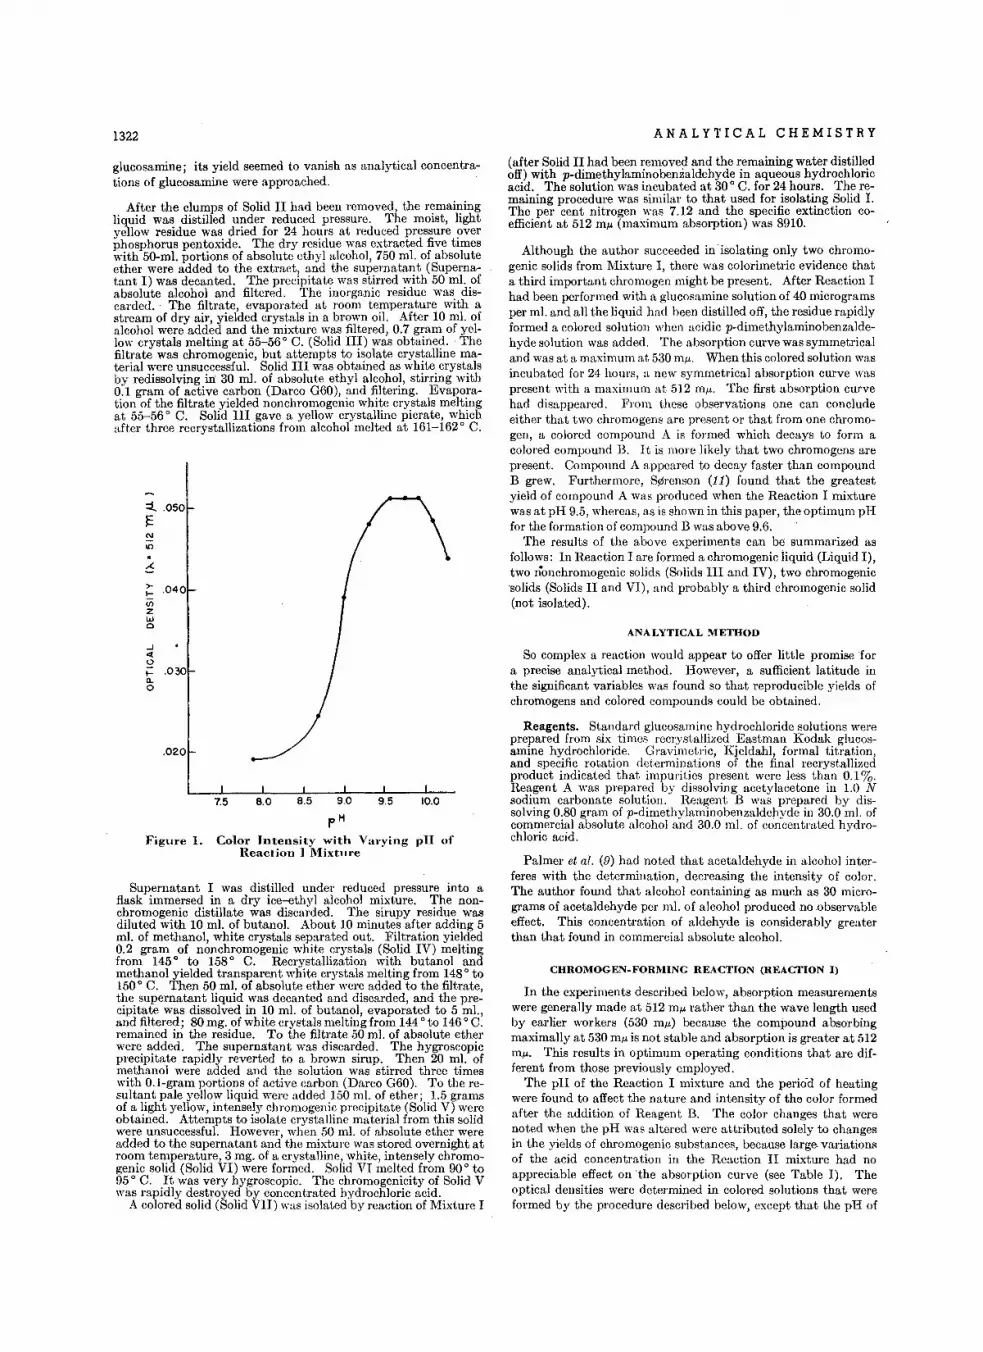
1322 ANALYTICAL CHEMISTRY
.020
pHFigure 1. Color Intensity with Varying pH of
Reaction I Mixture
glucosamine; its yield seemed to vanish as analytical concentrations of glucosamine were approached.
After the clumps of Solid II had been removed, the remainingliquid was distilled under reduced pressure. The moist, lightyellow residue was dried for 24 hours at reduced pressure overphosphorus pentoxide. The dry residue was extracted five timeswith 50-ml. portions of absolute ethyl alcohol, 750 ml. of absoluteether were added to the extract, and the supernatant (Supernatant I) was decanted. The precipitate was stirred with 50 ml. ofabsolute alcohol and filtered. The inorganic residue was discarded. The filtrate, evaporated at room temperature with astream of dry air,yielded crystals in a brown oil. After 10 ml. ofalcohol were added and the mixture was filtered, 0.7 gram of yellow crystals melting at 55-56 0 C. (Solid III) was obtained. 'Thefiltrate was chromogenic, but attempts to isolate crystalline material were unsuccessful. Solid III was obtained as white crystalsby redissolving in: 30 ml. of absolute ethyl alcohol, stirring with0.1 gram of active carbon (Darco 060), and filtering. Evaporation of the filtrate yielded non chromogenic white crystals meltingat 55-56 0 C. Solid III gave a yellow crystalline picrate, whichafter three recrystallizations from alcohol melted at 161-162 0 C.
CHROMOGEN-FORMING REACTION (REACTION I)
In the experiments described below, absorption measurementswere generally made at 512 m", rather than the wave length usedby earlier workers (530 me) because the compound absorbingmaximally at 530 mu is not stable and absorption is greater at 512mu. This results in optimum operating conditions that are different from those previously employed.
The pH of the Reaction I mixture and the perio-d of heatingwere found to affect the nature and intensityof the color formedafter the addition of Reagent 13. The color changes that werenoted when the pH was altered were attributed solely to changesin the yields of chromogenic substances, because large, variationsof the acid concentration in the Reaction II mixture had noappreciable effect on 'the absorption curve (see Table I). Theoptical densities were determined in colored solutions that wereformed by the procedure described below, except that the pH of
ANALYTICAL METHOD
SO complex a reaction would appear to offer little promise 'fora precise analytical method. However, a sufficient latitude inthe significant variables was found so that reproducible yields ofchromogens and colored compounds could be obtained.
Palmer et ai. (9) had noted that acetaldehyde in alcohol interferes with the determination, decreasing the intensity of color.The author found that aJeohol containing as much as 30 micrograms of acetaldehyde per ml. of alcohol produced no observableeffect. This concentration of aldehyde is considerably greaterthan that found in commercial absolute alcohol.
Reagents. Standard glucosamine hydrochloride solutions wereprepared from six times recrystallized Eastman Kodak glucosamine hydrochloride. Gravimetric, Kjeldahl, formal titration,and specific rotation determinations of the final recrystallizedproduct indicated that impurities present were less than 0.1 %.Reagent A was prepared by dissolving acetylacetone in 1.0 Nsodium carbonate solution. Reagent B was prepared by dissolving 0.80 gram of p-dimethyJaminobenzaldehyde in 30.0 ml, ofcommercial absolute alcohol and 30.0 ml, of concentrated hydrochloric acid.
Although the author succeeded inisolating only two chromogenic solids from Mixture I, there was colorimetric evidence thata third important chromogen might be present. After Reaction Ihad been performed with a glucosamine solution of 40 microgramsper ml. and all the liquid had been distilled off, the residue rapidlyformed a colored solution when acidic p-dimethylaminobenzaldehyde solution was added. The absorption curve was symmetricaland was at a maximum at ,530 mu. When this colored solution wasincubated for 24 hours, a new symmetrical absorption curve waspresent with a maximum at 512 m«, The first absorption curvehad disappeared. From these observations one can concludeeither that two chromogens are present or that from one chromogen, a colored compound A is formed which decays to form acolored compound B. It is more likely that two chromogens arepresent. Compound A appeared to decay faster than compoundB grew. Furthermore, S¢renson (11) found that the greatestyield of compound A was produced when the Reaction I mixturewas at pH 9.5, whereas, as is shown in this paper, the optimum p'Hfor the formation of compound B was above 9.6.
The results of the above experiments can be summarized asfollows: In Reaction I are formed a chromogenic liquid (Liquid I),two rionchromogonic solids (Solids III and IV), two chromogenic'solids (Solids II and VI), and probably a third chromogenic solid(not isolated).
(after Solid II had been removed and the remaining water distilledoff) with p-dimethylaminobenzaldehyde in aqueous hydrochloricacid. The solution was incubated at 30 0 C. for 24 hours. The remaining procedure was similar to that used for isolating Solid I.The per cent nitrogen was 7.12 and the specific extinction coefficient at 512 m", (maximum absorption) was 8910.
10.0
::t .050
~C\I
10..c
>- .040I-If)
ZW0
...J«oI- .030G-o
Supernatant I was distilled under reduced pressure into aflask immersed in a dry ice-ethyl alcohol mixture. The nonchromogenic distillate was discarded. The sirupy residue wasdiluted with 10 ml. of butanol. About 10 minutes after adding 5ml. of methanol, white crystals separated out. Filtration yielded0.2 gram of nonchromogenie white crystals (Solid IV) meltingfrom 145 0 to 158 0 C. Recrystallization with butanol andmethanol yielded transparent white crystals melting from 148 0 to150 0 C. Then 50 ml. of absolute ether were added to the filtrate,the supernatant liquid was decanted and discarded, and the precipitate was dissolved in 10 ml. of butanol, evaporated to 5 ml.,and filtered; 80 mg. of white crystals melting from 144 01,0146 0 C.remained in the residue. To the filtrate 50 ml. of absolute etherwere added. The supernatant was discarded. The hygroscopicprecipitate rapidly reverted to a brown sirup. Then 20 ml. ofmethanol were added and the solution was stirred three timeswith O.l-gram portions of active carbon (Darco 060). To the resultant pale yellow liquid were added 150 ml. of ether; 1..5 gramsof a light yellow, intensely chromogenic precipitate (Solid V) wereobtained. Attempts to isolate crystalline material from this solidwere unsuccessful. However, when 50 ml. of absolute ether wereadded to the supernatant and the mixture was stored overnight atroom temperature, 3 mg. of a crystalline, white, intensely chromogenic solid (Solid VI) were formed. Solid VI melted from 90 0 to95 0 C. It was very hygroscopic. The chromogenicity of Solid Vwas rapidly destroyed by concentrated hydrochloric acid.
A colored solid (Solid VII) was isolated by reaction of Mixture I
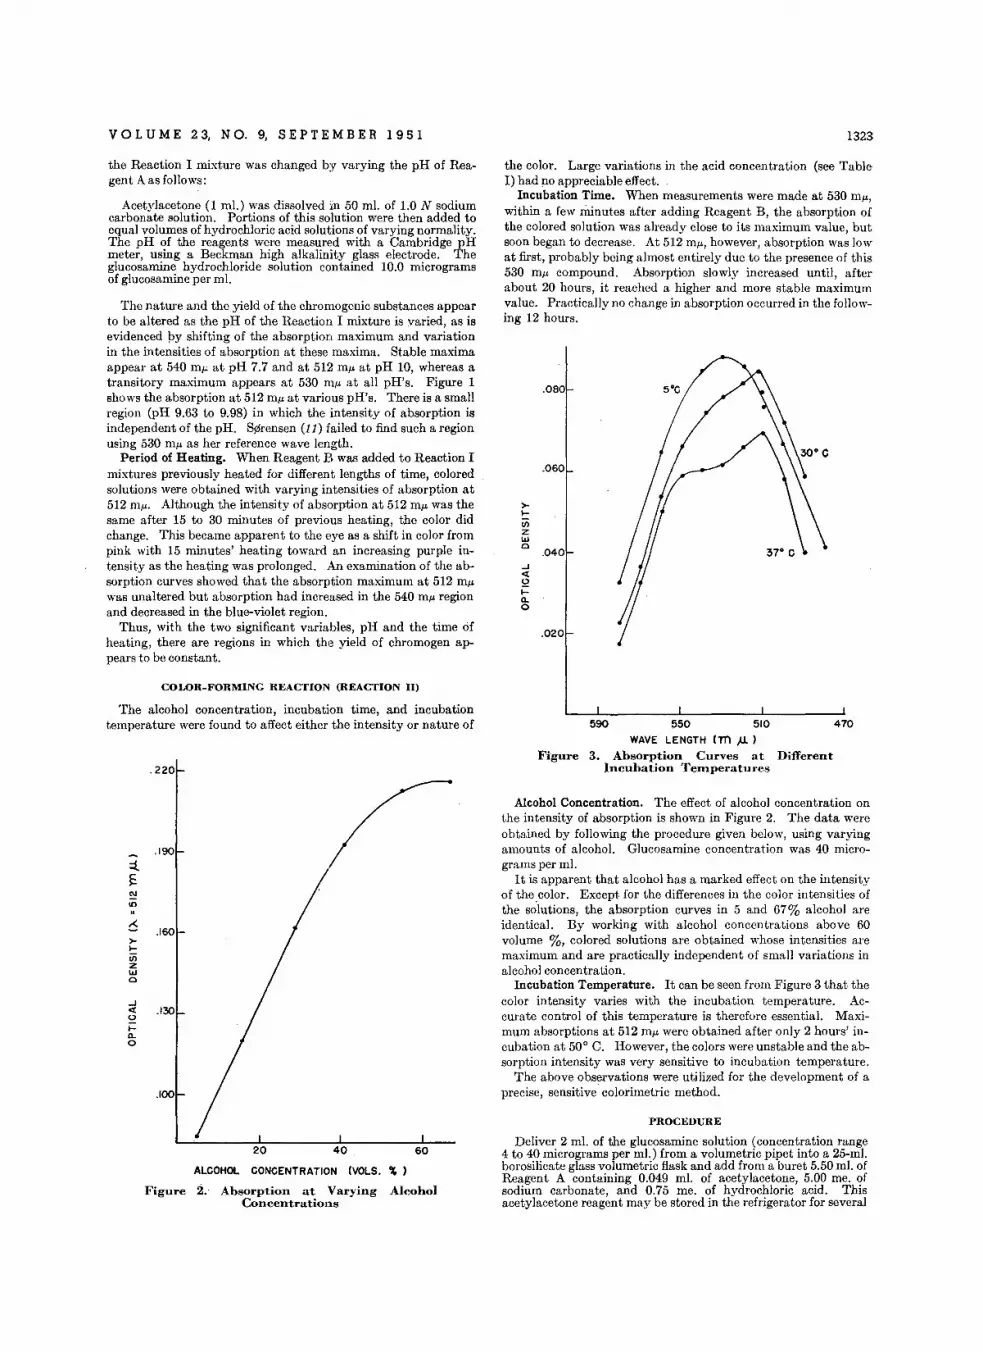
VOL U M E 2 3, N O. 9, S E PTE M B E R 1 9 5 1
the Reaction I mixture was changed by varying the pH of Reagent A as follows:
Acetylacetone (1 ml.) was dissolved in 50 ml. of 1.0 N sodiumcarbonate solution. Portions of this solution were then added toequal volumes of hydrochloric acid solutions of varying normality.The pH of the reagents were measured with a Cambridge pHmeter, using a Beckman high alkalinity glass electrode. Theglucosamine hydrochloride solution contained 10.0 microgramsof glucosamine per ml.
The nature and the yield of the chromogenic substances appearto be altered as the pH of the Reaction I mixture is varied, as isevidenced py shifting of the absorption maximum and variationin the intensities of absorption at these maxima. Stable maximaappear at 540 me at pH 7.7 and at 512 m)' at pH 10, whereas atransitory maximum appears at 530 m)' at all pH's. Figure 1shows the absorption at 512 m)' at various pH's. There is a smallregion (pH 9.63 to 9..98) in which the intensity of absorption isindependent of the pH, S¢rensen (11) failed to find such a regionusing 530 mu as her reference wave length.
Period of Heating. When Reagent B was added to Reaction Imixtures previously heated for different lengths of time, coloredsolutions were obtained with varying intensities of absorption at512 m«. Although the intensity of absorption at 512 m« was thesame after 15 to 30 minutes of previous heating, the color didchange. This became apparent to the eye as a shift in color frompink with 15 minutes' heating toward an increasing purple intensity as the heating was prolonged. An examination of the absorption curves showed that the absorption maximum at 512 muwas unaltered but absorption had increased in the 540 mu regionand decreased in the blue-violet region.
Thus, with the two significant variables, pH and the time ofheating, there are regions in which the yield of chromogen appears to be constant.
COWR-FORMING REACTION (REACTION II)
The alcohol concentration, incubation time, and incubationtemperature were found to affect either the intensity or nature of
.220
.190
::tEt\I
'"-c
.160>-f-ViZILl0
..J~ .1300
f-0-0
.100
ALCOHOL CONCENTRATION (YOLS. % )
Figure 2.· Absorption at Varying AlcoholConcentrations
1323
the color. Large variations in the acid concentration (see TableI) had no appreciable effect.
Incubation Time. When measurements were made at 530 mIL,within a few minutes after adding Reagent B, the absorption ofthe colored solution was already close to its maximum value, butsoon began to decrease. At 512 mIL, however, absorption was lowat first, probably being almost entirely due to the presence of this530 m)' compound. Absorption slowly increased until, afterabout 20 hours, it reached a higher and more stable maximumvalue. Practically no change in absorption occurred in the following 12 hours.
.080
.060
>-f-enzILl0
.040..J~
2f-0-0
.020
590 550 510 470
WAVE LENGTH trn )J. )
Figure 3. Absorption Curves at DifferentIncubation 'I'ernper-atu res
Alcohol Concentration. The effect of alcohol concentration onthe intensity of absorption is shown in Figure 2. The data wereobtained by following the procedure given below, using varyingamounts of alcohol. Glucosamine concentration was 40 micrograms per ml.
It is apparent that alcohol has a marked effect on the intensityof the color. Except for the differences in the color intensities ofthe solutions, the absorption curves in 5 and 67% alcohol areidentical. By working with alcohol concentrations above 60volume %, colored solutions are obtained whose intensities aremaximum and are practically independent of small variations inalcohol concentration.
Incubation Temperature. It can be seen from Figure 3 that thecolor intensity varies with the incubation temperature. Accurate control of this temperature is therefore essential. Maximum absorptions at 512 mu were obtained after only 2 hours' incubation at 50° C. However, the colors were unstable and the absorption intensity was very sensitive to incubation temperature.
The above observations were utilized for the development of aprecise, sensitive colorimetric method.
PROCEDURE
Deliver 2 ml. of the glucosamine solution (concentration range4 to 40 micrograms per ml.) from a volumetric pipet into a 25-ml.borosilicate glass volumetric flask and add from a buret 5.50 ml. ofReagent A containing 0.049 ml. of acetylacetone,5.00 me. ofsodium carbonate, and 0.75 me. of hydrochloric acid. Thisacetylacetone reagent may be stored in the refrigerator for several
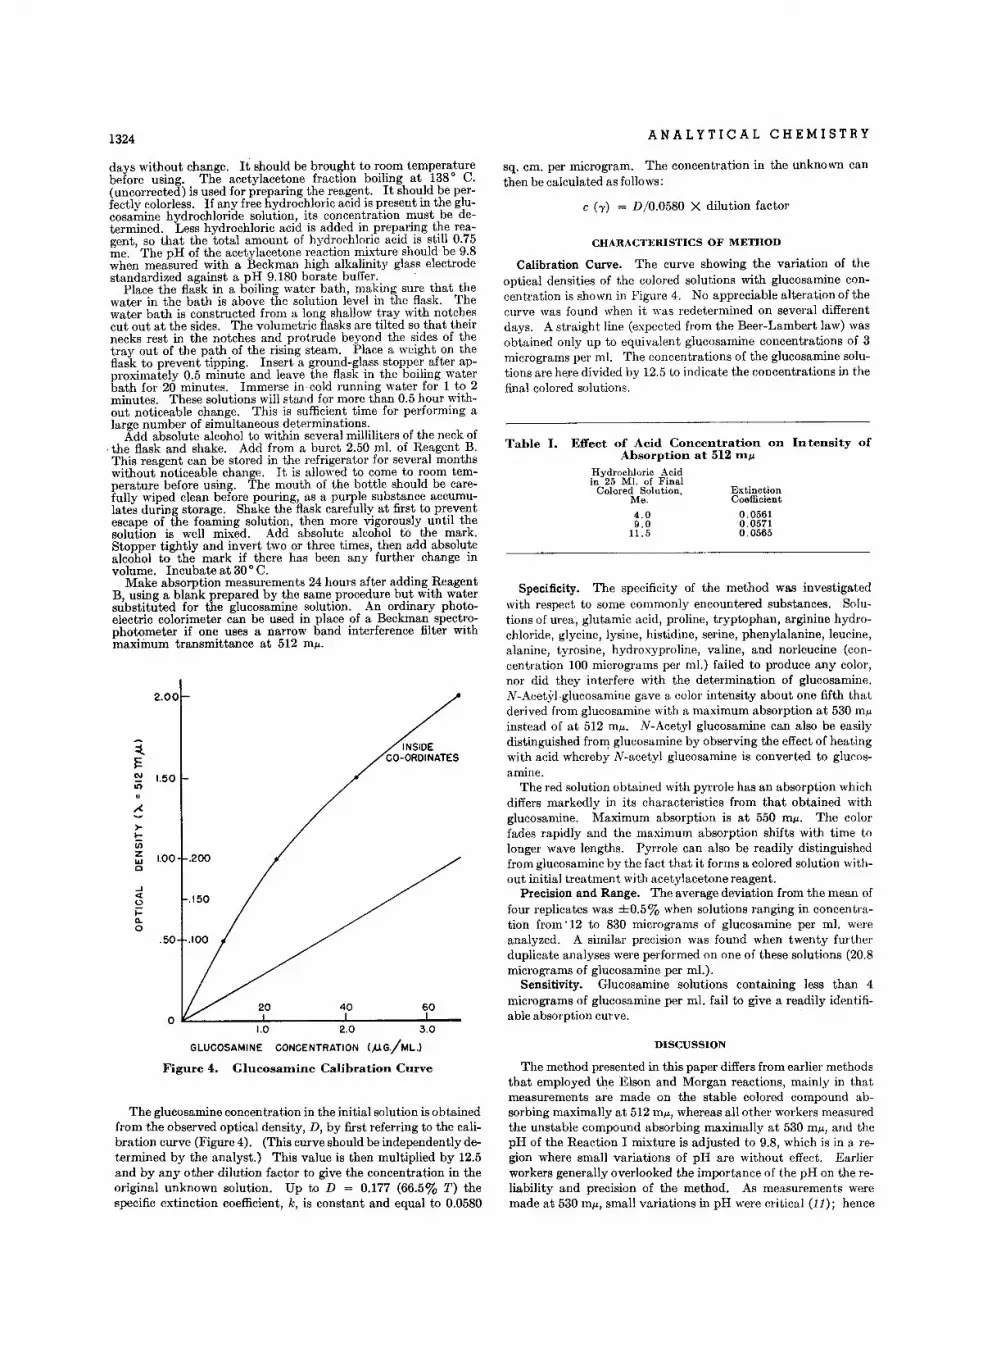
1324 ANALYTICAL CHEMISTRY
2.00
INSIDECO-ORDINATES
0.05610.05710.0565
ExtinctionCoefficient
Table I. Effect of Acid Concentration on Intensity ofAbsorption at 512 lll!,
Hydrochloric Acidin 25 Ml. of Final
Colored Solution,Me.
4.09.0
11.5
c (oy) = D/0.0580 X dilution factor
Specificity. The specificity of the method was investigatedwith respect to some commonly encountered substances. Solutions of urea, glutamic acid, proline, tryptophan, arginine hydrochloride, glycine, lysine, histidine, serine, phenylalanine, leucine,alanine, tyrosine, hydroxyproline, valine, and norleucine (concentration 100 micrograms per m!.) failed to produce any color,nor did they interfere with the determination of glucosamine.N-AcetYI·glucosamine gave a color intensity about one fifth thatderived from glucosamine with a maximum absorption at 530 muinstead of at 512 mu, N-Acetyl glucosamine can also be easilydistinguished from glucosamine by observing the effect of heatingwith acid whereby N-acetyl glucosamine is converted to glucosamine.
The red solution obtained with pyrrole has an absorption whichdiffers markedly in its characteristics from that obtained withglucosamine. Maximum absorption is at 550 me, The colorfades rapidly and the maximum absorption shifts with time tolonger wave lengths. Pyrrole can also be readily distinguishedfrom glucosamine by the fact that it forms a colored solution without initial treatment with acetylacetone reagent.
Precision and Range. The average deviation from the mean offour replicates was ±0.5% when solutions ranging in concentration from'12 to 830 micrograms of glucosamine per m!. wereanalyzed. A similar precision was found when twenty furtherduplicate analyses were performed on one of these solutions (20.8micrograms of glucosamine per m!.).
Sensitivity. Glucosamine solutions containing less than 4micrograms of glucosamine per ml. fail to give a readily identifiable absorption curve.
CHARACTERISTICS OF METHOD
Calibration Curve. The curve showing the variation of theoptical densities of the colored solutions with glucosamine concentration is shown in Figure 4. No appreciable alteration of thecurve was found when it was redetermined on several differentdays. A straight line (expected from the Beer-Lambert law) wasobtained only up to equivalent glucosamine concentrations of 3micrograms per m!. The concentrations of the glucosamine solutions are here divided by 12.5 to indicate the concentrations in thefinal colored solutions.
sq. em. per microgram. The concentration in the unknown canthen be calculated as follows:
604020
.150
O~---_.L.-_---"""----"""-
1.00 .200
1.50
>t:(J)
ZI.LJo
..J<[oi=a.o
days without change. It should be brought to room temperaturebefore using. The acetylacetone fraction boiling at 138 0 C.(uncorrected) is used for preparing the reagent. It should be perfectlv colorless. If any free hydrochloric acid is present in the glucosamine hydrochloride solution, its concentration must be determined. Less hydrochloric acid is added in preparing the reagent so that the total amount of hydrochloric acid is still 0.75me. 'The pH of the acetylacetone reaction mixture should be 9.8when measured with a Beckman high alkalinity glass electrodestandardized against a pH 9.180 borate buffer. .
Place the flask in a boiling water bath, making sure that thewater in the bath is above the solution level in the flask. Thewater bath is constructed from a long shallow tray with notchescut out at the sides. The volumetric flasks are tilted so that theirnecks rest in the notches and protrude beyond the sides of thetray out of the path of the rising steam. Place a weight on theflask to prevent tipping. Insert a ground-glass stopper after approximately 0.5 minute and leave the flask in the boiling waterbath for 20 minutes. Immerse in cold running water for 1 to 2minutes. These solutions will stand for more than 0.5 hour without noticeable change. This is sufficient time for performing alarge number of simultaneous determinations.
Add absolute alcohol to within several milliliters of the neck of. the flask and shake. Add from a buret 2.50 m!. of Reagent B.This reagent can be stored in the refrigerator for several monthswithout noticeable change. It is allowed to come to room temperature before using. The mouth of the bottle should be carefully wiped clean before pouring, as a purple substance accumulates during storage. Shake the flask carefully at first to preventescape of the foaming solution, then more vigorously until thesolution is well mixed. Add absolute alcohol to the mark.Stopper tightly and invert two or three times, then add absolutealcohol to the mark if there has been any further change involume. Incubate at 30 0 C.
Make absorption measurements 24 hours after adding ReagentB, using a blank prepared by the same procedure but with watersubstituted for the glucosamine solution. An ordinary photoelectric colorimeter can be used in place of a Beckman spectrophotometer if one uses a narrow band interference filter withmaximum transmittance at 512 ma.
1.0 2.0 3.0
GLUCOSAMINE CONCENTRATION (,uG.jML.l
Figure 4. G1ucosallline Calibration Curve
The glucosamine concentration in the initial solution is obtainedfrom the observed optical density, D, by first referring to the calibration curve (Figure 4). (This curve should be independently determined by the analyst.) This value is then multiplied by 12.5and by any other dilution factor to give the concentration in theoriginal unknown solution. Up to D = 0.177 (66.5% T) thespecific extinction coefficient, k, is constant and equal to 0.0580
DISCUSSION
The method presented in this paper differs from earlier methodsthat employed the Elson and Morgan reactions, mainly in thatmeasurements are made on the stable colored compound absorbing maximally at 512 m« whereas all other workers measuredthe unstable compound absorbing maximally at 530 mu and thepH of the Reaction I mixture is adjusted to 9.8, which is in a region where small variations of pH are without effect. Earlierworkers generally overlooked the importance of the pH on the reliability and precision of the method. As measurements weremade at 530 mu small variations in pH were critical (11); hence
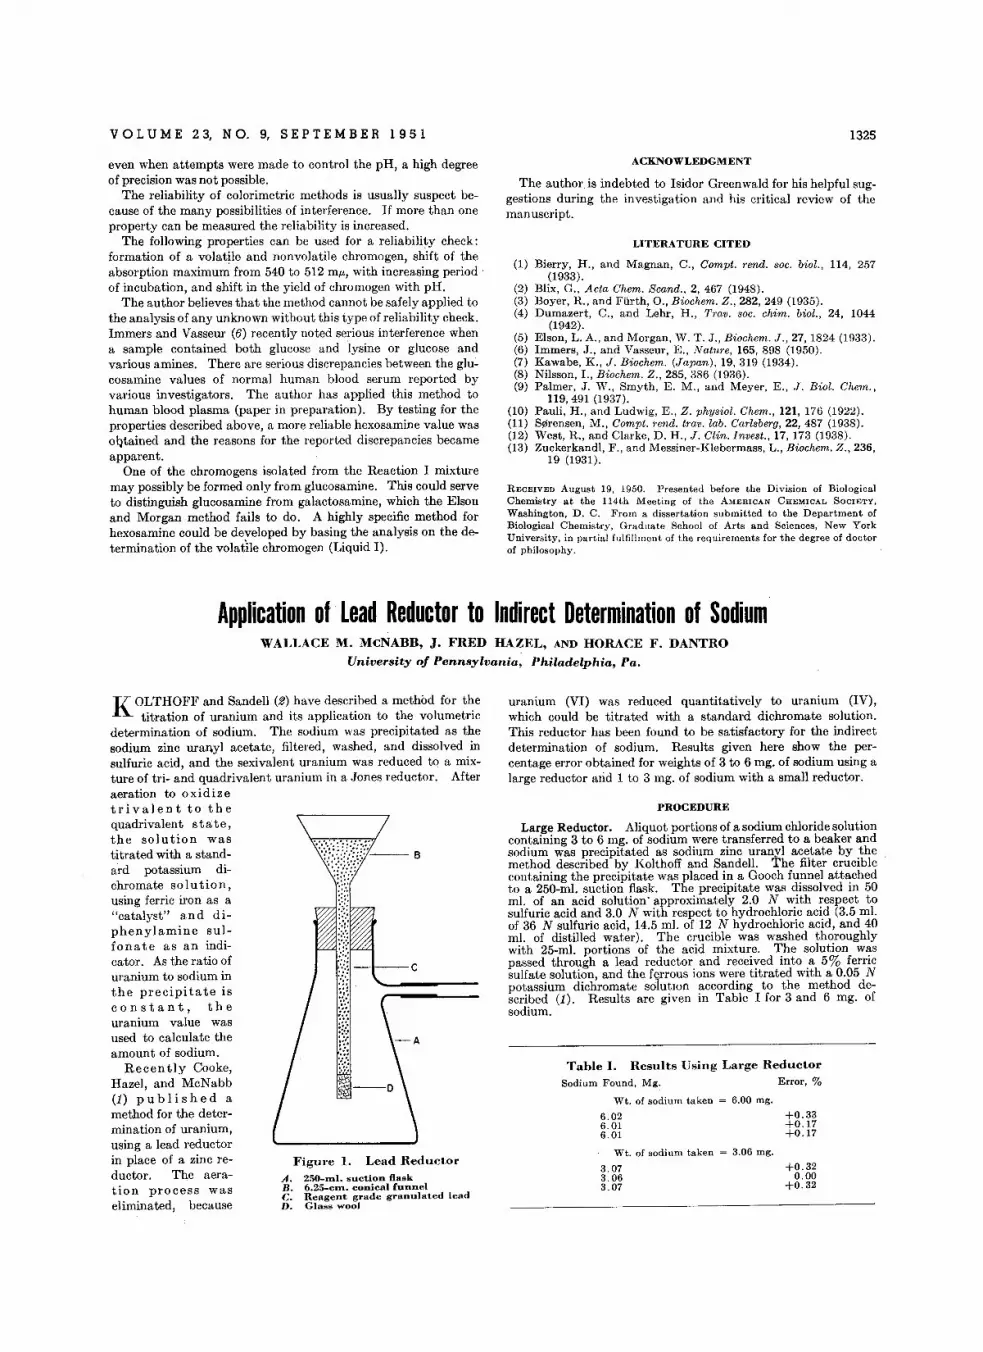
VOL U M E 2 3, N O. 9, S E PTE: M B E R 1 95 1 1325
even when attempts were made to control the pH, a high degreeof precision was not possible.
The reliability of colorimetric methods is usually suspect because of the many possibilities of interference. If more than oneproperty can be measured the reliability is increased.
The following properties can be used for a reliability check:formation of a volatile and nonvolatile chromogen, shift of theabsorption maximum from 540 to 512 m«, with increasing period'of incubation, and shift in the yield of chromogen with pH.
The author believes that the method cannot be safely applied tothe analysis of any unknown without this type of reliability check.Immers and Vasseur (6) recently noted serious interference whena sample contained both glucose and lysine or glucose andvarious amines. There are serious discrepancies between the glucosamine values of normal human blood serum reported byvarious investigators. The author has applied this method tohuman blood plasma (paper in preparation), By testing for theproperties described above, a more reliable hexosamine value wasobtained and the reasons for the reported discrepancies becameapparent.
One of the chromogens isolated from the Reaction I mixturemay possibly be formed only from glucosamine. This could serveto distinguish glucosamine from galactosamine, which the Elsonand Morgan method fails to do. A highly specific method forhexosamine could be developed by basing the analysis on the determination of the volatile chromogen (Liquid I).
ACKNOWLEDGMENT
The author is indebted to Isidor Greenwald for his helpful suggestions during the investigation and his critical review of themanuscript.
LITERATURE CITED
(1) Bierry, H., and Magnan, C., Compt. rend. soc. biol., 114, 257(1933).
(2) Blix, G., Acta Chcm. Scand., 2, 467 (1948).(3) Boyer, R., and Furth, 0., Biochem. Z., 282, 249 (1935).(4) Dumazert, C., and Lehr, H., Trav. soc. chim. biol., 24, 1044
(1942).(5) Elson, L. A., and Morgan, W. T. J., Biochem. .T., 27, 1824 (1933).(6) Immers, J., and Vasseur, E., Nature, 165, 898 (1950).(7) Kawabe, K., .T. Biochem. (.Tapan) , 19,319 (1934).(8) Nilsson, I., Biochem. Z., 285, 386 (1936).(9) Palmer, J. W., Smyth, E. M., and Meyer, E., .T. Bioi. Chem.,
119,491 (1937).(10) Pauli, H., and Ludwig, E., Z. physiol. Chem., 121, 176 (1922).(11) Sl'Irensen, M., Compt. rend. tra», lab. Carlsberg, 22, 487 (1938).(12) West, R., and Clarke, D. H.,.T. Clin. Invest., 17, 173 (1938).(13) Zuckerkandl, F., and Messiner-Kleberrnass, L., Biochem, Z., 236,
19 (1931).
RECEIVED August 19, 1950. Presented before the Division of BiologicalChemistry at the 114th Meeting of the AMERICAN CHEMICAL SOCIETY,Washington, D. C. From a dissertation submitted to the Department ofBiological Chemistry, Graduate School of Arts and Sciences, New YorkUniversity, in partial fulfillment of the requirements for the degree of doctorof philosophy.
Application of Lead Reductor to Indirect Determination of SodiumWALLACE M. McNABB, J. FRED HAZEL, AND HORACE F. DANTRO
University of Pennsylvania, Philadelphia, Pa,
+0.320.00
+0.32
+0.33+0.17+0.17
Wt. of sodium taken ~ 3.06 mg.
3.073.063.07
6.026.016.01
Table I. Results Using Large Reductor
Sodium Found, Mg. Error, %
Wt. of sodium taken = 6.00 mg.
uranium (VI) was reduced quantitatively to uranium (IV),which could be titrated with a standard dichromate solution.This reductor has been found to be satisfactory for the indirectdetermination of sodium. Results given here show the percentage error obtained for weights of 3 to 6 mg. of sodium using alarge reductor arid 1 to 3 mg. of sodium with a small reductor.
PROCEDURE
Large Reductor. Aliquot portions of a sodium chloride solutioncontaining 3 to 6 mg. of sodium were transferred to a beaker andsodium was precipitated as sodium zinc uranyl acetate by themethod described by Kolthoff and Sandell. The filter cruciblecontaining the precipitate was placed in a Gooch funnel attachedto a 250-m!. suction flask. The precipitate was dissolved in 50ml. of an acid solution' approximately 2.0 N with respect tosulfuric acid and 3.0 N with respect to hydrochloric acid (3.5 m!.of 36 N sulfuric acid, 14.5 ml. of 12 N hydrochloric acid, and 40m!. of distilled water). The crucible was washed thoroughlywith 25-m!. portions of the acid mixture. The solution waspassed through a lead reductor and received into a 5% ferricsulfate solution, and the ferrous ions were titrated with a 0.05 Npotassium dichromate solution according to the method described (1). Results are given in Table I for 3 and 6 mg. ofsodium.
J--+--C
Figure 1. Lead Reductor
A. 250-rnl. suction flaskB. 6.25-Clu. conical funnelC. Reagent grade granulated leadD. Glas!:; wooJ
ture of tri- and quadrivalent uranium in a Jones reductor.aeration to oxidizetrivalent to thequadrivalent state,the solution wastitrated with a standard potassium dichromate solution,using ferric iron as a"catalyst" and diphenylamine sulfonate as an indicator. As the ratio ofuranium to sodium inthe precipitate isconstant, theuranium value wasused to calculate theamount of sodium.
Recently Cooke,Hazel, and McNabb(1) pub lis h e d amethod for the determination of uranium,using a lead reductorin place of a zinc reductor. The aeration process waseliminated, because
K OLTHOFF and Sandell (2) have described a method for thetitration of uranium and its application to the volumetric
determination of sodium. The sodium was precipitated as thesodium zinc uranyl acetate, filtered, washed, and dissolved insulfuric acid, and the sexivalent uranium was reduced to a mix
After

1326 ANA L YTICAL CHEM'ISTR Y
Table II. Results Using Small Reductor
A small lead reductor was used for the determination of 1 to 3mg. of sodium. The reductor was made with a 6.25-cm. conicalfunnel of the conventional type. The tip was packed with glasswool and the funnel was filled with reagent grade granulated leadto a height extending through approximately two thirds of thecone. The reductor was supported by a rubber stopper placed ina 250-m1. suction flask. A diagram of the reductor is shown inFigure 1.
Sodium Found, Mg.
Wt. of sodium taken = 3.00 mg.
2.993.003.0J
Error, 0/0
-0.330.00
+0.33
sium dichromate solution. Results obtained for 1 and 3 mg. ofsodium are given in Table II.
DISCUSSION
The use of the lead reductor for the conversion of uranium (VI)to uranium (IV) in sulfuric acid solutions depends on the presenceof hydrochloric acid, which retards the formation of lead sulfateon the surface of the reducing agent. The successful applicationof the large reductor has been described (1). In the applicationof the small reductor to the indirect determination of sodium,some accumulation of salts has been found to take place after 10or 12 determinations, giving low results. The salts can be removed by passing 50 to 100 ml, of 1 M ammonium acetatethrough the column. The advantage of the small reductor is thelow cost of the apparatus and the ease of assembly.
Wt. of sodium taken = 1.00 mg.
1.001.010.991.001.02
0.00+1.00-1.00
0.00+2.00
ACKNOWLEDGMENT
The authors gratefully acknowledge a grant from the FacultyResearch Committee of the University of Pennsylvania.
Small Reductor. Solutions of the dissolved precipitate ofsodium zinc uranyl acetate containing the same concentration ofacids as mentioned above were passed through the reductor,with the aid of suction, at a rate of 80 to 100 drops per minuteand caught in 20 ml. of 5% ferric alum solution. The reductorwas washed with five 10-m1. portions of dilute hydrochloric acid(1 to 15) and the titration was carried out. with.a 0.05 N potas-
LITERATURE CITED
(1) Cooke, W. D., Hazel, J. F., and McNabb, W. M., ANAL. CHEM.,22, 664 (1950).
(2) Kolthoff, 1. M., and Sandell, E. B., "Textbook of QuantitativeInorganic Analysis," p. 610, New York, John Wiley & Sons,1943.
RECEIVED November 16, 1950. Presented before the Meeting-in-Miniatureof the Philadelphia Section, AMERICAN CHEMICAL SOCIETY,January 18. 1951.
Determination of Weight Curves in Column ProcessesLYMAN C. CRAIG, WERNER HAUSMANN, EDWARD H. AHRENS, JR., AND ELIZABETH J. HARF:ENIST
Rockefeller Institutefor Medical Research, New York, N. Y.
arranged in order of increasing weight on awire frame, as shown in Figure 1. Theframe can be made by twisting a series ofcopper wire loops around a glass tube 3 em,in outside diameter. The wire frame ishung on a small ring stand, which also supports a pair of small forceps for manipulatingthe shells. The jaws of the forceps can becovered with small pieces of rubber tubingto avoid damaging the shells.
The evaporator is a small steam bathplaced on an electric hot plate. The coverof the bath is fashioned from a flat sheet ofstainless steel with five holes drilled in it.One of the holes permits a reflux condenserto be attached, and the other four are ofsuch size, 3.0 cm., that the glass shells willnot fall through, yet large enough so thatmost of the under surface of the shells willbe exposed to the hot vapors when the shellsrest in the holes. A glass tube, 10 mm. ininside diameter, with its opening approximately 2 em. above the shell, serves as anair jet. Air to the jet is filtered through acotton plug.
The top shell of the series is a controltare. If the solvent system itself contains ameasurable residue, it may be advisable toevaporate an appropriate aliquot of the solvent as a blank in the tare shell each time aseries of determinations is made. In thismanner the weight of each fraction subsequently determined is automatically corrected. Otherwise, the tare receives thesame final drying treatment as the othermembers of the series.
An aliquot of the solution to be analyzed,0.1 to 3.0 ml., is added to the second shell
selected. The weight of a finished shell should approximate0.5 gram.
The shells are
Figure l.WeighingShells andWire Rack forDetermination of Res-idue Weight
APPARATUS AND PROCEDURE
THE column processes of the present day, such as chromatog-raphy, ion exchange, and countercurrent distribution, when
used at maximum efficiency require many determinations of soluteconcentration in order to plot effluent or distribution curves.The result is most informative and convincing if the method ofdetermination is all-inclusive. The simplest all-inclusive analytical procedure is direct determination of the weight of a residueobtained by evaporation of an aliquot of a solution. Only volatilesolutes fail to be detected by this procedure. Methods that arelimited to the analysis of certain solutes, such as spectroscopy andcolorimetry, often give additional specific information.
Several difficulties must be overcome .in order to achieve reliable analyses by weight. As in column processes a single curverequires many determinations, speed is essential if the method isnot to become unwieldy. As the best separations are usually obtained with very dilute solutions, small residues must be weighedwith accuracy and highly purifie1iesi~e-freesolvents must beemployed. The physical state of e residue often makes quantitative removal of the solvent di~lt and time-consuming.
During the past few years a vaIliity of different weighing vessels and drying procedures has ~een tried in this laboratory.The method described in this report has proved to be the mostsatisfactory to date.
Thin glass shells serve as both evaporation and weighing vessels. They are made by blowing a round bulb, approximately3.3. cm. in diameter, from soft glass ampoules. The lower halfof the bulb is detached by scratching a line on the fragile wallwith a diamond point and then cracking off the hemispherewith the hot wire of a glass cutter. The cracked edges arestrengthened by fire polishing. A sufficient number are madeso that shells weighing within ±50 mg. of each other can be

VOL U M E 23, NO.9, S EP T E M B E R 1951
after the latter has been placed on the steam bath. A hypodermic syringe is ideal for this purpose, and can be fitted with afine glass tip drawn out from an adapter (available from BectonDickinson & Co., Rutherford, N. J.). A current of air from thejet is blown at the solution at such a rate that the surface of thesolution is barely disturbed.
If an aqueous solution is to be analyzed, it will require 2 to 3minutes for a 1-m!. aliquot to be brought to dryness at 100° C.Higher or lower temperatures can be reached as desired by placingliquids of suitable boiling temperature in the bath. During thetime required fOI: the evaporation of the first aliquot, others canbe started on the remaining three holes of the bath.
As soon as the solution comes to dryness, the liquid clingingto the bottom of the shell is touched off with cotton gauze, andthe shell is placed in its proper position on the wire frame. Whenall the shells have been so treated, the wire frame with its shellsis placed in a large glass test tube fitted with a rubber collarnear its upper end. The tube and its contents are supported in asteam bath by means of this collar, and the open end is closed bya one-hole rubber stopper with a glass tube and rubber hose connection to a high vacuum oil pump. All the samples and thetare are dried together at 100°, 0.2 mm., for the required time,usually about 5 minutes. The shells are then weighed on a semimicro balance to ±0.0l mg. In weighing, the tare always nearlycounterbalances the shell containing the residue.
The Seederer-Kohlbuscb. balance used in this laboratoryutilizes riders for weights up to 100 mg., and hundredths of amilligram are measured by the degree of deflection. As theshells differ from the tare by no more than 100 mg., the entireseries of shells can be weighed by use of the riders alone. Thebalance is magnetically dampened, and each weighing requiresno longer than 1.5 minutes.
DISCUSSION
Thin shells have been found preferable to heavier ones. Because they provide less resistance to the interchange of heat, evaporation of solutions is more rapid, and in the steam bath thefinal drying temperature is reached more quickly. Even moreimportant is the rapid adjustment to atmospheric temperature,This permits reliable weighing immediately after removal from thesteam bath. Finally, there is the added precision of weighing
1327
very small residues in containers of the smallest possible weight.The method of evaporation presents several advantages.
The stream of air not only carries away solvent vapors but alsoprevents particles of dust from falling into the shells. The shellsare sufficiently large that the level of the liquid is well below therim of the hole in the steam plate, even with a 3-ml. aliquot.Thus, any solution tending to creep up the wall evaporates beforeit travels beyond the heated surface.
It is advisable to evaporate sufficient solution so that a residueof 0.5 to 5 mg. is obtained. With samples of this size there is noloss by spattering.even with crystalline residues. Usually a thinlayer of the residue covers the bottom of each shell, and conditionsfor final drying are optimal.
The fragile shells can be washed out easily without removingthem from the wire frame by flooding them two to three timeswith an appropriate solvent. Solvent remaining in the shells isaspirated conveniently by a rubber tube with a syringe needleattached for a nozzle.
The empty shells return to their original weight after washing.It is therefore necessary to recalibrate their weights only at infrequent intervals, or when there is reason to suspect an insolubleresidue.
Thus, the clean, wet shells can be placed directly on the evaporator for the next series of determinations. As the bottom of eachshell is of clear glass, a residue of 0.10 mg. can be seen with thenaked eye.
The above procedure has been in use in this laboratory for thepast 2 years, and has been applied successfully to the measurement of partition ratios and to the analysis of countercurrent distributions of amino acids, polypeptides, bile acids, 'and lipides.The volatility of some fatty acids required that water be replaced by ethyl alcohol in the evaporator, and some proteins andlipides could be freed of water only by final drying in the steambath for 15 to 20 minutes.
RECEIVED February 20, 1951.
High Frequency Titrations of Calcium and Magnesium Ions in Aqueous SolutionF. W. JENSEN, G. M. WATSON, AND L. G. VELA'
Agriculrural and Mechanical College of Texas, College Station, T'ex,
rrHE purpose of this work was to investigate the use of highfrequency titration in the determination of calcium and
magnesium ions in water, and to improve on the standard soapmethod (1, 3) of estimating total hardness.
The apparatus used was developed by Jensen and Parrack(5,6). An alternating current model was used in this determination. The wiring diagram is given in Figure 1.
SOI.UTIONS
The soap solutions were prepared according to the standardprocedure (1) and diluted with ethyl alcohol to approximately0.2N.
The standard calcium chloride solutions were prepared by dissolving a weighed amount of pure calcium carbonate with dilutehydrochloric acid (1).
The standard magnesium sulfate solutions were preparedfrom the best reagent grade magnesium sulfate heptahydrate andstandardized gravimetrically by precipitation of magnesium asmagnesium ammonium phosphate.
The hydrochloric acid was prepared by dilution from constantboiling mixture (7).
The sodium hydroxide solution was prepared carbonate-freeby decantation from saturated sodium hydroxide solution (7) andwas stored and standardized with the usual precautions.
1 Present address, Galveston Laboratories, Galveston, Tex.
L,
6 VOLTS
Figure I. Electrical Circuit for Alternating CurrentTitrinteter
A. 80 Lc: 10-tnh. n.}'. chockB. vn 75 MI. 0 to 10 maoC. 6C5 M,. 0 to 50 !La.C,. 8-mfd. electrolytic R,. 100,000 ohmsC.. O.OI-tnfd. .mice R,. 35,000 obmsC,. 10 to 58111111fd. trillllller R.. 10,000 ohtnsc.. C,. 100-tntnfd. variahle R.. 50,000 ohtnsC,. 0.003-tnfd. rntce R.. 1000 OhlllS
. L,. 15-henry choke R.. 500,000 obeasLl, L2. Identical coils of No. 14 copper wire, each 8 turns.1.5 inch in diall1.cter and evenly spaced over 2-inch length
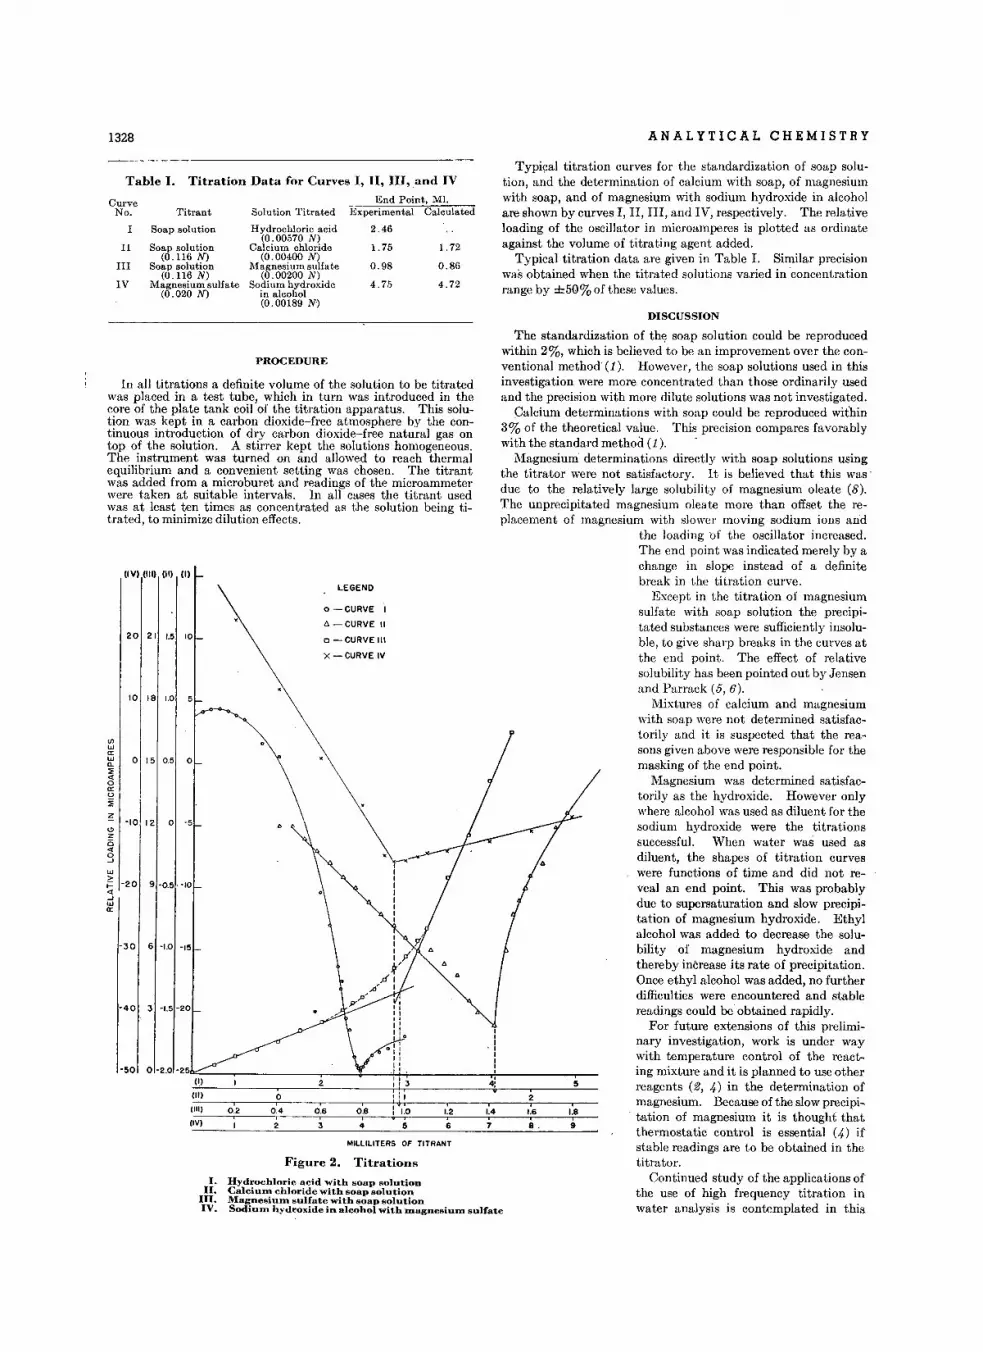
1328 ANALYTICAL CHEMISTRY
Table I. Titration Data for Curves I, II, III, and IV
Curve End Point, Ml.No. Titrant Solution Titrated Experimental Calculated
Soap solution Hydrochloric acid 2.46(0.00570 N)
II Soap solution Calcium chloride 1. 75 1. 72(0.116 N) (0.00400 N)
III Soap solution Magnesium sulfate 0.98 0.86(0.116 N) (0.00200 N)
IV Magnesium sulfate Sodium hydroxide 4.7.5 4.72(0.020 N) in alcohol
(0.00189 N)
Typical titration curves for the standardization of soap solution, and the determination of calcium with soap, of magnesiumwith soap, and of magnesium with sodium hydroxide in alcoholare shown by curves I, II, III, and IV, respectively. The relativeloading of the oscillator in microamperes is plotted as ordinateagainst the volume of titrating agent added.
Typical titration data are given in Table I. Similar precisionwas obtained when the titrated solutions varied in 'concentrationrange by ±50% of these values.
DISCUSSION
5
,9
,1.8
2
,8.
1.6
The standardization of the soap solution could be reproducedwithin 2%, which is believed to be an improvement over the conventional method' (1). However, the soap solutions used in thisinvestigation were more concentrated than those ordinarily usedand the precision with more dilute solutions was not investigated.
Calcium determinations with soap could be reproduced within3% of the theoretical value. This precision compares favorablywith the standard method (1).
Magnesium determinations directly with soap solutions usingthe titrator were not satisfactory. It is believed that this was'due to the relatively large solubility of magnesium oleate (8).The unprecipitated magnesium oleate more than offset the replacement of magnesium with slower moving sodium ions and
the loading of the oscillator increased.The end point was indicated merely by achange in slope instead of a definitebreak in the titration curve.
Except in the titration of magnesiumsulfate with soap solution the precipitated substances were sufficiently insoluble, to give sharp breaks in the curves atthe end point. The effect of relativesolubility has been pointed out by Jensenand Parrack (5, 6).
Mixtures of calcium and magnesiumwith soap were not determined satisfactorily and it is suspected that the reasons given above were responsible for themasking of the end point.
Magnesium was determined satisfactorily as the hydroxide. However onlywhere alcohol was used as diluent for thesodium hydroxide were the titrationssuccessful. When water was used asdiluent, the shapes of titration curveswere functions of time and did not reveal an end point. This was probablydue to supersaturation and slow precipitation of magnesium hydroxide. Ethylalcohol was added to decrease the solubility of magnesium hydroxide andthereby increase its rate of precipitation.Once ethyl alcohol was added, no furtherdifficulties were encountered and stablereadings could be obtained rapidly.
For future extensions of this preliminary investigation, work is under waywith temperature control of the reacting mixture and it is planned to use otherreagents (2, ..0 in the determination ofmagnesium. Because of the slow precipi-
. tation of magnesium it is thought thatthermostatic control is essential (,.0 ifstable readings are to be obtained in thetitrator.
Continued study of the applications ofthe use of high frequency titration inwater analysis is contemplated in this
Titrations
MILLILITERS OF TITRANT
LEGEND
o -CURVE 1
" -CURVE II
D -CURVE III
X-CURVE IV
Figure 2.
Hydrochloric acid with soap solutionCalcium. chloride with soap solutionMagnesium sulfate with soap solutionSodium. hydroxide in alcohol with JnagnesiuJn sulfat.e
I.II.
III.IV.
o
o -5
o 15 0.5
10 18 1.0
20 21 1.5 10
(IV) (III) (II) (I)
-50 0-2.0 -25(I) 2
(II) 0(III)
, , , , , ,0.2 0.4 0.6 os 1.2 1.4
(IV), , , , ,2 3 4 6 7
-30 6 -1.0 -15
-40 3 -1.5 -20
PROCEDURE
In all titrations a definite volume of the solution to be titratedwas placed in a test tube, which in turn was introduced in thecore of the plate tank coil of the titration apparatus. This solution was kept in a carbon dioxide-free atmosphere by the continuous introduction of dry carbon dioxide-free natural gas ontop of the solution. A stirrer kept the solutions homogeneous.The instrument was turned on and allowed to reach thermalequilibrium and a convenient setting was chosen. The titrantwas added from a microburet and readings of the microammeterwere taken at suitable intervals. In all cases the titrant usedwas at least ten times as concentrated as the solution being titrated, to minimize dilution effects.
<J)W0:WDo::;;<to0:<>:E
~ -10 12
'"z5<t
3w>f= -20 9 -0.5' -10<t..JW0:
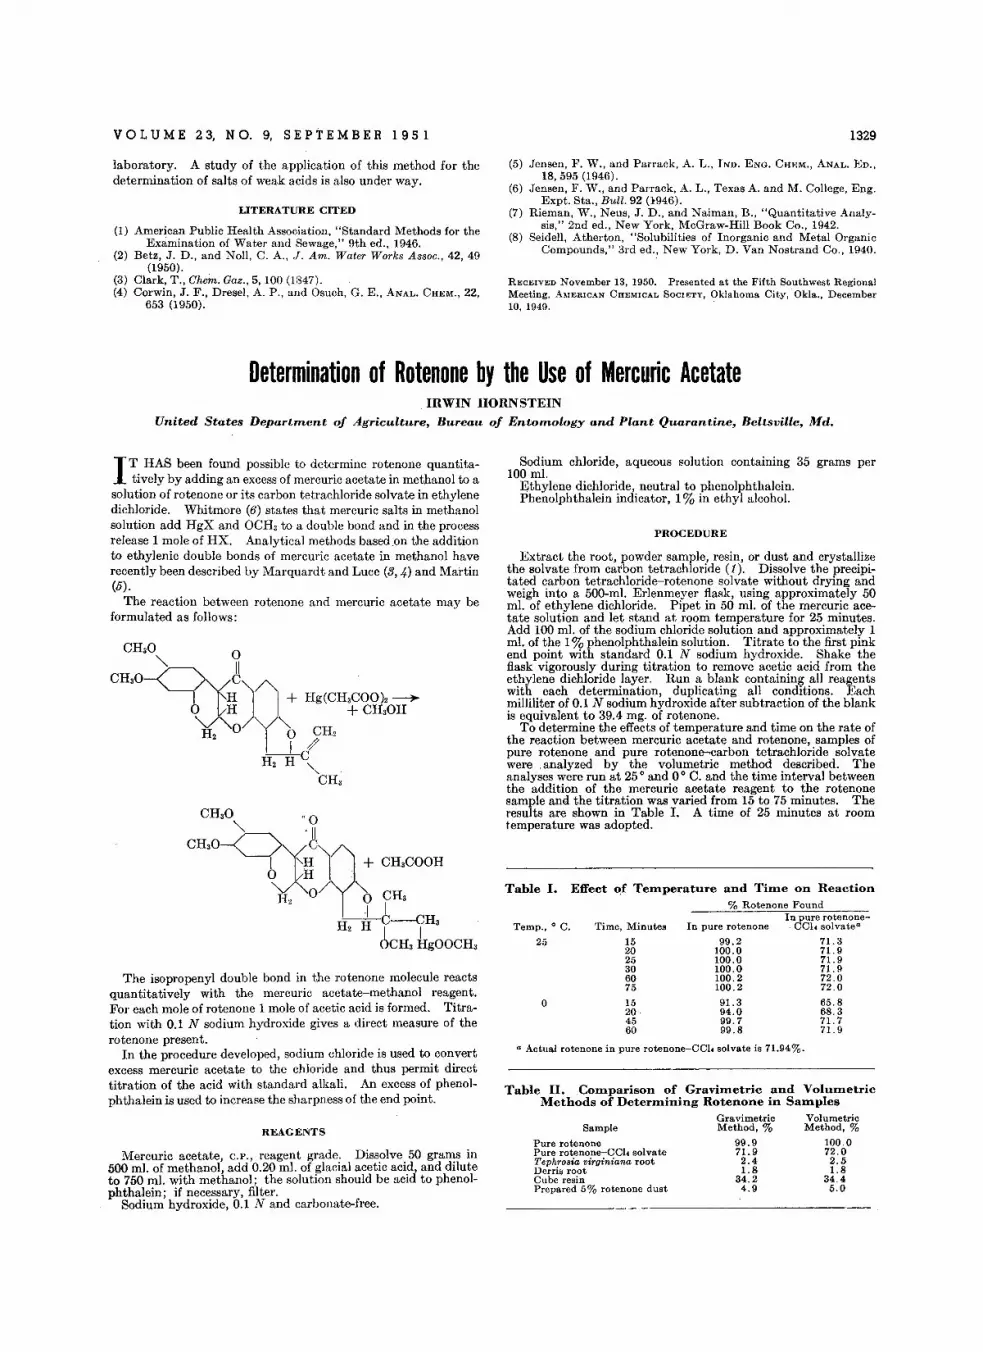
VOL U M E 2 3, N O. 9, SE r r s M B E R 1 9 5 1 1329
laboratory. A study of the application of this method for thedetermination of salts of weak acids is also under way.
LITERATURE CITED
(1) American Public Health Association, "Standard Methods for theExamination of Water and Sewage," 9th ed., 1946.
(2) Betz, J. D., and Noll, C. A., J. Am. Water Works Assoc., 42, 49(1950).
(3) Clark, T., Chem, Gaz., 5, 100 (1847).(4) Corwin, J. F., Dresel, A. P., and Osuch, G. E., ANAL. CHEM., 22,
653 (1950).
(5) Jensen, F. W., and Parrack, A. L., IND. ENG. CHEM., ANAL. ED.,18,595 (1946).
(6) Jensen, :F. W., and Parrack, A. L., Texas A. and M. College, Eng.Expt, Sta., Bull. 92 (~946).
(7) Rieman, W., Neus, J. D., and Naiman, B., "Quantitative Analysis," 2nd ed., New York, McGraw-Hill Book Co., 1942.
(8) Seidell, Atherton, "Solubilities of Inorganic and Metal OrganicCompounds," 3rd ed., New York, D. Van Nostrand Co., 1940.
RECEIVED November 13, 1950. Presented at the Fifth Southwest RegionalMeeting, AMERICAN CHEMICAL SOCIETY, Oklahoma City, Okla., December10, 1949.
Determination of Rotenone by the Use of Mercuric AcetateIRWIN HORNSTEIN
United States Depart.merit: of Agriculture, Bureau of Entomology and Plant Quarantine, Beltsville, Md.
PROCEDURE
In pure rotenoneTemp., 0 C. Time, Minutes In pure rotenone eel. solvate"
Table I. Effect of Temperature and Time on Reaction% Rotenone Found
71. 371.971. 971.972.072.0
65.868.371.771. 9
99.2100.0100.0100.0100.2100.2
91. 394.099.799.8
152025306075
1520·4560
Sample
o
25
Pure rotenonePure rotenone-COla solvateTephrosia virginiana rootDerris rootCube resinPrepared 5% rotenone dust
a Actual rotenone in pure rotenone-CCI. solvate is 71.94%.
Sodium chloride, aqueous solution containing 35 grams per100mJ.
Ethylene dichloride, neutral to phenolphthalein.Phenolphthalein indicator, 1% in ethyl alcohol.
Extract the root, powder sample, resin, or dust and crystallizethe solvate from carbon tetrachloride (1). Dissolve the precipitated carbon tetrachloride-rotenone solvate without drying andweigh into a 500-mJ. Erlenmeyer flask, using approximately 50mJ. of ethylene dichloride. Pipet in 50 ml. of the mercuric acetate solution and let stand at room temperature for 25 minutes.Add 100 mJ. of the sodium chloride solution and approximately 1m!. of the 1% phenolphthalein solution. Titrate to the first pinkend point with standard 0.1 N sodium hydroxide. Shake theflask vigorously during titration to remove acetic acid from theethylene dichloride layer. Run a blank containing all reagentswith each determination, duplicating all conditions. Eachmilliliter of 0.1 N sodium hydroxide after subtraction of the blankis equivalent to 39.4 mg. of rotenone.
To determine the effects of temperature and time on the rate ofthe reaction between mercuric acetate and rotenone, samples ofpure rotenone and pure rotenone-carbon tetrachloride solvatewere .analyzed by the volumetric method described. Theanalyses were run at 25 0 and 0 0 C. and the time interval betweenthe addition of the mercuric acetate reagent to the rotenonesample and the titration was varied from 15 to 75 minutes. Theresults are shown in Table I. A time of 25 minutes at roomtemperature was adopted.
Table II. Comparison of Gravimetric and VolumetricMethods of Determining Rotenone in Samples
Gravimetric VolumetricMethod, % Method, %
99.9 100.071.9 72.02.4 2.51.8 1.8
34.2 34.44.9 5.0
The isopropenyl double bond in the rotenone molecule reactsquantitatively with the mercuric acetate-methanol reagent.For each mole of rotenone 1 mole of acetic acid is formed. Titration with 0.1 N sodium hydroxide gives a direct measure of therotenone present.
In the procedure developed, sodium chloride is used to convertexcess mercuric acetate to the chloride and thus permit directtitration of the acid with standard alkali. An excess of phenolphthalein is used to increase the sharpness of the end point.
REAGENTS
I T HAS been found possible to determine rotenone quantitatively by adding an excess of mercuric acetate in methanol to a
solution of rotenone or its carbon tetrachloride solvate in ethylenedichloride. Whitmore (6) states that mercuric salts in methanolsolution add HgX and OCH, to a double bond and in the processrelease 1 mole of HX. Analytical methods basedon the additionto ethylenic double bonds of mercuric acetate in methanol haverecently been described by Marquardt and Luce (3, 4) and Martin(5).
The reaction between rotenone and mercuric acetate may beformulated as follows:
Mercuric acetate, C.P., reagent grade. Dissolve 50 grams in500 mJ. of methanol, add 0.20 mJ. of glacial acetic acid, and diluteto 750 mJ. with methanol; the solution should be acid to phenolphthalein; if necessary, filter.
Sodium hydroxide, 0.1 N and carbonate-free.
CH,O 0-,CH'O-q ~
YH)J + Hg(CHaCOO)2~o ~H + CHaOH"'-A -,
H 2 0 I 0 CH21/--C
H 2 H ",CH,

1330
The gravimetric and volumetric methods were compared onsamples of derris, cube root, resin, and dust extracted as described in the procedure of the Association of Official AgriculturalChemists (1) and also on samples of pure rotenone and purerotenone-carbon tetrachloride solvate (Table II).
DISCUSSION OF RESULTS
Mercuric acetate can either add to a double bond or act as anoxidizing agent. Under the conditions employed only additiontakes place. Table I shows that the reaction can be carried outat room temperature and is virtually complete after 15 minutes.There is little further change in titer with time. Table II showsthe volumetric method to give slightly higher results than thegravimetric method, but, as Jones (2) has shown, the lattermethod yields results generally about 1% lower than the correctvalue. The volumetric method appears to be as accurate as the
.gravimetric method. The method described has the further
ANALYTICAL CHEMISTRY
advantage that insoluble material present with the rotenonecarbon tetrachloride solvate will not interfere in the determination.
An attempt is being made to apply a modification of thismethod to the extracts directly.
I_ITERATURE CITED
(1) Assoc. Offic. Agr, Chemists, "Official and Tentative Methods ofAnalysis," 6th ed., p. 74, 1945.
(2) Jones, H. A., IND. ENG. CHEM., ANAL. ED., 9, 206--10 (1937).(3) Marquardt, R. P., and Luce, E. N., ANAL. CHEM., 20, 751-3
(1948).(4) Ibid., 21, 1194.(1949).(5) Martin, R. W., Ibid., 21, 921 (1949).(6) Whitmore, F. C., "Organic Compounds of Mercury," p. 31, New
York, Chemical Catalog Co., 1921.
RECEIVEDNovember 30, 1950. Report of a study made under the Researchand Marketing Act of 1946. From a thesis submitted in partial fulfillmentof the requirements for the M.S. degree at the University of Maryland.
Determination of Rotenone as an Impurity in DihydrorotenoneIRWIN HORNSTEIN
Bureau of Entomology and Plant Quarantine, United States Department of Agriculture, Beltsville. Md.
rrHE catalytic hydrogenation of the isopropenyl side chain inrotenone (1) with Raney nickel produces dihydrorotenone
(II) in good yield (4~). However, the hydrogenation of rotenone also proceeds with the opening of the oxygen link in ring E togivc rotenonic acid (III). Continued hydrogenation of rotenonicacid produces dihydrorotenonic acid (IV). Dihydrorotenol (V),formed by saturating the side-chain double bond and the openingof ring C, may also occur (2). Both dihydrorotenonic acid anddihydrorotenol are formed by adding 2 moles of hydrogen forevery mole of rotenone reacting in this' manner. Thus, if anappreciable amount of either or both of these products forms,mole-for-mole addition of hydrogen to rotenone will leave unreacted rotenone.
Goodhue and Haller (2) found that dihydrorotenone was theonly reduction product giving an appreciable red-color test bythe Goodhue (1) modification of the Gross-Smith test (3).This color is similar to the color given by rotenone and some ofthe rotenoids, In their method of determining dihydrorotenoneany rotenone prcsent would not be distinguished from dihydrorotenone. The physical properties in general are similar for thetwo compounds.
However, rotenone can be quantitatively determined bymeasuring the unsaturation in the rotenone side chain, using themercuric acetate method (7). Dihydrorotenone does not react
with this reagent. Correcting for the difference in the colorintensity of rotenone as compared with that of dihydrorotenoneand subtracting this corrected figure from the red-color dihydrorotenone value give the actual dihydrorotenone content of thesample.
I'REPARATION OF ROTENONE AND DIHYDROROTENONE
Rotenone was obtained by exhaustive chloroform extraction ofdried Tephrosia virginiana roots. The solvent was removed, andan excess of ether precipitated the crude rotenone. Three recrystallizations from carbon tetrachloride and recrystallization ofthe solvate from ethyl alcohol gave a pure product, melting point163 0 C. in borosilicate glass, no melting point lowering of anauthentic sample of rotenone; [al'l!' was -230 0 in benzene.
Dihydrorotenone was, obtained by the method of Haller andSchaffer (4~), using a Raney nickel catalyst. Dihydrorotenonewas separated from the phenolic substances with alkali and purified by recrystallizing from carbon tetrachloride and ethylalcohol.' The dihydrorotenone was again subjected to hydrogenation, and the dihydrorotenone obtained after alkali extraction was recrystallized from carbon tetrachloride and from ethylalcohol until no further test for unsaturation could be obtainedwith mercuric acetate. This product melted at 216 0 in borosilicate glass; [a]bO was -225 0 in benzene.
ANALYSIS
The Goodhue modification of the Gross-Smith red-color test iscarried out on separate samples of pure rotenone and dihydrorotenone, as described by Goodhue and Haller (2). Extinctioncurves are plotted by drawing a straight line from zero concentration and extinction to the point determined by the concentrationand extinction of each of these two standards. The color developed by both rotenone and dihydrorotenone follows Beer'slaw, and plotting extinctions against concentration gives a.straight line. On the photometer used per cent transmittance isread directly. The per cent transmittance on values are converted to extinction values by means of the formula
E = lo 100 2 101 .g % transmittance = - og /0 transmittance
When a mixture of dihydrorotenone and rotenone is analyzed,the transmittance for an accurately weighed sample of approximately 20 mg. is determined and the extinction calculated for themixture. The per cent rotenone is then determined by themercuric acetate method (7). This figure multiplied by the
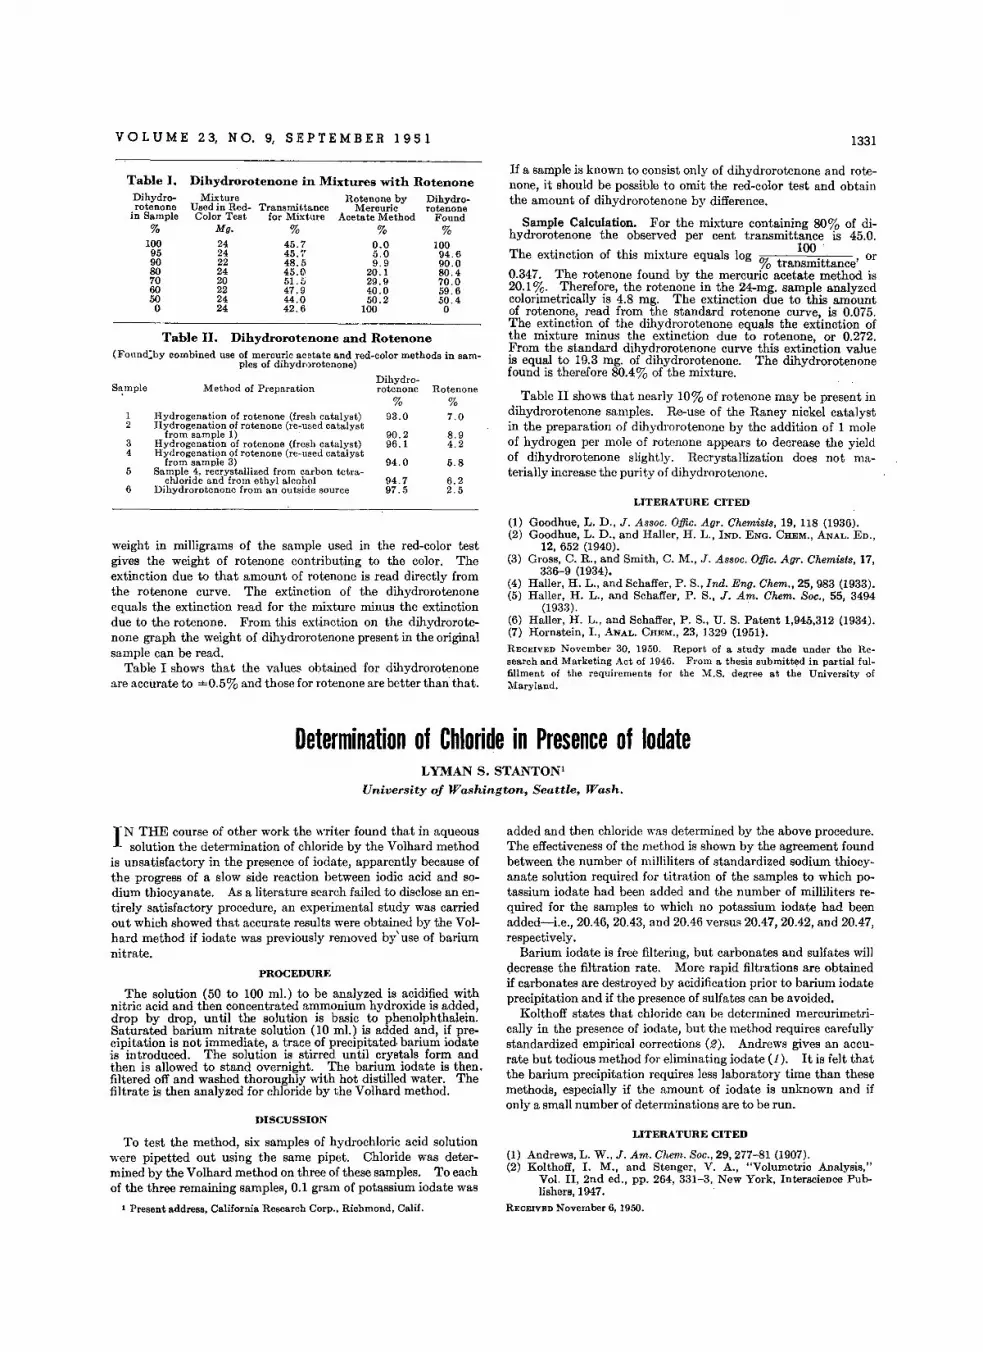
VOL U M E 2 3, N O. 9, S E PTE M B E R 1 9 5 1 1331
Table II. Dihydrorotenone and Rotenone(Fonnd:by combined use of mercuric acetate and red-color methods in sam
ples of dihydrorotenone)
Sample Method of PreparationDihydro-rotenone Rotenone
% %1 Hydrogenation of rotenone (fresh catalyst) 93.0 7.02 Hydrogenation of rotenone (re-used catalyst
from sample 1) 90.2 8.93 Hydrogenation of rotenone (fresh catalyst) 96.1 4.24 Hydrogenation of rotenone (re-used catalyst
from sample 3) 94.0 5.85 Sample 4, recrystallized from carbon tetra-
chloride and from ethyl alcohol 94.7 6.26 Dihydrorotenone from an outside source 97.5 2.5
Table I.Dihydrorotenone
in Sample
%100
959080706050o
Dihydrorotenone in Mixtures with RotenoneMixture Rotenone by Dihydrc-
Used in Red- Transmibtance Mercuric rotenoneColor Test for Mixture Acetate Method Found
Mg. % % %24 45.7 0.0 10024 45.~' 5.0 94.622 48.5 9.9 90.024 45.0 20.1 80.420 51.5 29.9 70.022 47.9 40.0 59.624 44.0 50.2 50.424 42.6 100 0
If a sample is known to consist only of dihydrorotenone and rotenone, it should be possible to omit the red-color test and obtainthe amount of dihydrorotenone by difference.
Sample Calculation. For the mixture containing 80% of dihydrorotenone the observed per cent transmittance is 45.0.
The extinction of this mixture equals log 1ft: 100. ' , oro transmittance
0.347. The rotenone found by the mercuric acetate method is20.1 %. Therefore, the rotenone in the 24-mg. sample analyzedcolorimetrically is 4.8 mg. The extinction due to this amountof rotenone, read from the standard rotenone curve, is 0.075.The extinction of the dihydrorotenone equals the extinction ofthe mixture minus the extinction due to rotenone, or 0.272.From the standard dihydrorotenone curve this extinction valueis equal to 19.3 mg. of dihydrorotenone. The dihydrorotenonefound is therefore 80.4% of the mixture.
Table II shows that nearly 10% of rotenone may be present indihydrorotenone samples. Re-use of the Raney nickel catalystin the preparation of dihydrorotenone by the addition of 1 moleof hydrogen per mole of rotenone appears to decrease the yieldof dihydrorotenone slightly. Recrystallization does not materially increase the purity of dihydrorotenone.
weight in milligrams of the sample used in the red-color testgives the weight of rotenone contributing to the color. Theextinction due to that amount of rotenone is read directly fromthe rotenone curve. The extinction of the dihydrorotenoneequals the extinction read for the mixture minus the extinctiondue to the rotenone. From this extinction on the dihydrorotenone graph the weight of dihydrorotenone present in the originalsample can be read.
Table I shows that the values obtained for dihydrorotenoneare accurate to =0.5% and those for rotenone are better than' that.
LITERATURE CITED
(1) Goodhue, L. D" J. Assoc. Offic. AgT. Chemists, 19, 118 (1936).(2) Goodhue, L. D., and Haller, H. L., IND. ENG. CHEM., ANAL. ED.,
12, 652 (1940).(3) Gross, C. R., and Smith, C. M., J. Assoc.Offic. AgT. Chemiste, 17,
336-9 (1934).(4) Haller, H. L., and Schaffer, P. S., Ind. Eng. Chem., 25, 983 (1933).(5) Haller, H. L., and Schaffer, P. S., J. Am. Chem, Soc., 55, 3494
(1933). '(6) Haller, H. L., and Schaffer, P. S., U. S. Patent 1,945,312 (1934).(7) Hornstein, 1., ANAL. CHEM., 23, 1329 (1951).
RECEIVED November 30. 1950. Report of a study made under the Hesearch and Marketing Act of 1946. From a thesis submitted in partial fulfillment of the requirements for the M.S. degree at the University ofMaryland.
Determination of Chloride in Presence of IodateLYMAN S. STANTON'
University of Washington, Seattle, Wash.
IN THE course of other work the writer found that in aqueoussolution the determination of chloride by the Volhard method
is unsatisfactory in the presence of iodate, apparently because ofthe progress of a slow side reaction between iodic acid and sodium thiocyanate. As a literature search failed to disclose an entirely satisfactory procedure, an experimental study was carriedout which showed that accurate results were obtained by the Volhard method if iodate was previously removed byuse of bariumnitrate.
PROCEDURE
The solution (50 to 100 001.) to be analyzed is acidified withnitric acid and then concentrated ammonium hydroxide is added,drop by drop, until the solution is basic to phenolphthalein.Saturated barium nitrate solution (10 001.) is added and, if precipitation is not immediate, a trace of precipitated, barium iodateis introduced. The solution is stirred until crystals form andthen is allowed to stand overnight. The barium iodate is then.filtered off and washed thoroughly with hot distilled water. Thefiltrate is then analyzed for chloride by the Volhard method.
DISCUSSION
To test the method, six samples of hydrochloric acid solutionwere pipetted out using the same pipet. Chloride was determined by the Volhard method on three of these samples. To eachof the three remaining samples, 0.1 gram of potassium iodate was
1 Present address, California Research Corp., Richmond, Calif.
added and then chloride was determined by the above procedure.The effectiveness of the method is shown by the agreement foundbetween the number of milliliters of standardized sodium thiocyanate solution required for titration of the samples to which potassium iodate had been added and the number of milliliters required for the samples to which no potassium iodate had beenadded-Le., 20.46, 20.43, and 20.46 versus 20.47, 20.42, and 20.47,respectively.
Barium iodate is free filtering, but carbonates and sulfates willdecrease the filtration rate. More rapid filtrations are obtainedif carbonates are destroyed by acidification prior to barium iodateprecipitation and if the presence of sulfates can be avoided.
Kolthoff states that chloride can be determined mercurimetrically in the presence of iodate, but the method requires carefullystandardized empirical corrections (2). Andrews gives an accurate but tedious method for eliminating iodate (1). It is felt thatthe barium precipitation requires less laboratory time than thesemethods, especially if the amount of iodate is unknown and ifonly a small number of determinations are to be run.
LITERATURE CITED
(1) Andrews, L. W., J. Am. Chern, Soc., 29, 277-81 (1907).(2) Kolthoff, 1. M., and Stenger, V. A., "Volumetric Analysis,"
Vol. II, 2nd ed., pp. 264, 331-3, New York, Interscience Publishers, 1947.
RECEIVEDNovember 6,1950.
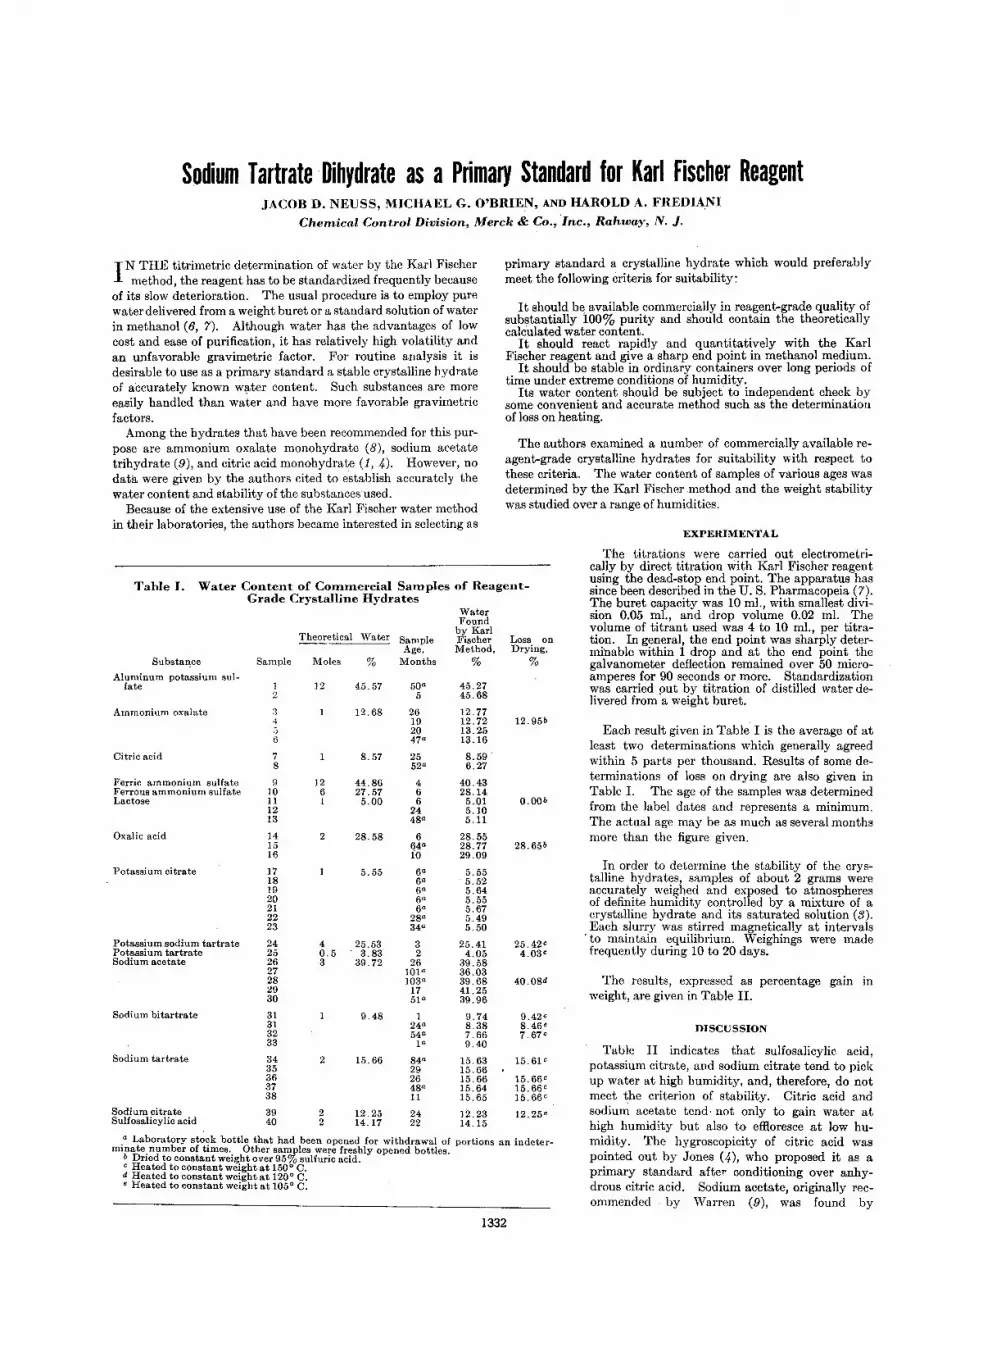
Sodium Tartrate·Dihydrate as aPrimary Standard for Karl Fischer ReagentJACOB D. NEUSS, MICHAEL G. O'BRIEN, AND HAROLD A. FREDIANI
Chemical Control Division, Merck & Co., inc., Rahway, N. J.
Table J. Water Content of Commercial Samples of ReagerrtGrade Crystalline Hydrates
." Laboratory sto~k bottle that had been opened for withdrawal of portions an indeter-minate number of tImes.. Other sam"ples were freshly opened bottles.
b Dried to constant weight over 95'70sulfuric acid.e Heated to COnstant weight at 150" C.d Heated to constant weight at 120" C.e Heated to constant weight at 105" C.
I N THE titrimetric determination of water by the Karl Fischermethod, the reagent has to be standardized frequently because
of its slow deterioration. The usual procedure is to employ purewater delivered from a weight buret or a standard solution of waterin methanol (6, 7). Although water has the advantages of lowcost and ease of purification, it has relatively high volatility andan unfavorable gravimetric factor. For routine analysis it isdesirable to use as a primary standard a stable crystalline hydrateof accurately known water content. Such substances are moreeasily handled than water and have more favorable gravimetricfactors.
Among the hydrates that have been recommended for this purpose are ammonium oxalate monohydrate (8), sodium acetatetrihydrate (9), and citric acid monohydrate (1, 4). However, nodata were given by the authors cited to establish accurately thewater content and stability of the substancesused.
Because of the extensive use of the Karl Fischer water methodin their laboratories, the authors became interested in selecting HS
primary standard a crystalline hydrate which would preferablymeet the following criteria for suitability:
EXPERIMENTAL
The titrations were carried out electrometrically by direct titration with Karl Fischer reagentusing the dead-stop end point. The apparatus hassince been described in the U. S. Pharmacopeia (7).The buret capacity was 10 mI., with smallest division 0.05 mI., and drop volume 0.02 ml. Thevolume of titrant used was 4 to 10 mI., per titration. In general, the end point was sharply determinable within 1 drop and at the end point thegalvanometer deflection remained over 50 microamperes for 90 seconds or more. Standardizationwas carried put by titration of distilled water delivered from a weight buret.
DISCUSSION
Table II indicates that sulfosalicylic. acid,potassium citrate, and sodium citrate tend to pickup water at high humidity, and, therefore, do notmeet the criterion of stability. Citric acid andsodium acetate tend not only to gain water athigh humidity but also to effloresce at low humidity. The hygroscopicity of citric acid waspointed out by Jones (4), who proposed it as aprimary standard after conditioning over anhydrous citric acid. Sodium acetate, originally recommended by Warren (9), was found by
Each result given in Table I is the average of atleast two determinations which generally agreedwithin 5 parts per thousand. Results of some determinations of loss on drying are also given inTable 1. The age of the samples was determinedfrom the label dates and represents a minimum.The actual age may be as much as several monthsmore than the figure given.
The results, expressed as percentage gain inweight, are given in Table II.
In order to determine the stability of the crystalline hydrates, samples of about 2 grams wereaccurately weighed and exposed to atmospheresof definite humidity controlled by a mixture of acrystalline hydrate and its saturated solution (3).Each slurry was stirred magnetically at intervals
. to maintain equilibrium. Weighings were madefrequently during 10 to 20 days.
O.OOb
9.42 e
8.46 e7.67 e
12.95b
40.08d
28.65b
15.61 e
15.66 e
15.66 e15.66 e
12.25"
25.42 e
4.03 e
Loss onDrying,
%
It should be available commercially in reagent-grade quality ofsubstantially 100% purity and should contain the theoreticallycalculated water content.
It should react rapidly and quantitatively with the KarlFischer reagent and give a sharp end point in methanol medium.
It should be stable in ordinary containers over long periods oftime under extreme conditions of humidity.
Its water content should be subject to independent check bysome convenient and accurate method such as the determinationof loss on heating.
The authors examined a number of commercially available reagent-grade crystalline hydrates for suitability with respect tothese criteria. The water content of samples of various ages wasdetermined by the Karl Fischer method and the weight stabilitywas studied over a range of humidities.
45.2745.68
12.7712.7213.2513.16
8.596.27
40.4328.145.015.105.11
28.5528.7729.09
5.555.525.645.555.675.495.50
25.414.05
39.5836 ..0339.6841.2539.96
9.748.387.669.40
15.6315.6615.6615.6415.65
12.2314.15
WaterFound
by KarlFischerMethod,
%
664"ro
50"5
6"6a
6a
6 a
6a
28"34"
26192047"
2552"
466
2448"
84a
292648a
11
2422
32
26ior103a
1751 a
SampleAge,
Months
4 25.53O. 5 3.833 39.72
9.48
2 15.66
2 12.252 14.17
Theoretical ","Tater
Moles %
12 45.57
12.68
8.57
12 44.866 27.571 5.00
2 28.58
5.55
12
:34;)
6
78
910111213
141516
17181920212223
24252627282930
31313233
3435363738
3940
Sample
Citric acid
Substance
Aluminum potassium sulfate
Ammonium oxalate
Potassium citrate
Ferric ammonium sulfateFerrous ammonium sulfateLactose
Oxalic acid
Sodium bitartrate
Sodium tartrate
Potassium sodium tartratePotassium tartrateSodium acetate
Sodium citrateSulfosalicylic acid
1332

V O.L U ME 23, NO.9, S E PTE M B E R 1951 1333
RECEIVED December 27,1950.
B. J. STURM
Burgess Battery Co., Freeport, Ill.
Residual Metal in DischargedMagnesium Batteries
(7) "Pharmacopeia of the United States ofAmerica," 14th Revision,pp: 795-7, Easton, Pa., Mack Publishing Co., 1950.
(8) Rennie, R. P., and Monkman, J. L., Can. Chem. Process Lruis.,29,366 (1945).
(9) Warren, G. G., iua., 29, 370 (1945).
Change ofWeight, Gram
-0.0001+0.0001+0.0001-0.0002
Solution
20% aqueous hydrofluoric acid20% hydrofluoric acid with 5% magnesium chloride20% hydrofluoric acid with 5% magnesium sulfateAcetone
EXPI.;RIMENTAL
The corrosive action on magnesium of the reagents-used in thedetermination was evaluated. Pieces of buffed magnesium 1.375X 1 X 0.006 inch, weighing approximately 0.22 gram each, wereimmersed for 10 minutes in the liquids listed below, dipped inacetone, and dried. The change in weight was noted. The balance used for the weighings had a sensibility of 0.0002 gram.
IT IS sometimes advantageous to know the quantity of unre-acted magnesium remaining in a discharged battery, in order
to evaluate its performance fully. If all corrosion products andbattery separator are removed from the electrode without attacking the free metal, the determination involves only weighing ofthe magnesium. Water is not suitable for removing corrosionproducts from magnesium, as these compounds are not verysoluble, and the electrode corrodes rapidly when wet because ofthe ions that are present. Magnesium batteries usually containhalides or sulfates which arc especially corrosive.
.Uhlig (1) reports that magnesium is attacked by all acids except hydrofluoric and chromic. The presence of halide or sulfateions, however, causes chromic acid to attack magnesium. MagnesiU:m resists corrosion by hydrofluoric acid because a thin layerof insoluble magnesium fluoride is formed on its surface.
Table n. Stability of Crystalline Hydrates at VariousHumidities
Hours% Gain in Weight at Relative Humidity of:Ex-
Substance posed 20% 31% 51% 65% 79%
Aluminum potassiumSulfate 497 +0.02 +0.04 +0.03 +0.05 +0.02
Ammonium oxalate 497 +0.03 +0.04 +0.03 +0.06 +0.04Citric acid 283 -8.30 -8.24 -0.25 +0.32 +1.26Ferrous amrnoni urn
sulfate 497 +0.02 +0.06 +0.06 +0.07 +0.07Lactose 497 +0.05 +0.07 +0.08 +0.05 +0.01Oxalic acid 283 -0.03 -0.02 .+0.01 -0.02 -0.03Potassium citrate 191 +0.01 +0.02 +0.03 +33.3 +40.3Sodium acetate 191 -3.22 +0.01 +0.02 +0.13 +1.94Sodium tartrate 191 +0.04 +0.03 +0.04 +0.01 +0.09Sodium citrate 144 +0.03 +5.40Sulfosalicylic acid 283 -0.08 -0.05 +3.25 +51.6 +46.7
McComb (5) to be stable and to contain the theoretical amount ofwater. However, Gladstone and Bruce (2) reported sodium acetate as unsatisfactory, because commercial samples contained asmuch as 103.5% of the theoretcal water content. Data in Tables I and II indicate that sodium acetate definitely does not meetthe criteria stated above.
Ammonium oxalate, ferrous ammonium sulfate, lactose, andoxalic acid, while they appear to be stable at extreme humidities,frequently contain appreciably more than the theoretical amountof water (Table I). The water content of lactose cannot bechecked by heating because of its instability even in a vacuum.Sodium bitartrate frequently contains considerably less than thetheoretical percentage of water.
Of all the substances tested, sodium tartrate proved to be outstanding. Not only isit stable at extreme humidities, but its watercontent is remarkably close to theory. A sample stored for 7years in a screw-cap bottle without special precautions was foundto contain substantially the theoretical water content (Table I).As an added advantage the water content can be independentlychecked by heating at 150 0 for 3 hours or to constant weight. Although it is relatively insoluble in absolute methanol, its watercontent is rapidly and quantitatively titratable to a sharp endpoint. The authors have found reagent-grade small prismaticcrystals, up to a few millimeters in length, a convenient physicalform. This substance has been used routinely as a primarystandard in these laboratories for about 3 years with very satisfactory results in several thousand determinations.
Both the direct titration and the back-titration with standardwater-in-methanol solution can be used.
'Standardization of Karl Fischer Solution Using Sodium Tartrate Dihydrate. Select a sample of reagent-grade sodium tartrate dihydrate small crystals, the water content of which hasbeen established as 15.66 ± 0.05% by heating at 150 0 C. for 3hours. A sample of 150 to 350 mg. will require 5 to 10 m!. of asolution whose strength is equivalent to about 5 mg. of water perm!.
Titrate about 25 m!. of absolute methanol to the end pointwith the Karl Fischer solution. Quickly add the sodium tartrate and titrate again. Determine the weight of sodium tartrate by difference. This weight multiplied by 0.1566 and dividedby the milliliters of Karl Fischer sol~tion used gives the strengthof the Karl Fischer solution in equivalent milligrams of water permilliliter.
LITERATURE CITED
(1) Cornish, G. R., Plastics (London), 10, 99 (1946).(2) Gladstone, T. P., and Bruce, T., ANAL. CHEM., 19, 884 (1947).(3) "International Critical Tables," Vol. I, p. 67, New York, Mc-
Graw-Hill Book Co., 1926.(4) Jones, G. K., Paint Mfg., 15,360 (1945).(5) McComb, E. A., ANAL.CHEM., 20,1219 (1948).(6) Mitchell, J., Jr., and Smith, D. M., "Aquametrv," p. 68, New
York, Interscience Publishers, 1948.
These results show that 20% hydrofluoric acid does not react appreciably with magnesium metal even in the presence of sulfate orchloride ions. Distilled water and acetone do not react with themetal appreciably during the 10-minute immersion. The procedure described below is based on the above experiments, andhas been used for analysis of both water-activated reserve batteries and dry batteries which use magnesium anodes. The determination represents elemental magnesium, when pure magnesium electrodes are used.
PROCEDURE
Immediately after discharge the battery is dissected and themagnesium electrode stripped of any easily removed separator.The metal is placed in 20% hydrofluoric acid for 10 minutes, in awax-coated beaker, and the solution is agitated with a coatedstirring rod. The electrode is removed from the hydrofluoricacid, dipped in acetone, and allowed to dry and its weight is determined.
LITERATURE CITED
(1) Uhlig, "Corrosion Handbook," p. 225, New York, John Wiley &Sons, 1948.
RECEIVED January 29, 1951.
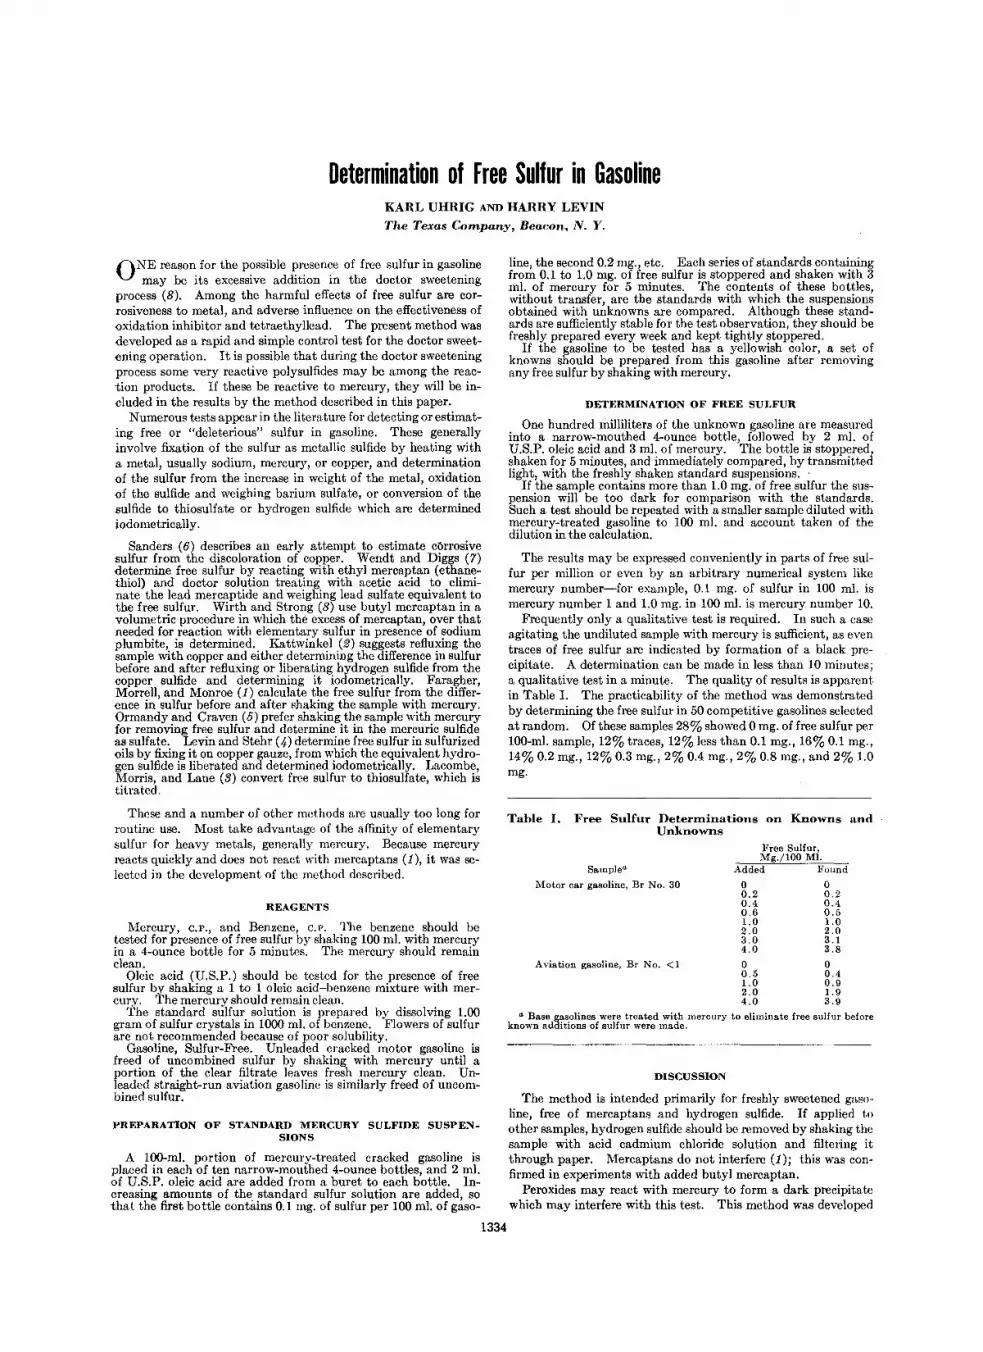
Determination of Free Sulfur in GasolineKARL UHRIG AND HARRY LEVIN
The Texas Company, Beacon. N. Y.
Aviation gasoline. Br No. <1
Sample"
Motor car gasoline, Br No. 30
ONE reason for the possible presence of free sulfur in gasolinemay be its excessive addition in the doctor sweetening
process (8). Among the harmful effects of free sulfur are corrosiveness to metal, and adverse influence on the effectiveness ofoxidation inhibitor and tetraethyllead. The present method wasdeveloped as a rapid and simple control test for the doctor sweetening operation. It is possible that during the doctor sweeteningprocess some very reactive polysulfides may be among the reaction products. If these be reactive to mercury, they will be ineluded in the results by the method described in this paper.
Numerous tests appear in the literature for detecting or estimating free or "deleterious" sulfur in gasoline. These generallyinvolve fixation of the sulfur as metallic sulfide by heating witha metal, usually sodium, mercury, or copper, and determinationof the sulfur from the increase in weight of the metal, oxidationof the sulfide and weighing barium sulfate, or conversion of thesulfide to thiosulfate or hydrogen sulfide which are determinediodometrically.
Sanders (6) describes an early attempt to estimate corrosivesulfur from the discoloration of copper. Wendt and Diggs (7)determine free sulfur by reacting with ethyl mercaptan (ethanethiol) and doctor solution treating with acetic acid to eliminate the lead mercaptide and weighing lead sulfate equivalent tothe free sulfur. Wirth and Strong (8) use butyl mercaptan in avolumetric procedure in which the excess of mercaptan, over thatneeded for reaction with elementary sulfur in presence of sodiumplumbite, is determined. Kattwinkel (2) suggests refluxing thesample with copper and either determining the difference in sulfurbefore and after refluxing or liberating hydrogen sulfide from thecopper sulfide and determining it iodometrically. Faragher,Morrell, and Monroe (1) calculate the free sulfur from the difference in sulfur before and after shaking the sample with mercury.Ormandyand Craven (5) prefer shaking the sample with mercuryfor removing free sulfur and determine it in the mercuric sulfideas sulfate. Levin and Stehr (.0 determine free sulfur in sulfurizedoils by fixing it on copper gauze, from which the equivalent hydrogen sulfide is liberated and determined iodometrically. Lacombe,Morris, and Lane (3) convert free sulfur to thiosulfate, which istitrated.
These and a number of other methods are usually too long forroutine use. Most take advantage of the affinity of elementarysulfur for heavy metals, generally mercury. Because mercuryreacts quickly and does not react with mercaptans (1), it was selected in the development of the method described.
REAGENTS
Mercury, C.P., and Benzene, C.P. The benzene should betested for presence of free sulfur by shaking 100 ml. with mercuryin a 4-ounce bottle for 5 minutes. The mercury should remainclean.
Oleic acid (U.S.P.) should be tested for the presence of freesulfur by shaking a 1 to 1 oleic acid-benzene mixture with mercury. The mercury should remain clean.
The standard sulfur solution is prepared by dissolving 1.00gram of sulfur crystals in 1000 ml. of benzene. Flowers of sulfurare not recommended because of poor solubility.
Gasoline, Sulfur-Free. Unleaded cracked motor gasoline isfreed of uncombined sulfur by shaking with mercury until aportion of the clear filtrate leaves fresh mercury clean. Unleaded straight-run aviation gasoline is similarly freed of uncombined sulfur.
PREPARATION OF STANDARD MERCURY SULFIDE SUSPENSIONS
A 100-ml. portion of mercury-treated cracked gasoline isplaced in each of ten narrow-mouthed 4-ounce bottles, and 2 ml.of U.S.P. oleic acid are added from a buret to each bottle. Increasing amounts of the standard sulfur solution are added, sothat the first bottle contains 0.1 mg. of sulfur per 100 ml. of gaso-
1334
line, the second 0.2 mg., etc. Each series of standards containingfrom 0.1 to 1.0 mg. of free sulfur is stoppered and shaken with 3ml. of mercury for 5 minutes. The contents of these bottles,without transfer, are the standards with which the suspensionsobtained with unknowns are compared. Although these standards are sufficiently stable for the test observation, they should befreshly prepared every week and kept tightly stoppered.
If the gasoline to be tested has a yellowish color, a set ofknowns should be prepared from this gasoline after removingany free sulfur by shaking with mercury.
DETERMINATION OF FREE SULFUR
One hundred milliliters of the unknown gasoline are measuredinto a narrow-mouthed 4-ounce bottle, followed by 2 ml. ofU.S.P. oleic acid and 3 ml. of mercury. The bottle is stopperedshaken for 5 minutes, and immediately compared, by transmittedlight, with the freshly shaken standard suspensions.
If the sample contains more than 1.0 mg. of free sulfur the suspension will be too dark for comparison with the standards.Such a test should be repeated with a smaller sample diluted withmercury-treated gasoline to 100 ml. and account taken of thedilution in the calculation.
The results may be expressed conveniently in parts of free sulfur per million or even by an arbitrary numerical system likemercury number-for example, 0.1 mg. of sulfur in 100 ml. ismercury number 1 and 1.0 mg. in 100 ml. is mercury number 10.
Frequently only a qualitative test is required. In such a caseagitating the undiluted sample with mercury is sufficient, as eventraces of free sulfur are indicated by formation of a black precipitate. A determination can be made in less than 10 minutes;a qualitative test in a minute. The quality of results is apparentin Table I. The practicability of the method was demonstratedby determining the free sulfur in 50 competitive gasolines selectedat random. Of these samples 28% showed 0 mg. of free sulfur per100-ml. sample, 12% traces, 12% less than 0.1 mg., 16% 0.1 mg.,14% 0.2 mg., 12% 0.3 mg., 2% 0.4 mg., 2% 0.8 mg., and 2% 1.0mg.
Table I. Free Sulfur Deterrnjnntfons on Knowns andUnknowns
Free Sulfur.Mg./100 Ml.
Added Found
o 00.2 0.20.4 0.40.6 0.51.0 1.02.0 2.03.0 3.14.0 3.8
o 00.5 0.41.0 0.92.0 1.94.0 3.9
II Base gasolines were treated with mercury to eliminate free sulfur beforeknown additions of sulfur were made.
DISCUSSION
The method is intended primarily for freshly sweetened gasoline, free of mercaptans and hydrogen sulfide. If applied toother samples, hydrogen sulfide should be removed by shaking thesample with acid cadmium chloride solution and filtering itthrough paper. Mercaptans do not interfere (1); this was confirmed in experiments with added butyl mercaptan.
Peroxides may react with mercury to form a dark precipitatewhich may interfere with this test. This method was developed
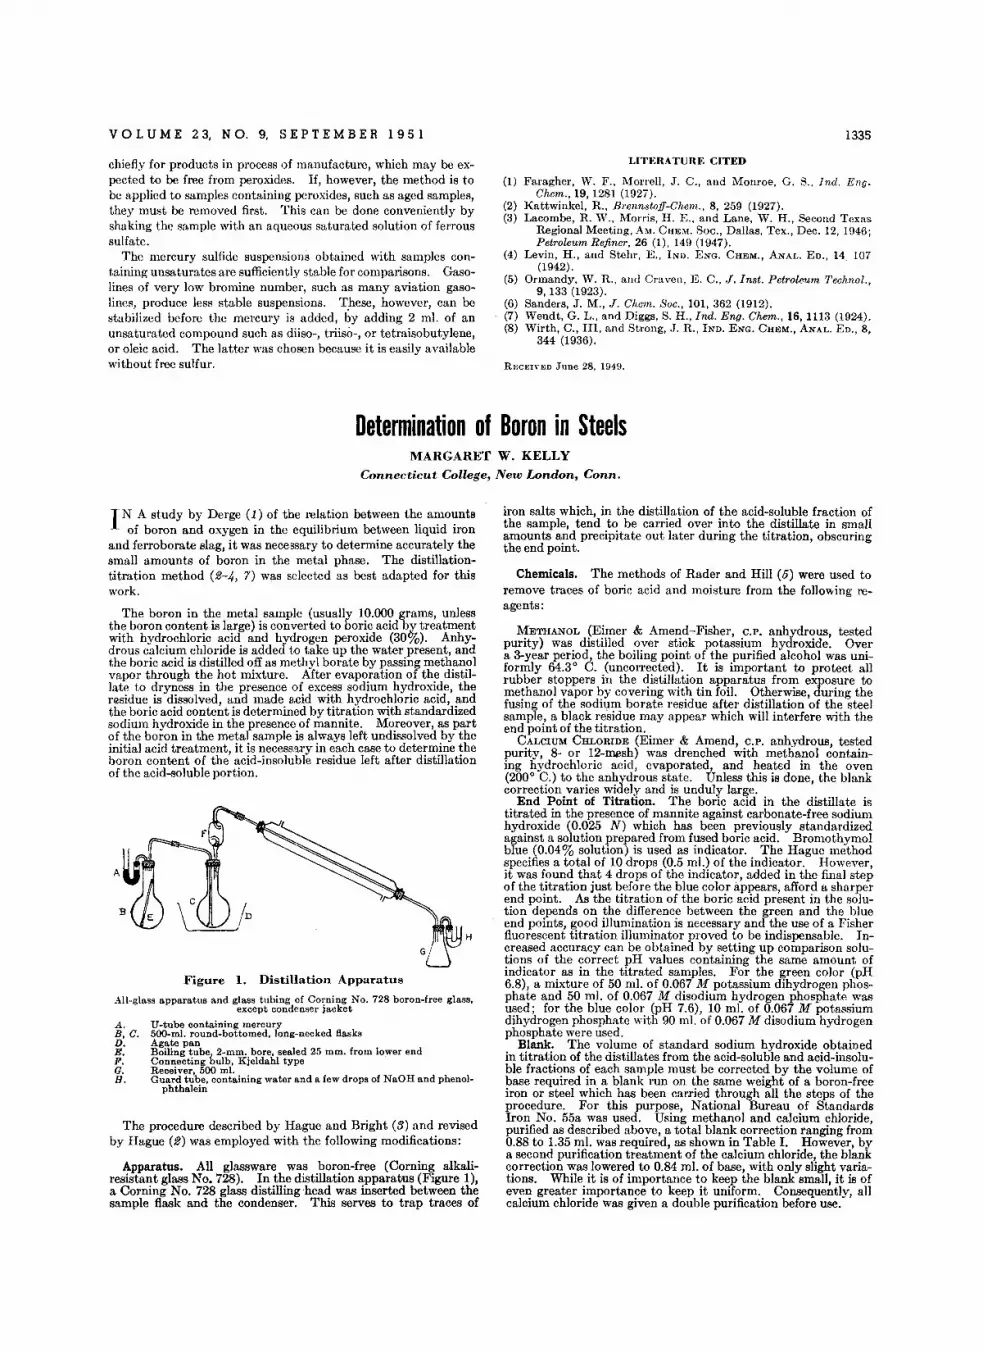
VOL U M E 2 3, N O. 9, S E PTE M B E R 1 95 1
chiefly for products in process of manufacture, which may be expected to be free from peroxides. If, however, the method is tobe applied to samples containing peroxides, such as aged samples,they must be removed first. This can be done conveniently byshaking the sample with an aqueous saturated solution of ferroussulfate.
The mercury sulfide suspensions obtained with samples containing unsaturates are sufficiently stable for comparisons. Gasolines of very low bromine number, such as many aviation gasolines, produce less stable suspensions. These, however, can bestabilized before the mercury is added, by adding 2 m!. of anunsaturated compound such as diiso-, triiso-, or tetraisobutylene,or oleic acid. The latter was chosen because it is easily availablewithout free sulfur.
1335
LITERATURE CITED
(1) Faragher, W. F., Morrell, J. C., and Monroe, G. Boo Ind. En(J.Chem., 19, 1281 (1927).
(2) Kattwinkel, R., Brennstoff-Chem., 8, 259 (1927).(3) Lacombe, R. W., Morris, H. E., and Lane, W. H., Second Texas
Regional Meeting, AM. CHEM. Soc., Dallas, Tex., Dec. 12, 1046;Petroleum Refiner, 26 (1), 149 (1947).
(4) Levin, H., and Stehr, Eo, IND. ENG. CHEM., ANAL. ED., 14 107(1942).
(5) Ormandv, W. R., and Craven, Eo C., J. Lnst. Petroleum Technol.,9,133 (1923).
(6) Sanders, J. M., J. Chern: Soc., 101, 362 (1912).(7) Wendt, G. L., and Diggs, S. H., Ind. Eng. Chem., 16, 1113 (1924).(8) Wirth, C., III, and Strong, J. R., IND. ENG. CHEM., ANAL. ED., 8,
344 (1936).
RECEIVED June 28, 1949.
Determination of Boron in SteelsMARGARET W. KELLY
Connecticu.t College, New London, Conn.
I N A study by Derge (1) of the relation between the amountsof boron and oxygen in the equilibrium between liquid iron
and ferroborate slag, it was necessary to determine accurately thesmall amounts of boron in the metal phase. The distillationtitration method (2-4, 7) was selected as best adapted for thiswork.
The boron in the metal sample (usually 10.000 grams, unlessthe boron content is large) is converted to boric acid by treatmentwith hydrochloric acid and hydrogen peroxide (30%). Anhydrous calcium chloride is added to take up the water present, andthe boric acid is distilled off as methyl borate by passing methanolvapor through the hot mixture. After evaporation of the distillate to dryness in the presence of excess sodium hydroxide, theresidue is dissolved, and made acid with hydrochloric acid, andthe boric acid content is determined by titration with standardizedsodium hydroxide in the presence of mannite. Moreover, as partof the boron in the metal sample is always left undissolved by theinitial acid treatment, it is necessary in each case to determine theboron content of the acid-insoluble residue left after distillationof the acid-soluble portion.
H
Figure 1. Distillation Apparatus
All-glass apparatus and glass tubing of Corning No. 728 boron-free glass,except condenser jacket
A. U-tube containing mercuryB, C. 500-ml. round-bottomed, long-necked flasksD. Agate panE. Boiling tube, 2-mm. bore, sealed 25 mm. from lower endF. Conneeting bulb, Kieldahl typeG. Receiver, 500 ml,H. Guard tube, containing water and a few drops of NaOH and phenol
phthalein
The procedure described by Hague and Bright (3) and revisedby Hague (2) was employed with the following modifications:
Apparatus. All glassware was boron-free (Corning alkaliresistant glass No. 728). In the distillation apparatus (Figure 1),a Corning No. 728 glass distilling head was inserted between thesample flask and the condenser. This serves to trap traces of
iron salts which, in the distillation of the acid-soluble fraction ofthe sample, tend to be carried over into the distillate in smallamounts and precipitate out later during the titration, obscuringthe end point.
Chemicals. The methods of Rader and Hill (5) were used toremove traces of boric acid and moisture from the following reagents:
METHANOL (Eimer & Amend-Fisher, C.P. anhydrous, testedpurity) was distilled over stick potassium hydroxide. Overa 3-year period, the boiling point of the purified alcohol was uniformly 64.3 0 C. (uncorrected). It is important to protect allrubber stoppers in the distillation apparatus from exposure tomethanol vapor by covering with tin foi!. Otherwise, during thefusing of the sodium borate residue after distillation of the steelsample, a black residue may appear which will interfere with theend point of the titration.
CALCIUM CHLORIDE (Eimer & Amend, C.P. anhydrous, testedpurity, 8- or 12-mesh) was drenched with methanol containing hydrochloric acid, evaporated, and heated in the oven(200 0 C.) to the anhydrous state. Unless this is done, the blankcorrection varies widely and is unduly large.
End Point of Titration. The boric acid in the distillate istitrated in the presence of mannite against carbonate-free sodiumhydroxide (0.025 N) which has been previously standardizedagainst a solution prepared from fused boric acid. Bromothymolblue (0.04% solution) is used as indicator. The Hague methodspecifies a total of 10 drops (0.5 ml.) of the indicator. However,it was found that 4 drops of the indicator, added in the final stepof the titration just before the blue color appears, afford a sharperend point. As the titration of the boric acid present in the solution depends on the difference between the green and the blueend points, good illumination is necessary and the use of a Fisherfluorescent titration illuminator proved to be indispensable. Increased accuracy can be obtained by setting up comparison solutions of the correct pH values containing the same amount ofindicator as in the titrated samples. For the green color (pH6.8), a mixture of 50 rnl. of 0.067 M potassium dihydrogen phosphate and 50 ml. of 0.067 M disodium hydrogen phosphate wasused; for the blue color (pH 7.6), 10 ml. of 0.067 M potassiumdihydrogen phosphate with 90 ml, of 0.067 M disodium hydrogenphosphate were used.
Blank. The volume of standard sodium hydroxide obtainedin titration of the distillates from the acid-soluble and acid-insoluble fractions of each sample must be corrected by the volume ofbase required in a blank run on the same weight of a boron-freeiron or steel which has been carried through all the steps of theprocedure. For this purpose, National Bureau of StandardsIron No. 5530 was used. Using methanol and calcium chloride,purified as described above, a total blank correction ranging from0.88 to 1.35 m!. was required, as shown in Table 1. However, bya second purification treatment of the calcium chloride, the blankcorrection was lowered to 0.84 ml, of base, with only slight variations. While it is of importance to keep the blank small, it is ofeven greater importance to keep it uniform. Consequently, allcalcium chloride was given a double purification before use.
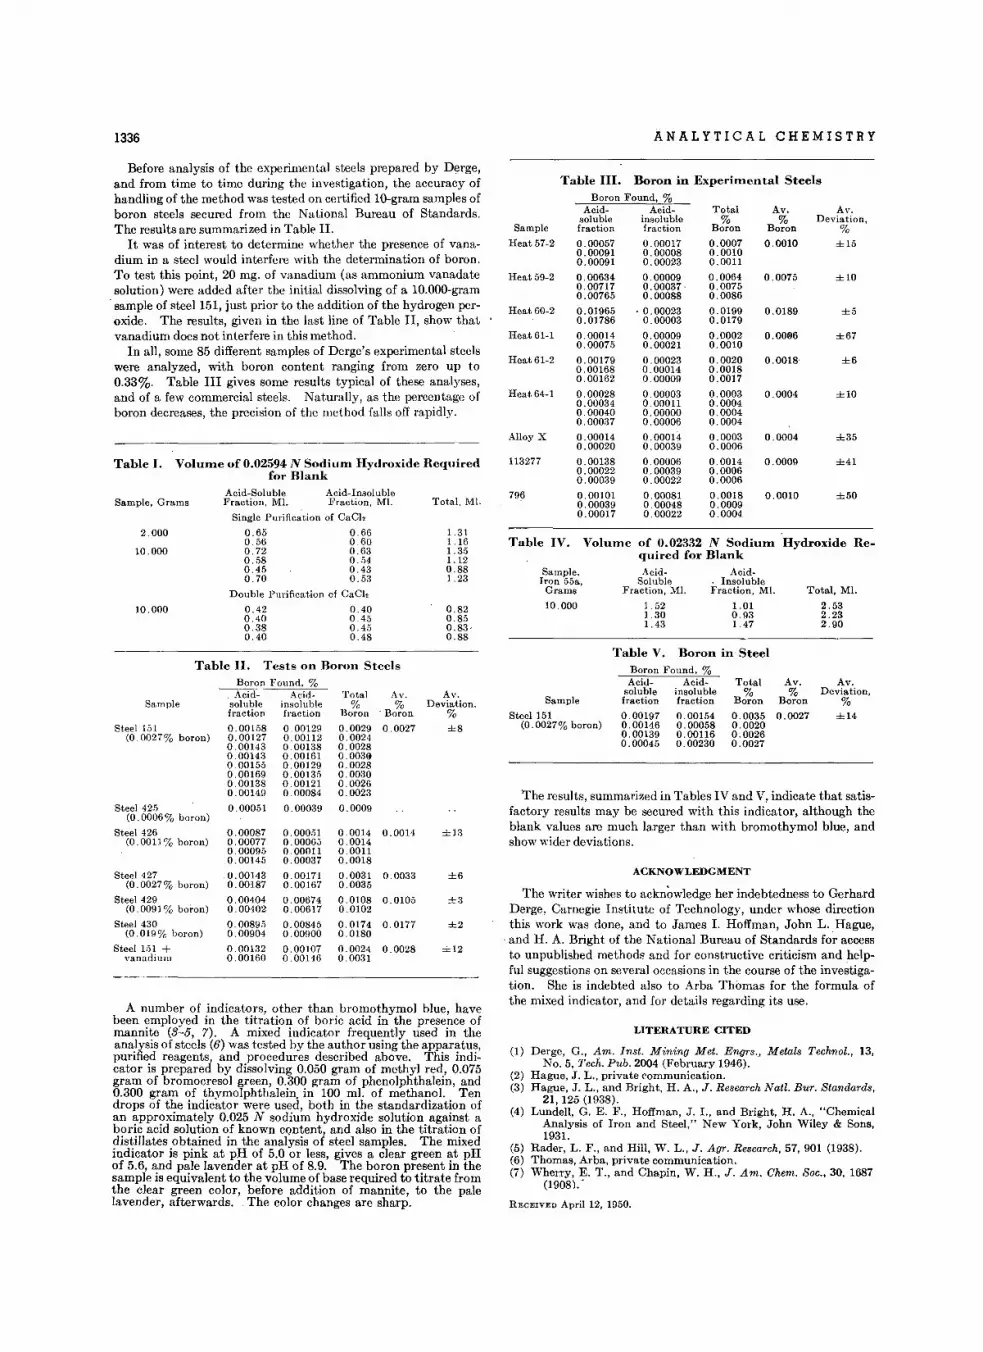
1336
Total, Ml.
2.532.232.90
Hydroxide Re-
1.010.931.47
1. 521.301.4.3
Volume of 0.02332 N Sodiumquired for BlankAcid- Acid-
Soluble . InsolubleFraction, Ml. Fraction, Ml.
ANALYTICAL CHEMISTRY
Table III. Boron in Experimental SteelsBoron Found, %
Acid- Acid- Total Av. Av.soluble insoluble % % Deviation,fraction fraction Boron Boron %0.00057 0.00017 0.0007 0.0010 ±150.00091 0.00008 0.00100.00091 0.00023 0.0011
0.00634 0.00009 0.0064 0.0075 ±1O0.00717 0.00037· 0.00750.00765 0.00088 0.0086
0.01965 ·0.00023 0.0199 0.0189 ±50.01786 0.00003 0.0179
0.00014 0.00009 0.0002 0.001ll6 ±670.00075 0.00021 0.0010
0.00179 0.00023 0.0020 0.0018 ±60.00168 0.00014 0.00180.00162 0.00009 0.0017
0.00028 0.00003 0.0003 0.0004 ±1O0.00034 0.00011 0.00040.00040 0.00000 0.00040.00037 0.00006 0.0004
0.00014 0.00014 0.0003 0.0004 ±350.00020 0.00039 0.0006
0.00138 0.00006 0.0014 0.0009 ±410.00022 0.00039 0.00060.00039 0.00022 0.0006
0.00101 0.00081 0.0018 0.0010 ±500.00039 0.00048 0.00090.00017 0.00022 0.0004
Sample,Iron 55a,
Grams
10.000
796
Heat 64-1
Alloy X
Sample
Heat 57-2
Heat 61-2
Heat 61-1
Table IV.
Heat 59-2
Heat 60-2
113277
0.820.850.83·0.88
1.311.161. 351. 120.881.23
Total, 1VI1.
0.400.450.4,';0.48
0.420.400.380.40
Double Purification of Ca Cl;
2.000
10.000
10.000
Sample, Grams
Table I. Volume of 0.02594 N Sodium Hydroxide Requiredfor Blank
Acid-Soluble Acid-InsolubleFraction, Ml. Fraction, Ml.
Single Purification of CaCl-
0.65 0.660.56 0.600.72 0.630.58 0.540.45 0.430.70 0.53
Before analysis of the experimental steels prepared by Derge,and from time to time during the investigation, the accuracy ofhandling of the method was tested on certified 10-gram samples ofboron steels secured from the National Bureau of Standards.The results are summarized in Table II.
lt was of interest to determine whether the presence of vanadium in a steel would interfere with the determination of boron.To test this point, 20 mg. of vanadium (as ammonium vanadatesolution) were added after the initial dissolving of a 1O.000-gramsample of steel 151, just prior to the addition of the hydrogen peroxide. The results, given in the last line of Table II, show thatvanadium does not interfere in this method.
In all, some 85 different samples of Derge's experimental steelswere analyzed, with boron content ranging from zero up to0.33%. Table III gives some results typical of these analyses,and of a few commercial steels. Naturally, as the percentage ofboron decreases, the precision of the method falls off rapidly.
A number of indicators, other than brornothymol blue, havebeen ~mployed in the tit:atio!!, o~ boric acid in the presence ofmanmte (3-5, 7). A mixed indicator frequently used in theanalysis of steels (6) was tested by the author using the apparatus,purified reagents, and procedures described above. This indicator is prepared by dissolving 0.050 gram of methyl red, 0.075gram of bromocresol green, 0.300 gram of phenolphthalein, and0.300 gram of thymolphthalein. in 100 ml. of methanol. Tendrops of t~e indicator were used, both in the standardization ofan approximately 0.025 N sodium hydroxide solution against aboric acid solution of known content, and also in the titration of?is~iIlates .obtftined in the analysis of steel samples. The mixedindicator IS pink at pH of 5.0 or less, gives a clear green at pHof 5.6, and pale lavender at pH of 8.9. The boron present in thesample is equivalent to the volume of base required to titrate fromthe clear green color, before addition of mannite, to the palelavender, afterwards. The color changes are sharp.
Table II.
RECEIVED April 12, 1950.
The results, summarized in Tables IV and V. indicate that satisfactory results may be secured with this indi~ator, although theblank values are much larger than with bromothymol blue, andshow wider deviations.
Av.Deviation,
%±14
Av.%
Boron
Totale:0.0035 0.00270.00200.00260.0027
0.001540.000580.001160.00230
0.001970.001460.001390.0004,5
Table V. Boron in SteelBoron Found, %Acid- Acid-
soluble insolublefraction fractionSample
Steel 151(0.0027% boron)
LITERATURE CITED
(1) Derge, G., Am.. Inst. Mining Met. Engrs., Metals Technol., 13,No.5, Teen. Pub. 2004 (February 1946).
(2) Hague, J. L., private communication.(3) Hague, J. L., and Bright, H. A., J. Research Nat!. Bur. Standards,
21,125 (1938).(4) Lundell, G. E. F., Hoffman, J. 1., and Bright, H. A., "Chemical
Analysis of Iron and Steel," New York, John Wiley & Sons,1931.
(5) Rader, L. F., and Hill, W. L., J. Agr. Research, 57, 901 (1938).(6) Thomas, Arba, private communication.(7) Wherry, E. T., and Chapin, W. H., J. Am. Chem. Soc., 30, 1687
(1908), .
ACKNOWLEDGMENT
The writer wishes to acknowledge her indebtedness to GerhardDerge, Carnegie Institute of Technology, under whose directionthis work was done, and to James I. Hoffman, John L. Hague,
. and H. A. Bright of the National Bureau of Standards fo~ accessto unpublished methods and for constructive criticism and helpful suggestions on several occasions in the course of the investigation. She is indebted also to Arba Thomas for the formula ofthe mixed indicator, and for details regarding its use.
Tests on Boron SteelsBoron Found, %Acid- Acid- Total Av. Av.
soluble insoluble % % Deviation,fraction fraction Boron . Boron %
0.00158 0.00129 0.0029 0.0027 ±80.00127 0.00112 0.00240.00143 0.00138 0.00280.00143 0.00161 0.003@000155 0.00129 0.00280.00169 0.00135 0.00300.00138 0.00121 0.00260.00149 0.00084 0.0023
0.00051 0.00039 0.0009
0.00087 0.000,')1 0.0014 0.0014 ±130.00077 0.00065 0.00140.0009,'; 0.00011 0.00110.00145 0.00037 0.0018
0.00143 0.00171 0.0031 0.0033 ±60.00187 0.00167 0.0035
0.00404 0.00674 0.0108 0.0105 ±30.00402 0.00617 0.0102
0.00895 0.0084,'; 0.0174 0.0177 ±20.00904 0.00900 0.0180
0.00132 0.00107 0.0024 0.0028 ±120.00160 0.00146 0.0031
Sample
Steel 1.5)(0.0027% boron)
Steel 425(0.0006 % boron)
Steel 426(0.0011% boron)
Steel 427(0.0027 % boron)
Steel 429(0.0091 % boron)
Steel 430(0.019% boron)
Steel 1.')1 +vanadium
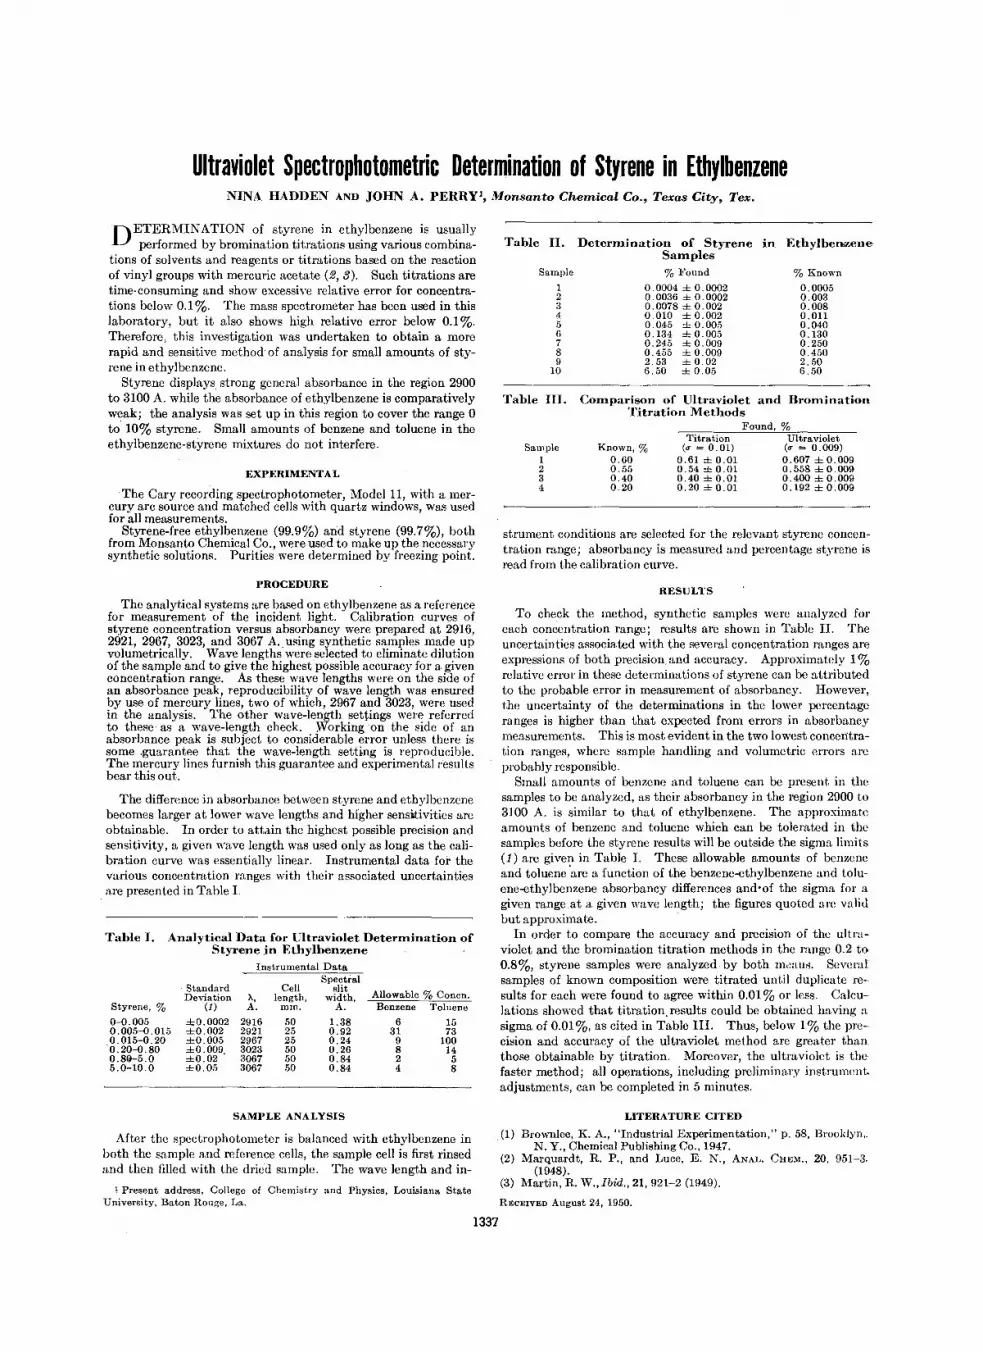
Ultraviolet Spectrophotometric Determination of Styrene in EthylbenzeneNINA HADDEN AND JOHN A. PERRyl, Monsanto Chemical Co., Texas City, Tex.
strument conditions are selected for the relevant styrene concentration range; absorbancy is measured and percentage styrene isread from the calibration curve.
Table II. Determination of Styrene in EthylbenzeneSamples
Sample % Found % Known
1 0.0004 ± 0.0002 0.00052 0.0036 ±0.0002 0.0033 0.0078 ±0.002 0.0084 0.010 ± 0.002 O.Oll5 0.045 ± 0.005 0.0406 0.134 ± 0.005 0.1307 0.245 ± 0.009 0.2508 0.455 ± 0.009 0.4509 2.53 ± 0.02 2.50
10 6.50 ± 0.05 6.50
Table III. Cornpar-lson of Ultraviolet and BrornjnrrtfonTitration Methods
DETERMINATION of styrene in ethylbenzene is usuallyperformed by bromination tit.rations using various combina
tions of solvents and reagents or titrations based on the reactionof vinyl groups with mercuric acetate (2, 3). Such titrations aretime- consuming and show excessive relative error for concentrations below 0.1 %. The mass spectrometer has been used in thislaboratory, but it also shows high relative error below 0.1%.Therefore, this investigation was undertaken to obtain a morerapid and sensitive method of analysis for small amounts of styrene in ethylbenzene.
Styrene displays strong general absorbance in the region 2900to 3100 A. while the absorbance of ethylbenzene is comparativelyweak; the analysis was set up in this region to cover the range 0to' 10% styrene. Small amounts of benzene and toluene in theethylbenzene-styrene mixtures do not interfere.
EXPERIMENTAL
The Cary recording spectrophotometer, Model 11, with a mercury arc source and matched cells with quartz windows, was usedfor all measurements.
Styrene-free ethylbenzene (99.9%) and styrene (99.7%), bothfrom Monsanto Chemical Co., were used to make up the necessarysynthetic solutions. Purities were determined by freezing point.
Sample1234
Known, %0.600.550.400.20
Titration(IT = 0.01)
0.61 ± 0.010.54 ±0.010.40 ±0.010.20 ± 0.01
Found, %Ultraviolet
(IT = 0.009)0.607 ± 0.0090.558 ± 0.0090.400 ± 0.0090.192 ± 0.009
PROCEDURE
The analytical systems are based on ethylbenzene as a referencefor measurement of the incident light. Calibration curves ofstyrene concentration versus absorbancy were prepared at 2916,2921, 2967, 3023, and 3067 A-.using synthetic samples made upvolumetrically. Wave lengths were selected to eliminate dilutionof the sample and to give the highest possible accuracy for a givenconcentration range. As these wave lengths were on the side ofan absorbance peak, reproducibility of wave length was ensuredby use of mercury lines, two of which, 2967 and 3023, were usedin the analysis. The other wave-length settings were referredto these as a wave-length check. Working on the side of anabsorbance peak is subject to considerable error unless there issome .guarantee that the wave-length setting is reproducible.The mercury lines furnish this guarantee and experimental resultsbear this out.
The difference in absorbance between styrene and ethylbcnzcnebecomes larger at lower wave lengths and higher sensitivities areobtainable, In order to attain the highest possible precision andsensitivity, a given wave length was used only as long as the calibration curve was essentially linear. Instrumental data for thevarious conccntration ranges with their associated uncertainties
. are presented in Table 1.
Table I. Analytical Data for Ultraviolet Deterlllination ofStyreneIn Ethylbenzene
Instrumental DataSpectral
Standard Cell slitAllowable % Ccncn.Deviation A, length, width,
Styrene, % (1) A. mrn. A. Benzene Toluene
0-0.005 ±0.0002 2916 50 1.38 6 150.005-0.015 ±0.002 2921 25 0.92 31 730.015-0.20 ±0.005 2967 25 0.24 9 1000.20-0.80 ±0.009. 3023 50 0.26 8 140.80-5.0 ±0.02 3067 50 0.84 2 55.0-10.0 ±0.05 3067 50 0.84 4 8
SAMI'LE ANALYSIS
After the spectrophotometer is balanced with ethylbenzene inboth the sample and reference cells, the sample cell is first rinsedand then filled with the dried sample. The wave length and in-
1 Present address, College of Chemistry and Physics, Louisiana StateUniversity, Baton Rouge, La.
1337
RESULTS
To check the method, synthetic samples were analyzed foreach concentration range; results arc shown in Table II. Theuncertainties associated with the several concentration ranges areexpressions of both precision. and accuracy. Approximately 1%relative error in these determinations of styrene can be attributedto the probable error in measurement of absorbancy. However,the uncertainty of the determinations in the lower percentageranges is higher than that expected from errors in absorbaneymeasurements. This is most evident in the two lowest coneentration ranges, where sample handling and volumetric errors arcprobably responsible.
Small amounts of benzene and toluene can be present in thesamples to be analyzed, as their absorbancy in the region 2900 to3100 A. is similar to that of ethylbenzene. The approximateamounts of benzene and toluene which can be tolerated in thesamples before the styrene results will be outside the sigma limits(1) are given in Table 1. These allowable amounts of benzeneand toluene 'are a function of the benzene-ethylbenzene and toluene-ethylbenzene absorbancy differences and-of the sigma for agiven range at a given wave length; the figures quoted arc validbut approximate.
In order to compare the accuracy and precision of the ultraviolet and the bromination titration methods in the range 0.2 to0.8%, styrene samples were analyzed by both means. Several'.samples of known composition were titrated until duplicate results for each were found to agree within 0.01 % or less. Calculations showed that titration. results could be obtained having asigma of 0.01 %, as cited in Table III. Thus, below 1% the precision and accuracy of the ultraviolet method are greater than.those obtainable by titration. Moreover, the ultraviolet is thefaster method; all operations, including preliminary instrument,adjustments, can be completed in 5 minutes.
LITERATURE CITED
(1) Brownlee, K. A., "Industrial Experimentation," p. 58, Brooklyn;N. Y., Chemical Publishing Co., 1947.
(2) Marquardt, R. P., and Luce, E. N., ANAl,. CHEM., 20, 951-3;(1948).
(3) Martin, R. W., Ibid., 21, 921-2 (1949).
RECEIVED August 24, 1950.

Determination of Nitrile-Type Nitrogen with Ordinary Kjeldahl DigestionCECIL H. VANETTEN AND MARY B. WIELE
Northern Regional Research Laboratory, Peoria, Ill.
N EARLY all published methods for the Kjeldahl determina-tion of nitrogen in nitrile-type compounds specify a reducing
treatment, usually with iodide ion, before the sulfuric acid digestion of the compound. Friedrich et al, (3) considered it necessaryto treat nitrile compounds with hydriodie acid in a sealed tube at200 0 C. in order to determine all the nitrogen present. They report analyses on only one nitrile compound which contained a nitroso group as well. The most recent work on use of reducingagents in the determination of nitrile nitrogen is that of Rose andZiliotto (6). They, however, were concerned only with a comparison of reducing agents, and reported no results on the determination without reducing treatment. Davis and Wiedeman(2) were able to determine acrylonitrile nitrogen by the ordinaryKjeldahl procedure.
Sulfuric acid hydrolyzes nitriles to the corresponding acid andammonia (5). Any reducing treatment, therefore, should beunnecessary in the Kjeldahl procedure. This paper presents results obtained when nitrile-type nitrogen was determined by theKjeldahl procedure without preliminary reducing treatment.
gen microdetermination. This capillary was crushed under thesulfuric acid with a stirring rod. When the sample was hydrolyzed in a sealed tube with 90% sulfuric acid before digestion,larger capillaries were used in which 10 to 20 mg. of the sampleand about 0.2 ml. of the acid were introduced. These sealedtubes were heated for 1 to 2 hours at 95 0 C. or held at room temperature as indicated in Table 1.
As was pointed out by Rose and Ziliotto (6), it was necessaryto use cdncentrated sulfuric acid because loss of nitrogen sometimes occurred if dilute sulfuric acid was used. For example,when 5 ml. of water were added to 1 ml. of acid before digestionin the determination of furonitrile and benzonitrile, over 90%of the nitrogen was lost. This was attributed to steam distillationof the compound.
Six of the compounds analyzed were analytical reagent grade orEastman White Label compounds. All others reported werecompounds prepared at this laboratory. Their purity was indicated by the Dumas nitrogen values reported or by carbon andhydrogen analyses. Aceto-, acrylo-, and benzonitriles were redistilled.
RESULTS
In the case of the volatile liquids, the sample was weighed in asmall capillary similar to the type used in the carbon and hydro-
The micro- and semimicro-Kjeldahl procedures used were essentially those described by Clark (1) except where otherwisenoted in Table 1.
15.05 ± O. 15 14.8 15.0526.01 ± 0.21 26.4226.31±O.18 26.4226. 45 ± O. 10 26. 4234.27±0.12 34.1534.07 ±0.21 34.1513.23±0.05 13.6013.08 ±0.07 13.60
e Acid hydrolyzed in sealed tube at 95 0 C.f Acid hydrolyzed in sealed tube at room
temperature.
3.92
13.089.52
11.9523.2016.6517.5526.6531. 8119.8925.5114.42
17.91
17.85
Theory,%
Results obtained from 72 determinations on 18 different nitriletype compounds are reported in Table 1. Average recovery ofnitrogen for the 18 compounds was 98.96%. For comparison, theaverage of 103 determinations on acetanilide (NBS No. 141), usedas a standard over a period of years, was 99.23% of theory(found 10.29%; theory 10.37%). As a further check on the accuracy and precision of the method, 22 replicate analyses were
run on the sodium salt of cyanoacetic acidwhich was shown by analysis to be pure (found:carbon 33.5%, hydrogen 1.90%, sodium 21.5%,nitrogen by Dumas 13.0%; theory: carbon33.6%, hydrogen 1.87%, sodium 21.5%, nitro-gen 13.08%). The arithmetical average of the22 Kjeldahl analyses was 12.88%, with a standard deviation of 0.11%. The arithmetical average of 10 analyses of the acetanilide samplerun at the same time as the sodium salt of cyanoacetic acid was 10.27% with a standard deviationof 0.08%.
Acrylo- and benzonitrile analyzed slightlybelow theory when digested directly in anopen Kjeldahl flask. These compounds andacetonitrile were reanalyzed using a sealed tubeas described to preclude loss by vaporization.This treatment at either 95 0 C. or room temperature gave the theoretical amount of nitrogenfor acrylonitrile but did not improve th~ results on benzonitrile. The acetonitrile gave theoretical results in both the open flask and sealedtube.
More than 98% of the theoretical nitrogenwas obtained in all the compounds reported except benzonitrile and cyanobenzoic acid, inwhich cases 96.3 and 96.8% of theory wasobtained. When these two compounds wereanalyzed by the hydriodic acid reduction procedure in an open flask, even lower values were obtained.
Following the work reported here, the methodwas used successfully on the macro scale inthe analysis of acrylonitrile derivatives of amino
Without
13.09.27
23.116.617.5
17.9
17.6
Nitrogenby Dumas,
%
3.97 ± 0.04
12.98±O.029.21 ±0.12
11.80 ± 0.2123.21 ±0.0516.35 ±0.1017.40 ± 0.0026.47 ±0.2831.60 ±0.1720.30 ± 0.3025.00 ±O.OO14.26 ± 0.10
17.48±0.07
17.76 ± 0.10
2
2
35532233223
38842232
Values Obtained on Nitrile CompoundsReducing Treatment
Nitrogen by Ordinary Kjeldahl, No. of Av.
deter- ± meanmina- deviation,tiona %
METHODS AND MATERIALS
Nitrogen
Compound
SolidsN a sal t of cyanoacetic acidCyanobenzoic acidaN -Cyanoethy I tyrosine bN-Dicyanoethyl glycineN-Cyanoethyl prolineN-Dicyanoethyl aspartic acidTricyanoethyl histidineTricyanoethyl amineK,Fe(CN)o.3H,Oc .KFe(CN)ocKSCNc
Table I.
CNI
CH,-CH/ '\.,
S N-CH,C.H,d
" /CH,-CH
6N
O- cooc.H'
-CHCNCOOC,H,
N-(a-cyanoethyl) glycine ethylester
Volatile liquidsFuronitrile b.p. 146 0 C.Acrylonitrile, b.p. 78 0 C.?Acrylonitrile, b.p. 78° C.".'Acrylonitrile, b.p. 78° c.aJAcetonitrile. b.p. 82° o.«Acetonitrile, b.p. 82° c.a,eBenzonitrile, b.p. 189° C."Benzonitrile, b.p. 189 0 C.". e
a Eastman White Label compound.h Macro Kjeldahl-Gunning-Arnold method.c Analytical reagent grade.d Willits, Coe, and Ogg modification (7).
1338
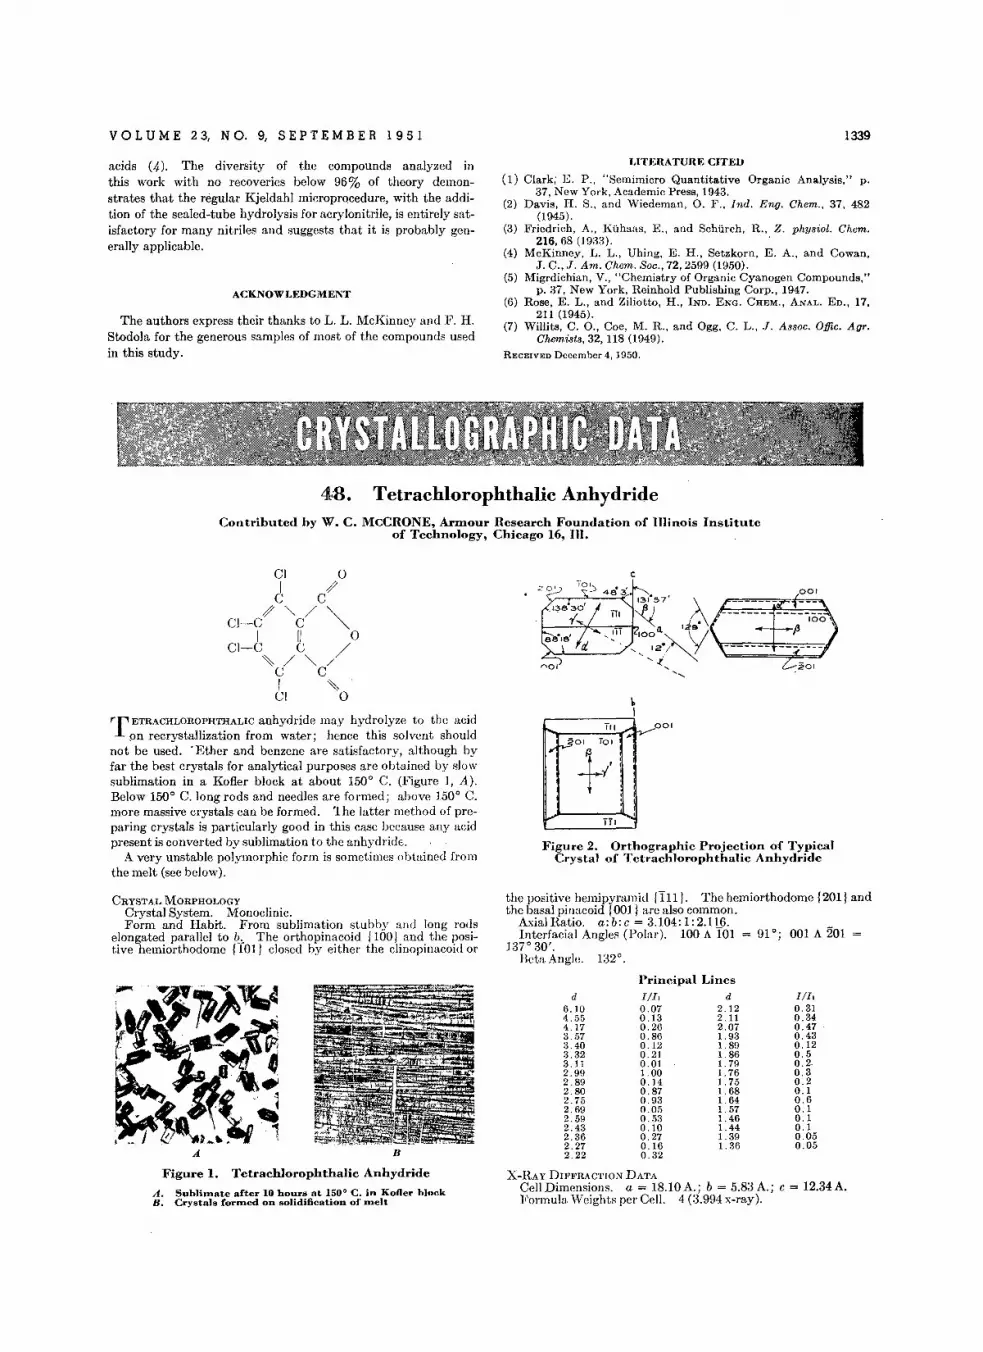
VOL U M E 2 3, N O. 9, S E PTE M B E R 1 9 5 1
acids en The diversity of the compounds analyzed inthis work with no recoveries below 96% of theory demonstrates that the regular Kjeldahl microprocedure, with the addition of the sealed-tube hydrolysis for acrylonitrile, is entirely satisfactory for many nitriles and suggests that it is probably generally applicable.
ACKNOWLEDGMENT
The authors express their thanks to L. L. McKinney and F. H.Stodola for the generous samples of most of the compounds usedin this study.
1339
LITERATURE CITEIJ
(1) Clark; E. P., "Semimicro Quantitative Organic Analysis," p.37, New York, Academic Press, 1943.
(2) Davis, H. S., and Wiedeman, O. F., Ind. Eng. Chem., 37, 482(1945).
(3) Friedrich, A., Kuhaas, E., and Sehiirch, R., Z. physiol. Chem.216,68 (1933).
(4) McKinney,L. L., Uhing, E. II., Setzkorn, E. A., and Cowan,J. C.,.T. Am. Chem. Soc., 72, 2599 (1950).
(5) Migrdichian, V., "Chemistry of Organic Cyanogen Compounds,"p. 37, New York, Reinhold Publishing Corp., 1947.
(6) Rose, E. L., and Ziliotto, II., IND. ENG. CHEM., ANAL. ED., 17.211 (1945).
(7) Willits, C. 0., Cae, M. R., and Ogg, C. L., J. Assoc. Offic. AUT.Chemists, 32,118 (1949).
RECEIVED December 4,1950.
4-8. Tetrachlorophthalic AnhydrideContributed by W'. C. McCRONE, Armour Research Foundation of Illinois Institute
of Technology, Chicago 16, Ill.
Cl 0I j/
C Cj/"/,,
CI-C C '"I II 0CI-C C /
""/"-/C CI ~,CI 0
Figure 2. Orthographic Projection of TypicalCrystal of Tctrachlorophthalic Anhydride
"r ETRACHLOROPHTHALIC anhydride may hydrolyze to the acidon recrystallization from water; hence this solvent should
not be used. 'Ether and benzene are satisfactory, although byfar the best crystals for analytical purposes are obtained by slowsublimation in a Kofler block at about 150° C. (Figure 1, A).Below 150° C. long rods and needles are formed; above 150° C.more massive crystals can be formed. 1he latter method of preparing crystals is particularly good in this case because any acidpresent is converted by sublimation to the anhydride,
A very unstable polymorphic form is sometimes obtained fromthe melt (see below).
Inf,301 Tal
I- +/:II
~Til 'i
001
CRYSTAL MORPHOLOGYCrystal System. Monoclinic.Form and Habit. From sublimation stubby and long rods
elongated parallel to b-,- The orthopinacoid {100) and the positive hemiorthodome (101) closed by either the clinopinacoid or
the positive bemipyramid {Ill J. The hemiorthodome {201} andthe basal pinacoid [DOl} are also common.
Axial Ratio, a: b: c = 3.104: 1: 2.116.Interfacial Angles (Polar). 100 A 101 = 91°; 001 A 201 =
137° 30'.BetaAngk 132°.
B
d6.104.554.173.573.403.323.112.9!J2.892.802.752.692.5!J2.432.362.272.22
Principal LinesI/Il d0.07 2.120.13 2.110.26 2.070.86 1.!J30.12 1.8!J0.21 1.860.01 1. 7!J1.00 1.760.14 1.750.87 1.680.!J3 1. 640.05 1.570.53 1.460.10 1.440.27 1.3!J0.16 1.360.32
I/I,0.310.340.470.430.120.50.20.30.20.10.60.10.10.10.050.05
Figure 1. Tetrachlorophthalic Anhydride
A. Sublirna~e af~er 10 hours at. 150 0 C. in Kofler blockB. Crystals furrned on solidificatJon of melt
X-HAY DIFFRACTION DATACell Dimensions. a = IS.10A.; b = 5.S3A.; c = 12.34A.Formula Weights per Cell. 4 (3.994 x-ray).
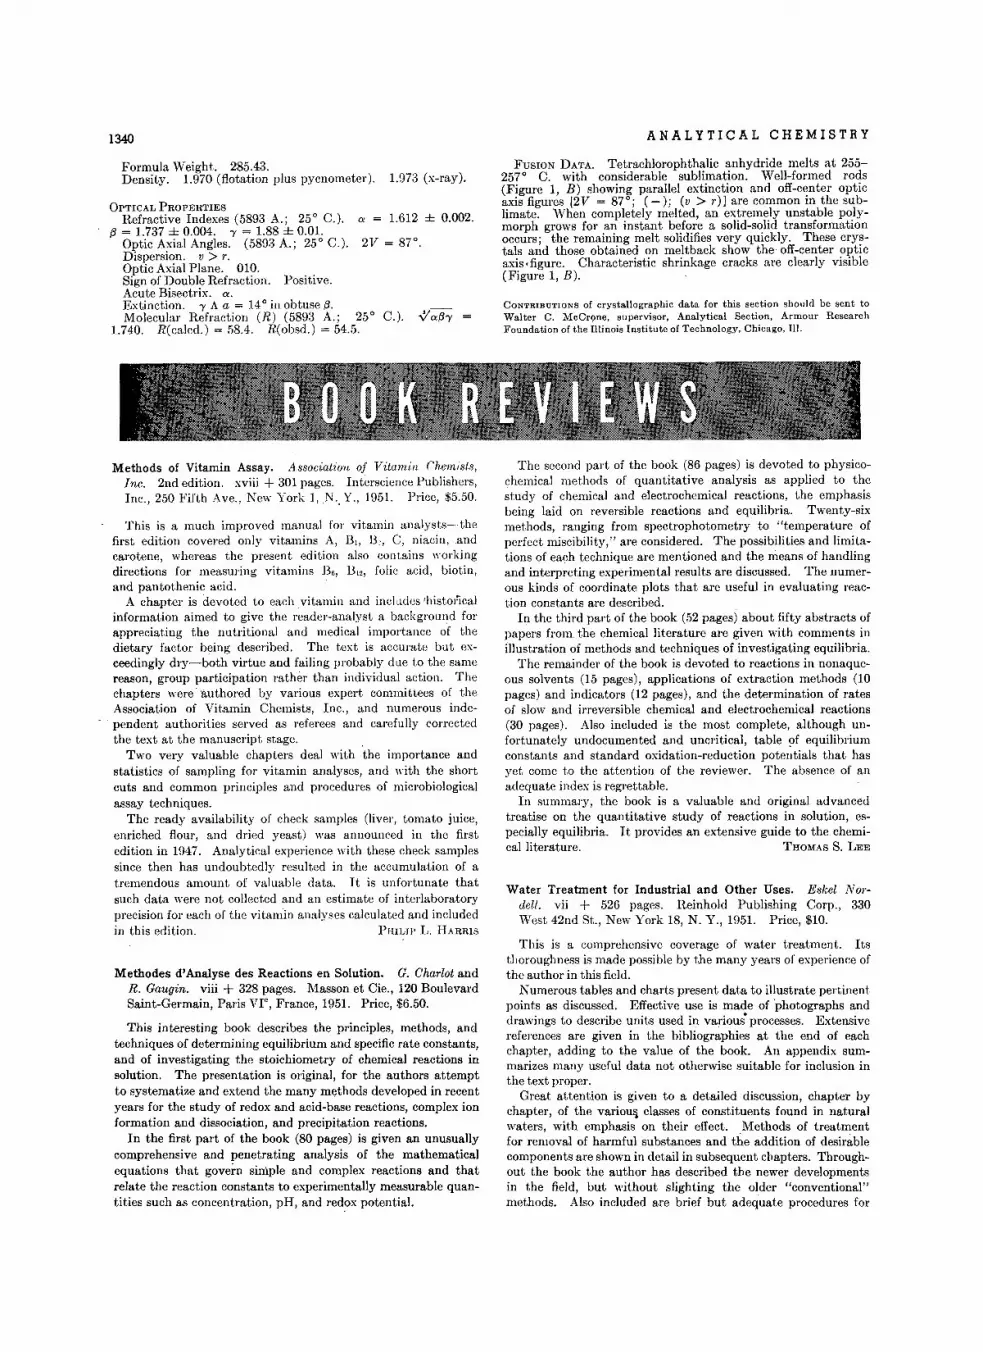
1340
Formula Weight. 285.43.Density. 1.970 (flotation plus pycnometer). 1.97:3 (x-ray).
OPTICAL PROPERTIESRefractive Indexes (5893 A.; 25° C.). '" = 1.612 ± 0.002.
{j = 1.737 ± 0.004. oy = 1.88 ± 0.01.Optic Axial Angles. (5893 A.; 25° C.). 2V = 87°.Dispersion. v > r.Optic Axial Plane. 010.Sign of Double Refraction. Positive.Acute Bisectrix. "'.Extinction. oy A a = 14° in obtuse {j.Molecular Refraction (R) (5893 A.; 25° C.). -,:;",{joy
1.740. R(calcd.) = 58.4. R(obsd.) = 54.5.
ANALYTICAL CHEMISTRY
FUSION DATA. Tetrachlorophthalic anhydride melts at 255257° C. with considerable sublimation. Well-formed rods(Figure 1, B) showing parallel extinction and off-center opticaxis figures [2V = 87°; (-); (v > r)] are common in the sublimate. When completely melted, an extremely unstable polymorph grows for an instant before a solid-solid transformationoccurs; the remaining melt solidifies very quickly. These crystals and those obtained on meltback show the off-center opticaxis. figure. Characteristic shrinkage cracks are clearly visible(Figure 1, B).
CONTRIBUTIONS of crystallographic data for this section should be sent toWalter C. MeCrone, supervisor, Analytical Section, Armour ResearchFoundation of the Illinois Institute of Technology, Chicago, Ill.
Methods of Vitamin Assay. Aesociation. of Vitam.in Chemists,Inc. 2nd edition. xviii + 301 pages. Interscience Publishers,Inc., 250 Fifth Ave., New York I, N., Y., 1951. Price, $5.50.
This is a much improved manual for vitamin analysts-thefirst edition covered only vitamins A, B
"B:, C, niacin, .and
carotene, whereas the present edition also contains workingdirections for measuring vitamins B6 , B 12 , folic acid, biotin,and pantothenic acid.
A chapter is devoted to each vitamin and includes -histoi'icalinformation aimed to give the reader-analyst a background forappreciating the nutritional and medical importance of thedietary factor being described. The text is accurate but exceedingly dry-both virtue and failing probably due to the samereason, group participation rather than individual action. Thechapters were "authored by various expert committees of theAssociation of Vitamin Chemists, Inc., and numerous independent authorities served as referees and carefully correctedthe text at the manuscript stage. .
Two very valuable chapters deal with the importance andstatistics of sampling for vitamin analyses, and with the shortcuts and common principles and procedures of microbiologicalassay techniques.
The ready availability of check samples (liver, tomato juice,enriched flour, and dried yeast) was announced in the firstedition in 1\.147. Analytical experience with these check samplessince then has undoubtedly resulted in the accumulation of atremendous amount of valuable data. It is unfortunate thatsuch data were not collected and an estimate of interlaboratoryprecision for each of the vitamin analyses calculated and includedin this edition. PHILIP L. HARRIS
Methodes d' Analyse des Reactions en Solution. G. Charlot andR. Gauqin. viii + 328 pages. Masson et Cie., 120 BoulevardSaint-Germain, Paris vr-, France, 1951. Price, $6.50.
This interesting book describes the principles, methods, andtechniques of determining equilibrium and specific rate constants,and of investigating thc stoichiometry of chemical reactions insolution. The presentation is original, for the authors attemptto systematize and extend the many methods developed in recentyears for the study of redox and acid-base reactions, complex ionformation and dissociation, and precipitation reactions.
In the first part of the book (80 pages) is given an unusuallycomprehensive and penetrating analysis of the mathematicalequations that govern simple and complex reactions and thatrelate the reaction constants to experimentally measurable quantities such as concentration, pH, and redox potential.
The second part of the book (86 pages) is devoted to physicochemical methods of quantitative analysis as applied to thestudy of chemical and electrochemical reactions, the emphasisbeing laid on reversible reactions and equilibria. Twenty-sixmethods, ranging from spectrophotometry to "temperature ofperfect miscibility," are considered. The possibilities and limitations of each technique are mentioned and the means of handlingand interpreting experimental results are discussed. The numerous kinds of coordinate plots that are useful in evaluating reaction constants are described.
In the third part of the book (52 pages) about fifty abstracts ofpapers from the chemical literature are given with comments inillustration of methods and techniques of investigating equilibria.
The remainder of the book is devoted to reactions in nonaqueous solvents (15 pages), applications of extraction methods (10pages) and indicators (12 pages), and the determination of ratesof slow and irreversible chemical and electrochemical reactions(30 pages). Also included is the most complete, although unfortunately undocumented and uncritical, table of equilibriumconstants and standard oxidation-reduction potentials that hasyet come to the attention of the reviewer. The absence of anadequate index is regrettable.
In summary, the book is a valuable and original advancedtreatise on the quantitative study of reactions in solution, especiallyequilibria. It provides an extensive guide to the. chemical literature. THOMAS S. LEE
Water Treatment for Industrial and Other Uses. Eskel Nordell. vii + 526 pages. Reinhold Publishing Corp., 330West 42nd St., New York 18, N. Y., 1951. Price, $10.
This is a comprehensive coverage of water treatment. Itsthoroughness is made possible by the many years of experience ofthe author in this field.
Numerous tables and charts present data to illustrate pertinentpoints as discussed. Effective use is made of 'photographs anddrawings to describe units used in various' processes. Extensivereferences are given in the bibliographies at the end of eachchapter, adding to the value of the book. An appendix summarizes many useful data not otherwise suitable for inclusion inthe text proper.
Great attention is given to a detailed discussion, chapter bychapter, of the variouq classes of constituents found in naturalwaters, with emphasis on their effect. Methods of treatmentfor removal of harmful substances and the addition of desirablecomponents are shown in detail in subsequent chapters. Throughout the book the author has described the newer developmentsin the field, but without slighting the older "conventional"methods. Also included are brief but adequate procedures for
VOL U M E 2 3, N O. 9, S E PTE M B E R 1 9 5 1
the analytical determinations that are required for quality control. The chemical reactions are given, including additional explanatory detail.
Special attention is given in one chapter to the general purpose of water usage, and methods of treatment for over threehundred types of industries. Another feature is the extent towhich the author has gone to show the mathematical relationships involved in water treatment.
The book is strongly recommended to every water treatmentchemist, engineer, and consultant. MERRILL L. RIEHL
Technical Publications, 1948. Arman E. Becker, editor.Standard Oil Co. (New Jersey) and Affiliated Companies, 15West 51st St., New York, N. Y., 1950. (Not for sale. Available for reference in college, industrial research, and publiclibraries.)
The Standard Oil Co. of New Jersey and its affiliated companieshave again presented a well-bound and well-printed volume oftechnical articles selected from those published by their employeesduring 1948. These are distributed into four approximatelyequal sections devoted to geology and production, manufacturingand fuel quality, rubber and plastics, and analysis.
Under the section on geology and production five papers arepresented. Primarily they are engineering in character and probably of more immediate concern to those dealing with productionand transportation of crude oil than to the geologist. The selection is good and affords a pertinent cross section of the problemtypes encountered in these fields. The papers on manufacturingand fuel quality include three on various aspects of the wartimeproject involving manufacture and use of xyliderie as an antiknock additive for aviation fuel. The section on rubber andplastics is the largest; the seven papers touch on chemical problems, vulcanization, physical testing, and product development.
Five of the six analytical papers are from the pages of ANALYTICAL CHEMISTRY. Two of them indicate the spreading use ofabsorption spectra in dealing with hydrocarbon mixtures. Alarge number of the papers are reprinted from otherjournals ofthe AMERICAN CHEMICAL SOCIETY, and as preface there is a heartening address by R. T. Haslam on the relation between peace andthe distribution of energy sources.
It is difficult to review the volume as a whole, because in such aselection there is little or no continuity, each paper standing byitself. Actually, the subject matter and treatment vary fromthe fundamental to the applied, and this is perhaps a fair arrangement because it pictures the wide interests of a large oil company.The management of the company and its employees are to becommended on the publication, its form, and its content.
W. A. GRUSE
Chemisch-Physikalische Vitamin-Bestimmungsmethoden fur dasChemische, Physiologische und Klinische Laboratorium(Chemical-Physical Methods for the Determination of Vitamins for Chemical, Physiological, and Clinical Laboratories).Fritz Gstirner. xii + 267 pages. Ferdinand Enke Verlag,Stuttgart, Germany, 1951. Price, 26.80 marks.
The author has brought together a rather large collection ofmethods for the estimation of vitamins in a variety of more orless well defined sources. For example, methods are given forthiamine ("aneurin") in plant and animal foods, yeast, milk,pharmaceuticals, tissues, blood, and urine. However, the bookis limited to chemical and physical procedures and no consideration at all is given to microbiological or animal assays even wheresuch methods (like those for vitamin D and various B vitamins)possess advantages of accuracy, if not precision. This probablyaccounts for the absence of methods for pantothenic acid andinositol and the paucity of data on vitamin B6 and biotin, although
1341
chemical methods, which are available for choline, nicotinamide,and vitamin BIZ are not included. Where several methods arepresented for the same determination, they are not criticallycompared. American readers will miss descriptions of or reference to procedures recognized in various official compendia andhandbooks.
References to original sources are numerous and show considerable attention to British and American publications; however,the index is inadequate.
The shortcomings of this volume are principally those of omission. Nevertheless, the number, variety, and technical detailsof the procedures presented justify its inclusion in the library ofthe vitamin analyst. BERNARD L. OSER
Introduction to Electron Optics. L. Jacob. x + 150 pages. JohnWiley & Sons, Inc., 440 Fourth Ave., New York 16, N. Y., 1951.Price, $2.00.
The appearance of this book is deceiving because, although it issmall in size, it is large in scope and very well written. By asimilar token the title is somewhat modest, in that the contents ofthe book comprise more than an introduction. In fact, the fullbenefits of the text will not be readily comprehended by a neophyte in the field of electron optics.
Chapter II provides excellent reading in its novel discussion ofFermat's and Hamilton's principles of "least time" and "leastaction," respectively. Not only have these old principles beenconsidered, but the newer theories and applications are adequately covered in the bibliography. Use of this bibliography issomewhat awkward, because the authors are not arranged alphabetically but rather in order of their mention in the particularchapter. The rather liberal use of illustrations tends to clarify thetext; however, in some cases the parameters are not properlyelucidated, so that the interpretation and significance of theillustrations are elusive.
Future readers of this book will gain confidence in its contentsprimarily because the author's knowledge and authority havebeen presented with finality. F. A. HAMM
Reagent Chemicals. 1950 Committee on Analytical Reagentsof the AMERICAN CHEMICAL SOCIETY, Edward Wichers, chairman. xiii + 401 pages. American Chemical Society, 1155Sixteenth St., N.W., Washington 6, D. C., 1951. Price, $5.00.
Unfortunately, commercial methods of producing most chemicals may not yield a product having a degree of purity adequatefor certain uses, such as reagents in the laboratory. For morethan a third of a oentury the AMERICAN CHEMICAL SOCIETY hasconcerned itself with the problem of recommending methods forascertaining the nature and the amount of impurities likely tooccur in the more common, refined reagent chemicals.
Much devoted service, on the part of committee members, hasbeen given to this project. This book, a cumulative report bythe current committee, is by far the most comprehensive yet published. It covers some 175 reagents.
An introductory section of 17 pages, entitled Definitions, Procedures, and Standards, describes the general methods .and materials to be used for the test procedures given later for eachchemical.
Then follow, alphabetically by name, the chemicals selected.They range from acetic acid to zinc sulfate. In each case thematerial included is divided into two sections: (1) requirements,or the specification of properties, such as color and clarity, and ofthe maximum permissible amount of likely impurities; (2) tests,or the operating directions for making each of the recommendeddeterminations. Some blank space is provided after the direc-

1342
tions for each chemical for the user to record notes on the procedure.
To the best of the writer's knowledge, the methods recommended are clearly stated, are suitable for the purpose designed,and have been adequately tested. However, as a skepticalchemist, he would venture several questions. What is the possibility, in a given case, of encountering some significant constituent not listed? Are the specifications and the test proceduresadequate for reagents to be used in micro and ultramicro procedures? To what extent are more sensitive tests feasible orneeded? Possibly there are more important questions.
Since this publication enjoys Society prestige, the reviewerwould have suggested the consistent use of I.U.C. nomenclature. At present the names of several organic compounds donot seem specific. Also, a more specific title would seem appropriate.
The book in its present excellent format and binding shouldlargely extend the use of these important testing methods. Thereviewer recommends it to all who are concerned with checkingthe quality of these reagents. M. G. MELLON
Elements of Optical Mineralogy. Part II. Descriptions ofMinerals. A. N. Winchell. 4th ed. 551 pages. John Wiley& Sons, Inc., 440 Fourth Ave., New York 16, N. Y., 1951.Price, $12.50.
The important developments in mineralogy in recent decadeshave demanded a thorough revision of the 1933 edition of thiswell-known and widely used book. The work is primarily areference for microscopic petrography and will probably be oflittle use to the chemist. The book follows the general outlineof the earlier edition. Changes have been made in arrangementand classification of minerals and a vast number of new datahave been added. The inclusion of the space group and unitcell dimensions for each mineral is a good feature. One outstanding quality of the work is the great number of variation diagramswhich relate the optical properties of minerals to their chemistry.The number of these diagrams is more than doubled in the recent edition. About 75 pages (out of the total 551) are devotedto the feldspar group, and justly so: It is surprising, however,that the author no more than mentions the fact that the opticalorientation of plagioclase in volcanic rocks differs from that ofplagioclase in low temperature rocks.
The reviewer made no attempt to check the work for accuracy,but considering the vast number of data compiled in this work itwould be most surprising if there were not at least a reasonablenumber of errors. On the whole the book is a very reliable sourceof information, and it will continue to be one of the standardreference works in this country and abroad.
CARLETON A. CHAPMAN
X-Ray Identification and Crystal Structures of Clay Minerals.G. W, Brindley, editor. 345 pages. The MineralogicalSociety, British Museum, London, England, 1951. Price, $6.
This book is a cooperative effort to which a number of theworld's outstanding workers in clay mineralogy have contributed.Beginners will find it a complete and authoritative introductionto this difficult subject, while the experienced worker will welcomeit as a convenient handbook and a reference source for the moreobscure topics in the field. The reviewer considers it to be atimely and most worthwhile contribution, and enthusiasticallyrecommends it.
Among the most ust(ul and important aspects of the book are:the critical evaluation and examination of the subject matter andexperimental data by the various authors; the convenient tablesof data for use in identification; the explicit instructions for
ANALYTICAL CHEMISTRY
identification of each mineral, and also for mixtures; the complete reference lists at the ends of the chapters; the three-partindex consisting of a mineral and substance index, a subject index, and a name (author) index; and the many good line drawingsand well reproduced halftones of diffraction patterns.
The reviewer observed very few errors, and is disturbed by onlyone instance; the d spacings used throughout the book for thefirst two lines of the quartz patterns apparently need revision.
HAROLD P. KLUG
Instrumental Methods of Analysis. H. H. Willard, L. L. Merritt, Jr., and' J. A. Dean. 2nd ed. 344 pages. D. VanNostrand Co., Inc., 250 Fourth Ave., New York 3, N. Y., 1951.Price, $5.50.
The review of this book can perhaps best begin by borrowingfrom the preface: "The text remains primarily an introductionto the use of the various instruments and the methods associatedwith them in analytical chemistry. It is the only text availablewhich gives working directions for typical laboratory experimentsin this important branch of analytical chemistry."
The inclusion of a large number of representative instrumentsin the various chapters has resulted in the inclusion of too muchdetail dealing specifically with the instrumentation, with a resultant loss or overshadowing of the fundamental principle andtheoretical concept to be derived from a particular method underconsideration. The student becomes flooded, and hence lost, bya wealth of detail and diagrams over a great number of instruments and is inclined to lose sight of the primary principle withwhich the particular section of the book is dealing. For example,on part of pages 1 and 2, a tremendous amount of definition ofsymbols and terms, etc., is brought to the student's attention before he is acquainted with the fundamental laws and principles towhich the section is devoted. This material, though very valuable, might better serve its purpose if it were included just aheadof the laboratory discussions, incorporated in the form of footnotes, or used in an appendix. Many of the schematic diagrams,for example, on pages 107 and 124, are far more elaborate thanthe student's previous preparation will permit him to understandor appreciate. Block diagrams in many instances would conserve his time and be more effective.
This book is unquestionably an improvement over the firstedition. A work of this kind is extremely difficult at best and theauthors have done creditable work in attacking a difficult task.
A. R. CHOPPIN'
Subject Index to Bibliography, of Scientific and IndustrialReports. Nina Holt Bradshaw. Part 2, Analytical Chemistry. 163 pages. Technical Information Service, 732 Woodward Bldg., Washington 5, D. C., 1951. Price, $5.
At the close of World War II, the U. S. Government hadthousands of scientific and technical reports brought to thiscountry from Germany. In addition, many British and American companies sent teams to Germany to investigate the statusof German science. The reports prepared by these teams, aswell as documents from civilian and military agencies of theUnited States and cooperating foreign governments, wereturned over to the Office of Technical Services for dissemination.To date, close to 200,000 technical documents have been processed.
Much of the material processed by OTS has been listed orabstracted in the Government's Bibliography of Scientific andIndustrial Reports. With this great volume of informationavailable, a comprehensive subject index was needed. TheTechnical Information Service, a private organization, is fillingthat need by issuing a series of indexes which will total 12 volumes.The first index, on agricultural chemicals, was published in June
VO L U M E 23, N O. 9, SE PTE M B E R 1 95 1
1950. Now the second volume, an index to the reports coveringanalytical chemistry, has been released. The remaining indexes--Qn such subjects as chemical engineering and equipment,detergents, dyes, inorganic chemicals, and ordnance chemicalswill be published in the months ahead.
The index on analytical chemistry is divided into five sections.The first section, a subject index, covers 402 basic reports andcontains 4835 entries, to which there are about 16,000 annotations. Section 2, a numerical index, lists the titles of the reports,names of authors, andcorrelations. Section 3 contains an indexto authors, agencies, and companies, while Section 4 providescorrelations with PB numbers. Section 5 includes abstracts onselected BIOS and FIAT microfilm reels.
The scientific and technical reports treated by this latest indexcontain a wealth of information of value to the analytical chemist.This well-prepared volume, which will save research workershours of tedious literature searching. provides a key to thetreasure chest.
Water Supply and Treatment. Charles P. Hoover. Bulletin211, 7th ed. xi + 211 pages. National Lime Association,925 Fifteenth St., Washington 5, D. C., 1951. Price, $1.25 pluspostage.
This seventh edition of the publication, first issued in 1934,maintains its tradition of concise comprehensive reporting of current practices in the field of water supply and treatment. Thechapters cover the subject from sources of supply, through treatment to methods of analysis. Practically everything is out ofthe long experience of the author in the design and operation. ofnotable water treatment plants. Besides charts, plant layouts,photographs, and diagrams of equipment, the illustrations include multicolored diagrams which show relationships not easilygrasped without the color.
Changes from the 1946 edition include additional discussionof handling of softening sludge, features of carbonation, polystyrene base exchangers, and the Verse nate method of determininghardness.
The quality of paper required by the illustrations and the superior job of bookmaking are in line with the character of the text.The substantial cloth binding will enable the book to stand upunder the constant use it will meet in water treatment plantsand in classrooms, laboratories, and libraries of educational institutions. W. D. COLLINS
Experimental Spectroscopy. R. A. Sawyer. 2nd ed. 368pages. Prentice-Hall, Inc., 70 Fifth Ave., New York, N. Y.,1951. Price, $6.65.
Since the appearance of the first edition in 1944, this book hasreceived wide acceptance in both academic and industrial circles.Aimed mainly at students and research workers, it has become astandard reference source. The bibliographies and references arewell chosen and the original material is ably and authoritativelypresented. Neither a highly theoretical treatise nor a cookbookof procedures, it achieves an excellent compromise between thetwo.
The second edition differs from the first .in the inclusion of anumber of more recent references and a slight expansion of thesections on light sources, optics of prism and grating spectrographs, infrared instruments, and vacuum ultraviolet spectroscopy. The final chapter on "Spectrochemical Analysis" wasnoticeably improved by the inclusion of some of the recent developments from the field of industrial analysis.
All in all, the revisions are not extensive enough to make thefirst edition obsolete and one could not recommend discarding thefirst in favor of the second. However, this is more indicative of
1343
the fine job which Sawyer did initially than of any particular deficiency in the revised edition.
This is one of the five or six mutually complementary booksonapplied spectroscopy which should appear on the shelves of everytechnical library and laboratory having a direct or indirect connection with applied spectroscopy. J. R. CHURCHILL
Progress in Chromatography 1938-1947. L. Zechmeister.xviii + 368 pages. John Wiley &Sons, 440 Fourth Ave., NewYork 16, N. Y., 1951. Price, $8.
This progress report on chromatography is what one wouldexpect from one of the pioneers in the field. It continues the traditions set by the author's earlier monograph with L. Cholnoky,"Principles and Practice .of Chromatography," which greatlystimulated interest and research in this field. It is to be regretted, perhaps, that the author has chosen to limit the treatment to -the work done during a 9-year interval because, at thepresent pace, it is likely that an equal amount of work has beenpublished in the few intervening years.
The book is eminently practical, for while the author, likemost chromatographers, awaits the day when much of chromatographic practice can be put on a rational basis, the theoreticaltreatments "have had so far a limited influence only on experimentation which has still remained essentially empirical."
After a chapter on principles, there is a second on methods.followed by a special section of 23 chapters devoted to specificclasses of substances, including one on inorganic chromatography.An excellent feature of the book is the author's description ofmethods, wherein sufficient details are given to enable one to testthe method without recourse to the original reference. In thisrespect, a nice balance is maintained between the "cookbookrecipe" and vague generalization. There are a name index andgeneral index and 39 pages of bibliography with well over 1000references. Binding and typography are good; the paper givesa faint hint of impending war.
It is to be hoped that Zechmeister will continue not only hisresearches in this field, but also his contributions to its permanentliterature. DORIS L. CLEGG
Standard Methods for Testing Tar and Its Products. 3rd edStandardization of Tar Products Tests Committee, 166 Piccadilly, London, W.1, England, 1950. Price, lOs Od., postage9d. extra,
The book contains methods that have been adopted by theStandardization of Tar Products Tests Committee, which represents a group of British organizations interested in tar andproducts derived therefrom.
This third edition is a thorough revision of the previous editionwhich appeared in 1938. The book is a group effort, the varioussections being revised by different panels. It is interesting to notehow some groups made progress during the 12-year interim between the two editions.
The determination of water in the coal tar bases now makes useof the Dean and Stark apparatus, a real improvement. However,in the determination of anthracene, filter paper is still used toseparate the anthraquinone from the oxidation mixture, eventhough sintered-glass crucibles are used for the determination ofthe insoluble matter in creosote oil.
In determining the softening point of pitch by the ring and ballmethod, a tapered ring is used, whereas our corresponding ASTMprocedure, E 28-42 T, now uses a shouldered ring. While theBritish in using the half-inch cube test for pitch suspend six cubesat one time in the bath, our ASTM D 61-38 procedure still usesonly one cube at a time.
The book will be of interest and value to all processors of coaltar. F. E. CISLAK
1344
Chemical Analysis of Foods and Food Products. Morris B.Jacobs. 2nd ed. xxiv + 902 pages. D. Van Nostrand Co.,Inc., 250 Fourth Ave., New York, N. Y., 1951. Price, $9.
This edition represents a considerable expansion of the originalwork, and contains 365 more pages. Five new chapters"Chemical Food Poisoining," "Vegetable Products," "Flavor andQuality Measurement," "Filth and Decomposition in Foods," and"Field Tests"-have been added, and one on alcoholic beverages'has been dropped. Although the old chapters have not been completely rewritten, much new material has been added. Examplesare a discussion of chromatography in the "Physical Methods"chapter, the listing of a number of the newer vitamins (includingB12) in' the vitamin chapter, and the addition of methods formonochloroacetic and propionic acids, thiourea, and quaternaryammonium compounds to the chapter on preservatives.
Whim Jacobs' book first appeared it invited comparison withLeach's "Food Inspection and Analysis," the fourth edition ofwhich had been published 18 years before, and with Woodman's"Food Analysis." It is more comprehensive than Woodman(which was written primarily as a classroom textbook), particularly with regard to the details of analytical methods, many ofwhich have been taken verbatim from the A.O.A.C. "Methodsof Analysis." It cannot on the other hand be considered a modernreplacement for Leach's monumental work because its descriptionof food products and their composition is much more limited.Leach will still remain the Bible of the food chemist, out of dateas it is, but this second edition of Jacobs' book will be a valuableaddition to the library of anyone concerned with food analysis.Two of its most valuable chapters are those on "Chemical FoodPoisoning" and "Field Tests"; the present reviewer has not seenas complete a discussion of these subjects in any other book.
HARRY J. FISHER
NEW BOOKS1950 Supplement to Book of ASTM Standards Including Tenta
tives. American Society for Testing Materials, 1916 Race St.,Philadelphia 3, Pa., 1951. $21 for complete set of six parts.Part 1. Ferrous Metals. x + 316 pages. $3.50. Part 2. NonFerrous Metals. x + 223 pages. $3.50. Part 3. Cement,Concrete, Ceramics, Thermal, Insulation, Road Materials,Waterproofing, Soils. xiii + 350 pages. $3.50. Part 4.Paint, Naval Stores, Wood, Adhesives, Paper, ShippingContainers. x + 340 pages. $3.50. Part 5. Textiles, Soap,Fuels, Petroleum, Aromatic Hydrocarbons, Antifreezes,Water. xvi + 579 pages. $3.50. Part 6. Electrical Insulation, Plastics, Rubber. x + 284 pages. $3.50.
A Source Book of Technical Literature on Fractional Distillation.259 + 129 pages. Gulf Research and Development Co., P. O.Box 2938, Pittsburgh 30, Pa., 1951. Not for sale. No cost toteachers and graduate students of chemical engineering.
Crystal Structures. Ralph W. G. Wyckoff. Vol. 2. 253 textpages, 74 illustrations, 256 pages of tables. Interscience Publishers, Inc., 250 Fifth Ave., New York 1, N. Y., 1951. $10.
Symposium on Analyses Relating to Manufactureof Butadiene
The Office of Rubber Reserve and Tech~ical Committee H ofASTM D-2 are jointly sponsoring a symposium to be held inFebruary 1952 at Washington, D. C., on methods of analysis relating to the manufacture of butadiene
A N A L Y TIC ALe H EM I ST R Y
It is planned to build the program around papers falling into thefollowing categories:
Chemical Methods of Analysis. Routine control methods aswell as modifications of current Rubber Reserve methods that areused in all steps and phases of butadiene manufacture. Alsomethods used in petroleum and chemical laboratories for otherlight hydrocarbons but applicable to the manufacture of butadiene.
Physical Methods of Testing. Methods of analysis involvinglow and high temperature fractionation, polarography, spectroscopy, chromatography, absorption, adsorption refractometry,etc.
Apparatus. Simple or specialized apparatus, operated manually or automatically, being used for control purposes or specification testing on intermediate or finished product streams.
Anyone desiring more information or having a paper to presentshould contact the program chairman, B. J. Heinrich, PhillipsPetroleum Co., Bartlesville, Okla.
Philadelphia Analytical and Microchemical GroupThe Analytical and Microchemical Group, Philadelphia Sec
tion, AMERICAN CHEMICAL SOCIETY, plans a meeting on October4 at 8 P.M. .at the Philadelphia Museum School of Art, Broadand Pine Sts., Philadelphia. Ernest G. Wollish, Products Control Laboratory, Hoffmann-La Roche, Inc., Nutley, N. J., willspeak on "Titrations in Nonaqueous Solutions."
International Congress on Analytical ChemistryThe International Congress on Analytical Chemistry is to meet
at Oxford, England, from September 4 to 9, 1952. Three mainlectures by eminent chemists have been arranged. The programof the scientific sessions is in the hands of a Programme Committeeunder the chairmanship of G. M. Bennett; L. W. Codd ishonorary secretary.
Papers will be issued in preprint form before the meeting, andthe contributors will give only a brief summary of their papers,as most of the time will be given over to discussion. Arrangements have been made to publish the proceedings in a specialnumber, or numbers, of the Analyst as soon as possible after thecongress.
Working demonstrations illustrating new techniques or specialapplications of older techniques in analytical chemistry areplanned, in addition to a trade exhibition of apparatus and booksunder the management of W. Thompson of Imperial College.Plant visits and excursions to places of interest will be arranged.
Honorary secretary of the congress is R. C. Chirnside, ResearchLaboratories, General Electric Co., Ltd., Wembley, England.
Society for Applied Spectroscopy. Socony-Vacuum TrainingCenter, 63 Park Row, New York, N. Y., October 2, 1951
Scientific Apparatus Makers AssociationRecorder-Controller Section, Absecon, N. J., October 9 to 12.Industrial .Instr-ument Section, Absecon, N. J., October
18 and 19 .Laboratory Apparatus, Optical, Nautical, Aeronautical
and Military Instrument Sections, New York, N. Y.,November 28 to 30
Electron Microscope Society of America. Franklin Institute,Philadelphia, Pa., November 8 to 10, 1951. Ninth annualmeeting, exhibit of electron micrographs, and Symposiumon Elementary Electron Optics and Factors Effecting theElectron Microscopical Image
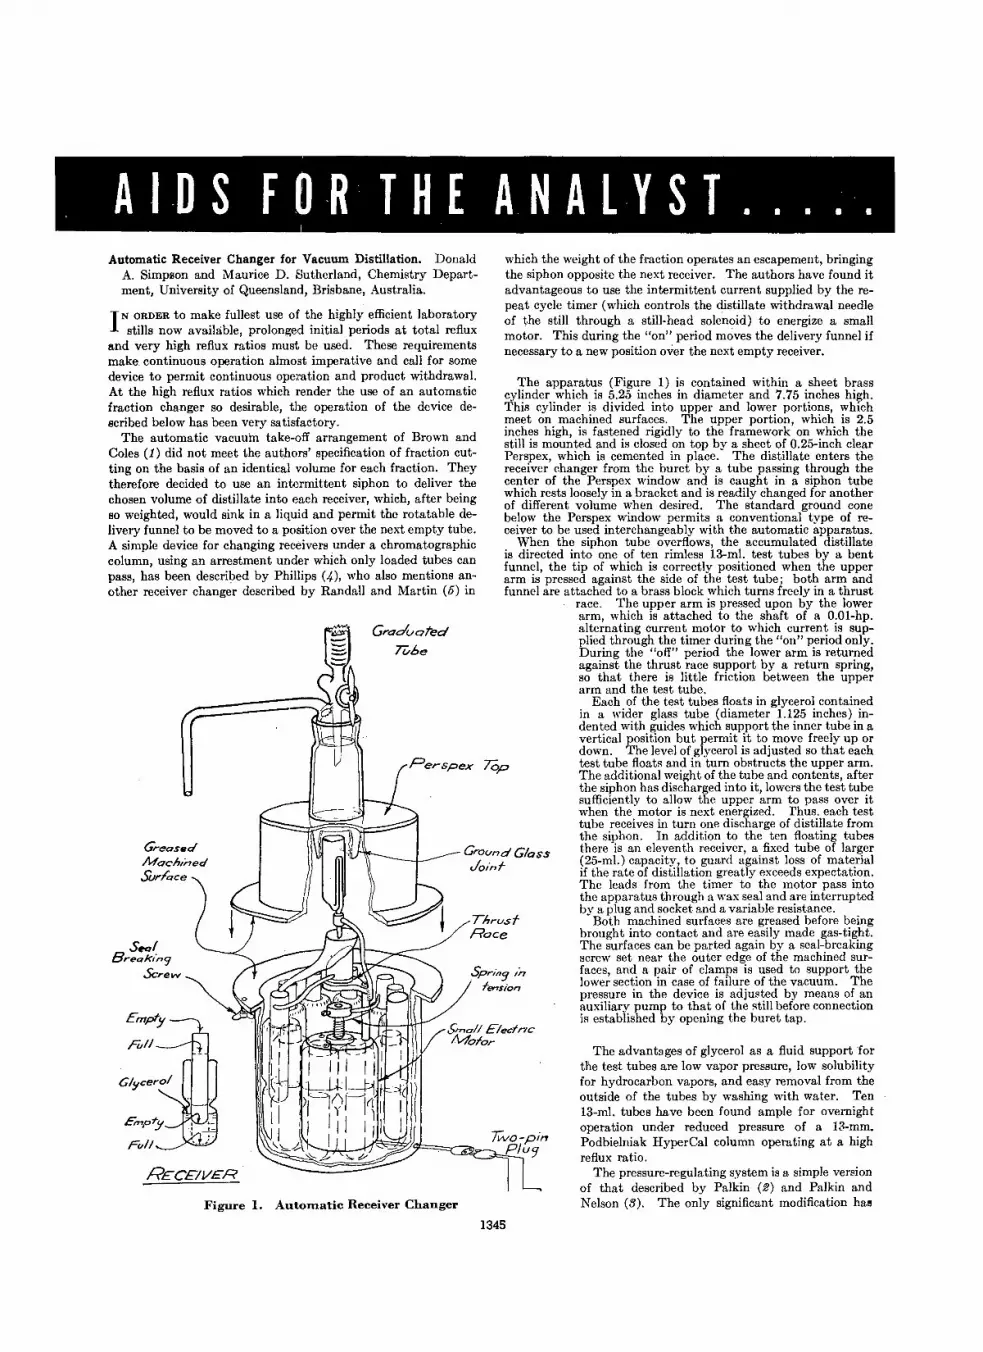
· AI ·0 S FO·R THE ANALYST. . . . .Automatic Receiver Changer for Vacuum Distillation. Donald
A. Simpson and Maurice D. Sutherland, Chemistry Department, University of Queensland, Brisbane, Australia.
I N ORDER to make fullest use of the highly efficient laboratorystills now available, prolonged initial periods at total reflux
and very high reflux ratios must, be used. These requirementsmake continuous operation almost imperative and call for somedevice to permit continuous operation and product withdrawal.At the high reflux ratios which render the use of an automaticfraction changer so desirable, the operation of the device described below has been very satisfactory.
The automatic vacuum take-off arrangement of Brown andColes (1) did not meet the authors' specification of fraction cutting on the basis of an identical volume for each fraction. Theytherefore decided to use an intermittent siphon to deliver thechosen volume of distillate into each receiver, which, after beingso weighted, would sink in a liquid and permit the rotatable delivery funnel to be moved to a position over the next empty tube.A simple device for changing receivers under a chromatographiccolumn, using an arrestment under which only loaded tubes canpass, has been described by Phillips (.n, who also mentions another receiver changer described by Randall and Martin (5) in
The advantages of glycerol as a fluid support forthe test tubes are low vapor pressure, low solubilityfor hydrocarbon vapors, and easy removal from theoutside of the tubes by washing with water. Ten13-ml. tubes have been found ample for overnightoperation under reduced pressure of a 13-mm.Podbielniak HyperCal column operating at a highreflux ratio.
The pressure-regulating system is a simple versionof that described by Palkin (2) and Pal kin andNelson (3). The only significant modification has
which the weight of the fraction operates an escapement, bringingthe siphon opposite the next receiver. The authors have found itadvantageous to use the intermittent current supplied by the repeat cycle timer (which controls the distillate withdrawal needleof the still through a still-head solenoid) to energize a smallmotor. This during the "on" period moves the delivery funnel ifnecessary to a new position over the next empty receiver.
The apparatus (Figure 1) is contained within a sheet brasscylinder which is 5.25 inches in diameter and 7.75 inches high.This cylinder is divided into upper and lower portions, whichmeet on machined surfaces. The upper portion, which is 2.5inches high, is fastened rigidly to the framework on which thestill is mounted and is closed on top by a sheet of O.25-inch clearPerspex, which is cemented in place. The distillate enters thereceiver changer from the buret by a tube passing through thecenter of the Perspex window and is caught in a siphon tubewhich rests loosely in a bracket and is readily changed for anotherof different volume when desired. The standard ground conebelow the Perspex window permits a conventional type of receiver to be used interchangeably with the automatic apparatus.
When the siphon tube overflows, the accumulated distillateis directed into one of ten rimless 13-ml. test tubes by a bentfunnel, the tip of which is correctly positioned when the upperarm is pressed against the side of the test tube; both arm andfunnel are attached to a brass block which turns freely in a thrust
race. The upper arm is pressed upon by the lowerarm, which is attached to the shaft of a O.OI-hp.alternating current motor to which current is supplied through the timer during the "on" period only.During the "off" period the lower arm is returnedagainst the thrust race support by a return spring,so that there is little friction between the upperarm and the test tube.
Each of the test tubes floats in glycerol containedin a wider glass tube (diameter 1.125 inches) indented with guides which support the inner tube in avertical position but permit it to move freely up ordown. The level of glycerol is adjusted so that eachtest tube floats and in turn obstructs the upper arm.The additional weight of the tube and contents, afterthe siphon has discharged into it, lowers the test tubesufficiently to allow the upper arm to pass over itwhen the motor is next energized. rhus. each testtube receives in turn one discharge of distillate fromthe siphon. In addition to the ten floating tubesthere is an eleventh receiver, a fixed tube of larger(25-mJ.) capacity, to guard against loss of materialif the rate of distillation greatly exceeds expectation.The leads from the timer to the motor pass intothe apparatus through a wax seal and are interruptedby a plug and socket and a variable resistance.
Both machined surfaces are greased before beingbrought into contact and are easily made gas-tight.The surfaces can be parted again by a seal-breakingscrew set near the outer edge of the machined surfaces, and a pair of clamps is used to support thelower section in case of failure of the vacuum. Thepressure in the device is adjusted by means of anauxiliary pump to that of the still before connectionis established by opening the buret tap.
ThrusfRace
Ground GlassJoint
GraduaTed
lZtt,e
Figure 1. Automatic Receiver Changer
RECEIVER
Gr=sedMachinedSur/ace
Empty
FiJ//
ElnpTy
Ft///
S_IBreakIng
Screw
1345
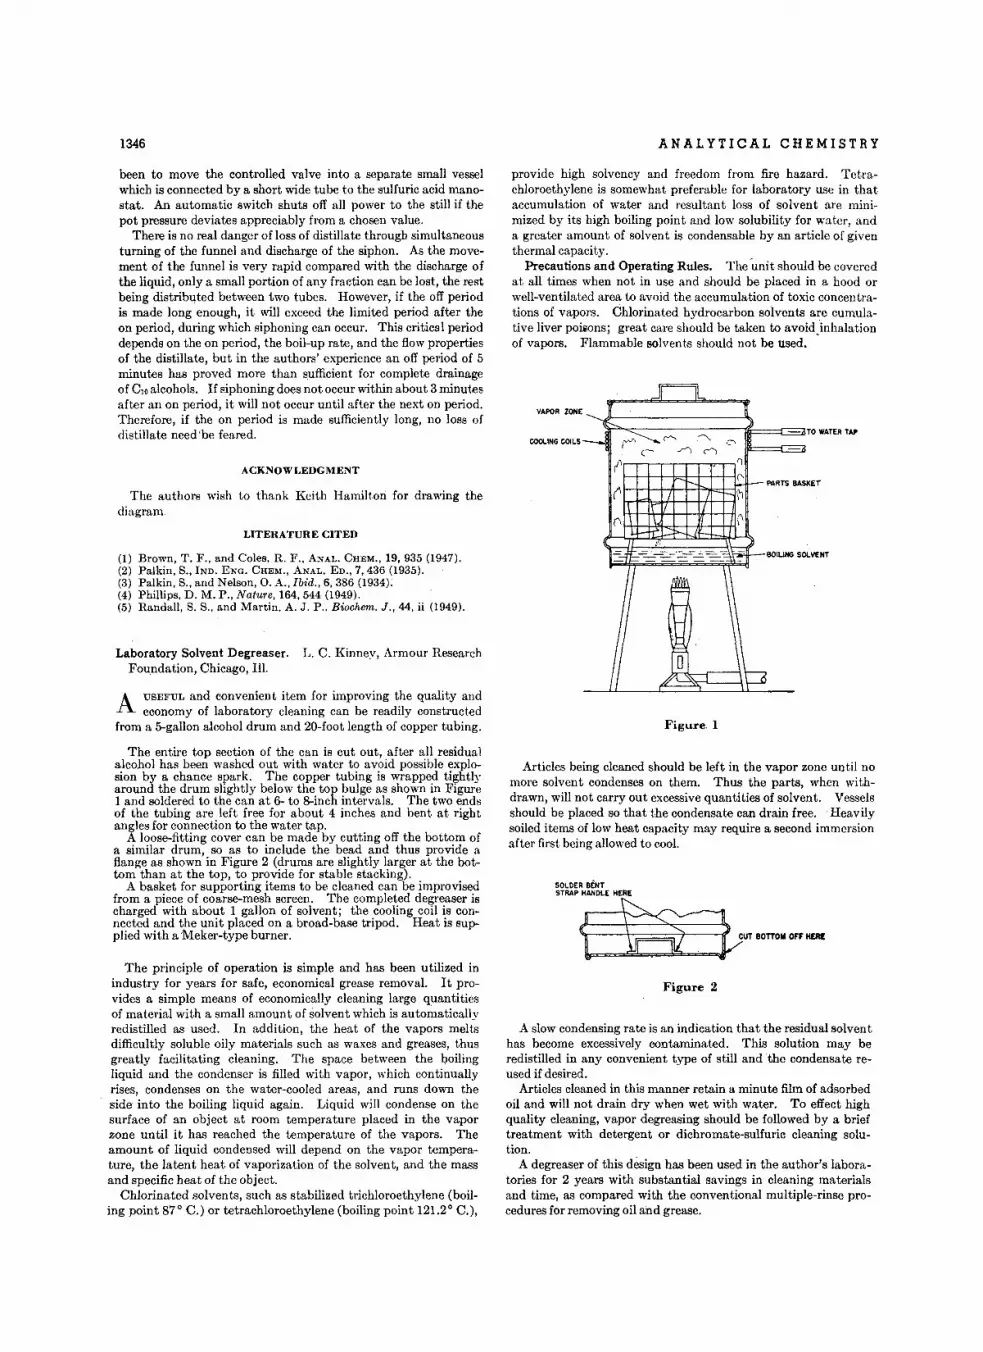
1346 ANALYTICAL CHEMISTRY
VAPOR ZONE ~_..d'----------"""
rlII
(\ 1\.1-fT-'
_ .¥j"'--:::::::::--=:-----=:::::---1F===i::=ODTO WATER TArCOOLING COILS !
provide high solvency and freedom from fire hazard. Tetrachloroethylene is somewhat preferable for laboratory use in thataccumulation of water and resultant loss of solvent are minimized by its high boiling point and low solubility for water, anda greater amount of solvent is condensable by an article of giventhermal capacity.
Precautions and Operating Rules. The unit should be coveredat all times when not in use and should be placed in a hood orwell-ventilated area to avoid the accumulation of toxic concentrations of vapors. Chlorinated hydrocarbon solvents are cumulative liver poisons: great care should be taken to avoidinhalationof vapors. Flammable solvents should not be used.
been to move the controlled valve into a separate small vesselwhich is connected by a short wide tube to the sulfuric acid mario
stat. An automatic switch shuts off all power to the still if thepot pressure deviates appreciably from a chosen value.
There is no real danger of loss of distillate through simultaneousturning of the funnel and discharge of the siphon. As the movement of the funnel is very rapid compared with the discharge ofthe liquid, only a small portion of any fraction can be lost, the restbeing distributed between two tubes. However, if the off periodis made long enough, it will exceed the limited period after theon period, during which siphoning can occur. This critical perioddepends on the on period, the boil-up rate, and the flow propertiesof the distillate, but in the authors' experience an off period of 5minutes has proved more than sufficient for complete drainageof C10 alcohols. If siphoning does not occur within about 3 minutesafter an on period, it will not occur until after the next on period.Therefore, if the on period is made sufficiently long, no loss ofdistillate need 'be feared.
ACKNOWLEDGMENT
LITERATURE CITED
The authors wish to thank Keith Hamilton for drawing thediagram
Figure 2
SOLDER BENTSTRAPHANDLE HERE
tiCB=,,-~-
Figure. 1
-=..:..--=_ --=--=- ~aolUHG SOLVENT
\
---1
Articles being cleaned should be left in the vapor zone until nomore solvent condenses on them. Thus the parts, when withdrawn, will not carry out excessive quantities of solvent. Vesselsshould be placed so that the condensate can drain free. Heavilysoiled items of low heat capacity may require a second immersionafter first being allowed to cool.
A slow condensing rate is an indication that the residual solventhas become excessively contaminated. This solution may beredistilled in any convenient type of still and the condensate reused if desired.
Articles cleaned in this manner retain a minute film of adsorbedoil and will not drain dry when wet with water. To effect highquality cleaning, vapor degreasing should be followed by a brieftreatment with detergent or dichromate-sulfuric cleaning solution.
A degreaser of this design has been used in the author's laboratories for 2 years with substantial savings in cleaning materialsand time, as compared with the conventional multiple-rinse procedures for removing oil and grease.
A USEFUL and convenient item for improving the quality andeconomy of laboratory cleaning can be readily constructed
from a 5-gallon alcohol drum and 20-foot length of copper tubing.
The entire top section of the can is cut out, after all residualalcohol has been washed out with water to avoid possible explosion by a chance spark. The copper tubing is wrapped tightlyaround the drum slightly below the top bulge as shown in Figure1 and soldered to the can at 6- to 8-inch intervals. The two endsof the tubing are left free for about 4 inches and bent at rightangles for connection to the water tap.
A loose-fitting cover can be made by cutting off the bottom ofa similar drum, so as to include the bead and thus provide aflange as shown in Figure 2 (drums are slightly larger at the hottom than at the top, to provide for stable stacking).
A basket for supporting items to be cleaned can be improvisedfrom a piece of coarse-mesh screen. The completed degreaser ischarged with about 1 gallon of solvent; the cooling coil is connected and the unit placed on a broad-base tripod. Heat is supplied with a Meker-type burner.
(1) Brown, T. F., and Coles, R. F .• ANAL. CHEM., 19, 935 (1947).(2) Palkin, S., IND. ENG. CHEM., ANAL. ED•• 7, 436 (1935).(3) Palkin, S., and Nelson, O. A., tu«, 6, 386 (1934):(4) Phillips, D. M. P., Nature, 164,544 (1949).(5) Randall, S. S.. and Martin. A. J. P .. Biochem. J., 44, ii (1949).
Laboratory Solvent Degreaser. L. C. Kinney, Armour ResearchFoundation, Chicago, III.
The principle of operation is simple and has been utilized inindustry for years for safe, economical grease removal. It provides a simple means of economically cleaning large quantitiesof material with a small amount of solvent which is automaticallyredistilled as used. In addition, the heat of the vapors meltsdifficultly soluble oily materials such as waxes and greases, thusgreatly facilitating cleaning. The space between the boilingliquid and the condenser is filled with vapor, which continuallyrises, condenses on the water-cooled areas, and runs down theside into the boiling liquid again. Liquid will condense on thesurface of an object at room temperature placed in the vaporzone until it has reached the temperature of the vapors. Theamount of liquid condensed will depend on the vapor temperature, the latent heat of vaporization of the solvent, and the massand specific heat of the object.
Chlorinated solvents, such as stabilized trichloroethylene (boiling point 87° C.) or tetrachloroethylene (boiling point 121.2° C.),

VOL U M E 23, NO.9, S E PTE M B E R 1 95 1 21 A
* Immediate shipmentfrom stock
FOR HIGH SPEEDQUANTITATIVE ANALYSIS OFFerrous and non·ferrous metals and alloys.Elee:troplating solutions and electro.deposits.Ores and minerals.Metals In biological materials.Metals In foods. solis. etc.Forensic materials.Micro and seml-mlere specimens;
SARGENTSLOMIN&~:;..~....,~~~~W/~
Designed for continuous trouble-free performanceThe Sargent-Slomin Electrolytic Analyzers have
through long service proved their value to analysts.Each unit is mounted within a case consisting of onepiece stainless steel panel, beaker platform and apronwith sturdy end castings. All models are completelyself-contained and operate from 50-60 cycle electriccircuits - no auxiliary generators or rheostats arerequired.
The two position analyzers consist of two complete.independently operating analyzer circuits. Duplicate orcheck analyses can be run at the same time or two different analyses can be run simultaneously at differentcurrent densities.
The central electrode is rotated by a new capacitortype induction motor, operating at 550 r.p.m., especiallyengineered for this application. Under developmentfor five years, this motor has been thoroughly testedand approved for continuous operation. Fully enclosedfor protection against corrosive fumes-the shaft, sleevebell-rings, and cap are made of stainless steel.
Outstanding 'features of this rugged motor are:Greater output than any motor of similar characteris
tics and size.No internal switches or brushes.No "permanent" magnets - full output for long
service life.
No speed change with change of load.
. All parts of the new electrode chucks are made ofstainless steel. A simplified design utilizes a positiveretaining spring which permits quick, easy insertion ofthe electrodes and maintains proper electrical contact.
These new analyzers used with the specially designedhigh efficiency corrugated electrodes rapidly producesmooth, close grained deposits at maximum currentdensity.
5-29460 ELECTROLYTIC ANALYZER - Sargenr-Slomin, One Position. For operation from 115 Volt, 50-60cycle circuits $275.00
5-29465 ELECTROLYTIC ANALYZER - Sargent-Slomin, Two Position. For operation from 115 Volt, 50-60cycle circuits $425.00
5-29632 ANODE-Platinum gauze, Corrugated Form,High Speed. (Patent pending). Price subject to market.
5-29672 CATHODE - Platinum gauge, CorrugatedForm, High Speed. (Patent pending.) Price subject tomarket.
SARGENTSCIENTIFIC LABORATORY INSTRUMENTS· APPARATUS· CHEMICALSE. H. SARGENT & COMPANY, 4647 W. FOSTER AVE., CHICAGO 30, ILLINOISMICHIGAN DIVISION, 1959 EAST JEFFERSON STREET, DETROIT 7. MICHIGAN
SOUTHWESTERN DIVISION, 5915 PEELER STREET, DALLAS 9, TEXAS

22A ANALYTICAL CHEMISTRY
Below: a Fisher Unitized Gas·Analysis assembly of the Precision Type , one of many modelsavailable with either rubber connectors or ball-and-socket joints.
For the first time, Fisher Unitized Gas-Analysis
Apparatus, in either the Precision or Technical
models, may be obtained with Pyrex Brand Glass
ball-and-socket joints in place of the conventional
rubber connectors.
More accurate results can be obtained by the elim
ination of rubber in the system. At . the same time,
the completely interchangeable parts of the system
may be assembled, rearranged or removed for cleaning
very easily and quickly.
All Fisher Unitized Gas-Analysis Apparatus may
now be obtained either with or without Pyrex Brand
Glass ball-and-socket joints.
Write for your free copy of the "Gas-Analyau Manual". It containa a wealth ofauthor.itative technical information on gas analylu,a description ofall unita including thole withthe new ball-and-socket connectora, and acomplete, current price lute
FISHERHeadquarters for Laboratory Supplies
SCIENTIFIC COMPANYPITTSBURGH
717 Forbes 119)• NEW YORK
635 Greenwich 114)• WASHINGTON
7722 Woodbury(Silver Spring, Md.)
• MONTREAL904 St. James
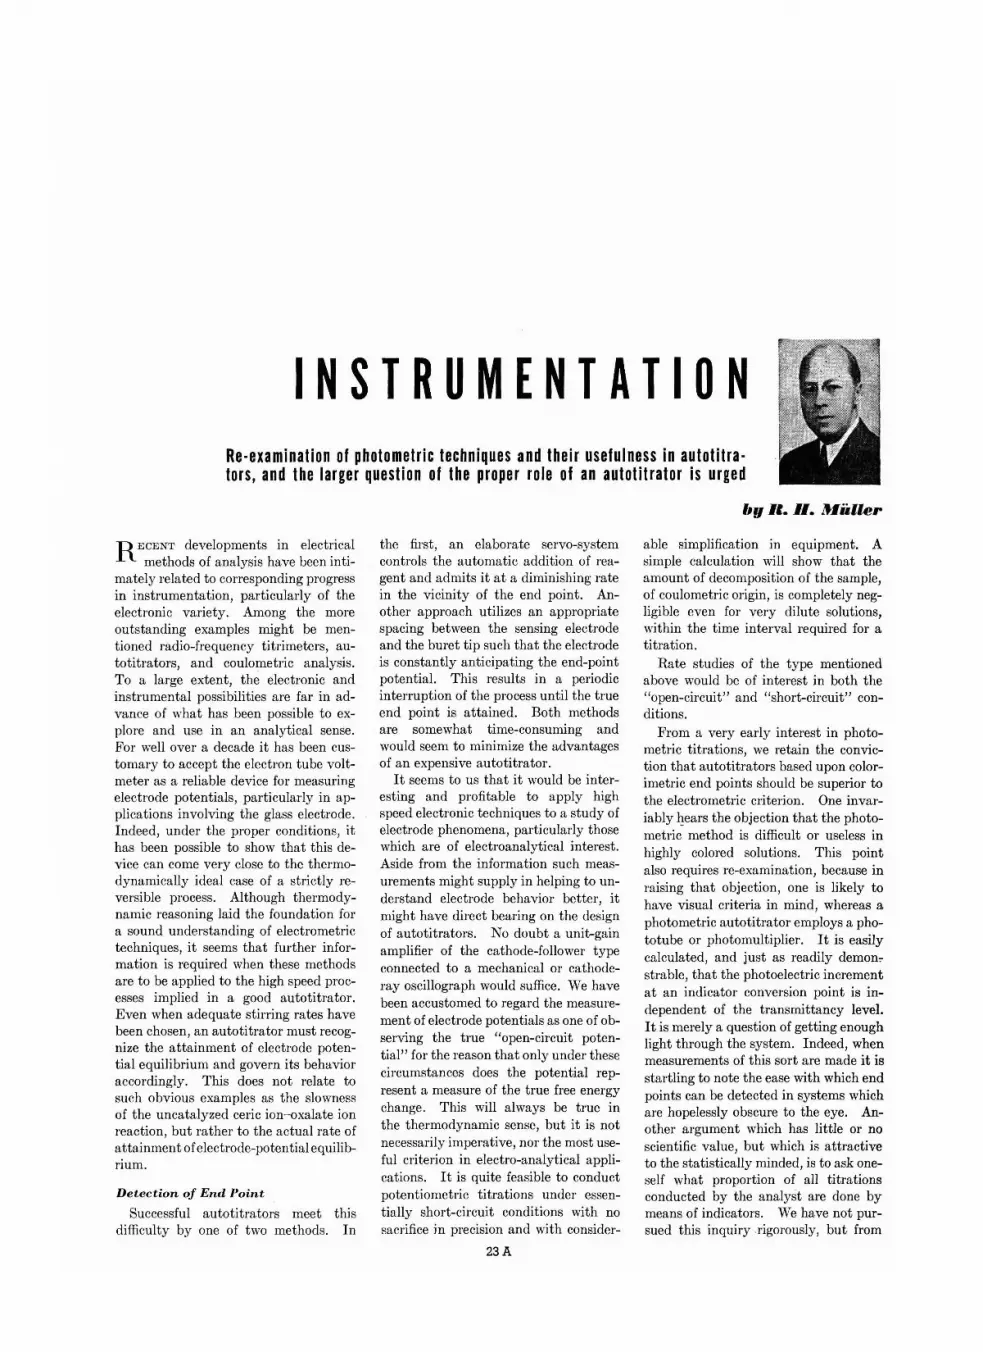
INSTRUMENTATIONRe-examination of photometric techniques and their usefulness in autotitra tors, and the larger question of the proper role of an autotitrator is urged
R E CENT developments in electricalmethods of analysis have been inti
mately related to corresponding progressin instrumentation, particularly of theelectronic variety. Among the moreoutstanding examples might be mentioned radio-frequency titrimeters, autotitrators, and coulometric ana lysis.To a large extent, the electronic andinstrumental possibilities are far in advance of what has been possible to explore and use in an analytical sense.For well over a decade it has been customary to accept the electron tube voltmeter as a reliable device for measuringelectrode potentials, particular ly in applications involving the glass electrode.Indeed, under the propel' conditions, ithas been possible to show that this device can come very close to the thermodynamically ideal case of a strictly reversible process. Although thermodynamic reasoning laid the foundation fora sound understanding of electrometrictechniques, it seems that further information is required when these methodsare to be applied to the high speed processes implied in a good autoti trator.Even when adeq uate stirring rates havebeen chosen, an autotitrator must recognize the attainment of electrode poten tial equilibrium and govern its behavioraccordingly. Th is does not relate tosuch obvious examples as the slownessof the uncatalyzed eerie ion-oxalate ionreaction, but rather to the actual rate ofattainment ofelectrod e-potential equilibrium.
De t ec tion of End Po in t
Successful autotitrators meet thisdifficulty by one of two methods . In
the first, an elabora te servo-systemcontro ls the automatic addition of reagent and admits it at a diminishing ratein the vicinity of the end point. Another approach utilizes an appropriatespacing between the sensing electrodeand the buret tip such that the electrodeis constantly anticipating the end-pointpotential. This results in a periodicinterruption of the process until the t rueend point is attained. Both methodsare somewhat time-consuming andwould seem to minimize the advantagesof an expensive autotitrator.
It seems to us that it would be interesting and profitab le to app ly highspeed electronic techn iques to a study ofelectrode phenomena, particularly thosewhich are of electroanalytical interest .Aside from the information such measurements might supp ly in helping to understand electrode behavior better, itmight have direct bearing on the designof autotitrators . No doubt a unit-gainamplifier of the cathode-follower typeconnected to a mechanica l or cathoderay oscillograph would suffice. We havebeen accustomed to regard the measurement of electrode potentials as one of observing the t rue "open-circuit potential" for the reason that only under thesecircumstances does the poten tial represent a measure of the tr ue free energychange. This wiII always be true inthe thermodynamic sense, but it is notnecessarily imperative, nor the most useful criterion in electro-ana lytical applications. It is quite feasible to conductpotentiometric titrations under essentia lly short-circuit conditions with nosacrifice in precision and with consider-
23A
I,y B.II. Muller
able simplification in equipment. Asimple calculation will show that theamount of decomposition of the sample,of coulometric origin, is completely negligible even for very dilute solutions,within the time interval required for atitration.
Rate studies of the type mentionedabove would be of interest in both the"open-circuit " and "short-circuit" condit ions.
From a very early interest in photometric t itrations, we retain the conviction that autotitrators based upon colorimetric end points should be superior tothe electrometric criterion. One invariably hears the objection that the photometric method is difficult or useless inhighly colored solutions. This pointalso requires re-examination, because inraising that objection, one is likely tohave visual criteria in mind, whereas aphotometric autotitrator employs a phototu be or photomultip lier. It is easilycalculate d, and just as readily demonstrable, that the photoelectric incrementat an indicator conversion point is independen t of the transmittancy level.It is merely a question of getting enoughlight through the system . Indeed, whenmeasurements of this sort are made it isstartling to note the ease with which endpoints can be detected in systems whichare hopelessly obscure to the eye. Another argument which has littl e or noscientific value, but which is attractiveto the statistically minded, is to ask oneself what proportion of all titrationsconducted by the ana lyst are done bymeans of indicators. We have not pursued this inquiry rigorously, but from
24A
Progress As aResult ofSelf-Competition
Analytical chemistry has been its owncompetition. From the classical wetmethod of analysis, this science nowutili zes some of the most modern instruments ever developed. Th is continuing prog ress is a result of the inquiring mind of the resourceful analyticalchemist coupled with the facilities ofcommercial enterprise that make the instruments and apparatus available to all .
Contributing to this progress hasbeen Kern, of Aarau, Switzer land, fineprecision instrument makers since 1819,whose LK 30 is the most useful inst rument for quantitative analysis of exceptiona lly sma ll amounts of complexsolutio ns containing high molecularweight substances.
K ern LK 30 M icro-el ec trophoresi sAp p a ra t us.
This apparatus works on the principle according to which the course ofthe refractive index within the cell ismeasured by interferometry*. Theinterferometer arrangement adopted inthe LK 30 allows the rays to passthro ugh the cell twice, thus doub lingthe sensitivity.
It is the only inst rument of this kindthat gives a picture of distributio n of refractive index over the ent ire hor izonta l.cross-section of the cell.
With the LK 30, an analysis can be'completed from start to finish with in11/ 2 hours. Only 0.1 cc. of serum is required for analysis. A standard deviation of only ± 1.1% prevai ls using a1.5% solution.. Adding to the attraction of the Kern
.LK 30 is its reasonably low price. Further useful data on micro-electrophoresis and the LK 30 is readily availableby writing to Kern Company, 5 BeekmanSt., New York 38, N. Y., * (L. G. Longsworth, ANAl,. CHEM.,p. 346, Feb. 1951).
Micro-elec:trophoresisApparatus (LK 30)
Full-Circle Polarimeter
'P r ecision Instruments for theChemical and Medical Laboratory.
INSTRUMENTATION
time to time have heard estimatesranging from 60 to 95%.
The instrumental aspects of the photometric method are somewhat moreattractive than those for the electrometric method. The phototube is a highimpedance device and therefore readi lymatched to a high gain amp lifier . Thereis also abundant exper ience in the art ofprecise photoelectric measurements.Even relatively simple equipment candistinguish transmittancy differenceswhich are imperceptible to the welltrained eye. For all but a few indicators, the ionic or ta utomeric equilibriawhich are involved in the color transition, are attained almost instantaneously.
Functionally, t he two modes of endpoint detection are simila r; the electrode potential is a logarithmic functionof titrant concentration and the deereaseof transmittancy of the indicator at theend point is also logarithmically relatedto titrant concentration. For the photometric case, a somewhat larger signalto-noise ratio can be attained in practice , compared with the electrometriccase.
Role of A u ro ritra to r
It has been our intention in all of thisto urge a re-examination of photometrictechniques for their usefulness in autotitrators . The larger question-whatis the proper role of an autotitrator? isstill unanswered. In special cases , suchas the continuous examination of theeffluent of a chromatographic column orfollowing the course of a slow and tedious process, the advantages are apparent. On the other hand, if the intentis to produce an automatic equivalentfor an expert technician, who is handlingroutine samples, the prob lem is largelyone of mechanical engineering of thefirst order of magnitude .
To a large extent many of OUl' presentinstrumental methods of analysis havebeen an attempt to mechanize existingmanual techniques . In a sense, coulometric analysis is a distinct departureand ill the more recent developments,there are indications that it may soonrender more conventional practices obsolete.
Electronics has played a large role inthe development of coulometric met hods , in the design of potentiostats and
. (Continued on page 26 A)
ANALYTICAL CHEMISTRY
AVAILABLE
REPRINTSOF
RetdeUJ6fUIUi
g~I;uun J4eSp~
••••A1~oIte~
1st REVIEW #R-4 $0.502nd REVIEW #R-14 $0.753rd REVIEW #R-20 .•. $0.504th REVIEW #R-30 . • . $0.75
'/,{IUiP~1st REVIEW #R-13 $0.502nd REVIEW #R-19 $0.503rd REVIEW #R-28 $0.50
'/,{1Ui(j~
3rd REVIEW #R-I0 $0.504th REVIEW #R-15 $0.505th REVIEW #R-22 $0.50
Il~e~1st REVIEW #R-16 $1.502nd REVIEW #R-24 $1.50Items R-16 and R-24 $2.50
S~Absorption and
Extraction #R-26 $0.75Adsorption #R-27 $0.50Atmospheric
Pollution #R-21 $0.75Sulfur #R-31 $0.75Titanium #R-23 $0.50
Key to year of publication:1947 - R·1 through R·9.1948 - R-IO " R-15.1949 - R-16 R-21.1950 - R-22 . .. ..
ORDER FROM:
Special Publications Dept.American Chemical Society1155-16th Street, N.W.Washington 6, D.C.

VOLUME 23, NO.9, SEPTEMBER 1951 25A
LABORATORY
VERGAnlE.TOOL -F O R THE
TITRATOR
VERSATILE . . . A single selector switch adaptsthe UNIVERSAL instantly to spectrophotometry,nephelometry, photofluorometry. The sensitive.easily read beam galvanometer may be usedfor micro-electric measurements. Titration issimple and precise . .. a sound investment any·where ••. offering maximum performance fordollar value.
CONVENIENT ... The UNIVERSAL ... whereverspeed or flexibility is important. Automaficallymaintains constant Bond-Pcss. No need tocalculate and readjust slit width with eachchange of wavelength.
Coleman Model 14 Universal SpectrophotometerWrite for Bulletin A B· 212
PRECISE . . . Exclusive Coleman design combining the convenient diffraction grating with a precision galvanometerinsures accuracy in the simplest possible manner.
RELIABLE . . . No mechanical complexities •.. analyticalsettings can be reproduced instantly and exactly ..• noamplifiers or vacuum tubes which change with time.
The Universal has been proved in practice. 10 years of analyticalprocedure attest its value as a trustworthy tool for the chemist.
C0LEMAN INSTRUMENTS I---~"'" pH ELICTROMETERS • ELICTRONIC PHOTOfLUOROMETERS
• CHEMISTS SPECTROPHOTOMETERS ' PHOTO·NEPHILOMETERS· ANOXIA PHOTOMETERS

26A A NALYTICA L CHEMISTRY
Send orders and inquiries to:
LEITZ S C IE NT I FIC I N ST RU M ENT S. BI NO CUL ARS. MI C RO S C O PESLEICA CA M ERA S AND A C CESS O RI ES
For de tails , writ e Dept . AC
E. LEITZ, Ine.; 304 Hudson Street. New York 13. N. Y.
INSTRUMENTATION
constant current circuits and in detect ingcircuits for end-point designation. Inaddition, some procedures for evaluatingthe time integral of transported chargehave involved electronic principles orcomponents. There has been a mostencouraging interplay between fundamental chemical researches and instrumental progress in th is field, apparentlywith each pacing the other. Followingthe definitive investigations of Lingane, the more recent work of Furmanand coworkers has given an exciting viewof the extension of coulometri c techniques to the ultramicro region.
Simultaneously DeFord and his associates have made a broad extension ofthe whole field, by developing a meansfor the external coulometric generationof reagents. There is scant sanctionhere for extended comment on theirwork [ANAL. CHEM., 23, 938, 941 (1951)],but we cannot refrain from expressinggreat enthusiasm for thi s work and theconviction that it holds untold promisefor analyt ical as well as inst rumentalprogress. These authors have not onlyestablished the reliability and versatility of this mode of electrically generatingreagents, but have extended the processto the completely automatic performance of titrations.
Another field of wide applicabilityanticipated by these authors is the automatic generation of standard solutions, wherein elect rical generation ofreagent at 100% efficiency for a statedperiod of time and at constant currentwillyield a definite amount of reagent.
It was von Helmholtz who first suspected the discrete nature of electricalcharge, as a consequence of MichaelFaraday's researches on the electrochemical equivalent . This century-oldfamiliarity with the equivalence betweenelectrical charge and parti culate matterdoes not diminish our satisfaction withthe promise that we can now visualizeour reagents in purely elect rical terms.Electrical quantities can be dispensed,controlled , counted, or recorded farmore expeditiously than solutions canbe handled .
In the same connection, one suspectsthat the large field of electro-organicchemistry can be re-examined withprofit . Many reactions with 100% electrode efficiency are known and others ofpotential value could be improved withthe help of these very same techniq ues.
• Classification by patentnumber is an enormoustimesaver.
Special Publications Dept., American Chemical Society1155 Sixteenth St., ItW., Washington 6, D. C.
CHEMICAL ABSTRACTS
toVolumes 31-40 of
COLLECTIVE NUMERICALPATENT INDEX
• Cloth bound, 182 pages,71/2" x 10" overall, 8 eel-
• Index references give vol. umns of listings per pageume, page and location of covering all patents abo
stracted in CHEMICAL AB-patent abstract in CHEMI· STRACTS from 1937-46,CAL ABSTRACTS. inclusive.
PRICE $6.50 POSTPAID
• Contains more than 143,000entries: · classified by coun·tries in numerical order.
Photoelectric ColorimeterIndustrial Model
VOL U M E 2 3, N O. 9, S E PTE M B E R 1 9 5 1 27A
Here-6 feet away from balanceis where the "Royalton" traps
magnetic distort ion,vibration, hum,
and hoot.
.c!l1eyetSC/ENTlI=,C SUPPLY
ce ., Inc215 NORTHEIGHTH ST'BROOKlYN II NY 'STAGG 2.237i .
JQ~~.
Cooler operafionduo to
gravity convection.
All e lectrical com po nents are Undorw rite ..' Approved . • • Forop er a t ion on I J5V 60 cycle s AC on ly . .. Complete with 14watt GE la mp . co rd . p lug a nd switch ; read y to plug in.
S 1250 F.e.B. N.Y.C.
Less 10% in lots of six
Immediate Delivery From Stock - Order How!
MAGNETIC DISTORTIONELIMINATED!
O nly the "Royalton" Sala nce Illuminat or is so made tha t the ballast is6 feet away from the balance . .. (In oth er lig hts the ball ast is with inthe ho using , th us emitt ing a st rong maqnet ic field in the immed ia te ereeof the ba lan ce . The ball a st al so vib re tes, hums. a nd de velops considerableheat) . . . All th is is ove rcome in the "Royalton" by th'e proper funct ionalp lacIng of the ba lla st .
New "Royalton" BALANCE ILLUMINATORRemoves Source of Magnetic Distortion,
Vibration, and Hum
Operates 35% cooler
BAllAST IS 6 FEET AWAY FROM THE BALANCE
COOL WHITE LIGHT WITHOUT GLARE - No Vibration!Gravity Convection Reduces Heat
Beca use 01 t he loc at io n of the ballast . t he " R0r.aItOn" op erates a t theminimum temperature of the fluoresce nt lamp itsel . A complete syste m fo rgravity conve ct ion further reduc.. . the temperature. Air is cir cu lated. heatwithd rawn consta ntly t hro ug h a ir intak e and exha ust por ts the full lengt h oft he re flecto r an d lamp hous ing .SPECIALLY COATED REFLECTOR in the " Royelton" intensifie s the lightreflected into the balance while a cce le rating the con vection of heat up ando ut of the housing.
"!loyalton" 8alanco Lights are finished in hand some grey wrinkle and fit 'a ll'conventional type analytical balances, both wood and metel cab inets.
It's What Technicians Prefer I
~~~LABORATORYand PRODUCTION OVENS
An exacting tes ting and productionoven that provides very close heatuniformity. Built-in indicating temperature controls. Emphasis hasbeen on heavy construction .. . evenheat distribution . .. capacity loads at
high speed . . . ability to "stand thegaff"-even under continuous 24.hour-a-day usage. Six sizes andtypes are available for the endlessvar iety of heating, drying, bakingand testing processes.
341 Despatch Building • Minneapolis 14, Minn,
• Guaranteed Heat Elements 2700 to 12,000WaUs
• Air Velocity Control
• High Volume Fan
•Modll V.15: 19 ". 19 " x 19 "3.6 KW; MI,. Temp, 500 0 F.
Speedy, Accurate Results
•Write for Laboratory
Bulletin No. 107
ovensfor allpurposes

28A ANALYTICAL CHEMISTRY
the most modern laboratory furniture in the worldModuline, by Aloe, comes in architectural approvedwidths and depths so that custom-built laboratoryfacilities may be developed from standard Modulineunits. Notice these details: concealed hinges; bakedsteel finishes with stainless steel table tops; Furnishedwith or without reagent shelves. Utilities can be top orsplashback mounted. No working space is taken upwith utilities. Each new installation is convincing morepersons that Moduline is the most functional, practical,laboratory furniture ever designed. Write for specialbooklet T-300 and learn how Moduline can help solveyour furniture problems.
Special schematic layouts forlaboratories available on request.
tQl D0tO\ R r? °0 rs-;n:;\ A °0 R °Or? D'V/S/~N OF THE A. S. ALOE :OMPANY~ ~\5 2J\.:l \.5UUU 11 \.:l 5655 Kongsbury • St. Lo ui s 12, Mo.
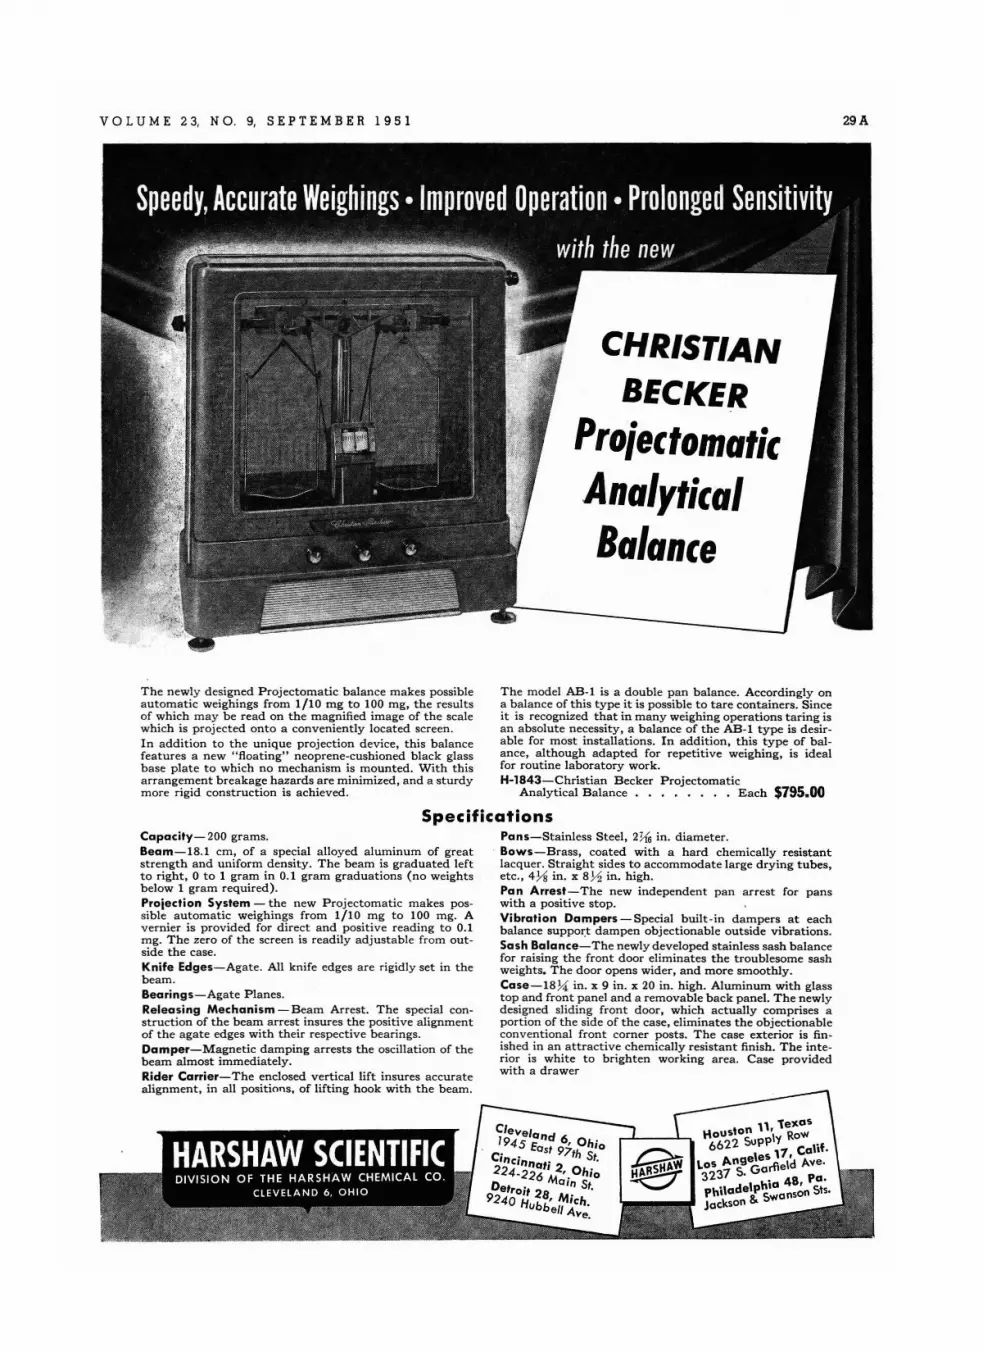
V OL U M E 23, N O. 9, S E PTE M B E R 1 9 5 1 29A
CHRISTIANBECKER
ProjectomaticAnalyticalBalance
The newly designed P roj ectorna t ic balance makes possibleautomatic weighings from 1/10 mg to 100 mg, the resultsof which may be read on the magnified image of the scalewhich is projected onto a conveniently located screen .In addition to the unique projection device, this balancefeatures a new " floa t ing" neoprene-cushioned black glassbase plate to which no mechanism is mounted. With thisa rrangem ent breakage haza rd s are minimized, and a sturdymore rigid construction is achieved.
The model AB-1 is a double pan balance. Accordingly ona balance of this type it is possible to tare containers. Sinceit is recognized that in many weighing operations taring isan absolute necessity, a balance of the AB -1 type is desirable for most installations. I n addition, this type of ba lance, although adapted for repetitive weighing, is idealfor routine la boratory work.H-1843-Christ ian B ecker Projectomatic
Analytical B al ance . . . . . . . • Each $795.00
SpecificationsPans-St ain less Steel , 2%; in. diameter.Bows-Brass , coated with a hard chemically resis tantlacquer. St ra igh t sides to accommodate la rge d ry ing t ubes,etc., 4Ys in . x BY2 in. h igh .Pan Arrest-The new in dependent pan arrest for panswith a positive stop.Vibrat ion Dampers -Special built -in dampers at ea chb alance support dampen objectionable ou tside vi brations.Sash Balance-The newly developed stainless sash ba lancefor raising the front d oor eliminates the troublesome sashweights. The door opens wider, and m ore smoothly.Case-1 B~ in. x 9 in . x 20 in . high. Alumin um with glasstop and front panel and a removable back panel. T he newlydesigned sliding front door, which actually comprises aportion of the side of the case, eliminates the objectionableconventional front corner posts. The case exterior is finish ed in an attractive chemically res istant finish. The interior is white to b righ t en working area. Case providedwith a drawer
Capacity - 200 grams .Beam- 1B.1 em, of a special alloyed aluminum of greatstrength and uniform density. The beam is graduated leftto right, 0 to 1 gram in 0. 1 gram graduations (no weightsbelow 1 gram 'required ) .Pro jection System - the new P rojectomat ic makes possible automatic weighings from 1/10 mg to 100 mg. Av ernier is provided for direct and positive reading to 0.1mg. The zero of the screen is readily adjustable fr om outside the case.Knife Edges- Aga t e. All knife ed ges a re rigidly set in theb eam.Bearings - Aga t e P lanes.Rel easing Mechanism - Beam Arrest. The special construction of the beam arrest insures the positive alignmentof the agate edges with their respective bearings.Damper-M agnet ic damping arrests the oscillation of thebeam almost immediately.Rider Carrier- T h e enclosed vertical lift insures accuratealignment, in all positions, of lifting hook with the beam .
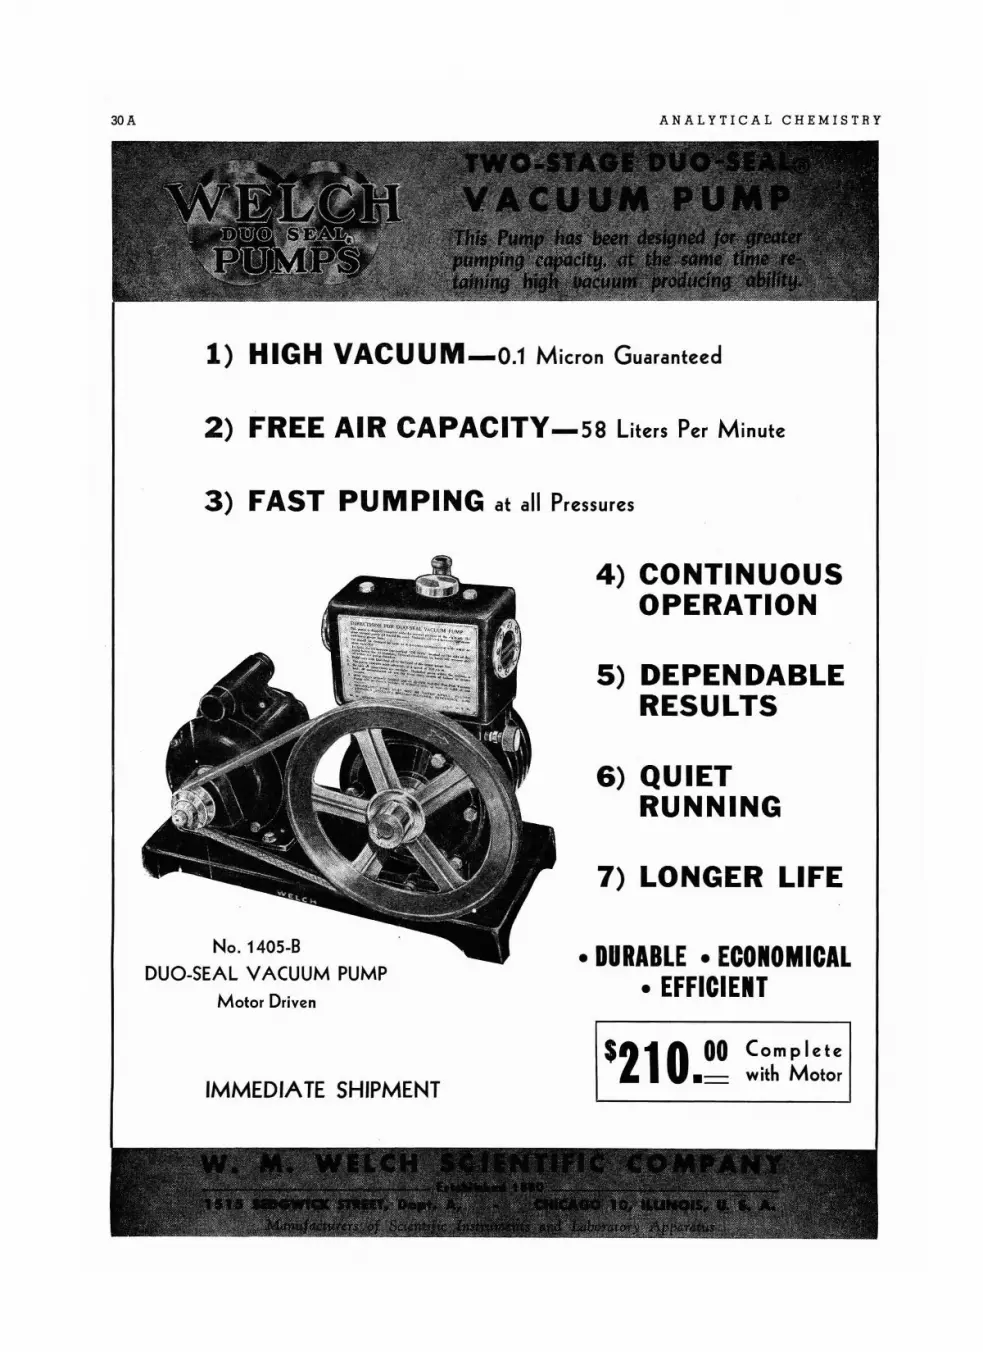
30A ANALYTICAL CHEMISTRY
1) HIGH VACUUM-o.1 Micron Guaranteed
2) FREE AIR CAPACITY-58 Liters Per Minute
3) FAST PUMPING at all Pressures
No. 1405-8
DUO-SEAL VACUUM PUMP
Motor Driven
IMMEDIATE SHIPMENT
4) CONTINUOUSOPERATION
5) DEPENDABLERESULTS
6) QUIETRUNNING
7) LONGER LIFE
• DURABLE • ECONOMICAL• EFFICIENT
$210 00 C~mplete_== with Motor

NEW PRODUCTS FOR ANALYSTS81t1ijtmf!1!. /!I:/1t14altts, JnsMttme!1ls, ;'?eatjcI11s. v1la1c'1ials
Barograph
American Paulin System has developed a barograph whichis constructed on the nul or zero-gaging principle. All
power in the actuating andrecording mechanism is supplied by two heavy-dutysealed instrument clocks,and no power is taken fromthepressure-sensitivedevice.The instrument records apressure curve over a range
of ± 1 inch of mercury and can be used at any elevation fromsea level to 10,000 feet by means of a convenient reset. The24-hour chart is graduated in intervals of 0.005 inch of mercury, easily read to 0.001 inch of mercury. Chart time isdivided into intervals of 10 minutes, readable to 1 minute.The curve is drawn on a specially surfaced paper by a metallicpoint, and no ink is used. The weight of the barograph, complete with recording thermometer, charts, and carrying case,is about 30 pounds. The outside case measurements are11 X 16 X 20 inches. 1
Water Chlorination
A new method for the chlorination of water has been developed by Mathieson Chemical Corp. This special productequipment combination by which dry chlorine can be accurately metered has been designed for applications where aslow, steady release of available chlorine is desired. Thenew product is high-purity calcium hypochlorite in tabletform. The equipment is a feeder called a Hypochlorinator,designed to dissolve the tablets and dispense the resultantchlorine solution at rates which can be controlled and quicklyvaried to cover a wide range of operating demands.
Hypochlorite has been used for years to convey chlorinein ~dry form for various applications, but it has always beennecessary to dissolve the granules in water and dispense theprepared solution through a feeding device. The Hypochlorinator eliminates the disposal of insoluble sludge and theclogging of equipment, the handling and storing of bulkyglass bottles of sodium hypochlorite, and all weighing, mixing,and 'handling operations.
The tablets, containing 70% available chlorine with no
.binder or filler and possessing good mechanical stability, are0.75 inch in diameter and 0.25 inch thick, with slightly curvedfaces to facilitate handling. Each tablet weighs about 0.17ounce, equivalent to about one teaspoonful of granular hypochlorite. Tablets sell at approximately the same price as thegranular material and come packed in 1000pound nonreturnable drums.
The equipment takes water from a high pressure point of asystem, at a rate controlled by a needle valve and indicatedby a flowmeter, and injects it into a tablet bed. This actionresults in the formation of a chlorine solution which is returned to the system at a low pressure point. Since the bodyof the unit is made of transparent plastic, the operator cantell at a glance when refilling is required. The standardmodel, 17 inches high and 8 inches in diameter and containingno moving parts, is designed to produce up to 6 pounds ofchlorine from a single filling. 2
Radiation Meter
An improved radiation survey meter has been announcedby Tracerlab, Inc. This~portable instrument is useful for
measuring beta and gamma radiation in "hot" laboratories whichhandle levels of radioactivity onthe order of millicuries. Themeter may be used in making spotchecks of the amount of radiationfrom each experimental setupwhere radioisotopes are involved,in monitoring storage and ' shipping containers, and in measuringroentgen dosage rates from x-rays
of energies as low as 50 kv. A new circuit designed in cooperation with the National Research Council of Canadamakes use of the principle~of inverse feedback. This permitsextremely stable operation and a large reduction in the timeconstant, which is now only 1.5 seconds on all ranges. Calibration accuracy is ±10% of full scale and is maintainedthroughout the specified battery life of approximately 800hours. .
The meter is provided with three full-scale ranges of 15,150, and 1500 milliroentgens per hour to permit rapid meas-
(PLEASE PRINT OR TYPE)
Name Position _
City -z..7,one State _
13 14
22 23
10 II 12
19 20 21
SEPTEMBER 1951
Company' _
Street _
TECHNICAL DATA DEPARTMENTANALYTICAL CHEMISTRY
I am interested in the following circled items:New Products 1 2 3 4 5 6 7 8 9
Manufacturers' Literature 15 16 17 1824 25 26 27 28 29 30 31
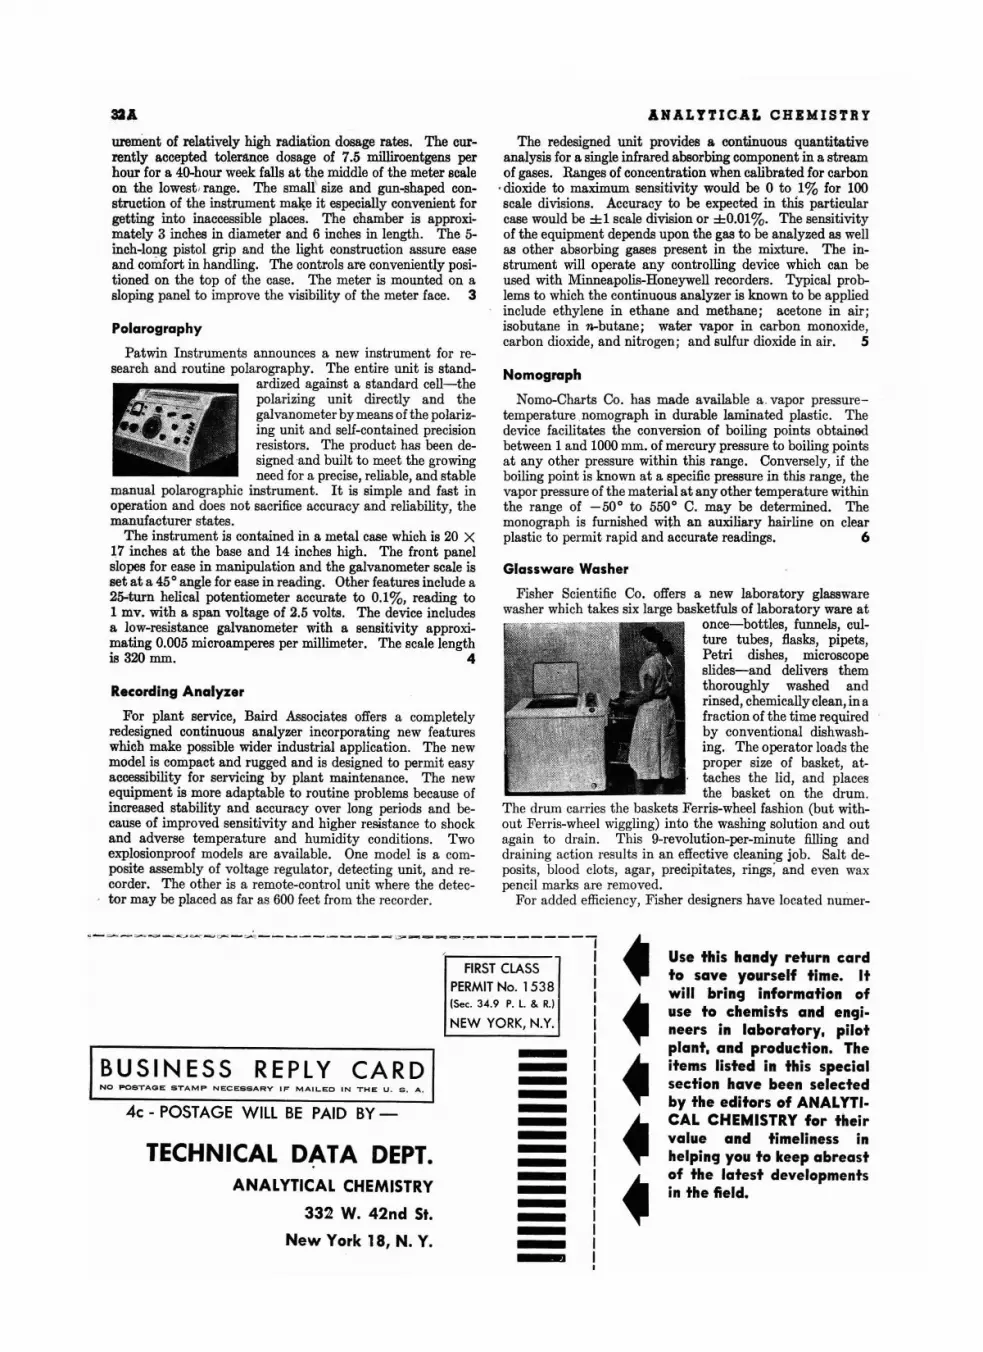
ANALYTIC.At CHEMISTRY
urement of relatively high radiation dosage rates. The currently accepted tolerance dosage of 7.5 milliroentgens perhour for a 4o-hour week falls at the middle of the meter scaleon the lowest , range. The small' size and gun-shaped construction of the instrument make it especially convenient forgetting into inaccessible places. The chamber is approximately 3 inches in diameter and 6 inches in length. The 5inch-long pistol grip and the light construction assure easeand comfort in handling. The controls are conveniently positioned on the top of the case. The meter is mounted on asloping panel to improve the visibility of the meter face. 3
Polarography
Patwin Instruments announces a new instrument for research and routine polarography. The entire unit is stand
ardized against a standard cell-thepolarizing unit directly and thegalvanometer by means of the polarizing unit and self-contained precisionresistors. The product has been designed ·and built to meet the growingneedfor a precise, reliable, and stable
manual polarographic instrument. It is simple and fast inoperation and does not sacrifice accuracy and reliability, themanufacturer states.
The instrument is contained in a metal case which is 20 X17 inches at the base and 14 inches high. The front panelslopes for ease in manipulation and the galvanometer scale isset at a 450 angle for ease in reading . Other features include a25-turn helical potentiometer accurate to 0.1%, reading to1 mv. with a span voltage of 2.5 volts. The device includesa low-resistance galvanometer with a sensitivity approximating 0.005 microamperes per millimeter. The scale lengthis 320 rom. 4
Recording Analyzer
For plant service, Baird Associates offers a completelyredesigned continuous analyzer incorporating new featureswhich make possible wider industrial application. The newmodel is compact and rugged and is designed to permit easyaccessibility for servicing by plant maintenance. The newequipment is more adaptable to routine problems because ofincreased stability and accuracy over long periods and because of improved sensitivity and higher resistance to shockand adverse temperature and humidity conditions. Twoexplosionproof models are available. One model is a composite assembly of voltage regulator, detecting unit, and recorder. The other is a remote-control unit where the detector may be placed as far as 600 feet from the recorder.
The redesigned unit provides a continuous quantitativeanalysis for a single infrared absorbing component in a streamof gases. Ranges of concentration when calibrated for carbon
. dioxide to maximum sensitivity would be 0 to 1% for 100scale divisions. Accuracy to be expected in this particularcase would be ±1 scale division or ±0.01%. The sensitivityof the equipment depends upon the gas to be analyzed as wellas other absorbing gases present in the mixture. The instrument will operate any controlling device which can beused with Minneapolis-Honeywell recorders . Typical problems to which the continuous analyzer is known to be appliedinclude ethylene in ethane and methane; acetone in air ;isobutane in n-butane; water vapor in carbon monoxide,carbon dioxide, and nitrogen; and sulfur dioxide in air. 5
Nomograph
Nomo-Charts Co. has made available a . vapor pressuretemperature .nomograph in durable laminated plastic. Thedevice facilitates the conversion of boiling points obtainedbetween 1 and 1000 mm. of mercury pressure to boiling pointsat any other pressure within this range. Conversely, if theboiling point is known at a specific pressure in this range, thevapor pressure of the material at any other temperature withinthe range of -50 0 to 5500 C. may be determined. Themonograph is furnished with an auxiliary hairline on clearplastic to permit rapid and accurate readings. 6
Glassware Washer
Fisher Scientific Co. offers a new laboratory glasswarewasher which take s six large basketfuls of laboratory ware at
once-bottles, funnels, culture tubes, flasks, pipets,Petri dishes, microscopeslides-and delivers themthoroughly washed andrinsed, chemically clean, in afraction of the time requiredby conventional dishwashing. The operator loads theproper size of basket, attaches the lid, and placesthe basket on the drum.
The drum carr ies the baskets Ferris-wheel fashion (but without Ferris-wheel wiggling) into the washing solution and outagain to drain. This 9-revolution-per-minute filling anddraining action results in an effective cleaning job. Salt deposits , blood clots, agar, precipitates, rings; and even waxpencil marks are removed.
For added efficiency, Fisher designers have located numer-
..-;;:;;..oo..._ :;..oo_ -..:;;>o' -";: ",J' ~-"' ~':'-:_ ~_-:: '"- ';,=-- :o-""" _
NO POSTAGE STAMP NECESSARY IF MAILED IN THE U . S . A.
4c - POSTAGE WILL BE PAID BY-
Use this handy return cardto save yourself time. Itwill brin9 information ofuse to chemists and en9ineers in laboratory, pilotplant, and production. Theitems listed in this specialsection have been selectedby the editors of ANALYTICAL CHEMISTRY for theirvalue and timeliness inhelpin9 you to keep abreastof the latest developmentsin the field.
FIRST CLASSPERMIT No. 1538(Sec. 34 .9 P. l. & R.)
NEW YORK, N.Y.
REPLY CARD
TECHNICAL DATA DEPT.ANALYTICAL CHEMISTRY
332 W. 42nd St.
New York 18, N. Y.
BUSINESS
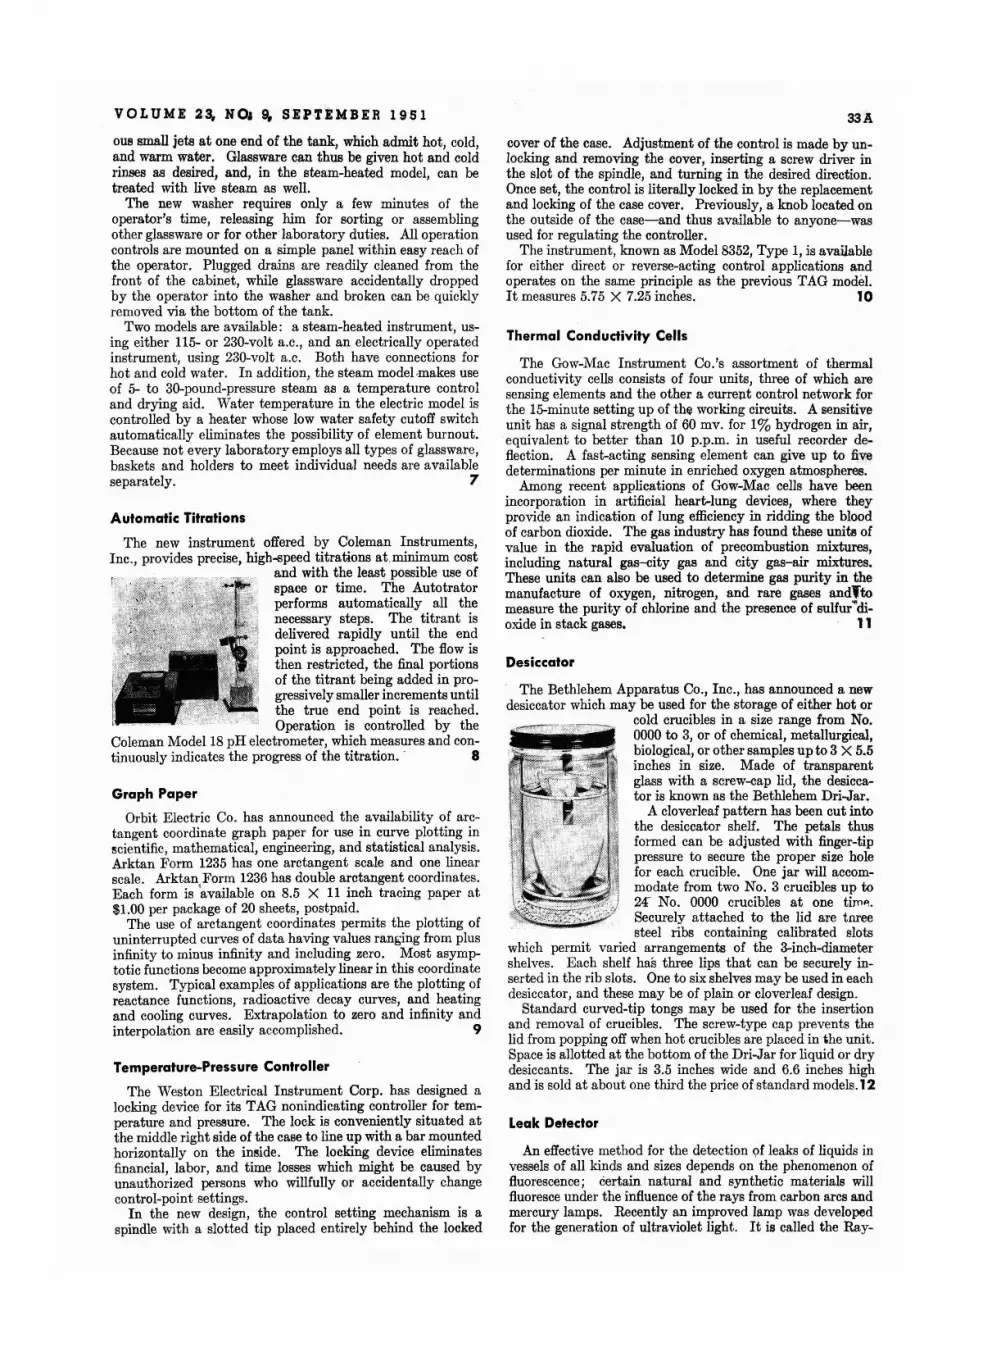
VOLUME 23, NO, 9, SEPTEMBER 1951
ous small jets at one end of the tank, which admit hot, cold,and warm water. Glassware can thus be given hot and coldrinses as desired, and, in the steam-heated model, can betreated with live steam as well.
The new washer requires only a few minutes of theoperator's time, releasing him for sorting or assemblingother glassware or for other laboratory duties. All operationcontrols are mounted on a simple panel within easy reach ofthe operator. Plugged drains are readily cleaned from thefront of the cabinet, while glassware accidentally droppedby the operator into the washer and broken can be quicklyremoved via the bottom of the tank.
Two models are available : a steam-heated instrument, using either 115- or 230-volt a.c., and an electrically operatedinstrument, using 230-volt a.c. Both have connections forhot and cold water. In addition, the steam model .makes useof 5- to 30-pound-pressure steam as a temperature controland drying aid. Water temperature in the electric model iscontrolled by a heater whose low water safety cutoff switchautomatically eliminates the possibility of element burnout.Because not every laboratory employs all types of glassware,baskets and holders to meet individual needs are availableseparately. 7
Automatic Titrations
The new instrument offered by Coleman Instruments,Inc. , provides precise, high-speed titrations at.minimum cost
and with the least possible use ofspace or time. The Autotratorperforms automatically all thenecessary steps. The titrant isdelivered rapidly until the endpoint is approached. The flow isthen restricted, the final portionsof the titrant being added in progressivelysmaller increments untilthe true end point is reached.Operation is controlled by the
Coleman Model 18 pH electrometer, which measures and continuously indicates the progress of the titration. . 8
Graph Paper
Orbit Electric Co. has announ ced the availability of arctangent coordinate graph paper for use in curve plotting inscientific, mathematical, engineering, and statistical analysis.Arktan Form 1235 has one arctangent scale and one linearscale. Arktan Form 1236 has double arctangent coordinates.Each form is 'available on 8.5 X 11 inch tracing paper at$1.00 per package of 20 sheets, postpaid.
The use of arctangent coordinates permits the plotting ofuninterrupted curves of data having values ranging from plusinfinity to minus infinity and including zero. Most asymptotic functions becomeapproximately linear in this coordinatesystem. Typical examples of applications are the plotting ofreactance functions, radioactive decay curves, and heatingand cooling curves. Extrapolation to zero and infinity andinterpolation are easily accomplished. 9
Temperature-Pressure Controller
The Weston Electrical Instrument Corp. has designed alocking device for its TAG nonindicating controller for temperature and pressure. The lock is conveniently situated atthe middle right side of the case to line up with a bar mountedhorizontally on the inside. The locking device eliminatesfinancial, labor, and time losses which might be caused byunauthorized persons who willfully or accidentally changecontrol-point set t ings.
In the new design, the control setting mechanism is aspindle with a slotted tip placed entirely behind the locked
33A
cover of the case. Adjustment of the control is made by unlocking and removing the cover, inserting a screw driver inthe slot of the spindle, and turning in the desired direction.Once set, the control is literally locked in by the replacementand locking of the case cover. Previously, a knob located onthe outside of the case-and thus available to anyone-wasused for regulating the controller.
The instrument, known as Model 8352, Type 1, is availablefor either direct or reverse-acting control applications andoperates on the same principle as the previous TAG model.It measures 5.75 X 7.25 inches. 10
Thermal Conductivity Cells
The Gow-Mac Instrument Co.'s assortment of thermalconductivity cells consists of four units, three of which aresensing elements and the other a current control network forthe I5-minute setting up of the working circuits. A sensitiveunit has a signal strength of 60 mv. for 1% hydrogen in air,
.equivalent to better than 10 p.p.m. in useful recorder deflection. A fast-acting sensing element can give up to fivedeterminations per minute in enriched oxygen atmospheres.
Among recent applications of Gow-Mac cells have beenincorporation in artificial heart-lung devices, where theyprovide an indication of lung efficiency in ridding the bloodof carbon dioxide. The gas industry has found these units ofvalue in the rapid evaluation of precombustion mixtures,including natural gas--city gas and city gas-air mixtures.These units can also be used to determine gas purity in themanufacture of oxygen, nitrogen, and rare gases andltomeasure the purity of chlorine and the presence of sulfur"dioxide in stack gases. 11
Desiccator
The Bethlehem Apparatus Co., Inc., has announced a newdesiccator which may be used for the storage of either hot or
cold crucibles in a size range from No.0000 to 3, or of chemical, metallurgical,biological,or other samples up to 3 X 5.5inches in size. Made of transparentglass with a screw-cap lid, the desiccator is known as the Bethlehem Dri-Jar,
A cloverleaf pattern has been cut intothe desiccator shelf. The petals thusformed can be adjusted with finger-tippressure to secure the proper size holefor each crucible. One jar will accommodate from two No.3 crucibles up to24 No. 0000 crucibles at one tirnp..Securely at tached to the lid are tnreesteel ribs containing calibrated slots
which permit varied arrangements of the 3-inch-diametershelves. Each shelf has three lips that can be securely inserted in the rib slots. One to six shelves may be used in eachdesiccator, and these may be of plain or cloverleaf design.
Standard curved-tip tongs may be used for the insertionand removal of crucibles. The screw-type cap prevents thelid from popping off when hot crucibles are placed in the unit.Space is allotted at the bottom of the Dri-Jar for liquid or drydesiccants. The jar is 3.5 inches wide and 6.6 inches highand is sold at about one third the price of standard models.12
Leak Detector
An effective method for the detection of leaks of liquids invessels of all kinds and sizes depends on the phenomenon offluorescence i certain natural and synthetic materials willfluoresce under the influence of the rays from carbon arcs andmercury lamps. Recently an improved lamp was developedfor the generation of ultraviolet light. It is called the Ray-
34A
master Model TFS4-B90 blacklight exploring lamp and isoffered by George W. Gates and Co. These lamps are particularly adaptable to the new method of leak detection underall conditions as they may be battery operated. All hazardsof shock from power circuits under wet conditions are eliminated , and the equipment is completely portable. The lightsource, complete with battery, measures 4.25 X 5.25 X 8inches and weighs 11 pounds.
In the suggested method, a dilute solution of an effectivefluorescing agent is placed inside the container or vessel to betested. The slightest Bow through the wall is signaled by abright glow under the influence of the rays from the exploringlamp. Detection must be done in a darkened area. 13
Nessler Tubes
Nessler color comparison tubes with interchangeablyground cap-type stoppers are now being made by Kimble
Glass, a division of Owens-IllinoisGlass Co. Both stoppers and tubeshave the Kimble shadowless bottomfeature. 'The use of stoppered Nesslertubes will do away with the type ofcontamination resulting from the tendency of some solutions, when exposedto air, to oxidize or form surface films.No dust willaccumulate on the surfaceof the column, and evaporation willbeminimized.
It is not necessary to remove thestopper when readings are being made.When these tubes are filled with liquidand viewed through the shadowlessglass, with a light source beneath the
tube, there are no dark spots to interfere with the comparisons. Moreover, the bottom will not distort the transmittedlight. Both standard and low form stoppered Nessler tubesare made in three sizes. The No.1 size is graduated at 50 ml.,the No.2 size at 100 ml., and the No.3 size at 50 and 100 ml,These tubes may be purchased in sets of 6 or 12 from regular laboratory supply houses. 14
MANUFACTURERS ' LITERATURE
Deionizer. A 6-page bulletin describes single-tank deionizers of a mixed-bed design which gives up to 44% morecapacity. Water is produced of high chemical purity, freefrom ionizable impurities, including carbon dioxide and silica.These units are said to replace distillation or evaporationequipment for as little as 1 to 10% of the cost, depending uponthe characteristics of the water. Elgin Softener Corp. 15
Insecticide. Manual describes biological effects of ethyl pnitrophenyl thionobenzenephosphonate, used to control insect pests. Booklet details new findings concerning toxicology, residues, specific dosages, and analytical methods fordetermining amounts of the chemical on harvested crops.Product is supplied as EPN-300 insecticide, a 25% wettablepowder. E. I. du Pont de Nemours &.Co. 16
X-Ray Spectrometer. Data sheet describes x-ray spectrometer made by North American Philips Co. Instrumentfeatures Geiger-counter goniometer and recorder. Illustrations and sample analytical results are included. Minneapolis-Honeywell Regulator Co. 17
Copper Naphthenate. Report discusses the action of 8%copper naphthenate, a fungicideand preservative for cellulosicmaterials. The product is a virtually permanent protective
ANALYTICAL CHEMISTRY
agent against fungus, mold, mildew, and marine parasit:s,although it has no harmful effect on wood, metal, or fabric,Witco Chemical Co. 18
Electromagnet. Technical paper describesan improved ironcore magnet for general laboratory use. Design considerations and operating characteristics are indicated for electromagnet which provides a field strength of over 40,000 gausswith a power input of 20 kw. Arthur D. Little, Inc. 19
Instruments. Illustrated booklet gives information onpyrometer controls, indicating pyrometers, thermocouples,panel meters, contact meter relays, and other equipment.Booklet contains numerous circuit diagrams. AssemblyProducts, Inc. 20
Laboratory Equipment. An 8-page bulletin describes Coleman spectrophotometers, de Fonbrune mioromanipulators,Wyandotte Dural-H detergent, special refrigerators, and bloodsedimentation racks. Aloe Scientific Division. 21
Chemicals from Soybeans. Bulletin discusses new corticosteroids, cortisone, and male and female sex hormones derived from soybeans. Such facts as common and chemicalnames, molecular weight, and empirical and structuralformulas are given for these materials. The Glidden Co. 22
Apparatus and Chemicals. "Laboratory Apparatus andChemicals Required for the Chemical Analysis of WaterAccording to 'Laboratory Manual for Chemical and Bacterial Analysis of Water and Sewage'" is the title of new 12page booklet. Central Scientific Co. 23
Reagent Chemicals. A comprehensive 256-page cataloglists the company's complete line of laboratory chemicals.Catalog describes methods used in manufacturing reagentchemicals. Tables are provided in the appendix. J. T.Baker Chemical Co. 24
Polyethylene. An 8-page booklet provides a summary ofthe physical and chemical properties of polyethylene resinshaving a molecular weight between 19,000 and 21,000.Mechanical, thermal, and electrical properties are indicated.American Agile Corp. 25
Electronic Supplies. A 132-pagecatalog gives informationconcerning hundreds of items including headphones, oscilloscopes, vacuum-tube voltmeters, signal generators, voltagecontrols, transformers, capacitors, resistors, switches, andbatteries. Sun Radio and Electronics Co. 26
Methyl Purple. Booklet describes the use of methyl purpleas an indicator. This product is suggested as a replacementfor methyl orange. Fleisher Chemical Co. 27
Laboratory Microscopes. Well-illustrated booklet describeslaboratory microscopes and optional equipment. Instrument features include ball bearings and rollers throughout thefocusing system, longer working distance, nondivisible lOXachromatic objective. Bausch & Lomb Optical Co. 28
Refractories. A 20-page booklet, including charts, tables,and illustrations, gives information on strength, chemicalinertness, thermal conductivity, and resistance to corrosionand abrasion of various refractories. Carborundum Co. 29
Electronic Computer. Pamphlet describeselectronic analogcomputer manufactured by Computer Corp. of America.Details are given on setup board, control panel, recorder,amplifiers, potentiometers, and power supply. BrujacElectronic Corp. 30
Diethyl Succinate. Technical data sheet outlines the possibilities of diethyl succinate as a chemical intermediate forthe synthesis of ring compounds. Physical properties aredescribed, as well as chemical reactions reported in theliterature. Monsanto Chemical Co. 31
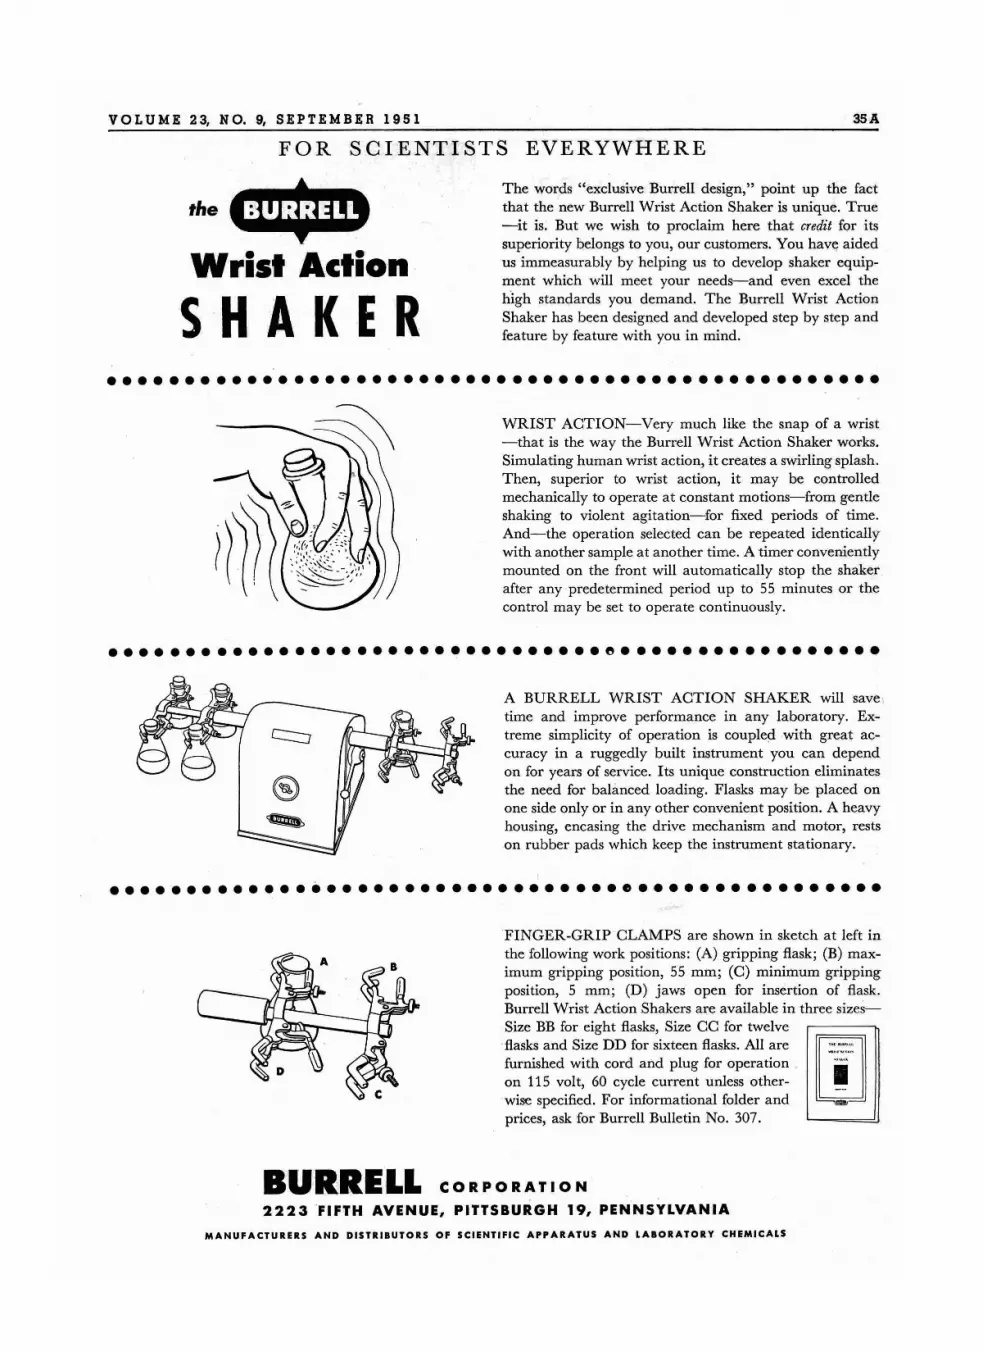
VOL U M E 23, N O. 9, SEPTE M B ER 1 9 5 1
FOR SCIENTISTS EVERYWHERE
35A
the
Wrist Action ·
SHAKER
The words "exclusive Burrell design," point up the factthat the new Burrell Wrist Action Shaker is unique. True-it is. But we wish to proclaim here that credit for itssuperiority belongs to you, our customers. You have aidedus immeasurably by helping us to develop shaker equipment which will meet your needs-and even excel thehigh standards you demand. The Burrell Wrist ActionShaker has been designed and developed step by step andfeature by feature with you in mind.
••••••••••••••••••••••••••••••••••••••••••••••••••
WRIST ACTION-Very much like the snap of a wrist-that is the way the Burrell Wrist Action Shaker works.Simulating human wrist action, it creates a swirling splash.Then, superior to wrist action, it may be controlledmechanically to operate at constant motions-from gentleshaking to violent agitation-for fixed periods of time.And-the operation selected can be repeated identicallywith another sample at another time. A timer convenientlymounted on the front will automatically stop the shakerafter any predetermined period up to 55 minutes or thecontrol may be set to operate continuously.
•••••••••••••••••••••••••••••••• e •••••••••••••••••
A BURRELL WRIST ACTION SHAKER will save ,time and improve performance in any laboratory. Extreme simplicity of operation is coupled with great accuracy in a ruggedly built instrument you can dependon for years of service. Its unique construction eliminatesthe need for balanced loading. Flasks may be placed onone side only or in any other convenient position. A heavyhousing, encasing the drive mechanism and motor, restson rubber pads which keep the instrument stationary.
W'..·....,....... ..."."
I-
••••••••••••••••••••••••••••••••• e ••••••••••••••••
FINGER-GRIP CLAMPS are shown in sketch at left inthe following work positions: (A) gripping flask; (B) maximum gripping position, 55 mm; (C) minimum grippingposition, 5 mm; (D) jaws open for insertion of flask.Burrell Wrist Action Shakers are available in three sizes.Size BB for eight flasks, Size CC for twelve.flasks and Size DD for sixteen flasks. All arefurnished with cord and plug for operation .on 115 volt, 60 cycle current unless otherwise specified. For informational folder andprices, ask for Burrell Bulletin No. 307.
BURRELL CORPORATION
2223 FIFTH AVENUE, PITTSBURGH 19, PENNSYLVANIA
MANUFACTURERS AND DISTRIBUTORS OF SCIENTIFIC APPARATUS AND LABORATORY CHEMICALS
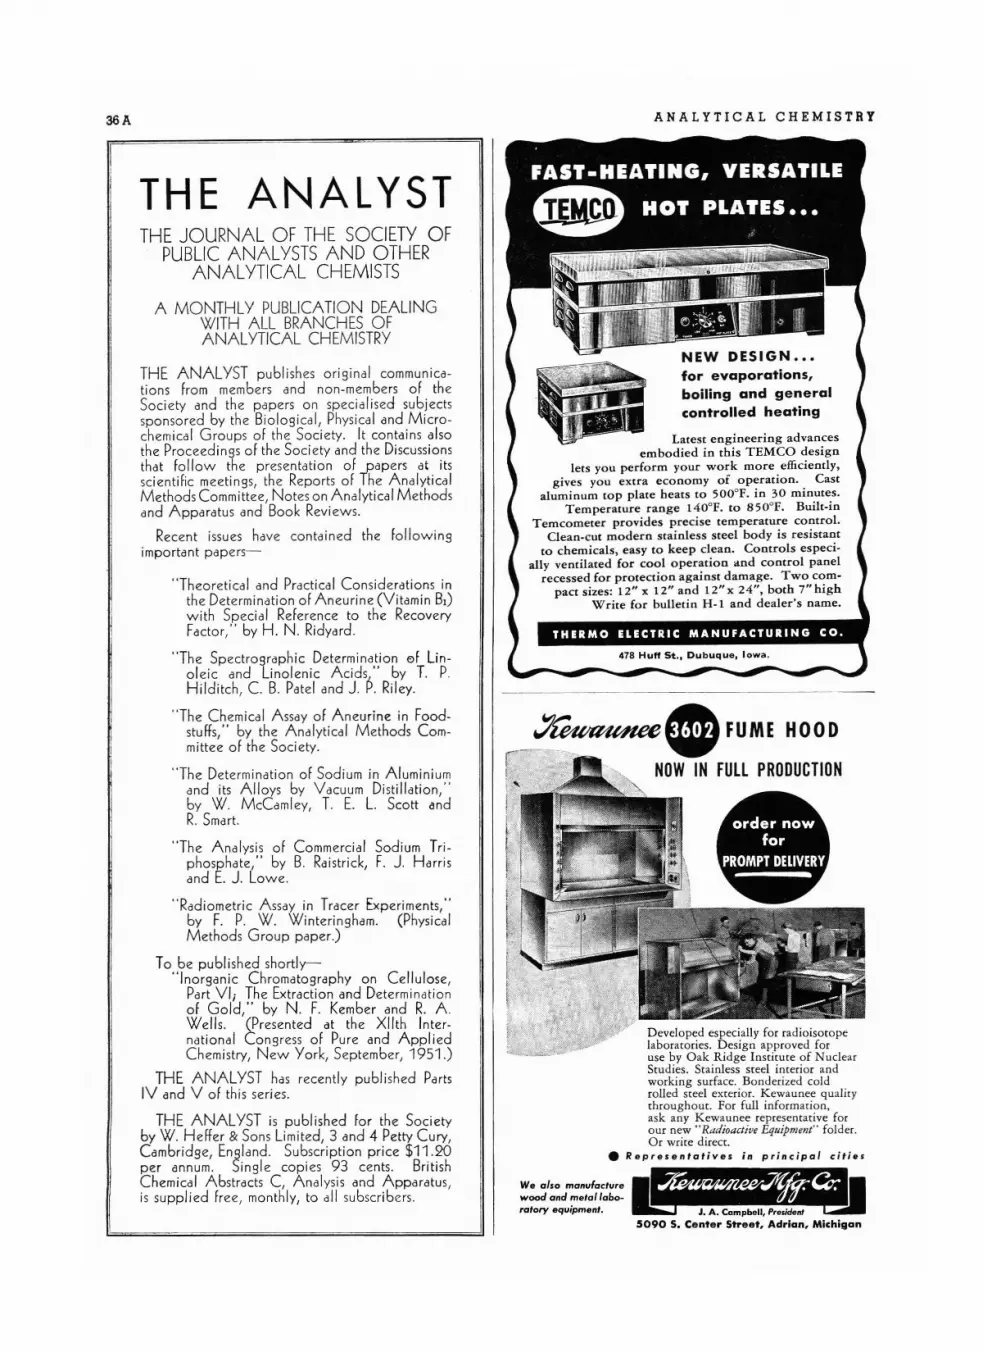
36A ANA LYTICA L CHEM ISTRY
Develo ped especially for rad ioisotopelabo rator ies. D esign app roved foruse by O ak Ridge Institute of NuclearStudies. Stai nless steel int erior andwork ing surface. Bon derized coldrolled steel exterior. K ewaunee q ualitythr o ugh out. For full inform acion ,ask an y K ewaunee representative foro ur new " Radioactive Equipment" folder.O r write direct,
• Repre sen tative s in prin cipa l citi ...
We also manu facturewood and me/al'abo-ratory equipment. J. A. Campbell, President
5090 S. Center Street, Adrian, Michigan
c~eFUME HOOD
[ . '-",} NOW IN FULL PRODUCTIONb' ~
A MONTH LY PUBLI CATIO N DEALINGW ITH A LL BRANCHES O FA NALYTICAL C HEMISTRY
"Theore tical and Practical Con siderations inthe Determination of An eurine (Vitamin B1)with Special Reference to the RecoveryFactor," by H. N . Ridyard.
"The Spectrographic Determination e ] linoleic and Linolenic Acids" by T. P.Hild itch, C. B. Patel and J. P. Riley.
"The Chemical A ssay of An eurine in Foodstuffs," by the Analyt ical Methods Committee of the Society.
"The Determination of Sodi um in Aluminiumand its Alloys by Vacuum Distillation,"by W. McCaml ey, T. E. L. Scott andR. Smart.
"The Anal ysis of Comm ercial Sodium Triphosphate," by B. Ra istrick, F. J. Harrisand E. J. Low e.
THE JOURNAL OF THE SOCIETY OFPUBLIC ANALYSTS AND OTHER
ANALYTICAL CHEMISTS
" Rad iometric A ssay in Tracer Exper iments,"by F. P. W. Wint eringham. (PhysicalMethods Group paper.)
To be published shortly-" Ino rganic C hromatography on Cellulose,
Part Vii The Extraction and Determinationof Go ld," by N. F. Kember and R. A.Wells. (Presented at the Xllth International Congress of Pure and Appl iedChemistry, New York, Sept ember, 1951 .)
THE ANALYST has recently publi shed PartsIV and V of this series.
THE ANALYST is published for the Soc ietyby W. H effer & Sons Limited, 3 and 4 Petty Cury,Cambr idge, Ensland. Subscription price $11.20per annum. Single cop ies 93 cents. BritishChemical Abstracts C, An alysis and Apparatus,is supplied free, monthly, to all subscribers.
THE ANALYST publishes original communications from members and non-membe rs of theSociety and the papers on special ised subje ctssponso red by the Biological, Physical and Microchemical G roups of the Society. It contains alsothe Proceedings of the Society and the Discussionsthat fo llow the presentation of y apers at itsscientific meetings, the Reports of Ihe AnalyticalMethod sCommittee, Noteson An alytical Methodsand Apparatus and Book Review s.
Recent issues have con tained the fo llow ingimpo rtant papers-
THE ANALYST

VO L U M E 2 3, N O. 9, SEPTE M B E R 1 9 5 1 37A
PHOTOVOLT Line-Operated
Electronic pH METER
CORP.New York 16, N. Y.
PHOTOVOLT9S Madison Avenue
A truly universal precision instrument• lor .ccu,.I. pH r••dln.. In Ioborclory .nd loctory UII
• lor op.r.,ion with .ny Iypn .nd dnlsn. 01 .Iectsodn• lor pH lests, titr.lIon, .nd oxld.llon.. eductlon polenll. l.• with 7' ...1. /rom pH 0 to 14, without r•••nal or.wltchlns• Fully stoblli••d, lor AC linn 9o-i75 .olb 50-60 cvcln• lor conllnuou. op.r.lIon, .1.0 .d.plebl. lor r.cordlns• •••II.bl. with prol.ct lve wood.n hou.lns lor portability• Fu,nl.h.d wllh .hl.lded slo...I.ctrod., .1.0 •••lIabl. with
.hl.ld.d comp.rtm.nl lor un.hleld.d mlcro-.lectrod ••
H••mcllc.lly •••I.d .mpIlR•• 10•••II.bl• •ervlee In humid .Imo.phorn.Minimum srld cu".nllor .ccu ••le m•••u......nl 01 non..."".ou. sampin.
Write (01' Bulletin #11 0 to
Availa bl e in"Twa St yle '_ Se t! Relow
Wr ile fo r
l eaflet760
• A p~aet.ica/, ac curate ~ir velocity meter for heating, air conditioning, andvenll/atlng work. IndISpensable for measuring grille velocilies and airdel iveries from reg isters and grilles; for balancing forced air heat ingsyslem s, and for checking air distribution of all kinds of ventilaling system•.
• Accura le velocity readings, automatically averaged over a 3" dia.free area, instantly indicated in feel per minute.
• Extension handle facilitates positioning of instrument away from theobserver for readings in hard -to -rea ch localions, or where Ihe ob server'sbody would interfere with lhe normal air movement.
• Unique scale lock make s po ssible to retain sca le reading when de sireduntil Ihe lock is re/eased-an indispensable feature where extensionrod is used 10 po sition instrumenl awa y from the ob server.
• Leather case is furnished as standard equipmenl for added prot ectionwhen the instrument is not in use and for convenience when carrying
il in the poc ket . Ei' her of two s' yle" O ne wlth a scale of 0-1000ft./min., a nd the other with a d oub le sca le of0-30 0 0 ft .fmin. and 0 ..35 miles per hour .
----------------------~
Something new ha s been added to all SeKo Analytical Balanceslo~ recognized for precision, quality and accu racy. Instead ofpolished mah ogany, th e case is now made of specia lly extrudedsolid aluminum, finished in light jeweler 's bronze (lacquered) I
SENSITIVE TO 1/20 Mg.UJiih ftulJ load!
• Solid Aluminum Case• Free-Floating Glass Sub-Base• Channel Notched Beam• Magnetic Damper• Chain Device
;....------~
S tyle No. 472M
No. S GA 833 SeKo Analytical Balance,Model 80 , Style 472M, as d escribed,complete $352.00
For routine analysis requiring an acc uracy of 1/ 20 mg., themodel pictured is ideal. Each pan has a capacity of 200 grams.The channel notched beam eliminates the need for fractionalweights. A magnetic damper br ings th e balance qu ickly to rest.Bearings and knife edges are agate. T he case (18" h x 16%:" w x9%:' deep) is fitte d with a drawer large enough to acco mmodate astandard set of SeKo weights. It has a counte rpoised front door,circular level and leveling screws. Write fo r new brochure!
'~SCIENTIFIC GLRSS RPPRRRTUS CO.,INc.BLOOMFIELD - NEW JERSEYlABORATORYAPPARATVS - IHSTRVMEIITS - CHEMICALS - GLASSWARE
II,,II,I_________...J

38 A ANALY TICAL C HEM IS TRY
FA LLINGBALL
HOEPPLER VISCOSIMETERPRECISION MODEL
········ f-,_0'-
(from 0° C to 100°C)
EQUALSB x (Sb-Sf) x TimeB = Ball Constant
Sb = Sp. gr. of ballSf = Sp. gr.of fluid
Bethlehem Merc urv OxiRerend Gcld-Adheslen Filter
Used by· Laboratories in many fields• Chemical Companies• G as and Oil Industries• Instrument Manufacturers and Users• Refiners
If you use mercury at an you need cleaning equipment.This process gives you the great advantage of having cleanmercury always at hand.
Made in three sizes: 5- , 25- and 150- lb. capacities. Comp letesets, $80, $220 and $725.
Write today lor illustrated brochure.
Bethlehem Apparatus Co., Inc.890 Front St., Hellertown, Pa.
T he Hoeppler Viscosimeter pro.vides a fas t and accurate method ofd etermin ing the viscosity of gases,liquid s, oils, plastics, syrups, visco ustars and dark colored liquids. Direct reading in cenripoises (or ce ntis tokes ). From 0.01 to 1,000,000ce ntipoises. Accuracy 0.1 % to0 .5 %. Small sample (30 cc) r equ ired. Resul ts consi stent and r eproduci b le.
O rder direct o r fr om leading labo ra to ry su pp ly dealer s.
Write today for Bulletin H V- 303.
Manufactured by FISH-SCHURMAN CORP.72 Portman Road, New Rochelle, N. Y.
VISCOSITY DIRECTLYIN CENTIPOISES
•No. 900-3
•
•
No. 2070
•
ELECTROPHORESIS APPARATUS. BIO·COLORIMETERSGLASS ABSORPTION CELLS. COLORIMETER NEPHELOM·ETERS • GLASS STANDARDS • KLETT REAGENTS
Designed for the rap id and a ccurate deter:mination of thia:min , r ib ofl avin, and o t her substanceswhich fluoresce in s ol ution. T h e sensitivityand s tability are s uch t hat it has been foundparticularly usefu l in det er:min ing ve ry s:malla :mounts of these substances.
Klett . . . .Photometers~
1i"""""===KLETT SCIENTIFIC PRODUCTS===j1
Klett Manufacturing Co.179 E AST 8 7T H ST R E E T , NE W Y O R K, N. Y.
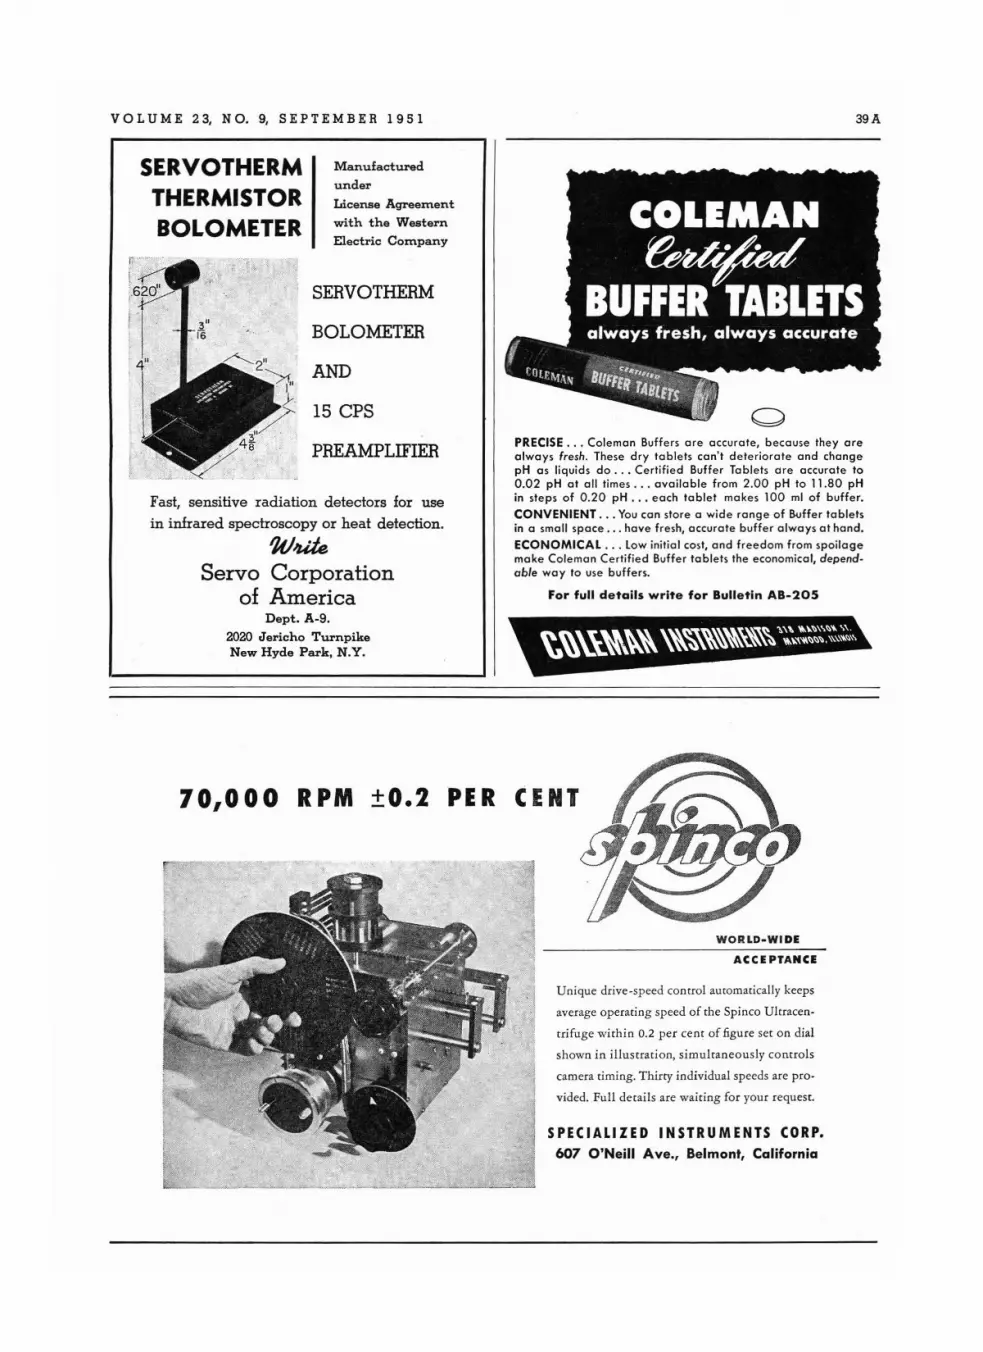
VOL U M E 2 3, N O. 9, S E PTE M B E R 1 9 5 1 39 A
Fast, sensitive radiation detectors for use
in infrared spectroscopy or heat detection.
'W1UteServo Corporation
of AmericaDept. A-9.
2020 Jericho TurnpikeNew Hyde Park, N.Y .
SERVOTHERMTHERMISTORBOLOMETER
Manufactured
under
License Agreement
with the Western
Electric Company
SERVOTHERM
BOLOMETER
AND
15 CPS
PREAMPLIFIER PRECISE . . . Cole man Buffers are accurate, because they a realways fresh. These dry ta blets ca n't d et e riora te a nd chang epH a s liquids do . . . Certi fied Buffer Tab let s are acc urate to0.02 pH at a ll time s available from 2.00 pH to 11.80 pHin steps of 0.20 pH each ta b let makes 100 ml of buffe r.
CONVENIENT You can sto re a wide rang e of Buffe r tablet sin a small spa ce ha ve fresh , accu ra te buffer al ways a t han d.
ECONOMICAL Low initia l cost, a nd free dom from spoilagema ke Cole ma n Cer tifie d Buff e r tab le ts the economical , dependable wa y to use buffe rs.
For full details write for Bulletin AB-20S
70,000 RPM +0.2 PER CEN T
WORLD- W I DE
ACCEPTANCE
U niq ue dr ive-speed co ntrol au tom atically keeps
ave rage operating sp eed of the Spinco Ultracen
trifuge with in 0.2 per cenr of figure set on dia l
sh own in il lusrrati on, simultaneously co nt ro ls
came ra riming . Thirty individual speeds are pro
vided . Full der ail s are wai ting for you r requesr.
SPECIALIZED INSTRUMENTS CORP.607 O'Neill Ave., Belmont, California

40A ANALYTICAL CHEMISTRY
Enables critical measurements which generally cannot be accomplished with ordinary photometers.
FARRA D'ELECTRON MULTIPLIERPHOTOMETER
PELLETPRESS
PRECISION OPTICS. ELECTRONICAND SCIENTIFIC INSTRUMENTS
Ask your PARR dealer for completeinformation or write to the factoryfor Spec. No . 281 I.
BULLETIN #804ON REQUEST
Designed for measurements at very low light levels.The detecting unit is comprised of a photomultipliertube of exceptionally high amplification and regionalresponse. The control unit consists of a stablebattery power supply enabling a wide range ofsensitivity selection, linear response and dark current balance. Arranged for easy attachment tovarious instruments.
FARRAND OPTICAL CO., Inc.BRONX BLVQ. and EAST· 238th STREET' NEW YORK 70, N. Y.
One-half inch diameter pellets, Up to one-half inchthick, can be formed from powdered materialin this hand operated press. Force in excess of2000 Ibs. can be exerted to operate the stainlesssteel punch.
231 NEW JER-5EY R. R. AVE .,NEWARK 5, N . J.
We pay highest prices lor scrap platinumand have facilities for prompt recovery 0/spent platinum and Palladium catalysts.
Electrodes, Stills, Retorts and other SpecialProcess Equipment to order.
Laboratory wares of all description.Sheet, Wire, Tubing, Gauze and Fine Foils.
Salts and Solutions.Platinum Metal Catalysts - Concentrated
forms and on carriers.Palladium, Iridium, Osmium, Rhodium and
Ruthenium.
THE AMERICANPLATINUM W"ORKS
WE INVITE YOUR INQUIRIES AND WILLSEND ON REQUEST FOLDERS:
1E-20,"Platinum, Gold & Silver for Science, Industry & fhe Arts"IE-21. "Platinum and Palladium Catalysts".
VOL U M E 2 3, N O. 9, S E PTE M B E R 1 9 5 1 41 A
• EASY TO GRIP• HARDNESS OF 9
(Moh's Scole)
• COMPLETELYVITRIFIEDANDNON-POROUS
• POLISHEDGRINDING
SURFACES
NEW ROCHELLE, N. Y.•32 RELYEA PLACE
Products of the Fin estin American I nqenui ly
and Craftsmanship
The Voland Spcedigram illustrated exemplifies spee d of weighing. I t is the easies t ba lance of all to use.
• Speed is Economy . . . only if the necessa ry accuracyand sensit ivity are retain ed.
• Accura cy is reproduceability.
• Built into th e Specdigra m are both accurac y and speed.
• Ask your dealer to demons trate th is superb instrument III
your own labora tory.
• Voland Balan ces are guaranteed to meet Federa l PerformanceSpecifications.
INO OUTSIDE WEIGHTS REQUIRED I
Price - $575. 00Fully equipped
0.05 milligramsensiti vit y
Voland Speed igramNo. 750D
200 gram capacity
THE THERMAL SYNDICATE, LTD.
• For use wilh any laboraloryapparalus lor which sleam Is
required.
PRICE
WRITE FORBULLETIN 3303C
• Aulomallc pressure resulalo'delivers up 10 30 lbs, work.ins pressu,e -100 lb•• pe,square inch.
• Develops lull .Ieam pressu,ewllhin 20 mlnules - .tarllnswilh a cold boiler.
• ASME code heavy weldodsleo l boiler is U.L. app,oved.
• Submersed heallns elemontsprovide excellenl heal lIans·Ie,. Rockwool insulallonkeeps heal Insido the boiler.
ANALYTICAL CHEMISTRY
LYNBROOK, N. Y.
81 Reade St., New York 7, New York
See Your Regular Supply O"al"r or Wril" Oir"clly 10 Us
LABORATORY SUPPLIES, Inc.
autolRaticstealR
generator,-
Visit Booth 669 at the show
Ava ila b le in 4 sizes accord ing to ca paci ty. Small sizehas 2 gal. water cap. , 7 Y2 x16 " boiler. Weighs 140 Ibs.
PALOforme,ly Palo-Myers, Inc.
VITREOSIL* (Vitreous Silica) laboratory ware is a
superior replacement for porcelain and glass and a satis
factory substitute for platinum in many cases. Greater
chemical purity and high resistance to heat shock as
compared to other ceramics and low initicil cost
compared to platinum have led to the universal
adoption of VITREOSIL as a substitute for platinum,
porcelain and other materials in many analytical
and research procedures.
Standard items of VITREOSIL Laboratory Ware
include transparent, glazed and unglazed crucibles,
evaporating dishes, beakers, tubing, etc.
Large stock enables prompt shipment
Write for Technical Bulletins giving full descriptions,specifications, and prices.
•••••
14 BIXLEY HEATH
for Catalog No.
PROMPT DELIVERY
For research work, routineanalyses, and diversified applications, the Hellige-DuboscqCo lorimeter has proved itssuperiority in different branchesof industry, engineering andscience . It is also the idealcolorimeter for clinical work asnon-fading precision glass colorstandards are available for 36bio-chemical tests. One of thespecial features is the five-foldincrease in the d rum scaleswhich permits 0.1 mm readingswithout use of a vernier.
42A
®
VOL U M E 2 3, N O. 9, S E PTE M B E R 1 9 5 1 43A
Demineral$83.0012.0057.60
AtJBBEA £0.
For 11 5 volt, 50-60 cycle operation.
No. 4837 Barnstead Bantamizer. less cartridge
No. 4837·C Cartridges, eachLots of Sill cartridges
.)/~ ~~ a;J fJ~SCIENTIFIC EQUIPMENT • LABORATORY SUPPlIE$
ANALYTICAL CHEMICALS
No. 4837
The Barnstead Bantam Water Deminera lizer is unsurpassed asa pract ical and convenient so urce of pure water for leboretory use .
A new direct reading purity indicator , calibrated both inspecific resistance and parts per million, te lls at a glance thequality of water produced. Also indicates when cartridgechange can be expected.
Improved high capacity cannister cartr idge removes morethan 1100 grai ns of salts by ion exchange and has Row rateof 5 to 8 gallons per hour.
The sturdy cast base is pra ct ical for bench or shelf use and isremovable for wall mounting.
The Barnstead Bantam Demineralizer is sup p lied completewith closely adjustable needle valve for inle t water, dra inpetcock, rubber delivery tube, copper inle t pipe and electriccord.
The Convenient WaterDemineralizer for Laboratories
~ke·J~
BARNSTEAD BANTAM
G et rh iJ i llformative bullelin d escri b i n g
the neu M odel 2 1·103 MaJI Sp ec.tro metcr, A Jk f or B" II" i" CEC·1800·X36.
exploratory analysis for both labor ator y or pl ant requi rements. Eve ry vo lati lemateria l pr esen t in a sample, in detectibleconcentra tion, regi ster s on the mass spectrum. The prese nce of eac h compo nent isthu s made kn own-wheth er antic ipa ted orno t-and may supp ly importa nt clu es fo rfurther q ua lita tive or qu ant itativ e ana lysis .
fundamental research may be accelerated and si mp lified becau se of thisinst ru ment's complete flexibility. W hi leopera tio n is auto matic fo r ro utine work, allvariables can be adj usted at th e will of the
op erator over wide ranges forspecial purposes in Fundamen tal or applied resea rch.
purity determinations. Becau se ofthi s in st rument's excep tiona l sensitivity, low" backg ro und" contam inati on, and highlyefficient recordi ng system it is ideall y suitedfor detecting mi nute traces ( five par ts permi llion in some cases) of contamina nts innearly pure ga seous and liquid compounds , .
and
faster
II routine analysis for hig hly complexI mixtur es. A separate qu ant itative deterrn iI nation of all components can of ten be made
- whether they be hydrocarbo ns, in organi cJ I gases, oxygena ted or othe r organic der iva-
y ou can uO I rives.
I control analysis for speci fic com poI ncnts in p lant contro l ope ra tions. When
these ana lyzing feed or product streams eithercompletely or for key compone nts, the factors of speed and accuracy are mo re thanad equa te ly p rov ided by th is instru men t.
better
CONSOLIDATED ENGINEERINGCorporation
A1lalytical 1115trume~/ts (I.... for Science and !ndu~try300 No. Sierra Madre V Illa tee Pasadena 8, Calijornia
~~
Siobs
44A
i!J15f51!!1J1!!!l1l_.•• for rapid, accurate preparationof Volumetric Solutions.. . . Laboratories requiring speed and accuracy areusing Acculute with excellent results.
ACCULUTE SAVES TIME-Open the ampoule-transfer the contents to a volumetric flask - dilute to volume (1000 mil - yourvolumetric solution is prepared.ACCULUTE IS RELIABLE - Close control of the spe cial manufacturing processes insu res uniformity of the produce. Acculuredoes not vary in ch em ical content - you can depend on it .ACCULUTE IS ACCURATE- Each a m po u le conra ins th e preciseconcentrated equivalent of the normality stated on the label.There is no need for subsequent standardization.
Caustic solutions a re supplied in wa x am po ules. others inchemically resistant glass .
Complet e instructions for p reparing Acculute solutions a refurnished with ea ch unit.
A special bulletin . listing Acculure con centrat es with pr icesand d iscounrs w ill be sent on request ,
Simple
Rapid
Accurate
Accutint is simple to use - just place a strip of the paper in contactw ith the su bstance to be tested and compare the color of the ex posedportion wi th the master colors on the vial.
Accurinr is rapid- it gi ves im med ia te results-no calculations arenecessary - vi sua l color comparison indicat es th e pH value.
Accurint is accurate - to I pH in th e wid e ran ge p aper and to0 .3 pH in the fractional range. W ide range papers are recommen dedwh ere the pH value is nor known to be w ithin th e lim its of a fractional ran ge paper. Fr acti onal range p apers are used for greater accuracy a fte r th e range has been d et ermined.5-65277 ACCUTINT TEST PAPERS. Packed In gl ass vi als . each vialcontains five p ads or 100 strips. Color chart and i nst r uct io ns are In -cluded w irh each vial. Per ViaL .. .. . $0.65Per 72 Vi als . .•_ ..__••••_ .••_••_ . •__• .._ 10 % DiscountS-6527B MASTER COLOR CHART. Jllusrra res color standards and readings for ev ery pH value in ea ch of the rw enry-three w id e and fractional ranges. Ch art helps in the selection of the most su itable rangesor papers for a speci fic purpose. Each.._ _ ... .••_•..__.•.. .._._.__..__ ~ l.uO
SARGENTSCIENTIFIC LABORATORY INSTRUMENTS· APPARATUS· CHEMICALSE. H. SARGENT & COMPANY. 4647 W. FOSTERAVE .. CHICAGO 3D. ILLINOISMICH IGAN OIVI~ION. 1959 EA~T JEFFER~ON ~TRE ET. DETRO IT 7, MICHIGANSOUTHWE STER N DIV ISJON. S91,S PEELER STR UT, DALLAS 9, TEXAS
ANALYTICAL CHEMISTRY
THESYNCHRO-LECTRIC
VISCOSIMETER
The Brookfield Synchro-Lectric Viscosimetermeets the demand for a rapid, efficient; accurate method of making viscositydeterminations adaptable to both laboratory and factory control work.
The principle upon which this instrumentoperates is the measurement of the dragproduced upon a Gylinder or disc rotatingat a definite constant speed while immersed in the material under test. A synchronous motor assures unvarying speed,and the torque measuring unit (a beryllium copper spiral spring) and affiliated partsare amply protected against strain, thus insuringpermanent accuracy.
The Brookfield Syncro-Lectric Viscosimeter offersthe advantages of:
Quick DeterminationsWide Ranges, High AccuracyResults in Viscosity UnitsModels for Many ApplicationsNo Adjustments, Minimum CarePortability, Easy CleaningOperating Simplicity
Write or phone Sherwood 2-1123 lor complete information
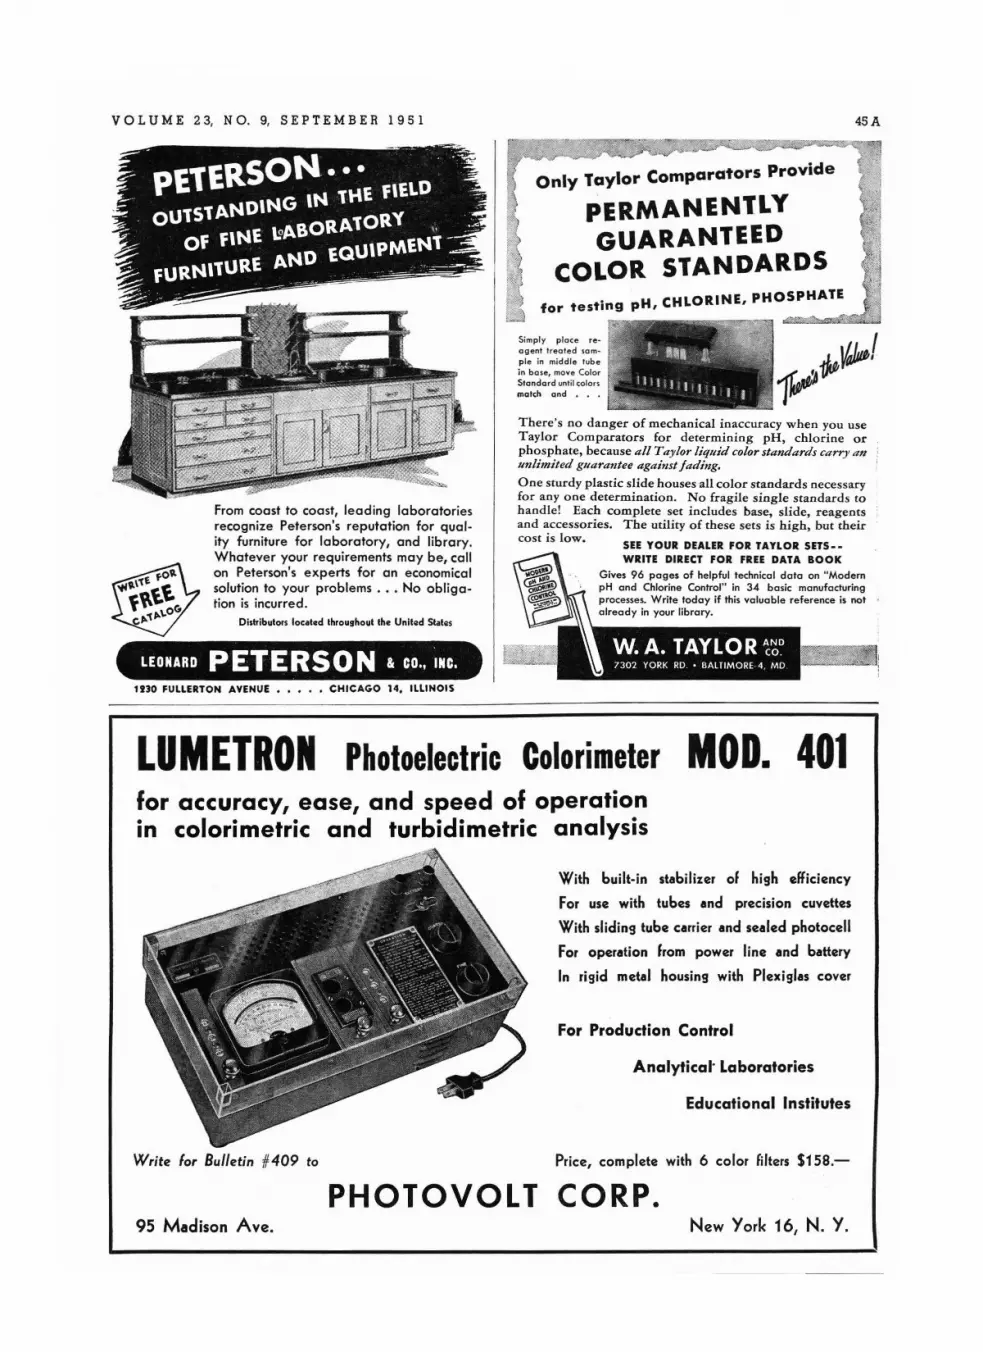
VOL U M E 23, N O. 9, S E PTE M B E R 1 95 1 45 A
LEONARD PETERSON & co., ~NC.
SEE YOUR DEALER FOR TAYLOR SETS- WRITE DIRECT FOR FREE DATA BOOK
Gives 96 pages of help ful technica l data on "Modemp H a nd Chlorine Control" in 34 basic manufa cturingprocesses. Wr ite today if this val ua ble re fer ence is nota lre a dy in your library.
Only Taylor Comparators Provide
PERMANENTLYGUARANTEED
COLOR STANDARDSfor testing pH , CHLORINE, PHOSPHATE
.£1$- '2" b3l~~
Simply place reagent treated scm
pie in middle tubein base, move ColorSta nd a rd until colonmc tch and • ••
T here 's no danger of mechanical inaccuracy when you useTaylo r Com parato rs fo r de te rmin ing pH, chlorine o rph o sphate, because all Taylor liquid color sta ndards carry-anunlimited guarantee against j ad ing.
One sturdy plastic slide houses all co lo r standards necessaryfor anyone de termination. No fragile single standards to
handle! Each co mpl ete set includes base, slide, reagentsand accessories. T he uti lity of these sets is high, but theircost is low.
From coast to coast, leading laboratoriesrecognize Peterson's reputation for quality furn iture fo r laboratory , and library.Whatever your requirements may be, callon Pete rson's experts for an econom icalsolution to your problems . • • No obligation is incurr ed .
Distributors located throughout the United States
1130 FULLERTON AVENUE • ••• • CHICAGO 14. ILLINOIS
LUMETRON Photoelectric Colorimeter MOD. 401for accuracy, ease, and speed of operationin colorimetric and turbidimetric analysis
~or.;W [Jf'>lf?~!}j' ''. ..•. : • "''1 . With built-in stabilizer of high efficiency
For use with tubes and precision cuvettes
With sliding tube carrier and sealed photocell
For operation from power line and battery
In rigid metal housing with Plexiglas cover
For Production Control
Analytical' Laboratories
Educational Institutes
Write For Bulletin #409 to Price, complete with 6 color fi lters $158.-
PHOTOVOLT CORP.95 Madison Ave. New York 161 N. Y.
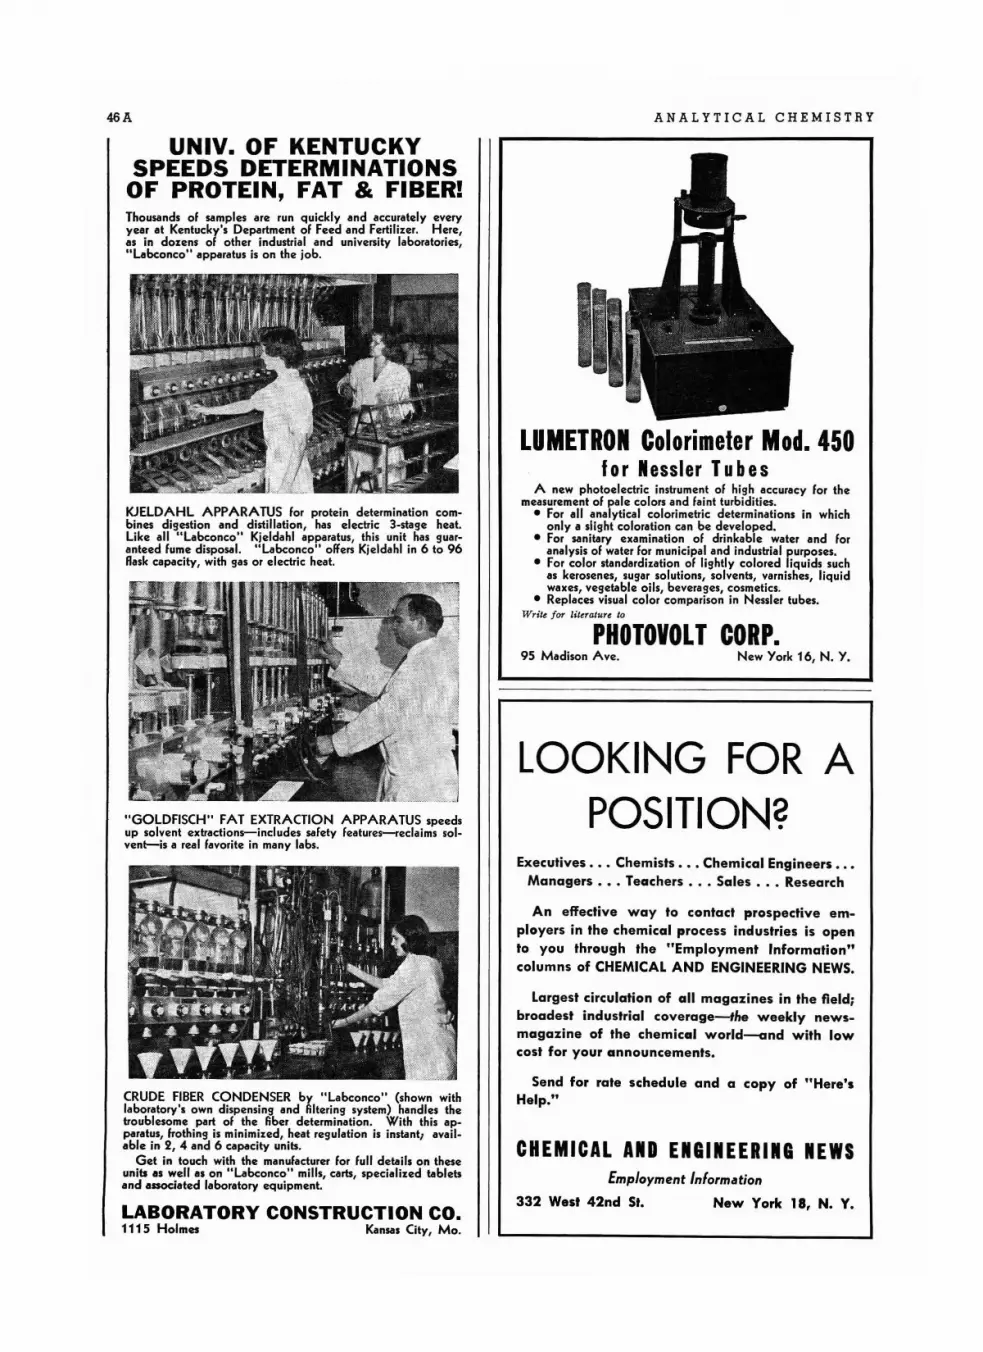
46A ANALYTICAL CHEMISTRY
PHOTOVOLT CORP.
LOOKING FOR APOSITION?
New York 16, N. Y.95 Madison Ave.
LUMETRON Colorimeter Mod. 450for Nessler Tubes
A new photoeledric instrument of high accuracy for themeasurement of pale colors and faint turbidities.
• For all analytical colorimetric determinations in whichonly a slight coloration can be developed.
• For sanitary examination of drinkable water and foranalysis of water for municipal and industrial purposes.
• For color standardization of lightly colored liquids suchas kerosenes, sugar solutions, solvents, varnishes, liquidwaxes, vegetable oils, beverages, cosmetics.
• Replaces visual color comparison in Nessler tubes.Write for literature ta
Thousands of samples are run quickly and accurately everyyear at Kentucky's Department of Feed and Fertilizer. Here,as in dozens of other industrial and university laboratories,"Labconco" apparatus is on the job.
" GO LDFISCH " FAT EXTRACTION APPARATUS speedsup solvent extradions-includes safety features-reclaims solvent-is a real favorite in many labs.
KJELDAHL APPARATUS for protein determination combines digestion and distillation, has electric 3-stage heat.Like all "Labconco" Kjeldahl apparatus, this unit has guaranteed fume disposal. " Labconco" offers K;eldahl in 6 to 96Rask capacity, with gas or electric heat.
UNIV. OF KENTUCKYSPEEDS DETERMINATIONS
OF PROTEIN, FAT & FIBER!
CRUDE FIBER CONDENSER by "Labconco" (shown withlaboratory's own dispensing and filtering system) handles thetroublesome part of the fiber determination. With this apparatus, frothing is minimized, heat regulation is instant! available in 2, 4 and 6 capacity units.
Get in touch with the manufadurer for full details on theseunits liS well as on "Labconco" mills, carts, specialized tabletsand associated laboratory equipment.
LABORATORY CONSTRUCTION CO.111 5 Holmes Kansas City, Mo.
Executives ••• Chemists ••• Chemical Engineers • ••Managers ••• Teachers ••• Sales ••• Research
An effective way to contact prospective employers in the chemical process industries is opento you through the "Employment Information"columns of CHEMICAL AND ENGINEERING NEWS.
Largest circulation of all magazines in the fleld;broadest industrial coverage-the weekly newsmagazine of the chemical world--and with lowcost for your announcements.
Send for rate schedule and a copy of "Here'sHelp."
CHEMICAL AND ENGINEERING NEWSEmployment In/ormation
332 West 42nd St. New York 18, N. Y.
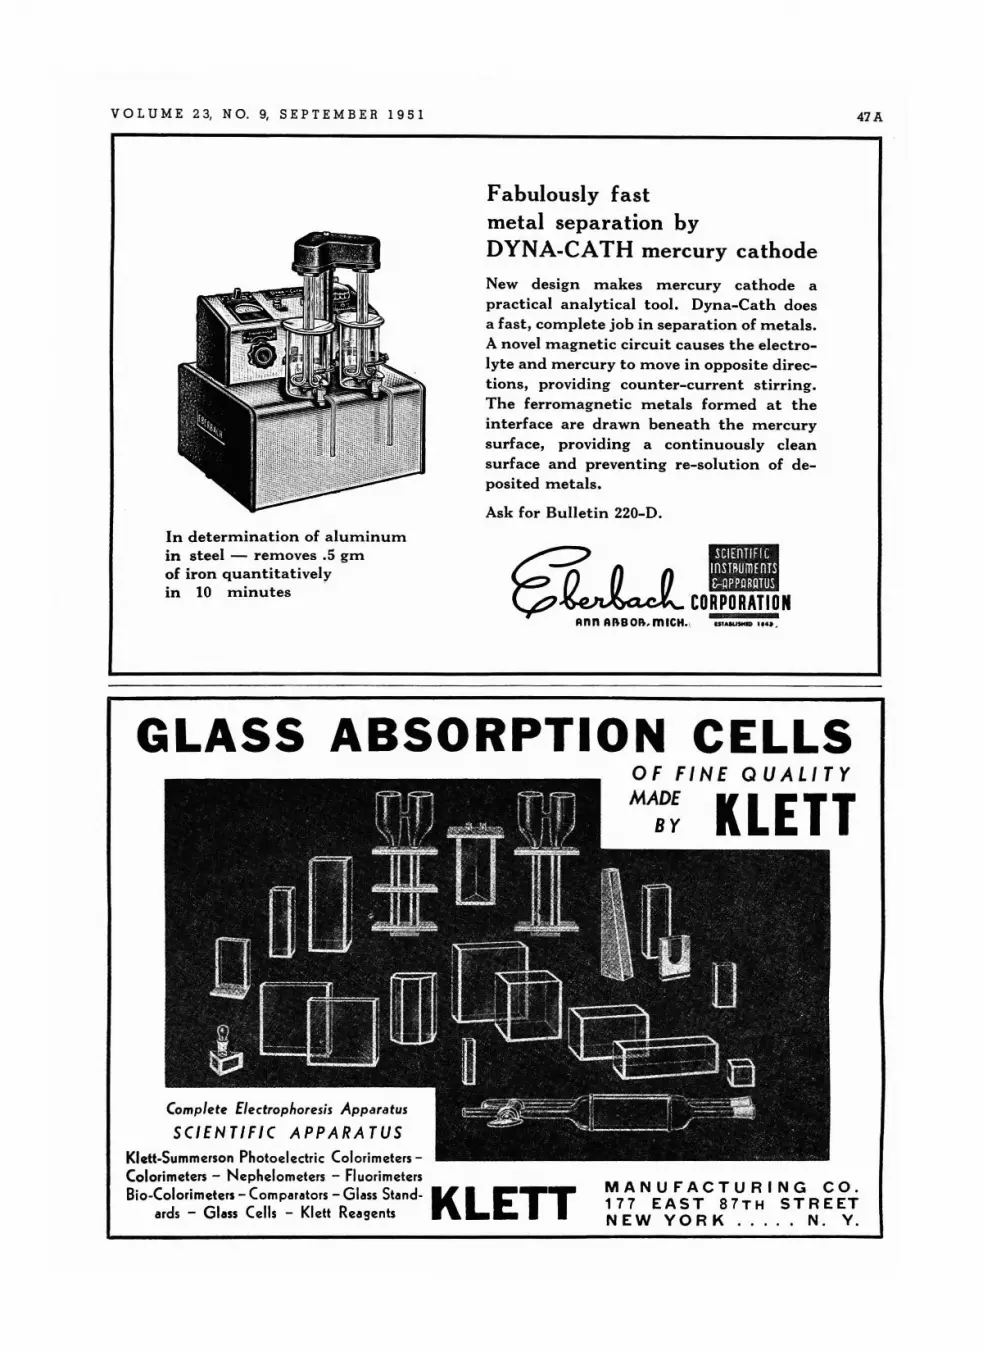
VOL U M E 2 3, N O. 9, S E PTE M B E R 1 9 5 1 47A
In determination of aluminumin steel - removes .5 grriof iron quantitativelyin 10 minutes
Fabulously fastmetal separation byDYNA-CATH mercury cathode
New design makes mercury cathode apractical analytical tool. Oyna-Cath doesa fast, complete job in separation of metals.A novel magnetic circuit causes the electrolyte and mercury to move in opposite directions, providing counter-current stirring.The ferromagnetic metals formed at theinterface are drawn beneath the mercurysurface, providing a continuously cleansurface and preventing re-solution of deposited metals.
Ask for Bulletin 220-0.
c:::::? n (J IIIc;?~CORPORATION
Ann ABBOB.mICH.\ ut_ .... .
GLASS ABSORPTION CELLS
KLETT
Complete Electrophoresis Appdrdtus
SCIENTIFIC APPARATUSKlett-Summerson Photoelectric ColorimetersColorimeters - Nephelometers - FluorimetersSio-Colorimeters - Comparators - Glass Stand-
ards - Glass Cells - Klett Reagents KLETT
OF FINE QUALITYMADE
BY
MANUFACTURING CO.1 77 E A 5 T 87 T H 5 T R E ETNEW YORK ... .. N. Y.
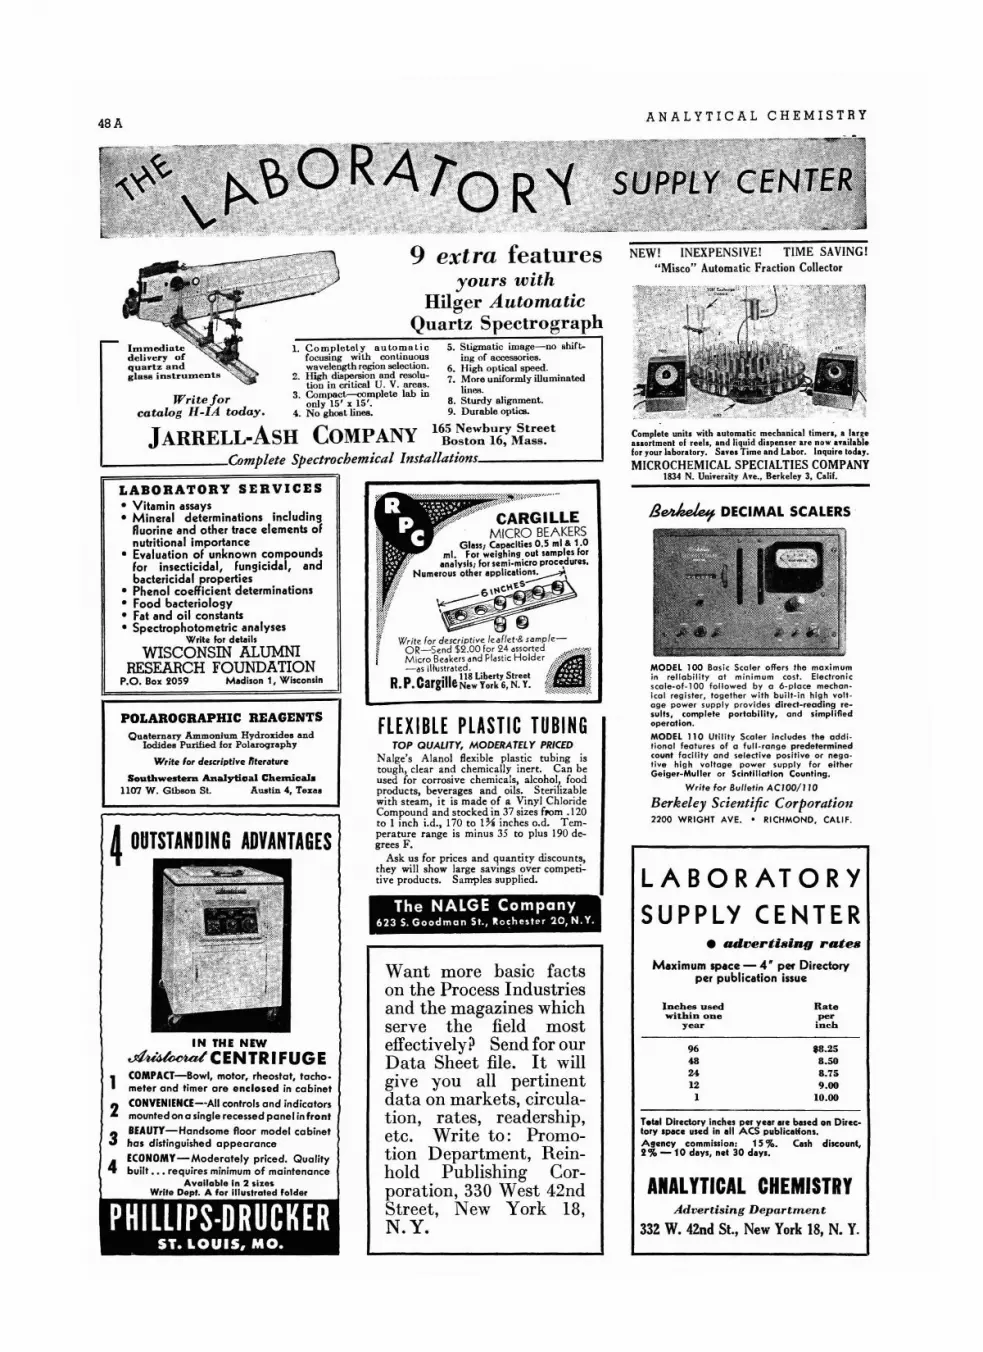
48AANALYTICAL CHEMISTRY
Rateperinch
t8.258.508.759 .00
10.00
96482412
I
Inches uoedwithin one.
year
Tetal Directory inches per year are based on Direc.tory spac. used In all ACS publicaHons.Agency eommlssion: 15 'lb. Cash discount,2'lb - 10 days, net 30 days.
ANALYTICAL CHEMISTRY
B~ DECIMAL SCALERS
• IUlverti"ing rates
Maximum space - 4' p~ Directoryper publication issue
MODEL 100 Bas ic Scaler offers the ma ximumi n re liabil ity a t min imum cost . Electron icscole-of-1 00 foll owed by 0 e -ploce mechenlea l regis te r. tog et her wit h bu ltt- In high vot t ag e po wer supply provide s d lrect- reading resu l.s, complete portability, and simplifiedoperation.
MODel 110 Uti lity Scaler Includes the cdd ttional fea tu re s of a full · ron ge predeterminedcount faci lity and se le cti ve pos it ive or ne go ·tlve high voltage power supply for eitherGeiger-Muller or Scintillation Counting,
W, i1e for Bullef in AC IOO/l 10
Berkeley Scientific Corporation2200 WRIGHT AVE. • RICHMOND, CALIF.
LABORATORYSUPPLY CENTER
Advertising Department
332 W, 42nd St., New York 18, N. Y.
Complete units with automatic mechanical limen, I lar ge...orlment of reels, and liquid dispenser are now ..,.ailablefor your laboratory. Saves Time and labor. Inquire today.
MICROCHEMICAL SPECIALTIES COMPANY1834 N. Uni.."ily A.... Berkeley 3, C.Iif.
NEW! INEXPENSIVE! TIME SAVING !"Misco" Automatic Fraction CoUector
9 extra featuresyours with
Hilger AutomaticQuartz Spectrograph
TOP QUALITY, MODERATELY PRICEDNalge's Alanol flexible plas tic tubing istough, clear and chemically iner t . Can beused for corrosive chemica ls, alcohol{ foodproducts, beverages and oils. Steri izablewith s team, it is made of a Vinyl Ch lorideCompound and stocked in 37 sizes from .120to 1 inch i.d., 170 to I ~ inches o.d, Temperature range is minus 35 to plus 190 degrees F.
Ask us for prices and quanti ty discounts,they will show large savings over competitiv e products. Samples supplied.
FLEXIBLE PLASTIC TUBING
CARGILLE. MICRO BEA KERS
Gla", Capacities 0.5 ml & 1.0"" ml. For weighing out samples lor
..f analysis ; for seml-mlerc procedures..:~r Numerous other appliclllt~~
.,., 56~':tt,C~~1f;~~~~~~-... ' '"'
\ ...~
Want more basic factson the Process Industriesand the magazines whichserve the field mosteffectively? Send for ourData Sheet file. It willgive you all pertinentdata on markets, circulation, rates, readership,etc. Write to: Promotion Department, Reinhold Publishing Corporation, 330 West 42ndStreet, New York 18,N.Y.
Writ £ for descript ive le4 (fet -& samp /e-OR-Send $2 .00 for 24 assort ed .M icro Beakers ond Flostic Holder-os ill.stroted .
C '11 118 Liberly StreetH.P. argl eNew York6,N . Y.
The NALGE Company6235. Goodman St., "ochest"r 20, N.Y.
POLAROGRAPHIC REAGENTS
IN THE NEW
~CENTRIFUGE
LABORATORY SERVICES• Vitamin assays• Mineral determinations including
fluorine and other trace elements ofnutritional importanceEvaluation of unknown compoundsfor insecticidal, fungicidal, andbactericidal properties
• Phenol coefficient determinations• Food bacteriology• Fat and oil constants• Spectrophotometric analyses
Write lor details
WISCONSIN ALUMNIRESEARCH FOUNDATION
P.O. Box 2059 Madison 1, Wisconsin
Ouaternery Ammonium Hydroxides andIodidea Purified lor Polaroqraphy
W,it~ lor descriptive ti'terature
Southwestens Analytical Chemical.1107 W . GibBOn 81. Austin 4, Te,.a.
4OUTSTANDING ADVANTAGES
1 COMPACT-Bowl, motor, rheostat, techemeter and timer are enclosed in cabinet
2 CONVENIENU--AII controls and indicatorsmounted on a single recessed panel in front
3 BEAUTY-Handsome floor model cabinethas distinguished appearance
ECONOMY-Moderately priced. Quality4 built • • • requires minimum of maintenance
Available In 2 sizesWrlle Dept. A for Illustrated folder
1. Co mp le te l y autom atic 5. Stigma tic image-no shift.•focusin g with continuous ing of acceseo eiee.wavelength region selection. 6. Iligh op tical speed,
2. High dispers ion and resolu- 7. More uniformly illumin atedlion in critical U. V. ar eas.
3. Compact--.:omplete lab in lines.Write for only 15' xiS'. 8. St urdy alignment.
catalog H-IA today. 4. No gboBtlinea. 9. Durable optics,
JARRELL.ASH COMPANY 16~~::,bi6;J~~:~tl-- Complete Spectrochemical Installations ......1

VOLUME 23, NO.9, SEP TEMBER 195 1
• • • •
49A
REPRINTS
of these symposia and feature articles from ACS journals may be obtained promptly. All are timely-each contains up-to-date informationcovering an important field of chemistry or chemical engineering:
Name" Fluorine Chemistry"
"Nuclei Formed in Fission" (page siz:e 71/2' x 10 ')" Ie n-Exchenge Resins"" Raman Spectra ""Vapor Pressure"" Unit Processes 1st Annual Review""Unit Processes 2nd Annual Review"" Materials of Construction 2nd Annual Review"" Materials of Construction 3rd Annual Review"" Unit Operation 3rd Annual Review"" Unit Operations 4th Annual Review""Analytical Chemistry 1st Annual Review"" A z:eotropic Data" Part II" A z:eotropic Data" Parts I & II, Combination only"Atmospheric Contamination & Purification"" Corrosion Testing in Pilot Plants"" Titanium Symposium""Chemical Facts & Figures-1950"" A bsorption & Extraction""Adsorption Sympos ium"
Reprinted fromr&EC, March '47 andAnalytical Ed., March '47JACS, November '46JACS, November '47Analytical Ed., Oct. '47r&EC, April '47I&EC, September '48I&EC, September '49I&EC, October '48I&EC, October '49I&EC, January '48I&EC, January '49Analytical Chemistry, Jan. & Feb. '49Analytical Chemistry, July '49Analytical Chemistry, Aug. '47 & July '49I&EC, November '49I&EC, March, April & May '49I&EC, February '50I&EC, June '50I&EC, June '50I&EC, Ju ly '50
21432
1147032
144114164
645656
28342
144109
5671
23280
Price
.75
.35
.35
.35
.35
.50
.50
.75
.50
.50
.501.50
.35
.85
.75
.25
.50
.75
.75
.50
------------- Send orders to ------------
Special PoblieaCions Department~ AMERICAN CH EMI CAL SOCIET~'
lIaG Sixteenth se., N.\V. Washington 6~ D. C.
INDEX TO ADVERTISERSAllied Chemical & Dy e Corp.. . . . . . . . . . . . . . . . . . . . . . . . . . . . . . 11 AAloe Co. , A. S. . . . . . . . . . . . . . . . . . . . . . . . . . . . . . . . . . . . . . . . . . . . 28 AAm erican Pl atinum Wor k. . . . . . . . . . . . . . . . . . . . . . . . . . . . . . . . . 40 AAnalyst. The . . . . . . . . . . . . . . . . . . . . . . . . . . . . . . . . . . . . . . . . . . . . 36 AApplied Re searc h Labora tories . . . . . . . . . . . . . . . . . . . . . . . . . . . . . 4 ABacharach Industrial I ns t rum ent Co.. . . . . . . . . . . . . . . . . . . . . .. 37 ABaker & Ad a mso n P roducts . . . . . . . . . . . . . 11 ABaker Chemical Co., J . T 2nd CoverBausch & Lomb Op t ica l Co , 50 ABeckman Instruments, Inc " . . . . . . . . . . . . . . . . . . . . 18 ABethlehem Apparatus Co . . . . . . . . . . . . . . . . . . . . . . . . . . . . . . . . . . 38 ABuffal o Apparatus Corp. . . . . . . . . . . . . . . . . . . . . . . . . . . . . . . . . .. 12 A.Burrell Corp " . . . . . . . . . . . . . . . . . . . . . . . . 35 ACe ntral Scientific Co . . . . . . . . . . . . . . . . . . . . . . . . . . . . . . . . . . . . . . 8 AChemic al R ub ber Co.. . . . . . . . . . . . . . . . . . . . . . . . . . . . . . . . . . 43 AColeman I nstruments, Inc 25 A :39 AConso lidated Engineering Co r p.. . . . . . . . . . . . . . . . . . . . . . . . . . . . 43 ACoo rs Porcelai n Co. . . . . . . . . . . . . . . . . . . . . . . . . . . . . . . . . . . . . . . 41 A
gi:l:,~ic~o~,vl'ta~~ ' w.. :: : : : : : : : : : : : : : : : : : : : : : : : : : : : : : : : : : ~I ~Eastma n Kodak Co .. . . . . . . . . . . . . . . . . . . . . . . . . . . . . . . . . . . . . . 7 AEbe rbech Co r p.. . . . .. . . . . . . . . . . 47 AFarrand Optical Co.. Inc.. . . . . . . . . . . . . . . . . . . . . . . . . . . . . . . .. 40 A
~l:~;~c~i~~tificCC~~· .. :::::::::::::::::::::::::::::::::::: ~~ 1Gen er al Chemical Div. . . . . . . . . . . . . . . . . . . . . . . . . . . . . . . . . . . . . 11 AGe nera l Labora tory Su pply Co.. . . . . . . . . . . . . . . . . . . . . . . . . . . . 44 AG rei ner Co .. E mil. . . . . . . . . . . . . . . . . . . . . . . . . . . . . . . . . . . . . . . . 5 AHarshaw Chemical Co .. . . . . . . . . . . . . . . . . . . . . . . . . . . . . . . . . . . . 29 A
"H elli ge . Inc ". . . . . . . . . . . . . . . . . . . . . . . . 42 AKern Co... 24 A
~i;~i:.n'6'I~!g:b:::':·. . : : : : : : : : : : : : : : : : : : : : : : : : : : : : : : : : : .iii; C~~':;Klett M fg. Co 38 A :47 ALaboratory Cons t ruc tio n Co . . . . . . . . . . . . . . . . . . . . . . . . . . . . . . . 46 ALee ds and N orthrup Co.. . . . . . . . . . . . . . . . . . . . . . . . . . . . . . . . . . 6 ALeitz, Inc., E .. .. .. .. .. .. . . . . . . . . . . . . . . . . . . . . . . . . . . . . . . . . . 26 ALind be rg Engineering Co.. .. . . . . . . . . . . . . . . . . . . . . . . . . . . . . . . 19 AM achlett & Son . E .. .. . . .. . . . . . . . . . . . . . . . . . . . . . . . . . . . . . . . . 17 AMall inckrodt Chemical Works . . . ... . .. . . . . . .. . . .. .. .. . . . . . 15 AMer ck & Co.. Inc.. . . . .. . . . . . . . . . . . .. . . . . . . .. . . . . .. . . . . ... 13 AMe yer Scientific Supply Co.. Inc.. . . . . . . . . . . . . . . . . . . . . . . . . . 27 ANo rt h American Philips Co .• Inc. . . . . . . . . . . . . . . . . . . . . . . . . . . 9 AOwens-Ill in ois Gl ass Co 4th Coye rPa lo Labor atory Supplies. Inc. . . . . . . . . . . . . . . . . . . . . . . . . . . . . . 42 A
~:;ki~iJ[~:e€~~~: ..'.'. '.'. '.'.:'.:::'.:'.:'.'.::'.::::::'. :'.:::'.'.'..: ig ~Peterson & Co .. I nc. , Leon ard . . . . . . . . . . . . . . . . . . . . . . . . . . . . 45 A
I'hotovolt Corp 37 A : 45 A :46 APrecision Scientific Co. . " . . . . . . . . . . . . . . . . . . . . . . . . . . . . . . . . . . 10 ASa rgen t & Co., E . II 2 1 A : 44 ASchaar & Co ... . .. . . . . . . . . . 14 AScientific Glass Appa ratus Co.. Inc.. . . . . . . . . . . . . . . . . . . . . . .. 37 ASer vo Corp. of America ... .. . . . . . . . . . . . . . . . . . . . . . . . . . . . . . . . 39 ASout he rn Scientific Co.. .. . . .. . . .. .. .. . . . . . . . . . . . . . . .. . . .. . 12 ASpecialized Instrumen ts Corp.. . . . . . . . . . . . . . . . . . . . . . . . . . . . . 39 ATaylor & Co ., W . A.. . .. '" . . . . . . . . . . . . . . . . . . . . . . . . . . . . . . . 45 AThermal Syndicate, Ltd.. . . . . . . . . . . . . . . . . . . . . . . . . . . . . . . . . . 42 ATher mo El ectric M fg. Co. . . . . . . . . . . . . . . . . . . . . . . . . . . . . . . . . . 36 AThomas Co ., Arthur H .. . . . . . . . . . . . . . . . . . . . . . . . . . . . . . . . . .. 20 ATorsion Bala nce Co 3rd Co verVoland & Sons, I nc ". . . . . . . . . . . . . 41 AWelch Scientific Co.. W. M .. .. . . . . .. . . . . . . . . . . . . . . . . . .. . . . 30 AWil ey & Son s, John 42 A :49 AWill Cor p.. 12 A
DIRECTORYLabor atory Su pply Ce nter . . . . . . . . . . . . . . . . . . . . . . . . . . . . . . . . . 48 ABerkeley Scientific Co rp. Nalge Co .Cargille , R . P . Phillips-Druck er Co .J arrell-Ash Co. So uthwes te rn Anal ytical C he mica l.Mi cro ch emic a l Spe cia lt ies Co. Wiscons in Alu mni R esea rch Foundation
REINHOLD PUBLISHING CO RPORATIONAdvertising Management for t he
American Ch em ical Society Publications330 W. 42nd Street, New York 18, N. Y.
ADVERTISING SALES REPRESENTATIVESMerald l.ue, Advertising Sale. Manager
:-l,·w York I 8-BRyant 9-4430; B. Franklyn LaRue E ast ern Adv er tising Sal es Manager ; J am es J. Su lliv an, Th om as F. Casey, BraytonC. Nic ho ls
Clevela nd 13 - 630 Term inal Tow er, PRosp ect 1-5583; Rodney D.Lo ng
Ch ica go 3-111 W est Washington Street. RAndoll'h 6-8497; G . E .Cochran, W est ern Advertising Sal es Man ag er; Edward J . Fregan
San Francisco 5-McDonald-Thompson, 625 Market Street, YUkon6-0647; Roy M. McDonald
Los Angeles 5-McDonald-Thompson , 3727 W est Sixth Street ,Dunkirk 7-5391 ; E . T . Thompson
Sea ttl e I-McD on ald-Thompson. T ermin al Sales Bld g.• Main 3 860;H ar ry Abn ey
Dallas II-McDonald-Thompson, 1118 Od eans Drive. Winfield 49II;Rich ard C. Wipperman
50A ANALYTICAL CHEMISTRY
BAUSCH & LOMB
LABROSCOPES
THE WORLD'S FINESTLABORATORY MICROSCOPES
Set higher standards for comfort, accuracyand speed in microscopy w ith new "Y ear sAhead" ad vanced design features.
• New Dua-rol LOW POSITION BallBearing and Roller Fine Adjustmentcritical focus, easier and faster; lesswear, longer life. New Roto-sphereBALL-BEARING Nosepiece-and mostaccurate parcentricity and smoothestrotation ever.
New Mechanical Stage with LOWPOSITION Controls for comfortableoperation; lOX Achromatic Objective;New type Variable Focus Condenser forlow-cost models; New attachable Integral Illuminator. AND-many othernew and service-proved advantages exclusive with or pi~ered by Bausch &Lomb ... further proof that the world'sfinest instruments are made in A mericaby B auscb & Lomb.
~~ for a demonstration and forcomplete information on this newline of microscopes. Bausch &Lomb Optical Co., 609-9 St. PaulSt., Rochester 2 , N. Y.
BAUSCH & LOMB OPTICAL CO.609·9 St. Paul St., Rochester 2, N.Y.Please send me complete informationon the new B&L Dyoopt;c Labroscopes.
o I would like a demonstra tion.NAME, _
SCHOOL OR FIRM _
I ADDRESS (
L~Y ~A::" __ ...I
Don~t
take weightstoo lightly! I!!l
,lVelf) t!Beckerloy~ Weights RetaiD Acc"r"cy.. . Corrosion and IVear Resistant!
Now you can be su re your wei ghts will be accurate.
New ' Beckerloy' wei ghts are made of a special non-magnetic,
cor r osion-resis tan t, stain less type alloy.
P ermanent mirror finish r equires no lacquering.
\Vhat's more, new 'Beekerloy' wei ghts provide
maximum r esistance to damaging action of alkaline and
ac id action, as we ll as to atmospheric con ditio ns .
They're unusually hard, too , an d cons tan t in mass,
to reduce abrasion to an abs ol ute minimum.
For full information on 'Beckerloy' wei ghts of all classes,
or precision brass wei ghts of all types, cont ac t your
Laboratory Supply House, today, or write to:
Division of
THE TORSION BALANCE COMPANY
Mai ll Office and Factor y : Clifton, New Jer sey Sales Offi ces: Chicago ' San Franelsco
k/",hI," " oo n vr vx" IJ" ,-,II, ' . \ ·'" / 70.'J1 , 100 ",1;/;i lllhl,.e-..... ou vi vx" l ' rrrision ( ; / fldua lrd C\ liftdo". \ '0. 20026', 250 1It1; /;t'lIIhl," ' · .\ ( I/:~ L\ :\ ~l "(lIII",!",, ;t11usN. \ '0.280 17. '150 "rI,
Scientists an~ glass weapons keep Ameriea strongWIE:\' T il E CHI PS ARE DOW:\' , the qnalityo f food , clothin g, weapons and equipmentcan spe ll dis as ter or vic tory.
Todav. as Am erica builds her defen ses.thonsan'(ls of scien tist s and th eir manvint ricat e glass weap on s-precision in st n ;-
ments- are ne eded to check the qu alityof thi s materiel before it goes overseas .
. And , too, new clothes, new weapon s, newfood s and new equ ipmen t mu st come Iroruresearch laboratori es to keep pace with the
" ck ll1ging ex igencies of world condi tions .
Kimble is humbl y proud to co n tr ibu te toour na tion al defense, and is det erminedto keep Am eri can scien tis ts arme d withwhat ever glass weapons th ey need to dothe wo rk th at will some cla v h rinv rea l• 0
an d lastin g peace .
D ivisio n o f O wcn s- Illiu oi s Glass C o mpa ny
KIMBLE GLASS TOL EDO I , O H IO