analysis of wind power generation with application of wind tunnel
TRANSCRIPT
University of Northern Iowa University of Northern Iowa
UNI ScholarWorks UNI ScholarWorks
Dissertations and Theses @ UNI Student Work
2013
Analysis of wind power generation with application of wind tunnel Analysis of wind power generation with application of wind tunnel
attachment attachment
Ulan Dakeev University of Northern Iowa
Copyright © 2013 Ulan Dakeev
Follow this and additional works at: https://scholarworks.uni.edu/etd
Part of the Engineering Commons
Let us know how access to this document benefits you
Recommended Citation Recommended Citation Dakeev, Ulan, "Analysis of wind power generation with application of wind tunnel attachment" (2013). Dissertations and Theses @ UNI. 4. https://scholarworks.uni.edu/etd/4
This Open Access Dissertation is brought to you for free and open access by the Student Work at UNI ScholarWorks. It has been accepted for inclusion in Dissertations and Theses @ UNI by an authorized administrator of UNI ScholarWorks. For more information, please contact [email protected].

Copyright by
ULAN DAKEEV
2013
All Rights Reserved
ANALYSIS OF WIND POWER GENERATION WITH APPLICATION OF
WIND TUNNEL ATTACHMENT
An Abstract of a Dissertation
Submitted
in Partial Fulfillment
of the Requirements for the Degree
Doctor of Technology
Approved:
________________________________________ Dr. Mohammed F. Fahmy, Committee Chair ___________________________________________ Dr. Michael J. Licari Dean of the Graduate College
Ulan Dakeev
University of Northern Iowa
December 2013
ABSTRACT
This study presents an empirical method for developing a new approach in which
a wind tunnel apparatus is used to improve the efficiency of power output by a small-
scale wind turbine. A custom-designed wind tunnel attachment was constructed to record,
analyze, and interpret both incoming and outgoing wind velocity readings. Moreover, the
dissertation project addresses a significant issue concerning the power generation of an
experimental wind turbine while the wind tunnel is attached.
Wind power characteristics that indicate power output versus wind velocity were
obtained by performing a number of case studies. The case studies included normal
operation of the experimental wind turbine at variable wind velocity values with and
without the proposed wind tunnel.
The statistical t-Test and One-way ANOVA analyses were performed to suggest
whether or not the proposed approach would be useful for wind turbine manufacturers to
evaluate the degree that contributes to the variability of renewable energy production.
Besides, the results may be helpful to support educational institutions in providing
renewable energy awareness in Iowa and in the US by providing adequate information
for the selection and handling of the parameters that control the variability of the energy
needs.
ANALYSIS OF WIND POWER GENERATION WITH APPLICATION OF
WIND TUNNEL ATTACHMENT
A Dissertation
Submitted
in Partial Fulfillment
of the Requirements for the Degree
Doctor of Technology
Approved:
________________________________________ Dr. Mohammed F. Fahmy, Chair ___________________________________________ Dr. Ali E. Kashef, Co-Chair ___________________________________________ Dr. Nilmani Pramanik, Committee Member ___________________________________________ Dr. Atul K. Mitra, Committee Member ___________________________________________ Dr. William Stigliani, Committee Member ___________________________________________ Dr. Ayhan Zora, Committee Member
Ulan Dakeev
University of Northern Iowa
December 2013

ii
ACKNOWLEGDEMENTS
This research project would not have been possible without the support of many
people. The author wishes to express his gratitude to his supervisor Dr. Mohammed
Fahmy who was abundantly helpful and offered invaluable assistance, support and
guidance. Deepest gratitude is also due to the members of the supervisory committee, Dr.
Atul Mitra, Dr. Ali Kashef, Dr. Nilmani Pramanik, Dr. Ayhan Zora and Dr. William
Stigliani without whose knowledge and assistance this study would not have been
successful.
To God Almighty, author thanks for the strength that kept him standing and for
the hope that kept him believing that this affiliation would be possible and more
interesting. All friends in Iowa, who have given their heart - whelming full support in
making this compilation a magnificent experience.
The author would also like to convey thanks to the Faculty of University of
Northern Iowa and University of Michigan – Flint for providing the financial means and
laboratory facilities.
The author wishes to express his gratitude to his spouse Cholpon Omuralieva and
his daughter Mariam Nalan Dakeev for their encouragement and full support through the
duration of his studies.

iii
TABLE OF CONTENTS
LIST OF TABLES .............................................................................................................. v
LIST OF FIGURES ........................................................................................................... vi
CHAPTER I INTRODUCTION ......................................................................................... 1
Motivation and Background ................................................................................... 1
Statement of Problem .............................................................................................. 1
Purpose of the Study ............................................................................................... 2
Need and Justification ............................................................................................. 2
Hypothesis/Research Questions .............................................................................. 4
Assumptions of the Study ....................................................................................... 5
Objectives ............................................................................................................... 6
CHAPTER II REVIEW OF RELATED LITERATURE ................................................... 7
Introduction ............................................................................................................. 7
Wind Speed Augmentation ..................................................................................... 8
CHAPTER III METHODOLOGY ................................................................................... 11
Overview of the Methodology .............................................................................. 11
Description of the System ..................................................................................... 11
Turbine Specifications for the Proposed Scheme ................................................. 12
Experimental Location Selection .......................................................................... 13
Development of Wind Tunnel Attachment ........................................................... 14
Construction of the System ................................................................................... 16
Data Collection and Analysis................................................................................ 19
Limitations/Delimitations ..................................................................................... 20
The Experiment ..................................................................................................... 20
Statistical Analysis ................................................................................................ 24
CHAPTER IV ANALYSIS OF THE RESULTS ............................................................. 25
Experimental Data ................................................................................................ 25

iv
Data Analysis ........................................................................................................ 26
Descriptive Statistics ............................................................................................. 27
t-Test Analysis ...................................................................................................... 33
Analysis of Variance (ANOVA) ........................................................................... 36
Cost Effectiveness ................................................................................................. 40
CHAPTER V CONCLUSION AND RECOMMENDATIONS ...................................... 44
Conclusion ........................................................................................................... 44
Recommendations ................................................................................................ 45
REFERENCES ................................................................................................................. 46
APPENDIX A DATA TABLES ....................................................................................... 48
APPENDIX B RELATED FIGURES .............................................................................. 55
v
LIST OF TABLES
TABLE PAGE
1 MS Excel 2013 Wind Velocity Descriptive Statistics ................................................27
2 SPSS 20 Wind Velocity Descriptive Statistics ...........................................................27
3 SPSS 20 Normality Test .............................................................................................31
4 Wind Velocity Group Statistics ..................................................................................34
5 Independent Sample t-Test Wind Velocity .................................................................34
6 Group Statistics Power Output ...................................................................................35
7 Independent Sample t-Test Power Output ..................................................................36
8 One way ANOVA Wind Velocity Descriptives .........................................................37
9 One way ANOVA Wind Velocity ..............................................................................38
10 Tukey’s HSD Post Hoc Test .......................................................................................39
11 One way ANOVA Power Output ...............................................................................40
12 Monthly Wind Velocity vs. Power Output .................................................................41
13 Electricity rate from Cedar Falls Utility .....................................................................42
14 Collected Wind Data during Experiments ...................................................................49
15 Power Output Data during Experiments ......................................................................50
16 Wind Data for September 2013 ...................................................................................52
17 Wind Data for October 2013 ........................................................................................53
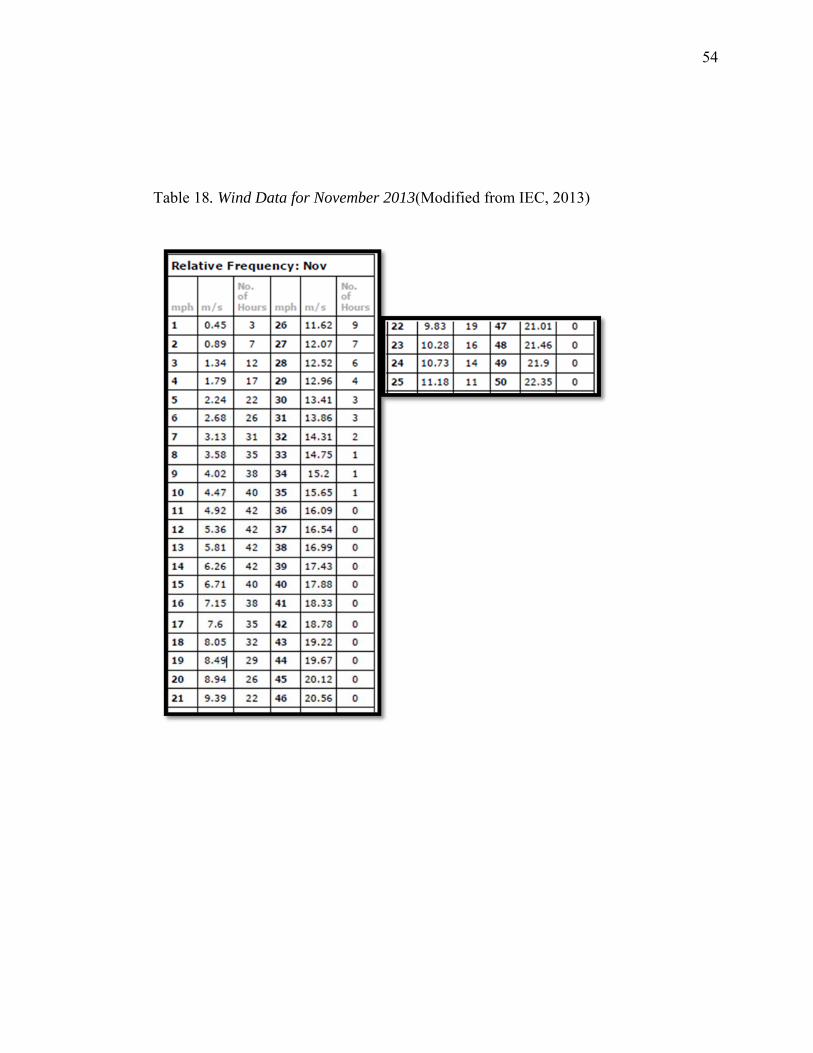
18 Wind Data for November 2013 ....................................................................................54

vi
LIST OF FIGURES
FIGURE PAGE
1 Power vs. Wind Speed characteristic of experimental Wind Turbine ..........................9
2 A typical wind turbine components ............................................................................12
3 Outdoor Experimental Locations ................................................................................13
4 MSB 115, Engineering Department, University of Michigan-Flint ...........................14
5 Schematic cross sectional view of a wind turbine and WTA .....................................15
6a 96”X78”, 3mm sheet metal .........................................................................................16
6b 50” diameter WTA ......................................................................................................16
7 Cone shaped wind guide attachment...........................................................................17
8 Research assistant with WTA .....................................................................................18
9 Stabilization of the Wind Guide Attachment ..............................................................18
10 Stabilization of Wind Guide Attachment ....................................................................19
11 45” Industrial Fan .......................................................................................................21
12 Alignment of the system .............................................................................................22
13 Wind Guide Apparatus ...............................................................................................23
14 Wind Velocity at Wind Turbine Hub..........................................................................23
15a Wind Velocity at Faculty Parking Lot ........................................................................24
15b Wind Velocity at White Building ...............................................................................24
16 Wind Velocity and Air pressure ...................................................................................26
17 Wind Speed comparison over time (Run Chart) ...........................................................29
18 Wind Speed comparison over time ...............................................................................29
19 Wind Turbine Power Output .........................................................................................30
vii
20 Wind Data Normality Plot for Bare WT .......................................................................31
21 Wind Data Normality Plot for Cone WGA ...................................................................32
22 Wind Data Normality Plot for Bell WGA ....................................................................33
23 Wind Velocity, Experiment 1 .......................................................................................56
24 Wind Velocity, Air pressure .........................................................................................56
25 Wind Velocity, Experiment 2 .......................................................................................57
26 Wind Data for October, Flint, MI, 2013 .......................................................................58
27 Wind Data for September, Iowa, 2013 .........................................................................59
28 Wind Data for October, Iowa, 2013 ..............................................................................60
29 Wind Data for November, Iowa, 2013..........................................................................61
30 Annual Wind Data for Iowa 2013 .................................................................................62
31 Undergraduate Research Approval Letter ....................................................................63

1
CHAPTER I
INTRODUCTION
Motivation and Background
Wind energy development is booming worldwide with China and the United
States being forerunners in installed capacity. Wind power capacity additions are growing
at a rapid pace in the United States. The U.S. wind industry now totals 51,630MW,
according to the U.S. Department of Energy (DOE, 2013) and American Wind Energy
Association (AWEA), and more than 40,000 turbines utilized through the end of
September 2012 (AWEA, 2013). Because of the developing wind power investment, an
efficient way of managing wind energy generation is needed. A custom-made wind
tunnel attachment may increase the amount of energy produced by a wind turbine. This
study will investigate whether a custom designed wind tunnel attachment is a suitable
apparatus to increase the wind power output or not.
Statement of Problem
The problem of this study is to determine the appropriateness of attaching a
custom-designed and constructed wind tunnel and managing wind power generation by
an experimental small-scale wind turbine, in improving the power output harvested from
such wind turbine.

2
Purpose of the Study
The main purpose of this study is:
1. To determine the physical specifications for the wind tunnel attachment apparatus
and its components.
2. To predict the overall power output of a small-scale wind turbine on a monthly
basis.
3. To develop educational models for integrating the system into the wind turbine
industry.
Need and Justification
Because of high-energy costs today, many people are becoming more and more
financially strapped, concerned about global warming and the effects of air pollution
(Bollen, Hers & Zwaan, 2010). The United States has a vast supply of coal, with almost
30% of world reserves (Hook & Aleklett, 2009). The US is also the world’s second
largest coal producer after China and annually produces more than twice as much coal as
India, the third largest producer (Hook & Aleklett, 2009). However, the reserves in the
US concentrated in a few states, decreasing from 29.2 MJ/kg in 1950 to 23.6 MJ/kg in
2007 as U.S. production moved subbituminous western coals (Hook & Aleklett, 2009). In
the generation of one kilowatt hour (kWh) of electricity by burning coal, 1kg of Carbon
Dioxide (CO2), seven grams of sulfur oxides, nitrogen oxides and particulates, more than
200 grams of ash and waste amounts of several different metals are released (Hyslop,

3
Davies, Wallace, Gazey & Holroyd, 1997) such as hydrogen sulfide (H2S), hydrocarbons
ethane (C2H6), Methane (CH4), etc. (Stracher & Taylor, 2004). In 1996 CO2 levels were
around 345,000 parts per billion, (Klingenberg, 1996) contrasted to 290,000 parts per
billion 100 years ago (Graedel & Crutzen, 1989). Wind energy systems reduce U.S.
dependence on fossil fuels, and they do not emit greenhouse gasses (U.S. Department of
Energy, 2013). The generation of electricity is not, of course, the only cause of record
levels of CO2 and other greenhouse gases in the atmosphere, but it does represent a large
share (Graedel & Crutzen, 1989).
Hence, environmentally friendly wind power generation is proven to reduce the
green house gas emissions in the atmosphere. In much of the United States, wind speeds
are low in the summer when the sun shines brightest and longest. The wind is strong in
the winter when there is less sunlight available (U.S. Department of Energy, 2013). Wind
tunnel attachment’s ability to capture low speed winds at lower altitudes may decrease
the overall cost of the wind turbine and improve its efficiency. Renewable source of
energy production could play a big role and wind power generation takes a large portion
of such sources, especially when it comes to the state of Iowa.
Successful large wind – power projects using hundreds of very large wind
turbines exist in several states. Being the second largest producer of wind energy in the
nation, Iowa has several of these large-scale projects (Iowa Energy Center [IEC], 2013).
Today, U.S. wind energy installations produce enough electricity on a typical day to
power the equivalent of more than 9.7 million homes (U.S. Department of Energy, 2013).

4
The five-year average annual growth rate for the wind industry now is 39%, up from 32%
between 2003 and 2008 (U.S. Department of Energy, 2013). All of such installations
could benefit from the wind tunnels in securing wind power generation and management
as well as prolonging the life and durability of wind turbines. This project intends to
provide data, which make aids available in deciding on how big an impact of wind tunnel
attachments to wind turbines can improve and secure continuous wind energy generation.
The exact relationship between wind speed and extracted power is one that must be
carefully evaluated for a particular site (IEC, 2013). Several authors of the wind energy
textbooks and publications try to base the success of any wind generation system on
generalized wind speed data charts collected from the National Weather Service (NWS)
data. They also base their data on whether the site is on a hill, or in a valley, surrounded
by trees, how close are the trees and how tall; what is the capacity of the rotor used, what
is the efficiency of the rotor, at what wind speed does it operate etc. (National Renewable
Energy [NREL], 2013). These are good places to start an investigation and for sure they
need to be considered. Moreover the use of a wind tunnel attachment to a wind turbine
could make the power generated more efficient and secure regardless of the
aforementioned factors.
Hypothesis/Research Questions
The goal of this research was to develop and evaluate a wind tunnel attachment
for Hampden Model H-WPG-1B-CA Wind Turbine in the natural environment and inside

5
a controlled laboratory. The Hampden Model H-WPG-1B-CA selected for this study is a
small – scale Wind Turbine with 400W power rating (Hampden, 2013).
Hypothesis 1: The null hypothesis, H10 is that there is no significant difference in
the wind velocity means with the use of a custom-constructed wind guide attachments.
The alternate hypothesis, H11 is that there is a significant difference in the wind
velocity means with the use of a custom-constructed wind guide attachments.
Hypothesis 2: The null hypothesis, H20 is that there is no significant difference in
the wind power output with the use of a custom-constructed wind guide attachments and
that such attachments will not affect the energy generation during low wind speeds.
The alternate hypothesis, H21 is that there is a significant difference in the wind
power output means with the use of a custom-constructed wind guide attachments and
that such attachments will affect the energy generation during low wind speeds.
Assumptions of the Study
For this study certain assumptions were made that would serve as the basis for
ensuring analysis. These assumptions were:
1- The values of the power output of the wind turbine generated by the
experimental wind turbine are relatively accurate.
2- The atmospheric pressure will be the same at each location.
3- Unexpected disturbances and uncontrollable influences have insignificant
effect on the process and may be rounded or deleted from the analysis.

6
4- The power output specifications provided by the manufacturer is correctly
developed and assumed to be a standard for all processes.
Objectives
The author proposed to build a custom - designed wind tunnel attachment for an
experimental small-scale wind turbine as a possible tool to improve power output. In this
experimental study he intended to achieve the following three goals:
1. Construct a custom designed wind tunnel attachment.
2. Conduct indoor and outdoor experiments and observe the effect of the
wind tunnel attachment in various wind conditions.
3. Complete a statistical analysis and interpret whether the wind tunnel
attachment meets the planned criteria.

7
CHAPTER II
REVIEW OF RELATED LITERATURE
Introduction
In the review of literature, there are a wide variety of research sources that have been
carefully examined. The literature review consists of two major points: (a) impact of
wind augmentation apparatus on wind speed, and (b) power output differences with the
use of custom-constructed wind augmentation systems.
Renewable energy such as wind energy and solar energy are receiving great attention
due to the price fluctuation of fossil fuels in the international market as well as the
adverse environmental problems from the process of power generation from fossil fuels.
Kim Bertelsen (2011), the owner of Electricon Inc. and a lightning protection expert,
stated that wind turbines are constantly increasing in size and complexity. The wind
turbines are relied upon as power plants in the overall power production planning. If a
sudden small interruption occurs, the effects cannot be tolerated and the turbine is
disconnected - leaving the grid on its own plants (Bertelsen, 2011). The modern wind
turbine has to stay connected even during a thunderstorm - and this can no longer be
claimed as an inevitable accident. It is decided that these machines should be running out
there and this demands the same approach to lightning protection, as well as known from
conventional onshore power plants (Bertelsen, 2011).
The US is expecting an increase in the number of re-powering projects in wind
farms that were constructed 10-15 years ago, which consist of replacing old turbines with

8
the new ones that may provide much higher power output. US, China and India are the
new high growth markets. The development of the US market is dependent upon the
successful implementation of President Obama's plan for renewable (Bertelsen, 2011).
The member states of Europe have taken effort to increase the energy efficiency by 20%
and reduce their global warming emissions by 20% by 2020 based on 1990 levels (Chong
et al., 2013).
Wind Speed Augmentation
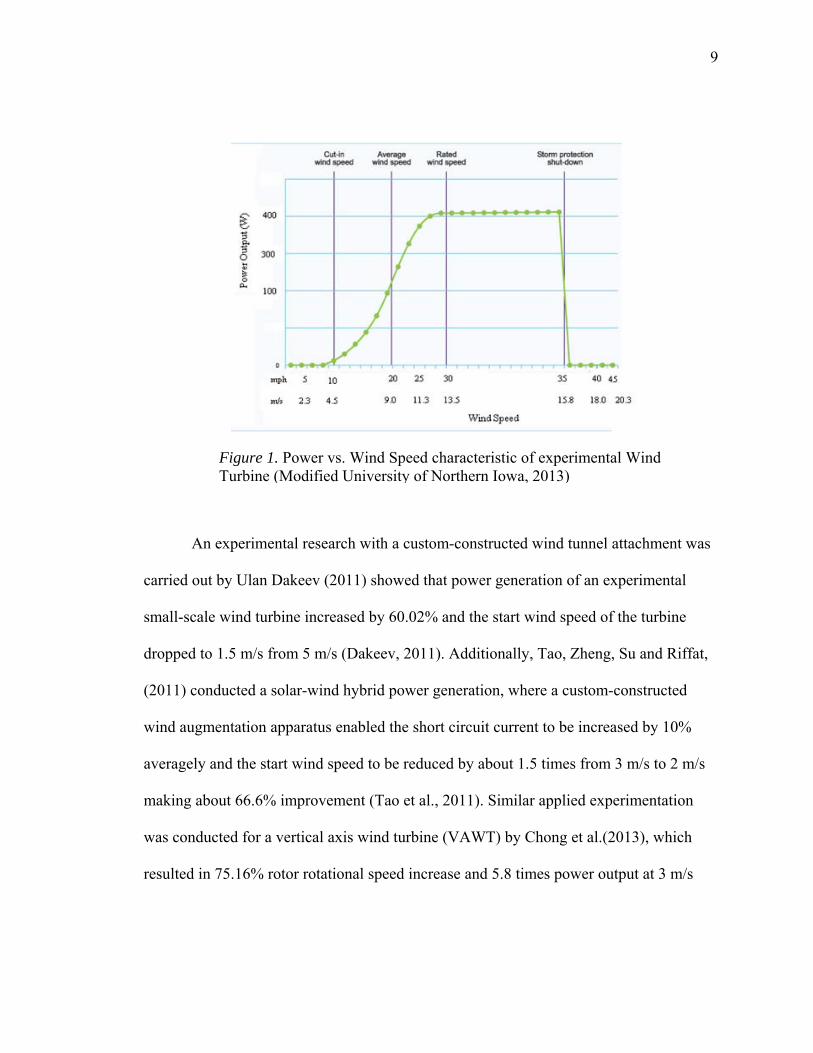
The energy (P) generated by a wind turbine is proportional to the swept area (A)
of the turbine and the third power of the wind speed (v), as follows (Matsushima, Tahagi
& Muroyama, 2006). Figure 1 shows the illustration of wind speed vs. power relationship
for the experimental wind turbine.
P 1
2Av
3 (ρ: density of air)
Therefore, enlarging the swept area (A) or increasing the wind speed (v) can effectively
increase the power output. In particular, since, the output is proportional to the third
power of the wind speed, increased output will be obtained even with a slight increase in
wind speed. One idea for increasing wind speed is the attachment of a wind augmentation
apparatus to a wind turbine to be presented in this study.
9
An experimental research with a custom-constructed wind tunnel attachment was
carried out by Ulan Dakeev (2011) showed that power generation of an experimental
small-scale wind turbine increased by 60.02% and the start wind speed of the turbine
dropped to 1.5 m/s from 5 m/s (Dakeev, 2011). Additionally, Tao, Zheng, Su and Riffat,
(2011) conducted a solar-wind hybrid power generation, where a custom-constructed
wind augmentation apparatus enabled the short circuit current to be increased by 10%
averagely and the start wind speed to be reduced by about 1.5 times from 3 m/s to 2 m/s
making about 66.6% improvement (Tao et al., 2011). Similar applied experimentation
was conducted for a vertical axis wind turbine (VAWT) by Chong et al.(2013), which
resulted in 75.16% rotor rotational speed increase and 5.8 times power output at 3 m/s
Figure 1. Power vs. Wind Speed characteristic of experimental Wind Turbine (Modified University of Northern Iowa, 2013)

10
wind speed (Chong et al., 2013). Proposed custom - designed wind tunnel apparatus was
intended to contain a wind guiding attachment to prove that the custom constructed wind
augmentation apparatus with wind guiding attachment may increase the power output of
the experimental wind turbine.

11
CHAPTER III
METHODOLOGY
Overview of the Methodology
The project involves testing and analyzing a proposed model to verify the
performance of an experimental wind turbine in indoor and outdoor environments. This
includes the development of a custom constructed wind tunnel attachment. An
anemometer and power-meter tool was used to conduct the experiment and collect data.
In order to test the proposed project in real indoor and outdoor environments, three
locations had been selected to complete the study. A statistical analysis package IBM
SPSS was used for the analysis of collected data.
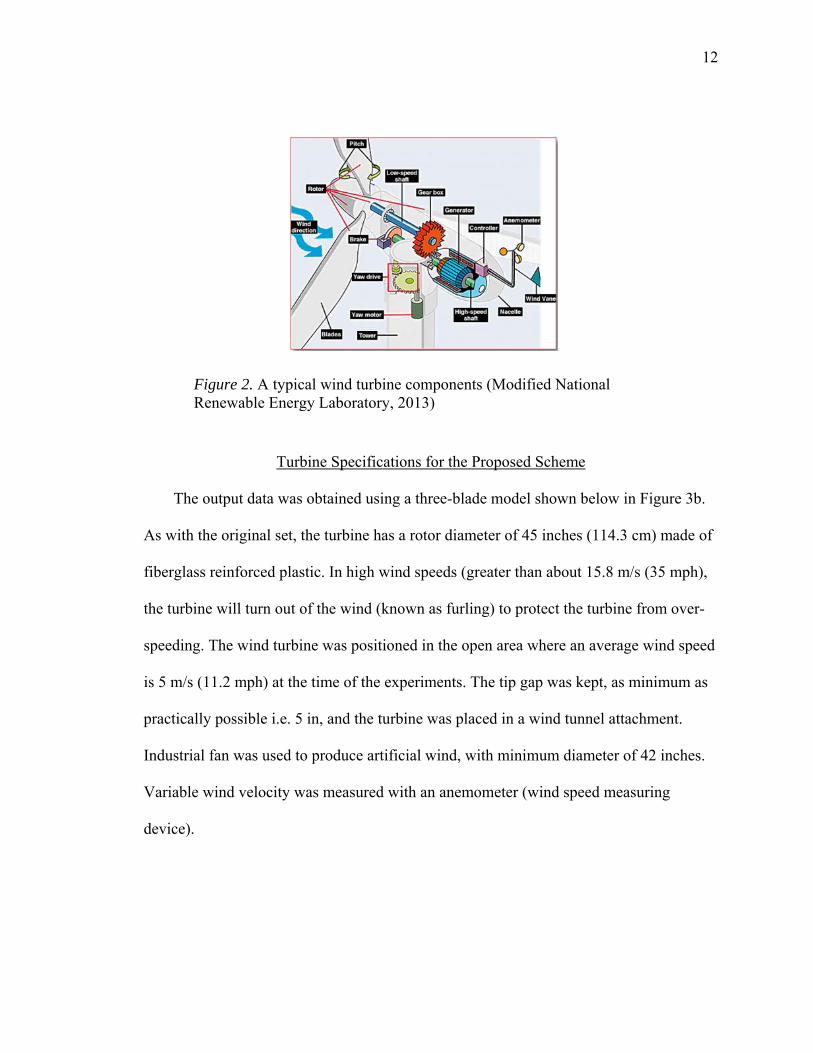
Description of the System
The system in this study consists of a wind turbine and the custom – constructed
diffuser as a wind turbine attachment. A typical wind turbine consists of the rotor (three
blades and hub), gearbox, conversion system, controls, and tower as shown in Figure 2.
The author intended to construct a real examination device by fitting a diffuser to the
experimental small-scale horizontal axis wind turbine and to examine the effects the
system on output power generation, in both outside field test and in closed laboratory
area. The results of the experiment and the obtained field test data were analyzed using
SPSS® 21 software. A 45-inch industrial fan was used to generate artificial wind speed.
12
Turbine Specifications for the Proposed Scheme
The output data was obtained using a three-blade model shown below in Figure 3b.
As with the original set, the turbine has a rotor diameter of 45 inches (114.3 cm) made of
fiberglass reinforced plastic. In high wind speeds (greater than about 15.8 m/s (35 mph),
the turbine will turn out of the wind (known as furling) to protect the turbine from over-
speeding. The wind turbine was positioned in the open area where an average wind speed
is 5 m/s (11.2 mph) at the time of the experiments. The tip gap was kept, as minimum as
practically possible i.e. 5 in, and the turbine was placed in a wind tunnel attachment.
Industrial fan was used to produce artificial wind, with minimum diameter of 42 inches.
Variable wind velocity was measured with an anemometer (wind speed measuring
device).
Figure 2. A typical wind turbine components (Modified National Renewable Energy Laboratory, 2013)
13
Experimental Location Selection
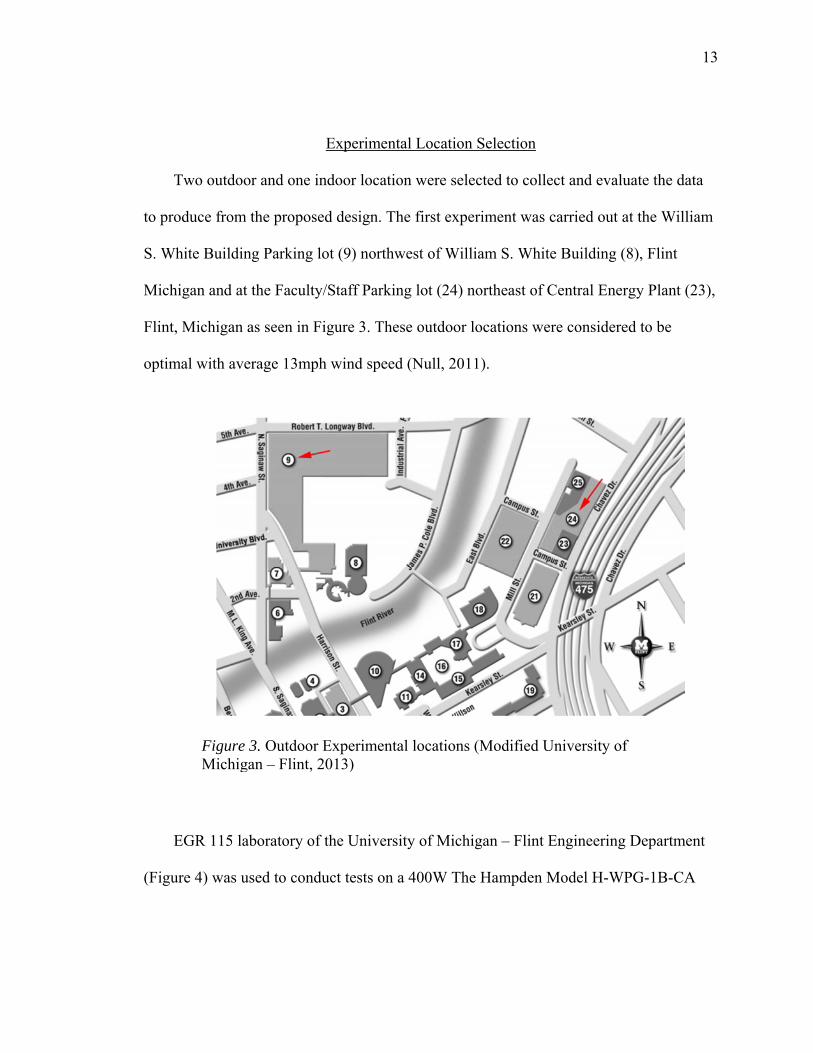
Two outdoor and one indoor location were selected to collect and evaluate the data
to produce from the proposed design. The first experiment was carried out at the William
S. White Building Parking lot (9) northwest of William S. White Building (8), Flint
Michigan and at the Faculty/Staff Parking lot (24) northeast of Central Energy Plant (23),
Flint, Michigan as seen in Figure 3. These outdoor locations were considered to be
optimal with average 13mph wind speed (Null, 2011).
EGR 115 laboratory of the University of Michigan – Flint Engineering Department
(Figure 4) was used to conduct tests on a 400W The Hampden Model H-WPG-1B-CA
Figure 3. Outdoor Experimental locations (Modified University of Michigan – Flint, 2013)
14
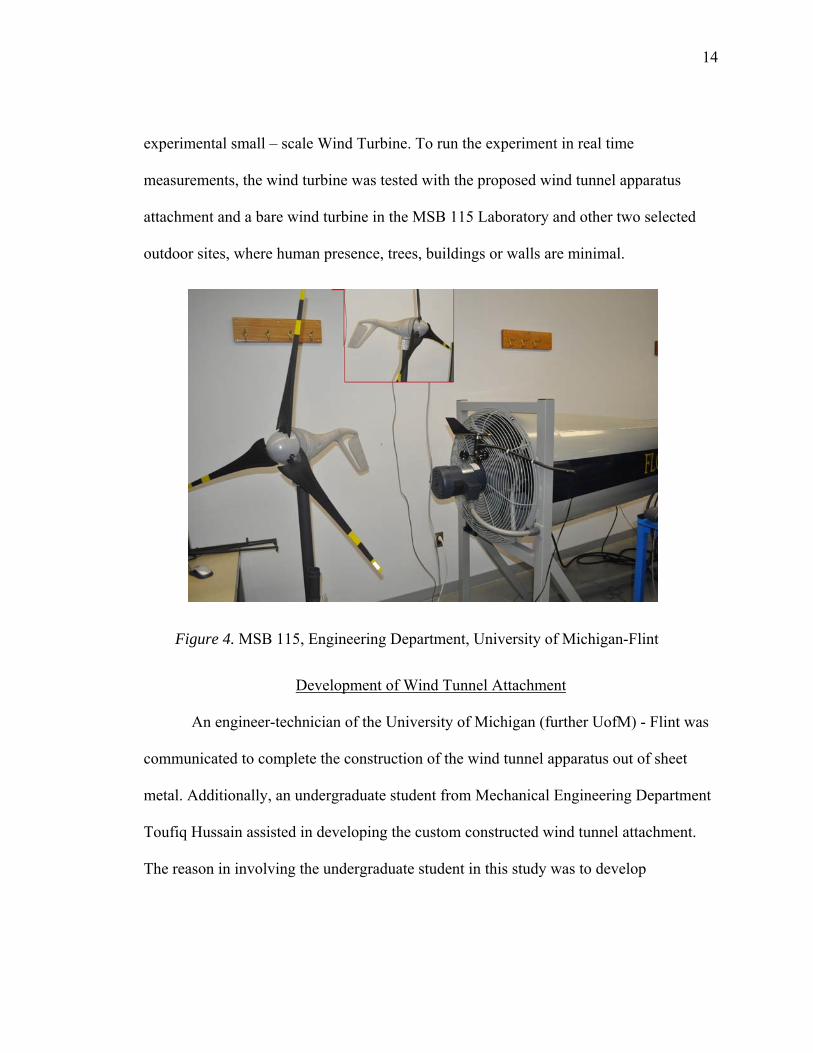
experimental small – scale Wind Turbine. To run the experiment in real time
measurements, the wind turbine was tested with the proposed wind tunnel apparatus
attachment and a bare wind turbine in the MSB 115 Laboratory and other two selected
outdoor sites, where human presence, trees, buildings or walls are minimal.
Development of Wind Tunnel Attachment
An engineer-technician of the University of Michigan (further UofM) - Flint was
communicated to complete the construction of the wind tunnel apparatus out of sheet
metal. Additionally, an undergraduate student from Mechanical Engineering Department
Toufiq Hussain assisted in developing the custom constructed wind tunnel attachment.
The reason in involving the undergraduate student in this study was to develop
Figure 4. MSB 115, Engineering Department, University of Michigan-Flint
15
experimental research skills of the student. The Undergraduate Research Opportunity
Program (UROP) of UofM-Flint (2013) states:
“The Undergraduate Research Opportunity Program (UROP) is designed to support collaborations between UM-Flint undergraduate students and faculty researchers. UROP allows students to earn paid (or volunteer), hands-on research experiences working along faculty on cutting-edge projects. Additionally, faculty are afforded the opportunity to mentor enthusiastic and talented students.”
The undergraduate research proposal for UROP required training in appropriate research
conduct practices for both faculty and the student involved in the project. The approved
UROP documentation can be found in the Appendix C. Construction of the wind tunnel
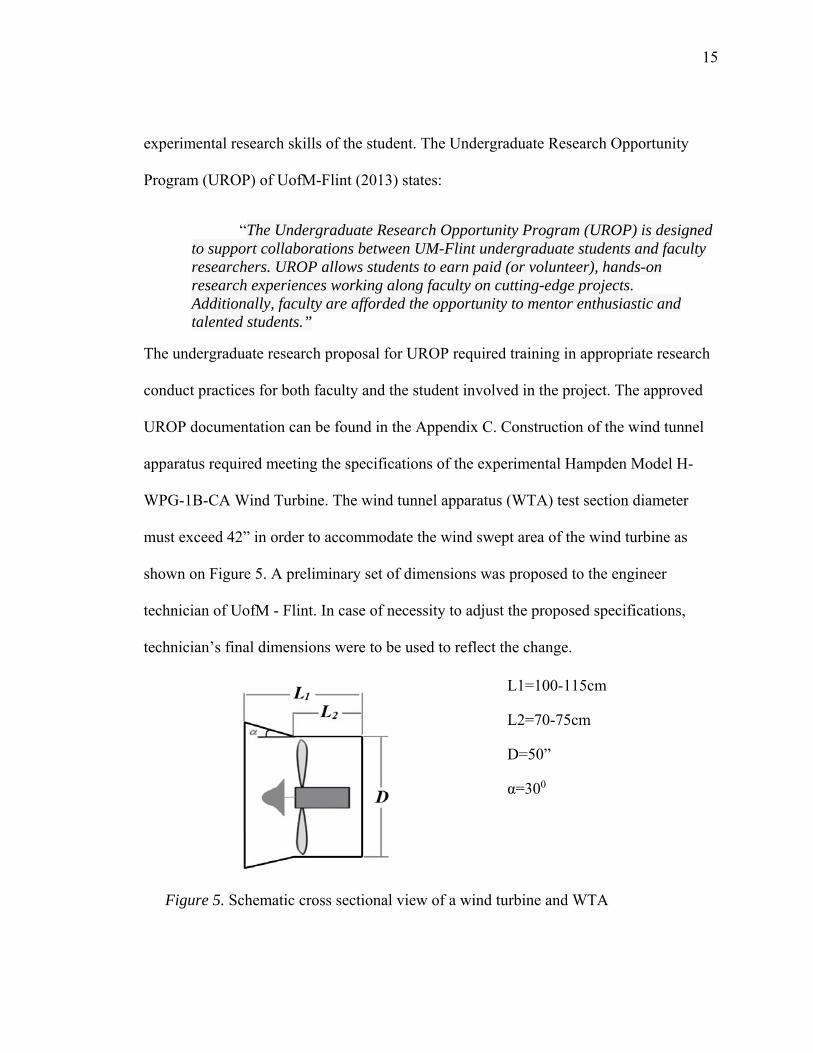
apparatus required meeting the specifications of the experimental Hampden Model H-
WPG-1B-CA Wind Turbine. The wind tunnel apparatus (WTA) test section diameter
must exceed 42” in order to accommodate the wind swept area of the wind turbine as
shown on Figure 5. A preliminary set of dimensions was proposed to the engineer
technician of UofM - Flint. In case of necessity to adjust the proposed specifications,
technician’s final dimensions were to be used to reflect the change.
L1=100-115cm
L2=70-75cm
D=50”
α=300
Figure 5. Schematic cross sectional view of a wind turbine and WTA
16
Construction of the System
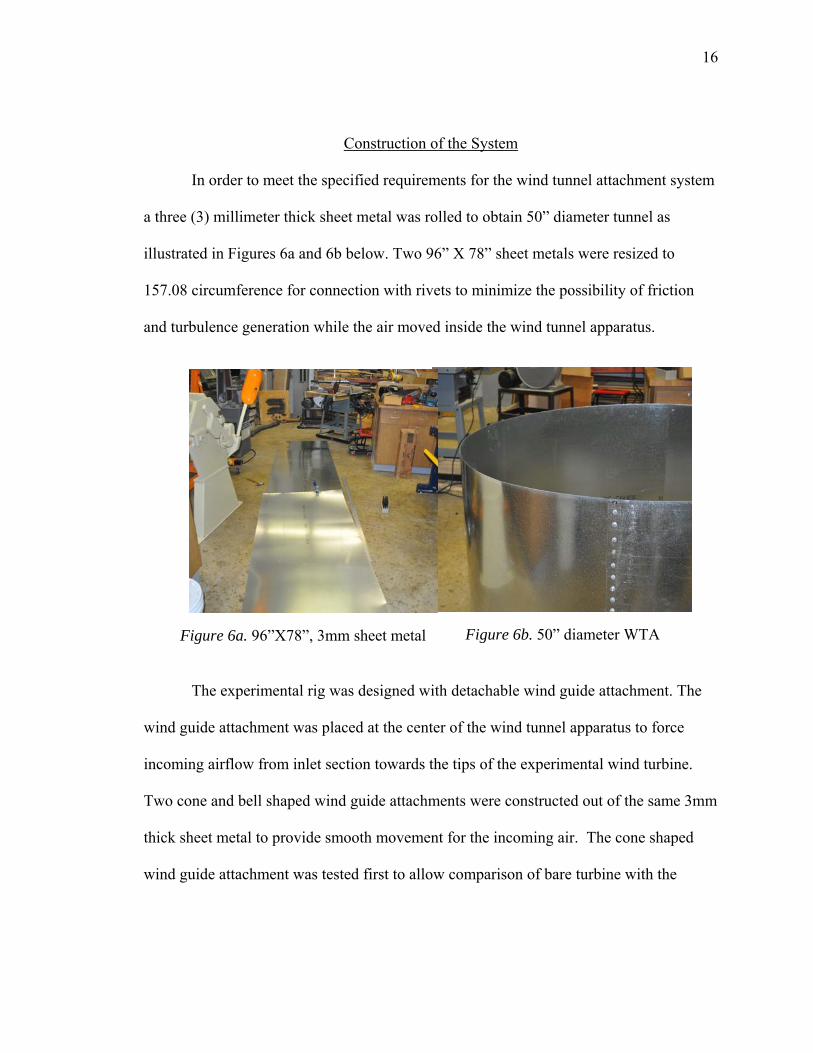
In order to meet the specified requirements for the wind tunnel attachment system
a three (3) millimeter thick sheet metal was rolled to obtain 50” diameter tunnel as
illustrated in Figures 6a and 6b below. Two 96” X 78” sheet metals were resized to
157.08 circumference for connection with rivets to minimize the possibility of friction
and turbulence generation while the air moved inside the wind tunnel apparatus.
The experimental rig was designed with detachable wind guide attachment. The
wind guide attachment was placed at the center of the wind tunnel apparatus to force
incoming airflow from inlet section towards the tips of the experimental wind turbine.
Two cone and bell shaped wind guide attachments were constructed out of the same 3mm
thick sheet metal to provide smooth movement for the incoming air. The cone shaped
wind guide attachment was tested first to allow comparison of bare turbine with the
Figure 6a. 96”X78”, 3mm sheet metal Figure 6b. 50” diameter WTA
17
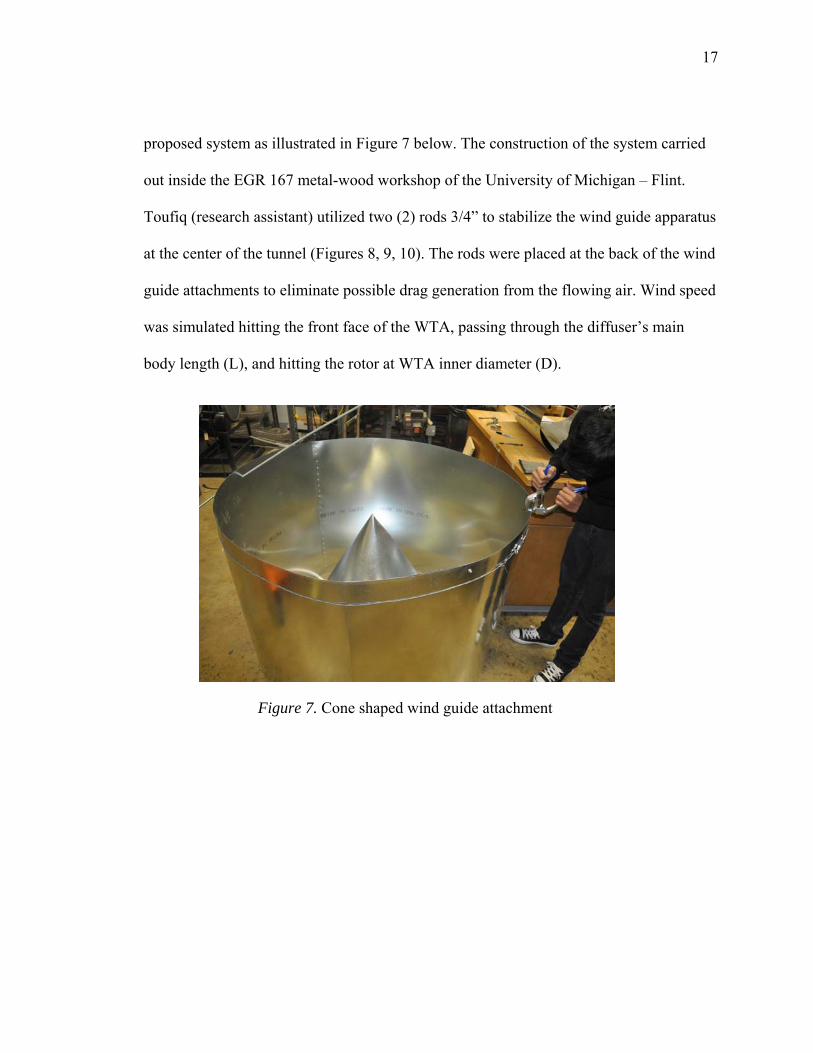
proposed system as illustrated in Figure 7 below. The construction of the system carried
out inside the EGR 167 metal-wood workshop of the University of Michigan – Flint.
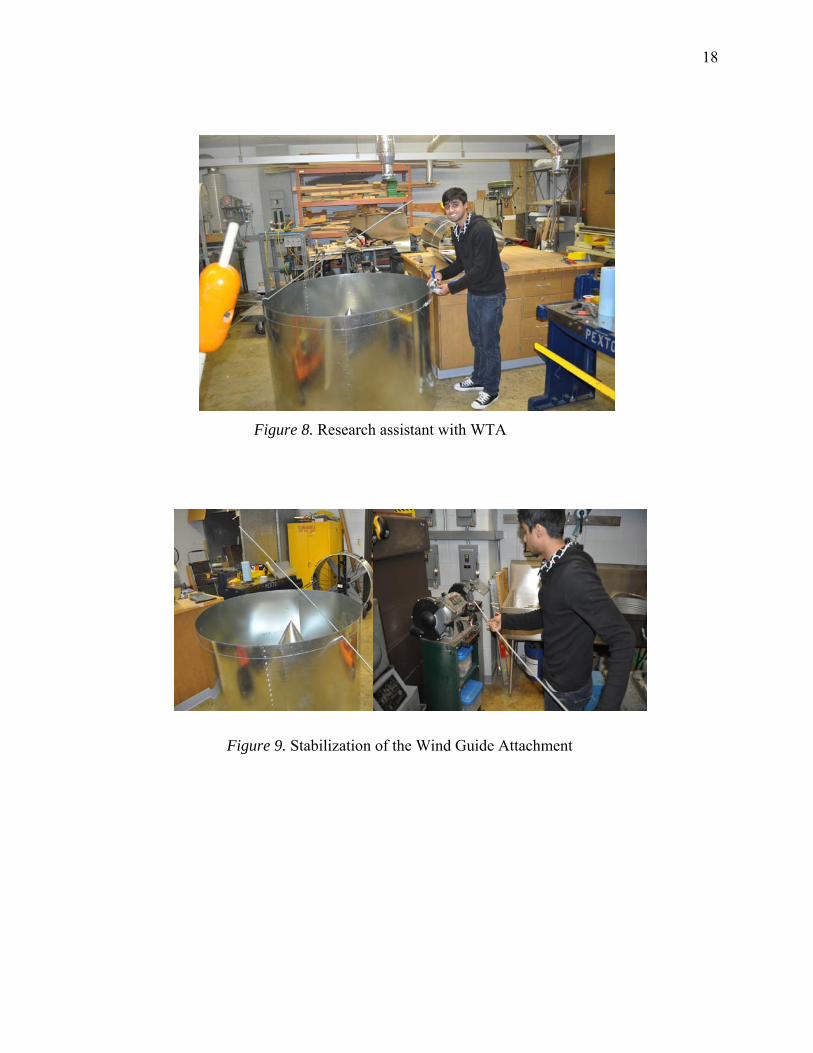
Toufiq (research assistant) utilized two (2) rods 3/4” to stabilize the wind guide apparatus
at the center of the tunnel (Figures 8, 9, 10). The rods were placed at the back of the wind
guide attachments to eliminate possible drag generation from the flowing air. Wind speed
was simulated hitting the front face of the WTA, passing through the diffuser’s main
body length (L), and hitting the rotor at WTA inner diameter (D).
Figure 7. Cone shaped wind guide attachment
18
Figure 8. Research assistant with WTA
Figure 9. Stabilization of the Wind Guide Attachment
19
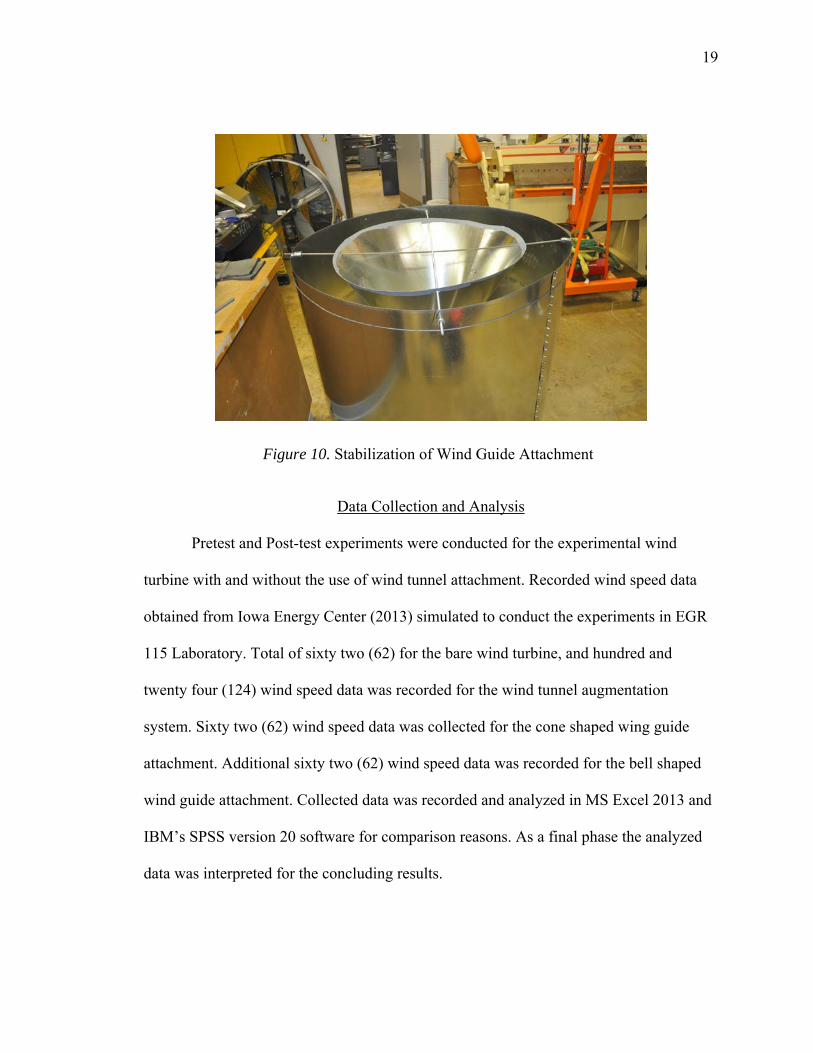
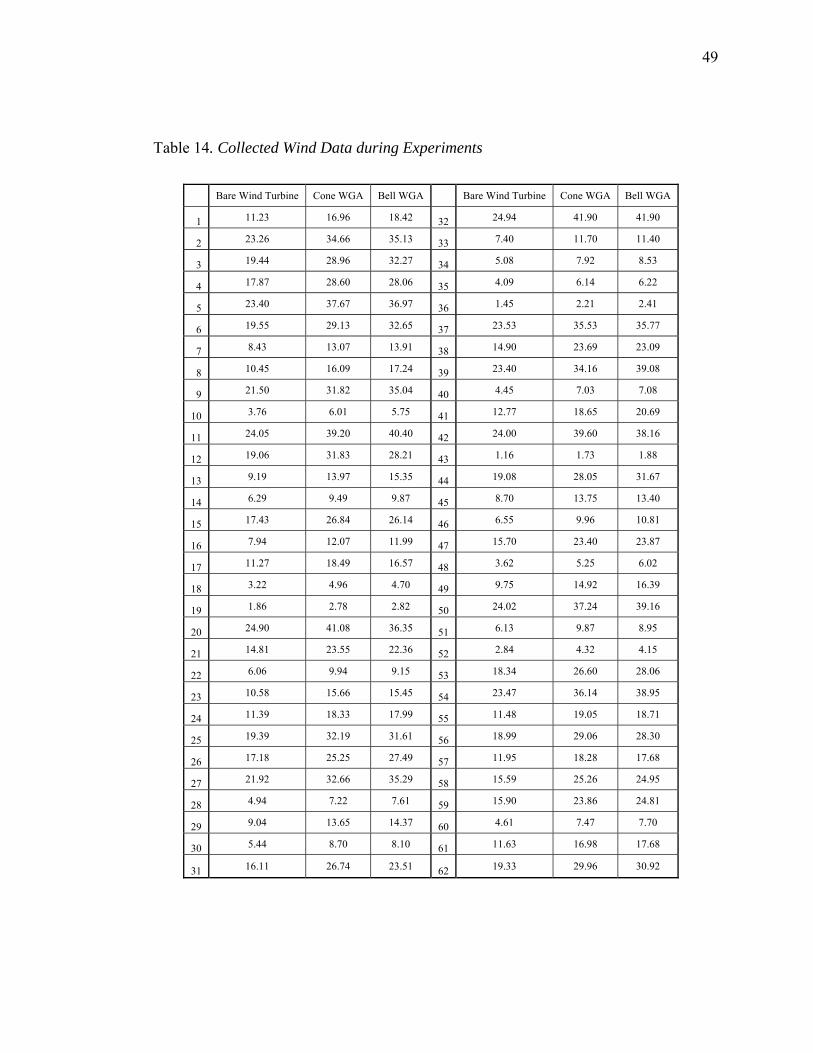
Data Collection and Analysis
Pretest and Post-test experiments were conducted for the experimental wind
turbine with and without the use of wind tunnel attachment. Recorded wind speed data
obtained from Iowa Energy Center (2013) simulated to conduct the experiments in EGR
115 Laboratory. Total of sixty two (62) for the bare wind turbine, and hundred and
twenty four (124) wind speed data was recorded for the wind tunnel augmentation
system. Sixty two (62) wind speed data was collected for the cone shaped wing guide
attachment. Additional sixty two (62) wind speed data was recorded for the bell shaped
wind guide attachment. Collected data was recorded and analyzed in MS Excel 2013 and
IBM’s SPSS version 20 software for comparison reasons. As a final phase the analyzed
data was interpreted for the concluding results.
Figure 10. Stabilization of Wind Guide Attachment

20
Limitations/Delimitations
The limitations for the development of this study were as follows:
1. The study would be conducted only using the experimental Hampden Model H-
WPG-1B-CA Wind Turbine manufactured by Hampden Company.
2. The testing would be conducted at variable indoor wind conditions.
3. The fan used in the system as wind source may have a diameter of 30” or larger
with maximum wind speed generation of 15 m/s.
The Experiment
In order to perform the data analysis related to the wind turbine experiments
properly, a number of sixty two (62) tests were performed with an artificial wind
generated by 45” industrial fan illustrated in Figure 11 below at 5.88 m/s (13.16 mph)
wind in average. Note that the size of the wind tunnel attachment was limited by the size
of the experimental wind turbine and 50” diameter was chosen to accommodate the wind
turbine. The augmentation effect of the wind tunnel apparatus and the wind guide
attachments was significant compared to the bare wind turbine.
The starting wind speed for the wind turbine was 2.2 m/s (5 mph); the average
wind speed collected during the experiment 5.88 m/s (13.16 mph) produced average
279.65 watts of power on the wind turbine. The maximum wind speed needed to generate
the optimum power from the 400W wind turbine was 4.73 m/s.
21
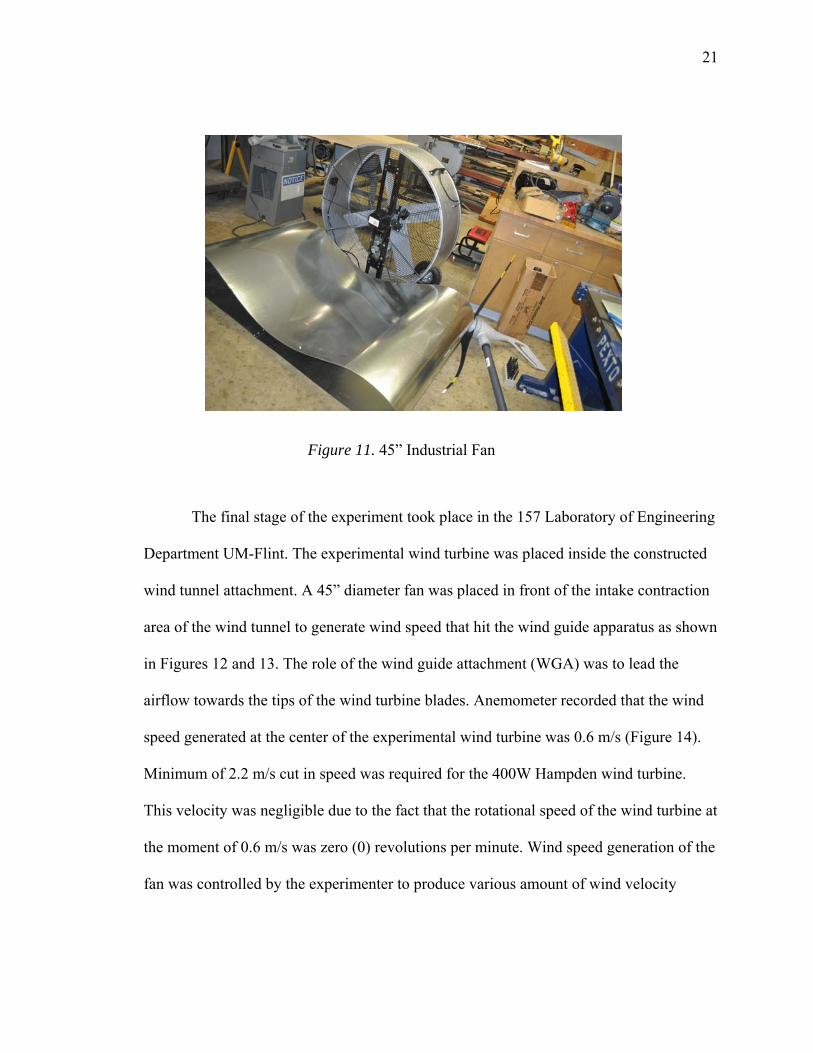
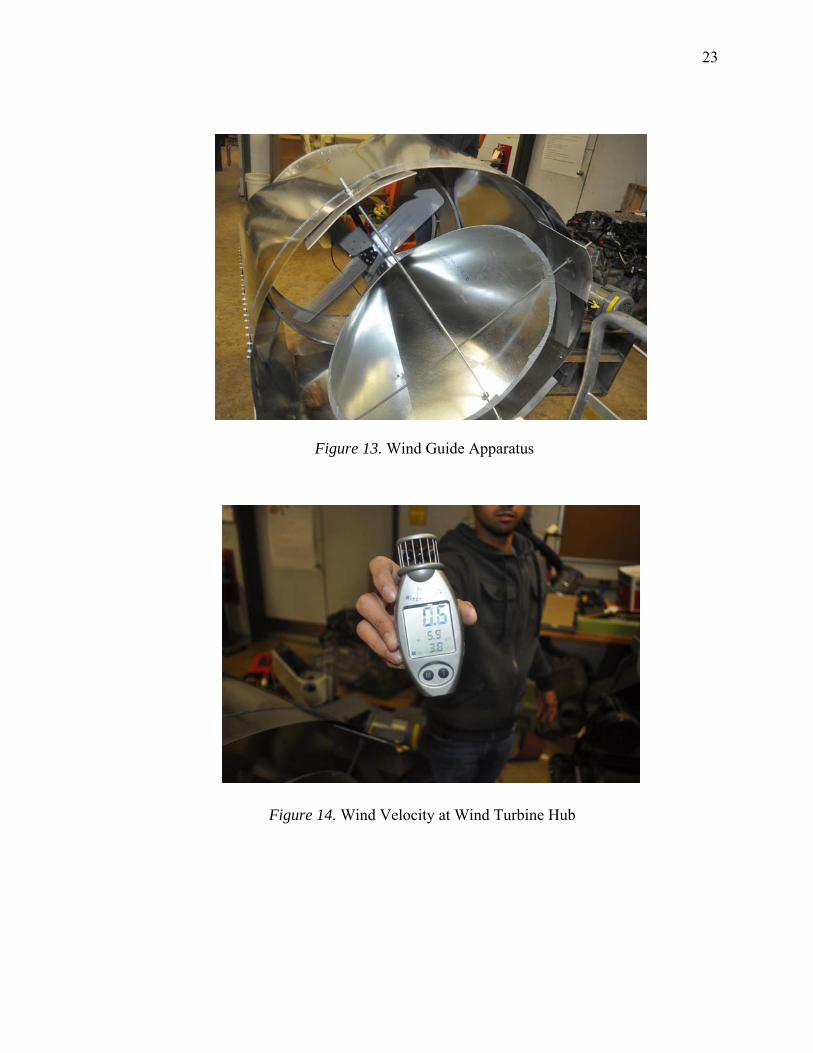
The final stage of the experiment took place in the 157 Laboratory of Engineering
Department UM-Flint. The experimental wind turbine was placed inside the constructed
wind tunnel attachment. A 45” diameter fan was placed in front of the intake contraction
area of the wind tunnel to generate wind speed that hit the wind guide apparatus as shown
in Figures 12 and 13. The role of the wind guide attachment (WGA) was to lead the
airflow towards the tips of the wind turbine blades. Anemometer recorded that the wind
speed generated at the center of the experimental wind turbine was 0.6 m/s (Figure 14).
Minimum of 2.2 m/s cut in speed was required for the 400W Hampden wind turbine.
This velocity was negligible due to the fact that the rotational speed of the wind turbine at
the moment of 0.6 m/s was zero (0) revolutions per minute. Wind speed generation of the
fan was controlled by the experimenter to produce various amount of wind velocity
Figure 11. 45” Industrial Fan
22
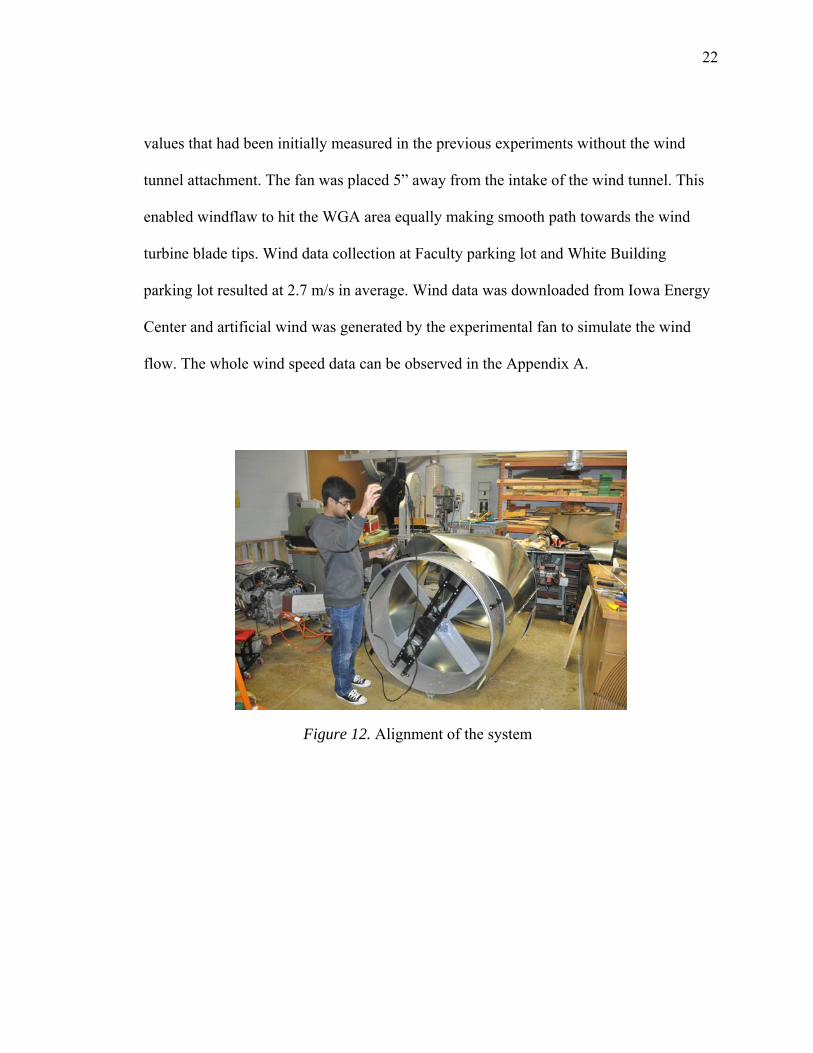
values that had been initially measured in the previous experiments without the wind
tunnel attachment. The fan was placed 5” away from the intake of the wind tunnel. This
enabled windflaw to hit the WGA area equally making smooth path towards the wind
turbine blade tips. Wind data collection at Faculty parking lot and White Building
parking lot resulted at 2.7 m/s in average. Wind data was downloaded from Iowa Energy
Center and artificial wind was generated by the experimental fan to simulate the wind
flow. The whole wind speed data can be observed in the Appendix A.
Figure 12. Alignment of the system
23
Figure 14. Wind Velocity at Wind Turbine Hub
Figure 13. Wind Guide Apparatus

24
Statistical Analysis
The overall data analysis was completed using IBM’s statistical package SPSS
version 20. SPSS was developed by IBM, Inc and provides a selection of data analysis,
data management, data mining, and data visualization procedures. Some of the features of
the SPSS software include basic and multivariate statistical analysis, quality control
modules and neural networks. Use of this statistical software helped in selecting a
number of combinations of variables that can be statistically examined and graphed to
assist in data interpretation and presentation.
Figure 15a. Wind Velocity at Faculty Parking Lot
Figure 15b. Wind Velocity at White Building

25
CHAPTER IV
ANALYSIS OF THE RESULTS
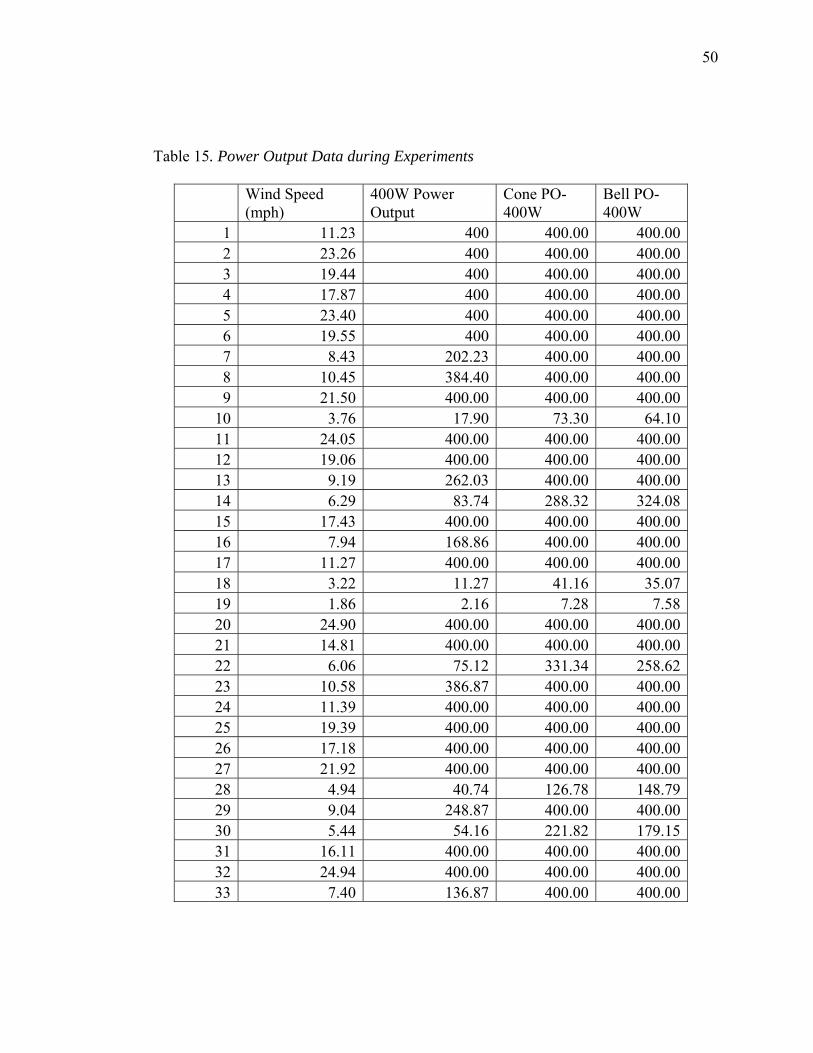
Experimental Data
The controllable variables during the final stage of the experimental process were
the wind speed and the wind guide apparatus mounted inside the wind tunnel attachment.
In view of that, the data collected during the power generation experiments was classified
in two main categories. The first category involved experimental wind turbine power
output collection performed at different wind speeds with cone shaped WGA attached.
The second category involved experimental wind turbine power output data collection
performed at the same wind speed ranges artificially generated by the industrial fan with
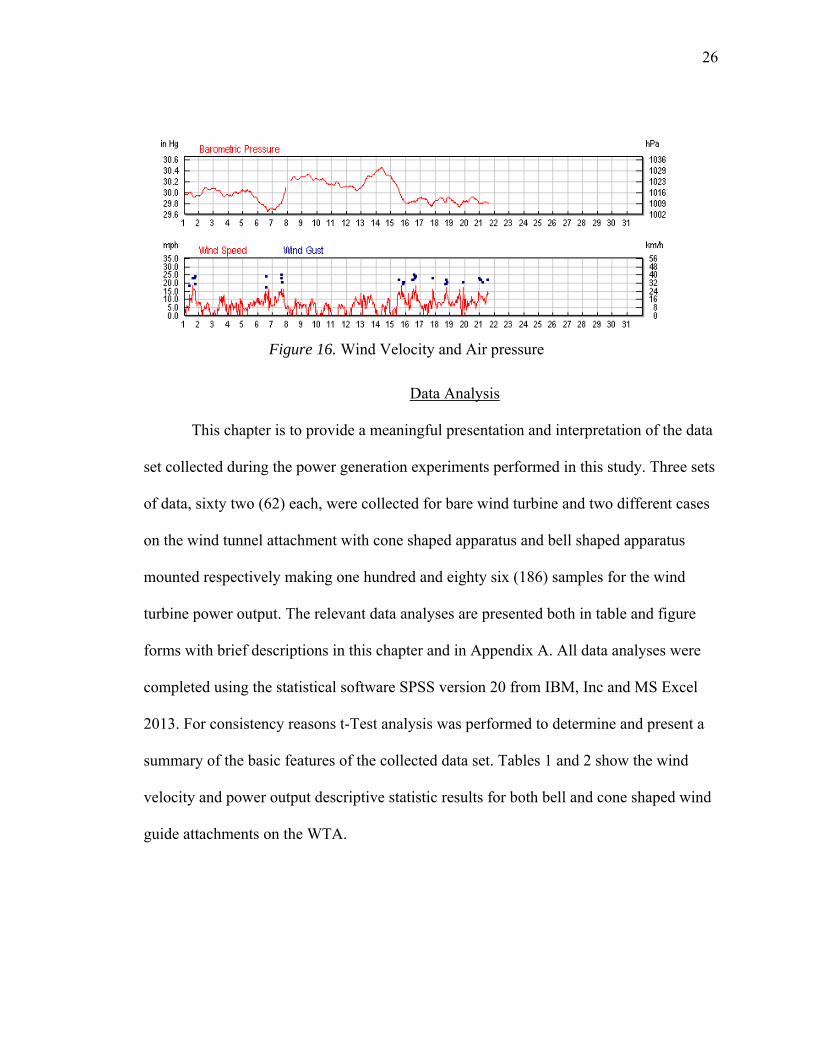
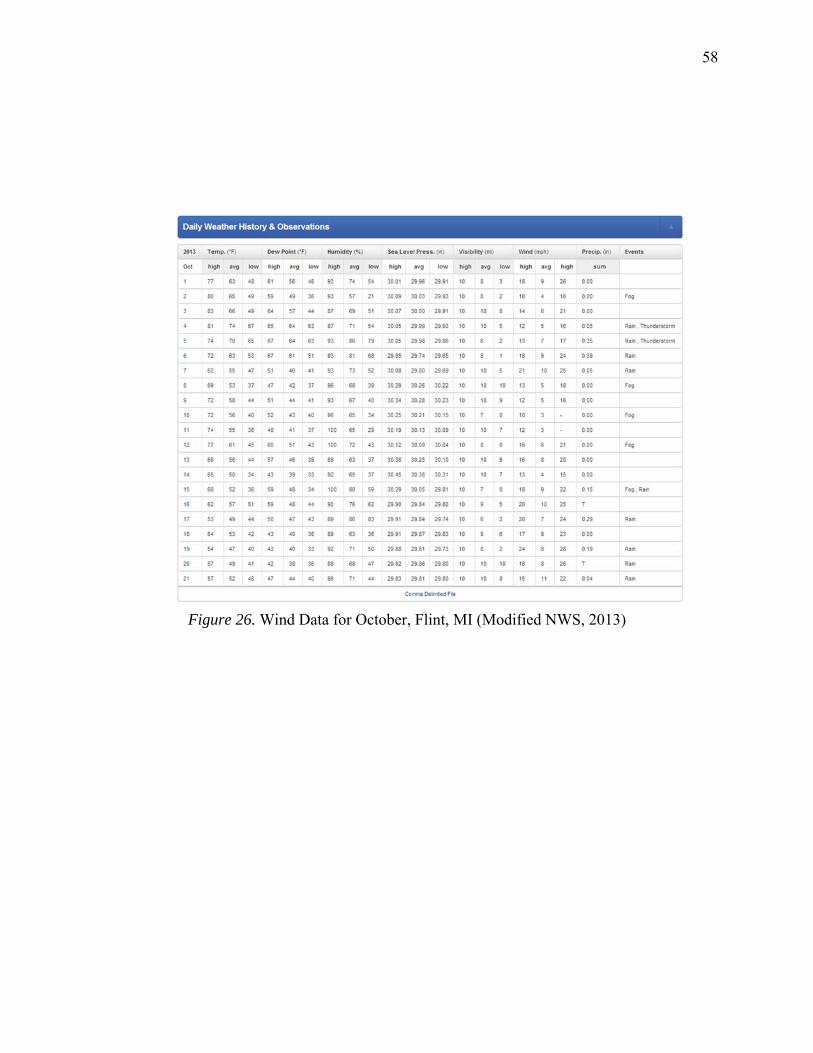
the with bell shaped WGA attached. National Weather Service (2013) indicated the
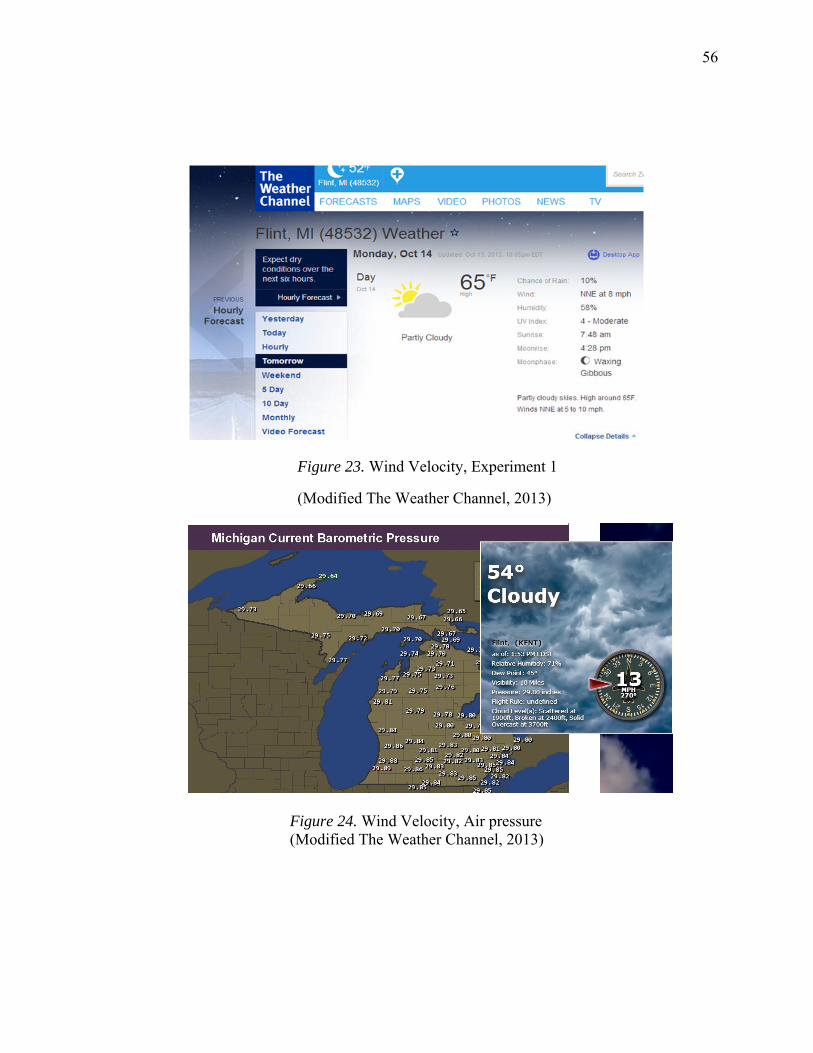
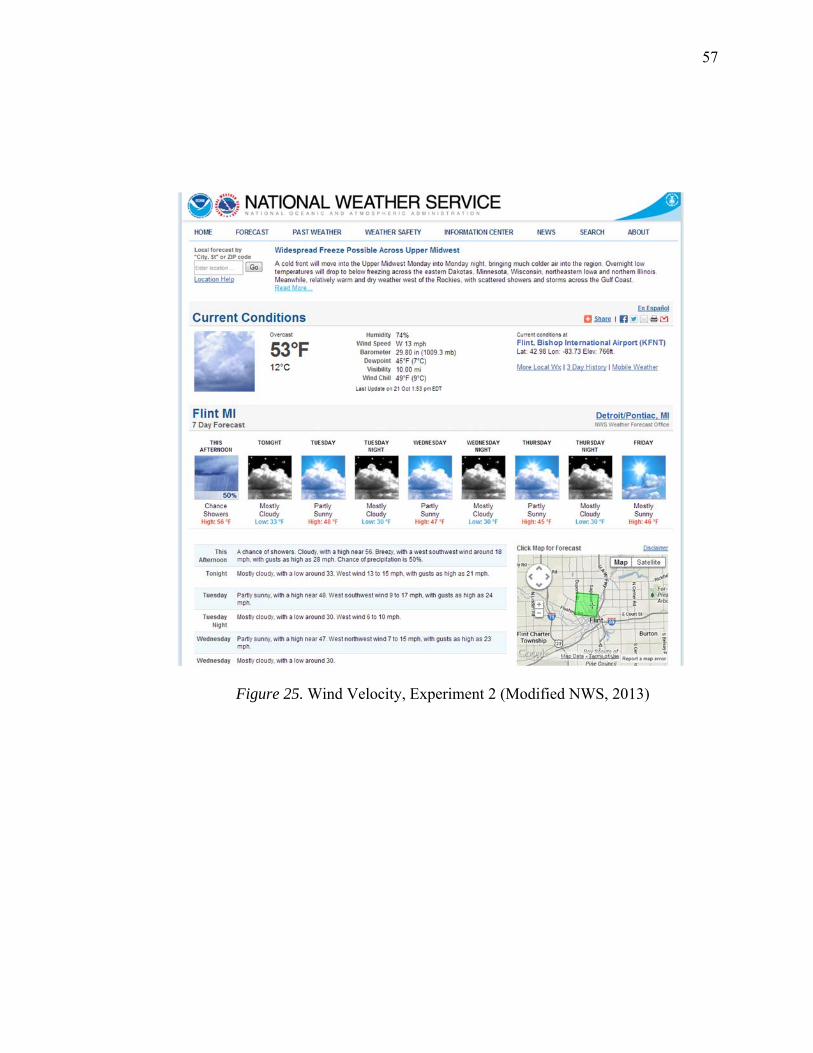
atmospheric pressure for October 21st was 29.8 in (See Appendix B). The average wind
speed for two thirds of October was 15 mph for Flint area (Figure16). During the data
collection period, October 17th to October 21st the air pressure was observed stable at
average 28 in as illustrated in Figure 16. The custom constructed wind tunnel attachment
amplified input wind speed from 1.16 mph – 24.94 mph to 1.88 mph – 41.90 mph
producing average from 279.65 Watts to 327.92 Watts. The reason that the upper range
of the power generation is limited to 400 Watts is due to the maximum power generation
capacity of the experimental wind turbine.
26
Data Analysis
This chapter is to provide a meaningful presentation and interpretation of the data
set collected during the power generation experiments performed in this study. Three sets
of data, sixty two (62) each, were collected for bare wind turbine and two different cases
on the wind tunnel attachment with cone shaped apparatus and bell shaped apparatus
mounted respectively making one hundred and eighty six (186) samples for the wind
turbine power output. The relevant data analyses are presented both in table and figure
forms with brief descriptions in this chapter and in Appendix A. All data analyses were
completed using the statistical software SPSS version 20 from IBM, Inc and MS Excel
2013. For consistency reasons t-Test analysis was performed to determine and present a
summary of the basic features of the collected data set. Tables 1 and 2 show the wind
velocity and power output descriptive statistic results for both bell and cone shaped wind
guide attachments on the WTA.
Figure 16. Wind Velocity and Air pressure
27
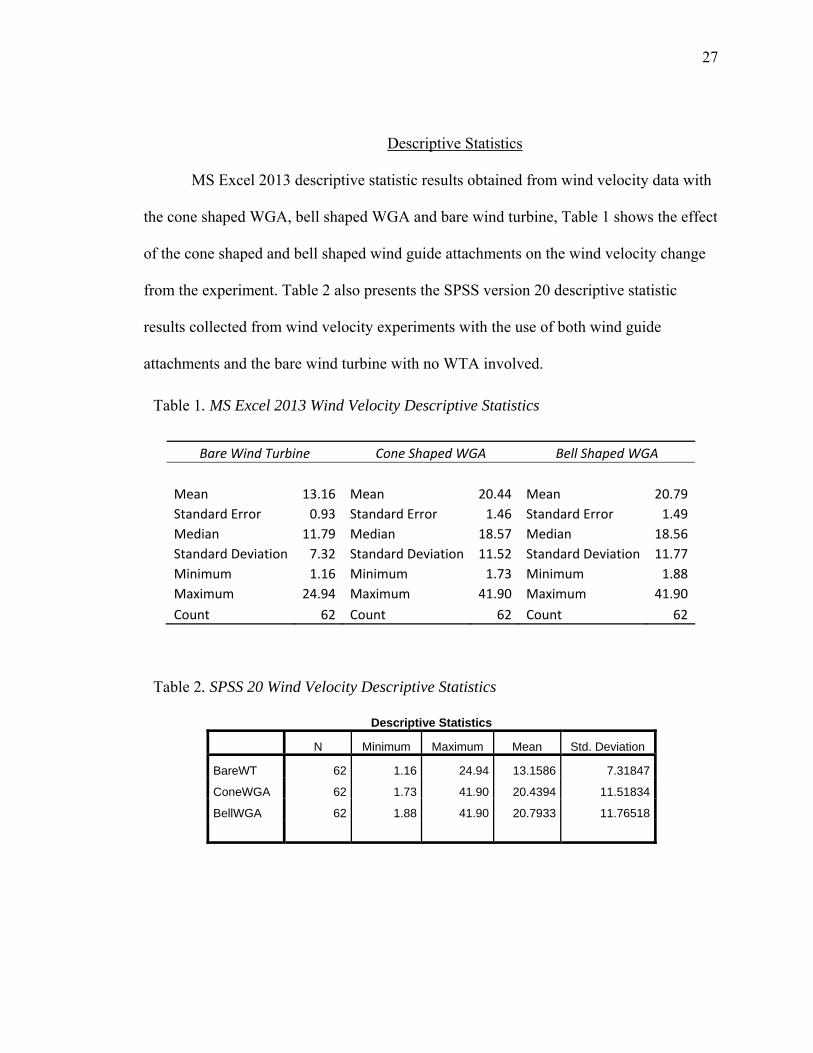
Descriptive Statistics
MS Excel 2013 descriptive statistic results obtained from wind velocity data with
the cone shaped WGA, bell shaped WGA and bare wind turbine, Table 1 shows the effect
of the cone shaped and bell shaped wind guide attachments on the wind velocity change
from the experiment. Table 2 also presents the SPSS version 20 descriptive statistic
results collected from wind velocity experiments with the use of both wind guide
attachments and the bare wind turbine with no WTA involved.
Bare Wind Turbine Cone Shaped WGA Bell Shaped WGA
Mean 13.16 Mean 20.44 Mean 20.79
Standard Error 0.93 Standard Error 1.46 Standard Error 1.49
Median 11.79 Median 18.57 Median 18.56
Standard Deviation 7.32 Standard Deviation 11.52 Standard Deviation 11.77
Minimum 1.16 Minimum 1.73 Minimum 1.88
Maximum 24.94 Maximum 41.90 Maximum 41.90
Count 62 Count 62 Count 62
Descriptive Statistics
N Minimum Maximum Mean Std. Deviation
BareWT 62 1.16 24.94 13.1586 7.31847
ConeWGA 62 1.73 41.90 20.4394 11.51834
BellWGA 62 1.88 41.90 20.7933 11.76518
Table 1. MS Excel 2013 Wind Velocity Descriptive Statistics
Table 2. SPSS 20 Wind Velocity Descriptive Statistics

28
Descriptive statistics obtained from both software present total number of 186
collected data. Mean wind velocity for the bare wind turbine, with no wind tunnel was
attached. was approximately 13.16 mph with standard deviation 7.13. Significant increase
in mean value is observed when cone and bell shaped wind guide attachments were
involved in the system (20.43 & 20.79). Slight difference between bell and cone shaped
mean shows that the shape of the wind guide did not have significant effect on the wind
speed increase.
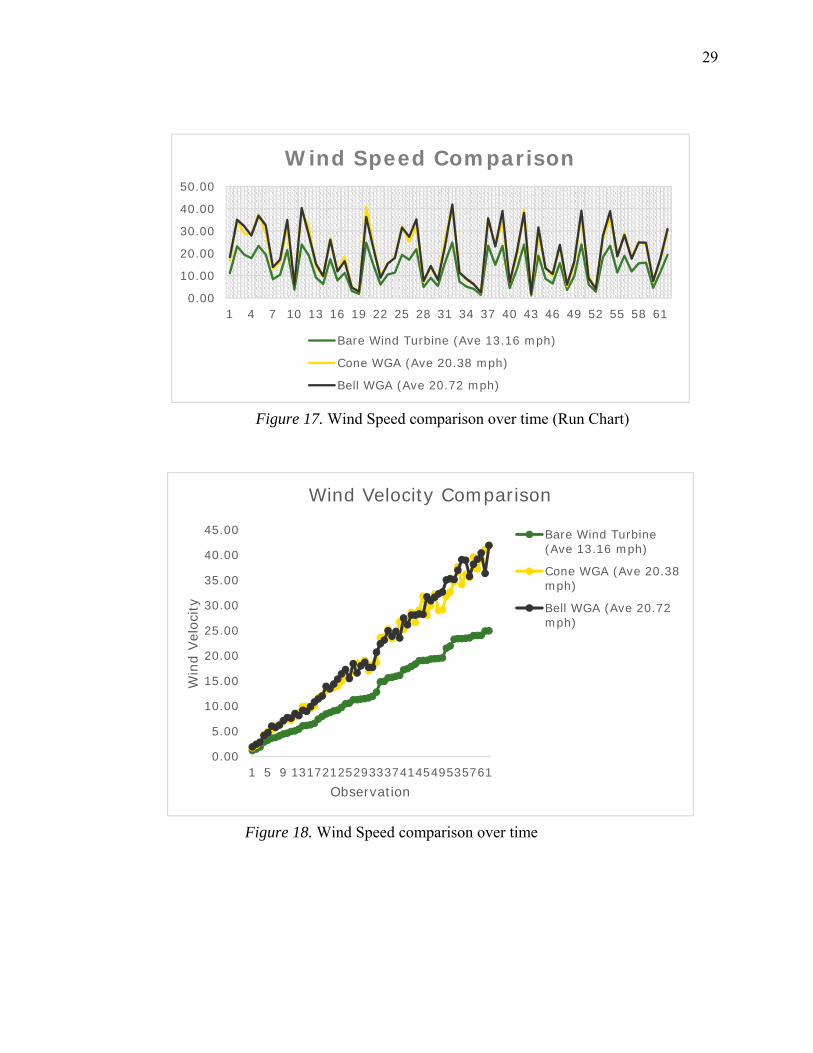
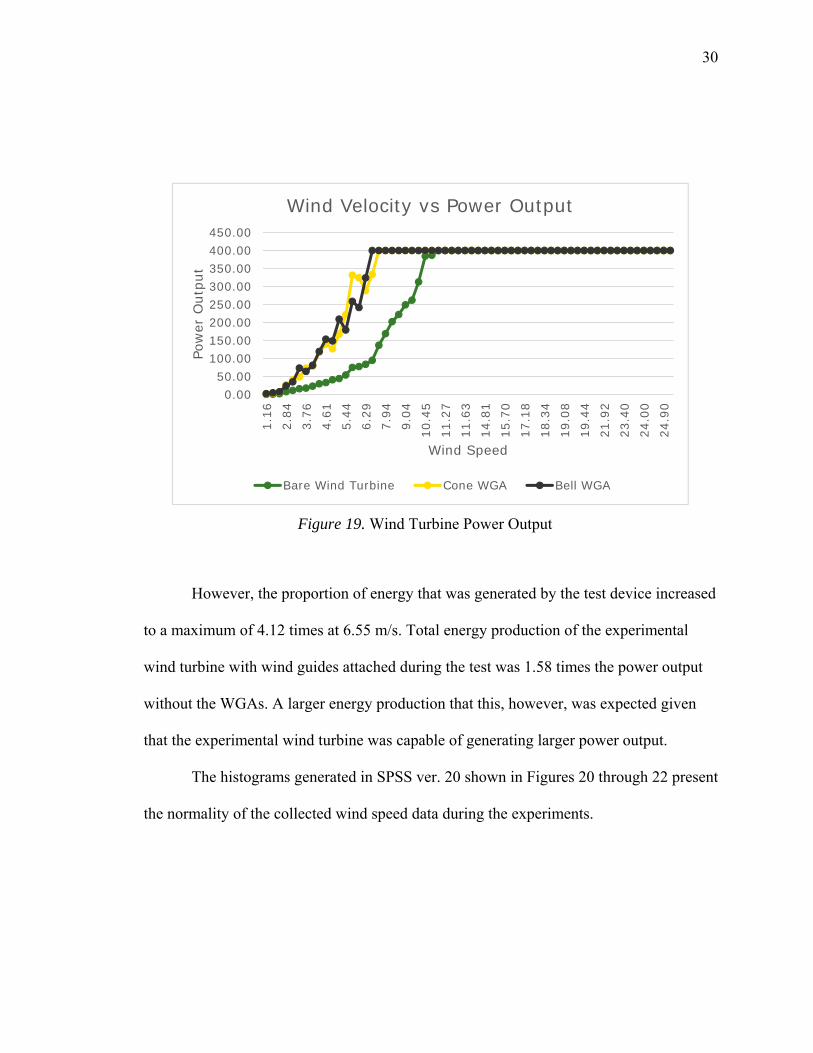
Figure from 17 through 19 show changes in wind velocity and power output over
time. Wind velocity was increased with the use of wind tunnel attachment device with
wind guides. However the difference between the wind speeds related to the shape of the
wind guide attachment was hardly noticeable. This means the wind velocity was higher
when using any of the wind guide attachments compared to the conventional wind
turbine with no attachments. Until 2.84 m/s wind speed the energy production of the
experimental wind turbine with WGA attachments was generally larger or equal to the
bare wind turbine (Figure 19).
29
0.00
10.00
20.00
30.00
40.00
50.00
1 4 7 10 13 16 19 22 25 28 31 34 37 40 43 46 49 52 55 58 61
Wind Speed Comparison
Bare Wind Turbine (Ave 13.16 mph)
Cone WGA (Ave 20.38 mph)
Bell WGA (Ave 20.72 mph)
Figure 17. Wind Speed comparison over time (Run Chart)
0.00
5.00
10.00
15.00
20.00
25.00
30.00
35.00
40.00
45.00
1 5 9 13172125293337414549535761
Win
d Vel
ocity
Observation
Wind Velocity Comparison
Bare Wind Turbine(Ave 13.16 mph)
Cone WGA (Ave 20.38mph)
Bell WGA (Ave 20.72mph)
Figure 18. Wind Speed comparison over time
30
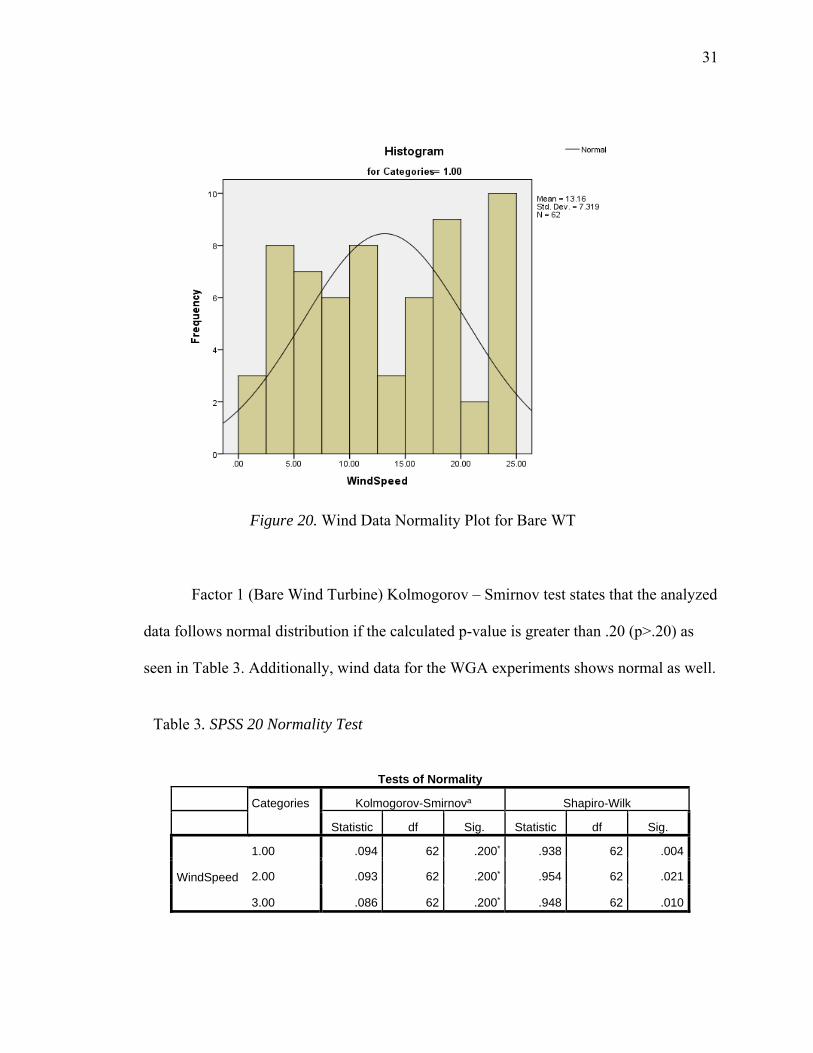
However, the proportion of energy that was generated by the test device increased
to a maximum of 4.12 times at 6.55 m/s. Total energy production of the experimental
wind turbine with wind guides attached during the test was 1.58 times the power output
without the WGAs. A larger energy production that this, however, was expected given
that the experimental wind turbine was capable of generating larger power output.
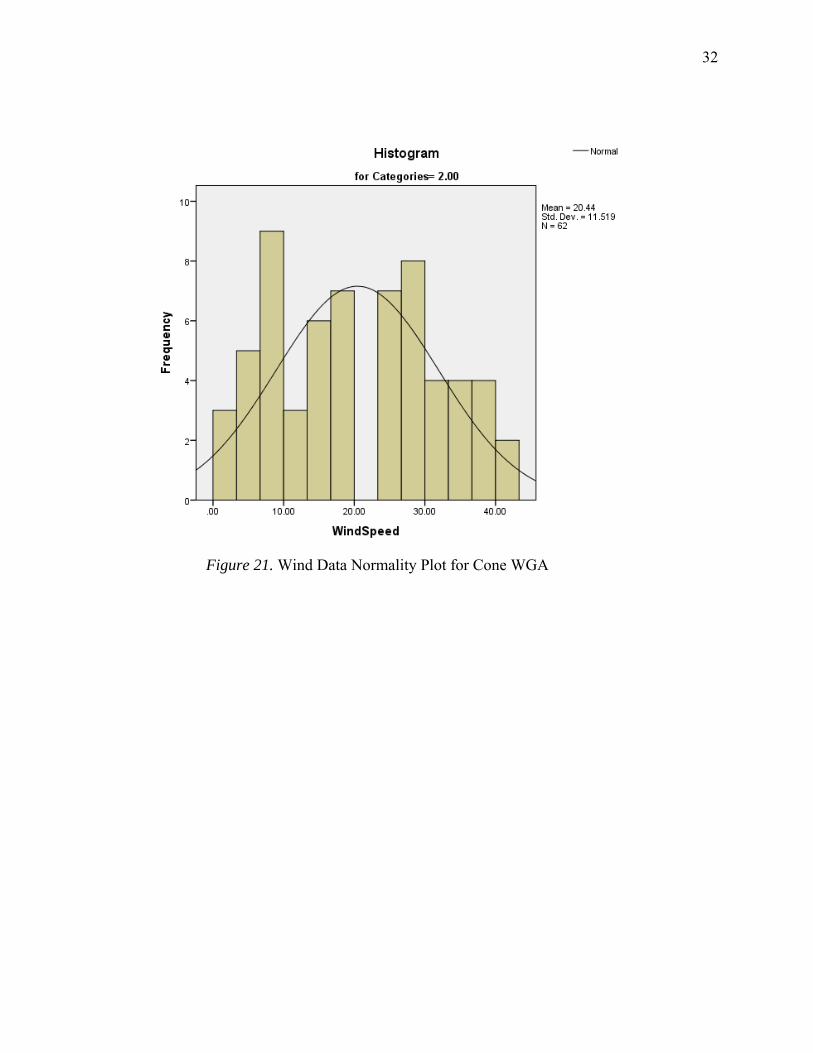
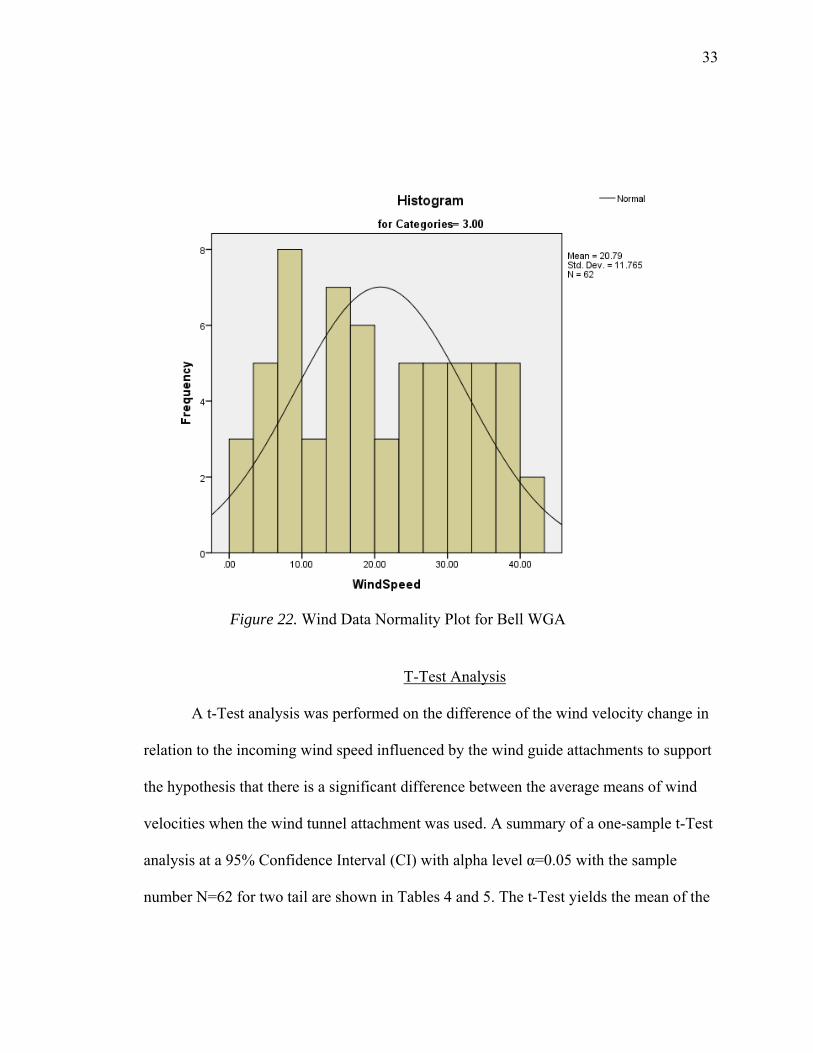
The histograms generated in SPSS ver. 20 shown in Figures 20 through 22 present
the normality of the collected wind speed data during the experiments.
0.0050.00
100.00150.00200.00250.00300.00350.00400.00450.00
1.16
2.84
3.76
4.61
5.44
6.29
7.94
9.04
10.4
511
.27
11.6
314
.81
15.7
017
.18
18.3
419
.08
19.4
421
.92
23.4
024
.00
24.9
0
Pow
er O
utpu
t
Wind Speed
Wind Velocity vs Power Output
Bare Wind Turbine Cone WGA Bell WGA
Figure 19. Wind Turbine Power Output
31
Factor 1 (Bare Wind Turbine) Kolmogorov – Smirnov test states that the analyzed
data follows normal distribution if the calculated p-value is greater than .20 (p>.20) as
seen in Table 3. Additionally, wind data for the WGA experiments shows normal as well.
Tests of Normality
Categories Kolmogorov-Smirnova Shapiro-Wilk
Statistic df Sig. Statistic df Sig.
WindSpeed
1.00 .094 62 .200* .938 62 .004
2.00 .093 62 .200* .954 62 .021
3.00 .086 62 .200* .948 62 .010
Figure 20. Wind Data Normality Plot for Bare WT
Table 3. SPSS 20 Normality Test
32
Figure 21. Wind Data Normality Plot for Cone WGA
33
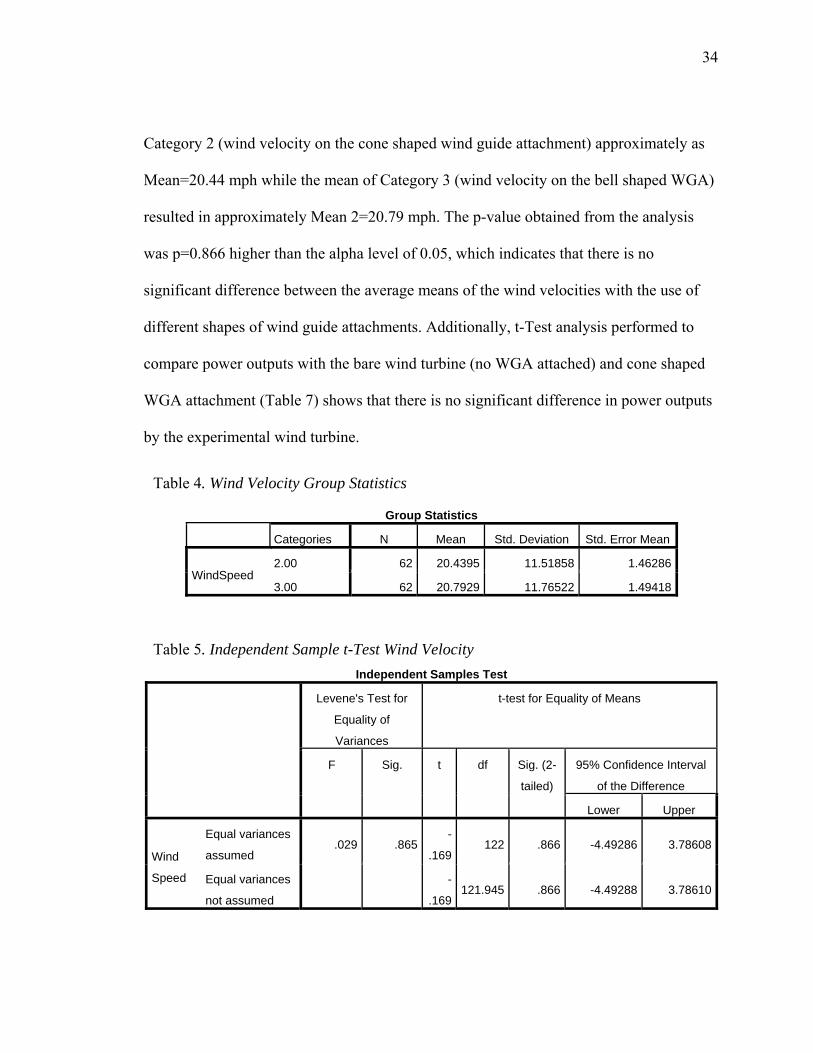
T-Test Analysis
A t-Test analysis was performed on the difference of the wind velocity change in
relation to the incoming wind speed influenced by the wind guide attachments to support
the hypothesis that there is a significant difference between the average means of wind
velocities when the wind tunnel attachment was used. A summary of a one-sample t-Test
analysis at a 95% Confidence Interval (CI) with alpha level α=0.05 with the sample
number N=62 for two tail are shown in Tables 4 and 5. The t-Test yields the mean of the
Figure 22. Wind Data Normality Plot for Bell WGA
34
Category 2 (wind velocity on the cone shaped wind guide attachment) approximately as
Mean=20.44 mph while the mean of Category 3 (wind velocity on the bell shaped WGA)
resulted in approximately Mean 2=20.79 mph. The p-value obtained from the analysis
was p=0.866 higher than the alpha level of 0.05, which indicates that there is no
significant difference between the average means of the wind velocities with the use of
different shapes of wind guide attachments. Additionally, t-Test analysis performed to
compare power outputs with the bare wind turbine (no WGA attached) and cone shaped
WGA attachment (Table 7) shows that there is no significant difference in power outputs
by the experimental wind turbine.
Group Statistics
Categories N Mean Std. Deviation Std. Error Mean
WindSpeed 2.00 62 20.4395 11.51858 1.46286
3.00 62 20.7929 11.76522 1.49418
Independent Samples Test
Levene's Test for
Equality of
Variances
t-test for Equality of Means
F Sig. t df Sig. (2-
tailed)
95% Confidence Interval
of the Difference
Lower Upper
Wind
Speed
Equal variances
assumed .029 .865
-
.169122 .866 -4.49286 3.78608
Equal variances
not assumed
-
.169121.945 .866 -4.49288 3.78610
Table 4. Wind Velocity Group Statistics
Table 5. Independent Sample t-Test Wind Velocity
35
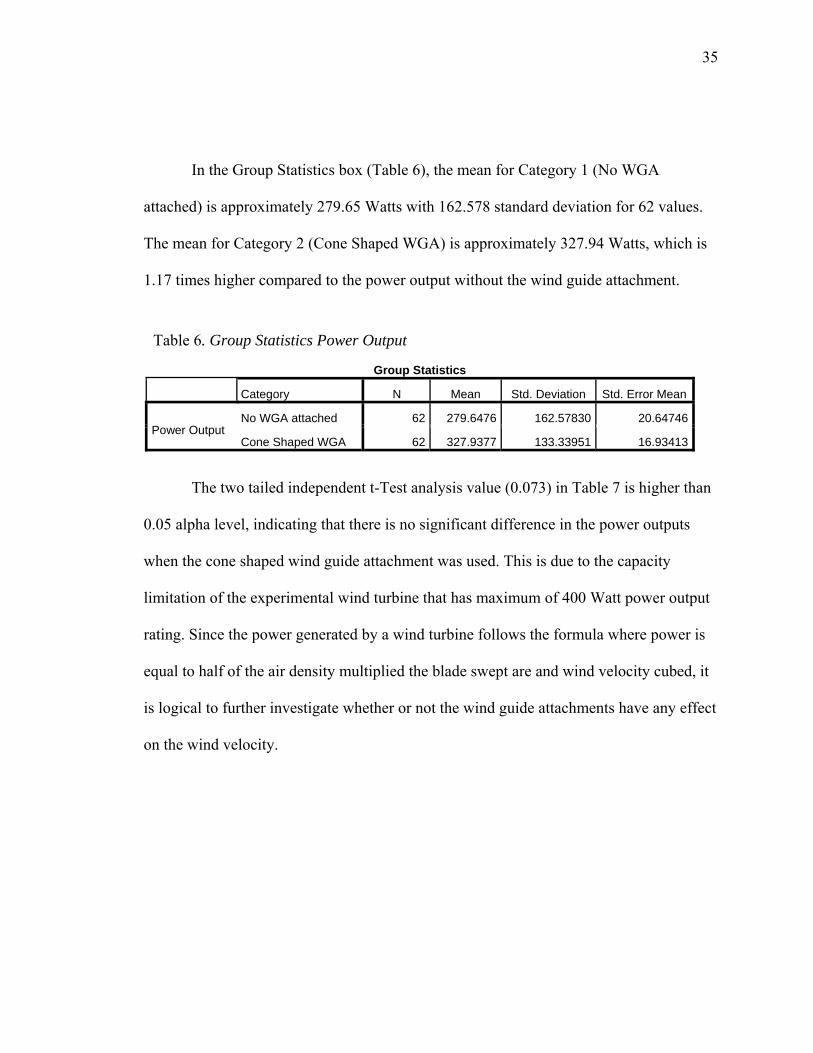
In the Group Statistics box (Table 6), the mean for Category 1 (No WGA
attached) is approximately 279.65 Watts with 162.578 standard deviation for 62 values.
The mean for Category 2 (Cone Shaped WGA) is approximately 327.94 Watts, which is
1.17 times higher compared to the power output without the wind guide attachment.
Group Statistics
Category N Mean Std. Deviation Std. Error Mean
Power Output No WGA attached 62 279.6476 162.57830 20.64746
Cone Shaped WGA 62 327.9377 133.33951 16.93413
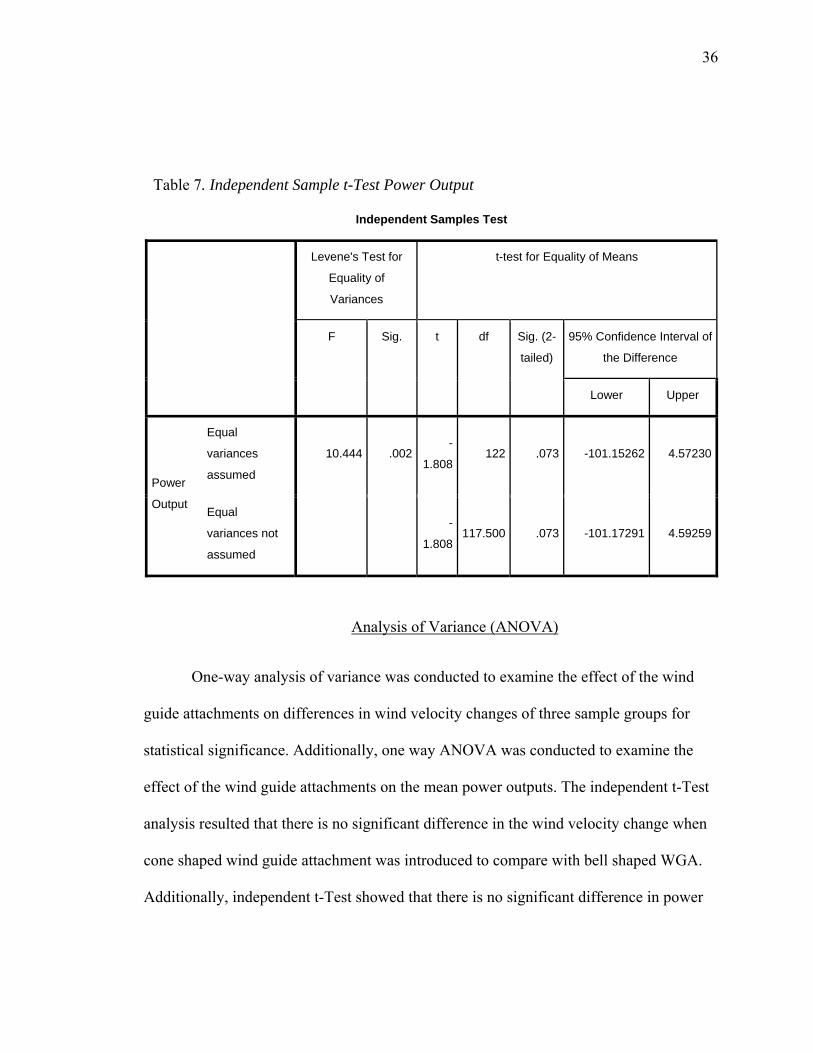
The two tailed independent t-Test analysis value (0.073) in Table 7 is higher than
0.05 alpha level, indicating that there is no significant difference in the power outputs
when the cone shaped wind guide attachment was used. This is due to the capacity
limitation of the experimental wind turbine that has maximum of 400 Watt power output
rating. Since the power generated by a wind turbine follows the formula where power is
equal to half of the air density multiplied the blade swept are and wind velocity cubed, it
is logical to further investigate whether or not the wind guide attachments have any effect
on the wind velocity.
Table 6. Group Statistics Power Output
36
Independent Samples Test
Levene's Test for
Equality of
Variances
t-test for Equality of Means
F Sig. t df Sig. (2-
tailed)
95% Confidence Interval of
the Difference
Lower Upper
Power
Output
Equal
variances
assumed
10.444 .002-
1.808122 .073 -101.15262 4.57230
Equal
variances not
assumed
-
1.808117.500 .073 -101.17291 4.59259
Analysis of Variance (ANOVA)
One-way analysis of variance was conducted to examine the effect of the wind
guide attachments on differences in wind velocity changes of three sample groups for
statistical significance. Additionally, one way ANOVA was conducted to examine the
effect of the wind guide attachments on the mean power outputs. The independent t-Test
analysis resulted that there is no significant difference in the wind velocity change when
cone shaped wind guide attachment was introduced to compare with bell shaped WGA.
Additionally, independent t-Test showed that there is no significant difference in power
Table 7. Independent Sample t-Test Power Output
37
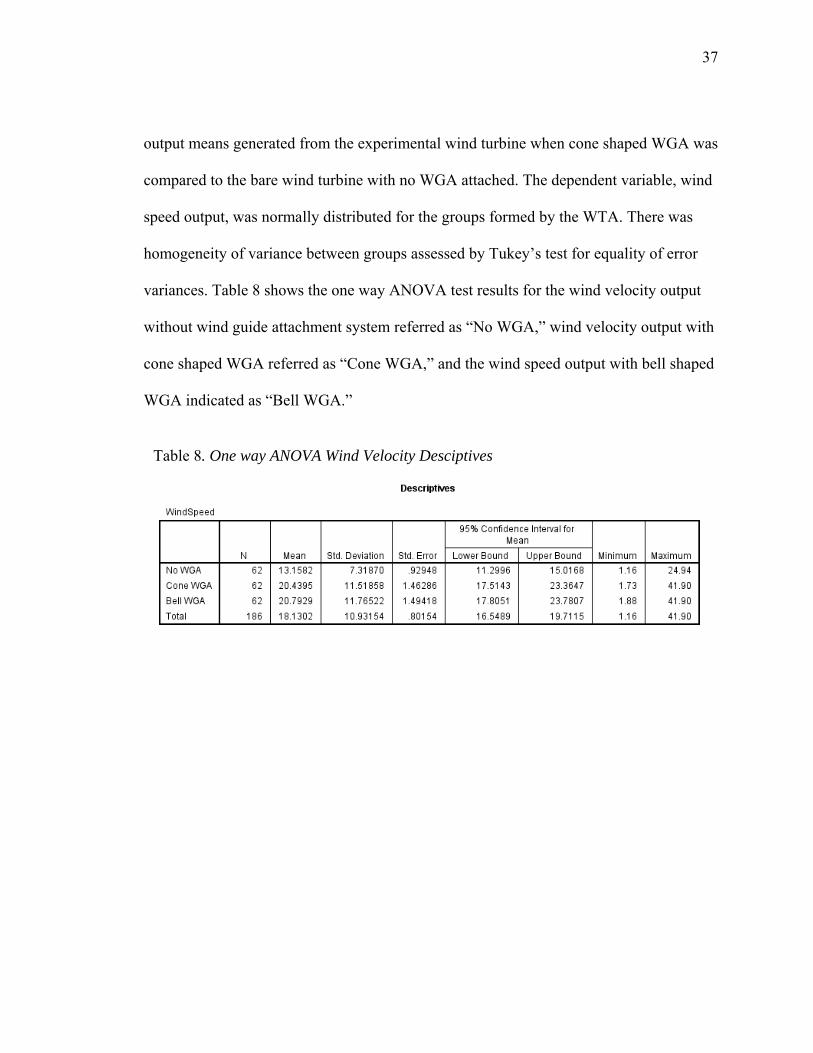
output means generated from the experimental wind turbine when cone shaped WGA was
compared to the bare wind turbine with no WGA attached. The dependent variable, wind
speed output, was normally distributed for the groups formed by the WTA. There was
homogeneity of variance between groups assessed by Tukey’s test for equality of error
variances. Table 8 shows the one way ANOVA test results for the wind velocity output
without wind guide attachment system referred as “No WGA,” wind velocity output with
cone shaped WGA referred as “Cone WGA,” and the wind speed output with bell shaped
WGA indicated as “Bell WGA.”
Table 8. One way ANOVA Wind Velocity Desciptives
38
ANOVA
WindSpeed
Sum of Squares df Mean Square F Sig.
Between Groups 2302.894 2 1151.447 10.640 .000
Within Groups 19804.357 183 108.221
Total 22107.251 185
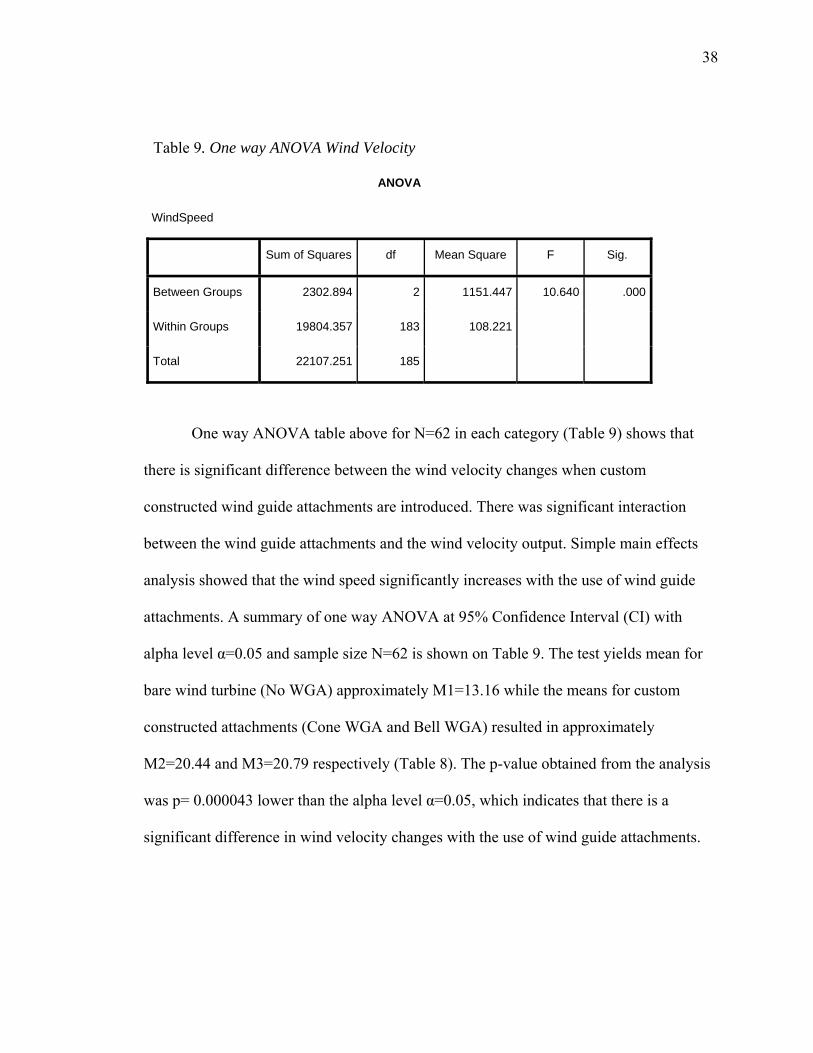
One way ANOVA table above for N=62 in each category (Table 9) shows that
there is significant difference between the wind velocity changes when custom
constructed wind guide attachments are introduced. There was significant interaction
between the wind guide attachments and the wind velocity output. Simple main effects
analysis showed that the wind speed significantly increases with the use of wind guide
attachments. A summary of one way ANOVA at 95% Confidence Interval (CI) with
alpha level α=0.05 and sample size N=62 is shown on Table 9. The test yields mean for
bare wind turbine (No WGA) approximately M1=13.16 while the means for custom
constructed attachments (Cone WGA and Bell WGA) resulted in approximately
M2=20.44 and M3=20.79 respectively (Table 8). The p-value obtained from the analysis
was p= 0.000043 lower than the alpha level α=0.05, which indicates that there is a
significant difference in wind velocity changes with the use of wind guide attachments.
Table 9. One way ANOVA Wind Velocity
39
Therefore null hypothesis H10 is rejected, where there is no significant difference in the
wind velocity means with the use of a custom-constructed wind tunnel attachments.
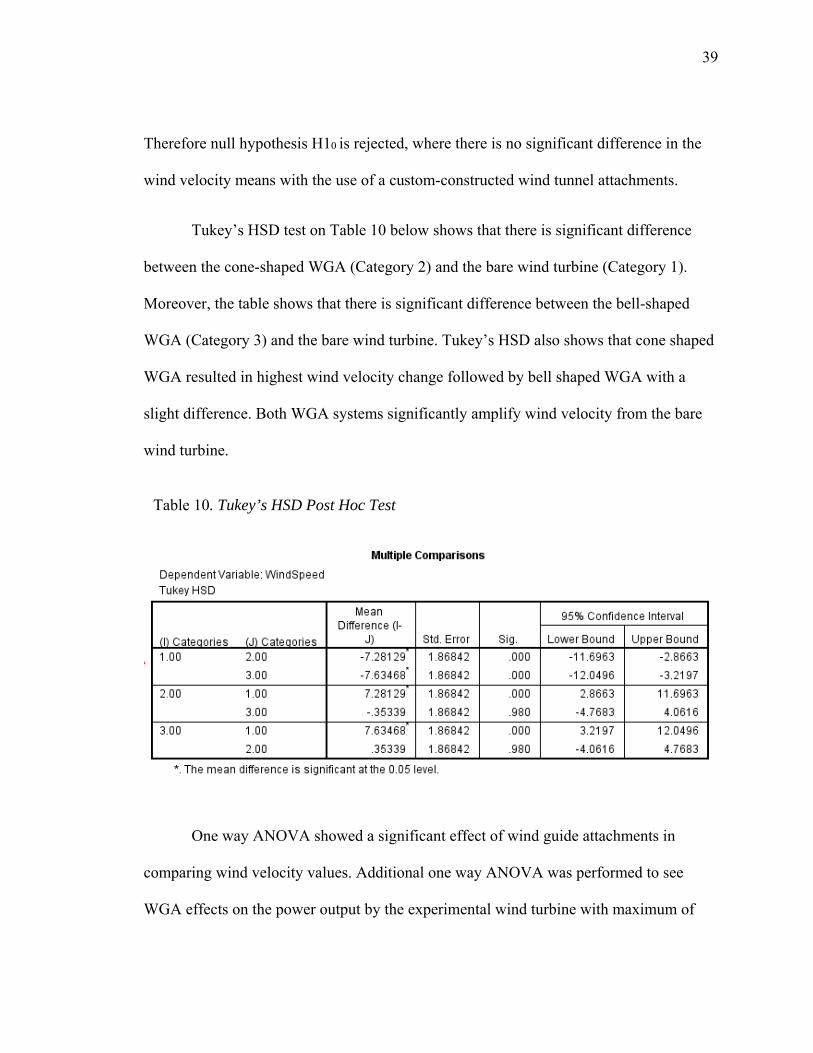
Tukey’s HSD test on Table 10 below shows that there is significant difference
between the cone-shaped WGA (Category 2) and the bare wind turbine (Category 1).
Moreover, the table shows that there is significant difference between the bell-shaped
WGA (Category 3) and the bare wind turbine. Tukey’s HSD also shows that cone shaped
WGA resulted in highest wind velocity change followed by bell shaped WGA with a
slight difference. Both WGA systems significantly amplify wind velocity from the bare
wind turbine.
One way ANOVA showed a significant effect of wind guide attachments in
comparing wind velocity values. Additional one way ANOVA was performed to see
WGA effects on the power output by the experimental wind turbine with maximum of
Table 10. Tukey’s HSD Post Hoc Test
40
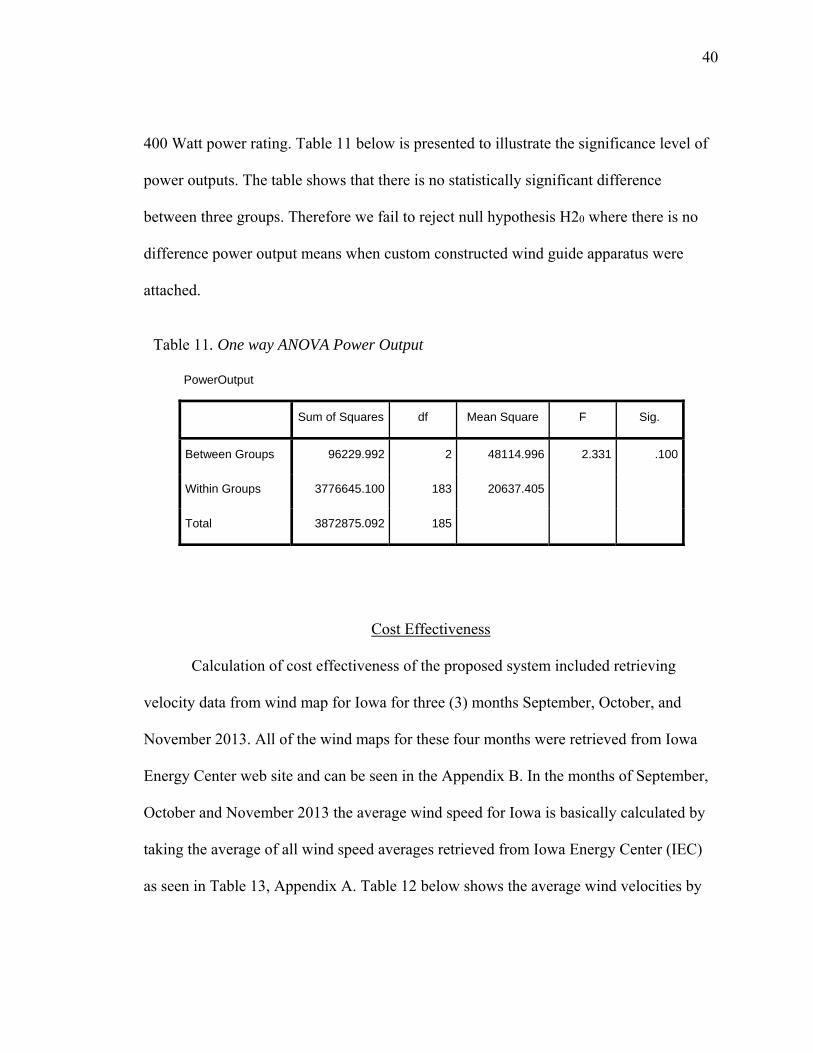
400 Watt power rating. Table 11 below is presented to illustrate the significance level of
power outputs. The table shows that there is no statistically significant difference
between three groups. Therefore we fail to reject null hypothesis H20 where there is no
difference power output means when custom constructed wind guide apparatus were
attached.
PowerOutput
Sum of Squares df Mean Square F Sig.
Between Groups 96229.992 2 48114.996 2.331 .100
Within Groups 3776645.100 183 20637.405
Total 3872875.092 185
Cost Effectiveness
Calculation of cost effectiveness of the proposed system included retrieving
velocity data from wind map for Iowa for three (3) months September, October, and
November 2013. All of the wind maps for these four months were retrieved from Iowa
Energy Center web site and can be seen in the Appendix B. In the months of September,
October and November 2013 the average wind speed for Iowa is basically calculated by
taking the average of all wind speed averages retrieved from Iowa Energy Center (IEC)
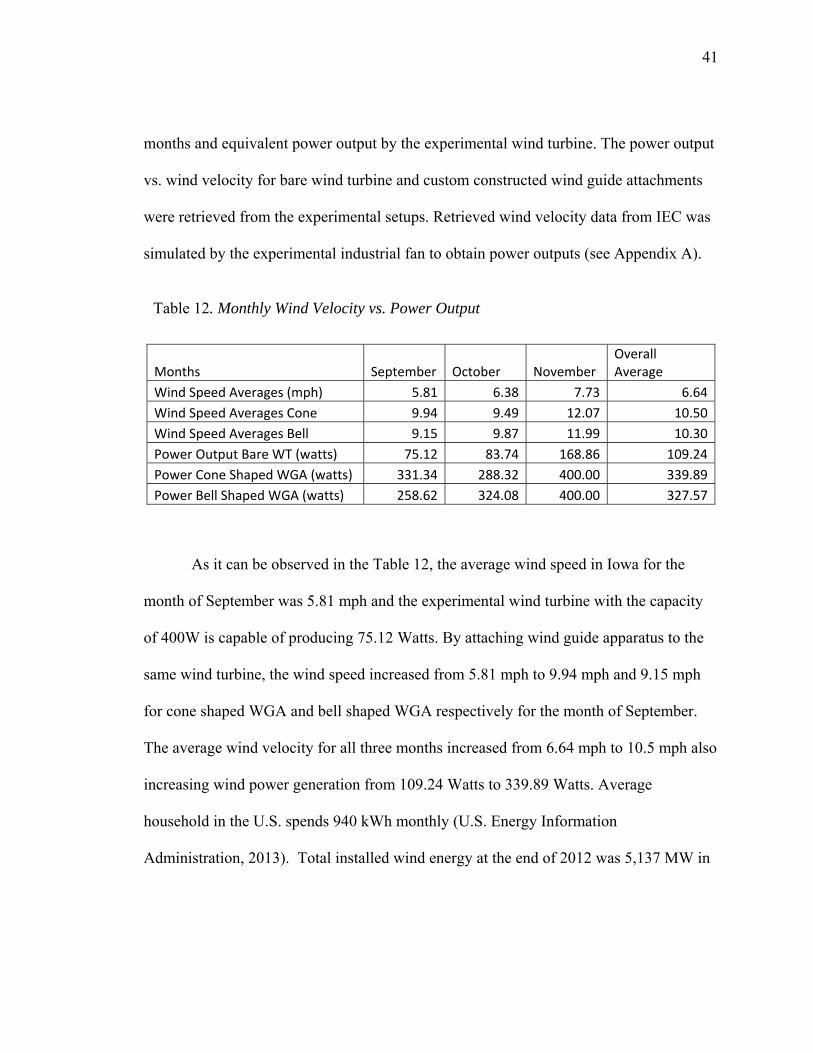
as seen in Table 13, Appendix A. Table 12 below shows the average wind velocities by
Table 11. One way ANOVA Power Output
41
months and equivalent power output by the experimental wind turbine. The power output
vs. wind velocity for bare wind turbine and custom constructed wind guide attachments
were retrieved from the experimental setups. Retrieved wind velocity data from IEC was
simulated by the experimental industrial fan to obtain power outputs (see Appendix A).
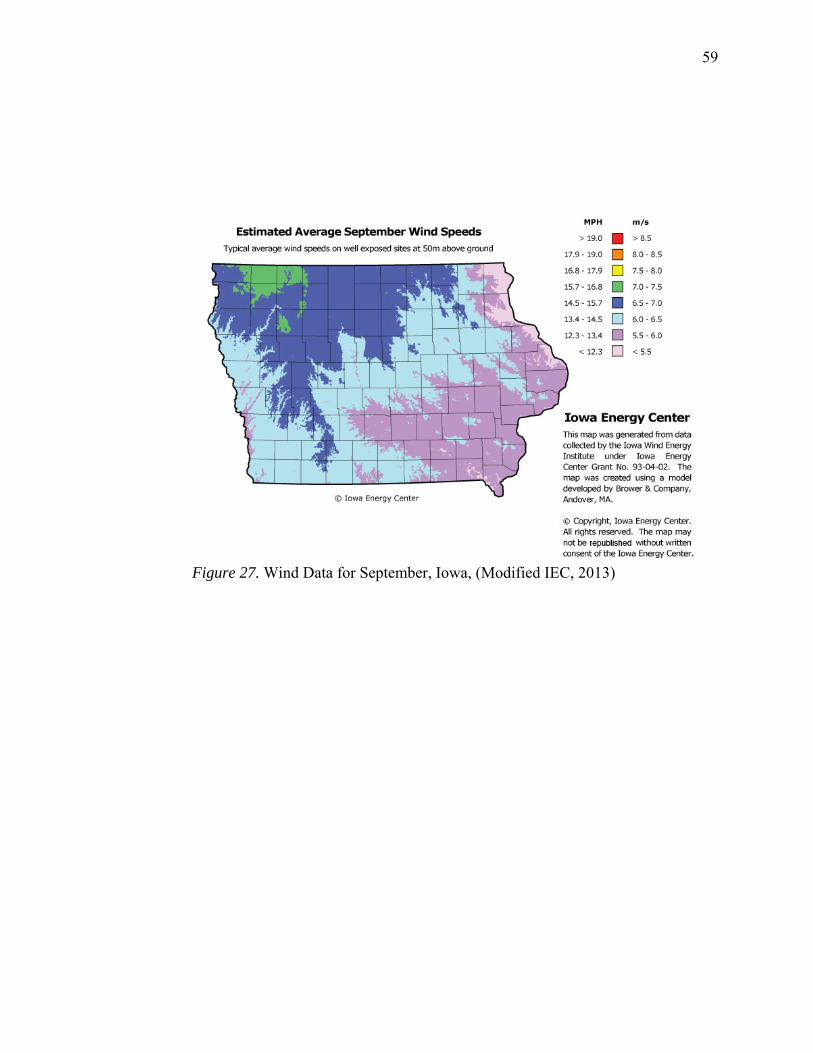
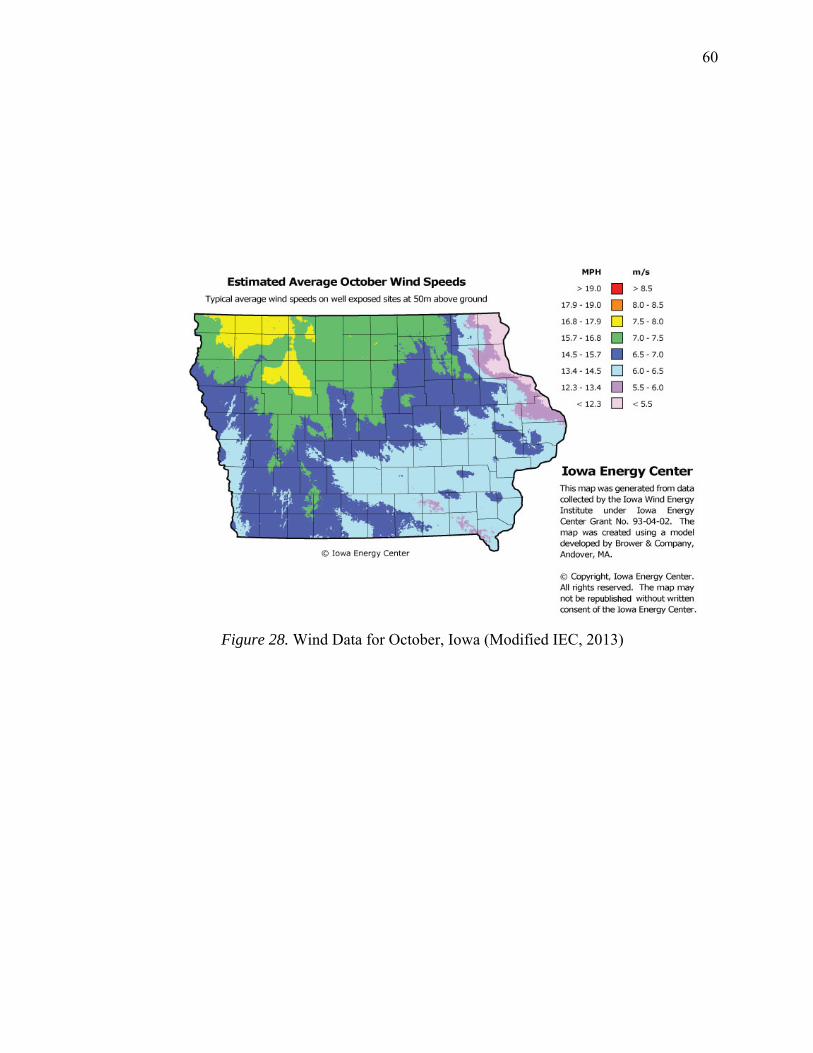
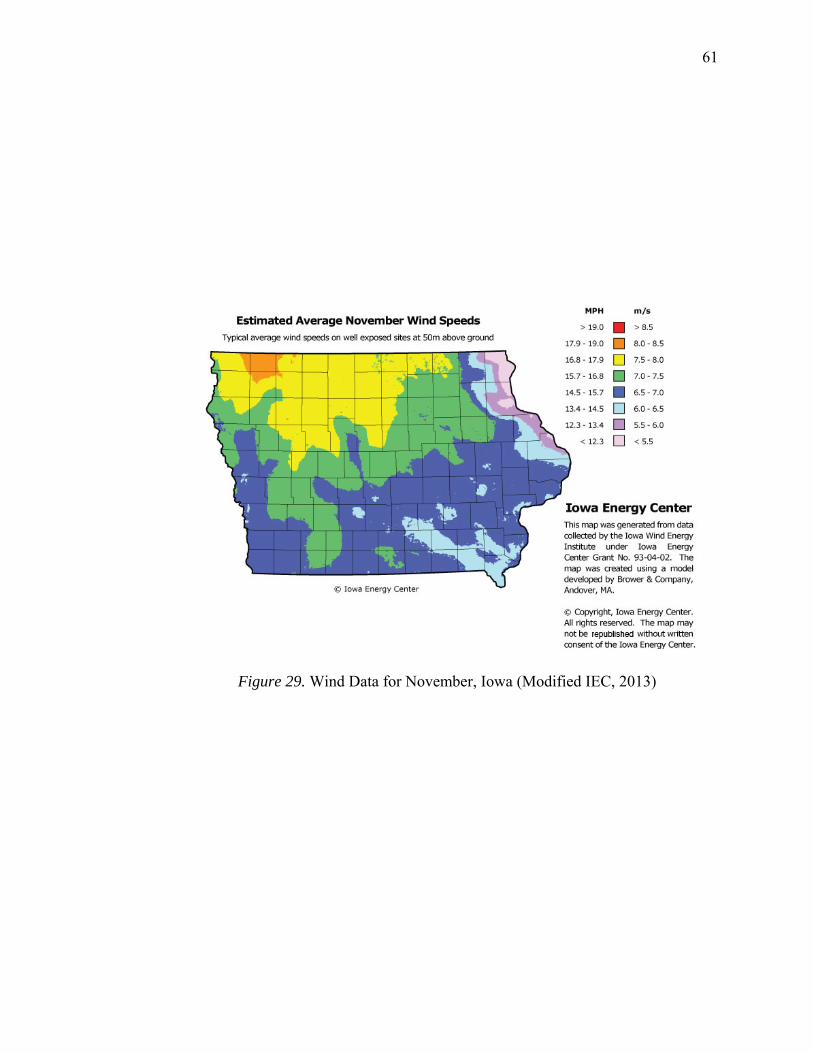
Months September October November Overall Average
Wind Speed Averages (mph) 5.81 6.38 7.73 6.64
Wind Speed Averages Cone 9.94 9.49 12.07 10.50
Wind Speed Averages Bell 9.15 9.87 11.99 10.30
Power Output Bare WT (watts) 75.12 83.74 168.86 109.24
Power Cone Shaped WGA (watts) 331.34 288.32 400.00 339.89
Power Bell Shaped WGA (watts) 258.62 324.08 400.00 327.57
As it can be observed in the Table 12, the average wind speed in Iowa for the
month of September was 5.81 mph and the experimental wind turbine with the capacity
of 400W is capable of producing 75.12 Watts. By attaching wind guide apparatus to the
same wind turbine, the wind speed increased from 5.81 mph to 9.94 mph and 9.15 mph
for cone shaped WGA and bell shaped WGA respectively for the month of September.
The average wind velocity for all three months increased from 6.64 mph to 10.5 mph also
increasing wind power generation from 109.24 Watts to 339.89 Watts. Average
household in the U.S. spends 940 kWh monthly (U.S. Energy Information
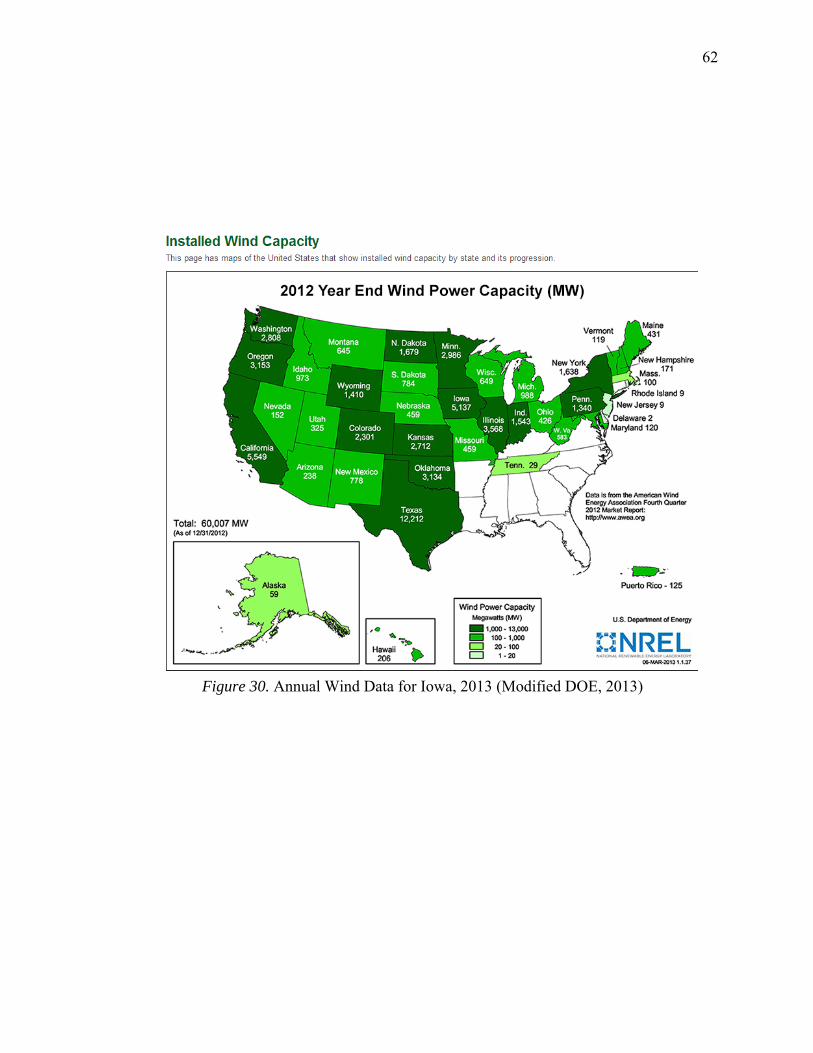
Administration, 2013). Total installed wind energy at the end of 2012 was 5,137 MW in
Table 12. Monthly Wind Velocity vs. Power Output
42
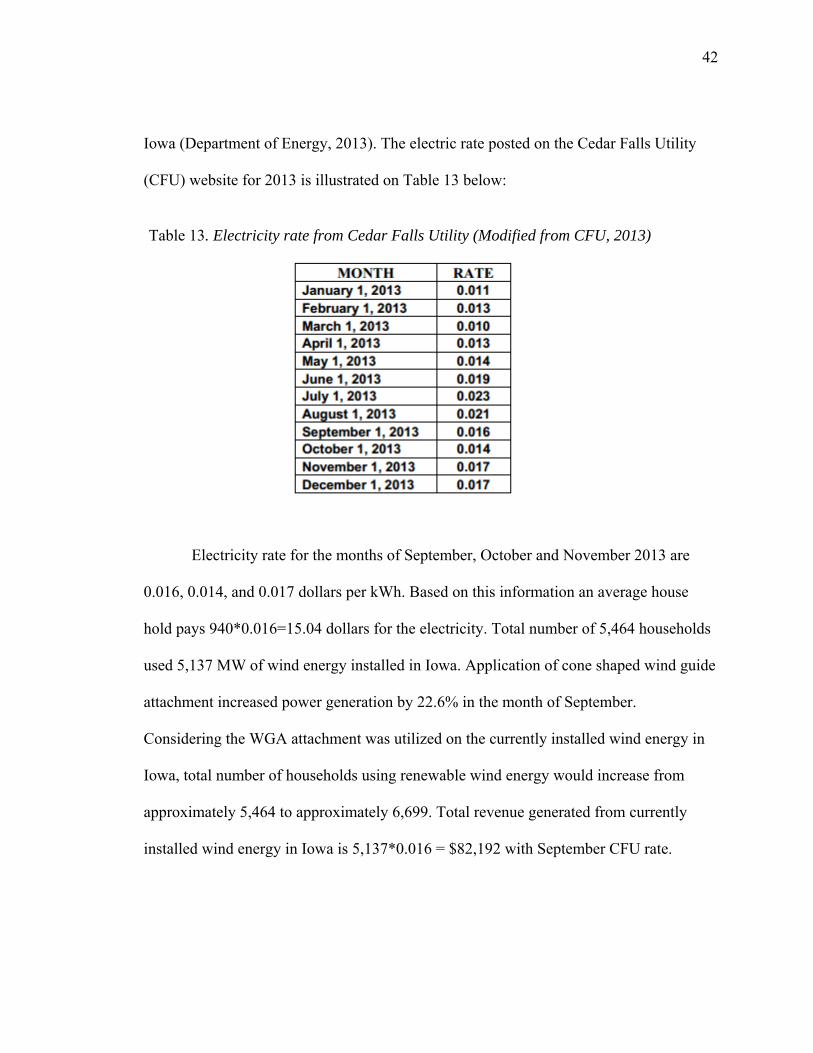
Iowa (Department of Energy, 2013). The electric rate posted on the Cedar Falls Utility
(CFU) website for 2013 is illustrated on Table 13 below:
Electricity rate for the months of September, October and November 2013 are
0.016, 0.014, and 0.017 dollars per kWh. Based on this information an average house
hold pays 940*0.016=15.04 dollars for the electricity. Total number of 5,464 households
used 5,137 MW of wind energy installed in Iowa. Application of cone shaped wind guide
attachment increased power generation by 22.6% in the month of September.
Considering the WGA attachment was utilized on the currently installed wind energy in
Iowa, total number of households using renewable wind energy would increase from
approximately 5,464 to approximately 6,699. Total revenue generated from currently
installed wind energy in Iowa is 5,137*0.016 = $82,192 with September CFU rate.
Table 13. Electricity rate from Cedar Falls Utility (Modified from CFU, 2013)

43
Produced wind energy with the application of WGA can increase the revenue by
$100,767.39-82,192=$18,575.39.

44
CHAPTER V
CONCLUSION AND RECOMMENDATIONS
Conclusion
The problems of this applied research study was to determine the strength of the
relationship between power output and the custom-constructed wind tunnel apparatus
with wind guide attachment. The null hypothesis, H10 was that there is no significant
difference in the wind velocity means with the use of a custom-constructed wind guide
attachment. Based on the statistical analysis (ANOVA) null hypothesis is rejected, where
one way ANOVA showed that there is significant difference in wind velocity means with
the application of custom constructed wind tunnel attachment. The power of a wind
turbine could be increased or decreased by simply attaching a wind tunnel to it (Dakeev,
2011). Application of wind guide attachments can increase power generation by 22.6%.
A general rule of thumb is to install a wind turbine on a tower with the bottom of the
rotor blades at least 9 meters (30 feet) above any obstacle that is within 90 meters (300
feet) of the tower (U.S. Department of Energy, 2013). Wind tunnel attachment’s ability to
capture low speed winds at lower altitudes may decrease the overall cost of the wind
turbine. Based on the experiment with statistical analysis, attachment of the wind guide
attachment on the wind turbine may increase the power generation significantly at α =
0.05 levels.

45
Recommendations
Further studies need to be considered on the Computational Fluid Dynamics
(CFD) analysis on the design of the wind tunnel apparatus and the wind guide
attachments. Custom constructed system can be modeled in the ANSYS Design Modeler,
Meshed with optimal number of hexes and analyzed with ANSYS Fluent. The simulated
air flow in the Fluent software may represent the effectiveness and/or validity of the
constructed attachments. The cost effectiveness of the current system was not analyzed
for large scale wind turbines therefore; transportation of the wind tunnel to far-distance
areas might be costly.

46
REFERENCES
American Wind Energy Association, (2013). Retrieved from www.awea.org Bertelsen, K., (2011). The update of IEC 61400-24 Lightning Protection of Wind
Turbines. 29th International Conference on Lighting Protection. [Electronic version]. Retrieved from www.germanlloyd.org
Bollen, J., Hers, S. & Zwaan, B., (2010). An integrated assessment of climate change, air pollution, and energy security policy. Energy Policy. [Electronic version]. Retrieved from www.elsevier.com
Cedar Falls Utility, (2013). Retrieved from www.cfu.net Chong, W.T., Pan, K.C., Poh, S.C., Fazilzan, A., Oon, C.S., Badarudin, A.& Nik-
Ghazali, N. (2013). Performance investigation of a power augmented vertical axis wind turbine for urban high-rise application. Renewable Energy. [Electronic version]. Retrieved from www.elsevier.com
Dakeev, U. (2011). Management of Wind Power Generation with the Attachment of
Wind Tunnel. Wind Tunnels-Design and Construction. [Electronic version]. Retrieved from www.library.uni.edu
Graedel, T. & Crutzen, P. (1989). Policy options for stabilizing Global Climate. National
Service Center for Environmental Publications. [Electronic version]. Retrieved form http://nepis.epa.gov
Hampden Engineering Corporation, (2013). Retrieved from www.hampden.com
Hook, M. & Aleklett, K., (2009). Historical trends in American coal production and a possible future outlook. International Journal of Coal Geology. [Electronic version]. Retrieved from www.elsevier.com
Hyslop, B., Davies, M., Wallace, A., Gazey, N. & Holroyd S. (1997). Effects of colliery waste on littoral communities in north – east England. Environmental Pollution. [Electronic version]. Retrieved from www.sciencedirect.com
Iowa Energy Center, (2013). Retrieved from www.iowaenergycenter.org
Klingenberg, C.P. (1996). Static, ontogenetic, and evolutionary algometry: a multivariate comparison in nine species of water spiders. American Naturalist. [Electronic version]. Retrieved from http://www.jstor.org

47
Matsushima, T., Takagi, S. & Muroyama, S., (2006). Characteristics of a highly efficient propeller type small wind turbine with a diffuser. Renewable Energy. [Electronic version]. Retrieved from www.elsevier.com
National Renewable Energy Laboratory (2013). Retrieved from www.nrel.gov National Weather Service, (2013). Retrieved from www.weather.gov
Null, J., (2011). Comparative Climatic Data, United States. Retrieved from www.ggweather.com
Stracher, G. & Taylor, T. (2004). Coal fires burning out of control around the world: thermodynamic recipe for environmental catastrophe. International Journal of Coal Geology. [Electronic version]. Retrieved from www.elsevier.com
Tao, T., Zheng, H., Su, Y. & Riffat, S. (2011). A novel combined solar concentration/wind augmentation system: Constructions and preliminary testing of a prototype. Applied Thermal Engineering. [Electronic version]. Retrieved from www.elsevier.com
University of Michigan-Flint, (2013). Retrieved from www.umflint.edu University of Northern Iowa, (2013). Retrieved from www.library.uni.edu
U.S. Department of Energy, (2013). Retrieved from www.energy.gov U.S. Energy Information Administration, (2013). Retrieved from www.eia.gov The Weather Channel, (2013). Retrieved from www.weather.com

48
APPENDIX A
DATA TABLES
49
Bare Wind Turbine Cone WGA Bell WGA Bare Wind Turbine Cone WGA Bell WGA
1 11.23 16.96 18.42 32 24.94 41.90 41.90
2 23.26 34.66 35.13 33 7.40 11.70 11.40
3 19.44 28.96 32.27 34 5.08 7.92 8.53
4 17.87 28.60 28.06 35 4.09 6.14 6.22
5 23.40 37.67 36.97 36 1.45 2.21 2.41
6 19.55 29.13 32.65 37 23.53 35.53 35.77
7 8.43 13.07 13.91 38 14.90 23.69 23.09
8 10.45 16.09 17.24 39 23.40 34.16 39.08
9 21.50 31.82 35.04 40 4.45 7.03 7.08
10 3.76 6.01 5.75 41 12.77 18.65 20.69
11 24.05 39.20 40.40 42 24.00 39.60 38.16
12 19.06 31.83 28.21 43 1.16 1.73 1.88
13 9.19 13.97 15.35 44 19.08 28.05 31.67
14 6.29 9.49 9.87 45 8.70 13.75 13.40
15 17.43 26.84 26.14 46 6.55 9.96 10.81
16 7.94 12.07 11.99 47 15.70 23.40 23.87
17 11.27 18.49 16.57 48 3.62 5.25 6.02
18 3.22 4.96 4.70 49 9.75 14.92 16.39
19 1.86 2.78 2.82 50 24.02 37.24 39.16
20 24.90 41.08 36.35 51 6.13 9.87 8.95
21 14.81 23.55 22.36 52 2.84 4.32 4.15
22 6.06 9.94 9.15 53 18.34 26.60 28.06
23 10.58 15.66 15.45 54 23.47 36.14 38.95
24 11.39 18.33 17.99 55 11.48 19.05 18.71
25 19.39 32.19 31.61 56 18.99 29.06 28.30
26 17.18 25.25 27.49 57 11.95 18.28 17.68
27 21.92 32.66 35.29 58 15.59 25.26 24.95
28 4.94 7.22 7.61 59 15.90 23.86 24.81
29 9.04 13.65 14.37 60 4.61 7.47 7.70
30 5.44 8.70 8.10 61 11.63 16.98 17.68
31 16.11 26.74 23.51 62 19.33 29.96 30.92
Table 14. Collected Wind Data during Experiments
50
Wind Speed (mph)
400W Power Output
Cone PO-400W
Bell PO-400W
1 11.23 400 400.00 400.002 23.26 400 400.00 400.003 19.44 400 400.00 400.004 17.87 400 400.00 400.005 23.40 400 400.00 400.006 19.55 400 400.00 400.007 8.43 202.23 400.00 400.008 10.45 384.40 400.00 400.009 21.50 400.00 400.00 400.00
10 3.76 17.90 73.30 64.1011 24.05 400.00 400.00 400.0012 19.06 400.00 400.00 400.0013 9.19 262.03 400.00 400.0014 6.29 83.74 288.32 324.0815 17.43 400.00 400.00 400.0016 7.94 168.86 400.00 400.0017 11.27 400.00 400.00 400.0018 3.22 11.27 41.16 35.0719 1.86 2.16 7.28 7.5820 24.90 400.00 400.00 400.0021 14.81 400.00 400.00 400.0022 6.06 75.12 331.34 258.6223 10.58 386.87 400.00 400.0024 11.39 400.00 400.00 400.0025 19.39 400.00 400.00 400.0026 17.18 400.00 400.00 400.0027 21.92 400.00 400.00 400.0028 4.94 40.74 126.78 148.7929 9.04 248.87 400.00 400.0030 5.44 54.16 221.82 179.1531 16.11 400.00 400.00 400.0032 24.94 400.00 400.00 400.0033 7.40 136.87 400.00 400.00
Table 15. Power Output Data during Experiments
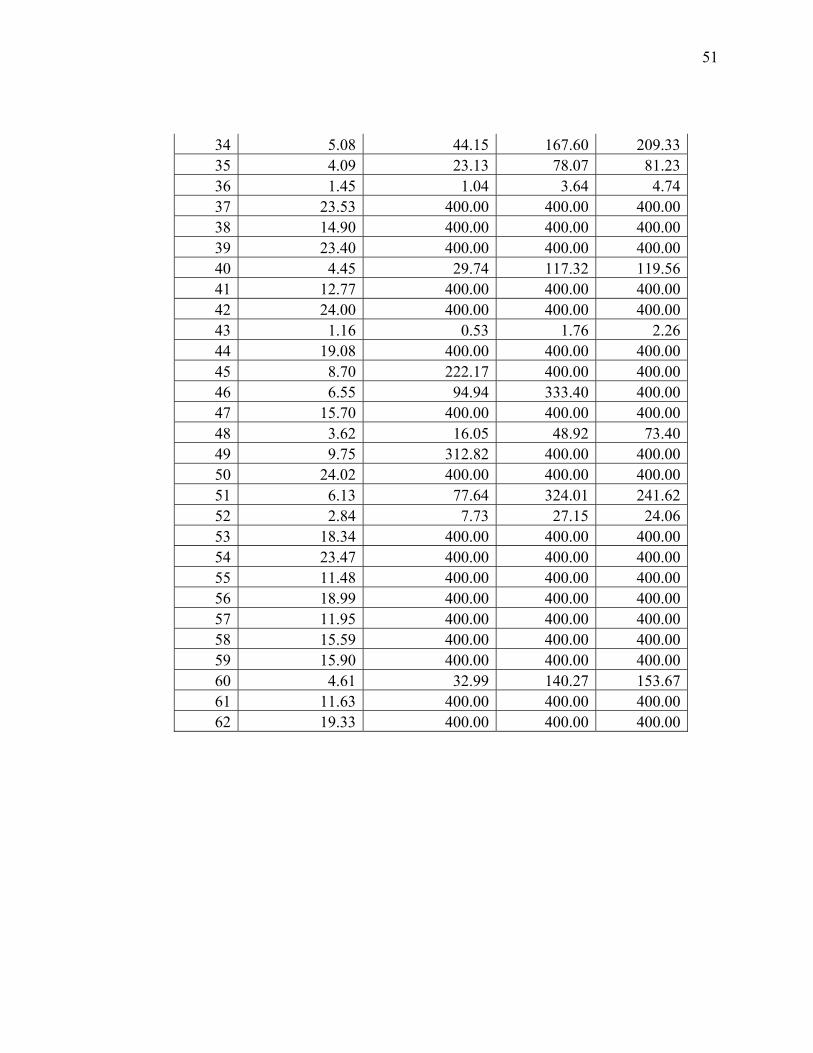
51
34 5.08 44.15 167.60 209.3335 4.09 23.13 78.07 81.2336 1.45 1.04 3.64 4.7437 23.53 400.00 400.00 400.0038 14.90 400.00 400.00 400.0039 23.40 400.00 400.00 400.0040 4.45 29.74 117.32 119.5641 12.77 400.00 400.00 400.0042 24.00 400.00 400.00 400.0043 1.16 0.53 1.76 2.2644 19.08 400.00 400.00 400.0045 8.70 222.17 400.00 400.0046 6.55 94.94 333.40 400.0047 15.70 400.00 400.00 400.0048 3.62 16.05 48.92 73.4049 9.75 312.82 400.00 400.0050 24.02 400.00 400.00 400.0051 6.13 77.64 324.01 241.6252 2.84 7.73 27.15 24.0653 18.34 400.00 400.00 400.0054 23.47 400.00 400.00 400.0055 11.48 400.00 400.00 400.0056 18.99 400.00 400.00 400.0057 11.95 400.00 400.00 400.0058 15.59 400.00 400.00 400.0059 15.90 400.00 400.00 400.0060 4.61 32.99 140.27 153.6761 11.63 400.00 400.00 400.0062 19.33 400.00 400.00 400.00

52
Table 16. Wind Data for September 2013 (Modified from IEC, 2013)

53
Table 17. Wind Data for October 2013(Modified from IEC, 2013)
54
Table 18. Wind Data for November 2013(Modified from IEC, 2013)

55
APPENDIX B
RELATED FIGURES
56
Figure 23. Wind Velocity, Experiment 1
(Modified The Weather Channel, 2013)
Figure 24. Wind Velocity, Air pressure (Modified The Weather Channel, 2013)
57
Figure 25. Wind Velocity, Experiment 2 (Modified NWS, 2013)
58
Figure 26. Wind Data for October, Flint, MI (Modified NWS, 2013)
59
Figure 27. Wind Data for September, Iowa, (Modified IEC, 2013)
60
Figure 28. Wind Data for October, Iowa (Modified IEC, 2013)
61
Figure 29. Wind Data for November, Iowa (Modified IEC, 2013)
62
Figure 30. Wind Data for November, Iowa, 2013
Figure 30. Annual Wind Data for Iowa, 2013 (Modified DOE, 2013)

63
Ulan Dakeev 10/04/2013
Figure 31. Undergraduate Research Approval Letter