analysis of polychlorinated biphenyls in transformer oil by using liquid–liquid partitioning in a...
TRANSCRIPT
Published: September 05, 2011
r 2011 American Chemical Society 7834 dx.doi.org/10.1021/ac2015867 |Anal. Chem. 2011, 83, 7834–7840
ARTICLE
pubs.acs.org/ac
Analysis of Polychlorinated Biphenyls in Transformer Oil by UsingLiquid�Liquid Partitioning in a Microfluidic DeviceArata Aota,* Yasumoto Date, Shingo Terakado, Hideo Sugiyama, and Naoya Ohmura*
Biotechnology Sector, Central Research Institute of Electric Power Industry, 1646 Abiko, Abiko City, Chiba, 270-1194 Japan
The most important application of polychlorinated biphenyls(PCBs), prior to their discontinuation in the late 1970s, was
in electrical equipment, including mainly capacitors as well astransformers, owing to their high chemical and thermal stabilityand low conductivity.1 However, as their toxicity and environ-mental persistence became apparent, their production and newapplications began to be prohibited around the world. After thenotorious Yusho incident in 1968,2 Japan became one of the firstnations to ban the production and use of PCBs in 1972;3 theUnited States did the same in 1976.4 Eventually, PCBs werebanned worldwide by the Stockholm Convention on PersistentOrganic Pollutants (POPs) on May 23, 2001.5 Unfortunately,the high stability of the compounds coupled with their wide-spread use prior to the ban has resulted in a situation where PCBcontamination still remains a global environmental problem.
In Japan, the present regulations for transformer oil ordainthat it must not have a PCB concentration of more than 0.5 mg/kg.This is a much stricter regulation than that currently imposedaround the world; for example, the United States has imposed amaximum PCB concentration criterion of 50 mg/kg.6 In Japan,even though PCBs have deliberately not been used since 1973,PCB-contaminated transformer oil with concentration levelsgreater than 0.5 mg/kg can still be found in service and instorage.7 In order to find and eliminate these contaminatedtransformers, the Japanese government has mandated that everytransformer in Japan be checked for PCB contamination whenit is removed from service; the government has further recom-mended that the transformers still in service also be tested.The methods that have generally been applied to the detectionof PCBs in transformer oil, which primarily include gas
chromatography with either mass spectrometry (GC/MS) orelectron capture detection (GC/ECD), are time-consuming andcostly, especially given the scale of the program. Many research-ers have proposed simple analysis methods.8�10 Quintana et al.8
developed a microfluidic lab-on-valve for solid-phase microex-traction. They determined the presence of PCBs in solid wasteleachates by using a lab-on-valve interfaced with GC/MS. Thisprocess was 25 times less expensive than the offline and onlinesolid-phase extraction counterparts. Criado et al.9 developed aPCB analysis using concentrated sulfuric acid treatment, dimethylsulfoxide (DMSO) partitioning, solid-phase extraction, andGC/AED (atomic emission detection). By using the abovepretreatment, they obtained good chromatograms. Takada et al.10
developed a PCB analysis using DMSO partitioning, solid-phaseextraction, and GC/MS. Their cleanup procedure of oil samplesis simple. The correlation between their method and the standardmethod was good when the PCB concentration in oil was morethan 1 mg/kg. Since these methods use gas chromatography, theoil samples of transformers or oil-filled cables must be deliveredand analyzed in laboratories or analytical centers. The storagevolume is limited because the delivered oil samples must bestrictly and safely stored in special rooms. Therefore, developinga rapid and low-cost method and an on-site analysis system forthe measurement of PCBs has been a matter of priority.
We previously reported the development of an immunoassayfor PCBs in oil and a suitable extraction and pretreatment
Received: June 21, 2011Accepted: September 5, 2011
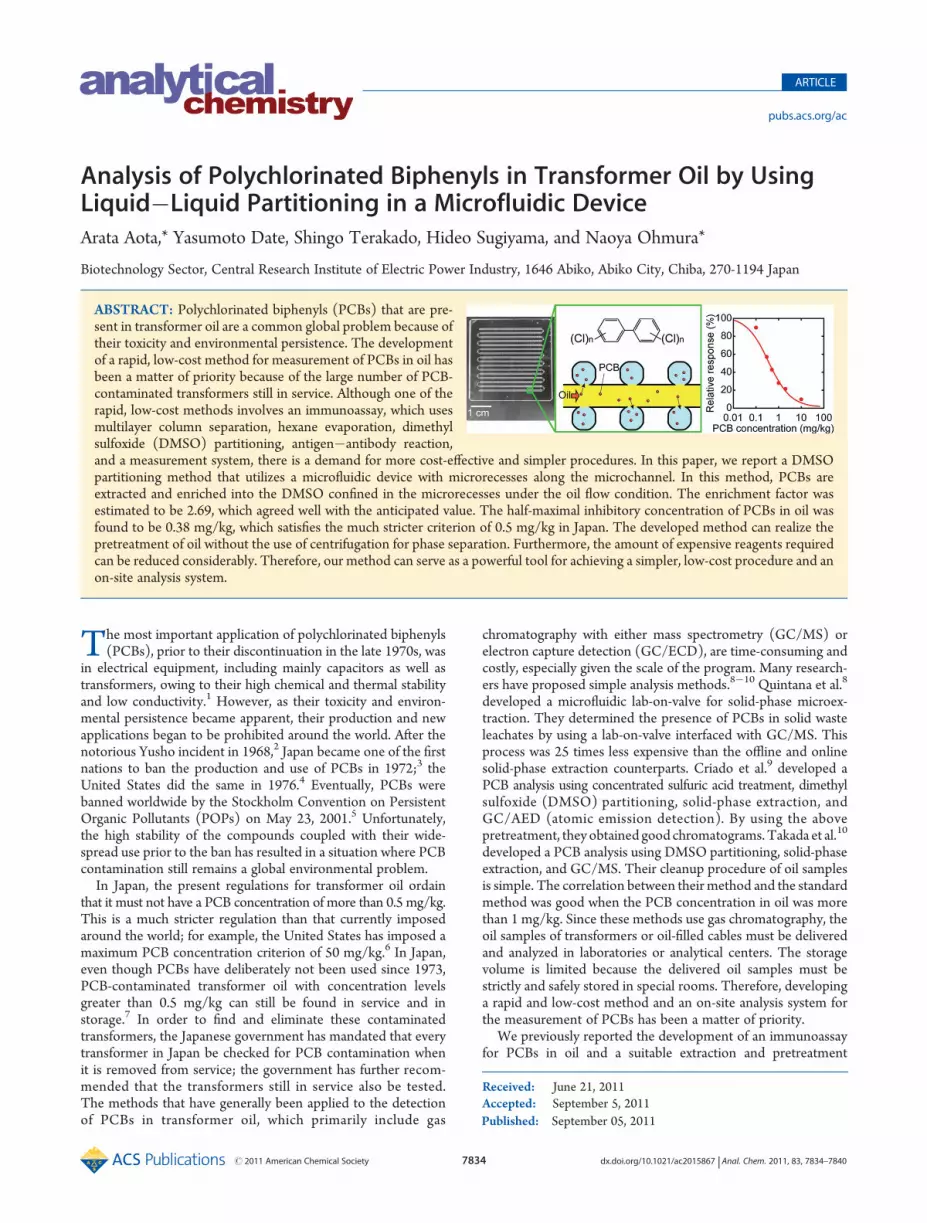
ABSTRACT: Polychlorinated biphenyls (PCBs) that are pre-sent in transformer oil are a common global problem because oftheir toxicity and environmental persistence. The developmentof a rapid, low-cost method for measurement of PCBs in oil hasbeen a matter of priority because of the large number of PCB-contaminated transformers still in service. Although one of therapid, low-cost methods involves an immunoassay, which usesmultilayer column separation, hexane evaporation, dimethylsulfoxide (DMSO) partitioning, antigen�antibody reaction,and a measurement system, there is a demand for more cost-effective and simpler procedures. In this paper, we report a DMSOpartitioning method that utilizes a microfluidic device with microrecesses along the microchannel. In this method, PCBs areextracted and enriched into the DMSO confined in the microrecesses under the oil flow condition. The enrichment factor wasestimated to be 2.69, which agreed well with the anticipated value. The half-maximal inhibitory concentration of PCBs in oil wasfound to be 0.38 mg/kg, which satisfies the much stricter criterion of 0.5 mg/kg in Japan. The developed method can realize thepretreatment of oil without the use of centrifugation for phase separation. Furthermore, the amount of expensive reagents requiredcan be reduced considerably. Therefore, our method can serve as a powerful tool for achieving a simpler, low-cost procedure and anon-site analysis system.
7835 dx.doi.org/10.1021/ac2015867 |Anal. Chem. 2011, 83, 7834–7840
Analytical Chemistry ARTICLE
process.11�16 A multilayer solid-phase extraction for the cleanupof PCBs in oil, a flow-based highly sensitive immunoassaymethod, and a simple hand-held readout instrument have allbeen developed. These systems have been approved by theJapaneseMinistry of the Environment and are now commerciallyavailable.17 The correlation between data from our method andfrom the standard method using high-resolution GC/high-resolution MS was found to be good.15 Furthermore, its applic-ability for screening real oil samples has been evaluated by use ofthe receiver operating characteristic plots for 500 oil samples.16
In the case where the maximum permissible concentration of thetotal PCBs was set as 0.5 mg/kg, the most suitable cutoffconcentration was calculated to be 0.4 mg/kg with false negativeand false positive rates of 0% and 7%, respectively. However, theapplication of the present system to an on-site analysis is difficultbecause oil pretreatment requires large evaporation equipment.A reduction of the evaporation volume will lead to a simplerevaporation process or even make it possible to eliminate thisprocess altogether. For this purpose, a suitable process for thepretreatment of a small volume of oil should be developed.
In recent years, there has been great interest in lab-on-a-chipor micro total analysis systems (μ-TAS), which are microfluidicdevices developed for miniaturizing chemical systems and inte-grating various chemical processes.18�20 These devices havemany advantages, including short analysis time; reduction ofsample, reagent, and waste volume; more effective reactionsowing to the large specific interfacial area and short diffusiondistance; and portability of the analysis systems. If the chemicalprocesses of the immunoassay for PCBs in oil are integrated on amicrochip, a portable PCB analysis system may be realized.
Microchemical processes can be designed by considering micro-unit operations, as proposed by Kitamori and co-workers.21,22 Thechemical processes related to the immunoassay for PCBs in oilconsist of solid-phase extraction, evaporation, liquid�liquid extrac-tion, mixing and reaction, surface reaction, and measurement. If thehighly efficient and simpleDMSOpartitioningmethod is realized fora small volume of oil, the amount of expensive reagent requiredcan be reduced, the instrument can be miniaturized, and the evap-oration processes can be simplified or omitted. Here, we focused onliquid�liquid extraction in microchips. Liquid�liquid extractionmethods in microchips have been previously investigated in manystudies.21,23�28 The methods employed in these studies mostlyutilize droplets23�25 or parallel multiphase microflows.21,26�28
These methods are effective in achieving rapid and highly efficientliquid�liquid extraction. The phase separation in these methodsdepends on the Laplace pressure induced by interfacial tensionbetween the two phases.24,25,29,30 However, the interfacial tensionbetween the insulating oil and the DMSO used for oil pretreatmentis low. Therefore, phase separation via the Laplace pressure is noteffective in this case. The other liquid�liquid extraction methoduses a confined extractant, which comes in contact with the samplesolution under the flow condition.31�33 This method confinesthe extractant through surface patterning31 or a microchannelstructure.32 The former depends on interfacial tension, and thelatter employs microrecesses.Microrecesses can be used for DMSOpartitioning. Fang and co-workers32,33 demonstrated the preconcen-tration of butylrhodamine B in the microrecesses by laser-inducedfluorescence and chemiluminescence detection. However, thismethod cannot be applied to immunoassay detection in themicrorecesses owing to the instability of the antibody in DMSO.
In this paper, we have reported DMSO partitioning, which isproposed for the cleanup of PCBs in insulating oil by use of a
microfluidic device. Fluid control in a fabricated microfluidicdevice was examined. Dependence of the efficiency of extractionand elution on the flow rates and dependence of the measurementsignals on the PCB concentration were investigated. The enrich-ment was estimated from the comparison between conventionaland microfluidics-based methods. Finally, the applicability of thedeveloped method for practical use has been discussed.
’EXPERIMENTAL SECTION
Chemicals. Commercial mixtures of PCBs (Kanechlor [KC]300, 400, 500, and 600, 1:1:1:1 mixture) were purchased from GLSciences Inc. (Tokyo, Japan). DMSO(catalog no. 346-03615)waspurchased from Dojindo Laboratories (Kumamoto, Japan). Bo-vine serum albumin (BSA) and fluorescein sodium salt werepurchased from Sigma Aldrich (Tokyo, Japan). Hexane waspurchased from Wako Pure Chemical Industries Ltd. (Osaka,Japan). Phosphate-buffered saline (PBS, consisting of 137 mMsodium chloride, 3 mM potassium chloride, 20 mM disodiumhydrogen phosphate, 1.5 mM potassium dihydrogen phosphate,and 1.5 mM sodium azide, pH 7.0) was prepared in-house. PBSBconsisted of PBS supplemented with 0.1% (w/w) BSA. PBSBDconsisted of PBSB supplemented with 2% (v/v)DMSO. PCB-freeinsulating oil for the electric transformers was purchased fromMatsumura Oil Co. Ltd. (Osaka, Japan). The pretreatmentcolumn kit was purchased from Sumika Chemical Analysis ServiceLtd. (Osaka, Japan). The positive photoresist (S-1818) waspurchased from Nippon Kayaku Co. Ltd. (Tokyo, Japan). Fluor-escent polystyrene microparticles (F8823) were purchased fromLife Technologies Japan Ltd. (Tokyo, Japan). Monoclonal anti-PCB antibody was purchased from Kyoto ElectricsManufacturingCo. Ltd. (Kyoto, Japan). Cy-5-labeled F(ab0)2 fragment goat anti-mouse IgG (heavy and light chains) was purchased from JacksonImmunoResearch Laboratories Inc. (West Grove, PA).Microchip. The microchip was fabricated by a photolitho-
graphic wet etching method. Tempax glass plates that were0.7 mm thick were used (top and bottom plates). The glass plateswere washed with piranha solution (3:1 v/v mixture of 95%sulfuric acid and 30% hydrogen peroxide), distilled water, and2-propanol. A Cr layer was sputtered on the glass plates. Apositive photoresist was spin-coated on the Cr layer and baked at95 �C. UV light was exposed through a photomask by using amask aligner to transfer the microchannel pattern onto thephotoresist. The photoresist was developed, and a pattern wasobtained. The photoresist was baked at 180 �C for 30 min. TheCr layer was etched with ammonium cerium nitrate solution. Thebare glass surface with the microchannel pattern was etched witha 47% hydrofluoric acid solution. After the etching, the remainingphotoresist was removed by the piranha solution and Cr wasremoved by the ammonium cerium nitrate solution. The micro-chip was washed with ethanol and hexane after each experimentaluse, and it was repeatedly used in the experiments.Operating Procedures. The experimental setup for the flow
control was similar to that described in the previous paper.34 Briefly,the solutions were introduced throughmicrosyringes and flow rateswere controlled viamicrosyringe pumps. Apoly(ether ether ketone)(PEEK) tube was used to connect the syringes to steel blocks withTeflon ferrules, which were pressed onto an inlet of the microchip.PCB Immunoassay. PCB immunoassays were performed on
the KinExA 3000 supplied by Sapidyne Instruments Inc. (Boise,ID). The theory and operation of this instrument have beenpreviously described by us11,35,36 and by others.37�39 Briefly,
7836 dx.doi.org/10.1021/ac2015867 |Anal. Chem. 2011, 83, 7834–7840
Analytical Chemistry ARTICLE
antigens were immobilized on N-hydroxysuccinimide (NHS) -activated Sepharose as described in our previous paper.40 Theantigen-coupled solid phase is captured in a small flow cell held atthe focus of a fluorometer. Samples, which are extracted oil in thepresent case, are mixed with a detection antibody and flowedthrough the solid phase. The detection antibody that binds theanalyte in the sample solution cannot bind to the antigen in thesolid phase and passes through the flow cell. A small fraction of theantibody that is not bound in the solution is captured on the solidphase. The captured detection antibody is labeled with a fluores-cently labeled anti-species antibody, and the binding signals aremeasured as fluorescent accumulation on the solid phase. A zeroPCB sample gives the highest response, and very high concentra-tions of PCB lead to total inhibition of the specific binding signal. Inour experiments, the concentration of the antibody prepared wasset as 250 pM and the measurement solutions were incubated for aminimum of 30 min at room temperature. The DMSO concentra-tion of the measurement solution prepared was set as 2% (v/v).Oil Pretreatment. The cleanup of PCBs was performed on a
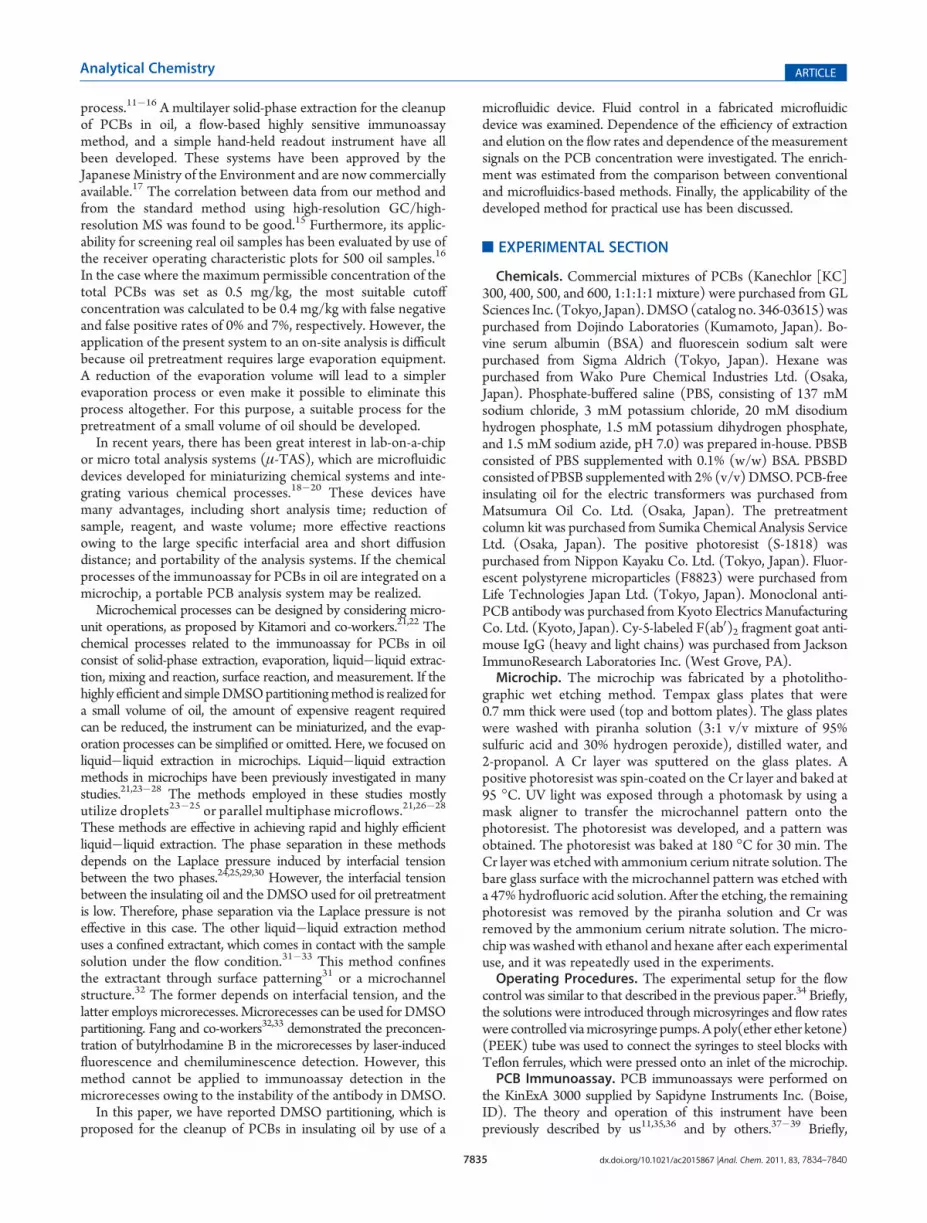
multilayer column supplied with the commercial kit developed byus. The procedure was based on our method described in a manualpublished by the Japanese Ministry of the Environment.17 In brief,the upper layer was 0.75 g of anhydrous sodium sulfate, the secondlayer was 2 g of oleum-impregnated silica gel, the third layer was0.75 g of anhydrous sodium sulfate, and the lower layer was 1.5 g ofaminopropyl silica gel, as shown in Figure 1. A quantity of 295μLofthe oil to be testedwas added to the column, and 3minwas allowedfor reaction between the oleum and the hydrocarbon chains in theoil. Next, 75 μL of hexane was added twice to the column to pro-mote infiltration of the oil in the upper layer or around the columnwall into the oleum-impregnated layer.Oneminutewas allowed forthe reaction. Then 10 mL of hexane was added to the column andall of the liquid that passed through the column was collected. Thehexanewas evaporated on a rotary evaporator with a hot water bathat 40 �C. The remaining liquid was used as experimental oilsamples for the microchip-based DMSO partitioning.
’RESULTS AND DISCUSSION
A schematic of the concept of the microchip-based DMSOpartitioning is shown in Figure 2. The microrecesses aligned
along the main microchannel are used for confinement of theDMSO used as extractant of the PCBs. After the microchannel isfilled with DMSO, the PCBs in the oil are extracted into theDMSO by passing the PCB-contaminated oil through themicrochannel. The DMSO remains in the microrecesses underthe oil flow condition. The oil is removed by the air flow used forpreventing oil contamination of the samples. Finally, the PCBs inthe DMSO are flowed out by buffer elution. The obtainedsamples are measured by immunoassays.
We have considered the enrichment factor in our concept.When conventional batch DMSO partitioning for the samevolume of DMSO and oil is performed, the PCB concentrationafter DMSO partitioning can be expressed as
K ¼ CO
CD¼ COi � CD
CDð1Þ
where K is the apparent partition coefficient of the total PCBcongeners andCO,CD, andCOi are the PCB concentrations in oiland DMSO after batch extraction and the initial PCB concentra-tion in oil, respectively. In our concept, the DMSO in themicrorecesses continuously comes in contact with high PCBconcentration oil because fresh oil continuously flows throughthe main microchannel. Here, the PCB concentration in DMSOis considered when the batch extraction is repeated. Therefore,the PCB concentration in DMSO in our concept can be
Figure 1. Schematic of multilayer silica gel column used for cleanup ofPCBs in oil.
Figure 2. DMSO partitioning procedures performed by using the micro-chip. (A) Themicrochip has a number of microrecesses aligned along bothsides of the main microchannel. (B) First, the microchannels were filledwith DMSO. (C) Second, the PCB-contaminated oil was introduced intothe main microchannel. The oil flowed only in the main microchannel.(D) Third, the oil was removed by introducing air flow. DMSO remainedin the microrecesses under the air flow. (E) Finally, the PCBs flowed outby introducing the buffer solution and eluting the DMSO.
7837 dx.doi.org/10.1021/ac2015867 |Anal. Chem. 2011, 83, 7834–7840
Analytical Chemistry ARTICLE
expressed as
CDmicro ¼ COi
Kð2Þ
whereCDmicro is the PCB concentration inDMSOaftermicrofluidicextraction. By use of eqs 1 and 2, the enrichment factor between thebatch extraction and microflow extraction can be expressed as
CDmicro
CD¼ K þ 1
Kð3Þ
In order to estimate the enrichment factor, K was estimated bymeasuring the PCBs. PCB-contaminated oil was prepared by addingthe commercial mixture of PCBs to pure insulating oil pretreatedby the multilayer column and evaporation. A quantity of 300 μL of2.22( 0.17 mg/L PCB oil was extracted to 300 μL of pure DMSOby vortex mixing for 1 min. The mixture was centrifuged at10 000 rpm for 1 min. A quantity of 170 μL of the lower DMSOphase was collected without the oil. The PCBs in the collectedDMSO were measured by use of the KinExA 3000. The PCB con-centration in the collected DMSO was estimated to be 1.37 (0.13mg/L;measurement errors corresponded to the standard devi-ation of triplicate measurements. Therefore, K and the enrichmentfactor were calculated to be 0.62( 0.12 and 2.61( 0.51, respectively.
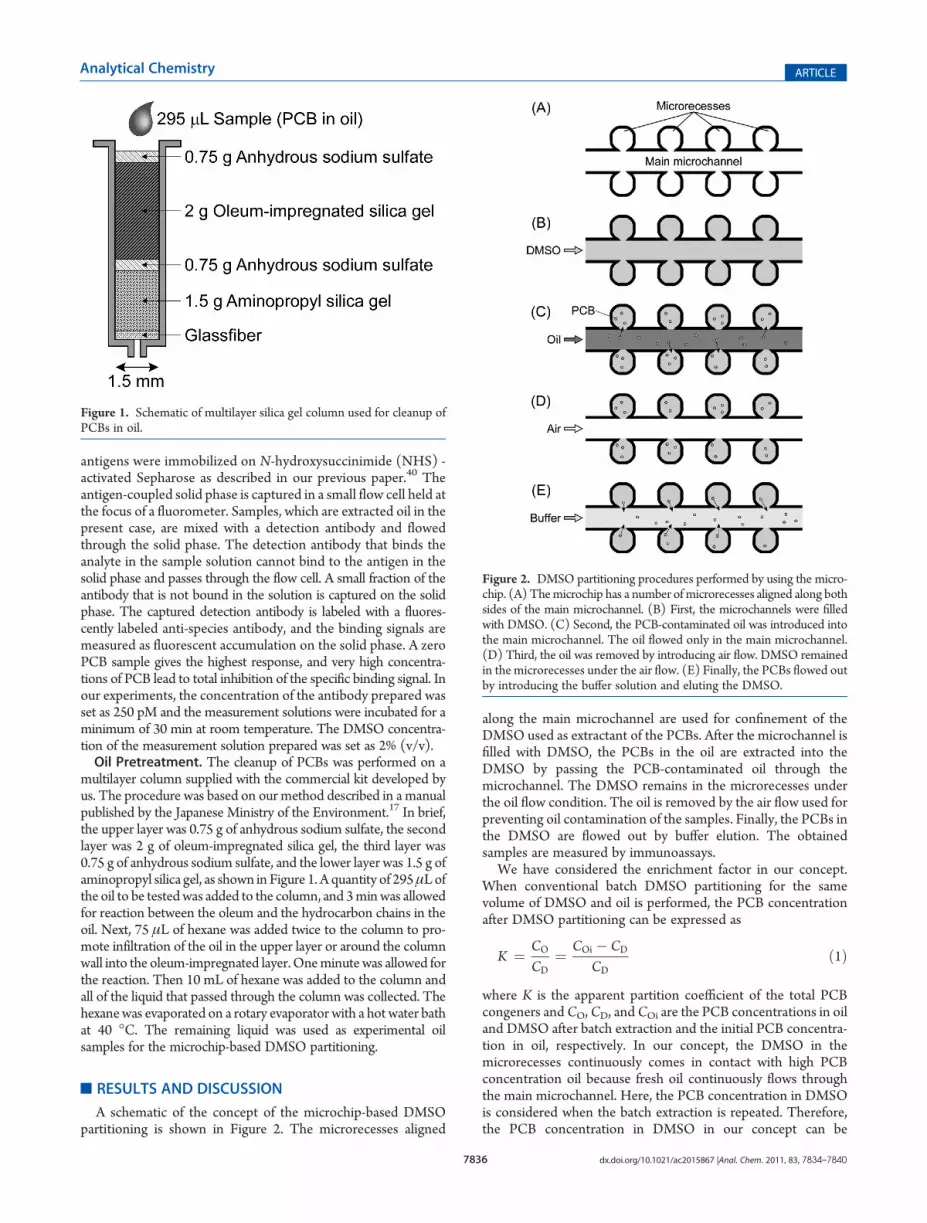
Figure 3 shows the photograph and scanning electron micro-scopy (SEM) image of themicrochip fabricated for this study. Themain microchannel had a width of 250 μm, depth of 50 μm, andlength of 610mm. Each of the 1472microrecesses had a circle-likestructure, a width of 250 μm, and a depth of 50 μm. Since thevolume of each of the microrecesses was estimated to be 2.3 nL,the total volume of the microrecesses was estimated to be 3.5 μL.
Flow control in the microchip was examined by dissolvingfluorescein sodium salt in DMSO. First, the fluorescent DMSOwas introduced in the microchip. Since fluorescence was observedin all themicrorecesses, as shown in Figure 4A, it is evident that themicrorecesses would be filled only with DMSO without any airbubbles. Second, oil was flowed in the main microchannel.Although small oil droplets intruded into a few microrecesses,the oil flowed only in the main microchannel as shown inFigure 4B. Third, the oil in the main microchannel could bepurged by introducing air, as shown in Figure 4C. Finally, PBSBwas introduced in themainmicrochannel. The fluorescentDMSOflowed out toward the outlet of the microchannel by dissolving inPBSB, as shown in Figure 4D. The oil droplets remained in the
microrecesses after the elution process. Therefore, the measure-ment sample solution did not contain oil, which interferes with theimmunoassay. The applicability of the fabricated microchip forDMSO partitioning was verified by the experiments.
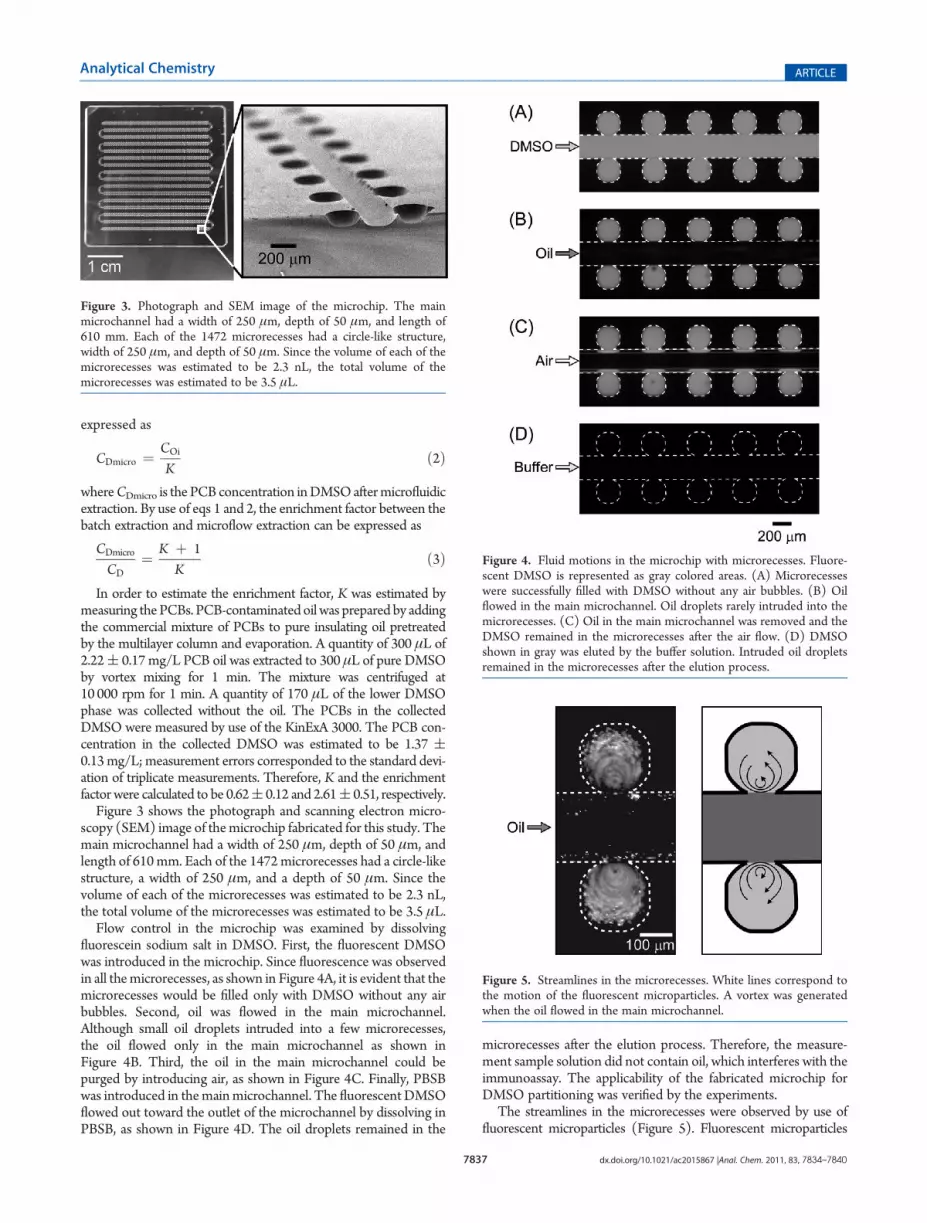
The streamlines in the microrecesses were observed by use offluorescent microparticles (Figure 5). Fluorescent microparticles
Figure 3. Photograph and SEM image of the microchip. The mainmicrochannel had a width of 250 μm, depth of 50 μm, and length of610 mm. Each of the 1472 microrecesses had a circle-like structure,width of 250 μm, and depth of 50 μm. Since the volume of each of themicrorecesses was estimated to be 2.3 nL, the total volume of themicrorecesses was estimated to be 3.5 μL.
Figure 4. Fluid motions in the microchip with microrecesses. Fluore-scent DMSO is represented as gray colored areas. (A) Microrecesseswere successfully filled with DMSO without any air bubbles. (B) Oilflowed in the main microchannel. Oil droplets rarely intruded into themicrorecesses. (C) Oil in the main microchannel was removed and theDMSO remained in the microrecesses after the air flow. (D) DMSOshown in gray was eluted by the buffer solution. Intruded oil dropletsremained in the microrecesses after the elution process.
Figure 5. Streamlines in the microrecesses. White lines correspond tothe motion of the fluorescent microparticles. A vortex was generatedwhen the oil flowed in the main microchannel.
7838 dx.doi.org/10.1021/ac2015867 |Anal. Chem. 2011, 83, 7834–7840
Analytical Chemistry ARTICLE
were seeded into theDMSOat a concentration of 0.02% by volume,and they dispersed uniformly. After introduction ofDMSOcontain-ing the microparticles in the microrecesses, the oil flowed at a flowrate of 10 μL/min. A vortex was observed in the microrecesses. Itwas caused by shear force at the interface between DMSO and oil.This vortex flow enhances molecular transport process.
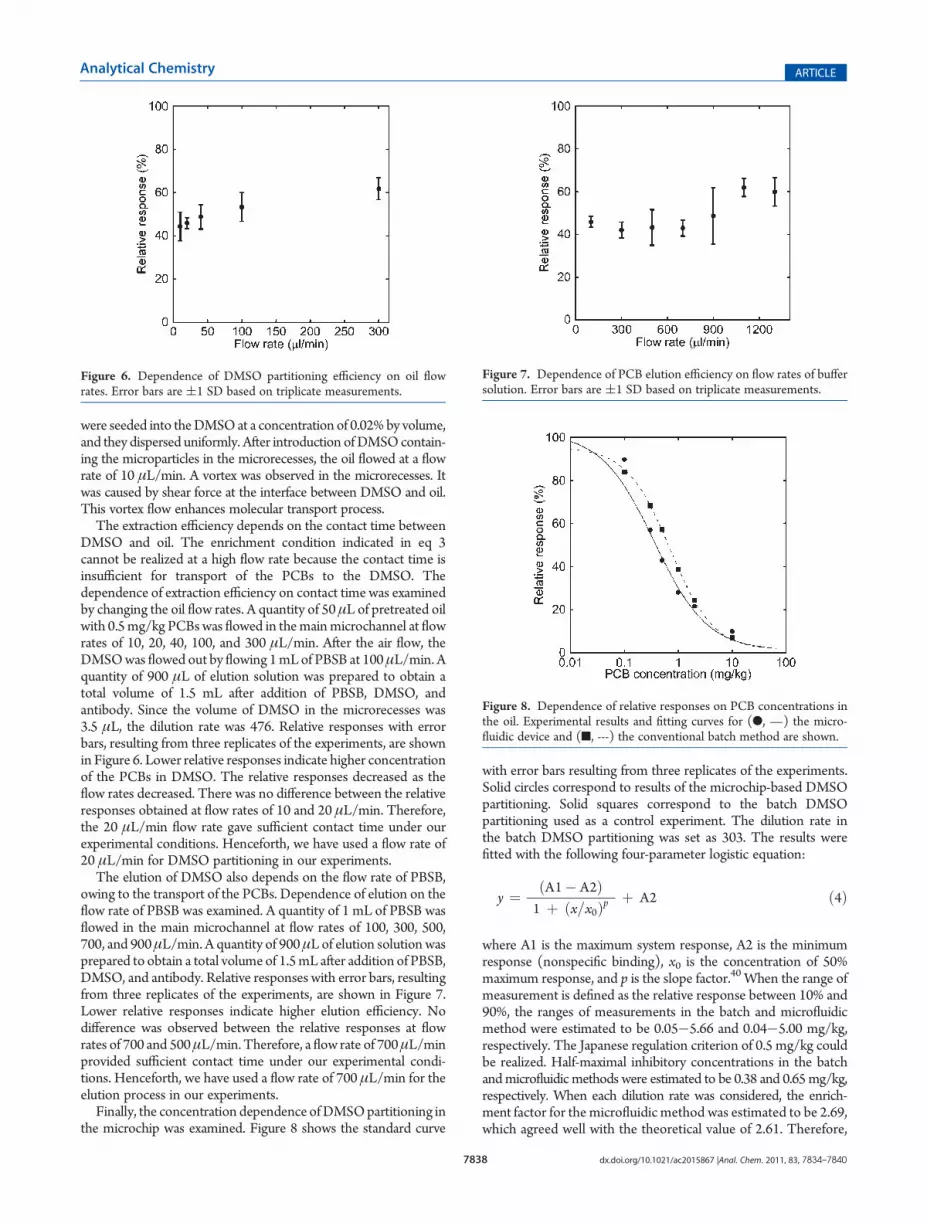
The extraction efficiency depends on the contact time betweenDMSO and oil. The enrichment condition indicated in eq 3cannot be realized at a high flow rate because the contact time isinsufficient for transport of the PCBs to the DMSO. Thedependence of extraction efficiency on contact time was examinedby changing the oil flow rates. A quantity of 50 μL of pretreated oilwith 0.5mg/kg PCBswas flowed in themainmicrochannel at flowrates of 10, 20, 40, 100, and 300 μL/min. After the air flow, theDMSOwas flowed out by flowing 1mLof PBSB at 100μL/min. Aquantity of 900 μL of elution solution was prepared to obtain atotal volume of 1.5 mL after addition of PBSB, DMSO, andantibody. Since the volume of DMSO in the microrecesses was3.5 μL, the dilution rate was 476. Relative responses with errorbars, resulting from three replicates of the experiments, are shownin Figure 6. Lower relative responses indicate higher concentrationof the PCBs in DMSO. The relative responses decreased as theflow rates decreased. There was no difference between the relativeresponses obtained at flow rates of 10 and 20 μL/min. Therefore,the 20 μL/min flow rate gave sufficient contact time under ourexperimental conditions. Henceforth, we have used a flow rate of20 μL/min for DMSO partitioning in our experiments.
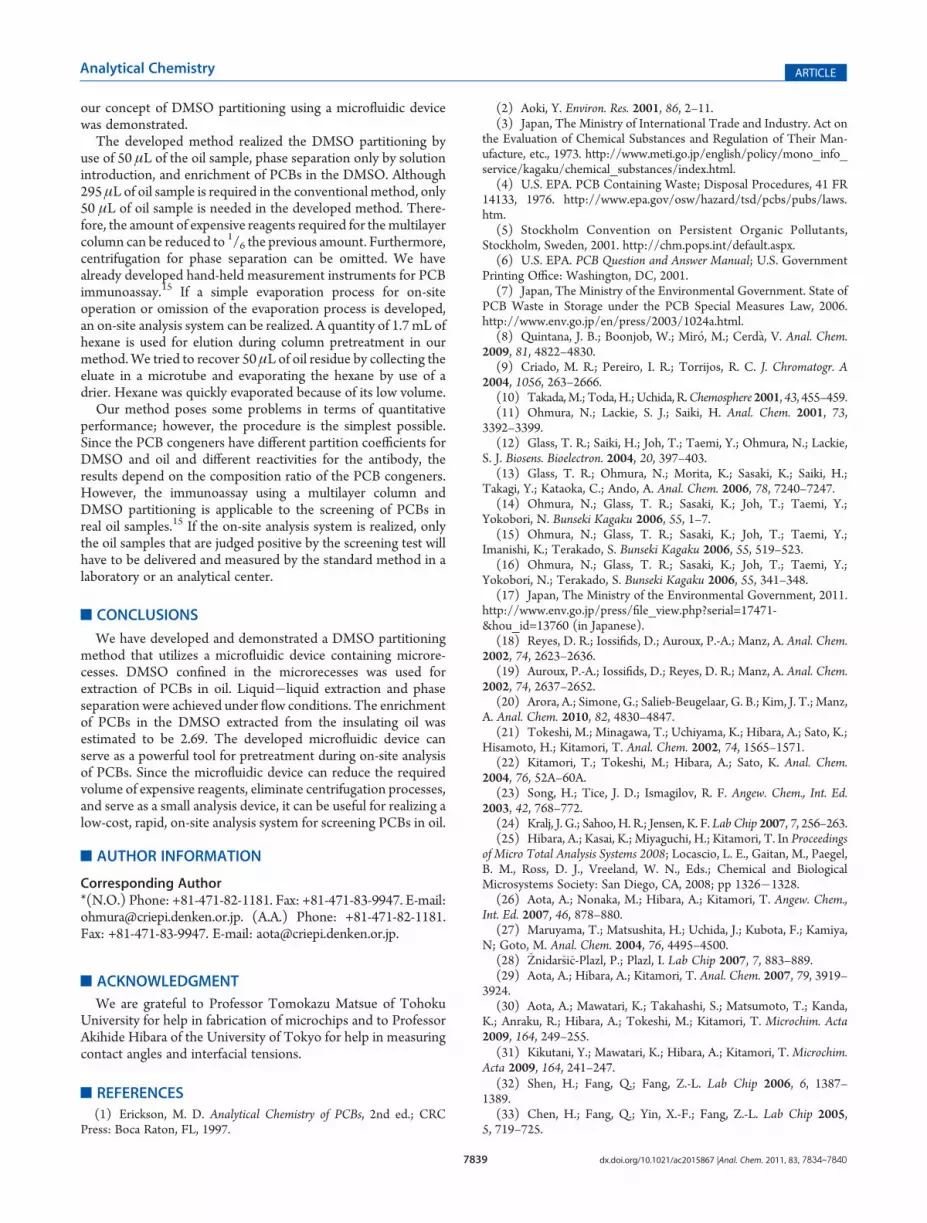
The elution of DMSO also depends on the flow rate of PBSB,owing to the transport of the PCBs. Dependence of elution on theflow rate of PBSB was examined. A quantity of 1 mL of PBSB wasflowed in the main microchannel at flow rates of 100, 300, 500,700, and 900μL/min. A quantity of 900μL of elution solution wasprepared to obtain a total volume of 1.5mL after addition of PBSB,DMSO, and antibody. Relative responses with error bars, resultingfrom three replicates of the experiments, are shown in Figure 7.Lower relative responses indicate higher elution efficiency. Nodifference was observed between the relative responses at flowrates of 700 and 500μL/min. Therefore, a flow rate of 700μL/minprovided sufficient contact time under our experimental condi-tions. Henceforth, we have used a flow rate of 700 μL/min for theelution process in our experiments.
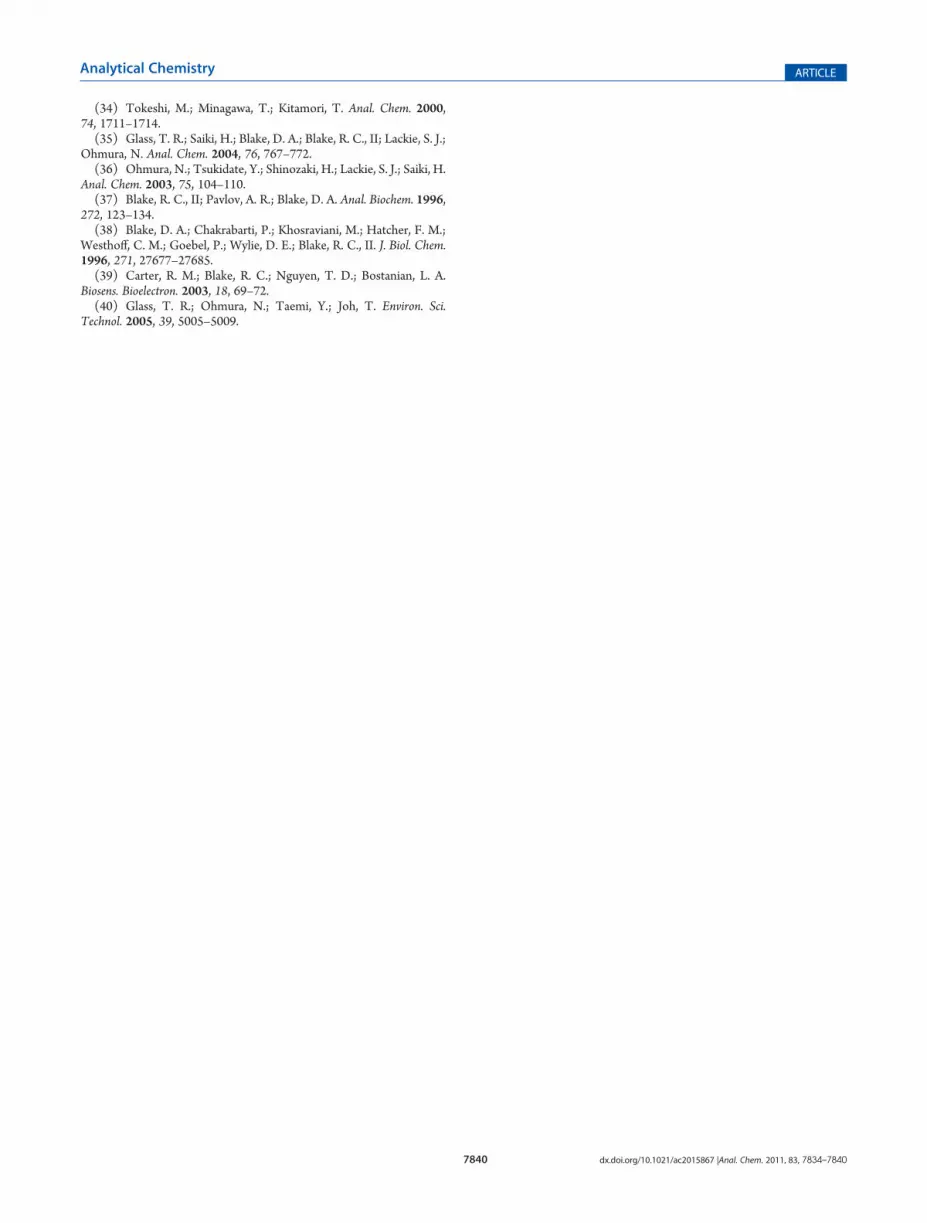
Finally, the concentration dependence ofDMSOpartitioning inthe microchip was examined. Figure 8 shows the standard curve
with error bars resulting from three replicates of the experiments.Solid circles correspond to results of the microchip-based DMSOpartitioning. Solid squares correspond to the batch DMSOpartitioning used as a control experiment. The dilution rate inthe batch DMSO partitioning was set as 303. The results werefitted with the following four-parameter logistic equation:
y ¼ ðA1� A2Þ1 þ x=x0ð Þp� � þ A2 ð4Þ
where A1 is the maximum system response, A2 is the minimumresponse (nonspecific binding), x0 is the concentration of 50%maximum response, and p is the slope factor.40 When the range ofmeasurement is defined as the relative response between 10% and90%, the ranges of measurements in the batch and microfluidicmethod were estimated to be 0.05�5.66 and 0.04�5.00 mg/kg,respectively. The Japanese regulation criterion of 0.5 mg/kg couldbe realized. Half-maximal inhibitory concentrations in the batchandmicrofluidic methods were estimated to be 0.38 and 0.65mg/kg,respectively. When each dilution rate was considered, the enrich-ment factor for the microfluidic method was estimated to be 2.69,which agreed well with the theoretical value of 2.61. Therefore,
Figure 6. Dependence of DMSO partitioning efficiency on oil flowrates. Error bars are (1 SD based on triplicate measurements.
Figure 7. Dependence of PCB elution efficiency on flow rates of buffersolution. Error bars are (1 SD based on triplicate measurements.
Figure 8. Dependence of relative responses on PCB concentrations inthe oil. Experimental results and fitting curves for (b, —) the micro-fluidic device and (9, ---) the conventional batch method are shown.
7839 dx.doi.org/10.1021/ac2015867 |Anal. Chem. 2011, 83, 7834–7840
Analytical Chemistry ARTICLE
our concept of DMSO partitioning using a microfluidic devicewas demonstrated.
The developed method realized the DMSO partitioning byuse of 50 μL of the oil sample, phase separation only by solutionintroduction, and enrichment of PCBs in the DMSO. Although295 μL of oil sample is required in the conventional method, only50 μL of oil sample is needed in the developed method. There-fore, the amount of expensive reagents required for themultilayercolumn can be reduced to 1/6 the previous amount. Furthermore,centrifugation for phase separation can be omitted. We havealready developed hand-held measurement instruments for PCBimmunoassay.15 If a simple evaporation process for on-siteoperation or omission of the evaporation process is developed,an on-site analysis system can be realized. A quantity of 1.7 mL ofhexane is used for elution during column pretreatment in ourmethod.We tried to recover 50 μL of oil residue by collecting theeluate in a microtube and evaporating the hexane by use of adrier. Hexane was quickly evaporated because of its low volume.
Our method poses some problems in terms of quantitativeperformance; however, the procedure is the simplest possible.Since the PCB congeners have different partition coefficients forDMSO and oil and different reactivities for the antibody, theresults depend on the composition ratio of the PCB congeners.However, the immunoassay using a multilayer column andDMSO partitioning is applicable to the screening of PCBs inreal oil samples.15 If the on-site analysis system is realized, onlythe oil samples that are judged positive by the screening test willhave to be delivered and measured by the standard method in alaboratory or an analytical center.
’CONCLUSIONS
We have developed and demonstrated a DMSO partitioningmethod that utilizes a microfluidic device containing microre-cesses. DMSO confined in the microrecesses was used forextraction of PCBs in oil. Liquid�liquid extraction and phaseseparation were achieved under flow conditions. The enrichmentof PCBs in the DMSO extracted from the insulating oil wasestimated to be 2.69. The developed microfluidic device canserve as a powerful tool for pretreatment during on-site analysisof PCBs. Since the microfluidic device can reduce the requiredvolume of expensive reagents, eliminate centrifugation processes,and serve as a small analysis device, it can be useful for realizing alow-cost, rapid, on-site analysis system for screening PCBs in oil.
’AUTHOR INFORMATION
Corresponding Author*(N.O.) Phone: +81-471-82-1181. Fax: +81-471-83-9947. E-mail:[email protected]. (A.A.) Phone: +81-471-82-1181.Fax: +81-471-83-9947. E-mail: [email protected].
’ACKNOWLEDGMENT
We are grateful to Professor Tomokazu Matsue of TohokuUniversity for help in fabrication of microchips and to ProfessorAkihide Hibara of the University of Tokyo for help in measuringcontact angles and interfacial tensions.
’REFERENCES
(1) Erickson, M. D. Analytical Chemistry of PCBs, 2nd ed.; CRCPress: Boca Raton, FL, 1997.
(2) Aoki, Y. Environ. Res. 2001, 86, 2–11.(3) Japan, The Ministry of International Trade and Industry. Act on
the Evaluation of Chemical Substances and Regulation of Their Man-ufacture, etc., 1973. http://www.meti.go.jp/english/policy/mono_info_service/kagaku/chemical_substances/index.html.
(4) U.S. EPA. PCB Containing Waste; Disposal Procedures, 41 FR14133, 1976. http://www.epa.gov/osw/hazard/tsd/pcbs/pubs/laws.htm.
(5) Stockholm Convention on Persistent Organic Pollutants,Stockholm, Sweden, 2001. http://chm.pops.int/default.aspx.
(6) U.S. EPA. PCB Question and Answer Manual; U.S. GovernmentPrinting Office: Washington, DC, 2001.
(7) Japan, The Ministry of the Environmental Government. State ofPCB Waste in Storage under the PCB Special Measures Law, 2006.http://www.env.go.jp/en/press/2003/1024a.html.
(8) Quintana, J. B.; Boonjob, W.; Mir�o, M.; Cerd�a, V. Anal. Chem.2009, 81, 4822–4830.
(9) Criado, M. R.; Pereiro, I. R.; Torrijos, R. C. J. Chromatogr. A2004, 1056, 263–2666.
(10) Takada,M.; Toda,H.;Uchida, R.Chemosphere 2001, 43, 455–459.(11) Ohmura, N.; Lackie, S. J.; Saiki, H. Anal. Chem. 2001, 73,
3392–3399.(12) Glass, T. R.; Saiki, H.; Joh, T.; Taemi, Y.; Ohmura, N.; Lackie,
S. J. Biosens. Bioelectron. 2004, 20, 397–403.(13) Glass, T. R.; Ohmura, N.; Morita, K.; Sasaki, K.; Saiki, H.;
Takagi, Y.; Kataoka, C.; Ando, A. Anal. Chem. 2006, 78, 7240–7247.(14) Ohmura, N.; Glass, T. R.; Sasaki, K.; Joh, T.; Taemi, Y.;
Yokobori, N. Bunseki Kagaku 2006, 55, 1–7.(15) Ohmura, N.; Glass, T. R.; Sasaki, K.; Joh, T.; Taemi, Y.;
Imanishi, K.; Terakado, S. Bunseki Kagaku 2006, 55, 519–523.(16) Ohmura, N.; Glass, T. R.; Sasaki, K.; Joh, T.; Taemi, Y.;
Yokobori, N.; Terakado, S. Bunseki Kagaku 2006, 55, 341–348.(17) Japan, The Ministry of the Environmental Government, 2011.
http://www.env.go.jp/press/file_view.php?serial=17471-&hou_id=13760 (in Japanese).
(18) Reyes, D. R.; Iossifids, D.; Auroux, P.-A.; Manz, A. Anal. Chem.2002, 74, 2623–2636.
(19) Auroux, P.-A.; Iossifids, D.; Reyes, D. R.; Manz, A. Anal. Chem.2002, 74, 2637–2652.
(20) Arora, A.; Simone, G.; Salieb-Beugelaar, G. B.; Kim, J. T.; Manz,A. Anal. Chem. 2010, 82, 4830–4847.
(21) Tokeshi, M.; Minagawa, T.; Uchiyama, K.; Hibara, A.; Sato, K.;Hisamoto, H.; Kitamori, T. Anal. Chem. 2002, 74, 1565–1571.
(22) Kitamori, T.; Tokeshi, M.; Hibara, A.; Sato, K. Anal. Chem.2004, 76, 52A–60A.
(23) Song, H.; Tice, J. D.; Ismagilov, R. F. Angew. Chem., Int. Ed.2003, 42, 768–772.
(24) Kralj, J. G.; Sahoo, H. R.; Jensen, K. F. Lab Chip 2007, 7, 256–263.(25) Hibara, A.; Kasai, K.; Miyaguchi, H.; Kitamori, T. In Proceedings
of Micro Total Analysis Systems 2008; Locascio, L. E., Gaitan, M., Paegel,B. M., Ross, D. J., Vreeland, W. N., Eds.; Chemical and BiologicalMicrosystems Society: San Diego, CA, 2008; pp 1326�1328.
(26) Aota, A.; Nonaka, M.; Hibara, A.; Kitamori, T. Angew. Chem.,Int. Ed. 2007, 46, 878–880.
(27) Maruyama, T.; Matsushita, H.; Uchida, J.; Kubota, F.; Kamiya,N; Goto, M. Anal. Chem. 2004, 76, 4495–4500.
(28) �Znidar�si�c-Plazl, P.; Plazl, I. Lab Chip 2007, 7, 883–889.(29) Aota, A.; Hibara, A.; Kitamori, T. Anal. Chem. 2007, 79, 3919–
3924.(30) Aota, A.; Mawatari, K.; Takahashi, S.; Matsumoto, T.; Kanda,
K.; Anraku, R.; Hibara, A.; Tokeshi, M.; Kitamori, T. Microchim. Acta2009, 164, 249–255.
(31) Kikutani, Y.; Mawatari, K.; Hibara, A.; Kitamori, T.Microchim.Acta 2009, 164, 241–247.
(32) Shen, H.; Fang, Q.; Fang, Z.-L. Lab Chip 2006, 6, 1387–1389.
(33) Chen, H.; Fang, Q.; Yin, X.-F.; Fang, Z.-L. Lab Chip 2005,5, 719–725.
7840 dx.doi.org/10.1021/ac2015867 |Anal. Chem. 2011, 83, 7834–7840
Analytical Chemistry ARTICLE
(34) Tokeshi, M.; Minagawa, T.; Kitamori, T. Anal. Chem. 2000,74, 1711–1714.(35) Glass, T. R.; Saiki, H.; Blake, D. A.; Blake, R. C., II; Lackie, S. J.;
Ohmura, N. Anal. Chem. 2004, 76, 767–772.(36) Ohmura, N.; Tsukidate, Y.; Shinozaki, H.; Lackie, S. J.; Saiki, H.
Anal. Chem. 2003, 75, 104–110.(37) Blake, R. C., II; Pavlov, A. R.; Blake, D. A. Anal. Biochem. 1996,
272, 123–134.(38) Blake, D. A.; Chakrabarti, P.; Khosraviani, M.; Hatcher, F. M.;
Westhoff, C. M.; Goebel, P.; Wylie, D. E.; Blake, R. C., II. J. Biol. Chem.1996, 271, 27677–27685.(39) Carter, R. M.; Blake, R. C.; Nguyen, T. D.; Bostanian, L. A.
Biosens. Bioelectron. 2003, 18, 69–72.(40) Glass, T. R.; Ohmura, N.; Taemi, Y.; Joh, T. Environ. Sci.
Technol. 2005, 39, 5005–5009.