seasonal and temporal trends in polychlorinated biphenyls and organochlorine pesticides in east...
TRANSCRIPT

Science of the Total Environment 331(2004) 107–124
0048-9697/04/$ - see front matter� 2004 Elsevier B.V. All rights reserved.doi:10.1016/j.scitotenv.2004.03.025
Seasonal and temporal trends in polychlorinated biphenylsand organochlorine pesticides in East Greenland polar bears
(Ursus maritimus), 1990–2001
R. Dietz *, F.F. Riget , C. Sonne , R. Letcher , E.W. Born , D.C.G. Muira, a a b c d
Department of Arctic Environment, National Environmental Research Institute, Frederiksborgvej 399, DK-4000 Roskilde,a
DenmarkGreat Lakes Institute for Environmental Research, University of Windsor, Windsor, ON, Canadab
Greenland Institute of Natural Resources, P.O. Box 570, DK-3900 Nuuk, Greenland, Denmarkc
National Water Research Institute, Environment Canada, Burlington, ON, Canadad
Accepted 1 March 2004
Abstract
Persistent organochlorine(OC) contaminants(PCBs, DDTs, chlordanes(CHLs), dieldrin, hexachlorocyclohexanes(HCHs), chlorobenzenes(CBzs)) were determined in adipose tissue of 92 polar bears(Ursus maritimus) sampledbetween 1999 and 2001 in central East Greenland(698009N to 748009N). OC data were presented from subadults(S:females:=5 years and males:=6 years), adult females(F: =5 years) and adult males(M: =6 years). Summedchlorobiphenyl(SCBs) concentrations(41 congeners including co-eluters), SCHLs andSDDTs were the dominantclasses of OCs.SCBs concentrations were found to be 6470, 8240 and 9100 ngyg lipid weight (lw) i subadults,adult females and adult males, respectively. The corresponding figures were: 2010(S), 2220(F) and 1710(M) ngyg lw for SCHLs and 462(S), 462 (F) and 559(M) ngyg lw for SDDTs. The dominant CB congeners were CB153(32.3%), CB180 (21.4%), CB170 (12.2%) and CB138(11.0%). The metabolitep,p9-DDE (88.2%) dominated theSDDTs, while oxychlordane was the dominant(57.1%) CHL-related compound. Concentrations ofSCBs, SCBzs,SDDTs, mirex and dieldrin were highest in adult males, whereas concentrations ofSHCHs were lower than in adultfemales but not than those in subadults. Adult females had the lowest concentrations ofSCBzs, mirex and dieldrin.Concentrations ofSCHLs were lowest in adult males, intermediate in subadults and highest in adult females.SCB,SHCH andSCHL concentrations showed high seasonal variability in adult females but remained relatively constantin adult males and subadults. In general, the OC levels in females appeared to be highest in March and lowest inJanuary or September. Concentrations ofSCBzs and dieldrin showed seasonal variability in all three groups, with amaximum in March in adult females.SCBz concentrations in adult males and subadults of both sexes peaked inApril–July, and dieldrin concentrations peaked in April–July in subadults, but not until August in adult males.SDDTconcentrations increased from January to a maximum in April–July for subadults and in August for adults. Temporaltrends within the last decade were examined by comparing the present data to the concentrations reported in samplesfrom 1990 from the same region.SCB, p,p9-DDE andSHCH concentrations in 1999–2001 were 22.1%, 66.3% and39.3% lower than the 1990 concentrations, respectively. in contrast,SCHL and dieldrin concentrations showeddifferences amongst sex and age groups in the temporal trends, where present concentrations are between 24.4% to
*Corresponding author. Tel.:q45-46-30-19-38; fax:q45-46-30-19-14.E-mail address: [email protected](R. Dietz).
108 R. Dietz et al. / Science of the Total Environment 331 (2004) 107–124
69.3% and 27.0% to 69.0% lower, respectively, relative to the 1990 levels. However, power analysis suggested thatfirm conclusions could not be drawn regarding the general time trend based on these two sampling periods. Therange of half-lives of the various OC classes were estimated to lie between 4.5 and 20.6 years depending on the ageand sex groups considered.� 2004 Elsevier B.V. All rights reserved.
Keywords: Polar bear;Ursus maritimus; East Greenland; Organochlorines; Dichlorodiphenyltrichloroethanes; PCBs; Chlordanes;Dieldrin; Hexachlorocyclohexane; Chlorobenzenes; Seasonal and temporal variation
1. Introduction
Since the 1950s, large quantities of organo-chlorine (OC) contaminants such as chlorinatedpesticides (dichlorodiphenyltrichloroethanes(DDTs), chlordanes(CHLs), hexachlorocyclohex-anes (HCHs), toxaphenes), industrial products(PCBs) and by-products (hexachlorobenzene(HCB), chlorinated dioxins and furans) have beenreleased into the atmosphere in the Northern Hem-isphere. The persistence and lipophility of theseOCs has resulted in their accumulation in animalsin the Arctic marine environment following long-range atmospheric transport from their areas of usein the mid-latitudes of Europe, Asia and NorthAmerica. The polar bear is one of the mostexposed species of the Arctic biota and, in avariety of Arctic marine biota, the highest OCconcentrations have generally been found in theEast Greenland, Svalbard and Kara Sea areas(deMarch et al., 1998; de Wit et al., 2004).
OCs concentrate through Arctic marine food-webs, and are stored in the adipose tissue due totheir high lipophilicity and persistence. Tissues ofpolar bears(Ursus maritimus) contain some of thehighest OC levels in the Arctic and the ArcticMonitoring and Assessment Programme(AMAP)has, therefore recommended that special attentionbe paid to this species(de March et al., 1998).Polar bears are reliant on a high fat(lipid) dietderived from their primary prey, ringed seal(Pho-ca hispida), and to a lesser extent from beardedseals(Erignathus barbatus) (Stirling and Archi-bald, 1977; Smith, 1980). In particular, high levelsof OCs are found in polar bear and ringed sealsfrom populations in the eastern Atlantic Arctic(Norstrom et al., 1988, 1998; Norheim et al., 1992;Kleivane et al., 1994; Norstrom and Muir, 1994;
de March et al., 1998; Muir and Norstrom, 2000;Andersen et al., 2001; Kucklick et al., 2002).
OCs were first detected in polar bears in 1975,in fat samples of individuals taken from CornwallisIsland and southern Hudson Bay, Canada andwestern Greenland(Bowes and Jonkel, 1975;Clausen and Berg, 1976). Subsequently, OC resi-dues have been detected in polar bears from mostArctic areas(Norstrom et al., 1988, 1998; Norheimet al., 1992; Kleivane et al., 1994; Norstrom andMuir 1994; Letcher et al., 1995a,b, 1998; Muirand Norstrom 2000; Andersen et al., 2001; Kuck-lick et al., 2002). Overall, concentrations of chlo-robiphenyls (CBs) and chlordanes(and meta-bolites such as oxychlordanes) have been found tobe quite high, whilst DDT and HCH are relativelylow.
Concentrations of OCs in some individual polarbears from East Greenland and Svalbard weresimilar to those suspected to have led to a reduc-tion in the reproductive rates of seals in the BalticSea and endocrine disruptions(e.g. Bergman andOlsson 1985; Colborn et al., 1993; Feldman 1995;Bergman 1999; Damstra et al., 2002). Halogenatedorganic substances such as OCs and their meta-bolites have been linked to adverse health effectsin laboratory mammals, birds as well as wildlifethrough interactions with immunologic, reproduc-tive and endocrine systems, as well as modulationof subcellular enzyme systems and metabolism(Helle et al., 1976; Bergman and Olsson, 1985;Safe 1986; Safe, 1991, 1994; Tanabe et al., 1987;Bergman et al., 1992; Swart et al., 1994; Wiig etal., 1998; Bergman, 1999; O’Hara and O’Shea,2001).
Polar bears mate in March–May(Rosing-Asvidet al., 2002) but active gestation does not com-mence until September–October, when the preg-
109R. Dietz et al. / Science of the Total Environment 331 (2004) 107–124
nant female enters the hibernation den(Ramsayand Stirling, 1988; Wiig et al., 1992). Duringhibernation(October–March) the female is fasting(for up to about 6 months) and is drawing on herfat reserves(Lentfer, 1975). During this period,and until the cubs are born approximately 1 Janu-ary (Arnould and Ramsay, 1994), the OCs thathave been stored in the female’s peripheral tissue(primary fat) are released into the blood stream,which may adversely affect the foetuses in utero.The cubs also receive additional OCs via lactation-al transfer from their mother during suckling(Tak-agi et al., 1976; Tanabe et al., 1982; Koppe et al.,1992; Polischuk et al., 1995, 2002; Bernhoft et al.,1997). Polar bear milk has an average fat contentof approximately 33%(range: approx. 24 toapprox. 48%; Jenness et al., 1972), and, thereforea high OC load is transferred to the cub duringsuckling, which may continue for up to 2 years(Arnould and Ramsay, 1994; Oehme et al., 1995).Polar bears may also experience periods whenfood is scarce or unavailable and, during suchperiods, the proportion of adipose tissue may bereduced from 50 to 10% of the body mass(Pondet al., 1992; Atkinson and Ramsay, 1995). Hence,the OC load of an individual polar bear not onlyreflects the initial loads received in utero andduring infancy, but also the bears sex and age, andthe season of the year(Polischuk et al., 1995,2002; Bernhoft et al., 1997; Muir et al., 1999;O’Hara and O’Shea, 2001). The purpose of thepresent study was to determine the extent ofchange in OC concentrations in the fat of EastGreenland polar since 1990, and to investigatehow OC concentrations vary with age, sex andseason. Fat samples were obtained from 92 indi-vidual polar bears that were collected as part ofthe hunt by the Inuit in central East Greenlandduring the period 1999–2001. Fat samples wereanalysed for CBs, DDTs, chlordanes, dieldrin,hexachlorocyclohexanes(HCHs) and chloroben-zenes(CBz).
2. Materials and methods
2.1. Sampling
Fat samples from polar bears were collected bylocal subsistence hunters in the Ittoqqortoormiity
Scoresby Sound area in central East Greenlandbetween 698009N and 748009N in 1999–2001. Alltissue samples were taken as soon as possiblepostmortem and stored in separate polyethylene(PE)Whirlpak bags. All samples were kept at outdoortemperature(y5 to y20 8C) until transferred toa freezer(y10 toy20 8C). Samples were shippedfrozen from Scoresby Sound to Roskilde, wherethe portion of fat that had been in contact with thePE was trimmed off and the remaining part wastransferred to precleaned glass containers withcleaned aluminum foil in between the lid and theglass container. Further storage was aty20 8C.
2.2. Age determination
Individual ages were obtained by counting annu-al growth layer groups in the cementum of the I3
tooth after decalcification, thin sectioning(14mm)and staining with toluidine blue using the methoddescribed by, e.g. Hensel and Sorensen(1980) andDietz et al. (1991). To assure the quality of ourreadings of GLGs, I teeth from four polar bears3
of known age(5 to 32 years), that had lived inAalborg Zoo, Denmark, were included in our study.In addition, an intercomparison exercise was con-ducted using thin-sections(P ) from 23 polar bears1
that had previously been prepared and their agesestimated by staff of the Canadian Wildlife Service(CWS, Edmonton).
For four individuals for which teeth were notavailable, their age was estimated from the lengthof the baculum based on a Gompertz ‘baculumlength-on-age’ relationship established for 42 agedmale specimens from Scoresby Sound(data notshown). These four individuals with baculumlengths of 7.5, 11.1, 19.5 and 20.2 cm wereestimated to be 0(cub of the year), 1.2(yearling),and more than 10 years old(two animals),respectively.
2.3. Contaminant analysis
All solvents were of analytical grade or better.Chromatographic materials used for analysis areas follows: Florisil (magnesium silicate, F100–�
500, 60–100 mesh) and basic aluminum oxide(Brockman activity grade I, 60–325 mesh), pur-
110 R. Dietz et al. / Science of the Total Environment 331 (2004) 107–124
chased from Fisher Scientific Inc.(Ottawa, Ontar-io, Canada) and silica gel (Grade 62, 60–200mesh, 150 A), purchased from Aldrich Chemicals˚(Milwaukee, WI, USA). Deactivation of thesematerials was achieved with double-distilled,n-hexane washed H O. Bio-beads S-X3(200–4002
mesh) were purchased from Bio-Rad Laboratories(Hercules, CA, USA).
CB and OC standard mixtures were supplied bythe Canadian Wildlife Service(Hull, PQ). Thecompound 1,3,5-tribromobenzene(Accu-StandardInc., New Haven, CT) was used as the CByOCinternal standard. The method for extraction andclean up of polar bear adipose tissue for OCs andCB analysis has been described elsewhere(Nor-strom and Won, 1985; Letcher et al., 1995a,b,1998; Sandala et al., 2004). Briefly, at approxi-mately 0.5 g sample of polar bear fat was homo-genised with sodium sulfate(6:1 ratio by weight),added to an extraction column containingn-hex-ane:dichloromethane(DCM) (1:1), and spikedwith the 1,3,5-tribromobenzene internal standard.A 10% portion of the lipid extract volume wasused for gravimetric lipid determination. Theremaining extract was concentrated and subjectedto gel permeation chromatography(GPC) for lipidremoval. The contaminant-containing GPC fractionwas reduced in volume and subjected to chromat-ographic clean-up with Florisil (8.0 g, 1.2%�
deactivated, by weight). Three fractions were col-lected, i.e. containing CBs(CB�1), most of theorganochlorines(OC �1), and OC�2 containingheptachlor epoxide and dieldrin. Each fraction wasconcentrated to 1 ml for the analysis by gaschromatography with micro electron capture detec-tion (GC-mECD). GC-mECD was performed onan Agilent 6890 instrument equipped with a Ni63
ECD detector and Agilent 7673 automated injectorusing a fused silica DB-5 GC columnw(5% phen-yl) methylpolysiloxane(J&W Scientific Inc., Fol-som, CA, 30 m=250 mm i.d., 0.25 mm filmthickness). Further details are described in Sandalaet al. (2004, this issue). Throughout the clean-upprocedure, no contaminant-containing fraction waspermitted to go to dryness.
An external standard quantification approachwas used for quantification of CBs and OCs basedon the peak area of the ECD response.SCB is the
sum of concentrations of the 41 individual or co-eluting congeners(in order of elution on a DB-5GC column): CB congeners numbers 31y28, 52,49, 44, 42, 64y71, 74, 70, 66y95, 60, 101y84, 99,97, 87, 110, 151, 149, 118, 146, 153, 105, 141,179, 138, 158, 129y178, 182y187, 183, 128, 174,177, 171y202y156, 200, 172, 180, 170y190, 201,203y196, 195, 194, 206. CB congeners are num-bered according to the corrected IUPAC numberingscheme as described by Guitart et al.(1993).SDDTs is the sum ofp,p9-DDT, p,p9-DDD andp,p9-DDE. SHCH is the sum of thea-, b- andg-hexachlorocyclohexanes.SCHL is the sum of oxy-chlordane, trans-chlordane, cis-chlordane, trans-nonachlor,cis-nonachlor and heptachlor epoxide.
Duplicate analyses(ns9) and method reagentblanks(ns9) were alternately assessed with eachbatch of five polar bear samples. Similar to theprocedure of Sandala et al.(2004, this issue), themean CByOC recoveries as indicated by recoveryof 1,3,5-tribromobenzene were 91"7% for allSRM, blank, and polar bear sample and duplicateanalyses. CB and OC concentrations were, there-fore not recovery-corrected. Other than CB con-geners and OC compounds, no significant, extra-neous positive or negative peaks were observedbeyond 5 min elution time in ECD chromatogramsof fractions CB�1, OC�1 and OC�2. ThemECDdetection limit for OCs and CB compounds was0.01 ngyg (lipid weight) for polar bear fat. Onceanalyzed at GLIER, CB�1, OC�1 and �2 frac-tions were re-combined and sent to NWRI to beanalysed for selected chlordane components andbrominated diphenyl ethers(BDEs) by GC-nega-tive ion chemical ionisation MS(Muir et al.,unpublished data).
Standard reference materials 1588a(cod liveroil) and 1945(pilot whale blubber) supplied bythe National Institute of Standards and Technology(NIST; Gaithersburg, MD, USA) were analysedusing identical the same methodology as used forCByOC analysis in polar bear fat(Hoekstra et al.,2003). Surrogate CB standard recoveries werewithin the range of 100–105% and analyte con-centrations were within 10–15% of the certifiedvalues. GLIER is certified within the CanadianEnvironmental Analytical Laboratory(CAEAL)program of the Canadian Standards Association, is
111R. Dietz et al. / Science of the Total Environment 331 (2004) 107–124
a participant in the NCP Quality Assurance Pro-gram(Stokker, 2003) and participates routinely ininterlaboratory comparisons with the NationalWildlife Research Centre of the Canadian WildlifeService.
2.4. Statistical analyses
An analysis of variance(ANOVA) was per-formed on the lipid content of the fat in order totest whether the fat content differed by season. Tonormalise the data, the square root of the percent-ages was arcsine transformed prior to the statisticalanalysis (cf. Zar, 1984). The polar bears weresampled between January 1999 and September2001. Samples taken during the months April toJuly were pooled because of the low numbers ofsamples obtained during these months. However,this is the peak period of hyperphagia whenfattening occurs prior to the ice break up(Ramsayand Stirling, 1988; Messier et al., 1992), whichmay also provide some biological justification forthis pooling. The fat concentration was found todiffer significantly between months(Fs4.16.Ps0.002), with the highest concentration occuringduring September and the lowest in the springmonths. OC concentrations were, thereforeexpressed as nanogram per gram lipid weight(lw)for presentation of results and further statisticalanalyses.
Plots of ln-transformed OC concentrations vs.age (not shown) did not suggest any clear rela-tionship (e.g. linear relationship) probably due tothe small sample size and the effect of seasonalvariation. However, there were tendencies for somecompounds to have lower concentrations infemales than in males. As no patterns could bedetected in the concentrations of OCs relative toage in adult animals as observed in other studies(e.g. Norstrom et al., 1998), the animals weregrouped into subadults bears of both sexes(below5 years for females and below 6 years for males),adult females(5 years old and above) and adultmales (6 years old and above) for statisticalanalysis.
ANOVA with the factors sex and age group(sub adult, adult females and adult males), month(January, February, March, April–July, August and
September) and their interactions were performedto test for differences in mean OC concentrations.The least square estimates of the marginal meansfrom the ANOVAs were back transformed togeometric means and plotted to illustrate the dif-ferences among months for each sex and age group(Fig. 2). Multivariate analyses of variance(MAN-OVA, Wilks l) were performed to investigatesimilarities in the patterns of OC(CBs, DDTs,HCHs, chlordane, chlorobenzene, dieldrin) con-centrations among months and sex and age groupsand their interactions. Similarities in the patternsamong OC were further analysed by reorganisingthe data prior to ANOVA so that the dependentvariable was ln-logarithmically transformed con-centrations and the factors were OC compound,month, sex and age groups and all first orderinteractions. Statistical tests of type III were usedfor both the ANOVA and the MANOVA.
Data concerning OC concentrations in polarbears from central East Greenland sampled in 1990(Norstrom et al., 1998) were made available cour-tesy of R. Norstrom(Dept. of Chemistry CarletonUniversity, Ottawa) so that a comparison could bemade of OC concentrations between 1990 and1999–2001. An ANOVA on ln-logarithmicallytransformed concentrations, using sex and agegroup (subadult, adult female and adult males),sampling period and the interactions as factors,was applied to test for differences in mean OCconcentrations. The least square estimates of themarginal means from the ANOVAs are used toillustrate the differences between the two samplingperiods. For calculation of the half-lives of theanalysed contaminants the standard formula:
y0.693tyT1y2AsA0
WhereT is the half-life,A is the concentration1y2 0
at time 0, andA is the concentration after theellapsed time(t) (Nave, 2000).
All calculations were performed using the statis-tical software package SAS(PC-version V8) and�
Excel 97 was used as a spreadsheet.�
3. Results
3.1. Sample composition
Polar bear tissue samples were collected bylocal subsistence hunters in the Ittoqqortoormiity
112 R. Dietz et al. / Science of the Total Environment 331 (2004) 107–124
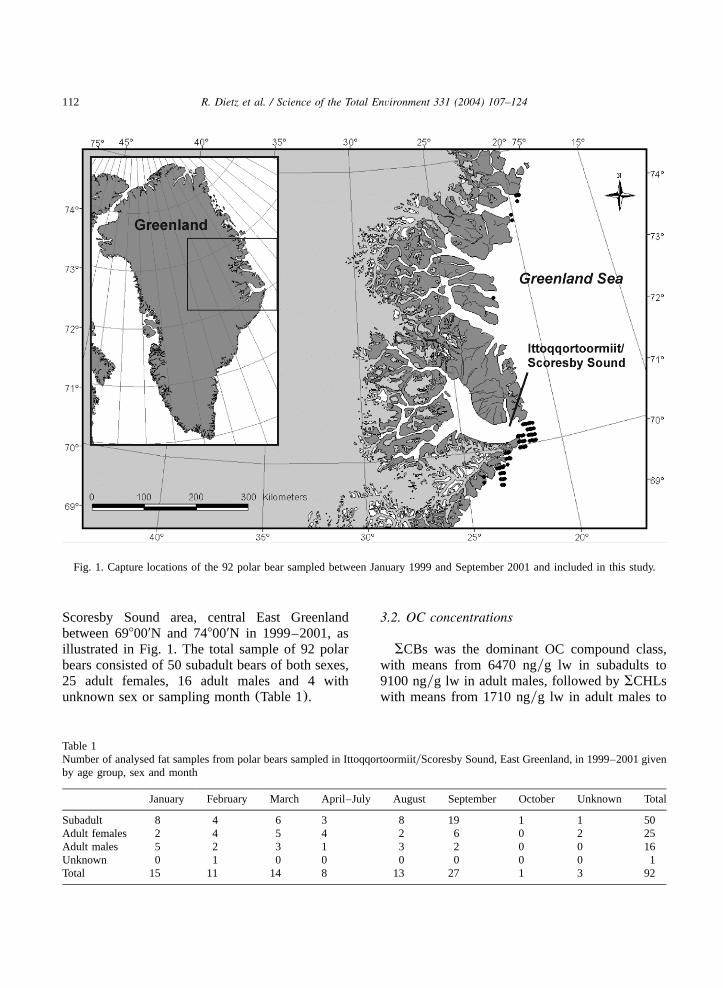
Fig. 1. Capture locations of the 92 polar bear sampled between January 1999 and September 2001 and included in this study.
Table 1Number of analysed fat samples from polar bears sampled in IttoqqortoormiityScoresby Sound, East Greenland, in 1999–2001 givenby age group, sex and month
January February March April–July August September October Unknown Total
Subadult 8 4 6 3 8 19 1 1 50Adult females 2 4 5 4 2 6 0 2 25Adult males 5 2 3 1 3 2 0 0 16Unknown 0 1 0 0 0 0 0 0 1Total 15 11 14 8 13 27 1 3 92
Scoresby Sound area, central East Greenlandbetween 698009N and 748009N in 1999–2001, asillustrated in Fig. 1. The total sample of 92 polarbears consisted of 50 subadult bears of both sexes,25 adult females, 16 adult males and 4 withunknown sex or sampling month(Table 1).
3.2. OC concentrations
SCBs was the dominant OC compound class,with means from 6470 ngyg lw in subadults to9100 ngyg lw in adult males, followed bySCHLswith means from 1710 ngyg lw in adult males to
113R. Dietz et al. / Science of the Total Environment 331 (2004) 107–124
Table 2Mean and S.D. of organochlorine concentrations(ngyg lw) in polar bear from IttoqqortoormiityScoresby Sound(1999–2001)
Group n SPCB SCBz SHCH SDDT
Mean S.D. Mean S.D. Mean S.D. Mean S.D.
Subadult 50 6470 2980 158 103 198 75 462 227Adult females 25 8240 5820 100 81 263 269 462 324Adult males 16 9100 3560 187 252 218 67 559 441
SCHL Mirex Dieldrin %LipidSubadult 50 2010 1110 4.08 6.20 218 107 92.9 5.62Adult females 25 2220 1540 2.79 5.10 208 73 85.4 18.66Adult males 16 1710 763 6.59 11.20 245 231 84.9 7.30
Table 3Average percent distribution of the individual PCB congeners, CHLs, DDTs and HCH in polar bears from IttoqqortoormiityScoresbySound(1999–2001) based on concentrations in ngyg lipid weight. Based on 92 analysed animals(See Table 1)
CB31y28 CB52 CB49 CB44 CB42 CB64y71 CB74 CB70 CB66y95 CB600.6 0.2 -0.1 -0.1 -0.1 0.1 0.5 -0.1 0.1 0.1CB101y84 CB99 CB97 CB87 CB110 CB151 CB149 CB118 CB146 CB1530.3 7.3 0.1 4.8 0.1 -0.1 0.2 1.5 1.2 32.3CB105 CB141 CB179 CB138 CB158 CB129y178 CB182y187 CB183 CB128 CB1740.1 -0.1 -0.1 11.3 -0.1 0.1 0.8 0.9 0.3 -0.1CB177 CB171y202* CB200 CB172 CB180 CB170y190 CB201 CB203196 CB195 CB194 CB2060.1 0.9 0.7 0.2 21.4 12.2 0.4 0.3 0.1 4.3 0.9oxy-CHL t-CHL c-CHL t-nonaCHL c-nonaCHL HEP p,p9-DDD p,p9-DDE p,p9-DDT57.1 0.4 19.0 13.9 0.7 8.9 2.9 88.2 8.9a-HCH b-HCH g-HCH24.7 74.3 1.0
Plusy156*
2220 ngyg lw in adult females(Table 2). ThemeanSDDT concentrations, ranging from 462 ngyg lw in subadults and adult females to 559 ngyglw in adult males, were relatively low comparedto those ofSCBs, reflecting the ability of polarbears to metabolise DDTs(e.g. Letcher et al.,1995a, 1998; Norstrom et al., 1998). Dieldrinexhibited mean concentrations of 208 ngyg inadult females and 245 ngyg lw in adult males,SHCH means ranged from 198 ngyg in subadultsto 263 ngyg lw in adult females, andSCBz meansranged from 100 ngyg adult females to 187 ngyglw in adult males. Mirex was found at the lowestconcentrations, ranging from 2.79 ngyg adultfemales to 6.59 ngyg lw in adult males.
Four CB congeners CB153(32%), CB180(21%), CB170 (12%) and CB138(11%) consti-tuted in total 76% of the total CB concentration(Table 3). Five additional congeners, CB99
(7.3%), CB87 (4.8%), CB194 (4.3%), CB118(1.5%) and CB146 (1.2%) comprised another19%, of the total whilst the remaining 32 conge-ners analysed constituted less than 5% of the total.The dominant chlordane compound was the meta-bolite oxy-chlordane(57%), followed bycis-chlor-dane(19.0%), trans-chlordane(13.9%) and hep-tachlor epoxide (8.9%) (Table 3). The meta-bolite p,p9-DDE (88.2%) dominated theSDDTsfollowed by p,p9-DDT (8.9%), andp,p9-DDD con-stituted the lowest fraction(2.9%) of the SDDT.The metaboliteb-HCH (88.2%) dominated theSHCHs, followed bya-HCH (24.7%) andg-HCH(1.0%).
3.3. OC concentrations in relation to sex, age andseason
Adult males had highestSCBs,SCBzs,SDDTs,mirex and dieldrin concentrations. In contrast,
114 R. Dietz et al. / Science of the Total Environment 331 (2004) 107–124
Table 4Results of ANOVAs(F-value and significance(P)) of TypeIII sum of squares with logarithmic transformed concentrationsof OC in polar bears from Ittoqqortoormiit Scoresby Sound(1999–2001) as dependent variable and the factors: Sex, agegroup and month(M), and their interactions
Ageysex Month Interaction
F P F P F P
SPCBs 2.29 0.109 2.13 0.061 0.87 0.561SDDTs 0.68 0.511 4.36 0.001 0.95 0.491SHCHs 0.46 0.634 4.21 0.001 2.54 0.011SCHLs 1.00 0.372 0.57 0.752 1.15 0.336SCBzs 6.18 0.003 1.28 0.280 1.70 0.098Dieldrin 0.56 0.573 1.18 0.330 1.17 0.324
concentrations ofSHCHs in adult males werelower than those in females, and concentrations ofSCHLs were lower than in both subadults andadult females.SCBz concentrations differed sig-nificantly (at 5% level) among sexes and agegroups, whereasSHCH andSDDT concentrationsdiffered significantly between months. Monthlydifference inSCB concentration was close to thelevel of significance(Ps0.061) (Table 4). Theinteraction factor was only significant for HCHs,which indicates a different monthly pattern for theageysex groups(Table 4). Although month, sexand age group were found to be significant foronly a few OC classes, the general pattern of OCconcentrations analysed by MANOVA was signif-icantly different between months and betweensexes and age groups(Wilks l, Ps0.0002 andPs0.0005, respectively; results not tabulated).
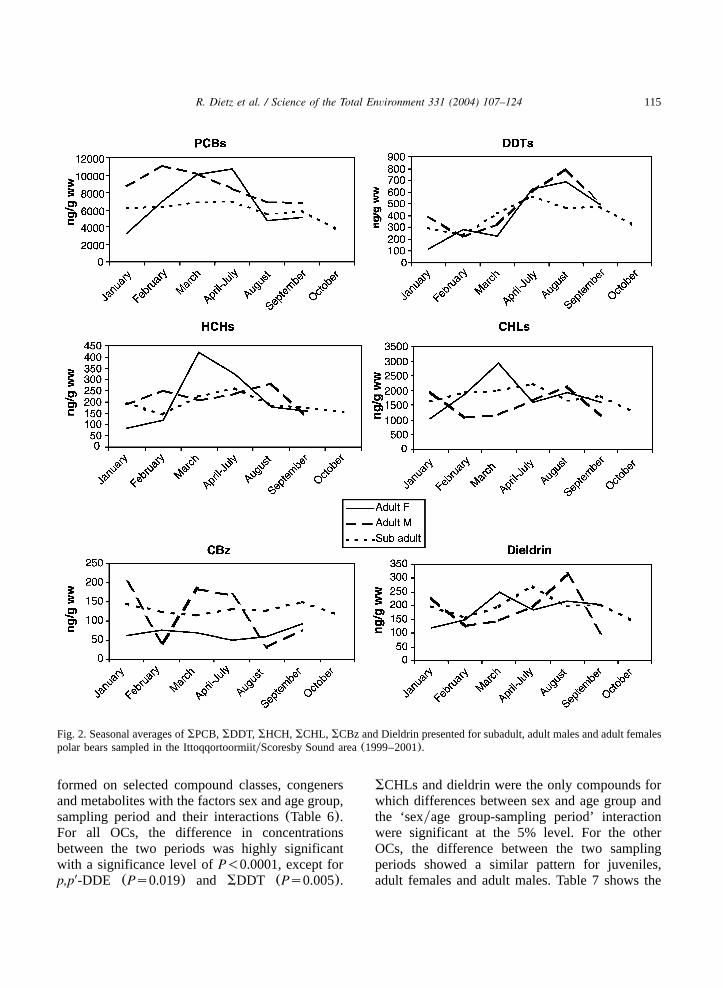
SCB, SHCH andSCHL concentrations showedrather similar monthly patterns, with high variabil-ity in adult females and relatively constant levelsin adult males and subadults(Fig. 2). The concen-trations in females appeared to be highest in Marchand lowest in January or September.SCHLs anddieldrin concentrations showed variability in allthree groups, also with a maximum for adultfemales occuring in March. ForSCBzs in adultmales and subadults the maxima were seen inApril–July. Dieldrin concentrations peaked inApril–July in subadults, but not before August inadult males.SDDT levels increased from Januaryto a maximum in late summer both for adultmales, adult females and subadults. This indicates
that the concentration of some OC compoundsvary seasonally in a similar manner, whilst othersdo not.
In order to test which OCs varied seasonally ina similar manner, the data was reorganised in sucha way that the dependent variable was the loga-rithmically transformed concentrations and theclass variables became the organochlorine com-pounds, the months and the ageysex groups. AnANOVA was performed including these three fac-tors and all first order interactions. As expectedfrom the previous analyses and deduced from Fig.2, all main factors and interactions were significant(Table 5). However, whenSDDTs were removedfrom the analysis the interaction between monthand organochlorine compound was no longer sig-nificant (Ps0.25, Table 5). This indicated that themonthly patterns seen for the other OCs(SCBs,SHCHs, SCHLs, SCBzs and dieldrin) were notsignificantly different. However, the monthly pat-tern still differed significantly among sexes andage groups as shown by the significant compound-group interaction.
SCBz was the only OC contaminant class show-ing significant differences among sexes and agegroups when analysing the compounds separately(Table 4). Generally,SCBz concentrations werehighest in subadult bears(Fig. 2). Performing theANOVA on the reorganised data as described inthe previous paragraph and removingSCBzs fromthe analysis(instead ofSDDTs), the interactionbetween ageysex group and OC compounds wasno longer significant(Ps0.42, Table 5). Thisindicated that the sex and age group patterns forthe other OC compounds(SPCBs, SDDTs, S-HCHs,SCHLs and Dieldrin) were not significant-ly different.
3.4. Long-term temporal changes in OCconcentrations
The following OCs were determined in polarbear fat in both the Norstrom et al.(1998) andthe present study: CB congener numbers 99, 149,118, 146, 153, 138, 183, 180, 170y190 and 194,a- and b-HCH, p,p9-DDE, p,p9-DDD and p,p9-DDT, oxychlordane,trans-nonachlor and heptach-lor epoxide, and dieldrin. An ANOVA was per-
115R. Dietz et al. / Science of the Total Environment 331 (2004) 107–124
Fig. 2. Seasonal averages ofSPCB,SDDT, SHCH, SCHL, SCBz and Dieldrin presented for subadult, adult males and adult femalespolar bears sampled in the IttoqqortoormiityScoresby Sound area(1999–2001).
formed on selected compound classes, congenersand metabolites with the factors sex and age group,sampling period and their interactions(Table 6).For all OCs, the difference in concentrationsbetween the two periods was highly significantwith a significance level ofP-0.0001, except forp,p9-DDE (Ps0.019) and SDDT (Ps0.005).
SCHLs and dieldrin were the only compounds forwhich differences between sex and age group andthe ‘sexyage group-sampling period’ interactionwere significant at the 5% level. For the otherOCs, the difference between the two samplingperiods showed a similar pattern for juveniles,adult females and adult males. Table 7 shows the
116 R. Dietz et al. / Science of the Total Environment 331 (2004) 107–124
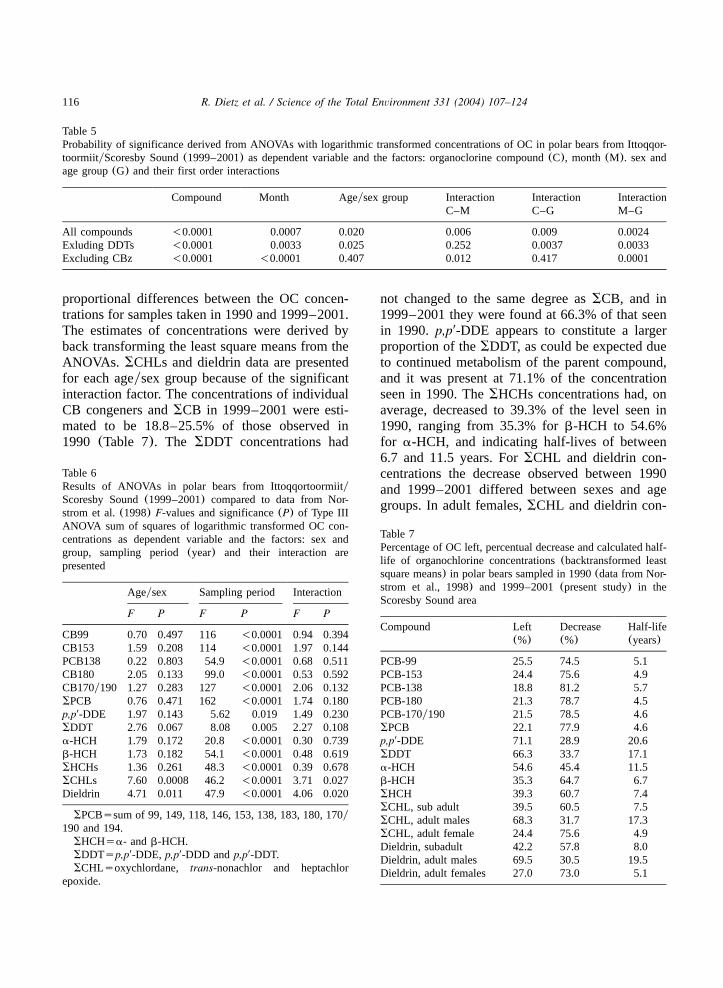
Table 5Probability of significance derived from ANOVAs with logarithmic transformed concentrations of OC in polar bears from Ittoqqor-toormiityScoresby Sound(1999–2001) as dependent variable and the factors: organoclorine compound(C), month(M). sex andage group(G) and their first order interactions
Compound Month Ageysex group Interaction Interaction InteractionC–M C–G M–G
All compounds -0.0001 0.0007 0.020 0.006 0.009 0.0024Exluding DDTs -0.0001 0.0033 0.025 0.252 0.0037 0.0033Excluding CBz -0.0001 -0.0001 0.407 0.012 0.417 0.0001
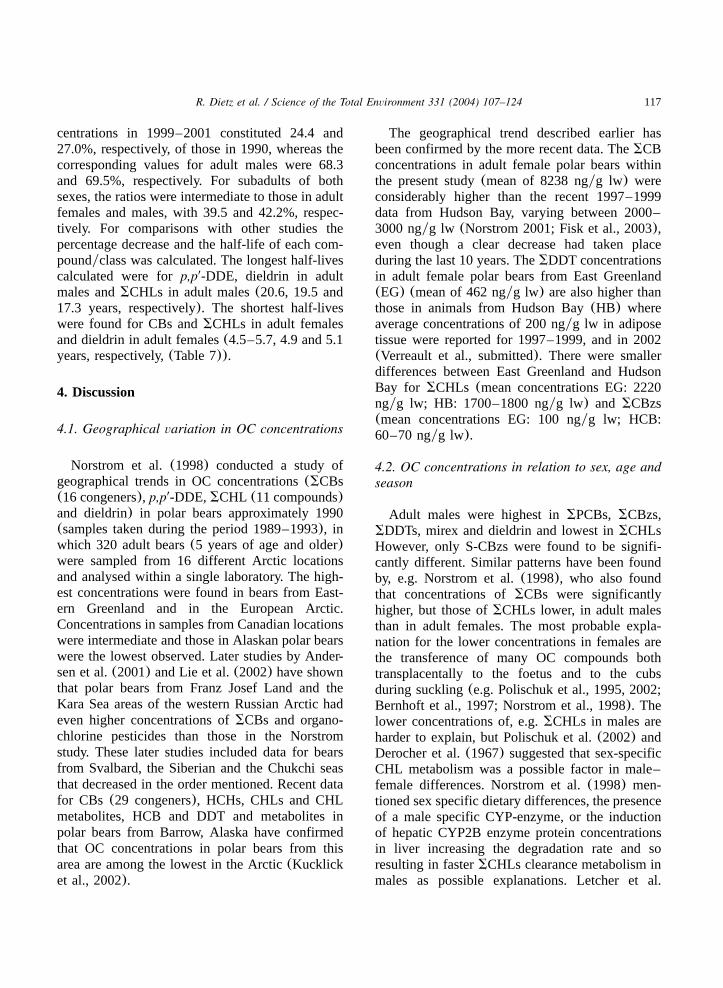
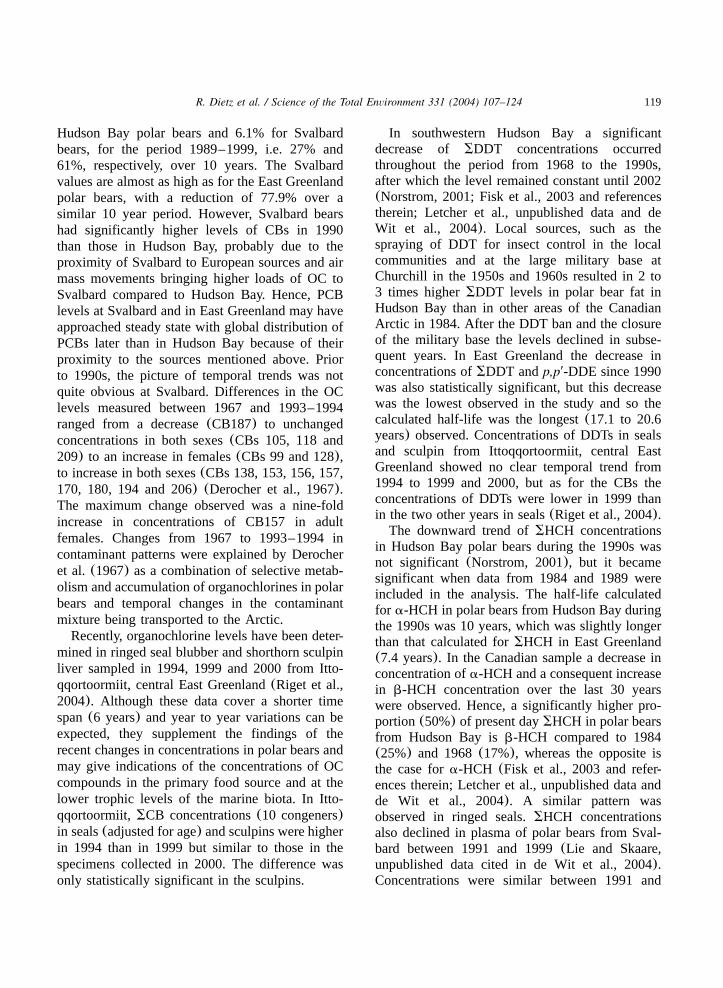
Table 6Results of ANOVAs in polar bears from IttoqqortoormiityScoresby Sound(1999–2001) compared to data from Nor-strom et al.(1998) F-values and significance(P) of Type IIIANOVA sum of squares of logarithmic transformed OC con-centrations as dependent variable and the factors: sex andgroup, sampling period(year) and their interaction arepresented
Ageysex Sampling period Interaction
F P F P F P
CB99 0.70 0.497 116 -0.0001 0.94 0.394CB153 1.59 0.208 114 -0.0001 1.97 0.144PCB138 0.22 0.803 54.9 -0.0001 0.68 0.511CB180 2.05 0.133 99.0 -0.0001 0.53 0.592CB170y190 1.27 0.283 127 -0.0001 2.06 0.132SPCB 0.76 0.471 162 -0.0001 1.74 0.180p,p9-DDE 1.97 0.143 5.62 0.019 1.49 0.230SDDT 2.76 0.067 8.08 0.005 2.27 0.108a-HCH 1.79 0.172 20.8 -0.0001 0.30 0.739b-HCH 1.73 0.182 54.1 -0.0001 0.48 0.619SHCHs 1.36 0.261 48.3 -0.0001 0.39 0.678SCHLs 7.60 0.0008 46.2 -0.0001 3.71 0.027Dieldrin 4.71 0.011 47.9 -0.0001 4.06 0.020
SPCBssum of 99, 149, 118, 146, 153, 138, 183, 180, 170y190 and 194.
SHCHsa- andb-HCH.SDDTsp,p9-DDE, p,p9-DDD andp,p9-DDT.SCHLsoxychlordane, trans-nonachlor and heptachlor
epoxide.
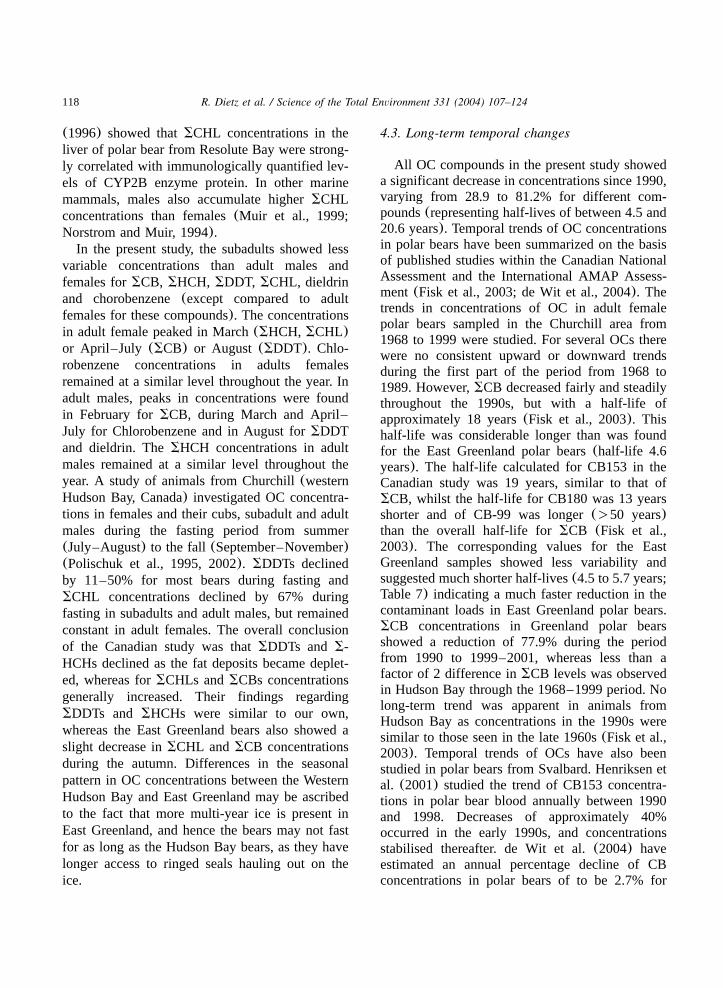
Table 7Percentage of OC left, percentual decrease and calculated half-life of organochlorine concentrations(backtransformed leastsquare means) in polar bears sampled in 1990(data from Nor-strom et al., 1998) and 1999–2001(present study) in theScoresby Sound area
Compound Left Decrease Half-life(%) (%) (years)
PCB-99 25.5 74.5 5.1PCB-153 24.4 75.6 4.9PCB-138 18.8 81.2 5.7PCB-180 21.3 78.7 4.5PCB-170y190 21.5 78.5 4.6SPCB 22.1 77.9 4.6p,p9-DDE 71.1 28.9 20.6SDDT 66.3 33.7 17.1a-HCH 54.6 45.4 11.5b-HCH 35.3 64.7 6.7SHCH 39.3 60.7 7.4SCHL, sub adult 39.5 60.5 7.5SCHL, adult males 68.3 31.7 17.3SCHL, adult female 24.4 75.6 4.9Dieldrin, subadult 42.2 57.8 8.0Dieldrin, adult males 69.5 30.5 19.5Dieldrin, adult females 27.0 73.0 5.1
proportional differences between the OC concen-trations for samples taken in 1990 and 1999–2001.The estimates of concentrations were derived byback transforming the least square means from theANOVAs. SCHLs and dieldrin data are presentedfor each ageysex group because of the significantinteraction factor. The concentrations of individualCB congeners andSCB in 1999–2001 were esti-mated to be 18.8–25.5% of those observed in1990 (Table 7). The SDDT concentrations had
not changed to the same degree asSCB, and in1999–2001 they were found at 66.3% of that seenin 1990. p,p9-DDE appears to constitute a largerproportion of theSDDT, as could be expected dueto continued metabolism of the parent compound,and it was present at 71.1% of the concentrationseen in 1990. TheSHCHs concentrations had, onaverage, decreased to 39.3% of the level seen in1990, ranging from 35.3% forb-HCH to 54.6%for a-HCH, and indicating half-lives of between6.7 and 11.5 years. ForSCHL and dieldrin con-centrations the decrease observed between 1990and 1999–2001 differed between sexes and agegroups. In adult females,SCHL and dieldrin con-
117R. Dietz et al. / Science of the Total Environment 331 (2004) 107–124
centrations in 1999–2001 constituted 24.4 and27.0%, respectively, of those in 1990, whereas thecorresponding values for adult males were 68.3and 69.5%, respectively. For subadults of bothsexes, the ratios were intermediate to those in adultfemales and males, with 39.5 and 42.2%, respec-tively. For comparisons with other studies thepercentage decrease and the half-life of each com-poundyclass was calculated. The longest half-livescalculated were forp,p9-DDE, dieldrin in adultmales andSCHLs in adult males(20.6, 19.5 and17.3 years, respectively). The shortest half-liveswere found for CBs andSCHLs in adult femalesand dieldrin in adult females(4.5–5.7, 4.9 and 5.1years, respectively,(Table 7)).
4. Discussion
4.1. Geographical variation in OC concentrations
Norstrom et al.(1998) conducted a study ofgeographical trends in OC concentrations(SCBs(16 congeners), p,p9-DDE, SCHL (11 compounds)and dieldrin) in polar bears approximately 1990(samples taken during the period 1989–1993), inwhich 320 adult bears(5 years of age and older)were sampled from 16 different Arctic locationsand analysed within a single laboratory. The high-est concentrations were found in bears from East-ern Greenland and in the European Arctic.Concentrations in samples from Canadian locationswere intermediate and those in Alaskan polar bearswere the lowest observed. Later studies by Ander-sen et al.(2001) and Lie et al.(2002) have shownthat polar bears from Franz Josef Land and theKara Sea areas of the western Russian Arctic hadeven higher concentrations ofSCBs and organo-chlorine pesticides than those in the Norstromstudy. These later studies included data for bearsfrom Svalbard, the Siberian and the Chukchi seasthat decreased in the order mentioned. Recent datafor CBs (29 congeners), HCHs, CHLs and CHLmetabolites, HCB and DDT and metabolites inpolar bears from Barrow, Alaska have confirmedthat OC concentrations in polar bears from thisarea are among the lowest in the Arctic(Kucklicket al., 2002).
The geographical trend described earlier hasbeen confirmed by the more recent data. TheSCBconcentrations in adult female polar bears withinthe present study(mean of 8238 ngyg lw) wereconsiderably higher than the recent 1997–1999data from Hudson Bay, varying between 2000–3000 ngyg lw (Norstrom 2001; Fisk et al., 2003),even though a clear decrease had taken placeduring the last 10 years. TheSDDT concentrationsin adult female polar bears from East Greenland(EG) (mean of 462 ngyg lw) are also higher thanthose in animals from Hudson Bay(HB) whereaverage concentrations of 200 ngyg lw in adiposetissue were reported for 1997–1999, and in 2002(Verreault et al., submitted). There were smallerdifferences between East Greenland and HudsonBay for SCHLs (mean concentrations EG: 2220ngyg lw; HB: 1700–1800 ngyg lw) and SCBzs(mean concentrations EG: 100 ngyg lw; HCB:60–70 ngyg lw).
4.2. OC concentrations in relation to sex, age andseason
Adult males were highest inSPCBs, SCBzs,SDDTs, mirex and dieldrin and lowest inSCHLsHowever, only S-CBzs were found to be signifi-cantly different. Similar patterns have been foundby, e.g. Norstrom et al.(1998), who also foundthat concentrations ofSCBs were significantlyhigher, but those ofSCHLs lower, in adult malesthan in adult females. The most probable expla-nation for the lower concentrations in females arethe transference of many OC compounds bothtransplacentally to the foetus and to the cubsduring suckling(e.g. Polischuk et al., 1995, 2002;Bernhoft et al., 1997; Norstrom et al., 1998). Thelower concentrations of, e.g.SCHLs in males areharder to explain, but Polischuk et al.(2002) andDerocher et al.(1967) suggested that sex-specificCHL metabolism was a possible factor in male–female differences. Norstrom et al.(1998) men-tioned sex specific dietary differences, the presenceof a male specific CYP-enzyme, or the inductionof hepatic CYP2B enzyme protein concentrationsin liver increasing the degradation rate and soresulting in fasterSCHLs clearance metabolism inmales as possible explanations. Letcher et al.
118 R. Dietz et al. / Science of the Total Environment 331 (2004) 107–124
(1996) showed thatSCHL concentrations in theliver of polar bear from Resolute Bay were strong-ly correlated with immunologically quantified lev-els of CYP2B enzyme protein. In other marinemammals, males also accumulate higherSCHLconcentrations than females(Muir et al., 1999;Norstrom and Muir, 1994).
In the present study, the subadults showed lessvariable concentrations than adult males andfemales forSCB, SHCH, SDDT, SCHL, dieldrinand chorobenzene(except compared to adultfemales for these compounds). The concentrationsin adult female peaked in March(SHCH, SCHL)or April–July (SCB) or August (SDDT). Chlo-robenzene concentrations in adults femalesremained at a similar level throughout the year. Inadult males, peaks in concentrations were foundin February forSCB, during March and April–July for Chlorobenzene and in August forSDDTand dieldrin. TheSHCH concentrations in adultmales remained at a similar level throughout theyear. A study of animals from Churchill(westernHudson Bay, Canada) investigated OC concentra-tions in females and their cubs, subadult and adultmales during the fasting period from summer(July–August) to the fall (September–November)(Polischuk et al., 1995, 2002). SDDTs declinedby 11–50% for most bears during fasting andSCHL concentrations declined by 67% duringfasting in subadults and adult males, but remainedconstant in adult females. The overall conclusionof the Canadian study was thatSDDTs and S-HCHs declined as the fat deposits became deplet-ed, whereas forSCHLs andSCBs concentrationsgenerally increased. Their findings regardingSDDTs and SHCHs were similar to our own,whereas the East Greenland bears also showed aslight decrease inSCHL andSCB concentrationsduring the autumn. Differences in the seasonalpattern in OC concentrations between the WesternHudson Bay and East Greenland may be ascribedto the fact that more multi-year ice is present inEast Greenland, and hence the bears may not fastfor as long as the Hudson Bay bears, as they havelonger access to ringed seals hauling out on theice.
4.3. Long-term temporal changes
All OC compounds in the present study showeda significant decrease in concentrations since 1990,varying from 28.9 to 81.2% for different com-pounds(representing half-lives of between 4.5 and20.6 years). Temporal trends of OC concentrationsin polar bears have been summarized on the basisof published studies within the Canadian NationalAssessment and the International AMAP Assess-ment (Fisk et al., 2003; de Wit et al., 2004). Thetrends in concentrations of OC in adult femalepolar bears sampled in the Churchill area from1968 to 1999 were studied. For several OCs therewere no consistent upward or downward trendsduring the first part of the period from 1968 to1989. However,SCB decreased fairly and steadilythroughout the 1990s, but with a half-life ofapproximately 18 years(Fisk et al., 2003). Thishalf-life was considerable longer than was foundfor the East Greenland polar bears(half-life 4.6years). The half-life calculated for CB153 in theCanadian study was 19 years, similar to that ofSCB, whilst the half-life for CB180 was 13 yearsshorter and of CB-99 was longer()50 years)than the overall half-life forSCB (Fisk et al.,2003). The corresponding values for the EastGreenland samples showed less variability andsuggested much shorter half-lives(4.5 to 5.7 years;Table 7) indicating a much faster reduction in thecontaminant loads in East Greenland polar bears.SCB concentrations in Greenland polar bearsshowed a reduction of 77.9% during the periodfrom 1990 to 1999–2001, whereas less than afactor of 2 difference inSCB levels was observedin Hudson Bay through the 1968–1999 period. Nolong-term trend was apparent in animals fromHudson Bay as concentrations in the 1990s weresimilar to those seen in the late 1960s(Fisk et al.,2003). Temporal trends of OCs have also beenstudied in polar bears from Svalbard. Henriksen etal. (2001) studied the trend of CB153 concentra-tions in polar bear blood annually between 1990and 1998. Decreases of approximately 40%occurred in the early 1990s, and concentrationsstabilised thereafter. de Wit et al.(2004) haveestimated an annual percentage decline of CBconcentrations in polar bears of to be 2.7% for
119R. Dietz et al. / Science of the Total Environment 331 (2004) 107–124
Hudson Bay polar bears and 6.1% for Svalbardbears, for the period 1989–1999, i.e. 27% and61%, respectively, over 10 years. The Svalbardvalues are almost as high as for the East Greenlandpolar bears, with a reduction of 77.9% over asimilar 10 year period. However, Svalbard bearshad significantly higher levels of CBs in 1990than those in Hudson Bay, probably due to theproximity of Svalbard to European sources and airmass movements bringing higher loads of OC toSvalbard compared to Hudson Bay. Hence, PCBlevels at Svalbard and in East Greenland may haveapproached steady state with global distribution ofPCBs later than in Hudson Bay because of theirproximity to the sources mentioned above. Priorto 1990s, the picture of temporal trends was notquite obvious at Svalbard. Differences in the OClevels measured between 1967 and 1993–1994ranged from a decrease(CB187) to unchangedconcentrations in both sexes(CBs 105, 118 and209) to an increase in females(CBs 99 and 128),to increase in both sexes(CBs 138, 153, 156, 157,170, 180, 194 and 206) (Derocher et al., 1967).The maximum change observed was a nine-foldincrease in concentrations of CB157 in adultfemales. Changes from 1967 to 1993–1994 incontaminant patterns were explained by Derocheret al. (1967) as a combination of selective metab-olism and accumulation of organochlorines in polarbears and temporal changes in the contaminantmixture being transported to the Arctic.
Recently, organochlorine levels have been deter-mined in ringed seal blubber and shorthorn sculpinliver sampled in 1994, 1999 and 2000 from Itto-qqortoormiit, central East Greenland(Riget et al.,2004). Although these data cover a shorter timespan(6 years) and year to year variations can beexpected, they supplement the findings of therecent changes in concentrations in polar bears andmay give indications of the concentrations of OCcompounds in the primary food source and at thelower trophic levels of the marine biota. In Itto-qqortoormiit,SCB concentrations(10 congeners)in seals(adjusted for age) and sculpins were higherin 1994 than in 1999 but similar to those in thespecimens collected in 2000. The difference wasonly statistically significant in the sculpins.
In southwestern Hudson Bay a significantdecrease of SDDT concentrations occurredthroughout the period from 1968 to the 1990s,after which the level remained constant until 2002(Norstrom, 2001; Fisk et al., 2003 and referencestherein; Letcher et al., unpublished data and deWit et al., 2004). Local sources, such as thespraying of DDT for insect control in the localcommunities and at the large military base atChurchill in the 1950s and 1960s resulted in 2 to3 times higherSDDT levels in polar bear fat inHudson Bay than in other areas of the CanadianArctic in 1984. After the DDT ban and the closureof the military base the levels declined in subse-quent years. In East Greenland the decrease inconcentrations ofSDDT andp,p9-DDE since 1990was also statistically significant, but this decreasewas the lowest observed in the study and so thecalculated half-life was the longest(17.1 to 20.6years) observed. Concentrations of DDTs in sealsand sculpin from Ittoqqortoormiit, central EastGreenland showed no clear temporal trend from1994 to 1999 and 2000, but as for the CBs theconcentrations of DDTs were lower in 1999 thanin the two other years in seals(Riget et al., 2004).
The downward trend ofSHCH concentrationsin Hudson Bay polar bears during the 1990s wasnot significant (Norstrom, 2001), but it becamesignificant when data from 1984 and 1989 wereincluded in the analysis. The half-life calculatedfor a-HCH in polar bears from Hudson Bay duringthe 1990s was 10 years, which was slightly longerthan that calculated forSHCH in East Greenland(7.4 years). In the Canadian sample a decrease inconcentration ofa-HCH and a consequent increasein b-HCH concentration over the last 30 yearswere observed. Hence, a significantly higher pro-portion(50%) of present daySHCH in polar bearsfrom Hudson Bay isb-HCH compared to 1984(25%) and 1968(17%), whereas the opposite isthe case fora-HCH (Fisk et al., 2003 and refer-ences therein; Letcher et al., unpublished data andde Wit et al., 2004). A similar pattern wasobserved in ringed seals.SHCH concentrationsalso declined in plasma of polar bears from Sval-bard between 1991 and 1999(Lie and Skaare,unpublished data cited in de Wit et al., 2004).Concentrations were similar between 1991 and
120 R. Dietz et al. / Science of the Total Environment 331 (2004) 107–124
1993, but declined by approximately three-foldbetween 1993 and 1996. Hence, the overalldecrease ofSHCH at Svalbard from 1991 to 1996is similar to the 2.5 fold decrease observed in EastGreenland between 1990 and 1999 to 2001. HCHconcentrations in both seals and sculpins fromIttoqqortoormiit, East Greenland showed a decreas-ing trend, and were significantly higher in 1994than in 1999 and 2000 in both male seals andsculpins. The proportion ofb-HCH in seals fromIttoqqortoormiit was also found to be increasingwith time, as would be expected(Riget et al.,2004).
SCHLs concentrations decreased by between31.7 and 75.6%, with the values being dependenton the sex and age group studied. Information ontime trends is scarce in the literature, but Muir andNorstrom(2000) reported a significant increase inSCHL concentrations in polar bears from DavisStrait between 1984 and 1989.
Dieldrin concentrations decreased by between30.5 and 73.0%, and values were dependent onthe sex and age group studied. Also, time trenddata for dieldrin are sparse. Muir and Norstrom(2000) reported a significant decrease in dieldrinconcentrations in animals from Barrow Strait inthe central archipelago, but no apparent changesin those from northern Baffin Bay.SHCH concen-trations in both seals and sculpins from Ittoqqor-toormiit showed a decreasing trend with time, andwere significantly higher in 1994 than in 1999 and2000 in both sculpins and male seals. The propor-tion of b-HCH in seals from Ittoqqortoormiit wasalso found to be increasing with time(Riget et al.,2004).
4.4. Congener composition
The dominant CB congener CB153 comprised32% of the SCBs, which was somewhat lowerthan the average(46.0%) for the 1989–1992 bearsreported by Norstrom et al.(1998). As the 12 CBcongeners included in both the two studies com-prised 96.1% of our 41 congeners and 97.3% ofNorstroms 16 congeners, the number of congenersanalysed could not explain these differences. Asummary of previous studies by Fisk et al.(2003)noted a change in the congener composition over
time, based on data from the Hudson Bay polarbears. A clear tendency observed was for theproportion of less chlorinated congeners toincrease, and for the porportion of the more highlychlorinated congeners to decrease. In the Canadianstudy, however, the proportion of the recalcitrantcongener CB153 showed no time trend, and wasstable at approximately 35% of the total, which issimilar to our findings. CB180 comprised 21% ofthe total CB concentration in 1999–2001 bearsfrom East Greenland, which is higher than reportedin other studies. Norstrom et al.(1998) foundCB180 to constitute 18.5% of the total in 1989–1992 bears from a large part of the Arctic. In asummary by Fisk et al.(2003), CB180 showed adecadal decrease from 17 to 14% of the total,which was the opposite of the trend in EastGreenland. A less chlorinated PCB congener likeCB99 comprised 7.3% of the 1999–2001 bearsfrom East Greenland, broadly similar to the 8.3%that Norstrom et al.(1998) reported from thetrans-Arctic survey of polar bears from 1989 to1992. Again this trend was directly opposite tothat reported for the Hudson Bay polar bears,where an increase from 10 to 12% was observedover the same decade. Bernhoft et al.(1997)provide less detailed information on the percentagecomposition of the CB congeners, but the sum ofCB153 and CB180 constituted 62% of theSCBs,similar to the 64.5% found in our study. A recentstudy from Svalbard, Franz Josef land, the KaraSea, the Siberian Sea and the Chuckchi Sea pro-vided percentage compositions of CB153 from45.4 to 57.5%, of CB180 from 20.4 to 32.1%, ofCB99 from 9.3 to 17.9%, of CB194 from 2.5 to7.6% and of CB118 from 0.6 to 2.0%, similar toour findings of 32.3, 21.4, 7.3, 4.3 and 1.5%,repectively. The simplicity of the PCB congenerpattern observed in polar bear fat is consistentwith other studies in Canadian polar bear. Letcheret al.(1998) reported similar percent compositionsof CB153, CB99, CB138, CB180, etc. in polarbear fat from Resolute Bay bears. The metabolicefficiency of polar bears towards a range of CBcongeners, even those with heptachloro- to nona-chloro-substitution, is demonstrated by the pres-ence of high levels of HO-PCB and MeSO -PCB2
metabolites, which were found in the adipose and
121R. Dietz et al. / Science of the Total Environment 331 (2004) 107–124
whole blood from a sub-set of 19 of the presentGreenland polar bears(Sandala et al., 2004), aswell as in blood, plasma or adipose tissue fromCanadian polar bears(Letcher et al., 1995a,b,1998; unpublished results; Wiberg et al., 1998;Sandau et al., 2000; Li and Letcher, 2003). Assummarized in Fisk et al.(2003), the proportionof a-HCH was found to be decreasing over timewhilst that ofb-HCH was increasing. Recently,b-HCH for the Hudson Bay bear was reported to beapproximately 50% of the total, which is signifi-cantly higher than in 1984(25%) and in 1968(17%). We therefore expected to find a similarpattern in East Greenland, but this was, however,not the case, asa-HCH increased from 17.8 to25.1% andb-HCH showed a decrease from 82.2to 74.9%. The high percentage ofb-HCH isconsistent with the findings from the Svalbardregion where Bernhoft et al.(1997) reportedb-HCH to constitute 81% of theSHCH. The domi-nant CHL compounds were the metaboliteoxy-chlordane (57%) followed by cis-chlordane(19.0%), trans-chlordane(13.9%) and heptachlorEpoxide (8.9%). Bernhoft et al.(1997) reportedan even higher percentage ofoxy-chlordane as72% was given as the average sum of chlordanes.Henriksen et al.(2001) investigated the minimumyearly sampling strategy required to detect a sig-nificant temporal trend by the use of power anal-ysis based on the natural variability observedbetween years. The conclusion from this study wasthat it would be unlikely to detect significant trendswith less than 7 or 8 years of sampling if theannual trend was 5%, and suggested a target of10–25 samples a year and suggested blood plasmaas the preferred matrix of contaminant analysis.However, a recent paper by Lydersen et al.(2002)concludes that blood is a poor substrate for moni-toring OC concentrations relative to blubber sam-ples in harp seals(Pagophilus groenlandicus).During a fasting period, the sumSCB concentra-tions in blubber samples remained unchanged,whereas blood levels in two out of three sealsshowed an increase of 720% during a 28 daysfasting period. However, adipose fat can still showsubstantial variability, as the use of blubber sam-ples from ringed seals of 2 to 4 years of age fromGreenland waters suggests that 13 years of sam-
pling and analysis may be necessary to detect anannual trend of 10% with a power of 90% at a5% significance level(Riget et al. 2000).
5. Conclusions
Consistent with other studies, no pattern couldbe observed in the concentrations of OCs relativeto age for the adult polar bears. Adult males werehighest in SCBs, SCBzs, SDDTs, mirex anddieldrin. In contrast, adult males had lower con-centrations than females forSHCHs and forSCHL, and also lower concentrations than suba-dults for SCHL. Seasonal variation in persistentOC concentrations is considerable and this mustbe taken into account in the design of monitoringprograms for the study of spatial and temporaltrends. The degree of seasonal variation is depend-ent on the analysed compound.SCB, SHCH andSCHL concentrations showed somewhat similarmonthly patterns, with high variability in adultfemales and relatively constant levels in adultmales and subadults. The levels in females appearto be highest in March and lowest in January orSeptember.SCBzs and dieldrin showed variabilityfor all three analysed groups, with a similar max-imum for concentrations in adult females in March.For SCBzs in adult males and subadults the peakappeared in April–July, and dieldrin concentrationspeaked in April–July for subadults, but not beforeAugust for adult males.SDDT concentrationsincreased from January to a maximum in latesummer for adult males, adult females and sub-adults. A significant decrease in OC concentra-tions was observed for all contaminants, age andsex groups studied over the period from 1990 to1999–2001. However, no firm conclusions shouldnot be drawn based on two sampling periodsdue to the year to year variability. The rate ofdecrease in concentrations is more rapid than thatobserved over the same period in polar bears fromCanada, but similar to that seenin polar bears fromSvalbard.
Acknowledgments
The Danish Co-operation for Environment inthe Arctic (DANCEA) and The Commission for
122 R. Dietz et al. / Science of the Total Environment 331 (2004) 107–124
Scientific Research in Greenland are acknowl-edged for financial support. We wish to thank theGreenland hunters who took the samples oftenunder difficult conditions during their hunting tripsfor polar bears. Jonas Brønlund is thanked fororganising the sampling locally. Mr. Greg. Sandalaand Ms. Rodica Lazar(GLIER) are acknowledgedfor conducting the PCB and OC chemical analysis.Maja Kirkegaard did the age determination togeth-er with the first author. We thank Ross Norstromfor providing the raw OC data from the 1990 EastGreenland samples which allowed us to make thestatistical investigation of the time trend. R. Lawand two anonymous reviewers are acknowledgedfor comments to a previous draft.
References
Andersen M, Lie E, Derocher AE, Belikov SE, Bernhoft A,Boltunov AN, Garner GW, Skaare JU, Wiig Ø. Geographicvariation of PCB congeners in polar bears(Ursus mariti-mus) from Svalbard east to the Chuckchi Sea. Polar Biol2001;24:231–238.
Arnould JPY, Ramsay MA. Milk production and milk con-sumption in polar bears during the ice-free period in westernHudson Bay. Can J Zool 1994;72:1365–1370.
Atkinson SN, Ramsay MA. The effect of prolonged fasting ofthe body composition and reproductive success of femalepolar bears(Ursus maritimus). Funct Ecol 1995;9:559–567.
Bergman A. Health condition of the Baltic grey seal(Halicho-erus grypus) during two decates. Apmis 1999;107:270–282.
Bergman A, Olsson M. Pathology of baltic grey seal andringed seal females with special reference to adrenocorticalhyperplasia: is environmental pollution the cause of a widelydistributed disease syndrome? Finnish Game Res 1985;44:47–62.
Bergman A, Olsson M, Reiland S. Skull-bone lesions in theBaltic grey seal(Halichoerus grypus). Ambio 1992;21:517–519.
Bernhoft A, Wiig Ø, Skaare JU. Organochlorines in polarbears (Ursus maritimus) at Svalbard. Environ Pollut1997;96:159–175.
Bowes GW, Jonkel CJ. Presence and distribution of polychlor-inated biphenyls(PCB) in arctic and subarctic marine foodchains. J Fish Res Board Can 1975;32:2111–2123.
Clausen J, Berg O. The content of polychlorinated hydrocar-bons in Arctic ecosystems. Pure Appl Chem 1976;42:223–232.
Colborn T, Vom SFS, Soto AM. Developmental effects ofendocrine-disrupting chemicals in wildlife and humans.Environ Health Perspect 1993;101:378–384.
Damstra T, Barlow S, Bergman A, Kavlock R, Kraak GVD.Global assessment of the state-of-the-science of endocrinedisruptors. World Health Organisation 2002;180.
de March BGE, deWit C,. Muir DCG, Braune B, Gregor DJ,Norstrom RJ, Olsson M, Skaare JU, Stange K. Chapter 6:Persistent Organic Pollutants. In: AMAP Assessment Report1998: Arctic Pollution Issues. Arctic Monitoring and Assess-ment Programme. Oslo. Norway: pp. 183–372.
de Wit CA, Fisk AT, Hobbs KE, Muir DCG, Gabrielsen GW,Kallenborn R, Krahn MM, Norstrom RJ, Skaare JU, AMAP,2004, AMAP Assessment 2002: Persistent Organic Pollut-ants in the Arctic. Arctic Monitoring and Assessment Pro-gramme(AMAP). Oslo. Norway. xviq310 pp.
Derocher AE, Wolkers H, Colborn T, Schlabach M, LarsenTS, Wiig Ø. Contaminants in Svalbard polar bear samplesarchived since 1967 and possible population level effects.Sci Total Environ 2003;301:163–174.
Dietz R, Heide-Jørgensen M-P, Teilmann J, Valentin N, Har-¨konen T. Age determination in European Harbour seals¨Phoca vitulina L. Sarsia 1991;76:17–21.
Feldman EC. Hyperadrenocorticism. In: Ettinger SJ, FeldmanEC, editors. Textbook of veterinary internal medicine, vol.II. Philadelphia, USA: WB Saunders Company, 1995. p.1538–1578.
In: Fisk AT, Hobbs KE, Muir DCG(Eds.) Contaminant Levelsand Trends in the Biological Environment. Canadian ArcticContaminants Assessment Report II. Indian and NorthernAffairs Canada 2003:111–127(and references therein).
Guitart R, Puig P, Gomeezcacatalan J. Requirements for astandardidized nomenclature criterium for PCBs-computer-assisstet assignment of correct congener denomination andnumbering. Chemosphere 1993;27(8):1451–1459.
Helle E, Olsson M, Jensen S. DDT and PCB levels andreproduction in ringed seal from the Bothnian Bay. Ambio1976;5:188–189.
Henriksen EO, Wiig Ø, Skaare JU, Gabrielsen GW, DerocherAE. Monitoring PCBs in polar bears: lessons learned fromSvalbard. J Environ Monit 2001;3(5):493–498.
Hensel RJ, Sorensen FE. Age determination of live polarbears. Int Conf Bear Res Manage 1980;4:93–100.
Hoekstra PF, Letcher RJ, O’Hara TM, Backus SM, SolomonKR, Muir DCG. Hydroxylated and methyl sulfonyl-contain-ing metabolites of PCBs in the blood-plasma and blubberof bowhead whale(Balaena mysticetus). Environ ToxicolChem 2003;22(11):2650–2658.
Jenness P, Erickson AW, Craighead JJ. Some comparativeaspects of milk from four species of bears. J Mammal1972;53:39–47.
Kleivane L, Skare JU, Wiig Ø. Chlorinated organic pesticides˚in polar bear. Occurrence. levels and potential effects. NorskPolarinst Skri 1994;132:1–46.
Koppe JG, Olie K, van Wijnen J. Placental transport of dioxinsfrom mother to fetus. II PCBs. dioxins and furans andvitamin K metabolism. Dev Pharmacol Ther 1992;18:9–13.
Kucklick JR, Struntz WDJ, Becker PR, York GW, O’HaraTM, Bohonowych JE. Persistent organochlorine pollutantsin ringed seals and polar bears collected from northernAlaska. The Sci Tot Environ 2002;287(1-2):45–59.
Lentfer JW. Polar bear denning on drifting isea ice. J Mammal1975;56(3):716–718.
123R. Dietz et al. / Science of the Total Environment 331 (2004) 107–124
Letcher RJ, Norstrom RJ, Bergman A. Geographical distribu-˚
tion and identification of methyl sulfone PCB and DDEmetabolites in pooled polar bear(Ursus maritimus) adiposetissue from western hemisphere Arctic and subarctic regions.Sci Total Environ 1995a;160:409–420.
Letcher RJ, Norstrom RJ, Bergman A. An integrated analytical˚
method for determination of polychlorinated aryl methylsulfone metabolites and polychlorinated hydrocarbon con-taminants in biological matrices. Anal Chem 1995b;67:4155–4163.
Letcher RJ, Norstrom RJ, Lin S, Ramsay MA, Bandiera SM.Immunoquantitation and microsomal monooxygenase activ-ities of hepatic cytochromes P450 1A and P450 2B andchlorinated hydrocarbon contaminant levels in polar bear(Ursus maritimus). Toxicol Appl Pharmacol 1996;137:127–140.
Letcher RJ, Norstrom RJ, Muir DCG. Biotransformation vs.bioaccumulation: sources of methyl sulfone PCB and 4,49-DDE metabolites in the polar bear food chain. Environ SciTechnol 1998;2:1656–1661.
Letcher RJ, Fisk AT, Norstrom RJ, Lunn N, Braune B, TaylorM, Nagy J, Branigan M, Stirling I, Obbard M, Wakeford B,Muir DCG. Temporal and spatial trends of contaminants inCanadian polar bears. 2003–2004 Report, Northern Contam-inants Program, Department of Indian and Northern AffairsCanada.
Li H, Letcher RJ. Determination of hydroxylated polychlori-nated biphenyls(HO-PCBs) by liquid chromatography-electrospray ionization-tandem quadrupole mass spectro-metry. J Chromatogr A 2003; submitted.
Lie E, Bernhoft A, Riget F, Belikow SE, Bultunov AN,Derocher AE, Garner GW, Wiig Ø, Skaare JU. Geographicaldistribution of organochlorine pesticides(OCPs) in polarbears (Ursus maritimus) in the Norwegian and RussianArctic. Sci Total Environ 2002;306(1–3):159–170.
Lydersen C, Wolkers H, Severinsen T, Kleiveane NES, SkaareJU. Blood is a poor substrate for monitoring pollutionburdens in phocid seals. Sci Total Environ 2002;292:193–203.
Messier F, Taylor MK, Ramsay MA. Seasonal activity patternsof female polar bears(Ursus maritimus) in the CanadianArctic as revealed by satellite telemetry. J Zool(London)1992;226:219–229.
Muir DCG, Braune B, de March B, Norstrom R, WagemannR, Lockhart L, Hargrave B, Bright D, Addison R, Payne J,Reimer K. Spatial and temporal trends and effects ofcontaminants in the Canadian arctic marine ecosystem: areveiw. Sci Tot Environ 1999;230:84–144.
Muir D, Norstrom RJ. Geographical differences and timetrends of persistent organic pollutants in the Arctic. ToxicolLett 2000;112–113:93–101.
Nave CR. Hyper Physics. Decay calculation. Georgia StateUniversity, Department of Physics and Astronomy: http:yyhyperphysics.phy-astr.gsu.eduyhbaseyclassyphscilabynucleari.html, 2000.
Norheim G, Skare JU, Wiig Ø. Some heavy metals, essential˚elements, and chlorinated hydrocarbons in polar bear(Ursusmaritimus) at Svalbard. Environ Poll 1992;77:51–57.
Norstrom RJ, Won H. Long term preservation of egg andtissue homogenates for determination of organochlorinecompounds: freezing versus freeze-drying. J Assoc OfficAnal Chem 1985;68:130–135.
Norstrom RJ, Simon M, Muir DCG, Schweinsburg RE. Organ-ochlorine contaminants in arctic marine food chains: iden-tification, geographical distribution and temporal trend inpolar bears (Ursus maritimus). Environ Sci Tech1988;22:1063–1071.
Norstrom RJ, Muir DCG. Chlorinated hydrocarbon contami-nants in arctic marine mammals. Sci Total Environ1994;154:107–128.
Norstrom RJ, Belikov S, Born EW, Garner GW, Malone B,Olpienski S, Ramsay MA, Schliebe S, Stirling I, StishovMS, Taylor MK, Wiig Ø. Chlorinated hydrocarbon contam-inants in polar bears from eastern Russia, North America,Greenland and Svalbard: Biomonitoring of Arctic pollution.Environ Contam and Toxicol 1998;35(2):354–367.
Norstrom R Effects and trends of POPs on polar bears. In: S.Kalhok (Ed.), Synopsis of Research Conducted Under the2000y01 Northern Contaminants Program, Ottawa:Indianand Northern Affairs Canada, 2001 pp. 215–226.
Oehme M, Biseth A, Schlabach M, Wiig Ø. Concentrations ofpolychlorinated dibenzo-p-dioxins, dibenzofurans and non-ortho substituted biphenyls in polar bear milk from Svalbard(Norway). Environ Pollut 1995;90:401–407.
O’Hara TM, O’Shea TJ. Toxicology. In: Dierauf LA, GullandFMD, editors. CRC handbook of marine mammal medicine,2nd ed. USA: CRC Press, 2001. p. 471–520.
Pond CM, Mattacks CA, Colby RH, Ramsay MA. Theanatomy, chemical composition and metabolism of adiposetissue in wild polar bears(Ursus maritimus). Can J Zool1992;70:326–341.
Polischuk SC, Letcher RJ, Norstrom RJ, Ramsay MA. Prelim-inary results of fasting on the kinetics of organochlorines inpolar bears(Ursus maritimus). Sci Total Environ 1995;160y161:465–472.
Polischuk SC, Norstrom RJ, Ramsay MA. Body burdens andtissue concentrations of organochlorines in polar bears(Ursus maritimus) vary during seasonal fasts. Environ Pollut2002;118:29–39.
Ramsay MA, Stirling I. Reproductive biology and ecology offemale polar bears(Ursus maritimus). J Zool (London)1988;214:601–634.
Riget F, Dietz R, Cleemann M. Evaluation of the AMAPprogramme 1994–95, by use of power analysis. Illustratedby selected heavy metals and POPs. Sci Total Environ2000;245:249–259.
Riget F, Dietz R, Vorkamp K, Johansen P, Muir D. Levels,spatial and temporal trends of contaminants in Greenlandterrestrial, fresh water and marine biota: an updated review.Sci Total Environ(PII S0048-9697(04)00201-3).
Rosing-Asvid A, Born E W, Kingsley MCS. Age at sexualmaturity of males and timing of the mating season of polar
124 R. Dietz et al. / Science of the Total Environment 331 (2004) 107–124
bears (Ursus maritimus) in Greenland. Polar Biol2002;25:878–883.
Safe S. Comparative toxicology and mechanism of action ofpolychlorinated dibenzo-p-dioxins and dibenzofurans. AnnRev Pharmacol Toxicol 1986;26:371–399.
Safe S. Polychlorinated dibenzo-p-dioxins and related com-pounds: sources, environmental distribution, and risk assess-ment. Environ Carcinogen Ecotoxi Rev 1991;C9:261–302.
Safe S. Polychlorinated biphenyls(PCBs).: environmentalimpact, biochemical and toxic responses. and implicationsfor risk assessment. Crit Rev Toxicol 1994;24:87–149.
Smith TG. Polar bear predation of ringed and bearded seals inthe land-fast sea ice habitat. Can J Zool 1980;58:2201–2209.
Stirling I, Archibald WR. Aspects of predation of seals bypolar bears. J Fish Res Bd Can 1977;34:1126–1129.
Sandala GM, Sonne-Hansen C, Dietz R, Muir DCG, ValtersK, Bennett ER, Letcher RJ. Methyl sulfone and hydroxylatedPCB metabolites in adipose and whole blood of polar bear(Ursus maritimus) from Scoresby Sound, Greenland. SciTotal Environ(PII S0048-9697(04)00201-3).
Sandau CD, McAlees AJ, Letcher RJ, Meerts IATM, ChittimB, Brouwer A, Norstrom RJ. Identification of 4-hydroxy-heptachlorostyrene in polar bear plasma and its bindingaffinity to transthyretin: a metabolite of octachlorostyrene?Environ Sci Technol 2000;34(18):3871–3877.
Stokker Y. Interlaboratory quality assurance for the northerncontaminants program. In: Fisk AT, Hobbs KE, Muir DCG(Eds.), 2003. Contaminant Levels and Trends in the Biolog-ical Environment. Canadian Arctic Contaminants Assess-ment Report II. Indian and Northern Affairs Canada2003:111–127.
Swart RL, Ross PS, Vedder LJ, Timmerman HH, HeisterkampS, Loveren HV, Vos JG, Reijnders PJH, Osterhaus ADME.Impairment of immune function in harbour seals(Phoca
vitulina) feeding on fish from polluted waters. Ambio1994;23:155–159.
Takagi Y, Otake T, Kataoka M, Murata Y, Aburada S, AkasakaS, Hashimoto K, Uda H, Kitaura T. Studies on the transferand distribution of C-polychlorinated biphenyls from14
maternal to fetal and suckling rats. Toxicol Appl Pharmocol1976;39:549–558.
Tanabe S, Tatsukawa R, Maruyama K, Miyazaki N. Trans-placental transfer of PCBs and chlorinated hydrocarbonpesticides from the pregnant striped dolphin(Stenella coe-ruleoalba) to her fetus. Agric Biol Chem 1982;46(5):1249–1254.
Tanabe S, Kannan N, Subramanian A, Watanabe S, TatsukawaR. Highly toxic coplanar PCBs: occurrence, source persist-ency and toxic implications to wildlife and humans. EnvironPollut 1987;47:147–163.
Verreault J, Muir DCG, Norstrom RJ, Stirling I, Fisk AT,Gabrielsen GW, Derocher AE, Evans T, Dietz R, Sonne C,Born EW, Riget FF, Sandala GM, Taylor MK, Nagy J,Letcher RJ. Chlorinated Hydrocarbon Contaminants andMetabolites in Polar Bears(Ursus maritimus) From Sval-bard, Greenland, Alaska and Canadian Arctic Populations:1999–2002. Sci Total Environ. Submitted.
Wiberg K, Letcher RJ, Sandau C, Duffe J, Norstrom RJ,Haglund P, Bildeman T. Enantioselective gas chromatogra-phyymass spectrometry of methylsulfonyl PCBs with appli-cation to Arctic marine mammals. Anal Chem 1998;70:3845–3852.
Wiig Ø, Gjertz I, Hansson R, Thomassen J. Breeding of polarbears in Hornsund, Svalbard. Polar Rec 1992;28:157–159.
Wiig Ø, Derocher AE, Cronin MM, Skaare JU. Femalepseudohermaphrodite polar bears at Svalbard. J Wildl Dis-ease 1998;34(4):792–796.
Zar JH. Biostatistical analysis, 2nd ed. New Jersey, USA:Prentice-Hall, Inc., Englewood Cliffs, 1984. p. 07632.