analysis of long-period events recorded at mount etna (italy) in 1992, and their relationship to...
TRANSCRIPT

Analysis of long-period events recorded at Mount Etna (Italy)in 1992, and their relationship to eruptive activity
S. Falsaperla a;�, E. Privitera a, B. Chouet b, P. Dawson b
a Istituto Nazionale di Geo¢sica e Vulcanologia, Sezione di Catania, Piazza Roma 2, 95123 Catania, Italyb U.S.G.S, 345 Middle¢eld Road, MS 910, Menlo Park, CA 94025, USA
Received 12 October 2000; received in revised form 26 July 2001; accepted 26 July 2001
Abstract
Seismic activity recorded at Mount Etna during 1992 was characterized by long-period (LP) events and tremorwith fluctuating amplitudes. These signals were associated with the evolution of the eruptive activity that began onDecember 14, 1991. Following the occurrence of numerous volcano-tectonic earthquakes at the onset of the eruption,LP events dominated the overall seismicity starting in January, 1992. The LP activity occurred primarily in swarms,which were temporally correlated with episodic collapses of the crater floor in the Northeast Crater. Source depthsdetermined for selected LP events suggest a source region located slightly east of Northeast Crater and extending fromthe surface to a depth of 2000 m. Based on the characteristic signatures of the time series, four families of LP eventsare identified. Each family shares common spectral peaks independent of azimuth and distance to the source. Thesespectral features are used to develop a fluid-filled crack model of the source. We hypothesize that the locus of the LPevents represents a segment of the magma feeding system connecting a depressurizing magma body with a dikeextending in the SSE direction along the western wall of Valle del Bove, toward the site of the Mount Etna eruption.We surmise that magma withdrawal from the source volume beneath Northeast Crater may have caused repeatedcollapses of the crater floor. Some collapse events may have produced pressure transients in the subjacent dike whichacted as seismic wave sources for LP events. 9 2002 Elsevier Science B.V. All rights reserved.
Keywords: long-period event; crack; Etna; eruption; pit crater
1. Introduction
Mount Etna is located along the eastern coastof Sicily (Fig. 1) in a complex geodynamic regiondominated by convergence between Africa andEurope and the tensional processes of the Cala-
brian Arc and Ionian boundary (e.g. Ghisetti,1984; Malinverno and Ryan, 1986; Pollitz, 1991;Caccamo et al., 1996; Facenna et al., 1996;Cocina et al., 1997). The region is intersected bylithospheric fault systems with E^W, NE^SW,NW^SE and NNW^SSE orientations (Cristofoliniet al., 1979; Ghisetti, 1979; Lanzafame and Bous-quet, 1997; Monaco et al., 1997). The NNW^SSEoriented fault system crosses the eastern £ank ofthe volcano and plays an important role in themagmatic transport system beneath Etna (Fraz-zetta and Villari, 1981; Lo Giudice and Rasa',
0377-0273 / 02 / $ ^ see front matter 9 2002 Elsevier Science B.V. All rights reserved.PII: S 0 3 7 7 - 0 2 7 3 ( 0 1 ) 0 0 2 9 9 - 2
* Corresponding author. Tel. : +39-95-448084;Fax: +39-95-435801.
E-mail address: [email protected] (S. Falsaperla).
VOLGEO 2408 24-5-02 Cyaan Magenta Geel Zwart
Journal of Volcanology and Geothermal Research 114 (2002) 419^440
www.elsevier.com/locate/jvolgeores

1986; Ferrucci and Patane', 1993; Patane' et al.,1994; Bonaccorso et al., 1996).The persistent volcanic activity in the summit
craters is characterized by phases of quiet degas-sing alternating with mild Strombolian activity,which occasionally evolves into fountaining andlava over£ows. Lateral eruptions may also occur
from fracture systems along the £anks of the vol-cano. Volcanic products range from tholeiitic toalkaline basalts, and analysis of recent eruptedmagmas reveals a composition spanning the Ha-waiite and alkali basalt ¢elds (Armienti et al.,1989).The 1991^1993 eruption of Mount Etna pro-
Fig. 1. Permanent seismic network monitoring Mount Etna. Vertical component sensors are indicated by solid circles, three-com-ponent broadband sensors are marked by solid triangles. The two insets show the geographic location of Mount Etna and detailsof the active crater area, respectively. CC marks the location of the central crater.
VOLGEO 2408 24-5-02 Cyaan Magenta Geel Zwart
S. Falsaperla et al. / Journal Volcanology and Geothermal Research 114 (2002) 419^440420
duced the largest lava e¡usion from this volcanoin the past 300 yr. The eruption started on De-cember 14, 1991, and terminated on March 31,1993. During 473 days, 235U106 m3 of magmawas erupted, forming a lava ¢eld extending overroughly 7.6 km2 (e.g. Barberi et al., 1993; Ar-mienti et al., 1994; Calvari et al., 1994). The erup-tion developed along a fracture system originatingnear the SE subterminal crater and extending inthe SSE direction along the western wall of theValle del Bove, closely matching a previous frac-ture ¢eld formed in 1989. On December 14, 1991,brief episodes of lava fountaining occurred in theuppermost section of the fracture system, and twosmall lava £ows extended down the wall of Valledel Bove. Between December 14 and 15, 1991,eruptive activity resumed with a quiet e¡usionof magma accompanied by Strombolian explo-sions at the distal end (2200 m asl) of the fracturesystem. Strombolian activity faded during the fol-lowing months and ceased by the middle ofMarch, 1992. From March, 1992 through theend of March, 1993, eruptive activity was limitedto a sustained lava £ow from the distal end of thefracture system.By early 1991, numerous swarms of volcano-
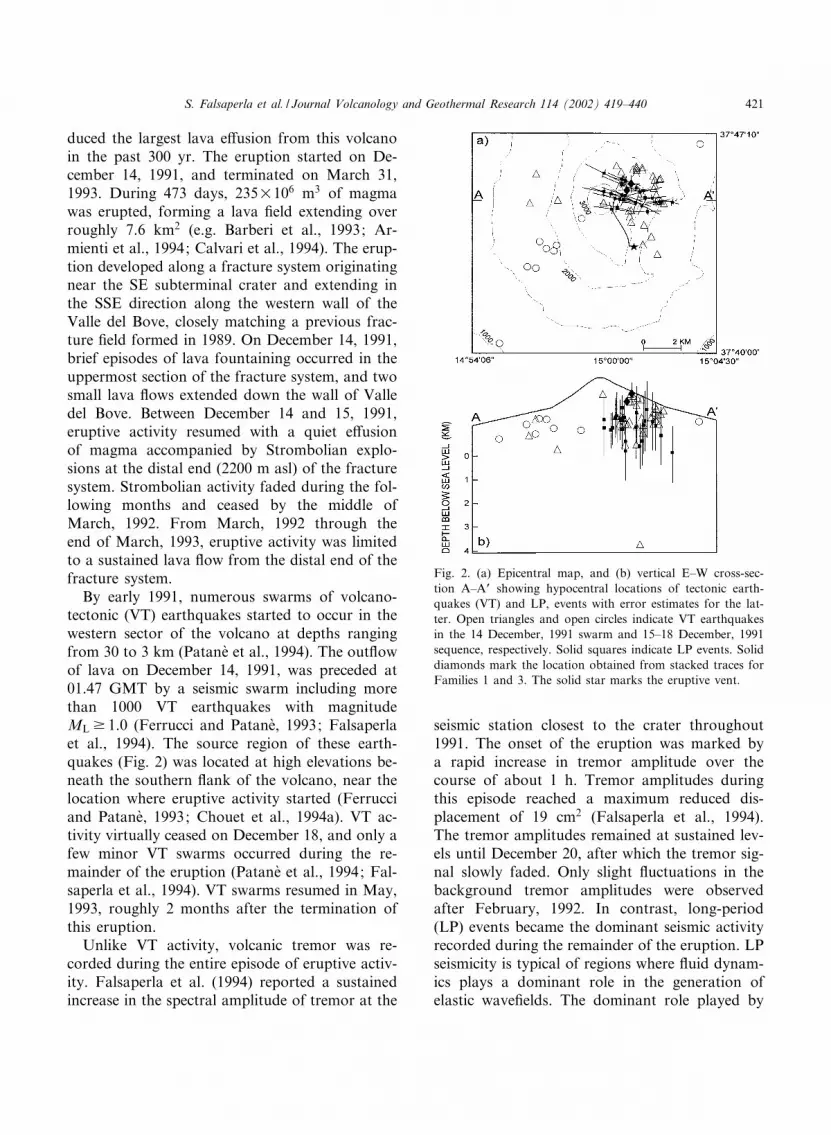
tectonic (VT) earthquakes started to occur in thewestern sector of the volcano at depths rangingfrom 30 to 3 km (Patane' et al., 1994). The out£owof lava on December 14, 1991, was preceded at01.47 GMT by a seismic swarm including morethan 1000 VT earthquakes with magnitudeMLv 1.0 (Ferrucci and Patane', 1993; Falsaperlaet al., 1994). The source region of these earth-quakes (Fig. 2) was located at high elevations be-neath the southern £ank of the volcano, near thelocation where eruptive activity started (Ferrucciand Patane', 1993; Chouet et al., 1994a). VT ac-tivity virtually ceased on December 18, and only afew minor VT swarms occurred during the re-mainder of the eruption (Patane' et al., 1994; Fal-saperla et al., 1994). VT swarms resumed in May,1993, roughly 2 months after the termination ofthis eruption.Unlike VT activity, volcanic tremor was re-
corded during the entire episode of eruptive activ-ity. Falsaperla et al. (1994) reported a sustainedincrease in the spectral amplitude of tremor at the
seismic station closest to the crater throughout1991. The onset of the eruption was marked bya rapid increase in tremor amplitude over thecourse of about 1 h. Tremor amplitudes duringthis episode reached a maximum reduced dis-placement of 19 cm2 (Falsaperla et al., 1994).The tremor amplitudes remained at sustained lev-els until December 20, after which the tremor sig-nal slowly faded. Only slight £uctuations in thebackground tremor amplitudes were observedafter February, 1992. In contrast, long-period(LP) events became the dominant seismic activityrecorded during the remainder of the eruption. LPseismicity is typical of regions where £uid dynam-ics plays a dominant role in the generation ofelastic wave¢elds. The dominant role played by
Fig. 2. (a) Epicentral map, and (b) vertical E^W cross-sec-tion A^AP showing hypocentral locations of tectonic earth-quakes (VT) and LP, events with error estimates for the lat-ter. Open triangles and open circles indicate VT earthquakesin the 14 December, 1991 swarm and 15^18 December, 1991sequence, respectively. Solid squares indicate LP events. Soliddiamonds mark the location obtained from stacked traces forFamilies 1 and 3. The solid star marks the eruptive vent.
VOLGEO 2408 24-5-02 Cyaan Magenta Geel Zwart
S. Falsaperla et al. / Journal Volcanology and Geothermal Research 114 (2002) 419^440 421

£uids produces a radiation spectrum characterizedby distinct narrow-band peaks and distinguishesthis seismicity from the B-type events described byMinakami (1974), whose broadband signatures
are characteristic of a source dominated by brittlefailure of rock. LP events are a manifestation ofpressurization inside magmatic and hydrothermalsystems (Fehler and Chouet, 1982; Chouet et al.,1994b; Chouet, 1996; Gil Cruz and Chouet,1997; Stix et al., 1997; Kumagai and Chouet,2000). During the 1991^1993 Etna eruption, LPevents usually occurred in swarms, although iso-lated LP events were observed beginning in Jan-uary, 1992. The largest LP swarm occurred onSeptember 6, 1992, and consisted of 60 LP events.During the periods February 26 through mid-March, 1992, on February 3, 1993, and March28 through April 4, 1993, LP swarms were tem-porally correlated with visual observations of re-peated collapses of the crater £oor in NE crater(Fig. 1), which led to the formation of a pit crater(Calvari et al., 1994; Coltelli et al., 1998). Thethree snapshots in Fig. 3 illustrate the evolutionof the Northeast Crater morphology from 1991 to1993. Although meteorological conditions and/orthe presence of vapor inside the crater did notallow other simultaneous observations, the signa-ture of LP events remained the same throughout1992, suggesting that a similar process of incre-mental collapses operated throughout the entireperiod. The temporal correspondence between LPseismicity and crater £oor collapses represents acase history for Mount Etna, as this type of occur-rence has not been reported for previous eruptions.In this paper, we focus on LP events recorded
at Etna during the interval February^September,1992. Our analyses are performed in the time,space, and frequency domains. The spectral peaksof the LP spectrum are used to model the LPsource. Our seismic results are compared withgravimetric and ground deformation data toshed light on the dynamics of the magma feedersystem during the 1991^1993 eruption.
2. Data
We analyze LP seismicity recorded in the inter-val February^September, 1992, which covers oneof the most active periods of seismic activity dur-ing the 1991^1993 eruption. The LP events wererecorded by a permanent seismic network com-
Fig. 3. (a) Aerial view of Northeast Crater a few days afterthe beginning of the eruption (December 19, 1991, courtesyof Al¢o Amantia). Details of the inner part of the crater canbe seen in the snapshots taken in July, 1992 (b) (courtesy ofPaola Del Carlo) and June 6, 1993 (c) (courtesy of SoniaCalvari), showing vertical walls and £at £oor typical of pitcraters. The photographs illustrate the deepening of the cra-ter from 1991 to 1993.
VOLGEO 2408 24-5-02 Cyaan Magenta Geel Zwart
S. Falsaperla et al. / Journal Volcanology and Geothermal Research 114 (2002) 419^440422

posed of nine stations (Fig. 1). The network is runby the Istituto Nazionale di Geo¢sica e Vulca-nologia, in Catania, which has monitored the vol-cano continuously since 1989. The network in-cludes seven analog stations equipped withvertical 1-Hz seismometers, and two digital sta-tions (ESP and EGA in Fig. 1) featuring broad-band (0.1^100 Hz) three-component sensors. Atemporary digital station equipped with a three-component short-period sensor was also used atsite TDF (Fig. 1). The seismic signals are trans-mitted either by cable or radio from the remotesites to Catania, where they are recorded on paperand processed by an automatic system that carriesout real-time analyses and archives the digitaldata. Located 2.5 km from the summit craters,station PDN (Fig. 1) shows the earliest P-wavearrivals for all the LP events analyzed. As PDNis the sensor nearest to the source, we use this siteas the reference station for our analyses. We se-lected a subset of LP events for our analysesbased on their reduced displacement being abovea minimum threshold amplitude.The reduced displacement for surface waves is
given by Fehler (1983) as:
RMSðuÞWffiffiffiffiffiffi1 r
p¼ A
ffiffiffiffiffi1
pr
2ffiffiffiffiffiffiffiffi2M
p ð1Þ
where u is the measured displacement amplitude,A is the peak to peak amplitude of surface waves,1 is the wavelength, r is the epicentral distance,and M is the instrument magni¢cation. LP eventsreaching a maximum reduced displacement of 104cm2 were recorded in April and September, 1992,during the most energetic phases of seismic activ-ity. Values of 110 cm2 were reported for LP seis-micity recorded at Galeras (Colombia) during theemplacement and extrusion of a lava dome in1991 (Gil Cruz and Chouet, 1997). We use 50LP events with a minimum reduced displacementof 8 cm2 selected from the data recorded at PDN.
2.1. Temporal and spectral characteristics of theLP seismicity
Chouet et al. (1994a) highlighted the di¡erencesin waveforms and spectral content between closelylocated VT and LP events at Etna. VT events arecharacterized by clear P and S arrivals and broad-
Fig. 4. Seismograms, spectrograms, and spectra of vertical ground velocity for stacked LP events in each of four LP families re-corded at PDN. (a) Family 1, (b) Family 2, (c) Family 3, and (d) Family 4.
VOLGEO 2408 24-5-02 Cyaan Magenta Geel Zwart
S. Falsaperla et al. / Journal Volcanology and Geothermal Research 114 (2002) 419^440 423

band spectral contents with corner frequencies ex-tending up to 10 Hz. LP events show emergent Pphases, weak or non-existent S phases, and multi-ple narrowband spectral peaks with dominant fre-quencies below 5 Hz. The absence of a high-fre-quency phase at the beginning of each eventdistinguishes the LP events recorded at MountEtna from those recorded at Redoubt (Chouetet al., 1994b) and Galeras (Gil Cruz and Chouet,1997), where typical LP signatures are character-ized by a high-frequency onset. This may be dueto anelastic attenuation a¡ecting the signals ob-served at Etna, and/or source e¡ects.
Earthquake families are a recurrent feature ofseismicity observed in volcanic areas (e.g. Okadaet al., 1981; Malone, 1983; Stephens et al., 1994),and are attributed to similar source mechanismsoperating in small volumes of rocks. Four familiesof LP events can be identi¢ed in the Etna databased on similarities between waveforms. Thesefamilies represent 60% of the selected events.Fig. 4 shows a stack of LP events representativeof each family at our reference station PDN. It isworth noting that a close similarity between sig-natures of events in each family is observed ateach station of the network. For example, the
Fig. 5. Vertical component of ground velocity recorded at di¡erent stations for Family 1. (a) Station PDN, (b) station ESP, (c)station EGA, (d) station SCV, and (e) station CTS. The bottom trace shows the stack obtained at each station. Year, month,day, hour and minute at the onset of each event are indicated at the upper left of each trace.
VOLGEO 2408 24-5-02 Cyaan Magenta Geel Zwart
S. Falsaperla et al. / Journal Volcanology and Geothermal Research 114 (2002) 419^440424

waveforms for Family 1 recorded at various dis-tances from the crater are depicted in Fig. 5.Three of the four families consist of events withindividual duration of about 20 s, whereas Family4 includes events with longer duration (about40 s). The temporal distribution of LP events in-dicates that the four families are concurrent (seeFigs. 5 and 6). No temporal evolution was ob-served in the signatures of LP events in individualfamilies.Hypocenters for the best constrained LP events
are located from ¢rst-arrival phase picks using amodi¢ed version of HYPOELLIPSE (Lahr,1989), and a seven-layer velocity model derivedfrom the velocity structure proposed by Hirn et
al. (1991). An epicentral map and an E^W cross-section of LP and VT hypocenters for events re-corded during the interval December, 1991^Sep-tember, 1992 are shown in Fig. 2. The sourceregion of LP events is located slightly east ofNortheast Crater and extends from the surfaceto sea level. No VT event occurs within this re-gion. The scattered distribution of LP hypocenters(Fig. 2) is the result of uncertainties in theP-phase picks. The observed similarity in wave-forms within each family at each site suggeststhat the source volume may be signi¢cantly small-er than that determined by hypocentral locations.To improve the signal-to-noise ratio and reducethe location errors, we also compute the sourcelocations for events of Families 1 and 3 usingtheir stacked traces. We consider these two fami-lies, which show the strongest similarity in wave-forms, to look for di¡erences in their relative lo-cation. The results of these analyses are depictedin Fig. 2 and can be compared with the locationsobtained for individual events. Higher precisionrelative locations obtained using the cross-spec-trum method of Fremont and Malone (1987) in-dicate that all LP events occurred within a re-stricted source volume a few hundred meterswide (S. Gambino, personal communication).Average spectra obtained at station PDN for
each family are shown in Fig. 4. We used thespectral averaging method of Yuen (1978). Thepower spectra in Fig. 4 were obtained by stackingand averaging the spectra calculated for the ver-tical component of ground velocity for each eventin a family. A 20-s-long window was used to cal-culate each spectrogram. LP events recorded atPDN exhibit a dominant peak at slightly di¡erentfrequencies in each family. The dominant fre-quency is 3 Hz in Family 1, 3.3 Hz in Families2 and 4, and 3.5 Hz in Family 3. Representativeexamples of power spectra obtained on the per-manent network for events from Family 1 aredepicted in Fig. 7. Narrow-band spectra are ob-served at all the stations for all the LP eventsanalyzed. The energy is concentrated between 1and 5 Hz, well below the usual frequency bandof VT events recorded at the same stations. Thefrequencies of the spectral peaks recorded at twoor more stations are listed in Table 1 for the four
Fig. 6. Vertical component of ground velocity recorded atstation PDN for: (a) Family 2, (b) Family 3, and (c) Family4. Note the di¡erent time scale in c. The bottom trace showsthe stack for each family. Year, month, day, hour and min-ute at the onset of each event are indicated at the upper leftof each trace.
VOLGEO 2408 24-5-02 Cyaan Magenta Geel Zwart
S. Falsaperla et al. / Journal Volcanology and Geothermal Research 114 (2002) 419^440 425

families of LP events. No spectral data are avail-able at SCV for Family 4, and EGA for Families3 and 4, as no records were obtained for theseevent families at these stations. Many commonspectral peaks are observed at stations separatedby distances of up to 20 km within our resolutionof P 0.05 Hz. A comparison of the spectra in Fig.7 highlights a range of excitation for spectralpeaks observed at di¡erent stations, which isprobably due to a combination of path and sitee¡ects. Despite these di¡erences in spectral ampli-tudes, however, the evidence for common spectralpeaks is compelling. As the wave¢elds recordedover such distant sites are obviously uncorrelated,some of the observed spectral features must besource related. In the following, we use polariza-tion analyses to explore some of the other char-acteristics of the source of LP events.
2.2. Polarization analyses
We use a method based on the algorithm ofFlinn (1965), as developed by Jurkevics (1988),to determine the wave¢eld composition. Usingthree-component records, we calculate a cova-riance matrix whose eigenvalues and eigenvectorsdetermine the amplitudes and directions of theparticle motion polarization. In this procedure,the data are ¢ltered and polarization is estimatedon overlapped, tapered windows. This methodprovides a powerful tool to characterize the com-position of the wave¢eld when a suitable networkgeometry is available and/or dense seismic anten-nas are deployed. Our analysis is only partiallyrepresentative of the overall seismic wave¢elddue to the limited number of three-componentrecords available. Nevertheless, it sheds light on
Fig. 7. Stacked spectra of vertical ground velocity obtained at ¢ve stations of the Etna network for the ¢rst family of LP eventsshown in Fig. 4a. Numbered arrows indicate peaks observed at two or more stations (see Table 1).
VOLGEO 2408 24-5-02 Cyaan Magenta Geel Zwart
S. Falsaperla et al. / Journal Volcanology and Geothermal Research 114 (2002) 419^440426

some characteristics of the waves associated withthe LP source.The subset of events analyzed consists of LP
events representative of each family recorded at
station ESP (Fig. 8), with the exception of Family2 for which no three-component record is avail-able at this station. We also carried out analysesof LP events belonging to Families 2 and 3 re-
Table 1Observed frequencies (Hz) of spectral peaks
Peak CTS EGA ESP PDN SCV
Family 11 0.85 0.85 ^ ^2 0.98 ^ ^ ^ 1.023 ^ 1.16 1.10 1.10 ^4 ^ ^ ^ 1.28 1.345 1.46 1.46 1.46 ^ ^6 ^ 1.95 2.01 2.05 2.017 2.26 2.32 2.26 ^ ^8 ^ 2.50 2.44 ^ 2.449 2.72 2.69 2.62 2.69 2.6210 ^ 3.05 ^ 2.99 3.0511 3.30 3.30 3.30 3.30 3.2512 3.60 3.60 ^ 3.54 3.5413 ^ 3.78 3.78 3.78 ^14 3.91 ^ ^ ^ 3.91
Family 21 ^ 0.85 0.85 ^ ^2 ^ 1.16 1.10 1.10 ^3 1.28 ^ ^ 1.28 1.284 1.40 1.46 ^ ^ ^5 ^ 1.95 ^ 2.05 2.016 ^ 2.50 2.44 2.44 2.447 2.62 2.69 2.62 2.69 ^8 2.81 ^ 2.87 ^ 2.879 ^ 3.05 ^ 2.99 ^10 3.30 3.30 3.25 3.35 3.3011 3.60 3.60 ^ 3.54 ^12 ^ 3.78 3.78 ^ ^13 3.91 ^ ^ 3.85 3.91
Family 31 1.59 ^ 1.53 ^ ^2 1.77 ^ 1.83 1.83 ^3 ^ ^ 2.26 2.26 ^4 ^ ^ 2.69 2.62 2.725 2.87 ^ 2.93 2.87 ^6 ^ ^ 3.11 ^ 3.117 3.30 ^ 3.35 3.30 3.258 ^ ^ 3.85 ^ 3.91
Family 41 1.16 ^ 1.16 1.22 ^2 ^ ^ 1.40 1.40 ^3 ^ ^ 1.77 1.77 ^4 ^ ^ 1.95 1.95 ^5 3.30 ^ 3.05 3.11 ^6 ^ ^ 3.30 3.30 ^7 3.85 3.85 ^
VOLGEO 2408 24-5-02 Cyaan Magenta Geel Zwart
S. Falsaperla et al. / Journal Volcanology and Geothermal Research 114 (2002) 419^440 427

corded at stations TDF and EGA. Station TDF islocated very close to the source region of LP seis-micity and is also very near the cli¡ £anking Valledel Bove to the WNW (Fig. 1). Characteristics ofthe wave¢eld observed in the TDF records werethus attributed to a combination of near-¢eld and
topographic e¡ects. For this reason, no furtherattempt was made to interpret the polarizationobserved at TDF in terms of source properties.The polarization analyses at ESP and EGA
highlight complex temporal patterns with highvariability of the incident wavefront (Fig. 8).
Fig. 8. Example of polarization analysis performed at stations ESP (Family 1, Family 3, and Family 4) and EGA (Family 3).The seismogram at the top of the ¢gure depicts the vertical component. Zero degrees corresponds to the east^west direction inazimuth, and vertical direction for the incidence angle. The vertical band of shading marks the LP event onsets, which are domi-nated by P motion. The vertical dotted line identi¢es the largest component of motion in the LP record due to SH waves.
VOLGEO 2408 24-5-02 Cyaan Magenta Geel Zwart
S. Falsaperla et al. / Journal Volcanology and Geothermal Research 114 (2002) 419^440428

The general interpretation of these patterns sug-gests the presence of body waves arriving from abroad range of azimuths. Apart from body waves,particle motion analysis shows surface waves,some of which have retrograde elliptical motioncharacteristic of Rayleigh waves (Chouet et al.,1994a).We describe the main polarization characteris-
tics shared at ESP and EGA by LP events indi¡erent families, focusing on the ¢rst arrivalsand maximum of the normalized eigenvalue func-tion. First arrivals (see vertical band of shading inFig. 8) are dominated by waves with high rectili-nearity and sharply varying azimuth. Incidenceangles at the event onset are nearly vertical andvary slightly in LP events belonging to di¡erentfamilies, probably re£ecting di¡erent sourcedepths.The dominant eigenvalue is characterized by a
high rectilinearity (see vertical dotted line in Fig.8) and is polarized in the horizontal plane in adirection that is almost orthogonal to the ¢rstarrival direction. This feature suggests that thesephases are dominated by SH waves. Overall, ourpolarization study reveals a wave¢eld character-ized by a combination of body and surface waves,which show similarities in events belonging to dif-ferent families. The main feature of the wave¢eldsis the prevalent horizontal polarization. These re-sults are in agreement with the ¢ndings of polar-ization analyses carried out on volcanic tremorand gas^piston events recorded at other volca-noes, such as Hawaii (Ferrazzini et al., 1991)and Stromboli (Chouet et al., 1997).
3. Crack model
The similar signatures of the LP waveforms andcommon spectral peaks observed at all the sta-tions suggest that a repeatedly activated resonatorgenerated the LP events. Table 1 shows that thespectral peaks are not regularly spaced. Simplespherical models (Crosson and Bame, 1985), ororgan pipe source models (e.g. Seidl et al., 1981;Chouet, 1985) cannot produce these types of har-monics. We assume that the observed spectralcharacteristics of LP events at Etna are produced
by a crack-like source, and compare the spectralpeaks of the four LP families with the modes ofresonance of the £uid-¢lled crack model ofChouet (1986, 1988, 1992). This model accountsfor the interference of the lateral and longitudinalmodes of resonance of the crack, which producesirregularly spaced peaks. In addition, a £uid-¢lledcrack is an excellent generator of shear waves andthus can provide a natural explanation for thestrong shear components observed in the signal.Chouet (1986) used a ¢nite di¡erence method
to calculate the dynamic response of a rectangular£uid-¢lled crack. The impulse response of thecrack depends on a dimensionless parametercalled the crack sti¡ness de¢ned as:
C ¼ bW
Ld
ð2Þ
where b is the bulk modulus of the £uid, W is therigidity of the solid, L is the crack length, and d isthe crack aperture. The crack sti¡ness controls thespeed of the crack wave, which is always slowerthan the acoustic speed of the £uid, leading toresonant periods that are longer than those ex-pected from acoustic resonance. The dispersioncharacteristics of the crack wave can be describedin terms of the dimensionless ratio e/a plotted asa function of dimensionless wavelength 1/L, inwhich e is the phase velocity of the crack wave,a is the acoustic speed of the £uid, and 1 is thewavelength. Dispersion curves are shown in Fig. 9for several values of crack sti¡ness. A transversecrack sti¡ness may be de¢ned by replacing thecrack length L by the crack width W in Eq. 2.In our analysis, we consider a crack containing
a two-phase £uid composed of gas and liquid, andassume that the gas phase is dominated by watervapor. The robustness of our model is tested fordi¡erent values of the ratio K/a, where K is thecompressional wavespeed in the rock, which isassumed constant.
3.1. Application of the crack model
The physical parameters of the solid (e.g. ri-gidity, density, P- and S-wave velocities) and £uid
VOLGEO 2408 24-5-02 Cyaan Magenta Geel Zwart
S. Falsaperla et al. / Journal Volcanology and Geothermal Research 114 (2002) 419^440 429

(e.g. bulk modulus, density, sound velocity) play acritical role in the estimation of the source dimen-sion. We de¢ne these parameters by consideringtwo plausible conditions representative of £uidsmostly constituted by liquid (Model 1), or foam(Model 2). We also consider a third, more ex-treme condition in which the £uid is a pure gas(Model 3). The model parameters are ¢xed fromthermodynamic conditions (Table 2). The valuesfor Model 1 are based on thermodynamic condi-tion number 3 in Table 2, and those for Model 2represent average values of the parameters ob-tained in thermodynamic conditions 1, 2, and 4in Table 2. Parameter values for Model 3 arebased on literature data (see Appendix A).To determine whether the frequencies listed in
Table 1 are compatible with the dispersion curvesin Fig. 9, we calculate the dimensionless frequencyXP= (e/a)/((K/a)(1/L)), in which e/a is obtainedfrom the dispersion curves. We assume the oscil-lation mode associated with a speci¢c spectralpeak, and use the wavelength 1 of that modegiven by the model. The crack length, L, is thencalculated from the observed spectral peak fre-quency, X, using the relation L=KXP/X. The matchbetween our data and the dispersion curves isfound by applying a trial and error procedure.We accept the ¢t when it is obtained on a su⁄-cient number of spectral peaks in the sequence ofTable 1, and is compatible with a single crackdimension within a tolerance of 10%. In oursearch for a match, we ¢rst ¢t the sequence offrequencies listed in Table 1 by assuming thatthese represent the longitudinal modes of vibra-tion. The frequencies that do not ¢t are thentreated as lateral modes using the same procedure.In that case, the parameter L is substituted withthe parameter W in Fig. 9, and we calculate the
transverse crack sti¡ness Ct = (b/W)(W/d), which isdirectly derived from the ratio W/L. For eachfamily, we apply a wide range of combinationsof modes of resonance and spectral peaks for avariety of crack sti¡nesses. The procedure is re-peated using di¡erent values of sound velocity(Table 2). We obtained one model (Model 2)which shows a reasonable ¢t for each family. Oth-er models show a high number of frequencies thatdo not match the ¢xed crack dimensions. Theresults of the ¢ts are shown in Table 3. Longitu-dinal and lateral modes of resonance that matchthe observed spectral peaks of the four familiesare reported in Table 4. The few spectral peaksthat do not match the models are interpreted asthe results of departures from the rectangularcrack geometry and/or simpli¢ed £uid dynamics
Table 2Thermodynamic parameters
Condition P H2O Ag bl bg bm cpg cvg cl m am b b/W K/am bm/bs(MPa) (wt%) (g/cm3) (g/cm3) (g/cm3) (kJ/K kg) (kJ/K kg) (kJ/K kg) (km/s) (MPa)
1 10 1 0.47 2.57 0.02 1.37 2.61 2.15 1.44 0.004 1.72 25.6 0.0026 1.98 0.552 10 2 0.76 2.57 0.02 0.63 2.59 2.13 1.44 0.014 1.75 14.3 0.0014 1.94 0.263 25 1 0 2.56 ^ 2.56 ^ ^ 1.45 0 2 1.7^
1.9U1041.7172 1.7 1.04
4 25 2 0.34 2.54 0.04 1.69 2.67 2.21 1.46 0.007 1.82 80.6 0.0081 1.87 0.68
Fig. 9. Ratio e/a of the phase velocity of the crack wave toacoustic speed of the £uid, plotted as a function of dimen-sionless wavelength 1/L for various crack sti¡nesses rangingbetween 50 and 500. (Reproduced from Chouet, 1986, 1992;Chouet et al., 1994b.)
VOLGEO 2408 24-5-02 Cyaan Magenta Geel Zwart
S. Falsaperla et al. / Journal Volcanology and Geothermal Research 114 (2002) 419^440430

in Chouet’s model. The overall results provide anargument in favor of the assumption that the fre-quencies listed in Table 1 are the e¡ects of sourceproperties.
3.2. Excess pressure
To complete our analysis, we consider the ex-cess pressure vP acting at the LP source. Theexcess pressure may be estimated from the expres-sion for surface waves given by (Aki, 1984):
RMSðvPÞ ¼ 2ZRMSðuÞffiffiffiffiffiffi1 r
p
ð1=QRÞ1=2½V=ðN X b sbcÞ�1=2 ð3Þ
where RMS(u) is the reduced displacement ofsurface waves, QR is the quality factor corre-sponding to the radiation loss, V is the volumeof the crack, N is a factor characterizing the e¡ec-tive depth of penetration of surface waves, X is thedominant frequency of LP events, bs is the densityof the solid, b is the bulk modulus of the £uid,and c is the surface wave velocity.We estimate vP for the minimum and maxi-
mum values of the reduced displacements of Ray-leigh waves. For the LP seismicity consideredhere, these reduced displacements range from 8to 104 cm2. The volume of the crack is di¡erentin each of the four families of LP events. Theactual values of V we use for each model arereported in Table 3. We assume a homogeneoushalf space and ¢x N=0.2 (Aki, 1984). Values of Xare 3.0 Hz (Family 1), 3.3 Hz (Family 2), 3.5 Hz(Family 3), and 3.3 Hz (Family 4). These valuescorrespond to the spectral peak having the largestamplitude at PDN. Based on the assumptions de-scribed in Appendix A, we ¢x bs = 2.47 g/cm3,b=1.8U104, 25.6, 14.3, and 14 MPa, respectively,in the four simulations considered, and usec=1.59 km/s.The quality factor QR is obtained from the re-
lation Q31R =Q313Q31
i (Aki, 1984), where Q isthe apparent quality factor and Qi is the qualityfactor due to intrinsic losses at the source. Thevalues of QR we consider for Models 1 and 2are obtained from the results of Kumagai andChouet (2000), and are representative of cracks
containing a pure liquid (Model 1), or foamy liq-uid (Model 2) for the physical conditions consid-ered in our simulations. For all families we ¢xQR = 5 for a pure liquid (Model 1), and QR = 180for a foamy liquid (Model 2) (Kumagai andChouet, 1999, 2000) (Table 3).For a pure gas, Q31
i is negligibly small com-pared to Q31
R (Kumagai and Chouet, 2000) sothat QVQR. Therefore, our estimate of QR forModel 3 is the result of a direct measurement ofthe quality factor for each family. The factor Q isgiven by (Aki and Richards, 1980):
Q ¼ X
vX
ð4Þ
where X is the frequency of the dominant spectralpeak, and vX is the bandwidth of the spectralpeak measured at mid-spectral amplitude. Fromthe largest spectral peak at PDN, we obtainQ=17 for Family 1 and Family 2, Q=13 forFamily 3, and Q=18 for Family 4 (Table 3).These values are used in Eq. 3 assuming QRwQ.The excess pressures estimated with Eq. 3 are
listed in Table 3. Although there are remarkabledi¡erences in the values of vP calculated for thethree models, the range of variation in all familiesof LP events for a given model is quite small. Theminimum and maximum excess pressures associ-ated with the four families are 20 and 280 kPa forModel 1. In Model 2, vP spans the range 5^60kPa, and in Model 3, vP is in the range 0.8^17kPa.
4. Discussion and conclusions
The locus of LP seismicity in 1992 is con¢nedto a small volume located southeast of the summitcraters and ranging in depth from the surface tosea level (Fig. 2). No VT earthquake occurred inthe same area immediately before and/or duringthe eruption. VT earthquakes were located in awide area surrounding the region of LP hypocen-ters (Fig. 2). Chouet et al. (1994a) postulated thatthe lack of VT seismicity in this region may bedue to the absence of strong barriers to magmaticintrusion along a pathway overlapping the NE
VOLGEO 2408 24-5-02 Cyaan Magenta Geel Zwart
S. Falsaperla et al. / Journal Volcanology and Geothermal Research 114 (2002) 419^440 431

Table 3Longitudinal (Long) and lateral (Lat) modes of resonance
Family 1
Model 1 Model 2 Model 3
C=500 L=388 m C=500 L=396 m C=200 L=386 mCt = 466 W=370 m Ct = 457 W=362 m Ct = 191 W=365 mb/W=0.1 d=7.8 cm b/W=0.1 d=7.9 cm b/W=0.1 d=19.3 cmK/a=1.7 V=11 198 m3
K/a=2.3 V=11 325 m3K/a=3.4 V=27 192 m3
QR =5 vP=21.9^284.4 kPa QR = 180 vP=4.9^64 kPa QR =17 vP=1^12.7 kPa
Vibration mode dimensions (m)
X(Hz) Long. Lat L W X(Hz) Long. Lat L W X(Hz) Long. Lat L W
0.85 L/2 424 0.85 W/2 338 0.85 W/2 3531.00 W/2 384 1.00 2L/5 389 1.00 2L/5 4031.13 1.13 2W/5 368 1.131.30 2L/5 400 1.30 L/3 412 1.30 2W/5 3401.46 2W/5 380 1.46 W/3 395 1.46 L/3 3862.00 L/3 358 2.00 2W/7 356 2.00 2L/7 3532.29 W/3 336 2.29 L/4 369 2.292.46 2L/7 359 2.46 2L/9 415 2.46 L/4 3902.69 2W/7 354 2.69 W/4 343 2.69 W/4 3463.00 L/4 376 3.00 L/5 407 3.00 2L/9 3893.30 W/4 373 3.30 2W/9 338 3.30 2W/9 3933.57 2L/9 382 3.57 W/5 350 3.57 L/5 3783.78 2W/9 394 3.78 2L/11 385 3.78 W/53.91 L/5 417 3.91 2W/11 404 3.91 2L/11 405 394
Family 2
Model 1 Model 2 Model 3
C=500 L=389 m C=500 L=407 m C=200 L=396 mCt = 466 W=378 m Ct = 480 W=391 m Ct = 183 W=362 mb/W=0.1 d=7.8 cm b/W=0.1 d=8.1 cm b/W=0.1 d=19.8 cmK/a=1.7 V=11 469 m3
K/a=2.3 V=12 890 m3K/a=3.4 V=28 384 m3
QR =5 vP=21.6^281 kPa QR = 180 vP=4.6^60 kPa QR =17 vP=0.9^16.8 kPa
Vibration mode dimensions (m)
X(Hz) Long. Lat L W X(Hz) Long. Lat L W X(Hz) Long. Lat L W
0.85 L/2 424 0.85 0.85 W/2 3531.13 1.13 2W/5 368 1.13 2L/5 3541.28 2L/5 406 1.28 L/3 418 1.28 2W/5 3461.43 2W/5 388 1.43 W/3 403 1.43 L/3 3942.00 L/3 358 2.00 L/4 422 2.00 2W/7 3792.47 2L/7 359 2.47 W/4 374 2.47 L/4 3892.66 2W/7 358 2.66 2L/9 384 2.66 W/4 3502.84 2.84 2W/9 393 2.84 2L/9 4113.02 L/4 374 3.02 L/5 404 3.023.30 W/4 373 3.30 W/5 402 3.30 L/5 4093.57 2L/9 382 3.57 2L/11 408 3.57 2W/9 3633.78 2W/9 394 3.78 3.78 2L/11 4193.91 L/5 417 3.91 2W/11 404 3.91 W/5 381
VOLGEO 2408 24-5-02 Cyaan Magenta Geel Zwart
S. Falsaperla et al. / Journal Volcanology and Geothermal Research 114 (2002) 419^440432

branch of the fracture system which opened in1989. Based on this assumption we suggest thatanomalous thermal conditions may have stronglya¡ected the region in which LP events occurred.Thus, high temperatures due to magma intrusionmay have e¡ectively prevented the brittle failureof rocks and attendant occurrence of VT earth-quakes.The majority of LP events can be classi¢ed into
four families on the basis of waveform similarity.Particle motion and polarization analyses provideevidence for the presence of both body and sur-face waves in the wave¢elds of LP events. The
wave¢elds show dominant horizontal polariza-tion. These features suggest that the source is ane⁄cient SH wave generator, and are indicativethat the source geometry is incompatible with asimple spherical or vertical pipe-like object. Fur-thermore, spectral analyses reveal several domi-nant peaks that are common to records fromwidely separated stations for which the wave¢eldsare obviously uncorrelated. The common spectralpeaks are interpreted as evidence of a source ef-fect, and are used to model the source. The sourceis modeled as a £uid-¢lled crack (Chouet, 1986,1988, 1992), which is an e⁄cient SH-wave gener-
Table 3 (Continued).
Family 3
Model 1 Model 2 Model 3
C=500 L=401 m C=500 L=395 m C=200 L=412 mCt = 466 W=370 m Ct = 489 W=386 m Ct = 183 W=378 mb/W=0.1 d=8.0 cm b/W=0.1 d=7.9 cm b/W=0.1 d=20.6 cmK/a=1.7 V=11 869 m3
K/a=2.3 V=12 045 m3K/a=3.4 V=32 082 m3
QR =5 vP=21.3^276.2 kPa QR = 180 vP=4.8^62.2 kPa QR =13 vP=0.8^10.2 kPa
Vibration mode dimensions (m)
X(Hz) Long. Lat L W X(Hz) Long. Lat L W X(Hz) Long. Lat L W
1.56 2W/5 356 1.56 2L/7 424 1.56 W/3 3901.80 L/3 397 1.80 2W/7 396 1.80 2L/7 3932.26 2L/7 391 2.26 L/4 374 2.26 L/4 4252.66 2W/7 358 2.66 2L/9 384 2.66 W/4 3502.93 L/4 385 2.93 L/5 417 2.93 2L/9 3993.11 W/4 396 3.11 2W/9 359 3.11 L/5 4343.30 2L/9 413 3.30 W/5 402 3.30 2W/9 3933.88 L/5 420 3.88 2L/11 375 3.88 2L/11 408
Family 4
Model 1 Model 2 Model 3
C=500 L=402 m C=500 L=393 m C=200 L=400 mCt = 460 W=396 m Ct = 471 W=370 m Ct = 191 W=381 mb/W=0.1 d=8.0 cm b/W=0.1 d=7.9 cm b/W=0.1 d=20.0 cmK/a=1.7 V=12 735 m3
K/a=2.3 V=11 487 m3K/a=3.4 V=30 480 m3
QR =5 vP=20.5^266.7 kPa QR = 180 vP=4.9^63.5 kPa QR =18 vP=0.9^12.3 kPa
Vibration mode dimensions (m)
X(Hz) Long. Lat L W X(Hz) Long. Lat L W X(Hz) Long. Lat L W
1.19 1.19 1.19 2W/5 3721.40 2W/5 396 1.40 L/3 383 1.40 L/3 4031.77 L/3 404 1.77 2L/7 374 1.77 2L/7 3991.95 W/3 395 1.95 L/4 433 1.95 2W/7 3893.08 L/4 366 3.08 L/5 396 3.08 2L/9 3793.30 2L/9 413 3.30 W/5 370 3.30 L/5 4093.85 L/5 423 3.85 2L/11 378 3.85 2L/11 411
VOLGEO 2408 24-5-02 Cyaan Magenta Geel Zwart
S. Falsaperla et al. / Journal Volcanology and Geothermal Research 114 (2002) 419^440 433

ator and can explain irregularly spaced peaks interms of the interference between the lateral andlongitudinal modes of resonance of the crack. Weconsidered di¡erent values of the model parame-ters assuming physical conditions of the systemthat are representative of a pure liquid (Model1), foam (Model 2), or pure gas (Model 3). Weobtained a good match between our spectral dataand the dispersion characteristics of a crack wave,from which we derived several crack modelswhose dimensions are listed in Table 4.The observed eruptive activity leads us to reject
Model 3 as unrealistic. The remaining two modelsmay be representative of actual conditions in themagmatic system, and di¡erences between thesemodels may be ascribed to di¡erent sourcedepths. Model 2 is the preferred solution becauseit is closer to the actual pressure conditions at thedepth of the LP sources as inferred from analyt-ical locations obtained from stacked traces.As the dimensions of the rectangular cracks
obtained from our simulations are comparable,the di¡erences among Families 1, 2 and 3 maybe explained as the result of slight variations inthe position of the trigger of crack resonance. Theresults of high-precision, relative locations sup-
port this assumption, suggesting di¡erences in fo-cal depths on the order of tens of meters (S. Gam-bino, personal communication) for LP eventsbelonging to Families 1 and 3.LP events belonging to Family 4 have longer
duration than those observed in the other threefamilies. This increased duration of the signal maybe explained by an increase in the impedance con-trast between £uid and solid, associated withchanges in the £uid properties. Speci¢cally, anincrease in gas content would produce decreasesin the bulk modulus and acoustic speed of the£uid. We surmise that slight changes in magmacomposition (for example, an increase in wt%H2O) could be at the origin of the longer durationsignals.The relationship between eruptive activity and
LP seismicity is an intriguing aspect of the 1991^1993 eruption. Joint visual and seismological ob-servations point to a temporal correlation be-tween LP swarms and collapses of the crater £oorin Northeast Crater. This correlation is well docu-mented for the interval from February 26 to mid-March, 1992, on February 3, 1993, and fromMarch 28 through April 4, 1993. Although nosimultaneous observations of the £oor of NE cra-
Table 4Application of the £uid-¢lled crack model
Model C Ct L W d Z vP K/am bm/bs b/W Number of peaksmatched
(m) (m) (cm) (kPa)
Family 11 500 466 388P 25 370P 21 7.8P 0.5 5.35 21.9^284.4 1.7 1.04 0.1 13/142 500 457 396P 18 362P 26 7.9P 0.4 7.29 4.9^64 2.3 0.50 0.1 14/143 200 191 386P 18 365P 26 19.3P 0.9 24.42 1^12.7 3.4 0.05 0.1 12/14
Family 21 500 466 389P 27 378P 16 7.8P 0.5 5.37 21.6^281 1.7 1.04 0.1 11/132 500 480 407P 15 391P 16 8.1P 0.3 7.31 4.6^60 2.3 0.50 0.1 11/133 200 183 396P 23 362P 14 19.8P 1.2 24.46 0.9^16.8 3.4 0.05 0.1 12/13
Family 31 500 466 401P 15 370P 23 8.0P 0.3 5.38 21.3^276.2 1.7 1.04 0.1 8/82 500 489 395P 24 386P 23 7.9P 0.5 7.33 4.8^62.2 2.3 0.50 0.1 8/83 200 183 412P 17 378P 24 20.6P 0.9 24.53 0.8^10.2 3.4 0.05 0.1 8/8
Family 41 500 460 402P 25 396P 1 8.0P 0.5 5.38 20.5^266.7 1.7 1.04 0.1 6/72 500 471 393P 24 370a 7.9P 0.4 7.34 4.9^63.5 2.3 0.50 0.1 6/73 200 191 400P 13 381P 12 20P 0.6 24.56 0.9^12.3 3.4 0.05 0.1 7/7
a Value computed for a single spectral frequency peak.
VOLGEO 2408 24-5-02 Cyaan Magenta Geel Zwart
S. Falsaperla et al. / Journal Volcanology and Geothermal Research 114 (2002) 419^440434

ter and LP events are available for the remainderof the LP sequence, the similarities in LP signa-tures throughout 1992 lead us to hypothesize thata similar process of incremental collapse was op-erating during the entire period. The repeated oc-currence of such collapses produced a pit crater(Calvari et al., 1994; Coltelli et al., 1998). Therelationship between seismic activity and pit cra-ter formation has been reported for other volcanicareas (e.g. Garcia et al., 1998). However, this isthe ¢rst time that a similar sequence has beenobserved on Mount Etna. This activity o¡ers aunique opportunity to study LP events in relationto changes in magma supply dynamics. Based onthe temporal relationship between seismic andvolcanic phenomena, we infer that the LP eventsrepresent pressure transients in the dike feedingthe Mount Etna eruption. We suggest that massevacuation during the sustained eruption resultedin a gradual decrease of pressure in the feederdike beneath Northeast Crater, which led to in-cremental collapse of the crater £oor. This, inturn, triggered the excitation of the segment of
feeder dike located immediately beneath North-east Crater. According to this hypothesis, theLP events originate in a shallow segment of themagma conduit beneath Northeast Crater.Fig. 10 shows the location of the crack and its
spatial relationship with the magma feeder andother features inferred from geophysical data. Us-ing electronic distance measurements, global posi-tioning system (GPS), and tilt data, Bonaccorso etal. (1994) and Bonaccorso (1996) attribute themain part of the ground deformation ¢eld totwo di¡erent sources that were active during the1991^1993 eruption. The ¢rst source is a shallowtensile fracture whose spatial location is coinci-dent with the eruptive fracture ¢eld. Micro-gra-vimetry and height change data (e.g. Rymer etal., 1993) provide further independent supportfor this interpretation. The second source is anellipsoidal depressurizing body located slightlysouthwest from the summit craters at a depth of3 km below sea level. Nunnari and Puglisi (1994)and Puglisi et al. (2000) con¢rm the presence ofthis depressurizing body based on independent
Fig. 10. Three-dimensional map of b-value (for mean earthquake magnitude) in the shallow crust beneath Mount Etna (modi¢edfrom Murru et al., 1999). The location of the £uid-¢lled crack (FFC) is shown in relation to the two ground deformation sourcesmodeled by Bonaccorso (1996) (TC= tensile crack; EDB=ellipsoidal depressurizing body). The trace of the eruptive fracture(EF), b-value anomaly (1) (Murru et al., 1999), and positions of NE Crater (NEC), station PDN (PDN), and northern rim ofValle del Bove (VBR) are also indicated.
VOLGEO 2408 24-5-02 Cyaan Magenta Geel Zwart
S. Falsaperla et al. / Journal Volcanology and Geothermal Research 114 (2002) 419^440 435

analyses of GPS data. Other evidence for this lat-ter source is provided in a study by Murru et al.(1999), who mapped b-values for local earth-quakes recorded between 1990 and 1997. Theyidenti¢ed a body with anomalously high b-valueslocated southwest of the summit craters at depthsof 4^5 km, which they interpreted as a magmachamber. Using synthetic aperture radar (SAR)data, Massonet et al. (1995) attributed the overallde£ation of Etna to a deep, depressurizing bodylocated about 2 km east of the summit craters atdepths of 12^14 km. The presence of this deepersource remains controversial (Puglisi et al., 2000).Lanari et al. (1998) reinterpreted the SAR dataafter removal of topographic e¡ects and obtaineda source located 5.7 km below sea level. In a morerecent study, Beauducel et al. (2000) concludedthat the residual fringes observed on MountEtna images after removal of the topographic ef-fects may be a tropospheric artifact.The data analyzed in our study cover a time
interval that only partially overlaps with the peri-ods considered by other studies. The deformation¢eld modeled by Bonaccorso (1996) may thus bere£ecting sources acting either concurrently, or atsuccessive times, during the eruption. Based onthe seismicity, we postulate a strict relationshipbetween a magma body located about 2^3 kmbelow sea level ^ the source for the main dikefeeding the eruptive fracture system ^ and thevolume within which LP events were generated.We suggest that LP activity was the result of mag-ma transport in a source region beneath North-east Crater. In our model, the LP source volumerepresents a part of the feeding system that linksthe deeper depressurizing magma body with thedike extending southeast along the western wall ofValle del Bove, toward the site where the surfacebreakout of lava was located.
Acknowledgements
We are grateful to Massimo Pompilio andGiovanni Macedonio for their suggestions onthermodynamic simulations. We thank MiltonGarcTes, Randy White, Javier Almendros and ananonymous reviewer for their reviews and sugges-
tions. This work was supported by GruppoNazionale per la Vulcanologia (Italy) and twoNato-CNR senior fellowships (n. 217.25 and n.217.28).
Appendix A
In our application of the £uid-¢lled crack mod-el, the basic assumption is that LP events aregenerated by a pressure disturbance in a two-phase £uid composed of liquid magma and gas.We also consider an extreme condition, in whichwe assume a £uid consisting of pure gas whoseparameters are obtained from literature data.To constrain the physical conditions of the two-
phase £uid, we assume a temperature of 1100‡Cbased on ¢eld measurements of Etna lava (Calvariet al., 1994). The values of pressure P, whichrange from 10 to 25 MPa, are based on the hypo-central depths of LP events. To set up thermody-namic parameters (Ghiorso and Sack, 1995), weuse the mean chemical composition of the lavaerupted in 1991^1993 (Armienti et al., 1994) anda water content ranging from 1 to 2 wt% follow-ing Metrich and Clocchiatti (1989).We consider four thermodynamic conditions by
taking into account the range of variation ofwater content and pressure (Table 2). Speci¢cally,conditions 1, 2, and 4 (Table 2) are representativeof £uids mostly constituted by foam, whereascondition 3 is representative of a liquid. Althoughwe ¢nd a relevant percentage of solid in two cases(conditions 1 and 2, Table 2), we neglect the pres-ence of crystals. We assume that crystals wouldnot produce marked changes in acoustic speed aslong as we are dealing with a magma that behaveslike a liquid.A bubbly liquid is characterized by a gas^vol-
ume fraction (ratio of the volume of gas to thetotal volume of the two-phase mixture) Ag =Vg/Vm6 0.1 (Martinelli, 1991). Foams are in therange 0.19 Ag9 0.9, and sprays are characterizedby Ags 0.9 (Martinelli, 1991). We estimate thevalues for gas density (bg) and liquid density (bl)compatible with physical conditions ranging froma single-phase liquid magma (condition 3, Table 2)to those of foams (conditions 1, 2, 4, Table 2).
VOLGEO 2408 24-5-02 Cyaan Magenta Geel Zwart
S. Falsaperla et al. / Journal Volcanology and Geothermal Research 114 (2002) 419^440436
The density bm of the two-phase mixture is calcu-lated as (Wylie and Streeter, 1983):
bm ¼ A gb g þ ð13A gÞb l ðA1Þ
The sound velocity of the liquid (al) is ¢xed at2.0 km/s based on measurements of basaltic melts(Murase and McBirney, 1973). The sound velocityof the foams (am) is obtained from the expression(Hsieh and Plesset, 1961):
1am
¼ 1alþ
ffiffiffiffiffiffiffiffiffiffiffiffiffiffiffiffiffiffiffiffiffiffiffiffiffiffiffibmf=ð1þ f Þ
Q mP
sðA2Þ
where j= Ag/Al, and Qm is the isentropic coe⁄cientof the mixture given by:
Q m ¼ mcpg þ clmcvg þ cl
ðA3Þ
in which cpg and cvg are the speci¢c heats of thegas at constant pressure and constant volume,respectively, cl is the speci¢c heat of the liquidmagma, and m is the mass ratio of gas to liquid.These parameters are listed in Table 2 along withthe estimated sound velocities for the four ther-modynamic conditions considered.In our model, b is related to the compressibility
of the two-phase gas^liquid mixture representingthe magma. As the compressibility of the gas bub-bles is dominant (i.e. it is three orders of magni-tude larger than that of the liquid), a reasonableapproximation for b may be obtained by neglect-ing the contribution of the liquid. Therefore, as-suming isothermal conditions and an ideal gas, bmay be roughly expressed as (Van Wijngaarden,1972; Lu et al., 1990):
bWPA g
ðA4Þ
The values of b are listed in Table 2. For ther-modynamic condition 3 (pure liquid), we use val-ues of b in the range 1.7^1.9U104 MPa that arerepresentative of experimentally determined val-ues for basaltic melts (Rivers and Carmichael,1987).
In our computations, the compressional wavevelocity K=3.4 km/s is based on results of a seis-mic tomography study by Hirn et al. (1991).Assuming the equivalence VrW between Lame¤elastic moduli in the rock (Patane' et al., 1992),we use the corresponding shear wave velocityL=2.0 km/s. Combined interpretations of gravityand deep dipole geoelectric data (Loddo et al.,1989) yield bs = 2.47 g/cm3 for volcanic rock atMount Etna. The corresponding rigidity of thesolid is W= bs L
2 = 9.9U103 MPa.Using the above parameter values, we obtain
the ratios b/W, K/am, and bm/bs for the four con-ditions listed in Table 2. The ratio b/W rangesfrom 0.0014 to 1.7172. As the dispersion curvesare not too sensitive to the actual value of thisratio (Gil Cruz and Chouet, 1997), we assume a¢xed value of b/W=0.1, within the range of varia-tion estimated. To simplify our analyses, we as-sume 1.5 and 2.0 km/s as minima and maxima forthe sound velocity of the gas^liquid mixture. Fora £uid consisting of pure gas, we use a soundvelocity of 1.0 km/s (Gil Cruz and Chouet, 1997).Accordingly, we consider the three velocity ratios,K/am = 1.7, K/am =2.3, and K/am =3.4, and threedensity ratios, bm/bs = 1.04, bm/bs = 0.56 (meanvalue of the ratios obtained in conditions 1, 2,and 3), and bm/bs = 0.05 (density ratio for £uidsmainly constituted by gas according to Gil Cruzand Chouet, 1997). The velocity and density ra-tios are then combined to re£ect conditions rep-resentative of £uids consisting of pure liquid(Model 1), foam (Model 2), and gas (Model 3),respectively (see Table 3).Finally, as the longer duration of seismograms
in Family 4 is assumed to be related to changes inthe properties of the £uid and solid that may af-fect the impedance contrast Z, we estimate Z ac-cording to Chouet (1992):
Z ¼ffiffiffiffiffiffiffiffiffiffiffiffi3W b s
bb f
sðA5Þ
where bs and bf are the densities of the solid and£uid, respectively, W is the rigidity of the solid,and b is the bulk modulus of the £uid. The resultsare reported in Table 4.
VOLGEO 2408 24-5-02 Cyaan Magenta Geel Zwart
S. Falsaperla et al. / Journal Volcanology and Geothermal Research 114 (2002) 419^440 437

References
Aki, K., 1984. Evidence for magma intrusion during the Mam-moth Lakes earthquakes of May 1980 and implications forthe absence of volcanic (harmonic) tremor. J. Geophys. Res.89, 7689^7696.
Aki, K., Richards, P.G., 1980. Quantitative Seismology:Theory and Methods, Vol. 1. Freeman, New York, 560 pp.
Armienti, P., Innocenti, F., Petrini, R., Pompilio, M., Villari,L., 1989. Petrology and Sr^Nd isotope geochemistry of re-cent lavas from Mount Etna: bearing on the volcano feedingsystem. J. Volcanol. Geotherm. Res. 39, 315^327.
Armienti, P., Pareschi, M.T., Innoccenti, F., Pompilio, M.,1994. E¡ects of magma storage and ascent on the kineticsof crystal growth. The case of the 1991^93 Mount Etnaeruption. Contrib. Mineral. Petrol. 115, 402^414.
Barberi, F., Carapezza, M.L., Valenza, M., Villari, L., 1993.The control of lava £ow during 1991^1992 eruption ofMount Etna. J. Volcanol. Geotherm. Res. 56, 1^34.
Beauducel, F., Briole, P., Froger, J.L., 2000. Volcano-widefringes in ERS synthetic aperture radar interferograms ofEtna (1992^1998): deformation or tropospheric e¡ect?J. Geophys. Res., 105, 16391^16402.
Bonaccorso, A., Velardita, R., Villari, L., 1994. Ground defor-mation modeling of geodynamic activity associated with the1991^93 Etna eruption. Acta Vulcanol. 4, 87^96.
Bonaccorso, A., 1996. Dynamic inversion of ground deforma-tion data for modelling volcanic sources (Etna 1991^1993).Geophys. Res. Lett. 23, 451^454.
Bonaccorso, A., Ferrucci, F., Patane', D., Villari, L., 1996. Fastdeformation processes and eruptive activity at Mount Etna(Italy). J. Geophys. Res. 101, 17467^17480.
Caccamo, D., Neri, G., Sarao', A., Wyss, M., 1996. Estimatesof stress direction by inversion of earthquake fault planesolutions in Sicily. Geophys. J. Int. 125, 857^868.
Calvari, S., Coltelli, M., Pompilio, M., Neri, M., 1994. 1991^1993 Etna eruption: geological observation and chronologyof eruptive events. Acta Vulcanol. 4, 1^14.
Chouet, B.A., 1985. Excitation of buried magmatic pipe: aseismic source model for volcanic tremor. J. Geophys. Res.90, 1881^1893.
Chouet, B.A., 1986. Dynamics of a £uid-driven crack in threedimensions by the ¢nite di¡erence method. J. Geophys. Res.91, 13967^13992.
Chouet, B.A., 1988. Resonance of a £uid-driven crack: radia-tion properties and implications for the source of long-peri-od events and harmonic tremor. J. Geophys. Res. 93, 4375^4400.
Chouet, B.A., 1992. A seismic model for the source of long-period events and harmonic tremor. In: Gasparini, P., Scar-pa, R., Aki, K. (Eds.), Volcanic Seismology. IAVCEI Proc.in Volcanology, 3, Springer-Verlag, Berlin, pp. 133^156.
Chouet, B.A., Dawson, P., Falsaperla, S., Privitera, E., 1994a.A characterization of long-period events recorded during theeruptive activity of Mount Etna, Italy, in 1992. Acta Vul-canol. 4, 81^86.
Chouet, B.A., Page, R.A., Stephens, C.D., Lahr, J.C., Powell,
J.A., 1994b. Precursory swarms of long-period events atRedoubt volcano (1989^1990), Alaska: their origin anduse as a forecasting tool. J. Volcanol. Geotherm. Res. 62,95^136.
Chouet, B.A., 1996. Long-period volcano seismicity: its sourceand use in eruption forecasting. Nature 300, 309^316.
Chouet, B.A., Saccorotti, G., Martini, M., Dawson, P.B., DeLuca, G., Milana, G., Scarpa, R., 1997. Source and pathe¡ects in the wave¢elds of tremor and explosions at Strom-boli volcano, Italy. J. Geophys. Res. 102, 15129^15150.
Cocina, O., Neri, G., Privitera, E., Spampinato, S., 1997.Stress tensor computation in the Mount Etna area (SouthernItaly) and tectonic implication. J. Geodyn. 23, 109^127.
Coltelli, M., Pompilio, M., Del Carlo, P., Calvari, S., Pannuc-ci, S., Scribano, V., 1998. Etna: eruptive activity. Acta Vul-canol. 10, 141^149.
Cristofolini, R., Fichera, R., Patane', G., Rasa', R., 1979. In-tegrazione di dati geologici, geo¢sici e petrologici per lastesura di un pro¢lo crostale in corrispondenza dell’Etna.Boll. Soc. Geol. It. 98, 239^247.
Crosson, R.S., Bame, D.A., 1985. A spherical source model forlow-frequency volcanic earthquakes. J. Geophys. Res. 90,10237^10247.
Facenna, C., Davy, P., Brun, J.P., Funicello, R., Giardini, D.,Mattei, M., Nalpas, T., 1996. The dynamics of back-arcextension: an experimental approach to the opening of theTyrrhenian sea. Geophys. J. Int. 126, 781^795.
Falsaperla, S., Privitera, E., Spampinato, S., Cardaci, C., 1994.Seismic activity related to the December 14, 1991 MountEtna eruption. Acta Vulcanol. 4, 63^73.
Fehler, F., Chouet, B.A., 1982. Operation of a digital seismicnetwork on Mount St. Helens volcano and observations oflong-period events that originate under the volcano. Geo-phys. Res. Lett. 9, 1017^1020.
Fehler, M., 1983. Observations of volcanic tremor at MountSt. Helens volcano. J. Geophys. Res. 88, 3476^3484.
Ferrazzini, V., Aki, K., Chouet, B.A., 1991. Characteristics ofseismic waves composing Hawaiian volcanic tremor andgas^piston events observed by a near-source array. J. Geo-phys. Res. 93, 4367^4373.
Ferrucci, F., Patane', D., 1993. Seismic activity accompanyingthe outbreak of the 1991^1993 eruption of Mount Etna(Italy). J. Volcanol. Geotherm. Res. 57, 125^135.
Flinn, E.A., 1965. Signal analysis using rectilinearity and di-rection of particle motion. Proc. IEEE 53, 1974^1976.
Frazzetta, G., Villari, L., 1981. The feeding of the eruptiveactivity of Etna volcano: the regional stress ¢eld as a con-straint to magma uprising and eruption. Bull. Volcanol. 44,269^282.
Fremont, M.J., Malone, S.D., 1987. High precision relativelocations of earthquakes at Mount St. Helens, Washington.J. Geophys. Res. 92, 10223^10236.
Garcia, M., Rubin, K.H., Norman, M.D., Rhodes, J.M., Gra-ham, D.W., Muenow, D., Spencer, K., 1998. Petrology andgeochronology of basalt breccia from the 1996 earthquakeswarm of Loihi Seamount, Hawaii: magmatic history of its1996 eruption. Bull. Volcanol. 59, 577^592.
VOLGEO 2408 24-5-02 Cyaan Magenta Geel Zwart
S. Falsaperla et al. / Journal Volcanology and Geothermal Research 114 (2002) 419^440438

Ghiorso, M.S., Sack, R.O., 1995. Chemical mass transfer inmagmatic processes IV: A revised and internally consistentthermodynamic model for the interpolation and extrapola-tion of liquid solid equilibria in magmatic system at elevatedtemperatures and pressures. Contrib. Mineral. Petrol. 119,197^212.
Ghisetti, F., 1979. Relazione tra strutture e fasi trascorrenti edistensive lungo i sistemi Messina-Fiumefreddo, Tindari-Le-tojanni e Alia-Malvagna (Sicilia nord-orientale): uno studiomicrotettonico. Geol. Romana 18, 23^58.
Ghisetti, F., 1984. Recent deformation and the seismogenicsource in the Messina Strait (Southern Italy). Tectono-physics 109, 191^208.
Gil Cruz, F., Chouet, B.A., 1997. Long-period events, themost characteristic seismicity accompanying the emplace-ment and extrusion of a lava dome in Galeras volcano,Colombia, in 1991. J. Volcanol. Geotherm. Res. 77, 121^158.
Hirn, A., Nercessian, A., Sapin, M., Ferrucci, F., Wittlinger,G., 1991. Seismic heterogeneity of Mount Etna: structureand activity. Geophys. J. G. Int. 105, 139^153.
Hsieh, H.Y., Plesset, M.S., 1961. On the propagation of soundin a liquid containing gas bubbles. Phys. Fluids 4, 970^975.
Jurkevics, A., 1988. Polarization analysis of tree-componentdata. Bull. Seism. Soc. Am. 78, 1725^1743.
Kumagai, H., Chouet, B.A., 1999. The complex frequency oflong-period events as probes of £uid compositions beneathvolcanoes. Geophys. J. Int. 138, F7^F12.
Kumagai, H., Chouet, B.A., 2000. Acoustic properties of acrack containing magmatic or hydrothermal £uids. J. Geo-phys. Res., 105, 25493^25512.
Lahr, J.C., 1989. HYPOELLIPSE/Version 2.0: A computerprogram for determining local earthquake hypocentral pa-rameters, magnitude, and ¢rst motion pattern. U.S. Geol.Surv. Open-¢le rep. 95, 89^116.
Lanari, R., Lundgren, P., Sansosti, E., 1998. Dynamic defor-mation of Etna volcano observed by satellite radar interfer-ometry. Geophys. Res. Lett. 25, 1541^1544.
Lanzafame, G., Bousquet, J.C., 1997. The Maltese escarpmentand its extension from Etna to Aeolian Islands (Sicily): im-portance and evolution of a lithosphere discontinuity. ActaVulcanol. 9, 113^120.
Loddo, M., Patella, D., Quarto, R., Ruina, G., Tramacere, A.,Zito, G., 1989. Application of gravity and deep dipole geo-electrics in the volcanic area of Mount Etna (Sicily). J. Vol-canol. Geotherm. Res. 39, 17^39.
Lo Giudice, E., Rasa', R., 1986. The role of the NNW struc-tural trend in the recent geodynamic evolution of north-east-ern Sicily and its volcanic implications in the Etnean area.J. Geodyn. 5, 309^330.
Lu, N.Q., Prosperetti, A., Yoon, S.W., 1990. Underwater noiseemissions from bubble clouds. IEEE J. Oceanic Eng. 15,275^281.
Malinverno, A., Ryan, W.B.F., 1986. Extension in the Tyrrhe-nian sea and shortening in the Apennines as result of arcmigration driven by sinking of the lithosphere. Tectonics 5,227^245.
Malone, S.D., 1983. Volcanic earthquakes: examples fromMount St. Helens. In: Kanamori, H., Boschi, E. (Eds.),Earthquakes: Observations, Theory and Interpretation. El-sevier/North-Holland, Amsterdam, pp. 436^455.
Martinelli, B., 1991. Compressible Flow and Volcanic Tremor.Swiss Seismol. Serv., Inst., Geophys. ETH Zurich, Contrib.9376.
Massonet, D., Briole, P., Arnaud, A., 1995. De£ation ofMount Etna monitored by spaceborne radar interferometry.Nature 375, 567^570.
Metrich, N., Clocchiatti, R., 1989. Melt inclusion investigationof the volatile behavior in historical alkali basaltic magma ofMount Etna. Bull. Volcanol. 51, 185^198.
Minakami, T., 1974. Seismology of volcanoes in Japan. In:Civetta, L., Gasparini, P., Luongo, G., Rapolla, A. (Eds.),Physical Volcanology. Elsevier, Amsterdam, pp. 1^28.
Monaco, C., Tapponnier, P., Tortorici, L., Gillot, P.Y., 1997.Late Quaternary slip rates on the Acireale^Piedimonte nor-mal fault and tectonic origin of Mount Etna (Sicily). EarthPlanet. Sci. Lett. 147, 125^139.
Murase, T., McBirney, A.R., 1973. Properties of some com-mon igneous rocks and their melts at high temperature.Geol. Soc. Am. Bull. 84, 3563^3592.
Murru, M., Montuori, C., Wyss, M., Privitera, E., 1999. Thelocation of magma chambers at Mt. Etna, Italy, mapped byb-values. Geophys. Res. Lett. 26, 2553^2556.
Nunnari, G., Puglisi, G., 1994. The global position system asan useful technique for measuring ground deformation involcanic area. J. Volcanol. Geotherm. Res. 61, 267^280.
Okada, H., Watanabe, H., Yamashita, H., Yokoyama, I.,1981. Seismological signi¢cance of the 1977^1978 eruptionsand the magma intrusion process of Usu volcano, Hokkai-do. J. Volcanol. Geotherm. Res. 9, 311^334.
Patane', D., De Miguel, F., Ibanez, J.M., 1992. A basic pro-gram based on the Wadati diagram to calculate earthquakesfocal depth and P and S waves velocities: application in theEtnean area. C.N.R. Istituto Internazionale di Vulcanologia,Open File Rep., 3/91, p. 5.
Patane', D., Privitera, E., Ferrucci, F., Gresta, S., 1994. Seismicactivity leading to the 1991^93 eruption of Mount Etna andits tectonic implications. Acta Vulcanol. 4, 47^56.
Pollitz, F.F., 1991. Two stage model of African absolute mo-tion during the last 30 million years. Tectonophysics 194,91^106.
Puglisi, G., Bonforte, A., Maugeri, S.R., 2000. Ground defor-mation patterns on Mt. Etna, between 1992 and 1994, in-ferred from GPS data. Bull. Volcanol., in press.
Rivers, M.L., Carmichael, I.S.E., 1987. Ultrasonic studies ofsilicate melts. J. Geophys. Res. 92, 9247^9270.
Rymer, H., Murray, J.B., Brown, G.C., Ferrucci, F., McGuire,W.J., 1993. Mechanisms of magma eruption and emplace-ment at Mt Etna between 1989 and 1992. Nature 361, 439^441.
Seidl, D., Schick, R., Riuscetti, M., 1981. Volcanic tremors atEtna: a model for hydraulic origin. Bull. Volcanol. 44, 43^56.
Stephens, C.D., Chouet, B.A., Page, R.A., Lahr, J.C., Power,
VOLGEO 2408 24-5-02 Cyaan Magenta Geel Zwart
S. Falsaperla et al. / Journal Volcanology and Geothermal Research 114 (2002) 419^440 439

J.A., 1994. Statistical forecasting of repetitious dome failuresduring the waning eruption of Redoubt volcano, Alaska,February^April 1990. J. Volcanol. Geotherm. Res. 62,153^182.
Stix, J., Torres, R.C., Narva¤ez, L., Corte¤s, G.P., Raigosa, J.A.,Go¤mez, D.M., Castonguay, R., 1997. Volcanic tremor andshort-term prediction of eruptions. J. Volcanol. Geotherm.Res. 77, 285^304.
Van Wijngaarden, 1972. One-dimensional £ow of liquids con-taining small gas bubbles. Annu. Rev. Fluid Mech. 4, 369^396.
Wylie, E.B., Streeter, V.L., 1983. Fluid Transients. McGraw-Hill, New York, 384 pp.
Yuen, C.K., 1978. Quadratic windowing in the segment aver-aging method for power spectrum computation. Technomet-rics 20, 196^200.
VOLGEO 2408 24-5-02 Cyaan Magenta Geel Zwart
S. Falsaperla et al. / Journal Volcanology and Geothermal Research 114 (2002) 419^440440