a double seismic array experiment on mt. etna
TRANSCRIPT

A Double Seismic Array Experiment on Mt. Etna
Osservatorio Vesuviano
Open file report n 2-2000
Participant institutions
Osservatorio Vesuviano
Mario Castellano*, Marco Capello, Edoardo Del Pezzo**, Flora Giudicepietro,
Mario La Rocca, Marcello Martini, Simona Petrosino, Gilberto Saccorotti.
Instituto Andaluz de Geofisica - Universidad de Granada
Jesus Ibanez, Miguel Abril, Javier Almendros, Enrique Carmona, Carmen
Martinez, Jaime Vilchez.
Progetto POSEIDON – INGV
Eugenio Privitera, Salvo Alparone , Giuseppe Di Grazia, Stefano Gresta.
*Field Survey Organiser
**Responsible of the Project
CNR-GNV Grant # 2-13-3-46-23 Osservatorio Vesuviano
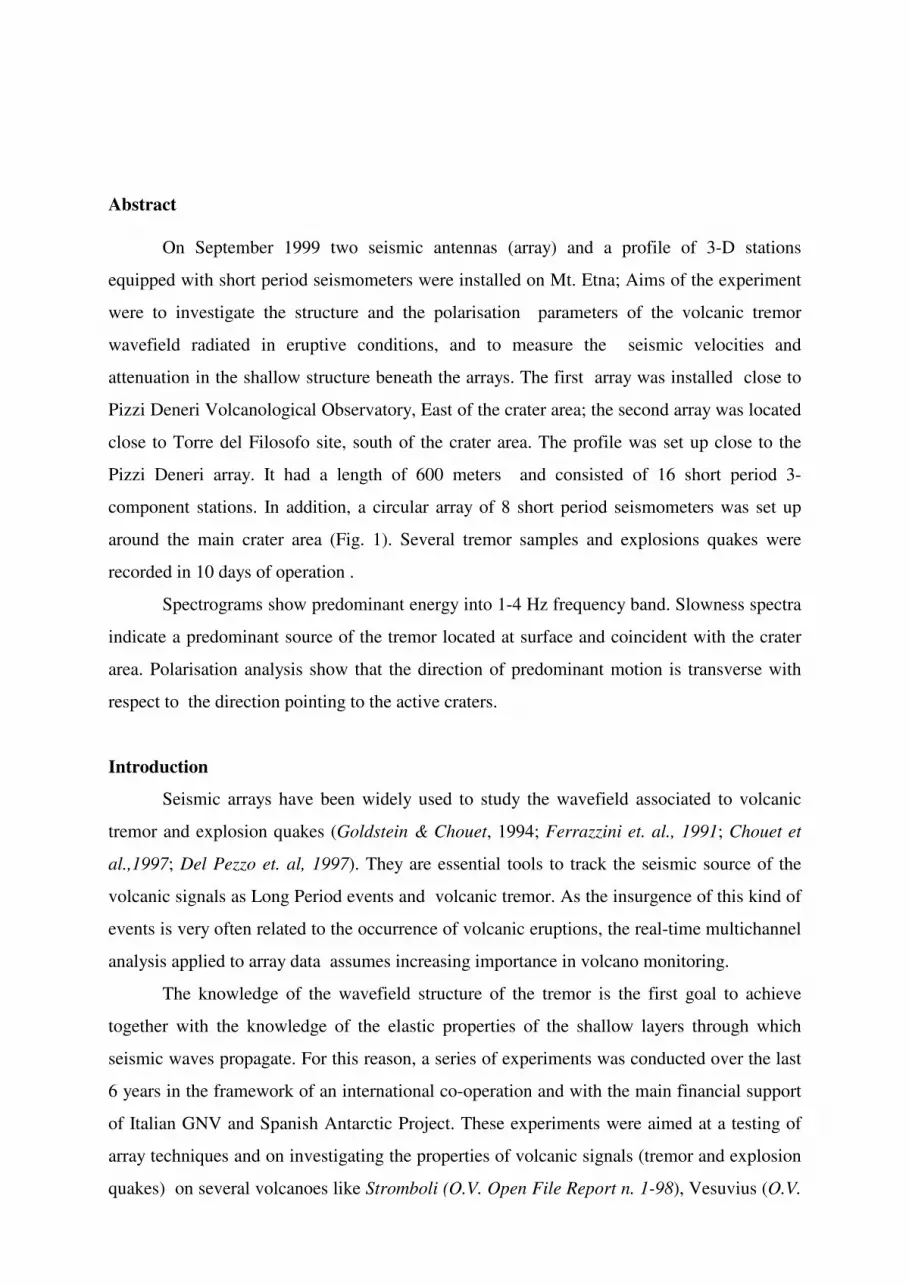
Abstract
On September 1999 two seismic antennas (array) and a profile of 3-D stations
equipped with short period seismometers were installed on Mt. Etna; Aims of the experiment
were to investigate the structure and the polarisation parameters of the volcanic tremor
wavefield radiated in eruptive conditions, and to measure the seismic velocities and
attenuation in the shallow structure beneath the arrays. The first array was installed close to
Pizzi Deneri Volcanological Observatory, East of the crater area; the second array was located
close to Torre del Filosofo site, south of the crater area. The profile was set up close to the
Pizzi Deneri array. It had a length of 600 meters and consisted of 16 short period 3-
component stations. In addition, a circular array of 8 short period seismometers was set up
around the main crater area (Fig. 1). Several tremor samples and explosions quakes were
recorded in 10 days of operation .
Spectrograms show predominant energy into 1-4 Hz frequency band. Slowness spectra
indicate a predominant source of the tremor located at surface and coincident with the crater
area. Polarisation analysis show that the direction of predominant motion is transverse with
respect to the direction pointing to the active craters.
Introduction
Seismic arrays have been widely used to study the wavefield associated to volcanic
tremor and explosion quakes (Goldstein & Chouet, 1994; Ferrazzini et. al., 1991; Chouet et
al.,1997; Del Pezzo et. al, 1997). They are essential tools to track the seismic source of the
volcanic signals as Long Period events and volcanic tremor. As the insurgence of this kind of
events is very often related to the occurrence of volcanic eruptions, the real-time multichannel
analysis applied to array data assumes increasing importance in volcano monitoring.
The knowledge of the wavefield structure of the tremor is the first goal to achieve
together with the knowledge of the elastic properties of the shallow layers through which
seismic waves propagate. For this reason, a series of experiments was conducted over the last
6 years in the framework of an international co-operation and with the main financial support
of Italian GNV and Spanish Antarctic Project. These experiments were aimed at a testing of
array techniques and on investigating the properties of volcanic signals (tremor and explosion
quakes) on several volcanoes like Stromboli (O.V. Open File Report n. 1-98), Vesuvius (O.V.

Open File Report n. 1-99), Deception Island (O.V. Open File Report n. 3-99 and n. 1 2000),
Teide (Almendros et al., 2000) and the present one at Mt. Etna.
The present report provides information about the array set up and operation,
instrument calibration and data format.
Site selection
A preliminary survey was carried out on the end of May, 1999, in order to select the
sites for the installation of the two seismic antennas and the profile. We searched two flat and
geologically homogeneous zones, about 300 meters wide, positioned at about 90° apart with
respect to the position of the source, which was assumed to be located in close proximity of
the crater area (fig.1). Using this geometry, the estimate of the spatial location of the source is
optimised, as shown in O.V open file report n. 1-98 and in Saccorotti et al.,1998. The area
around Pizzi Deneri Volcanological Observatory (area1) and the area around Torre del
Filosofo site (area 2) resulted the most suitable for the installation. Area 1 was selected also
for the deployment of the seismic profile, due to the easier accessibility.
Instrument positioning and installation. Array configuration.
1. Time schedule of the instrument installation
September 8. Installation of array P (fig. 2) at Pizzi dei Neri site
September 9 – September 10 . Installation of array abc+L (fig. 3) at Pizzi Deneri site
September 10 – September 11. Installation of array def (fig. 4)at Torre del Filosofo
September 16 – September 17. Installation of array abc+U(fig. 5) at Pizzi Deneri
September 17 – “Circular” (fig. 6) array around craters.
2. Co-ordinates of all the array stations except the array “Circular” were measured using a
total EDM station and referred to an absolute GPS benchmark located nearby. Array
“Circular” co-ordinates were obtained directly by GPS positioning. Uncertainties are less
than 5 cm for the co-ordinates measured with the total station, and about 100 meters for
the circular array station co-ordinates. In Table 1 is reported the list of the co-ordinates of
all the array configurations.
Data collection and storage.
Array abc and def are composed by MARK L-4 C sensors cable-connected to 8
channel data loggers. The instruments were designed by Ramon Ortiz and G. Alguacil, and

described in Del Pezzo et al. (1997) where the original references (in spanish) can be found.
Details about the electronic scheme are reported in Ortiz et al. (1997). Seismic signals are
amplified, sampled with a 16 bits A/D converter and anti-alias filtered before the storage onto
the hard disk of a portable P.C. Time synchronisation is performed by a GPS antenna
connected to the data logger.
Array P,U and “Circular” are equipped with 3-channel, MARS LITE data loggers,
and 3-D, 4.5 electronically extended to 1 Hz sensors.
The time operation of the instruments is reported in Fig. 7 and 8.
Transfer function of the instruments.
Calibration of Mars Lite seismometers has been checked using a Teledune Geotech 3-
D S13 seismometer as reference. A long noise sample has been recorded both at Mars-Lite
seismometer and S-13 using identical data loggers. The ratio between the Fourier Transforms
of the noise samples at homologue components is the ratio of the transfer functions of the
sensors. S-13 (critically damped) has been calibrated through the access to the moving mass
(see S-13 operation and maintenance manual) . Results show that S-13 and MARS-Lite
seismometers have the same amplitude response at frequencies higher than 1 Hz, as shown in
fig. 9 where the amplitude spectral ratio between the two vertical components is plotted as a
function of frequency. Phase responses of the two instruments are compared in fig. 10.
Velocity transduction results of 400 V/m/s, coincident with that reported in the Mars-Lite data
sheet.
Mark L4 seismometers were damped at 65% critical damping (arrays abc and def).
Amplitude and phase response curves are reported in fig. 11.
Description of the Etna eruptive activity during the experiment.
Etna volcano was active during the experiment . This eruptive phase started on January
1999 with a moderate activity at Bocca Nuova. Seven eruptive episodes (January 5 –
February 4) occurred at S-E crater and terminated with the opening of a fracture at the cone
base, directed toward S-E. Strombolian activity together with lava fountains accompanied a
lava flow started on February 4, which rapidly reached Valle del Bove. The lava flow
continued for the whole period of the experiment. On September 4 new activity started at
Voragine crater, characterised by important lava fountains (information and maps on line at
http://193.204.162.114/gnv/index-etna.html)

Purposes and Methods.
The experiment was aimed at a) the investigation of the kinematic properties of the
volcanic tremor wavefield from frequency-slowness analysis; b) the constrain of the location
of its source, c) the measurement of the seismic attenuation and d) the study of the
polarisation properties of the tremor wavefield.
Slowness spectra can be calculated using time or frequency domain techniques. In time
domain we use the so called Zero-Lag Cross-correlation technique (Del Pezzo et al., 1997); in
frequency domain we use MUSIC algorithm (Goldstein and Archuleta, 1987) .
The double array configuration will allow the space tracking of the source using the
probabilistic method described in Saccorotti et al., 1998.
The Profile oriented toward the craters (L-array of fig. 3) will permit the estimate of the
spatial attenuation of tremor energy, and hence the seismic quality factor of the earth
medium.
Circular array will allow the study of the particle motion pattern of the tremor waves
around the craters. Polarisation parameters of the waves composing the tremor wavefield will
be fully investigated using the 3-D stations (La Rocca, 2000).
Application of the correlation method of Aki (1957, 1965) to both Pizzideneri and Torre
Del Filosofo arrays will allow to derive the dispersive properties of Rayleigh and Love waves,
from which a shallow velocity structure beneath the arrays may eventually be obtained.
Preliminary results
An example of data recorded at L005 station is shown in fig. 12.
The spectrogram of a sample of tremor recorded at array A shows the highest energy
concentrated between 1 and 4 Hz, with some additional bursts between 4 and 6 Hz (fig. 13) .
Preliminary frequency-slowness analysis carried out on a tremor sample recorded at
array p, shows a predominant back-azimuth in the direction of the crater area (fig.14).
Polarisation analysis shows a predominant particle motion direction around 110
degrees, approximately normal to the back-azimuth. The incidence is around 90 degrees,
showing an almost horizontal wave motion. Taken together with the high values of the
rectilinearity coefficient, these observations are suggestive of a wavefield dominated by SH-
Love (fig.15).
The correlation coefficients averaged over the array stations as a function of the
frequency have been calculated for array abc for receiver spacing of 50, 100, and 150 m (Fig.

16). The smooth thin lines superimposed to the data represent the theoretical correlation
coefficients derived from eq. 4 of Chouet et al., (1998), using the dispersion curve shown in
the last panel of the same figure. The procedure is described in Chouet et al., 1998. From this
dispersion curve the velocity model can be inferred with an inversion procedure.
Future developments
We have planned to extend the above approaches to the whole data set in order to
characterise the wavefield structure of the volcanic tremor at Etna volcano. Moreover we will
extend the same methods to the explosion quakes which in many cases were superimposed to
the background tremor radiation. The aim of this second analysis is twofold: first we could
constrain the space position of the source of the explosion quake; second, we could compare
the spectral characteristics of the volcanic tremor with those of the explosion quakes, in order
to contribute to the understanding of the explosion quake source processes. Ferrucci et al.
(1990), analyse the polarisation properties of the tremor at Etna, using a 3 stations array
located onto the south-western flanks of the volcano. They tentatively link the tremor source
to the main dyke-system of Etna and exclude the confinement of the tremor source to the only
active vent. A check of this result may be obtained by the analysis of the present data, and
particularly from the array “circular”, which would better enlighten the polarisation pattern of
the tremor around the crater area.
Acknowledgements
Orazio Consoli is gratefully acknowledged for his help at Pizzi Deneri Observatory.
Ente Parco dell’Etna is acknowledged for its NULLA OSTA for the experiment.

References
Almendros, J., Ibanez, J.M., Alguacil, G., Morales, J., Del Pezzo, E., La Rocca, M., Ortiz, R.,
Arana, V., Blanco, M.J.,2000. A double seismic antenna experiment at Teide Volcano:
existence of local seismicity and evidence for the non existence of volcanic tremor. In press
for J. Volcanol and Geoth. Res.
Aki, K., 1957. Space and time spectra of stationary stochastic waves, with special reference to
microtremors, Bull. Earthquake Res. Inst. Tokyo Univ. 25, 415-457
Aki, K., 1959 Correlational study of near earthquake waves Bull. Earthquake Res. Inst. Tokyo
Univ, 37, 207-232
Chouet B.A., Saccorotti G., Martini M., Dawson P.B., De Luca G., Milana G. and Scarpa R.,
1997. Source and path effects in the wavefields of tremor and explosions at Stromboli
volcano, Italy. J. Geophys. Res., 102, 15129-15150
Chouet, B.A., De Luca, G., Dawson, P.B., Milana, G., Martini, M. and Scarpa R., 1998.
Shallow velocity structure of Stromboli volcano, Italy, derived from small-aperture array
measurements of Strombolian tremor. Bull. Seism. Soc. Amer., 88, 653-666.
Del Pezzo E., La Rocca M., Ibanez J., 1997. Observation of high-frequency scattered waves
using dense arrays at Teide volcano. Bull. Seism. Soc. Amer., 87,6,1637-1647.
Ferrazzini, V.,Aki, K., Chouet, B. 1991. Characteristics of seismic waves composing Hawaian
volcanic tremor and gas-piston events observed by a near source array, J. Geophys. Res.,96,
6199-6209
Ferrucci, F.,Godano, C., Pino, N.A. Approach to the volcanic tremor by covariance
analysis:application to the 1989 eruption of Mt. Etna (Sicily), 1990. Geophys. res. Letters,
17,12, 2425-2428.
Goldstein, P., and Archuleta, R.J., 1987. Array analysis of seismic signals. Geophys. Res.
Lett., 14, 13-16.
Goldstein P., Chouet B., 1994. Array measurements and modeling of a source of shallow
volcanic tremor at Kilauea Volcano, Hawaii. J. Geophys. Res. , 99:2637-2652
La Rocca, M. 2000. Multichannel array techniques applied to volcanic hazard. Ph.D. Thesis.
University of Salerno. Science faculty.
La Rocca M., Petrosino S., Saccorotti G., Simini M., Ibanez J., Almendros J. and Del Pezzo
E., 1998. Location of the source and shallow velocity model deduced from the explosion

quakes recorded by two seismic antennas at Stromboli volcano. Phys. Chem. of the Earth
(Invited paper- in press)
Ortiz, R., Garcia, A., Astiz, M., 1997 Estacion de registro sismico continuo. Instrumentacion
en volcanologia vol II. Ortiz (edt) Report Projecto Teide, Volcan lab europeo. CSIC, Madrid,
pp.103-107
O.V. Open File Reports: all availble on line at http://www.osve.unina.it
Saccorotti, G., Chouet, B.A., Martini, M. and Scarpa R., 1998. Bayesian Statistics applied to
the location of the source of explosions at Stromboli volcano, Italy. Bull. Seism. Soc.
Amer.,5,1099-1111.
Figure Captions
Fig. 1 . Sketch map of the Etna area around craters. In the zones of Torre del Filosofo and
Pizzi Deneri the array configurations are plotted together. In particular at Pizzi Deneri we
overplot 3 different configurations, used separately in different time periods. Note that the
array represented by black triangles, (see details in the next Fig. 6) , is in reality composed by
8 stations: the northernmost and southernmost stations are not represented by black triangles
as their symbol would have covered part of the semicircular array configurations.
Fig. 2 . Sketch map of array P at Pizzi Deneri site. Mars Lite stations were used in this
configuration.
Fig. 3 . Array abc and L (profile) at Pizzi Deneri site. L array was made by Mars Lite. abc is
composed by 3 8-channels data loggers, connected to MARK L4 sensors (see text).
Fig. 4 . Array def, at Torre del Filosofo site. Configuration is similar to and instruments are
the same of array abc.
Fig. 5 . Array abc and U. Mars lite stations were deployed in a tripartite profile configuration.
This configuration was called MEDUSA.
Fig. 6 . Array “circular”. This configuration was obtained using Mars-Lite stations.
Fig. 7 . Time table of the overall operation for array abc and def
Fig. 8 . Time table for the overall operation of a) array P, b) array L, c) array R and d) array U.
Fig. 9 . Spectral ratio between long duration noise samples recorded at the same site, using
the same data logger connected to a S13 couple (1 vertical and 1 horizontal) and to a 3-D
Mars-lite seismometer.
Fig. 10 . Phase response of Mars lite and vertical S13, reported for comparison.

Fig. 11 Phase and amplitude response for the overall instrument chain used for abc and def
arrays.
Fig. 12 . Example of 4-hours continuous data recording. Filtering between 0.1 and 10 Hz is
applied in order to reduce the high frequency noise. Vertical lines are the minute marks.
Fig. 13 . Spectrogram of a tremor sample. The spectral power is normalised to the maximum.
The grey scale evidences along the sample a maximum power between 1.5 and 4.5 Hz.
Fig. 14 Slowness spectrum obtained using MUSIC method applied to a tremor sample
recorded at array abc. Power is reproduced by the grey scale. Maximum power is compatible
with the direction of craters.
Fig. 15 . Polarisation parameters as a function of lapse time along the same tremor sample of
figure 13. First panel from the top shows the particle motion dominant direction. The second
represents the dominant incidence angle. The third reports Rectilinearity and the largest
eigenvalue of the co-variance matrix. All quantities are plotted as a function of the lapse time
along the sample.
Fig 16 . Correlation coefficient averaged over azimuth for different station spacing. This data
permitted to estimate the dispersion curve, shown in the panel below, from which a velocity
model can be obtained using an inversion scheme.

Table 1
Station lat. deg.
lat. min.
lat. sec. lon. deg.
lon. min.
lon. sec Cartesian Y axis (km)
Cartesian X axis(km)
u05 37 45 53,8193 15 0 54,6124 4180,58 1336,53
u04 37 45 54,8492 15 0 53,0056 4180,61 1336,49
u03 37 45 55,8518 15 0 51,4092 4180,64 1336,45
u02 37 45 56,868 15 0 49,8093 4180,67 1336,41
u01 37 45 58,049 15 0 47,9244 4180,71 1336,36
u010 37 45 59,6008 15 0 54,5815 4180,76 1336,53
u09 37 45 59,4498 15 0 52,9472 4180,75 1336,49
u08 37 45 59,0378 15 0 51,2238 4180,74 1336,45
u07 37 45 59,1614 15 0 49,6994 4180,74 1336,41
u06 37 45 59,0241 15 0 48,2369 4180,74 1336,37
za 37 45 58,873 15 0 46,6129 4180,74 1336,33
4a 37 45 59,1751 15 0 44,6045 4180,74 1336,28
zb 37 46 0,39734 15 0 45,9332 4180,78 1336,32
4c 37 45 57,28 15 0 46,2387 4180,69 1336,32
5c 37 45 55,7007 15 0 45,8714 4180,64 1336,31
6c 37 45 54,0939 15 0 45,4937 4180,59 1336,3
zc 37 45 57,7606 15 0 45,1263 4180,7 1336,3
7c 37 45 56,6345 15 0 43,6466 4180,67 1336,26
8c 37 45 55,5222 15 0 42,1635 4180,63 1336,22
5a 37 45 58,461 15 0 42,5686 4180,72 1336,23
6a 37 45 58,2413 15 0 40,5396 4180,72 1336,18
7a 37 46 0,4248 15 0 43,0115 4180,78 1336,24
8a 37 46 1,20758 15 0 41,2296 4180,81 1336,2
7b 37 46 1,92169 15 0 45,2499 4180,83 1336,3
8b 37 46 3,47351 15 0 44,5599 4180,88 1336,28
4b 37 46 0,47974 15 0 46,9906 4180,78 1336,34
5b 37 46 2,07275 15 0 47,3579 4180,83 1336,35
6b 37 46 3,6795 15 0 47,7322 4180,88 1336,36
L001 37 46 3,95416 15 0 51,6975 4180,89 1336,46
L002 37 46 2,93793 15 0 50,6847 4180,86 1336,43
L003 37 46 1,92169 15 0 49,6616 4180,83 1336,41
L004 37 46 0,90546 15 0 48,6488 4180,8 1336,38
L005 37 45 59,903 15 0 47,6292 4180,77 1336,36
L006 37 45 58,873 15 0 46,6129 4180,74 1336,33
L007 37 45 57,8568 15 0 45,6001 4180,7 1336,31
L008 37 45 56,8543 15 0 44,5805 4180,67 1336,28
L009 37 45 55,8243 15 0 43,5642 4180,64 1336,26
L010 37 45 54,8218 15 0 42,5446 4180,61 1336,23
L011 37 45 53,8055 15 0 41,5318 4180,58 1336,21
L012 37 45 52,7756 15 0 40,5087 4180,55 1336,18
L013 37 45 51,7731 15 0 39,4959 4180,52 1336,16
L014 37 45 50,7568 15 0 38,4762 4180,49 1336,13
L015 37 45 49,7406 15 0 37,46 4180,45 1336,11
L016 37 45 48,7244 15 0 36,4403 4180,42 1336,08
zd 37 43 57,6526 15 0 29,7455 4177,01 1335,92
6f 37 43 59,8224 15 0 24,4103 4177,07 1335,78
5f 37 43 59,0945 15 0 26,1887 4177,05 1335,83
4f 37 43 58,3804 15 0 27,9568 4177,03 1335,87

2f 37 43 59,3417 15 0 27,6203 4177,06 1335,86
3f 37 44 0,4541 15 0 26,2127 4177,09 1335,83
8f 37 44 1,89606 15 0 27,0298 4177,14 1335,85
7f 37 44 0,4953 15 0 27,919 4177,1 1335,87
zf 37 43 59,0808 15 0 28,8288 4177,05 1335,89
2d 37 44 1,60767 15 0 28,9593 4177,13 1335,9
6d 37 44 2,41791 15 0 30,6931 4177,15 1335,94
5d 37 44 0,82489 15 0 30,3806 4177,11 1335,93
4d 37 43 59,1083 15 0 30,669 4177,05 1335,94
7d 37 43 59,9597 15 0 32,6363 4177,08 1335,99
8d 37 44 1,08582 15 0 34,0679 4177,11 1336,02
3d 37 43 59,4928 15 0 34,2773 4177,06 1336,03
8ee 37 43 57,9135 15 0 35,8704 4177,02 1336,07
7ee 37 43 57,8311 15 0 33,8173 4177,01 1336,02
ze 37 43 57,7487 15 0 31,7608 4177,01 1335,97
4ee 37 43 56,9247 15 0 31,572 4176,99 1335,96
5ee 37 43 56,2106 15 0 33,3435 4176,96 1336
6ee 37 43 55,4553 15 0 35,1872 4176,94 1336,05
3ee 37 43 57,0346 15 0 34,7443 4176,99 1336,04
p101 37 45 58,873 15 0 46,6129 4180,74 1336,33
p102 37 45 57,8293 15 0 45,5692 4180,7 1336,31
p103 37 45 56,8131 15 0 44,5118 4180,67 1336,28
p104 37 45 55,7968 15 0 43,4681 4180,64 1336,25
p107 37 45 57,3898 15 0 42,0399 4180,69 1336,22
p106 37 45 57,8842 15 0 43,5642 4180,7 1336,26
p105 37 45 58,3786 15 0 45,0817 4180,72 1336,29
p108 37 45 58,7769 15 0 44,9856 4180,73 1336,29
p109 37 45 58,6807 15 0 43,3376 4180,73 1336,25
p110 37 45 58,6121 15 0 41,6966 4180,73 1336,21
p113 37 46 0,15015 15 0 41,9128 4180,77 1336,22
p112 37 45 59,7107 15 0 43,4784 4180,76 1336,26
p111 37 45 59,2987 15 0 45,0577 4180,75 1336,29
p114 37 45 59,7794 15 0 45,4216 4180,76 1336,3
p115 37 46 0,69946 15 0 44,2165 4180,79 1336,27
p116 37 46 1,60584 15 0 43,0252 4180,82 1336,24
R00A 37 45,96 0 15 0,84 0 4180,7 1336,43
R001 37 45,87 0 15 0,035 0 4180,53 1335,23
R002 37 45,8 0 14 59,365 0 4180,4 1334,24
R003 37 45,564 0 14 59,14 0 4179,97 1333,9
R004 37 45,12 0 14 59,13 0 4179,15 1333,89
R005 37 44,64 0 14 59,18 0 4178,26 1333,96
R006 37 44,38 0 14 59,75 0 4177,78 1334,81
R007 37 44,015 0 15 0,43 0 4177,11 1335,82
CRATER
POSITION
37 45 0 14 59 30 4178,93 1334,44

1332.0 1333.0 1334.0 1335.0 1336.0 1337.0
Longitude (km)
4176.0
4176.5
4177.0
4177.5
4178.0
4178.5
4179.0
4179.5
4180.0
4180.5
4181.0
4181.5
4182.0
La
titu
de
(km
)
Crater area
Pizzi Deneri
Torre del Filosofo
Circular Array Stations
Figure 1

-0.20 -0.10 0.00 0.10
Longitude (km)
-0.20
-0.10
0.00
0.10
La
titu
de
(km
)
p101-3D
p102-3D
p103-3D
p104-3D
p107-3D
p106-3D
p105-3D
p108-3Dp109-3Dp110-3D
p113-3D
p112-3D
p111-3D
p114-3D
p115-3D
p116-3D
Fig. 2

-0.40 -0.20 0.00 0.20
Longitude (km)
-0.40
-0.20
0.00
0.20
La
titu
de
(km
) za4a
zb-3D
4c
5c
6c
zc
7c
8c
5a6a
7a
8a
7b
8b
4b
5b
6bL001-3D
L002-3D
L003-3D
L004-3D
L005-3D
L006-3D
L007-3D
L008-3D
L009-3D
L010-3D
L011-3D
L012-3D
L013-3D
L014-3D
L015-3D
L016-3D
Fig. 3

-0.30 -0.20 -0.10 0.00 0.10
Longitude (km)
-0.10
0.00
0.10
0.20
0.30
La
titu
de
(km
)
zd-3D
6f
5f
4f
2f
3f
8f
7f
zf-3D
2d
6d
5d
4d
7d
8d
3d
8ee7eeze-3D
4ee
5ee
6ee
3ee
Fig. 4
-0.20 -0.10 0.00 0.10 0.20
Longitude (km)
-0.20
-0.10
0.00
0.10
0.20
La
titu
de
(km
)
u05-3D
u04-3D
u03-3D
u02-3D
u01-3D
u010-3Du09-3D
u08-3Du07-3Du06-3Dza
4a
zb-3D
4c
5c
6c
zc-3D
7c
8c
5a6a
7a
8a
7b
8b
4b
5b
6bL001-3D
L002-3D
L003-3D
L004-3D
L005-3D
L006-3D
Fig 5

87 88 89 90 91
Longitude (km)
81
82
83
84
85
Latitu
de (
km
)
R00AM
R001MR002M
R003M
R004M
R005M
R006M
R007M
Fig. 6

253 254 255 256 257 258 259 260 261JULIAN DAY
F
E
D
C
B
A
Fig. 7

250 251 252 253 254 255JULIAN DAY
0
1
2
3
4
5
6
7
8
9
10
11
12
13
14
15
16
17
18
Array P time-table.
Fig. 8 (a)

252 254 256 258 260 262JULIAN DAY
0
1
2
3
4
5
6
7
8
9
10
11
12
13
14
15
16
17
18
Fig. 8 (b)
Array L time-table

258 259 260 261 262JULIAN DAY
0
1
2
3
4
5
6
7
8
9
10
Array R time-table
Fig. 8 (c)

258 259 260 261 262JULIAN DAY
0
1
2
3
4
5
6
7
8
9
10
11
12
Array U time-table
Fig. 8 (d)

0.1 1 10 100
Frequency (Hz)
0.1
1
10
Sp
ectr
al R
atio
Spectral Ratio between S13 and Mars-Lite(Vertical component)
Fig. 9

0.1 1 10
Frequency (Hz)
-2
0
2
Ph
ase
(R
ad
ian
s)
Phase ResponseVertical Mars-Lite
Horizontal Mars-Lite
Vertical S13
Fig. 10

1
0.1 1 10
Frequency (Hz)
1.00E+006
1.00E+007
1.00E+008
1.00E+009
Velo
city R
espo
nse
(cou
nts
/m/s
)
0.1 1 10
-2
0
2
Phase
(R
ad
ians)
Response Curve Amplitude
Phase
Mark L-4 5600 Ohm coil Resistanceconnected to 8-channel Data Logger
Fig. 11

2
Fig. 12
09/13/1999 12:25 Band Pass Filter 0.1 – 10 Hz

3
5 10 15 20 25 30 35 40 45
TIME (S)
0
2
4
6
8
F
R
E
Q
U
E
N
C
Y
H
Z
10-09-99 13:49:45.00 GMT VERTICAL COMPONENT
ETNA 1999 - ARRAY PIZZI DENERI
Fig. 13

4
Fig. 14

5
1.8 11.8 21.8 31.8 41.8
TIME (S)
0
90
INC
IDE
NC
E (D
EG
)
0
1
RE
CT+LE
V
0
90
180
AZIM
UTH
(D
EG
)
RECT
LEV
ETNA 1999 - ARRAY PIZZI DENERI
10-09-99 13:49:45.00 GMT ARRAY A
Fig. 15

6
50 M100 M 150 M
V=0.44*V^(-0.36)
0 2 4 6 8 10
-1
-0
0
0
1
CO
RR
ELA
TIO
N C
OE
FFIC
IEN
T
0 2 4 6 8 10FREQUENCY (HZ)
0 2 4 6 8 10FREQUENCY (HZ)
0
0.2
0.4
0.6
0.8
1
PH
AS
E V
ELO
CIT
Y (K
M/S
)
ETNA 1999 - ARRAY PIZZI DENERI
0 2 4 6 8 10
Fig. 16